Enhancing T Cell Chemotaxis and Infiltration in Glioblastoma
Dynamic Proteomic Overview of Glioblastoma Cells (A172)Exposed to Perillyl Alcohol
Juliana de Saldanha da Gama Fischer1,2, Lujian Liao2, Paulo C. Carvalho2,3, Valmir CBarbosa3, Gilberto B. Domont1, Maria da Gloria da Costa Carvalho4, and John R Yates III2,*1 Laboratory for Protein Chemistry, Chemistry Institute, and the Rio de Janeiro Proteomic Network,Federal University of Rio de Janeiro, Rio de Janeiro, Brazil2 Department of Chemical Physiology, The Scripps Research Institute, La Jolla, California, USA3 Systems Engineering and Computer Science Program, COPPE, Federal University of Rio deJaneiro, Rio de Janeiro, Brazil4 Laboratory for Control of Gene Expression, Carlos Chagas Filho Biophysics Institute, FederalUniversity of Rio de Janeiro, Brazil
AbstractPerillyl alcohol (POH) is a naturally occurring terpene and a promising chemotherapeutic agent forglioblastoma multiform; yet, little is known about its molecular effects. Here we present results of asemi-quantitative proteomic analysis of A172 cells exposed to POH for different time-periods (1′,10′, 30′, 60′, 4h, and 24h). The analysis identified more than 4,000 proteins; which were clusteredusing PatternLab for proteomics and then linked to Ras signaling, tissue homeostasis, induction ofapoptosis, metallopeptidase activity, and ubiquitin-protein ligase activity. Our results make availableone of the most complete protein repositories for the A172. Moreover, we detected thephosphorylation of GSK-3β (Glycogen synthase kinase) and the inhibition of ERK’s (extracellularregulated kinase) phosphorylation after 10′, which suggests a new mechanism of POH’s activationfor apoptosis.
KeywordsPerillyl alcohol; glioblastoma; time-course; A172 cells; MudPIT; GSK-3; ERK
IntroductionGlioblastoma multiform (GBM) is by far the most common and malignant glioma, and isassociated with a dismal prognosis. During the last 25 years, no significant advances in thetreatment of GBMs have been developed. Currently, patients with surgical resection who aretreated by radiation or chemotherapy have an approximate survival time of 12 months [1]. Insuch a scenario, the quest for more effective chemotherapeutic agents is of great importance.Perillyl alcohol (POH) is a naturally occurring terpene that is a new and promisingchemotherapeutic agent. It has cytostatic and cytotoxic effects [2] and induces apoptosis in
*Corresponding author: [email protected]'s Disclaimer: This is a PDF file of an unedited manuscript that has been accepted for publication. As a service to our customerswe are providing this early version of the manuscript. The manuscript will undergo copyediting, typesetting, and review of the resultingproof before it is published in its final citable form. Please note that during the production process errors may be discovered which couldaffect the content, and all legal disclaimers that apply to the journal pertain.
NIH Public AccessAuthor ManuscriptJ Proteomics. Author manuscript; available in PMC 2011 March 10.
Published in final edited form as:J Proteomics. 2010 March 10; 73(5): 1018–1027. doi:10.1016/j.jprot.2010.01.003.
NIH
-PA Author Manuscript
NIH
-PA Author Manuscript
NIH
-PA Author Manuscript
lung [3], leukocyte [4], prostate [5], and breast [6] cancer cell lines. In vivo, POH has anti-metastatic effects and is a potent inhibitor of angiogenesis [7;8]. Its chemotherapeutic effectsare under evaluation in several clinical trials, including patients with colorectal, breast, orovarian cancer [9–11]. In particular, we previously reported an ongoing clinical trial (phase I)comprising GBM patients treated by intranasal delivery that, statistically, has been shown toincrease survival time [1].
Prior pharmacological studies have generated clues on the mechanism of action of POH. It hasbeen demonstrated that POH acts by inhibiting the isoprenylation of the small GTPase Rasproteins by blocking their tethering in the cytoplasmic membrane, thus inhibiting Ras signaltransduction [12;13]. In addition, POH has been shown to induce apoptosis [4;14;15], as wellas to cause G0/G1 arrest in several types of cancers [16;17], to instigate transitory G2/M arrest,and also to induce enhanced Fas-mediated apoptosis [18]. The ability of POH to disrupt proteinanchorage to cell membrane suggests it may interfere with other signaling processes.
Membrane proteins constitute about one third of the proteins encoded by the human genomeand perform a wide variety of functions required for the development of tissues and thehomeostasis of the organism. The disruption of their organization usually leads to variousdiseases [19;20]. Furthermore, membrane proteins represent about two thirds of the knownprotein targets for drugs [21], so the identification of differential protein expression underdefined perturbations is necessary to understanding the fundamental roles of biologicalprocesses and for finding new drug targets [22;23].
We postulate that investigating POH’s effects on the cellular membrane proteome could helpunderstand the mechanism of action of POH, and potentially improve the treatment regimesby combining POH with other surgical/molecular approaches. We designed an experiment thattackles this problem by exposing the human GBM A172 cell line to POH and monitoring thethousands of proteins that constantly change in space and time by harvesting the cells at severaltime instances during exposure (0, 1′, 10′, 30′, 60′, 4h, and 24h). We then analyzed themembrane-enriched fraction by using a shotgun proteomics strategy that comprises two-dimensional liquid chromatography coupled on-line with tandem mass spectrometry, alsoknown as Multi-dimensional Protein Identification Technology (MudPIT) [24]. Relativequantitation of proteins was performed using spectral counting [25;26]. To help interpret theresults, we developed new modules for the PatternLab for proteomics suite[27] that providethree orthogonal data analysis strategies. These strategies include: clustering proteinsaccording to similar expression profiles (TrendQuest module); identifying proteins that areunique to a state (Approximately area-proportional Venn diagram module); and identifyingstatistically significant changes in protein expression for roughly the same set of states (XFoldmodule). Further insights into selected protein groups were obtained using PatternLab’s GeneOntology Explorer module (GOEx) [27;28]. We used western blotting to verify a subset ofdifferentially expressed proteins and to probe several targets derived from our analysis.
Materials and MethodsCell Culture and POH Treatment
The A172 cells were grown as monolayers in 25 cm2 tissue culture flasks in Dulbecco’smodified Eagle medium (D-MEM) supplemented with 0.2 mM nonessential amino acids, 10%fetal calf serum, penicillin (100 U/ml), streptomycin (100 μg/ml), and amphotericin B(fungizone, 2.5 mg/ml). For sub-cultivations, confluent monolayers were gently washed withphosphate-buffered saline (PBS 1X) pH 7.2, and after short trypsinization the cells weresuspended in the culture medium. Three subcultures were treated with 1.8 mM of POH (Sigma-Aldrich, 96%) during 1′, 10′, 30′, 60′, 4h, and 24h; three other subcultures received no POHtreatment. The medium from all cultures was discarded and a pellet was obtained by
de Saldanha da Gama Fischer et al. Page 2
J Proteomics. Author manuscript; available in PMC 2011 March 10.
NIH
-PA Author Manuscript
NIH
-PA Author Manuscript
NIH
-PA Author Manuscript
centrifugation at 700 RCF. After washing three times with PBS, the pellets were incubated inice for 45′ with 10 mM Tris (pH 7.5) and 1 mM EDTA for enrichment of the membrane fraction.Cells were lysed in a 1cc U-100 insulin syringe filled with cell suspension by pushing andcompressing the plunger several times. The soluble fraction was separated from the membranefraction by ultra-centrifugation (18,000 RCF).
Protein Solubilization with RapiGest and Trypsin DigestionEach protein pellet was re-suspended independently with RapiGest SF (1% stock) accordingto the manufacturer’s instructions. Ten millimolar of dithiothreitol (DTT) were added to eachpellet and the proteins were incubated at 60 °C during 30′. The pellets were cooled to roomtemperature and incubated with 10 mM of iodacetamide (IAA) for 20′. Then 100 mM Tris-HCl and 1 mM CaCl2 were added to make the final concentration of RapiGest 0.1%. Allsamples were digested with 1μg of trypsin (Promega) overnight at 37 °C. Following digestion,all reactions were acidified with 90% formic acid (5% final) to stop the proteolysis. Thensamples were centrifuged during 30′ at 18,000 RCF to remove insoluble material.
Protein Identification by MudPITSeventy micrograms of the digested peptide mixture were loaded onto a biphasic (strong cationexchange/reversed phase) capillary column and washed with a buffer containing 5%acetonitrile, 0.1% formic acid diluted in HPLC grade water. The two-dimensional liquidchromatography separation and tandem mass spectrometry conditions were as described byWashburn et al.26 The flow rate at the tip of the biphasic column was 100 nL/min when themobile phase composition was 95% H2O, 5% acetonitrile, and 0.1% formic acid. The ion trapmass spectrometer, Finnigan LTQ-XL (Thermo, San Jose, CA), was set to the data-dependentacquisition mode with dynamic exclusion turned on. One MS survey scan was followed bynine MS/MS scans and 12 salt steps were performed. Mass spectrometer scan functions andHPLC solvent gradients were controlled by the Xcalibur data system (Thermo, San Jose, CA).
Tandem mass spectra were extracted from the raw files using RawExtract1_9_3 [29] and weresearched against the Homo sapiens plus common contaminant proteins; all sequences weredownloaded as FASTA-formatted from the EBI-IPI protein database (version 3.23, releasedon November 2, 2006) [30]. To calculate confidence levels and false-positive rates, a decoydatabase that contained the reverse sequences of the original dataset appended to the targetdatabase was used [31], and the best matching sequences from the combined database wereindicated by SEQUEST. The searches were done on a cluster of Intel Xeon 80 processorsrunning the Linux operating system. The peptide mass search tolerance was set to 3 Da. Nodifferential modifications were considered. No enzymatic cleavage conditions were imposedon the database search, so the search space included all candidate peptides whose theoreticalmass fell within the 3 Da mass tolerance window, regardless of their tryptic status.
The validity of peptide/spectrum matches was assessed in DTASelect 2 [32] according to theSEQUEST [33] cross-correlation score (XCorr) and the SEQUEST normalized difference incross-correlation score (DeltaCN). The search results were grouped by charge state (+1, +2,and +3) and tryptic status (fully tryptic, half-tryptic, and non-tryptic), resulting in 9 distinctsubgroups. In each of the subgroups, the distribution of XCorr and DeltaCN values for thedirect and decoy database hits was obtained, and the two subsets were separated by quadraticdiscriminant analysis. Outlier points in the two distributions (for example, matches with verylow XCorr but very high DeltaCN) were discarded. As the full separation of the direct anddecoy subsets is not generally possible, the discriminant score was set such that a falsediscovery rate of 1% was determined based on the number of accepted decoy database peptides.This procedure was independently performed on each data subset, resulting in a false-positiverate independent of tryptic status or charge state. In addition, a minimum sequence length of
de Saldanha da Gama Fischer et al. Page 3
J Proteomics. Author manuscript; available in PMC 2011 March 10.
NIH
-PA Author Manuscript
NIH
-PA Author Manuscript
NIH
-PA Author Manuscript
7 amino acid residues was required, and each protein on the list was supported by at least twopeptide identifications. These additional requirements, especially the latter, resulted in theelimination of most decoy database and false-positive hits, as these tended to beoverwhelmingly present as proteins identified by single peptide matches. After this last filteringstep, the estimated false discovery rate was reduced to below 1%.
PatternLab for Proteomics data parsingFirst, the DTASelect filtered files (which contain the spectral counting information) wereconverted to PatternLab’s native data format (the index and sparse matrix files) by usingPatternLab’s DTASelect to Sparse Matrix parser. The index file lists all identified proteinswithin all the project’s assays and assigns to each one a unique Protein IDentification (PID)integer. As for the sparse matrix, each row corresponds to an assay and follows the schema:⟨class label⟩ ⟨PID1⟩:⟨value1⟩ … ⟨PIDn⟩:⟨valuen⟩, where n is the number of identified proteinsfor that assay. In this work, ⟨class label⟩ is a member of {0,1,10,30,60,240,1440} and is usedto indicate the POH exposure time (thus, 0 represents the control group and, e.g., 30 stands for30 minutes of exposure to POH). Accordingly, ⟨PIDi⟩ and ⟨valuei⟩ correspond, respectively,to the ith protein’s identification integer and its spectral count for the respective assay. Theresulting sparse matrix has 21 rows obtained from seven exposure durations analyzed intriplicates. The index and sparse matrix are available in Supplemental Data I.
Gene Ontology Explorer AnalysisTo help interpret the data output by the new modules we used PatternLab’s Gene OntologyExplorer (GOEx) module [28]. GOEx is targeted at proteomic studies because it considersprotein fold changes besides searching for over-represented terms. Our data analysis used thegene ontology database (OBO v1.2, downloaded on June 30, 2009) and the human annotationfile (GOA, downloaded on June 30, 2009) from http://geneontology.org andhttp://www.ebi.ac.uk, respectively.
Western Blot AnalysesFifteen micrograms of the membrane-enriched fraction lysate were run on a precast 4% to 12%Bis-Tris gel (Invitrogen, NP0322) and transferred onto a nitrocellulose membrane (Invitrogen,LC 2000). The membrane was blocked with 5% nonfat dry milk in TBST (50 mM Tris pH 7.5,150 mM NaCl, and 0.1% Tween 20) during 1 h at room temperature. The blocking solutionwas discarded and the membrane was washed several times in milk-free TBST and incubatedovernight at 4°C with anti-HSP70 primary antibody (1:2500; BD Biosciences, cat. no 610607)diluted in 1% nonfat dry milk in TBST, according to the supplier’s instructions. The followingday, the membrane was washed three times in milk-free TBST and incubated with anti-mousehorseradish peroxidase-conjugated antibodies diluted 1:10000 in 1% nonfat dry milk TBSTduring 1h. After successive washes, the membranes were submitted to a Super Signal WestPico chemiluminescent substrate (Thermo, cat. no 34080) and exposed to X-ray Kodak film(X-Omat). The same procedure was performed for: anti-β-catenin (1:1000; Abcam, ab6301),anti-phospho-p44/42 ERK (1:500; Cell Signaling Technology, mAb # 4376), anti-p44/42 ERK(1:1000; Cell Signaling Technology, mAb # 9107), anti-phospho-GSK-3βSer 9 (1:1000; CellSignaling Technology, mAb # 9323), and anti-GSK-3β (1:1000; Cell Signaling Technology,mAB # 9315).
Results and DiscussionTools Created for the Data Analysis
a) TrendQuest Module—The TrendQuest module clusters proteins having similarexpression profiles throughout the time-course experiment. The software proceeds as follows.
de Saldanha da Gama Fischer et al. Page 4
J Proteomics. Author manuscript; available in PMC 2011 March 10.
NIH
-PA Author Manuscript
NIH
-PA Author Manuscript
NIH
-PA Author Manuscript
The sparse matrix is loaded onto TrendQuest and quality filters are set. Here the filters wereset to eliminate proteins averaging less than 5 spectral counts or detected in less than 12 of the21 assays. Secondly, the sparse matrix is normalized. Here we opted for the total signalnormalization strategy: briefly, it divides the spectral count of each protein by the sum of allspectral counts from that experiment. Thirdly, for each protein a representative time-expressionprofile vector is generated having one element for each of the possible time durations. Suchan element contains the average spectral count of that protein for the corresponding timeduration. The vector is then normalized to 1.
Finally, a hierarchical-like clustering is performed on these vectors, using the Pearsoncorrelation coefficient as a similarity measure. To this end, the following procedure is used.Initially, one cluster is created for each vector and the vector becomes the cluster’srepresentative. Then a sequence of clustering steps takes place. At each of these steps, the twoclusters with the most similar representatives (those for which the Pearson correlationcoefficient is highest) are merged together into a new cluster, whose representative is createdby averaging all its vectors (those that were contained within both the original clusters). Thealgorithm finishes when no two clusters can be coalesced into another one, by virtue of beinginsufficiently similar (i.e., no pair of representatives yields a Pearson correlation coefficientsuperior to a user-specified value, 0.95 in our case). Figure 1A shows TrendQuest’s graphicaluser interface.
b) XFold Module—We designed the XFold module to pinpoint differentially expressedproteins when comparing multiple states. This tool extends the concept of the existing TFoldand ACFold [27;28] modules, which are targeted at comparing two states by combining astatistical test (the t-test or the AC-test, respectively) with protein expression fold changes anda theoretical false discovery rate estimator [34] (the latter is necessary to address the massivemultiple hypothesis testing problem). The XFold algorithm proceeds as follows. First itautomatically performs a TFold (or ACFold) analysis for all organism-state pairs to find thedifferentially expressed proteins. Secondly, a table is generated having a row for each proteinand a column for each state. A table entry is either 1 (for differentially expressed) or 0 (for notdifferentially expressed). Thirdly, a score is obtained by computing how many times a proteinwas classified as differentially expressed (i.e., summing up each row’s entries). Finally, thetable’s rows are sorted by score and then clustered according to the Hamming distance betweenconsecutive rows. This results in groups of proteins (rows) that were differentially expressedfor roughly the same set of different conditions. Figure 1B shows XFold’s graphical userinterface.
c) Approximately Area-Proportional Venn Diagram Module—The approximatelyarea-proportional Venn diagram (AAPVD) module can pinpoint proteins that are unique toeach condition. This module offers a quality filter capable of retaining only proteins identifiedwithin a minimum number of replicates for each condition. For this study, proteins detected inonly one of the three replicates were discarded. Figure 1C shows AAPVD’s graphical userinterface. By clicking on each Venn diagram’s labels for any section, a list of the proteinsbelonging to that section is presented, together with details such as the assays in which eachprotein was identified and its spectral counts. The graphics are highly customizable, besidesproviding important visual information. When analyzing more than two conditions, a tablelisting the unique proteins for every pairwise combination of conditions is also provided. Byclicking on the table entry of interest, the common proteins are listed.
Differentially expressed proteins in early time pointsWe used the XFold module to search for differentially expressed proteins found during theearly time points (≤ 10min). This is because the membrane proteins are extremely dynamic
de Saldanha da Gama Fischer et al. Page 5
J Proteomics. Author manuscript; available in PMC 2011 March 10.
NIH
-PA Author Manuscript
NIH
-PA Author Manuscript
NIH
-PA Author Manuscript
and will be the first ones to come in contact with POH. The condition for differential expressionwas to have an absolute fold change of at least 2.5 and a t-test p-value of less than 0.01. Agroup of 10 proteins was selected accordingly and is given in Supplemental Data II. GOExindicated the “Binding” term (GO: 0005488) as overrepresented for this protein list. Morespecifically, the proteins were divided into the following child categories: anion binding,growth factor binding, cytokine binding, phospholipid binding, ribonucleotide binding, andpurine binding. Within the cellular component namespace of GO, GOEx also indicated theseproteins to be mainly related to intracellular membrane-bound organelles (GO: 0043241) (p <0.01).
Proteins unique to a stateWe generated an approximately area proportional Venn diagram (AAPVD) comparing theunique proteins identified for three states, namely control, 1h, and 24h exposure to 1.8 mM ofPOH (Figure 2). These two time durations were chosen to emphasize the analysis of proteinsgenerated in the presence of POH. The list of the unique proteins identified for each section ofthe AAPVD, together with a description of each protein, is available in Supplemental Data III.The results show a considerable reduction in the number of identified proteins (from 2238 to704) when comparing the two extreme conditions (control and 24h of exposure to POH).Among the uniquely identified proteins in the 24h case, the PICALM isoform 2 ofPhosphatidylinositol-binding clathrin assembly protein (IPI00216184.3) and the AP2A1isoform B of AP-2 complex subunit alpha-1 (IPI00256684.1) were found. AP2A1 is acomponent of the endocytotic clathrin-coated vesicles and abnormal expression or mutationof some endocytosis proteins has been reported in human cancers [35].
Proteins sharing similar expression profilesBased on the hypothesis that proteins functioning at similar signal transduction pathways arelikely to show correlated expression profiles both temporally and spatially [36], we designedand utilized a TrendQuest algorithm to search for temporal patterns of protein expression afterPOH treatment on a glioblastoma cell line as described in Materials and Methods.
The TrendQuest analysis showed three distinct trends that we further analyzed using GOEx tomap their proteins onto the Gene Ontology “Response to Stimulus” child terms (Figure 3).Trend A shows proteins whose expression increased after 24h in relation to other cell proteins.Trend B, in turn, shows proteins that increased after a 4h exposure to POH but then decreasedafter 24h. The proteins shown in trend C are the ones that are consistently decreasing inexpression. The proteins belonging to each group are listed in Supplemental Data IV.
Trend A lists mostly proteins from the Ras pathway (e.g., Rab-2A, Rab-2B, NRAS GTPase,RAB8A, RAB5B, RAB10, and RAB14), together with some stress-related proteins, such asHSP70. Indeed, a known action mechanism of POH is its ability to inhibit the farnesylation inG proteins. The p21 Ras is a small G protein involved in signal transduction at the plasmamembrane that couples signals from cell surface tyrosine kinase receptors to the cytosolicsecond messenger, ultimately resulting in an increase in cell growth [37;38]. The Ras proteinbecomes active after farnesylation, allowing its attachment to the cellular membrane and thuspermitting signal transduction [39]. One of the proposed anticancer activities of POH lies inattenuating the Ras pathway by inhibiting the farnesylation of Ras [40]. Our results show theexpression of the proteins from this pathway to be among the ones least affected by POH after24h. This is indirectly reflected by the sudden increase in the last step of trend A. The rationaleis as follows: the AAPVD showed that the general trend for the majority of the proteins isdown-regulation. TrendQuest, on the other hand, normalized the data according to the totalprotein expression, so the ones that were least affected or not affected at all will present apositive slope in their trends. These given, our results suggest that this pathway is a key
de Saldanha da Gama Fischer et al. Page 6
J Proteomics. Author manuscript; available in PMC 2011 March 10.
NIH
-PA Author Manuscript
NIH
-PA Author Manuscript
NIH
-PA Author Manuscript
mechanism for survival and its stability is essential when trying to compensate for the effectsof POH.
Another protein from this cluster that is indirectly linked with the Ras pathway is Caveolin(Figure 3A). It has been previously described that glioblastoma cells expressing caveolins aremore aggressive and metastatic because of a potential for anchorage-independent growth[41;42]. Our results are aligned with these findings by showing an elevated expression ofCaveolin in the A172 clones that resisted POH after 24h. These results suggest Caveolin as acandidate marker for prognosis and drug target.
Heat shock proteins (HSP) were also found in the same trend. The HSPs are highly conservedproteins that have an important cellular function as molecular chaperones, protecting cells fromvarious forms of stress [43]. The HSP super family includes several different molecular-weightclass families, of which the Hsp70 family represents the most highly conserved [44]. The highexpression of HSPs in malignant gliomas indicates a possible role of these proteins in resistanceto cancer chemotherapy [45,46]. This is because HSPs protect cells from many cell-damagingagents or conditions of environmental stress [47,44]. Ours results suggest that an over-expression of HSP70 as compared to the general downtrend after 24h of POH exposure isassociated with the surviving cells. A western blotting using an antibody against HSP70 wasperformed to validate trend A; its expression profile (Figure 4) correlated well withTrendQuest’s result (Figure 3A).
Biological ValidationsThe known function of POH as a mediator of posttranslational modification and inhibitor ofRas, together with our finding that several Ras proteins are up regulated in our membrane-enriched fraction, prompted us to look for downstream signaling proteins of the Ras/Raf/MEKpathway. We used a western blot to check the phosphorylation states of several key molecules,including ERK, GSK3, and β–catenin.
Mitogen-activated protein kinases (MAPKs) are serine threonine kinases activated byphosphorylation in response to a wide array of extracellular stimuli[48]. Three distinct groupsof MAPKs have been identified in mammalian cells, namely extracellular signal regulatedkinases (ERKs), c-Jun amino terminal kinases (JNKs), and p38, all of which play importantroles in diverse cellular processes[49]. The extra-cellular related kinase (ERK) is a key MAPKdownstream of the Ras pathway. Previously we demonstrated that POH inhibits ERKphosphorylation in lung cancer cells when exposed to POH[50]. In accordance, here we showedthat POH inhibits the phosphorylation of the ERKs in glioblastoma cells after 1 minute of POHexposure, suggesting a similar mechanism of action on different cancer cells for thischemotherapeutic agent (Figure 5). Because the ERKs are thought to regulate cell growth anddifferentiation upon extracellular stimuli and their activation rely on serine phosphorylation,our observation indicates that POH treatment resulted in a shutting down of cell proliferationin our glioblastoma cell line.
GSK3β (Glycogen synthase kinase) has been shown to induce the activation of the mitogen-activated protein kinase, MEKK1, an activator of JNK, and thereby to promote signaling bythe stress-activated protein kinase pathway [51]. MEK-1/2 is involved in the phosphorylationof Ty216 in GSK-3, which increases GSK-3 activity, in human skin fibroblasts [52]. On theother hand, phosphorylation at Ser9 of GSK3β has been shown to reduce its activity [53]. Usingan antibody recognizing Ser9 phosphorylated GSK3β, we showed by western blot that POHrapidly induces GSK3β phosphorylation at 10 minutes, and maintains the phosphorylation stateuntil 24 hours, without dramatically changing the total level of GSK3β (Figure 5). Thisindicates that POH can exert a quick and lasting effect in deactivating GSK3β. Althoughactivation of GSK3β has been shown to influence cell survival by inducing apoptosis in a
de Saldanha da Gama Fischer et al. Page 7
J Proteomics. Author manuscript; available in PMC 2011 March 10.
NIH
-PA Author Manuscript
NIH
-PA Author Manuscript
NIH
-PA Author Manuscript
variety of pharmacological and pathological conditions [54], studies in solid tumor and cancercell lines have associated inhibition of GSK3β activity with cancer cell apoptosis [55–57].Specifically, a recent study showed that inhibition of GSK3β by multiple small-moleculeinhibitors and genetic down-regulation of GSK3β significantly reduced glioma cell survivaland clonogenicity [58]. Consistently, our observation that POH mediated the increase inGSK3β phosphorylation may play at least a partial role in its induction of apoptosis.
GSK3β inhibition has been shown to increase ERK phosphorylation, a state that activates theERK [59]. Our western data indicates a rapid decrease in ERK phosphorylation, while anobvious increase of GSK3β phosphorylation happens at about 10 minutes, a time lag that cannotbe used to account for a GSK3β-mediated ERK phosphorylation change. One possibility isthat the two pathways work independently but in concert in our system, leading to the activationof downstream targets.
One known substrate of GSK3β is β-catenin, which plays a key role in intercellular adhesionand in the regulation of gene expression. Down-regulation of β-catenin is associated withoncogenic properties through inactivation of the tumor suppressor adenomatous polyposis coli(APC) or mutations in β-catenin itself [60]. In the absence of growth and differentiation signals,the cytoplasmic β-catenin is degraded by the ubiquitin-proteasome system [61] after sequentialphosphorylation by the serine/threonine kinases CKI and GSK3β [62] through a scaffoldingcomplex containing axin and APC protein [63]. Ours results showed a decreasing of the totallevel of β-catenin after 24 hours, which is consistent with the decreased activity of GSK3βafter phosphorylation at ser9.
We have described and included three new computational tools in the PatternLab forproteomics suite for analyzing time-course shotgun proteomic experiments. We used thesetools to analyze the effects of POH in the human glioblastoma cells A172. Our results containmore than 4,000 proteins and clusters related to several signaling pathways (e.g., Ras). Wethen described the phosphorylation of GSK-3β (Glycogen synthase kinase) and the inhibitionof ERKs (extracellular regulated kinases) phosphorylation after 10 minutes, suggesting a newmechanism of POH action for apoptosis.
Supplementary MaterialRefer to Web version on PubMed Central for supplementary material.
AcknowledgmentsThis work was supported by CAPES, CNPq, the Rio de Janeiro Proteomic Network, a FAPERJ BBP grant, and theNational Institutes of Health P41 RR011823.
Reference List1. da Fonseca CO, Landeiro JA, Clark SS, Quirico-Santos T, da Costa Carvalho MG, Gattass CR. Recent
advances in the molecular genetics of malignant gliomas disclose targets for antitumor agent perillylalcohol. Surg Neurol 2006;65 (Suppl 1):S1. [PubMed: 16427438]
2. Clark SS, Zhong L, Filiault D, Perman S, Ren Z, Gould M, Yang X. Anti-leukemia effect of perillylalcohol in Bcr/Abl-transformed cells indirectly inhibits signaling through Mek in a Ras- and Raf-independent fashion. Clin Cancer Res 2003;12:4494–504. [PubMed: 14555523]
3. Yeruva L, Pierre KJ, Elegbede A, Wang RC, Carper SW. Perillyl alcohol and perillic acid induced cellcycle arrest and apoptosis in non small cell lung cancer cells. Cancer Lett 2007;2:216–26. [PubMed:17888568]
4. Clark SS. Perillyl alcohol induces c-Myc-dependent apoptosis in Bcr/Abl-transformed leukemia cells.Oncology 2006;1:13–8. [PubMed: 16439861]
de Saldanha da Gama Fischer et al. Page 8
J Proteomics. Author manuscript; available in PMC 2011 March 10.
NIH
-PA Author Manuscript
NIH
-PA Author Manuscript
NIH
-PA Author Manuscript
5. Chung BH, Lee HY, Lee JS, Young CY. Perillyl alcohol inhibits the expression and function of theandrogen receptor in human prostate cancer cells. Cancer Lett 2006;2:222–8. [PubMed: 16029925]
6. Yuri T, Danbara N, Tsujita-Kyutoku M, Kiyozuka Y, Senzaki H, Shikata N, Kanzaki H, Tsubura A.Perillyl alcohol inhibits human breast cancer cell growth in vitro and in vivo. Breast Cancer Res Treat2004;3:251–60. [PubMed: 15026623]
7. Loutrari H, Hatziapostolou M, Skouridou V, Papadimitriou E, Roussos C, Kolisis FN, PapapetropoulosA. Perillyl alcohol is an angiogenesis inhibitor. J Pharmacol Exp Ther 2004;2:568–75. [PubMed:15210838]
8. Teruszkin BI, ves de PS, Henriques SN, Curie CM, Gibaldi D, Bozza M, Orlando da FC, Carvalho DaGloria da Costa. Effects of perillyl alcohol in glial C6 cell line in vitro and anti-metastatic activity inchorioallantoic membrane model. Int J Mol Med 2002;6:785–8.
9. Meadows SM, Mulkerin D, Berlin J, Bailey H, Kolesar J, Warren D, Thomas JP. Phase II trial ofperillyl alcohol in patients with metastatic colorectal cancer. Int J Gastrointest Cancer 2002;(2–3):125–8. [PubMed: 12794248]
10. Stearns V, Coop A, Singh B, Gallagher A, Yamauchi H, Lieberman R, Pennanen M, Trock B, HayesDF, Ellis MJ. A pilot surrogate end point biomarker trial of perillyl alcohol in breast neoplasia. ClinCancer Res 2004;(22):7583–91. [PubMed: 15569989]
11. Bailey HH, Levy D, Harris LS, Schink JC, Foss F, Beatty P, Wadler S. A phase II trial of daily perillylalcohol in patients with advanced ovarian cancer: Eastern Cooperative Oncology Group StudyE2E96. Gynecol Oncol 2002;(3):464–8. [PubMed: 12051875]
12. Hardcastle IR, Rowlands MG, Barber AM, Grimshaw RM, Mohan MK, Nutley BP, Jarman M.Inhibition of protein prenylation by metabolites of limonene. Biochem Pharmacol 1999;(7):801–9.[PubMed: 10075086]
13. Crowell PL, Ren Z, Lin S, Vedejs E, Gould MN. Structure-activity relationships among monoterpeneinhibitors of protein isoprenylation and cell proliferation. Biochem Pharmacol 1994;(8):1405–15.[PubMed: 8185648]
14. Mills JJ, Chari RS, Boyer IJ, Gould MN, Jirtle RL. Induction of apoptosis in liver tumors by themonoterpene perillyl alcohol. Cancer Res 1995;(5):979–83. [PubMed: 7867007]
15. Fernandes J, da Fonseca CO, Teixeira A, Gattass CR. Perillyl alcohol induces apoptosis in humanglioblastoma multiforme cells. Oncol Rep 2005;(5):943–7. [PubMed: 15809762]
16. Bardon S, Picard K, Martel P. Monoterpenes inhibit cell growth, cell cycle progression, and cyclinD1 gene expression in human breast cancer cell lines. Nutr Cancer 1998;(1):1–7. [PubMed: 9824849]
17. Bardon S, Foussard V, Fournel S, Loubat A. Monoterpenes inhibit proliferation of human coloncancer cells by modulating cell cycle-related protein expression. Cancer Lett 2002;(2):187–94.[PubMed: 12175534]
18. Rajesh D, Howard SP. Perillyl alcohol mediated radiosensitization via augmentation of the Faspathway in prostate cancer cells. Prostate 2003;(1):14–23. [PubMed: 12886519]
19. Carter P, Smith L, Ryan M. Identification and validation of cell surface antigens for antibody targetingin oncology. Endocr Relat Cancer 2004;(4):659–87. [PubMed: 15613445]
20. Frame MC. Src in cancer: deregulation and consequences for cell behaviour. Biochim Biophys Acta2002;(2):114–30. [PubMed: 12020799]
21. Rabilloud T. Membrane proteins ride shotgun. Nat Biotechnol 2003;(5):508–10. [PubMed:12721575]
22. Hopkins AL, Groom CR. The druggable genome. Nat Rev Drug Discov 2002;(9):727–30. [PubMed:12209152]
23. Josic D, Clifton JG. Mammalian plasma membrane proteomics. Proteomics 2007;(16):3010–29.[PubMed: 17654460]
24. Washburn MP, Wolters D, Yates JR III. Large-scale analysis of the yeast proteome bymultidimensional protein identification technology. Nat Biotechnol 2001;(3):242–7. [PubMed:11231557]
25. Liu H, Sadygov RG, Yates JR III. A model for random sampling and estimation of relative proteinabundance in shotgun proteomics. Anal Chem 2004;(14):4193–201. [PubMed: 15253663]
26. Carvalho PC, Hewel J, Barbosa VC, Yates JR III. Identifying differences in protein expression levelsby spectral counting and feature selection. Genet Mol Res 2008;(2):342–56. [PubMed: 18551400]
de Saldanha da Gama Fischer et al. Page 9
J Proteomics. Author manuscript; available in PMC 2011 March 10.
NIH
-PA Author Manuscript
NIH
-PA Author Manuscript
NIH
-PA Author Manuscript
27. Carvalho PC, Fischer JS, Chen EI, Yates JR III, Barbosa VC. PatternLab for proteomics: a tool fordifferential shotgun proteomics. BMC Bioinformatics 2008;(9):316. [PubMed: 18644148]
28. Carvalho PC, Fischer JS, Chen EI, Domont GB, Carvalho MG, Degrave WM, Yates JR III, BarbosaVC. GO Explorer: A gene-ontology tool to aid in the interpretation of shotgun proteomics data.Proteome Sci 2009;(7):6. [PubMed: 19239707]
29. McDonald WH, Tabb DL, Sadygov RG, MacCoss MJ, Venable J, Graumann J, Johnson JR, CociorvaD, Yates JR III. MS1, MS2, and SQT-three unified, compact, and easily parsed file formats for thestorage of shotgun proteomic spectra and identifications. Rapid Commun Mass Spectrom 2004;(18):2162–8. [PubMed: 15317041]
30. Kersey PJ, Duarte J, Williams A, Karavidopoulou Y, Birney E, Apweiler R. The International ProteinIndex: an integrated database for proteomics experiments. Proteomics 2004;(7):1985–8. [PubMed:15221759]
31. Peng J, Elias JE, Thoreen CC, Licklider LJ, Gygi SP. Evaluation of multidimensional chromatographycoupled with tandem mass spectrometry (LC/LC-MS/MS) for large-scale protein analysis: the yeastproteome. J Proteome Res 2003;(1):43–50. [PubMed: 12643542]
32. Tabb DL, McDonald WH, Yates JR III. DTASelect and Contrast: tools for assembling and comparingprotein identifications from shotgun proteomics. J Proteome Res 2002;(1):21–6. [PubMed:12643522]
33. Eng JK, McCormack AL, Yates, Yates JR III. An Approach to Correlate Tandem Mass Spectral Dataof Peptides with Amino Acid Sequences in a Protein Database. J Am Soc Mass Spectrom 1994;(5):976–89.
34. Benjamini Y, Hochberg Y. Controlling the false discovery rate: a practical and powerful approach tomultiple testing. J R Stat Soc Ser B 1995;(57):289–300.
35. Corsi F, De PC, Colombo M, Allevi R, Nebuloni M, Ronchi S, Rizzi G, Tosoni A, Trabucchi E,Clementi E, Prosperi D. Towards Ideal Magnetofluorescent Nanoparticles for Bimodal Detection ofBreast-Cancer Cells. Small. 2009
36. Zhang B, VerBerkmoes NC, Langston MA, Uberbacher E, Hettich RL, Samatova NF. Detectingdifferential and correlated protein expression in label-free shotgun proteomics. J Proteome Res 2006;(11):2909–18. [PubMed: 17081042]
37. Barbacid M. ras genes. Annu Rev Biochem 1987;(56):779–827. [PubMed: 3304147]38. Liu JJ, Chao JR, Jiang MC, Ng SY, Yen JJ, Yang-Yen HF. Ras transformation results in an elevated
level of cyclin D1 and acceleration of G1 progression in NIH 3T3 cells. Mol Cell Biol 1995;(7):3654–63. [PubMed: 7791772]
39. Rowinsky EK, Windle JJ, Von Hoff DD. Ras protein farnesyltransferase: A strategic target foranticancer therapeutic development. J Clin Oncol 1999;(11):3631–52. [PubMed: 10550163]
40. Chaudhary SC, Alam MS, Siddiqui MS, Athar M. Perillyl alcohol attenuates Ras-ERK signaling toinhibit murine skin inflammation and tumorigenesis. Chem Biol Interact 2009;(2–3):145–53.[PubMed: 19161993]
41. Abulrob A, Giuseppin S, Andrade MF, McDermid A, Moreno M, Stanimirovic D. Interactions ofEGFR and caveolin-1 in human glioblastoma cells: evidence that tyrosine phosphorylation regulatesEGFR association with caveolae. Oncogene 2004;(41):6967–79. [PubMed: 15273741]
42. Martin S, Cosset EC, Terrand J, Maglott A, Takeda K, Dontenwill M. Caveolin-1 regulatesglioblastoma aggressiveness through the control of alpha(5)beta(1) integrin expression andmodulates glioblastoma responsiveness to SJ749, an alpha(5)beta(1) integrin antagonist. BiochimBiophys Acta 2009;(2):354–67. [PubMed: 18992284]
43. Jaattela M. Heat shock proteins as cellular lifeguards. Ann Med 1999;(4):261–71. [PubMed:10480757]
44. Nylandsted J, Brand K, Jaattela M. Heat shock protein 70 is required for the survival of cancer cells.Ann N Y Acad Sci 2000;(926):122–5. [PubMed: 11193027]
45. Hermisson M, Strik H, Rieger J, Dichgans J, Meyermann R, Weller M. Expression and functionalactivity of heat shock proteins in human glioblastoma multiforme. Neurology 2000;(6):1357–65.[PubMed: 10746610]
46. Strik HM, Weller M, Frank B, Hermisson M, Deininger MH, Dichgans J, Meyermann R. Heat shockprotein expression in human gliomas. Anticancer Res 2000;(6B):4457–62. [PubMed: 11205288]
de Saldanha da Gama Fischer et al. Page 10
J Proteomics. Author manuscript; available in PMC 2011 March 10.
NIH
-PA Author Manuscript
NIH
-PA Author Manuscript
NIH
-PA Author Manuscript

47. Gyrd-Hansen M, Nylandsted J, Jaattela M. Heat shock protein 70 promotes cancer cell viability bysafeguarding lysosomal integrity. Cell Cycle 2004;(12):1484–5. [PubMed: 15539949]
48. Schaeffer HJ, Weber MJ. Mitogen-activated protein kinases: specific messages from ubiquitousmessengers. Mol Cell Biol 1999;(4):2435–44. [PubMed: 10082509]
49. Seger R, Krebs EG. The MAPK signaling cascade. FASEB J 1995;(9):726–35. [PubMed: 7601337]50. Fischer JS, Carvalho PC, Gattass CR, Paschoal EM, da Mota e Silva MS, Carvalho MG. Effects of
perillyl alcohol and heat shock treatment in gene expression of human lung adenocarcinoma cell lineA549. J Exp Ther Oncol 2006;(4):301–7. [PubMed: 17024970]
51. Kim JW, Lee JE, Kim MJ, Cho EG, Cho SG, Choi EJ. Glycogen synthase kinase 3 beta is a naturalactivator of mitogen-activated protein kinase/extracellular signal-regulated kinase kinase kinase 1(MEKK1). J Biol Chem 2003;(16):13995–4001. [PubMed: 12584189]
52. Takahashi-Yanaga F, Shiraishi F, Hirata M, Miwa Y, Morimoto S, Sasaguri T. Glycogen synthasekinase-3beta is tyrosine-phosphorylated by MEK1 in human skin fibroblasts. Biochem Biophys ResCommun 2004;(2):411–5. [PubMed: 15020233]
53. Jope RS, Johnson GV. The glamour and gloom of glycogen synthase kinase-3. Trends Biochem Sci2004;(2):95–102. [PubMed: 15102436]
54. Grimes CA, Jope RS. The multifaceted roles of glycogen synthase kinase 3beta in cellular signaling.Prog Neurobiol 2001;(4):391–426. [PubMed: 11527574]
55. Ougolkov AV, Fernandez-Zapico ME, Savoy DN, Urrutia RA, Billadeau DD. Glycogen synthasekinase-3beta participates in nuclear factor kappaB-mediated gene transcription and cell survival inpancreatic cancer cells. Cancer Res 2005;(6):2076–81. [PubMed: 15781615]
56. Demarchi F, Bertoli C, Sandy P, Schneider C. Glycogen synthase kinase-3 beta regulates NF-kappaB1/p105 stability. J Biol Chem 2003;(41):39583–90. [PubMed: 12871932]
57. Tan J, Zhuang L, Leong HS, Iyer NG, Liu ET, Yu Q. Pharmacologic modulation of glycogen synthasekinase-3beta promotes p53-dependent apoptosis through a direct Bax-mediated mitochondrialpathway in colorectal cancer cells. Cancer Res 2005;(19):9012–20. [PubMed: 16204075]
58. Kotliarova S, Pastorino S, Kovell LC, Kotliarov Y, Song H, Zhang W, Bailey R, Maric D, ZenklusenJC, Lee J, Fine HA. Glycogen synthase kinase-3 inhibition induces glioma cell death through c-MYC,nuclear factor-kappaB, and glucose regulation. Cancer Res 2008;(16):6643–51. [PubMed:18701488]
59. Wang Q, Zhou Y, Wang X, Evers BM. Glycogen synthase kinase-3 is a negative regulator ofextracellular signal-regulated kinase. Oncogene 2006;(1):43–50. [PubMed: 16278684]
60. Persad S, Troussard AA, McPhee TR, Mulholland DJ, Dedhar S. Tumor suppressor PTEN inhibitsnuclear accumulation of beta-catenin and T cell/lymphoid enhancer factor 1-mediated transcriptionalactivation. J Cell Biol 2001;(6):1161–74. [PubMed: 11402061]
61. Aberle H, Bauer A, Stappert J, Kispert A, Kemler R. beta-catenin is a target for the ubiquitin-proteasome pathway. EMBO J 1997;(13):3797–804. [PubMed: 9233789]
62. Polakis P. Casein kinase 1: a Wnt’er of disconnect. Curr Biol 2002;(14):R499–R501. [PubMed:12176352]
63. Cadigan KM, Nusse R. Wnt signaling: a common theme in animal development. Genes Dev 1997;(24):3286–305. [PubMed: 9407023]
de Saldanha da Gama Fischer et al. Page 11
J Proteomics. Author manuscript; available in PMC 2011 March 10.
NIH
-PA Author Manuscript
NIH
-PA Author Manuscript
NIH
-PA Author Manuscript
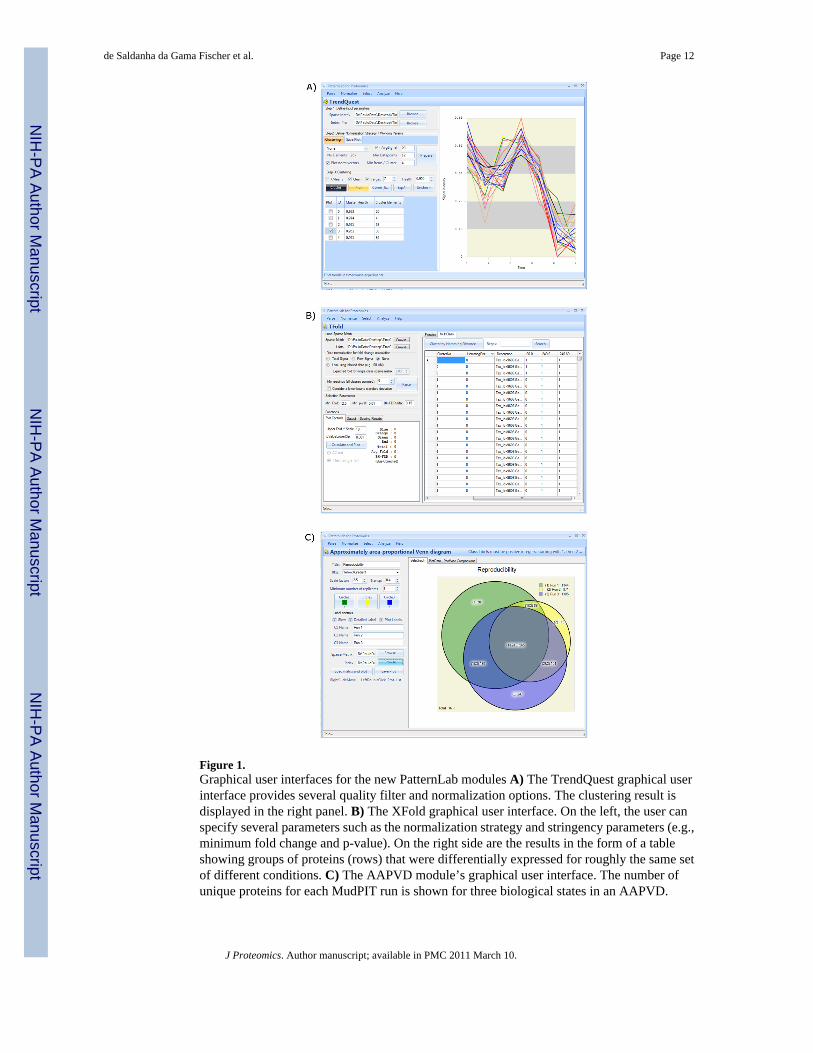
Figure 1.Graphical user interfaces for the new PatternLab modules A) The TrendQuest graphical userinterface provides several quality filter and normalization options. The clustering result isdisplayed in the right panel. B) The XFold graphical user interface. On the left, the user canspecify several parameters such as the normalization strategy and stringency parameters (e.g.,minimum fold change and p-value). On the right side are the results in the form of a tableshowing groups of proteins (rows) that were differentially expressed for roughly the same setof different conditions. C) The AAPVD module’s graphical user interface. The number ofunique proteins for each MudPIT run is shown for three biological states in an AAPVD.
de Saldanha da Gama Fischer et al. Page 12
J Proteomics. Author manuscript; available in PMC 2011 March 10.
NIH
-PA Author Manuscript
NIH
-PA Author Manuscript
NIH
-PA Author Manuscript

Clicking on the diagram’s annotations within the circles lists the proteins and further detailssuch as the quantitation information for each experiment.
de Saldanha da Gama Fischer et al. Page 13
J Proteomics. Author manuscript; available in PMC 2011 March 10.
NIH
-PA Author Manuscript
NIH
-PA Author Manuscript
NIH
-PA Author Manuscript
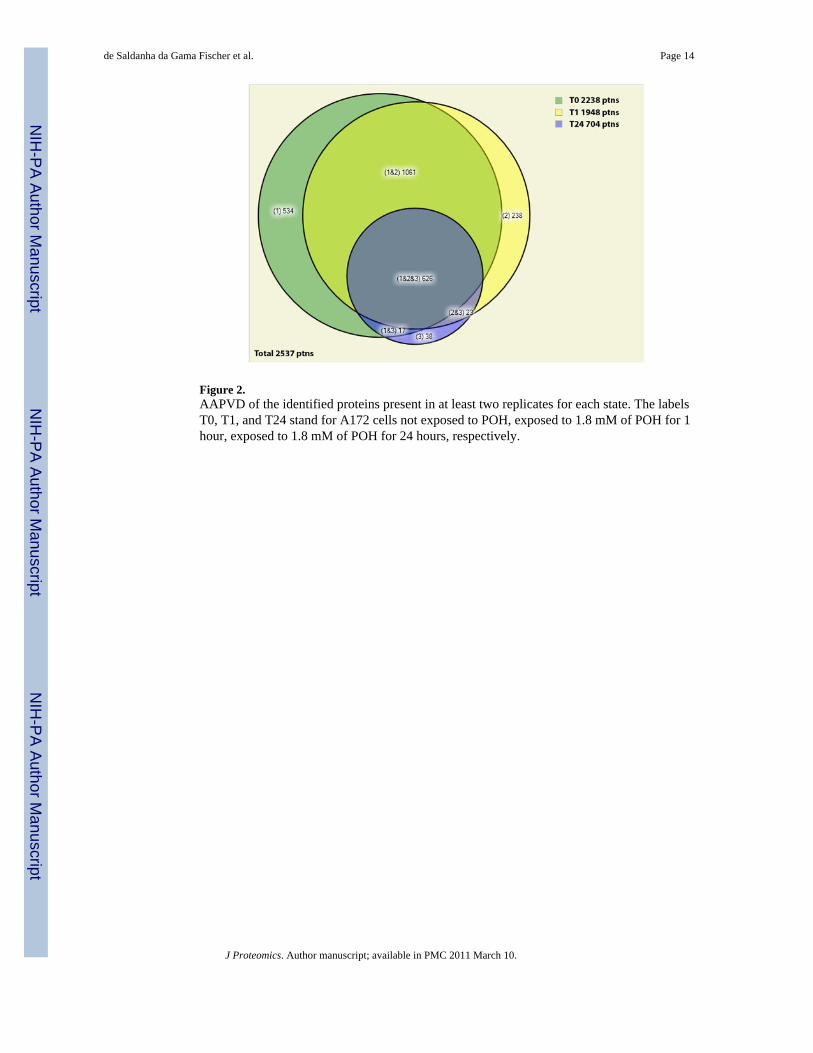
Figure 2.AAPVD of the identified proteins present in at least two replicates for each state. The labelsT0, T1, and T24 stand for A172 cells not exposed to POH, exposed to 1.8 mM of POH for 1hour, exposed to 1.8 mM of POH for 24 hours, respectively.
de Saldanha da Gama Fischer et al. Page 14
J Proteomics. Author manuscript; available in PMC 2011 March 10.
NIH
-PA Author Manuscript
NIH
-PA Author Manuscript
NIH
-PA Author Manuscript
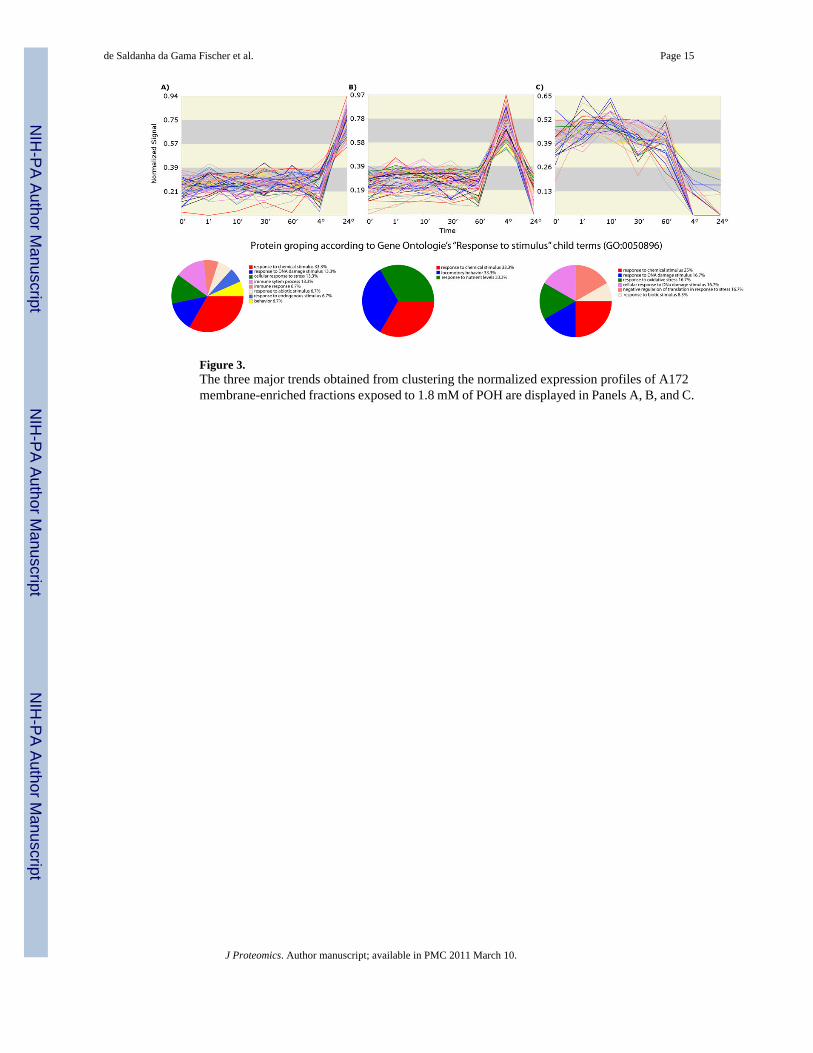
Figure 3.The three major trends obtained from clustering the normalized expression profiles of A172membrane-enriched fractions exposed to 1.8 mM of POH are displayed in Panels A, B, and C.
de Saldanha da Gama Fischer et al. Page 15
J Proteomics. Author manuscript; available in PMC 2011 March 10.
NIH
-PA Author Manuscript
NIH
-PA Author Manuscript
NIH
-PA Author Manuscript
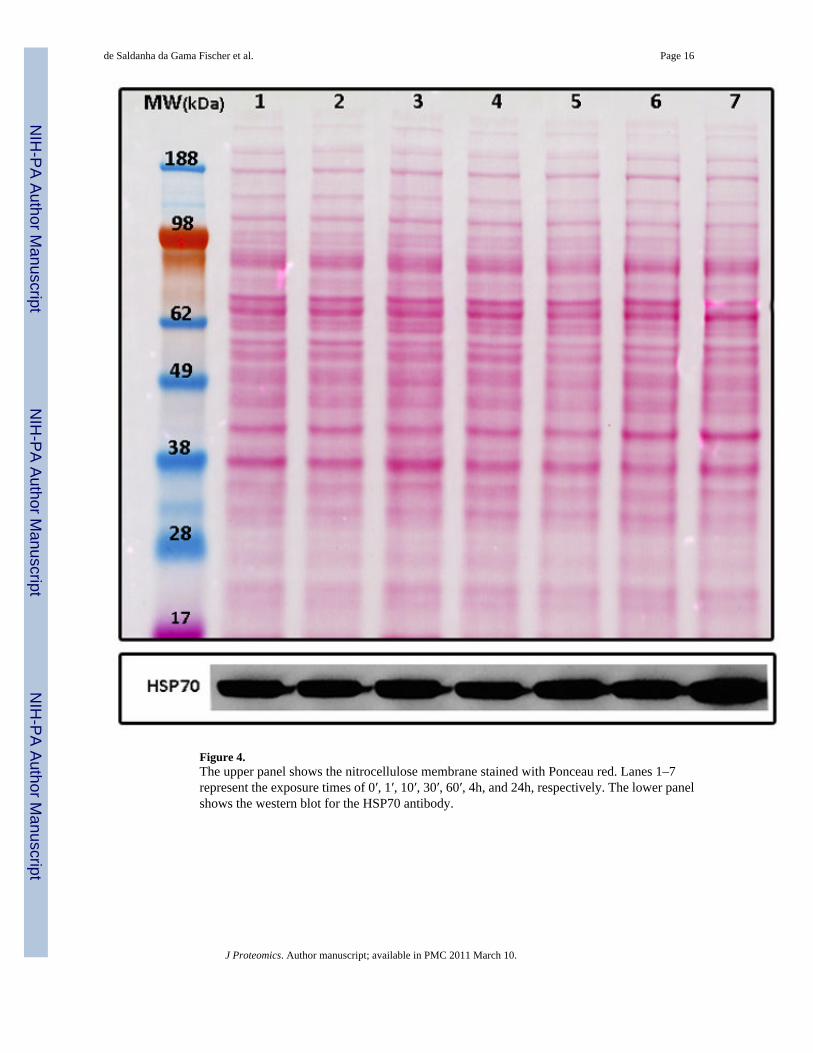
Figure 4.The upper panel shows the nitrocellulose membrane stained with Ponceau red. Lanes 1–7represent the exposure times of 0′, 1′, 10′, 30′, 60′, 4h, and 24h, respectively. The lower panelshows the western blot for the HSP70 antibody.
de Saldanha da Gama Fischer et al. Page 16
J Proteomics. Author manuscript; available in PMC 2011 March 10.
NIH
-PA Author Manuscript
NIH
-PA Author Manuscript
NIH
-PA Author Manuscript
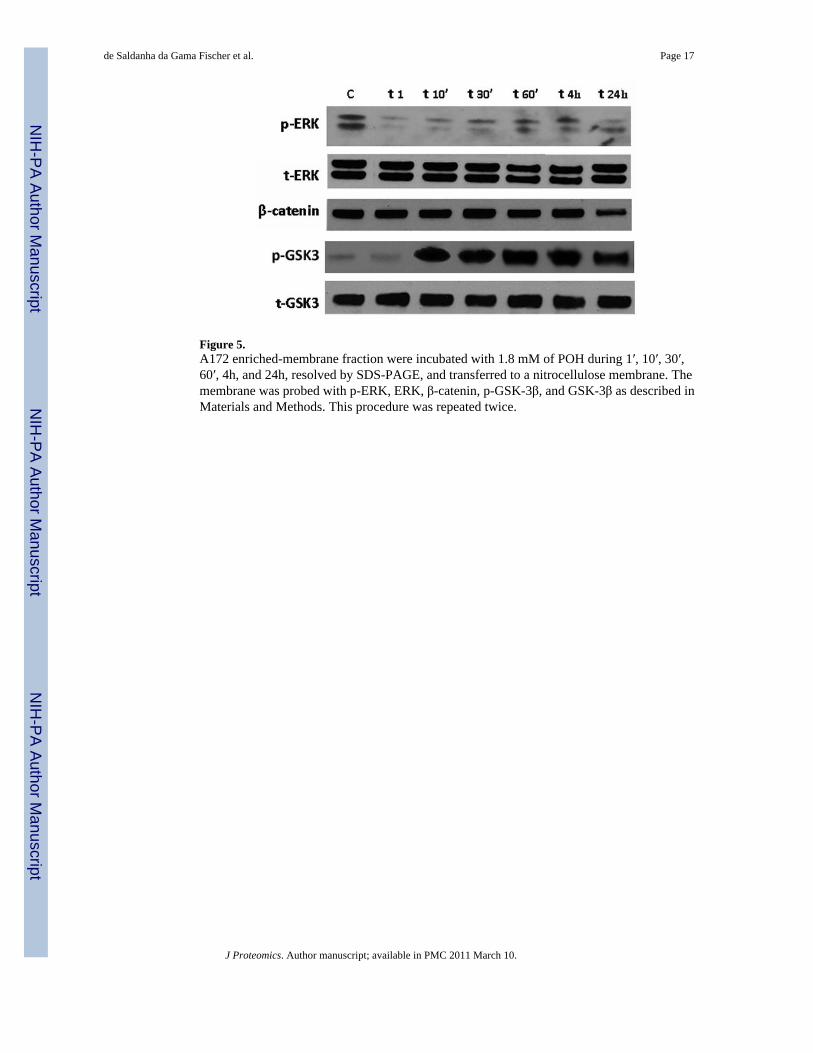
Figure 5.A172 enriched-membrane fraction were incubated with 1.8 mM of POH during 1′, 10′, 30′,60′, 4h, and 24h, resolved by SDS-PAGE, and transferred to a nitrocellulose membrane. Themembrane was probed with p-ERK, ERK, β-catenin, p-GSK-3β, and GSK-3β as described inMaterials and Methods. This procedure was repeated twice.
de Saldanha da Gama Fischer et al. Page 17
J Proteomics. Author manuscript; available in PMC 2011 March 10.
NIH
-PA Author Manuscript
NIH
-PA Author Manuscript
NIH
-PA Author Manuscript
Copyright © 2022 FDOKUMEN