Dynamic percolation of carbon nanotubes in liquid medium
8
Dynamic percolation of carbon nanotubes in liquid medium Ma ´rcio D. Lima,* ab Mo ˆnica J. Andrade, ab Viera Ska ´kalova ´, b Carlos P. Bergmann a and Siegmar Roth b Received 9th July 2007, Accepted 20th September 2007 First published as an Advance Article on the web 3rd October 2007 DOI: 10.1039/b710417k In this article we have measured the electrical behaviour of carbon nanotubes (CNTs) suspended in electrically insulating liquid. The concentration dependence of conductivity shows a percolation behaviour similar to that observed in electrical composites with an insulating matrix. The value of the critical percolation concentration is strongly determined by the aspect ratio of the fillers forming the network through dynamic percolation. We characterized several single- and multi- wall carbon nanotube materials by the newly proposed method and received a good correlation with the results obtained by methods commonly used for CNT characterization (Raman spectroscopy, transmission electron microscopy and electrical conductivity of free standing papers). As a comparison, fine graphite material has also been evaluated. The electrical properties of the suspensions can be used as a method for CNT characterization. This method can yield important information for CNT producers and for the selection of electrically conducting structures for composites applications. Introduction Carbon nanotubes (CNTs) have unique physical and chemical properties, yielding more than 24000 publications in the last 16 years. 1 Their high electrical conductivity, good chemical stability combined with huge aspect ratio (.1000) make carbon nanotubes particularly suitable for use as fillers for electrical composites and as ideal materials for transparent conductive coatings. For these applications, CNTs have to form 2- or 3-dimensional percolating networks. Thanks to their extremely high aspect ratio, CNTs may reach the percolation threshold at concentrations two orders of magni- tude lower than those of networks formed from other sp 2 carbon forms. 2 However, the optimum performance of the percolating networks may be limited by defects in the CNT structure as well as by impurities (amorphous carbon, onions, catalyst particles, etc.) often present in the source material. In order to use CNTs for particular applications, it is therefore extremely important to characterize the CNT material. A large number of characterization techniques are com- monly used: electron microscopic techniques (HRTEM, SEM, and AFM), thermogravimetric analysis (TGA), IR-optical and Raman spectroscopy, specific surface area, and electrical conductivity of free standing papers and pellets. However, the evaluation of the CNT purity remains a challenging task. HRTEM was the first technique used for characterizing nanotubes. However, the major problem of this technique is the small scale of the sample, usually of the order of 10 212 – 10 213 g, 3 providing only very local information. The same problem is faced whenever SEM or AFM are used. TGA allows the measurement of the precise total amount of carbon in the sample. This makes it suitable for identifying the concentration of residual catalysts. However, it is not good for distinguishing between the different forms of carbon— amorphous carbon, graphite or CNTs. Each carbon structure burns at slightly different temperatures, 4 but the temperature can be affected by the density and surface area of the material, as well as by the presence of metals and by the heating rate. 5 Near-infrared (NIR) spectroscopy has been established as an important tool for estimating the content of single-walled CNTs (SWCNTs) in the sample 3,6 and their diameter distribu- tion. The interband electronic transitions produce prominent features in the NIR spectral ranges that, while typical for SWCNTs, are not present in the absorption spectra of other carbonaceous structures, such as multiwalled CNTs (MWCNTs), for example. Raman spectroscopy is used as the major technique for characterizing CNTs. The resonance nature of the Raman effect in SWCNTs enables the selective determination of the diameters of the tubes present in the sample, when the excitation photon energy is tuned over a wide range. On the other hand, the resonance enhancement of the signal coming from SWCNTs makes it impossible to determine the amount of SWCNTs in a mixture with other carbonaceous structures. The characterization of CNTs in bulk form (free standing papers or pellets) by conventional measurements of electrical conductivity is costly in terms of the time consumed for sample preparation and of the amount of material used. Moreover, as the density of bulk samples may vary (packing of the particles and residues of surfactant), the measured values of conductivity often differ from sample to sample for the same CNT material. To conclude, none of the currently used techniques provides satisfying information on the characteristics of the CNT material, especially with respect to applications that require the formation of a percolation network of nanotubes. The new method that we propose for characterization of CNTs overcomes many of the limitations/problems mentioned a Federal University of Rio Grande do Sul, Porto Alegre, Brazil. E-mail: [email protected] b Max Planck Institute for Solid State Research, Stuttgart, Germany PAPER www.rsc.org/materials | Journal of Materials Chemistry 4846 | J. Mater. Chem., 2007, 17, 4846–4853 This journal is ß The Royal Society of Chemistry 2007 Published on 03 October 2007. Downloaded by University of Texas at Dallas on 30/12/2014 02:25:38. View Article Online / Journal Homepage / Table of Contents for this issue
-
Upload
independent -
Category
Documents
-
view
2 -
download
0
Transcript of Dynamic percolation of carbon nanotubes in liquid medium

Dynamic percolation of carbon nanotubes in liquid medium
Marcio D. Lima,*ab Monica J. Andrade,ab Viera Skakalova,b Carlos P. Bergmanna and Siegmar Rothb
Received 9th July 2007, Accepted 20th September 2007
First published as an Advance Article on the web 3rd October 2007
DOI: 10.1039/b710417k
In this article we have measured the electrical behaviour of carbon nanotubes (CNTs) suspended
in electrically insulating liquid. The concentration dependence of conductivity shows a percolation
behaviour similar to that observed in electrical composites with an insulating matrix. The value of
the critical percolation concentration is strongly determined by the aspect ratio of the fillers
forming the network through dynamic percolation. We characterized several single- and multi-
wall carbon nanotube materials by the newly proposed method and received a good correlation
with the results obtained by methods commonly used for CNT characterization (Raman
spectroscopy, transmission electron microscopy and electrical conductivity of free standing
papers). As a comparison, fine graphite material has also been evaluated. The electrical properties
of the suspensions can be used as a method for CNT characterization. This method can yield
important information for CNT producers and for the selection of electrically conducting
structures for composites applications.
Introduction
Carbon nanotubes (CNTs) have unique physical and chemical
properties, yielding more than 24000 publications in the last
16 years.1 Their high electrical conductivity, good chemical
stability combined with huge aspect ratio (.1000) make
carbon nanotubes particularly suitable for use as fillers for
electrical composites and as ideal materials for transparent
conductive coatings. For these applications, CNTs have to
form 2- or 3-dimensional percolating networks. Thanks to
their extremely high aspect ratio, CNTs may reach the
percolation threshold at concentrations two orders of magni-
tude lower than those of networks formed from other sp2
carbon forms.2
However, the optimum performance of the percolating
networks may be limited by defects in the CNT structure as
well as by impurities (amorphous carbon, onions, catalyst
particles, etc.) often present in the source material. In order to
use CNTs for particular applications, it is therefore extremely
important to characterize the CNT material.
A large number of characterization techniques are com-
monly used: electron microscopic techniques (HRTEM, SEM,
and AFM), thermogravimetric analysis (TGA), IR-optical
and Raman spectroscopy, specific surface area, and electrical
conductivity of free standing papers and pellets. However, the
evaluation of the CNT purity remains a challenging task.
HRTEM was the first technique used for characterizing
nanotubes. However, the major problem of this technique is
the small scale of the sample, usually of the order of 10212–
10213g,3 providing only very local information. The same
problem is faced whenever SEM or AFM are used.
TGA allows the measurement of the precise total amount of
carbon in the sample. This makes it suitable for identifying the
concentration of residual catalysts. However, it is not good
for distinguishing between the different forms of carbon—
amorphous carbon, graphite or CNTs. Each carbon structure
burns at slightly different temperatures,4 but the temperature
can be affected by the density and surface area of the material,
as well as by the presence of metals and by the heating rate.5
Near-infrared (NIR) spectroscopy has been established as
an important tool for estimating the content of single-walled
CNTs (SWCNTs) in the sample3,6 and their diameter distribu-
tion. The interband electronic transitions produce prominent
features in the NIR spectral ranges that, while typical for
SWCNTs, are not present in the absorption spectra of
other carbonaceous structures, such as multiwalled CNTs
(MWCNTs), for example.
Raman spectroscopy is used as the major technique for
characterizing CNTs. The resonance nature of the Raman
effect in SWCNTs enables the selective determination of
the diameters of the tubes present in the sample, when the
excitation photon energy is tuned over a wide range. On the
other hand, the resonance enhancement of the signal coming
from SWCNTs makes it impossible to determine the amount
of SWCNTs in a mixture with other carbonaceous structures.
The characterization of CNTs in bulk form (free standing
papers or pellets) by conventional measurements of electrical
conductivity is costly in terms of the time consumed for sample
preparation and of the amount of material used. Moreover,
as the density of bulk samples may vary (packing of the
particles and residues of surfactant), the measured values of
conductivity often differ from sample to sample for the same
CNT material.
To conclude, none of the currently used techniques provides
satisfying information on the characteristics of the CNT
material, especially with respect to applications that require
the formation of a percolation network of nanotubes.
The new method that we propose for characterization of
CNTs overcomes many of the limitations/problems mentioned
aFederal University of Rio Grande do Sul, Porto Alegre, Brazil.E-mail: [email protected] Planck Institute for Solid State Research, Stuttgart, Germany
PAPER www.rsc.org/materials | Journal of Materials Chemistry
4846 | J. Mater. Chem., 2007, 17, 4846–4853 This journal is � The Royal Society of Chemistry 2007
Publ
ishe
d on
03
Oct
ober
200
7. D
ownl
oade
d by
Uni
vers
ity o
f T
exas
at D
alla
s on
30/
12/2
014
02:2
5:38
. View Article Online / Journal Homepage / Table of Contents for this issue

above. It is based on electrical conductivity measurements of
CNTs suspended in an electrically insulating liquid (chloro-
form was used in this study) with nanotubes forming a
‘‘dynamic’’ percolating network. It is a fast, simple and
inexpensive measurement, using small amounts of material. It
also allows the determination of the value of the percolation
threshold concentration, by way of systematically tuning the
amount of CNTs in the liquid. Since its value depends on the
average aspect ratio of the conductive particles in the sample
and the presence of impurities in the sample decreases the
average aspect ratio of the system, the percolation threshold
concentration also reflects the amount of impurities in the
CNT material.
Herein we describe how this new technique was used for
evaluating the quality of several CNT materials with respect to
percolation network applications.
Experimental
Electrical conductivity in liquid measurements
Electrical measurements in a 2-probe configuration (distance
between the electrodes was 3 mm and 1 6 15 6 5 mm were the
dimensions of each immersed electrode) and ultrasonication
were performed in a cell schematically shown in Fig. 1. DC
current between 1.5 and 10 V was applied between the
electrodes (0.104 and 6.934 V cm21, respectively). For
comparison, we also performed measurements in a four-probe
configuration. Chloroform (dielectric constant = 4.8069) was
used as the liquid medium for the CNT suspensions. The
electrical conductivity was calculated by using the relation
s = I 6 L/(V 6 A) (1)
where s is the electrical conductivity, I is the electrical current
measured between the electrodes, V is the voltage applied
between the electrodes and A is the area of the electrodes
immersed in the liquid.
In order to avoid heating the CNT suspension, the
sonication and electrical experiments were done under immer-
sion in a water-ice bath. This preserves a stable temperature
during the measurements and also ensures better dispersion.
The ultrasonicator used was a UP100H Dr. Hielscher, with a
titanium probe of a diameter of 2.5 mm, output power of
100 W and a working frequency of 30 kHz.
Materials
CNT samples prepared through different techniques were
analysed: arc-discharge (AD) SWCNTs, produced using a
Ni–Y catalyst without any purification; purified HipCo
SWCNTs from Carbon Nanotechnology Inc.; and three
different samples from CVD MWCNTs that were called
MWCNT I, MWCNT I-short (shortened MWCNT I) and
MWCNT II. As a comparison, a sample of fine graphite
powder from Merck was also analysed. Suspensions with
carbon material concentrations ranging from 0.01 to
5 mg mL21 were prepared. At higher concentrations of carbon
material the viscosity of the suspensions increases, reducing
heat dissipation by convection, which leads to local evapora-
tion of the solvent and loss of sonication energy. At
concentrations above 1 mg mL21, the dispersion becomes less
homogeneous.
The measured value of electrical conductivity of pure
chloroform (Merck, analytical grade) was 1–3 6 1028 S cm21.
After removal of CNTs from the chloroform suspension by
centrifugation (2000 g for half an hour), the value of electrical
conductivity for the chloroform was found not to have
changed.
Characterization of the materials
Free standing papers made of CNT materials were also
prepared for electrical conductivity measurements in a 4-probe
configuration (Keithley Instruments). The microstructure
of the samples was evaluated using a Philips CM 200
Transmission Electron Microscope (TEM). Raman spectro-
scopy measurements were done with a 206 objective lens with
a 632.8 nm laser line and a laser power of about 4 mW (Jobin
Yvon-LabRam spectrometer).
Results and discussion
Structure features of the carbonaceous materials
The TEM images of the carbon samples studied in this
work are presented in Fig. 2. Fig. 2A shows a structureless
agglomeration of graphitic particles over the carbon grid
membrane. All MWCNT samples (Fig. 2B, C and D) look
very similar, even though, as demonstrated later by the results
obtained from our new method, they exhibit quite different
electrical properties of percolating networks. The average
diameter for MWCNT I and MWCNT I-short is about
5–10 nm, while for MWCNT II it is between 10–20 nm, as
measured by TEM. The MWCNT II also have a ‘‘bamboo
structure’’ more pronounced than that of the MWCNT I. This
structure is caused by a conical angle along the tubes.7 An
appreciation of the purity and diameter of SWCNT materials
can be made by comparing the images of HipCo SWCNTs
and AD SWCNTs, respectively (Fig. 2E and F). As can be
observed, the AD SWCNTs contain a larger amount of metal
catalyst impurities than the HipCo material. Both have a
carbon nanotube diameter of 1–2 nm.Fig. 1 Apparatus used for the electrical measurements.
This journal is � The Royal Society of Chemistry 2007 J. Mater. Chem., 2007, 17, 4846–4853 | 4847
Publ
ishe
d on
03
Oct
ober
200
7. D
ownl
oade
d by
Uni
vers
ity o
f T
exas
at D
alla
s on
30/
12/2
014
02:2
5:38
. View Article Online

Fig. 3 shows Raman spectra of CNTs and graphite. All the
spectra are normalized to the D* mode at about 2600 cm21,
which does not depend on defect concentration.8
Raman spectra of the two SWCNT samples are shown in
Fig 3A. From comparison of the radial breathing modes
(RBM) at low frequencies it follows that AD SWCNTs have a
diameter distribution around 1.5 nm, while HipCo SWCNTs
have a broader distribution centred on 1.2 nm. The Diamond
(or ‘‘defect’’) mode (D) at about 1302 cm21, induced by sp3
electronic states (considered as defects in the planar sp2
graphitic structure), indicates that HiPco SWCNTs contain
less structural defects than the AD SWCNTs material, since
the intensity of this mode in the latter is almost double that of
the former. In the case of SWCNTs, the strong signal of the
graphene tangential mode (G) at about 1580 cm21 is strongly
affected by the resonance effect, which impairs the reliability of
the G/D ratio; some reports, therefore, use D/D* instead.8 The
D/D* ratios of SWCNTs are listed in Table 1.
The Raman spectra of graphite and MWCNTs (Fig. 3B)
differ from the spectra of SWCNTs mainly by the absence of
the RBM feature. Since the resonance effect in MWCNTs is
small, structural disorder is well characterized by the ratio of
the G to D modes’ intensities. The values of this ratio are
summarized in Table 1 and demonstrate that the graphite
Fig. 2 TEM pictures of the several carbon samples analysed in this study: (A) graphite, (B) MWCNT I-short, (C) MWCNT II, (D) MWCNT I,
(E) HipCo SWCNT, (F) AD SWCNT. Scale bar for A: 500 nm; for B to F: 50 nm.
Fig. 3 Raman spectra of carbon samples analysed with a laser line of 632.8 nm.
Table 1 G/D ratios of graphite and MWCNTs materials and D/D* of SWCNTs after normalization of the D* mode8
HiPCo SWCNT AD SWCNT Graphite MWCNT I MWCNT I-short MWCNT II
G/D ratio 19 3 2.5 0.6 0.59 0.57D/D* ratio 0.43 0.54 — — — —
4848 | J. Mater. Chem., 2007, 17, 4846–4853 This journal is � The Royal Society of Chemistry 2007
Publ
ishe
d on
03
Oct
ober
200
7. D
ownl
oade
d by
Uni
vers
ity o
f T
exas
at D
alla
s on
30/
12/2
014
02:2
5:38
. View Article Online
studied in the work has far fewer sp3 defects than MWCNTs.
Slightly more defects are present in MWCNT I-short than in
MWCNT I (longer tubes), but MWCNT II exhibits the
most disordered structure. This coincides with the observa-
tions from the TEM images (Fig. 2). The more pronounced
‘‘bamboo-like’’ structure in MWCNT II could be considered
as reflecting defects in its structure.
Electrical conductivity in an electrically insulating liquid
When nanotubes are dispersed in an electrically insulating
matrix, they are capable of conducting electrical current. At a
critical concentration, percolation of the conductive particles
is reached.9 In solid composites or coatings, the CNTs form
a pathway between the electrodes in an electrical circuit.
According to other reports,10,11 CNTs can also create such
percolating networks and conduct electrical current in a liquid
medium. In this case, the connections between the suspended
tubes are dynamic (Brownian motion and, eventually, liquid
agitation).
The electrical conductivity of CNTs in suspensions was
measured under ultrasonication (Fig. 4a), as well as in the
static state (without ultrasonication), once the electrical
current stabilized (Fig. 4b). At higher concentrations of
CNTs (above the percolation threshold), the conductivity of
the suspensions is approximately the same in both cases,
namely with or without ultrasonication. However, at lower
concentrations (below the percolation threshold), there is a
clear difference in the shapes of the conductivity curves.
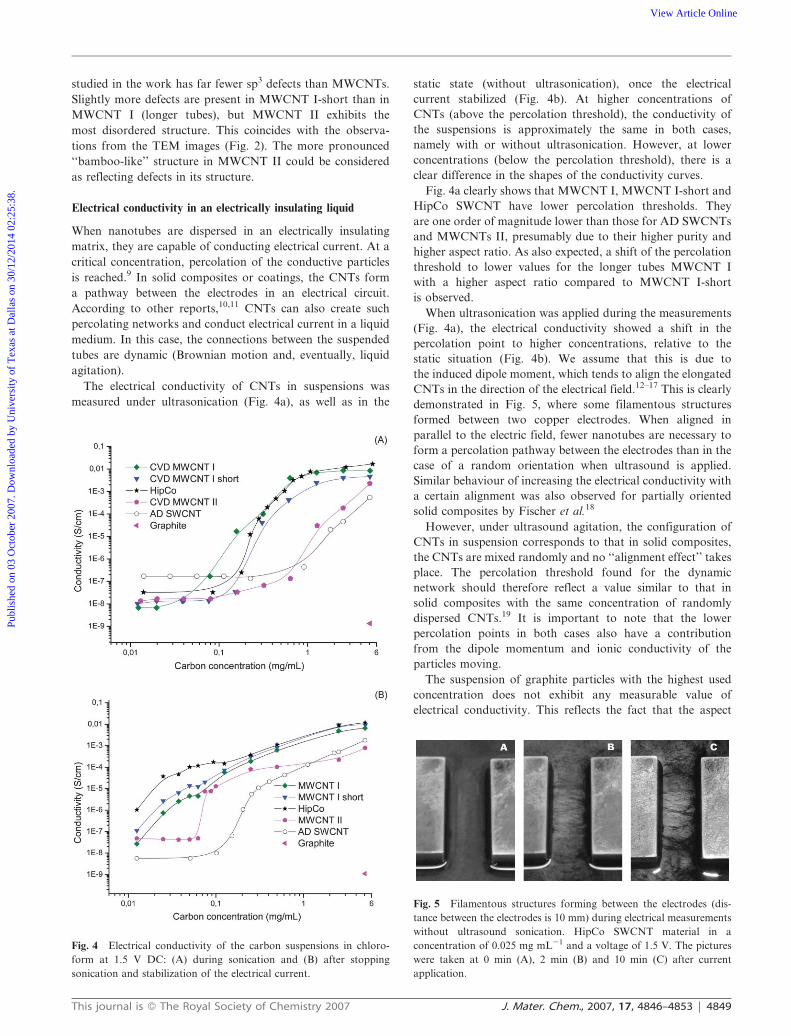
Fig. 4a clearly shows that MWCNT I, MWCNT I-short and
HipCo SWCNT have lower percolation thresholds. They
are one order of magnitude lower than those for AD SWCNTs
and MWCNTs II, presumably due to their higher purity and
higher aspect ratio. As also expected, a shift of the percolation
threshold to lower values for the longer tubes MWCNT I
with a higher aspect ratio compared to MWCNT I-short
is observed.
When ultrasonication was applied during the measurements
(Fig. 4a), the electrical conductivity showed a shift in the
percolation point to higher concentrations, relative to the
static situation (Fig. 4b). We assume that this is due to
the induced dipole moment, which tends to align the elongated
CNTs in the direction of the electrical field.12–17 This is clearly
demonstrated in Fig. 5, where some filamentous structures
formed between two copper electrodes. When aligned in
parallel to the electric field, fewer nanotubes are necessary to
form a percolation pathway between the electrodes than in the
case of a random orientation when ultrasound is applied.
Similar behaviour of increasing the electrical conductivity with
a certain alignment was also observed for partially oriented
solid composites by Fischer et al.18
However, under ultrasound agitation, the configuration of
CNTs in suspension corresponds to that in solid composites,
the CNTs are mixed randomly and no ‘‘alignment effect’’ takes
place. The percolation threshold found for the dynamic
network should therefore reflect a value similar to that in
solid composites with the same concentration of randomly
dispersed CNTs.19 It is important to note that the lower
percolation points in both cases also have a contribution
from the dipole momentum and ionic conductivity of the
particles moving.
The suspension of graphite particles with the highest used
concentration does not exhibit any measurable value of
electrical conductivity. This reflects the fact that the aspect
Fig. 4 Electrical conductivity of the carbon suspensions in chloro-
form at 1.5 V DC: (A) during sonication and (B) after stopping
sonication and stabilization of the electrical current.
Fig. 5 Filamentous structures forming between the electrodes (dis-
tance between the electrodes is 10 mm) during electrical measurements
without ultrasound sonication. HipCo SWCNT material in a
concentration of 0.025 mg mL21 and a voltage of 1.5 V. The pictures
were taken at 0 min (A), 2 min (B) and 10 min (C) after current
application.
This journal is � The Royal Society of Chemistry 2007 J. Mater. Chem., 2007, 17, 4846–4853 | 4849
Publ
ishe
d on
03
Oct
ober
200
7. D
ownl
oade
d by
Uni
vers
ity o
f T
exas
at D
alla
s on
30/
12/2
014
02:2
5:38
. View Article Online
ratio of graphite particles is many orders of magnitude lower
than the aspect ratio of carbon nanotubes.
Fig. 5 presents a sequence of image captions of two
electrodes immersed in a suspension with 0.025 mg mL21 of
HipCo SWCNTs, after 0 min (A), 2 min (B), and 10 min (C) of
applying a voltage of 1.5 V between the electrodes. It clearly
demonstrates the development of the aligned percolating
pathway. Over the application period of the field, the CNTs
tend to form fibrous structures, while some areas of the
suspension become more diluted.
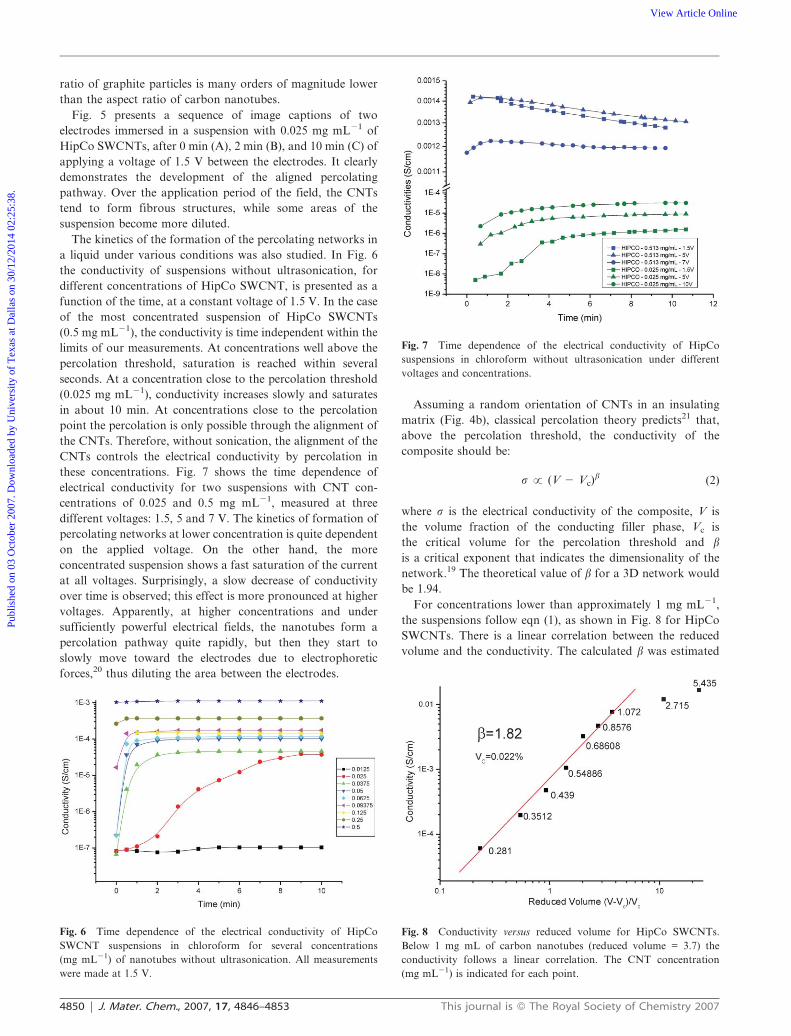
The kinetics of the formation of the percolating networks in
a liquid under various conditions was also studied. In Fig. 6
the conductivity of suspensions without ultrasonication, for
different concentrations of HipCo SWCNT, is presented as a
function of the time, at a constant voltage of 1.5 V. In the case
of the most concentrated suspension of HipCo SWCNTs
(0.5 mg mL21), the conductivity is time independent within the
limits of our measurements. At concentrations well above the
percolation threshold, saturation is reached within several
seconds. At a concentration close to the percolation threshold
(0.025 mg mL21), conductivity increases slowly and saturates
in about 10 min. At concentrations close to the percolation
point the percolation is only possible through the alignment of
the CNTs. Therefore, without sonication, the alignment of the
CNTs controls the electrical conductivity by percolation in
these concentrations. Fig. 7 shows the time dependence of
electrical conductivity for two suspensions with CNT con-
centrations of 0.025 and 0.5 mg mL21, measured at three
different voltages: 1.5, 5 and 7 V. The kinetics of formation of
percolating networks at lower concentration is quite dependent
on the applied voltage. On the other hand, the more
concentrated suspension shows a fast saturation of the current
at all voltages. Surprisingly, a slow decrease of conductivity
over time is observed; this effect is more pronounced at higher
voltages. Apparently, at higher concentrations and under
sufficiently powerful electrical fields, the nanotubes form a
percolation pathway quite rapidly, but then they start to
slowly move toward the electrodes due to electrophoretic
forces,20 thus diluting the area between the electrodes.
Assuming a random orientation of CNTs in an insulating
matrix (Fig. 4b), classical percolation theory predicts21 that,
above the percolation threshold, the conductivity of the
composite should be:
s 3 (V 2 Vc)b (2)
where s is the electrical conductivity of the composite, V is
the volume fraction of the conducting filler phase, Vc is
the critical volume for the percolation threshold and b
is a critical exponent that indicates the dimensionality of the
network.19 The theoretical value of b for a 3D network would
be 1.94.
For concentrations lower than approximately 1 mg mL21,
the suspensions follow eqn (1), as shown in Fig. 8 for HipCo
SWCNTs. There is a linear correlation between the reduced
volume and the conductivity. The calculated b was estimated
Fig. 6 Time dependence of the electrical conductivity of HipCo
SWCNT suspensions in chloroform for several concentrations
(mg mL21) of nanotubes without ultrasonication. All measurements
were made at 1.5 V.
Fig. 7 Time dependence of the electrical conductivity of HipCo
suspensions in chloroform without ultrasonication under different
voltages and concentrations.
Fig. 8 Conductivity versus reduced volume for HipCo SWCNTs.
Below 1 mg mL of carbon nanotubes (reduced volume = 3.7) the
conductivity follows a linear correlation. The CNT concentration
(mg mL21) is indicated for each point.
4850 | J. Mater. Chem., 2007, 17, 4846–4853 This journal is � The Royal Society of Chemistry 2007
Publ
ishe
d on
03
Oct
ober
200
7. D
ownl
oade
d by
Uni
vers
ity o
f T
exas
at D
alla
s on
30/
12/2
014
02:2
5:38
. View Article Online
to be 1.82, which is quite close to the theoretical value for a
3D network.
The value of the critical volume can be calculated by:
1{ exp {VexV
SVeT
� �~Vc (3)
V is the excluded volume of each filler ‘‘particle’’, in this case,
of the carbon nanotubes. Vex represent the total excluded
volume. For randomly oriented infinitely thin cylinders it gives
a value of 1.4, and for spheres, 2.8.2 For the calculation of the
critical volume of real cylindrical particles, these values should
be considered as the lowest and highest limits. The excluded
volume (Ve) can be calculated by:
Ve~4p
3W 3z2pW 2Lz
p
2WL2 (4)
where W is the diameter and L is the length of the nanotubes.
From eqn (3) and (4), it is possible to demonstrate that the
percolation threshold volume fraction is inversely proportional
to the aspect ratio. Longer CNTs will present a percolation
threshold volume lower than for shorter nanotubes, for same
diameter materials. In this way, it is possible to estimate the
aspect ratio of the filler material.
However, the random orientation of the nanotubes in the
suspension could only be assured under ultrasound sonication.
In this case, the suspension’s behaviour could be similar to that
of solid composites with random orientation of CNTs, with a
defined percolation threshold.
From Fig. 4a it is possible to calculate the percolation
threshold of some carbon materials by fitting with eqn (2),
assuming a density of 1.2 g cm23.22 Table 2 presents the
estimated critical percolation thresholds for HipCo SWCNTs,
MWCNT I and MWCNT I-short. The aspect ratios calculated
from eqn (3) and (4) are also shown. However, the dynamic
movement of the particles should yield to a lower percolation
threshold (dipole momentum plus ionic conductivity); this
effect, therefore, needs to be more deeply studied.
When the values of Vex predicted by the percolation theory
for cylinders (1.4) are used, the calculated aspect ratios
obtained are higher by a factor of 6–7 than those observed
by microscopy. Using a Vex of 0.3 in eqn (3) and (4) it is
possible to obtain better agreement between the observed
ratios. The explanation for this much reduced total exclude
volume could be a very high local anisotropy in the filler
orientation,23 caused by the ultrasonication.
The percolation thresholds measured by our novel method
are one order of magnitude lower than the typical percolation
threshold values obtained for CNTs in isolating matrix
composites, usually around 0.1–0.4 wt%.24 However, using
special techniques, such as in-situ polymerization, McLachlan
et al. achieved a very low percolation threshold of 0.05 wt%25
for HipCo tubes. This value is similar to that found here for
the HipCo samples under ultrasonic agitation (0.02–0.03 wt%).
The advantages of the proposed method are most clearly
demonstrated by the results of electrical conductivity measure-
ments for various MWCNT suspensions. To achieve a con-
ductivity of 1 6 1025 S cm21, the amount of MWCNT II
material required is six times higher than that for MWCNT I
material for a given volume of suspension.
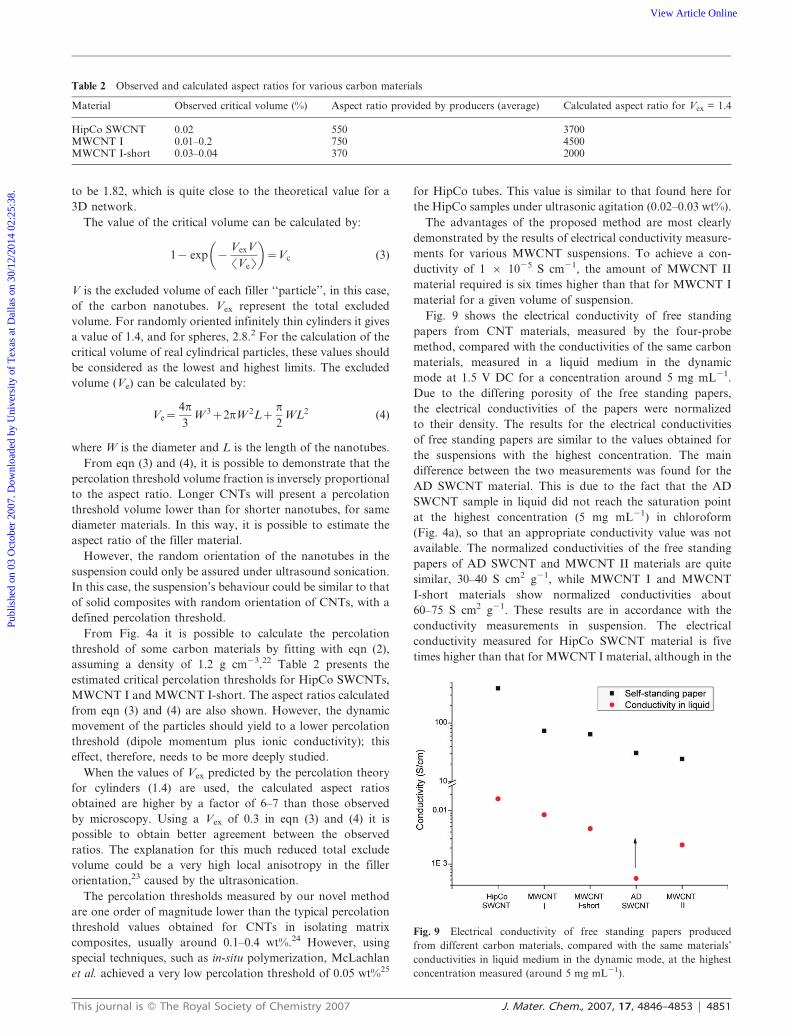
Fig. 9 shows the electrical conductivity of free standing
papers from CNT materials, measured by the four-probe
method, compared with the conductivities of the same carbon
materials, measured in a liquid medium in the dynamic
mode at 1.5 V DC for a concentration around 5 mg mL21.
Due to the differing porosity of the free standing papers,
the electrical conductivities of the papers were normalized
to their density. The results for the electrical conductivities
of free standing papers are similar to the values obtained for
the suspensions with the highest concentration. The main
difference between the two measurements was found for the
AD SWCNT material. This is due to the fact that the AD
SWCNT sample in liquid did not reach the saturation point
at the highest concentration (5 mg mL21) in chloroform
(Fig. 4a), so that an appropriate conductivity value was not
available. The normalized conductivities of the free standing
papers of AD SWCNT and MWCNT II materials are quite
similar, 30–40 S cm2 g21, while MWCNT I and MWCNT
I-short materials show normalized conductivities about
60–75 S cm2 g21. These results are in accordance with the
conductivity measurements in suspension. The electrical
conductivity measured for HipCo SWCNT material is five
times higher than that for MWCNT I material, although in the
Table 2 Observed and calculated aspect ratios for various carbon materials
Material Observed critical volume (%) Aspect ratio provided by producers (average) Calculated aspect ratio for Vex = 1.4
HipCo SWCNT 0.02 550 3700MWCNT I 0.01–0.2 750 4500MWCNT I-short 0.03–0.04 370 2000
Fig. 9 Electrical conductivity of free standing papers produced
from different carbon materials, compared with the same materials’
conductivities in liquid medium in the dynamic mode, at the highest
concentration measured (around 5 mg mL21).
This journal is � The Royal Society of Chemistry 2007 J. Mater. Chem., 2007, 17, 4846–4853 | 4851
Publ
ishe
d on
03
Oct
ober
200
7. D
ownl
oade
d by
Uni
vers
ity o
f T
exas
at D
alla
s on
30/
12/2
014
02:2
5:38
. View Article Online

suspensions with ultrasonication, the HipCo SWCNT material
exhibits a conductivity only two times higher than that of the
MWCNT I material. This discrepancy could be explained by
the fact that in composites (with a liquid or solid matrix),
the conductivity for smaller concentrations of nanotubes is
dominated by the electrical resistance of the contacts between
the nanotubes. On the other hand, for higher concentrations of
nanotubes, the intrinsic resistance of the nanotubes starts
to play the dominant role. SWCNTs have a higher specific
conductivity than MWCNTs. Usually only the external shell
of the MWCNT participates in electrical conduction.26 Free
standing papers can be seen as extremely concentrated
composites. In their case, the intrinsic electrical conductivity
of the tubes plays the dominant role.
Conclusions
The pattern of changes over time in the electrical conductivity
of several CNT materials suspended in chloroform has been
investigated, using applied electric fields at different concen-
trations and voltages.
It was observed that the electrical conductivity of CNT
suspensions in an insulating liquid is dependent on the CNT
concentration, their aspect ratio, the type of CNTs used,
the applied electric field and the randomicity of the CNT
distribution in the liquid medium. When the liquid is not
disturbed, the nanotubes are aligned by the electric field and a
very low percolation threshold is achieved. However, when the
suspension is submitted to ultrasonication, the percolation
threshold value is closer to that for composites of randomly
dispersed CNTs in an insulating solid matrix with a strong
dependence on the average aspect ratio of the samples, while
the electrical conductivity of the suspensions follows a power
law, as predicted by classical percolation theory.
However, the values of the percolation threshold for
suspensions were found to be smaller than most reports about
solid composites with randomly aligned CNTs. A possible
explanation for this is that, under dynamic conditions,
the probability for the constantly moving nanotubes in the
suspension to form a percolation network is higher than under
static conditions.
A clear correlation was also found between the conduc-
tivities measured for suspensions of CNTs in an insulating
liquid, after reaching the percolation point, compared to those
of free standing papers. Thus, the new measurement method
presented herein promises to be a fast and inexpensive
technique for CNT characterization. The authors believe that
this method will be particularly useful for the selection of
carbon nanotube materials to be used for the preparation
of electrically conductive composites, as well as for quality
control in CNT synthesis processes. This same procedure
should also be applicable for any other conductive particles.
Acknowledgements
M.J.A. and M.D.L. are grateful for CNPq/DAAD grants. We
thank Peter van Aken and Marion Kelch for help in operating
the TEM, and Max Planck Institute for Metals Research
for providing access to the TEM. We also are grateful for
the assistance of Mr Kalman Blum for contributions in text
corrections.
References
1 Web of science search engine using the words ‘‘carbon nanotube*’’(www.isiknowledge.com).
2 A. Celzard, E. McRae, C. Deleuze, M. Dufort, G. Furdin and J. F.Mareche, Critical concentration in percolating systems containinga high-aspect-ratio filler, Phys. Rev. B, 1996, 53, 6209–6214.
3 M. E. Itkis, D. E. Perea, S. Niyogi, S. M. Rickard, M. A. Hamon,H. Hu, B. Zhao and R. C. Haddon, Purity Evaluation ofAs-Prepared Single-Walled Carbon Nanotube Soot by Use ofSolution-Phase Near-IR Spectroscopy,, Nano Lett., 2003, 3(3),309–314.
4 M. Zhang, M. Yudasaka, A. Koshio and S. Iijima,Thermogravimetric analysis of single-wall carbon nanotubesultrasonicated in monochlorobenzene, Chem. Phys. Lett., 2002,364, 420–426.
5 S. Arepalli, P. Nikolaev, O. Gorelik, V. G. Nadjiev, W. Holmes,B. Files and L. Yowell, Protocol for the characterization of single-wall carbon nanotube material quality, Carbon, 2004, 42,1783–1791.
6 M. E. Itkis, D. E. Perea, R. Jung, S. Niyogi and R. C. Haddon,Comparison of analytical techniques for purity evaluation ofsingle-walled carbon nanotubes, J. Am. Chem. Soc., 2005, 127,3439–3448.
7 Y. D. Li, J. L. Chen, Y. M. Ma, J. B. Zhao, Y. N. Qin andL. Chang, Formation of bamboo-like nanocarbon and evidence forthe quasi-liquid state of nanosized metal particles at moderatetemperatures, Chem. Commun., 1999, 1141–1142.
8 J. Mautzsch, S. Reich, C. Thomsen, S. Webster, R. Czerw,D. L. Carroll, S. M. C. Vieira, P. R. Birkett and C. A. Rego,Raman characterization of boron-doped multiwalled carbonnanotubes, Appl. Phys. Lett., 2002, 81, 2647–2649.
9 J. N. Coleman, S. Curran, A. B. Dalton, A. P. Davey,B. McCarthy, W. Blau and R. C. Barklie, Percolation-dominatedconductivity in a conjugated-polymer-carbon-nanotube composite,Phys. Rev. B, 1998, 58, R7492–R7495.
10 L. Y. Liu, Y. G. Yang and Y. F. Zhang, A study on the electricalconductivity of multi-walled carbon nanotube aqueous solution,Physica E, 2004, 24, 343–348.
11 M. O. Lisunova, N. I. Lebovka, E. V. Melezhyk and Y. P. Boiko,Stability of the aqueous suspensions of nanotubes in the presenceof nonionic surfactant, J. Colloid Interface Sci., 2006, 299,740–746.
12 L. X. Benedict, S. G. Louie and M. L. Cohen, StaticPolarizabilities of Single-Wall Carbon Nanotubes, Phys. Rev. B,1995, 52, 8541–8549.
13 K. Yamamoto, S. AkitA and Y. Nakayama, Orientation andpurification of carbon nanotubes using ac electrophoresis, J. Phys.D: Appl. Phys., 1998, 31, L34–L36.
14 X. Q. Chen, T. Saito, H. Yamada and K. Matsushige, Aligningsingle-wall carbon nanotubes with an alternating-current electricfield, Appl. Phys. Lett., 2001, 78, 3714–3716.
15 M. R. Diehl, S. N. Yaliraki, R. A. Beckmann, M. Barahona andJ. R. Heath, Angew. Chem., 2002, 114, 363.
16 L. A. Nagahara, I. Amlani, J. Lewenstein and R. K. Tsui, Directedplacement of suspended carbon nanotubes for nanometer-scaleassembly, Appl. Phys. Lett., 2002, 80, 3826–3828.
17 R. Krupke, F. Hennrich, H. B. Weber, D. Beckmann, O. Hampe,S. Malik, M. M. Kappes and H. V. Lohneysen, Contacting singlebundles of carbon nanotubes with alternating electric fields, Appl.Phys. A, 2003, 76, 397–400.
18 S. Badaire, V. Pichot, C. Zakri, P. Poulin, P. Launois, J. Vavro,C. Guthy, M. Chen and J. E. Fischer, Correlation of propertieswith preferred orientation in coagulated and stretch-aligned single-wall carbon nanotubes, J. Appl. Phys., 2004, 96, 7509–7513.
19 I. Balberg, N. Bibenbaum and N. Wagner, Percolation Thresholdsin the 3-Dimensional Sticks System, Phys. Rev. Lett., 1984, 52,1465–1468.
20 K. Yamamoto, S. Akita and Y. Nakayama, Orientation of carbonnanotubes using electrophoresis, Jpn. J. Appl. Phys., Part 2, 2006,35(7B), L917–L918.
4852 | J. Mater. Chem., 2007, 17, 4846–4853 This journal is � The Royal Society of Chemistry 2007
Publ
ishe
d on
03
Oct
ober
200
7. D
ownl
oade
d by
Uni
vers
ity o
f T
exas
at D
alla
s on
30/
12/2
014
02:2
5:38
. View Article Online

21 J.-M. Benoit, B. Corraze, S. Lefrant, P. Bernier and O. Chauvet,Electric transport properties and percolation in carbon nanotubes/PMMA composites, Mater. Res. Soc. Symp. Proc., 2002, 706,85–90.
22 J. M. Benoit, B. Corraze, S. Lefrant, P. Bernier and O. Chauvet,Electric transport properties and percolation in carbon nanotubes/PMMA composites, Mater. Res. Soc. Symp. Proc., 2001, 706,85–90.
23 I. Balberg, ‘‘Universal’’ percolation-threshold limits in the con-tinuum, Phys. Rev. B, 1985, 31, 6.
24 V. Skakalova, U. Dettlaff-Weglikowska and S. Roth, Electricaland mechanical properties of nanocomposites of single wall carbonnanotubes with PMMA, Synth. Met., 2005, 152, 349–352.
25 D. S. McLachlan, C. Chiteme, C. Park, K. E. Wise, S. E. Lowther,P. T. Lillehei, E. J. Siochi and J. S. Harrison, AC and DCpercolative conductivity of single wall carbon nanotube polymercomposites, J. Polym. Sci., Part B: Polym. Phys., 2005, 43,3273–3287.
26 Z. L. Wang, C. Hui, Electron Microscopy of nanotubes, KluwerAcademic Publishers, Boston, 2003, pp. 215–216.
This journal is � The Royal Society of Chemistry 2007 J. Mater. Chem., 2007, 17, 4846–4853 | 4853
Publ
ishe
d on
03
Oct
ober
200
7. D
ownl
oade
d by
Uni
vers
ity o
f T
exas
at D
alla
s on
30/
12/2
014
02:2
5:38
. View Article Online