Do Capacity Coupled Electric Fields Accelerate Tibial Stress Fracture Healing?
Upload
independentCategory
view
2download
0
1
Short communication 1
Dynamic Contact Stress Patterns on the Tibial Plateaus during 2
Simulated Gait: A Novel Application of Normalized Cross 3
Correlation 4
Hongsheng Wang, PhD1*, Tony Chen, PhD1*, Peter Torzilli, PhD2, Russell Warren, MD3, 5
Suzanne Maher, PhD1§ 6
7
1Department of Biomechanics, 2Laboratory for Soft Tissue Research and 3Sports Medicine and 8
Shoulder Service, Hospital for Special Surgery, New York, NY 10021 9
* Both sharing first authorship equally 10
11
12
13
§Corresponding Author: 14
Suzanne A Maher, PhD, 15
Department of Biomechanics, 16
Hospital for Special Surgery, 17
535 East 70th Street, New York, NY 10021. 18
19
This is manuscript draft, for more information, contact 20
Hongsheng Wang 21
Hospital for Special Surgery, 22
535 East 70th Street, New York, NY 10021. 23
(646)714-6122 25
26

2
ABSTRACT 27
The spatial distribution and pattern of local contact stresses within the knee joint during 28
activities of daily living have not been fully investigated. The objective of this study was to 29
determine if common contact stress patterns exist on the tibial plateaus of human knees during 30
simulated gait. To test this hypothesis, we developed a novel normalized cross-correlation (NCC) 31
algorithm and applied it to the contact stresses on the tibial plateaus of twelve human cadaveric 32
knees subjected to multi-directional loads mimicking gait. The contact stress profiles at different 33
locations on the tibial plateaus were compared, where regions with similar contact stress patterns 34
were identified across specimens. Three consistent regional patterns were found, among them two 35
most prominent contact stress patterns were shared by 9 to 12 of all the knees and the third pattern 36
was shared by 6 to 8 knees. The first pattern was located at the posterior aspect of the medial tibial 37
plateau and had a single peak stress that occurred during the early stance phase. The second pattern 38
was located at the central-posterior aspects of the lateral plateau and consisted of two peak stresses 39
coincident with the timing of peak axial force at early and late stance. The third pattern was found 40
on the anterior aspect of cartilage-to-cartilage contact region on the medial plateau consisted of 41
double peak stresses. The differences in the location and profile of the contact stress patterns 42
suggest that the medial and lateral menisci function to carry load at different points in the gait 43
cycle: with the posterior aspect of the medial meniscus consistently distributing load only during 44
the early phase of stance, and the posterior aspect of the lateral meniscus consistently distributing 45
load during both the early and late phases of stance. This novel approach can help identify 46
abnormalities in knee contact mechanics and provide a better understanding of the mechanical 47
pathways leading to post-traumatic osteoarthritis. 48
KEYWORDS: Contact mechanics, cadaveric model, meniscus function, knee simulator, pressure 49
sensor 50

3
INTRODUCTION 51
Gait analysis based on stereo-photogrammetry (Cappozzo et al., 2005), dual-fluoroscopy (Li 52
et al., 2008) and stereo-radiography (Tashman and Anderst, 2003) has been widely used to 53
characterize in vivo joint kinematics. By combining knee joint kinematics with bony geometry, a 54
connection between the tibiofemoral joint contact kinematics and the health of the cartilage at the 55
site of contact has emerged (Anderst and Tashman, 2009; Beveridge et al., 2013). This has been 56
further enhanced with the inclusion of articular cartilage into the models (DeFrate et al., 2004; Li 57
et al., 2006). To date, an underlying but as yet unproven premise is that as the contact location 58
changes after soft tissue injury (i.e. ACL rupture, meniscus tear), the spatial distribution and local 59
characteristics of contact stresses on the articular cartilage also change, to which the tissue cannot 60
readily adapt. To further explore this concept, a more detailed understanding of the regional contact 61
stress patterns that articular cartilage is exposed to in uninjured knees is required. Unfortunately, 62
patient-based studies do not allow for such measures, and most previous cadaveric studies do not 63
mimic the complex multi-directional loading that knees experience in vivo. Added to this 64
complexity is the fact that different regions of the articular cartilage are loaded and unloaded 65
during different phases of activities of daily living (e.g. walking). 66
The objective of this study was to determine if common contact stress patterns exist on the 67
tibial plateaus of human knees during gait. To satisfy this objective, we developed a novel 68
normalized cross-correlation (NCC) algorithm and applied it to the contact stresses on the tibial 69
plateaus of twelve human cadaveric knees subjected to multi-directional loads mimicking human 70
gait. 71
72
MATERIALS AND METHODS 73
1. Experimental Protocol 74

4
Twelve normal human cadaveric knees free of visible evidence of chondral defects, meniscus 75
or ligament damage were used in this study (Table 1). The knees were carefully stripped of all soft 76
tissue except for the capsule, collateral ligaments, cruciate ligaments and menisci. After stripping 77
the knees, they were pinned through the epicondylar axis (Fig. 1c); this ensured that the 78
flexion/extension (FE) axis of the knee was aligned with the FE axis of a load-controlled Stanmore 79
Knee Simulator (University College London, Middlesex, UK) (Fig. 1a). The tibia-fibula complex 80
and the femur were then potted into fixtures with polymethylmethacrylate (PMMA) bone cement. 81
An electronic sensor (Model-4010N, Tekscan Inc., Boston, MA, USA) was placed on the tibial 82
plateaus under the menisci and used to measure the contact stresses (Fig. 1b). The pressure sensor 83
is a 22×34 matrix of sensing elements (sensel), and each sensel has a dimension of 2 mm by 2 mm. 84
It was augmented with plastic tabs and sealed between two layers of Tegaderm adhesive dressing 85
(3M, Minneapolis, MN) and calibrated with loads approximating 20% and 80% of the maximum 86
axial load during gait (Brimacombe et al., 2009). The sensor was fixed to the surface of tibial 87
plateau by suturing the augment tabs (Fig. 1b). Approximately 1 cm incisions were made in the 88
meniscotibial ligaments anteriorly and posteriorly of both menisci, which allowed the sensor to be 89
passed underneath the menisci with minimal disruption of the meniscocapsular attachments. The 90
sensor tabs were then sutured in place using 3-0 Ethibond sutures via the tibial insertion of the 91
anterior cruciate ligament (ACL) and the posteroinferior capsule (Bedi et al., 2010). The sensor 92
position was adjusted to capture loads across the entire plateau under a 1000 N axial load (Fig. 1d). 93
A custom scribe, which was attached through a drill hole in the cement mantle of the tibial potting 94
block, was used to register positions of the sensor on the tibial plateaus ensuring the sensor was 95
positioned consistently for each knee. 96

5
The simulator applied synchronized multidirectional loads (Fig. 2), including axial force, 97
anterior-posterior (AP) force and internal/external (IE) torque to the tibia, while controlling the 98
femur flexion/extension to mimic gait, according to ISO 14243-1. The other degrees of freedom 99
of the tibia (medial-lateral translation, varus/valgus rotation) were uncontrolled (Bedi et al., 2010; 100
Cottrell et al., 2008). To ensure reasonable, physiological joint kinematics, reflective markers were 101
rigidly attached to the femoral and tibial fixtures for a sub-set of five knees (Fig. 1a), and their 102
positions relative to the bone were registered with a 3D digitizer (accuracy: 0.23 mm) (MicroScribe; 103
Immersion, San Jose, California). Anatomic landmarks (femoral epicondyles, medial/lateral edges 104
of tibial plateau, tibial spine, etc.) were identified using the 3D digitizer to define the reference 105
frames that describe the motion of the femur relative to the tibia (Wang and Zheng, 2010). The 106
motion data were recorded at 50 Hz by a motion capture system (MotionAnalysis Inc., CA) and 107
the normal contact stress was collected by a Tekscan sensor at 100 Hz. Twenty gait cycles were 108
collected from each knee to ensure the sensor and the knee simulator reached steady state (Cottrell 109
et al., 2008). 110
2. Contact Stress Pattern within Each Knee 111
To normalize the location of contact stress to individual tibia plateau geometry, the stress maps 112
were aligned to the center of each meniscus and uniformly scaled based on the meniscus size. The 113
meniscus was approximated by fitting a circle to the manually selected points on the periphery of 114
each meniscus. This method was validated (medial r2 = 0.68, lateral r2 = 0.72, p < 0.01, 5 knees) 115
by comparing the radius of the best fitting circle to that measured from 3D meniscus models 116
segmented from MR images (3D CUBE scan, voxel size: 0.3 × 0.3 × 0.6 mm3) (Gold et al., 2007). 117
The raw contact stress data at each sensel was then low-pass filtered (4th order zero-lag low-pass 118
Butterworth) with a cut-off frequency of 6 Hz to remove high-frequency noise. The degree of 119

6
similarity between the stress patterns of any two sensels was determined using cross-correlation, 120
which has been widely used for pattern recognition in computer vision (Nakhmani and 121
Tannenbaum, 2013). To remove the effect of contact stress magnitude on the pattern recognition 122
algorithm, a normalized cross-correlation (NCC) algorithm was used (eq. 1). A custom MATLAB 123
program (Mathworks Inc, Natick, MA) was used for data analysis. 124
1 1
22
1
))(())((
))()()((
Nut
ut
Nut
ut
u
Nut
ut
u
N N
N
utftf
utftf
NCC
(1) 125
where t is the frame number, N is the total number of frames during a gait cycle (N = 200), u is the 126
time-shift, f is the function describing the pattern of interest (here denotes the contact stress profile 127
at a comparison sensel-Sk,l, Fig. 3a), uf is the mean of the current time window, is the template 128
function (here denotes the contact stress profile at the template sensel-Si,j), and is the mean of 129
the current template function. 130
The NCC was used as a metric of similarity in contact stress profile shape between any two 131
sensels within each knee (0<=NCC<=1, 0-no match, 1-identical). Using the algorithm described 132
below, sensels with the NCC values greater than a pre-selected threshold (i.e. 0.93) were identified 133
and grouped together. Briefly, each sensel was assigned two properties: pattern ID and 134
characteristic NCC, the latter being the maximum NCC value between itself and the previous 135
sensels (Fig. 3a). At the beginning of the algorithm, the first sensel in the matrix was taken as the 136
template sensel (Si,j) with an initial pattern ID of 1 and characteristic NCC value of 0. The pattern 137
ID and character NCC were then iteratively updated by calculating the NCC between the template 138
sensel and all remaining comparison sensels (Sk,l) (Fig. 3a). The comparison sensel was grouped 139
with the current template if its NCC was greater than the threshold (Fig. 2b) and greater than the 140

7
NCCs with previous template sensels. Once all remaining sensels were compared to the current 141
template, the next sensel in the sensel matrix was taken as the current template and the comparison 142
process was repeated. A series of piecewise comparisons were performed to determine the pattern 143
IDs of all sensels. Pseudo code for the comparisons is given in Appendix-i. Once the NCC for each 144
sensel across the tibial plateaus of each cadaveric knee was calculated, sensels with similar stress 145
profiles were identified and assigned a unique pattern ID (Fig. 3c). For each pattern, an average 146
profile (shape of contact stress during gait) was calculated and used to represent the characteristic 147
contact stress profile of this sensel group. To reduce the number of trivial patterns, we only report 148
patterns which include at least 8 member sensels. 149
3. Common Contact Stress Patterns among Knees 150
The characteristic contact stress profiles of each knee were compared between different knees 151
to determine if common patterns existed by using the normalized cross correlation algorithm. Two 152
criteria were used to identify common patterns: occur at the same location and with NCC value 153
greater than the pre-selected threshold (Fig. 4). To assess the profiles of common contact stress 154
patterns between knees, each sensel was assigned a weight based on the number of knees sharing 155
the same pattern at that sensel location (
n
i iii NNw1
/ , where n denotes the total number of 156
member sensels, iN denotes the number of knees at sensel-i). By using this method, the common 157
contact stress profile was represented by a weighted mean and standard deviation of individual 158
contact stress profiles of all member sensels, calculated as 159
n
i
iiw xwx1
(2) 160

8
n
wn
xxw
n
i
i
n
i
wii
w
1
1
2
)1(
)(
(3) 161
where wx and w denote the weighted mean and standard deviation of the common profile, and 162
ix is the mean individual profile at sensel-i (average of individual knees at sensel-i). 163
164
RESULTS 165
The tibiofemoral kinematics of cadaveric knees was computed as the motion of the femur 166
relative to the tibia (Fig. 5). It was compared to the in vivo knee motion during stance phase 167
previously reported by Kozanek et al. using dual fluoroscopic technique (Kozanek et al., 2009) 168
and by Wang et al. using skin markers (Wang et al., 2013). To minimize the variances in reference 169
position between the current study and that reported in literature, the kinematic components were 170
normalized to their values at 0% of gait. In general, the kinematics of our cadaveric knees 171
resembled in vivo kinematics of Kozanek et al. study; while differences did exist in 172
flexion/extension (FE) and internal/external (IE) profiles, the values reported in the current study 173
were consistent with those by (Wang et al., 2013). 174
Multiple common contact stress patterns were found across 12 knees. Nine to twelve knees 175
shared the same pattern at the posterior aspect of the medial tibial plateau (pattern-6, Fig 6). The 176
contact stress pattern consisted of a single peak with an average magnitude of 1.30 ± 0.40 MPa 177
(mean +/- SD) during the stance phase of gait, which corresponded to the timing of the first axial 178
force peak during normal gait (~14% of the gait cycle). Another prominent pattern was found at 179
the central-posterior aspect of the lateral tibial plateau from 8~11 knees (pattern-5). It had two 180
9
peaks that corresponded to the timing of two peaks of applied axial forces; the first and second 181
peak stresses were 1.66 ± 0.62 MPa and 1.75 ± 0.75 MPa respectively. Finally, a third strongest 182
pattern was found at the anterior aspect of the cartilage-to-cartilage contact region on the medial 183
plateau (pattern-7), it consisted of two peaks with the second one significantly higher than the first. 184
There were several less strong patterns located at various locations on tibial plateaus (pattern 1-4, 185
7). Although the number of knees sharing the same pattern changes with the pre-selected 186
correlation thresholds, the identification of the most prominent patterns are unaffected (results for 187
threshold at 0.90, 0.93, 0.94, 0.95 were shown in Appendix ii). 188
189
DISCUSSION 190
In this study, we identified common contact stress patterns on tibial plateau surfaces of 12 191
human cadaveric knees during simulated gait by using a novel normalized cross correlation 192
algorithm. Seven recurring contact stress patterns were found on the tibial plateaus. Two of them 193
were most prominent and located at posterior aspect of the medial plateau and central-posterior 194
aspect of the lateral plateau, respectively. Since the characteristic contact stress profiles represents 195
the weighted average (eq. 2) of all the sensels that share the common pattern, the peak stresses in 196
the current study are much lower than those in our previous study (Bedi et al., 2010). It should be 197
noted that the average peak contact stresses across the entire plateau, are within the range of that 198
previously reported. 199
On the medial tibial plateau, a single-peak contact stress pattern was located near the posterior 200
horn of the medial meniscus. The peak stress occurred at 14-18% of the gait cycle suggesting that 201
the medial meniscus consistently distributes high joint load during the early phase of stance. 202
Another prominent pattern was located at the central-posterior (Pattern-5) aspect of the lateral 203

10
tibial plateau which is partially covered by the posterior horn of lateral meniscus. The pattern 204
consisted of two peaks which occurred at 14% and 45% of the gait cycle corresponding to the 205
peaks of axial loading. This finding suggests the lateral meniscus provides consistent load 206
distribution during both the early and late phase of stance. The different roles of the medial and 207
lateral menisci are most likely due to differences in meniscal attachment and plateau surfaces. The 208
elongated “C”- shaped medial meniscus has attachments to the medial collateral ligament and joint 209
capsule in addition to the root attachments to the tibial plateau. On the other hand, the lateral 210
meniscus is more circular in shape, relatively smaller in size than the medial meniscus, and it has 211
no attachments to the lateral collateral ligament or joint capsule. Coupled with the convex surface 212
of the lateral tibial plateau, the lateral meniscus is more mobile than its medial counterpart 213
(Renstrom and Johnson, 1990). It can be retracted with the femoral condyle for load transmission 214
and joint stabilization during the late phase of stance when the knee approaches terminal extension. 215
Moreover, according to a kinematic study by Koo and Andriacchi (Koo and Andriacchi, 2008), 216
the knee joint center of rotation is predominantly on the lateral side (lateral pivot) during normal 217
walking. That indicated a greater anterior excursion of the medial femoral condyle on the tibial 218
plateau surface than the lateral condyle at the later phase of stance, which may separate it from the 219
posterior aspect of the medial meniscus. Of note, both prominent common patterns (pattern-5, 6) 220
were located in the inner half region of the tibial plateau (close to the tibial spine), where the 221
cartilage is thicker than that of the peripheral regions (Andriacchi et al., 2009; Li et al., 2005). 222
Following ACL or meniscus injuries, the local contact stress patterns may shift or be altered 223
following changes in joint kinematics. These predictable changes may lead to deleterious loading 224
that the underlying cartilage cannot quickly adapt to; thus could predispose the cartilage to 225
accelerated damage. 226

11
There were several limitations in this study. First, we selected a NCC threshold of 0.93 as the 227
criteria for determining similarity. Since there is no standard in the literature that recommends an 228
appropriate threshold, we computed the contact stress patterns at different threshold values (0.90, 229
0.93, 0.94 and 0.95; see Appendix). Different thresholds still resulted in the same patterns located 230
in similar regions, suggesting that the NCC algorithm is not highly sensitive to the threshold. 231
Second, our model does not take into account knee-to-knee variability in joint forces (for example 232
caused by variations in body weight, walking speed and muscle activation), neither do we control 233
for medial-lateral translation or varus/valgus rotation. 234
In summary, this study presented a method to determine common dynamic contact stress 235
patterns within the tibiofemoral joint under simulated gait load. Two prominent common patterns 236
were found in regions close to the posterior horns of menisci. This novel approach may better 237
identify abnormalities in cartilage contact mechanics in order to understand the mechanical 238
pathways leading to post-traumatic osteoarthritis. In future studies, we will investigate the 239
alterations in knee joint contact stress patterns after ACL injuries or/and meniscus tears. 240
241
ACKNOWLEDGEMENT 242
Research reported in this publication was supported by the National Institute of Arthritis and 243
Musculoskeletal and Skin Diseases, part of the National Institutes of Health, under Award Number 244
R01 AR057343. The content is solely the responsibility of the authors and does not necessarily 245
represent the official views of the National Institutes of Health. Funding was also received from 246
KL2RR000458 of the NIH funded Clinical and Translational Science Center at Weill Cornell 247
Medical College. We thank Albert Gee, MD, Ian Hutchinson, MD, Kirsten Stoner, MS and Suza 248
Gilbert, MS for specimen preparation and data collection. We thank Nick Polatta, MD for help 249
with preliminary data analysis. 250

12
REFERENCE 251
Anderst, W.J., Tashman, S., 2009. The association between velocity of the center of closest 252 proximity on subchondral bones and osteoarthritis progression. J Orthop Res 27 (1), 71-77. 253
Andriacchi, T.P., Koo, S., Scanlan, S.F., 2009. Gait mechanics influence healthy cartilage 254 morphology and osteoarthritis of the knee. The Journal of bone and joint surgery. American 255 volume 91 Suppl 1), 95-101. 256
Bedi, A., Kelly, N.H., Baad, M., Fox, A.J., Brophy, R.H., Warren, R.F., Maher, S.A., 2010. 257 Dynamic contact mechanics of the medial meniscus as a function of radial tear, repair, and partial 258
meniscectomy. The Journal of bone and joint surgery. American volume 92 (6), 1398-1408. 259
Beveridge, J.E., Heard, B.J., Shrive, N.G., Frank, C.B., 2013. Tibiofemoral centroid velocity 260 correlates more consistently with Cartilage damage than does contact path length in two ovine 261
models of stifle injury. J Orthop Res. 262
Brimacombe, J.M., Wilson, D.R., Hodgson, A.J., Ho, K.C., Anglin, C., 2009. Effect of calibration 263 method on Tekscan sensor accuracy. Journal of biomechanical engineering 131 (3), 034503. 264
Cappozzo, A., Della Croce, U., Leardini, A., Chiari, L., 2005. Human movement analysis using 265
stereophotogrammetry. Part 1: theoretical background. Gait & posture 21 (2), 186-196. 266
Cottrell, J.M., Scholten, P., Wanich, T., Warren, R.F., Wright, T.M., Maher, S.A., 2008. A new 267
technique to measure the dynamic contact pressures on the Tibial Plateau. Journal of biomechanics 268 41 (10), 2324-2329. 269
DeFrate, L.E., Sun, H., Gill, T.J., Rubash, H.E., Li, G., 2004. In vivo tibiofemoral contact analysis 270 using 3D MRI-based knee models. J Biomech 37 (10), 1499-1504. 271
Gold, G.E., Busse, R.F., Beehler, C., Han, E., Brau, A.C., Beatty, P.J., Beaulieu, C.F., 2007. 272 Isotropic MRI of the knee with 3D fast spin-echo extended echo-train acquisition (XETA): initial 273 experience. AJR. American journal of roentgenology 188 (5), 1287-1293. 274
Koo, S., Andriacchi, T.P., 2008. The knee joint center of rotation is predominantly on the lateral 275 side during normal walking. Journal of biomechanics 41 (6), 1269-1273. 276
Kozanek, M., Hosseini, A., Liu, F., Van de Velde, S.K., Gill, T.J., Rubash, H.E., Li, G., 2009. 277 Tibiofemoral kinematics and condylar motion during the stance phase of gait. Journal of 278
biomechanics 42 (12), 1877-1884. 279
Li, G., Moses, J.M., Papannagari, R., Pathare, N.P., DeFrate, L.E., Gill, T.J., 2006. Anterior 280
cruciate ligament deficiency alters the in vivo motion of the tibiofemoral cartilage contact points 281 in both the anteroposterior and mediolateral directions. The Journal of bone and joint surgery 88 282 (8), 1826-1834. 283
13
Li, G., Park, S.E., DeFrate, L.E., Schutzer, M.E., Ji, L., Gill, T.J., Rubash, H.E., 2005. The cartilage 284
thickness distribution in the tibiofemoral joint and its correlation with cartilage-to-cartilage contact. 285 Clinical biomechanics 20 (7), 736-744. 286
Li, G., Van de Velde, S.K., Bingham, J.T., 2008. Validation of a non-invasive fluoroscopic 287
imaging technique for the measurement of dynamic knee joint motion. J Biomech 41 (7), 1616-288 1622. 289
Nakhmani, A., Tannenbaum, A., 2013. A New Distance Measure Based on Generalized Image 290 Normalized Cross-Correlation for Robust Video Tracking and Image Recognition. Pattern 291 recognition letters 34 (3), 315-321. 292
Renstrom, P., Johnson, R.J., 1990. Anatomy and biomechanics of the menisci. Clinics in sports 293
medicine 9 (3), 523-538. 294
Tashman, S., Anderst, W., 2003. In-vivo measurement of dynamic joint motion using high speed 295
biplane radiography and CT: application to canine ACL deficiency. J Biomech Eng 125 (2), 238-296 245. 297
Wang, H., Fleischli, J.E., Zheng, N.N., 2013. Transtibial Versus Anteromedial Portal Technique 298
in Single-Bundle Anterior Cruciate Ligament Reconstruction: Outcomes of Knee Joint Kinematics 299 During Walking. The American journal of sports medicine doi: 10.1177/0363546513490663. 300
Wang, H., Zheng, N.N., 2010. Knee joint secondary motion accuracy improved by quaternion-301
based optimizer with bony landmark constraints. J Biomech Eng 132 (12), 124502. 302
303
304
14
Caption of Figures 305
306
307
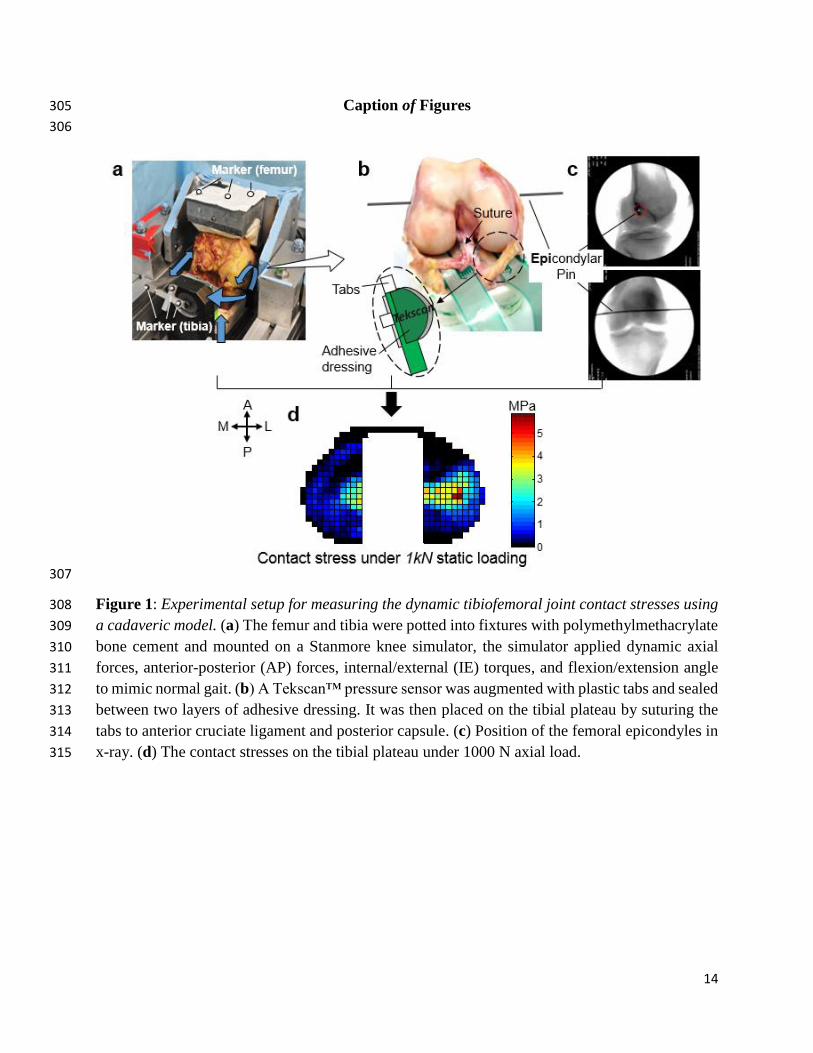
Figure 1: Experimental setup for measuring the dynamic tibiofemoral joint contact stresses using 308
a cadaveric model. (a) The femur and tibia were potted into fixtures with polymethylmethacrylate 309
bone cement and mounted on a Stanmore knee simulator, the simulator applied dynamic axial 310
forces, anterior-posterior (AP) forces, internal/external (IE) torques, and flexion/extension angle 311
to mimic normal gait. (b) A Tekscan™ pressure sensor was augmented with plastic tabs and sealed 312
between two layers of adhesive dressing. It was then placed on the tibial plateau by suturing the 313
tabs to anterior cruciate ligament and posterior capsule. (c) Position of the femoral epicondyles in 314
x-ray. (d) The contact stresses on the tibial plateau under 1000 N axial load. 315

15
316
Figure 2: Inputs of dynamic knee simulator. The simulator applies flexion/extension rotation, 317
anterior-posterior force, axial force and internal/external torque. The forces and torque were 318
applied on the tibia, and the flexion and extension was applied on the femur. The other degrees of 319
freedom – varus/valgus rotation and medial-lateral translation were not controlled. 320

16
321
Figure 3: The process of finding contact stress patterns on the tibial plateaus within each knee 322
using a normalized cross correlation (NCC) algorithm. (a) First row – starting with the first sensel 323
(green square) as the template, all of the remaining sensels (white square) are individually 324
compared to the template. Second row – the next sensel is then taken as the template and the above 325
process is repeated. This process is repeated until the contact stress profiles of all sensels are 326
compared. (b) Two representative scenarios are shown: first, for a comparison sensel whose 327
contact stress pattern is considered different from the template, the NCC is smaller than the 328
threshold value and is therefore not grouped with the template sensel; second, for a comparison 329
sensel with a similar contact stress profile as the template, thus is grouped with template sensel 330
and assigned the same pattern ID. (c) After completing the comparisons, sensels with similar 331
contact stress profiles are grouped together and assigned a unique pattern ID (same color). 332
333

17
334
Figure 4: Schematic representation depicting the process for identifying the common contact 335
stress patterns among different knees. The characteristic contact stress profiles within each knee 336
are identified. The profiles are compared between the knees using normalized cross correlation 337
(NCC). To consider two individual profiles from different knees as a common pattern, they must 338
meet two criteria: first, they are at the same location; second, the NCC must be greater than the 339
threshold. For the example shown in the plot, groups 2, 5 satisfied these two criteria, thus 340
considered common patterns between these two knees. The process was repeated until all knees 341
were compared. 342
343

18
Figure 5: Showing 6 DOFs of tibiofemoral kinematics of cadaveric knees during the stance phase 344
of a simulated gait cycle. The kinematics here represents the motion of femur relative to tibia. 345
Shaded area stands for mean +/- a standard deviation. All values are normalized to the values at 346
0% gait. The results are compared to in vivo kinematics from Kozanek et al. (solid blue) (Kozanek 347
et al., 2009) and Wang et al. (dash red) (Wang et al., 2013). 348
349
Figure 6: The location and contact stress profiles of the common patterns found on the tibial 350
plateaus of intact knees. The characteristic profile stands for the weighted mean +/- standard 351
derivation of all sensels sharing the same pattern. Colors in heat map stand for the number of knees 352
sharing this pattern at each sensel location. Seven consistent regional patterns were found, among 353
them two most prominent contact stress patterns were shared by 9 to 12 of all the knees. One 354
pattern was located at the posterior aspect of the medial tibial plateau and had a single peak stress 355
that occurred during the early stance phase (pattern-6). Another pattern was located at the central-356
posterior aspects of the lateral plateau and consisted of two peak stresses coincident with the timing 357
of peak axial force at early and late stance (pattern-5). 358
359
360
Copyright © 2022 FDOKUMEN