Dual UV-Thermal Curing of Biobased Resorcinol Epoxy Resin ...
25
Article Dual UV-Thermal Curing of Biobased Resorcinol Epoxy Resin-Diatomite Composites with Improved Acoustic Performance and Attractive Flame Retardancy Behavior Quoc-Bao Nguyen 1,2,3 , Henri Vahabi 4 , Agustín Rios de Anda 1 , Davy-Louis Versace 1 , Valérie Langlois 1 , Camille Perrot 2,3 , Vu-Hieu Nguyen 2,3 , Salah Naili 2,3 and Estelle Renard 1, * Citation: Nguyen, Q.-B.; Vahabi, H.; Rios de Anda, A.; Versace, D.-L.; Langlois, V.; Perrot, C.; Nguyen, V.-H.; Naili, S.; Renard, E. Dual UV-Thermal Curing of Biobased Resorcinol Epoxy Resin-Diatomite Composites with Improved Acoustic Performance and Attractive Flame Retardancy Behavior. Sustain. Chem. 2021, 2, 24–48. https://doi.org/10.3390/ suschem2010003 Received: 2 November 2020 Accepted: 29 December 2020 Published: 14 January 2021 Publisher’s Note: MDPI stays neu- tral with regard to jurisdictional clai- ms in published maps and institutio- nal affiliations. Copyright: © 2021 by the authors. Li- censee MDPI, Basel, Switzerland. This article is an open access article distributed under the terms and con- ditions of the Creative Commons At- tribution (CC BY) license (https:// creativecommons.org/licenses/by/ 4.0/). 1 Paris-Est Institute of Chemistry and Materials (ICMPE), University Paris Est Creteil, F-94320 Thiais, France; [email protected] (Q.-B.N.); [email protected] (A.R.d.A.); [email protected] (D.-L.V.); [email protected] (V.L.) 2 Multi-Scale Modeling and Simulation Laboratory (MSME), University Gustave Eiffel, F-77454 Marne-la-Vallée, France; [email protected] (C.P.); [email protected] (V.-H.N.); [email protected] (S.N.) 3 Multi-Scale Modeling and Simulation Laboratory (MSME), University Paris Est Creteil, F-94010 Creteil, France 4 Optical Materials, Photonics and Systems Laboratory (LMOPS), Université de Lorraine, F-57000 Metz, France; [email protected] * Correspondence: [email protected] Abstract: This study has developed novel fully bio-based resorcinol epoxy resin–diatomite com- posites by a green two-stage process based on the living character of the cationic polymerization. This process comprises the photoinitiation and subsequently the thermal dark curing, enabling the obtaining of thick and non-transparent epoxy-diatomite composites without any solvent and amine- based hardeners. The effects of the diatomite content and the compacting pressure on microstructural, thermal, mechanical, acoustic properties, as well as the flame behavior of such composites have been thoroughly investigated. Towards the development of sound absorbing and flame-retardant construction materials, a compromise among mechanical, acoustic and flame-retardant properties was considered. Consequently, the composite obtained with 50 wt.% diatomite and 3.9 MPa compact- ing pressure is considered the optimal composite in the present work. Such composite exhibits the enhanced flexural modulus of 2.9 MPa, a satisfying sound absorption performance at low frequencies with Modified Sound Absorption Average (MSAA) of 0.08 (for a sample thickness of only 5 mm), and an outstanding flame retardancy behavior with the peak of heat release rate (pHRR) of 109 W/g and the total heat release of 5 kJ/g in the pyrolysis combustion flow calorimeter (PCFC) analysis. Keywords: resorcinol epoxy resin; diatomite; composite; cationic polymerization; photochemistry; mechanical properties; sound absorption; flame retardancy 1. Introduction Diatomite is composed of sediments enriched with silica in the form of siliceous skeletons of diatoms which are a collection of diverse microscopic single-celled algae. The varied and complex structures of these siliceous skeletons bestow unique properties upon diatomite. Indeed, it is widely used due to its high porosity (up to 90%), excellent liq- uid absorption capacity, low density, non-toxicity, great abundance, and low cost [1–3]. Adapted for different applications, diatomite exists in various forms including 0.5–3 mm granules for absorbents, powder for natural mineral fillers, or dust for production of insu- lation materials. It is used to form light and porous ceramics for construction thanks to its thermal insulation properties and capacity for humidity control [4–6]. The production of these ceramics is carried out by sintering, which normally requires high operating temper- atures. Although mixing diatomite with agricultural residues such as ash from Brazil nut Sustain. Chem. 2021, 2, 24–48. https://doi.org/10.3390/suschem2010003 https://www.mdpi.com/journal/suschem
-
Upload
khangminh22 -
Category
Documents
-
view
1 -
download
0
Transcript of Dual UV-Thermal Curing of Biobased Resorcinol Epoxy Resin ...

Article
Dual UV-Thermal Curing of Biobased Resorcinol EpoxyResin-Diatomite Composites with Improved AcousticPerformance and Attractive Flame Retardancy Behavior
Quoc-Bao Nguyen 1,2,3, Henri Vahabi 4 , Agustín Rios de Anda 1, Davy-Louis Versace 1, Valérie Langlois 1 ,Camille Perrot 2,3, Vu-Hieu Nguyen 2,3, Salah Naili 2,3 and Estelle Renard 1,*
�����������������
Citation: Nguyen, Q.-B.; Vahabi, H.;
Rios de Anda, A.; Versace, D.-L.;
Langlois, V.; Perrot, C.; Nguyen, V.-H.;
Naili, S.; Renard, E. Dual UV-Thermal
Curing of Biobased Resorcinol Epoxy
Resin-Diatomite Composites with
Improved Acoustic Performance and
Attractive Flame Retardancy
Behavior. Sustain. Chem. 2021, 2,
24–48. https://doi.org/10.3390/
suschem2010003
Received: 2 November 2020
Accepted: 29 December 2020
Published: 14 January 2021
Publisher’s Note: MDPI stays neu-
tral with regard to jurisdictional clai-
ms in published maps and institutio-
nal affiliations.
Copyright: © 2021 by the authors. Li-
censee MDPI, Basel, Switzerland.
This article is an open access article
distributed under the terms and con-
ditions of the Creative Commons At-
tribution (CC BY) license (https://
creativecommons.org/licenses/by/
4.0/).
1 Paris-Est Institute of Chemistry and Materials (ICMPE), University Paris Est Creteil, F-94320 Thiais, France;[email protected] (Q.-B.N.); [email protected] (A.R.d.A.); [email protected] (D.-L.V.);[email protected] (V.L.)
2 Multi-Scale Modeling and Simulation Laboratory (MSME), University Gustave Eiffel,F-77454 Marne-la-Vallée, France; [email protected] (C.P.);[email protected] (V.-H.N.); [email protected] (S.N.)
3 Multi-Scale Modeling and Simulation Laboratory (MSME), University Paris Est Creteil,F-94010 Creteil, France
4 Optical Materials, Photonics and Systems Laboratory (LMOPS), Université de Lorraine, F-57000 Metz, France;[email protected]
* Correspondence: [email protected]
Abstract: This study has developed novel fully bio-based resorcinol epoxy resin–diatomite com-posites by a green two-stage process based on the living character of the cationic polymerization.This process comprises the photoinitiation and subsequently the thermal dark curing, enabling theobtaining of thick and non-transparent epoxy-diatomite composites without any solvent and amine-based hardeners. The effects of the diatomite content and the compacting pressure on microstructural,thermal, mechanical, acoustic properties, as well as the flame behavior of such composites havebeen thoroughly investigated. Towards the development of sound absorbing and flame-retardantconstruction materials, a compromise among mechanical, acoustic and flame-retardant propertieswas considered. Consequently, the composite obtained with 50 wt.% diatomite and 3.9 MPa compact-ing pressure is considered the optimal composite in the present work. Such composite exhibits theenhanced flexural modulus of 2.9 MPa, a satisfying sound absorption performance at low frequencieswith Modified Sound Absorption Average (MSAA) of 0.08 (for a sample thickness of only 5 mm),and an outstanding flame retardancy behavior with the peak of heat release rate (pHRR) of 109 W/gand the total heat release of 5 kJ/g in the pyrolysis combustion flow calorimeter (PCFC) analysis.
Keywords: resorcinol epoxy resin; diatomite; composite; cationic polymerization; photochemistry;mechanical properties; sound absorption; flame retardancy
1. Introduction
Diatomite is composed of sediments enriched with silica in the form of siliceousskeletons of diatoms which are a collection of diverse microscopic single-celled algae.The varied and complex structures of these siliceous skeletons bestow unique propertiesupon diatomite. Indeed, it is widely used due to its high porosity (up to 90%), excellent liq-uid absorption capacity, low density, non-toxicity, great abundance, and low cost [1–3].Adapted for different applications, diatomite exists in various forms including 0.5–3 mmgranules for absorbents, powder for natural mineral fillers, or dust for production of insu-lation materials. It is used to form light and porous ceramics for construction thanks to itsthermal insulation properties and capacity for humidity control [4–6]. The production ofthese ceramics is carried out by sintering, which normally requires high operating temper-atures. Although mixing diatomite with agricultural residues such as ash from Brazil nut
Sustain. Chem. 2021, 2, 24–48. https://doi.org/10.3390/suschem2010003 https://www.mdpi.com/journal/suschem
Sustain. Chem. 2021, 2 25
shells [7] or with tourmaline as well as sintering additives [8] helps to reduce the sinteringtemperature, this process remains considerably energy-consuming. The development ofcomposites using diatomite as siliceous fillers is an alternative to the sintering techniquefor advanced diatomite-based material prospects. Examples of composites using diatomitein various types of polymeric matrices such as epoxy [9], polyacrylate [10], polyetherim-ide [11], polyurethane [12], polylactide [13], chitosan [14], or different kinds of rubber [15]have shown the improvement of thermal stability and mechanical properties of composites.In these researches, the fillers have been incorporated at a rate not exceeding 15% by weightfor the mechanical reinforcement purpose. Additionally, diatomite can be also combinedwith, for instance paraffin [16] or sodium nitrate [17], to make composite phase changematerials for thermal energy storage applications. Considering the increase in demandfor sound absorbing porous composites in construction, it seems interesting to study thepotential of diatomite granules as porous fillers for the preparation of porous epoxy com-posites. Indeed, epoxy resins are materials of growing interest in many areas because oftheir superior chemical resistance, excellent mechanical and thermal properties as wellas relatively low price [18,19]. These properties are due to their cross-linked structureand the presence of aromatic rings in the monomers such as diglycidyl ether bisphenol A(DGEBA) for some technical resins [20]. However, the production and applications of theseresins have been faced with environmental challenges and human health issues as regardstheir dependence on fossil resources and harmfulness of bisphenol A [21–23]. For sus-tainable development, it is crucial to develop more environmentally friendly materials,and therefore to find alternatives to the use of DGEBA. In a previous work, the preparationof a bio-sourced epoxy resin from resorcinol diglycidyl ether (RDGE) has been performedusing cationic photopolymerization under UV light exposure in our laboratory [24]. Thisprocess follows the principles of green chemistry due to numerous advantages such assimple equipment, unpolluted formulations, reduced cycle time and particularly absenceof solvents as well as harmful amine-based hardeners [25]. The use of such formulationsto prepare fully bio-sourced epoxy-diatomite composites seems particularly attractive fordeveloping new functional materials fulfilling environmental criteria.
The use of porous diatomite granules could generate porosity for the composites,thus enhancing their sound absorption performance [26]. Despite this fact, to the best ofour knowledge, only a very scarce number of works have studied this aspect, leaving theinfluence of diatomite on the acoustic behavior of the diatomite-based composites as asubject to be explored. The incorporation of siliceous diatomite is also expected to decreasethe high inflammability of epoxy resins. Indeed, silicon compounds could be utilized indi-vidually [27,28] or in conjunction with other flame retardants such as phosphorus-basedones [29–31] to provide attractive thermal resistance and flame retardancy performances ofepoxy-based composites. Despite these advantages, the elaboration of such kind of com-posites based on photopolymerization is hindered by limitations in the radiation process.Indeed, the opaque nature of diatomite prevents the infiltration of UV radiations into theformulation; hence, precluding the cross-linking of the resin. A similar phenomenon canbe also observed in a bulk polymerization situation in which the resin portion closest tothe source of radiation is generally cross-linked first, forming a non-transparent resin layerstopping the penetration of radiations and thus leaving the rest of the formulation noncross-linked [24].
The objective of this paper is to develop thick and non-transparent composites byphotochemistry from the commercially available resorcinol derivative called resorcinoldiglycidyl ether (RDGE) as a monomer and granular diatomite as fillers. In order to over-come the above-mentioned drawbacks concerning the radiation process, an alternativephotochemical approach to the process established in our previous work on the bulkresorcinol epoxy resin [24] has been developed, based on characteristics of the cationicpolymerization of epoxies. On the one hand, this kind of polymerization exhibits a slowpolymerization rate, particularly in case of monomers of the phenyl glycidyl ether type withthe presence of a slow induction phase [32]. On the other hand, active centers generated
Sustain. Chem. 2021, 2 26
during the cationic polymerization have an extremely long lifetime. These two featuresgive this type of polymerization a “living” character [33], enabling the development of atwo-stage process. Thus, the polymerization can be initiated under radiation, and thencontinued by thermal activation without any light source. The composite systems resultingfrom this practical process are amine- and solvent-free. During the elaboration of suchcomposites, the compaction step in which a pressure was applied to the composite formu-lation for attaining homogeneous distribution of the resin matrix around diatomite fillerswas also conducted. The influences of the compacting pressure and the diatomite contenton the microstructural, mechanical, acoustic absorption and flame-retardant properties ofepoxy-diatomite composites were thoroughly investigated.
2. ExperimentalMaterials
Resorcinol diglycidyl ether (RDGE) was obtained from Sigma Aldrich. Deuteron-UV1242 (bis (dodecylphenyl) iodonium hexafluoro-antimonate), hereafter called Iod,was supplied by Deuteron GmbH. Granular calcinated diatomite with size ranging from 0.3to 0.7 mm and apparent density of 0.53 g/cm3 was purchased from Denios. The calcinationtreatment of raw diatomite removes pore-clogging impurities. All these chemicals wereused as received without any further purification procedure.
3. Sample preparation
Mixtures composed of RDGE as a monomer and Iod as a photoinitiator were pre-treated in a convection oven at 90 ◦C for 10 min and then stirred thoroughly to liquefyand homogenize the reactants. The liquid mixtures were then stirred using a magneticbar at 7 rpm and irradiated by a UV lamp at room temperature under air simultaneously.The irradiation unit was a Hg-Xe Hamamatsu lamp with a broad emission spectral rangefrom 250 to 450 nm (Lightning Cure LC8 (L8251), 200 W) coupled to a flexible light guide.The irradiation intensity of this polychromatic lamp was 22 mW/cm2 at 20.5 cm from theirradiation source. The irradiation step was conducted in a manner so that the mixturesremained liquid after irradiated.
To prepare porous composites with diatomite inclusions, the photoinitiated mixtures(RDGE + Iod) were poured down the molds and left at room temperature for 10 min toincrease their viscosity, restricting their penetration later in diatomite grains. The diatomitegrains were then poured over the molds and stirred carefully with the resin mixtures untilcomplete impregnation by the resin was observed; i.e., diatomite’s color turned somberwhen in contact with the resin mixtures. Afterwards, the resin-diatomite mixtures wereput under compression loading for 1 min by a Specac manual hydraulic press providing amaximum load configuration of 15 tons. Compacted mixtures were then separated fromthe molds and placed in the convection oven for thermal treatment. The weight ratio of thephotoinitiator with respect to the monomer and of the diatomite with respect to the totalformulation, the irradiation time, the thermal treatment conditions, and the compactionpressure were investigated in this work.
Two types of molds were utilized: rectangular prism molds with inner cross-sectionaldimensions of 40 × 10 mm2 to fabricate samples for three-point bending tests and cylindri-cal molds with inner diameter of 40 mm to produce samples for acoustic tests. The heightof both types of molds allows to obtain samples with the maximum thickness of 35 mm.The absolute quantities of substances which were taken to make composite samples dependon the weight ratios of substances, the expected sample dimensions and the compactionpressure as well. For instance, regarding the optimal composite obtained in this study,rectangular-prism-shaped samples with the thickness of 3 mm and compaction pressureof 3.9 MPa were made by taking 1159.4 mg RDGE, 40.6 mg Iod, and 1200 mg diatomite,whereas cylindrical samples with the thickness of 5 mm and compaction pressure of3.9 MPa were fabricated with 4830.9 mg RDGE, 169.1 mg Iod, and 5000 mg diatomite.

Sustain. Chem. 2021, 2 27
Note that these two kinds of samples resulted from the same elaboration process and hencerepresented the same material.
Experimental Techniques
Fourier transform infrared (FTIR) spectra were recorded on a Bruker Tensor 27 spec-trometer equipped with an ATR apparatus with a wavenumber range of 4000–400 cm−1.The epoxy conversion was calculated by means of infrared spectroscopy from the 908 cm−1
band assigned to epoxy bonds and the bands corresponding to aromatic C=C bonds at1400–1530 cm−1. The relative conversion α was calculated according to the following equa-tion:
α =
(R0 − Rt
R0
)× 100 (1)
with the ratio before irradiation R0 = Aepoxy/AC=C, ar, where Aepoxy corresponds to thearea of the band at 908 cm−1 and AC=C, ar is the area of the bands between 1400 and1530 cm−1.
The true density of diatomite was determined by a Quantachrome Ultrapyc 1200e he-lium pycnometer. The X-ray diffraction (XRD) analysis of diatomite was undertaken usinga D8–Bruker diffractometer equipped with a Lynxeye rapid detector with the followingprocessing parameters: the voltage of 40 kV, a current of 40 mA, a power of 1600 W, and anangle sweep 2θ from 5◦ to 80◦ with a step of 0.01◦.
Mercury intrusion porosimetry (MIP) analyses were conducted on diatomite by aMicromeritics AutoPore IV 9500 porosimeter yielding a maximum pressure of 33,000 psia(about 227.5 MPa) and measures the pore diameter of the range from 0.003 to 360 µm.During MIP analyses, mercury is intruded at low pressures to fill in large pores and thenat high pressures to fill in small pores. The intruded mercury volume is recorded at eachpressure level, establishing the relation between these two parameters. This relation isthen converted into the relation between the intruded mercury volume and the pore sizeby using Washburn’s equation which, with the assumption that the pore geometry iscylindrical, relates pressures needed to force mercury into pores and the correspondingpore sizes as follows [34]:
P = 2γ cos θ/r (2)
where P is the applied pressure, r is the corresponding pore radius, γ is the surface tensionof mercury and θ is the contact angle between the solid and mercury. From the volume ofthe penetrometer and the intruded mercury volume recorded at each pressure, the volumeof open pore Vp which is the total volume of intruded mercury and the bulk volume of thesample Vb which includes the pore volume and the matrix volume can be identified [35],leading to the determination of the material porosity φ by the following equation:
φ = Vp/Vb (3)
Scanning electron microscopy (SEM) analyses were carried out on a Merlin microscope(Carl Zeiss Company, Jena, Germany) using SE2, BSE and InLens detectors with a 30 µmdiaphragm aperture and an accelerating tension of 2 to 3 kV. The acquisition of SEM micro-graphs was achieved by the combination of the energy dispersive X-ray (EDX) and electronbackscatter diffraction (EBSD) (Oxford Instruments Company, Oxford, UK) microanalysissystems. Before analyses, samples were coated with a 4-nm layer of palladium/platinumalloy in a Cressington 208 HR sputter-coater. The pore number distribution was determinedthrough the post-processing of SEM images by means of the software ImageJ.
Differential scanning calorimetry (DSC) analyses were carried out on a TA InstrumentsQ25 DSC. As water traces were found in the samples, the Modulated mode was utilizedto perform the analyses for characterizing the glass transition temperature (Tg) of thematerials while avoiding any signal pollution caused by the water evaporation during theanalyses. Samples of about 15 mg were heated from 25 ◦C to either 200 ◦C or 250 ◦C at a rateof 3 ◦C/min, with temperature modulation of ±2 ◦C and a period of 60 s under a nitrogen
Sustain. Chem. 2021, 2 28
flow of 50 mL/min. Analyzing the reversing heat flow signal allowed to determine Tg ofwhich the value was taken at the half height of the step-change in the signal [36–38].
Thermogravimetric analyses (TGA) were conducted on a Setaram Setsys Evolution16 apparatus. Samples were heated from 20 ◦C to 30 ◦C at 10 ◦C/min and kept at 30 ◦Cfor 10 min for stabilization, then heated from 30 ◦C to 800 ◦C at 10 ◦C/min under the airatmosphere. Finally, they were cooled from 800 ◦C to 30 ◦C at 30 ◦C/min and kept at 30 ◦Cfor 30 min. Two samples per formulation were tested.
Flexural properties were characterized by three-point bending tests using an Instron5965 Universal Testing Machine equipped with a 100 N force cell. Samples of 40 × 10 ×(3 ± 0.5) mm3 were tested with a crosshead speed of 5 mm/min. The distance betweensupports was of 80% of the total length according to the ASTM D790 standard [39] (i.e.,32 mm). The displacement was taken from the crosshead displacement. Five samples performulation were characterized.
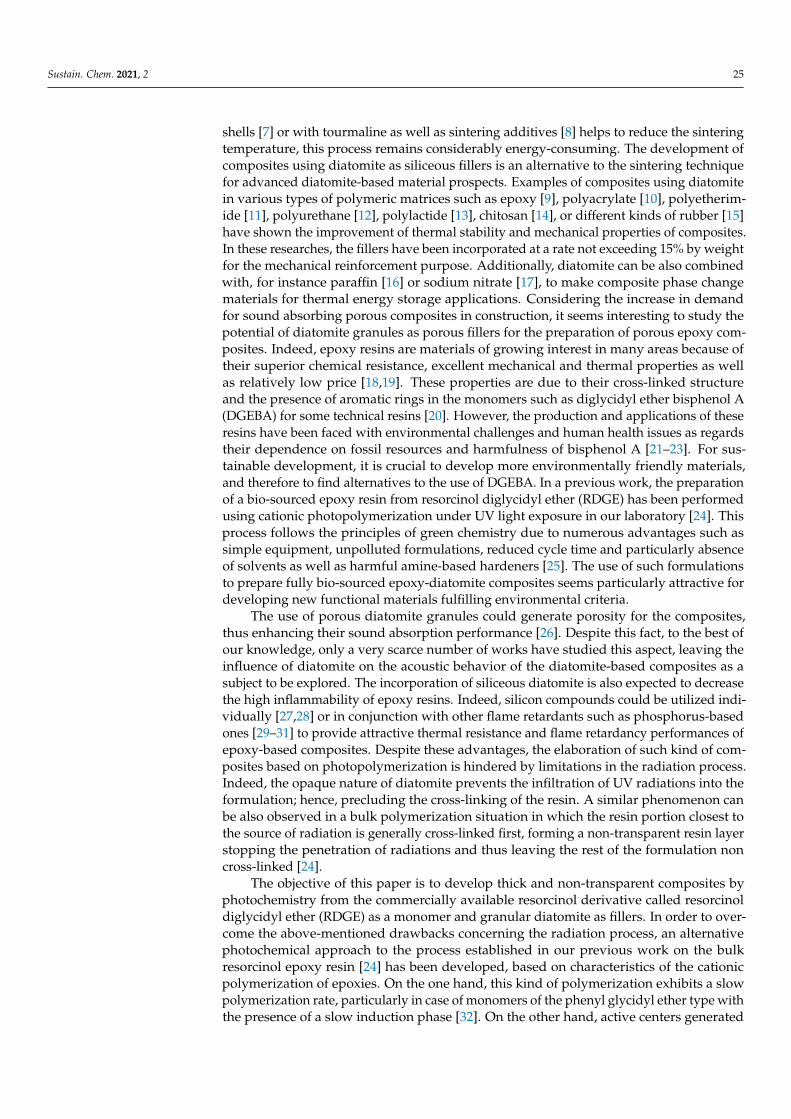
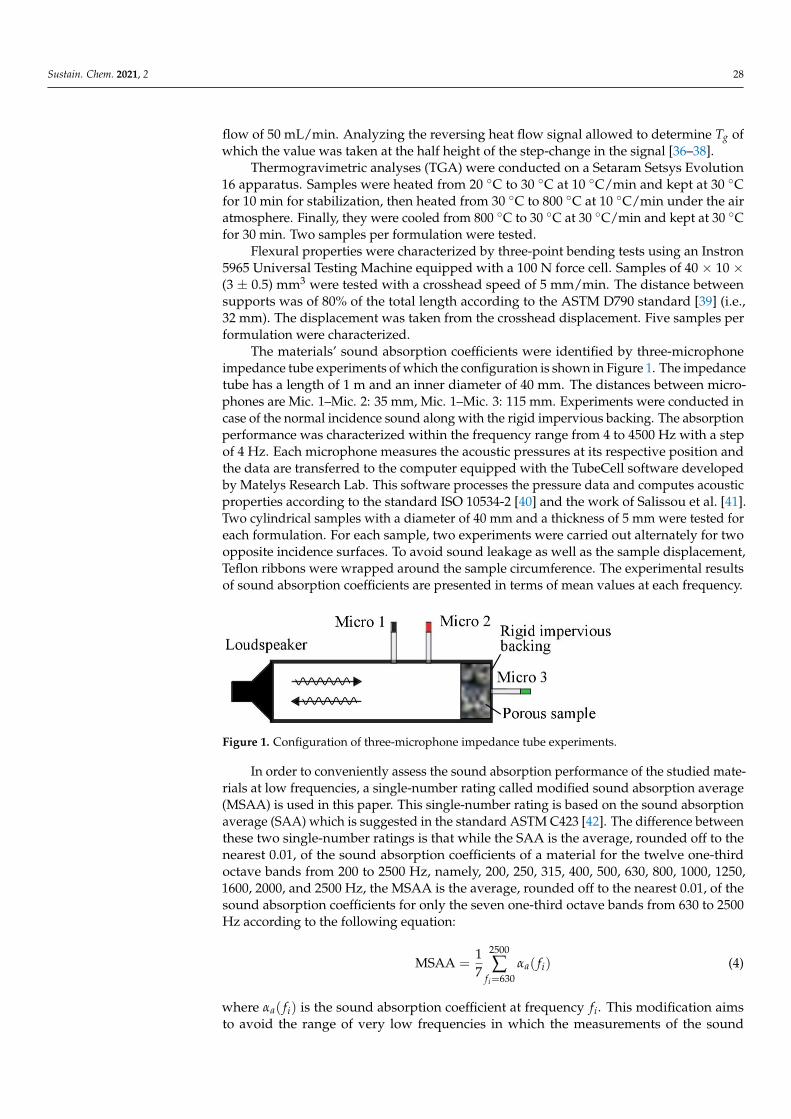
The materials’ sound absorption coefficients were identified by three-microphoneimpedance tube experiments of which the configuration is shown in Figure 1. The impedancetube has a length of 1 m and an inner diameter of 40 mm. The distances between micro-phones are Mic. 1–Mic. 2: 35 mm, Mic. 1–Mic. 3: 115 mm. Experiments were conducted incase of the normal incidence sound along with the rigid impervious backing. The absorptionperformance was characterized within the frequency range from 4 to 4500 Hz with a stepof 4 Hz. Each microphone measures the acoustic pressures at its respective position andthe data are transferred to the computer equipped with the TubeCell software developedby Matelys Research Lab. This software processes the pressure data and computes acousticproperties according to the standard ISO 10534-2 [40] and the work of Salissou et al. [41].Two cylindrical samples with a diameter of 40 mm and a thickness of 5 mm were tested foreach formulation. For each sample, two experiments were carried out alternately for twoopposite incidence surfaces. To avoid sound leakage as well as the sample displacement,Teflon ribbons were wrapped around the sample circumference. The experimental resultsof sound absorption coefficients are presented in terms of mean values at each frequency.
Sustain. Chem. 2021, 2, FOR PEER REVIEW 5
Differential scanning calorimetry (DSC) analyses were carried out on a TA Instru-ments Q25 DSC. As water traces were found in the samples, the Modulated mode was utilized to perform the analyses for characterizing the glass transition temperature ( gT ) of the materials while avoiding any signal pollution caused by the water evaporation during the analyses. Samples of about 15 mg were heated from 25 °C to either 200 °C or 250 °C at a rate of 3 °C/min, with temperature modulation of ±2 °C and a period of 60 s under a nitrogen flow of 50 mL/min. Analyzing the reversing heat flow signal allowed to deter-mine gT of which the value was taken at the half height of the step-change in the signal [36–38].
Thermogravimetric analyses (TGA) were conducted on a Setaram Setsys Evolution 16 apparatus. Samples were heated from 20 °C to 30 °C at 10 °C/min and kept at 30 °C for 10 min for stabilization, then heated from 30 °C to 800 °C at 10 °C/min under the air at-mosphere. Finally, they were cooled from 800 °C to 30 °C at 30 °C/min and kept at 30 °C for 30 min. Two samples per formulation were tested.
Flexural properties were characterized by three-point bending tests using an Instron 5965 Universal Testing Machine equipped with a 100 N force cell. Samples of 40 × 10 × (3 ± 0.5) mm3 were tested with a crosshead speed of 5 mm/min. The distance between sup-ports was of 80% of the total length according to the ASTM D790 standard [39] (i.e., 32 mm). The displacement was taken from the crosshead displacement. Five samples per formulation were characterized.
The materials’ sound absorption coefficients were identified by three-microphone impedance tube experiments of which the configuration is shown in Figure 1. The imped-ance tube has a length of 1 m and an inner diameter of 40 mm. The distances between microphones are Mic. 1–Mic. 2: 35 mm, Mic. 1–Mic. 3: 115 mm. Experiments were con-ducted in case of the normal incidence sound along with the rigid impervious backing. The absorption performance was characterized within the frequency range from 4 to 4500 Hz with a step of 4 Hz. Each microphone measures the acoustic pressures at its respective position and the data are transferred to the computer equipped with the TubeCell soft-ware developed by Matelys Research Lab. This software processes the pressure data and computes acoustic properties according to the standard ISO 10534-2 [40] and the work of Salissou et al. [41]. Two cylindrical samples with a diameter of 40 mm and a thickness of 5 mm were tested for each formulation. For each sample, two experiments were carried out alternately for two opposite incidence surfaces. To avoid sound leakage as well as the sample displacement, Teflon ribbons were wrapped around the sample circumference. The experimental results of sound absorption coefficients are presented in terms of mean values at each frequency.
Figure 1. Configuration of three-microphone impedance tube experiments.
In order to conveniently assess the sound absorption performance of the studied ma-terials at low frequencies, a single-number rating called modified sound absorption aver-age (MSAA) is used in this paper. This single-number rating is based on the sound ab-sorption average (SAA) which is suggested in the standard ASTM C423 [42]. The differ-ence between these two single-number ratings is that while the SAA is the average, rounded off to the nearest 0.01, of the sound absorption coefficients of a material for the twelve one-third octave bands from 200 to 2500 Hz, namely, 200, 250, 315, 400, 500, 630, 800, 1000, 1250, 1600, 2000, and 2500 Hz, the MSAA is the average, rounded off to the
Figure 1. Configuration of three-microphone impedance tube experiments.
In order to conveniently assess the sound absorption performance of the studied mate-rials at low frequencies, a single-number rating called modified sound absorption average(MSAA) is used in this paper. This single-number rating is based on the sound absorptionaverage (SAA) which is suggested in the standard ASTM C423 [42]. The difference betweenthese two single-number ratings is that while the SAA is the average, rounded off to thenearest 0.01, of the sound absorption coefficients of a material for the twelve one-thirdoctave bands from 200 to 2500 Hz, namely, 200, 250, 315, 400, 500, 630, 800, 1000, 1250,1600, 2000, and 2500 Hz, the MSAA is the average, rounded off to the nearest 0.01, of thesound absorption coefficients for only the seven one-third octave bands from 630 to 2500Hz according to the following equation:
MSAA =17
2500
∑fi=630
αa( fi) (4)
where αa( fi) is the sound absorption coefficient at frequency fi. This modification aimsto avoid the range of very low frequencies in which the measurements of the sound
Sustain. Chem. 2021, 2 29
absorption coefficient often encounter noticeable fluctuations as well as unphysical values.Following the definition of the SAA, the MSAA also varies from 0 to 1: MSAA = 0 impliesa perfect sound reflection and MSAA = 1 signifies a perfect sound absorption.
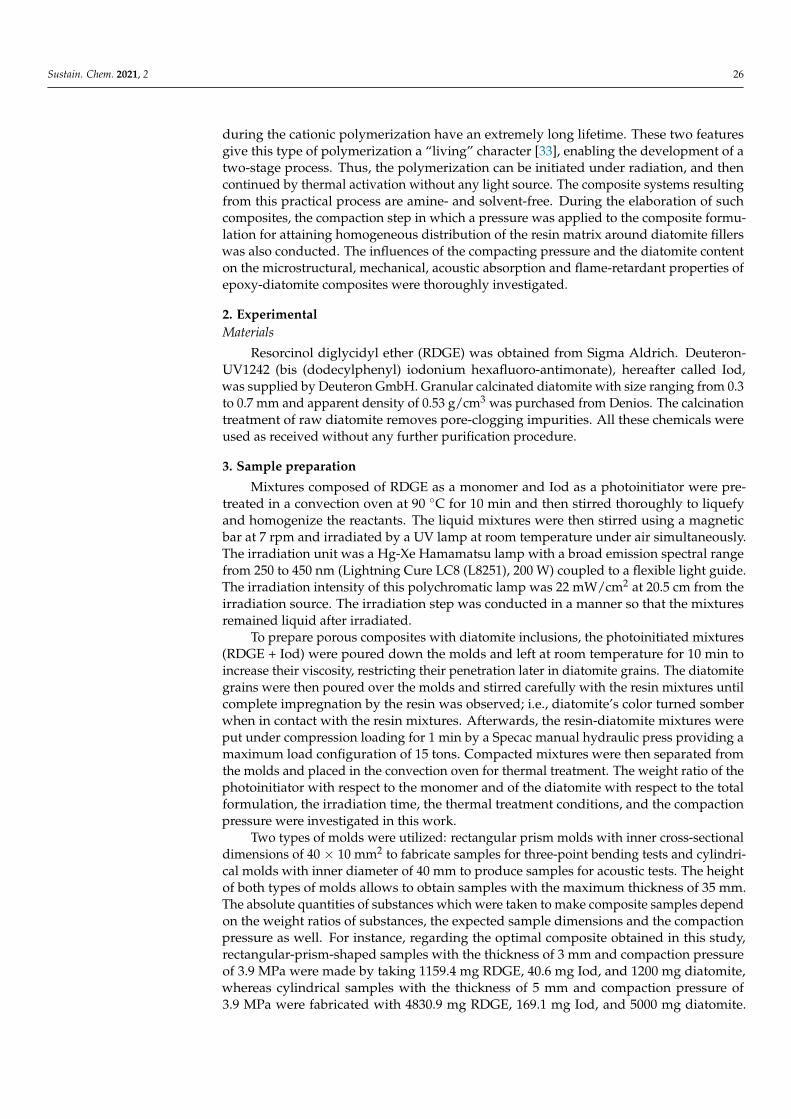
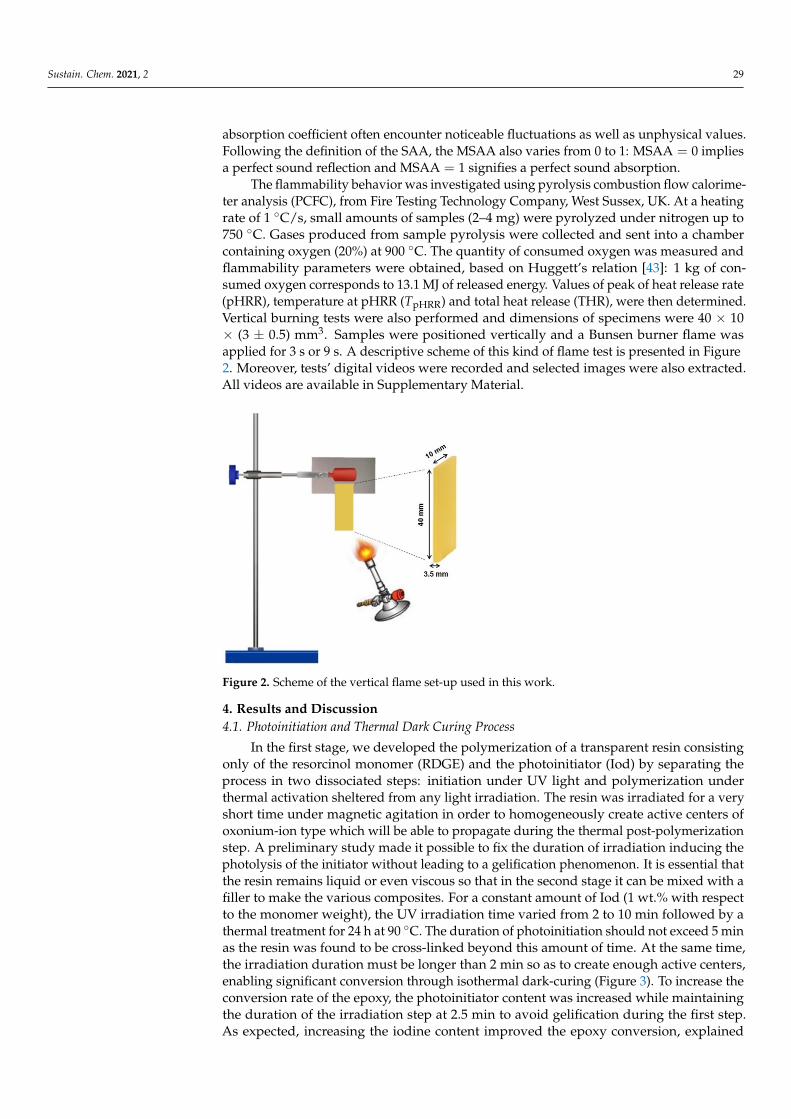
The flammability behavior was investigated using pyrolysis combustion flow calorime-ter analysis (PCFC), from Fire Testing Technology Company, West Sussex, UK. At a heatingrate of 1 ◦C/s, small amounts of samples (2–4 mg) were pyrolyzed under nitrogen up to750 ◦C. Gases produced from sample pyrolysis were collected and sent into a chambercontaining oxygen (20%) at 900 ◦C. The quantity of consumed oxygen was measured andflammability parameters were obtained, based on Huggett’s relation [43]: 1 kg of con-sumed oxygen corresponds to 13.1 MJ of released energy. Values of peak of heat release rate(pHRR), temperature at pHRR (TpHRR) and total heat release (THR), were then determined.Vertical burning tests were also performed and dimensions of specimens were 40 × 10× (3 ± 0.5) mm3. Samples were positioned vertically and a Bunsen burner flame wasapplied for 3 s or 9 s. A descriptive scheme of this kind of flame test is presented in Figure2. Moreover, tests’ digital videos were recorded and selected images were also extracted.All videos are available in Supplementary Material.
Sustain. Chem. 2021, 2, FOR PEER REVIEW 6
nearest 0.01, of the sound absorption coefficients for only the seven one-third octave bands from 630 to 2500 Hz according to the following equation:
( )2500
630
1MSAA7
i
a if
fα=
= (4)
where ( )a ifα is the sound absorption coefficient at frequency if . This modification aims to avoid the range of very low frequencies in which the measurements of the sound ab-sorption coefficient often encounter noticeable fluctuations as well as unphysical values. Following the definition of the SAA, the MSAA also varies from 0 to 1: MSAA 0= implies a perfect sound reflection andMSAA 1= signifies a perfect sound absorption.
The flammability behavior was investigated using pyrolysis combustion flow calo-rimeter analysis (PCFC), from Fire Testing Technology Company, UK. At a heating rate of 1 °C/s, small amounts of samples (2–4 mg) were pyrolyzed under nitrogen up to 750 °C. Gases produced from sample pyrolysis were collected and sent into a chamber con-taining oxygen (20%) at 900 °C. The quantity of consumed oxygen was measured and flammability parameters were obtained, based on Huggett’s relation [43]: 1 kg of con-sumed oxygen corresponds to 13.1 MJ of released energy. Values of peak of heat release rate (pHRR), temperature at pHRR (TpHRR) and total heat release (THR), were then deter-mined. Vertical burning tests were also performed and dimensions of specimens were 40 × 10 × (3 ± 0.5) mm3. Samples were positioned vertically and a Bunsen burner flame was applied for 3 s or 9 s. A descriptive scheme of this kind of flame test is presented in Figure 2. Moreover, tests’ digital videos were recorded and selected images were also ex-tracted. All videos are available in Supporting Information.
Figure 2. Scheme of the vertical flame set-up used in this work.
4. Results and Discussion 4.1. Photoinitiation and Thermal Dark Curing Process
In the first stage, we developed the polymerization of a transparent resin consisting only of the resorcinol monomer (RDGE) and the photoinitiator (Iod) by separating the process in two dissociated steps: initiation under UV light and polymerization under ther-mal activation sheltered from any light irradiation. The resin was irradiated for a very short time under magnetic agitation in order to homogeneously create active centers of oxonium-ion type which will be able to propagate during the thermal post-polymeriza-tion step. A preliminary study made it possible to fix the duration of irradiation inducing the photolysis of the initiator without leading to a gelification phenomenon. It is essential that the resin remains liquid or even viscous so that in the second stage it can be mixed with a filler to make the various composites. For a constant amount of Iod (1 wt.% with
Figure 2. Scheme of the vertical flame set-up used in this work.
4. Results and Discussion4.1. Photoinitiation and Thermal Dark Curing Process
In the first stage, we developed the polymerization of a transparent resin consistingonly of the resorcinol monomer (RDGE) and the photoinitiator (Iod) by separating theprocess in two dissociated steps: initiation under UV light and polymerization underthermal activation sheltered from any light irradiation. The resin was irradiated for a veryshort time under magnetic agitation in order to homogeneously create active centers ofoxonium-ion type which will be able to propagate during the thermal post-polymerizationstep. A preliminary study made it possible to fix the duration of irradiation inducing thephotolysis of the initiator without leading to a gelification phenomenon. It is essential thatthe resin remains liquid or even viscous so that in the second stage it can be mixed with afiller to make the various composites. For a constant amount of Iod (1 wt.% with respectto the monomer weight), the UV irradiation time varied from 2 to 10 min followed by athermal treatment for 24 h at 90 ◦C. The duration of photoinitiation should not exceed 5 minas the resin was found to be cross-linked beyond this amount of time. At the same time,the irradiation duration must be longer than 2 min so as to create enough active centers,enabling significant conversion through isothermal dark-curing (Figure 3). To increase theconversion rate of the epoxy, the photoinitiator content was increased while maintainingthe duration of the irradiation step at 2.5 min to avoid gelification during the first step.As expected, increasing the iodine content improved the epoxy conversion, explained

Sustain. Chem. 2021, 2 30
by the resultant increase in the amount of active centers in the first UV step (Figure 4).Additionally, increasing the duration of the thermal post-curing permitted to reach aconversion rate close to 80% with a photoinitiator content higher than 3 wt.%. A quantityof 3.5 wt.% Iod was chosen for the rest of the study.
Sustain. Chem. 2021, 2, FOR PEER REVIEW 7
respect to the monomer weight), the UV irradiation time varied from 2 to 10 min followed by a thermal treatment for 24 h at 90 °C. The duration of photoinitiation should not exceed 5 min as the resin was found to be cross-linked beyond this amount of time. At the same time, the irradiation duration must be longer than 2 min so as to create enough active centers, enabling significant conversion through isothermal dark-curing (Figure 3). To in-crease the conversion rate of the epoxy, the photoinitiator content was increased while maintaining the duration of the irradiation step at 2.5 min to avoid gelification during the first step. As expected, increasing the iodine content improved the epoxy conversion, ex-plained by the resultant increase in the amount of active centers in the first UV step (Figure 4). Additionally, increasing the duration of the thermal post-curing permitted to reach a conversion rate close to 80% with a photoinitiator content higher than 3 wt.%. A quantity of 3.5 wt.% Iod was chosen for the rest of the study.
Figure 3. Photographs of the resins obtained with 1 wt.% Iod after various irradiation time and 24 h thermal treatment at 90 °C.
Figure 4. Influences of Iod content on the epoxy conversion of resins after 2.5 min irradiation and different thermal treatment conditions.
Figure 3. Photographs of the resins obtained with 1 wt.% Iod after various irradiation time and 24 hthermal treatment at 90 ◦C.
Sustain. Chem. 2021, 2, FOR PEER REVIEW 7
respect to the monomer weight), the UV irradiation time varied from 2 to 10 min followed by a thermal treatment for 24 h at 90 °C. The duration of photoinitiation should not exceed 5 min as the resin was found to be cross-linked beyond this amount of time. At the same time, the irradiation duration must be longer than 2 min so as to create enough active centers, enabling significant conversion through isothermal dark-curing (Figure 3). To in-crease the conversion rate of the epoxy, the photoinitiator content was increased while maintaining the duration of the irradiation step at 2.5 min to avoid gelification during the first step. As expected, increasing the iodine content improved the epoxy conversion, ex-plained by the resultant increase in the amount of active centers in the first UV step (Figure 4). Additionally, increasing the duration of the thermal post-curing permitted to reach a conversion rate close to 80% with a photoinitiator content higher than 3 wt.%. A quantity of 3.5 wt.% Iod was chosen for the rest of the study.
Figure 3. Photographs of the resins obtained with 1 wt.% Iod after various irradiation time and 24 h thermal treatment at 90 °C.
Figure 4. Influences of Iod content on the epoxy conversion of resins after 2.5 min irradiation and different thermal treatment conditions. Figure 4. Influences of Iod content on the epoxy conversion of resins after 2.5 min irradiation anddifferent thermal treatment conditions.
According to our previous study on photo-cross-linked bulk resins [24], a thermal post-curing at 130 ◦C (above the glass transition temperature Tg) led to complete conversion.In this work, we investigated the effect of the duration of the second step carried outat 130 ◦C on epoxy conversion (Figure 5). The post-thermal duration of 24 h at 130 ◦Cwas enough to achieve full epoxy group conversion. The preliminary study allowedto validate the two-step process whose optimal conditions are as follows: mixture ofRDGE and 3.5 wt.% Iod irradiated for 2.5 min, then a thermal post-curing at 130 ◦Cfor 24 h. This optimal process opens the way to obtain full cross-linking of thick oropaque formulations.

Sustain. Chem. 2021, 2 31
Sustain. Chem. 2021, 2, FOR PEER REVIEW 8
According to our previous study on photo-cross-linked bulk resins [24], a thermal post-curing at 130 °C (above the glass transition temperature gT ) led to complete conver-sion. In this work, we investigated the effect of the duration of the second step carried out at 130 °C on epoxy conversion (Figure 5). The post-thermal duration of 24 h at 130 °C was enough to achieve full epoxy group conversion. The preliminary study allowed to validate the two-step process whose optimal conditions are as follows: mixture of RDGE and 3.5 wt.% Iod irradiated for 2.5 min, then a thermal post-curing at 130 °C for 24 h. This optimal process opens the way to obtain full cross-linking of thick or opaque formulations.
Figure 5. Influences of the duration of the thermal treatment conducted at 130 °C on the epoxy conversion of resins with 3.5 wt.% Iod and 2.5 min irradiation.
4.2. UV-Induced Epoxy-Diatomite Composites with Thermal Post-Curing Morphological and spectroscopic characterization of diatomite granules The as-received diatomite granules were characterized by FTIR (Figure S1) and XRD
(results not shown). The X-ray diffraction spectrum reveals the amorphous silica phase as the major phase. The amorphous state of the silica phase results from the calcination treat-ment carried out at a temperature lower than 1000 °C [44].
The pore structure of diatomite was investigated by MIP and SEM. MIP results reveal heterogeneity in the pore size distribution. It can be seen in Figure 6 that the pore size varies from about 0.01 to 110 µm with two major pore size populations centered around 0.01 and 3.3 µm. The average open porosity calculated from MIP analyses is 58%. SEM images of the diatomite surface in Figure 7 also illustrate porous microstructures with agglomerated, irregular morphology, and various pore sizes. Additionally, fragments of diatom frustules, which are a biomass material derived from highly silicified cell walls of diatoms, are observed in this figure as well.
Figure 5. Influences of the duration of the thermal treatment conducted at 130 ◦C on the epoxyconversion of resins with 3.5 wt.% Iod and 2.5 min irradiation.
4.2. UV-Induced Epoxy-Diatomite Composites with Thermal Post-Curing
Morphological and spectroscopic characterization of diatomite granulesThe as-received diatomite granules were characterized by FTIR (Figure S1) and XRD
(results not shown). The X-ray diffraction spectrum reveals the amorphous silica phaseas the major phase. The amorphous state of the silica phase results from the calcinationtreatment carried out at a temperature lower than 1000 ◦C [44].
The pore structure of diatomite was investigated by MIP and SEM. MIP results revealheterogeneity in the pore size distribution. It can be seen in Figure 6 that the pore sizevaries from about 0.01 to 110 µm with two major pore size populations centered around0.01 and 3.3 µm. The average open porosity calculated from MIP analyses is 58%. SEMimages of the diatomite surface in Figure 7 also illustrate porous microstructures withagglomerated, irregular morphology, and various pore sizes. Additionally, fragments ofdiatom frustules, which are a biomass material derived from highly silicified cell walls ofdiatoms, are observed in this figure as well.
Sustain. Chem. 2021, 2, FOR PEER REVIEW 9
Figure 6. Mercury intrusion porosimetry (MIP) profile of the pore size distribution of diatomite.
Figure 7. SEM images of the surface of as-received diatomite.
4.3. RDGE Composites with Diatomite Granules: Effects of Diatomite Content Based on the optimal resin formulation previously determined, a series of composites
consisting of such formulation with initial weight ratio of diatomite fillers from 30 to 60 wt.% with respect to the total weight of the composite formulation has been developed. The mixture of RDGE monomer and Iod photoinitiator was preliminarily irradiated under UV light for 2.5 min and then mixed with the diatomite. As mentioned before, mixing was carried out at room temperature to ensure a higher viscosity of the resin mixture, hinder-ing its penetration into porous fillers. A compacting pressure of 3.9 MPa was applied to obtain a better homogeneous distribution of the epoxy formulation around the diatomite
Figure 6. Mercury intrusion porosimetry (MIP) profile of the pore size distribution of diatomite.

Sustain. Chem. 2021, 2 32
Sustain. Chem. 2021, 2, FOR PEER REVIEW 9
Figure 6. Mercury intrusion porosimetry (MIP) profile of the pore size distribution of diatomite.
Figure 7. SEM images of the surface of as-received diatomite.
4.3. RDGE Composites with Diatomite Granules: Effects of Diatomite Content Based on the optimal resin formulation previously determined, a series of composites
consisting of such formulation with initial weight ratio of diatomite fillers from 30 to 60 wt.% with respect to the total weight of the composite formulation has been developed. The mixture of RDGE monomer and Iod photoinitiator was preliminarily irradiated under UV light for 2.5 min and then mixed with the diatomite. As mentioned before, mixing was carried out at room temperature to ensure a higher viscosity of the resin mixture, hinder-ing its penetration into porous fillers. A compacting pressure of 3.9 MPa was applied to obtain a better homogeneous distribution of the epoxy formulation around the diatomite
Figure 7. SEM images of the surface of as-received diatomite.
4.3. RDGE Composites with Diatomite Granules: Effects of Diatomite Content
Based on the optimal resin formulation previously determined, a series of compositesconsisting of such formulation with initial weight ratio of diatomite fillers from 30 to60 wt.% with respect to the total weight of the composite formulation has been developed.The mixture of RDGE monomer and Iod photoinitiator was preliminarily irradiated underUV light for 2.5 min and then mixed with the diatomite. As mentioned before, mixing wascarried out at room temperature to ensure a higher viscosity of the resin mixture, hinder-ing its penetration into porous fillers. A compacting pressure of 3.9 MPa was applied toobtain a better homogeneous distribution of the epoxy formulation around the diatomitefillers. In addition, due to the thermal insulation properties of porous fillers, the secondstep, i.e., the thermal dark curing step, was prolonged to 48 h to achieve complete conver-sion of epoxy groups. The complete epoxy conversion was confirmed by DSC thermograms(Figure S2, Supplementary Material) which display that there are no exothermic peaks forboth the pure resin and the composites. Figure 8 shows relatively homogeneous dispersionof diatomite particles within the epoxy matrix. Samples became darker with the increase inthe RDGE content of the composite which gives a brownish color after thermal post-curing.The presence of holes on the sample surfaces is also noted and attributed to two reasons.The first reason is related to the composite formulation including a large amount of di-atomite and accordingly a small amount of resin as in case of 60 wt.% diatomite. In this case,the resin content is insufficient to fill all of voids between diatomite granules, leading tothe presence of mentioned holes. The second reason involves the elaboration processing.During the dark thermal curing, the resin is in the liquid state with less viscosity. Therefore,part of resin on the top of the sample tends to flow downwards, leaving holes on the topsurface of the sample. Additionally, when a large amount of resin is used (cases of 30–50 wt.% diatomite), if the composite sample was left in the mold during the dark thermalcuring, there would exist a layer of resin at the bottom of the sample (interface between thecomposite and the mold). The presence of such a resin layer on the one hand makes theobtained material be of sandwich type which is not the objective of the study, on the otherhand weakens the sound absorption of the composite. In order to avoid this covering resinlayer and make a rough surface for improving the sound absorption performance [45],the sample was unmolded before the dark thermal curing. As a consequence, during the

Sustain. Chem. 2021, 2 33
thermal curing, part of resin on the bottom surface of the sample flowed out of the sample,generating holes on the bottom surface instead of the formation of a covering resin layer.
Sustain. Chem. 2021, 2, FOR PEER REVIEW 10
fillers. In addition, due to the thermal insulation properties of porous fillers, the second step, i.e., the thermal dark curing step, was prolonged to 48 h to achieve complete conver-sion of epoxy groups. The complete epoxy conversion was confirmed by DSC thermo-grams (Figure S2, Supporting Information) which display that there are no exothermic peaks for both the pure resin and the composites. Figure 8 shows relatively homogeneous dispersion of diatomite particles within the epoxy matrix. Samples became darker with the increase in the RDGE content of the composite which gives a brownish color after thermal post-curing. The presence of holes on the sample surfaces is also noted and at-tributed to two reasons. The first reason is related to the composite formulation including a large amount of diatomite and accordingly a small amount of resin as in case of 60 wt.% diatomite. In this case, the resin content is insufficient to fill all of voids between diatomite granules, leading to the presence of mentioned holes. The second reason involves the elab-oration processing. During the dark thermal curing, the resin is in the liquid state with less viscosity. Therefore, part of resin on the top of the sample tends to flow downwards, leaving holes on the top surface of the sample. Additionally, when a large amount of resin is used (cases of 30–50 wt.% diatomite), if the composite sample was left in the mold dur-ing the dark thermal curing, there would exist a layer of resin at the bottom of the sample (interface between the composite and the mold). The presence of such a resin layer on the one hand makes the obtained material be of sandwich type which is not the objective of the study, on the other hand weakens the sound absorption of the composite. In order to avoid this covering resin layer and make a rough surface for improving the sound absorp-tion performance [45], the sample was unmolded before the dark thermal curing. As a consequence, during the thermal curing, part of resin on the bottom surface of the sample flowed out of the sample, generating holes on the bottom surface instead of the formation of a covering resin layer.
Figure 8. Photographs of epoxy RDGE-diatomite composite specimens with different diatomite weight ratio. Specimens were obtained with 3.5 wt.% Iod, 2.5 min irradiation, 3.9 MPa compaction and 48 h thermal treatment at 130 °C. (a) 30 wt.%; (b) 40 wt.%; (c) 50 wt.%; (d) 60 wt.%.
A deeper understanding of composites’ morphology is achieved by studying the ob-tained SEM micrographs. In Figure 9, SEM images of external surfaces of composites with different diatomite contents are displayed. It can be seen that diatomite grains are well covered by the resin matrix for 30, 40, and 50 wt.% diatomite (Figure 9a–c), but not in case of 60 wt.% diatomite (Figure 9d). Indeed, a larger amount of filler in the latter case makes the resin not enough to cover diatomite grains in the composite. Moreover, still for the case of 60 wt.% diatomite, it can be seen that a considerable amount of pieces of diatomite has the size smaller than that of purchased diatomite granules (300 µm minimum) as well as cracks on many larger grains (Figure 9d) are present in the samples. This phenomenon is attributed to the effect of the compaction during the elaboration process. When the filler content in composites increases, the impact of compaction loading becomes severer on
Figure 8. Photographs of epoxy RDGE-diatomite composite specimens with different diatomiteweight ratio. Specimens were obtained with 3.5 wt.% Iod, 2.5 min irradiation, 3.9 MPa compactionand 48 h thermal treatment at 130 ◦C. (a) 30 wt.%; (b) 40 wt.%; (c) 50 wt.%; (d) 60 wt.%.
A deeper understanding of composites’ morphology is achieved by studying theobtained SEM micrographs. In Figure 9, SEM images of external surfaces of compositeswith different diatomite contents are displayed. It can be seen that diatomite grains are wellcovered by the resin matrix for 30, 40, and 50 wt.% diatomite (Figure 9a–c), but not in caseof 60 wt.% diatomite (Figure 9d). Indeed, a larger amount of filler in the latter case makesthe resin not enough to cover diatomite grains in the composite. Moreover, still for the caseof 60 wt.% diatomite, it can be seen that a considerable amount of pieces of diatomite hasthe size smaller than that of purchased diatomite granules (300 µm minimum) as well ascracks on many larger grains (Figure 9d) are present in the samples. This phenomenon isattributed to the effect of the compaction during the elaboration process. When the fillercontent in composites increases, the impact of compaction loading becomes severer ondiatomite granules, together with the fact that porous diatomite granules with porosity of58% are fragile, causing damage to the grains, even breaking them into fragments.
Micrographs of fracture surfaces of composites after three-point bending tests arepresented in Figure 10. It is noted that in case of 30, 40, and 50 wt.% diatomite, there existsgreat adhesion between the resin and diatomite grains, resulting partly from essentialroughness of diatomite surfaces, and consequently one cannot observe any debondingof the matrix from the fillers. The composite failure mechanism is then related to thefracture of diatomite grains during mechanical loading. Another failure mechanism isfound for the 60 wt.% diatomite composite. Its failure occurred around filler granules.As illustrated above, the use of a high diatomite content diminishes the amount of the resinaround fillers, leading to the structure in which granules stick loosely together (Figure 10d).Under loading during three-point bending tests, these weak connections among diatomitegrains tend to be damaged and to yield, causing the final failure of the composite with60 wt.% diatomite.

Sustain. Chem. 2021, 2 34
Sustain. Chem. 2021, 2, FOR PEER REVIEW 11
diatomite granules, together with the fact that porous diatomite granules with porosity of 58% are fragile, causing damage to the grains, even breaking them into fragments.
Figure 9. SEM micrographs of external surfaces of composites with different diatomite contents. The composites were obtained with 3.5 wt.% Iod, 2.5 min irradiation, 3.9 MPa compaction and 48 h thermal treatment at 130 °C. (a) 30 wt.%; (b) 40 wt.%; (c) 50 wt.%; (d) 60 wt.%.
Micrographs of fracture surfaces of composites after three-point bending tests are presented in Figure 10. It is noted that in case of 30, 40, and 50 wt.% diatomite, there exists great adhesion between the resin and diatomite grains, resulting partly from essential roughness of diatomite surfaces, and consequently one cannot observe any debonding of the matrix from the fillers. The composite failure mechanism is then related to the fracture of diatomite grains during mechanical loading. Another failure mechanism is found for
Figure 9. SEM micrographs of external surfaces of composites with different diatomite contents.The composites were obtained with 3.5 wt.% Iod, 2.5 min irradiation, 3.9 MPa compaction and 48 hthermal treatment at 130 ◦C. (a) 30 wt.%; (b) 40 wt.%; (c) 50 wt.%; (d) 60 wt.%.
The influences of the diatomite content on the thermal properties were also inves-tigated. As above-mentioned, DSC thermograms (Figure S2, Supplementary Material)show that there not exist exothermic peaks for the pure resin as well as for the composites,indicating complete conversion of epoxy groups. The glass transition temperatures Tgof composites are about 50 ◦C lower than that of the pure epoxy resin as presented inTable 1. This difference could be related to the thermal insulation properties of diatomitewhich have limited the diffusion of heat during polymerization, leading to faults in thepolymeric network. Furthermore, a high diatomite content leads to dispersion of activemolecules in the resin mixture, reducing reaction efficiency and consequently decreasingTg values of composites. However, it is noted that Tg values of all composites underconsideration are comparable to those of DGEBA-based composites with additives suchas melamine, silica nanoparticles and a phosphorus-based compound developed for ad-vanced thermo-mechanical and flame retardancy properties [47]. TGA was performedto study the influence of diatomite on the composite thermal decomposition. For pure

Sustain. Chem. 2021, 2 35
diatomite, the char yield of 99 wt.% at 750 ◦C shows that siliceous diatomite is very stableat high temperature. A comparison of the char yield of the pure resin and those of com-posites (Table 1) indicates that diatomite contents in the obtained composites are slightlyhigher than the corresponding initial filler weight percentages, which is attributed tosmall resin loss during elaboration process. Indeed, during the elaboration of the compos-ites, the compaction step with the application of a pressure to the composite formulationfor attaining homogeneous distribution of the resin matrix around diatomite fillers wasconducted. Because the resin mixture in the composite formulation was in the liquidstate during this step, the compacting pressure made part of the resin mixture leave themold, leading to the loss of resin and the decrease in resin amount in the final composites.As a consequence, the real weight percentage of diatomite fillers in the final composites,and accordingly the percentage of composite residues, became higher than the initial val-ues of diatomite percentage. Nonetheless, it is worth noting that the loss of resin due tothe compaction step is unavoidable (we can see the same phenomenon in, for example,the reference [48]). Figure 12 displays similar thermal decomposition profiles for the pureresin and composites with the diatomite content lower than 50 wt.%. In addition, a highdiatomite content induces a decrease in the initial decomposition temperature, suggestingthat the epoxy network is less well cross-linked in case of a great amount of fillers, which isconsistent with DSC analyses. Based on TGA results, calculations of the porosity of com-posites (φ1) were undertaken (Equation (S3) in Supplementary Material). The porosity φ1was calculated by noting that the microstructure of obtained composites is composed ofthree domains, namely resin, diatomite skeleton and pore domains. As mentioned above,the resin loss during composite processing lead to the change in weight percentages ofthe resin and diatomite components compared to their initial values. From TGA results,the weight percentages of these two components remaining in the final materials werecalculated (Equations (S1) and (S2) in Supplementary Material). Knowing the total massof final composites samples, true densities of resin as well as diatomite, and consideringthat the air mass is negligible, the masses and volumes of resin and diatomite skeletondomains were identified. The volume of the pore domain was then calculated by subtract-ing volumes of resin and diatomite skeleton domains from the total volume of compositesamples, and finally the porosity φ1 was determined as the ratio of the pore volume tothe total sample volume. The porosity φ1 calculated by the strategy above includes bothintraparticle porosity (i.e., pores inside diatomite granules) and interparticle porosity (i.e.,blank space or holes between granules) of the final materials. Note that the MIP analysiscannot be applied to determine the overall porosity of the studied composites because thefillers are well covered by the resin matrix and mercury cannot penetrate into the grains,missing the significant contribution of the intrapartile porosity to the overall porosity ofcomposites. In addition to the porosity φ1, it is also worth calculating another porosityparameter denoted by φ2. This parameter corresponds to the composite porosity in ideal-ized conditions that there is no loss of resin mixture during composite processing (i.e., theweight percentage of diatomite in final materials is the same as the initial value), and thatthe space among diatomite grains is filled completely by the resin and the resin does notpenetrate into diatomite grains. As a consequence, only intraparticle porosity is presentwithin the composite in this case and the porosity φ2 refers to this kind of porosity. Thecalculation of φ2 was performed with Equations (S4)–(S7) (see Supplementary Material),based on the same principle as in the calculation of φ1, that is, determining firstly massesand volumes of resin and diatomite skeleton domains, then calculating the pore volumewith the use of porosity of diatomite (58%), and finally taking the porosity φ2 as the ratioof the pore volume to the total sample volume. From calculated values of φ1 and φ2, itis noted that φ1 is lower than φ2 in case of 30, 40 and 50 wt.% diatomite. This result isrelated to the noticeable penetration of resin into grains as shown in SEM images. For thecomposite with 60 wt.% diatomite, the high filler content restricts the matrix to penetrateinto diatomite grains and also reduces the amount of resin around the grains, resulting inφ1 being higher than φ2. The incorporation of diatomite, which has a relatively high true

Sustain. Chem. 2021, 2 36
density (ρd = 2.64 g/cm3), generally provokes the density of composites to become largerthan that of the pure resin. However, the augmentation of the diatomite content leads to adecrease in the density of the composites, which can be explained by the increase in theoverall porosity. In case of 60 wt.% diatomite, the density of the composite is even lowerthan that of the pure resin because of the considerable overall porosity of the compositeinduced by the significant reduction in the amount of the resin matrix around as well asinside diatomite grains as demonstrated in SEM images.
Sustain. Chem. 2021, 2, FOR PEER REVIEW 12
the 60 wt.% diatomite composite. Its failure occurred around filler granules. As illustrated above, the use of a high diatomite content diminishes the amount of the resin around fill-ers, leading to the structure in which granules stick loosely together (Figure 10d). Under loading during three-point bending tests, these weak connections among diatomite grains tend to be damaged and to yield, causing the final failure of the composite with 60 wt.% diatomite.
Figure 10. SEM micrographs of interfaces between the resin matrix and the fillers in composites with different diatomite contents. The composites were obtained with 3.5 wt.% Iod, 2.5 min irradi-ation, 3.9 MPa compaction and 48 h thermal treatment at 130 °C. (a) 30 wt.%; (b) 40 wt.%; (c) 50 wt.%; (d) 60 wt.%.
Figure 10. SEM micrographs of interfaces between the resin matrix and the fillers in composites withdifferent diatomite contents. The composites were obtained with 3.5 wt.% Iod, 2.5 min irradiation,3.9 MPa compaction and 48 h thermal treatment at 130 ◦C. (a) 30 wt.%; (b) 40 wt.%; (c) 50 wt.%; (d)60 wt.%.

Sustain. Chem. 2021, 2 37
Sustain. Chem. 2021, 2, FOR PEER REVIEW 13
Knowing that surfaces in Figure 10a–c are cross-sectional surfaces of diatomite grains, it is noted that the resin matrix not only covers the fillers but also penetrate them, lessening their intraparticle porosity (i.e., inner porosity) compared to the state without resin. This remark is supported by EDX data in Figure 11 which were obtained from the composites’ fracture surfaces. In EDX cartographs, the red color corresponds to the carbon element representing the polymer matrix while the green color denotes the silicon element representing the diatomite. The distribution of these two elements in the fracture surfaces confirms the penetration of the resin into diatomite granules and the filling of the intra-particle voids by the matrix. This phenomenon has been also observed during the manu-facture of commercial composites with porous granular inclusions [46]. Furthermore, the increase in the filler content reduces the amount of matrix around and inside the grains, increasing both the interparticle and intraparticle porosities of the composite accordingly.
Figure 11. Energy dispersive X-ray (EDX) cartographs of fracture surfaces of composites with different diatomite contents. The composites were obtained with 3.5 wt.% Iod, 2.5 min irradiation, 3.9 MPa compaction and 48 h thermal treatment at 130 °C. The red and green colors signify respectively carbon and silicon elements. (a) 30 wt.%; (b) 40 wt.%; (c) 50 wt.%; (d) 60 wt.%.
The influences of the diatomite content on the thermal properties were also investi-gated. As above-mentioned, DSC thermograms (Figure S2, Supporting Information) show that there not exist exothermic peaks for the pure resin as well as for the composites, in-dicating complete conversion of epoxy groups. The glass transition temperatures gT of composites are about 50 °C lower than that of the pure epoxy resin as presented in Table 1. This difference could be related to the thermal insulation properties of diatomite which have limited the diffusion of heat during polymerization, leading to faults in the poly-meric network. Furthermore, a high diatomite content leads to dispersion of active mole-cules in the resin mixture, reducing reaction efficiency and consequently decreasing gTvalues of composites. However, it is noted that gT values of all composites under consid-eration are comparable to those of DGEBA-based composites with additives such as mel-amine, silica nanoparticles and a phosphorus-based compound developed for advanced thermo-mechanical and flame retardancy properties [47]. TGA was performed to study
Figure 11. Energy dispersive X-ray (EDX) cartographs of fracture surfaces of composites with differ-ent diatomite contents. The composites were obtained with 3.5 wt.% Iod, 2.5 min irradiation, 3.9 MPacompaction and 48 h thermal treatment at 130 ◦C. The red and green colors signify respectivelycarbon and silicon elements. (a) 30 wt.%; (b) 40 wt.%; (c) 50 wt.%; (d) 60 wt.%.
Table 1. Thermal characteristic data collected from differential scanning calorimetry (DSC) andthermogravimetric analyses (TGA) analyses of the pure resin and composites.
Diatomite Content(wt.%) 0 30 40 50 60
Tg(◦C) 153 ± 3 105 ± 1 100 ± 1 99 ± 1 96 ± 1T5% (◦C) 359 355 355 334 310
R750 (wt.%) 6.5 47.0 53.5 57.5 71.4Calculated diatomite
cntent (wt.%) * - 43.8 50.8 55.1 70.2
φ1 (%) * - 17.5 19.3 24.2 41.9φ2 (%) * - 19.6 25.6 31.5 37.2
Density (g/cm3) 1.318 1.437 1.427 1.380 1.181T5%: temperature at which the weight loss is 5%. R750: residual weight at 750 ◦C. * Details of calculations aredescribed in Supplementary Material.
Sustain. Chem. 2021, 2, FOR PEER REVIEW 15
composite with 60 wt.% diatomite, the high filler content restricts the matrix to penetrate into diatomite grains and also reduces the amount of resin around the grains, resulting in1φ being higher than 2φ . The incorporation of diatomite, which has a relatively high true
density ( 32.64 g/cmdρ = ), generally provokes the density of composites to become larger than that of the pure resin. However, the augmentation of the diatomite content leads to a decrease in the density of the composites, which can be explained by the increase in the overall porosity. In case of 60 wt.% diatomite, the density of the composite is even lower than that of the pure resin because of the considerable overall porosity of the composite induced by the significant reduction in the amount of the resin matrix around as well as inside diatomite grains as demonstrated in SEM images.
Table 1. Thermal characteristic data collected from differential scanning calorimetry (DSC) and thermogravimetric anal-yses (TGA) analyses of the pure resin and composites.
Diatomite Content (wt.%) 0 30 40 50 60
gT (°C) 153 ± 3 105± 1 100 ± 1 99 ± 1 96 ± 1
5%T (°C) 359 355 355 334 310
750R (wt.%) 6.5 47.0 53.5 57.5 71.4
Calculated diatomite cntent (wt.%)* - 43.8 50.8 55.1 70.2
1φ (%) * - 17.5 19.3 24.2 41.9
2φ (%) * - 19.6 25.6 31.5 37.2
Density (g/cm3) 1.318 1.437 1.427 1.380 1.181
5%T : temperature at which the weight loss is 5%. 750R : residual weight at 750 °C. * Details of calculations are described in Supporting Information.
Figure 12. TGA thermograms (under air) of the pure resin, diatomite and composites with differ-ent diatomite contents. The composites were obtained with 3.5 wt.% Iod, 2.5 min irradiation, 3.9 MPa compaction, and 48 h thermal treatment at 130 °C.
The mechanical behavior of the composites with different diatomite contents is of interest as well. Figure 13 shows the flexural modulus and the flexural strength of such
Figure 12. TGA thermograms (under air) of the pure resin, diatomite and composites with differentdiatomite contents. The composites were obtained with 3.5 wt.% Iod, 2.5 min irradiation, 3.9 MPacompaction, and 48 h thermal treatment at 130 ◦C.

Sustain. Chem. 2021, 2 38
The mechanical behavior of the composites with different diatomite contents is ofinterest as well. Figure 13 shows the flexural modulus and the flexural strength of suchcomposites as functions of the diatomite content. It can be seen in Figure 13 that, while theflexural modulus is enhanced for composites with up to 50 wt.% diatomite, the flexuralstrength is degraded for all composite formulations in comparison with that of the pureresin. This degradation of the flexural strength is noticeably associated with the presence ofvoids in the composite structures building up the porosity of at least about 16%. When thediatomite weight percentage is increased, reductions in the flexural modulus and the flexu-ral strength are observed. This trend is accounted for mainly by the increase in the overallcomposite porosity. In addition, there exists an auxiliary reason which is the faults in thepolymeric network resulting from the restriction of heat diffusion and of dispersion ofreactive molecules during polymerization due to large amounts of diatomite. Particularly,the use of 60 wt.% diatomite induces sharp drops in both flexural properties (reductions byfactors of three and seven in respectively the flexural modulus and the flexural strengthcompared to those of the composite with 50 wt.% diatomite). This phenomenon is at-tributed to the substantial increase in the porosity of the composite (from 22% porosity incase of 50 wt.% diatomite to 40% porosity with 60 wt.% diatomite) and to also the changein the failure mechanism as shown in SEM analyses. While the failure of composites wasinduced by the fracture of filler grains in case of 30, 40, and 50 wt.% diatomite, the appliedbending load tended to break weak connections among filler granules, leading to theundemanding failure of the composite with 60 wt.% diatomite. It is worth noting that themechanical properties of composites with 30, 40, and 50 wt.% diatomite are comparable tothose of porous silicon carbide ceramics [49] as well as high performance DGEBA-basedcomposites, including melamine, silica nanoparticles, or a phosphorus-based compoundas additives [47]; particularly, the studied composites exhibits mechanical properties no-tably superior to those of various commercial polymeric foams such as polyurethane [50],polyimide [51], and epoxy [48] foams.
Sustain. Chem. 2021, 2, FOR PEER REVIEW 16
composites as functions of the diatomite content. It can be seen in Figure 13 that, while the flexural modulus is enhanced for composites with up to 50 wt.% diatomite, the flexural strength is degraded for all composite formulations in comparison with that of the pure resin. This degradation of the flexural strength is noticeably associated with the presence of voids in the composite structures building up the porosity of at least about 16%. When the diatomite weight percentage is increased, reductions in the flexural modulus and the flexural strength are observed. This trend is accounted for mainly by the increase in the overall composite porosity. In addition, there exists an auxiliary reason which is the faults in the polymeric network resulting from the restriction of heat diffusion and of dispersion of reactive molecules during polymerization due to large amounts of diatomite. Particu-larly, the use of 60 wt.% diatomite induces sharp drops in both flexural properties (reduc-tions by factors of three and seven in respectively the flexural modulus and the flexural strength compared to those of the composite with 50 wt.% diatomite). This phenomenon is attributed to the substantial increase in the porosity of the composite (from 22% porosity in case of 50 wt.% diatomite to 40% porosity with 60 wt.% diatomite) and to also the change in the failure mechanism as shown in SEM analyses. While the failure of compo-sites was induced by the fracture of filler grains in case of 30, 40, and 50 wt.% diatomite, the applied bending load tended to break weak connections among filler granules, leading to the undemanding failure of the composite with 60 wt.% diatomite. It is worth noting that the mechanical properties of composites with 30, 40, and 50 wt.% diatomite are com-parable to those of porous silicon carbide ceramics [49] as well as high performance DGEBA-based composites, including melamine, silica nanoparticles, or a phosphorus-based compound as additives [47]; particularly, the studied composites exhibits mechan-ical properties notably superior to those of various commercial polymeric foams such as polyurethane [50], polyimide [51], and epoxy [48] foams.
Figure 13. Flexural properties of the pure resin and composites with different diatomite contents. The composites were obtained with 3.5 wt.% Iod, 2.5 min irradiation, 3.9 MPa compaction, and 48 h thermal treatment at 130 °C.
The effects of diatomite content on the sound absorption performance of composites were further studied. Figure 14 displays the measurements of sound absorption coeffi-cients of the pure resin and composites with different diatomite contents. The pure resin exhibits weak absorption effect with MSAA = 0.01. Indeed, as a non-porous material, the pure resin reflects rather than absorbs incoming sound waves. As expected, the use of diatomite fillers helps to enhance sound absorption performance as seen in Figure 14. It was determined that the more diatomite content used in the formulation, the higher sound
Figure 13. Flexural properties of the pure resin and composites with different diatomite contents.The composites were obtained with 3.5 wt.% Iod, 2.5 min irradiation, 3.9 MPa compaction, and 48 hthermal treatment at 130 ◦C.
The effects of diatomite content on the sound absorption performance of compositeswere further studied. Figure 14 displays the measurements of sound absorption coefficientsof the pure resin and composites with different diatomite contents. The pure resin exhibitsweak absorption effect with MSAA = 0.01. Indeed, as a non-porous material, the pure resinreflects rather than absorbs incoming sound waves. As expected, the use of diatomite fillershelps to enhance sound absorption performance as seen in Figure 14. It was determined that

Sustain. Chem. 2021, 2 39
the more diatomite content used in the formulation, the higher sound absorption capacityof the composite. The improvement of the sound absorption performance of compositesis quantified by MSAA values which are 0.03, 0.04, 0.08, and 0.10 for composites withrespectively 30, 40, 50, and 60 wt.% diatomite. Accordingly, a notable rise by a factor oftwo in the MSAA is recorded when increasing the diatomite content from 40 to 50 wt.%.It can be noted that the MSAA values obtained with 5 mm thick samples of 50 and 60 wt.%diatomite composites are promising results for the development of construction materialsabsorbing sound waves at low frequencies. Indeed, the use of 50 and 60 wt.% diatomiteon the one hand leads to considerable overall porosities. On the other hand, it generatesmicrostructures possessing agglomerated, irregular morphology with the presence of bothinterparticle and intraparticle voids, resulting in higher tortuosity and resistivity of thecomposites compared to those with a lower diatomite content. Due to these two advantages,it was demonstrated herein that the composites with 50 and 60 wt.% diatomite exhibitimpressive sound absorption performances at low frequencies.
Sustain. Chem. 2021, 2, FOR PEER REVIEW 17
absorption capacity of the composite. The improvement of the sound absorption perfor-mance of composites is quantified by MSAA values which are 0.03, 0.04, 0.08, and 0.10 for composites with respectively 30, 40, 50, and 60 wt.% diatomite. Accordingly, a notable rise by a factor of two in the MSAA is recorded when increasing the diatomite content from 40 to 50 wt.%. It can be noted that the MSAA values obtained with 5 mm thick samples of 50 and 60 wt.% diatomite composites are promising results for the development of con-struction materials absorbing sound waves at low frequencies. Indeed, the use of 50 and 60 wt.% diatomite on the one hand leads to considerable overall porosities. On the other hand, it generates microstructures possessing agglomerated, irregular morphology with the presence of both interparticle and intraparticle voids, resulting in higher tortuosity and resistivity of the composites compared to those with a lower diatomite content. Due to these two advantages, it was demonstrated herein that the composites with 50 and 60 wt.% diatomite exhibit impressive sound absorption performances at low frequencies.
Figure 14. Normal incidence sound absorption coefficients of the pure resin and composites with different diatomite contents. The samples have a thickness of 5 mm. The composites were ob-tained with 3.5 wt.% Iod, 2.5 min irradiation, 3.9 MPa compaction, and 48 h thermal treatment at 130 °C.
The flammability behavior of all material samples was investigated using pyrolysis combustion flow calorimetry (PCFC) [52] tests, according to ASTM D7309 [53]. The heat release rate (HRR) curve of diatomite displayed in Figure S3 (Supporting Information) reveals its practically null contribution to flammability. This means that flammability of the epoxy resin matrix is responsible for overall flammability of studied composites. The HRR curves of the pure resin and composite samples with different diatomite contents are presented in Figure 15 and the collected data are summarized in Table 2. It can be observed in Figure 15 that all samples generally present one peak of HRR (pHRR), show-ing the homogeneity of the resin matrix. The existence of a small shoulder at higher tem-perature than that of the main pHRR for the curve of the pure resin sample corresponds to the degradation of char residues formed previously. For the pure resin sample, the peak of 487 W/g occurs at 384 °C. In the presence of diatomite, the peak is shifted to higher temperature, except for the 30 wt.% diatomite sample. A sharp drop of pHRR is observed for all composite samples, with respect to that of the pure resin. Thus, the pHRR is 129 W/g, 132 W/g, 109 W/g and 97 W/g respectively for 30, 40, 50, and 60 wt.% diatomite sam-ples. Total heat release (THR) values were calculated by the integration of HRR curves. It is shown that the THR value also considerably decreases from 16.2 kJ/g for the pure resin to 5.7 kJ/g, 6 kJ/g, 5 kJ/g and 4.4 kJ/g, respectively, for 30, 40, 50, and 60 wt.% diatomite samples. For both pHRR and THR, a decreasing trend is generally observed with respect
Figure 14. Normal incidence sound absorption coefficients of the pure resin and composites withdifferent diatomite contents. The samples have a thickness of 5 mm. The composites were obtainedwith 3.5 wt.% Iod, 2.5 min irradiation, 3.9 MPa compaction, and 48 h thermal treatment at 130 ◦C.
The flammability behavior of all material samples was investigated using pyrolysiscombustion flow calorimetry (PCFC) [52] tests, according to ASTM D7309 [53]. The heatrelease rate (HRR) curve of diatomite displayed in Figure S3 (Supplementary Material)reveals its practically null contribution to flammability. This means that flammability ofthe epoxy resin matrix is responsible for overall flammability of studied composites. TheHRR curves of the pure resin and composite samples with different diatomite contentsare presented in Figure 15 and the collected data are summarized in Table 2. It canbe observed in Figure 15 that all samples generally present one peak of HRR (pHRR),showing the homogeneity of the resin matrix. The existence of a small shoulder at highertemperature than that of the main pHRR for the curve of the pure resin sample correspondsto the degradation of char residues formed previously. For the pure resin sample, thepeak of 487 W/g occurs at 384 ◦C. In the presence of diatomite, the peak is shifted tohigher temperature, except for the 30 wt.% diatomite sample. A sharp drop of pHRRis observed for all composite samples, with respect to that of the pure resin. Thus, thepHRR is 129 W/g, 132 W/g, 109 W/g and 97 W/g respectively for 30, 40, 50, and 60 wt.%diatomite samples. Total heat release (THR) values were calculated by the integration ofHRR curves. It is shown that the THR value also considerably decreases from 16.2 kJ/gfor the pure resin to 5.7 kJ/g, 6 kJ/g, 5 kJ/g and 4.4 kJ/g, respectively, for 30, 40, 50, and60 wt.% diatomite samples. For both pHRR and THR, a decreasing trend is generally

Sustain. Chem. 2021, 2 40
observed with respect to the increase of the diatomite content. From similar values for 30and 40 wt.% diatomite samples, noticeable reductions in pHRR and THR are perceivedwhen using higher diatomite contents. The significant reductions in pHRR and THRof composite samples compared with those of the pure resin are attributed, on the onehand, to the fact that the flammable contents (i.e., resin contents) of composite samples aremuch less than that of the pure resin. On the other hand, the diffusion of the resin matrixbetween and inside excellently thermally resistant diatomite grains favors the protectionof the resin against the flame, hence reducing both pHRR and THR. In comparison withhigh performance polymers such as poly(ether ether ketone) (PEEK) which possesses apHRR of around 200 W/g [54,55] or polyimide (PI) with a pHRR of about 260 W/g [56],it is clear that the studied epoxy-diatomite composite samples exhibit a satisfying flameretardancy behavior.
Sustain. Chem. 2021, 2, FOR PEER REVIEW 18
to the increase of the diatomite content. From similar values for 30 and 40 wt.% diatomite samples, noticeable reductions in pHRR and THR are perceived when using higher diat-omite contents. The significant reductions in pHRR and THR of composite samples com-pared with those of the pure resin are attributed, on the one hand, to the fact that the flammable contents (i.e., resin contents) of composite samples are much less than that of the pure resin. On the other hand, the diffusion of the resin matrix between and inside excellently thermally resistant diatomite grains favors the protection of the resin against the flame, hence reducing both pHRR and THR. In comparison with high performance polymers such as poly(ether ether ketone) (PEEK) which possesses a pHRR of around 200 W/g [54,55] or polyimide (PI) with a pHRR of about 260 W/g [56], it is clear that the studied epoxy-diatomite composite samples exhibit a satisfying flame retardancy behavior.
Figure 15. Heat release rate (HRR) curves obtained in pyrolysis combustion flow calorimeter (PCFC) tests for the pure resin and 30–60 wt.% diatomite samples. The composites were obtained with 3.5 wt.% Iod, 2.5 min irradiation, 3.9 MPa compaction, and 48 h thermal treatment at 130 °C.
Table 2. Summary results obtained in PCFC tests for the pure resin and 30–60 wt.% diatomite samples. The composites were obtained with 3.5 wt.% Iod, 2.5 min irradiation, 3.9 MPa compac-tion, and 48 h thermal treatment at 130 °C.
Diatomite Content (wt.%)
pHRR
(W/g)
TpHRR (°C)
THR (kJ/g)
0 487 384 16.2 30 129 377 5.7 40 132 390 6 50 109 390 5 60 97 394 4.4
Since PCFC is not considered as a real flame test, the real flame behavior of samples with different diatomite contents was examined using a vertical burning test (Figure 2). Two series of tests were performed. For the first series, the Bunsen burner flame was ap-plied during 3 s and then moved up to observe the apparition of a clear flame. This oper-ation was repeated in case of absence of flame on sample. It was observed that for the pure resin the inflammation was easier, whereas for all composite samples it was needed to apply the Bunsen burner flame many times to have a flame on each composite sample (Videos S1–5, Supporting Information). Even when a flame appeared, after the ignition
Figure 15. Heat release rate (HRR) curves obtained in pyrolysis combustion flow calorimeter (PCFC)tests for the pure resin and 30–60 wt.% diatomite samples. The composites were obtained with3.5 wt.% Iod, 2.5 min irradiation, 3.9 MPa compaction, and 48 h thermal treatment at 130 ◦C.
Table 2. Summary results obtained in PCFC tests for the pure resin and 30–60 wt.% diatomite samples.The composites were obtained with 3.5 wt.% Iod, 2.5 min irradiation, 3.9 MPa compaction, and 48 hthermal treatment at 130 ◦C.
Diatomite Content (wt.%) pHRR (W/g) TpHRR (◦C) THR (kJ/g)
0 487 384 16.230 129 377 5.740 132 390 650 109 390 560 97 394 4.4
Since PCFC is not considered as a real flame test, the real flame behavior of sampleswith different diatomite contents was examined using a vertical burning test (Figure 2).Two series of tests were performed. For the first series, the Bunsen burner flame wasapplied during 3 s and then moved up to observe the apparition of a clear flame. This op-eration was repeated in case of absence of flame on sample. It was observed that forthe pure resin the inflammation was easier, whereas for all composite samples it wasneeded to apply the Bunsen burner flame many times to have a flame on each composite

Sustain. Chem. 2021, 2 41
sample (Videos S1–S5, Supplementary Material). Even when a flame appeared, after theignition source was removed, it went out after several seconds in case of a small flame.All of these thing indicate that the studied composites display self-extinguishing propertyin case of short ignition time. Nevertheless, when a large enough flame appeared (aftermany times of the Bunsen burner application or a long ignition time), the flame tended topropagate on the sample surfaces by burning resin matrix, showing that the compositesdid not exhibit the self-extinguishing anymore.
In the second series of tests, the Bunsen burner flame was applied for 9 s in order tohave a flame on each sample. The photographs of flame tests as a function of burning timeare presented in Figure 16 to clarify the effect of diatomite on flame retardancy. Figure 16clearly shows the size of flames during the tests for all samples. When the pure resinsample was ignited, a big flame immediately appeared and continued until the flameout. A smaller flame height was observed for all composite samples compared with thatfor the pure resin. Overall, the best behavior was observed in case of 60 wt.% diatomitewith the smallest flame within the shortest time of burning and flame out. It is alsonoted that the pure resin sample exhibited a high shrinkage during the test, whereas noshrinkage was observed for the composite samples. In addition, for all samples, no drippingbehavior was observed and at the end of the tests large quantities of residues were obtained(Figure 17). Particularly, the residue of the pure resin sample was brittle, whereas thoseof composite samples were interestingly highly cohesive, which is an important featurerelated to the flame resistance character [57]. The fact that the composite residues werehighly cohesive justifies that not all of resin was burned out. The cohesion observed here isobviously not the result of burning diatomite but is the characteristic of the residues of burntresin. If the resin was burnt totally, its residues would be brittle char instead of cohesiveproducts. The presence of cohesive products in this case is explained by the fact thatsintered diatomite grains with their highly thermal insulation property behaved as thermalbarriers protecting the resin component and reducing thermal effect of the flame on thiscomponent, particularly for part of resin far from the sample surfaces. Therefore, only resinon or near the sample surfaces was burnt completely, whereas the remaining resin turnedinto an intermediate state with the cohesive characteristic. It is also seen that the cohesionof these composite residues became more important with respect to the increase in thediatomite content. Indeed, not only the flame retardancy characteristic but also the flameresistance behavior and hence the structural integrity, which is involved in mechanicalproperties of composites during combustion, is a key feature offering the possibility of usingthese epoxy-diatomite composites in construction and building applications. Nonetheless,in order to obtaining such a characteristic, an appropriate diatomite content is required. Ifthere is too little diatomite, a major part of resin will be exposed to the flame and burntcompletely. Conversely, if there are too much diatomite, the resin content will not beenough to bond diatomite granules after burning process.
Towards the development of sound absorbing and flame-retardant construction mate-rials, the mechanical properties, the acoustic performance and the flammability behaviorof composites need to be all considered. The enhancement of the sound absorption per-formance and the flammability behavior comes at the cost of degrading the materialmechanical properties. Although the composite with 60 wt.% diatomite displays the bestsound absorption performance and the best flammability behavior among the studiedcomposites, a significant drop in its flexural properties compared to those of other compos-ites is recorded. On the contrary, although 30 and 40 wt.% diatomite composites possessgood flexural modulus, their sound absorption capacities are much more restricted thanthat of two other composites. Taking into account a compromise among mechanical prop-erties, acoustic characteristics and the flammability behavior, the diatomite content of50 wt.% can be considered the optimal value in this work for the attainment of a compositewith good mechanical properties, a good sound absorption performance and a satisfyingflammability behavior.

Sustain. Chem. 2021, 2 42
Sustain. Chem. 2021, 2, FOR PEER REVIEW 20
Figure 16. Digital photos showing the examination of the flame behavior during the vertical flame tests for the pure resin and composite samples with different diatomite contents. The Bunsen burner flame was applied for 9 s. The composites were obtained with 3.5 wt.% Iod, 2.5 min irradiation, 3.9 MPa compaction and 48 h thermal treatment at 130 °C. (a) Pure resin, (b) 30 wt.% diatomite; (c) 40 wt.% diatomite; (d) 50 wt.% diatomite; (e) 60 wt.% diatomite.
Figure 16. Digital photos showing the examination of the flame behavior during the vertical flametests for the pure resin and composite samples with different diatomite contents. The Bunsen burnerflame was applied for 9 s. The composites were obtained with 3.5 wt.% Iod, 2.5 min irradiation,3.9 MPa compaction and 48 h thermal treatment at 130 ◦C. (a) Pure resin, (b) 30 wt.% diatomite;(c) 40 wt.% diatomite; (d) 50 wt.% diatomite; (e) 60 wt.% diatomite.
Sustain. Chem. 2021, 2, FOR PEER REVIEW 21
Figure 17. Digital photos of the residues of the pure resin and composite samples with different diatomite contents at the end of flame tests. The Bunsen burner flame was applied for 9 s. The composites were obtained with 3.5 wt.% Iod, 2.5 min irradiation, 3.9 MPa compaction and 48 h thermal treatment at 130 °C. (a) Pure resin, (b) 30 wt.% diatomite; (c) 40 wt.% diatomite; (d) 50 wt.% diatomite; (e) 60 wt.% diatomite.
Towards the development of sound absorbing and flame-retardant construction ma-terials, the mechanical properties, the acoustic performance and the flammability behav-ior of composites need to be all considered. The enhancement of the sound absorption performance and the flammability behavior comes at the cost of degrading the material mechanical properties. Although the composite with 60 wt.% diatomite displays the best sound absorption performance and the best flammability behavior among the studied composites, a significant drop in its flexural properties compared to those of other com-posites is recorded. On the contrary, although 30 and 40 wt.% diatomite composites pos-sess good flexural modulus, their sound absorption capacities are much more restricted than that of two other composites. Taking into account a compromise among mechanical properties, acoustic characteristics and the flammability behavior, the diatomite content of 50 wt.% can be considered the optimal value in this work for the attainment of a com-posite with good mechanical properties, a good sound absorption performance and a sat-isfying flammability behavior.
Effects of Compacting Pressure In addition to the diatomite content, the compacting pressure is also a key parameter
influencing the obtained composites’ behavior. In order to determine the optimal com-pacting pressure, 50 wt.% diatomite formulations were compacted under pressures of 1.95, 3.9, and 5.85 MPa. It was found that, the porosity decreases with increasing compact-ing pressure (Figure 18) due to more compact packing of diatomite grains and better fill-ing of both intraparticle and interparticle voids by the resin. At the same time, the residual percentage increases accordingly because of more loss of the resin mixture during com-paction and the rising composite compactness. The decrease of the porosity is also the reason for the improvement of both flexural modulus and flexural strength of the compo-site when increasing the compacting pressure as seen in Figure 19. Although the flexural properties of the composite are enhanced, the increase in the compacting pressure lessens the sound absorption performance of the composite (Figure 20). While raising the com-pacting pressure from 1.95 to 3.9 MPa leads to a merely slight reduction in the MSAA (from 1.0 to 0.08), a significant drop of this single-number rating from 0.8 down to 0.03 is observed for a rise of the pressure from 3.9 to 5.85 MPa. It is obvious that the deterioration of the sound absorption performance of the composite is associated with the decrease of the porosity when augmenting the compacting pressure. The less porosity or more com-pactness of the composite, the more reflection rather than absorption capacity of the ma-terial. The effect of compacting pressure on flammability was also evaluated in PCFC anal-yses. The results showed that the HRR curves of 50 wt.% diatomite composites compacted
Figure 17. Digital photos of the residues of the pure resin and composite samples with differentdiatomite contents at the end of flame tests. The Bunsen burner flame was applied for 9 s. The com-posites were obtained with 3.5 wt.% Iod, 2.5 min irradiation, 3.9 MPa compaction and 48 h thermaltreatment at 130 ◦C. (a) Pure resin, (b) 30 wt.% diatomite; (c) 40 wt.% diatomite; (d) 50 wt.% diatomite;(e) 60 wt.% diatomite.
Effects of Compacting Pressure
In addition to the diatomite content, the compacting pressure is also a key parameterinfluencing the obtained composites’ behavior. In order to determine the optimal com-pacting pressure, 50 wt.% diatomite formulations were compacted under pressures of 1.95,
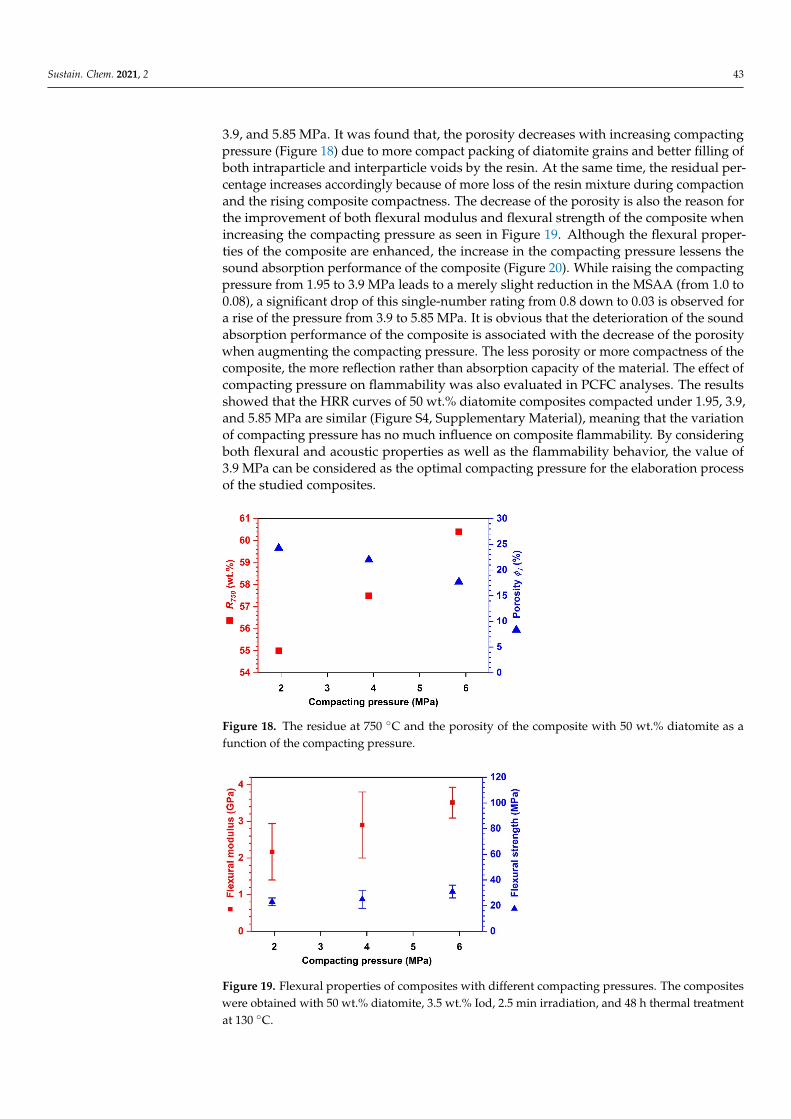
Sustain. Chem. 2021, 2 43
3.9, and 5.85 MPa. It was found that, the porosity decreases with increasing compactingpressure (Figure 18) due to more compact packing of diatomite grains and better filling ofboth intraparticle and interparticle voids by the resin. At the same time, the residual per-centage increases accordingly because of more loss of the resin mixture during compactionand the rising composite compactness. The decrease of the porosity is also the reason forthe improvement of both flexural modulus and flexural strength of the composite whenincreasing the compacting pressure as seen in Figure 19. Although the flexural proper-ties of the composite are enhanced, the increase in the compacting pressure lessens thesound absorption performance of the composite (Figure 20). While raising the compactingpressure from 1.95 to 3.9 MPa leads to a merely slight reduction in the MSAA (from 1.0 to0.08), a significant drop of this single-number rating from 0.8 down to 0.03 is observed fora rise of the pressure from 3.9 to 5.85 MPa. It is obvious that the deterioration of the soundabsorption performance of the composite is associated with the decrease of the porositywhen augmenting the compacting pressure. The less porosity or more compactness of thecomposite, the more reflection rather than absorption capacity of the material. The effect ofcompacting pressure on flammability was also evaluated in PCFC analyses. The resultsshowed that the HRR curves of 50 wt.% diatomite composites compacted under 1.95, 3.9,and 5.85 MPa are similar (Figure S4, Supplementary Material), meaning that the variationof compacting pressure has no much influence on composite flammability. By consideringboth flexural and acoustic properties as well as the flammability behavior, the value of3.9 MPa can be considered as the optimal compacting pressure for the elaboration processof the studied composites.
Sustain. Chem. 2021, 2, FOR PEER REVIEW 22
under 1.95, 3.9, and 5.85 MPa are similar (Figure S4, Supporting Information), meaning that the variation of compacting pressure has no much influence on composite flamma-bility. By considering both flexural and acoustic properties as well as the flammability behavior, the value of 3.9 MPa can be considered as the optimal compacting pressure for the elaboration process of the studied composites.
Figure 18. The residue at 750 °C and the porosity of the composite with 50 wt.% diatomite as a function of the compacting pressure.
Figure 19. Flexural properties of composites with different compacting pressures. The composites were obtained with 50 wt.% diatomite, 3.5 wt.% Iod, 2.5 min irradiation, and 48 h thermal treat-ment at 130 °C.
Figure 18. The residue at 750 ◦C and the porosity of the composite with 50 wt.% diatomite as afunction of the compacting pressure.
Sustain. Chem. 2021, 2, FOR PEER REVIEW 22
under 1.95, 3.9, and 5.85 MPa are similar (Figure S4, Supporting Information), meaning that the variation of compacting pressure has no much influence on composite flamma-bility. By considering both flexural and acoustic properties as well as the flammability behavior, the value of 3.9 MPa can be considered as the optimal compacting pressure for the elaboration process of the studied composites.
Figure 18. The residue at 750 °C and the porosity of the composite with 50 wt.% diatomite as a function of the compacting pressure.
Figure 19. Flexural properties of composites with different compacting pressures. The composites were obtained with 50 wt.% diatomite, 3.5 wt.% Iod, 2.5 min irradiation, and 48 h thermal treat-ment at 130 °C.
Figure 19. Flexural properties of composites with different compacting pressures. The compositeswere obtained with 50 wt.% diatomite, 3.5 wt.% Iod, 2.5 min irradiation, and 48 h thermal treatmentat 130 ◦C.

Sustain. Chem. 2021, 2 44Sustain. Chem. 2021, 2, FOR PEER REVIEW 23
Figure 20. Normal incidence sound absorption coefficients of composites with different compact-ing pressures. The thickness of samples is 5 mm. The composites were obtained with 50 wt.% diat-omite, 3.5 wt.% Iod, 2.5 min irradiation, and 48 h thermal treatment at 130 °C.
5. Conclusions This study has developed a new kind of fully bio-based composites from a commer-
cially available resorcinol derivative as a monomer and granular diatomite as fillers. The composite elaboration has followed the green two-stage process which is inspired by the living character of the cationic polymerization. This practical two-stage process, consist-ing in the photoinitiation and then the thermal dark curing, has allowed to obtain thick and non-transparent epoxy-diatomite composites without any solvent or amine-based hardener. The influence of diatomite content and the compacting pressure on microstruc-tural, thermal, mechanical, and acoustic properties as well as the flame behavior of the obtained composites have been investigated. It is noted that the increase in the diatomite content leads to the increase in the overall composite porosity by the presence of more interparticle and intraparticle voids. Additionally, while good adhesion between the resin and diatomite grains is obtained in case of 30–50 wt.% diatomite, weak connections among grains are observed for composites with 60 wt.% diatomite. It is revealed that there exist two failure mechanisms of the studied composites: fractures of diatomite grains when the diatomite content is from 30 to 50 wt.%, and failure of weak connections among filler granules when the diatomite content is as high as 60 wt.%. In addition, the incorporation of diatomite leads to a drop of about 50 °C in the glass transition temperatures gT of the composites compared to that of the pure resin. Furthermore, when the amount of diato-mite increases, gT decreases accordingly. The drop in gT is attributed to two factors. On the one hand, the thermal insulation characteristic of diatomite limits the heat diffusion dur-ing polymerization, causing faults in the cross-linked network. On the other hand, a higher diatomite content leads to more dispersion of active molecules in the resin mixture and hence decreases reaction efficiency. It is also shown that the flexural modulus of the composites with 30–50 wt.% diatomite is enhanced in comparison with that of the pure resin. However, the increase in the overall porosity and the change of the failure mecha-nism when raising the diatomite content lessen mechanical properties of the composites, especially in case of the 60 wt.% diatomite composite. In contrast, the increase in the diat-omite content helps to improve the composite sound absorption performance, particularly at low frequencies. As regards the flame behavior, the flame retardancy feature of the di-atomite-based composites is highlighted by their self-extinguishing behavior and by great reductions of their pHRR and THR compared to those of the pure resin. In addition, the pHRR and THR tend to decrease when the diatomite content increases. The fact that no
Figure 20. Normal incidence sound absorption coefficients of composites with different compactingpressures. The thickness of samples is 5 mm. The composites were obtained with 50 wt.% diatomite,3.5 wt.% Iod, 2.5 min irradiation, and 48 h thermal treatment at 130 ◦C.
5. Conclusions
This study has developed a new kind of fully bio-based composites from a com-mercially available resorcinol derivative as a monomer and granular diatomite as fillers.The composite elaboration has followed the green two-stage process which is inspiredby the living character of the cationic polymerization. This practical two-stage process,consisting in the photoinitiation and then the thermal dark curing, has allowed to obtainthick and non-transparent epoxy-diatomite composites without any solvent or amine-basedhardener. The influence of diatomite content and the compacting pressure on microstruc-tural, thermal, mechanical, and acoustic properties as well as the flame behavior of theobtained composites have been investigated. It is noted that the increase in the diatomitecontent leads to the increase in the overall composite porosity by the presence of moreinterparticle and intraparticle voids. Additionally, while good adhesion between the resinand diatomite grains is obtained in case of 30–50 wt.% diatomite, weak connections amonggrains are observed for composites with 60 wt.% diatomite. It is revealed that there existtwo failure mechanisms of the studied composites: fractures of diatomite grains whenthe diatomite content is from 30 to 50 wt.%, and failure of weak connections among fillergranules when the diatomite content is as high as 60 wt.%. In addition, the incorporationof diatomite leads to a drop of about 50 ◦C in the glass transition temperatures Tg of thecomposites compared to that of the pure resin. Furthermore, when the amount of diatomiteincreases, Tg decreases accordingly. The drop in Tg is attributed to two factors. On the onehand, the thermal insulation characteristic of diatomite limits the heat diffusion duringpolymerization, causing faults in the cross-linked network. On the other hand, a higher di-atomite content leads to more dispersion of active molecules in the resin mixture and hencedecreases reaction efficiency. It is also shown that the flexural modulus of the compositeswith 30–50 wt.% diatomite is enhanced in comparison with that of the pure resin. However,the increase in the overall porosity and the change of the failure mechanism when raisingthe diatomite content lessen mechanical properties of the composites, especially in case ofthe 60 wt.% diatomite composite. In contrast, the increase in the diatomite content helps toimprove the composite sound absorption performance, particularly at low frequencies. Asregards the flame behavior, the flame retardancy feature of the diatomite-based compositesis highlighted by their self-extinguishing behavior and by great reductions of their pHRRand THR compared to those of the pure resin. In addition, the pHRR and THR tend todecrease when the diatomite content increases. The fact that no dripping behavior andno shrinkage were observed for composites during the vertical burning tests and thereexisted large amounts of composite residues with great cohesion also discloses the flameresistance behavior of the studied composites and their structural integrity when subjectedto the flame. Both the flame retardancy and the flame resistance characteristics along with

Sustain. Chem. 2021, 2 45
the structural integrity are key features for potential applications of the studied diatomite-based composites in the construction industry. Concerning the compacting pressure, itsincrease reduces the porosity and hence improves mechanical properties. Nevertheless,the decrease of the porosity by raising the compacting pressure diminishes the soundabsorption capacity of the composite. It is demonstrated that the variation of the com-pacting pressure has no much effect on composite flammability. Taking into account acompromise among mechanical, acoustic and flame-retardant properties, the diatomitecontent of 50 wt.% and the compacting pressure of 3.9 MPa are considered optimal valuesin the present work which have resulted in the composite with the flexural modulus of2.9 MPa, the MSAA of 0.08 (for a sample thickness of 5 mm), the pHRR of 109 W/g and theTHR of 5 kJ/g. Such composite exhibits the enhanced flexural modulus compared to thatof the pure resin, the satisfying sound absorption performance at low frequencies and theimpressive flame retardancy behavior compared with other well-known high performanceflame-retardant polymers. For deeper insights into microstructures-properties relation,the effects of microstructural features of the studied composites on simultaneously theireffective mechanical, acoustic and thermal properties will be the topic of a further study.Within such a study, pore characteristics will be characterized by X-ray microtomographyand imaging techniques, and a multiscale approach [58–61] will be applied to performnumerical parametric investigations, towards the optimization of microstructures for thebest properties of interest.
Supplementary Materials: The following are available online at https://www.mdpi.com/2673-4079/2/1/3/s1, Figure S1: FTIR spectrum of diato-mite showing the characteristic bands of silicaat 1047 cm−1 (Si–O–Si asymmetric stretching ), 799 cm−1 (Si-O symmetric stretching vibration inamorphous silica), 556 cm−1 (Si-O stretching vibration corresponding to defect SiO2 structural unit)and 451 cm−1 (O-Si-O deformation vibration), Figure S2: DSC thermograms of (a) the pure resinand (b) composites with different diatomite contents. The composites were obtained with 3.5 wt.%Iod, 2.5 min irradiation, 3.9 MPa compaction, and 48 h thermal treatment at 130 ◦C; Figure S3: HRRcurve obtained in the PCFC test for diatomite; Figure S4: HRR curves obtained in PCFC tests forcomposite samples with different compacting pressures. The composites were obtained with 50wt.% diatomite, 3.5 wt.% Iod, 2.5 min irradia-tion, and 48 h thermal treatment at 130 ◦C. Video S1:Video_1-Pure_resin; Video S2: Video_2-30wt%diatomite; Video S3: Video_3-40wt%diatomite; VideoS4: Video_4-50wt%diatomite; Video S5: Video_5-60wt%diatomite.
Author Contributions: Conceptualization, Q.-B.N., E.R., A.R.d.A.; methodology, Q.-B.N., E.R.,A.R.d.A., D.-L.V.; validation, all authors; formal analysis and investigation, Q.-B.N., A.R.d.A., C.P.,H.V.; writing—original draft preparation, Q.-B.N.; writing—review and editing, all authors; super-vision, E.R., A.R.d.A., S.N., V.-H.N.; funding acquisition, S.N. and E.R. All authors have read andagreed to the published version of the manuscript.
Funding: This research received no external funding.
Institutional Review Board Statement: Not applicable.
Informed Consent Statement: Not applicable.
Acknowledgments: This work has benefited from a French government grant managed by ANRwithin the frame of the national program of Investments for the Future ANR-11-LABX-022- 01 (LabExMMCD project). The authors are indebted to Léon Preira (ICMPE) for the fabrication of two specificmolds used in the study. H. Vahabi also would like to thank IUT de Moselle Est-“Plastinnov” for thePCFC tests.
Conflicts of Interest: The authors declare no conflict of interest.
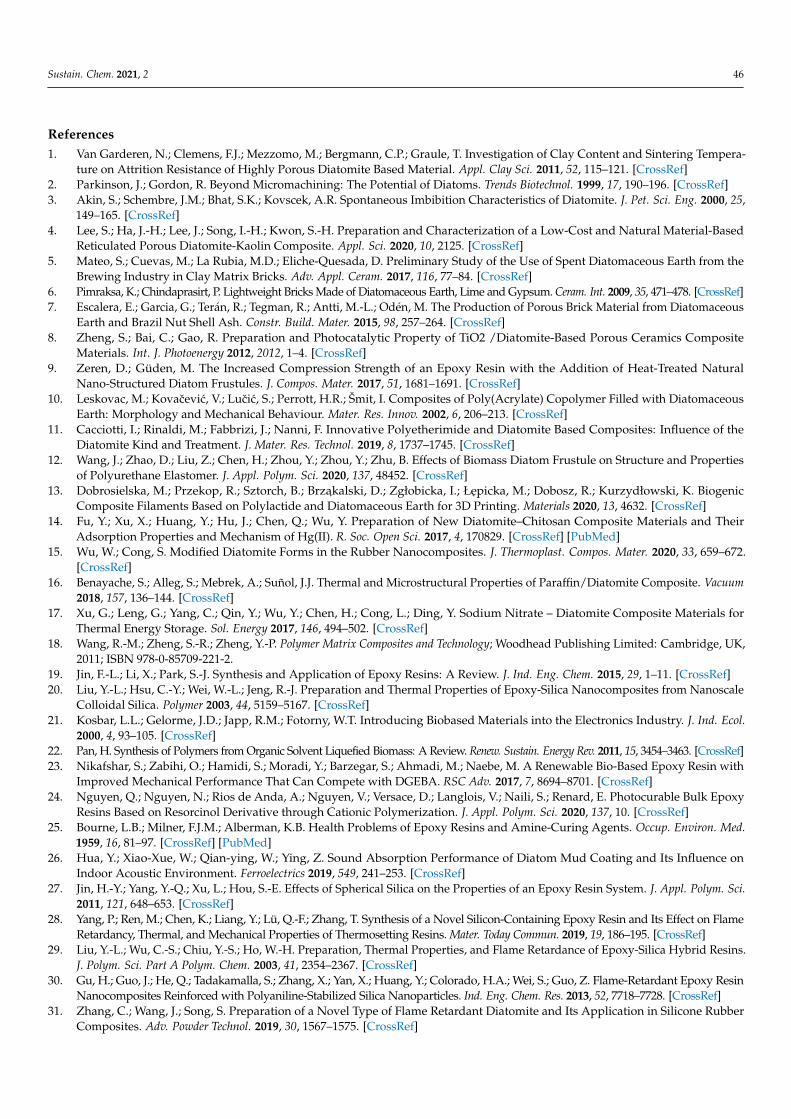
Sustain. Chem. 2021, 2 46
References1. Van Garderen, N.; Clemens, F.J.; Mezzomo, M.; Bergmann, C.P.; Graule, T. Investigation of Clay Content and Sintering Tempera-
ture on Attrition Resistance of Highly Porous Diatomite Based Material. Appl. Clay Sci. 2011, 52, 115–121. [CrossRef]2. Parkinson, J.; Gordon, R. Beyond Micromachining: The Potential of Diatoms. Trends Biotechnol. 1999, 17, 190–196. [CrossRef]3. Akin, S.; Schembre, J.M.; Bhat, S.K.; Kovscek, A.R. Spontaneous Imbibition Characteristics of Diatomite. J. Pet. Sci. Eng. 2000, 25,
149–165. [CrossRef]4. Lee, S.; Ha, J.-H.; Lee, J.; Song, I.-H.; Kwon, S.-H. Preparation and Characterization of a Low-Cost and Natural Material-Based
Reticulated Porous Diatomite-Kaolin Composite. Appl. Sci. 2020, 10, 2125. [CrossRef]5. Mateo, S.; Cuevas, M.; La Rubia, M.D.; Eliche-Quesada, D. Preliminary Study of the Use of Spent Diatomaceous Earth from the
Brewing Industry in Clay Matrix Bricks. Adv. Appl. Ceram. 2017, 116, 77–84. [CrossRef]6. Pimraksa, K.; Chindaprasirt, P. Lightweight Bricks Made of Diatomaceous Earth, Lime and Gypsum. Ceram. Int. 2009, 35, 471–478. [CrossRef]7. Escalera, E.; Garcia, G.; Terán, R.; Tegman, R.; Antti, M.-L.; Odén, M. The Production of Porous Brick Material from Diatomaceous
Earth and Brazil Nut Shell Ash. Constr. Build. Mater. 2015, 98, 257–264. [CrossRef]8. Zheng, S.; Bai, C.; Gao, R. Preparation and Photocatalytic Property of TiO2 /Diatomite-Based Porous Ceramics Composite
Materials. Int. J. Photoenergy 2012, 2012, 1–4. [CrossRef]9. Zeren, D.; Güden, M. The Increased Compression Strength of an Epoxy Resin with the Addition of Heat-Treated Natural
Nano-Structured Diatom Frustules. J. Compos. Mater. 2017, 51, 1681–1691. [CrossRef]10. Leskovac, M.; Kovacevic, V.; Lucic, S.; Perrott, H.R.; Šmit, I. Composites of Poly(Acrylate) Copolymer Filled with Diatomaceous
Earth: Morphology and Mechanical Behaviour. Mater. Res. Innov. 2002, 6, 206–213. [CrossRef]11. Cacciotti, I.; Rinaldi, M.; Fabbrizi, J.; Nanni, F. Innovative Polyetherimide and Diatomite Based Composites: Influence of the
Diatomite Kind and Treatment. J. Mater. Res. Technol. 2019, 8, 1737–1745. [CrossRef]12. Wang, J.; Zhao, D.; Liu, Z.; Chen, H.; Zhou, Y.; Zhou, Y.; Zhu, B. Effects of Biomass Diatom Frustule on Structure and Properties
of Polyurethane Elastomer. J. Appl. Polym. Sci. 2020, 137, 48452. [CrossRef]13. Dobrosielska, M.; Przekop, R.; Sztorch, B.; Brzakalski, D.; Zgłobicka, I.; Łepicka, M.; Dobosz, R.; Kurzydłowski, K. Biogenic
Composite Filaments Based on Polylactide and Diatomaceous Earth for 3D Printing. Materials 2020, 13, 4632. [CrossRef]14. Fu, Y.; Xu, X.; Huang, Y.; Hu, J.; Chen, Q.; Wu, Y. Preparation of New Diatomite–Chitosan Composite Materials and Their
Adsorption Properties and Mechanism of Hg(II). R. Soc. Open Sci. 2017, 4, 170829. [CrossRef] [PubMed]15. Wu, W.; Cong, S. Modified Diatomite Forms in the Rubber Nanocomposites. J. Thermoplast. Compos. Mater. 2020, 33, 659–672.
[CrossRef]16. Benayache, S.; Alleg, S.; Mebrek, A.; Suñol, J.J. Thermal and Microstructural Properties of Paraffin/Diatomite Composite. Vacuum
2018, 157, 136–144. [CrossRef]17. Xu, G.; Leng, G.; Yang, C.; Qin, Y.; Wu, Y.; Chen, H.; Cong, L.; Ding, Y. Sodium Nitrate – Diatomite Composite Materials for
Thermal Energy Storage. Sol. Energy 2017, 146, 494–502. [CrossRef]18. Wang, R.-M.; Zheng, S.-R.; Zheng, Y.-P. Polymer Matrix Composites and Technology; Woodhead Publishing Limited: Cambridge, UK,
2011; ISBN 978-0-85709-221-2.19. Jin, F.-L.; Li, X.; Park, S.-J. Synthesis and Application of Epoxy Resins: A Review. J. Ind. Eng. Chem. 2015, 29, 1–11. [CrossRef]20. Liu, Y.-L.; Hsu, C.-Y.; Wei, W.-L.; Jeng, R.-J. Preparation and Thermal Properties of Epoxy-Silica Nanocomposites from Nanoscale
Colloidal Silica. Polymer 2003, 44, 5159–5167. [CrossRef]21. Kosbar, L.L.; Gelorme, J.D.; Japp, R.M.; Fotorny, W.T. Introducing Biobased Materials into the Electronics Industry. J. Ind. Ecol.
2000, 4, 93–105. [CrossRef]22. Pan, H. Synthesis of Polymers from Organic Solvent Liquefied Biomass: A Review. Renew. Sustain. Energy Rev. 2011, 15, 3454–3463. [CrossRef]23. Nikafshar, S.; Zabihi, O.; Hamidi, S.; Moradi, Y.; Barzegar, S.; Ahmadi, M.; Naebe, M. A Renewable Bio-Based Epoxy Resin with
Improved Mechanical Performance That Can Compete with DGEBA. RSC Adv. 2017, 7, 8694–8701. [CrossRef]24. Nguyen, Q.; Nguyen, N.; Rios de Anda, A.; Nguyen, V.; Versace, D.; Langlois, V.; Naili, S.; Renard, E. Photocurable Bulk Epoxy
Resins Based on Resorcinol Derivative through Cationic Polymerization. J. Appl. Polym. Sci. 2020, 137, 10. [CrossRef]25. Bourne, L.B.; Milner, F.J.M.; Alberman, K.B. Health Problems of Epoxy Resins and Amine-Curing Agents. Occup. Environ. Med.
1959, 16, 81–97. [CrossRef] [PubMed]26. Hua, Y.; Xiao-Xue, W.; Qian-ying, W.; Ying, Z. Sound Absorption Performance of Diatom Mud Coating and Its Influence on
Indoor Acoustic Environment. Ferroelectrics 2019, 549, 241–253. [CrossRef]27. Jin, H.-Y.; Yang, Y.-Q.; Xu, L.; Hou, S.-E. Effects of Spherical Silica on the Properties of an Epoxy Resin System. J. Appl. Polym. Sci.
2011, 121, 648–653. [CrossRef]28. Yang, P.; Ren, M.; Chen, K.; Liang, Y.; Lü, Q.-F.; Zhang, T. Synthesis of a Novel Silicon-Containing Epoxy Resin and Its Effect on Flame
Retardancy, Thermal, and Mechanical Properties of Thermosetting Resins. Mater. Today Commun. 2019, 19, 186–195. [CrossRef]29. Liu, Y.-L.; Wu, C.-S.; Chiu, Y.-S.; Ho, W.-H. Preparation, Thermal Properties, and Flame Retardance of Epoxy-Silica Hybrid Resins.
J. Polym. Sci. Part A Polym. Chem. 2003, 41, 2354–2367. [CrossRef]30. Gu, H.; Guo, J.; He, Q.; Tadakamalla, S.; Zhang, X.; Yan, X.; Huang, Y.; Colorado, H.A.; Wei, S.; Guo, Z. Flame-Retardant Epoxy Resin
Nanocomposites Reinforced with Polyaniline-Stabilized Silica Nanoparticles. Ind. Eng. Chem. Res. 2013, 52, 7718–7728. [CrossRef]31. Zhang, C.; Wang, J.; Song, S. Preparation of a Novel Type of Flame Retardant Diatomite and Its Application in Silicone Rubber
Composites. Adv. Powder Technol. 2019, 30, 1567–1575. [CrossRef]
Sustain. Chem. 2021, 2 47
32. Bulut, U.; Crivello, J.V. Investigation of the Reactivity of Epoxide Monomers in Photoinitiated Cationic Polymerization. Macro-molecules 2005, 38, 3584–3595. [CrossRef]
33. Goethals, E.; Duprez, F. Carbocationic Polymerizations. Prog. Polym. Sci. 2007, 32, 220–246. [CrossRef]34. Washburn, E.W. The Dynamics of Capillary Flow. Phys. Rev. 1921, 17, 273–283. [CrossRef]35. Lowell, S.; Shields, J.E.; Thomas, M.A.; Thommes, M. Characterization of Porous Solids and Powders: Surface Area, Pore Size and
Density; Particle Technology Series; Springer: Dordrecht, The Netherlands, 2004; Volume 16, ISBN 978-90-481-6633-6.36. De Anda, A.R.; Fillot, L.A.; Rossi, S.; Long, D.; Sotta, P. Influence of the Sorption of Polar and Non-Polar Solvents on the Glass
Transition Temperature of Polyamide 6,6 Amorphous Phase. Polym. Eng. Sci. 2011, 51, 2129–2135. [CrossRef]37. Rios De Anda, A.; Fillot, L.A.; Preda, F.M.; Rossi, S.; Long, D.R.; Sotta, P. Sorption and Plasticization Effects of Ethanol–Toluene–
Isooctane Ternary Mixtures in Polyamide 6,6 and Induced Plasticization Effects. Eur. Polym. J. 2014, 55, 199–209. [CrossRef]38. Rios de Anda, A.; Fillot, L.-A.; Long, D.R.; Sotta, P. Influence of the Amorphous Phase Molecular Mobility on Impact and Tensile
Properties of Polyamide 6,6. J. Appl. Polym. Sci. 2016, 133, 9. [CrossRef]39. ASTM D790-03: Standard Test Methods for Flexural Properties of Unreinforced and Reinforced Plastics and Electrical Insulating Materials;
ASTM International: West Conshohocken, PA, USA, 2003.40. ISO 10534-2: Acoustics-Determination of Sound Absorption Coefficient and Impedance in Impedance Tubes. Part 2: Transfer-Function
Method; International Organization for Standardization: Geneva, Switzerland, 1998.41. Salissou, Y.; Panneton, R. Wideband Characterization of the Complex Wave Number and Characteristic Impedance of Sound
Absorbers. J. Acoust. Soc. Am. 2010, 128, 2868–2876. [CrossRef]42. ASTM C423: Standard Test Method for Sound Absorption and Sound Absorption Coefficients by the Reverberation Room Method; ASTM
International: West Conshohocken, PA, USA, 2002.43. Huggett, C. Estimation of Rate of Heat Release by Means of Oxygen Consumption Measurements. Fire Mater. 1980, 4, 61–65.
[CrossRef]44. Chaisena, A.; Rangsriwatananon, K. Effects of Thermal and Acid Treatments on Some Physico-Chemical Properties of Lampang
Diatomite. Suranaree J. Sci. Technol. 2004, 11, 289–299.45. Kulpe, J.A.; Lee, C.-Y.; Leamy, M.J. Computation of Acoustic Absorption in Media Composed of Packed Microtubes Exhibiting
Surface Irregularity. J. Acoust. Soc. Am. 2011, 130, 826–834. [CrossRef]46. Swift, M.J.; Bris, P.; Horoshenkov, K.V. Acoustic Absorption in Re-Cycled Rubber Granulate. Appl. Acoust. 1999, 57, 203–212.
[CrossRef]47. Bifulco, A.; Parida, D.; Salmeia, K.A.; Nazir, R.; Lehner, S.; Stämpfli, R.; Markus, H.; Malucelli, G.; Branda, F.; Gaan, S. Fire
and Mechanical Properties of DGEBA-Based Epoxy Resin Cured with a Cycloaliphatic Hardener: Combined Action of Silica,Melamine and DOPO-Derivative. Mater. Des. 2020, 193, 108862. [CrossRef]
48. Butler, S.; Fotsing, E.R.; Ross, A. Acoustic Thermoset Open-Cell Foams Produced by Particulate Leaching Process. J. Mater. Sci.2019, 54, 12553–12572. [CrossRef]
49. Ali, M.S.; Mohamed Ariff, A.H.; Jaafar, C.N.A.; Tahir, S.M.; Mazlan, N.; Maori, K.A.; Naser, H. Factors Affecting the Porosity andMechanical Properties of Porous Ceramic Composite Materials. In Reference Module in Materials Science and Materials Engineering;Elsevier: Amsterdam, The Netherlands, 2017; ISBN 978-0-12-803581-8.
50. Patel, P.S.; Shepherd, D.E.; Hukins, D.W. Compressive Properties of Commercially Available Polyurethane Foams as MechanicalModels for Osteoporotic Human Cancellous Bone. BMC Musculoskelet. Disord. 2008, 9. [CrossRef] [PubMed]
51. Yang, S.-Y. Advanced Polyimide Materials: Synthesis, Characterization, and Applications; Elsevier: Amsterdam, The Netherlands, 2018;ISBN 978-0-12-812641-7.
52. Sonnier, R.; Vahabi, H.; Ferry, L.; Lopez-Cuesta, J.-M. Pyrolysis-Combustion Flow Calorimetry: A Powerful Tool To Evaluate theFlame Retardancy of Polymers. In Fire and Polymers VI: New Advances in Flame Retardant Chemistry and Science; Morgan, A.B.,Wilkie, C.A., Nelson, G.L., Eds.; ACS Symposium Series; American Chemical Society: Washington, DC, USA, 2012; Volume 1118,pp. 361–390. ISBN 978-0-8412-2780-4.
53. ASTM D7309-20: Standard Test Method for Determining Flammability Characteristics of Plastics and Other Solid Materials UsingMicroscale Combustion Calorimetry; ASTM International: West Conshohocken, PA, USA, 2020.
54. Lyon, R.E.; Walters, R.N. A Microscale Combustion Calorimeter; Federal Aviation Administration, Office of Aviation Research:Washington, DC, USA, 2002.
55. Wu, H.; Sulkis, M.; Driver, J.; Saade-Castillo, A.; Thompson, A.; Koo, J.H. Multi-Functional ULTEMTM1010 Composite Filamentsfor Additive Manufacturing Using Fused Filament Fabrication (FFF). Addit. Manuf. 2018, 24, 298–306. [CrossRef]
56. Butnaru, I.; Bruma, M.; Gaan, S. Phosphine Oxide Based Polyimides: Structure–Property Relationships. RSC Adv. 2017, 7,50508–50518. [CrossRef]
57. Schartel, B.; Wilkie, C.A.; Camino, G. Recommendations on the Scientific Approach to Polymer Flame Retardancy: Part 1—Scientific Terms and Methods. J. Fire Sci. 2016, 34, 447–467. [CrossRef]
58. Nguyen, Q.-B.; Nguyen, V.-H.; Perrot, C.; Rios de Anda, A.; Renard, E.; Naili, S. Multiscale Approach to Characterize EffectiveMechanical, Hydraulic and Acoustic Properties of a New Bio-Based Porous Material. Mater. Today Commun. 2021, 26, 101938.[CrossRef]

Sustain. Chem. 2021, 2 48
59. Yorov, K.E.; Kottsov, S.Y.; Baranchikov, A.Е.; Boytsova, O.V.; Kiskin, M.A.; Varaksina, E.A.; Kopitsa, G.P.; Lermontov, S.A.; Sidorov,A.A.; Pipich, V.; et al. Photoluminescent Porous Aerogel Monoliths Containing ZnEu-Complex: The First Example of AerogelModified with a Heteronuclear Metal Complex. J. Sol Gel Sci. Technol. 2019. [CrossRef]
60. Brinker, C.J.; Scherer, G.W. Sol-Gel Science-The Physics and Chemistry of Sol-Gel Processing; Academic Press Inc.: Cambridge, MA,USA, 1990.
61. Al-Oweini, R.; El-Rassy, H. Synthesis and Characterization by FTIR Spectroscopy of Silica Aerogels Prepared Using SeveralSi(OR)4 and R′ ′Si(OR′)3 Precursors. J. Mol. Struct. 2009, 919, 140–145. [CrossRef]