Sludge recycling within cemented paste backfill: Study of the mechanical and leachability properties
Minerals Engineering 22 (2009) 772–785
Contents lists available at ScienceDirect
Minerals Engineering
journal homepage: www.elsevier .com/locate /mineng
Effect of curing under pressure on compressive strength developmentof cemented paste backfill
Erol Yilmaz a,b, Mostafa Benzaazoua a,b,*, Tikou Belem a,b, Bruno Bussière a
a Industrial NSERC-Polytechnique-UQAT Chair on Environment and Mine Waste Management, Université du Québec en Abitibi-Temiscamingue (UQAT),Department of Applied Sciences, 445 Boul. de l’Université, Rouyn-Noranda, Québec, Canada J9X 5E4b Canada Research Chair on Integrated Management of Sulphidic Mine Tailings Using Fill Technology, Université du Québec en Abitibi-Temiscamingue (UQAT),Department of Applied Sciences, 445 Boul. de l’Université, Rouyn-Noranda, Québec, Canada J9X 5E4
a r t i c l e i n f o
Article history:Received 3 October 2008Accepted 7 February 2009Available online 9 March 2009
Keywords:Mine tailingsPaste backfillConsolidationCuring stressCompressive strength
0892-6875/$ - see front matter � 2009 Elsevier Ltd. Adoi:10.1016/j.mineng.2009.02.002
* Corresponding author. Address: Industrial NSERon Environment and Mine Waste Management, UnivTemiscamingue (UQAT), Department of Applied ScienRouyn-Noranda, Québec, Canada J9X 5E4. Tel.: +1 819797 4727.
E-mail address: [email protected] (M.
a b s t r a c t
The mechanical performance of cemented paste backfill (CPB) placed in underground openings (e.g., minestopes) often differs from laboratory-predicted performance, even under the same atmospheric curingconditions (ambient temperature and relative humidity). This is probably due to the specific self-weightconsolidation, different drainage conditions and confinement pressures encountered in the paste back-filled stopes. A new test system named CUAPS (Curing Under Applied Pressure System) was designedat the Université du Québec en Abitibi-Témiscamingue (UQAT) to assess the hydro-mechanical perfor-mance of in situ CPB samples at laboratory scale. The CUAPS apparatus allows the effective curing ofCPB samples subjected to an assortment of vertical pressure applications (curing under stresses) thatcan mimic in situ placement and consolidation conditions. The compressive strength development ofCPB samples prepared from sulphide-rich mine tailings from Garpenberg polymetallic mine (Sweden)was investigated using CUAPS apparatus and conventional plastic moulds (unconsolidated undrainedsamples) in parallel. The effect of curing stress (i.e. simulating different consolidation conditions) onresultant geotechnical index parameters and hydromechanical properties of CPB samples was analyzed.The primary observation is the confirmation that the compressive strength development of the consoli-dated CPB samples is higher than that of unconsolidated undrained ones. It could be attributed to theremoval of excess pore water mainly due to the applied pressure during the effective curing process,which seems to improve consolidation process of the CPB material. The results also account for the dif-ferences in the CPB strength observed between laboratory samples and in situ samples. Thus, CUAPSwould be more suitable than conventional plastic moulds to collect data for preliminary and final designof CPB systems.
� 2009 Elsevier Ltd. All rights reserved.
1. Introduction
Cemented Paste Backfill (CPB) technology has become wellestablished in the Canadian hard rock mining industry over thepast three decades, and has been extensively used as an alterna-tive tailings management method for the safe disposal of the tail-ings produced during mineral processing operations (Landriaultand Lidkea, 1993; Brackebusch, 1994; Hassani and Archibald,1998). Basically, mine backfill consists of an efficient secondaryground support system for underground mine stopes that providea secure working environment for mine operators. As a substitute
ll rights reserved.
C-Polytechnique-UQAT Chairersité du Québec en Abitibi-ces, 445 Boul. de l’Université,762 0971x2404; fax: +1 819
Benzaazoua).
for all other types of underground mine backfill (e.g., hydraulic filland rock fill), CPB offers a variety of advantages from the opera-tional, financial, and environmental perspectives (Hassani andArchibald, 1998; Bussière, 2007). Given the strict environmentalregulations and increasing public awareness, CPB allows a safeunderground disposal of potentially detrimental wastes such assulphide-rich tailings, consequently limiting the well knownproblem of acid mine drainage (Aubertin et al., 2002; Yilmazet al., 2004). Accordingly, the vast majority of underground minesworldwide contemplate using CPB as a proven, cost-effective, andhigh-quality backfill system (Cayouette, 2003; Belem and Benzaa-zoua, 2007).
Paste backfill is a relatively complex material consisting of amixture of dewatered mill tailings (75–85 wt% solids, dependingon mineralogy and specific gravity), binding agent to meet thebackfill stability requirements, and sufficient water to reach thedesired consistency for transporting the paste to the mine back-filled stope (Amaratunga and Yaschyshyn, 1997; Benzaazoua

E. Yilmaz et al. / Minerals Engineering 22 (2009) 772–785 773
et al., 1999). Even if the understanding of backfill behaviour hasimproved, CPB still continues to attract a great deal of attention,as testified by a number of works authored by mining practitio-ners, consultants, academics, and researchers (e.g. Belem et al.,2000; Benzaazoua et al., 2002, 2004; Yilmaz, 2003; Kesimalet al., 2003, 2004; Godbout, 2005; Fall et al., 2005; Rankine andSivakugan, 2007; Ouellet, 2007). However, some aspects of CPBmaterials need to be further investigated such as the effects ofplacement (i.e. behaviour under self-weight or time-dependantconsolidation) and the evolution of geotechnical properties withcuring.
Nonetheless, numerous investigations indicated that well-drained backfilled stope conditions generate better mechanicalstrength development and long-term stability than poorly drainedones (Belem et al., 2002; Helinski et al., 2007a,b). Furthermore,compared to field data, laboratory studies using conventionalplastic (non-perforated) mould, which is typically used to deter-mine mine backfill design values, tend to underestimate themechanical strength of a given CPB mixture over the same curingperiod (Cayouette, 2003; Revell, 2004; Le Roux et al., 2005; Belemet al., 2006; Grabinsky and Bawden, 2007). This phenomenoncould be attributed to the settling and hardening processes occur-ring within the CPB material and the removal of its excess porewater. After placement of the mine backfill material in the stope,the self-weight consolidation controls these phenomena (Belemet al., 2006). Binder hydration can also notably influence porewater pressure (PWP) and the development of effective stresswithin the CPB through early age chemical shrinkage (Helinskiet al., 2006, 2007a,b; Grabinsky and Simms, 2006; Simms et al.,2007). Helinski et al. (2006) and Grabinsky and Simms (2006) ob-served experimentally that as the PWP dissipates the effectivestress increases and the total vertical stress in the stopes de-creases. Consequently, the reduction of PWP gives rise to a reduc-tion in horizontal total stresses and barricade loads. In mostcases, these underground conditions are neglected in backfillstudies except for a few investigations (Le Roux et al., 2005; Gra-binsky and Simms, 2006; Belem et al., 2006, 2007; Helinski et al.,2006, 2007a,b; Fourie et al., 2007; Grabinsky and Bawden, 2007),apparently as a result of difficulties with appropriate laboratoryequipments and test procedures in order to examine the im-proved behaviour of CPB materials subjected to the differentplacement techniques.
A small number of investigations are reported in the literatureon the consolidation characteristics of CPB materials (Mitchelland Smith, 1981; Bussière, 1993; Belem et al., 2006, 2007; Yilmazet al., 2006, 2008a,b,c). Overall, the literature focuses mainly onodometer tests (Pierce et al., 1998; Le Roux et al., 2005; Grabin-sky and Bawden, 2007) in order to determine the consolidationparameters. Also, the one-dimensional consolidation tests areperformed using modified triaxial cells (Mitchell and Smith,1981) or triaxial cells (Grabinsky and Simms, 2006; Helinskiet al., 2006). Due to the fact that triaxial cells do not give flexibleworking conditions, an affordable and efficient experimental set-up that allows understanding of in situ curing conditions (control-ling curing stress) of CPB materials was developed and namedCUAPS (Curing Under Applied Pressure System; Benzaazouaet al., 2006).
The originality of this paper consists in the evaluation of the ef-fect of pressure application (during curing) on the properties ofCPB, using the CUAPS apparatus. The main parameters investigatedduring the tests are geotechnical index parameters and the uniax-ial compressive strength for both standard moulds and CUAPSsamples. The quality of drainage water is also presented to betterunderstand the geotechnical results observed. Several mix recipes(different binder types and proportions) are tested using Garpen-berg polymetallic Mine tailings (Sweden).
2. Materials and methods
2.1. CUAPS apparatus
The experimental setup used to simulate backfill consolidationtests is the CUAPS (Curing Under Applied Pressure System) appara-tus which was developed to mimic in situ placement and effectivecuring conditions at laboratory scale (Benzaazoua et al., 2006). Thisapparatus was inspired from a previous consolidation setup used byBelem et al. (2002). CUAPS apparatus can be used to assess the ac-tual strength performance of the CPB materials under loading byapplying pneumatic pressure (up to 500 kPa) to the upper portionof the sample. The operating principle of the CUAPS apparatus con-sists of one-dimensional compression of CPB sample in a pressurevessel (Perspex cylinder) by vertical pressure (curing stress) appli-cation. The applied pressure allows the excess pore water to escapefrom the CPB material through a drainage port located at the bot-tom of the unit. During the consolidation, drainage water is col-lected and the drainage rate can be calculated. This equipment issimple to operate, readily portable, and relatively affordable.
Fig. 1a presents a schematic illustration of the CUAPS apparatusand a photograph is shown in Fig. 1b. Specifically designed for lab-oratory scale tests, it can capture time-dependent sensitivity of theevolution of CPB materials in a variety of consolidation loadingschemes and drainage conditions. CUAPS consists of three maincomponents (Benzaazoua et al., 2006): a rigid top plate with an ax-ial loading piston that applies a pneumatic pressure and equippedwith a dial gauge and pressure valve; a rigid Perspex mould (i.e.transparent polycarbonate round tube) protected by a metal cylin-der to hold backfill specimen; and a bottom plate with a centralport equipped with a ceramic plate and drainage port to drainthe CPB sample excessive pore water. It was proven that underthe range of applied pressure (0–500 kPa) the Perspex mould radialdeformation is less than 1%. This allows simulating the at-rest con-dition (K0 consolidation), which is the most realistic conditions forin situ CPB. Perspex cylinders of 101.6 mm (4 in.) diameter and203.2 mm (8 in.) height are used as backfill specimen holders. Oncethe CUAPS apparatus is filled with the paste material, the loadingpiston is installed at the top and a small bottle is plugged to thedrainage port at the bottom to collect drainage water at a constanttime interval. The chemical composition of drainage water canthen be analyzed.
2.2. Materials characterization
The tailings sample used for CPB preparation is coarse-grainedtailings from the Garpenberg Mine (Stockholm, Sweden), one ofthe world’s largest zinc mines. Approximately 1.1 million tonnes(Mt) of ore are mined yearly, resulting in a production of approxi-mately 0.6 Mt of sulphidic tailings per year; nearly 45% of the totalmine tailings are returned underground as CPB (Lindqvist et al.,2006).
The physical properties (grain size distribution, solids specificgravity, and specific surface area), chemical and mineralogicalanalyses of the tailings were determined. The average initial watercontent of the tailings was 15.2 wt% and was used to set pasteproperties such as solids content and slump, in accordance withASTM D2216 standard. Mixing water was analyzed for chemicalcomposition (ICP-AES), and for pH.
2.2.1. Grain size distributionGrain size distribution (GSD) of tailings is an important prop-
erty since it can affect the resultant paste consistency, chemicalreactivity, and the overall hydromechanical properties. The GSDcurves of tailings samples were determined using a Malvern Laser

Fig. 1. CUAPS (curing under applied pressure system) apparatus developed for CPB consolidation and drainage tests (Benzaazoua et al., 2006).
774 E. Yilmaz et al. / Minerals Engineering 22 (2009) 772–785
Mastersizer S 2000� where particles between 0.05 lm and 880 lmcan be measured with an accuracy of ±1%, according to both ASTMD421 and ASTM D422 standards. Fig. 2 presents the GSD curves ofthe Garpenberg tailings, comparing to a typical range of GSDcurves of 11 mine tailings sampled from the underground mineslocated in the province of Quebec and Ontario, Canada (Ouellet,2007). The D85 (particle size at 85% passing) of tailings was0.16 mm, with a highest particle size of 0.88 mm. Based on the uni-fied soil classification system, the tailings can be classified as anon-plastic silt, like most of the tailings produced in hard rockmines (Bussière, 2007). The amount of particles finer than 20 lm(fine fraction) was 20.6 wt%, indicating a good ability to retain suf-ficient water to form a paste. According to Landriault (2001), thestudied mine tailings may be classified as coarse-grained. TheGarpenberg Mine tailings have Cu and Cc values of 13.4 and 2.1,
0
10
20
30
40
50
60
70
80
90
100
0.01 0.1 1 10 100 1000
Grain size (µm)
Cum
ulat
ive
volu
me
(%)
0
1
2
3
4
5
6
7
Incr
emen
tal v
olum
e (%
)
CumulativeHistogram
Clay (less than 2 µm) Silt (2 – 50 µm) Sand (50 − 2000 µm)
0
10
20
30
40
50
60
70
80
90
100
0.01 0.1 1 10 100 1000
Grain size (µm)
Cum
ulat
ive
volu
me
(%)
0
1
2
3
4
5
6
7
Incr
emen
tal v
olum
e (%
)
CumulativeHistogram
Clay (less than 2 µm) Silt (2 – 50 µm) Sand (50 − 2000 µm)
Typical range of paste backfill in Canadian mines
Typical range of paste backfill in Canadian mines
Fig. 2. Grain size distribution curves of the Garpenberg mine tailings, compared toa typical range of GSD curves of 11 mine tailings sampled from Canadian hard rockmines.
respectively, and can be categorized as a well-graded material, fol-lowing the standard criteria (e.g. Hassani and Archibald, 1998;McCarthy, 2007).
2.2.2. Solids specific gravity and specific surface areaThe specific gravity of tailing solids Gs-t is important for the mix
proportioning and geotechnical index parameters calculation. Spe-cific gravity (Gs-t) of the tested tailings was determined to be 2.96,using a Micromeritics� AccuPyc 1330 helium pycnometry in accor-dance to ASTM C128 standard. Specific surface area by mass (SSA)is a good indicator of material fineness. As particle size becomessmaller, specific surface area per unit mass or weight of solids in-creases, and so paste consistency increases. The most common ap-proach to obtain the SSA value is the isothermal adsorption ofnitrogen, using either a single point or multipoint calculationmethod. In this study, the BET (Brunauer, Emmett, and Teller)theory of multilayer gas adsorption behaviour by means of multi-point calculation was used to evaluate the SSA value of the tailings,using a Micromeritics� Gemini surface analyzer, which was1032.3 m2/kg.
2.2.3. Chemical composition of tailings sample and mixing waterThe sulphide content of mine tailings is of prime importance in
the CPB operation, since it controls tailings specific gravity andtherefore the binder content by weight to be added per unit vol-ume, along with the short- and long-term strength durability ofthe CPB materials (Kesimal et al., 2005; Klein and Simon, 2006).The elemental analysis of the Garpenberg Mine tailings was donefrom digested samples using a Perkin–Elmer Inductively CoupledPlasma – Atomic Emission Spectroscopy (Optima 3100 RL ICP-AES). As shown in Table 1, the tailings sample contained largelysilica (32.7 wt%) and, to a lesser extent, magnesium (2.62 wt%),calcium (3.55 wt%), aluminium (2.59 wt%), and iron (6.91 wt%),with a relatively low total sulphur content (4.69 wt%). Table 2 pre-sents the chemical analysis of the tailings interstitial water (de-rived from the Garpenberg tailings slurries) by means of ICP-AES.Tailings water contains some metal species (e.g. 0.016 mg/L of Al,5.18 mg/L of Mg, 0.056 mg/L of Cu and 0.116 mg/L of Zn) and

Table 1Chemical composition of the Garpenberg Mine tailings.
Element Grade (%) Element Grade (%)
Al 2.590 Fe 6.910As 0.018 Mg 2.620B 0.020 Mn 0.697Ba 0.041 Na 0.656Ca 3.550 Pb 0.191Cd 0.001 S 4.690Co 0.001 Se 0.144Cr 0.004 Si 32.7Cu 0.009 Zn 0.210
Table 2Tailings pore-water chemical analysis.
Element Content (mg/L) Element Content (mg/L)
S 1450 Na 94.3As 0.143 Ca 805Ba 0.033 Mg 5.180Bi ��� Al 0.016Mn 0.339 Fe ���Cd ��� Si 6.330Co ��� Cr ���Se 0.118 Cu 0.056Mo 0.009 Pb ���SO2�
4a 4344 Ni 0.010
Ti 0.003 Zn 0.116
��� = The ICP-AES detection limit.a Total sulphur was assumed expressed exclusively as SO2�
4 .
Table 4Characteristics of Portland cement and slag used in the mixtures.
Property Portlandcement, PCI
Blastfurnace slag
Slag blend binder PCI–Slag(20–80 wt%)
Al2O3 (%) 4.82 10.28 8.39B2O3 (%) 0.03 0.48 0.33BaO (%) 0.01 0.09 0.08CaO (%) 60.59 31.34 42.82
E. Yilmaz et al. / Minerals Engineering 22 (2009) 772–785 775
relatively high sulphate concentration (i.e. 4344 mg/L, based on astochiometric conversion assuming all sulphur ions in the sulphateform), signifying an expected aggressiveness towards cementdurability according to DIN 4030 standard. The water also containsa relatively high level of calcium (805 mg/L), presumably due tothe addition of lime for pH control during mineral processing. AnOrion Model 920A pH meter equipped with a Thermo Orion Triodecombination electrode (Orion Inc., Boston, MA) was used for pHmeasurements. The pH value for the mixing water was 7.88.
2.2.4. Mineralogical composition of tailings sampleInformation on the mineralogy of the tailings was obtained
from X-ray diffraction (XRD) analysis, using a Bruker AXS D8 Ad-vance diffractometer equipped with a Cobalt anticathode. Data col-lection was performed at angle 2h varying from 5� to 70� with astep width of 0.005� and a counting time of 0.5 s per step. The dif-fractograms used to quantify the detectable mineral phases of thetailings specimen (using EVA identification software) were evalu-ated by Rietveld fitting method using TOPAS software (Rietveld,1993). The analysis results are listed in Table 3. The mineralogicalcomposition reveals that the Garpenberg tailings sample was dom-inated by quartz (62.35 wt%). Minor quantities of alumino-silicateminerals including actinolite (12.29 wt%), anorthite (8.41 wt%),muscovite (6.7 wt%) and chlorite (3.17 wt%) were detected as wellas small amount of sulphides (mainly pyrite; 7.09 wt%). The
Table 3Mineralogical composition of the Garpenberg Mine tailings.
Element Grade (wt%)
Quartz 62.35Actinolite 12.29Anorthite 8.41Muscovite 6.70Chlorite 3.17Pyrite 7.09
amount and type of sulphides within the tailings may affect boththe short- and long-term strength development of CPB samplesand the selection of binder type, considering the water retentionpotential of the phyllosilicates and the sulphate generationpotential of the iron sulphides (Benzaazoua et al., 2002; Fall andBenzaazoua, 2005).
2.2.5. Binder characterizationThe primary binder used for the present study was ordinary
Portland cement (PCI) supplied by St-Laurent Cement. Mineraladditive such as blast furnace slag, supplied by Lafarge Cement,was also used for blending with PCI as a binding agent to hardenCPB samples. Two mixtures of binder were used: ordinary Portlandcement (PCI) and Slag blend binder (PCI–Slag). The blending ratio is20:80 of PCI and Slag. The binder content (Bw%) used ranges from 3wt% to 10 wt%, representing the lower and upper limits encoun-tered in mining applications. Table 4 presents the chemical compo-sition of Portland cement (PCI) and Slag binders (by ICP-AESanalysis), and some physical properties. The Portland cement(PCI) shows a typical chemistry for this type of cement, and the cal-culated Bogue’s composition is 64.4% for C3S, 6.6% for C2S, 8.7% forC3A and 7.4% for C4AF. The hydraulic index ([SiO2 + Al2O3]/[CaO + MgO]) values for the Portland cement and Slag binders arecalculated as 0.38 and 1.09, respectively. Blast furnace slag con-forms to Taylor’s (1990) recommendation to prevent sulphate at-tack with the use of a binder containing an Al2O3 percentagelower than 11%. In addition, PCI must contain a maximum MgO va-lue of 5%. Slag has the highest BET specific surface area (SSA) with avalue of 3540 m2/kg, compared to PCI with a SSA value of 1580 m2/kg. PCI and Slag binders have specific gravities of 3.08 and 2.89,respectively.
2.3. Experimental procedures
2.3.1. Mixing, casting, and curing of paste backfillA total of 60 CPB cylinders having a diameter of 101.6 mm
(4 in.) and a height of 203.2 mm (8 in.) were prepared with differ-ent binder contents (3 wt%, 5 wt%, 7 wt% and 10 wt%). The tailings,binder, and water were mixed during about 7 min in a conven-tional concrete mixer. The targeted slump value was 178 mm(7 in.), and the slump test was conducted following the ASTMC143 standard. Water-to-cement (w/c) ratio and volumetric solidsconcentration Cv obtained from each CPB are listed in Table 5. Forthe range of binder contents used, the Cv value varies between 50.8and 52.3%v/v for PCI binder, and between 50.2 and 52.8%v/v for
Fe2O3 (%) 2.42 0.51 0.64K2O (%) 0.81 0.48 0.55MgO (%) 2.19 11.18 6.19MnO (%) 0.04 0.37 0.25Na2O (%) 2.10 2.01 2.03SO3 (%) 3.92 3.20 3.35SiO2 (%) 19.25 36.37 30.91TiO2 (%) 0.26 0.61 0.56Loss on ignition (%) 2.97 2.83 2.96Hydraulic index 0.38 1.09 0.80Specific gravity Gs 3.08 2.89 2.93Specific surface BET
(m2/kg)1580 3540 2850

Table 5Constant slump paste mixture properties (178 mm slump).
Mixturenumber
Bindertype
Blending BindercontentBw (%)
Volumetricbindercontent Bv
(%)
Volumetricsolidscontent Cv
(%)
Water-to-cementratio (w/c)
#1 PCI 1 3 3.54 50.8 11.38#2 PCI 1 5 5.90 50.7 6.99#3 PCI 1 7 8.26 53.5 4.54#4 PCI 1 10 11.79 52.3 3.42#5 PCI–
Slag1–4 3 3.85 50.2 11.64
#6 PCI–Slag
1–4 5 6.41 49.9 7.21
#7 PCI–Slag
1–4 7 8.98 50.7 5.07
#8 PCI–Slag
1–4 10 12.83 52.8 3.34
776 E. Yilmaz et al. / Minerals Engineering 22 (2009) 772–785
Slag blend binder (PCI–Slag). The corresponding w/c ratios were11.4–3.4, and 11.6–3.3 for PCI and PCI–Slag binder types, respec-tively. The prepared pastes were poured into both conventionalplastic and CUAPS Perspex moulds. CPB samples were then sealedand stored in a humidity chamber maintained at �80% relativehumidity and 24 �C ± 2 in order to mimic curing conditions sus-tained in the underground mines. Fig. 3 shows the CUAPS consoli-dation test preparation steps, from backfill casting to test runningin the humidity chamber.
Fig. 3. Photos illustrating CPB preparation steps: (a) filling Perspex cylinders with backfiequipped with pneumatic pressure application system; and (d) CUAPS cells running tes
2.3.2. CUAPS reproducibility testsA series of uniaxial compression tests were first performed on
CPB samples in order to verify the CUAPS apparatus reproducibilityfrom one setup to another. For that purpose, the PCI–Slag bindertype was used at a binder content of 7 wt%. Ten CUAPS cells wereused to obtain ten CPB cylinders. After 14 days of curing, the back-fill cylinders were subjected to uniaxial compression tests. Fig. 4presents the UCS variability of CPB samples, taking into accountthe effect of the ambient air curing. The first five CUAPS cells werecured inside the controlled humidity chamber (condition 1) whilethe remaining 5 CUAPS cells were cured outside of the humiditychamber (condition 2). From these test results submitted to twodifferent curing environments, it was inferred that there was nosignificant UCS difference between ‘‘inside” samples and ‘‘outside”samples, the CPB moulds being well sealed. Moreover, a mean UCSvalue l of 3167 kPa and a standard deviation r of 376.8 kPa wereobserved. Calculated coefficient of variation CV (=r/l) is approxi-mately 12%. This relatively low CV value confirmed that CUAPScells give reliable and repeatable results.
2.3.3. Pressure application schemeAfter validating CUAPS cells, two final constant pressures were
chosen for two sequential stope filling scenarios: pv = 250 kPa forscenario A and pv = 375 kPa for scenario B. Table 6 and Fig. 5a pres-ent the pressure application scenarios during experiments simulat-ing an underground stope sequential backfilling over four days. Theapplied vertical pressure (pv) generated during stope filling and
ll material; (b) Mould with supporting cover and PVC loading piston; (c) upper platets in a controlled humidity chamber.

0
500
1000
1500
2000
2500
3000
3500
4000
UC
S va
riabi
lity
(kPa
)
Mean value = 3147 kPa95% confidence limits
Condition 1 Condition 20
500
1000
1500
2000
2500
3000
3500
4000
1 2 3 4 5 6 7 8 9 11 2 3 4 5 6 7 8 9 10
Sample/CUAPS cell number
Mean value = 3147 kPa95% confidence limits
Mean value = 3147 kPa95% confidence limits
Mean value = 3147 kPa95% confidence limits
Condition 1 Condition 2
Fig. 4. The consolidated CPB samples UCS variability over ten test samples/CUAPScells. The first five CUAPS cells were cured inside of the controlled humiditychamber (condition 1) while the remaining 5 CUAPS cells were cured outside of thehumidity chamber (condition 2).
0
50
100
150
200
250
300
350
400
0 4 8 12 16 20 24 28Elapsed time (days)
Appl
ied
vert
ical
pre
ssur
e (k
Pa)
02468
101214161820
0 4 8 12 16 20 24 28
Elapsed time (days)
Equi
vale
ntba
ckfil
l hei
ght (
m)
Total backfilled height: 30m
Scenario A
Scenario BAB30
m 19 m 12.7
m
Scenario A
Scenario BAB30
m 19 m 12.7
m
0
50
100
150
200
250
300
350
400
App
lied
vert
ical
pre
ssur
e (k
Pa)
a
02468
101214161820
Equi
vale
ntba
ckfil
l hei
ght (
m)
b
Total backfilled height: 30m
Scenario A
Scenario BAB30
m 19 m 12.7
m Scenario A
Scenario B
Scenario A
Scenario BAB30
m 19 m 12.7
m
AB30
m 19 m 12.7
m
Scenario A
Scenario BAB30
m 19 m 12.7
m Scenario A
Scenario B
Scenario A
Scenario BAB30
m 19 m 12.7
m
AB30
m 19 m 12.7
m
Fig. 5. Comparison of the two simulated scenarios: (a) vertical pressure applicationscheme and (b) corresponding equivalent CPB height of surcharge.
E. Yilmaz et al. / Minerals Engineering 22 (2009) 772–785 777
corresponding equivalent backfill height h (where h = pv/c) are alsogiven (see Fig. 5b). Notice that equivalent backfill height dependson the CPB bulk unit weight c which was taken to be 19.63 kN/m3 (in this case, arching effect was not taken into account, onlyat-rest condition with K0 consolidation). It should be stated thatduring the first 24 h after the sample placement, no vertical pres-sure was applied. Then, pressure was incrementally increased upto final pressure of 250 kPa (scenario A) and 375 kPa (scenario B)at an average compression rate of 2.6 kPa/h (filling rate of0.133 m/h) for scenario A and 3.9 kPa/h (filling rate of 0.199 m/h)for scenario B. These stresses correspond to an equivalent CPBoverburden pressure of about 12.7 m for 250 kPa (scenario A)and 19.1 m for 375 kPa (scenario B), respectively. Note that thepressure range applied in the tests was determined by the mineand the equivalent CPB heights were back-calculated from thepressure range.
2.3.4. Measurement of drainage waterThe volume of free water within the CPB material has a strong
influence on strength development. Although excess pore wateris necessary to transport paste underground in pipelines, it nega-tively affects the strength development of the CPB material. Excesspore water tends to bleed (if no drain present) or to drain throughthe backfill material upon the placement (Belem et al., 2006). Bleedand drainage waters will in turn reduce initial w/c ratio and even-tually the mechanical strength of the CPB (Benzaazoua et al., 2004;Grabinsky and Bawden, 2007). In order to increase the reliability
Table 6CUAPS pressure application scheme and scenarios simulating a stope fillingsequences and filling rate.
Elapsed time(day)
Appliedverticalpressure, pv
Equivalent height, h(m)
Equivalent filling rate(m/h)
(kPa) (psi)
Scenario A1 0 0 0 02 125 18 6.4 0.1333 200 29 10.2 0.1424 250 36 12.7 0.133
Scenario B1 0 0 0 02 187.5 27 9.6 0.1993 300 44 15.3 0.2124 375 54 19.1 0.199
and validity of test results, two different methods for drainagewater collection were followed. The first method consists of weigh-ing each CUAPS-consolidated CPB mould at the beginning and theend of testing. The second method, used in the present study, con-sists of measuring the volume of drained waters from consolidatedCPB samples at specific time intervals as a function of pressureapplication.
2.3.5. Uniaxial compression testsFor this laboratory investigation, only one curing time of
28 days was chosen arbitrarily. Following this curing time, CPB cyl-inders were subjected to uniaxial compression tests described inthe ASTM C39 standard for determining the unconfined compres-sive strength (UCS). After backfill cylinder faces rectification (bothsides were smoothed with a cutter), the length and weight of CPBsamples were first recorded and then were placed between the twoplates of a mechanical press for compression test. In this study, aservo/computer-controlled stiff testing machine (MTS SintechMaterial Testing Work-station, Sintech 10/GL load frame) with a50 kN loading capacity was used for compression tests. Each sam-ple was broken at a constant deformation rate of 1 mm/min. Theapplied loading to the CPB material was measured using a pressurecell having a full-scale precision of 1%. The UCS value correspondsto the maximum stress value (failure peak) reached during thecompression test.
3. Results and interpretation
3.1. Analysis of drainage water of consolidated CPB samples
Fig. 6 shows the variation of drainage water proportion with theelapsed time since the beginning of drainage for the consolidatedCPB samples prepared with 3 wt%, 5 wt%, 7 wt%, and 10 wt% of

0
2
4
6
8
10
12
0.1 1 10 100 1000 0.1 1 10 100 1000
0.1 1 10 100 10000.1 1 10 100 1000
0.1 1 10 100 1000
Time (hours)
0
2
4
6
8
10
12
0
2
4
6
8
10
12
0
2
4
6
8
10
12
0
2
4
6
8
10
12
PCI @ 3 wt%
PCI @ 5 wt%
PCI @ 7 wt%
PCI @ 10 wt%
no pressure
no pressure
no pressure
no pressure
no pressure
applying pressure
applying pressure
applyingpressure
applying pressure
applying pressure
Dra
ined
wat
er (
wt%
)
Time (hours)
Dra
ined
wat
er (w
t%)
Time (hours)
Dra
ined
wat
er (
wt%
)
Time (hours)
Dra
ined
wat
er (
wt%
)
Time (hours)
Dra
ined
wat
er (
wt%
)
Specimen 1
Specimen 2
Specimen 3
Specimen 1
Specimen 2
Specimen 3
Specimen 1
Specimen 2
Specimen 3
Specimen 1
Specimen 2
Specimen 3
PCI @ 3wt% PCI @ 5wt%
PCI @ 7wt% PCI @ 10wt%
0
2
4
6
8
10
12
0
2
4
6
8
10
12
0
2
4
6
8
10
12
0
2
4
6
8
10
12
0
2
4
6
8
10
12
PCI @ 3 wt%
PCI @ 5 wt%
PCI @ 7 wt%
PCI @ 10 wt%
no pressure
no pressure
no pressure
no pressure
no pressure
applying pressure
applying pressure
applyingpressure
applying pressure
applying pressure
Specimen 1
Specimen 2
Specimen 3
Specimen 1
Specimen 2
Specimen 3
Specimen 1
Specimen 2
Specimen 3
Specimen 1
Specimen 2
Specimen 3
PCI @ 3wt% PCI @ 5wt%
PCI @ 7wt% PCI @ 10wt%
a
c
e
d
b
Fig. 6. Variation of drainage water proportion with time elapsed from the beginning of drainage of CPB samples prepared with the PCI cement: (a) 3 wt% binder; (b) 5 wt%binder; (c) 7 wt% binder; (d) 10 wt% binder; and (e) mean results.
778 E. Yilmaz et al. / Minerals Engineering 22 (2009) 772–785
ordinary Portland cement (PCI) binder. During the first 24-h period(no applied pressure), CPB samples were allowed to settle underself-weight consolidation and curing conditions, and only a limitedamount of water (between 3.4 wt% and 5.4 wt% of total water) wasdrained from CPB samples.
After the initial period (no applied pressure), CPB samples werecured inside the CUAPS apparatus under incrementally appliedpressure from 125 kPa to a final confining pressure of 250 kPato simulate overburden backfill weight during a stope filling(Scenario A). When the final pressure of 250 kPa was applied toCPB samples during a 26-h curing period, a substantial increasein water drainage was observed, as shown in Fig. 6. Total drainagewater volume seems to depend on the binder proportion beingused within the CPB material. The volume of drainage water fromCPB samples prepared with 3 wt% binder (PCI) was 9.2 wt%(133 mL) compared with 3.9 wt% (51.2 mL) for those prepared with10 wt% of binder. This could be attributed to the higher amount ofwater required for hydration at 10 wt% binder. The water drainagepattern for the CPB materials prepared using PCI–Slag binder(Fig. 7) is not comparable with that of ordinary Portland cementalone. Indeed, over the first 24-h period (no applied pressure),water drainage is slightly higher than with PCI alone, presumably
due to low water consumption capacity of PCI–Slag binder com-pared with PCI. In this case, the average total volume of drainagewater from the CPB materials with PCI–Slag binder decreased from189.9 mL (12.2 wt%) to 116.5 mL (8.7 wt%) when binder contentwas increased from 3 to 10 wt%.
Figs. 6 and 7 illustrate that, for a given binder content (curingtime of 28 days), the amount of drainage water from CPB samplesprepared with PCI–Slag binder was approximately 1.5 times higherthan the amount drained from the ones prepared with PCI. Thiscould be attributed to the inherent hydration characteristics ofeach binder type, i.e. slower hydration process of Slag blend binderat early age curing time (up to 28 days) due to the pozzolanic ef-fect. Furthermore, grain size distribution of the Garpenberg Minetailings, categorized as coarse-grained tailings according to the finefraction content, appeared to largely contribute to the relativelyhigh amount of water drainage. The degree of water retentionwould be expected to depend on the hydration products formedwithin the CPB material at an early age depending on the type ofbinder used. Benzaazoua et al. (2004) has noticed that the drainageof excess pore water can positively contribute to binder hydration,and consequently a higher strength development in the CPBmaterial.

0
3
6
9
12
15
Dra
ined
wat
er (w
t%)
Time (hours)
no pressure
applying pressure
Specimen 1Specimen 2Specimen 3
0
3
6
9
12
15
Dra
ined
wat
er (w
t%)
Time (hours)
Specimen 1Specimen 2Specimen 3
no pressure
applying pressure
0
3
6
9
12
15
no pressure
applying pressure
Dra
ined
wat
er (w
t%)
Specimen 1Specimen 2Specimen 3
Time (hours) Time (hours)
0
3
6
9
12
15
PCI-Slag @ 3wt%PCI-Slag @ 5 wt%
PCI-Slag @ 7 wt%PCI-Slag @ 10 wt%
Dra
ined
wat
er (w
t%)
Time (hours)
no pressure
applying pressure
PCI-Slag @ 3wt% PCI-Slag @ 5wt%
PCI-Slag @ 7wt%
0
3
6
9
12
15
no pressure
applying pressure
Dra
ined
wat
er (w
t%)
Specimen 1Specimen 2Specimen 3
PCI-Slag @ 10wt%
0
3
6
9
12
15
Dra
ined
wat
er (w
t%)
Time (hours)
no pressure
applying pressure
Specimen 1Specimen 2Specimen 3
0
3
6
9
12
15
Dra
ined
wat
er (w
t%)
Time (hours)
Specimen 1Specimen 2Specimen 3
no pressure
applying pressure
0
3
6
9
12
15
no pressure
applying pressure
Dra
ined
wat
er (w
t%)
Specimen 1Specimen 2Specimen 3
Time (hours) Time (hours)
0
3
6
9
12
15
PCI-Slag @ 3wt%PCI-Slag @ 5 wt%
PCI-Slag @ 7 wt%PCI-Slag @ 10 wt%
Dra
ined
wat
er (w
t%)
Time (hours)
no pressure
applying pressure
PCI-Slag @ 3wt% PCI-Slag @ 5wt%
PCI-Slag @ 7wt%
0
3
6
9
12
15
no pressure
applying pressure
Dra
ined
wat
er (w
t%)
Specimen 1Specimen 2Specimen 3
PCI-Slag @ 10wt%
0.1 1 10 100 1000 0.1 1 10 100 1000
0.1 1 10 100 10000.1 1 10 100 1000
0.1 1 10 100 1000
a b
c d
e
Fig. 7. Variation of drainage water proportion with time elapsed from the beginning of drainage for CPB samples with a Slag blend binder PCI–Slag@20–80: (a) 3 wt% binder;(b) 5 wt% binder; (c) 7 wt% binder; (d) 10 wt% binder; and (e) mean values.
E. Yilmaz et al. / Minerals Engineering 22 (2009) 772–785 779
3.2. Analysis of geotechnical index parameters
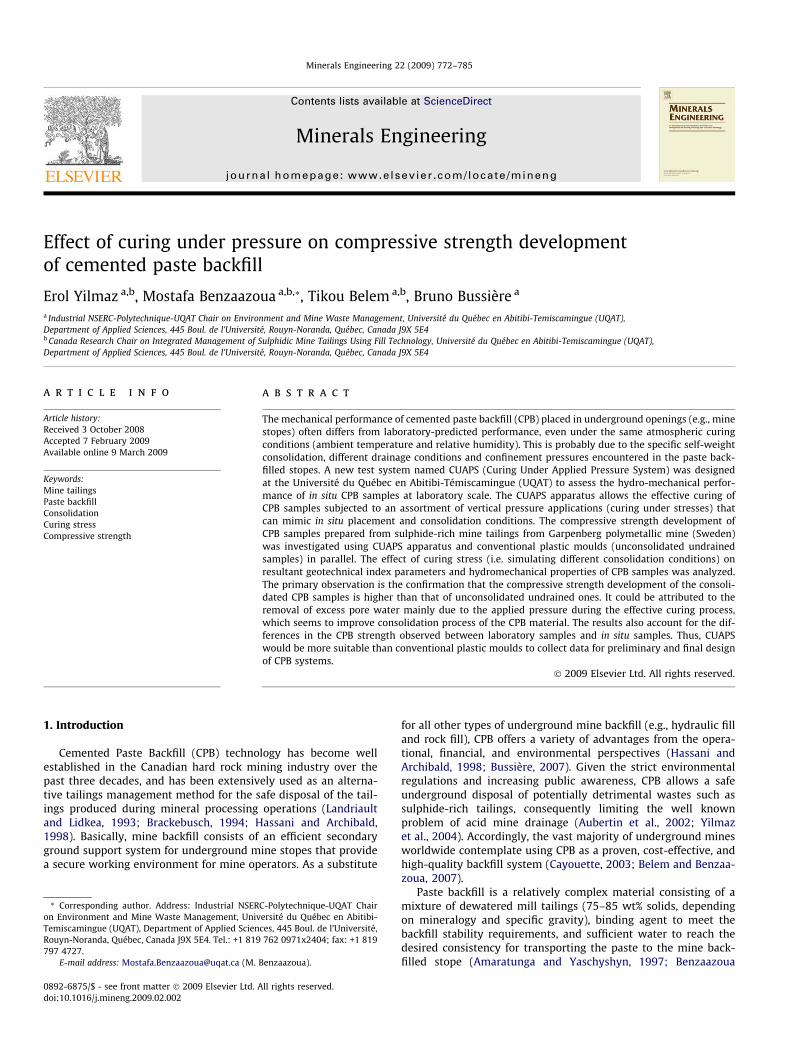
Table 7 presents the mechanical and geotechnical index param-eters (bulk properties) of the CUAPS-consolidated CPB samplesafter 28 days of curing. It can be observed that the porosity n anddegree of saturation Sr decreased with the increase in binder con-tent (3–10 wt%) while the modulus of deformation E and specificsurface area Sm increased with the increase of binder content forboth ordinary Portland cement (PCI) and Slag blend binder (PCI–Slag@20–80). There is a significant variation in degree of saturationSr (98–69%), porosity n (0.45–0.37), and specific surface area Sm
(3.975–14.775 m2/g). The final specific gravity Gs-bkf, water contentw and solid concentration Cw of the CPB material are influenced bythe applied pressure during curing, so it is generally expected thatthe water content of the paste will decrease (26–16%) with in-creased solids concentration (79.2–86.8) when binder content isincreased from 3 wt% to 10 wt%. However, there was marginalchange (2.895–2.806) of the Gs-bkf values of CPB at similar rangeof binder content. Also, n and Sm values are strongly influencedby the drainage ability of freshly produced CUAPS-consolidated
CPB samples. The compressive strength UCS of the CPB materialis remarkably consistent with water content. The highest bindercontent (10 wt%) of CPB samples exhibits the lowest water contentand degree of saturation, regardless of binder type. This observa-tion is readily explained by the different initial w/c ratios (see Table5) and amounts of water required for binder hydration. Also, spe-cific gravity of the CPB solids (Gs-bkf) slightly decreased with an in-crease in binder proportions within the mixture. It is well knownthat a high-quality CPB should have a high specific surface, lowporosity and degree of saturation.
Fig. 8 shows that there is a clear relationship between the bulkproperties and binder contents for both consolidated and uncon-solidated CPB samples in terms of specific surface, porosity, degreeof saturation, specific gravity, gravimetric water content, and voidratio versus degree of saturation. Overall, the backfill porosity (orvoid ratio) is strongly influenced by the drainage ability of earlyage CPB (up to 3–5 days). The consolidated backfills show lessporosity and smaller degree of saturation than unconsolidated un-drained ones for a given binder type (Fig. 8b and c). This is probablydue to the fact that the reduced pore size and population of CPB
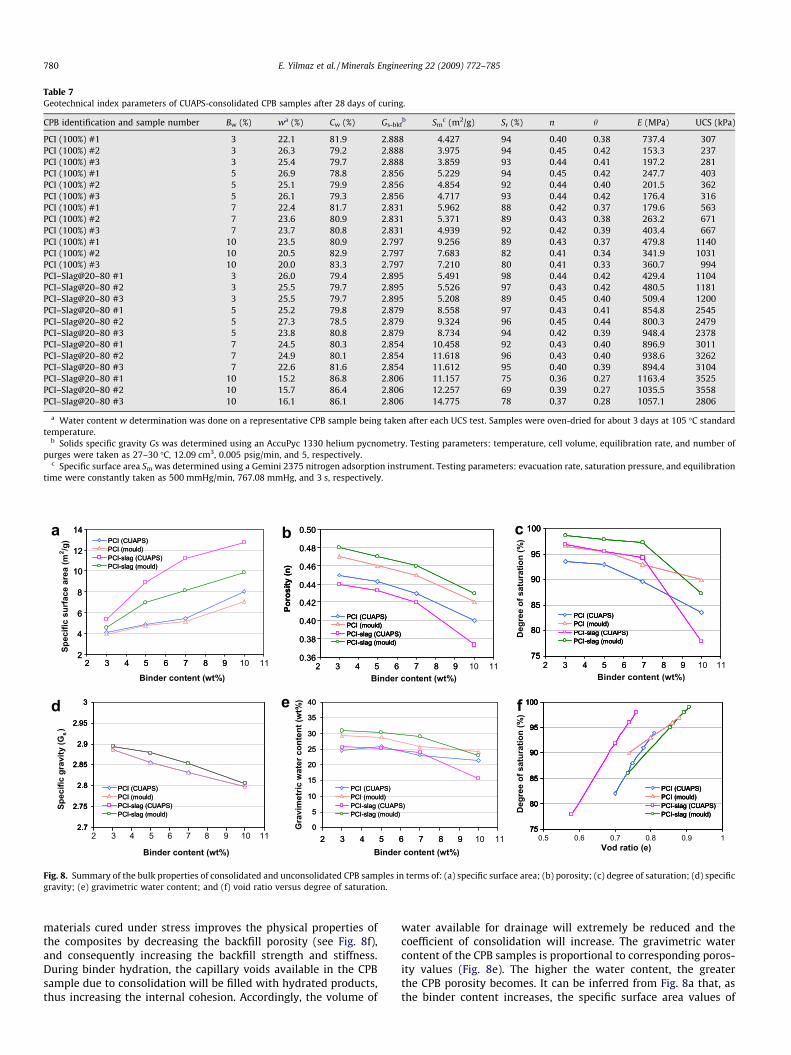
Table 7Geotechnical index parameters of CUAPS-consolidated CPB samples after 28 days of curing.
CPB identification and sample number Bw (%) wa (%) Cw (%) Gs-bkfb Sm
c (m2/g) Sr (%) n h E (MPa) UCS (kPa)
PCI (100%) #1 3 22.1 81.9 2.888 4.427 94 0.40 0.38 737.4 307PCI (100%) #2 3 26.3 79.2 2.888 3.975 94 0.45 0.42 153.3 237PCI (100%) #3 3 25.4 79.7 2.888 3.859 93 0.44 0.41 197.2 281PCI (100%) #1 5 26.9 78.8 2.856 5.229 94 0.45 0.42 247.7 403PCI (100%) #2 5 25.1 79.9 2.856 4.854 92 0.44 0.40 201.5 362PCI (100%) #3 5 26.1 79.3 2.856 4.717 93 0.44 0.42 176.4 316PCI (100%) #1 7 22.4 81.7 2.831 5.962 88 0.42 0.37 179.6 563PCI (100%) #2 7 23.6 80.9 2.831 5.371 89 0.43 0.38 263.2 671PCI (100%) #3 7 23.7 80.8 2.831 4.939 92 0.42 0.39 403.4 667PCI (100%) #1 10 23.5 80.9 2.797 9.256 89 0.43 0.37 479.8 1140PCI (100%) #2 10 20.5 82.9 2.797 7.683 82 0.41 0.34 341.9 1031PCI (100%) #3 10 20.0 83.3 2.797 7.210 80 0.41 0.33 360.7 994PCI–Slag@20–80 #1 3 26.0 79.4 2.895 5.491 98 0.44 0.42 429.4 1104PCI–Slag@20–80 #2 3 25.5 79.7 2.895 5.526 97 0.43 0.42 480.5 1181PCI–Slag@20–80 #3 3 25.5 79.7 2.895 5.208 89 0.45 0.40 509.4 1200PCI–Slag@20–80 #1 5 25.2 79.8 2.879 8.558 97 0.43 0.41 854.8 2545PCI–Slag@20–80 #2 5 27.3 78.5 2.879 9.324 96 0.45 0.44 800.3 2479PCI–Slag@20–80 #3 5 23.8 80.8 2.879 8.734 94 0.42 0.39 948.4 2378PCI–Slag@20–80 #1 7 24.5 80.3 2.854 10.458 92 0.43 0.40 896.9 3011PCI–Slag@20–80 #2 7 24.9 80.1 2.854 11.618 96 0.43 0.40 938.6 3262PCI–Slag@20–80 #3 7 22.6 81.6 2.854 11.612 95 0.40 0.39 894.4 3104PCI–Slag@20–80 #1 10 15.2 86.8 2.806 11.157 75 0.36 0.27 1163.4 3525PCI–Slag@20–80 #2 10 15.7 86.4 2.806 12.257 69 0.39 0.27 1035.5 3558PCI–Slag@20–80 #3 10 16.1 86.1 2.806 14.775 78 0.37 0.28 1057.1 2806
a Water content w determination was done on a representative CPB sample being taken after each UCS test. Samples were oven-dried for about 3 days at 105 �C standardtemperature.
b Solids specific gravity Gs was determined using an AccuPyc 1330 helium pycnometry. Testing parameters: temperature, cell volume, equilibration rate, and number ofpurges were taken as 27–30 �C, 12.09 cm3, 0.005 psig/min, and 5, respectively.
c Specific surface area Sm was determined using a Gemini 2375 nitrogen adsorption instrument. Testing parameters: evacuation rate, saturation pressure, and equilibrationtime were constantly taken as 500 mmHg/min, 767.08 mmHg, and 3 s, respectively.
2
4
6
8
10
12
14
2 3 4 5 6 7 8 9 10 11
Binder content (wt%)
Spec
ific
surf
ace
area
(m2 /g
)
2.7
2.75
2.8
2.85
2.9
2.95
3
Binder content (wt%)
Spec
ific
grav
ity (G
0
5
10
15
20
25
30
35
40
Binder content (wt%)
Gra
vim
etric
wat
er c
onte
nt (w
t%)
75
80
85
90
95
100
0.5 0.6 0.7 0.8 0.9 1Vod ratio (e)
Deg
ree
of s
atur
atio
n (%
)
0.36
0.38
0.40
0.42
0.44
0.46
0.48
0.50
Binder content (wt%)
Poro
sity
(n)
PCI (CUAPS)PCI (mould)PCI-slag (CUAPS)PCI-slag (mould)
PCI (CUAPS)PCI (mould)PCI-slag (CUAPS)PCI-slag (mould)
PCI (CUAPS)PCI (mould)PCI-slag (CUAPS)PCI-slag (mould)
PCI (CUAPS)PCI (mould)PCI-slag (CUAPS)PCI-slag (mould)
PCI (CUAPS)PCI (mould)PCI-slag (CUAPS)PCI-slag (mould)
PCI (CUAPS)PCI (mould)PCI-slag (CUAPS)PCI-slag (mould)
(a)
(d)
75
80
85
90
95
100
Binder content (wt%)
Deg
ree
of s
atur
atio
n (%
)
2
4
6
8
10
12
14
2 3 4 5 6 7 8 9 2 3 4 5 6 7 8 9 10 112 3 4 5 6 7 8 9 2 3 4 5 6 7 8 9 10 112 3 4 5 6 7 8 9
2 3 4 5 6 7 8 9 10 112 3 4 5 6 7 8 92 3 4 5 6 7 8 9 10 112.7
2.75
2.8
2.85
2.9
2.95
3
s
2.7
2.75
2.8
2.85
2.9
2.95
3
)
0
5
10
15
20
25
30
35
40
75
80
85
90
95
100
75
80
85
90
95
100
75
80
85
90
95
100
0.36
0.38
0.40
0.42
0.44
0.46
0.48
0.50
Poro
sity
(n)
PCI (CUAPS)PCI (mould)PCI-slag (CUAPS)PCI-slag (mould)
PCI (CUAPS)PCI (mould)PCI-slag (CUAPS)PCI-slag (mould)
PCI (CUAPS)PCI (mould)PCI-slag (CUAPS)PCI-slag (mould)
PCI (CUAPS)PCI (mould)PCI-slag (CUAPS)PCI-slag (mould)
PCI (CUAPS)PCI (mould)PCI-slag (CUAPS)PCI-slag (mould)
PCI (CUAPS)PCI (mould)PCI-slag (CUAPS)PCI-slag (mould)
PCI (CUAPS)PCI (mould)PCI-slag (CUAPS)PCI-slag (mould)
PCI (CUAPS)PCI (mould)PCI-slag (CUAPS)PCI-slag (mould)
PCI (CUAPS)PCI (mould)PCI-slag (CUAPS)PCI-slag (mould)
PCI (CUAPS)PCI (mould)PCI-slag (CUAPS)PCI-slag (mould)
PCI (CUAPS)PCI (mould)PCI-slag (CUAPS)PCI-slag (mould)
PCI (CUAPS)PCI (mould)PCI-slag (CUAPS)PCI-slag (mould)
75
80
85
90
95
100
75
80
85
90
95
100a b c
d e f
Fig. 8. Summary of the bulk properties of consolidated and unconsolidated CPB samples in terms of: (a) specific surface area; (b) porosity; (c) degree of saturation; (d) specificgravity; (e) gravimetric water content; and (f) void ratio versus degree of saturation.
780 E. Yilmaz et al. / Minerals Engineering 22 (2009) 772–785
materials cured under stress improves the physical properties ofthe composites by decreasing the backfill porosity (see Fig. 8f),and consequently increasing the backfill strength and stiffness.During binder hydration, the capillary voids available in the CPBsample due to consolidation will be filled with hydrated products,thus increasing the internal cohesion. Accordingly, the volume of
water available for drainage will extremely be reduced and thecoefficient of consolidation will increase. The gravimetric watercontent of the CPB samples is proportional to corresponding poros-ity values (Fig. 8e). The higher the water content, the greaterthe CPB porosity becomes. It can be inferred from Fig. 8a that, asthe binder content increases, the specific surface area values of

Table 8Geotechnical index parameters of mould unconsolidated CPB samples after 28 days of curing.
CPB identification and sample number Bw (%) wa (%) Cw (%) Gs-bkfb Sm
c (m2/g) Sr (%) n h E (MPa) UCS (kPa)
PCI (100%) #1 3 29.5 77.2 2.888 4.148 97 0.47 0.45 100.4 147PCI (100%) #2 3 29.2 77.4 2.888 3.932 97 0.47 0.45 52.2 187PCI (100%) #3 3 29.2 77.4 2.888 3.855 96 0.47 0.45 36.4 184PCI (100%) #1 5 28.9 77.6 2.856 4.849 95 0.47 0.44 129.6 256PCI (100%) #2 5 28.9 77.6 2.856 4.814 96 0.46 0.45 132.1 255PCI (100%) #3 5 29.2 77.4 2.856 4.452 96 0.47 0.46 116.1 275PCI (100%) #1 7 25.8 79.5 2.831 5.469 90 0.45 0.40 316.9 448PCI (100%) #2 7 25.3 79.8 2.831 5.348 92 0.44 0.40 303.4 467PCI (100%) #3 7 26.3 79.2 2.831 4.712 93 0.44 0.42 284.1 463PCI (100%) #1 10 24.1 80.6 2.797 7.390 91 0.43 0.38 449.1 920PCI (100%) #2 10 25.0 80.0 2.797 7.159 92 0.43 0.40 371.2 924PCI (100%) #3 10 23.2 81.2 2.797 6.624 90 0.42 0.38 376.1 863PCI–Slag@20–80 #1 3 31.1 76.3 2.895 4.889 99 0.48 0.47 220.1 549PCI–Slag@20–80 #2 3 30.5 76.6 2.895 4.844 98 0.47 0.47 268.2 555PCI–Slag@20–80 #3 3 31.1 76.3 2.895 3.988 99 0.48 0.47 286.8 594PCI–Slag@20–80 #1 5 30.6 76.6 2.879 7.403 98 0.47 0.47 655.9 1507PCI–Slag@20–80 #2 5 29.7 77.1 2.879 7.511 96 0.47 0.45 768.4 1487PCI–Slag@20–80 #3 5 30.3 76.7 2.879 6.983 98 0.47 0.46 556.4 1487PCI–Slag@20–80 #1 7 29.5 77.2 2.854 8.098 99 0.46 0.45 769.7 2131PCI–Slag@20–80 #2 7 28.9 77.6 2.854 7.697 96 0.46 0.45 798.4 2032PCI–Slag@20–80 #3 7 28.9 77.6 2.854 6.989 97 0.46 0.45 801.6 2129PCI–Slag@20–80 #1 10 22.1 81.9 2.806 9.854 86 0.42 0.36 948.7 3067PCI–Slag@20–80 #2 10 22.9 81.4 2.806 8.258 87 0.43 0.37 974.1 3026PCI–Slag@20–80 #3 10 23.8 80.8 2.806 7.007 89 0.43 0.38 944.1 3088
a Water content w determination was done on a representative CPB sample being taken after each UCS test. Samples were oven-dried for about 3 days at 105 �C standardtemperature.
b Solids specific gravity Gs was determined using an AccuPyc 1330 helium pycnometry. Testing parameters: temperature, cell volume, equilibration rate, and number ofpurges were taken as 27–30 �C, 12.09 cm3, 0.005 psig/min, and 5, respectively.
c Specific surface area Sm was determined using a Gemini 2375 nitrogen adsorption instrument. Testing parameters: evacuation rate, saturation pressure, and equilibrationtime were constantly taken as 500 mmHg/min, 767.08 mmHg, and 3 s, respectively.
0
200
400
600
800
1000
1200
Binder content (wt%)
Com
pres
sive
str
engt
h U
CS
(kPa
) C
ompr
essi
ve s
tren
gth
UC
S (k
Pa)
PCI (CUAPS)
PCI (Mould)
PCI @ 100%
Difference: 37.1%
27.3%
27.5%
14.5%
0
750
1500
2250
3000
3750
Binder content (wt%)
PCI-Slag (CUAPS)
PCI-Slag (Mould)
PCI-Slag @ 20%-80%Difference:
51.4%
39.5%
32.9%7.2%
b
a
200
400
600
800
1000
1200
0 2 4 6 8 10 10 12
0 2 4 6 80 10 12
PCI (CUAPS)
PCI (Mould)
PCI (CUAPS)
PCI (Mould)
PCI @ 100%
Difference: 37.1%
27.3%
27.5%
14.5%
0
750
1500
2250
3000
3750
PCI-Slag (CUAPS)
PCI-Slag (Mould)
PCI-Slag (CUAPS)
PCI-Slag (Mould)
PCI-Slag @ 20%-80%Difference:
51.4%
39.5%
32.9%7.2%
Fig. 9. Variation in UCS with binder content for all CPB samples prepared using fortwo binder types: (a) ordinary Portland cement (PCI@100%); (b) Slag blend binder(PCI–Slag@20–80%). Results shown are the average of three tests for each binderproportion and error bars represents standard error of the mean.
E. Yilmaz et al. / Minerals Engineering 22 (2009) 772–785 781
consolidated CPB samples are higher than those of unconsolidatedundrained ones because of the more efficient cement hydrationunder stress. This is also valid for the specific gravity measure-ments, but in the negative way (Fig. 8d). With increasing bindercontent, the specific gravity slightly reduces. This reduction is lesswith ordinary Portland cement than with Slag blend cement.
Similar observations are also made for the unconsolidated CPBsamples obtained using conventional plastic moulds (Table 8). Bycomparing Tables 7 and 8, it is observed that the porosity of con-solidated CPB samples were lower than those of the unconsoli-dated ones. It was also observed that the CPB prepared from thecoarse-grained tailings (Fig. 2) induced lower porosities. Therefore,less water was required to fill the relatively small amounts of voidsbetween particles, which in turn increased the solids concentra-tion. This phenomenon is greatly related to the lower w/c ratioand higher strength for a given binder content.
3.3. Effects of binder type and proportion on strength development
Fig. 9 illustrates the UCS differences observed between consol-idated samples and unconsolidated samples as a function of bindertype and content (for a fixed slump of 178 mm (7 in.) and curingtime of 28 days). As expected, the samples’ strength increases withthe increase of binder added to the mixture. For consolidated back-fills, ordinary Portland cement (PCI) produced lower mechanicalstrengths than the ones obtained from Slag blend binder (PCI–Slag)for the range of binder content 3–10 wt% after 28 days of curing.When compared to unconsolidated samples, the consolidatedCPB samples provided a compressive strength increase of 27.1%,27.3%, 27.5%, and 14.5% for PCI binder (Fig. 9a), and of 51.4%,39.5%, 32.9%, and 7.2% for PCI–Slag binder (Fig. 9b) for binder con-tent of 3 wt%, 5 wt%, 7 wt% and 10 wt%, respectively. The CPB com-pressive strength varies between 237 kPa and 1140 kPa for PCIbinder, and between 1104 kPa and 3558 kPa for PCI–Slag binder.Overall, Slag blend binder produces higher UCS values than the
PCI binder due to its chemistry (hydraulic index, Table 4) whichgreatly affects the cement hydration process. PCI is vulnerable to

782 E. Yilmaz et al. / Minerals Engineering 22 (2009) 772–785
sulphate attack although it is a commonly used binder. However,Slag (used as partial replacement of PCI up to 80%) blend binderis known to develop better cohesion in the CPB matrix (poresrefinement), but exhibits slow hydration rate at an early age beforeattaining higher compressive strength for longterm curing periods(e.g., Belem et al., 2000; Benzaazoua et al., 2000; Petrolito et al.,2005; Ouellet et al., 2007).
It appears from Fig. 9 that consolidated backfills always developbetter compressive strength than the unconsolidated ones, regard-less of the curing time. This difference in the strength developmentis interpreted mainly as a result of the following phenomena:
1. Consolidation reduces the porosity of the CPB compared to theundrained backfill sample (Belem et al., 2002). This observationwas confirmed by various mercury intrusion porosimetry (MIP)tests performed on both consolidated and unconsolidated CPBsamples (El Aatar et al., 2007; Yilmaz et al., 2008c). Fig. 10 isa schematic representation of the effect of curing stress onthe resultant CPB microstructure, regardless of the binder typeand its proportion. CPB samples produced with fine-grainedtailings give in general a lower hydraulic conductivity and alower elastic modulus, leading to slower consolidation rate.
2. In addition, saturation indices regarding some ions (such as sul-phates) is more easily reached since lower water contents areobserved in the consolidated CPB backfills, and no (or marginal)cement species are lost during the drainage (Belem et al., 2007).This leads to more dense cementitious matrices (i.e. the fillingof the pore size occurred due to hydration) which is reflectedby a better cohesion.
3. Garpenberg mine tailings are relatively coarse-grained (Fig. 2),which may help faster consolidation (high drainage ability).Numerous authors (e.g. Kesimal et al., 2003; Fall et al., 2005;Yilmaz et al., 2007; Belem and Benzaazoua, 2008) showed thatfor a given w/c ratio, the CPB material prepared using coarse-grained tailings generates higher UCS than CPB made of fine-grained tailings due to lower void ratio or porosity.
The results of this study illustrate that this newly developedlaboratory apparatus (CUAPS), can investigate the compressivestrength differences observed between laboratory backfill samplesand in situ backfill samples. Consequently, in order to obtain a bet-ter knowledge on the overall performance of fresh and hardenedCPB materials, CUAPS can advantageously replace conventionalplastic (non-perforated) moulds for a better CPB mix design.
ba
Undrained (no effective stress)
App
Effect of curing stress: Decreasing vo
Con(effe
Undrained (no effective stress)
App
Con(effe
Fig. 10. Schematic representation of the effect of curing stress on CPB performance: (a)
4. Discussion
4.1. Assessment of chemical analysis of drainage water
Water quality (interstitial and mixing water) is an importantparameter for determining the quality and transportation charac-teristics of any CPB, since the water-to-cement ratio affects thestrength and stability of the prepared backfill samples, and the ce-ment hydration process is greatly affected by the chemical compo-sition of waters used in the mixtures (Benzaazoua et al., 2002).Accordingly, tailings interstitial water and water drained fromCUAPS-consolidated samples were collected during the first 7 daysof testing for chemical analysis and pH measurement. Results arepresented in Table 9.
For a given binder type, the analysis results showed that iron Fe(0.1–0.5 mg/L), magnesium Mg (0.6–0.03 mg/L), and aluminium Al(0.1–0.07 mg/L) concentrations remained negligible in drainagewater, attesting of their stability within the CPB solid matrix.Sodium Na (24.7159 mg/L) content is important, as well as calciumCa (864–495 mg/L) and sulphate SO2�
4 (14,859–1435 mg/L). SiliconSi (34.5–13.4 mg/L) concentrations decreased with increasing bin-der content in CPB (310 wt% binder). Ca and Si participate in CSHgel phases formation and remain trapped in the porous media(CPB sample) during the early age hydration, since only negligibleCa and Si losses were observed in the drained waters. The chemicaldifferences observed between the different waters collected can beattributed to the different chemical compositions of the two bindertypes. These factors affect the hydration and hardening process atearly ages. The hardening reaction during the first days of hydra-tion is progressive due to both anhydrous cement direct hydrationand oversaturated phases precipitation, providing continuousinternal cohesion growth over months and/or years (Benzaazouaet al., 2004). Slag blend binders have a 2.5–3 times higher SiO2/CaO ratio than ordinary Portland cement (see Table 4); this ex-plains the well–known vulnerability of the later in acidic and sul-phate-rich waters. In fact, the high amount of anhydrous silicatesleads to less Portlandite and more C–S–H gels formation that aremore stable at lower pH. Backfill water retention can be mitigatedby controlling the hydration process, which are in turn controlledby the pH and dissolved cations in the medium (Kesimal et al.,2005). The cement buffers in the backfill were at pH values of11–13. Ca and Fe in drainage water were at high concentrations.Besides, SO2�
4 concentration is relatively low since the sulphatesparticipate in the cementation process and remain in the solid
lied pressures
id ratio / porosity
solidated ctive stress)
Drainage water
Coarse particle
Fine particle
Hydrate product
Cementitiousmatrix
lied pressures
solidated ctive stress)
Drainage water
Coarse particle
Fine particle
Hydrate product
Cementitiousmatrix
unconsolidated undrained CPB sample; and (b) consolidated drained CPB sample.

Table 9Chemical analysis of drainage water from CUAPS-consolidated CPB samples.
Specimen identification pH (mg/L) Al (mg/L) Ca (mg/L) Cu (mg/L) Fe (mg/L) Mg (mg/L) Na (mg/L) SO2�4
a (mg/L) Si (mg/L) Zn (mg/L)
PCI@3 wt% binder 12.55 0.155 864 0.034 0.276 0.195 27.4 5842 27.8 0.173PCI@5 wt% binder 11.78 0.129 657 0.019 0.301 0.056 105 2019 24.8 0.082PCI@7 wt% binder 12.50 0.086 592 0.052 0.307 0.033 103 1486 18.1 0.525PCI@10 wt% binder 12.34 0.078 495 0.045 0.509 0.035 159 1435 13.45 0.634PCI–Slag@20–80@3 wt% binder 11.64 0.185 798 0.031 0.101 0.656 24.7 9167 34.5 0.047PCI–Slag@20–80@5 wt% binder 11.62 0.156 688 0.020 0.128 0.544 103 14,859 38.5 0.061PCI–Slag@20–80@7 wt% binder 12.30 0.104 686 0.039 0.123 0.319 118 12,103 36.1 0.082PCI–Slag@20–80@10 wt% binder 11.00 0.105 631 0.026 0.138 0.262 122.8 6771 21.5 0.051
a SO2�4 was estimated from the total sulphur: [SO2�
4 ] = 2.9956*[S].
0
500
1000
1500
2000
2500
3000
3500
3 4 5 6 7 8 9 10Binder content (wt%)
Com
pres
sive
str
engt
h U
CS
(kPa
)
Scenario AScenario BControl
Binder: PCI-Slag@20:80
Curing age: 28 days
Difference: 8.3%
6.6%5.6%
5.7%
b
0
500
1000
1500
2000
2500
3000
3500
0 100 200 300 400Applied vertical pressure pv (kPa)
Com
pres
sive
str
engt
h U
CS
(kPa
)
250 375
Bw=3wt% Bw=5wt%Bw=7wt% Bw=10wt%
Binder: PCI-Slag@20:80
Curing age: 28 days
Scenario A Scenario B
AB30
m 19 m 12.7
m
AB30
m 19 m 12.7
m
0
500
1000
1500
2000
2500
3000
3500
3 4 5 6 7 8 9 10
Com
pres
sive
str
engt
h U
CS
(kPa
)
Scenario AScenario BControl
a
Binder: PCI-Slag@20:80
Curing age: 28 days
Difference: 8.3%
6.6%5.6%
5.7%
0
500
1000
1500
2000
2500
3000
3500
0 100 200 300 400
Com
pres
sive
str
engt
h U
CS
(kPa
)
250 375
Bw=3wt% Bw=5wt%Bw=7wt% Bw=10wt%Bw=3wt% Bw=5wt%Bw=7wt% Bw=10wt%
Binder: PCI-Slag@20:80
Curing age: 28 days
Scenario A Scenario B
AB30
m 19 m 12.7
m
AB30
m 19 m 12.7
m
AB30
m 19 m 12.7
m
AB30
m 19 m 12.7
mFig. 11. Comparison of the UCS of the two simulated scenario: (a) evolution of UCSas a function of binder content and (b) evolution of UCS as a function of appliedvertical stress.
E. Yilmaz et al. / Minerals Engineering 22 (2009) 772–785 783
state (as in this case). The binder chemistry combined with themixing-water chemistry (mainly sulphate concentration) stronglyaffects the hydration processes depending on the binder type inthe course of curing time. CPB strengthening was proven to be con-ditioned mainly by the hydration of unhydrated cement as well asthe precipitation of secondary hydrated phases (like gypsum). Slagblend binder hydration seems to be inhibited by the presence ofvery high soluble sulphate concentration in contrast to Portlandcement blend binder. In general, Slag blend binders give the beststrength for low and medium sulphide-rich tailings for which Port-land blend blends have a relatively low strength. The sulphate con-centration levels and their effect on paste hardening werediscussed in depth in Benzaazoua et al. (2002, 2004). Accordingto the DIN 4030 standards, the sulphate content in water drainedfrom CPB with 5–10 wt% PCI was classified as ‘‘highly aggressive”and the remaining sulphate levels (3 wt% PCI and 3–10 wt% PCI–Slag) were ‘‘very highly aggressive” at concentrations varying be-tween 5842 and 15,167 mg/L (Table 9).
4.2. Effects of compression rate on CPB performance
The aim of the load applied in the CUAPS is to evaluate the ef-fect incremental pressure on the properties of CPBs. In situ obser-vations have shown a lower void ratio, higher solids concentration,and higher compressive strength near the bottom of a backfillstope and a higher void ratio, lower solids concentration, and lowercompressive strength near the top of the backfilled stope (Cayou-ette, 2003). The effect of pressure increment on the compressivestrength development of CPB was investigated following two dif-ferent scenarios (A and B) that are simulating two different CPBheights (or depth in a stope) based on the applied maximum ver-tical pressure Pmax and the backfill bulk unit weight c using Slagblend binder (CPI–Slag@20–80). Scenario A is the one presentedin the previous section (pressure of 0, 125, 200, and 250 kPa ap-plied after 1, 2, 3, and 4 days of curing, respectively; correspondsto a depth of approximately 12.7 m). Scenario B was similar to sce-nario A, but with a 50% pressure increase which vary from 0 to375 kPa (corresponding to a point located below top surface atabout 19.1 m). The simulated total height of the backfilled stopewas 30 m (Fig. 11).
Fig. 11a shows that the compressive strength values of the CPBsamples increase with increasing vertical pressure. The highestUCS increase was obtained with 5 wt% binder, notably increasingfrom 2467 kPa to 2673 kPa when the applied Pmax value was in-creased from 250 kPa to 375 kPa. A 50% increase in the verticalpressure produced an 8.3% increase of UCS (Fig. 11b). Increasingthe applied pressure leads to an increase of drainage water, whichmay have favoured better hydration process due to over-saturationof dissolved ions.
However, further work is needed to better understand the ef-fects of binder type and proportion on the improved behaviour ofthe CPB materials cured under different drainage configurations/
curing stresses or loading rates which enable operators to simulatethe different heights of the backfill material placed in an under-ground stope, and how these properties affect the overall qualityand performance of fresh and hardened CPB materials over the dif-ferent curing times.
5. Conclusions
A new paste backfill consolidation setup named CUAPS wasused to simulate the in situ curing conditions of CPB under self-weight consolidation settlement and/or time-dependent geostaticstress to enable better characterization of the mechanical, physical,and chemical properties of lab-prepared backfill materials. CUAPSwas used to evaluate the properties of CPB prepared with sul-phide-rich tailings using two binder types: Slag blend binder(PCI–Slag) and ordinary Portland cement (PCI) alone at binder con-tents varying from 3 wt% to 10 wt%. The effects of vertical pressureon the compressive strength development of CPB samples wereanalyzed. Based on the different results presented, the followingconclusions can be drawn:

784 E. Yilmaz et al. / Minerals Engineering 22 (2009) 772–785
1. Drainage water measurements revealed that the amount ofwater recovered from CPB samples was higher (by 31%) for Slagblend binder than for ordinary Portland cement. In other words,the water to cement ratio in the interstitial water is lower forthe recipes made of Slag blend binder.
2. Chemical analyses of drainage water for sulphate contentshowed that the water obtained from CPB samples with 5–10wt% PCI is classified as ‘‘highly aggressive” and the remainingsulphate levels (3–10 wt% PCI–Slag and 3 wt% PCI) were ‘‘veryhighly aggressive” at concentrations varying between 5842and 15,167 mg/L according to DIN 4030 standards.
3. Geotechnical index parameters showed that porosity, degree ofsaturation, and specific surface area of the consolidated CPBsamples were, respectively 11.9%, 4.9%, 7.1% lower, and 19.3%higher than those of the unconsolidated ones, for a given bindertype and content.
4. The consolidated CPB samples containing Slag blend bindergave a 51.4% and 7.2% higher UCS than the unconsolidated onesat 3 wt% and 10 wt% binder contents, respectively. For ordinaryPortland cement, the consolidated CPB samples provided a37.1% and 14.5% higher UCS than unconsolidated ones at 3wt% and 10 wt% binder contents, respectively.
5. The incremental compression rate test results showed that CPBstrength increases with higher pressure rate applied to samples(e.g. 8.3% increase in the compressive strength when the pres-sure was increased from 250 kPa to 375 kPa at 5 wt% binder).
This preliminary study demonstrated that the recently devel-oped CUAPS apparatus can be a valuable tool for the collection ofreliable data at laboratory scale, and for the assessment of the ef-fects of various in situ conditions on the CPB performance. This set-up should be a useful device for backfill researchers andpractitioners striving to better understand the quality of labora-tory-prepared fresh and hardened CPB samples.
Acknowledgements
The authors would like to express their sincere appreciation toFredrik Ogren from Boliden Mineral AB (Garpenberg Mine, Swe-den) for partially funding the project, providing tailings material,and granting permission to publish the results of the tests per-formed. This project was also funded through a doctoral Grant un-der the Canada Research Chair on Integrated management ofsulphidic mine tailings using fill technology and the NSERC-Poly-technique-UQAT Industrial Chair on Environment and mine wastesmanagement. Special thanks go to the Canadian Foundationfor Innovation (CFI) for the manufacture of the CUAPS apparatus,Hugues Bordeleau for mechanical testing, Mathieu Villeneuve forchemical and mineralogical analyses. The authors also thank Dr.Haci Deveci and two reviewers for their constructive and usefulcomments that significantly improved the quality of themanuscript.
References
Amaratunga, L.M., Yaschyshyn, D.N., 1997. Development of a high modulus paste fillusing fine gold mill tailings. Geotechnical and Geological Engineering 15 (3),205–219.
ASTM Designation C128–97, 2002. Standard test method for density, relativedensity (specific gravity), and absorption of fine aggregate. Annual Book ofASTM Standards, 04.01, Easton, MD, pp. 45–52.
ASTM Designation C143–90, 2002. Standard test method for slump of hydrauliccement concrete. Annual Book of ASTM Standards, 04.01. American Society ofTesting Material, Easton, MD, pp. 68–76.
ASTM Designation C39–98, 2002. Standard test method for compressive strength ofcylindrical concrete specimens. Annual Book of ASTM Standards, 04.02.American Society of Testing Material, Easton, MD, pp. 15–23.
ASTM Designation D2216–92, 1999. Standard test method for laboratorydetermination of water (moisture) content of soil and rock. Annual Book ofASTM Standards, 04.08. American Society of Testing Material, pp. 188–191.
ASTM Designation D421–85, 1999. Standard practice for dry preparation of soilsamples for particle size analysis and determination of soil constants. AnnualBook of ASTM Standards, 04.08. American Society of Testing Material, Easton,MD, pp. 8–9.
ASTM Designation D422–63, 1999. Standard test method for particle size analysis ofsoils. Annual Book of ASTM Standards, 04.08. American Society of TestingMaterial, Easton, MD, pp. 10–17.
Aubertin, M., Bussière, B., Bernier, L., 2002. Environnement et gestion des résidusminiers. Presses Internationales Polytechnique, CD-ROM, Montréal, Québec,Canada.
Belem, T., Benzaazoua, M., 2007. Design and application of underground mine pastebackfill technology. Geotechnical and Geological Engineering 26 (2), 147–174.
Belem, T., Benzaazoua, M., 2008. Predictive models for pre-feasibility cementedpaste backfill mix design. In: Post-Mining’08, February 6–8, Nancy, France, pp.1–13.
Belem, T., Benzaazoua, M., Bussière, B., 2000. Mechanical behaviour of cementedpaste backfill. In: Proceedings of the 53rd Canadian Geotechnical Conference‘‘Geotechnical Engineering at the Dawn of the Third Millennium”, Montreal,Quebec, Canada, October 15–18, vol. 1, pp. 373–380.
Belem, T., Benzaazoua, M., Bussière, B., Dagenais, A.M., 2002. Effects of settlementand drainage on strength development within mine paste backfill. In:Proceedings of the 9th International Conference on Tailings and Mine Waste,Vail, Fort Collins, Colorado. AA Balkema, Rotterdam, pp. 139–148 (January 27–30).
Belem, T., El Aatar, O., Bussière, B., Benzaazoua, M., Fall, M., Yilmaz, E., 2006.Characterization of self-weight consolidated paste backfill. In: Jewell, R.,Lawson, S., Newman, P. (Eds.), Proceedings of the 9th International Seminaron Paste and Thickened Tailings, Limerick, Ireland. ACG, pp. 333–345 (April 3–7).
Belem, T., El Aatar, O., Benzaazoua, M., Bussière, B., Yilmaz, E., 2007. Hydro-geotechnical and geochemical characterization of column consolidatedcemented paste backfill. In: Proceedings of the 9th International Symposiumin Mining with Backfill. CIM, Montreal, Quebec, Canada (April 29–May 2).
Benzaazoua, M., Ouellet, J., Servant, S., Newman, P., Verburg, R., 1999. Cementitiousbackfill with high sulfur content: physical, chemical and mineralogicalcharacterization. Cement and Concrete Research 29 (5), 719–725.
Benzaazoua, M., Belem, T., Jolette, D., 2000. Investigation de la stabilité chimique etde son impact sur la qualité des remblais miniers cimentés. In: IRSST Report No.R260, Montreal, pp. 1–172.
Benzaazoua, M., Belem, T., Bussiere, B., 2002. Chemical factors that influence theperformance of mine sulphidic paste backfill. Cement and Concrete Research 32(7), 1133–1144.
Benzaazoua, M., Fall, M., Belem, T., 2004. A contribution to understanding thehardening process of cemented pastefill. Minerals Engineering 17 (2), 141–152.
Benzaazoua, M., Belem, T., Yilmaz, E., 2006. Novel lab tool for paste backfill.Canadian Mining Journal 127 (3), 31.
Brackebusch, F.W., 1994. Basics of paste backfill systems. Mining Engineering 46(10), 1175–1178.
Bussière, B., 1993. Evaluation des propriétés hydrogéologiques de résidus miniersutilisés comme barrières de recouvrement. MSc thesis, Université de MontréalÉcole Polytechnique, Québec, Canada, pp. 1–171.
Bussière, B., 2007. Colloquium 2004: Hydrogeotechnical properties of hard rocktailings from metal mines and emerging geoenvironmental disposalapproaches. Canadian Geotechnical Journal 44 (9), 1019–1052.
Cayouette, J., 2003. Optimization of the paste backfill plant at Louvicourt mine. CIMBulletin 96 (1075), 51–57.
DIN Designation 4030, 2001. Standard Assessment of Water, Soil, and Gases forTheir Aggressiveness to Concrete; Principles and Limiting Values. GermanStandard, Construction Materials and Building, Berlin, pp. 35–46.
El Aatar, O., Belem, T., Bussiere, B., Benzaazoua, M., Yilmaz, E., 2007. Microstructuralproperties of column consolidated paste backfill. In: Proceedings of the 60thCanadian Geotechnical Conference and the 8th Joint CGS/IAH-CNCGroundwater Conference, Ottawa, Ontario, Canada, October 21–24, pp. 45–52.
Fall, M., Benzaazoua, M., 2005. Modeling the effect of sulphate on strengthdevelopment of paste backfill and binder mixture optimization. Cement andConcrete Research 35 (2), 301–314.
Fall, M., Benzaazoua, M., Ouellet, S., 2005. Experimental characterization of theinfluence of tailings fineness and density on the quality of cemented pastebackfill. Minerals Engineering 18 (1), 41–44.
Fourie, A.B., Fahey, H., Helinski, M., 2007. Using effective stress theory tocharacterize the behaviour of backfill. CIM Bulletin 100 (1103), 1–9 (Paper no.27).
Godbout, J., 2005. Évolution des propriétés hydriques des remblais minierscimentés en pate durant le curage. MSc thesis, Université de Montréal ÉcolePolytechnique, Québec, Canada, pp. 1–190.
Grabinsky, M.W.F., Bawden, W.F., 2007. In situ measurements for geomechanicaldesign of cemented paste backfill systems. CIM Bulletin 100 (1103), 1–8 (Paperno. 21).
Grabinsky, M., Simms, P., 2006. Self-desiccation of cemented paste backfill andimplications for mine design. In: Jewell, R., Lawson, S., Newman, P. (Eds.),Proceedings of the 9th International Seminar on Paste and Thickened Tailings,Limerick, Ireland. Australian Centre for Geomechanics, pp. 323–332 (April 3–7).

E. Yilmaz et al. / Minerals Engineering 22 (2009) 772–785 785
Hassani, F.P., Archibald, J.F., 1998. Mine Backfill Handbook. CIM, Montreal, Quebec,Canada (in CD-ROM).
Helinski, M., Fourie, A.B., Fahey, M., 2006. Mechanics of early age cemented pastebackfill. In: Jewell, R., Lawson, S., Newman, P. (Eds.), Proceedings of the 9thInternational Seminar on Paste and Thickened Tailings, Limerick, Ireland.Australian Centre for Geomechanics, pp. 313–322 (April 3–7).
Helinski, M., Fahey, F., Fourie, A.B., 2007a. Numerical modelling of cemented pastebackfill deposition. Journal of Geotechnical and Geoenvironmental Engineering13 (10), 1308–1319.
Helinski, M., Fourie, A.B., Fahey, F., Ismail, M., 2007b. Assessment of the self-desiccation process in cemented mine backfills. Canadian Geotechnical Journal44 (10), 1148–1156.
Kesimal, A., Ercikdi, B., Yilmaz, E., 2003. The effect of desliming by sedimentation onpaste backfill performance. Minerals Engineering 16 (10), 1009–1011.
Kesimal, A., Yilmaz, E., Ercikdi, B., 2004. Evaluation of paste backfill test resultsobtained from different size slumps with varying cement contents for sulphurrich mill tailings. Cement and Concrete Research 34 (10), 1817–1822.
Kesimal, A., Yilmaz, E., Ercikdi, B., Alp, I., Deveci, H., 2005. Effect of properties oftailings and binder on the short and long terms strength and stability ofcemented paste backfill. Materials Letters 59 (28), 3703–3709.
Klein, K., Simon, D., 2006. Effect of specimen composition on the strength developmentin cemented paste backfill. Canadian Geotechnical Journal 43 (3), 310–324.
Landriault, D.A., 2001. Backfill in underground mining: underground miningmethods engineering fundamentals and international case studies. In:Hustrulid, W., Bullock, R.L. (Eds.), Society for Mining, Metallurgy andExploration – SME, Littleton, Colorado, pp. 601–614 (Chapter 69).
Landriault, D.A., Lidkea, W., 1993. Paste fill and high density slurry fill. In: Bawden,W.F., Archibald, J.F. (Eds.), Proceedings of the International Conference onInnovative Mine Design for the 21st Century, Kingston, Ontario, Canada. AABalkema, Rotterdam, pp. 111–118 (August 23–26).
Le Roux, K.A., Bawden, W.F., Grabinsky, M.W.F., 2005. Field properties of cementedpaste backfill at the Golden Giant mine. Min Tech: IMM Trans Sec A 114 (2), 65–86.
Lindqvist, T., Nystrom, B.A., Norling, L., 2006. Paste backfill at Garpenberg NorthMine. In: Jewell, R., Lawson, S., Newman, P. (Eds.), Proceedings of the 9thInternational Seminar on Paste and Thickened Tailings, Limerick, Ireland.Australian Centre for Geomechanics, pp. 303–311 (April 3–7).
McCarthy, D.F., 2007. Essentials of Soil Mechanics and Foundations: BasicGeotechnics, seventh ed. Pearson Prentice Hall, Toronto, Canada. pp. 1–864.
Mitchell, R., Smith, J., 1981. The compression–percolation test for mine tailingsbackfill. CIM Bulletin 74 (833), 85–89.
Ouellet, S., 2007. Mineralogical characterization, microstructural evolution andenvironmental behaviour mine cemented paste backfills. PhD dissertation,UQAT, Rouyn-Noranda, Quebec, Canada, pp. 1–310.
Ouellet, S., Bussiere, B., Aubertin, M., Benzaazoua, M., 2007. Microstructuralevolution of cemented paste backfill: Mercury intrusion porosimetry testresults. Cement and Concrete Research 37 (12), 1654–1665.
Petrolito, J., Anderson, R.M., Pigdon, S.P., 2005. A review of binder materials used instabilized backfills. CIM Bulletin 98 (1085), 1–7.
Pierce, M.E., Bawden, W.F., Paynter, J.T., 1998. Laboratory testing and stabilityanalysis of paste backfill at the Golden Giant Mine. In: Proceedings of the 6thInternational Symposium on Mining with Backfill, Brisbane, Australia.Australian Centre for Geomechanics, pp. 159–165 (April 14–16).
Rankine, R.M., Sivakugan, N., 2007. Geotechnical properties of cemented pastebackfill from Cannington Mine, Australia. Geotechnical and GeologicalEngineering 25 (4), 383–393.
Revell, M.B., 2004. Paste – how strong is it? In: Proceedings of the 8th InternationalSymposium on Mining with Backfill. Nonferrous Metals Society of China,Beijing, China, pp. 286–294 (September 19–21).
Rietveld, H.M., 1993. The Rietveld Method. Oxford University Press, London. pp. 1–321.
Simms, P., Grabinsky, M.W., Zhan, G., 2007. Modelling evaporation to optimizesurface deposition of paste tailings at the Bulyanhulu mine. CanadianGeotechnical Journal 44 (12), 1417–1432.
Taylor, H.F.W., 1990. Cement Chemistry, third ed. Academic Press, New York. pp. 1–475.
Yilmaz, E., 2003. Investigation of the strength characteristics of the cemented pastebackfill samples prepared from sulphide-bearing mine tailings. MSc thesis,Black Sea Technical University (KTU), Turkey, pp. 11–17.
Yilmaz, E., Kesimal, A., Ercikdi, B., 2004. Evaluation of acid producing sulphidic minetailings as a paste backfill. Turkish Journal of Earth Science Review 17 (1), 11–19.
Yilmaz, E., El Aatar, O., Belem, T., Benzaazoua, M., Bussiere, B., 2006. Effect ofconsolidation on the performance of cemented paste backfill. In: Proceedings ofthe 21st Underground Mine Support Conference, Val d’Or, Quebec, Canada, April11–12, pp. 1–14.
Yilmaz, E., Belem, T., Benzaazoua, M., Kesimal, A., Ercikdi, B., 2007. Evaluation of thestrength properties of deslimed tailings paste backfill. Minerals ResourcesEngineering 12 (2), 129–144.
Yilmaz, E., Belem, T., Benzaazoua, M., Bussiere, B., 2008a. Experimentalcharacterization of the influence of curing under stress on thehydromechanical and geotechnical properties of cemented paste backfill. In:Proceedings of the 15th International Conference on Tailings and Mine Waste,Vail, Colorado, USA, October 18–23, pp. 139–152.
Yilmaz, E., Belem, T., Bussiere, B., Benzaazoua, M., 2008b. Consolidationcharacteristics of early age cemented paste backfill. In: Proceedings of the61st Canadian Geotechnical Conference and the 9th Joint CGS/IAH-CNCGroundwater Conference, Edmonton, Alberta, Canada, September 21–24,2008, pp. 797–804.
Yilmaz, E., Belem, T., Bussiere, B., Benzaazoua, M., 2008c. Evaluation of strength,microstructure and consolidation properties of cemented paste backfill usingnew laboratory equipment. In: Proceedings of the 3rd InternationalSymposium on Mines and the Environment, Rouyn-Noranda, Quebec,November 2–5.
Copyright © 2022 FDOKUMEN