Effect of Curing Conditions on the Service Life Design of RC Structures in the Persian Gulf Region
7
Effect of Curing Conditions on the Service Life Design of RC Structures in the Persian Gulf Region R. Alizadeh 1 ; P. Ghods 2 ; M. Chini 3 ; M. Hoseini 4 ; M. Ghalibafian 5 ; and M. Shekarchi 6 Abstract: Corrosion of reinforcement is the major cause of deterioration of concrete structures exposed to chloride in the Persian Gulf region. In this hot marine environment, curing is one of the crucial factors that can affect the chloride penetration into concrete and consequently the service life of reinforced concrete structures. In this paper, the values of diffusion coefficient and surface chloride content were determined in concrete specimens made of two mixture proportions, subjected to six initial alternate curing regimes and exposed to seawater in the Persian Gulf for three months. Finally, the effect of various curing regimes was investigated on the estimation of time-to-corrosion initiation of reinforced concrete structures using the DuraPGulf model. DOI: 10.1061/ASCE0899-1561200820:12 CE Database subject headings: Durability; Corrosion; Coastal environment; Computer models; Chlorides; Concrete structures; Middle East. Introduction Concrete structures are increasingly being deteriorated in the Per- sian Gulf region, mainly due to the chloride-induced corrosion of the embedded steel. Severity of this environment in which the average of maximum temperature is around 33° C and the relative humidity is about 76% has made the Persian Gulf one of the most aggressive environments in the world Ghoddusi et al. 1998. Initial curing, to which concrete is subjected, prior to exposure to chloride environment, plays an important role in the rate of chloride penetration, especially at the early ages of exposure Khatib and Mangat 2002. Time and temperature histories of curing regime can also affect the strength development in con- crete Kim et al. 1998. Drying of cementious materials due to poor curing, particularly at the surface, leads to restricted hydra- tion in the surface layers and thus results in higher porosity and permeability Mangat and Limbachiya 1999. Because chloride ions diffuse through this cover area to reach the reinforcement, curing has an important effect on the diffusivity of the surface layer and, therefore, on the time of corrosion initiation in con- crete. The matter would be more critical in the case of concrete containing silica fume replacement because the pozzolanic reac- tion is, in general, very sensitive to the curing procedure Toutanji and Bayasi 1999. From the modeling point of view, the effect of curing con- ditions on the chloride diffusion coefficient has not been well studied. Unfortunately, quantification of the curing of concrete and related effects has never been completely performed Maekawa et al. 1999. However, it has been suggested to include a coefficient for curing as k curing so that D curing = k curing D 0 where D 0 = diffusion coefficient of standard cured concrete; k curing = curing factor; and D curing = diffusion coefficient of cured specimen Mejlbro 1996. It is very difficult to find such a coef- ficient, since curing is considered by the duration of providing concrete with sufficient humidity and appropriate temperature conditions that cannot be easily quantified in relation to the dif- fusion coefficient. In this study, which is a part of the national durability project in the Persian Gulf region, necessary experiments were conducted to quantitatively evaluate the influence of curing conditions on the diffusion of chloride ions into concrete. Experimental Procedure Mixture Proportions The concrete mixture proportions detailed in Table 1 were used to study the effect of curing on both portland cement and silica fume concrete labeled as NPC and SFC, respectively. Chemical analysis of cement and silica fume is presented in Table 2. A siliceous river stone with maximum particle size of 12 mm was 1 Ph.D. Student of Civil Engineering, Institute for Research in Construction, National Research Council of Canada, 1200 Montreal Rd., Bldg. M-20, Ottawa, Ontario, Canada K1A 0R6 corresponding author. E-mail: [email protected] 2 Ph.D. Student, Dept. of Civil and Environmental Engineering, Carleton Univ., Ottawa, ON, Canada. E-mail: pghods@connect. carleton.ca 3 Ph.D. Student, Dept. of Structural Engineering, Norwegian Univ. of Science and Technology NTNU, Trondheim, Norway. E-mail: [email protected] 4 Graduate ResearchAssistant, CMI at the Univ. of Tehran, P.O. Box 11365-4563, Tehran, Iran. E-mail: [email protected] 5 Associate Professor, Director of Construction Materials Testing Laboratory, Univ. of Tehran, P.O. Box 11365-4563, Tehran, Iran. E-mail: ghalibafi[email protected] 6 Assistant Professor, Director of CMI, Univ. of Tehran, P.O. Box 11365-4563, Tehran, Iran. E-mail: [email protected] Note. Associate Editor: Byung Hwan Oh. Discussion open until June 1, 2008. Separate discussions must be submitted for individual papers. To extend the closing date by one month, a written request must be filed with the ASCE Managing Editor. The manuscript for this paper was submitted for review and possible publication on May 16, 2005; approved on November 30, 2006. This paper is part of the Journal of Materials in Civil Engineering, Vol. 20, No. 1, January 1, 2008. ©ASCE, ISSN 0899-1561/2008/1-2–8/$25.00. 2 / JOURNAL OF MATERIALS IN CIVIL ENGINEERING © ASCE / JANUARY 2008
-
Upload
independent -
Category
Documents
-
view
2 -
download
0
Transcript of Effect of Curing Conditions on the Service Life Design of RC Structures in the Persian Gulf Region

lfndnttoof
s;
Effect of Curing Conditions on the Service Life Design of RCStructures in the Persian Gulf Region
R. Alizadeh1; P. Ghods2; M. Chini3; M. Hoseini4; M. Ghalibafian5; and M. Shekarchi6
Abstract: Corrosion of reinforcement is the major cause of deterioration of concrete structures exposed to chloride in the Persian Guregion. In this hot marine environment, curing is one of the crucial factors that can affect the chloride penetration into concrete aconsequently the service life of reinforced concrete structures. In this paper, the values of diffusion coefficient and surface chloride contewere determined in concrete specimens made of two mixture proportions, subjected to six initial alternate curing regimes and exposedseawater in the Persian Gulf for three months. Finally, the effect of various curing regimes was investigated on the estimationtime-to-corrosion initiation of reinforced concrete structures using the DuraPGulf model.
DOI: 10.1061/�ASCE�0899-1561�2008�20:1�2�
CE Database subject headings: Durability; Corrosion; Coastal environment; Computer models; Chlorides; Concrete structureMiddle East.
Introduction
r-ofhevest
reofreofn-toa-
tion in the surface layers and thus results in higher porosity anddet,
cen-tec-ji
n-ellteedde
te;edf-
ngreif-
ctedhe
toe
alAas
ind.,r�.
g,ct.
iv.il:
ox
ngil:
ox
neToithedonin
Concrete structures are increasingly being deteriorated in the Pesian Gulf region, mainly due to the chloride-induced corrosionthe embedded steel. Severity of this environment in which taverage of maximum temperature is around 33°C and the relatihumidity is about 76% has made the Persian Gulf one of the moaggressive environments in the world �Ghoddusi et al. 1998�.
Initial curing, to which concrete is subjected, prior to exposuto chloride environment, plays an important role in the ratechloride penetration, especially at the early ages of exposu�Khatib and Mangat 2002�. Time and temperature historiescuring regime can also affect the strength development in cocrete �Kim et al. 1998�. Drying of cementious materials duepoor curing, particularly at the surface, leads to restricted hydr
1Ph.D. Student of Civil Engineering, Institute for ResearchConstruction, National Research Council of Canada, 1200 Montreal RBldg. M-20, Ottawa, Ontario, Canada K1A 0R6 �corresponding authoE-mail: [email protected]
2Ph.D. Student, Dept. of Civil and Environmental EngineerinCarleton Univ., Ottawa, ON, Canada. E-mail: [email protected]
3Ph.D. Student, Dept. of Structural Engineering, Norwegian Unof Science and Technology �NTNU�, Trondheim, Norway. [email protected]
4Graduate Research Assistant, CMI at the Univ. of Tehran, P.O. B11365-4563, Tehran, Iran. E-mail: [email protected]
5Associate Professor, Director of Construction Materials TestiLaboratory, Univ. of Tehran, P.O. Box 11365-4563, Tehran, Iran. [email protected]
6Assistant Professor, Director of CMI, Univ. of Tehran, P.O. B11365-4563, Tehran, Iran. E-mail: [email protected]
Note. Associate Editor: Byung Hwan Oh. Discussion open until Ju1, 2008. Separate discussions must be submitted for individual papers.extend the closing date by one month, a written request must be filed wthe ASCE Managing Editor. The manuscript for this paper was submittfor review and possible publication on May 16, 2005; approvedNovember 30, 2006. This paper is part of the Journal of MaterialsCivil Engineering, Vol. 20, No. 1, January 1, 2008. ©ASCE, ISSN0899-1561/2008/1-2–8/$25.00.
2 / JOURNAL OF MATERIALS IN CIVIL ENGINEERING © ASCE / JANUA
permeability �Mangat and Limbachiya 1999�. Because chloriions diffuse through this cover area to reach the reinforcemencuring has an important effect on the diffusivity of the surfalayer and, therefore, on the time of corrosion initiation in cocrete. The matter would be more critical in the case of concrecontaining silica fume replacement because the pozzolanic reation is, in general, very sensitive to the curing procedure �Toutanand Bayasi 1999�.
From the modeling point of view, the effect of curing coditions on the chloride diffusion coefficient has not been wstudied. Unfortunately, quantification of the curing of concreand related effects has never been completely perform�Maekawa et al. 1999�. However, it has been suggested to inclua coefficient for curing as kcuring so that
Dcuring = kcuring � D0
where D0=diffusion coefficient of standard cured concrekcuring=curing factor; and Dcuring=diffusion coefficient of curspecimen �Mejlbro 1996�. It is very difficult to find such a coeficient, since curing is considered by the duration of providiconcrete with sufficient humidity and appropriate temperatuconditions that cannot be easily quantified in relation to the dfusion coefficient.
In this study, which is a part of the national durability projein the Persian Gulf region, necessary experiments were conductto quantitatively evaluate the influence of curing conditions on tdiffusion of chloride ions into concrete.
Experimental Procedure
Mixture Proportions
The concrete mixture proportions detailed in Table 1 were usedstudy the effect of curing on both portland cement and silica fumconcrete �labeled as NPC and SFC, respectively�. Chemicanalysis of cement and silica fume is presented in Table 2.siliceous river stone with maximum particle size of 12 mm w
RY 2008
ofermre
0orx-
dr-inedteer-
beedinC
heg
heedd
ofhen-
lf,tee-d-
aheoflsn-m
ononns
e-ngmon
i-ir
thottei-inasi-tep-ofngoftep-ndof
ofngapis
he-Cs,ofofz-n.
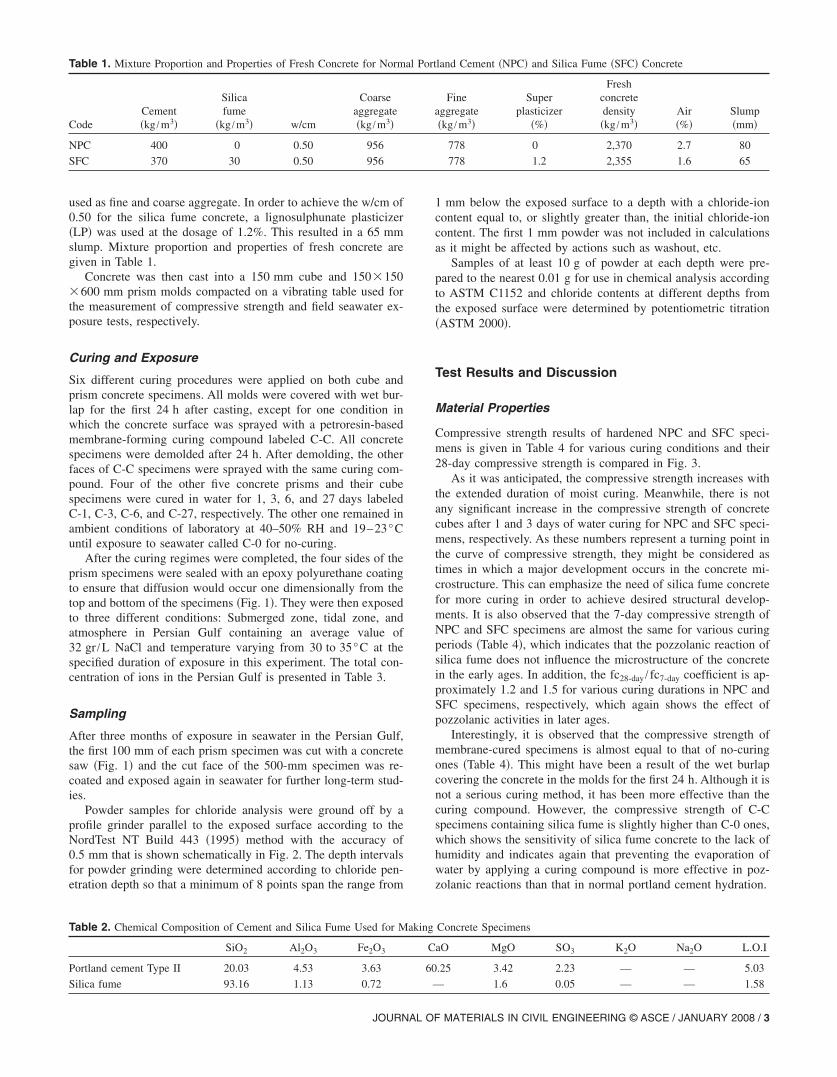
Table 1. Mixture Proportion and Properties of Fresh Concrete for Normal Portland Cement �NPC� and Silica Fume �SFC� Concrete
Maki
.I
3
8
used as fine and coarse aggregate. In order to achieve the w/cm0.50 for the silica fume concrete, a lignosulphunate plasticiz�LP� was used at the dosage of 1.2%. This resulted in a 65 mslump. Mixture proportion and properties of fresh concrete agiven in Table 1.
Concrete was then cast into a 150 mm cube and 150�15�600 mm prism molds compacted on a vibrating table used fthe measurement of compressive strength and field seawater eposure tests, respectively.
Curing and Exposure
Six different curing procedures were applied on both cube anprism concrete specimens. All molds were covered with wet bulap for the first 24 h after casting, except for one conditionwhich the concrete surface was sprayed with a petroresin-basmembrane-forming curing compound labeled C-C. All concrespecimens were demolded after 24 h. After demolding, the othfaces of C-C specimens were sprayed with the same curing compound. Four of the other five concrete prisms and their cuspecimens were cured in water for 1, 3, 6, and 27 days labelC-1, C-3, C-6, and C-27, respectively. The other one remainedambient conditions of laboratory at 40–50% RH and 19–23°until exposure to seawater called C-0 for no-curing.
After the curing regimes were completed, the four sides of tprism specimens were sealed with an epoxy polyurethane coatinto ensure that diffusion would occur one dimensionally from ttop and bottom of the specimens �Fig. 1�. They were then exposto three different conditions: Submerged zone, tidal zone, anatmosphere in Persian Gulf containing an average value32 gr /L NaCl and temperature varying from 30 to 35°C at tspecified duration of exposure in this experiment. The total cocentration of ions in the Persian Gulf is presented in Table 3.
Sampling
After three months of exposure in seawater in the Persian Guthe first 100 mm of each prism specimen was cut with a concresaw �Fig. 1� and the cut face of the 500-mm specimen was rcoated and exposed again in seawater for further long-term stuies.
Powder samples for chloride analysis were ground off byprofile grinder parallel to the exposed surface according to tNordTest NT Build 443 �1995� method with the accuracy0.5 mm that is shown schematically in Fig. 2. The depth intervafor powder grinding were determined according to chloride peetration depth so that a minimum of 8 points span the range fro
CodeCement�kg /m3�
Silicafume
�kg /m3� w/cm
Coarseaggregat�kg /m3�
NPC 400 0 0.50 956
SFC 370 30 0.50 956
Table 2. Chemical Composition of Cement and Silica Fume Used for
SiO2 Al2O3 Fe2O3
Portland cement Type II 20.03 4.53 3.63
Silica fume 93.16 1.13 0.72
JOURNAL
1 mm below the exposed surface to a depth with a chloride-icontent equal to, or slightly greater than, the initial chloride-icontent. The first 1 mm powder was not included in calculatioas it might be affected by actions such as washout, etc.
Samples of at least 10 g of powder at each depth were prpared to the nearest 0.01 g for use in chemical analysis accordito ASTM C1152 and chloride contents at different depths frothe exposed surface were determined by potentiometric titrati�ASTM 2000�.
Test Results and Discussion
Material Properties
Compressive strength results of hardened NPC and SFC specmens is given in Table 4 for various curing conditions and the28-day compressive strength is compared in Fig. 3.
As it was anticipated, the compressive strength increases withe extended duration of moist curing. Meanwhile, there is nany significant increase in the compressive strength of concrecubes after 1 and 3 days of water curing for NPC and SFC specmens, respectively. As these numbers represent a turning pointthe curve of compressive strength, they might be consideredtimes in which a major development occurs in the concrete mcrostructure. This can emphasize the need of silica fume concrefor more curing in order to achieve desired structural develoments. It is also observed that the 7-day compressive strengthNPC and SFC specimens are almost the same for various curiperiods �Table 4�, which indicates that the pozzolanic reactionsilica fume does not influence the microstructure of the concrein the early ages. In addition, the fc28-day / fc7-day coefficient is aproximately 1.2 and 1.5 for various curing durations in NPC aSFC specimens, respectively, which again shows the effectpozzolanic activities in later ages.
Interestingly, it is observed that the compressive strengthmembrane-cured specimens is almost equal to that of no-curiones �Table 4�. This might have been a result of the wet burlcovering the concrete in the molds for the first 24 h. Although itnot a serious curing method, it has been more effective than tcuring compound. However, the compressive strength of Cspecimens containing silica fume is slightly higher than C-0 onewhich shows the sensitivity of silica fume concrete to the lackhumidity and indicates again that preventing the evaporationwater by applying a curing compound is more effective in pozolanic reactions than that in normal portland cement hydratio
Fineaggregate�kg /m3�
Superplasticizer
�%�
Freshconcretedensity�kg /m3�
Air�%�
Slump�mm�
778 0 2,370 2.7 80
778 1.2 2,355 1.6 65
ng Concrete Specimens
CaO MgO SO3 K2O Na2O L.O
60.25 3.42 2.23 — — 5.0
— 1.6 0.05 — — 1.5
e
OF MATERIALS IN CIVIL ENGINEERING © ASCE / JANUARY 2008 / 3

he’sn
1�
2�
�;den
or
arveCs
otceofreheofg
ly,ldn-
edanto
if-isel-nttyldor
nte,
te,t-a-chnddebe
nereistbeg-heatreid
nd
alt
00
als
us
ty
Chloride Profiles
The chloride penetration rate as a function of depth from tconcrete surface and time can reasonably be represented by Ficksecond law of diffusion, according to the following expressio�Crank 1975�:
�C
�t= DC
�2C
�x2 �
Considering the following boundary conditions:
C�x � 0,t = 0� = 0
C�x = 0,t � 0� = Cs
C�x = �,t � 0� = 0
The solution for this differential equation is
C�x,t� = Cs�1 − erf� x
2�DCt�� �
where x=distance from concrete surface �m�; t=time �secDC=diffusion coefficient �m2 /s�; Cs=equilibrium chloriconcentration on concrete surface; C�x , t�=chloride concentratioat the depth of x from the surface after time t; and erf=errfunction.
Using a computer statistical analysis program, the nonlineregression was carried out on the experimental data and by curfitting of Fick’s second law of diffusion the values of DC andwere determined. It should be noted that DC and Cs might nnecessarily represent chloride diffusion coefficient and surfaconcentration, but simply represent the regression coefficientsa penetration profile. The results from curve fitting, which agiven in Table 5, are the average values of DC obtained from ttop and bottom of the specimens. Cs values, the averageswhich are given in Table 6, were very scattered against curintime, which might be due to the short exposure time. Practicallong-term studies on the specimens in the Persian Gulf woushow the effect of various parameters on surface chloride co
Table 3. Concentration of Various Ions in Seawater at Persian Gulf
Ion type K+ Ca++ Mg++ SO4− − Na+ Cl−Totsal
Concentration�g/l�
0.450 0.430 1.460 2.720 12.400 21.450 38.9
Fig. 1. Typical concrete prism specimen for diffusivimeasurements
4 / JOURNAL OF MATERIALS IN CIVIL ENGINEERING © ASCE / JANUA
tents. However, based on these limited results, it can be observthat the Cs values are generally higher in SFC specimens thNPC ones and also in tidal and submerged zones, comparedatmosphere.
Comparing the values of DC in Table 5, as expected, the dfusion coefficient decreases as moist curing time increases. Thisdue to the fact that providing water for a longer period of timwould result in further hydration of cement particles and deveopment of the pore structure. The problem is extremely importafor lower days of curing since depercolation of capillary porosiis mostly achieved during this period. So, obvious changes woube observed in shorter curing periods as it is shown in Fig. 4 fNPC specimens.
As it is observed in Fig. 4, the values of diffusion coefficiefor the same curing time are high to low in the order of tidal zonsubmerged zone, and atmosphere, respectively. For the concrewhich is in contact with the splash water, the main and dominaing transport mechanism of chloride into concrete is the penetrtion through capillary suction of the water. This process is mufaster than the pure diffusion process. Also, frequent wetting adrying of the specimen in seawater would increase the chloriamount of surface pore structure. The same observation canmade for SFC specimens.
The rates of decrease in DC for submerged and tidal zospecimens are almost the same and are higher than atmospheones as it is shown in Fig. 4 These can indicate that the mocuring is more effective in more severe conditions and canshortened in nonaggressive environments. Moreover, in less agressive conditions, such as atmosphere, the overall value of tdiffusion coefficient is low irrespective of curing time, and thmeans the curing is not that important for these kinds of exposuconditions, and minimum curing would be enough just to avothe shrinkage cracks.
In Fig. 5, the diffusion coefficient values of normal portla
Table 4. Seven-Day and 28-Day Compressive Strengths of NormPortland Cement and Silica Fume Concrete Cured in Various Duration
Code
fc �kg /cm2� fc28 day / fc7 day
NPC SFC
NPC SFC7 days 28 days 7 days 28 days
C-0 260 313 260 371 1.20 1.43
C-1 300 366 299 453 1.22 1.52
C-3 308 379 329 514 1.23 1.56
C-6 335 390 344 536 1.16 1.56
C-27 335 398 344 552 1.19 1.60
C-C 225 300 269 385 1.33 1.43
Fig. 2. Powder sampling by grinding the exposed surface at variodepths
RY 2008
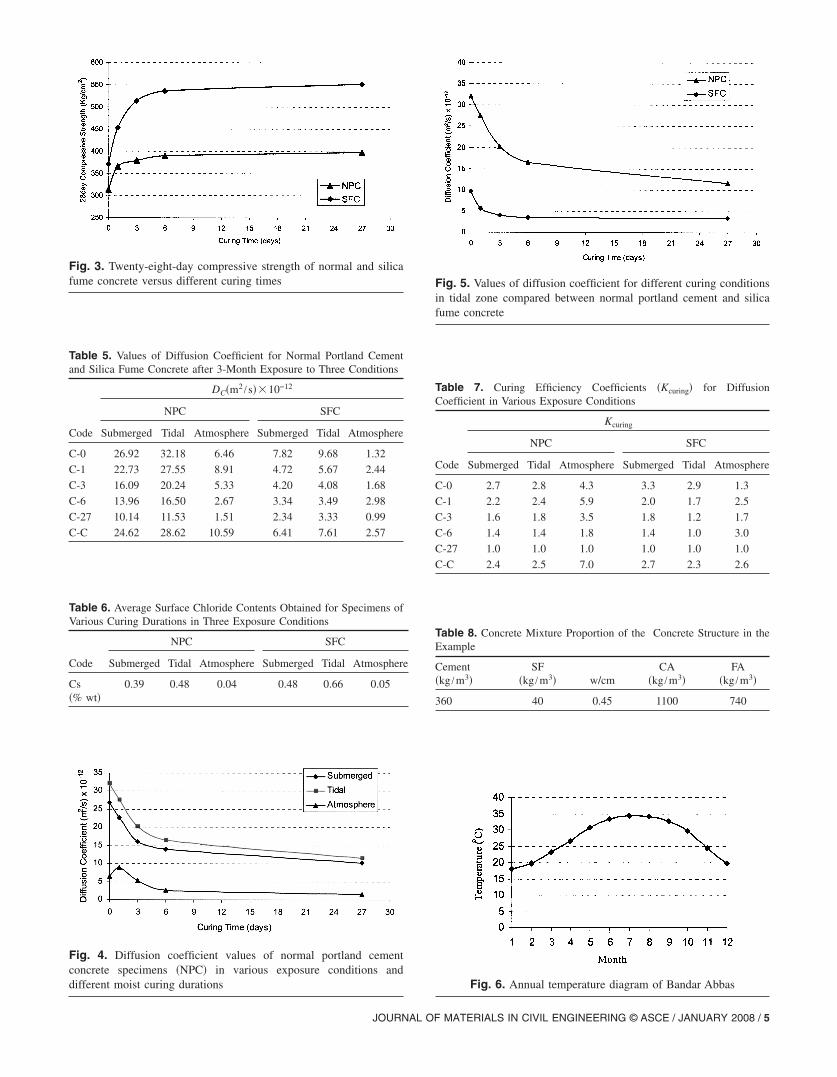
Table 5. Values of Diffusion Coefficient for Normal Portland Cements
re
Table 7. Curing Efficiency Coefficients �Kcuring� for Diffusion
re
ca
nsca
and Silica Fume Concrete after 3-Month Exposure to Three Condition
Code
DC�m2 /s��10−12
NPC SFC
Submerged Tidal Atmosphere Submerged Tidal Atmosphe
C-0 26.92 32.18 6.46 7.82 9.68 1.32
C-1 22.73 27.55 8.91 4.72 5.67 2.44
C-3 16.09 20.24 5.33 4.20 4.08 1.68
C-6 13.96 16.50 2.67 3.34 3.49 2.98
C-27 10.14 11.53 1.51 2.34 3.33 0.99
C-C 24.62 28.62 10.59 6.41 7.61 2.57
Table 6. Average Surface Chloride Contents Obtained for Specimens of
ere
Table 8. Concrete Mixture Proportion of the Concrete Structure in the
Various Curing Durations in Three Exposure ConditionsCode
NPC SFC
Submerged Tidal Atmosphere Submerged Tidal Atmosph
Cs�% wt�
0.39 0.48 0.04 0.48 0.66 0.05
ntnd
JOURNAL
Coefficient in Various Exposure Conditions
Code
Kcuring
NPC SFC
Submerged Tidal Atmosphere Submerged Tidal Atmosphe
C-0 2.7 2.8 4.3 3.3 2.9 1.3
C-1 2.2 2.4 5.9 2.0 1.7 2.5
C-3 1.6 1.8 3.5 1.8 1.2 1.7
C-6 1.4 1.4 1.8 1.4 1.0 3.0
C-27 1.0 1.0 1.0 1.0 1.0 1.0
C-C 2.4 2.5 7.0 2.7 2.3 2.6
Example
Cement�kg /m3�
SF�kg /m3� w/cm
CA�kg /m3�
FA�kg /m3�
360 40 0.45 1100 740
Fig. 3. Twenty-eight-day compressive strength of normal and silifume concrete versus different curing times
Fig. 4. Diffusion coefficient values of normal portland cemeconcrete specimens �NPC� in various exposure conditions adifferent moist curing durations
Fig. 5. Values of diffusion coefficient for different curing conditioin tidal zone compared between normal portland cement and silifume concrete
Fig. 6. Annual temperature diagram of Bandar Abbas
OF MATERIALS IN CIVIL ENGINEERING © ASCE / JANUARY 2008 / 5
ri-orintete.
ahee.u-ced,is
ofisty
reednger
onheer,
cement are compared with silica fume concrete in terms of vaous curing times. The rate of decrease in DC values decreases fcuring periods approximately after 3 days in NPC and 6 daysSFC specimens. This can indicate that the silica fume concrerequires more curing time than normal portland cement concreThese optimum values for the length of moist curing are fromdurability point of view and are almost twice as much as toptimum values from a strength point of view mentioned beforThis is due to the fact that the curing conditions can only inflence some few centimeters of the surface layer of concrete. Sinstrength properties are gained by the whole mass of concrete anin contrast, chloride diffusion occurs in the surface layer, curing
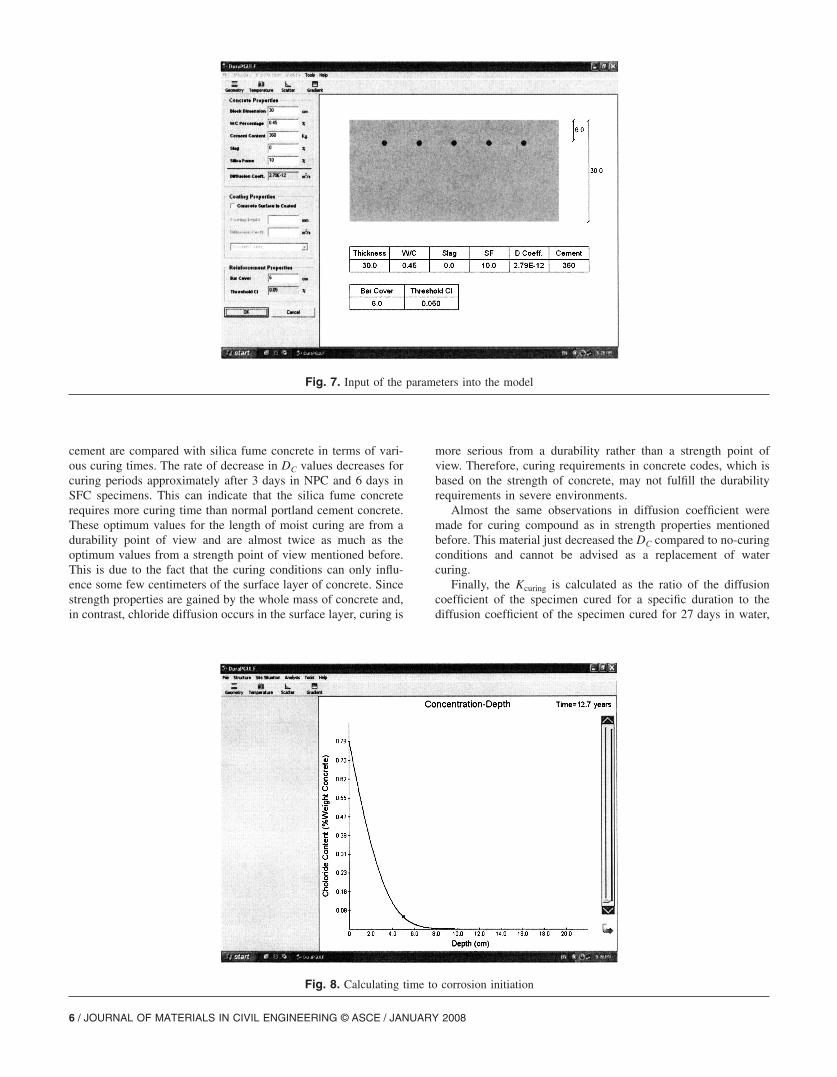
Fig. 7. Input of th
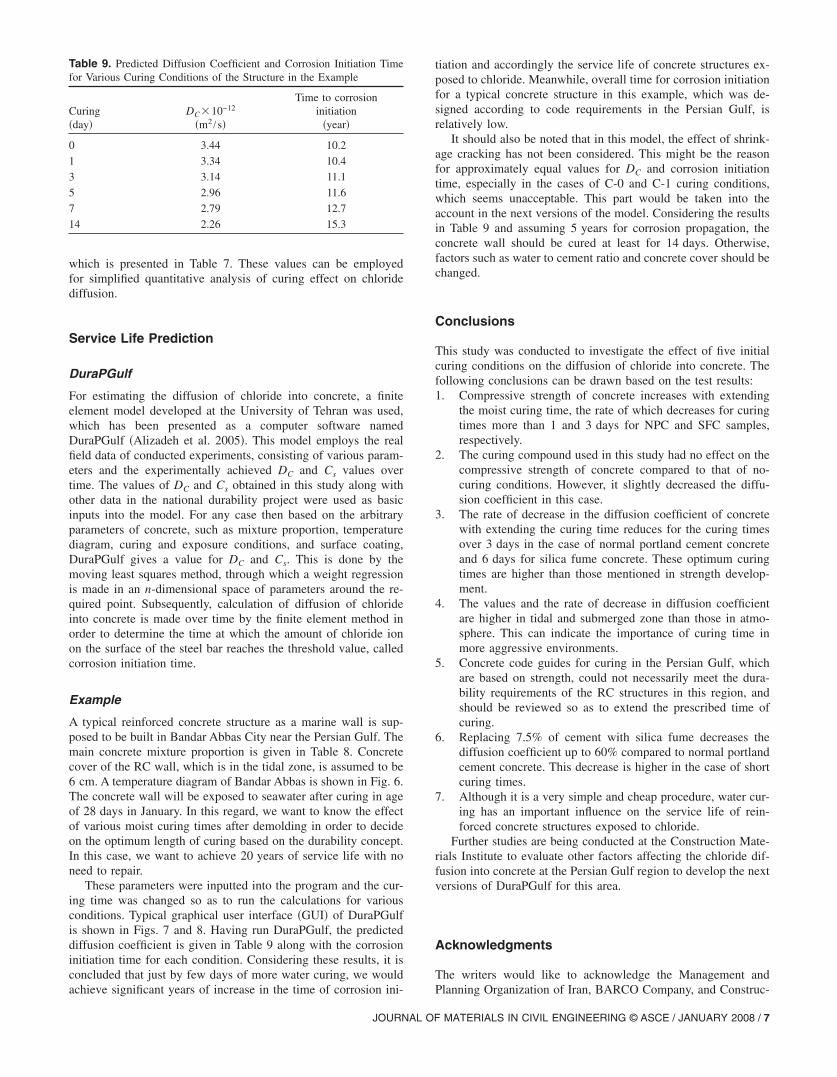
Fig. 8. Calculatin
6 / JOURNAL OF MATERIALS IN CIVIL ENGINEERING © ASCE / JANUA
more serious from a durability rather than a strength pointview. Therefore, curing requirements in concrete codes, whichbased on the strength of concrete, may not fulfill the durabilirequirements in severe environments.
Almost the same observations in diffusion coefficient wemade for curing compound as in strength properties mentionbefore. This material just decreased the DC compared to no-curiconditions and cannot be advised as a replacement of watcuring.
Finally, the Kcuring is calculated as the ratio of the diffusicoefficient of the specimen cured for a specific duration to tdiffusion coefficient of the specimen cured for 27 days in wat
meters into the model
to corrosion initiation
e para
g time
RY 2008
edde
ted,edal-
erthicryreg,hen
e-deinn
ed
p-hetebe6.gectdet.o
r-uslf
ednisldi-
tiation and accordingly the service life of concrete structures ex-one-is
k-onons,
heltshee,
be
ialhe
ngngs,
heo-u-
teeste
ngp-
nto-in
cha-ndof
hendrt
r-n-
e-if-xt
ndc-
Table 9. Predicted Diffusion Coefficient and Corrosion Initiation Time
which is presented in Table 7. These values can be employfor simplified quantitative analysis of curing effect on chloridiffusion.
Service Life Prediction
DuraPGulf
For estimating the diffusion of chloride into concrete, a finielement model developed at the University of Tehran was usewhich has been presented as a computer software namDuraPGulf �Alizadeh et al. 2005�. This model employs the refield data of conducted experiments, consisting of various parameters and the experimentally achieved DC and Cs values ovtime. The values of DC and Cs obtained in this study along wiother data in the national durability project were used as basinputs into the model. For any case then based on the arbitraparameters of concrete, such as mixture proportion, temperatudiagram, curing and exposure conditions, and surface coatinDuraPGulf gives a value for DC and Cs. This is done by tmoving least squares method, through which a weight regressiois made in an n-dimensional space of parameters around the rquired point. Subsequently, calculation of diffusion of chloriinto concrete is made over time by the finite element methodorder to determine the time at which the amount of chloride ioon the surface of the steel bar reaches the threshold value, callcorrosion initiation time.
Example
A typical reinforced concrete structure as a marine wall is suposed to be built in Bandar Abbas City near the Persian Gulf. Tmain concrete mixture proportion is given in Table 8. Concrecover of the RC wall, which is in the tidal zone, is assumed to6 cm. A temperature diagram of Bandar Abbas is shown in Fig.The concrete wall will be exposed to seawater after curing in aof 28 days in January. In this regard, we want to know the effeof various moist curing times after demolding in order to decion the optimum length of curing based on the durability concepIn this case, we want to achieve 20 years of service life with nneed to repair.
These parameters were inputted into the program and the cuing time was changed so as to run the calculations for varioconditions. Typical graphical user interface �GUI� of DuraPGuis shown in Figs. 7 and 8. Having run DuraPGulf, the predictdiffusion coefficient is given in Table 9 along with the corrosioinitiation time for each condition. Considering these results, itconcluded that just by few days of more water curing, we wouachieve significant years of increase in the time of corrosion in
for Various Curing Conditions of the Structure in the Example
Curing�day�
DC�10−12
�m2 /s�
Time to corrosioninitiation
�year�
0 3.44 10.2
1 3.34 10.4
3 3.14 11.1
5 2.96 11.6
7 2.79 12.7
14 2.26 15.3
JOURNAL
posed to chloride. Meanwhile, overall time for corrosion initiatifor a typical concrete structure in this example, which was dsigned according to code requirements in the Persian Gulf,relatively low.
It should also be noted that in this model, the effect of shrinage cracking has not been considered. This might be the reasfor approximately equal values for DC and corrosion initiatitime, especially in the cases of C-0 and C-1 curing conditionwhich seems unacceptable. This part would be taken into taccount in the next versions of the model. Considering the resuin Table 9 and assuming 5 years for corrosion propagation, tconcrete wall should be cured at least for 14 days. Otherwisfactors such as water to cement ratio and concrete cover shouldchanged.
Conclusions
This study was conducted to investigate the effect of five initcuring conditions on the diffusion of chloride into concrete. Tfollowing conclusions can be drawn based on the test results:1. Compressive strength of concrete increases with extendi
the moist curing time, the rate of which decreases for curitimes more than 1 and 3 days for NPC and SFC samplerespectively.
2. The curing compound used in this study had no effect on tcompressive strength of concrete compared to that of ncuring conditions. However, it slightly decreased the diffsion coefficient in this case.
3. The rate of decrease in the diffusion coefficient of concrewith extending the curing time reduces for the curing timover 3 days in the case of normal portland cement concreand 6 days for silica fume concrete. These optimum curitimes are higher than those mentioned in strength develoment.
4. The values and the rate of decrease in diffusion coefficieare higher in tidal and submerged zone than those in atmsphere. This can indicate the importance of curing timemore aggressive environments.
5. Concrete code guides for curing in the Persian Gulf, whiare based on strength, could not necessarily meet the durbility requirements of the RC structures in this region, ashould be reviewed so as to extend the prescribed timecuring.
6. Replacing 7.5% of cement with silica fume decreases tdiffusion coefficient up to 60% compared to normal portlacement concrete. This decrease is higher in the case of shocuring times.
7. Although it is a very simple and cheap procedure, water cuing has an important influence on the service life of reiforced concrete structures exposed to chloride.
Further studies are being conducted at the Construction Matrials Institute to evaluate other factors affecting the chloride dfusion into concrete at the Persian Gulf region to develop the neversions of DuraPGulf for this area.
Acknowledgments
The writers would like to acknowledge the Management aPlanning Organization of Iran, BARCO Company, and Constru
OF MATERIALS IN CIVIL ENGINEERING © ASCE / JANUARY 2008 / 7
tion Materials Institute �CMI� at the University of Tehran for their
.lfir,
nd
ss,
A.of
re
and low-humidity curing on chloride penetration in blended cement
the.”
tes-
on9,
if-n-B,
de
on1.
financial support.
References
Alizadeh, R., Ghods, P., Chini, M., Hoseini, M., and Shekarchi, M�2005�. “Durability based design of RC structures in Persian Guregion using DuraPGulf model.” Proc., Int. Conf. on Concrete RepaRehabilitation and Retrofitting, Capetown, South Africa, 391–394.
ASTM. �2000�. “Test method for acid-soluble chloride in mortar aconcrete.” C1152, West Conshohocken, Pa.
Crank, J. �1975�. The mathematics of diffusion, 2nd Ed., Oxford PreLondon.
Ghoddousi, P., Ganjian, E., Parhizkar, T., and Ramezanianpour, A.�1998�. Concrete technology in the environmental conditionsPersian Gulf, BHRC Publication, Iran.
Khatib, J. M., and Mangat, P. S. �2002�. “Influence of high-temperatu
8 / JOURNAL OF MATERIALS IN CIVIL ENGINEERING © ASCE / JANUA
concrete.” Cem. Concr. Res., 32, 1743–1753.Kim, J. K., Moon, Y. H., and Eo, S. H. �1998�. “Compressive streng
development of concrete with different curing time and temperaturCem. Concr. Res., 28, 1761–1773.
Maekawa, K., Chaybe, R., and Kishi, T. �1999�. Modelling of concreperformance: Hydration, microstructure formation and mass tranport, E & FN Spon, London.
Mangat, P. S., and Limbachiya, M. C. �1999�. “Effect of initial curingchloride diffusion in concrete repair materials.” Cem. Concr. Res., 21475–1485.
Mejlbro, L. �1996�. “The complete solution of Fick’s second law of dfusion with time-dependent diffusion coefficient and surface concetration.” Durability of concrete in saline environment, Cementa ADanderyd, Sweden, 127–158.
NordTest NT Build. �1995�. “Concrete, hardened: Accelerated chloripenetration.” 443, Espoo, Finland.
Toutanji, H. A., and Bayasi, Z. �1999�. “Effect of curing proceduresproperties of silica fume concrete.” Cem. Concr. Res., 29, 497–50
RY 2008