In vitro tests to predict in vivo performance of liposomal dosage forms

285
The progression of atherosclerotic deposits from their early beginnings (the so-called fatty streak) to the formation
of mature plaques with a fibrous cap, the accumulation of macrophages behind the fibrous cap, the potential for plaque rupture (the so-called vulnerable plaques), and the formation of stable, calcified plaques are all reported extensively in the literature.1–5 Of these phases, the vulnerable plaque is the most feared because of the usually catastrophic consequences of plaque rupture, the thrombus lodging at the site of rupture and associated dynamic vasoconstriction leading to acute obstruc-tions of blood flow, often leading in turn, to an acute myocar-dial infarction or a stroke.6 The detection of atherosclerotic plaques and the identification of vulnerable plaques among them are therefore sought-after goals.
Clinical Perspective on p 294
Some of the key features of high-risk plaques include the presence of a large necrotic core with a thin fibrous cap (<65 μm) consisting mostly of type 1 collagen with few smooth
muscle cells.3–5 In addition, detailed histological studies have demonstrated that a significant cause of plaque vulnerability is the accumulation of macrophages behind the fibrous cap of the plaque, attracted to the site by inflammation surrounding the plaque as it protrudes into the bloodstream.7 Targeting inflammatory response, the macrophages recruited to the site, or the receptors that participate in the recruitment is a viable method to target vulnerable plaques. Several attempts have been made to develop contrast agents enabling noninvasive imaging of macrophage-rich plaques. These include agents for use with nuclear imaging,8,9 optical imaging,10 MRI,11 and x-ray imaging.12 In addition, signal-amplification strategies using nanoparticle platforms have been investigated.13–17 Although they are all presumably being readied for the clinic, one expects that their progress would be slowed by the relative dearth of clinical safety data for these particle platforms.
In this work, we evaluated the feasibility of a liposomal-iodinated contrast agent for computed tomography (CT) imaging of macrophage-rich plaques in a mouse model of
Background—The accumulation of macrophages in inflamed atherosclerotic plaques has long been recognized. In an attempt to develop an imaging agent for detection of vulnerable plaques, we evaluated the feasibility of a liposomal-iodine nanoparticle contrast agent for computed tomography imaging of macrophage-rich atherosclerotic plaques in a mouse model.
Methods and Results—Liposomal-iodine formulations varying in particle size and polyethylene glycol coating were fabricated and shown to stably encapsulate the iodine compound. In vitro uptake studies using optical and computed tomography imaging in the RAW 264.7 macrophage cell line identified the formulation that promoted maximal uptake. Dual-energy computed tomography imaging using this formulation in apolipoprotein E–deficient (ApoE−/−) mice (n=8) and control C57BL/6 mice (n=6) followed by spectral decomposition of the dual-energy images enabled imaging of the liposomes localized in the plaque. Imaging cytometry confirmed the presence of liposomes in the plaque and their colocalization with a small fraction (≈2%) of the macrophages in the plaque.
Conclusions—The results demonstrate the feasibility of imaging macrophage-rich atherosclerotic plaques using a liposomal-iodine nanoparticle contrast agent and dual-energy computed tomography. (Circ Cardiovasc Imaging. 2013;6:285-294.)
Key Words: atherosclerosis ◼ computed tomography ◼ contrast media ◼ liposome ◼ macrophage
© 2013 American Heart Association, Inc.
Circ Cardiovasc Imaging is available at http://circimaging.ahajournals.org DOI: 10.1161/CIRCIMAGING.112.000119
Received March 5, 2012; accepted January 3, 2013.From the Singleton Department of Pediatric Radiology, Texas Children’s Hospital, Houston, TX (R.B., K.B.G., A.A.); Department of Radiology, Duke
University, Durham, NC (C.B., D.C., A.J.); and The Texas Heart Institute, Houston, TX (D.V., J.T.W.).The online-only Data Supplement is available at http://circimaging.ahajournals.org/lookup/suppl/doi:10.1161/CIRCIMAGING.112.000119/-/
DC1.Correspondence to Ananth Annapragada, PhD, Professor and Director of Basic Research, The Singleton Department of Pediatric Radiology, 1102 Bates
Ave, Ste 850, Texas Children’s Hospital, Houston, TX 77030. E-mail [email protected]
Dual-Energy Computed Tomography Imaging of Atherosclerotic Plaques in a Mouse Model Using a
Liposomal-Iodine Nanoparticle Contrast AgentRohan Bhavane, PhD; Cristian Badea, PhD; Ketan B. Ghaghada, PhD; Darin Clark, BS;
Deborah Vela, MD; Anoosha Moturu; Akshaya Annapragada; G. Allan Johnson, PhD; James T. Willerson, MD; Ananth Annapragada, PhD
Original Article
by guest on October 16, 2016http://circimaging.ahajournals.org/Downloaded from by guest on October 16, 2016http://circimaging.ahajournals.org/Downloaded from by guest on October 16, 2016http://circimaging.ahajournals.org/Downloaded from by guest on October 16, 2016http://circimaging.ahajournals.org/Downloaded from by guest on October 16, 2016http://circimaging.ahajournals.org/Downloaded from by guest on October 16, 2016http://circimaging.ahajournals.org/Downloaded from by guest on October 16, 2016http://circimaging.ahajournals.org/Downloaded from by guest on October 16, 2016http://circimaging.ahajournals.org/Downloaded from by guest on October 16, 2016http://circimaging.ahajournals.org/Downloaded from by guest on October 16, 2016http://circimaging.ahajournals.org/Downloaded from by guest on October 16, 2016http://circimaging.ahajournals.org/Downloaded from by guest on October 16, 2016http://circimaging.ahajournals.org/Downloaded from by guest on October 16, 2016http://circimaging.ahajournals.org/Downloaded from by guest on October 16, 2016http://circimaging.ahajournals.org/Downloaded from

286 Circ Cardiovasc Imaging March 2013
atherosclerosis. We hypothesized that a liposomal nanopar-ticle encapsulating a large payload of iodinated contrast agent would localize sufficient iodine in macrophage-laden plaques to enable in vivo imaging. The choice of a liposomal platform for development of a CT contrast agent was based on the following: (1) extensive historical data on clinical use18 and (2) capacity to encapsulate a large payload of clinically used iodine contrast agent molecules.19,20
MethodsMaterials1,2-Dipalmitoyl-sn-glycero-3-phosphatidylcholine, cholesterol (Chol), and 1,2-dipalmitoyl-sn-glycero-3-phosphoglycerol, sodium salt (DPPG) were purchased from Avanti Polar lipids (Alabaster, AL). N-(carbonyl-methoxy polyethylene glycol 2000)-1,2-distearoyl-sn-glycero-3 phosphoethanolamine (mPEG-2000-DSPE) was purchased from Genzyme Pharmaceuticals (Cambridge, MA). Lissamine rho-damine B 1,2-dihexadecanoyl-sn-glycero-3-phosphoethanolamine triethylammonium salt (rhodamine-DHPE) was purchased from Invitrogen Corp (Carlsbad, CA). MTS-based cell viability assay kit was purchased from Promega Corp (Madison, WI). RAW 264.7 murine macrophages were obtained from ATCC (Manassas, VA). Whatman Nuclepore polycarbonate track-etch membranes of 100-, 200-, and 400- nm pore sizes were purchased from Fisher Scientific (Waltham, MA). Common laboratory reagents and cell culture me-dium were obtained from Sigma-Aldrich (St. Louis, MO), VWR International (West Chester, PA), and Fisher Scientific.
Preparation of Liposomal FormulationsTwo types of liposomal formulations were prepared: (1) rhodamine-labeled liposomes used in fluorescent-based cell culture experiments and (2) liposomal-iodixanol used for in vitro CT imaging of cells and in vivo studies in mice. Liposomes were prepared using extrusion methods as described previously.19 To study the effect of surface coat-ing on macrophage uptake, 2 surface compositions of liposomes were chosen: PEGylated liposomes, liposomes containing 3% polyethyl-ene glycol (PEG), and non-PEGylated liposomes (Table 1). DPPG, a charged lipid, was included in the non-PEG liposomes to prevent liposome aggregation in the absence of PEG.
To prepare the formulations, lipids were dissolved in ethanol (10% of total volume) and then hydrated with 10 mmol/L Tris saline buffer (pH 7.2) or iodixanol solution (400 mg I/mL) for 30 minutes with constant stirring at 60°C to 65°C. The hydrated lipids were then ex-truded 7 to 10 times at 65°C through either a 400-, 200-, or 100-nm Nuclepore membrane with a high-pressure extruder (Northern Lipids, Vancouver, BC, Canada), thus forming liposomes over a range of sizes.
The liposomal suspensions were diafiltered using a MicroKros module (Spectrum Laboratories Inc, CA; 500-kDa molecular weight cutoff) to remove unencapsulated iodixanol. The iodine concentra-tion was determined by ultraviolet spectrometry (λ=245 nm) using a blank liposome suspension to correct for background absorbance
attributable to scattering. Total phospholipid content of the liposomal formulations was determined by measuring total phosphorus using inductively coupled plasma atomic emission spectroscopy.
The size and the charge of the liposomes were determined using a Brookhaven Instruments Dynamic Light Scattering instrument (Brookhaven Instruments Corp, Holtsville, NY). The zeta potential of the liposomes was measured in 10 mmol/L Tris at pH ≈7.2. The size measurement was performed in Tris-buffered saline at pH ≈7.2.
The in vitro stability of liposomal-iodine was tested in bovine plas-ma. Briefly, liposomes were incubated with plasma at 37°C for 90 minutes. The mixture was then dialyzed against 150 mmol/L saline using a 10 000 MWCO membrane at room temperature. The exter-nal phase was analyzed periodically by ultraviolet-Vis spectrometry (λ
Abs=245 nm) for the next 20 hours to determine the amount of io-
dine that leaked out of the liposomes. As a control, plasma of equal volume was dialyzed to rule out absorbance from plasma components that could appear in the external phase.
Cell Culture and Microscopy
Uptake of Fluorescent Liposomes by RAW 264.7 MacrophagesRAW 264.7 macrophages were plated on 8-chamber glass slides (≈20 000 cells per well) supplemented with DMEM containing 10% fetal bovine serum and 1% antibiotics. After 24 hours, the medium was replenished with fresh medium, and the adherent cells were incu-bated with the rhodamine-labeled liposomal formulations for 2, 4, 6, 10, 18, 24, and 36 hours at 750-μmol/L lipid concentration.
At the end of the incubation period, the medium was discarded followed by gentle washes twice with DMEM and 3 times with phosphate-buffered saline (PBS). The cells were fixed with cold 4% paraformaldehyde in PBS for 5 minutes. They were washed 3 times with PBS and incubated with 0.1% Triton X-100 PBS contain-ing 1% BSA for 5 minutes. The cells were finally washed with PBS and incubated with mounting medium containing 4′,6-diamidino-2- phenylindole (DAPI) for nuclear staining. The slides were cover-slipped and imaged by epifluorescent microscopy.
Image-based cytometry of liposome uptake in vitro was performed using the Lipid Droplet Algorithm on CyteSeer (Vala Sciences, San Diego, CA). The average pixel intensity in the rhodamine channel asso-ciated with each cell was determined. The mean and SD were calculat-ed over all imaged cells in each preparation. The Student double-tailed t test with the Bonferroni correction for multiple testing was then used to determine whether the uptake levels for the 3 preparations (100, 200, 400 nm) in each group (PEG, non-PEG) at each time point were signifi-cantly different (H0: μ1=μ2) from each other. Differences at the 95% confidence level (uncorrected P<0.05) were considered significant.
CT Detection of Liposomal-Iodine Uptake by RAW 264.7 MacrophagesRAW 264.7 macrophages were plated in standard 6-well plates (≈200 000 cells per well) supplemented with DMEM complete me-dium containing 10% fetal bovine serum and 1% antibiotics. After 24 hours, the medium was replenished with fresh medium, and the adherent cells were incubated with liposomal-iodixanol formulations for 2, 4, 10, and 24 hours at 750-μmol/L lipid concentration.
Table 1. Description of Liposomal Preparations
Study Formulation Type Lipid Composition Nanoparticle Sizes,* nm Imaging Moiety
In vitro optical imaging Non-PEG DPPC:Chol:DPPG:Rh-DHPE–44.9:35:20:0.1 100, 200, or 400 Rhodamine
PEG DPPC:Chol:mPEG-2000-DSPE:Rh-DHPE–61.9:35:3:0.1 100, 200, or 400 Rhodamine
In vitro CT imaging Non-PEG DPPC:Chol:DPPG 45:35:20 100, 200, or 400 Iodine
PEG DPPC:Chol:mPEG-2000-DSPE–62:35:3 100, 200, or 400 Iodine
In vivo CT imaging Non-PEG DPPC:Chol:DPPG 45:35:20 400 Iodine and rhodamine
CT indicates computed tomography; DHPE, 1,2-dihexadecanoyl-sn-glycero-3-phosphoethanolamine triethylammonium salt; DPPC, 1,2-dipalmitoyl-sn-glycero-3-phosphatidylcholine; DPPG, 1,2-dipalmitoyl-sn-glycero-3-phosphoglycerol; DSPE, 1,2-distearoyl-sn-glycero-3 phosphoethanolamine; and PEG, polyethylene glycol.
*The numbers 100, 200, and 400 indicate pore sizes of filter membranes through which the liposomes were extruded.
by guest on October 16, 2016http://circimaging.ahajournals.org/Downloaded from

Bhavane et al Dual-Energy CT Imaging of Atherosclerosis in Mice 287
At the end of each incubation time point, the medium was dis-carded, and the adherent cells were rinsed twice with fresh DMEM. The cells were then detached using a cell scraper and centrifuged at 150g for 5 minutes. The cell pellet was resuspended in DMEM, and the cells were counted on a hemocytometer. A cell suspension volume corresponding to approximately 2 million cells was collected in a mi-crocentrifuge and centrifugally separated. The resulting cell pellet was then stored in PBS at 4°C for up to 24 hours before CT imaging.
Imaging was performed on a GE preclinical CT scanner. The fol-lowing parameters were used for the scans: beam energy of 80 kVp, tube current of 450 μA, exposure time of 500 milliseconds, spatial res-olution of 92 μm, and 360 projections. The scan time was 10 minutes.
Quantitative analysis of in vitro CT images was performed in OsiriX (version 3.6, 64 bit). Three regions of interest were drawn in each cell pellet. The image intensity was recorded in Hounsfield units (HU). The Student double-tailed t test with the Bonferroni correction for multiple testing was used to test whether the measured uptake of particles was significantly different (H0: μ1=μ2) between each of the 3 preparations (100, 200, 400 nm) in each group (PEG, non-PEG) at each time point. Differences at the 95% confidence level (uncorrected P<0.05) were considered significant.
Cell Viability After Incubation With Liposomal-IodineTo determine the viability of cells after incubation with liposomes, an MTS assay (CellTiter 96 Aqueous Non-Radioactive Cell Proliferation Assay, Promega, Madison, WI) was performed following instructions on the kit. Briefly, the assay uses a solution of [3-(4,5-dimethylthi-azol-2-yl)-5-(3-carboxymethoxyphenyl)-2-(4-sulfophenyl)-2H-tetra-zolium, inner salt; MTS] that is bioreduced by live cells to form a formazan product that is soluble in cell culture medium.
About 4000 cells per well were plated in a 96-well black-walled plate with clear bottom. Half of the medium (DMEM) was replaced the next day with fresh medium. The cells were then incubated ini-tially in DMEM and then spiked with a liposomal-iodixanol formu-lation (750 μmol/L of lipids in each well) for 2, 6, 24, and 36 hours. The total incubation period for each well (time in DMEM plus time with formulation) was held constant at 36 hours. Untreated controls were prepared identically, except no liposomes were present in the sham spike. At the end of the incubation period, the medium was dis-carded, and the adherent cells were gently rinsed with fresh medium. The cells were then incubated with freshly prepared MTS solution. The absorbance of the formazan product at 490 nm was measured and was directly proportional to the number of living cells. The cell viability was determined by the following formula: %Viability= (absorbance of cells treated with liposomes/average absorbance of untreated cells)×100. Results were presented as mean values of treat-ments (n=3) with the error bars indicating SDs. The Student double-tailed t test was used to test the significance of difference of each treatment group (H0: μ1=μ2) individually from the untreated control group (n=6). Any value of P<0.05 was considered significant.
Animal StudiesAll animal procedures were approved by the Institutional Animal Care and Use committees at Duke University Medical Center and University of Texas Health Science Center, Houston. Eight apoli-poprotein E–deficient (ApoE−/−) mice (12±2 months) and 6 control C57BL/6 mice were used for the study. The ApoE−/− mice were fed with a Western type diet for 4 to 12 weeks before CT imaging studies.
The imaging studies were performed on a custom-built dual-source micro-CT system described previously,21 using 40 kVp, 250 mA, 16 milliseconds per exposure for 1 imaging chain and 80 kVp, 160 mA, 10 milliseconds for the other imaging chain. For each imaging set, 360 projections were acquired over a complete rotation. The 2 x-ray tubes fired simultaneously. Mice were kept anesthetized with 1.5% isoflurane during scanning. Temperature was maintained with heat lamps and a feedback controller. A prospective 2-channel gating method was used to eliminate both respiratory and cardiac motion during scanning.22 The ECG signal was monitored from the footpads, while the pulmonary signal was monitored with a pneumatic pillow. Both signals were integrated for gating using a custom LabVIEW script. CT images were acquired at 4 time points: precontrast injection
and 2, 48, and 96 hours postcontrast injection. Liposomal-iodixanol contrast agent was injected into the tail vein at 20 μL/gm (1.4 mg of I/g body weight) over 2 to 3 minutes. We did not include a control group with free iodixanol injection (instead of the liposomal-iodixa-nol) because there is no evidence of ulceration or rupture of plaques in ApoE−/− mice in the age range of our study, and free iodixanol does not localize in plaques in the absence of ulceration.23
CT reconstructions were performed using the Feldkamp algorithm resulting in 2 CT data sets (512×512 matrix size and 88-μm voxel size) corresponding to the 2 source energies at each imaging time point.24 Each of the 2 CT sets was first processed with edge-preserv-ing bilateral filtering to reduce noise and then used to perform a dual-energy material-decomposition using scripts written in MATLAB as described previously.25,26 Based on the decomposition, 3-dimensional iodine and calcium concentration maps were generated. Color-coded decomposed images displaying either iodine or calcium signal or fused iodine–calcium signal were generated using ImageJ (National Institutes of Health, v1.46a 64-bit).
Ex Vivo Studies of Liposome Uptake in PlaquesThe liposomes injected into ApoE−/− and C57BL/6 mice for CT im-aging also contained rhodamine. After CT imaging, the mice were euthanized and perfused with PBS. The aortas were excised and fixed in 4% parafomaldehyde for 3 to 4 hours and then incubated in 30% sucrose solution for 24 hours. The aortas were then cut and embedded in OCT and frozen at −80°C. Sections of 10-μm thickness were cut from the frozen blocks on a cryotome and mounted on glass slides. The slides were then stained with a nuclear stain (DAPI) and FITC-labeled Mac-2 antibody, for macrophages, and imaged in the DAPI, rhodamine, and FITC channels on an epifluorescent microscope. The incident light intensity and camera exposure settings for each channel were kept constant for all the sections imaged.
Aorta sections from ApoE−/− mice fed normal chow and not treated with rhodamine liposomes were also imaged in the same 3 channels as a control group to account for any background fluorescence (in the rhodamine channel) associated with the plaques.
The images were processed using ImageJ (v1.46r 64 bit) and Fiji (v1.47b 64 bit) to crop out any areas not associated with intimal tis-sue or plaques. The excluded areas were either sections of the vessel wall (media, adventitia) or vessel lumen. The cropped images were then analyzed in CyteSeer (Vala Sciences, San Diego, CA) using the colocalization algorithm. Cyteseer operates by identifying individual nuclei (via the signal in the DAPI channel) and tessellating the re-maining space into individual cells, each cell containing 1 nucleus. Artifactual cells in the whitespace surrounding the cropped images were then manually removed from the analysis. The average FITC channel intensity of each cell was then plotted against the average rhodamine intensity for image-based cytometry.
ResultsCharacterization of Liposomal FormulationsThe non-PEG liposomes, containing the negatively charged lipid DPPG, showed 1.5- to 2-fold higher surface negative charge compared with their PEG counterparts (Table 2). The rhodamine-labeled liposomes exhibited particle sizes similar to those seen previously for liposomes of similar composi-tions extruded through the filter pore sizes used in this study.27 The use of highly concentrated and viscous iodixanol solu-tion impacted particle size when compared with rhodamine-labeled liposomes that were extruded in a noniodinated buffer solution. The liposomal formulations extruded through the 400-nm filter membranes, because of their high encapsulation volume, showed the largest iodine-to-lipid ratio (Table 3). In vitro stability analysis of liposomal-iodixanol formulations in bovine plasma demonstrated stable encapsulation of iodixanol
by guest on October 16, 2016http://circimaging.ahajournals.org/Downloaded from

288 Circ Cardiovasc Imaging March 2013
as shown by <2% free iodixanol measured over 20 hours of dialysis (Figure I in the online-only Data Supplement).
Fluorescent Uptake Studies With RAW 264.7 MacrophagesTo study macrophage uptake of PEGylated and non-PEGylated liposomes, rhodamine-labeled liposomes were incubated with RAW 264.7 murine macrophages. The non-PEGylated liposomal formulations were taken up more avidly
than PEGylated liposomal formulations (Figure 1). Quantita-tive analysis of fluorescent images demonstrated that the non-PEG liposomal formulation extruded through 400-nm filter membrane showed a significantly higher uptake after 6 hours when compared with 100- and 200-nm non-PEG liposomes (Figure 2A). An increase in signal intensity was seen with incubation time for all the liposomal formulations. Although the PEG-liposomes exhibited a positive correlation between macrophage uptake and incubation period, no significant dif-ferences in uptake were seen among various sizes (Figure 2B).
CT Uptake Studies With RAW 264.7 MacrophagesTo evaluate the feasibility of detecting macrophages containing nanoparticle contrast agent using CT imaging, non-PEGylated and PEGylated liposomes containing the iodine contrast agent iodixanol were incubated with RAW 264.7 macrophages for different incubation periods. No detectable signal was seen at the 2-hour incubation period for any of formulations. At 4 hours, only the cells incubated with non-PEGylated 400-nm liposomes
Table 2. Size and Zeta Potential Analysis of Liposomal Preparations
Liposome Formulation*
Effective Diameter, nm
(PDI)†
Zeta Potential,
mV
Rhodamine liposomes for in vitro optical imaging
Non-PEG–100 108 (0.074) −81±7
Non-PEG–200 166 (0.059) −65±2
Non-PEG–400 270 (0.177) −70±4
PEG–100 103 (0.073) −36±2
PEG–200 146 (0.111) −39±2
PEG–400 218 (0.125) −39±3
Liposomal-iodixanol for in vitro CT imaging
Non-PEG–100 93 (0.067) −58±3
Non-PEG–200 144 (0.115) −60±2
Non-PEG–400 225 (0.121) −69±2
PEG–100 98 (0.112) −37±2
PEG–200 119 (0.108) −33±2
PEG–400 153 (0.071) −33±1
Liposomal-iodixanol for in vivo studies
IV-400 172 (0.1) −69±1
CT indicates computed tomography; PDI, polydispersity index; and PEG, polyethylene glycol.
*The numbers 100, 200, and 400 indicate pore sizes of filter membranes through which the liposomes were extruded.
†PDI is defined as the ratio of the volume mean diameter to the number mean diameter.
Table 3. Final Iodine Concentration Assayed by Ultraviolet Absorbance and Final Lipid Concentration Determined by Phosphorus Assay of the Phospholipids by Inductively Coupled Plasma Atomic Emission Spectroscopy
CT Liposome Formulation
Final Iodine Concentration,
mg/mL
Final Lipid Concentration,
mg/mL
Final Iodine: Lipid Ratio,
mg/mg
Non PEG–100 32 38 0.84
Non PEG–200 69 43 1.6
Non PEG–400 82 42 1.96
PEG–100 23 36 0.64
PEG–200 45 45 0.99
PEG–400 56 41 1.35
IV-400 70 47 1.47
CT indicates computed tomography; and PEG, polyethylene glycol.
Figure 1. Effect of liposome size and incubation time on the uptake of rhodamine-labeled non-PEGylated liposomes (A) and PEGylated liposomes (B) by RAW 264.7 macrophages. Cell nucleus was stained with DAPI (blue color). Images were acquired at ×40 magnification. PEG indicates polyethylene glycol.
by guest on October 16, 2016http://circimaging.ahajournals.org/Downloaded from

Bhavane et al Dual-Energy CT Imaging of Atherosclerosis in Mice 289
showed detectable signal. After 24 hours of incubation, all the pellets showed detectable signal. At the 24-hour point, the 400-nm non-PEG liposomes showed significantly higher uptake with a CT number of 600 HU (Figure 2C). In comparison, the CT number in a blank pellet was 6±2.2 HU. Based on the in vitro results, the non-PEG liposomal formulation extruded through 400-nm membrane was used for in vivo testing.
MTS Assay for Cell ViabilityThe viability of the cells after incubation with liposomal-iodix-anol was determined by MTS assay. Although sporadic sam-ples showed statistically different cell viability compared with the control as indicated by the P values, no particular trend was observed either with increased incubation time or differences in formulation, suggesting that the liposomal formulations had little to no effect on the viability of cells (Figure 3).
In Vivo StudiesAnimals were imaged on a dual-source micro-CT scanner before and after injection of rhodamine containing liposomal-iodixanol
contrast agent. All the 8 ApoE−/− mice scanned in this study showed some level of calcification in the aorta. Mice were imaged at 40 and 80 kVp to enable spectral decomposition of images for separation of iodine and calcium signal. The high blood–pool signal attenuation obtained immediately post-contrast facilitated clear visualization of the vessel lumen in areas adjacent to calcified plaques (Figure 4). By 48 hours, the majority of contrast agent was cleared from systemic circula-tion as demonstrated by the absence of any residual blood–pool enhancement. The use of spectral imaging enabled detection of iodine signal in areas of calcified plaques (Figure 5). The iodine signal was visible at several regions in the aorta, most notably the aortic arch and aortic sinus. CT imaging of control mice did not demonstrate nonspecific signal enhancement in any regions of the aorta (Figure 5). Additional images from the other ani-mals are provided in the online-only Data Supplement.
Ex Vivo Studies of Liposome Uptake in PlaquesTo analyze the extent of macrophage uptake of the rhodamine liposomes, aortic sections were stained for macrophage and
Figure 2. Quantitative analysis of uptake of rhodamine-labeled non-PEGylated liposomes (A) and PEGylated liposomes (B) by RAW 264.7 macrophages. A total of 100 cells were used for the analysis. Computed tomography (CT) number of iodine-containing macro-phages (C and D). Macrophages were incubated with non-PEGylated liposomal-iodine (C) and PEGylated liposomal-iodine (D). Error bars represent SDs. PEG indicates polyethylene glycol.
by guest on October 16, 2016http://circimaging.ahajournals.org/Downloaded from

290 Circ Cardiovasc Imaging March 2013
cell nucleus and imaged using fluorescent microscopy. Local-ization of rhodamine label seemed consistent but was weak in all areas of concentrated macrophage populations at exposed regions of plaques and in smooth muscle of the vascular wall proximal to the lumen. Figure 6 shows a representative section of plaque infiltrated with macrophages and with rhodamine liposomes localized in the plaque.
Image-based cytometric analysis by tessellating the image into approximations of cell boundaries as in Figure 6D is shown in Figure 7. Each point represents the mean rhodamine and FITC intensity within each such approximate cell. Tissues from normal mice showed low levels of macrophages and
low-rhodamine signal (blue points). ApoE−/− mice not treated with rhodamine-labeled liposomes (black points) showed a greater level of macrophages, as expected because they have significant plaque buildup. However, their rhodamine signal was only marginally higher and is attributed to tissue background. ApoE−/− mice treated with rhodamine liposomes, however, showed a distinct population of macrophage cells in which high levels of rhodamine label are observed (red points). This population is clearly distinct from the C57BL/6 control (normal) mice and the ApoE−/− control mice not treated with rhodamine-labeled liposomes. The fraction of cells showing the elevated rhodamine levels is relatively small, ≈2%.
DiscussionMacrophages play a central role in the development and progression of atherosclerotic plaques. As they engulf lipid deposits behind the fibrous cap, macrophages transform into foam cells, and apparently, many of them remain in situ, contributing in part to a swelling of the plaque, further inflammation, and a cascade to even more rapid macrophage recruitment to the site. Atheroma macrophage burden is known to increase continuously from plaque erosion to plaque rupture.28 Quantitative analysis of macrophage burden and atherosclerotic plaque progression has primarily been investigated using histological techniques. A semiquantitative, immunohistological analysis of macrophages in plaques, as a function of age, showed that macrophages occupied 40% to 60% of plaque area.29 Systemic infections have also been shown to enhance inflammation at plaque sites, causing an increase in macrophage infiltration both within the plaque and the surrounding adventitia. In several cases, the infections result in acute myocardial infarction and deaths. Madjid et al30 used histological analysis to show that patients with influenza infection had twice as many macrophages (582±774 per 1 mm2) in atheromatous lesions as control subjects (281±321 per 1 mm2) with atherosclerosis and no infection. The number of macrophages in the adventitial layer was 5 times more in infected cases (1577±1872 per 1 mm2) than in the control cases (265±185 per
Figure 3. Effect of liposomal-iodine uptake on cell viability of RAW 264.7 macrophages. The macrophages were incubated with non-PEG liposomal-iodine (A) and PEGylated liposomal-iodine (B) for different incubation times, and the cell viability was assessed using the MTS assay. Error bars represent SD. Untreated cells were used as controls; their viability numbers were averaged and normalized to 100%, and all other test cases normalized against this standard. PEG indicates polyethylene glycol
Figure 4. Three-dimensional volume-rendered image and orthogonal slices demonstrating covisualization of blood-pool (red) and calcified plaques (yellow regions) in an apolipoprotein E–deficient mouse. Images were acquired within 2 hours postad-ministration of the liposomal contrast agent.
by guest on October 16, 2016http://circimaging.ahajournals.org/Downloaded from

Bhavane et al Dual-Energy CT Imaging of Atherosclerosis in Mice 291
1 mm2). Noninvasive imaging techniques that enable quantitative analysis of plaque macrophage burden could therefore assist in identification of these so-called vulnerable patients.
Positron emission tomography imaging using18F-FDG has been investigated, both preclinically and clinically, to assess macrophage burden. However, the low spatial resolution and limited specificity present challenges despite its high contrast sensitivity.31 CT and MRI provide relatively high spatial resolution compared with positron emission tomography imaging. MRI also has the advantage of far higher sensitivity when compared with CT. However, quantitative analysis of MR images is challenging because of the lack of linearity in signal intensity and contrast agent concentration. CT is better suited
for quantitative imaging because signal attenuation is directly proportional to contrast agent concentration. However, most CT systems clinically installed today provide very limited material discrimination because of the use of a single energy in scanning. Because of this limitation, calcified deposits, which are frequently observed in atherosclerotic plaques and result in high-signal attenuation, may be indistinguishable from iodinated contrast agents that accumulate at these sites. The low contrast sensitivity of CT technique is further accentuated by the limitations of conventional iodine–based contrast agents, namely lack of target specificity and signal amplification capabilities, because a single targeting molecule can only be associated with a single imaging moiety, in this case iodine. Recent advances in spectral CT imaging using dual-energy CT scanners and fast scanning voltages (kVp) switching have the potential to overcome these issues.32
In this preclinical study, we therefore used CT as the mode of detection and a liposomal-iodinated contrast agent for pro-viding target specificity and signal amplification for imaging of macrophage-rich plaques. Liposomes have been used as drug delivery vehicles for nearly 20 years, with the major use being in the delivery of chemotherapeutics to solid tumors.33 Recently, both CT and MR imaging agents using PEGylated liposomes as carriers for the imaging agents have been demon-strated.19,20,34,35 The primary clearance route of these particles from the bloodstream is via the reticulo-endothelial system, and as such, their presence in circulatory macrophages that localize into atherosclerotic plaques is quite likely. However, their long circulation half-life (≈40 hours) implies that the localized particles are not likely to be visible in a CT scan over the background of the residual particles in the blood-stream.36 To develop a short blood half-life contrast agent, a non-PEGylated liposomal construct was considered. A reduc-tion in the PEG levels would also accelerate the macrophage uptake rate of these particles. In addition, previous studies have shown that the macrophage uptake rate is dependent on the size of liposome particles.37 We therefore chose to vary the particle size and select a particle size that maximizes the macrophage uptake rate. The choice of iodine as the imaging
Figure 5. Representative gray scale (rows 1 and 3) and corre-sponding decomposed (rows 2 and 4) coronal images of an apo-lipoprotein E–deficient (ApoE−/−) mouse and a control C57BL/6 mouse before and after administration of liposomal-iodine con-trast agent. Red denotes iodine and green denotes calcium. The white arrows indicate region of signal enhancement attributable to accumulation of liposomal-iodine in plaques.
Figure 6. Histological examination of plaque sec-tion showing localization of rhodamine in regions of macrophage infiltration. A, Hematoxylin and eosin section showing plaque and vessel wall (tunica media and portions of the adventitia; ×10). B, Inset from A, enlarged. C, DAPI–FITC-rhodamine–merged image showing blue: cell nuclei, red: rhodamine in liposomes, and green: macrophages labeled by Mac-2 FITC. D, Cropped image of C used in imag-ing cytometric analysis, with computer-generated tessellation to approximate cell boundaries.
by guest on October 16, 2016http://circimaging.ahajournals.org/Downloaded from

292 Circ Cardiovasc Imaging March 2013
moiety was based on the availability of clinical data with iodinated contrast agents (in this work, iodixanol was encap-sulated in the liposomes). Other studies have demonstrated the use of higher Z elements, specifically gold and bismuth, for development of x-ray contrast agents.16,38,39 Although such agents have greater attenuation efficiency, the lack of safety and toxicity data, n both preclinical and clinical testing, pres-ents challenges for clinical translation.
In vivo imaging studies were performed on a dual-energy micro-CT scanner to enable material discrimination. In the ApoE-deficient model, calcified plaques typically develop after about 6 to 8 months of age.40 A dual-energy spectral separation technique was therefore developed to differentiate calcium deposits from iodine on the basis of the differences in their x-ray absorption spectra.25 Briefly, a postreconstruction dual-energy decomposition was applied to the CT data, resulting in independent images of iodine and calcium. The selection of the 2 scanning energies was based on simulations and validated in phantom studies to maximize the selectivity between the 2 images. For the dual-source micro-CT system, 40 kVp is the lowest voltage allowed by the x-ray generator of the CT system. This voltage provides minimum enhancement, whereas values in the range of 70 or 80 kVp provide maximum enhancement when imaging iodine. Calcium, on the other hand, has a maximum CT attenuation at 40 kVp, and this monotonically decreases with an increase in kVp. Therefore, in the ApoE−/− mice studies, we selected 40 and 80 kVp as the scanning energies to optimize contrast discrimination between calcium and iodine. With a dual-energy scan and elemental decomposition, it was possible to separate the signal between calcium and any iodine that may be taken up macrophages. The presence of iodine in the plaque can be attributed both to uptake of the liposomes by macrophages residing in the plaque
and to circulating macrophages that have taken up liposomes and trafficked into the plaque lesions. Swirski et al41 have shown that certain populations of splenic monocytes can be recruited into inflamed regions of the aorta, suggesting that macrophages from the reticulo-endothelial system could also contribute. In the ApoE−/− model, our data suggest that it takes at least 48 hours for a detectable number of liposomes (or macrophages loaded with liposomes) to enter inflamed plaque.
Image-based cytometric analysis of the atherosclerotic lesions suggests that the lesions are rich in macrophages, con-sistent with their inflamed status, and that the iodine-containing liposomes are localized in a small fraction of these macro-phages. This small fraction is consistent with the relatively short duration of time for which the animals were exposed to the particles and with the fact that the macrophages had to take up the particles and be transported to the lesion. However, this relatively small number of macrophages still contain enough iodinated liposomes to be readily detected by CT imaging.
The limitations of this work include the following points. First, the small feature size in mice necessitated the use of a micro-CT system, making clinical translation difficult because of differences in both pathophysiology and imaging hard-ware.42,43 Lacking an HU calibration on this scanner, we were unable to quantify the plaques observed. Before starting clini-cal trials, testing in larger animal species on clinical CT scan-ners will be necessary. Second, the surface charge on DPPG liposomes has the potential for eliciting hypersensitivity reac-tions.44 Studies to evaluate the potential toxicity of these agents are clearly warranted and will be required for an investigational new drug application. Third, in addition to their enhanced uptake by macrophages, the non-PEGylated 400-nm liposomes carry a greater amount of iodine per unit of lipid in comparison with typical liposomal formulations. However, the size of parti-cles may pose challenges in sterilization, and aseptic processing may be necessary to manufacture a sterile product for clinical use. Fourth, the current generation of clinical CT scanners do not enable imaging below 80 kVp, although spectral decom-position techniques to separate calcium from iodine at stan-dard clinical energies have been investigated.32 Furthermore, challenges still remain attributable to small feature sizes, large voxel size on clinical CT systems, and the potential for par-tial volume effects, resulting in limited contrast sensitivity. However, the technological advances in dual-energy CT scan-ners, with respect to material discrimination, photon counting detectors, low radiation dose, and increased spatial resolution, coupled with improved image processing techniques for noise reduction, are likely to have a positive impact on the use of CT for quantifying and detecting vulnerable plaques.16 There is also growing evidence in the literature for the role of macro-phages in other diseases with inflammatory processes,5,45,46 all of which could be imaged using the methods presented in this study. In summary, in short, the methods described in this study are appealing for investigational use, but their use in humans will have to wait for regulatory approval.
AcknowledgmentsWe would like to acknowledge Drs Yi Qi (Duke University) and Laurence Hedlund for help with the animal studies; Tommy Reese and Betsy Molinari (Texas Heart Institute) for assistance with
Figure 7. Imaging cytometric analysis of aorta sections from mice that received rhodamine-labeled liposomes (red dots). Apo-lipoprotein E–deficient (ApoE−/−) mice with no liposomes (black dots) and background C57BL/6 animals with liposome treat-ment (blue dots) were used as controls. Note that the C57BL/6 animals show practically no rhodamine or FITC signal, indicating no macrophages and no liposomes in the aortic wall. Untreated ApoE−/− mice show significant FITC signal, indicating a significant macrophage level. The corresponding rhodamine signal is attrib-uted to tissue background and establishes the baseline criterion. The treated ApoE−/− mice show a significant elevation in rhoda-mine levels for a fraction of the cells (top right quadrant, ≈2% of cells), suggesting that avid uptake of rhodamine is limited to ≈2% of the macrophages in the plaques that are imaged.
by guest on October 16, 2016http://circimaging.ahajournals.org/Downloaded from

Bhavane et al Dual-Energy CT Imaging of Atherosclerosis in Mice 293
histology; Evan Johnson and Charles Kingsley (MD Anderson Cancer Center) for CT imaging of in vitro phantoms; and the veterinary staff at UTHSCH and Duke Medical Center. Dr Zbigniew Starosolski as-sisted with the 3-dimensional volume renderings.
Sources of FundingThis work was supported in part by funding from Marval Biosciences Inc. (to Drs Annapragada and Ghaghada). Part of this work was sup-ported by National Institutes of Health/NCRR National Biomedical Technology Resource Center grants (P41 RR005959, NCI U24 CA092656; Dr Badea and Johnson).
DisclosuresDrs Annapragada and Ghaghada are both significant stockhold-ers in Marval Biosciences Inc. The other authors have no conflicts to report.
References 1. Hansson G. Inflammation, atherosclerosis, and coronary artery disease. N
Engl J Med. 2005;352:1685–1695. 2. Duff G. The pathogenesis of atherosclerosis. Can Med Assoc J.
1951;64:387–394. 3. Virmani R, Burke AP, Farb A, Kolodgie FD. Pathology of the unstable
plaque. Prog Cardiovasc Dis. 2002;44:349–356. 4. Virmani R, Narula J, Leon M, Willerson J. The Vulnerable Atherosclerotic
Plaque: Strategies for Diagnosis and Management. John Wiley & Sons Ltd; 2007.
5. Libby P. Inflammation in atherosclerosis. Nature. 2002;420:868–874. 6. Naghavi M, Libby P, Falk E, Casscells SW, Litovsky S, Rumberger J,
Badimon JJ, Stefanadis C, Moreno P, Pasterkamp G, Fayad Z, Stone PH, Waxman S, Raggi P, Madjid M, Zarrabi A, Burke A, Yuan C, Fitzgerald PJ, Siscovick DS, de Korte CL, Aikawa M, Juhani Airaksinen KE, Assmann G, Becker CR, Chesebro JH, Farb A, Galis ZS, Jackson C, Jang IK, Koenig W, Lodder RA, March K, Demirovic J, Navab M, Priori SG, Rekhter MD, Bahr R, Grundy SM, Mehran R, Colombo A, Boerwinkle E, Ballantyne C, Insull W Jr, Schwartz RS, Vogel R, Serruys PW, Hansson GK, Faxon DP, Kaul S, Drexler H, Greenland P, Muller JE, Virmani R, Ridker PM, Zipes DP, Shah PK, Willerson JT. From vulnerable plaque to vulnerable patient: a call for new definitions and risk assessment strate-gies: Part I. Circulation. 2003;108:1664–1672.
7. Virmani R, Burke AP, Farb A, Kolodgie FD. Pathology of the vulnerable plaque. J Am Coll Cardiol. 2006;47(8 suppl):C13–C18.
8. Johnson LL, Schofield L, Donahay T, Narula N, Narula J. 99mTc-annexin V imaging for in vivo detection of atherosclerotic lesions in porcine coro-nary arteries. J Nucl Med. 2005;46:1186–1193.
9. Nahrendorf M, Keliher E, Panizzi P, Zhang H, Hembrador S, Figueiredo JL, Aikawa E, Kelly K, Libby P, Weissleder R. 18F-4V for PET-CT imag-ing of VCAM-1 expression in atherosclerosis. JACC Cardiovasc Imaging. 2009;2:1213–1222.
10. Chen J, Tung CH, Mahmood U, Ntziachristos V, Gyurko R, Fishman MC, Huang PL, Weissleder R. In vivo imaging of proteolytic activity in athero-sclerosis. Circulation. 2002;105:2766–2771.
11. Botnar RM, Perez AS, Witte S, Wiethoff AJ, Laredo J, Hamilton J, Quist W, Parsons EC Jr, Vaidya A, Kolodziej A, Barrett JA, Graham PB, Weiss-koff RM, Manning WJ, Johnstone MT. In vivo molecular imaging of acute and subacute thrombosis using a fibrin-binding magnetic resonance imag-ing contrast agent. Circulation. 2004;109:2023–2029.
12. Hyafil F, Cornily JC, Feig JE, Gordon R, Vucic E, Amirbekian V, Fisher EA, Fuster V, Feldman LJ, Fayad ZA. Noninvasive detection of macrophages using a nanoparticulate contrast agent for computed tomography. Nat Med. 2007;13:636–641.
13. Nahrendorf M, Zhang H, Hembrador S, Panizzi P, Sosnovik DE, Aikawa E, Libby P, Swirski FK, Weissleder R. Nanoparticle PET-CT imaging of macrophages in inflammatory atherosclerosis. Circulation. 2008;117:379–387.
14. Ruehm SG, Corot C, Vogt P, Kolb S, Debatin JF. Magnetic resonance imag-ing of atherosclerotic plaque with ultrasmall superparamagnetic particles of iron oxide in hyperlipidemic rabbits. Circulation. 2001;103:415–422.
15. Litovsky S, Madjid M, Zarrabi A, Casscells SW, Willerson JT, Naghavi M. Superparamagnetic iron oxide-based method for quantifying recruit-ment of monocytes to mouse atherosclerotic lesions in vivo: enhancement
by tissue necrosis factor-alpha, interleukin-1beta, and interferon-gamma. Circulation. 2003;107:1545–1549.
16. Cormode DP, Roessl E, Thran A, Skajaa T, Gordon RE, Schlomka JP, Fuster V, Fisher EA, Mulder WJ, Proksa R, Fayad ZA. Atheroscle-rotic plaque composition: analysis with multicolor CT and targeted gold nanoparticles. Radiology. 2010;256:774–782.
17. Hyafil F, Cornily JC, Rudd JH, Machac J, Feldman LJ, Fayad ZA. Quantification of inflammation within rabbit atherosclerotic plaques us-ing the macrophage-specific CT contrast agent N1177: a comparison with 18F-FDG PET/CT and histology. J Nucl Med. 2009;50:959–965.
18. Alberts DS, Muggia FM, Carmichael J, Winer EP, Jahanzeb M, Venook AP, Skubitz KM, Rivera E, Sparano JA, DiBella NJ, Stewart SJ, Kavanagh JJ, Gabizon AA. Efficacy and safety of liposomal anthracyclines in phase I/II clinical trials. Semin Oncol. 2004;31(suppl 13):53–90.
19. Mukundan S Jr, Ghaghada KB, Badea CT, Kao CY, Hedlund LW, Provenzale JM, Johnson GA, Chen E, Bellamkonda RV, Annapragada A. A liposomal nanoscale contrast agent for preclinical CT in mice. AJR Am J Roentgenol. 2006;186:300–307.
20. Samei E, Saunders RS, Badea CT, Ghaghada KB, Hedlund LW, Qi Y, Yuan H, Bentley RC, Mukundan S Jr. Micro-CT imaging of breast tumors in ro-dents using a liposomal, nanoparticle contrast agent. Int J Nanomedicine. 2009;4:277–282.
21. Johnston SM, Johnson GA, Badea CT. Geometric calibration for a dual tube/detector micro-CT system. Med Phys. 2008;35:1820–1829.
22. Badea C, Hedlund LW, Johnson GA. Micro-CT with respiratory and car-diac gating. Med Phys. 2004;31:3324–3329.
23. Sun Z, Cao Y. Multislice CT angiography assessment of left coronary ar-tery: correlation between bifurcation angle and dimensions and develop-ment of coronary artery disease. Eur J Radiol. 2011;79:e90–e95.
24. Feldkamp L, Davis L, Kress J. Practical cone-beam algorithm. J Opt Soc Am. 1984;1:612–619.
25. Badea C, Johnston S, Qi Y, Ghaghada K, Johnson G. Dual-energy micro- CT imaging for differentiation of iodine- and gold-based nanoparticles. Paper presented at: Progress in Biomedical Optics and Imaging— Proceedings of SPIE 7961; 2011; Lake Buena Vista, FL.
26. Clark D, Johnson GA, Badea CT. Denoising of 4D cardiac micro-CT data using median-centric bilateral filtration. Proc SPIE. 2012:8314: 83143Z.
27. Ghaghada K, Hawley C, Kawaji K, Annapragada A, Mukundan S Jr. T1 relaxivity of core-encapsulated gadolinium liposomal contrast agents— effect of liposome size and internal gadolinium concentration. Acta Radiol. 2008;15:1259–1263.
28. Narula J, Garg P, Achenbach S, Motoyama S, Virmani R, Strauss HW. Arithmetic of vulnerable plaques for noninvasive imaging. Nat Clin Pract Cardiovasc Med. 2008;(suppl 2):S2–10.
29. van Oostrom O, Velema E, Schoneveld AH, de Vries JP, de Bruin P, Seldenrijk CA, de Kleijn DP, Busser E, Moll FL, Verheijen JH, Virmani R, Pasterkamp G. Age-related changes in plaque composition: a study in patients suffering from carotid artery stenosis. Cardiovasc Pathol. 2005;14:126–134.
30. Madjid M, Vela D, Khalili-Tabrizi H, Casscells SW, Litovsky S. Sys-temic infections cause exaggerated local inflammation in atherosclerotic coronary arteries: clues to the triggering effect of acute infections on acute coronary syndromes. Tex Heart Inst J. 2007;34:11–18.
31. Folco EJ, Sheikine Y, Rocha VZ, Christen T, Shvartz E, Sukhova GK, Di Carli MF, Libby P. Hypoxia but not inflammation augments glucose up-take in human macrophages: implications for imaging atherosclerosis with 18fluorine-labeled 2-deoxy-D-glucose positron emission tomography. J Am Coll Cardiol. 2011;58:603–614.
32. Primak AN, Giraldo JC, Eusemann CD, Schmidt B, Kantor B, Fletcher JG, McCollough CH. Dual-source dual-energy CT with additional tin fil-tration: dose and image quality evaluation in phantoms and in vivo. AJR Am J Roentgenol. 2010;195:1164–1174.
33. Ranson MR, Carmichael J, O’Byrne K, Stewart S, Smith D, Howell A. Treat-ment of advanced breast cancer with sterically stabilized liposomal doxorubi-cin: results of a multicenter phase II trial. J Clin Oncol. 1997;15:3185–3191.
34. Burke SJ, Annapragada A, Hoffman EA, Chen E, Ghaghada KB, Sieren J, van Beek EJ. Imaging of pulmonary embolism and t-PA therapy effects using MDCT and liposomal iohexol blood pool agent: preliminary results in a rabbit model. Acad Radiol. 2007;14:355–362.
35. Ghaghada KB, Bockhorst KH, Mukundan S Jr, Annapragada AV, Narayana PA. High-resolution vascular imaging of the rat spine using li-posomal blood pool MR agent. AJNR Am J Neuroradiol. 2007;28:48–53.
36. Ghaghada KB, Badea CT, Karumbaiah L, Fettig N, Bellamkonda RV, Johnson GA, Annapragada A. Evaluation of tumor microenvironment in
by guest on October 16, 2016http://circimaging.ahajournals.org/Downloaded from

294 Circ Cardiovasc Imaging March 2013
an animal model using a nanoparticle contrast agent in computed tomog-raphy imaging. Acad Radiol. 2011;18:20–30.
37. Chono S, Tauchi Y, Morimoto K. Pharmacokinetic analysis of the up-take of liposomes by macrophages and foam cells in vitro and their dis-tribution to atherosclerotic lesions in mice. Drug Metab Pharmacokinet. 2006;21:37–44.
38. Pan D, Williams TA, Senpan A, Allen JS, Scott MJ, Gaffney PJ, Wickline SA, Lanza GM. Detecting vascular biosignatures with a colloidal, radio-opaque polymeric nanoparticle. J Am Chem Soc. 2009;131:15522–15527.
39. Rabin O, Manuel Perez J, Grimm J, Wojtkiewicz G, Weissleder R. An X-ray computed tomography imaging agent based on long-circulating bis-muth sulphide nanoparticles. Nat Mater. 2006;5:118–122.
40. Nakashima Y, Plump AS, Raines EW, Breslow JL, Ross R. ApoE-deficient mice develop lesions of all phases of atherosclerosis throughout the arte-rial tree. Arterioscler Thromb. 1994;14:133–140.
41. Swirski FK, Nahrendorf M, Etzrodt M, Wildgruber M, Cortez-Retamozo V, Panizzi P, Figueiredo JL, Kohler RH, Chudnovskiy A, Waterman P, Ai-kawa E, Mempel TR, Libby P, Weissleder R, Pittet MJ. Identification of splenic reservoir monocytes and their deployment to inflammatory sites. Science. 2009;325:612–616.
42. Jawień J, Nastałek P, Korbut R. Mouse models of experimental atheroscle-rosis. J Physiol Pharmacol. 2004;55:503–517.
43. Badimon L, Vilahur G, Padro T. Atherosclerosis and thrombosis: insights from large animal models. J Bioenerg Biomembr. 2011.
44. Szebeni J. The interaction of liposomes with the complement system. Crit Rev Ther Drug Carrier Syst. 1998;15:57–88.
45. Cassetta L, Cassol E, Poli G. Macrophage polarization in health and dis-ease. ScientificWorldJournal. 2011;11:2391–2402.
46. Zeyda M, Stulnig TM. Adipose tissue macrophages. Immunol Lett. 2007;112:61–67.
CLINICAL PERSPECTIVEThis article describes the results of a study testing the ability of liposomes to localize in atherosclerotic plaque. Circulating liposomes could localize in the plaques by passive extravasation, or they could be carried there by macrophages that are transported to the plaque. An iodine-containing liposome formulation for maximal macrophage uptake was first optimized in vitro by testing uptake in a macrophage cell line (RAW264.7). In apolipoprotein E–deficient mice with sizeable plaque buildup, these optimal liposomes, when injected intravenously, readily localized to the plaques and were detectable and dif-ferentiable from calcifications by dual-energy computed tomography. The locations of the liposomes within the plaque were measured by imaging cytometry and showed that the liposomes were associated with a small fraction of the macrophages present in the plaques. There was no evidence for liposome localization in the absence of a macrophage in the vicinity. Although not conclusive, these data are consistent with the theory of macrophage-mediated trafficking and uptake of the liposomes in the plaques.
by guest on October 16, 2016http://circimaging.ahajournals.org/Downloaded from

AnnapragadaMoturu, Akshaya Annapragada, G. Allan Johnson, James T. Willerson and Ananth
Rohan Bhavane, Cristian Badea, Ketan B. Ghaghada, Darin Clark, Deborah Vela, AnooshaModel Using a Liposomal-Iodine Nanoparticle Contrast Agent
Dual-Energy Computed Tomography Imaging of Atherosclerotic Plaques in a Mouse
Print ISSN: 1941-9651. Online ISSN: 1942-0080 Copyright © 2013 American Heart Association, Inc. All rights reserved.
Dallas, TX 75231is published by the American Heart Association, 7272 Greenville Avenue,Circulation: Cardiovascular Imaging
doi: 10.1161/CIRCIMAGING.112.0001192013;6:285-294; originally published online January 24, 2013;Circ Cardiovasc Imaging.
http://circimaging.ahajournals.org/content/6/2/285World Wide Web at:
The online version of this article, along with updated information and services, is located on the
http://circimaging.ahajournals.org/content/suppl/2013/01/24/CIRCIMAGING.112.000119.DC1.htmlData Supplement (unedited) at:
http://circimaging.ahajournals.org//subscriptions/
is online at: Circulation: Cardiovascular Imaging Information about subscribing to Subscriptions:
http://www.lww.com/reprints Information about reprints can be found online at: Reprints:
document. Permissions and Rights Question and Answer information about this process is available in the
requested is located, click Request Permissions in the middle column of the Web page under Services. FurtherCenter, not the Editorial Office. Once the online version of the published article for which permission is being
can be obtained via RightsLink, a service of the Copyright ClearanceCirculation: Cardiovascular Imagingin Requests for permissions to reproduce figures, tables, or portions of articles originally publishedPermissions:
by guest on October 16, 2016http://circimaging.ahajournals.org/Downloaded from

Supplement Figure 1. In vitro leak test of liposomes encapsulating iodixanol in bovine plasma.

!"#$" %"#$&" '("#$&" )*"#$&"
!"#$" %"#$&" '("#$&" )*"#$&"+"

!"#$" %"#$&" '("#$&" )*"#$&"
!"#$" %"#$&" '("#$&" )*"#$&"+"

!"#$" %"#$&" '("#$&" )*"#$&"
!"#$" %"#$&" '("#$&" )*"#$&"+"

!"#$" %"#$&" '("#$&" )*"#$&"
!"#$" %"#$&" '("#$&" )*"#$&"+"

!"#$" %"#$&" '("#$&" )*"#$&"+"
!"#$" %"#$&" '("#$&" )*"#$&"

!"#$" %"#$&" '("#$&" )*"#$&"
!"#$" %"#$&" '("#$&" )*"#$&"+"

!"#$" %"#$&" '("#$&" )*"#$&"
!"#$" %"#$&" '("#$&" )*"#$&"+"
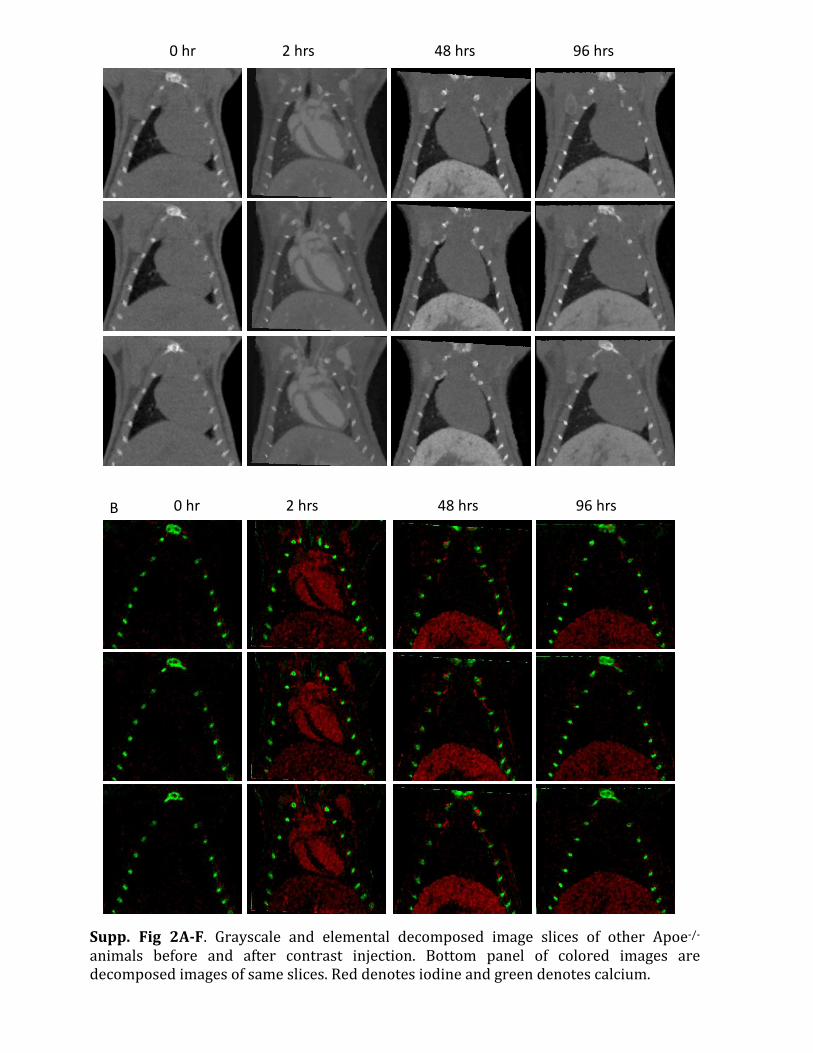
Supp. Fig 2A-‐F. Grayscale and elemental decomposed image slices of other Apoe-‐/-‐ animals before and after contrast injection. Bottom panel of colored images are decomposed images of same slices. Red denotes iodine and green denotes calcium.
!"#$" %"#$&" '("#$&" )*"#$&"
!"#$" %"#$&" '("#$&" )*"#$&"+"

!"#$" %"#$&" '("#$&" )*"#$&"
!"#$" %"#$&" '("#$&" )*"#$&"+"

!"#$" %"#$&" '("#$&" )*"#$&"
!"#$" %"#$&" '("#$&" )*"#$&"+"

Supp. Fig 3A-‐E. Grayscale and elemental decomposed image slices of other control BL6 animals before and after contrast injection. Bottom panel of colored images are decomposed images of same slices. Red denotes iodine and green denotes calcium.
!"#$" %"#$&" '("#$&" )*"#$&"
!"#$" %"#$&" '("#$&" )*"#$&"+"
Copyright © 2022 FDOKUMEN