Driving Forces Behind Participation and Satisfaction with Social Networking Sites
Upload
khangminh22Category
view
2download
0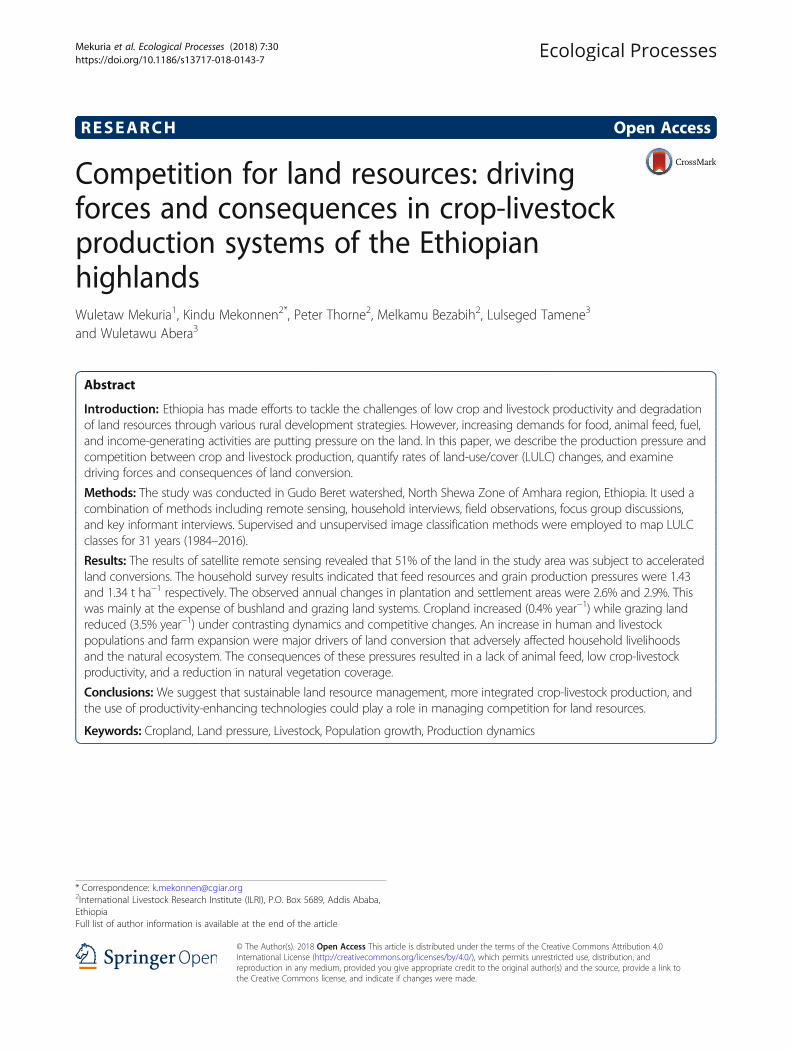
RESEARCH Open Access
Competition for land resources: drivingforces and consequences in crop-livestockproduction systems of the EthiopianhighlandsWuletaw Mekuria1, Kindu Mekonnen2*, Peter Thorne2, Melkamu Bezabih2, Lulseged Tamene3
and Wuletawu Abera3
Abstract
Introduction: Ethiopia has made efforts to tackle the challenges of low crop and livestock productivity and degradationof land resources through various rural development strategies. However, increasing demands for food, animal feed, fuel,and income-generating activities are putting pressure on the land. In this paper, we describe the production pressure andcompetition between crop and livestock production, quantify rates of land-use/cover (LULC) changes, and examinedriving forces and consequences of land conversion.
Methods: The study was conducted in Gudo Beret watershed, North Shewa Zone of Amhara region, Ethiopia. It used acombination of methods including remote sensing, household interviews, field observations, focus group discussions,and key informant interviews. Supervised and unsupervised image classification methods were employed to map LULCclasses for 31 years (1984–2016).
Results: The results of satellite remote sensing revealed that 51% of the land in the study area was subject to acceleratedland conversions. The household survey results indicated that feed resources and grain production pressures were 1.43and 1.34 t ha−1 respectively. The observed annual changes in plantation and settlement areas were 2.6% and 2.9%. Thiswas mainly at the expense of bushland and grazing land systems. Cropland increased (0.4% year−1) while grazing landreduced (3.5% year−1) under contrasting dynamics and competitive changes. An increase in human and livestockpopulations and farm expansion were major drivers of land conversion that adversely affected household livelihoodsand the natural ecosystem. The consequences of these pressures resulted in a lack of animal feed, low crop-livestockproductivity, and a reduction in natural vegetation coverage.
Conclusions: We suggest that sustainable land resource management, more integrated crop-livestock production, andthe use of productivity-enhancing technologies could play a role in managing competition for land resources.
Keywords: Cropland, Land pressure, Livestock, Population growth, Production dynamics
* Correspondence: [email protected] Livestock Research Institute (ILRI), P.O. Box 5689, Addis Ababa,EthiopiaFull list of author information is available at the end of the article
© The Author(s). 2018 Open Access This article is distributed under the terms of the Creative Commons Attribution 4.0International License (http://creativecommons.org/licenses/by/4.0/), which permits unrestricted use, distribution, andreproduction in any medium, provided you give appropriate credit to the original author(s) and the source, provide a link tothe Creative Commons license, and indicate if changes were made.
Mekuria et al. Ecological Processes (2018) 7:30 https://doi.org/10.1186/s13717-018-0143-7
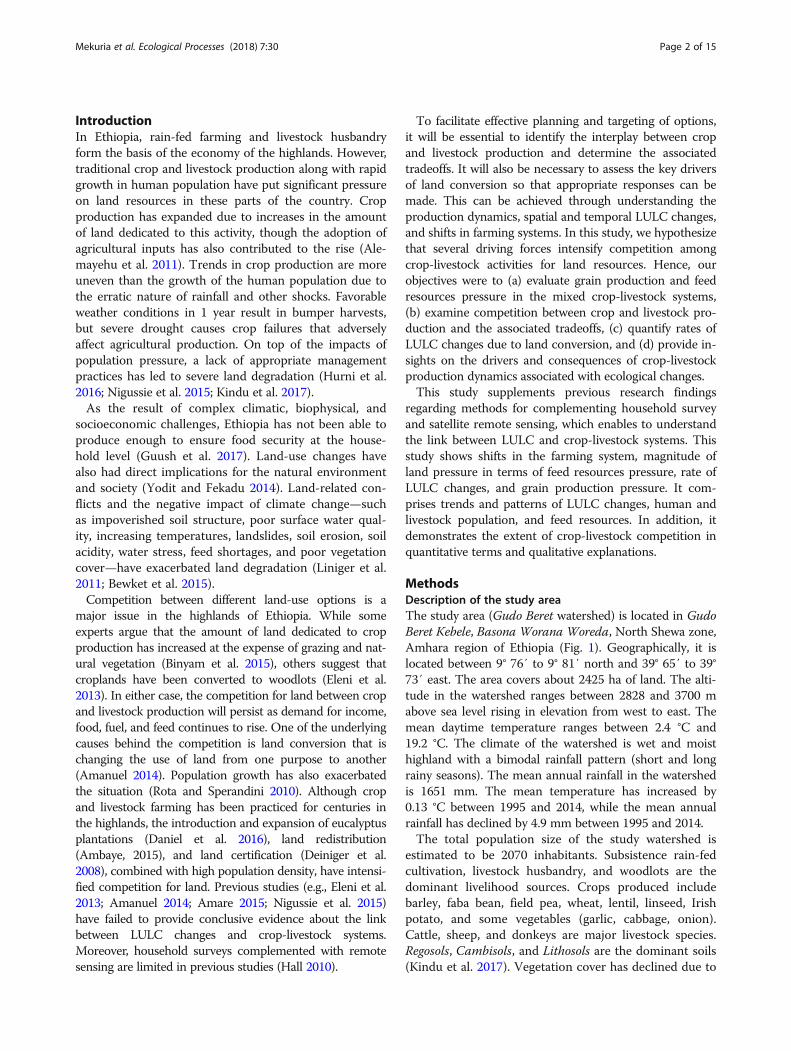
IntroductionIn Ethiopia, rain-fed farming and livestock husbandryform the basis of the economy of the highlands. However,traditional crop and livestock production along with rapidgrowth in human population have put significant pressureon land resources in these parts of the country. Cropproduction has expanded due to increases in the amountof land dedicated to this activity, though the adoption ofagricultural inputs has also contributed to the rise (Ale-mayehu et al. 2011). Trends in crop production are moreuneven than the growth of the human population due tothe erratic nature of rainfall and other shocks. Favorableweather conditions in 1 year result in bumper harvests,but severe drought causes crop failures that adverselyaffect agricultural production. On top of the impacts ofpopulation pressure, a lack of appropriate managementpractices has led to severe land degradation (Hurni et al.2016; Nigussie et al. 2015; Kindu et al. 2017).As the result of complex climatic, biophysical, and
socioeconomic challenges, Ethiopia has not been able toproduce enough to ensure food security at the house-hold level (Guush et al. 2017). Land-use changes havealso had direct implications for the natural environmentand society (Yodit and Fekadu 2014). Land-related con-flicts and the negative impact of climate change—suchas impoverished soil structure, poor surface water qual-ity, increasing temperatures, landslides, soil erosion, soilacidity, water stress, feed shortages, and poor vegetationcover—have exacerbated land degradation (Liniger et al.2011; Bewket et al. 2015).Competition between different land-use options is a
major issue in the highlands of Ethiopia. While someexperts argue that the amount of land dedicated to cropproduction has increased at the expense of grazing and nat-ural vegetation (Binyam et al. 2015), others suggest thatcroplands have been converted to woodlots (Eleni et al.2013). In either case, the competition for land between cropand livestock production will persist as demand for income,food, fuel, and feed continues to rise. One of the underlyingcauses behind the competition is land conversion that ischanging the use of land from one purpose to another(Amanuel 2014). Population growth has also exacerbatedthe situation (Rota and Sperandini 2010). Although cropand livestock farming has been practiced for centuries inthe highlands, the introduction and expansion of eucalyptusplantations (Daniel et al. 2016), land redistribution(Ambaye, 2015), and land certification (Deiniger et al.2008), combined with high population density, have intensi-fied competition for land. Previous studies (e.g., Eleni et al.2013; Amanuel 2014; Amare 2015; Nigussie et al. 2015)have failed to provide conclusive evidence about the linkbetween LULC changes and crop-livestock systems.Moreover, household surveys complemented with remotesensing are limited in previous studies (Hall 2010).
To facilitate effective planning and targeting of options,it will be essential to identify the interplay between cropand livestock production and determine the associatedtradeoffs. It will also be necessary to assess the key driversof land conversion so that appropriate responses can bemade. This can be achieved through understanding theproduction dynamics, spatial and temporal LULC changes,and shifts in farming systems. In this study, we hypothesizethat several driving forces intensify competition amongcrop-livestock activities for land resources. Hence, ourobjectives were to (a) evaluate grain production and feedresources pressure in the mixed crop-livestock systems,(b) examine competition between crop and livestock pro-duction and the associated tradeoffs, (c) quantify rates ofLULC changes due to land conversion, and (d) provide in-sights on the drivers and consequences of crop-livestockproduction dynamics associated with ecological changes.This study supplements previous research findings
regarding methods for complementing household surveyand satellite remote sensing, which enables to understandthe link between LULC and crop-livestock systems. Thisstudy shows shifts in the farming system, magnitude ofland pressure in terms of feed resources pressure, rate ofLULC changes, and grain production pressure. It com-prises trends and patterns of LULC changes, human andlivestock population, and feed resources. In addition, itdemonstrates the extent of crop-livestock competition inquantitative terms and qualitative explanations.
MethodsDescription of the study areaThe study area (Gudo Beret watershed) is located in GudoBeret Kebele, Basona Worana Woreda, North Shewa zone,Amhara region of Ethiopia (Fig. 1). Geographically, it islocated between 9° 76′ to 9° 81′ north and 39° 65′ to 39°73′ east. The area covers about 2425 ha of land. The alti-tude in the watershed ranges between 2828 and 3700 mabove sea level rising in elevation from west to east. Themean daytime temperature ranges between 2.4 °C and19.2 °C. The climate of the watershed is wet and moisthighland with a bimodal rainfall pattern (short and longrainy seasons). The mean annual rainfall in the watershedis 1651 mm. The mean temperature has increased by0.13 °C between 1995 and 2014, while the mean annualrainfall has declined by 4.9 mm between 1995 and 2014.The total population size of the study watershed is
estimated to be 2070 inhabitants. Subsistence rain-fedcultivation, livestock husbandry, and woodlots are thedominant livelihood sources. Crops produced includebarley, faba bean, field pea, wheat, lentil, linseed, Irishpotato, and some vegetables (garlic, cabbage, onion).Cattle, sheep, and donkeys are major livestock species.Regosols, Cambisols, and Lithosols are the dominant soils(Kindu et al. 2017). Vegetation cover has declined due to
Mekuria et al. Ecological Processes (2018) 7:30 Page 2 of 15

anthropogenic factors. The watershed has eucalyptus treesaround homesteads, hillsides, and gully buffers. The maininfrastructures and institutions found in the study water-shed are a small town (Gudo Beret), local market, kebeleagriculture office, human and animal health clinics, ruralvillages, churches, elementary schools, electricity powerline, mobile telephone facilities, and asphalt road.
Sampling and data collection proceduresThe study watershed was purposively selected for thereason that the study area is part of the USAID, Feed theFuture funded Africa RISING project in the highlands ofEthiopia. Moreover, the watershed was selected because ofhigh mixed crop-livestock production potential. The water-shed was delineated from a digital elevation model (DEM)following the standard watershed extraction procedureusing GIS. The watershed was enclosed starting from thebottom confluence point between two streams, Feleku andWeynabchu.There are 447 households in the study area of which
211 (29% female-headed) were selected using systematicrandom sampling.The total sample size was determined using the fol-
lowing formula adapted by Yamane (1967):
n ¼ N
1þ NðeÞ2 ð1Þ
where n is the total sample size, e is the precision level,and N is the total household in the study watershed.
Trained enumerators conducted household interviewsfrom May to June 2016.In order to gain an overall picture and an adequate
description of the study area, preliminary field assessmentswere carried out in consultation with the agriculturalexperts. Transect walks and field observations wereundertaken to understand the institutions, infrastructure,settlement patterns, and the landscapes in the watershed.Key informant interviews were conducted to identifycrop-livestock portfolios, verify LULC changes, andexamine crop-livestock-related shifts. The coordinatereadings for the outlet point were collected and recordedby a hand-held GPS as part of the field survey from whichthe watershed is delineated.Satellite images were acquired and used for LULC ana-
lysis (Eleni et al. 2013; Amare 2015). The images includeLandsat Thematic Mapper (LTM) of 1984 and a LandsatEnhanced Thematic Mapper Plus (ETM+) from 2004 and2016. LTM acquired on December 17, 1984 (path 168, row053), ETM+ acquired on January 25, 2004 (path 168, row053), and on March 28, 2016 (path 168, row 053) wereused. More visible and freely available periods (1984, 2004,and 2016) were selected. The 2016 data were used tovalidate the satellite images with primary data that werecollected from respondent households. A spatial resolutionof 30 m was applied to all images. Band 7 was used for thefirst and the second periods, while band 8 was applied forthe third period. Seventy-seven ground control points werecollected from different LULC types using Google EarthProfessional to verify land classification accuracies. A
Fig. 1 Location map of the study watershed
Mekuria et al. Ecological Processes (2018) 7:30 Page 3 of 15
topographic map was used to estimate altitude, interpretimages, and visualize landscape features such as cliffs,mountains, forest, and other related information. Arc-GIS10.1 and Earth Resource Data Analysis System (ERDAS-I-magine10) software were employed to analyze the data.To collect socioeconomic and satellite data, both remote
sensing and household survey were used in a comple-menting manner. Household interviews were conductedusing a semi-structured questionnaire. This questionnairewas designed to capture socioeconomic, institutional, anddemographic data including crop varieties, livestockbreeds, LULC types, feed resources, feeding systems,household income, and other household attributes. Feedconversion rates and LULC accuracy verification indica-tors were gathered from both primary and secondarysources. In order to measure the dynamics ofcrop-livestock production systems, the most importantanalytical indicators (grain production pressure, feed re-sources pressure, and LULC changes) were adapted fromMcIntire et al. (1992) and Liniger et al. (2011). In addition,farmer focus group discussions were conducted to collectancillary information and perceptions on the availability offeed resources, the major drivers of land conversions, andtenure arrangements. The focus group discussants werehousehold heads residing in the study watershed.
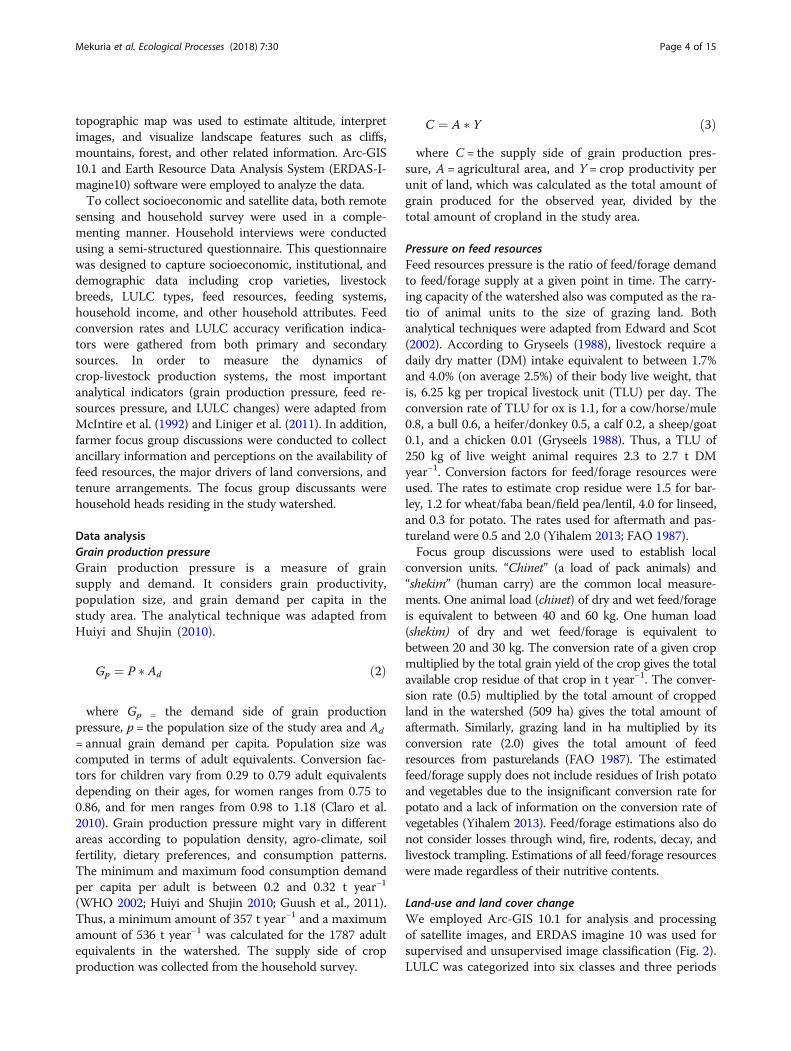
Data analysisGrain production pressureGrain production pressure is a measure of grainsupply and demand. It considers grain productivity,population size, and grain demand per capita in thestudy area. The analytical technique was adapted fromHuiyi and Shujin (2010).
Gp ¼ P � Ad ð2Þ
where Gp = the demand side of grain productionpressure, p = the population size of the study area and Ad
= annual grain demand per capita. Population size wascomputed in terms of adult equivalents. Conversion fac-tors for children vary from 0.29 to 0.79 adult equivalentsdepending on their ages, for women ranges from 0.75 to0.86, and for men ranges from 0.98 to 1.18 (Claro et al.2010). Grain production pressure might vary in differentareas according to population density, agro-climate, soilfertility, dietary preferences, and consumption patterns.The minimum and maximum food consumption demandper capita per adult is between 0.2 and 0.32 t year−1
(WHO 2002; Huiyi and Shujin 2010; Guush et al., 2011).Thus, a minimum amount of 357 t year−1 and a maximumamount of 536 t year−1 was calculated for the 1787 adultequivalents in the watershed. The supply side of cropproduction was collected from the household survey.
C ¼ A � Y ð3Þ
where C = the supply side of grain production pres-sure, A = agricultural area, and Y = crop productivity perunit of land, which was calculated as the total amount ofgrain produced for the observed year, divided by thetotal amount of cropland in the study area.
Pressure on feed resourcesFeed resources pressure is the ratio of feed/forage demandto feed/forage supply at a given point in time. The carry-ing capacity of the watershed also was computed as the ra-tio of animal units to the size of grazing land. Bothanalytical techniques were adapted from Edward and Scot(2002). According to Gryseels (1988), livestock require adaily dry matter (DM) intake equivalent to between 1.7%and 4.0% (on average 2.5%) of their body live weight, thatis, 6.25 kg per tropical livestock unit (TLU) per day. Theconversion rate of TLU for ox is 1.1, for a cow/horse/mule0.8, a bull 0.6, a heifer/donkey 0.5, a calf 0.2, a sheep/goat0.1, and a chicken 0.01 (Gryseels 1988). Thus, a TLU of250 kg of live weight animal requires 2.3 to 2.7 t DMyear−1. Conversion factors for feed/forage resources wereused. The rates to estimate crop residue were 1.5 for bar-ley, 1.2 for wheat/faba bean/field pea/lentil, 4.0 for linseed,and 0.3 for potato. The rates used for aftermath and pas-tureland were 0.5 and 2.0 (Yihalem 2013; FAO 1987).Focus group discussions were used to establish local
conversion units. “Chinet” (a load of pack animals) and“shekim” (human carry) are the common local measure-ments. One animal load (chinet) of dry and wet feed/forageis equivalent to between 40 and 60 kg. One human load(shekim) of dry and wet feed/forage is equivalent tobetween 20 and 30 kg. The conversion rate of a given cropmultiplied by the total grain yield of the crop gives the totalavailable crop residue of that crop in t year−1. The conver-sion rate (0.5) multiplied by the total amount of croppedland in the watershed (509 ha) gives the total amount ofaftermath. Similarly, grazing land in ha multiplied by itsconversion rate (2.0) gives the total amount of feedresources from pasturelands (FAO 1987). The estimatedfeed/forage supply does not include residues of Irish potatoand vegetables due to the insignificant conversion rate forpotato and a lack of information on the conversion rate ofvegetables (Yihalem 2013). Feed/forage estimations also donot consider losses through wind, fire, rodents, decay, andlivestock trampling. Estimations of all feed/forage resourceswere made regardless of their nutritive contents.
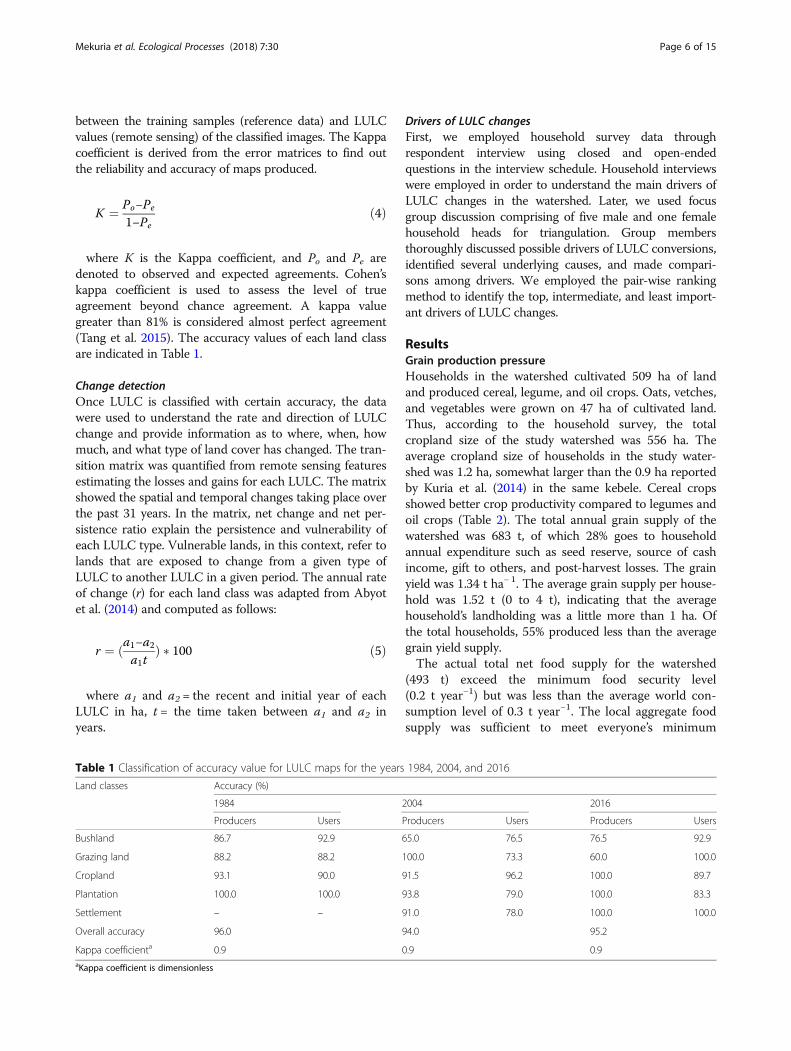
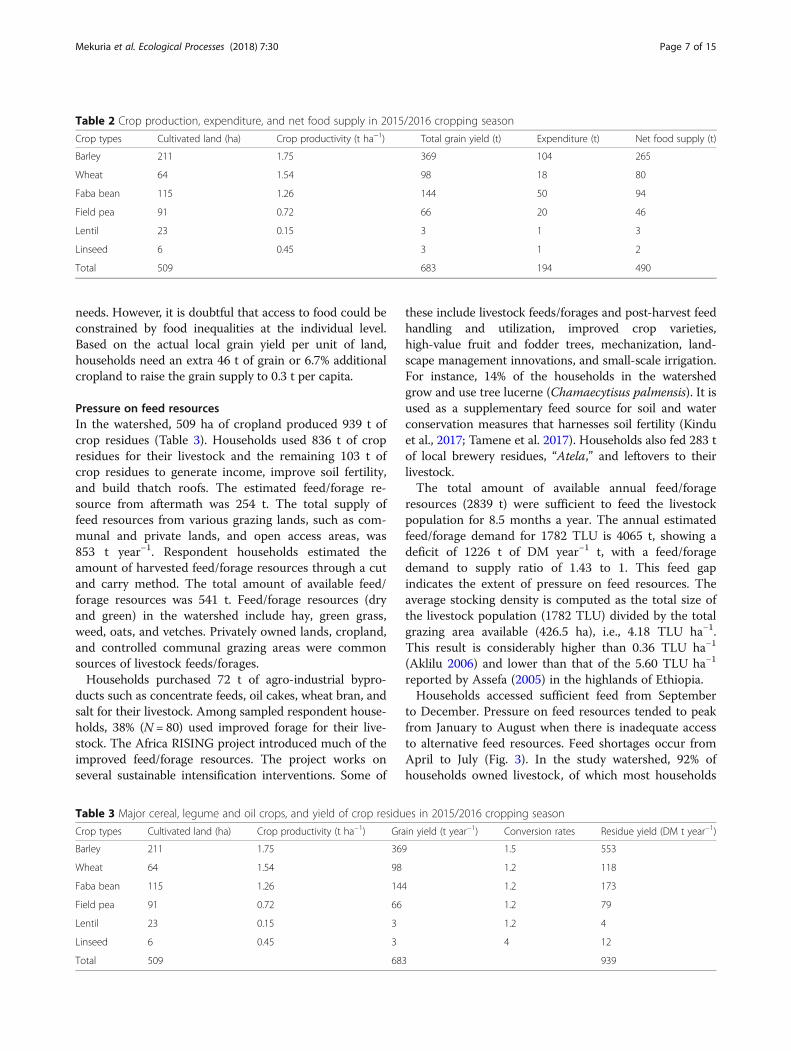
Land-use and land cover changeWe employed Arc-GIS 10.1 for analysis and processingof satellite images, and ERDAS imagine 10 was used forsupervised and unsupervised image classification (Fig. 2).LULC was categorized into six classes and three periods
Mekuria et al. Ecological Processes (2018) 7:30 Page 4 of 15
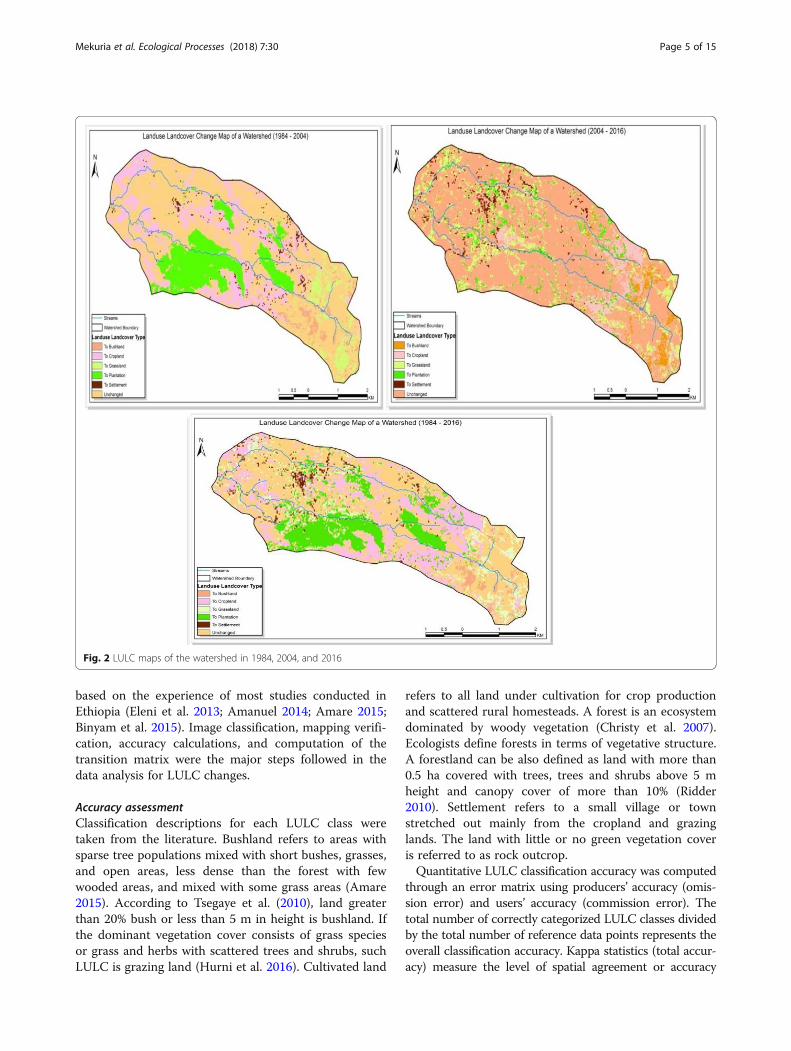
based on the experience of most studies conducted inEthiopia (Eleni et al. 2013; Amanuel 2014; Amare 2015;Binyam et al. 2015). Image classification, mapping verifi-cation, accuracy calculations, and computation of thetransition matrix were the major steps followed in thedata analysis for LULC changes.
Accuracy assessmentClassification descriptions for each LULC class weretaken from the literature. Bushland refers to areas withsparse tree populations mixed with short bushes, grasses,and open areas, less dense than the forest with fewwooded areas, and mixed with some grass areas (Amare2015). According to Tsegaye et al. (2010), land greaterthan 20% bush or less than 5 m in height is bushland. Ifthe dominant vegetation cover consists of grass speciesor grass and herbs with scattered trees and shrubs, suchLULC is grazing land (Hurni et al. 2016). Cultivated land
refers to all land under cultivation for crop productionand scattered rural homesteads. A forest is an ecosystemdominated by woody vegetation (Christy et al. 2007).Ecologists define forests in terms of vegetative structure.A forestland can be also defined as land with more than0.5 ha covered with trees, trees and shrubs above 5 mheight and canopy cover of more than 10% (Ridder2010). Settlement refers to a small village or townstretched out mainly from the cropland and grazinglands. The land with little or no green vegetation coveris referred to as rock outcrop.Quantitative LULC classification accuracy was computed
through an error matrix using producers’ accuracy (omis-sion error) and users’ accuracy (commission error). Thetotal number of correctly categorized LULC classes dividedby the total number of reference data points represents theoverall classification accuracy. Kappa statistics (total accur-acy) measure the level of spatial agreement or accuracy
Fig. 2 LULC maps of the watershed in 1984, 2004, and 2016
Mekuria et al. Ecological Processes (2018) 7:30 Page 5 of 15
between the training samples (reference data) and LULCvalues (remote sensing) of the classified images. The Kappacoefficient is derived from the error matrices to find outthe reliability and accuracy of maps produced.
K ¼ Po−Pe
1−Peð4Þ
where K is the Kappa coefficient, and Po and Pe aredenoted to observed and expected agreements. Cohen’skappa coefficient is used to assess the level of trueagreement beyond chance agreement. A kappa valuegreater than 81% is considered almost perfect agreement(Tang et al. 2015). The accuracy values of each land classare indicated in Table 1.
Change detectionOnce LULC is classified with certain accuracy, the datawere used to understand the rate and direction of LULCchange and provide information as to where, when, howmuch, and what type of land cover has changed. The tran-sition matrix was quantified from remote sensing featuresestimating the losses and gains for each LULC. The matrixshowed the spatial and temporal changes taking place overthe past 31 years. In the matrix, net change and net per-sistence ratio explain the persistence and vulnerability ofeach LULC type. Vulnerable lands, in this context, refer tolands that are exposed to change from a given type ofLULC to another LULC in a given period. The annual rateof change (r) for each land class was adapted from Abyotet al. (2014) and computed as follows:
r ¼ ða1−a2a1t
Þ � 100 ð5Þ
where a1 and a2 = the recent and initial year of eachLULC in ha, t = the time taken between a1 and a2 inyears.
Drivers of LULC changesFirst, we employed household survey data throughrespondent interview using closed and open-endedquestions in the interview schedule. Household interviewswere employed in order to understand the main drivers ofLULC changes in the watershed. Later, we used focusgroup discussion comprising of five male and one femalehousehold heads for triangulation. Group membersthoroughly discussed possible drivers of LULC conversions,identified several underlying causes, and made compari-sons among drivers. We employed the pair-wise rankingmethod to identify the top, intermediate, and least import-ant drivers of LULC changes.
ResultsGrain production pressureHouseholds in the watershed cultivated 509 ha of landand produced cereal, legume, and oil crops. Oats, vetches,and vegetables were grown on 47 ha of cultivated land.Thus, according to the household survey, the totalcropland size of the study watershed was 556 ha. Theaverage cropland size of households in the study water-shed was 1.2 ha, somewhat larger than the 0.9 ha reportedby Kuria et al. (2014) in the same kebele. Cereal cropsshowed better crop productivity compared to legumes andoil crops (Table 2). The total annual grain supply of thewatershed was 683 t, of which 28% goes to householdannual expenditure such as seed reserve, source of cashincome, gift to others, and post-harvest losses. The grainyield was 1.34 t ha− 1. The average grain supply per house-hold was 1.52 t (0 to 4 t), indicating that the averagehousehold’s landholding was a little more than 1 ha. Ofthe total households, 55% produced less than the averagegrain yield supply.The actual total net food supply for the watershed
(493 t) exceed the minimum food security level(0.2 t year−1) but was less than the average world con-sumption level of 0.3 t year−1. The local aggregate foodsupply was sufficient to meet everyone’s minimum
Table 1 Classification of accuracy value for LULC maps for the years 1984, 2004, and 2016
Land classes Accuracy (%)
1984 2004 2016
Producers Users Producers Users Producers Users
Bushland 86.7 92.9 65.0 76.5 76.5 92.9
Grazing land 88.2 88.2 100.0 73.3 60.0 100.0
Cropland 93.1 90.0 91.5 96.2 100.0 89.7
Plantation 100.0 100.0 93.8 79.0 100.0 83.3
Settlement – – 91.0 78.0 100.0 100.0
Overall accuracy 96.0 94.0 95.2
Kappa coefficienta 0.9 0.9 0.9aKappa coefficient is dimensionless
Mekuria et al. Ecological Processes (2018) 7:30 Page 6 of 15
needs. However, it is doubtful that access to food could beconstrained by food inequalities at the individual level.Based on the actual local grain yield per unit of land,households need an extra 46 t of grain or 6.7% additionalcropland to raise the grain supply to 0.3 t per capita.
Pressure on feed resourcesIn the watershed, 509 ha of cropland produced 939 t ofcrop residues (Table 3). Households used 836 t of cropresidues for their livestock and the remaining 103 t ofcrop residues to generate income, improve soil fertility,and build thatch roofs. The estimated feed/forage re-source from aftermath was 254 t. The total supply offeed resources from various grazing lands, such as com-munal and private lands, and open access areas, was853 t year−1. Respondent households estimated theamount of harvested feed/forage resources through a cutand carry method. The total amount of available feed/forage resources was 541 t. Feed/forage resources (dryand green) in the watershed include hay, green grass,weed, oats, and vetches. Privately owned lands, cropland,and controlled communal grazing areas were commonsources of livestock feeds/forages.Households purchased 72 t of agro-industrial bypro-
ducts such as concentrate feeds, oil cakes, wheat bran, andsalt for their livestock. Among sampled respondent house-holds, 38% (N = 80) used improved forage for their live-stock. The Africa RISING project introduced much of theimproved feed/forage resources. The project works onseveral sustainable intensification interventions. Some of
these include livestock feeds/forages and post-harvest feedhandling and utilization, improved crop varieties,high-value fruit and fodder trees, mechanization, land-scape management innovations, and small-scale irrigation.For instance, 14% of the households in the watershedgrow and use tree lucerne (Chamaecytisus palmensis). It isused as a supplementary feed source for soil and waterconservation measures that harnesses soil fertility (Kinduet al., 2017; Tamene et al. 2017). Households also fed 283 tof local brewery residues, “Atela,” and leftovers to theirlivestock.The total amount of available annual feed/forage
resources (2839 t) were sufficient to feed the livestockpopulation for 8.5 months a year. The annual estimatedfeed/forage demand for 1782 TLU is 4065 t, showing adeficit of 1226 t of DM year−1 t, with a feed/foragedemand to supply ratio of 1.43 to 1. This feed gapindicates the extent of pressure on feed resources. Theaverage stocking density is computed as the total size ofthe livestock population (1782 TLU) divided by the totalgrazing area available (426.5 ha), i.e., 4.18 TLU ha−1.This result is considerably higher than 0.36 TLU ha−1
(Aklilu 2006) and lower than that of the 5.60 TLU ha−1
reported by Assefa (2005) in the highlands of Ethiopia.Households accessed sufficient feed from September
to December. Pressure on feed resources tended to peakfrom January to August when there is inadequate accessto alternative feed resources. Feed shortages occur fromApril to July (Fig. 3). In the study watershed, 92% ofhouseholds owned livestock, of which most households
Table 2 Crop production, expenditure, and net food supply in 2015/2016 cropping season
Crop types Cultivated land (ha) Crop productivity (t ha−1) Total grain yield (t) Expenditure (t) Net food supply (t)
Barley 211 1.75 369 104 265
Wheat 64 1.54 98 18 80
Faba bean 115 1.26 144 50 94
Field pea 91 0.72 66 20 46
Lentil 23 0.15 3 1 3
Linseed 6 0.45 3 1 2
Total 509 683 194 490
Table 3 Major cereal, legume and oil crops, and yield of crop residues in 2015/2016 cropping season
Crop types Cultivated land (ha) Crop productivity (t ha−1) Grain yield (t year−1) Conversion rates Residue yield (DM t year−1)
Barley 211 1.75 369 1.5 553
Wheat 64 1.54 98 1.2 118
Faba bean 115 1.26 144 1.2 173
Field pea 91 0.72 66 1.2 79
Lentil 23 0.15 3 1.2 4
Linseed 6 0.45 3 4 12
Total 509 683 939
Mekuria et al. Ecological Processes (2018) 7:30 Page 7 of 15
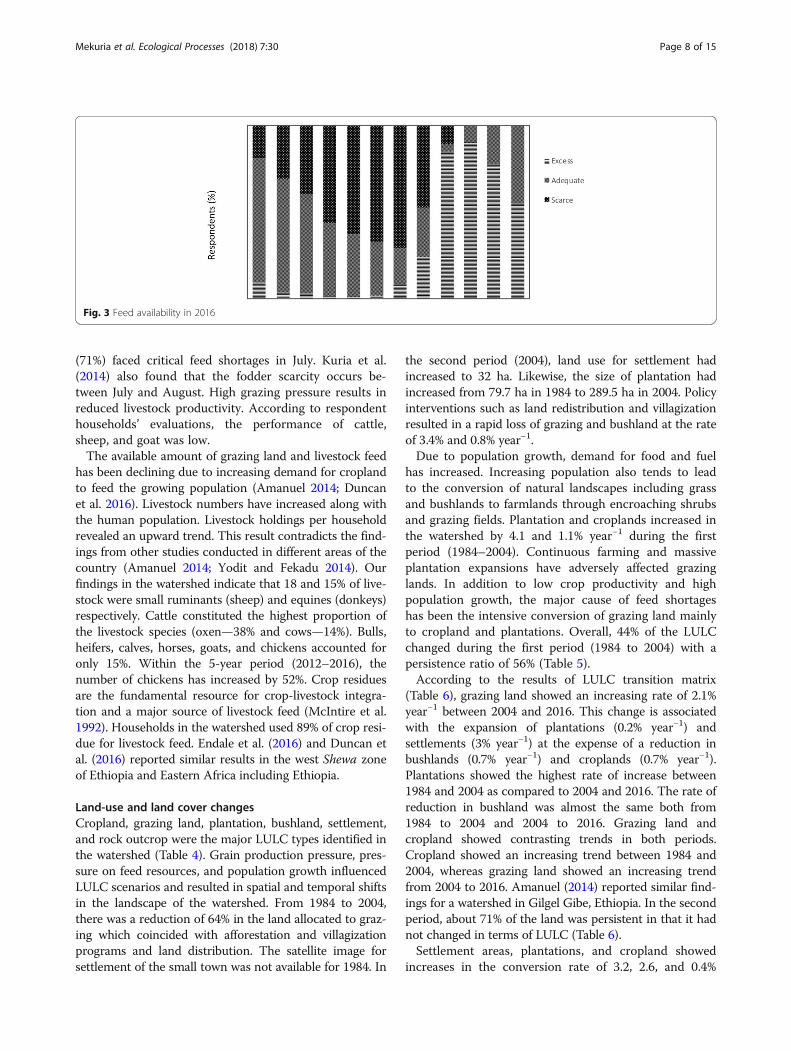
(71%) faced critical feed shortages in July. Kuria et al.(2014) also found that the fodder scarcity occurs be-tween July and August. High grazing pressure results inreduced livestock productivity. According to respondenthouseholds’ evaluations, the performance of cattle,sheep, and goat was low.The available amount of grazing land and livestock feed
has been declining due to increasing demand for croplandto feed the growing population (Amanuel 2014; Duncanet al. 2016). Livestock numbers have increased along withthe human population. Livestock holdings per householdrevealed an upward trend. This result contradicts the find-ings from other studies conducted in different areas of thecountry (Amanuel 2014; Yodit and Fekadu 2014). Ourfindings in the watershed indicate that 18 and 15% of live-stock were small ruminants (sheep) and equines (donkeys)respectively. Cattle constituted the highest proportion ofthe livestock species (oxen—38% and cows—14%). Bulls,heifers, calves, horses, goats, and chickens accounted foronly 15%. Within the 5-year period (2012–2016), thenumber of chickens has increased by 52%. Crop residuesare the fundamental resource for crop-livestock integra-tion and a major source of livestock feed (McIntire et al.1992). Households in the watershed used 89% of crop resi-due for livestock feed. Endale et al. (2016) and Duncan etal. (2016) reported similar results in the west Shewa zoneof Ethiopia and Eastern Africa including Ethiopia.
Land-use and land cover changesCropland, grazing land, plantation, bushland, settlement,and rock outcrop were the major LULC types identified inthe watershed (Table 4). Grain production pressure, pres-sure on feed resources, and population growth influencedLULC scenarios and resulted in spatial and temporal shiftsin the landscape of the watershed. From 1984 to 2004,there was a reduction of 64% in the land allocated to graz-ing which coincided with afforestation and villagizationprograms and land distribution. The satellite image forsettlement of the small town was not available for 1984. In
the second period (2004), land use for settlement hadincreased to 32 ha. Likewise, the size of plantation hadincreased from 79.7 ha in 1984 to 289.5 ha in 2004. Policyinterventions such as land redistribution and villagizationresulted in a rapid loss of grazing and bushland at the rateof 3.4% and 0.8% year−1.Due to population growth, demand for food and fuel
has increased. Increasing population also tends to leadto the conversion of natural landscapes including grassand bushlands to farmlands through encroaching shrubsand grazing fields. Plantation and croplands increased inthe watershed by 4.1 and 1.1% year−1 during the firstperiod (1984–2004). Continuous farming and massiveplantation expansions have adversely affected grazinglands. In addition to low crop productivity and highpopulation growth, the major cause of feed shortageshas been the intensive conversion of grazing land mainlyto cropland and plantations. Overall, 44% of the LULCchanged during the first period (1984 to 2004) with apersistence ratio of 56% (Table 5).According to the results of LULC transition matrix
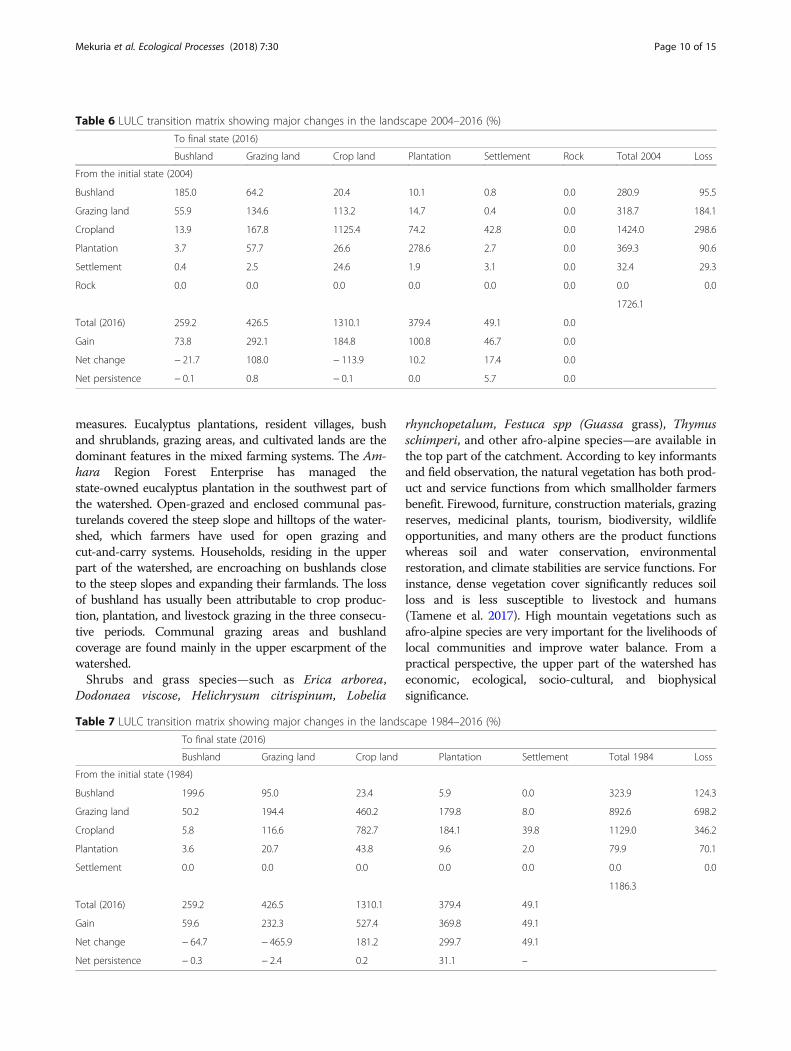
(Table 6), grazing land showed an increasing rate of 2.1%year−1 between 2004 and 2016. This change is associatedwith the expansion of plantations (0.2% year−1) andsettlements (3% year−1) at the expense of a reduction inbushlands (0.7% year−1) and croplands (0.7% year−1).Plantations showed the highest rate of increase between1984 and 2004 as compared to 2004 and 2016. The rate ofreduction in bushland was almost the same both from1984 to 2004 and 2004 to 2016. Grazing land andcropland showed contrasting trends in both periods.Cropland showed an increasing trend between 1984 and2004, whereas grazing land showed an increasing trendfrom 2004 to 2016. Amanuel (2014) reported similar find-ings for a watershed in Gilgel Gibe, Ethiopia. In the secondperiod, about 71% of the land was persistent in that it hadnot changed in terms of LULC (Table 6).Settlement areas, plantations, and cropland showed
increases in the conversion rate of 3.2, 2.6, and 0.4%
Fig. 3 Feed availability in 2016
Mekuria et al. Ecological Processes (2018) 7:30 Page 8 of 15
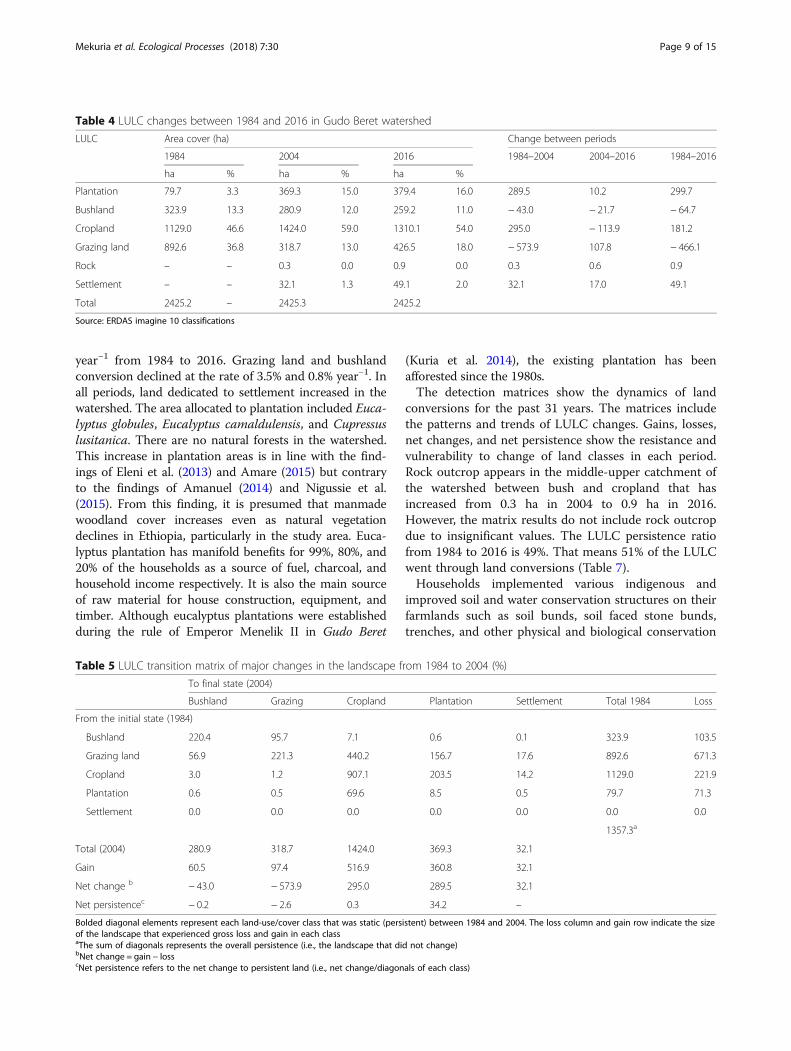
year−1 from 1984 to 2016. Grazing land and bushlandconversion declined at the rate of 3.5% and 0.8% year−1. Inall periods, land dedicated to settlement increased in thewatershed. The area allocated to plantation included Euca-lyptus globules, Eucalyptus camaldulensis, and Cupressuslusitanica. There are no natural forests in the watershed.This increase in plantation areas is in line with the find-ings of Eleni et al. (2013) and Amare (2015) but contraryto the findings of Amanuel (2014) and Nigussie et al.(2015). From this finding, it is presumed that manmadewoodland cover increases even as natural vegetationdeclines in Ethiopia, particularly in the study area. Euca-lyptus plantation has manifold benefits for 99%, 80%, and20% of the households as a source of fuel, charcoal, andhousehold income respectively. It is also the main sourceof raw material for house construction, equipment, andtimber. Although eucalyptus plantations were establishedduring the rule of Emperor Menelik II in Gudo Beret
(Kuria et al. 2014), the existing plantation has beenafforested since the 1980s.The detection matrices show the dynamics of land
conversions for the past 31 years. The matrices includethe patterns and trends of LULC changes. Gains, losses,net changes, and net persistence show the resistance andvulnerability to change of land classes in each period.Rock outcrop appears in the middle-upper catchment ofthe watershed between bush and cropland that hasincreased from 0.3 ha in 2004 to 0.9 ha in 2016.However, the matrix results do not include rock outcropdue to insignificant values. The LULC persistence ratiofrom 1984 to 2016 is 49%. That means 51% of the LULCwent through land conversions (Table 7).Households implemented various indigenous and
improved soil and water conservation structures on theirfarmlands such as soil bunds, soil faced stone bunds,trenches, and other physical and biological conservation
Table 4 LULC changes between 1984 and 2016 in Gudo Beret watershed
LULC Area cover (ha) Change between periods
1984 2004 2016 1984–2004 2004–2016 1984–2016
ha % ha % ha %
Plantation 79.7 3.3 369.3 15.0 379.4 16.0 289.5 10.2 299.7
Bushland 323.9 13.3 280.9 12.0 259.2 11.0 − 43.0 − 21.7 − 64.7
Cropland 1129.0 46.6 1424.0 59.0 1310.1 54.0 295.0 − 113.9 181.2
Grazing land 892.6 36.8 318.7 13.0 426.5 18.0 − 573.9 107.8 − 466.1
Rock – – 0.3 0.0 0.9 0.0 0.3 0.6 0.9
Settlement – – 32.1 1.3 49.1 2.0 32.1 17.0 49.1
Total 2425.2 – 2425.3 2425.2
Source: ERDAS imagine 10 classifications
Table 5 LULC transition matrix of major changes in the landscape from 1984 to 2004 (%)
To final state (2004)
Bushland Grazing Cropland Plantation Settlement Total 1984 Loss
From the initial state (1984)
Bushland 220.4 95.7 7.1 0.6 0.1 323.9 103.5
Grazing land 56.9 221.3 440.2 156.7 17.6 892.6 671.3
Cropland 3.0 1.2 907.1 203.5 14.2 1129.0 221.9
Plantation 0.6 0.5 69.6 8.5 0.5 79.7 71.3
Settlement 0.0 0.0 0.0 0.0 0.0 0.0 0.0
1357.3a
Total (2004) 280.9 318.7 1424.0 369.3 32.1
Gain 60.5 97.4 516.9 360.8 32.1
Net change b − 43.0 − 573.9 295.0 289.5 32.1
Net persistencec − 0.2 − 2.6 0.3 34.2 –
Bolded diagonal elements represent each land-use/cover class that was static (persistent) between 1984 and 2004. The loss column and gain row indicate the sizeof the landscape that experienced gross loss and gain in each classaThe sum of diagonals represents the overall persistence (i.e., the landscape that did not change)bNet change = gain − losscNet persistence refers to the net change to persistent land (i.e., net change/diagonals of each class)
Mekuria et al. Ecological Processes (2018) 7:30 Page 9 of 15
measures. Eucalyptus plantations, resident villages, bushand shrublands, grazing areas, and cultivated lands are thedominant features in the mixed farming systems. The Am-hara Region Forest Enterprise has managed thestate-owned eucalyptus plantation in the southwest part ofthe watershed. Open-grazed and enclosed communal pas-turelands covered the steep slope and hilltops of the water-shed, which farmers have used for open grazing andcut-and-carry systems. Households, residing in the upperpart of the watershed, are encroaching on bushlands closeto the steep slopes and expanding their farmlands. The lossof bushland has usually been attributable to crop produc-tion, plantation, and livestock grazing in the three consecu-tive periods. Communal grazing areas and bushlandcoverage are found mainly in the upper escarpment of thewatershed.Shrubs and grass species—such as Erica arborea,
Dodonaea viscose, Helichrysum citrispinum, Lobelia
rhynchopetalum, Festuca spp (Guassa grass), Thymusschimperi, and other afro-alpine species—are available inthe top part of the catchment. According to key informantsand field observation, the natural vegetation has both prod-uct and service functions from which smallholder farmersbenefit. Firewood, furniture, construction materials, grazingreserves, medicinal plants, tourism, biodiversity, wildlifeopportunities, and many others are the product functionswhereas soil and water conservation, environmentalrestoration, and climate stabilities are service functions. Forinstance, dense vegetation cover significantly reduces soilloss and is less susceptible to livestock and humans(Tamene et al. 2017). High mountain vegetations such asafro-alpine species are very important for the livelihoods oflocal communities and improve water balance. From apractical perspective, the upper part of the watershed haseconomic, ecological, socio-cultural, and biophysicalsignificance.
Table 6 LULC transition matrix showing major changes in the landscape 2004–2016 (%)
To final state (2016)
Bushland Grazing land Crop land Plantation Settlement Rock Total 2004 Loss
From the initial state (2004)
Bushland 185.0 64.2 20.4 10.1 0.8 0.0 280.9 95.5
Grazing land 55.9 134.6 113.2 14.7 0.4 0.0 318.7 184.1
Cropland 13.9 167.8 1125.4 74.2 42.8 0.0 1424.0 298.6
Plantation 3.7 57.7 26.6 278.6 2.7 0.0 369.3 90.6
Settlement 0.4 2.5 24.6 1.9 3.1 0.0 32.4 29.3
Rock 0.0 0.0 0.0 0.0 0.0 0.0 0.0 0.0
1726.1
Total (2016) 259.2 426.5 1310.1 379.4 49.1 0.0
Gain 73.8 292.1 184.8 100.8 46.7 0.0
Net change − 21.7 108.0 − 113.9 10.2 17.4 0.0
Net persistence − 0.1 0.8 − 0.1 0.0 5.7 0.0
Table 7 LULC transition matrix showing major changes in the landscape 1984–2016 (%)
To final state (2016)
Bushland Grazing land Crop land Plantation Settlement Total 1984 Loss
From the initial state (1984)
Bushland 199.6 95.0 23.4 5.9 0.0 323.9 124.3
Grazing land 50.2 194.4 460.2 179.8 8.0 892.6 698.2
Cropland 5.8 116.6 782.7 184.1 39.8 1129.0 346.2
Plantation 3.6 20.7 43.8 9.6 2.0 79.9 70.1
Settlement 0.0 0.0 0.0 0.0 0.0 0.0 0.0
1186.3
Total (2016) 259.2 426.5 1310.1 379.4 49.1
Gain 59.6 232.3 527.4 369.8 49.1
Net change − 64.7 − 465.9 181.2 299.7 49.1
Net persistence − 0.3 − 2.4 0.2 31.1 –
Mekuria et al. Ecological Processes (2018) 7:30 Page 10 of 15

In many developing countries including Ethiopia, landparcels are small (Todaro and Smith 2012). Amongseveral dynamics and human needs, the demand forcropland and grazing land is increasing due to theincrease of both human and livestock population.Consequently, crops and livestock are competing forland resources (crops for nutrient and livestock for graz-ing). Increasing household demand for cropland andgrazing land results in crop-livestock competition forland resources (Fig. 4). As a result, changes in LULC aremainly associated with deforestation of natural vegeta-tion and an expansion in agricultural production forfood. Ethiopia has experienced various types of spatialpatterns and temporal trends of LULC changes in differ-ent parts of the country (Table 8).
Shifts in the farming systemGPS, SRS, and GIS techniques may not capture some en-dogenous and exogenous shifts in the production processand LULC changes (Liniger et al. 2011). Several predictableshifts are also indicators of the dynamics in the smallholderfarming system, which permit exploration of the spatial andtemporal features of crop-livestock production. Some cropvarieties and livestock breeds have shifted tomarket-demanded activities within the farming system. Theevolved highland fruits such as apple and malt barley seedvarieties are among the predominant shifts in cropping sys-tems. Although fallowing and intercropping have declined,the uses of compost and Nitrogen-Phosphorus-Sulfur(NPS) fertilize1rs have increased over time to improve soilfertility and increase crop productivity. In terms of bodysize, households have replaced their large livestock withsmall animals (calves, chickens, sheep, and donkeys). Theprevalence of animal diseases has dropped somewhat.Changes from open grazing to stall feeding are importantshifts in livestock feeding systems. Industrial feed bypro-ducts and improved forage trees have been introduced tofarms and other landscapes. The reduction of springs andriver flows has also caused considerable shifts in the farm-ing systems. Erica arborea, Hagenia abyssinica, Rosa
abyssinica, and Juniperus procera are threatened indigen-ous tree species. Kuria et al. (2014) reported over 20 extincttree species in the study and neighboring areas.Although lifestyles—in terms of housing conditions, the
use of electric power, and improved access to potable waterfor domestic purposes—have changed, human and live-stock population is increasing and putting pressure on landresources. One third of households have access to mobilephones. The main tarmac road cuts through the center ofthe watershed and the small town of Gudo Beret. These fa-cilities have improved communication networks. The socialpositions and responsibilities of households and a numberof kebele-level extension workers have been enhanced. Thenumbers of governmental and non-governmental organi-zations operating in the watershed have also increased overtime. Increases in the human and livestock populations,land conversion, shortages in animal feed, lowcrop-livestock productivity, and a reduction of naturalvegetation are noticeable shifts in the study area.
Drivers and consequences of LULC changeA number of interacting forces, anthropogenic and naturaldrivers, are driving losses and gains in LULC. Respondenthouseholds identified drivers of LULC conversions. Focusgroup participants identified the ranks for more than 14drivers as being important to LULC changes in the studyarea (Fig. 5). The results of pair-wise ranking demonstratethat human population pressure, farm expansion, andhigh stocking density are the most important drivers ofland conversion followed by soil degradation, dynamicland tenure arrangements, increased demand for fuel-wood, and household income. The average populationdensity of the highlands, including in the study area, hasincreased almost twofold within 25 years, from 44 individ-uals per km2 in the 1990s (Gryseels 1988) to 85 km2 inthe 2010s. The extent of carrying capacity has changedfrom a medium to high level of density within twodecades. As the human population increases, demand forfood, fuel, income, and other means of livelihood alsoincrease. High stock density, combined with frequent
Fig. 4 Land-use/land cover changes in crop and grazing lands from 1984 to 2016. Vertical bars show standard errors of the mean
Mekuria et al. Ecological Processes (2018) 7:30 Page 11 of 15
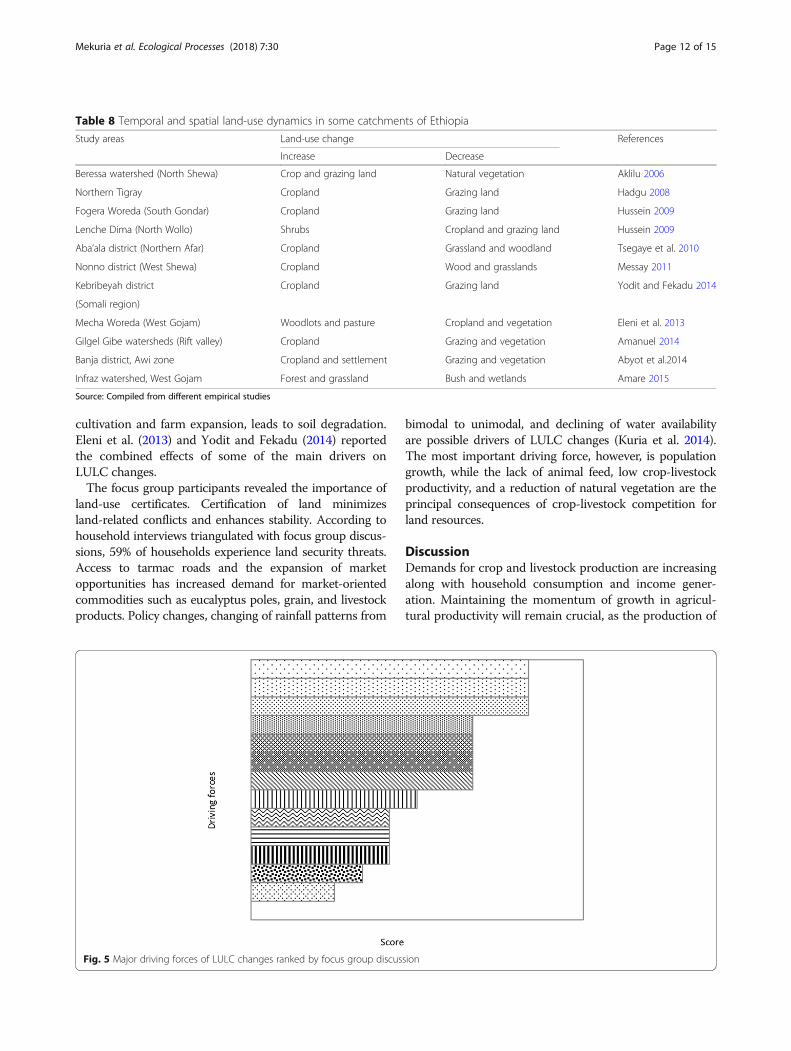
cultivation and farm expansion, leads to soil degradation.Eleni et al. (2013) and Yodit and Fekadu (2014) reportedthe combined effects of some of the main drivers onLULC changes.The focus group participants revealed the importance of
land-use certificates. Certification of land minimizesland-related conflicts and enhances stability. According tohousehold interviews triangulated with focus group discus-sions, 59% of households experience land security threats.Access to tarmac roads and the expansion of marketopportunities has increased demand for market-orientedcommodities such as eucalyptus poles, grain, and livestockproducts. Policy changes, changing of rainfall patterns from
bimodal to unimodal, and declining of water availabilityare possible drivers of LULC changes (Kuria et al. 2014).The most important driving force, however, is populationgrowth, while the lack of animal feed, low crop-livestockproductivity, and a reduction of natural vegetation are theprincipal consequences of crop-livestock competition forland resources.
DiscussionDemands for crop and livestock production are increasingalong with household consumption and income gener-ation. Maintaining the momentum of growth in agricul-tural productivity will remain crucial, as the production of
Table 8 Temporal and spatial land-use dynamics in some catchments of Ethiopia
Study areas Land-use change References
Increase Decrease
Beressa watershed (North Shewa) Crop and grazing land Natural vegetation Aklilu 2006
Northern Tigray Cropland Grazing land Hadgu 2008
Fogera Woreda (South Gondar) Cropland Grazing land Hussein 2009
Lenche Dima (North Wollo) Shrubs Cropland and grazing land Hussein 2009
Aba’ala district (Northern Afar) Cropland Grassland and woodland Tsegaye et al. 2010
Nonno district (West Shewa) Cropland Wood and grasslands Messay 2011
Kebribeyah district Cropland Grazing land Yodit and Fekadu 2014
(Somali region)
Mecha Woreda (West Gojam) Woodlots and pasture Cropland and vegetation Eleni et al. 2013
Gilgel Gibe watersheds (Rift valley) Cropland Grazing and vegetation Amanuel 2014
Banja district, Awi zone Cropland and settlement Grazing and vegetation Abyot et al.2014
Infraz watershed, West Gojam Forest and grassland Bush and wetlands Amare 2015
Source: Compiled from different empirical studies
Fig. 5 Major driving forces of LULC changes ranked by focus group discussion
Mekuria et al. Ecological Processes (2018) 7:30 Page 12 of 15
basic staple foods need to increase. Mixed farming is animportant livelihood strategy that plays a fundamental rolein reducing risks and improving nutritional outcomes. Inthe watershed, 97% and 93% of households respectivelyproduce crops and rear livestock to fulfill their subsistenceneeds. More than half of households receive 18% of theirannual cash income from crop yields. Households dependlargely on crop production for home consumption. Theaverage landholding size of households to produce crops,keep animals, and grow woodlots is 1.3 ha. More than60% of households own not more than 1 ha of fragmentedplots. Even though crops contribute a lot, the types ofvarieties planted are limited and poor in productivity. Themajority of grain yields are lower than the averageproductivity of crops. High grain production pressurearises when the productive capacity of grain is lower thanthe actual productivity of crops. If climate conditions areunfavorable, the consequences will affect crop-livestocksystems adversely and significantly. This pressure willintensify when food supply is less than food demand forthe study population.Likewise, livestock provide manure, food, fuel, draft
power, transportation, cash income, and reduce risks andvulnerability during critical periods (McIntire et al. 1992).A majority (64%) of households receive 38% of their an-nual cash income from livestock products. Rising popula-tions, together with increasing livestock density and grainproduction pressure exerts considerable pressure on landresources. As the livestock population increases, stockingrate and grazing pressure also increases (Duncan et al.2016). The spatial dimension of LULC for grazing landhas declined. This result is consistent with the findings ofother studies (Yodit and Fekadu 2014; Amanuel 2014). Acommon bottleneck for livestock productivity is feedshortages and a reduction and degradation of pasturelands(Endale et al. 2016). The majority of the households (72%)practice open grazing combined with other feedingstrategies. One fifth (22%) of households have used zerograzing, while 5% and 1% of households practice strip androtational grazing strategies.Crop production, livestock husbandry, and LULC are
the key indicators of land pressure in the mixedcrop-livestock systems. Traditional production systemshave come under increasing pressure due to competitionfor land resources. For instance, eucalyptus plantationshave competed with croplands for soil nutrients and waterresources (Kuria et al. 2014). The findings of this researchreveal that 180 ha of grazing lands and 184 ha of croplandshave been converted to plantation within three decades(1984–2016). On the one hand, households have beeninvolved in extensive agriculture, expanding their farmsthrough cultivation of the natural vegetation in the upperpart of the watershed. Alternatively, households have facedanimal feed shortages because of high livestock densities
along with a decline in grazing lands. On the other hand,intensive agriculture has been practiced in terms of theuse of immense external inputs such as pesticides andherbicides that affect the environment adversely (Kuria etal. 2014). These two parallel scenarios have led tocrop-livestock competition for land resources as well aspotential threats for soil degradation and land-relatedconflicts.Cropland is the leading LULC in the study watershed
and in most other catchments of Ethiopia. Amanuel(2014), Yodit and Fekadu (2014), Amare (2015), andBinyam et al. (2015) reported similar findings. However,we have observed a wide gap between the satelliteimagery and household survey regarding cropland. Theremotely sensed images accessed in 2016 showed that1310 ha of LULC was classified as cropland, butrespondent households did not account for 57% of theland detected by satellite imagery. The possible explana-tions for the discrepancy between remote sensing andhousehold survey relate to accuracy issues. The useraccuracy showed an error of commission while pixelscommitted error classes. The satellite images show 10%of error commission in the transition matrix. In thisdetection matrix (Table 5), the expansion of 527 ha ofcropland is mainly at the expense of 460 ha of grazingland. It means the detection matrix has misclassifiedmore than 123 ha of land gained from grazing land,bushland, and plantation to cropland. The satelliteimages include not only land covered with annual cropsbut also areas covered by scattered villages, homesteads,roads, degraded farmlands, gully buffers, waterways, landstransferred to household members through inheritance orgifts to youth groups, and farmlands held by householdswho settled outside the watershed are classified undercroplands. With this in mind, it would appear that satelliteremote sensing provides opportunities to measure landcover (Hall 2010), while the household survey describes aland use for cropland more effectively.Respondent households described cropland as “cultivated
areas that produce only annual crops.” This finding is inagreement with the proclamation of article 24, sub-article6 and regulation 5, sub-article 1 of Amhara region. Thedecree states that the land below a minimum holding of0.25 ha could not register in landholding certificates(BoEPLAU 2010). It implies that households who ownunregistered parcel of land in their book of holdings maynot report it in household interviews. This is also likely tobe a contributing factor in explaining why the quantitativedata for remote sensing was higher than the data collectedfrom the household survey. Accordingly, we have used thesatellite images to understand the LULC conversionsacross different periods and the extent of land stability,while the data obtained through the household survey havebeen used to estimate animal feed, crop productivity, food
Mekuria et al. Ecological Processes (2018) 7:30 Page 13 of 15
supply, and grazing pressures. Therefore, one can deducethat the rapidly changing legal framework and differentdata sources, coupled with technical limitations, create asignificant divergence between satellite imagery andhousehold survey with regard to LULC for croplands.Nevertheless, the discrepancy between remote sensingand household survey towards cropland should not leadto a deceptive conclusion. According to previous findings,the size of farmland land per household in the study areais not more than 1.0 ha (Kuria et al. 2014). The remotesensing data were tested using Cohen’s kappa coefficientand the result suggests that the classification is highlyperfect, corresponding to 89.7% accuracy rate. Accordingto Tang et al. (2015), it is above the required level ofagreement (81%).
ConclusionsRemote sensing along with household surveys is aninnovative approach to assess farm system dynamics.LULC change, grain production pressure, and pressure onfeed resources are the three major indicators that measureland conversion and food and feed balance. Conservationstructures, woodlands, water resources, irrigation activities,afro-alpine reserves, access to road and local market, andrecently introduced practices—such as highland fruits,malt barley seeds, tree lucerne seedlings, and improvedanimal breeds—are important interventions to improveland productivity, economic gains, and food security.Increased numbers of endangered tree species, high graz-ing pressure, and intensive land conversions are, however,potential threats to enhance the management of improvedland resources. Settlement and plantation have increasedtremendously, in line with the increasing humanpopulation. The rising population is also causing a con-comitant shrinkage in natural vegetation. If the underlyingcrop-livestock dynamics affecting the system remain un-changed, competition for land resources and environmen-tal damage is certain to accelerate. This situation warrantsfurther investment in sustainable land resource manage-ment and efficient institutional arrangements that canpreserve the natural landscape and minimize the extent ofcrop-livestock competition. Promoting multipurposeforage and crop varieties could provide enough biomass tomeet the needs of humans and livestock as well as enhancesoil fertility. Increasing crop production alone will not besufficient to meet the farmers’ animal feed. We concludethat the adoption of improved forages and fodder speciesand better integrating crop-livestock production cansustainably alleviate human food and animal feed demandsin the highlands of Ethiopia.
AcknowledgmentsThis research was undertaken partly with support from Africa RISING, aprogram financed by the United States Agency for InternationalDevelopment (USAID) as part of the United States Government’s Feed the
Future Initiative. The content is solely the responsibility of author/s and doesnot necessarily represent the official views of USAID or the U.S. Governmentor that of the Africa RISING program. Africa RISING is aligned with researchprograms of the CGIAR. Addis Ababa University and the University of Gondarare also acknowledged for technical and financial support offered to the firstauthor for his PhD studies. We thank the data collectors and respondentfarmers who shared their knowledge and spare time during interview andgroup discussions. We gratefully acknowledge the constructive commentsfrom the two reviewers that significantly improved the manuscript.
FundingThis study was financially supported by the United States Agency forInternational Development (USAID) through Africa RISING research program.Hence, it has played a great role to cover field data collection.
Availability of data and materialsThe authors declare that the data and materials presented in this manuscriptcan be made publicly available by Springer Open as per the editorial policy.
Authors’ contributionsWM has contributed in designing the study, collection, analysis, andinterpretation of data. He also participated in writing the manuscript. KMcontributed in the designing of the study, writing, and reviewing of themanuscript. PT provided technical support and reviewed the manuscript.MB, LT, and WA reviewed the manuscript. All authors read and approvedthe final manuscript.
Ethics approval and consent to participateNot applicable
Competing interestsThe authors declare that they have no competing interests.
Publisher’s NoteSpringer Nature remains neutral with regard to jurisdictional claims inpublished maps and institutional affiliations.
Author details1Centre for Rural Development, College of Development Studies, AddisAbaba University, P.O. Box 1176, Addis Ababa, Ethiopia. 2InternationalLivestock Research Institute (ILRI), P.O. Box 5689, Addis Ababa, Ethiopia.3International Center for Tropical Agriculture (CIAT), P. O. Box 5689 AddisAbaba, Ethiopia.
Received: 6 June 2018 Accepted: 21 August 2018
ReferencesAbyot Y, Birhanu G, Solomon A, Ferede Z (2014) Forest cover change detection
using remote sensing and GIS in Banja district, Amhara Region, Ethiopia. Int JEnviron Mon An 2(6):354–360
Aklilu A (2006) Caring for the land: best practices in soil and water conservationin Beressa watershed, highlands of Ethiopia. Dissertation, WageningenUniversity
Alemayehu ST, Dorosh P, Sinafikeh A (2011) Crop production in Ethiopia: regionalpatterns and trends. International Food Policy Research Institute, EthiopiaStrategy Support Program II (ESSP II), Working Paper No. 16. https://www.africaportal.org/publications/crop-production-in-ethiopia-regional-patterns-and-trends/. Accessed 20 Apr 2018.
Amanuel A (2014) Assessing the consequence of land use change on agriculturalproductivity in Nadda Asendabo watershed, Gilgel Gibe sub-catchment ofEthiopia. Int J Environ Sci 3(2):72–77
Amare S (2015) LULC change at Infraz watershed, northwestern Ethiopia. JLandscape Ecol 8(1):69–83
Assefa A (2005) Farm management in mixed crop-livestock systems in thenorthern highlands of Ethiopia. Dissertation, Wageningen University
Bewket W, Radeny M, Mungai C (2015) Agricultural adaptation and institutionalresponses to climate change vulnerability in Ethiopia. CCAFS Working Paperno. 106. CGIAR Research Program on Climate Change, Agriculture and FoodSecurity (CCAFS). Copenhagen. https://ccafs.cgiar.org/publications/
Mekuria et al. Ecological Processes (2018) 7:30 Page 14 of 15
agricultural-adaptation-and-institutional-responses-climate-change-vulnerability#.W4PJ08J9ipo. Accessed 20 Feb 2018
Binyam A, Efrem G, Zewudu E, Habtemariam K (2015) Land use and land coverchanges and associated driving forces in north western lowlands of Ethiopia.Int Res J Agr Sci Soil Sci 5(1):28–44
Bureau of Environment Protection, Land Administration and Utilization(BoEPLAU) (2010) Rural land administration and utilization proclamation, rulesand regulations. Bureau of Environment Protection, Land Administration andUtilization, Bahir Dar
Christy LC, Di Leva CE, Lindsay JM, Takoukam PT (2007) Forest law andsustainable development: addressing contemporary challenges through legalreforms. The World Bank, Washington, D.C.
Claro RM, Levy RB, Bandoni DH, Mondini L (2010). Per capita versus adultequivalent estimates of calorie availability in household budget survey. CadSaúde Pública, Rio de Janeiro 26 (11), 2188–2195
Daniel J, Mbilinyi B, Mahoo H, Mulugeta L (2016) Eucalyptus expansion asrelieving and proactive tree in Ethiopia. J Agric Ecol Res Int 6(3):1–12
Deiniger K, Daniel AA, Tekie A (2008) Impacts of land certification on tenuresecurity, investment, and land markets: evidences from Ethiopia. Policyresearch working paper 4764. World Bank, Washington D.C
Duncan AJ, Fantu B, Kindu M, Diego V, Gedion R, Dagnachew L, Mesfin B, Olaf E(2016) Crop residue allocation to livestock feed, soil improvement and otheruses along a productivity gradient in Eastern Africa. Agric Ecosyst Environ228:101–110
Edward BR, Scot B (2002) Understanding pasture stocking rate and carryingcapacity. http://www.sccd.org/wp-content/uploads/2015/07/Understanding-Pasture-Stocking-Rate-and-Carrying-Capacity.pdf . Accessed 10 January 2018
Eleni Y, Wolfgang W, Michael E, Dagnachew L, Gunter B (2013) Identifying LULCdynamics in the Koga catchment, Ethiopia, from multi-scale data, andimplications for environmental change. ISPRS Int J Geo-Inform 2(2):302–323
Endale Y, Abule E, Lemma F, Getnet A (2016) Livestock feed production and feedbalance in Meta- Robi district, West Shewa zone, Oromiya regional state.Ethiopia Acad Res J Agri Sci Res 4(2):45–54
Food and Agriculture Organization (FAO) (1987) Master land-use plan. Ethiopianrange livestock technical report. Food and Agriculture Organization, Rome
Gryseels G (1988) Role of livestock on mixed smallholder farms in the Ethiopianhighlands. A case study from the Baso and Worena Wereda near DebreBerehan. Dissertation, Wageningen University
Guush B, John HF, Neha K (2017) Synopsis: the impact of Ethiopia’s ProductiveSafety Net Programme on the nutritional status of children: 2008–2012.Ethiopia Strategy Support Program (ESSP) research notes 64, InternationalFood Policy Research Institute (IFPRI). http://ebrary.ifpri.org/utils/getfile/collection/p15738coll2/id/131145/filename/131356.pdf. Accessed 3 April 2018
Hadgu K (2008) Temporal and spatial changes in land use patterns andbiodiversity in relation to farm productivity at multiple scales in Tigray,Ethiopia. Dissertation, Wageningen University
Hall O (2010) Remote sensing in social science research. Open Rem Sens J 3:1–16https://benthamopen.com/contents/pdf/TORMSJ/TORMSJ-3-1.pdf. Accessed1 Aug 2018
Huiyi Z, Shujin H (2010) Land pressure and adaptation in the mountainousregion of northern China: an empirical analysis of 21 small watersheds. JGeogr Sci 20(6):913–922
Hurni H, Berhe WA, Chadhokar P, Daniel D, Gete Z, Grunder M, Kassaye G (2016)Soil and water conservation in Ethiopia: guidelines for development agents.Second revised edition. Centre for Development and Environment (CDE),University of Bern. https://doi.org/10.7892/boris.80013
Hussein A (2009) Land use and land cover change, drivers and its impact: acomparative study from Kuhar Michael and Lenche Dima of Blue Nile andAwash basins of Ethiopia. Thesis, Cornell University
Kindu M, Jogo W, Melkamu B, Mulema A, Thorne P (2017) Determinants ofsurvival and growth of tree lucerne (Chamaecytisus palmensis) in thecrop-livestock farming systems of the Ethiopian highlands. AgroforestSyst.https://doi.org/10.1007/s10457-016-0066-1
Kuria A, Lamond G, Pagella T, Gebrekirstos A, Hadgu K, Sinclair F (2014) Localknowledge of farmers on opportunities and constraints to sustainableintensification of crop- livestock- trees mixed systems in Lemo Woreda,Southern Nations Nationalities and People Region (SNNPR), Ethiopian highlands.A field study report. https://cgspace.cgiar.org/bitstream/handle/10568/41669/Lemo_ARmay.pdf?sequence=1&isAllowed=y. Accessed 8 March 2018.
Liniger H, Mekdaschi-Studer R, Hauert C, Gurtner M (2011) Guidelines and bestpractices for Sub-Saharan Africa, field application. TerrAfrica, World Overview
of Conservation Approaches and Technologies (WOCAT) and Food andAgriculture Organization (FAO) of the United Nations, Rome
McIntire J, Bourzat D, Prabhu P (1992) Crop-livestock interaction in Sub-SaharanAfrica. World Bank, Washington, DC
Messay M (2011) Land-use/land-cover dynamics in Nonno district, centralEthiopia. J Sustain Dev Afr 13(1):123–141
Nigussie H, Tsunekawa A, Nyssen JU, Poesen J, Tsubo M, Derege TM, Schutt B,Enyew A, Firew T (2015) Soil erosion and conservation in Ethiopia: a review.Prog Phys Geogr 39(6):750–774
Ridder RM (2010) Global forest resources assessment 2010: options andrecommendations for a global remote sensing survey of forests. FAO ForestResources Assessment Program Working Paper 141. FAO, Rome
Rota A, Sperandini S (2010) Integrated crop-livestock farming systems. LivestockThematic Papers - Tools for Project Design. International Fund for AgricultureDevelopment (IFAD). Rome. https://www.slideshare.net/copppldsecretariat/integrated-crop. Accessed 25 Jan 2018
Tamene L, Adimassu Z, Ellison J, Yaekob T, Woldearegay K, Mekonnen K, ThorneP, Le QB (2017) Mapping soil erosion hotspots and assessing the potentialimpacts of land management practices in the highlands of Ethiopia.Geomorphology 292:153–163
Tang W, Hu J, Zhang H, Wu P, He H (2015) Kappa coefficient: a popular measureof rater agreement. Biostat Pychiat 27(1):62–67
Todaro MP, Smith SC (2012) Economic development. Addison-Wesley, BostonTsegaye D, Moe SR, Vedeld P, Ermias A (2010) LULC dynamics in northern Afar
rangelands. Ethiopia Agri Ecosyst Environ 139:174–180WHO (World Health Organization) (2002) Food and nutrition needs in emergencies.
Guideline. http://apps.who.int/iris/bitstream/handle/10665/68660/a83743.pdf;jsessionid=D23F137E291D2FD5B3B22BDADD037F97?sequence=1. Accessed 28March 2018.
Yamane T (1967) Statistics: an introductory analysis, second ed. New York: Harperand Rao
Yihalem D (2013) Livestock feed formulation and feeding for livestock breedingexperts. Training Manual/handout. Andasa, Amhara Region AgriculturalResearch Institute (ARARI), Ethiopia
Yodit A, Fekadu B (2014) Examining drivers of land use change amongpastoralists in Eastern Ethiopia. J Land Use Sci 9(4):402–413
Mekuria et al. Ecological Processes (2018) 7:30 Page 15 of 15
Copyright © 2022 FDOKUMEN