Nutri2Cycle D.1.3 Driving forces of farming systems and their ...
91
This project has received funding from the European Union’s Horizon 2020 research and innovation programme under grant agreement No 773682. Page 1 of 91 Work package leader: Stichting Wageningen Research Authors: O. Oenema 1 , J.P. Lesschen 1 , R. Rietra 1 , J. Rieger, L 2 . Stokkermans 1 , C. Hendriks 1 1 Wageningen University and Research, Netherlands 2 Thünen Institute of Farm Economics, Germany Quality review: Dissemination Type: Final version Public Date: 19/04/2020 (revised 29/1/2021) Grant Agreement N°: 773682 Starting Date: 01/10/2018 Duration: 48 months Co-ordinator: Prof. Erik Meers, Ghent University Contact details: [email protected] Nutri2Cycle D.1.3 Driving forces of farming systems and their impacts on CNP ratios and flows
-
Upload
khangminh22 -
Category
Documents
-
view
0 -
download
0
Transcript of Nutri2Cycle D.1.3 Driving forces of farming systems and their ...
This project has received funding from the European Union’s Horizon 2020 research and innovation programme
under grant agreement No 773682.
Page 1 of 91
Work package leader:
Stichting Wageningen Research
Authors: O. Oenema1, J.P. Lesschen1, R. Rietra1, J. Rieger, L2. Stokkermans1, C. Hendriks1 1 Wageningen University and Research, Netherlands 2 Thünen Institute of Farm Economics, Germany
Quality review: Dissemination Type:
Final version Public
Date: 19/04/2020 (revised 29/1/2021)
Grant Agreement N°: 773682
Starting Date: 01/10/2018
Duration: 48 months
Co-ordinator: Prof. Erik Meers, Ghent University
Contact details: [email protected]
Nutri2Cycle
D.1.3 Driving forces of farming systems
and their impacts on CNP ratios and flows
This project This project has received funding from the European Union’s Horizon 2020 research and
innovation programme under grant agreement No 773682
Page 2 of 91
Table of Contents
Table of Contents .................................................................................................................. 2
Summary .............................................................................................................................. 4
1. Introduction .................................................................................................................... 6
1.1 Background............................................................................................................. 6
1.2 Objective ................................................................................................................. 7
1.3 Outline of the report ................................................................................................ 7
2. Analysis framework ........................................................................................................ 8
2.1 Introduction ............................................................................................................. 8
2.2 Coupling and decoupling processes for C, N and P ................................................ 9
2.3 Relative enrichment / impoverishment of N and P ................................................. 10
2.4 Framework for analysing changes in C, N and P ratios and coupling .................... 12
3. Overview of current farming systems ........................................................................... 15
3.1 Farming systems................................................................................................... 15
3.2 Livestock farming .................................................................................................. 17
3.3 Manure management ............................................................................................ 19
3.3.1 Manure storage systems ................................................................................ 19
3.3.2 Manure processing ........................................................................................ 21
3.3.3 Manure export ................................................................................................ 23
3.4 Crop farming ......................................................................................................... 24
4. Driving forces and responses of farming systems ........................................................ 27
4.1 Brief history of agricultural developments .............................................................. 27
4.2 Driving forces of agricultural systems .................................................................... 29
4.3 Driving forces of nutrient cycling ........................................................................... 32
4.4 Main changes in agricultural systems .................................................................... 36
4.4.1 Farming systems ........................................................................................... 36
4.4.2 Crop production ............................................................................................. 38
4.4.3 Livestock production ...................................................................................... 40
4.4.4 Trade of crop and animal products ................................................................. 42
4.4.5 Fertilizer consumption .................................................................................... 44
This project This project has received funding from the European Union’s Horizon 2020 research and
innovation programme under grant agreement No 773682
Page 3 of 91
4.4.6 Manure management ..................................................................................... 46
4.4.7 Nutrient balances ........................................................................................... 47
5. Ecological stoichiometry – definitions, concept and mechanism................................... 51
5.1 Introduction ........................................................................................................... 51
5.2 Definitions ............................................................................................................. 51
5.3 C:N:P ratios of components of plants and animals ................................................ 53
5.4 C:N:P ratios of plants ............................................................................................ 54
5.5 C:N:P ratios of animals ......................................................................................... 59
5.6 Stoichiometric interactions at ecosystem level ...................................................... 62
6. Review of C:N:P stoichiometry in agriculture ................................................................ 66
6.1 C:N:P stoichiometry in crops ................................................................................. 66
6.2 C:N:P stoichiometry in animal products ................................................................. 67
6.3 C:N:P stoichiometry in animal manures ................................................................ 68
6.4 C:N:P stoichiometry in topsoils .............................................................................. 70
7. Synthesis ..................................................................................................................... 75
7.1 C:N:P ratios as indicators for leakiness ................................................................. 75
7.2 Driving forces of farming systems and C:N:P stoichiometry .................................. 76
7.3 How to manage C:N:P stoichiometry in agriculture? ............................................. 78
7.4 Recommendations ................................................................................................ 83
References ......................................................................................................................... 85
This project This project has received funding from the European Union’s Horizon 2020 research and
innovation programme under grant agreement No 773682
Page 4 of 91
Summary
Carbon, nitrogen and phosphorus have numerous functions in plants, animals and humans, and hence
in food production, and in the interactions between food production systems and the wider
environment. Ecological stoichiometry concerns the way that the elemental compositions of
organisms shape the interactions between organisms and in the end all life on earth. It deals with the
balance of elemental ratios and how these affect organism growth, nutrient cycling, and the
interactions with the biotic and abiotic worlds. While the C:N:P ratios of components of natural
systems have been studied extensively, there are only few studies that have examined (changes in)
C:N:P ratios of components of agricultural systems and the whole food production – consumption
system in a comprehensive manner. Most studies focus on either yield (energy, C) and/or N and/or P.
This report therefore reviews the changes in C:N:P ratios in pools, flows and losses of farming systems
in Europe over time. The underlying hypothesis is that the relative proportions of C, N and P in pools
and flows in farming systems affect the leakiness of these systems. Understanding the stoichiometry
of C:N:P in farming systems may help to identify options to decrease the leakiness.
This report focusses on (i) describing and understanding the conceptual/mechanistic relationships
between driving forces of agricultural systems and their possible/likely impacts on C:N:P ratios and C,
N and P coupling, and (ii) the simulation of the likely impacts of main driving forces on C:N:P ratios in
agriculture. First an overview of the current farming systems is provided in terms of farm type
characteristics, livestock numbers, manure management and crop production.
Chapter 4 provides a qualitative description of the driving forces of farming systems, based on a
literature review, and a semi-quantitative analyses of the changes over time in farm structure. The
main driving forces of European agriculture (markets, science & technology and policy) have led to the
specialization, intensification, upscaling (enlargement) of farming systems, and to the introduction of
treatment technology in the food production – consumption chain. The more specialized, intensive,
and large farming systems, with often similar farm types in concentrated areas, are producing
relatively N and P rich products, and have decreased the C:N and C:P ratios of soil organic matter. The
narrowing of the C:N and C:P ratios have made the systems more leaky and vulnerable to external
changes.
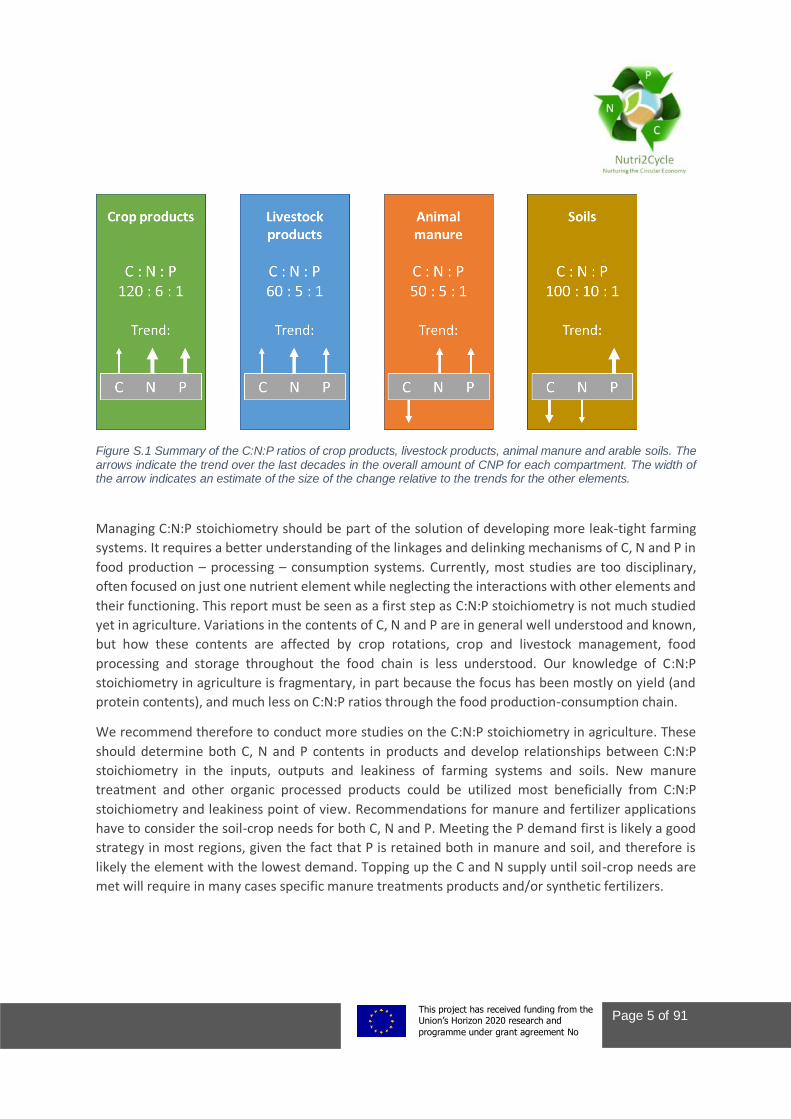
Figure S.1 provides a summary to illustrate the C:N:P ratios and the changes in CNP for the main
compartments of agriculture (crop products, livestock products, animal manure and soils). The C:N:P
ratios were estimated as the average of all crops, livestock products and manures for the EU-28, using
weighted averages based on the total amount of nitrogen. The review of C:N:P ratios in Chapter 6
shows that the variation in C:N:P ratios can be large among crops, livestock products, manures and
soils. Nevertheless, the overall averages provide a good picture of how CNP stoichiometry changes for
the different compartments of agriculture.
This project This project has received funding from the European Union’s Horizon 2020 research and
innovation programme under grant agreement No 773682
Page 5 of 91
Figure S.1 Summary of the C:N:P ratios of crop products, livestock products, animal manure and arable soils. The arrows indicate the trend over the last decades in the overall amount of CNP for each compartment. The width of the arrow indicates an estimate of the size of the change relative to the trends for the other elements.
Managing C:N:P stoichiometry should be part of the solution of developing more leak-tight farming
systems. It requires a better understanding of the linkages and delinking mechanisms of C, N and P in
food production – processing – consumption systems. Currently, most studies are too disciplinary,
often focused on just one nutrient element while neglecting the interactions with other elements and
their functioning. This report must be seen as a first step as C:N:P stoichiometry is not much studied
yet in agriculture. Variations in the contents of C, N and P are in general well understood and known,
but how these contents are affected by crop rotations, crop and livestock management, food
processing and storage throughout the food chain is less understood. Our knowledge of C:N:P
stoichiometry in agriculture is fragmentary, in part because the focus has been mostly on yield (and
protein contents), and much less on C:N:P ratios through the food production-consumption chain.
We recommend therefore to conduct more studies on the C:N:P stoichiometry in agriculture. These
should determine both C, N and P contents in products and develop relationships between C:N:P
stoichiometry in the inputs, outputs and leakiness of farming systems and soils. New manure
treatment and other organic processed products could be utilized most beneficially from C:N:P
stoichiometry and leakiness point of view. Recommendations for manure and fertilizer applications
have to consider the soil-crop needs for both C, N and P. Meeting the P demand first is likely a good
strategy in most regions, given the fact that P is retained both in manure and soil, and therefore is
likely the element with the lowest demand. Topping up the C and N supply until soil-crop needs are
met will require in many cases specific manure treatments products and/or synthetic fertilizers.
This project This project has received funding from the European Union’s Horizon 2020 research and
innovation programme under grant agreement No 773682
Page 6 of 91
1. Introduction
1.1 Background Food and animal feed contain on average 40 to 50% carbon (C), 2 to 5% nitrogen (N) and 0.1 to 0.5%
phosphorus (P). The other part of the food and feed is made up of oxygen (O), hydrogen (H), essential
nutrients (K, Ca, Mg, Na, S, Cl, Fe, Cu, Zn, Mn, Co, Mo, Se, I, Cr, F) and non-essential nutrients, metals
and non-metals (e.g., Si, Al, Cd, Pb). The relative proportions of C, N and P differ between different
food and feed commodities, while the relative availabilities of these commodities have changed over
time due to changes in food preferences and in farming systems. The study of the relative proportions
of elements in food and feed and other substances is termed stoichiometry. Stoichiometry has its basis
in ‘the law of definite proportions’, which was founded by Joseph Proust by the end of the 18th century,
and states that a chemical compound (or molecule) contains its elements in fixed ratios. Stoichiometry
also deals with the ‘law of conservation of mass and energy’. Ecological stoichiometry involves the
balance of elements and energy in ecological interactions and processes (Sterner and Elser, 2003).
The saying 'You are what you eat' reflects ‘ecological stoichiometry’; to be fit and healthy you need to
eat good food. Though there is a truth in this saying, the reality is a bit more complex. In fact, the C:N:P
ratios in humans and animal species are remarkably constant, and to a large extent independent of
what we eat (but there are large differences in C:N:P ratios among animal species). The C:N and C:P
ratios in humans and animal species are remarkably constant due to homeostasis, the physiological
regulation of the humans’ and animals’ internal environment, which reduces changes in C:N and C:P
ratios within humans and animals. Greater truth is in the saying ‘You excrete what you eat’, and even
more in the saying ‘You excrete what you eat, minus the fractions you respire or retain’. Indeed, C:N:P
excretion by humans and animals equals C:N:P intake minus C:N:P retention minus C respiration. It
reflects the laws of definite proportions and of mass conservation; the excreted C, N and P become
available to other organisms.
Plants (and algae) are autotrophs and have not such a strict homeostasis as humans and animals. As
a result, the C:N and C:P ratios of plants can vary substantially in response to the external
environment, i.e., the incoming solar radiation and the availability of N and P. The growth,
development as well as elemental composition of plants depend on the genotype and the balance of
photosynthetic active radiation (energy) and the availability of N and P (and other essential nutrients)
near plant roots. There is also variation in C:N:P ratios among plant parts and biomolecules within
plants; the C:N and C:P ratios of proteins, nucleic acid, lipids, cellulose and cell walls differ one to two
orders of magnitude.
The biomass of natural terrestrial ecosystems is carbon-rich with an average C:N:P ratio of about
50000:100:1. The ‘new’ N (derived from biological N2 fixation) and ‘new’ P (derived from weathering)
are recycled on average 100 to 200 times in these systems (Sterner and Elser, 2003). In contrast,
marine biomass has on average a much lower (narrower) C:N:P ratio of 106:16:1 (so-called Redfield
ratio; Falkowski et al., 1998). The average C:N:P ratio of the biomass of freshwater systems is in
This project This project has received funding from the European Union’s Horizon 2020 research and
innovation programme under grant agreement No 773682
Page 7 of 91
between that of natural terrestrial ecosystems and the marine system. Humans have greatly altered
the C:N:P ratios and cycling through agriculture and fossil fuel combustion (Vitousek et al., 1997;
Schlesinger and Bernhardt, 2014). Agriculture has more than doubled the annual inputs of ‘new’ N
(through the Haber-Bosch process) and P (through P fertilizers derived from mined rock phosphates).
Agriculture has also contributed to land use change, and has introduced new crop varieties and animal
breeds. By doing so, agriculture also influences the C:N:P ratios of freshwater systems and marine
coastal areas, as well as the ecological functioning of these systems. It has been suggested that the N
and P loading of surface waters has exceeded critical boundaries (Steffen et al., 2015). More than half
of the N and P input to surface waters is from agriculture, and this fraction is increasing (Beusen et al.,
2016).
1.2 Objective While the C:N:P ratios of components of natural systems have been studied in a comprehensive
manner for decades (Sterner and Elser, 2003; Van der Waal et al., 2018), there are few studies that
have examined (changes in) C:N:P ratios of components of agricultural systems and of whole food
production-consumption systems in a comprehensive manner. Most studies focus on either yield
(energy, C) and/or N and/or P. As a result, there are as yet no comprehensive reviews and overviews
of the changes in C:N:P ratios in agricultural systems and in whole food production-consumption
systems.
This report therefore reviews the changes in C:N:P ratios in pools, flows and losses of farming systems
in Europe over time. The underlying hypothesis is that the relative proportions of C, N and P in pools
and flows in farming systems affect the leakiness of these systems. A related hypothesis is that
understanding the stoichiometry of C:N:P in farming systems may help to identify options to decrease
the leakiness. This review is therefore based on a several compartmental reviews coupled through a
discussion and synthesis at the end.
1.3 Outline of the report Following this Introduction, Chapter 2 will present the analysis framework for this review of the driving
forces of changes in farming systems and of their effects on CNP flows and their stoichiometry.
Chapter 3 presents a brief overview of the main characteristics of current farming systems in Europe
Union (EU). Chapter 4 provides a qualitative description of the driving forces of farming systems, based
on a literature review, and a semi-quantitative analyses of the changes over time in farm structure.
Chapter 5 briefly describes the concept of ecological stoichiometry as it is applied to natural
ecosystems, and how it may be applied to agro-ecosystems. Chapter 6 presents results from a review
on C:N:P ratios in agriculture, making distinction among crop and animal products, manures and soils.
Chapter 7 is a synthetic discussion, which links the driving forces of farming systems discussed in
Chapter 4 to the changes in CNP stoichiometry of agricultural products and CNP losses discussed in
Chapter 6. Next, chapter 7 identifies possible options and technologies to improve the CNP
stoichiometry in agricultural products and to decrease CNP losses. The chapter concludes with some
main findings and recommendations.
This project This project has received funding from the European Union’s Horizon 2020 research and
innovation programme under grant agreement No 773682
Page 8 of 91
2. Analysis framework
2.1 Introduction Carbon, nitrogen and phosphorus have numerous functions in plants, animals and humans, and hence
in food production, and in the interactions between food production systems and the wider
environment. They make up significant fractions of plants, animals and humans, and of the various
biological molecules and components in plants, animals and humans. They are essential, ubiquitous
and often in short or excess supply, with contrasting implications. Yet, their functioning is suboptimal
in the biosphere when one or more of the other essential elements are in short or excess supply,
including sulphur (S), calcium (Ca), magnesium (Mg) and micronutrients such as iron (Fe), zinc (Zn),
copper (Cu) and molybdenum (Mo). All essential nutrients, vitamins, light, and water have to be
available at specific levels for proper functioning of plants, animals, humans and ecosystems, but C, N
and P have very special roles here (Smil, 1997).
Why do C, N and P have these roles and why is this report focussed on C, N and P?
- C has the ability (i) to form four stable, high-energy covalent bonds with a number of elements,
including N, O and S, (ii) to form diverse redox states (-4 to +4), (iii) to generate a flexible
architecture, and (iv) to store energy.
- N has the ability (i) to form a diversity of redox states, (ii) store energy, (iii) form amine groups
with is a core of amino acids, and (iv) is able to link to and associate with other elements (Fe,
Mg, Mo).
- P has the ability to form strong linkages with other elements, and thereby to provide stability
for polymeric molecules, and is ubiquitous in cellular metabolisms and biological structures.
It is present in genetic polymers (RNA, DNA), coenzymes, intermediate metabolites, and is the
principle vehicle of biochemical energy (ATP).
These three basic reasons explain why C, N and P have such important role in life on earth. In addition,
C, N and P are essential ingredients of a whole range of industrial products. Further, C and N are also
involved in the greenhouse gas effect, climate change, and the acidification of oceans, lakes and soils,
while N and P are involved in eutrophication of natural habitats, including lakes and oceans. Evidently,
C, N and P are key elements in the biosphere and food production systems, but due to human
influences on the biosphere, ‘there is often too much C, N and P, at wrong places’.
In the biosphere, C, N and P are intimately linked in organic matter, in a whole range of different
organic molecules with different C:N:P ratios, but they occur as free molecules as well. Through plant
metabolism, C, N and P are intimately coupled and decoupled, depending on growth stage. Plant
metabolism is defined here as the complex of photosynthesis, respiration, and the synthesis of organic
compounds. Photosynthesis produces the substrates for respiration and the starting organic
This project This project has received funding from the European Union’s Horizon 2020 research and
innovation programme under grant agreement No 773682
Page 9 of 91
compounds used as building blocks for subsequent biosynthesis of nucleic acids, amino acids, and
proteins, carbohydrates and organic acids, lipids, and natural products. Plants are harvested and
consumed by humans and/or animals, and thereby new couplings and decoupling of C, N and P occurs.
The same occurs in food production systems, but two changes have occurred: (i) the relative
proportions of C, N and P in main products have changed, and (ii) the coupling-decoupling mechanisms
of C, N and P have changed (Schlesinger and Bernhardt, 2014; Smil, 2002).
The purpose of this chapter is to present an analytical framework for analysing changes in C:N:P ratios
in food production systems.
2.2 Coupling and decoupling processes for C, N and P The dominant coupling mechanism for C, N and P in the biosphere is through photosynthesis and
subsequent biosynthesis of various organic molecules in photoautotrophic algae and plants (Table
2.1). In specific niches, there is chemosynthesis of organic molecules in nature (in anaerobic
environments). Biosynthesis and coupling of C, N and P also occurs in animals and humans. And there
is biosynthesis and chemosynthesis in reactors, in industry.
Basic decoupling processes are respiration, decomposition and mineralization of organic matter.
Partial decoupling occurs via excretion of urine and faeces in animals and humans, with some specific
differences between animal species. In faeces, most of the C, N and (part of) P are still coupled, while
urine contains dissolved organic compounds, which are easily decomposed, and inorganic solutes. In
ruminants most of the P (>90%) is excreted in faeces, in humans and pigs, most of the P is excreted in
urine as solutes (Table 2.1).
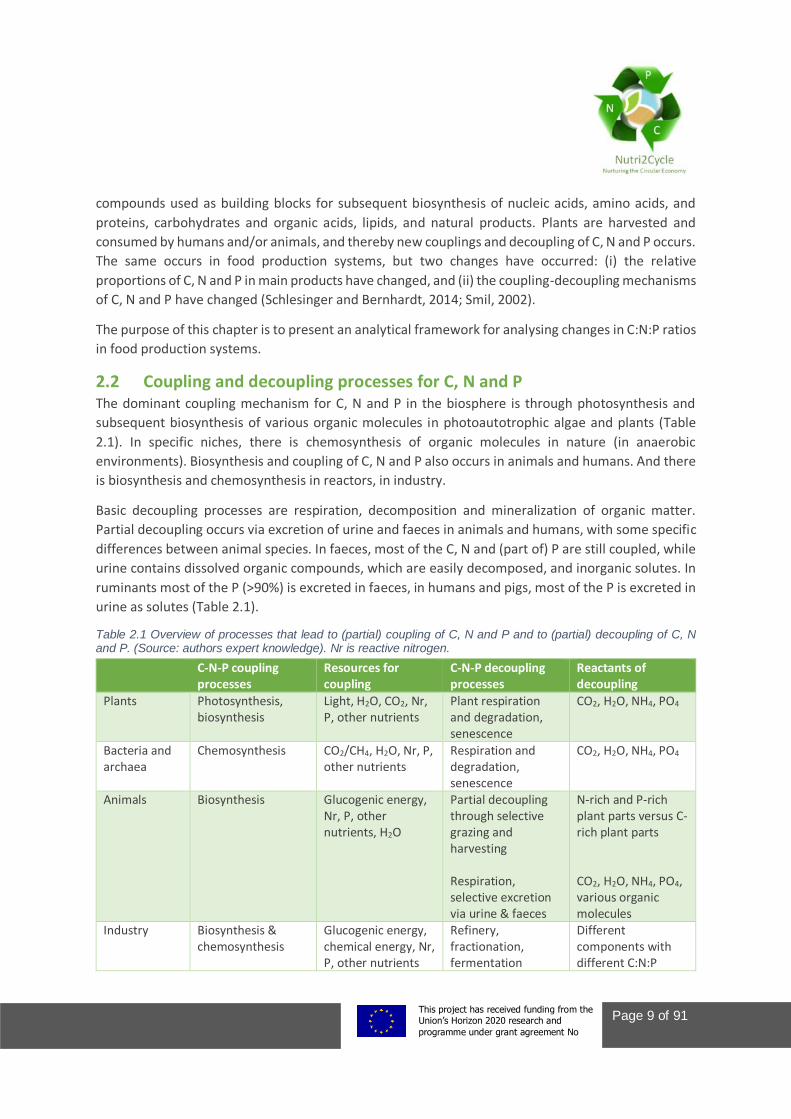
Table 2.1 Overview of processes that lead to (partial) coupling of C, N and P and to (partial) decoupling of C, N and P. (Source: authors expert knowledge). Nr is reactive nitrogen.
C-N-P coupling processes
Resources for coupling
C-N-P decoupling processes
Reactants of decoupling
Plants Photosynthesis, biosynthesis
Light, H2O, CO2, Nr, P, other nutrients
Plant respiration and degradation, senescence
CO2, H2O, NH4, PO4
Bacteria and archaea
Chemosynthesis CO2/CH4, H2O, Nr, P, other nutrients
Respiration and degradation, senescence
CO2, H2O, NH4, PO4
Animals Biosynthesis Glucogenic energy, Nr, P, other nutrients, H2O
Partial decoupling through selective grazing and harvesting Respiration, selective excretion via urine & faeces
N-rich and P-rich plant parts versus C-rich plant parts CO2, H2O, NH4, PO4, various organic molecules
Industry Biosynthesis & chemosynthesis
Glucogenic energy, chemical energy, Nr, P, other nutrients
Refinery, fractionation, fermentation
Different components with different C:N:P
This project This project has received funding from the European Union’s Horizon 2020 research and
innovation programme under grant agreement No 773682
Page 10 of 91
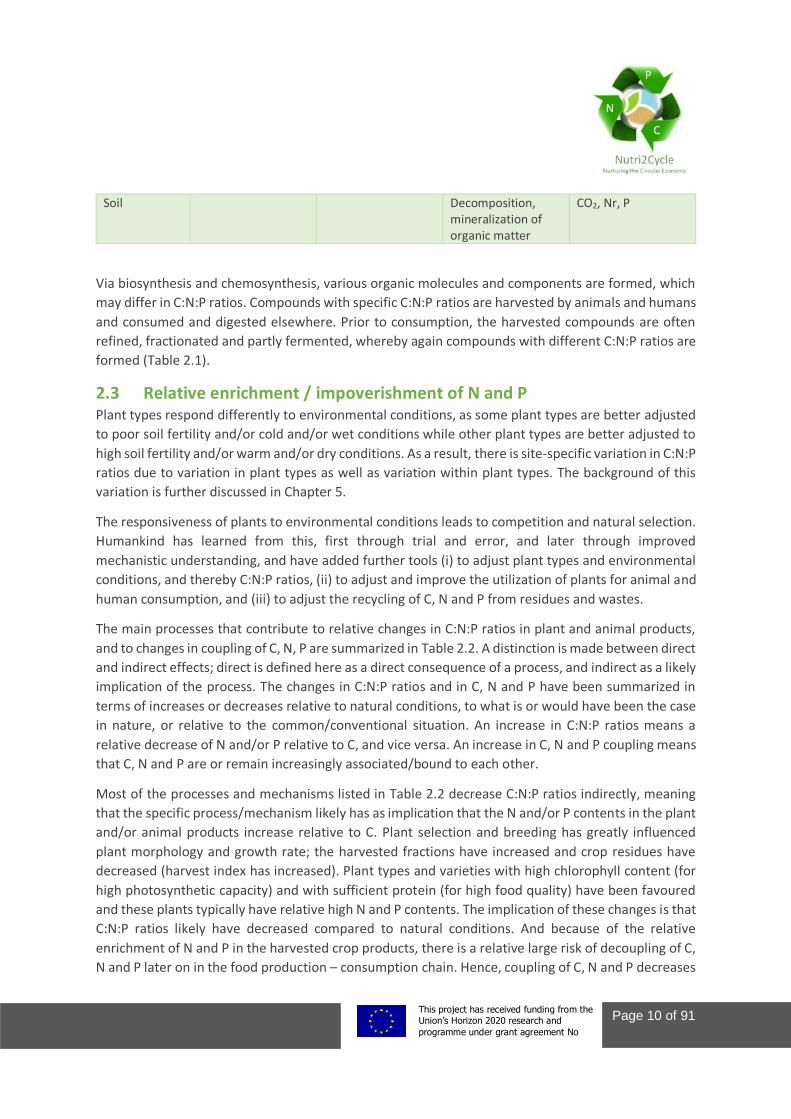
Soil Decomposition, mineralization of organic matter
CO2, Nr, P
Via biosynthesis and chemosynthesis, various organic molecules and components are formed, which
may differ in C:N:P ratios. Compounds with specific C:N:P ratios are harvested by animals and humans
and consumed and digested elsewhere. Prior to consumption, the harvested compounds are often
refined, fractionated and partly fermented, whereby again compounds with different C:N:P ratios are
formed (Table 2.1).
2.3 Relative enrichment / impoverishment of N and P Plant types respond differently to environmental conditions, as some plant types are better adjusted
to poor soil fertility and/or cold and/or wet conditions while other plant types are better adjusted to
high soil fertility and/or warm and/or dry conditions. As a result, there is site-specific variation in C:N:P
ratios due to variation in plant types as well as variation within plant types. The background of this
variation is further discussed in Chapter 5.
The responsiveness of plants to environmental conditions leads to competition and natural selection.
Humankind has learned from this, first through trial and error, and later through improved
mechanistic understanding, and have added further tools (i) to adjust plant types and environmental
conditions, and thereby C:N:P ratios, (ii) to adjust and improve the utilization of plants for animal and
human consumption, and (iii) to adjust the recycling of C, N and P from residues and wastes.
The main processes that contribute to relative changes in C:N:P ratios in plant and animal products,
and to changes in coupling of C, N, P are summarized in Table 2.2. A distinction is made between direct
and indirect effects; direct is defined here as a direct consequence of a process, and indirect as a likely
implication of the process. The changes in C:N:P ratios and in C, N and P have been summarized in
terms of increases or decreases relative to natural conditions, to what is or would have been the case
in nature, or relative to the common/conventional situation. An increase in C:N:P ratios means a
relative decrease of N and/or P relative to C, and vice versa. An increase in C, N and P coupling means
that C, N and P are or remain increasingly associated/bound to each other.
Most of the processes and mechanisms listed in Table 2.2 decrease C:N:P ratios indirectly, meaning
that the specific process/mechanism likely has as implication that the N and/or P contents in the plant
and/or animal products increase relative to C. Plant selection and breeding has greatly influenced
plant morphology and growth rate; the harvested fractions have increased and crop residues have
decreased (harvest index has increased). Plant types and varieties with high chlorophyll content (for
high photosynthetic capacity) and with sufficient protein (for high food quality) have been favoured
and these plants typically have relative high N and P contents. The implication of these changes is that
C:N:P ratios likely have decreased compared to natural conditions. And because of the relative
enrichment of N and P in the harvested crop products, there is a relative large risk of decoupling of C,
N and P later on in the food production – consumption chain. Hence, coupling of C, N and P decreases
This project This project has received funding from the European Union’s Horizon 2020 research and
innovation programme under grant agreement No 773682
Page 11 of 91
in the food production – consumption chain; it is an indirect effect (implication) of the selection and
breeding towards faster-growing, higher-yielding, and protein-richer crops.
Animal selection and breeding has also resulted in fast growing animals with relatively high carcass
weight and relatively low fat deposition (with low N and P contents). As will be shown later, the N and
P contents of animal components is remarkable constant, but the relative proportions of these
components changes through selection and breeding. Though cattle dominate the world in terms of
animal biomass, there is a relative increase in poultry and pork production in the world because the
latter require relatively less feed (have higher feed conversion coefficients). The relative carcass
weight (the usable portion of animals) changes in the order poultry > pigs > cattle. In summary, animal
selection and breeding has contributed indirectly to a relative decrease in C:N:P ratios, and indirectly
also to a decrease in coupling of C, N and P in the food production – consumption chain.
Fertilization with N and P has a direct effect on crop growth and C:N:P ratios. As uptake of N and P
proceeds growth (photosynthesis and biosynthesis), there is in general a relative enrichment of plants
with N and P following fertilization. Indirectly, this leads to less coupling of C, N and P in the food
production – consumption chain.
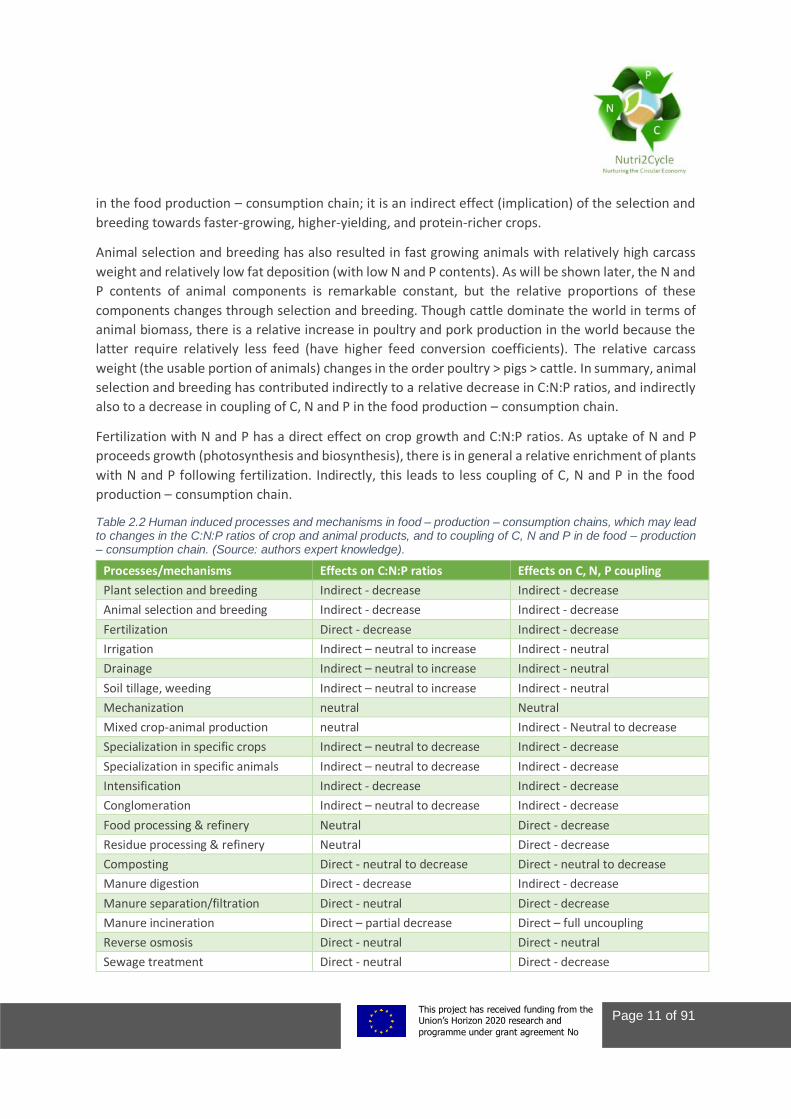
Table 2.2 Human induced processes and mechanisms in food – production – consumption chains, which may lead to changes in the C:N:P ratios of crop and animal products, and to coupling of C, N and P in de food – production – consumption chain. (Source: authors expert knowledge).
Processes/mechanisms Effects on C:N:P ratios Effects on C, N, P coupling
Plant selection and breeding Indirect - decrease Indirect - decrease
Animal selection and breeding Indirect - decrease Indirect - decrease
Fertilization Direct - decrease Indirect - decrease
Irrigation Indirect – neutral to increase Indirect - neutral
Drainage Indirect – neutral to increase Indirect - neutral
Soil tillage, weeding Indirect – neutral to increase Indirect - neutral
Mechanization neutral Neutral
Mixed crop-animal production neutral Indirect - Neutral to decrease
Specialization in specific crops Indirect – neutral to decrease Indirect - decrease
Specialization in specific animals Indirect – neutral to decrease Indirect - decrease
Intensification Indirect - decrease Indirect - decrease
Conglomeration Indirect – neutral to decrease Indirect - decrease
Food processing & refinery Neutral Direct - decrease
Residue processing & refinery Neutral Direct - decrease
Composting Direct - neutral to decrease Direct - neutral to decrease
Manure digestion Direct - decrease Indirect - decrease
Manure separation/filtration Direct - neutral Direct - decrease
Manure incineration Direct – partial decrease Direct – full uncoupling
Reverse osmosis Direct - neutral Direct - neutral
Sewage treatment Direct - neutral Direct - decrease
This project This project has received funding from the European Union’s Horizon 2020 research and
innovation programme under grant agreement No 773682
Page 12 of 91
2.4 Framework for analysing changes in C, N and P ratios and coupling Paragraphs 2.2 and 2.3 have indicated that C:N:P ratios of crop and animal products, and C, N and P
coupling in the food production – consumption chain are influenced by many processes and
mechanisms. In addition, there will be interactions, for example between plant breeding and
fertilization, in C:N:P ratios of crop products, and in C, N and P coupling in the food production –
consumption chain. Evidently, there is a myriad of processes and mechanism that affect C:N:P ratios.
Examining the effects of each of the processes and mechanisms separately and in detail is beyond the
scope of this study. Rather, this study focusses on (i) describing and understanding the
conceptual/mechanistic relationships between driving forces of the food production – consumption
chain and their possible/likely impacts on C:N:P ratios and C, N and P coupling, and (ii) simulation of
the likely impacts of main driving forces on C:N:P ratios and C, N and P coupling in the food production
– consumption chain. This paragraph presents the conceptual framework for analysing relationships
between driving forces of the food production – consumption chain and their possible/likely impacts
on C:N:P ratios and C, N and P coupling.
The processes/mechanisms listed in Table 2.2 are directly and indirectly fuelled by the three main
external driving forces of the food production – consumption chain, namely markets, technology and
policy. Markets include the whole of demand and supply of food products, and are in turn influenced
by population growth, economic growth, globalization, culture, as well as by external disturbances
(climate change, diseases, pests, war). Technology represents the whole of scientific and technological
progress, including processing technology, mechanization, information technology, and new
production designs and products. Policy encompasses production and market support/control, and
regulation of production methods by governments. These three external driving forces determine how
farmers and suppliers, processing industries and retail respond, and how farming systems and the
food production - consumption chain develop.
The responses of farmers to markets, technology and policy greatly varies across countries, due to
differences in socio-economic and environmental conditions, and education and culture. Again,
examining the differences in responses between individual farmers is beyond the scope of this study.
Rather, we focus on overall main responses, which can be summarized by four main factors, namely
(i) specialization, (ii) intensification, (iii) up-scaling, and (iv) treatment. Specialization includes the
selection of only few main activities, crops or animals, and often includes outsourcing (transfer of
activities to others). Intensification refers to increasing the output per unit of land, labour and animal,
through increasing knowledge, management and non-factor inputs (e.g. fertilizers, irrigation,
mechanization). Upscaling refers to increasing total output of a farm or firm, often through
enlargement of the farm/firm, mechanization and often also through specialization/outsourcing.
Treatment encompasses a whole range of activities aimed at increasing the value of crop and animal
products at the farm, firm and/or processing industry. These four factors basically capture the
This project This project has received funding from the European Union’s Horizon 2020 research and
innovation programme under grant agreement No 773682
Page 13 of 91
influences of all processes/mechanisms listed in Table 2.2 that contribute to changes in C:N:P ratios
of crop and animal products, and in C, N and P coupling in the food production – consumption chain.
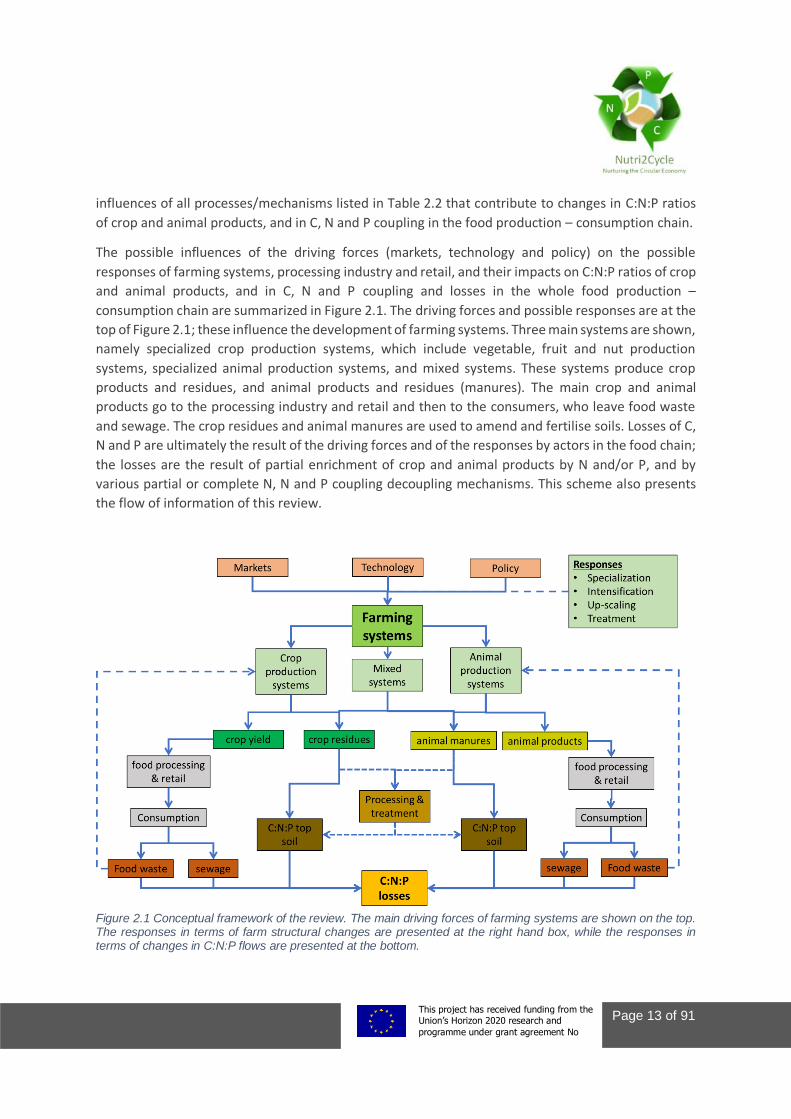
The possible influences of the driving forces (markets, technology and policy) on the possible
responses of farming systems, processing industry and retail, and their impacts on C:N:P ratios of crop
and animal products, and in C, N and P coupling and losses in the whole food production –
consumption chain are summarized in Figure 2.1. The driving forces and possible responses are at the
top of Figure 2.1; these influence the development of farming systems. Three main systems are shown,
namely specialized crop production systems, which include vegetable, fruit and nut production
systems, specialized animal production systems, and mixed systems. These systems produce crop
products and residues, and animal products and residues (manures). The main crop and animal
products go to the processing industry and retail and then to the consumers, who leave food waste
and sewage. The crop residues and animal manures are used to amend and fertilise soils. Losses of C,
N and P are ultimately the result of the driving forces and of the responses by actors in the food chain;
the losses are the result of partial enrichment of crop and animal products by N and/or P, and by
various partial or complete N, N and P coupling decoupling mechanisms. This scheme also presents
the flow of information of this review.
Figure 2.1 Conceptual framework of the review. The main driving forces of farming systems are shown on the top. The responses in terms of farm structural changes are presented at the right hand box, while the responses in terms of changes in C:N:P flows are presented at the bottom.

This project This project has received funding from the European Union’s Horizon 2020 research and
innovation programme under grant agreement No 773682
Page 14 of 91
This project This project has received funding from the European Union’s Horizon 2020 research and
innovation programme under grant agreement No 773682
Page 15 of 91
3. Overview of current farming systems
This chapter presents a brief overview of the main characteristics of current farming systems in Europe
Union (EU). This overview aims to illustrate what EU agriculture looks like nowadays, including its
diversity among Europe. We will present data on farming systems, livestock numbers and distribution,
information about manure management and crop areas and fertilisation. The data are derived from
Eurostat and FAOSTAT databases, literature and results from the MITERRA-Europe model (Velthof et
al., 2009; see also Nutri2Cycle Deliverable 1.5).
3.1 Farming systems European scale data about farming systems are collected by Eurostat through the Farm Structure
Survey (FSS) and presented as “agricultural production systems”. The classification of farm types is
detailed with 62 particular types, which are aggregated to 22 principal types and 9 general types (EC,
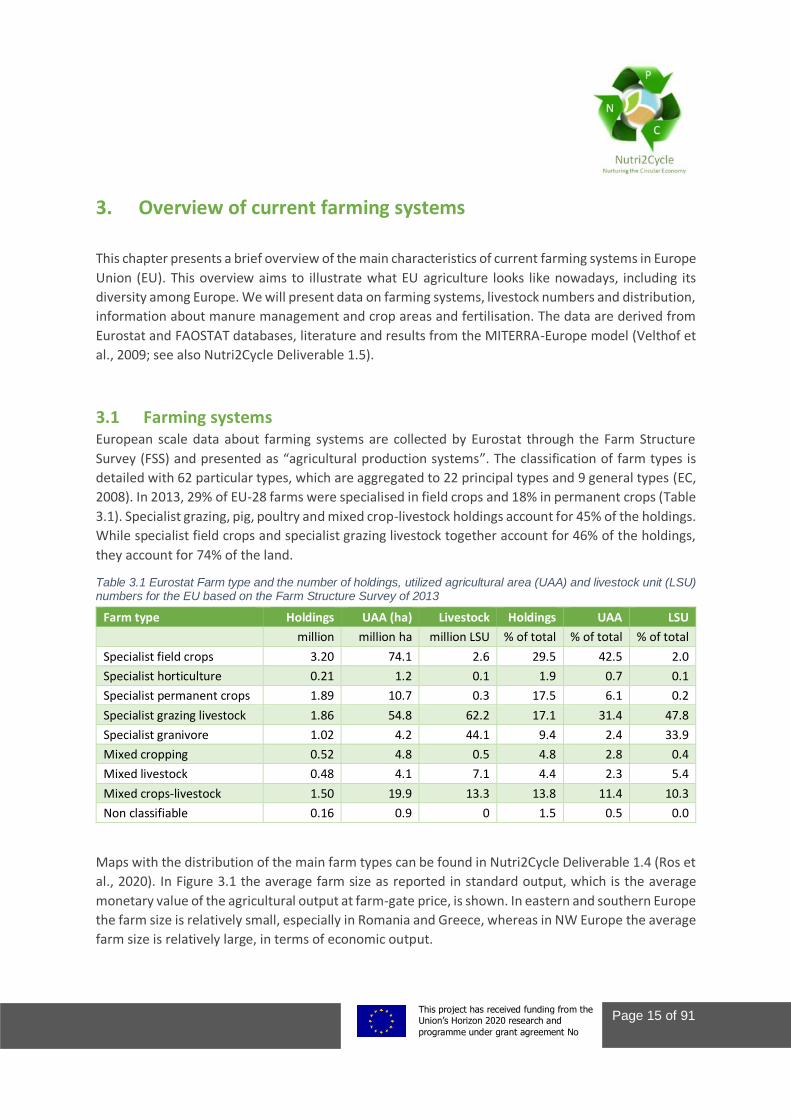
2008). In 2013, 29% of EU-28 farms were specialised in field crops and 18% in permanent crops (Table
3.1). Specialist grazing, pig, poultry and mixed crop-livestock holdings account for 45% of the holdings.
While specialist field crops and specialist grazing livestock together account for 46% of the holdings,
they account for 74% of the land.
Table 3.1 Eurostat Farm type and the number of holdings, utilized agricultural area (UAA) and livestock unit (LSU) numbers for the EU based on the Farm Structure Survey of 2013
Farm type Holdings UAA (ha) Livestock Holdings UAA LSU million million ha million LSU % of total % of total % of total
Specialist field crops 3.20 74.1 2.6 29.5 42.5 2.0
Specialist horticulture 0.21 1.2 0.1 1.9 0.7 0.1
Specialist permanent crops 1.89 10.7 0.3 17.5 6.1 0.2
Specialist grazing livestock 1.86 54.8 62.2 17.1 31.4 47.8
Specialist granivore 1.02 4.2 44.1 9.4 2.4 33.9
Mixed cropping 0.52 4.8 0.5 4.8 2.8 0.4
Mixed livestock 0.48 4.1 7.1 4.4 2.3 5.4
Mixed crops-livestock 1.50 19.9 13.3 13.8 11.4 10.3
Non classifiable 0.16 0.9 0 1.5 0.5 0.0
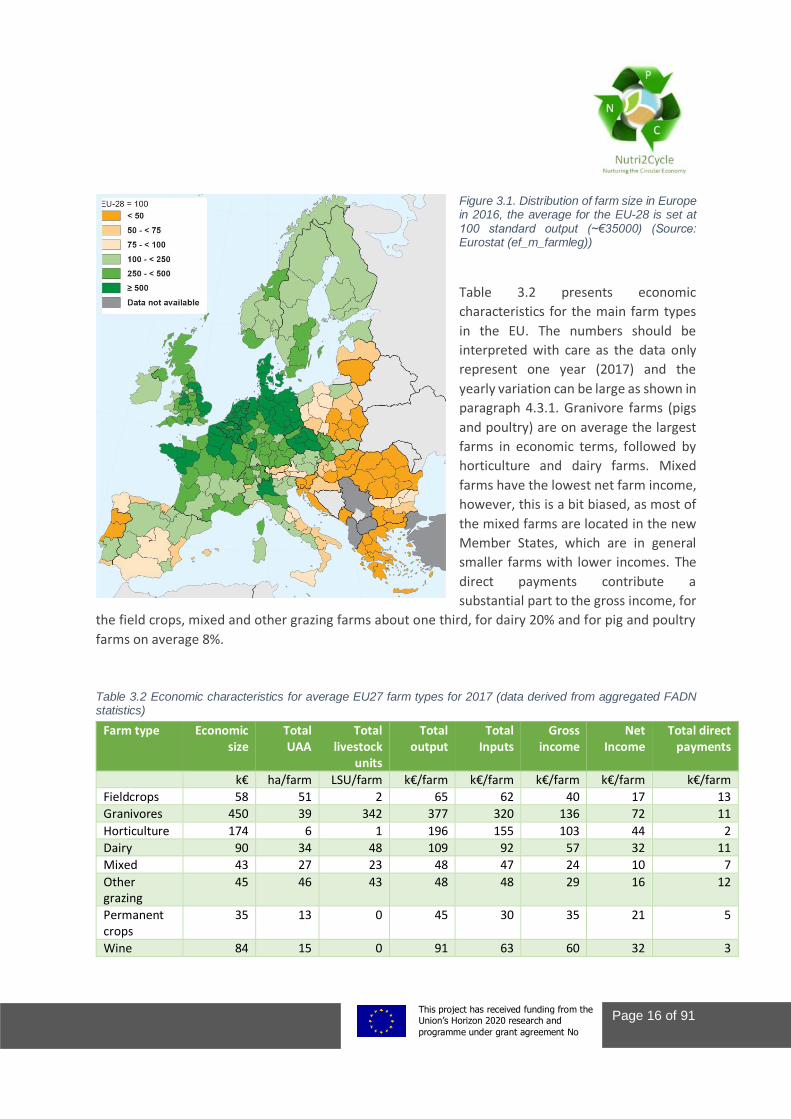
Maps with the distribution of the main farm types can be found in Nutri2Cycle Deliverable 1.4 (Ros et
al., 2020). In Figure 3.1 the average farm size as reported in standard output, which is the average
monetary value of the agricultural output at farm-gate price, is shown. In eastern and southern Europe
the farm size is relatively small, especially in Romania and Greece, whereas in NW Europe the average
farm size is relatively large, in terms of economic output.
This project This project has received funding from the European Union’s Horizon 2020 research and
innovation programme under grant agreement No 773682
Page 16 of 91
Figure 3.1. Distribution of farm size in Europe in 2016, the average for the EU-28 is set at 100 standard output (~€35000) (Source: Eurostat (ef_m_farmleg))
Table 3.2 presents economic
characteristics for the main farm types
in the EU. The numbers should be
interpreted with care as the data only
represent one year (2017) and the
yearly variation can be large as shown in
paragraph 4.3.1. Granivore farms (pigs
and poultry) are on average the largest
farms in economic terms, followed by
horticulture and dairy farms. Mixed
farms have the lowest net farm income,
however, this is a bit biased, as most of
the mixed farms are located in the new
Member States, which are in general
smaller farms with lower incomes. The
direct payments contribute a
substantial part to the gross income, for
the field crops, mixed and other grazing farms about one third, for dairy 20% and for pig and poultry
farms on average 8%.
Table 3.2 Economic characteristics for average EU27 farm types for 2017 (data derived from aggregated FADN statistics)
Farm type Economic size
Total UAA
Total livestock
units
Total output
Total Inputs
Gross income
Net Income
Total direct payments
k€ ha/farm LSU/farm k€/farm k€/farm k€/farm k€/farm k€/farm
Fieldcrops 58 51 2 65 62 40 17 13
Granivores 450 39 342 377 320 136 72 11
Horticulture 174 6 1 196 155 103 44 2
Dairy 90 34 48 109 92 57 32 11
Mixed 43 27 23 48 47 24 10 7
Other grazing
45 46 43 48 48 29 16 12
Permanent crops
35 13 0 45 30 35 21 5
Wine 84 15 0 91 63 60 32 3
This project This project has received funding from the European Union’s Horizon 2020 research and
innovation programme under grant agreement No 773682
Page 17 of 91
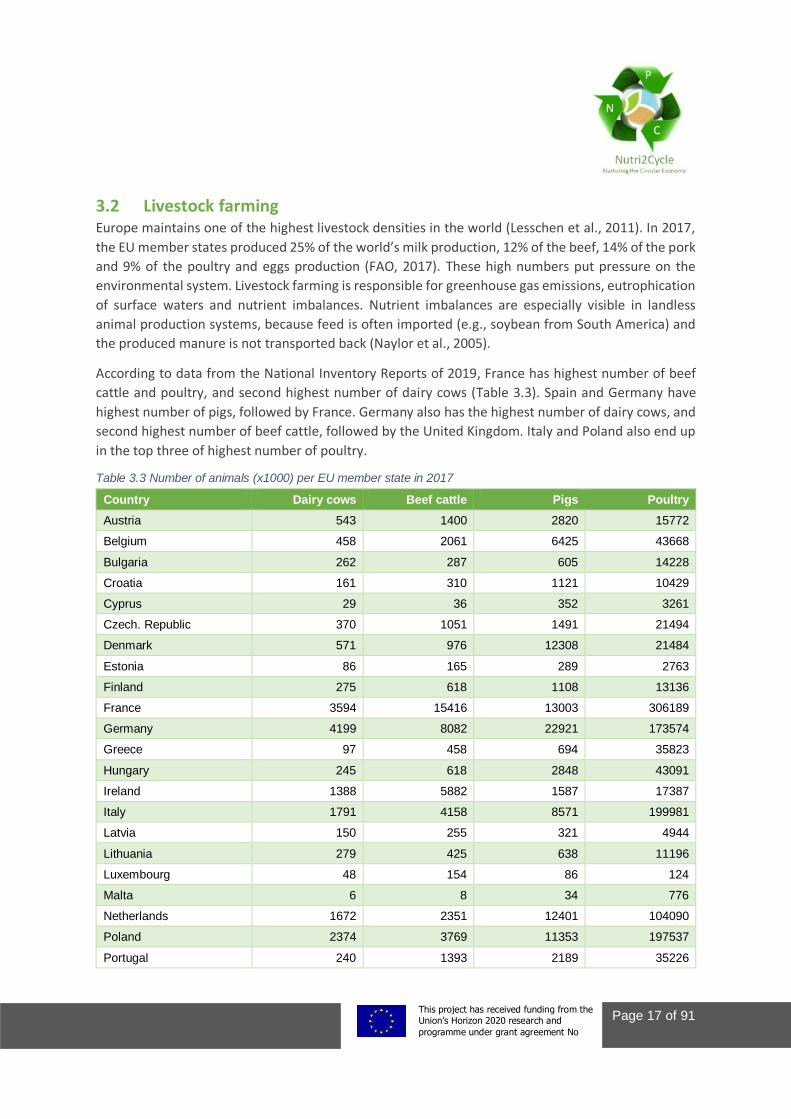
3.2 Livestock farming Europe maintains one of the highest livestock densities in the world (Lesschen et al., 2011). In 2017,
the EU member states produced 25% of the world’s milk production, 12% of the beef, 14% of the pork
and 9% of the poultry and eggs production (FAO, 2017). These high numbers put pressure on the
environmental system. Livestock farming is responsible for greenhouse gas emissions, eutrophication
of surface waters and nutrient imbalances. Nutrient imbalances are especially visible in landless
animal production systems, because feed is often imported (e.g., soybean from South America) and
the produced manure is not transported back (Naylor et al., 2005).
According to data from the National Inventory Reports of 2019, France has highest number of beef
cattle and poultry, and second highest number of dairy cows (Table 3.3). Spain and Germany have
highest number of pigs, followed by France. Germany also has the highest number of dairy cows, and
second highest number of beef cattle, followed by the United Kingdom. Italy and Poland also end up
in the top three of highest number of poultry.
Table 3.3 Number of animals (x1000) per EU member state in 2017
Country Dairy cows Beef cattle Pigs Poultry
Austria 543 1400 2820 15772
Belgium 458 2061 6425 43668
Bulgaria 262 287 605 14228
Croatia 161 310 1121 10429
Cyprus 29 36 352 3261
Czech. Republic 370 1051 1491 21494
Denmark 571 976 12308 21484
Estonia 86 165 289 2763
Finland 275 618 1108 13136
France 3594 15416 13003 306189
Germany 4199 8082 22921 173574
Greece 97 458 694 35823
Hungary 245 618 2848 43091
Ireland 1388 5882 1587 17387
Italy 1791 4158 8571 199981
Latvia 150 255 321 4944
Lithuania 279 425 638 11196
Luxembourg 48 154 86 124
Malta 6 8 34 776
Netherlands 1672 2351 12401 104090
Poland 2374 3769 11353 197537
Portugal 240 1393 2189 35226
This project This project has received funding from the European Union’s Horizon 2020 research and
innovation programme under grant agreement No 773682
Page 18 of 91
Country Dairy cows Beef cattle Pigs Poultry
Romania 1160 832 4406 73294
Slovakia 130 310 614 13354
Slovenia 109 371 257 6410
Spain 824 5703 29328 130771
Sweden 322 1179 1362 21142
United Kingdom 1901 7936 4969 181811
EU-28 23284 66204 144101 1702955
The amount of livestock in 2017 was compared to the amount of livestock in 1990. Most member
states did not show a significant difference between the livestock numbers of 1990 and 2017.
However, it became clear that the livestock numbers decreased most in the member states of eastern
Europe and the number of dairy cows decreased in all EU member states except Cyprus and Ireland.
The number of beef cattle increased most in Spain and Portugal, and also the number of pigs almost
doubled in Spain between 1990 and 2017. The number of poultry increased in half of the member
states, of which Luxembourg showed highest increase.
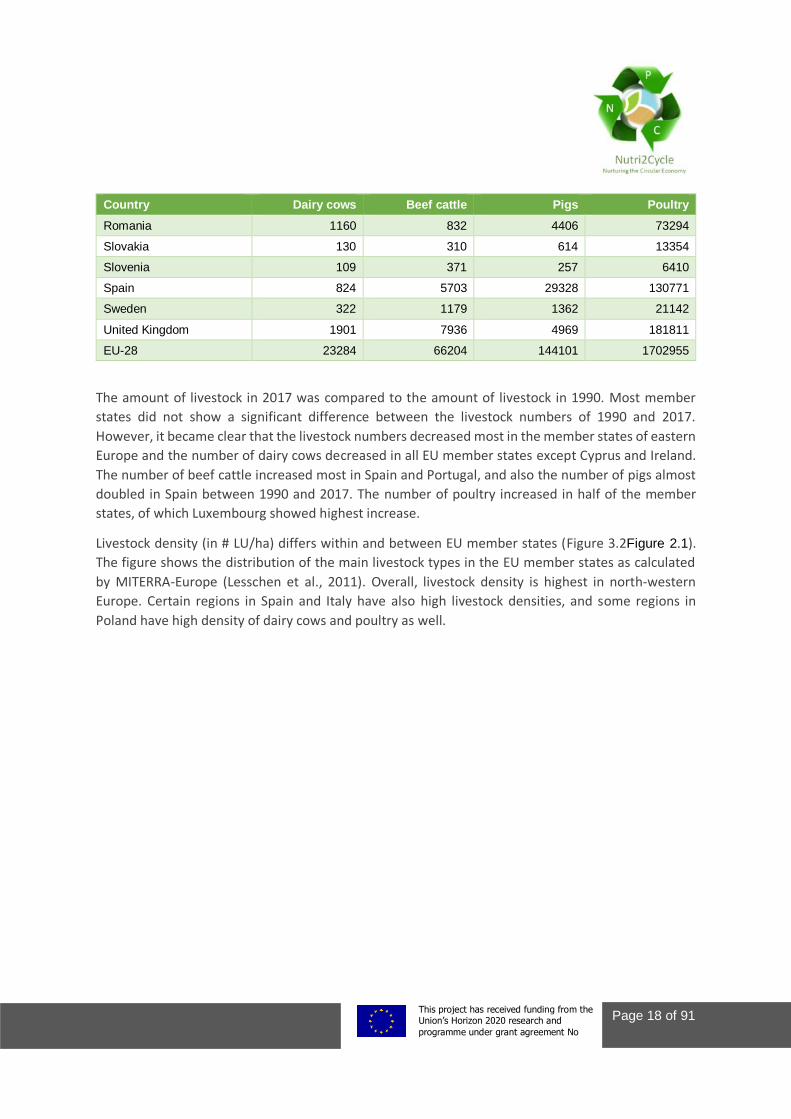
Livestock density (in # LU/ha) differs within and between EU member states (Figure 3.2Figure 2.1).
The figure shows the distribution of the main livestock types in the EU member states as calculated
by MITERRA-Europe (Lesschen et al., 2011). Overall, livestock density is highest in north-western
Europe. Certain regions in Spain and Italy have also high livestock densities, and some regions in
Poland have high density of dairy cows and poultry as well.
This project This project has received funding from the European Union’s Horizon 2020 research and
innovation programme under grant agreement No 773682
Page 19 of 91
Figure 3.2 Livestock density of dairy cows (A), beef cattle (B), pigs (C) and poultry (D) in livestock units/ha UAA.
3.3 Manure management
3.3.1 Manure storage systems
Data on manure management are often not harmonised across EU member states and often obtained
during single surveys. In the Eurostat survey of agricultural production methods (SAPM) also data on
manure management was collected in 2010 including information on: manure application, manure
storage, manure management and treatment facilities. Additionally the Manure Management
Inventory was carried out by Eurostat in 2012. Also the obligatory country reports on the Nitrates
This project This project has received funding from the European Union’s Horizon 2020 research and
innovation programme under grant agreement No 773682
Page 20 of 91
Directive are used as the basis for a 4-yearly report by the EU commissions on the implementation of
the Directive (EC, 2013). In addition countries report in the National Inventory reports on GHG
emissions on the usage of manure management systems following the IPCC classification. Although
this information might lack detail, it is probably the most comprehensive source for trends in manure
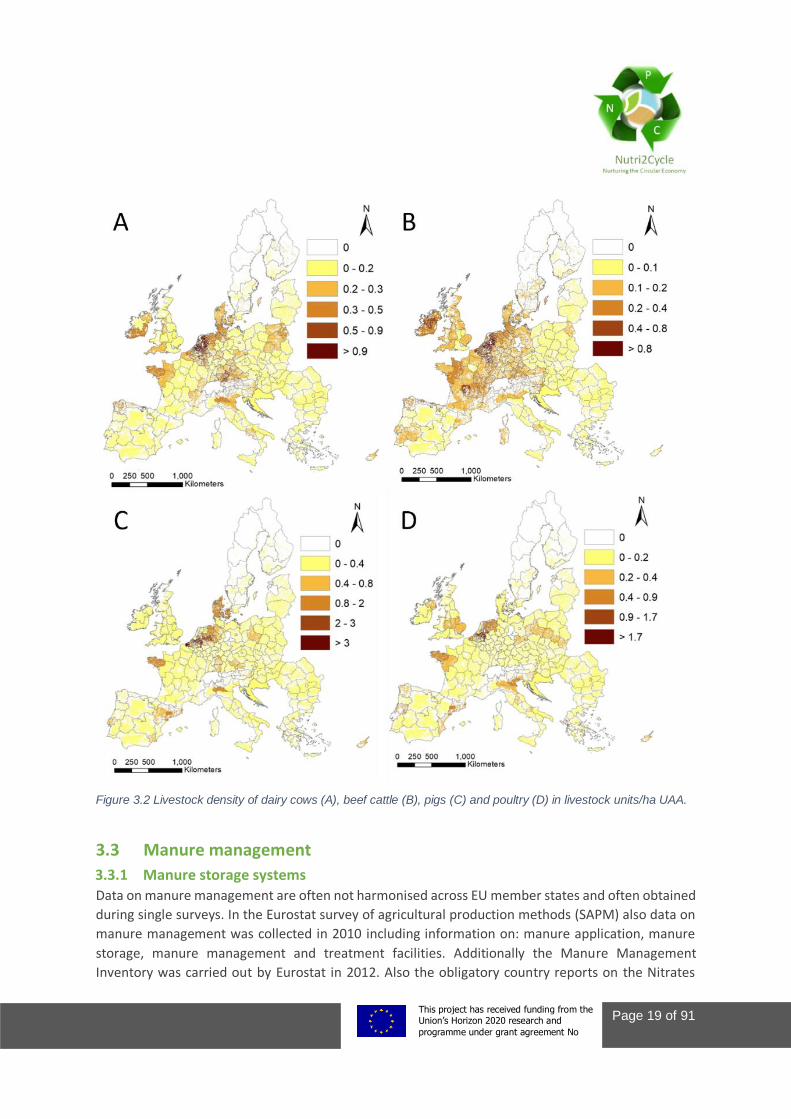
management. Figure 3.3 shows the use of manure management systems, based on the amount of N
excreted of all livestock, for the EU member states. Most of the manure is excreted in pasture and
paddock, followed by liquid systems and solid storage. These three systems account for 83% of the
manure. Digestion of manure has become relevant in some countries as well, whereas daily spread,
anaerobic lagoons and composting are hardly used in the EU.
This project This project has received funding from the European Union’s Horizon 2020 research and
innovation programme under grant agreement No 773682
Page 21 of 91
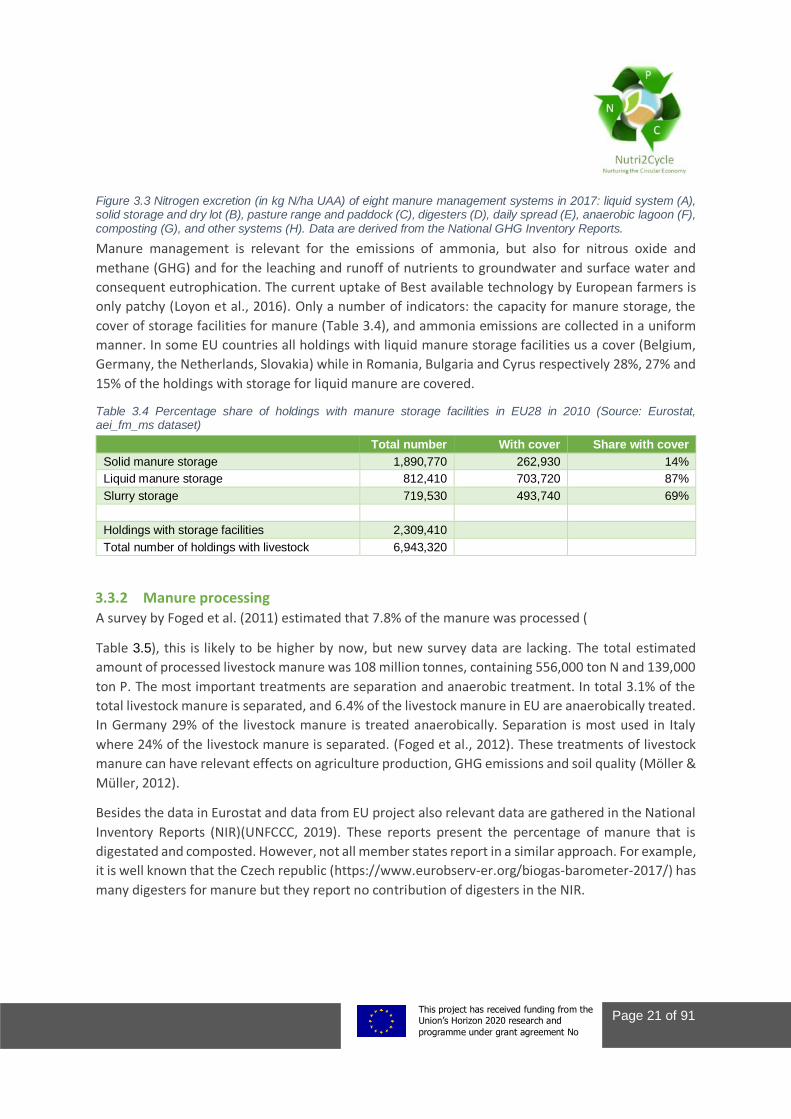
Figure 3.3 Nitrogen excretion (in kg N/ha UAA) of eight manure management systems in 2017: liquid system (A), solid storage and dry lot (B), pasture range and paddock (C), digesters (D), daily spread (E), anaerobic lagoon (F), composting (G), and other systems (H). Data are derived from the National GHG Inventory Reports.
Manure management is relevant for the emissions of ammonia, but also for nitrous oxide and
methane (GHG) and for the leaching and runoff of nutrients to groundwater and surface water and
consequent eutrophication. The current uptake of Best available technology by European farmers is
only patchy (Loyon et al., 2016). Only a number of indicators: the capacity for manure storage, the
cover of storage facilities for manure (Table 3.4), and ammonia emissions are collected in a uniform
manner. In some EU countries all holdings with liquid manure storage facilities us a cover (Belgium,
Germany, the Netherlands, Slovakia) while in Romania, Bulgaria and Cyrus respectively 28%, 27% and
15% of the holdings with storage for liquid manure are covered.
Table 3.4 Percentage share of holdings with manure storage facilities in EU28 in 2010 (Source: Eurostat, aei_fm_ms dataset)
Total number With cover Share with cover
Solid manure storage 1,890,770 262,930 14%
Liquid manure storage 812,410 703,720 87%
Slurry storage 719,530 493,740 69%
Holdings with storage facilities 2,309,410
Total number of holdings with livestock 6,943,320
3.3.2 Manure processing A survey by Foged et al. (2011) estimated that 7.8% of the manure was processed (
Table 3.5), this is likely to be higher by now, but new survey data are lacking. The total estimated
amount of processed livestock manure was 108 million tonnes, containing 556,000 ton N and 139,000
ton P. The most important treatments are separation and anaerobic treatment. In total 3.1% of the
total livestock manure is separated, and 6.4% of the livestock manure in EU are anaerobically treated.
In Germany 29% of the livestock manure is treated anaerobically. Separation is most used in Italy
where 24% of the livestock manure is separated. (Foged et al., 2012). These treatments of livestock
manure can have relevant effects on agriculture production, GHG emissions and soil quality (Möller &
Müller, 2012).
Besides the data in Eurostat and data from EU project also relevant data are gathered in the National
Inventory Reports (NIR)(UNFCCC, 2019). These reports present the percentage of manure that is
digestated and composted. However, not all member states report in a similar approach. For example,
it is well known that the Czech republic (https://www.eurobserv-er.org/biogas-barometer-2017/) has
many digesters for manure but they report no contribution of digesters in the NIR.
This project This project has received funding from the European Union’s Horizon 2020 research and
innovation programme under grant agreement No 773682
Page 22 of 91
Table 3.5 Treatment of livestock manure in EU (Foged et al., 2011)
Nr of installations Million tonnes % of total manure
Separation 11130 49 3.1
Additives and other pretreatments 668 7.5 0.5
Anaerobic treatment 5256 88 6.4
Treatment of soild fraction 1486 10.4 0.8
Treatment of liquid fraction 587 9.4 0.7
Air cleaning 69 4 0.3
Total amount of treatment 108 7.8
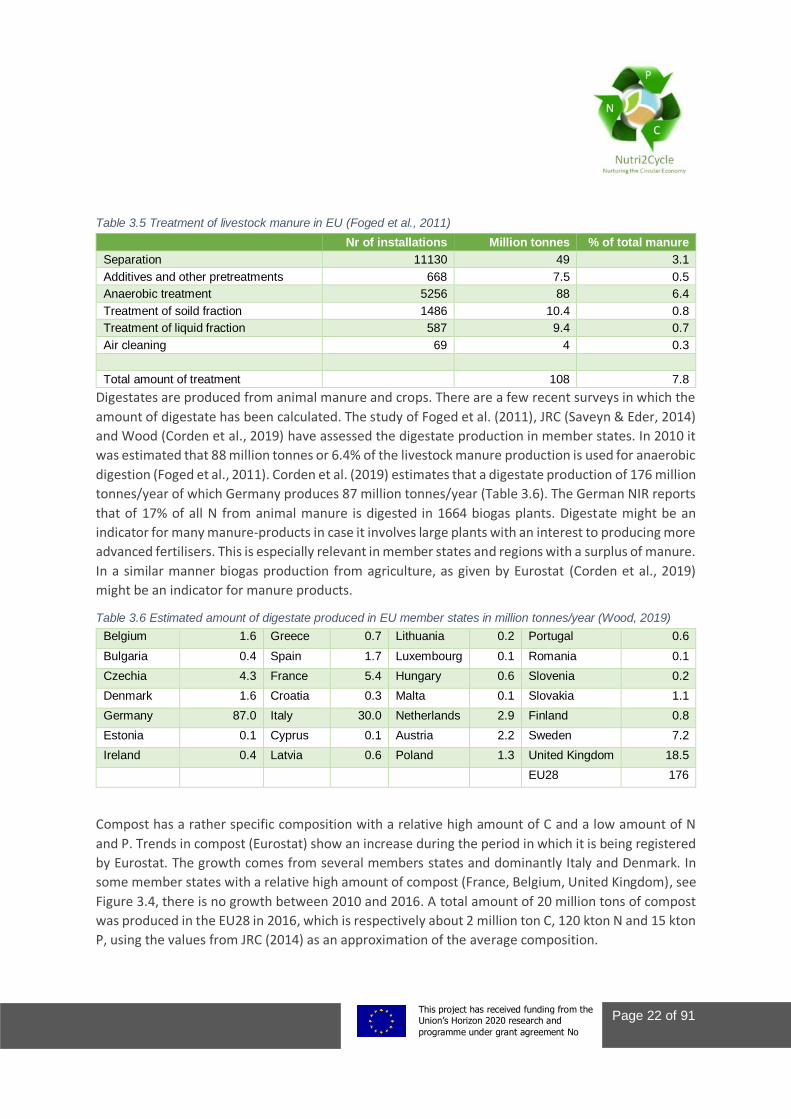
Digestates are produced from animal manure and crops. There are a few recent surveys in which the
amount of digestate has been calculated. The study of Foged et al. (2011), JRC (Saveyn & Eder, 2014)
and Wood (Corden et al., 2019) have assessed the digestate production in member states. In 2010 it
was estimated that 88 million tonnes or 6.4% of the livestock manure production is used for anaerobic
digestion (Foged et al., 2011). Corden et al. (2019) estimates that a digestate production of 176 million
tonnes/year of which Germany produces 87 million tonnes/year (Table 3.6). The German NIR reports
that of 17% of all N from animal manure is digested in 1664 biogas plants. Digestate might be an
indicator for many manure-products in case it involves large plants with an interest to producing more
advanced fertilisers. This is especially relevant in member states and regions with a surplus of manure.
In a similar manner biogas production from agriculture, as given by Eurostat (Corden et al., 2019)
might be an indicator for manure products.
Table 3.6 Estimated amount of digestate produced in EU member states in million tonnes/year (Wood, 2019)
Belgium 1.6 Greece 0.7 Lithuania 0.2 Portugal 0.6
Bulgaria 0.4 Spain 1.7 Luxembourg 0.1 Romania 0.1
Czechia 4.3 France 5.4 Hungary 0.6 Slovenia 0.2
Denmark 1.6 Croatia 0.3 Malta 0.1 Slovakia 1.1
Germany 87.0 Italy 30.0 Netherlands 2.9 Finland 0.8
Estonia 0.1 Cyprus 0.1 Austria 2.2 Sweden 7.2
Ireland 0.4 Latvia 0.6 Poland 1.3 United Kingdom 18.5
EU28 176
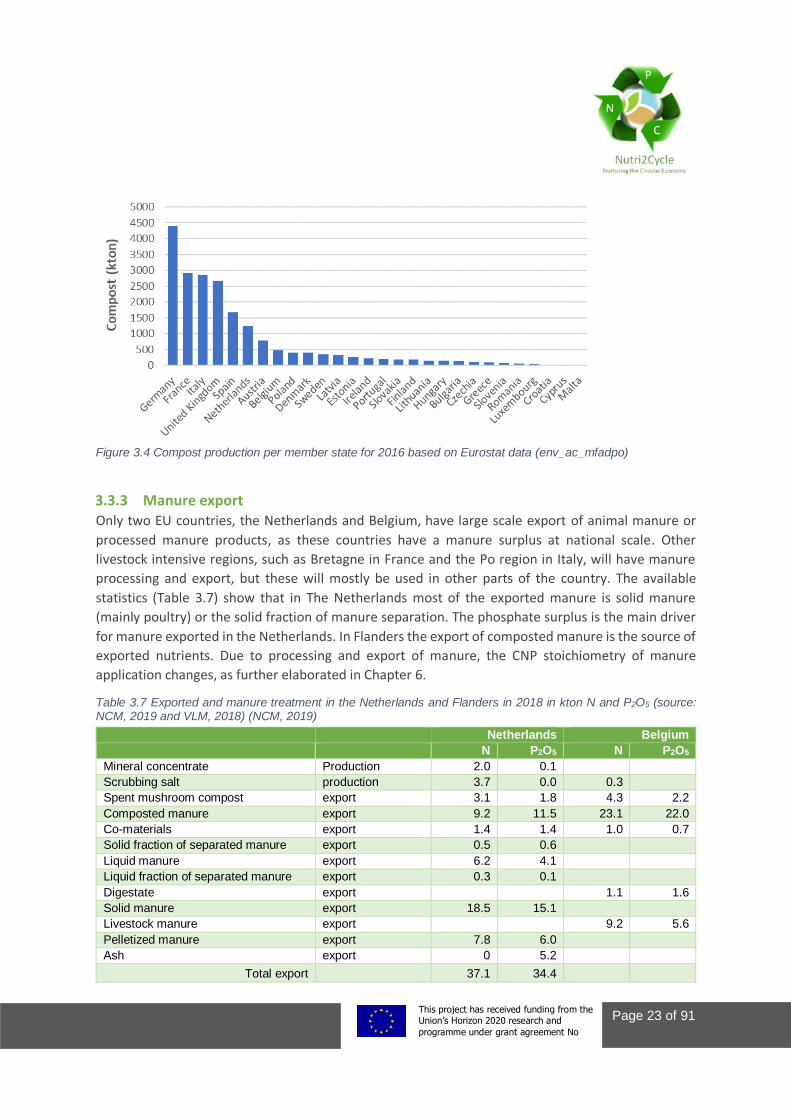
Compost has a rather specific composition with a relative high amount of C and a low amount of N
and P. Trends in compost (Eurostat) show an increase during the period in which it is being registered
by Eurostat. The growth comes from several members states and dominantly Italy and Denmark. In
some member states with a relative high amount of compost (France, Belgium, United Kingdom), see
Figure 3.4, there is no growth between 2010 and 2016. A total amount of 20 million tons of compost
was produced in the EU28 in 2016, which is respectively about 2 million ton C, 120 kton N and 15 kton
P, using the values from JRC (2014) as an approximation of the average composition.
This project This project has received funding from the European Union’s Horizon 2020 research and
innovation programme under grant agreement No 773682
Page 23 of 91
Figure 3.4 Compost production per member state for 2016 based on Eurostat data (env_ac_mfadpo)
3.3.3 Manure export Only two EU countries, the Netherlands and Belgium, have large scale export of animal manure or
processed manure products, as these countries have a manure surplus at national scale. Other
livestock intensive regions, such as Bretagne in France and the Po region in Italy, will have manure
processing and export, but these will mostly be used in other parts of the country. The available
statistics (Table 3.7) show that in The Netherlands most of the exported manure is solid manure
(mainly poultry) or the solid fraction of manure separation. The phosphate surplus is the main driver
for manure exported in the Netherlands. In Flanders the export of composted manure is the source of
exported nutrients. Due to processing and export of manure, the CNP stoichiometry of manure
application changes, as further elaborated in Chapter 6.
Table 3.7 Exported and manure treatment in the Netherlands and Flanders in 2018 in kton N and P2O5 (source: NCM, 2019 and VLM, 2018) (NCM, 2019)
Netherlands Belgium
N P2O5 N P2O5
Mineral concentrate Production 2.0 0.1
Scrubbing salt production 3.7 0.0 0.3
Spent mushroom compost export 3.1 1.8 4.3 2.2
Composted manure export 9.2 11.5 23.1 22.0
Co-materials export 1.4 1.4 1.0 0.7
Solid fraction of separated manure export 0.5 0.6
Liquid manure export 6.2 4.1
Liquid fraction of separated manure export 0.3 0.1
Digestate export 1.1 1.6
Solid manure export 18.5 15.1
Livestock manure export 9.2 5.6
Pelletized manure export 7.8 6.0
Ash export 0 5.2
Total export 37.1 34.4
This project This project has received funding from the European Union’s Horizon 2020 research and
innovation programme under grant agreement No 773682
Page 24 of 91
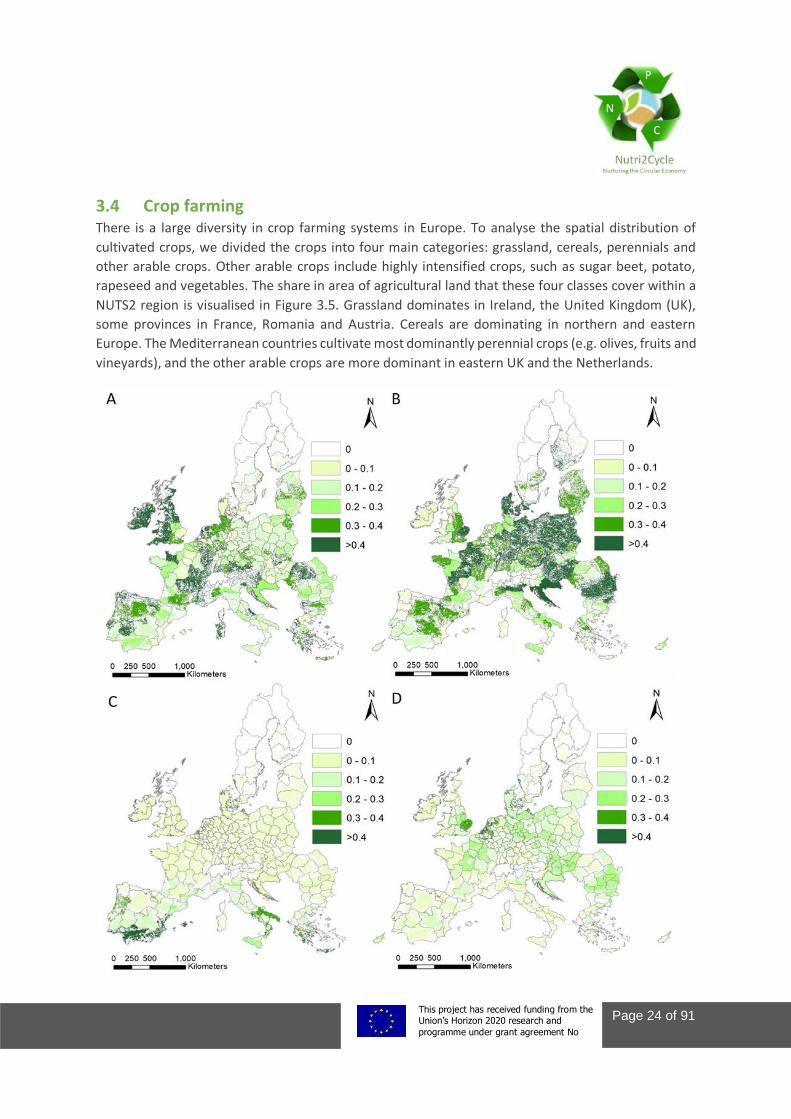
3.4 Crop farming There is a large diversity in crop farming systems in Europe. To analyse the spatial distribution of
cultivated crops, we divided the crops into four main categories: grassland, cereals, perennials and
other arable crops. Other arable crops include highly intensified crops, such as sugar beet, potato,
rapeseed and vegetables. The share in area of agricultural land that these four classes cover within a
NUTS2 region is visualised in Figure 3.5. Grassland dominates in Ireland, the United Kingdom (UK),
some provinces in France, Romania and Austria. Cereals are dominating in northern and eastern
Europe. The Mediterranean countries cultivate most dominantly perennial crops (e.g. olives, fruits and
vineyards), and the other arable crops are more dominant in eastern UK and the Netherlands.
This project This project has received funding from the European Union’s Horizon 2020 research and
innovation programme under grant agreement No 773682
Page 25 of 91
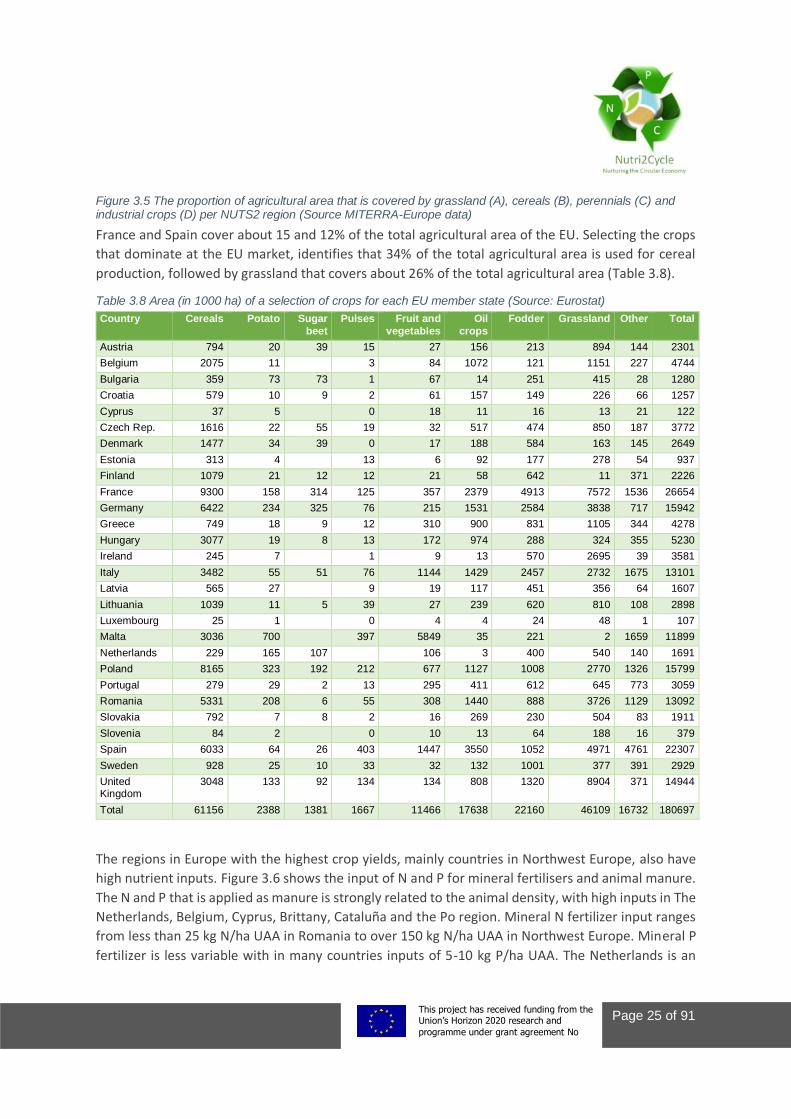
Figure 3.5 The proportion of agricultural area that is covered by grassland (A), cereals (B), perennials (C) and industrial crops (D) per NUTS2 region (Source MITERRA-Europe data)
France and Spain cover about 15 and 12% of the total agricultural area of the EU. Selecting the crops
that dominate at the EU market, identifies that 34% of the total agricultural area is used for cereal
production, followed by grassland that covers about 26% of the total agricultural area (Table 3.8).
Table 3.8 Area (in 1000 ha) of a selection of crops for each EU member state (Source: Eurostat)
Country Cereals Potato Sugar
beet
Pulses Fruit and
vegetables
Oil
crops
Fodder Grassland Other Total
Austria 794 20 39 15 27 156 213 894 144 2301
Belgium 2075 11
3 84 1072 121 1151 227 4744
Bulgaria 359 73 73 1 67 14 251 415 28 1280
Croatia 579 10 9 2 61 157 149 226 66 1257
Cyprus 37 5
0 18 11 16 13 21 122
Czech Rep. 1616 22 55 19 32 517 474 850 187 3772
Denmark 1477 34 39 0 17 188 584 163 145 2649
Estonia 313 4
13 6 92 177 278 54 937
Finland 1079 21 12 12 21 58 642 11 371 2226
France 9300 158 314 125 357 2379 4913 7572 1536 26654
Germany 6422 234 325 76 215 1531 2584 3838 717 15942
Greece 749 18 9 12 310 900 831 1105 344 4278
Hungary 3077 19 8 13 172 974 288 324 355 5230
Ireland 245 7
1 9 13 570 2695 39 3581
Italy 3482 55 51 76 1144 1429 2457 2732 1675 13101
Latvia 565 27
9 19 117 451 356 64 1607
Lithuania 1039 11 5 39 27 239 620 810 108 2898
Luxembourg 25 1
0 4 4 24 48 1 107
Malta 3036 700
397 5849 35 221 2 1659 11899
Netherlands 229 165 107
106 3 400 540 140 1691
Poland 8165 323 192 212 677 1127 1008 2770 1326 15799
Portugal 279 29 2 13 295 411 612 645 773 3059
Romania 5331 208 6 55 308 1440 888 3726 1129 13092
Slovakia 792 7 8 2 16 269 230 504 83 1911
Slovenia 84 2
0 10 13 64 188 16 379
Spain 6033 64 26 403 1447 3550 1052 4971 4761 22307
Sweden 928 25 10 33 32 132 1001 377 391 2929
United Kingdom
3048 133 92 134 134 808 1320 8904 371 14944
Total 61156 2388 1381 1667 11466 17638 22160 46109 16732 180697
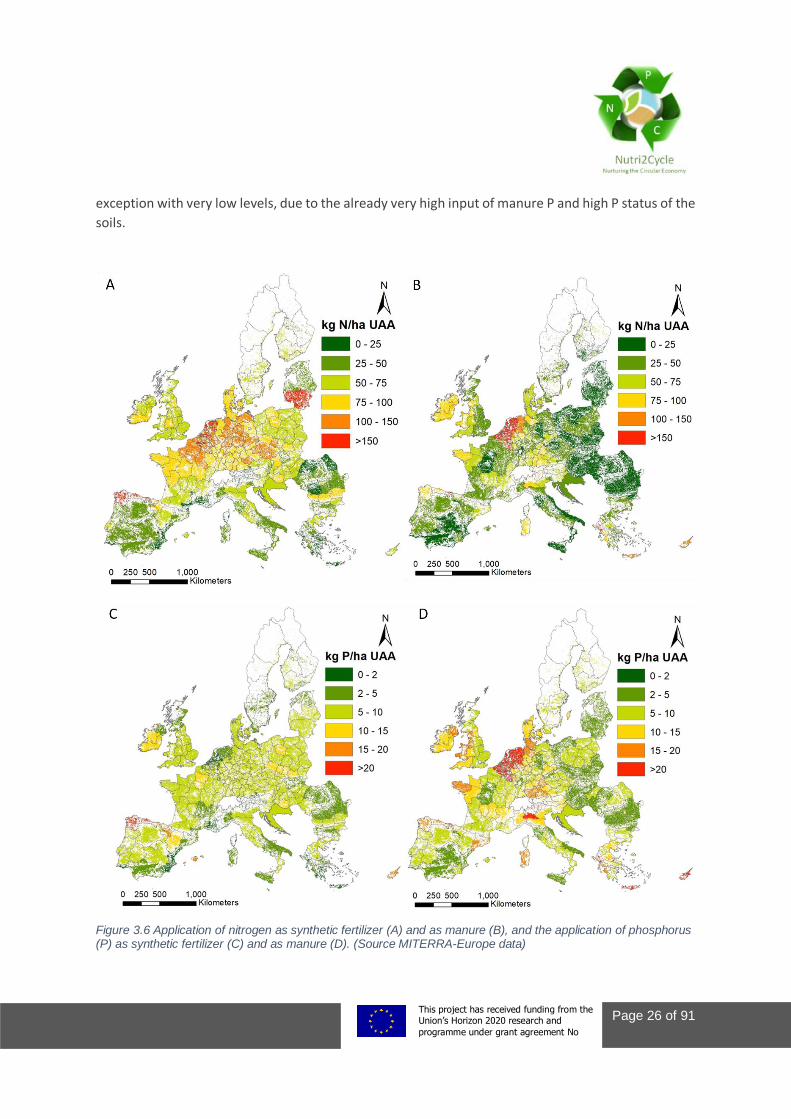
The regions in Europe with the highest crop yields, mainly countries in Northwest Europe, also have
high nutrient inputs. Figure 3.6 shows the input of N and P for mineral fertilisers and animal manure.
The N and P that is applied as manure is strongly related to the animal density, with high inputs in The
Netherlands, Belgium, Cyprus, Brittany, Cataluña and the Po region. Mineral N fertilizer input ranges
from less than 25 kg N/ha UAA in Romania to over 150 kg N/ha UAA in Northwest Europe. Mineral P
fertilizer is less variable with in many countries inputs of 5-10 kg P/ha UAA. The Netherlands is an
This project This project has received funding from the European Union’s Horizon 2020 research and
innovation programme under grant agreement No 773682
Page 26 of 91
exception with very low levels, due to the already very high input of manure P and high P status of the
soils.
Figure 3.6 Application of nitrogen as synthetic fertilizer (A) and as manure (B), and the application of phosphorus (P) as synthetic fertilizer (C) and as manure (D). (Source MITERRA-Europe data)
This project This project has received funding from the European Union’s Horizon 2020 research and
innovation programme under grant agreement No 773682
Page 27 of 91
4. Driving forces and responses of farming systems
This chapter provides a brief qualitative description of the driving forces of farming systems, based on
a literature review, and semi-quantitative analyses of the changes over time (last few decades) in farm
structure. The influences of changes in markets, technology, and governmental policies on farming
systems are discussed, in terms of responses by actors in the food production – consumption chain,
i.e., (i) specialization, (ii) intensification, (iii) up-scaling and (iv) treatment, as briefly introduced already
in Chapter 2.
4.1 Brief history of agricultural developments Expansion of agricultural area was for ages the only way to supply sufficient food for the increasing
European population. At the beginning of the Middle Ages more than 80% of the population was
working in agriculture using the land in the best possible way given the limited external resources that
were available to increase productivity and the absence of labour replacing machinery (Slicher van
Bath, 1964; Rabbinge and Van Diepen, 2000).
In their seminal book ‘A History of World Agriculture’, Mazoyer and Roudart (2006) describe the many
changes that have occurred in agriculture in different places in the world from the Neolithic age until
the beginning of the 21st century. There have been series of agricultural revolutions that have changed
and (re)shaped agricultural practices and systems. Much of these changes were the result of ‘trial and
error’ and basic circumstantial evidence, and with different success rate. These changes largely
developed independent of each other in different parts of the world. The initial successes were related
to site specific conditions, to the presence of basic resources (fertile land, genotypes, water)
(Diamond, 1999; 2006). The success of improved agricultural methods increased the output and
allowed populations to increase in number and relative prosperity. The agricultural output has had a
strong influence on the total human population throughout history (Hardin, 1993; Smil, 2000; Mazoyer
and Roudart (2006). Access to land and ownership of land has been a critical factor for the success of
agricultural production and the stewardship of the land and surrounding environment (Linklater,
2013; McNeil and Winiwarter, 2006).
Progress through ‘trial and error’ was slowly replaced by progress through scientific research and
understanding from the 18th century onwards. Agricultural production became increasingly based on
science-based insights and technology. This is commonly called the second agricultural revolution of
modern times (the advent of sedentary agriculture some 10,000 years ago is commonly called the first
agricultural revolution; Mazoyer and Roudart, 2006). The industrial revolution from the end of the 18th
century and the associated urbanization have directly and indirectly facilitated the modernization of
agricultural practices. It resulted in to new crop rotations, soil tillage methods and animal husbandry
practices. Synthetic fertilizers, new energy sources and fossil energy fuelled machines came on the
market. The agricultural output increased as did the global population.
This project This project has received funding from the European Union’s Horizon 2020 research and
innovation programme under grant agreement No 773682
Page 28 of 91
Major changes occurred in the 20th century, and especially in the second half of the 20th century. This
is commonly called the third agricultural revolution, and includes the so-called ‘green revolution’ of
the 1950s to 1970s (Mazoyer and Roudart, 2006; Evenson and Gollins, 2003). Agricultural output
greatly increased through new crop and animal breeds, fertilization, irrigation, pest and diseases
control, and mechanization and industrialization (Evans, 1998; Hazell and Woods, 2008). It has also
led to division of labour and to an extension of the food production – consumption chain. The role of
suppliers, processing industry & retail, research, advisors and governments have increased in
agricultural production, while farmers have become more dependent on the other actors, both in
terms of information, inputs and economic returns.
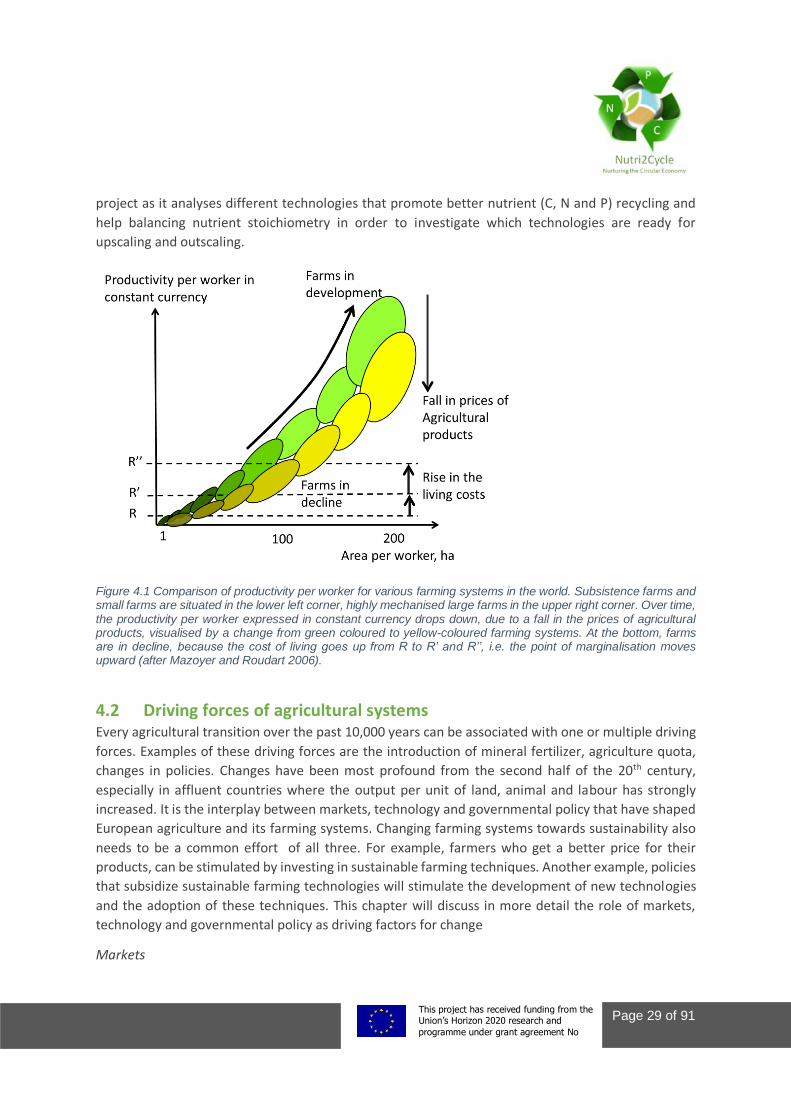
In the last chapter of their book, Mazoyer and Roudart (2006) hypothesize and explain the ‘agrarian
crisis’, which is roughly a result of the increase in agricultural production, globalization and the uneven
distribution of resources and wealth across the world. Large food companies, processing industries
and retail increasingly define product quality and price and production methods. These pressive
conditions resulted in the specialization, intensification and up-scaling of farming systems. This
increased the productivity per ha, per animal and per unit labour increases. As a consequence, the
prices for agricultural commodities decrease. At the same time, cost of living increase due to
increasing standards of living, especially in developed countries, and because of inflation. As a result,
farmers with low productivity drop out, while new, higher productive farms develop further on the
other side of the spectrum. These lines of thoughts are visualized in Figure 4.1. For decades, this
agricultural model was seen as the only way to compete in this highly competitive production system.
Farmers in the EU are supported financially through direct payments (Table 3.2) and through Rural
Development Programs (e.g., OECD, 2020; Michalek et al., 2020). Also farmers in many other affluent
(OECD) countries in the world receive governmental subsidies (OECD, 2020). This provides farmers in
affluent countries a competitive advantage relative to farmers living in countries with little financial
support.
Over the last decades, the awareness for sustainability gained increased attention across the value
chain and across scales. Intensive production systems are increasingly constraint by social and
governmental acceptability (e.g. Pollan, 2006). Society’s interest in regionally or environmentally
friendly produced products increased. Whereas policy initiatives aim to reduce nutrient leaching (e.g.,
the Nitrates Directive), greenhouse gas emissions or waste streams (e.g., the European Green Deal)
to support the transitions towards sustainable and circular agriculture. The transition requires
investments in innovative techniques. For example, valuable bio-based fertilizers can be produced
from manure through digestion plants (Sigurnjak et al., 2019) and energy can be recovered from bio-
waste through anaerobic digestion or combined heat and power systems (Purdy et al., 2018).
Emissions can reduce when emission-poor stables are introduced or separate solid and liquid manure
in stables (Aguirre-Villegas et al., 2019) and precision agriculture has proven its potential to increase
the water and nutrient use efficiency (Balafoutis et al., 2017). To realize the transition, upscaling (i.e.,
increase of the technology in terms of numbers) and outscaling (i.e., geographical spreading) of
innovative techniques that stimulate sustainable and circular agriculture will become important in the
next few decades (Wigboldus et al., 2016). That aspect just indicates the relevance of the Nutri2Cycle
This project This project has received funding from the European Union’s Horizon 2020 research and
innovation programme under grant agreement No 773682
Page 29 of 91
project as it analyses different technologies that promote better nutrient (C, N and P) recycling and
help balancing nutrient stoichiometry in order to investigate which technologies are ready for
upscaling and outscaling.
Figure 4.1 Comparison of productivity per worker for various farming systems in the world. Subsistence farms and small farms are situated in the lower left corner, highly mechanised large farms in the upper right corner. Over time, the productivity per worker expressed in constant currency drops down, due to a fall in the prices of agricultural products, visualised by a change from green coloured to yellow-coloured farming systems. At the bottom, farms are in decline, because the cost of living goes up from R to R’ and R’’, i.e. the point of marginalisation moves upward (after Mazoyer and Roudart 2006).
4.2 Driving forces of agricultural systems Every agricultural transition over the past 10,000 years can be associated with one or multiple driving
forces. Examples of these driving forces are the introduction of mineral fertilizer, agriculture quota,
changes in policies. Changes have been most profound from the second half of the 20th century,
especially in affluent countries where the output per unit of land, animal and labour has strongly
increased. It is the interplay between markets, technology and governmental policy that have shaped
European agriculture and its farming systems. Changing farming systems towards sustainability also
needs to be a common effort of all three. For example, farmers who get a better price for their
products, can be stimulated by investing in sustainable farming techniques. Another example, policies
that subsidize sustainable farming technologies will stimulate the development of new technologies
and the adoption of these techniques. This chapter will discuss in more detail the role of markets,
technology and governmental policy as driving factors for change
Markets
This project This project has received funding from the European Union’s Horizon 2020 research and
innovation programme under grant agreement No 773682
Page 30 of 91
Markets are briefly defined by the demand, supply and prices of products. Changes in the demand for
food emanate from changes in the global population and in the composition of the diets (Tilman et
al., 2011). Changes in the supply of food result from a combination of changes in crop and animal
productivity through technological and managerial advances, but also from temporal changes in
weather and climate, trade conflicts, and pest and diseases (Evans, 1998). Changes in the price of food
products reflect changes in the balance between food supply and demand, but may also reflect market
interventions by individual governments and by international agreements between different
governments (e.g., through tariffs, subsidies, regulations).
Markets as physical meeting places for exchange of goods have existed for as long as humans have
engaged in trade, i.e. for millennia. Over time, markets have greatly developed, especially following
the introduction of money, banks and information technology. On one hand, markets influence the
decisions of farmers on which product to produce (demand driven) and on the other hand markets
influence the decision of consumers on which products to buy (supply driven). This largely influences
product prices. When demand of specific products is larger than supply, prices go up and vice versa.
This is theory; in practice, there are often many constraints, which lead farmers to respond differently.
Possible constraints include (i) lack of sufficient information about markets, (ii) lack of knowledge
about the production of new products (with higher prices), (iii) lack of capital for investing in new
production methods, (iv) large investments (with loans from banks) in existing production capacity,
which have not been depreciated yet. As a consequence, farmers may try to produce more when
prices go down, in order to get sufficient income. This may lead to further distortion of markets and
to the collapse of farms with the highest cost of production and least financial reserves. Ultimately, it
also leads to re-adjustment of the supply to better match demand.
The cyclical fluctuations in livestock markets have been described by the term pork cycle, following
the observation of cyclic variations in the supply and prices of pork in United states and Europe in the
beginning of the 20th century. When prices are high, more investments are made. However, the effect
of these investments is delayed due to the investment and breeding time - the production lag.
Eventually, the market becomes saturated, leading to a decline in prices, and production is thus
decreased. This also takes time, leading to increased demand and again increased prices (Holst and
Cramon-Taubadel, 2011). Globalization resulted in a fast increase in production (Mellor, 1992). To
keep up the market position during the industrialization and mechanisation of the agriculture, most
farming systems within the European Union intensified production. The use of mineral fertilizer
increased exponentially and most farming systems were specializing in a single crop or livestock
product (Ilbery and Bowler, 2003).
Technology
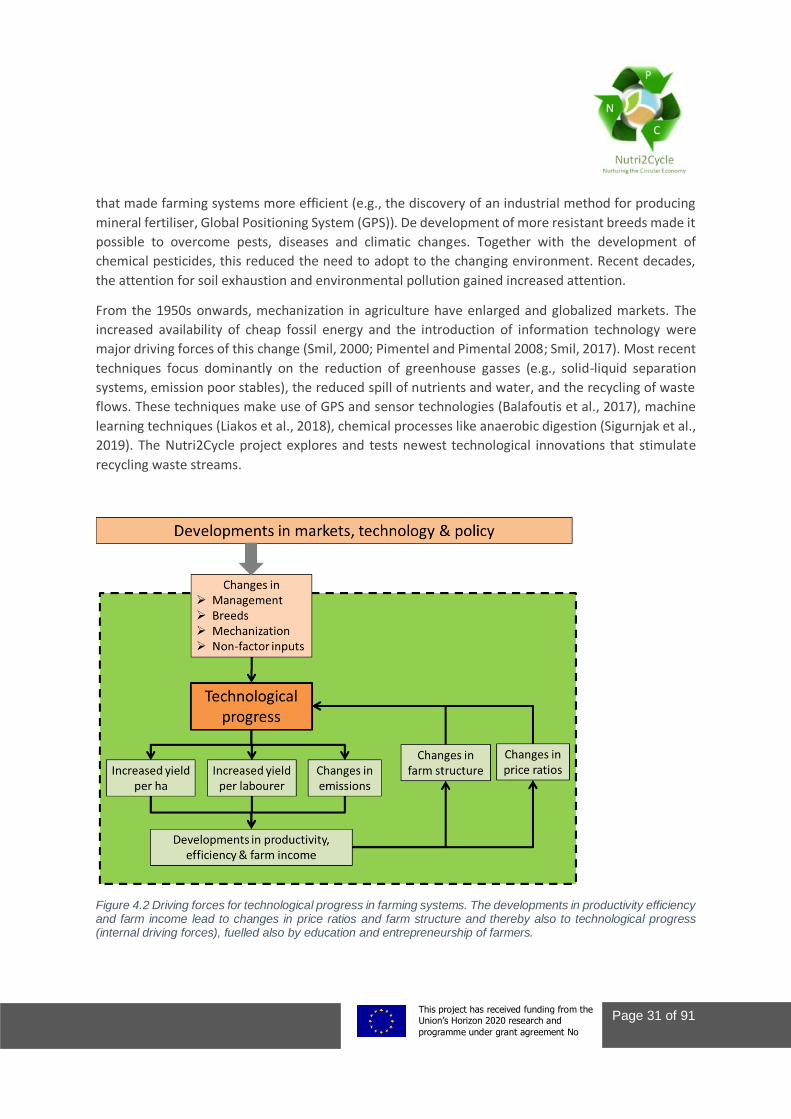
Technical progress is driven by developments in markets, technology and policy and has effect on the
farm structure and price ratios (Figure 4.2). Changes in farm management were for example driven by
political decisions on land consolidation that eased the use of bigger machinery on land (Vitikainen,
2004), the industrialization that stimulated farming systems to intensify and specialize on a single crop
(Ilbery and Bowler, 2003), and the development or discovery of new farm management techniques
This project This project has received funding from the European Union’s Horizon 2020 research and
innovation programme under grant agreement No 773682
Page 31 of 91
that made farming systems more efficient (e.g., the discovery of an industrial method for producing
mineral fertiliser, Global Positioning System (GPS)). De development of more resistant breeds made it
possible to overcome pests, diseases and climatic changes. Together with the development of
chemical pesticides, this reduced the need to adopt to the changing environment. Recent decades,
the attention for soil exhaustion and environmental pollution gained increased attention.
From the 1950s onwards, mechanization in agriculture have enlarged and globalized markets. The
increased availability of cheap fossil energy and the introduction of information technology were
major driving forces of this change (Smil, 2000; Pimentel and Pimental 2008; Smil, 2017). Most recent
techniques focus dominantly on the reduction of greenhouse gasses (e.g., solid-liquid separation
systems, emission poor stables), the reduced spill of nutrients and water, and the recycling of waste
flows. These techniques make use of GPS and sensor technologies (Balafoutis et al., 2017), machine
learning techniques (Liakos et al., 2018), chemical processes like anaerobic digestion (Sigurnjak et al.,
2019). The Nutri2Cycle project explores and tests newest technological innovations that stimulate
recycling waste streams.
Figure 4.2 Driving forces for technological progress in farming systems. The developments in productivity efficiency and farm income lead to changes in price ratios and farm structure and thereby also to technological progress (internal driving forces), fuelled also by education and entrepreneurship of farmers.
This project This project has received funding from the European Union’s Horizon 2020 research and
innovation programme under grant agreement No 773682
Page 32 of 91
Governmental policies
The phenomena of the pork cycle, the cyclical fluctuations in crop production, due to variations in
weather conditions and the incidence of pest and diseases (and wars), and the low education level,
innovation capacity, and incomes of rural farmers have led governments to support farmers and
markets, especially from the 20th century onwards (Ilbery and Bowler, 2003). Indeed, the
establishment of the common agricultural policy by the predecessors of the European Union in 1962
has provided strong incentives to the modernization of agricultural practices. The initial objectives of
the common agricultural policy were (i) to increase agricultural productivity by promoting technical
progress, (ii) to ensure a fair standard of living for farmers, (iii) to stabilize markets, (iv) to ensure
stability of supplies, and (v) to ensure that supplies reach the consumers at reasonable price. The EU
policy supported markets of agricultural products and the modernization and agricultural production
methods, through subsidies and research. Side effects of this policy (surplus production and
environmental pollution), and discussions in the world trade organization (WTO) and its predecessors
initiated a series of policy reforms in the EU. These led to production quota, a change from market
support to direct farm payments, series of environmental regulations, rural development programs,
and the need for innovations (Recanati et al., 2019; Détang-Dessendre et al, 2018).
4.3 Driving forces of nutrient cycling In natural, terrestrial systems, nutrients cycle between soils, plants and animals, and then back to soils
again. Some nutrients cycle also through the atmosphere (e.g., N and S), while fractions of basically all
nutrients are transported to groundwater bodies and/or the sea and then to sediments. The cycling
occurs because of driving forces, of energy sources (Liu et al., 2020). Four primary energy sources are
distinguished in natural systems (Figure 4.3). These four primary driving forces fuel a number of
secondary driving forces, which subsequently fuel nutrient transformation and transport processes.
Sunlight fuels photosynthesis, the hydrological cycle (evapotranspiration) and wind and water
currents (in combination with gravitational energy and internal particle energy). Natural gravity and
the internal energy of particles govern the earth motion (seasonal and diurnal cycles), the physical
interaction between elementary particles, including diffusion, and the physical transport of particles,
following the laws of thermodynamics. The heat (energy) in the core of the earth governs tectonic
uplift and volcanic activity (Smil, 2017).
Wind, rain and evapotranspiration are considered secondary driving forces for nutrient
transformation and transport because they are fuelled by the energy from the sun, gravitation and
the internal particle energy. This holds as well for the orbital motion of the earth and the other so-
called secondary driving forces. These secondary driving forces, alone or in combination, drive a large
number of nutrient transformation and transport processes. This includes heterotrophy, i.e., bacteria,
animals and humans which utilize the energy derived from the sun in the carbohydrates and protein
and the nutrients in plants, for growth, development and (re)production (Schlesinger and Bernhardt
2013). Biological N2 fixation is indirectly also fuelled by the sun; microorganism utilizes carbohydrates
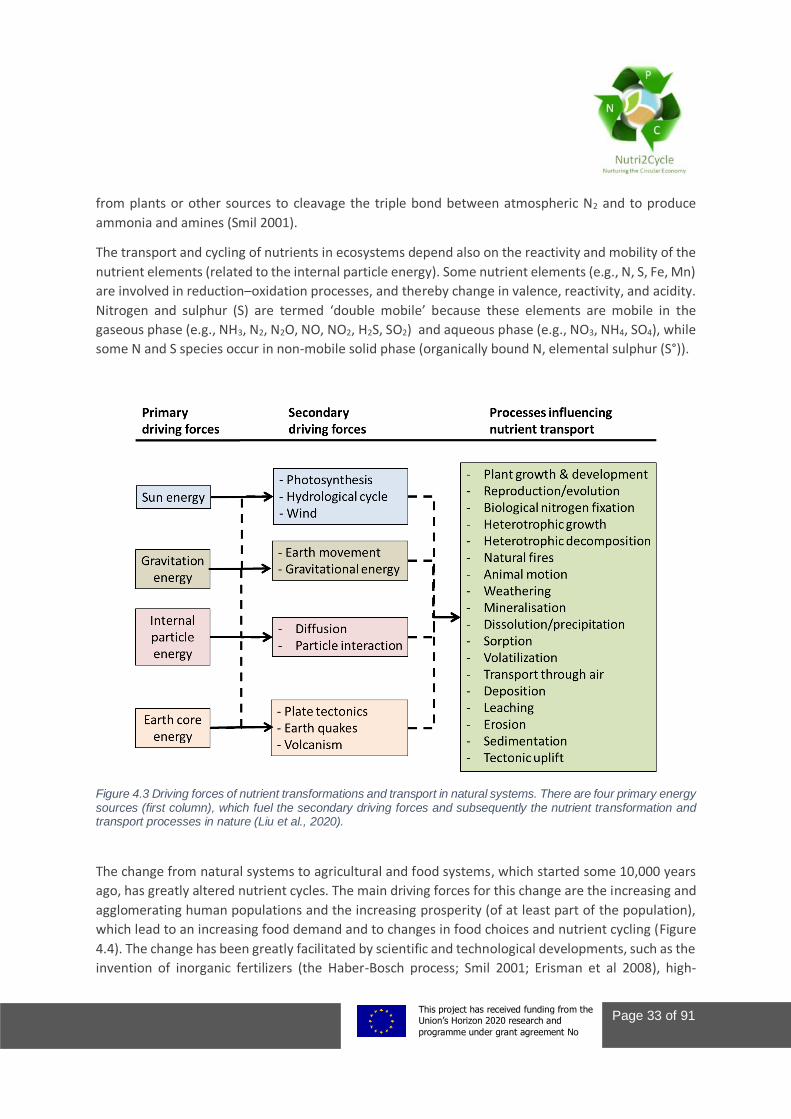
This project This project has received funding from the European Union’s Horizon 2020 research and
innovation programme under grant agreement No 773682
Page 33 of 91
from plants or other sources to cleavage the triple bond between atmospheric N2 and to produce
ammonia and amines (Smil 2001).
The transport and cycling of nutrients in ecosystems depend also on the reactivity and mobility of the
nutrient elements (related to the internal particle energy). Some nutrient elements (e.g., N, S, Fe, Mn)
are involved in reduction–oxidation processes, and thereby change in valence, reactivity, and acidity.
Nitrogen and sulphur (S) are termed ‘double mobile’ because these elements are mobile in the
gaseous phase (e.g., NH3, N2, N2O, NO, NO2, H2S, SO2) and aqueous phase (e.g., NO3, NH4, SO4), while
some N and S species occur in non-mobile solid phase (organically bound N, elemental sulphur (S°)).
Figure 4.3 Driving forces of nutrient transformations and transport in natural systems. There are four primary energy sources (first column), which fuel the secondary driving forces and subsequently the nutrient transformation and transport processes in nature (Liu et al., 2020).
The change from natural systems to agricultural and food systems, which started some 10,000 years
ago, has greatly altered nutrient cycles. The main driving forces for this change are the increasing and
agglomerating human populations and the increasing prosperity (of at least part of the population),
which lead to an increasing food demand and to changes in food choices and nutrient cycling (Figure
4.4). The change has been greatly facilitated by scientific and technological developments, such as the
invention of inorganic fertilizers (the Haber-Bosch process; Smil 2001; Erisman et al 2008), high-
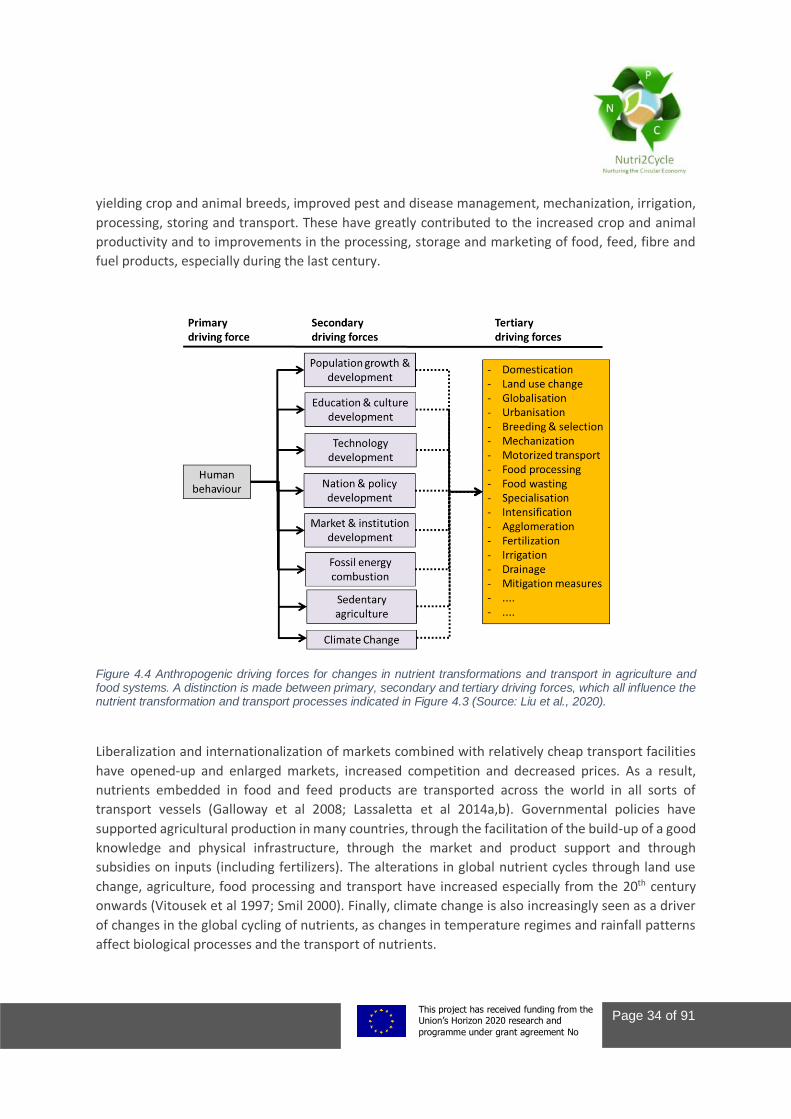
This project This project has received funding from the European Union’s Horizon 2020 research and
innovation programme under grant agreement No 773682
Page 34 of 91
yielding crop and animal breeds, improved pest and disease management, mechanization, irrigation,
processing, storing and transport. These have greatly contributed to the increased crop and animal
productivity and to improvements in the processing, storage and marketing of food, feed, fibre and
fuel products, especially during the last century.
Figure 4.4 Anthropogenic driving forces for changes in nutrient transformations and transport in agriculture and food systems. A distinction is made between primary, secondary and tertiary driving forces, which all influence the nutrient transformation and transport processes indicated in Figure 4.3 (Source: Liu et al., 2020).
Liberalization and internationalization of markets combined with relatively cheap transport facilities
have opened-up and enlarged markets, increased competition and decreased prices. As a result,
nutrients embedded in food and feed products are transported across the world in all sorts of
transport vessels (Galloway et al 2008; Lassaletta et al 2014a,b). Governmental policies have
supported agricultural production in many countries, through the facilitation of the build-up of a good
knowledge and physical infrastructure, through the market and product support and through
subsidies on inputs (including fertilizers). The alterations in global nutrient cycles through land use
change, agriculture, food processing and transport have increased especially from the 20th century
onwards (Vitousek et al 1997; Smil 2000). Finally, climate change is also increasingly seen as a driver
of changes in the global cycling of nutrients, as changes in temperature regimes and rainfall patterns
affect biological processes and the transport of nutrients.
This project This project has received funding from the European Union’s Horizon 2020 research and
innovation programme under grant agreement No 773682
Page 35 of 91
As indicated in Chapter 2 of this report, C, N and P are coupled and decoupled at various stages of
nutrient cycling in natural and agricultural systems, and the C:N:P stoichiometry of crop and animal
products is influenced by changes in cycling and the relative importance of the driving forces of this
cycling. Photosynthesis, chemosynthesis and biosynthesis lead to coupling of C, N and P, while
respiration, senescence, fermentation, grazing, harvesting, decomposition, mineralization, refinery,
and fractionation lead to (partial) uncoupling of CNP. The single, biggest event in history that has
contributed to decoupling of CNP is the advent of synthetic fertilizer production, notably the
production of synthetic N fertilizers. Fertilizers have become the largest sources of ‘new’ N and P in
the terrestrial biosphere during the 20th century. It has allowed to greatly increase food production,
through increased capture of solar radiance, also through the availability of high-yielding cultivars. It
has also allowed to greatly increase animal feed production and thereby to increase animal
production. This has subsequently contributed to increased manure production, with decreased C:N
and C:P ratios in feces and urine. As a result, of the increased productivity and manure production,
and the changed CNP stoichiometry, the susceptibility of crop and animal production systems to N
and P losses has increased.
Evidently, a combination of primary and secondary driving forces have contributed to the changes in
agricultural systems and to changes in nutrient cycling and in CNP stoichiometry. The total flow (input)
of nutrients in agriculture has increased, the C:N and C:P ratios of crop and animal production have
decreased, and the balance between C, N, P coupling and decoupling has changes. There is more
uncoupling, because of the greater abundance of N and P compared to C. If the process of
photosynthesis (and chemosynthesis and biosynthesis) could be improved per unit of incoming solar
radiation, the coupling would be improved again.
Low-input systems have low productivity, but a relatively tight coupling of C, N and P, and hence low
losses of N and P. Systems relying on N input via biological N2 fixation have inherently a more tight
CNP coupling than systems relying on N inputs via chemical N2 fixation (N fertilizers). Low-protein
animal feeding also reduces the uncoupling of CNP, as a much greater fraction of the ingested CNP is
excreted in dung as coupled CNP, and little N and P (in case of pigs and humans) is excreted via urine
in uncoupled forms.
Food processing and fractionation commonly leads to some uncoupling of CNP and/or to food
fractions with different C:N:P stoichiometry. The use of these food fractions ultimately defines the
fate of the CNP in these food fractions. Examples include the polishing of cereal grains; during polishing
the most nutritious parts of the grain, i.e., the bran and the germ is removed. The only part that
remains is the endosperm, which is primarily rich in carbohydrates (C) and devoid of N and P (and
other nutrients). Hence, consumption of whole-cereal and multigrain brain leads to less uncoupling of
CNP than consumption of bread made from polished grains.
Manure treatment is a way to reduce the manure volume (by reducing the water content), to improve
the manure quality and biosecurity (by composting, pasteurization), to fractionate manure in fractions
with different C:N:P ratios, and to manipulate the C:N:P ratio of these fractions. This may allow a more
complete utilization of the manure CNP in crop production. The emphasis in manure treatment is quite
This project This project has received funding from the European Union’s Horizon 2020 research and
innovation programme under grant agreement No 773682
Page 36 of 91
often on one or two elements in manure, e.g., in manure digestion the focus is on C (energy), in slurry
separation the focus is on obtaining a N-rich and P-poor fraction, and the C and P rich fraction, in NH3
stripping the focus is on removing NH3-N, in incineration the focus is on C (energy) and P (and some
other nutrients in ashes). Evidently, the challenge for manure treatment is to combine treatment
combinations and management approaches that lead to (i) a high utilization of both C, N and P jointly,
and (ii) to identify options for greater coupling of CNP.
4.4 Main changes in agricultural systems The changes in the driving forces of European agriculture (paragraph 4.3) have led to the
specialization, intensification, upscaling (enlargement) of farming systems, and to the introduction of
treatment technology in the food production – consumption chain. Specialization includes the
selection of only few main activities, crops or animals within a farm, and often includes outsourcing
(transfer of activities to others). Intensification refers to increasing the output per unit of land, labour
and animal on a farm, through increasing knowledge, management and non-factor inputs (e.g.
fertilizers, irrigation, mechanization). Upscaling refers to increasing total output of a farm or firm,
often through enlargement of the farm/firm, mechanization and often also through specialization/
outsourcing. Treatment encompasses a whole range of activities aimed at increasing the value of crop
and animal products at the farm, firm and/or processing industry.
This chapter provides a brief qualitative description of the driving forces of farming systems, based on
a literature review, and a semi-quantitative analyses of the changes over time in farm structure. The
influences of changes in markets, technology and governmental policies on farming systems over the
last few decades are discussed, in terms of specialization, intensification, and up-scaling. Most of these
data were derived from FAOSTAT, which has for many indicators data since 1961.
4.4.1 Farming systems Detailed data per farm type for the EU is only available in the FSS and FADN statistics, where FADN
have yearly values available. However, these statistical data are not available for such a long period as
the FAOSTAT data. For FADN for most countries data is available since 2004. Although the period since
2004 is relatively short, it clearly shows that the trend of upscaling is still continuing, especially in the
intensive livestock sector, where the number of pigs and poultry per farm doubled in the period 2004-
2017 (Figure 4.5). For the dairy and mixed farm types, a slight increase in number of livestock per farm
occurred, whereas in other grazing farms (i.e. beef and sheep) the number of animals per farm
remained stable.
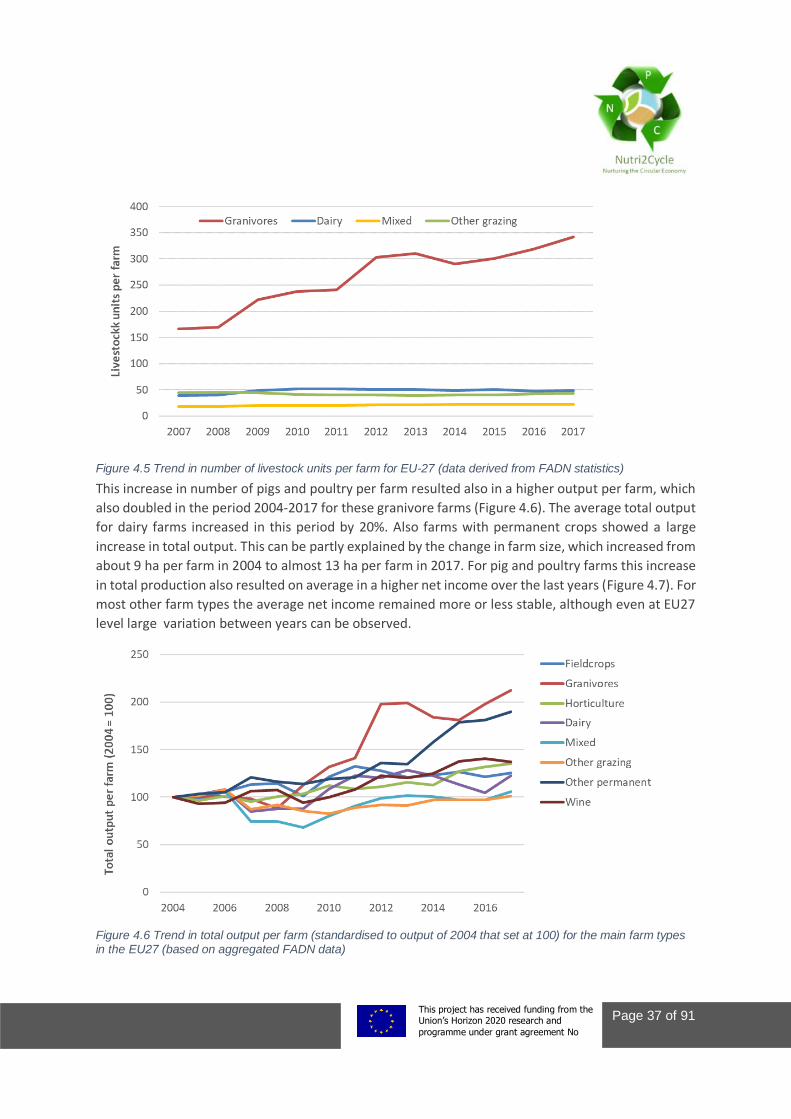
This project This project has received funding from the European Union’s Horizon 2020 research and
innovation programme under grant agreement No 773682
Page 37 of 91
Figure 4.5 Trend in number of livestock units per farm for EU-27 (data derived from FADN statistics)
This increase in number of pigs and poultry per farm resulted also in a higher output per farm, which
also doubled in the period 2004-2017 for these granivore farms (Figure 4.6). The average total output
for dairy farms increased in this period by 20%. Also farms with permanent crops showed a large
increase in total output. This can be partly explained by the change in farm size, which increased from
about 9 ha per farm in 2004 to almost 13 ha per farm in 2017. For pig and poultry farms this increase
in total production also resulted on average in a higher net income over the last years (Figure 4.7). For
most other farm types the average net income remained more or less stable, although even at EU27
level large variation between years can be observed.
Figure 4.6 Trend in total output per farm (standardised to output of 2004 that set at 100) for the main farm types in the EU27 (based on aggregated FADN data)
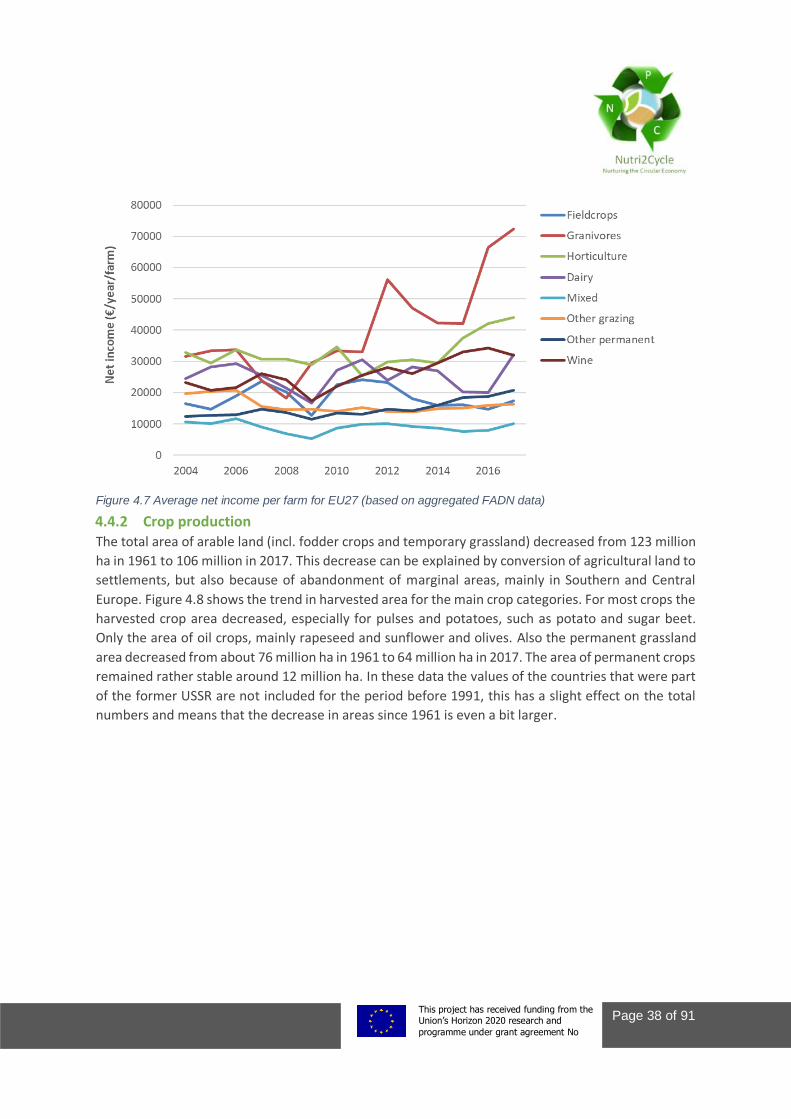
This project This project has received funding from the European Union’s Horizon 2020 research and
innovation programme under grant agreement No 773682
Page 38 of 91
Figure 4.7 Average net income per farm for EU27 (based on aggregated FADN data)
4.4.2 Crop production The total area of arable land (incl. fodder crops and temporary grassland) decreased from 123 million
ha in 1961 to 106 million in 2017. This decrease can be explained by conversion of agricultural land to
settlements, but also because of abandonment of marginal areas, mainly in Southern and Central
Europe. Figure 4.8 shows the trend in harvested area for the main crop categories. For most crops the
harvested crop area decreased, especially for pulses and potatoes, such as potato and sugar beet.
Only the area of oil crops, mainly rapeseed and sunflower and olives. Also the permanent grassland
area decreased from about 76 million ha in 1961 to 64 million ha in 2017. The area of permanent crops
remained rather stable around 12 million ha. In these data the values of the countries that were part
of the former USSR are not included for the period before 1991, this has a slight effect on the total
numbers and means that the decrease in areas since 1961 is even a bit larger.
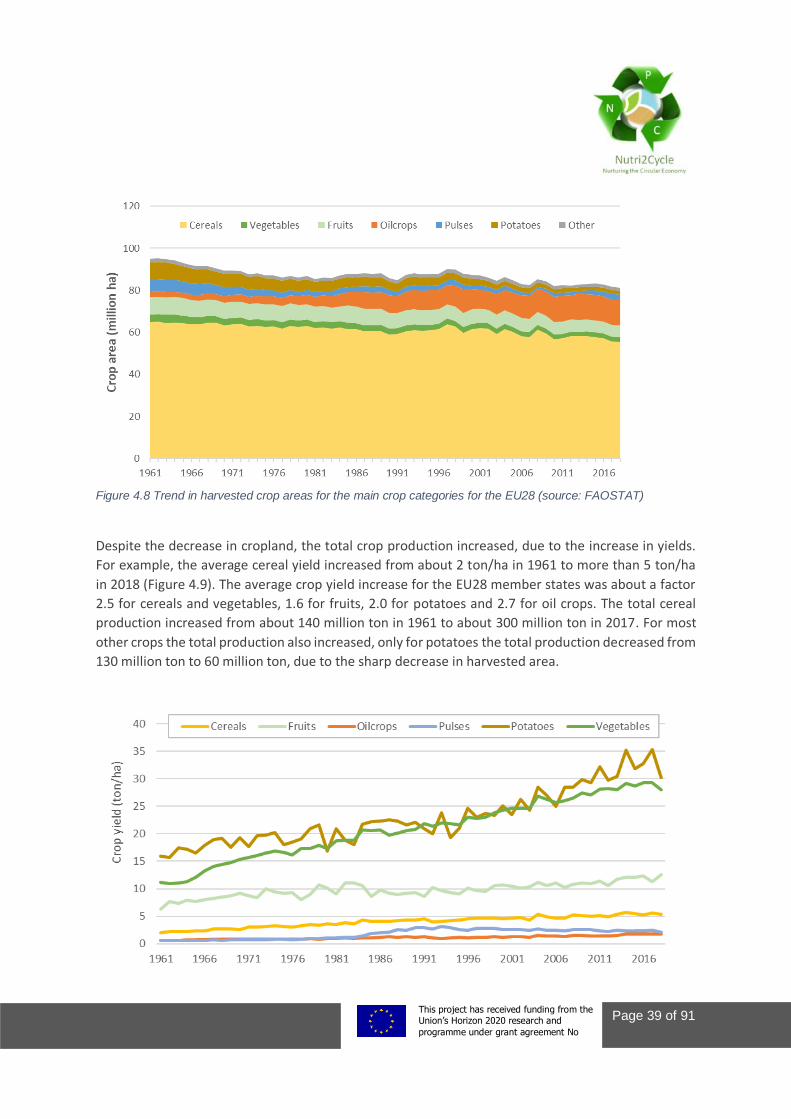
This project This project has received funding from the European Union’s Horizon 2020 research and
innovation programme under grant agreement No 773682
Page 39 of 91
Figure 4.8 Trend in harvested crop areas for the main crop categories for the EU28 (source: FAOSTAT)
Despite the decrease in cropland, the total crop production increased, due to the increase in yields.
For example, the average cereal yield increased from about 2 ton/ha in 1961 to more than 5 ton/ha
in 2018 (Figure 4.9). The average crop yield increase for the EU28 member states was about a factor
2.5 for cereals and vegetables, 1.6 for fruits, 2.0 for potatoes and 2.7 for oil crops. The total cereal
production increased from about 140 million ton in 1961 to about 300 million ton in 2017. For most
other crops the total production also increased, only for potatoes the total production decreased from
130 million ton to 60 million ton, due to the sharp decrease in harvested area.
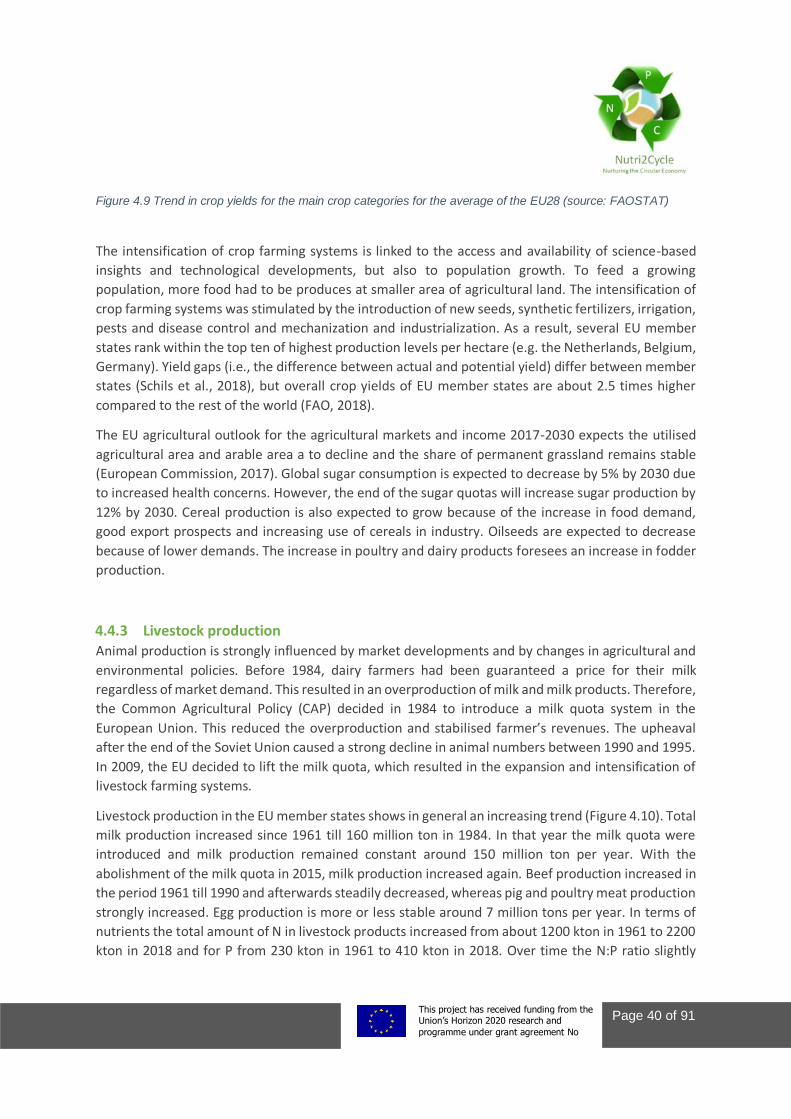
This project This project has received funding from the European Union’s Horizon 2020 research and
innovation programme under grant agreement No 773682
Page 40 of 91
Figure 4.9 Trend in crop yields for the main crop categories for the average of the EU28 (source: FAOSTAT)
The intensification of crop farming systems is linked to the access and availability of science-based
insights and technological developments, but also to population growth. To feed a growing
population, more food had to be produces at smaller area of agricultural land. The intensification of
crop farming systems was stimulated by the introduction of new seeds, synthetic fertilizers, irrigation,
pests and disease control and mechanization and industrialization. As a result, several EU member
states rank within the top ten of highest production levels per hectare (e.g. the Netherlands, Belgium,
Germany). Yield gaps (i.e., the difference between actual and potential yield) differ between member
states (Schils et al., 2018), but overall crop yields of EU member states are about 2.5 times higher
compared to the rest of the world (FAO, 2018).
The EU agricultural outlook for the agricultural markets and income 2017-2030 expects the utilised
agricultural area and arable area a to decline and the share of permanent grassland remains stable
(European Commission, 2017). Global sugar consumption is expected to decrease by 5% by 2030 due
to increased health concerns. However, the end of the sugar quotas will increase sugar production by
12% by 2030. Cereal production is also expected to grow because of the increase in food demand,
good export prospects and increasing use of cereals in industry. Oilseeds are expected to decrease
because of lower demands. The increase in poultry and dairy products foresees an increase in fodder
production.
4.4.3 Livestock production Animal production is strongly influenced by market developments and by changes in agricultural and
environmental policies. Before 1984, dairy farmers had been guaranteed a price for their milk
regardless of market demand. This resulted in an overproduction of milk and milk products. Therefore,
the Common Agricultural Policy (CAP) decided in 1984 to introduce a milk quota system in the
European Union. This reduced the overproduction and stabilised farmer’s revenues. The upheaval
after the end of the Soviet Union caused a strong decline in animal numbers between 1990 and 1995.
In 2009, the EU decided to lift the milk quota, which resulted in the expansion and intensification of
livestock farming systems.
Livestock production in the EU member states shows in general an increasing trend (Figure 4.10). Total
milk production increased since 1961 till 160 million ton in 1984. In that year the milk quota were
introduced and milk production remained constant around 150 million ton per year. With the
abolishment of the milk quota in 2015, milk production increased again. Beef production increased in
the period 1961 till 1990 and afterwards steadily decreased, whereas pig and poultry meat production
strongly increased. Egg production is more or less stable around 7 million tons per year. In terms of
nutrients the total amount of N in livestock products increased from about 1200 kton in 1961 to 2200
kton in 2018 and for P from 230 kton in 1961 to 410 kton in 2018. Over time the N:P ratio slightly
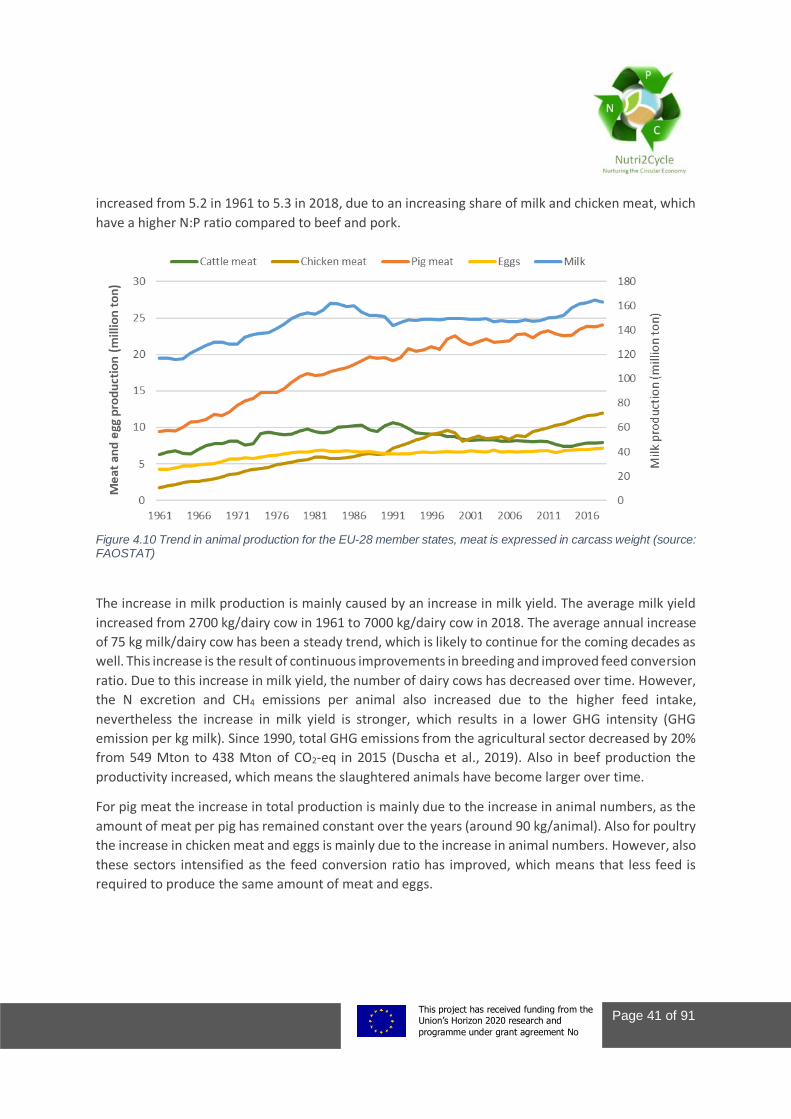
This project This project has received funding from the European Union’s Horizon 2020 research and
innovation programme under grant agreement No 773682
Page 41 of 91
increased from 5.2 in 1961 to 5.3 in 2018, due to an increasing share of milk and chicken meat, which
have a higher N:P ratio compared to beef and pork.
Figure 4.10 Trend in animal production for the EU-28 member states, meat is expressed in carcass weight (source: FAOSTAT)
The increase in milk production is mainly caused by an increase in milk yield. The average milk yield
increased from 2700 kg/dairy cow in 1961 to 7000 kg/dairy cow in 2018. The average annual increase
of 75 kg milk/dairy cow has been a steady trend, which is likely to continue for the coming decades as
well. This increase is the result of continuous improvements in breeding and improved feed conversion
ratio. Due to this increase in milk yield, the number of dairy cows has decreased over time. However,
the N excretion and CH4 emissions per animal also increased due to the higher feed intake,
nevertheless the increase in milk yield is stronger, which results in a lower GHG intensity (GHG
emission per kg milk). Since 1990, total GHG emissions from the agricultural sector decreased by 20%
from 549 Mton to 438 Mton of CO2-eq in 2015 (Duscha et al., 2019). Also in beef production the
productivity increased, which means the slaughtered animals have become larger over time.
For pig meat the increase in total production is mainly due to the increase in animal numbers, as the
amount of meat per pig has remained constant over the years (around 90 kg/animal). Also for poultry
the increase in chicken meat and eggs is mainly due to the increase in animal numbers. However, also
these sectors intensified as the feed conversion ratio has improved, which means that less feed is
required to produce the same amount of meat and eggs.
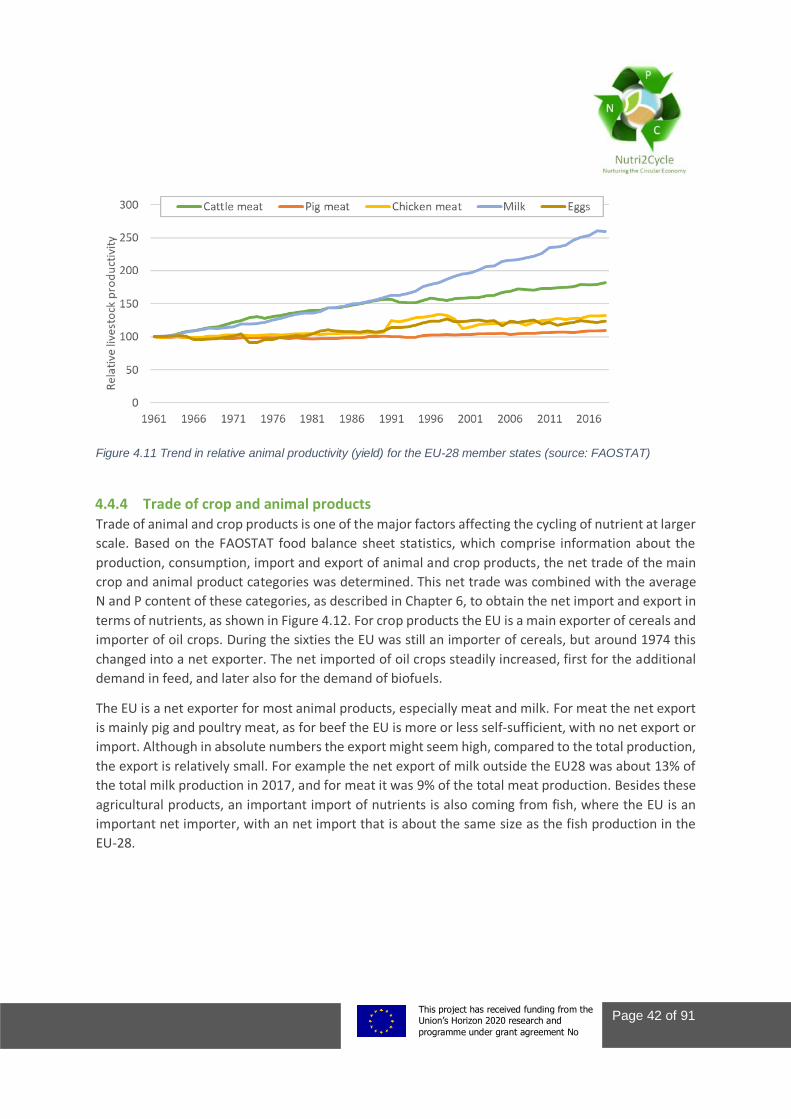
This project This project has received funding from the European Union’s Horizon 2020 research and
innovation programme under grant agreement No 773682
Page 42 of 91
Figure 4.11 Trend in relative animal productivity (yield) for the EU-28 member states (source: FAOSTAT)
4.4.4 Trade of crop and animal products Trade of animal and crop products is one of the major factors affecting the cycling of nutrient at larger
scale. Based on the FAOSTAT food balance sheet statistics, which comprise information about the
production, consumption, import and export of animal and crop products, the net trade of the main
crop and animal product categories was determined. This net trade was combined with the average
N and P content of these categories, as described in Chapter 6, to obtain the net import and export in
terms of nutrients, as shown in Figure 4.12. For crop products the EU is a main exporter of cereals and
importer of oil crops. During the sixties the EU was still an importer of cereals, but around 1974 this
changed into a net exporter. The net imported of oil crops steadily increased, first for the additional
demand in feed, and later also for the demand of biofuels.
The EU is a net exporter for most animal products, especially meat and milk. For meat the net export
is mainly pig and poultry meat, as for beef the EU is more or less self-sufficient, with no net export or
import. Although in absolute numbers the export might seem high, compared to the total production,
the export is relatively small. For example the net export of milk outside the EU28 was about 13% of
the total milk production in 2017, and for meat it was 9% of the total meat production. Besides these
agricultural products, an important import of nutrients is also coming from fish, where the EU is an
important net importer, with an net import that is about the same size as the fish production in the
EU-28.
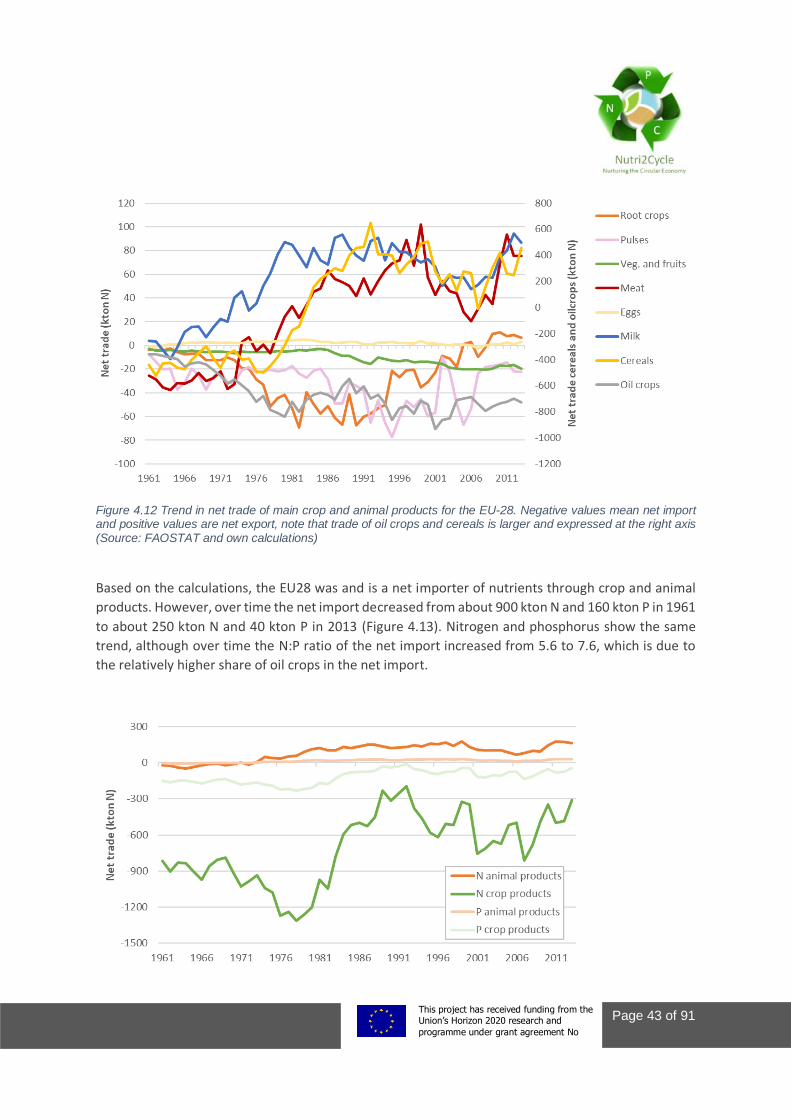
This project This project has received funding from the European Union’s Horizon 2020 research and
innovation programme under grant agreement No 773682
Page 43 of 91
Figure 4.12 Trend in net trade of main crop and animal products for the EU-28. Negative values mean net import and positive values are net export, note that trade of oil crops and cereals is larger and expressed at the right axis (Source: FAOSTAT and own calculations)
Based on the calculations, the EU28 was and is a net importer of nutrients through crop and animal
products. However, over time the net import decreased from about 900 kton N and 160 kton P in 1961
to about 250 kton N and 40 kton P in 2013 (Figure 4.13). Nitrogen and phosphorus show the same
trend, although over time the N:P ratio of the net import increased from 5.6 to 7.6, which is due to
the relatively higher share of oil crops in the net import.
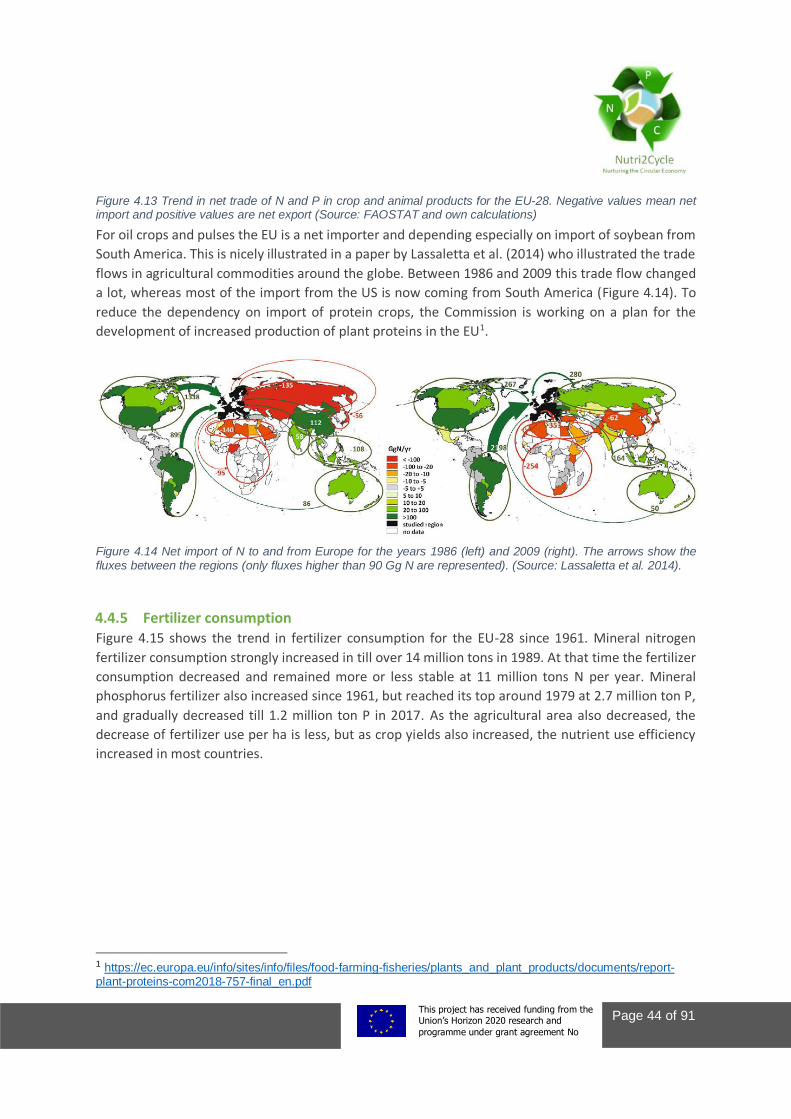
This project This project has received funding from the European Union’s Horizon 2020 research and
innovation programme under grant agreement No 773682
Page 44 of 91
Figure 4.13 Trend in net trade of N and P in crop and animal products for the EU-28. Negative values mean net import and positive values are net export (Source: FAOSTAT and own calculations)
For oil crops and pulses the EU is a net importer and depending especially on import of soybean from
South America. This is nicely illustrated in a paper by Lassaletta et al. (2014) who illustrated the trade
flows in agricultural commodities around the globe. Between 1986 and 2009 this trade flow changed
a lot, whereas most of the import from the US is now coming from South America (Figure 4.14). To
reduce the dependency on import of protein crops, the Commission is working on a plan for the
development of increased production of plant proteins in the EU1.
Figure 4.14 Net import of N to and from Europe for the years 1986 (left) and 2009 (right). The arrows show the fluxes between the regions (only fluxes higher than 90 Gg N are represented). (Source: Lassaletta et al. 2014).
4.4.5 Fertilizer consumption Figure 4.15 shows the trend in fertilizer consumption for the EU-28 since 1961. Mineral nitrogen
fertilizer consumption strongly increased in till over 14 million tons in 1989. At that time the fertilizer
consumption decreased and remained more or less stable at 11 million tons N per year. Mineral
phosphorus fertilizer also increased since 1961, but reached its top around 1979 at 2.7 million ton P,
and gradually decreased till 1.2 million ton P in 2017. As the agricultural area also decreased, the
decrease of fertilizer use per ha is less, but as crop yields also increased, the nutrient use efficiency
increased in most countries.
1 https://ec.europa.eu/info/sites/info/files/food-farming-fisheries/plants_and_plant_products/documents/report-plant-proteins-com2018-757-final_en.pdf
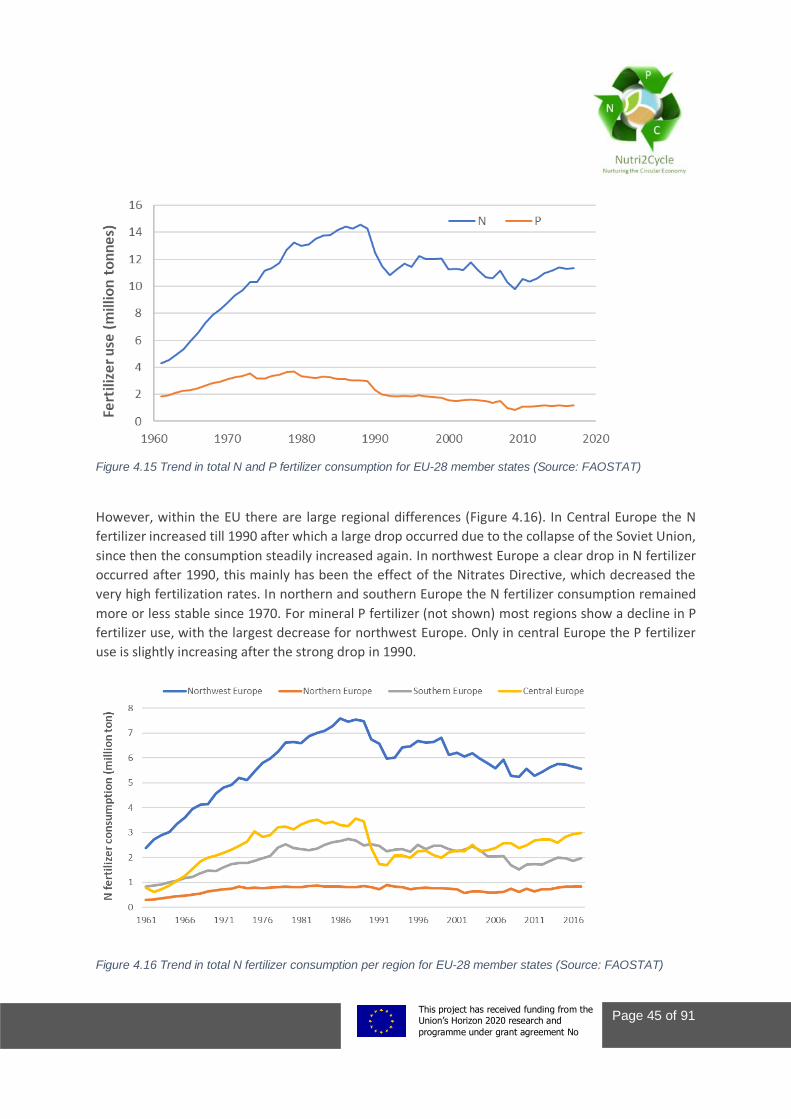
This project This project has received funding from the European Union’s Horizon 2020 research and
innovation programme under grant agreement No 773682
Page 45 of 91
Figure 4.15 Trend in total N and P fertilizer consumption for EU-28 member states (Source: FAOSTAT)
However, within the EU there are large regional differences (Figure 4.16). In Central Europe the N
fertilizer increased till 1990 after which a large drop occurred due to the collapse of the Soviet Union,
since then the consumption steadily increased again. In northwest Europe a clear drop in N fertilizer
occurred after 1990, this mainly has been the effect of the Nitrates Directive, which decreased the
very high fertilization rates. In northern and southern Europe the N fertilizer consumption remained
more or less stable since 1970. For mineral P fertilizer (not shown) most regions show a decline in P
fertilizer use, with the largest decrease for northwest Europe. Only in central Europe the P fertilizer
use is slightly increasing after the strong drop in 1990.
Figure 4.16 Trend in total N fertilizer consumption per region for EU-28 member states (Source: FAOSTAT)
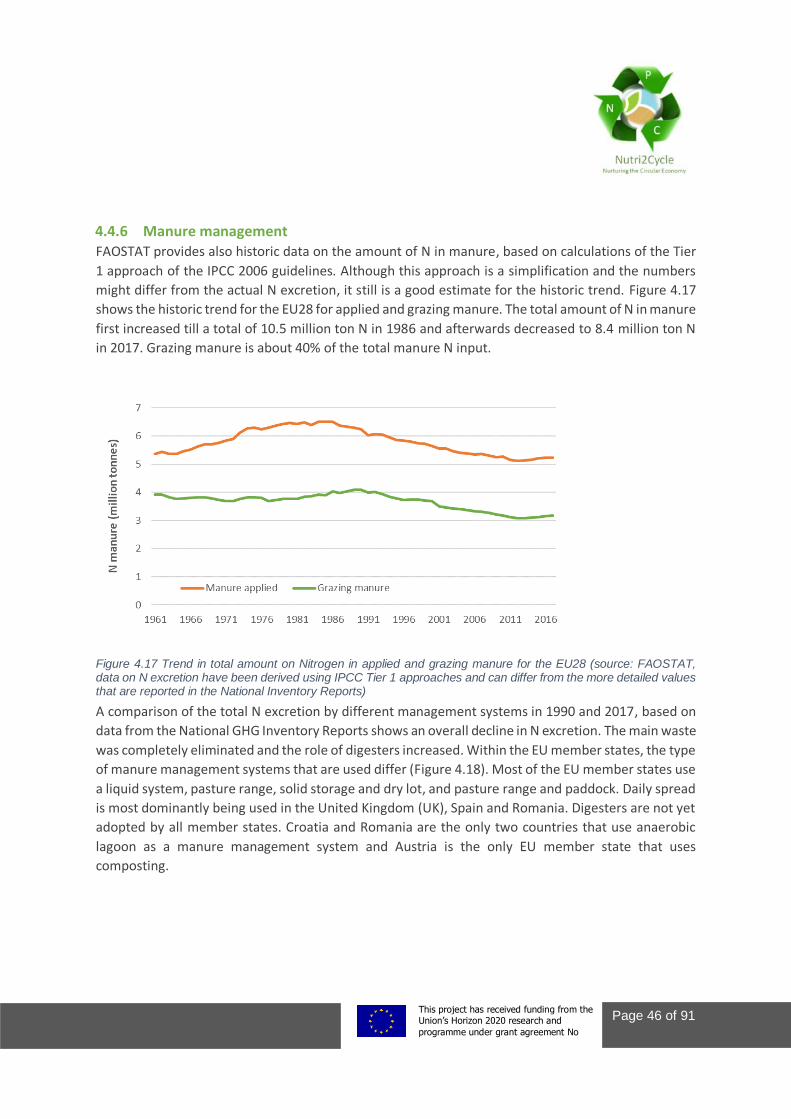
This project This project has received funding from the European Union’s Horizon 2020 research and
innovation programme under grant agreement No 773682
Page 46 of 91
4.4.6 Manure management FAOSTAT provides also historic data on the amount of N in manure, based on calculations of the Tier
1 approach of the IPCC 2006 guidelines. Although this approach is a simplification and the numbers
might differ from the actual N excretion, it still is a good estimate for the historic trend. Figure 4.17
shows the historic trend for the EU28 for applied and grazing manure. The total amount of N in manure
first increased till a total of 10.5 million ton N in 1986 and afterwards decreased to 8.4 million ton N
in 2017. Grazing manure is about 40% of the total manure N input.
Figure 4.17 Trend in total amount on Nitrogen in applied and grazing manure for the EU28 (source: FAOSTAT, data on N excretion have been derived using IPCC Tier 1 approaches and can differ from the more detailed values that are reported in the National Inventory Reports)
A comparison of the total N excretion by different management systems in 1990 and 2017, based on
data from the National GHG Inventory Reports shows an overall decline in N excretion. The main waste
was completely eliminated and the role of digesters increased. Within the EU member states, the type
of manure management systems that are used differ (Figure 4.18). Most of the EU member states use
a liquid system, pasture range, solid storage and dry lot, and pasture range and paddock. Daily spread
is most dominantly being used in the United Kingdom (UK), Spain and Romania. Digesters are not yet
adopted by all member states. Croatia and Romania are the only two countries that use anaerobic
lagoon as a manure management system and Austria is the only EU member state that uses
composting.
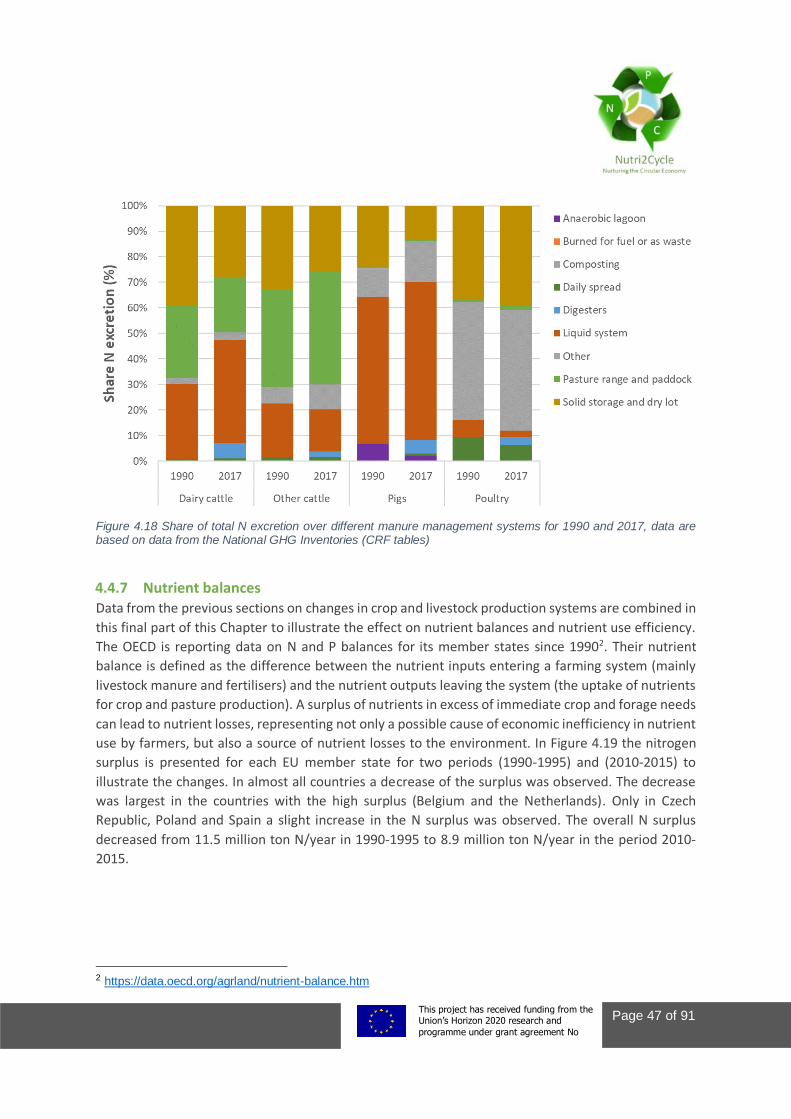
This project This project has received funding from the European Union’s Horizon 2020 research and
innovation programme under grant agreement No 773682
Page 47 of 91
Figure 4.18 Share of total N excretion over different manure management systems for 1990 and 2017, data are based on data from the National GHG Inventories (CRF tables)
4.4.7 Nutrient balances Data from the previous sections on changes in crop and livestock production systems are combined in
this final part of this Chapter to illustrate the effect on nutrient balances and nutrient use efficiency.
The OECD is reporting data on N and P balances for its member states since 19902. Their nutrient
balance is defined as the difference between the nutrient inputs entering a farming system (mainly
livestock manure and fertilisers) and the nutrient outputs leaving the system (the uptake of nutrients
for crop and pasture production). A surplus of nutrients in excess of immediate crop and forage needs
can lead to nutrient losses, representing not only a possible cause of economic inefficiency in nutrient
use by farmers, but also a source of nutrient losses to the environment. In Figure 4.19 the nitrogen
surplus is presented for each EU member state for two periods (1990-1995) and (2010-2015) to
illustrate the changes. In almost all countries a decrease of the surplus was observed. The decrease
was largest in the countries with the high surplus (Belgium and the Netherlands). Only in Czech
Republic, Poland and Spain a slight increase in the N surplus was observed. The overall N surplus
decreased from 11.5 million ton N/year in 1990-1995 to 8.9 million ton N/year in the period 2010-
2015.
2 https://data.oecd.org/agrland/nutrient-balance.htm
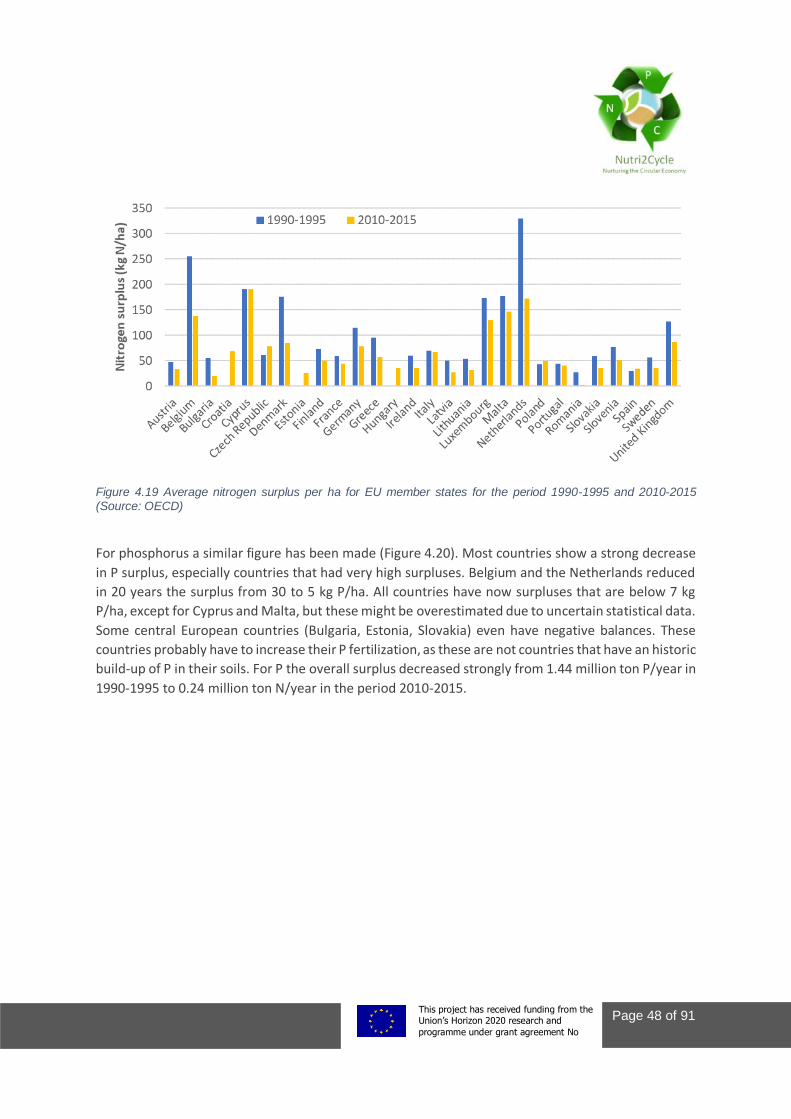
This project This project has received funding from the European Union’s Horizon 2020 research and
innovation programme under grant agreement No 773682
Page 48 of 91
Figure 4.19 Average nitrogen surplus per ha for EU member states for the period 1990-1995 and 2010-2015 (Source: OECD)
For phosphorus a similar figure has been made (Figure 4.20). Most countries show a strong decrease
in P surplus, especially countries that had very high surpluses. Belgium and the Netherlands reduced
in 20 years the surplus from 30 to 5 kg P/ha. All countries have now surpluses that are below 7 kg
P/ha, except for Cyprus and Malta, but these might be overestimated due to uncertain statistical data.
Some central European countries (Bulgaria, Estonia, Slovakia) even have negative balances. These
countries probably have to increase their P fertilization, as these are not countries that have an historic
build-up of P in their soils. For P the overall surplus decreased strongly from 1.44 million ton P/year in
1990-1995 to 0.24 million ton N/year in the period 2010-2015.
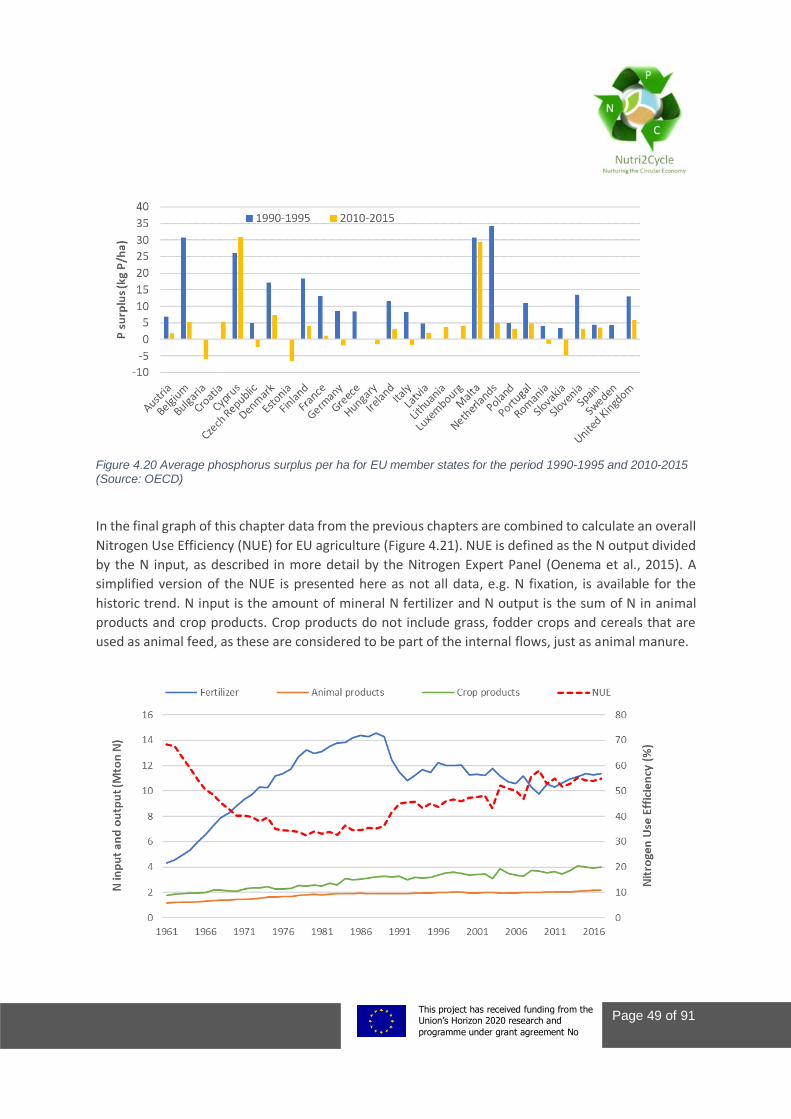
This project This project has received funding from the European Union’s Horizon 2020 research and
innovation programme under grant agreement No 773682
Page 49 of 91
Figure 4.20 Average phosphorus surplus per ha for EU member states for the period 1990-1995 and 2010-2015 (Source: OECD)
In the final graph of this chapter data from the previous chapters are combined to calculate an overall
Nitrogen Use Efficiency (NUE) for EU agriculture (Figure 4.21). NUE is defined as the N output divided
by the N input, as described in more detail by the Nitrogen Expert Panel (Oenema et al., 2015). A
simplified version of the NUE is presented here as not all data, e.g. N fixation, is available for the
historic trend. N input is the amount of mineral N fertilizer and N output is the sum of N in animal
products and crop products. Crop products do not include grass, fodder crops and cereals that are
used as animal feed, as these are considered to be part of the internal flows, just as animal manure.
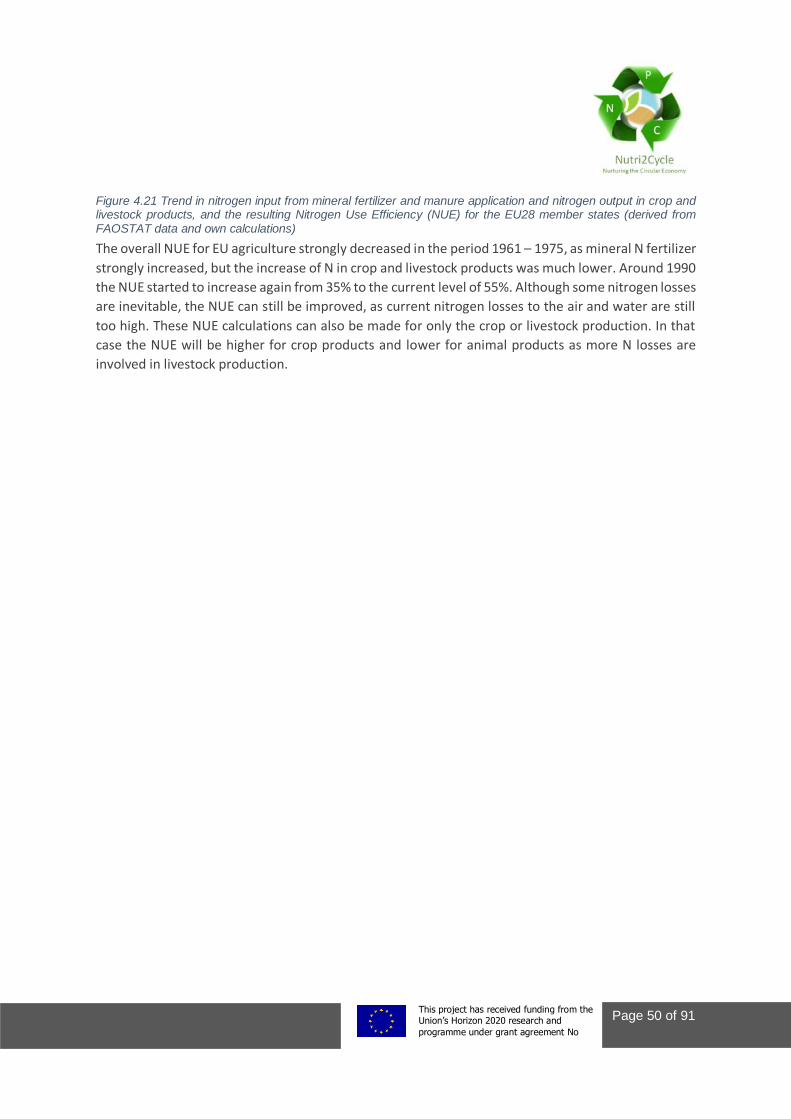
This project This project has received funding from the European Union’s Horizon 2020 research and
innovation programme under grant agreement No 773682
Page 50 of 91
Figure 4.21 Trend in nitrogen input from mineral fertilizer and manure application and nitrogen output in crop and livestock products, and the resulting Nitrogen Use Efficiency (NUE) for the EU28 member states (derived from FAOSTAT data and own calculations)
The overall NUE for EU agriculture strongly decreased in the period 1961 – 1975, as mineral N fertilizer
strongly increased, but the increase of N in crop and livestock products was much lower. Around 1990
the NUE started to increase again from 35% to the current level of 55%. Although some nitrogen losses
are inevitable, the NUE can still be improved, as current nitrogen losses to the air and water are still
too high. These NUE calculations can also be made for only the crop or livestock production. In that
case the NUE will be higher for crop products and lower for animal products as more N losses are
involved in livestock production.
This project This project has received funding from the European Union’s Horizon 2020 research and
innovation programme under grant agreement No 773682
Page 51 of 91
5. Ecological stoichiometry – definitions, concept and mechanism
5.1 Introduction Ecological stoichiometry concerns the way that the elemental compositions of organisms shape the
interactions between organisms and in the end all life on earth. It deals with the balance of elemental
ratios and how these affect organism growth, nutrient cycling, and the interactions with the biotic and
abiotic worlds. All organisms consume nutrients from the environment proportional to their needs.
As a consequence, the elemental composition of organisms provide a set of constraints through which
the biogeochemical cycles must pass. Variations in food availability have profoundly influenced the
evolution of animals, because in many aspects an animal is what it eats.
This chapter provides an introduction to the concept and definitions of ecological stoichiometry. It is
largely based on the book ‘Ecological Stoichiometry – The Biology of Elements from Molecules to the
Biosphere’ (Sterner and Elser, 2003), and on papers in the special issue ‘Progress in Ecological
Stoichiometry’, which were published in Frontiers in Microbiology, Frontiers in Ecology and Evolution,
Frontiers in Environmental Science, Frontiers in Marine Science, Frontiers in Earth Science and
Frontiers in Plant Science (Van der Waal et al., 2018).
5.2 Definitions Stoichiometry refers to the proportions of elements in reactants and products of reactions and
processes; it deals with the application of the law of definite proportions. Strict stoichiometry means
that the elements of a compound are in fixed proportions, as in for example glucose (C6H12O6), sodium
chloride (NaCl), diammonium phosphate ((NH4)2HPO4), and amino acids. Commonly, the ratios of the
elements are expressed as mole:mole ratios3.
Non-strict stoichiometry refers to compounds that lack fixed proportions of elements. This is the
situation for most soil minerals, such as for example illite (K,H3O)(Al,Mg,Fe)2(Si,Al)4O10[(OH)2,(H2O)]
and vermiculite ((Mg,Fe2+,Fe3+)3[(Al,Si)4O10](OH)2·4H2O).
Homeostasis refers to the resistance of an organism to change its internal composition to its food, to
its external world. It refers to the ability of organisms to keep the chemical composition of their body
constant, despite changes in the chemical composition of the environment, including their food.
Strict homeostasis means that consumers stoichiometry does not vary with the food (resource)
stoichiometry. No homeostasis means that consumer stoichiometry is similar to resource
stoichiometry. In practice, organisms differ in the degree of homeostasis, depending on the resource
3 Ratios are sometimes presented as mass:mass ratio, which is possible. However, mass:mass ratio and mole:mole ratios
should not be mixed.
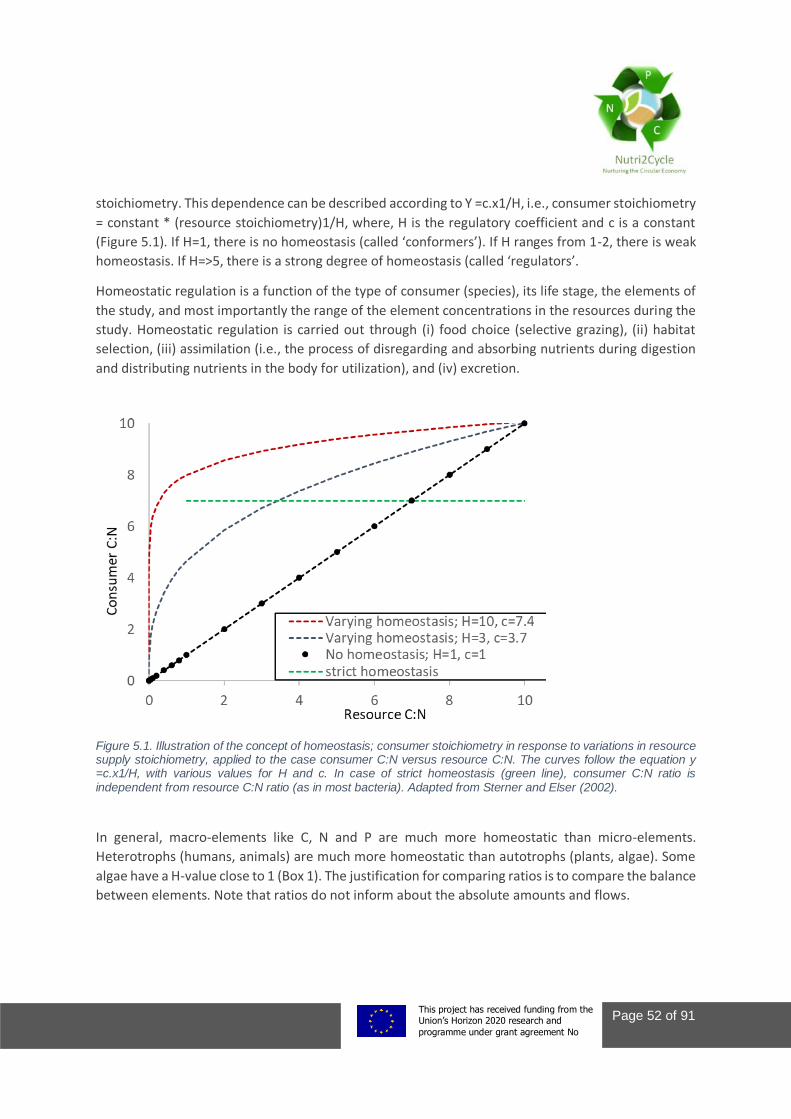
This project This project has received funding from the European Union’s Horizon 2020 research and
innovation programme under grant agreement No 773682
Page 52 of 91
stoichiometry. This dependence can be described according to Y =c.x1/H, i.e., consumer stoichiometry
= constant * (resource stoichiometry)1/H, where, H is the regulatory coefficient and c is a constant
(Figure 5.1). If H=1, there is no homeostasis (called ‘conformers’). If H ranges from 1-2, there is weak
homeostasis. If H=>5, there is a strong degree of homeostasis (called ‘regulators’.
Homeostatic regulation is a function of the type of consumer (species), its life stage, the elements of
the study, and most importantly the range of the element concentrations in the resources during the
study. Homeostatic regulation is carried out through (i) food choice (selective grazing), (ii) habitat
selection, (iii) assimilation (i.e., the process of disregarding and absorbing nutrients during digestion
and distributing nutrients in the body for utilization), and (iv) excretion.
Figure 5.1. Illustration of the concept of homeostasis; consumer stoichiometry in response to variations in resource supply stoichiometry, applied to the case consumer C:N versus resource C:N. The curves follow the equation y =c.x1/H, with various values for H and c. In case of strict homeostasis (green line), consumer C:N ratio is independent from resource C:N ratio (as in most bacteria). Adapted from Sterner and Elser (2002).
In general, macro-elements like C, N and P are much more homeostatic than micro-elements.
Heterotrophs (humans, animals) are much more homeostatic than autotrophs (plants, algae). Some
algae have a H-value close to 1 (Box 1). The justification for comparing ratios is to compare the balance
between elements. Note that ratios do not inform about the absolute amounts and flows.
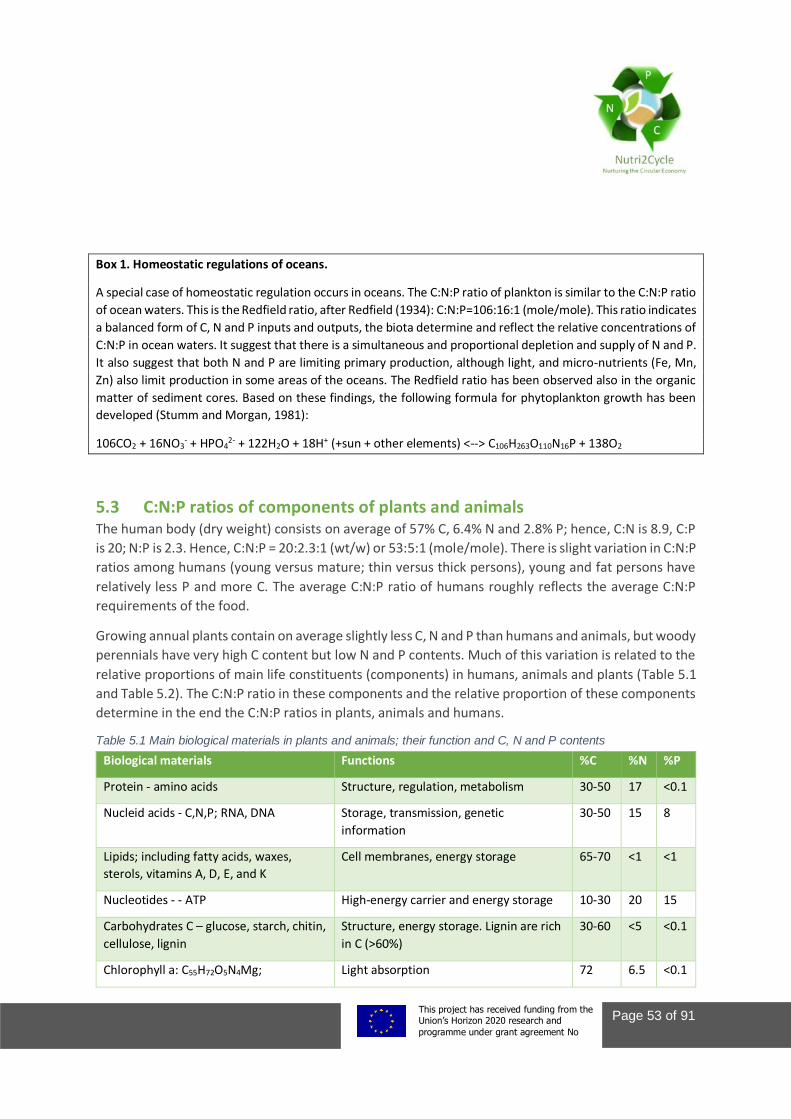
This project This project has received funding from the European Union’s Horizon 2020 research and
innovation programme under grant agreement No 773682
Page 53 of 91
Box 1. Homeostatic regulations of oceans.
A special case of homeostatic regulation occurs in oceans. The C:N:P ratio of plankton is similar to the C:N:P ratio
of ocean waters. This is the Redfield ratio, after Redfield (1934): C:N:P=106:16:1 (mole/mole). This ratio indicates
a balanced form of C, N and P inputs and outputs, the biota determine and reflect the relative concentrations of
C:N:P in ocean waters. It suggest that there is a simultaneous and proportional depletion and supply of N and P.
It also suggest that both N and P are limiting primary production, although light, and micro-nutrients (Fe, Mn,
Zn) also limit production in some areas of the oceans. The Redfield ratio has been observed also in the organic
matter of sediment cores. Based on these findings, the following formula for phytoplankton growth has been
developed (Stumm and Morgan, 1981):
106CO2 + 16NO3- + HPO4
2- + 122H2O + 18H+ (+sun + other elements) <--> C106H263O110N16P + 138O2
5.3 C:N:P ratios of components of plants and animals The human body (dry weight) consists on average of 57% C, 6.4% N and 2.8% P; hence, C:N is 8.9, C:P
is 20; N:P is 2.3. Hence, C:N:P = 20:2.3:1 (wt/w) or 53:5:1 (mole/mole). There is slight variation in C:N:P
ratios among humans (young versus mature; thin versus thick persons), young and fat persons have
relatively less P and more C. The average C:N:P ratio of humans roughly reflects the average C:N:P
requirements of the food.
Growing annual plants contain on average slightly less C, N and P than humans and animals, but woody
perennials have very high C content but low N and P contents. Much of this variation is related to the
relative proportions of main life constituents (components) in humans, animals and plants (Table 5.1
and Table 5.2). The C:N:P ratio in these components and the relative proportion of these components
determine in the end the C:N:P ratios in plants, animals and humans.
Table 5.1 Main biological materials in plants and animals; their function and C, N and P contents
Biological materials Functions %C %N %P
Protein - amino acids Structure, regulation, metabolism 30-50 17 <0.1
Nucleid acids - C,N,P; RNA, DNA Storage, transmission, genetic
information
30-50 15 8
Lipids; including fatty acids, waxes,
sterols, vitamins A, D, E, and K
Cell membranes, energy storage 65-70 <1 <1
Nucleotides - - ATP High-energy carrier and energy storage 10-30 20 15
Carbohydrates C – glucose, starch, chitin,
cellulose, lignin
Structure, energy storage. Lignin are rich
in C (>60%)
30-60 <5 <0.1
Chlorophyll a: C55H72O5N4Mg; Light absorption 72 6.5 <0.1
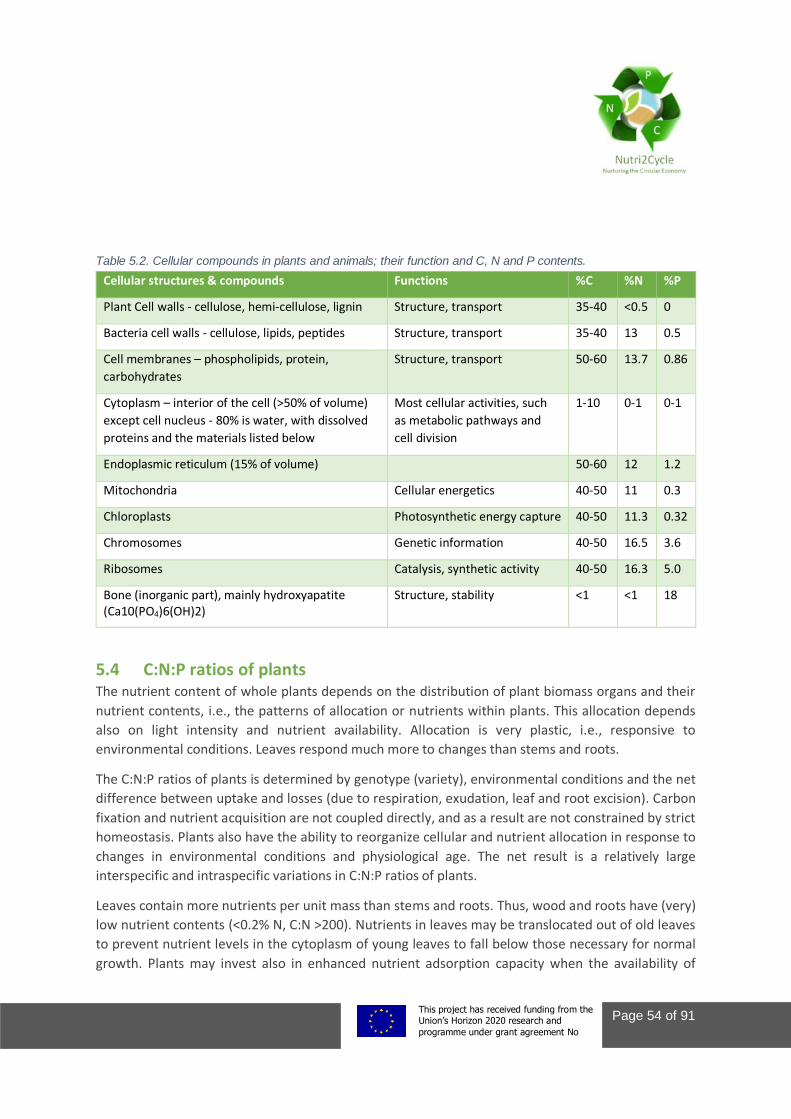
This project This project has received funding from the European Union’s Horizon 2020 research and
innovation programme under grant agreement No 773682
Page 54 of 91
Table 5.2. Cellular compounds in plants and animals; their function and C, N and P contents.
Cellular structures & compounds Functions %C %N %P
Plant Cell walls - cellulose, hemi-cellulose, lignin Structure, transport 35-40 <0.5 0
Bacteria cell walls - cellulose, lipids, peptides Structure, transport 35-40 13 0.5
Cell membranes – phospholipids, protein,
carbohydrates
Structure, transport 50-60 13.7 0.86
Cytoplasm – interior of the cell (>50% of volume)
except cell nucleus - 80% is water, with dissolved
proteins and the materials listed below
Most cellular activities, such
as metabolic pathways and
cell division
1-10 0-1 0-1
Endoplasmic reticulum (15% of volume) 50-60 12 1.2
Mitochondria Cellular energetics 40-50 11 0.3
Chloroplasts Photosynthetic energy capture 40-50 11.3 0.32
Chromosomes Genetic information 40-50 16.5 3.6
Ribosomes Catalysis, synthetic activity 40-50 16.3 5.0
Bone (inorganic part), mainly hydroxyapatite (Ca10(PO4)6(OH)2)
Structure, stability <1 <1 18
5.4 C:N:P ratios of plants The nutrient content of whole plants depends on the distribution of plant biomass organs and their
nutrient contents, i.e., the patterns of allocation or nutrients within plants. This allocation depends
also on light intensity and nutrient availability. Allocation is very plastic, i.e., responsive to
environmental conditions. Leaves respond much more to changes than stems and roots.
The C:N:P ratios of plants is determined by genotype (variety), environmental conditions and the net
difference between uptake and losses (due to respiration, exudation, leaf and root excision). Carbon
fixation and nutrient acquisition are not coupled directly, and as a result are not constrained by strict
homeostasis. Plants also have the ability to reorganize cellular and nutrient allocation in response to
changes in environmental conditions and physiological age. The net result is a relatively large
interspecific and intraspecific variations in C:N:P ratios of plants.
Leaves contain more nutrients per unit mass than stems and roots. Thus, wood and roots have (very)
low nutrient contents (<0.2% N, C:N >200). Nutrients in leaves may be translocated out of old leaves
to prevent nutrient levels in the cytoplasm of young leaves to fall below those necessary for normal
growth. Plants may invest also in enhanced nutrient adsorption capacity when the availability of
This project This project has received funding from the European Union’s Horizon 2020 research and
innovation programme under grant agreement No 773682
Page 55 of 91
nutrients is low; they may increase the specific root length (increase total root length and thereby the
capacity to explore the soil), and they may increase the root : shoot ratios (again invest in roots to be
able to scavenge nutrients from soil). Conversely, when the nutrient availability is high, plants may do
the opposite; decrease the root : shoot ratio and the specific root length.
All plant cells have a cell wall, a nucleus, some mitochondria, various organelles, ribosomes,
chloroplasts, and a large central vacuole. Cell walls contain C but no P and little N. The vacuole
functions as a storage of organic compounds and nutrients during growth; it is a major factor in
decoupling nutrient uptake from biomass growth in response to immediate environmental conditions.
Luxury consumption refers to increases in nutrient contents over what is immediately required for
growth during the vegetative growth period; the nutrients (e.g., nitrate, potassium, inorganic P)
mainly accumulate in the vacuole (Yang et al., 2017). Seeds and grains function as storage organs
during generative grow phase. In many higher plants, P is stored in seeds and grains as phytate
(C6H18O24P6) with a C:P ratio (mole/mole) of 1. Through P storage, autotrophs can have low C:P and
low N:P ratios, when they have access to abundant P under conditions of N limited growth.
Luxury consumption and storage of nutrients in the vacuole has a cost, because a large vacuole
provides no direct contributions to cellular mechanisms. It also lowers the surface area : volume ratio
of the cell and thus decreases the nutrient acquisition ability of the cell. In nature, plants have evolved
different strategies (i) low allocation of cellular space to storage; these plants have an elemental
composition directly related to growth rate, and have a high growth rate (due to large surface area :
volume ratio), but they are sensitive to varying nutrient contents, or (ii) increased allocation of excess
nutrients to vacuoles for storage of potentially limiting nutrients, which is advantageous under
variable nutrient supply conditions, but at the cost of lower growth rates. As a result, three different
plant types have developed over time:
- Competitive strategists: species with high growth rate adapted to fertile areas, and high
degree of phenotypic plasticity in response to interactions with adjacent plants (growth
strategies)
- Ruderal strategies: adapted to fertile areas with frequent disturbances: high growth rates and
low degree of interaction with adjacent plants (affinity strategies)
- Stress tolerators: adapted to inhospitable conditions, and with the ability to extensive
accumulation of reserves (storage strategies)
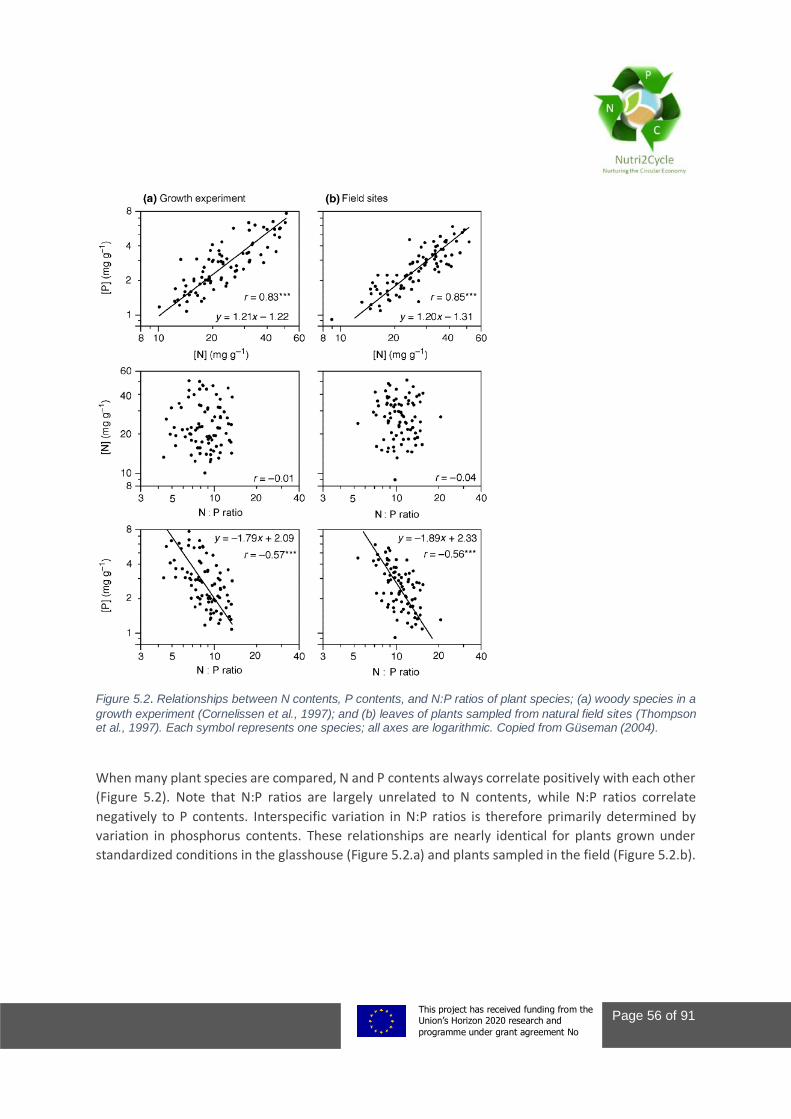
This project This project has received funding from the European Union’s Horizon 2020 research and
innovation programme under grant agreement No 773682
Page 56 of 91
Figure 5.2. Relationships between N contents, P contents, and N:P ratios of plant species; (a) woody species in a
growth experiment (Cornelissen et al., 1997); and (b) leaves of plants sampled from natural field sites (Thompson et al., 1997). Each symbol represents one species; all axes are logarithmic. Copied from Güseman (2004).
When many plant species are compared, N and P contents always correlate positively with each other
(Figure 5.2). Note that N:P ratios are largely unrelated to N contents, while N:P ratios correlate
negatively to P contents. Interspecific variation in N:P ratios is therefore primarily determined by
variation in phosphorus contents. These relationships are nearly identical for plants grown under
standardized conditions in the glasshouse (Figure 5.2.a) and plants sampled in the field (Figure 5.2.b).
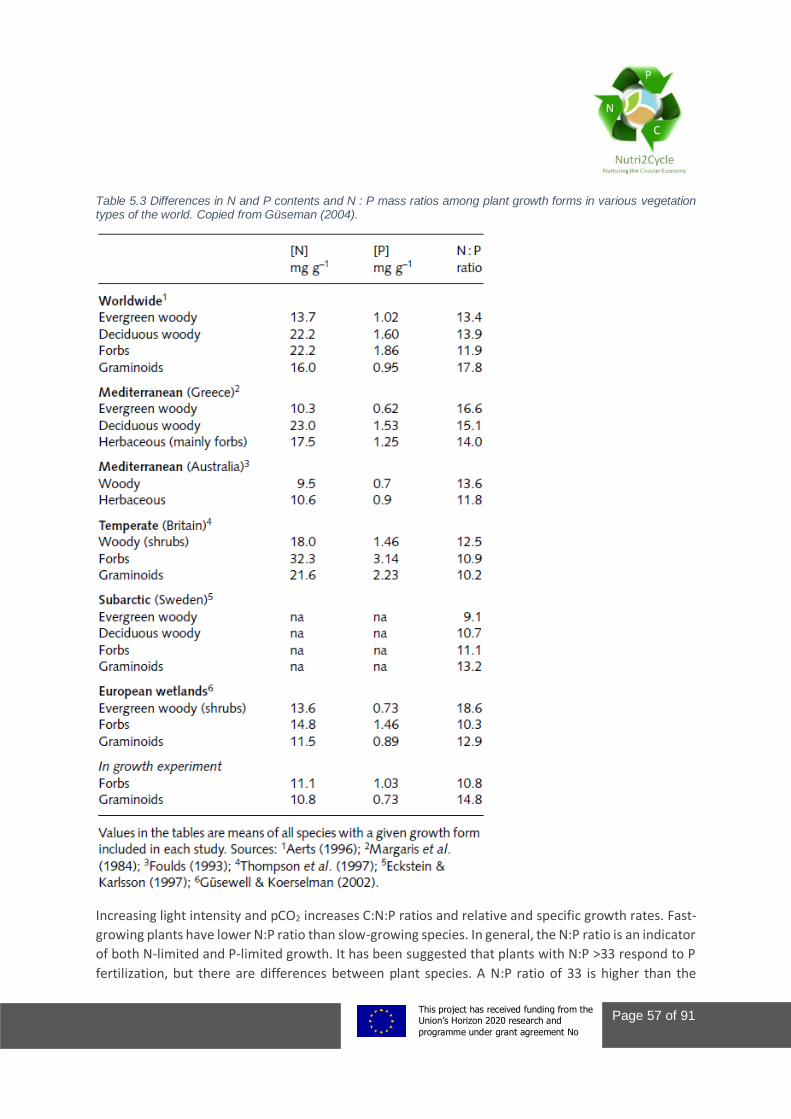
This project This project has received funding from the European Union’s Horizon 2020 research and
innovation programme under grant agreement No 773682
Page 57 of 91
Table 5.3 Differences in N and P contents and N : P mass ratios among plant growth forms in various vegetation types of the world. Copied from Güseman (2004).
Increasing light intensity and pCO2 increases C:N:P ratios and relative and specific growth rates. Fast-
growing plants have lower N:P ratio than slow-growing species. In general, the N:P ratio is an indicator
of both N-limited and P-limited growth. It has been suggested that plants with N:P >33 respond to P
fertilization, but there are differences between plant species. A N:P ratio of 33 is higher than the
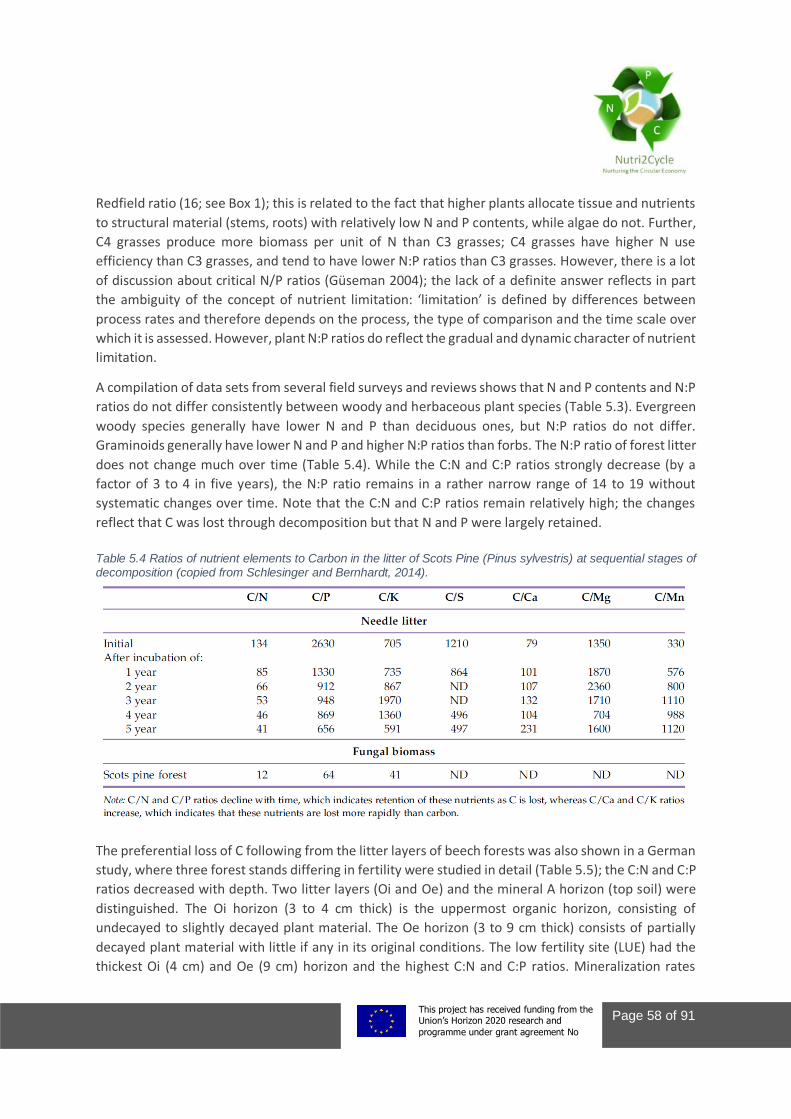
This project This project has received funding from the European Union’s Horizon 2020 research and
innovation programme under grant agreement No 773682
Page 58 of 91
Redfield ratio (16; see Box 1); this is related to the fact that higher plants allocate tissue and nutrients
to structural material (stems, roots) with relatively low N and P contents, while algae do not. Further,
C4 grasses produce more biomass per unit of N than C3 grasses; C4 grasses have higher N use
efficiency than C3 grasses, and tend to have lower N:P ratios than C3 grasses. However, there is a lot
of discussion about critical N/P ratios (Güseman 2004); the lack of a definite answer reflects in part
the ambiguity of the concept of nutrient limitation: ‘limitation’ is defined by differences between
process rates and therefore depends on the process, the type of comparison and the time scale over
which it is assessed. However, plant N:P ratios do reflect the gradual and dynamic character of nutrient
limitation.
A compilation of data sets from several field surveys and reviews shows that N and P contents and N:P
ratios do not differ consistently between woody and herbaceous plant species (Table 5.3). Evergreen
woody species generally have lower N and P than deciduous ones, but N:P ratios do not differ.
Graminoids generally have lower N and P and higher N:P ratios than forbs. The N:P ratio of forest litter
does not change much over time (Table 5.4). While the C:N and C:P ratios strongly decrease (by a
factor of 3 to 4 in five years), the N:P ratio remains in a rather narrow range of 14 to 19 without
systematic changes over time. Note that the C:N and C:P ratios remain relatively high; the changes
reflect that C was lost through decomposition but that N and P were largely retained.
Table 5.4 Ratios of nutrient elements to Carbon in the litter of Scots Pine (Pinus sylvestris) at sequential stages of decomposition (copied from Schlesinger and Bernhardt, 2014).
The preferential loss of C following from the litter layers of beech forests was also shown in a German
study, where three forest stands differing in fertility were studied in detail (Table 5.5); the C:N and C:P
ratios decreased with depth. Two litter layers (Oi and Oe) and the mineral A horizon (top soil) were
distinguished. The Oi horizon (3 to 4 cm thick) is the uppermost organic horizon, consisting of
undecayed to slightly decayed plant material. The Oe horizon (3 to 9 cm thick) consists of partially
decayed plant material with little if any in its original conditions. The low fertility site (LUE) had the
thickest Oi (4 cm) and Oe (9 cm) horizon and the highest C:N and C:P ratios. Mineralization rates
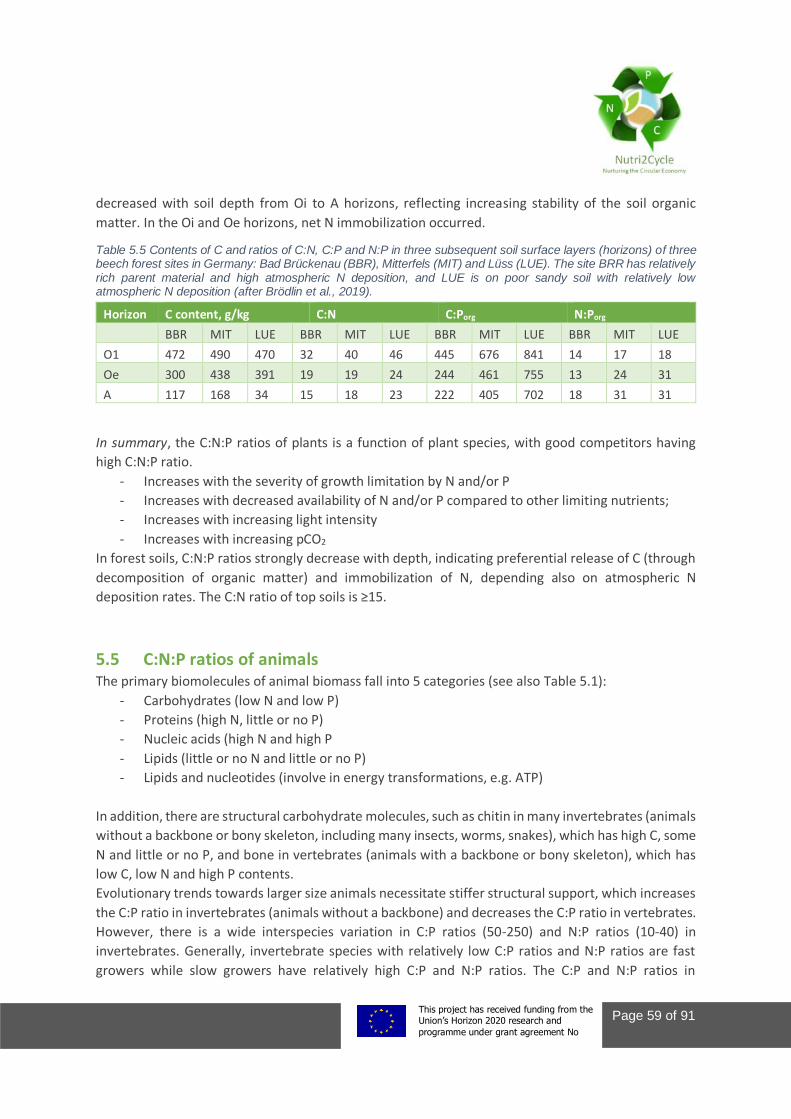
This project This project has received funding from the European Union’s Horizon 2020 research and
innovation programme under grant agreement No 773682
Page 59 of 91
decreased with soil depth from Oi to A horizons, reflecting increasing stability of the soil organic
matter. In the Oi and Oe horizons, net N immobilization occurred.
Table 5.5 Contents of C and ratios of C:N, C:P and N:P in three subsequent soil surface layers (horizons) of three beech forest sites in Germany: Bad Brückenau (BBR), Mitterfels (MIT) and Lüss (LUE). The site BRR has relatively rich parent material and high atmospheric N deposition, and LUE is on poor sandy soil with relatively low atmospheric N deposition (after Brödlin et al., 2019).
Horizon C content, g/kg C:N C:Porg N:Porg
BBR MIT LUE BBR MIT LUE BBR MIT LUE BBR MIT LUE
O1 472 490 470 32 40 46 445 676 841 14 17 18
Oe 300 438 391 19 19 24 244 461 755 13 24 31
A 117 168 34 15 18 23 222 405 702 18 31 31
In summary, the C:N:P ratios of plants is a function of plant species, with good competitors having
high C:N:P ratio.
- Increases with the severity of growth limitation by N and/or P
- Increases with decreased availability of N and/or P compared to other limiting nutrients;
- Increases with increasing light intensity
- Increases with increasing pCO2
In forest soils, C:N:P ratios strongly decrease with depth, indicating preferential release of C (through
decomposition of organic matter) and immobilization of N, depending also on atmospheric N
deposition rates. The C:N ratio of top soils is ≥15.
5.5 C:N:P ratios of animals The primary biomolecules of animal biomass fall into 5 categories (see also Table 5.1):
- Carbohydrates (low N and low P)
- Proteins (high N, little or no P)
- Nucleic acids (high N and high P
- Lipids (little or no N and little or no P)
- Lipids and nucleotides (involve in energy transformations, e.g. ATP)
In addition, there are structural carbohydrate molecules, such as chitin in many invertebrates (animals
without a backbone or bony skeleton, including many insects, worms, snakes), which has high C, some
N and little or no P, and bone in vertebrates (animals with a backbone or bony skeleton), which has
low C, low N and high P contents.
Evolutionary trends towards larger size animals necessitate stiffer structural support, which increases
the C:P ratio in invertebrates (animals without a backbone) and decreases the C:P ratio in vertebrates.
However, there is a wide interspecies variation in C:P ratios (50-250) and N:P ratios (10-40) in
invertebrates. Generally, invertebrate species with relatively low C:P ratios and N:P ratios are fast
growers while slow growers have relatively high C:P and N:P ratios. The C:P and N:P ratios in
This project This project has received funding from the European Union’s Horizon 2020 research and
innovation programme under grant agreement No 773682
Page 60 of 91
vertebrates (e.g., humans, ruminants, etc.) are strongly influenced by the bone structure and the large
amounts of P in bones. About 85% of P in humans is in bones (N:P=0.8), 14% in muscles and organs
(soft tissue, with N:P ~40-50) and 1% in blood (N:P ratio <50). Skin has high N content (16%) and no P.
The N:P ratio of vertebrates decreases with body size, due to a decrease in N and an increase in P
contents.
There are three ways that animal species can maintain its C:N:P ratios (homeostasis) when confronted
with imbalanced resources: (i) selective feeding/grazing and/or supplementation of specific food
items, (ii) alter assimilation patters, regulating the passage of feed materials across the gut wall so
that they match consumer needs, (iii) homeostatic regulation through its metabolism, such as
increased protein degradation and subsequent increased release of N wastes when the diet is high in
protein-N, or conserve / recycle nutrients under nutrient scarcity. The reasons why animal species
have the C:N:P ratios they have, range from evolutionary pressure on life, to the need to support
structure, to the distribution of the availability of energy and materials in ecosystems. Under
conditions of feed (and or nutrient) limitation, yield maximization is favoured by selection. The most
balanced and efficient C:N:P consumer-resource pair is cannibalism.
Gross growth efficiency (GGE) is defined as ‘consumer growth rate per unit of feed intake’ (ingestion).
GGE is a composite measure of (i) the ratio of assimilation4 to ingestion (assimilation efficiency S), and
(ii) the ratio of growth to assimilation (net growth efficiency NGE). Hence, GGE = S x NGE.
The second law of thermodynamics imposes an upper limit for carbon utilization by animals: 70 to
90% by unicellular organisms (including bacteria, archaea, protozoa and fungi), and 35-50% by
metazoans (including vertebrates). However, most consumers fail to achieve these high upper levels.
The assimilation efficiency S increases in the order detrivores (S=10-40%) < herbivores (S=30-80%) <
carnivores (S=60-100%). The net growth efficiency NGE increases in the same order as the that for
assimilation efficiency: detrivores (NGE=10-40%) <~herbivores (10-60%) <~carnivores (10-80%). Mean
GGE is about 30% (25 and 75 percentile values 15-45%). Much of this variation is related to the C:N:P
ratios of the resource and the consumer. Animals with low GGE are those that have C:N:P in the feed
resources that differs greatly from their own C:N:P ratio.
Further, animals have requirements for some 13 vitamins part of which they either cannot synthesize
at all or have such limited abilities to synthesize that they need to be ingested. Humans also have
three essential vitamins that are not present in plant-sourced food. Deficiency in one or more
vitamins, and deficiency in one or more of the essential amino acids, decreases GGE.
4 Assimilation is the combination of two processes to supply cells with nutrients. The first process is the process of absorption of
vitamins, minerals, and other chemicals from food within the gastrointestinal tract. In humans this is always done with a chemical
breakdown (enzymes and acids) and physical breakdown (oral mastication and stomach churning). The second process of bio assimilation is the chemical alteration of substances in the bloodstream by the liver or cellular secretions. Although a few similar compounds can be absorbed in digestion bio assimilation, the bioavailability of many compounds is dictated by this second
process since both the liver and cellular secretions can be very specific in their metabolic action. This second process is where the absorbed food reaches the cells via the liver.
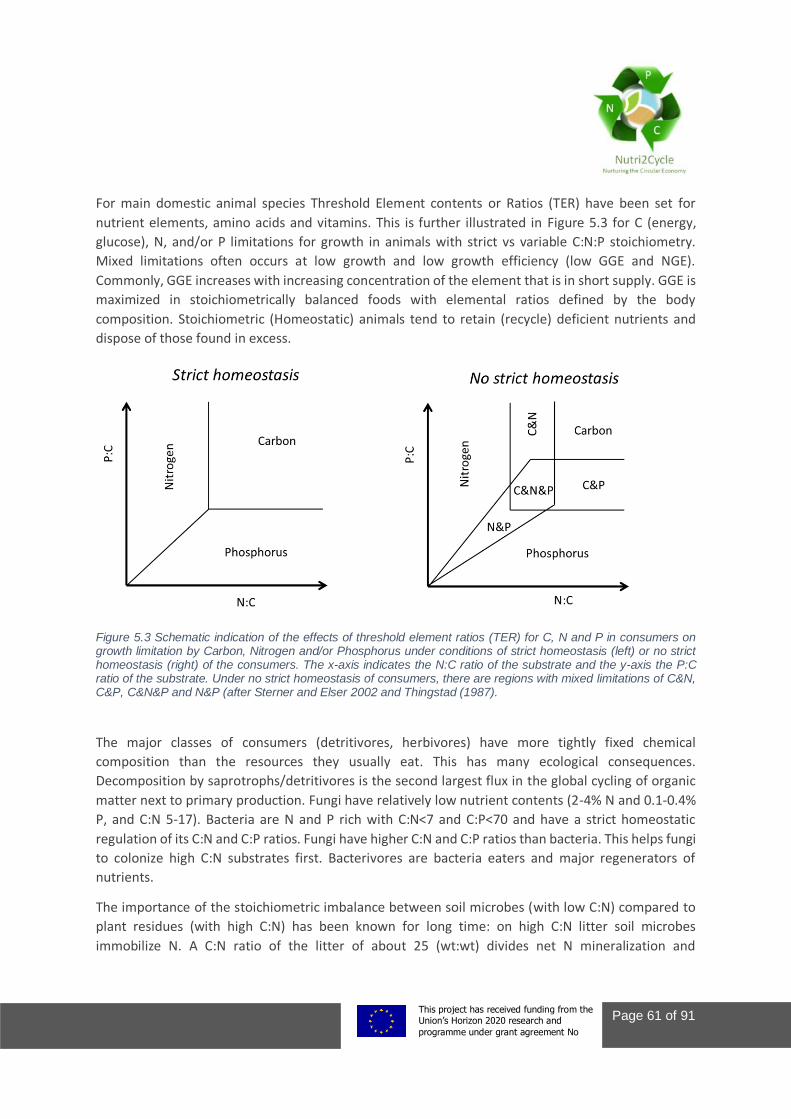
This project This project has received funding from the European Union’s Horizon 2020 research and
innovation programme under grant agreement No 773682
Page 61 of 91
For main domestic animal species Threshold Element contents or Ratios (TER) have been set for
nutrient elements, amino acids and vitamins. This is further illustrated in Figure 5.3 for C (energy,
glucose), N, and/or P limitations for growth in animals with strict vs variable C:N:P stoichiometry.
Mixed limitations often occurs at low growth and low growth efficiency (low GGE and NGE).
Commonly, GGE increases with increasing concentration of the element that is in short supply. GGE is
maximized in stoichiometrically balanced foods with elemental ratios defined by the body
composition. Stoichiometric (Homeostatic) animals tend to retain (recycle) deficient nutrients and
dispose of those found in excess.
Figure 5.3 Schematic indication of the effects of threshold element ratios (TER) for C, N and P in consumers on growth limitation by Carbon, Nitrogen and/or Phosphorus under conditions of strict homeostasis (left) or no strict homeostasis (right) of the consumers. The x-axis indicates the N:C ratio of the substrate and the y-axis the P:C ratio of the substrate. Under no strict homeostasis of consumers, there are regions with mixed limitations of C&N, C&P, C&N&P and N&P (after Sterner and Elser 2002 and Thingstad (1987).
The major classes of consumers (detritivores, herbivores) have more tightly fixed chemical
composition than the resources they usually eat. This has many ecological consequences.
Decomposition by saprotrophs/detritivores is the second largest flux in the global cycling of organic
matter next to primary production. Fungi have relatively low nutrient contents (2-4% N and 0.1-0.4%
P, and C:N 5-17). Bacteria are N and P rich with C:N<7 and C:P<70 and have a strict homeostatic
regulation of its C:N and C:P ratios. Fungi have higher C:N and C:P ratios than bacteria. This helps fungi
to colonize high C:N substrates first. Bacterivores are bacteria eaters and major regenerators of
nutrients.
The importance of the stoichiometric imbalance between soil microbes (with low C:N) compared to
plant residues (with high C:N) has been known for long time: on high C:N litter soil microbes
immobilize N. A C:N ratio of the litter of about 25 (wt:wt) divides net N mineralization and
This project This project has received funding from the European Union’s Horizon 2020 research and
innovation programme under grant agreement No 773682
Page 62 of 91
immobilization. Dissolved carbon (DOC) export by rivers is also related to the soil C:N ratio: DOC export
is higher when soil C:N is high.
Herbivores differ in size and composition and in foraging strategy and in digestion strategy, and hence
in N:P excretion. Small herbivores have short gut passage and lose a large fraction of ingested nutrients
in their faeces and have a high TER (are easily N limited) because of low assimilation efficiency. Large
herbivores can extract more energy from plant material than small herbivores (due to longer gut
passage). Their high C:N TER’s allow them to choose a wider range of forages. Two other cases are
presented in box 2, showing how animals deal with meeting their nutrient requirements from feed
resources that do not match directly.
Summarizing, the N:P ratio of excreted nutrients depend on the N:P ratio of the food, the gross growth
efficiency of the nutrients (accumulation efficiency) and on the N:P ratio of the consumer itself (animal
retention/production). The relationship between N:P recycled and N:P food is linear when food N:P is
> retention N:P, and curvilinear when food N:P < retention N:P. A distinction should be made between
assimilated and then metabolized nutrients and excreted, and nutrient not assimilated and hence
released in solid form as egesta. Excreted nutrients are usually more soluble and available for
mineralization (and losses) than egested nutrients. Decomposition and mineralization rates are
inversely related to the C:N and C:P ratio of the excreta and egesta.
Box 2. How do mammals, deer and termites meet their nutrient requirements
Generally, the Ca and P demand increases in body size of the animals, due to skeletal investments. Mammals
have high Ca and P requirement during lactation, especially in high-yielding dairy cows, which they mobilize
temporarily in part from their own bones. Deer and moose have a large antler, which is rich in Ca and P (about
7 kg Ca (23%) and 3 kg P, equivalent to 10% of antler weight) and replaced each year. This represents a large
annual Ca and P demand which is difficult to extract from plants. Thus, there is Ca and P translocation from the
animal’s skeleton each year.
Termites are famous wood consumers. Termites’ N content is 8-13% with C:N ratios of 4-12. In making termites
with C:N of 10 out of wood with C:N of 100-1000, requires N supplementation and homeostatic regulation
through its metabolism: (i) many termites have symbiotic N fixers in their guts, (ii) under strong N shortage,
termites are cannibalistic, and (iii) termites release excess C via CH4 from the methanogenic bacteria in their
guts.
5.6 Stoichiometric interactions at ecosystem level In ecological stoichiometry, distributions of nutrients within ecosystems (i.e., the amounts and ratios
of nutrients within plants, animals, decomposers, soils, etc. at different trophic levels and life stages
are being examined to address ecosystem-level questions about e.g. yield, carbon and nutrient use
efficiencies, carbon and nutrient losses, and their differences between ecosystems and
compartments. A common way to express the result is via x-y scatter plots, with nutrient X1 on one
axis and nutrient X2 on the other. In this paragraph, we few general observations and generalization
are made.
This project This project has received funding from the European Union’s Horizon 2020 research and
innovation programme under grant agreement No 773682
Page 63 of 91
- The C:N:P ratios of plant and animal species in natural ecosystems are highly variable. This
variation is related to differences in trophic level, soil fertility, plant and animal physiological
responses, and time (aging). The situation is different for life in oceans (box 3).
- The N content of leaves determines photosynthesis rate more or less linearly; the higher the
N content, the higher the rate of photosynthesis. This links the carbon and nitrogen cycles.
Nutrient-rich leaves are more efficient at using N to gain C, because at high N relatively more
N is located in the leafy photosynthetic machinery, compared to structural proteins and
defensive compounds. However, nitrogen use efficiency (NUE) tends to go down when the
the light:N ratios goes down significantly. Hence, biomass production per unit N uptake will
decrease (hence, NUE will decrease) when available N surpasses some critical level.
- The carbon use efficiency (CUE) is the efficiency of transfer of carbon between trophic levels.
CUE tends to be inversely related to NUE, because of the constancy of the C:N:P ratios in
consumers, independent of the composition of the resources consumed. Animals utilize the
N in feed for animal production very efficiently if the feed C:N ratio is high (hence, NUE is very
high), even if the absolute rate of animal production is low. Simultaneously, they use the
carbon very inefficiency (hence, CUE is low).
- In fertile soils, productivity and NUE will be high initially due to capture of photosynthetic
radiation by green leaves, but productivity and NUE decreases rapidly due to aging, formation
of structural biomass (which does not capture photosynthetic radiation effectively), and the
resulting effects of self-shading. Hence, at high-fertility, plants with high growth:light ratios
are favoured, and the biomass yield per unit of N (or per unit of other nutrients) is reduced at
high soil fertility. As a result, fertile soils are inefficient at making plant biomass out of the
available nutrients, but they are efficient at making animals out of plant carbon (hence CUE is
high).
- In non-fertile soils, plant species with high C:N ratio are superior competitors for N compared
to species with low C:N ratio (high N content). Hence, at low-fertility, plants with high
growth:N ratios are favoured. Thus non-fertile soils commonly have high NUE (in plants), but
low CUE in the food chain (because animals are not able to utilize the C effectively due to
shortage of nutrients). Also, the percentage of biomass consumed by animals and the
decomposition rate of the biomass decrease in general when the biomass has low N and P
contents. This will lead to accumulation of refractory biomass C.
- The nutrient contents of plants decreases in general with the size of the plants. Further, the
C:P ratio commonly decrease with trophic level. The C:P ratio is higher in most plants and trees
than in their consumers, while the C:P ratio is higher in small consumers than in large
consumers.
- Humans alter and accelerate the global cycles of C, N and P greatly and disproportionately.
The C:N:P ratio of the annual cycling of CO2 (from atmosphere through photosynthesis), N
(from atmosphere through N2 fixation) and P (from soil weathering) in the natural terrestrial
system (background) is about 50,000:100:1 (Sterner and Elser, 2003).
- The C:N:P ratio of the exhausts of fossil fuel combustion (including N2 fixation during
combustion) was about 24,000:80:1, while the C:N:P ratio of the CO2, N and P introduced into
This project This project has received funding from the European Union’s Horizon 2020 research and
innovation programme under grant agreement No 773682
Page 64 of 91
the ecosystem through fossil fuel combustion and synthetic fertilizer production during the
last decade was about 1,700:25:1. This indicates that, despite the massive emphasis on the
massive CO2 emissions in to the atmosphere, the amounts of P and N introduced into the
biosphere/environment have been much larger than the amount of CO2, when compared to
the C, N and P flows and fluxes of the natural (background) system.
Box 3. N:P ratios in oceans
At low N:P in lakes and oceans, N2 fixation is high, to make up the N debt (N deficiency). Hence, N2 fixation rate
is inversely related to the N:P ratio. N2 fixation in lakes and oceans seems to be controlled also by the availability
of light and metals. At the opposite end of the spectrum, denitrification removes N especially in eutrophic coastal
zones and deep waters. This helps to keep the N:P balance close to the Redfield ratio (16:1). Although there is
ongoing discussion/debate about the factors limiting ocean primary production, it seems that open ocean are
both N and P limited (and Fe, Zn limited), but depending on the locations. In lakes, P seems to be more limiting
than N.
Rivers feed into oceans, and they have different degree of pollution. Redfield’s hypothesis about P controls on
oceanic productivity in geological time leads to the expectation that the N:P ratio in the outflow of major rivers
is high. The N:P ratio of potential nutrient sources for lakes and oceans vary widely, from ~250 in the in runoff
from unfertilized land to as low as <5 from earth crust and urban runoff.
Oceans contribute about 50% to primary production and hence to O2 production into the atmosphere. It has
been suggested that the efficiency of P burial in oceans is determining ocean productivity and in part the stability
of O2 concentrations in the atmosphere over geological time (500 million years). If O2 concentration goes up, P
in ocean goes down because of oxidation of iron (Fe) oxides and the subsequent binding of P to FeOOH, and
subsequently ocean productivity and O2 production goes down (feedback mechanism).
Summarizing, there are large differences in C:N:P ratios of autotrophic species (plants) and
heterotrophic species (animals) on land, oceans and fresh water bodies, but yet are linked through
trophic (feeding) interactions. The differences in C:N:P ratios and trophic interactions have developed
over time through competition and natural selection, and are complex and not fully understood. Major
drivers affecting ecosystem C:N:P ratios include the light-to-nutrient ratio (light-to-soil fertility ratio)
in oceans and on land, the spatial variations in fertile and non-fertile habitats, the C:N:P requirements
of major autotrophs and heterotrophs, as function of size, and the human alterations of the global
and regional C, N, P cycles. The implications of changes in C:N:P ratios are different for different trophic
levels. Stoichiometric imbalanced ecosystems through N and P enrichment results in inefficient use of
N and P by primary producers (NUE is low), but create a different imbalance for herbivores as they are
then efficient at using carbon for their own growth (CUE is high), but NUE is low. Balanced
stoichiometry means an ecosystem where major biotic pools are similar. This happens approximately
in oceans where C:N:P ratios in biomass and water are close to 106:16:1 (Redfield C:N:P ratios). The
This project This project has received funding from the European Union’s Horizon 2020 research and
innovation programme under grant agreement No 773682
Page 65 of 91
Redfield ratio may provide an absolute point of comparison, because this C:N:P ratio governs ocean
plankton and seawater composition, and this ratio is close to that of most animals (Boxes 1 and 3).
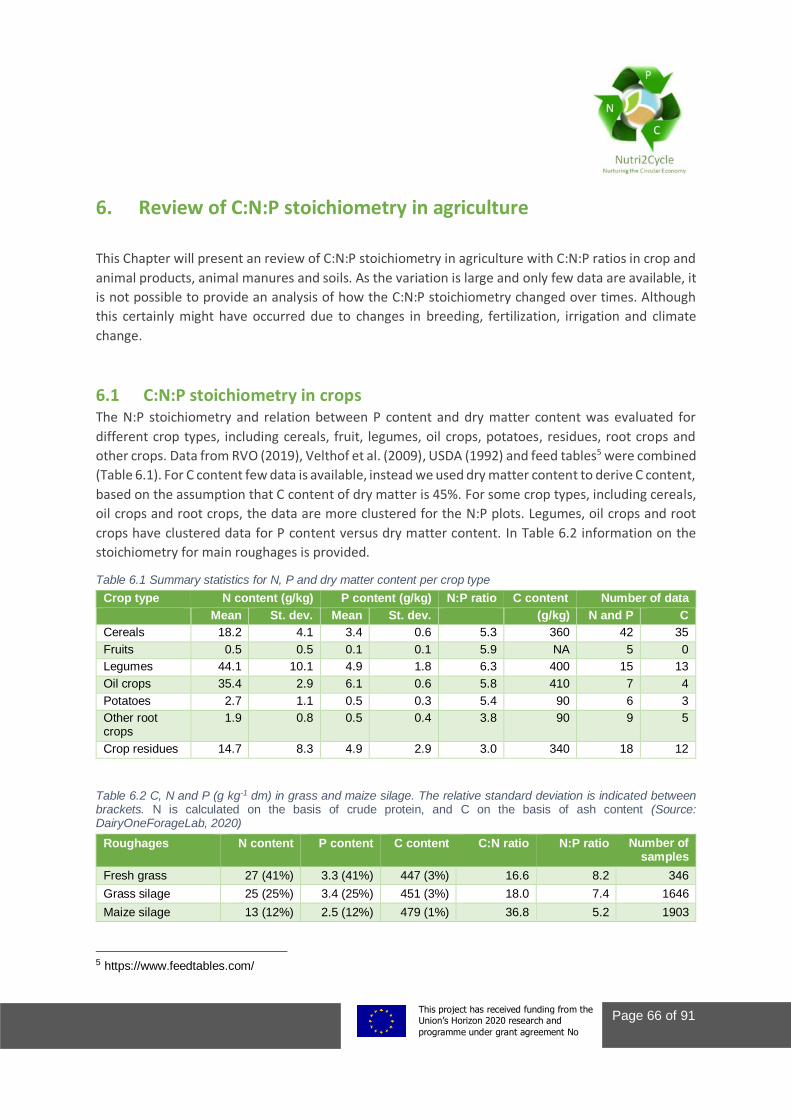
This project This project has received funding from the European Union’s Horizon 2020 research and
innovation programme under grant agreement No 773682
Page 66 of 91
6. Review of C:N:P stoichiometry in agriculture
This Chapter will present an review of C:N:P stoichiometry in agriculture with C:N:P ratios in crop and
animal products, animal manures and soils. As the variation is large and only few data are available, it
is not possible to provide an analysis of how the C:N:P stoichiometry changed over times. Although
this certainly might have occurred due to changes in breeding, fertilization, irrigation and climate
change.
6.1 C:N:P stoichiometry in crops The N:P stoichiometry and relation between P content and dry matter content was evaluated for
different crop types, including cereals, fruit, legumes, oil crops, potatoes, residues, root crops and
other crops. Data from RVO (2019), Velthof et al. (2009), USDA (1992) and feed tables5 were combined
(Table 6.1). For C content few data is available, instead we used dry matter content to derive C content,
based on the assumption that C content of dry matter is 45%. For some crop types, including cereals,
oil crops and root crops, the data are more clustered for the N:P plots. Legumes, oil crops and root
crops have clustered data for P content versus dry matter content. In Table 6.2 information on the
stoichiometry for main roughages is provided.
Table 6.1 Summary statistics for N, P and dry matter content per crop type
Crop type N content (g/kg) P content (g/kg) N:P ratio C content Number of data
Mean St. dev. Mean St. dev. (g/kg) N and P C
Cereals 18.2 4.1 3.4 0.6 5.3 360 42 35
Fruits 0.5 0.5 0.1 0.1 5.9 NA 5 0
Legumes 44.1 10.1 4.9 1.8 6.3 400 15 13
Oil crops 35.4 2.9 6.1 0.6 5.8 410 7 4
Potatoes 2.7 1.1 0.5 0.3 5.4 90 6 3
Other root crops
1.9 0.8 0.5 0.4 3.8 90 9 5
Crop residues 14.7 8.3 4.9 2.9 3.0 340 18 12
Table 6.2 C, N and P (g kg-1 dm) in grass and maize silage. The relative standard deviation is indicated between brackets. N is calculated on the basis of crude protein, and C on the basis of ash content (Source: DairyOneForageLab, 2020)
Roughages N content P content C content C:N ratio N:P ratio Number of samples
Fresh grass 27 (41%) 3.3 (41%) 447 (3%) 16.6 8.2 346
Grass silage 25 (25%) 3.4 (25%) 451 (3%) 18.0 7.4 1646
Maize silage 13 (12%) 2.5 (12%) 479 (1%) 36.8 5.2 1903
5 https://www.feedtables.com/
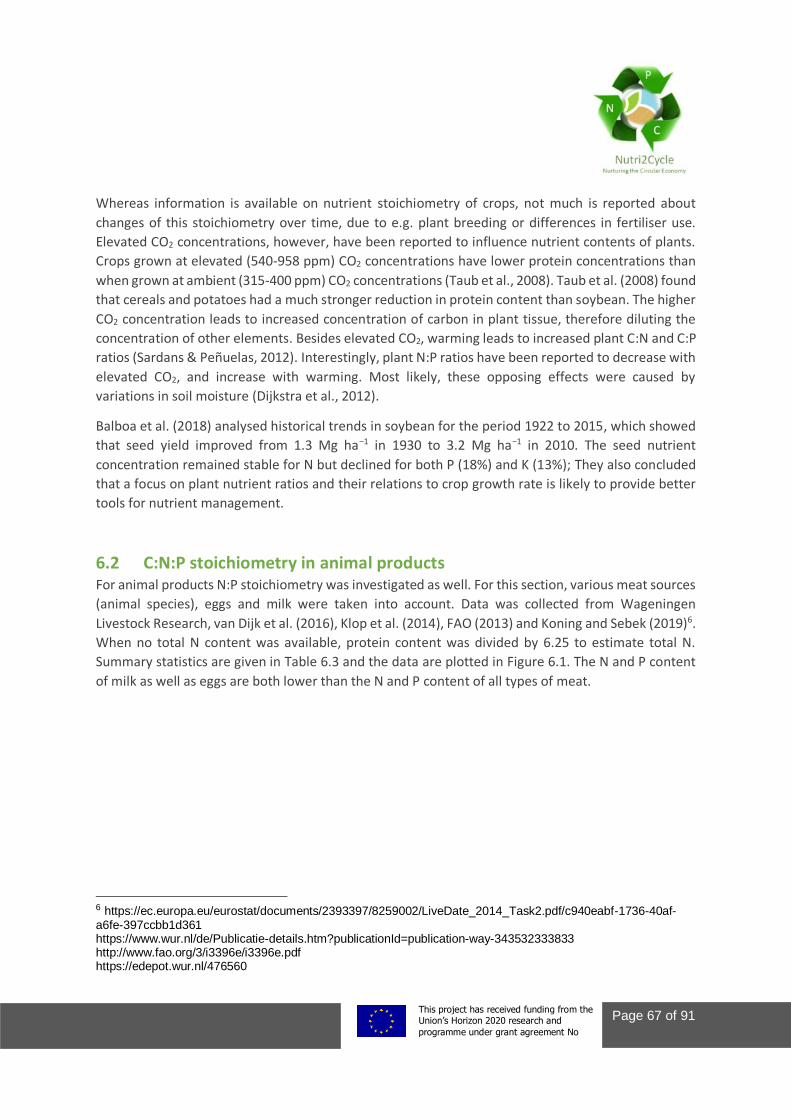
This project This project has received funding from the European Union’s Horizon 2020 research and
innovation programme under grant agreement No 773682
Page 67 of 91
Whereas information is available on nutrient stoichiometry of crops, not much is reported about
changes of this stoichiometry over time, due to e.g. plant breeding or differences in fertiliser use.
Elevated CO2 concentrations, however, have been reported to influence nutrient contents of plants.
Crops grown at elevated (540-958 ppm) CO2 concentrations have lower protein concentrations than
when grown at ambient (315-400 ppm) CO2 concentrations (Taub et al., 2008). Taub et al. (2008) found
that cereals and potatoes had a much stronger reduction in protein content than soybean. The higher
CO2 concentration leads to increased concentration of carbon in plant tissue, therefore diluting the
concentration of other elements. Besides elevated CO2, warming leads to increased plant C:N and C:P
ratios (Sardans & Peñuelas, 2012). Interestingly, plant N:P ratios have been reported to decrease with
elevated CO2, and increase with warming. Most likely, these opposing effects were caused by
variations in soil moisture (Dijkstra et al., 2012).
Balboa et al. (2018) analysed historical trends in soybean for the period 1922 to 2015, which showed
that seed yield improved from 1.3 Mg ha−1 in 1930 to 3.2 Mg ha−1 in 2010. The seed nutrient
concentration remained stable for N but declined for both P (18%) and K (13%); They also concluded
that a focus on plant nutrient ratios and their relations to crop growth rate is likely to provide better
tools for nutrient management.
6.2 C:N:P stoichiometry in animal products For animal products N:P stoichiometry was investigated as well. For this section, various meat sources
(animal species), eggs and milk were taken into account. Data was collected from Wageningen
Livestock Research, van Dijk et al. (2016), Klop et al. (2014), FAO (2013) and Koning and Sebek (2019)6.
When no total N content was available, protein content was divided by 6.25 to estimate total N.
Summary statistics are given in Table 6.3 and the data are plotted in Figure 6.1. The N and P content
of milk as well as eggs are both lower than the N and P content of all types of meat.
6 https://ec.europa.eu/eurostat/documents/2393397/8259002/LiveDate_2014_Task2.pdf/c940eabf-1736-40af-a6fe-397ccbb1d361 https://www.wur.nl/de/Publicatie-details.htm?publicationId=publication-way-343532333833 http://www.fao.org/3/i3396e/i3396e.pdf https://edepot.wur.nl/476560
This project This project has received funding from the European Union’s Horizon 2020 research and
innovation programme under grant agreement No 773682
Page 68 of 91
Table 6.3 Summary statistics for N and P content per animal product
Product type N content (g/kg) P content (g/kg) N:P ratio Number of data points
Mean St. dev Mean St. dev
Bovines 24.6 3.0 7.3 0.19 3.4 2
Chicken 30.8 2.3 5.0 0.84 6.2 6
Pig 24.7 4.8 5.0 0.80 4.9 7
Sheep or Goat 24.5 0.7 7.8 0.07 3.1 2
Other birds 30.6 4.5 5.1 0.48 6.0 4
Other animals 29.2 0.7 6.7 0.76 4.4 5
Egg 17.6 0.4 2.1 0.09 8.4 3
Milk 5.4 0.1 1.0 0.05 5.9 7
Figure 6.1 N content (g/kg) versus P content (g/kg) for cattle, chicken and pig meat, eggs and milk
6.3 C:N:P stoichiometry in animal manures The CNP stoichiometry in animal manure can be quite variable and is determined by feed
characteristics, retention of nutrients in the animal and type of manure storage. There are quite some
sources that provide data or report on manure excretion (e.g., Livedate project of Eurostat (2014),
Eurostat-OECD, FAOSTAT, the Intergovernmental Panel on Climate Change (IPCC), Nitrates Directive,
Gothenburg protocol, UNFCCC National Inventory Submission, EMEP/EEA), but there are only few
sources that report the underlying nutrient and carbon composition in animal manures. Data of
Velthof et al. (2015) and the Grassland and Fodder Fertilisation Committee (2019) have been
combined and show average CNP values of manure (Table 6.4). Cattle in Europe obtain most of their
feed from roughages (grass and maize) and additional feeds resulting animal products and excretion:
77% and 66% of N and P respectively are excreted by cattle (data for the Netherlands; CBS, 2020).
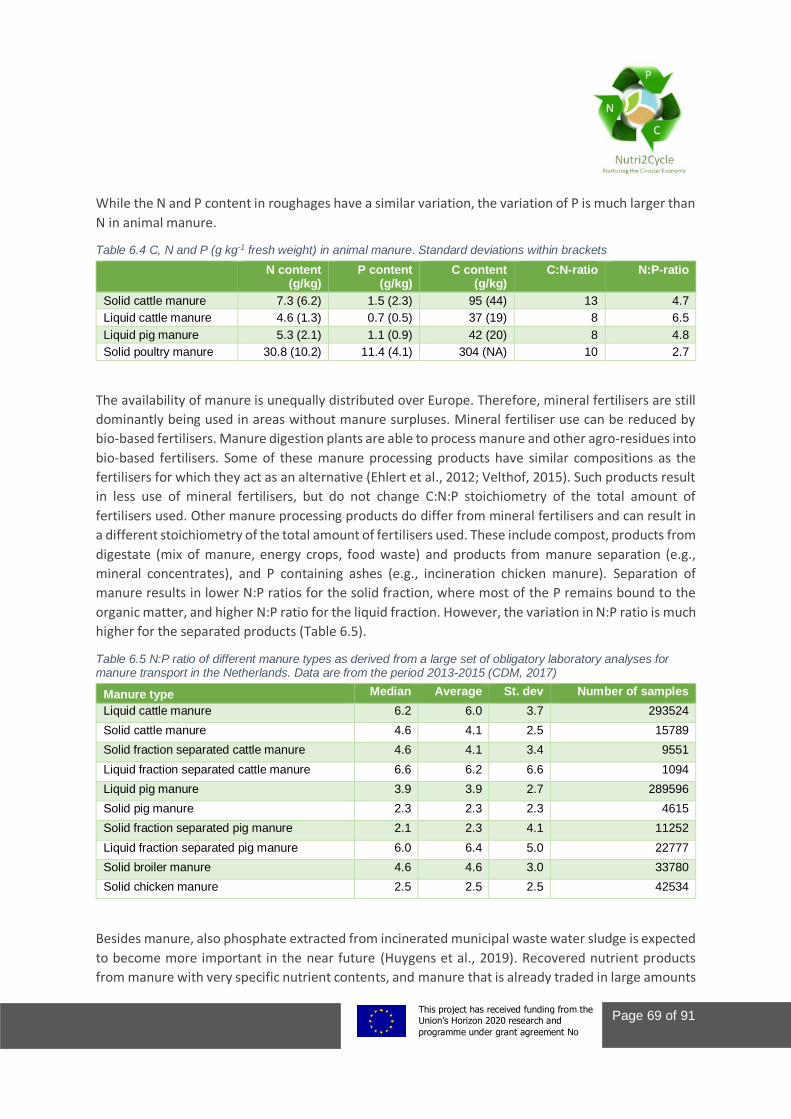
This project This project has received funding from the European Union’s Horizon 2020 research and
innovation programme under grant agreement No 773682
Page 69 of 91
While the N and P content in roughages have a similar variation, the variation of P is much larger than
N in animal manure.
Table 6.4 C, N and P (g kg-1 fresh weight) in animal manure. Standard deviations within brackets
N content (g/kg)
P content (g/kg)
C content (g/kg)
C:N-ratio N:P-ratio
Solid cattle manure 7.3 (6.2) 1.5 (2.3) 95 (44) 13 4.7
Liquid cattle manure 4.6 (1.3) 0.7 (0.5) 37 (19) 8 6.5
Liquid pig manure 5.3 (2.1) 1.1 (0.9) 42 (20) 8 4.8
Solid poultry manure 30.8 (10.2) 11.4 (4.1) 304 (NA) 10 2.7
The availability of manure is unequally distributed over Europe. Therefore, mineral fertilisers are still
dominantly being used in areas without manure surpluses. Mineral fertiliser use can be reduced by
bio-based fertilisers. Manure digestion plants are able to process manure and other agro-residues into
bio-based fertilisers. Some of these manure processing products have similar compositions as the
fertilisers for which they act as an alternative (Ehlert et al., 2012; Velthof, 2015). Such products result
in less use of mineral fertilisers, but do not change C:N:P stoichiometry of the total amount of
fertilisers used. Other manure processing products do differ from mineral fertilisers and can result in
a different stoichiometry of the total amount of fertilisers used. These include compost, products from
digestate (mix of manure, energy crops, food waste) and products from manure separation (e.g.,
mineral concentrates), and P containing ashes (e.g., incineration chicken manure). Separation of
manure results in lower N:P ratios for the solid fraction, where most of the P remains bound to the
organic matter, and higher N:P ratio for the liquid fraction. However, the variation in N:P ratio is much
higher for the separated products (Table 6.5).
Table 6.5 N:P ratio of different manure types as derived from a large set of obligatory laboratory analyses for manure transport in the Netherlands. Data are from the period 2013-2015 (CDM, 2017)
Manure type Median Average St. dev Number of samples
Liquid cattle manure 6.2 6.0 3.7 293524
Solid cattle manure 4.6 4.1 2.5 15789
Solid fraction separated cattle manure 4.6 4.1 3.4 9551
Liquid fraction separated cattle manure 6.6 6.2 6.6 1094
Liquid pig manure 3.9 3.9 2.7 289596
Solid pig manure 2.3 2.3 2.3 4615
Solid fraction separated pig manure 2.1 2.3 4.1 11252
Liquid fraction separated pig manure 6.0 6.4 5.0 22777
Solid broiler manure 4.6 4.6 3.0 33780
Solid chicken manure 2.5 2.5 2.5 42534
Besides manure, also phosphate extracted from incinerated municipal waste water sludge is expected
to become more important in the near future (Huygens et al., 2019). Recovered nutrient products
from manure with very specific nutrient contents, and manure that is already traded in large amounts
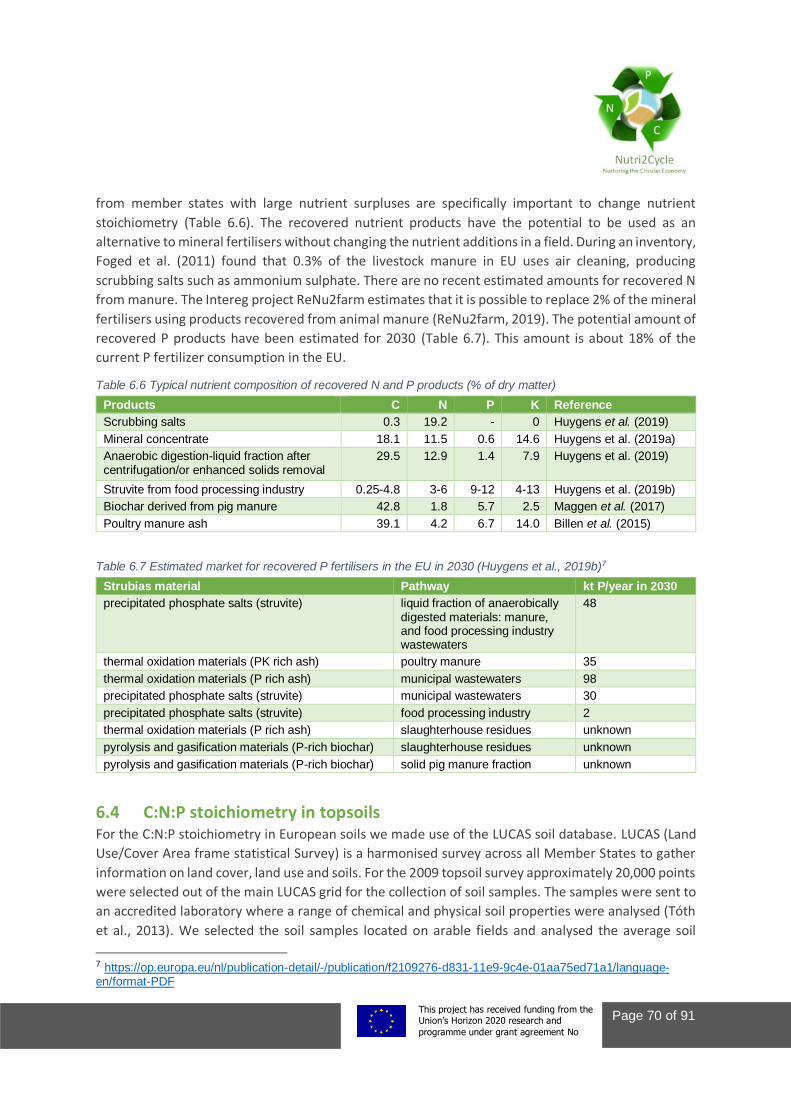
This project This project has received funding from the European Union’s Horizon 2020 research and
innovation programme under grant agreement No 773682
Page 70 of 91
from member states with large nutrient surpluses are specifically important to change nutrient
stoichiometry (Table 6.6). The recovered nutrient products have the potential to be used as an
alternative to mineral fertilisers without changing the nutrient additions in a field. During an inventory,
Foged et al. (2011) found that 0.3% of the livestock manure in EU uses air cleaning, producing
scrubbing salts such as ammonium sulphate. There are no recent estimated amounts for recovered N
from manure. The Intereg project ReNu2farm estimates that it is possible to replace 2% of the mineral
fertilisers using products recovered from animal manure (ReNu2farm, 2019). The potential amount of
recovered P products have been estimated for 2030 (Table 6.7). This amount is about 18% of the
current P fertilizer consumption in the EU.
Table 6.6 Typical nutrient composition of recovered N and P products (% of dry matter)
Products C N P K Reference
Scrubbing salts 0.3 19.2 - 0 Huygens et al. (2019)
Mineral concentrate 18.1 11.5 0.6 14.6 Huygens et al. (2019a)
Anaerobic digestion-liquid fraction after centrifugation/or enhanced solids removal
29.5 12.9 1.4 7.9 Huygens et al. (2019)
Struvite from food processing industry 0.25-4.8 3-6 9-12 4-13 Huygens et al. (2019b)
Biochar derived from pig manure 42.8 1.8 5.7 2.5 Maggen et al. (2017)
Poultry manure ash 39.1 4.2 6.7 14.0 Billen et al. (2015)
Table 6.7 Estimated market for recovered P fertilisers in the EU in 2030 (Huygens et al., 2019b)7
Strubias material Pathway kt P/year in 2030
precipitated phosphate salts (struvite) liquid fraction of anaerobically digested materials: manure, and food processing industry wastewaters
48
thermal oxidation materials (PK rich ash) poultry manure 35
thermal oxidation materials (P rich ash) municipal wastewaters 98
precipitated phosphate salts (struvite) municipal wastewaters 30
precipitated phosphate salts (struvite) food processing industry 2
thermal oxidation materials (P rich ash) slaughterhouse residues unknown
pyrolysis and gasification materials (P-rich biochar) slaughterhouse residues unknown
pyrolysis and gasification materials (P-rich biochar) solid pig manure fraction unknown
6.4 C:N:P stoichiometry in topsoils For the C:N:P stoichiometry in European soils we made use of the LUCAS soil database. LUCAS (Land
Use/Cover Area frame statistical Survey) is a harmonised survey across all Member States to gather
information on land cover, land use and soils. For the 2009 topsoil survey approximately 20,000 points
were selected out of the main LUCAS grid for the collection of soil samples. The samples were sent to
an accredited laboratory where a range of chemical and physical soil properties were analysed (Tóth
et al., 2013). We selected the soil samples located on arable fields and analysed the average soil
7 https://op.europa.eu/nl/publication-detail/-/publication/f2109276-d831-11e9-9c4e-01aa75ed71a1/language-en/format-PDF
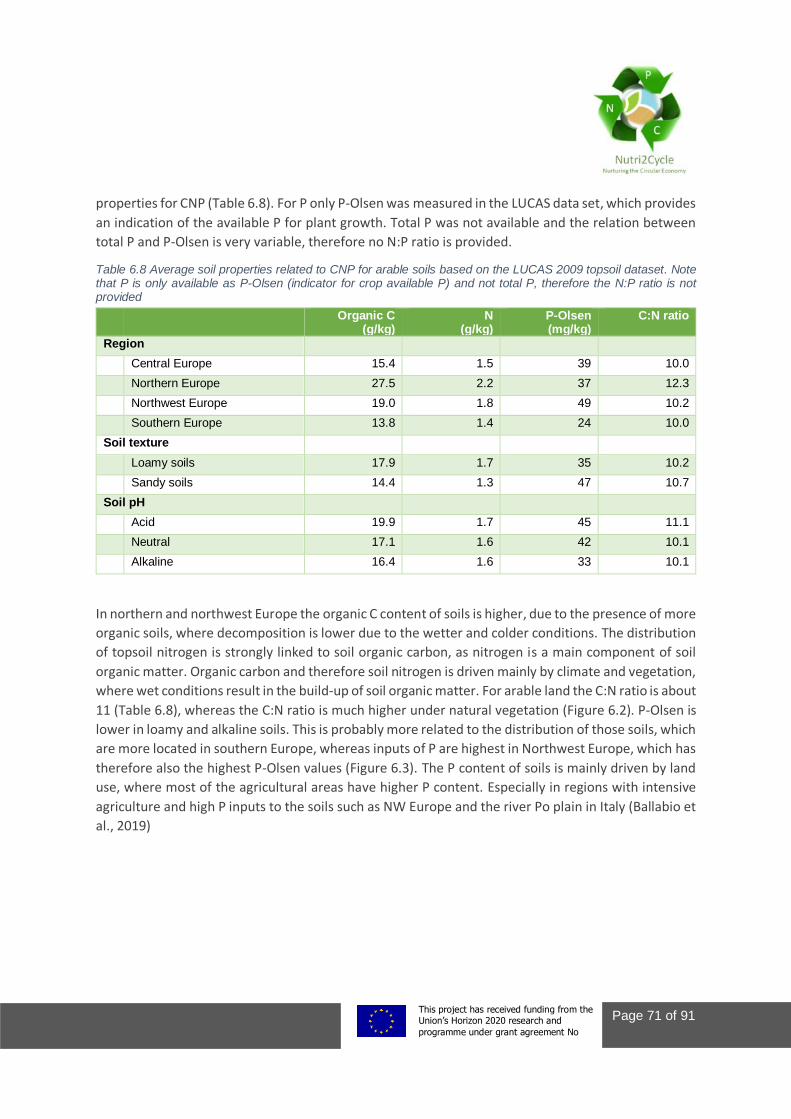
This project This project has received funding from the European Union’s Horizon 2020 research and
innovation programme under grant agreement No 773682
Page 71 of 91
properties for CNP (Table 6.8). For P only P-Olsen was measured in the LUCAS data set, which provides
an indication of the available P for plant growth. Total P was not available and the relation between
total P and P-Olsen is very variable, therefore no N:P ratio is provided.
Table 6.8 Average soil properties related to CNP for arable soils based on the LUCAS 2009 topsoil dataset. Note that P is only available as P-Olsen (indicator for crop available P) and not total P, therefore the N:P ratio is not provided
Organic C
(g/kg) N
(g/kg) P-Olsen (mg/kg)
C:N ratio
Region
Central Europe 15.4 1.5 39 10.0
Northern Europe 27.5 2.2 37 12.3
Northwest Europe 19.0 1.8 49 10.2
Southern Europe 13.8 1.4 24 10.0
Soil texture
Loamy soils 17.9 1.7 35 10.2
Sandy soils 14.4 1.3 47 10.7
Soil pH
Acid 19.9 1.7 45 11.1
Neutral 17.1 1.6 42 10.1
Alkaline 16.4 1.6 33 10.1
In northern and northwest Europe the organic C content of soils is higher, due to the presence of more
organic soils, where decomposition is lower due to the wetter and colder conditions. The distribution
of topsoil nitrogen is strongly linked to soil organic carbon, as nitrogen is a main component of soil
organic matter. Organic carbon and therefore soil nitrogen is driven mainly by climate and vegetation,
where wet conditions result in the build-up of soil organic matter. For arable land the C:N ratio is about
11 (Table 6.8), whereas the C:N ratio is much higher under natural vegetation (Figure 6.2). P-Olsen is
lower in loamy and alkaline soils. This is probably more related to the distribution of those soils, which
are more located in southern Europe, whereas inputs of P are highest in Northwest Europe, which has
therefore also the highest P-Olsen values (Figure 6.3). The P content of soils is mainly driven by land
use, where most of the agricultural areas have higher P content. Especially in regions with intensive
agriculture and high P inputs to the soils such as NW Europe and the river Po plain in Italy (Ballabio et
al., 2019)
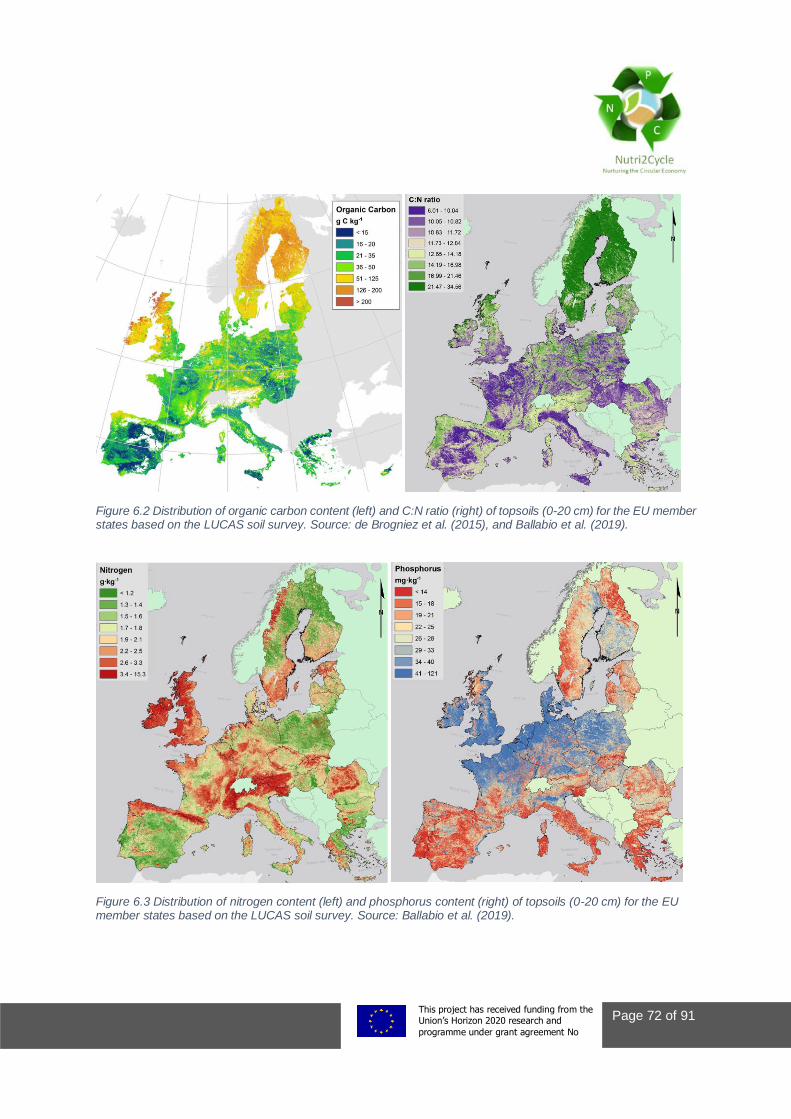
This project This project has received funding from the European Union’s Horizon 2020 research and
innovation programme under grant agreement No 773682
Page 72 of 91
Figure 6.2 Distribution of organic carbon content (left) and C:N ratio (right) of topsoils (0-20 cm) for the EU member states based on the LUCAS soil survey. Source: de Brogniez et al. (2015), and Ballabio et al. (2019).
Figure 6.3 Distribution of nitrogen content (left) and phosphorus content (right) of topsoils (0-20 cm) for the EU member states based on the LUCAS soil survey. Source: Ballabio et al. (2019).
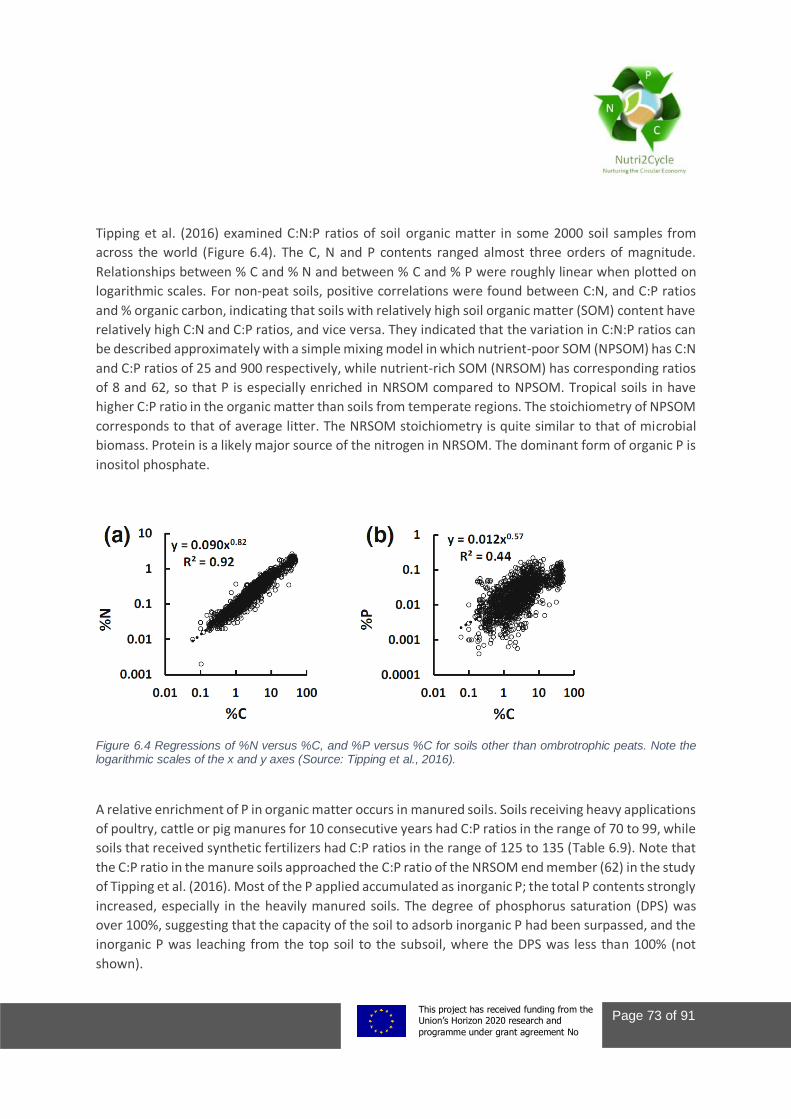
This project This project has received funding from the European Union’s Horizon 2020 research and
innovation programme under grant agreement No 773682
Page 73 of 91
Tipping et al. (2016) examined C:N:P ratios of soil organic matter in some 2000 soil samples from
across the world (Figure 6.4). The C, N and P contents ranged almost three orders of magnitude.
Relationships between % C and % N and between % C and % P were roughly linear when plotted on
logarithmic scales. For non-peat soils, positive correlations were found between C:N, and C:P ratios
and % organic carbon, indicating that soils with relatively high soil organic matter (SOM) content have
relatively high C:N and C:P ratios, and vice versa. They indicated that the variation in C:N:P ratios can
be described approximately with a simple mixing model in which nutrient-poor SOM (NPSOM) has C:N
and C:P ratios of 25 and 900 respectively, while nutrient-rich SOM (NRSOM) has corresponding ratios
of 8 and 62, so that P is especially enriched in NRSOM compared to NPSOM. Tropical soils in have
higher C:P ratio in the organic matter than soils from temperate regions. The stoichiometry of NPSOM
corresponds to that of average litter. The NRSOM stoichiometry is quite similar to that of microbial
biomass. Protein is a likely major source of the nitrogen in NRSOM. The dominant form of organic P is
inositol phosphate.
Figure 6.4 Regressions of %N versus %C, and %P versus %C for soils other than ombrotrophic peats. Note the logarithmic scales of the x and y axes (Source: Tipping et al., 2016).
A relative enrichment of P in organic matter occurs in manured soils. Soils receiving heavy applications
of poultry, cattle or pig manures for 10 consecutive years had C:P ratios in the range of 70 to 99, while
soils that received synthetic fertilizers had C:P ratios in the range of 125 to 135 (Table 6.9). Note that
the C:P ratio in the manure soils approached the C:P ratio of the NRSOM end member (62) in the study
of Tipping et al. (2016). Most of the P applied accumulated as inorganic P; the total P contents strongly
increased, especially in the heavily manured soils. The degree of phosphorus saturation (DPS) was
over 100%, suggesting that the capacity of the soil to adsorb inorganic P had been surpassed, and the
inorganic P was leaching from the top soil to the subsoil, where the DPS was less than 100% (not
shown).
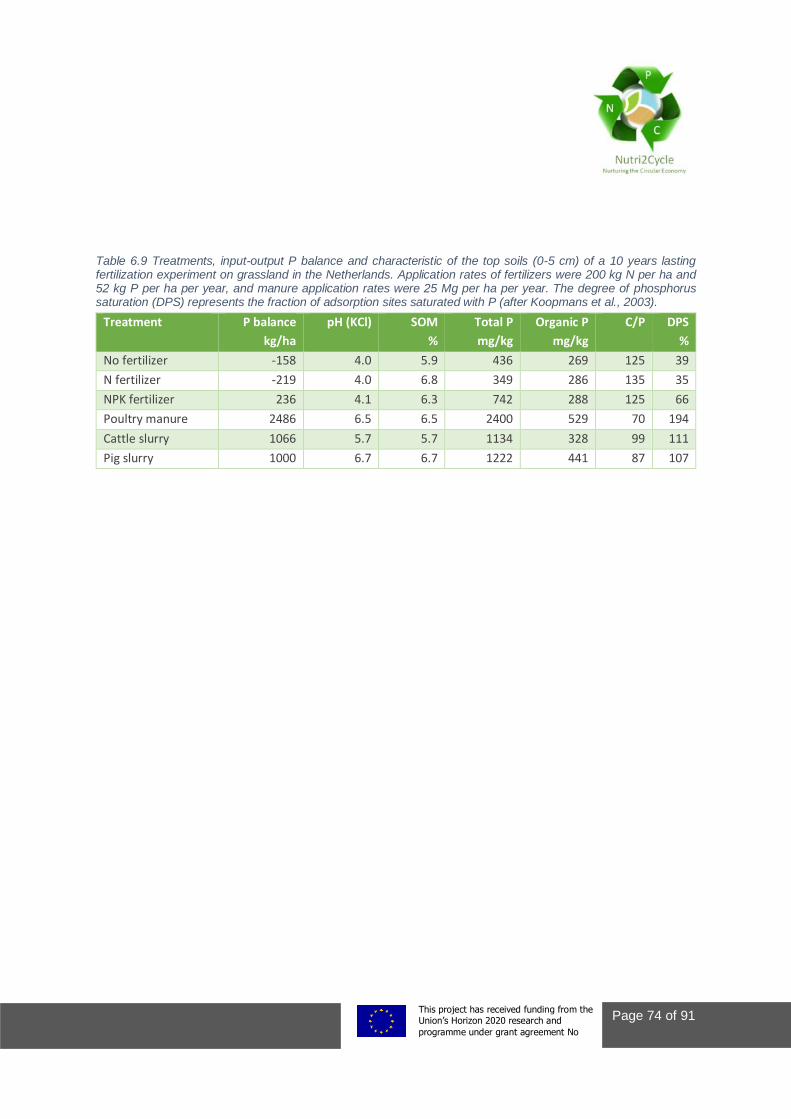
This project This project has received funding from the European Union’s Horizon 2020 research and
innovation programme under grant agreement No 773682
Page 74 of 91
Table 6.9 Treatments, input-output P balance and characteristic of the top soils (0-5 cm) of a 10 years lasting fertilization experiment on grassland in the Netherlands. Application rates of fertilizers were 200 kg N per ha and 52 kg P per ha per year, and manure application rates were 25 Mg per ha per year. The degree of phosphorus saturation (DPS) represents the fraction of adsorption sites saturated with P (after Koopmans et al., 2003).
Treatment P balance
kg/ha
pH (KCl) SOM
%
Total P
mg/kg
Organic P
mg/kg
C/P DPS
%
No fertilizer -158 4.0 5.9 436 269 125 39
N fertilizer -219 4.0 6.8 349 286 135 35
NPK fertilizer 236 4.1 6.3 742 288 125 66
Poultry manure 2486 6.5 6.5 2400 529 70 194
Cattle slurry 1066 5.7 5.7 1134 328 99 111
Pig slurry 1000 6.7 6.7 1222 441 87 107
This project This project has received funding from the European Union’s Horizon 2020 research and
innovation programme under grant agreement No 773682
Page 75 of 91
7. Synthesis
7.1 C:N:P ratios as indicators for leakiness Carbon, nitrogen and phosphorus have numerous functions in plants, animals and humans, and hence
in food production, and in the interactions between food production systems and the wider
environment. In organic matter C, N and P are intimately linked in a whole range of different organic
molecules with different C:N:P ratios. The linking of C, N and P occurs through biosynthesis and
chemosynthesis in plants and animals (and also in industry). Delinking or decoupling mainly occurs
through decomposition and mineralization of organic matter (also in animals), and partly also through
fragmentation, fractionation, fermentation and refinery. High C:N and C:P ratios are indicative for tight
N and P cycling, high N and P use efficiencies and low C use efficiency, and low N and P losses.
Conversely, low C:N and C:P ratios are indicative for low N and P use efficiencies and high C use
efficiency by heterotrophs.
Agriculture has changed (i) the relative proportions of C, N and P in plants, animals, soils and water
bodies, and (ii) the coupling-decoupling mechanisms of C, N and P. Natural ecosystems commonly
have high C:N and high C:P ratios, with N:P in the range of 10 to 18 (wt:wt). Most agricultural crops
have relatively low C:N (10-20, up to 37 for silage maize) and low C:P ratios, with N:P in the range of 3
to 8 (Chapter 6). Hence, agricultural crops are relatively rich in N and P. Further, increased animal
production has contributed to increased CNP decoupling mechanism through N rich and C poor urine
production (C:N < 5) , and C rich faeces production (C:N > 15). In modern animal production systems,
the C use efficiency (CUE) is relatively high and the N use efficiency (NUE) and P use efficiency (PUE)
are relatively low when compared to semi-natural and extensive animal production systems. Modern
animal production systems produce animal manures with relatively low C:N and C:P ratios and with
N:P ranging from 2 to 8 (Chapter 6).
In natural ecosystems, the C:N ratio of the soil is commonly in the range of 15 to 25 (Chapters 5 and
6). Agriculture has decreased the C:N ratio of most soils in Europe to on average 10 to 12 (Chapter 6).
Net immobilization of N in soil organic matter occurs when the C:N ratio is >15, while net N
mineralization occurs when the C:N ratio is ≤15. Further, soils may accumulate organic N during soil C
sequestration; soil C and N sequestration are determined by land use, soil cultivation, soil clay content
and climate. Note, mineral N may accumulate temporarily in soils in the form of NH4+ and NO3-, but
the total amounts of mineral N are very small compared to the amounts of organically bound N.
Mineral N in soils with a C:N ratio of ≤15 in the organic matter is either taken up by plant roots or is
lost through leaching or denitrification. In contrast, P in soils may accumulate as organically bound P
and as mineral P. The C:P ratio of the organic matter in natural soils is commonly >200 and between
60 and 200 in agricultural soils (Chapters 5 and 6). Accumulation of inorganic P in soils occurs in the
form of calcium phosphate (apatite) in high-pH soils and as iron and aluminium bound phosphate in
acidic soils (pH<6.5). Accumulation rates depend on the availability of calcium (carbonates) in high-pH
soils and iron and aluminium (oxy-hydroxides) in acidic soils. Hence, soils store N in organic form and
store P in both organic and inorganic forms. The capacity of the soils to store N and P is finite; in
This project This project has received funding from the European Union’s Horizon 2020 research and
innovation programme under grant agreement No 773682
Page 76 of 91
agricultural soils, much of the capacity has been used already, and this is a main reason why these
soils have become leaky for especially N but also P (heavily manured soils).
7.2 Driving forces of farming systems and C:N:P stoichiometry Agriculture responds to changes in markets, science & technology and governmental policy. Food
demand and food diversity have strongly increased during the last centuries, in response to increases
in the number of people in the world and in economic wealth of at least a percentage of the people.
Developments in science, technology and policy have facilitated agriculture to increase production
and to help meeting the increasing food demand and increasing diversity in food demand over time.
The pressures to produce more food and more diversified food have led to changes in farming
systems. Production has become more specialized, with only one or a few crops per farm and only one
or a few animal species on a farm. Production has also become more intensified, with more output
per unit of surface area, animal, labourer and/or capital. Further, production has been upscaled, with
more produce per farm and/or entrepreneur. Also, specialized production has become more
concentrated in specific areas. As a result, farms have become specialized, more productive, larger,
and similar farms tend to concentrate in specific areas.
This specialization, intensification, up-scaling and concentration of farms has influenced the C:N and
C:P ratios of agricultural products, and C, N and P cycling. The C:N and C:P ratios of crop products have
become lower on average, mainly through selection, breeding and fertilization. This is most apparent
in the production of grassland and leafy vegetables, which are harvested in a vegetative growth phase
and have the ability to increase the protein content through N fertilization. Moreover, these crops are
able to store N (as nitrate) and P (as polyphosphates) in inorganic forms within cells, when well
fertilized. It is also apparent in the breeding of wheat varieties and the use of split N application so as
to increase the protein content and the baking quality of the wheat flour (Xue et al., 2019).
The C:N and C:P ratios of animal production have also become lower, through selection, breeding and
improved animal feeding. The fat content has decreased and the protein content has increased. The
protein N and digestible P contents have increased and the quality of the feed protein (amino acid
composition) have improved and thereby the growth rate and the feed conversion coefficients, i.e., a
greater fraction of the feed is converted into useful animal products. Regulations have now limited
the protein and P contents in the feed in many countries and as a result, the N and P use efficiency in
animal production have also increased. Yet, animal manures have become richer in N and P compared
to a few decades ago, with much of the N and P in mineral forms. As a result, the fertilization values
of the manures have increased but at the same time have become more conducive to N losses
(Chapter 6).
Processing industries, retail and animal feed companies have further diversified the food and feed
through selection, fractionation, refinery, processing, and synthesis. Products have become more
uniform in composition and more digestible, with narrow C:N and C:P ratios. Residues and rest
This project This project has received funding from the European Union’s Horizon 2020 research and
innovation programme under grant agreement No 773682
Page 77 of 91
products are either processed in the animal feed industries, or are digested/composted and used as
soil amendment or are lost during processing via waste streams. Studying the C:N and C:P ratios of
processed food and feed products and of the waste products of the processing industries was beyond
the scope of this study. Yet, processing industries are modifying food and feed and thereby also the
C:N and C:P ratios, but the overall net effect remains unclear.
Manure processing has direct impact on the C:N and C:P ratios of the resulting manure products.
Anaerobic digestion results in decoupling of C, N and P in organic matter and results in more mineral
N and P in the digestate, while C has accumulated in the biogas as CH4 and CO2. Solid liquid separations
of animal slurries produces a relatively N rich and C and P poor liquid, and a relatively C and P rich and
N poor solid fraction. Composting (of the solid fraction) results in a relatively stable C-rich compost,
because most of the easily decomposable C and N compounds have been decomposed and volatilized
as CO2, NH3, N2 and N2O. Reverse osmosis of the liquid fractions results in a concentrated solution with
relatively high N content, and a watery solution, with little or no C, N and P. Ammonia stripping of the
slurries and liquids results in a relative low-N animal slurry and a N-rich solution. Nitrification-
denitrification of animal slurries and liquids results in the mineralization of organic matter and the loss
of N via emissions of N2, NO and N2O. Evidently, almost all manure processing techniques alter C:N
and C:P ratio of the manure products, and not necessarily make the C, N and P cycling less leaky.
Evidently, agriculture has also decreased the C:N and C:P ratios of agricultural soils, through
fertilization, soil cultivation and drainage, and selection of specific crops. Specialization of cereal based
systems (e.g. wheat, maize and rice), with return of C rich and N and P poor crop residues has likely
resulted in soil organic matter with relatively high C:N (>12) and C:P (>120) ratios. Specialization of
cropping systems with N-rich crops and crop residues, and with liberal use of N-rich animal manures
likely result in a soil organic matter with relatively low C:N (<12) and C:P (<120) ratios. Soils with
relatively high C:N and C:P ratios have much greater capacity to respond to and absorb N and P
released through sudden changes in environmental conditions (climate variations, changes in farming
practices ) than soils with relatively low C:N and C:P ratios, depending also on other soil characteristics.
Based on the information collected and presented in this report, a summary figure was made to
illustrate the C:N:P ratios and the changes in CNP for the main compartments of agriculture (crop
products, livestock products, animal manure and soils (Figure 7.1). The C:N:P ratios were estimated as
the average of all crops, livestock products and manures for the EU-28, using weighted averages based
on the total amount of nitrogen. For soils the information as derived from the LUCAS survey for arable
soils was used. As shown in Chapter 6, the variation in C:N:P ratios can be very large among crops,
livestock products, manures and soils, but the overall average is less different, with similar N:P ratios
for crops, livestock products and animal manure.
Figure 7.1 also provides an indication of the trend over the last decades in total CNP for each
compartment. For crops CNP increased as a result of the increased crop yields, but as described above,
the increase in N and P was relatively larger due to fertilization and improved breeding of crops. Also
the amount of CNP in livestock products increased, as a result of higher yields and for pork and poultry
also the strong increase in animal numbers. The increase in N in livestock products was higher because
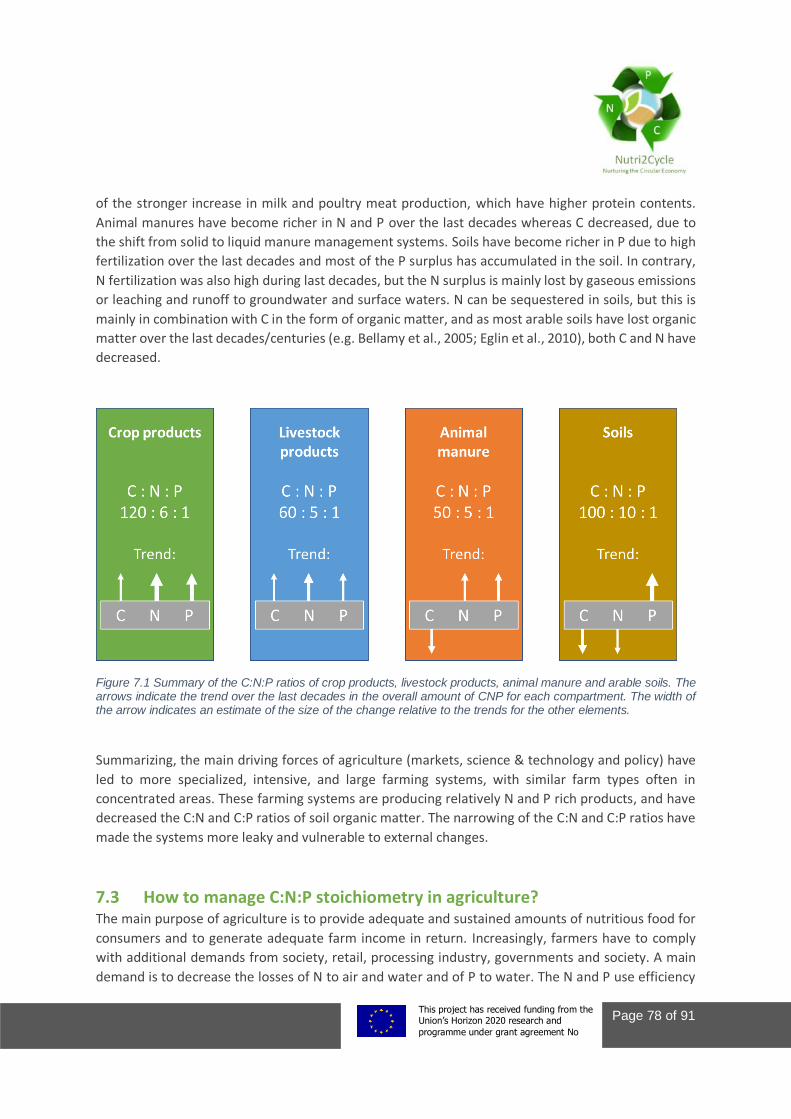
This project This project has received funding from the European Union’s Horizon 2020 research and
innovation programme under grant agreement No 773682
Page 78 of 91
of the stronger increase in milk and poultry meat production, which have higher protein contents.
Animal manures have become richer in N and P over the last decades whereas C decreased, due to
the shift from solid to liquid manure management systems. Soils have become richer in P due to high
fertilization over the last decades and most of the P surplus has accumulated in the soil. In contrary,
N fertilization was also high during last decades, but the N surplus is mainly lost by gaseous emissions
or leaching and runoff to groundwater and surface waters. N can be sequestered in soils, but this is
mainly in combination with C in the form of organic matter, and as most arable soils have lost organic
matter over the last decades/centuries (e.g. Bellamy et al., 2005; Eglin et al., 2010), both C and N have
decreased.
Figure 7.1 Summary of the C:N:P ratios of crop products, livestock products, animal manure and arable soils. The arrows indicate the trend over the last decades in the overall amount of CNP for each compartment. The width of the arrow indicates an estimate of the size of the change relative to the trends for the other elements.
Summarizing, the main driving forces of agriculture (markets, science & technology and policy) have
led to more specialized, intensive, and large farming systems, with similar farm types often in
concentrated areas. These farming systems are producing relatively N and P rich products, and have
decreased the C:N and C:P ratios of soil organic matter. The narrowing of the C:N and C:P ratios have
made the systems more leaky and vulnerable to external changes.
7.3 How to manage C:N:P stoichiometry in agriculture? The main purpose of agriculture is to provide adequate and sustained amounts of nutritious food for
consumers and to generate adequate farm income in return. Increasingly, farmers have to comply
with additional demands from society, retail, processing industry, governments and society. A main
demand is to decrease the losses of N to air and water and of P to water. The N and P use efficiency

This project This project has received funding from the European Union’s Horizon 2020 research and
innovation programme under grant agreement No 773682
Page 79 of 91
in global agriculture may have to increase by more than a factor of two, while global food and feed
production will have to increase by 50 to 70% between 2010 and 2050 (Godfray et al., 2010; Steffen
et al., 2015; Zhang et al., 2015). These targets will be different for different countries. Also, the need
for greater food and feed production appears to smaller, relatively, than the need to decrease
ammonia and nitrous oxide emissions to air, and nitrogen and phosphorus losses to surface waters,
especially in affluent countries (i.e., EU, North America).
What is the role of managing C:N:P stoichiometry in achieving these agronomic and environmental
targets? This is a major question but cannot be answered fully at this stage, because of lack of
knowledge, tools and clear targets so as what to achieve when and where. Yet, the content of this
report provides a number of insights which may be used as basis for further study, as listed here below:
• Farming systems have developed in response to markets, science and technology and
governmental policy. These developments have increased over time, and have led to
specialized, intensive, and large farms, with specific farms tending to concentrate in specific
areas, because of proximity to market, easy access to suppliers, research and technology, and
because of specific environmental and climate conditions. Concentration near urban areas is
especially the case for intensive vegetable production and animal production. These driving
forces have to be understood to be able to understand the changes in farming systems; in
general they have been geared toward increasing the productivity and economic profitability
of farming systems so as to sustain adequate food supply.
• While the per capita food supplies have expanded in total quantities of food calories, protein,
fat, and weight during the last five decades, the crop species contributing to the world’s food
supplies have narrowed in diversity, with increased proportions sourced from energy-dense
foods (Khoury et al., 2014). National food supplies worldwide have become more similar in
composition, correlated particularly with an increased supply of a number of globally
important cereal and oil crops, and a decline of other cereal, oil, and starchy root species. The
interdependence among countries has increased in regard to availability and access to food
sources and the genetic resources supporting their production (Khoury et al., 2014). It is likely
that the C:N and C:P ratios of the overall mean food sources have decreased, but our data are
too limited to confirm this hypothesis for the global scale.
• Animal production has become more globalized and uniform, in the order: poultry production
> pork production > dairy production > beef production > sheep and goat production (Liu et
al., 2017). The interdependence among countries has also increased in regard to availability
and access to animal source food, the genetic resources supporting their production, as well
as animal feed. It is very likely that the C:N and C:P ratios of the overall mean animal source
food have decreased, but our data are too limited to confirm this hypothesis for the global
scale.
• The C:N and C:P ratios of food sources have decreased especially through N and P fertilization
of crops and through supplementation of animal feed with protein-rich feed and/or specific
amino acids and highly soluble and digestible monocalcium phosphate (MCP). The C:N and C:P
ratios of the food intake by humans have also decreased during the last decade; the average
This project This project has received funding from the European Union’s Horizon 2020 research and
innovation programme under grant agreement No 773682
Page 80 of 91
consumption of protein-N and P in food in EU-28 in 2015 was on average a factor of two higher
than recommended/needed (Westhoek et al., 2018). The largest use of mined rock
phosphates is in P fertilizers (83%), while animal feed–grade phosphates are estimated to
account for 6% of total world phosphate consumption. The EU has a share of 10-15 % in the
world consumption of feed-grade calcium phosphates. The increased %N and %P in food and
feed have also increased the %N and % P in animal manures and human wastes. Fertilization
with N and P fertilizers, manures and wastes have also decreased the C:N and C:P ratios of soil
organic matter.
• The increases in N and P inputs in farming systems together with all other changes in crop and
animal production have increased N and P losses from farming systems. At the same time, N
and P losses from food processing industries, retail, restaurants and households have also
increased, especially in affluent countries. Total losses of N and P to the environment have
created a range of unwanted human health and ecological effects; losses have crossed the
safe zones of our planet (Steffen et al., 2015). It is as yet unknown how much of the losses
have to be ascribed to just changes in C:N and C:P of food and feed products or to the use of
N and P for the production of the food and feed products.
• Several studies have indicated strategies to increase nitrogen and phosphorus use efficiencies
and to decrease nitrogen and phosphorus losses (Sutton et al., 2013; Houlton et al 2019).
Houlton et al (2019) proposed the following strategies for ensuring sufficient food production
and decreasing N losses at the same time:
o Improving nitrogen‐use efficiency for food, feed, and fiber production
o Getting nitrogen to where it is needed most
o Removing nitrogen pollution from the environment (emission mitigation)
o Reducing food waste
o Encouraging diets with low nitrogen footprints
• Similar strategies can be defined for phosphorus. An additional strategy for utilizing soil
phosphorus is needed here, because large amounts of phosphorus can be stored in soil
organic matter (mainly as inositol phosphate) and as inorganic phosphorus adsorbed to
aluminium and iron hydroxides (in acidic soils) or precipitated as calcium phosphate (apatite).
In soil organic matter, the C:N ratio usually ranges threefold, between 8 and 25, but the C:P
ratio may range more than tenfold, from 60 to 900, clearly indicating the role of organic
phosphorus in soils.
• Ecologists define N and P use efficiencies in natural vegetations commonly by the %N and %P
in plants; the lower the %N and %P the higher the N and P use efficiencies. High C:N and C:P
ratios in vegetations are associated with high N and P use efficiencies and with low N and P
losses. Increasing N and P use efficiencies in plant production does have implications for C, N
and P use efficiencies in animal production and in human nutrition; increasing the N and P use
efficiencies in animal feed production (decreasing %N and %P in the feed) will decrease the
feed conversion efficiency (carbon use efficiency) in animal production, because of suboptimal
N and P nutrition. Evidently, a balance has to be found here between increasing N and P use
efficiencies in crop production and animal production.
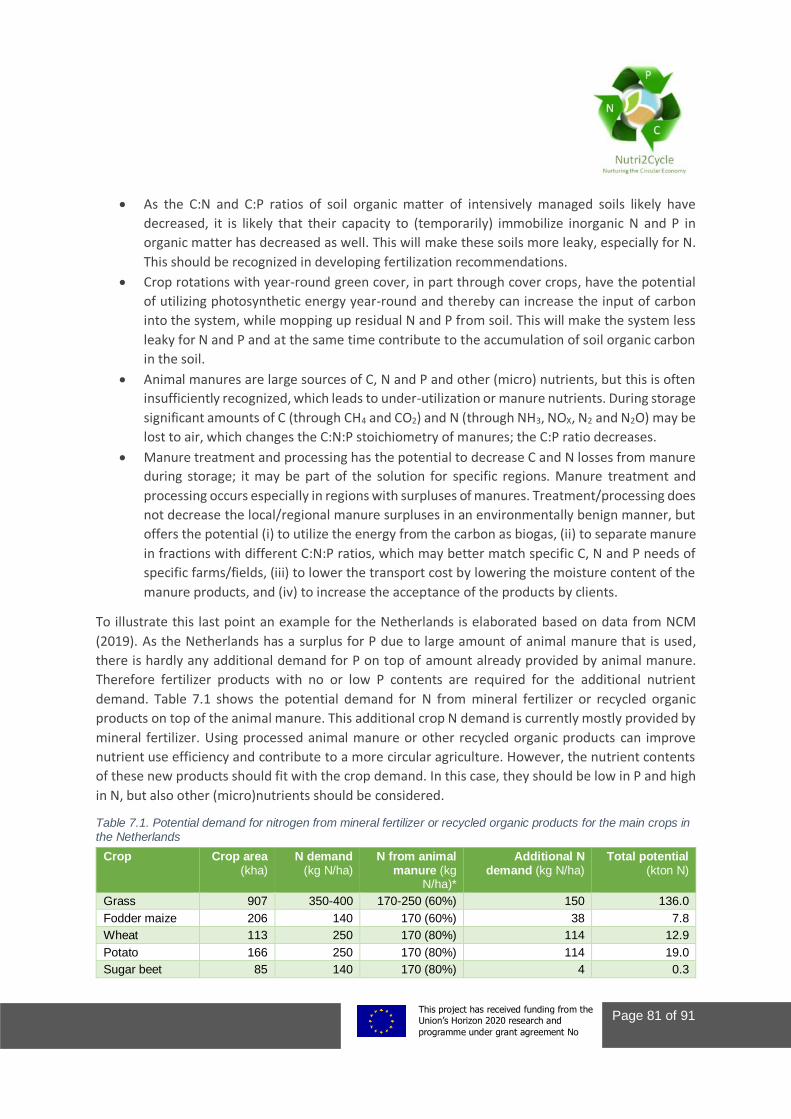
This project This project has received funding from the European Union’s Horizon 2020 research and
innovation programme under grant agreement No 773682
Page 81 of 91
• As the C:N and C:P ratios of soil organic matter of intensively managed soils likely have
decreased, it is likely that their capacity to (temporarily) immobilize inorganic N and P in
organic matter has decreased as well. This will make these soils more leaky, especially for N.
This should be recognized in developing fertilization recommendations.
• Crop rotations with year-round green cover, in part through cover crops, have the potential
of utilizing photosynthetic energy year-round and thereby can increase the input of carbon
into the system, while mopping up residual N and P from soil. This will make the system less
leaky for N and P and at the same time contribute to the accumulation of soil organic carbon
in the soil.
• Animal manures are large sources of C, N and P and other (micro) nutrients, but this is often
insufficiently recognized, which leads to under-utilization or manure nutrients. During storage
significant amounts of C (through CH4 and CO2) and N (through NH3, NOX, N2 and N2O) may be
lost to air, which changes the C:N:P stoichiometry of manures; the C:P ratio decreases.
• Manure treatment and processing has the potential to decrease C and N losses from manure
during storage; it may be part of the solution for specific regions. Manure treatment and
processing occurs especially in regions with surpluses of manures. Treatment/processing does
not decrease the local/regional manure surpluses in an environmentally benign manner, but
offers the potential (i) to utilize the energy from the carbon as biogas, (ii) to separate manure
in fractions with different C:N:P ratios, which may better match specific C, N and P needs of
specific farms/fields, (iii) to lower the transport cost by lowering the moisture content of the
manure products, and (iv) to increase the acceptance of the products by clients.
To illustrate this last point an example for the Netherlands is elaborated based on data from NCM
(2019). As the Netherlands has a surplus for P due to large amount of animal manure that is used,
there is hardly any additional demand for P on top of amount already provided by animal manure.
Therefore fertilizer products with no or low P contents are required for the additional nutrient
demand. Table 7.1 shows the potential demand for N from mineral fertilizer or recycled organic
products on top of the animal manure. This additional crop N demand is currently mostly provided by
mineral fertilizer. Using processed animal manure or other recycled organic products can improve
nutrient use efficiency and contribute to a more circular agriculture. However, the nutrient contents
of these new products should fit with the crop demand. In this case, they should be low in P and high
in N, but also other (micro)nutrients should be considered.
Table 7.1. Potential demand for nitrogen from mineral fertilizer or recycled organic products for the main crops in the Netherlands
Crop Crop area (kha)
N demand (kg N/ha)
N from animal manure (kg
N/ha)*
Additional N demand (kg N/ha)
Total potential (kton N)
Grass 907 350-400 170-250 (60%) 150 136.0
Fodder maize 206 140 170 (60%) 38 7.8
Wheat 113 250 170 (80%) 114 12.9
Potato 166 250 170 (80%) 114 19.0
Sugar beet 85 140 170 (80%) 4 0.3
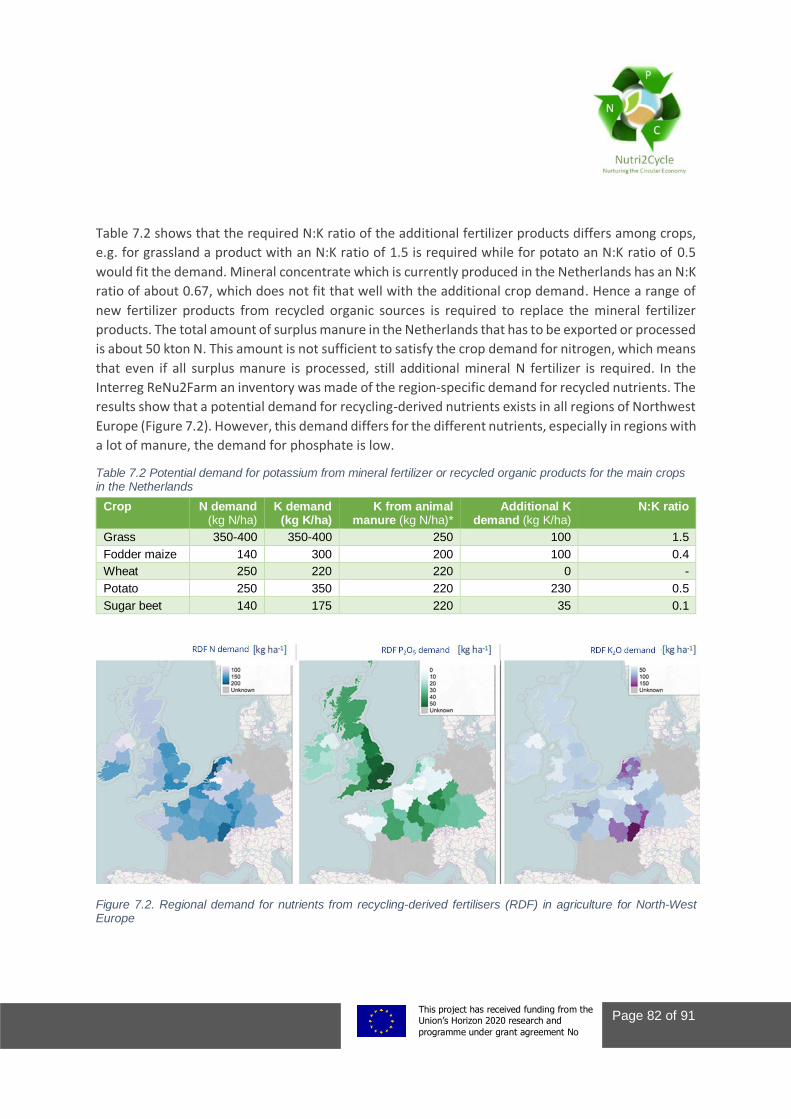
This project This project has received funding from the European Union’s Horizon 2020 research and
innovation programme under grant agreement No 773682
Page 82 of 91
Table 7.2 shows that the required N:K ratio of the additional fertilizer products differs among crops,
e.g. for grassland a product with an N:K ratio of 1.5 is required while for potato an N:K ratio of 0.5
would fit the demand. Mineral concentrate which is currently produced in the Netherlands has an N:K
ratio of about 0.67, which does not fit that well with the additional crop demand. Hence a range of
new fertilizer products from recycled organic sources is required to replace the mineral fertilizer
products. The total amount of surplus manure in the Netherlands that has to be exported or processed
is about 50 kton N. This amount is not sufficient to satisfy the crop demand for nitrogen, which means
that even if all surplus manure is processed, still additional mineral N fertilizer is required. In the
Interreg ReNu2Farm an inventory was made of the region-specific demand for recycled nutrients. The
results show that a potential demand for recycling-derived nutrients exists in all regions of Northwest
Europe (Figure 7.2). However, this demand differs for the different nutrients, especially in regions with
a lot of manure, the demand for phosphate is low.
Table 7.2 Potential demand for potassium from mineral fertilizer or recycled organic products for the main crops in the Netherlands
Crop N demand (kg N/ha)
K demand (kg K/ha)
K from animal manure (kg N/ha)*
Additional K demand (kg K/ha)
N:K ratio
Grass 350-400 350-400 250 100 1.5
Fodder maize 140 300 200 100 0.4
Wheat 250 220 220 0 -
Potato 250 350 220 230 0.5
Sugar beet 140 175 220 35 0.1
Figure 7.2. Regional demand for nutrients from recycling-derived fertilisers (RDF) in agriculture for North-West Europe
This project This project has received funding from the European Union’s Horizon 2020 research and
innovation programme under grant agreement No 773682
Page 83 of 91
In a circular agricultural system, with no or low use of mineral fertilizers, the crop specific demand for
nutrients and the soil specific requirement of C to maintain soil quality (i.e. prevent a negative soil
carbon balance) should be derived from manure and recycled organic products. This requires an
optimisation of the available manure and other organic inputs over the different crops and soils on a
farm or within a region. In the remaining time of the Nutri2Cycle project this kind of optimisation will
be further elaborated using the MITERRA model, which can make such a kind of optimisation of the
available manure and manure processing products to satisfy the crop and soil demand for CNP and to
improve nutrient cycling, reduce nutrient losses and maintain or increase soil carbon levels.
Summarizing, managing C:N:P stoichiometry is not a panacea. It is part of the solution of developing
more leak-tight farming systems. It requires in-depth understanding of the linkages and delinking
mechanisms of C, N and P in food production – processing – consumption systems. Currently, our
notions and studies are too disciplinary, often focused on just one nutrient element while neglecting
the interactions with other elements and their functioning. This report must be seen as a first step.
The C:N:P stoichiometry is not much studied yet in agriculture. Variations in the contents of C, N and
P are in general well understood and known, but how these contents are affected by crop rotations,
crop and livestock management, food processing and storage throughout the food chain is less
understood. Our knowledge of C:N:P stoichiometry in agriculture is fragmentary, in part because the
focus has been mostly on yield (and protein contents), and much less on C:N:P ratios through the food
production-consumption chain.
7.4 Recommendations • More studies have to be conducted on the C:N:P stoichiometry in agriculture. Currently, there
is a lack of quantitative data and information about the changes in C:N and C:P ratios of food
and feed products and how these changes are related to changes in farming practices. This
requires that both C, N and P contents have to be determined in products.
• Relationships should be developed between C:N:P stoichiometry in soils and the leakiness of
these soils. Also, relationships should be developed between C:N:P stoichiometry in the inputs
and outputs of farming systems and the leakiness of the these farming systems.
• It is imperative that C, N and P contents are determined in products from manure treatment
and other organic residues and that hypotheses are developed and tested about where and
how these products can be utilized most beneficial from C:N:P stoichiometry and leakiness
point of view. Upcoming processing technologies can affect the CNP flows and stoichiometry
and should be applied in such a way that the contribute positively to the demand for CNP.
• Recommendations for manure and fertilizer applications have to consider the soil-crop needs
for C, N and P. Meeting the P demand first is likely a good strategy, given the fact that P is
retained both in manure and soil, and therefore is likely the element with the lowest demand.
This project This project has received funding from the European Union’s Horizon 2020 research and
innovation programme under grant agreement No 773682
Page 84 of 91
Topping up the C and N supply until soil-crop needs are met, will require in many cases specific
manure treatments products and/or synthetic fertilizers.
This report provides a foundation for further work in Nutri2Cycle. First, it provides background
information about the nature, driving forces and changes in C:N:P stoichiometry in crop and animal
production systems. Second, it indicates the importance of considering C, N and P cycling and
utilization in agriculture coherently. Third, it shows (indirectly) the relationships between C:N:P
stoichiometry and the leakiness of agricultural systems. Fourth, it provides guidance to selecting the
types of managerial measures that decrease N and P losses from agricultural systems. In the
Nutri2Cycle project we propose to have a workshop in the first half of 2021 to discuss the findings and
the usefulness of the framework for application into practice.
This project This project has received funding from the European Union’s Horizon 2020 research and
innovation programme under grant agreement No 773682
Page 85 of 91
References
Aguirre-Villegas, H.A., Larson, R.A., Sharara, M.A., 2019. Anaerobic digestion, solid-liquid separation,
and drying of dairy manure: Measuring constituents and modeling emission. Science of The
Total Environment 696: 134059.
Balafoutis, A., Beck, B., Fountas, S., Vangeyte, J., Van de Wal, T., Soto, I., Gómez-Barbero, M., Barnes,
A., Eory, V., 2017. Precision Agriculture Technologies Positively Contributing to GHG Emissions
Mitigation, Farm Productivity and Economics. Sustainability 9: 1339.
Balboa, G.R., V.O. Sadras and I.A. Ciampitti. 2018. Shifts in Soybean Yield, Nutrient Uptake, and
Nutrient Stoichiometry: A Historical Synthesis-Analysis. Crop Science, 58(1): 43-54.
Ballabio, C., E. Lugato, O. Fernández-Ugalde, A. Orgiazzi, A. Jones, P. Borrelli, L. Montanarella and P.
Panagos. 2019. Mapping LUCAS topsoil chemical properties at European scale using Gaussian
process regression. Geoderma, 355: 113912.
Bellamy, P. H., P. J. Loveland, R. I. Bradley, R. M. Lark and G. J. D. Kirk. 2005. Carbon losses from all
soils across England and Wales 1978-2003. Nature 437(7056): 245-248.
Beusen, A. H. W., Bouwman, A.F., Van Beek, L., Mogollón, J.M. & Middelburg, J. J. (2016). Global
riverine N and P transport to ocean increased during the twentieth century despite increased
retention along the aquatic continuum, Biogeosciences 13, doi:10.5194/bg-13-2441-2016.
Billen, P., Costa, J., Van der Aa, L., Van Caneghem, J. & Vandecasteele, C. 2015. Electricity from poultry
manure: a cleaner alternative to direct land application. Journal of Cleaner Production, 96, 467-
475.
CDM (Commissie Deskundigen Meststoffenwet). 2017. Advies ‘Actualisatie bijlage I
Uitvoeringsregeling Meststoffenwet’.
Corden, C., Bougas, K. Cunningham, E., Tyrer, D., Kreissig, J. Zettl, E., Gamero, E. Wildey, R. and
Crookes, M., 2019. Digestate and compost as fertilisers: Risk assessment and risk management
options. Wood Environment & Infrastructure Solutions, United Kingdom
DairyOne 2020. Feed Composition Library. DairyOne.
de Brogniez, D., C. Ballabio, A. Stevens, R. J. A. Jones, L. Montanarella and B. van Wesemael. 2015). A
map of the topsoil organic carbon content of Europe generated by a generalized additive model.
European Journal of Soil Science, 66(1): 121-134.
de Vries, W., Leip, A., Reinds, G.J., Kros, J., Lesschen, J.P., Bouwman, A.F. 2011. Comparison of land
nitrogen budgets for European agriculture by various modelling approaches. Environmental
Pollution, 159: 3254-3268.
This project This project has received funding from the European Union’s Horizon 2020 research and
innovation programme under grant agreement No 773682
Page 86 of 91
den Boer, D., Reijneveld, J., Schroder, J. & Van Middelkoop, J. 2012. Mestsamenstelling in adviesbasis
bemesting grasland en voedergewassen. In., Wageningen UR Livestock Research, Commissie
Bemesting Grasland en Voedergewassen.
Détang-Dessendre, C., Geerling-Eiff, F., Guyomard, H. and Poppe, K. 2018. EU Agriculture and
innovation: What role for the CAP?, INRA and WUR, 32p.
Dijkstra, F. A., Pendall, E., Morgan, J. A., Blumenthal, D. M., Carrillo, Y., Lecain, D. R., … Williams, D. G.
2012. Climate change alters stoichiometry of phosphorus and nitrogen in a semiarid grassland.
New Phytologist. https://doi.org/10.1111/j.1469-8137.2012.04349.x
Duscha, V., Eckstein, J., Herbst, A., Manz, P., Marscheider-Weidemann, F., et al., 2019. GHG-neutral
EU2050, technical annex. Climate Change 40/2019. ISSN 1862-4804, Dessau-Roßlau, November
2019.
EC 2008. Commission Regulation (EC) No 1242/2008 of 8 December 2008 establishing a Community
typology for agricultural holdings. . Official Journal of the European Union, L 335, 3-24.
EC 2013. Report from the Commission to the Council and the European Parliament, on the
implementation of Council Directive 91/676/EEC concerning the protection of waters against
pollution caused by nitrates from agricultural sources based on Member State reports for the
period 2008–2011 COM(2013) 683 final. {SWD(2013) 405 final} Brussels.
Eglin, T., P. Ciais, S.L. Piao, P. Barre, V. Bellassen, P. Cadule, C. Chenu, T. Gasser, C. Koven, M. Reichstein
and P. Smith. 2010. Historical and future perspectives of global soil carbon response to climate
and land-use changes. Tellus B 62(5): 700-718.
Ehlert, P.A.I., Nelemans, J., Velthof, G.L., 2012. Stikstofwerking van mineralenconcentraten.
Stikstofwerkingscoëfficiënten en verliezen door denitrificatie en stikstofimmobilisatie bepaald
onder gecontroleerde omstandigheden. Wageningen, Alterra, Alterra rapport 2314.
European Commission (EC), 2017. EU Agricultural Outlook for the Agricultural Markets and Income
2017- 2030. Publications Office of the European Union, Luxembourg.
Eurostat 2013. Agri-environmental indicator - animal housing http://ec.europa.eu/eurostat/statistics-
explained/index.php?title=Archive:Agri-environmental_indicator_-
_animal_housing&oldid=153117#Animal_housing
Eurostat 2019. Material flow accounts - domestic processed output (env_ac_mfa).
Evans, L. T. 1998 Feeding the ten billion: plants and population growth. Cambridge, UK: Cambridge
University Press.
Evenson, R. E. & Gollin, D. 2003 Assessing the impact of the Green Revolution, 1960 to 2000. Science
300, 758–762. (doi:10.1126/science.1078710)
FAO. 2013. Milk and dairy products in human nutrition. Retrieved from www.fao.org/
This project This project has received funding from the European Union’s Horizon 2020 research and
innovation programme under grant agreement No 773682
Page 87 of 91
FeedTables. (n.d.). Tables of composition and nutritional values of feed materials INRA CIRAD AFZ.
Retrieved March 27, 2020, from https://www.feedtables.com/
Foged, H., Flotats Ripoll, X., Bonmatí Blasi, A., Palatsi Civit, J., Magrí Aloy, A. & Schelde, K. M. 2011.
Inventory of manure processing activities in Europe.
Food and Agriculture Organization of the United Nations, 2018. FAOSTAT statistical database. Rome:
FAO.
Godfray, H. C. J., J. R. Beddington, I. R. Crute, L. Haddad, D. Lawrence, J. F. Muir, J. Pretty, S. Robinson,
S. M. Thomas and C. Toulmin. 2010. Food Security: The Challenge of Feeding 9 Billion People.
Science, 327(5967): 812-818.
Güsewell, S. 2004. N : P ratios in terrestrial plants: variation and functional significance. Tansley
review. New Phytologist. doi: 10.1111/j.1469-8137.2004.01192.x
Hazell, P., & Wood, S. (2008). Drivers of change in global agriculture. Philosophical transactions of the
Royal Society of London. Series B, Biological sciences, 363(1491), 495–515.
https://doi.org/10.1098/rstb.2007.2166.
Holst, C. & Cramon-Taubadel, S. 2011. International Synchronisation of the Pork Cycle. Review of
Agricultural and Applied Economics. 15. 10.15414/raae.2012.15.01.18-23.
Huygens, D., Orveillon, G. & Emanuele Lugato, S. 2019a. SAFEMANURE Developing criteria for safe use
of processed manure in Nitrates Vulnerable Zones above the threshold established by the
Nitrates Directive. Interim Report.
Huygens, D., Saveyn, H., Tonini, D., Eder, P. & Delgado Sancho, L. 2019b. Technical proposals for
selected new fertilising materials under the Fertilising Products Regulation (Regulation (EU)
2019/1009). FeHPO CaHPO, 4.
Ilbery, B.W., Bowler, I.R., 2003. Industrialization and world agriculture. In: Companion Encyclopedia of
Geography: The Environmental and Humankind. Douglas, I., Huggett, R.J. (eds.).
Khoury, C.K., A.D. Bjorkman, H. Dempewolf, J. Ramirez-Villegas, L. Guarino, A.Jarvis, L.H. Rieseberg,
and P.C. Struik. 2014. Increasing homogeneity in global food supplies and the implications for
food security. PNAS, 111 (11): 4001-4006.
Klop, G., Ellis, J. L., Blok, M. C., Brandsma, G. G., Bannink, A., & Dijkstra, J. 2014. Variation in phosphorus
content of milk from dairy cattle as affected by differences in milk composition.
https://doi.org/10.1017/S0021859614000082
Koning, L. & Šebek, L. 2019. Jaarrond gemiddeld fosforgehalte in melk. Retrieved from
www.wageningenUR.nl/livestockresearch
Koopmans, G.F., Chardon, W.J., Dolfing, J., Oenema, O., van der Meer, P. and van Riemsdijk, W.H.
2003. Wet chemical and phosphorus-31 nuclear magnetic resonance analysis of phosphorus
This project This project has received funding from the European Union’s Horizon 2020 research and
innovation programme under grant agreement No 773682
Page 88 of 91
speciation in a sandy soil receiving long-term fertilizer or animal manure applications. Journal
of Environmental Quality, 32(1): :287-295.
Lassaletta, L., G. Billen, B. Grizzetti, J. Garnier, A. Leach and J. Galloway. 2014. Food and feed trade as
a driver in the global nitrogen cycle: 50-year trends. Biogeochemistry, 118: 225-241.
Lesschen, J.P. , Van den Berg, M., Westhoek, H.J., Witzke, H.P., Oenema, O. 2011. Greenhouse gas
emission profiles of European livestock sectors. Animal Feed Science & Technology, 166-167:
16-28.
Liakos, K.G., Busato, P., Moshou, D., Pearson, S., Bochtis, D., 2018. Machine Learning in Agriculture: A
Review. Sensors 18: 2674.
Loyon, L., Burton, C., Misselbrook, T., Webb, J., Philippe, F., Aguilar, M., Doreau, M., Hassouna, M.,
Veldkamp, T. & Dourmad, J. 2016. Best available technology for European livestock farms:
Availability, effectiveness and uptake. Journal of environmental management, 166, 1-11.
Maggen, J., Carleer, R., Yperman, J., De Vocht, A., Schreurs, S., Reggers, G. & Thijsen, E. 2017. Biochar
Derived from the Dry, Solid Fraction of Pig Manure as Potential Fertilizer for Poor and
Contaminated Soils. Sustainable Agriculture Research, 6.
Mellor, J. 1992. Agriculture on the Road to Industrialization, Johns Hopkins University Press, Baltimore.
Michalek, J., P. Ciaian & F. Di Marcantonio. 2020. Regional impacts of the EU Rural Development
Programme: Poland’s food processing sector. Regional Studies, 54:10, 1389-
1401, DOI: 10.1080/00343404.2019.1708306.
Möller, K. & Müller, T. 2012. Effects of anaerobic digestion on digestate nutrient availability and crop
growth: A review. Engineering in Life Sciences, 12, 242-257.
Naylor, R., Steinfeld, H., Falcon, W., Galloway, J., Smil, V., et al., 2005. Losing the links between
livestock and land. Science 310: 1621-1622. doi: 10.1126/science.1117856.
NCM (Nederlands Centrum Mestverwaarding). 2019. Landelijke rapportage en inventarisatie export
en verwerking dierlijke mest.
https://www.mestverwaarding.nl/storage/article/files/2019/10/5db1fceb2b362.pdf
ReNu2farm 2019. https://www.nweurope.eu/projects/project-search/renu2farm-nutrient-recycling-
from-pilot-production-to-farms-and-fields/
OECD. 2020 Agricultural Policy Monitoring and Evaluation 2020. OECD, 200 pp.
https://doi.org/10.1787/928181a8-en.
Oenema, O., Brentrup, F., Lammel, J., Bascou, P., Billen, G., Dobermann, A., Erisman, J.W., Garnett, T.,
Hammel, M., Haniotis, T., Hillier, J., Hoxha, A., Jensen, L.S., Oleszek, W., Pallière, C., Powlson, D.,
Quemada, M., Schulman, M., Sutton, M.A., Van Grinsven, H.J.M., Winiwarter, W. (EU Nitrogen
Expert Panel). 2015. Nitrogen Use Efficiency (NUE) - an indicator for the utilization of nitrogen
This project This project has received funding from the European Union’s Horizon 2020 research and
innovation programme under grant agreement No 773682
Page 89 of 91
in agriculture and food systems. Wageningen University and Research, Wageningen,
Netherlands.
Purdy, A., Pathare, P.B., Wang, Y., Roskilly, A.P., Huang, Y., 2018. Towards sustainable farming:
Feasibility study into energy recovery from bio-waste on a small-scale dairy farm. Journal of
Cleaner Production 174: 899-904.
Recanati, F., Maughan, C. Pedrotti, M. Dembska, K., Antonelli, M. 2019. Assessing the role of CAP for
more sustainable and healthier food systems in Europe: A literature review. Science of The Total
Environment 653, 908-919. https://doi.org/10.1016/j.scitotenv.2018.10.377
RVO. 2019. Tabel 9 Opbrengst en gehalten stikstof en fosfaat in ruwvoer en enkelvoudig diervoer.
Retrieved from https://www.rvo.nl/sites/default/files/2019/01/Tabel-9-Opbrengst-en-
gehalten-stikstof-en-fosfaat-in-ruwvoer-en-enkelvoudig-diervoer-2019-2021.pdf
Sardans, J. & Peñuelas, J. 2012. The role of plants in the effects of global change on nutrient availability
and stoichiometry in the plant-soil system. Plant Physiology.
https://doi.org/10.1104/pp.112.208785
Saveyn, H. & Eder, P. 2014. End-of-waste criteria for biodegradable waste subjected to biological
treatment (compost & digestate): Technical proposals. IPTS: Sevilla, Spain.
Schils, R., Olesen, J.E., Kersebaum, K.-C , Rijk, B., Oberforster, M., et al., 2018. Cereal yield gaps across
Europe. European Journal of Agronomy 101: 109-120. doi: 10.1016/j.eja.2018.09.003
Šebek, L. B., Bikker, P., Van Vuuren, A. M., & Van Krimpen, M. 2014. Nitrogen and phosphorous
excretion factors of livestock Task 2 : In-depth analyses of selected country reports.
Sigurnjak, I., Brienza, C., Snauwaert, E., De Dobbelaere, A., De Mey, J., Vaneeckhaute, C., Michels, E.,
Schoumans, O., Adani, F., Meers, E., 2019. Production and performance of bio-based mineral
fertilizers from agricultural waste using ammonia (stripping-)scrubbing technology. Waste
Management 89: 265-274.
Slicher van Bath, B.H. 1964. Eighteenth Century agriculture on the continent of Europe: evolution or
revolution. Agric. Hist., 43, 164-180.
Smil, V. 1997. Cycles of Life: Civilization and the Biosphere. Scientific American.
Smil, V. 2000. Feeding the World – A Challenge for the Twenty-First Century. MIT Press, Cambridge
Smil, V. 2002. The Earth’s Biosphere – Evolution, Dynamics and Change. MIT Press, Cambridge.
Smil, V. 2017. Energy and Civilization – A History. MIT Press, Cambridge
Steffen, W., K. Richardson, J. Rockström, S. E. Cornell, I. Fetzer, E. M. Bennett, R. Biggs, S. R. Carpenter,
W. de Vries, C. A. de Wit, C. Folke, D. Gerten, J. Heinke, G. M. Mace, L. M. Persson, V.
This project This project has received funding from the European Union’s Horizon 2020 research and
innovation programme under grant agreement No 773682
Page 90 of 91
Ramanathan, B. Reyers and S. Sörlin. 2015. Planetary boundaries: Guiding human development
on a changing planet. Science, 347(6223): 1259855.
Sutton M.A., Bleeker A., Howard C.M., Bekunda M., Grizzetti B., de Vries W., van Grinsven H.J.M.,
Abrol Y.P., Adhya T.K., Billen G.,. Davidson E.A, Datta A., Diaz R., Erisman J.W., Liu X.J., Oenema
O., Palm C., Raghuram N., Reis S., Scholz R.W., Sims T., Westhoek H. & Zhang F.S. 2013. Our
Nutrient World: The challenge to produce more food and energy with less pollution. Global
Overview of Nutrient Management. Centre for Ecology and Hydrology, Edinburgh on behalf of
the Global Partnership on Nutrient Management and the International Nitrogen Initiative.
Taub, D. R., Miller, B., & Allen, H. 2008. Effects of elevated CO2 on the protein concentration of food
crops: A meta-analysis. Global Change Biology. https://doi.org/10.1111/j.1365-
2486.2007.01511.x
Tipping, E., C.J. Somerville & J. Luster. 2016. The C:N:P:S stoichiometry of soil organic matter.
Biogeochemistry, 130: 117–131.
Tóth, G., Jones, A. and Montanarella, L. (eds). 2013. LUCAS topsoil survey - methodology, data and
results. JRC, Ispra, Italy.
USDA. (n.d.). APPENDIX I. Nutrient Uptake And Removal. Retrieved from
https://www.nrcs.usda.gov/wps/portal/nrcs/detailfull/null/?cid=nrcs143_014150
Velthof, G.L. 2015. Mineral concentrate from processed manure as fertiliser. Wageningen, Alterra
Wageningen UR (University & Research centre), Alterra report 2650.
Velthof, G.L., Oudendag, D., Witzke, H.P., Asman, W.A.H., Klimont, Z., Oenema, O. 2009. Integrated
assessment of nitrogen emissions from agriculture in EU-27 using MITERRA-EUROPE. J. Environ.
Qual. 38, 402-417.
Vitikainen, A., 2014. An Overview of Land Consolidation in Europe. Nordic Journal of Surveying and
Real Estate Research, 1: 25-44.
VLM 2018. Mestrapport 2018. Vlaamse Landmaatschappij, Brussel.
Wigboldus, S., Klerkx, L., Leeuwis, C., Schut, M., Muilerman, S., Jochemsen, H. 2016. Systemic
perspectives on scaling agricultural innovations. A review. Agronomy for Sustainable
Development 36: 46.
Xue, C., Matros, A., Mock, H.P. and Mühling, K.H. 2019. Protein Composition and Baking Quality of
Wheat Flour as Affected by Split Nitrogen Application. Front. Plant Sci., 15 May 2019,
https://doi.org/10.3389/fpls.2019.00642

This project This project has received funding from the European Union’s Horizon 2020 research and
innovation programme under grant agreement No 773682
Page 91 of 91


![Elevator Catalog [1.3 MB] - Wirerope Works](https://static.fdokumen.com/doc/165x107/6327034c6d480576770d1104/elevator-catalog-13-mb-wirerope-works.jpg)