Driver Resources Inc \ 'o - Geology Ontario
45
Geophysical Assessment Report for Driver Resources Inc \ 'o Yarrow-1-95 Property Yarrow Township larder L ake Mining Division o .~i. O M C Exploration Services IRC Sept 1996
-
Upload
khangminh22 -
Category
Documents
-
view
0 -
download
0
Transcript of Driver Resources Inc \ 'o - Geology Ontario

Geophysical Assessment Reportfor
Driver Resources Inc \ 'o
Yarrow-1-95 PropertyYarrow Township
larder Lake Mining Division
o.~i.
O
M C Exploration Services IRC Sept 1996

Table Of Contents
Summary
1.0 Introduction
(i)
2.O Property2.1 Owner Se. Description2.2 Location fc Accessibility2.3 Past Exploration
3.O Geology3 . l Topography Se. Drainage3.2 General Geology3.3 Property Geology
4.O Geophysical Agenda4.1 Line Cutting4.2 TFM Survey Procedure4.3 TFM Survey Results4.4 VLF-EM Survey Procedure4.5 VLF-EM Survey Results4.6 IP Survey Procedure4.7 IP Survey Results
5.0 Implications5.1 Conclusion5.2 Recommendation
6.O Addendum6.1 Author Certification6.2 References6.3 Equipment Spec, with additional theories
223
3 fie 4
4
88999
1011
1212
1314
15 to 18
10
OO O
List of FiguresFigure l Yarrow Property (contours and 1995 selected grid) l Figure 2a TFM colour contours (1: 20,000) overlay 5 Figure 2b Picket Line Map with IP i VLF anomalies, 1: 20,000 6 Figure 3a Proposed Geology with drainage 1: 20,000 7
List Of IP Sections
L 1300E L 1200E
L 800E L 700E
L 200EL 100EL 300W
NOTE: The sections are found at the back of the report,
Plan l Plan 2 Plan 3
Compilation Plan MapMagnetic Survey, posted and contouredVLF-EM Survey, posted and profiled
1: 50001: 50001: 5000

Summary
The Yarrow-95-1 Property, registered to Driver Resources of Vancouver, B.C.,
found eight (8) kilometers S W of Matachewan, ON, is in the Larder Lake
Mining Division. The property, covers a former Au occurence referred to as
the George Christie Claims (decade of the 30's) which has a similar geological
setting as the Young-Davidson Mine (ODM/ OGS Map 2546, Geology of
Yarrow and Doon ). After assessing the property using past and recent work
a 1200 m drill program is proposed (page 12). The 1995 exploration
comprised of line cutting, VLF-EM, TFM, induced polarization surveys
delineated several targets warranting the said drill program.
(O

l .0 IntroductionDriver Resources Inc, of Vancouver, B.C., contracted M.C. Exploration Services of South Porcupine, ON, to do geophysical prospecting on their Yarrow-95-1 Property. The property is eight kilometers SW of Matachewan, ON. The 1995 exploration comprises the following; line cutting, total field magnetic, VLF-EM, and induced polarization surveys. The topographical relief and water coverage impeded the survey to a certain extent (refer to Figure l below). There is now near ninety kilometers of picket lines on the property being reported on. The property, is a suitable gold prospect with a gold occurrence appearing along an inner boundary (south boundary of claim 1201 792) of the property. The gold showing, previously called George Christie Gold Claims was initially worked in the decade of the 30's. It was compared to a similar geological setting as the Young-Davidson Mine, resulting from a similar intrusion of syenite porphyry (reported just north of the showing). The host of the mineralization comprises quartz stringers (grey SC white) within a carbonate schist. The occurrence of gold in conjunction with the opening of lands for mineral prospecting at the time, prompted Driver to investigate the area. The gathering of government reports and maps along with the recent exploration program contributed to assess the property reported on.
Figure 1; Yarrow-95-1 Property incorporating 18 contiguous claims.
.1,

2.0 Property
2.1 Owner SC Description
The eighteen claims of mineral rights comprises near sixty seven (67) hectares of land (or sixty seven units), in Yarrow Township, wholly owned by Driver Resources of Vancouver, British Columbia. The adjoining claims, recorded in Kirkland Lake, ON, are in the Larder Lake Mining Division registered as follows;
Claim Units Claim Units1201786 9 1201785 91203809 6 1203830 91203829 16 1203808 61201790 l 1201791 l1201792 l 1201793 11201794 1 1201795 11201796 l 1206154 11204197 l 1203805 11203806 1 1203807 1
37 Units + 30 Units^ 67 Units Total
2.1 Location se Accessibility
The property, found 8 kilometers southwest of Matachewan, ON, is near 80 kilometers southeast of Timmins, ON. From Timmins, Highway 101 east
reaches the Kirkland Lake-Matachewan cross-roads after near one hundred and forty kilometers of travel. Then Highway 66 reaches Matachewan and continues coarsely west, beyond the town where it becomes Highway 566. Near three kilometers past Matachewan a bush road heading coarsely southwest reaches the Mistinikon Lake causeway (bridge), after near 1 5 kilometers. Half a kilometer before the crossing a bush road heads southerly reaching the property after one or two kilometers.
(2)

2.3 Past Exploration
The property, reported to be developed in 1934 by George Christie, who at the time attempted to find substantial gold within quartz veins. A geological report, Volume 44, part 2, narrates "On claim No. 9,929, Yarrow Township, near the east shore of Mistinikon Lake. George Chrisite has uncovered an interesting zone of carbonate schist, with lenses of silicified schist and stringers of quartz."
3.0 Geology
3. l Topography 6C Drainage
The crews observed steep topography at several locations on the grid where passage became hazardous. Rapid elevations of fifty to one hundred and fifty feet can be observed where the intrusive syenite and granite bodies rise above the level of the area of volcanic rocks, and diabase dikes form north-trending ridges. Several creeks bisect the property predominantly following the north and northwest trends of the main system of faults and joints. The reader may refer to Figure l, showing the topography and drainage on the said property Yarrow-95-1.
3.2 General Geology
The Yarrow-95-1 Property, centrally located in Yarrow Township is found within the mapped Round Lake Batholith (Map 2546, Yarrow and Doon Townships). Three types of porphyry are known to exist in the area as follows; a cherry-red, coarsely crystalline type, in which the porphyritic texture is not generally seen, a grey, more compact type, with more distinct phenocrysts, and a fine-grained, dense, dark-brown type, with a tendency towards smaller phenocrysts.
(3)

3.2 General Geology continued
A little quartz is sometimes present, but it is thought to be secondary, and calcite is present in quite large amounts. Accessory minerals are magnetite, pyrite, apatite, titanite, and zircon. The grey porphyry shows alteration to red along quartz veins, it is believed that the cherry-red rock has formed by alteration from the grey porphyry by action of ore-bearing solutions. The oxidation is evidently pre-glacial. Ore is found only in the cherry-red porphyry. The gold has been brought in by a branching system of quartz veins, which are seldom over one inch thick, mineralization in the ore body is chiefly coarse pyrite, with some chalcopyrite, magnetite, and hematite. The gold, a good deal of which is native, was nearly always in the quartz, although some of it is in the porphyry, john Davidson made his original discovery (1916) in stockwork of quartz in rusty carbonatized greenstone, with considerable development of green mica. The Young-Davidson Mine is along the contact between the Timiskaming and the Keewatin. The old Matachewan Consolidated Mine is within altered Keewatin volcanics, off the south flank of the intrusion.
3.2 Property Geology
The Yarrow-95-1 Property, mapped and sampled by a junior geologist, Mr Mark Rochefort in the summer of 1995 is predominantly underlain by felsic intrusive rocks. A proposed geology for the property, Figure 3a delineates the proximity of the contacts. The latter archean mafic intrusive rocks are mainly magnetically inferred. The fault axis are further delineated with the help of the VLF-EM survey. The property is believed to also include parts of the gowganda formation postulated to be squeezed between large intrusive units (inferred by the induced polarization survey). The gowganda formation is not presented on Figure 3a due to lack of evidence and IP coverage. Contacts are gradational, a crude spatial relationship prevails between the silicic intrusive rocks seen on Figure 3a. Grab samples also taken by Mr Rochefort while mapping were sent to the Swastika Laboratory for assaying and the results are plotted on Plan 1, Compilation Map (pocket).
(4)


BKSBM
o VLF-EM In
ph
tM
CuttJw ,
Charg*obirrty Anomaly (V
/ mV)
FRtarvd IP Effw
H (n
l to n4) Poto Dtpoto Array
Undflflrw
d

Baseline O
Uoke or P
ond
Accass Rood
Bush Rood (ATV only)
• Syenite Poipfryry C
fitorrt* Schist
E3
Figure 3a; Proposed Geology
Contoc tFault
——
—
—
——
—
M
opr Fault —
—
——
——
- ———
Unit B t
9 mainly m
agnetically inlerred

4.0 Geophysical Agenda
4. l Line cutting
MG Exploration Services line cutting crews established the grid start point in July, 1994. The O + OO/ 0 + 00 start point, at post #3 of claim 1201 794 is where the base line with an azimuth of N90 0 T extends 2940 m west (restricted by water) and 2300 m east (proximate to the east boundary). The topography made it difficult to achieve straight picket alignment, therefore crews had to restart with a new bearing at some locations. The baseline, first of all lines is where the deviation in pickets is most crucial. Crews took all intersections and bearings necessary to produce the final picket line map (grid lines on all maps) to achieving a real grid presentation. Line O also intersected a cliff, alternatively crews used line 10OE to control the chainage on tie lines 400S and 800S. All of the cross-lines, turned at 90 0 to the baseline end at a tie line up to line 1 100 W. The remainder of the westerly lines end at tie line 800 S and lake Mistinikon at the north limit. The 1995 Yarrow-95-1 Grid comprises 88.3 km of survey lines picketed at 25 m intervals. Five tie lines, a baseline and fifty two cross-lines covers an area of 660 hectares on the Yarrow-95-1 Property.
4.2 TFM Survey Procedure
MG Exploration Services geophysical technician, Don Caron of Timmins, ON, started the survey in August 1995 and read the grid with the Overhauser GSM- 19 magnetometer. An interval of 12.5 m tallies 7125 stations read on the Yarrow-95-1 Grid with total magnetic field intensities ranging from 52857 nT to 64782 nT. An average of 58387 nT is seen on the property conformable to intrusive type rocks for the area. The samples were smoothed with a similar GSM-19 base station magnetometer reading diurnal drifts at a 30 second interval from grid co-ordinate Tie line 400N, station 400W. A reference field of 581 14 was chosen. Additional information on survey procedures/ theories along with equipment specifications can be found in the reports addendum.
(8)

4.3 TFM Survey Results
The Total Field Magnetic Survey, Plan 2 (pocket) and Figure 3c predominantly maps the diabase dikes trending north and northeast and the diorite dikes trending coarsely eastwest. The magnetic background elevated beyond 58450 nT along the east part of the grid trending eastwest infers that the mapped granodiorite is more iron rich. The anomaly flanking east of the granodiorite postulates that a graben may exist on the property. It occurs where a major fault is mapped on several government geology maps, following the coarse of a creek and several small lakes. The felsic intrusive rocks are poorly delineated by the magnetic survey due to the overwhelming response of the dikes. The interpretation of the magnetics can be seen on the compilation plan map (pocket).
4.4 VLF-EM Survey Procedure
Mr D crowley of Timmins, ON, accomplished the VLF-EM survey using the Geonics, EM-16 instrument to read vertical In-phase and vertical out-phase parameters on the Yarrow-95-1 Grid. A selected 25 m interval read all cross lines using the 24.0 KHz, Guttler frequency. All reading were sampled facing proximate to grid north. The reader may refer to the addendum for additional survey and equipment specifications.
4.5 VLF-EM Survey Results
The several trains of VLF anomalies seen on Plan 3 (pocket) shows a labyrinth of responses distributed by faults in several directions. All trends correlate with faults with the exception of the four anomaly train seen from line 800E/ 1 SON trending westerly unto line 500E/ 225N. This trend occurs along the south flank of a broad chargeability anomaly, it is postulated that this trend may continue into the lake seen at the junction of tie line SOON and line 0. The sinuous trend can perhaps be related to a squeezed volcanic package bordering the intrusive found just north.
(9)

4.6 IP Survey Procedure
The time domain induced polarization survey, Pole Dipole Array read nl to n6 (inclusively) with an A spacing of 50 m on seven selected lines. The Scintrex, TSQ-3 (3000 Watt) fixed transmitter in conjunction with the Androtex, TDR-6 read six (6) simultaneous samples at a 50 m interval on each section presented. All lines were energized with the current electrodes lagging south with the exception of section 300W. Line 300W, with the remote electrode 800 m north of the line was traversed from north to south. Lines l OOE and 200E, with the remote electrode at l 50E and l 100 m south was read from south to north. Lines 700E, 800E, 1200E, and 1300E, with the remote at l 350 m south of l OOOE were all read from south to north. Good contact resistances were achieved on all lines and the transmitter provided an average induced current (lg) of 0.5 Amperes.
4.7 IP Survey Results
•300W; A central chargeability anomaly infers a near horizontal superpose slightly dipping to the north. The increase in conductance at this location theorizes an inclusion of volcanics extending at depth. The anomalies flanking south and north (600S and 200N) perhaps delineates silicious carbonatized zones bordering felsic intrusive rocks.
•lOOE; This section infers a fault under 400S lacking metallic minerals or platy silicates. A large intrusive body is inferred from 200S to the north limit. Theintrusive is chargeable and displays an unconformity at the south limit. The contours on the IP section shows homogeneity until 400S. Perhaps high grade metamorphism can explain the lowered resistivities at the south limit.
•200E; Shows inferior (compared with the six other sections) penetration at the south limit. It can perhaps be related to horizontal beds hampering current penetration. The south anomaly correlates with a fault while the north anomaly infers a partial delineation of an intrusive body. Both resistivity and chargeability sections infer a north dip. The response at the south limit is obscured by noise perhaps generated by a water/clay saturated fault.
(10)

4.7 IP Survey Results continued
•700E; Three chargeability targets as follows; under 300S a deep and narrow zone is moderately chargeable with a low resistivity and correlates with a mapped fault. The central aberrative response with a twosome IP effect has a high resistivity signature inferring an intrusive body. The third most north anomaly appears to originate from surface with a reverse pantleg on the resistivity section. The IP effects continue till n6. Anomalies appear near vertical.
•800E; The IP anomaly under 200S is believed to be a result of two parallel faults with the most northerly one being most prominent. The broad aberrative response along the north can be separated into three individual zones. (l) The most north from 400N to 600N infers an iron rich intrusive unit. (2) A central narrow zone inferring a mineralized contact. (3) A south zone from 200N to 300N inferring squeezed volcanics that are perhaps very silicious and calcitic. The possibility of pyrite mineralization is not ruled out.
•1200E; A deep IP effect under 400S occurs near and perhaps along a magnetically inferred northeast trending dike. A second anomaly under 300N continues northerly and is not completely defined (Off line anomaly). This anomaly along with an east anomaly seen on line l 300E appears to be bound by faults. This entrapment infers squeezed volcanics with bordering felsic intrusive rocks.
•1300E; A broad chargeability anomaly at the north limit infers a possible underlay of squeezed volcanics with a low resistivity signature. This anomaly correlates with the anomaly on line 1200E bound by faults on both flanks.
(11)

5.0 Implications
5.1 Conclusion
It is obvious that the VLF-EM survey delineates efficiently the faults on the property while the magnetic survey delineates well the dikes. The gradational contacts on the property poses a problem attempting to delineate the contacts across the grid. The IP survey insinuates that volcanic rocks are present on the property and that they are perhaps comprised of the Gowganda Formation. The property, with a similar setting as the Young-Davidson Mine warrants further investigation.
5.2 Recommendations
Depending on the topography, five locations for future drilling are favoured;
•L800E/ 550N; A dip of -50 0 , Azimuth of l 80 0 , 200m depth to test a dominant IP effect with a shallow dip to the north. The horizontal contours perhaps reflect the shearing in this vicinity. This hole may determine the validity of the anomalies on lines 1200 and l 300 E.•L800E/ 300N; A dip of -50 0 , Azimuth of l 80 0 , 250 depth to test a moderate IP effect and low apparent resistivity. A mapped fault also occurs in this vicinity and may be problematical.•L800E/ 25N; A dip of -50 0 , Azimuth of 1 80 0 , 250m depth to test a third anomaly on this line•L100E/ l SON; A dominant IP anomaly as line 800E with a higher resistivity signature, the bottom of the hole nearing 250m is assumed to intersect a fault.•L300W/ 750S; A deep chargeability appearing along a postulated south contact of a large intrusive unit. A NE trending fault is also delineated along this axis. Assuming 250 m to test this target.
DATE; Respectfully Submitted;
R J Daigle (12)

6.0 Addendum
6. l Author Certification
I, Richard ] Daigle residing at l l l 5 Maclean Drive, Unit 1 5, in the city of Timmins,
ON, certify;
l .0 This is my l 7th year of practice in mining exploration.
2.0 I am registered with the Ontario Association of Certified Technologist.
3.0 l have been employed by MC Exploration Services Inc since 1992 and presently have the job title Geophysical Evaluator/ Manager Of Operations.
4.0 Accomplished geophysical contracts (IP, HLEM,TFM, SP) and property assessments in Eastern Canada, 1987 to 1992.
5.0 Accomplished geophysical contracts in northeastern ON, 1985-87.
6.0 Geophysicist Assistant/ Senior Technician for Kidd Creek Mines under the supervision of Mr D Londry, 1981- 85.
7.0 Experienced Max-Min (HLEM) surveys/ interpretations under the supervision of MR] Betz, 1979- 81.
8.0 Received Electronic Technologist Certificate in 1979.
9.0 l have no direct interest in the property reported on.
Date;^^——^^—
Timmins, ON.
(13)

6.2 References
Geological Report; Vol XLIV, Part (2), page 50, 1935. Christie George, Gold Claims, Yarrow Twp
Map 2546 ; OGS/ ODM, R M Junnila and assistants, 1987 Precambrian Geology, Yarrow se Doon Townships issued 1990.
Report 51 ; ODM/ OGS, H L Lovell, 1967 Geology of the Matachewan Area.
(14)

GEM Systems Advanced Magnetometers GSM-19GEM Systems Inc V. 4.0 52 West Beaver Creek Road, Unit 14Richmond Hill, Ontario Phone; (905) 764- 8008 Canada, L4B-1L9 Fax ; (905) 764- 9329
l .0 Instrument Description•The sensor is a dual coil type designed to reduce noise and improve gradient tolerance. The coils are electrostatically shielded and
contain a proton rich liquid in a pyrex bottle, which also acts as an RF resonator.
The sensor cable is coaxial, typically RG-58/U, up to 100m long.
•The staff is made of strong aluminum tubing sections. This construction allows for a selection of sensor elevations above the ground
during surveys. For best precision the full staff length should be used. Recommended sensor separation in gradiometer mode is one staff section, although two or three section separations are sometimes used for maximum sensitivity.
•The console contains all the electronic circuitry. It has a sixteen key keyboard, a 4x20 character alphanumeric display, and
sensor and power input/ output connectors. The keyboard also serves as an ON-OFF switch.
•The power input/output connector also serves as a RS232 input/output and optionally as analog output and contact closure
triggering input.
•The keyboard front panel, and connectors are sealed (can operate under rainy conditions)
•The charger has two levels of charging, full and trickle, switching automatically from one to another. Input is normally
l 10V 50/60HZ. Optionally, 12V DC can be provided.
•The all-metal housing of the console guarantees excellent EM protection.
2.0 Instrument SpecificationsResolution 0.01 nT, magnetic field and gradientAccuracy 0.20 nT over operating rangeRange 20,000 to 120,000 nT automatic tuning, requiring initial setupGradient Tolerance over 10,000 nT/mOperating Interval 3 seconds minimum, faster optional. Reading initiated from keyboard, external trigger, orcarriage return via RS-232
Input/Output 6 pin weatherproof connectorsPower Requirements 12V, 200mA peak, 30mA standby, 300mA peak with GradiometerPower Source Internal 12V, l .9Ah sealed lead-acid battery standard, external source optional.Battery Charger Input; l l O/ 220VAC, 50/60HZ and/or 12VDC
Output; 12V dual level charging Operating Ranges Temperatures; -40 0 C to -t-60 0 C
Battery Voltages; 10.0 V min to l 5.0V maxHumidity; up to 9007o relative, non condensing
Storage Temperature -50"C to + 65°C Dimensions Console; 223 X 69 X 240 cm
Sensor Staff; 4 x 450mm sectionsSensor; 170 x 71 mm diameterWeight; Console 2. l Kg Staff 0.9Kg Sensors; 1. l Kg
(15)

Induced Polarization•AndrOteX TDR-6; The TDR-6 induced polarization receiver is a highly cost-effective instrument for the detailed measurements of IP effects and apparent resistivity phenomenon. Up to six dipoles can be measured simultaneously, thus increasing production. A wide input voltage range, up to 30V, simplifies surveys over the narrow shallow conductors of large resistivity contrast. Input signal indicators are provided for each dipole. All data are displayed on a 2x16 character display LCD module and any selected parameters con be monitored on a separate analogue meter for noise evaluation during the stacking/averaging. Although the TDR-6 receiver is automatic it allows full control and communications with the operator at all times during measurements. Since the input signal synchronizes the receiver at each cycle, the transmitter timing stability is not critical and any standard time domain transmitter can be used. Data are stored in the internal memory with a capacity of up to 2700 readings (450 stadons). The data format is directly compatible with Geosoft without the necessity of an instrument conversion program.Features•Wide input signal range -Automatic self-potential cancellation•Staking/averaging of Vp and M for high measurement accuracy in noisy environments 'High rejection of power line interference •Continuity resistance test 'Switch selectable delay and integration time 'Multiwindow chargeability measurements 'Digital output for data logger 'Six channel input provided -Compatible with standard time domain transmitters 'Alpha-numeric LCD display 'Audio indicator for automatic SP compensation•PortableSpecifications•Dipole nl to n6 simultaneously•Input Impedance 10 megohm•Input Voltage (Vp) rangerlOO/yV to 30 Volts (automatic), accuracy:.25 07o, resolution: 10/vV.•Self Potential (SP) range: ±2V,accuracy: 1 07o,Automatic compensation +1•Chargeability (M) range:300mV7V,accuracy:.25 07o,resoIution:.1mV7V•Automatic Stacking 2 to 32 cycles•Delay Time programmable•Integration Time programmable for each gate (10 gates)•Total Chargeability Time During integration time of all gates•Synchronization Signal programmable from channel l to 6•Filtering power lines:dual notch 60/180Hz or 50/150Hz, lOOdB, other:Anti-alias, RF and spike rejection.•Internal Test Vp= l V,M = 30mV/V
•Ground resistance test O to 200 Kohm
•Transmitting Time 1,2,4 and 8 sec pulse duration, ON/OFF.•Digital Display Two line 16 alphanumeric LCD.•Analogue Meters Six-monitoring input signal and course resistance testing.•Controls Push button reset, toggle start-stop, rotary Rs-in-test, rotary (data scroll) display, rotary
(data scroll) Dipole, keypad 16 key 4x4.•Memory Capacity 2700 readings, 450 stations (nl to n6).•Data Output serial I/O RS-232 (programmable baud rate), Geosoft compatible output format.•Temperature Range Operating:-30 0 to -l-50"C,storage -40" to -i-600 C.•Power Supply Four 1.5V D cells.•Dimensions 31x16x29 cm•Weight 6.5 kg(14.3Ibs)
(16)

TSQ-3;The Motor-Generator set consists of a reliable Briggs and Stratton four stroke engine, coupled to a brushless permanent magnet alternator. The transmitter design employs solid-state components both for power switching and control circuits. Output waveforms and frequencies are selectable; square wave continuous for frequency domain and square wave interrupted for time domain. The programmer is crystal controlled for high stability. While care still must be taken when working with high voltages, the TSQ-3 features overload, underload and thermal protection for maximum safety. Stabilization circuitry ensures that the output current (lg) is automatically controlled to within ± . l 07o for up to 2007o external load or ± 1 007o input voltage variations. Voltage, current and circuit resistance are presented on a LED digital display. The system functions as follows; The motor turn turns the generator (alternator) which produces 800Hz, three phase, 230VAC. This energy is transformed upwards according to a front panel voltage setting in a large transformer housed in the TSQ-3. The resulting AC is then rectified is a rectifier bridge. Commutator switches then control the DC voltage output according to thewaveform and frequency selected.Specifications•Output Power 3000 VA maximum•Output Voltages 300,400,500,600,750,900,1050,1200,1350 S 1500V
Output Current 10 amperes maximum•Output Current Stability Automatic controlled to within ±.! 07o for up to 2007o external load variation or up to ± 1 007o input voltage variation.•Stabilization Protection (Over-range) High Voltage shuts off automatically if the control range exceeds 2007o.•Digital Display Light emitting diodes permit display up to 1999 with variable decimal point; switch selectable to read input voltage, output current, external
circuit resistance, dual current range, switch selectable.•Current Reading Resolution 10mA on coarse range (1-10A) and 1mA on fine range(0-2A).Time Domain Cycle t:t:t:t; ON:OFF:ON:OFF:automatic
•Polarity Change Each 2t, automatic.•Pulse Duration Standard t^ l,2,,4,8,16 and 32 seconds, optional
•Stability Crystal controlled to better than . 1 07o with external clock option better than 20ppm over operating temperature range.•Efficiency .78•Operating Temperature Range; -30 0 C to -l- 500 C•Overload Protection Automatic shut-off at 3000VA.
•Underload Protection Automatic shut-off at current below 85mA.
•Thermal Protection Automatic shut-off at internal temp, of 85 0 C.
•Dimensions 350cm x 530cm x 320cm (transmitter).•Motor Briggs and Stratton, four stroke 8 H P.•Alternator Permanent magnet type, SOOHz, three phase 230VAC at full load.•Output Power 3000 VA maximum.
•Dimensions 520cm x 715cm x 560cm (generator assembly).
•Weight Transmitter;25.0kg, Generator Assembly 72.5kg.
Output DC interrupted squarewave used for survey.^ 2 seconds, ON se OFF time. Total duty Cycle Used; 8 seconds.
(17)

IP MethodThe phenomena of Induced Polarization (IP) was reported as early as 1920 by Schlumberger. The IP survey technique allows a variety of arrays (which all have advantages and disadvantages) and reads two separate elements;( l )The chargeability or IP effect (M) and Apparent Resistivity. The IP technique is useful for detecting sulphide bodies and is also useful as a structural mapping tool. The IP effect is the measurement of the residual voltage in rocks that remains after the interception of a primary voltage. It includes many types of dipolar charge distributions set up by the passage of current through consolidated or unconsolidated rocks. Among the causes are concentration polarization and electrokinetic effects in rocks containing electronic conductors such as metallic sulphides and graphite. The term overvoltage applies to secondary voltages set up by a current in the earth which decays when it is interrupted. These secondary effects are measure by a receiver via potential electrodes. The current flow is actually maintained by charged ions in the solutions. The IP effect is created when this ionic current flow is converted to electronic current flow at the surface of metallic minerals (or some clays, and platy silicates). The IP method is generally used for prospecting low grade ( or disseminated) sulphide ores where metallic particles, sulfides in particular, give an anomalous response. Barren rock (with certain exceptions) gives a low response. In practice, IP is measured in one or two ways;(l) In a pure form, a steady current of some seconds (nominally 2 seconds) is passed and abruptly interrupted. The slowly decaying transient voltage existing in the ground are measured after interruption. This is known as the time domain method. The factor Vs/ Vp is the integrated product for a specified time, and several readings are averaged (suppressing noise and coupling effects). The resultant chargeability, M is essentially an unitless value but it is usually represented in mV/V. The second method entails a comparison of the apparent resistivity using sinusoidal alternating currents of 2 frequencies within the normal range of O. l to 10.0 cps.. The factor used to represent the IP effect by this frequency domain method is the percent frequency effect (PFE) and is defined by (R1-R2)XRlxl0007o where RI and R2 are the apparent resistivities at the low and high frequencies.Use and LimitationsThe effective depth of penetration of any IP survey is a function of the resistivity of the surface layer('s) with respect to the resistivity of the lower layer. All arrays have different effects from this resistivity contrast, some are less affected than others. When the surface layer is 0.01 of the lower layer, the effective penetration is very poor hence the term masking. Masking occurs most often in areas of thick clay cover. The size of the target therefore becomes important when detection is desirous under a conductive surface layer. The frequency domain methods are the most adversely affected by masking as inductive coupling can be much greater than the response.
Standard Definitions of ChargeabilityThe IP parameter, chargeability (M) varies with time. For practical reasons the entire decay curve is not sampled. Instead the secondary voltage is sampled one or more times at various intervals. Because the secondary voltage is received at extremely low levels in many prospecting situations, measurements of its amplitude at any given time is extremely susceptible to noise. Therefore, the secondary voltage is usually integrated for a period of time called a gate. Thus, if the noise has a zero mean, the integration will tend to cancel the noise. The Newmount M Factor is a standard time domain IP parameter. The gate delay, of 80 mSeconds (used by the TDR-6) was chosen to allow time for normal electromagnetic effects and capacitive coupling effects between the transmitter and receiver to attenuate so that the secondary voltage consists only of the IP decay voltage.The TDR-6 total integration time of l 580 milliSeconds (gate) is divided into ten individual gates. The time- constant of the IP dispersion curve, Cole-Cole dispersion (W H Pelton, 1977), obtained from the ten individual gates (windows) is directly related to the physical size of the metallic particles. This data is available at the clientsrequest since all of the obtained field data is archived (downloaded) to computer.
(18)

l l I - i -' I - T"'T~ r-- r - T —T"""T"- ,- - • 1 —- T - - T--- T -~ T - . T "l —— T ——-, —— - J- --p --y - - T -- -f - - T - - -p————— y - y- - -p- . J --j. -.j.-. y - -y——— y --y-- j- . ,- —— -y --j T-~-f—- T~" f —-J-— -y —— T ~- -T——, r
MF i RES
.7.3 L4712
l J
IH
6.7
L.__l__1.__l__ .1——.U—l——l__J_-l.—. -L.—1. .--1... .1___l___L.— -]-._l__J_...1..._L——l—- Lo
6+00 7+00 S 6+00 S
proposed drill targetsN ++OON 5+oJh 7+00 N
filter 8 filter
4.4 J S
4.7 4.? 4.4 4.7 4.7 4.] 4.) } .l 3 .1 4.2 4.1 S.I 5.1 5.5 I.I 7,1 ID/ 12 14 15 IB
, . s . - . ,
4.1 4.5 1.4 il— J.I 2 . ] A /, l.l S l// s ll'* r'S.? 7.2 /7.J J.J-^: 11 -^ 14is s /s ^v" ^
/ X- / l
j, X 7 , , 7 X'X , 5
J.I S.I 4.1 4,1 4.7 4.1
i \ \ j S "^ ^4,1 l 3 .1 4.) V^iy 4 J 3 ' y S''
J.? J.I 4.1 4.4 4' — 4.7 4.1 0.7
4 4.1 4.3 M s 5 .2 \4.l C*-' l 4 .J J.i ~——J.J
4.1 4.1 4.3
4.3 4.4
4.1 4.1^54 S.I \ 4.1 4.4 l 3 .2 3.1 35/5.3 S 4.1 .
5, 5 1 j! —— ̂ j, j i 4, 53 S 5 N i ± s* ] 7 ,- 4 4 an 4 4
ft+OD S
7711
ns'i 7134 n 3714 — JJ51 ya M54 l OK
0 = 2
LO .0
Topo
interpretation
Chargeability
Interpretation
Resistivityohm/meters
soot:
Poie-Dipoie Array
--(EH...—.--^ J
plot point
Filter* m
* * n2* * * n3
* * * n4
Cont. IntervalsResistivity ; 500 ohm/meter Chargeability ; 1.0 mV/V Metal Factor ; 1 7,
Profiles
INSTRUMENTSAndrotex TDR6, Time Domain Receiver
1760mSec Total Intergration Time, 80mS Delay. ^ ( 80+80+80+80+160+160+160+320+320+320 ) mSec
Scintrex TSQ-3 Transmitter SSecond Total Duty Cycle, 2Sec On/Off Time.
INTERPRETATIONLow EffectPoorly Chargeable mV/V, IP effectLow Apparent Resistivity, rho
Moderately Low Effect
Moderately High Effect
High EffectGood Chargeability rnV/V, ip effectHigh Apparent Resistivity, rho
Scale 1:500050 100 150 200 250 30050
(meters)
Driver Resources IncInduced Polarization Survey
Yarrow-1-95 Grid Yarrow Twp., NTS: 41- P/ NE
Larder Lake Mining DivisionM. C. Exploration Services Inc. Oct. 1995
i

5.4
ip- '^-;
Top:
interpret
Chargeat- mV A'
mterpretot'i-r.'r
Resistivity ohm/meters
- r -.-- T ---j -' T - 'T " T —T""" I - T" 3 4 r!2K .9.9
/\
.7.
\k
' UF T RES
\ . j (.1 .7 [.6151
\
-..L, i . -i - .1_-i-- -i-....j.... j_L..JLO LO LO
7*00 S S+OO S 5+00 S 4+00 S 3+00 S 2+00 Sf fi r 4-5 4.] 4.1 J. S 4.1 4.4 4. S 4. S 4.5 4.] 4.1 1.1 4.: 4.4 4.3 4. S 4. J 4.4 4.3 4.6 S 5,8 I.I 11 H 14 10 4. t filter
3.5/ \'-4y/ .Li-/ ) S 3 I / M 4- 3 4 pS ^ J' 7 g' ! ' !l 1 J 3 l3 j M 4 s X-/ s ^— -^i*^ O^s 4 ' 4 4.5^^,4 , 4 y '-'y/'''//// " "~~— " ^ W .s^Mfc J 7
f l * f l^-J*'* * 4 J 4 4 J ^'^ 4N| 1.3^^—4 1.7^X4.1 4.3 4.5 4.7 -Xl. li *.4 4.4 4.SX 3.7 *.2 -^ l J X^- •••y// ) 5 -~lt.JLl^ MM "
55^ 1.7 1.4 i. IX 4.! 4.) 4.5 4 4.4 f J. 4 /4.7 J 3.1 X 4.1 [77 4.1 4 "^"^3. S y/4.3 4,4 4 3.3 4.ty/ 1.3 /Vl.3XX 13 14 HZ 13^^1.3
4.3^^,4-^^1.5 f" 3.7 X 4.5 4.1 4.1 4.1 3.1 x 4.4 4.8 4.2 J.5 /4.a '^ 1.4 /^ 1.7 /y 1^,^, 13^^ II -^''l
—— " (,5 '/l. 4 /^ '2 12 ^" " -^8.8
4.3 V^JJ^^- 4.1 4. S 4.1 4.1 4.4
4. S 4.5 4.1 4.1 4. S 4.1 /-' , 3.1 4.4 4.1 —— "4.5 4 , 5 4.4 [ 3.4 .4.2 4.6 4.5 f 3.5/^~^\ ^ ^ ( \ \ \s5.1 4.7 4.1' S.I ^ 4.1 "^ i.5 '4.1 4.1 4.7 4.1 4.4 4.1' —— 4.1 4-~"^.l 4,5 4.1 3. J '4.5 I.I
0=4
0 = 6
tilter
0=1
0 = 4
0 = 5
0=6
ft+00 S | l* lit
7+00 S | Ut nn till UK
5+00 S |
UK UK
4+00 S t
UK H71 I71J
MO S t
Nil
2+00 S |
l W 1443
1+00 S |
UK 1544
0+00
10K I1K
1+00 N^ IK 13K
2+001^
I7X UK
3+OON^ ^ 4+00 N t t 5tpONl [
1547 I7H W10 5011 4*06 4370
IfTJ \ 5173 ' f
v\\\^,-y' "^ f AI1 1 '7//
(133 - TiH l 5313
frOON
~"" *M filter
0=3
0=4
0=5
0=6
L4.9
Topo
Interpretation
Chargeability
Interpretation
Resistivity ohm/meters
Pole-Dipole Arraya ^no a
Cr-i r--®-,
plot point
Filter * n1
* * n2* * * n3
* * * * n4
Cont. IntervalsResistivity ; 500 ohm/meter Chargeability ; 1.0 mV/V Metal Factor ; 1 55
Profiles
INSTRUMENTSAndrotex TDR6, Time Domain Receiver
1760mSec Total Intergration Time, 80mS Delay. ( 80+80+80+80+160+160+160+320+320+320 j mSec
Scintrex TSQ-3 Transmitter SSecond Total Duty Cycle, 2Sec On/Off Time.
INTERPRETATIONLow EffectPoorly Chargeable mV/V, IP effectLow Apparent Resistivity, rho
"j Moderately Low Effect
Moderately High Effect
High EffectGood Chargeability mV/V, IP effectHigh Apparent Resistivity, rho
Scale 1:500050 100 150 200 250 300^™"""B
(meters)
50
Driver Resources Incinduced Po arization Survey
Yarrow-1 -95 Grid Yarrow Twp., NTS: 41- P/ NE
Larder Lake Mining DivisionM. C. Exploration Services Inc. Oct. 1995.

i n :. c r n r e r n i
Interpretati
Resistivit.
ohm/meters
j f——T——T -~-1 ~'T'~T " T * T—-y- J .8643 ,..10
MF RES
.1.5 L4322
ft+00 S
4.2 4.3
TtOO S 5+00 S | 4+00 S wo s-t——l——l——l——l——t——t—2+00 0+00 1+00 N 2+OON 3+00 4+00 N
5 4,1 4,1 4.] 4,7 4.3 4.7 4.1 4.3 4.2 4.] 4.3 4.4 4.4 4.5 4.5 4.2 4.4 4.t 13 14 filter.1 s 1.1 4 .1 \ .\ , 2 .7 ^ 4 .5 4.5 4.1 4.1 4 3.1 3.1 3.1 3.1—^ c — "i ^
H.J^", 4.3 l M/ *-' 3-2 ]' s J.l^--4.t~-i 3.1 ,l l l X--^ ^ ——— X
'-l —— 4 4.5 4.7 V 3.3 3.1 4 4.7 4.1 4,1
4.7 __ 4.4 3.4|
7.3 -" S.2 5.3 4.1"^ - 3.1 -"^ 1.5
4.4 4.1 4.1 3.5 3.1 x 4.2
5.3 5. J
ft+00 S | | | TtOfl S | g+pos 5+00 S 4+00 5 ?tOON | MON t | 4r*OON |
H'' lin ^ W f i(ter(185*
6271 /x 45M 419* ea 2J72 .\lltf \ } \ //?i^^^ IL 5771 L 45M /V Mtl ^41^X ^J^/l V MM KM — mi5 ~^ fra
IP
Topo
interpretation
Chargeability mV/V
Interpretation
Resistivity ohm/meters
L- 1200E
Pole-Dipole Array
-B- r-®—}
V plot point
Filter* n1
* * n2* * * n3* * * n4
Cont. Intervals ProfilesResistivity ; 500 ohm/meter -- — -- --Chargeability ; 1.0 mV/V - ~ - ~ ~ -Metal Factor ; 1 7. ——————-
INSTRUMENTSAndrotex TDR6, Time Domain Receiver
l760mSec Total Intergration Time, 80mS Delay. ( 80+80+80+80+160+160+160+320+320+320 ) mSec
Scintrex TSQ-3 Transmitter SSecond Total Duty Cycle, 2Sec On/Off Time.
INTERPRETATIONLow EffectPoorly Chargeable mV/V, IP effectLow Apparent Resistivity, rho
l
Moderately Low Effect
Moderately High Effect
High EffectGood Chargeability mV/V, IP effectHigh Apparent Resistivity, rho
50Scale 1:5000
50 100 150 200•L- b(meters)
250 300
— Driver Resources IncInduced Polarization Survey
Yarrow-1-95 Grid -- Yarrow Tw^. L NTS^ 41^ .P/ NE
Larder Lake Mining DivisionM. C. Exploration Services Inc. Oct. 1995

4, 9008., 1,8 1.8 ,.9008
Topo
Interpretation
Chargeability mV/V
Interpretation
Resistivity ohm/meters
-.1-__L.-J__J__.L., l. _l___U~-1___l__-l__L—J...-.J__-1. .—i.__U—J.— -I__J__.1___l__J.__ -O
8+00 J^
filter 5-' 3- 4 *
0 = 1 7.1 , i 3 .3 4.5
7+00 S 1+00 S
-i——'——T
0+00 1+00 N 2+OON J+OON 4+00 N 5+OON 6+00 N 7+00 N
filter
i y n x, 2t -z^. 22 w^ u 12 ssti^( QVM^W^tftFF
9+00 S TtOOS 6+00 S 5+00 S 4+00 S 3+00 S
filter
0=1 0=2 0=3 0=4
0 = 5 0=6
""
mi i*3S#*
2+00 S 1+00 S 0+00 1+00 N 2+OON 5+OON 6+OON 7+00 N
1411 4731 3775
2372
2UO 2120
^ 1 *4*
MU
•ss&r/y i JKp^i^9pr -s\\ i 7^ TvC^^^gA^^v^r l?/ a^w^^ 3413 ^///UM l|4WK~ni4 -; 7H4 7) 4111 3111 //.'J^i^i^:^^\\\\\^c^ /////'•z- m m TUT -7 mi IJH o 4212 # i NT^. J^^lfr^V^m///
2W 373J 4771
"\ ^JrfN5M^- IMW B 471
1411 ' 1J34
Topo
Interpretation
ChargeabilitymV/V
Interpretation
Resistivityohm/meters
Pole-Dipole Arraya na a—— -t - - - — — - -——-- f——
.l...7...J,.
0=501^
plot point
Filter* n1
* * n.2* * * n3
* * * * n4
Cont. Intervals ProfilesResistivity ; 500 ohm/meter — -- ~ —Chargeability ; 1.0 mV/V - - - -Metal Factor ; 1 7, ———————
INSTRUMENTSAndrotex TDR6, Time Domain Receiver
1760mSec Total Intergration Time, 80mS Delay. ^ ( 80+80+80+80+160+160+160+320+320+320 ) mSec
Scintrex TSQ-3 Transmitter SSecond Total Duty Cycle, 2Sec On/Off Time.
INTERPRETATIONl "l Low Effect————— Poorly Chargeable mV/V, IP effect
Low Apparent Resistivity, rho
50
Moderately Low Effect
Moderately High Effect
High EffectGood Chargeability mV/V. IP effectHigh Apparent Resistivity, rho
Scale 1:500050 100 150 200 250 300 g"*"^
(meters)
Driver Resources IncInduced Polarization Survey
Yarrow-1-95 Grid - Yarrow Twp. , NTS: 41- P/ NE ^
Larder Lake Mining DivisionM. C. Exploration Services Inc. Oct. 1995.

11. 7969., 1.6
IP
5.3.
RES UF
3985-1
Topo
Interpretation
ChargeabilitymV/V
Interpretation
Resistivity ohm/meters
-1.6 ^7969
"RES
..81 L3985
.o Lo
wws1.7 1.4 2.1 1.1 l 1,1
t+pos 5+00S WIOS i+OOS 2+OOS 1+00 S (HOD 2+OON
filter filter
|171 ~ Sin S 47T 37W \ 141}
IP
-5.3
Topo
Interpretation
Chargeability mVA
Interpretation
Resistivity ohm/meters
L- 2 00 E
Pole-Dipole Arrayna
0=50^
plot point
niter* nl
* * n2
* * * * n4
ProfilesCont. IntervalsResistivity ; 500 ohm/meter Chargeability ; 1.0 mV/V Metal Factor ; 1 7,
INSTRUMENTSAndrotex TDR6, Time Domain Receiver
1760mSec Total Intergration Time, 80mS Delay. = ( 80+80+80+80+160+160+160+320+320+320 ) mSec
Scintrex TSQ-3 Transmitter SSecond Total Duty Cycle, 2Sec On/Off Time.
INTERPRETATIONLow EffectPoorly Chargeable mV/V, IP effectLow Apparent Resistivity, rho
Moderately Low Effect
Moderately High Effect
High EffectGood Chargeability mV/V, IP effectHigh Apparent Resistivity, rho
50Scale 1:5000
50 100 150 200•^ (meters)
250 300
Driver Resources IncInduced Polarization Survey
Yarrow-1-95 Grid Yarrow
Larder Lake Mining DivisionM. C. Exploration Services Inc. Oct. 1995.

20K., .95.
IP ~, R ES l UF
4 8., 9908.
0.., CL
.48
\ ''
X
..- J... ...i.— 4 -
95 r20K r.9.6
f MF f RES ' IP
..46 .9908 ^4.
LO
100 F.
Poie-Dipoie Arra)
l..,. 1...y
0=50^
plot point
Topo i opo
* * r\L.* * * nJ
* * * * n4
Interpretation
Chargeability
interpretation
Resistivity ohm/meters
proposed drill target0+00 1+00 N /-v 2+00 N 3+OON
fjjt er 12 filter
•-x' 4' J / y i '.' \ ''' i 3 '•^x// lv) \ y//4.7 X 7.5 v (.1 J H'/11 f i VJX/x/ "
8+OOS 7+OOS 5+00 S 4+OOS 3+OOS 2+OOS 1+00 S 0+00 1+00 N 2+OON 3+OONf|J(- er 732? HI 7 4M4 IMS 1521 5734 5122 5431 4H3 4SM 4(13 1131 7M3 1540 UK 13K filter
3tH K. I5K M. MU 1117 -^ 3711. - 5371 4tM
7341 ^ SOW f 31U
45M " 3Mt — 3514 UHl 11K ^SS (31
3tN 4455 " lilt --^ UK'" 1" 4214 4417 3514 — H5S 4451 ^ IIH
5730 7 3513 \ SIM ^ 4151, l 7134
3M5 V M31^^ 5411
g'7741 141477/3(42 3(44 4114 O* I5M — lin ^ WK
Interpretation
Chargeability mV/V
interpretation
Resistivity ohm/meters
Cont. Intervals Profiles Resistivity ; 500 ohm/meter -- — — -- Chargeability ; 1.0 mV/V Metal Factor ; i % - ————-
INSTRUMENTSAndrotex TDR6, Time Domain Receiver
1760mSec Total Integration Time, 80mS Delay. T- ( 80+80+80+80+160+160+160+320+320+320 j mSec
Scintrex TSQ-3 Transmitter SSecond Total Duty Cycle, 2Sec On/Off Time.
INTERPRETATIONLow Effect PooiiLow
50 O
lv Chargeable mV/V, IP effect Apparent Resistivity, rho
Moderately Low Effect
Moderately High Effect
High EffectGood Chargeability mV/V, IP effectHigh Apparent Resistivity, rho
Scale 1:500050 100 150 200 250 300
(meters)
Driver Resources IncInduced Polarization Survey
Yarrow-1 -95 Grid Yarrow Twp. ,^NTS: 41- P/ NE
Larder Lake Mining DivisionC. Explorcftion Services Inc. Oct. 1995.

r - T ' T --p—-r - - T-—-J —-T-—r~T"~T—T- — p—-p - -i --p H r2.4 L-- 300W
; P , RES i MF '
7 7j 9066J i.24|
\
interpretation
Chargeability mV/V
interpretation
Resistivity ohm/meters
"MF i RES
i.1.2 L 9066
J L l— -L... i.__L—.-l...- i ..j ___L._L__.L- _L ...J... I.._^__ -i_-1-- -L __i__-.L-. J_..J__J__.-i_ a___L—..
'//////7/jin urn -^- w 11-f t fm—
proposed drill target7*005 6*00 S 5*005
^4*005
V.2.7 2.8 2.6 4.9 6.7 7.8 11 13 16 19 20 21
HOPS
19 18
(HOO 1-tOON 2+OON WXN14 12
0=2
0=3
0=4
11 ,, 16 x, 21 —— 2^. . 19 ^ K ^vv, t.5 ^__6.9— 8.3 8' 2 "/ " __-
X/ 16 7// 20 -^ 1*""- 20\ 19 \\ 15^^ 11 ^̂12 ~^il.t l 1 0 X , ft" -
9.8 9.6 9.4 8.7 9.4 7.5 fj|ter
'•7ov.-SJy x \* \ \ 3 - 4 n^ 1
. —.w w.- "v.""' n^z/y -^ N\'^9.6-—-8.8 S 9 .8 11 \\ 7.1 0=3—N \ \ r
6.7 J 9.2 ^S 1 0 9.9
9————.9 ( 'l2~^Vl 10.1 c r-^^8.1 ^^ 9.C v 8.1 ~—- 9.1
0=4
0=5
0=6
1*00 N 2+OON 3+OON
filter 63)2
0=1 *",yjf **
0=2 OT7
^=5
IP
L7.7
.-i_l LO Lo L0
Topo
Interpretation
Chargeability
Interpretation
Resistivityohm/meters
Poie-Dipole Array
0=501^1
Profiles
plot point
niter* n1
* * n2 * * * n3
* * * * n4
Cont. IntervalsResistivity ; 500 ohm/meter Chargeability ; 1.0 mV/V Metal Factor ; 1 2!
INSTRUMENTSAndrotex TDR6, Time Domain Receiver
1760mSec Total Intergration Time, 80mS Delay.MT= ( 80+80+80+80+160+160+160+320+320+320 ) mSec
Scintrex T5Q-3 Transmitter SSecond Total Duty Cycle, 2Sec On/Off Time.
INTERPRETATION
50
Low EffectPoorly Chargeable mV/V. IP effectLow Apparent Resistivity, rho
Moderately Low Effect
Moderately High Effect
High EffectGood Chargeability mV/V, IP effectHigh Apparent Resistivity, rho
Scale 1:500050 100 150 200 250 300jr—sas
(meters)
Driver Resources IncInduced Polarization Survey
Yarrow-1-95 Grid Yarrow Twp. , NTS: 41- P/ NE
Larder Lake Mining DivisionM. C. Exploration Services Inc. Oct. 1995.

GEM Systems Advanced Magnetometers GSM-19GEM Systems Inc V. 4.052 West Beaver Creek Road, Unit 14 Richmond Hill, Ontario Canada, L4B-1L9
Phone; (905) 764- 8008 Fax ; (905) 764- 9329
1.0 Instrument Description The sensor is a dual coil type designed to reduce noise and improve gradient tolerance. The coils are electrostatically shielded and contain a proton rich liquid in a pyrex bottle, which also acts as an RF resonator. The sensor cable is coaxial, typically RG-58/U, up to 100m long. The staff is made of strong aluminum tubing sections. This construction allows for a selection of sensor elevations above the ground during surveys. For best precision the full staff length should be used. Recommended sensor separation in gradiometer mode is one staff section, although two or three section separations are sometimes used for maximum sensitivity. The console contains all the electronic circuitry. It has a sixteen key keyboard, a 4x20 character alphanumeric display, and sensor and power input/ output connectors. The keyboard also serves as an ON-OFF switch. The power input/output connector also serves as a RS232 input/output and optionally as analog output and contact closure triggering input. The keyboard front panel, and connectors are sealed (can operate under rainy conditions) The charger has two levels of charging, full and trickle, switching automatically from one to another. Input is normally 110V 50/60HZ. Optionally, 12V DC can be provided. The all-metal housing of the console guarantees excellent EM protection.
2.0 Instrument SpecificationsResolution 0.01 nT, magnetic field and gradient Accuracy 0.20 nT over operating range
20,000 to 120,000 nT automatic tuning, requiring initial setupover 10,000 nT/m3 seconds minimum, faster optional. Reading initiatedfrom keyboard, external trigger, or carriage return viaRS-2326 pin weatherproof connectors12V, 200mA peak, 30mA standby, 300mA peak with GradiometerInternal 12V, 1.9Ah sealed lead-acid battery standard,external source optional.Input; HO/ 220VAC, 50/60HZ and/or 12VDCOutput; 12V dual level chargingTemperatures; -40 0 C to *60"CBattery Voltages; 10.0 V min to 15.0V maxHumidity; up to 90% relative, non condensing
Storage Temperature -50 0 C to *65 0 C Dimensions Console; 223 X 69 X 240 cm
Sensor Staff; 4 x 450mm sectionsSensor; 170 x 71 mm diameterWeight; Console 2.1Kg Staff 0.9Kg Sensors; I.iKg
Range
Gradient Tolerance Operating Interval
Input/Output Power Requirements Power Source
Battery Charger
Operating Ranges
(21)

Magnetic Survey Theory; *
The magnetic method is based on measuring alteration in the shape and magnitude of the earth's naturally occurring magnetic field caused by changes in the magnetization of the rocks in the earth. These changes in magnetization are due mainly to the presence of the magnetic minerals, of which the most common is magnetite, and to a lesser extent ilmenite, pyrrhotite, and some less common minerals. Magnetic anomalies in the earth's filed are caused by changes in two types of magnetization; (1) Induced, caused by the magnetic field being altered and enhanced by increases in the magnetic susceptibility of the rocks, which is a function of the concentration of the magnetic minerals. (2) Remanent magnetism is independent of the earth's magnetic field, and is the permanent magnetization of the magnetic particles (magnetite, etc..) in the rocks. This is created when these particles orient themselves parallel to the ambient field when cooling. This magnetization may not be in the same direction as the present earth's field, due to changes in the orientation of the rock or the field. The unit of measurement (variations in intensity) is commonly known as the Gamma which is equivalent to the nanotesla (nT).
Method;
The magnetometer, GSM-19 with an Overhauser sensor measures the Total Magnetic Field (TEM) perpendicular to the earth's field (horizontal position in the polar region). The unit has no moving parts, produces an absolute and relatively high resolution measurement of the field and displays the measurement on a digital lighted display and is recorded (to memory). Initially, the tuning of the instrument should agree with the nominal value of the magnetic field for each particular area. The Overhauser procession magnetometer collected the data with a 0.2 nanoTesla accuracy. The operator read each and every line at a 12.5 m interval with the sensor attached to the top of three (56cm) aluminum tubing sections. The readings were corrected for changes in the earth's magnetic field (diurnal drift) with a similar GSM-19 magnetometer, >>base station<< which automatically read and stored the readings at every 30 seconds. The data from both units was then downloaded to PC and base corrected values were computed.
(22)

EM 16Geonics Limited2 Thorncliffe Park DriveToronto, ON, CanadaM4H-1H2 (416) 425-1821
SpecificationsSource Of primary Field VLF transmitting stations eg. NAA 24.0 KHz
read by plug-in frequency crystalsParameters measured (1) The vertical in-phase component (tangent of the
tilt angle of the polarization ellipsoid). (2) The vertical out-phase (quadrature) component (the short axis of the polarization ellipsoid compared to the long axis).
Method of reading In-Phase from mechanical inclinometer and quadraturefrom a calibrated dial. Nulling by audio tone.
Scale range In-Phase */- 1 5C^, quadrature + S- 40t.Readability +/- l *Reading time 10-40 seconds, depending on signal strengthOperating temperature -40" to +50 0 C.Operating controls On-Off switch, push-button battery test, station
selector, volume control, quadrature dial, inclinometer dial.
Power supply six (6) AA alkaline cells, life about 200 hrs.Dimensions 42 x 14 x 9 cmWeight l. 6 kg
Since the beginning of 1965 a large number of mining companies have found the EM 16 system to meet the need for a simple, light and effective exploration tool for mining geophysics. The VLF-EM method uses the military and time standard VLF transmissions as primary field. Only a receiver is then used to measure the secondary fields radiating from the local conductive targets. This allows a very light, one-man instrument to do the survey. Because of the almost uniform primary field, good response from deeper targets is obtained. The EM 16 provides In-Phase S Quadrature components of the secondary field with the polarities indicated. Interpretation technique has been highly developed particularly to differentiate deeper targets from the many surface indications. The VLF transmitting stations have vertical antennas. The magnetic signal component is then horizontal and concentric around the transmitter locations.
Principal of OperationThe VLF transmitting stations operating from communications with submarines have concentric horizontal magnetic fields around them. When the fields meet conductive bodies in the ground, there will be secondary fields radiating from these bodies. The EM 16 measures the vertical components of these secondary fields. The instrument is simply a sensitive receiver covering the frequency band of the selected station with means of measuring the vertical field components. The receiver has two inputs, with two receiving coils built into the instrument. One coil has normally vertical axis and the other is horizontal. The vertical coils signal is first minimized by tilting the instrument. The tilt-angle is calibrated in percentage. The remaining signal in this coil is finally balanced out by a measure of percentage of the signal from the other coil, after being shifted 90" (normally parallel to the primary field). Thus, if the secondary signals are small compared to the primary horizontal field, the mechanical tilt-angle is an accurate measurement of the vertical real-component (In-Phase), and the compensation rr/2-signal from the horizontal coil is a measure of the vertical signal (Quadrature).
(23)

Selection Of The StationThe magnetic field lines from the station are at right angles to the direction of the station. Always select a station which gives the field approximate at right angles to the main strike of the ore bodies or geological structure of the area being surveyed. The strike of the geology should point to the transmitter, a variation of */- 45 0 is tolerable in practice. Following is a list of some of the available stations;
Station NAA; Cuttler, Maine 24.0 KHz Station NLK; Seattle Washington 24.8 KHz Station NSS; Annapolis, Maryland 21.4 KHz
Taking A ReadingThe direction of the survey lines should be selected approximately along the lines of the primary magnetic field, at right angles to the direction to the station being used. Before starting the survey, the instrument can be used to orient oneself in that respect. By turning the instrument sideways, the signal is minimum when the instrument is pointing towards the station, thus indicating that the magnetic field is at right angles to the receiving coils inside the handles. To take a reading, first orient the reference coil (lower end of the handle) along the magnetic lines. Swing the instrument back and forth for minimum sound intensity. Use the volume for comfortable listening. Then use the left hand to adjust the quadrature component dial to further minimize the sound. When the minimum sound level is achieved read the inclinometer by looking into the lense, then take note of both readings. The dials inside the inclinometer are calibrated in positive and negative percentages. If the instrument is facing ISO 0 from the original direction of travel, the polarities of the readings will be reversed. Therefore always face the same direction (station being at right angle of the nulling direction).Fraser FilterVLF-EM data often yields complex patterns which require considerable study for a proper interpretation. A method, Fraser Filter was developed which allows field operators to transform the noncontourable dip angles into contourable data, producing conductor (anomaly) patterns which are immediately apparent to exploration personnel. The contoured data peaks very close to the top of the conductive axis, thereby allowing drill holes to be spotted accurately. The contoured data is expressed in degrees and only the positive quantities are contoured. This is dependant on the direction the filter was applied, usually a south to north or west to east filter is used and produces positive peaks where maximum deflection is seen on the In-Phase profile. The filter should only be applied to evenly spaced readings (eg, 25 m reading interval along the entire line read).
Formula (ipl-t-ip2)- (ip3H-ip4)The formula is the sum of station l 6 station 2 minus the sum of station 3 and 4. The plot point is in the middle of the stations calculated. This method is extremely useful in reducing noise and eliminating regional effects.
(24)

Induced Polarization•Androtex TDR-6; The TDR-6 induced polarization receiver is a highly cost- effective instrument for the detailed measurements of IP effects and apparent resistivity phenomenon. Up to six dipoles can be measured simultaneously, thus increasing production. A wide input voltage range, up to 30V, simplifies surveys over the narrow shallow conductors of large resistivity contrast. Input signal indicators are provided for each dipole. All data are displayed on a 2x16 character display LCD module and any selected parameters con be monitored on a separate analogue meter for noise evaluation during the stacking/averaging. Although the TDR-6 receiver is automatic it allows full control and communications with the operator at all times during measurements. Since the input signal synchronizes the receiver at each cycle, the transmitter timing stability is not critical and any standard time domain transmitter can be used. Data are stored in the internal memory with a capacity of up to 2700 readings (450 stations). The data format is directly compatible with Geosoft without the necessity of an instrument conversion program.Features Wide input signal range -Automatic self-potential cancellation Staking/averaging of Vp and M for high measurement accuracy in noisy environments -High rejection of power line interference 'Continuity resistance test -Switch selectable delay and integration time -Multiwindow chargeability measurements 'Digital output for data logger 'Six channel input provided Compatible with standard time domain transmitters -Alpha-numeric LCD display Audio indicator for automatic SP compensation -PortableSpecifications
nl to n6 simultaneously10 megohmrange:lOOyV to 30 Volts (automatic),accuracy:.25%, resolution:lOpV.range: 2V,accuracy:J.%,Automatic compensation 1range:SOOmV/V,accuracy:.25%, resolution:.ImV/V2 to 32 cyclesprogrammableprogrammable for each gate (10 gates)During integration time of all gates programmable from channel l to 6 power lines:dual notch 60/lSOHz or 50/lSOHz,lOOdB, other:Anti-alias, RF and spike rejection.
Dipole' Input Impedance Input Voltage (Vp)
Self Potential (SP) Chargeability (M) Automatic Stacking Delay Time Integration Time Total Chargeability Time Synchronization Signal ' Filtering
' Internal Test•Ground resistance test•Transmitting Time•Digital Display•Analogue Meters
1 Controls
Memory Capacity Data Output
Temperature Range 'Power Supply Dimensions Weight
O to 200 Kohm1,2,4 and 8 sec pulse duration, ON/OFF.Two line 16 alphanumeric LCD.
Six-monitoring input signal and course resistance testing.Push button reset, toggle start-stop, rotary Rs-in-test, rotary (data scroll) display, rotary (data scroll) Dipole, keypad 16 key 4x4. 2700 readings, 450 stations (nl to n6).serial I/O RS-232 (programmable baud rate), Geosoft compatible output format. Operating:-30 0 to *50 0 C,storage -40" to *60"C. Four 1.5V D cells. 31x16x29 cm 6.5 kg (14.31bs)
(25)

Scintrex TSQ-3; The Motor-Generator set consists of a reliable Briggs and Stratton four stroke engine, coupled to a brushless permanent magnet alternator. The transmitter design employs solid-state components both for power switching and control circuits. Output waveforms and frequencies are selectable; square wave continuous for frequency domain and square wave interrupted for time domain. The programmer is crystal controlled for high stability. While care still must be taken when working with high voltages, the TSQ-3 features overload, underload and thermal protection for maximum safety. Stabilization circuitry ensures that the output current (lg) is automatically controlled to within .14 for up to 204 external load or 104 input voltage variations. Voltage, current and circuit resistance are presented on a LED digital display. The system functions as follows; The motor turn turns the generator (alternator) which produces 800Hz, three phase, 230VAC. This energy is transformed upwards according to a front panel voltage setting in a large transformer housed in the TSQ-3. The resulting AC is then rectified is a rectifier bridge. Commutator switches then control the DC voltage output according to the waveform and frequency selected.Specifications Output Power Output Voltages Output Current Output Current Stability
Stabilization Protection
Digital Display
Current Reading Resolution
Time Domain Cycle Polarity Change Pulse Duration Stability
'Efficiency Operating Temperature Overload Protection Underload Protection Thermal Protection 'Dimensions Motor Alternator
Output Power 'Dimensions Weight
3000 VA maximum300,400,500,600,750,900,1050,1200,1350 S 1500V 10 amperes maximumAutomatic controlled to within .14 for up to 204 external load variation or up to 104 input voltage variation.(Over-range) High Voltage shuts off automatically if the control range exceeds 204.Light emitting diodes permit display up to 1999 with variable decimal point; switch selectable to read input voltage, output current, external circuit resistance, dual current range, switch selectable.10mA on coarse range (1-lOA) and 1mA on fine range (0-2A).t:t:t:t; ON:OFF:ON:OFF:automatic Each 2t, automatic. Standard t^, 2 , , 4, 8,16 and 32 seconds, optionalCrystal controlled to better than .14 with external clock option better than 20ppm over operating temperature range. .78Range; -30 0 C to *50"C Automatic shut-off at 3000VA. Automatic shut-off at current below 85mA. Automatic shut-off at internal temp, of 85 C C. 350cm x 530cm x 320cm (transmitter). Briggs and Stratton, four stroke 8HP.Permanent magnet type, SOOHz, three phase 230VAC at full load.
3000 VA maximum.520cm x 715cm x 560cm (generator assembly).Transmitter;25.Okg, Generator Assembly 72.5kg.
Output DC interrupted squarewave used for survey.
*-t-* *-t-*
= 2 seconds, ON Se OFF time. Total duty Cycle (26)
LUsed; 8 seconds.

IP MethodThe phenomena of Induced Polarization (IP) was reported as early as 1920 by Schlumberger. The IP survey technique allows a variety of arrays (which all have advantages and disadvantages) and achieves two separate elements;(l)The chargeability or IP effect (M) and Apparent Resistivity. The IP technique is useful for detecting sulphide bodies and also useful as a structural mapping tool. The IP effect is the measurement of the residual voltage in rocks that remains after the interception of a primary voltage. It includes many types of dipolar charge distributions set up by the passage of current through consolidated or unconsolidated rocks. Among the causes are concentration polarization and electrokinetic effects in rocks containing electronic conductors such as metallic sulphides and graphite. The term overvoltage applies to secondary voltages set up by a current in the earth which decays when it is interrupted. These secondary effects are measure by a receiver via potential electrodes. The current flow is actually maintained by charged ions in the solutions. The IP effect is created when this ionic current flow is converted to electronic current flow at the surface of metallic minerals (or some clays, and platy silicates). The IP method is generally used for prospecting low grade ( or disseminated) sulphide ores where metallic particles, sulfides in particular, give an anomalous response. Barren rock (with certain exceptions) gives a low response. In practice, IP is measured in one or two ways;(l) In a pure form, a steady current of some seconds (nominally 2 seconds) is passed and abruptly interrupted. The slowly decaying transient voltage existing in the ground are measured after interruption. This is known as the time domain method. The factor Vs/ Vp is the integrated product for a specified time, and several readings are averaged (suppressing noise and coupling effects). The resultant chargeability, M is essentially an unitless value but it is usually represented in mV/V. The second method entails a comparison of the apparent resistivity using sinusoidal alternating currents of 2 frequencies within the normal range of 0.1 to 10.0 cps. . The factor used to represent the IP effect by this frequency domain method is the percent frequency effect (PFE) and is defined by (R1-R2)/RlxlOO% where RI and R2 are the apparent resistivities at the low and high frequencies. Use and LimitationsThe effective depth of penetration of any IP survey is a function of the resistivity of the surface layer('s) with respect to the resistivity of the lower layer. All arrays have different effects from this resistivity contrast, some are less affected than others. When the surface layer is 0.01 of the lower layer, the effective penetration is very poor hence the term masking. Masking occurs more often in areas of thick overburden. The size of the target therefore becomes important when detection is desirous under a conductive surface layer. The frequency domain methods are the most adversely affected by masking as inductive coupling can be much greater than the response. Standard Definitions of ChargeabilityThe IP parameter, chargeability (M) varies with time. For practical reasons the entire decay curve is not sampled. Instead the secondary voltage is sampled one or more times at various intervals. Because the secondary voltage is received at extremely low levels in many prospecting situations, measurements of its amplitude at any given time is extremely susceptible to noise. Therefore, the secondary voltage is usually integrated for a period of time called a gate. Thus, if the noise has a zero mean, the integration will tend to cancel the noise. The Newmount M Factor is a standard time domain IP parameter. The gate delay, of 80 mSeconds (used by the TDR-6) was chosen to allow time for normal electromagnetic effects and capacitive coupling effects between the transmitter and receiver to attenuate so that the secondary voltage consists only of the IP decay voltage.
(27)

Induced Polarization SurveyElectrode Arrays
rD1MJLE-D1POLI '
Figure 1.0
Figure 1.1,
(*l ci-)
II 1 1 1 1' t di * d2 * di * d4 * di * dC|B) Ml H2 Ml H4 MS M6
—— —— " —— -*l
1*- D -*
II 1 1 1 1 * ' d) * d2 * d] * d4 * di * dC(l) Ml HJ Ml H4 MS M6
\ff^] tf^\ . - -"'
. ' 'f3 C (B)~-~-.-.- , c ...............,|
1
N7
l
HI
Figure 2.0
Vp Vs
Gate (windov.) width Expressfcd in miiliSecoridb
M 234 S e 7 8 9 ID J l
l—— —— Total Intergrolion Time. IbBOmS - —— - j
l —— —— —— 2Second Tx OFF Time - — —- —— —— .
Windows for the semi-logarithmic decoy sampling mode .
Ml :BOmS . M2:80m5 . W3:80mS , W4:80mS , M5: 1 60mS M6:160rr,S.M7:160mS.M8:320mS.M9:320mS.Ml0.320mS
KFigure 1.3
SCKLUK VE S '
Figure 1.4 '
SCHLUM P P FI.J\
ViE'.NIln vjs
Figure 1.6
WI:.NtR P h. F J.
/r r-r-LINF^^ - J..J-
o if
l ———— l
* *HI H;
* B
Nl M2—— —— ——'l
O -4-.1--4- -7
1
c
1
*
B
K A l K 2 1
A HI H; *
DIPOLE Di^Ott ARRAY tt Th fi.^ 50mElr\ Traverse *,th Current electrooei troilhngCurrtr.t lliO-:liOr.; E oilerij
V, 1
Figure 3.0
Spr.oc lr,;r.-r,.-,l
'g-
nl n2 n3 n4 n5
n6
IP Section Plot Point(with theoreticql depths (rorr, n1 to nE)
NOTE Pole Dipole Plot Pointi ore at some locations.

Ministry ofNorthern Developmentvia M ines
Ontario i
Report of Work Conducted After Recording Claim
Mining Act
Transaction Number
DOCUMENT No.
fy * J. O O ^** O
Personal '".formation collected on this form Is obtained under the authority of the Mining Act. Thlt Information will be used (or correspondence. Question* abo^i this collection should be directed lo the Provincial Manager, Mining Lands, Ministry of Northern Development and Mines, Fourth Floor, 168 Cedar Street, Sudbury, Ontario. P3E 6A5, telephone (705) 670-7264.
Instructions: - Please type or print and submit in duplicate.- Refer to the Mining Act and Regulations '
Recorder.- A separate copy of this form must be coi- Technical reports and maps must accom- A sketch, showing the claims the work is 41P15NE0009 2 1 6528 Y ARROW goQ
Recorded Holders) /)
Xe sou s w c. Client No.
Address
833Telephone No.
MOT/A- t /3,0Mining Division [Township/Arss M or Q Plan No.
Dates Work Performed
From: — 'C *J *~ •X ^ . f
To:
Work Performed (Check One Work Group Only)Work Group
Geotechnical Survey
Physical Work. Including Drilling
Rehabilitation
Other Authorized Work
Assay*
Assignment from Reserve
Type lS^lWri^t. |
Li*e tvrr'-^-rrWG' SV-t^-y - Q-erciocLy — VtF Smut** - f*? So*v*ji*1
'
1
1
Total Assessment Work Claimed on the Attached Statement of Costs ^ ^^ ^oO
Note: The Minister may reject for assessment work credit all or part of the assessment work submitted if the recorded holder cannot verify expenditures claimed in the statement of costs within 30 days of a request for verification.
Persons and Survey Company Who Performed the Work (Give Name and Address of Author of Report)Name Address
ex i M.. Pj &X
{attach i schedule It necessary)
Certification of Beneficial Interest * See Note No. 1 on reverse sidel certify-that at th* time the work was performed, the claims covered in this work report were recorded In the current holder's name or held under a beneficial Interest by the current recorded holder.
Date Recorded Holder or Agent (Signature)
Certification of Work Reportl certify that l have a personal knowledge of the facts set forth In this Work report, having performed the work or witnessed same during and/or after Its completion and annexed report is true.
Name and Address of Person Certifying
P.o fa*
For Office Uso Only
0241 (OM1)

M C. EXPLORATION INC
V
7052358038
V
P . 03
B ™ *
ONJ O O
uN O O
,
xl
0
^'-J
(VIo*—^. NJ
o O oNJ
v/
X/
— o
sLJ c-
0
^ CA
o2
f\J
o
(V
O
•st: Co
8 Oo
rvN-J
Oo
Ajk..
erv
O O
OO
-.Si1*
i /x/
0
^ •VSS
CN.O 0 s
o O
JsOfcCv Oo Ci
Oo
xjV
Ooi
CiQ
Oo^ 8.
o b
oo \o
B
Ci
Mc O
Ci
fe
CK s
Vs,
V
D C.r\o
s, -i-71 i.i
s*ro
O.o, O
NJO O
(i 0 Ci
(3
M
o
fV
C O
'*"
Credits you ara claiming In this report may be cul back, in order to minimize the adverse erfeeia of such deletions, plaase (naicouo i.y.. which claim* you wish to prlorlze tha deletion of credit*. Please mark (x) one of the. following:1. D Credits ara to be cut back Harling with the claim listed last, working backward*.2. D Credlta ara to be cut back aqtMJjy over all claim* contained in this raport of work.3. D Credits ara to be Cut back a* prtorlzed go (he attached appendix.
In the event that you have not specilpd you1 ohoic* of priority, option ono will be implemented.
Hole 1: Examples of beneficial Intftrejetfr* unrecorded Uaneiera, opUon dgreemenu, memorandum of agreement*, eto., wun .-.^. lo the mining claim*. ' ^
Note 2: If work haa been performed e| patented or leaaad land, pteaat* templet* UM following:
j lhal UHI racordod holder had a benfjttal IruareM in (tie Or teased land el trie Urn* trie work **a parUxmed.
Qua

Oniario
Ministry ofNorriiern Developmentand Mines
Mmistere du Developpement du Nord et des mines
Statement of Costs for Assessment CreditEtat des couts aux fins du credit devaluation
Mining Act/Loi sur les mines
Trans
9680
Personal information collected on this form is obtained under the authority of the M ining Act. This information will be used to maintain a record and ongoing status of the mining claim(s). Questions about this collection should be directed to the Provincial Manager, Minings Lands. Ministry of Northern Development and Mines. 4th Floor, 159 Cedar Street, Sudbury, Ontario P3E 6A5, telephone (705) 670-7264.
Les renseignements personnels contenus dans la presente formule sont recueillis en vertu de la Loi sur les m ines ei serviront a tenir a jour un registre des concessions minieres. Adresser toute quesiton sur la collece de ces renseignements au chef provincial des terrains miniers, mimstere du Developpement du Nord et des Mines, 159, rue Cedar, 4 e etage, Sudbury (Ontario) P3E 6A5, telephone (705) 670-7264.
1. Direct Costs/Gouts directs
Type
Wages Salaires
Contractor's and Consultant's Fees Droits de ('entrepreneur et de ('expert- consell
Supplies Used Fournltures utillsees
Equipment Rental Location de materiel
Description
Labour Main-d'oeuvreField Supervision Supervision sur le terrain
TypVvcC,' r^-t m 40. ~ vt.r~ W i"-"1i, f S y O' f ydfc-rtcCiCft /MfftM
Type
Type
Amount Montan!
•f
*
Totals Total global
tiw.0i
Total Direct Costs ^y^- c Total des couts directs j&b Jtf7,
2. Indirect Costs/Gouts indirects* * Note: When claiming Rehabilitation work Indirect costs are not
allowable as assessment work.Pour le remboursement des travaux de rehabilitation, les couts indirects ne sont pas admissibles en tant que travaux d'evaluation.
Type
Transportation Transport
Food and Lodging Nourriture et hebergementMobilization and Demobilization Mobilisation et demobilisation
Description
Type
Amount Montant
Sub Total of Indirect Costs Total partiel des couts indirects
Amount Allowable (not greater than 20H of Direct Costs) Montant admissible (n'excedant pas 20 W des couts directs)
Total Value of Assessment Credit Valeur totale du credit (Total of Direct and Allowable d'evaluation Indirect costs) (Total de* couts directs
Totals Total global
9t I ndlrects admissible*
Note: The recorded holder will be required to verify expenditures claimed in this statement of costs within 30 days of a request for verification. If verification is not made, the Minister may reject for assessment work all or part of the assessment work submitted.
Note : Le titulaire enregistre sera tenu de verifier les depenses Oemandees dans le present etat des couts dans les 30 jours suivant une demande b cet effet. Si la verification n'est pas effectuee, le ministre peut rejeter tout ou une partie des travaux devaluation presentes.
Filing Discounts
1. Work filed within two years of completion is claimed at 1000xb of the above Total Value of Assessment Credit.
Remises pour depdt
1. Les travaux deposes dans les deux ans suivant leur achievement sont rembourses a 100 0A de la valeur totale susmentionnee du credit d'evaluation.
2. Work filed three, four or five years after completion is claimed at 5007o of the above Total Value of Assessment Credit. See calculations below:
Total Value of Assessment Credit Total Assessment Claimed
x 0.50
2. Les travaux deposes trois, quatre ou cinq ans apres leur achievement sont rembourses a 50 07o de la valeur totale du credit d'evaluation susmentionne. Voir les calculs ci-dessous.
Valeur totale du credit d'evaluation
x 0,50Evaluation totale demandee
Certification Verifying Statement of Costs
l hereby certify:that the amounts shown are as accurate as possible and these costs were incurred while conducting assessment work on the lands shown on the accompanying Report of Work form.
that as l am authorized(Recorded Holder, Agent, Position in Company)
to make this certification
Attestation de I'dtat des couts
J'atteste par la presente :que les montants indiques sont le plus exact possible et que ces depenses ont et6 engagees pour effectuer les travaux d'evaluation sur les terrains indiques dans la formule de rapport de travail ci-joint.
Et qu'a litre de -.--.—^^^^————————^-^— je suis autorise(titulaire enregistre, representant, posts occupe dans la compagnie)
a faire cette attestation.
0212 (04/9)) Nota : Dans cette formule, lorsqv'il designe des personnes, le masculin est utilise au sens neutre

Ministry ofNorthern Developmentand Mines
September 13, 1996
Roy SpoonerMining Recorder4 Government Road EastKirkland Lake, ONP2N 1A2
Ministere d u Developpement du Nord et des Mines Ontario
Geoscience Assessment Office 933 Ramsey Lake Road 6th Floor Sudbury, Ontario P3E 6B5
Telephone: Fax:
(705) (705)
670-5853 670-5863
Dear Sir or Madam: Submission Number: 2.16528
Subject: Transaction Number(s): W 9680.00200
After reviewing the Work Report(s) we have prepared this letter and the attached summary, which lists the results of our review. Requirements of the Assessment Work Regulation may not have been fully met. Please examine the summary to determine the next course of action concerning the identified Work Report(s).
NOTE: The 90 day deemed approval provision, subsection 6(7) of the Assessment Work Regulation, is no longer in effect for this submission.
PLEASE NOTE ANY REQUESTED REVISIONS MUST BE SUBMITTED IN DUPLICATE.
If the anniversary dates for the mining claims affected by this correspondence have not passed, a number of options are available. Please contact the Mining Recorder to discuss these options.
If you have any questions regarding this correspondence, please contact Lucille Jerome at (705)670-5858.
Yours sincerely,
ORIGINAL SIGNED BYRon C. GashinskiSenior Manager, Mining Lands SectionMines and Minerals Division
Correspondence ID: 10204
Copy for: Assessment Library

Work Report Assessment Results
Submission Number: 2 .16528
Date Correspondence Sent: September 13, 1996 Assessor: Lucille Jerome
Transaction Number
First ClaimNumber Township(s) l A rea(s)
W9680.00200 1201790
Section:14 Geophysical IP 14 Geophysical MAG 14 Geophysical VLF
YARROW
Status
Approval After Notice
Approval Date
September 06, 1996
Correspondence to:Mining Recorder Kirkland Lake, ON
Resident Geologist Kirkland Lake, ON
Assessment Files Library Sudbury, ON
Other Recorded Holder(s) and/or Agent(s):Mike Caron PORCUPINE, ONTARIO
DRIVER RESOURCES INC. VANCOUVER, B.C.
Page: l
Correspondence ID: 10204

C/l COo
Powell Twp. (M.-241)4 M
SM
i s/r7J207640 1207504
MR
'29665TMR"
l 29672
? SIT*7S .V
4958S P29673 MHO©
2M
--r-*! i 494092-
--i—j 12.94594 1494893 j
l l
5I6
MR
UU.P. TRANSMSSIONJ.^
4MSMVnJfrS
1207629
'V,.1206100
W..tyy l "3142 @523,43•"^^^r/^T :'~- - f"^ '^•^•••-H*
1206098 l
l l - - r . . ̂^5^!?® \495898' 495899,'
1206080' wO".
6G (Q 4222
66
1 446423 l
'223367
itf!
1207505
120,
TA—
f
O ^Q ^)
CL--3iH~———— ^
"ST
12076)9
CV1 l 4229 l Ol S VGG^l ^ V3^29)
)96
II2D6093
- v.l 1223368
lOrovtl"l"
' 140441
1223364
5M
LUP. rRANSMSSKM LME
4M
'86'1201785' )3809
l! 120380^'9t '1206•:PP
RWD6ICC4I96
1207663.I2Q38;
^
3M
12038^ ft 6,
l
, 477178
.477178
L.U.P.*
DLUJ".
iLUJ*.
THE INFORMATION THAT APPEARS ON THIS MAP HAS BEEN COMPILED FROM VARIOUS SOURCES, AND ACCURACY IS NOT GUARANTEED. THOSE WISHING TO STAKE MIN ING CLAIMS SHOULD CON SULT WITH THE MINING RECORDER, MINISTRY OF NORTHERN DEVELOP MENT AND MINES, FOR AD DITIONAL INFORMATION ON THE STATUS OF THE LANDS SHOWN HEREON.
Rankin Twp. (M.-242)
[LOP.
J./---J
—--
IQ76757
\Orphan WalfefstonL .'- -.
5M 4M2M IM
'IM
470 52'22"
80 039'30" 0PP
O CD l/)
Morel Twp. (M.-238)
CIRCULATED JAN. 31, 1995
ON JUNF ui/. - - —— ... ..... .mm IM II" IIH Mill l
41P15NE0009 2.16528 YARROW200
TRIM LINE
THE TOWNSHIP OF
YARROWDISTRICT OF
TIMISKAMING
LARDER LAKEMINING DIVISION
SCALE: 1-INCH 40 CHAINS
LEGENDPATENTED LANDCROWN LAND SALELEASESLOCATED LAND
LICENSE OF OCCUPATIONMINING RIGHTS ONLYSURFACE RIGHTS ONLYROADSIMPROVED ROADSKING'S HIGHWAYSRAILWAYS
POWER LINES
MARSH OR MUSKEGMINES
CANCELLEDPATENTED S.R.O.
or
NOTES400* Surface Rights Reservation along the Shores of all Lakes and Rivers.L.O. 7601 Covers Flooding Rights inthis Township to below Contour 870*for Ont. Hydro. File 12290 v.2.
^jj^jW,iijL^^^— . -Lj-\ -i- ^xiJ\ft Pftill.
M1NIN6 AND SURTACE RIGHTS WITHDRAWN ORDER NO. W-L-21/93 DATED MARCHSOJ999
MtNMG ft SURTACE RIGHTS REOTENED TO v-' TROSPECTWG, SALE OR LEASE. ORDER O-L-IO/99.
PREVIOUSLY WITHDRAWN UNDER ORDER *W 63/13.
^ MINMG AND SURTACE RIGHTS WITHDRAWN ^ ORDER NO. W-L-K/93 DATED MARCHSOJ99S. )
PREVIOUSLY WITHDRAWN UNDER ORDER 0NRW 69/1
NOTICE OF FORESTRY ACTIvi, \THIS TOWNSHIP f A REA FALLS WITHIN THE ELK LAKE MANAGEMENT UNIT AND MAY BE SUBJECT TO FORESTRY OPERATION! THE MNR UNIT FORESTER FOR THIS AREA CAN Bf CONTACTED AT KL. ONT.
\
POK I TO
PLAN NO.260
ONTARIO
MINISTRY OF NATURAL RESOURCESSURVEYS AND MAPPING BRANCH O
(D LO

Mistinikon Lake
BASELINE
Lake or Pond
Access Road
Bush Road (ATV only)
Located Claim Post
Assumed Location
Claim Line
VLF-EM Inphase AnomalyGuttler , Maine .
Chargeability Anomaly (V/ rnV)
Filtered IP Effect (n1 to n4)
Dipole Dipole Array
Andesite Tuff
Syenite Porphyryi
Chlorite Schist
GneissGranodiorite Diorite PorphyryUltramafic j
Diorite Dikei
Diabase Dike (Matachewan)
Location Sample Au (PPB) .As (PPM) Cu (PPM)
Undefined
41P15NE0009 2.16528 YARROW
ContactFault
Major Fault
234567
89101112131415161718192021222324252627282930
454514545245453454544545645457•4S-+58
4545945460454614546245463454654546645467454684546945470454794548045481454824548345484454854548645487454884548945490
nil nil nil nil
3 nilnil
3nil nil nil nil
3nil nil nil nil
3nil nil 10 nil nil
3nil nil nil nil nil nil
167152161157
99
1 7
100 158 56 1 1 40 20 31 10 8
i 63551673108768816610282" 77
42132173
proposed drill targets
l 2t
DUPLICATE
R l
100Scale 1:5000
O 100 200 300
(meter*)
210
i
Unit 8 8c 9 mainly magnetically inferred
DRIVER RESOURCES Inc.COMPILATION MAP
Yarrow-1-95 GridYarrow Township, NTS: 41-P / N E
Larder Lake Mining DivisionMC Exploration Services Inc. Jan 1996
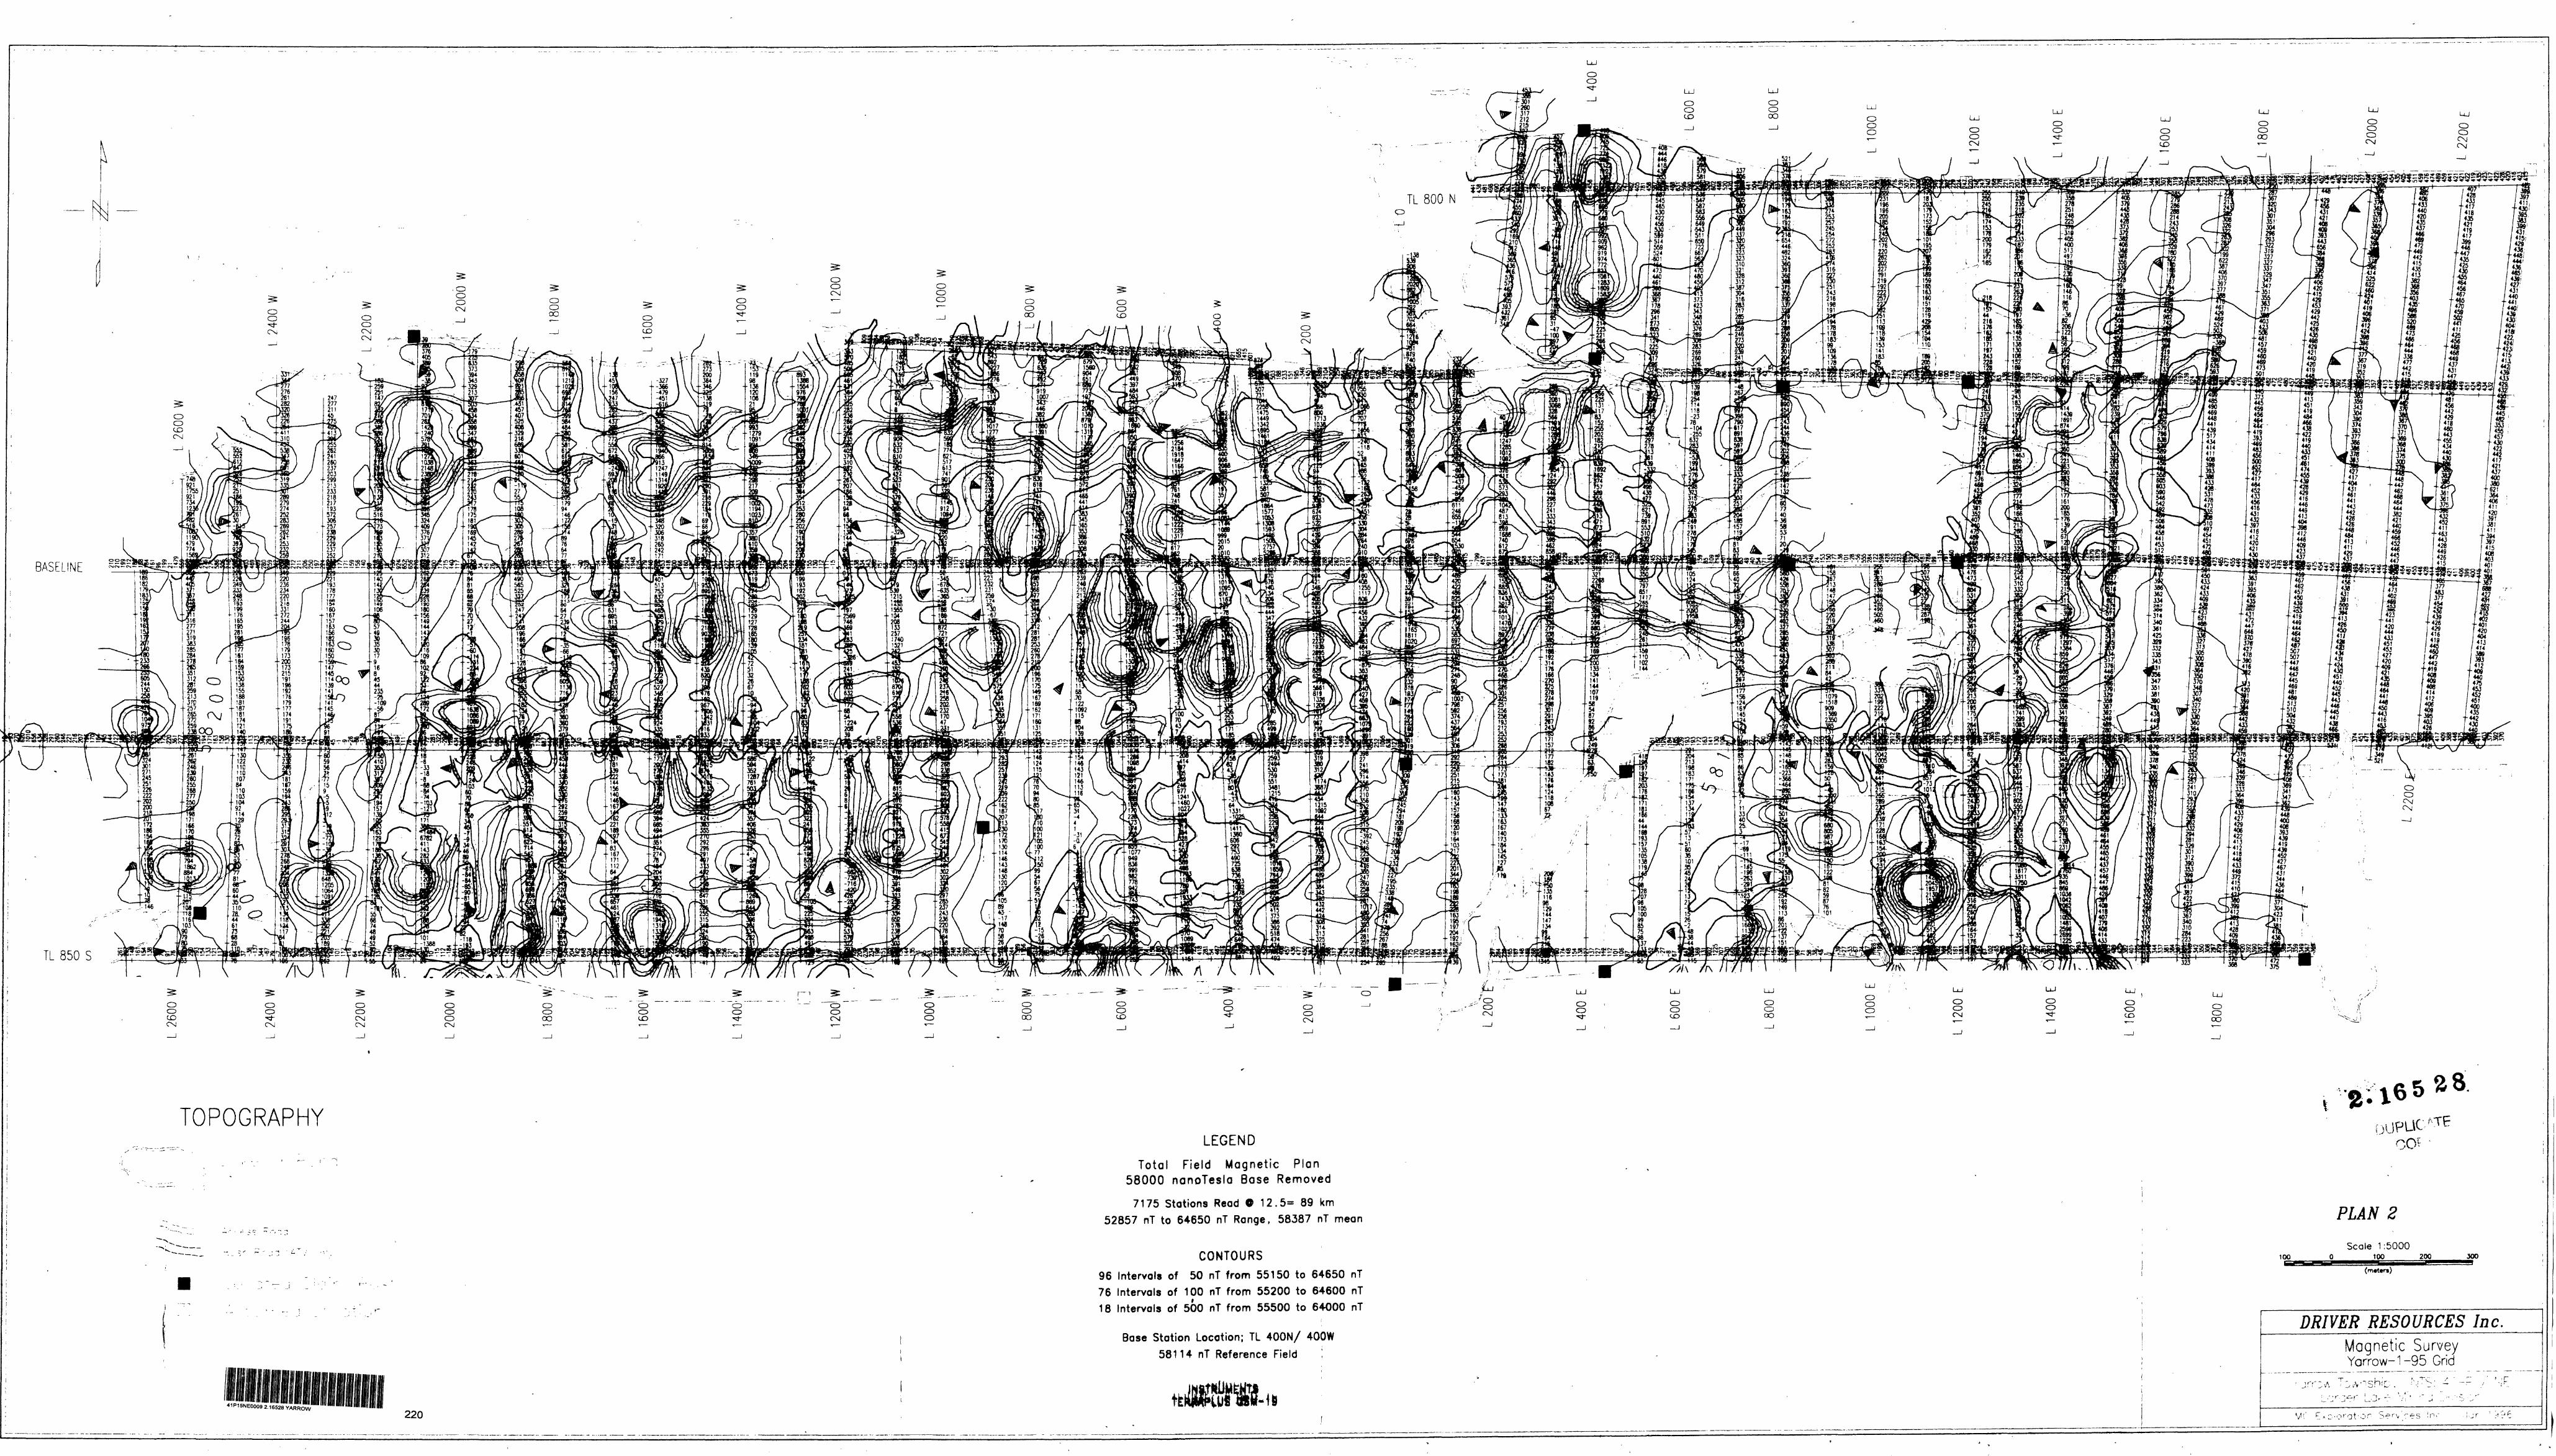
53815555555559589
BASELINE
, 427420
+ 409421435448464441450
f 443 ' 4T6
TL 850 S
TOPOGRAPHYLEGEND
Total Field Magnetic P lan 58000 nanoTesla Base Removed
7175 Stations Read 9 12.5~ 89 km 52857 nT to 64650 nT Range, 58387 nT mean
CONTOURS96 Intervals of 50 nT from 55150 to 64650 nT 76 Intervals of 100 nT from 55200 to 64600 nT 18 Intervals of 500 nT from 55500 to 64000 nT
Base Station Location; TL 400N/ 400W 58114 nT Reference Field !
PLAN 2
100Scale 1:5000
O tOO______200 300
(m*ters)
41P15NE0009 2.16528 YARROW
220
DRIVER RESOURCES Inc.Magnetic SurveyYarrow-1-95 Grid
V'" E"D'O r ot'O" Serv'res i

TL 850 S
VLF-EM Inphase Anomaly
C J T ^ E R We 1
M S T K J M E N T L MF -r j O rO . if" ' RESOURCES Inc
VLF-EM SurveyYarrow-1 -95 GT&
Yarrow Township, NTS: 41-P 7 NE Larder Lake Mining Division
41P1SNE0009 2 16528 YARROW
C. Exploration Services inc.