A. A.1 A.1.1 Penyiapan Bahan A.1.1. 1 Pengayak (Screening ...
Upload
khangminh22Category
view
5download
0
Novel electrochemical methods in analysis of selecteddrugs using carbon nanotubes-based sensors
Sadiković, Mirela
Doctoral thesis / Disertacija
2018
Degree Grantor / Ustanova koja je dodijelila akademski / stručni stupanj: University of Zagreb, Faculty of Pharmacy and Biochemistry / Sveučilište u Zagrebu, Farmaceutsko-biokemijski fakultet
Permanent link / Trajna poveznica: https://urn.nsk.hr/urn:nbn:hr:163:413913
Rights / Prava: In copyright
Download date / Datum preuzimanja: 2022-08-23
Repository / Repozitorij:
Repository of Faculty of Pharmacy and Biochemistry University of Zagreb

University of Zagreb FACULTY OF PHARMACY AND BIOCHEMISTRY
Mirela Sadiković
NOVEL ELECTROCHEMICAL METHODS IN ANALYSIS OF SELECTED DRUGS
USING CARBON NANOTUBES-BASED SENSORS
DOCTORAL THESIS
Zagreb, 2018.

University of Zagreb FACULTY OF PHARMACY AND BIOCHEMISTRY
Mirela Sadiković
NOVEL ELECTROCHEMICAL METHODS IN ANALYSIS OF SELECTED DRUGS
USING CARBON NANOTUBES-BASED SENSORS
DOCTORAL THESIS
Supervisor: Prof. Biljana Nigović, PhD
Zagreb, 2018.

Sveučilište u Zagrebu FARMACEUTSKO-BIOKEMIJSKI FAKULTET
Mirela Sadiković
NOVE ELEKTROKEMIJSKE METODE U ANALITICI ODABRANIH LIJEKOVA
PRIMJENOM SENZORA S UGLJIKOVIM NANOCJEVČICAMA
DOKTORSKI RAD
Mentor: prof.dr.sc. Biljana Nigović
Zagreb, 2018.

The doctoral thesis was submitted to the Faculty Council of the Faculty of Pharmacy and
Biochemistry, University of Zagreb in order to acquire a PhD degree in the area of
Biomedicine and Health, the field of Pharmacy, the branch of Pharmacy.
The work presented in this doctoral thesis was performed at the Faculty of Pharmacy and
Biochemistry, University of Zagreb, under supervision of Prof. Biljana Nigović, PhD, in
collaboration with Division of Materials Chemistry of the Rudjer Boskovic Institute.

ZAHVALE / ACKNOWLEDGEMENTS
Mojoj mentorici, prof. dr. sc. Biljani Nigović, koja je svoju strast i predanost prema
istraživanju prenijela na mene još za vrijeme studentskih dana. Hvala na uvođenju u svijet
znanosti, posebno u područje analitike lijekova, u kojoj sam pronašla onaj segment
farmaceutske struke kojim se želim do kraja života baviti. Veliko hvala na nesebičnoj podršci,
pomoći i savjetima tijekom svih ovih godina istraživanja i izrade doktorskog rada.
Doc. dr. sc. Mirandi Sertić na pomoći i svim savjetima oko ''kromatografskog'' dijela ovog
doktorskog rada te na prijateljstvu.
Mojoj najdražoj tehničarki Đurđici Nestić koja je svojim bodrenjem i osmijehom uvijek
obasjavala laboratorij, pa čak i onda kad bi analiza ''zapela''.
Svim ostalim djelatnicima Zavoda za analitiku i kontrolu lijekova na ugodnoj atmosferi i
druženjima.
Dr.sc. Miri Ristić i njezinim suradnicima sa Zavoda za kemiju materijala Instituta Ruđer
Bošković na snimanjima uzoraka elektronskom mikroskopijom.
Mojim dragim prijateljima uz koje je sve bilo puno lakše i vedrije.
Mojim roditeljima i bratu na bezuvjetnoj ljubavi, vjeri i podršci. Posebno hvala mami i tati što
su mi omogućili da danas budem sve što jesam i sve što mogu zamisliti.
Danielu, mojoj ljubavi i vjernom pratiocu kroz sve ove godine školovanja. Hvala ti što si mi
uvijek bio oslonac i što si uvijek vjerovao u mene te bio pun razumijevanja i kad su neke
druge stvari ''trpile'' zbog sati i sati provedenih u laboratoriju.

Sveučilište u Zagrebu
Farmaceutsko-biokemijski fakultet
Zavod za analitiku i kontrolu lijekova
A. Kovačića 1, 10 000 Zagreb
Mirela Sadiković
NOVE ELEKTROKEMIJSKE METODE U ANALITICI ODABRANIH LIJEKOVA
PRIMJENOM SENZORA S UGLJIKOVIM NANOCJEVČICAMA
Doktorski rad
Zagreb, 2018.
Mentor:
prof. dr. sc. Biljana Nigović (Farmaceutsko-biokemijski fakultet Sveučilišta u
Zagrebu)
Ova disertacija napisana je na engleskom jeziku temeljem članka 15. Pravilnika o
doktorskom studiju (Farmaceutsko-biokemijski fakultet u Zagrebu, 2017.)
Disertacija je pisana kao skup objavljenih znanstvenih radova popraćen kritičkim
preglednim poglavljem (tzv. skandinavski model), temeljem članka 14. Pravilnika o
doktorskom studiju (Farmaceutsko-biokemijski fakultet u Zagrebu, 2017.)

SUMMARY
Due to strict requirements regarding quality control of pharmaceuticals and with the aim of
obtaining maximal efficacy and safety of drug therapy for patients, there is a constant demand
for developing new reliable analytical methods to determine drug concentrations in complex
samples. Electroanalytical techniques, especially voltammetric, represent a powerful
analytical tool. Electrochemical nanosensors have recently found extensive applications in
pharmaceutical analysis. Therefore, the aim of this doctoral thesis was to develop new
electroanalytical methods for the determination of selected pharmaceuticals in dosage forms
and biological fluids using novel sensors based on multi-walled carbon nanotubes dispersed in
Nafion matrix, as well as their combination with zirconium oxide nanoparticles.
Electrochemical behaviour of selected drugs was examined by cyclic voltammetry to get an
insight into their redox mechanism at modified electrodes. Experimental conditions and
instrumental parameters that could affect the electroanalytical performance of proposed
sensors were carefully optimised. New methods were validated according to ICH guidelines.
Direct pulse voltammetric techniques (square-wave or differential pulse) were used to
determine the content of ropinirole, L-dopa, mesalazine and nebivolol in tablets, except for
ondansetron in which case adsorptive stripping procedure was employed. The good recoveries
indicated that excipients did not interfere with the assay of active ingredient in any case. In
comparison to the high performance liquid chromatographic methods, there were no
significant differences regarding the accuracy and precision; however voltammetric
techniques offer high sensitivity, rapid response and simplicity. Finally, nanosensors were
applied for the simultaneous quantification of selected pharmaceuticals with other co-
administered drugs in therapy (such as ondansetron with morphine and ropinirole with L-
dopa) or their metabolites (mesalazine and N-acetylated metabolite) in human serum samples
using adsorptive stripping voltammetry. Integration of the nanoparticles in the sensor
improved notably the determination of therapeutic concentrations of nebivolol in serum.
Excellent recoveries in the range of 98.7 – 102.6 % were obtained in all cases, without the
need for sample pretreatment. A considerable enhancement effect on voltammetric responses
of selected drugs is due to synergy of remarkable properties of nanomaterials and cation-
exchange polymer that enhanced the preconcentration of positively charged drug molecules.
KEYWORDS: multi-walled carbon nanotubes, zirconium oxide nanoparticles, Nafion,
voltammetry, electrochemical nanosensors, ondansetron, morphine, ropinirole, L-dopa,
mesalazine, metabolite of mesalazine, nebivolol

SAŽETAK
Uvod: S obzirom na sve složenije zahtjeve u kontroli kvalitete lijekova, a s ciljem
osiguravanja maksimalne učinkovitosti i sigurnosti terapije za pacijente, postoji neprestani
zahtjev za razvojem novih analitičkih metoda za određivanje lijekova u farmaceutskim
dozirnim oblicima i biološkim tekućinama. Elektroanalitičke tehnike su jako osjetljive,
selektivne, točne i precizne, a istodobno jednostavne i relativno jeftine s kratkim vremenom
analize. Zahvaljujući svojim brojnim prednostima, u posljednje vrijeme pronalaze sve
značajniju primjenu u analitici lijekova. Među njima se ističu voltametrijske tehnike, kao
najčešće korištene u području kvalitativnih i kvantitativnih ispitivanja lijekova. Razvoj
elektroanalitičkih tehnika usmjeren je ponajprije na razvoj novih elektrokemijskih senzora,
među kojima se posebno ističu nanosenzori. Ugljikove nanocjevčice, zbog svoje jedinstvene
strukture i izvanrednih svojstava, privukle su veliku pozornost u pripremi elektrokemijskih
senzora. Stoga su u sklopu ove doktorske disertacije razvijene nove voltametrijske metode za
određivanje odabranih elektroaktivnih lijekova slabo bazičnih svojstava primjenom
elektrokemijskih senzora s ugljikovim nanocjevčicama. Ugljikove nanocjevčice dispergirane
su u polimernom matriksu Nafiona, a u nekim ispitivanjima i dodatno obogaćene
nanočesticama cirkonijeva dioksida (ZrO2). Nakon validacije u skladu s ICH smjernicama,
metode su primijenjene za određivanje lijekova u gotovim farmaceutskim oblicima, kao i za
simultane analize zajedno primjenjivanih lijekova u terapiji ili lijekova i metabolita u
biološkim tekućinama.
Metode: Različite voltametrijske tehnike korištene su u svrhu kvalitativnog i kvantitativnog
ispitivanja odabranih lijekova. Cikličkom voltametrijom ispitano je elektrokemijsko
ponašanje lijekova radi stjecanja uvida u mehanizam i kinetiku redoks procesa koji se odvijaju
na modificiranim elektrodama. Pravokutnovalna voltametrija primijenjena je za određivanje
sadržaja ondansetrona, ropinirola, levodope i mesalazina u tabletama. Diferencijalna pulsna
voltametrija primijenjena je za određivanje sadržaja nebivolola u tabletama. Tablete su
nabavljene u ljekarnama u Republici Hrvatskoj. Kao usporedna tehnika za evaluaciju točnosti
i preciznosti novorazvijenih metoda korištena je tekućinska kromatografija visoke
djelotvornosti (HPLC) primjenom statističkih alata. Adsorptivna pravokutnovalna tehnika
korištena je za simultanu analizu ondansetrona s morfinom i ropinirola s levodopom te
mesalazina s glavnim N-acetiliranim metabolitom, dok je adsorptivna diferencijalno pulsna

metoda primijenjena za određivanje nebivolola u uzorcima seruma. Uzorci seruma prikupljeni
su od zdravih dobrovoljaca koji nisu uzimali nikakvu drugu terapiju u vrijeme davanja krvi te
su potpisali informirani pristanak i bili upoznati sa svrhom korištenja dobivenih uzoraka
seruma. Predloženi elektrokemijski senzori pripremljeni su dispergiranjem nanomaterijala u
Nafionu te nanošenjem odgovarajućih volumena suspenzije na površinu prethodno ispolirane
elektrode od staklastog ugljika, nakon čega je uslijedila evaporacija otapala. Morfologija
površine pripremljenih senzora ispitana je elektronskom mikroskopijom (scanning electron
microscopy, SEM) te cikličkom voltametrijom. U svrhu obrade podataka za potrebe ovog
doktorskog rada korišteni su programski paketi GPES 4,9 μ-Autolab potenciostata te
Microsoft office Excel 2010 i OriginPro 7,5 i 9,0.
Rezultati:
Elektrokemijsko ponašanje antiemetika ondansetrona ispitano je prvi put u sklopu
ovog doktorskog rada na nemodificiranoj i modificiranoj elektrodi od staklastog ugljika. U
odnosu na nemodificiranu elektrodu, modifikacija elektrode ugljikovim nanocjevčicama u
polimernom matriksu dovela je do izvanrednog poboljšanja voltametrijskog odgovora
ondansetrona zahvaljujući sinergističkom učinku modifikatora. 0,1 M sumporna kiselina
odabrana je kao optimalni elektrolit, a najveća osjetljivost dobivena je nanošenjem 5 μL
suspenzije koja je sadržavala ugljikove nanocjevčice i Nafion u omjeru 1:1. Razvijena metoda
primijenjena je za određivanje sadržaja ondansetrona u tabletama metodom standardnog
dodatka. Dobivena vrijednost analitičkog prinosa od 99,7 % ukazuje na dobru točnost metode
te prikladnost predloženog senzora za ovu svrhu. Analitički prinos dodane otopine standarda u
prethodno analiziranu otopinu tableta od 98,1 % pokazuje da pomoćne tvari u formulaciji ne
interferiraju s određivanjem aktivne tvari te nije potreban separacijski korak. Rezultati su
uspoređeni s rezultatima razvijene HPLC metode te je statističkom analizom pokazano da
nema značajne razlike u izvedbi ovih dviju metoda što se tiče točnosti i preciznosti.
Predloženi senzor uspješno je primijenjen i za simultanu analizu s analgetikom morfinom u
uzorcima seruma s kojim se nerijetko primjenjuje u terapiji. Dobivena je linearna ovisnost
njihovih voltametrijskih odgovora u području koncentracija 1,0 x 10⁻⁷
– 5,0 x 10⁻⁶
M za
ondansetron i 1,0 x 10⁻⁷
– 4,0 x 10⁻⁶
M za morfin nakon akumulacije pri optimalnim
vrijednostima Eacc = -0,5 V i tacc = 360 s. Razlika potencijala od 430 mV između strujnih
vrhova ondansetrona i morfina te niska granica detekcije (3,1 x 10⁻⁸
za ondansetron i 3,2-8
M

za morfin) omogućili su simultano određivanje vrlo niskih koncentracija ondansetrona i
morfina kakve se mogu naći u biološkim tekućinama nakon primjene uobičajenih terapijskih
doza s vrijednostima analitičkih prinosa 98,7 % ± 1,5 % za ondansetron i 102,6 % ± 2,7 % za
morfin.
Nanosenzor predložen u sklopu ovog doktorskog rada pokazao je izvrsnu osjetljivost i
selektivnost te je primijenjen u razvoju nove analitičke metode za simultanu analizu ropinirola
i levodope. Iako se ropinirol i levodopa vrlo često koriste zajedno u terapiji Parkinsonove
bolesti, dosad u literaturi nije bilo analitičke metode za njihovu simultanu analizu. Za
optimalnu izvedbu nanosenzora primijenjeno je 5 μL suspenzije koncentracije 1 mg/mL, pri
čemu je uzeta 0,5 % etanolna otopina Nafiona. Sva mjerenja u svrhu kvantifikacije provedena
su u 0,1 M sumpornoj kiselini. Pri optimalnim uvjetima postignut je linearan odgovor za
ropinirol u širokom području koncentracija 1,0 x 10⁻⁷
– 1,0 x 10⁻⁵
M te 2,5 x 10⁻⁷
– 1,0 x 10⁻⁵
M za levodopu. Velika razlika potencijala od 720 mV omogućila je simultanu analizu
ropinirola i levodope uz optimalnu akumulaciju pri Eacc = 0 V i tacc = 240 s prije samog
voltametrijskog mjerenja. Dobivene su vrijednosti analitičkih prinosa 99,6 % ± 2,2 % za
ropinirol i 98,8 % ± 2,3 % za levodopu u složenom matriksu poput seruma bez kompliciranog
postupka ekstrakcije prije analize. Nadalje, predloženi senzor primijenjen je i za individualno
određivanje sadržaja ropinirola i levodope u gotovim farmaceutskim oblicima. Dobiveni
rezultati pokazuju slaganje s deklariranim sadržajima u tabletama. Vrijednosti analitičkih
prinosa od 99,2 % za ropinirol i 99,4 % za levodopu ukazuju da pomoćne tvari ne
interferiraju, a t-test i F-test da nema statistički značajne razlike u pogledu točnosti i
preciznosti između novorazvijenih voltametrijskih i HPLC metoda.
U sklopu ovog doktorskog rada razvijena je prva elektroanalitička metoda za
simultanu analizu mesalazina i N-acetiliranog metabolita. Po prvi put ispitano je
elektrokemijsko ponašanje metabolita mesalazina. Zahvaljujući svojim odličnim svojstvima
predloženi nanosenzor omogućio je selektivno određivanje strukturno vrlo sličnih spojeva kao
što su lijek i njegov metabolit zajedno u serumu bez prethodne separacije. Razlika potencijala
na senzoru s ugljikovim nanocjevčicama u polimernom matriksu bila je 200 mV. Senzor je
pripremljen nanošenjem 3 μL suspenzije ugljikovih nanocjevčica u omjeru 1:1 s 0,3 %
etanolnom otopinom Nafiona. Britton-Robinson pufer pH 2,0 pokazao se kao optimalan za
simultanu kvantifikaciju. Bilo je potrebno svega 30 sekundi za simultano određivanje
mesalazina i metabolita u složenom matriksu poput seruma s visokom osjetljivošću (2,33 x
107 za mesalazin i 8,37 x 10
6 μA M
-1 za metabolit) i bez interferencija s endogenim biološkim

tvarima, što se vidi po vrijednostima analitičkih prinosa 100,1 % ± 2,7 % za mesalazin i 99,3
% ± 2,8 % za N-acetilirani metabolit. Direktnom pravokutnovalnom voltametrijom određen je
sadržaj mesalazina u dva različita farmaceutska oblika dostupna na tržištu Republike
Hrvatske. Dobivene vrijednosti analitičkih prinosa u vrijednosti 100,7 % te 99,8 %
omogućuju usporedbu njihove kvalitete i ukazuju na slaganje s deklariranim sadržajima u oba
slučaja. Ispitan je utjecaj pomoćnih tvari na voltametrijski odgovor mesalazina i ustanovljeno
je da nema interferencije (analitički prinos u rasponu 98,4 – 101,6 % za oba farmaceutska
proizvoda). Usporedbom točnosti i preciznosti s postojećim HPLC metodama u literaturi,
zaključeno je da nema statistički značajne razlike u njihovim izvedbama.
U sklopu razvoja nove voltametrijske metode za određivanje kardioselektivnog beta
blokatora nebivolola u farmaceutskom dozirnom obliku i serumu, senzor predložen u ranijim
istraživanjima dodatno je obogaćen nanočesticama ZrO2 kako bi se integracijom učinaka
dvaju nanomaterijala na elektrokatalitičku aktivnost postigao još bolji voltametrijski odgovor
lijeka i veća osjetljivost metode za praćenje terapijskih koncentracija lijeka u serumu. Posebna
pažnja pridodana je optimizaciji samog nanosenzora. S ciljem dobivanja maksimalne
osjetljivosti sinergističkim djelovanjem ugljikovih nanocjevčica, ZrO2 nanočestica i Nafiona,
ispitan je utjecaj omjera koncentracija dvaju nanomaterijala, koncentracije Nafiona u
etanolnoj otopini te volumena konačne suspenzije na elektrokemijsko ponašanje nebivolola.
Na inovativnom nanosenzoru dobiven je linearni odgovor nebivolola u području koncentracija
1,5 x 10⁻⁶
– 1,0 x 10⁻⁴
M bez akumulacije te u području koncentracija 1,0 x 10⁻⁷
– 6,0 x 10⁻⁶
M
s akumulacijom od 240 sekundi neposredno prije voltametrijskog mjerenja. Diferencijalno
pulsnom voltametrijom određen je sadržaj nebivolola u tabletama i pokazano je slaganje
dobivenih rezultata s deklariranim sadržajem (analitički prinos 98,3 %). Nema statistički
značajne razlike u odnosu na rezultate dobivene prethodno razvijenom HPLC metodom.
Utjecaj pomoćnih tvari ispitan je metodom standardnog dodatka i ustanovljeno je da nema
interferencija (analitički prinos 98,1 %). Očekivane koncentracije nebivolola u serumu nalaze
se unutar linearnog područja metode nakon kratke akumulacije na površinu elektrode te je
adsorptivna diferencijalno pulsna voltametrija korištena za određivanje nebivolola u uzorcima
seruma. Srednja vrijednost analitičkog prinosa 100,8 % ukazuje na odličan potencijal
predloženog nanosenzora za praćenje nebivolola u biološkim tekućinama.

Zaključak: Razvoj novih elektroanalitičkih metoda predstavlja važan znanstveni doprinos u
analizi onih lijekova za koje ovakve metode nisu dosad uopće razvijene ili nisu razvijene na
inovativnim elektrokemijskim senzorima. Nanosenzori predloženi u sklopu istraživanja ovog
doktorskog rada znatno su utjecali na poboljšanje osjetljivosti, selektivnosti i
reproducibilnosti novorazvijenih metoda zahvaljujući sinergističkom učinku modifikatora. S
druge strane, predloženi nanosenzori pokazuju dobru stabilnost u duljem vremenskom
razdoblju, a njihova priprema i regeneracija su vrlo jednostavne i brze. Suvremene
elektroanalitičke metode temeljene na ovakvim inovativnim elektrokemijskim senzorima
imaju velik potencijal za primjenu u složenom matriksu, kao što su farmaceutski dozirni
oblici i biološke tekućine, ne samo za istraživanja u akademske svrhe, već i u rutinskim
analizama lijekova. Predloženi nanosenzori mogu stoga doprinijeti u procjeni kvalitete
gotovih farmaceutskih proizvoda te poslužiti u kliničkoj medicini i farmaciji za praćenje
terapijskih koncentracija lijekova u biološkim uzorcima s ciljem postizanja što boljeg
farmakološkog učinka i manje toksičnih nuspojava.
KLJUČNE RIJEČI: ugljikove nanocjevčice, nanočestice cirkonijeva dioksida, Nafion,
voltametrija, elektrokemijski nanosenzori, ondansetron, morfin, ropinirol, levodopa,
mesalazin, N-acetilirani metabolit mesalazina, nebivolol

ABBREVIATIONS AND SYMBOLS
A electrode area
Ac-5-ASA N-acetylated metabolite of mesalazine
AdDPV adsorptive differential pulse voltammetry
AdSV adsorptive stripping voltammetry
AdSWV adsorptive square wave voltammetry
API active pharmaceutical ingredient
BDD boron-doped diamond
BDDE boron-doped diamond electrode
BR Britton-Robinson
C concentration
CE cappilary electrophoresis
CEC capillary electrochromatography
CMEs chemically modified electrodes
CNTs carbon nanotubes
CP carbon paste
CV cyclic voltammetry
CVD chemical vapor depostition
D diffusion coefficient
DMF dimethylformamide
DNA deoxyribonucleic acid
DPV differential pulse voltammetry
Emax maximum peak potential
Emin minimum peak potential
Ep,a anodic peak potential
Ep,c cathodic peak potential
EDXS energy dispersive x-ray spectroscopy
Esw square-wave amplitude
f frequency
FIA flow injection analysis
GC glassy carbon, gas chromatography
GCE glassy carbon electrode
HOPG highly oriented pyrolytic graphite
HPLC high performance liquid chromatography
Ip,a anodic peak current
Ip,c cathodic peak current
L-dopa levodopa
LC liquid chromatography
MALDI matrix-assisted laser desorption ionization
MOR morphine
MWCNTs multi-walled carbon nanotubes
n number of electrons
na number of electrons in the rate-determining step
NBV nebivolol
NPs nanoparticles
NPV normal pulse voltammetry
OND ondansetron
Ph.Eur. European Pharmacopoeia
ROP ropinirole
RVC reticulated vitreous carbon
SEM scanning electron microscopy
SPAB 2-hydroxy-5-[(4-sulfophenyl)azo]benzoic acid
SPC screen-printed carbon strips

SPE solid phase extraction
SPME solid phase micro extraction
SV staircase voltammetry, stripping voltammetry
SWCNTs single-walled carbon nanotubes
SWV square-wave voltammetry
XRD X-ray diffraction
5-ASA 5-aminosalicylic acid, mesalazine
α charge transfer coefficient
ν scan rate
τ duration of a potential cycle
ΔE step potential
ΔI difference in current

TABLE OF CONTENTS
1. INTRODUCTION ............................................................................................................... 1
1.1. THE IMPORTANCE OF PHARMACEUTICAL ANALYSIS ....................................... 2
1.2. ELECTROANALYTICAL TECHNIQUES IN PHARMACY ........................................ 2
1.3. VOLTAMMETRY ........................................................................................................... 5
1.3.1. Cyclic voltammetry ................................................................................................. 6
1.3.2. Pulse voltammetric techniques ............................................................................... 7
1.3.2.1. Differential pulse voltammetry ………………………………………………..8
1.3.2.2. Square-wave voltammetry …………………………………………………….9
1.3.2.3. Stripping voltammetry ……………………………………………………….11
1.4. ELECTRODES IN VOLTAMMETRY .......................................................................... 12
1.4.1. Carbon-based electrodes ....................................................................................... 13
1.4.1.1. Glassy carbon electrode ……………………………………………………..13
1.5. CHEMICALLY MODIFIED ELECTRODES ............................................................... 14
1.5.1. Carbon nanotubes-based electrochemical sensors ................................................ 14
1.5.1.1. Carbon nanotubes/Nafion composite film …………………………………...19
1.5.1.2. Metal nanoparticles and carbon nanotubes-based nanohybrids…………….20
1.5.1.3. Other analytical applications of carbon nanotubes in pharmacy and
medicine……………………………………...……………………………………………21
2. Multi-walled carbon nanotubes/Nafion composite film modified electrode as a sensor
for simultaneous determination of ondansetron and morphine ............................... 23
3. Voltammetric determination of ropinirole in the presence of levodopa at the surface of
a carbon nanotubes based electrochemical sensor in pharmaceuticals and human
serum .............................................................................................................................. 32
4. Electrochemical sensing of mesalazine and its N-acetylated metabolite in biological
samples using functionalized carbon nanotubes ........................................................ 42
5. Development of electrochemical platform based on carbon nanotubes decorated with
zirconium oxide nanoparticles for determination of nebivolol ................................. 52
6. GENERAL DISCUSSION ................................................................................................. 67

7. CONCLUSIONS ................................................................................................................. 85
8. REFERENCE LIST ........................................................................................................... 88
9. SUPPLEMENTAL DATA ............................................................................................... 106
9.1. Supplemental data 1: Multi-walled carbon nanotubes/Nafion composite film modified
electrode as a sensor for simultaneous determination of ondansetron and morphine 107
9.2. Supplemental data 2: Voltammetric determination of ropinirole in the presence of
levodopa at the surface of a carbon nanotubes based electrochemical sensor in
pharmaceuticals and human serum ............................................................................. 110
9.3. Supplemental data 3: Electrochemical sensing of mesalazine and its N-acetylated
metabolite in biological samples using functionalized carbon nanotubes .................. 114
9.4. Supplemental data 4: Development of electrochemical platform based on carbon
nanotubes decorated with zirconium oxide nanoparticles for determination of
nebivolol ..................................................................................................................... 117
10. BIOGRAPHY ................................................................................................................. 120

1
1. INTRODUCTION

2
1.1. The importance of pharmaceutical analysis
In recent years, there has been extraordinary progress in the discovery, synthesis,
sensitive analysis and means of delivery of pharmaceutically active compounds used in the
diagnosis, prevention and treatment of human diseases [1]. During the development of a new
drug product from the discovery stage to the commercial market, analytical chemistry plays a
great role [2]. The pharmaceutical and biomedical analysis is among the most important
branches of applied analytical chemistry [3]. Drug analysis is essential in various stages of
drug design and development, such as quality control, stability testing, preclinical and clinical
trials [4,5]. All these investigations require sensitive and reliable analytical methods in order
to measure drugs in pure and formulated forms as well as in complex media such as biofluids
[5] with the aim of obtaining data that can contribute to the maximal efficacy and safety of
drug therapy and maximal economy of the production of pharmaceuticals [6]. The increased
level of regulatory scrutiny under which the pharmaceutical industry should operate has also
fostered the continued development of analytical methods [4].
1.2. Electroanalytical techniques in pharmacy
Electrochemistry is a fast-growing field with a number of possible applications in
pharmacy. The great diversity of electroanalytical methods allows the application of
electrochemistry in various stages of drug research and development [7]. Oxidation and
reduction of functional groups are also important transformations in organic synthesis [8] and
therefore, electroorganic synthesis of pharmacologically interesting molecules can be used in
the early stages of drug research [9]. It represents a cost-efficient and sustainable ''green-
chemistry'' method [8,10,11] with possibility of easily scaling up many electrochemical
reactions [12]. Furthermore, electroorganic synthesis can provide outstanding selectivity and
reactivity due to accurate potential control [7] and in some cases the formation of products
that are not accessible via conventional methods [10]. In recent years, there have been several
examples of electrochemical synthesis of potential pharmaceuticals, such as novel 1,3-
indandione derivatives as possible antiplatelet agents [13], phenoxazine and diphenoxazine
derivatives which were shown through previous examinations to be effective antitumor,
antileukemia and antimicrobial material [14], benzoxazoles that represent an important
structure of several natural products, pharmaceuticals and biologically active compounds [15]

3
and benzofuranoquinone derivatives [16] with triad structures of catechol, benzofuran and
quinone that were shown to be useful from the point of view of pharmaceutical properties.
In addition to the synthetic approach, electrochemistry can be used at an early stage of
drug research for screening the pharmacological activity of a homologous series of newly
synthesized molecules [9]. The screening is based on correlation between oxidation or
reduction potential of investigated group of compounds with their molecular structure and
pharmacological activity [7]. For example, the relationship between antioxidant activity of
natural phenolic compounds and their voltammetric behaviour was investigated using
electroanalytical approach [17]. Antioxidant capacity of several drug products with
acetylsalicylic acid was also evaluated using voltammetry [18]. In early screening of new
analogues of clozapine, oxidation potential was correlated with their potential for
hematotoxicity. It was shown that only the compounds that did not easily oxidise could be
promising antipsychotic candidates with low side effects [19].
Electroanalytical methods can be quite useful to directly measure the stability of
certain pharmaceuticals in aqueous solution [20]. Depending on the compounds involved it
can be used to monitor either the decomposition of a drug [21–24] or the formation of a
decomposition product [25,26].
Electron transfer reactions have an important role in biochemical processes and hence
in biotransformation of drugs [7]. Due to similarity in the electrochemical and biological
reactions, it can be assumed that the oxidation/reduction mechanisms taking place at the
electrode and in the body share similar principles [27]. In such cases, when a relationship
between voltammetry and drugs exists, the knowledge of the mechanism of their electrode
reactions can help us to elucidate the mechanism of their interaction with living cells [28] and
their metabolic fate [29,30] in the human body after administration of the dosage form [31].
Using modern electroanalytical techniques, interactions of drugs with biologically
important macromolecules can be studied [7]. The extent to which a drug is bound to plasma
proteins may influence its distribution, onset of activity and rate of metabolism and excretion
[20]. In pharmacology, the free drug concentration, as opposed to the total drug concentration,
is suggested to reflect therapeutic efficacy. Banis et al. examined sensing performance of
clozapine using fundamental electrochemical methods with respect to the impact of protein
binding, showing lack of significant electrochemical activity resulting from bound clozapine
in protein complexes [32]. The decay in the current of paracetamol, after the addition of

4
protein, also confirmed a decrease in free drug concentration and formation of electroinactive
biocomplex [33]. Since the discovery of the electrochemical activity of nucleic acids,
interaction of anticancer drugs and other DNA targeted molecules with DNA has been the
focus of many electrochemical investigations [34]. Electrochemical approach can provide new
insight into rational drug design and would lead to further understanding of the interaction
mechanism between anticancer drugs and DNA [35–37]. The interaction mechanism can be
investigated in three different ways, by using DNA modified electrode, drug-modified
electrode and interaction in solution [38]. Moreover, DNA modified electrodes have recently
been often used in developing novel electrochemical biosensors for selective drug
determination [39–41].
Although there is an increase in utility of electrochemical methods in different parts of
pharmaceutical field, most publications dealing with electrochemistry describe its use in
solving analytically oriented pharmaceutical problems [9]. It can be used as an alternative or
complementary technique to spectrophotometric and separation chromatographic techniques
due to their many advantages [1,4]. Nevertheless, those methods are still commonly employed
for the determination of the drug in bulk form, pharmaceutical formulations and biological
fluids despite their many disadvantages, such as the need for derivatization, time-consuming
extraction procedures, consumption of large solvent volumes, expensive instrumentation and
running costs [27].
On the other hand, electroanalytical methods are a powerful and versatile analytical
tool that offers high sensitivity, selectivity, accuracy and precision, often in spectacularly
reproducible way [6] with relatively simple and inexpensive instrumentation [31] and rapid
analysis time [4]. It only requires very small sample volumes, often in microliter range. For
these reasons, electrochemistry is suited for the analysis of pharmaceuticals in biological
samples for clinical investigations, where small volumes of blood or urine are analysed for
low concentrations of drug products and metabolites [1]. Besides in biological fluids,
electroanalytical methods are well suited for the determination of drugs in various samples,
such as raw material and different pharmaceutical dosage forms, even those involving a
complex matrix, due to their very large useful linear concentration range [31].
They are, of course, restricted to determination of compounds, which can undergo
electrochemical oxidation or reduction in the available potential range, which depends on the
structure of the analysed species [42]. Most of the pharmaceutical active compounds were

5
found to be as electrochemically active and readily oxidised or reduced in contrast to the
excipients of pharmaceutical dosage forms [1]. The principal advantage is that electroanalysis
of pharmaceuticals in their dosage forms or biological samples is usually not affected from
the possible interferences depending on their oxidation or reduction potentials [1] and
generally the separation and extraction procedure is not necessary [43].
They can also be used as electrochemical detectors as they can very well adapt to
hydrodynamic conditions such as those encountered in liquid chromatography (LC), in
capillary electrophoresis, or in flow injection analysis (FIA) applied to drug compound
analysis [42]. Some of them are already implemented in European Pharmacopoeia (Ph. Eur.),
such as potentiometry, voltammetry, conductometry or amperometric titration in the
determination of water in pharmaceutically active compounds by Karl-Fischer titration [44].
The application of electrochemical techniques in the analysis of pharmaceuticals has
greatly increased over the few years [31] and there are many examples demonstrating
applicability of these methods in pharmaceutical and biomedical area, with only few selected
ones presented here, seeing that the extent of this doctoral thesis makes it impossible to quote
all papers dealing with various electrochemical, especially voltammetric determination of
drugs [45–66]. Examples include mainly innovative electrode materials and techniques,
similar to those used for the research in this doctoral thesis and described in the following
chapters.
1.3. Voltammetry
Among the variety of electrochemical techniques available for drug analysis,
voltammetry has become the most important and widespread technique [42]. The term
voltammetry refers to a group of electroanalytical methods in which information about
analyte is aquired by measuring current in an electrochemical cell as a function of applied
potential [67]. A plot of potential vs. current is called a voltammogram. Analysis of
voltammograms can yield analytical, kinetic and thermodynamic information as well as
information on other phenomena such as adsorption on the electrode surface [42]. Some of the
most important types of voltammetry, which are used for gaining both qualitative and
quantitative information about investigated drugs in this doctoral thesis, are discussed in the
following sections.

6
1.3.1. Cyclic voltammetry
In cyclic voltammetry (CV) the current response of a small stationary electrode in an
unstirred solution is excited by a triangular voltage waveform [42], which is shown in Figure
1, a).
Figure 1. One cycle of the triangular potential-excitation signal (a). The resulting cyclic
voltammogram (b). From [68].
The starting potential value is usually selected so that the chemical species under
investigation is not initially oxidised or reduced. The potential is then swept to a voltage Emax
or Emin (positive or negative sweep, respectively), at which point the scan direction is reversed
back to the original or to a different potential value. The potential window is selected so that
includes the oxidation or reduction process of interest. The current vs. applied potential curve
is recorded over one sweep (linear sweep), one cycle or multiple cycles [42]. The rate of
change of potential with time is referred to as the scan rate [1].
CV is the most widely used technique for acquiring qualitative information about
electrochemical reactions [11] of new systems and has also proven very useful in obtaining
information about fairly complicated electrode reactions particularly in the field of organic
chemistry and pharmaceutical compounds [42]. It is perhaps the most versatile
electroanalytical technique in pharmaceutical analysis [27] and often the first experiment
performed in an electrochemical study [27,42]. The power of CV results from its ability to
rapidly determine formal redox potentials of electroactive species, determine number of

7
electrons transferred and number of protons involved in redox reaction [9], detect chemical
reactions that precede or follow electron transfer or evaluate electron transfer kinetics [11,27].
The important parameters in CV are the magnitudes of the peak currents, Ip,a and Ip,c
and the potentials at which peaks occur, Ep,a and Ep,c (Figure 1, b)) that provide the basis for
analysing the cyclic voltammetric response [11]. A redox couple in which both species
rapidly exchange electrons with electrode, i.e. the potential-current profile which is governed
solely by diffusion and by Nernst equation, is termed an electrochemically reversible couple.
For a reversible couple, the anodic peak current, Ip,a , is given by the Randles-Sevcik equation
(T = 25 ºC):
Ip,a = 2,69 x 10⁵ n
3/2 A D
1/2 ν
1/2 C
where Ip,a is the anodic peak current (in amperes), ν is the scan rate (V s-1
), n is the
number of electrons transferred per species, A is the electrode area (cm2), D is the diffusion
coefficient of the electroactive species (cm2s
-1) and C is the concentration of analyte in bulk
solution (mol cm-3
). For a cathodic peak, Ip,c is given by the same expression but with a
negative sign [42].
Moving towards irreversible CV systems, when the kinetics has a successively greater
effect in slowing the electron transfer, the current peaks become more widely separated. In the
irreversible limit, no reverse reaction is observed, which happens with the oxidation of the
most pharmaceutical compounds (38). For an irreversible system the peak current is:
Ip = 2,99 x 10⁵ n(αna)
1/2 A D
1/2 ν
1/2 C
where na is the number of electrons in the rate-determining step of the electrode
process and α is the charge transfer coefficient. The detection limit of CV is usually about 10-6
M and it is not sensitive enough to determine drugs in body fluids after therapeutic doses [43],
but it can be very useful in optimising analytical conditions [3].
1.3.2. Pulse voltammetric techniques
Many limitations of CV, such as slowness and poor detection limits, were overcome
by the development of pulse methods [67]. The potential step is the basis of various pulse
techniques and sequence of such potential steps, each with a duration between 20 and 50 ms,
is applied to the working electrode [11,42]. Due to the short pulse duration, great increase in
sensitivity is achieved when compared to sweep or similar voltammetric methods. By

8
substantially increasing the ratio between the faradaic and non-faradaic currents compared to
sweep techniques and increasing sensitivity, pulse techniques may permit a limit of
quantitation at about 10-8
M concentration level, and, with correctly chosen parameters, the
measured current consists almost solely of the faradaic current [42].
The difference between the various pulse voltammetric techniques is the excitation
waveform and the current sampling regime [11]. After developing more sensitive pulse
methods, the electroanalytical methods are more regularly used on the drug analysis in their
dosage forms and especially in biological samples [1]. The most common types are staircase
(SV), normal pulse (NPV), differential pulse (DPV) and square wave (SWV) voltammetric
techniques, the most widely used being DPV and SWV [42].
1.3.2.1. Differential pulse voltammetry
Application of fixed-magnitude pulses superimposed on a linear potential waveform to
the working electrode results in differential pulse voltammetric techniques [69]. The
minimisation of charging current is achieved by sampling the current twice [1,42], before
pulse application and at the end of the pulse (Figure 2, a)). The difference in current (ΔI) per
pulse is recorded [67] as a function of the linearly increasing excitation voltage (Figure 2, b)).
a) b)
Figure 2. Potential program for differential pulse voltammetry (a). From [69]. Voltammetric
profile of ΔI versus staircase potential in DPV (b). From [70].
A consequence of double sampling and representing ΔI against potential is that the
DPV curves are peak-shaped and thus are well suited to analytical purposes [43]. Peak height
is directly proportional to the concentration of electroactive species [42]. Because of the

9
derivative shape of differential pulse voltammograms, the resolution of two compounds with
similar redox potentials is improved. Individual peak maxima without overlapping can be
observed for substances with a small potential difference such as 40-50 mV. In contrast,
normal-pulse voltammetry requires a potential difference of about 200 mV for resolving
waves [67]. Due to its high sensitivity and the availability of low-cost instruments, DPV is
often the choice for the determination of drug-active compounds in their dosage forms and in
body fluids [42].
1.3.2.2. Square-wave voltammetry
SWV is a powerful electrochemical technique suitable for analytical application,
mechanistic study of electrode processes and electrokinetic measurements. Nowadays it is
considered as one of the most advanced voltammetric techniques, which unifies the
advantages of pulse techniques (enhanced sensitivity), cyclic voltammetry (insight into the
electrode mechanism) and impedance techniques (kinetic information of very fast electrode
processes) [71]. In SWV, a waveform composed of a symmetrical square wave and
superimposed on a base staircase potential is applied to the working electrode [11] (Figure 3,
a)).
Figure 3. Potential waveform (a) and one potential cycle (b). From [72].
The main parameters of a potential cycle composed of two neighbouring pulses
(Figure 3, b)) are the height of the pulses (reffered as the SW amplitude, Esw), SW frequency
(f, defined as f =1/τ, where τ is the duration of a potential cycle) [72] and height of the
staircase waveform (potential increment, step potential, ΔE) [73].
10
The current is sampled twice during each square-wave cycle, once at the end of the
forward pulse and once at the end of the reverse pulse (Figure 3, b)). The difference between
the two measurements is plotted versus the base staircase potential [11]. Similarity with DPV
lies in the fact that the current is sampled at two different times in the waveform [1] and that
detrimental effects of charging current are reduced [42], however SWV has few advantages
over DPV and other pulse techniques which is why it is employed more often than others in
pharmaceutical analysis [1]. The main advantage of SWV is its speed. The analysis time is
drastically reduced; a complete voltammogram can be recorded within a few seconds, where
in DPV it takes about 2-3 minutes [11].
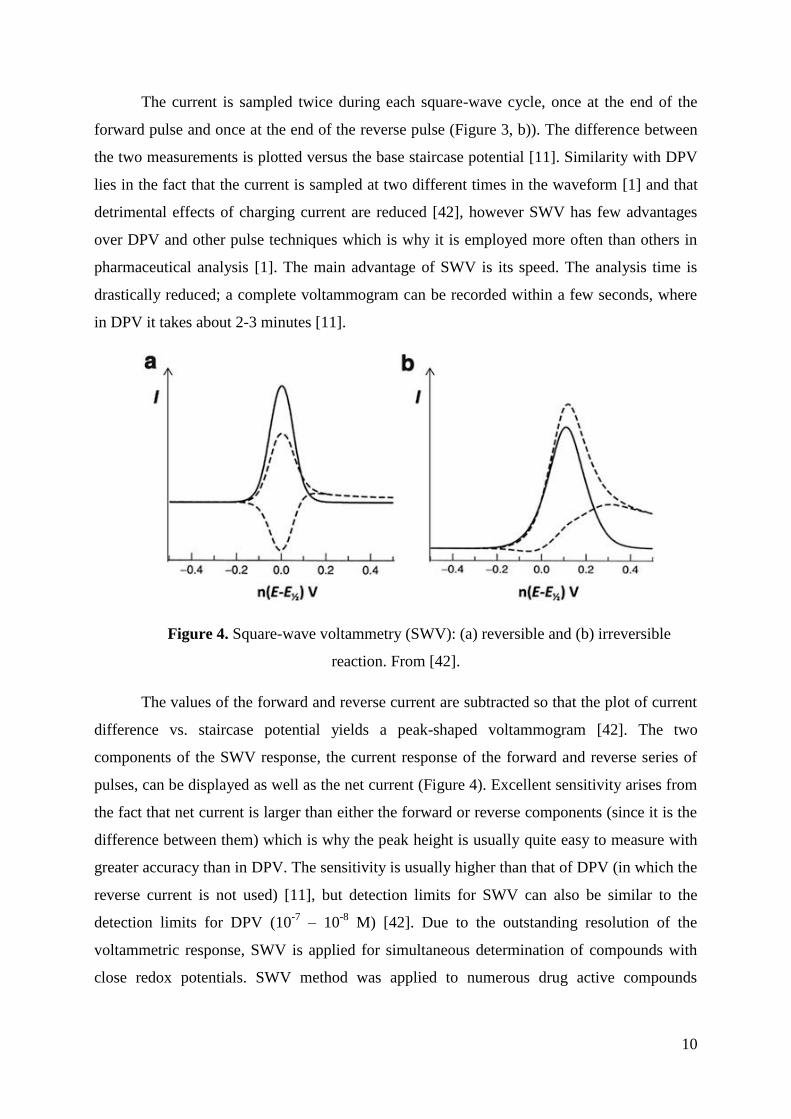
Figure 4. Square-wave voltammetry (SWV): (a) reversible and (b) irreversible
reaction. From [42].
The values of the forward and reverse current are subtracted so that the plot of current
difference vs. staircase potential yields a peak-shaped voltammogram [42]. The two
components of the SWV response, the current response of the forward and reverse series of
pulses, can be displayed as well as the net current (Figure 4). Excellent sensitivity arises from
the fact that net current is larger than either the forward or reverse components (since it is the
difference between them) which is why the peak height is usually quite easy to measure with
greater accuracy than in DPV. The sensitivity is usually higher than that of DPV (in which the
reverse current is not used) [11], but detection limits for SWV can also be similar to the
detection limits for DPV (10-7
– 10-8
M) [42]. Due to the outstanding resolution of the
voltammetric response, SWV is applied for simultaneous determination of compounds with
close redox potentials. SWV method was applied to numerous drug active compounds

11
because of its sensitivity and rapidity and it is very useful for drug analysis in their dosage
forms and biological samples because of the low LOD and LOQ values achieved with it [1].
1.3.2.3. Stripping voltammetry
Growing concerns about trace amounts of pharmaceutically active compounds and
heavy metal combinations have led to an increase in the monitoring of their low amounts in a
variety of matrices such as biological fluids or wastewater samples and environment [42,74].
In the analysis of such dilute samples, it is often necessary to employ some type of
preconcentration step prior to the actual quantification. This happens when the analyte
concentration is below the detection limit of the instrumental technique applied [43].
Stripping voltammetric (SV) forms a subdivision of voltammetry and constitutes one of the
most important groups of electroanalytical techniques [1].
There are different types of SV, classified primarily by the nature of the
preconcentration steps and scan direction of the stripping steps: anodic, cathodic, adsorptive
(AdSV) or potentiometric stripping voltammetry [42]. Even though those techniques have
their own unique features, they all have two steps in common [4]. First, the analyte is
accumulated or deposited on the electrode surface at open curcuit or under controlled applied
potential. During this accumulation step, the solution is usually stirred to increase solution
flow and thus also increasing the deposition rate. After equilibration, if needed, and after stop
stirring, the measurement (stripping) step is carried out [42]. Depending on the nature of
analyte, different modes of stripping analysis are used, such as linear sweep, NPV, DPV SWV
or potentiometric methods [1]. Pulse voltammetric waveforms are especially useful for the
stripping step as they effectively correct for background current contributions [4]. Using DPV
and SWV in the determination step, following the preconcentration, the detection limits can
be lowered down to 10-10
– 10-12
M [42]. Because of that, SV represents an extremely
sensitive electroanalytical technique [11] and can also increase in many cases the selectivity
of the method as it is less sensitive to matrix effects from excipients (in drug dosage forms) or
endogenous substances (in biological media) [27].
Numerous pharmaceuticals and biomolecules have a strong tendency to be adsorbed
from solutions onto an electrode surface [9] so the application of AdSV in the determination
of pharmaceuticals in biological fluids and drug dosage forms have been widely reviewed.
The primary difference between AdSV and other stripping methods is that preconcentration
step of the analyte is accomplished by adsorption on the electrode surface or by specific

12
reactions at chemically modified electrodes rather than accumulation by electrolysis. To
achieve maximum sensitivity with AdSV, optimum conditions for maximum adsorption
should be utilized during the accumulation step [4]. The main disadvantage of AdSV is
interference from other substances in the sample solution. Such compounds are usually
organic but can also be inorganic. Interference effects can often be minimised by applying the
right accumulation potential, shorter accumulation time and appropriate electrolyte parameter
(e.g. pH, buffer, ionic strength). AdSV techniques are well established and represent a large
area with many possible applications in the analysis of pharmaceutically active compounds in
their dosage forms or in biological media. AdSV with pulse techniques is highly selective,
sensitive and precise for detecting ultra-trace amounts of pharmaceutically active compounds,
important in research into drug design, bioavailability and safety [42].
1.4. Electrodes in voltammetry
Modern electroanalytical analyses are usually performed in a vessel containing a three
electrode cell system [31], immersed in a solution containing the analyte and also an excess of
a nonreactive electrolyte called a supporting electrolyte [67]. The performance of the
voltammetric procedure is strongly influenced by the material of the working electrode [11].
As voltammetric methods continue to develop, the range of working electrode materials
continues to expand [75]. A great challenge for high-quality electroanalytical determinations
is reproducibility, a low background current, an easily renewable electrode surface and a fast
electron transfer rate for target analyte [42].
Mercury used to be a very attractive choice of electrode material because it provides a
clean, reproducible surface for each determination with every new drop [3]. It also has a high
hydrogen overpotential that greatly extends the cathodic potential window (compared to solid
electrode materials). Disadvantages of the use of mercury are its limited anodic range (due to
the oxidation of mercury at low positive potentials) and its toxicity. The limited anodic
potential range of mercury electrodes has precluded their utility for monitoring oxidizable
compounds [11]. Moreover, at present time, in many countries the mercury electrodes are
considered as undesirable due to the toxic character of mercury and related salts.
Accordingly, solid electrodes with extended potential windows have attracted
considerable analytical interest [11]. Despite the difficulty of controlling their surfaces in a
reproducible manner, solid electrodes have distinct advantages over the mercury electrode
[76]. They have much larger positive potential range and are more mechanically stable and

13
environmentally friendly. The performance of an electroanalytical method depends on the
geometry and material composition of the solid electrode. In the selection of the solid
material, the redox behavior of the analyte, the nature of the supporting electrolyte, the pH
and the potential region required for the measurement of the redox processes of electroactive
drugs have to be considered [42]. Many different solid materials can be used as working
electrodes. The most often used are carbon-based and metal electrodes [76].
1.4.1. Carbon-based electrodes
Carbon, in different forms, is the most widely used solid electrode material. The most
popular carbon electrode materials are those involving glassy carbon (GC), carbon paste (CP),
carbon fiber, screen-printed carbon strips (SPC), reticulated vitreous carbon (RVC), highly
oriented pyrolytic graphite (HOPG), carbon films, pencil lead graphite, boron doped diamond
(BDD), etc. [42]. Electrochemical reactions on carbon-based electrodes are often slower than
at noble metal electrodes [11], the electron transfer kinetics being dependent on structure and
surface preparation [11,42], but they have a wider useful potential range than metal electrodes
in the negative and particularly so in the positive direction, due to slow kinetics of carbon
oxidation [75].
The high degree of delocalisation of π electrons, together with weak van der Waals
forces, provide good electrical conductivity and influence the electrical double layer,
molecular adsorption and electrode polarity [76]. The high surface activity of carbon materials
explains their susceptibility to electrode fouling by adsorption of organic compounds and
especially by electroactive pharmaceutical compounds. Many pretreatment cleaning
procedures have been developed, depending on the type of carbon, both renewing the surface
and activating carbon-based electrodes [42], and play a role in increasing the π electron
transfer rates [75]. The successful application of carbon electrodes in electroanalytical studies
of electroactive pharmaceutical compounds is due to the high chemical and electrochemical
stability of carbon materials, relatively high hydrogen and oxygen overpotential in different
electrolytes, a broad working potential range and availability of different carbon materials
[42], as well as their low background current, rich surface chemistry and low cost [11].
1.4.1.1. Glassy carbon electrode
Glassy carbon electrode (GCE) represents the most commonly used carbon electrode
in electroanalysis since the 1980s. The structure of GCE consists of graphitic planes randomly
organised as tetrahedral domains in a complex topology linked by short oxygen-containing

14
bridges, closely related to that of a vitreous material, with high lustre and glass-like fracture
characteristics, hence the designations of glassy carbon, vitreous carbon or pyrolytic carbon
[42]. GCE has remarkable physico-chemical properties, such as high strength, high thermal
and electrical conductivity [76] and also high chemical inertness [11] making it probably the
most inert carbon-based material [42]. It is mechanically polishable, extremely impermeable
to gases and liquids and compatible with all common solvents [75]. It is well known that the
GCE electrode possesses six-membered aromatic ring structures (sp2 hybridized carbon) in
which functional groups such as benzoquinone/ hydroquinone, phenolic and carboxylic acids
are present [77]. These influence reactivity, and thence also chemical derivatisations that are
possible on GCE [42]. The formation of these oxygen-containing functional groups is
common for almost all carbon surfaces of sp2 hybridized materials due to their reaction with
oxygen and water [78]. This surface chemistry can be very complex and has to be considered
during the study of the structure-function relationships at carbon-based electrodes [42].
1.5. Chemically modified electrodes
As far as solid electrodes are concerned, their perfection consists of the development
of electrochemical sensors, searching for and using new electrode materials [76]. Chemically
modified electrodes (CMEs) consist of conducting or semiconducting materials modified
using different reagents with the objective of obtaining specific surface properties for
electroanalytical applications [42]. For electroanalytical purposes, such deliberate alteration of
electrode surfaces aims at improving sensitivity, selectivity and/or stability [79]. It also very
often enables preferential accumulation of analyte or acceleration of electron transfer
reactions [11]. The unmodified electrodes are called ''bare'', ''native'' or ''virgin'' electrodes
[42] .
1.5.1. Carbon nanotubes-based electrochemical sensors
Nano-sized materials, also called nanostructured materials, have been shown to have a
number of novel and interesting physical and chemical properties which led to rapid growth
of using nanotechnology in the sensor fields [80]. Among them various families of novel
carbon materials with unique properties and advanced electrochemical performances emerged
and rapidly established themselves as reliable alternatives in electroanalysis due to their nano-
sizes and/or special structures [81]. Electrochemical nanosensors have recently found
extensive applications in pharmaceutical and biomedical industries with some great
advantages such as lower detection limits, wider linear response range, sensitivity, good

15
stability and reproducibility when compared with other sensors and techniques. Carbon
nanotubes (CNTs) represent an increasingly important group of nanomaterials and they have
recently received enormous attention in the preparation of electrochemical sensors [80] and
biosensors [82].
CNTs are built from sp2 carbon units arranged in graphene sheets, which have been
rolled up to form a seamless hollow tube [83]. Based on the number of layers, structures of
CNTs are classified into two types (Figure 5): single-walled carbon nanotubes (SWCNTs) and
multiwalled carbon nanotubes (MWCNTs) [84,85]. SWCNTs, as the name suggests, consist
of a single hollow tube with diameters between 0.4 and 2 nm while MWCNTs are composed
of multiple concentric nanotubes 0.38 nm apart where the final MWCNT has diameters of 2–
100 nm [84]. At present, the three main methods employed for CNTs synthesis are arc-
discharge, laser ablation, and chemical vapor deposition (CVD) [86].
Figure 5. Rolling a sheet of graphene to form SWCNT (a) and MWCNT (b). From
[87].
CNTs, a novel carbon form, has been exploited as an electrode material in
electroanalysis as a result of its unique structure [83] and extraordinary electronic, chemical
and mechanical properties. Their impressive structural, mechanical and electronic properties
are due to their small size and mass, their incredible mechanical strength [84], high surface-
to-volume ratio [88], chemical stability [89] and their high electrical and thermal conductivity
[84]. The conductivity of the tubes, as a consequence of their electronic properties, is
important for the role of these unique nanomaterials in electrochemistry. MWCNTs are
regarded as metallic conductors, a highly attractive property for an electrode. The situation is

16
not so clear for SWCNTs which can be metallic or semiconducting depending on their
chirality [81] and diameter [80].
Figure 6. Carbon nanotube structures of armchair, zigzag and chiral configurations.
From [84].
The chirality of SWCNTs relates to the angle at which the grafene sheets roll up and
hence the alignment of the π-orbitals [80]. There are three distinct ways for the molecule to do
the rolling, depending upon its direction: armchair, zigzag, and chiral (Figure 6.). Thus,
metallic nanotubes are achiral and in arm-chair configuration, while chiral and achiral zigzag
tubes are semi-conducting [84].
CNTs are have been proved to possess distinct electrochemical behaviour from other
carbon-based electrode materials because of which they are intensively exploited in
electrochemistry [90]. CNTs-based electrodes have been reported with various advantages,
such as negligible surface fouling [81,90], increased heterogenous electron transfer (ET) rates
[81] and consequently decreased over-potential [90], enhanced electroanalytical signals [91]
shown as increased voltammetric currents [84] and also increased sensitivity and therefore
lowered detection limits [90]. Analytical methods based on voltammetric stripping techniques
have also benefited from the unique properties of CNTs-modified electrodes, mainly due to
the stronger adsorption of many organic compounds on CNTs in comparison with
conventional working electrode materials [91].

17
An important part of the impressive success of the use of CNTs for electroanalytical
applications is probaby due to the ability of this nanomaterial to promote electron transfer in
electrochemical reactions [91]. CNTs are closed structures that represent two well defined
regions with clearly different properties, the tube and the cap (the tips and sidewalls), which is
half-fullerene-like molecule with topological defects that in this case are mainly pentagons
[92] (Figure 7).
Figure 7. A carbon nanotube with closed ends. From [84].
The electrocatalytic effect of CNTs has been attributed to the activity of edge-plane-
like graphite sites at the CNTs ends. MWCNTs have a sidewall structure similar to graphite
basal plane of HOPG, and the open-end is similar to the edge plane of HOPG. Accordingly,
electron transfer rates similar to a graphite edge-plane electrode can be expected [91]. The
presence of pentagonal defects produce regions with charge density higher than those
observed in the region of hexagonal graphite, either in planar or in tubular structures
demonstrating the connection between topological defects and CNTs electroactivity. It was
proposed by Compton's group that the reason for enhanced electrocatalytic activity of CNTs
is due to the presence of edge-plane like sites located at the end and in the ''defects'' areas of
the tubes [93].
It has been demonstrated that the electrocatalytic activity of MWCNTs strongly
depended on the CNTs fabrication mode [91] and a higher electrochemical reactivity of CNTs
was achieved when they were produced in CVD manner [94]. With carbon electrodes the rate
of electron transfer has been shown many times to be very surface dependant hence the
electrochemical activity is also influenced by the electrode preparation [90]. The protocols of
pretreatment are typically based on the oxidation of CNTs under different conditions.
Activation by treatment in acidic solutions has been widely used [92]. Modified electrodes
with CNTs which were pretreated with concentrate acids in order to open nanotubes and to

18
create carboxylic groups (Figure 8), exhibited an intense catalytic activity towards the
electrochemical oxidation [91].
Figure 8. Functionalisation of CNTs with strong acids. From [95].
Besides improving the electron transfer properties, this type of acidic purification is
also used for eliminating metallic impurities [92]. Most widely used method in commercial
preparation of CNTs is CVD in the presence of metal catalysts [81] which can usually cause
for CNTs to have metallic, nanographitic and amorphous carbon-based impurities. These
impurities can dramatically influence the electrochemical properties of CNTs and influence
the electrochemical responses of a large number of substances on CNTs-based electrodes
[96].
Electrocatalytic activity of CNTs also depends on the dispersing agent used to
immobilize them on the electrode surface [91], however one of the problems for the
preparation of sensors based on the use of carbon nanotubes is to achieve a homogenous
dispersion in usual solvents [92]. Before application to analytical assays, CNTs first must be
modified to facilitate homogenous dispersion [97]. First step in the modification of CNTs
with aim to improve their dispersion in various solvents has already been achieved upon
purification of the nanotubes, mentioned above [80]. The ends of CNTs, being terminated in
oxygenated species are quite hydrophilic but the walls, which comprise the vast majority of
the tube, are highly hydrophobic. This hydrophobicity presents a major challenge when it
comes to dispersing and manipulating CNTs to give controlled modification of electrode
surface. In aqueous solution or in polar solvents tubes have a tendency to rapidly coagulate

19
(agglomerate). As a consequence, dispersing tubes is usually performed in non-polar organic
solvents such as dimethylformamide (DMF) or with the aid of surfactants or polymers [92].
Using a polymer/CNTs composite is one way of improving the adhesion properties and the
film reproducibility since CNTs poor adhesion to the electrode surface and the CNTs
dispersion difficulty in most solvents results in the inconsistent electrocatalytic reaction at the
electrode [90]. The preparation of hybrid composite materials, based on integration of CNTs
with other materials possessing well-known electrochemical significance, has led to modified
electrode surfaces that exhibit special properties due to the synergistic effect from the
individual components. Materials used for such purposes mostly include polymers and metal
nanoparticles, but composites with cyclodextrines, microparticles or more recently ionic
liquids, have also been reported [91].
1.5.1.1. Carbon nanotubes/Nafion composite film
The polymer that has been often used as dispersing agent for CNTs is Nafion [90].
CNTs can be homogeneously dispersed in Nafion solution because of the hydrophobic side
chains and polar head groups of Nafion. CNTs/Nafion composite thin film modified
electrodes have their attractive effects in electroanalytical applications [98]. In general,
Nafion is the most extensively investigated ion-exchange polymer used for preparing CMEs
[20]. It is generated by copolymerization of a perflourinated vinyl ether comonomer with
tetrafluoroethylene [99] (Figure 9). Perfluorinated sulfonated cation exchanger has been
widely used as an electrode modifier due to its attractive permselective, ion-exchange and
antifouling properties [11].
Figure 9. Chemical structure of Nafion. From [100].
Nafion is chemically and thermally inert, non-electroactive, conductive and insoluble
in water and is, therefore, particularly suitable for the modification of electrodes [101].

20
Previously reported results have shown that Nafion membrane can enrich metal cations,
improve voltammetric signal-to-noise ratios, and increase the electrode’s resistance against
fouling by surface-active compounds effectively [102]. The modification of GCE by Nafion is
a quite simple and almost standardized way of enhancing electrode performances. After usual
polishing procedures of the GCE electrode, the modification is typically obtained by dropping
few microliters of alcoholic solution of Nafion onto the electrode surface, and by some
subsequent drying procedure [103].
One important reason for the application of Nafion modified electrodes in
electroanalytical chemistry is their ability to preconcentrate positively charged molecules,
which increases the sensitivity of the method. The accumulation mechanism of Nafion can be
explained through an electrostatic interaction due to the hydrophilic negatively charged
sulfonate groups in the polymer structure, whereas its ionic selectivity for hydrophobic
organic cations is achieved through hydrophobic interactions with the hydrophobic
fluorocarbons of the film. These two factors give Nafion selectivity for cations, and especially
high selectivity for hydrophobic organic cations [104].
In recent years, CNTs/Nafion-based electrodes have been increasingly used to solve
demanding electrochemical problems and often offer advantages over other types of electrode
materials [80]. The nano-hybridization by polymers is regarded as an effective technology for
obtaining the stable colloidal dispersion while simultaneously preserving the inherent
properties of carbon [105]. It is well known that homogeneous CNT dispersion and strong
interfacial adhesion with the matrix are critical issues in the development of polymer/CNTs
composites in order to attain improved properties. The combination of polymers with carbon
nanomaterials for the preparation of chemical sensors is opening up exciting areas of research
due to their biocompatibility, excellent sensitivity and selectivity [106].
1.5.1.2. Metal nanoparticles and carbon nanotubes-based nanohybrids
Nowadays, due to the fast development of nanotechnology, various nanomaterials,
including carbon nanotubes, nanoparticles of metals and metal oxides, as well as their hybrids
have been introduced to construct electrochemical sensors [107]. In recent years, metal
nanoparticles (NPs) have attracted much more attention in electroanalysis because of their
unusual physical and chemical properties [108]. These unique properties can often be
advantageous in electroanalytical techniques [109] and can result in an enhanced mass

21
transport, high surface area and high electrocatalytic activity [110]. This is all owing to their
nanosize and is not typical for the corresponding bulk material [111].
Generally, metal nanoparticles have excellent conductivity and catalytic properties,
which make them suitable for enhancing the electron transfer rate [111] for compounds which
have sluggish redox process at bare electrodes. The introduction of nanoparticles with
catalytic properties into electrochemical sensors and biosensors can decrease overpotentials of
many analytically important electrochemical reactions, and even realize the reversibility of
some redox reactions, which are irreversible at common unmodified electrodes [108].
Incorporation of nanoparticles to CNTs electrode matrices has demonstrated to
enhance the electrocatalytic efficiency of many electrochemical processes [91]. An interesting
class of carbon nanotube derivatives results from deposition of metal nanoparticles on the
tubular surfaces. Furthermore, uniform dispersion of metal nanoparticles decorated on CNTs
surfaces can yield ideal nanocatalysts for application in chemically modified electrodes [110].
Recently, there have been a growing number of electrochemical sensors that incorporate
different metal nanoparticles together with CNTs, solubilized in Nafion to form
nanocomposites for electrochemical detection [91].
1.5.1.3. Other analytical applications of carbon nanotubes in pharmacy and medicine
Although CNTs application in voltammetric techniques is especially favorable and
numerous publications in literature discuss about the use of CNTs as electrode materials or
modifiers of conventional working electrodes in analytical voltammetry [86], CNTs have also
contributed in different areas of drug analysis. In the field of analytical chemistry,
nanomaterials and especially CNTs can be used as matrices in matrix-assisted laser desorption
ionization (MALDI), as stationary phases in gas chromatography (GC), high performance
liquid chromatography (HPLC) or capillary electrochromatography (CEC), as
pseudostationary phases in capillary electrophoresis (CE) and as new solid-phase extraction
(SPE) materials [112]. Due to their strong interaction with other molecules, particularly with
those containing benzene rings, CNTs surfaces possess excellent adsorption ability.
Nonfunctionalized or functionalized CNTs have been successfully employed in extraction
techniques, such as SPE and solid phase micro-extraction (SPME) alone or in conjugation
with classical SPE sorbents for the analytical extraction of drugs in different media such as
biological fluids or drug preparations [84]. Due to their chirality they can be used also as
chiral selectors, with or without further modification, for the enantioseparation of

22
pharmaceuticals [113]. The excellent electroanalytical capabilities of CNTs modified
electrodes have also found important application in electrochemical detection systems
coupled with separation techniques such as liquid chromatography (LC) and capillary
electrophoresis [91]. Furthermore, CNTs have attracted great attention as suitable electrode
materials to be applied for the construction of biosensing platforms for in vivo and in vitro
diagnostics and therapeutic monitoring [89].
As a new and emerging nanomaterial, the use of CNTs as drug delivery carriers has
brought great attention in recent years [114]. The main applications of CNTs in pharmacy and
medicine include drug, biomolecule and gene delivery to cells or organs, tissue regeneration,
and biosensor diagnostics and analysis. Many studies have demonstrated that when bonded to
CNTs, these molecules are delivered more effectively and safely into cells than by traditional
methods [84]. Moreover, CNTs have been recently revealed as a promising antioxidant. It was
observed that the presence of –COOH groups would increase the free radical scavenging
activity of SWCNTs and that carboxylated SWCNTs are at least as good as, or even better,
free radical scavengers than their nonfunctionalized partners. Their antioxidant property has
been used in anti-aging cosmetics and sunscreen creams to protect skin against free radicals
formed by the body or by UV sunlight [84]. As with any new technology, there are concerns
over the application of nanomedicine, stemming from the lack of proper knowledge and the
need for the establishment of regulatory measures [114]. Identification of pharmacological
and toxicological profiles is of critical importance for the use of nanoparticles as drug carriers
in nanomedicine [115]. Despite a large number of studies performed in the past several years
to explore the potential toxic effects of CNTs, the results are still often contradictory [116] .

23
2. Multi-walled carbon nanotubes/Nafion composite film
modified electrode as a sensor for simultaneous determination of
ondansetron and morphine

Multi-walled carbon nanotubes/Nafion composite film modifiedelectrode as a sensor for simultaneous determinationof ondansetron and morphine
Biljana Nigović n, Mirela Sadiković, Miranda SertićUniversity of Zagreb, Faculty of Pharmacy and Biochemistry, A. Kovacica 1, 10000 Zagreb, Croatia
a r t i c l e i n f o
Article history:Received 19 November 2013Received in revised form17 January 2014Accepted 22 January 2014Available online 31 January 2014
Keywords:OndansetronMorphineMulti-walled carbon nanotubesNafionModified glassy carbon electrode
a b s t r a c t
The electrochemical behavior of ondansetron was studied on the multi-walled carbon nanotubes/Nafionpolymer composite modified glassy carbon electrode (MWCNTs–Nafion/GCE). The oxidation peakpotential was shifted from 1.32 V to 1.18 V compared to the bare electrode indicating excellentelectrocatalytic activity of immobilized film toward drug molecule. The modified electrode exhibited aremarkable enhancement effect on voltammetric response due to the synergistic effect of nanomaterialand cation-exchange polymer on the electron transfer rate, the effective electrode area and theaccumulation capability. After optimizing the experimental parameters, adsorptive stripping procedurewas used for the determination of ondansetron in pharmaceutical formulation. The results were satisfactoryin comparison with those obtained by high-performance liquid chromatography. In addition, theMWCNTs–Nafion/GCE exhibited high selectivity in the voltammetric measurements of ondansetron andco-administrated drug morphine with potential difference of 430 mV. The response peak currents had linearrelationship with drug concentration in the range of 1.0�10�7–5.0�10�6 M and 1.0�10�7–4.0�10�6 Mwith detection limits 3.1�10�8 and 3.2�10�8 M for ondansetron and morphine, respectively. The electrodewas successfully applied for simultaneous electrochemical sensing of both drugs in human serum samplesafter selective accumulation at the electrode surface.
& 2014 Elsevier B.V. All rights reserved.
1. Introduction
Ondansetron (OND) is a selective 5-HT3 receptor antagonistwidely used in the treatment of emetogenic side effects accom-panying cancer chemotherapy or radiotherapy (Scheme 1). It hasalso become the first line therapy for the prevention of post-operative nausea and vomiting [1]. In addition, OND is used toameliorate pruritus, irritable bowel syndrome, diarrhea associatedwith cryptosporidiosis or diabetes, chronic refractory diarrhea,anxiety and sleep disorders, alcohol dependency, opiate with-drawal syndrome, vertigo, Tourette's syndrome and psychosis inadvanced Parkinson's disease [2]. The studies on the use of OND innew indications continue and, therefore, the development of asensitive analytical method to evaluate the quality of its pharma-ceutical product or to determine drug concentration in biologicalfluids is highly required.
At present, several analytical methods have been employed forthe determination of OND in biological samples or pharmaceuticalpreparations, such as HPLC combined with mass spectrometry [3–5]
or UV detection [6–8], supercritical fluid chromatography/tandemmass spectrometry [9], HPTLC [10], spectrophotometry [11], radio-immunoassay [12] and capillary zone electrophoresis [13]. However,most of these methods are time-consuming, solvent-usage intensive,expensive and involve tedious sample preparations or, on the otherhand, suffer from poor selectivity.
Morphine (MOR) is a widely used and highly effective analgesicagent for the treatment of acute and chronic pain associated withcancer, recommended by the World Health Organization. ONDoften coexists with MOR in biological fluids as these drugs areco-administered for control of pain, nausea and vomiting inpatients undergoing surgical procedure and chemotherapy. Toprevent overdose-induced toxicity, monitoring of the therapeuticlevels of OND and MOR concentrations in biological samples ofpatients is a critical issue in clinical medicine. Therefore, it isnecessary to establish simple, rapid and sensitive analyticalmethods for detection and quantitation of OND and MOR inbiological matrix for clinical, toxicological and pharmacologicalstudies. Recently, some new electrochemical methods have beenproposed for morphine detection [14–19]. However, up to now,only one analytical method has been reported in the literatureon the simultaneous determination of OND and MOR [20].Two analytes were separated within 20 min and determined in
Contents lists available at ScienceDirect
journal homepage: www.elsevier.com/locate/talanta
Talanta
0039-9140/$ - see front matter & 2014 Elsevier B.V. All rights reserved.http://dx.doi.org/10.1016/j.talanta.2014.01.026
n Corresponding author. Tel.: þ385 1 6394 453; fax: þ385 1 4856 201.E-mail address: [email protected] (B. Nigović).
Talanta 122 (2014) 187–194

pharmaceutical dosage form by HPLC method with UV detection.Consequently, a cheap, highly sensitive and selective method is ofgreat demand for simultaneous determination of both drugs.
Electrochemical detection of an analyte is a very elegantmethod in pharmaceutical analysis due to its high sensitivity,rapid response, simple operations and low cost [21,22]. In spite ofthat, the redox behavior and electrochemical determination ofOND in pharmaceutical formulation or human fluids have not beenreported in the literature to this date. Our preliminary resultsshowed that the voltammetric response of OND at the glassycarbon electrode (GCE) was not satisfactory because of slowheterogeneous electron transfer. In the light of these findings, itwas a challenge to find a new electrode material for determinationof OND using voltammetric technique.
In recent years, carbon nanotubes (CNTs) have attractedincreasing attention in the electrode preparation due to theirunique structure and extraordinary electronic properties [23].CNTs have huge surface area, significant mechanical strength, highelectrical conductivity and efficient electrocatalytic activity. On theother hand, Nafion has been extensively applied as an electrodemodifier due to its excellent antifouling capacity, high permeabil-ity to cations and strong adsorption ability. The hydrophilicnegatively charged sulfonate group in Nafion film enables selectivepreconcentration of positively charged drug molecules throughelectrostatic interaction, whereas, the hydrophobic fluorocarbonnetwork of the polymer gives a selectivity for the hydrophobicpart of the molecule [24].
Based on the above advantages of nanomaterial and cation-exchange polymer, a simple and sensitive electrochemical sensorwas developed for simultaneous trace analysis of OND and MOR.To take advantage of the remarkable properties of MWCNTs inelectrochemical sensing application, the MWCNTs should beproperly functionalized and uniformly immobilized at electrodesurface. However, the MWCNTs are inclined to form agglomeratesdue to strong Van der Waals interactions when they are dispersedin water or organic solvents [23]. To overcome this difficulty,Nafion was selected as the binder in electrode fabrication proce-dure. In the presence of Nafion, the MWCNTs were homoge-neously dispersed into ethanol via ultrasonication. Consequently,a stable and uniform film was easily achieved at the electrodesurface after organic solvent evaporation.
The electrochemical behavior of OND on the multi-walledcarbon nanotubes/Nafion polymer composite modified glassycarbon electrode (MWCNTs–Nafion/GCE) strongly revealed selec-tive interfacial accumulation of positively charged drug moleculeand excellent electrocatalytic activity toward target, thus improv-ing the sensitivity and voltammetric signal-to-noise ratios as wellas the stability of the resulting film. The proposed method wasapplied for the quantification of OND in real drug samples. Theability of the modified electrode for voltammetric response ofMOR was also evaluated. Finally, the MWCNTs–Nafion/GCE was
successfully used as an electrochemical sensor for the simulta-neous determination of OND and MOR at trace levels in biologicalsamples.
2. Experimental
2.1. Apparatus
Voltammetric measurements were performed using a μ-Autolabpotentiostat (Eco Chemie, Utrecht, The Netherlands) controlled byGPES 4.9 software. A conventional three-electrode system wasemployed, comprising a bare GCE (3-mm diameter, Metrohm,Switzerland) or MWCNTs/Nafion film modified GCE as a workingelectrode, a platinum wire as a counter electrode and an Ag/AgCl/3 M KCl (Metrohm) as the reference electrode. All electrochemicalexperiments were carried out at room temperature (2371 1C).When required, stirring was applied using a computer-controlledstirrer at ca. 300 rpm.
Scanning electron microscopy (SEM) measurement was per-formed on a Jeol JSM-7000 F microscope (Jeol Ltd., Tokyo, Japan).High-performance liquid chromatographic experiments were car-ried out using an Agilent 1100 Series LC system equipped with adiode array detector (Agilent Technologies, Waldbronn, Germany).
2.2. Chemicals
OND, kindly donated by Pliva (Zagreb, Croatia), was used asreceived without any further purification. Ondantors (Sandoz)film-coated tablets, containing ondansetron hydrochloride dihy-drate equivalent to 8 mg of OND, were supplied by local pharmacy.MOR was obtained from the Agency for Medicinal Products andMedical Devices (Zagreb, Croatia). Multi-wall carbon nanotubes(498%, O.D. 6–13 nm, length 2.5–20 mm) and Nafion (5 wt%solution in a mixture of lower aliphatic alcohols and water) werefrom Sigma-Aldrich (Steinheim, Germany). All other chemicalswere of analytical grade quality. Ultra-pure water used for thepreparation of standard solutions and buffers was obtained by aMilli-Q system (Millipore, Bradford, USA).
2.3. Preparation of MWCNTs/Nafion electrode
Before use, the received MWCNTs were sonicated in concen-trated HNO3 for 4 h to generate carboxylic acid-functionalizedMWCNT surface. The suspension was filtered through a cellulosenitrate membrane with a 200 nm pore size. The solid powderswere washed thoroughly with double distilled water to removeany residual acid and then dried under vacuum at room tempera-ture. The immobilizing suspension was prepared by dispersing1 mg of functionalized MWCNTs in 1 mL of 0.5% (m/v) Nafionsolution prepared in ethanol. The mixture was then sonicated for
Scheme 1. Chemical structures of ondansetron (OND) and morphine (MOR).
B. Nigović et al. / Talanta 122 (2014) 187–194188

30 min to get a stable and well-distributed MWCNTs–Nafionsuspension. Prior to modification, the GCE was polished withaqueous slurry of 0.05 μm alumina powder on a smooth polishingcloth, thoroughly rinsed with water and then ultrasonicallycleaned in water for 30 s. Finally, the electrode was washed withpurified water and dried. The cleaned GCE was uniformly coatedwith 5 mL of the MWCNTs–Nafion suspension and air-dried atroom temperature. Then, the modified electrode was carefullyrinsed with purified water. At the beginning of experiment, themodified electrode was scanned by two successive cyclic voltam-metric sweeps between 0 and 1.4 V at 100 mV/s in a blank solutionof 0.1 M H2SO4. The relative electrochemical surface areas of theMWCNTs–Nafion/GCE and bare GCE were determined by cyclicvoltammetry (CV) between �0.2 and 0.7 V in 1�10�3 M ferri-cyanide solution as a redox probe in 0.1 M KCl electrolyte atdifferent scan rates (v). From the slope of the plot of anodic peakcurrent versus v1/2, the electro active area was calculated. Themodified MWCNTs–Nafion/GCE showed a surface area 5.2 timesgreater than the bare GCE. The MWCNTs–Nafion/GCE can be storedin air or kept in distilled water for several weeks without the lossof activity. For comparison, a Nafion modified GCE was preparedusing the same procedure described previously, but withoutMWCNTs, and denoted as Nafion/GCE.
2.4. Electrochemical measurement procedures
Stock solution of OND (1�10�3 M) was prepared in purifiedwater and stored under refrigeration. Stock solutions of MOR(1�10�3 M) were freshly prepared for daily use with purifiedwater. The working standard solutions of OND and MOR wereobtained by serial dilution of stock solutions with a supportingelectrolyte just before voltammetric measurements. The studieswere carried out in 0.1 M H2SO4 solution and Britton–Robinsonbuffer (0.04 M in each of acetic, phosphoric and boric acids)adjusted to the desired pH with 0.2 M sodium hydroxide solution.The oxidative behavior of OND was investigated by CV in the scanrange from 0.0 V to 1.5 V. Square-wave voltammetry (SWV) wasused for the determination procedures of OND and MOR. Thesensor was immersed in the sample solution and preconcentrationof both analytes was carried out at potential �0.5 V with a 360 saccumulation step. After 5 s equilibrium period, the voltammo-gram was recorded in the SWV mode (frequency, 75 Hz; potentialstep, 8 mV; amplitude, 25 mV) from 0.7 to 1.4 V. Following eachmeasurement, the MWCNTs–Nafion/GCE was transferred to thesolution of supporting electrolyte to regenerate the electrodesurface by applying single positive-going SWV potential scan from0.7 to 1.4 V.
2.5. Pharmaceutical dosage form assay procedure
To prepare the solutions of OND commercial pharmaceuticalproduct, ten tablets were weighted and crushed to a fine powder.An accurately weighted powdered sample of the drug formulationequivalent to 3.6 mg of active ingredient was transferred into a10.0 mL calibrated flask and dispersed in water. The tablet solutionwas sonicated for 15 min to provide complete dissolution of theactive ingredient. After sonification, the sample was filteredthrough 0.45 μm Acrodisc GHP filters (Gelman, Ann Arbor, USA).An aliquot of filtrate was then transferred into a calibrated flaskand diluted with water to yield a final drug concentration of1.0�10�4 M. A series of dilutions were made with the supportingelectrolyte to cover the working concentration range. Solutionswere subjected to voltammetric measurements as previouslydescribed and the content of OND in the pharmaceutical prepara-tions was determined by the standard addition method. For
recovery studies, aliquots of the OND standard solutions wereadded to real samples prepared from tablets.
For the comparison study, HPLC experiments were carried outusing a chromatographic column Zorbax C18, 250�4.1 mm, par-ticle size 5 mm (Agilent Technologies, Waldbronn, Germany). Themobile phase, consisted of acetonitrile, ultra-pure water andtetraethylammonium hydroxide at the ratio of 50:50:1 (v/v/v),was filtered through cellulose nitrate filter (0.45 μm, Sartorius,Goettingen, Germany). The HPLC analyses were carried out atconstant temperature (25 1C) with a flow-rate of 0.7 mL/min underisocratic conditions. For chromatographic analysis, standard solu-tions of OND were made by dilution with the mobile phase andfiltered through a 0.2 μm Acrodisc GHP filters (Gelman, Ann Arbor,USA). The 10 μL aliquots were injected into the HPLC system foranalysis. The DAD detector recorded UV spectra in the range from190 to 400 nm and chromatogram was obtained at 248 nm. Allchromatographic data acquisition and processing was performedusing ChemStation software (Agilent Technologies, Waldbronn,Germany).
2.6. Determination of OND and MOR in biological samples
Human serum samples were obtained from healthy volunteersabstained from any medications during the week preceding thestudy and were stored frozen until assay. Serum samples werefortified with the appropriate aliquot volume of OND and MORstandard solutions to achieve final concentrations (5.0�10�7 and1.0�10�7 M) that are found in serum after the treatment withtherapeutic daily doses of 16 and 80 mg for OND and MOR,respectively [25,26]. An aliquot of serum sample containing ONDand MOR was mixed with acetonitrile (1:1) to remove serumproteins effectively. After vortexing for 60 s, the mixture was thencentrifuged for 6 min at 6000 rpm. Appropriate volumes of thissupernatant were transferred into the volumetric flask and dilutedwith the supporting electrolyte and analyzed in the voltammetriccell. Quantitations in biological fluids were performed using thestandard addition method by adding three successive aliquots ofdrug standard solutions.
3. Results and discussion
3.1. Electrochemical response of OND at GCE
In this paper, the redox behavior of OND was studied for thefirst time and initially, we started with the investigation of theelectrochemical oxidation of drug molecule at a bare GCE by cyclicvoltammetry. A poorly defined anodic current response wasobserved during the scanning from 0 to 1.5 V (Fig. 1, curve a).On the reverse potential scan, there was no corresponding reduc-tion peak, suggesting that the electrode reaction of OND is totallyirreversible. The voltammetric response was broad due to slowelectron transfer. In addition, the peak potential of OND obtainedat GCE had a relatively high value, close to þ1.32 V in 0.1 M H2SO4
solution, which resulted in the merging of the signal current withthe background current. Therefore, the effect of pH on theelectrochemical response of OND was studied over the pH rangeof 2.0–9.0 in BR buffer. However, the peak potential of theoxidation process remained almost constant in the pH interval2.0–7.0 (Ep (V)¼1.37–0.009 pH). As the pH value was increasedabove 7, the oxidation peak shifted to less positive potentials, but itwas split into two broad and overlapped waves, together with adecrease in peak currents.
The effect of scan rate on the oxidative peak currents was alsoevaluated. Variation of the scan rate in the range of 20–500 mV/sresulted in a linear relationship between the anodic peak current
B. Nigović et al. / Talanta 122 (2014) 187–194 189

and the square-root of a scan rate. This indicates that the electrodeprocess was controlled by diffusion rather than adsorption. Addi-tionally, a plot of logarithm of peak current versus logarithm ofscan rate gave a straight line log i¼0.456 log v –0.326 (r¼0.993)with a slope very close to the theoretical value of 0.5, an expectedvalue for an ideal reaction of solution species [27]. Therefore, thepreliminary results clearly revealed that the voltammetricresponse of OND at bare GCE was not satisfactory for the analyticalapplication due to slow electron transfer reaction, reduced sensi-tivity since the adsorption of drug molecule could not be purpo-sely used as a preconcentration step, electrode fouling problemsand unstable analytical signal.
3.2. Electrochemical behavior of OND on modified electrode
To improve the electrochemical response of OND, the electrodewas modified with nanomaterial and cation-exchange polymer.The surface morphology of MWCNTs–Nafion/GCE was character-ized by SEM. As shown in Fig. 2, the MWCNTs were well dispersedin the Nafion and entrapped in the polymer matrix. The nano-composite film deposited at the surface of the GCE formed a three-dimensional structure and reticular formation revealing a muchlarger surface area than electrode geometric area.
The cyclic voltammograms of 1.0�10�4 M drug solution in0.1 M H2SO4 obtained at the MWCNTs–Nafion/GCE, Nafion/GCE
and a bare GCE with a scan rate of 100 mV/s are presented in Fig. 1.When the bare GCE surface was coated with 0.5% Nafion film, awell-shaped oxidationwave (ip¼9.6 mA) appeared at 1.29 V (inset ofFig. 1). Nafion as a cation-exchanger attracted positively chargeddrug molecules from the bulk solution to enhance the anodic signal.However, the electroanalytical performance of the MWCNTs–Nafion/GCE for measuring OND was advantageous over that observedat the Nafion/GCE and bare GCE. Compared with Nafion/GCE, thevoltammetric response of OND intensively increased at MWCNTs–Nafion/GCE with a current of 30.5 mA and a peak potential of 1.18 V.The oxidation peak potential of OND was shifted to less positivevalues by 140 mV compared with that of using a bare GCE indicat-ing faster electron transfer reaction at the electrode surface andexcellent electrocatalytic activity of immobilized film toward drugmolecule. The experimental results clearly indicated a remarkableenhancement effect on the electrochemical response of ONDobtained from the combined contribution of Nafion and CNTs. Thisis due to the larger surface area of the modified electrode as well asthe synergistic effect of the electronic conductivity and electroca-talytic activity of MWCNTs with ionic conductivity and ion-exchange capacity of Nafion. OND is a weak basic compound withpKa 7.4 and therefore, the molecule is completely protonated in theexperimental conditions under which voltammetric measurementswere performed. It is evident that Nafion enhances the preconcen-tration of drug molecules through electrostatic interaction withnegatively charged sulfonate group in Nafion polymer structure,leading to a considerable improvement in the analytical sensitivity.Another effect of Nafion observed here was fixing CNTs onto GCEsurface tightly and enhancing the stability of the electrochemicalsensor. On the other hand, the sensor exhibited a higher sensitivityfor OND determination owing to the excellent properties ofMWCNTs, thus indicating an improvement in the electrode kineticsand a decrease in the oxidation potential substantially. The ONDoxidation observed at the high potential using GCE was more facileat the MWCNTs–Nafion/GCE due to the shift in peak potentials toless positive values, thus placing the electrochemical oxidationoutside of the solvent window.
For evaluating the reaction character of OND at the MWCNTs–Nafion/GCE, cyclic voltammetry was performed in a 5.0�10�5 MOND solution with different scan rates. The peak potential waspositively shifted from 1.116 to 1.241 V when increasing the scanrates from 20 to 500 mV/s. The dependence of the peak potentialis linear with logarithm of the scan rate, which could be expressedas a regression equation: Ep (V)¼0.0927 log v (mV/s)þ0.989(r¼0.996), allowing the calculation of αn¼0.638 (inset of Fig. 3).Using the value of the charge transfer coefficient (0.66) obtainedfrom the difference between the peak potential (Ep) and the halfwave potential (Ep/2), taking the equation α¼(47.7/Ep–Ep/2) [28], thenumber of electrons exchanged was calculated to be n¼0.96. Thevoltammetric response of OND at the modified electrode is probablyinitiated by one-electron transfer to form the cation radical atnitrogen atom in the imidazole ring. On the other hand, peakcurrents were linearly increased with the scan rates from 20 to200 mV/s, and their relationship obeyed the following regressionequation ip (mA)¼0.227 v (mV/s)þ7.838 (r¼0.997). This resultindicated that the electrochemical reaction of OND at theMWCNTs–Nafion/GCE was a surface-controlled process [27]. There-fore, to obtain the highest sensitivity of the method, the adsorptionof OND at the modified electrode surface was purposely used insubsequent analytical measurements as an effective accumulationstep prior to the voltammetric quantitation of the drug.
3.3. Selection of the experimental conditions
The electrochemical oxidation of OND was examined in differ-ent electrolyte solutions using CV. Various types of the supporting
Fig. 1. Cyclic voltammograms of ondansetron (1�10�4 M) at a bare GCE (a) andthe MWCNTs–Nafion/GCE (b) together with corresponding background recording(c) in 0.1 M H2SO4. Inset: cyclic voltammograms of ondansetron at a bare GCE(a) and the Nafion/GCE (d). Scan rate: 100 mV/s.
Fig. 2. The surface image of MWCNTs–Nafion/GCE produced by scanning electronmicroscopy. Scale bar: 100 nm.
B. Nigović et al. / Talanta 122 (2014) 187–194190

electrolytes, including BR buffer pH 2.0–6.0, H2SO4, HCl andCH3COOH, were tested for the electroanalytical measurements,as shown in Fig. 3. The comparison of voltammograms showedthat only in lower pH values OND could exhibit higher peakcurrent. The drug molecule is completely protonated on thenitrogen atom in the imidazole ring and could be more effectivelyattracted to the modified electrode surface. A lower peak potentialand highest peak current was achieved in 0.1 M H2SO4 and,therefore, this solution was selected as the suitable supportingelectrolyte for the drug determination using the MWCNTs–Nafion/GCE.
To improve the sensitivity, SWV was employed for measuringOND due to the most favorable response compared to othervoltammetric modes such as differential pulse voltammetry andlinear-sweep voltammetry. Variation of the peak current for ONDrecorded at the MWCNTs–Nafion/GCE was monitored while chan-ging instrumental parameters, i.e. frequency (25 Hzr fr100 Hz),pulse amplitude (5 mVrar50 mV) and potential step (2 mVrΔEsr10 mV). The most favorable response was achieved using acombination of a frequency of 75 Hz, a pulse amplitude of 25 mVand a potential step of 8 mV.
The thickness of the cast film on the GCE surface, which wasdetermined by the amount of MWCNTs–Nafion suspension, hadcertain effects on the current response of OND. The volume ofMWCNTs–Nafion suspension coated on the electrode changed theproperties and functions of the electrode surface. When thevolume of MWCNTs–Nafion suspension added to the GCE surfaceincreased from 3 to 5 μL, the oxidation peak current enhancednotably, but with further increase of the amount of MWCNTs–Nafion suspension to 9 μL, the oxidation peak current converselyshowed gradual decline. The Nafion film became thicker andlowered the electrical conductivity of MWNTs and, consequently,retarded the electron transfer rate of OND oxidation as well as themass transportation between the drug and the electrode resultingin the higher electric resistance. In the beginning, on increasingthe amount of the modifier, the sites of electron exchangeincreased and the adsorption of OND was enhanced. However,the accumulation capacities of the film depend on the amount ofNafion, leading to an increment of the ion-exchange capacity ofthe film up to a certain limit, which is determined by the natureof the analyte and its diffusion through the film. The voltammetricsignal increased up to 0.5% of Nafion concentration in theimmobilizing suspension. The SWV response of OND reachedthe maximum when the composite film was uniformly coated on
the electrode surface using 5 μL of homogenous MWCNTs–Nafionsuspension.
3.4. Adsorption characteristics of OND on modified electrode
Since the modification of the electrode surface with a MWNTs–Nafion layer led to a strong interfacial accumulation of OND, thepossibility of the analyte preconcentration before voltammetricmeasurement was investigated in order to obtain lower detectionlimits. Fig. 4 shows square-wave voltammograms for 2.5�10�6 Msolutions of OND without accumulation and after a 360 s accumu-lation step at the MWCNTs–Nafion/GCE. To achieve the maximumsensitivity and the optimum conditions for the maximum adsorp-tion, the influence of accumulation potential on the stripping peakcurrent was evaluated from �1.0 to 0.9 V using SWV mode. Whenthe accumulation potential shifted from 0 to 0.9 V, the strippingpeak current greatly decreased. The results showed that theoxidation peak current increased as the accumulation potentialbecame more negative. The optimum deposition potential of�0.5 V was selected for subsequent sensitive determination ofOND. Square-wave voltammograms with increasing accumulationtimes (between 30 s and 480 s) were recorded for solutionscontaining OND at concentration level of 1�10�6 M. The accu-mulation time significantly affected the voltammetric response ofOND at the MWCNTs–Nafion/GCE. The oxidation peak currentenhanced greatly with the increase of the accumulation timewithin 360 s (Fig. 5). The linear relationship between the voltam-metric response and the deposition time pointed to a constantadsorption of positively charged drug molecules attracted on thesurface of the MWCNTs–Nafion/GCE. Further increment of accu-mulation time period showed a deviation of the peak current fromlinearity, thus indicating surface adsorption saturation. Therefore,the value of 360 s was considered as optimum to achieve thehighest possible sensitivity in acceptable analysis time.
3.5. Simultaneous determination of OND and MOR
To develop a new electroanalytical method for simultaneousdetermination of OND and MOR, the voltammetric response ofMOR was also studied at the MWCNTs–Nafion/GCE. Fig. 6 showsthe SWV responses from the electrochemical oxidation of ONDand MOR in 0.1 M H2SO4 solution following preconcentration for360 s at �0.5 V. The proposed sensor exhibited potent electronmediating behavior followed by well-separated oxidation peakstowards OND and MOR at 1.17 and 0.74 V, respectively. The large
Fig. 4. Square-wave voltammograms of ondansetron (2.5�10�6 M) at theMWCNTs–Nafion/GCE in 0.1 M H2SO4 after accumulation time of 360 s (a), withoutaccumulation (b) and blank solution (c). SWV settings: frequency of 75 Hz,amplitude of 25 mV and potential step of 8 mV, Eacc¼�0.5 V.
Fig. 3. Influence of supporting electrolyte on ondansetron oxidation at theMWCNTs–Nafion/GCE: 0.1 M H2SO4 (a), 0.5 M H2SO4 (b), Britton–Robinson bufferpH 2 (c) and pH 4 (d), 0.1 M CH3COOH (e) and 0.01 M HCl (f). Scan rate: 100 mV/s;c¼1�10�5 M. Inset depicts peak potential vs. logarithm of scan rates from 20 to500 mV/s in 0.1 M H2SO4.
B. Nigović et al. / Talanta 122 (2014) 187–194 191

separation of the peak potentials allows simultaneous determina-tion of OND and MOR in their mixture.
On the basis of previous investigation of MOR oxidationmechanism using GCE, the anodic voltammetric signal of MOR atthe MWCNTs–Nafion/GCE can be ascribed to oxidation of phenolicgroup which involves one electron transfer [29]. The tertiaryamine of MOR has a pKa of 8.4, and the phenolic group has apKa of 9.4. Therefore, MOR was also completely in the cationicform under used voltammetric condition and MOR molecule, likeOND, showed adsorption at the MWCNTs–Nafion/GCE. As shownin Fig. 5, the accumulation time of 120 s provided for MOR thelargest peak current in the linearity range indicating fasteradsorption of MOR then OND on the surface of the modifiedelectrode. However, the value of 360 s was used as the optimumfor simultaneous quantification of both drugs because the peakcurrent of MOR increased up to a maximum at tacc¼360 s whichwas selected previously as the optimal value for OND.
The oxidation peak of OND at 1.17 V in 0.1 M H2SO4 solutionafter 360-second accumulation time showed a linear response atthe MWCNTs–Nafion/GCE for concentration in the range of1.0�10�7–5.0�10�6 M. The calibration plot is described by thefollowing regression curve: ip (μA)¼3.38�107c (M)–0.43, r¼0.999. Since the presence of MOR may affect the quantificationof OND due to its competitive adsorption, the variation of
adsorptive stripping SWV peak current versus OND concentrationin the presence of MOR (1.5�10�6 M) was also checked usingMWCNTs–Nafion/GCE (Fig. 6). The sensitivity of the modifiedelectrode towards the oxidation of OND in the presence of MORis 3.27�107 mA M�1, which is very close to the value observed inthe absence of MOR (3.38�107 mA M�1), indicating that theoxidation of OND and MOR at the MWCNTs–Nafion/GCE, as wellas their adsorption at electrode surface in the accumulation step,are independent. The detection limit (LOD) and the quantificationlimit (LOQ) estimated from the calibration curve as LOD¼3s/b andLOQ¼10s/b, where s is the standard deviation of the intercept andb is the slope of the calibration curve, were calculated to be3.1�10�8 M for LOD and 9.6�10�8 M for LOQ. Compared withother methods, the linearity range obtained at proposed electro-chemical sensor for OND was in the similar concentration range asfor HPLC methods with UV detection and HPTLC [6,8,10]. The LODand LOQ values are better than those obtained in capillaryelectrophoresis and spectrophotometry [11,13], but are higherthan LODs reported for chromatographic methods coupled to massspectrometry [3–5]. However, the LC–MS analytical proceduresdemand expensive and sophisticated equipment that is not avail-able in many laboratories. The proposed voltammetric methodusing the MWCNTs–Nafion/GCE offers several advantages overchromatographic techniques applied only to the quantitativedetermination of a drug, including short analysis time, simplicityof operation and lower running cost. It should be mentioned onceagain that in the literature there are no studies on electrochemicalbehavior of OND or its voltammetric determination.
Fig. 7 shows the square-wave voltammograms for the solutionscontaining various concentrations of MOR and constant concen-tration of OND (1.5�10�6 M). It can be seen that the related peakcurrents increased by increasing MOR concentration, while thereare no significant changes in the peak current and potential ofOND. The calibration graph obtained for anodic peak current ofMOR at the MWCNTs–Nafion/GCE was linear within the concen-tration range of 1.0�10�7–4.0�10�6 M (inset of Fig. 7). Theregression equation was expressed as ip (μA)¼2.90�107c (M)þ11.99 with a correlation coefficient of 0.999. The calculated LODand LOQ values were found to be 3.2�10�8 and 9.8�10�8 M,respectively.
Fig. 6. Adsorptive stripping square-wave voltammograms of ondansetron at theMWCNTs–Nafion/GCE recorded in 0.1 M H2SO4 at different concentrations (1�10�7–5�10�6 M) in the presence of morphine (1.5�10�6 M). SWV settings andaccumulation conditions same as in Fig. 4. Inset shows a calibration graph for thequantification of ondansetron.
Fig. 7. Adsorptive stripping square-wave voltammograms of the mixture contain-ing morphine at different concentrations (1�10�7–5�10�6 M) and ondansetron(1.5�10�6 M) recorded at the MWCNTs–Nafion/GCE in 0.1 M H2SO4. SWV settingsand accumulation conditions same as in Fig. 4. Inset shows a calibration graph formorphine.
Fig. 5. Effect of the accumulation time on the oxidation peak current for ondansetron(1�10�6 M) (circles) and morphine (1�10�6 M) (squares). SWV settings andaccumulation conditions same as in Fig. 4.
B. Nigović et al. / Talanta 122 (2014) 187–194192

In comparison to HPLC–UV procedure developed for the simul-taneous quantification of MOR and OND mixtures in 0.9% sodiumchloride injection, the MWCNTs–Nafion/GCE showed wider linearrange for the quantification of both drugs [20]. The detection andquantification limits of OND and MOR obtained at this sensor areof the same order as for the HPLC method, but the proposedelectroanalytical method is simpler, cheaper and faster. In HPLCmethod the separation time of 20 min was necessary for theanalysis. In addition, the HPLC method requires a high percentageof organic solvent making it less environmental friendly.
3.6. Stability and reproducibility of the modified electrode
The stability of the MWCNTs–Nafion/GCE was checked bymeasuring the adsorptive stripping SWV response in 2.5�10�6 M OND and MOR solution over a period of four weeks.Before measurements, the modified electrode was scannedbetween 0.5 and 1.4 V in the solution of supporting electrolyteuntil the SWV response was stable. When the nanocompositemodified electrode was stored in the air at room temperature for10 days, the peak potential of both drugs was unchanged and thecurrent response of OND and MOR decreased by about 2.6% and3.2%, respectively. The high mechanical strength of the MWCNTs-interspersed in the polymer film could be the reason for the highstability of the proposed electrochemical sensor. Repeating theexperiment after a longer time period, it was found that thecurrent responses decreased about 15% in three weeks for bothdrugs.
To evaluate the repeatability of the electrode response, the samemodified electrode was used for six successive measurements of1.0�10�6 M OND and MOR solution. After each measurement, thesurface of the MWCNTs–Nafion/GCE was regenerated by applyingsingle positive-going SWV potential scan from 0.5 to 1.5 V in a blanksolution of 0.1 M H2SO4. The recorded oxidation peak potentialsfor OND (mean Ep¼1.17 V) and MOR (mean Ep¼0.74 V) wereunchanged. The RSD values of the peak current for OND (meanip¼35.4 μA) and MOR (mean ip¼36.9 μA) were 1.9% and 1.2%,respectively. These results indicated that the MWCNTs–Nafion/GCEwas stable in repeated measurements for selective determination ofOND and MOR compounds. The reproducibility of the modifiedelectrode was characterized by three replicate measurements of1�10�6 M OND and MOR over three days using freshly preparedstandard solutions. The RSDs of the anodic peak current for ONDand MOR were not greater than 2.5% and 1.7%, respectively.Additionally, a series of five sensors prepared repeatedly in thesame manner were also tested and the RSDs of peak potentials andcurrents for both drugs were in the range 0.5–0.7% and 2.5–3.1%,respectively, indicating good fabrication reproducibility.
All experiments confirmed that the prepared MWCNTs–Nafioncomposite film has good durability, homogeneity in deposition,reproducibility, more active sites and strong adherence to elec-trode surface. These characteristics are suitable for long-termelectrochemical sensing applications.
3.7. Interference
The influence of potential interfering species, which are likelyto be in biological samples or are co-formulated with the activepharmaceutical ingredient, on the voltammetric responses of ONDand MOR was examined. A fixed amount of 1�10�6 M OND andMOR, spiked with various excess amounts of interfering species,was evaluated under optimized experimental conditions describedpreviously. The tolerance limit was defined as the maximumconcentration of the interfering substance that caused an errorless than 75% in the determination of both drugs. The presence ofNaþ , Cl� (2000 fold), Kþ , NO3� , SO4
2� , HPO42� (1000 fold), Zn2þ ,
Ca2þ , Mg2þ , Cu2þ , Fe3þ , Na2EDTA, manitol (500 fold), L-alanine,L-glycine, L-aspartic acid, L-glutamic acid, citric acid (400 fold),lactose, sucrose, starch (300 fold) and L-cysteine (200 fold), had noinfluence on the peak current of both drugs. Also, nitrite (400 fold)did not interfere with voltammetric response of both drugsalthough nitrite ions were oxidized at þ0.75 V, very close toMOR potential. However, the MWCNTs–Nafion composite filmallows facile accumulation of the positively charged MOR mole-cule, while prevent accumulation of negatively charged oxidizablenitrite ions onto the electrode surface. The experiments displayedthat the oxidation peak current of OND and MOR at the MWCNTs–Nafion/GCE did not change after adding 400-fold concentration ofascorbic acid and 300-fold of glucose indicating that the selectivityof the method could be satisfactory for the quantification of bothdrugs in biological fluids where these endogenous substances arealways present. When 200-fold concentration of uric acid wasadded into the solution containing 1�10�6 M OND and MOR, noobvious interference was observed for OND quantification, but thecurrent response of MOR increased significantly due to the oxida-tion of uric acid at þ0.65 V. Selectivity of the developed procedurewas also investigated by observing any interference encounteredfrom dopamine. The results showed that dopamine is oxidized atpotential þ0.49 V, however, in the presence of equal concentra-tion do not cause a competitive adsorption onto the surface ofmodified electrode since a decrease in the currents of both drugswas not greater than 5%.
3.8. Applications of electrochemical sensor
The applicability of the MWCNTs–Nafion/GCE was examinedvia quantitation of OND in pharmaceutical dosage form. OND wasanalyzed in commercial film-coated tablets using the standardaddition method in order to eliminate matrix effects. The resultsobtained using the proposed sensor are in good agreement withthe claimed amount (Table 1). The analysis of OND in its pharma-ceutical formulation exhibited the mean recovery of 99.7% withthe relative standard deviation of 1.3% indicating good accuracyand precision as well as the suitability of the proposed sensor forthis purpose. To evaluate possible interactions with excipients,recovery experiments were carried out by spiking the formulationsolution samples with known amount of standard OND solution.The mean recovery of 98.1% indicated that excipients have nointerference effect on the analysis of OND, therefore a separationstep can be avoided.
The film-coated tablets were also analyzed by the reverse-phaseHPLC method. The developed HPLC method with UV-detection wasvalidated according to standard procedure [30]. The results obtained
Table 1Analysis of ondansetron in film-coated tablets by the proposed adsorptive strippingSWV and HPLC methods.
Technique AdSWV HPLC
Stated content (mg) 8.00 8.00Detected content (mg)a 7.97 8.02RSD % 1.25 0.39Added (mol L�1) 5.00�10�7 2.00�10�5
Found (mol L�1) b 4.91�10�7 1.97�10�5
Recovery % 98.1 98.5RSD % 3.46 0.24F c 0.10 –
t c 0.37 –
a Each value is the mean of five experiments.b Each value is the mean of three experiments.c The theoretical values of F and t-test at 95% confidence limit are 6.39 and 2.31,
respectively.
B. Nigović et al. / Talanta 122 (2014) 187–194 193

with the proposed sensor were compared to those obtained by theHPLC method (Table 1). Statistical analysis of the results obtainedusing voltammetric and HPLC procedures showed no significantdifference between the performance of the two methods regardingaccuracy and precision, as revealed by the student t-test andvariance ratio F-test. However, the electroanalytical method doesnot require separation, degassing and expensive solvents that areneeded for an HPLC procedure.
Finally, the MWCNTs–Nafion/GCE was applied for simultaneousdetermination of OND and MOR in biological samples. Thesensitivity of the proposed method complies with the expectedserum concentration level for both drugs after the treatment withthe therapeutic daily dose. However, the quantitation of OND andMOR in human serum at the therapeutic concentration rangecould not be feasible without accumulation of protonated drugmolecules on the MWCNTs–Nafion/GCE surface. Furthermore, theMWCNTs–Nafion film contains sulfonate groups and such surfacelayer prevents accumulation of negatively charged oxidizablesubstances found in biological fluids onto the electrode surface.The recovery studies of both drugs in serum samples wereperformed using the standard addition method to nullify anyremaining interference. The mean recovery of 98.771.5% forOND and 102.672.7% for MOR was achieved in this type ofmatrix. From the experimental results, it is obvious that theproposed electrochemical sensor has great potentials for practicalanalysis of biological samples.
4. Conclusions
The paper describes, for the first time, the oxidative behaviorand electrochemical determination of OND. A simple, but power-ful, approach was applied for the fabrication of stable CNT-basedelectrochemical sensor. The MWCNTs–Nafion/GCE exhibited aremarkable enhancement effect on the voltammetric response ofOND due to excellent electrocatalytic activity and adsorptioncapability of the immobilized film toward the drug molecule. Thiswork provides a new and convenient electroanalytical method fordirect quantitation of OND in film-coated tablets. In comparison toHPLC method, the proposed sensor possesses numerous advan-tages such as high sensitivity, rapid response, low cost and simpli-city. In addition, the MWCNTs–Nafion/GCE exhibited high selectivityin the voltammetric measurements of OND and co-administrateddrug MOR with potential difference of 430 mV. The electrode was
successfully applied for the simultaneous determination of bothdrugs in human serum samples after selective accumulation at theelectrode surface.
References
[1] A. Markham, E.M Sorkin, Drugs 45 (1993) 931–952.[2] J.H. Ye, R. Ponnudurai, R. Schaefer, CNS Drug Rev. 7 (2001) 199–213.[3] F. Musshoff, B. Madea, F. Stuber, U.M. Stamer, J. Anal. Toxicol. 34 (2010)
581–586.[4] K. Liu, X.J. Dai, D.F. Zhong, X.Y. Chen, J. Chromatogr. B 864 (2008) 129–136.[5] Y. Dotsikas, C. Kousoulos, G. Tsatsou, Y.L. Loukas, J. Chromatogr. B 836 (2006)
79–82.[6] R. Sheshala, Y. Darwis, N. Khan, Chromatographia 70 (2009) 75–81.[7] V. Zizkovsky, R. Kucera, J. Klimes, J. Pharm. Biomed. Anal. 44 (2007)
1048–1055.[8] D. Chandrasekar, S. Ramakrishna, P.V. Diwan, Arzneim. –Forsch. 54 (2004)
655–659.[9] Y. Hsieh, L. Favreau, J. Schwerdt, K.C. Cheng, J. Pharm. Biomed. Anal. 40 (2006)
799–804.[10] P.B. Raval, M. Puranik, S.J. Wadher, P.G. Yeole, J. Pharm. Sci. 70 (2008) 386–390.[11] A. Raza, A.S. Ijaz, Atta-ur-RehmanU. Rasheed, J. Chin. Chem. Soc. 54 (2007)
223–227.[12] S.A. Wring, R.M. Rooney, C.P. Goddard, I. Waterhouse, W.N. Jenner, J. Pharm.
Biomed. Anal. 12 (1994) 361–371.[13] C. Arama, A. Varvara, C.M. Monciu, Farmacia 59 (2011) 34–43.[14] K.C. Ho, C.Y. Chen, H.C. Hsu, L.C. Chen, S.C. Shiesh, X.Z. Lin, Biosens. Bioelectron.
20 (2004) 3–8.[15] A. Salimi, R. Hallaj, G.R. Khayatian, Electroanalysis 17 (2005) 873–879.[16] F. Li, J. Song, C. Shan, D. Gao, X. Xu, L. Niu, Biosens. Bioelectron. 25 (2010)
1408–1413.[17] N.F. Atta, A. Galal, R.A. Ahmed, Electroanalysis 23 (2011) 737–746.[18] N.F. Atta, A. Galal, S.M. Azab, Analyst 136 (2011) 4682–4691.[19] A. Babaei, M. Babazadeh, H.R. Momeni, Int. J. Electrochem. Sci. 6 (2011)
1382–1395.[20] T.G. Venkateshwaran, J.T. Stewart, D.T. King, J. Liq. Chromatogr. Relat. Technol.
19 (1996) 1329–1338.[21] B. Nigović, S.B. Hocevar, Electrochim. Acta 58 (2011) 523–527.[[22] B. Nigović, J. Spajić, Talanta 86 (2011) 393–399.[23] G.A. Rivas, M.D. Rubianes, M.C. Rodrıguez, N.F. Ferreyra, G.L. Luque,
M.L. Pedano, S.A. Miscoria, C. Parrado, Talanta 74 (2007) 291–307.[24] B. Nigović, M. Marušić, S. Jurić, J. Electroanal. Chem. 663 (2011) 72–78.[25] R. de Wit, J.H. Beijnen, O. van Tellingen, J.H. Schellens, M. de Boer-Dennert,
J. Verweij, Br. J. Cancer 74 (1996) 323–326.[26] F. Tagliaro, D. Franchi, R. Dorizzi, M. Marigo, J. Chromatogr. B 488 (1989)
215–228.[27] E. Laviron, J. Electroanal. Chem. 112 (1980) 1–9.[28] A.J. Bard, L.R. Faulkner, Electrochemical Methods Fundamentals and Applica-
tions, 2nd ed., Wiley, New York, 2004.[29] J.M.P.J. Garrido, C.D. Matos, F. Borges, T.R.A. Macedo, A.M.O. Brett, Electro-
analysis 16 (2004) 1419–1426.[30] International Conference on Harmonization (ICH), Validation of Analytical
Procedures: Text and Methodology Q2 (R1), 2005.
B. Nigović et al. / Talanta 122 (2014) 187–194194

32
3. Voltammetric determination of ropinirole in the presence of
levodopa at the surface of a carbon nanotubes based
electrochemical sensor in pharmaceuticals and human serum

Voltammetric determination of ropinirole in the presence of levodopaat the surface of a carbon nanotubes based electrochemical sensorin pharmaceuticals and human serum
Mirela Sadikovic, Biljana Nigovic ⇑, Sandra Juric, Ana MornarUniversity of Zagreb, Faculty of Pharmacy and Biochemistry, A. Kovacica 1, 10000 Zagreb, Croatia
a r t i c l e i n f o
Article history:Received 4 July 2014Received in revised form 11 September 2014Accepted 17 September 2014Available online 28 September 2014
Keywords:RopiniroleLevodopaCarbon nanotubesElectrochemical sensorStripping analysis
a b s t r a c t
A nanostructured electrochemical sensor was developed to establish an innovative way to measureropinirole and levodopa in real pharmaceutical and biological samples, which offers a high selectivityderived from the stable carbon nanotubes-Nafion polymer film. The surface morphology of the modifiedelectrodes was characterized by scanning electron microscopy. The effect of surface modifications,supporting electrolyte, amount of carbon nanotubes suspension, accumulation time and potential wereinvestigated. A sensitive electroanalytical methodology for the simultaneous determination of both drugsco-administrated in advanced Parkinson’s disease patients using adsorptive stripping square-wave vol-tammetry is presented. Under the optimized conditions, ropinirole and levodopa gave a linear responsein the range 1 � 10�7–1 � 10�5 M and 2.5 � 10�7–1 � 10�5 M with detection limits 1.6 � 10�8 M and5.2 � 10�8 M, respectively. The method was successfully utilised for their quantification in human serumsamples and good recoveries were obtained without interference from endogenous dopamine, uric andascorbic acid. In addition, the proposed sensor was successfully applied in the independent determina-tion of ropinirole and levodopa content in pharmaceutical formulations, whose accuracy was attestedby good agreement of the results with those, obtained using high performance liquid chromatography.The proposed sensor is characterized by high sensitivity and reproducibility, simple fabrication proce-dure, easy handling, resistance against surface fouling and low cost.
� 2014 Elsevier B.V. All rights reserved.
1. Introduction
Parkinson’s disease is one of the most common neurodegenera-tive disorders in humans leading to progressive deterioration ofmotor function due to loss of dopamine-producing brain cells.Ropinirole (ROP) is a novel nonergoline dopamine agonist indi-cated for the treatment of early and advanced Parkinson’s disease(Scheme 1). It is used as monotherapy in the first stages of the dis-ease [1]. When used as an adjunct to dopamine precursor levodopa(L-dopa) in advanced Parkinson’s disease patients with motorfluctuations, ROP reduces daily off time and allows a reduction ofL-dopa dose. ROP is also one of the four medications approved bythe FDA for the treatment of primary restless legs syndrome affect-ing up to ten percent of the population [2].
To date, only a few analytical methods have been described forthe determination of ROP, such as liquid chromatography-massspectrometry methods for quantification of ROP in biological fluids
[3,4], HPLC with UV detection for drug impurity profiling [5,6] andstability-indicating assays [7], high performance thin layer chro-matography [8], capillary zone electrophoresis [9], spectrophotom-etry [10], spectrofluorimetry [11] and ultra-performance liquidchromatography [12,13]. The official method for quantification ofROP has not yet been approved in European Pharmacopoeia [14].The literature has only one report for electroanalytical determina-tion of ROP employing glassy carbon electrode (GCE) [15]. How-ever, due to the surface-active properties of drug oxidationproduct, the adsorption of ROP on the electrode surface could notbe used as an effective preconcentration step prior to voltammetricquantification of the drug. Consequently, the obtained concentra-tion range with the GCE was sufficient for measurements of ROPin pharmaceutical formulation, but not in biological samples.Therefore, the development of electrochemical sensors for ROPdetermination with lower quantification limit without time-consuming surface cleaning as in the case of GCE is of greatimportance. On the other hand, ROP often coexists with L-dopain biological fluids as these drugs are co-administrated in advancedParkinson’s disease patients. Surprisingly, up to now, no study has
http://dx.doi.org/10.1016/j.jelechem.2014.09.0201572-6657/� 2014 Elsevier B.V. All rights reserved.
⇑ Corresponding author. Tel.: +385 1 6394 453; fax: +385 1 4856 201.E-mail address: [email protected] (B. Nigovic).
Journal of Electroanalytical Chemistry 733 (2014) 60–68
Contents lists available at ScienceDirect
Journal of Electroanalytical Chemistry
journal homepage: www.elsevier .com/locate / je lechem

been published in the literature reporting the simultaneous deter-mination of ROP and L-dopa. The monitoring of the therapeuticlevel concentrations of both drugs in serum samples is a criticalsubject in clinical medicine to prevent overdose-induced toxicity.The development and application of electrochemical sensors forL-dopa quantification in pharmaceuticals and biological fluids hasreceived considerable interest in recent two years [16–26].
In continuation to our work on analysis of ROP [15], the aim ofthis study was to construct a simple, stable and sensitive electro-chemical sensor for ROP determination. Carbon nanotubes (CNTs)have embarked a new epoch as novel electrode material in phar-maceutical analysis. CNTs can be homogenously dispersed in Naf-ion (NAF) solution due to hydrophobic side chains [27], while thehydrophilic negatively charged sulfonate group in NAF film enablesselective preconcentration of positively charged drug moleculesthrough electrostatic interaction [28,29]. Therefore, the adsorptioncharacteristic of ROP molecule was investigated at the surface ofglassy carbon electrode modified with carbon nanotubes and Naf-ion as cation exchange polymer (CNT-NAF/GCE). The analyticalperformance of the modified electrode for ROP quantification inthe presence of L-dopa was also evaluated. Thus, here we reportedfor the first time, the development of analytical method for simul-taneous determination of ROD and L-dopa. The adsorptive strip-ping voltammetric method was applied for trace analysis of bothdrugs in human serum samples. To achieve a better medicinaleffect and lower toxicity, it is very important to control the contentof ROP and L-dopa in pharmaceutical dosage forms. Therefore, themodified electrode was also used to develop simple, inexpensive,fast and accurate method for direct voltammetric quantificationof ROP and L-dopa individually in commercial pharmaceutical for-mulations. The HPLC was selected as the comparative methods forevaluating the proposed new electroanalytical method.
2. Experimental
2.1. Instrumentation
Voltammetric experiments were carried out using a l-Autolabpotentiostat (Eco Chemie, Utrecht, The Netherlands). The experi-mental conditions were controlled by General Purpose Electro-chemical System (GPES) software, version 4.9. A three-electrodeconfiguration was used with a bare or modified GCE (3-mm diame-ter, Metrohm, Switzerland) as working electrode, Ag/AgCl (KCl 3 M,Metrohm) reference electrode and a platinum counter electrode.When required, stirring was applied using a computer-controlledstirrer at ca. 300 rpm. All measurements were performed at roomtemperature (23 ± 2 �C) in a 20 mL electrochemical cell. HPLC anal-ysis were performed using an Agilent 1100 Series LC system (AgilentTechnologies, Waldbronn, Germany) equipped with a diode array
detector, controlled by ChemStation software. The scanning elec-tron microscope employed for surface characterisation of the elec-trodes was a Jeol JSM-7000F model (Jeol Ltd., Tokyo, Japan) withan operating voltage of 5 or 10 kV.
2.2. Chemicals
Ropinirole hydrochloride (99.4%), kindly donated by Pliva(Zagreb, Croatia), was used as received without any further purifi-cation. L-dopa was purchased from Fluka (Laramie, USA). The pur-ity of L-dopa was high enough to comply with the EuropeanPharmacopoeia. Requip� film-coated tablets (GlaxoSmithKline,London, United Kingdom) containing 2.28 mg of ropinirole hydro-chloride, equivalent to 2 mg of ROP, and Madopar� tablets (Hoff-mann-La Roche, Basel, Switzerland) containing 100 mg of L-dopaand 25 mg of benserazide, were supplied from local pharmacy.Multi-wall carbon nanotubes (purity more than 98%) with o.d.between 6 and 13 nm and tube length from 2.5 to 20 lm as wellas Nafion (5 wt% solution in a mixture of lower aliphatic alcoholsand water) were from Sigma–Aldrich (Steinheim, Germany). Allsolutions were prepared from analytical grade chemicals andultra-pure water obtained by a Milli-Q system (Millipore, Bradford,USA).
Stock solutions of ROP and L-dopa for voltammetric measure-ments were prepared in ultra-pure water at a concentration of1.0 � 10�3 M and stored at 4 �C in a refrigerator. Both ROP andL-dopa standard solutions were prepared by appropriate dilutionof these stock solutions with the selected supporting electrolytejust before use. The supporting electrolytes were sulfuric acid,hydrochloric acid, acetic acid and Britton-Robinson buffer adjustedto the desired pH with 0.2 M sodium hydroxide solution.
2.3. Preparation of the modified electrodes
A mass of 50 mg of the multi-wall carbon nanotubes was dis-persed in 20 mL of concentrated nitric acid. The mixture was thensonicated for 4 h to generate carboxylic acid-functionalized sur-face. The suspension was filtered through a 200 nm membraneand washed with double distilled water to reach neutral pH. Thesolid powders were dried under vacuum at room temperature.Then, 1 mg of the functionalized CNTs was dispersed in 1 mL of0.5% (m/v) Nafion ethanol solution and sonicated for 30 min toform homogenous suspension. The CNT-NAF/GCE was preparedby casting 5 lL of the immobilizing suspension on the polishedGCE surface allowing the solvent to evaporate at room tempera-ture. Finally, the modified electrode was carefully rinsed with puri-fied water and scanned by two successive cyclic voltammetricsweeps between 0 and 1.5 V at 100 mV s�1 in a blank solution of0.1 M H2SO4 prior to first electrochemical measurements. The sur-face areas of modified electrodes were obtained by cyclic voltam-metry (CV) using 1.0 � 10�3 M K3Fe(CN)6 as a probe in 0.1 M KClelectrolyte at different scan rates (v). From the slope of the anodicpeak current versus v1/2 plot, the surface areas of the GCE and theCNT-NAF/GCE was calculated to be 0.057 and 0.298 cm2, respec-tively. For comparison, the carbon nanotubes modified GCE (CNT/GCE) and the Nafion modified GCE (NAF/GCE) were also preparedin the same way as described but without the addition NAF andCNTs, respectively.
2.4. Electrochemical measurements
CV was carried out from 0 to 1.5 V with the scan rate varyingfrom 10 to 500 mV s�1. Square-wave voltammetry (SWV) was usedfor the determination procedures of ROP and L-dopa. Thevoltammograms were recorded in the SWV mode from 0.4 to1.5 V either immediately in quiescent solution or after adsorptive
NH
N
O
HCl.
ROP L-dopa
HO
HO
OH
NH2
O
Scheme 1. Chemical structures of ropinirole (ROP) and levodopa (L-dopa).
M. Sadikovic et al. / Journal of Electroanalytical Chemistry 733 (2014) 60–68 61

accumulation for selected time at the predetermined potential instirred solution. The preconcentration of both analytes was carriedout at 0 V with a 240 s accumulation step. After an equilibriumperiod of 5 s the potential scan was started. Operating instrumen-tal conditions for SWV were: pulse amplitude of 25 mV, frequencyof 50 Hz and scan increment of 8 mV. After each measurement, thesensor was transferred to the solution of 0.1 M H2SO4 to regeneratethe electrode surface by applying single positive-going CV poten-tial scan from 0 to 1.5 V.
2.5. Determination in samples
Ten tablets of each analyzed pharmaceutical formulation wereweighed and separately powdered in a mortar. An adequateamount of prepared powders, equivalent to a stock solution of con-centration 1.0 � 10�3 M, was weighed and individually dispersedin purified water in a 10.0 mL volumetric flask. The mixtures weresonicated for 10 min to provide complete dissolution of activeingredients and filtered through 0.45 lm Acrodisc GHP filters (Gel-man, Ann Arbor, USA). To obtain final concentrations in the rangeof calibration curve, the sample solutions of both drugs were suit-ably diluted with supporting electrolyte and subjected to directSWV measurements as previously mentioned. The content of ROPand L-dopa in formulated products was determined by standardaddition method.
The ROP determination by HPLC was carried out using a chro-matographic column XBridge C18, 3.0 � 50 mm, particle size2.5 lm (Waters, Miliford, Mass., USA). The mobile phase composedof acetonitrile, ultra-pure water and ammonium hydroxide (25%)at the ratio of 400:600:0.04 (v/v/v) were filtered through cellulosenitrate filter (0.45 lm, Sartorius, Goettingen, Germany). The chro-matography was carried out at constant temperature (25 �C) witha flow-rate of 1 mL/min under isocratic conditions. The standardsolutions and the appropriate tablet solutions for HPLC analysiswere prepared in mobile phase and filtered through a 0.2 lm Acro-disc GHP filters (Gelman, Ann Arbor, USA). The injection volumewas 5 lL. The UV spectra were recorded from 190 to 400 nm andthe chromatogram was obtained at 250 nm. The nominal contentof ROP tablet amounts were calculated from the correspondingregression equations of previously plotted calibration plots. Theofficial HPLC method described in USP was used for comparativeanalysis of L-dopa tablets [30].
Serum samples were obtained from healthy volunteers andstored frozen until assay. A 500 lL aliquot of human serum sam-ples was fortified with the appropriate aliquot volume of ROPand L-dopa standard solutions to achieve final concentrations(1.0 � 10�7 and 5 � 10�7 M) that are found after the treatmentwith therapeutic daily doses of 6 and 100 mg for ROP and L-dopa,respectively [31,32] and mixed with acetonitrile (1.5 mL) toremove serum proteins effectively. The mixture was vortexed for5 min. After centrifugation of sample for 10 min at 6000 rpm thesupernatant was separated. Appropriate volumes of clear superna-tant solution were transferred into the volumetric flask and dilutedwith the supporting electrolyte and analyzed in the voltammetriccell. To reduce the matrix effect the standard addition methodwas employed in direct analysis of human serum samples.
3. Results and discussion
3.1. Electrochemical behaviour of ROP and L-dopa
The cyclic voltammograms of 5 � 10�5 M ROP solution in 0.1 MH2SO4 were recorded at the CNT-NAF/GCE, the CNT/GCE, the NAF/GCE and a bare GCE using a scan rate of 100 mV s�1. A single anodicpeak was observed showing that the oxidation of ROP molecule is a
totally irreversible process. As seen in Fig. 1, moving from the GCEto CNT-NAF/GCE, the oxidation peak was found to be extremelywell-defined with enhanced peak current. ROP is completely incationic form (pKa 9.5) in experimental conditions used in the vol-tammetric measurements. When the bare GCE surface was coatedwith 0.5% Nafion film, an oxidation wave (ip = 26.6 lA) at 1.36 Vwas increased due to electrostatic attraction of positively chargeddrug molecules. However, compared with NAF/GCE, the voltam-metric response of ROP was remarkable increased at the CNT-NAF/GCE with a current of 91.7 lA and a peak potential of1.24 V. The oxidation peak potential was shifted to less positivevalues by 120 mV indicating faster electron transfer at the elec-trode surface and excellent electrocatalytic activity of immobilizedCNTs toward ROP molecule. Therefore, it can be concluded that thesynergistic effect of CNTs and NAF combination leads to a consid-erable improvement in the analytical sensitivity.
To characterize the modified electrode, the surface morphologyof the NAF/GCE, the CNT/GCE and the CNT-NAF/GCE was studiedusing scanning electron microscopy (SEM). The SEM image of theNAF/GCE showed a smooth film of cation-exchange polymer(Fig. 2). On the other hand, the film of the CNT/GCE showed plentyof tubes irregularly placed in thread-like formations revealing amuch larger surface area. The SEM image of the CNT-NAF compos-ite film offers a uniform coating with higher accessible surface areaforming bundle structures. The CNTs were embedded into thepolymer matrix making the composite film surface rough. Thisunique surface morphology of CNT-NAF/GCE gave a high accessiblearea improving the preconcentration of ROP molecules throughelectrostatic interaction with negatively charged sulfonate groupin NAF polymer structure. Furthermore, the CNTs were tightlyfixed in the NAF matrix onto GCE surface in a reproducible wayenhancing the stability of CNT-NAF/GCE.
The influence of the scan rate on the electrochemical response ofROP was investigated by CV at the CNT-NAF/GCE. A plot of the ano-dic peak current versus the scan rate in the range of 10–200 mV s�1
gave the linear relationship ip (lA) = 0.23 v (mV s�1) + 9.85(r = 0.996), indicating that the electrooxidation of drug moleculeat the modified electrode was a adsorption-controlled process.The oxidation peak potential was shifted to more positive poten-tials as the scan rate increased from 10 to 500 mV s�1. The depen-dence of the peak potential is linear with logarithm of the scanrate with a slope of 63.5 mV/decade (inset of Fig. 1), allowing thecalculation of an = 0.93. Using the value of the charge transfer coef-ficient (a = 0.53) obtained from the difference between the peak
0.6 0.8 1.0 1.2 1.4
0
50
100
d
cb
a
i / µ
A
E / V vs. Ag/AgCl
1.2 1.6 2.0 2.4 2.81.24
1.28
1.32
1.36
Ep
/ V
log v
Fig. 1. Cyclic voltammograms of ropinirole (5 � 10�5 M) at a bare GCE (a), the NAF/GCE (b), the CNT/GCE (c) and the CNT-NAF/GCE (d) in 0.1 M H2SO4. Scan rate:100 mV s�1. Inset: plot of peak potential vs. logarithm of scan rates from 10 to500 mV s�1 at the CNT-NAF/GCE.
62 M. Sadikovic et al. / Journal of Electroanalytical Chemistry 733 (2014) 60–68

potential (Ep) and the half wave potential (Ep/2) by the equationEp–Ep/2 = (47.7/a) mV, the number of electrons exchanged wascalculated to be n = 1.76. Our earlier investigation of ROPelectrooxidation mechanism at bare GCE over a wide pH range(1.0–12.0) in buffered aqueous media indicated that the voltam-metric signal in strong acid media was assigned to an over-all2e�/2H+ oxidation process involving indol-2-one ring [15]. The oxi-dation pattern of ROP molecule observed at the CNT-NAF/GCE in0.1 M H2SO4 solution was well-consistent with that obtained atthe bare GCE, thus, we can corroborate that the oxidation of ROPat the CNT-NAF composite film occurs at indol-2-one moiety. How-ever, at the surface of the CNT-NAF/GCE not only the sensitivity wasincreased in comparison with the GCE, but the fouling effect of ROPand its oxidation product was also decreased.
In order to develop electrochemical sensor for simultaneousdetermination of ROP and L-dopa co-administrated in advancedParkinson’s disease patients, the oxidation of L-dopa was also stud-ied at the CNT-NAF/GCE, the CNT/GCE, the NAF/GCE and a bare GCEusing CV. A single reversible oxidation peak at +0.52 V wasobserved at the CNT-NAF/GCE, which can be assigned, in accor-dance with previous studies [19], to a 2e�/2H+ oxidation of L-dopato corresponding quinone form (inset of Fig. 3). The L-dopa mole-cule has positively charged nitrogen atom (pKa 8.7) in 0.1 MH2SO4 solution [33] and NAF as ion exchange polymer alsoattracted cationic form of L-dopa from bulk to electrode surface,thus facilitating the electrode process. The experimental resultsclearly indicated a higher current response of L-dopa at the CNT-NAF/GCE in comparison with that of using a bare GCE or othertwo modified electrodes. This remarkable current enhancementcan be undoubtedly attributed to the unique structure and proper-ties of CNT-NAF film, including very large specific area, strongadsorptive ability, and subtle electronic properties. The potential
difference of 720 mV between the two peak potentials of ROPand L-dopa at the CNT-NAF/GCE is large enough to determine theconcentration of both drugs individually and simultaneously.
3.2. Optimisation of experimental conditions
Different supporting electrolytes, including sulfuric acid, hydro-chloric acid, acetic acid and BR buffer pH 2.0–6.0, were tested inorder to develop a new electroanalytical method for simultaneous
Fig. 2. SEM images of the NAF/GCE (a), the CNT/GCE (b) and the CNT-NAF/GCE (c). Scale bar: 100 nm.
0.6 0.8 1.0 1.2 1.4 1.6
0
50
100
150
e
d
c
a
b
E / V vs. Ag/AgCl
i / µ
A
0.0 0.4 0.8 1.2
0
50
100
i / µ
A
E / V vs. Ag/AgCl
Fig. 3. Effect of supporting electrolyte on ropinirole voltammetric response at theCNT-NAF/GCE: 0.1 M H2SO4 (a), 0.01 M H2SO4 (b), Britton-Robinson buffer pH 4 (c),0.01 M HCl (d) and 0.1 M CH3COOH (e). Scan rate: 100 mV s�1; c = 5 � 10�5 M.Inset: Cyclic voltammograms of levodopa at the CNT-NAF/GCE (solid line) andtogether with ropinirole (doted line) and blank at CNT-NAF/GCE (dashed line).
M. Sadikovic et al. / Journal of Electroanalytical Chemistry 733 (2014) 60–68 63

determination of ROP and L-dopa at the CNT-NAF/GCE. The exper-iments showed that well-defined voltammetric response of ROPwas obtained only in strong acid media and beyond pH 2 the peakcurrent started to deteriorate, as shown in Fig. 3. A maximum cur-rent intensity was obtained in 0.1 M H2SO4 solution and conse-quently, it was employed for further studies.
Since ROP oxidation was observed at relatively high potentialand this drug was found in lower concentration limits then L-dopain real samples, the effect of modifier amount on the performanceof the CNT-NAF/GCE was investigated using SWV in order to obtainthe most favourable response of ROP. Therefore, when varying pro-portions of CNTs dispersed in NAF solution (1–9 lL) were castedonto the GCE surface, 5 lL of homogenous suspension served asthe optimum amount for NAF-CNT film coating on the electrodebecause maximum current of ROP was obtained, and thereafter,the oxidation peak current conversely showed gradual decline.The thickness of the composite film was determined by the volumeof NAF-CNT suspension applied on the GCE surface. When thethickness of the film increased, there were more –SO3 sites thatconducted ion-exchange with the ROP molecules leading to anincrement of accumulation capacities, and similarly, more CNTsdramatically promoted electron transfer reaction. These twoaspects resulted in a corresponding increase in the peak current.The SWV response of ROP was increased up to 0.5% of NAF concen-tration in the immobilizing suspension. Then, the NAF film becamethicker and lowered the electrical conductivity of CNTs and, conse-quently, retarded the electron transfer rate of ROP oxidation aswell as the analyte mass transportation through the film resultingin the higher electric resistance.
To obtain a much more sensitive peak currents for analyticalstudies, the variation of the peak currents recorded at the CNT-NAF/GCE was monitored while changing instrumental SWVparameters, i.e. frequency (10 Hz 6 f 6 130 Hz), pulse amplitude(10 mV 6 a 6 70 mV) and potential step (2 mV 6 DEs 6 10 mV).The most favourable response was achieved using a combinationof a frequency of 50 Hz, pulse amplitude of 25 mV and a potentialstep of 8 mV. Additionally, according to the square-wave theory[34], the slope of 0.069 V obtained from the Ep versus log f plotwas used to calculate the value of an as 0.86. Taking the value of0.53 for the charge transfer coefficient, the number of electronstransferred in the oxidation process of ROP was estimated to be1.71, again a value of approximately 2, which was in agreementwith the result obtained by CV experiments confirming the two-electron mechanism of ROP electrooxidation at the CNT-NAF/GCE.
3.3. Adsorption properties of ROP and L-dopa on CNT-NAF/GCE
Since the modification of the electrode surface with CNT-NAFlayer led to a strong interfacial accumulation of positively chargeddrug molecules, possibility of effective analyte preconcentrationbefore voltammetric measurement was examined. To achieve theoptimum conditions for the maximum adsorption, the influenceof accumulation potential on the stripping peak current wasevaluated from �1.0 to 1.0 V. A maximum was observed at 0 V,so this deposition potential was selected in all subsequent studies.Square-wave voltammograms with increasing accumulation times(between 0 s and 360 s) were recorded for solutions containingROP and L-dopa at concentration level of 2.5 � 10�6 M. Fig. 4shows square-wave voltammograms for solution without accumu-lation and after a 240 s accumulation step at the CNT-NAF/GCE.The accumulation time significantly affected the voltammetricresponse of both drugs at the CNT-NAF/GCE. The peak current ofROP increased up to 360 s, however, the accumulation time of240 s provided the largest peak current in the linearity rangerevealing a constant adsorption of drug molecules attracted onthe surface of the CNT-NAF/GCE. Further increment of deposition
time period showed a deviation of the peak current from linearitysuggesting saturation of the surface coverage. On the other hand,the peak current of L-dopa enhanced greatly within 30 s indicatingfaster adsorption then ROP, as shown in inset of Fig. 4. The voltam-metric response of L-dopa increased up to a maximum at 120 s andthen remained almost constant. However, the value of 240 s wasconsidered as the optimum for simultaneous quantification of bothdrugs because the peak current of L-dopa slowly increased up to240 s which was selected as the optimal value for ROP to achievethe highest possible sensitivity in acceptable analysis time.
3.4. Simultaneous analysis and validation studies
The use of an electrochemical sensor for ROP determination hasnot been reported in the literature and in addition, this work is thefirst report for simultaneous determination of ROP and L-dopaused in combination to treat advanced Parkinson’s disease. Theelectrocatalytic peak currents of ROP and L-dopa at 1.24 and0.52 V, respectively, obtained at proposed sensor were used fordetermination of both drugs in solution, involving SWV andadsorptive stripping square-wave voltammetry (AdSWV) for drugquantitation at low levels.
When all parameters that affect ROP and L-dopa quantificationhad been studied, variation of the current response with the drugconcentration was performed. In the case of a square-wave scanwithout any accumulation step, the oxidation peak showed a linearresponse in the concentration range of 1 � 10�6–5 � 10�5 M forROP and 1 � 10�6–1 � 10�5 M for L-dopa. By using drug accumula-tion at the CNT-NAF/GCE prior to SWV measurement, higher sensi-tivities were achieved. Fig. 5 shows the SWV responses from theelectrochemical oxidation of ROP and in 0.1 M H2SO4 solution aftera 240 s preconcentration step. Calibration graph using AdSWVshowed two linear segments for ROP detection. The first linearrange was from 1 � 10�7 to 1.5 � 10�6 M and the second lineardynamic range was between 1.5 � 10�6 and 1 � 10�5 M (inset ofFig. 5). The break in the calibration curve of ROP adsorptive strip-ping current reflected the formation of a sub-monolayer in the firstrange of calibration and formation of a monolayer in the secondrange. Since the presence of L-dopa in solution may affect thequantification of ROP due to competitive adsorption and therefore,
0.4 0.6 0.8 1.0 1.2 1.4150
200
250
300
cb
a
i / µ
A
E / V vs. Ag/AgCl
0 50 100 150 200 250 300 3500
10
20
30
40
50
60
tacc / s
i / µ
A
Fig. 4. Square-wave voltammograms of ropinirole (2.5 � 10�6 M) and L-dopa(2.5 � 10�6 M) at the CNT-NAF/GCE in 0.1 M H2SO4 after preconcentration time of240 s (a), without preconcentration (b) and blank solution (c). SWV settings:frequency of 50 Hz, amplitude of 25 mV and potential step of 8 mV, Eacc = 0 V. Inset:Effect of the accumulation time on the oxidation peak current for ropinirole (circles)and L-dopa (squares).
64 M. Sadikovic et al. / Journal of Electroanalytical Chemistry 733 (2014) 60–68

the interference of each analyte in the simultaneous determinationof its pairs was performed by changing one analyte concentrationand keeping the other unchanged. The variation of adsorptivestripping SWV peak current versus ROP concentration in the pres-ence of L-dopa at the fixed concentration of 2.5 � 10�6 M gave thesensitivities of the CNT-NAF/GCE towards the ROP oxidation of4.75 � 107 and 2.96 � 107 lA M�1 for lower and higher concentra-tion ranges, respectively. The values obtained are very close (rela-tive errors 1.43% and 2.31%) to the values observed in the absenceof L-dopa (Table 1), indicating independent adsorption of bothdrugs in the accumulation step at the proposed electrochemicalsensor. Therefore, simultaneous determination of ROP and L-dopais possible without interferences. Fig. 6 shows the voltammetricresponses for the solutions containing various concentrations ofL-dopa and constant concentration of ROP (1 � 10�6 M). Therelation between the stripping peak current and concentration ofL-dopa was found to be linear over the range 2.5 � 10�7–1 �10�5 M (inset of Fig. 6). The analytical characteristics and therelated validation parameters of developed methods are given inTable 1. The detection and quantification limits of were calculatedfrom the calibration curves as 3s/m and 10s/m, respectively, wheres is the standard deviation of the intercept and m is the slope of thecalibration curve [35].
For validation of the proposed method, the intra-day precision ofthe voltammetric response using the CNT-NAF/GCE was evaluatedby six replicate measurements of 1.5 � 10�6 M ROP and L-dopa
solution yielding unchanged oxidation peak potentials for ROPand L-dopa and the RSD values of 1.4% and 1.7% for ROP (meanip = 70.4 lA) and L-dopa peak currents (mean ip = 33.5 lA),respectively. These results indicated that proposed electrochemicalsensor was stable in repeated measurements for selective determi-nation of ROP and L-dopa. The inter-day precision of the electroderesponse was characterized by three replicate measurements of2.5 � 10�6 M ROP and L-dopa over three days, each time using afreshly prepared CNT-NAF/GCE and standard solutions. The RSDsvalues of the anodic stripping currents for ROP (mean ip = 96.4 lA)and L-dopa (mean ip = 53.8 lA) were 2.5% and 2.9%, respectively,while the RSDs of peak potentials for both drugs were no greaterthan 0.7%, indicating excellent fabrication reproducibility.
The proposed electrochemical sensor can be stored in air or keptin distilled water for several weeks without the loss of activity. Thestability of the CNT-NAF/GCE was evaluated by measuring the cur-rent response of 2.5 � 10�6 M ROP and L-dopa solution over a per-iod of three weeks. The modified electrode was used daily andstored in the air at room temperature. Before measurements, themodified electrode was scanned between 0.5 and 1.4 V in the solu-tion of supporting electrolyte until the SWV response was stable.The experimental results indicated that the CNT-NAF/GCE couldretain 97.5% and 98.3% of initial response after two weeks forROP and L-dopa, respectively, revealing that sensor fabricated pos-sesses long-term stability. Thereafter, the voltammetric signal
0.6 0.8 1.0 1.2 1.4
200
300
400
500
600
i / µ
A
E / V vs. Ag/AgCl
0.0 2.0x10⁻⁶ 4.0x10⁻⁶ 6.0x10⁻⁶ 8.0x10⁻⁶ 1.0x10-50
50
100
150
200
250
300
350
i / µ
A
c / M
Fig. 5. Adsorptive stripping square-wave voltammograms of ropinirole at the CNT-NAF/GCE recorded in 0.1 M H2SO4 at different concentrations (1 � 10 7–1 � 10�5 M). SWV settings and accumulation conditions same as in Fig. 4. Insetshows a calibration graph for the quantification of ropinirole.
Table 1Analytical parameters for the voltammetric determination of ROP and L-dopa by SWV and AdSWV using CNT-NAF/GCE.
ROP L-dopa
SWV AdSWV SWV AdSWV
Linearity range (M) 1 � 10�6–5 � 10�5 1 � 10�7–1.5 � 10�6 1.5 � 10�6–1 � 10�5 1 � 10�6–1 � 10�5 2.5 � 10�7–1 � 10�5
Slope (lA M�1) 2.22 � 106 4.81 � 107 3.04 � 107 1.46 � 107 1.89 � 107
Intercept (lA) 0.20 0.28 26.78 �4.45 2.64Sx/y
a 2.16 1.86 7.40 5.62 3.52Sb
b 4.63 � 104 1.62 � 106 1.05 � 106 6.99 � 105 3.55 � 105
Sac 0.19 0.27 1.30 0.79 0.33
Correlation coefficient 0.999 0.998 0.998 0.995 0.999Detection limit (M) 2.6 � 10�7 1.6 � 10�8 1.3 � 10�7 1.6 � 10�7 5.2 � 10�8
Quantitation limit (M) 8.7 � 10�7 5.5 � 10�8 4.3 � 10�7 5.4 � 10�7 1.7 � 10�7
a Standard deviations of residuals.b Standard deviations of the slope.c Standard deviations of the intercept.
0.4 0.6 0.8 1.0 1.2 1.4
250
300
350
400
450
i / µ
A
E / V vs. Ag/AgCl
0.0 5.0x10⁻⁶ 1.0x10-50
50
100
150
200
i / µ
A
c/M
Fig. 6. Adsorptive stripping square-wave voltammograms of the mixture contain-ing levodopa at different concentrations (2.5 � 10�7–1 � 10�5 M) and ropinirole(1 � 10�6 M) recorded at the CNT-NAF/GCE in 0.1 M H2SO4. SWV settings andaccumulation conditions same as in Fig. 4. Inset shows a calibration graph forlevodopa.
M. Sadikovic et al. / Journal of Electroanalytical Chemistry 733 (2014) 60–68 65

started to decrease indicating the need for re-depositing of a newnanostructured film.
3.5. Interference studies
Prior to the analysis of samples, the selectivity of the proposedelectrochemical sensor for quantification of ROP and L-dopa wasalso evaluated. The addition of possible interference compoundscommonly present in the analyzed pharmaceutical dosage formsor biological samples was investigated in a standard solutioncontaining ROP and L-dopa at 1 � 10�6 M concentration. The toler-ance limit was taken as the concentration of foreign substanceswhich gave an error less than ±5% in the determination of thedrugs. According to the analysis of the obtained voltammetricresponses, Na+, Cl� (2000-fold), K+, Zn2+, SO4
2, NO3� (1000-fold),
Ca2+, Mg2+, Cu2+, lactate (500-fold), HPO42�, citric acid, L-glycine,
L-alanine, L-aspartic acid, L-glutamic acid (400-fold), Fe3+, starch(300-fold), lactose, sucrose, L-cysteine (200-fold) did not showinterference in the determination of both drugs. Also, the interfer-ence of ascorbic acid, glucose and uric acid was examined becausetheses endogenous substances are always present in complexmatrices such as biological fluids. It was observed that the adsorp-tive stripping peak current of ROP and L-dopa did not change afteradding 400-fold of ascorbic acid and 300-fold of glucose. In thepresence of uric acid, new well-defined oxidation peak appearedat the potential around +0.69 V. The results showed that 50-foldconcentration of uric acid did not cause a positive or a negativeerror greater than 5% in the determination of L-dopa. However, uricacid did not influence the peak current of ROP even up to 200-foldexcess. As expected, the interferences from negatively charged oxi-dizable ions were eliminated by prevention their accumulationusing application of a Nafion-coated membrane. Also, dopamineat the concentration ratio 2:1 (interferent: drug standard solution)did not interfere with ROP voltammetric response, but showedinterference with L-dopa quantification due to dopamine oxidationat +0.48 V, very close to L-dopa potential. However, normal plasmalevels of endogenous free dopamine (26 pg/mL) [36] did not affectL-dopa voltammetric response at the CNT-NAF/GCE.
3.6. Analytical applications
To evaluate the validity and practical utility of the proposedmethod for individual quantification of ROP and L-dopa, two com-mercially available pharmaceutical products containing ROP(Requip, GlaxoSmithKline) as well as L-dopa and benserazide(Madopar, Hoffmann-La Roche) were analyzed using the standardaddition method in order to eliminate matrix effects. Due to thehigh concentration of active ingredients in their dosage forms
(2 mg per ROP tablet and 100 mg per L-dopa tablet), no accumula-tion time was needed and the tablets assay was carried out usingdirect anodic SWV technique. Results summarized in Table 2shows that the content of assayed tablets obtained by utilizingthe CNT-NAF/GCE are in good agreement with those declared inthe label of the pharmaceutical products. The effect of excipientsupon the voltammetric response of ROP and L-dopa at theCNT-NAF/GCE was studied by adding different known amounts ofstandard to the formulation solution samples. The recoveries of99.2% for ROP and 99.4% for L-dopa were obtained from this typeof matrix, indicating adequate accuracy of the proposed analysisprocedures. The obtained recoveries revealed that excipients didnot interfere with the assay avoiding a separation step, and thuscorroborating the suitability of the proposed sensor for thispurpose. Also, the data indicate that benserazide present in com-bined pharmaceutical dosage form with L-dopa had no interfer-ence effect on L-dopa determination in real sample using theCNT-NAF/GCE.
The results obtained with the proposed sensor were comparedwith those obtained by developed reverse-phase HPLC methodfor ROP and official HPLC method described in USP for L-dopa tab-lets [30]. Recovery tests were also performed for chromatographicmethods. Statistical comparison were performed on data obtainedusing both voltammetric and HPLC procedures. The results of thestudent t-test and variance ratio F-test show that there are no sig-nificant differences between the techniques with regard to accu-racy and precision (Table 2). Therefore, the modified electrodecan be efficiently used for individual determination of ROP andL-dopa in pharmaceutical preparations. The newly developedmethods using the CNT-NAF/GCE can be successfully applied incontrolling the quality of active pharmaceutical ingredient anddosage forms as a selective method that is very precise, rapidand inexpensive.
To check the analytical applicability of the proposed electro-chemical sensor for simultaneous quantification of ROP andL-dopa, the AdSWV method was applied to the determination ofboth drugs in human serum samples. Pharmacokinetic studiesfound in the literature suggest that the sensitivity of the proposedsensor complies with the expected serum concentration level inParkinson patients treated with usual recommended daily dose.The average plasma concentration of L-dopa ranged from4.4 � 10�6 to 11 � 10�6 M [32]. However, the maximum plasmaconcentration of ROP at steady state is much lower [31] and thequantitation of ROP in human serum at the therapeutic concentra-tion range could not be feasible without preconcentration step onthe modified electrode surface. The recovery studies of both drugsin serum samples were performed using the standard additionmethod. The mean recovery of 99.6 ± 2.2% for ROP and 98.8 ±
Table 2Application of the CNT-NAF/GCE for individual determination of ROP and L-dopa in pharmaceutical dosage forms by the proposed SWV.
Samples ROP L-dopa
SWV HPLC SWV HPLC
Label value (mg) 2 2 100 100Determined value (mg)a 2.02 2.06 95.23 95.04RSD% 1.16 0.49 1.25 0.06Bias% 0.95 2.85 �4.77 �4.96Added (M) 5.00 � 10�6 5.00 � 10�5 2.50 � 10�6 1.00 � 10�3
Found (M)a 4.96 � 10�6 5.03 � 10�5 2.48 � 10�6 1.02 � 10�3
Recovery% 99.2 100.6 99.4 101.8RSD% 1.65 0.28 2.23 0.44Bias% �0.76 0.64 �0.72 1.80Fb 5.41 – 4.21 –tb 1.54 – 1.99 –
a n = 3.b The theoretical values of F and t-test at 95% confidence limit are 6.39 and 2.31, respectively.
66 M. Sadikovic et al. / Journal of Electroanalytical Chemistry 733 (2014) 60–68

2.3% for L-dopa was achieved (Table 3). Using the proposed electro-chemical sensor, no sample pre-treatment was required, otherthan precipitation of the serum proteins with acetonitrile and adilution step with the selected supporting electrolyte. The possibil-ity of monitoring ROP and L-dopa concentration expected aftertherapeutic dose could make the method proposed useful for phar-macokinetic purposes.
3.7. Comparison of analytical methods
The analytical characteristics observed during validation of theproposed methods were compared with those obtained in earlierreported electroanalytical methods for the determination of ROPand L-dopa (Table 4). The electrochemical behaviour of ROP hasnot been investigated to date at modified electrodes, while manyelectrochemical sensors have been developed for the L-dopa deter-mination. Very recently, we have developed SWV and differential-pulse voltammetric method (DPV) for ROP determination using abare GCE [15]. Compared with those methods (slope of the calibra-tion graph was 4.08 � 106 lA M�1 for SWV and 1.92 � 105 lA M�1
for DPV), the better sensitivity of adsorptive stripping analyticalprocedure was obtained at the CNT-NAF/GCE for measurement ofROP (Table 1). Also, the LOQ values obtained at proposed sensorusing AdSWV are lower than that obtained at the GCE [15]. Oneof the most important attributes of the CNT-NAF/GCE is its remark-ably improved reproducibility without the need for additional andtime-consuming mechanical polishing of the electrode surfacebefore each measurement as in the case of GCE.
Additionally, the quantification limits of ROP obtained atdeveloped electrochemical sensor are comparable to some HPLC
methods with UV detection [6,7] and are better than that obtainedin capillary electrophoresis [9], spectrophotometry [10] and highperformance thin layer chromatography [8], but the detection lim-its are higher than LODs reported for chromatographic methodscoupled to mass spectrometry [3,4,13] and spectrofluorimetricmethod reported previously [11]. However, spectrofluorimetricmethod additionally require derivatization of ROP with 4-chloro-7-nitrobenzofurazan before detection step, while LC-MS analyticalprocedures demand expensive and sophisticated equipment thatcould not be available in many laboratories. In addition, the pro-posed electroanalytical methods offer several advantages overchromatographic techniques applied only to the quantification ofdrug, including short analysis time, simplicity of operation andlower running cost.
The comparison between the analytical performance of theCNT-NAF/GCE and other electrochemical sensors described inthe literature in recent two years for determination of L-dopais also presented in Table 4. The proposed electrochemical sensorexhibited wide linear working range and appreciable detectionlimit compared to previously developed sensors for L-dopaquantification. The LOD obtained with adsorptive accumulationat CNT-NAF/GCE is similar or even better than those found withsome other electrochemical sensors described in the literature.However, in comparison with most others it can be easilyconstructed in a simple procedure and the surface of electrodeis also easily renewable. Moreover, the developed methods wereapplied for both pharmaceutical formulations and biologicalfluids whereas the reported literature methods [17,19,20,23,24]have been applied either for pharmaceutical or biologicalsamples.
Table 3Results on recovery tests for serum samples by proposed AdSWV method for simultaneous determination of ROP and L-dopa using CNT-NAF/GCE.
Samples found/R.S.D., average Added 106 c (M) Found 106 c (M) Recovery (%) RSDa (%)
ROP 0.10 0.099 98.66 2.470.25 0.247 98.93 2.440.50 0.505 101.07 1.84
L-dopa 10.00 9.873 98.73 2.7915.00 14.653 97.69 2.2520.00 19.983 99.92 1.86
a Average of three measurements.
Table 4Comparison of various voltammetric methods for the determination of ROP and L-dopa with the present work.
Analyte Technique Electrode Concentration range (M) LOD (M) Reference
ROP DPV GCE 1 � 10�6–2 � 10�5 2.5 � 10�7 15SWV GCE 5 � 10�7–2 � 10�5 1.1 � 10�7 15SWV CNT-NAF/GCE 1 � 10�6–5 � 10�5 2.6 � 10�7 This workAdSWV CNT-NAF/GCE 1 � 10�7–1 � 10�5 1.6 � 10�8 This work
L-dopa DPV Cumarine derivative/TiO2 NPa/ILb/CPEc 1 � 10�7–9 � 10�4 4.1 � 10�8 16AdDPV Ni(OH)2 NPa/MWCNT/GCE 1 � 10�7–1 � 10�4 7.6 � 10�8 17AdSWV Cu(II) complex/Ag NPa/CPEc 7.8 � 10�9–9.1 � 10�6 2.4 � 10�9 18AdDPV Poly(methyl orange) CPEc 2 � 10�5–8 � 10�4 3.7 � 10�6 19SWV Co(III) complex/MWCNT/BPPGEd 3 � 10�6–1 � 10�4 8.6 � 10�7 20DPV Quercetin/ MWCNT/GCE 9 � 10�7–8.5 � 10�5 3.8 � 10�7 21DPV Co-porphyrin/TiO2 NPa/CPEc 1 � 10�7–1 � 10�4 6.9 � 10�8 22DPV SWCNT/chitosan/ILb/GCE 2 � 10�6–4.5 � 10�4 1.6 � 10�7 23DPV Au NP/Nafion/CPEc 2 � 10�7–2 � 10�5 1.5 � 10�9 24
5 � 10�5–3 � 10�3 2.8 � 10�6 24DPV Nanosized mesoporous molecular sieves/CPEc 1.3 � 10�7–1.25 � 10�3 7.2 � 10�8 25DPV Co-hexacyanoferrate/large mesopore carbon/GCE 1 � 10�7–1.9 � 10�3 1.7 � 10�8 26SWV CNT-NAF/GCE 1 � 10�6–1 � 10�5 1.6 � 10�7 This workAdSWV CNT-NAF/GCE 2.5 � 10�7–1 � 10�5 5.2 � 10�8 This work
a Nanoparticles.b Ionic liquid.c Carbon paste electrode.d Basal plane pyrolytic graphite electrode.
M. Sadikovic et al. / Journal of Electroanalytical Chemistry 733 (2014) 60–68 67

4. Conclusion
The result of this investigation shows that developed electro-chemical sensor based on carbon nanotubes embedded into thepolymer Nafion matrix is high sensitive and selective analyticaltool for voltammetric determination of ROP and L-dopa. For thefirst time, the analytical method for simultaneous determinationof ROP and L-dopa was developed. The large separation of the peakpotentials at the CNT-NAF/GCE allows fast simultaneous quantifi-cation of trace amounts of both drugs in human serum samples.The very high sensitivity of the modified electrode can be relatedto very large surface area, low resistance, electrocatalytic effectand strong adsorption ability of the CNTs-NAF nanocomposite.The proposed sensor is also a feasible alternative for direct mea-surements of ROP and L-Dopa individually in pharmaceutical sam-ples by SWV. The prepared modified electrode shows severaladvantages such as simple preparation procedure, high sensitivityand stability, ease of the electrode surface regeneration with excel-lent reproducibility. We believe that the proposed method wouldbe a potential step forward in the development of a reverse-phaseHPLC procedure with electrochemical detection for simultaneoustrace determination of ROP and L-dopa co-administrated inadvanced Parkinson’s disease patients.
Conflict of interest
There is no conflict of interest.
References
[1] J. Kulisevsky, J. Pagonabarraga, Drug Saf. 33 (2010) 147–161.[2] C.A. Kushida, Neuropsychiatr. Dis. Treat. 2 (2006) 407–419.[3] J. Bhatt, A. Jangid, R. Shetty, B. Shah, S. Kambli, G. Subbaiah, S. Singh, J. Pharm.
Biomed. Anal. 40 (2006) 1202–1208.[4] D.V. Bharathi, B. Jagadeesh, S.S. Kumar, R.N. Lakshmi, K.K. Hotha, A. Naidu, R.
Mullangi, Biomed. Chrom. 23 (2009) 557–562.[5] B. Sahasrabuddhey, R. Naudyal, H. Acharya, S. Khyade, P.K. Luthra, P.B.
Deshpande, J. Pharm. Biomed. Anal. 43 (2007) 1587–1593.[6] A. Kakouris, V. Samara, A. Kalaskani, I. Panderi, Chromatographia 77 (2014)
447–457.
[7] G. Parmar, S. Sharma, K. Singh, G. Bansal, Chromatographia 69 (2009) 199–206.[8] G. Mustafa, S. Baboota, J. Ali, A. Ahuja, J. Pharm. Innov. 7 (2012) 47–55.[9] P. Coufal, K. Stulik, H.A. Claessens, M.J. Hardy, M. Webb, J. Chromatogr. B 720
(1998) 197–204.[10] A. Onal, S. Caglar, Chem. Pharm. Bull. 55 (2007) 629–631.[11] Z. Aydogmus, Spectrochim. Acta Mol. Biomol. Spectros. 70 (2008) 69–78.[12] C. Krishnaiah, M.V. Murthy, A.R. Reddy, R. Kumar, K. Mukkanti, J. Chin. Chem.
Soc. 57 (2010) 348–355.[13] G. Mustafa, N. Ahmad, S. Baboota, J. Ali, A. Ahuja, J. Chin. Chem. Soc. 59 (2012)
1021–1030.[14] European Pharmacopoeia, 8th ed., Council of Europe, Strasbourg, 2013.[15] B. Nigovic, S. Juric, A. Mornar, I. Malenica, J. Chem. Sci. 125 (2013) 1197–1205.[16] M. Mazloum-Ardakani, A. Khoshroo, Anal. Chim. Acta 798 (2013) 25–32.[17] A. Babaei, M. Sohrabi, A.R. Taheri, J. Electroanal. Chem. 689 (2013) 45–51.[18] B.J. Sanghavi, S.M. Mobin, P. Mathur, G.K. Lahiri, A.K. Srivastava, Biosens.
Bioelectron. 39 (2013) 124–132.[19] K. Reddaiah, T.M. Reddy, P. Raghu, J. Electroanal. Chem. 682 (2012) 164–171.[20] F.R. Leite, C.M. Maroneze, A.B. de Oliveira, W.T. dos Santos, F.S. Damos, R. de
Cássia Silva Luz, Bioelectrochemistry 86 (2012) 22–29.[21] J.B. Raoof, R. Ojani, M. Amiri-Aref, M. Baghayeri, Sensor Actuat. B-Chem. 166
(2012) 508–518.[22] M. Mazloum-Ardakani, Z. Taleat, A. Khoshroo, H. Beitollahi, H. Dehghani,
Biosens. Bioelectron. 35 (2012) 75–81.[23] A. Babaei, M. Babazadeh, M. Afrasiabi, Sensor Lett. 10 (2012) 993–999.[24] N.F. Atta, A. Galal, S.M. Azab, J. Electrochem. Soc. 159 (2012) H765–H771.[25] M. Mazloum-Ardakani, M.A. Sheikh-Mohseni, M. Abdollahi-Alibeik, A. Benvidi,
Analyst 137 (2012) 1950–1955.[26] X. Yan, D. Pan, H. Wang, X. Bo, L. Guo, J. Electroanal. Chem. 663 (2012) 36–42.[27] G.A. Rivas, M.D. Rubianes, M.C. Rodrıguez, N.F. Ferreyra, G.L. Luque, M.L.
Pedano, S.A. Miscoria, C. Parrado, Talanta 74 (2007) 291–307.[28] B. Nigovic, M. Marušic, S. Juric, J. Electroanal. Chem. 663 (2011) 72–78.[29] B. Nigovic, M. Sadikovic, M. Sertic, Talanta 122 (2014) 187–194.[30] The United States Pharmacopoeia, 37th ed., United States Pharmacopeial
Convention, Rockville, MD, 2013, pp 3535–3536.[31] A.C. Taylor, A. Beerahee, D.R. Citerone, M.J. Cyronak, T.J. Leigh, K.L. Fitzpatrick,
A. Lopez-Gil, S.D. Vakil, E. Burns, G. Lennox, Pharmacotherapy 19 (1999) 150–156.
[32] S. Dethy, M.A. Laute, N. Van Blercom, P. Damhaut, S. Goldman, J. Hildebrand,Clin. Chem. 43 (1997) 740–744.
[33] J.E.F. Reynolds (Ed.), Martindale: The Extra Pharmacopoeia, 30th ed., ThePharmaceutical Press, London, 1993. pp. 466–472.
[34] V. Mirceski, Š. Komorsky-Lovric, M. Lovric, Square-wave voltammetry: theoryand applications, in: F. Scholz (Ed.), Monographs in Electrochemistry, Springer,Heidelberg, 2007, pp. 143–150.
[35] International Conference on Harmonization (ICH) 2005 Validation ofAnalytical Procedures: Text and Methodology Q2 (R1).
[36] K. Sano, Y. Kodama, M. Hirano, I. Takishima, A. Makino, T. Nakamura, Y. Kitta,K. Kawabata, J. Obata, K. Kugiyama, Circulation 118 (2008) S434.
68 M. Sadikovic et al. / Journal of Electroanalytical Chemistry 733 (2014) 60–68

42
4. Electrochemical sensing of mesalazine and its N-acetylated
metabolite in biological samples using functionalized carbon
nanotube

Electrochemical sensing of mesalazine and its N-acetylated metabolitein biological samples using functionalized carbon nanotubes
Biljana Nigović n, Mirela Sadiković, Sandra JurićUniversity of Zagreb, Faculty of Pharmacy and Biochemistry, A. Kovacica 1, 10000 Zagreb, Croatia
a r t i c l e i n f o
Article history:Received 23 June 2015Received in revised form9 September 2015Accepted 12 September 2015Available online 16 September 2015
Keywords:Mesalazine5-Aminosalicylic acidMetaboliteCarbon nanotubesNafionVoltammetry
a b s t r a c t
A rapid analytical method without the time-consuming separation step was developed to simultaneouslydetermine mesalazine and its N-acetylated metabolite. A simply designed electrochemical sensor withfunctionalized carbon nanotubes in a Nafion matrix was constructed for this purpose. The presence of thenanocomposite modifier on the electrode surface significantly affects the voltammetric response oftarget analytes. The morphology of the modified surface was investigated by scanning electron micro-scopy. The effect of modifier amount on the sensor performance was investigated in order to obtain themost favorable response of mesalazine since it was found in lower concentration limits in real samplesthen its metabolite due to the rapid drug elimination and the slightly slower renal metabolite excretion.Under optimal conditions, the anodic peak currents measured by square-wave voltammetry increasedlinearly after short accumulation of 30 s in the range of 5.0�10�8–2.5�10�6 M and1.0�10�7�5.0�10�6 M for drug and metabolite, respectively. In addition to stable response, the sensorhas excellent performance associated with high sensitivity (2.33�107 and 8.37�106 mA M�1 for drugand metabolite, respectively). The synergistic effect of the carbon nanotubes and Nafion polymer filmyielded detection limit of 1.2�10�8 M for mesalazine and 2.6�10�8 M for its metabolite that is com-parable to known chromatographic methods. Due to the easy preparation and regeneration, the pro-posed sensor opens new opportunity for fast, simple and sensitive analysis of drug and its metabolite inhuman serum samples as well as direct quantification of mesalazine in delayed-release formulations.
& 2015 Elsevier B.V. All rights reserved.
1. Introduction
Mesalazine (5-aminosalicylic acid, 5-ASA) is an anti-inflammatorydrug widely prescribed for the therapy of ulcerative colitis and Crohn'sdisease (Scheme 1). It may also provide protection against the devel-opment of colorectal cancer in patients suffering from inflammatorybowel diseases [1]. In addition, 5-ASA inhibits cell injury in the in-flamed mucosa by scavenging reactive oxygen metabolites, thus sup-pressing their toxicity. The drug is absorbed quickly from the smallintestine when administrated orally and therefore, modified-releasedosage forms are designed to deliver drug in the terminal ileum andcolon [2]. After absorption, 5-ASA is metabolized by N-acetyltransfer-ase to its N-acetyled-5-ASA derivative (Ac-5-ASA) in the liver and in-testinal mucosa. This compound is the major metabolite present inblood with a half-life of up to 10 h. In plasma, both 5-ASA and Ac-5-ASA are found 40–50% and 80%, respectively bound to proteins.
Various analytical methods were described in the literature forthe determination of 5-ASA, such as liquid chromatography coupled
to mass spectrometry for drug quantification in plasma samples [3],HPLC with UV detection for stability-indicating assays [4] andanalysis in pharmaceutical formulations [5], capillary electrophor-esis for drug impurity profiling [6], spectrophotometry [7], fluor-escence spectroscopy [8], automated chemiluminescence [9] andultra-performance liquid chromatography [10]. At present, severalHPLC methods with a fluorescence [11–13], electrochemical [14,15]and mass spectrometry detection [16,17] were developed for si-multaneous quantification of 5-ASA and its N-acetylated metabolite.The satisfactory results were obtained with excellent selectivity andlow detection limit. However, the developed chromatographicmethods require derivatization of drug and metabolite before de-tection step, tedious sample preparations, consumption of largesolvent volumes and time-consuming procedures. In developedHPLC methods the analytical run time per sample took about 10–40 min.
The electroanalytical methods have proved to be useful forsensitive and selective determination of many pharmaceuticalsowing to fast response, low instrument and analysis cost as well assimplicity of samples preparation [18,19]. In spite of that, no at-tempt has been made to this date to determine 5-ASA and itsmetabolite by an electroanalytical method. There are only a few
Contents lists available at ScienceDirect
journal homepage: www.elsevier.com/locate/talanta
Talanta
http://dx.doi.org/10.1016/j.talanta.2015.09.0360039-9140/& 2015 Elsevier B.V. All rights reserved.
n Corresponding author. Fax: þ385 1 4856 201.E-mail address: [email protected] (B. Nigović).
Talanta 147 (2016) 50–58

reports available on the electrochemical determination of 5-ASA.The sonolinear sweep voltammetric method was developed fordetermination of drug in tissue culture medium [20]. 5-ASA wasquantified using glassy carbon electrode (GCE) [21] and pencilgraphite electrode [22], however both methods were applied onlyto analysis of pharmaceutical formulations. The abrasive strippingvoltammetry was used for identification of 5-ASA in commercialdosage forms [23], but proposed method was not quantitative. Theamperometric catalase-peroxidase based biosensor was developedfor measurement of 5-ASA concentration by indirect methodmonitoring dissolved oxygen level [24]. The high cost of enzymesused in the kit limits widespread application of the method forroutine purpose. The oxidative behavior of 5-ASA was studied onthe surface of GCE modified with nanoporous film and subse-quently, electrochemically deposited polypyrrole using 1,5-naph-talenedisulfonic acid as dopant [25], however the developedmethod was designed only for quantitation of 5-ASA. Due toprolonged therapy and maintenance of remission in inflammatorybowel diseases, as well as the need for clinical and bioequivalencestudies after the administration of newly developed delayed-re-lease formulations, a simple, inexpensive and highly sensitiveelectroanalytical method is in great demand for simultaneousdetermination of 5-ASA and its metabolite.
Carbon based electrodes are commonly used in electro-analytical chemistry because of their low cost and wide avail-ability. On the other hand, carbon nanotubes (CNTs) have attractedscientific interests in recent years owing to unusual mechanicalstrength and electrical conductivity, unique structure with hugesurface area and excellent electrocatalytic activity [26]. Theirsexceptional properties offered versatile platform to employ themas the active material for the preparation of various compositeelectrode materials. CNTs-based sensors generally have highersensitivities at low concentration levels or in the complex matrix,lower detection limits and faster electron transfer kinetics thantraditional carbon electrodes. However, many factors need to beinvestigated in order to create an optimal CNTs-based sensor.
In the present study, the composite material based on thecoupling of multi-walled CNTs and Nafion as cation exchangepolymer was used to develop a fast and simple method for si-multaneous measurement of 5-ASA and its metabolite without aseparation step. The developed electrochemical sensor was suc-cessfully applied for simultaneous determination of 5-ASA and Ac-5-ASA metabolite at trace levels in serum samples using ad-sorptive stripping square-wave voltammetry (SWV). In addition,the proposed sensor was used to develop inexpensive and rapidmethod for direct measurement of active ingredient in different5-ASA delayed-release formulations.
2. Experimental
2.1. Apparatus
Voltammetric measurements were performed using a μ-Auto-lab potentiostat (Eco Chemie, Utrecht, The Netherlands) controlledby GPES 4.9 software. A three-electrode cell system was used. The
multi-walled CNTs and Nafion polymer modified GCE (CNTs-N/GCE) and a bare GCE (3-mm diameter, Metrohm, Switzerland)were used as a working electrode, a platinumwire and an Ag/AgCl/3 M KCl (Metrohm) were used as the counter and reference elec-trodes, respectively. In preliminary measurements, a bare goldelectrode (2-mm diameter, Metrohm, Switzerland) and gold elec-trode modified in the same way as GCE were also employed as theworking electrode. Prior to modification, the working electrodewas polished with aqueous slurry of 0.05 μm alumina powder on asmooth polishing cloth, thoroughly rinsed with water and thenultrasonically cleaned in water for 30 s. Finally, the electrode waswashed with purified water and dried. All electrochemical ex-periments were carried out at room temperature (2371 °C).When required, stirring was applied using a computer-controlledstirrer at ca. 300 rpm.
Scanning electron microscopy (SEM) measurement was pe-formed on a Jeol JSM-7000F microscope (Jeol Ltd., Tokyo, Japan).
2.2. Chemicals
5-ASA supplied by Merck (Darmstadt, Germany) was usedwithout further purification. Ac-5-ASA metabolite, the multi-wal-led CNTs (498%, O.D. 6–13 nm, length 2.5–20 mm) and Nafion(5 wt% solution in a mixture of lower aliphatic alcohols and water)were obtained from Sigma-Aldrich (Steinheim, Germany). Allother chemicals were of analytical grade quality. Ultra pure waterused for the preparation of standard solutions and buffers wasobtained by a Milli-Q system (Millipore, Bradford, USA). Salofaks
(Dr. Falk Pharma, Germany) and Pentases (Ferring GmbH, Ger-many) delay-released tablets containing 500 mg of 5-ASA weresupplied from local pharmacy.
Stock solution of 5-ASA (1�10�3 M) was prepared by dissol-ving appropriate amount of the compound in purified water withaddition of a drop of 1 M HCl to minimize the risk of 5-ASA oxi-dation [21] and stored in the dark under refrigeration. Stock so-lution of Ac-5-ASA (1�10�3 M) was prepared by dissolving itsadequate amount in methanol. Standard solutions were prepareddaily by diluting the stock solutions with a supporting electrolytejust before use. Britton–Robinson (BR) buffer solutions (0.04 M ineach of acetic, phosphoric and boric acids) adjusted to the desiredpH with addition of a 0.2 M NaOH were used as supportingelectrolytes.
2.3. Preparation of CNTs-N/GCE
To generate carboxylic acid-functionalized surface the multi-walled CNTs (50 mg) were added to plentiful concentrated nitricacid and then sonicated for about 4 h. The suspension was filteredand washed with redistilled water to neutral. The solid powderswere dried under vacuum at room temperature. One milligram ofacid-treated CNTs was dispersed in 0.3% Nafion ethanol solution togive a 1.0 mg mL�1 black suspension with the aid of ultrasonicagitation. The nanocomposite film modified electrode was fabri-cated by dropping 3 μL of black suspension on cleaned workingelectrode surface and evaporating the solvent at room temperature.To obtain a stable cyclic voltammogram as well as strength CNTsadhesion to the electrode surface, the modified electrode wasscanned prior to first measurement by two successive cyclic vol-tammetric sweeps between 0 and 1.5 V at 100 mV s�1 in a blanksolution of BR buffer pH 2.0. The surface area of modified electrodewas obtained by cyclic voltammetry (CV) using 1.0�10�3 M K3Fe(CN)6 in 0.1 M KCl electrolyte at different scan rates (v) between�0.2 and 0.7 V. From the slope of the anodic peak current versusv1/2 relation, the surface area of the CNTs-N/GCE was calculated tobe 0.156 cm2, which was about three times greater than the surfaceof the bare GCE. For comparison, the carbon nanotubes modified
NH2HO
COOH
NHCOCH3HO
COOH
5-ASA Ac-5-ASA
Scheme 1. Chemical structures of mesalazine (5-ASA) and its N-acetylated meta-bolite (Ac-5-ASA).
B. Nigović et al. / Talanta 147 (2016) 50–58 51

GCE (CNTs/GCE) and the Nafion modified GCE (NGCE) were alsoprepared in the same way as described but without the additionNafion and CNTs, respectively.
2.4. Electrochemical measurement procedures
The oxidative behavior of 5-ASA and Ac-5-ASA was investigatedby CV in the range from 0 V to 1.0 V with the scan rate varyingfrom 10 to 500 mV s�1. Before the square-wave voltammetricdetermination of drug and its metabolite in the adsorptive strip-ping procedures, the CNTs-N/GCE was immersed in the samplesolution with 30 s accumulation at 0.1 V under stirring condition.After 5 s equilibrium period, the voltammogram was recorded byapplying a SWV potential scan from 0.3 to 1.0 V. The CNTs-N/GCEwas applied for direct SWV measurement of 5-ASA in delay-re-leased dosage forms. Operating instrumental conditions for SWVwere: pulse amplitude of 50 mV, frequency of 70 Hz and scan in-crement of 2 mV. The analytes adsorbed on the modified electrodesurface after measurement were readily removed by applyingsingle positive-going CV potential scan from 0 to 1.5 V in blanksupporting electrolyte.
2.5. Determination in samples
Serum samples were obtained from healthy volunteers andstored frozen until assay. Samples were fortified with appropriatealiquot volume of 5-ASA and Ac-5-ASA standard solutions toachieve final concentrations (2.5�10�7 and 1.0�10�6 M) that arefound in serum after treatment with recommended daily dose of2 g [16,27]. To remove serum proteins a 500 mL aliquot of serumsample containing drug and its metabolite was mixed with acet-onitrile (1:1). After vortexing for 60 s, the mixture was centrifugedfor 6 min at 6000 rpm. Appropriate volumes of clear supernatantwere transferred into the volumetric flask and diluted with sup-porting electrolyte before voltammetric measurements. Analysis ofhuman serum samples were performed using the standard addi-tion method to reduce the matrix effect by adding three successivealiquots of standard solutions.
To prepare the solutions of 5-ASA delay-released dosage forms,10 tablets were weighted and crushed to a fine powder. A quantityof finely ground material equivalent to 1.5 mg of 5-ASA wastransferred into a calibrated 10.0 mL flask and dispersed in water.The content of the flask was sonicated for 10 min to providecomplete dissolution of active ingredient and then completed tothe volume with water. Tablet solution was then filtered through0.45 μm Acrodisc GHP filters (Gelman, Ann Arbor, USA). An aliquotof filtrate was transferred into a calibrated flask and diluted withwater to yield a final drug concentration of 1.0�10�4 M. A seriesof dilutions were made with supporting electrolyte to cover theworking concentration range. Solutions were subjected to directSWV measurements and the content of 5-ASA in the commercialpharmaceutical products was determined by standard additionmethod. For recovery studies, aliquots of the 5-ASA standard so-lutions were added to real samples prepared from tablets.
3. Results and discussion
3.1. Electrochemical behavior of 5-ASA and its metabolite on devel-oped sensor
To improve the sensor response we examined in preliminarymeasurements the influence of the working electrode material,glassy carbon and gold, on oxidation peak heights of 5-ASA and itsmetabolite. As sensitivity did not improve when using gold elec-trode (the inset of Fig. 1), the GCE were used in subsequent
experiments due to their significantly lower cost. The cyclic vol-tammograms of 5�10�5 M 5-ASA solution in BR buffer pH2.0 obtained at the bare GCE, the NGCE, the CNTs/GCE and theCNTs-N/GCE using a scan rate of 100 mV s�1 are presented inFig. 1. As can be seen, 5-ASA shows one well-defined voltammetricoxidation peak in aqueous solutions and moving from the bareGCE to CNTs-N/GCE it becomes well-defined with enhanced peakcurrent. Due to the presence of the primary aromatic amino group(pKa¼6), carboxylic group (pKa¼3) and phenolic group(pKa¼13.9) in the molecule [28], 5-ASA was completely in cationicform in experimental conditions used in the voltammetric mea-surements. Nafion as a cation-exchanger attracted positivelycharged drug molecules through electrostatic interaction from thebulk solution to enhance the anodic signal (ip¼7.25 mA). However,the voltammetric response of 5-ASA was remarkable increased atthe CNTs-N/GCE with a current of 13.9 mA at peak potential of0.54 V compared with that of using a bare GCE (ip¼2.85 mA). Thesynergistic effect of CNTs and cation-exchange polymer combina-tion leads to a considerable improvement in the analytical sensi-tivity. To obtain information regarding the adsorptive behavior of5-ASA at the CNTs-N/GCE, the influence of the scan rate on theelectrochemical response of drug molecule was investigated by CV.The oxidation peak current of 5-ASA increased with scan rate in-creasing and a linear relationship was observed in the range 10–500 mV s�1 following the relation ip (μA)¼0.071 v (mV s�1)þ5.14. The oxidation peak current was significantly suppressed insecond cyclic scan. Those results indicated that the electrodeprocess of 5-ASA at the developed electrochemical sensor is con-trolled by an adsorption step.
5-ASA showed at slow scan rates an irreversible oxidationwave, while in the reverse scan a single reduction wave was ob-served at much more negative potential (0.43 V) than would beexpected for reversible process. This indicated that the initialoxidation product underwent a chemical reaction to yield a secondproduct that was reduced at more negative potentials. With scanrate increase the oxidation of 5-ASA became quasi-reversible.Furthermore, the electrochemical behavior of 5-ASA at developedsensor was studied over pH range of 2.0–5.0 in buffered aqueousmedia. A linear shift of the peak potential towards less positivevalues was observed while increasing the pH. The slope valueobtained was 65.0 mV pH�1. The oxidation pattern of 5-ASA mo-lecule observed at the CNT-N/GCE was well-consistent with ourprevious studies at the GCE [21], thus, we can corroborate that theoxidation of drug at the nanocomposite film involves the initial2e�/2Hþ oxidation of 5-ASA to the quinone imine, followed byhydrolysis to produce the corresponding quinones.
In this paper, the redox behavior of Ac-5-ASA was studied for
0.0 0.2 0.4 0.6 0.8 1.0
-10
-5
0
5
10
15
20
25d
ba
c
i /
A
E / V vs. Ag/AgCl
V
Fig. 1. Cyclic voltammograms of 5-ASA (5�10�5 M) at a bare GCE (a), the NGCE(b), the CNTs/GCE (c) and the CNTs-N/GCE (d) in BR buffer pH 2.0. Inset: compar-ison of gold electrode (dashed line) and GCE (solid line) modified with CNTs/Nafioncomposite film in the same conditions. Scan rate: 100 mV s�1.
B. Nigović et al. / Talanta 147 (2016) 50–5852

the first time. The cyclic voltammograms of Ac-5-ASA in BR bufferpH 2.0 obtained at the bare GCE, the NGCE, the CNTs/GCE and theCNTs-N/GCE using a scan rate of 100 mV s�1 are depicted in Fig. 2.When the bare GCE surface was coated with Nafion film, thevoltammetric response of metabolite did not change significantly.The metabolite molecule has a pKa of 2.7 and 12.9 [28]. Therefore,83.4% of the metabolite was in unionised form under used vol-tammetric condition and cannot not be attracted through elec-trostatic interaction with cation-exchange polymer. Upon mod-ification with multi-walled CNTs, remarkable enhancement effectto the current response of metabolite was observed due to verylarger surface area of the modified electrode. However, the CNTswere tightly fixed in the Nafion matrix onto GCE surface in a re-producible way enhancing the stability of proposed electro-chemical sensor and improving the measurement precision.Hence, the CNTs-N/GCE exhibited convenient electroanalyticalperformance for simultaneous measuring of 5-ASA and Ac-5-ASA.The potential difference of 200 mV between the two peak poten-tials at the CNTs-N/GCE is large enough to determine the con-centration of drug and its metabolite simultaneously.
A well-defined anodic current response of Ac-5-ASA was ob-served at 0.74 V at the CNTs-N/GCE. On the reverse potential scan,there was no corresponding reduction peak, suggesting that theelectrode reaction is irreversible. The electrochemical oxidation ofAc-5-ASA was studied using CNTs-N/GCE in aqueous solutionswith different pH values in the range of 2.0–5.0. The peak poten-tials were shifted to less positive values with increasing pH and alinear relationship was observed following the equations: Ep (V)¼0.86�0.057 pH (r¼0.999). The linear dependence implies that theprotonation reaction occurred in the overall electrode process. Aslope of �0.059 V pH�1 is characteristic for the oxidation poten-tial as a function of the pH in the 2e�/2Hþ process correspondingto the oxidation of the hydroxyl group in metabolite molecule to
the corresponding ketone. The cyclic voltammetric behavior wasfurther examined as a function of the scan rate in the range of 10–500 mV s�1. The signal for Ac-5-ASA was linearly dependent onthe scan rate with relation ip (μA)¼0.048 v (mV s�1)þ2.21 andtogether with the observed positive potential shift of the oxidationsignals with increasing the scan rate indicate that the electrodeprocess is an adsorption-controlled irreversible oxidation.
The surface morphology of the CNTs-N/GCE was characterizedby SEM. As shown in Fig. 3a, the nanocomposite film depositedformed unique bundle structures. The SEM image of compositefilm (Fig. 3b) showed a uniform coating of CNTs well dispersed inpolymer matrix making the surface rough with a high accessiblearea improving the preconcentration of 5-ASA molecules throughelectrostatic interaction with negatively charged sulfonate groupin Nafion polymer structure as well as metabolite moleculescaused by the increase in working electrode efficient area due toCNTs incorporation. On the other hand, the large surface area ofthe CNTs/GCE had the tubes irregularly placed in thread-likeformations.
3.2. Optimization studies
To get more insights into the electroanalytical performance ofthe CNTs-N/GCE and in addition, to optimize its performance withrespect to nanocomposite film deposition, SWV was used for fur-ther electrochemical measurement of 5-ASA and its metabolite.The mean steady state plasma levels of unchanged 5-ASA are ra-ther lower (range 0.02–1.2 μg mL�1) whereas those of Ac-5-ASAare always higher (range 0.1–2.9 μg mL�1). This is due to the rapidelimination of 5-ASA (t1/2¼0.4–2.4 h) and the slightly slower renalexcretion of the Ac-5-ASA (t1/2¼6–9 h) [27]. Since the drug wasfound in lower concentration limits then its metabolite in realsamples, the effect of modifier amount on the performance of theCNTs-N/GCE was investigated in order to obtain the most favorableresponse of 5-ASA.
Firstly, when varying different amounts of multi-walled CNTsdispersed in Nafion ethanol solution, the concentration of1 mg mL�1 was selected as optimum. The SWV response of 5-ASAwas increased up to 0.5% of Nafion concentration in the im-mobilizing suspension due to more – SO3
− sites in polymer film thatconducted ion-exchange with drug molecules leading to an in-crement of accumulation capacities. At higher concentrations, thepolymer film became thicker and lowered the electrical con-ductivity of CNTs. Furthermore, the Nafion polymer retarded theelectron transfer rate of Ac-5-ASA oxidation as well as its masstransportation through the film resulting in the lower currentresponse. The SWV response of both analytes in simultaneousanalysis reached the optimal value when the composite film wasuniformly coated on the electrode surface using 0.3% Nafion con-centration for preparation of homogenous CNTs suspension. Thethickness of the composite film was determined by the volume of
0.0 0.2 0.4 0.6 0.8 1.0
-10
-5
0
5
10
15
20d c
bai /
A
E / V vs. Ag/AgCl
Fig. 2. Cyclic voltammograms of Ac-5-ASA (5�10�5 M) at a bare GCE (a), the NGCE(b), the CNTs/GCE (c) and the CNTs-N/GCE (d) in BR buffer pH 2.0. Scan rate:100 mV s�1.
Fig. 3. The surface image of the CNTs-N/GCE obtained by scanning electron microscopy (a) and same surface at high magnification (b). Scale bar: 100 nm.
B. Nigović et al. / Talanta 147 (2016) 50–58 53

CNTs-Nafion suspension coated onto the GCE surface. When thevolume of suspension increased up to 3 μL, the oxidation peakcurrent enhanced notably for both analytes due to increment ofeffective surface area and more CNTs dramatically promotedelectron transfer reaction, but with further increase the oxidationpeak currents showed gradual decline owing to the higher electricresistance.
Additionally, various types of the supporting electrolytes, in-cluding 0.01 and 0.1 M sulfuric acid, 0.01 M hydrochloric acid,acetate buffer pH 3.5 and BR buffer pH 2.0–5.0, were tested inorder to obtain better sensitivity for simultaneous determinationof drug and its metabolite. A maximum current intensity andlower background current was achieved in BR buffer solution atpH 2.0 and consequently, it was employed for further studies.
To obtain much more sensitive peak currents for analyticalstudies, the variation of the current response recorded at theCNTs-N/GCE was monitored while changing instrumental SWVparameters, i.e. frequency (20 Hzr fr110 Hz), pulse amplitude(10 mVrar60 mV) and potential step (2 mVrΔEsr10 mV).The most favorable responses were achieved using a combinationof a frequency of 70 Hz, pulse amplitude of 50 mV and a potentialstep of 2 mV. Compared to other voltammetric techniques, theSWV offers several advantages such as a high speed in analysis, awide dynamic concentration range, low consumption of electro-active compounds and reduced problems with electrode surfaceblocking, a high signal-to-noise ratio and a low detection limitbecause of its efficient discrimination of capacitance current [29].
To obtain lower detection limits the possibility of 5-ASA and itsmetabolite preconcentration before SWV measurement was in-vestigated because the modification of the electrode surface led toa strong interfacial accumulation of both analytes. To achieve theoptimum conditions for the maximum adsorption, the influence ofaccumulation potential (between �1.0 and 0.9 V) and depositiontime (between 10 s and 120 s) on the voltammetric responses ofboth analytes was evaluated in solution containing 5-ASA and Ac-5-ASA at concentration level of 1�10�6 M. A maximum was ob-served at 0.1 V, so this accumulation potential was selected in allsubsequent studies. The deposition time significantly affected thevoltammetric responses of both analytes at the CNTs-N/GCE. Thepeak current of 5-ASA enhanced greatly within 30 s due to elec-trostatic interactions of positively charged drug molecules withnegatively charged sulfonate groups in Nafion polymer structure(Fig. 4). The voltammetric response increased up to 60 s and thenbecame constant at higher accumulation times. On the other hand,the peak current of Ac-5-ASA increased slowly up to 120 s re-vealing a constant adsorption of metabolite molecules attracted onthe large surface of the CNTs-N/GCE. The increment of accumula-tion time period above 60 s showed a deviation of the metabolite
peak current from linearity, thus indicating surface adsorptionsaturation. The value of 30 s was considered as optimal value toachieve the highest possible sensitivity of both analytes in a moreshort analysis time.
3.3. Simultaneous determination of 5-ASA and its metabolite
The peak currents of 5-ASA and Ac-5-ASA at 0.53 and 0.74 V,respectively, obtained at proposed sensor were used for simulta-neous determination of drug and its metabolite involving ad-sorptive stripping SWV. The SWV measurement in the potentialrange from 0.3 to 1.0 V takes only 5 s using the pulse frequency of70 Hz with 2 mV potential step. Since the presence of metabolite insolution may affect the quantification of drug, and vise versa, theinterference of each analyte in the simultaneous determination ofits pairs was performed by changing one analyte concentration andkeeping the other unchanged. Fig. 5 shows the SWV responsesobtained for solutions of increasing drug concentration in the pre-sence of metabolite at the fixed concentration of 2.5�10�6 M. Therelation between the stripping peak current and concentration of5-ASA was found to be linear over the range 5.0�10�8–
2.5�10�6 M (the inset of Fig. 5). The variation of adsorptivestripping SWV peak current versus 5-ASA concentration in the ab-sence of metabolite gave the sensitivities of the CNTs-N/GCE to-wards drug oxidation of 2.33�107 mA M�1. The value obtained isvery close (relative error is 1.1%) to the values observed in thepresence of metabolite (Table 1), indicating independent adsorptionof both analytes in the accumulation step at the surface of theproposed electrochemical sensor. Fig. 6 shows the voltammetric
0 20 40 60 80 100 1200
4
8
12
16
ip /
A
tacc / s
Fig. 4. Effect of the accumulation time on the oxidation peak current for 5-ASA(squares) and its metabolite (circles). SWV settings: frequency of 15 Hz, amplitudeof 25 mV and potential step of 4 mV, c¼1�10�6 M.
0.3 0.4 0.5 0.6 0.7 0.8 0.9 1.0
240
250
260
270
280
290
i /
A
E / V vs. Ag/AgCl
Fig. 5. Square-wave voltammograms of 5-ASA at the CNTs-N/GCE recorded in BRbuffer pH 2.0 at different concentrations (5.0�10�8–2.5�10�6 M) in the presenceof its metabolite (2.5�10�6 M). tacc¼30 s, SWV settings same as in Fig. 4. Insetshows a calibration graph for the quantification of 5-ASA.
Table 1Validation data for determination of 5-ASA and its N-acetylated metabolite usingdeveloped electrochemical sensor.
Parameter Adsorptive stripping SWV SWV
5-ASA Ac-5-ASA 5-ASA
Linearity range (M) 5.0�10�8–
2.5�10�61.0�10�7–
5.0�10�65.0�10�7–
1.0�10�5
Slope (μA M�1) 2.33�107 8.37�106 1.75�106
Intercept (μA) 2.79 �0.15 �0.56Sx/y 0.964 0.662 0.386SD of slope (Sb) 4.37�105 1.61�105 4.57�104
SD of intercept (Sa) 0.100 0.072 0.063Correlationcoefficient
0.999 0.999 0.999
Limit of detection (M) 1.2�10�8 2.6�10�8 1.1�10�7
Limit of quantitation(M)
4.2�10�8 8.7�10�8 3.6�10�7
B. Nigović et al. / Talanta 147 (2016) 50–5854

responses for the solutions containing various concentrations ofmetabolite and constant concentration of 5-ASA (1�10�6 M). Anexcellent linear response in the concentration range of 1.0�10�7–
5.0�10�6 M was obtained for Ac-5-ASA (the inset of Fig. 6). Theresponse of CNTs-N/GCE was also followed for successive increaseof the metabolite concentrations in the absence of drug. The sensorrevealed the sensitivity of 8.37�106 mA M�1 with relative error of0.7% in comparison to the slope observed in the absence of 5-ASAconfirming independent preconcentration and oxidation of bothanalytes. Therefore, simultaneous determination of drug and itsmetabolite is possible without interferences. Since drug monitoringplays important role in drug quality control and has a great impacton public health, it is very important to quantify of active ingredientin pharmaceutical dosage forms. Due to the high concentration of5-ASA in its dosage forms (500 mg per tablet), the variation of thecurrent response at the CNTs-N/GCE with the drug concentrationwas monitored by direct SWV measurements. In the case of asquare-wave scan without any accumulation step, the oxidationpeak showed a linear response in the concentration range of5.0�10�7–1.0�10�5 M. The analytical characteristics and the re-lated validation parameters of developed methods are given in Ta-ble 1. The detection and quantification limits were calculated fromthe calibration curves as 3s/m and 10s/m, respectively, where s isthe standard deviation of the intercept and m is the slope of thecalibration curve [30].
3.4. Selectivity, reproducibility and stability of developed sensor
The selectivity of the CNTs-N/GCE was investigated in solutionscontaining 5-ASA and Ac-5-ASA at 2.5�10�6 M concentration.The influence of potential interfering species, commonly presentin biological samples or co-formulated with active ingredient, onthe voltammetric responses of both analytes was examined. Thetolerance limit was defined as the maximum concentration of theinterfering substance that caused an error less than 75% in thevoltammetric responses. The experiments displayed that the oxi-dation peak current of 5-ASA and its metabolite at the CNTs-N/GCEdid not change after adding 300-fold of glucose and 500-foldconcentration of ascorbic acid indicating that the selectivity of themethod may be adequate for the quantification in biological fluidswhere these endogenous substances are always present. In thepresence of uric acid, new well-defined oxidation peak appearedat the potential around þ0.66 V. However, uric acid did not in-fluence on the peak current of 5-ASA and its metabolite up to5-fold excess. According to the analysis of the obtained voltam-metric responses, Naþ , Cl� (2000-fold), SO4
2− (1000-fold), Kþ , NO3−,
HPO42− (500-fold), Zn2þ , Ca2þ , Mg2þ , Cu2þ , lactate (50-fold), Fe3þ
(10-fold), L-glycine, L-alanine, L-aspartic acid, L-glutamic acid(500-fold) and L-cysteine (200-fold) did not show interference inthe determination of both analytes. The presence of citric acid,starch, lactose, sucrose (500-fold) had no influence on the peakcurrent of 5-ASA.
The repeatability of the voltammetric response was evaluatedby six replicate measurements of 1.0�10�6 M 5-ASA and Ac-5-ASA solution yielding unchanged oxidation peak potentials forboth analytes and the RSD values of 1.7% and 1.3% for the peakcurrents of 5-ASA (mean ip¼26.6 μA) and Ac-5-ASA (meanip¼8.1 μA), respectively. These results indicated that proposedelectrochemical sensor was stable in repeated measurements forselective determination of 5-ASA and its metabolite. The re-producibility of the electrode response was characterized by threereplicate measurements of 1.0�10�6 M 5-ASA and Ac-5-ASA overthree days, each time using a freshly prepared the CNTs-N/GCEand standard solutions. The RSDs values of the anodic strippingcurrents for 5-ASA and As-5-ASA were 2.6% and 2.8%, respectively,while the RSDs of peak potentials for both drugs were no greaterthan 0.9%, indicating excellent fabrication reproducibility.
The proposed electrochemical sensor can be stored in air atroom temperature or kept in distilled water for several weekswithout the loss of activity. The stability of the CNTs-N/GCE waschecked by measuring the voltammetric response in 2.5�10�6 Mof 5-ASA and Ac-5-ASA solution over a period of four weeks. Be-fore measurements, the modified electrode was scanned by CVbetween 0 and 1.5 V in the solution of blank supporting electrolyteuntil the response was stable. The experimental results indicatedthat the peak potential for both analytes was unchanged and thecurrent response of drug and its metabolite decreased after twoweeks by about 3.2% and 3.5%, respectively. Repeating the ex-periments after longer time, it was found that the current re-sponses decreased about 20% in four weeks for both analytes. Theexperiments revealed that the prepared multi-walled CNTs-Nafioncomposite film has good stability and durability due to high me-chanical strength of the CNTs incorporated into polymer matrixand strong adherence to electrode surface enabling long-termelectrochemical sensing applications.
3.5. Analytical applications
The CNTs-N/GCE was applied for simultaneous determinationof 5-ASA and its metabolite in human serum samples (Fig. 7). Theexpected serum concentration level for drug and its metaboliteafter treatment with the therapeutic daily dose recommended forulcerative colitis and Crohn’s disease are within the linear con-centration range of the newly developed method using proposedelectrochemical sensor. The quantitation of drug and metabolite in
0.3 0.4 0.5 0.6 0.7 0.8 0.9 1.0
220
230
240
250
260
270
280
i /
A
E / V vs. Ag/AgCl
Fig. 6. Square-wave voltammograms of Ac-5-ASA at the CNTs-N/GCE recorded inBR buffer pH 2.0 at different concentrations (1.0�10�7–5.0�10�6 M) in the pre-sence of 5-ASA (1.0�10�6 M). tacc¼30 s, SWV settings same as in Fig. 4. Insetshows a calibration graph for the quantification of As-5-ASA.
0.3 0.4 0.5 0.6 0.7 0.8 0.9 1.0
70
80
90
i /
A
E / V vs. Ag/AgCl
Fig. 7. Square-wave voltammograms of 5-ASA and its metabolite at the CNTs-N/GCE recorded in spiked human serum for increasing concentrations together withcorresponding background recordings. tacc¼30 s, SWV settings same as in Fig. 4.
B. Nigović et al. / Talanta 147 (2016) 50–58 55

human serum at the therapeutic concentration range is not fea-sible without analyte accumulation on the CNTs-N/GCE surface. Onthe other hand, the Nafion-coated membrane contains sulfonategroups and such surface layer prevents accumulation of negativelycharged oxidizable ions found in biological fluids onto the elec-trode surface. The recovery studies of both analytes in serumsamples were performed using the standard addition method tonullify any remaining interference. The mean recovery of100.172.7% for 5-ASA and 99.372.8% for Ac-5ASA was achievedfrom this type of matrix (Table 2). From the experimental results, itis obvious that the proposed electrochemical sensor has greatpotentials for practical analysis of biological samples and bioe-quivalence studies when a new drug formulation is prepared. Theknowledge of the pharmacokinetic profile of 5-ASA from the dif-ferent controlled-released formulations is important for the ef-fective therapy of inflammatory bowel diseases.
The determination of 5-ASA content in pharmaceutical for-mulations was carried out using the direct SWV measurements. Toeliminate matrix effects 5-ASA was quantified in delay-releasedtablets using the standard addition method. The analysis of 5-ASAin its pharmaceutical formulations exhibited mean recoveries of100.7% and 99.8% with relative standard deviations of 0.8% and0.7% for Salofaks and Pentases, respectively, indicating adequateprecision and accuracy of the SWV method as well as the suit-ability of the developed sensor for this purpose. The effect of ex-cipients on the voltammetric response of 5-ASA was studied byadding of known amount of drug standard solution (2.5�10�7 M)to the different pre-analyzed formulation solution samples. Therecoveries in the range of 98.4–101.6% indicated that excipients didnot interfere with assay of active ingredient. The results obtainedwith the described method were compared with those obtainedby the reported HPLC methods [4,5]. No significant differenceswere found between the performances of those methods regard-ing the accuracy and precision. Moreover, the electroanalyticalmethod does not require separation, sophisticated instrument andexpensive solvents that are needed for HPLC procedures and only
5 s is necessary for direct SWV measurement.
3.6. Comparison with other analytical methods
The analytical characteristics of the CNTs-N/GCE were com-pared with those obtained by HPLC methods for the simultaneousdetermination of 5-ASA and its metabolite (Table 3.). The detectionlimits of both analytes at the CNTs-N/GCE are comparable tochromatographic methods reported previously, moreover, theachieved values are better than those reported for HPLC methodswith fluorescence [12] and electrochemical detection [15]. Com-pared with HPLC method coupled to mass spectrometry [17], theLODs obtained with CNTs-N/GCE for both examined analytes werein a higher concentration range. However, the LOQ values obtainedat the CNTs-N/GCE as 6.3 and 16.9 ng/mL for 5-ASA and Ac-5-ASA,respectively, are adequate to quantify concentration levels of5-ASA and its main metabolite generally found in human plasmasamples collected during clinical and pharmacokinetic studies inwhich delay-released formulations are administered at ther-apeutic dosage. In comparison with the previously developedchromatographic methods, the present electroanalytical methodoffers undoubted advantages including short analysis time, sim-plicity of operation and lower running cost. The HPLC methodsrequire a high percentage of organic solvent making them lessenvironmental friendly. Additionally, HPLC method with fluores-cence detection require derivatization reaction of analytes beforedetection step, while LC–MS analytical procedures demand ex-pensive and sophisticated equipment that is not available in manylaboratories.
The electrochemical behavior of Ac-5-ASA has not been in-vestigated to date, while only few electroanalytical methods weredeveloped for the determination of 5-ASA. The comparison be-tween the analytical performance of the CNT-N/GCE and otherelectrochemical sensors described earlier in the literature for thequantification of drug is also presented in Table 4. The LOQ valuefor 5-ASA obtained in this work is almost two orders of magnitudebetter than that obtained at bare GCE [21]. However, the mostimportant advantage of the CNT-N/GCE is its remarkable im-provement in the reproducibility, with no requirement for tediousmechanical maintenance by polishing the substrate surface beforeeach measurement as in the case of GCE. Also compared withother methods, the linearity range obtained at proposed electro-chemical sensor for 5-ASA was in the lower concentration range.The CNT-N/GCE with adsorptive accumulation of 30 s exhibited asimilar linear range as GCE modified with nanoporous film andelectrochemically deposited polypyrrole after 90 s accumulationstep (slope of the calibration plot was 1.36�105 mA M�1) [25], butthe improved sensitivity was obtained in the case of CNT-N/GCE(slope of the calibration plot was 2.33�107). In relation to otherelectroanalytical methods for determination of 5-ASA, the LODobtained with direct SWV measurement at CNT-N/GCE is similar,
Table 2Quantification of 5-ASA and its N-acetylated metabolite in serum samples by ad-sorptive stripping SWV.
Samples Added 106 c (M) Found 106 c (M) Recovery (%) RSDa (%)
5-ASA 0.25 0.253 101.28 2.650.50 0.501 100.27 2.960.75 0.745 99.33 2.281.00 0.995 99.47 2.70
Ac-5-ASA 1.00 0.989 98.91 3.342.00 1.964 98.22 3.113.00 2.988 99.61 2.824.00 4.019 100.47 2.06
a Average of three measurements.
Table 3Comparison of HPLC methods for the simultaneous determination of 5-ASA and its N-acetylated metabolite with the present work.
5-ASA Ac-5-ASA
Detection Concentration range LOD Concentration range LOD Reference
Fluorescence 5–10,000 ng/mL 5 ng/mL 5–10,000 ng/mL 5 ng/mL [11]Fluorescence 100–8000 ng/mL 20 ng/mL 100–8000 ng/mL 20 ng/mL [12]Fluorescence 3.2�10�7–4.9�10�6 M 5.0�10�8 M 1.3�10�7–4.9�10�6 M 2.0�10�8 M [13]Electrochemical 1–300 ng/mL 1 ng/mL 10–1000 ng/mL 1 ng/mL [14]Electrochemical 50–3200 ng/mL 5 ng/mL 50–3200 ng/mL 10 ng/mL [15]Mass spectrometry 50–4000 ng/mL 15 ng/mL 50–4000 ng/mL 15 ng/mL [16]Mass spectrometry 2–1500 ng/mL 1 pg/mL 10–2000 ng/mL 2 pg/mL [17]CNTs-N/GCE 5.0�10�8–2.5�10�6 M 1.2�10�8 M 1.0�10�7–5.0�10�6 M 2.6�10�8 M This work
(7.5–375 ng/mL) (1.8 ng/mL) (19.5–975 ng/mL) (5.1 ng/mL)
B. Nigović et al. / Talanta 147 (2016) 50–5856

or even better using adsorptive accumulation of drug molecules onthe porous thin film at its surface, than those found with otherelectrodes. The lower LOD value showed only the GCE modifiedusing layer by layer procedure with nanofilm deposition andsubsequently electropolimerization of pyrrole in the presence ofaromatic anion dopant [25], however, the CNT-N/GCE can be easierfabricated in a simple and fast procedure and the surface of elec-trode is also easily renewable.
4. Conclusions
In the present work, we have developed for the first timeanalytical method for simultaneous determination of 5-ASA andits metabolite without the need for prior time-consuming se-paration step using electrochemical sensor with functionalizedCNTs. A simple approach was applied for the modification ofelectrode surface. The presence of the nanocomposite modifier onthe surface of the GCE significantly affects the response sensitivityof target analytes. Additionally, the proposed electrode showedlong-term stability and very easy surface regeneration. The ob-tained results reveal that the CNT-N/GCE in combination with theproposed pulse voltammetric method is reliable and extremelyselective tool with short response time for sensing convenientlylow concentration levels of 5-ASA and its metabolite in biologicalsamples. The reported results also imply a promising application ofthe CNT-N/GCE for rapid and direct measurement of 5-ASA inpharmaceutical samples providing significant advantage overpreviously developed methods.
References
[1] H. Allgayer, Review article: mechanisms of action of mesalazine in preventingcolorectal carcinoma in inflammatory bowel disease, Aliment. Pharmacol.Ther. 18 (2003) 10–14.
[2] W.J. Sandborn, S.B. Hanauer, Systematic review: the pharmacokinetic profilesof oral mesalazine formulations and mesalazine pro-drugs used in the man-agement of ulcerative colitis, Aliment. Pharmacol. Ther. 17 (2003) 29–42.
[3] J. Qin, X. Di, X. Wang, Y. Liu, Development and validation of an LC–MS/MSmethod for the determination of mesalazine in beagle dog plasma and itsapplication to a pharmacokinetic study, Biomed. Chromatogr. 29 (2015)261–267.
[4] S.H. Gatkal, P.R. Mhatre, V.V. Chopade, P.D. Choudhari, Development and va-lidation of stability indicating HPLC assay method for determination of me-salamine in bulk drug and tablet formulation, Int. J. Pharm. Sci. Rev. Res. 20(2013) 200–204.
[5] K. Sivarami Reddy, B. Ramachandra, N.V.S. Naidu, Development and validationof HPLC assay method for determination of mesalamine in bulk drug and ta-blet formulation, Int. J. Sci. Eng. Res. 2 (2014) 52–56.
[6] R. Gotti, R. Pomponio, C. Bertucci, V. Cavrini, Determination of 5-aminosalicylicacid related impurities by micellar electrokinetic chromatography with an ion-pair reagent, J. Chromatogr. A 916 (2001) 175–183.
[7] S.Yu Garmonov, Z.C. Nguyen, I.F. Mingazetdinov, L.M. Yusupova, N.S. Shitova,R.N. Ismailova, V.F. Sopin, Spectrophotometric determination of mesalazine inurine for assessing the acetylation phenotype in vivo in humans, Pharm.
Chem. J. 45 (2012) 757–760.[8] H. Abdolmohammad-Zadeh, S. Kohansal, Determination of mesalamine by
spectrofluorometry in human serum after solid-phase extraction with Ni-Allayered double hydroxide as a nanosorbent, J. Braz. Chem. Soc. 23 (2012)473–481.
[9] E.J. Llorent-Martinez, P. Ortega-Barrales, M.L. Fernandez de Cordova, A. Ruiz-Medina, Development of an automated chemiluminescence flow-throughsensor for the determination of 5-aminosalicylic acid in pharmaceuticals: acomparative study between sequential and multicommutated flow techni-ques, Anal. Bioanal. Chem. 394 (2009) 845–853.
[10] S. Nandipati, V.K. Reddy, S. Uba, A validated ultra performance liquid chro-matography method for assay determination of mesalamine, Int. J. Pharm.Pharm. Sci. 5 (2013) 312–316.
[11] F.N. Hussain, R.A. Ajjan, M. Moustafa, J.C. Anderson, S.A. Riley, Simple methodfor the determination of 5-aminosalicylic and N-acetyl-5-aminosalicylic acidin rectal tissue biopsies, J. Chromatogr. B 716 (1998) 257–266.
[12] B. Bystrowska, J. Nowak, J. Brandys, Validation of a LC method for the de-termination of 5-aminosalicylic acid and its metabolite in plasma and urine, J.Pharm. Biomed. Anal. 22 (2000) 341–347.
[13] M. Nobilis, Z. Vybiralova, K. Sladkova, M. Lisa, M. Holcapek, J. Kvetina, High-performance liquid-chromatographic determination of 5-aminosalicylic acidand its metabolites in blood plasma, J. Chromatogr. A 1119 (2006) 299–308.
[14] G. Palumbo, G. Carlucci, P. Mazzeo, G. Frieri, M.T. Pimpo, D. Fanini, Simulta-neous determination of 5-aminosalicylic acid, acetyl-5-aminosalicylic acid and2,5-dihydroxybenzoic acid in endoscopic intestinal biopsy samples in humansby high-performance liquid chromatography with electrochemical detection,J. Pharm. Biomed. Anal. 14 (1995) 175–180.
[15] G. Palumbo, S. Bacchi, L. Primavera, P. Palumbo, G. Carlucci, A validated HPLCmethod with electrochemical detection for simultaneous assay of 5-amino-salicylic acid and its metabolite in human plasma, Biomed. Chromatogr. 19(2005) 350–354.
[16] E. Pastorini, M. Locatelli, P. Simoni, G. Roda, E. Roda, A. Roda, Development andvalidation of a HPLC–ESI–MS/MS method for the determination of 5-amino-salicylic acid and its major metabolite N-acetyl-5-aminosalicylic acid in hu-man plasma, J. Chromatogr. B 872 (2008) 99–106.
[17] K. Kanala, N.T. Hwisa, B.R. Chandu, F.H. Assaleh, K. Mukkanti, P. Katakam, B.S. Reddy Challa, Simultaneous quantification of mesalamine and its metaboliteN-acetyl mesalamine in human plasma by LC–MS/MS and its application to abioequivalence study, BJPR 4 (2014) 1568–1590.
[18] B. Nigović, J. Spajić, A novel electrochemical sensor for assaying of anti-psychotic drug quetiapine, Talanta 86 (2011) 393–399.
[19] B. Nigović, S.B. Hocevar, Square-wave voltammetric determination of panto-prazole using ex situ plated antimony film electrode, Electrochim. Acta 109(2013) 818–822.
[20] E.L. Beckett, N.S. Lawrence, R.G. Evans, J. Davis, R.G. Compton, Sonoelec-trochemically enhanced determination of 5-aminosalicylic acid, Talanta 54(2001) 871–877.
[21] B. Nigović, B. Simunić, Determination of 5-aminosalicylic acid in pharma-ceutical formulation by differential pulse voltammetry, J. Pharm. Biomed.Anal. 31 (2003) 169–174.
[22] C.V. Uliana, H. Yamanaka, G.S. Garbellini, G.R. Salazar-Banda, Determination of5-aminosalicylic acid in pharmaceutical formulations by square wave vol-tammetry at pencil graphite electrodes, Quim. Nova 33 (2010) 964–967.
[23] Š. Komorsky-Lovrić, B. Nigović, Identification of 5-aminosalicylic acid, cipro-floxacin and azithromycin by abrasive stripping voltammetry, J. Pharm.Biomed. Anal. 36 (2004) 81–89.
[24] A. Akkaya, C. Altug, N. Kasikara Pazarlioglu, E. Dinckaya, Determination of5-aminosalicylic acid by catalase-peroxidase based biosensor, Electroanalysis21 (2009) 1805–1810.
[25] S. Shahrokhian, P. Hosseini, Z. Kamalzadeh, Investigation of the electro-chemical behavior of mesalazine on the surface of a glassy carbon electrodemodified with CNT/PPY doped by 1,5-Naphthalenedisulfonic acid, Electro-analysis 25 (2013) 2481–2491.
[26] G.A. Rivas, M.D. Rubianes, M.C. Rodrıguez, N.F. Ferreyra, G.L. Luque, M.L. Pedano, S.A. Miscoria, C. Parrado, Carbon nanotubes for electrochemicalbiosensing, Talanta 74 (2007) 291–307.
Table 4Comparison of the analytical parameters obtained using different electrodes and the CNTs-N/GCE for 5-ASA determination.
Technique Electrode Concentration range (M) LOD (M) Reference
Sono LSVa GCE 1.0�10�6–5.7�10�5 3.0�10�7 [20]DPVb GCE 2.0�10�6–1.0�10�4 8.2�10�7 [21]SWV Pencil graphite electrodes 9.8�10�7–7.3�10�5 2.1�10�8 [22]Amperometry Catalase-peroxidase based biosensor 2.0�10�5–6.0�10�4 – [23]AdLSVc CNT/PPY doped by 1,5-naphthalenedisulfonic acid 1.0�10�8– 1.0�10�6 3.0�10�9 [24]SWV CNTs-N/GCE 5.0�10�7–1.0�10�5 1.1�10�7 This workAdSWVd CNTs-N/GCE 5.0�10�8–2.5�10�6 1.2�10�8 This work
a Sonoelectrochemically enhanced linear sweep voltammetry.b Differential pulse voltammetry.c Adsorptive stripping linear sweep voltammetry.d Adsorptive stripping square-wave voltammetry.
B. Nigović et al. / Talanta 147 (2016) 50–58 57

[27] U. Klotz, K.E. Maier, Pharmacology and pharmacokinetics of 5-aminosalicylicacid, Dig. Dis. Sci. 32 (1987) 46S–50S.
[28] H. Allgayer, J. Sonnenbichler, W. Kruis, G. Paumgartner, Determination of thepK values of 5-aminosalicylic acid and N-acetylaminosalicylic acid and com-parison of the pH dependent lipid-water partition coefficients of sulphasala-zine and its metabolites, Arzneimittelforschung 35 (1985) 1457–1459.
[29] V. Mirčeski, Š. Komorsky-Lovrić, M. Lovrić, Square-wave voltammetry: theoryand applications, in: F. Scholz (Ed.), Monographs in Electrochemistry, Springer,Heidelberg, 2007, pp. 143–150.
[30] International Conference on Harmonization (ICH) Validation of AnalyticalProcedures: Text and Methodology Q2 (R1), 2005.
B. Nigović et al. / Talanta 147 (2016) 50–5858

52
5. Development of electrochemical platform based on carbon
nanotubes decorated with zirconium oxide nanoparticles for
determination of nebivolol

Int. J. Electrochem. Sci., 12 (2017) 9675 – 9688, doi: 10.20964/2017.10.10
International Journal of
ELECTROCHEMICAL SCIENCE
www.electrochemsci.org
Development of Electrochemical Platform Based on Carbon
Nanotubes Decorated with Zirconium Oxide Nanoparticles for
Determination of Nebivolol
Mirela Sadiković and Biljana Nigović
*
University of Zagreb, Faculty of Pharmacy and Biochemistry, A. Kovacica 1, 10000 Zagreb, Croatia *E-mail: [email protected]
Received: 23 June 2017 / Accepted: 19 July 2017 / Published: 12 September 2017
Electrochemical sensor based on carbon nanotubes decorated with zirconium oxide nanoparticles was
developed for the determination of nebivolol at the potential of +1.05 V (vs. Ag/AgCl). Nanomaterials
were dispersed in an anionic polymer and deposited by simple one-step casting method on glassy
carbon electrode. Scanning electron microscopy and energy dispersive X-ray spectroscopy were used
to study the surface morphology and structure characterization of deposited film. The sensor has a
strongly improved sensitivity (9.29 10-6
μA M-1
). The electrocatalytical peak current of nebivolol
shows a linear response from 100 nM to 10 mM with detection limit of 12 nM. Low-cost analysis of
drug in serum samples was carried out after adsorption of nebivolol at the nanocomposite using
differential pulse voltammetry. In comparison with HPLC method, the electrochemical method ensures
faster and simpler quantification of nebivolol in pharmaceutical samples.
Keywords: Nebivolol, Zirconium oxide nanoparticles, Carbon nanotubes, Differential-pulse
voltammetry, Nafion
1. INTRODUCTION
Nebivolol (NBV) is a recently approved beta(1)-selective blocker drug for the treatment of
hypertension. According to the World Health Organization, hypertension is one of the leading causes
of premature death worldwide. Hypertension increases the risk for a variety of cardiovascular diseases,
including stroke, coronary artery disease, heart failure, atrial fibrillation and peripheral vascular
disease [1]. NBV has additional mechanism besides beta-blocking effects that contribute to its unique
pharmacologic profile. It has an endothelium dependent vasodilator property mediated via L-arginine-
nitric oxide pathway [2]. Nitric oxide also inhibits platelet and leucocyte adhesion to vascular

Int. J. Electrochem. Sci., Vol. 12, 2017
9676
endothelium, prevents smooth muscle hyperplasia following vascular injury and scavenging
superoxide anion activity.
The development of sensitive analytical methods for determination of NBV is highly required
due to the important role of the drug in treatment of chronic diseases. In addition, an official method
for its quantification in bulk form and pharmaceutical formulations has not been approved in any
pharmacopoeia. Several analytical methods were reported for drug quantification in biological samples
and pharmaceuticals including LC-MS methods [3,4], HPLC methods with UV detection [5-7], high
performance thin layer chromatography [8], spectrophotometry [9] and spectrofluorimetry [10] Among
these methods, electrochemical techniques usually provide greater sensitivity, in addition to its other
outstanding features such as rapid response, low cost, easy operation, short analysis time and excellent
potential for miniaturization and portable equipment construction [11, 12].
At present, in the literature only three methods were published on the voltammetric behaviour
of NBV. The poorly defined voltammetric response was obtained on an electrode modified with
undoped silver oxide nanoparticles using two-electrode system [13]. The proposed method was not
fully validated and it was not applied to real samples of bulk drug or its pharmaceutical dosage forms.
We used unmodified boron-doped diamond electrode for rapid square-wave voltammetric
determination of NBV [14], but the working range of the method is suitable for quantification of NBV
in its pharmaceutical dosage forms. Very recently, graphene nanocomposite modified electrode was
employed for determination of NBV at relatively high potential of 1.33 V versus Ag/AgCl [15].
One of the most widely used nanostructure materials for electrode surface modification is
carbon nanotubes (CNTs) [16]. The CNTs are very attractive in the field of sensor development due to
their advantageous properties for electroanalysis, such as enhanced electronic properties, high
electrical conductivity, excellent chemical stability and high surface-to-volume ratio [17]. Therefore,
the CNTs-based sensors generally have higher sensitivities and lower detection limits than traditional
carbon electrodes [18]. Also, CNTs have the ability to support metal nanoparticles (NPs). The
combination of metal NPs with CNTs can provide a promising way for fabrication of novel sensors
with significantly improved performance [19]. Metal exhibits very important physical, optical and
electrocatalytic properties that can be improved by mixing with CNTs without losing any of the
electronic properties of CNTs. There are several methods of preparing metal NPs-CNT
nanocomposites including electrochemical deposition method, electroless deposition, dispersion of
metal NPs on the functionalized CNTs and physical methods. For successful external decoration of
CNTs, metal NPs could be obtained from bulk metals or the interaction of CNTs with already prepared
suspensions of metal NPs [20, 21].
In recent years, the use of zirconium dioxide nanoparticles (ZrO2 NPs) is rapidly growing in
biomedical fields. They are widely used as drug delivery carriers for controlled release of medicines,
as gene delivery vehicles with target specificity for some tissues, biocompatible matrix for protein
immobilization as well as in orthopedics for improving the properties of traditional bone cements [22].
ZrO2 NPs have also been employed for construction of various electrochemical sensors and biosensors
due to their large surface area, chemical inertness, thermal stability, mechanical strength and lack of
toxicity [23-25]. ZrO2 is naturally available, environmentally friendly and neutral bioceramic material
with good potential to be extensively used in pharmaceutical and medical applications.

Int. J. Electrochem. Sci., Vol. 12, 2017
9677
In this paper, glassy carbon electrode modified with carbon nanotubes and ZrO2 nanoparticles
(ZrONP-CNT/GCE), obtained by simple one-step modification, was used to provide sensitive method
for the voltammetric determination of NBV. Nafion is a useful material to enhance the adsorption of
the drug molecules onto the electrode [26, 27] and therefore, the nanomaterials were dispersed in a
Nafion matrix to ensure high sensitivity. The developed adsorptive stripping differential-pulse
voltammetric (AdDPV) method was used for NBV analysis in serum samples. The modified electrode
showed excellent performance for direct measurements of NBV in pharmaceutical dosage forms with
good accuracy. The voltammetric data were estimated with those obtained by validated HPLC method.
2. EXPERIMENTAL
2.1 Chemicals
Nebivolol hydrochloride was obtained by the Agency for Medicinal Products and Medical
Devices (Zagreb, Croatia). Nibel
tablets (Belupo, Croatia) containing nebivolol hydrochloride,
equivalent to 5 mg of NBV, were supplied from a local pharmacy. ZrO2 nanoparticles (purity 99.95%,
crystal phase monoclinic), average particle size 20 nm, were purchased from US Research
Nanomaterials, Inc. (Houston, USA, http://www.us-nano.com). The multi-walled CNTs (>98%, O.D.
6-13 nm, length 2.5-20 µm), Nafion (5 wt % solution in a mixture of lower aliphatic alcohols and
water) and propranolol hydrochloride were obtained from Sigma-Aldrich (Steinheim, Germany).
Bisoprolol fumarate, carvedilol and atenolol were supplied from Pliva (Zagreb, Croatia).
Hydrochlorothiazide was purchased from Fluka (Laramie, USA).
Stock solutions of NBV (1.0 × 10⁻³
M) for voltammetric measurements were prepared in ultra-
pure water and stored at 4 C. The standard solutions were prepared by appropriate dilution of these
stock solutions with the selected electrolyte just before use. The supporting electrolytes were 0.5, 0.1
and 0.01 M H2SO4, 0.1 and 0.01 M HCl and Britton-Robinson buffer adjusted to the desired pH with
0.2 M sodium hydroxide solution.
2.2 Equipment and Conditions
Voltammetric measurements were taken at room temperature using a computer-controlled -
Autolab potentiostat (Eco Chemie, Utrecht, The Netherlands) with GPES 4.9 software. A three-
electrode configuration was used with a bare or modified GCE (3-mm diameter, Metrohm,
Switzerland) as working electrode, Ag/AgCl (KCl 3M, Metrohm) reference electrode and a platinum
counter electrode. Cyclic voltammetry (CV) was carried out from 0.5 to 1.5 V with the scan rate from
10 to 350 mV s-1
. Differential pulse voltammetry (DPV) was used for determination of NBV in the
potential range from 0.6 to 1.4 V. The accumulation of NBV was carried out at 0 V with a 240 s step
using a computer-controlled stirrer. The pulse amplitude of 50 mV, pulse width of 75 ms and scan rate
of 20 mV s-1
were used. After each measurement, the modified electrode was refreshed in blank
electrolyte by one CV scan from 0.5 to 1.4 V until the peak of NBV disappeared completely.

Int. J. Electrochem. Sci., Vol. 12, 2017
9678
The structure and morphology of nanocomposite was characterized by a field emission
scanning electron microscope Jeol JSM-7000F coupled with an energy dispersive X-ray spectroscopy
(Jeol Ltd., Tokyo, Japan). HPLC analysis were performed using an Agilent 1100 Series LC system
(Agilent Technologies, Waldbronn, Germany) equipped with a diode array detector, controlled by
ChemStation software.
2.3 Preparation of the ZrONP-CNT/GCE
Before modification, the working electrode was polished with 0.05 m alumina slurry, rinsed
with water and then cleaned ultrasonically for 30 s in water and dried. The suspension (1 mg/mL) was
prepared by dispersing the ZrO2 NPs and functionalized CNTs in 0.5% Nafion ethanol solution to
obtain mixture containing a ratio in weight of 1:1 (ZrO2 NPs-CNTs) under ultrasonic stirring for 2 h
prior to use. The carboxylic acid functionalized CNTs were prepared according to the previously
described method [28]. The GCE was modified by casting 5 μL of suspension on an electrode surface
and dried at room temperature. To obtain a stable cyclic voltammogram and strength adhesion to the
electrode surface, the ZrONP-CNT/GCE was scanned prior to the first measurement by two successive
cyclic voltammetric sweeps between 0 and 1.5 V at 100 mV s-1
in a blank solution of 0.1 M H2SO4. To
measure the electroactive surface area of the ZrONP-CNT/GCE, the cyclic voltammograms of 1.0 ×
10-3
M K3Fe(CN)6 as redox probe were recorded. According to the Randles-Sevcik equation the
electroactive area was calculated to be 0.311 cm2, nearly 5.5 times greater than GCE [16]. For
comparison of electrochemical performance, the ZrO2 modified GCE (ZrONP/GCE), the carbon
nanotubes modified GCE (CNT/GCE) and the Nafion modified GCE (Naf/GCE) were also prepared in
the same way as described but without the addition of CNTs, the ZrO2 NPs and both nanomaterials,
respectively.
2.4 Application of the ZrONP-CNT/GCE
To prepare the sample of NBV dosage forms, a quantity of finely ground tablets equivalent to
4.4 mg of NBV was dispersed into a calibrated 10.0 mL flask. The mixture was sonicated for 10 min.
The mixture was filtered through 0.45 m Acrodisc GHP filters (Gelman, Ann Arbor, USA) and was
diluted with supporting electrolyte to prepare the solutions in certain concentrations. Solutions were
analysed by direct DPV measurements. The content of NBV in the commercial pharmaceutical
products was determined by standard addition method. For recovery studies, aliquots of the NBV
standard solutions were added to samples prepared from tablets. The NBV determination by HPLC
was carried out according to procedure described earlier [14].
Serum samples were collected from healthy volunteers and stored at -20°C until assay. Samples
were fortified with aliquot volume of NBV standard solution to achieve concentrations (1.0 × 10⁻⁷
M)
found in serum after treatment with recommended dose of 10 mg [29]. A 500 µL aliquot of serum
sample containing drug was vortexed with acetonitrile (1:1) for 60 s and than centrifuged for 6 min at
6000 rpm. The suitable volumes of supernatant were transferred into the volumetric flask and diluted

Int. J. Electrochem. Sci., Vol. 12, 2017
9679
with supporting electrolyte before AdDPV measurements. Analysis of human serum samples were
performed using the standard addition method.
3. RESULTS AND DISCUSSION
3.1 Morphological characterization of ZrO2 NPs-CNTs nanocomposite
Figure 1. SEM images of the ZrONP-CNT/GCE with different magnifications (A, scale at 100 m and
B, scale at 100 nm) and its corresponding EDS spectra (C).
The surface morphology of the ZrONP-CNT/GCE was examined by a field emission scanning
electron microscopy (FE-SEM). As shown in Fig. 1a, low-magnification FE-SEM image indicates that
homogeneous film is very uniformly deposited onto the whole surface. The compact coating reveals
ZrO2 NPs observed as white dots well dispersed in CNTs-Nafion matrix. Generally, coating was well
adherent to the substrate. The Fig. 1b displays the same surface at high magnification. The unique
structure of CNTs with tubes placed in the bundle reveals a large surface area of the coating with ZrO2
NPs entrapped into the matrix. The ZrO2 NPs are in uniform spherical shape with average diameter of
about 20 nm.
A B
C

Int. J. Electrochem. Sci., Vol. 12, 2017
9680
The structure characterization of the ZrO2 NPs-CNTs nanocomposite was examined using the
energy dispersive X-ray spectroscopic (EDS) pattern (Fig. 1c). EDS analysis shows presence of
zirconium at 2.10 keV and oxygen at 0.54 keV. The EDS pattern presents carbon peak at 0.26 keV
attributed to the carbon nanotubes. The oxygen signal detected also originates from carboxyl and
hydroxyl groups introduced onto the CNT surfaces in performed functionalisation procedure [16]. The
fluor detected at 0.66 keV is present from Nafion. The peak corresponding to the copper appears at
0.90 keV and comes from the supporting copper grid. The composition of nanomaterial on electrode
surface was calculated using the EDS measurement and presented 34.86% of carbon, 18.10% of
oxygen, 16.95% of fluor and 30.12% of zirconium.
3.2 Electrochemical properties of NBV on ZrONP-CNT/GCE
0.6 0.8 1.0 1.2 1.4
0
50
100
150
200
d
b
c
a
i / A
E / V vs. Ag/AgCl
Figure 2. Cyclic voltammograms of NBV (1.0 × 10
-4 M) in 0.1 M H2SO4 recorded on different
electrode surfaces: bare GCE (a), ZrO/GCE (b), CNT/GCE (c) and ZrONP-CNT/GCE (d).
Scan rate: 100 mVs-1
. Inset: Chemical structure of NBV.
As can be seen in Fig 2, NBV exhibits a weak irreversible voltammetric response (5.6 A) at
1.28 V using a bare GCE. When the GCE surface is modified with ZrO2 NPs in Nafion matrix, the
response is increased with a current of 18.1 A. The oxidation peak potential is shifted to less positive
values by 110 mV. To enhance sensitivity towards drug molecule, the GCE functionalized with CNTs
was also tested under the same condition [16]. After modification of electrode surface, the oxidation
peak current intensity on the CNT/GCE is about 7.8-fold higher than that on the bare GCE. Finally, the
ZrONP-CNT/GCE reveals a remarkable increase of the voltammetric response of NBV obtained from
the combined effects of CNTs and ZrO2 NPs. Compared with the response obtained at bare GCE, the
oxidation peak current is increased up to 88.7 A at the ZrONP-CNT/GCE with a well-defined
response at 1.13 V shifted by 152 mV to less positive potential. This finding is due to increased
O
F
NH
OHOH
O
F

Int. J. Electrochem. Sci., Vol. 12, 2017
9681
electroactive surface area of the ZrO2 NPs-CNTs nanocomposite as well as the the electronic
conductivity and electrocatalytic activity of CNTs modifying layer [16]. Nafion polymer was used to
fix the nanomaterials tightly onto GCE [30]. Additionally, the sulfonate groups in Nafion have ability
to attract positively charged NBV prior to quantification in order to increase sensitivity.
The effect of scan rate on the oxidative peak currents at the ZrONP-CNT/GCE was also
evaluated. In the range of 10 - 350 mV s-1
a linear relationship between the peak current and the scan
rate was obtained. This result indicates adsorption-controlled process at the ZrONP-CNT/GCE. The
dependence of the peak potential is linear with logarithm of the scan rate with a slope of 82.6
mV/decade, indicating n = 0.72. Using the calculated value of the charge transfer coefficient (0.40),
the number of electrons exchanged was found to be n=1.8.
It is known that alcohols are oxidised in many cases in 2e-/2H
+ process to ketones as stable
intermediates 31. The voltammetric response observed at ZrONP-CNT/GCE corresponds to the
oxidation of one of the secondary hydroxyl groups to the corresponding C=O group in drug molecule
(inset of Fig. 2). The same mechanism was proposed for electrooxidation of NBV at boron-doped
diamond electrode 14 and graphene nanocomposite modified electrode 15 as well as for other beta-
blocker drugs such as propranolol [32] and atenolol whose oxidation product was isolated and
characterized by 1H NMR [33].
3.3 Optimisation of ZrONP-CNT/GCE preparation
The relationship between voltammetric signal of NBV at the ZrONP-CNT/GCE and different
concentration ratios of ZrO2 NPs : CNTs (1:1, 2:1) and Nafion concentration (0.3-0.7% v/v) in
suspension for surface modification was studied by DPV. The most favorable peak current was
achieved at concentration ratio of 1:1 (ZrO2 NPs : CNTs) with the ZrO2 NPs concentration of 1 mg
mL-1
in 0.5% Nafion ethanol solution. The peak current decreased with the increase of ZrO2 NPs
applied on the electrode surface over the concentration of 1 mg mL-1
. The decrease of peak current at
higher amount of ZrO2 NPs may be due to lower adhesion between the nanocomposite film and the
electrode surface as well as the agglomeration of the nanoparticles [34]. The 0.5% Nafion
concentration was the optimized loading of nanomaterials. The film became thicker at higher
concentrations hindering the conductivity of nanomaterials doped in polymer.
To obtain a much more sensitive peak current for analytical studies, the variation of NBV
current response was examined at the ZrONP-CNT/GCE in different supporting electrolytes, such as
sulfuric acid, hydrochloric acid and Britton-Robinson buffer (pH 2-6) [28]. The comparison of
voltammograms indicates that NBV exhibits higher peak current at lower pH values. The NBV
(pKa=8.9) is completely protonated on the nitrogen atom in acidic media and therefore, more
effectively attracted to the modified electrode surface. Analysing the current response, 0.1 M sulfuric
acid was chosen as the optimum supporting electrolyte for subsequent analytical measurements.

Int. J. Electrochem. Sci., Vol. 12, 2017
9682
3.4 Adsorption properties of NBV and analytical performance
Since CV detected some adsorption of NBV at the ZrONP-CNT/GCE, the possibility of analyte
preconcentration at electrode surface before DPV measurements was investigated. The differential
pulse voltammograms without accumulation and after a 240 s accumulation step at the ZrONP-
CNT/GCE are shown in Fig. 3. The improved sensitivity is achieved due to adsorption of NBV
through electrostatic interaction with sulfonate group in Nafion matrix [30]. To maximise the DPV
signal, the influence of accumulation potential and preconcentration time was estimated in solution
containing NBV at 5 10-7
M concentration. A maximum enhancement of the voltammetric response
was observed at accumulation potential of 0 V. The peak current magnified linearly up to 300 s
preconcentration time (inset of Fig. 3), however to achieve the highest sensitivity in shorter analysis
time, the value of 240 s was taken as the optimum for NBV quantification.
0.6 0.8 1.0 1.2
20
40
i / A
E / V vs. Ag/AgCl
ba
Figure 3. Differential-pulse voltammograms of NBV (5.0 × 10
-7 M) at the ZrONP-CNT/GCE in 0.1 M
H2SO4 after preconcentration time of 240 s (a) and without preconcentration (b). DPV settings:
pulse amplitude of 50 mV, pulse width of 75 ms and scan rate of 20 mV s-1
, Eacc = 0 V. Inset:
Influence of the preconcentration time on the NBV oxidation peak current.
Table 1. Analytical parameters for the calibration curves of nebivolol determination using ZrONP-
CNT/GCE
Parameter DPV AdDPV
Linearity range (M) 1.5 × 10⁻⁶ – 1.0 × 10⁻⁴ 1.0 × 10⁻⁷ – 6.0 × 10⁻⁶
Slope (μA M-1) 4.36 × 10⁵ 9.29 × 10⁶
Intercept (μA) -0.37 0.79
Sx/y 16.21 16.85
SD of slope (Sb) 1.39 × 10⁴ 2.01 × 10⁵
SD of intercept (Sa) 0.072 0.058
Correlation coefficient 0.996 0.998
Limit of detection (M) 5.5 × 10⁻⁷ 1.8 × 10⁻⁸
Limit of quantitation (M) 1.6 × 10⁻⁶ 6.2 × 10⁻⁸
0 50 100 150 200 250 300
0
2
4
6
8
i / A
tacc
/ s

Int. J. Electrochem. Sci., Vol. 12, 2017
9683
The electrocatalytic peak current of NBV obtained at 1.05 V using the ZrONP-CNT/GCE was
employed for determination of drug in aqueous solution. In the case of a DPV scan without
preconcentration, the oxidation peak showed a linear response in the concentration range of 1.5 × 10⁻⁶
– 1.0 × 10⁻⁴
M. By using drug accumulation at the ZrONP-CNT/GCE prior to DPV measurement (Fig.
4), the current response after 240 s accumulation showed linear relationship in the range of 1.0 × 10⁻⁷
–
6.0 × 10⁻⁶
M (inset of Fig. 4). The analytical parameters are given in Table 1. The detection limit
(LOD) and the quantification limit (LOQ) were estimated as LOD = 3s/b and LOQ = 10s/b, where s is
the standard deviation of the intercept and b is the slope of the calibration curve [35].
0.6 0.8 1.0 1.2 1.40
20
40
60
80
100
i / A
E / V vs. Ag/AgCl
Figure 4. Adsorptive stripping differential-pulse voltammograms of NBV at ZrONP-CNT/GCE in 0.1
M H2SO4 recorded at different concentrations (1 × 10⁻⁷
– 6 × 10⁻⁶
M) after preconcentration
time of 240 s with corresponding background recording. DPV settings same as in Fig. 3. Inset:
calibration graph for NBV quantification.
3.5 Selectivity, precision and stability of ZrONP-CNT/GCE
The effect of different possible interfering species in the analysis of NBV was studied in the
mixed solutions of these species with 2.5 10-6
M NBV using AdDPV method. The tolerance limit
was calculated as molar ratio of NBV/interference which gave an error less than ±5% in the
determination of the drug [36]. It was found that some ions such as Na+, K
+, Cl
-, HPO4
2- had no
influence on NBV response at concentration of about 1000-fold of NBV. The experiments also
revealed that NBV response did not change after adding 500-fold of ascorbic acid, lactose and citric
acid as well as 400-fold of glucose. In the presence of uric acid, new well-defined oxidation peak was
registered at the potential +0.49 V. However, the results showed that 100-fold concentration of uric
acid did not cause an increase in the NBV current as well as dopamine present in equal concentration.
However, the interference effect was observed with equal concentrations of other beta-blockers like
atenolol, carvedilol, propranolol and bisoprolol. In the presence of propranolol and carvedilol, new
0.0 2.0x10⁻⁶
4.0x10⁻⁶
6.0x10⁻⁶
0
10
20
30
40
50
60
i A
c / M

Int. J. Electrochem. Sci., Vol. 12, 2017
9684
oxidation peaks were found in the voltammograms (+0.75 V for propranolol and +0.96 for carvedilol)
with a significant influence on the distortion of the NBV response (-10.1% and -38.9%, respectively).
On the other hand, atenolol and bisoprolol did not display well-developed voltammetric response in
investigated potential range; however, these substances caused a positive error (+9.3% and +25.4%,
respectively) in the NBV current. Furthermore, the interference studies showed that the equal
concentration of hydrochlorothiazide caused an increase of 46.4% in the NBV current response.
Hydrochlorothiazide is used for the treatment of hypertension, separately or together with NBV in a
combined pharmaceutical formulation. Its oxidation potential (+1.02 V) is very close to that of NBV,
resulting in overlapping voltammetric responses (Fig. 5).
0.6 0.8 1.0 1.2 1.4
20
40
60
80
100
120
b
c
a
i / A
E / V vs. Ag/AgCl
Figure 5. Comparison of voltammetric responses of NBV (line a), hydrochlorothiazide (line b) and
their mixture (1:1) (line c) recorded at ZrONP-CNT/GCE in 0.1 M H2SO4. DPV settings same
as in Fig. 3. Inset: voltammetric responses recorded in BR buffer pH 4.
To obtain the differentiation of the responses, the influence of supporting electrolyte pH value
(0.1 M sulfuric acid and BR buffer pH 4) on peak potentials was studied on a mixture containing both
drugs. With the increase of pH, the peak potential of hydrochlorothiazide was shifted to less positive
value (inset of Fig. 5). Unfortunately, the potential difference obtained at the ZrONP-CNT/GCE was
not large enough to overcome this problem. Therefore, the ZrONP-CNT/GCE cannot be applied to
simultaneous analysis of NBV and hydrochlorothiazide as well as studied beta-blockers.
For method validation, the precisions of the electrode response were evaluated by adsorptive
stripping DPV measurements of 2.5 10-6
M NBV solutions. Unchanged oxidation peak potential and
the RSD value of 1.1% for peak current (mean ip = 23.2 A) were estimated for intra-day
measurements with the same modified electrode. The inter-day precision of the electrode response was
tested by three replicate measurements over three days [16], each time using a freshly prepared
ZrONP-CNT/GCE. The RSD value of the peak current was 2.8%, while the RSD of peak potential for
was 0.4%, indicating excellent fabrication reproducibility.
0.6 0.8 1.0 1.2 1.4
25
ca
b
i / A
E / V vs. Ag/AgCl

Int. J. Electrochem. Sci., Vol. 12, 2017
9685
The stability of the ZrONP-CNT/GCE was examined by recording the voltammetric response
over the course of two weeks. The modified electrode was kept at room temperature between
experiments. The peak potential was unchanged, while the drug current response decreased after a 10-
day use by 4.1%. After this period the signal decreased progressively. To explore a reusable
application of electrochemical sensor the renewability of the ZrONP-CNT/GCE was examined
considering the adsorption of NBV or its oxidation product on the modified surface. A simple
electrochemical approach to clean the used sensor was used by running CV between 0.5 and 1.4 V in
blank supporting electrolyte. The voltammetric responses obtained at regenerated ZrONP-CNT/GCE
after CV scan were compared with the ones obtained during its first-time use. The regenerated sensor
exhibited similar responses (recovery of 99.1±2.5% based on three measurements) indicating that the
adsorbed molecules were successfully removed through the cleaning process.
3.6 Analytical applications
The ZrONP-CNT/GCE in combination with the DPV was applied for direct measurement of
NBV in pharmaceutical formulations using the standard addition method in order to eliminate matrix
effects. The assay showed that drug content of pharmaceutical product is in good agreement with the
declared value (Table 2).
Table 2. Analysis of NBV in pharmaceutical dosage forms by the proposed DPV method at ZrONP-
CNT/GCE and HPLC method
DPV HPLC
Label value (mg) 5 5
Determined value
(mg)a
4.92 4.91
Recovery % 98.3 98.2
RSD % 1.15 0.64
Bias % -1.60 -1.80
Added (M) 1.00 × 10⁻⁵
3.00 × 10⁻⁵
Found (M) a 0.98 × 10
-5 2.96 × 10
-5
Recovery % 98.1 98.7
RSD % 1.28 0.87
Bias % -2.00 -1.33
F b 3.21 -
t b 0.85 -
a n=5
b The theoretical values of F and t-test at 95% confidence limit
are 6.39 and 2.31, respectively.
The recovery study was carried out by adding known concentration of standard to the
formulation solution to define the accuracy of the new method using ZrONP-CNT/GCE. In addition,
the results obtained with the voltammetric method were compared with those obtained by developed

Int. J. Electrochem. Sci., Vol. 12, 2017
9686
reverse-phase HPLC method [14] for NBV (Table 2). The results of the student t-test and variance
ratio F-test show that there are no significant differences between the methods regarding the accuracy
and precision. This finding revealed that the ZrONP-CNT/GCE can be used as a reliable and
inexpensive electrochemical platform for quantification of NBV in pharmaceutical preparation.
Moreover, the method developed at the ZrONP-CNT/GCE is faster and simpler in comparison with
HPLC (the retention time of NBV was 17.6 min) [14].
The serum concentration of NBV administered in therapy of hypertension and cardiovascular
diseases, the leading cause of the death in the world, can be monitored only after preconcentration of
the drug on the modified electrode surface. To check the potential of ZrONP-CNT/GCE for use in
analysis of NBV at trace level, the AdDPV method was applied to drug determination in human serum.
NBV is on the list of prohibited substances in certain sports according to list of several anti-doping
agencies. Therefore, the ZrONP-CNT/GCE was also tested for screening of drug intake or abuse. The
standard addition method was used for the recovery studies in serum samples. The results are
presented in Table 3. From mean recovery of 100.8±1.7%, it is obvious that the ZrONP-CNT/GCE
has potential to determine of NBV in serum samples.
Table 3. Quantification of NBV in serum samples at ZrONP-CNT/GCE by adsorptive stripping DPV
Added 107 c (M) Found 10
6 c (M) Recovery (%) RSD
a (%)
1.50 1.51 100.67 1.99
2.50 2.52 100.80 2.21
5.00 5.09 101.87 2.16
7.50 7.49 99.87 0.61
a average of three measurements
3.7. Comparison of analytical methods
The ZrONP-CNT/GCE was compared with other electrochemical sensors developed for the
determination of NBV (Table 4). The higher sensitivity was obtained at the ZrONP-CNT/GCE for
measurement of NBV and wider linear range was achieved allowing the use of method for both
applications, pharmaceutical products and biological samples. The LOD value obtained at the ZrONP-
CNT/GCE using adsorptive stripping DPV is in lower concentration range than that obtained at other
electrodes, except for the electrode modified with undoped silver oxide nanoparticles [12]. However, it
is unclear whether the current response at this electrode has changed with concentration, and the
method was not fully validated. The method developed using unmodified boron-doped diamond
electrode is faster but obtained sensitivity is lower compared to the ZrONP-CNT/GCE.
In relation to the other developed analytical methods for determination of NBV, the linearity
obtained at the ZrONP-CNT/GCE is in a lower concentration range compared to the previously
reported HPLC methods with UV detection [6,9]. The LOQ value obtained by AdDPV is better than
those found with HPLC using UV detector [6,9], high performance thin layer chromatography [8],

Int. J. Electrochem. Sci., Vol. 12, 2017
9687
spectrophotometry [9] and comparable with spectrofluorimetry [10]. The LOD value is higher than
LODs reported for LC-MS method [4,5], but this technique is not widely available.
Table 4. Comparison of various voltammetric methods for the determination of NBV with the present
work
Technique Electrode Concentration range
(M)
Sensitivity
(μA M-1
)
LOD
(M)
Referenc
e
I-Va Undoped AgO
NPs/GCE
5.5 × 10⁻⁹
– 9.9 × 10-
5
3.48 × 10³ 0.9 × 10
-
9
12
SWVb BDDE 2.5 × 10
-7 – 1.5 × 10
-
5
3.46 × 10⁵ 3.2 × 10
-
8
13
AdDPV Graphene-
Nafion/GCE
5.0 × 10⁻⁷
– 2.4 × 10-
5
4.52 × 10⁵ 4.6 × 10
-
8
14
DPV ZrONP-CNT/GCE 1.5 × 10⁻⁶
– 1.0 × 10-
4
4.36 × 10⁵ 5.5 × 10
-
7
This
work
AdDPV ZrONP-CNT/GCE 1.0 × 10⁻⁷
– 6.0 × 10-
6
9.29 × 10⁶ 1.8 × 10
-
8
This
work a I-V measurement in two electrode system
b Square-wave voltammetry
c Boron-doped diamond electrode
4. CONCLUSION
A simple modification of a GCE with ZrO2 NPs and carboxylic acid functionalized multi-
walled CNTs was examined and elaborated. Nanocomposite film displayed high electrocatalytic
activity to oxidation of NBV. DPV and AdDPV were used to investigate the sensitivity of ZrONP-
CNT/GCE to drug molecule oxidized at 1.03 V. The modified electrode showed a wide linear range
for NBV with high sensitivity. The ZrONP-CNT/GCE is able to detect NBV in serum samples. This
modified electrode can be used with short response time for direct measurements of NBV in
pharmaceutical dosage forms with satisfactory results in comparison with HPLC method.
References
1. J. Fongemie and E. Felix-Getzik, Drugs, 75 (2015) 1349.
2. A. Fratta Pasini, U. Garbin, M.C. Nava, C. Stranieri, A. Davoli, T. Sawamura, V. Lo Cascio and
L. Cominacini, J. Hypertens., 23 (2005) 589.
3. D.V. Neves, C.P. Vieira, E.B. Coelho, M.P. Marques and V.L. Lanchote, J. Chromatogr. B, 940
(2013) 47.
4. J. Nandania, S.J. Rajput, P. Contractor, P. Vasava, B. Solanki and M. Vohra, J. Chromatogr. B,
923 (2013) 110.

Int. J. Electrochem. Sci., Vol. 12, 2017
9688
5. K. Visweswara Rao, K. Padmaja Reddy and P. Haldar, J. Chromatogr. Sci., 52 (2014) 1051.
6. D. Sharma, A. Jain and A. Shrivastava, Pharm. Methods, 2 (2011) 9.
7. A.S. Doshi, S.S. Bhagwan, T.N. Mehta, V.K. Gupta and G. Subaaiah, J. AOAC Int., 91 (2008)
292.
8. T.S. Reddy and P.S. Devi, J. Planar. Chromatogr. - Mod. TLC, 20 (2007) 149.
9. E.A. Abdel Hameed, R.A. Abdel Salam and G.M. Hadad, Spectrochim. Acta A Mol. Biomol.
Spectrosc., 141 (2015) 278.
10. F. Ibrahim, N. El-Enany, S.H. Shalan and R.A. Abo Shabana, Luminescence, 30 (2015) 1011.
11. C. Batchelor-McAuley, E. Kätelhön, E.O. Barnes, R.G. Compton, E. Laborda and A. Molina,
Chemistry Open, 4 (2015) 224.
12. A. Motaharian and M.R.M. Hosseini, Anal Methods, 8 (2016) 6305.
13. M.M. Rahman, S.B. Khan, A.M. Asiri, K.A. Alamry and A.O. Al-Youbi, Int. J. Electrchem. Sci.,
8 (2013) 323.
14. B. Nigović, A. Mornar and M. Završki, J. AOAC Int., 98 (2015) 1535.
15. E. Er, H. Çelikkan and N. Erk, Sens. Actuators B, 224 (2016) 170.
16. B. Nigović, S. Jurić and I. Mitrović, Talanta, 164 (2017) 201.
17. K. Scida, P.W. Stege, G. Haby, G.A. Messina and C.D. Garcia, Anal. Chim. Acta., 691 (2011) 6.
18. B. Nigović, M. Sadiković and M. Sertić, Talanta, 122 (2014) 187.
19. B. Wu, Y. Kuang, X. Zhang and J. Chen, Nano Today, 6 (2011) 75.
20. B. Kharisov, V. Kharissova Oxana, U. Ortiz Méndez and I.G. De La Fuente, Synth. React. Inorg.
Met.-Org. Chem., 46 (2016) 55.
21. H. Kaur, J. Singh, S. Chopra and N. Kaur, Talanta, 146 (2016) 122.
22. G. Garnweitner, Zirconia nanomaterials: Synthesis and biomedical application in
nanotechnologies for the life sciences, Vol. 2: Nanostructured oxides, Wiley-VCH, (2010),
Hoboken, NJ, USA, DOI: 10.1002/9783527610419.ntls0144
23. G. Liu and Y. Lin, Anal. Chem., 77 (2005) 5894.
24. A.T. Ezhil Vilian, M. Rajkumar and S.M. Chen, Colloids Surf. B. Biointerfaces, 115 (2014) 295.
25. B. Devadas, M. Rajkumar, S.M. Chen and P.C. Yeh, Anal. Methods, 6 (2014) 4686.
26. B. Nigović, M. Marušić and S. Jurić, J. Electroanal. Chem. 663 (2011) 72.
27. B. Nigović, A. Mornar and M. Sertić, Microchim. Acta, 183 (2016) 1459.
28. M. Sadiković, B. Nigović, S. Jurić and A. Mornar, J. Electroanal. Chem., 733 (2014) 60.
29. G.N. Sahana, N. Sarala and T.N. Kumar, Int. J. Biol. Med. Res., 2 (2011) 577.
30. B. Nigović, M. Sadiković and S. Jurić, Talanta, 147 (2016) 50.
31. J. Grimshow, Electrochemical Reactions and Mechanisms in Organic Chemistry, Elsevier, (2000)
Amsterdam, pp. 261–275.
32. S.X. dos Santos and E.T. Gomes Cavalheiro, Anal. Lett., 44 (2011) 850.
33. R.N. Hedge, B.E. Kumara Swamy, B.S. Sherigara and S.T. Nandibewoor, Int. J. Electrochem.
Sci., 3 (2008) 302.
34. A. K. Mahmoud, Z. Fadhill, S. I. Al-nassar, F. I. Husein, E. Akman and A. Demir, J. Mater. Sci.
Eng. B, 3 (2013) 364.
35. International Conference on Harmonization (2005) Validation of analytical procedures: Text and
methodology Q2 (R1)
36. N. Karadas-Bakirhan, S.Patris, S. A. Ozkan, A. Can and J.M. Kauffmann, Electroanalysis, 28
(2016) 358.
© 2017 The Authors. Published by ESG (www.electrochemsci.org). This article is an open access
article distributed under the terms and conditions of the Creative Commons Attribution license
(http://creativecommons.org/licenses/by/4.0/).

67
6. GENERAL DISCUSSION

68
Due to strict and highly demanding requirements regarding the quality of
pharmaceuticals, imposed by the pharmacopoeias, pharmaceutical industry and quality control
laboratories, there is an ever-present challenge of developing reliable, more robust and
selective methodologies with short analysis times, minimizing the influence of excipient
substances and matrix effects and also allowing low LOD and LOQ to be obtained as newly
developed drugs are often more physiologically active and therefore can be administrated in
smaller amounts [9,117]. Due to their considerable advantages, electroanalytical techniques
have been proved to meet all the above-mentioned requirements. Voltammetric techniques are
the most frequently used electroanalytical techniques in pharmaceutical analysis. Since the
development of electrochemical sensors is currently one of the most active areas of
electroanalytical research [9], the main focus is finding a novel material in fabrication of
sensors in order to make the developed methods more selective and sensitive. Seeing that the
recent developments in nanotechnology have provided excellent opportunities in design and
construction of novel electrochemical detection tools [5], we have chosen carbon nanotubes
(CNTs) as the basis of electrochemical sensors developed in this doctoral thesis.
The fact that there are two groups of CNTs, SWCNTs and MWCNTs, raised a
challenging question: which type is right for targeted analytical investigations? Although
there are many examples in the literature describing benefits of both types of nanotubes in
pharmaceutical analysis, in the end, we have chosen to use the MWCNTs in our research.
Moreover, the low production yield of SWCNTs compared to that of MWCNTs makes it
rather challenging to obtain in large quantities and at affordable prices [81]. Bulk synthesis of
MWCNTs is easier than that of SWCNTs and MWCNTs can be produced without a catalyst
because their purity level is much higher [118]. The synthesis of SWCNTs requires higher
quality control process than MWCNTs and hence it is more costly to produce large amounts
of SWCNTs than MWCNTs [113], which results in their higher price. The commercial cost of
SWCNTs is much higher, but with lower purity. Also, MWCNTs are achiral and therefore
always regarded as metallic conductors, a highly attractive property for an electrode, whereas
SWCNTs' conductivity depends on their chirality and diameter [80].
The aim of our research was to develop new electroanalytical methods for direct
quantification of selected pharmaceutically active substances (active pharmaceutical
ingredients, API) in their dosage forms using novel electrochemical sensors with MWCNTs.
Furthermore, those same sensors were also applied for the simultaneous determination of
selected pharmaceuticals in trace amounts with other co-administered drugs in therapy or their

69
metabolites in very complex media, such as biological fluids, using adsorptive stripping
voltammetry. The selection of pharmaceuticals to be investigated followed few criteria.
Although derivatisation can be used to introduce an electroactive group into the structure of
compound in order to determine it electrochemically [7], instead we have chosen to use drugs
that are electroactive by its nature. Fortunately, it was shown that most of the drugs are
electrochemically active [42]. By avoiding the derivatisation step, the developed methods are
cheaper and simpler. In contrast, spectrophotometric and chromatographic techniques often
aquire some form of derivatisation step prior to analysis [27]. Another criterion that was
considered was the lack of available analytical methods described in the literature for the
selected drugs, with emphasis on the lack of electroanalytical methods. The choice of drugs
depended also on their wide use in clinical medicine. Selected drugs are often prescribed by
physicians, very often as the first line of therapy. Despite the extensive use in approved
indications, some of the selected drugs are also being widely studied in numerous new
indications and therefore the development of new reliable methods for evaluation of the
quality of their pharmaceutical products or determination drug concentrations in biological
fluids is highly required.
The first drug that was investigated as a part of this doctoral thesis was the antiemetic
drug ondansetron (OND), a selective 5-HT3 antagonist. We started our research with this
particular drug because its redox behaviour and electrochemical determination in
pharmaceutical formulations or human fluids have not been reported in the literature at all. It
was investigated electrochemically for the first time as a part of our research. Ondansetron
often coexists with morphine (MOR) in biological fluids as these drugs are co-administered
for control of pain, nausea and vomiting in patients undergoing surgery or chemotherapy.
Furhermore, in recent years ondansetron has been successfully used in prevention of
morphine-induced pruritus and postoperative nausea and vomiting in patients receiving
neuraxial injections of morphine as postoperative analgesia [119,120]. Despite of that, there is
no electroanalytical method for the simultaneous determination of OND and MOR in
biological fluids, which is why we applied the proposed electrochemical sensor for their
simultaneous quantification in human serum samples. Up to now, only one analytical method
has been reported in the literature regarding their simultaneous determination in injections and
not in biological fluids. Two analytes were separated within 20 minutes by HPLC method
with UV detection [121].

70
Ropinirole (ROP) is a novel nonergoline dopamine agonist indicated for the treatment
of early and advanced Parkinson's disease. The only report for electroanalytical determination
of ROP found in the literature up to that time was published by our group [122] at the
Department of Pharmaceutical Analysis of Faculty of Pharmacy and Biochemistry. However,
employment of the bare GCE for ROP determination had its drawbacks. Therefore, one of the
goals of this doctoral thesis was to construct for the first time an electrochemical sensor for
ROP determination with the aim of improving some deficiencies of previously developed
methods on the bare GCE. Not only that the electrochemical behaviour of ROP at modified
electrodes has not been investigated up to that time, but also the official method for
quantification of ROP in the Ph. Eur. has not yet been approved at the time of our research of
ROP. The monograph of ROP was reported for the first time in the Ph. Eur. just recently with
its edition 8.7 that was implented on 1 April, 2016, while during our research of ROP, the 7th
edition was in use [44]. After publishing our work on ROP, the awareness of practical utility
of electroanalytical methods and the importance of development of new sensors for ROP
determination has been recognised by other researchers [123–125]. ROP often coexists with
L-dopa in biological fluids as these drugs are co-administered in advanced Parkinson's disease
patients but surprisingly, up to now, no study has been published in the literature reporting the
simultaneous determination of ROP and L-dopa.
Mesalazine (5-aminosalicylic acid, 5-ASA) is an anti-inflammatory drug widely
prescribed for the therapy of chronic inflammatory bowel diseases (IBDs), such as ulcerative
colitis and Crohn's disease. Although it has been used in therapy for some time now and there
are few reports [126–131] available on the electrochemical determination of 5-ASA, still no
attempt has been made to determine 5-ASA and its major N-acetylated metabolite (Ac-5-
ASA) by an electrochemical method. The electrochemical behaviour of Ac-5-ASA was
investigated for the first time as a part of this doctoral research. The knowledge of
pharmacokinetics and metabolism of 5-ASA from mesalazine-containing drugs is mandatory
when new drug formulations are developed for the treatment of IBDs, and therefore validated
analytical methods are needed for bioequivalence studies [132]. Development of the method
for simultaneous determination of the drug and its metabolite can be quite a challenge due to
high selectivity of the method required in order to simultaneously determine structurally very
similar compounds. Furthermore, we have employed proposed sensor for fast and reliable
determination of 5-ASA content in two different delayed-release formulations which enabled

71
us to compare the qualities of two pharmaceutical products with the same active ingredient
present on our market.
Nebivolol is a third-generation, long-acting and highly selective beta(1) blocker (β1-
blocker) with a pharmacological profile that differs from those of other drugs in its class. In
addition to cardioselectivity mediated via β1 receptor blockade, NBV induces nitric oxide-
mediated vasodilation by stimulating endothelial nitric oxide synthase. Its unique
pharmacological profile, based on the highest cardioselectivity and additional vasodilatory
effect, provides NBV the highest efficacy and tolerability for the treatment of hypertension
and chronic heart failure among others of its class [133]. Due to its important role in treatment
of chronic cardiovascular diseases and the fact that an official method for its quantification in
bulk form and pharmaceutical formulations has not been approved in any pharmacopoeia, we
have recognized the need to develop new sensitive analytical method for NBV determination.
NBV has already been investigated [134] at bare boron-doped electrode (BDDE) as well as
other β1-blockers [104], by our group at the Department of Pharmaceutical Analysis. Studies
have been shown that metal NPs supported on the MWCNTs may provide much improved
electrocatalytic activity [135]. Therefore, in order to take full advantage of the two kinds of
nanomaterials, our idea was to construct a simple and sensitive electrochemical sensor based
on both NPs and MWCNTs, so that the individual properties of each material can be
integrated and the interactions between the two components may bring out novel properties.
No electrochemical studies on NBV determination using this kind of nanocomposite film
were reported in scientific literature. However, during the preparation of the manuscript, a
paper dealing with the electrochemical determination of NBV appeared, but it is based on
oxidation of drug at GCE modified with graphene as another type of nanomaterial [136].
Once obtained, MWCNTs were purified and activated before use. The most common
pretreatment step with nanotube modified electrodes is to purify the tubes in strong acid
which gives an improvement in the electron transfer rate. Solutions of sulfuric, nitric and
hydrochloric acids, either concentrated or diluted, alone or mixed have been used at room
temperature or under refluxing, with or without sonication for different times [92]. Sonication
of dispersion of MWCNTs in concentrated HNO3 for 4 hours showed to be suitable protocol
for activation of nanotubes for our purposes.
To take advantage of the remarkable properties of MWCNTs in electrochemical
sensing applications, the MWCNTs should be properly functionalized and uniformly

72
immobilized at electrode surface. For that purpose, we chose Nafion as the dispersing agent.
Not only did Nafion homogenously disperse MWCNTs, fixing them onto the electrode
surface tightly and enhancing the stability of proposed electrochemical sensor, but it also
enhanced the electrochemical response together with MWCNTs thanks to their synergistic
effect. The investigated drugs are all weak basic compounds that were completely protonated
in the experimental conditions under which voltammetric measurements were performed and
Nafion as a cation-exchanger attracted them from the bulk solution. The electrode that was
employed in performed voltammetric measurements was GCE, which is not untypical for this
type of investigation. Selected drugs (except for 5-ASA) were oxidized at relatively high
potential values on the bare GCE, and MWCNTs, due to their electrocatalytic activity, made
that oxidations more facile, and thus placing them outside the solvent window. Modification
of GCE with either MWCNTs or Nafion led to advantageous electroanalytical performance,
while a remarkable enhancement effect on electrochemical responses of all investigated drugs
was obtained from the combined contribution of MWCNTs and Nafion. The analytical
performance of the modified electrodes, besides for the drugs in our primary focus, was also
evaluated for the co-administered drugs and metabolite. The results also showed a
considerable improvement of their voltammetric responses. The differences between the two
peak potentials were large enough for the development of simultaneous methods in all cases,
even for the structurally very similar 5-ASA and its metabolite. Furthermore, implementing
the ZrO2 NPs for NBV determination enabled even more enhanced voltammetric response
obtained from the combined effects of ZrO2, MWCNTs and Nafion.
During the preliminary investigations and before constructing electrochemical sensors
based on MWCNTs, different modifiers and different types of electrodes were studied to find
the most favorable electrochemical response. Since the redox behaviour of OND was studied
for the first time as a part of this doctoral thesis, the investigation of the electrochemical
oxidation of drug molecule was started at a bare GCE. The preliminary results indicated that
the voltammetric response of OND at bare GCE was not satisfactory for the analytical
purposes because of slow heterogeneous electron transfer, electrode fouling problems,
unstable analytical signal and reduced sensitivity due to the fact that adsorption of drug
molecule could not be purposely used as a preconcentration step. In light of these findings, it
was a challenge to find a new electrode material for determination of OND using
voltammetric technique.

73
One common approach for incorporating a modifier onto the solid surface is to cover it
with an appropriate polymer film [76]. Polymer-modified electrodes are often prepared by
casting a solution containing the dissolved polymer onto the surface and allowing the solvent
to evaporate or via electropolymerization in the presence of the dissolved monomer. Polymer-
modified electrodes prepared by electropolymerization have received extensive interest in the
detection of analytes, not only due to their high sensitivity and selectivity, but also because of
the film homogeneity attained in electrochemical deposition, its chemical stability and strong
adherence to the electrode surface [137]. So, for the initial modification of GCE for the
investigation of OND behaviour, 2-hydroxy-5-[(4-sulfophenyl)azo]benzoic acid (SPAB) was
chosen. The electrochemical properties of SPAB were investigated at GCE [138,139] and
hanging mercury drop electrode (HMDE) [140,141] in previously published papers. Getting
the insight into the electrochemical behaviour of SPAB enabled the application of
electrooxidation of its monomer to generate polymer layer on GCE with incorporated
polyanions that can show cation selectivity and adsorption of positively charged drug
molecules [137]. The electrochemical sensor based on SPAB was developed for the first time
to determine analytes by voltammetry at the Department of Pharmaceutical Analysis by our
group. Based on excellent experience with poly(SPAB) as a novel sensor for sensitive and
selective determination of antipsychotic drug quetiapine, we tested it in preliminary studies of
OND using experimental conditions (Supplemental data 1, Figure 1) that were previously
selected as optimum (SPAB, c = 1 x 10⁻³
M in Britton-Robinson (BR) buffer pH 4, between -
0.1 and 1.6 V, ν = 100 mV/s, 10 cycles).
Because of the presence of the charged carboxylic and sulfonate groups in the
structure of SPAB, the adsorption of positively charged OND molecules onto the modified
electrode due to the electrostatic interactions was expected. Nevertheless, the electrode
modified with SPAB did not give much better results than that of bare GCE as it was the case
for quetiapine. The peak potential of OND was shifted to less positive values by 20 mV,
indicating weak electrocatalytic activity of immobilized film towards OND, but there was
clearly no enhanced effect of SPAB on peak current (Supplemental data 1, Figure 2). The
adsorption of drug molecules could not be obtained on GCE modified with poly(SPAB) under
such experimental conditions, and therefore higher sensitivity could not be achieved which
was needed for the application of the sensor to determine trace amounts of OND found in
biological fluids after the therapeutic doses. It is possible that some steric factors limit the
good electrostatic interaction between positively charged nitrogen atom in OND structure and

74
negatively charged carboxylic and sulfonate groups in SPAB structure. On the other hand,
functional groups of SPAB may not be charged enough under the acidic conditions of the
experiments; however, a maximum current intensity was obtained in 0.1 M H2SO4 during the
preliminary investigation on bare GCE. Therefore, it was employed as optimum supporting
electrolyte for further studies.
SPAB belongs to the same class of compounds as two azosalicylic acids, sulfasalazine
and olsalazine, which are employed in clinical praxis as precursor of 5-ASA [137]. SPAB was
also proposed as potential novel prodrug of 5-ASA by the earlier investigations [138]. 5-ASA
is identified as an active component in the therapy of IBDs and a novel sensor has been
proposed for its determination as a part of this doctoral thesis. However, due to its similarity
with SPAB, which was applied as a modifier, we investigated the possible use of 5-ASA for
synthesis of polymer film for sensitive determination of ROP. Also, Eriksson et al. (142)
proposed possible way of 5-ASA polymerization during its electrooxidation on GCE and Mu
(143) performed the copolymerization of aniline and 5-ASA by CV to introduce pH
functional groups (-OH and –COOH) with 5-ASA in order to improve the pH dependance of
redox activity of polyaniline, which is also used for electrochemical sensing due to its
conductivity and redox activity. The assumption was that 5-ASA could attract positively
charged ROP molecules from the bulk solution by its negatively charged carboxylic groups.
Voltammetric response of ROP turned out to be much better on GCE modified with poly(5-
ASA) than that obtained at the bare GCE, so we proceeded with the optimization of 5-ASA
polymer film in order to get the most favorable response for ROP (Supplemental data 2,
Figure 3).
Parameters that could affect electropolymerization of 5-ASA and therefore the
voltammetric response of ROP on GCE modified with poly(5-ASA) were optimized: potential
window, number of cycles, scan rate, as well as concentration and pH of 5-ASA solution. The
efficiency of the film growth was the highest when an electrode was cycled in the
modification solution between -0.2 and +0.9 V. The wider potential window resulted in lower
peak currents of 5-ASA and the preparation of the polymer film was longer. Also, peak
current for ROP was sharper and higher when shorter potential range of cyclization was
applied. When 10 cycles with ν = 100 mV/s were used for the deposition of the polymer film,
voltammetric responses of ROP were sharper and higher in comparison with 20 cycles with ν
= 200 mV/s. Poly(5-ASA) was prepared in BR buffer. In order to find optimum conditions for
its electropolymerization, the pH value of BR buffer was varied between 2 and 6. Although

75
the pH had great effect on 5-ASA oxidation, it did not seem to affect the voltammetric
response of ROP that much. BR buffer pH 2.0 was finally chosen as optimum because it
resulted in the highest 5-ASA peak current and therefore the highest film growth. On the other
hand, concentration of 5-ASA solution appeared to be the critical parameter for ROP
voltammetric response. Its peak current significantly increased with the increase of 5-ASA
concentration and the value of 1 x 10⁻³
M was selected as optimum (Supplemental data 2,
Figures 1 and 2).
Although the sensor with poly(5-ASA) looked very promising compared to SPAB that
has similar structure, we were not able to achieve the accumulation of ROP on that film. It
might have been that carboxylic groups where not charged enough to concentrate ROP
molecules by electrostatic interaction. Since one of the imperatives of our research was to
develop methods that would be sensitive enough to be able to quantify very low
concentrations of drugs in biofluids, GCE modified with poly(5-ASA) proved to be
unsatisfactory for this purposes. However, some other type of investigation, such as the
determination of drug content in pharmaceutical dosage forms where such high sensitivities
are not necessary, could possibly benefit from this type of sensor. In order to achieve
accumulation we tried to construct an electrochemical sensor based on both 5-ASA and
MWCNTs. Instead on bare GCE, electropolymerization of 5-ASA was performed on the GCE
surface on which was previously casted a suspension of MWCNTs in DMF, but we did not
achieve satisfactory results with that modification either. Later, we found in the literature a
publication concerning a novel solid-phase extractor based on MWCNTs with 5-ASA for
preconcentration of Pb2+
[144]. To construct such an extractor, the covalent bond was
established between carboxylic groups of functionalized MWCNTs and amino group of 5-
ASA. In our electroanalytical studies we did not use those covalent types of MWCNTs
functionalisation, but rather non-covalent, which are simpler. Future investigations could
perhaps try to employ such covalent functionalisation with 5-ASA for electrochemical
sensing.
BDDE have found many applications as electrode material in electroanalysis due to
their outstanding properties, such as very wide electrochemical potential window, low
background current [145], exceptional chemical inertness and mechanical strength, negligible
adsorption of organic compounds [146], and thus reduced fouling [147], extreme hardness
and applications in aggressive media such as strong acids [42]. These properties make BDDE
particularly suitable for electrochemical studies of analytes with a high oxidation potential

76
[148] and ROP is one of them. Furthermore, previous work on ROP by our group at the bare
GCE [122] revealed fouling effect of ROP oxidation product. The sp3 surface of BDDE is less
vulnerable to surface oxidation and fouling than sp2, such as GCE [78], which is why we
investigated the electrochemical behaviour of ROP on modified and bare BDDE as well.
Modification of BDDE with MWCNTs and Nafion led to similar results as observed on GCE
in terms of synergistic effect from MWCNTs and Nafion (Supplemental data 2, Figure 5).
When compared to MWCNTs/Nafion-GCE (Supplemental data 2, Figure 6),
MWCNTs/Nafion-BDDE did not provide much better results (BDDE: ip = 128 μA at 1.26 V
vs. GCE: ip = 110 μA at 1.24 V for c (ROP) = 5 x 10⁻⁵
M). However, it is more expensive and
more difficult to maintain as it cannot be cleaned by severe polishing because of its surface
doping [77]. It is usually pretreated cathodically [148,149] or anodically [77], which can last
even for a few minutes. Also, it has been reported that repeated electrochemical cleaning of
the BDDE surface can decrease the electrode activation [77]. The fouling effect of ROP and
its oxidation product was decreased on MWCNTs/Nafion-GCE anyway, and so it was not
necessary to use expensive BDDE for such a small progress in peak current.
To improve the sensor response we examined in preliminary measurements, once
again, the influence of the working electrode material, this time glassy carbon and gold (Au),
on oxidation peak height of 5-ASA. Au is together with platinum (Pt) the most used solid
metal electrode material [11]. They are commonly considered to be inert [76], but their
inertness should be considered as relative [42] because under certain electrochemical
conditions these electrodes are highly active [76]. At certain applied potentials, oxides are
formed by reaction between the electrooxidised metal and oxygen and electrodes' otherwise
highly active surface can be covered by a surface oxide film over a broad range of positive
potentials. This will influence the electrode oxidation processes since the electrochemical
charge transfer reactions will occur at the surface oxide rather than the metal surface [42].
Such films can also strongly alter the kinetics of the electrode reaction, leading to
irreproducible data [11]. Since the Au electrode in aqueous electrolyte at potentials higher
than +0.8 V is covered by an Au oxide film, making its use in the positive potential range
reduced [42], this type od metal electrode could only be applied in our research for 5-ASA as
its oxidation occurs below +0.8 V. For other investigated drugs oxidation happens at
potentials higher than +1.0 V. As sensitivity did not improve when using gold electrode
(Supplement data 3, Figures 1-4), the GCE was used in subsequent experiments due to its
significantly lower cost.

77
For fabrication of novel nanosensor based on both metal nanoparticles and carbon
nanotubes, we investigated NPs that were not so commonly used for sensing of
pharmaceuticals. Noble metal nanoparticles (NPs) such as gold, platinum and silver were
mostly used in this area [5], but a wide variety of metal NPs, which are not typically used
materials such as those mentioned above, have been studied in electroanalysis [109]. Bismuth
NPs represent innovative material in sensing applications. They have attracted growing
attention recently [150] and so we tried them in combination with carbon nanotubes that have
already proven to be an excellent tool for sensing. However, the results obtained from
combining those two modifiers were unexpected. The peak potential of NBV shifted to less
positive values, while the peak current was higher at the electrode modified only with
nanotubes. There was no synergistic effect observed from those two types of nanomaterials
(Supplemental data 4, Figures 1 and 2). Lee et al. [151] reported the formation of
agglomerates with petal shape, observed by SEM, emerging from well-connected spherical
NPs with Nafion, which existed at the beginning of the measurement process. It is believed
that they decreased due to chemical reaction of Bi with ions in electrolyte solution and Bi
oxidation. X-ray diffraction (XRD) patterns confirmed that most of the Bi oxidized to BiOCl
at pH 3.0 and the agglomerates observed by SEM are thought to be BiOCl. Thus, it is
suggested that the pH of the solution significantly influences the phase stability of bismuth
and that the phase transition of pure bismuth into the other forms leads to a considerable
decrease in sensitivity of the nano-bismuth fixed electrode. Our preliminary study on NBV
oxidation has shown that the best voltammetric response was obtained in very acidic media
due to NBV protonation and interaction with Nafion, which is why it was not feasible to apply
this nanosensor with Bi NPs for NBV determination in this selected conditions. On the other
hand, ZrO2 NPs proved to be a useful material for enhancing sensitivity together with
MWCNTs and Nafion. Since only few papers on its use in sensing of pharmaceuticals have
been reported [152–154], it is considered as a very attractive and innovative nanomaterial in
this field. Although some sensors based on both ZrO2 NPs and MWCNTs have been reported,
the sensor that would combine ZrO2 NPs and MWCNTs together with Nafion, to our
knowledge, has not yet been reported in pharmaceutical and biomedical field.
Although various modifiers and types of electrodes were explored in our search for a
novel electrochemical sensor, those based on MWCNTs dispersed in Nafion, decorated with
ZrO2 NPs in case of NBV, proved to give the most favorable voltammetric responses for all
drugs investigated. Therefore, the next step was optimisation of all experimental conditions

78
and parameters that could affect the electroanalytical performance of that sensor. The surface
morphology and structure characterization of the modified electrodes was examined by
scanning electron microscopy (SEM), energy dispersive X-ray spectroscopy (EDXS) and CV.
Since the modification of the electrode with nanomaterials and Nafion led to such great
improvement in electrochemical responses of all drugs, it was necessary to optimize the
amounts of modifiers in suspension. An increase of the amounts of nanomaterials in polymer
film was expected to result in enhanced peak currents due to their unique properties; however,
too high MWCNTs or ZrO2 NPs concentrations led to large background currents and lower
stability of the nanocomposite film due to lower adhesion on the electrode surface as well as
the agglomeration of nanomaterials. The optimum concentration ratios for our investigations
appeared to be 1:1 (MWCNTs : Nafion) and 1:1:1 (MWCNTs : ZrO2 : Nafion) for NBV
sensing. Nafion concentrations were also studied in the range of 0.1-0.7 %. The optimum
value was 0.5 % for all selected pharmaceuticals, except for the Ac-5-ASA. The metabolite
could not have been effectively attracted by the cation-exchange polymer, which is why 0.3 %
Nafion concentration was chosen as optimal value for simultaneous analysis of 5-ASA and its
acetylated metabolite. Finally, the volume of suspension, which determines the thickness of
the cast film, was varied between 1 and 9 μL. The maximum responses were achieved when
electrode surface was coated with 5 μL, except for simultaneous analysis of 5-ASA and Ac-5-
ASA where 3 μL were casted. The smaller amount of Nafion used in this method (0.3 %)
resulted in less viscosity of the suspension and therefore the better adhesion at the electrode
surface and better stability of the immobilised film were obtained with smaller suspension
volume.
The choice of the supporting electrolyte is very important in method development. If
no information is found in the literature for the given electroactive compound or related
compounds, a number of various supporting electrolytes must be used to find one in which the
best developed and easy measurable waves are obtained [42]. First, to obtain better sensitivity
for analytical studies, the electrochemical oxidation of selected drugs was examined using CV
in different supporting electrolytes, including BR buffer and acetate buffer with different pH
values, as well as the sulfuric acid, hydrochloric acid and acetic acid in different
concentrations. For analyses of electroactive organic components that are most frequently
present in drugs, the supporting electrolytes are usually buffers, solutions of a strong acid or
of a strong base [31]. The experiments have shown that well-defined voltammetric response
of selected drugs was obtained only at lower pH values. A 0.1 M H2SO4 was chosen as the

79
optimum electrolyte for sensitive determination of NBV, as well as for selective simultaneous
determination of OND with MOR and ROP with L-dopa. On the other hand, in BR buffer
solution pH 2.0 a maximum current intensity together with lower background current was
achieved for simultaneous determination of 5-ASA and its metabolite. These supporting
electrolytes were employed in further studies. As was already mentioned, all of these drugs
are weak basic compounds and in this kind of acidic media they were completely protonated
and thus effectively attracted by Nafion to the electrode surface.
For evaluating the redox reaction character of selected drugs on modified electrodes,
the CV measurements with different scan rates (ν) were performed and the effects of scan rate
change on peak potentials and peak currents were evaluated. For all drugs peak currents
linearly increased with the scan rate, and a plot of anodic peak current versus the scan rate
gave the linear relationship, indicating that the eletrooxidation of drug molecules at modified
electrodes was an adsorption-controlled process. Therefore, to obtain the highest sensitivity of
the method, the adsorption of drug molecules was used in subsequent analytical
measurements as an effective accumulation step prior to the voltammetric quantification of
drugs. In cases of all drugs, peak potentials shifted positively when increasing scan rate and
dependance of the peak potential was linear with logaritm of scan rate, as expected for an
irreversible electrode process. This established relation allowed, using the appropriate
equations, to calculate the number of electrons exchanged during the oxidation process on
modified electrodes. The slopes of the plots of peak potentials versus pH demonstrated that
equal number of protons participated in redox processes of ROP, 5-ASA and NBV. As for
OND, the peak potential remained almost constant with the pH change, indicating that protons
did not participate in its oxidation process.
To obtain a much more sensitive peak currents for analytical studies, the variation of
the peak currents recorded at the modified electrodes was monitered while changing
instrumental SWV parameters for OND, ROP and 5-ASA and DPV parameters for NBV
determination. The pulse amplitude and the potential scan rate were optimized to acquire
voltammograms of relatively high sensitivity and well-shaped waves with a relatively narrow
peak width. Selection of these parameters is very important for sensitivity, resolution and
analysis time [9]. Because of its speed, SWV was employed in most cases for sensitive and
fast determinations in our research. The effective scan rate is given by f ΔE [11]. For example,
the optimisation of SWV parameters for OND determination resulted in f = 75 Hz and ΔE = 8
mV, which gave the value of effective scan rate of 600 mV/s. Since the SWV voltammograms

80
were recorded in potential scan from 0.7 to 1.4 V, it took only 1.17 seconds to obtain the
entire voltammogram for OND determination. Analysis time is, therefore, drastically reduced
by the careful choice of SWV parameters.
CV studies revealed surface-controlled processes at the modified electrodes; therefore,
the possibility of effective analyte preconcentration before voltammetric measurement was
examined. To achieve the optimum conditions for the maximum adsorption, the influence of
accumulation potential and deposition time on voltammetric responses of investigated drugs
were evaluated. Our observations of the influence of accumulation potential on the stripping
peak currents were in accordance with the Langmuir isotherm in voltammetric studies, which
means that the peak currents increased, for such electroactive molecules oxidized at positive
potentials, as the accumulation potential shifted to more negative values. As it is common,
accumulation potentials were not close to the oxidation potentials of investigated drugs [49].
The accumulation time significantly affected voltammetric responses of all selected drugs
with enhanced increase of their oxidation peak currents with the increase of tacc until surface
adsorption saturation occured. However, the adsorption kinetics appeared to be quite different
for simultaneously determined drugs. Although, MOR showed much faster adsorption at the
modified electrode surface than OND, as well as L-dopa opposed to ROP, a little longer tacc
was chosen as optimum in order to achieve the highest possible sensitivity in the linearity
range for quantification of the targeted drugs of this research in biological fluids (OND and
ROP) in acceptable analysis time. As for 5-ASA and its metabolite, an extremely short tacc
allowed the needed sensitivity to measure the expected serum concentrations after treatment
with the therapeutic daily doses recommended for IBDs.
Every analytical procedure needs to be validated to be regarded as suitable for
intended purpose [155]. After all the experimental conditions and instrumental parameters
that could affect voltammetric response of our investigated drugs were optimized, and before
the applicability of proposed sensors on pharmaceutical dosage forms and human serum
samples was examined, the developed methods were validated according to ICH guidelines
using those optimized conditions. The validation parameters that were checked during the
development of new methods using proposed sensors were selectivity, linear range, LOD and
LOQ, precision as inter-day and intra-day precision, accuracy and stability. The linearity
range was examined with pulse techniques, DPV for NBV and SWV for all other selected
drugs, both with and without accumulation step. Obtained linear responses without
preconcentration step allowed direct determination of these drugs in their dosage forms due to

81
high concentrations of API in tablets. Although electrochemical methods are generally
considered to be very sensitive [156], the quantification in human serum samples where these
drugs are basically found in trace amounts after therapeutic doses could not be feasible
without accumulation step prior to SWV or DPV. So, linearity was also checked under
optimum accumulation conditions, and, thus higher sensitivities were achieved.
By changing one analyte concentration and keeping the other unchanged, obtained
sensitivities (slopes of the calibration curves) were compared to the values observed in the
absence of co-administered drugs or metabolite. Results indicated independent adsorption of
examined analytes in the accumulation step at the proposed electrochemical sensor.
Therefore, simultaneous determination of selected drugs or drug with its metabolite was
possible without inteferences. There are several different approaches for LOD and LOQ
determination recommended by the official guidelines and pharmacopoeias. The most widely
used approach in electroanalytical chemistry and also in our investigations, estimates the LOD
and LOQ values from the standard deviation of the intercept and the slope of the related
calibration curves [42]. LOD and LOQ values obtained with proposed sensors were
comparable or even better than in previously reported chromatographic methods which are
less environmentally friendly, more expensive and demand sophisticated equipment.
ICH Q2 defines that precision of the method can be considered at three levels:
repeatability (intra-day precision), intermediate precision (inter-day precision) and
reproducibility (ruggedness, USP). Reproducibility is used especially for collaborative
studies. It is employed for the standardization of an electroanalytical method, for instance, for
inclusion of procedures in pharmacopoeias [42], but it is not normally expected as the
mandatory validation parameter if intermediate precision is performed [156]. The intra-day
precision of voltammetric responses using proposed sensors was evaluated by six replicate
measurements yielding unchanged oxidation peak potentials for all investigated drugs and
relative standard deviations (RSD) for stripping peak currents, all below 2 %. The inter-day
precision was characterized by three replicate measurements over three days, each time using
freshly prepared sensor and standard solutions. The RSD values for stripping currents were
not greater then 3 % and were also less then 1 % for peak potentials. For evaluation of
precisions of the electrode response, adsorptive stripping technique was employed, that was
later used for trace amount assay in biological fluids. Since the precision criterion for trace
amount assay in electroanalytical methods should be ≤ 5 % [156], we can conclude that
proposed sensors showed excellent precision and also great fabrication reproducibility. The

82
stability of proposed sensors was checked over a period of four weeks by evaluating the
analytes oxidation peak potential and peak currents.
Accuracy of the method is usually expressed as recovery and rarely as bias or relative
bias and it can be obtained in different ways. It is not uncommon for the electroanalytical
assay of pharmaceuticals that accuracy is determined by spiking a blank matrix with known
concentrations of compounds [42], for example when measuring a drug active compound in a
complex and/or unknown matrix media such as biological samples or pharmaceutical dosage
forms. Also, in order to eliminate interferences such as excipients in tablets or endogenous
substances in serum samples, standard addition methods can be used for quantification and
recovery studies.
Prior to the analysis of samples, the selectivity of the proposed electrochemical
sensors for quantification of selected drugs and metabolite was also evaluated. Their fixed
amounts in standard solutions were spiked with various excess amounts of interfering species
that are likely to be found in biological samples or are co-formulated with the API. Many
inorganic electrolytes, such as Na+, Cl
-, K
+, NO3
-, SO4
2-, HPO4
2-, Zn
2+, Ca
2+, Mg
2+, Cu
2+ and
Fe3+
did not intefere even when they were added in amounts much larger than usual
physiological levels. L-alanine, L-glycine, L-aspartic acid, L-glutamic acid, L-cysteine,
lactose, sucrose, glucose, starch, citric acid, Na2EDTA and manitol also did not cause an error
more then ± 5 % in the voltammetric responses of investigated analytes.
Exploring the influence of dopamine (DA), ascorbic acid (AA), uric acid (UA) and
nitrite ions (NO2-) was particularly interesting for quantification of our analytes in serum
samples as these biomolecules regularly coexist in many biological matrices and their
simultaneous determination is one of the most important points in sensor fabrication due to
their very close oxidation potentials at bare electrodes [157]. At bare GCE they can usually be
seen as one overlapped and broad oxidation peak, but modifications with different MWCNTs-
based sensors allowed separation of their peaks [158,159]. Unfortunately, the separated peaks
due to their potential values may intefere with the voltammetric determinations of some of our
analytes. However, Nafion with its negatively charged sulfonate groups prevented the
accumulation of negatively charged oxidizable NO2-, while allowing facile accumulation of
the positively charged analytes (Supplemental data 1, Figure 4). Ascorbic acid (pKa = 4,17) is
neutral [160] under the experimental conditions so it was not rejected by Nafion, but its
oxidation potential on electrodes modified with MWCNTs can be seen at very low oxidation

83
potentials, outside our potential window. DA is positively charged (pKa = 8.89) under
experimental conditions [160] conducted in our measurements and was attracted by Nafion
and therefore could have been showing possible competitive adsorption on this type of
electrode surface. However, DA showed only interference with L-dopa (Supplemental data 2,
Figure 7 a) and b)), which is actually used as DA precursor in the treatment of Parkinson's
disease, due to their very similar structure and very close peak potentials (+0.48 V for DA vs
+0.52 V for L-dopa). However, normal plasma levels of endogenous free DA (26 pg/mL) did
not affect L-dopa voltammetric response at the proposed sensor. UA, although without charge
[160] under optimized experimental conditions (pKa = 5.4), influenced on peak currents of
MOR (Supplemental data 1, Figure 3) and L-dopa (Supplemental data 2, Figure 8), as well as
5-ASA and its metabolite (Supplemental data 3, Figure 5) due to closeness of their potentials.
As it was the case with DA, no interferences were seen on real samples. For NBV, additional
inteferences studies were performed and the inteference effect was observed with equal
concentrations of other β-blockers, like atenolol, carvedilol, propranolol and bisoprolol
(Supplemental data 4, Figures 2-5), as well as with hydrochlorothiazide that can be combined
with NBV for the treatment of hypertension.
To evaluate the validity and practical utility of newly developed methods on proposed
sensors, analytes were determined in tablets obtained from local pharmacy and in human
serum samples obtained from healthy volunteers. Direct measurements with pulse techniques
(DPV for NBV and SWV for others) were employed for the determination of drug contents in
dosage forms, except for OND due to unstable analytical signal without preconcentration step.
Otherwise, due to high concentration of API in tablets, no accumulation step was needed.
Voltammograms were obtained by SWV within few seconds and such fast quantification in
pharmaceutical formulations, without complicated sample preparation and with higher or at
least of the same order sensitivity and selectivity, cannot be usually achieved with commonly
used analytical methods for determination of drug content, such as chromatographic,
spectroscopic and capillary electrophoretic methods. For NBV determination DPV is
employed instead of SWV because of the much lower background current and significantly
lower overpotential of NBV achieved in this way. It has been reported in the literature that
SWV can lead to drawbacks with kinetically slow processes because of its high speed, when
DPV is to be preferred [42].
The results obtained with the proposed sensors were in good agreement with the
claimed amount. Mean recoveries were 98.3 – 101.0 % with RSD values 0.7 – 1.3 %,

84
depending on the analyte, indicating good accuracy and precision as well as the suitability of
the proposed sensor for this purpose. Only for L-dopa determination recoveries obtained by
both SWV (95.23 %) and HPLC (95.04 %) were slightly outside of that narrow range, but
were still more than acceptable. Similar recoveries were obtained with both techniques which
is why it cannot be prescribed to the technique used for measurements but were probably
caused by the nature of sample as L-dopa is present with another component - benzerazid in
combined pharmaceutical dosage form. Also, the recoveries in the range of 98.1 – 99.4 %
indicated that excipients did not interfere with assay of active ingredient in any case. The
results obtained with newly developed methods were compared with those obtained by HPLC
methods reported in literature (5-ASA), official HPLC methods described in USP (L-dopa),
previously developed HPLC methods by our group (ROP, NBV) or HPLC methods
developed as a part of this doctoral thesis (OND). Recovery tests were also performed for
chromatographic methods. Statistical analysis of the results obtained using voltammetric and
HPLC procedures showed no significant difference between the performance of the two
methods regarding accuracy and precision, as revealed by the student t-test and variance ratio
F-test.
MWCNTs/Nafion sensor was also applied for the first time for simultaneous
determination of OND and MOR, ROP and L-dopa, 5-ASA and its metabolite Ac-5-ASA in
human serum samples by AdSWV. ZrO2-MWCNTs/Nafion sensor was applied for the
determination of NBV in serum by AdDPV. The expected serum concentrations with the
therapeutic daily doses were within linear concentration ranges of the newly developed
method using proposed electrochemical sensors after the accumulation step in duration of 360
s for OND and MOR, 240 s for ROP and L-dopa, 30 s for 5-ASA and metabolite and 240 s
for NBV. The analysis time was still very short, especially when it was compared to other
methods and there was no need for expensive and complicated extraction procedures. The
recovery studies in serum samples were performed using the standard addition method to
nullify any remaining interference. In this type of complex matrix, such as biological fluids,
excellent recoveries were obtained in the range 98.7 – 102.6 % with RSD 1.5 – 2.8 %.

85
7. CONCLUSIONS

86
In present doctoral thesis new electroanalytical methods using novel
MWCNTs/Nafion or ZrO2-MWCNTs/Nafion sensors were developed, validated and applied
in pharmaceutical dosage forms and human serum samples for selected pharmaceuticals.
The oxidative behaviour and electrochemical determination of OND were studied for
the first time. MWCNTs/Nafion-GCE exhibited high selectivity in the voltammetric
measurements of OND and co-administered drug MOR with potential difference of
430 mV. It was succesfully applied for the simultaneous determination of both drugs
in human serum samples by AdSWV after short accumulation at the electrode surface.
A newly developed voltammetric method was applied for quantification of OND in
film-coated tablets.
The use of an electrochemical sensor for ROP determination has been reported for the
first time by our work. The proposed nanostructured sensor was utilised for direct
measurements of ROP, as well as co-administered drug L-dopa, individually in
pharmaceutical formulations by SWV. In addition, the analytical method for their
simultaneous determination was developed for the first time. The large separation of
the peak potentials of 720 mV at the MWCNTs/Nafion sensor allowed fast
simultaneous quantification of trace amounts of both drugs in human serum samples.
For the first time, an electroanalytical method was developed for selective
simultaneous determination of 5-ASA and its major metabolite, Ac-5-ASA without the
need for prior time-consuming separation step. The potential difference of 200 mV
between the peaks at the MWCNTs/Nafion sensor was large enough to determine
structurally very similar analytes in very low concentrations by AdSWV. Proposed
sensor was also used for direct measurements of 5-ASA contents by SWV in two
pharmaceutical formulations available on our market.
Proposed sensor with MWCNTs in Nafion matrix was decorated with ZrO2 NPs in
order to improve its performance and electrochemical sensing of NBV by utilising all
of the exceptional properties of the two nanomaterials. ZrO2-MWCNTs/Nafion sensor
was applied for fast quantification of NBV in tablets by DPV and also for very
sensitive analysis of NBV in serum samples by AdDPV.

87
Development of new electroanalytical methods in the present doctoral thesis represent
an important scientific contribution of our research in the field of pharmaceutical analysis,
especially for the drugs characterised with the lack of analytical methods for their qualitative
and quantitative examination. It is a significant progress for drugs that have not yet been
investigated electrochemically, particularly using novel electrochemical sensors.
A considerable enhancement effect on voltammetric responses of selected drugs was
observed due to synergy of remarkable properties of nanomaterials and cation-exchange
polymer that were used to construct a promising platform for electrochemical sensing.
Enhanced peak currents and lower potential values were obtained due to larger electroactive
surface area and excellent electrocatalytic activity of nanomaterials together with ion-
exchange capacity and improved accumulation capability provided by Nafion matrix.
Electrochemical sensors proposed in the present doctoral thesis, therefore, offer improved
sensitivity and selectivity for electroanalytical methods, which is with their low cost and short
analysis time very appealing in pharmaceutical analysis.
The preparation of sensors was quite simple; obtained by dispersing nanomaterials in
polymer and depositing of the homogenous dispersion by one-step casting method on GCE.
Additionally, the proposed sensor has shown long-term stability due to high mechanical
strength of MWCNTs and also very easy surface regeneration by applying a single SWV or
CV potential scan in blank supporting electrolyte, thus avoiding tedious polishing as in the
case of bare GCE before every measurement.
The modern electroanalytical methods based on such modified electrodes have great
potential for practical application in complex media such as real pharmaceutical and
biological samples, not only for fundamental research in laboratories, but also for routine
analyses. Generally, the separation and extraction procedures are not necessary, as compared
to the chromatographic methods that usually require some type of sample pretreatment, such
as liquid-liquid extraction (LLE) or solid-phase extraction (SPE) prior to the analysis of
biological samples.
Novel sensors proposed in this doctoral thesis can be used for evaluation of the quality
of pharmaceutical products in order to achieve better medicinal effect and lower toxicity.
They can also be successfully applied for monitoring of the therapeutic levels of drug
concentrations in biological samples in patients in clinical medicine to prevent overdose
toxicity or for pharmacokinetic purposes.

88
8. REFERENCE LIST

89
[1] B. Uslu, S.A. Ozkan, Electroanalytical methods for the determination of
pharmaceuticals: A review of recent trends and developments, Anal. Lett. 44 (2011)
2644–2702.
[2] M.R. Siddiqui, Z.A. Alothman, N. Rahman, Analytical techniques in pharmaceutical
analysis: A review, Arab. J. Chem. 10 (2017) 1409–1421.
[3] S. Ozkan, Principles and techniques of electroanalytical stripping methods for
pharmaceutically active compounds in dosage forms and biological samples, Curr.
Pharm. Anal. 5 (2009) 127–143.
[4] Q. Xu, A. Yuan, R. Zhang, X. Bian, D. Chen, X. Hu, Application of electrochemical
methods for pharmaceutical and drug analysis, Curr. Pharm. Anal. 5 (2009) 144–155.
[5] A. Rahi, K. Karimian, H. Heli, Nanostructured materials in electroanalysis of
pharmaceuticals, Anal. Biochem. 497 (2016) 39–47.
[6] B.U. Burcu Dogan-Topal, Sibel A. Ozkan, The analytical applications of square wave
voltammetry on pharmaceutical analysis, Open Chem. Biomed. Methods J. 3 (2010)
56–73.
[7] B. Nigović, S. Behetić, Elektroanalitika u farmaciji, Farm. Glas. 63 (2007) 162–175.
[8] J. Yoshida, K. Kataoka, R. Horcajada, A. Nagaki, Modern strategies in electroorganic
synthesis, Chem. Rev. 108 (2008) 2265–2299.
[9] B. Nigović, Application of electrochemistry to the analysis of pharmaceuticals and
biological samples, in: The Analysis of Pharmacologically Active Compounds and
Biomolecules in Real Samples, R. Injac (ed), Transworld Research Network, Kerala
(2009) 1–44.
[10] C. Gütz, B. Klöckner, S.R. Waldvogel, Electrochemical screening for electroorganic
synthesis, Org. Process Res. Dev. 20 (2016) 26–32.
[11] J. Wang, Analytical electrochemistry, John Wiley & Sons, Inc., New York (2000)
[12] E.J. Horn, B.R. Rosen, P.S. Baran, Synthetic organic electrochemistry: An enabling
and innately sustainable method, ACS Cent. Sci. 2 (2016) 302–308.

90
[13] S. Amidi, F. Kobarfard, A. Bayandori Moghaddam, K. Tabib, Z. Soleymani,
Electrochemical synthesis of novel 1,3-indandione derivatives and evaluation of their
antiplatelet aggregation activities, Iran. J. Pharm. Res. 12 (2013) 91–103.
[14] S.S. Hosseiny Davarani, M. Kalate Bojdi, A. Mehdinia, A new way for synthesis of
phenoxazine and diphenoxazine derivatives via electrochemical method, Chem. Pharm.
Bull. 59 (2011) 1209–13.
[15] T. Gieshoff, A. Kehl, D. Schollmeyer, K.D. Moeller, S.R. Waldvogel, Electrochemical
synthesis of benzoxazoles from anilides – a new approach to employ amidyl radical
intermediates, Chem. Commun. 53 (2017) 2974–2977.
[16] S.S.H. Davarani, M. Shamsipur, D. Nematollahi, S. Ramyar, L. Masoumi, An
environmentally friendly electrochemical method for synthesis of benzofuranoquinone
derivatives, Chem. Pharm. Bull 55 (2007) 1198-1202
[17] A.J. Blasco, M.C. González, A. Escarpa, Electrochemical approach for discriminating
and measuring predominant flavonoids and phenolic acids using differential pulse
voltammetry: towards an electrochemical index of natural antioxidants, Anal. Chim.
Acta 511 (2004) 71–81.
[18] L. Campanella, A. Bonanni, D. Bellantoni, G. Favero, M. Tomassetti, Comparison of
fluorimetric, voltammetric and biosensor methods for the determination of total
antioxidant capacity of drug products containing acetylsalicylic acid, J. Pharm.
Biomed. Anal. 36 (2004) 91–99.
[19] A. Mouithys-Mickalad, J.M. Kauffmann, C. Petit, J. Bruhwyler, Y. Liao, H. Wikström,
J. Damas, J. Delarge, G. Deby-Dupont, J. Géczy, J.F. Liégeois, Electrooxidation
potential as a tool in the early screening for new safer clozapine-like analogues, J. Med.
Chem. 44 (2001) 769-776.
[20] P. T. Kissinger, W. R. Heineman, Laboratory techniques in electroanalytical chemistry,
Marcel Dekker, Inc., New York, (1996)
[21] A. Álvarez-Lueje, J. Sturm, L.J. Núñez-Vergara, J.A. Squella, A selective
voltammetric method to follow the hydrolytic degradation of nitrendipine and
nisoldipine, Electroanalysis 13 (2001) 1485–1490.

91
[22] B. Uslu, S.A. Ozkan, P. Zuman, Contribution to the alkaline degradation of cefepime,
Microchem. J. 76 (2004) 61–63.
[23] A. Radi, Adsorptive stripping square-wave voltammetric study of the degradation of
lansoprazole in aqueous solutions, Microchem. J. 73 (2002) 349–354.
[24] T.-S. Chen, K.-L. Huang, Electrochemical detection and degradation of acetaminophen
in aqueous solutions, Int. J. Electrochem. Sci. 7 (2012) 6877–6892.
[25] L.J. Nunez-Vergara, S. Bollo, J. Fuentealba, J. C. Strum, Electrochemical and
spectroelectrochemical behavior of the main photodegradation product of nifedipine:
The nitrosopyridine derivative, Pharm. Res. 19 (2002) 522–529.
[26] A.A.J. Torriero, J.M. Luco, L. Sereno, J. Raba, Voltammetric determination of salicylic
acid in pharmaceuticals formulations of acetylsalicylic acid, Talanta 62 (2004) 247–
254.
[27] V.K. Gupta, R. Jain, K. Radhapyari, N. Jadon, S. Agarwal, Voltammetric techniques
for the assay of pharmaceuticals—A review, Anal. Biochem. 408 (2011) 179–196.
[28] B. Nigović, B. Simunić, Z. Mandić, Comparison of the electrochemical properties of
some colon-specific prodrugs of mesalazine., Pharmazie 57 (2002) 468–70.
[29] J.M.P.J. Garrido, C. Delerue-Matos, F. Borges, T.R.A. Macedo, A.M. Oliveira-Brett,
New insights into the oxidation pathways of apomorphine, J. Chem. Soc. Perkin Trans.
2 (2002) 1713–1717.
[30] Z. Mandić, Z. Weitner, M. Ilijaš, Electrochemical oxidation of azithromycin and its
derivatives, J. Pharm. Biomed. Anal. 33 (2003) 647–654.
[31] S.A. Ozkan, B. Uslu, From mercury to nanosensors: Past, present and the future
perspective of electrochemistry in pharmaceutical and biomedical analysis, J. Pharm.
Biomed. Anal. 130 (2016) 126–140.
[32] G. Banis, T. Winkler, P. Barton, S. Chocron, E. Kim, D. Kelly, G. Payne, H. Ben-
Yoav, R. Ghodssi, The binding effect of proteins on medications and its impact on
electrochemical sensing: Antipsychotic clozapine as a case study, Pharmaceuticals 10
(2017) 69-80.

92
[33] P. Daneshegar, A.A. Moosavi-Movahedi, P. Norouzi, M.R. Ganjali, M. Farhadi, N.
Sheibanid, Characterization of paracetamol binding with normal and glycated human
serum albumin assayed by a new electrochemical method, J. Braz. Chem. Soc. 23
(2012) 315–321.
[34] F. Arjmand, M. Aziz, S. Tabassum, Cyclic Voltammetry-An electrochemical approach
to study metal-based potential antitumor drug-DNA interaction, Curr. Anal. Chem. 7
(2011) 71–79.
[35] D. Hynek, L. Krejcova, O. Zitka, V. Adam, L. Trnkova, J. Sochor, M. Stiborova, T.
Eckschlager, J. Hubalek, R. Kizek, Electrochemical study of doxorubicin interaction
with different sequences of single stranded oligonucleotides, Part I, Int. J. Electrochem.
Sci. Int. 7 (2012) 13–33.
[36] B. Rafique, A.M. Khalid, K. Akhtar, A. Jabbar, Interaction of anticancer drug
methotrexate with DNA analyzed by electrochemical and spectroscopic methods,
Biosens. Bioelectron. 44 (2013) 21–26.
[37] R. Hajian, P. Hossaini, Z. Mehrayin, P. M. Woi, N. Shams, DNA-binding studies of
valrubicin as a chemotherapy drug using spectroscopy and electrochemical techniques,
J. Pharm. Anal. 7 (2017) 176–180.
[38] S. Rauf, J.J. Gooding, K. Akhtar, M.A. Ghauri, M. Rahman, M.A. Anwar, A.M.
Khalid, Electrochemical approach of anticancer drugs–DNA interaction, J. Pharm.
Biomed. Anal. 37 (2005) 205–217.
[39] J.P. Marco, K.B. Borges, C.R.T. Tarley, E.S. Ribeiro, A.C. Pereira, Development of a
simple, rapid and validated square wave voltametric method for determination of
promethazine in raw material and pharmaceutical formulation using DNA modified
multiwall carbon nanotube paste electrode, Sensors Actuators B Chem. 177 (2013)
251–259.
[40] F. Wang, Y. Wu, J. Liu, B. Ye, DNA Langmuir–Blodgett modified glassy carbon
electrode as voltammetric sensor for determinate of methotrexate, Electrochim. Acta 54
(2009) 1408–1413.

93
[41] A.A. Ensafi, E. Heydari-Bafrooei, B. Rezaei, Different interaction of codeine and
morphine with DNA: a concept for simultaneous determination., Biosens. Bioelectron.
41 (2013) 627–33.
[42] S.A. Ozkan, J.-M. Kauffmann, P. Zuman, Electroanalysis in biomedical and
pharmaceutical sciences, Springer, Berlin, (2015)
[43] S.A. Özkan, B. Uslu, H.Y. Aboul-Enein, Analysis of pharmaceuticals and biological
fluids using modern electroanalytical techniques, Crit. Rev. Anal. Chem. 33 (2003)
155–181.
[44] European Pharmacopoeia, 9th
ed., Council of Europe, Strasbourg, 2017
[45] H. Fayazfar, A. Afshar, A. Dolati, M. Ghalkhani, Modification of well-aligned carbon
nanotubes with dihexadecyl hydrogen phosphate: application to highly sensitive
nanomolar detection of simvastatin, J. Appl. Electrochem. 44 (2014) 263–277.
[46] M. Ławrywianiec, J. Smajdor, B. Paczosa-Bator, R. Piech, Application of a glassy
carbon electrode modified with carbon black nanoparticles for highly sensitive
voltammetric determination of quetiapine, Anal. Methods. 9 (2017) 6662–6668.
[47] Y. Li, Z. Ye, J. Zhou, J. Liu, G. Song, K. Zhang, B. Ye, A new voltammetric sensor
based on poly(L-arginine)/graphene–Nafion composite film modified electrode for
sensitive determination of Terbutaline sulfate, J. Electroanal. Chem. 687 (2012) 51–57.
[48] B. Kilicyaldir, A. Aslıhan Avan, K. Guclu, M. Ozyurek, H. Filik, Electrochemical
Determination of Rivastigmine Hydrogen Tartrate at β-Cyclodextrin/Multi-Walled
Carbon Nanotubes Modified Electrode, Curr. Pharm. Anal. 13 (2017).
[49] E. Er, H. Çelikkan, N. Erk, A novel electrochemical nano-platform based on
graphene/platinum nanoparticles/nafion composites for the electrochemical sensing of
metoprolol, Sensors Actuators B Chem. 238 (2017) 779–787.
[50] B. Mekassa, M. Tessema, B.S. Chandravanshi, Simultaneous determination of caffeine
and theophylline using square wave voltammetry at poly( l -aspartic acid)/
functionalized multi-walled carbon nanotubes composite modified electrode, Sens.
Bio-Sensing Res. 16 (2017) 46–54.

94
[51] S. Can, S. Yilmaz, G. Saglikoglu, M. Sadikoglu, N. Menek, Electrocatalytic Oxidation
of Acyclovir on Poly( p -Aminobenzene Sulfonic Acid) Film Modified Glassy Carbon
Electrode, Electroanalysis 27 (2015) 2431–2438.
[52] S. Tajik, M.A. Taher, H. Beitollahi, First report for simultaneous determination of
methyldopa and hydrochlorothiazide using a nanostructured based electrochemical
sensor, J. Electroanal. Chem. 704 (2013) 137–144.
[53] P.B. Desai, A.K. Srivastava, Adsorptive stripping differential pulse voltammetric
determination of metoprolol at Nafion-CNT-nano-composite film sensor, Sensors
Actuators B Chem. 176 (2013) 632–638.
[54] P.B. Desai, A.K. Srivastava, Determination of amiloride at Nafion–CNT-nano-
composite film sensor employing adsorptive stripping differential pulse voltammetry,
Sensors Actuators B Chem. 169 (2012) 341–348.
[55] N. Karadas, S.A. Ozkan, Electrochemical preparation of sodium dodecylsulfate doped
over-oxidized polypyrrole/multi-walled carbon nanotube composite on glassy carbon
electrode and its application on sensitive and selective determination of anticancer
drug: Pemetrexed, Talanta 119 (2014) 248–254.
[56] Y. Shoja, A.A. Rafati, J. Ghodsi, Electropolymerization of Ni–LD metallopolymers on
gold nanoparticles enriched multi-walled carbon nanotubes as nano-structure
electrocatalyst for efficient voltammetric sertraline detection in human serum,
Electrochim. Acta 203 (2016) 281–291.
[57] S.J. Malode, J.C. Abbar, N.P. Shetti, S.T. Nandibewoor, Voltammetric oxidation and
determination of loop diuretic furosemide at a multi-walled carbon nanotubes paste
electrode, Electrochim. Acta 60 (2012) 95–101.
[58] S. Cheemalapati, S. Palanisamy, V. Mani, S.-M. Chen, Simultaneous electrochemical
determination of dopamine and paracetamol on multiwalled carbon nanotubes /
graphene oxide nanocomposite-modified glassy carbon electrode, Talanta 117 (2013)
297–304.

95
[59] E. Asadian, S. Shahrokhian, A. Iraji Zad, F. Ghorbani-Bidkorbeh, Glassy carbon
electrode modified with 3D graphene–carbon nanotube network for sensitive
electrochemical determination of methotrexate, Sensors Actuators B Chem. 239 (2017)
617-627.
[60] R. Liu, X. Zeng, J. Liu, J. Luo, Y. Zheng, X. Liu, A glassy carbon electrode modified
with an amphiphilic, electroactive and photosensitive polymer and with multi-walled
carbon nanotubes for simultaneous determination of dopamine and paracetamol,
Microchim. Acta 183 (2016) 1543–1551.
[61] B. Deiminiat, G.H. Rounaghi, M.H. Arbab-Zavar, Development of a new
electrochemical imprinted sensor based on poly-pyrrole, sol–gel and multiwall carbon
nanotubes for determination of tramadol, Sensors Actuators B Chem. 238 (2017) 651–
659.
[62] K. Sarhangzadeh, A.A. Khatami, M. Jabbari, S. Bahari, Simultaneous determination of
diclofenac and indomethacin using a sensitive electrochemical sensor based on
multiwalled carbon nanotube and ionic liquid nanocomposite, J. Appl. Electrochem. 43
(2013) 1217–1224.
[63] M.A. Mohamed, A.M. Yehia, C.E. Banks, N.K. Allam, Novel MWCNTs/graphene
oxide/pyrogallol composite with enhanced sensitivity for biosensing applications.,
Biosens. Bioelectron. 89 (2017) 1034–1041.
[64] T.A. Silva, H. Zanin, F.C. Vicentini, E.J. Corat, O. Fatibello-Filho, Differential pulse
adsorptive stripping voltammetric determination of nanomolar levels of atorvastatin
calcium in pharmaceutical and biological samples using a vertically aligned carbon
nanotube/graphene oxide electrode, Analyst 139 (2014) 2832.
[65] A. Afkhami, A. Bahiraei, T. Madrakian, Gold nanoparticle/multi-walled carbon
nanotube modified glassy carbon electrode as a sensitive voltammetric sensor for the
determination of diclofenac sodium, Mater. Sci. Eng. C. 59 (2016) 168–176.
[66] M. Rahimi-Nasrabadi, A. Khoshroo, M. Mazloum-Ardakani, Electrochemical
determination of diazepam in real samples based on fullerene-functionalized carbon
nanotubes/ionic liquid nanocomposite, Sensors Actuators B Chem. 240 (2017) 125–
131.

96
[67] D.A. Skoog, D.M. West, F.J. Holler, S.R. Crouch, Fundamentals of analytical
chemistry, Brooks/Cole, Belmont, 2014.
[68] D. Harvey, Modern analytical chemistry, McGraw-Hill, USA, 2000.
[69] Z. Stojek, Pulse voltammetry in: Electroanalytical methods, F. Scholz (ed.), Springer,
Berlin, (2010) 107-119.
[70] D.A.C. Brownson, C.E. Banks, Interpreting electrochemistry, in: The handbook of
graphene electrochemistry, Springer, London ( 2014) 23–77.
[71] V. Mirceski, R. Gulaboski, M. Lovric, I. Bogeski, R. Kappl, M. Hoth, Square-Wave
Voltammetry: A Review on the Recent Progress, Electroanalysis 25 (2013) 2411–2422.
[72] V. Mirceski, R. Gulaboski, Recent achievements in square-wave voltammetry (A
review), Maced. J. Chem. Chem. Eng. 33 (2014) 1-12.
[73] V. Mir eski, S. Komorsky-Lovrić, M. Lovrić, Square-wave voltammetry : theory and
application, Springer, Berlin (2007)
[74] D. Omanović, C. Garnier, K. Gibbon–Walsh, I. Pižeta, Electroanalysis in
environmental monitoring: Tracking trace metals—A mini review, Electrochem.
Commun. 61 (2015) 78–83.
[75] B. Uslu, S. Ozkan, Electroanalytical Application of carbon based electrodes to the
pharmaceuticals, Anal. Lett. 40 (2007) 817–853.
[76] B. Uslu, S.A. Ozkan, Solid electrodes in electroanalytical chemistry: present
applications and prospects for high throughput screening of drug compounds, Comb.
Chem. High Throughput Screen. 10 (2007) 495–513.
[77] M. Narmadha, M. Noel, V. Suryanarayanan, Relative deactivation of boron-doped
diamond (BDD) and glassy carbon (GC) electrodes in different electrolyte media
containing substituted phenols – Voltammetric and surface morphologic studies, J.
Electroanal. Chem. 655 (2011) 103–110.
[78] J.H.T. Luong, K.B. Male, J.D. Glennon, Boron-doped diamond electrode: synthesis,
characterization, functionalization and analytical applications, Analyst 134 (2009)
1965-1979.

97
[79] A.-E. Radi, Recent updates of chemically modified electrodes in pharmaceutical
analysis, Comb. Chem. High Throughput Screen. 13 (2010) 728–752.
[80] S. Kurbanoglu, S.A. Ozkan, Electrochemical carbon based nanosensors: A promising
tool in pharmaceutical and biomedical analysis, J. Pharm. Biomed. Anal. 147 (2018)
439–457.
[81] W. Zhang, S. Zhu, R. Luque, S. Han, L. Hu, G. Xu, Recent development of carbon
electrode materials and their bioanalytical and environmental applications, Chem. Soc.
Rev. 45 (2016) 715–752.
[82] J.C. Claussen, J. Shi, A.R. Diggs, D.M. Porterfield, T.S. Fisher, Electrochemical
biosensors based on carbon nanotubes in: Nanotechnologies Life Sci., C.S.S.R. Kumar
(ed.) Wiley-VCH Verlag GmbH & Co. KGaA, Weinheim (2012)
[83] X. Yang, B. Feng, X. He, F. Li, Y. Ding, J. Fei, Carbon nanomaterial based
electrochemical sensors for biogenic amines, Microchim. Acta 180 (2013) 935-956.
[84] H. He, L.A. Pham-Huy, P. Dramou, D. Xiao, P. Zuo, C. Pham-Huy, Carbon nanotubes:
applications in pharmacy and medicine, Biomed. Res. Int. 2013 (2013)
<http://dx.doi.org/10.1155/2013/578290>
[85] M. Porwal, V. Rastogi, A. Kumar, An Overview on Carbon Nanotubes, MOJ Bioequiv.
Availab. 3 (2017). doi: 10.15406/mojbb.2017.03.00045
[86] M. Trojanowicz, Analytical applications of carbon nanotubes: a review, TrAC Trends
Anal. Chem. 25 (2006) 480–489.
[87] R. Vidu, M. Rahman, M. Mahmoudi, M. Enachescu, T.D. Poteca, I. Opris,
Nanostructures: a platform for brain repair and augmentation, Front. Syst. Neurosci. 8
(2014). doi: 10.3389/fnsys.2014.00091
[88] B.-R. Adhikari, M. Govindhan, A. Chen, Carbon nanomaterials based electrochemical
sensors/biosensors for the sensitive detection of pharmaceutical and biological
compounds, Sensors 15 (2015) 22490–22508.
[89] A. Chen, S. Chatterjee, Nanomaterials based electrochemical sensors for biomedical
applications, Chem. Soc. Rev. 42 (2013) doi: 10.1039/c3cs35518g

98
[90] N. Punbusayakul, Carbon nanotubes architectures in electroanalysis, Procedia Eng. 32
(2012) 683–689.
[91] P. Yanez-Sedeno, J. M. Pingarron, J. Riu, F. X. Rius, Electrochemical sensing based on
carbon nanotubes, TrAC Trends Anal. Chem 29 (2010) 939-953.
[92] G.A. Rivas, M.D. Rubianes, M.C. Rodríguez, N.F. Ferreyra, G.L. Luque, M.L. Pedano,
S.A. Miscoria, C. Parrado, Carbon nanotubes for electrochemical biosensing, Talanta.
74 (2007) 291–307.
[93] C.E. Banks, R.G. Compton, New electrodes for old: from carbon nanotubes to edge
plane pyrolytic graphite, Analyst 131 (2006) 15–21.
[94] M. Musameh, N.S. Lawrence, J. Wang, Electrochemical activation of carbon nanotubes,
Electrochem. Commun. 7 (2005) 14–18.
[95] P. Singh, S. Campidelli, S. Giordani, D. Bonifazi, A. Bianco, M. Prato, Organic
functionalisation and characterisation of single-walled carbon nanotubes, Chem. Soc.
Rev. 38 (2009) 2214-2230.
[96] M. Pumera, A. Ambrosi, E.L.K. Chng, Impurities in graphenes and carbon nanotubes
and their influence on the redox properties, Chem. Sci. 3 (2012) 3347-3355.
[97] C.B. Jacobs, M.J. Peairs, B.J. Venton, Review: Carbon nanotube based electrochemical
sensors for biomolecules, Anal. Chim. Acta 662 (2010) 105-127.
[98] G. Li, S. Yang, L. Qu, R. Yang, J. Li, Simultaneous voltammetric determination of
ascorbic acid and uric acid using a Nafion/multi-wall carbon nanotubes composite film-
modified electrode, J. Solid State Electrochem. 15 (2011) 161–166..
[99] K.A. Mauritz, R.B. Moore, State of understanding of Nafion, Chem. Rev. 104 (2004)
4535–4585.
[100] X. Wang, S. Uchiyam, Polymers for biosensors construction in: State of the art in
biosensors-General aspects, T. Rinken (ed.), InTech, 2013. doi: 10.5772/54428
[101] C. Kokkinos, A. Economou, Disposable Nafion-modified micro-fabricated bismuth-
film sensors for voltammetric stripping analysis of trace metals in the presence of
surfactants, Talanta 84 (2011) 696–701.

99
[102] D. Li, J. Jia, J. Wang, A study on the electroanalytical performance of a bismuth film-
coated and Nafion-coated glassy carbon electrode in alkaline solutions, Microchim.
Acta 169 (2010) 221–225.
[103] E. Desimoni, B. Brunetti, Glassy Carbon Electrodes Film-Modified with Acidic
Functionalities. A Review, Electroanalysis. 24 (2012) 1481–1500.
[104] B. Nigović, M. Marušić, S. Jurić, A highly sensitive method for determination of β-
blocker drugs using a Nafion-coated glassy carbon electrode, J. Electroanal. Chem. 663
(2011) 72–78.
[105] Y. Li, Z. Ye, J. Zhou, J. Liu, G. Song, K. Zhang, B. Ye, A new voltammetric sensor
based on poly(L-arginine)/graphene–Nafion composite film modified electrode for
sensitive determination of Terbutaline sulfate, J. Electroanal. Chem. 687 (2012) 51–57.
[106] H.J. Salavagione, A.M. Díez-Pascual, E. Lázaro, S. Vera, M.A. Gómez-Fatou,
Chemical sensors based on polymer composites with carbon nanotubes and graphene:
The role of the polymer, J. Mater. Chem. A. 2 (2014) 14289–14328.
[107] X. Li, L. Wang, Q. Wu, Z. Chen, X. Lin, A nonenzymatic hydrogen peroxide sensor
based on Au-Ag nanotubes and chitosan film, J. Electroanal.Chem. 735 (2014) 19-23.
[108] J. Tashkhourian, M.R.H. Nezhad, J. Khodavesi, S. Javadi, Silver nanoparticles modified
carbon nanotube paste electrode for simultaneous determination of dopamine and
ascorbic acid, J. Electroanal. Chem. 633 (2009) 85–91.
[109] F.W. Campbell, R.G. Compton, The use of nanoparticles in electroanalysis: an updated
review, Anal. Bioanal. Chem. 396 (2010) 241–259.
[110] M. Ghalkhani, S. Shahrokhian, F. Ghorbani-Bidkorbeh, Voltammetric studies of
sumatriptan on the surface of pyrolytic graphite electrode modified with multi-walled
carbon nanotubes decorated with silver nanoparticles, Talanta 80 (2009) 31–38.
[111] L. Zhu, L. Xu, B. Huang, N. Jia, L. Tan, S. Yao, Simultaneous determination of Cd(II)
and Pb(II) using square wave anodic stripping voltammetry at a gold nanoparticle-
graphene-cysteine composite modified bismuth film electrode, Electrochim. Acta 115
(2014) 471-477.

100
[112] V. F. Samanidou, E. G. Karageorgou, Carbon nanotubes in sample preparation, Curr.
Org. Chem. 16 (2012) 1645–1669.
[113] A. Hemasa, N. Naumovski, W. Maher, A. Ghanem, Application of carbon nanotubes in
chiral and achiral separations of pharmaceuticals, biologics and chemicals,
Nanomaterials 7 (2017) doi:10.3390/nano7070186
[114] S. Prakash, M. Malhotra, W. Shao, C. Tomaro-Duchesneau, S. Abbasi, Polymeric
nanohybrids and functionalized carbon nanotubes as drug delivery carriers for cancer
therapy, Adv. Drug Deliv. Rev. 63 (2011) 1340–1351.
[115] Z. Yang, Y. Zhang, Y. Yang, L. Sun, D. Han, H. Li, C. Wang, Pharmacological and
toxicological target organelles and safe use of single-walled carbon nanotubes as drug
carriers in treating Alzheimer disease, Nanomedicine NBM. 6 (2010) 427–441.
[116] M. Adeli, R. Soleyman, Z. Beiranvand, F. Madani, Carbon nanotubes in cancer
therapy: a more precise look at the role of carbon nanotube–polymer interactions,
Chem. Soc. Rev. 42 (2013) 5231-5256.
[117] T.M.B.F. Oliveira, F.W.P. Ribeiro, J.E.S. Soares, P. de Lima-Neto, A.N. Correia,
Square-wave adsorptive voltammetry of dexamethasone: Redox mechanism, kinetic
properties, and electroanalytical determinations in multicomponent formulations, Anal.
Biochem. 413 (2011) 148–156.
[118] R. Hirlekar, M. Yamagar, H. Garse, M. Vij, V. Kadam, Carbon nanotubes and its
application: A review, Asian J. Pharm. Clin. Res. 2 (2009) 17-27.
[119] W. Wang, L. Zhou, L. Sun, Ondansetron for neuraxial morphine-induced pruritus: A
meta-analysis of randomized controlled trials, J. Clin. Pharm. Ther. 42 (2017) 383–393.
[120] R.B. Koju, B.S. Gurung, Y. Dongol, Prophylactic administration of ondansetron in
prevention of intrathecal morphine-induced pruritus and post-operative nausea and
vomiting in patients undergoing caesarean section, BMC Anesthesiol. 15 (2015)
doi:10.1186/1471-2253-15-18
[121] T.G. Venkateshwaran, J.T. Stewart, D.T. King, HPLC Determination of
Morphineondansetron and Meperidine-Ondansetron Mixtures in 0.9% Sodium
Chloride Injection, J. Liq. Chromatogr. Relat. Technol. 19 (1996) 1329–1338.

101
[122] B. Nigović, S. Jurić, A. Mornar, I. Malenica, Electrochemical studies of ropinirole, an
anti-Parkinson’s disease drug, J. Chem. Sci. 125 (2013) 1197–1205.
[123] B. Bozal-Palabiyik, B. Uslu, A novel electroanalytical nanosensor based on
MWCNT/Fe2O3 nanoparticles for the determination of antiparkinson drug ropinirole,
Ionics, 22 (2016) 115–123.
[124] N.N. Salama, H.E. Zaazaa, S.M. Azab, S.A. Atty, N.M. El-Kosy, M.Y. Salem, A novel
cesium modified carbon paste electrode for rapid selective determination of ropinirole
in presence of co-administered and interference substances, Sensor. Actuat. B Chem.
240 (2017) 1291–1301.
[125] I. Habib, M. Rizk, D. Mohamed, S. Mowaka, R. El-Eryan, Square wave voltammetric
determination of ropinirole HCl in bulk, dosage forms and biological samples on
carbon paste electrode, Br. J. Pharm. Res. 11 (2016) 1–13.
[126] E.L. Beckett, N.S. Lawrence, R.G. Evans, J. Davis, R.G. Compton,
Sonoelectrochemically enhanced determination of 5-aminosalicylic acid., Talanta. 54
(2001) 871–877.
[127] B. Nigović, B. Simunić, Determination of 5-aminosalicylic acid in pharmaceutical
formulation by differential pulse voltammetry, J. Pharm. Biomed. Anal. 31 (2003)
169–174.
[128] S. Komorsky-Lovrić, B. Nigović, Identification of 5-aminosalicylic acid, ciprofloxacin
and azithromycin by abrasive stripping voltammetry, J. Pharm. Biomed. Anal. 36
(2004) 81–9.
[129] A. Akkaya, C. Altug, N.K. Pazarlioglu, E. Dinckaya, Determination of 5-
Aminosalicylic Acid by Catalase-Peroxidase Based Biosensor, Electroanalysis 21
(2009) 1805–1810.
[130] C. V. Uliana, H. Yamanaka, G.S. Garbellini, G.R. Salazar-Banda, Determination of 5-
aminosalicylic acid in pharmaceutical formulations by square wave voltammetry at
pencil graphite electrodes, Quim. Nova 33 (2010) 964–967.

102
[131] S. Shahrokhian, P. Hosseini, Z. Kamalzadeh, Investigation of the electrochemical
behavior of mesalazine on the surface of a glassy carbon electrode modified with
CNT/PPY doped by 1,5-Naphthalenedisulfonic acid, Electroanalysis 25 (2013) 2481–
2491.
[132] E. Pastorini, M. Locatelli, P. Simoni, G. Roda, E. Roda, A. Roda, Development and
validation of a HPLC-ESI-MS/MS method for the determination of 5-aminosalicylic
acid and its major metabolite N-acetyl-5-aminosalicylic acid in human plasma, J.
Chromatogr. B. 872 (2008) 99–106.
[133] J. Fongemie, E. Felix-Getzik, A Review of Nebivolol Pharmacology and Clinical
Evidence, Drugs 75 (2015) 1349–1371.
[134] B. Nigović, A. Mornar, M. Završki, Rapid Electroanalytical Method for Determination
of Nebivolol at a Boron-Doped Diamond Electrode, J. AOAC Int. 98 (2015) 1535–
1541.
[135] B. Habibi, M. Jahanbakhshi, Silver nanoparticles/multi walled carbon nanotubes
nanocomposite modified electrode: Voltammetric determination of clonazepam,
Electrochim. Acta 118 (2014) 10–17
[136] E. Er, H. Çelikkan, N. Erk, Highly sensitive and selective electrochemical sensor based
on high-quality graphene/Nafion nanocomposite for voltammetric determination of
nebivolol, Sensor Actuat. B Chem. 224 (2016) 170–177.
[137] B. Nigović, J. Spajić, A novel electrochemical sensor for assaying of antipsychotic
drug quetiapine, Talanta 86 (2011) 393–399.
[138] B. Nigović, Z. Mandić, B. Simunić, I. Fistrić, Voltammetric studies of 2-hydroxy-5-
[(4-sulfophenyl)azo]benzoic acid as a novel prodrug of 5-aminosalicylic acid, J. Pharm.
Biomed. Anal. 26 (2001) 987–994.
[139] Z. Mandić, B. Nigović, B. Šimunić, The mechanism and kinetics of the electrochemical
cleavage of azo bond of 2-hydroxy-5-sulfophenyl-azo-benzoic acids, Electrochim. Acta
49 (2004) 607–615.

103
[140] Š. Komorsky-Lovrić, B. Nigović, Kinetics of the Surface Redox Reaction of 2-
Hydroxy-5-[(4-sulfophenyl)azo]benzoic Acid, Croatica Chemica Acta 78 (2005) 85-90.
[141] B. Nigović, Š. Komorsky-Lovrić, B. Šimunić, Electroanalytical Studies of Biologically
Active Azosalicylic Acid at a Hanging Mercury Drop Electrode, Electroanalysis 17
(2005) 839–845.
[142] A. Eriksson, L. Nyholm, A comparative study of the oxidation of 3-, 4- and 5-
aminosalicylic acids at glassy carbon electrodes, Electroanalysis 10 (1998) 198-203.
[143] S. Mu, Synthesis of poly(aniline-co-5-aminosalicylic acid) and its properties, Synth.
Met. 161 (2011)1306-1312.
[144] E.M. Soliman, H.M. Marwani, H.M. Albishri, Novel solid-phase extractor based on
functionalization of multi-walled carbon nano tubes with 5-aminosalicylic acid for
preconcentration of Pb(II) in water samples prior to determination by ICP-OES,
Environ. Monit. Assess. 185 (2013) 10269–10280.
[145] Y. Yu, Y. Zhou, L. Wu, J. Zhi, Electrochemical Biosensor Based on Boron-Doped
Diamond Electrodes with Modified Surfaces, Int. J. Electrochem. 2012 (2012) 1–10.
[146] B. Dogan, S. Tuncel, B. Uslu, S.A. Özkan, Selective electrochemical behavior of
highly conductive boron-doped diamond electrodes for fluvastatin sodium oxidation,
Diam. Relat. Mater. 16 (2007) 1695–1704.
[147] J. V. Macpherson, A practical guide to using boron doped diamond in electrochemical
research, Phys. Chem. Chem. Phys. 17 (2015) 2935–2949.
[148] B.C. Lourenção, R.A. Medeiros, R.C. Rocha-Filho, L.H. Mazo, O. Fatibello-Filho,
Simultaneous voltammetric determination of paracetamol and caffeine in
pharmaceutical formulations using a boron-doped diamond electrode, Talanta 78
(2009) 748–752.
[149] E.R. Sartori, R.A. Medeiros, R.C. Rocha-Filho, O. Fatibello-Filho, Square-wave
voltammetric determination of propranolol and atenolol in pharmaceuticals using a
boron-doped diamond electrode, Talanta 81 (2010) 1418–1424.

104
[150] B. Nigović, S. Jurić, I. Mitrović, Bismuth nanoparticles-carbon nanotubes modified
sensor for sulfasalazine analysis, Talanta 164 (2017) 201–208.
[151] G.-J. Lee, C.K. Kim, M.K. Lee, C.K. Rhee, Effect of phase stability degradation of
bismuth on sensor characteristics of nano-bisanith fixed electrode, Talanta 83 (2010)
682–685.
[152] A.K. Baytak, T. Teker, S. Duzmen, M. Aslanoglu, A sensitive determination of
terbutaline in pharmaceuticals and urine samples using a composite electrode based on
zirconium oxide nanoparticles, Mater. Sci. Eng. C. 67 (2016) 125–131.
[153] R. Sharma, P. Pandey, R. Nayar, Zirconium oxide based boron doped diamond
electrochemical sensor and its application for determination of bronchodilator, anti-
inflammatory and mucoregulator drug acebrophylline, J. Environ. Sci. 1 (2015) 54-68.
[154] P. Norouzi, B. Larijani, M.R. Ganjali, F. Faridbod, Determination of rutin in
pharmaceutical formulations using admittance biosensor based on DNA and nano
composite film using coulometric FFT admittance voltammetry, Int. J. Electrochem.
Sci. 9 (2014) 3130–3143.
[155] International Conference on Harmonization (2005) Validation of analytical
procedures: Text and methodology Q2 (R1)
[156] M. Gumustas, S. A. Ozkan, The role of and the place of method validation in drug
analysis using electroanalytical techniques, Open Anal. Chem. J. 5 (2014) 1–21.
[157] C.-H. Su, C.-L. Sun, Y.-C. Liao, Printed combinatorial sensors for simultaneous
detection of ascorbic acid, uric acid, dopamine and nitrite, ACS Omega 2 (2017) 4245–
4252.
[158] W. Zhang, R. Yuan, Y.-Q. Chai, Y. Zhang, S.-H. Chen, A simple strategy based on
lanthanum–multiwalled carbon nanotube nanocomposites for simultaneous
determination of ascorbic acid, dopamine, uric acid and nitrite, Sens. Actuat. B Chem.
166–167 (2012) 601–607.
[159] Y.J. Yang, W. Li, CTAB functionalized graphene oxide/multiwalled carbon nanotube
composite modified electrode for the simultaneous determination of ascorbic acid,
dopamine, uric acid and nitrite, Biosens. Bioelectron. 56 (2014) 300–306.

105
[160] Y.-T. Shieh, H.-F. Jiang, Graphene oxide-assisted dispersion of carbon nanotubes in
sulfonated chitosan-modified electrode for selective detections of dopamine, uric acid,
and ascorbic acid, J. Electroanal. Chem. 736 (2015) 132–138.

106
9. SUPPLEMENTAL DATA

107
9.1. Supplemental data 1: Multi-walled carbon nanotubes/Nafion composite
film modified electrode as a sensor for simultaneous determination of
ondansetron and morphine
0,0 0,2 0,4 0,6 0,8 1,0 1,2 1,4 1,6
-10
0
10
20
30
40
50
i p /
A
E / V vs Ag /AgCl
Supplementary Figure 1. Electrochemical polymerization of 2-hydroxy-5- [(4-
sulfophenyl)azo]benzoic acid on GCE surface for ten cycles in Britton-Robinson buffer
solution (pH 4) containing 1 x 10⁻³
M SPAB (scan rate 100 mVs-1
)
0,8 1,0 1,2 1,4
-5
0
5
10
15
20
i / A
E / V vs. Ag/AgCl
Supplementary Figure 2. Cyclic voltammograms of OND (1 x 10⁻⁴
M) at a bare GCE (blue)
and the poly(SPAB)-GCE (red) in 0.1 M H2SO4

108
0,6 0,8 1,0 1,2 1,4
250
300
350
400
450
500
550
i / A
E / V vs. Ag/AgCl
Supplementary Figure 3. Square-wave voltammograms of OND and MOR (1 x 10⁻⁶
M) at
the MWCNTs/Nafion-GCE with 200-fold uric acid (red) and without uric acid (blue). SWV
settings: f = 75 Hz, Esw = 25 mV and ΔE = 8 mV (Eacc = -0.5 V, tacc = 360 s)
0,6 0,8 1,0 1,2 1,4
100
150
200
250
300
i /
A
E / V vs Ag/AgCl
Supplementary Figure 4. Square-wave voltammograms of OND and MOR (1 x 10⁻⁶
M) at
the MWCNTs/Nafion-GCE with 400-fold nitrite ions (red) and without nitrite ions (blue).
SWV settings: f = 75 Hz, Esw = 25 mV and ΔE = 8 mV (Eacc = -0.5 V, tacc = 360 s)

109
1,0 1,2 1,4
200
250
300
350
i / A
E / V vs. Ag/AgCl
Supplementary Figure 5. Square-wave voltammograms of OND at the MWCNTs/Nafion-
GCE recorded in tablets for increasing concentrations (1.0 x 10⁻⁶
M – 2.5 x 10⁻⁶
M). SWV
settings: f = 75 Hz, Esw = 25 mV and ΔE = 8 mV (Eacc = -0.5 V, tacc = 360 s)
0,6 0,8 1,0 1,2 1,4
60
80
100
120
140
160
180
200
220
240
260
i /
E / V vs. Ag/AgCl
Supplementary Figure 6. Square-wave voltammograms of OND and MOR at the
MWCNTs/Nafion-GCE recorded in spiked human serum for increasing concentrations (5.0 x
10-7
M – 2.5 x 10⁻⁶
M for OND and 1.0 x 10⁻⁷
M – 1.0 x 10⁻⁶
M for MOR). SWV settings: f =
75 Hz, Esw = 25 mV and ΔE = 8 mV (Eacc = -0.5 V, tacc = 360 s)

110
9.2. Supplemental data 2: Voltammetric determination of ropinirole in the
presence of levodopa at the surface of a carbon nanotubes based
electrochemical sensor in pharmaceuticals and human serum
-0,2 0,0 0,2 0,4 0,6 0,8 1,0
-15
-10
-5
0
5
10
15
20
25
i / A
E / V vs. Ag/AgCl
Supplementary Figure 1. Electrochemical polymerization of 5-ASA on GCE surface for ten
cycles in BR buffer solution (pH 2) containing 1 x 10⁻³
M 5-ASA (scan rate 100 mVs-1
)
-0,2 0,0 0,2 0,4 0,6 0,8 1,0
-5
0
5
10
15
20
25
i / A
E / V vs. Ag/AgCl
Supplementary Figure 2. The effect of pH value of BR buffer solution on 5-ASA (5 x 10⁻⁴
M) electropolymerization (first cycle): pH 2 (red), pH 4 (green) and pH 6 (blue)

111
0,8 1,0 1,2 1,4 1,6
10
20
30
i / A
E / V vs. Ag/AgCl
Supplementary Figure 3. Square-wave voltammograms of ROP (5 x 10⁻⁵
M) at a bare GCE
(blue) and at poly(5-ASA)-GCE (red) together with corresponding background recording in
BR buffer pH 2 (green)
0,8 1,0 1,2 1,4
50
100
150
200
250
i / A
E / V vs. Ag/AgCl
Supplementary Figure 4. Square-wave voltammograms of ROP (5 x 10⁻⁵
M) in 0.1 M
H2SO4 at poly(5-ASA)-GCE (blue) and at the MWCNTs/Nafion-GCE (red)

112
0,8 1,0 1,2 1,4
-50
0
50
100
150
200
250
i / A
E / V vs. Ag/AgCl
Supplementary Figure 5. Cyclic voltammograms of ROP (5 x 10⁻⁵
M) at a bare BDDE
(black), the Nafion-BDDE (green), the MWCNTs-BDDE (blue) and MWCNTs/Nafion-
BDDE (red). Scan rate: 100 mVs-1
0,8 1,0 1,2 1,4
100
150
200
250
300
350
i / A
E /V vs Ag/AgCl
Supplementary Figure 6. Square-wave voltammograms of ROP (5 x 10⁻⁵
M) at the
MWCNTs/Nafion-BDDE (blue) and the MWCNTs/Nafion-GCE (red)

113
0,4 0,6 0,8 1,0
150
200
250
i /
A
E /V vs. Ag/AgCl
a) b)
0,4 0,6 0,8 1,0
150
200
250
300
350
400
i /
A
E / V vs. Ag/AgCl
Supplementary Figure 7. Square-wave voltammograms of L-dopa (1 x 10⁻⁶
M) at the
MWCNTs/Nafion-GCE: (a) with equal DA concentration (red) and without DA (blue). (b)
with plasma concentration (26 pg/mL) of DA (red) and without DA (blue). SWV settings: f =
50 Hz, Esw = 25 mV and ΔE = 8 mV (Eacc = 0 V, tacc = 240 s)
0,4 0,6 0,8 1,0 1,2 1,4 1,6
100
150
200
250
300
350
400
450
i / A
E / V vs. Ag/AgCl
Supplementary Figure 8. Square-wave voltammograms of L-dopa (1 x 10⁻⁶
M) at the
MWCNTs/Nafion-GCE with 50-fold uric acid (red) and without uric acid (black). SWV
settings: f = 50 Hz, Esw = 25 mV and ΔE = 8 mV (Eacc = 0 V, tacc = 240 s)

114
9.3. Supplemental data 3: Electrochemical sensing of mesalazine and its N-
acetylated metabolite in biological samples using functionalized carbon
nanotubes
0,0 0,2 0,4 0,6 0,8 1,0
-4
-3
-2
-1
0
1
2
3
4
5
i / A
E / V vs. Ag/AgCl
Supplementary Figure 1. Cyclic voltammograms of 5-ASA (5 x 10⁻⁵
M) at a bare gold
electrode (dashed line) and a bare GCE (solid line). Scan rate: 100 mVs-1
0,0 0,2 0,4 0,6 0,8 1,0
-10
-5
0
5
10
15
20
i / A
E / V vs. Ag/AgCl
Supplementary Figure 2. Cyclic voltammograms of 5-ASA (5 x 10⁻⁵
M) at a gold electrode
(dashed line) and GCE (solid line) modified with MWCNTs/Nafion composite film. Scan
rate: 100 mVs-1

115
0,0 0,2 0,4 0,6 0,8 1,0
-4
-2
0
2
4
i / A
E / V vs. Ag/AgCl
Supplementary Figure 3. Cyclic voltammograms of Ac-5-ASA (5 x 10⁻⁵
M) at a bare gold electrode (dashed line) and a bare GCE (solid line). Scan rate: 100 mVs
-1
0,0 0,2 0,4 0,6 0,8 1,0
-10
-5
0
5
10
15
i / A
E / V vs. Ag/AgCl
Supplementary Figure 4. Cyclic voltammograms of Ac-5-ASA (5 x 10⁻⁵
M) at a gold
electrode (dashed line) and GCE (solid line) modified with MWCNTs/Nafion composite film.
Scan rate: 100 mVs-1

116
0,4 0,6 0,8 1,0
315
320
325
330
335
340
i / A
E / V vs. Ag/AgCl
Supplementary Figure 5. Square-wave voltammograms of 5-ASA and Ac-5ASA (2.5 x 10⁻⁶
M) at the MWCNTs/Nafion-GCE with 5-fold uric acid (red) and without uric acid (blue).
SWV settings: f = 70 Hz, Esw = 50 mV and ΔE = 2 mV (Eacc = 0.1 V, tacc = 30 s)

117
0,6 0,8 1,0 1,2 1,4
50
100
150
200
i / A
E / V vs. Ag/AgCl
9.4. Supplemental data 4: Development of electrochemical platform based on
carbon nanotubes decorated with zirconium oxide nanoparticles for
determination of nebivolol
a) b)
0,6 0,8 1,0 1,2 1,4 1,6
0
50
100
150
200
250
300
i / A
E / V vs. Ag/AgCl
Supplementary Figure 1. Cyclic voltammograms (a) of NBV (1 x 10⁻⁴
M) in 0.1 M H2SO4 at
a bare GCE (black), the BiNP/GCE (green), the MWCNTs/Nafion-GCE (red) and BiNP-
MWCNTs/GCE (blue). Differential pulse voltammograms (b) of NBV (1 x 10⁻⁴
M) in 0.1 M
H2SO4 at the MWCNTs/Nafion-GCE (blue) and BiNP-MWCNTs/GCE (red) together with
corresponding background current (black)
0,6 0,8 1,0 1,2 1,4
0
50
100
150
i /
A
E / V vs. Ag/AgCl
Supplementary Figure 2. Differential pulse voltammograms of NBV (2.5 x 10⁻⁶
M, blue)
and mixture of NBV with carvedilol (1:1, red) in 0.1 M H2SO4. DPV settings: pulse amplitude
of 50 mV, pulse width of 75 ms and scan rate of 20 mV s-1
(Eacc = 0 V, tacc= 240 s)

118
0,6 0,8 1,0 1,2 1,4
0
50
100
150
i /
A
E / V vs. Ag/AgCl
Supplementary Figure 3. Differential pulse voltammograms of NBV (2.5 x 10⁻⁶
M, blue)
and mixture of NBV with propranolol (1:1, red) in 0.1 M H2SO4. DPV settings: pulse
amplitude of 50 mV, pulse width of 75 ms and scan rate of 20 mV s-1
(Eacc = 0 V, tacc= 240 s)
0,6 0,8 1,0 1,2 1,4
0
50
100
150
i /
A
E / V vs. Ag/AgCl
Supplementary Figure 4. Differential pulse voltammograms of NBV (2.5 x 10⁻⁶
M, blue)
and mixture of NBV with atenolol (1:1, red) in 0.1 M H2SO4. DPV settings: pulse amplitude
of 50 mV, pulse width of 75 ms and scan rate of 20 mV s-1
(Eacc = 0 V, tacc= 240 s)

119
0,6 0,8 1,0 1,2 1,4
0
50
100
150
i /
A
E / V vs. Ag/AgCl
Supplementary Figure 5. Differential pulse voltammograms of NBV (2.5 x 10⁻⁶
M, blue)
and mixture of NBV with bisoprolol (1:1, red) in 0.1 M H2SO4. DPV settings: pulse
amplitude of 50 mV, pulse width of 75 ms and scan rate of 20 mV s-1
(Eacc = 0 V, tacc= 240 s)

120
10. BIOGRAPHY

121
Mirela Sadiković was born on 3rd
of May, 1988 in Zagreb, Croatia. She finished elementary
school and the Fourth Gymnasium in Zagreb. In 2007, she started studying Pharmacy at the
Faculty of Pharmacy and Biochemistry, University of Zagreb. During her studies, she has
been awarded several different scholarships and graduated in 2012 among the top 10% of
students in her generation. With her Master thesis, titled ''Electrochemical Properties of
Lovastatin and Corresponding β-hydroxycarboxylic Acid'', she has began her scientific
research in the field of pharmaceutical analysis. In 2012 and 2013, she did an internship in a
pharmacy, passed the state exam and obtained the Licence for independent work. Up to now,
she has worked at the pharmacy and as a teaching assistant at the Department of
Pharmaceutical Analysis at the Faculty of Pharmacy and Biochemistry, where she started her
PhD in Pharmacy. Her main field of interest is the development of new electroanalytical
methods for determination of selected pharmaceuticals in dosage forms and biological fluids
using novel sensors based on carbon nanotubes. In 2016, she began her postgraduate
specialization in Analysis and control of medicinal products. She is the co-author of four
research papers and has participated in several international scientific congresses.
List of publications:
B. Nigović, M. Sadiković, M. Sertić, Multi-walled carbon nanotubes/ Nafion composite film modified
electrode as a sensor for simultaneous determination of ondansetron and morphine, Talanta 122
(2014) 187-194.
M. Sadiković, B. Nigović, S. Jurić, A. Mornar, Voltammetric determination of ropinirole in the
presence of levodopa at the surface of a carbon nanotubes based electrochemical sensor in
pharmaceuticals and human serum, J. Electroanal. Chem. 733 (2014) 60-68.
B. Nigović, M. Sadiković, S. Jurić, Electrochemical sensing of mesalazine and its N-acetylated
metabolite in biological samples using functionalized carbon nanotubes, Talanta 147 (2016) 50-58.
M. Sadiković, B. Nigović, Development of electrochemical platform based on carbon nanotubes
decorated with zirconium oxide nanoparticles for determination of nebivolol, Int. J. Electrochem. Sci.
12 (2017) 9675-9688.

Basic documentation card PhD thesis
University of Zagreb
Faculty of Pharmacy and Biochemistry
Department of Pharmaceutical Analysis
A. Kovačića 1, 10000 Zagreb, Croatia
PhD thesis
NOVEL ELECTROCHEMICAL METHODS IN ANALYSIS OF SELECTED DRUGS USING
CARBON NANOTUBES-BASED SENSORS
Mirela Sadiković
SUMMARY
Due to strict requirements regarding quality control of pharmaceuticals and with the aim of obtaining maximal efficacy and
safety of drug therapy for patients, there is a constant demand for developing new reliable analytical methods to determine drug
concentrations in complex samples. Electroanalytical techniques, especially voltammetric, represent a powerful analytical tool.
Electrochemical nanosensors have recently found extensive applications in pharmaceutical analysis. Therefore, the aim of this
doctoral thesis was to develop new electroanalytical methods for the determination of selected pharmaceuticals in dosage forms
and biological fluids using novel sensors based on multi-walled carbon nanotubes dispersed in Nafion matrix, as well as their
combination with zirconium oxide nanoparticles. Electrochemical behaviour of selected drugs was examined by cyclic
voltammetry to get an insight into their redox mechanism at modified electrodes. Experimental conditions and instrumental
parameters that could affect the electroanalytical performance of proposed sensors were carefully optimised. New methods were
validated according to ICH guidelines. Direct pulse voltammetric techniques (square-wave or differential pulse) were used to
determine the content of ropinirole, L-dopa, mesalazine and nebivolol in tablets, except for ondansetron in which case
adsorptive stripping procedure was employed. The good recoveries indicated that excipients did not interfere with the assay of
active ingredient in any case. In comparison to the high performance liquid chromatographic methods, there were no significant
differences regarding the accuracy and precision; however voltammetric techniques offer high sensitivity, rapid response and
simplicity. Finally, nanosensors were applied for the simultaneous quantification of selected pharmaceuticals with other co-
administered drugs in therapy (such as ondansetron with morphine and ropinirole with L-dopa) or their metabolites (mesalazine
and N-acetylated metabolite) in human serum samples using adsorptive stripping voltammetry. Integration of the nanoparticles
in the sensor improved notably the determination of therapeutic concentrations of nebivolol in serum. Excellent recoveries in
the range of 98.7 – 102.6 % were obtained in all cases, without the need for sample pretreatment. A considerable enhancement
effect on voltammetric responses of selected drugs, is due to synergy of remarkable properties of nanomaterials and cation-
exchange polymer, that enhanced the preconcentration of positively charged drug molecules.
The thesis is deposited in the Central Library of the University of Zagreb Faculty of Pharmacy and Biochemistry.
Thesis includes: 121 pages, 4 schemes, 58 figures, 13 tables and 160 references. Original is in English language.
Keywords: multi-walled carbon nanotubes, zirconium oxide nanoparticles, Nafion, voltammetry,
electrochemical nanosensors, ondansetron, morphine, ropinirole, L-dopa, mesalazine, metabolite
of mesalazine, nebivolol
Supervisor: Biljana Nigović, Ph.D. / Full Professor, Faculty of Pharmacy and Biochemistry, University of Zagreb
Reviewers: Ana Mornar Turk, Ph.D. Associate Professor, Faculty of Pharmacy and Biochemistry, University of Zagreb
Jelena Filipović-Grčić, Ph.D. Full Professor, Faculty of Pharmacy and Biochemistry, University of Zagreb
Dario Omanović, Ph.D. Senior researcher, Ruđer Bošković Institute
The thesis was accepted: January 24th
, 2018

Temeljna dokumentacijska kartica
Sveučilište u Zagrebu
Farmaceutsko-biokemijski fakultet
Zavod za analitiku i kontrolu lijekova
A. Kovačića 1, 10000 Zagreb, Hrvatska
Doktorski rad
NOVE ELEKTROKEMIJSKE METODE U ANALITICI ODABRANIH LIJEKOVA
PRIMJENOM SENZORA S UGLJIKOVIM NANOCJEVČICAMA
Mirela Sadiković
SAŽETAK
Uslijed strogih zahtjeva u pogledu kontrole kakvoće lijekova, a s ciljem postizanja maksimalne u inkovitosti i sigurnosti
terapije za pacijente, postoji neprestani zahtjev za razvojem novih pouzdanih analiti kih metoda za određivanje koncentracija
lijekova u složenim uzorcima. Elektroanaliti ke tehnike, među kojima posebno voltametrijske, predstavljaju moćan analiti ki
alat u tom cilju. S druge strane, elektrokemijski nanosenzori su u posljednje vrijeme našli zna ajnu primjenu u analitici
lijekova. Stoga je cilj ovog doktorskog rada bio razvoj novih elektroanaliti kih metoda za određivanje odabranih lijekova u
dozirnim oblicima i biološkim tekućinama primjenom inovativnih senzora s ugljikovim nanocjev icama dispergiranima u
matriksu Nafiona, kao i u kombinaciji s nano esticama cirkonijeva dioksida. Elektrokemijsko ponašanje odabranih lijekova
ispitano je cikli kom voltametrijom radi stjecanja uvida u mehanizam redoks procesa na modificiranim elektrodama.
Eksperimentalni uvjeti i instrumentalni parametri koji bi mogli utjecati na elektroanaliti ku izvedbu predloženih senzora
pažljivo su optimirani. Nove metode validirane su u skladu s ICH smjernicama. Za određivanje sadržaja ropinirola, levodope,
mesalazina i nebivolola u tabletama primijenjene su direktne pulsne voltametrijske tehnike (pravokutnovalna ili diferencijalno
pulsna), osim u slu aju ondansetrona kada je primijenjena adsorptivna tehnika. Vrijednosti analiti kih prinosa ukazuju da
pomoćne tvari ne interferiraju s određivanjem aktivnih tvari odabranih lijekova. Usporedbom s rezultatima tekućinske
kromatografije visoke djelotvornosti, nisu nađene zna ajne razlike između tehnika što se ti e to nosti i preciznosti, ali su
voltametrijske tehnike jednostavnije, brže i nude visoku osjetljivost. Nadalje, nanosenzori su korišteni i za simultanu
kvantifikaciju lijekova koji se primijenjuju zajedno u terapiji (poput ondansetrona s morfinom i ropinirola s levodopom) te za
simultanu kvantifikaciju lijekova s njihovim metabolitima (mesalazin s N-acetiliranim metabolitom mesalazina) u humanim
uzorcima seruma primjenom adsorptivne voltametrije. Integracijom nano estica u senzore omogućeno je osjetljivije
određivanje terapijskih koncentracija nebivolola u serumu. Postignute su izvrsne vrijednosti analiti kih prinosa u rasponu od
98.7 % do 102.6 % u svim slu ajevima, bez potrebe za predobradbom uzoraka. Znatno poja anje voltametrijskih odgovora
odabranih lijekova posljedica je sinergisti kog u inka izvanrednih svojstava nanomaterijala i kationskog izmjenjiva a, koji je
omogućio ukoncentriravanje pozitivno nabijenih molekula lijekova.
Rad je pohranjen u Središnjoj knjižnici Sveu ilišta u Zagrebu Farmaceutsko-biokemijskog fakulteta.
Rad sadrži: 121 stranicu, 4 sheme, 58 slika, 13 tablica i 160 literaturnih navoda. Izvornik je na engleskom jeziku.
Klju ne rije i: ugljikove nanocjev ice, nano estice cirkonijeva dioksida, Nafion, voltametrija, elektrokemijski
nanosenzori, ondansetron, morfin, ropinirol, levodopa, mesalazin, N-acetilirani metabolit
mesalazina, nebivolol
Mentor: Dr. sc. Biljana Nigović, redoviti profesor, Farmaceutsko-biokemijski fakultet Sveučilišta u Zagrebu
Ocjenjiva i: Dr.sc. Ana Mornar Turk, izvanredni profesor, Farmaceutsko-biokemijski fakultet Sveučilišta u Zagrebu
Dr.sc. Jelena Filipović-Grčić, redoviti profesor, Farmaceutsko-biokemijski fakultet Sveučilišta u Zagrebu
Dr.sc. Dario Omanović, znanstveni savjetnik, Institut Ruđer Bošković
Rad prihvaćen: 24. sije nja 2018.
Copyright © 2022 FDOKUMEN