Doetterl et al 2012 ESPL
14
Towards constraining the magnitude of global agricultural sediment and soil organic carbon fluxes Sebastian Doetterl, 1 * Kristof Van Oost 1 and Johan Six 2 1 Université catholique de Louvain, TECLIM - Georges Lemaître Centre for Earth and Climate Research, Louvain-la-Neuve BE 1348, Belgium 2 Universtiy of California at Davis, Department of Plant Sciences, Davis, CA USA Received 25 February 2011; Revised 15 December 2011; Accepted 19 December 2011 *Correspondence to: S. Doetterl, Université catholique de Louvain, TECLIM - Georges Lemaître Centre for Earth and Climate Research, Bât. Mercator, 3, Place Louis Pasteur, Louvain-la-Neuve, BE 1348, Belgium. E-mail: [email protected] ABSTRACT: Reliable quantitative data on the extent and rates of soil erosion are needed to understand the global significance of soil-erosion induced carbon exchange and to underpin the development of science-based mitigation strategies, but large uncertain- ties remain. Existing estimates of agricultural soil and soil organic carbon (SOC) erosion are very divergent and span two orders of magnitude. The main objective of this study was to test the assumptions underlying existing assessments and to reduce the uncertainty associated with global estimates of agricultural soil and SOC erosion. We parameterized a simplified erosion model driven by coarse global databases using an empirical database that covers the conterminous USA. The good agreement between our model results and empirical estimates indicate that the approach presented here captures the essence of agricultural erosion at the scales of continents and that it may be used to predict the significance of erosion for the global carbon cycle and its impact on soil functions. We obtained a global soil erosion rate of 10.5 Mg ha -1 y -1 for cropland and 1.7 Mg ha -1 y -1 for pastures. This corresponds to SOC erosion rates of 193 kg C ha -1 y -1 for cropland and 40.4 kg C ha -1 y -1 for eroding pastures and results in a global flux of 20.5 (10.3) Pg y -1 of soil and 403.5 (201.8) Tg C y -1 . Although it is difficult to accurately assess the uncertainty associated with our estimates of global agricultural erosion, mainly due to the lack of model testing in (sub-)tropical regions, our estimates are significantly lower than former assessments based on the extrapolation of plot experiments or global application of erosion models. Our approach has the potential to quantify the rate and spatial signature of the erosion-induced disturbance at continental and global scales: by linking our model with a global soil profile database, we estimated soil profile modifications induced by agriculture. This showed that erosion-induced changes in topsoil SOC content are significant at a global scale (an average SOC loss of 22% in 50 years) and agricultural soils should therefore be considered as dynamic systems that can change rapidly. Copyright © 2012 John Wiley & Sons, Ltd. KEYWORDS: global soil erosion; soil carbon fluxes; global carbon cycle Introduction Under natural conditions, soil systems are considered to be sus- tainable as the loss of soil material by erosion is approximately balanced by the production of soil as a result of weathering (Montgomery, 2007; Verheijen et al., 2009). A shift from natural to agricultural land use removes the protective natural vegeta- tion and this typically increases soil erosion by one to two orders of magnitude (Montgomery, 2007), thereby accelerating physical erosion well over equilibrium levels. Research on the implications of accelerated erosion has traditionally focused on on-site nutrient and crop productivity losses (Bakker et al., 2004) and erosion effects on water quality (Lal, 2007a). More recently, the erosion-induced changes in bio-geochemical cycles (Kutsch et al., 2010) have received considerable atten- tion, in particular resulting C flows between soils and the atmosphere. The substantial human impact on soil resources is raising global sustainability issues (Pimentel, 2000; Lal, 2007a; Kummerer et al., 2010) and thus reliable quantitative data on the extent and rates of soil erosion are needed to under- stand how agricultural ecosystems can maintain their delivery of critical services such as food production (Den Biggelaar et al., 2004; Pimentel 2006) and influence global biogeochemical cycles (Lal, 2007b; Quinton et al. 2010). For example, several global assessments of the influence of erosion processes on the carbon cycle suggest a net uptake or sink of carbon but results are very divergent and range between 0.1 and 1.0 Pg C y -1 . Although it is clear that there is insufficient understanding of the interactions between erosion and carbon cycling at the process level (Liu et al., 2003), this wide range also reflects uncertainties associated with estimates of the magnitude of agricultural erosion (Boardman, 2006; Quinton et al., 2010). EARTH SURFACE PROCESSES AND LANDFORMS Earth Surf. Process. Landforms 37, 642–655 (2012) Copyright © 2012 John Wiley & Sons, Ltd. Published online 20 February 2012 in Wiley Online Library (wileyonlinelibrary.com) DOI: 10.1002/esp.3198
Transcript of Doetterl et al 2012 ESPL

EARTH SURFACE PROCESSES AND LANDFORMSEarth Surf. Process. Landforms 37, 642–655 (2012)Copyright © 2012 John Wiley & Sons, Ltd.Published online 20 February 2012 in Wiley Online Library(wileyonlinelibrary.com) DOI: 10.1002/esp.3198
Towards constraining the magnitude of globalagricultural sediment and soil organic carbonfluxesSebastian Doetterl,1* Kristof Van Oost1 and Johan Six21 Université catholique de Louvain, TECLIM - Georges Lemaître Centre for Earth and Climate Research, Louvain-la-Neuve BE 1348,Belgium
2 Universtiy of California at Davis, Department of Plant Sciences, Davis, CA USA
Received 25 February 2011; Revised 15 December 2011; Accepted 19 December 2011
*Correspondence to: S. Doetterl, Université catholique de Louvain, TECLIM - Georges Lemaître Centre for Earth and Climate Research, Bât. Mercator, 3, Place LouisPasteur, Louvain-la-Neuve, BE 1348, Belgium. E-mail: [email protected]
ABSTRACT: Reliable quantitative data on the extent and rates of soil erosion are needed to understand the global significance ofsoil-erosion induced carbon exchange and to underpin the development of science-based mitigation strategies, but large uncertain-ties remain. Existing estimates of agricultural soil and soil organic carbon (SOC) erosion are very divergent and span two orders ofmagnitude. The main objective of this study was to test the assumptions underlying existing assessments and to reduce theuncertainty associated with global estimates of agricultural soil and SOC erosion. We parameterized a simplified erosion modeldriven by coarse global databases using an empirical database that covers the conterminous USA. The good agreement betweenour model results and empirical estimates indicate that the approach presented here captures the essence of agricultural erosionat the scales of continents and that it may be used to predict the significance of erosion for the global carbon cycle and its impacton soil functions. We obtained a global soil erosion rate of 10.5Mg ha-1 y-1 for cropland and 1.7Mg ha-1 y-1 for pastures. Thiscorresponds to SOC erosion rates of 193 kg C ha-1 y-1 for cropland and 40.4 kg C ha-1 y-1 for eroding pastures and results in a globalflux of 20.5 (�10.3) Pg y-1 of soil and 403.5 (�201.8) Tg C y-1. Although it is difficult to accurately assess the uncertainty associatedwith our estimates of global agricultural erosion, mainly due to the lack of model testing in (sub-)tropical regions, our estimates aresignificantly lower than former assessments based on the extrapolation of plot experiments or global application of erosion models.Our approach has the potential to quantify the rate and spatial signature of the erosion-induced disturbance at continental and globalscales: by linking our model with a global soil profile database, we estimated soil profile modifications induced by agriculture.This showed that erosion-induced changes in topsoil SOC content are significant at a global scale (an average SOC loss of 22%in 50 years) and agricultural soils should therefore be considered as dynamic systems that can change rapidly. Copyright © 2012 JohnWiley & Sons, Ltd.
KEYWORDS: global soil erosion; soil carbon fluxes; global carbon cycle
Introduction
Under natural conditions, soil systems are considered to be sus-tainable as the loss of soil material by erosion is approximatelybalanced by the production of soil as a result of weathering(Montgomery, 2007; Verheijen et al., 2009). A shift from naturalto agricultural land use removes the protective natural vegeta-tion and this typically increases soil erosion by one to twoorders of magnitude (Montgomery, 2007), thereby acceleratingphysical erosion well over equilibrium levels. Research on theimplications of accelerated erosion has traditionally focusedon on-site nutrient and crop productivity losses (Bakker et al.,2004) and erosion effects on water quality (Lal, 2007a). Morerecently, the erosion-induced changes in bio-geochemicalcycles (Kutsch et al., 2010) have received considerable atten-tion, in particular resulting C flows between soils and theatmosphere.
The substantial human impact on soil resources is raisingglobal sustainability issues (Pimentel, 2000; Lal, 2007a;Kummerer et al., 2010) and thus reliable quantitative dataon the extent and rates of soil erosion are needed to under-stand how agricultural ecosystems can maintain theirdelivery of critical services such as food production (DenBiggelaar et al., 2004; Pimentel 2006) and influence globalbiogeochemical cycles (Lal, 2007b; Quinton et al. 2010).For example, several global assessments of the influence oferosion processes on the carbon cycle suggest a net uptakeor sink of carbon but results are very divergent and rangebetween 0.1 and 1.0 Pg C y-1. Although it is clear that thereis insufficient understanding of the interactions betweenerosion and carbon cycling at the process level (Liu et al.,2003), this wide range also reflects uncertainties associatedwith estimates of the magnitude of agricultural erosion(Boardman, 2006; Quinton et al., 2010).
globa
lerosionestim
ates
based
ondifferen
tmethods
Typeoferosion
Method
Estim
ated
soilorsedim
ent
[Pgy-1]
Estim
ated
Ceroded
[Pgy-1]
Totalerosion
Glassodsurvey,Model
extrap
olatio
n50.0
-alcu
lated
Totalerosion
Extrap
olated
suspen
ded
sedim
ent
393.0
-
992
Largeriverflu
xes
Plotriversedim
entdata,
model
extrap
olation
16.0–2
4.0
-To
talerosion
Extrap
olationofplotdata
75.0
-Erosiononagricu
lturalland
Extrap
olationofplotdata
73.5
-To
talerosion
Mode
lextrap
olatio
nofdifferen
tsedim
entyieldscen
arios
23.7–6
4.9
0.45–
1.23
Constructionan
dagricu
lturalpractices
Erosiondata
percapita,e
xtrapo
latio
nusingpo
pulatio
nfigures
120.0
-To
tale
rosion
andhu
man
increase
ofsoilerosion
Modifie
dRUSLEbased
simulatio
ns
132.7
-So
ilerosionincrease
byhu
man
s60
%To
talerosion
Extrap
olationofriversedim
entestim
ates
201.0
-To
talerosion
Extrap
olationofriversedim
entestim
ates
201.0
4.0–6
.0Erosiononagricu
lturalland
Extrap
olationofplotdata,
takenfrom
Pim
entel1995
75.0
1.1–3
.7Water
erosion
Modifie
dRUSLEmodellin
gap
proach
172.2
1.6
Pasture
andCroplan
derosion
Erosionplotdata,
modified
RUSLEforlocalextrap
olation
33.4�4.4
0.5�0.06
2007
Erosiononagricu
lturalland
Ploterosiondata,
modeled
extrap
olation
28.1–3
9.9
-
643AGRICULTURAL SEDIMENT AND SOC FLUXES
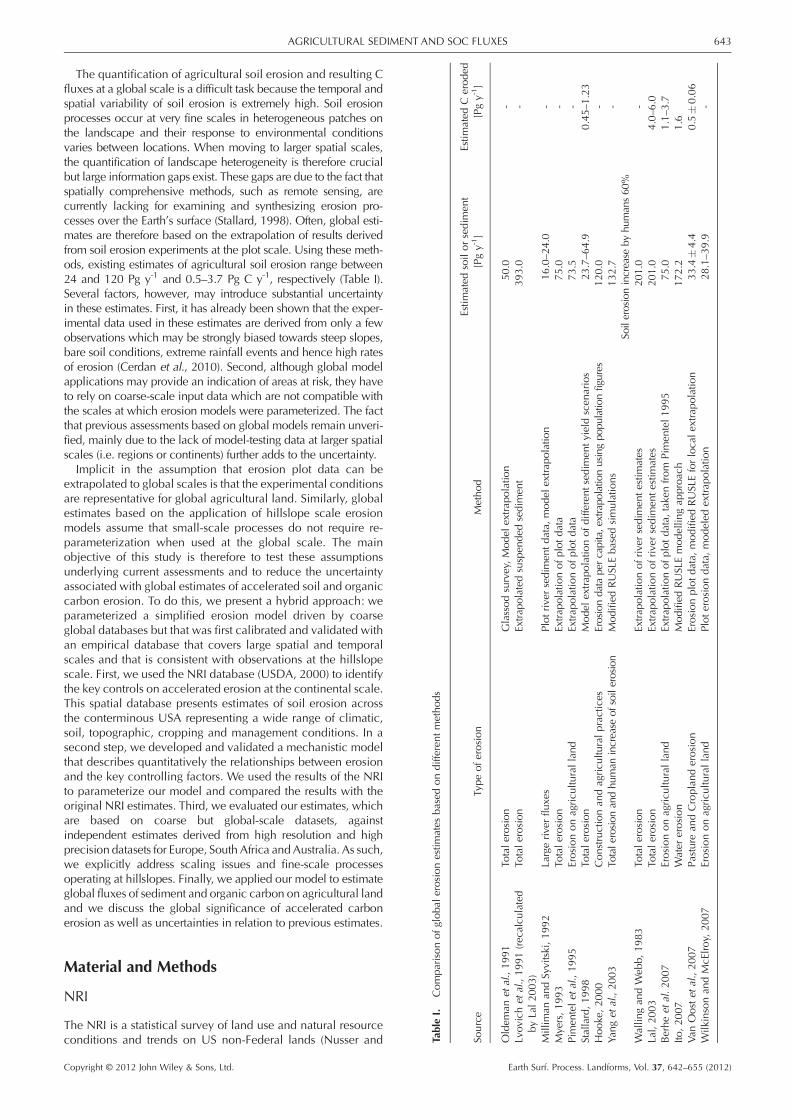
The quantification of agricultural soil erosion and resulting Cfluxes at a global scale is a difficult task because the temporal andspatial variability of soil erosion is extremely high. Soil erosionprocesses occur at very fine scales in heterogeneous patches onthe landscape and their response to environmental conditionsvaries between locations. When moving to larger spatial scales,the quantification of landscape heterogeneity is therefore crucialbut large information gaps exist. These gaps are due to the fact thatspatially comprehensive methods, such as remote sensing, arecurrently lacking for examining and synthesizing erosion pro-cesses over the Earth’s surface (Stallard, 1998). Often, global esti-mates are therefore based on the extrapolation of results derivedfrom soil erosion experiments at the plot scale. Using these meth-ods, existing estimates of agricultural soil erosion range between24 and 120 Pg y-1 and 0.5–3.7 Pg C y-1, respectively (Table I).Several factors, however, may introduce substantial uncertaintyin these estimates. First, it has already been shown that the exper-imental data used in these estimates are derived from only a fewobservations which may be strongly biased towards steep slopes,bare soil conditions, extreme rainfall events and hence high ratesof erosion (Cerdan et al., 2010). Second, although global modelapplications may provide an indication of areas at risk, they haveto rely on coarse-scale input data which are not compatible withthe scales at which erosion models were parameterized. The factthat previous assessments based on global models remain unveri-fied, mainly due to the lack of model-testing data at larger spatialscales (i.e. regions or continents) further adds to the uncertainty.Implicit in the assumption that erosion plot data can be
extrapolated to global scales is that the experimental conditionsare representative for global agricultural land. Similarly, globalestimates based on the application of hillslope scale erosionmodels assume that small-scale processes do not require re-parameterization when used at the global scale. The mainobjective of this study is therefore to test these assumptionsunderlying current assessments and to reduce the uncertaintyassociated with global estimates of accelerated soil and organiccarbon erosion. To do this, we present a hybrid approach: weparameterized a simplified erosion model driven by coarseglobal databases but that was first calibrated and validated withan empirical database that covers large spatial and temporalscales and that is consistent with observations at the hillslopescale. First, we used the NRI database (USDA, 2000) to identifythe key controls on accelerated erosion at the continental scale.This spatial database presents estimates of soil erosion acrossthe conterminous USA representing a wide range of climatic,soil, topographic, cropping and management conditions. In asecond step, we developed and validated a mechanistic modelthat describes quantitatively the relationships between erosionand the key controlling factors. We used the results of the NRIto parameterize our model and compared the results with theoriginal NRI estimates. Third, we evaluated our estimates, whichare based on coarse but global-scale datasets, againstindependent estimates derived from high resolution and highprecision datasets for Europe, South Africa andAustralia. As such,we explicitly address scaling issues and fine-scale processesoperating at hillslopes. Finally, we applied our model to estimateglobal fluxes of sediment and organic carbon on agricultural landand we discuss the global significance of accelerated carbonerosion as well as uncertainties in relation to previous estimates.
TableI.
Comparisonof
Source
Oldem
anet
al.,1991
Lvov
ichet
al.,1991(rec
byLal2003)
Millim
anan
dSyvitski,1
Myers,1993
Pim
entelet
al.,1995
Stallard,1998
Hooke,2000
Yanget
al.,2003
Wallin
gan
dWeb
b,1983
Lal,2003
Berhe
etal.2007
Ito,2007
Van
Oostet
al.,2007
Wilk
insonan
dMcElroy,
Material and Methods
NRI
The NRI is a statistical survey of land use and natural resourceconditions and trends on US non-Federal lands (Nusser and
Copyright © 2012 John Wiley & Sons, Ltd. Earth Surf. Process. Landforms, Vol. 37, 642–655 (2012)

644 S. DOETTERL, K. VAN OOST AND J. SIX
Goebel, 1997; USDA, 2000). Data are available for severalyears since 1982 but here we used the results of the surveyconducted from July 1997 to October 1998 as this covers thesame period as our land use datasets (see further). This exten-sive database, with 417357 entries for US agricultural land, isto our knowledge the most detailed database describing landuse, crop type and factors controlling soil erosion for crop- andpastureland that covers a large region (i.e. the conterminousUSA). For each observation point, water erosion (sheet, interrilland rill erosion) was estimated using the widely used USLE(Wischmeier and Smith, 1978). The USLE is an empiricalequation that predicts the annual average, long-term watererosion as the product of a rainfall erosivity factor (R), a soilerodibility factor (K), a slope length factor (L), a slopesteepness factor (S), a crop cover factor (C) and a managementfactor (P). In addition to soil erosion estimates, the databasealso provides estimates for each USLE factor separately basedon field observations and information on land cover and use.In our analysis, we spatially aggregated the NRI estimates totwo levels: counties and HUC4 watersheds (Seaber et al.,1987), resulting in 2755 and 211 observations points with amean surface area of c. 2900 and 43 000 km2, respectively.We performed a stepwise linear multiple regression analysis(Forthofer et al., 2006) on the NRI database to identifythe key factors controlling soil erosion variability at thecontinental scale.
Estimating erosion factors with global databases
In our analysis, high precision and fine resolution NRI datawere compared with estimates derived from coarse, but globalscale, databases. Here, we describe the global databases thatare used. Land use data was derived from the gridded HYDE3.1 dataset (Klein-Goldewijk et al., 2010) which representsthe fraction of agricultural land (both cropland and agricultur-ally used grassland, i.e. sum of pastures and rangelands) witha resolution of 5 by 5 arc-minutes for the year 2000. While adirect comparison between the NRI and HYDE databases canbe performed for croplands, this is not the case for grasslands.Erosion related estimates in the NRI database only cover pas-tures and not rangelands; this prohibited a meaningful spatialcorrelation with HYDE estimates. As we will discuss below, thislimited our analysis and estimates for global pastures. Globalestimates for the R factor were calculated at a resolution of5 by 5 arc-minutes from the annual precipitation (Hijmanset al., 2005) using the empirical relationship betweenannual rainfall and rainfall erosivity presented by Renard andFreimund (1994). We used the GTOPO elevation model(USGS, 1996; Gesch et al., 1999) to derive slope estimates ata 5 arc-minute resolution using the methods described in VanOost et al. (2007). The USLE slope steepness factor was thencalculated using the continuous function of Nearing (1997).We used the global crop type abundance map of Leff et al.(2004) at a resolution of 5 by 5 arc-minutes to estimate Cfactors. The NRI point estimates were used to calculatemean C factor values for all major US crop types and aweighted mean C factor was then calculated for each gridusing crop type abundance. Our analysis showed that soilerodibility (K), slope length (L) and management (P) didnot contribute much to explaining NRI-based variability insoil erosion at the continental scale (see below), andtherefore, we did not include it in our analysis. For eacherosion factor derived from global databases, we proposedcorrection functions by minimizing the difference betweenNRI- and global database-derived USLE factors for bothcropland and grasslands.
Copyright © 2012 John Wiley & Sons, Ltd.
Model implementation
After identifying the key controls on soil erosion at the con-tinental scale and scaling global databases, we calculatederosion rates for cropland on a 5 by 5 arc-minutes grid usingthe following formula:
Ewc ¼ Sr � Rr � Cr � ENRIref (1)
where EWC is the estimated average soil loss per year oncultivated cropland by water erosion (Mgha-1 y-1 ), Sr is thelocal S factor divided by the NRI derived mean for the US, Rr
is the local R factor divided by the NRI derived mean for theUS, Cr is the local C factor divided by the NRI derived meanfor the US and ENRIref is the average annual erosion rate forUS cultivated cropland for 1997 normalized to a slope of 9%(Mg ha-1 y-1).
This approach ensured that the mean erosion estimate for theUS derived from global databases equals the NRI estimate.Using the HYDE cropland area (Lc, km2), EWC was thenconverted into an erosion flux (FWC, in Mg y-1). The sameapproach was implemented for erosion on agriculturalgrassland (EWAG and FWAG). For grasslands, Cr was notderived from global databases due to the lack of data butwas reduced by 42%, relative to croplands, conform to thefindings of Yang et al. (2003) for grassland C factors and as-suming an equal distribution of sparse and dense grasslandon eroding pastures.
We also considered the effect of rock fragments on erosionprocesses in stony soils (Poesen et al., 1994). In our globalapplication, we took into account the protective effect of rockfragments against splash erosion and reduced erosion by 80%for stony soils, which is consistent with field observations(Poesen et al., 1994). Based on the average gravel contentreported for WISE 1.1 (Batjes, 2006) map units dominated bylitho- and regosols, stony soils were identified as having gravelcontent above 12%. Using the WISE 1.1 (Batjes, 2006) soil typedistribution on a 5 by 5 arc-minutes grid and the WISE 3.1(Batjes, 2008) spatial soil profile database with information ongravel content from more than 10 000 soil profiles, a globalmap reflecting the protection by stones against splasherosion has been created. This analysis was performed byonly considering profiles that were identified as agriculturalsoils. In our estimates for pasture and rangeland erosion,only environments where vegetation is sparse and whichare subjected to accelerated erosion when grazed wereconsidered. This approach is consistent with observationsthat erosion rates on grasslands in humid, temperate regionsare very low (Cerdan et al., 2006). We did this by onlytaking into account areas where the potential vegetation isgrassland or steppe as described in the ISLSCP PotentialVegetation Types database (Ramankutty and Foley, 1999).We then applied our model to the global scale at a 5 by 5arc-minutes resolution.
Using the soil carbon content (%), the amount of croplandand pasture/rangeland soil erosion was then converted intocarbon erosion. The estimated average percentage of SOC inthe toplayer (upper 20 cm) of cropland and pasture/rangelandwas taken from the WISE 3.1 database (Batjes, 2008), and onlythose profiles that were identified as agricultural soils wereconsidered.
Uncertainty assessment
In order to constrain the uncertainty associated with our esti-mate, we adopted the following approach. First, we evaluated
Earth Surf. Process. Landforms, Vol. 37, 642–655 (2012)

645AGRICULTURAL SEDIMENT AND SOC FLUXES
our estimates by comparing them with large-scale estimates ofwater erosion reported in the literature for cropland outsidethe US. These observations are therefore outside the data cloudwhere our model has been calibrated. Secondly, we conductedan analysis to identify the potential error of key parametersand total model error using the NRI dataset as a validationset following the methodology described in Van Rompaeyand Govers (2002). The error of the model output associ-ated with the input data was assessed by Monte Carloanalysis. The model was run 100 times for each HUC4watershed with stochastically generated input layers, wherefor each input parameter (i.e. R, S and C) a probabilisticdistribution was assessed. The error on each parameterwas considered to have a normal distribution with a zeromean and a standard deviation of 1.5 times the observedstandard deviation for each HUC4 watershed. The latterwas extracted from the NRI database. The relative rootmean square error (RRMSE) of the model output was thencalculated by comparing the 100 model estimates for totalerosion with the NRI-derived estimates. In addition, weperformed an analysis to assess the model error. We derivedthree simplified models from the full model (see Equation(1)) where one factor was kept constant. For eachsimplified model, the spatially distributed input was
SlopeC ¼
3:21þ Slope � 0:08ERð Þ � 1:20þ �0:002ELþ 0:26ð Þð Þ1:08 � 0:95 if EL > 600 and ER > 1003:21þ Slope � 0:08ERð Þ � 1:20ð Þ1:08 � 0:95 if EL < 600 and ER > 100
Slope � 0:82ð Þ1:43 � 0:53 � 1:20þ �0:002ELþ 0:26ð Þ� �1:08
� 0:95 if EL > 600 and ER < 100
Slope � 0:82ð Þ1:43 � 0:53 � 1:20� �1:08
� 0:95 if EL < 600 and ER < 100
8>>>>><>>>>>:
(2)
replaced by a single constant value. The latter was consid-ered to be the mean value of the eliminated factor. Theresults of this analysis were then interpreted in terms ofrequired model complexity. This analysis was performedusing cropland water erosion fluxes. However, we use theresulting uncertainty estimate also on estimates for tillageerosion and pasture water erosion, as the lack of similardata for these types of erosion prohibits a comparableseparate assessment.
Results
Identification of key factors controlling erosion inthe US
We found that slope steepness and rainfall/runoff erosivity arethe most important factors controlling erosion rates on croplandat the continental scale (Table II). About 75% of the watererosion variability can be explained by rainfall and slope alone,while other factors such as slope length, support practice, soilerodibility and crop type contribute little and slope lengthand management factor are not significant. In contrast tocroplands, rainfall erosivity plays a minor role for pastureswhile up to 64% of the water erosion variability is explainedby slope steepness alone. Rainfall erosivity and slopesteepness, and to a lesser extent crop type, are thus the primarycontrols on soil erosion by water at the continental scale. If thevariability of these key factors can be captured by globaldatabases, they can be used to provide estimates of soil erosionvariability at larger spatial scales.
Copyright © 2012 John Wiley & Sons, Ltd.
Characterizing R, S and C with global databases
After aggregation at the HUC4 watershed level, we comparedlow resolution and low precision rainfall erosivity, slope steep-ness and crop factor estimates derived from global databaseswith high resolution and precision estimates from the NRIdatabase.
Rainfall erosivity factor: For both land use types good spatialcorrelations between NRI and global database estimates(R² = 0.80, P< 0.01) were observed (Figure 1). The rainfall ero-sivity was underestimated by 2% and 52% for cropland andpastures, respectively, and we corrected for this systematic bias.
Slope steepness factor: The comparison for cropland indi-cated a substantial overestimation of cropland slopes inwatersheds which are situated in mountainous regions. Thiscan be explained by our global slope estimates being basedon a study that focused on lowland agriculture (Van Oost etal., 2009). This also indicates that croplands in mountainousareas are preferentially situated on relatively flat terrain; andthis is not captured by global databases. Therefore, wereanalyzed the data and explored the predictive power ofseveral topographical indices to identify these areas. Wefound an optimal fit between NRI and global estimates whenthe range of elevation was included as follows:
where SlopeC is the corrected NRI adjusted slope (%), ER (m)is the range of elevation and EL (m) is the mean elevation in a3 by 3 window (based on GTOPO data (USGS, 1996)). Theminimum slope was set to 0%.
This approach resulted in good predictions of croplandslopes at an aggregation level of HUC4 watersheds (R² = 0.62,P< 0.01, Figure 1). A similar trend for pastures towardsoverestimation was observed. Because of the previouslydescribed limited entries for agricultural grasslands in theNRI database, correction for these could therefore only im-prove systematical errors while a spatial evaluation was notpossible.
Crop factor: Using the NRI data, we calculated mean C factorvalues for all major US crop types. We derived spatial estimatesbased on this information using global crop type abundancemaps and compared them with NRI estimates. The NRI data-base showed that US cropland is dominated by maize, wheatand soy; together these crops represent 70% of the total crop-land area. The relative contribution of different crop types forthe US is well represented by the global database (Table III).The most important crop types are characterized by a narrowrange of C factors with mean values that range between 0.22and 0.24. However, specific crop types have a much highermean value (e.g. potatoes and sugar beets). Although the globaldatabase gave a good prediction of mean C factors at thecontinental scale, the spatial correlation between NRI and globaldatabase-derived C factors at the HUC4 watershed level wassignificant, but relatively weak (R²=0.20, P< 0.001, Figure 1).
We were unable to relate a global soil dataset to NRIestimates for the K factor (data not shown). We also did notinclude those factors that were not contributing significantly
Earth Surf. Process. Landforms, Vol. 37, 642–655 (2012)

Figure 1. Scatter plots of erosion controlling factors derived from NRI and global databases. Data is aggregated at the HUC4 watershed level.
Table II. Step-wise linear regressions between NRI soil erosion estimates (A) and USLE factors aggregated at the HUC4 watershed level. R= rainfallerosivity factor, S= Slope percent, K= Soil erodibility factor, L=Slope length, P= support practice factor). Significance level p expressed as: 1%= **;not significant (P>0.1) = ns
Factor Model
US cultivated cropland US pastures US dry pastures
(N=211) (N=208) (N=120)
Model R2 Partial correlation Model R2 Partial correlation Model R2 Partial correlation
R A=R 0.28 0.53** 0.75 0.87** 0.64 0.80**
R A=RS 0.75 0.81** 0.8 0.89** 0.8 0.89**S 0.81** 0.43** 0.67**
R A=RSK 0.77 0.82** 0.86 0.93** 0.84 0.90**S 0.81** 0.63** 0.74**K 0.24** 0.55** 0.42**
R A=RSKC 0.78 0.83** 0.87 0.93** 0.86 0.90**S 0.82** 0.63** 0.75**K 0.28** 0.55** 0.41**C 0.25** 0.19** 0.37**
R A=RSKCP 0.78 0.81** 0.87 0.93** 0.86 0.89**S 0.79** 0.61** 0.71**K 0.29** 0.53** 0.41**C 0.25** 0.18** 0.33**P �0.11 ns 0.09 ns 0.11 ns
R A=RSKCPL 0.78 0.78** 0.87 0.93** 0.86 0.89**S 0.79** 0.61** 0.71**K 0.28** 0.53** 0.41**C 0.25** 0.18** 0.33**P �0.11 ns 0.09 ns 0.10 ns
L �0.02 ns �0.02 ns �0.04 ns
646 S. DOETTERL, K. VAN OOST AND J. SIX
to the variation in water erosion at the continental scale, i.e.slope length (L) and management (P). For these three factors,we did not provide spatial estimates but used the average valuefor the US instead.
Copyright © 2012 John Wiley & Sons, Ltd.
Comparison with NRI soil erosion estimates
We compared our estimates, aggregated at the HUC4 water-shed level, with NRI derived estimates for cropland and
Earth Surf. Process. Landforms, Vol. 37, 642–655 (2012)

Table III. C factor estimates and differences in abundance for major crop types
Region USA USA USA World
Source USDA (2000); Nusser and Goebel (1997) USDA (2000); Nusser and Goebel (1997) Leff et al. (2004) Leff et al. (2004)
Crop Type C Factor (� 1 StDev) Fraction (%) Fraction (%) Fraction (%)
Wheat 0.22 (� 0.07) 22.0 22.8 22Maize 0.22 (� 0.08) 26.4 28.3 13Rice 0.22 (� 0.08) 1.2 1.3 11Barley 0.22 (� 0.08) 1.8 2.6 9Soy 0.24 (� 0.08) 21.3 24.1 5Potatoes 0.32 (� 0.09) 0.4 0.5 3Cotton 0.46 (� 0.10) 4.7 6.2 3Sorghum 0.29 (� 0.08) 3.4 4 3Sunflower 0.23 (� 0.06) 0.8 1.2 2Sugar beet 0.31 (� 0.07) 0.4 0.6 1Other 0.25 (� 0.03) 17.8 8.5 28Area (103 km2) 1284 1471 17920
Figure 2. Scatter plots of NRI- and model-derived water erosion estimates for US cropland and pastures.
647AGRICULTURAL SEDIMENT AND SOC FLUXES
pastureland erosion. For croplands, we obtained a rea-sonably good fit (Figure 2), although our estimates for largerwatersheds were consistently higher than NRI estimates forerosion rates above 10Mg ha-1 y-1 (representing c. 20% ofUS cropland). This results from the fact that our approachfocused on a correct prediction of single factors and didnot optimize the output of the multiplicative model, i.e.soil erosion rates. Rather than (re)adjusting individualfactors, we choose to adjust the erosion estimates for crop-land as follows:
Copyright © 2012 John Wiley & Sons, Ltd.
EWCf ¼ 4:7 � ln EWCð Þ � 1:79 (3)
where EWCf is our final estimate of erosion (Mg ha-1 y-1).This resulted in an overall model efficiency (R2) of 0.57 for
both water erosion rate and sediment flux (Figure 2). Nosystematic bias in our predictions for pastureland water erosionwas observed and a comparable model performance for erosionrate was achieved. However, due to the previously describedlimitations of land use datasets, soil water erosion fluxes on pas-tures were poorly predicted (model efficiency (R2) <0.1).
Earth Surf. Process. Landforms, Vol. 37, 642–655 (2012)
648 S. DOETTERL, K. VAN OOST AND J. SIX
Uncertainty analysis
Consistent with the identification of key controls on soil ero-sion, this analysis showed that the highest parameter uncertain-ties were associated with the R and S factors with an RRMSE ofthe parameter estimates of 52% and 116%, respectively; theseare also the parameters with the highest spatial variability. Incontrast, the input error for the C factor is much lower (RRMSEof 30%). However, the analysis clearly indicated that, when allfactors are considered, the effect of uncertainty associated withthe model input on model predictions is relatively small. Whenapplying the simplified models where one of the three factorswere kept constant, we observed that the full complexity modelwas the best model with a total error of 33%. Model structuresthat do not incorporate slope and rainfall erosivity factorsresulted in much higher errors (RRMSE between 43 and 35%).This analysis shows that the model used here is relatively robustbecause the error on the total erosion flux on US cropland isrelatively low (RRMSE of 33%).In a next step we applied our model, which was calibrated
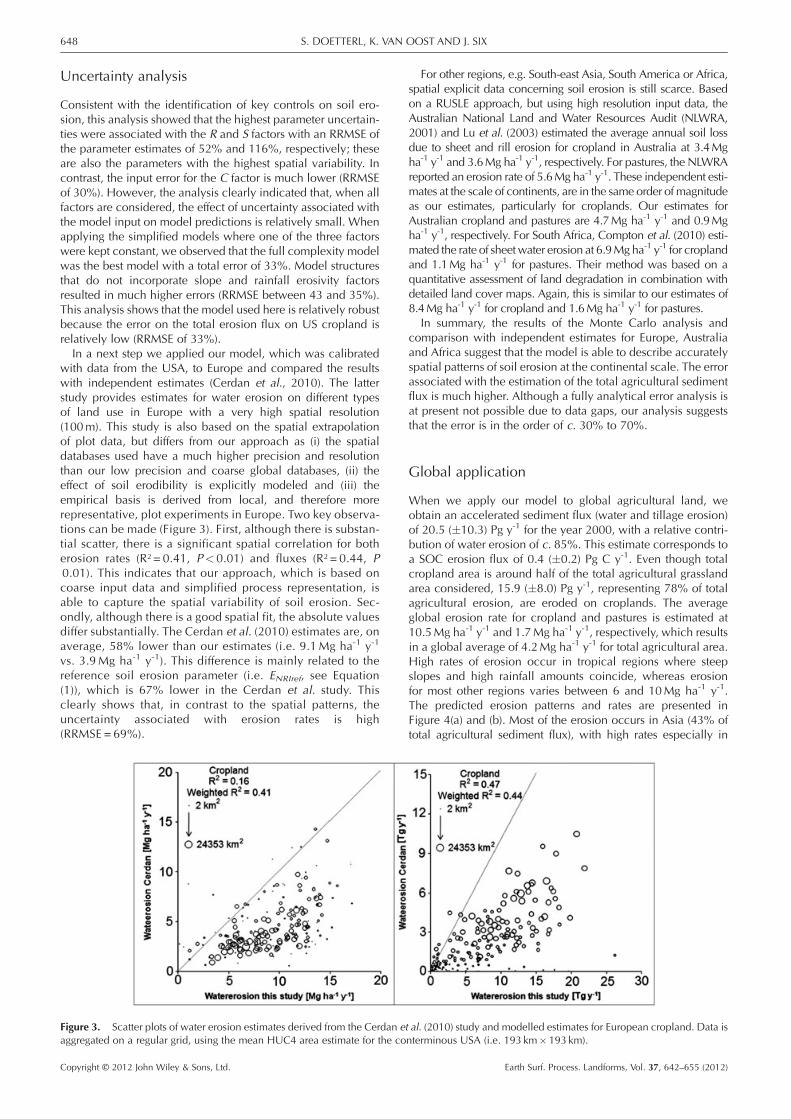
with data from the USA, to Europe and compared the resultswith independent estimates (Cerdan et al., 2010). The latterstudy provides estimates for water erosion on different typesof land use in Europe with a very high spatial resolution(100m). This study is also based on the spatial extrapolationof plot data, but differs from our approach as (i) the spatialdatabases used have a much higher precision and resolutionthan our low precision and coarse global databases, (ii) theeffect of soil erodibility is explicitly modeled and (iii) theempirical basis is derived from local, and therefore morerepresentative, plot experiments in Europe. Two key observa-tions can be made (Figure 3). First, although there is substan-tial scatter, there is a significant spatial correlation for botherosion rates (R² = 0.41, P< 0.01) and fluxes (R² = 0.44, P0.01). This indicates that our approach, which is based oncoarse input data and simplified process representation, isable to capture the spatial variability of soil erosion. Sec-ondly, although there is a good spatial fit, the absolute valuesdiffer substantially. The Cerdan et al. (2010) estimates are, onaverage, 58% lower than our estimates (i.e. 9.1Mg ha-1 y-1
vs. 3.9Mg ha-1 y-1). This difference is mainly related to thereference soil erosion parameter (i.e. ENRIref, see Equation(1)), which is 67% lower in the Cerdan et al. study. Thisclearly shows that, in contrast to the spatial patterns, theuncertainty associated with erosion rates is high(RRMSE = 69%).
Figure 3. Scatter plots of water erosion estimates derived from the Cerdan eaggregated on a regular grid, using the mean HUC4 area estimate for the co
Copyright © 2012 John Wiley & Sons, Ltd.
For other regions, e.g. South-east Asia, South America or Africa,spatial explicit data concerning soil erosion is still scarce. Basedon a RUSLE approach, but using high resolution input data, theAustralian National Land and Water Resources Audit (NLWRA,2001) and Lu et al. (2003) estimated the average annual soil lossdue to sheet and rill erosion for cropland in Australia at 3.4Mgha-1 y-1 and 3.6Mg ha-1 y-1, respectively. For pastures, the NLWRAreported an erosion rate of 5.6Mg ha-1 y-1. These independent esti-mates at the scale of continents, are in the same order of magnitudeas our estimates, particularly for croplands. Our estimates forAustralian cropland and pastures are 4.7Mg ha-1 y-1 and 0.9Mgha-1 y-1, respectively. For South Africa, Compton et al. (2010) esti-mated the rate of sheetwater erosion at 6.9Mgha-1 y-1 for croplandand 1.1Mg ha-1 y-1 for pastures. Their method was based on aquantitative assessment of land degradation in combination withdetailed land cover maps. Again, this is similar to our estimates of8.4Mg ha-1 y-1 for cropland and 1.6Mg ha-1 y-1 for pastures.
In summary, the results of the Monte Carlo analysis andcomparison with independent estimates for Europe, Australiaand Africa suggest that the model is able to describe accuratelyspatial patterns of soil erosion at the continental scale. The errorassociated with the estimation of the total agricultural sedimentflux is much higher. Although a fully analytical error analysis isat present not possible due to data gaps, our analysis suggeststhat the error is in the order of c. 30% to 70%.
Global application
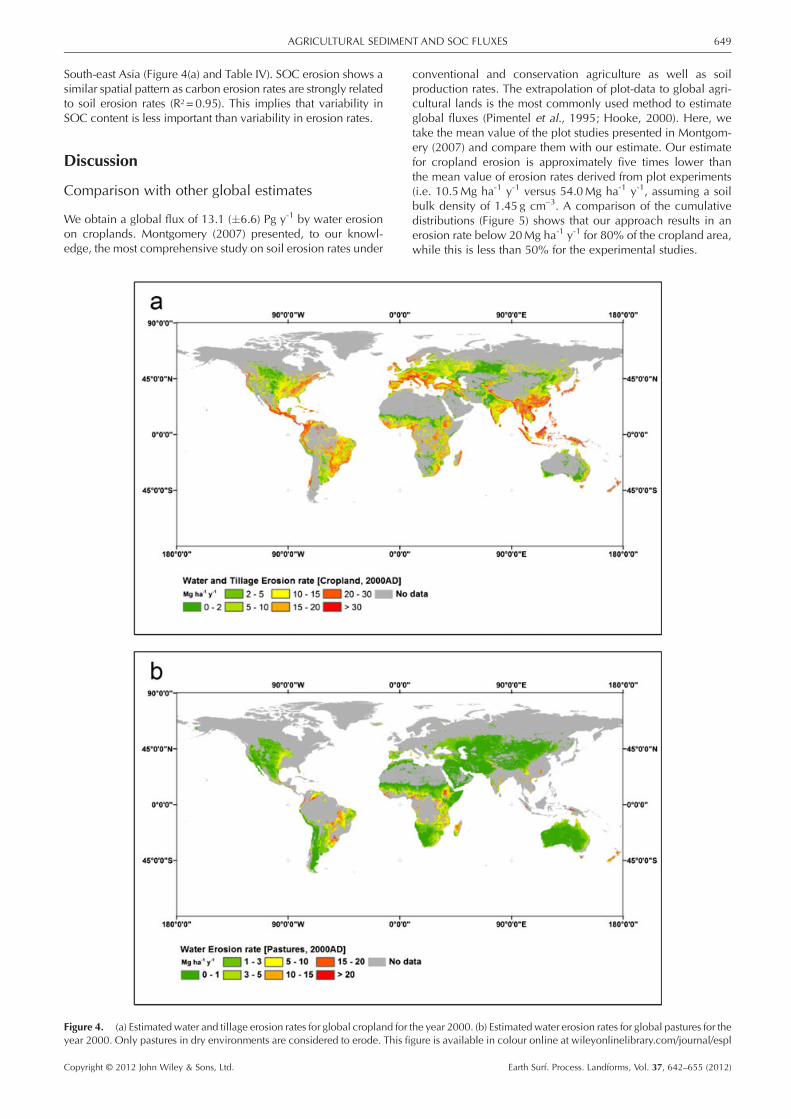
When we apply our model to global agricultural land, weobtain an accelerated sediment flux (water and tillage erosion)of 20.5 (�10.3) Pg y-1 for the year 2000, with a relative contri-bution of water erosion of c. 85%. This estimate corresponds toa SOC erosion flux of 0.4 (�0.2) Pg C y-1. Even though totalcropland area is around half of the total agricultural grasslandarea considered, 15.9 (�8.0) Pg y-1, representing 78% of totalagricultural erosion, are eroded on croplands. The averageglobal erosion rate for cropland and pastures is estimated at10.5Mg ha-1 y-1 and 1.7Mg ha-1 y-1, respectively, which resultsin a global average of 4.2Mg ha-1 y-1 for total agricultural area.High rates of erosion occur in tropical regions where steepslopes and high rainfall amounts coincide, whereas erosionfor most other regions varies between 6 and 10Mg ha-1 y-1.The predicted erosion patterns and rates are presented inFigure 4(a) and (b). Most of the erosion occurs in Asia (43% oftotal agricultural sediment flux), with high rates especially in
t al. (2010) study and modelled estimates for European cropland. Data isnterminous USA (i.e. 193 km�193 km).
Earth Surf. Process. Landforms, Vol. 37, 642–655 (2012)
649AGRICULTURAL SEDIMENT AND SOC FLUXES
South-east Asia (Figure 4(a) and Table IV). SOC erosion shows asimilar spatial pattern as carbon erosion rates are strongly relatedto soil erosion rates (R² = 0.95). This implies that variability inSOC content is less important than variability in erosion rates.
Discussion
Comparison with other global estimates
We obtain a global flux of 13.1 (�6.6) Pg y-1 by water erosionon croplands. Montgomery (2007) presented, to our knowl-edge, the most comprehensive study on soil erosion rates under
Figure 4. (a) Estimatedwater and tillage erosion rates for global cropland foryear 2000. Only pastures in dry environments are considered to erode. This fi
Copyright © 2012 John Wiley & Sons, Ltd.
conventional and conservation agriculture as well as soilproduction rates. The extrapolation of plot-data to global agri-cultural lands is the most commonly used method to estimateglobal fluxes (Pimentel et al., 1995; Hooke, 2000). Here, wetake the mean value of the plot studies presented in Montgom-ery (2007) and compare them with our estimate. Our estimatefor cropland erosion is approximately five times lower thanthe mean value of erosion rates derived from plot experiments(i.e. 10.5Mg ha-1 y-1 versus 54.0Mg ha-1 y-1, assuming a soilbulk density of 1.45 g cm–3. A comparison of the cumulativedistributions (Figure 5) shows that our approach results in anerosion rate below 20Mg ha-1 y-1 for 80% of the cropland area,while this is less than 50% for the experimental studies.
the year 2000. (b) Estimatedwater erosion rates for global pastures for thegure is available in colour online at wileyonlinelibrary.com/journal/espl
Earth Surf. Process. Landforms, Vol. 37, 642–655 (2012)

Table IV. Estimates for globally eroded sediment and linked SOC fluxes for cropland and pastures for the year 2000 (uncertainty 30–70%). Onlypastures in dry environments are considered to erode
Region
AREA 2000 Sediment flux SOC Flux
(106 km2) (Pg y-1) (Tg C y-1)
C P P C P C p
Total Total Dry Water Tillage Water Water Tillage Water
Central America 0.4 1.0 0.6 0.5 0.2 0.1 9.7 3.6 2.6Central Asia 0.4 2.8 2.8 0.1 0.1 0.1 1.2 1.0 2.7China 1.6 4.0 3.0 1.3 0.4 0.2 23.7 7.0 5.4Europe 2.5 1.4 0.5 1.9 0.6 0.1 39.5 12.0 2.4India 2.0 0.2 0.1 1.9 0.3 0.0 30.4 3.9 0.5Middle East 0.6 2.2 2.1 0.4 0.4 0.1 6.8 7.4 1.3North Africa 0.3 0.7 0.7 0.2 0.1 0.0 2.8 1.1 0.7North America 2.3 2.5 2.0 1.6 0.2 0.3 31.5 4.5 6.1North East Asia 0.5 1.7 1.5 0.1 0.1 0.1 3.5 2.5 1.3Oceania 0.5 4.2 4.1 0.3 0.0 0.5 4.3 0.6 10.5South America 1.2 4.6 2.9 1.4 0.1 1.4 26.7 2.5 36.2South East Asia 0.9 0.2 0.0 1.5 0.2 0.1 31.2 3.0 3.0Sub Saharan Africa 2.0 8.1 7.0 1.8 0.2 1.7 29.9 2.5 38.0Total 15.1 33.4 27.4 13.1 2.8 4.6 241.1 51.7 110.7
650 S. DOETTERL, K. VAN OOST AND J. SIX
Comparison with global estimates (Table I) available in theliterature and which are based on extrapolation of erosion plotdata (Myers, 1993 [50 Pg y-1]; Pimentel et al., 1995 [73.5 Pg y-1];Wilkinson and McElroy, 2007 [28.1 Pg y-1]), shows that these esti-mates are two to five times higher than our estimate. Similar, otherapproaches to derive erosion fluxes based on river sedimentfluxes and yield enhancement factors (Stallard, 1998 [23.7–64.9Pg y-1]), extrapolation of erosion rates multiplied per capita(Hooke, 2000 [120 Pg y-1]), or the application of erosion modelson a global scale (Van Oost et al., 2007 [28.3 Pg y-1]; Yang et al.,2003 [79.6 Pg y-1]; Ito, 2007 [172.2 Pg y-1]) all result in muchhigher fluxes than our approach of calibration with high-resempirical data and application of a simplified model on a globalscale. This indicates that empirical studies are biased towardsareas that are characterized by high erosion rates and are probablynot fully representative for global cropland. Extrapolating withouttaking into account the spatial variability of controlling factors orapplying erosion models with relatively coarse input data willtherefore overestimate total erosion and consequently lead toerroneous conclusions when applied to large areas. Although thissuggests that existing estimates are likely to be overestimations,
Figure 5. Frequency distributions of soil erosion and soil productionderived from point observations (Montgomery, 2007) and our estimatesof cropland water erosion for the year 2000.
Copyright © 2012 John Wiley & Sons, Ltd.
rates of accelerated erosion are well above typical rates of soilformation (which is estimated on average at 0.53Mg ha-1 y-1,assuming a soil bulk density of 1.45g cm-3; Montgomery, 2007).
Syvitski et al. (2005) present an assessment of the humanimpact on global river sediment discharge. They estimate theglobal human-induced river sediment flux at 2.3 �0.6 Pg y-1.Here, we discuss this river flux in relation to our estimates ofaccelerated erosion, which reflects mobilization of sedimentin uplands. We do this by taking into account the retentionand delivery of sediments to the fluvial system. Althoughcontrolled by a series of factors including basin area, climateand topography, between 10 to 30% of the material mobilizedby accelerated erosion are typically delivered to the fluvialsystems (Walling and Webb, 1996; De Vente et al., 2007).When this ratio is applied to our estimates, we obtain ahuman-induced river flux of 1.8–5.4 Pg y-1. This is similar tothe flux estimated by Syvitski et al. (2005) and suggests thatour global estimates are in the right order of magnitude.
Linking eroded soil and SOC to river sedimentand POC
We compared our estimates of agricultural sediment mobiliza-tion with estimates of total suspended sediment (TSS) and par-ticulate organic carbon (POC) fluxes to the oceans, providedby NASA-ISLSCP II river discharge data set (Hall et al., 2005).
able V. Comparison mean values for global river TSS, POC andOC (Hall et al., 2005) to our estimates of water induced soil andOC erosion for the year 2000
rea [106 km2]: 133.2 N=6070 Fluxes [Pg y-1]
OC 0.20OC 0.15SS 16.7roded Soil 17.6roded SOC 0.35OC in TSS [%] 0.9OC in eroded soil [%] 1.9
TDS
A
DPTEEPS
Earth Surf. Process. Landforms, Vol. 37, 642–655 (2012)

Figure 6. Left panel: Global river sediment vs. accelerated, agricultural soil erosion fluxes for the year 2000. Right panel: Global particulate organiccarbon in river systems vs. SOC fluxes induced by accelerated erosion for the year 2000.
651AGRICULTURAL SEDIMENT AND SOC FLUXES
The total sediment flux to the global ocean is estimated at 16.7Pg y-1 (Hall et al., 2005) and this integrates both natural and hu-man-induced sediment fluxes. This is very similar to our esti-mate of accelerated water erosion, i.e. 17.6 (� 8.8) Pg y-1
from which only about 10–30% are delivered to fluvial systems(see above). The POC flux to the global ocean is estimated at153.9 Tg y-1, while our estimates of accelerated SOC erosionare in the order of 348.4 (�174.2) Tg y-1 (Table V).When specific sediment yields and accelerated erosion for
all global basins are compared, no significant relation isobserved (data not shown). Low correlations (R²=0.16, P< 0.001)are found for sediment fluxes (Tg y-1) as basin area is accounted for.This indicates that, on a global scale, other factors than agriculturalerosion control the export of sediment to the ocean. This can beexplained by the fact that natural erosion fluxes are mainlycontrolled by slope parameters (McElroy and Wilkinson, 2005;Wilkinson and McElroy, 2007) while most of the agriculturalregions are situated in lowlands. Similar observations can bemadefor particulate carbon export (Figure 6).
Figure 7. Ratios of eroded soil/TSS for major basins for the year 2000. This fi
Copyright © 2012 John Wiley & Sons, Ltd.
We illustrate graphically the relative contribution of agricul-tural erosion for all basins by considering the ratio between ag-ricultural and natural (assuming that TSS estimates arerepresentative for undisturbed conditions) sediment flux(Figure 7). This shows that in areas of intensive agriculture,typically located in lowlands, the relative contribution ofaccelerated erosion is high and often dominates river sedimentfluxes (e.g. Central Europe). In contrast, for basins with moun-tainous uplands (e.g. South America or Southern Asia) naturalprocesses are more important and the footprint of humanactivities is smaller which confirms the assumptions made inthe previous section.
As discussed above, recent studies indicate that humanactivities have a relatively small effect on the total flux to theocean (Syvitski et al., 2005; Walling, 2009). This implies thatvast amounts of sediment and SOC eroded on agriculturallands do not reach the fluvial system but are buried in terrestrialdepositional zones, such as wetlands, reservoirs, floodplainsand colluvial soils (McCarty and Ritchie, 2002; Smith et al.
gure is available in colour online at wileyonlinelibrary.com/journal/espl
Earth Surf. Process. Landforms, Vol. 37, 642–655 (2012)
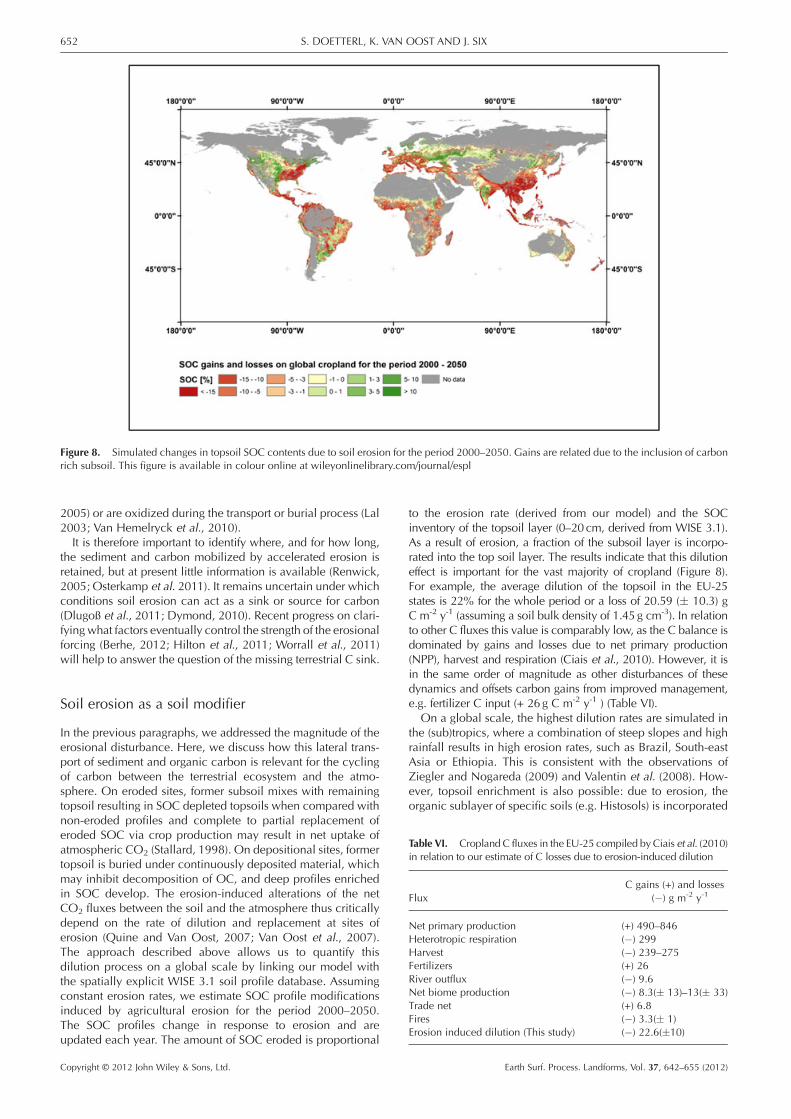
Figure 8. Simulated changes in topsoil SOC contents due to soil erosion for the period 2000–2050. Gains are related due to the inclusion of carbonrich subsoil. This figure is available in colour online at wileyonlinelibrary.com/journal/espl
652 S. DOETTERL, K. VAN OOST AND J. SIX
2005) or are oxidized during the transport or burial process (Lal2003; Van Hemelryck et al., 2010).It is therefore important to identify where, and for how long,
the sediment and carbon mobilized by accelerated erosion isretained, but at present little information is available (Renwick,2005; Osterkamp et al. 2011). It remains uncertain under whichconditions soil erosion can act as a sink or source for carbon(Dlugoß et al., 2011; Dymond, 2010). Recent progress on clari-fying what factors eventually control the strength of the erosionalforcing (Berhe, 2012; Hilton et al., 2011; Worrall et al., 2011)will help to answer the question of the missing terrestrial C sink.
able VI. Cropland C fluxes in the EU-25 compiled byCiais et al. (2010)relation to our estimate of C losses due to erosion-induced dilution
luxC gains (+) and losses
(�) g m-2 y-1
et primary production (+) 490–846eterotropic respiration (�) 299arvest (�) 239–275ertilizers (+) 26iver outflux (�) 9.6et biome production (�) 8.3(� 13)–13(� 33)rade net (+) 6.8ires (�) 3.3(� 1)rosion induced dilution (This study) (�) 22.6(�10)
Soil erosion as a soil modifier
In the previous paragraphs, we addressed the magnitude of theerosional disturbance. Here, we discuss how this lateral trans-port of sediment and organic carbon is relevant for the cyclingof carbon between the terrestrial ecosystem and the atmo-sphere. On eroded sites, former subsoil mixes with remainingtopsoil resulting in SOC depleted topsoils when compared withnon-eroded profiles and complete to partial replacement oferoded SOC via crop production may result in net uptake ofatmospheric CO2 (Stallard, 1998). On depositional sites, formertopsoil is buried under continuously deposited material, whichmay inhibit decomposition of OC, and deep profiles enrichedin SOC develop. The erosion-induced alterations of the netCO2 fluxes between the soil and the atmosphere thus criticallydepend on the rate of dilution and replacement at sites oferosion (Quine and Van Oost, 2007; Van Oost et al., 2007).The approach described above allows us to quantify thisdilution process on a global scale by linking our model withthe spatially explicit WISE 3.1 soil profile database. Assumingconstant erosion rates, we estimate SOC profile modificationsinduced by agricultural erosion for the period 2000–2050.The SOC profiles change in response to erosion and areupdated each year. The amount of SOC eroded is proportional
Copyright © 2012 John Wiley & Sons, Ltd.
to the erosion rate (derived from our model) and the SOCinventory of the topsoil layer (0–20cm, derived from WISE 3.1).As a result of erosion, a fraction of the subsoil layer is incorpo-rated into the top soil layer. The results indicate that this dilutioneffect is important for the vast majority of cropland (Figure 8).For example, the average dilution of the topsoil in the EU-25states is 22% for the whole period or a loss of 20.59 (� 10.3) gC m-2 y-1 (assuming a soil bulk density of 1.45 g cm-3). In relationto other C fluxes this value is comparably low, as the C balance isdominated by gains and losses due to net primary production(NPP), harvest and respiration (Ciais et al., 2010). However, it isin the same order of magnitude as other disturbances of thesedynamics and offsets carbon gains from improved management,e.g. fertilizer C input (+ 26g C m-2 y-1 ) (Table VI).
On a global scale, the highest dilution rates are simulated inthe (sub)tropics, where a combination of steep slopes and highrainfall results in high erosion rates, such as Brazil, South-eastAsia or Ethiopia. This is consistent with the observations ofZiegler and Nogareda (2009) and Valentin et al. (2008). How-ever, topsoil enrichment is also possible: due to erosion, theorganic sublayer of specific soils (e.g. Histosols) is incorporated
Tin
F
NHHFRNTFE
Earth Surf. Process. Landforms, Vol. 37, 642–655 (2012)

Table VII. Representativeness of US cropland and grasslands
FactorWorld average cropland
(�1 StDev)US average cropland
(�1 StDev)World average dry pastures
(�1 StDev)US average dry pastures
(�1 StDev)
C 0.26 (� 0.02) 0.25 (� 0.03) - -R 2970 (� 3521) 2688 (� 1452) 2147 (� 4158) 1568 (� 1155)S 0.48 (� 0.51) 0.31 (� 0.29) 0.44 (� 0.23) 0.47 (� 0.18)K 0.92 (� 0.24) 0.97 (� 0.15) 0.82 (� 0.32) 0.88 (� 0.29)
653AGRICULTURAL SEDIMENT AND SOC FLUXES
into the topsoil layer. The cropland area experiencing gainsis small (22%) compared with cropland experiencing SOClosses (78%) (Figure 8). It is important to note that the datapresented here should be interpreted in terms of a disturbance.It is clear that dynamic processes such as the replacementof eroded carbon by new photosynthate, on-site changesof microbial decomposition or during transportation anderosion-induced changes in soil properties are essential to fullyunderstand SOC changes (Jacinthe and Lal, 2001; Jacintheet al., 2001; Billings et al., 2010). However, this analysis showsthat erosion-induced changes in topsoil carbon content aresignificant at a global scale and that agricultural soils shouldbe considered as dynamic systems that can change rapidly.For example, the substantial dilution has implications for soilcarbon monitoring studies that usually do not consider erosionand identify all (topsoil) SOC losses as a source for atmosphericCO2 (Goidts et al., 2009).
Caveats
The approach taken here aims to simplify and parameterize thekey factors that control accelerated erosion and SOC erosionbased on quantities that can be inferred at global scales. As isthe case with any global-scale model, it is subject to drawbacksand it does not capture the subtleties that drive small-scalevariation. Although our analysis shows that a simplified modeland coarse, but global, input data allow for a good predictionof spatial patterns in both the USA and Europe, the uncertaintyassociated with the magnitude of global accelerated erosion iswithout any doubt high.First, US agricultural land may not be fully representative for
global agricultural land (Table VII). US slope factors are onaverage 35% lower than global values because US croplandis biased towards lowland agriculture in the Mississippi valley.In addition, R factors on eroding dry pastures in the USA areabout 27% less than the world average, as the US rangelandsare typically situated in the very dry continental mountainranges which might not be fully representative for the (full)range of grassland in other parts of the world (e.g. Australia,Brazil, Central Asia).Although distributions of the major crop types (e.g. wheat,
maize) are similar, the more erodible crop types (e.g. potatoesand sugar beets) are more abundant on global cropland(Table III). In particular, the combination of steep slopes andhigh rainfall erosivity is rare in the USA, while our globalextrapolation shows that these conditions make up most ofthe global accelerated erosion (e.g. more than 26% of theglobal flux occurs in South-east Asia and India, Table IV).At present, accurate continental- or regional-scale assess-
ments of agricultural soil erosion are lacking in these regionsand we are therefore unable to verify our model predictions.In addition, the management of agricultural land in the USA,which is representative for high-input agriculture, might bedifferent elsewhere (e.g. in terms of landscape structure, covercrops, conservation techniques, etc.).
Copyright © 2012 John Wiley & Sons, Ltd.
Second, our approach is based on an empirical model.Although the limitations and drawbacks of the USLE werediscussed recently (Parsons et al., 2004), it is based on morethan 10 000 plot-years of soil erosion data and should beconsidered as one of the largest data-collecting efforts inenvironmental sciences.
Third, other processes, which may dominate acceleratederosion at different spatial scales or under specific conditionsare not included in our analysis such as (ephemeral) gullyerosion, wind erosion and soil losses associated with harvest(Poesen et al., 1996). To our knowledge, neither the requiredempirical data nor models are currently available to presenta meaningful assessment of these processes at largerspatial scales.
In summary, the approach we used is admittedly not verycomplex – the lack of (spatial) data on how erosion varies withsoil erodibility or management (e.g. terracing), as well as infor-mation on what controls agricultural erosion in mountainous(sub-)tropical or low-input agricultural systems, precludes amore detailed formulation. However, the good spatial predic-tions of agricultural erosion suggest that our coarse model isable to capture variability at the continental scale. US condi-tions are diverse and can be considered to be representativefor a large fraction of global agricultural land. It is not possibleto assess accurately the uncertainty associated with ourestimates of global agricultural erosion due to the lack of modeltesting data in specific regions. However, comparison withestimates for Europe, South Africa and Australia and the resultsfrom our uncertainty assessment indicate that the uncertaintywill be in the order of 30–70%.
Conclusions
We parameterized a simplified global-scale model with the NRIdata for the USA. The good agreement between our approachand empirical estimates for larger regions suggests that theapproach may capture the essence of accelerated erosion. Assuch, the model may be used to predict the significance ofaccelerated erosion for the global carbon cycle, soil evolutionor sustainability of agricultural practices at continental orglobal scales. The lack of data on how erosion varies with soilerodibility or management, as well as information on whatcontrols agricultural erosion in mountainous (sub-)tropical orlow-input agricultural systems, precludes a more detailedformulation and validation. However, to date our global assess-ment is the only attempt we know of that is (i) consistent withempirical observations at relevant spatial scales and (ii) isvalidated at the continental scale. Nevertheless, at present itis not possible to assess accurately the uncertainty associatedwith our estimates of global agricultural erosion due to thelack of model testing data in regions which differ fromUS conditions.
We estimate soil/SOC erosion rate on a global scale at10.5Mg ha-1 y-1/193 kg C ha-1 y-1 and 1.7Mg ha-1 y-1/40.4 kgC ha-1 y-1 for croplands and eroding pastures, respectively. This
Earth Surf. Process. Landforms, Vol. 37, 642–655 (2012)

654 S. DOETTERL, K. VAN OOST AND J. SIX
corresponds to a total flux of 20.5 (�10.3) Pg y-1 of soil and403.5 (�201.8) Tg y-1 SOC due to agricultural erosion for theyear 2000. Although the uncertainty is high, our numbers aresignificantly lower than former assessments based on extrapo-lation of local data and show that only a small area of croplandand pastures is subjected to high erosion rates. It is likely thatempirical studies are biased towards intensively eroding areasand may therefore overestimate global erosion substantially.Current assessments of the global significance of agriculturalerosion for the global carbon cycles are typically based onlargely unverified assumptions about the intensity and extentof erosion. Our analysis shows that simplified global-scaleapproaches may well capture the spatial variability ofaccelerated erosion and that existing estimates are likely tooverestimate the erosion of SOC induced by human activities.Nevertheless, there is no doubt that even these lower estimatesof agricultural erosion largely exceed rates of soil formation –especially in (sub)tropical regions – and this should beconsidered as a serious threat to the soil resource.
Acknowledgement—This research is supported by the UCL-FSR andby the Communauté Française de Belgique (convention number 09/14-022). K.V.O is a research associate of the Fonds de la RechercheScientifique (FNRS), Belgium. We thank the two anonymous reviewersfor their helpful comments.
ReferencesBakker MM, Govers G, Rounsevell MDA. 2004. The crop-productivity-erosion relationship: an analysis based on experimental work.Catena 57(1): 55–76.
Batjes NH. 2006. ISRIC-WISE derived soil properties on a 5 by 5 arc-minutes global grid. Report 2006/02. ISRIC – World Soil Information.Wageningen.
Batjes NH. 2008. ISRIC-WISE Harmonized Global Soil Profile Dataset(Ver. 3.1). Report 2008/02. ISRIC-World Soil Information.Wageningen.
Berhe A. 2012. Decomposition of organic substrates at eroding vs.depositional landform positions. Plant and Soil 350: 261–280.
Berhe A, Harte J, Harden J, Torn M. 2007. The significance of theerosion-induced terrestrial carbon sink. Bioscience 57: 337–346.
Billings SA, Buddemeier RW, Richter DD, Van Oost K, Bohling G. 2010.A simple method for estimating the influence of eroding soil profileson atmospheric CO2. Global Biogeochemical Cycles 24: GB2001.DOI: 10.1029/2009GB003560. 14 pp
Boardman J. 2006. Soil erosion science: Reflections on the limitationsof current approaches. Catena 68(2–3): 73–86.
Cerdan O, Govers G, Le Bissonnais Y, Van Oost K, Poesen J, Saby N,Gobin A, Vacca A, Quinton J, Auerswald K, Klik A, Kwaad FJPM,Raclot D, Ionita I, Reijman J, Rousseva S, Muxart T, Roxo MJ, DostalT. 2010. Rates and spatial variations of soil erosion in Europe: a studybased on erosion plot data. Geomorphology 122(1–2): 167–177.
Cerdan O, Poesen J, Govers G, Saby N, Le Bissonnais A, Gobin A,Vacca A, Quinton J, Auerswald K, Klik A, Kwaad FPM, Roxo MJ.2006. Sheet and rill erosion. In Soil Erosion in Europe, Boardman J,Poesen J (eds). Wiley: New York; 501–513.
Ciais P, Wattenbach M, Vuichard N, Smith P, Piao SL, Don A, LuyssaertS, Janssens IA, Bondeau A, Dechow R, Leip A, Smith PC, Beer C, Vander Werf GR, Gervois S, Van Oost K, Tomelleri E, Freibauer A,Schulze ED and CarboEurope Synthesis Team. 2010. The Europeancarbon balance. Part 2: Croplands. Global Change Biology 16:1409–1428.
Compton JS, Herbert CT, Hoffman MT, Schneider RR, Stuut JB. 2010. Atenfold increase in the Orange River mean Holocene mud flux:implications for soil erosion in South Africa. The Holocene 20(1):115–122.
De Vente J, Poesen J, Arabkhedri M, Verstraeten G. 2007. The sedimentdelivery problem revisited. Progress in Physical Geography 31(2):155–178.
Copyright © 2012 John Wiley & Sons, Ltd.
Den Biggelaar C, Lal R, Wiebke K, Breneman V. 2004. The global im-pact of soil erosion on productivity. Advances in Agronomy 81: 1–48.
Dlugoß V, Fiener P, Van Oost K, Schneider K. 2011. Model basedanalysis of lateral and vertical soil carbon fluxes induced by soilredistribution processes in a small agricultural catchment. EarthSurface Processes and Landforms 37(2): 193–208.
Dymond JR. 2010. Soil erosion in New Zealand is a net sink of CO(2).Earth Surface Processes and Landforms 35(15): 1763–1772.
Forthofer RN, Lee ES, Hernandez M. 2006. Biostatistics, Secondedition: A Guide to Design, Analysis and Discovery. ElsevierAcademic Press: Burlington.
Gesch DB, Verdin KL, Greenlee SK. 1999. New land surface digitalelevation model covers the earth. Eos, Transactions, AmericanGeophysical Union 80(6): 69–70.
Goidts E, Van Wesemael B, Van Oost K. 2009. Driving forces of soilorganic carbon evolution at the landscape and regional scale usingdata from a stratified soil monitoring. Global Change Biology15(12): 2981–3000.
Hall FG, Collatz G, Los S, Brown de Colstoun E, Landis D. 2005.ISLSCP Initiative II, NASA, DVD/CD-ROM. NASA. Available onlineat: http://islscp2.sesda.com/ISLSCP2_1/html_pages/groups/carbon/river_carbon_flux_hdeg.html.
Hijmans RJ, Cameron SE, Parra JL, Jones PG, Jarvis A. 2005. Very highresolution interpolated climate surfaces for global land areas.International Journal of Climatology 25(15): 1965–1978.
Hilton RG, Meunier P, Hovius N, Bellingham PJ, Galy A. 2011.Landslide impact on organic carbon cycling in a temperate montaneforest. Earth Surface Processes and Landforms 36(12): 1670–1679.
Hooke RL. 2000. On the history of humans as geomorphic agents.Geology 28(9): 843–846.
Ito A. 2007. Simulated impacts of climate and land-cover change on soilerosion and implication for the carbon cycle, 1901 to 2100. Geophys-ical Research Letters 34(9). L09403. DOI: 10.1029/2007GL029342.
Jacinthe PA, Lal R. 2001. A mass balance approach to asssess carbondioxide evolution during erosional events. Land Degradation &Development 12(4): 329–339.
Jacinthe PA, Lal R, Kimble JM. 2001. Assessing water erosion impactson soil carbon pools and fluxes. In Assessment Methods for SoilCarbon, Lal R, Kimble JM, Follett RF, Stewart BA (eds). LewisPublishers: Boca Raton, FL; 427–450.
Klein-Goldewijk K, Beusen A, Van Drecht G, De VosM. 2010. The HYDE3.1 spatially explicit database of human induced land use change overthe past 12,000years.Global Ecology and Biogeography 20(1): 73–86.
Kummerer K, Held M, Pimentel D. 2010. Sustainable use of soils andtime. Journal of Soil and Water Conservation 65(2): 141–149.
Kutsch WL, Bahn M, Heinemeyer A. 2010. Soil Carbon Dynamics - AnIntegrated Methodology. Cambridge University Press: New York.
Lal R. 2003. Soil erosion and the global carbon budget. Environment In-ternational 29(4): 437–450.
Lal R. 2007a. World soils and global issues. Soil & Tillage Research97(1): 1–4.
Lal R. 2007b. Anthropogenic influences on world soils and implica-tions to global food security. Advances in Agronomy 93: 69–93.
Leff B, Ramankutty N, Foley JA. 2004. Geographic distribution of majorcrops across the world. Global Biogeochemical Cycles 18(1):GB1009. DOI: 10.1029/2003GB002108
Liu SG, Bliss N, Sundquist E, Huntington TG. 2003. Modeling carbondynamics in vegetation and soil under the impact of soil erosionand deposition. Global Biogeochemical Cycles 17(2): 1074.
Lu H, Prosser IP, Moran CJ, Gallant JC, Priestley G, Stevenson JG. 2003.Predicting sheetwash and rill erosion over the Australian continent.Australian Journal of Soil Research 41(6): 1037–1062.
Lvovich MI, Karasik GY, Bratseva NL, Medvedeva GP, Maleshko AV.1991. Contemporary Intensity of the World Land IntercontinentalErosion. USSR Academy of Sciences: Moscow.
McCarty GW, Ritchie JC. 2002. The Impact of soil movement oncarbon sequestration in agricultural ecosystems. EnvironmentalPollution 116: 423–430.
McElroy B, Wilkinson B. 2005. Climatic control of continental physiog-raphy. Journal of Geology 113(1): 47–58.
Milliman JD, Syvitski JPM. 1992. Geomorphic tectonic control of sedi-ment discharge to the ocean – the importance of small mountainousrivers. Journal of Geology 100(5): 525–544.
Earth Surf. Process. Landforms, Vol. 37, 642–655 (2012)

655AGRICULTURAL SEDIMENT AND SOC FLUXES
Montgomery DR. 2007. Soil erosion and agricultural sustainability.Proceedings of the National Academy of Sciences of the United Statesof America 104(33): 13268–13272.
Myers N. 1993. Gaia: An Atlas of Planet Management. Anchor Press:Garden City.
National Land and Water Resources Audit (NLWRA). 2001. AustralianAgriculture Assessment 2001. Available online at http://www.anra.gov.au/topics/agriculture/pubs/national/agriculture_soil_erosion.html.
Nearing MA. 1997. A single, continuous function for slope steepnessinfluence on soil loss. Soil Science Society of America Journal 61(3): 917–919.
Nusser SM, Goebel JJ. 1997. The National Resources Inventory: a long-term multi-resource monitoring programme. Environmental andEcological Statistics 4(3): 181–204.
Oldeman LR, Hakkeling RTA, Sombroek WG. 1991. World Map of theStatus of Human-Induced Soil Degradation: An Explanatory Note.ISRIC. Wageningen and United Nations Programme, Nairobi.
Osterkamp WR, Hupp CR, Stoffel M. 2011. The interactions betweenvegetation and erosion: new directions for research at the interfaceof ecology and geomorphology. Earth Surface Processes andLandforms 37(1): 23–36.
Parsons AJ, Wainwright J, Powell DM, Kaduk J, Brazier RE. 2004. Aconceptual model for determining soil erosion by water. Earth Sur-face Processes and Landforms 29(10): 1293–1302.
Pimentel D. 2000. Soil erosion and the threat to food security and theenvironment. Ecosystem Health 6(4): 221–226.
Pimentel D. 2006. Soil erosion: a food and environmental threat.Environment, Development and Sustainability 8: 119–137.
Pimentel D, Harvey C, Resosudarmo P, Sinclair K, Kurz D, Mcnair M,Crist S, Shpritz L, Fitton L, Saffouri R, Blair R. 1995. Environmentaland economic costs of soil erosion and conservation benefits.Science 267(5201): 1117–1123.
Poesen JW, Torri D, Bunte K. 1994. Effects of rock fragments on soil erosionby water at different spatial scales – a review. Catena 23(1–2): 141–166.
Poesen J, Vandaele K, Van Wesemael B. 1996. Contribution of gullyerosion to sediment production on cultivated lands and rangelands.In Erosion and Sediment Yield: Global and Regional Perspectives.Proceedings of the Exeter Symposium, July 1996. IAHS Publ. no. 236.
Quine TA, Van Oost K. 2007. Quantifying carbon sequestration as aresult of soil erosion and deposition: retrospective assessment usingcaesium-137 and carbon inventories. Global Change Biology13(12): 2610–2625.
Quinton JN, Govers G, Van Oost K, Bardgett RD. 2010. The impactof agricultural soil erosion on biogeochemical cycling. NatureGeoscience 3(5): 311–314.
Ramankutty N, Foley JA. 1999. Estimating historical changes in globalland cover: croplands from 1700 to 1992. Global BiogeochemicalCycles 13(4): 997–1027.
Renard KG, Freimund JR. 1994. Using monthly precipitation data toestimate the R-factor in the revised USLE. Journal of Hydrology157(1–4): 287–306.
Renwick WH. 2005. Contemporary meanings in physical geography:From what to why? Geographical Review 95(4): 609–611.
Seaber PR, Kapinos FP, Knapp GL. 1987. Hydrologic Unit Maps. USGeological Survey Water-Supply Paper 2294.
Smith SV, Sleezer RO, Renwick WH, Buddemeier RW. 2005. Fates oferoded soil organic carbon: Mississippi basin case study. EcologicalApplications 15(6): 1929–1940.
Stallard RF. 1998. Terrestrial sedimentation and the carbon cycle: cou-pling weathering and erosion to carbon burial. Global Biogeochem-ical Cycles 12(2): 231–257.
Copyright © 2012 John Wiley & Sons, Ltd.
Syvitski JPM, Vorosmarty CJ, Kettner AJ, Green P. 2005. Impact ofhumans on the flux of terrestrial sediment to the global coastal ocean.Science 308(5720): 376–380.
US Department of Agriculture. 2000. Summary Report: 1997 NationalResources Inventory (revised December 2000). Natural ResourcesConservation Service, Washington, DC, and Statistical Laboratory,Iowa State University, Ames, Iowa.
U.S. Geological Survey. 1996. GTOPO30 Global 30 Arc-SecondElevation Data Set. EROS Data Center (EDC) Distributed ActiveArchive Center (DAAC), Sioux Falls. Available online at http://edcdaac.usgs.gov/gtopo30/gtopo30.html.
Valentin C, Agus F, Alamban R, Boosaner A, Bricquet JP, Chaplot V, DeGuzman T, De Rouw A, Janeau JL, Orange D, Phachomphonh K, DoDuy Phai, Podwojewski P, Ribolzi O, Silvera N, Subagyono K,Thiébaux JP, Tran Duc Toan, Vadari T. 2008. Runoff and sedimentlosses from 27 upland catchments in southeast Asia: impact of rapidland use changes and conservation practices. Agriculture, Ecosystemsand Environment 128: 225–238.
Van Hemelryck H, Govers G, Van Oost K, Merckx R. 2010. Evaluatingthe impact of soil redistribution on the in situ mineralization of soilorganic carbon. Earth Surface Processes and Landforms 36(4):427–438.
Van Oost K, Cerdan O, Quine TA. 2009. Accelerated sediment fluxesby water and tillage on European agricultural land. Earth Surface Pro-cesses and Landforms 34(12): 1625–1634.
Van Oost K, Quine TA, Govers G, De Gryze S, Six J, Harden JW, RitchieJC, McCarty GW, Heckrath G, Kosmas C, Giraldez JV, Da Silva JRM,Merckx R. 2007. The impact of agricultural soil erosion on the globalcarbon cycle. Science 318(5850): 626–629.
Van Rompaey AJJ, Govers G. 2002. Data quality and model complexityfor regional scale soil erosion prediction. International Journal ofGeographical Information Science 16(7): 663–680.
Verheijen FGA, Jones RJA, Rickson RJ, Smith CJ. 2009. Tolerable versusactual soil erosion rates in Europe. Earth-Science Reviews 94(1–4):23–38.
Walling DE. 2009. The impact of global change on erosion andsediment transport by rivers: current progress and future challenges.Scientific Paper for the UNESCO-IHP International SedimentInitiative (ISI). UNESCO, France.
Walling DE, Webb BW. 1983. Patterns of sediment yield. In Back-ground to Palaeohydrology, Gregory KJ (ed). Wiley: Chichester:69–100.
Walling DE, Webb BW. 1996. Erosion and sediment yield: a globaloverview. In Erosion and Sediment Yield: Global and RegionalPerspectives, Proceeding of the Exeter Symposium, July 1996, IAHSpublication No 236.
Wilkinson BH, McElroy BJ. 2007. The impact of humans on continentalerosion and sedimentation. Geological Society of America Bulletin119(1–2): 140–156.
Wischmeier WH, Smith DD. 1978. Predicting rainfall erosion losses - aguide to conservation planning. United States Department ofAgriculture, Agricultural Handbook 537.
Worrall F, Rowson JG, Evans MG, Pawson R, Daniels S, Bonn A. 2011.Carbon fluxes from eroding peatlands - the carbon benefit ofrevegetation following wildfire. Earth Surface Processes and Landforms36(11), 1487–1498.
Yang DW, Kanae S, Oki T, Koike T, Musiake K. 2003. Global potentialsoil erosion with reference to land use and climate changes. Hydro-logical Processes 17(14): 2913–2928.
Ziegler A, Nogareda JS. 2009. Environmental management systems andtechnological environmental innovations: exploring the causalrelationship. Research Policy 38(5): 885–893.
Earth Surf. Process. Landforms, Vol. 37, 642–655 (2012)