Yao Tsytsarev et al NI 2012
10
UNCORRECTED PROOF 1 Noninvasive photoacoustic computed tomography of mouse brain metabolism in vivo 2 Junjie Q1 Yao a, 1 , Jun Xia a, 1 , Konstantin I. Maslov a , Mohammadreza Nasiriavanaki a , Vassiliy Tsytsarev b , 3 Alexei V. Demchenko c , Lihong V. Wang a, ⁎ 4 a Optical Imaging Laboratory, Department of Biomedical Engineering, Washington University in St. Louis, St. Louis, MO 63130, USA 5 b Department of Anatomy and Neurobiology, University of Maryland School of Medicine, Baltimore, MD 21201, USA 6 c Department of Chemistry and Biochemistry, University of Missouri-St. Louis, St. Louis, MO 63121, USA 7 8 abstract article info 9 Article history: 10 Accepted 15 August 2012 11 Available online xxxx 12 13 14 15 Keywords: 16 Photoacoustic computed tomography 17 Brain imaging 18 2-NBDG 19 Forepaw stimulation 20 Glucose metabolism 21 Hemodynamic response 22 We have demonstrated the feasibility of imaging mouse brain metabolism using photoacoustic computed to- 23 mography (PACT), a fast, noninvasive and functional imaging modality with optical contrast and acoustic res- 24 olution. Brain responses to forepaw stimulations were imaged transdermally and transcranially. 2-NBDG, 25 which diffuses well across the blood–brain-barrier, provided exogenous contrast for photoacoustic imaging 26 of glucose response. Concurrently, hemoglobin provided endogenous contrast for photoacoustic imaging of 27 hemodynamic response. Glucose and hemodynamic responses were quantitatively decoupled by using 28 two-wavelength measurements. We found that glucose uptake and blood perfusion around the somatosen- 29 sory region of the contralateral hemisphere were both increased by stimulations, indicating elevated neuron 30 activity. While the glucose response area was more homogenous and confined within the somatosensory re- 31 gion, the hemodynamic response area had a clear vascular pattern and spread wider than the somatosensory 32 region. Our results demonstrate that 2-NBDG-enhanced PACT is a promising tool for noninvasive studies of 33 brain metabolism. 34 © 2012 Published by Elsevier Inc. 35 36 37 38 39 Introduction 40 In mammals, the brain performs numerous computation-intensive 41 tasks such as information processing, perception, motor control and 42 learning, and thus consumes a large amount of energy in proportion 43 to its volume. For example, humans devote 20–25% of their metabo- 44 lism to the brain, where the energy is mostly used for sustaining the 45 electric charge (membrane potential) of neurons (Mink et al., 46 1981). In humans and many other species, the brain gets most of its 47 energy from oxygen-dependent metabolism of glucose (Coghill et 48 al., 1994; Fox and Raichle, 1986; Gjedde et al., 2002; Hall et al., 49 2012; Smith et al., 2009). An abnormal metabolic rate of glucose 50 and/or oxygen usually reflects a diseased status of the brain, such as 51 cancer or Alzheimer's disease (Fulham et al., 1992; Mosconi et al., 52 2009). In addition, physiologically active regions of the cerebral cor- 53 tex consume more energy than inactive regions (Raichle and 54 Gusnard, 2002). These phenomena have formed the basis for func- 55 tional brain imaging methods, including positron emission tomogra- 56 phy (PET) and functional magnetic resonance imaging (fMRI) 57 (Mehagnoul-Schipper et al., 2002; Schlemmer et al., 2008). 58 However, PET depends on the administration of radioactively-labeled 59 tracers (e.g., 2-deoxy-2-fluoro-D-glucose, FDG), a complex procedure 60 with exposure to ionizing radiation. fMRI is primarily sensitive to 61 deoxy-hemoglobin and suffers from slow imaging speed. Moreover, 62 both PET and fMRI are expensive techniques with poor spatial resolutions. 63 Therefore, a fast, noninvasive and non-ionizing imaging modality with 64 good spatial resolutions is needed to advance metabolism-associated 65 studies of brain physiology and pathology. 66 On the basis of the photoacoustic effect, photoacoustic tomog- 67 raphy (PAT) solves the resolution drawback of pure optical imag- 68 ing and the contrast drawback of pure ultrasonic imaging (Itoh et 69 al., 2004; Wang, 2008, 2009a; Yao and Wang, 2011). In PAT, photon 70 energy absorbed by molecules is partially or completely converted 71 into heat, which thermoelastically induces pressure waves. The in- 72 duced pressure waves are detected by ultrasonic detectors to form 73 an image (Itoh et al., 2004). PAT is capable of anatomical, function- 74 al, molecular and metabolic imaging of small animals, with highly 75 scalable spatial resolution and penetration depth (Wang, 2009a, 76 2009b; Yao and Wang, 2011; Zhang et al., 2006). Photoacoustic 77 computed tomography (PACT) is a major implementation of PAT, 78 which aims at fast data acquisition, sub-millimeter resolution and 79 deep penetration depth beyond the optical diffusion limit (Li et 80 al., 2008, 2010; Wang et al., 2003; Xia et al., 2011). Noninvasive, 81 label-free and functional PACT of the rat brain was demonstrated 82 by accurately mapping brain lesions and cerebral hemodynamics 83 (Wang et al., 2003). Molecular imaging of a mouse brain tumor NeuroImage xxx (2012) xxx–xxx ⁎ Corresponding author at: One Brookings Drive, Campus Box 1097, Washington University Q3 in St. Louis, St. Louis, MO 63130, USA. Fax: +1 314 935 7448. E-mail address: [email protected] (L.V. Wang). 1 These authors contributed equally to this work. YNIMG-09735; No. of pages: 10; 4C: 1053-8119/$ – see front matter © 2012 Published by Elsevier Inc. http://dx.doi.org/10.1016/j.neuroimage.2012.08.054 Contents lists available at SciVerse ScienceDirect NeuroImage journal homepage: www.elsevier.com/locate/ynimg Please cite this article as: Yao, J., et al., Noninvasive photoacoustic computed tomography of mouse brain metabolism in vivo, NeuroImage (2012), http://dx.doi.org/10.1016/j.neuroimage.2012.08.054
Transcript of Yao Tsytsarev et al NI 2012

UNCO
RRECTED P
RO
OF
1 Noninvasive photoacoustic computed tomography of mouse brain metabolism in vivo
2 JunjieQ1 Yao a,1, Jun Xia a,1, Konstantin I. Maslov a, Mohammadreza Nasiriavanaki a, Vassiliy Tsytsarev b,3 Alexei V. Demchenko c, Lihong V. Wang a,⁎
4a Optical Imaging Laboratory, Department of Biomedical Engineering, Washington University in St. Louis, St. Louis, MO 63130, USA
5b Department of Anatomy and Neurobiology, University of Maryland School of Medicine, Baltimore, MD 21201, USA
6c Department of Chemistry and Biochemistry, University of Missouri-St. Louis, St. Louis, MO 63121, USA
7
8
a b s t r a c ta r t i c l e i n f o
9 Article history:
10 Accepted 15 August 2012
11 Available online xxxx
121314
15 Keywords:
16 Photoacoustic computed tomography
17 Brain imaging
18 2-NBDG
19 Forepaw stimulation
20 Glucose metabolism
21 Hemodynamic response
22We have demonstrated the feasibility of imaging mouse brain metabolism using photoacoustic computed to-
23mography (PACT), a fast, noninvasive and functional imaging modality with optical contrast and acoustic res-
24olution. Brain responses to forepaw stimulations were imaged transdermally and transcranially. 2-NBDG,
25which diffuses well across the blood–brain-barrier, provided exogenous contrast for photoacoustic imaging
26of glucose response. Concurrently, hemoglobin provided endogenous contrast for photoacoustic imaging of
27hemodynamic response. Glucose and hemodynamic responses were quantitatively decoupled by using
28two-wavelength measurements. We found that glucose uptake and blood perfusion around the somatosen-
29sory region of the contralateral hemisphere were both increased by stimulations, indicating elevated neuron
30activity. While the glucose response area was more homogenous and confined within the somatosensory re-
31gion, the hemodynamic response area had a clear vascular pattern and spread wider than the somatosensory
32region. Our results demonstrate that 2-NBDG-enhanced PACT is a promising tool for noninvasive studies of
33brain metabolism.
34© 2012 Published by Elsevier Inc.
3536
37
38
39 Introduction
40 In mammals, the brain performs numerous computation-intensive
41 tasks such as information processing, perception, motor control and
42 learning, and thus consumes a large amount of energy in proportion
43 to its volume. For example, humans devote 20–25% of their metabo-
44 lism to the brain, where the energy is mostly used for sustaining the
45 electric charge (membrane potential) of neurons (Mink et al.,
46 1981). In humans and many other species, the brain gets most of its
47 energy from oxygen-dependent metabolism of glucose (Coghill et
48 al., 1994; Fox and Raichle, 1986; Gjedde et al., 2002; Hall et al.,
49 2012; Smith et al., 2009). An abnormal metabolic rate of glucose
50 and/or oxygen usually reflects a diseased status of the brain, such as
51 cancer or Alzheimer's disease (Fulham et al., 1992; Mosconi et al.,
52 2009). In addition, physiologically active regions of the cerebral cor-
53 tex consume more energy than inactive regions (Raichle and
54 Gusnard, 2002). These phenomena have formed the basis for func-
55 tional brain imaging methods, including positron emission tomogra-
56 phy (PET) and functional magnetic resonance imaging (fMRI)
57 (Mehagnoul-Schipper et al., 2002; Schlemmer et al., 2008).
58However, PET depends on the administration of radioactively-labeled
59tracers (e.g., 2-deoxy-2-fluoro-D-glucose, FDG), a complex procedure
60with exposure to ionizing radiation. fMRI is primarily sensitive to
61deoxy-hemoglobin and suffers from slow imaging speed. Moreover,
62both PET and fMRI are expensive techniqueswithpoor spatial resolutions.
63Therefore, a fast, noninvasive and non-ionizing imaging modality with
64good spatial resolutions is needed to advance metabolism-associated
65studies of brain physiology and pathology.
66On the basis of the photoacoustic effect, photoacoustic tomog-
67raphy (PAT) solves the resolution drawback of pure optical imag-
68ing and the contrast drawback of pure ultrasonic imaging (Itoh et
69al., 2004; Wang, 2008, 2009a; Yao andWang, 2011). In PAT, photon
70energy absorbed by molecules is partially or completely converted
71into heat, which thermoelastically induces pressure waves. The in-
72duced pressure waves are detected by ultrasonic detectors to form
73an image (Itoh et al., 2004). PAT is capable of anatomical, function-
74al, molecular and metabolic imaging of small animals, with highly
75scalable spatial resolution and penetration depth (Wang, 2009a,
762009b; Yao and Wang, 2011; Zhang et al., 2006). Photoacoustic
77computed tomography (PACT) is a major implementation of PAT,
78which aims at fast data acquisition, sub-millimeter resolution and
79deep penetration depth beyond the optical diffusion limit (Li et
80al., 2008, 2010; Wang et al., 2003; Xia et al., 2011). Noninvasive,
81label-free and functional PACT of the rat brain was demonstrated
82by accurately mapping brain lesions and cerebral hemodynamics
83(Wang et al., 2003). Molecular imaging of a mouse brain tumor
NeuroImage xxx (2012) xxx–xxx
⁎ Corresponding author at: One Brookings Drive, Campus Box 1097, Washington
UniversityQ3 in St. Louis, St. Louis, MO 63130, USA. Fax: +1 314 935 7448.
E-mail address: [email protected] (L.V. Wang).1 These authors contributed equally to this work.
YNIMG-09735; No. of pages: 10; 4C:
1053-8119/$ – see front matter © 2012 Published by Elsevier Inc.
http://dx.doi.org/10.1016/j.neuroimage.2012.08.054
Contents lists available at SciVerse ScienceDirect
NeuroImage
j ourna l homepage: www.e lsev ie r .com/ locate /yn img
Please cite this article as: Yao, J., et al., Noninvasive photoacoustic computed tomography of mouse brain metabolism in vivo, NeuroImage(2012), http://dx.doi.org/10.1016/j.neuroimage.2012.08.054

UNCO
RRECTED P
RO
OF
84 in vivo was also performed with PACT, using IRDye-800-c as the
85 contrast agent (Li et al., 2008).
86 Here, for the first time, we have demonstrated that PACT is able to
87 image glucose uptake in themouse brain, using a newly developed glu-
88 cose analog 2-deoxy-2-[N-(7-nitrobenz-2-oxa-1,3-diazol-4-yl)amino]-
89 D-glucopyranose (2-NBDG). To demonstrate the metabolic imaging
90 capability of PACT, we studied in vivo forepaw stimulation responses.
91 Our phantom and animal studies showed that PACT could spectrally
92 separate 2-NBDG and blood using two-wavelength measurements,
93 thus decouple the glucose and hemodynamic responses to the stimula-
94 tions. Open-scalp photoacoustic microscopy and fluorescence imaging
95 were used to validate the results from PACT.
96 Materials and methods
97 2-NBDG
98 2-NBDG is a newly developed fluorescent 2-deoxyglucose (2-DG)
99 analog (Bem et al., 2007; Cheng et al., 2006; Gaudreault et al., 2008;
100 Itoh et al., 2004; Langsner et al., 2011; Millon et al., 2011; O'Neil et
101 al., 2005; Sheth et al., 2009; Tsytsarev et al., 2012). Like the FDG
102 (molecular weight: 181) used in PET studies, 2-NBDG is transported
103 into cells via the same GLUT as glucose (Sheth et al., 2009). Once
104 taken up by the cells, 2-NBDG is phosphorylated to 2-NBDG-6-P,
105 which prevents it from being released again from the cells. However,
106 because of the lack of the 2-hydroxyl group needed for glycolysis,
107 2-NBDG-6-P cannot be further metabolized. Therefore, the distribu-
108 tion of trapped 2-NBDG is a good reflection of glucose metabolism
109 (O'Neil et al., 2005). Because 2-NBDG is a relatively small molecule
110 (molecular weight: 342) [Fig. 1a], it crosses the blood–brain-barrier
111 much more easily than other near-infrared fluorophore-labeled
112 2-DG analogs, such as IRDye800-DG (molecular weight: 1330)
113 (Cheng et al., 2006; Itoh et al., 2004). Moreover, 2-NBDG has its
114 peak absorption at 478 nm, where hemoglobin has a much lower ab-
115 sorption than at the peak absorbing wavelength [Fig. 1b]. As a result,
116 the signal contribution from hemoglobin can be neglected at this
117 wavelength. These features have made 2-NBDG particularly suitable
118 for brain studies.
119 Noninvasive photoacoustic computed tomography (PACT)
120 Fig. 2a is the schematic of the PACT setup. An OPO laser (BasiScan
121 120, Spectra-Physics) is pumped by a Nd:YAG laser (Brilliant B,
122 Quantel) with a third harmonic generator (355 nm) to provide
123 pulses with wavelengths tunable from 420 nm to 680 nm. The
124 pulse duration is 6 ns, and the pulse repetition rate is 10 Hz. The
125 laser beam is homogenized by an optical diffuser (EDC-5, RPC
126 Photonics) to provide uniform illumination over the mouse brain.
127 The maximum light intensity at the tissue surface is approximately
128 10 mJ/cm2, below the ANSI limit at the chosen wavelengths. The
129 photoacoustic signals are detected by a 5 cm diameter full-ring
130 ultrasonic transducer array with 512 elements (Imasonic, Inc.). The
131 central frequency of the ultrasonic transducer array is 5 MHz, and
132 the 6-dB bandwidth is more than 80%. Each element in the array is
133 directly shaped into an arc to produce an axial focal depth of
134 19 mm. The combined foci of all elements form a relatively uniform
135 imaging region of 20 mm diameter and 1 mm thickness. Within
136 this region, the axial (radial) resolution is 0.10 mm, and the trans-
137 verse (tangential) resolution is 0.25 mm (Gamelin et al., 2009). As
138 shown in Fig. 2b, after a complete data acquisition from all 512 ele-
139 ments, the raw data is reconstructed to form a photoacoustic image
140 of the brain based on the universal back-projection algorithm (Xu
141 and Wang, 2007). The imaging speed of the current system is 1.6 s
142 per frame.
143Optical-resolution photoacoustic microscopy (OR-PAM)
144OR-PAM, another implementation of PAT, aims at capillary-level
145resolution within the optical diffusion limit (Hu et al., 2011; Maslov
146et al., 2008; Yao and Wang, 2010, 2011; Yao et al., 2009, 2010,
1472011). As shown in Fig. 2c, by focusing the laser pulses to a
148diffraction-limit spot using an objective with an NA of 0.1
149(AC127-050-A, Thorlabs), OR-PAM achieves a transverse resolution
150of 5 μm. By using a single-element ultrasonic transducer with a cen-
151tral frequency of 50 MHz and a 6-dB bandwidth of 100% (V214-
152BB-RM, Olympus-NDT), OR-PAM achieves an axial resolution of
15315 μm. Due to scattering by the tissue, the penetration depth of
154OR-PAM is limited to ~1 mm, which is sufficient for transcranial im-
155aging of the cerebral cortex but not transdermal imaging. The arrival
156time of the PA signal provides depth information, and volumetric im-
157aging is acquired by two-dimensional raster scanning of the sample.
158In this study, to validate the cortical vascular image obtained by
159PACT, the same mouse was imaged by OR-PAM at 570 nm after the
160PACT imaging. The scalp was surgically removed, while the skull
161was left intact. It took about 30 min to acquire an OR-PAM image
162over a 5×10 mm2 area.
163Fluorescence imaging
164To confirm the stimulation induced changes in 2-NBDG uptake
165in the brain, open-scalp fluorescence imaging using the same
Fig. 1. 2-NBDG (C12H14N4O8). (a) Chemical structure. (b) Molar extinction spectra of
2-NBDG, deoxy- and oxy-hemoglobin.
2 J. Yao et al. / NeuroImage xxx (2012) xxx–xxx
Please cite this article as: Yao, J., et al., Noninvasive photoacoustic computed tomography of mouse brain metabolism in vivo, NeuroImage(2012), http://dx.doi.org/10.1016/j.neuroimage.2012.08.054

UNCO
RRECTED P
RO
OF
166 experimental protocol was performed on a different mouse. The
167 fluorescence imaging system shown in Fig. 2d has been reported pre-
168 viously (Tsytsarev et al., 2012). Briefly, the light source is a 120-watt
169 xenon arc lamp (Oriel Inc.) with an excitation filter (450±20 nm,
170 FB450-40, Thorlabs). Fluorescence images are captured by a
171 low-noise CCD camera (Meade Inc.). An emission filter (550±
172 20 nm, FB550-40, Thorlabs) and an achromatic doublet (NT45-265,
173 Edmund) comprise the camera lens. In this study, the fluorescence
174 images were acquired with a CCD exposure time of 0.5 s. White-
175 light images were acquired with a CCD exposure time of 0.05 s
176 after removing the emission filter and turning on the room light.
177Because blood vessels appeared darker than the background in the
178white-light images, the image intensity was reversed for better
179clarity.
180Animal preparation
181Female ND4 Swiss Webster mice (Harlan Laboratory, 16 to 20 g)
182were used for the current study. The laboratory animal protocols for
183this work were approved by the Animal Studies Committee of Wash-
184ington University in St. Louis. To enhance 2-NBDG uptake, the mice
185were fast for 24 h before the experiment (Sheth et al., 2009). Before
Fig. 2. Photoacoustic and fluorescence imaging systems. (a) Schematic of the PACT system. (b) In PACT, upon laser excitation, the time-domain PA signals recorded by each trans-
ducer element are back-projected into the 2D imaging space based on the delay times, and then summed to form an image of the mouse cortex. (c) Schematic of the OR-PAM sys-
tem, where the capillary-level lateral resolution is provided by the tight optical focusing. UT, ultrasonic transducer; CorL, correction lens; RAP, right-angled prism; RhP, rhomboid
prism; SOL, silicone oil layer. (d) Schematic of the fluorescence imaging system.
3J. Yao et al. / NeuroImage xxx (2012) xxx–xxx
Please cite this article as: Yao, J., et al., Noninvasive photoacoustic computed tomography of mouse brain metabolism in vivo, NeuroImage(2012), http://dx.doi.org/10.1016/j.neuroimage.2012.08.054

UNCO
RRECTED P
RO
OF
186 imaging, the hair on each mouse's head was removed with a
187 depilatory. An intraperitoneal dose of 90 mg/kg ketamine plus
188 10 mg/kg xylazine was used for anesthesia. The mouse was then
189 taped to a lab-made animal holder, which was then mounted to the
190 PACT system. Instead of being fully immersed in water, the animal
191 was supported from below, with the head being covered by a flexible
192 membrane. The entire experiment took less than one hour, therefore
193 additional injection of the anesthetic mixture was not needed. The
194 animal preparation for OR-PAM and fluorescence imaging was simi-
195 lar, except that there was no water coupling for fluorescence imaging.
196 Three mice were used for PACT and subsequent OR-PAM imaging, and
197 one mouse was used for fluorescence imaging.
198 Forepaw stimulation
199 Thirty minutes after the injection of 0.3 mL 3 mM 2-NBDG via the
200 tail vein, stimulations were introduced by two pairs of needle elec-
201 trodes inserted under the skin of the right and left forepaws, respec-
202 tively. The electrodes were connected to a function generator (DS345,
203 Stanford Research Systems) through a manual switch. The whole
204 procedure consisted of four periods, each lasting for 3 min [Fig. 3a].
205 The first and third periods (P1 and P3) were resting states, while the
206 second period (P2) was right paw stimulation (RPS) and the fourth
207 period (P4) was left paw stimulation (LPS). Each stimulation period
208 consisted of a train of electrical pulses with an amplitude of 2 mA, a
209 pulse width of 0.25 s and a repetition rate of 2 Hz [Fig. 3b]. PACT
210 acquired images continuously through the four periods. The proce-
211 dure was first performed for 12 min at 478 nm and then repeated
212 for 12 min at 570 nm after a pause of 10 min. We assumed that
213 brain responses were repeatable within the time window of the
214 experiment.
215 Image co-registration
216 Before quantitative analysis, the PA images at 570 nm from OR-PAM
217 and PACT were co-registered by using the MATLAB Image Processing
218 Toolbox (R2010b, Mathworks, Boston, MA). Here, a 2D rigid registration
219 was performed, which included linear translation, scaling, and rotation.
220 The first stepwas tomanually select 10–20 control points in the two im-
221 ages. The spatial translation, scaling and rotation matrix was computed
222based on the coordinates of these control points. The entire OR-PAM
223image was then transformed and registered to the PACT image using
224this matrix. To show the co-registration performance, the co-
225registered OR-PAM image was superimposed on top of the PACT
226image, with the overlay transparency proportional to the OR-PAM
227image pixel values.
228Signal processing
229In PACT, for both phantom and in vivo studies, the images acquired at
230478 nmand570 nmwere used to reconstruct the distribution of 2-NBDG
231and hemoglobin, respectively. Since deoxy- and oxy-hemoglobin have
232the same absorption coefficients at 570 nm, the PA signal amplitude
233was proportional to the total hemoglobin concentration CHb, an index
234for blood perfusion.
235For open-scalp OR-PAM, because the mouse skull is translucent,
236the attenuation of light due to the skull was neglected. The laser
237fluence measured at the skull surface is a good approximation of the
238actual fluence at the blood vessels. Therefore, CHb can be estimated
239as (Hall et al., 2012)
CHb ¼V570OR
kORε570Hb F570OR
: ð1Þ
240241
242Here, the subscript OR denotes the OR-PAM system and the super-
243script 570 denotes the wavelength. kOR is a calibration factor mea-
244sured from blood in a clear medium, which incorporates the system
245detection efficiency and Grueneisen coefficient. εHb570 is the molar
246extinction coefficient of hemoglobin at 570 nm, FOR570 is the laser
247fluence at the skull surface, and VOR570 is the OR-PAM signal amplitude.
248Because PACT shares the same absorption contrast as OR-PAM, the
249calibrated CHb from OR-PAM can be directly transferred to PACT once
250the images from the two systems are co-registered. We estimate the
251calibration factor kCT for PACT by
kCT ¼V570CT
CHbε570Hb F570CT
: ð2Þ
252253
254Here, the subscript CT denotes the PACT system. FCT570 is the laser
255fluence measured at the scalp surface and VCT570 is the PACT signal
256amplitude. In addition to the system detection efficiency and
257Grueneisen coefficient, kCT also incorporates an attenuation factor of
258the laser fluence at 570 nm, which cannot be neglected in PACT
259owing to the scalp.
260The fluence attenuation of the scalp is wavelength dependent.
261However, the effective attenuation coefficients of the nude mouse
262scalp at 478 nm (7.1 cm−1) and 570 nm (6.5 cm−1) are approxi-
263mately the same (Smith et al., 2009), and the mouse scalp is relatively
264thin (less than 1.5 mm) (Azzi et al., 2005). Therefore, the fluence at-
265tenuations at the two wavelengths were treated as the same. We also
266assumed that the heterogeneity of the scalp was negligible. Accord-
267ingly, we can estimate the 2-NBDG concentration C2−NBDG as
C2−NBDG ¼V478CT
kCTε4782−NBDGη2−NBDGF
478CT
: ð3Þ
268269
270Here, ε2−NBDG478 is the molar extinction coefficient of 2-NBDG at
271478 nm. η2−NBDG is the conversion efficiency from absorbed optical
272energy to heat, which is 45% for 2-NBDG (Fox and Raichle, 1986).
273The conversion efficiency for hemoglobin is absent in Eq. (2) because
274it is 100%.
275Eqs. (1)–(3) can be used to estimate the absolute concentrations
276of hemoglobin and 2-NBDG in the brain. Because the absolute
Fig. 3. Time course of forepaw stimulation. (a) At each wavelength, the procedure
consisted of four periods: two resting periods (P1 and P3) and two stimulation periods
(P2 and P4). Each period lasted for 3 min. (b) Each stimulation period consisted of a
train of electrical pulses with an amplitude of 2 mA, a pulse width of 0.25 s and a rep-
etition rate of 2 Hz.
4 J. Yao et al. / NeuroImage xxx (2012) xxx–xxx
Please cite this article as: Yao, J., et al., Noninvasive photoacoustic computed tomography of mouse brain metabolism in vivo, NeuroImage(2012), http://dx.doi.org/10.1016/j.neuroimage.2012.08.054
UNCO
RRECTED P
RO
OF
277 baseline signals vary across the brain, relative changes are more ro-
278 bust for quantifying the responses induced by stimulations. However,
279 it is also important to demonstrate the absolute imaging capability of
280 PACT, which is useful for the baseline mapping. In addition, future
281 quantifications of the metabolic rates of oxygen and glucose require
282 knowledge of the absolute concentrations.
283 In forepaw stimulations, PACT images acquired during each period
284 (P1–4) were averaged at each wavelength to increase the signal-to-noise
285 ratio. The relative changes were computed as (P2−P1)/P1 for RPS, and
286 as (P4−P3)/P3 for LPS. Only pixels with amplitude above 1.5 times the
287 noise level were used for calculation. In response quantifications, only
288 pixels with response magnitude above 10% of the maximum magnitude
289 were averaged. The same procedure was also applied to the fluorescence
290 imaging results.
291 Response areas at the two wavelengths were also quantified. Here,
292 the response area was defined by the pixels with a response magnitude
293above 10% of the maximum response magnitude. The cortical area
294covered by the responding vessels was estimated as well. An
295ellipse was used to fit the outline of the responding vessels, with
296the center, major axis, minor axis and orientation being the fitting
297variables. The area of the best fit ellipse was approximated as the
298covered area.
299Results
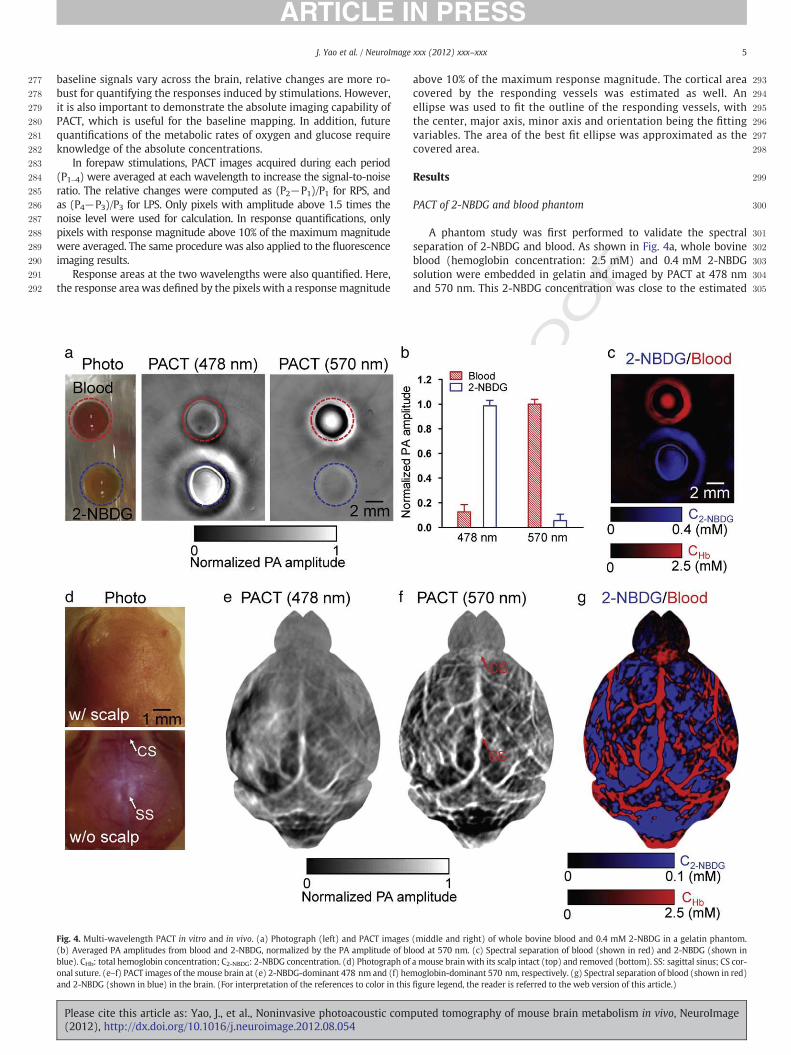
300PACT of 2-NBDG and blood phantom
301A phantom study was first performed to validate the spectral
302separation of 2-NBDG and blood. As shown in Fig. 4a, whole bovine
303blood (hemoglobin concentration: 2.5 mM) and 0.4 mM 2-NBDG
304solution were embedded in gelatin and imaged by PACT at 478 nm
305and 570 nm. This 2-NBDG concentration was close to the estimated
Fig. 4. Multi-wavelength PACT in vitro and in vivo. (a) Photograph (left) and PACT images (middle and right) of whole bovine blood and 0.4 mM 2-NBDG in a gelatin phantom.
(b) Averaged PA amplitudes from blood and 2-NBDG, normalized by the PA amplitude of blood at 570 nm. (c) Spectral separation of blood (shown in red) and 2-NBDG (shown in
blue). CHb: total hemoglobin concentration; C2-NBDG: 2-NBDG concentration. (d) Photograph of a mouse brain with its scalp intact (top) and removed (bottom). SS: sagittal sinus; CS cor-
onal suture. (e–f) PACT images of the mouse brain at (e) 2-NBDG-dominant 478 nm and (f) hemoglobin-dominant 570 nm, respectively. (g) Spectral separation of blood (shown in red)
and 2-NBDG (shown in blue) in the brain. (For interpretation of the references to color in this figure legend, the reader is referred to the web version of this article.)
5J. Yao et al. / NeuroImage xxx (2012) xxx–xxx
Please cite this article as: Yao, J., et al., Noninvasive photoacoustic computed tomography of mouse brain metabolism in vivo, NeuroImage(2012), http://dx.doi.org/10.1016/j.neuroimage.2012.08.054

UNCO
RRECTED P
RO
OF
306 2-NBDG concentration in animal studies to be performed later. The
307 ratios between the averaged PA signal amplitudes of 2-NBDG and
308 blood at 478 nm and 570 nm were 9:1 and 0.06:1, respectively
309 [Fig. 4b]. Blood was almost invisible at 478 nm, so was 2-NBDG at
310 570 nm. The PA amplitude of the 2-NBDG sample happened to be
311 nearly identical to (0.98 times) that of the blood sample at 570 nm.
312 Therefore, 2-NBDG and blood could be separated as shown in
313 Fig. 4c. In addition, we found that 2-NBDG was more diffusive than
314 hemoglobin (molecular weight: 64,458) in gelatin, due to the much
315 smaller size of 2-NBDG molecules.
316 PACT of mouse brain
317 Figs. 4e–f are noninvasive PACT images of a mouse brain, acquired
318 30 min after 2-NBDG administration. At 478 nm, the PA signal ampli-
319 tudes reflected the 2-NBDG concentration in the brain tissue [Fig. 4e].
320 At 570 nm, the PA signal amplitudes reflected the total hemoglobin
321 concentration in blood vessels [Fig. 4f]. Cortical vascular landmarks
322 including the sagittal sinus (SS) and coronal suture (CS) were clearly
323 imaged by PACT and confirmed by open-scalp photography. A merged
324 image of CHb and C2-NBDG is shown in Fig. 4g, where 2-NBDG signals
325 from blood vessels were excluded. The hemoglobin distribution was
326 superimposed on top of the 2-NBDGdistribution,with the transparency
327 of the hemoglobin layer proportional to its pixel values. Capillary-level
328 OR-PAM images of the same mouse are shown in Figs. 5a–b. The
329 co-registration results show that the transdermal and transcranial
330 PACT image agreed well with the open-scalp OR-PAM image, as
331 shown in Figs. 5c–d.
332 PACT of cortical responses to forepaw stimulations
333 Figs. 6a–b are the relative changes of PA signals induced by forepaw
334 stimulations. At 478 nm [Fig. 6a], the RPS and LPS caused PA signal
335 amplitudes to increase by 3.6%±2.2% and 2.0%±1.1% in the somato-
336 sensory region (SR) of the contralateral hemisphere, respectively.
337Such increases indicate elevated glucose uptake rates, and thus reflect
338increased neuron activity. Under the two stimulations, the response
339areas were 5.7±1.3 mm2 and 7.4±2.5 mm2, respectively.
340Similarly, at 570 nm [Fig. 6b], the RPS and LPS caused PA signal am-
341plitudes to increase by 6.4%±5.3% and 3.2%±2.9% in the contralateral
342hemisphere, respectively. Such changes indicate an increase in total
343hemoglobin concentration arising from elevated inflows of fresh
344blood, and thus reflect increased neuron activity as well. Under the
345two stimulations, the response areas were 4.7±1.5 mm2 and 4.5±
3461.2 mm2, respectively. Furthermore, the responding vessels covered
347much larger cortical regions of 16.5±3.3 mm2 and 15.1±2.5 mm2,
348respectively, as shown in Fig. 7a. The areas covered by the responding
349vessels were significantly wider than the 2-NBDG response areas for
350both RPS and LPS, with p values less than 0.05 (Fig. 7b).
351In addition, the linear regression shows that the 2-NBDG
352response amplitude was approximately proportional to that of the
353hemoglobin response for both RPS and LPS, with ratios of ~0.48
354and ~0.52, respectively (Fig. 8a). Similarly, the ratios between the
3552-NBDG response area and the area covered by the responding ves-
356sels were ~0.41 and ~0.57 for RPS and LPS, respectively (Fig. 8b).
357The high correlation of the two responses may reflect the close cou-
358pling between oxygen metabolism and glucose metabolism in the
359brain.
360Fluorescence imaging of cortical responses to forepaw stimulations
361First, whole bovine blood and 2-NBDG (0.4 mM) were enclosed in
3621 mm diameter glass tubes and imaged by our fluorescence setup
363[Fig. 9a]. The fluorescence image shows that blood did not generate
364fluorescence while 2-NBDG did profusely.
365Second, using the same experimental protocol as in PACT, we
366imaged the cortical responses to forepaw stimulations on a different
367mouse using the fluorescence setup. The results are shown in
368Fig. 9b. While the white light image shows the detailed cortical vascu-
369lature, the fluorescence image shows the 2-NBDG distribution and
Fig. 5. High-resolution OR-PAM imaging of the mouse brain after PACT imaging. (a) OR-PAM image of the mouse brain, acquired at 570 nmwith the scalp removed and the skull left
intact. CHb: total hemoglobin concentration; SS: sagittal sinus; CS: coronal suture. The numbers denote representative control points selected for image co-registration. (b) Close-up
of region inside the dashed box in (a) showing the dense capillaries in the brain cortex. CP: capillary. (c) PACT image of the same mouse brain with intact scalp and skull. The num-
bers denote the control points corresponding to those in (a). (d) Co-registered OR-PAM image (shown in color) superimposed on the PACT image (shown in gray). (For interpre-
tation of the references to color in this figure legend, the reader is referred to the web version of this article.)
6 J. Yao et al. / NeuroImage xxx (2012) xxx–xxx
Please cite this article as: Yao, J., et al., Noninvasive photoacoustic computed tomography of mouse brain metabolism in vivo, NeuroImage(2012), http://dx.doi.org/10.1016/j.neuroimage.2012.08.054

UNCO
RRECTED P
RO
OF
370 thus the glucose metabolism. The RPS and LPS induced fluorescence
371 intensity to increase by 5.1% and 6.2% in the SR of the contralateral
372 hemisphere, respectively. Such increases indicate elevated glucose
373 uptakes in the SR, which qualitatively agree with the glucose
374 responses assessed by PACT.
375 Discussion
376 The pathways of oxygen metabolism and glucose metabolism are
377 closely coupled in neuron activity. One of the recent uses of PACT is
378 the label-free measurement of metabolic rate of oxygen (MRO2)
379 (Wang, 2008; Yao et al., 2011). Currently, except for blood flow speed,
380 PACT can measure all the other parameters required for quantifying
381 MRO2, namely vessel cross-section, oxygen saturation and total concen-
382 tration of hemoglobin, and tissue volume. Recently, a few PA methods
383 have been proposed for blood flow measurement in deep tissue,
384 which may be applicable to PACT (Brunker and Beard, 2010; Fang et
385al., 2007; Sheinfeld and Eyal, 2012; Sheinfeld et al., 2010). Therefore,
386PACT has the potential to simultaneously image the two metabolic
387pathways: oxygen metabolism as described by others, and glucose me-
388tabolism as shown in this paper.
389Previous studies by PET and fMRI have shown that forepaw stim-
390ulations can increase the cerebral metabolic rate of oxygen (CMRO2)
391(Liu et al., 2004; Mandeville et al., 1998; Ogawa et al., 1994). Because
392the blood oxygenation change is much smaller than the blood flow
393change, such an increase in CMRO2 is mainly attributed to the elevat-
394ed blood perfusion (Liu et al., 2004; Mandeville et al., 1998; Ogawa et
395al., 1994). In our results, the intensified photoacoustic signal at
396570 nm provided a direct evidence of the increase in blood perfusion.
397For absolute CMRO2 quantification, our future work will incorporate
398multiwavelength measurement of oxygenation.
399In addition, we found that the glucose response area was confined
400within the SR, while the hemodynamic response area was much larg-
401er than that. Glucose response was a focal activity restricted to
Fig. 6. PACT of the cortical responses to forepaw stimulations. (a–b) Relative changes of the PA amplitudes (shown in color) acquired at (a) 2-NBDG-dominant 478 nm and
(b) hemoglobin-dominant 570 nm under the right paw stimulation (RPS) and left paw stimulation (LPS), superimposed on the resting-state image (shown in gray). The threshold
for the overlay transparency was set to be 10% of the maximum response. (c) Overlaid images showing the relative changes of 2-NBDG concentration (C2-NBDG, shown in blue) and
total hemoglobin concentration (CHb, shown in red), superimposed on the resting-state image at 570 nm (shown in gray). (d) Relative changes of C2-NBDG and CHb averaged over
three mice. Error bars: standard deviation. The p values were calculated from paired Student's t-test between stimulated states P2 or P4 and resting states P1 or P3. (For interpre-
tation of the references to color in this figure legend, the reader is referred to the web version of this article.)
7J. Yao et al. / NeuroImage xxx (2012) xxx–xxx
Please cite this article as: Yao, J., et al., Noninvasive photoacoustic computed tomography of mouse brain metabolism in vivo, NeuroImage(2012), http://dx.doi.org/10.1016/j.neuroimage.2012.08.054

UNCO
RRECTED P
RO
OF
402 neurons responsible for the stimulated site. In contrast, hemodynam-
403 ic response was less spatially restricted since fresh blood must be de-
404 livered from the major feeding arteries, through the capillaries of the
405 SR, to the major draining veins. Moreover, the hemodynamic re-
406 sponse may spread into neighboring vessels of the same vascular
407 network.
408 Except for the dimensional discrepancy, the glucose response area
409 was more homogenous than the hemodynamic response area. The
410 latter was characterized by a strong vascular pattern. Moreover,
411 there was a clear core for the glucose response, which is indicated
412 by the double arrows in Fig. 6a. Such a core was not seen in the hemo-
413 dynamic response. This again suggests that glucose response was a
414 focal activity. The core region contained the neurons most sensitive
415 to the stimulated site.
416 In summary, using 2-NBDG as the exogenous contrast and hemo-
417 globin as the endogenous contrast, we have demonstrated that PACT
418 is capable of imaging the metabolic response of a mouse brain to fore-
419 paw stimulations. As a quantitative imaging modality, PACT can spec-
420 trally separate 2-NBDG and hemoglobin by virtue of its optical
421 absorption contrast. As a fast imaging modality, PACT can acquire a
422 volumetric image in less than two seconds with a laser repetition
423 rate of 10 Hz. This imaging speed can be further improved by a
424 laser system with higher repetition rate and automatic wavelength
425switch. As a deep imaging modality, PACT can transdermally and
426transcranially localize the spatial patterns of the brain responses by
427virtue of its high ultrasonic resolution. With all these merits, we
428expect PACT to be applied to more brain metabolism studies in the
429future.
430Acknowledgments
431The authors appreciate Prof. James Ballard's close reading of the
432manuscript, and thank Arie Krumholz, Muhammad Chatni and Lidai
433Wang for their useful discussion and technical assistance. This work
434was sponsored by the National Institutes of Health (NIH) grants R01
435EB000712, R01 EB008085, R01 CA134539, U54 CA136398, R01
436EB010049, R01 CA157277, and R01 CA159959. Lihong Wang has a fi-
437nancial interest in Endra, Inc., which, however, did not support this
438work. Lihong Wang and K. Maslov have a financial interest in
439Microphotoacoustics, Inc., which did not support this work.
Fig. 7. Quantification of the cortical region covered by responding vessels. (a) An ellipse
was used to fit the outline of the responding vessels, with the center, major axis, minor
axis and orientation being the fitting variables. (b) Quantification of hemoglobin response
area, 2-NBDG response area and cortical region covered by responding vessels, averaged
over three mice. Error bars: standard deviation. The p values were calculated from paired
Student's t-test between the 2-NBDG response area and the cortical region covered by
responding vessels.
Fig. 8. Correlation of the hemodynamic response and glucose response. (a) Linear re-
gression of the 2-NBDG response amplitude and the hemoglobin response amplitude
for RPS and LPS on three mice. (b) Linear regression of the 2-NBDG response area
and cortical area covered by responding vessels for RPS and LPS on three mice.
8 J. Yao et al. / NeuroImage xxx (2012) xxx–xxx
Please cite this article as: Yao, J., et al., Noninvasive photoacoustic computed tomography of mouse brain metabolism in vivo, NeuroImage(2012), http://dx.doi.org/10.1016/j.neuroimage.2012.08.054

UNCO
RRECTED P
RO
OF
440 References
441 Azzi, L., El-Alfy, M., Martel, C., Labrie, F., 2005. Gender differences in mouse skin mor-442 phology and specific effects of sex steroids and dehydroepiandrosterone. J. Invest.443 Dermatol. 124, 22–27.444 Bem, M., Badea, F., Draghici, C., Caproiu, M.T., Vasilescu, M., Voicescu, M., Beteringhe, A.,445 Caragheorgheopol, A., Maganu, M., Constantinescu, T., Balaban, A.T., 2007. Synthe-446 sis and properties of some new 4-amino-7 nitrobenzoxadiazole derivatives.447 Arkivoc 2007, 87–104.448 Brunker, J., Beard, P., 2010. In: Oraevsky, A.A., Wang, L.V. (Eds.), Pulsed photoacoustic449 Doppler flowmetry using a cross correlation method. SPIE, San Francisco, Califor-450 nia, USA, pp. 756426–756428.451 Cheng, Z., Levi, J., Xiong, Z.M., Gheysens, O., Keren, S., Chen, X.Y., Gambhir, S.S., 2006.452 Near-infrared fluorescent deoxyglucose analogue for tumor optical imaging in453 cell culture and living mice. Bioconjug. Chem. 17, 662–669.454 Coghill, R.C., Talbot, J.D., Evans, A.C., Meyer, E., Gjedde, A., Bushnell, M.C., Duncan, G.H.,455 1994. Distributed-processing of pain and vibration by the human brain. J. Neurosci.456 14, 4095–4108.457 Fang, H., Maslov, K., Wang, L.V., 2007. Photoacoustic Doppler effect from flowing small458 light-absorbing particles. Phys. Rev. Lett. 99, 184501.459 Fox, P.T., Raichle, M.E., 1986. Focal physiological uncoupling of cerebral blood flow and460 oxidative metabolism during somatosensory stimulation in human subjects. Proc.461 Natl. Acad. Sci. U. S. A. 83, 1140–1144.462 Fulham, M.J., Bizzi, A., Dietz, M.J., Shih, H.H.L., Raman, R., Sobering, G.S., Frank, J.A., Dwyer,463 A.J., Alger, J.R., Dichiro, G., 1992. Mapping of brain-tumormetaboliteswith protonMR464 spectroscopic imaging – clinical relevance. Radiology 185, 675–686.465 Gamelin, J., Maurudis, A., Aguirre, A., Huang, F., Guo, P.Y., Wang, L.V., Zhu, Q., 2009. A466 real-time photoacoustic tomography system for small animals. Opt. Express 17,467 10489–10498.468 Gaudreault, N., Scriven, D.R.L., Laher, I., Moore, E.D.W., 2008. Subcellular characterization of469 glucose uptake in coronary endothelial cells. Microvasc. Res. 75, 73–82.470 Gjedde, A., Marrett, S., Vafaee, M., 2002. Oxidative and nonoxidative metabolism of471 excited neurons and astrocytes. J. Cereb. Blood Flow Metab. 22, 1–14.472 Hall, C.N., Klein-Flügge, M.C., Howarth, C., Attwell, D., 2012. Oxidative phosphorylation,473 not glycolysis, powers presynaptic and postsynaptic mechanisms underlying brain474 information processing. J. Neurosci. 32, 8940–8951.475 Hu, S., Maslov, K., Wang, L.V., 2011. Second-generation optical-resolution photoacoustic476 microscopy with improved sensitivity and speed. Opt. Lett. 36, 1134–1136.477 Itoh, Y., Abe, T., Takaoka, R., Tanahashi, N., 2004. Fluorometric determination of glucose478 utilization in neurons in vitro and in vivo. J. Cereb. Blood Flow Metab. 24, 993–1003.479 Langsner, R.J., Middleton, L.P., Sun, J., Meric-Bernstam, F., Hunt, K.K., Drezek, R.A., Yu,480 T.K., 2011. Wide-field imaging of fluorescent deoxy-glucose in ex vivo malignant481 and normal breast tissue. Biomed. Opt. Express 2, 1514–1523.482 Li, M.L., Oh, J.T., Xie, X.Y., Ku, G., Wang, W., Li, C., Lungu, G., Stoica, G., Wang, L.V., 2008.483 Simultaneous molecular and hypoxia imaging of brain tumors in vivo using spec-484 troscopic photoacoustic tomography. Proc. IEEE 96, 481–489.485 Li, C.H., Aguirre, A., Gamelin, J., Maurudis, A., Zhu, Q., Wang, L.V., 2010. Real-time486 photoacoustic tomography of cortical hemodynamics in small animals. J. Biomed.487 Opt. 15.488 Liu, Z.H.M., Schmidt, K.F., Sicard, K.M., Duong, T.Q., 2004. Imaging oxygen consumption489 in forepaw somatosensory stimulation in rats under isoflurane anesthesia. Magn.490 Reson. Med. 52, 277–285.
491Mandeville, J.B., Marota, J.J.A., Kosofsky, B.E., Keltner, J.R., Weissleder, R., Rosen, B.R.,492Weisskoff, R.M., 1998. Dynamic functional imaging of relative cerebral blood493volume during rat forepaw stimulation. Magn. Reson. Med. 39, 615–624.494Maslov, K., Zhang, H.F., Hu, S., Wang, L.V., 2008. Optical-resolution photoacoustic495microscopy for in vivo imaging of single capillaries. Opt. Lett. 33, 929–931.496Mehagnoul-Schipper, D.J., van der Kallen, B.F.W., Colier, W.N.J.M., van der Sluijs, M.C., van497Erning, L.J.T.O., Thijssen, H.O.M., Oeseburg, B., Hoefnagels, W.H.L., Jansen, R.W.M.M.,4982002. Simultaneous measurements of cerebral oxygenation changes during brain ac-499tivation by near-infrared spectroscopy and functional magnetic resonance imaging in500healthy young and elderly subjects. Hum. Brain Mapp. 16, 14–23.501Millon, S.R., Ostrander, J.H., Brown, J.Q., Raheja, A., Seewaldt, V.L., Ramanujam, N., 2011.502Uptake of 2-NBDG as a method to monitor therapy response in breast cancer cell503lines. Breast Cancer Res. Treat. 126, 55–62.504Mink, J.W., Blumenschine, R.J., Adams, D.B., 1981. Ratio of central nervous-system to505body metabolism in vertebrates – its constancy and functional basis. Am. J. Physiol.506241, R203–R212.507Mosconi, L., Mistur, R., Switalski, R., Tsui, W.H., Glodzik, L., Li, Y., Pirraglia, E., De Santi,508S., Reisberg, B., Wisniewski, T., de Leon, M.J., 2009. FDG-PET changes in brain509glucose metabolism from normal cognition to pathologically verified Alzheimer's510disease. Eur. J. Nucl. Med. Mol. Imaging 36, 811–822.511Ogawa, M., Magata, Y., Ouchi, Y., Fukuyama, H., Yamauchi, H., Kimura, J., Yonekura, Y.,512Konishi, J., 1994. Scopolamine abolishes cerebral blood-flow response to somato-513sensory stimulation in anesthetized cats – PET study. Brain Res. 650, 249–252.514O'Neil, R.G.,Wu, L., Mullani, N., 2005. Uptake of a fluorescent deoxyglucose analog (2-NBDG)515in tumor cells. Mol. Imaging Biol. 7, 388–392.516Raichle, M.E., Gusnard, D.A., 2002. Appraising the brain's energy budget. Proc. Natl.517Acad. Sci. U. S. A. 99, 10237–10239.518Schlemmer, H.P.W., Pichler, B.J., Schmand, M., Burbar, Z., Michel, C., Ladebeck, R., Jattke, K.,519Townsend, D., Nahmias, C., Jacob, P.K., Heiss, W.D., Claussen, C.D., 2008. Simultaneous520MR/PET imaging of the human brain: feasibility study. Radiology 248, 1028–1035.521Sheinfeld, A., Eyal, A., 2012. In: Oraevsky, A.A., Wang, L.V. (Eds.), Flow-dependant522photothermal modulation of the photoacoustic response. SPIE, San Francisco,523California, USA, p. 8223-8221D Q2.524Sheinfeld, A., Gilead, S., Eyal, A., 2010. Photoacoustic Doppler measurement of flow525using tone burst excitation. Opt. Express 18, 4212–4221.526Sheth, R.A., Josephson, L., Mahmood, U., 2009. Evaluation and clinically relevant appli-527cations of a fluorescent imaging analog to fluorodeoxyglucose positron emission528tomography. J. Biomed. Opt. 14.529Smith, S.M., Fox, P.T., Miller, K.L., Glahn, D.C., Fox, P.M., Mackay, C.E., Filippini, N., Watkins,530K.E., Toro, R., Laird, A.R., Beckmann, C.F., 2009. Correspondence of the brain's func-531tional architecture during activation and rest. Proc. Natl. Acad. Sci. U. S. A. 106,53213040–13045.533Tsytsarev, V., Maslov, K.I., Yao, J.J., Parameswar, A.R., Demchenko, A.V., Wang, L.H.V.,5342012. In vivo imaging of epileptic activity using 2-NBDG, a fluorescent535deoxyglucose analog. J. Neurosci. Methods 203, 136–140.536Wang, L.V., 2008. Prospects of photoacoustic tomography. Med. Phys. 35, 5758–5767.537Wang, L.V., 2009a. Multiscale photoacoustic microscopy and computed tomography.538Nat. Photonics 3, 503–509.539Wang, L.V., 2009b. Photoacoustic imaging and spectroscopy. CRC, Boca Raton.540Wang, X.D., Pang, Y.J., Ku, G., Xie, X.Y., Stoica, G., Wang, L.H.V., 2003. Noninvasive laser-541induced photoacoustic tomography for structural and functional in vivo imaging of542the brain. Nat. Biotechnol. 21, 803–806.
Fig. 9. Fluorescence imaging of mouse brain responses to forepaw stimulations. (a) Left: intensity-reversed white-light image of two glass tubes filled with 2-NBDG (0.4 mM) and
whole bovine blood. Right: fluorescence image of the two tubes. (b) Relative changes of the fluorescence intensity under RPS and LPS (shown in color), superimposed on the
intensity-reversed white-light image of the brain cortex (shown in gray), with the scalp removed and skull left intact. The threshold for the overlay transparency was set to be
10% of the maximum response. (For interpretation of the references to color in this figure legend, the reader is referred to the web version of this article.)
9J. Yao et al. / NeuroImage xxx (2012) xxx–xxx
Please cite this article as: Yao, J., et al., Noninvasive photoacoustic computed tomography of mouse brain metabolism in vivo, NeuroImage(2012), http://dx.doi.org/10.1016/j.neuroimage.2012.08.054

UNCO
RRECTED P
RO
OF
543 Xia, J., Guo, Z.J., Maslov, K., Aguirre, A., Zhu, Q., Percival, C., Wang, L.H.V., 2011. Three-544 dimensional photoacoustic tomography based on the focal-line concept. J. Biomed.545 Opt. 16.546 Xu, M.H., Wang, L.V., 2007. Universal back-projection algorithm for photoacoustic com-547 puted tomography. (vol. 71, art no 016706, 2005) Phys. Rev. E 75.548 Yao, J., Wang, L.V., 2010. Transverse flow imaging based on photoacoustic Doppler549 bandwidth broadening. J. Biomed. Opt. 15, 021304.550 Yao, J., Wang, L.V., 2011. Photoacoustic tomography: fundamentals, advances and pros-551 pects. Contrast Media Mol. Imaging 6, 332–345.
552Yao, J., Maslov, K., Hu, S., Wang, L.V., 2009. Evans blue dye-enhanced capillary-553resolution photoacoustic microscopy in vivo. J. Biomed. Opt. 14, 054049.554Yao, J., Maslov, K.I., Shi, Y., Taber, L.A., Wang, L.V., 2010. In vivo photoacoustic imaging555of transverse blood flow by using Doppler broadening of bandwidth. Opt. Lett. 35,5561419–1421.557Yao, J., Maslov, K.I., Zhang, Y., Xia, Y., Wang, L.V., 2011. Label-free oxygen-metabolic558photoacoustic microscopy in vivo. J. Biomed. Opt. 16, 076003.559Zhang, H.F., Maslov, K., Stoica, G., Wang, L.V., 2006. Functional photoacoustic microscopy560for high-resolution and noninvasive in vivo imaging. Nat. Biotechnol. 24, 848–851.
561
562
10 J. Yao et al. / NeuroImage xxx (2012) xxx–xxx
Please cite this article as: Yao, J., et al., Noninvasive photoacoustic computed tomography of mouse brain metabolism in vivo, NeuroImage(2012), http://dx.doi.org/10.1016/j.neuroimage.2012.08.054