Cv ET 2012
14
1 23 Cardiovascular Engineering and Technology ISSN 1869-408X Cardiovasc Eng Tech DOI 10.1007/s13239-012-0113-7 In Vitro Quantification of the Size Distribution of Intrasaccular Voids Left After Endovascular Coiling of Cerebral Aneurysms Chander Sadasivan, Jeremy Brownstein, Bhumika Patel, Ronak Dholakia, Joseph Santore, Fawaz Al-Mufti, Enrique Puig, Audrey Rakian, et al.
Transcript of Cv ET 2012

1 23
Cardiovascular Engineering andTechnology ISSN 1869-408X Cardiovasc Eng TechDOI 10.1007/s13239-012-0113-7
In Vitro Quantification of the SizeDistribution of Intrasaccular Voids LeftAfter Endovascular Coiling of CerebralAneurysms
Chander Sadasivan, Jeremy Brownstein,Bhumika Patel, Ronak Dholakia, JosephSantore, Fawaz Al-Mufti, Enrique Puig,Audrey Rakian, et al.

1 23
Your article is protected by copyright and
all rights are held exclusively by Biomedical
Engineering Society. This e-offprint is for
personal use only and shall not be self-
archived in electronic repositories. If you
wish to self-archive your work, please use the
accepted author’s version for posting to your
own website or your institution’s repository.
You may further deposit the accepted author’s
version on a funder’s repository at a funder’s
request, provided it is not made publicly
available until 12 months after publication.

In Vitro Quantification of the Size Distribution of Intrasaccular Voids
Left After Endovascular Coiling of Cerebral Aneurysms
CHANDER SADASIVAN,1 JEREMY BROWNSTEIN,1 BHUMIKA PATEL,1 RONAK DHOLAKIA,1 JOSEPH SANTORE,1
FAWAZ AL-MUFTI,3 ENRIQUE PUIG,4,6 AUDREY RAKIAN,4,5 KENNETH D. FERNANDEZ-PRADA,4,7 MOHAMED
SAMY ELHAMMADY,2 HAMAD FARHAT,2,8 DAVID J. FIORELLA,1 HENRY H. WOO,1 MOHAMMAD A.AZIZ-SULTAN,2 and BARUCH B. LIEBER
1
1Department of Neurological Surgery, Stony Brook University Medical Center, 100 Nicolls Road, HSC T12, Room 080, StonyBrook, NY 11794-8122, USA; 2Department of Neurological Surgery, University of Miami, Miami, FL, USA; 3Department of
Neurology, Stony Brook University Medical Center, Stony Brook, NY, USA; 4Department of Biomedical Engineering,University of Miami, Miami, FL, USA; 5University of Texas Health Science Center at San Antonio, San Antonio, TX, USA;6Ponce School of Medicine, Ponce, PR, USA; 7Johnson & Johnson, New Brunswick, NJ, USA; and 8NorthShore University
Health System, The University of Chicago Pritzker School of Medicine, Evanston, IL, USA
(Received 4 August 2012; accepted 11 December 2012)
Associate Editor Keefe B. Manning oversaw the review of this article.
Abstract—Endovascular coiling of cerebral aneurysmsremains limited by coil compaction and associated recana-lization. Recent coil designs which effect higher packingdensities may be far from optimal because hemodynamicforces causing compaction are not well understood sincedetailed data regarding the location and distribution of coilmasses are unavailable. We present an in vitro methodologyto characterize coil masses deployed within aneurysms byquantifying intra-aneurysmal void spaces. Eight identicalaneurysms were packed with coils by both balloon- andstent-assist techniques. The samples were embedded, sequen-tially sectioned, and imaged. Empty spaces between the coilswere numerically filled with circles (2D) in the planar imagesand with spheres (3D) in the three-dimensional compositeimages. The 2D and 3D void size histograms were analyzedfor local variations and by fitting theoretical probabilitydistribution functions. Balloon-assist packing densities(31 ± 2%) were lower (p = 0.04) than the stent-assist group(40 ± 7%). The maximum and average 2D and 3D void sizeswere higher (p = 0.03–0.05) in the balloon-assist group ascompared to the stent-assist group. None of the void sizehistograms were normally distributed; theoretical probabilitydistribution fits suggest that the histograms are most prob-ably exponentially distributed with decay constants of6–10 mm. Significant (p £ 0.001 to p = 0.03) spatial trendswere noted with the void sizes but correlation coefficientswere generally low (absolute r £ 0.35). In conclusion, themethodology we present can provide valuable input data fornumerical calculations of hemodynamic forces impinging on
intra-aneurysmal coil masses and be used to compare andoptimize coil configurations as well as coiling techniques.
Keywords—Histogram, Exponential distribution, Porous
media, Stent, Balloon, Silicone model.
INTRODUCTION
Aneurysmal subarachnoid hemorrhage (SAH)affects between 25,000 and 33,000 people annually in theUS and has a worldwide incidence of 10.5/100,000.20,44
Advances in the medical and surgical management ofSAH have resulted in a dramatic decline in hospitalmortality.1,47 Nevertheless, SAH remains a major causeof premature mortality, accounting for 2–5% of allstrokes,5 5% of all deaths from stroke, and 27% of allstroke-related potential years of life lost before age 65.2
The 30-day mortality rate of SAH is 45% with 10% ofindividuals dying at onset and 25% within 24 h. It isestimated that the prevalence of undiagnosed cerebralaneurysms in the worldwide adult population is 2%.33
An estimated 80% of SAH cases are attributed toruptured cerebral aneurysms.21 Left untreated, the riskof rebleeding of ruptured aneurysms is around 4% inthe first day after SAH,14 decreases to 1–2% in thefollowing weeks, and accumulates to 30–50% over thefirst 3 months.18 When a cerebral aneurysm is diag-nosed, it can be treated in several ways. Surgical clip-ping and endovascular coil embolization are twopopular options.
Address correspondence to Baruch B. Lieber, Department of
Neurological Surgery, Stony Brook University Medical Center, 100
Nicolls Road, HSC T12, Room 080, Stony Brook, NY 11794-8122,
USA. Electronic mail: [email protected]
Cardiovascular Engineering and Technology (� 2012)
DOI: 10.1007/s13239-012-0113-7
� 2012 Biomedical Engineering Society
Author's personal copy

Endovascular coil embolization was first introducedin the early 1990s4,12,27,34 as a means of treatment forpatients at high surgical risk. The international sub-arachnoid aneurysm trial (ISAT), a multicenter ran-domized trial involving more than 2000 patients, foundthat surgical treatment was associated with higherrates of poor neurologic outcome defined as modifiedRankin score of 3–6 in 31% of surgical patients asopposed to 23% of coiling patients. However, theISAT trial also reported that endovascular procedureshad a higher risk of recurrence and late rebleeding at1 year than neurosurgical clipping procedures.23
The ultimate goal of coil embolization is the occlusionof the aneurysm and its exclusion from the parent vesseland the circulation, eventually eliminating aneurysmalinflowwith thrombosis being an important intermediatestep of this process. Endovascular coiling of cerebralaneurysms has been largely successful, but the phe-nomena of coil compaction and aneurysm recanaliza-tion remain limiting factors with recurrence rates ofaround 20%,11 but as high as 80%8 having beenreported in the literature. One factor that may contrib-ute to recurrence after coiling is poor packing density ofcoils within the aneurysmal sac. Coil compaction andaneurysm recanalization are largely caused by hemo-dynamic impingement forces with every cardiac cycleeither directly on the coil mass or at the interfacebetween the coil mass and the aneurysmwall. Aneurysmrecanalization may be detected through periodicangiographic follow-ups and requires possible aneu-rysm re-treatment; a meta-analysis suggests half ofrecurred aneurysms require re-treatment (20% recur-rence rate and 10% re-treatment rate).11
Compaction of the coil mesh is largely a physicalphenomenon and has been intuitively attributed to the‘‘water hammer’’ effect of the pulsatile blood flow.While intuition serves to illustrate the phenomenon,the more accurate description is the impulse forcegenerated by systolic blood impingement or change inthe direction of blood flow momentum. It has beenshown that compaction almost exclusively occurs inthe first 6 months after coil placement and that largeaneurysm size is the most important risk factor forcompaction.42 Smaller dome and neck sizes and largerdome-to-neck ratios correlate well with treatmentsuccess.9,25 Aneurysms with neck diameters less than4 mm have been associated with 83–85% completethrombosis rate compared to 15–55% of aneurysmswith necks 4 mm or greater.10,13 Furthermore, aneu-rysms with a dome-to-neck ratio of 2.0 or more wereassociated with an occlusion rate of 77%, whereas theocclusion rate was only 53% if the dome-to-neck ratiowas less than 2.0.9
Prediction of compaction post-coiling is difficult butit was shown that the probability of compaction was
significantly higher when the coil packing ratio wasunder 50%.16 However, dense packing is subjective,depending on the skill of the operator and onunreliable radiographic observations based on theradio-opacity of the coil mass. Conventionally, theeffectiveness of coiling has been characterized bythe packing density measure, which is the ratio of thetotal volume of coils inserted into the aneurysm andthe volume of the aneurysm.19,37,45,46 This is onequantitative measure, amongst others, that correlateswith compaction rates.
Lower packing densities have been correlated withhigher coil compaction and associated recanalizationrates.43,50 Therefore, aneurysms are generally coiled tomaximal packing. Although it has been shown thathigher packing density bears a positive correlation withlow aneurysm recurrence rates, coiling techniques havenot been correlated with packing density accu-rately.32,48 Wide-necked aneurysms are generallyassociated with an inclination of coil loops to cross thebroad neck and herniate into the parent arterial lumen.This technical difficulty can result in lower packing andthus higher coil-compaction rates.29 Coiling of wide-necked aneurysms is performed either with the tem-porary support of a balloon that is removed post-coiling or with the support of an intracranial stent thatis implanted in the parent vessel and which traversesthe aneurysm neck. Such assist devices also improveaneurysm packing densities.3
While packing density is a useful and easily calcu-lated measure, it is nevertheless a global variable thatdoes not provide insight into either variability in localcoil distribution or the mechanisms leading to coilcompaction as a result of any non-uniform distribu-tion. Better understanding of aneurysm re-growthrequires better understanding of local coil distributionswithin the aneurysm. Such distributions can providecrucial information for detailed flow studies of coiledaneurysms7,17 and lack of this knowledge has resultedin a limited understanding of the blood flow-coil massinteraction. Coil assist by either balloon or stent canlead to different packing densities but it is not clear if,for example, coil distribution at the neck or the dome isbetter with stents (or balloons). Elucidation of how acoil mass is distributed inside an aneurysm with thedifferent techniques can help answer some of thesequestions and help in the construction of more accu-rate hemodynamic investigations of coil compaction.
At present, there is limited knowledge of the rela-tionship between coil packing density and the sizedistribution of the voids between the coils and theimpact of such distributions on the risk of coil com-paction and aneurysm recurrence. The goal of thisin vitro investigation is to develop a method forquantification of the void size distribution in an
SADASIVAN et al.
Author's personal copy

experimental aneurysm that was coiled both by bal-loon-assist and stent-assist techniques. We use multiplespecimens having identical aneurysmal geometry toevaluate the probability distribution function of voidsizes and the differences in local distribution of the coilmass between the different coiling techniques.
METHODS
Eight identical elastomeric vascular replicas repre-sentative of the rabbit elastase-induced aneurysmmodel were fabricated from an implant grade siliconeelastomer dispersion (Part no: 40000, Applied SiliconeCorp, Santa Paula, CA).38 These aneurysm modelswere each connected to a flow apparatus driven by aperistaltic pump and placed on an angiographic table(Siemens Medical Solutions, Angiostar plus, Forch-heim, Germany). All aneurysms were coiled usingTruFill DCS Orbit detachable coils (Codman &Shurtleff, Raynham, MA) by one neuro-intervention-alist to avoid inter-rater/operator variability. Weattempted, within reason and scheduling constraints,to separate each coiling session by a period of1–2 months. The coiling stopping criterion for eachcase was decided by the same neuro-interventionalistas in the clinical setting. Balloon-assist and stent-assisttechniques were utilized in the coiling process andhence four aneurysm models were coiled by the bal-loon-assist technique (either Hyperform or Hyperglideballoons, Covidien, Mansfield, MA) and four werecoiled via stent-assist technique (Cordis Enterprise,Codman & Shurtleff, Raynham, MA). Figure 1ashows the geometry of the aneurysm model. Thepacking density of each sample was calculated as theratio of total coil volume deposited to aneurysm
volume; the aneurysm volume was calculated using theellipsoid equation as is done clinically.
Following the coiling process, the models weredrained of fluid and were dried in a closed chambercontaining a hygroscopic material for 48 h. After thesamples dried, the vascular lumen including the coiledaneurysms were filled with a low viscosity epoxy andplaced under vacuum to ensure that the epoxy pene-trated all the gaps between the coils. Mild heating wasapplied to achieve complete polymerization of theepoxy. Once the epoxy inside cured, the vasculaturewas trimmed to retain the aneurysm and adjacentblood vessels (Fig. 1b). The specimen was then posi-tioned in a square box that was filled with industrialgrade epoxy to completely embed the specimen. Theepoxy-blocks were then extracted from the moldingbox, trimmed, and marked for subsequent processing.
The samples where then fed to a belt sander equippedwith a specially designed holding fixture mounted on amicrometer-driven traverse such that the face of eachsample facing the belt was sanded down at 100 lmintervals. After each 100 lmsanding, the specimen blockwas removed from the holding fixture to facilitate pol-ishing and imaging of the sanded face (Fig. 2, top leftinset). The holding fixture guaranteed proper reposi-tioning of the specimen block after each imaging session.The microscope stage was also equipped with a speciallydesigned holder to ensure proper repeatable positioningof the specimenon the stage for each imaging session.Themicroscope holder also angled the block such that thenormal vector to the imaged surface bisected the anglebetween the source of incident light and the image cap-ture camera so as to maximize reflection off the surfacemetal. Thus, at each interval the sanded face was imagedwith a light microscope to provide a ‘‘histological’’ viewof the coil distribution inside the aneurysm (Fig. 2).
FIGURE 1. (a) Geometry representative of the rabbit elastase-induced aneurysm used for the study; (b) silicone replica of thegeometry after stent-assisted coiling; the lumen has been filled with epoxy as a fixative.
Endovascular Coiling of Cerebral Aneurysms
Author's personal copy

Once all the images were obtained, each specimenyielded a series of images showing the coil cross sec-tions in the plane of imaging. This stack of parallelimages could then be analyzed. As a first step, analysiswas conducted in the plane of each image. In eachsection of the aneurysm, the largest circle that could fitin the void space left by the coil mass was determined;this region was then considered to be ‘‘filled’’ and thenext largest circle that could fit within the remainder ofthe void space was calculated. The void space was thusiteratively and optimally filled with circles (Fig. 2,bottom right inset). Iterations were stopped when thelargest circle that could fit in the remaining space hada diameter less than the coil wire diameter (300 lm).Each sectional image of an aneurysm was optimallyfilled in this manner. Similarly, the entire aneurysmvolume was iteratively and optimally filled withspheres of decreasing diameter (limited to coil wirediameter, Fig. 3). Representative packing densitymeasures based on the 2D circular
Parea ofð½
slices�P
area of circlesÞ=P
areað of slicesÞ� and the3D spherical voids Aneurysm volume from slices�ð½P
volume of spheresÞ= Aneurysmð volume from slicesÞ�
were calculated. For each aneurysm, the circle diameterswere combined to provide a 2D planar histogram andthe sphere diameters were combined to provide a 3Dvolumetric histogram of the void space within theaneurysm. Pore-size distributions have in general beencharacterized by the gamma (Eq. 1), lognormal (Eq. 2),or Weibull (Eq. 3) distributions.6,36,39 The cumulativedistribution function (cdf) of these three distributionswere fit to the empirical 2D and 3D cdfs in the least-squares sense to evaluate the best-fit distribution basedon residual error.
p dð Þ ¼ 1
raC að Þ d� d0ð Þða�1Þe�d�d0
r
� �
ð1Þ
p dð Þ ¼ 1
rffiffiffiffiffiffi2pp
d� d0ð Þe� log d�d0ð Þ�lð Þ2
2r2
� �
ð2Þ
p dð Þ ¼ c
rd� d0
r
� �c�1e�
d�d0r
� �cð3Þ
The constant d0 relates to location of the distribu-tion (translated origin) in each case, while a, r, l, and
FIGURE 2. Top left to bottom right: image of the sanded face of a sample, a stack of such ‘‘slices’’ through the sample, and theempty space within the aneurysm lumen maximally filled with circles.
SADASIVAN et al.
Author's personal copy
c are constants that define the distributions. Theoptimal (best-fit to data) values of these parameterswere obtained and used to characterize the data sets.
The orientation of the aneurysm volume of the sam-ples was aligned (for roll and yaw). The locations of the2D and 3D voids were then evaluated for any trends inthe distal-to-proximal and dome-to-neck directions. Allimage processing and analysis was done with Matlab(The Mathworks, Natick, MA). Statistical tests wereconducted with either SAS (SAS Institute, Cary, NC) orInstat (Graphpad Software, La Jolla, CA).
RESULTS
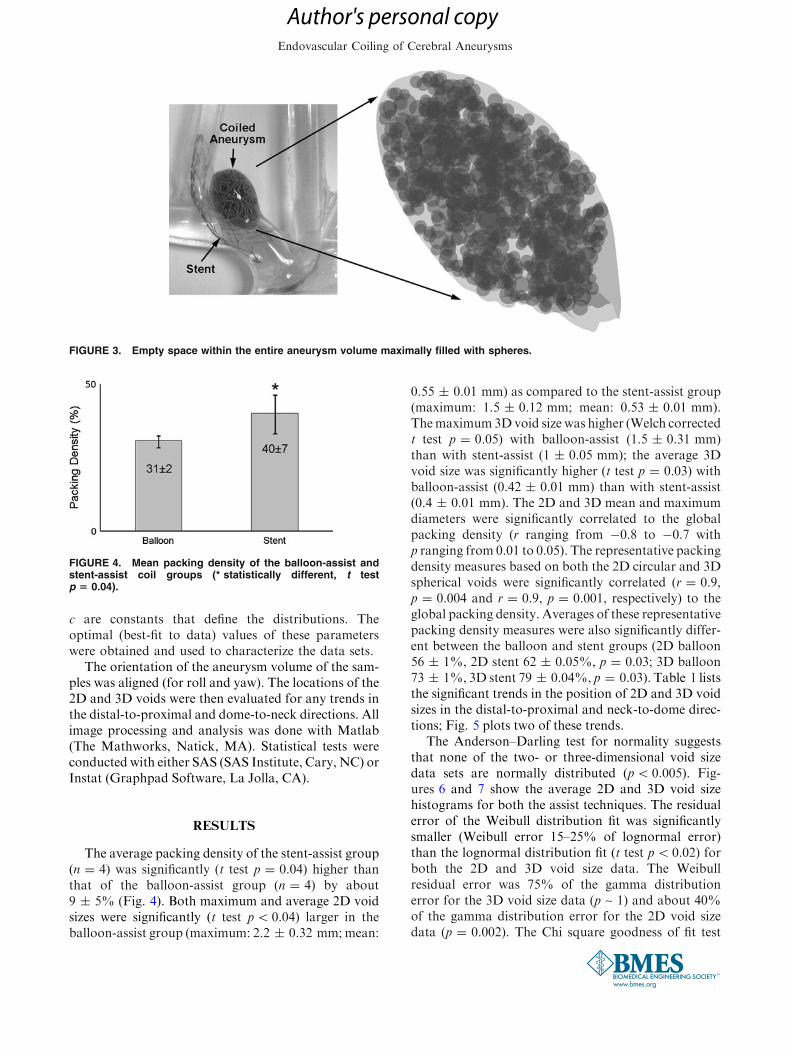
The average packing density of the stent-assist group(n = 4) was significantly (t test p = 0.04) higher thanthat of the balloon-assist group (n = 4) by about9 ± 5% (Fig. 4). Both maximum and average 2D voidsizes were significantly (t test p< 0.04) larger in theballoon-assist group (maximum: 2.2 ± 0.32 mm;mean:
0.55 ± 0.01 mm) as compared to the stent-assist group(maximum: 1.5 ± 0.12 mm; mean: 0.53 ± 0.01 mm).Themaximum3Dvoid size was higher (Welch correctedt test p = 0.05) with balloon-assist (1.5 ± 0.31 mm)than with stent-assist (1 ± 0.05 mm); the average 3Dvoid size was significantly higher (t test p = 0.03) withballoon-assist (0.42 ± 0.01 mm) than with stent-assist(0.4 ± 0.01 mm). The 2D and 3D mean and maximumdiameters were significantly correlated to the globalpacking density (r ranging from �0.8 to �0.7 withp ranging from 0.01 to 0.05). The representative packingdensity measures based on both the 2D circular and 3Dspherical voids were significantly correlated (r = 0.9,p = 0.004 and r = 0.9, p = 0.001, respectively) to theglobal packing density. Averages of these representativepacking density measures were also significantly differ-ent between the balloon and stent groups (2D balloon56 ± 1%, 2D stent 62 ± 0.05%, p = 0.03; 3D balloon73 ± 1%, 3D stent 79 ± 0.04%, p = 0.03). Table 1 liststhe significant trends in the position of 2D and 3D voidsizes in the distal-to-proximal and neck-to-dome direc-tions; Fig. 5 plots two of these trends.
The Anderson–Darling test for normality suggeststhat none of the two- or three-dimensional void sizedata sets are normally distributed (p< 0.005). Fig-ures 6 and 7 show the average 2D and 3D void sizehistograms for both the assist techniques. The residualerror of the Weibull distribution fit was significantlysmaller (Weibull error 15–25% of lognormal error)than the lognormal distribution fit (t test p< 0.02) forboth the 2D and 3D void size data. The Weibullresidual error was 75% of the gamma distributionerror for the 3D void size data (p ~ 1) and about 40%of the gamma distribution error for the 2D void sizedata (p = 0.002). The Chi square goodness of fit test
FIGURE 4. Mean packing density of the balloon-assist andstent-assist coil groups (* statistically different, t testp 5 0.04).
FIGURE 3. Empty space within the entire aneurysm volume maximally filled with spheres.
Endovascular Coiling of Cerebral Aneurysms
Author's personal copy

suggests that the data may follow all three theoreticaldistributions tested (non-rejection of null hypothesisthat data and theoretical distributions are same). TheChi square statistic of the Weibull distribution was alsosignificantly (p< 0.001) lower than the lognormal(Weibull v2 15% of lognormal v2) and gamma fits(Weibull v2 30% of gamma v2) for the 2D void data.The Chi square statistic was not significantly differentbetween the three distribution fits for the 3D void data.The optimized c and r parameter values for the Wei-bull distribution are given in Table 2; Fig. 8 shows theWeibull distribution superposed on the 2D void sizedistribution for the balloon-assist group.
The Kolmogorov–Smirnov two sample test suggeststhat the 2D void size distributions of the stent-assistand balloon-assist groups come from the same distri-bution (p = 0.14), but that the two 3D void size dis-tributions differ from each other (p = 0.002). TheWeibull distribution fits to the 2D and 3D data sets,however, show no significant difference between theoptimized parameter values of the balloon-assist andstent-assist groups (p> 0.3).
DISCUSSION
We have established an in vitro method to investi-gate the detailed local distribution of coil masseswithin aneurysms through the voids left between thecoils inside the aneurysms. These results shed light onthe distribution of the voids that presumably play arole in coil compaction; such distributions through theaneurysm volume have, to the best of our knowledge,not been investigated thus far. The importance ofinvestigating intra-aneurysmal coil configurations inlocal detail is recognized in the literature. Initial in vitrostudies30,31 quantified differences in packing densitiesdue to different coils or coiling techniques, but morerecent ones have used image analysis of in vitro3,22 andin vivo24,40 sections to quantify variables such asrecanalization regions, local coil densities, neck cov-erage, and spatial homogeneity.
TABLE 1. Correlation coefficients of trends in the voiddiameters in the distal-to-proximal and neck-to-dome direc-tions; significant trends are shaded; the two rows with darker
shades are plotted in Fig. 5.
FIGURE 5. Variation in the average radius of voids in theneck-to-dome direction for (a) the balloon-assist group and(b) the stent-assist group. Regression lines (solid) with 95%confidence intervals (dotted) are shown along with correlationcoefficients.
SADASIVAN et al.
Author's personal copy

Although there is significant value to epidemiolog-ical evaluations of coiling outcome using the packingdensity as a variable,16,19,29,32,37,41,43,45,46,48,50 suchstudies do not consider the hemodynamic forcesexerted on the coil mass. A sidewall aneurysm may, forexample, completely occlude at 10% packing densitybut the identical aneurysm at a terminal location mayrecanalize at 50% packing density. Some care must,therefore, be exercised when using only the packingdensity as a threshold parameter to determine aneu-rysm occlusion probability. This consideration alsoapplies to different coil designs where three-dimen-sional, complex-shape, and/or thicker wire coils canprovide better packing densities,41 but the void spacesleft within these coils and the hemodynamic effects onthe coil mass due to the distribution of these voidspaces is not yet clear. For example, coils with thickerwires will tend to leave larger interstitial spaces.45
Numerical hemodynamics studies have only recentlybegun to evaluate the flow regime within coiled aneu-rysms,7,17 but the accuracy of these studies could bemarkedly improved if data on how the coils areinterspersed within aneurysms were available.
Void size distributions such as those acquired herecan not only provide valuable input information forhemodynamic analyses but could also be usedto analyze, compare, and optimize coil deployment
configurations and techniques. It is generally accepted,and has been shown,35 that successively filling aneu-rysms in an ‘‘onion-layer’’ fashion provides theoreti-cally optimal packing densities. The voids distributionof such optimal packing is possibly discrete in terms ofsize (constant void diameters) and isotropic in terms oflocation. Void distributions of different coil configu-rations can thus be evaluated using this methodologyand compared to the theoretical optimum.
The same methodology could be used with elasto-mer models derived from patient imaging data, but wechose the rabbit model to facilitate further testing ofthe void distributions. Repeatability is more readilyachieved in the rabbit model as compared to patientdata, void spaces could be correlated to histologicalsections of in vivo samples,24 and any predictive tests ofcoil compaction derived from future computationalfluid dynamics studies using such void size distribu-tions with different coil designs could be evaluatedin vivo. In the aneurysm model we have used, stent-assisted coiling provided about 30% higher packingdensity and about 30% smaller maximum void size. Ascan be noted from Table 1 and underlined in Fig. 5,the spatial trends in void sizes also seem to differbetween the two groups, at least in the neck-to-domedirection. The larger balloon-assist voids are at theneck and reduce in size towards the dome (negative
FIGURE 6. Average histograms of 2D void sizes for the (a) balloon-assist and (b) stent-assist groups. Voids with diameter greaterthan 1.2 mm are not included in the plot.
Endovascular Coiling of Cerebral Aneurysms
Author's personal copy

correlation coefficients), but the voids are the smallestat the neck and increase in size towards the dome in thestent-assist group (positive correlation coefficients).The statistically significant differences in these fewvariables suggest that stent-assisted coiling may besuperior to balloon-assisted coiling in this model, butcertain points need to be considered before that con-clusion can be drawn. The intra-group comparison islimited by the fact that there were only 4 samples pergroup. Although the maximum void size was 30%smaller with stent-assist, the average void size was onlyabout 5% smaller, even if statistically significant. Thevoid sizes decrease from the distal to the proximal endin both groups. Moreover, the correlation coefficientsof void size to location are low in general. The Kol-mogorov–Smirnov test suggests a difference in the 3D
void size distributions between the two groups, but notthe 2D distributions. Finally, the fact that the opti-mized Weibull distribution fit parameters are not sig-nificantly different between the two groups supportssimilarity of (or shows insufficient evidence to con-clude a difference between) the two distributions.
Porous media are encountered in various fields suchas metallurgy, materials science, fibers, filtration,petroleum engineering, and hydrogeology. Character-ization of such media usually involves quantification ofthe spatial organization (pore connectivity or pore net-work structure) and estimation of somemeasure of poresizes or pore size variation. This size measure is com-monly quantified by fitting pore size (usually porediameter) data to theoretical distributions.6 Together,the spatial organization model and the size distributionmodel can completely represent the medium in numeri-cal simulations; alternately, a simplified assumption ofthe spatial organization may be used along with thetheoretical pore size distributions49 to model the med-ium. Pore-size data generally follow a skewed normaldistribution and, for this reason, havemost effectively orcommonly been modeled by the Weibull and lognormalfamilies26,36; pore size data in fibrous and filtrationmedia have been noted to more closely follow a gamma
FIGURE 7. Average histograms of 3D void sizes for the (a) balloon-assist and (b) stent-assist groups. The bin size is wider for the3D voids data because the images had to be reduced in size to conserve computational resources in order to calculate the 3Dvolumetric void locations. Voids with diameter greater than 1 mm are not included in the plot.
TABLE 2. Average values of the optimized parameters forthe Weibull distribution fits to the 2D and 3D data sets.
Data group c r (mm)
2D balloon-assist 0.82 ± 0.04 0.17 ± 0.005
2D stent-assist 0.85 ± 0.04 0.17 ± 0.01
3D balloon-assist 0.9 ± 0.07 0.1 ± 0.01
3D stent-assist 1 ± 0.12 0.12 ± 0.01
SADASIVAN et al.
Author's personal copy

distribution15 because of this distribution’s constantcoefficient of variance. The shape parameter (variablec inEq. 3) of theWeibull distribution also forms apowerlaw exponent relating material strength to pore size.28
The 2D and 3D void size distributions were thus evalu-ated by fitting these three theoretical models. Based onthe residual error between the data and optimized dis-tribution fits and the corresponding Chi square values,theWeibull distribution seems to fit the data better thanthe gamma or the lognormal distributions. Testing threedistributions does not prove that the Weibull distribu-tion is the best descriptor of the data (some samples alsoshow a deviation from the Weibull at the extreme tails),but based on the widespread use of these models, it isreasonable to expect that void sizes left after coilingwithin aneurysms follow the Weibull distribution. Itshould be noted that when the shape parameter in theWeibull (variable c in Eq. 3) and the gamma (variable ain Eq. 1) distributions is equal to 1, these distributionsreduce to the exponential distribution. With averagec ~ 0.9 and average a ~ 1 in our data sets, the void sizesmay potentially follow an exponential distribution. Itcan plausibly be concluded that (given our modelgeometry and coils chosen), void size distributions incoiled aneurysms follow an exponential decay constant(1/r, Table 2) of 6–10 mm.
Some limitations of the study may be noted.Although in vitro studies allow better control and quan-tification, the luminal interface of elastomeric modelsmay behave differently than in vivo models. Themanner in which coils handle the parent vessel-aneu-rysm interface may also differ especially considering
that the model we used was wide-necked. Any inter-action of the coil mass to thrombus forming during thecoiling session cannot easily be replicated in vitro. Theeffect of thrombus on void space distributions, quan-tification of the space between the coil mass and theluminal aneurysmal surface, or quantification ofeffective porosity of the coil mass at the aneurysm necksurface were not part of the current study aims and arenot evaluated here. The coiling was conducted by asingle interventionalist to preclude inter-operator var-iability, but this limits the scope of the study in thesense that different results may be obtained by differ-ent interventionalists. A single operator repeatedlycoiling the same aneurysm is also subjected to alearning curve. We attempted to circumvent thislearning curve by spreading the coiling sessions over aperiod of months (average period between sessions was103 ± 203 days), alternating the coil-assist methods,by blinding the operator to previous coil sizing records,and by requiring the operator to use slightly differentcoil sizes instead of the sizes called for during thecoiling process. Although we exercised great care withthe samples until they were embedded, the absence of astent may have preferentially disturbed the coil mass inthe samples of the balloon-assist group. In terms ofimage processing, the images had to be reduced in sizeby about four times to calculate optimal filling of theaneurysm volume with spheres in order to conserveavailable computational resources (after reduction,each sample took 5–6 h on a 3 GHz CPU, 3 GB RAMPC). We tried to maintain the same aneurysm orien-tation when the samples were placed in the box to be
FIGURE 8. Average Weibull distribution fit (solid line) for the balloon-assist 2D void size distribution superposed over the dataset. The dashed lines are 61 standard deviation.
Endovascular Coiling of Cerebral Aneurysms
Author's personal copy

embedded, but this could not be precisely controlled.Although the orientations in the roll and yaw direc-tions were numerically aligned during post-processing,the pitch may not be identical across the samples,which may affect the spatial trends in void sizes.
The methodology reported here can be used tocharacterize the distribution of coil masses withinaneurysms. Such distributions may be invaluable tonumerical assessment of the hemodynamic forcescausing coil compaction. Further, the methodologycan be used to objectively compare different coildesigns and coil-assist devices, which may facilitateoptimization of coil configurations deployed inpatients.
ACKNOWLEDGMENTS
The study was partly supported by NIH R01-NS045753 to B.B.L. Coils and stents were provided byCodman & Shurtleff Inc. M.A.S. currently holds aresearch grant from Covidien.
CONFLICT OF INTEREST
No benefits in any form have been or will bereceived from a commercial party related directly orindirectly to the subject of this manuscript.
REFERENCES
1Badjatia, N., A. Carpenter, L. Fernandez, J. M. Schmidt,S. A. Mayer, J. Claassen, et al. Relationship betweenC-reactive protein, systemic oxygen consumption, and de-layed cerebral ischemia after aneurysmal subarachnoidhemorrhage. Stroke 42(9):2436–2442, 2011. doi:10.1161/STROKEAHA.111.614685.2Bederson, J. B., E. S. Connolly, Jr., H. H. Batjer, R. G.Dacey, J. E. Dion, M. N. Diringer, et al. Guidelines for themanagement of aneurysmal subarachnoid hemorrhage: astatement for healthcare professionals from a special writinggroup of the Stroke Council, American Heart Association.Stroke 40(3):994–1025, 2009. doi:10.1161/STROKEAHA.108.191395.3Bendok, B. R., R. J. Parkinson, Z. A. Hage, J. G. Adel,and M. J. Gounis. The effect of vascular reconstructiondevice-assisted coiling on packing density, effective neckcoverage, and angiographic outcome: an in vitro study.Neurosurgery 61(4):835–840; discussion 840–841, 2007. doi:10.1227/01.NEU.0000298913.24625.26.4Brilstra, E. H., G. J. Rinkel, Y. van der Graaf, W. J. vanRooij, and A. Algra. Treatment of intracranial aneurysmsby embolization with coils: a systematic review. Stroke30(2):470–476, 1999.5Broderick, J. P., T. Brott, T. Tomsick, R. Miller, and G.Huster. Intracerebral hemorrhage more than twice as
common as subarachnoid hemorrhage. J. Neurosurg.78(2):188–191, 1993. doi:10.3171/jns.1993.78.2.0188.6Brutsaert, W. Probability laws for pore-size distributions.Soil Sci. 101(2):85–92, 1966.7Cha, K. S., E. Balaras, B. B. Lieber, C. Sadasivan, andA. K. Wakhloo. Modeling the interaction of coils with thelocal blood flow after coil embolization of intracranialaneurysms. J. Biomech. Eng. 129(6):873–879, 2007. doi:10.1115/1.2800773.8Crobeddu, E., G. Lanzino, D. F. Kallmes, and H. J. Cloft.Review of 2 decades of aneurysm-recurrence literature,part 1: reducing recurrence after endovascular coiling.AJNR Am. J. Neuroradiol. 2012. doi:10.3174/ajnr.A3032.9Debrun, G. M., V. A. Aletich, P. Kehrli, M. Misra,J. I. Ausman, and F. Charbel. Selection of cerebral aneu-rysms for treatment using Guglielmi detachable coils: thepreliminary University of Illinois at Chicago experience.Neurosurgery 43(6):1281–1295; discussion 96–97, 1998.
10Fernandez Zubillaga, A., G. Guglielmi, F. Vinuela, andG. R. Duckwiler. Endovascular occlusion of intracranialaneurysms with electrically detachable coils: correlation ofaneurysm neck size and treatment results. AJNR Am.J. Neuroradiol. 15(5):815–820, 1994.
11Ferns, S. P., M. E. Sprengers, W. J. van Rooij, G. J.Rinkel, J. C. van Rijn, S. Bipat, et al. Coiling of intracra-nial aneurysms: a systematic review on initial occlusion andreopening and retreatment rates. Stroke 40(8):e523–e529,2009. doi:10.1161/STROKEAHA.109.553099.
12Hayakawa, M., Y. Murayama, G. R. Duckwiler,Y. P. Gobin, G. Guglielmi, and F. Vinuela. Natural historyof the neck remnant of a cerebral aneurysm treated with theGuglielmi detachable coil system. J. Neurosurg. 93(4):561–568, 2000. doi:10.3171/jns.2000.93.4.0561.
13Hope, J. K., J. V. Byrne, and A. J. Molyneux. Factorsinfluencing successful angiographic occlusion of aneurysmstreated by coil embolization. AJNR Am. J. Neuroradiol.20(3):391–399, 1999.
14Jane, J. A., H. R. Winn, and A. E. Richardson. The naturalhistory of intracranial aneurysms: rebleeding rates duringthe acute and long term period and implication for surgicalmanagement. Clin. Neurosurg. 24:176–184, 1977.
15Johnston, P. R. Revisiting the most probable pore-sizedistribution in filter media: the gamma distribution. Filtr.Sep. 35(3):287–292, 1998.
16Kai, Y., J. Hamada, M. Morioka, S. Yano, and J. Kuratsu.Evaluation of the stability of small ruptured aneurysmswith a small neck after embolization with Guglielmidetachable coils: correlation between coil packing ratio andcoil compaction. Neurosurgery 56(4):785–792; discussion792, 2005.
17Kakalis, N. M., A. P. Mitsos, J. V. Byrne, and Y. Ventikos.The haemodynamics of endovascular aneurysm treatment:a computational modelling approach for estimating theinfluence of multiple coil deployment. IEEE Trans. Med.Imaging 27(6):814–824, 2008. doi:10.1109/TMI.2008.915549.
18Kassell, N. F., and J. C. Torner. Aneurysmal rebleeding: apreliminary report from the Cooperative Aneurysm Study.Neurosurgery 13(5):479–481, 1983.
19Kawanabe, Y., A. Sadato, W. Taki, and N. Hashimoto.Endovascular occlusion of intracranial aneurysms withGuglielmi detachable coils: correlation between coil pack-ing density and coil compaction. Acta Neurochir. 143(5):451–455, 2001.
SADASIVAN et al.
Author's personal copy

20Linn, F. H., G. J. Rinkel, A. Algra, and J. van Gijn.Incidence of subarachnoid hemorrhage: role of region,year, and rate of computed tomography: a meta-analysis.Stroke 27(4):625–629, 1996.
21Mayberg, M. R., H. H. Batjer, R. Dacey, M. Diringer,E. C. Haley, R. C. Heros, et al. Guidelines for the man-agement of aneurysmal subarachnoid hemorrhage. Astatement for healthcare professionals from a special writ-ing group of the Stroke Council, American Heart Associ-ation. Circulation 90(5):2592–2605, 1994.
22Mehra, M., M. C. Hurley, M. J. Gounis, R. M. King, A.Shaibani, G. Dabus, et al. The impact of coil shape designon angiographic occlusion, packing density and coil massuniformity in aneurysm embolization: an in vitro study. J.Neurointervent. Surg. 3(2):131–136, 2011. doi:10.1136/jnis.2010.004390.
23Molyneux, A. J., R. S. Kerr, L. M. Yu, M. Clarke, M.Sneade, J. A. Yarnold, et al. International subarachnoidaneurysm trial (ISAT) of neurosurgical clipping versusendovascular coiling in 2143 patients with ruptured intra-cranial aneurysms: a randomised comparison of effects onsurvival, dependency, seizures, rebleeding, subgroups, andaneurysm occlusion. Lancet 366(9488):809–817, 2005. doi:10.1016/S0140-6736(05)67214-5.
24Morales, H. G., I. Larrabide, A. J. Geers, D. Dai,D. F. Kallmes, and A. F. Frangi. Analysis and quantifi-cation of endovascular coil distribution inside saccularaneurysms using histological images. J. Neurointervent.Surg. 2012. doi:10.1136/neurintsurg-2012-010456.
25Moret, J., C. Cognard, A. Weill, L. Castaings, and A. Rey.The ‘‘Remodelling technique’’ in the treatment of wideneck intracranial aneurysms. Angiographic results andclinical follow-up in 56 cases. Intervent. Neuroradiol.3(1):21–35, 1997.
26Neithalath, N., M. S. Sumanasooriya, and O. Deo. Char-acterizing pore volume, sizes, and connectivity in perviousconcretes for permeability prediction. Mater. Charact.61(8):802–813, 2010. doi:10.1016/j.matchar.2010.05.004.
27Ogilvy, C. S. Neurosurgical clipping versus endovascularcoiling of patients with ruptured intracranial aneurysms.Stroke 34(10):2540–2542, 2003. doi:10.1161/01.STR.0000092894.71909.FF.
28Orlovskaja, N., H. Peterlik, W. Steinkellner, and K.Kromp. Prediction of strength of recrystallized siliconcar-bide from pore size measurement. Part I. The bimodality ofthe distribution. J. Mater. Sci. 35(3):699–705, 2000. doi:10.1023/a:1004705300886.
29Phatouros, C. C., R. T. Higashida, and V. V. Halbach.New methods of treatment for cerebral aneurysms. West.J. Med. 169(5):286–287, 1998.
30Piotin, M., A. Iijima, H. Wada, and J. Moret. Increasingthe packing of small aneurysms with complex-shapedcoils: an in vitro study. AJNR Am. J. Neuroradiol. 24(7):1446–1448, 2003.
31Piotin, M., S. Mandai, K. J. Murphy, K. Sugiu, P. Gail-loud, J. B. Martin, et al. Dense packing of cerebral aneu-rysms: an in vitro study with detachable platinum coils.AJNR Am. J. Neuroradiol. 21(4):757–760, 2000.
32Raymond, J., F. Guilbert, A. Weill, S. A. Georganos, L.Juravsky, A. Lambert, et al. Long-term angiographicrecurrences after selective endovascular treatment ofaneurysms with detachable coils. Stroke 34(6):1398–1403,2003. doi:10.1161/01.STR.0000073841.88563.E9.
33Rinkel, G. J., M. Djibuti, A. Algra, and J. van Gijn.Prevalence and risk of rupture of intracranial aneurysms: asystematic review. Stroke 29(1):251–256, 1998.
34Roy, D., G. Milot, and J. Raymond. Endovascular treat-ment of unruptured aneurysms. Stroke 32(9):1998–2004,2001.
35Sadasivan, C., and B. B. Lieber. Numerical investigation ofcoil configurations that provide ultra-high packing densityof saccular aneurysms. J. Med. Devices 3(4):41005, 2009.doi:10.1115/1.4000453.
36Sampson, W. W., and S. J. Urquhart. The contribution ofout-of-plane pore dimensions to the pore size distributionof paper and stochastic fibrous materials. J. Porous Mater.15(4):411–417, 2008. doi:10.1007/s10934-006-9088-9.
37Satoh, K., S. Matsubara, H. Hondoh, and S. Nagahiro.Intracranial aneurysm embolization using interlockingdetachable coils. Correlation between volume embolizationrate and coil compaction. Intervent. Neuroradiol. 3(Suppl2):125–128, 1997.
38Seong, J., C. Sadasivan, M. Onizuka, M. J. Gounis,F. Christian, L. Miskolczi, et al. Morphology of elastase-induced cerebral aneurysm model in rabbit and rapidprototyping of elastomeric transparent replicas. Biorheol-ogy 42(5):345–361, 2005.
39Shen, H., S. M. Oppenheimer, D. C. Dunand, andL. C. Brinson. Numerical modeling of pore size and dis-tribution in foamed titanium. Mech. Mater. 38(8–10):933–944, 2006.
40Sherif, C., H. Plenk, Jr., K. Grossschmidt, F. Kanz, and G.Bavinzski. Computer-assisted quantification of occlusionand coil densities on angiographic and histological imagesof experimental aneurysms. Neurosurgery 58(3):559–566;discussion 566, 2006. doi:10.1227/01.NEU.0000197490.60670.A8.
41Slob, M. J., W. J. van Rooij, and M. Sluzewski. Influenceof coil thickness on packing, re-opening and retreatment ofintracranial aneurysms: a comparative study between twotypes of coils. Neurol. Res. 27(Suppl 1):S116–S119, 2005.doi:10.1179/016164105X49292.
42Sluzewski, M., W. J. van Rooij, G. J. Rinkel, and D.Wijnalda. Endovascular treatment of ruptured intracranialaneurysms with detachable coils: long-term clinical andserial angiographic results. Radiology 227(3):720–724, 2003.doi:10.1148/radiol.2273020656.
43Sluzewski, M., W. J. van Rooij, M. J. Slob, J. O. Bescos,C. H. Slump, and D. Wijnalda. Relation between aneurysmvolume, packing, and compaction in 145 cerebral aneu-rysms treated with coils. Radiology 231(3):653–658, 2004.doi:10.1148/radiol.2313030460.
44Suarez, J. I., R. W. Tarr, and W. R. Selman. Aneurysmalsubarachnoid hemorrhage. N. Engl. J. Med.354(4):387–396, 2006. doi:10.1056/NEJMra052732.
45Tamatani, S., Y. Ito, H. Abe, T. Koike, S. Takeuchi, andR. Tanaka. Evaluation of the stability of aneurysms afterembolization using detachable coils: correlation betweenstability of aneurysms and embolized volume of aneurysms.AJNR Am. J. Neuroradiol. 23(5):762–767, 2002.
46Uchiyama, N., S. Kida, M. Nomura, M. Hasegawa, T.Yamashima, J. Yamashita, et al. Significance of volumeembolization ratio as a predictor of recanalization on en-dovascular treatment of cerebral aneurysms with guglielmidetachable coils. Intervent. Neuroradiol. 6(Suppl 1):59–63,2000.
Endovascular Coiling of Cerebral Aneurysms
Author's personal copy

47van Gijn, J., and G. J. Rinkel. Subarachnoid haemorrhage:diagnosis, causes and management. Brain 124(Pt 2):249–278, 2001.
48Wakhloo, A. K., M. J. Gounis, J. S. Sandhu, N. Akkawi,A. E. Schenck, and I. Linfante. Complex-shaped platinumcoils for brain aneurysms: higher packing density, im-proved biomechanical stability, and midterm angiographicoutcome. AJNR Am. J. Neuroradiol. 28(7):1395–1400,2007. doi:10.3174/ajnr.A0542.
49Wang, X., and K. K. Mohanty. Critical condensate satu-ration in porous media. J. Colloid Interface Sci.214(2):416–426, 1999. doi:10.1006/jcis.1999.6223.
50Yagi, K., K. Satoh, J. Satomi, S. Matsubara, and S.Nagahiro. Evaluation of aneurysm stability after endo-vascular embolization with Guglielmi detachable coils:correlation between long-term stability and volume embo-lization ratio. Neurol. Med. Chir. 45(11):561–565; discus-sion 565–566, 2005.
SADASIVAN et al.
Author's personal copy