Ethernet Patch Cord Wiring Ethernet Patch Cords & RJ-45 Connectors
Upload
independentCategory
view
3download
0
OIKOS 97: 195–204, 2002
Does variation in patch use among butterfly species contribute tonestedness at fine spatial scales?
Keith S. Summerville, Joseph A. Veech and Thomas O. Crist
Summerville, K. S., Veech, J. A. and Crist, T. O. 2002. Does variation in patch useamong butterfly species contribute to nestedness at fine spatial scales? – Oikos 97:195–204.
A nested pattern occurs whenever the species observed in depauperate habitatpatches are a subset of those found in more species-rich patches. Ecologists havedocumented many instances of nestedness caused by population-level processes suchas colonization and extinction at biogeographic scales. However, few researchers haveexamined whether nestedness may exist at fine scales due to the ways in whichindividual organisms discriminate among potential habitat patches. In 1999, weexperimentally fragmented an old-field habitat into patches of varying size to testwhether nestedness could exist on a fine spatial scale. Five treatments of differingpatch size were replicated five times in a Latin square design by selectively mowing15×15 m2 plots within an old-field (patch areas: 225, 180, 135, 90, and 45 m2).Specifically, we tested whether butterflies foraging within a network of patchesdiffering in area conformed to a nested subset structure. We also classified speciesaccording to (1) their flight height while foraging (high or low), and (2) their adulthabitat breadth (ubiquitous, general, or restricted) to determine whether nestednesscould be explained by difference in species’ tendency to discriminate among patchesdiffering in area.We found significant evidence that a community of foraging Lepidoptera conformedto a nested subset structure based on the difference between the observed nestednesswithin the butterfly community and the nestedness obtained from randomly gener-ated species presence/absence matrices. Poisson regression analyses demonstratedthat high-flying, habitat-restricted species avoided the smallest patches (90 and 45 m2)in favor of larger remnants, whereas low-flying, habitat generalists used all patchsizes. Thus, our study is one of the first to demonstrate that nestedness among speciessubsets can be observed at fine spatial scales (within a single 1.5 hectare field) andmay be maintained by species behavioral differences: discriminating species (i.e.high-flying, habitat restricted) avoided the smallest patches, and less discriminatingspecies (i.e. low-flying, ubiquitous) were distributed throughout the field withoutregard to patch size. Our results also suggest that nestedness should be viewed as yetanother scalar pattern in ecology, generated by variation in patch use by individualsat fine-scales as well as the more traditionally invoked processes of extinction andcolonization of species at broad-scales.
K. S. Summer�ille, J. A. Veech and T. O. Crist, Dept of Zoology, Miami Uni�.,Oxford, OH 45056, USA ([email protected]).
A corollary to the well-known species-area relationshipis that species occurrences across a gradient of islandsizes tend to form nested subsets (Schoener andSchoener 1983, Simberloff and Levin 1985, Pattersonand Atmar 1986, Kadmon 1995, Lomolino 1996, Hoek-stra and Fagan 1998, Wright et al. 1998, and Sfen-
thourakis et al. 1999). An assemblage is nested whenthe species present in relatively depauperate sites aresubsets of the species present in richer sites (Patterson1987). Area is often positively correlated with speciesrichness (Connor and McCoy 1979), so species presentin smaller patches of habitat frequently are subsets of
Accepted 21 December 2001
Copyright © OIKOS 2002ISSN 0030-1299
OIKOS 97:2 (2002) 195
the species present in larger patches. Although firstdiscovered in island communities and archipelagos,nestedness also exists in mainland systems, particularlywithin fragmented landscapes (see Boecklen 1997 for areview). Thus, small fragments of habitat tend to sup-port a nested subset of the species found in largerfragments (Blake 1991, Bolger et al. 1991, Cutler 1991,Cook 1995, Telleria and Santos 1995, Warburton 1997,Worthen et al. 1998, Fleishman and Murphy 1999,Honnay et al. 1999, Kerr et al. 2000, Patterson andAtmar 2000, Vallan 2000).
While existence of nested subsets at biogeographicscales (i.e. among islands in an archipelago) is clearlyestablished, there is little consensus on the ecologicalprocesses that most frequently generate the pattern(Simberloff and Martin 1991, Boecklen 1997). The the-ory of island biogeography suggests that any of themechanisms responsible for producing the species-arearelationship may apply to nested subsets (see Connorand McCoy 1979). Such mechanisms include: 1) differ-ential extinction rates (Patterson 1990, Lomolino 1996,Wright et al. 1998); 2) differential dispersal abilities(Cook and Quinn 1995, Lomolino 1996, Sfenthourakiset al. 1999); 3) nestedness of microhabitats (Calme andDesrochers 1999); and 4) passive sampling (Cutler1994). All of these processes have been documented tooperate at relatively large spatial scales (�1 km2), andfew studies have attempted to examine the role offine-scale processes such as behavioral differences increating or maintaining nested species subsets (but seeWorthen et al. 1998).
Indeed, all of the broad-scale mechanisms used toexplain nested patterns among islands have been citedas potential causes of nestedness within fragmentedterrestrial communities, with selective extinctions orimprobable colonizations being the most frequentlyimplicated (Patterson 1987, Blake 1991, Bolger et al.1991, Cutler 1991, Telleria and Santos 1995, Warburton1997, Patterson and Atmar 2000). These explanationsare appealing for butterfly communities sampled fromdiscrete sites within a landscape because extinction andcolonization dynamics are known to frequently influ-ence many species distributions (Thomas et al. 1992,Hanski et al. 1995, Thomas 2000). Comparisons of thecomposition of remnant communities long after faunalrelaxation, however, are not likely to render powerfultests of the processes that contributed to observedpresence/absence patterns (Simberloff and Martin1991). Sampling of fragments created in the past alsoprecludes identification of the role that species behaviormay play in structuring remnant communities. Forexample, local ‘‘extinctions’’ in patchy populations maybe attributable to selective emigration from (or com-plete avoidance of) disturbed or lower quality patches– demographic and environmental stochasticity neednot be invoked (Resetarits 1989, Kuussaari et al. 1996,Thomas and Hanski 1997, Leon-Cortes et al. 2000,Thomas et al. 2000).
Experimental studies of butterfly movement have re-vealed that behavioral responses to patch size andquality significantly influence species distributions andcommunity composition (Jones 1977, Thomas andSinger 1987, Banks 1998, Conradt et al. 2000, Steffan-Dewenter and Tscharntke 2000, Summerville and Crist2001). Furthermore, butterfly dispersal may decreaseexponentially with distance from an occupied patch sothat densities and distributions are significantly influ-enced by local movement among patches (Thomas andHarrison 1992, Shreeve 1994, Thomas et al. 1998,2000). Therefore, at very fine scales (i.e. within onehabitat �1 ha), butterfly species can potentially be-come nested as adults behaviorally respond to variationin resource availability and quality.
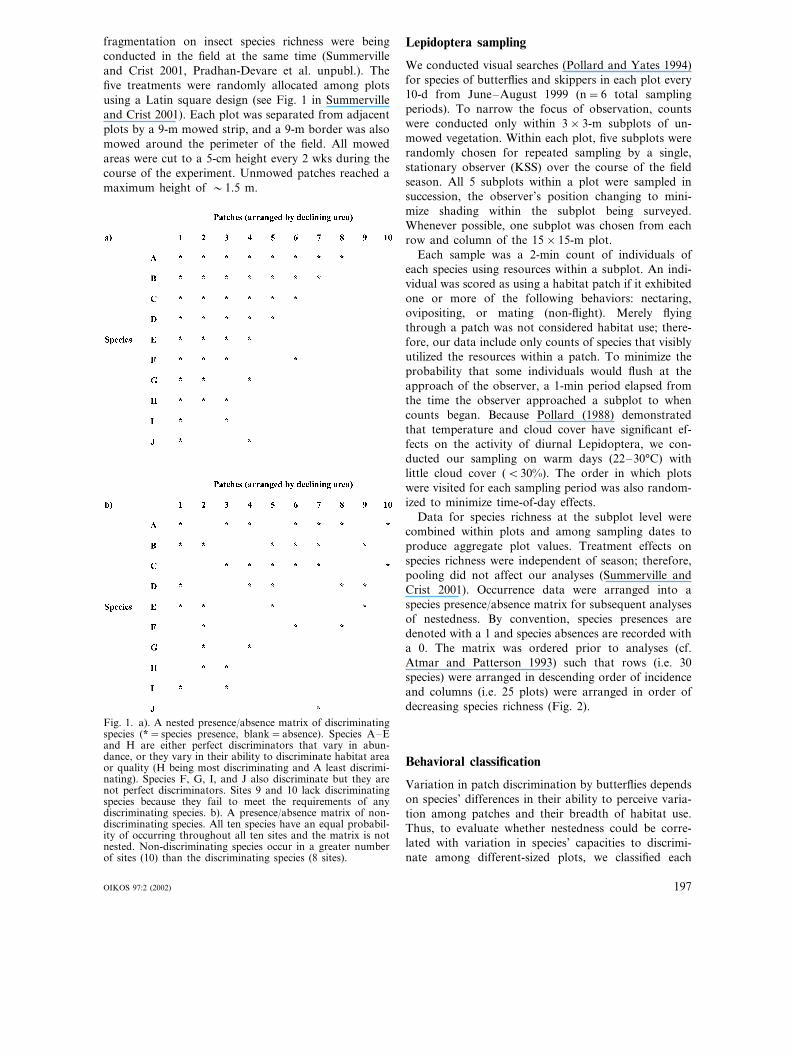
In this study, we experimentally manipulated an old-field habitat to examine the pattern of lepidopteranspecies’ distributions with across a gradient of patchsizes. We tested whether the species observed foragingwithin a network of resource patches differing in areaconformed to a nested subset pattern. In addition, wedetermined whether nestedness could be explained bydifferences in species’ tendency to discriminate amongpatch size or quality. For example, when discriminatingspecies select the largest or highest quality patches andother species use a broader range of patch sizes, apattern of nestedness should exist (Fig. 1a). In contrast,if species do not discriminate, then (all else being equal)they should have a similar probability of occurringamong the patches independent of size and nestednessshould not exist (Fig. 1b).
Methods
Experimental design
For many species of butterflies, area is an importantvariable correlated with the resource quality of foragingor breeding habitat (Thomas and Singer 1987, Harrisonet al. 1988, Thomas and Jones 1993, Hill et al. 1996,Steffan-Dewenter and Tscharntke 2000). Therefore, in1999 we mowed portions of an old field (see Sum-merville and Crist 2001 for habitat description) tocreate 25 plots 15×15 m in size. Plots were assigned tofive treatments of patch size, with area decreasing in20% increments from a maximum area of 225 m2 to aminimum area of 45 m2 (treatment levels: 225, 180, 135,90, 45 m2). Each 15×15 m plot was further subdividedinto 25 subplots 3×3 m in size. To experimentallyreduce patch area, we then mowed randomly chosensubplots such that the number of mowed subplotscorresponded to the proportional level of area reduc-tion in our treatments. This approach to area reductioncreated several differences in the shape of our smallestpatches, however, this was unavoidable because an-other set of experiments testing the effects of habitat
196 OIKOS 97:2 (2002)
fragmentation on insect species richness were beingconducted in the field at the same time (Summervilleand Crist 2001, Pradhan-Devare et al. unpubl.). Thefive treatments were randomly allocated among plotsusing a Latin square design (see Fig. 1 in Summervilleand Crist 2001). Each plot was separated from adjacentplots by a 9-m mowed strip, and a 9-m border was alsomowed around the perimeter of the field. All mowedareas were cut to a 5-cm height every 2 wks during thecourse of the experiment. Unmowed patches reached amaximum height of �1.5 m.
Lepidoptera sampling
We conducted visual searches (Pollard and Yates 1994)for species of butterflies and skippers in each plot every10-d from June–August 1999 (n=6 total samplingperiods). To narrow the focus of observation, countswere conducted only within 3×3-m subplots of un-mowed vegetation. Within each plot, five subplots wererandomly chosen for repeated sampling by a single,stationary observer (KSS) over the course of the fieldseason. All 5 subplots within a plot were sampled insuccession, the observer’s position changing to mini-mize shading within the subplot being surveyed.Whenever possible, one subplot was chosen from eachrow and column of the 15×15-m plot.
Each sample was a 2-min count of individuals ofeach species using resources within a subplot. An indi-vidual was scored as using a habitat patch if it exhibitedone or more of the following behaviors: nectaring,ovipositing, or mating (non-flight). Merely flyingthrough a patch was not considered habitat use; there-fore, our data include only counts of species that visiblyutilized the resources within a patch. To minimize theprobability that some individuals would flush at theapproach of the observer, a 1-min period elapsed fromthe time the observer approached a subplot to whencounts began. Because Pollard (1988) demonstratedthat temperature and cloud cover have significant ef-fects on the activity of diurnal Lepidoptera, we con-ducted our sampling on warm days (22–30°C) withlittle cloud cover (�30%). The order in which plotswere visited for each sampling period was also random-ized to minimize time-of-day effects.
Data for species richness at the subplot level werecombined within plots and among sampling dates toproduce aggregate plot values. Treatment effects onspecies richness were independent of season; therefore,pooling did not affect our analyses (Summerville andCrist 2001). Occurrence data were arranged into aspecies presence/absence matrix for subsequent analysesof nestedness. By convention, species presences aredenoted with a 1 and species absences are recorded witha 0. The matrix was ordered prior to analyses (cf.Atmar and Patterson 1993) such that rows (i.e. 30species) were arranged in descending order of incidenceand columns (i.e. 25 plots) were arranged in order ofdecreasing species richness (Fig. 2).
Behavioral classification
Variation in patch discrimination by butterflies dependson species’ differences in their ability to perceive varia-tion among patches and their breadth of habitat use.Thus, to evaluate whether nestedness could be corre-lated with variation in species’ capacities to discrimi-nate among different-sized plots, we classified each
Fig. 1. a). A nested presence/absence matrix of discriminatingspecies (*=species presence, blank=absence). Species A–Eand H are either perfect discriminators that vary in abun-dance, or they vary in their ability to discriminate habitat areaor quality (H being most discriminating and A least discrimi-nating). Species F, G, I, and J also discriminate but they arenot perfect discriminators. Sites 9 and 10 lack discriminatingspecies because they fail to meet the requirements of anydiscriminating species. b). A presence/absence matrix of non-discriminating species. All ten species have an equal probabil-ity of occurring throughout all ten sites and the matrix is notnested. Non-discriminating species occur in a greater numberof sites (10) than the discriminating species (8 sites).
OIKOS 97:2 (2002) 197
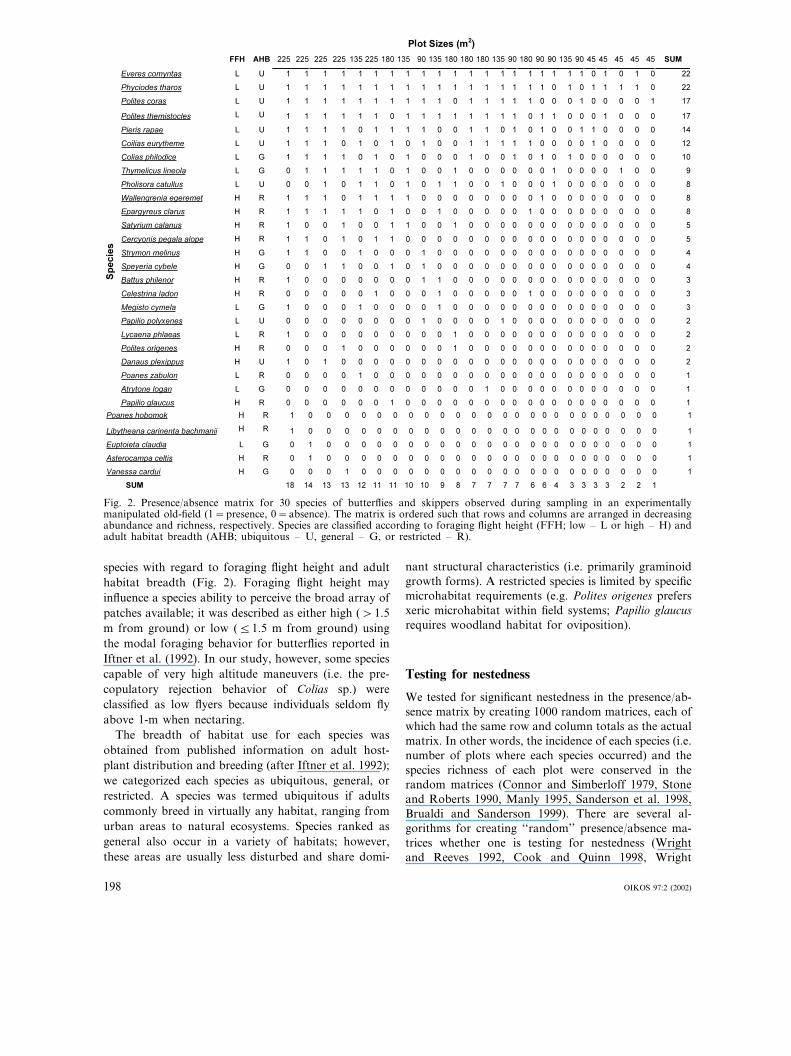
Fig. 2. Presence/absence matrix for 30 species of butterflies and skippers observed during sampling in an experimentallymanipulated old-field (1=presence, 0=absence). The matrix is ordered such that rows and columns are arranged in decreasingabundance and richness, respectively. Species are classified according to foraging flight height (FFH; low – L or high – H) andadult habitat breadth (AHB; ubiquitous – U, general – G, or restricted – R).
species with regard to foraging flight height and adulthabitat breadth (Fig. 2). Foraging flight height mayinfluence a species ability to perceive the broad array ofpatches available; it was described as either high (�1.5m from ground) or low (�1.5 m from ground) usingthe modal foraging behavior for butterflies reported inIftner et al. (1992). In our study, however, some speciescapable of very high altitude maneuvers (i.e. the pre-copulatory rejection behavior of Colias sp.) wereclassified as low flyers because individuals seldom flyabove 1-m when nectaring.
The breadth of habitat use for each species wasobtained from published information on adult host-plant distribution and breeding (after Iftner et al. 1992);we categorized each species as ubiquitous, general, orrestricted. A species was termed ubiquitous if adultscommonly breed in virtually any habitat, ranging fromurban areas to natural ecosystems. Species ranked asgeneral also occur in a variety of habitats; however,these areas are usually less disturbed and share domi-
nant structural characteristics (i.e. primarily graminoidgrowth forms). A restricted species is limited by specificmicrohabitat requirements (e.g. Polites origenes prefersxeric microhabitat within field systems; Papilio glaucusrequires woodland habitat for oviposition).
Testing for nestedness
We tested for significant nestedness in the presence/ab-sence matrix by creating 1000 random matrices, each ofwhich had the same row and column totals as the actualmatrix. In other words, the incidence of each species (i.e.number of plots where each species occurred) and thespecies richness of each plot were conserved in therandom matrices (Connor and Simberloff 1979, Stoneand Roberts 1990, Manly 1995, Sanderson et al. 1998,Brualdi and Sanderson 1999). There are several al-gorithms for creating ‘‘random’’ presence/absence ma-trices whether one is testing for nestedness (Wrightand Reeves 1992, Cook and Quinn 1998, Wright
198 OIKOS 97:2 (2002)
et al. 1998) or species co-occurrences (Gotelli 2000).Methods that conserve row and column totals of thepresence/absence matrices are significantly less prone toType I error (Sanderson et al. 1998, Brualdi andSanderson 1999, Gotelli 2000).
Our algorithm for creating presence/absence matriceswith conserved row and column totals was recursive inthe sense of Sanderson et al. (1998) and Brualdi andSanderson (1999). We started with a matrix of the samesize as the actual matrix but filled solely with zeros. Thealgorithm then randomly selected a column (C) and arow (R) and replaced the zero at that position with thenumber, ‘‘1’’, to represent the randomized occurrenceof species R in plot C. Once a particular plot waschosen to represent an occurrence of a given species,the algorithm prevented reselection of that same plotfor the species. The selection process was repeated untilevery species had been randomly placed in the samenumber of plots as it was originally observed in anduntil every plot had the same number of species as wasoriginally observed. In this way, each random matrixhad the same row and column totals as did the actualmatrix. Our algorithm eliminated matrices that wereduplicates of previously created matrices. A detaileddescription of the algorithm (including computer code)can be obtained from JAV.
A variety of metrics have been proposed to quantifythe nestedness of a species presence/absence matrix(reviewed in Wright et al. 1998). Many of these, how-ever, are incompatible with null matrices generated withconstrained row and column totals or are inappropriatefor matrices in which several sites (columns) contain thesame number of species (Cook and Quinn 1998, Brualdiand Sanderson 1999). Thus, we used discrepancy (d) toquantify nestedness (Brualdi and Sanderson 1999). Thediscrepancy of a matrix is calculated as d=�ki for i=1to K sites where ki is the number of 0’s in the first ri
positions of site or column i and ri equals the numberof species at site i. For instance, the ki of the matrix inFig. 1b are 1, 3, 2, 1, 1, 1, 1, 2, 2, and 1 which gives anobserved discrepancy of 15. Lower discrepancy valuesare suggestive of significant nestedness. The expecteddiscrepancy is obtained as the mean of a null distribu-tion of discrepancy values, and the significance of anobserved d can be assessed by the proportion of nullmatrices with discrepancy values less than the observedvalue.
Testing for differences among species: nestedness
We examined whether the 30 butterfly species differedin their relative contributions to overall nestedness. Inparticular, we were interested to see if nestedness dif-fered between low and high flying species or among thethree groups of adult habitat breadth. To measure thenestedness of each species, we used a modified
Wilcoxon rank-sum test as proposed by Simberloff andLevin (1985) and employed by Simberloff and Martin(1991), Kadmon (1995), Hecnar and M’Closkey (1997),and Fleishman and Murphy (1999). This is a two-grouptest in which one group consists of the 1’s and the othergroup consists of the 0’s for a species (row) of thepresence/absence matrix. The rank of either a 1 (pres-ence) or a 0 (absence) is obtained from the communitymatrix (Fig. 2), with the left-most column (i.e. plot)representing a rank of zero and the right-most columna rank of 25. To test the significance of each Wilcoxonscore and then compare among species, the scores werestandardized by being converted to z-scores (after Sokaland Rohlf 1995).
Testing for differences among species: patchdiscrimination
We also used Poisson regression to test whether thenumber of species occurring within old-field habitatpatches differed according to patch area, species’ forag-ing flight height (or adult habitat breadth), and theirinteraction (SAS PROC GENMOD, SAS Institute1996). These models provided a test of whether species’behaviors have a role in predicting species’ distributionswithin the fragmented field irrespective of an underly-ing nested structure. For example, a significant interac-tion effect would suggest that species are differentiallyaffected by patch size based on their behavioral re-sponses to patch size. We used the ESTIMATE state-ment (SAS Institute 1996) to assess the sign ofsignificant interaction terms. An assumption of thisregression approach is that overall species richness re-sponds linearly to patch size within the context of ourexperimental system, an assumption validated by Sum-merville and Crist (2001). Furthermore, Poisson regres-sion is a robust analysis technique even when speciesabundance data are not exactly Poisson (Jongman et al.1995), and we transformed our data to presence-ab-sence, as recommended by Jongman et al. (1995). Thus,our regression model included the main effects of patcharea as a continuous variable (df=1), behavioral clas-sification as a categorical variable (df=1 for flightheight; df=2 for adult habitat breadth), and theirinteractions (df=1 for flight height; df=2 for habitatbreadth).
Results
Testing for nestedness
Ordering of the observed presence/absence matrix withregard to column totals (i.e. species richness per plot)generally resulted in an ordering of patch sizes fromlargest to smallest (Fig. 2). Some variation in column
OIKOS 97:2 (2002) 199
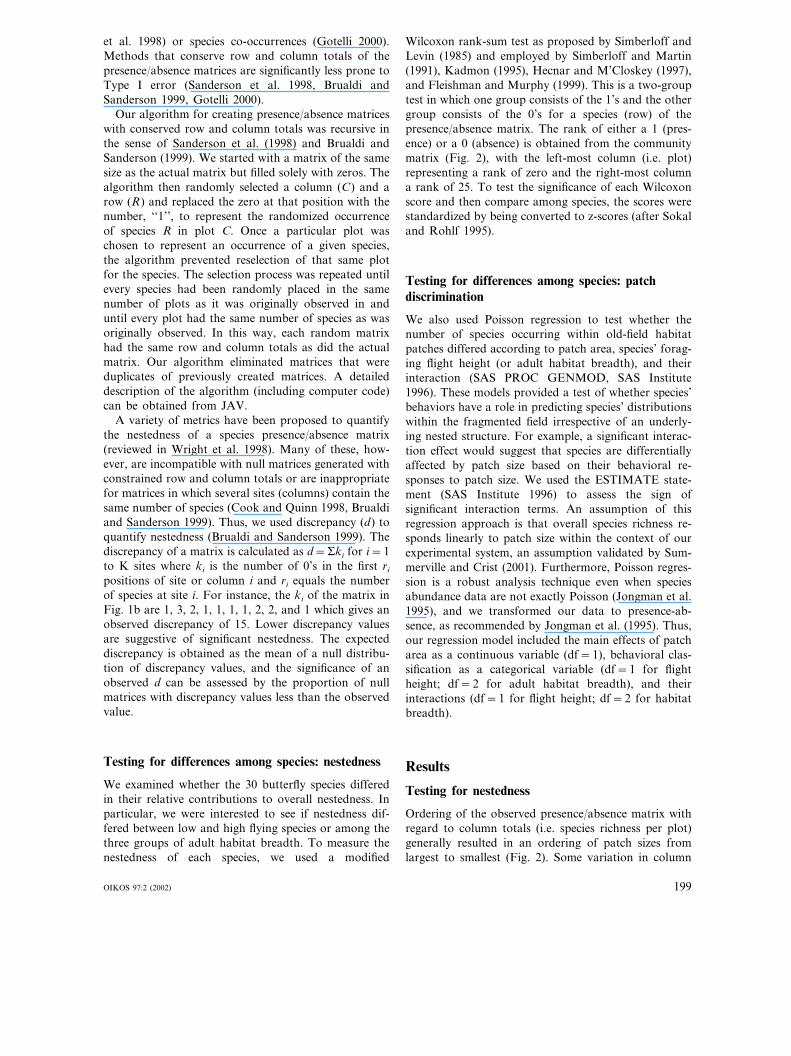
Fig. 3. The null distribution of discrepancy values obtainedfrom the random presence/absence matrices. The dashed lineshows the location of the actual discrepancy value.
Wilcoxon score was 1.82 for the low flyers and 1.93 forthe high flyers. There was considerable overlap in the95% confidence intervals of both groups; low flyers:1.38–2.26, and high flyers: 1.53–2.36. When groupedaccording to habitat breadth, the mean standardizedWilcoxon scores of the restricted (1.79), general (1.74),and ubiquitous (2.13) species were not significantlydifferent. The 95% confidence intervals of all threegroups were overlapping: restricted (1.30–2.28), general(1.17–2.31), and ubiquitous (1.60–2.66). Therefore,each group of species did not contribute disproportion-ately to the observed nestedness of the entire commu-nity. As with the high fliers, however, no restrictedspecies were present in the smallest habitat patches,suggesting that discrimination occurs largely becausethe very smallest patches are avoided.
Testing for differences among species: patchdiscrimination
Poisson regressions revealed that variation in the distri-bution of species was related to patch size. Whenanalyzed with respect to foraging flight height, the maineffect of patch size was highly significant (df=1; �2=9.95; P�0.005), because fewer species were found inthe smallest patches. The main effect of behavioralclassification was non-significant (df=1; �2=3.46;P�0.05), but there was a significant interaction be-tween patch size and behavioral classification (df=1;�2=5.99; P�0.015). Parameter estimates from themodel indicated that the species richness of high fliersincreased in larger patches.
When species were analyzed with respect to adulthabitat breadth, the results were similar. The maineffect of patch size was significant while the main effectof behavioral classification was not (patch size: df=1;�2=11.17; P�0.001, classification: df=2; �2=5.20;P�0.05). The interaction between patch size and be-
ordering was evident at intermediate patch sizes, espe-cially among the 135-m2 (60%) and 90-m2 (40%) plots,which occurred in several non-consecutive locationsacross the column array (Fig. 2). The null distributionof discrepancy contained values ranging from 45 to 62,with only 4.3% of the null matrices having discrepancyvalues less than 49 (Fig. 3). Therefore, the overallpresence/absence matrix of 30 butterfly species dis-tributed among 25 plots exhibited significant nestednesswhen compared to the random presence/absence ma-trices (P=0.043). Larger patches of habitat containedthe richer species assemblages, while the smallestpatches were the most species depauperate (Fig. 2).
Testing for differences among species: nestedness
In the overall presence/absence matrix, 19 of 30 but-terfly species contributed to the significant nestedness(P�0.05) as indicated by the standardized Wilcoxonscores (Table 1). Of these 19 species, 10 were low flyersand 9 were high flyers. The mean standardized
Table 1. Standardized Wilcoxon scores (z-scores) for low-flying and high-flying butterfly species. †P�0.05.
Low fliers High fliers
Species z-score P Species z-score P3.20W. egeremet 0.001†0.006†2.51E. comyntas
P. tharos 2.01 0.022† E. clarus 3.26 0.001†P. coras 2.97 0.001† S. calanus 2.31 0.010†
0.001†2.97 0.001† C. pegala alope 3.06P. themistocles0.005†2.41 0.008† S. melinus 2.59P. rapae0.016†2.15S. cybele0.019†2.07C. eurytheme0.056C. philodice 2.39 0.009† B. philenor 1.590.2790.59C. ladon0.018†2.09T. lineola
1.10P. origenes0.046† 0.1351.69P. catullus0.014†1.92 0.027† D. plexippusM. cymela 2.20
P. polyxenes 0.30 0.382 P. glaucus 0.83 0.203L. phlaes 1.40 0.080 P. hobomok 1.66 0.048†
0.048†1.66L. carinenta bachmanii0.1341.11P. zabulonA. logan 0.00 0.500 A. celtis 1.53 0.064E. claudia 1.53 0.064 V. cardui 1.25 0.106
200 OIKOS 97:2 (2002)
havioral classification was also significant (df=2; �2=8.12; P�0.02), suggesting that species whose adults arerestricted to specific microhabitats occurred more fre-quently in larger habitat patches. Similar responses ofhigh fliers and habitat restricted species were likely dueto dependence in the two behavioral classificationschemes. Species classified as high fliers also tended tobe habitat restricted (10 of 15 species), whereas speciesconsidered low fliers were predominantly ubiquitous orgeneral (12 of 15 species).
Discussion
Butterfly species foraging within an experimentally cre-ated network of patches conformed to a nested subsetstructure. As with the study of Fleishman and Murphy(1999), the overall nested pattern was not driven by anyparticular species attribute. High-flying species or habi-tat-restricted species, presumed to be more capable ofpatch discrimination, did not contribute to nestednessany more than did low-flying species. The absence ofstronger nestedness among discriminating species has amechanistic explanation: species subsets are not formedwhen there is universal avoidance of the smallest habi-tat remnants and all species are found only in thelargest remnants. Species must differ in their ability orwillingness to use resources in lower quality patches inorder for nestedness to exist. Thus, despite the interac-tion between discrimination ability and patch-size use,the nested subset pattern stems from a gradual loss ofindividual species from large to small habitat patches.In our study, a critical threshold in patch-size discrimi-nation may be indicated by the avoidance of 90-m2 and45-m2 patches by high fliers or habitat restricted spe-cies. This threshold is similar to that observed bySummerville and Crist (2001) for the effects of habitatfragmentation on patch occupancy by rare Lepi-doptera. We are unaware, however, of previous workthat shows that nested subsets of species may be ob-served at such fine spatial scales (i.e. within one field;but also see Worthen et al. 1998).
Our study also suggests that nestedness may be main-tained as a consequence of patch discrimination abili-ties. The tendency to discriminate among patches thatvary in habitat area differs among species and is likelyto be influenced by two factors: (1) perceptual rangeand responses to differences in habitat patches (Zollner2000) and (2) patch selection and preferences amongpatches of different sizes or quality (Worthen et al.1998). Studies of butterfly perception are limited, withmost focusing on the events surrounding host plantselection and oviposition (for a review, see Renwickand Chew 1994). At broader scales, evidence suggeststhat butterflies in flight cannot visually orient to a patch�80 m in the distance (Harrison 1989, Conradt et al.
2000) which is near the upper limit of our experimentalsystem. An individual’s ability to perceive a ‘‘land-scape’’ of patches, however, may also be affected by itsvantage point (Wiens and Milne 1989, Kotliar andWiens 1990). If so, species that fly high above thevegetation would be more likely to visualize the gradi-ent of available patches (i.e. resource distribution) andselect sites most suitable for nectaring or oviposition.Low-flying species (especially E. comyntas, P. tharos, P.coras, and P. themistocles, which rarely fly at heights�0.25–0.5 m; see Iftner et al. 1992) may be moreconstrained in their ability to evaluate differencesamong foraging sites; even a small patch might appearlarge to an individual immersed within the vegetation.Therefore, nestedness may be partly due to a range ofdiscriminating ability among species, resulting in biaseddistributions of some species and equiprobable distribu-tions of others.
We analyzed butterflies according to the reportedrange of adult habitat preferences; however, studies ofhost plant selection by butterflies frequently considerthe range of plant types (e.g. families) selected foroviposition as a surrogate for habitat or niche breadth(Renwick and Chew 1994). The ability to discriminateamong potential host plants clearly has evolutionaryconsequences, and recent experiments have demon-strated that species that are host-plant generalists havea large error rate when presented with choices amongfavorable and non-favorable host species (Bernays andWcislo 1994, Janz and Nylin 1997, Bernays 1998, Nylinet al. 2000). Thus, generalist butterflies apparently can-not accurately discriminate host plant quality. A similarphenomenon may apply to Lepidoptera foragingamong habitat patches: ubiquitous species need notdistinguish among habitat patches when foraging ifnearly any habitat will do. In contrast, habitat special-ists may be more adept at locating high quality habitat,and nestedness will be produced when habitat restrictedspecies have biased distributions. We observed such apattern in our old-field: restricted species were limitedto the larger patches; only ubiquitous species occurredin the smallest treatments. This pattern agrees with theexperimental results of Steffan-Dewenter and Tscharn-tke (2000), who noted that monophagous butterfly spe-cies were most diverse in unfragmented patches.
Together, these results suggest that fine-scale nested-ness of a foraging butterfly community was producedby (1) species that discriminate among patches andfavor large areas, and (2) species which either cannot ordo not select foraging sites based on area. Because wedid not test for the degree of nestedness in the butterflycommunity before experimental manipulation of theold field, we cannot unequivocally conclude that patchdiscrimination in response to fragmentation was thesole cause of the nested subset pattern. Regardless ofwhether the butterfly species were nested before ourexperiment, however, the behaviors of individual spe-
OIKOS 97:2 (2002) 201
cies clearly maintained the nestedness, suggesting thatthis pattern of species distribution is not a phenomenonuniquely observed across biogeographic scales drivenby extinction-colonization dynamics.
Another interesting and novel behavioral explanationfor nestedness at the scale of this study is that differ-ences in optimal foraging behavior among species maycreate the observed pattern of resource utilizationwithin the old-field. Optimal foraging could producenestedness if species differ in their cost of travelingbetween patches or in their perception of profitabilitywhile foraging within patches that differ in size, forcingsome species to restrict their activities to only thelargest habitat remnants (Spencer et al. 1996). Specieswith lower costs of searching or movement would bemore likely to occur ubiquitously within old-field rem-nants. In our system, high-flying butterflies may bemore apparent to avian predators when on the wing,rendering inter-patch movement a risky behavior andcausing high-flying species to spend most of their timeforaging in larger patches. Nestedness may also beexpected from resource matching as it occurs whenindividuals are foraging optimally (i.e. an ideal freedistribution); large patches may simply have a higherlevel of resources (e.g. oviposition sites; larval hostplant sources; nectar sources) than do small patches(Golden and Crist 1999).
Aside from the role of species behaviors in maintain-ing nestedness, the most parsimonious explanation fornestedness is passive sampling of the species pool bylarger plots (Connor and Simberloff 1979, Cutler 1994).We are currently examining whether nestedness can beproduced by the random occurrence of individualsamong patches of varying sizes, as in the randomplacement model of Coleman et al. (1982). Largerpatches of habitat could also have contained moremicrohabitats (Thomas and Hanski 1997), with suchmicrohabitats nested across the gradient of patch sizes(Calme and Desrochers 1999). The cover of floweringforbs, however, did not differ systematically with patcharea, nor did row and column effects from in the LatinSquare design influence butterfly distributions (Sum-merville and Crist 2001), indicating an overall similarityin habitat composition among the plots. Lepidopteraare remarkably sensitive to variation in habitat quality(Dennis and Eales 1997), however, so we do not com-pletely rule out the possibility that other habitat vari-ables may have contributed to the nestedness of thebutterfly species. At broader scales, habitat heterogene-ity does appear to be one of the most important factorsaffecting the distribution of species richness for butterfl-ies (Atauri and de Lucio 2001). Experiments that simul-taneously vary patch quantity and quality will berequired to rigorously separate these effects at the patchscale, and we note that all of the alternative hypothesesdiscussed above will require additional experimentationto adequately test.
In conclusion, our data lend additional support tothe notion that large resource patches should be valuedfor the maintenance of butterfly and skipper biodiver-sity. High flying, habitat restricted species appeared tobe the most significantly affected by variation in patchsize, and the presence of a nested subsets of species inthe manipulated old-field system may indicate that spe-cies rapidly respond to the quality of remaining habitat.These results also suggest that the behavioral responseto habitat loss is a potential causal mechanism fornestedness. Therefore, faunal relaxation may occur atmultiple scales: over broad scales of space and timethrough extinction-colonization dynamics of popula-tions, or at fine scales through foraging choices madeby individuals. Additional research into how speciesperceive variation among patches, how species chooseto occupy available habitats, and how movement af-fects multi-species turnover among patches (Sutcliffe etal. 1997, Debinski et al. 2001) is needed to connectmore explicitly fine-scale behavior with broad-scalepopulation and community dynamics.
Acknowledgements – Funding for this research was providedby grants from the Ohio Board of Regents and the MiamiUniversity Committee on Faculty Research. We thankHeather Summerville, Ryan Stander, and Sharmila Pradhanfor their assistance in the field. Daniel Simberloff, RobertRobbins, Chris Thomas, Bruce Patterson, Erica Fleishman,Eric Metzler, David Golden, David Gorchov, Henry Stevens,Sean Walker, and two anonymous reviewers provided manyinsightful comments and thoughtful discussion on the ideaspresented in this manuscript. Sean Walker, James Sanderson,and Ralph Selfridge contributed their expertise to our nullmodel algorithm and statistical analyses.
ReferencesAtmar, W. and Patterson, B. P. 1993. The measure of order
and disorder in the distribution of species in fragmentedhabitat. – Oecologia 96: 373–382.
Atauri, J. A. and de Lucio, J. V. 2001. The role of landscapestructure in species richness distribution in birds, amphibi-ans, reptiles, and lepidopterans in Mediterranean land-scapes. – Lands. Ecol. 16: 147–159.
Banks, J. M. 1998. The scale of landscape fragmentationaffects herbivore response to vegetation heterogeneity. –Oecologia 117: 239–246.
Bernays, E. A. 1998. The value of being a resource specialist:behavioral support for a neural hypothesis. – Am. Nat.151: 451–464.
Bernays, E. A. and Wcislo, W. T. 1994. Sensory capabilities,information processing, and resource specialization. –Quart. Rev. Biol. 69: 187–204.
Blake, J. G. 1991. Nested subsets and the distribution of birdson isolated woodlots. – Conserv. Biol. 5: 58–66.
Boecklen, W. J. 1997. Nestedness, biogeographic theory, andthe design of nature reserves. – Oecologia 112: 123–142.
Bolger, D. T., Alberts, A. C. and Soule, M. E. 1991. Occur-rence patterns of bird species in habitat fragments: sam-pling, extinction, and nested species subsets. – Am. Nat.137: 155–166.
Brualdi, R. A. and Sanderson, J. G. 1999. Nested speciessubsets, gaps, and discrepancy. – Oecologia 119: 256–264.
Calme, S. and Desrochers, A. 1999. Nested bird and micro-habitat assemblages in a peatland archipelago. – Oecologia118: 361–370.
202 OIKOS 97:2 (2002)
Coleman, B. D., Mares, M. A., Willig, M. R. and Hsieh, Y-H.1982. Randomness, area, and species richness. – Ecology63: 1121–1133.
Connor, E. F. and McCoy, E. D. 1979. The statistics andbiology of the species-area relationship. – Am. Nat. 113:791–833.
Connor, E. F. and Simberloff, D. 1979. The assembly ofspecies communities: chance or competition? – Ecology 60:1132–1140.
Conradt, L., Bodsworth, E. J., Roper, T. J. and Thomas, C.D. 2000. Non-random dispersal in the butterfly Maniolajurtina : implications for metapopulation models. – Proc.R. Soc. Lond. B. 267: 1505–1510.
Cook, R. R. 1995. The relationship between nested subsets,habitat subdivision, and species diversity. – Oecologia 101:204–210.
Cook, R. R. and Quinn, J. F. 1995. The influence of coloniza-tion in nested species subsets. – Oecologia 102: 413–424.
Cook, R. R. and Quinn, J. F. 1998. An evaluation of random-ization models for nested species subset analysis. – Oecolo-gia 113: 584–592.
Cutler, A. H. 1991. Nested faunas and extinction in frag-mented habitats. – Conserv. Biol. 5: 496–505.
Cutler, A. H. 1994. Nested biotas and biological conservation:metrics, mechanisms, and meaning of nestedness. –Landsc. Urban. Plan. 28: 73–82.
Debinski, D. M., Ray, C. and Saveraid, E. H. 2001. Speciesdiversity and the scale of the landscape mosaic: do scales ofmovement and patch size affect diversity? – Biol. Conserv.98: 179–190.
Dennis, R. L. H. and Eales, H. T. 1997. Patch occupancy inCoenonympha tullia (Muller 1764) (Lepidoptera: Satyri-nae): habitat quality matters as much as patch size andisolation. – J. Insect. Conserv. 1: 167–176.
Fleishman, E. and Murphy, D. D. 1999. Patterns and pro-cesses of nestedness in a Great Basin butterfly community.– Oecologia 119: 133–139.
Golden, D. M. and Crist, T. O. 1999. Experimental effects ofhabitat fragmentation on old-field canopy insects: commu-nity, guild, and species responses. – Oecologia 118: 371–380.
Gotelli, N. J. 2000. Null model analysis of species co-occur-rence patterns. – Ecology 81: 2606–2621.
Hanski, I., Pakkala, T., Kuussaari, M. and Lei, G. 1995.Metapopulation persistence of an endangered butterfly in afragmented landscape. – Oikos 72: 21–28.
Harrison, S. 1989. Long-distance dispersal and colonization inthe bay checkerspot butterfly, Euphydryas editha bayensis.– Ecology 70: 1236–1243.
Harrison, S., Murphy, D. D. and Ehrlich, P. R. 1988. Distri-bution of the bay checkerspot butterfly, Euphydryas edithabayensis : Evidence for a metapopulation model. – Am.Nat. 132: 360–382.
Hecnar, S. J. and M’Closkey, R. T. 1997. Patterns of nested-ness and species association in a pond dwelling amphibianfauna. – Oikos 80: 371–381.
Hill, J. K., Thomas, C. D. and Lewis, O. T. 1996. Effects ofhabitat patch size and isolation on dispersal by Hesperiacomma butterflies: implications for metapopulation struc-ture. – J. Anim. Ecol. 65: 725–735.
Hoekstra, H. E. and Fagan, W. F. 1998. Body size, dispersalability and compositional disharmony: the carnivore-domi-nated fauna of the Kuril Islands. – Divers. Dist. 4: 135–149.
Honnay, O., Hermy, M. and Coppin, P. 1999. Nested plantcommunities in deciduous forest fragments: species relax-ation or nested habitats? – Oikos 84: 119–129.
Iftner, D., Shuey, J., and Calhoun, J. 1992. Butterflies andskippers of Ohio. – Ohio Biol. Surv. Bull. New Ser., V9,N1.
Janz, N. and Nylin, S. 1997. The role of female searchbehavior in determining host plant range in plant feedinginsects: a test of the information processing hypothesis. –Proc. R. Soc. Biol. Sci. 264: 701–707.
Jones, R. E. 1977. Movement patterns and egg distribution incabbage butterflies. – J. Anim. Ecol. 46: 195–212.
Jongman, R. H. G., Ter Braak, C. J. F. and Tongeren, O. F.R. 1995. Data analysis in community and landscape ecol-ogy. – Cambridge Univ. Press.
Kadmon, R. 1995. Nested species subsets and geographicisolation: a case study. – Ecology 76: 458–465.
Kerr, J. T., Sugar, A. and Packer, L. 2000. Indicator taxa,rapid biodiversity assessment, and nestedness in an endan-gered ecosystem. – Conserv. Biol. 14: 1726–1734.
Kotliar, N. B. and Wiens, J. A. 1990. Multiple scales ofpatchiness and patch structure: a hierarchical frameworkfor the study of heterogeneity. – Oikos 59: 253–260.
Kuussaari, M., Nieminen, M. and Hanski, I. 1996. An experi-mental study of migration in the Glanville fritillary but-terfly Melitaea cinxia. – J. Anim. Ecol. 65: 791–801.
Leon-Cortes, J. L., Cowley, M. J. R. and Thomas, C. D. 2000.The distribution and decline of a widespread butterfly in apastoral landscape. – Ecol. Entomol. 25: 285–294.
Lomolino, M. V. 1996. Investigating causality of nestedness ofinsular communities: selective immigrations or extinctions?– J. Biogeogr. 23: 699–703.
Manly, B. F. J. 1995. A note on the analysis of speciesco-occurrences. – Ecology 76: 1109–1115.
Nylin, S., Bergstrom, A. and Janz, A. 2000. Butterfly hostplant choice in the face of possible confusion. – J. Insect.Behav. 13: 469–482.
Patterson, B. D. 1987. The principle of nested subsets and itsimplications for biological conservation. – Conserv. Biol.1: 323–334.
Patterson, B. D. 1990. On the temporal development of nestedsubset patterns of species composition. – Oikos 59: 330–342.
Patterson, B. D. and Atmar, W. 1986. Nested subsets and thestructure of insular mammalian faunas and archipelagos. –Biol. J. Linn. Soc. 28: 65–82.
Patterson, B. D. and Atmar, W. 2000. Analyzing speciescomposition in fragments. – In: Reinwald, G. (ed.), Iso-lated vertebrate communities in the tropics. Vol. 46. BonnZool. Monogr., pp. 9–24.
Pollard, E. 1988. Temperature, rainfall and butterfly numbers.– J. Appl. Ecol. 25: 819–828.
Pollard, E. and Yates, T. 1994. Monitoring butterflies forecology and conservation. – Chapman & Hall.
Renwick, J. A. A. and Chew, F. S. 1994. Oviposition behaviorin Lepidoptera. – Ann. Rev. Entomol. 39: 277–400.
Resetarits, W. J. 1989. Choise of oviposition site by Hylachrysoscelis : role of predators and competitors. – Ecology70: 220–228.
Sanderson, J. G., Moulton, M. P. and Selfridge, R. G. 1998.Null matrices and the analysis of species co-occurrences. –Oecologia 116: 275–283.
SAS Institute 1996. SAS for Windows: Release 6.12. – SASInstitute, Inc.
Schoener, T. and Schoener, A. 1983. Distribution of verte-brates on some very small islands. 1. Occurrence sequencesof individual species. – J. Anim. Ecol. 52: 209–235.
Sfenthourakis, S., Giokas, S. and Mylonas, M. 1999. Testingfor nestedness in terrestrial isopods and snails of Kykladesislands (Aegean archipelago, Greece). – Ecography 22:384–395.
Shreeve, T. 1994. Butterfly mobility. – In: Pullin, A. S. (ed.),The ecology and conservation of butterflies. Chapman &Hall, pp. 37–45.
Simberloff, D. and Levin, B. 1985. Predictable sequences ofspecies loss with decreasing island area-land birds in twoarchipelagoes. – N. Z. J. Ecol. 8: 11–20.
Simberloff, D. and Martin, J.-L. 1991. Nestedness of insularavifaunas: simple summary statistics masking complex spe-cies patterns. – Ornis. Fenn. 68: 178–192.
Sokal, R. and Rohlf, F. 1995. Biometry. – W. H. Freeman.Spencer, H. G., Kennedy, M. and Gray, R. 1996. Perceptual
constraints on optimal foraging: the effects of variationamong foragers. – Evol. Ecol. 10: 331–339.
OIKOS 97:2 (2002) 203
Steffan-Dewenter, I. and Tscharntke, T. 2000. Butterfly com-munity structure in fragmented habitats. – Ecol. Letters 3:449–456.
Stone, L. and Roberts, A. 1990. The checkerboard score andspecies distributions. – Oecologia 85: 74–79.
Summerville, K. S. and Crist, T. O. 2001. Effects of ex-perimental habitat fragmentation on patch use by butter-flies and skippers (Lepidoptera). – Ecology 82: 1360–1370.
Sutcliffe, O. L., Thomas, C. D. and Peggie, D. 1997. Area-de-pendent migration by ringlet butterflies generates a mixtureof patchy population and metapopulation attributes. –Oecologia 109: 229–234.
Telleria, J. and Santos, T. 1995. Effects of forest fragmenta-tion on a guild of wintering passerines: the role of habitatselection. – Biol. Conserv. 71: 61–67.
Thomas, C. D. 2000. Dispersal and extinction in fragmentedlandscapes. – Proc. R. Soc. Lond. B. 267: 139–145.
Thomas, C. D. and Hanski, I. 1997. Butterfly metapopula-tions. – In: Hanski, I. and Gilpin, M. (eds), Metapopula-tion biology. Academic Press, pp. 359–384.
Thomas, C. D. and Harrison, S. 1992. Spatial dynamics of apatchily-distributed butterfly species. – J. Anim. Ecol. 61:437–446.
Thomas, C. D. and Jones, T. M. 1993. Partial recovery of askipper butterfly (Hesperia comma) from populationrefuges: lessons for conservation in a fragmented land-scape. – J. Anim. Ecol. 62: 472–481.
Thomas, C. D. and Singer, M. C. 1987. Variation in hostpreference affects movement patterns within a butterflypopulation. – Ecology 68: 1262–1267.
Thomas, C. D., Baguette, M. and Lewis, O. T. 2000. Butter-fly movement and conservation in patchy landscapes. –In: Gosling, L. and Sutherland, W. (eds), Behaviour
and conservation. Cambridge Univ. Press, pp. 85–104.
Thomas, C. D., Thomas, J. and Warren, M. 1992. Distribu-tions of occupied and vacant butterfly habitats in frag-mented landscapes. – Oecologia 92: 563–567.
Thomas, C. D., Jordano, D., Lewis, O. T. et al. 1998. Butterflydistributional patterns, processes, and conservation. – In:Mace, G., Balmford, A. and Ginsberg, J. (eds), Conserva-tion in a changing world. Cambridge Univ. Press, pp.107–138.
Vallan, D. 2000. Influence of forest fragmentation on amphib-ian diversity in the nature reserve of Ambohitantely, high-land Madagascar. – Biol. Conserv. 96: 31–43.
Warburton, N. 1997. Structure and conservation of forestavifauna in isolated rainforest remnants in tropical Aus-tralia. – In: Laurance, W. and Bierregaard, R. (eds),Tropical forest remnants. Univ. of Chicago Press, pp.190–206.
Wiens, J. A. and Milne, B. T. 1989. Scaling of ‘landscapes’ inlandscape ecology, or landscape ecology from a beetle’sperspective. – Landsc. Ecol. 3: 87–96.
Worthen, W. B., Jones, M. T. and Jetton, R. M. 1998.Community structure and environmental stress: desiccationpromotes nestedness in mycophagous fly communities. –Oikos 81: 45–54.
Wright, D. H. and Reeves, J. H. 1992. On the meaning andmeasurement of nestedness of species assemblages. – Oe-cologia 92: 416–428.
Wright, D. H, Patterson, B. D., Mikkelson, G. et al. 1998. Acomparative analysis of nested subset patterns of speciescomposition. – Oecologia 113: 1–20.
Zollner, P. A. 2000. Comparing the landscape level perceptualabilities of forest sciurids in fragmented agricultural land-scapes. – Landsc. Ecol. 15: 523–533.
204 OIKOS 97:2 (2002)
Copyright © 2022 FDOKUMEN


![Patch Antenna[1]](https://static.fdokumen.com/doc/165x107/63158e4cc32ab5e46f0d5c89/patch-antenna1.jpg)