Monetary Economics (ECS3701) 26 - Transmission Mechanisms Of Monetary Policy

WILLIE J. BELTON, JR. RICHARD J. CEBULA
Georgia Institute of Technology
Atlanta. Georgia
Does the Federal Reserve Create Political Monetary Cycles?
This research examines the existence of a political monetary cycle that would help incumbents create political business cycles. Previous research in this area examined similar issues but employed a reaction function that forced the author to make a specific determination as to the policy target employed by the Federal Reserve across a given time period. The relevant literature reveals that if the Federal Reserve is attempting to optimize policy response to external shocks, then some mixture of interest rate and monetary aggregate targets is superior to either target individually. The model in this paper solves this problem through the use of the gr coefficient. The g, coefficient is derived from the underlying behavior of the Federal Reserve in its attempt to choose and employ the optimal policy targets necessary for offsetting unanticipated shocks to the economy. The change in gr is regressed on twelve electoral variables to determine the impact of presidential elections on Federal Reserve policy.
1. Introduction and Motivation While empirical evidence confirming the political business cycle is far
from overwhelming, its theoretical importance has led to continued empirical work.1 Most modem research in this area assumes that the goal of a politician is to get reelected and that monetary policy can enhance the probability of success through the process of “pumping up” the economy before an elec- tions If the positive effects of increased employment are felt before the negative effects of inflation, and if the electorate fails to account for future consequences of such policy, then the incumbent can gain by fooling the voters into crediting him with prosperity.
Most time series studies show that there is a relationship between the state of the economy and electoral outcomes3 While this relationship is generally weaker in cross-sectional studies, Kiewiet (1983) finds that voters’ perception of recent trends in the nation’s economy shift dramatically in response to changes in current economic performance. This shift is generally toward a more favorable assessment of the incumbent and support for his/her party, when current economic conditions are favorable.
Much of the literature in macroeconomics has been based on the notion that politicians and policymakers cannot systematically fool voters across
‘See Alt and Chrystal (1983, chap. 5). ‘Obviously, fiscal policy can also be used for this purpose. “See Kiewiet (1983) for a summary of such work.
Jownal of Macroeconomics, Summer 1994, Vol. 16, No. 3, pp. 461477 Copyright 0 1994 by Louisiana State University Press 01640704/94/$1.50
461

Willie J. Belton, Jr. and Richard J. Cebula
time; therefore, monetary policy cannot be used for the purpose of mis- leading the electorate across elections.4 Barro (1977), Sargent (1973), Sargent and Wallace (1975), and Lucas (1973) argue that anticipated policy changes will have little impact on economic activity if economic agents form their expectations rationally. However, Gordon (1982), Mishkin (1983), Hoelscher (1983), Barth, Iden and Russek (1985), and Cebula (1991) find empirically that even anticipated policy can indeed have genuine economic impact. Given that Barro’s (1977) study provides the only significant empirical ev- idence of consistent policy ineffectiveness, the weight of the evidence may well fall on the side of those who argue the contrary. Most of the empirical evidence suggests that it may indeed be possible for a president to engender a political business cycle through the use of monetary policy if he is able to get the cooperation of the monetary authorities.
To address the challenge offered by the rational expectations paradigm, a new class of models called “Partisan” models has emerged in the literature. Havrilesky (1988a), Alesina (1988), Hibbs (1987), Grier (1991), and Alesina and Sachs (1988) have all made major contributions in the development of the Partisan model structure. In these models, political parties with different preferences for equilibrium inflation rates compete electorally. Some mod- els, such as Hibbs (1987), assume that the difference in preferences comes from different points on an exploitable Phillips curve. Alesina (1987), Alesina and Sachs (1988), and Havrilesky (1988a) argue that political parties rep- resent constituencies that differ with respect to the distributional effects of inflation. Grier (1991) goes even further to show that the political affiliation of the chairperson of select senatorial committees may have a significant impact on monetary policy. The implication of this finding is significant since conventional wisdom suggests that congress has little impact on monetary policy.
Havrilesky (1988a; 198813) and White (1988) argue that one of the great myths regarding monetary policy is that the Federal Reserve is an indepen- dent, politically neutral, institution. White (1988) suggests that the Federal Reserve has at least three political incentives: (1) the Federal Reserve can expand its command over goods and services in the economy through the creation of seigniorage; (2) the Federal Reserve can enhance its economic well-being by spending its interest earnings rather than rebating them to the Treasury; and (3) the Federal Reserve can use its control over monetary policy to enhance the political prospects of Congress, the president and itself.
Havrilesky (1988a) reveals that there are indeed political signals flowing from the executive branch to the Federal Reserve and that these signals have
‘%ee Barro (1977) for an empirical account of the policy ineffectiveness proposition and Sargent (1973) and Sargent and Wallace (1975) for theoretical accounts.
462

Does the Federal Reserue Create Political Monetary Cycles?
a significant impact on monetary policy. In contrast, signals flowing from Congress, which supposedly has the greatest control over the Federal Re- serve, have no significant impact on monetary policy. Alesina and Sachs (1988) complement the work of Havrilesky (1988a) and White (1988) in that they develop a theoretical model suggesting that the Federal Reserve is political in nature. They examine empirically the difference in money growth across Democratic and Republican administrations and show that the real effects of new policies are stronger over the first two years of a new admin- istration than over the second two years, as predicted by traditional political business cycle theory. In contrast to most traditional research, Crier (1991) finds that there is significant congressional influence on U.S. monetary policy. He shows that changes in the leadership of the Senate Banking Committees are significantly correlated with money growth. More liberal leadership is associated with more rapid growth in the monetary base, whereas more conservative leadership leads to more restrained money growth.
Given that most of the recent research suggests that the Federal Reserve is political in nature, and may respond to political pressure from the executive and legislative branches, the purpose of this study is to examine the policy making process empirically to determine the significance of the pres- sure from the executive and legislative branches in the creation of the hypothesized political business cycle: that is, is there a political monetary cycle? Many other authors have examined this issue, but in most cases their models are restricted to a small range of outcomes.” Typically a study iden- tifies a policy target that the Federal Reserve uses to influence economic activity; most studies choose an interest rate, such as the Federal funds rate, and/or a monetary aggregate, such as nonborrowed reserves, and examine them independently for evidence of monetary cycles.
The theoretical literature on optimal policy targets suggests that the use of a combination of monetary and interest rate targets across time will produce outcomes that dominate those that result from employing either target individually.” The present study employs a model developed by Kar- amouzis and Lombra (1989) and Lombra (199I), one that allows explicit examination of the Feds desired shift between interest rate and monetary aggregate targets as the economy is exposed to various shocks across time. A presidential election can be thought of as an external shock, to which a politically motivated Fed may react by moving towards stabilizing interest rates. In this case, the Federal Reserve may not use policy to induce political
“See Beck (1987) and McCdum (1978).
‘Poole (1970) provided the initial work in this area and Woglom (1979) extends Poole’s results to include rational expectations and endogenous price levels, Sellon and Teigen (1982) give examples of how optimal policy options vary with the type of external shock to the economic system.
463

Willie J. Belton, Jr. and Richard J. Cebula
business cycles but may instead act to accommodate changes in economic activity that are caused by alterations in fiscal policy.7
Along with a more general policy rule, this study also examines explicitly the issue of Fed accommodation relative to inducement of political business cycles. Here, an empirical construct that allows explicit examination of the Feds desired policy path is estimated. This policy path can then be examined to determine whether the Federal Reserve creates political business cycles through the use of political monetary cycles or merely reacts to political business cycles created by other forces in the economy.
Unlike most other studies in the area, the present study brings together the impact of the legislative and executive influence on monetary policy. We also examine the interaction between unanticipated economic shocks and Federal Reserve policy. Federal Reserve reaction to economic shocks may vary depending on the timing of the next election. If reaction does indeed depend on the imminence of elections, an interaction term made up of unanticipated economic shocks and political monetary cycle variables should capture this behavior in the model.
The remainder of this study is organized as follows. Section 2 offers a model of the Federal Reserve’s policy process. This model is employed to estimate the policy rule that is used to determine the impact of presidential elections on Fed policy behavior. Section 3 derives the empirical model and uses this formulation to examine the impact of twelve electoral variables on Federal Reserve policy. The final section of the paper attempts to reconcile the empirical findings with Federal Reserve behavior across the 1974 to 1983 time interval. This particular time period was chosen because internal data on money growth targets became available only after the Federal Reserve started reporting specified ranges of money growth to Congress in the early 1970s. The time interval is not extended past 1983:iv because the Federal Reserve de-emphasized Ml growth targets in favor of M2 targets after October 1982.
2. The Federal Reserve’s Policy Process The literature on the optimal policy targets has its roots in a seminal
paper by Poole (1970). Employing a simple IS-LM stochastic model, he shows that in the case of a non-zero disturbance term, the optimal policy target, that is, the choice between interest rates and monetary targets, depends on the type of disturbance. For example, the optimal reaction to a
‘Beck (1987) examines the accommodation issue through the use of a money growth reaction function and finds that it is likely that the Federal Reserve does move to accommodate fiscal action across elections.
464

Does the Federal Reserve Create Political Monetary Cycles?
money demand shock is an “interest rate constant” policy. Conversely, the optimal response to a spending shock is a “money stock constant policy.“*
The general implication of Poole’s (1970) results is that the relative effectiveness of money stock targets will increase as the variance of unan- ticipated spending disturbances rises relative to the variance of unanticipated changes in the demand for money. Movement of variances in the opposite direction, that is, the variance of the demand for money rises relative to spending variance, will enhance the effectiveness of interest rate targets. Poole (1970) argues that neither of these variances will be zero; therefore, some combination of money stock and interest rate targets will always dom- inate outcomes that employ either process exclusively.
Lombra (1991) argues that most of the research on the conduct of monetary policy and the available data from the internal workings of the policy process suggest that the constrained optimization problem solved by policymakers can be best represented by an interest rate rule. Lombra (1991) suggests that the Feds policy rule can be best represented by the following interest rate rule:
rt = go + glt(Mt - MT) ) (1)
where r, is a short-term rate of interest in period t, such as the Federal funds rate; Mt is actual money growth in period t; and @ is the Feds target for money growth in period t, given the ultimate objectives of high employment and price stability. The parameter g, captures the interest elasticity of money growth deviation from its target level. Here, if the Fed wants to engage in money growth targeting, it allows g, to become large. In effect, unanticipated changes in money growth bring a large interest rate response. Conversely, when interest rate targets are used, g, becomes small, as unexpected changes in money growth produce small changes in the rate of interest.
Using quarterly data, fitting an equation similar to (8) over the I974:i to 1983:iv period, and regressing the federal funds rate on the lagged federal funds rate, and the lagged difference between actual growth rates of money stock, M,, and the targeted growth rate of Mf, yields a time series of gl.s The fitted equation was estimated using the TVARING procedure with the Kalman filter algorithm in RATS.rO
“See Sellon and Teigen (1982). 9The partial adjustment specification, that is, the lagged federal funds rate, is employed
because of the substantial evidence that indicates that the Fed believes that there is substantial cost associated with rapid adjustment of the federal funds rate. (See Lombra and Struble 1979 and Hoelscher 1983) Target growth rates of M, are available for the period 1973:i to 1983:iv. Lombra (1991) and Karamouzis and Lombra ( 1989) estimated equations similar to ( 17) over the lS7%1983 period.
r’“gr” is assumed to follow a first-order Markov process of the form grr = gIt- r + cr. Iombra
465
Willie J. Belton, Jr. and Richard J. Cebula
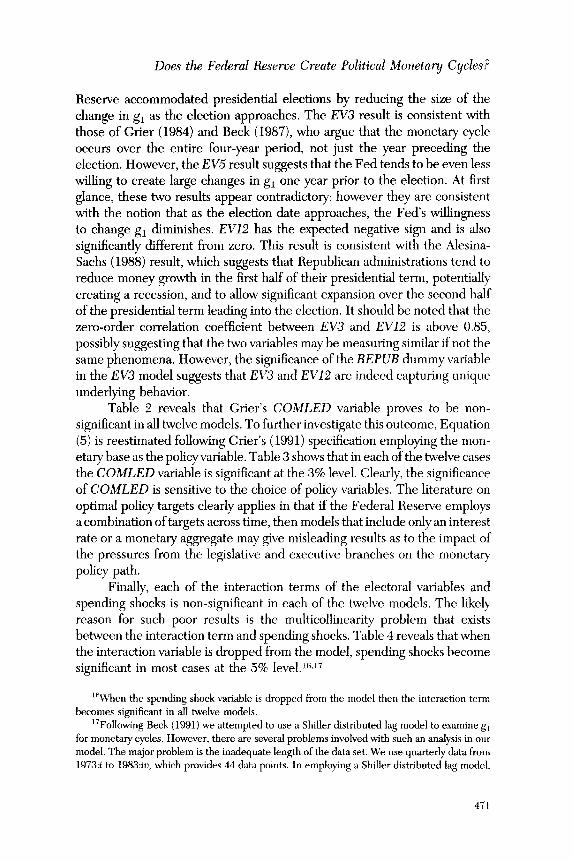
3. Elections and the Fed Policy Rule The Federal Reserve’s policy response to shocks to the economy will
be reflected in changes in the g, coefficient across time. The work by Poole (1970) and others suggests that the Feds response to shocks in the economy should depend on the relative size of money demand and spending variances. Lombra (1991) reveals that the Fed does indeed respond to spending and velocity shocks across time. He estimates the following model:
4, = PlSL1+ P2VSt-1 ) (2)
where Agu is the change in the time-varying parameter from Equation (l), SS represents spending shocks and VS represents velocity shocks.11 If pres- idential elections can be thought of as just another shock to the system, then it is possible to extend Lombra’s formulation to examine whether the Federal Reserve generates political monetary cycles in response to or to induce political business cycles. To that end, Equation (2) must be respecified to include an electoral variable. The following equation can be estimated:
Aglt = Q,SS,-, + S&KS-, + &-2,EV, , (3)
where EV is a proxy for several electoral variables, which are discussed in detail below.
McCallum (1978) and Allen (1986) develop ten different electoral variables that can be employed in regression equations to capture the elec- toral phases of money growth that are implied by the Nordhaus (1975) theory of political business cycles. 12 The most straight-forward specification has the value of the variable rising linearly for the first eight quarters after a pres- idential election, signifying a monetary tightening, and falling over the en-
Note cont. from page 465 (1991) and Karamouzis and Lombra (1989) argue that this result is not sensitive to the initial- ization of the procedure, the use of first difference specification, to logarithmic transformations, or the inclusion of other variables.
“Lombra (1991) employs information contained in internal documents (Greenbook and Bluebook) produced by the Federal Reserve to develop proxies for velocity and spending shocks. The difference between the “Feds” forecast of nominal GNP, made in the first quarter of each month, and actual GNP in the current period is used to calculate the forecast error. The absolute forecast error is averaged over a four quarter period. The resulting mean absolute error is lagged one period and employed as the spending prosy.
A similar process is carried out for identifying the portfolio shocks. More specifically, the money growth target (Ml) obtained from the “Feds” internal documents is used along with nominal GNP forecast to derive a “Fed’ forecast of velocity. The difference between the forecast and actual velocity is employed as the portfolio shock.
“Nordhaus (1975) suggests that incumbents stimulate the economy close to election time in order to increase the chance of reelection. At the beginning of the new term, inflationary effects of preelection expansion are eliminated with a recession.
486

Does the Federal Reserve Create Political Monetary Cycles?
TABLE 1. Electoral Variables
EVl 12 3 4 5 678 7 6 5 4 3210 EV2 1 2 3 4 5 6 7 8 9 10 11 12 9 6 3 0 EV3 15 14 13 12 11 10 9 8 7 6 5 4 3210 EV4 2 3 4 5 6 7 8 9 10 11 12 13 14 7 0 1 EVS 1 1 1 1 1 111 11 1 10000 EV6 1 1 1 1 1 111 11 11 1 0 0 1 EV7 1 1 1 1 1 111 11 1 10001 EV8 1 1 1 1 0 001 11 11 0 0 0 1 EV9 1 1 1 1 1001 11 11 1 0 0 1 EVlO 12 3 4 3 210 12 3 4 3210 EVll 15 14 13 12 11 10 9 8 8 8 8 8 8888 EV12 8 8 8 8 8 888 7 6 5 4 3210
suing eight quarters leading up to the next election, reflecting a monetary expansion. These variables represent the political constraint imposed on the Federal Reserve as it tries to minimize the hypothesized quadratic loss function of relevant economic variables in the face of an upcoming election. Implicit in this process of course is the notion that the incumbent wants to maximize the probability of being reelected.
Table 1 provides the empirical description of the variable discussed above and eleven other specifications of the electoral variables. If a president prefers lower nominal interest rates just prior to an election, money growth should increase two to four quarters before the event, as shown by EV2 and EV4-EV7. EV8, EV9, and EVlO represent both the two-year congressional cycle and the four-year presidential cycle. EV3 assumes that the Federal Reserve accommodates presidential actions by allowing the supply of money to grow over the entire presidential term but immediately contracts money growth in the quarter following the election. EVll and EV12 reveal the phases of money growth implicit in Partisan models.13 This model suggests that the real effect of policy is stronger during the first eight quarters after a presidential 1 ti e ec on than during the eight quarters prior to an election. EVll captures the sequence of events for Democratic administrations, which tend to increase money growth more rapidly over the first half of a presi- dential term than over the second half of the term. EV12 reflects Republican
‘3tiesina and Sachs (1988) assume that different political parties represent different con- stituencies that have different preferences over the average rate of inflation, and predict lower money growth under Republican administrations. EVll and EV12 captures the hypothesized behavior of Democratic and Republican administration respectively.
467

Willie J. Belton, Jr. and Richard J. Cebula
tendencies that are the reverse of the Democrats; that is, money growth is stronger over the second half of the term rather than the first half.
To determine whether the Federal Reserve is responsible for creating political business cycles through the use of monetary policy, the timing of policy changes relative to outcomes is examined. As Friedman (1960; 1963; 1968) has argued for many years, “monetary policy affects the economy with long and variable lags.” If the Fed induces political business cycles through monetary policy, then policy changes must occur before the actual stimu- lation in the economy is needed. For example, if a president prefers to have unemployment falling during the election quarter, the economy must be exposed to a monetary stimulus two to three quarters before the election. However, if the Federal Reserve is in the business of accommodating cycles generated through other means, monetary policy will react passively.
The variables in Table 1 are, for the most part, of the inducing variety. EVI-EV2, EV4-EVIO, and EV12 all show money increasing at various period lengths before an election. Conversely, EV3 assumes that money growth increases over the entire period and contracts only immediately after a presidential election. The contraction is short-lived, as money is allowed to grow over the next presidential term. EVll shows money growth increasing over the first half of the presidential term and remaining stable thereafter. Policy behavior reflected in this variable should produce expansion over the first two years of a presidential term but little change in economic activity over the eight-quarter period leading to a presidential election.
Havrilesky (1988b) argues that an administration may use fiscal and regulatory shocks to which the Federal Reserve responds, thus indirectly forcing the Fed to create monetary cycles that ultimately help to produce political business cycles; that is, spending and velocity shocks may be a function of electoral variables. To capture such behavior, a multiplicative interaction term is added to Equation (3). The interaction terms are the product of each of the election variables in Table 1 and spending shocks, SS. In effect, twelve interaction terms are developed and the following model is estimated employing each term individually:
Aglt = Q,SS,-, + C12KQ1 + Q,EV, + Q(EV,)(SS,-,) . (4)
As observed earlier, Grier (1991) reveals that the behavior of the monetary authorities is indeed influenced by congress. Grier (1991) examines the ADA (Americans for Democratic Action) scores for the chairperson of each of three key senatorial committees. The committees are the Senate Banking Committee, the Financial Institutions Subcommittee, and the Pro- duction and Stabilization Committee. As ADA scores become higher, sen- ators systematically lose corporate contributions and gain labor contributions. According to Crier’s model a lo-point increase in the ADA score raises labor
468

Does the Federal Reserve Create Political Monetary Cycles?
contributions by $10,000 and lowers corporate PAC giving by $11,000. Clearly, there is economic content to ADA scores. Grier (1991, 211-12) argues that “if voter’s preferences affect interest group contributions, then the sharp split between business and labor PAC behavior is evidence that low ADA senators represent a distinctly different constituency than do their high ADA colleagues.” Grier calculates the average ADA score for the chairper- sons of the three senatorial committees across the 1957 to 1984 time period. He then employs this variable in a Federal Reserve reaction function, where monetary base is the policy variable. Grier (1991) finds that the average ADA score explains a significant portion of the variation of monetary base across time.
In this study, we employ Grier’s (1991) measure of congressional influence. The ADA scores for the chairperson of the Senate Banking Com- mittee, the Financial Institutions Subcommittee, and the Production and Stabilization Committee are averaged over the 1973 to 1984 time period. We also use a dummy variable for Republican administrations in models that employ EVI-EVlO. Grier (1991) argues that Alesina and Sachs (1988) as- sume that different political parties represent different constituencies that have different preferences regarding the average rate of inflation, and predict lower money growth under Republican administrations. Models that employ EVll and EV12 do not use the dummy variable since these variables explicitly capture differences in behavior across Democratic and Republican admin- istrations. The average value of the ADA scores across committees, which we refer to as COMLED and the dummy variable REPUB, are included in the following equation:
A& = QISS,-, + i22VS,-1 + Q,EV, + R,(EV,)(SS,-,) + QJCOMLED,-,) + Q,(REPUB,) , (5)
where the only new variables in the model are COMLED, which Grier (1991) suggests be lagged two periods, and the dummy variable for Republican administrations, REPUB.
Equation (5) is estimated for each of the twelve election variables and the twelve interaction terms over the 1974:i to 1983:iw time interval.14 Table 2 provides the results for all twelve regressions. Variables EVl, EV2, EV4, and EVG-EVll are not significantly different from zero in their respective models.15 However, EV3 and EV5 are significant and reveal that the Federal
‘4This time period is employed because Federal Reserve data on money growth targets became available starting in 1973. The Federal Reserve de-emphasized Ml in the early 1980s. Given these two boundaries, the best data set possible was selected.
15The Carter administration represents the only Democratic administration which is cap- tured in this study. Given the small sample problem, the coefficient associated with EVll should be interpreted with care.
469

TABL
E 2.
Fe
dera
l R
eser
ve’s
Pol
icy
Rul
e an
d El
ecto
ral
Varia
bles
: Es
timat
ion
Inte
rval
:197
4:i
to 1
983:
iv
Coe
ffici
ents
Q
l Q
2 Q
3 Q
4 Q
5 n6
D
.W.
R2
2 D
epen
dent
El
ecto
ral
Varia
ble
Varia
ble
43
4%
43
41
43
43
43
41
4%
43
43
43
EV
l
EV2
EV3
EV4
EV5
EV6
EV7
EV8
EV9
EV
lO
EV
ll
EV12
0.07
8 0.
w
0.06
7 (1
.19)
0.
06
(1.4
1)
0.07
1 (1
.23)
0.
085
(1.7
1)
(I%)
0.08
4 (1
.51)
0.
075
(1.4
1)
0.10
3 (2
.02)
" 0.
082
(1.3
9)
0.07
3 (1
.33)
0.
087
(1.7
7)
-0.0
85
-0.2
91
(-2.
74)*
(-
0.09
) -
0.08
6 -0
.009
(-
2.87
)*
(-0.
38)
-0.0
7 -0
.05
(-2.
73)*
(-
2.61
)*
-0.0
86
-0.0
13
(-2.
84)*
(-
0.65
) -0
.087
-0
.49
(-3.
09)*
(-
2.50
)"
-0.0
84
-0.1
9 (-
2.71
)*
(-1.
02)
-0.0
84
-0.2
2 (-
2.73
)*
(-1.
15)
-0.0
83
-0.2
0 (-
2.73
)*
(-1.
05)
-0.0
89
-0.1
6 (-
3.09
)*
(-1.
34)
-0.0
86
-0.1
05
(-2.
83)"
(-
1.35
) -0
.058
-0
.034
(-
1.82
) (-
1.85
) -0
.83
-0.0
7 (-
2.99
)"
(-2.
62)"
(Et)
0.00
5 (0
.73)
0.
008
(1.5
0)
0.00
5 (0
.82)
0.
09
(1.6
8)
0.02
(0
.50)
0.
035
(0.6
6)
0.05
(0
.93)
0.
03
(0.8
5)
0.02
(1
.07)
0.
002
(0.3
8)
0.01
1 (1
.44)
-0.0
002
(-0.
113)
-0
.000
02
(-0.
02)
0.00
2 (1
.20)
0.
0000
8 (0
.049
) 0.
001
(0.9
7)
0.00
04
(0.2
4)
(8:y
0.
0001
(0
.09)
-0
.000
1 (-
0.09
6)
0.00
05
(0.2
9)
0.00
2 (1
.24)
0.
002
(1.3
1)
0.09
(1
.02)
0.
09
(1.1
3)
0.16
(2
.14)
" 0.
96
(1.1
1)
0.12
(1
.61)
0.
11
(1.3
1)
0.12
(1
.41)
0.
11
(1.3
0)
0.10
5 (1
.22)
0.
12
(1.3
5)
1.64
1.70
1.88
1.64
1.80
1.70
1.73
1.70
1.7
1.60
1.64
1.80
0.14
0.14
0.37
0.14
0.30
0.16
0.17
0.15
0.17
0.17
0.26
0.34
NOTE
: t-s
tatist
ic in
pare
nthes
es.
* sig
n&an
t at
the
0.05
level.
Does the Federal Reserve Create Political Monetary Cycles?
Reserve accommodated presidential elections by reducing the size of the change in g, as the election approaches. The EV3 result is consistent with those of Grier (1984) and Beck (1987), who argue that the monetary cycle occurs over the entire four-year period, not just the year preceding the election. However, the EV5 result suggests that the Fed tends to be even less willing to create large changes in g, one year prior to the election. At first glance, these two results appear contradictory; however they are consistent with the notion that as the election date approaches, the Feds willingness to change g, diminishes. EV12 has the expected negative sign and is also significantly different from zero. This result is consistent with the Alesina- Sachs (1988) result, which suggests that Republican administrations tend to reduce money growth in the first half of their presidential term, potentially creating a recession, and to allow significant expansion over the second half of the presidential term leading into the election. It should be noted that the zero-order correlation coefficient between EV3 and EV12 is above 0.85, possibly suggesting that the two variables may be measuring similar if not the same phenomena. However, the significance of the REPUZ? dummy variable in the EV3 model suggests that EV3 and EV12 are indeed capturing unique underlying behavior.
Table 2 reveals that Crier’s COMLED variable proves to be non- significant in all twelve models. To further investigate this outcome, Equation (5) is reestimated following Grier’s (1991) specification employing the mon- etary base as the policy variable. Table 3 shows that in each of the twelve cases the COMLED variable is significant at the 3% level. Clearly, the significance of COMLED is sensitive to the choice of policy variables. The literature on optimal policy targets clearly applies in that if the Federal Reserve employs a combination of targets across time, then models that include only an interest rate or a monetary aggregate may give misleading results as to the impact of the pressures from the legislative and executive branches on the monetary policy path.
Finally, each of the interaction terms of the electoral variables and spending shocks is non-significant in each of the twelve models. The likely reason for such poor results is the multicollinearity problem that exists between the interaction term and spending shocks. Table 4 reveals that when the interaction variable is dropped from the model, spending shocks become significant in most cases at the 5% level.16,‘7
‘“When the spending shock variable is dropped from the model then the interaction term becomes significant in all twelve models.
“Following Beck (1991) we attempted to use a Shiller distributed lag model to examine g, for monetary cycles. However, there are several problems involved with such an analysis in our model. The major problem is the inadequate length of the data set. We use quarterly data from 1973:i to 1983:io, which provides 44 data points. In employing a Shiller distributed lag model,
471

TABL
E 3.
M
onet
ary
Base
Pol
icy
Rul
e an
d El
ecto
ral
Varia
bles
: Es
timat
ion
Inte
rvak
1974
:i to
198
3:iv
Coe
ffici
ents
f4
f&
I Q
L,
Qa
QL,
sz
, D
.W.
p**
2 D
epen
dent
El
ecto
ral
Varia
ble
Varia
ble
AMB
AMB
AMB
AMB
AMB
AMB
AMB
AMB
AMB
AMB
AMB
AMB
EV
l
EV2
EV3
EV4
EV5
EV6
EV7
EV8
EV9
EV
lO
EV
ll
EV12
0.16
0.
88
(0.3
4)
(3.3
6)”
0.18
0.
91
(0.3
9)
(3.3
7)”
0.33
0.
74
(0.7
1)
(2.5
3)”
0.17
0.
91
(0.3
5)
(3.6
8)*
0.31
0.
78
(0.6
7)
(2.8
1)”
0.17
0.
84
(0.3
4)
(3.1
0)”
0.24
0.
80
(0.5
1)
(2.8
8)”
0.24
0.
82
(0.5
3)
(3.0
9)*
0.07
0.
86
(0.1
4)
(3.1
0)”
0.14
0.
82
(0.3
0)
(2.9
7)*
0.05
0.
74
(0.1
0)
(2.6
0)*
0.20
0.
89
(0.4
1)
(3.4
2)”
0.63
(1
.53)
0.
49
(2.0
8)”
0.17
(0
.98)
0.
38
(2.0
6)”
2.94
(1
.62)
2.
41
(1.5
1)
2.25
(1
.33)
(f::) 0.91
(0
.97)
0.
73
(1.1
7)
0.17
(1
.45)
0.
12
(0.8
7)
-0.1
8 0.
05
(-1.8
1)
(3.0
5)
-0.1
3 0.
05
(-2.4
0)”
(3.2
5)”
-0.0
2 0.
042
(-0.4
1)
(2.1
5)”
-0.1
1 0.
05
(-2.2
7)*
(3.3
6)*
-0.6
3 0.
04
(-1.2
9)
(2.3
7)”
-0.5
3 0.
05
(-1.1
6)
(2.8
8)h
-0.3
3 0.
041
(-0.7
2)
(2.1
9)*
-0.6
3 0.
05
(-1.4
0)
(2.9
5)*
0.00
9 0.
047
(0.0
4)
(2.6
1)”
-0.1
0 0.
04
(-0.6
3)
(2.6
3)*
-0.0
2 0.
05
(-0.4
8)
(3.1
3)*
-0.0
6 0.
06
(-1.0
5)
(3.8
9)”
0.31
(0
.31)
0.
38
(0.4
2)
-0.2
3 (-0
.20)
0.
39
(0.4
2)
-0.1
5 (-0
.14)
-0
.72
(0.7
0)
-0.3
1 (-0
.28)
-0
.20
(-0.2
0)
-0.6
35
(-0.0
5)
-0.1
0 (-0
.09)
1.97
1.70
2.03
2.00
2.02
1.93
1.86
1.91
1.87
1.94
1.86
1.86
0.34
(1
.84)
0.
25
(1.4
0)
0.46
(2
.74)
0.
26
(1.4
3)
0.41
(2
.40)
0.
35
(2.0
4)
(i::) 0.35
(2
.03)
0.
47
(2.7
7)
0.45
(2
.58)
0.
39
(2.4
2)
0.39
(2
.45)
NOTE
: t-s
tatis
tic
in pa
rent
hese
s. *
signi
fican
t at
th
e 0.
05
leve
l. **
In
dica
te
corre
ction
fo
r se
rial
corre
latio
n wa
s ne
cess
ary.

TABL
E 4.
Fe
dera
l Re
serv
e’s
Polic
y Ru
le an
d El
ecto
ral
Varia
bles:
Estim
atio
n Zn
terv
al:1
974:
i to
19
83:iv
Coe
ffici
ents
Dep
ende
nt
Varia
ble
Elec
tora
l Va
riabl
e
43
41
43
4%
41
41
43
43
43
3 41
EVl
EV2
EV3
EV4
EV5
EV6
EVi’
EV8
EV9
EVlO
EVll
EV12
0.09
-0
.088
0.
003
-0.0
005
(1.6
2)
(-2.9
2)”
(0.1
8)
(-0.3
1)
0.08
-0
.089
0.
006
-0.0
004
(1.5
3)
(-3.0
6)”
(0.5
3)
(-0.3
1)
0.09
-0
.09
-0.0
2 0.
001
(2.2
7)”
(-3.5
2)*
(-3.1
3)”
(1.1
1)
0.08
8 -0
.09
0.00
1 -0
.000
4 (1
.63)
(-3
.05)
” (0
.13)
(-0
.26)
0.
11
-0.0
9 -0
.19
o.oo
o9
(2.4
2)”
(-3.5
7)*
(-2.1
5)”
(0.6
1)
0.10
-0
.09
-0.1
1 0.
0002
(2
.09)
* (-3
.12)
* (-1
.03)
(0
.14)
0.
10
-0.0
91
-0.1
1 0.
0004
(2
.03)
” (-3
.15)
” (-1
.12)
(0
.25)
0.
09
-0.0
89
-0.0
3 -0
.000
2 (1
.99)
” (-3
.04)
* (-0
.50)
(-0
.14)
0.
105
-0.0
91
-0.0
9 -0
.000
1 (2
.08)
” (-3
.14)
” (-1
.05)
(-0
.10)
0.
10
-0.0
93
-0.0
3 -0
.003
(2
.05)
” (-3
.19)
* (-0
.80)
(-0
.20)
0.
09
- 0.
065
-0.0
2 0.
002
(2.0
6)*
(-3.0
6)
(-1.3
8)
(1.2
3)
0.11
-0
.097
-0
.03
0.00
2 (2
.54)
” (-3
.65)
* (-2
.72)
” (1
.16)
0.09
(1
.12)
0.
10
(1.1
7)
0.16
(2
.00)
” 0.
10
(1.1
5)
0.13
(1
.59)
0.
11
(1.3
1)
0.12
(1
.39)
0.
10
(1.2
1)
0.10
6 (1
.25)
0.
10
(1.2
0)
1.60
1.62
1.76
1.60
1.71
1.70
1.71
1.66
1.7
1.60
1.70
1.70
0.15
0.15
0.35
0.15
0.26
0.17
0.18
0.15
0.18
0.17
0.28
0.31
NOTE
: t-s
tatist
ic in
pare
nthes
es.
* sig
nifica
nt at
the
0.05
level.

Willie J. Belton, Jr. and Richard J Cebula
4. Concluding Remarks The motivation for this research was to examine the existence of a
political monetary cycle that would help incumbents create political business cycles. Previous research in this area examined similar issues but employed a reaction function that forced one to make a specific determination as to the policy target employed by the Federal Reserve across a given time period. The theoretical literature on optimal policy targets reveals that if the Federal Reserve is attempting to optimize policy response to external shocks, then some mixture of interest rate and monetary aggregate targets is superior to either target individually. The model in this paper addresses this issue through the use of the g, coefficient. The g, coefficient is derived from the underlying behavior of the Federal Reserve in its attempt to choose and employ the optimal policy targets necessary for offsetting unanticipated shocks to the economy.
Most of the previous research other than Grier (1991) suggests that congress has little influence on Fed policy. The present research has ad- dressed this issue in a general framework that allows for both congressional and executive branch influence. The results of our investigation suggest that the choice of policy variables, that is, money growth versus interest rate targets, has a significant impact on whether one finds congressional influence or the lack thereof. The policy variable employed in this study, g,, is more general than those used in previous research and the results suggest that congress may influence money growth but may have little influence over the ultimate policy outcomes.ls
The issue of whether an administration employs unanticipated changes in fiscal policy to force the Feds hand as elections approach was also ex- amined. However, no clear conclusion can be drawn from the results because of significant muliticollinearity problems.
Finally, of the twelve electoral variables, only EV3, EV5, and El712 were shown to have a significant impact on the policy path. The EV12 model suggests that there is indeed some difference in the policy path under Democratic and Republican administrations. However, this result should be interpreted with care since the available data set spanned only one Demo-
Note cont. from page 471 a 16 quarter lag is needed, which is the length of a presidential term, so that the degrees of freedom associated with the regression become extremely low. Given the small number of degrees of freedom, the results are unreliable. Nevertheless, we note that the Shiller lag results are consistent with Beck’s (1991) finding that no monetary cycle exists in the policy instrument.
‘me Federal Reserve has two types of policy targets at its disposal, interest rates and monetary aggregates. The Fed can offset the policy impact of one target by altering the other given the relationship between money growth and the rate of interest.
474

Does the Federal Reserve Create Political Monetary Cycles?
cratic administration, The model for EV3 suggests that during elections, across the 1974 to 1983 time interval, the Federal Reserve behaved in an accommodating mode. However, the model for EV5 reveals that the Feds willingness to change g, diminished as the election approached.
Given that the Federal Reserve may derive much of its power from the perception that it is nonpartisan, making nonpartisan, technical decisions, it is not surprising that concrete empirical evidence of political monetary cycles is in short supply. The finding that the Fed behaves in an accommodating fashion may be all the evidence available given the significant contact be- tween the Fed and the executive branch and the impact of changing sen- atorial committee heads.lg Havrilesky’s (1988a) recommendation for re- search into the relationship among fiscal and regulatory shocks, monetary policy and presidential election cycles may provide the only clear avenue for confirming the presence or absence of monetary election cycles
Received: August 1992 Final version: November 1993
References Alesina, Alberto. “Macroeconomic Policy in a Two-Party System as a Re-
peated Game.” Quarterly Journal of Economics 102 (1987): 651-78. Alesina, Alberto, and Jeffery Sachs. “Political Parties and the Business Cycle
in the United States, 19481984.“]ournal of Money, Credit and Banking 19 (February 1988): 63-82.
Allen, Stuart. “The Federal Reserve and the Electoral Cycle.” Journal of Money, Credit, and Banking 18 (February 1986): 88-94.
Alt, J., and A. Chrystal. Political Economy. Berkeley: University of California Press, 1983.
Barth, James R., George Iden, and Frank S. Russek. “Do Federal Deficits Really Matter?’ Contemporary Policy Issues 3 (Fall 198485): 79-95.
~ “Federal Reserve Borrowing and Short-Term Interest Rates.” Southern Economic Journal 52 (October 1985): 554-59.
Barr-o, R. “Unanticipated Money Growth and Unemployment in the United States.” American Economic Reuiew 67 (1977): 101-13.
Beck, Nathaniel. “Elections and the Fed: Is There a Political Monetary Cycle?’ American Jour& of Political Science 31 (1987): 194-216.
“The Fed and the Political Business Cycle.” Contemporary Policy Zssutis 9 (April 1991): 2538.
lgFor detailed accounts of the frequency of contact between the Fed and the administration see Havrilesky (1988a).
475

Willie J. Belton, Jr. and Richard J. Cebula
Cebula, Richard J. “A Note on Federal Budget Deficits and the Term Structure of Real Interest Rates in the United States.” Southern Economic Journal 58 (April 1991): 1170-73.
Friedman, Milton. A Programfor Monetary Stability. New York: Fordham University Press, 1960.
- “The Role of Monetary Policy.” American Economic Review 58 (1968): 1-17.
Friedman, Milton, and Anna Jacobson Schwartz. A Monetary History of the United States, 1867-1960. Princeton: Princeton University Press, 1963.
Gordon, Robert J. “Price Inertia and Policy Ineffectiveness in the United States, 1890-1980.“]ounzal of Political Economy 90 (1982): 1087-1117.
Grier, K. The Political Economy of Monetary Policy. Ph.D. diss., Washington University, 1984.
-. “Congressional Influence on U. S. Monetary Policy.” Journal of Monetary Economics 28 (1991): 201-20.
Havrilesky, Thomas M . “Monetary Policy Signaling from the Administration to the Federal Reserve.“Journal of Money, Credit and Banking 19 (Feb- ruary 1988a): 83-101.
-. “Two Monetary and Fiscal Policy Myths.” In Political Business Cycles, edited by Thomas D. Willett, 320-36. Durham, NC: Duke Uni- versity Press, 1988b.
Hibbs, Douglas A. The American Political Economy. Cambridge, Mass: Harvard University Press, 1987.
Hoelscher, Gregory. “Federal Reserve Borrowing and Short Term Interest Rates.” Southern Economic Journal (October 1983): 319-33.
Karamouzis, Nicholas, and Raymond Lombra. “Federal Reserve Policymak- ing: An Overview and Analysis of the Policy Process.” In International Debt, Federal Reserve Operations and Other Essays, edited by K. Brunner and A. Meltzer, Carnegie-Rochester Conference Series on Public Policy, 7-62. Spring 1989.
Kiewiet, D. R. Macroeconomics and Micropolitics. Chicago: University of Chicago Press, 1983.
Lombra, Raymond. “Modeling Changes in Monetary Policy Regimes.” Manuscript, The Pennsylvania State University, September 1991.
Lombra, Raymond, and Frederick Struble. “Monetary Aggregate Targets and the Volatility of Interest Rates: A Taxonomic Discussion.“JournuI of Money, Credit, and Banking 11 (August 1979): 284300.
Lucas, Robert E. “Some International Evidence on Output-Inflation Trade Offs.” American Economic Review 63 (1973): 326-34.
McCallum, Bennett T. “The Political Business Cycle: An Empirical Test.” Southern Economic Journal 44 (1978): 504-15.
476

Does the Federal Reserve Create Political Monetary Cycles?
Mishkin, Frederick A. “Does Anticipated Monetary Policy Matter? An Eco- nomic Investigation.” Journal of Political Economy 90 (1983): 22-51.
Nordhaus, William. “The Political Business Cycle.” Review of Economic Studies 42 (April 1975): 169-90.
Poole, William. “Optimal Choice of Monetary Policy Instruments in a Simple Stochastic Macro Model.” QuarterlyJournal of Economics 84 (May 1970): 197-216.
Sargent, Thomas J. “Rational Expectations, the Real Rate of Interest, and the Natural Rate of Unemployment.” The Brooking Papers on Economic Activity 4 (1973): 429-72.
Sargent, Thomas J., and Neil Wallace. “Rational Expectations, the Optimal Monetary Instrument, and the Optimal Money Supply Rule.“]ownal of Political Economy 83 (1975): 241-54.
Sellon, G., and Ronald Teigen. “The Choice of Short-Run Targets for Mon- etary Policy.” In Issues in Monetary Policy: II, 2740. Kansas City, MO.: Federal Reserve Bank of Kansas City, 1982.
White, Lawrence H. “Problems Inherent in Political Money Supply Regimes: Some Historical and Theoretical Lessons.” In Political Business Cycles, edited by Thomas D. Willett, 301-1.9. Durham, NC: Duke University Press, 1988.
Willet, Thomas D. Political Business Cycles. Durham, NC: Duke University Press, 1988.
Woglom, Geoffrey. “Rational Expectations and Monetary Policy in a Simple Macroeconomic Model.” Quarterly Journal of Economics 91 (February 1979): 91-105.
477
Copyright © 2022 FDOKUMEN