Does Executive Compensation Disclosure Alter Pay at the Expense of Incentives?
45
Does Executive Compensation Disclosure Alter Pay at the Expense of Incentives? ∗ This version: June 2006 Peter L. Swan † University of New South Wales and Xianming Zhou ‡ University of Hong Kong Abstract According to the “keeping up with the Jones” theory promulgated by compensation consultants, compensation disclosure is responsible for increases in executive pay levels. Jensen and Murphy (1990a), however, contend that disclosure is responsible for a decline in performance pay, as public scrutiny penalizes boards that provide incentives resulting in high payouts. We provide evidence contrary to both theories using data on pay levels and incentives pre- and post-disclosure. Disclosure does not appear to alter pay levels but it does enhance incentives. Our findings suggest failure in managerial incentive contracts when pay is opaque to shareholders. JEL classification: G34; G38; J33 Keywords: CEO compensation, disclosure, regulation, contracts, pay levels, pay sensitivity ∗ We thank Arthur Hosios and Aloysius Siow for their constructive suggestions and encouragement. We are grateful to Kevin J. Murphy, who has made many insightful comments that have greatly improved this paper. We also benefited from the feedback of seminar participants at the Universities of Hong Kong, New South Wales, Sydney, Tilburg, Toronto, York and the Hong Kong University of Science and Technology, as well as from the financial support of the Social Sciences and Humanities Research Council (SSHRC) of Canada and the Australian Research Council (ARC). Hongquan Zhu provided valuable research assistance. † School of Banking and Finance, University of New South Wales, Sydney, NSW 2052, Australia, Tel: (612) 9385 5871; Fax: (612) 9385 6347; Email: [email protected]. ‡ School of Economics and Finance, University of Hong Kong, Pokfulam Road, Hong Kong, Tel: (852) 2857 8564; Fax: (852) 2548 1152; Email: [email protected].
-
Upload
independent -
Category
Documents
-
view
4 -
download
0
Transcript of Does Executive Compensation Disclosure Alter Pay at the Expense of Incentives?

Does Executive Compensation Disclosure Alter Pay at the Expense of Incentives?∗
This version: June 2006
Peter L. Swan†
University of New South Wales
and
Xianming Zhou‡
University of Hong Kong
Abstract
According to the “keeping up with the Jones” theory promulgated by compensation consultants,
compensation disclosure is responsible for increases in executive pay levels. Jensen and Murphy
(1990a), however, contend that disclosure is responsible for a decline in performance pay, as public
scrutiny penalizes boards that provide incentives resulting in high payouts. We provide evidence
contrary to both theories using data on pay levels and incentives pre- and post-disclosure.
Disclosure does not appear to alter pay levels but it does enhance incentives. Our findings suggest
failure in managerial incentive contracts when pay is opaque to shareholders.
JEL classification: G34; G38; J33
Keywords: CEO compensation, disclosure, regulation, contracts, pay levels, pay sensitivity
∗We thank Arthur Hosios and Aloysius Siow for their constructive suggestions and encouragement. We are grateful to Kevin J. Murphy, who has made many insightful comments that have greatly improved this paper. We also benefited from the feedback of seminar participants at the Universities of Hong Kong, New South Wales, Sydney, Tilburg, Toronto, York and the Hong Kong University of Science and Technology, as well as from the financial support of the Social Sciences and Humanities Research Council (SSHRC) of Canada and the Australian Research Council (ARC). Hongquan Zhu provided valuable research assistance. †School of Banking and Finance, University of New South Wales, Sydney, NSW 2052, Australia, Tel: (612) 9385 5871; Fax: (612) 9385 6347; Email: [email protected]. ‡ School of Economics and Finance, University of Hong Kong, Pokfulam Road, Hong Kong, Tel: (852) 2857 8564; Fax: (852) 2548 1152; Email: [email protected].

1
1. Introduction
In January 2006, the Securities and Exchange Commission (SEC) announced proposed disclosure
rules to further improve the quality of information relating to executive compensation.1 The drive
by the SEC to improve executive pay disclosure, a process it began as early as the late 1930s, is a
likely win for shareholders. This assessment is based on evidence presented here consistent with
the idea that greater transparency of compensation contracts reduces asymmetric information
between shareholders and boards. Reduced opacity enables better shareholder monitoring of
executive pay and performance. This perspective contrasts with two popular although conflicting
views. The first of these is that pay transparency also allows executives and company boards to
observe the pay level and structure of their rival companies. The more complete disclosure is, the
greater the pressures on company boards to meet executives’ requirements for such outcomes as
being “in the top pay quartile.”2 The supposition is that executive compensations will rise as a
consequence of disclosure, regardless of incentives, as the Los Angeles Times reports:
"We have a good probability that pay will actually increase based on increased disclosure,"
said Dan Wetzel, a vice president with the Pearl Meyer & Partners compensation consulting
firm in Los Angeles. "To keep up with the Joneses, there will be some increases that are
required." (Peterson, 2006). Emphasis added.
1 In January 2006 the SEC announced proposed disclosure rules that would include the values of stock options,
retirement and severance plans and perks worth over $10,000 for each of the top-five executives and all directors
(Wharton Business School, 2006, p.1). 2 Of course, even in the absence of public disclosure compensation consultants gain information from clients that can
be used to benchmark the pay of executives employed by other clients. Hence, strictly speaking, public disclosure is not
essential for this pay-leverage effect to operate to some degree. The compensation consultant, Crystal (1991), also
provides a perspective claiming excessive executive pay. He describes the problem of overcompensation and also the
skewed procedure for setting compensation packages. See also Bebchuk et al. (2002) and Bebchuk and Fried (2004).
2
Some call this “keeping up with the Jones” theory or a bootstrap effect, while others call it pay
envy or jealousy.
The second view is quite contrary to this view that disclosure increases pay. Jensen and Murphy
(1990a) find that CEO direct pay in the form of salaries fell from 0.11% of firm value in the 1930s,
when disclosure laws on executive compensation were first introduced, to 0.03% during the period
1974-86. Moreover, a $1,000 increase in shareholder value raised CEO pay by 17.5 cents, as
opposed to merely 1.9 cents fifty years later, so that the sensitivity of executive pay to performance
fell dramatically. Jensen and Murphy attribute both the fall in pay and decline in the pay-
performance sensitivity to adverse political forces unleashed by public disclosure of executive
compensation. Political forces such as labor unions and Congress limited CEO pay and discouraged
boards from entering into appropriate or effective incentive contracts with mangers.
However, comparisons over fifty years are difficult, as a great deal more than simply disclosure
changed. To address the important issues of managerial pay and incentives raised by Jensen and
Murphy and compensation consultants, we require detailed executive compensation data covering
disclosure regulatory shocks for similar and adjacent countries geographically, as well as in the
same time frame. The introduction of the new Canadian laws in the 1990s provides an ideal
experiment for such a purpose. In October 1993, the province of Ontario enacted the first Canadian
regulation specifying individually named disclosure of executive compensation.3 Beginning in
fiscal year 1993, all publicly traded companies in Ontario were required to disclose the
compensation of their five highest paid executives, including the CEO, for the current fiscal year
and the two immediately preceding years. With the majority of the listed Canadian firms being
3 Ontario Regulation 638, filed on October 14, 1993.

3
traded on the Toronto Stock Exchange and thus subject to Ontario law,4 the disclosure regulation
affected nearly all major Canadian companies. Critically, the resulting hand-collected Canadian
executive compensation data contains information for fiscal years both before and after the
disclosure event for the same firms and same named executives. The Canadian data is as detailed
as, and directly comparable to, the extensively examined U.S. data whereas the Jensen and Murphy
data is for a small number of large firms without individual executive identifiers. Identifiers are
necessary to control for executive characteristics and abilities when there is a regime shift.
Therefore, the implementation of this new legislation provides a unique natural experiment from
which to evaluate the regulatory impact.
In this paper, we conduct a direct study of the regulatory effects of executive compensation
disclosure on pay levels and pay-performance relations. By examining CEO compensation of 461
listed Canadian companies over three fiscal years pre-disclosure (1991-1993) and five years post-
disclosure (1994-1998) we document that the link between CEO wealth and shareholder value
substantially increased after the disclosure regulation was enacted. This observation is reinforced
when we use comparable U.S. firms as a control group. In a comparison in which Canadian firms
are matched one-to-one with U.S. firms according to size and industry, we obtain two findings: (i)
before disclosure, the pay-performance sensitivity for Canadian CEOs was only a small fraction of
that for U.S. CEOs, and (ii) the sensitivity increased dramatically for Canadian CEOs after the
disclosure requirement in Canada. Our findings are statistically significant and economically
strong, as well as robust to model specification. They support the belief of the SEC and legislators
that, by removing information asymmetry in executive compensation schemes, disclosure helps
make executives more effective agents of shareholders. 4 For example, by either total assets or sales in fiscal year 1993, more than 90% of the 300-largest Canadian firms are
traded on the Toronto Stock Exchange.
4
Following Jensen and Murphy (1990a) our linear regressions include an intercept term reflecting
pay levels not explained by performance. We fail to identify any disclosure effect on the intercept.
After controlling for firm size and performance, we find no meaningful difference in this fixed
component of pay between Canadian CEOs and U.S. CEOs, either before or after the disclosure
requirement in Canada. Our results show that after disclosure, the total compensation to Canadian
CEOs increased relative to U.S. CEOs. However, the increase resulted from higher incentive pay
due to a stronger pay-performance relation. Thus, our results do not support the view that public
disclosure helps either increase or reduce their compensation levels as such, but disclosure
improves pay-performance sensitivity.
This paper proceeds as follows. Section 2 briefly reviews related studies. Section 3 describes the
data. Section 4 documents post-disclosure changes of CEO pay-performance relations of Canadian
firms. Section 5 presents the main results on the disclosure effects from a matching sample
comparison between Canadian firms and U.S. firms. Following a discussion of our main findings in
Section 6, the final section concludes.
2. Related Literature
It is questionable that the compensation system is working in the best interests of shareholders,
because managerial pay is not decided by shareholders but by the board of directors, who may be
beholden to the CEO.5 Commenting on the disciplining role of corporate democracy, Bogus (1993,
p. 8) notes, “In theory, directors set an executive’s compensation and, in accordance with their
fiduciary duties to the shareholders, compensate executives in the manner most advantageous to the
5 In 2005, Australia introduced legislation requiring a vote by shareholders on executive pay, but the vote is not binding
on the company.

5
company and its stockholders. If the directors fail to do so, the shareholders should, in theory, elect
new directors.”
A fundamental question then arises: do directors have the right incentives to perform their fiduciary
duties to protect shareholders’ interests? Our findings suggest that they may not. Directors and
executives are often bound by reciprocal self-interest, so it may not be in the best interests of
directors for them to be honest with shareholders. As Bogus notes, “The independent director has
turned out to exist only in theory; in the real world all directors are beholden to management”
(Bogus, 1993, p. 34). Besides, directors often own only a small part of the firm’s equity and, as
they are not fully rewarded for their input, there is a free-rider problem in monitoring. Such
problems would be difficult to detect without information on executive pay schemes that reveal
how directors perform their duties in monitoring and motivating the management. Therefore, the
agency relationship between the board and the CEO may fail to implement an effective
compensation system. Consequently, government intervention is warranted to make managerial
compensation both public and transparent. With disclosure, the informational asymmetry in
managerial pay between shareholders and the board of directors is removed; shareholders become
aware of how much and, to a certain extent, how management is paid. This provides a monitoring
scheme that disciplines the behavior of the board’s compensation committee. Some commentators
speak highly of this disclosure effect. Johnson (1995) argues that a thorough disclosure requirement
paves the way for shareholders to take back their companies.
Perry and Zenner (2001) find evidence of increased pay-performance sensitivity and Rose and
Wolfram (2002) find mixed results when examining the effects of the regulatory changes in the
early 1990s. Consistent with our findings, Andjelkovic, Boyle and McNoe (2002) find no
association between pay and performance for a small sample of New Zealand firms at the time of
6
disclosure in 1997, but indications that disclosure will in future raise pay-performance sensitivity.
In their study, prior pay-performance sensitivities before disclosure were not revealed in a
systematic fashion, but voluntary disclosure was biased towards firms instigating incentive
schemes for the first time. Likewise, Lo (2003) ingeniously conducts an event study to see if the
SEC’s 1992 reforms mandating more effective disclosure enhanced shareholder wealth. Firms who
lobbied most intensively against the 1992 disclosure reforms by the SEC are likely to either have
boards most captured by the CEO or incur the highest costs of compliance. Since the performance
of these firms improved the most, the capture hypothesis is more strongly supported than the
regulatory cost hypothesis, as worsening performance would be consistent with the latter
hypothesis. Since U.S. CEOs have been subject to named disclosure since the late 1930s, the
opportunity to conduct direct tests of disclosure at the time of the 1992 changes is not applicable.
3. The Regulatory Change in Canada
3.1. The Ontario Regulation Act
Until October 1993, proxy disclosure requirements under the Ontario Security Act called for
disclosure of aggregate total compensation for all executives. In contrast, U.S. rules governing the
disclosure of executive compensation required individually named disclosure in addition to
aggregate information. In response to public criticism on the disparity between the Canadian and
U.S. regulations, the Ontario Security Commission (OSC) began to review executive compensation
disclosure requirements in the province in the fall of 1990. In June 1991, the Multijurisdictional
Disclosure System (MJDS) came into effect in Canada. Before that time, Canadian companies that
were reporting issuers in the U.S. were required to provide individually named disclosure of
executive compensation. However, after MJDS, they were only required to provide whatever
disclosure was required in Canada. This is important, as it reveals some of the obstacles to

7
attempting to use pay disclosure in the U.S. by Canadian firms as controls, Canadian companies
issuing capital in the U.S. were required, for a time, to disclose their compensation of Canadian
executives in their U.S. proxy filings. In early 1992, the OSC settled upon a proposal to further
alter disclosure rules. The proposal suggested aggregate disclosure of the top-five executives, with
individual disclosure only when an executive earned more than 40% of the total compensation
received by the five persons receiving the highest aggregate compensation. The new regulation,
announced on October 14, 1993, went much further than the proposed one. It requires thorough,
individually named disclosure on the compensation of the five highest paid executives. The new
regulation made the disclosure rules very similar to those in the U.S. at the time, putting “Ontario at
the forefront of openness and accountability to shareholders” (Laughren, 1993, p. 5106). The
important point here is that the actual regulations introduced were far tougher than those that had
been initially proposed and are, therefore, unlikely to have been anticipated.
The regulation took effect on October 31, 1993. The disclosure rules include three main
components. First, corporations must detail total executive compensation in several tables with a
standardized format. The critical point from the perspective of the present paper is that completing
the tables requires compensation information for the current fiscal year and the two preceding
years. The rules require compensation disclosure regarding the CEO and the four highest paid
executives with total compensation in excess of $100,000 in the most recent fiscal year. Such a
reporting format provides shareholders with a concise and more comprehensive overview of
compensation awarded, earned or paid in the reporting period, and makes it easier for shareholders
to compare compensation practices among reporting corporations.
Second, the compensation committee of a corporation must disclose to the shareholders its
compensation policy—the basis for the compensation granted to senior executives. While a general

8
statement of compensation policy is required for all reported senior executives, a specific statement
is required for the CEO to specify the relation of corporate performance to executive compensation.
In order to ensure that shareholders know which directors are responsible for compensation polices,
the report is made along with the names of the directors serving on the compensation committee.
Therefore, the compensation committee report requirement provides information that permits
shareholders to assess, to a certain extent, how well directors are representing their interests in
executive compensation practices.
Third, the disclosure rules adopt the U.S. requirement for a corporation to graphically present the
corporation’s performance by cumulative total shareholder returns. This figure must be compared
to both a market index and an industry or peer group index. The graph must show data for a
minimum of five years including the base year. This requirement complements the compensation
committee report and summarizes information on the relationship of executive compensation to
corporate performance in a given fiscal year.
3.2. Data
We may assume that the disclosure rules were not anticipated in early 1993, and so we take the two
fiscal years before and including 1993 to be the pre-disclosure period. This assumption is based on
the following discussion. A proposal for new disclosure rules was put forth to the public in March
1992 (Wright, 1992). The public did not seem to anticipate the new disclosure rules before mid-
1993 as the proposal did not require individually named disclosure and, from the release of the
proposal until late 1993, there were no public discussions from the Ontario Security Commission
(OSC) on new disclosure rules. In fact, the public in the meantime was still debating the early
changes adopted in 1991 under MJDS. The editorial article in the Financial Post, on May 12, 1993,

9
complained that “as the U.S. moves forward, Canada treads water. The Ontario government cannot
even bring itself to adopt the OSC proposal for limited disclosure.”
In personal communication the OSC advised us that the issuers were first informed of the 1993
Regulation in either late September or early October 1993 (within two weeks of the effective date
of the regulation). As companies usually decide on managerial pay schemes at the beginning of a
fiscal year, it is logical for us to take the fiscal year 1994 to be the first year when the new
regulation influenced the compensation system.
We focus on the compensation to the firm’s CEO. Compensation data are compiled from the
corporate proxy statements filed with the OSC and mailed to shareholders. The data cover proxy
statements submitted from October 1993 to December 1998, which reported executive
compensation for the fiscal year 1991 through 1998. The data were obtained directly from Zhou
(2000), (initially compiled in 1996 and then updated in 1999). The data contain detailed
information of different components of executive remuneration. Current cash payments (salary,
annual bonus, and various benefits) are reported, along with stock options, grants of restricted stock
shares, and long-term incentive plan payments. Because the disclosure rules require firms to
provide only the current year’s information on stock ownership and unexercised prior options, our
discussion on equity ownership including prior options would apply only to the fiscal years 1993 to
1998. Firm data are obtained from the Compact D database distributed by the company, Disclosure,
which contains business and financial information for essentially all publicly listed Canadian
companies. Our five-year post-disclosure period is, to some extent, arbitrary and makes the
judgment that five years is the appropriate period to allow firms to adjust to the new regime.
The sample originally included all Canadian firms that submitted proxy statements to the OSC
during the sample period. We then excluded observations with partial compensation due to CEO

10
turnover and with missing financial data. Because our main interest is in the disclosure effects, we
confine our sample to firms that have at least one-year of data on CEO pay both before and after
the disclosure regulation. Our methodology does not introduce bias, as disclosure of prior pay was
compulsory rather than voluntary (as in New Zealand), while there is no reason to believe that
excluding companies appearing only once or those where the CEO changed mid-year creates a bias.
The final sample consists of 461 firms.
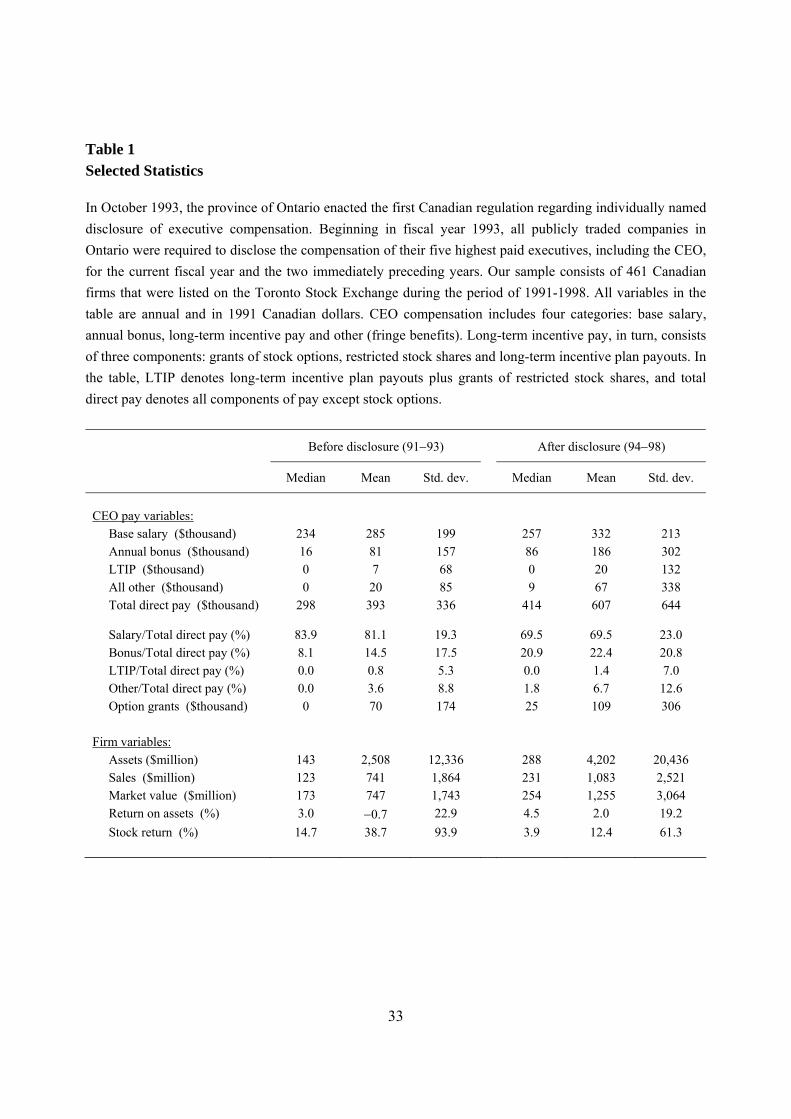
Selected statistics of CEO pay as well as some firm variables are summarized in Table 1. There are
two notable changes in CEO compensation since the disclosure regulation. First, CEO
compensation increased markedly. Based on the sample means, CEO total pay, excluding stock
option grants, increased by 54.5%. The general rise in the compensation level is not surprising
because firm size increased as well in the post-disclosure period.6 Second, there is a clear shift in
the structure of pay from base salary to the components of incentive pay. While the portion of base
salary in total direct pay decreased by 11.6%, the portion of annual bonus and long-term incentive
payments, excluding options, increased by 8.5%. There was an even greater increase in the grants
of stock options: in terms of share units, the average grant increased by 55.7%. These changes
appear to suggest that CEO pay schemes became more performance-based after the introduction of
the disclosure rules.
INSERT TABLE 1 ABOUT HERE
4. Canadian CEO Incentives: Post-Disclosure Changes
In this section we examine how CEO incentives changed in Canada after the introduction of the
Ontario regulation pertaining to executive compensation disclosure. We first examine CEO direct
6 It is well established in the executive compensation literature that the level of managerial pay is positively correlated
to firm size. See Rosen (1992) for a survey of this issue.

11
compensation consisting of all cash payments and awards of restricted stock. After the disclosure
regulation, direct pay became the most visible component of CEO wealth, so we expect it to be
more responsive to the disclosure requirement than indirect-pay–related CEO wealth in stock
ownership and option holdings.
In the literature of managerial incentives and executive compensation, incentive strength is
estimated by the correlation of CEO wealth to shareholder value (Murphy, 1999). Following this
literature, we estimate four commonly used empirical models for the CEO pay-performance
relationship. Allowing for post-disclosure changes, our pay-performance (arithmetic) sensitivity
model is:
∆(CEO pay) = (a1 + a2 × Disclosure) + (b1 + b2 × Disclosure) × ∆(Shareholder value). (1)
CEO pay is salary plus bonus, or total compensation excluding grants of stock options. Shareholder
value realized at a fiscal-year end is calculated as stock price plus dividend per share times the
number of shares outstanding. Disclosure is a dummy variable that equals one for post-disclosure
years. b1 estimates the pre-disclosure pay-performance sensitivity and b2 estimates the post-
disclosure change of the sensitivity. For the model to be econometrically correct, the constant term
is also allowed to change in the post-disclosure period.
The independent variable, ∆(Shareholder value), is slightly different from a related one that is
calculated as the total shareholder return. Conceptually, this variation makes little difference
because year-to-year changes in a firm’s shares outstanding and dividend payments are typically
small compared to stock price fluctuations. On the other hand, our model allows us to take first
12
differences with respect to both the dependent and independent variables, which helps mitigate any
uncontrolled factors in the performance measure.7
The second model estimates the elasticity of CEO pay with respect to shareholder value, using the
following specification:
∆ln(CEO pay) = (a1 + a2 × Disclosure) + (b1 + b2 × Disclosure) × ∆ln(Shareholder value). (2)
The coefficients b1 and b2 estimate the pre-disclosure elasticity and its post-disclosure change,
respectively.
Our third and forth models estimate the semi-elasticity of CEO pay with respect to the firm’s stock
return and the accounting return on total assets, respectively. The model specification is:
ln(CEO pay) = (a1 + a2 × Disclosure + a3 × Year) + (b1 + b2 × Disclosure) × ln(Sales)
+ (c1 + c2 × Disclosure) × Return , (3)
where firm fixed effects are included. The variable Year controls for a time trend in pay levels
(which is not needed in models (1) and (2), because the variables in these two models are in first
differences). The performance variable, Return, is either stock return or the (accounting) return on
total assets. Coefficients c1 and c2 estimate the pre-disclosure semi-elasticity and its post-disclosure
change, respectively.
The first two columns of Table 2 present the regressions for the sensitivity model, eq. (1). Both
regressions show an increase in the sensitivity after the enactment of the disclosure regulation.
Before disclosure, the sensitivity for CEO salary plus bonus and total direct pay was about three
cents and five cents, respectively, in response to every $1000 change in shareholder value. The
7 We also run regressions using shareholder return as the independent variable. While the results do not change
qualitatively, this model consistently performs better in terms of the t-ratios and R-squared.
13
magnitude of these sensitivities is consistent with previous studies of U.S. firms. After disclosure,
the sensitivity increased to nine cents for salary plus bonus and to twelve cents for total pay.
Though the post-disclosure changes are only marginally statistically significant, they are large in
magnitude. Both sensitivities more than double after disclosure.
The third and forth columns present the regressions for the elasticity model, eq. (2). The parameter
estimates also indicate a notable increase in the pay-performance relationship for the post-
disclosure period. The increase is statistically more significant with the elasticity model than with
the sensitivity model.
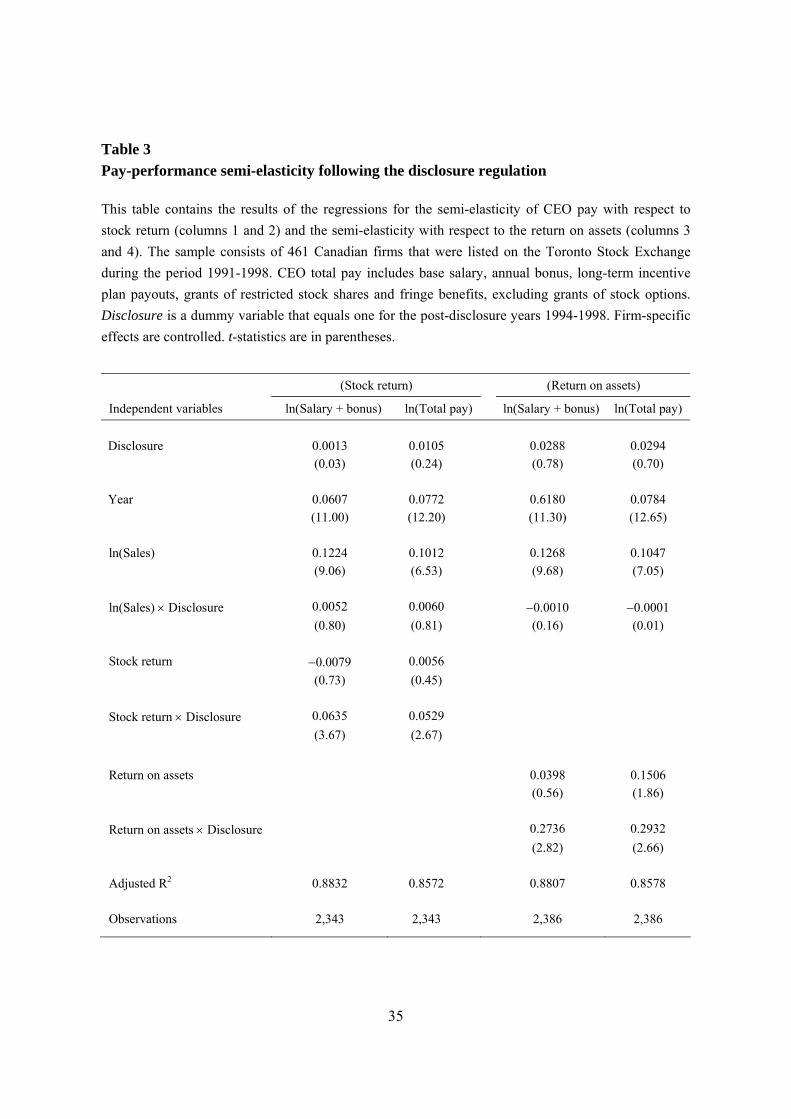
Table 3 reports the regressions for the semi-elasticity model, eq. (3), where columns 1 and 2
present the semi-elasticity of CEO pay with respect to stock return, and columns 3 and 4 present the
semi-elasticity with respect to the return on total assets. We make two main observations based on
these regressions. First, in terms of the semi-elasticity measures, the pay-performance link was
either insignificant or negligibly weak in the years before disclosure, and after disclosure the link
increased significantly. Second, after controlling for firm size and return performance, there is no
meaningful change in the level of CEO compensation from the pre-disclosure period to the post-
disclosure period, while an increasing time trend is found throughout the sample period. This
observation does not support the Jensen and Murphy (1990a) view that disclosure laws help reduce
executive pay due to political influences, nor the “keeping up with the Jones” theory that pay levels
escalate as a consequence of disclosure.
We now examine CEO equity incentives from stock options and share ownership. It is well
recognized that option holdings have become increasingly important in executive compensation.
However, it remains difficult to accurately measure option-based incentives. One reason for the
difficulty is the complexity in executive stock option valuation because of various restrictions, such

14
as non-transferability and an employment requirement. Insufficient data on the composition of
previously granted options, including expiration dates, exercise price and repricing conditions,
make the measurement more difficult and less precise. As far as the disclosure effects are
concerned, there is another complexity: option incentives in the post-disclosure period are
associated with options granted in the pre-disclosure period. Because of these problems, we do not
directly examine the pay-performance sensitivity for CEO stock options by estimating the Black-
Scholes values of options. Following an alternative approach, we examine the ratio of CEO stock
options over the firm’s total shares outstanding both for current-year grants and for unexercised
prior options, and analyze how the ratio changed after disclosure. This approach is suitable for our
purposes, as our main focus is on the post-disclosure changes and not on the absolute values of
CEO incentive parameters.
CEO stock ownership as a percentage of the firm’s shares outstanding presents a direct measure of
the relationship between CEO wealth and shareholder value. Hence, for stock ownership
incentives, we examine the percentage of the firm’s shares owned by the CEO.
Table 4 presents summarized statistics for current-year option grants, unexercised prior options and
share ownership. Because the data on prior options and share ownership are only available for the
years 1993 to 1998, the pre-disclosure statistics for these two items are calculated for the year 1993
only. The numbers in the table indicate an increase in all three items after the disclosure
requirements, though the increase in current options and stock ownership is relatively small, of
which the mean values only increased modestly. The change in unexercised prior options is large:
the mean option holdings almost doubled in the post-disclosure period, indicating notably
strengthened incentives from CEO option holdings.

15
In summary, the results in Tables 2 to 4 indicate that pay-performance relations notably increased
in the post-disclosure period. The increase mainly came from CEO direct pay and unexercised
stock options. On the other hand, after controlling for firm size and performance, there is no
significant change in the fixed component of pay. Though CEO total compensation increased in the
post-disclosure period, the increase is associated with an increase in the component of incentive
pay. These findings are consistent with the view that increased public information on executive
compensation is efficient in that it forces the board of directors to tie managerial pay more closely
to shareholder wealth due to greater shareholder scrutiny.
5. Evidence from a Difference-in-Difference Analysis
5.1. Identifying Control Firms
The above results establish that CEO pay-performance relations in Canada became stronger after
executive compensation became public information. This observation, however, is insufficient for
us to conclude that the change resulted from the disclosure regulation. An obvious criticism here is
that factors unrelated to the Canadian disclosure regulation, coinciding with the timing of the event,
could have caused the changes in the estimated pay-performance sensitivities. For instance, the
U.S. regulatory changes8 adopted in the early 1990s regarding executive compensation might have
caused a spill-over effect on the compensation practices in Canada, and Canadian and U.S. firms
above some minimum size may form part of a more global market for executive talent. A general
trend of increasing incentive pay in executive compensation in North America in the late 1990s
might also be responsible for the results. In addition, stock market fluctuations could also have
contributed to the observed changes in our parameter estimates.
8 This required a standardized format for reporting executive compensation, and the U.S. Congress also enacted tax
legislation limiting the deductibility of non-performance–related compensation (see Brownsterin and Panner, 1992).

16
We address this issue by identifying a group of control firms. Ideally, control firms should have the
same firm characteristics and have the same market environment as Canadian firms, while their
executive compensation practices are unlikely to be affected by the Canadian disclosure
requirements. Many Canadian firms have been listed on U.S. markets and have been subject to U.S.
regulation, including disclosure rules on executive compensation. Therefore, one may consider
such Canadian firms to be ideal controls. However, as discussed in Section 3.1, the disclosure
requirement for such firms changed in 1991, which made the situation complex. Beginning in 1991,
Canadian firms listed on U.S. markets were no longer required to disclose executive compensation
to their U.S. shareholders. As a result, the vast majority stopped disclosing this information (though
a handful continued doing so voluntarily) until the enactment of the Canadian disclosure regulation.
Therefore, Canadian firms that previously followed U.S. disclosure rules are not adequate controls.
Indeed, even for years before 1991, it remains unclear that the information disclosed in the U.S.
would attract sufficient attention of the shareholders at home in Canada and be effective in adding
to public scrutiny.
We choose a sample of size- and industry-matched U.S. firms as our control group. The control
group is determined by a one-to-one matching process: each firm in the Canadian sample is
matched with a U.S. firm in the Standard & Poor’s ExecuComp sample if both firms were in the
same industry (based on the one-digit SIC code9) and were of the same company size in the pre-
disclosure period. Company size is measured by average sales, and the criterion for size matching
9 Ideally, we would do the matching based on the two-digit SIC code. But the requirement for the two-digit SIC
matching would substantially reduce the sample size and make the comparison difficult. On the other hand, as far as the
control–sample comparisons are concerned, there should be no substantive difference between one-digit SIC matching
and two-digit SIC matching, given that the focus is not on the magnitude of CEO incentive parameters but on their
post-disclosure changes, and particularly, in relative terms (between Canadian and U.S. firms).

17
is that the difference in the average sales between a matched Canadian firm and its U.S. counterpart
should be smaller than 15%. The resulting sample consists of 220 pairs of Canadian and U.S. firms.
This matched sample provides an accepted methodological design for us to investigate the
disclosure effects. On one hand, the extensive cultural, economic and institutional linkages between
Canada and the U.S. establish close relations between the two countries, so that they share
similarities in a wide range of areas. With size and industry being controlled, we expect the U.S.
firms to capture the market and firm behavior-related factors common to both countries. On the
other hand, there is a stark difference between the two countries in the timing of executive
compensation disclosure. Because U.S. firms began to disclose executive compensation as early as
in the 1930s, the Ontario disclosure requirement was unlikely to have any meaningful influence on
U.S. firms. Therefore, if executive compensation disclosure matters, we expect Canadian firms, but
not U.S. firms, to respond to the Canadian disclosure regulation. Then the regulatory effects should
show up in the difference in post-disclosure changes in compensation contracts between Canadian
firms and U.S. firms.
This issue is well-suited for a difference-in-difference analysis. To investigate, we revise the three
specifications, eqs. (1) to (3), by adding a dummy variable for Canadian firms. In order to make the
parameter estimated from the comparison data as precise as possible and to properly capture any
changes in differences, we do not alter pay levels for any exchange rate changes between the U.S.
and Canada. Nor do we need to be concerned with essentially permanent factors that might differ
marginally between the two matched samples, such as the proportion of founding CEOs, as these
factors do not enter into changes in the differences between the two samples.
Taking the arithmetic sensitivity model as an example, the specification changes into:

18
∆(CEO pay) = ( a1 + a2 × Disclosure + a3 × Canadian + a4 × Canadian × Disclosure)
+ ( b1 + b2 × Disclosure + b3 × Canadian + b4 × Canadian × Disclosure )
× ∆(Shareholder value), (4)
where Canadian and Disclosure are dummy variables. Coefficient b1 estimates CEO pay-
performance sensitivity of U.S. firms before the introduction of disclosure rules in Canada and b2
estimates the sensitivity change of U.S. firms after this event. Coefficients b3 and b4 estimate
Canada–U.S. differences, b3 for the difference in the sensitivity before disclosure and b4 for the
difference in the post-disclosure change of the sensitivity. One may view b4 as an estimate of the
relative change of Canadian firms.
If compensation disclosure plays a role in incentive contracting, differences between Canadian
firms and U.S. firms in the pay-performance relations, both before and after the event, should
reflect the disclosure effects. Therefore, we expect b3 and b4 to have different signs. For instance, if
disclosure rules enhance managerial incentives, then we expect to observe b3 to be significantly
negative and b4 to be significantly positive. This means that the pay-performance link for Canadian
firms should have been weak previously, but after executive compensation becomes public
information, the link should increase relative to U.S. counterpart and any pre-disclosure differences
between the two countries should diminish.
5.2. The Relation of CEO Pay to Firm Performance
Table 5 presents the difference-in-difference regressions for CEO pay-performance sensitivity and
elasticity. The constant terms are of little interest here, so they are not reported in the table (which
will be discussed in Section 5.4).
19
All four regressions indicate a clear pattern of differences in pay-performance relations between
Canadian firms and U.S. firms consistent with a positive disclosure impact on CEO incentives. The
coefficients on the interaction terms Δ(Shareholder value) × Canadian and Δln(Shareholder value)
× Canadian are all negative, indicating a weaker pay-performance relation in Canadian firms than
in U.S. firms in the years before disclosure. The parameter estimates are statistically significant and
economically strong. For CEO total pay (columns 2 and 4), the sensitivity of Canadian firms was
merely 18% of U.S. firms and the elasticity was only 25% of the U.S. counterpart.
On the other hand, the coefficients on the interaction terms Δ(Shareholder value) × Canadian ×
Disclosure and Δln(Shareholder value) × Canadian × Disclosure are all positive and highly
statistically significant. Complementing the observation on the pre-disclosure differences, these
coefficients suggest a marked increase in pay-performance relations of Canadian firms relative to
U.S. firms after the disclosure regulation in Canada. Based on the regressions of total pay (columns
2 and 4), the relative increases in sensitivity and elasticity for Canadian firms are close to or
comparable with the pre-disclosure differences between Canadian firms and U.S. firms.
These observations indicate a strong positive regulatory effect of executive compensation
disclosure on the pay-performance relationship. Because of this effect, the relation was previously
substantially weaker in Canadian firms than in U.S. firms, but it was greatly strengthened in
Canadian firms after the introduction of the disclosure requirement in Canada.
Table 6 reports the difference-in-difference regressions for the semi-elasticity specification. With
the two dummy variables Canadian and Disclosure, the constant term and the size variable
ln(Sales) are also split into four components in the regressions, for which the coefficients are not
reported in the table. Firm random effects are included in this estimation. We did not control for
fixed effects in these regressions due to the following consideration: we needed to isolate firm

20
individual effects that capture uncontrolled firm characteristics in the determination of managerial
incentives, yet we also needed to estimate the pre-disclosure difference between Canadian firms
and U.S. firms, which, as a constant, would disappear in panel data with fixed effects. Therefore,
the random effects estimator was suitable for our purposes. For a robustness check, we compared
the parameter estimates between the two estimators but found little difference, either statistically or
economically, with regard to the disclosure effects.
The first two columns in Table 6 present the regressions for the semi-elasticity of CEO pay with
respect to stock return. In terms of this semi-elasticity measure, the pay-performance link was
essentially non-existent with Canadian firms before the disclosure regulation. In the post-disclosure
period, the semi-elasticity of both Canadian firms and U.S. firms increased substantially. In other
words, the pay-performance link of Canadian firms jumped in the post-disclosure period relative to
U.S. firms.
Columns 3 and 4 present the regressions for the semi-elasticity of CEO pay with respect to the
return on assets. Like the results in Table 5 for sensitivity and elasticity, this accounting
performance–based semi-elasticity indicates a significantly weaker pay-performance relation for
Canadian CEOs before compensation disclosure and a strong increase in this relation relative to
U.S. CEOs after the disclosure requirements. The post-disclosure increase is strikingly large
compared to the other three incentive parameters estimators.
In Table 7 we summarize the above results of the difference-in-difference analysis for the
disclosure effects on CEO direct-pay incentives. The numbers in the table highlight two main
observations. First, before the introduction of the disclosure rules in Canada, the incentive strength
for Canadian CEOs was no more than one third that of U.S. CEOs, depending on the model we use
in the estimation of the incentive parameter. Second, after disclosure, all incentive strength

21
measures jumped for Canadian CEOs relative to U.S. CEOs and, consequently, the measures
mostly became comparable between the two counties. Though the Canada–U.S. differences vary
with the model specification, the qualitative results remain strong and robust.
We note that with our sample, the results indicate mixed changes in the post-disclosure changes in
pay-performance relations of U.S. firms: both the arithmetic sensitivity and the accounting return–
based semi-elasticity decreased, the elasticity remains essentially unchanged, and the pay semi-
elasticity with respect to stock return increased. This observation, however, does not undermine our
results for the regulatory impact of disclosure rules in Canada. By the difference-in-difference
nature, our results rely on the differences before and after the Canadian disclosure regulation
between Canadian firms and U.S. firms, which hold consistently with all four incentive measures.
5.3. CEO Incentives from Stock Options and Share Ownership
Table 8 presents the mean and median values as a percentage of the firm’s shares outstanding of
current-year grants of CEO stock options, unexercised prior options and share ownership. All three
items appear to have increased in the post-disclosure period for both Canadian firms and U.S.
firms. The statistics of unexercised options show a pattern similar to direct compensation: the mean
and median option holdings of Canadian CEOs were previously notably lower than those of U.S.
CEOs but, after disclosure, increased more than the U.S. counterparts. The statistics of option
grants and share ownership, however, are mixed and show less of a clear-cut pattern for the pre-
disclosure differences and post-disclosure changes between Canadian firms and U.S. firms.
To further investigate, we perform regression analyses of CEO equity incentives, including both
option holdings and share ownership. The results are reported in Table 9. The first three columns
present the regressions for option grants, unexercised options and share ownership, respectively.
The fourth column presents the regression of share ownership plus option holdings, which, with

22
option holdings being discounted by a ratio of 0.6, is a proxy for CEO total equity incentives. In the
regressions, we control for the time trend and, following the difference-in-difference approach,
allow equity holdings and their relations to firm size to differ between Canadian CEOs and U.S.
CEOs and between the pre-disclosure period and the post-disclosure period. For the same reason as
for the semi-elasticity estimation (Table 6), firm random effects are included for CEO equity
incentives.
Consistent with anecdotal observation, the regression results indicate a strong trend of increasing
stock options in executive compensation during the sample period. Along with this trend, there is
an upward pattern of CEO equity incentives in this period: the coefficient on the trend variable in
the forth column, Year, is positive and highly statistically significant.
Reinforcing our findings on CEO direct pay, the incentive parameter estimates in Table 9 show
differences between Canadian firms and U.S. firms consistent with a positive disclosure effect. The
regression in column 4 is representative, which highlights our observation on CEO total equity
incentives. The coefficient on the dummy variable Canadian is negative and the coefficient on the
dummy variable interaction Canadian × Disclosure is positive. The two coefficients are of a
similar magnitude and are both highly statistically significant. This observation means that the
equity incentives of Canadian CEOs were weaker than those of U.S. CEOs in the pre-disclosure
period and that much of the difference disappeared after Canadian CEOs’ compensation became
public information.
5.4. The Level of CEO Compensation
We have so far ignored the levels of CEO compensation. The public, particularly the shareholder
activists, contend that executive compensation is unjustifiably high and believe that disclosure

23
rules, by increasing shareholder scrutiny, help reduce executive pay.10 On the other hand, as
discussed in Section 2, there is also a concern that public disclosure may actually drive up
executive pay because of “keeping up with the Jones” and managerial pay envy. Essentially, it is an
empirical matter as to how the levels of managerial pay change in response to compensation
disclosure.
Table 10 presents the summary statistics for a brief comparison of pay levels between Canadian
CEOs and U.S. CEOs. The average pay increased in the post-disclosure period in both countries.
The statistics further show that the increase was higher in Canadian firms than in U.S. firms. Based
on the median values, Canadian CEOs earned 64% to 71% of the compensation of U.S. CEOs in
the years before disclosure, depending on the components of pay included in the statistics. These
percentages rose to 75% to 80% in the post-disclosure period. An important question here is: what
is the source of the relative increase in the compensation to Canadian CEOs? Alternatively, which
component of pay increased more for Canadian CEOs than for U.S. CEOs: the fixed component of
pay or the incentive pay component? These statistics, however, do not answer this question.
To clarify, in Table 11 we summarize the coefficients on the dummy variable Canadian and the
dummy variable interaction Canadian × Disclosure from the regressions in Tables 5 and 6, which
we did not discuss. These two terms capture the pre-disclosure difference in the fixed component of
CEO pay and the difference in the post-disclosure changes of this component between Canadian
CEOs and U.S. CEOs, respectively. From the sensitivity and elasticity models (the first two
columns), all the coefficients are not statistically different from zero, which suggests that there was
no difference in pay levels between Canadian CEOs and U.S. CEOs after controlling for company 10 Consistent with the public’s concern that executives are paid excessively, Bebchuk, Fried, and Walker (2002) and
Bebchuk and Fried (2004) argue that managers have considerable power to shape their own compensation and to
extract rent.

24
performance. On the other hand, the coefficients from the semi-elasticity models give mixed
results: while there were no significant differences before disclosure, the coefficients indicate a
higher increase in the total pay to Canadian CEOs than to U.S. CEOs in the post-disclosure period.
Due to a lack of data on capital gains from exercising stock options for the two years, 1991-1992,
the regression results in Tables 5 and 6 do not include CEO wealth from option holdings. For this
reason, we also examine the annual changes of CEO wealth including capital gains from exercising
stock options after the disclosure rules in Canada were implemented. The reason for this
examination is clear: if the disclosure requirements affected the levels of executive compensation,
we expect to observe a significant difference in compensation growth between Canadian CEOs and
U.S. CEOs after this event.
We run the regression of the annual percentage change of CEO wealth against the annual changes
in company size and stock return performance, controlling for firm individual effects and time
trend. In the regression (not reported), the coefficients on both the dummy variable Canadian and
the dummy variable interaction Canadian × Disclosure are not different from zero, either
statistically or economically. We therefore conclude that, after taking into account direct pay and
capital gains from stock option exercises and controlling for firm size and performance, there were
no meaningful differences in the fixed component of pay between Canadian CEOs and U.S. CEOs,
both before and after executive compensation became public information in Canada. In other
words, after compensation disclosure, the total compensation of Canadian CEOs increased by more
than the U.S. counterpart because of increased pay-performance relationships that resulted in higher
incentive pay. Also, there was no pay increase unrelated to performance, e.g., due to the “keeping
up with the Jones” hypothesis promoted by compensation consultants, and no decline in pay due to
political forces.

25
6. Discussion
Our main finding—executive compensation disclosure enhances managerial incentives without
affecting pay levels as such—is based on our observation on the differences in pay-performance
relationships between Canadian firms and U.S. firms before and after the Ontario regulation
introducing executive compensation disclosure. Such differences are indicative of the regulatory
effects subject to two conditions: (i) during the sample period, there were no major market or
regulatory changes in Canada other than the 1993 disclosure regulation that were related to
executive compensation; and (ii) no major events occurred in the U.S. that affected executive
compensation and coincided in timing with the disclosure regulation in Canada.
The first condition holds reasonably. We are unaware of any major policy, tax or regulatory
changes, such as the tax treatment of pay inclusive of executive options, which took place in
Canada during the sample period and would have had an obvious relevance to executive
compensation.
The second condition apparently does not hold. As mentioned earlier, regulatory changes with
respect to executive compensation were adopted in the U.S. in late 1992 and in 1993 which
required a standardized format—enhanced disclosure—for reporting executive compensation, and
tax legislations were enacted limiting the deductibility of non-performance–related compensation
over one million dollars.
There are two different situations that determine how the U.S. regulatory changes might have
affected our results. (i) We fail to identify a meaningful difference between Canadian firms and
U.S. firms. In this case, our results would tell us little because a disclosure effect might have been
disguised in a co-movement in executive compensation across the border. This would occur when
U.S. firms were affected by the U.S. regulatory changes in the same direction and at a similar time
26
as Canadian firms were affected by the Canadian regulation. This would also occur when there had
been a spill-over effect from the U.S. practices during the long history of U.S. disclosure
requirements.
(ii) We identify a significant difference between Canadian firms and U.S. firms. This is the case
with our results. In this case, both a co-movement effect and a spill-over effect would actually help
strengthen our observations. This is because any such effect could have reduced the observed
difference between Canadian firms and U.S. firms. Indeed, Perry and Zenner (2001) observe that
the U.S. regulatory changes strengthened pay-performance relations. Therefore, to the extent that
the disclosure regulation in Canada and the regulatory changes in the U.S. affected managerial
incentive contracts in a similar manner, our results should have underestimated the Canadian
disclosure effects.
What if executive compensation practices in Canada were affected by U.S. disclosure rules? Given
the high degree of market integration across the border and the close economic and institutional
linkages between the two countries, a spill-over effect may have occurred from U.S. executive
compensation practices, given the long history of compensation disclosure in the U.S. However,
given the difference-in-differences nature of our research methodology, this possibility poses no
problem to our main results. Indeed, to the extent that Canadian firms were already indirectly
affected by U.S. disclosure rules, our results tend to underestimate such regulatory influence.
We also note that the U.S. regulatory changes in the early 1990s added little to the visibility of
direct compensation and thus might not have had a meaningful disclosure influence. Both Perry and
Zenner (2001) and Rose and Wolfram (2002) focus on the regulatory effects of the tax deductibility
on “million-dollar firms.” On the other hand, the disclosure rules in Ontario required, for the first
time in Canadian history, a complete individually named disclosure of executive compensation.
27
The requirements were so thorough that they included the U.S. enhanced disclosure rules.
Therefore, it is not surprising that we have been able to identify significant differences between
Canadian firms and U.S. firms consistent with a positive disclosure impact on managerial
incentives, even though the regulatory changes in the U.S. that occurred at a similar time may have
weakened our results.
In addition, we could not completely rule out the possibility that investors in Canadian firms
anticipated the disclosure requirement. Again, this possibility should not affect our conclusion,
because if such a possibility did occur, our results would also have underestimated the disclosure
effects.
Canadian pay levels did not fall as a result of disclosure and, hence, this aspect of the Jensen and
Murphy (1990a) political forces hypothesis is not supported. We cannot be so definitive with
respect to the impact of political forces on the pay-performance sensitivity. However, we suspect
that their role in suppressing pay-performance relations was small if it existed. Political influence is
only ever as strong as the cost incurred by a firm due to paying its manager at an apparently
unacceptably high level. Firms may have little concern about this cost given the negligible marginal
influence of an individual firm’s pay practice on the public and the legislature. Though the
collective behavior of firms may substantially influence public opinion, there is a free-rider
problem. The perceived cost of paying managers high compensation may be negligibly small to
individual firms, and so has little effect on compensation practices.
It is possible that political forces take time to build and regulate executive compensation, so the
role of political forces may not be evident in the early years of executive compensation disclosure.
While this possibility exists, it seems unlikely that the role would be sufficiently strong to offset a
positive effect of shareholder scrutiny on pay-performance relations. International comparisons

28
illustrate this point. The U.S. is the only county in the world that has disclosed detailed information
on executive compensation for more than half a century, yet the pay-performance relationship is
substantially stronger in the U.S. than in any other country examined (Murphy, 1999; Conyon and
Murphy, 2000; Zhou, 2000; Merhebi et al., 2006)
The role of political forces can be complex because it may strengthen public scrutiny. Although the
public may be critical of high compensation levels, it is the firm’s pay strategy and its relevance to
performance that are under ever-increasing scrutiny of shareholders and the general public. It seems
to have become a consensus in the debate on executive compensation that “it’s not how much you
pay, but how” (Jensen and Murphy, 1990b, p.138). As evidenced by the experience of the U.S. in
the early 1990s, political forces may directly urge stronger public monitoring of the compensation
system and, explicitly or implicitly, force firms to tie managerial pay more closely to performance.
Not surprisingly, CEO compensation in the U.S. has become more sensitive to performance over
the past two decades, coinciding with the substantially increased public attention to executive
compensation over this period.
7. Conclusion
Corporate executive compensation has been public information in the United States since the late
1930s. However, it is only in recent years that a few other countries such as the United Kingdom
(Conyon and Murphy, 2000), Canada (Zhou, 2000) and Australia (Merhebi et al., 2005) began
disclosing executive compensation, while most counties in the world still do not require public
disclosure of this information. It remains unclear how disclosure affects managerial compensation.
In particular, does public information on managerial pay enhance or reduce the efficiency of
incentive contracting? The debate among economists, regulators and the general public on this

29
issue has not yet reached a consensus. Due to lack of critical data, the disclosure effects have
remained empirically unexplored.
The disclosure regulation enacted in Canada provides us with a unique opportunity to address this
issue. Given the close ties between Canada and the U.S. in culture, institution and market on one
hand, and a contrasting difference in the timing of the disclosure rules on the other, we are able to
construct matching samples that are close to a natural experiment. By matching sample
comparisons, we identify a positive impact of executive compensation disclosure on managerial
incentives, but no impact on pay levels as such. The pay-performance relationship in Canadian
firms was substantially weaker than in U.S. firms previously, and it increased dramatically relative
to U.S. firms after the disclosure regulation was enacted in Canada. This finding is statistically
significant and economically strong, and is robust to model specification. It supports the belief
among legislators and public commentators that by removing information asymmetry in executive
compensation practices, disclosure rules increase public scrutiny of compensation decisions made
by corporate directors and further aligns managerial pay with corporate performance.
On the other hand, after controlling for firm size and performance, we find no meaningful
differences in the fixed, i.e., base pay, component of pay between Canadian CEOs and U.S. CEOs,
either before or after the disclosure requirement in Canada. This observation does not support the
compensation consultant’s view that pay levels are determined by the “keeping up with the Jones”
effect, nor the shareholder activists’ view that, due to a lack of shareholder scrutiny, managers were
excessively paid and that public disclosure of executive pay helps reduce compensation levels.
Instead, our evidence suggests that international differences in executive pay levels may arise from
differing pay-performance relations, but not due to the visibility of the compensation to top
executives.

30
Having established that managerial pay is tied more closely to company performance after
disclosure, the next question to be answered is how firms have responded in terms of performance.
If incentive contracting matters importantly for the success of a firm, as agency theory predicts, one
should be able to observe significant improvement in corporate performance after executive
compensation becomes public information. This issue merits a study that may eventually determine
whether or not public disclosure of executive compensation is in the best interests of shareholders.
31
References`
Andjelkovic, A., G. Boyle and W. McNoe. “Public Disclosure of Executive Compensation: Do Shareholders Need to Know?” Pacific-Basin Finance Journal, 10 (2002), 97-117.
Bebchuk, L. A., J. M. Fried and D. I. Walker. “Managerial Power and Rent Extraction in the Design of Executive Compensation.” The University of Chicago Law Review, 69 (2002), No. 3, 751-846.
Bebchuk, L. A., and J. M. Fried. Pay without Performance: The Unfulfilled Promise of Executive Compensation, Cambridge, MA: Harvard University Press (2004).
Bogus, C. T. “Excessive Executive Compensation and the Failure of Corporate Democracy.” Buffalo Law Review, 41 (1993), 1-83.
Brownsterin, A. R., and M. J. Panner. “Who Should Set CEO Pay? The Press? Congress? Shareholders?” Harvard Business Review, May-June (1992), 28-38.
Conyon, M. J., and K. J. Murphy. “The Prince and the Pauper? CEO Pay in the United States and United Kingdom.” Economic Journal, 110 (2000), F640-F671.
Crystal, C. S. In Search of Excess: The Overcompensation of American Executives, New York: W.W. Norton (1991).
Jensen, M. C., and K. J. Murphy. “Performance Pay and Top-Management Incentives.” Journal of Political Economy, 98 (1990a), 225-264.
Jensen, M. C., and K. J. Murphy. “CEO Incentives—It's Not How Much You Pay, but How.” Harvard Business Review, May-June (1990b), 138-149.
Johnson, T. S. “Pay for Performance: Corporate Executive Compensation in the 1990s.” Delaware Journal of Corporate Law, 20 (1995), 183-224.
Laughren, F. “Statement to the Legislature on Disclosure of Executive Compensation.” Ontario Securities Commission Bulletin, (October 15, 1993), 5104-5106.
Lo, K. “Economic Consequences of Regulated Changes in Disclosure: The Case of Executive Compensation.” Journal of Accounting and Economics, 35 (2003), 285-314.
Merhebi, R., P. L. Swan and X. Zhou. “Australian CEO Remuneration: Pay and Performance.” Accounting and Finance, (2006), forthcoming.
Murphy, K. J. “Executive Compensation.” In Handbook of Labor Economics, Vol. 3, O. Ashenfelter and D. Card, eds., Amsterdam: North Holland (1999).
Perry, T., and M. Zenner. “Pay for Performance? Government Regulation and the Structure of Compensation Contracts.” Journal of Financial Economics, 62 (2001), 453-488.
Peterson, J. “Transparency on execs' pay could make them bigger,” Los Angeles Times, (January 19, 2006).
Rose, N. L., and C. Wolfram. “Regulating Executive Pay: Using the Tax Code to Influence Chief Executive Officer Compensation.” Journal of Labor Economics, 20 (2002), S138-S175.

32
Rosen, S. “Contracts and the Market for Executives.” In Contract Economics, L. Werin and H. Wijkander, eds., Cambridge, Massachusetts: Basil Blackwell (1992).
Wharton Business School. “SEC's Spotlight on Executive Pay: Will It Make a Difference?” knowledge@Wharton (2006), 1-3.
Wright, R. J. “Remarks at Securities Law Superconference.” Ontario Securities Commission Bulletin (May 1, 1992), 1845-1847.
Zhou, X. “CEO Pay, Firm Size, and Corporate Performance: Evidence from Canada.” Canadian Journal of Economics, 33 (2000), 213-251.
33
Table 1 Selected Statistics
In October 1993, the province of Ontario enacted the first Canadian regulation regarding individually named disclosure of executive compensation. Beginning in fiscal year 1993, all publicly traded companies in Ontario were required to disclose the compensation of their five highest paid executives, including the CEO, for the current fiscal year and the two immediately preceding years. Our sample consists of 461 Canadian firms that were listed on the Toronto Stock Exchange during the period of 1991-1998. All variables in the table are annual and in 1991 Canadian dollars. CEO compensation includes four categories: base salary, annual bonus, long-term incentive pay and other (fringe benefits). Long-term incentive pay, in turn, consists of three components: grants of stock options, restricted stock shares and long-term incentive plan payouts. In the table, LTIP denotes long-term incentive plan payouts plus grants of restricted stock shares, and total direct pay denotes all components of pay except stock options.
Before disclosure (91−93) After disclosure (94−98)
Median Mean Std. dev. Median Mean Std. dev.
CEO pay variables: Base salary ($thousand) 234 285 199 257 332 213 Annual bonus ($thousand) 16 81 157 86 186 302 LTIP ($thousand) 0 7 68 0 20 132 All other ($thousand) 0 20 85 9 67 338 Total direct pay ($thousand) 298 393 336 414 607 644 Salary/Total direct pay (%) 83.9 81.1 19.3 69.5 69.5 23.0 Bonus/Total direct pay (%) 8.1 14.5 17.5 20.9 22.4 20.8 LTIP/Total direct pay (%) 0.0 0.8 5.3 0.0 1.4 7.0 Other/Total direct pay (%) 0.0 3.6 8.8 1.8 6.7 12.6 Option grants ($thousand) 0 70 174 25 109 306 Firm variables: Assets ($million) 143 2,508 12,336 288 4,202 20,436 Sales ($million) 123 741 1,864 231 1,083 2,521 Market value ($million) 173 747 1,743 254 1,255 3,064 Return on assets (%) 3.0 −0.7 22.9 4.5 2.0 19.2 Stock return (%) 14.7 38.7 93.9 3.9 12.4 61.3

34
Table 2 Pay-performance sensitivity and elasticity following the disclosure regulation This table contains the results of the regressions for CEO pay-performance sensitivity (columns 1 and 2) and elasticity (columns 3 and 4). The sample consists of 461 Canadian firms that were listed on the Toronto Stock Exchange during the period 1991-1998. CEO total pay includes base salary, annual bonus, long-term incentive plan payouts, grants of restricted stock shares and fringe benefits, excluding grants of stock options. Disclosure is a dummy variable that equals one for the post-disclosure years 1994-1998. t-statistics are in parentheses.
Pay-performance sensitivity Pay-performance elasticity
Independent variables Δ(Salary + bonus) Δ(Total pay) Δln(Salary
+ bonus) Δln(Total pay)
Intercept 24.095 32.581 0.0471 0.0575 (2.09) (1.51) (3.03) (3.19) Disclosure 4.959 12.292 0.0186 0.0187 (0.36) (0.48) (1.02) (0.88) Δ(Shareholder value) 0.0339 0.0466 (1.22) (0.90) Δ (Shareholder value) × Disclosure 0.0583 0.0750 (1.94) (1.34)
Δln(Shareholder value) 0.0807 0.1300 (3.37) (4.69) Δln(Shareholder value) × Disclosure 0.1048 0.0556 (3.29) (1.50) Adjusted R2 0.0387 0.0191 0.0513 0.0459 Observations 1,592 1,592 1,592 1,592
35
Table 3 Pay-performance semi-elasticity following the disclosure regulation
This table contains the results of the regressions for the semi-elasticity of CEO pay with respect to stock return (columns 1 and 2) and the semi-elasticity with respect to the return on assets (columns 3 and 4). The sample consists of 461 Canadian firms that were listed on the Toronto Stock Exchange during the period 1991-1998. CEO total pay includes base salary, annual bonus, long-term incentive plan payouts, grants of restricted stock shares and fringe benefits, excluding grants of stock options. Disclosure is a dummy variable that equals one for the post-disclosure years 1994-1998. Firm-specific effects are controlled. t-statistics are in parentheses.
(Stock return) (Return on assets)
Independent variables ln(Salary + bonus) ln(Total pay) ln(Salary + bonus) ln(Total pay) Disclosure 0.0013 0.0105 0.0288 0.0294 (0.03) (0.24) (0.78) (0.70) Year 0.0607 0.0772 0.6180 0.0784 (11.00) (12.20) (11.30) (12.65) ln(Sales) 0.1224 0.1012 0.1268 0.1047 (9.06) (6.53) (9.68) (7.05) ln(Sales) × Disclosure 0.0052 0.0060 −0.0010 −0.0001 (0.80) (0.81) (0.16) (0.01) Stock return −0.0079 0.0056 (0.73) (0.45) Stock return × Disclosure 0.0635 0.0529 (3.67) (2.67)
Return on assets 0.0398 0.1506 (0.56) (1.86) Return on assets × Disclosure 0.2736 0.2932 (2.82) (2.66) Adjusted R2 0.8832 0.8572 0.8807 0.8578 Observations 2,343 2,343 2,386 2,386

36
Table 4 CEO stock options and equity holdings following the disclosure regulation This table presents the mean and median values of CEO stock option grants, unexercised prior options and share ownership as a percentage of the firm’s shares outstanding. The sample consists of 461 Canadian firms that were listed on the Toronto Stock Exchange during the period 1991-1998. The pre-disclosure period covers the years 1991-1993 and the post-disclosure period covers the years 1994-1998. The data on current option grants are available for all sample years, and the data on prior options and stock ownership are available for the years 1993-1998.
Pre-disclosure Post-disclosure Change
CEO Pay Variables Median Mean Median Mean Median Mean Current grants of options 0.000 0.344 0.054 0.345 +0.054 +0.001 Unexercised options 0.000 0.537 0.327 0.960 +0.327 +0.423 Stock ownership 0.213 3.567 0.294 4.162 +0.081 +0.595

37
Table 5 Difference-in-difference analysis (1): Pay-performance sensitivity and elasticity This table contains the results of the difference-in-difference regressions for CEO pay-performance sensitivity (columns 1 and 2) and elasticity (columns 3 and 4). The sample consists of 220 pairs of Canadian firms and U.S. firms, which are matched, one-to-one, by size (based on sales) and by industry (based on the one-digit SIC code). The Canadian firms are chosen from the original Canadian sample consisting of 461 companies listed on the Toronto Stock Exchange during the period 1991-1998, while the U.S. firms are chosen from the Standard & Poor’s ExecuComp sample of the same period. CEO total pay includes base salary, annual bonus, long-term incentive plan payouts, grants of restricted stock shares and fringe benefits, excluding grants of stock options. Disclosure is a dummy variable that equals one for the post-disclosure years 1994-1998. Canadian is a dummy variable for Canadian firms. To be consistent with the presence of the two dummy variables, the constant term contains four components, the coefficients of which are not reported in the table. t-statistics are in parentheses.
Pay-performance sensitivity Pay-performance elasticity Independent variables
Δ(Salary + bonus)
Δ(Total pay)
Δln(Salary + bonus)
Δln(Total pay)
Δ(Shareholder value) 0.1242 0.2572 (4.37) (4.64) Δ(Shareholder value) × Disclosure −0.0653 −0.1809 (2.26) (3.21) Δ(Shareholder value) × Canadian −0.0917 −0.2118 (1.80) (2.14) Δ(Shareholder value) × Canadian × Disclosure 0.1474 0.2948 (2.64) (2.71)
Δln(Shareholder value) 0.2774 0.3377 (7.11) (7.06) Δln(Shareholder value) × Disclosure −0.0251 −0.0463 (0.54) (0.82) Δln(Shareholder value) × Canadian −0.2056 −0.2537 (4.06) (4.08) Δln(Shareholder value) × Canadian × Disclosure 0.1494 0.1987 (2.33) (2.53) Adjusted R2 0.0720 0.0385 0.0830 0.0773 Observations 2,171 2,171 2,171 2,171

38
Table 6 Difference-in-difference analysis (2): Pay-performance semi-elasticity This table contains the results of the difference-in-difference regressions for the semi-elasticity of CEO pay with respect to stock return (columns 1 and 2) and the semi-elasticity with respect to the return on assets (columns 3 and 4). The sample consists of 220 pairs of Canadian firms and U.S. firms, which are matched, one-to-one, by size (based on sales) and by industry (based on the one-digit SIC code). The Canadian firms are chosen from the original Canadian sample consisting of 461 companies listed on the Toronto Stock Exchange during the period 1991-1998, while the U.S. firms are chosen from the Standard & Poor’s ExecuComp sample of the same period. CEO total pay includes base salary, annual bonus, long-term incentive plan payouts, grants of restricted stock shares and fringe benefits, excluding grants of stock options. Disclosure is a dummy variable that equals one for the post-disclosure years 1994-1998. Canadian is a dummy variable for Canadian firms. In the presence of the two dummy variables, the constant term and the size variable ln(Sales) each contains four components, the coefficients of which are not reported in the table. In all regressions, a trend variable is included and firm-specific effects are controlled. t-statistics are in parentheses.

39
(Stock return) (Return on assets) Independent variables ln(Salary
+ bonus) ln(Total
pay) ln(Salary + bonus)
ln(Total pay)
Stock return 0.0781 0.1049 (3.81) (4.01) Stock return × Disclosure 0.0980 0.1316 (3.24) (3.41) Stock return × Canadian −0.0869 −0.1106 (3.30) (3.29) Stock return × Canadian × Disclosure –0.0011 −0.0226 (0.03) (0.42) Return on assets 1.1254 1.1632 (7.12) (5.79) Return on assets × Disclosure −0.5543 −0.8486 (3.48) (4.16) Return on assets × Canadian −0.6770 −0.7714 (2.96) (2.65) Return on assets × Canadian × Disclosure 1.1104 1.9064 (4.14) (5.55) Adjusted R2 0.4868 0.4851 0.4681 0.4677 Observations 2,726 2,727 2,740 2,741

40
Table 7 A summary of the estimates of CEO incentive parameters This table summarizes the parameter estimates of the four CEO incentive parameters obtained from the regressions reported in Tables 5 and 6.
Before disclosure After disclosure Change Change in percentage
Arithmetic sensitivity: Canadian firms 0.0454 0.1593 +0.1139 +251% US firms 0.2572 0.0763 −0.1809 −70% Canadian as of US 18% 209% Elasticity: Canadian firms 0.0840 0.2364 +0.1524 +181% US firms 0.3377 0.2914 −0.0463 −14% Canadian as of US 25% 81% Semi-elasticity (stock return): Canadian firms −0.0057 0.1033 +0.1090 +1,912% US firms 0.1049 0.2365 +0.1316 +125% Canadian as of US −5% 44% Semi-elasticity (return on assets): Canadian firms 0.3918 1.4496 +1.0578 +270% US firms 1.1632 0.3146 −0.8486 −73% Canadian as of US 34% 461%

41
Table 8 A brief comparison of CEO stock options and equity holdings This table presents the mean and median values of CEO stock option grants, unexercised prior options and share ownership as the percentage of the firm’s shares outstanding. The sample consists of 220 pairs of Canadian firms and U.S. firms, which are matched, one-to-one, by size (based on sales) and by industry (based on the one-digit SIC code). The Canadian firms are chosen from the original Canadian sample consisting of 461 companies listed on the Toronto Stock Exchange during the period 1991-1998, while the U.S. firms are chosen from the Standard & Poor’s ExecuComp sample of the same period. The pre-disclosure period covers the years 1991-1993 and the post-disclosure period covers the years 1994-1998. The data on current option grants are available for all sample years, and the data on prior options and stock ownership are available for the years 1993-1998.
Pre-disclosure Post-disclosure Change
Median Mean Median Mean Median Mean Current option grants: Canadian 0.000 0.235 0.029 0.243 +0.029 +0.008 US 0.018 0.167 0.080 0.271 +0.062 +0.104 Canadian as of US 0% 141% 36% 90% Unexercised options: Canadian 0.000 0.401 0.227 0.839 +0.227 +0.438 US 0.325 0.852 0.547 1.051 +0.222 +0.199 Canadian as of US 0% 47% 41% 80% Sock ownership: Canadian 0.103 3.286 0.121 3.709 +0.018 +0.423 US 0.394 3.319 0.411 3.762 +0.017 +0.443 Canadian as of US 26% 99% 29% 99%

42
Table 9 Difference-in-difference analysis (3): CEO equity incentives This table contains the results of the difference-in-difference regressions for CEO stock options and equity holdings. The independent variables are option grants or equity holdings, calculated as the percentage of the firm’s shares outstanding. The sample consists of 220 pairs of Canadian firms and U.S. firms, which are matched, one-to-one, by size (based on sales) and by industry (based on the one-digit SIC code). The Canadian firms are chosen from the original Canadian sample consisting of 461 companies listed on the Toronto Stock Exchange during the period 1991-1998, while the U.S. firms are chosen from the Standard & Poor’s ExecuComp sample of the same period. Disclosure is a dummy variable that equals one for the post-disclosure years 1994-1998. Canadian is a dummy variable for Canadian firms. Firm-specific effects are controlled. t-statistics are in parentheses.
Dependent variables
Independent variables ln(Option grants)
ln(Option holding)
ln(Share ownership)
ln(Equity incentives)
Intercept –3.5424 –0.4087 0.6142 1.6622 (6.60) (0.67) (1.17) (4.23) Year 0.1804 0.2341 0.0359 0.1137 (4.97) (7.05) (1.47) (6.16) Disclosure –0.3161 –0.4080 –0.5244 –0.6511 (0.61) (0.83) (1.55) (2.55) Canadian –2.2028 –7.3708 –1.0201 –1.9431 (3.02) (8.00) (1.15) (2.88) Canadian × Disclosure 0.0639 3.8600 1.2316 1.6090 (0.09) (5.07) (1.95) (3.36) ln(Sales) –0.1808 –0.3266 –0.2840 –0.3347 (2.12) (3.31) (3.36) (5.26) ln(Sales) × Disclosure 0.1101 0.0837 0.1129 0.1111 (1.36) (1.07) (2.12) (2.77) ln(Sales) × Canadian 0.2653 0.8114 0.0400 0.1953 (2.25) (5.43) (0.29) (1.83) ln(Sales) × Canadian × Disclosure –0.0463 –0.5010 –0.2326 –0.2556 (0.40) (4.11) (2.37) (3.41) Adjusted R2 0.0599 0.1385 0.0954 0.1295 Observations 2,824 2,299 2,050 1,991

43
Table 10 A brief comparison of changes of CEO compensation levels This table presents the mean and median values of CEO compensation and the firms’ return performance. The sample consists of 220 pairs of Canadian firms and U.S. firms, which are matched, one-to-one, by size (based on sales) and by industry (based on the one-digit SIC code). The Canadian firms are chosen from the original Canadian sample consisting of 461 companies listed on the Toronto Stock Exchange during the period 1991-1998, while the U.S. firms are chosen from the Standard & Poor’s ExecuComp sample of the same period. The pre-disclosure period covers the years 1991-1993 and the post-disclosure period covers the years 1994-1998. CEO total pay includes base salary, annual bonus, long-term incentive plan payouts, grants of restricted stock shares and fringe benefits, excluding grants of stock options. CEO pay data are available for all sample years, and the data on capital gains from exercising stock options are available for the years 1993-1998.
Pre-disclosure Post-disclosure Percentage change
Median Mean Median Mean Median Mean
Salary + bonus:
Canadian ($thousand) 377 476 519 656 +38% +38% US ($thousand) 534 654 645 835 +21% +28% Canadian as of US 71% 73% 80% 79% Total pay: Canadian ($thousand) 394 507 577 761 +46% +50% US ($thousand) 588 826 740 1,138 +26% +38% Canadian as of US 67% 61% 78% 67% Total pay + capital gains: Canadian ($thousand) 446 660 620 1,112 +39% +68% US ($thousand) 697 1,256 831 1,633 +19% +30% Canadian as of US 64% 53% 75% 68%

44
Table 11 Difference-in-difference analysis (4): CEO compensation levels This table summarizes the coefficients for two constant-term components obtained from the regressions reported in Tables 5 and 6. The sample for the regressions consists of 220 pairs of Canadian firms and U.S. firms, which are matched, one-to-one, by size (based on sales) and by industry (based on the one-digit SIC code). The Canadian firms are chosen from the original Canadian sample consisting of 461 companies listed on the Toronto Stock Exchange during the period 1991-1998, while the U.S. firms are chosen from the Standard & Poor’s ExecuComp sample of the same period. Disclosure is a dummy variable that equals one for the post-disclosure years 1994-1998. Canadian is a dummy variable for Canadian firms. The coefficient on the dummy variable Canadian estimates the pre-disclosure difference in the fixed component of pay between Canadian CEOs and U.S. CEOs. The coefficient on the dummy variable interaction Canadian × Disclosure estimates the difference in the post-disclosure changes in pay levels between Canadian CEOs and U.S. CEOs. t-statistics are in parentheses.
Pay-performance relation models
Independent variables Arithmetic sensitivity Elasticity Semi-elasticity
(stock return) Semi-elasticity
(return on assets)
Salary + bonus
Canadian –7.4313 0.0118 –0.1109 –0.2049 (0.26) (0.50) (0.81) (1.52) Canadian × Disclosure 4.5458 0.0071 0.2073 0.1560 (0.13) (0.25) (2.29) (1.74) Total direct pay:
Canadian –23.2294 0.0068 0.0509 –0.0365 (0.42) (0.23) (0.32) (0.23) Canadian × Disclosure –0.6056 0.0102 0.2860 0.2312
(0.01) (0.29) (2.47) (2.02)