DOCUMENT - Renault Group
360
DRIVE THE CHANGE REGISTRATION DOCUMENT INCLUDING THE ANNUAL FINANCIAL REPORT 2013
-
Upload
khangminh22 -
Category
Documents
-
view
0 -
download
0
Transcript of DOCUMENT - Renault Group

DRIVE THE CHANGE
REGISTRATIONDOCUMENT
INCLUDING THE ANNUAL FINANCIAL REPORT
2013

SUMMARY
1 4
5
6
7
2
3
The elements of the
annual fi nancial report are
identifi ed by AFR sign.
✦ Global Reporting
Initiative (GRI) directives
labeltransparence.com
This label recognizes the most transparent Registration Documents according to the
criteria of the Annual Transparency Ranking.
THE RENAULT GROUP 3
1.1 Overview of Renault and the Group 4
1.2 The Renault-Nissan Alliance 26
1.3 Earnings report-2013 AFR 41
1.4 Research and development AFR 58
1.5 Risk factors ✦ AFR 70
1.6 Drive the change ✦ 89
1.7 Post balance sheet events 91
CSR: SUSTAINABLE MOBILITY 93
2.1 Renault, a responsible company committed to sustainable development ✦ 94
2.2 Stakeholder dialogue and information ✦ 99
2.3 Labor relations AFR 107
2.4 Environmental dimension AFR 122
2.5 social performance ✦ AFR 146
2.6 Sustainability ratings and indexes 161
2.7 Grenelle II cross reference table 163
2.8 Appendices 167
CORPORATE GOVERNANCE 183
3.1 Report of the Chairman of the Board ✦ AFR 184
3.2 Statutory auditors’ report, prepared in accordance with article L. 225-235 of the French Company Law (Code de commerce), on the report prepared by the Chairman of the Board of Directors of Renault AFR 209
3.3 Remuneration of Senior Executives AFR 210
3.4 Internal rules of the Board of Directors 219
FINANCIAL STATEMENTS AFR 227
4.1 Statutory auditors’ report on the consolidated financial statements ✦ 228
4.2 Consolidated financial statements 230
4.3 Statutory auditors’ report 298
4.4 Renault SA parent-company financial statements 302
RENAULT AND ITS SHAREHOLDERS 319
5.1 General information 320
5.2 General information about Renault’s share capital 322
5.3 Market for Renault shares ✦ 327
5.4 Investor relations policy ✦ 330
MIXED GENERAL MEETING OF APRIL 30, 2014 333
Presentation of the resolutions 334
ADDITIONAL INFORMATION 343
7.1 Person responsible for the registration document AFR 344
7.2 Information concerning FY 2011 and 2012 ✦ 345
7.3 Statutory auditors AFR 346
7.4 Cross reference tables 347
GLOSSARY 352

RENAULT REGISTRATION DOCUMENT 2013✦ Global Reporting Initiative (GRI) directives 1
The French version has been fi led with the AMF (French Financial Markets Authority) on March 13, 2014.
REGISTRATIONDOCUMENT
INCLUDING THE ANNUAL FINANCIAL REPORTAPPROVED BY THE BOARD OF DIRECTORS ON FEBRUARY 12, 2014
2013
This Registration Document is on line on the website
www.renault.com

Find out more at www.renault.comREGISTRATION DOCUMENT RENAULT 20132
120 REPRESENTED IN MORE THANCOUNTRIESGROUP ’S REVENUES
40,932MILLION EUROS
121,807TOTAL STAFF

REGISTRATION DOCUMENT RENAULT 2013✦ Global Reporting Initiative (GRI) Directives 3
1.1 OVERVIEW OF RENAULT AND THE GROUP 4
1.1.1 Key figures ✦ 4
1.1.2 Background and highlights 5
1.1.3 Strategic objectives ✦ 8
1.1.4 Main Group activities ✦ 8
1.1.5 Management bodies at March 1, 2014 ✦ 20
1.1.6 Main Group subsidiaries and detailed organization chart ✦ 22
1.2 THE RENAULT-NISSAN ALLIANCE 26
1.2.1 Alliance objectives ✦ 26
1.2.2 Operational structure of the Alliance ✦ 30
1.2.3 The status of synergies 34
1.2.4 Nissan’s strategy and results in 2013 36
1.2.5 Alliance combined sales performance and financial indicators ✦ 37
1.3 EARNINGS REPORT-2013 AFR 41
1.3.1 Sales performance ✦ 42
1.3.2 Financial results ✦ 52
1.4 RESEARCH AND DEVELOPMENT AFR 58
1.4.1 R&D highlights in 2013 58
1.4.2 R&D: performance and innovation 59
1.4.3 Technology plan 63
1.4.4 Long-term targets 65
1.4.5 Skills, professions, expertise and partnerships 65
1.5 RISK FACTORS ✦ AFR 70
1.5.1 Financial risk 70
1.5.2 Operational risk 81
1.5.3 Other risks 87
1.6 DRIVE THE CHANGE ✦ 89
1.7 POST BALANCE SHEET EVENTS 91
1THE RENAULT GROUP
The elements of the annual fi nancial report are identifi ed by AFR sign.

Find out more at www.renault.comREGISTRATION DOCUMENT RENAULT 20134
THE RENAULT GROUP1 OVERVIEW OF RENAULT AND THE GROUP
1.1 OVERVIEW OF RENAULT AND THE GROUP
1.1.1 KEY FIGURES ✦
Three-year consolidated figures – published data(1)
(€ million) 2013 2012 RESTATED* 2012 PUBLISHED 2011 PUBLISHED
Revenues 40,932 40,720 41,270 42,628
Operating margin 1,242 782 729 1,091
Share in Nissan Motor net income 1,498 1,213 1,234 1,332
Renault net income 586 1,749 1,772 2,092
Earnings per share (€) 2.15 6. 43 6. 51 7. 68
Capital 1,127 1,127 1,127 1,127
Shareholders’ equity 23,214 24,564 24,547 24,567
Total assets 74,992 75,414 75,414 72,934
Dividends (€) 1. 72(2) 1. 72 1. 72 1. 16
Automotive cash flow(3) 2,914 2,573 2,577 2,910
Automotive net cash position 1,761 1,532 1,492 (299)
TOTAL STAFF AT DECEMBER 31 121,807 127,086 127,086 128,322
(1) This information is for reference only and is not always directly comparable year-on-year, since it may include changes in scope and/or accounting practices. See chapter 4, note 3 in the notes to the consolidated financial statements.
(2) Proposal to be submitted to the AGM on April 30, 2014.
(3) Excludes dividends received from associated companies.
* Restated to reflect the retroactive application of the IFRS 11 “partnerships” and revised IAS 19 “employee benefits” standards.
RENAULT SHAREHOLDERS AT DECEMBER 31, 2013
Brea kdown of capital as a % of shares
63.00%
Public
3.10%
Daimler AG
2.61%
Employees
15.01%
French state
1.28%
Treasury shares
15.00%
Nissan
Brea kdown of capital as a % of voting rights
75.25%
Public
3.12%
Employees
3.70%
Daimler AG
17.93%
French state

REGISTRATION DOCUMENT RENAULT 2013✦ Global Reporting Initiative (GRI) Directives 5
THE RENAULT GROUP 1
1
OVERVIEW OF RENAULT AND THE GROUP
1.1.2 BACKGROUND AND HIGHLIGHTS
1898Société Renault Frères was formed to manufacture motor vehicles, taking
advantage of patents such as the first direct-drive transmission. Based in
the Paris suburb of Billancourt, the Company achieved international renown
through its success in motor sports, and initially specialized in the construction
of passenger cars and taxis. During the First World War, it produced substantial
volumes of trucks, light tanks and aircraft engines.
1922Having expanded strongly in the passenger car and commercial vehicle
markets, Renault became a limited company. Establishing production centers
in France and abroad, Renault gradually emerged as the French market leader.
1945The Company was nationalized in January, renamed “Régie Nationale des
Usines Renault”, and concentrated on producing the 4CV.
1972Renault 5 arrived on the market. It remains one of the Group’s best-selling
models ever.
THE 1980SThrough to the mid-1980s, Renault followed a strategy of diversification in the
industrial, financial and service sectors, while at the same time growing its
industrial and commercial activities internationally. But in 1984, the Company
ran into financial difficulties. As a result, it concentrated on restructuring and
refocusing on its core activities and returned to profit in 1987.
THE 1990SIn 1990, Renault became a limited company once again. In the same year, it
signed an agreement for close cooperation with the Volvo group. In 1991, the
two groups linked their automotive and commercial vehicle businesses via
cross-shareholdings. This arrangement was unwound after plans to merge
the two groups were shelved in late 1993.
On November 17, 1994 the French government opened Renault to outside
capital, a first step towards privatization, which took place in July 1996.
In 1998, the year of its centenary, Renault opened the Technocentre in
Guyancourt for its design and development teams, and a bodywork/assembly
plant in Curitiba, Brazil.
The year 1999 marked the start of a new era in Renault’s history with the
signing of an Alliance with Nissan, on March 27 in Tokyo. In the same year,
Renault acquired a new brand by taking a 51% stake in Romanian carmaker
Dacia.
2000Renault raised its stake in Dacia to 80.1% and acquired a new brand –
Samsung Motors – in South Korea.
2001Renault and Volvo joined forces to form the world’s second-biggest truck
manufacturer. Renault became the main shareholder in the Volvo group, with
a 20% stake, after selling the Renault V.I./Mack group to Volvo.
2002Renault and Nissan implemented the second stage of their Alliance, aimed
at strengthening their equity ties and creating a joint strategic structure.
Renault raised its stake in Nissan from 36.8% to 44.4%. At the same time,
Nissan took a 15% ownership interest in Renault. The French government’s
ownership interest was reduced to 25.9% and then to 15.7% in 2003 by
selling shares both to Company employees and on the market.
2003This was the year of Mégane II. With five body styles (Scénic II, Grand Scénic,
Mégane coupé-cabriolet, Mégane 4-door sedan and Mégane Sport Tourer)
as well as the two models launched in 2002, a total of seven models were
launched in 17 months. Mégane II became Europe’s best-selling model.
2004The year was marked by two major product launches: Modus and Logan.
Modus is Renault’s entry-level MPV. It was the first Renault-badged vehicle
built on the B platform shared with Nissan, and the first vehicle in its class
to score five stars in Euro NCAP crash tests. Logan, developed by Renault
and manufactured and marketed by Dacia, offers excellent value for money.
It has enjoyed great success since its launch, both on its domestic market of
Romania, and on export markets. The car will be the spearhead of Renault’s
international expansion in the years ahead.
2005At the Annual General Meeting on April 29, Carlos Ghosn was named Chief
Executive Officer of Renault. Louis Schweitzer kept his position as Chairman
of the Board of Directors. The Group pursued its international expansion
with the development of industrial facilities for Logan in Russia, Colombia
and Morocco. Renault signed an agreement with Mahindra & Mahindra to
manufacture and market Logan in India from 2007. It launched two landmark
products: Clio III, the eighth Renault vehicle to obtain five stars in Euro NCAP
crash tests and “Car of the Year 2006”, and the 2.0 dCi engine, the first
diesel powerplant developed by the Renault-Nissan Alliance. Also this year,
the Renault F1 Team scored a double win, taking the World Constructors’ and
Drivers’ championship titles.

Find out more at www.renault.comREGISTRATION DOCUMENT RENAULT 20136
THE RENAULT GROUP1 OVERVIEW OF RENAULT AND THE GROUP
2006On February 9, Carlos Ghosn announced Renault Commitment 2009, a plan
based on three key commitments: quality, profitability and growth. The aim
is to position Renault as Europe’s most profitable volume automaker. For the
second year running, the Renault F1 Team scored a double win with the new
R26, taking the World Constructors’ and Drivers’ Championship titles. At the
Paris Motor Show, Renault unveiled the Twingo Concept show car, and Koleos
Concept, the first future crossover vehicle in the range.
2007The product offensive began with the launch of New Twingo (produced in
Slovenia) in May and of New Laguna (produced in France) in October. Both
vehicles aim to achieve the highest standards of quality and reliability. In
Korea, Renault Samsung Motors began production of QM5, a Koleos-based
crossover vehicle, designed by Renault and developed by Nissan. Half of the
total output is scheduled for export. Expanding its international presence,
Renault founded new subsidiaries in Ireland and Scandinavia, increased its
production capacity in Russia, and signed a memorandum of understanding
for a future industrial complex in Morocco. In May, Renault launched the
eco2 label for its most ecological and economical vehicles. Eco2 vehicles
are produced in certified plants and emit less than 140g of CO2 per km or
run on biofuel. They also include at least 5% recycled plastics, and are 95%
recyclable.
2008The global economy was hit by a severe financial and economic crisis on
an exceptional scale. In July, Renault put in place a new action plan aimed
primarily at limiting inventories and cutting costs and investments in order to
reflect new market realities. New business locations planned by the Renault-
Nissan Alliance in Tangiers (Morocco) and in Chennai (India) were deferred
or put on hold. To take advantage of the high growth potential of the Russian
market, Renault is relying on its subsidiary Avtoframos, which produces Logan
and sells a range of imported Renault vehicles, and also on its strategic
partnership with AVTOVAZ. Renault signed several agreements to market
electric vehicles, including one in Israel with Project Better Place, one in
Denmark and one in Portugal. In October, Patrick Pélata was appointed Chief
Operating Officer, reflecting Carlos Ghosn’s decision to reinforce operational
management through grassroots managerial practices and fast decision-
making. All Renault industrial sites are now ISO 14001 certified. The vehicle
range is undergoing a renewal with the launches of New Mégane, Kangoo,
Koleos and Sandero.
2009Renault pursued its crisis management plan by cutting its costs and operating
capital requirements, through its Renault Voluntary Plan and the establishment
of a crisis social contract (short-time working with no reduction in pay) in order
to achieve a positive free cash flow. Carlos Ghosn is appointed Chairman of
the Board of Directors, following the departure of Louis Schweitzer. Six new
vehicles were launched: Grand Scénic III, Scénic III, Mégane III estate, Mégane
Renault Sport, Fluence and Kangoo be bop. Renault confirmed its long-term
vision of the automotive and zero-emission mobility by unveiling its future
range of electric vehicles (Twizy Concept, ZOE Concept, Fluence Concept
and Kangoo Concept) and its new brand baseline, “Drive the change”, at the
Frankfurt Motor Show. An agreement was signed with the French government
for the creation of a battery plant at Flins (France). The Renault-Nissan
Alliance, which celebrated its 10th anniversary, aims to become the leading
volume manufacturer of zero emission vehicles and has already entered
partnerships with some 40 governments, local authorities and energy utilities
all over the world. The foundations of the Tangiers plant were laid.
2010Vehicle sales (PC+LCV) attained a record level of more than 2,625,000 units,
benefiting the Group’s three brands and all the Regions, particularly outside
Europe.
New models were presented at the motor shows, including the Mégane CC
and Wind convertibles at Geneva, the Latitude sedan at Moscow, the Kangoo
Express Z.E. and Maxi, Trafic and Master at Hanover, the complete range of
electric vehicles (Fluence Z.E., Twizy, ZOE Preview and Kangoo Z.E.), upper
range models (Latitude, Laguna and Espace) and the DeZir concept car at
Paris, giving practical form to the Group’s new strategy in design, based on
the life cycle.
In April the Alliance and Daimler signed a long-term strategic cooperation
agreement on the future generations of Smart Fortwo and Twingo, the pooling
of powertrains and collaborative work on light commercial and electric
vehicles. The agreement was strengthened by cross shareholdings, with
Daimler taking a 3.1% share in Renault and Nissan capital and Renault and
Nissan each taking a 1.55% share in Daimler.
Renault paid back ahead of time €1 billion of the loan granted by the French
government and sold its B shares in AB Volvo, generating a capital gain of
€2 billion.
In Russia, the second phase of the Avtoframos plant was launched and the
restructuring and recapitalization agreement was signed with AVTOVAZ.
Sandero was launched on the Russian market.
Carlos Ghosn was re-elected as Chairman and Chief Executive Officer of
Renault for a four-year period.
2011The Company faced three major crises in 2011: the earthquake and tsunami
in Japan in early March and its strong impact on supplies, the sovereign debt
crisis in the euro zone and a case of attempted fraud.
In February, the Group launched its new strategic plan, Renault 2016 –
Drive the Change.
Group PC+LCV sales, driven by international markets, totaled a record high
of 2.72 million units. The Company met its commitment of €500 million in
operational free cash flow, and net debt fell to the same level as in 1998.
Renault made early repayment (in two installments of €1 billion) of the loan
granted by the French government in April 2009.
At the Frankfurt Motor Show, Renault presented New Twingo and the new
range of Energy engines. The first electric vehicles – Kangoo Z.E. and Fluence
Z.E. – arrived on the market at the end of the year.
Following the attempted fraud case at the start of the year, Renault reviewed
its system of corporate governance. It appointed a new Chief Operating
Officer as well as an ethics manager. The Office of the CEO, the Audit, Risk
Management and Organization department, and Group Human Resources
now report directly to the Chairman and CEO.
REGISTRATION DOCUMENT RENAULT 2013✦ Global Reporting Initiative (GRI) Directives 7
THE RENAULT GROUP 1
1
OVERVIEW OF RENAULT AND THE GROUP
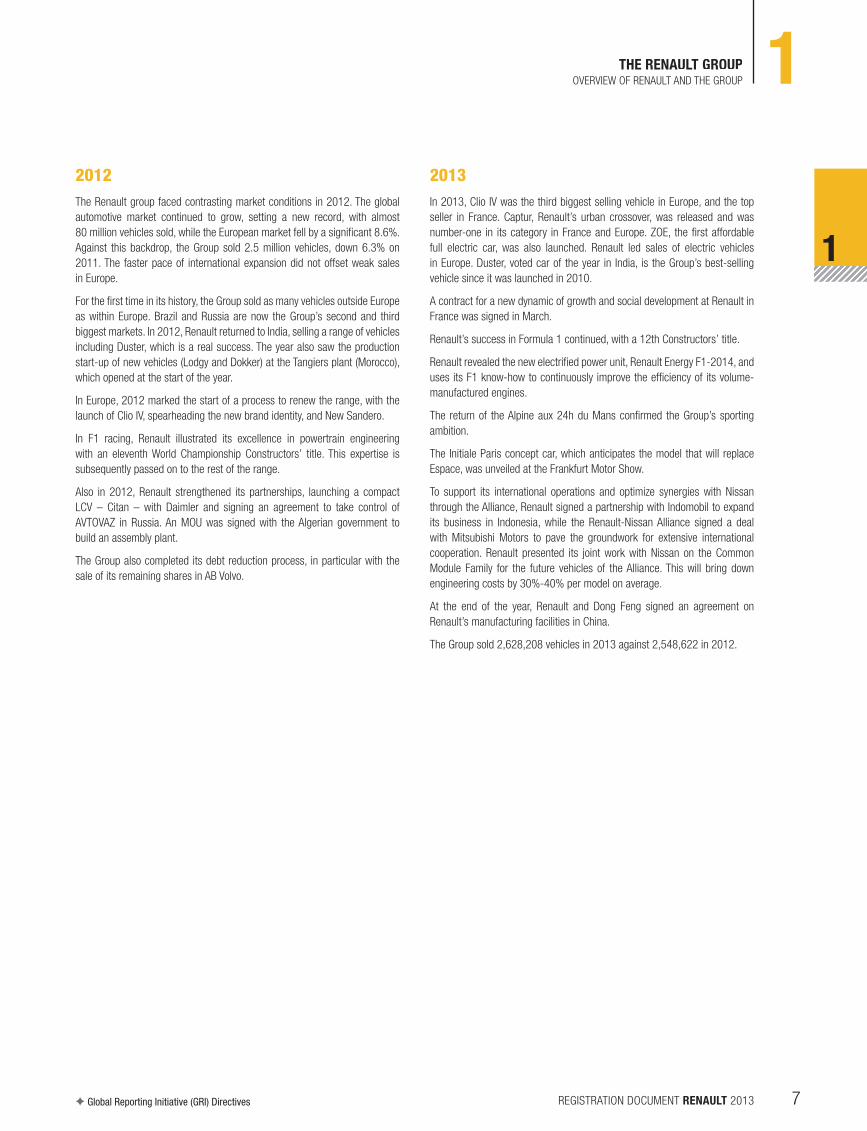
2012The Renault group faced contrasting market conditions in 2012. The global
automotive market continued to grow, setting a new record, with almost
80 million vehicles sold, while the European market fell by a significant 8.6%.
Against this backdrop, the Group sold 2.5 million vehicles, down 6.3% on
2011. The faster pace of international expansion did not offset weak sales
in Europe.
For the first time in its history, the Group sold as many vehicles outside Europe
as within Europe. Brazil and Russia are now the Group’s second and third
biggest markets. In 2012, Renault returned to India, selling a range of vehicles
including Duster, which is a real success. The year also saw the production
start-up of new vehicles (Lodgy and Dokker) at the Tangiers plant (Morocco),
which opened at the start of the year.
In Europe, 2012 marked the start of a process to renew the range, with the
launch of Clio IV, spearheading the new brand identity, and New Sandero.
In F1 racing, Renault illustrated its excellence in powertrain engineering
with an eleventh World Championship Constructors’ title. This expertise is
subsequently passed on to the rest of the range.
Also in 2012, Renault strengthened its partnerships, launching a compact
LCV – Citan – with Daimler and signing an agreement to take control of
AVTOVAZ in Russia. An MOU was signed with the Algerian government to
build an assembly plant.
The Group also completed its debt reduction process, in particular with the
sale of its remaining shares in AB Volvo.
2013In 2013, Clio IV was the third biggest selling vehicle in Europe, and the top
seller in France. Captur, Renault’s urban crossover, was released and was
number-one in its category in France and Europe. ZOE, the first affordable
full electric car, was also launched. Renault led sales of electric vehicles
in Europe. Duster, voted car of the year in India, is the Group’s best-selling
vehicle since it was launched in 2010.
A contract for a new dynamic of growth and social development at Renault in
France was signed in March.
Renault’s success in Formula 1 continued, with a 12th Constructors’ title.
Renault revealed the new electrified power unit, Renault Energy F1-2014, and
uses its F1 know-how to continuously improve the efficiency of its volume-
manufactured engines.
The return of the Alpine aux 24h du Mans confirmed the Group’s sporting
ambition.
The Initiale Paris concept car, which anticipates the model that will replace
Espace, was unveiled at the Frankfurt Motor Show.
To support its international operations and optimize synergies with Nissan
through the Alliance, Renault signed a partnership with Indomobil to expand
its business in Indonesia, while the Renault-Nissan Alliance signed a deal
with Mitsubishi Motors to pave the groundwork for extensive international
cooperation. Renault presented its joint work with Nissan on the Common
Module Family for the future vehicles of the Alliance. This will bring down
engineering costs by 30%-40% per model on average.
At the end of the year, Renault and Dong Feng signed an agreement on
Renault’s manufacturing facilities in China.
The Group sold 2,628,208 vehicles in 2013 against 2,548,622 in 2012.
Find out more at www.renault.comREGISTRATION DOCUMENT RENAULT 20138
THE RENAULT GROUP1 OVERVIEW OF RENAULT AND THE GROUP
1.1.3 STRATEGIC OBJECTIVES ✦
S ee paragraph 1.6 Drive the change.
1.1.4 MAIN GROUP ACTIVITIES ✦
The Group’s activities have been organized into two main business sectors, in
more than 120 countries:
W Automotive: design, manufacturing and distribution of products through the
sales network (including the Renault Retail Group subsidiary):
W new vehicles, with three ranges – passenger cars, light commercial
vehicles and electric vehicles – marketed under three badges: Renault,
Dacia and Renault Samsung Motors (except electric vehicles, which are
exclusive to Renault). Vehicles manufactured by Dacia and RSM may be
sold under the Renault badge in some countries,
W used vehicles, and spare parts;
W Renault powertrains, sold B2B,
W Services: sales financing, leasing, maintenance and service contracts.
In addition to these two business lines, Renault has equity investments in the
following two companies;
W Nissan;
W AVTOVAZ.
These holdings are accounted for in the Group’s financial statements using
the equity method.
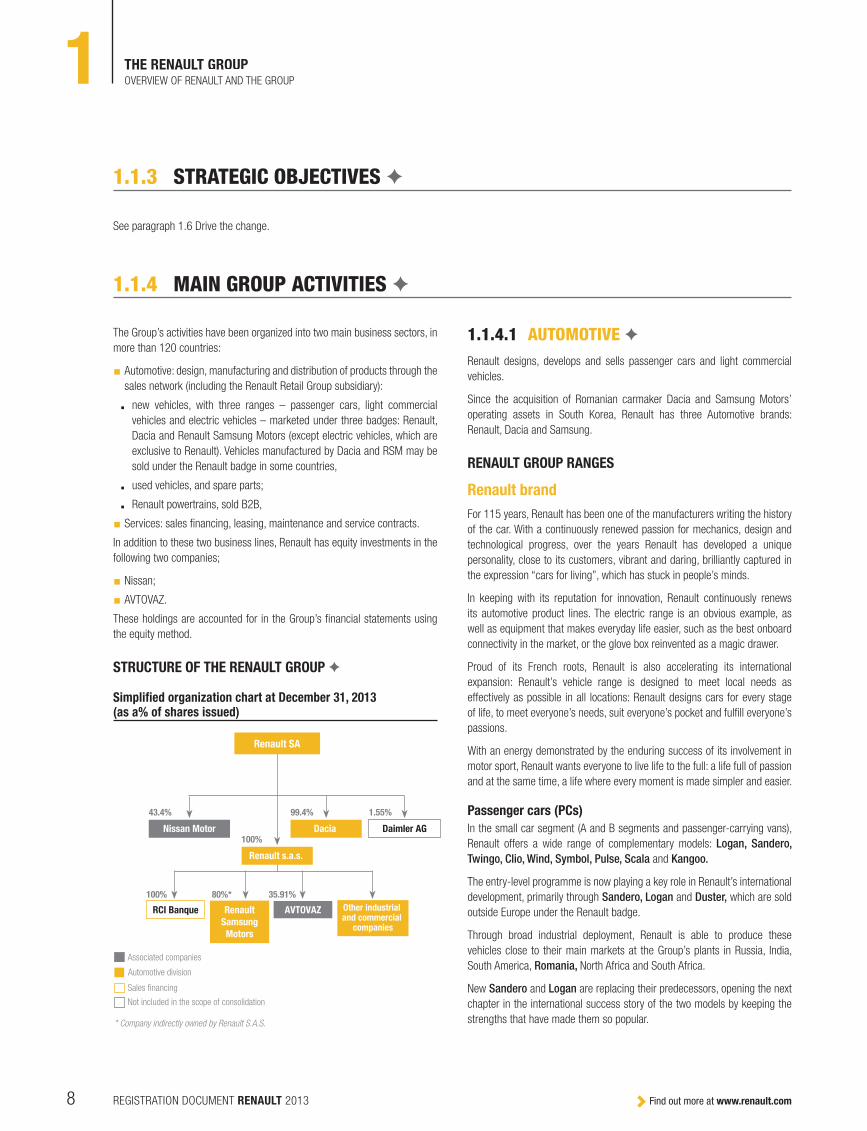
STRUCTURE OF THE RENAULT GROUP ✦
Simplified organization chart at December 31, 2013 (as a% of shares issued)
RCI Banque
100%
Renault
Samsung
Motors
80%*
Nissan Motor
Renault s.a.s.
43.4%
100% Dacia
99.4%
Daimler AG
1.55%
AVTOVAZ
35.91%
Other industrial and commercial
companies
Renault SA
* Company indirectly owned by Renault S.A.S.
Associated companies
Sales financing
Not included in the scope of consolidation
Automotive division
1.1.4.1 AUTOMOTIVE ✦Renault designs, develops and sells passenger cars and light commercial
vehicles.
Since the acquisition of Romanian carmaker Dacia and Samsung Motors’
operating assets in South Korea, Renault has three Automotive brands:
Renault, Dacia and Samsung.
RENAULT GROUP RANGES
Renault brand
For 115 years, Renault has been one of the manufacturers writing the history
of the car. With a continuously renewed passion for mechanics, design and
technological progress, over the years Renault has developed a unique
personality, close to its customers, vibrant and daring, brilliantly captured in
the expression “cars for living”, which has stuck in people’s minds.
In keeping with its reputation for innovation, Renault continuously renews
its automotive product lines. The electric range is an obvious example, as
well as equipment that makes everyday life easier, such as the best onboard
connectivity in the market, or the glove box reinvented as a magic drawer.
Proud of its French roots, Renault is also accelerating its international
expansion: Renault’s vehicle range is designed to meet local needs as
effectively as possible in all locations: Renault designs cars for every stage
of life, to meet everyone’s needs, suit everyone’s pocket and fulfill everyone’s
passions.
With an energy demonstrated by the enduring success of its involvement in
motor sport, Renault wants everyone to live life to the full: a life full of passion
and at the same time, a life where every moment is made simpler and easier.
Passenger cars (PCs)
In the small car segment (A and B segments and passenger-carrying vans),
Renault offers a wide range of complementary models: Logan, Sandero,
Twingo, Clio, Wind, Symbol, Pulse, Scala and Kangoo.
The entry-level programme is now playing a key role in Renault’s international
development, primarily through Sandero, Logan and Duster, which are sold
outside Europe under the Renault badge.
Through broad industrial deployment, Renault is able to produce these
vehicles close to their main markets at the Group’s plants in Russia, India,
South America, Romania, North Africa and South Africa.
New Sandero and Logan are replacing their predecessors, opening the next
chapter in the international success story of the two models by keeping the
strengths that have made them so popular.

REGISTRATION DOCUMENT RENAULT 2013✦ Global Reporting Initiative (GRI) Directives 9
THE RENAULT GROUP 1
1
OVERVIEW OF RENAULT AND THE GROUP
Affordable, roomy and robust, Renault Logan continued to enjoy huge
success in 2013 in South America (accounting for almost 10% of sales in
this Region) and Russia (almost 24 % of sales for this country). Delivering
unbeatable value for money, it is particularly attractive to buyers of family
vehicles.
Sandero, with a modern design, spacious interior, reliability and value for
money meets the needs of global customers, from young couples in Brazil to
singles in Russia. The model accounts for 45% of sales in Brazil and 20% of
sales in Russia.
In the A segment of city cars, Twingo II remains the benchmark on its
segment. Launched in January 2012, it was the first vehicle in the range
to feature the new brand design identity. Twingo is celebrating its 20th
anniversary in 2013 but it still looks as fresh and bold as it did on launch:
cheery colors, an original customization programme and unrivalled modular
design/functionality. A vehicle of exceptional reliability and flawless quality,
with continuously upgraded engines that are on the cutting edge for low CO2
emissions (85g for the Euro 5 diesel in January 2013), it remains No. 1 in
its segment in France, with a 27.7% segment share, and fourth in Europe
(6.7%) in a fiercely competitive environment.
In the B segment, New Clio, launched at the Paris Motor Show in October 2012,
has opened a new page in the Clio saga. One year on, Clio IV has been
highly successful and looks set to keep its place in the top three bestsellers in
Europe, taking 7.2% of the segment.
Building on the fundamentals inherited from the previous generations, Clio IV
makes a fresh start with its sensual design and wide range of customized
features, the R-Link multimedia tactile screen interface with a built-in
navigation system, a rich array of equipment, and new engines combining
dynamic performance with record-breaking fuel efficiency. The new Energy
TCe 90 gasoline engine consumes just 4.3 l/100km and emits no more than
99g of CO2/km, while the latest optimized version of the highly appreciated
Energy dCi 90 attains an unequalled 3.2 l/100km.
The station wagon version, with its original shooting-brake styling, was
successfully launched in February 2013, taking 31% and second place in the
sub-B station wagon segment in Europe. This was followed, in March 2013,
by an RS version with a turbocharged gasoline engine mated to an automatic
transmission with the EDC dual-clutch system, offering unprecedented
versatility in the sports car segment.
At the same time, the older generations of Clio live on, since Clio III Collection
and Clio II are still present as Clio entry-level models in Europe and North
Africa respectively, while Clio II, restyled to reflect Renault’s new design
identity, is marketed in Brazil and Argentina.
After the renewal of Clio, Renault continued its design offensive by releasing
Captur, the first urban crossover in the range, on the market since April 2013.
A distinctive vehicle, Captur offers the best of three vehicle styles: the
expressive styling and driving position of an SUV, the interior space and
modular design of a minivan, and the handling and drivability of a compact
hatchback. In just a few months, by July 2013, Captur was already leading
the B Crossover segment in Europe.
The first Renault vehicle manufactured on a Nissan platform, Renault
Pulse delivers everything Renault needs to establish itself in the Indian
market alongside Renault Duster. A small hatchback ideally suited to Indian
conditions, it is positioned in a premium segment aimed at young, upwardly
mobile, urban customers. The three-box variant, Renault Scala, based on the
same platform, sets high standards in comfort with its features and size suited
to young families.
The Kangoo modular van, launched in 2008, underwent a complete
makeover in mid-2013. New Kangoo now has a new front end that expresses
Renault’s new brand identity. It also features a new central console and new
engines – the 1.6 ENERGY 115 bhp diesel engine, and the 1.2 ENERGY 115
gasoline engine – offering some of the best fuel economy in the category.
New Kangoo also has new equipment, including the R-Link navigation system.
It still comes in two lengths, including Grand Kangoo, with a 5-seater and a
7-seater version, and is manufactured in Maubeuge (France). The previous
version of Kangoo is still on the market and continues to be produced in
Cordoba (Argentina).
2013 was an eventful year for Scénic and Grand Scénic with the launch of
a new derivative in March: Scénic Xmod, which blends the exciting design of
a crossover with the expertise of the benchmark maker of compact MPVs.
With a raised ride height, the Scénic Xmod has an expressive design that
speaks the language of a crossover, with distinctive front and rear bumpers,
body moldings, and chrome roof bars (on some trim levels).
On the inside, a fixed central console makes the driver feel like a pilot, with
a driving position designed like a cockpit. The console, within easy reach,
includes the Extended Grip lever and the multi-directional joystick for
navigating the multimedia interface. The dash, with the Thin Film Transistor
(TFT) digital display and the Renault R-Link connected touchscreen multimedia
system, shows all the information the driver needs simply and visibly.
In time for the launch of Scénic Xmod, Scénic and Grand Scénic were also
upgraded to feature Renault’s new brand identity. Scénic held on to the No. 1
position in the European compact minivan market with a 16% share of the
segment at end-December 2013.
Revealed at the Istanbul Motor Show in November 2012 and launched on the
market in January 2013, New Fluence also features Renault’s new design
identity, with LED daytime-running lights for a dynamic, modern look.
New Fluence ships with a range of powertrains tailored to the needs of
customers in the countries where it is sold, with two engines combining fuel
efficiency with drivability, the new 1.6 16v 115 cv X-Tronic, delivering 156Nm
of torque at 4,000rpm 156Nm, and the 1.6 dCi 130 diesel. Designed first
and foremost for driving pleasure, the 1.6 dCi 130 is the most powerful diesel
engine in its category. It delivers 130hp for cubic capacity of 1,598cc. By
combining a low cubic capacity with a range of high-tech innovations, it cuts
fuel consumption to just 4.6 l/100km over a combined cycle with emissions
of just 119g of CO2/km. It therefore carries the Renault eco2 logo.
Fluence is also contributing to the Group’s efforts in environmental protection,
since it is available as an electric vehicle, Renault Fluence Z.E., launched in
Europe in fall 2011.

Find out more at www.renault.comREGISTRATION DOCUMENT RENAULT 201310
THE RENAULT GROUP1 OVERVIEW OF RENAULT AND THE GROUP
2013 was also an exciting year for Mégane, which adopted the new brand
identity, revealed at the Frankfurt Motor Show, with a new bumper, new
elliptical headlights and new daytime running lights that stretch along the
side of the bumper. The Mégane range also pioneers the combination of the
130 bhp gasoline engine with the dual clutch EDC automatic gearbox, and
has the latest equipment and advanced technology of the brand, such as
the Renault R-Link multimedia system. The emblematic sports versions of
Mégane have also been restyled with the Renault design identity. Apart from
these aesthetic modifications, Mégane R.S. has been enhanced with the R.S.
Replay function available on the R.S. Monitor 2.0. The GT trim is now available
with the 2.0T Renault Sport 220 engine.
The Renault Group is continuing to invest in the revival of Alpine, its exceptional
sports car marque.
Development of the first 21st century Alpine is now at an advanced stage and
promises to deliver a highly gratifying driving experience.
Meanwhile the return of the Alpine marque to competition resulted in a
maiden title at the 2013 European Le Mans Series.
The outstanding performance of the young Alpine team revived the marque’s
fame and promoted its image to an international customer base that shares
a passion.
Koleos, launched in 2008, confirmed its role as the premium-vehicle
spearhead of the Renault brand on international markets. A new Phase 3 was
launched in September 2013. With a new front-end design incorporating the
new brand identity, a spacious interior with quality finishing, new technology
(the Renault R-Link multimedia system, reversing camera, and blind spot
warning system), a new 2.0 l 143 bhp engine, and proven 4x4 technologies
borrowed from Nissan, the Koleos Phase 3 SUV has been unanimously
praised for its comfort, equipment and off-road properties.
With more than 250,000 units sold since the launch in 2008, the model is
sold in around 60 countries. In 2013, on this particularly competitive SUV
segment, Koleos notched up more than 47,000 sales, of which 82% outside
Europe. In Eurasia, Latin America and China, it is Renault’s main model in the
higher market segments.
Attentive to quality and comfort in all its forms, Latitude is a large prestige
saloon that places the emphasis squarely on passenger well-being, with
its generous dimensions, comprehensive equipment, massaging driver’s
seat, and an original air treatment system using an ionizer for a purifying,
relaxing effect. Latitude is a pure product of the Alliance, combining technical
components from both Renault and Nissan to offer optimum drivability and
a subtle road feel. It was developed in France and Korea, where it is built
alongside Koleos at the Busan plant. Marketed around the world, Latitude
reflects Renault’s efforts to move upmarket internationally and enhance its
image by targeting new customer groups.
Laguna III has sold more than 330,000 units since its launch in 2007. In
2013, Renault launched the Phase 3 incorporating new features, like R-Link,
LED daytime running lights and automatic transmission for the 1.5 dCi engine.
Laguna gained the latest automotive technologies developed for comfort and
driving pleasure: the 4Control chassis with four-wheel steering, the Carminat
TomTom® Live navigation system, and the Bose® Sound System. It also ships
with efficient engines: on the hatchback, for example, 109g of CO2/km for
the 1.5 dCi 110 engine and 118g of CO2/km for the 2.0 Energy dCi 130
and 150 engines. Renault’s commitment to quality is underscored by a
3-year/150,000km warranty.
Sporty, elegant and efficient, with its 4Control chassis, Laguna coupé
is also the most fuel-efficient coupé in its category, with the lowest CO2
emissions (1.5 dCi 110 with 109g of CO2/km). As a result of these efforts,
Renault remains a key player in this body style segment, particularly in France,
where Laguna coupé has been No. 1 for five consecutive years.
In the executive E segment, Espace continues to set the standard in the
executive minivan segment as it has done for almost 30 years, with more than
1.3 million vehicles sold. It combines exceptional comfort at both front and
rear with a modular layout creating bright, spacious conditions for comfortable
and safe travel.
Espace IV phase 4 embodies contemporary design and French luxury,
with dynamic design lines that showcase the new brand styling identity.
The attractive, high-quality interior features Teflon® seat upholstery to
protect every fiber without detracting from appearance, as well as liberating
technologies fitted as standard on all versions (hands-free card, automatic
parking brake, TomTom® Live connected navigation system, Bluetooth radio
with audio streaming), a new built-in high-definition reversing camera and the
biggest panoramic sunroof on the market.
In 2013 New Renault Espace added a new, seamlessly integrated and
supremely comfortable video system, with two 7’’ (18cm) 16:9 screens. Each
high tech screen has a separate video input, compatible with all formats (DivX,
MPEG, MP3, etc.) for watching video from a DVD, USB or SD card, and new
individual infrared headphones.
Committed to improving its environmental performance, Renault has
invested in research to cut fuel consumption and CO2 emissions, which has
reduced emissions from the 2.0 dCi (manual transmission) to 150g/km, an
improvement of 20g.
Like Laguna, Espace IV is built in France at Sandouville, the first Renault plant
to obtain ISO 14001 certification (in 1998). Reaping the full benefits of the
progress made by Renault in quality, the two models gained a manufacturer’s
warranty of three years/150,000km in 2008.
With more than 854, 286 units sold worldwide in little over three years, Duster
is the Renault group’s bestselling model. Proof of its success, Duster has
received 28 honors around the globe, including several “car of the year”
awards. Manufactured at five plants and sold in more than 100 countries,
Duster is a mainstay of the Renault group’s international growth. In 2013,
Duster went on sale in six new countries: UK, Ireland, Norway, Denmark,
Cyprus and Malta.
Duster is now being restyled (at Pitesti initially) with a new interior and exterior
design, building on its intrinsic qualities of roominess, versatility, off-road
capabilities, and as always its affordable price tag.
As for technology, Duster has been fitted with the new H5ft 125 bhp gasoline
engine, which, mated to a six-speed gearbox, consumes 6.3 l/100km with
de CO2 emissions of 145g. These new features were revealed at the 2013
Frankfurt Motor Show.

REGISTRATION DOCUMENT RENAULT 2013✦ Global Reporting Initiative (GRI) Directives 11
THE RENAULT GROUP 1
1
OVERVIEW OF RENAULT AND THE GROUP
Light commercial vehicles (LCVs)
The Renault group continues to develop light commercial vehicles. The range
is marketed under the Renault and Dacia badges, and through manufacturing
partnerships with General Motors, Nissan, and Renault Trucks and, since late
2012, with Daimler on the Citan small van.
Renault has maintained its position as Europe’s leading LCV brand – a
position it has held since 1998 – with a European market share of 14.5% (at
end-December 2013). Outside Europe, Renault’s LCV sales volumes dipped
0.6% in a market that contracted by 1.7%.
Renault strives to satisfy its business customers by expanding the Pro+
specialized LCV network, as well as through agreements with independent
coachbuilders to offer a wide array of transformed vehicles.
Renault’s LCV range comprises vehicles from 1.6 to 6.5 metric tons and from
2 m3 to 22 m3, in gasoline, diesel and electric versions (Kangoo Z.E.).
In the small van segment (under 2 metric tons), Kangoo is the industry leader,
and entered a new phase in 2013. New Kangoo features a new, more robust
front end that visually incorporates the new brand identity. The model now
offers two new engines, the 1.6 ENERGY 115 bhp diesel and the 1.2 ENERGY
115 bhp gasoline. New Kangoo offers three front seats, and the R-Link
navigation system as options. The model still comes in three lengths and has
three electric versions (Kangoo Z.E., the 2-seater Kangoo Maxi Z.E. and the
5-seater Kangoo Maxi Z.E.).
First-generation Kangoo is still built in Cordoba (Argentina) for South America.
In the van segment (between 2 and 6.5 metric tons), Renault is continuing
its offensive with the support of new vehicles that were added to the range
in 2010: Trafic Phase 3 and Master III.
Since its launch at the end of 2001, Trafic has become the benchmark in
the compact van segment (between 2.0 and 2.9 metric tons). Developed in
partnership with General Motors, Trafic is produced at the Nissan plant in
Barcelona (Spain). Trafic phase 3 comes with a 2.0 dCi 90,115 bhp engine
and has cut CO2 emissions to 180g/100km.
In 2013 Renault Trafic took a 14.8% share of the small van segment in
Europe (at end-December).
In the large van segment, Renault continues to develop its Master range,
launched in 2010. Available in front- and rear-wheel drive versions in four
lengths and three heights, Master has a maximum authorized weight of
4.5 metric tons. The range comprises 350 versions and boasts a modern
design and very comfortable cabin. In 2013, the M9T 2.3 dCi engine (100-
150 bhp) could be fitted with Stop & Start and Electric Smart Management
(ESM). Qualifying for the ENERGY label, this engine reduces fuel consumption
by 1 l/100km compared with the Euro 5 2012 range. Master is manufactured
at the Batilly plant (France).
Master is sold in 30 countries. The model consolidated its No. 3 position in the
large van segment, with a segment share of 13% (including Renault Trucks
sales). Master continued to make inroads in the Euromed-Africa Region, with
more than 15,433 units sold in 2013. This includes confirming its No. 1
position in Algeria, where it took 47 % of the large van segment.
Master 3 is also expanding in South America, where it is produced in the
Curitiba plant (Brazil). It was released in Brazil in April and in Argentina in May.
The model is the leader in its category, with more than 15,600 Master van
and passenger-carrying van registered at end-December 2013.
Master 2 and Master 3 clocked up a total of 95,049 new registrations in
2013.
Dokker and Dokker Van, launched in late 2012, continued to grow in
2013 in Europe and internationally. Some 90,000 units have already been
manufactured.
Dokker is a practical, versatile five-seater crew van. With a generous boot
capacity and a simple modular configuration, it is ideally suited to customers
looking for a mixed-usage vehicle, which can carry bulky items as well as
transport a family in comfort.
Dokker Van, the small van version, caters to all the expectations of business
customers. Reliable and robust, it offers among the best loading capacity in
the segment, an innovative modular configuration and fuel economy.
Electric vehicles (EVs)
2013 was a key year for Renault in the electric vehicle market, with the
release of ZOE in Europe. The new model will support an increase in our
zero-emissions (Z.E.) sales volumes as well as our leadership of the European
market.
At end-December 2013, we had sold more than 37,500 electric vehicles
worldwide, including slightly more than 8,857 ZOEs.
Renault is the uncontested leader of the European market. Almost one in two
electric vehicles sold in Europe is a Renault.
Worldwide, the Alliance has almost 64% of the electric vehicle market.
EV markets continued to grow strongly everywhere despite slower-than-
planned infrastructure development. The global market is now 100,000 units.
Electric vehicles are growing 10-20 times faster than hybrid cars in their
day. The arrival of major rivals like VW and BMW vindicates our strategy and
boosts awareness of electric vehicles.
France is now the third-biggest market for EVs, after the United States and
Japan.
Building on its strong European base and uncontested leadership of the
European electric vehicle market, in 2013 Renault began to concretize the
expansion of its international electric vehicle strategy to all five continents.
We need to expand fast in order to consolidate our image as the leader of all
markets around the world.
In Latin America, through the subsidiaries and importers, Renault has made
contact with numerous customers, including Fedex and national post offices
in a majority of countries. The first contracts have been signed, in Colombia,
Uruguay and Brazil. For example, Renault signed a partnership with Brazilian-
Paraguayan power generator Itaipu, which will soon assemble Twizy in
Parana State.

Find out more at www.renault.comREGISTRATION DOCUMENT RENAULT 201312
THE RENAULT GROUP1 OVERVIEW OF RENAULT AND THE GROUP
Projects are also being set up with governments and city councils, to promote
electric vehicles and deploy the ecosystem of electric mobility, starting with
recharging infrastructure. Renault and Nissan are partners in an ambitious
scheme by the Ecuadorian government.
Renault continued to roll out Z.E. in Asia. After Hong Kong, where Fluence
Z.E. holds 79% of the EV market, and Kangoo Z.E. was awarded a contract
with the airport, 2013 saw the start of production and sales of the SM3 Z.E.
in South Korea under the Renault Samsung Motors badge (November 1). A
total of 398 SM3 Z.E. were sold in 2013, representing 72% market share. In
Singapore, Kangoo Z.E. will be launched in 2014. In Japan, a Nissan-badged
Twizy is on the road in autoshare schemes in Yokohama and Teshima. In
2014, Twizy will move in Macao and Kangoo Z.E. in Australia.
In Dubai, the police have incorporated two Twizy into their fleet. Given the
enthusiastic response of Dubai residents, Twizy will be launched on the
market in the United Arab Emirates in a few weeks’ time.
The power of innovation symbolized by the electric car is a real advantage
for the Renault brand in the Euromed Region. After Turkey with Fluence Z.E.
phase 2, Romania with Kangoo Z.E. phase 1 and Saint Barthélemy with Twizy
in 2012, in 2013 Reunion Island showcased the benefits of Z.E. vehicles in
tourist destinations.
As part of the VERT Project, supported by ADEME, France’s Environment and
Energy Management Agency, Renault has been testing nine electric vehicles
(three Fluence Z.E. and six Kangoo Z.E.) in corporate fleets on Reunion Island
since 2012. The project tested the suitability of electric vehicles for a tropical
island climate as well as the installation and use of charging stations with
solar panels and electric storage batteries. That meant that the system for
recharging Renault’s Z.E. electric vehicles was Z.E. too. Renault’s retail
network on Reunion started selling Twizy in September 2013, soon to be
followed by ZOE.
The Z.E. revolution is underway in Bulgaria too, initiated by our partner
Omnicar, a logistics firm, which has just been delivered its first Kangoo Z.E..
Twizy has already dazzled 400 prospective customers at public presentations
prior to the official market launch. 2013 ended with the launches of Kangoo
Z.E. and Twizy in Morocco.
In 2014, in the Euromed Region, Renault will continue to roll out the Z.E.
range by releasing Twizy in Turkey and Romania, ZOE in Morocco, and moving
into the French Caribbean: Martinique, Guadeloupe and French Guiana.
In Europe, 2014 will be a year of growth, and Renault expects to reap the
rewards of the enormous amount of work in European countries since 2011.
The occasional recharge cable, which will be available for ZOE in March 2014,
will enable users to recharge their vehicles by plugging them into a household
socket. This occasional charge solution is perfect for customers who want to
be able to recharge their vehicles when they are away from their own homes,
at a holiday home, hotel or friends’.
Public and private infrastructure projects are now being built and huge
progress will be made in 2014, including the development of several
motorway corridors in Europe, with fast charge stations.
The record level of satisfaction among our ZOE and Kangoo Z.E. customers
is another positive sign, and we will be able to rely more and more on our
customers to boost awareness and the image of our Z.E. range.
Dacia brand
Dacia is the Renault group’s regional brand, present in Europe and the
Mediterranean basin. In just eight years, it has established itself as a key
player on the automotive market.
Present in 43 countries, from Europe to North Africa and Turkey, Dacia has
experienced stronger growth than any other brand since its launch, multiplying
sales by 7 between 2005 and 2012. In 2013 Dacia posted sales growth of
19.2% on 2012
For a brand that fulfills demand, success is not a question of years. In 2013,
Dacia topped 2.4 million vehicles sold since 2004.
In 2013, Dacia’s market share was almost 2.11% in Europe and 5.37 % in
Euromed.
In Europe, Dacia increased market share by 0.4 point on 2012. Dacia grew
in all the large countries, achieving an exceptional 4% share of the Spanish
market, an increase of 1.7 point on 2012.
In the Euromed-Africa Region, Dacia’s market share improved by 0.22 point
on 2012 to 5.37 % . Dacia achieved outstanding results in Turkey, with 4.28%
market share (up 0.63 point on 2012) and Algeria with 8.7% market share
(down 1 point on 2012).
Dacia is the leading brand in Romania, with a 31.7% share of the PC+LCV
market, and in Morocco, with 25.2%.
The success of the Dacia brand is based, among other factors, on unbeatable
value for money, on an exact par with the requirements of our customers, and
a level of vehicle quality/reliability that has been part of the brand’s DNA right
from the first models.
Dacia is attracting a new and very diverse customer base, with a large
proportion of customers coming from the used vehicle market (all segments
and brands).
Dacia Duster is a real success with its attractive design, space, reliability
and off-road capabilities, all at an affordable price. The model has sold
407,575 units in three years on the market.
In early 2012, Dacia expanded its range with Dacia Lodgy, a vehicle with the
interior space of a large C-segment minivan sold for the price of a B-segment
minivan. This vehicle is a response to the needs of families who traditionally
buy used vehicles. It was extremely well received by the network, customers
and the press against a backdrop of difficult market conditions for minivan
consumer sales in Europe.
In mid-2012, Dacia also launched Dokker and Dokker Van, an inexpensive
compact LCV and a crew van, expanding the LCV offering of the Renault
group.

REGISTRATION DOCUMENT RENAULT 2013✦ Global Reporting Initiative (GRI) Directives 13
THE RENAULT GROUP 1
1
OVERVIEW OF RENAULT AND THE GROUP
At the end of the year, Dacia gained the new TCe 115 engine, symbolizing
the excellence of the Renault group in powertrain technology. This 1,198cc
engine combines drivability with limited fuel consumption (6 l/100km) and
CO2 emissions (135g/km).
Four emblematic Dacia models have received their first restyle, with the new
Dacia Logan, Sandero, Sandero Stepway and Duster. This was a major
challenge since the new models aim to combine “more” (equipment, features)
and “better” (stronger and more attractive exterior design) qualities for the
same price, while respecting the Dacia spirit: essential vehicles, on an exact
par with the requirements of our customers.
Renault Samsung Motors brand
Renault Samsung Motors (RSM) sells five passenger cars (QM3, SM3,
SM5, SM7 and QM5) in South Korea, covering the local B, C, D, E and SUV
segments.
QM3, launched in December 2013, is a B-segment urban crossover derived
from Renault Captur and designed exclusively for the South Korean market.
The new model extends RSM’s range into the B segment. For Renault
Samsung Motors, QM3 represents a first in several respects: it is the first
model released in the B segment, the first model manufactured outside Korea
to be sold in Korea, and the first model with the new brand identity.
SM3, launched in September 2002, was restyled in July 2009. A new phase
2 was launched in September 2012. New SM3 has enjoyed great success,
with market share of 19.1% on the M1 segment and 19,200 sales in 2013.
SM5, an executive sedan, has enjoyed continuous success since its launch
in 2001. The third generation SM5, launched in January 2010, was an
immediate success. A new phase 2 called SM5 Platinum was launched in
November 2012. SM5 sold 30,700 units in 2013, for a market share of
13.7% on the M2 segment in South Korea.
SM7, launched in November 2004, is a roomy sedan, with a luxurious,
comfortable cabin. This executive vehicle, which ships with a V6 engine,
incorporates the latest technology from the Renault-Nissan Alliance. The
second generation All-New SM7 was launched in August 2011. It sold
3,600 units in South Korea in 2013.
QM5, launched in December 2007, is the first real crossover vehicle on the
Korean market. Phase 2 was successfully brought to market in July 2011. It
sold 5,350 units in 2013, taking a 3.9% share of its segment in South Korea.
SM3, SM5, SM7 and QM5 are manufactured at the Busan plant in South Korea.
In 2013 RSM sold 66,779 vehicles, of which 60,027 on its domestic market.
RENAULT POWERTRAIN RANGE
The powertrain business is one of the main sectors implementing industrial
synergies in R&D with Renault’s partners (with Nissan as part of the Alliance
or outside the Alliance). A dedicated department oversees this B2B business,
both for exchanges of powertrain sub-systems with partners, and for related
engineering. The aim of these synergies is to pool development costs, to
absorb fixed production costs, to generate economies of scale in the industrial
activities of Renault and its suppliers, and ultimately, to improve free cash flow
at Renault.
Business to business powertrain Activity
Beyond the Alliance with Nissan, which enables the two manufacturers
to share a range, manufacturing system and network of suppliers, B2B
engineering seeks to: promote and market Renault Powertrain sub-systems
through automotive cooperation projects (for example, with Daimler, AVTOVAZ,
and General Motors-Opel) and sales to other parties. They enable our partners
to benefit from Renault technology and give Renault access, where useful,
to its partners’ developments and manufacturing capacity. This activity also
serves as a basis on which to identify and set up one-off cooperation projects.
Advantages of Renault Powertrain
A modern powertrain range with low carbon emissions: Through its
powertrain range, Renault is stating its ambitions to lead the way in reducing
the eco-footprint of cars. The qualities of the Energy range have convinced
our partners of the advantages of using our engines for their vehicles.
Partnerships have been developed for both diesel and gasoline engines as
well as for transmissions (more than 30% of Renault’s output is delivered to
partners).
Renault’s image as a strong performer has been further reinforced by its
12th World Championship title in Formula-1. The Constructors’ title secured
in the 2013 season confirms Renault’s continued dominance of Formula-1.
The F1 engines are designed by engineering teams who share their expertise
with the engineers developing the Energy range, thus ensuring the direct
transfer of the best technologies to production vehicles.
Business to business organization
Operating as part of Renault powertrain engineering, this skilled department
identifies opportunities, prepares product offerings, negotiates contracts and
supports business activities during the development and industrial phases.
Dedicated to customers, it liaises with all Renault engineering departments
to ensure a fast response.
A dedicated website (www.powertrain.renault.com) promotes Renault’s
powertrain range.
MAIN MANUFACTURING SITES
Renault has about 30 manufacturing sites for its automotive business. Based
on a standard figure of 3,760 hours (one year’s production based on two
eight-hour shifts a day, five days a week, for 47 weeks a year), production
capacity utilization rates in 2013 were 87% globally and 61% in the Europe
Region.
The Alliance and Renault’s strategic partnerships enable these manufacturers
to share manufacturing facilities and therefore costs.
Renault-Nissan vehicles are manufactured at facilities shared with AVTOVAZ
in Russia, and Daimler uses the plant in Maubeuge. Renault uses Nissan’s
plants in Barcelona (Spain) and Rosslyn (South Africa) and Renault-Nissan
have a common plant in India.

Find out more at www.renault.comREGISTRATION DOCUMENT RENAULT 201314
THE RENAULT GROUP1 OVERVIEW OF RENAULT AND THE GROUP
Main manufacturing sites by brand – 2013 production (units) ✦
2013 SITES PRODUCTION (units) VEHICLES OR COMPONENTS
RENAULT BRAND
RENAULT SITES
Europe
France Batilly 92,811 Master III(1)
Choisy-le-Roi 190,762 Reconditioning of engines, transmissions, injection pumps and sub-assembliesShort-run machining
Cléon 1,101,985 Engines, transmissions. Aluminum foundry: 11,900 metric tons
Fonderie de Bretagne 25,400 Aluminum foundry (metric tons)
Dieppe 5,217 Clio III Renault Sport
Douai 115,429 Mégane III (coupé-cabriolet), Scénic III (5- and 7-seater)
Douvrin (FM – Renault unit) 264,971 Engines
Flins 129,884 Clio III phase 2, ZOE, Clio IV
Le Mans/Villeurbanne 5,669,876 Front/rear suspensions, subframes, lower armsAluminum foundry: 91,141 metric tons
Maubeuge 137,175 Kangoo Z.E., Kangoo III(2)
Ruitz 83,066 Automatic transmissions
Sandouville 25,394 Laguna III (hatch, station wagon, coupé), Espace IV
Spain Palencia 142,749 Mégane III
Valladolid 124,944 Twizy, Clio III, Captur
1,247,579 Engines
Seville 789,298 Transmissions
Portugal Cacia 649,169 Transmissions
Slovenia Novo Mesto 93,733 Clio II phase 4, Twingo II, Wind
Euromed-Africa
Morocco Casablanca 66,545 Logan (I and II), Kangoo, Sandero (I and II)
Tangiers 101,054 Lodgy, Dokker, Dokker Van, Sandero II
Turkey Bursa 330,546 Symbol, Fluence incl. Z.E., Mégane, Clio IV
1,611,759 Engines, transmissions, front/rear suspensions, subframes
Americas
Argentina Cordoba 117,081 Symbol, Clio II, Kangoo, Kangoo Express, FluenceAluminum foundry: 4,476 metric tons
Brazil Curitiba 292,241 Duster, Sandero, Logan (Renault), Master (II and III)(5)
359,740 Engines
Colombia Envigado 74,664 Duster, Sandero, Clio II, Logan (I and II)
Chile Los Andes 352,079 Transmissions
Asia-Pacific
Iran* Teheran 33,407 Mégane II, Logan (Renault), Logan Pick-up(3)
117,263 Front/rear suspensions, subframes and lower arms
India* Chennai 80,344 Fluence, Koleos, Duster, Pulse, Scala
Eurasia
Russia Avtoframos 195,112 Duster, Mégane, Fluence, Logan (Renault), Sandero (Renault)
AVTOVAZ* 204 Logan II (Renault), Sandero II (Renault)
NISSAN SITESSpain Barcelona 67,517 Trafic II(4)
South Africa Pretoria 6,401 Sandero
DACIA BRAND
Romania Pitesti 343,213 Duster, Logan (I and II, MCV), Sandero (I and II)
2,934,772 Engines, transmissions, front/rear suspensions, axles, subframes,idler modules. Aluminum foundry: 16,701 metric tons
RENAULT SAMSUNG BRAND
South Korea Busan 132,541 SM3, Fluence, Latitude, SM7, Koleos
115,542 Engines
(1) Batilly also manufactures Master for General Motors Europe and Nissan. These vehicles are sold under the name Movano for the Opel and Vauxhall brands, and Interstar for the Nissan brand.
(2) The Maubeuge site also builds Kangoo vehicles for Nissan, sold under the name Kubistar (a Nissan brand) and for Daimler, sold under the name Citan (Daimler brand).
(3) In partnership with the Iranian companies Pars Khodro and Iran Khodro.
(4) Nissan’s Barcelona plant also manufactures compact vans marketed under the names Primastar and Vivaro by Nissan and Opel respectively.
(5) Renault’s Curitiba plant also makes LCVs for Nissan.
* Partner plants.
REGISTRATION DOCUMENT RENAULT 2013✦ Global Reporting Initiative (GRI) Directives 15
THE RENAULT GROUP 1
1
OVERVIEW OF RENAULT AND THE GROUP
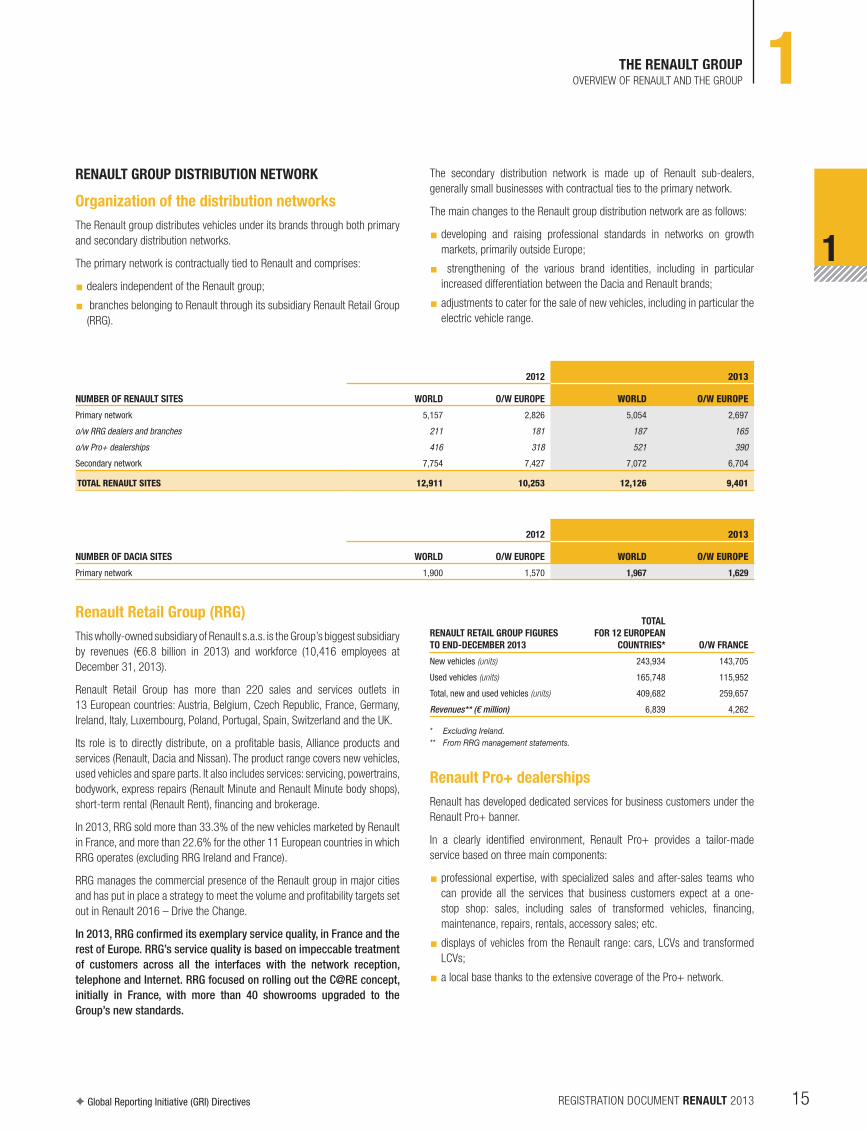
RENAULT GROUP DISTRIBUTION NETWORK
Organization of the distribution networks
The Renault group distributes vehicles under its brands through both primary
and secondary distribution networks.
The primary network is contractually tied to Renault and comprises:
W dealers independent of the Renault group;
W branches belonging to Renault through its subsidiary Renault Retail Group
(RRG).
The secondary distribution network is made up of Renault sub-dealers,
generally small businesses with contractual ties to the primary network.
The main changes to the Renault group distribution network are as follows:
W developing and raising professional standards in networks on growth
markets, primarily outside Europe;
W strengthening of the various brand identities, including in particular
increased differentiation between the Dacia and Renault brands;
W adjustments to cater for the sale of new vehicles, including in particular the
electric vehicle range.
NUMBER OF RENAULT SITES
2012 2013
WORLD O/W EUROPE WORLD O/W EUROPE
Primary network 5,157 2,826 5,054 2,697
o/w RRG dealers and branches 211 181 187 165
o/w Pro+ dealerships 416 318 521 390
Secondary network 7,754 7,427 7,072 6,704
TOTAL RENAULT SITES 12,911 10,253 12,126 9,401
NUMBER OF DACIA SITES
2012 2013
WORLD O/W EUROPE WORLD O/W EUROPE
Primary network 1,900 1,570 1,967 1,629
Renault Retail Group (RRG)
This wholly-owned subsidiary of Renault s.a.s. is the Group’s biggest subsidiary
by revenues (€6.8 billion in 2013) and workforce (10,416 employees at
December 31, 2013).
Renault Retail Group has more than 220 sales and services outlets in
13 European countries: Austria, Belgium, Czech Republic, France, Germany,
Ireland, Italy, Luxembourg, Poland, Portugal, Spain, Switzerland and the UK.
Its role is to directly distribute, on a profitable basis, Alliance products and
services (Renault, Dacia and Nissan). The product range covers new vehicles,
used vehicles and spare parts. It also includes services: servicing, powertrains,
bodywork, express repairs (Renault Minute and Renault Minute body shops),
short-term rental (Renault Rent), financing and brokerage.
In 2013, RRG sold more than 33.3% of the new vehicles marketed by Renault
in France, and more than 22.6% for the other 11 European countries in which
RRG operates (excluding RRG Ireland and France).
RRG manages the commercial presence of the Renault group in major cities
and has put in place a strategy to meet the volume and profitability targets set
out in Renault 2016 – Drive the Change.
In 2013, RRG confirmed its exemplary service quality, in France and the
rest of Europe. RRG’s service quality is based on impeccable treatment
of customers across all the interfaces with the network reception,
telephone and Internet . RRG focused on rolling out the C@RE concept,
initially in France, with more than 40 showrooms upgraded to the
Group’s new standards.
RENAULT RETAIL GROUP FIGURES
TO END-DECEMBER 2013
TOTAL
FOR 12 EUROPEAN
COUNTRIES* O/W FRANCE
New vehicles (units) 243,934 143,705
Used vehicles (units) 165,748 115,952
Total, new and used vehicles (units) 409,682 259,657
Revenues** (€ million) 6,839 4,262
* Excluding Ireland.
** From RRG management statements.
Renault Pro+ dealerships
Renault has developed dedicated services for business customers under the
Renault Pro+ banner.
In a clearly identified environment, Renault Pro+ provides a tailor-made
service based on three main components:
W professional expertise, with specialized sales and after-sales teams who
can provide all the services that business customers expect at a one-
stop shop: sales, including sales of transformed vehicles, financing,
maintenance, repairs, rentals, accessory sales; etc.
W displays of vehicles from the Renault range: cars, LCVs and transformed
LCVs;
W a local base thanks to the extensive coverage of the Pro+ network.

Find out more at www.renault.comREGISTRATION DOCUMENT RENAULT 201316
THE RENAULT GROUP1 OVERVIEW OF RENAULT AND THE GROUP
In 2013, 105 new Pro+ dealerships were opened, bringing the total to
521 Pro+ dealerships in 36 countries.
The Renault Pro+ network continues to expand its coverage in Europe, and is
gathering pace in other regions to support growing LCV sales. Now more than
one-quarter of Pro+ dealerships are located outside Europe. Brazil opened
50 Pro+ dealerships between mid-2012 and end-2013, and Australia plans
to open its first Pro+ sites in early 2014.
CASH MANAGEMENT IN THE AUTOMOTIVE BUSINESS
For Automotive, the Renault group has established a financial organization
whose aims are to:
W automate the processing of routine cash inflows and outflows;
W meet the subsidiaries’ refinancing requirements and pool surplus cash;
W centralize the handling of euro-denominated and foreign exchange
transactions so as to optimize the management of currency, liquidity,
interest rate, counterparty and country risk while reducing financial and
administrative costs;
W centralize virtually all financing operations, including securities issuance,
bank loans and credit agreements, at parent company level.
Within this framework, Renault’s Financing and Treasury department, which
is responsible for cash management and financing for the Group’s industrial
and commercial activities in Europe, has a specialized entity, Renault Finance,
which manages the following:
W capital market trading, after intra-Group netting: forex, fixed income
securities and short-term investments;
W foreign currency payments by French and European subsidiaries;
W foreign currency cash pooling for some subsidiaries.
For the euro zone, cash is centralized through a Renault SA IT platform that
manages all subsidiaries’ euro-denominated transactions and interfaces
with the automotive sector’s banks. Renault Finance is also involved in cash
management arrangements covering foreign currency payments made by
French and European subsidiaries.
Outside the euro zone, the cash flows of certain subsidiaries are accounted
for centrally in Renault Finance’s accounts.
Renault Finance
Renault Finance, a Swiss corporation based in Lausanne, is an active player
on the forex and fixed income markets and the market for hedging industrial
metals transactions. It operates within a strict risk management framework.
Through its arbitraging activities, it can obtain competitive quotes for all
financial products. The company is therefore Renault’s natural counterparty
for most automotive market transactions. By extending this service to the
Nissan group, Renault Finance has become the Alliance’s trading floor. It
manages spot and forward foreign exchange transactions for both Renault
and Nissan, hedging itself in the market accordingly. Renault Finance takes
no risks on behalf of any entity in the Nissan or Renault groups.
Aside from financial market transactions, Renault Finance has been offering
a number of services since 2008, including commercial and financial foreign
currency payments for Renault and Nissan and a foreign currency cash
pooling service for a number of Renault entities (Czech Republic, Denmark,
Hungary, Poland, Romania, Sweden, Switzerland and the UK). Other foreign
currency cash pooling services are currently being developed.
At end-December 2013, parent company net income was €86.2 million
(compared with €49.8 million at end-December 2012), and total parent
company assets amounted to €8,999 million (compared with €8,800 million
at end-December 2012).
1.1.4.2 SALES FINANCINGRCI Banque, Renault’s captive financing arm, finances sales of the Renault,
Renault Samsung Motors (RSM), Dacia, Nissan, and Infiniti brands.
The RCI Banque group operates in 36 countries:
W in Europe: France, Austria, Belgium, Croatia, Czech Republic, Denmark,
Estonia, Germany, Hungary, Ireland, Italy, Latvia, Lithuania, Luxembourg,
Malta, the Netherlands, Poland, Portugal, Serbia, Slovakia, Slovenia, Spain,
Sweden, Switzerland, and the UK;
W in the Americas: Argentina, Brazil, Colombia ;
W in the Euromed Region: Algeria, Bulgaria, Morocco, Romania and Turkey;
W in the Eurasia Region: Russia and Ukraine;
W in Asia: South Korea.
At December 31, 2013, the RCI Banque group had total assets of
€29,505 million.
The Group employed an average of 2,848 people over the year, of whom
46.4% in France.
In the countries in which the RCI Banque group operates, Sales Financing
accounts for 34.6%* of new vehicle sales under the Renault and Nissan
brands.
In its capacity as a brand financing entity, the Group is tasked with providing
a complete range of financing and service solutions:
W customer activity (consumers and professionals):
W credit for new and used vehicles,
W leasing with purchase option,
W hire purchase,
W contract hire,
W associated services, such as maintenance and warranty extension,
insurance and assistance, fleet management and credit cards;
W network activities:
W financing inventories of new and used vehicles and spare parts, and
funding dealers’ long-term financing operations,
W managing and controlling risk,
W securing the network’s future by standardizing and regularly monitoring
financial procedures,
W acting as the network’s financial partner.
In order to diversify its sources of financing, the RCI Banque group set up a
savings plan in February 2012 aimed at the general public in France. This
new activity was expanded in 2013, firstly in Germany where a savings
passbook account and a term account were introduced at the beginning of
the year, and in France, where a term account was introduced in July. The
amounts collected totaled €4,333 million at December 31, 2013, limiting the
need for market financing.
* Turkey and Russia were integrated into the consolidated scope in 2013. On the same scope as 2012, the proportion of new vehicles financed in 2013 was 36.7%, a ten-year high.

REGISTRATION DOCUMENT RENAULT 2013✦ Global Reporting Initiative (GRI) Directives 17
THE RENAULT GROUP 1
1
OVERVIEW OF RENAULT AND THE GROUP
1.1.4.3 ASSOCIATED COMPANIES, PARTNERSHIPS AND COLLABORATIVE PROJECTS ✦
NISSAN
Renault’s shareholding in Nissan is described in detail in chapter 1.2 on the
Renault-Nissan Alliance.
Nissan’s market capitalization at December 31, 2013 was ¥3,996 billion,
(€27,614 million) based on a closing price of ¥884 per share.
Renault holds 43.4% of Nissan’s share capital. At December 31, 2013 the
market value of the shares held by Renault totaled €11,985 million, based on
a conversion rate of ¥114.7 for €1.
Renault accounts for its shareholding in Nissan using the equity method, as
described in chapter 4, note 13 of the notes to the consolidated financial
statements.
AVTOVAZ
The partnership with AVTOVAZ, Russia’s leading vehicle manufacturer and
owner of the LADA brand, moved on to another level on December 12, 2012,
with the announcement of an agreement on increasing Renault and the
Renault-Nissan Alliance’s stake in AVTOVAZ progressively .
Under the terms of the agreement, the Renault-Nissan Alliance and the
Russian public holding company Russian Technologies set up a joint venture –
Alliance Rostec Auto b.v. – Alliance Rostec Auto b.v. holds 74.5% of AVTOVAZ
as of December 31, 2013. By grouping the shareholdings of each partner in
AVTOVAZ, it will act as a majority shareholder promoting long-term stability.
This organization will make it easier for the three partners to take strategic
decisions. It will also contribute to the process initiated by Renault, Nissan and
LADA to build synergies and develop new products on the growing Russian
market in the coming years.
The Renault-Nissan Alliance will invest RUB23 billion to raise its stake to
67.13 % of the shares of Alliance Rostec Auto b.v. eventually (63.64% at end-
December 2013) .
Renault, which had already acquired 25% in AVTOVAZ in 2008, will invest
RUB11.3 billion totally and plans to own 50.1% of Alliance Rostec Auto b.v.
by 2014.
Transactions relating to the agreement completed in 2013 were:
W all AVTOVAZ shares owned by Russian Technologies, and Renault were
transferred to Alliance Rostec Auto b.v. in March 2013;
W Alliance Rostec Auto b.v. bought AVTOVAZ shares held by Troika Dialog
Investment Ltd.
W Renault bought some of Alliance Rostec Auto b.v. shares from Russian
Technologies in March and June 2013;
W Renault s.a.s. and Nissan International Holding b.v. mad e a cash
subscription for new shares in Alliance Rostec Auto b.v. in March and
June 2013;
W Renault had spent RUB8.05 billion (€190 million) and raised its interest to
48.20% of Alliance Rostec Auto b.v. by end-2013.
Alliance Rostec Auto B.V. – Changes to ownership structure:
RENAULT NISSAN
RUSSIAN
TECHNOLOGIES
At end-March 2013 44.26% 8.40% 47.34%
At end-June 2013 48.20% 15.44% 36.36%
Eventually 50.10% 17.03% 32.87%
The partnership between Renault, Nissan and AVTOVAZ is a first between
three groups. It is unique in its ambitions, spanning production, integration
and local content in a market set to become Europe’s biggest. It will also bring
the Renault-Nissan Alliance additional production capacity at a time when
Renault sales in Russia are growing strongly. Russian sales rose 10.7% in
2013, with more than 210,000 units sold.
The transformation of AVTOVAZ continued in 2013, with Renault-Nissan
Alliance and AVTOVAZ investing in the ramp-up of the B0 line, shared by
the three brands, with Almera produced by AVTOVAZ for Nissan and the
introduction in late 2013 of New Logan, which will be made for Renault
from 2014 onwards. Various other projects were also launched, including
the startup of production of a new line for K4 and H4 engines and gearboxes
(J gearbox), with an annual capacity of 450,000 engines, for all three brands.
At the same time, the upgrade of the plant in Izhevsk continued, with the
ramp-up of LADA Granta and the introduction of a new vehicle, which will be
manufactured for Nissan from 2014 onwards.
When this process is complete, the Renault-Nissan Alliance and AVTOVAZ will
have an annual production capacity in Russia of at least 1.7 million vehicles
by 2016.
This progress supports the range renewal, with an ambitious product plan,
including the creation of new LADA vehicle ranges adapted for the Russian
car market. AVTOVAZ’s product line has been rebuilt, based on economical
vehicles, with the launches of LADA Granta in the economical car segment,
LADA Largus derived from Logan MCV, and New Kalina in 2013. In the future,
there will also be sedans and SUVs for the B and C segments. The new models
will be based on AVTOVAZ or Renault-Nissan Alliance platforms.
Renault accounts for its shareholding in AVTOVAZ using the equity method,
as described in chapter 4, note 14-A of the notes to the consolidated financial
statements.
PARTNERSHIPS AND COLLABORATIVE PROJECTS
Strategic cooperation between Renault Nissan Alliance and Daimler AG
Please see Chapter “Strategic cooperation with Daimler AG” in
Chapter 1.2.2.2 .
Supplier relations and support ✦
In view of the current economic conditions, it is crucial for manufacturers and
suppliers to collaborate closely in order to create value together. Renault’s
objective is to build performance as part of an equitable, educational, long-
term partnership with suppliers.

Find out more at www.renault.comREGISTRATION DOCUMENT RENAULT 201318
THE RENAULT GROUP1 OVERVIEW OF RENAULT AND THE GROUP
To this end, Renault has put in place a policy to support suppliers worldwide,
which involves:
W working closely with suppliers from the outset of projects, with the aim of
meeting price and quality targets and cutting development times;
W sharing best industrial practices (regular meetings, expert assignments);
W optimising processes in order to help suppliers cut costs without reducing
their margins;
W assisting suppliers to improve quality. More than 300 quality experts
around the world are involved in quality assessments based on a single
questionnaire, shared with Nissan. If the supplier’s score is deemed
inadequate, a quality expert from Renault (or Nissan, depending on
location) will help the supplier to reach the required standard and thus
become stronger. In 2013, the emphasis was on action plans to reduce the
number of vehicle breakdowns attributable to suppliers;
W offering suppliers an opportunity to growth with the group. Renault’s
manufacturing facilities in other countries (Russia, China, etc.) and
partnerships (Nissan, AVTOVAZ, Daimler) create opportunities for suppliers
to expand into new markets or increase their volumes;
W cooperating on innovation. Beyond the research and advanced studies
conducted internally and with Nissan, Renault works with suppliers on new
joint innovations, sharing its strategic aims right from project design;
W raising suppliers’ awareness of CSR. Renault has incorporated CSR
criteria into its supplier referencing and selection processes, and regularly
evaluates its suppliers’ CSR performance. Renault also applies charters on
best practices in customer-supplier relations.
To show the Group’s appreciation of its suppliers, every year Renault presents
Supplier Awards. The awards are given to suppliers that achieve highly in
any of three priority categories for Renault – quality, innovation and CSR –
irrespective of the supplier’s size, country of origin or business sector. In
2013, twelve suppliers won awards for their outstanding achievements in
one of those areas.
Finally, as part of efforts to strengthen supplier relations, in 2011 Renault and
Nissan initiated a joint process for selecting preferred partners, known as
Alliance Growth Partners (AGP). These are partners who have demonstrated
their competitiveness and their ability to support the developments introduced
by the two Alliance partners.
Light commercial vehicles
In the field of light commercial vehicles, Renault has several agreements with
General Motors Europe, Nissan and Daimler.
Renault and General Motors Europe signed a framework agreement
in 1996 that included a commitment to work together. The aim was for the
two manufacturers to increase their market presence in Europe and share
development costs.
In compact vans, Renault Trafic and Opel/Vauxhall (GM) Vivaro have been
produced at the GM Europe plant in Luton (UK) since 2001 and the Nissan
plant in Barcelona (Spain) since 2002. In March 2011, Renault and Opel/
Vauxhall announced the locations of production sites for the next generation
of Vivaro and Trafic. Opel/Vauxhall confirmed that the next generation Vivaro
will be built in Luton. Renault will build the next generation Trafic as well as
the upcoming high roof (H2) version of the Opel Vivaro at its Sandouville site.
Production is expected to begin in the first half of 2014.
The offering in the large vans segment was renewed in 2010, with the
launch of the new range of Renault Master and Opel/Vauxhall (GM) Movano,
manufactured by Renault at its Batilly plant in France.
Movano is sold to GM as part of a supply agreement signed at the end
of 2007.
New Master is also distributed by the Renault Trucks network under the
terms of sales agreements entered into in 2009. These agreements are the
continuation of agreements covering the distribution by Renault Trucks (AB
Volvo group) of Mascott and the previous generation of Master.
Still as part of the Renault-Nissan Alliance, an agreement was signed
to develop a van based on the new Renault Master called NV400. This
vehicle has been sold by Nissan since end-2011. This project reflected the
continuation of agreements implemented by the two companies in 2003 for
the distribution by Nissan of Interstar (based on the previous generation of
Master and replaced by NV400) and Primastar (a compact van based on
Trafic).
As part of the strategic cooperation between the Renault-Nissan Alliance
and Daimler announced on April 7, 2010, Renault and Daimler studied the
development of a light commercial vehicle to expand the Mercedes range.
Citan, the new urban LCV by Mercedes Benz, was developed by Renault on
the basis of the Kangoo platform and is built exclusively alongside Kangoo and
Kangoo Z.E. at the Renault plant in Maubeuge (France). Citan nevertheless
maintains the visible features expressing the identity of the Mercedes brand,
in both interior and exterior design. Citan has been sold by Mercedes since
fall 2012.
Accelerating international expansion ✦
Various agreements have been entered into with local partners (manufacturers
and local authorities).
In China
In the People’s Republic of China, Renault strengthened its presence in the
imported vehicle market, with more than 30,000 units sold in 2013, driven
primarily by the success of Koleos and a range of hatchbacks, from Fluence
to Talisman.
On December 16, 2013, Carlos Ghosn and Xu Ping, Chairman of Dongfeng
Motor, signed an agreement to set up Dongfeng Renault Automotive
Company (DRAC), a car manufacturing joint venture in China. The project was
approved by the National Development and Reform Commission (NDRC) on
December 2, 2013.
50-50 owned by the two partners, the new company will benefit from a total
investment of CNY7.76 billion (€870 million). Under the terms of the deal
between Dongfeng and Renault, the future plant will go into production in
2016. Annual capacity will be 150,000 vehicles in phase 1, and is expected
to double after that. The plant will be located in Wuhan, capital of Hubei
Province, and will cover an area of 95 hectares.
Each partner will contribute its expertise and know-how to ensure a successful
collaborative arrangement, a source of major synergies, in research and
development as well as in innovation and design. DRAC’s product plan is
initially for a new range of crossovers with the first models scheduled for
release in 2016. The Group is also expanding its sales network, which is
expected to increase from 92 dealerships in 2013 to 120 by 2016.

REGISTRATION DOCUMENT RENAULT 2013✦ Global Reporting Initiative (GRI) Directives 19
THE RENAULT GROUP 1
1
OVERVIEW OF RENAULT AND THE GROUP
In Russia
Avtoframos sales grew by almost 11% in 2013, driven by the success of the
vehicles manufactured mainly in Russia at the Moscow plant, which is now
operating at full capacity. Avtoframos has been wholly owned by Renault since
end-2012, when Renault acquired the shares held by Moscow City Hall.
The partnership with AVTOVAZ will give Avtoframos additional production
capacity, including capacity at the plants in Togliatti and Izhevsk reserved for
launches scheduled for 2014, including New Logan manufactured in Togliatti.
This extra capacity will enable Renault to continue to grow in Russia on the
strength of Duster, Logan and Sandero and Renault’s entry into the C segment.
In India
W In Chennai, the Alliance built its first joint production site as part of a joint
venture (JV RNAIPL). Production of Nissan Micra started in 2010. In 2011
Renault started production of Fluence and Koleos, and in 2012 Pulse,
Scala and Duster, which is currently enjoying great commercial success on
the Indian market. In late 2013, Nissan launched the new premiums SUV
Terrano, derived from Renault Duster.
W In the same region, RNTBCI, a joint venture between Renault and Nissan,
has been providing services in engineering, purchasing and accounting
since 2008.
W In August 2010 Renault changed the structure of its industrial and
commercial partnership with Mahindra & Mahindra, selling its share in
the MRPL joint venture to its partner. Renault also granted a license to
Mahindra & Mahindra to produce and sell Logan in India under its own
brand. The vehicle was restyled in 2011 and is now sold under the “Verito”
name.
In Indonesia
In September 2013, Renault signed a partnership agreement with Indomobil –
Indonesia’s second-biggest carmaker, which has partnered Nissan since
1981 – to launch Renault in Indonesia. In this country, which has a population
of 250 million, where less than 4% of people own a vehicle, the aim is to
become one of the leading brands on the market, with the gradual launch,
first of imported vehicles then locally assembled vehicles, covering the core
market.
2013 was devoted to the first product launches (Duster, Koleos, Mégane RS)
to make Renault known, and to developing a sales network in Jakarta and the
rest of the Indonesian archipelago.
In Iran
Renault is maintaining its presence, while enforcing the legal constraints
linked to the international sanctions applicable to this country. Production has
been sharply reduced after sanctions were toughened in mid-2013, with the
White House Executive Order of June 3, 2013.
Renault is working primarily with the X90 platform and the vehicle L90
(Logan). More than 300,000 Tondar (the local name for Logan) vehicles have
been built since production began in 2007. Mégane is also assembled in Iran
by the manufacturer Pars Khodro. More than 39,000 Mégane vehicles have
been assembled since the start of cooperation in 2008.
The Iranian business, which has contracted sharply after the sanctions, was
taken out of the Group’s consolidated scope. That position will be adjusted in
line with political and economic developments in relation to Iran.
In South Africa
Following a cooperation agreement entered into in May 2007, the Alliance
invested ZAR 1 billion (€88 million) in the local assembly of vehicles from the
Logan range (Pick-up and Sandero) at the Nissan plant in Rosslyn, starting
in 2009. The pick-up is assembled by Nissan and sold under its own brand
name. Sandero, which is also assembled by Nissan, is marketed by the
Renault South Africa subsidiary, which has sold almost 28,000 units since
production of this vehicle started.
In 2013, Renault s.a.s. signed an agreement with its historic South African
commercial partner, Imperial Group, to transfer the majority of the shares
in their joint subsidiary, Renault South Africa. Since December 1, 2013,
Renault s.a.s has owned 40% of the shares in the subsidiary (compared with
51% previously) and Imperial 60% (compared with 49% before). The aim of
this operation is to boost the expansion of the Renault group in this country,
where its penetration is low. South Africa is the biggest car market on the
African continent with 624,615 units sold.
In Morocco
The first production line of the Tangiers plant went into operation in 2012,
producing 55,700 entry-level vehicles: Lodgy, Dokker and Dokker Van. In
2013 the second production line (Sandero II) started up. Production at the
plant exceeds 100,000 vehicles in 2013, and come close to 200,000 in
2014. The Somaca plant in Casablanca also successfully started production
of Logan II, Sandero II and Symbol made a record volume of 66,500 units.
In Algeria
In December 2012, Renault signed an agreement with the Algerian authorities
to build an assembly plant in the region of Oran. Under the agreement, a joint
venture, Renault Algérie Production, will be set up in partnership with Société
Nationale des Véhicules Industriels (SNVI) and the National Investment Fund
(FNI). Production at the plant is scheduled to start up in late 2014 with local
assembly of New Symbol with the aim of building up to an initial capacity of
25,000 units/year, then gradually increasing local integration. In the future,
manufacturing facilities including a sheet metal workshop and painting will be
installed to raise capacity to 75,000 vehicles/year.
The environment
Renault Environnement, a wholly-owned subsidiary of Renault s.a.s., was
founded in mid-2008. Its role is to develop new business around the themes
of sustainable development and the environment, in line with Renault’s eco2
policy.
Renault Environnement has a joint venture with SITA Recyclage, a subsidiary
of Suez Environnement, to develop the recycling of ELVs (end-of-life vehicles)
and the marketing of re-used materials and parts.
Through its subsidiary GAIA and its equity investment in BCM, Renault
Environnement recovers automotive parts (production scrap and end-of-line
parts) and metallic waste from Group sites.
For more details, see chapter 2.3.

Find out more at www.renault.comREGISTRATION DOCUMENT RENAULT 201320
THE RENAULT GROUP1 OVERVIEW OF RENAULT AND THE GROUP
1.1.5 MANAGEMENT BODIES AT MARCH 1, 2014 ✦
STRENGTHENING OPERATIONAL MANAGEMENT
In September 2013, the Chairman and Chief Executive Officer and the Board
of Directors adapted the organization of the Renault group by creating two
new departments:
W a Competitiveness department, headed by the Chief Competitiveness
Officer, tasked with facilitating the development of an attractive product
range, enhancing the competitiveness of the product lines, optimizing
costs, improving quality and boosting the profitability of the programmes;
W a Performance department, headed by the Chief Performance Officer,
responsible for increasing market share and profitability of sales.
The CEO, Carlos Ghosn, has direct responsibility for strategic decisions,
together with oversight of financial and legal matters, public affairs, Human
Resources, audit, risk and organizational issues.
Renault’s senior management bodies consist of two committees:
W the Group Executive Committee;
W the Operations Review Committee.
1.1.5.1 GROUP EXECUTIVE COMMITTEEThe Group Executive Committee (GEC) is responsible for the design and
implementation of strategic policies and decisions.
These are reflected in the budget and Renault Plan, product planning, major
investments, and plans for new strategic sites .
The Executive Committee has ten members:
W the Chairman and CEO;
W the Chief Performance Officer, and Sales and Marketing Director;
W the Chief Competitiveness Officer;
W the Executive Vice-President, Office of the CEO;
W the Executive Vice-President, Engineering, Quality and IS/IT Group;
W the Executive Vice-President, Human Resources;
W the Executive Vice-President, Product Planning, Programmes and LCV;
W the Executive Vice-President, Manufacturing and Supply Chain;
W the Chief Financial Officer;
W the Executive Vice-President, Chairman of Europe Region.
The Renault Executive Committee meets once a month and at seminars held
twice a year.
1.1.5.2 RENAULT OPERATIONS REVIEW COMMITTEE
The Operations Review Committee is in charge of operational decisions and
reviewing:
W business KPIs;
W free cash flow;
W profitability, programmes and planning;
W various reports: quality, electric vehicles, fixed costs, etc.
The Operations Review Committee has 16 permanent members:
W the 10 members of the Group Executive Committee;
W the Chairmen of the Eurasia, Americas, Euromed-Africa and Asia-Pacific
Regions;
W the SVP, Group Control;
W the SVP, Purchasing.
The Operations Review Committee meets once a month for a whole day.

REGISTRATION DOCUMENT RENAULT 2013✦ Global Reporting Initiative (GRI) Directives 21
THE RENAULT GROUP 1
1
OVERVIEW OF RENAULT AND THE GROUP
Carlos Ghosn: Chairman and CEO
Marie-Françoise Damesin: EVP, Human Resources
Christian Mardrus: SVP, Alliance CEO Office Managing Director Alliance Global Logistics
Mouna Sepehri: EVP, CEO Office
Thierry Bolloré: Chief Competitive Officer J. Michel Billig: EVP, Engineering, I.S and Quality Christian Deleplace: SVP, Expert Fellow Nadine Leclair: SVP, Project Engineering
Jean-Pierre Vallaude: EVP Deputy, Engineering, I.S and Quality
Jose Vicente de Los Mozos Obispo: EVP, Manufacturing and Supply Chain
Christian Mardrus: Alliance Global Logistics
Philippe Klein: EVP, Product Planning , Programs and LCV
Thomas Lane: SVP, Product Planning
Laurens Van Den Acker: SVP, Corporate Design
Christian Vandenhende: SVP, Purchasing Renault; Alliance Global PurchasingChairman and Managing Director, RNPO
Jérôme Stoll: Chief Performance Officer
Nicolas Wertans: SVP, Sales Worldwide Bruno Ancelin: SVP, Managing Director Renault in Russia
♦ Chairman of Eurasia Region
Denis Barbier: ♦ SVP, Chairman of Americas Region J.Christophe Kugler: ♦ Chairman of Euromed Africa Region Jacques Prost: General Manager of Renault in Morocco Stefan Mueller: ♦ EVP, Chairman of Europe Region and Renault Retail Group Bernard Cambier: SVP, Market Area France
Jérôme Olive: SVP, Manufacturing and Supply Chain Europe Gilles Normand: ♦ Chairman of Asia-Pacific Region Jacques Daniel: Joint Venture Project China
Michael van der Sande: SVP, Marketing Dominique Thormann: EVP, Chief Financial Officer; CEO RCI Banque Clotilde Delbos: SVP, Performance and Controling Groupe
Member of the Group Executive Committee (CEG)
Chairman of Region
1.1.5.3 ORGANIZATION CHART AT MARCH 1, 2014

Find out more at www.renault.comREGISTRATION DOCUMENT RENAULT 201322
THE RENAULT GROUP1 OVERVIEW OF RENAULT AND THE GROUP
1.1.6 MAIN GROUP SUBSIDIARIES AND DETAILED ORGANIZATION CHART ✦
* The individual revenue data are calculated and presented according to the standards used for the consolidated financial statements.
1.1.6.1 MAIN SUBSIDIARIES ✦
RENAULT S.A.S.
13-15, quai Le Gallo
92512 Boulogne-Billancourt Cedex (France)
Wholly owned subsidiary of Renault.
Business: design, manufacture, sale, repair, maintenance and leasing of motor
vehicles (commercial, light commercial and passenger vehicles, tractors,
farm machinery and construction equipment) as well as the design and
production of parts and equipment used in connection with the manufacture
and operation of vehicles. Also, all types of services relative to such activities
and, more generally, all industrial, commercial, financial, investment and real-
estate transactions relating directly or indirectly, in whole or in part, to any of
the above purposes (see Article 3 of the articles of incorporation).
2013 revenues: €32,165 million.
Workforce at December 31, 2013: 33,735.
RENAULT ESPAÑA
Carretera de Madrid, km 185
47001 Valladolid (Spain)
99.78% owned by Renault s.a.s.
Business: manufacture and marketing, via its sales subsidiary Recsa, of
Renault passenger cars and light commercial vehicles in Spain.
Plants in Valladolid, Palencia and Seville.
2013 revenues: €4,626 million.
Workforce at December 31, 2013: 7,875.
RENAULT DEUTSCHLAND
Renault-Nissan strasse 6-10
50321 Bruhl (Germany)
60% owned by Renault s.a.s. and 40% by Renault G roupe b.v.
Business: Renault and Nissan joint commercial organization in Germany.
2013 revenues: €2,120 million.
Workforce at December 31, 2013: 410.
OYAK-RENAULT OTOMOBIL FABRIKALARI
Barbaros Plaza C blok No 145 K/6
80 700 Dikilitas Besiktas
Istanbul (Turkey)
51.64% owned by Renault s.a.s.
Business: assembly and manufacture of Renault vehicles.
Plant in Bursa.
2013 revenues: €3,262 million.
Workforce at December 31, 2013: 5,739.
DACIA
Calea Floreasca
Nr. 133-137 – Sector 1
Bucharest (Romania)
99.43% owned by Renault.
Business: manufacture and marketing of motor vehicles.
Plant in Pitesti.
2013 revenues: €4,131 million.
Workforce at December 31, 2013: 14,098.
RENAULT ITALIA
Via Tiburtina 1159
Rome (Italy)
Wholly owned by Renault s.a.s.
Business: marketing of Renault passenger cars and light commercial vehicles.
2013 revenues: €1,399 million.
Workforce at December 31, 2013: 255.
REVOZ
Belokranska Cesta 4
8000 Novo Mesto (Slovenia)
Wholly owned by Renault s.a.s.
Business: manufacture of vehicles.
Plant in Novo Mesto.
2013 revenues: €655 million.
Workforce at December 31, 2013: 2,036.
RENAULT FINANCE
48, avenue de Rhodanie
Case postale
1002 Lausanne (Switzerland)
Wholly owned by Renault s.a.s.
Business: capital market transactions (foreign exchange, interest rates,
hedging of industrial metals transactions) for Renault and Nissan; interbank
dealing for own account.
Total assets (consolidated) at December 31, 2013: €9,038 million.
Workforce at December 31, 2013: 31.

REGISTRATION DOCUMENT RENAULT 2013✦ Global Reporting Initiative (GRI) Directives 23
THE RENAULT GROUP 1
1
OVERVIEW OF RENAULT AND THE GROUP
RCI BANQUE
14, avenue du Pavé-Neuf
93168 Noisy-le-Grand Cedex (France)
Wholly owned by Renault s.a.s.
Business: holding company for the sales financing and customer services
entities of Renault and Nissan. Inventory financing (vehicles and spare parts)
for Renault and Nissan Europe.
Net financings in 2013: €11.4 billion.
Total assets (consolidated) at December 31, 2013: €29,505 million.
Workforce at December 31, 2013: 2,823.
RENAULT SAMSUNG MOTORS
17th floor, HSBC Building
25, Bongrae-Dong 1-Ga, Jung-Gu
Seoul 100-161 (South Korea)
79.79% owned by Renault group B. V.
Business: manufacture and marketing of motor vehicles.
Plant in Busan.
2013 revenues: €2,279 million.
Workforce at December 31, 2013: 4,387.
RENAULT UK
The Rivers Office Park
Denham Way, Maple Cross
WD3 9YS Rickmansworth
Hertfordshire (United Kingdom)
Wholly owned by Renault group.
Business: marketing of Renault passenger cars and light commercial vehicles.
2013 revenues: €1,043 million.
Workforce at December 31, 2013: 168.
RENAULT RETAIL GROUP (FRANCE)
117-199, avenue Victor-Hugo
92100 Boulogne-Billancourt (France)
Wholly owned by Renault s.a.s.
Business: trade, repair, maintenance and leasing of passenger cars and light
commercial vehicles.
65 branches in France.
2013 revenues: €3,833 million.
Workforce at December 31, 2013: 6,820.
AVTOFRAMOS
Vorontsovskaya ulitsa, 35
109147 Moscow (Russia)
Wholly owned by Renault group.
Business: assembly, import, marketing and sale of Renault vehicles.
2013 revenues: €2,431 million.
Workforce at December 31, 2013: 4,904.
RENAULT DO BRASIL
1300 av. Renault, Borda do Campo
Estado do Parana, São José dos Pinhais (Brazil)
99.85% owned by Renault group.
Business: vehicle production and assembly, production of equipment,
parts and accessories for vehicles.
2013 revenues: €3,494 million.
Workforce at December 31, 2013: 6,603.
RENAULT ARGENTINA
Fray Justo Santa Maria de Oro 1744
1414 Buenos Aires (Argentina)
Wholly owned by Renault group.
Business: manufacture and marketing of Renault vehicles.
2013 revenues: €1,850 million.
Workforce at December 31, 2013: 2,490.
RENAULT BELGIQUE LUXEMBOURG
Boulevard de la Plaine, 21
1050 – Brussels (Belgium)
Wholly owned by Renault s.a.s.
Business: importing vehicles and replacement parts for the Renault and Dacia
brands to Belgium and the Grand Duchy of Luxembourg.
2013 revenues: €1,083 million.
Workforce at December 31, 2013: 204.
RENAULT ALGÉRIE SPA
13, route Dar-El-Beida
Zone industrielle Oued Smar
16000 – Algiers (Algeria)
Wholly owned by Renault s.a.s.
Business: marketing Renault and Dacia brand passenger cars and LCVs.
2013 revenues: €1,140 million.
Workforce at December 31, 2013: 429.
RENAULT MAROC (RENAULT MAROC COMMERCIAL)
44 Boulevard Khalid Ibnou Loualid
Ain Sebaa
20250 – Casablanca (Morocco)
80% owned by Renault s.a.s.
Business: importing and marketing Renault and Dacia brand vehicles.
2013 revenues: €532 million.
Workforce at December 31, 2013: 160.
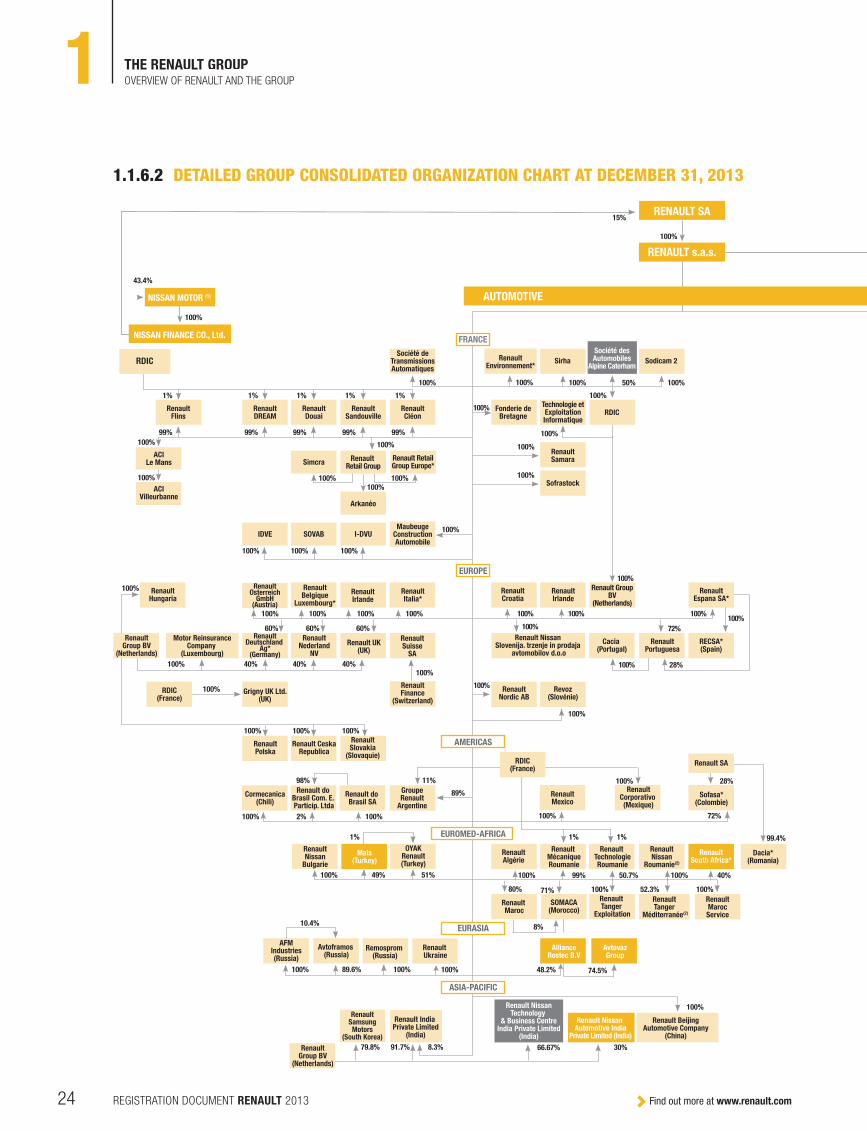
Find out more at www.renault.comREGISTRATION DOCUMENT RENAULT 201324
THE RENAULT GROUP1 OVERVIEW OF RENAULT AND THE GROUP
1.1.6.2 DETAILED GROUP CONSOLIDATED ORGANIZATION CHART AT DECEMBER 31 , 2013
RENAULT SA
RENAULT s.a.s.
AUTOMOTIVE
FRANCE
RDIC
RenaultFlins
ACILe Mans
ACIVilleurbanne
RenaultHungaria
RDIC(France)
Motor ReinsuranceCompany
(Luxembourg)
RenaultOsterreich
GmbH(Austria)
RenaultDeutschland
Ag*(Germany)
RenaultNederland
NV
RenaultSuisse
SA
RenaultFinance
(Switzerland)
Renault UK(UK)
Grigny UK Ltd.(UK)
RenaultPolska
Renault do Brasil Com. E. Particip. Ltda
Mais(Turkey)
Renault Ukraine
OYAKRenault(Turkey)
RenaultNissan
Bulgarie
RenaultSamsungMotors
(South Korea)
Renault do Brasil SA
GroupeRenault
Argentine
Renault CeskaRepublica
RenaultSlovakia
(Slovaquie)RDIC
(France)
RenaultMexico
RenaultAlgérie
Renault TechnologieRoumanie
RenaultNissan
Roumanie(2)
Renault Maroc
SOMACA(Morocco)
Renault Tanger
Exploitation
Dacia*(Romania)
RenaultSouth Africa*
Renault Tanger
Méditerranée(2)
RenaultMarocService
Renault MécaniqueRoumanie
RenaultCorporativo (Mexique)
Sofasa*(Colombie)
Renault SA
RenaultBelgique
Luxembourg*
RenaultIrlande
RenaultItalia*
RenaultGroup BV
(Netherlands)
RenaultGroup BV
(Netherlands)
RenaultDREAM
RenaultDouai
RenaultSandouville
Renault Retail Group
Arkanéo
Renault RetailGroup Europe*
Simcra
SOVAB I-DVU
RenaultCléon
Société deTransmissionsAutomatiques
Sirha
Technologie etExploitationInformatique
RDIC
Société desAutomobiles
Alpine Caterham
RenaultSamara
RenaultCroatia
Renault Nissan Slovenija. trzenje in prodaja
avtomobilov d.o.o
Revoz(Slovénie)
RenaultNordic AB
RenaultIrlande
Cacia (Portugal)
RECSA*(Spain)
RenaultPortuguesa
RenaultEspana SA*
Renault GroupBV
(Netherlands)
Sodicam 2
NISSAN MOTOR (1)
NISSAN FINANCE CO., Ltd.
EUROPE
AMERICAS
EUROMED-AFRICA
EURASIA
ASIA-PACIFIC
100%
15%
100%
43.4%
100%
100%
100%
100% 72%
28%
99.4%
40%100%50.7%100% 99%
AllianceRostec B.V
AvtovazGroup
48.2%
1% 1%
80%
8%
71%
100% 100%
100%100%
28%
72%
100%
100%
100%
100% 100%50%
100%
100%
100%
1%
99%
100%
100% 100%
100%
100% 100% 100%
1%1%1%1%
99%99%99%99%
100%
100%
100%
100%
100%
60% 60% 60%
40%100% 40% 40%
100% 100% 100%
100%
100%
98%
100% 49% 51%
Renault India Private Limited
(India)
2%
11%
89%
100% 100%
RenaultEnvironnement*
100%
Sofrastock100%
100%
MaubeugeConstructionAutomobile
100%
8.3%91.7%79.8%
Renault NissanTechnology
& Business CentreIndia Private Limited
(India)
66.67%
Renault Nissan Automotive India
Private Limited (India)
30%
100%
AFM Industries
(Russia)
Avtoframos (Russia)
Remosprom (Russia)
100%89.6%100%
10.4%
100%52.3%100%
Fonderie de Bretagne
Cormecanica(Chili)
100%
74.5%100%
Renault BeijingAutomotive Company
(China)
100%
IDVE
1%
100%

REGISTRATION DOCUMENT RENAULT 2013✦ Global Reporting Initiative (GRI) Directives 25
THE RENAULT GROUP 1
1
OVERVIEW OF RENAULT AND THE GROUP
SALES FINANCING
FRANCE
EUROPE
AMERICAS
EUROMED
ASIA-PACIFIC
EURASIA
AUTOMOTIVE
Diac S.A.
Autofin (Belgium)
Renault CréditCar (Belgium)
RCI Financial Service B.V.
(Netherlands)
Administradora de Consorcio RCI Brasil Ltda
(Brazil)
RomboCompaniaFinanciera(Argentina)
Courtage S.A.(Argentina)
RCI FinancialServices Korea
Co Ltd(South Korea)
GroupeRenault
Argentine
Companhia de Credito Financiamento
e Investimento RCI Brasil (Brazil)
Companhiade Arrendamento
Mercantil RCIBrasil
(Brazil)
Corretorade Seguros
RCI Brasil S.A
(Brazil)
RCI FinantareRomania
(Romania)
RCI Broker deAsigurare(Romania)
RDFM(Morocco)
RCI FinanceMaroc
RCI VersicherungsService GmbH
(Germany)
SogesmaDiac
Location S.A.
REAL ESTATE FINANCINGFOR THE RENAULT GROUP
CASH MANAGEMENTFOR THE RENAULT GROUP
SCIARenaultFinance
(Switzerland)
SICOFRAM
SCI ParcIndustrieldu Mans
Immobilièred’Epone
SCIPlateau de Guyancourt
Fully consolidated companies
Companies accountedfor by the equity method
Companies consolidated according to the percentage of participation of each element of the balance sheetand profit and loss account.
and subsidiaries *
100%
55% 50.1%
100% 100%
100%
100%
100%
60%
100%
60.11%
100%
99.92%100%
100%
100%45%
100%
100%
100%
100% 100%
RCI Banque SA et ses succursales
100%
100%
100%
Overlease(Spain)
RCI Gest Instituiçao
Financeira deCredito. S.A (Portugal)
RCI Gest Seguros-
Mediadores deSeguros LDA(Portugal)
100%
100%
100%
RCI Leasing Romania IFN S.A
(Romania)
100% 100%
000 RN Finance RUS
(Russia)
100%
100%
100%
RCI FinancialServices Ltd
(UK)
RCI Zrt Hongrie(Hungary)
RCI LeasingPolska
(Pologne)
RCI FinancialServices S.r.o.
(Czech Republic)
RCI FinanceCZ s.r.o.
(Czech Republic)
100%
95% 5%
RCI Services Ltd (Malta)
RCI InsuranceLtd
(Malta)
RCI Life Ltd (Malta)
100%100%
100%
RCI Finance S.A.(Switzerland)
100%
RCI Financial Service S.A.
(Belgium)
100%
100%Es Mobility S.r.l
(Italie)
ORFINFinansman Anonim
Sirketi (Turkey)
50%(1) Renault owns 43.4% of Nissan's equity. After taking Nissan's
treasury stock into account, Renault's stake in Nissan is 43.7%.
(2) The percentage of holding differs from the percentage of
interest because of reciprocal put and call options concerning the
participations of minority stake holders in these controlled entities.
The percentages represent ownership.
50%

Find out more at www.renault.comREGISTRATION DOCUMENT RENAULT 201326
THE RENAULT GROUP1 THE RENAULT-NISSAN ALLIANCE
1.2 THE RENAULT-NISSAN ALLIANCE
On March 27, 1999 Renault acquired a 36.8% equity stake in Nissan, as well
as Nissan’s European finance subsidiaries, for ¥643 billion (approximately
€5 billion or $5.4 billion at that time).
The main stages in the construction of the Alliance are described in
chapter 1.2.2.1.
1.2.1 ALLIANCE OBJECTIVES ✦
1.2.1.1 VISION – DESTINATION OF THE RENAULT-NISSAN ALLIANCE
FOURTEEN YEARS OF COOPERATION AND SYNERGY
The Renault-Nissan Alliance is the auto industry’s most productive and stable
cross-cultural strategic collaboration. This unique partnership is a pragmatic,
flexible business tool that can expand to accommodate new projects and
partners worldwide. In particular, the Alliance has emerged in the past half-
decade as an important buffer to protect partners during regional downturns,
and it has accelerated Renault and Nissan’s momentum in some of the
world’s fastest growing economies.
In 2013, the Alliance sold a record 8.26 million units worldwide, up 2.1%
from the previous year. 2013 was the fifth straight year of sales growth for the
Renault-Nissan Alliance. The total figure includes sales from the Alliance’s five
major brands – Renault, Dacia, Renault Samsung, Nissan and Infiniti – as well
as Russia’s AVTOVAZ Lada. The Alliance captured about 10% of the global
market in 2012, ranking it fourth in volume terms behind Toyota, Volkswagen
and General Motors.
ALLIANCE PRINCIPLES
The Alliance is based on trust, respect and transparency among all partners.
It strives for “win-win” solutions that benefit partners and consumers. It seeks
to maximize economies of scale while preserving the distinct identities of
brands and corporate cultures.
OBJECTIVES
The Alliance pursues a strategy of profitable growth with three objectives that
are meant to be sustainable over the long term:
W to be recognized by customers as being among the best three automotive
groups in terms of the quality and value of its products and services in each
region and market segment;
W to be among the best three automotive groups in key technologies, each
partner being a leader in specific fields of excellence;
W to consistently generate a total operating profit that is among the top three
automotive groups in the world, by maintaining a high operating margin
and steady growth.
Since sales began in late 2010 to the end of 2013, the Alliance has sold
more than 134,000 zero-emission vehicles globally, including Twizy, Renault’s
electric two-seater tandem. That is more than all of the other major global
automakers combined.
STRATEGIC MANAGEMENT
Renault and Nissan, headquartered in Boulogne-Billancourt, France and
Yokohama, Japan, respectively, have separate management structures. The
responsibility for managing their activities lies with their respective Executive
Committees, which are answerable to their individual Boards of Directors and
their own shareholders.
In March 2002, the Alliance set up a strategic management company,
incorporated under Dutch law and jointly and equally owned by Renault
and Nissan. The aim was to establish a common strategy and manage all
synergies. Renault-Nissan b.v. (RNBV) hosts the Alliance Board, chaired by
Carlos Ghosn, its Chairman and CEO.
1.2.1.2 RENAULT’S MAJOR BENEFITS FROM THE ALLIANCE
RESEARCH AND ADVANCED ENGINEERING
Thanks to the Alliance, Renault is able to share development costs for new
technologies with Nissan. Together, Renault and Nissan have a total research
and development budget of about €5 billion.
The Alliance is the global automotive leader in sustainable mobility, having
committed €4 billion in related projects since 1992. The Alliance helped
accelerate both companies’ development of zero-emission vehicles.
Pure electric vehicles
W The Alliance has the widest range of 100% electric vehicles (EVs) on the
road.

REGISTRATION DOCUMENT RENAULT 2013✦ Global Reporting Initiative (GRI) Directives 27
THE RENAULT GROUP 1
1
THE RENAULT-NISSAN ALLIANCE
W The Alliance’s first EV – Nissan LEAF – went on sale in December 2010.
Nissan LEAF is the world’s best-selling EV and has won numerous
international accolades, including “World and European Car of the Year
2011”, as well as “Japan Car of the Year 2011-2012.”
W In October 2011, Renault launched the Kangoo Z.E., the first electric
commercial vehicle from the Alliance. Awarded “International Van
of the Year 2012”, Kangoo Z.E. won a bid for 15,000 units from a
group of 19 French companies, including the French postal service.
Renault Fluence Z.E., a family sedan, went on sale in December 2011.
Twizy was launched in March 2012. Orders for the compact ZOE began in
late 2012. ZOE has a range of 210km (NEDC).
W Nissan will launch its second zero-emission model, the e-NV200 van, in
2014.
Fuel-cell electric vehicles
The Alliance partners are also working on other technologies aimed at
reducing CO2 emissions, including hybrids, biofuel and hydrogen powered
cars.
In January 2013, the Renault-Nissan Alliance, Daimler AG and Ford Motor
Company announced a unique three-way agreement to accelerate the
commercialization of fuel-cell electric vehicle technology. Together they will
develop a common fuel cell stack and fuel cell system that can be used
by each company in the launch of highly differentiated, separately branded
FCEVs, which produce no CO2 emissions while driving.
POWERTRAINS
The Powertrain Cross-Company Team (CCT), supported by the Alliance
Powertrain Planning Office, has been leading the effort to increase efficiency
and reduce diversity at the powertrain level since 2009. In 2011, co-owned
and cross-exchanged engines and transmissions represented respectively
58% of total engines and 74% of total transmissions across the Alliance. In
2013 , almost 80% of all powertrains were shared. This represented synergies
of €670 million . Powertrain sharing also represented €1.8 billion in cross sales.
Increasing efficiency and meeting tough new emissions standards is also an
important principle within the Alliance.
In 2013, the Alliance introduced two new co-developed engines: Energy dCi
110 and 130 and Energy TCe 115. The Energy dCi is among the most frugal in
its class with fuel consumption of 4.3l/100km and 112g of CO2/km. This diesel
engine is fitted on the Renault Mégane and Scénic and the Nissan Qashqai.
The Energy TCe 115 delivers enhanced driveability with pull-away and mid-
range acceleration responde among the crispest in its class, plus significantly
lower combined-cycle fuel consumption and CO2 emissions at 6.1l/100km
and from 90g/CO2/km for Renault Mégane and from 99g/CO
2/km for Nissan.
This gasoline engine is fitted on the same Renault and Nissan models.
Both the Energy dCi 110 and Energy TCe 115 are also fitted on the Daimler
Citan city van while the dCi 110 is fitted on the Mercedes Benz A class.
Renault “J” gearbox production in India and China
In 2013, Renault-Nissan Alliance India Private Limited (RNAIPL), the Alliance
plant in Chennai, India, as well as Dongfeng Nissan Engine Company (DNEC)
in Huadu, China, began production of Renault’s best-selling “J” five-speed
manual gearbox. The localization of production in India and China helps
relieve capacity constraints in Europe and also helps the Alliance minimize its
foreign exchange exposure in those markets.
More than 90% of all Renault and Nissan cars sold in India are fitted with the
gearbox, while the gearbox is fitted on 30% of Nissan’s cars in China. The
gearbox will also be fitted on Renault cars when Renault starts production in
China in 2016.
Production of the “J” gearbox began in 1981 at the Renault Cleon plant in
France. The gearbox, which sold about 2.7 million units in 2013, is fitted on
Renault and Nissan vehicles, as well as Mercedes-Benz and LADA cars.
Alliance manufacturing facilities support Renault and Nissan expansion worldwide
Thanks to the Alliance, Renault and Nissan achieve economies of scale by
producing vehicles together in seven countries around the world: Brazil, India,
France, Russia, Spain, South Africa and South Korea. The RNBV Alliance
Industrial Sourcing operation, created in 2009, identifies the best Alliance
plants for producing vehicles in order to share existing plants and platforms
to minimize costs and reduce the total delivery cost (TdC). The Group also
identifies business opportunities for one partner through cross-manufacturing
by the other partner in a new market.
India
India is a key pillar of the Alliance’s strategic focus on new growth markets.
The Chennai plant, inaugurated in 2010, is the first dedicated Alliance plant in
the world and is home to the largest platform-sharing project in the Alliance.
The plant produces the sub-compact Nissan Micra and Nissan Sunny sedan
for global export, the Nissan Evalia multi-purpose van as well as the Nissan
premium compact Terrano SUV. It also produces the Renault Koleos premium
SUV, the Renault Fluence family sedan, the new compact Renault Pulse, the
Duster SUV and the Scala premium sedan, all for the Indian market. The
Koleos and the Fluence are completely knocked down (CKD) vehicles, while
the rest are built from scratch at the plant. Renault also exports the Duster
to other right-hand drive markets in Europe, Asia and Africa The Chennai
plant also produces powertrains for the Alliance’s vehicles produced in
India, including Renault’s best-selling “J” manual gearbox. The Alliance
aims to make the Chennai workforce best-in-class compared to other Indian
manufacturers. To reach this target, Chennai management has adopted the
Alliance Integrated Manufacturing System (AIMS) and the Alliance Production
Way which combines Renault-Nissan best practices and benchmarking while
also helping to keep costs to a minimum.

Find out more at www.renault.comREGISTRATION DOCUMENT RENAULT 201328
THE RENAULT GROUP1 THE RENAULT-NISSAN ALLIANCE
Chennai is home to the Alliance’s first jointly-owned technical center, Renault-
Nissan Technology and Business Centre India Private Ltd. (RNTBCI). The center
has fully integrated Renault and Nissan’s operations, including engineering,
purchasing, cost analysis, Human Resources, finance, information systems
and administration. The center supports all developments for Indian activities,
such as product and process engineering, manufacturing, as well as styling
and support to special projects for Renault’s design studios in Mumbai and
Chennai. Renault was the first European manufacturer to set up a design
team in India in order to design vehicles that meet the needs and aspirations
of Indian customers.
The Alliance also operates a logistics platform in Pune, which manufactures
components for Alliance plants worldwide.
Russia
Russia is one of the growth pillars for the Alliance in the next half-decade. In
December 2012, the Alliance and state corporation Rostec (previously known
as Russian Technologies) created a joint venture to control AVTOVAZ, Russia’s
leading automaker. According to the terms of the deal, Renault-Nissan will
invest RUB23 billion in the joint venture to help modernize AVTOVAZ. The
investment will give Renault-Nissan 67.13% of the joint venture in the future .
The joint venture holds 74.5% of AVTOVAZ. The Alliance holds a 63.64%
stake in the joint venture at the end of 2013, with Renault s.a.s. owning
48.20% and Nissan Holding International B.V. owning 15.44%.
The Alliance has four manufacturing bases in Russia: Togliatti, Moscow,
St. Petersburg and Izhevsk. By 2016, the Alliance expects to have total
production capacity of 1.6 million units in Russia, up from 1.1 million units
in 2011.
Production at the new common production line at the Togliatti plant, the
largest assembly plant in the world, began in April 2012 with the Lada Largus
multi-purpose van. Later that year, Nissan Almera sedan rolled off the line.
Five separate models from the three companies will soon be produced on the
line, reducing costs while preserving the unique characteristics of each brand.
The Alliance is aiming for a market share of 40% in Russia by 2016, up from
about 30% in 2013.
South Korea
In South Korea, the Renault Samsung plant in Busan produces Nissan
vehicles – such as the previous-generation SM3 – for export to Russia and
other countries.
In July 2012, the Renault-Nissan Alliance announced it would invest
US$160 million in Korea to meet anticipated demand for the next-generation
Nissan Rogue and accelerate growth of Renault Samsung Motors. Production
of Nissan Rogue crossover in Busan, Korea, will begin in 2014, with an annual
capacity of about 80,000 units.
Next-generation Rogue production in Busan gives more momentum to Renault
Samsung Motors, which earlier that year launched the “RSM 2012 Revival
Plan.” The plan aims to achieve efficiency and cost competitiveness in Busan,
while expanding RSM’s vehicle lineup, which today consists of four models.
SALES & MARKETING
Joint media buying in Europe
Since 2009, Renault and Nissan have been using the same media purchasing
agency in Europe – Omnicom-OMD.
Omnicom-OMD handles media purchasing for Renault in 24 countries in
greater Europe and in 20 countries for Nissan. The combined budget was
approximately €617 million in 2013.
Joint fleet contract
Thanks to the Alliance’s wide product lineup and global sales footprint, Renault
and Nissan were able to sign an exclusive fleet contract with the Paris-based
nutritional food company Danone in 2012. Under this first-of-its-kind deal
for the Alliance, the two companies will together provide 15,000 vehicles to
Danone in 25 countries for at least five years.
Danone fleet managers can select vehicles from four brands under the
Renault-Nissan Alliance: Renault, Dacia, Nissan and Infiniti. The product range
stretches from passenger cars in the A to the E segments and commercial
vehicles, including electric models. The highest volumes will be in Russia,
Mexico and France.
DIVERSITY
Refer to chapter 2 of this Registration document, paragraph 2.5.2.4.

REGISTRATION DOCUMENT RENAULT 2013✦ Global Reporting Initiative (GRI) Directives 29
THE RENAULT GROUP 1
1
THE RENAULT-NISSAN ALLIANCE
1.2.1.3 RENAULT AND NISSAN SHARE VALUE EVOLUTION SINCE 1999, THE ALLIANCE CREATION
Renault share price from March 29, 1999 to end-December 2013
0
50
100
150
200
250
300
350
400
Renault CAC 40
Base 100
2000199903/29/99
2001 2002 2003 2004 2005 2007 2008 20092006 2010 201103/29/13
20132012
14 years of Renault-Nissan cooperation
Renault+67%
CAC 40-26%
Source: Reuters.
Nissan share price from March 29, 1999 to end-December 2013
0
50
100
150
200
250
300
350
Base 100
Nissan Nikkei 225
14 years of Renault-Nissan cooperation
Nissan+89.9%
Nikkei 225-1.8%
2000199903/29/99
2001 2002 2003 2004 2005 2007 2008 20092006 2010 201103/29/13
20132012
Source: Reuters.

Find out more at www.renault.comREGISTRATION DOCUMENT RENAULT 201330
THE RENAULT GROUP1 THE RENAULT-NISSAN ALLIANCE
AUTOMAKERS MARKET CAPITALIZATION – MARCH 1999 VS DECEMBER 2013
(€ million) MARCH 29, 1999 RANKING DECEMBRE 31, 2013
Toyota 96,736 1 Toyota 152,837
Daimler 81,541 2 VW 92,867
Ford 59,848 3 Daimler 67,286
GM 52,518 4 BMW 54,671
Honda 39,961 5 Honda 54,155
VW 22,159 6 Ford 44,167
BMW 16,277 7 Hyundai 41,356
Fiat 13,522 8 GM 41,195
Nissan 9,049 9 Nissan 27,592
Renault 8,393 10 Renault 17,285
PSA 6,615 11 Fiat 7,435
Hyundai 678 12 PSA 3,349
1.2.2.1 MAIN STAGES IN THE CONSTRUCTION OF THE ALLIANCE
In accordance with the principles set out in the initial agreement signed
in March 1999, the Renault-Nissan Alliance entered its second phase in
2002 aimed at strengthening the community of interests between Renault
and Nissan. Renault increased its equity stake in Nissan on March 1, 2002,
from 36.8% to 44.3% by exercising the warrants it had held since 1999.
At the same time, Nissan took a stake in Renault through its wholly-owned
subsidiary, Nissan Finance Co., Ltd., which acquired 15% of Renault through
two reserved capital increases, on March 29 and May 28, 2002. By acquiring
a stake in Renault, Nissan gained a direct interest in its partner’s results, as
was already the case for Renault with regards to Nissan. Nissan also obtained
a second seat on Renault’s Board of Directors.
During this phase, the two companies also established Renault-Nissan b.v.
and the Alliance Board which was tasked with defining the Alliance’s strategy
and developing a joint long-term vision.
Since the signing of the Strategic Cooperation with Daimler in April 2010,
Renault’s stake in Nissan is now 43.4% while Nissan’s stake in Renault
remains unchanged at 15%.
1.2.2.2 GOVERNANCE AND OPERATIONAL STRUCTURE
CREATION OF RENAULT-NISSAN B.V. (RNBV)
Formed on March 28, 2002, Renault-Nissan b.v. is a joint company,
incorporated under Dutch law and equally owned by Renault SA and Nissan
Motor Co., Ltd., and responsible for the strategic management of the Alliance.
RNBV decides on medium- and long-term strategy, as described below under
“Powers of Renault-Nissan b.v.” It bolsters the management of the Renault-
Nissan Alliance and coordinates joint activities at a global level, allowing for
decisions to be made while respecting the autonomy of each partner and
guaranteeing a consensual operating procedure.
RNBV possesses clearly defined powers over both Renault SA and Nissan
Motor Co., Ltd.
RNBV holds all the shares of existing and future joint subsidiaries of Renault SA
and Nissan Motor Co., Ltd.
Examples include Renault-Nissan Purchasing Organization (RNPO), created
in April 2001, and Renault-Nissan Information Services (RNIS), a common
information systems company created in July 2002. RNPO was originally
equally owned by Renault and Nissan until its shares were transferred to
RNBV in June 2003.
In January 2014, the Renault-Nissan Alliance announced plans to study
further convergence in four key functions: purchasing, manufacturing and
logistics, R&D and Human Resources – in order to accelerate synergies and
enhance performance. Each project will be headed by one single leader.
This major next step in the evolution of the Alliance is expected to generate
annualized synergies of 4.3 billion in 2016, up from an estimated €2.8 billion
in 2013. The convergence projects are expected to be presented to the
appropriate employee representation and corporate decision-making bodies
for Renault in France and for Nissan in Japan, and confirmed by the end of
the first quarter 2014 for implementation.
1.2.2 OPERATIONAL STRUCTURE OF THE ALLIANCE ✦
Volvo has been taken out the list because of its focus on the industrial activity.

REGISTRATION DOCUMENT RENAULT 2013✦ Global Reporting Initiative (GRI) Directives 31
THE RENAULT GROUP 1
1
THE RENAULT-NISSAN ALLIANCE
Alliance structure
43.4%
StrategicmanagementStrategic
management
JOINT COMPANIESRNPO RNIS
POWERS OF RENAULT-NISSAN B.V.
RNBV implements the decisions made by the Alliance Board set up by
Renault SA and Nissan Motor Co., Ltd.
RNBV has limited decision-making power with respect to Nissan Motor Co.,
Ltd. and Renault s.a.s. In order of importance, these are decisions that would
be difficult for the two companies to take separately while ensuring that they
would be able to pursue global implementation and thus take advantage of
economies of scale. This decision-making power is limited to the following
areas:
W adoption of three-, five- and ten-year plans (strategic company projects,
with quantified data);
W approval of product plans (parts of strategic projects corresponding to the
design, development, manufacture and sale of current or future products,
vehicles and components);
W decisions concerning the commonization of products and powertrains
(such as platforms, vehicles, gearboxes, engines and other components);
W financial policy, including:
W rates of discount used for ROIC studies and hurdle rates, applicable
to future models and investments,
W risk-management rules and the policy governing them,
W rules on financing and cash management,
W debt leverage;
W management of common subsidiaries, and steering of Cross-Company
Teams (CCT) and Functional Task Teams (FTT) including TT (Task Teams)
creation, modification or disbandment. These groups operate in all the
main sectors and areas of activity and are tasked with exploring new
synergies between the two companies. Team managers report regularly to
the Alliance Board on the progress made in their specific area of activity;
W any other subject or project assigned to RNBV on a joint basis by Nissan
Motor Co., Ltd., and Renault s.a.s.
RNBV also has the exclusive power to make proposals on a range of
decisions by the two operating companies, Nissan Motor Co., Ltd., and
Renault s.a.s. These two entities are free to accept or reject these proposals.
However, they can implement these decisions only if a proposal has been
made by RNBV. The power of initiative of RNBV thus ensures that the two
partners harmonize their policies.
The areas covered include:
W creation and scope of joint subsidiaries;
W supplementary financial incentive schemes;
W significant changes in scope, whether geographic or in terms of products,
for total amounts of $100 million or more;
W strategic investments, i.e. investments other than product-related
investments, amounting to $500 million or more;
W strategic cooperation between basis by Nissan Motor Co., Ltd., or
Renault s.a.s. and other companies.
All other aspects relating to Renault SA and Nissan Motor Co., Ltd.,
whether operational, commercial, financial or labor-related, are managed
independently by each company and the corresponding decisions will be
taken independently by these companies’ respective governing bodies. The
two companies retain their autonomy of management, the identity of their
respective brands, their employee-representative bodies and their employees.
They are also responsible for their own results.
In May 2009, the organization of the Alliance was strengthened by the creation
of a small, dedicated team who helps foster deeper, broader cooperation and
to maximize the contribution of synergies to the performance of both partners.
The team is focused on several priority areas including: purchasing, common
platforms and parts, global logistics, IS/IT, the zero-emission business, as well
as the battery business, A-segment vehicles and marketing communications.
This team reports directly to Carlos Ghosn and meets monthly at the
Amsterdam offices of RNBV to review projects and make recommendations
to the Alliance Board on new areas of synergies and business opportunity.
ALLIANCE & SUSTAINABILITY: ZERO-EMISSION LEADERSHIP
See chapter 1.2.1.2 paragraph Research and advanced engineering.
STRATEGIC ALLIANCES
The Alliance seeks out strategic alliances with other partners in order to
increase economies of scale, to help accelerate growth in new regions and to
fund research and development of next-generation powertrains and vehicles,
including vehicles that meet or exceed tougher environmental requirements.
Today the Alliance operates strategic collaborations with numerous
automakers, including Germany’s Daimler, China’s Dongfeng Motor, and with
regional manufacturers such as Ashok Leyland in India.
In 2013, the Alliances announced plans to explore a wide-ranging
cooperation with Mitsubishi Motors, including shared products, technologies
and manufacturing capacity. The decision to explore various projects together
came about thanks to Nissan’s existing relationship with Mitsubishi. The
two companies have a joint venture co-developing kei or small cars for both
brands in Japan.
Find out more at www.renault.comREGISTRATION DOCUMENT RENAULT 201332
THE RENAULT GROUP1 THE RENAULT-NISSAN ALLIANCE
As part of the agreement, Nissan and Mitsubishi are discussing the co-
development of a new small-segment car for the global market, including an
electric version. Meanwhile, Renault and Mitsubishi are studying the launch
of Mitsubishi-badged sedans for the US market based on Renault vehicles,
among other projects.
Cooperation with Daimler
In April 2010, the Alliance announced a strategic cooperation with luxury-
car maker Daimler AG. This strategic cooperation is strengthened by cross-
shareholdings, with Daimler holding a 3.1% share in Renault and Nissan
capital and Renault and Nissan holding a 1.55% share in Daimler.
The partnership is managed by a Cooperation Committee which is co-chaired
by Carlos Ghosn and Dieter Zetsche and made up of senior executives from
the Alliance, Renault, Nissan and Daimler. The Governance Board, which
meets nearly every month, ensures the implementation of the agreed projects
and makes proposals for new ones. The cooperation is managed for the
Alliance by RNBV.
Cooperation between the two companies has expanded significantly since
they joined forces in 2010 and has also become more global in scope.
The first products of the 2010 Daimler and Renault-Nissan strategic
cooperation are already on the road: in September 2012, Daimler released its
Citan city van, which is based on Renault’s Kangoo. The vehicle is produced in
Renault’s plant in Maubeuge, France, where Renault also produces its Kangoo
light commercial vehicle.
The Citan, which accounts for about 25% of total production output in
Maubeuge, also features a jointly developed Renault-Daimler four-cylinder,
1.5-liter diesel engine. A variant of this engine had its market introduction in
the new Mercedes-Benz A-and B-Class models in 2012.
In October 2013, Nissan’s premium brand Infiniti launched the Q50 sports
sedan equipped with a jointly developed Nissan-Daimler four-cylinder,
2.2-liter diesel engine. A 2-liter gasoline version for the Q50 was unveiled at
the Quangzhou motor show in China later that same year.
In addition, Renault and Daimler are also working on the next-generation
Twingo and four-seat smart production in Novo Mesto, Slovenia. These small
cars are now jointly developed on the basis of a shared architecture, but will
remain independent products with an unmistakable brand identity. The cars
will be launched in the second half of 2014.
Nissan and Daimler are also working on several bi-lateral projects, including
joint production of Mercedes-Benz four-cylinder gasoline engines at Nissan’s
powertrain assembly plant in Decherd, Tennessee, USA. Production of the
engines, which will be fitted on Mercedes-Benz and Infiniti models, will begin
in mid-2014, with installed capacity of 250,000 units per year once full ramp-
up is achieved. In addition, Nissan, Daimler and Ford Motor Co. are working
on the development of a joint fuel-cell stack and system to accelerate the
market-readiness of fuel-cell electric vehicles.
All partners are keeping an open mind, looking with fresh eyes at all potential
new areas of collaboration. At the same time, the Renault-Nissan Alliance
and Daimler will continue to study opportunities in areas such as exchanging
benchmarks and best practices.
In 2013, Renault and Daimler received the prestigious Franco-German
Business Award for their industrial cooperation. Awarded by the Franco-
German Chamber of Commerce and Industry, the prize recognizes French
and German companies that are benchmarks for cooperation in four areas:
industrial cooperation, the environment, innovation and new technologies,
and Human Resources.
THE ALLIANCE BOARD ✦
Role of the Alliance Board
The Alliance Board (AB) held its first meeting on May 29, 2002. AB is the
decision-making body for all issues affecting the Alliance’s future, and met
nine times in 2013. The Alliance Board also convenes regular meetings
for all top executives at both companies. The most recent meeting was in
January 2014, when 200 senior executives met in Amsterdam for a two-
day “Alliance Convention” where Carlos Ghosn announced plans for four
new convergence projects in purchasing, manufacturing and logistics, R&D
and Human Resources – in order to accelerate synergies and enhance
performance.
Both Renault and Nissan continue to manage their business and perform
as two separate companies. The operational management of each group
remains in the hands of senior management accountable to their own Board
of Directors.
Alliance Board members
As of November 2011, the Board is chaired by Carlos Ghosn, President and
CEO of Renault and President and CEO of Nissan. The Alliance Board, who
steers medium and long-term strategy, also includes four members from
Renault (Mouna Sepehri, Jean-Michel Billig, Thierry Bolloré and Jérôme Stoll)
and four from Nissan (Toshiyuki Shiga, Mitsuhiko Yamashita, Hidetoshi Imazu
and Greg Kelly).
Other members of Renault’s and Nissan’s Executive Committees attend the
Alliance Board. Decisions are officially approved by the Alliance Board at the
end of the meetings.
As RNBV is a joint company incorporated under Dutch law, it has no
Supervisory Board. Nevertheless, theRNBV managers can still be dismissed
by the parent companies, Renault SA and Nissan Motor Co., Ltd.
2013 activities
With the support of the dedicated Alliance teams, the Alliance Board has
formulated strategic recommendations focusing on several key directions:
W acceleration and increase of synergies: RNBV has a key role in optimizing
the utilization of Renault and Nissan’s manufacturing operations, especially
in emerging markets. RNBV is consistently seeking logistic cost reduction
opportunities across the Alliance;
W common Alliance projects and organizations: supporting the Alliance’s
international growth, RNBV drives the creation of common entities. In
2013, the Alliance created a common purchasing organization (CPO) with
AVTOVAZ in Russia. RNBV also drives key projects aiming at enhancing the
performance of both Renault and Nissan;

REGISTRATION DOCUMENT RENAULT 2013✦ Global Reporting Initiative (GRI) Directives 33
THE RENAULT GROUP 1
1
THE RENAULT-NISSAN ALLIANCE
W common development organization for CMF-A vehicles: a common
development organization for the most affordable category of cars in
the Common Module Family, Renault-Nissan’s unique, modular system
of vehicle architecture, was established in 2012 headed by a dedicated
Alliance Managing Director based in India. This marks the first all-new
programme developed from the ground up by Renault s.a.s. and Nissan
Motor Co., Ltd., teams working side by side from inception. In 2013, the
Alliance announced that production from the CMF-A scope will begin in
2015 at the Renault-Nissan Alliance plant in Chennai, India;
W OEM partnerships: RNBV is a driving force for forging new partnership
between the Alliance and other OEMs. The Alliance operates strategic
collaborations with numerous automakers, including Germany’s Daimler,
China’s Dongfeng, and with regional manufacturers such as Ashok Leyland
in India. In 2013, the Alliance announced it was exploring a wide-ranging
global product and technology partnership with Mitsubishi Motors;
W communications: RNBV supports the Alliance activities and businesses
through targeted initiatives on high-profile events such as the Women’s
Forum and the World Economic Forum. The Alliance also supports high-
visibility environmental conferences. In 2013, the Alliance was a partner
of the Vienna conference sponsored by R20, the climate action group
founded by former Governor of California Arnold Schwarzenegger. The
Alliance communication team is also accelerating internal communications
on the Alliance at both companies.
STEERING COMMITTEES (SCS)
The steering committees are tasked with defining the Alliance’s cross-
functional strategic operational priorities, submitting topics to the ABM that
may be given priority status in the agenda and coordinating the activities of
the Cross-Company Teams (CCTs), Functional Task Teams (FTTs) and Task
Teams (TTs) that fall within the scope of the steering committees. They take
operational decisions that are not within the scope of the CCTs, report on
progress to the ABM and, wherever necessary, seek arbitration on and/or
confirmation for decisions.
There are eleven SCs, each focusing on a different field, that support the
CCTs and FTTs in the implementation of Alliance projects:
1. Planning 7. America
2. Product Development and Manufacturing 8. Europe
3. Sales and Services 9. Russia
4. Marketing and Communications 10. China
5 Africa 11 Asia and Pacific (excl. China)
6 Middle East and India
CROSS-COMPANY TEAMS (CCTS)
The CCTs are working groups comprising staff and experts from both
companies that are tasked with exploring possible areas of cooperation and
synergy between Renault and Nissan, defining and concretely specifying
projects and then monitoring the implementation of projects approved by the
Board.
There are 17 teams working in the following areas:
1. Product Planning 9. EV
2. Light commercial vehicle 10. Korea
3. Research & Advanced Engineering 11. South Africa
4. Vehicle Engineering 12 India
5. Powertrain 13 Raw materials
6. Process Engineering 14 Corporate Sales
7. Manufacturing 15 Joint Marketing Research
8. Parts and Accessories 16 PR/Press/Coms
17. Asean
The CCTs are headed by two co-leaders, one from Renault and one from
Nissan.
The 17 CCTs report to the Alliance Board on the state of progress of their work
and their results through the steering committees.
FUNCTIONAL TASK TEAMS (FTTS)
The FTTs are made up of experts from both Renault and Nissan and provide
the CCTs with essential support in terms of benchmarking, the promotion of
best practices and the harmonization of tools used in the support functions.
There are 16 FTTs that cover the following key areas:
1. Corporate Planning 9. Global Tax
2. Product Engineering Performance 10. Human Resources
3. Quality 11. Joint Events & Motor Shows
4. Industrial Strategy 12. Joint Agencies
5. Cost Management & Control 13. Marketing Organization
6. Joint Media Buying 14 Sales Expansion
7. Service Engineering 15 Customer Experience
8. Legal & Intellectual Property 16 Alliance Motorsport
TASK TEAMS (TTS)
As soon as a specific issue is identified, a Task Team (TT) is appointed to work
on the issue within a certain timeframe.
There are currently two TTs working on the following topics:
1. Mexico 2. Brazil

Find out more at www.renault.comREGISTRATION DOCUMENT RENAULT 201334
THE RENAULT GROUP1 THE RENAULT-NISSAN ALLIANCE
1.2.3 THE STATUS OF SYNERGIES
Since the Alliance agreement was signed in 1999, Renault and Nissan have
initiated cooperation programmes in a broad range of fields of activity. The
synergies generated can be classified into two categories:
W structural cooperation;
W regional cooperation.
In 2010, the Alliance set an objective to maintain €1 billion in new synergies
every year. In 2012, the Alliance posted record synergies of €2.7 billion, up
54% from the previous year. As in previous years, the major contributors to
synergies were in the areas of vehicle engineering, powertrains, purchasing
and logistics. The Alliance forecasts synergies of about €2.8 billion for 2013.
Synergies are derived from revenue increase, cost reductions and cost
avoidance. Only new synergies – not cumulative synergies -- are taken
into account every year. The Renault-Nissan Alliance expects synergies to
continue to grow thanks to its new Common Module Family (CMF) approach
and as it expands in emerging markets. Increased collaboration between the
two partners in all areas, including non-engineering areas, is also expected
to boost synergies.
1.2.3.1 STRUCTURAL COOPERATION
VEHICLE ENGINEERING
The sharing of platforms or engineering architecture and, more significantly,
the sharing of major components is a key reason behind the Renault-Nissan
Alliance’s success. The two companies strive to maximize the number of
platforms shared across multiple models whenever it makes sense from a
cost and branding perspective
Platform sharing as usual
The B platform, one of the earliest common platforms, has been used by
Nissan since 2002 starting with March (Micra in Europe) and Cube. Modus,
unveiled in 2004, was the first Renault model to be built on the platform.
Today this versatile platform also builds Nissan Sylphy and Tiida, as well as
the new Renault Clio IV and Captur launched in 2013.
The main models built on the C platform are Renault Mégane, Scénic and
Fluence, as well as Nissan Qashqai.
The current Nissan Micra released in 2010 was the first model to be built on
the V-Platform, which can build about 1 million cars a year, and is also used
to build the new Nissan Sunny, the Renault Pulse and Renault Scala in the
Alliance factory in Chennai, India. It is also used to produce the Nissan Sunny
in Thailand and China.
A new approach: the Common Module Family
Today the Renault-Nissan Alliance is going beyond platform-sharing with
the adoption of a new approach called Common Module Family (CMF).
CMF aims to double common parts and components in future Renault and
Nissan ranges. By sharing the technical architecture among a wide variety of
models, the Alliance is dramatically reducing costs, while increasing customer
choice and quality. The approach cuts engineering costs by up to 40% and
purchasing costs by up to 30%.
The new CMF approach is based on the “4+1 Big Modules” concept.
The four modules – engine compartment, cockpit, front underbody and
rear underbody – as well as the architecture for electrical and electronic
components are designed to be combined in a variety of vehicles – compacts,
sedans or SUVs – of the Renault and Nissan ranges.
The new Nissan X-Trail and Qashqai released in late 2013 are the first Alliance
vehicles built using the CMF approach. The vehicles are built on CMF C/D,
which covers large vehicles. The first Renault CMF vehicles to be released in
late 2014 will also be based on CMF C/D.
The Alliance will extend CMF to other vehicle segments in the future, including
affordable, small vehicles, such as those expected to be produced in Chennai,
India starting in 2015. By 2018, CMF will represent 70% of the Alliance’s
total production.
Powertrains (engines and gearboxes)
See powertrain section in chapter 1.2.1.2.
RESEARCH AND ADVANCED ENGINEERING
Strengthening innovation
Renault and Nissan cooperate in strategic fields of research and advanced
engineering in which they have common interests in order to optimize the
allocation of their resources. By doing so, they are able to cover a broader
range of potential technical solutions and accelerate work in order to achieve
technology breakthroughs and bring new products to market.
Renault and Nissan have a technology plan [T] which is composed of four
common pillars: safety, the environment-CO2, life-on-board and dynamic
performance. These four pillars determine the priority areas of investment for
key technologies and innovations.
By using their unique strengths, international market knowledge and networks,
the two companies are well positioned to increase their technological portfolio
and deliver innovative solutions to place the Alliance among the best three
automotive groups in key technologies.

REGISTRATION DOCUMENT RENAULT 2013✦ Global Reporting Initiative (GRI) Directives 35
THE RENAULT GROUP 1
1
THE RENAULT-NISSAN ALLIANCE
In 2011, the Renault-Nissan Alliance opened a research office in the heart of
Silicon Valley to capitalize on the region’s world-class engineering talent and
to stay ahead of trends. The center is mainly focused on research related to
autonomous driving and connected cars.
QUALITY
Alliance Quality Charter ✦
The Charter precisely defines the joint quality directives and procedures;
it is applied to all Alliance projects.
The Charter covers all the key quality processes: customer quality surveys,
Group quality targets, quality control in the development of new models,
production quality assurance, quality assurance of outsourced components,
service quality assurance (sales and after-sales), quality of technical progress,
and warranty policy and procedures.
The Charter brings Renault and Nissan closer together through the use of
common quality tools, such as Alliance Vehicle Evaluation System (AVES),
Alliance New Product Quality Procedure (ANPQP), Alliance Supplier Evaluation
System (ASES) and the definition of the parts per million (PPM) targets for
parts manufactured outside the Group. In particular:
W ANPQP, a quality measurement system developed for suppliers, has been
extended to all new projects;
W AVES Standard (Alliance Vehicle Evaluation Standard) has been established
as the only common and unique method for both Renault and Nissan
to evaluate the quality of their final products, as well as those of their
competitors, from the customer’s preliminary point of view;
W ASES (Alliance Supplier Evaluation Standard) to evaluate the level of the
quality management system of the supplier in terms of results and process.
Exchange of best practices
The Quality FTT studies best practices at Renault and Nissan in order to
improve quality at both companies and to help them achieve their mid-term
quality targets. The best practices are sourced from Japan, the United States
and Europe and are implemented by both companies if necessary.
Activities by the Quality FTT in 2013 include:
W enhancing joint quality management on common platform models;
W comparison of processes and exchange of best practices in the following
fields: perceived quality, field quality andelectrical vehicles.
PURCHASING
The Alliance has been able to make substantial cost savings by pursuing a
joint purchasing strategy and building a network of common suppliers.
Renault-Nissan Purchasing Organization (RNPO)
The Renault-Nissan Purchasing Organization (RNPO), established in April 2001,
was the first Alliance joint-venture company. RNPO initially managed about
30% of Nissan’s and Renault’s global annual purchasing turnover. Since
April 2009, RNPO has accounted for 100% of all commodity purchasing
across the Alliance. The geographical scope of RNPO has been extended to
all regions where Renault and Nissan have production activities in an effort
to respond to worldwide needs. As a joint Renault and Nissan procurement
structure, RNPO helps to improve purchasing efficiency by using a global
management system for purchases coming within the scope of the Alliance,
while local purchasing departments work increasingly for both companies as
a single purchasing organization. In 2013, the Alliance established a common
purchasing organization with AVTOVAZ in Russia modelled on RNPO.
IS/IT
The Alliance has also been able to generate significant synergies from IS/IT.
Renault-Nissan Information Services (RNIS)
Renault-Nissan Information Services was established in July 2002 to operate
all activities where IS/IT communization between Renault and Nissan adds
value by improving performance and reducing costs. It covers planning,
architecture and control functions, as well as common operations where
expertise and best practices can be shared, or where it is possible to unify
the negotiation power with major vendors in conjunction with RNPO. Since
June 2009, under the management of the RNBV IS Managing Director and
common CIO, Renault and Nissan have developed their collaboration in
terms of architecture (standardization of operating systems and software
packages, common solutions), IT planning and synergies (delivery of an
Alliance standard workstation, common sourcing for infrastructure operations
in Europe), project management office and IS synergies (portfolio optimization,
common applications, offshore application maintenance and development
and development tools standardization).
MANUFACTURING
Renault and Nissan have actively exchanged know-how in the area of
production performance management since 1999. Both companies’
manufacturing systems – Renault Production System (SPR) and Nissan
Production Way (NPW) – are now fully aligned, allowing shop managers to
benchmark directly against each other in all areas, including machining,
engine assembly, stamping, welding, painting, trim and chassis in order to
identify and deploy best practices in all Renault and Nissan plants. Each
year, all Alliance plants are ranked according to QCTP (quality, cost, time and
productivity) to evaluate their performance against each other. New challenges
related to environmental targets (eg electric vehicle battery recycling and
energy reduction) represent a new field for the exchange of best practices. As
of 2013, Renault and Nissan have begun standardizing their manufacturing
processes. By 2015, the Alliance will roll out the Alliance Production Way
(APW) at all plants around the world where cross-manufacturing takes place.
By 2017, all Renault and Nissan plants are expected to have adopted APW.
LOGISTICS
Major savings have been achieved over the past decade through logistics
synergies. Until 2008, logistics synergies amounted to about €25 million a
year. By 2009 those savings had doubled to more than €56 million and in
2012 reached €238 million (98% due to cost reductions). Synergies will
exceed €260 million in 2013.

Find out more at www.renault.comREGISTRATION DOCUMENT RENAULT 201336
THE RENAULT GROUP1 THE RENAULT-NISSAN ALLIANCE
These savings have been made possible by the creation of Alliance Global
Logistics within RNBV and the decision in 2009 to accelerate the convergence
of Renault and Nissan in all logistics areas. Alliance Logistics Europe (ALE),
created in November 2009 and merging the Renault and Nissan logistics
teams under a single director in Europe, is a good example of this acceleration.
Combining logistics operations under the Alliance umbrella has enabled
each company to benefit from each other’s best practices, delivering huge
economies of scale and addressing new projects with common logistics
solutions (eg projects with partners like Daimler or AVTOVAZ). Cost reduction
and synergies have been achieved while maintaining a good level of service
to Renault and Nissan regions in close relationship with Renault and Nissan
operations. This includes leadtime reliability, as well as the quality of parts
and vehicle deliveries.
Below are some of the numerous common logistics activities:
W delivery of Dacia cars in UK: The Alliance is now using the same port of
entry in UK (Port of Tyne) to bring Nissan and Dacia cars. From India, Dacia
Dusters and Nissan Micras, which are produced in the Renault-Nissan
plant in Chennai, use the same vessels. After inspection and fittings,
those vehicles are loaded in shared Alliance trucks for shipment to UK
dealerships. This reduces overall costs and complexity;
W combined Renault/Nissan/VAZ delivery flows in Russia: By bundling
Renault, Nissan and Dacia volumes in Russia which enables to optimize
load factor, reduce lead times and increase backflows, the Alliance will
achieve significant cost reductions in coming years,
W Central & Eastern Europe tender: by combining Renault & Nissan cars
flows in Central & Eastern Europe, logistics and purchasing teams could
generate synergies through bundling effect and backflow optimisation.
This led to more than €16 million in savings over three years, as well as a
significant impact on free cash flow due to leadtime reduction;
W common standard packaging: the implementation of a common approach
to the design of new packaging has reduced both costs and development
times and has generated new opportunities for synergies through the
consolidation of purchased volumes of future common packaging;
W on inbound parts supply, best practice sharing on packaging optimisation,
filling rate and delivery frequency helped increase the truck filling ratio to
more than 70% and save close to €25 million in Europe in 2013,
W on inter-regional parts, the International Parts Centers (IPC) cross-use
helps support business expansion and purchasing strategies of both
companies. For example, parts sourced in Mexico for Renault are
delivered from Nissan’s IPC in Mexico. Several Nissan IPCs deliver parts
to Renault’s factory in Korea as well. Meanwhile, Renault’s Russia IPC
delivers parts to Nissan;
W Tangiers: for Renault and Nissan exports from Tangiers, the ALE has
created an integrated shipping schedule, implemented common ports of
entry and assigned the same suppliers to distribute the cars in the markets
they are destined for;
W global tender: Renault/Nissan organized a global tender driven by RNPO
for maritime flows. The main actions undertaken by the Alliance included
alignment of specifications, route optimization and bundling between
Renault and Nissan. This led to a €12 million cost reduction for the Alliance
in 2012;
W common logistics solutions in the Alliance’s key emerging markets such as
Russia, Brazil and India.
1.2.4 NISSAN’S STRATEGY AND RESULTS IN 2013
Nissan’s financial statements are prepared under Japanese accounting
standards, which differ from the standards used by Renault. The statements
include intermediate operating totals and some Nissan-specific indicators.
To measure the contribution to Renault’s results, Nissan’s financial statements
are restated, as described in chapter 4, note 13 to the consolidated financial
statements.
Nissan has production facilities in over 20 countries and regions. In fiscal year
2012, ended March 2013, Nissan sold a record 4,914,485 units worldwide,
up 1.4% compared with the previous fiscal year. The company operates in
Japan, the Americas, Europe, China and other overseas markets.
1.2.4.1 NISSAN’S STRATEGY AND GROWTH
FISCAL YEAR 2013 AFTER NINE MONTHS
On February 10, 2014, Nissan Motor Co., Ltd., announced cumulative financial
results for the nine-month (April-December) period to December 31, 2013,
and earnings for the third quarter of the fiscal year ending March 31, 2014.

REGISTRATION DOCUMENT RENAULT 2013✦ Global Reporting Initiative (GRI) Directives 37
THE RENAULT GROUP 1
1
THE RENAULT-NISSAN ALLIANCE
Nissan reported the following pro forma financial results for the first nine
months of fiscal year 2013 (based on foreign exchange rates of JPY 99.4/
USD and JPY 132.2/EUR, the average rates for fiscal year 2013 to date):
W net revenue of ¥7.9356 trillion ($79.8 billion, €60 billion);
W operating profit of ¥370.8 billion ($3.73 billion, €2.80 billion);
W ordinary profit of ¥337.9 billion ($3.40 billion, €2.56 billion); and
W net income of ¥274.1 billion ($2.76 billion, €2.07 billion).
In the nine months to December 31, 2013, Nissan sold 3,673,000 vehicles
globally, a 1.0% increase year-on-year. For the third quarter, net income rose
by ¥30 billion to ¥84.3 billion compared with the same three-month period
of FY2012.
“Nissan has delivered a solid nine-month performance amid growing demand
for new models in several key markets,” said Nissan President and CEO Carlos
Ghosn. “Sales in Japan and North America helped offset emerging market
volatility and sluggish conditions in Europe. Based on its strong product line-
up and current market demand, Nissan is maintaining its full-year earnings
guidance.”
Nissan’s unchanged forecast for the fiscal year ending March 31, 2014,
comes as the company launches models including the all-new Qashqai in
Europe; the Datsun GO in India; the X-Trail, DAYZ ROOX and Skyline in Japan,
and the Rogue in the US.
1.2.4.2 NISSAN’S 2013 CONTRIBUTION TO RENAULT’S RESULTS
CONTRIBUTION TO RENAULT’S CONSOLIDATED NET INCOME
Nissan’s contribution to Renault’s earnings was €1,498 million in 2013
compared with €1,234 million, in 2012, recorded in the financial statements
as a share in net income of companies accounted for by the equity method.
(See chapter 4 note 13 to the consolidated financial statements.)
DIVIDEND PAYOUT
In June 2013, Renault received a dividend of ¥12,5 per share as a complement
to the down-payment made in November 2012 for a total of €190 million.
In November 2013, Renault received a first dividend payment of ¥15 per
share for fiscal year 2013 of €216 million.
1.2.5 ALLIANCE COMBINED SALES PERFORMANCE AND FINANCIAL INDICATORS ✦
1.2.5.1 ALLIANCE COMBINED SALES FOR 2013
The Renault-Nissan Alliance sold a record 8,264,821 vehicles in 2013,
propelled by record sales in the car group’s two largest markets, China and
the United States.
Renault-Nissan’s 2013 calendar-year sales, which include sales of Russia’s
AVTOVAZ, increased 2.1% from 2012. This marks the fifth straight year of
sales growth. Together, Renault, Nissan and AVTOVAZ account for one in ten
cars sold worldwide.
“Strong demand in the world’s top markets more than offset anemic growth
and declines elsewhere,” said Renault-Nissan Chairman and CEO Carlos
Ghosn. “We will always experience periods of regional instability, but we
remain bullish: The auto industry is a long-term growth story – and the
Renault-Nissan Alliance is well positioned to continue to play a major role in
all major segments globally.”
Renault group sold 2,628,208 units worldwide in 2013, up 3.1% from 2012.
Sales in Europe rose 2.4% to 1,301,864 units despite a 1.7% decline in the
overall market. Renault’s European market share rose 0.4 percentage points
to 9.5%, making it the fastest growing automotive group in Europe in 2013.
Renault continued to generate more than 50% of its sales outside of Europe
for the second consecutive year with sales outside of the home continent
totaling 1,326,344 units, up 3.8% from 2012.
Nissan Motor Corporation sold 5,102,979 units worldwide, up 3.3% – a
record for the fourth straight calendar year. Nissan continued to generate
more than one million units in its two biggest markets: China and the United
States.
AVTOVAZ, owner of the iconic LADA brand, sold 533,634 vehicles globally,
down 12.1% from 2012 amid the economic slowdown in Russia. The Renault-
Nissan Alliance has a majority stake in AVTOVAZ, Russia’s largest automaker,
through a joint venture with state corporation RosTech (formerly known as
Russia Technologies). Together, the Renault-Nissan Alliance and AVTOVAZ sell
about one in three cars in Russia.

Find out more at www.renault.comREGISTRATION DOCUMENT RENAULT 201338
THE RENAULT GROUP1 THE RENAULT-NISSAN ALLIANCE
RENAULT AND NISSAN HIGHLIGHTS
The Alliance’s top ten markets in 2013 were China, US, Russia, Japan,
France, Mexico, Brazil, Germany, the UK and Turkey.
In China, the world’s largest auto market, Nissan sold a record 1,266,167 units
in 2013, up 17.2%. Nissan is the leading Japanese brand in China, with a
5.9% market share. Nissan’s sales include Venucia, its local Chinese brand
with partner Dongfeng Motor.
In December 2013, Renault announced it had received approval from
Chinese authorities to start producing cars in China in 2016 through a joint
venture with Dongfeng. The joint venture will establish a plant in Wuhan with
production capacity of 150,000 units a year, with the potential to double that
figure in the future.
In the United States, Nissan reported sales of 1,248,421 units for Nissan
and Infiniti brand vehicles, up 9.4% compared with 2012. Nissan brand
sales increased 10.8% to a record 1,131,966 units amid strong demand for
several models including the Altima sedan, the Rogue crossover, the Versa
compact car and the all-electric Nissan LEAF. Nissan and Infiniti together held
a market share of 8.0% in the US in 2013, a 0.1 percentage point increase
versus the prior year.
Despite the economic downturn in Russia, Renault’s sales increased 10.7%
to a record 210,099 units. Russia is Renault’s third-largest market after
France and Brazil.
Renault was Russia’s leading foreign brand and second most popular brand
in 2013 after Lada thanks to the popularity of its Duster SUV. Renault’s
market share stood at record 7.6%, up 1.1 percentage points. Nissan sold
154,996 units in Russia and its market share edged up 0.1 percentage points
to 5.6%.
In its home market Japan, Nissan’s sales grew 2.9% to 678,824 units,
including mini-vehicles. Mini-vehicles jumped 21.3% to 185,929 units,
a record for the second straight year. Nissan’s market share in Japan was
12.6%, up 0.3 percentage points from 2012.
In France, Renault’s home market, Renault’s group sales totaled 547,693 units,
down 0.7%. Renault had six vehicles among France’s top ten passenger cars
in 2013, including the compact Clio, the best-selling car in the country, and
Captur, the most popular crossover. Renault’s market share was 25.4%.
Mexico marked another bright spot for the Alliance in 2013. Nissan remained
the number one brand in the country with sales rising 7.6% to 264,463 units,
marking an all-time calendar year record. Nissan’s market share stood at
24.9%, unchanged from 2012.
In India, a key strategic market for the Alliance in the future and home to
its first dedicated Alliance plant, Renault’s sales soared 83.1% to 64,368
units despite a 7.5% slump in the passenger car market. Renault’s sales
were boosted by the success of Duster, making Renault the leading European
automaker in the market. Renault’s market share in India stood at 2.6%,
almost double that of 2012.
AVTOVAZ HIGHLIGHTS
AVTOVAZ, the maker of the iconic Lada brand, sold 456,309 vehicles in
Russia in 2013. Together Renault-Nissan and AVTOVAZ sold 821,404 units in
Russia in 2013, down 7.8% from 2012 as the overall economy slowed. The
Alliance’s market share, including AVTOVAZ, stood at 29.6%.
In December 2012, the Renault-Nissan Alliance created a joint venture with
state corporation RosTech to take control of AVTOVAZ. Renault-Nissan will
invest RUB23 billion in the joint venture to help modernize AVTOVAZ. The
investment will give Renault-Nissan 67.13% of the joint venture in the future .
By 2016, the Alliance and AVTOVAZ are expected to have a production
capacity of at least 1.7 million cars per year in Russia. Today their joint
manufacturing complex in Togliatti is home to one of the largest platform-
sharing programmes in the Renault-Nissan Alliance. The site – one of the
world’s largest car plants – already produces the LADA Largus and the Nissan
Almera. Production will soon span five models across four brands – LADA,
Renault, Nissan and Datsun.
Investments in this project will total about €400 million.
ZERO-EMISSION HIGHLIGHTS
The Renault-Nissan Alliance is the only automaker with a wide range of 100%
electric vehicles (EVs) which can be charged with purely renewable energy.
In 2013, the Alliance sold 66,809 electric vehicles worldwide, up 52% from
the previous year. Sales of the Nissan LEAF rose 77% to 47,716 units, while
sales of Renault’s four electric vehicle models – Kangoo Z.E., Fluence Z.E.,
ZOE and Twizy – grew 13% to 19,093 units.
In France alone, the Kangoo Z.E. small van sold 4,174 units, up 46% from
2012, representing about 12% of all Kangoo light commercial vehicles sales.
The Alliance’s worldwide zero-emission market share in 2013 stood at 63%,
including Twizy, Renault’s two-seater urban commuter. LEAF was the world’s
best-selling EV with a market share of 45% in 2013. In Europe, Renault was
the leader with a 38.6% share.
The Alliance sold a cumulative 134,383 zero-emission vehicles globally from
December 2010 – when Nissan LEAF went on sale – until the end of 2013,
more than all major automakers combined.
Nissan LEAF sold a cumulative 96,847 units during that period. On
January 20, 2014, Nissan celebrated the sale of its 100,000th LEAF to a
customer in the U.K.
Since the debut of Renault’s first EV – the Kangoo Z.E. – in October 2011 until
the end of 2013, the French automaker sold 37,536 zero-emission vehicles
cumulatively.

REGISTRATION DOCUMENT RENAULT 2013✦ Global Reporting Initiative (GRI) Directives 39
THE RENAULT GROUP 1
1
THE RENAULT-NISSAN ALLIANCE
Top 10 Alliance markets
TOTAL SALES MARKET SHARE (%)
China 1,300,324 6.1%
US 1,248,421 8.0%
Russia* 821,404 29.6%
Japan 682,592 12.7%
France 612,885 28.4%
Brazil 314,158 8.8%
Mexico 285,650 26.9%
Germany 218,693 6.9%
UK 205,334 8.1%
Turkey 164,001 19.3%
* Including AVTOVAZ.
Top 10 Renault markets
TOTAL SALES MARKET SHARE (%)
France 547,693 25.4%
Brazil 236,360 6,6%
Russia 210,099 7.6%
Germany 162,509 5.1%
Turkey 144,706 17.0%
Argentina 141,217 15.4%
Algeria 111,378 26.2%
Italy 101,387 7.2%
Spain 98,024 12.1%
Belgium & Luxembourg 77,353 13.0%
Top 10 Nissan markets
TOTAL SALES MARKET SHARE (%)
China* 1,266,167 5.9%
U.S. 1,248,421 8.0%
Japan 678,824 12.6%
Mexico 264,463 24.9%
Russia 154,996 5.6%
Thailand 128,171 5.1%
UK 98,187 7.4%
Brazil 91,551 5.3%
Canada 77,798 2.2%
Australia 76,869 6.8%
* Including Venucia brand.

Find out more at www.renault.comREGISTRATION DOCUMENT RENAULT 201340
THE RENAULT GROUP1 THE RENAULT-NISSAN ALLIANCE
Production sites ✦
Mexico
United States
Colombia
Chile
Argentina
Brazil
Renault group products
Nissan/Infinity products
Vehicle assembly
Powertrain
Cross production activites
Kenya
Egypt
Indonesia
Russia
China
Burma
South Korea
Japan
South Africa
Morocco Algeria
Nigeria
India
Malaysia
Iran
Taïwan
Philippines
Thailand Vietnam
United Kingdom
Spain
Portugal
FranceSlovenia
Romania
Turkey
1.2.5.2 VALUE OF JOINT OPERATIONSTotal sales by Renault to Nissan and purchases by Renault from Nissan amounted to an estimated €2,100 million and €2,200 million respectively as mentioned
in chapter 4 of the consolidated financial statements. (NOTE 13 J).
1.2.5.3 FINANCIAL INFORMATION ON THE ALLIANCESee chapter 1.3.2.3.

REGISTRATION DOCUMENT RENAULT 2013✦ Global Reporting Initiative (GRI) Directives 41
THE RENAULT GROUP 1
1
EARNINGS REPORT-2013
1.3 EARNINGS REPORT-2013
KEY FIGURES
2013 2012 RESTATED* CHANGE 2012 PUBLISHED
Worldwide Group registrations million vehicles 2.63 2.55 3.1% 2.55
Group revenues € million 40,932 40,720 0.5% 41,270
Group operating profit € million 1,242 782 460 729
% revenues 3.0% 1.9% 1.1pt 1.8%
Contribution from associated companies € million 1,444 1,475 (31) 1,504
o/w Nissan 1,498 1,213 285 1,234
o/w AB Volvo - 80 (80) 80
o/w AVTOVAZ (34) 186 (220) 186
Net income € million 695 1,712 (1,017) 1,735
Net income, Group share € million 586 1,749 (1,163) 1,772
Earnings per share € 2.15 6.43 (4.28) 6.51
Operational free cash flow** € million 827 609 218 597
Automotive net cash position € million 1,761 1,532 229 1,492
Sales Financing, average loans outstanding € billion 24.2 24.0 0.8% 24.2
* Restated to reflect the retroactive application of the IFRS 11 “partnerships” and revised IAS 19 “employee benefits” standards.
** Operational free cash flow: cash flow (excluding dividends from publicly listed companies) minus tangible and intangible investments net of disposals +/- changes in the working capital requirement.
OVERVIEWThe Renault group sold 2,628,208 vehicles in 2013, up 3.1% from 2012,
in a global automobile market that grew by 3.9%.
Volumes outside Europe remained stable at 50.5%, with 1,326,344 vehicles
sold. Excluding Iran, whose market was closed in July 2013, the Group
increased its market shares in all Regions, with new models driving the
improvement. The Renault group recorded the strongest market share growth
among automakers in the European market, with a 0.4-point increase to
9.5%. The Group sold 1,301,864 vehicles in Europe, up 2.4%, despite the
1.7% decline in the European market.
Group revenues in 2013 came to €40,932 million, up 0.5% . Automotive
contributed €38,775 million to revenues, an increase of 0.4% vs 2012(1), from
a rise in registrations and despite a highly negative foreign currency impact. At
the same time, the Group posted a positive price effect, reflecting its pricing
policy aimed at improving the value of the Renault brand and offsetting the
weakness of certain foreign currencies.
Group operating profit stood at €1,242 million, compared to €782 million in
2012(1), representing 3.0% of revenues (1.9% in 2012(1)).
Automotive operating profit increased €461 million(1) to €495 million,
representing 1.3% of revenues. This improved result was achieved despite a
negative foreign currency effect through pricing and cost controls.
Sales Financing contributed €747 million to Group operating profit,
compared to €748 million in 2012(1). The cost of risk (including country risk)
remained under control, at 0.42% of average performing loans, compared to
0.38% in 2012.
Other operating income and expense items came to -€1,276 million, mainly
due to a provision of €514 million to cover the Group’s entire exposure to Iran
(already recorded in the first half), €488 million in provisions and impairment
of assets, and €423 million in restructuring costs, primarily related to the
competitiveness agreement signed in France. As a result, earnings before
interest and taxes came to -€34 million, compared to €183 million in 2012(1).
The contribution of associated companies, mainly Nissan, came to
€1,444 million in 2013, compared to €1,475 million in 2012(1) (which
included a contribution from AB Volvo until September 2012).
Net income came to €695 million and Group share to €586 million (€2.15
per share compared with €6.43 per share in 2012(1)).
Automotive operational free cash flow in the period was positive at
€827 million, including a positive €790 million change in the working capital.
At end-December 2013, total inventory (including the independent dealer
network) represented 63 days of sales compared to 65 at end-December
2012.
(1) Restated to reflect the retroactive application of the IFRS 11 partnerships’ and revised IAS 19’ employee Benefits’ standards .

Find out more at www.renault.comREGISTRATION DOCUMENT RENAULT 201342
THE RENAULT GROUP1 EARNINGS REPORT-2013
The Automotive division’s net cash position came to €1,761 million, up by
€229 million vs December 31, 2012(1).
RCI Banque continued to diversify its refinancing through its retail savings
account business, with net collected savings totaling €4.3 billion in France
and Germany at end-December 2013.
A dividend of €1.72 per share, unchanged vs last year, will be submitted for
approval at the next Shareholders’ Annual General Meeting.
2014 OUTLOOKThe Group expects the European markets to stabilize. At the same time,
growth in emerging markets, still driven by China, is more uncertain in the
short term.
In this context Renault aims to:
W increase registrations and Group revenues (at constant exchange rates);
W improve Group operating profit and that of the Automotive division;
W achieve positive Automotive operational free cash flow.
(1) Restated to reflect the retroactive application of the IFRS 11 partnerships’ and revised IAS 19’ employee Benefits’ standards .
1.3.1 SALES PERFORMANCE ✦
OVERVIEW
W In a global automotive market up 3.9% last year, the Group’s sales of
passenger cars and LCVs reached 2,628,208 vehicles – a rise of 3.1%
compared to 2012.
W Market share outside Europe remained stable at 50.5%, with 1,326,344
units sold.
W Excluding Iran, where the market was partially closed in July 2013, the
Group gained market share in all the Regions, helped by the popularity of
its latest models.
W The Group recorded its highest progress in the European market,
increasing its market share by 0.4 point to 9.5%. With 1,301,864 vehicles
sold in Europe, the Group saw a 2.4% rise in sales, even though the
European market fell by 1.7%.
W In 2013, the number of new financing contracts by RCI Banque rose 19%
on 2012, thanks to the pursuit of its international development, the rise in
the penetration rate on new vehicles and for the different Alliance brands
(apart from RSM) and the increasing volumes of used-vehicle financing
contracts.
The Renault group’s top fifteen markets
SALES
SALES VOLUMES 2013*
(units)
PC/LCV MARKET SHARE 2013
(%)
CHANGE IN MARKET SHARE ON 2012
(points)
1 France 547,693 25.4 +1.2
2 Brazil 236,360 6.6 -0.0
3 Russia 210,099 7.6 +1.1
4 Germany 162,509 5.1 -0.0
5 Turkey 144,706 17.0 +1.8
6 Argentina 141,217 15.4 +0.6
7 Algeria 111,378 26.2 +0.2
8 Italy 101,387 7.2 +0.9
9 Spain 98,024 12.1 +1.4
10 Belgium + Luxembourg 77,353 13.0 +0.5
11 United Kingdom 77,163 3.0 +0.6
12 India 64,368 2.2 +1.1
13 South Korea 60,027 4.0 +0.0
14 Morocco 47,030 38.9 +2.3
15 Netherlands 46,040 9.8 +0.3
* Figures to end-December 2013.
Source: Local statistical figures from registration offices and CCFA for France.

REGISTRATION DOCUMENT RENAULT 2013✦ Global Reporting Initiative (GRI) Directives 43
THE RENAULT GROUP 1
1
EARNINGS REPORT-2013
1.3.1.1 AUTOMOTIVE
Group sales worldwide by Region
PASSENGER CARS AND LIGHT COMMERCIAL VEHICLES (units ) 2013* 2012 CHANGE (%)
GROUP 2,628,208 2,548,622 3.1
EUROPE REGION 1,301,864 1,271,393 2.4
Renault 1,011,422 1,040,777 -2.8
Dacia 290,442 230,616 25.9
AMERICAS REGION 466,976 450,934 3.6
Renault 460,841 445,169 3.5
Renault Samsung Motors 6,135 5,765 6.4
ASIA-PACIFIC REGION 238,445 257,564 -7.4
Renault 176,464 195,863 -9.9
Dacia 1,851 1,775 4.3
Renault Samsung Motors 60,130 59,926 0.3
EUROMED-AFRICA REGION 388,922 360,923 7.8
Renault 250,888 233,275 7.6
Dacia 137,247 127,648 7.5
Renault Samsung Motors 787 - -
EURASIA REGION 232,001 207,808 11.6
Renault 231,879 207,808 11.6
Renault Samsung Motors 122 - -
* Preliminary figures.
Europe
The Group sales rose 2.4% in a market that fell 1.7% and achieved its biggest
increase in market share in the Region (up 0.4 point ) to 9.5%.
The Renault brand was ranked third in the market for PC/LCV, with 7.4%
market share. It retained its leadership of the LCV market for the sixteenth
consecutive year, with a market share of 14.5%.
As the first brand to put four electric models on sale, Renault is the European
leader with 37.0% market share and 15,074 units sold.
New Clio and Captur enabled Renault to take the top slot in the European B
segment.
In France the Renault brand strengthened its leadership. New Clio is the best-
selling vehicle in the country, with 119,367 new registrations, and Captur is
the most popular cross-over of the B segment since its launch in 2013. The
Group has five vehicles among France’s top ten passenger cars.
The brand continued to dominate the LCV market with a share of 31.7%
(-0.5 point ), despite a 5.8% drop in new registrations.
Dacia was the fifth-largest brand in France, earning another 0.6 point to reach
a market share of 4.3% due to the success of New Sandero, which became
the third best-selling passenger car of the market.
In the UK, Group sales rose 37.3%, up 0.6 point , notably thanks to the launch
of Dacia in January which recorded 17,146 new registrations and market
share has reached 0.7%.
In Italy, Spain and Belgium, thanks to the success of new vehicles, the
Group won market shares respectively 0.9 point , 1.4 point and 0.5 point .
In Germany, Group market share remains stable at 5.1%.
Outside Europe
Americas
The Renault group achieved records in sales, with 466,976 vehicles sold, and
market share, which reached 6.7%.
In Brazil, in line with the overall market that fell by 1.6%, the Group saw its
sales slump by 2.2%. This was partly due to the closure of the Curitiba plant
for two months at the start of the year for extension work to increase its
capacity. Sandero and Duster continued to sell well.
In Argentina, the Renault brand was ranked second of the market and sales
rose by 18.9% to 141,217 units, thanks to the popularity of Clio, Duster and
Sandero. Market share stood at 15.4% (+0.6 point ).
Asia-Pacific
Having managed to break into the Indian market, Group sales in the Asia-
Pacific Region recorded total progress of 28.9% compared to 2012 – except
for Iran, where the market was closed since July.
In India, in a passenger car market that slumped 7.5%, Renault recorded an
83.1% rise in sales due to the success of Duster (over 51,400 units), which
became the best-selling SUV in the C segment. The Renault brand recorded

Find out more at www.renault.comREGISTRATION DOCUMENT RENAULT 201344
THE RENAULT GROUP1 EARNINGS REPORT-2013
market share of 2.6% – almost double that of 2012. Renault became the top
European automaker on the Indian market. The brand continued to deploy the
expansion of its dealer network, and had 125 dealerships at the end of 2013.
In South Korea, Renault Samsung Motors ended the year by recording seven
consecutive months with better sales results than those for 2012. Overall
sales stabilised, with 60,027 new registrations, an increase of 0.2%.
In Iran, where the market has been closed since July, Renault sold about
64,500 fewer vehicles than in 2012.
Euromed-Africa
With 388,922 vehicles sold, the Renault group set a sales record and
increased its market share in most of its markets of the Region.
In Turkey, Renault is the brand which increased the most in market share
(+1.2 point ) reaching 12.7%. It remained the leading brand in the passenger
car market, with a share of 14.6% (up 1.5 point ), thanks to the success of
New Symbol, New Clio, and Fluence, which were all the top sellers in their
respective segments.
The Dacia brand reached a 4.3% market share (+0,5 point ) thanks to the
success of Lodgy (leader of its segment) and Dokker.
In Algeria, in a market down 2.6% overall, the Group sold more than
100,000 vehicles for the second consecutive year (111,378 units) and
reached market share of 26.2%, a rise of 0.2 point . Renault is the second-
ranked brand due to the popularity of New Symbol and New Clio, which was
the best-selling vehicle in the B segment. Dacia moved up to become the
country’s third-ranked brand, thanks to the success of Logan and Duster.
Eurasia
The Renault group set a new record, with more than 232,000 vehicles sold,
and won over 7.1% market share for the first time.
In Russia, the Group’s third-biggest market, the Renault brand set records
for both sales, with 210,099 vehicles (up 10.7%), and 7.6% market share
(up 1.1 point ), whereas the market as a whole fell 5.9%. It was the leading
foreign brand and the second-ranked brand on the Russian market, behind
Lada. One reason was the success of Duster, the most popular SUV in the
country in 2013.
Group sales by brand and by type
PASSENGER CARS AND LIGHT COMMERCIAL VEHICLES (units) 2013* 2012 CHANGE (%)
GROUP 2,628,208 2,548,622 3.1
BY BRAND
Renault 2,131,494 2,122,892 0.4
Dacia 429,540 360,039 19.3
Renault Samsung 67,174 65,691 2.3
BY VEHICLE TYPE
Passenger cars 2,293,049 2,211,794 3.7
Light commercial vehicles 335,159 336,828 -0.5
* Preliminary figures.
Sales of the Renault brand rose by 0.4% compared to 2012. With 2,131,494
units sold, Renault accounted for 81.1% of Group sales.
Sales of the Dacia brand went up by 19.3% to 429,540 units, due in large
part to the popularity of Duster and the updated Logan/Sandero range. Dacia
offers the youngest range in Europe (less than two years old since Lodgy was
launched) and accounted for 16.3% of Group sales.
In 2013, Renault Samsung Motors increased its sales by 2.3%. The
recovery plan of the dealer network and the product range, launched in South
Korea in 2012, is starting to show results. After five difficult months at the
start of the year, RSM recorded seven consecutive months with better results
than those for 2012.
1.3.1.2 SALES FINANCING
PENETRATION RATE ON NEW VEHICLES FINANCED AND SERVICES
In 2013, the number of new financing contracts rose 19 % on 2012.
The increase resulted from:
W the continued international development of RCI Banque, notably with the
consolidation of the Turkish and Russian subsidiaries;
W the rise in the penetration rate on new vehicles financed in numerous
countries and for the different Alliance brands (apart from Renault
Samsung Motors);
W the strategy on increasing volumes of used-vehicle financing contracts,
initiated in 2011. Volumes rose 6% in 2013.
RCI Banque pursued its international development in 2013, in line with the
development of the Alliance brands. The share of international business
(outside Europe) now accounts for 38% of total new-vehicle financing
contracts, compared with 29% in 2012.

REGISTRATION DOCUMENT RENAULT 2013✦ Global Reporting Initiative (GRI) Directives 45
THE RENAULT GROUP 1
1
EARNINGS REPORT-2013
RCI Banque financing performance
2013 2012 CHANGE (%)
Number of financing contracts (thousands) 1,161 976 +18.9
P including UV contracts (thousands) 189 178 +6.2
New financing contracts (€ billion) 11.4 10.8 +5.5
Average loans outstanding (€ billion) 24.2 24.2 0
RCI Banque services performance
2013 2012 CHANGE
Number of services contracts (thousands) 1,756 1,311 +34%
Penetration rate on services 62.7% 57.5% +5.2pt
Developing the sales of services contributes to customer satisfaction, fosters
loyalty towards the Alliance brands and increases the profitability of RCI
Banque. As such, it is a strategic activity for the Group.
RCI BANQUE NEW FINANCING CONTRACTS AND AVERAGE LOANS OUTSTANDING
In a contracting automotive market, and for the same scope as in 2012, RCI
Banque benefitted from the momentum of the Alliance brands. The penetration
rate on vehicles financed grew 1.7 point pro-forma on 2012 to 36.7%, the
Group’s best performance in the last ten years. This rate corresponds to the
ratio of the number of RCI financings and the number of cars sold.
With the consolidation in 2013 of the new subsidiaries in Turkey and Russia,
whose penetration rate vehicle financing is lower than the Group average,
RCI Banque’s penetration rate on vehicle financing stood at 34.6%, down
0.4 point on 2012.
Penetration rate on new vehicle registrations financed by RCI Banque, by brand
2013 (%) 2012 (%) CHANGE (points)
Renault 35.2 36.6 -1.4**
Dacia 33.5 33.0 +0.6
Renault Samsung Motors 47.5 57.8 -10.3
Nissan 32.5 29.1 +3.4
Infiniti* 33.8 - +33.8
RCI Banque 34.6 35.0 -0.4
* Infiniti brand consolidated in 2013.
** On a like-for-like basis (excl. Turkey and Russia), a 1.4 point increase for the Renault brand.
Penetration rate on new vehicle registrations financed by RCI Banque, by Region
2013 (%) 2012 (%) CHANGE (points)
Europe 35.1 33.9 +1.2
Americas 42.7 37.1 +5.6
Asia-Pacific 47.4 57.3 -9.9
Euromed-Africa 26.0 26.3 -0.3**
Eurasia* 25.0 - +25.0
RCI Banque 34.6 35.0 -0.4
* Eurasia Region (Russia) consolidated in 2013.
** On a like-for-like basis (excl. Turkey and Russia), a 1.5 point increase in Euromed-Africa.
Find out more at www.renault.comREGISTRATION DOCUMENT RENAULT 201346
THE RENAULT GROUP1 EARNINGS REPORT-2013
In the Europe Region, RCI Banque offset the downturn in the automotive
market through the good performance of Alliance registrations, and through
an increase in the penetration rate new vehicles financed and a rise in
financing contracts for used vehicles. Overall, new financing contracts in
Europe increased 4.4% on 2012.
In the Americas Region (Brazil, Argentina), marked by a contraction in the
Brazilian market and strong growth in Argentina, RCI Banque continued
to grow, with a 42.7% penetration rate on vehicles financed. Brazil was
confirmed as the number-two contributor in terms of the number of new
vehicle financing contracts.
In the Asia-Pacific Region (South Korea), despite fierce competition from
banking networks in 2013, RCI Banque posted a strong performance with a
47.4% penetration rate on financing.
Bolstered by growth in the Turkish market, the number of RCI Banque new
vehicle financing contracts in the Euromed-Africa Region (Romania,
Morocco and Turkey) nearly tripled, to 58,167. The penetration rate on new
vehicles financed was stable at 26.0%. Turkey, consolidated by RCI Banque
in 2013, is already the number-eight contributor to new-vehicle financing
contracts.
The penetration rate on financing in the Eurasia Region (Russia), consolidated
by RCI Banque in 2013, came to 25.0%. Russia is already the number-three
RCI Banque subsidiary on new-vehicle financing contracts.
INTERNATIONAL DEVELOPMENT AND NEW ACTIVITIES
RCI Banque is pursuing its international expansion by supporting the
market development of Alliance brands. The share of non-European business
continues to increase, now accounting for over one-third of financing
contracts (35%, compared with 26% in 2012).
In Turkey, the joint venture between RCI Banque and Oyak completed its first
full year of business, with a 25.0% penetration rate on vehicle financing and
a total 37,970 contracts financed.
In Russia, the financing bank in partnership with Nissan and Unicredit started
up activity in November. It will make a strong contribution to the growth of RCI
Banque group by supporting Alliance sales in this strategic market.
Following the successful launch in France of the ZESTO savings plan in
2012, RCI Banque continued its policy of diversifying financing sources in
2013, successfully extending its savings deposit business to Germany. At end-
December, total deposits amounted to €4.3 billion, of which €784 million in
term deposit accounts. RCI Banque has thus positioned the savings business
as a major lever for refinancing its automotive loan activity.
RCI Banque has in two years become a services operator for electric-vehicle
battery rental in 19 countries for the Renault and Nissan brands. At end-
2013, the number of batteries in service totaled over 31,000 (with five
marketed models: Kangoo Z.E., Fluence Z.E., Twizy, ZOE for Renault and Leaf
for Nissan).
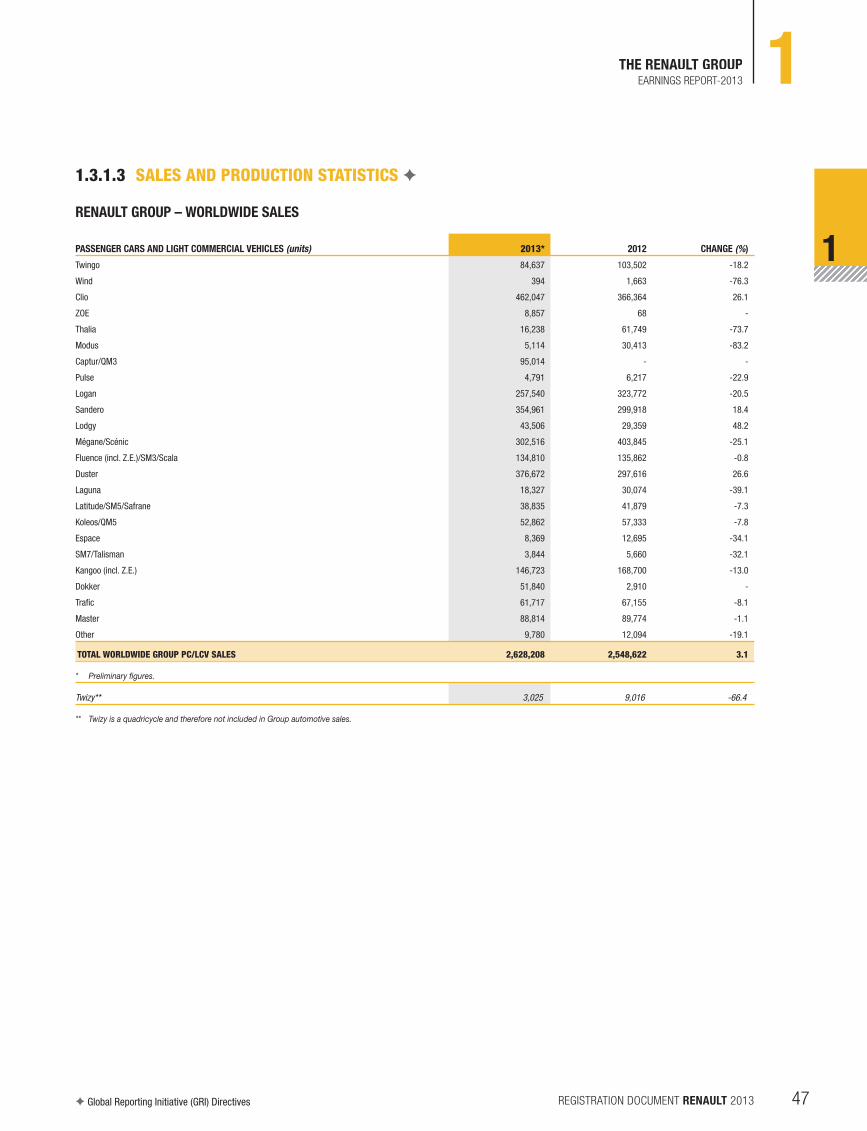
REGISTRATION DOCUMENT RENAULT 2013✦ Global Reporting Initiative (GRI) Directives 47
THE RENAULT GROUP 1
1
EARNINGS REPORT-2013
1.3.1.3 SALES AND PRODUCTION STATISTICS ✦
RENAULT GROUP – WORLDWIDE SALES
PASSENGER CARS AND LIGHT COMMERCIAL VEHICLES (units) 2013* 2012 CHANGE (%)
Twingo 84,637 103,502 -18.2
Wind 394 1,663 -76.3
Clio 462,047 366,364 26.1
ZOE 8,857 68 -
Thalia 16,238 61,749 -73.7
Modus 5,114 30,413 -83.2
Captur/QM3 95,014 - -
Pulse 4,791 6,217 -22.9
Logan 257,540 323,772 -20.5
Sandero 354,961 299,918 18.4
Lodgy 43,506 29,359 48.2
Mégane/Scénic 302,516 403,845 -25.1
Fluence (incl. Z.E.)/SM3/Scala 134,810 135,862 -0.8
Duster 376,672 297,616 26.6
Laguna 18,327 30,074 -39.1
Latitude/SM5/Safrane 38,835 41,879 -7.3
Koleos/QM5 52,862 57,333 -7.8
Espace 8,369 12,695 -34.1
SM7/Talisman 3,844 5,660 -32.1
Kangoo (incl. Z.E.) 146,723 168,700 -13.0
Dokker 51,840 2,910 -
Trafic 61,717 67,155 -8.1
Master 88,814 89,774 -1.1
Other 9,780 12,094 -19.1
TOTAL WORLDWIDE GROUP PC/LCV SALES 2,628,208 2,548,622 3.1
* Preliminary figures.
Twizy** 3,025 9,016 -66.4
** Twizy is a quadricycle and therefore not included in Group automotive sales.

Find out more at www.renault.comREGISTRATION DOCUMENT RENAULT 201348
THE RENAULT GROUP1 EARNINGS REPORT-2013
RENAULT GROUP – EUROPEAN SALES
PASSENGER CARS AND LIGHT COMMERCIAL VEHICLES (units) 2013* 2012 CHANGE (%)
Twingo 82,117 97,262 -15.6
Wind 360 1,557 -76.9
Clio 313,747 271,259 15.7
ZOE 8,846 68 -
Thalia 825 4,557 -81.9
Modus 5,111 30,409 -83.2
Captur/QM3 86,804 - -
Pulse - - -
Logan 17,667 29,010 -39.1
Sandero 122,036 72,510 68.3
Lodgy 34,481 27,613 24.9
Mégane/Scénic 266,002 337,885 -21.3
Fluence (incl. Z.E.)/SM3/Scala 6,448 10,458 -38.3
Duster 84,693 100,275 -15.5
Laguna 18,049 29,528 -38.9
Latitude/SM5/Safrane 585 2,076 -71.8
Koleos/QM5 8,428 15,386 -45.2
Espace 8,368 12,686 -34.0
SM7/Talisman - - -
Kangoo (incl. Z.E.) 86,859 98,624 -11.9
Dokker 31,507 1,107 -
Trafic 54,848 61,051 -10.2
Master 54,664 56,504 -3.3
Other 9,419 11,568 -18.6
TOTAL EUROPEAN GROUP PC/LCV SALES 1,301,864 1,271,393 2.4
* Preliminary figures
Twizy** 2,999 9,011 -66.7
** Twizy is a quadricycle and therefore not included in Group automotive sales.

REGISTRATION DOCUMENT RENAULT 2013✦ Global Reporting Initiative (GRI) Directives 49
THE RENAULT GROUP 1
1
EARNINGS REPORT-2013
RENAULT GROUP – INTERNATIONAL SALES
PASSENGER CARS AND LIGHT COMMERCIAL VEHICLES (units) 2013* 2012 CHANGE (%)
Twingo 2,520 6,240 -59.6
Wind 34 106 -67.9
Clio 148,300 95,105 55.9
ZOE 11 - -
Thalia 15,413 57,192 -73.1
Modus 3 4 -25.0
Captur/QM3 8,210 - -
Pulse 4,791 6,217 -22.9
Logan 239,873 294,762 -18.6
Sandero 232,925 227,408 2.4
Lodgy 9,025 1,746 -
Mégane/Scénic 36,514 65,960 -44.6
Fluence (yc Z.E.)/SM3/Scala 128,362 125,404 2.4
Duster 291,979 197,341 48.0
Laguna 278 546 -49.1
Latitude/SM5/Safrane 38,250 39,803 -3.9
Koleos/QM5 44,434 41,947 5.9
Espace 1 9 -88.9
SM7/Talisman 3,844 5,660 -32.1
Kangoo (yc Z.E.) 59,864 70,076 -14.6
Dokker 20,333 1,803 -
Trafic 6,869 6,104 12.5
Master 34,150 33,270 2.6
Other 361 526 -31.4
TOTAL INTERNATIONAL GROUP PC/LCV SALES 1,326,344 1,277,229 3.8
* Preliminary figures.
Twizy 26 5 -
** Twizy is a quadricycle and therefore not included in Group automotive sales.

Find out more at www.renault.comREGISTRATION DOCUMENT RENAULT 201350
THE RENAULT GROUP1 EARNINGS REPORT-2013
RENAULT GROUP – WORLDWIDE PRODUCTION BY MODEL(1)
PASSENGER CARS AND LIGHT COMMERCIAL VEHICLES (units) 2013* 2012 CHANGE (%)
Twizy 2,288 11,325 -79.8
Twingo/Wind 83,875 101,508 -17.4
Clio 458,302 393,228 16.5
ZOE 9,969 446 -
Thalia 10,195 51,779 -80.3
Modus - 31,193 -
Captur/QM3 117,517 - -
Logan 212,734 183,216 16.1
Sandero 369,022 294,339 25.4
Other Logan 17,761 46,168 -61.5
Duster 323,299 287,953 12.3
Lodgy 34,254 41,455 -17.4
Dokker 56,705 8,901 -
Mégane/Scénic 278,188 377,685 -26.3
Fluence (incl. Z.E.)/SM3/Scala 120,212 150,084 -19.9
Laguna 17,902 27,703 -35.4
Latitude/SM5 37,550 40,162 28.5
Koleos 51,606 54,957 -6,1
Espace 7,494 12,931 -42.0
SM7/Talisman 3,805 3,768 1.0
Kangoo (incl. Z.E.) 172,316 195,072 -11.7
Master 108,300 117,190 -7.6
Other 27,039 13,594 92.6
GROUP GLOBAL PRODUCTION 2,518,045 2,433,332 3.5
o/w produced for partners:
GM (Master) 13,834 13,039 6.1
Nissan (Mercosur/Korea) 31,010 43,818 -29.2
Daimler (Citan) 17,687 14,099 25.4
PRODUCED BY PARTNERS FOR RENAULT
Nissan (incl. India) 154,262 98,228 57.0
Others (GM, Iran, AVTOVAZ) 33,611 113,786 -70.5
* Preliminary figures.
(1) Production data concern the number of vehicles leaving the production line.

REGISTRATION DOCUMENT RENAULT 2013✦ Global Reporting Initiative (GRI) Directives 51
THE RENAULT GROUP 1
1
EARNINGS REPORT-2013
GEOGRAPHICAL ORGANIZATION OF THE RENAULT GROUP BY REGION – COUNTRIES IN EACH REGION
At December 31, 2013
EUROPE AMERICAS ASIA-PACIFIC EUROMED-AFRICA EURASIA
Metropolitan France Northern Latin America Japan Eastern Europe Russia
Austria Colombia South Korea Bulgaria Armenia
Germany Costa Rica India Moldova Azerbaïjan
Belgium-Lux. Cuba Iran Romania Belarus
Denmark Ecuador Saudi Arabia Turkey Georgia
Spain Honduras Gulf States Kazakhstan
Finland Mexico Iraq Africa Kyrgyzstan
Greece Nicaragua Israel Algeria Uzbekistan
Ireland Panama Jordan Morocco Tajikistan
Iceland El Salvador Lebanon Tunisia Turkmenistan
Italy Venezuela Pakistan Egypt Ukraine
Norway Dominican Rep. Sub Saharian African countries
Netherlands Asean South Africa
Portugal Southern Latin America Brunei Madagascar
United Kingdom Argentina Cambodia Libya
Sweden Brazil Indonesia
Switzerland Bolivia Laos French overseas departments
Albania Chili Malaysia West Indies and Indian Ocean
Bosnia Paraguay Philippines Guadeloupe
Cyprus Peru Hong Kong French Guiana
Croatia Uruguay Singapore Martinique
Hungary Thailand Saint Martin
Macedonia Viet Nam St Pierre and Miquelon
Malta Australia Réunion
Montenegro New Caledonia Comoro Islands
Baltic States New Zealand Seychelles
Poland Tahiti Mauritius
Czech Rep.
Serbia China
Slovakia
Slovenia

Find out more at www.renault.comREGISTRATION DOCUMENT RENAULT 201352
THE RENAULT GROUP1 EARNINGS REPORT-2013
1.3.2 FINANCIAL RESULTS ✦
OVERVIEW
(€ million) 2013 2012 RESTATED* CHANGE 2012 PUBLISHED
Group revenues 40,932 40,720 0.5% 41,270
Operating profit 1,242 782 460 729
Operating income (34) 183 (217) 122
Financial result (282) (321) 39 (266)
Contribution from associated companies 1,444 1,475 (31) 1,504
o/w Nissan 1,498 1,213 285 1,234
Gain from the disposal of AB Volvo A shares - 924 (924) 924
Net income 695 1,712 (1,017) 1,735
Automotive operational free cash flow 827 609 218 597
Automotive net cash position 1,761 1,532 229 1,492
Shareholders’ equity 23,214 24,564 (1,350) 24,547
* Restated to reflect the retroactive application of the IFRS 11 “partnerships” and revised IAS 19 “employee benefits” standards.
1.3.2.1 COMMENTS ON THE FINANCIAL RESULTS
CONSOLIDATED INCOME STATEMENT ✦
Operating segment contributon to Group revenues
(€ million)
2013 2012 RESTATED*
Q1 Q2 Q3 Q4 YEAR Q1 Q2 Q3 Q4 YEAR
Automotive 7,736 11,647 7,483 11,909 38,775 8,852 10,701 7,804 11,255 38,612
Sales Financing 529 529 515 584 2,157 519 550 513 526 2,108
TOTAL 8,265 12,176 7,998 12,493 40,932 9,371 11,251 8,317 11,781 40,720
(%)
CHANGE 2013/2012 RESTATED*
Q1 Q2 Q3 Q4 YEAR
Automotive -12.6 8.8 -4.1 5.8 0.4
Sales Financing 1.9 -3.8 0.4 11.0 2.3
TOTAL -11.8 8.2 -3.8 6.0 0.5
* Restated to reflect the retroactive application of the IFRS 11 “partnerships” and revised IAS 19 “employee benefits” standards.
The Automotive division’s contribution to revenues was €38,775 million,
up 0.4%, despite a negative exchange rate effect of 4.1 points, reflecting
the substantial devaluation of a basket of currencies and in particular the
Argentine peso, the Brazilian real, the Iranian rial, the Russian ruble, and the
Indian rupee. This trend was mainly attributable to:
W increased new vehicles sales, resulting in a positive volume effect of
1.6 point ;
W a positive geographic mix of 0.7 point and a neutral product mix;
W a positive price effect of 1.3 point , reflecting the pricing policy instituted
by the Group to enhance the value of the Renault brand and offset the
weakness of certain currencies;
W other Group sales (including powertrain components and vehicles to
partners), which had a positive impact of 1.1 point .
By Region (excluding other businesses):
W Europe accounted for 0.3 point of the decrease in revenues;
W International(1) operations contributed 0.5 point , despite the negative
exchange rate effect.
(1) Restated to reflect the retroactive application of the IFRS 11 “partnerships” and revised IAS 19 “employee benefits” standards.

REGISTRATION DOCUMENT RENAULT 2013✦ Global Reporting Initiative (GRI) Directives 53
THE RENAULT GROUP 1
1
EARNINGS REPORT-2013
Operating segment contribution to Group operating profit
(€ million) 2013 2012 (RESTATED*) CHANGE 2012 (PUBLISHED)
Automotive division 495 34 461 -25
% of division revenues 1.3% 0.1% 1.2pt -0.1%
Sales Financing 747 748 -1 754
TOTAL 1,242 782 460 729
% of Group revenues 3.0% 1.9% 1.1 pt 1.8%
* Restated to reflect the retroactive application of the IFRS 11 “partnerships” and revised IAS 19 “employee benefits” standards.
The contribution of Sales Financing to the Group operating profit was
€747 million, compared with €748 million in 2012(2 ). This stability was
notably related to the €31 million negative exchange rate effect stemming
from the devaluation of the Brazilian real and the Argentine peso. The cost of
risk (including country risk) remained under control, at 0.42% of the average
outstanding loans, compared with 0.38% in 2012. A cost of risk remaining
below the structural threshold is a reflection of the sound approval policy
i nitiated in 2009 and efficient collection management.
Other operating income and expenses showed a net expense of
€1,276 million, compared with an expense of €607 million in 2012. This net
expense consisted mainly of:
W a complementary provision of €514 million registered in the first-half to
cover all exposure in Iran;
W depreciation of assets amounting to €488 million for various vehicle
programmes;
W restructuring charges amounting to €423 million, related mainly to the
competitiveness agreement signed in France;
W €153 million in capital gains on disposals.
After recognizing other operating income and expenses, the Group reported
negative operating income of €34 million, compared with positive operating
income of €183 million in 2012(2).
The net financial result showed a net charge of €282 million, compared with
a net charge of €321 million in 2012(2).
Renault’s share in associated companies generated a gain of
€1,444 million, including:
W €1,498 million from Nissan (compared with €1,213 million in 2012(2));
W -€34 million from AVTOVAZ (compared with €186 million in 2012 ).
Current and deferred taxes showed a charge of €433 million (compared
with €549 million in 2012(2)), including a charge of €443 million for current
taxes and €10 million in net income from deferred tax assets.
Net income came to €695 million, compared with €1,712 million in
2012(2). Net income, Group share, amounted to €586 million (compared with
€1,749 million in 2012(2)).
Shareholders’ equity fell down €1,350 million to €23,214 million, impacted
by translation adjustments, notably on the yen .
(2) Restated to reflect the retroactive application of the IFRS 11 “partnerships” and revised IAS 19 “employee benefits” standards.
The Automotive division’s operating profit increased by €461 million to
€495 million (1.3% of its revenues), owing mainly to:
W the Monozukuri plan, which reduced costs by €714 million (including the
€86 million decrease in raw materials costs);
W the positive mix/price/enhancement effect of €276 million. Combining to
produce this result were a virtuous pricing policy in Europe linked to sales
performance of new models, and higher prices in international(1) markets
aimed at offsetting the negative exchange rate effects of certain currencies;
W an increase in volumes, which had a positive impact of €121 million;
W an €18 million reduction in overheads.
These positive effects made up for a negative exchange rate effect of
€619 million, stemming mainly from the devaluation of the Argentine peso,
the Russian ruble, and the Iranian rial.
(1) Regions excluding Europe: Americas, Asia-Pacific, Euromed-Africa and Eurasia.
Renault group – research and development expenses*
(€ million) 2013 2012 (RESTATED*) CHANGE 2012 (PUBLISHED)
R&D expenses 1,793 1,863 70 1,889
Capitalized development expenses -732 -764 32 -764
% of R&D expenses -40.8% -41.0% 0.2% -40.4%
Amortization 751 790 39 790
GROSS R&D EXPENSES RECORDED IN THE INCOME STATEMENT 1,812 1,889 77 1,915
* Restated to reflect the retroactive application of the IFRS 11 “partnerships” and revised IAS 19 “employee benefits” standards.

Find out more at www.renault.comREGISTRATION DOCUMENT RENAULT 201354
THE RENAULT GROUP1 EARNINGS REPORT-2013
AUTOMOTIVE FREE CASH FLOW AND NET CASH POSITION
Automotive free cash flow
(€ million) 2013 2012 (RESTATED)* CHANGE 2012 (PUBLISHED)
Cash flow 2,914 2,573 342 2,577
Change in the working capital requirement 790 918 (128) 922
Tangible and intangible investments net of disposals (2,543) (2,654) 111 (2,674)
Leased vehicles and batteries (334) (228) (107) (228)
OPERATIONAL FREE CASH FLOW 827 609 218 597
* Restated to reflect the retroactive application of the IFRS 11 “partnerships” and revised IAS 19 “employee benefits” standards.
In 2013, the Automotive division reported positive free cash flow of
€827 million, resulting from:
W cash flow of €2,914 million;
W a negative change in the working capital requirement of €790 million;
W tangible and intangible investments net of disposals of -€2,543 million,
stable compared with 2012 (-€2,654 million) and in line with the Plan’s
objective of under 9% of revenues;
W a €334 million increase in leased vehicles and batteries.
This free cash flow net of dividend payments (-€105 million) and diverse
transactions such as the increase in the Group’s equity interest in AVTOVAZ
through the Alliance Rostec Auto B.V. accounted for the €269 million
increase in the Automotive division’s net cash position, which stood at
€1,761 million on December 31, 2013.
Tangible and intangible investments net of disposals by operating segment
(€ million) 2013 2012 (RESTATED*) 2012 (PUBLISHED)
Tangible investments (excluding capitalized leased vehicles and batteries) 1,914 1,916 1,936
Intangible investments 827 900 900
o/w capitalized R&D 732 764 764
Total acquisitions 2,741 2,816 2,836
Disposal gains (198) (162) (162)
TOTAL AUTOMOTIVE DIVISION 2,543 2,654 2,674
TOTAL SALES FINANCING 8 11 11
TOTAL GROUP 2,551 2,665 2,685
* Restated to reflect the retroactive application of IFRS 11 “partnerships” and revised IAS 19 “employee benefits” standards.
Total gross investment was down slightly in 2013, compared with 2012; the
breakdown was 60% in Europe and 40% in the rest of the world:
W in Europe: investment went mainly to the development and the adaptation
of the industrial equipment linked to the renewal of the B range (Captur),
the C range (Scénic Xmod, new brand identity), the D range (New Espace),
the future Twingo project and the renewal of the LCV range (New Trafic);
W outside Europe: investments mainly concerned the Entry range (Morocco,
Romania, Russia and South America), modernization and capacity
increases (mechanical components and vehicles).

REGISTRATION DOCUMENT RENAULT 2013✦ Global Reporting Initiative (GRI) Directives 55
THE RENAULT GROUP 1
1
EARNINGS REPORT-2013
Net CAPEX and R&D expenses
(€ million) 2013 2012 (RESTATED*) 2012 (PUBLISHED)
Tangible and intangible investments net of disposals (excluding capitalized leased vehicles and batteries) 2,551 2,665 2,685
Capitalized development expenses (732) (764) (764)
Other (272) (145) (145)
NET INDUSTRIAL AND COMMERCIAL INVESTMENTS(1) 1,547 1,756 1,776
% of Group revenues 3.8% 4.3% 4.3%
R&D expenses 1,793 1,863 1,889
o/w billed to third parties (277) (313) (319)
NET R&D EXPENSES(2) 1,516 1,550 1,570
% of Group revenues 3.7% 3.8% 3.8%
NET CAPEX AND R&D EXPENSES (1) + (2) 3,063 3,306 3,346
% of Group revenues 7.5% 8.2% 8.1%
* Restated to reflect the retroactive application of the IFRS 11 “partnerships” and the revised IAS 19 “employee benefits” standards.
Automotive division net cash position
12/31/201312/31/2012
(RESTATED*)
12/31/2012
(PUBLISHED)
Non-current financial liabilities (6,837) (6,355) (6,276)
Current financial liabilities (3,449) (3,680) (3,802)
Non-current financial assets – other securities, loans and derivatives on financial operations 368 348 348
Current financial assets 975 1,150 1,150
Cash and cash equivalents 10,704 10,069 10,072
NET CASH POSITION 1,761 1,532 1,492
* Restated to reflect the retroactive application of the IFRS 11 “partnerships” and revised IAS 19 “employee benefits” standards.
CASH POSITION AT DECEMBER 31, 2013
In 2013, the Automotive contracted nearly €2.4 billion in medium-term loans
and has thus refinanced its 2013 bond repayments as well as part of those
falling due in 2014. In 2013, Renault once again confirmed its access to the
euro, yen (Samurai bond) and yuan (Dim Sum bond) markets. The Automotive
division’s cash reserves stood at €14.1 billion at end-December 2013. These
reserves consisted of:
W €10.7 billion in cash and cash equivalents;
W €3.4 billion in undrawn confirmed lines of credit.
At December 31, 2013, RCI Banque had available liquidity of €7.5 billion,
consisting of:
W €4.1 billion in undrawn confirmed lines of credit;
W €2.5 billion in central-bank eligible collateral;
W €0.9 billion in cash.
1.3.2.2 CONSOLIDATED FINANCIAL STATEMENTS
Refer to chapter 4.2 of this Registration document.
1.3.2.3 FINANCIAL INFORMATION ON THE ALLIANCE
The purpose of the financial data in this section is twofold: to broadly
quantify the economic significance of the Renault-Nissan Alliance through
key performance indicators, and to make it easier to compare the assets
and liabilities of the two groups. The data of both groups comply with the
accounting standards applied by Renault in 2013.
The characteristics of the Alliance mean, among other things, that Renault
and Nissan’s assets and liabilities cannot be combined. Consequently, these
data do not correspond to a consolidation as defined by generally accepted
accounting principles and are not certified by the statutory auditors.
Information concerning Renault is based on the consolidated figures released
at December 31, 2013, while the information concerning Nissan is based on
the restated consolidated figures prepared for the purposes of the Renault
consolidation, covering the period from January 1 to December 31, 2013
whereas Nissan’s financial year-end is March 31.

Find out more at www.renault.comREGISTRATION DOCUMENT RENAULT 201356
THE RENAULT GROUP1 EARNINGS REPORT-2013
KEY PERFORMANCE INDICATORS
The preparation of the key performance indicators under Renault accounting
policies takes into account restatement of figures published by Nissan
under Japanese Accounting Standards into IFRS. Additionally, the following
treatments have been performed:
W reclassifications have been made when necessary to harmonize the
presentation of the main income statement items;
W restatements for harmonization of accounting standards and adjustments
to fair value applied by Renault for acquisitions of 1999 and 2002 are
included.
Revenues 2013
(€ million) RENAULT NISSAN(1)
INTERCOMPANY
ELIMINATIONS ALLIANCE
Sales of goods and services of the Automotive segment 38,775 70,912 (3,246) 106,441
Sales Financing revenues 2,157 4,987 (149) 6,995
REVENUES 40,932 75,899 (3,395) 113,436
(1) Converted at the average exchange rate: EUR 1 = JPY 129.7.
The Alliance’s intercompany business mainly consists of commercial
transactions between Renault and Nissan. Those items have been eliminated
to produce the revenue indicator. Their value is estimated on the basis of
Renault’s 2013 results.
The operating margin, the operating income and the net income of the
Alliance in 2013 are as follows:
(€ million)
OPERATING
MARGIN
OPERATING
INCOME NET INCOME(2)
Renault 1,242 (34) (803)
Nissan(1) 3,748 3,794 3,623
ALLIANCE 4,990 3,760 2,820
(1) Converted at the average exchange rate for 2013: EUR 1 = JPY 129.7.
(2) Renault’s net income is adjusted to exclude Nissan’s contribution and Nissan’s net income is similarly adjusted to exclude Renault’s contribution.
Intercompany transactions impacting the indicators are minor and have
therefore not been eliminated.
For the Alliance, the operating margin is equivalent to 4.4% of revenues.
In 2013, the Alliance’s research and development expenses, after
capitalization and amortization, are as follows:
(€ million)
Renault 1,812
Nissan(1) 3,042
ALLIANCE 4,854
(1) Converted at the average exchange rate for 2013: EUR 1 = JPY 129.7.
BALANCE SHEET INDICATORS
Condensed Renault and Nissan balance sheets
Renault at December 31, 2013
ASSETS (€ million) SHAREHOLDERS’ EQUITY AND LIABILITIES (€ million)
Intangible assets 3,282 Shareholders’ equity 23,214
Property, plant and equipment 10,973 Deferred tax liabilities 121
Investments in associates (excluding Alliance) 806 Provisions for pension and other long-term employee benefit obligations 1,558
Deferred tax assets 396 Financial liabilities of the Automotive segment 9,761
Inventories 3,162 Financial liabilities of the Sales Financing segment and sales financing debts 24,017
Sales financing receivables 23,650 Other liabilities 16,321
Automotive receivables 970
Other assets 6,024
Cash and cash equivalents 11,661
TOTAL ASSETS EXCLUDING INVESTMENT IN NISSAN 60,924
Investment in Nissan 14,068
TOTAL ASSETS 74,992 TOTAL SHAREHOLDERS’ EQUITY AND LIABILITIES 74,992

REGISTRATION DOCUMENT RENAULT 2013✦ Global Reporting Initiative (GRI) Directives 57
THE RENAULT GROUP 1
1
EARNINGS REPORT-2013
Nissan at December 31, 2013 (1)
ASSETS (€ million) SHAREHOLDERS’ EQUITY AND LIABILITIES (€ million)
Intangible assets 4,636 Shareholders’ equity 35,153
Property, plant and equipment 34,803 Deferred tax liabilities 4,694
Investments in associates (excluding Alliance) 2,918 Provisions for pension and other long-term employee benefit obligations 1,775
Deferred tax assets 810 Financial liabilities of the Automotive segment 402
Inventories 9,657 Financial liabilities of the Sales Financing division and sales financing debts 41,851
Sales financing receivables 35,219 Other liabilities 21,834
Automotive receivables 3,532
Other assets 7,458
Cash and cash equivalents 5,059
TOTAL ASSETS EXCLUDING INVESTMENT IN RENAULT 104,092
Investment in Renault 1,617
TOTAL ASSETS 105,709 TOTAL SHAREHOLDERS’ EQUITY AND LIABILITIES 105,709
(1) Converted at the closing rate at December 31, 2013: EUR 1 = JPY 144.7.
The values shown for Nissan assets and liabilities reflect restatements for
harmonization of accounting standards and adjustments to fair value applied
by Renault for acquisitions made in 1999 and 2002, mainly concerning
revaluation of land, capitalization of development expenses, and pension-
related provisions.
Balance sheet items have been reclassified where necessary to make the
data consistent across both groups.
Nissan’s restated balance sheet includes the securitized items presented off-
balance sheet in Nissan’s financial statements under Japanese GAAP.
Purchases of property, plant and equipment by both Alliance groups for
2013, excluding leased vehicles and batteries, amount to:
(€ million)
Renault 1,918
Nissan(1) 4,076
ALLIANCE 5,994
(1) Converted at the average exchange rate for 2013: EUR 1 = JPY 129.7.
Based on the best available information, Renault estimates that the impact
of full consolidation of Nissan on its shareholders’ equity calculated under
current accounting policies would result in:
W a maximum 5-10% decrease in shareholders’ equity – Group share;
W a €21 billion increase in shareholders’ equity – minority interests’ share.

Find out more at www.renault.comREGISTRATION DOCUMENT RENAULT 201358
THE RENAULT GROUP1 RESEARCH AND DEVELOPMENT
1.4 RESEARCH AND DEVELOPMENT
At Renault, R&D is a source of innovation that contributes to the competitiveness
and long-term strategy of the company. With more than €1,5 billion invested
in 2013, Renault is showing its determination to meet automotive industry
challenges and to converge with major technological and social trends.
Research and development expenditure *
2013 *** 2012 2011 2010 2009
Net R&D expenses (€ million) ** 1,516 1,570 1,637 1,567 1,531
Group revenues (€ million) as published 40,932 41,270 42,628 38,971 33,712
R&D spend ratio 3.7% 3.8% 3.8% 4.0% 4.5%
R&D headcount, Renault group 16,426 17,037 17,278 17,854 17,881
Renault group patents 620 607 499 304 362
* All R&D expenditure is incurred by Automotive.
** = R&D expenses – R&D expenses billed to third parties and others.
*** Group Turnover in restated value.
1.4.1 R&D HIGHLIGHTS IN 2013
The most recent R&D results can be seen on our latest vehicles and
subsystems:
VEHICLES POWERTRAIN COMPONENTS
CAPTUR TCe 130 engine
SCÉNIC XMOD fitted with Extended Grip traction control
QM3 in South Korea (Korean version of Captur)
SM3 Z.E. in South Korea
1.4.1.1 VEHICLES
CAPTUR: TRAVELLING COMFORT
The new urban crossover Renault Captur has two particularly useful
innovations for everyday motoring:
W a large “Easy Life” storage drawer, the first glove box accessible from the
driver’s seat. With an 11-liter capacity for storing everyday items such as
laptops, cameras and handbags, the Easy Life drawer is an original solution
that is more attractive and practical than a regular glove box. It is also
equipped with customizable LED lighting (depending on trim);
W “Zip Collection” seat covers that can be unzipped and washed in the
machine. No need to remove seat stains or clean the seats inside the car
itself, which makes sprucing the car up for resale that much easier. The
front seat shells can be washed with a simple swipe of the sponge, as can
the sides of the trunk and the removable, reversible floor, so transporting
dirty objects is no problem.
Renault Captur also boasts original two-tone body paint that differentiates the
roof, pillars and wing mirror shells from the rest of the body, a personalizable
feature that is particularly appreciated by some customers.
QM3 is the South Korean version of Captur, with all the same innovations.
SCÉNIC XMOD: COMBINING PRACTICALITY AND PLEASURE
Scénic Xmod is the first vehicle in the range to feature the new Extended
Grip system.
An advanced traction control function, Extended Grip is an upgraded anti-
skid system enabling the car to grip the road confidently in difficult driving
conditions involving snow, mud and sand. Drivers manually activate the thumb
wheel on the center console to choose the assistance level required, “Road”,
“Loose Ground” or “Expert”.

REGISTRATION DOCUMENT RENAULT 2013✦ Global Reporting Initiative (GRI) Directives 59
THE RENAULT GROUP 1
1
RESEARCH AND DEVELOPMENT
SM3 Z.E. IN SOUTH KOREA
Launched in South Korea in October, the Renault Samsung Motors-badged
SM3 Z.E. uses the same technology and charging equipment as Renault
Fluence Z.E. Produced at the Busan plant, it is the first electric car in the
intermediate segment in the South Korean market.
1.4.1.2 POWERTRAIN COMPONENTS
TCE 130
The Energy range was extended with a new engine in 2013, the TCe 130, a
more powerful version of the Energy TCe 115 taking over from the 1.4-liter
TCe 130. Developing 130hp at 5,500rpm and 205Nm from as low as
2,000rpm, the latest-generation 1.2-liter direct-injection turbo offers the
performance of a normally-aspirated 2-liter powerplant, making it ideal for
use on major roads. “Energy” technology reduces fuel consumption by 15%
to 20%, or a full 1 l/100km, compared with its predecessor.
EXTENDED GRIP, AN ADVANCED YET BROADLY AFFORDABLE TECHNOLOGY
W The default “Road” mode, for use on hard road surfaces (dry,
wet or icy), corresponds to a conventional anti-grip system
setting. It reconnects automatically above 40kph if another
mode has been selected between times.
W Drivers select “Loose Ground” mode to hand over drive-
wheel management to the Extended Grip system, which
automatically works on engine torque and the brakes to allow
the front wheels to skid more. The M&S (Mud and Snow) tires
clear the mud or sand from the road surface to gain a firmer
grip and keep moving forward.
W In “Expert” mode, drivers get total control over torque,
deciding on the car’s acceleration while the system controls
the brakes. Extended Grip is systematically combined with
Mud and Snow tires featuring a special tread that is more
effective on mud, sand and soft snow.
1.4.2 R&D: PERFORMANCE AND INNOVATION
The determination to sharpen the Company’s competitive edge has led all
sectors to rethink their work, including upstream activities. Engineering as
a whole is vital to the Company’s competitiveness. In 2013 engineering
policy directions were redefined and new impetus was imparted to boost
development with a view to enhancing performance and value creation. The
Engineering reports to the Competitiveness Department which has been
created in September 2013.
1.4.2.1 GROUP IT QUALITY ENGINEERING DEPARTMENT
NEW ORGANIZATION STRUCTURE FOR IT QUALITY ENGINEERING
Engineering was comprehensively reorganized in 2013 with two main
objectives in mind:
W improve the performance of our plants while safeguarding our advantages;
W strengthen the appeal of our products and the creation of value.
To meet the first objective, production engineering as a whole came under the
control of Group Manufacturing and Supply Chain to bring it all the necessary
industrial performance resources.
The second objective led to the introduction of a new organization structure
for product engineering, and more globally, for all engineering, quality and IT
activities, to bring the Company a product engineering entity (PC/LCV) aimed
at reaching the highest performance levels:
W engineering is a “project manager”, responsible for developing automotive
products in terms of quality, cost, lead times and features;
W quality is responsible for ensuring the quality and reliability expected by
customers, from the R&D phase through to the end of product life;
W IT is responsible for maintaining and developing all necessary Group
IT tools and data, in coordination with Nissan, as part of the synergies
implemented between the two Alliance members.
ENGINEERING
The new organization structure is based on:
W a department in charge of all project coordination. The Project Engineering
department groups all the players involved in coordinating engineering
projects, from vehicles, powertrains and platforms to systems and hybrid
technologies. It is tasked with ensuring that engineering, in this phase
of development, creates value for the customer. To ensure the global
performance of projects, it handles upstream project framework and
coordinates the development of projects in terms of quality, cost, lead times
and features with the support of a Project Management Office, responsible
for the consolidation and operational monitoring of all projects in the range
plan. This approach strengthens and improves project management;
Find out more at www.renault.comREGISTRATION DOCUMENT RENAULT 201360
THE RENAULT GROUP1 RESEARCH AND DEVELOPMENT
W an entity dedicated to the production of new ideas and the coordination
of innovations. The Engineering Innovation department operates in project
mode so as to more rapidly integrate innovations in the range through the
systems and functions, thereby reducing time to market;
W three functional departments responsible for designing, developing
and validating systems, vehicles and powertrain components: the
Vehicle Engineering, Powertrain Engineering and Systems Engineering
departments. This last department was set up to roll out Group-wide the
policy of the same name. The aim of the functions is to standardize and
develop modules with a view ultimately to strengthening their contribution
to the creation of value;
W an entity grouping a set of services and resources contributing to design
efficiency. The Tests & Services Engineering department includes technical
documentation, modeling and digital simulations, regulatory watch and
vehicle homologation, materials engineering, vehicle and powertrain
prototypes both physical and digital, and vehicle, powertrain and systems
testing;
W an entity in charge of all engineering business activities contributing to
Renault’s profitable growth. The new Engineering Partnership and Business
Development department groups the sales and purchasing of components,
systems, modules and parts and the sales and purchasing of engineering
services involved in strategic partnerships or for third-party customers. The
department was created in response to the strong growth in these activities
over the last two years, a testament to the quality of, and the trust of the
automotive industry in, the Group’s R&D.
AN ORGANIZATION STRUCTURE WITH AN INTERNATIONAL FOCUS
The new organization structure also aims to take full advantage of the
worldwide network of global engineering centers (RTxs). Responsibilities
are clearly delineated between corporate and the RTxs, with these last
contributing to the knowledge of local markets, local sourcing and production
life and having varying degrees of responsibility in the development of a
vehicle, module, function or skills center in a given technical field (see
chapter 1.4.4.1). Naturally, corporate is responsible for coordinating the
whole to ensure global performance.
The new structure retains the fundamental guiding principles of the
project platforms and product-process convergence, which remain vital to
performance.
The system is also underpinned by a refocus on core business activities.
An engineering function focused on its core business is able to delegate
activities falling outside of this scope to better skilled and/or more competitive
partners. The regular use of specialized partners in non-core business
activities is organized through work packages, with regular and independent
partners committing to results and long-term competitive costs as part of a
medium-term collaborative view and responsible for upskilling to meet the
commitments. These activities are coordinated by corporate engineering.
UNIFYING INJECTION SYSTEMS WITHIN THE ALLIANCE
Increasingly stringent environmental standards, the rise in
engine power and torque, the reduction of fuel consumption,
and the improvement of driving pleasure are all leading to
the development of more sophisticated and complex engine
control systems.
New engine control systems have to fully control engine
operation and bring customers a flexible, brisk and smooth
engine that starts up in all weather conditions. They also
have to reduce pollutant emissions and fuel consumption. In
addition, these systems interact with other vehicle systems
including the onboard power network, Electronic Stability
Control and Stop&Start to increase safety and driving pleasure.
Given this growing complexity, Renault and Nissan powertrain
engineering teams have started to work together and pool
new engine control systems (electronic control unit, injectors,
ignition coils, spark plugs, sensors) for new vehicle platforms
(the Common Module Family).
In 2013 these efforts led to a 50% reduction in the diversity
of gasoline injection control units, as part of the switch from
Euro 5 to Euro 6, with a direct impact on the cost of injection
systems.
QUALITY
The new organization structure aims to strengthen the cross-cutting work of
the Quality department, built on three pillars:
W a Quality Assurance unit grouping quality assurance engineers from all
programmes;
W central quality management organized into three parts:
W a Customer Quality department grouping all customer data, including
warranty claims and customer survey analysis. The aim is to facilitate
the continuous improvement of Quality results in order to rank Renault
among the very best across all fields on a lasting basis,
W an Alliance Vehicle Evaluation Standard (AVES) department, in line with
priorities in perceived quality,
W an organization and performance department;
W six departments per function: engineering, production engineering,
manufacturing, logistics, purchasing, and light commercial. These
departments round out the existing network of Regions, plants and other
functions.
IT
In the main new development, a Renault IT department has been created
to ensure local management at a time of significant change for the Group,
consistent with the strategic policy directions of the Alliance.
The department is tasked with:
W implementing at Renault the Alliance IS/IT strategy drawn up by Alliance
CIO;

REGISTRATION DOCUMENT RENAULT 2013✦ Global Reporting Initiative (GRI) Directives 61
THE RENAULT GROUP 1
1
RESEARCH AND DEVELOPMENT
W supplying all the IT services at the Renault group with the service quality
required by Group users;
W providing support for the strategy and the performance of the functions;
W continuously improving the performance of the IT function by reducing
costs and adapting resources at global level.
1.4.2.2 PERFORMANCE RESOURCES
STANDARDIZATION
In 2013 Renault pursued its standardization policy based on a strategy of
sharing platforms with Nissan and on the introduction of modular design.
The rollout of modular design is well underway with 94 modules (out of a
long-term 110) introduced in six waves. At end-December 2013, 56 modules
– 19 of which in 2013 – will have gone into the advanced development phase
with a view to definite or almost-definite future launch. Savings are in line with
the objectives set for all contractual modules:
W an average 40% reduction in parts diversity and as much as 80% for some
parts;
W an average 35% reduction in initial outlay;
W a considerable decrease in unit costs, over 20% on average, by optimizing
design and increasing volumes per reference.
A final wave will be launched in 2014 to reach the mark of 110 modules,
covering over two-thirds of the value of the vehicles.
In other noteworthy news, the module design process is now part of the
Renault design system and V3P (see below).
The standardization level of each new project is systematically controlled by
setting a “carry over carry across” (COCA) objective (for parts that are reused
or cross-functionalized right from the start) and through monitoring at each
project milestone.
The Common Module Family (CMF) approach is a new phase in standardization,
for Renault and for the Alliance. The guiding principles of the CMF approach
are to:
W standardize what the customer does not see (underbody) and bring
customers diversity in what they do see (upper body);
W determine the right sizing and the right level of associated features;
W take advantage of the economies of scale of the Alliance (number of
vehicles and geographical coverage) to increase competitiveness, with the
Alliance having sold 8 million vehicles worldwide in 2013.
The CMF leads not just to the pooling of parts or a platform, but also to
standardized architecture zones, called “big modules”, made up of pre-
assigned volumes, positions and interfaces of a group of major components.
Four big modules exist in terms of physical architecture – engine compartment,
cockpit, front underbody and rear underbody – along with a big module for
the electric and electronic architecture (interconnected with the components
of the other big modules). With these basic building blocks, we can devise
multiple combinations and build CMFs applying to several range segments or
platforms, allowing for more product diversity and better cost control.
T he CMF approach can be used to address all cost items, including synergies,
volume sharing, economies of scale and shared risk as part of the Alliance,
in terms of:
W component purchasing: 20% to 30% reduction of costs at Alliance level;
W investments: 30% to 40% reduction of costs in product and process
engineering, with variations between Nissan and Renault.
The CMF generates an “Alliance parts bank” big enough to build a diverse
product range meeting customer needs as closely as possible. This is
achieved through the support of the Renault Nissan Purchasing Organization
(RNPO) and the procurement power of an Alliance that sold 8 million vehicles
in 2013.
Renault aims to implement this approach in the compact and family-car
segments (C and D), followed by city cars (A segment) and versatile vehicles
(B segment) in 10 countries on five continents.
ECONOMIES OF SCALE
Renault has its own experience in pooling parts and initial
modules with its own vehicles:
W before the Alliance was formed, Renault produced several
bodies on a single platform, notably with Mégane I from 1995-
1996: six bodies (B, D, J, L, K, E 64);
W followed by standard architecture for the engine compartment
(CMO 2010/Engine compartment 2010) and electric/electronic
architecture (Media Nav);
W more recently, a number of parts (radio, navigation, steering
wheel-mounted controls) were pooled for 10 Renault group
models (1.3 million vehicles) in the B and Entry segments.
By sharing their B segment platforms, Renault and Nissan have
since 2002 pooled components to a level of 60% in terms of
underbodies and engine compartments on 25 vehicles:
W 8 Renault bodies: Clio III and Clio III Estate, Modus, Grand
Modus, Clio IV, Clio IV Estate, ZOE, Captur;
W 17 Nissan bodies: Micra 3, Cube 2, Cube 3, Note 1, Juke,
Bluebird Sylphy, Livina, Grand Livina, Tiida (Versa), Tiida Latio
(Versa Sedan), Wingroad, AD-Van, NV 200, Leaf, New Tiida H/B,
New Sylphy/Sentra.
While component sharing for the C platform is considerably
lower than the 60% for the B platform, it forms the basis for
several models and remains a symbol of sharing:
W 17 Renault bodies: Mégane II (B, C, T, R, E, L, K), Mégane III (B,
D, J, R, E, K), Kangoo II (L0, L1, L2), Fluence/SM3.
V3P: VALUE-UP PRODUCT PROCESS PROGRAMME
Following the 2012 rollout of Renault’s new engineering development
approach, V3P, the approach in 2013 was centered on vehicle projects in the C
and D segments. In addition to implementation, the focus was on feedback for
each project at the end of four phases: upstream, optimization, development,
and industrialization. Eight sets of feedback were analyzed in 2013. The
recurring problems identified are being processed with a view to providing
continuous assistance to Renault players working on current projects by
enabling them to benefit from solutions found for previous projects. In parallel,
an approach on analyzing and increasing robustness at each milestone is
focusing on the most complex aspects and the toughest objectives so as to
be able to pass the milestone in the next development phase.

Find out more at www.renault.comREGISTRATION DOCUMENT RENAULT 201362
THE RENAULT GROUP1 RESEARCH AND DEVELOPMENT
QUALITY – DURABILITY
Quality is a major component in the Renault – Drive the Change plan and
maintaining quality over time remains a priority objective. Durability is tested
in particular via EDAU tests on durability in appearance and use, which
reproduce everyday vehicle handling over a two-month period equivalent to
three years in the life of a vehicle.
ADAC REPORT
The report produced by ADAC (Allgemeiner Deutscher
Automobil-Club) is one of our most important external
indicators, especially in Europe, for the reliability of one- to six-
year-old vehicles. The survey compiles vehicle breakdowns for
all makes and all models on German highways.
In the latest report, published in April 2013, Twingo was rated
as a leader in its category, scoring the best performance by
a Renault model in each of the six model years, underlining
its durability. Scénic also posted a strong performance, with
consistently strong results for all models produced since 2009.
In 2013 perceived quality became a new lever in the Group’s quality
strategy. A systematic “perceived quality” review is made at each major
project milestone. Also, no fewer than 16 exterior and interior geometry and
methodology projects are underway. We are working day to day to improve
our design standards in the medium term, notably in reducing gaps and
enhancing flush mounting. Real-life results are already visible on Clio IV,
which has made a real leap forward on quality.
CLIO IV JUDGED BY CUSTOMERS
A survey carried out with the first Clio IV customers in France
shows that they appreciate the perceived quality of the
products. Interior and exterior finish quality were rated as
“Very good” by over 55% of respondents, with no negative
opinions. Only the quality of the interior materials received a
somewhat mixed reception, with 47% “Very good” ratings.
We are continuing our policy on improving durability and perceived quality
in our current development projects with a view to ensuring customer
satisfaction in all our markets.
INNOVATIONS AND PARTNERSHIPS
The innovation process was revised in 2013 to more robustly integrate
innovation in projects and to factor in standardization plans and systems
management early on in the development process. New criteria on brand
values were taken into account so that innovation makes a better contribution
to strengthening brand image. In addition, process synchronization work was
finalized for pre-projects, the aim being to list the innovations to be factored
in to the development of each vehicle project.
Three highlights can be noted in terms of the organization and running of
partnerships:
W a framework agreement was signed with France’s national scientific
research center CNRS (see below) to smoothen out contracting with
research laboratories;
W a process is being implemented with Nissan on identifying, right from the
product demand phase, innovations that could be co-developed without
the partners doing the same work twice;
W Renault’s strong commitment to the French automobile platform (PFA),
aimed among other things at unifying the research work of manufacturers
and national laboratories while benefitting from public financing (through
the French government’s “Investissements d’avenir” investment plan). In
addition to its presence and responsibilities as part of the PFA, Renault
notably focused on the project for a vehicle consuming 2 l/100km or less,
with some ten collaborative initiatives having been organized to that end,
some of them in the form of joint innovation contracts with our partners.
COLLABORATIVE TOOLS
Renault employees now make habitual use of collaborative tools such as online
chats and virtual audio and video conferences, with more than 16 million
virtual dialogue sessions per month, three times more than in 2012.
In 2013, through training and tutoring, the emphasis was on collaborative
work via virtual communities as part of cross-cutting projects and initiatives.
Engineering has gained a firm grasp of these resources and remains by far
the biggest user.
The rollout of the Renault’s company social network, My Declic, begun in
June 2012, continued in 2013, with the number of users reaching 16,4 00 in
December 2013, twice as many as at end-2012.
REGISTRATION DOCUMENT RENAULT 2013✦ Global Reporting Initiative (GRI) Directives 63
THE RENAULT GROUP 1
1
RESEARCH AND DEVELOPMENT
1.4.3 TECHNOLOGY PLAN
Renault’s technology plan remains the backbone of Research and Advanced
Studies, structured into quantified, planned and prioritized projects. Projects
are grouped into six priority subject areas: innovative architectures, electric
vehicles and their ecosystem, internal combustion/eco² vehicles, onboard
comfort and reassurance, new services, and affordable costs
The objective of 15 innovations a year in the second part of the Renault –
Drive the Change plan was confirmed in 2013, as was the strategy of strong
links between innovations and brand identity. As such, the priority topics
logically remained the same. As part of this continuity, existing projects are
moving ahead and new ones being introduced.
1.4.3.1 INNOVATIVE ARCHITECTURESIt is in this field that Renault has undoubtedly marked automotive history, as
seen with R16, Espace, Scénic and Twizy.
The legacy is being continued with new projects:
W in 2013 Renault revealed a concept car, Twin Z, previewing the styling of
a future city car. Drawing its inspiration as much from Twingo as from the
Renault 5, two superminis that broke new ground in ways that truly marked
their time, Twin Z is a rear-wheel drive car with a rear-mounted engine.
This architecture enabled the wheels to be pushed out to the car’s extreme
corners to provide it with a solid grounding and large platform, resulting in
outstanding cabin space in relation to its compact footprint;
W Renault is preparing a broadly affordable vehicle consuming just 2 l/100km.
The objective is to reduce vehicle mass and drag by 30% while maintaining
cost price. A demonstration vehicle planned for 2014 will herald a number
of innovations, including the use of new materials and the integration and
adaptation of functions – such as the powertrain – to the new vehicle mass,
along with an adapted body, with no impact on roominess, functionalities
or styling.
1.4.3.2 ELECTRIC VEHICLES AND THE ECOSYSTEM
Renault is a pioneer and leader in this expanding market with a range of zero-
emission vehicles that makes a clean break on CO2 emissions.
The Company is focusing on increasing battery range and keeping costs
down, through work on battery chemistry, cooling management, increased
capacity and durability regardless of vehicle use conditions, and reduced
charging times.
1.4.3.3 INTERNAL COMBUSTION VEHICLESTo respond to the planet’s energy and environmental challenges, Renault has
set an objective to significantly reduce CO2 emissions.
In first-half 2013 the Renault group was the European leader on low CO2
emissions in passenger car sales, with an average 115.9 g/km of CO2
(Source: AAA DATA). The average CO2 emissions for the entire Renault group
range were reduced by nearly 10 grams between 2012 and first-half 2013,
falling from 125.5 g/km to 115.9 g/km. The objective is to go under the
100 g/km mark in 2016 with the integration of the electric vehicle.
THE AWARD-WINNING ALMA PROJECT
France’s PREDIT programme on land transport research
and innovation this year awarded an Innovation prize to the
collaborative project ALMA (Architecture for Low Mass) in the
competitive manufacturing category. The award acknowledges
the scientific results achieved in a key PREDIT area, “Transport
Industry Competitiveness”, coordinated by the Ministry for
Industrial Renewal. In practical terms, the results lead to
a 110kg weight cut for a C segment car, through the use of
innovative architectures and materials.
Examples:
W polymers were used for the seats, enabling the integration of
floor-linked functions;
W 51kg was shed by using new high-performance steel solutions
that reduce thickness;
W new thermoplastic and hybrid solutions were employed,
including for side openings, favoring cutting that enables the
integration of functions;
W high-temperature thermoplastic was used in the engine
compartment instead of aluminum;
W mass was also reduced through the use of composite
components in the suspension system.
Renault partners in the ALMA project: Arcelor Mittal, Ecole
Normale Supérieure de Cachan, Faurecia, L&L Products,
Mecacorp, Plastic Omnium, Promold and SARA Composite.
To maintain a high level, Renault has committed to the 2 l/100km project
(see above), which will be ecological, economical and connected. Four priority
objectives are involved:
W the reduction of energy consumption. We are exploring several paths,
including weight reduction, improved aerodynamics, reduced friction
and improved efficiency for energy-consuming accessories such as air
conditioning;
W improved efficiency for conventional engines and transmissions;
W to take things up a notch, the use of hybrid drive trains and electric power;

Find out more at www.renault.comREGISTRATION DOCUMENT RENAULT 201364
THE RENAULT GROUP1 RESEARCH AND DEVELOPMENT
W connectivity, key to reducing energy consumption. Eco-driving assistance
and informed navigation – traffic management to avoid jams – can reduce
consumption by around 25%.
While these are not the only priorities, they are the most important in the
2 l/100km vehicle project.
1.4.3.4 ONBOARD COMFORT AND REASSURANCE
Renault’s brand identity is an invitation to R&D to stimulate innovation in every
area that helps to make driving a pleasant and relaxing experience. Renault
projects in this field focus on several types of breakthrough: in technologies,
in use, and in business models. The aim is to make new functions in comfort
and well-being available to everybody. These breakthroughs are to be simple,
intuitive, affordable and customizable, in line with the brand image.
Example: the “Smart Objects” project aims to make cars more intuitive and
user-friendly by extending the possibilities of in-car multimedia devices, at
two levels:
W the driver and the vehicle: with near field communication tagging, the
vehicle is able to identify its owner in all locations (office, home, etc.),
while connected services are secure at all times. In addition, connected IP
cameras enable remote vehicle control;
W nomad devices and the vehicle: smartphones and other mobile devices
are becoming real extensions of the in-car multimedia system (diary,
navigation, multimedia library, etc.).
The aim is to reinvent interaction between motorists and their vehicles by
integrating the entire set of communicating technologies and make the car a
connected product in its own right.
Another example, this time concerning light commercial vehicles, is the
“Flexible Cargo” project, aimed at improving onboard comfort through the
personalization and optimization of load areas. The idea is to develop a
number of “small extras” that are extremely practical to use. The load area
consists of a “bird cage” structure covered in standardized, smooth plastic
panels, contoured in vehicle assembly. This structure can be used to pre-
equip the load area, making it easy for customers to personalize it in line
with their needs. A prototype shown to a panel of customers proved an
overwhelming success!
The NEXT TWO autonomous vehicle, Renault’s exploration of broadly
affordable hyper-connected car travel.
The prototype reflects Renault’s vision of the autonomous vehicle for 2020, a
combination of semi-driverless operation that frees up time for motorists and
hyper-connectivity to use that time to the full and invent the accompanying
lifestyle:
W freeing up time through semi-driverless operation at an affordable cost;
W using that time to the full with in-car hyper-connectivity.
1.4.3.5 NEW SERVICESSociety is changing, with the advent of new technological possibilities and
new lifestyles and social relations. Collaborative work and interaction are on
the increase, as are networks and communities, and non-stop connectivity is
becoming a more important need. Electronic technology is changing across
all fields. At the crossroads of these two major trends, the automobile also
has to change. In particular, in addition to real-time information it has to
provide continuity of use in each of the different environments of the driver
and passengers.
Example: the advanced urban mobility platform, or PAMU. This project
consists in developing an automated valet service. The vehicle is designed to
function in driverless mode in a controlled environment with no passengers
on board. The car functions autonomously between the parking/charging area
and the meeting point designated by the user.
Implementation of the service hinges on four main systems:
W a computer-controlled chassis system;
W an environment perception system;
W a vehicle localization and navigation system;
W an off-board supervision system.
A prototype based on Fluence Z.E. has been produced and tested in partnership
with the Yvelines General Council, UTC, ENSTA, IFSTTAR, Mobileye, Bosch,
Acumine, Tecris and Viveris.
1.4.3.6 AFFORDABLE COSTSMaking mobility accessible to all means deploying a range of modules,
components and systems with an emphasis on simplification and
standardization, both of which make vehicles more affordable (see above).

REGISTRATION DOCUMENT RENAULT 2013✦ Global Reporting Initiative (GRI) Directives 65
THE RENAULT GROUP 1
1
RESEARCH AND DEVELOPMENT
1.4.4 LONG-TERM TARGETS
1.4.5 SKILLS, PROFESSIONS, EXPERTISE AND PARTNERSHIPS
1.4.5.1 INTERNATIONALRenault engineering has several decentralized entities (RTx ) located close
to the Company’s target markets. South Korea, Romania, Brazil, India and
Russia make up a worldwide network supported by corporate teams in their
growth and upskilling.
Tasks are clearly broken down between corporate and RTx :
W corporate is responsible for developing platforms, powertrain components
and initial vehicles or new-generation powertrain components (known
as “mother” and “grandmother” components) and the module policy.
Corporate is responsible for the upstream phase;
W the RTX entities contribute to knowledge of local markets, local sourcing
and production life. Their role is to adapt brand products locally to the needs
and expectations of new customers and to local regulatory and economic
constraints. They have varying responsibilities in the development of
vehicles, modules, functions or skills centers in a given technical field.
RTR: UPSKILLING AND DELEGATION
Renault Technology Romania (RTR) focused on skills improvement in 2013.
Set up in Romania in 2006, the engineering center is now responsible for
the development of the Entry range, having managed the renewal of Logan,
Sandero and Sandero Stepway.
Taken over officially in July 2011 at the end of the design phase, the Logan
project illustrates the Franco-Romanian collaborative effort following Duster
development in 2010. Before the transfer, a team of Romanian engineers
worked on the project in France and Romania over an 18-month period. Once
the project was fully handed over to RTR, it was led to completion in Romania,
again over an 18-month period, watched over by supervisors from central
engineering in France and locally in Romania.
RTR today coordinates the international rollout of the new Entry range at six
plants, with the cooperation of the other local engineering centers (RTX) and
corporate teams.
Upstream of the technology plan, the Research Plan (plan [R]) is aimed at
establishing breakthrough target values, setting out road maps to achieve
those values – by identifying the requisite scientific and technical knowledge
– and, ultimately, acquiring the key knowledge required to make the
breakthroughs in question. In short, target values pave the way for clean
breaks in terms of technology and use.
Example: in-car technologies for mobility.
Cars are becoming increasingly “intelligent” through the combination of three
sets of functionalities made possible by the development and integration of a
range of technologies:
W driving is increasingly automated. Tasks already assisted by driving aids
will gradually require less and less driver input, at least during journey
phases (context-based delegation). This change will become affordable
through progress in sensors, actuators, control algorithms, and systems
engineering. Examples include the widespread availability of automatic
parking functions and pedestrian-detection emergency braking systems;
W vehicles and occupants are connected to the outside world. Connectivity
brings motorists connected services (apps designed for cars) while
providing safe driving conditions. Examples here include fleet management
and predictive maintenance. Connectivity also improves mobility conditions.
Journey management, either by driver or in-car automation, is to become
context-based and predictive through the use of information provided by
communication resources. The automobile can now be connected to any
number of information sources or “smart” resources, as seen in variable
speed limiter systems based on traffic conditions, in which the speed
limiter setting is automatically adjusted to actual conditions;
W cars are being integrated in a global system of mobility and transport
modes. Automated and connected cars are becoming a sub-system of a
global system of means of transport using web technologies that optimize
the multimodal use of transport resources. Local and decentralized
supervision will coexist with centralized management and supervision.
Examples include a back office for optimized global traffic management
and an inter-modality management system.
A number of conditions have to be fulfilled for this future to take real-life form,
including regulations, infrastructure, interoperability, and collaborative work
between the automotive industry and public authorities. But that future is
taking form, as seen in France with the PFA automotive industry platform.
And Renault is part of the development, especially in the use of smart
technology to improve motorists’ lives, freeing up their time and helping
them to use it better. “Non-productive” time in traffic jams is estimated at an
average 45 minutes a day at under 5kph in agglomerations, while parking in
large cities takes an average 20 minutes per trip. The response lies in hyper-
connectivity (Bluetooth, WiFi, 2G, 3G and 4G), which makes the car a place for
living, similar to houses and offices, and a linked-up hub in an open system.
Just as R-Link, based on Android, is open to “external” apps, tomorrow’s cars
will be directly in the cloud.
Examples: include smart diaries, TV, web radio, Internet, video conferences,
online ticket booking, local contacts, social networks contacts.

Find out more at www.renault.comREGISTRATION DOCUMENT RENAULT 201366
THE RENAULT GROUP1 RESEARCH AND DEVELOPMENT
1.4.5.2 NEW DESIGN AND VALIDATION RESOURCES
The technical centers and test resources are the main components of
the global engineering system and key to the performance, quality and
competitiveness of Renault R&D. In 2013 an investment plan worth around
€30 million was focused in particular on simulation and R&D tools and the
improvement of worldwide test resources, continuing on from previous years.
NEW IMMERSIVE INTERACTIVE 3D SIMULATOR AT THE TECHNOCENTRE
As part of its digital validation strategy, in 2013 Renault engineering in France
equipped the Technocentre in Guyancourt, France with an all-new immersive,
interactive 3D simulator with the highest resolution quality currently available.
The simulator features Cave Automatic Virtual Environment (CAVE™)
technology with 70 million 3D pixels and considerable computing power,
measured in tens of Teraflops. The new resource is used to observe and
interact with a scale-one digital vehicle, outside and in, and analyze all details
in real time using digital databases from design and engineering. The aim
is to continuously improve the perceived quality and ergonomics of future
Renault vehicles.
DIGITALLY CONTROLLED SCALE-ONE MILLING MACHINE FOR PROTOTYPES
The Technocentre invested in new prototyping equipment in 2013 in the
shape of a digitally controlled milling machine that, in a world first, creates
scale-one vehicle aerodynamic models in a single go.
The new resource also produces large molds for units and models and can
mill several parts in batches at the same time for cabin/livability models. The
investment was made to shorten development times and prepare even further
ahead for vehicle development.
STRENGTHENING WORLD ENGINEERING R&D RESOURCES
The larger part of this year’s investments in conventional vehicle and
powertrain design and development were made in equipment used to
optimize friction and test benches for 4x4 vehicles at the Lardy and Aubevoye
sites, with the upgrading of ‘world’ facilities to meet new pollution standards
and vehicle testing linked to the reduction of development times.
In electric vehicles, after substantial investments in 2008-2012, Renault
in the Paris region now has a sizeable testing infrastructure for validating
electric components and sub-assemblies.
These resources cover all specific components and systems, power
electronics, batteries and the Group’s electric drivetrain.
INTERNATIONAL DEVELOPMENT OF J GEARBOX
The J gearbox, produced in six countries in multiple versions and shipped
to over 30 assembly plants on four continents, is an ideal illustration of
Renault’s international development strategy. After 30 years of production, the
50 millionth unit was produced in 2012. In 2013 it arrived in two new Renault
markets: India, with production approval given in January, and China, where
a few months later the first models came out of the Dongfeng Nissan Engine
Company (DNEC) plant, to be fitted on Nissan cars sold in China.
THE “FABLAB” COLLABORATIVE CREATIVITY SPACE
The FabLab, opened at the Technocentre in 2013, is a space dedicated to
experimenting and following through on new ideas. It is a place where people
can come together and talk, presenting, debating and improving fresh ideas
and projects. It is also a place where ideas can take physical form, using
a range of fast prototyping tools, including 3D printers. The FabLab is an
informal and productive venue.
1.4.5.3 THE EXPERTISE NETWORKThe expertise network, launched in January 2010, is organized into
50 strategic expertise areas, 35 of which are now overseen by a “leader
expert”.
INTERNAL/EXTERNAL NETWORK
The internal network of strategic expertise areas has grown, from 122 experts
at end-October 2012 to 141 at end-December 2013, and from 343 to 408
consultants over the same period.
The external skills network also grew over the same timeframe, to some
850 entities. The objective is to have the best external skills for benchmarking,
sharing R&AE work – with Nissan as well as other carmakers, including
PSA (eg engine consortium) – developing co-innovation projects (as we
do with equipment suppliers), accelerating upskilling in core activities, and
promoting Renault interests with national and international bodies, including
the ACEA, IEA and UN. As part of France’s PFA automotive industry platform,
the expertise network helps to prepare technical automotive committee
meetings though strong commitments to developing projects such as the
2 l/100km car. The network’s links with regulatory bodies are used to help
build regulation and keep the Company informed of any future changes, the
aim being to get a head start on the requisite technical characteristics. The
network addresses long-anticipated standards and regulations (EuroNCAP,
CO2, vehicle emissions) as well as changes in these regulations, an example
being the European directive introduced in September 2013 reducing the
share of biofuels in alternative energies.

REGISTRATION DOCUMENT RENAULT 2013✦ Global Reporting Initiative (GRI) Directives 67
THE RENAULT GROUP 1
1
RESEARCH AND DEVELOPMENT
ONE NETWORK, MANY ROLES
By building strategic policy directions, the expertise network has, since 2010
and working with Nissan, helped to establish scenarios on sharing best
practices and pooling purchases of the raw materials used in automotive
production. The plan, part of the Raw Materials Cross Company Team,
generated gains of several tens of millions of euros for Renault in 2012 and
2013.
Technical and economic road maps, drawn up under the responsibility
of leader experts for key areas including product strategy, regulations and
competitiveness, give the Company the necessary visibility on the timing
of the introduction of product, process and service innovations and on
development costs and the accompanying gains. The road maps address the
major breakthroughs to be taken into account over the long term, and are
informed by the main priorities in the Research and Innovation plans. They
also support the Company’s work on achieving low CO2 emissions, a field in
which Renault was the European leader in first-half 2013 with an average
115.9 g/km (value based on 100% of vehicles sold).
The expertise projects guiding and underpinning company strategy involve
on a cross-functional basis all of the players concerned on work to improve
features and optimize the architecture and production of vehicles. In 2013,
eight such projects were presented, their conclusions helping to upgrade
technical policies and applied rapidly to programmes.
Projects in the Research and Innovation plan, coordinated by Renault Research
and Innovation, are informed by priority technological focuses. As part of the
development of synergies with Nissan, additional topics proposed by Renault
and Nissan leader experts will be shared starting in 2014.
Coordinated by the leader experts, the Design Review process, mirroring that
of Nissan, serves to increase the number of innovations developed in projects
while supervising their quality level. In terms of vehicles, a considerable
number of innovations introduced in 2012 and 2013 (in areas including
multimedia and safety) will contribute to improving features and onboard
comfort. In powertrains, a range of innovations integrated in 2012 and 2013
(including reduced friction) will lead to extra reductions of several g/km of CO2
on the next generation of engines.
In production life, the expertise network is involved in drawing up scenarios
on the replacement of components and systems to offset disruptions in
supply from our suppliers, resulting from industrial accidents or major natural
catastrophes.
The expertise network is also responsible for devising solutions to sharpen
the Company’s competitive edge. Savings of several million euros can be
generated in the approval and design phase by using simulations rather than
heavy, physical tests and by introducing automatic optimization techniques
applied to vehicle mass reduction, and in manufacturing by adapting anti-
corrosion treatment and supervising the introduction of precious metals in
post-treatment processes.
In terms of labor, the expertise network helped to draft the Renault group
competitiveness agreement signed in March 2013.
In parallel to the work carried out with the corporate teams, the expertise
network is also involved as early as necessary in support for the Regions, for
example by drawing up recommendations on adapting existing vehicles to
local customer needs or local regulations (for example, on fuel consumption
and CO2 emissions), as well as improving fleet sales.
As planned, benchmarking on the introduction and performance of the
expertise network was carried out in 2013 with several groups and entities,
including Eurocopter, Safran, Plastic Omnium, Faurecia and Cartier. The
exercise endorsed the policy directions taken internally on the structure of the
network, the definition of strategic areas based on core-activity analysis, and
above all on the assignments and responsibilities allocated to the network.
This benchmarking can also be used to fuel the plan on improving the
operation of the expertise network (for example, through showcase events).
The expertise network will continue to be rolled out in 2014, particularly in
the sales functions. Work on contributing to the development of the Regions
will also be stepped up. Expertise network operation will be strengthened
through the introduction of processes formalized in 2013, including career
paths, performance appraisals, showcase events and job grading, that will be
fully integrated in the Company’s HR processes.
1.4.5.4 SCIENTIFIC AND TECHNICAL PARTNERSHIPS ✦
INNOVATION AND PARTNERSHIPS
R&D collaboration contracts are an essential component of research activities.
They contribute to skills development and cost-sharing while acting as a lever
to speed up the pace of innovation. This can be seen in the figures for 2013
(figures at December 31 , 2013):
Collaboration contracts: 97 CIFRE agreements: 102
European contracts: 33 French contracts: 64
Here are a few examples from the portfolio of projects:
W Elibama (European Li-ion Battery manufacturing for electric vehicles) led
by Renault;
W Powerful (Powertrain of Future light-duty vehicles) led by Renault;
W Atmo (development of deNox system modeling tools to design Euro 6 and
Euro 6+ exhaust lines) led by Renault;
W Asap (ultrasound welding control) led by Renault;
W Voiesur (Vehicle Occupant Infrastructure, studies into safety of road users
– LAB (EIG with PSA)) led by Renault;
W Udrive (European naturalistic Driving and Riding for Infrastructure & Vehicle
safety and Environment – LAB (EIG with PSA)) partnered by Renault.
LINTERMAC PROJECT WINS AN AWARD
In addition to ALMA (see above), the PREDIT land transport
research and innovation programme recently awarded a prize
in the Energy and Environment/Technologies category to the
linterMAC project focused on modeling the flame/wall interface
in spark-ignition engines, and as part of which Renault is the
partner of IFP Energies Nouvelles.

Find out more at www.renault.comREGISTRATION DOCUMENT RENAULT 201368
THE RENAULT GROUP1 RESEARCH AND DEVELOPMENT
COMPETITIVENESS CLUSTERS
The main competitive clusters in which Renault is strongly involved remain
Mov’eo and System@atic in and around Paris, and ID4Car in western France.
One of the remits of the competitiveness clusters is to bring together large
groups with small and medium enterprises and academic institutions as part
of collaborative research projects. Through the clusters, Renault leads or
partners several certified projects, namely:
W Alma (Architecture for Low Mass & Aerodynamic drag – weight reduction)
led by Renault;
W LaBS (Lattice Boltzmann Solver digital tool) led by Renault;
W Cineli (interoperable electric induction charger) led by Renault;
W Simcal (modeling of calendar ageing of electric energy storage systems on
board road vehicles) in which Renault is a partner;
W Bicnanocat (ionic bombardment processes for nano-catalyst design) in
which Renault is a partner;
W Osccar NOx (tools for simulating and understanding NO
x reduction catalysis)
led by Renault.
Alongside these collaborative projects, Renault is proactively involved in the
way these clusters work, notably participating in the organizational bodies
of the clusters, including the Board of Directors and offices, scientific and
operational committees, and members and coordinators of strategic activity
areas.
In 2013, to meet growing expectations on support for innovative small and
medium enterprises, Renault with the Mov’eo cluster implemented regular
reviews of the innovations devised by the businesses in the cluster. Following
the reviews, partnerships may be formed between the business and Renault
to develop innovation. Three partnerships with businesses are currently under
review.
STRATEGIC AGREEMENTS
Renault-CNRS framework agreement
Following a year of scientific, strategic and legal discussions, Renault and
CNRS signed a new framework agreement on May 15, 2013 for a three-year
period.
The strategic project between Renault and France’s largest research institute
fosters the emergence of new solutions in sustainable mobility.
Renault and CNRS have signed some 100 contracts involving nearly 100 CNRS
laboratories across France (in Lyon, Lille, Montpellier, Clermont, Rouen, Paris,
Orléans, Bordeaux, Poitiers, Grenoble, Rennes and Strasbourg) since early
2010. Over one-third of the contracts governing these collaborative projects
are for multi-year periods, including CIFRE.
The majority of the projects concern the sciences of engineering and systems
and notably focus on combustion, material fatigue, and thermal and aero-
acoustic fields (analysis and prediction of aerodynamic-origin noise).
The new framework agreement confirms the continuation of current projects
with CNRS laboratories and also fosters the exploration of new collaborative
and innovation research areas in the coming years. For Renault and CNRS
teams, these new fields will include neuroscience, virtual reality, ergonomics,
new materials, and catalysis.
CEA: several R&D agreements
On June 24, 2010 Renault and the French Alternative Energies and Atomic
Energy Commission (CEA) entered a research and development agreement
to work together in the field of clean vehicles and sustainable mobility for
all. Since then, Renault and CEA have worked on a number of joint research
projects in a number of areas, including new energies for transport, the
electrical and electronic architecture of the future, and smart charging and
discharging networks.
Also in 2010, a second agreement was signed on new generations of batteries
for electric vehicles. In 2011 joint project teams were set up, including the
creation of a joint laboratory at the CEA in Grenoble staffed by a permanent
team of Renault researchers. The activities of this joint laboratory cover all
areas relating to Li-ion batteries, from the development and benchmarking of
active materials to breakthrough scenarios. In July 2012 the initial agreement
between Renault and CEA was partially extended to LG Chem, world leader
in Li-ion batteries and supplier for ZOE and Twizy. The aim is to make a new
step forward in the development of the next generation of batteries. To that
end, new materials are being jointly developed and assessed with a view to
significantly increasing the energy density of the cells of the batteries while
reducing their cost.
Daimler: co-research and co-development
Renault and Daimler are involved in a project to develop a small car and also
work together upstream in:
W European projects:
W Elibama (European Li-ion battery advanced manufacturing for electric
vehicles), on mass production processes for Li-ion batteries and electric
components,
W WIC2IT (Wireless inductive charging to interpolation testing), on
contactless charging;
W fuel-cell powertrains. Research continues as part of a cooperation
agreement between the Renault-Nissan Alliance and Daimler, with Nissan
taking a headlining role for the Alliance;
W processes (materials, specifications, use), in which synergies, collaborative
work and dialogue have been identified between Renault and Daimler, as
well as with Nissan;
W more future-looking topics such as driverless cars, where discussions are
underway.

REGISTRATION DOCUMENT RENAULT 2013✦ Global Reporting Initiative (GRI) Directives 69
THE RENAULT GROUP 1
1
RESEARCH AND DEVELOPMENT
PSA-Renault Research and Study economic interest grouping
The PSA-Renault Research and Study economic interest grouping (a form
of cooperative venture) houses the cooperation projects between the two
manufacturers in shared fields of interest. Historically, the two main areas of
study were linked to the LAB, set up in 1969 and focused on accidentology,
biomechanics and human behavior, and the GSM, set up in 1980 and working
in biofuels, diluted gasoline combustion, modeling and reducing diesel
pollutant for Euro 7, engine/motor optimization for hybrid vehicles, and low-
power internal-combustion engines.
The PIA RAMSE3S project, led by GSM, was confirmed in 2013. The project
covers a work programme of a little over three years for a total €17 million.
In 2012 the PSA-Renault economic interest grouping extended its scope of
cooperation to include electro-technical aspects and efforts to make vehicles
lighter. These directions took real-life form in 2013 through the presence of
Renault and PSA, under the PSA-Renault economic interest grouping, at the
materials technological research institutes (Jules Verne and M2P).
INVESTING IN THE FUTURE
The main economic programmes launched in 2010 included a €35 billion
programme on investments for the future. Since then, Renault has submitted
several key high-tech projects on the following subjects:
W vehicles of the future: mobility systems, charging infrastructure, combustion
drivetrain, lighter vehicles, aerodynamics and structure;
W the circular economy: recycling;
W the digital economy: software engineering.
Renault has submitted projects concerning key strategic areas for the
Company, with the contract process underway with ADEME. The projects
include HYDIVU (a hybrid diesel drivetrain for an urban light commercial
vehicle), BADDGE (a second-generation Li-ion battery) and COCTEL (optimal
design of an electric drivetrain).
Not only has Renault committed as leader or partner in these major
technological projects, it has also become involved in initiatives to create
the research structures qualified to take up these major challenges for the
country. These are partnership-based research structures such as the IRTs
(technology research institutes) and IEEDs (institutes of excellence in carbon-
free energies), these latter now going under the name of ITSEs (institutes for
the energy transition).
Renault is placing particular emphasis on two structures studying the
materials of the future (the Jules Verne and M2P IRTs), and the SystemX IRT
on systems engineering. These three institutes started up in 2013.
Renault is playing an active role in the VeDeCom project on zero-carbon
communicating vehicles and their mobility, selected in 2012 by France’s
Commissariat général aux investissements d’avenir (General commission
for investments in the future). The institute, grouping some 45 industrial
and academic partners, aims to bring about the sustainable breakthroughs
necessary to increase the energy efficiency of individual transport. The
objective is to significantly cut energy consumption while eliminating pollutant
emissions, primarily in and around cities.
BRGM: a competitive edge in procurement
Renault and the BRGM office of geological and mining research entered a
strategic partnership agreement in 2010. Since the agreement was signed:
W regular, multiple and structured exchanges have been put in place, making
it possible to react proactively to the fast pace of events on the strategic
metals market: crisis in the supply and pricing of rare earths since summer
2010, analysis of the impact of new commodity-backed financial products
and index funds (ETP, ETF) on price volatility;
W joint R&D projects are underway, including the ANR ESPEER project on the
analysis of commodities flows in the French economy, with a particular
focus on copper (thesis submitted in December 2013);
W the partnership is also involved in high-level working groups: Renault
membership of the scientific committee for the European project Eurare
(rare earths), contribution to the European network Era-Min and a day
event organized by ADEME in June 2013 on commodities, appointment
by the French Ministry of Industry (COMES) of Renault (as chair) and
BGRM (as vice-chair) of a working group asked to submit a report and
recommendations on identifying the needs of French industry in terms of
strategic commodities, with the dissemination to all French companies of a
tool for analyzing exposure to strategic metals, adapted from an approach
developed by Renault with the support of BRGM (http://www.dgcis.gouv.fr/
secteurs-professionnels/industrie/chimie/metaux-strategiques).

Find out more at www.renault.comREGISTRATION DOCUMENT RENAULT 201370
THE RENAULT GROUP1 RISK FACTORS
1.5 RISK FACTORS ✦
The Renault group makes every effort to control the risks inherent in its
various activities – namely financial risk, operational risk and legal risk. This
chapter details the main risks, together with the procedures put in place by
the Company to reduce their likelihood and severity. However, as the Group
expands internationally, enters into new partnerships, and becomes more IT-
dependent – and as new malicious behaviors emerge – existing risks are
aggravated and new ones created. These factors can increase the severity of
potential crises and the damage they may cause.
Risk management, which is essential for any global manufacturing Company,
needs to be reinforced and made proactive. It is therefore an integral part of
the Group’s operational management procedures.
The Group adopts a three-pronged approach to risk management:
W at Group level, the Risk Management department (DMR) provides methods
and an overall view of major risks and how they should be prevented and
handled. It does this, in particular, by monitoring them using risk-mapping
techniques and implementing preventive measures in high-risk areas;
W at a cross-functional level, the Group’s Prevention and Protection
department is responsible for identifying and handling risks linked to the
protection of assets, sensitive Group information and corporate personnel
based outside France. It is also responsible for implementing crisis
management procedures, in liaison with corporate communication. The
Quality, Internal Control and Risk Management departments provide advice,
methods and coordinating expertise for the management of operational
processes and risks with other Group departments;
W in all entities involved in business-critical processes, experts are
appointed to identify and prioritize risk control solutions and oversee their
implementation.
1.5.1 FINANCIAL RISK
1.5.1.1 GROUP’S OVERALL FRAMEWORK FOR CONTROLLING FINANCIAL RISK
For the Automotive sector, the management of market risk focuses mainly
on the Central Cash Management and Financing department of Renault
and Renault Finance, whose main activities are described at the end of
chapter 1.1.4.1 of this Registration document.
Securities trades executed by companies in the RCI Banque group are
intended solely to hedge risks related to sales financing and inventories held
by the Company’s distribution networks. Most of these trades are made by
the RCI Banque trading room, which plays a pivotal role in refinancing the
RCI Banque group under the overall Group-wide governance policy.
Monitoring and control tools exist both for each individual entity and at
consolidated level. The results of these controls are reported on a monthly
basis.
For each entity, financial risks are monitored at three levels:
W first-level control: carried out by line personnel through self-monitoring and
by each business line manager through formalized monitoring;
W second-level control: carried out by internal auditors under the authority of
the entity’s Chief Executive;
W third-level control: carried out by control bodies (Renault Internal Audit or
external firms commissioned by it). These third-level control organizations
carry out a critical, independent analysis of the quality of the control
system. The statutory auditors also contribute to this analysis under the
terms of their engagement.
Because RCI Banque is chartered as a credit institution, it is required to
implement a special internal control system that meets the requirements of
the French prudential supervisor.
Information on the analyses carried out to measure the sensitivity of
financial instruments can be found in note 25-B to the consolidated financial
statements.
1.5.1.2 LIQUIDITY RISK
AUTOMOTIVE
Risk factors
Automotive must have sufficient financial resources to finance the day-to-day
running of the business and the investment needed for its expansion. The
Group was a net lender at December 31, 2013 to the amount of €1,761 million
(net lending position of €1,492 million at December 31, 2012). Automotive
needs to borrow regularly from banks and on capital markets to refinance
its gross debt and ensure liquidity. This creates a liquidity risk if markets are
frozen during a long period or credit is hard to access.

REGISTRATION DOCUMENT RENAULT 2013✦ Global Reporting Initiative (GRI) Directives 71
THE RENAULT GROUP 1
1
RISK FACTORS
Management procedures and principles
Under its centralization policy, Renault raises most of the refinancing for
Automotive in the capital markets, mainly through long-term financial
instruments (bonds and private placements), short-term financing such
as commercial paper, or in the form of financing obtained from public or
parastatal institutions.
To this end, Renault has an EMTN bond programme for a maximum of
€7 billion.
Under this programme, Renault has issued one euro bond in 2 blocks totaling
€900 million. Renault also completed a three-year offshore yuan issue in
April 2013, totaling 750 million, strengthening its presence in this new
refinancing market for Renault.
Renault also has an issue programme under the Shelf Registration scheme
on the Japanese market. Renault SA issued two bonds for a total amount of
¥87.6 billion in June and November 2013.
Renault received €400 million in additional funding from the EIB.
The contractual documentation covering these financing arrangements,
including bank finance, contains no clauses that could affect the continued
supply of credit as a result of changes in either Renault’s credit rating or
its financial ratios. Some types of financing, particularly market financing,
are covered by standard market clauses (pari passu, negative pledge, cross
default).
Renault also has a commercial paper programme for a maximum €2.5 billion.
The total outstanding at December 31, 2013 was €64 million.
Renault SA issuance programme at December 31, 2013
ISSUER PROGRAMME MARKET AMOUNT
Renault SA Euro CP France €2,500 m
Renault SA Euro EMTN Euro €7,000 m
Renault SA Shelf documentation Japan (Samurai) ¥150,000 m
The graph below shows the maturity schedule for Renault SA bonds and
equivalent debt, which account for most of Automotive’s long-term financial
liabilities. A maturity schedule of Automotive’s financial liabilities is included in
note 23-C to the consolidated financial statements.
Assuming a constant balance sheet structure, medium-term refinancing
requirements in 2014 will consist of €1,723 million for maturing bond issues
and equivalent debt and €64 million for maturing commercial paper
Renault SA – M aturity schedule for bonds and equivalent debt at December 31, 2013 (1)
16
2014 2015 2016 2017 2018 2019
1,723
1,441
1,217
1,490
1,035
342
0
2,000
1,800
1,600
1,400
1,200
1,000
800
600
400
200
(€ million)
(1) Nominal amounts valued at December 31, 2013.
Renault also has confirmed credit lines opened with banks worth
€3,435 million, maturing at various times up to 2018. None of these credit
lines was used in 2013. These confirmed credit lines form a liquidity reserve
for the Automotive segment.
The contractual documentation for these confirmed bank credit facilities
contains no clause that might adversely affect credit availability or continuation
as a result of a change in Renault’s credit rating or financial ratio compliance.

Find out more at www.renault.comREGISTRATION DOCUMENT RENAULT 201372
THE RENAULT GROUP1 RISK FACTORS
Renault – Liquidity reserve at December 31, 2013
(in €M)
2010 20112009
16,000
14,000
12,000
10,000
8,000
6,000
4,000
2,000
0
5,408 8 815 7,619 10,072
9,478
12,830
11,429
13,557
4,070 4,015 3,810 3,485
2012
14,139
2013
Cash & cash equivalentConfirmed credit lines Liquidity reserve
10,704
3,435
In view of its available cash and committed credit lines not drawn at the
reporting date, Automotive has sufficient financial resources to honor its
commitments for the next 12 months.
SALES FINANCING
Risk factors
Sales financing depends on access to financial resources for its business
activities. Restricted access to banking and financial markets would force it
to scale down its financing activities and/or lead to an increase in the cost of
financing arrangements.
At all times, and especially during challenging periods, RCI Banque must have
sufficient financial resources at its disposal to support the expansion of its
business. To this end, RCI Banque applies strict internal standards.
Management procedures and principles
Liquidity risk is closely monitored on a regular basis. The static liquidity
position has always been positive in recent years, indicating an excess of
long-term sources over uses. The level is currently similar to that of previous
years. Accordingly, RCI Banque grants loans using funds raised several
months previously, thus maintaining a stable financial margin.
After launching ZESTO, a savings passbook account aimed at personal
savers, in France in 2012, the Group pursued its strategy of accessing
household savings and started under the Renault Bank Direkt brand an
activity in deposit-collection in Germany, now offering a passbook savings
account and term accounts. Deposits collected in France and Germany over
the year rose by €3.4 billion (of which almost €0.8 billion in term deposits)
to a total of €4.3 billion, generating 52% of new financing in Europe. This
diversification has reduced the Group’s reliance on market funding, which
totaled €3.1 billion, down sharply on the previous year (€5.0 billion in 2012).
On the bond market, while pursuing its strategy of diversifying its sources of
funding, the RCI group raised the equivalent of €2.1 billion by issuing debt in
both traditional markets (two debt issues and one tap in euro and one debt
issue in Swiss francs), and less common markets. After seven years’ absence,
RCI Banque returned to the sterling market, issuing GBP300 million of debt,
as well as issuing debt in US dollars for the second time (USD600 million). The
Group’s subsidiaries have also regularly issued debt on their domestic markets
in Argentina, South Korea and most of all Brazil: after the first debt issue in
2011, the Brazilian subsidiary confirmed its capacity to access local liquidity,
increased its investor base, and issued the equivalent of €1,4billion BRL.
In the structured finance segment, in response to investors’ desire for a
more simplified approach, RCI Banque restructured its German securitization
programme. The single master trust set up in 2007 was replaced by two
separate securitization vehicles. One vehicle placed €800 million in floating-
rate securities with investors, while the other vehicle was used for issues
self-underwritten by RCI Banque, and eligible as collateral for the European
Central Bank’s (ECB) open market operations. The German securitization
programme thus replicates the structure implemented in France in 2012.
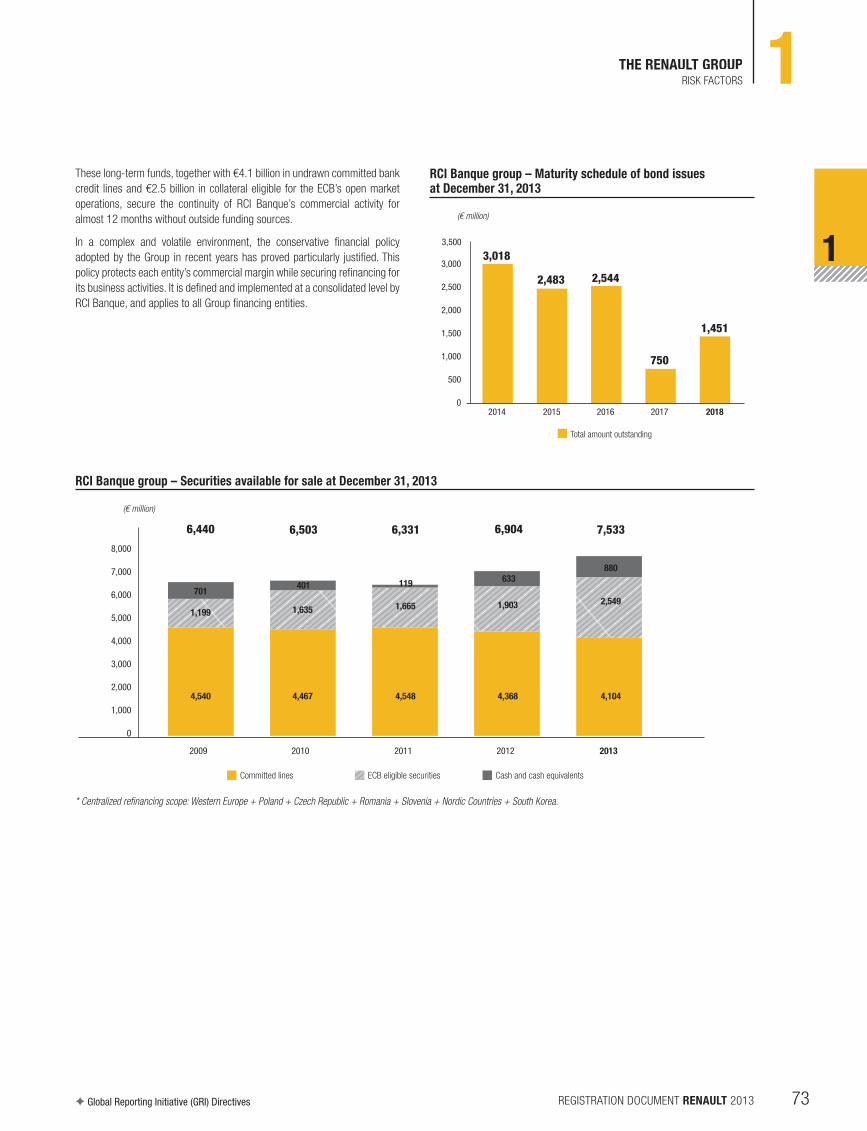
REGISTRATION DOCUMENT RENAULT 2013✦ Global Reporting Initiative (GRI) Directives 73
THE RENAULT GROUP 1
1
RISK FACTORS
These long-term funds, together with €4.1 billion in undrawn committed bank
credit lines and €2.5 billion in collateral eligible for the ECB’s open market
operations, secure the continuity of RCI Banque’s commercial activity for
almost 12 months without outside funding sources.
In a complex and volatile environment, the conservative financial policy
adopted by the Group in recent years has proved particularly justified. This
policy protects each entity’s commercial margin while securing refinancing for
its business activities. It is defined and implemented at a consolidated level by
RCI Banque, and applies to all Group financing entities.
RCI Banque group – Maturity schedule of bond issues at December 31, 2013
0
500
1,000
1,500
2,000
2,500
3,000
3,500
2014 2015 2017
3,018
2,483 2,544
750
2018
1,451
(€ million)
2016
Total amount outstanding
RCI Banque group – Securities available for sale at December 31, 2013
2011 20122009 2010
ECB eligible securitiesCommitted lines Cash and cash equivalents
2013
(€ million)
8,000
7,000
6,000
5,000
4,000
3,000
2,000
1,000
0
1,199 1,635 1,665 1,903 2,549701
401 119633
4,540 4,467 4,548 4,368 4,104
880
6,440 6,503 6,331 6,904 7,533
* Centralized refinancing scope: Western Europe + Poland + Czech Republic + Romania + Slovenia + Nordic Countries + South Korea.

Find out more at www.renault.comREGISTRATION DOCUMENT RENAULT 201374
THE RENAULT GROUP1 RISK FACTORS
RCI Banque Group – Liquidity position at December 31, 2013
(€ million)
0
5,000
10,000
15,000
20,000
25,000
30,000
35,000
Static liabilities + available liquidity
Static liabilities
Static assets
12/31/2013 03/31/2013 03/31/201506/30/2014 09/30/2014 06/30/2015 09/30/201512/31/2014 12/31/2015
Static assets and liabilities: lending and borrowing transactions that take place on the assumption they will not be renewed.
RCI Banque Issuance programme at December 31, 2013
ISSUER PROGRAMME MARKET AMOUNT
RCI Banque Euro CP Euro €2,000m
RCI Banque Euro MTN Euro €12,000m
RCI Banque CD France €4,500m
RCI Banque BMTN France €2,000m
Diac CD France €1,000m
Diac BMTN France €1,500m
Rombo Compania Financiera SA Bond Programme * Argentina ARS 1000m
RCI Financial Services Korea Co. Ltd. Bond Issues * South Korea KRW 865bn
CFI RCI Brasil Bond Issues * Brazil BRL 1700m
* Locally rated.
The RCI Banque group’s programmes are focused on five issuers: RCI Banque, Diac, Rombo Compania Financiera (Argentina), RCI FS K (South Korea)
and CFI RCI Brazil .

REGISTRATION DOCUMENT RENAULT 2013✦ Global Reporting Initiative (GRI) Directives 75
THE RENAULT GROUP 1
1
RISK FACTORS
RCI Banque
COUNTRY
SECURITIZATION – PUBLIC ISSUES
FRANCE ITALY GERMANY
CEDING ENTITY DIAC SA DIAC SA DIAC SA DIAC SA
RCI BANQUE
SUCCURSALE
ITALIANA
RCI BANK
NIEDERLASSUNG
RCI BANK
NIEDERLASSUNG
Collateral concernedAuto loans to
customersAuto loans to
customersAuto loans to
customersReceivables
independent dealersAuto loans to
customersAuto loans to
customersAuto loans to
customers
Asset SPV
CARS Alliance Auto Loans France FCT
Master
CARS Alliance Auto Loans France F
2012-1
CARS Alliance Auto Loans France V
2012-1FCT Cars Alliance
DFP France
Cars Alliance Warehouse Italy
SRLCARS Alliance Auto
Loans Germany FCT
CARS Alliance Auto Loans Germany
V2013-1
Start date May-2012 June-2012 November-2012 July-2013 June-2012 December-2011 December-2013
Maximum term of fund August-2030 September-2021 February-2024 July-2023 December-2029 May-2024 December-2024
Initial purchase of receivables €715m €867m €826m €1,020m €777m €1,793m €977
Credit enhancement as of the initial date
Cash reserve for 1%Over-
collateralization of receivables 15%
Cash reserve for 1%Over-
collateralization of receivables 13%
Cash reserve for 1%Over-
collateralization of receivables 13.5%
Cash reserve for 1%Over-
collateralization of receivables 20.35%
Cash reserve for 2 %Over-
collateralization of receivables 14.5%
Cash reserve for 1%Over-
collateralization of receivables 12.7%
Cash reserve for 1%Over-
collateralization of receivables 12%
Receivables purchased as of 12/31/2013 €615m €281m €756m €1,041m €709m €607m €911m
Notes in issue(including any units held by RCI Banque group)
Class A Class A Class A Class A Class A Class R Class A
rating: AAA rating: AAA rating: AAA rating: AAA rating: AAA rating: AAA rating: AAA€516m €190m €656m €750m €619m €547m €800m
Class B Class B Class B Class BClass S
Not rated Class B
Not rated Not rated Not rated Not rated €18m rating: A€92m €102m €109m €137m €57m
Class T Class C
Not rated Not rated€62m €52m
Period Revolving Fixed Term Fixed Term Revolving Revolving Revolving Revolving
Nature of transaction retained market market retained retained retained market
In 2013, the RCI Banque group carried out a number of securitization
transactions using special purpose vehicles, relating to dealer receivables in
France and to loans to end customers in Germany. Some of these transactions
were underwritten by RCI Banque SA, making the resulting securities eligible
as collateral with the ECB.
All the Group’s securitization transactions meet the 5% economic capital
requirement referred to in Article 122a of European Directive 2006/48/EC.
In addition, and as part of the Group’s efforts to diversify its refinancing, some
transactions were completed by conduit. Since these issues were private,
their terms and conditions are not disclosed in the above table. Securitization
transactions were completed in relation to customer loans in the United
Kingdom and Italy as well as leasing receivables and dealer receivables in
Germany. At end-December 2013, the total amount of financing secured
through securitization by conduit was €2,007 million.
Receivables assigned under these transactions were not moved off the
balance sheet. Accordingly, the amount of sales financing receivables
maintained on the balance sheet was €7,680 million December 31, 2013
(€8,814 million at end-December 2012), i.e.,:
W securitization transactions placed on the market: €1,948 million;
W retained securitization transactions: €2,972 million;
W private securitization transactions: €2,760 million.
The fair value of these receivables at December 31, 2013 was €7,792 million.
A liability of €3,602 million has been recognized under “Other debt
evidenced by certificates”, corresponding to securities issued as part of these
securitization transactions. The fair value of this liability at December 31,
2013 was €3,643 million.
The difference between the amount of receivables assigned and the amount of
the aforementioned liability corresponds to the required credit enhancement
in respect of these transactions and the share of securities retained by
RCI Banque group, which constitute a liquidity reserve.

Find out more at www.renault.comREGISTRATION DOCUMENT RENAULT 201376
THE RENAULT GROUP1 RISK FACTORS
RATING RENAULT GROUP
AGENCY RATING OUTLOOK REVISION PREVIOUS RATING
Renault
Moody’s Ba1/NP Stable 12/13/2011Baa1/P2 perspective
positive
S&P BB+/B Stable 11/03/2010 BB/B stable
Fitch BB+/NR Positive 09/18/2013 BB+/NR stable
R&I BBB+ Stable 03/31/2009 A/NR negative
JCR A- Stable 12/09/2011 BBB+
RCI Banque
Moody’s Baa3/P3 Stable 01/18/2013 Baa2/P2 negative
S&P BBB/A2 Negative 10/25/2012 BBB/A2 stable
R&I BBB+/a-2 Stable 12/09/2011 A/a1 negative
Renault SA’s credit rating was changed in September 2013 by Fitch from
‘stable’ to’ positive’.
Following the economic downturn in Europe, particularly in France, S&P
placed the credit ratings of French banks under review in October 2012. RCI
Banque’s ratings were confirmed at BBB/A2, and the outlook was lowered
from stable to negative.
In January 2013, Moody’s completed a review of European automotive
captive banks it started in late 2012 as part of a broader review of the entire
sector, which resulted in an average downgrade of the banking system.
RCI Banque’s intrinsic rating was lowered from “C-/baa2” to “D+/baa3”, and
the long-term and short-term ratings were cut from “Baa2/P2” to “Baa3/P3”.
All the outlooks were stable.
For the first time Moody’s raised the possibility of systemic support from the
French government should the need arise. The agency’s statement offered
assurance that RCI Banque’s long-term rating would remain at Investment
Grade well into the future.
Any downgrade in these ratings could limit and increase the cost of access
to capital markets.
1.5.1.3 CURRENCY RISK
AUTOMOTIVE
Risk factors
Automotive is naturally exposed to currency risk through its industrial and
commercial activities. Currency risk arising on these activities is monitored
through Renault’s Cash Management and Financing department from the
automotive branche.
Management procedures and principles
Foreign currency transactions are carried out by Renault Finance on
currencies tradable on global markets. Exchange rate fluctuations may have
an impact in six areas:
W operating margin;
W working capital requirement (WCR);
W net financial income;
W share in the net income of associated companies;
W shareholders’ equity;
W net financial debt.
Impact on operating margin: the Automotive segment’s main exposure
to currency risk is operating margin. The exposures shown below represent
yearly flows with the net result of inflows and outflows in the same currency.
Operating margin may be affected by exchange-rate fluctuations in operating
flows. Currency hedges must be formally authorized by the Finance
department or senior management. Once such hedges have been put in
place, their results must be reported to senior management. In 2013, the
Group set up a currency hedge to partly cover Renault Samsung Motors’
purchases in yen, and a currency hedge to partly protect Renault Argentina
against the risk of increase in US dollar against the Argentine peso.
The Group estimates that a 1% appreciation in the euro against all other
currencies would have a negative impact of €68 million on its annual
operating margin for 2013, excluding WCR items.

REGISTRATION DOCUMENT RENAULT 2013✦ Global Reporting Initiative (GRI) Directives 77
THE RENAULT GROUP 1
1
RISK FACTORS
Renault – Operational yearly net flows in currency at December 31, 2013 and impact on operating margin
Main exposure in 2013 was focused on the Russian ruble, amounting to a sensitivity of around €16 million for every 1% rise in the euro. The main exposures and
sensitivities are shown in the table below, in millions of euros: with a minimum of 5 million.
CURRENCY
IMPACT OF 1% EURO
APPRECIATION
Russian rouble RUB (16)
Algerian dinar DZD (9)
Pound sterling GBP (9)
Argentinian peso ARS (9)
Chinese yuan CNY (5)
Working capital requirement: like the operating margin, the WCR is sensitive
to exchange rate fluctuations. Currency hedges must be formally authorized
by the Finance department or senior management. Once hedges have been
put in place, reports must be submitted to senior management on the results.
In 2013, the Group partially hedged currency risk on the Turkish lira payables
of Oyak-Renault, whose proprietary currency is the euro.
Net financial income: the key principle of the Group’s management policy
is to minimize the impact of currency risk on net financial income. All Group
currency risk exposures affecting net financial income are aggregated and
monitored by the Central Cash Management and Financing department and
reported on a monthly basis to the Chief Financial Officer.
Investments by Automotive subsidiaries are partly financed through equity
injections. Other financing requirements are usually met by Renault SA in
local currency. Foreign currency funding provided by Renault is hedged in the
relevant currencies, thereby ensuring that exchange rate fluctuations do not
distort net financial income.
When local circumstances prevent Renault from refinancing a subsidiary
under reasonable conditions, that subsidiary may call on external sources of
funding, under the control of the Renault’s Central Cash Management. Where
external financing in non-local currencies is necessary, it is closely monitored
by the parent company. Cash surpluses recognized in countries not pooled
at parent company level are usually invested in local currency under the
supervision of Central Cash Management.
Renault Finance may also engage in foreign exchange transactions for its own
account within strictly defined risk limits. Its foreign exchange positions are
monitored and marked to market in real time. Such proprietary transactions,
intended chiefly to maintain the Group’s expertise on financial markets,
involve only very short-term exposures not exceeding a few tens of millions
of euros, and are managed in such a way as to avoid material impacts on
Renault’s consolidated financial statements.
Share in the net income of associated companies: on the basis of their
contributions to 2013 net income, a 1% rise in the euro against the Japanese
yen or the Russian ruble would have decreased Nissan’s contribution by
€15 million and AVTOVAZ’s by €0.3 million.
These impacts correspond only to the impact of euro fluctuation on the
contribution these entities make to Renault relative to their operating
currency; it excludes the inherent impact of euro fluctuations on the entities’
own financial statements, given that those two groups both do a more or less
significant level of eurozone business that Renault has no control over.
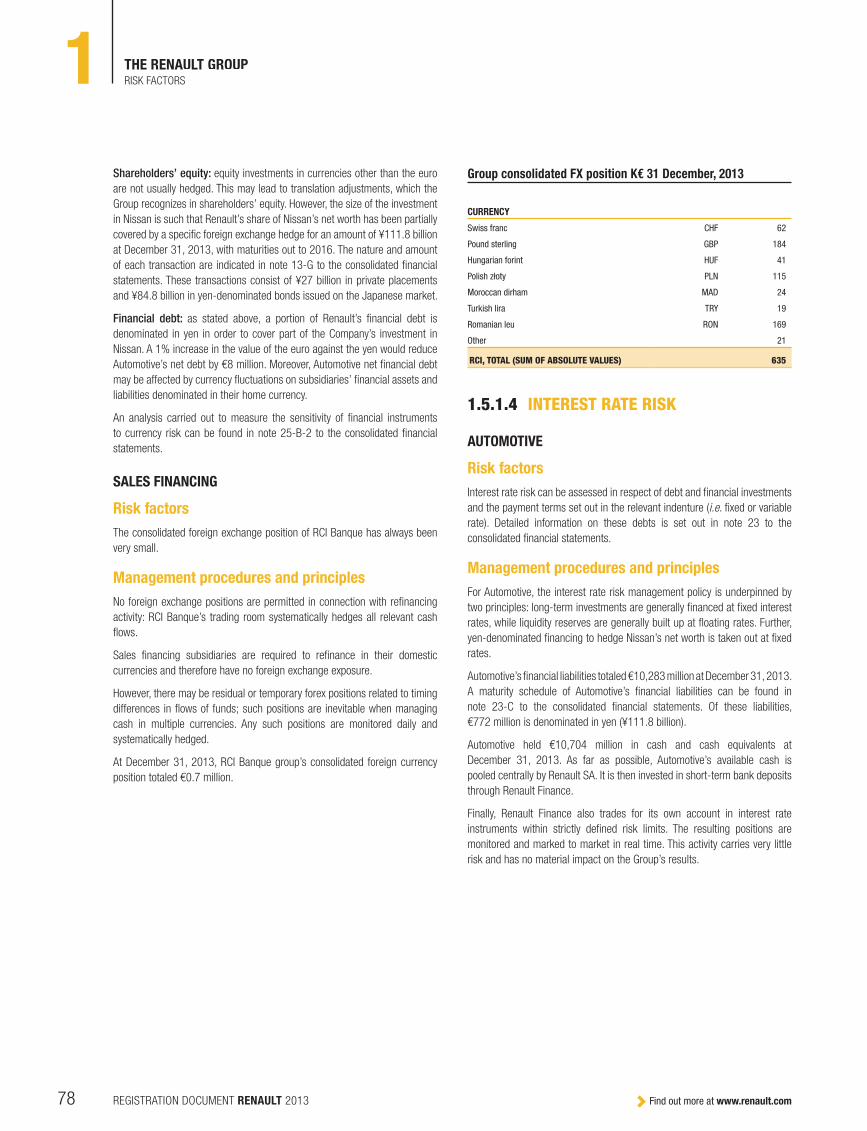
Find out more at www.renault.comREGISTRATION DOCUMENT RENAULT 201378
THE RENAULT GROUP1 RISK FACTORS
Shareholders’ equity: equity investments in currencies other than the euro
are not usually hedged. This may lead to translation adjustments, which the
Group recognizes in shareholders’ equity. However, the size of the investment
in Nissan is such that Renault’s share of Nissan’s net worth has been partially
covered by a specific foreign exchange hedge for an amount of ¥111.8 billion
at December 31, 2013, with maturities out to 2016. The nature and amount
of each transaction are indicated in note 13-G to the consolidated financial
statements. These transactions consist of ¥27 billion in private placements
and ¥84.8 billion in yen-denominated bonds issued on the Japanese market.
Financial debt: as stated above, a portion of Renault’s financial debt is
denominated in yen in order to cover part of the Company’s investment in
Nissan. A 1% increase in the value of the euro against the yen would reduce
Automotive’s net debt by €8 million. Moreover, Automotive net financial debt
may be affected by currency fluctuations on subsidiaries’ financial assets and
liabilities denominated in their home currency.
An analysis carried out to measure the sensitivity of financial instruments
to currency risk can be found in note 25-B-2 to the consolidated financial
statements.
SALES FINANCING
Risk factors
The consolidated foreign exchange position of RCI Banque has always been
very small.
Management procedures and principles
No foreign exchange positions are permitted in connection with refinancing
activity: RCI Banque’s trading room systematically hedges all relevant cash
flows.
Sales financing subsidiaries are required to refinance in their domestic
currencies and therefore have no foreign exchange exposure.
However, there may be residual or temporary forex positions related to timing
differences in flows of funds; such positions are inevitable when managing
cash in multiple currencies. Any such positions are monitored daily and
systematically hedged.
At December 31, 2013, RCI Banque group’s consolidated foreign currency
position totaled €0.7 million.
Group consolidated FX position K€ 31 December, 2013
CURRENCY
Swiss franc CHF 62
Pound sterling GBP 184
Hungarian forint HUF 41
Polish złoty PLN 115
Moroccan dirham MAD 24
Turkish lira TRY 19
Romanian leu RON 169
Other 21
RCI, TOTAL (SUM OF ABSOLUTE VALUES) 635
1.5.1.4 INTEREST RATE RISK
AUTOMOTIVE
Risk factors
Interest rate risk can be assessed in respect of debt and financial investments
and the payment terms set out in the relevant indenture (i.e. fixed or variable
rate). Detailed information on these debts is set out in note 23 to the
consolidated financial statements.
Management procedures and principles
For Automotive, the interest rate risk management policy is underpinned by
two principles: long-term investments are generally financed at fixed interest
rates, while liquidity reserves are generally built up at floating rates. Further,
yen-denominated financing to hedge Nissan’s net worth is taken out at fixed
rates.
Automotive’s financial liabilities totaled €10,283 million at December 31, 2013.
A maturity schedule of Automotive’s financial liabilities can be found in
note 23-C to the consolidated financial statements. Of these liabilities,
€772 million is denominated in yen (¥111.8 billion).
Automotive held €10,704 million in cash and cash equivalents at
December 31, 2013. As far as possible, Automotive’s available cash is
pooled centrally by Renault SA. It is then invested in short-term bank deposits
through Renault Finance.
Finally, Renault Finance also trades for its own account in interest rate
instruments within strictly defined risk limits. The resulting positions are
monitored and marked to market in real time. This activity carries very little
risk and has no material impact on the Group’s results.

REGISTRATION DOCUMENT RENAULT 2013✦ Global Reporting Initiative (GRI) Directives 79
THE RENAULT GROUP 1
1
RISK FACTORS
Financial assets and liabilities by maturity and type of rate at December 31, 2013
LESS THAN 1 YEAR MORE THAN 1 YEAR TOTAL
Financial Assets
Fixed rate 59 173 232
Floating rate 11,368 64 11,432
11,427 237 11,664
Financial liabilities before hedging
Fixed rate 1,776 6,157 7,933
Floating rate 1,246 680 1,925
3,022 6,837 9,858
Hedgings
Fixed rate/Floating 391 3,862 4,253
Floating rate/Fixed 293 0 293
684 3,862 4,546
Financial liabilities after hedging
Fixed rate 1,333 2,305 3,638
Floating rate 1,689 4,532 6,220
3,022 6,837 9,858
Sensitivity to interest rate risk at December 31, 2013
IMPACT ON FINANCIAL INCOME
BEFORE TAXES
in €M
IMPACT ON SHAREHOLDERS’ EQUITY
BEFORE TAXES
in €M
Impact of a 100bp rise in interest rates +55.1 +1.3
Impact of a 100bp fall in interest rates (55.1) (1.4)
SALES FINANCING
Risk factors
The Renault group’s exposure to interest rate risk mainly arises on sales
financing activities carried out by RCI Banque and its subsidiaries. In this
context, the aggregate interest rate risk represents the impact of a change in
interest rates on the future gross financial margin.
Management procedures and principles
Interest rate risk is monitored on a daily basis by measuring sensitivity to each
currency, management entity and asset portfolio. A single set of methods
is used by the entire RCI Banque group to ensure that interest rate risk is
measured in a consistent manner across the entire scope of consolidation.
The sensitivity of the commercial asset portfolio is monitored daily and
systematically hedged. Each subsidiary aims to hedge its entire interest rate
risk in order to protect its commercial margin. However, a slight degree of
latitude is permitted in risk hedging, reflecting the difficulty of adjusting the
borrowing structure so that it exactly matches the structure of financing to
customers.
Movements in RCI Banque’s consolidated exposure to interest rate risk over
2013 show that sensitivity to interest rate risk, measured by the impact of a
100-basis point rise or fall in interest rates on the Group’s results, was limited.
RCI Banque group – Daily sensitivity to interest rate movements (2013)
5
10
15
20
25
35
30
RCI sensitivity limit(€ million)
01/201302/2013
03/201304/2013
05/201306/2013
07/201308/2013
09/201310/2013
11/201312/2013
The solidity of the balance sheet can also be measured in terms of market
risks (interest rate, exchange rate and counterparty risk), which are very low
and monitored daily on a consolidated basis.
In 2013, RCI Banque’s sensitivity to interest rate risk remained below the
€30 million limit set by the G roup till 10/15/2013 and €35 million since.

Find out more at www.renault.comREGISTRATION DOCUMENT RENAULT 201380
THE RENAULT GROUP1 RISK FACTORS
At end-December, an interest rate rise of 100 basis points would have had
the following impact:
W -€0.7million in euros;
W +€0.6 million in Swiss francs;
W +€0.5 million in sterling;
W +€0.4 million in BRL;
W +€0.7 million in MAD.
In absolute terms, the total sensitivity of all the currencies amounts to
€3.87 million.
1.5.1.5 COUNTERPARTY RISK
RISK FACTORS
In managing currency risk, interest rate risk and payment flows, the Group
enters into transactions on the financial and banking markets for the
placement of its liquidity which may give rise to counterparty risk.
MANAGEMENT PROCEDURES AND PRINCIPLES
Management of counterparty risk incurred by Group entities is fully coordinated
and uses an internal rating system based mainly on counterparties’ long-term
credit ratings and equity. This system is used by all Renault group companies
exposed to counterparty risk.
Some Group companies have significant exposure to counterparty risk owing
to the nature of their business. These companies are monitored daily to ensure
that they comply with authorized limits by counterparties, in accordance with
specific internal control procedures.
The Group produces a consolidated monthly report that encompasses all its
bank counterparties, organized by credit rating. This report provides a detailed
analysis of compliance with limits in terms of amount, term and type, as well
as a list of the main exposures.
Special attention is paid to deposit counterparties, unless this is impossible.
Deposits are made essentially with major network banks in order to spread
risks and mitigate systemic risk. Furthermore, the deposits are made on an
overnight basis or on very short term so that funds can be reallocated swiftly
if a counterparty comes under stress.
In 2013, the Group suffered no financial loss as a result of the failure of a
banking counterparty.
The Group does not trade in the credit derivatives market.
1.5.1.6 COMMODITY RISKRenault uses a wide variety of materials in its vehicles, mainly consisting of
organic materials (including in part elastomers and polymers), ferrous metals,
non-ferrous metals and glass.
The following chart shows how the weight distribution of various categories of
material has evolved over different generations of vehicles in the same range
(R19 and Mégane I, II and III).
0%
10%
20%
30%
40%
50%
60%
70%
80%
90%
100%
Golf IV 1998 Confort 1595ccGasoline
Golf V 2003 Confort1600cc FSI
Gasoline
Golf VI 2008 Confort 1390cc 1.4 TSI 122
Gasoline
R19 - PH2 Mégane 1 - B64 Engine: 1.4 16v RXE
Mégane 2 - B84 Engine: K4M/ JHQ
(1,4 16V)
Mégane 3 - B95 Engine: B95 K4M R859
56% 55% 67% 67% 64% 62%
Total Mass
Electronic components
Paint with mastic and blackson
Liquids (fuel, oil, electrolyte, freon, etc)
Glass, ceramics
Elastomers ( rubber,silicone,tyres, etc)
Other organic materials (wood, paper, cardboard, leather, textiles, IFF, carbon, etc)
Polymers (thermoplastic, thermoset, septums, alveolars, non metallic fixings, etc)
Non ferrous metals (copper, alloy, zamak,etc)
Aluminium (from foundry, from transformations, etc)
Iron cast (spheroidal, lamellar, etc)
Steel
1,188
xx
1,252 1,321 1,019 1,071 1,183 1,272
57%

REGISTRATION DOCUMENT RENAULT 2013✦ Global Reporting Initiative (GRI) Directives 81
THE RENAULT GROUP 1
1
RISK FACTORS
RISK FACTORS
Commodity risk is first and foremost a form of price risk. The Group’s aim in
managing this risk is to:
W accept price rises only if they are economically justified;
W take advantage of all economically justified price falls.
Supply risk in respect of commodities, and in particular certain metals and
rare earths, platinum group metals, etc., is a strategic issue for the Alliance.
MANAGEMENT PROCEDURES AND PRINCIPLES
The guidelines that buyers apply to price increases and decreases are set by
an ad hoc committee, the Raw Material and Currencies Committee (RMCC).
Furthermore, an Operational Material Committee was formed by the Senior
Vice-President, Purchasing of the Renault-Nissan Purchasing Organization
(RNPO) at the end of 2010. The committee meets once a month to review all
opportunities to reduce the impact of commodities on Renault’s earnings. The
committee also ensured that the fall in market commodity prices in 2013 was
reflected in falls in the purchase price of commodities.
Price rises and cuts are subject to a prior authorization process, which either
ensures that the guidelines are observed or explicitly authorizes waivers
following a detailed review.
Under certain conditions, price indexing agreements may be used to
automate increases and decreases according to a mechanism that is defined
and shared with suppliers.
Renault’s Purchasing department can use derivatives to hedge risk on indexed
commodities. Hedging is limited to purchases by the Purchasing department
of Renault and RNPO for Renault projects throughout the world. Hedges are
linked to physical purchases to meet the needs of the relevant production
sites.
The Group relies on Renault Finance to execute these hedging transactions in
the markets. Renault Finance tracks the metals markets and monitors market
values on a daily basis. It uses over-the-counter cash-settled swaps to hedge
commodities. As the Alliance’s dealing room, Renault Finance has extended
this trading and monitoring activity to meet the needs of the Nissan group.
These transactions are authorized by senior management, subject to limits in
terms of volume, maturity and price thresholds. They are covered by monthly
reports detailing the performance of hedges and hedged items. Proposals
to hedge commodities are discussed by the Chief Financial Officer and the
Senior Vice-President of Purchasing before being submitted to the Chairman
and CEO, who is the only person with decision-making powers in this area.
Non-indexed commodities (for example steel, rubber and plastic) account for
around 80% of the materials used in vehicle manufacture, compared with just
20% for indexed commodities.
In 2013, Renault Finance hedged purchases of aluminum, lead, copper,
palladium and platinum on behalf of RNPO. These hedges covered a
maximum of 70% of monthly volumes and were put in place from January
onwards whenever financial market prices fell below thresholds approved by
the Chairman and CEO.
The RMCC also implements a methodology developed by Renault since 2010
to objectively establish the criticality of mineral commodities based on the
following:
W supply risks and cost variations;
W importance and impact for Renault (depending on the volumes consumed
and purchase prices).
This criticality matrix has helped identify those metals to which the Alliance is
most exposed and develop strategies to reduce their use and recycle and/or
replace them. Renault is also jointly tracking a list of ten critical metals with
Nissan under the aegis of the Raw Material Cross Company Team.
Moreover, the criticality analysis method developed by Renault is becoming
a benchmark. In September 2011, France’s Interministerial Committee
for Strategic Metals (COMES) asked Renault to oversee an industry-wide
working group to identify and assess the needs of French industries for
strategic commodities. All industry sectors now have access to a tool for
self-diagnosing exposure to commodity risk. This tool can form the basis of
an overall approach to risk management, with public authorities providing
support in respect of any priority areas for action that might be identified.
1.5.2 OPERATIONAL RISK
1.5.2.1 SUPPLIER RISK ✦
RISK FACTORS
Parts from suppliers account for 57% of the total vehicle cost price. As such,
the technical, logistical and financial performance of Renault’s suppliers is
critical to the Group’s business. Any failure on the part of suppliers, whether
in relation to the quality of parts delivered, logistical problems, deteriorating
financial health or reputational loss, has a considerable impact on both
production at Renault plants and the smooth running of projects.
Volumes purchased from key suppliers across the entire Group are weighted
as follows:
W TOP 1: 5%;
W TOP 5: 16%;
W TOP 10: 25%.
METHODOLOGY
Risk is mainly managed in four ways:
W by drawing up and issuing standards that serve as a benchmark;
W by detecting non-conformity with standards;

Find out more at www.renault.comREGISTRATION DOCUMENT RENAULT 201382
THE RENAULT GROUP1 RISK FACTORS
W by applying a “filter” to sourcing processes to help buyers identify non-
compliant suppliers;
W by taking corrective action if a major or critical non-conformity is detected
in relation to a supplier.
STANDARDS AND DETECTION OF NON-CONFORMITY
Operational and financial risk
Financial analysis is undertaken by a worldwide network of Renault Nissan
analysts using a matrix of criteria shared by Renault and Nissan.
Such analyses are completed annually for suppliers considered strategic
using a list of criteria including, in particular, the risk of supply shortages. They
are also completed whenever new purchases are made from non-strategic
suppliers.
Buyers rate parts suppliers for operational and strategic risk annually using a
grid that includes criteria linked to company management, competitiveness
and investment capacity, future-proofing of technology and dependence on
Renault.
Risk of natural disaster: Business Continuity Plan
Renault and Nissan learned lessons from efficient intervention by teams
tasked with restarting the supply chain for Group production sites following
the natural disasters that occurred in Japan and Thailand in 2011.
As a result of this learning, all suppliers considered for a given project are
reviewed to assess their back-up solutions in the event of a natural disaster.
Suppliers located in high-risk areas must undertake to have at their disposal
two sites in different countries or propose an alternative that will enable them
to resume supplies in less than four weeks. They must also ensure that their
own supply chain meets this requirement.
CSR risk ✦
Renault has established a number of CSR standards for its suppliers (see
chapter 2.2.3.1 ), which serve as a reference framework for the Group’s CSR
assessments.
The Group carries out two complementary types of assessment. Priority is
given to assessing suppliers using a risk mapping based on an evaluation
of risks arising from the manufacturing process (safety, working conditions
and the environment) combined with country risk information (on respect for
human rights, corruption, environmental risk, political risk, etc.) supplied by
the agency OEKOM :
W the first type of assessment is based on field observation at production
sites. Such assessments are carried out in-house by Renault experts (1,544
had been completed by end December 2013), and include questions on
working conditions and the environment;
W the second type of assessment is based on CSR management at supplier
groups and carried out by a third party. Groups are selected on the basis
of purchasing volumes or the risk arising from their production activities;
523 groups, representing 74.5% of Renault’s 2013 revenue, have already
been assessed. The assessment questionnaire includes questions on
environmental management, working conditions and human rights, ethics
and supply chain management. While Renault has outsourced analysis of
the questionnaire to an external specialist, the Group accepts all official
rankings proposed by suppliers. An equivalence scale has been established
to facilitate the use of this information.
Annual assessments of supplier sites (by number) at 31 December 2013
2007 2008 2009 2010 2011 2012
71 151 247
549
1,091
1,316
2013
1,544
Plant (1st) Plant (2nd) Plant (3nd) Sites (cumulated)
2,000
1,500
1,000
500
600
500
400
300
200
100
Suppliers are regularly assessed, as Renault wants to have the most recent
data. Those who obtained insufficient results will be reevaluated following
their action plan. In both cases of re-evaluation, the result only counts once:
the year of the last evaluation. That’s why values from former years can
change over time.
Annual assessments of groups (by number)
2010 2011 2012
4898
387
2013
523
BOP* NBOP** Cumulated
400
500
600
300
200
100
* Bought out parts** Non bought out parts
At end December 2013, 95% of high-risk suppliers (based on a combination
of process and country risk) had been assessed and all necessary action
plans were either in progress or had been completed.
All information arising from these assessments is made available to the
Group’s buyers via an online platform.
An action plan is requested whenever a supplier’s score does not meet
Renault’s requirements, irrespective of the reason. Furthermore, where
a critical non-conformity is suspected or confirmed during an internal
assessment, an external audit may be required, along with an action plan to
address the non-conformity.
The Purchasing Sustainable Development department carries out monitoring
to ensure that action plans are properly rolled out and requests practical proof
of implementation. Once an action plan has been completed, the relevant site
or group is reassessed.

REGISTRATION DOCUMENT RENAULT 2013✦ Global Reporting Initiative (GRI) Directives 83
THE RENAULT GROUP 1
1
RISK FACTORS
The opinion of the Purchasing Sustainable Development department is
communicated to buyers in the form of a “Go/No go” decision. If a buyer
wishes to use a supplier with a poor CSR ranking, he/she must obtain an
action plan against which the supplier will be monitored until the minimum
acceptable CSR score is achieved.
Quality risk
Suppliers’ quality management systems are assessed by more than 300 quality
experts worldwide via a shared audit with Nissan based on the ISO TS 16 949
standard. All new suppliers are assessed before being accepted, as are all
suppliers responsible for a mass production quality defect.
All suppliers failing to achieve the required minimum rating are supported by
quality experts until they reach this level. All suppliers must have a positive
quality rating before they can be accepted.
At end 2013, 230 assessments had been completed, 30% of which involved
re-rating a supplier after an improvement plan had been put in place.
Capacity risk
Other types of risk (capacity risk, logistical risk, etc.) are handled by
operational purchasing departments. In the event of an established failure,
these departments implement replacement solutions, sometimes within very
short timescales, using the supplier base to ensure continuity of supply.
The following points are regularly examined via operating performance
reviews: engineering excellence, ability to respond to demand in terms of
volume, quality, costs and lead times, and appropriate logistical capability.
Suppliers’ ability to deliver projected volumes of parts to Group production
sites is continually audited using the “capacity benchmarking” process.
The capacity benchmarking process is the Renault group’s standard process
for managing its capacity over a two-year time horizon.
Capacity requirements are calculated down to individual component level on
the basis of weekly volumes to be met by the industrial system (encompassing
both suppliers and production sites).
The scope and frequency of capacity surveys may vary in line with capacity
risks and opportunities identified by the Renault group.
After being assessed by the Renault group, responses to the capacity
survey from suppliers and production sites are used to validate the capacity
benchmarking process.
The capacity survey is carried out via a global information system
(DCP@Renault).
Every year, almost 10,000 parts are examined in this way.
FILTERING AND RESPONDING TO NON-CONFORMITIES
Information on supplier risk is made available to buyers via computer systems
and used for sourcing purposes. Risk ratings are incorporated into supplier
comparison and selection tools (the Alliance Sourcing Committee Sheet). This
ensures that any non-conformities are immediately visible to buyers.
Including in particular financial and strategic ratings, undertakings to resume
production following a natural disaster, quality ratings, CSR commitments
(signature of the Declaration of Fundamental Employee Rights/DDSF, the
agreement on CSR guidelines, etc.) and CSR scores obtained via assessments.
Suppliers identified as being at risk are presented at bimonthly Risk Committee
Meetings. The committee, which has a wide-ranging remit, is chaired by the
Purchasing department and brings together all affected functions: finance,
legal, financial control, logistics, communication, public affairs and HR. It
decides on the measures to be adopted to ensure long-term security of supply.
1.5.2.2 GEOGRAPHICAL RISK
RISK FACTORS
The Group has an industrial and/or commercial presence in many countries,
some of which carry various risks: GDP volatility, economic and political
instability, social unrest, regulatory changes, payment collection problems,
fluctuations in interest and exchange rates, lack of foreign currency liquidity,
and foreign exchange controls. For example, Renault faces difficulties in
repatriating funds from Iran, and has noted a hardening of regulations in
Argentina resulting in delays in intra-group transfers.
MANAGEMENT PROCEDURES AND PRINCIPLES
All decisions to set up manufacturing operations form part of an overall Group
growth strategy that factors the risk of instability into an overall industrial
approach.
The Group also seeks to continually increase local integration at its production
facilities so as to make them more competitive in the local market. The
geographical distribution of Renault’s industrial and commercial investments
outside Europe helps diversify the Group’s risk, since GDP and solvency
trends vary from region to region.
With regard to industrial investment, to which the Group does not hedge its
exposure as a rule, the cost of risk is taken into account when calculating
the expected return on investment. An exception is Iran, where Renault’s
investments are partially guaranteed by a credit insurer.
With regard to trading flows, the Group hedges against the risk of non-
payment for most payments originating from high-risk countries. The main
exceptions are sales to Renault subsidiaries and countries where hedging
is not available; in the latter category, the risk is chiefly concentrated in Iran
(arrangements for provisioning this risk are detailed in chapter 4, Note 6-E
to the consolidated financial statements . The two main hedging instruments
used are bank guarantees (documentary credits, standby letters of credit and
first-demand guarantees issued by top-tier banks) and guarantees from credit
insurers. Residual country risk is regularly monitored.
In order to centrally manage the risk of non-payment and put in place
hedges on competitive terms, the Group has designed a “hub and spoke”
invoicing system. Manufacturing subsidiaries sell their export production
to Renault s.a.s., which sells it on to trading subsidiaries and independent
importers, granting them supplier credit. The associated risk is managed
by the parent company. Some sales between countries covered by customs
agreements do not use this system. In such cases, the exporting subsidiary
is responsible for managing its risks, with business support provided by the
parent company.
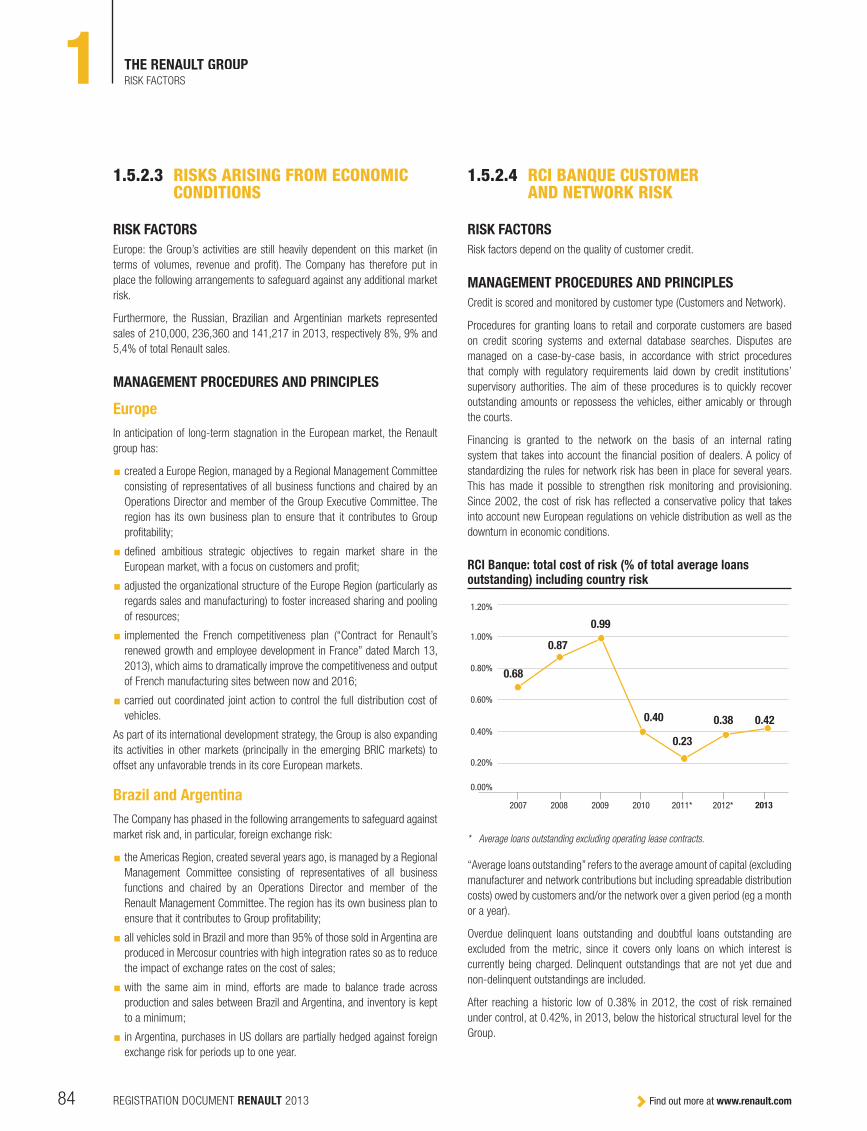
Find out more at www.renault.comREGISTRATION DOCUMENT RENAULT 201384
THE RENAULT GROUP1 RISK FACTORS
1.5.2.3 RISKS ARISING FROM ECONOMIC CONDITIONS
RISK FACTORS
Europe: the Group’s activities are still heavily dependent on this market (in
terms of volumes, revenue and profit). The Company has therefore put in
place the following arrangements to safeguard against any additional market
risk.
Furthermore, the Russian, Brazilian and Argentinian markets represented
sales of 210,000 , 236,360 and 141,217 in 2013, respectively 8%, 9% and
5,4% of total Renault sales.
MANAGEMENT PROCEDURES AND PRINCIPLES
Europe
In anticipation of long-term stagnation in the European market, the Renault
group has:
W created a Europe Region, managed by a Regional Management Committee
consisting of representatives of all business functions and chaired by an
Operations Director and member of the Group Executive Committee. The
region has its own business plan to ensure that it contributes to Group
profitability;
W defined ambitious strategic objectives to regain market share in the
European market, with a focus on customers and profit;
W adjusted the organizational structure of the Europe Region (particularly as
regards sales and manufacturing) to foster increased sharing and pooling
of resources;
W implemented the French competitiveness plan (“Contract for Renault’s
renewed growth and employee development in France” dated March 13,
2013), which aims to dramatically improve the competitiveness and output
of French manufacturing sites between now and 2016;
W carried out coordinated joint action to control the full distribution cost of
vehicles.
As part of its international development strategy, the Group is also expanding
its activities in other markets (principally in the emerging BRIC markets) to
offset any unfavorable trends in its core European markets.
Brazil and Argentina
The Company has phased in the following arrangements to safeguard against
market risk and, in particular, foreign exchange risk:
W the Americas Region, created several years ago, is managed by a Regional
Management Committee consisting of representatives of all business
functions and chaired by an Operations Director and member of the
Renault Management Committee. The region has its own business plan to
ensure that it contributes to Group profitability;
W all vehicles sold in Brazil and more than 95% of those sold in Argentina are
produced in Mercosur countries with high integration rates so as to reduce
the impact of exchange rates on the cost of sales;
W with the same aim in mind, efforts are made to balance trade across
production and sales between Brazil and Argentina, and inventory is kept
to a minimum;
W in Argentina, purchases in US dollars are partially hedged against foreign
exchange risk for periods up to one year.
1.5.2.4 RCI BANQUE CUSTOMER AND NETWORK RISK
RISK FACTORS
Risk factors depend on the quality of customer credit.
MANAGEMENT PROCEDURES AND PRINCIPLES
Credit is scored and monitored by customer type (Customers and Network).
Procedures for granting loans to retail and corporate customers are based
on credit scoring systems and external database searches. Disputes are
managed on a case-by-case basis, in accordance with strict procedures
that comply with regulatory requirements laid down by credit institutions’
supervisory authorities. The aim of these procedures is to quickly recover
outstanding amounts or repossess the vehicles, either amicably or through
the courts.
Financing is granted to the network on the basis of an internal rating
system that takes into account the financial position of dealers. A policy of
standardizing the rules for network risk has been in place for several years.
This has made it possible to strengthen risk monitoring and provisioning.
Since 2002, the cost of risk has reflected a conservative policy that takes
into account new European regulations on vehicle distribution as well as the
downturn in economic conditions.
RCI Banque: total cost of risk (% of total average loans outstanding) including country risk
0.23
0.420.38
0.99
0.87
0.68
0.40
0.00%
0.20%
0.60%
0.40%
1.00%
0.80%
1.20%
2012*2011*2010200920082007 2013
* Average loans outstanding excluding operating lease contracts.
“Average loans outstanding” refers to the average amount of capital (excluding
manufacturer and network contributions but including spreadable distribution
costs) owed by customers and/or the network over a given period (eg a month
or a year).
Overdue delinquent loans outstanding and doubtful loans outstanding are
excluded from the metric, since it covers only loans on which interest is
currently being charged. Delinquent outstandings that are not yet due and
non-delinquent outstandings are included.
After reaching a historic low of 0.38% in 2012, the cost of risk remained
under control, at 0.42 %, in 2013, below the historical structural level for the
Group.

REGISTRATION DOCUMENT RENAULT 2013✦ Global Reporting Initiative (GRI) Directives 85
THE RENAULT GROUP 1
1
RISK FACTORS
This cost of risk correspond to provisions for non-recoverable outstanding
and doubtful loans as well as abandoned outstanding loans and provisions
for country risks.
This is translated into the account for a charge of 101,6 MEUR en 2013,
corresponding to 0.42% of total average loans outstanding.
1.5.2.5 DISTRIBUTION RISK
RISK FACTORS
The types of risk to which Renault is exposed depends on the type of
distribution channel involved:
W at commercial import subsidiaries, the main risks relate to the use of sales
and marketing resources;
W at importers, the main risk relates to their financial health;
W within the network of proprietary distribution subsidiaries, which in Europe
are grouped together under the umbrella of Renault Retail Group, Renault’s
risks primarily relate to decentralization and the diversity of these entities;
W the financial health of dealer networks is also a source of risk.
Another risk related to the Group’s commercial activities is the risk of
customer default.
MANAGEMENT PROCEDURES AND PRINCIPLES
Import subsidiaries
Central and local systems and procedures have been put in place to enable
the Group’s import subsidiaries to control financial assistance paid to the
network and monitor its cost.
In some countries, independent auditors carry out inspections to ensure that
subsidiaries can substantiate the assistance they receive.
Furthermore, an annual internal control self-assessment has been put in place
using a tool designed in conjunction with the Internal Control department.
In 2007, the Sales and Marketing department began rolling out a tool for
the payment and monitoring of financial assistance provided to the network
(Planet).
Importers
Hedging of commercial risks is included in the contracts that Renault signs
with importers.
Such hedging may be:
W undertaken by the importer by issuing banking instruments (documentary
credits, first demand guarantees and standby letters of credit);
W taken out by Renault in the form of export credit insurance policies.
Hedging instruments must be put in place before trading activity with
importers begins.
European distribution subsidiaries (Renault Retail Group)
Internal control at the Group’s distribution subsidiaries (Renault Retail Group)
is based on a set of standards and procedures. Annual self-assessments
are carried out using internal control quality tools developed by RRG Internal
Control in conjunction with the Internal Audit department, which carries out
regular audits to verify that the system is operating effectively.
Dealer network
Renault and RCI Banque jointly monitor the financial position of dealerships
in countries in which RCI Banque operates. A dealer rating system is used to
prevent and limit the risk of default. In other countries, Renault puts in place
a credit monitoring system.
Risk Committee Meetings are held monthly in countries in which RCI Banque
operates. For Central Europe, a Risk Supervision Committee meets at head
office every four months to review monthly operating reports on the network’s
financial position and the status of receivables.
Default risk is transferred to RCI Banque in those geographical regions in
which RCI has special purpose vehicles to carry risk arising on the network
and personal customers. If RCI Banque cannot handle this risk, Renault either
carries it directly or transfers all or part of the risk to local banks.
In 2007, a reporting system was introduced as part of the credit management
system, including indicators for monitoring Automotive’s trade receivables.
These tools improve the monitoring and management of payment terms and
help manage customer risk and portfolio quality more effectively.
1.5.2.6 INDUSTRIAL RISK
RISK FACTORS
The Group’s exposure to industrial risk is potentially significant as a result
of the production of certain models and components being concentrated at
one or two sites (see the table of manufacturing sites in chapter 1.1.4.1)
and the interdependence of its production facilities. For the past 20 years, in
consultation with its insurers, the Company has therefore adopted an ambitious
and rigorous prevention policy which is now applied at all production sites.
This policy covers personal safety as well as property security and business
continuity.
MANAGEMENT PROCEDURES AND PRINCIPLES
For many years, the Group has endeavored to reduce the risk of fire,
explosion and machine breakdown, giving priority in this effort to production
sites, as well as engineering and testing centers and the most strategically
important logistics platforms. Most existing plants have achieved a high
level of prevention and protection, recognized via the “Highly Protected Risk”
(HPR) rating, an international standard awarded by insurance companies
that verify the application of prevention and protection rules every year (and
systematically for all new projects) across more than 50 sites. More than 90%
of the insured capital within the industrial, engineering and logistical scope
covered by the Renault group’s general insurance programme has received
the “Highly Protected Risk” rating from the Group’s insurers, in recognition
of efforts made and in line with the HPR programme rollout plan. This high
degree of control over risks, which is recognized by insurers, has a direct
positive impact on the terms at which the Group is able to buy insurance
cover.

Find out more at www.renault.comREGISTRATION DOCUMENT RENAULT 201386
THE RENAULT GROUP1 RISK FACTORS
Risks related to natural disasters such as storms, flooding, typhoons (mainly
in South Korea) and earthquakes (particularly in Romania, Chile, Turkey and
Maroco) are incorporated into the Group’s prevention policy.
The prevention policy is supported, in particular, by a specialized central
team that works with the Group’s insurers to define and update standards for
worldwide application, as well as taking part in all projects to modernize or
extend existing plants or open new ones. This France-based central team is
supported by regional hubs in Spain, Romania and South America, as well as
a network of field teams at each production site.
1.5.2.7 ENVIRONMENTAL RISK
RISK FACTORS
Alongside the systems and policies (described in chapter 2.4 , “Environmental
Dimension ”) put in place to reduce the environmental impact of vehicles in
the design, manufacture, operation and recycling phases, environmental risk
at Renault also covers environmental impacts arising from malfunctioning
facilities, harm to individuals, and pollution caused by past activities.
MANAGEMENT PROCEDURES AND PRINCIPLES
Although Renault has no high environmental risk facilities, it has put in place
a management system to guard against environmental risk. This system is
ISO 14001 certified and has, since 2005, been integrated into the Renault
Production Way in the form of instructions on the management of chemical
products and waste at workstations.
A team of business specialists coordinates the tasks performed by the
system. These specialists are supported at each production site by a network
of local teams. Techniques and structures for identifying risks, quantifying
their impact, organizing prevention and protection, and defining controls are
implemented at all the Group’s manufacturing sites.
Methods and tools have been defined for every stage of the environmental
risk management process: risk identification, choice of prevention and/or
protection solutions, management and training procedures, and a scorecard
of impact data that is checked by the statutory auditors.
1.5.2.8 IT RISK
RISK FACTORS
The Renault group’s business depends in part on the smooth running of the
Group’s IT systems. These are under the responsibility of the Information
Systems department (DI-R), which has put in place a security policy, technical
architecture and processes to combat risks associated with the following:
W partial destruction of the Group’s data center, which hosts around 3,000 IT
applications. Redundancy is built into the 11 applications that support
strategic business processes so that they can restart in less than a week
in the event of an incident. It would take several months to restart all the
Group’s IT applications;
W cyber crime: computerized attacks on Renault, for example in response to
events widely reported in the media such as site closures, or simply with the
aim of deriving benefit (through the resale of information, blackmail, etc.).
Such attacks aim to steal or corrupt sensitive data (i.e. confidential or
personal information), crash applications or the Group’s entire intranet
network, and deface web sites. All companies, including those in the
manufacturing sector, are targeted by such attacks. Furthermore, the
Renault group’s exposure to such threats is likely to increase with the
development of connected vehicles, with attacks targeting in-vehicle
systems (both Renault and partner applications);
W industrial espionage targeting sensitive data;
W non-compliance with legislation governing IT-related activities: protection
of personal data, professional secrecy, the Act on confidence in the digital
economy, etc.
The occurrence of these types of risks can adversely affect the Group’s brand
image as well as its financial position and/or competitive advantage.
MANAGEMENT PROCEDURES AND PRINCIPLES
Risks are controlled, in particular, through the following:
W the IT Risk Committee, which is chaired by a member of the Renault
Management Committee and coordinated by Group IT Security, under
Renault’s Information Systems department (DSIR), in conjunction with
the Information Management Programme department. This committee
consists of representatives from the business lines (business information
systems security managers – RMSSIs) and Risk Management department;
W management of data security within each business by the designated
RMSSI;
W committees coordinated by Renault Group IT Security, which carry out
checks at operational level to verify the effective application of IT security
procedures, in line with the information systems security policy and best
practice;
W a process for defining security requirements, which must be able to adapt
as technologies evolve (an example being the development of cloud-
based offerings). This process is used within IT projects, depending on the
criticality of the applications and data used;
W a high level of protection for the Group’s IT network, such that resources
can safely be used not only by suppliers and partners but also by entities
based in high-risk countries;
W awareness-raising activities;
W compliance checks carried out jointly by Renault’s Information Systems
department and Prevention and Protection department (D2P).
Key IT security projects carried out in 2013 covered the following areas:
W maintaining the inventory of applications supporting strategic Group
processes, to ensure that those applications can be restarted as a priority
in the event of an incident;
W maintaining the inventory of systems hosting confidential data (types A and
B) and personal information;
W security support for strategic international partnership projects (Russia,
China, Algeria, etc.);

REGISTRATION DOCUMENT RENAULT 2013✦ Global Reporting Initiative (GRI) Directives 87
THE RENAULT GROUP 1
1
RISK FACTORS
W project support in drawing up contracts with suppliers for the purchase of
“cloud” services;
W actions to improve intranet and mobile handset security;
W work to detect advanced attacks on sensitive areas of the Company;
W intrusion testing on systems installed in connected vehicles;
W periodic vulnerability testing on around 750 machines supporting Renault
applications accessible via the Internet;
W coordination of the Group’s network of security correspondents within its
various business lines;
W tooling and training to support a new process for integrating security into
projects.
1.5.2.9 INSURING AGAINST OPERATIONAL RISK
Within the Renault group, protection against operational risk has three facets:
W high-impact, low-probability risks are transferred to the insurance and
reinsurance markets;
W common risks that are statistically known and whose financial impact
can be predicted are provisioned by the Group, unless there is a legal
requirement to insure them;
W the Group negotiates global insurance policies that provide Group-wide
cover.
The Insurance department conducts negotiations and directly entrusts
financially solvent insurers with these worldwide programmes. In 2013,
two programmes were renegotiated and placed jointly with Nissan, thereby
becoming Alliance programmes (“Property damage and business interruption”
and “Transportation and storage”). The Insurance department is directly
involved in defining the Group’s prevention and protection policy. As such,
the nature and scope of cover is determined via a preliminary risk analysis of
operating entities. This approach is used for the following types of risk:
W “Transportation and storage of vehicles in depots”: the Alliance buys a
capacity of €220 million per claim in four lines from around ten insurers,
with deductibles of €100,000 per claim for damage to vehicles in depots
and €45,000 per claim involving overland or air shipment;
W “Property damage and business interruption”: the Alliance buys a capacity
of €1.5 billion per claim in five lines from around ten insurers with sub-
limits on some types of claim, in particular natural disasters and machinery
breakdown. Consequential operating losses are assessed at Group-
wide level. Deductibles for the Group’s manufacturing activities amount
to €5 million per claim. Deductibles for commercial activities amount to
€8,000 per claim;
W “Civil liability”: the Group buys a capacity of €100 million in two lines
covering general civil liability and civil liability related to products, the
environment and repairs made by Renault Retail Group’s sales subsidiaries.
Renault’s insurers partially reinsure these worldwide programmes with Motor
Reinsurance Company (MRC), a captive insurance company wholly owned
by the Group. Renault’s policy is to reinsure high-frequency risks through its
captive and pool low-frequency high-impact risks on the insurance market by
contracting with outside insurers. This policy has enabled the Group to keep
the cost of insurance services from outside insurers almost constant, despite
the Group’s continuous expansion in international markets.
MRC mainly operates as follows:
W “Transportation and storage of vehicles in depots”: MRC covers up to
€10 million per incident, with a maximum total annual commitment of
€25 million. The Group has decided to cover certain depots exposed to
natural hazards, such as storms or hail, in particular in Slovenia, Brazil,
Spain and Algeria;
W “Property damage and business interruption”: €18 million per incident,
subject to a maximum total annual commitment;
W “Civil liability”: up to a maximum total annual commitment of €2.3 million;
W “Group employee benefits”: subject to a maximum total annual commitment
of €7.5 million.
Finally, some risks, such as defects covered by manufacturer’s warranties and
vehicle recall campaigns, are not insured.
The reasons for keeping deductibles high include the Group’s consistent
policy of prevention, and a desire to make each risk-bearing sector more
accountable.
A plan to extend MRC’s operations to include risks associated with purchases
of the Group’s receivables is being studied. No significant changes to the risk
transfer policy are planned for 2014.
1.5.3 OTHER RISKS
1.5.3.1 LEGAL AND FISCAL RISKS
RISK FACTORS
Legal and arbitration proceedings
In the normal course of its business, the Group is involved in various legal
proceedings. Generally, all known legal disputes in which Renault or Group
companies are involved are reviewed at the year-end. After seeking the
opinion of the appropriate advisers, the Group sets aside any provisions
deemed necessary to cover the estimated risk.
In the last twelve months, there have been no government, court or arbitration
proceedings (including any pending or potential proceedings of which the
issuer is aware) that could have or have recently had a material impact on the
financial position, the activities or the results of the Group.

Find out more at www.renault.comREGISTRATION DOCUMENT RENAULT 201388
THE RENAULT GROUP1 RISK FACTORS
Joint venture risk
The Group has entered into joint venture agreements with other companies of
international standing or state-owned companies. In each of these entities, the
Group exercises a predominant or significant influence, and these operations
do not involve any particular associated risks.
Regulatory changes
Renault has to abide by all laws applicable to companies, and seeks to adopt
a faultless attitude. It requires subsidiaries to comply with local regulations in
countries in which the Company operates. To safeguard against risks arising
from regulatory changes, Renault is engaged in ongoing dialog with national
and regional authorities responsible for specific regulations applicable to
products in the automotive industry.
On September 14, 2004, the European Commission issued a proposed
directive amending Directive 98/71 on the protection of designs and models.
The proposal calls for the abrogation of protection of spare parts under
design law. This proposal was approved by the European Parliament, with an
amendment providing for a five-year transition period. However, the proposal
has yet to be adopted by the European Council of Ministers owing to the
co-decision process for the adoption of EU directives. As such, the transition
period has not yet begun and existing Member State legislation still applies
to designs and models. The sale of copies of spare parts after this date
could have a negative impact on Group earnings, given that around 1.5% of
Renault’s revenue arises from the sale of so-called captive parts, which are
protected under design law.
Granting of licenses for industrial property rights
The Group may use patents held by third parties under licensing agreements
negotiated with those parties.
Every year, Renault s.a.s. files several hundred patents (see chapter 1.4)
some of which are covered by fee-paying licenses granted to third parties.
As part of the sale of Renault V.I. to Volvo, Renault granted the Volvo group a
license to use the Renault brand name in an agreement signed on January 2,
2001 for commercial vehicles (3.5 tonnes and over). This is a perpetual
worldwide license and is used by the Volvo group at its own risk.
MANAGEMENT PROCEDURES AND PRINCIPLES
The risks identified above are controlled by implementing prevention policies
in the realms of health and safety at work, the industrial environment,
intellectual and industrial property rights in relation to vehicle safety, the
quality of the Group’s products and services, and legal protection for the
Group’s operations.
From a legal standpoint, internal control in respect of these risks is based on
two main guidelines:
W reporting, which relies on the networking of the legal function within
the Renault group via a dual system of both hierarchical and functional
reporting;
W the precautionary principle, which stems from two factors:
W each member of the legal function has a highly developed sense of
responsibility and is used to working on a cross-functional and ethical
basis at all times,
W legal teams are brought in at a very early stage for major cases and play
a proactive role in solving subsequent disputes.
RESEARCH TAX CREDIT The research tax credit, or CIR, introduced by the French government applies
to a portion of the Group’s R&D spend in France. The average basis of
assessment adopted in recent years to compute the CIR (i.e. €800 million) is
approximately 50% of total R&D outlays. The CIR tax rules apply to this basis.
Naturally, there is a risk of tax inspection. To mitigate it, we endeavor to
scrupulously follow the recommendations made by the authorities and our
auditors. Provisions are set aside for potential risk.
1.5.3.2 RISK ARISING FROM PENSION LIABILITIES
Renault operates in countries in which, as a rule, pension systems are
publicly run. Renault’s liabilities in this respect consist primarily of retirement
compensation, as specifie in note 20 to the consolidated financial statements.
These liabilities may be sensitive to changes in the parameters used to
calculate them (funding, labor characteristics, interest rates, etc.).
MANAGEMENT SYSTEMS AND POLICIES
These pension commitments are monitored as part of centralized risk
management, based on regular valuations, and any significant change to the
plan undergoes a process of approval by the CEO.
Over the past ten years, the Group’s policy has been to avoid implementing
new defined-benefit plans, in favor of defined-contribution plans, which by
nature do not generate actuarial liabilities.

REGISTRATION DOCUMENT RENAULT 2013✦ Global Reporting Initiative (GRI) Directives 89
THE RENAULT GROUP 1
1
DRIVE THE CHANGE
1.6 DRIVE THE CHANGE ✦
The Renault 2016 – Drive the Change plan, unveiled on February 10, 2011,
is built on Renault’s ambition of making sustainable mobility accessible to all.
This ambition is embodied in the brand signature, Drive the Change.
The Renault group’s strategic plan covers a six-year period.
Renault 2016 – Drive the Change is designed to meet two objectives:
W deliver growth for the Group;
W generate sustainable free cash flow.
With, for the 2011-2013 period:
W more than 3 million vehicle sold in 2013;
W a minimum of €2 billion in cumulative operational free cash flow.
To achieve these objectives, the Renault group makes use of seven key
drivers:
W a continuing policy of innovation;
W a robust product plan;
W a strengthened Renault brand;
W the excellence of our network in managing customer relations;
W optimized R&D and investment expenditures;
W reduced costs;
W steady positions in Europe and international expansion.
Midway through the plan, at end-2013, the following results are noteworthy:
W the Renault group surpassed its objective for 2011-2013, with €2.5 billion
in cumulative free cash flow.
SUCCESS OF THE NEW RENAULT AND DACIA VEHICLES
The renewal of the Renault range is off to a good start. New Clio is No. 1 in
France and No. 3 in Europe. Captur is the best-selling crossover in France and
No. 1 in its segment in Europe. A pioneer in zero-emissions mobility, Renault
has kept its word by bringing to market a complete range of electric vehicles.
A BETTER-BALANCED GEOGRAPHIC MIX
On the international front, the Group has increased its penetration of its main
markets. The proportion of total sales outside France rose from 38% in 2010
to more than 50% in 2013. Brazil and Russia have become, respectively, the
Group’s second- and third-largest markets. The unique positioning of the M0
range is paying off, as the popularity of Duster, the Group’s best-selling car in
2013, is demonstrating.
INITIATIVES IN 2014-2016
CONTINUING RENEWAL OF THE PRODUCT RANGE
W The Renault group is going to step up the renewal of its range, beginning
in the autumn of 2014 with new Twingo and new Trafic, then with the
successors to Espace, a new D segment vehicle and the successors to
Megane and Scénic. These vehicles will be based on the common Alliance
platform with 3 million vehicles for the C and D segments.
W At the same time, the Group is going to increase its market coverage with
a comprehensive range of crossovers and an entry range vehicle (A-entry)
for India and Latin America as well as new models of light commercial
vehicles (pick-ups) for international marketing.
INTERNATIONAL EXPANSION AND FRESH AMBITIONS IN EUROPE
W Following a successful start, the Group is aiming for a market share above
8% in Brazil and Russia and above 5% in India.
W China is a priority for the coming years. A plant with a capacity of
150,000 vehicles a year is being set up at Wuhan, and a range of products
based on the C and D segment crossovers is planned.
W In Europe, the Renault brand’s aim is to reclaim its second-place ranking
among full-line manufacturers with a renewed range of connected, user-
friendly and environmentally responsible vehicles. Meanwhile, the Dacia
brand will seek to reinforce its leadership in its category.

Find out more at www.renault.comREGISTRATION DOCUMENT RENAULT 201390
THE RENAULT GROUP1 DRIVE THE CHANGE
STRENGTHENING COMPETITIVENESS
W The Renault group is counting, first, on scale effects and a boost in
competitiveness from the sharing of platforms and architectures (CMF),
which will apply to more than 80% of future launches, and second, on
standardized modules, which will make up two-thirds of the value of future
vehicles.
W More local sourcing and better use of industrial capacities will round out
the strategy aimed at controlling vehicle costs.
W The Group will reap the benefits of the competitiveness plans signed in
France and Spain and the additional volumes supplied by its partners.
W Altogether, the Group expects to achieve a 100% utilization rate for its
capacities in Europe by the end of the plan (calculated on the basis of the
standard definition: two shifts per day).
SYNERGIES IN THE ALLIANCEDevelopment of synergies in the Alliance will contribute to the Renault group’s
profitability. The projects aimed at convergence in purchasing, engineering,
manufacturing and logistics as well as human resources are expected to yield
at least €4.3 billion from synergies at the end of 2016.
CONTROLLING CAPITAL INVESTMENTThis strategy implemented in the framework of the Alliance and its partnerships
increases the number of upstream projects while keeping the ratio of R&D +
CAPEX to revenues under 9%.
TWO OBJECTIVES AT THE END OF PLAN
At the end of the plan, the Renault group is aiming to achieve the following
objectives(1):
W €50 billion(2) in revenues, comprising vehicle sales, related services, and
sales to partners, based on a constant scope;
W sustained profitability, with an operating margin exceeding 5% of revenues
and positive free cash flow each year.
The Group has set ambitious and realistic objectives to be reached at the end
of the Drive the Change plan (measured in 2017):
W revenues of €50 billion(3) ;
W operating margin exceeding 5% of revenues, with a positive free cash flow
each year.
“The strategy defined in the first phase of our Drive the Change plan has
produced results. Thanks to these gains, the Renault group has all the
resources needed to implement an ambitious and realistic second phase,”
said Renault’s Chairman and CEO Carlos Ghosn.
(1) Measured in 2017, the first year of the plan’s full effect. Excluding consolidation of AVTOVAZ(2) Based on exchange rate assumptions agreed upon by the banks in early 2014.(3) Based on exchange rate assumptions agreed upon by the banks in early 2014.
REGISTRATION DOCUMENT RENAULT 2013✦ Global Reporting Initiative (GRI) Directives 91
THE RENAULT GROUP 1
1
POST BALANCE SHEET EVENTS
1.7 POST BALANCE SHEET EVENTS
None

Find out more at www.renault.comREGISTRATION DOCUMENT RENAULT 201392
IN THREE YEARS, BETWEEN 2010 AND 2013 , THE GROUP HAS REDUCED BY
10%
THE CARBON FOOTPRINT PER SOLD VEHICLE*
* See details chapter 2.4.2.1 Energy and Climate change and appendice 2.8.2.1

REGISTRATION DOCUMENT RENAULT 2013✦ Global Reporting Initiative (GRI) Directives 93
The elements of the annual fi nancial report are identifi ed by AFR sign.
2.1 RENAULT, A RESPONSIBLE COMPANY COMMITTED TO SUSTAINABLE DEVELOPMENT ✦ 94
2.1.1 The Renault group vision 94
2.1.2 CSR is a deep-rooted tradition 95
2.1.3 Cross-functional governance 96
2.1.4 Guidelines and standards 97
2.1.5 About SRI reporting ✦ 97
2.2 STAKEHOLDER DIALOGUE AND INFORMATION ✦ 99
2.2.1 Customers ✦ 100
2.2.2 Employees ✦ 101
2.2.3 Suppliers ✦ 102
2.2.4 Investors and financial partners ✦ 103
2.2.5 Residents, local communities and regions 104
2.2.6 Institutions and associations ✦ 104
2.3 LABOR RELATIONS AFR 107
Methodological Note 107
2.3.1 Optimize the allocation of resources 108
2.3.2 Developing talent and promoting diversity 112
2.3.3 Support employee involvement 116
2.3.4 Social dialogue 120
2.4 ENVIRONMENTAL DIMENSION AFR 122
2.4.1 Environmental challenges ✦ 122
2.4.2 Environmental impact: actions and indicators ✦ 123
2.4.3 Cross-company management of environmental issues ✦ 140
2.5 SOCIAL PERFORMANCE ✦ AFR 146
2.5.1 Renault, an active participant in the economic growth and development of its operating regions ✦ 146
2.5.2 Programmes and initiatives implemented for the four priority themes ✦ 149
2.5.3 CSR in the value chain 159
2.6 SUSTAINABILITY RATINGS AND INDEXES 161
2.6.1 Renault’s ratings in 2013 161
2.6.2 Inclusion in socially responsible indexes ✦ 162
2.7 GRENELLE II CROSS REFERENCE TABLE 163
2.8 APPENDICES 167
2.8.1 Appendices concerning labor relations 167
2.8.2 Appendices concerning the environment 168
2.8.3 Appendices concerning social committment 176
2.8.4 Independent verifier’s report on consolidated social, environmental and societal information presented in the management report ✦ 179
2CSR: SUSTAINABLE MOBILITY
Find out more at www.renault.comREGISTRATION DOCUMENT RENAULT 201394
CSR: SUSTAINABLE MOBILITY2 RENAULT, A RESPONSIBLE COMPANY COMMITTED TO SUSTAINABLE DEVELOPMENT
2.1 RENAULT, A RESPONSIBLE COMPANY COMMITTED TO SUSTAINABLE DEVELOPMENT ✦
2.1.1 THE RENAULT GROUP VISION
CARLOS GHOSN, RENAULT
CHAIRMAN AND CEO
No large company can
focus solely on economic
performance without paying
attention to what is going on
around it. Our responsibility –
and our interest – is to get
involved in environmental
issues, as well as in the
corporate and social life of the
countries where we operate.
WE WANT TO ENSURE THAT SUSTAINABLE MOBILITY IS A DRIVER OF WORLDWIDE DEVELOPMENT AND PROGRESS FOR EVERYONE.
The cornerstones of Renault’s approach to corporate, social
and environmental responsibility consist in lessening our
environmental footprint throughout the “lifecycle”, making
sensible use of natural resources, protecting the health of
road-users, local communities and employees, developing
skills, and applying the principle of equal opportunities
based on merit. These fundamental principles reflect
the Group’s capacity for openness to the world and its
determination to respond to society’s expectations.
Mobility is vital to economic development and social cohesion.
In addition to being a source of freedom and pleasure, it serves a
practical purpose and promotes social inclusion. But it can also lead
to accidents and impact on health and the environment, presenting
major challenges on a global scale. Our industry accepts its share of
responsibility in improving everyone’s quality of life.
The challenge facing Renault – a responsible carmaker and pioneer
of sustainable mobility for all – involves developing mobility solutions
accessible to the greatest number, designing innovative technologies
such as electric vehicles with zero emission during use, and consuming
energy and raw materials frugally. We also have to support changes in
behavior and practices, and invent suitable economic models that not
only contribute to the Company’s long-term future but that generate
value-added for stakeholders.
A company is above all a group of women and men whose motivation and
skills are essential sources of competitiveness. That is why Renault pays close
attention to developing its human capital. Throughout the world, we make
it a priority to provide a motivating workplace, training courses that are in
line with the Company’s needs as well as employees’ aspirations, and fair
rules of recognition designed to boost individual and collective performance.
Wherever we operate, we support initiatives to promote education and
diversity, both in higher education and among younger people, particularly
through our Foundations.
In line with our priorities and values, we have set seven goals corresponding to
the most demanding international standards of corporate social responsibility
(CSR):
W apply ethical rules strictly at all levels and pursue fair business practices;
and guarantee our suppliers’ commitment to CSR;
W create motivating employment conditions, in compliance with fundamental
rights, that attract and promote employees in all countries; and encourage
diversity and equal opportunity;
W ensure employability by developing future skills;
W reduce our environmental footprint throughout the vehicle’s lifecycle, and
from one generation to the next, by incorporating the principles of the
circular economy into our processes, products and services;
W contribute to public health objectives: to reduce road deaths, particularly in
developing countries, and do our utmost to protect the health of employees,
users and local communities;
W offer innovative mobility solutions accessible to the greatest number;
W support responsible economic and social development in the countries
where we operate by pursuing initiatives in the fields of education and
access to mobility that are aimed at local communities.

REGISTRATION DOCUMENT RENAULT 2013✦ Global Reporting Initiative (GRI) Directives 95
CSR: SUSTAINABLE MOBILITY 2
2
RENAULT, A RESPONSIBLE COMPANY COMMITTED TO SUSTAINABLE DEVELOPMENT
2.1.2 CSR IS A DEEP-ROOTED TRADITION
First ISO 14001 certified factories.
200420011999
2010 2009 2008
2012
1949 1955
20042005
1962
1960
2007
1998
1989
20112013
2011
1970 1964 1963
2013
SOCIAL
ENVIRONNEMENT
EMPLOYMENT
Renault did not wait until the 1990s and the
emergence of the concept of sustainable
development to act responsibly towards the
societies and ecosystems in which it
operates. Initiatives concerning employee
welfare, society and the environment have
long been engrained in the Company.
Renault Spain Foundation for sustainable mobility.
Creation of Mobiliz Invest (a social enterprise investment fund)(see Sustainable Mobility 2.5.2.1)
Clio IV fitted with an Energy dCi 90 engine: certified emissions of 83g CO2/km.
Tangiers plant, designed on the basis of carbon-neutral technologies with zero industrial effluent discharges.
Contract for a new dynamic of Renault growth and social development of Renault in France.
Global framework agreement on social, employment and environmental responsibility.
Renault contributes to the “Positive Economy” report commissioned by the French president. The Renault-Nissan Alliance takes part in the “third industrial revolution” in the Nord-Pas de Calais region (see 2.2.6).
In Europe, the Group’s passenger cars emit an average 114.8 g/km of CO2.
Renault’s carbon footprint is 10% lighter than in 2010.
Captur is the 15th Brand vehicle (since 2001) to obtain a five-star EuroNCAP rating.
Launch of the electric range: Kangoo Z.E, Fluence Z.E., Tvvizy, ZOE.
Skills and Employment Planning Agreement, designed to adapt the Company’s skills to its strategy requirements and develop employability(see Chapter 2.2.). Renault is a founding partner
of the Ellen MacArthur Foundation for the circular economy.
Instituto Renault do Brasil to implement CSR initiatives in Brazil.
Sustainable Mobility Institute, Renault-ParisTech.
The “Crisis-Period Labor Deal” establishes a welfare maintain the jobs and pay of employees placed on short-time working
Creation of Renault Environnement and acquisition of a stake in Indra (automotive recycling).
Signing of eco2, based on three environmental criteria (manufacturing, emissions and recycling).
Certification of environmental data by the statutory auditors.
Signature of the “Living Agreement” aimed at the development of Renault and the professional, personal and cultural advancement of its employees.
First purification plantson production sites.
Creation of the Laboratory of Accidentology, Biomechanics and Human Behavior (LAB).
A foundation in Spain to fund scholarships for employees’ children.
Launch of the standard replacement activity at the Choisy-le-Roi plant.
Labor Deal: payment for public holidays, third week of paid vacation and introduction of a supplementary pension plan.
Renault Argentina Foundation, providing innovative environmental and mobility initiatives.
Renault has rolled out social initiatives since the 1960s, notably in education.
Institutes and foundations have been regularly set up in the Group’s operating territories.
Fourth week of paid vacation, retirement at 61 for women and 63 for men.
Creation of the Renault industrial hygiene laboratory to closely monitor the chemicals used in Renault plants.
Signing of the Declaration of Employees’ Fundamental Rights, the Diversity Charter.
First Life Cycle Assessment (LCA) of Scénic II.
Renault Corporate Foundation for higher education(see Education 2.5.2.3).

Find out more at www.renault.comREGISTRATION DOCUMENT RENAULT 201396
CSR: SUSTAINABLE MOBILITY2 RENAULT, A RESPONSIBLE COMPANY COMMITTED TO SUSTAINABLE DEVELOPMENT
2.1.3 CROSS-FUNCTIONAL GOVERNANCE
2.1.3.1 CSR IN THE HIGHEST ECHELONS OF THE COMPANY
Corporate social responsibility (CSR) strategies and guidelines are discussed
and decided by the Group Executive Committee. CSR issues are addressed
holistically at this level. Examples include the global framework agreement
for sustainable growth and development in 2013, the supplier CSR policy,
ethics and the risk management roadmap. These are all important subjects
of discussion.
CSR topics are submitted to the agenda of Group Executive Committee
Meetings by managers of entities responsible for coordinating the specific
topics. The main areas of action for CSR are entrusted to three specialist
departments: Human Resources, Corporate Social Responsibility, and
Strategic Environmental Planning. These three entities report to the Chairman
and CEO or a member of the Group Executive Committee.
Each entity is supported by an internal network of representatives in the
Regions and the Group’s major functions and by special entities set up to
develop external partnerships and innovative economic models. When
synergies are identified, the networks are pooled and a single representative
coordinates several CSR topics. This network-based organization, which
is both cost-efficient and cross-functional, ensures that CSR issues are
addressed through organizational structures linked closely to the decision-
making and implementation processes.
In their specialist field, the three entities are responsible for:
W putting forward strategies and objectives to the Group Executive Committee;
W rolling out these objectives within the Company;
W identifying and managing risks and opportunities;
W reporting regularly to the Company’s management bodies and stakeholders
on progress Status reports on major issues are given to the Group Executive
Committee several times a year. As required, the three entities also give
presentations to the Management Committee, the Board of Directors and
the Annual General Meeting;
W maintaining relationships with stakeholders who are interested in their area
of action.
The entities jointly coordinate common projects covering several CSR fields,
such as chemicals management (environment/HR), diversity (CSR/HR), and
relations with the academic community. The CSR department coordinates
cross-functional activities, including the Group’s communications and
sustainability reporting.
Governance scheme CSR
Pu
blic A
ffa
irs
Leg
al A
ffa
irs
Co
mm
un
ica
tio
n
Reg
ion
sE
uro
pe
Eu
rasi
a
Am
eri
ca
sA
sia
– P
acifi
cE
uro
med
- A
fric
a
Fin
an
ce
Pu
rch
asi
ng
En
gin
eeri
ng
Pro
du
ct
Pro
gra
ms
Ma
nu
factu
rin
gLo
gis
tics
Sa
les/
Ma
rketi
ng
Sta
keh
old
ers
Eth
ics
Strategy and Environmental
Planning department
Corporate Social Responsibility department
Group Human Resources department
RenaultEnvironnement
Mobiliz Invest sas
Fondation Renault
Group Corporate Strategy and
Planning department
Cross-functional actions
Chairman and CEO Executive Vice President,
Office of the CEOExecutive Vice President,
Human Resources
Human Resources function network
Environment network
CSR department network
Group Executive Committee, including

REGISTRATION DOCUMENT RENAULT 2013✦ Global Reporting Initiative (GRI) Directives 97
CSR: SUSTAINABLE MOBILITY 2
2
RENAULT, A RESPONSIBLE COMPANY COMMITTED TO SUSTAINABLE DEVELOPMENT
2.1.3.2 CSR IN THE ETHICS AND RISK MANAGEMENT SYSTEM
The Human Resources, Environment and CSR functions also contribute to
corporate programmes to promote ethics and map and manage risks. The
functions are members of the Ethics and Compliance Committee, which
is coordinated by the Ethics department, and assist with the analysis and
mapping of major risks as set out by the Risk Management department.
Major risk factors include risks associated with the CSR performance
of the supplier chain (compliance with employees’ fundamental rights,
environmental management), risks of harm to the environment and individuals
in the event of equipment malfunction, management of pollution caused by
past activities, and changes in raw materials prices (see chapter 1.5 . 1 .6 ).
Other risks, such as the environmental impacts of automotive products (eg
CO2 emissions) are identified as part of the risk mapping process. At present,
risks are controlled effectively and are therefore monitored as part of the
Group’s routine operations.
reporting reporting
coordinationcoordination
Ethics department
Ethics and Compliance Committee
Risk mapping
Risk Management department
Group Executive Committee
Board of DirectorsAudit, Risks and Ethics Committee (CARE)
Corporate Social Responsibility
department
Strategic Environmental
Planning department
Human Resources department
Renault complies with international standards designed to regulate
businesses’ corporate social responsibility practices. The Group factors these
principles into its policies and also implements its own standards.
The main references are:
W the 10 principles of the Global Compact, adopted at the initiative of the
United Nations and signed by Renault on July 26, 2001. The Global
Compact refers to the Universal Declaration of Human Rights, the ILO
Convention, the Rio Declaration at the first Earth Summit and the UN
Convention Against Corruption;
W the OECD Guidelines for Multinational Enterprises, updated May 25, 2011;
W the global framework agreement covering corporate social responsibility,
signed July 2, 2013 and based in particular on International Labor
Organization (ILO) standards;
W the ISO 26000 standard, which the Renault group has recognized as its
benchmark;
W the Group’s ethical Charter, approved by the Renault Board of Directors on
October 3, 2012 (replacing the Code of good conduct).
2.1.5 ABOUT SRI REPORTING ✦
2.1.5.1 FRAMEWORKThe socially responsible investment (SRI) reporting included in this Registration
document has been prepared in accordance with the New Environmental
Regulations Act (2001) and Article L. 225-102-1 of the Grenelle 2 Act of
April 24, 2012 on corporate transparency in CSR practices.
Furthermore, Renault complies with the Global Reporting Initiative’s G3.1
guidelines. GRI indicators are selected in accordance with the materiality
focus of the Renault group. A cross-reference table is supplied in 7.4.3 . All
guidelines used are specified alongside the relevant indicators.
2.1.5.2 MATERIALITY ANALYSISThe SRI information presented in this document has been selected in
accordance with material topics. Each of the three departments in charge of
the Renault group’s HR, social and environmental policies selects the topics
for their area of responsibility.
Material topics are determined using two types of criteria:
W relevant for stakeholders: stakeholder interest expressed and actual or
potential impacts on stakeholders. These criteria are identified through
dialogue with stakeholders (see chapter 2.2) and an analysis of international
guidelines (Global Compact, GRI) and ratings;
W relevant for the Renault group: impacts on the Company’s operations,
economic performance and long-term future.
2.1.4 GUIDELINES AND STANDARDS
Find out more at www.renault.comREGISTRATION DOCUMENT RENAULT 201398
CSR: SUSTAINABLE MOBILITY2 RENAULT, A RESPONSIBLE COMPANY COMMITTED TO SUSTAINABLE DEVELOPMENT
The materiality focus of the topics and information presented is subject
to a critical review by the statutory auditors as part of their verification of
compliance with the Grenelle 2 Act.
2.1.5.3 SCOPEThe target scope of this reporting initiative is identical to that of the Renault
group’s consolidated financial reporting (see chapter 4.2 note 31 to the
consolidated financial statements).
The scope may be smaller for some indicators due to the availability of
data. The scope for each of the CSR indicators is therefore specified when
disclosed.
2.1.5.4 THIRD-PARTY VERIFICATIONThe Renault group has voluntarily asked its statutory auditors to certify the
environmental impacts of its main industrial, office and logistics sites since
1999. This verification is done with the same reasonable level of assurance
as for financial data. The indicators covered by “reasonable assurance” are
listed in chapter 2.8.2. 3 .
Ahead of the implementation of Article L. 225-102-1 of the Grenelle 2 Act
of April 24, 2012, the CSR information presented in this document has been
checked since 2012 by the statutory auditors for accuracy and completeness
(with a moderate level of assurance). The indicators and data covered by
“moderate assurance” are listed in the Grenelle 2 cross-reference table in
chapter 2.7 .

REGISTRATION DOCUMENT RENAULT 2013✦ Global Reporting Initiative (GRI) Directives 99
CSR: SUSTAINABLE MOBILITY 2
2
STAKEHOLDER DIALOGUE AND INFORMATION
2.2 STAKEHOLDER DIALOGUE AND INFORMATION ✦
Under its strategic plan, Drive the Change, Renault has endorsed a primarily
humanistic vision of the automobile and placed people at the center of its
corporate programme. Consistent with its vision, Renault maintains open and
constructive dialogue with stakeholders.
Faced with different expectations, Renault strives to engage in dialogue on a
global scale, partnering major players such as the IndustriALL Global Union
and the International Federation of Red Cross and Red Crescent Societies
as part of the Global Road Safety Partnership. Renault also operates locally,
responding to the questions and needs of customers and local communities.
There are many forms of dialogue. A roadmap of stakeholders and types of
engagement provides an overview of Renault’s initiatives.
RENAULT IN THE EYES OF…
Dame Ellen MacArthur, founder of the Ellen MacArthur
Foundation
“Back in 2010, when I asked Renault to become one of the
main partners of the Foundation, I was certain the Company
would commit to a circular economy that is less dependent
on natural resources. Three years on, I have witnessed a real
change in Renault’s strategy, whether it be on the production
lines at the Choisy plant or in the management team itself.
Choisy has become a benchmark for the viability of the
circular model – and for my public presentations. The circular
economy is currently gaining ground through the Foundation’s
awareness-raising initiatives and economic reports.”
Pieter Venter, CEO, Global Road Safety Partnership
“There shouldn’t be any ownership of knowledge in road safety.
When best practice is established, we need to access the
knowledge, study the data, implement the programmes, monitor
and evaluate them and then review them. But first and foremost
we need to share knowledge. By teaming up with governments
and civil society, companies such as Renault can help to identify,
develop and implement best practice and thereby contribute to the
emergence of road safety solutions that are sustainable because
they are integrated and managed locally.”
Jyrki Raina, General Secretary of IndustriALL Global Union
“The global framework agreement [signed on July 2, 2013]
includes significant improvements in the field of employees’
fundamental rights, notably concerning freedom of association,
health and safety, training, and the environment. IndustriALL
welcomes Renault’s strong commitment to advance these rights
at its suppliers and sub-contractors and promote social dialogue
worldwide.”

Find out more at www.renault.comREGISTRATION DOCUMENT RENAULT 2013100
CSR: SUSTAINABLE MOBILITY2 STAKEHOLDER DIALOGUE AND INFORMATION
STAKEHOLDERS KEY TOPICS KEY PLAYERS BY DEGREE OF CLOSENESS TYPES OF ENGAGEMENT FROM MOST TO LEAST DIRECT
Customers P Quality P Vehicles’ environmental performance, Z.E.
range P Road and vehicle safety P Product safety P Sustainable mobility
P Retail and business customers P Sales network and importers P Consumer groups P Road users/general public
P Services and direct dialogue in the sales network P Customer Relations departments P Training/awareness-raising initiatives P Labels and signatures (Euro NCAP, Eco2) P Website/media
Employees P Corporate strategy and results P Group news P HR, environmental and social policy
P Individual employees P Managers P Employee-representative bodies
P Local management P Local employee dialogue (site, country) P Renault group Works Council P Internal communications
Suppliers P Environmental management P Carbon footprint reduction P Innovation P CSR performance
P Suppliers P Industry bodies
P Supplier management by RNPO: Supplier Account managers, CSR team, Crisis Management team P Industry bodies (FIEV, French automotive industry platform,
Modernization Fund for Automobile Equipment Suppliers) P Renault-Nissan CSR Guidelines for Suppliers
Investors P Labor relations, environmental and social performance P Impacts on results and outlook
P Shareholders, financial institutions P Rating agencies/analysts
P Seminars, roadshows P Investor Relations department P Responses to rating requests P Group Registration document
Local communities P Economic and social development P Level of activity of sites P Environment/noise P Road safety
P Local residents P Elected officials and local authorities P Local associations
P Partnership/local sponsorship contracts P Regional development Charters and agreements P Direct dialogue and plant tours P Procedures for handling complaints from local residents P Plants’ websites/local media
Institutions and associations
P Government regulations and incentives P Z.E. range and development of charging
infrastructure P Circular economy P Road safety
P Industry bodies (CCFA, ACEA, ANFAC, etc.) P Trade representation bodies P Academics and researchers P National, European and international legislators P NGOs/think-tanks P Media
P Partnership contracts (Ellen MacArthur Foundation, research institutes) P Involvement in working groups on different topics P Responses to public consultations P Informal discussions
Renault’s stated goal of being a pioneer of “sustainable mobility for all”
means providing solutions to problems of pollution, global warming and traffic
congestion. It also means developing products and services which fulfill the
need for greater connectivity, safety and affordability and which may be
consistent with a functional economy, favoring use over ownership. In other
words, Renault must contribute to a sustainable ecosystem which satisfies
the aspirations of its different customers as well as citizens as a whole.
In order to meet these many challenges, Renault is relying on:
W the improvement of existing technologies with new generations of low-
emission internal combustion engines;
W the “zero emission” breakthrough programme with a full range of electric
vehicles which improve air quality in cities and produce no odors or engine
noise;
W the adoption of circular economy principles throughout the Company’s
processes;
W the Renault Mobiliz programme, offering mobility solutions to vulnerable
groups in society;
W a TPMR product range (driving and transfer aids for people with reduced
mobility).
Renault has chosen to keep people at the center of its concerns. Renault must
design, manufacture and sell products that meet or anticipate the need for
change which impacts on the mobility of goods and people. It is not up to the
world to adapt to the automobile; it is up to the automobile to adapt to people.
That is Renault’s vision: “Renault is an innovative manufacturer that is close to
its customers and makes sustainable mobility available to everyone.”
This vision of Drive the Change is reflected in customer care processes and
dialogue with customer representatives, such as consumer groups and the
numerous associations linked to the brand that have been set up worldwide.
2.2.1.1 CUSTOMER SATISFACTIONProcesses designed to improve customer satisfaction are based on customer
care standards from the upstream stages (research into expectations and
needs by the Customer Knowledge department and the Product Planning
department) to the downstream stages (eg complaint handling and
management of vehicle recall campaigns).
To improve customer satisfaction, Renault has deployed the Renault Excellence
Plan to guide the processes aimed at providing all customers with greater
satisfaction at all times. This plan consists of 20 “essentials” that impact on
the customer experience during the sales and after-sales processes. In 2011,
Renault launched its global “customer promise” programme – a commitment
to provide flawless service.
In 2013, a Customer department was set up within the Sales and Marketing
department. Its goal is to maximize customer satisfaction by optimizing
the digital and physical customer experience from pre-sales to after-sales.
2.2.1 CUSTOMERS ✦

REGISTRATION DOCUMENT RENAULT 2013✦ Global Reporting Initiative (GRI) Directives 101
CSR: SUSTAINABLE MOBILITY 2
2
STAKEHOLDER DIALOGUE AND INFORMATION
Behavior-based training has been introduced for sales representatives and
staff at customer call centers in order to improve techniques for listening to
customers.
Regular surveys conducted in all countries to evaluate the customer
experience make it possible to react rapidly to market trends and customer
expectations.
Renault also monitors incidents during the warranty period. All the indicators
show progress on quality and reliability.
Around the world, some 700 people are in contact with customers daily in
order to respond to their questions or complaints about all sales and after-
sales issues and provide information about products and services. A trial is
under way in Brazil to test new tools designed to significantly improve the
quality of customer relations in call centers. These solutions may be rolled out
in other countries in 2014.
These two levels of contact ensure that “the customer’s voice” is heard in the
upstream functions of the Company.
ISO 9001 certification of the Sales and Marketing department France (DCF)
and the distribution network in France is tangible proof that this management
system is effective.
For example, to take all these aspects of customer care into account and
further improve our performance, a policy to increase the percentage of
women has been introduced, with a target of women making up 50% of
new hires for the sales force in Renault’s French network. This target was
exceeded in 2012.
2.2.1.2 ENVIRONMENTAL COMMUNICATIONS
ECO2 LABEL
The Renault eco² label was launched in 2007 to highlight the most
environment-friendly and economical cars in the range. This initiative is part
of the ambition to initiate a transparent and open dialogue with customers
regarding progress achieved by Renault at every stage in a vehicle’s
lifecycle. Renault eco² vehicles meet three environmental criteria in terms of
manufacturing, use – for CO2 emissions – and recycling.
In October 2008 the Dacia brand launched its own label, Dacia eco2, based
on the same scoring criteria as the Renault label. In March 2010 Renault also
introduced an eco-label for vans, based on the same criteria for production
and recycling, but with an adapted emissions threshold (195g CO2/km).
In 2011 Renault tightened the eligibility criteria for the eco2 label for
passenger cars and LCVs by lowering the eligibility threshold to 120g CO2/km
and increasing the percentage of recycled plastics required to at least 7%.
End 2013, 75% of the line-up of passenger cars sold in Europe under Renault
and Dacia Brand were available in eco2 version.
In a bid to maintain the label’s high standards and continue to market models
with the smallest ecological footprint, Renault is planning an in-depth review
of the eco² eligibility criteria in 2014.
DISCLOSURE OF LIFECYCLE ANALYSES
In a move to provide transparency about the environmental performance of
its vehicles and respond to requests from an informed public, Renault has
chosen to disclose the lifecycle analyses (LCA) of its electric vehicles.
At end-2013, the LCA of Fluence Z.E., is posted on the Group’s website.
It also includes a critical review by independent experts from outside the
Renault group – proof of the quality and reliability of the LCAs. Kangoo, ZOE
and Twizy LCAs will be available in 2014.
2.2.1.3 ADVERTISINGIn France, Renault submits most of its advertising projects to the French
Regulatory Authority for Advertising (ARPP).
In 2008 Renault signed the responsible advertising Charter drafted by the
National Association of Advertisers (UDA).
In keeping with this Charter, a programme is underway to make
communications to the network paperless using web-based communication.
To economize further on advertising materials, reusable POS materials have
been developed to limit the number of disposable items, which waste large
quantities of paper.
In the area of consumer protection, Renault customer databases are managed
with strict compliance with the rules laid down by the French Data Protection
Agency (CNIL) .
2.2.2 EMPLOYEES ✦
It is Renault’s ambition to create the conditions for in-depth and transparent
dialogue at all levels with employees and their representatives. The Company
encourages negotiation to promote decision-making at grassroots level and
to optimize preparation and management of change by seeking the best
possible balance and convergence of interests between the Company and
its employees.
Central to the Group’s HR policy, employee dialogue is addressed in the
chapter on Labor Relations (see chapter 2.3).
CSR topics are often the subject of internal communications (intranet, Global
in-house magazine) in order to build employee commitment and highlight
Renault’s progress in these areas. Environmental communications are
showcased at events to launch new products and services (presentations,
exhibitions and vehicle test-drives), technological innovations (Innov’days)
and special events (Environment Day). In 2013 the main focus of internal
environmental communications was the Z.E. range and vehicle and engine
performance.

Find out more at www.renault.comREGISTRATION DOCUMENT RENAULT 2013102
CSR: SUSTAINABLE MOBILITY2 STAKEHOLDER DIALOGUE AND INFORMATION
C ommunities have been set up to allow interactive communication with
employees who are interested in these topics:
W the Environment Web 2.0 virtual community, which was started in 2012,
replaced and expanded an internal blog about the environment in the
manufacturing process. The blog had been online since 2008;
W Women@Renault is the Group’s largest social network, with 4,000 members
and local networks in 12 countries. Its goal is to improve the representation
of women at all levels in the Company (see chapter 2.3.2);
W Handi@Renault is an internal network launched in 2012 which aims
to better address disability in the workplace. Taking the form of a web
2.0 platform, Handi@Renault provides a host of information and fosters
discussion (see chapter 2.3.2).
2.2.3 SUPPLIERS ✦
Suppliers account for 57% of a vehicle’s cost price. That is why their technical,
logistics and financial performance is vital to the Renault group’s operations.
Any failure on the part of suppliers, whether in relation to the quality of parts
delivered, logistics problems, deteriorating financial health or reputational
loss, has a considerable impact on both production at Renault plants and the
smooth running of projects.
Compliance with Renault’s labor relations and environmental requirements,
detailed in the ethical standards distributed to suppliers, is one of the selection
criteria for suppliers, together with quality, financial robustness, costs, and
production and logistics capacity.
Supplier relations and support in CSR areas have enabled Renault to meet new
challenges in the supply of both vehicle parts and services used by Renault.
2.2.3.1 SUPPLIER CSR POLICY AND STANDARDS
(see chapter 1.5.2.1 on CSR risk)
Standards, based on the principles of the International Labor Organization
(ILO), have been drafted since 2004 and are regularly revised.
An organization has been set up to monitor the implementation of these
standards using assessments and audits and support suppliers in making the
necessary progress in order to meet our requirements.
2.2.3.2 ETHICAL STANDARDSRenault’s CSR requirements are detailed in the following standards:
W declaration of Employees’ Fundamental Rights (2004). Originally drafted
for Renault employees, the document was transposed to our suppliers,
who are required to sign it prior to joining our supplier panel or for any
sourcing. It was revised in July 2013 following the agreement signed
with IndustriALL Global Union (see chapter 2.3.4.1 ) and will be gradually
distributed to suppliers as part of new sourcing arrangements;
W Renault-Nissan Purchasing Way (2006). Distributed to all tier-one suppliers
worldwide, this booklet presents a vision, values and similar purchasing
procedures. It describes the missions and specifies the tools and processes
for supplier selection, the technical support provided to suppliers, and
partnership arrangements. It emphasizes in particular the importance of
the key values of the Renault-Nissan Alliance: mutual respect, transparency
and trust;
W a Performance and Best Practices Code for customer-supplier relations
in the French automotive industry was signed by stakeholders in 2009,
i.e. the Committee of French Automobile Manufacturers (CCFA), the
Liaison Committee for Automotive Industry Suppliers (CLIFA), the finance,
industry and employment minister and the junior minister for industry and
consumption. It sets out the mutual commitments of manufacturers and
suppliers concerning business relations, sharing of intellectual property
rights, use of contract data and cost defrayal;
W Renault-Nissan CSR Guidelines for Suppliers. Distributed to all tier-
one suppliers worldwide in 2010, these guidelines set out Renault-Nissan’s
purchasing expectations with regard to suppliers in relation to safety and
quality, human and labor rights, the environment, compliance, and non-
disclosure of information. It was distributed again in February 2013 together
with the quality objectives for 2013 to all parts suppliers to Renault plants;
W Renault Green Purchasing Guidelines (2012), setting out expectations in
terms of environmental management, substances and recycling policy in
relation to delivered parts and materials and management of chemical
preparations used in industrial processes by Renault’s suppliers. The
document was distributed in March 2012 to 3,384 tier-one suppliers. It is
currently being brought into line with Nissan’s guidelines.
2.2.3.3 COLLECTIVE DIALOGUERenault actively takes part in the French automotive industry platform,
formed in 2009 as a permanent forum for cooperation and dialogue among
all stakeholders to help the industry and its professions prepare for and
successfully implement change. The platform comprises key industry players,
the Committee of French Automobile Manufacturers (CCFA) and major
federations of equipment makers (FIEV) and subcontractors, who together
form the Liaison Committee for Automotive Industry Suppliers (CLIFA).
The platform aims to fulfill its role of cross-industry coordination in the
following areas:
W research, innovation and techniques and the associated standards;
W professions, skills and training;
W industrial excellence;
W strategies and change.

REGISTRATION DOCUMENT RENAULT 2013✦ Global Reporting Initiative (GRI) Directives 103
CSR: SUSTAINABLE MOBILITY 2
2
STAKEHOLDER DIALOGUE AND INFORMATION
A working group on CSR in the French automotive industry was set up in mid-
2012. The remit of the group, composed of two major French carmakers and
tier-one equipment suppliers and a member of the Federation of Equipment
Makers (FIEV), is to review each company’s CSR practices and harmonize
them so they can be implemented more easily throughout the industry. One
significant aspect of this initiative concerns the participants’ responsible
procurement policies (approaches and methods for checking and supporting
the supply chain); the aim being to align participants’ practices and ultimately
produce a common set of industry standards.
Renault also hosts its top 200 suppliers:
W annually, at the supplier convention which aims to provide visibility on the
Renault-Nissan group’s strategy;
W several times a year to present sales forecasts.
A supplier council made up of the 12 most representative suppliers meets
annually. Suppliers’ top management and senior executives from Renault
Purchasing gather to obtain feedback on Renault’s supplier relations and
compare the findings with those of other carmakers.
Each purchasing unit hosts its main suppliers annually at performance
appraisals in order to review the year’s difficulties and jointly draft progress
plans in areas such as quality, costs, delivery times and CSR.
2.2.3.4 INDIVIDUAL DIALOGUE AND SUPPORTRenault supports its suppliers with a view to establishing long-term relations
in a climate of mutual respect, transparency, trust, and ongoing dialogue (see
chapter 2.5.3).
For the second year in a row, Renault presented its CSR Awards at a
ceremony held in recognition of its suppliers’ initiatives in quality, innovation
and CSR. CSR is one of the selection criteria for suppliers to join the Renault
panel. Many medium-sized companies have won awards – proof that quality,
innovation and CSR are not only reserved for large corporations.
The three winners of the 2013 CSR Awards are:
W Brazilian association Borda Viva for its community sewing workshop (see
chapter 2.5.1);
W Turkish company Estas for improving workstation ergonomics and working
conditions at its site and reinforcing safety rules and information;
W the company Dow Chemicals, which was rated very highly by rating agency
EcoVadis for its environmental management, sustainable development and
regulatory compliance.
Since it was listed in November 1994, Renault has endeavored to provide
its shareholders and investors with clear and transparent information on a
regular basis.
2.2.4.1 INDIVIDUAL SHAREHOLDERSTo meet shareholder requirements, the Group is continuing to introduce
innovative services. Numerous means of communication have accordingly
been created: a Shareholders’ club, a Group news brochure, a dedicated
webpage, an online interactive web function to manage Renault registered
shares, a toll-free voicemail number, an e-mail address for shareholder
questions ([email protected]), in particular ahead
of the Annual General Meeting, and a Shareholders Consultative Committee,
whose role is to see that the information provided to shareholders is
transparent and of high quality.
In 1995, Renault set up a Shareholders’ club to enable investors to become
better acquainted with the Company, its issues and products as well as with
the world of automobiles in general. Open to anyone holding at least one
share, the Club currently has some 8,000 members who are invited to visit
Renault plants and research centers, to attend breakfasts and conferences on
a range of subjects and, since 2010, to observe electric car tests. More than
300 shareholders per year benefit from this wide-ranging programme which
also gives them the opportunity to meet Renault experts.
To inform shareholders about the Group’s activities on a regular basis, Renault
has made tools available 24/7. In addition to its “Renault Actu” magazine, a
Group news brochure sent to Club members three times a year, shareholders
also have access to a toll-free voicemail number, a dedicated e-mail address
and a shareholders’ section on the Finance page of the Group’s website at
www.renault.com.
To make voting more accessible and offer greater flexibility to shareholders,
Renault offers the possibility of using Votaccess to vote online at the Annual
General Meeting.
Eco-friendly and innovative, this solution also contributes to shareholder
democracy.
In 2009, Renault added a Shareholders’ space to the Finance section at www.
renault.com, to enable all Club members to sign up for events on line and/or
to manage their accounts. It also enables them to browse the latest issue of
the magazine in electronic format (interactive PDF file).
Live video broadcasts of results meetings (annual and half-yearly) and of the
Annual General Meeting are transmitted on the www.renault.com website, so
that shareholders can follow the highlights of the Group’s financial events in
real time or after the event.
2.2.4 INVESTORS AND FINANCIAL PARTNERS ✦

Find out more at www.renault.comREGISTRATION DOCUMENT RENAULT 2013104
CSR: SUSTAINABLE MOBILITY2 STAKEHOLDER DIALOGUE AND INFORMATION
To ensure that information provided to shareholders is clear, a Shareholder
Consultative Committee was formed in 1996. Composed of nine Renault
shareholders (including two active or retired employees), it meets at Company
headquarters several times a year and at the time of the Annual General
Meeting to work on improving and innovating in Renault’s communications
with shareholders in all media (see the Renault Actu magazine in the Finance
section of the website).
To stay in touch with its shareholders, Renault organizes discussions at
regional meetings. The Investor Relations team visits various French cities
over the year to take part in meetings with more than 250 shareholders.
These meetings are organized either by Renault branches or together
with the French Federation of Investment Clubs. Since 2006, Renault has
attended more than 20 regional shareholder meetings. For example, in 2013
the Investor Relations department met shareholders in Aubagne, Lyon and
Strasbourg.
2.2.4.2 INSTITUTIONAL INVESTORS/SOCIALLY RESPONSIBLE INVESTORS
The Group organizes analysts’ meetings to coincide with the release of its
financial results or the announcement of exceptional events. It also holds
individual meetings with investors throughout the year, both in France and
abroad, and Renault managers give presentations at industry conferences
and major motor shows.
To secure investor support over the long term, Renault maintains close
links with analysts and investors in the socially responsible investment
(SRI) community. This involves individual meetings and topical conferences
organized by specialized intermediaries in Europe and the USA. Renault
managers regularly speak out on social and environmental issues for the
attention of SRI analysts and investors.
2.2.5 RESIDENTS, LOCAL COMMUNITIES AND REGIONS
2.2.5.1 BEING PART OF THE COMMUNITYRenault believes that companies only benefit fully from operating in a region
if it is growing and prospering and if its residents accept the Company’s
manufacturing or sales operations. That is why it is important for Renault
to foster the economic and social development of local populations. Renault
endeavors to redistribute wealth among its various stakeholders, while striking
the right financial balance for the Company.
To achieve this, the Group carries out a range of initiatives on varying scales,
either alone or alongside partners. These initiatives are consistent with the
four priorities of Renault’s CSR strategy (see chapter 2.5.1).
2.2.5.2 LOCAL DIALOGUE ON ENVIRONMENTAL IMPACTS
Relations with local residents, authorities and associations are coordinated by
environment managers working at each Renault plant or site. In addition to
legal consultation procedures (community surveys, etc.), Renault plants have
implemented procedures to handle complaints from local residents in order to
effectively manage any form of nuisance problems which may be caused by
their operations (noise, smells, etc.). In order to improve relations with local
players, environmental fact sheets for each facility are posted on the website.
Renault is also involved in local initiatives to reduce environmental impacts.
Renault is a member of the Greater Paris Club for sustainable development, a
forum for sharing best practices between small and medium-sized companies
in the Paris region and large companies. Set up in 2005 by the Greater
Paris Regional Directorate for Industry, Research And Energy (DRIRE), the
club disseminates the principles of the UN Global Compact concerning the
environment, human rights, labor standards and the fight against corruption.
In Argentina, Renault has been running an event dubbed “Eco-Tour” for
several years in partnership with its dealer network. Free introductory courses
in eco-driving are offered to the general public.
2.2.6 INSTITUTIONS AND ASSOCIATIONS ✦
In a business environment that is increasingly competitive, highly regulated
and demanding for companies, Renault has forged close links with institutions
that are very diverse in terms of size, status and purpose, given that a quality
relationship can only develop between Renault and an institution when both
parties retain their own identity, values and independence and commit to a
long-term relationship.
Renault is therefore in contact with numerous institutions that have
demonstrated their legitimacy and credibility through their competence and
know-how, and that comply with codes of conduct, and, each in their own
way, work to create a sustainable and cohesive society.
They are all at the center of society and actively contribute to its construction.
REGISTRATION DOCUMENT RENAULT 2013✦ Global Reporting Initiative (GRI) Directives 105
CSR: SUSTAINABLE MOBILITY 2
2
STAKEHOLDER DIALOGUE AND INFORMATION
2.2.6.1 INDUSTRY BODIESThese are firstly organizations whose business is of fundamental importance
to automotive manufacturing.
Renault is a member of the Committee of French Automobile Manufacturers
(CCFA), the European Automobile Manufacturers Association (ACEA), the
Society of Automotive Engineers (SIA), the French automotive industry
platform (PFA) and, more recently, the European Motorcycle Manufacturers
Association (ACEM). Likewise, Renault’s subsidiaries around the world are
members of local associations of automobile manufacturers if they operate a
production facility in the country or of importers’ associations if they operate
as sales subsidiaries.
These organizations focus on issues directly related to the automotive industry
and support Renault in its knowledge of current affairs in each country where
the Group operates.
Industry bodies enable automobile manufacturers and the industry as
a whole to share a short-, medium- or long-term vision and serve as an
interface between Renault and legislators. They are even commissioned
by governments to guide industry-specific public policy and coordinate the
different players. The PFA fulfils this role in France. The PFA and its members,
including Renault, are in charge of implementing the automotive industry
contract announced by the French government in October 2012 and have
committed to four pillars designed to secure visibility and build a sustainable
industry in France. Through the PFA’s working groups, Renault is involved
in projects covering issues such as innovation, international development of
suppliers, sales volume visibility, and employment and skills.
2.2.6.2 TRADE REPRESENTATION BODIESRenault is also a member of trade representation bodies, notably the French
Business Confederation (MEDEF) through the CCFA, MEDEF International,
the Union of Metalworking Industries and Professions (UIMM), as well as the
French Association of Private Companies (AFEP).
These institutions regularly organize working groups, which Renault joins in
order to provide its vision and experience and share best practices.
Discussions often go beyond the automotive industry. Topics covered include
major social changes and economic, HR and other issues that are vital to
large corporations, which have to know their rights and duties and take a
position on public policy via these organizations.
2.2.6.3 SUSTAINABLE MOBILITY INSTITUTIONS AND ASSOCIATIONS
Renault is dedicated to mobility now and in the future and has therefore
formed bonds with organizations at the center of sustainable mobility issues.
These bonds are of crucial importance since they facilitate the development
and achievement of disruptive technological, environmental, and behavioral
shifts. Renault has always been a pioneer, from minivans, to ultra-efficient
engines offering ever greater energy savings, to the eco2 label and now
electric vehicles. The future will see Renault pursue its ambitious strategy of
disruptive innovation.
Renault maintains dialogue regarding “sustainable mobility for all” issues
with entities such as the Association for the Development of Electric Mobility
(AVERE), Companies for the Environment (EPE), the Mov’eo competitiveness
cluster, and ATEC-ITS, a non-profit organization for the development of
transport, environmental and traffic technologies.
Other institutions, like the European T&E think-tank, Be Citizen and Greenpeace
help provide us with a better understanding of civil society’s expectations and
expand our outlook on major environmental and human challenges.
ELLEN MACARTHUR FOUNDATION – A KEY PARTNER
Renault is a founding partner of the Ellen MacArthur Foundation,
which aims to construct a prosperous and sustainable future
by accelerating the transition to the circular economy. As an
alternative to the linear “take, make, dispose” model, which
relies on large quantities of resources and energy, the circular
economy provides a model based on reusing, refurbishing and
recycling products.
The Ellen MacArthur Foundation works with business, schools
and colleges, higher education and decision-makers to raise
their awareness and promote circular economy models and
develop scientific and managerial knowledge of the circular
economy and the potential for economic and environmental
benefits.
Under this partnership, Renault helps to fund the Ellen
MacArthur Foundation, contributes to the Foundation’s work
and events (McKinsey/Foundation circular economy reports,
case studies, Circular Economy 100 business platform and
awareness programmes in schools) and undertakes to develop
activities based on circular economy principles.
The Ellen MacArthur Foundation supports Renault in raising
the awareness of its employees and shareholders and takes
part in in-house studies at both managerial and operational
levels with a view to implementing the circular economy model
within Renault. The Ellen MacArthur Foundation is particularly
interested in the Économie Circulaire Compétitive (ECC) project.
The contract between Renault and the Ellen MacArthur
Foundation was renewed in 2013 for three years.
For more information about the Ellen MacArthur Foundation:
www.ellenmacarthurfoundation.org
Sustainable mobility is also linked to affordability. Renault works with
associations, government bodies and academics to identify and implement
mobility solutions to suit the needs of low income earners. The Renault Mobiliz
programme is detailed in chapter 2.5.2.1.

Find out more at www.renault.comREGISTRATION DOCUMENT RENAULT 2013106
CSR: SUSTAINABLE MOBILITY2 STAKEHOLDER DIALOGUE AND INFORMATION
2.2.6.4 ROAD SAFETY INSTITUTIONS AND ASSOCIATIONS
Renault has been committed to road safety for many decades and has
developed solid relationships with a large number of institutions and
associations working in the field around the world.
On an international scale:
W Fédération Internationale de l’Automobile (FIA), either directly or within
the framework of discussions as a member of the European Automobile
Manufacturers Association (ACEA). Renault contributed actively to the
Debate on Youth and Road Safety held in Brussels on November 12, 2013;
W The Global Road Safety Partnership (GRSP) and the United Nations’ Decade
of Action for Road Safety, which enable us to carry out initiatives not only
in countries where we sell our vehicles, but also in other countries with the
highest rates of road deaths and injuries (see chapter 2.5.2.2).
In France, Renault has an ongoing partnership with the Delegation to the
Safety for Trafic and Road Safety for Traffic and Road Safety (DSCR) and the
National Road Safety Council (CNSR), as well as their sister organizations in
other countries, including Morocco.
Renault also works closely with France’s National Federation of Fire
and Rescue Services (see chapter 2.5.2.2), the road safety organization
Prévention Routière and the French Medical Automobile Club (ACMF) as part
of the French Traffic Medicine Committee.
2.2.6.5 ACADEMIC WORLDRenault maintains close ties with the academic world in order to contribute to
safeguarding and developing the skills required to carry out its business and
tap into the innovations produced by research labs, students and researchers.
Renault’s academic relations cover research partnerships, joint creation of
higher education programmes and financial support for specialized academic
chairs.
Renault is involved in other types of partnerships and support for primary and
secondary schools. These programmes are detailed in chapter 2.5.2.3.
2.2.6.6 INSTITUTIONS SPECIALIZED IN POLITICAL AND ECONOMIC AFFAIRS
As a result of regular meetings and/or close monitoring of their work, Renault
cultivates links with bodies responsible for observing and analyzing political
and economic life, such as the French Institute for International Relations
(IFRI), the World Economic Forum (WEF), the Fabrique de l’Industrie, the
Robert Schuman Foundation, Terra Nova, Europa Nova and ORSE, a corporate
social responsibility observatory.
In 2013, Renault continued to support the LH Forum, an event attended by
public and private players, business leaders, social entrepreneurs, economists,
trade unions and members of the public. The forum aims to promote a positive
economy serving future generations and supporting responsible, sustainable
and inclusive growth. Respect for the environment and a strong community
focus are also goals of the positive economy movement. During the Forum,
Renault launched a call for inclusive mobility projects as part of its Renault
Mobiliz programme (see chapter 2.5.2.1).
Renault also contributed to drafting a report on the positive economy
commissioned during the LH Forum in 2012 and submitted to the French
President in September 2013 prior to the 2013 LH Forum.
In 2013, the Nord-Pas-de-Calais Regional Council in northern France
contracted Jeremy Rifkin, an authority on the impact of scientific and
technological change on the economy, to apply his vision of the “Third
Industrial Revolution” to the region. Rifkin’s revolution is based on energy
sources which are distributed, not centralized. Energy is delivered over smart
grids like information is delivered over the Internet. Renault’s involvement
in the May 2013 seminar provided Renault with a unique opportunity to
present the way in which electric mobility will contribute to the transition to
a decarbonized economy. Historically, this field has been very important to
Renault.
2.2.6.7 GOVERNMENTS AND NATIONAL AND EUROPEAN LEGISLATORS
Renault liaises directly and indirectly with governments in office, elected
officials and the European Commission. Indirectly, Renault is represented
through the various automotive industry bodies and other associations of
which it is a member. Direct contact is established for several reasons. First,
Renault is 15% owned by the French state and is required to report to this
public investor in the same way as the Finance department reports to other
investors. Second, Renault owns plants and sites in regional areas and plays
an integral role in local employment pools. Renault engages with local elected
officials through its regional operations. These officials in turn consult with
local business in drafting regional policy in order to obtain a degree of visibility
for the economic development of their regions. Third, Renault is heard by the
public authorities with regard to government matters and by the European
Commission.

REGISTRATION DOCUMENT RENAULT 2013✦ Global Reporting Initiative (GRI) Directives 107
CSR: SUSTAINABLE MOBILITY 2
2
LABOR RELATIONS
2.3 LABOR RELATIONS
Renault, the Renault group Works Council and IndustriALL Global Union
signed a global framework agreement, “Committing together for sustainable
growth and development,” on July 2, 2013 as a result of a fruitful social
dialogue at international level,this agreement is embedded in the Declaration
of the Employees Fundamental Social Rights signed in October 2004, which
it enhances and modernizes to adapt to new social and economic demands.
With this agreement, Renault renews and strengthens its commitment to:
W comply with the principles set forth in the 1998 Declaration on
Fundamental Principles and Rights at Work prepared by the International
Labor Organization (effective abolition of child labor, elimination of all forms
of forced or compulsory labor, elimination of discrimination in respect
of employment and occupation, freedom of association and effective
recognition of the right to collective bargaining);
W comply with the universal principles of human rights set out in the United
Nations Global Compact, adopted by Renault on July 26, 2001;
W comply with the OECD guidelines for multinational companies, adopted
on June 27, 2000, and updated in May 2011, and with ILO Convention
No. 158 of 1982;
W recognize ISO 26000 as a standard of reference.
The agreement also brings a commitment from Renault “to respect and
promote the advancement of its employees around the world; to encourage
social dialogue; to take actions to ensure health, safety and quality of life
in the workplace; to support employment of its employees; and to promote
diversity.”
On the basis of these principles and social dialogue, Renault is implementing
a Human Resources policy with three priorities:
W optimizing the allocation of resources and related skills;
W developing high-potential employees and promoting diversity;
W encouraging employee involvement.
METHODOLOGICAL NOTE
In 2013, the labor relations indicators were revised to align them as closely
as possible with new laws and in particular the provisions of Article 225 of
Act No. 2010-788 of July 12, 2010 (referred to as the Grenelle II Act), and its
implementation decree.
As a result, the introduction of new indicators or changes in the scope of
existing ones preclude a comparison of 2013 with past years in the following
areas:
W hiring on both fixed-term and permanent contracts, until 2012, Renault
only kept data on permanent contracts;
W number of employees laid off, previously recorded only for France;
W age breakdown of employees, since the age brackets were changed in
2013 to conform to current practices;
W average labor cost by region;
W occupational illnesses, recorded only for France until 2012;
W global absenteeism rate;
W employment rate in the Group for disabled employees.
CONSOLIDATION SCOPE The consolidation scope covers the Group’s subsidiaries consolidated fully or
corresponding to the definitions of a joint operation.
Several scopes are used in this chapter:
W global: 100% of the Group’s employees;
W subsidiaries consolidated globally : 115 entities (out of 117) and 98% of the
Group’s employees; the two consolidated companies on a joint operation
basis are Renault Alpine (France; 50%) and RNTBCI (India; 66.67%);
W the “10 major countries” (Argentina, Brazil, France, India, Morocco,
Romania, Russia, South Korea, Spain and Turkey), representing 90% of the
Group’s employees.
Some indicators are not covering 100% of the consolidated scope due to
data unavailability.
Changes in the consolidation scope in 2013:
W disposals: Renault South Africa, Française de mécanique ;
W modification of the consolidation method: Indra Investissements s.a.s.,
Renault Alpine, RCI Financial Services s.r.o., Renault Pars ;
W added: RN Finance Russia.

Find out more at www.renault.comREGISTRATION DOCUMENT RENAULT 2013108
CSR: SUSTAINABLE MOBILITY2 LABOR RELATIONS
DATA COLLECTION Three methods are used to collect employee data:
W the HR information system collects part of the data for the entire scope;
W the Talent@Renault tool, deployed in 16 countries as of end-2013,
provides data for white collars (Algeria, Argentina, Brazil, Chile, Colombia,
France, Hong Kong, Mexico, Morocco, Portugal, Romania, Russia, Spain,
Turkey, United Kingdom, Venezuela) and covers more than 85% of white
collar workers;
W f or the data not available in these systems, it is collected with a questionnaire
sent to the regions. This questionnaire includes four indicators: absenteeism
rate, number and subject of major collective agreements concluded during
the year, total hours of training, and the percentage of disabled employees.
A specific definition for each indicator is communicated to each region.
A continuous improvement process for these collection methods has been put
in place, taking into account the recommendations of the statutory auditors.
DEFINITIONS OR CALCULATION METHODS FOR CERTAIN INDICATORS End of month total headcount (registered workforce): all the employees
with a permanent or fixed-term contract with the entity at the end of the
month – except for CASA in France and Relevos in Spain. Every employee on
the payroll is counted as « one » regardless of his contractual working time
(activity rate).
Region average headcount = (region headcount as of 31st of December
of the previous year + region headcount as of 31st of December of current
year) / 2. Region headcount as of 31st of December is equal to end of December
total headcount for all regions except Europe. For Europe region, it is equal
to end of month total headcount excluding employees under exemption of
activity in the framework of GPEC in France.
Average active headcount: the average active headcount is equal to end of
month total headcount, excluding “off activity” employees. Active headcount
is measured every end of month. Average active headcount is equal to twelve-
month averaging of active headcount.
«Off activity»: all the persons having an employment contract with the
company/entity and thus appearing in registered workforce, but physically
absent of the entity for a long period even if they are paid. This category
consists mainly of: unworked notice of resignation, unpaid leaves of absence
for various personal reasons including parental leave, sabbatical leave, end
of professional career leaves including exemptions of activity under GPEC in
France, long term medical leave (illness or accident), military service. Persons
on sick leave (excluding long-term) and on maternity leave are not considered
as “off activity” employees.
Woman Manager rate: number of women managers out of total managers
headcount at the end of December. “Manager” is defined as a white collar
employee, supervising at least one other white collar employee.
F1 Rate (frequency): working accidents requiring external care per million
hours worked.
F2 Rate (frequency): working accidents requiring external care and resulting
in a medical leave of absence per million hours worked.
G Rate (severity ): number of calendar days of sick leaves for occupational
accidents per thousand hours worked.
For the rates F1, F2, G, the working hours are increased by 10% in order to
take into account the time before and after effective working hours where the
employee is exposed at a risk of accident within the entity.
Occupational illnesses: reported occupational illnesses, expressed in K per
1,000 employees .
Rate of disabled persons: % of disabled persons on total headcount as of
December 31st .
Absenteeism rate (absences for unforeseen reasons) : the rate is expressed
in percentage, and the calculation is based on the average monthly active
headcount (permanent and fixed-term) and on yearly theoretical days number.
Absence’s days number is given in working days, excluding short-time work,
lay-off, strikes and holydays (including maternity leaves).
Formula: yearly absence’s days number / (average active headcount X yearly
theoretical days number).
The choice of assumptions for the calcualtion of theoretical days number is
left up to the entities , since local factors may result in minor differences.
2.3.1 OPTIMIZE THE ALLOCATION OF RESOURCES
To enhance its competitiveness around the globe, Renault has improved the
management of its planning of ressources and competencies. This section
reviews data concerning employment, labor costs, the organization of work,
and training.
2.3.1.1 THE WORKFORCE: BREAKDOWN AND TRENDS
As of December 31, 2013, the Group’s workforce (permanent + fixed-term
contracts) totaled 121,807 employees, with 118,965 in the Automotive
branch and 2,842 in the finance branch. This is a decline from the total of
127,086 in 2012. The decrease is explained first by a change in the scope
of consolidation. No longer included are Française de Mécanique, Indra
Investissements SAS, Renault South Africa Ltd., Renault Pars, and 50% of
Renault Alpine, while RCI Financial Services s.r.o. and RN Finance Russia
(a total of 2,297 people) were newly included at a proportion of 50%. Using
the 2013 scope of consolidation, the number of employees at December 31,
2012, would have been 125,670. A second factor in the overall decrease in
employees is the cutback in Europe to adjust to the shrinking market (down
1.7% in 2013, following a decline of 8.6% in 2012) and a leveling off in the
Group’s other regions. In France, where the market decreased by 5.5% in

REGISTRATION DOCUMENT RENAULT 2013✦ Global Reporting Initiative (GRI) Directives 109
CSR: SUSTAINABLE MOBILITY 2
2
LABOR RELATIONS
2013, after contracting 13% in 2012, the workforce decreased by 5.8% like-
on-like in 2013. Under the terms of the competitiveness agreement signed
on March 13, 2013, Renault is committed to keeping all its manufacturing
sites in France open and to adjusting workforce levels without resorting to
redundancies or a voluntary departure plan. Additionally, the manufacturing
capacity and sales network in Argentina were optimized. Meanwhile, the
number of employees increased in Morocco owing to the addition of a second
production line at the Tangiers plant, and in Brazil, where production capacity
was boosted in response to market demand.
The Group’s employees work in 36 countries, organized into five Regions.
The “10 major countries” (Argentina, Brazil, France, India, Morocco, Romania,
Russia, South Korea, Spain and Turkey) account for 90% of the total workforce.
In 2013, women accounted for 17.6% of the Group’s workforce, compared with 17.4% in 2012.
The breakdown by age remains well balanced: 18% of employees are under 30, 60% are between 30 and 50, and 22% are over 50.
82.4%
Men
17.6%
Women
33.7%
30-39 y.o
17.8%
20-29 y.o
0.4%
<20 y.o
1.9%
>60 y.o
25.9%
40-49 y.o
20.3%
50-59 y.o
* The men/women breakdown by age is calculated on the basis of fully consolidated companies.
In 2013, Renault hired 10,986 people (open-ended and fixed-term contracts)
from outside the Group to keep pace with the growth in its activities in
Morocco, Spain, Brazil and India and in response to the high turnover rate in
certain countries such as Russia. In France, Renault hired 1,072 people on
fixed-term, apprenticeship contracts. Meanwhile, the number of layoffs (that
is, the number of contracts terminated on the employer’s initiative) totaled
1,893.
Hiring by Region:
35.1%
Euromed-Africa
31.5%
Europe
6.5%
Asia-Pacific
14.4%
Eurasia
12.5%
Americas
Workforce by Region:
2012 2013 SHARE IN 2013
GROUP* 127,086 121,807
Europe 71,444 66,467 54.6
o/w France 53,203 48,550 39.9
Euromed-Africa 30,758 31,166 25.6
Americas 12,252 12,043 9.9
Asia-Pacific 7,307 7,133 5.8
Eurasia 5,325 4,998 4.1
* Expatriates are counted in their home country.

Find out more at www.renault.comREGISTRATION DOCUMENT RENAULT 2013110
CSR: SUSTAINABLE MOBILITY2 LABOR RELATIONS
2.3.1.2 CONTROLLED LABOR COSTSGroup labor costs totaled €5,494 million in 2013, of which €5,278 million
were in the Automotive branch. They were lower than in 2012 in absolute
value (down €124 million) and in proportion to revenues, coming from 13,8%
to 13.4 % of the Group turnover. The 10 major countries (Argentina, Brazil,
France, India, Morocco, Romania, Russia, South Korea, Spain and Turkey)
accounted for over 90% of the Group’s labor costs.
The decline in labor costs in 2013 was due to the revaluation of the euro,
control of headcount evolution , implementation of a wage policy aligned
with the market and negotiated wherever possible with the labor unions,
and the conclusion of multi-year agreements on jobs and wages in Spain
(November 2012), France (March 2013) and South Korea (July 2013).
LABOR COSTS BY REGION 2012* 2013 AVERAGE COST
GROUP 5,618 5,494 45.0
Europe** 4,220 4,084 61.1
o/w France 3,409 3,240 67.7
Euromed-Africa 503 549 17.7
Americas 466 448 36.7
Asia-Pacific 295 269 38.0
Eurasia 134 144 27.9
* 2012 restated to take into account the removal of Française de Mécanique and Indra Investissement s.a.s. from the scope of consolidation and net interest on pension commitments.
* * Europe including Renault-Nissan Global Management.
2.3.1.3 FLEXIBLE WORK ORGANIZATIONIn terms of working hours, Renault complies with the legal obligations and
collective agreements of the countries where it has operations.
To preserve jobs and adapt to fluctuations in automotive markets, Renault
has instituted measures to allow more work-time flexibility. It has sought
to find the best possible balance between the Company’s interests and the
quality of life in the workplace for employees through consultations with
employee representatives and labor unions. The measures focus in particular
on reorganizing work time, for example, by adding mandatory shifts to meet
heavy demand and reducing work time when demand falls, notably by using
individual or collective rest days.
At sites in France, for example, the opening period runs from 6:30am to 9pm
for workers doing a “normal” 35-hour average workweek during a one-year
period. In factories, the principle is two alternating eight-hour shifts and, in
the event of spiking demand, a fixed night shift. The teams work on average
35 hours per week worked.
In Spain, the 2014-2016 labor agreement concluded with the three largest
labor unions (UGT, CC.OO and CCP) provides a way to deal with the strong
demand for Captur by instituting a voluntary, “anti-stress” team. This gives the
Company the possibility of working seven days a week, while ensuring, with
the help of the medical services, that there is no interference with employees’
biological rhythms.
Renault has also introduced systems locally to achieve a better personal life/
work life balance for its employees. In France, the homeworking agreement
signed on January 22, 2007, enables employees to work from home
between one and four days a week if they wish and if their activity permits.
End 2013 , 1,408 employees have participated in this program as of end
2013 . Homeworkers all say that the scheme improves their personal life/
work life balance and makes them more efficient, particularly by reducing
their commuting time.
2.3.1.4 DYNAMIC SKILLS MANAGEMENTIn a continually changing industry, remaining competitive requires regularly
improving employees’ skills and anticipating ones that will be needed to
design, manufacture and sell cars in the future. This is the aim of Renault’s
dynamic skills management policy, which also gives employees the means at
the personal level to upgrade the skills used in their jobs and improve their
employability.
In practice, this means that each business line receives support from HR in
drawing up a worldwide assessment of its skills and precisely identifying:
W “critical” skills – those which the Company increasingly needs and which
must be developed through hiring and training;
W “sensitive” skills – those the Company needs less and less and for which
plans must be prepared to manage collective and individual retraining and
reallocation of resources.
These analyses, viewed along with the real situations and priorities of Renault
entities worldwide, provide a basis for establishing a mid-term view, revised
annually, of the optimum allocation of resources and the action plans to be
deployed in each country concerning:
W recruitment, in partnership with schools and colleges;
W training, guidelines for which are provided by the business line schools;

REGISTRATION DOCUMENT RENAULT 2013✦ Global Reporting Initiative (GRI) Directives 111
CSR: SUSTAINABLE MOBILITY 2
2
LABOR RELATIONS
W career paths, which contribute to the development of skills by broadening
the range of experiences;
W the expertise network, which optimizes development and dissemination of
knowledge throughout the Company.
For example, this system enabled the Manufacturing business line to reduce
the number of critical skills* it required worldwide. According to the mapping
for 35 of the Group’s manufacturing facilities completed in May 2013, the
average number of critical skills per plant decreased from 25 in 2011 to 19
in 2012 and to 13 in 2013.
THE GPEC IN FRANCE
In the framework of a skills and employment planning agreement (GPEC)
signed on February 4, 2011, in France, the Group’s strategic challenges and
the resulting changes in skills in each business line have been discussed
with the labor unions, notably at the Employment and Skills Observatory held
on September 19, 2013. This information has also been passed on to all
employees of Renault s.a.s.
Drawing on a comprehensive range of tools, GPEC also aims to supply the
“critical” skills required and manage retraining of employees with “sensitive”
skills. Since the programme’s launch in 2011 nearly 4,030 employees have
signed up for various GPEC initiatives: support for the start-up or takeover
of a business, a period of external mobility, or work time arrangements for
people in jobs deemed stressful. Training/retraining programmes have been
developed to enable employees to change business lines by teaching them
skills both more strategic for the Company and more useful in terms of
employability. GPEC also allows employees to be transferred temporarily to
another production site to deal with changing patterns of activity. In 2013,
681 people worked at a site other than their own . Since 2011, 1,070 people
have been hired from outside in the GPEC programme.
Employment and skills offices were opened at each site to help and advice
employees interested in the programme. A dedicated intranet site also offers
information about GPEC measures, training courses and feedback from
employees regarding their careers.
TRAINING
Renault is committed to training all its employees, regardless of age, rank or
position in the Company.
The Group’s training courses therefore cover all areas, from courses related
specifically to each of the Company’s business lines to individualized courses
designed for personal development, learning foreign languages, or acquiring
cross-functional skills (for management training, see 2.3.2).
The top priority of the Group’s training policy is the development of critical skills
and retraining for sensitive skills. The 12 business line schools responsible for
skills development base their worldwide training programmes on the dynamic
skills management policy. Training priorities are indicated at mid-year so that
training plans can be worked out in each country for the following year. The
skills development plans are then implemented by the countries.
In the Manufacturing business line, there are regional training centers in
nine geographic regions. After learning new skills at these centers, training
instructors can then conduct courses at all Group plants. Pooling of resources
in this way and capitalizing on the best practices in the Group’s plants are
powerful ways of developing business line skills on a global level.
In 2013, the number of hours of training was 2,942,077 (compared with
3,318,733 hours in 2012). The breakdown for the Group’s ten major countries
(Automotive branch) was the following:
The figures below are for 90 % of the scope considered.
TRAINING/COUNTRY ARGENTINA BRAZIL FRANCE INDIA MOROCCO ROMANIA RUSSIA SOUTH KOREA SPAIN TURKEY
Total hours 2013 50,828 75,938 902,925 183,522 414,795 470,416 152,800 25,667 393,096 272,090
Total hours 2012 81,374 84,067 1,090,967 91,325 458,711 519,797 173,254 32,782 435,709 350,747
The decline in the number of training hours in 2013, compared with 2012,
is due partly to:
W a 4% decrease in the workforce in the 10 major countries between 2012
and 2013;
W a focus on training in critical skills development and retraining for sensitive
skills. The system of dynamic skills management enables better targeting
of training each year in relation to the Group’s needs and the employability
of employees;
W a reduction in training hours in Morocco following the major training effort
in 2012 to support the development of the Tangiers plant.

Find out more at www.renault.comREGISTRATION DOCUMENT RENAULT 2013112
CSR: SUSTAINABLE MOBILITY2 LABOR RELATIONS
DEVELOPMENT OF THE EXPERTISE NETWORK
The expertise network was established at the start of 2010 to capitalize
better on the Company’s knowledge and know-how with the aim of boosting
performance and customer satisfaction.
This network consists of 50 areas of strategic expertise in all of Renault’s
main business lines: product design and development, manufacturing, sales,
knowledge of customers and markets, economic performance, and support
functions.
There are four levels of expertise in the network:
W one expert fellow, appointed by the Chairman of Renault, who sits on
Renault’s Management Committee. He is tasked with providing input for
decisions to be taken by senior management that require a high level of
technical expertise. The expert fellow also oversees the list of fields of
strategic expertise and coordinates the community of lead experts with
a view to sharing best practices across the various areas of strategic
expertise;
W 35 expert leaders, each reporting to a Vice-President. Lead experts
have responsibility for a field of strategic expertise. They are tasked with
developing expertise, coordinating the internal network of experts, and
building an external network to make this knowledge and know-how
available to the Company’s operational personnel;
W 146 experts, responsible for secondary fields of expertise. They promote
standards, file patent applications, carry out benchmarking, and identify
relevant partners;
W 390 consultants, responsible for a specific activity. They improve the state
of the art by establishing standards and passing on their expertise to the
business lines.
Development of the expertise network over the last three years has succeeded
in breaking down barriers between fields of knowledge, better capitalizing on
them, and disseminating and communicating them throughout the Group.
2.3.2 DEVELOPING TALENT AND PROMOTING DIVERSITY
2.3.2.1 TARGETED SUPPORT FOR MANAGEMENT DEVELOPMENT
Renault continually strives to improve the quality of its management on the
basis of a regular employee assessment survey.
In 2013, the Group offered new management training programmes targeted
precisely to the needs at each level of responsibility and designed to ensure
the buy-in of all managers to the Renault Management Way (RMW), a set
of management standards and code of conduct applicable throughout the
Group.
W at the Group level, a one-day Renault Management Way workshop is held
for all new managers to explain the management roles and standards
expected of them in the Group;
W in each country, management training is conducted regularly and organized
according to the level of management responsibility.
TOP
EXECUTIVES, HIGH
POTENTIAL PEOPLE
Manager of Managers
(Comex Members)
Visa Management 2
Feedback
Keys for New Managers
Visa Management 1
Feedback
Communication
GENERAL MANAGERS
SECOND LINE MANAGERS
FIRST LINE MANAGERS
New comers
RE
NA
ULT
MA
NA
GE
ME
NT
WA
Y W
OR
KS
HO
P
Local programs
Corporate programs

REGISTRATION DOCUMENT RENAULT 2013✦ Global Reporting Initiative (GRI) Directives 113
CSR: SUSTAINABLE MOBILITY 2
2
LABOR RELATIONS
In 2013, the figures for management training in the Group’s major countries were the following:
COUNTRY
NUMBER OF MANAGERS
TRAINED
% OF MANAGERS
TRAINED
NUMBER OF HOURS OF
TRAINING
Argentina 145 43% 1,232
Brazil 289 52% 4,013
France 1,185 26% 28,135
Morocco 626 92% 16,168
Romania 862 24% 36,313
South Korea 483 57% 2,050
Spain 323 43% 7,007
Turkey 133 29% 3,599
To give some examples, the following training was done in these countries
in 2013:
W in France, a new programme was added for general managers (members
of the Executive Committee). This nine-day programme created and
conducted by Renault and the EM Grenoble is designed to develop
leadership capacities in change situations;
W in Spain, new management training programmes started in 2013, for
a deployment that will continue until 2017 . These are multidimensional
programmes that combine 360° assessment, classroom training,
e-learning, internal or external coaching, participation in a Learning
Community, and regular preparation of individual development plans at
each stage of the programme;
W in Romania, new training programmes have been created that are intended
to run for five years. Three standard programmes have been developed
for three target groups: first-level managers (excluding manufacturing),
second-level managers, and manufacturing unit heads. There is also a
specific programme for high-potential managers.
In addition to the training programmes offered to managers, the Company
has introduced new ways to assist them individually and support them over
the long term.
W Internal coaching: besides the coaching provided occasionally by outside
suppliers for a necessarily limited number of managers, training and
certification of internal coaches (HR or other managers) has begun in
France to strengthen and broaden the capacity to assist the Company’s
managers. Such a programme has also been started in Turkey and will be
deployed internationally in 2014.
W Mentoring for first-time managers: to assist young managers, a mentoring
programme was set up in France in 2013 for employees who are taking
on the responsibility of managing staff for the first time. In this programme,
offered in addition to the training course already designed for these
individuals, new managers benefit from personal support over several
months from an experienced manager with whom they can discuss their
questions, ideas and experiences.
W Other tools are currently under study or in a test phase prior to deployment
in the Group in 2014, including 360° feedback and a managers community
on the internal social network, among others.
All these programmes have the Renault Management Way label, certifying
that they meet Renault’s management standards.
REGULAR ASSESSMENT OF LOCAL MANAGEMENT PERFORMANCE
In 2013, as in previous years, the employee involvement survey of all
Group employees (see 2.3.3), included a management quality indicator
(Renault Management Way index). This indicator measures the proximity
of the employee’s direct manager, the manager’s capacity to assess and
recognize the performance of his employees, and the interest he takes in their
professional development in a continually changing environment. In 2013, the
positive response rate in the survey was 68%, one point higher than in 2010
( last survey conducted on the same scope). At the Group level, as at the local
level, the results of this survey are used to draw up action plans in addition to
the measures mentioned above to improve management quality.
2.3.2.2 PREPARING TOMORROW’S LEADERSThe policies for talent development have evolved since 2012 to adapt to the
Group’s international expansion:
W the application everywhere in the world of explicit and consistently defined
selection criteria for identifying individuals with high potential at three
levels. To encourage diversity, the criteria of age and fluency in French
have been dropped;
W decentralization of the process for talent detection (for the three levels)
and validation (for two levels). The countries and regions are henceforth
responsible for identifying high-potential employees and candidates for key
positions.
RENAULT LEADERSHIP ASSESSMENT
Another means used to detect talents in addition to the sustainable
performance assessments and individual appraisals is the Renault Leadership
Assessment (RLA). This development tool is based on seven leadership
criteria. Carried out with the assistance of a specialized consulting firm,
the RLA is a decision-support tool for the career planning committees that
validate the selection of talented individuals at Renault. It reinforces objectivity
and fairness in the assessment of employees with potential. In 2012, an RLA
was done on about 120 people and in 2013 on over 210. The results of the
RLA are shared with the assessed employees, and an individual development
plan is drawn up based on them.

Find out more at www.renault.comREGISTRATION DOCUMENT RENAULT 2013114
CSR: SUSTAINABLE MOBILITY2 LABOR RELATIONS
The RLA is also used for collective analyses to adjust our priorities and our
development tools. These development plans can combine several elements:
W complete educational programmes like those of business schools;
W training to strengthen specific skills, in terms both of knowledge (finance,
international negotiations, etc.) and know-how (eg, communication);
W personal coaching, done externally or internally, to prepare for a new
position critical for Renault or to improve specific points (managerial
stature, communication, etc.);
W mentoring (learning about other business lines in the Company,
management through innovation, peer relations, etc.);
W learning situations, through a change of function or participation in work
groups or cross-function teams.
OPENNESS TO MULTICULTURAL PARTNERSHIPS
These development plans also include multicultural partnerships, particularly
in the Alliance with Nissan.
Since 1999, employee exchanges have been one of the mainstays of the
Renault-Nissan Alliance. These exchanges have improved collaboration
between the two companies and the implementation of synergies and best
practices in the Alliance. In addition to those on temporary assignment,
90 employees of Renault and Nissan were working at the partner company
in 2013. Most of these exchanges involve high-potential individuals, so that
tomorrow’s global leaders gain more international experience, and experts, so
that critical skills are shared and developed in the Alliance. These exchanges
of experts are managed at the Regional level.
Along with these exchanges, a joint Renault-Nissan training programme is
helping to develop an Alliance culture. Designed for high-potential individuals
and senior executives in the two companies, the Alliance Leadership
Development Programme (ALDP) contributes to a better understanding of the
partner company and thus to the strengthening of synergies.
The links with Renault’s other partners (Daimler and Avtovaz) are also
reinforcing an international outlook and the capacity to work productively
together.
2.3.2.3 PROMOTE DIVERSITY
CARLOS GHOSN, CHAIRMAN AND CEO,
RENAULT-NISSAN ALLIANCE
Our commitment to diversity
is a competitive advantage
that helps us to better
meet the expectations of
our customers around the
world, in particular during
a period where the so-
called emerging markets
have become the drivers
of the economy…
Renault wants to benefit from the cultural diversity and wealth of experience
of all its component parts. Diversity is a key driver of employee performance,
motivation and commitment. Diversity is a decisive competitive advantage:
the varied educational backgrounds, talents and career paths of the personnel
are sources of innovation. The Company will understand and best meet its
customers’ expectations by reflecting the many aspects of the 128 countries
in which it sells vehicles.
Following a diversity appraisal conducted in the Group in 2010 by an
independent organization, four priority areas for action were identified: gender
diversity, cultural diversity, employment of the disabled, and age diversity. In
2012, Renault also initiated a discussion on the theme of LGBT (lesbian, gay,
bisexual, transgender) employees.
WOMEN@RENAULT, A COMPREHENSIVE PLAN FOR WOMEN IN THE COMPANY
In early 2010, Renault launched Women@Renault, a comprehensive plan for
improving the representation of women at all levels of the Company.
The first aspect of this plan involves revising HR processes (recruitment,
training and career management). Renault has set specific targets for the
plan:
W recruit women for 30% of technical positions and 50% of sales positions;
W increase the proportion of women in the key positions in the Group;
W propose at least one woman for every three applicants in succession plans
for key positions in the Group.
At the end of 2013, women accounted for 17.6% of the workforce (compared
with 17.4% in 2012). While Renault wants to further increase this percentage,
it should be pointed out that women are represented in roughly equal
proportions at all levels of the Company: 18.4% of management, 19.3% of
the key positions in the Group (about 2,000 positions) , 16% of the top 150
positions (compared with 14.4% in 2012) and 20% of the Group Executive
Committee – a particularly high proportion in the automotive sector. Four of
the nineteen Directors on the Renault Board of Directors are women.
Renault is also attentive to the issue of gender equality. In France, there have
been several advances:
W annual statistical analyses highlight average gender equality;
W a specific budget has been set up to ensure that the Company agreement
on pay for women on maternity leave is applied.
Second aspect, t he Women@Renault plan has also led to the creation and
development of a social network in the Company. This diverse network, which
is open to all employees, is now the largest social network in the Group, with
4,00 members and local networks in 12 countries (Algeria, Argentina, Brazil,
Colombia, France, India, Korea, Morocco, Romania, Russia, Spain and Turkey).
It promotes employee initiative in multiple ways:
W by providing information and a channel of communication, with conferences
organized to discuss the place of women in the Company;

REGISTRATION DOCUMENT RENAULT 2013✦ Global Reporting Initiative (GRI) Directives 115
CSR: SUSTAINABLE MOBILITY 2
2
LABOR RELATIONS
W new ideas: the business lines can turn to the network for new ideas,
feedback, or simply different approaches to the business;
W actions to promote women, like the mentoring initiative begun in
October 2013 to give young women joining the Company support during
their early days in their new positions.
Many actions are being carried out internationally and locally in the Company
to promote women, but initiatives are also pursued outside the Company to
encourage female high school and university students to go into scientific
fields and to consider careers in the automotive industry. In France, Renault
works with the association Elles bougent (Women on the Move) to introduce
female high school students to professions in the automotive sector through
meetings with women in the Company. In Romania, women engineers regular
give talks at universities to promote the notion that professions are not
reserved exclusively for men or women.
BETTER REFLECT CUSTOMER DIVERSITY IN RENAULT TEAMS
The diversity of in-house talent should reflect the diversity of the markets
in which Renault operates. This is essential to the performance of a global
group. It is impossible to respond to the wide range of needs expressed by
customers across 128 countries without having this diversity in the Company.
The promotion of cultural diversity is therefore a key driving force behind the
Group’s whole HR policy. For this diversity to be effective at the highest level
of the Company, an objective of increasing the percentage of employees with
non-French nationality in the key positions at the Group was set (about 2,000
key positions in the Group).This part was 26.2% end-2013.
INTEGRATING THE DISABLED INTO THE WORKFORCE
In 2013, Renault continued its initiatives at the local level to promote
integration, job retention and support for people with disabilities. There are
four aspects of this policy:
W integration: at the end of 2013, the level of employment of disabled people
in the Group (scope: 94% of the workforce) was 3.57%. Renault s.a.s.
is particularly committed to supporting the integration of young people
with disabilities through work/study contracts or internships and through
partnerships with non-profit organizations promoting workplace integration;
W workstation adjustments (eg, installation of lifting tables and pallet turning
devices);
W access to workstations and Company facilities (parking spaces, access
ramps, etc.);
W prevention, awareness-raising and training: various initiatives are organized
internally, particularly to develop managers and employees’ understanding
of the issues.
In France, Renault signed a sixth agreement with all labor unions concerning
employment of the disabled on July 8, 2013. The Company thereby reaffirmed
its commitments in this area and opened new prospects for progress,
including greater reliance on the protected sector and more recruiting of
disabled youths on work/study contracts.
Other initiatives are being taken locally. For example, Renault Do Brasil is
offering signing lessons to managers and volunteer employees. Renault Spain
has signed contracts for goods and services (work clothes, office supplies,
gardening) with several centers that employ the disabled.
In July 2012, Renault launched an internal social network on the theme of
disabilities with the participation of Human Resources, Renault Tech (the
subsidiary that produces vehicles for the disabled), the CSR department,
Purchasing, Manufacturing and Marketing. This network, which has
800 members today, provides a discussion forum where employees can report
difficulties they encounter and share best practices. The Handi@Renault plan,
which is coordinated by a steering committee, has led to several partnerships,
notably with the French sports federation for the disabled.
PROMOTING TALENT AT ALL AGES
Renault is committed to developing talents at all ages, particularly by
supporting young people’s integration into the workplace and capitalizing on
the experience of seniors.
In relation to young people, Renault pursues an active policy to forge links
between the worlds of education and employment, to professionalize and
develop their employability, and to promote equal opportunities.
Key achievements in this area in 2013 included:
W training more than 3,500 young people (interns, apprentices, etc.) within
the scope of Renault s.a.s.;
W a proactive apprenticeship policy: 5% of the workforce of Renault s.a.s.;
W as part of its commitment regarding integration of young people without
qualifications, Renault has welcomed 3,850 youths on professional training
or apprenticeship contracts since 1992;
W the organization by Renault of Job Forums to help interns and apprentices
find work;
W in France, the apprenticeship tax paid by Renault benefited more than
300 approved schools and institutions.
In Spain, Renault has created a training programme for young engineers in
collaboration with the University of Valladolid and the Castile and Leon region.
The aim is to improve the employability of young engineers from the region,
build a skills incubator, and facilitate the transition from the university to the
Company. The programme is divided into three phases: intensive training at
the university, internships in the Company, and for some of the trainees, a
fixed-term contract with Renault.
On December 19, 2013, Renault s.a.s. signed an agreement to promote the
employment of young people and seniors and to develop solidarity between
generations. Renault makes detailed commitments on the employment and
employability of young people (in France): 5% work/study contracts per year,
800 youth employment contracts over three years, 30% of new hires on
open-ended contracts reserved for young people, and 10% of former holders
of work/study contracts.

Find out more at www.renault.comREGISTRATION DOCUMENT RENAULT 2013116
CSR: SUSTAINABLE MOBILITY2 LABOR RELATIONS
As for seniors, Renault makes a commitment in this agreement to maintain
the proportion of employees over age 55 at 14% through 2016, to reserve
2% of hires on open-ended contracts for people 50 or over, and to continue
its in-house training effort without age discrimination.
Last, to promote intergenerational exchanges and the passing on of know-
how, the agreement calls for the development of internal training (30% of
training will now be provided by the Group’s senior employees) and innovative
measures like part-time positions for the “transmission of expertise.”
In September 2013, Renault had a survey of all the Group’s employees
conducted to assess their degree of involvement. As in previous years, the
survey was done by an independent firm(1). Key indicators are monitored, and
Renault’s results are compared with the average of those of other companies
in the tracking group (“the global standard”). The response rate was very high
with a participation rate of 88% of total employees. The two main indicators
measured in the survey are involvement and enablement (i.e., the conditions
provided to enable employees to succeed).
The involvement level reflects the Group’s capacity to make employees want
to give the best of themselves. A total of 72% of responses were positive.
While this indicator has declined for all companies in the tracking group owing
to the prevailing economic uncertainty, Renault’s one is stable compared with
2010 (the last survey conducted on the same scope) and six points higher
than the global standard. The key factors of involvement remain solid:
W pride in working for the Group: 80%, or three points higher than the global
standard;
W motivation to do more than what is asked in one’s job to contribute to
Renault’s success: 81%, or 13 points higher than the global standard.
The second indicator, enablement, refers to Renault’s capacity to create the
conditions that will allow employees to do their job as well as possible. This
indicator remains stable, compared with 2010, and is at the level of the global
standard, i.e., 66%. Also, 66% of employees feel that in their team, there is no
major obstacle preventing them from doing their job well. This is nine points
above the global standard.
Action plans based on the results of this survey will be implemented at the
global and local levels to bolster employee involvement.
2.3.3.1 IMPROVING THE WORK ENVIRONMENT
The risk prevention, health, safety and workplace environment policy is based
on the commitments made with the Declaration of Employees’ Fundamental
Rights in 2004, which was broadened with the global framework agreement
on social, societal and environmental responsibility on July 2, 2013, and the
Renault-Nissan Alliance Charter. The policy applies to the employees of the
Group’s brands – Renault, Dacia and Renault Samsung Motors – around the
world. Based on risk prevention, the policy is designed to ensure employee
safety, promote physical and mental health, and offer an attractive and
motivating work environment.
PROCESSES DEEPLY ROOTED IN THE COMPANY
To implement its health, safety and workplace environment policy, Renault
draws on deeply rooted policies:
A management system is applied in all countries, sites and functions. Other
factors include the commitment of management, awareness-raising, and
continuous training of managers in risk prevention and the commitment of
employees and management. Thanks to these efforts, the Health, Safety and
Workplace Environment departments are systematically involved in all new
projects, ensuring that the human factor is taken into account whenever a
project is being prepared.
Renault has an international network of specialists in health, safety and
working conditions. The members of these networks – engineers, technicians,
ergonomics consultants, doctors, nurses, social workers, and heads of the
disabled taskforce – receive regular training to expand their fields of expertise
and cover the Company’s new challenges. Regular medical check-ups allow
for preventive action, early screening of disorders, and continuous medical
follow-up of employees. Renault also organizes information and training
campaigns on topics such as stress, ergonomics and healthy eating.
Regarding the prevention of psychosocial risks and work-related stress, a
new training course to identify people in difficulty was introduced in 2012 and
2013. This complements the system already in place, consisting of:
W help-lines for occupational physicians dealing with mental health in the
workplace;
W the possibility for employees to take a voluntary, individual pre-diagnostic
test performed by the stress, anxiety and depression observation unit
(OMSAD) set up in 1998. At the end of 2013, more than 90,000 tests had
been carried out as part of medical check-ups;
W at a collective level, processes to identify extreme stress have been put in
place, along with prevention plans;
W surveys designed to measure stress factors and their impact on employees
have been conducted at all French sites employing more than 500 people.
The findings were used to develop site and business-line action plans.
Renault has developed an ergonomic analysis method to assess its
workstations. Used in all Renault production plants worldwide, the method has
now been extended to other companies. Supervisors can use it to help them
better analyze risks and improve working conditions on an ongoing basis. A
monthly reporting system tracks changes in workstation geography, classified
according to ergonomic constraints, across all the Group’s industrial plants.
(1) Hay Group is an independent firm that conducts the same survey at many major multinational companies.
2.3.3 SUPPORT EMPLOYEE INVOLVEMENT

REGISTRATION DOCUMENT RENAULT 2013✦ Global Reporting Initiative (GRI) Directives 117
CSR: SUSTAINABLE MOBILITY 2
2
LABOR RELATIONS
Furthermore, new tools introduced in 2009 have optimized the processes
used to match workstations to employees, particularly for staff of restricted
capacity. A standardized employability initiative and regulated individual files
are used by managers and medical staff to transfer persons suffering from
restrictions to more suitable jobs.
To measure implementation of the occupational health, safety and working
environment policy, assessments based on a standard are carried out in
Group entities by internal experts and an outside body. This standard is
established by Renault and approved by Socotec, an international organization
specialized in health and safety. If conditions are met, then “Management
System for Safety and Working Conditions” accreditation (SMSSCT) is
awarded for a renewable three-year period. It can be withdrawn in the event
of a serious anomaly. A full 98% of industrial, engineering and office sites are
now certified. Since the initiative was launched in 2005, 76% of sales sites in
France have been certified.
A NEW GLOBAL FRAMEWORK TO ENSURE LONG-TERM CONVERGENCE BETWEEN GROUP PERFORMANCE AND EMPLOYEE DEVELOPMENT
A new global framework for the workplace environment was established in
2012. It aims to make Renault a place where quality of life in the workplace is
recognized by employees around the world and contributes to the Company’s
global, long-term performance.
This general framework is based on four key areas:
W workplace environment and workspaces: access to premises, travel,
collaborative tools, location;
W work/life balance: homeworking, meetings, employee services;
W management and commitment: participative management, acknowledgment,
team spirit;
W health and well-being: intercultural exchanges, belonging to the Group,
atmosphere.
This framework has been set up in all countries where Renault operates. On
this basis, each facility and country has done a self-appraisal of all the items
listed and then selected priorities suited to its local needs. This worldwide
system provides a Group-wide map of workplace environments and identifies
weaknesses to be remedied as well as best practices to disseminate, with a
view to achieving general and continuous progress.
Each country has undertaken concrete actions to improve workplace
conditions. The quality and diversity of efforts at the Sofasa plant in Colombia in
2013 made them particularly impressive. They included training office staff in
the proper adjustment of their workstations for comfort and health, developing
services for the personnel (collective transport and a travel agency), providing
on-site sports facilities and organizing tournaments, holding regular “coffee
chats” with the President of Sofasa, and conducting physical exercises at the
start of each factory shift.
OCCUPATIONAL ACCIDENT TRENDS
Occupational accidents are all accidents occurring during and at the place
of work.
W the F2 rate (number of lost-time occupational accidents per million hours
worked) was 3.34 at end-2013, compared with 3.44 at end-2012;
W the F1 rate (number of occupational accidents requiring treatment off-site
per million hours worked) was 6.21 at end-2013, compared with 6.12 at
end-2012;
W the occupational accident severity rate (number of days lost due to
occupational incapacity) has remained stable over the last four years. This
rate is the number of calendar days lost due to occupational incapacity
divided by the number of hours of exposure to risk multiplied by one
thousand.
F2 frequency rate – Renault group (per million hours worked)
2.5
2.7
2.9
3.1
3.3
3.5
3.73.54
3.613.60
3.52
3.373.44
3.35
2007 2008 2009 2010 20122011 2013
Evolution in severity rate (per thousand hours worked)
2007 2008 2009 2010 20122011
0.13
0.17
0.19
0.16
0.180.17
0.1
0.2
0.3
2013
0.17
N.-B.: figures for occupational accidents concern 92% of the Group’s total workforce.
Three small entities, outside the consolidated scope, have been included in the Group’s
occupational accident results (Renault Formula 1, Renault Sports Technologies and
Renault Tech).

Find out more at www.renault.comREGISTRATION DOCUMENT RENAULT 2013118
CSR: SUSTAINABLE MOBILITY2 LABOR RELATIONS
Continual improvement in workstation ergonomics: scoring of manufacturing workstations
2011 2012 2013 2011 2012 2013 2011 2012 2013
Total Manufacturing
4% 4%
70%
26% 26%
4%
69% 70%
27%
Body Assembly Plants
5%
64%
31% 33%
5%5%
63%62%
32%
Powertrain Plants
1%
90%
9%2%1%
90%90%
8%9%
Adequate positions
Positions of limited difficulty
Difficult positions
Road risk prevention
2013 CARS TWO-WHEELERS PEDESTRIANS COLLECTIVE TRANSPORT
Breakdown of lost-time commuting accidents 41% 30% 24% 5%
Breakdown of lost-time days 24% 48% 26% 2%
Occupational illnesses
“Occupational illnesses” are pathologies caused by work. These illnesses do not always entail a medical leave of absence.
For the Renault group, the rate of reported occupational illnesses per one thousand employees goes from 5.28 in 2012 to 5.24 in 2013.
EUROPE EUROMED-AFRICA EURASIA ASIA-PACIFIC AMERICAS
2013 8.10 0.87 0 2.95 5.96
Reported occupational illnesses expressed in K per 1,000 employees.
No occupational illnesses were reported in Eurasia in 2013. One notable factor in this result is the lack of statistics for occupational illnesses related to musculo -
skeletal disorders in the countries of this region.
Absenteeism
The absenteeism rate for the Renault group (taking into account 99 % of the total workforce) is 2.91 %.
2013 EUROPE EUROMED-AFRICA EURASIA ASIA-PACIFIC AMERICAS
Absenteeism rate 3.40 2.14 2.29 3.08 2.48
Scope coverage 99 % 100% 99 % 99 % 99 %
The absenteeism rate is expressed as a percentage and is calculated on the
basis of the average monthly workforce (permanent + fixed-term contracts)
and an annual theoretical workday.
The number of days of absence is expressed in working days, excluding
short-time working, layoffs, strikes, holidays (including maternity leave). An
explanation of the calculation is available in the Methodological note .

REGISTRATION DOCUMENT RENAULT 2013✦ Global Reporting Initiative (GRI) Directives 119
CSR: SUSTAINABLE MOBILITY 2
2
LABOR RELATIONS
2.3.3.2 ASSESSMENT, DEVELOPMENT AND REMUNERATION
The assessment, development and remuneration system has been revised
to make it fairer and more competitive. Talent@Renault is an all-inclusive
technique combining these three aspects (assess, develop, remunerate),
which was first implemented in late 2012 with the deployment of a single
tool for use by managers, staff (white collor), and the HR function. At the end
of 2013, this tool had been introduced in 16 countries . Its deployment will
continue in 2014 to cover the entire Group.
Performance is assessed through the annual performance and development
review, which is based on three principles – collegiality, common criteria, and
dialogue.
Job performance is assessed according to specific criteria that are identical
throughout the entire Group. The assessment made by the employee’s
manager is now systematically supplemented with an appraisal by other
staff members to ensure greater consistency and fairness. The assessment
is based on a one-to-one discussion between manager and employee. The
performance and development review is an opportunity to look at the results
of the past year, to set objectives for the year ahead, and to discuss the
employee’s contribution to the Company’s performance. This meeting is also
when employees formalize their training requests and discuss their career
outlook with their manager. If results fall short of expectations, a programme
of improvement is implemented by the manager and employee to give fresh
impetus to individual performance.
Talent@Renault also provides a way to share policies and practices in
employee development, such as the criteria for selecting high-potential
individuals, the systematic implementation of development programmes for
these people that include a career plan. Talent@Renault is now a tool for more
closely managing the succession plans for the key positions in the Company.
The remuneration of managers and executives may now be based on:
W the level of responsibility. Positions have been assessed to define their
level of responsibility according to the Hay Group international standard.
This assessment makes it possible to draw up a complete internal map
of positions across the various business lines and Regions, thereby
guaranteeing greater transparency and global equality for career paths.
Another advantage is that Renault can compare its pay scales with the
market to better manage competitiveness and the attractiveness of the
remuneration policy. The fixed and variable remuneration system is now
determined on the basis of this job classification;
W work performance, or the capacity to hold the position, defined with precise
and shared criteria to make assessment more objective and standardized
within the Group;
W the extent to which targets are achieved.
Analysis of these three components ensures that remuneration is based on
the individual’s contribution to the Company, independent of any other factor.
The variable share of the remuneration of managers and executives is
calculated according to the following principles:
W the higher the level of responsibility, the higher the share of variable
remuneration;
W payment of variable remuneration is determined by achievement of shared
targets at Group level;
W variable remuneration is based on collective targets as well as the
assessment of individual performance.
Two systems were applied:
W a Group system for executives in positions with the highest levels of
responsibility;
W a system defined at country level for other managers and executives.
The remuneration of senior executives is discussed in chapter 3.3.
INCENTIVE SCHEMES
Renault has an incentive scheme that includes the redistribution of profits.
This can also take the form of bonus payments for local performance. Four
trade unions (CFE-CGC, CFDT, FO and CFTC) signed an agreement on
December 6, 2010. Most of the Group’s French facilities have signed up to
the three-year agreement, which includes:
W maintaining local incentive schemes based on site performance;
W basing a portion of the bonus on the Group’s financial results.
This agreement, which came into effect on January 1, 2011, is primarily
based on two indicators: Group free cash flow and operating margin.
Over the past three years, incentive and performance-related bonuses at
Renault s.a.s. have totaled the following amounts:
YEAR
AGGREGATE AMOUNT: INCENTIVE AND
PERFORMANCE-RELATED BONUSES (€ million)
2011 129.01
2012 66.32
2013 74.65
EMPLOYEE STOCK OWNERSHIP AND SAVINGS
In France, Renault operates a voluntary company savings plan open to all
subsidiaries that are more than 50% owned (10 member subsidiaries). The
plan consists of five employee savings funds (FCPE) invested in accordance
with Socially Responsible Investment (SRI) standards and endorsed by the
trade union assessment body Comité Intersyndical de l’Épargne Salariale, and
three profit-sharing funds invested in Company stock (Renault share, ISIN
code FR0000131906). The securities held in the SRI portfolios are selected on
the basis of the issuer’s employment policies, working conditions, corporate
governance, and compliance with environmental standards. Employees can
make top-up payments into these five savings funds and the Renault share
throughout the year.

Find out more at www.renault.comREGISTRATION DOCUMENT RENAULT 2013120
CSR: SUSTAINABLE MOBILITY2 LABOR RELATIONS
In 2013 total payments into Renault’s savings scheme amounted to €10 million
(up 10%, compared with 2012), of which 98% in the form of bonus transfers.
The total value of the Company savings plan at December 31, 2013, was
€570.7 million.
In 2011 Renault put in place a group retirement scheme (PERCO), enabling
employees to build up savings that will be available in the form of annuities or
a lump sum when they retire.
With this system, employees can pay their bonuses, voluntary payments or
part of their individual time savings leave (up to 10 days per year) into the
plan. In addition, Renault will contribute the equivalent of 25% of the flex days
paid into the plan.
Employees can choose between ordinary management of their savings
through the funds made available as part of the Group savings plan (with the
exception of the stock ownership funds) or life-cycle management through
the generational funds in the Natixis Horizon Retraite range.
In 2013, total payments into Renault’s collective retirement plan amounted
to €12.5 million, of which 75% came from the cash-out of paid leave. The
total value of Renault’s PERCO at December 31, 2013, was €27 million (see
data in annexes).
COLLABORATIVE INNOVATION
Involving all personnel in a process of collaborative innovation has been part of
Renault’s corporate culture for more than 20 years, through the organization
and promotion of “practical suggestions for improvement” (PSI). The approach
is based on Group-wide fundamentals and involves encouraging all employees
to formalize their innovative ideas and rewarding the best contributions to the
Company’s long-term performance.
In 2013, Renault continued to harmonize the collaborative innovation
approach across every global region where it is applied (new site included:
Morocco-Tangiers). Based on a total of 91,177 people in 2013 (compared
with 94,379 in 2012), Renault:
W achieved a participation rate of 50% (54% in 2012);
W made savings of €103.1 million, an average of €1,132 per person
(€129.7 million, or €1,374 on average per person in 2012);
W reported 2.83 PSIs per person in 2013 (3.06 in 2012).
In 2013, the social dialogue in the Group was very productive, testifying the
will to prioritize the negotiation path to tackle today’s challenges . This will
call for allying competitiveness and workforce unity, while taking into account
the diverse range of expectations and the sharp differences between local
economic conditions.
2.3.4.1 A SOCIAL DIALOGUE ACROSS FIVE CONTINENTS
The Renault group Works Council (CGR), which celebrated its twentieth
anniversary in 2013, is the body representing all the Group’s employees.
It is made up of 40 representatives from 20 countries: 34 representatives
from Renault’s majority-owned subsidiaries in the European Union, and six
observers from the rest of the world (Brazil, Argentina, South Korea, Turkey,
Russia and Morocco).
In 2013, the CGR held a plenary session lasting more than three days during
which members of senior management, including the Chairman, discussed
the Group’s strategy. The CGR restricted committee met nine times. A
“learning session” was held in Tangiers and the surrounding area to gain a
better understanding of the industrial and commercial challenges there as
well as labor issues facing Renault in Morocco.
GLOBAL FRAMEWORK AGREEMENT
“Committing together for sustainable growth and development.”
With the agreement signed on the July 2nd 2013, concerning social and
environmental responsibility, the signatories undertake to work together in
five key areas:
W respect for fundamental social rights – the agreement renews and
strengthens commitments made with the Declaration in October 2004;
W social responsibility to employees – expressed through social
dialogue, health and safety policies, employment and skills management,
remuneration and social protection, and the promotion of diversity;
W social responsibility where the Renault group has operations –
including support for educational projects, helping young people to begin
working in the automotive industry, and promoting road safety;
W relations with suppliers and subcontractors – their respect for
fundamental rights becomes a decisive criterion in their selection;
W reduction of the environmental footprint – reconciling the Renault
group’s offerings of products and services with environmental protection,
and strengthening environmental management throughout the Company;
Furthermore, a policy for prevention, health, safety and the work environment
arised from the commitments made with the signing of the Declaration of
Employees’ Fundamental Rights in 2004, which were reinforced by the global
framework agreement on social, societal and environmental responsibility.
Based on risk prevention, this policy is aimed at ensuring the safety of the
personnel, preserving their physical and mental health, and providing them
with a motivating work environment.
2.3.4 SOCIAL DIALOGUE

REGISTRATION DOCUMENT RENAULT 2013✦ Global Reporting Initiative (GRI) Directives 121
CSR: SUSTAINABLE MOBILITY 2
2
LABOR RELATIONS
This agreement is applicable everywhere in the world, in all companies in
which Renault s.a.s. owns, either directly or indirectly, more than one-half of
the capital.
A follow-up committee met in Spain in November to discuss measures for
implementing the agreement and to observe labor and social policies in that
country.
2.3.4.2 ONGOING SOCIAL DIALOGUEIn 2013, 14 major agreements were signed within the Group , testifying to its
desire for responsible social dialogue, and in particular:
In Spain, a three-year agreement (2014-2016), concluded with the three
largest labor unions (UGT,CCOO and CCP), contains measures concerning
workforce flexibility, a gradual increase in annual working time, and wage
control . This agreement is resulting in increased activity at Body assembly and
powertrain plants and job creation .
In South Korea, the agreement signed in July 2013, covering the period
2013-2014, concerns wages, working time, and the operations at the Busan
plant, where the new Rogue Nissan will be manufactured starting in 2014
owing to gain in competitiveness.
In France, six collective agreements were signed by Renault s.a.s. in 2013,
bringing the total to 28 since 2010, the year the agreement for “a new social
dialogue” was first implemented. These six agreements concern in particular:
W the implementation the conditions and resources needed to spur growth
and social development at Renault in France (March 13, 2013);
W measures to assist the disabled (July 8, 2013);
W an amendment to the agreement of December 8, 2010, encouraging
employee initiative and creativity (December 19, 2013);
W promotion of the employment of young people and seniors and
intergenerational solidarity (December 19, 2013).
The “Contract for a new dynamic of Renault growth and social
development in France” was signed with the CFDT, CFE-CGC, and FO.
Through a series of balanced measures to generate gains in competitiveness,
this agreement aims to endow Renault with a solid and sustainable foundation
for its manufacturing, engineering and tertiary activities in France and to
bring about stronger growth than would result from relying solely on trends in
European markets. Under this agreement, Renault is committed to:
W maintaining activity at all manufacturing sites in France as well as in
Engineering, Sales and Marketing, and Service departments;
W developing activity at French facilities between now and 2016, producing
a minimum of 710,000 vehicles in France, including 630,000 Renault
vehicles and a minimum of 80,000 vehicles from partners;
W maintaining or increasing activities at powertrain and logistic sites in
France;
W adjusting workforce numbers without a redundancy or voluntary departure
plan by not replacing 7,500 positions between now and 2016;
The diversity of subjects covered by the agreement, the length of the
discussions, the caliber of the dialogue during the negotiations, and the
challenges addressed demonstrate the innovativeness of this approach and
the responsible attitude of all parties involved.
2.3.4.3 RESPONSIVE INTERNAL COMMUNICATION ✦
Dialogue within the Group is also nurtured by responsive and varied internal
communication. Renault ensures that employees are always kept up to date
on what is happening in the Company through a network of communications
teams working in the functions lines and countries.
The Group has a single magazine, Global, intended for all its employees
worldwide. More than 100,000 copies of Global are printed in French and
English, with local editions for Spain, Romania, Russia, Turkey, Argentina,
Brazil, Slovenia, and Colombia.
The second cornerstone of Group internal communications is the Declic
intranet portal, in French and English. Some 65,000 employees worldwide
are connected to Declic. The information on the homepage is updated daily
to ensure rapid and wide dissemination of Group news. The aim, whenever
possible, is to give employees information either before or simultaneously
with its external publication. Since 2009, employees have been able to
comment directly on all news releases, articles and reports, allowing them
to share their views and ask questions. Employees can also watch video
streaming broadcasts of strategic events (financial results, announcement of
partnerships, etc.). Open forums with senior executives are organized on a
regular basis.
The Chairman and CEO and the Management Committee hold frequent
e-conferences to brief managers in advance on the Group’s strategic projects.
Educational materials are also regularly sent out to all managers so they can
inform their teams of the month’s news and upcoming events.

Find out more at www.renault.comREGISTRATION DOCUMENT RENAULT 2013122
CSR: SUSTAINABLE MOBILITY2 ENVIRONMENTAL DIMENSION
2.4 ENVIRONMENTAL DIMENSION
2.4.1 ENVIRONMENTAL CHALLENGES ✦
The exponential growth in human population and activity since the industrial
revolution is having harmful effects on the environment and threatening the
fragile balance between humans and ecosystems. However, adequate natural
resources and robust ecosystems, in addition to their intrinsic value, are
essential to people’s well-being and sustainable economic prosperity.
Renault is a responsible company aware of the serious environmental
challenges represented by climate change, air and water quality, and the
depletion of natural resources. It therefore strives to reduce the environmental
impact of its operations and products. One way it does this is by using the
life cycle assessment approach to measure the impacts of a vehicle from
the design phase to its end-of-life, thus enabling it to effectively target
environmentally positive actions.
This approach helps to preserve and add to the Company’s value because
environmental challenges are also competitiveness and profitability
challenges. Its operations are thus influenced by the need to comply with
environmental regulations on vehicles and industrial sites. The raw materials
it uses also affect its financial performance. Meanwhile, the expectations of
vehicle users are changing. In the major markets, fuel consumption is now an
important factor in the purchasing decision, while new usages are appearing
in conjunction with shared mobility.
In 2013, Renault revised its environmental policy to advance the improvement
policy begun in 1995 and respond to new needs and expectations. This new
policy, which is in keeping with Renault’s CSR Vision, has three priorities and
is being applied in five key areas for action. It will be progressively deployed
at Renault’s sites and in its subsidiaries.
RENAULT ENVIRONMENTAL POLICY – 2013
1. Curb and reduce the environmental footprint and health
impacts of our products, services, and operations by
applying life cycle analysis and the principles of the circular
economy.
2. Contribute actively to Renault’s competitiveness and to the
protection of its tangible and intangible assets.
3. Implement environmental management throughout the
Group and its value chain to bring about continual progress
and ensure compliance with regulations and respect of
voluntary commitments.
Key areas for action:
W climate change and energy efficiency;
W resources and competitive circular economics;
W health and ecosystems;
W innovative mobility services and systems;
W environmental management, transparent and responsible
communication, and dialogue with stakeholders.
CONCEPTION
Manufacture Distribution
an
d e
nerg
ies
recycling
Pro
duct
uti
liza
tio
n
Ra
w m
ate
rials
Used product

REGISTRATION DOCUMENT RENAULT 2013✦ Global Reporting Initiative (GRI) Directives 123
CSR: SUSTAINABLE MOBILITY 2
2
ENVIRONMENTAL DIMENSION
2.4.2 ENVIRONMENTAL IMPACT: ACTIONS AND INDICATORS ✦
Since 2004, Renault has assessed the environment performance of its
products over their entire life cycle rather than during their utilization
phase alone. As of end-2013, a life cycle analysis (LCA) was being done
for a majority of vehicles marketed by Renault (the Renault, Dacia and RSM
brands). Comparisons between internal combustion engine vehicles in the
same segment but from a different generation, for example between the
Clio III and Clio IV, are carried out systematically to confirm progress from
one car to the next.
The methodology used by Renault, based on the ISO 14040 standard,
underwent a critical review by a group of experts in the LCA of Fluence Z.E.
This five-member review committee made up of three international experts
and two NGOs concluded that Renault’s LCA method was compliant with
ISO 14040 and 14044 standards and state-of-the-art in the automotive
industry. The LCA report on Fluence Z.E. and the critical review are available
online at renault.com.
A more detailed description of the methods used in the life cycle analysis is
found in Annex 2.8.2.1.
Comparative life cycle analysis of the Dacia Sandero and New Sandero diesel
0% 20% 40% 60% 80% 100%
Vehicle manufacturing Fuel production Vehicle use End-of-life
Sandero
New Sandero
Sandero
New Sandero
Sandero
New Sandero
Sandero
New Sandero
Sandero
New Sandero
Natural resourcedepletion potential
Photochemical ozonecreation potential
Climate changepotential
Acidificationpotential
Eutrophicationpotential
-11%
-11%
-16%
-10%
-14%
Comparative life cycle analysis of ZOE
Vehicle manufacturing Electric charge Vehicle use End-of-life
Natural resourcedepletion potential
Photochemical ozonecreation potential
Climate changepotential
Acidificationpotential
Eutrophicationpotential
0% 20% 40% 60% 80% 100%
53% 40% 1% 6%
48% 43% 2% 7%
61% 23% 11% 5%
65% 27% 3% 5%
69% 21% 5% 5%

Find out more at www.renault.comREGISTRATION DOCUMENT RENAULT 2013124
CSR: SUSTAINABLE MOBILITY2 ENVIRONMENTAL DIMENSION
2.4.2.1 ENERGY AND CLIMATE CHANGE ✦
MAIN OBJECTIVES
OBJECTIVE
SET TARGET YEAR
SITUATION END-2013
(IDENTICAL SCOPE)
All sectorsReduce the average carbon footprint of Renault group vehicles sold worldwide by 10% between 2010 and 2013 and by an average of 3% annually between 2010 and 2016 2010 2016
-10% between 2010 and 2013 (provisional figure)
Product Market a range of zero-emission-during-use vehicles in markets where there is a demand 2012 20164 vehicles marketed in
Europe
Product
Reduce average CO2 emissions of the European range to 120g CO2/km in 2013 (personal vehicles, all brands, all engines) and achieve the European objective of 95 CO2/km by 2020 (passenger vehicles, all brands) for vehicles with internal combustion engines. 2011 2020 114.8 g CO2/km in 2013
ManufacturingReduce GHG emissions from the production of a vehicle by 10% between 2013 and 2016 (direct and indirect emissions related to energy consumption) 2012 2016
Manufacturing Reach a 20% share of renewable energies (direct and indirect) at manufacturing sites 2008 2020 14.1 % in 2013
Logistics Reduce CO2 intensity by 10% in global transport operations between 2010 and 2016 2013 2016 -5%
Product & servicesMarket combined product-service offers for corporate fleets that will allow monitoring and reduction of the environmental footprint 2009 2016
Business eco2 rangeEco2-driving training
Fleet Asset Management
The carbon footprint of a product corresponds to the greenhouse gas emissions
it generates over its life cycle, from the extraction of the raw materials needed
to manufacture it to its recycling. It comprises the GHG emissions of scopes 1
and 2 and the principal emissions of scope 3, as defined by the GHG Protocol.
This indicator is a worldwide first in the automotive industry. It encompasses
all sectors of the Company and thus allows action to be focused on a common
objective.
In 2011, in the framework of the Renault 2016 Drive The Change strategic
plan, Renault committed to reducing the average carbon footprint of vehicles
sold worldwide by 10% between 2010 and 2013. In light of the results
achieved, this objective was extended to the second part of the plan: Renault
is now aiming to reduce its carbon footprint by a yearly average of 3%
between 2010 and 2016.
More details of the method used to calculate Renault’s carbon footprint are
found in annex 2.8.2.1.
Renault carbon footprint – 2010
30.7
t CO2 eq/veh
2010
2013
8.2%
Fuels
3.2%
Manufacturing & Logistics
11.7%
Materials
73.6%
Use
3.2%
End-of-life
0.1%
Employees commuting & travel
27.5t CO
2 eq/veh
2013
* 2013 data are communicated for information purpose only.Methodology: all PCV’s and LCV’s registered under Renault and Dacia Brand worldwide (appendice 2.8.2.1)
-10%

REGISTRATION DOCUMENT RENAULT 2013✦ Global Reporting Initiative (GRI) Directives 125
CSR: SUSTAINABLE MOBILITY 2
2
ENVIRONMENTAL DIMENSION
Strategies for reducing greenhouse gas emissions by sector
EMISSIONS DURING
USE & FUELS
Reduce fuel consumption and emissions of vehicles with internal combustion enginesDownsizing with turbochargingStop & Start, braking energy recoveryGeneral vehicle optimization (aerodynamics, mass, friction, electrical consumption management, etc.)Market a range of zero-emission-during-use vehiclesKangoo Z.E. (light commercial vehicle)Fluence Z.E. (saloon)ZOE (multipurpose city car)Twizy (two-seat city car)Promote eco-driving: Driving eco2 programmeIn-car assistance systems (eco-mode)Eco-driving training
MATERIALS AND
COMPONENTSIncrease the proportion of recycled materials (see 2.4.2.2)Reduce the consumption of materials (see 2.4.2.2)
PLANTS Reduce energy consumptionIntroduce technical and managerial best practices (kaizen)Reduce energy consumption outside of production periodsIncrease energy efficiency Develop renewable energies and substitutes for fossil energies
LOGISTICS Logistics eco2 programmeReduce distances traveled (local suppliers, optimized routes)Reduce the number of trucks/containers transported (optimization of load factors for trucks/containers and packages)Rely more on sea, waterway and rail transport as alternatives to road transportReduce fuel consumption (in partnership with transport operators)
LOGISTICS ✦Implementation of the Logistics eco2 programme continued in 2013 in all four
key improvement areas.
The main effort was focused on improving container and truck load factors.
For example, on the 3 main export flows by sea from France, Romania and
Spain . T he improvement reduced the number of containers by 1% and
emissions by nearly 1,100 tons of CO2. Similarly, increasing truck load factors
in Europe took 9,700 trucks off the road and reduced CO2 emissions by
8,000 tons approximately.
Further gains were achieved by adding a second train on the logistics route
linking Portugal, Spain and northern France, eliminating 7,000 tons of CO2
emissions.
Renault has also collaborated with the European organization Odette(1) in the
preparation of guidelines for the calculation of CO2 emissions from logistics
operations in the automotive industry. Published in October 2013, these
guidelines promote standardized reporting by transport operators according
to the new European norm CEN 16258. They also facilitate the application of
the new French regulation introduced in 2013 requiring logistics providers
to inform their customers of the quantity of CO2 emitted by the services
performed for them.
MANUFACTURING
Knowing that 90% of greenhouse gas emissions at Renault sites come from
energy consumption the strategy of reducing GHG emissions is inseparable
from the strategy of reducing energy consumption and increasing the use of
renewable energies. This strategy, implemented through continuous progress
and breakaway action when modernizing boilers and setting up new plants,
has four strands:
1. manage energy consumption outside production periods (minimal
consumption). A specific system is in place to completely shut down
machines and general facilities whenever possible outside production
periods;
2. manage convergence towards the best practices identified in techniques
and organization. Ventilation and operating conditions (temperature and
humidity) have been optimized in paint shops, which consume the most
energy in body assembly plants. Equipment downtime and re-start has also
been optimized to minimize consumption. Specific measures have also
been put in place for other production processes, including management
of compressed air consumption for stamping, optimized cooling of welding
guns used in sheet metal work, and optimization of cooling for machined
parts;
3. increase the energy efficiency of resources, particularly by experimenting
with energy recovery solutions such installing heat exchangers at exit
doors of paint drying ovens and decentralizing energy consumption to limit
heat losses on the network;
4. develop renewable energies and replace fossil fuels. The Tangiers plant,
opened in 2012, was equipped with a biomass boiler. Likewise, the
Sandouville factory is now supplied with steam produced by Sedibex from
industrial waste, a solution that cuts natural gas consumption. Although
the electricity produced by photovoltaic installations at its main sites in
France, Spain and South Korea does not go exclusively to Renault plants,
these installations do help to reduce the carbon intensity of the electricity
consumed (see inset below).
In recent years, the replacement of fuel oil with cleaner-burning natural gas
has made a substantial contribution to reducing GHG emissions. Fuel oil now
represents only 0.2 % of Renault’s energy consumption, so any further shift in
the consumption of these fuels will not significantly reduce emissions.
(1) Odette: a European organization of logistics operators in the automotive industry.

Find out more at www.renault.comREGISTRATION DOCUMENT RENAULT 2013126
CSR: SUSTAINABLE MOBILITY2 ENVIRONMENTAL DIMENSION
Renault sees climate- and energy-related challenges as an opportunity for
innovation. Thus, for its plant in Tangiers, Renault has developed technologies
to reduce energy requirements and technologies to produce thermal energy
with no carbon emissions. As a result of the partnership between the Kingdom
of Morocco, Renault and Veolia Environnement, the Renault plant in Tangiers
is exemplary in terms of environmental performance. In 2013 the plant was in
the starting phase. From the first year of full exploitation, the energy needs for
the plant were covered by 90% through electric renewable sources and by its
biomass heating plant avoiding 80,000 tons of CO2 emission.
These innovative initiatives are fully consistent with the Kyoto protocol and are
covered by a specific development mechanism that is under approval.
Energy consumption ✦
2010 201120092002 ... 2012 2013
Consumption per vehicle produced(MWh/vehicle)
0
1,000,000
2,000,000
3,000,000
4,000,000
5,000,000
6,000,000
7,000,000
0
1
2
3
5,97
2,74
3
4,70
4,45
8
5,42
6,71
6
5,1
55,9
28
5,17
7,69
0
5,47
9,39
6
Total consumption (MWh)
2.63
2.142.10
1.942.17
2.17
Scope: the reporting scope for GHGs in 2012 (Scope 1 and Scope 2 for electricity consumption) includes all production plants and main logistics, tertiary and engineering sites, excluding the RRG commercial network (reporting scope described in annex 2.8.2 .2 ). The number and list of sites included varies from year to year depending on the disposals and acquisitions made by Renault.
Energy consumption by type of energy ✦
TOTAL CONSUMPTION
O/W
MANUFACTURING
SITES
O/W ENGINEERING, LOGISTICS
AND SUPPORT SITES
% MWH MWH MWH
Electricity 48% 2,649,697 2,358,500 291,197
Natural gas 47% 2,576,641 2,368,615 208,026
Purchased thermal energy 3% 182,503 163,326 19,177
Other fossil fuels 1% 57,471 57,471 0
Heavy fuel oil and heating oil 0.2% 13,083 4,020 9,063
TOTAL 100% 5,479,395 4,951,932 527,463
o/w renewable energy or energy produced from renewable sources 14.1%

REGISTRATION DOCUMENT RENAULT 2013✦ Global Reporting Initiative (GRI) Directives 127
CSR: SUSTAINABLE MOBILITY 2
2
ENVIRONMENTAL DIMENSION
Greenhouse gas emissions ✦
576,791
613,866
1,190,6581,251,518
1,191,009 1,193,244 1,224,965
577,173 584,082 559,059 551,100
674,344 606,927 617,132 634,204
22,13117,529
17,051
1,500,000
900,000
600,000
300,000
0
2011 20122009 2010
Direct GHG emissions (t CO2 eq) Direct GHG emissions related to
stationnary air-conditionning(measured since 2012)
Indirect GHG emissions (t CO2 eq )
Indirect GHG emissions related topurchased thermal energy(measured since 2013)
Total GHGH emissions(t CO
2 eq)
GHG emissions per vehicle produced(t CO
2 eq/vehicle)
2013
0.540.48
0.450.49
0.47
0.0
0.1
0.2
0.3
0.4
0.5
0.6
0.7
0.8
B reakdown of GHG emissions and reporting perimeter ✦
2013 2012 MEASURED SINCE
DIRECT EMISSIONS (SCOPE 1) 54 % 53 %
Stationary combustion installation 45 % 44 % 2003
Filling of mobile air-condition ers on produced vehicles 3 % 3 % 2003
Tests of gear boxes, engines and vehicules 1 % 1 % 2003
Company cars 3 % 3 % 2009
Filling of station ary air-condition ing systems 2 % 1 % 2012
INDIRECT EMISSIONS (SCOPE 2) 46 % 47 %
Electricity 45 % 47 % 2009
Thermal energy 1 % NR 2013
Scope: the reporting scope for GHGs in 2013 (Scope 1 and Scope 2 for electricity consumption) includes all production plants and main logistics, tertiary and engineering sites, excluding the RRG commercial network (reporting scope described in appendix 2.8.1 .1 ). Company vehicles include pool vehicles available to employees, shuttles, handling systems and forklifts.
The emission indicator for GHG per produced vehicle is calculated for the direct and indirect emissions by taking the measured emissions on the complete period 2009-2013. The extensions of the scope of measures which took place in 2012 (emissions linked to airconditioning of locals) and in 2013 (those limited to bought thermal energy) are not counted.
Scope: the reporting scope for GHGs in 2013 (Scope 1 and Scope 2 for electricity consumption) includes all production plants and main logistics, tertiary and engineering sites, excluding the RRG commercial network (reporting scope described in annex 2.8.2.2 ). The number and list of sites included varies from year to year depending on the disposals and acquisitions made by Renault.
Methodology: Greenhouse Gas Protocol; EPE protocol (Entreprises pour l’environnement) for quantifying and reporting GHG emissions.

Find out more at www.renault.comREGISTRATION DOCUMENT RENAULT 2013128
CSR: SUSTAINABLE MOBILITY2 ENVIRONMENTAL DIMENSION
Adjusting to the consequences of climate change
An increase in the number of extreme weather events could disrupt or even,
in the most severe cases, reduce Renault production capacities and logistics
activities. The main natural risks likely to impact Renault’s sites are flooding
(French plants of Choisy-le-Roi and Flins, located close to the Seine River),
typhoons (Busan plant in South Korea) and hail storms (the plants in Santa
Isabel at Cordoba in Argentina, Valladolid in Spain, Flins in France, Revoz in
Slovenia, and Dacia in Romania).
Hail has by far the highest recurring financial impact, since a large number
of vehicles are stored in uncovered areas. To reduce the risk of hail damage,
Renault has launched an ambitious investment plan to cover vehicle storage
areas. Financed partly by Renault and partly by investors, the plan is part of a
programme to install photovoltaic panel arrays.
No other risks linked to climate change have so far led to any notable
disruptions or material damage to sites or products. Sites subject to risks of
flooding or typhoons are suitably protected, and emergency plans are in place
to protect people and property and prevent or limit production shutdowns.
VEHICLE USAGE
To achieve a significant impact in terms of the environment and global
warming, one of Renault’s objectives is to provide mobility solutions that
are more ecological, economical, and accessible to the greatest number.
In line with the objective stated in the Renault 2016 – Drive the Change
strategic plan, Renault reduced the average CO2 emissions of new passenger
PHOTOVOLTAIC PANELS: FRANCE, SPAIN, AND NOW SOUTH KOREA
In 2012, solar panels were installed in France (60 MW) and in
Spain (8 MW) on employee parking lots and vehicle storage
areas at the main plants. Renault Samsung Motors (RSM)
followed suit in 2013 with a solar power set-up at the Busan
plant in South Korea.
This 20-MW, 300,000-m2 installation covering a large portion
of the roofs and land at the plant will produce 25,000 MWh
of power annually. By doing so, it will reduce the quantity of
CO2 emitted for electricity production by 10,600 tons a year.
The electricity is fed into the local power grid, thus helping to
reduce the carbon intensity of electricity production in South
Korea.
The solar panels installed at Renault sites around the world
have a combined capacity of 88 MW.
cars in Europe to less than 120g/km in 2013. This objective has even been
surpassed, as in 2013, according to the data available when this report
was published(1) , average emissions were estimated at 115g CO2/km. This
performance is especially impressive as it was achieved almost exclusively in
the range of vehicles with internal combustion engines.
Average CO2 emissions of passenger vehicles sold in the European Union (g CO
2/km) – Renault and Dacia brands ✦
80
90
100
110
120
130
140
150
160
170
180 180.7
162.9
148
135
114.8
201220112010200920082007200620052004200320022001200019991998199719961995 2013
Sources and scope: passenger vehicles registered under the Renault and Dacia brands. Average certified CO2 emissions in the New European Driving Cycle (NEDC).
1995-2010 data: UE15, AAA DATA (Association auxiliaire de l’automobile).2011-2012 data: European Environmental Agency, EU 27.2013 provisional data: EU 24 (all EU countries except Cyprus, Malta, Romania and Bulgaria), AAA DATA.
(1) The available data are for sales in 24 countries of the European Union, that is, the countries of EU 27 except Malta, Romania and Bulgaria.

REGISTRATION DOCUMENT RENAULT 2013✦ Global Reporting Initiative (GRI) Directives 129
CSR: SUSTAINABLE MOBILITY 2
2
ENVIRONMENTAL DIMENSION
Internal combustion engine vehicles
To obtain these results, Renault continued reducing the fuel consumption
and CO2 emissions of its gasoline IC vehicles, in particular with its and more
efficient Energy engines and the Stop & Start technology.
In 2013, Renault benefited from a full year of sales of models introduced in
2012, notably Clio IV, with 83g CO2/km for the best-performing version, as
well as Mégane and Scénic Collection 2012, with emissions of, respectively,
90g CO2/km and 105g CO
2/km with the Energy dCi 110 diesel engine, and
119g CO2/km and 135g CO
2/km with the Energy TCe 115 engine. In the
Dacia range, New Sandero and New Logan also contributed to these results,
with certified emissions of 99g CO2/km for the versions fitted with the dCi 75
and dCi 90 engines and 116g CO2/km for the TCe 90 gasoline engines.
The new models rolled out in 2013 bring further improvement. Captur emits
95g CO2/km with the Energy dCi 90 diesel engine and 113g CO
2/km with
the Energy TCe 90 gasoline engine. Emissions from New Logan MCV are
comparable to those of New Sandero and New Logan.
In addition, a range of vehicles that run on alternative fuels is offered to
respond to demand in regional and local markets. In 2013, eighteen Renault
and Dacia vehicles were available with LPG engines, with the largest share
marketed in Europe, South Korea and Turkey. In Brazil, a large portion of the
Renault range is available in a flexfuel version capable of running on 100%
ethanol fuel.
In the under-3.5-ton commercial vehicle market, Renault is making a notable
contribution to the achievement of the EU goal of 175g CO2/km for new
vehicles marketed in 2017. In 2012, the light commercial vehicles (less than
3.5 tons) sold by Renault and Dacia emitted, on average, 169g CO2/km.
Electric vehicles
Renault has made electric vehicles a lynchpin of its strategy and plans to
mass-market vehicles combining zero CO2 emissions, during use and
excluding wear parts, with zero pollutant emissions and zero engine noise.
The rollout of ZOE in early 2013 rounded out the range of four electric
vehicles. Sales of ZOE, Kangoo Z.E. and Fluence Z.E. are now helping to lower
the average emissions of Renault’s passenger vehicle range in Europe.
International marketing of Z.E. vehicles continued apace. SM3 Z.E., based on
Fluence Z.E. and manufactured by the Renault Samsung Motors (RSM) plant
at Busan, was launched in South Korea in late 2013. In several countries,
valuable commercial contacts were established with major companies.
Specifically targeted were companies in the energy sector, particularly
in Brazil (CPFL Companhia Paulista de Força e Luz, Itaipu Binationale). As
a result, some Twizy vehicles will be assembled by Itaipu Binationale (a
Brazilian-Paraguayan renewable energy producer).
Renault is aware that increased use of electric vehicles depends on the
availability of charging points and is accordingly working to develop charging
infrastructure and services. The infrastructure is growing in Europe, with the
number of charging points doubling between 2011 and 2013. Renault is
continuing its efforts, with public and private partnerships set up in 2013
helping to move this process along in France and across Europe as well as
locally and in international markets.
Renault and three partners have created Gireve SAS, a company whose aim
is to facilitate the use of public charging terminals in France and Europe by
making them visible, accessible and compatible for all electric vehicle drivers.
Similarly, the partnership with E. Leclerc is intended to increase the density
of the network in France by installing charging terminals in the parking lots of
this retailer’s shopping centers. Renault is also making a direct contribution:
since September 2013, over 370 outlets in the Renault sales network in
France have offered one hour of charging daily to EV users. A total of 875
accelerated charging points are thus available to all EV users.
At the local level, Renault is lending its support to the most active organizations
such as the SyDEV (Syndicat Départemental d’Énergie et d’Équipement de la
Vendée), which it will provide with consulting services for the deployment
of 350 charging terminals in 191 municipalities in western France between
2014 and 2016.
Renault is also participating in European projects like the multi-manufacturer
consortium Rapid Charge Network (RCN), which has plans to deploy a
network of multi-standard, rapid-charging terminals along motorways
in the UK and Ireland. In South Korea, Renault Samsung Motors (RSM) is
a member of the Korean Smart Grid Association (KSGA), whose objectives
include the standardization of charging infrastructures. In cooperation with
the South Korean Ministry of Commerce, Industry and Energy and as part of
a consortium of companies, RSM is taking part in a field test on the island of
Jeju in a programme to implement smart grids that would incorporate electric
vehicle charging stations.
Eco-driving
Fuel consumption actually observed by an average driver can diverge
significantly from the certified values, with differences possibly exceeding
20% depending on the type of driving. That is because the certified
consumption values are calculated for standardized cycles that do not reflect
all driving styles (more or less aggressive) or all driving conditions (no heating
or air conditioning, fluid urban and suburban traffic). In addition to new
technologies, changing driver behavior by promoting eco-driving is another
way to lower fuel consumption.
To encourage the adoption of more ecological driving, Renault has created the
Driving eco2 programme to explore two complementary means of progress:
in-car assistance tools and training services.
Three types of eco-driving aids are installed on the most recent Renault and
Dacia models:
W eco-mode, triggered by simply pressing a button, modifies vehicle
performance and regulates thermal comfort to reduce fuel consumption
by as much as 10%;
W assessment tools and driver coaching integrated in multimedia systems
(R-Link, Médianav) supply information and advice that improve driving
behavior. For example, the journey report, or eco-scoring, provides an
assessment at the end of the journey according to three eco-driving
criteria (acceleration, speed and anticipation). Eco-coaching provides the
driver with personalized advice based on the scores obtained. Eco-route
calculates the most fuel-efficient route for a given journey;
W the driving-style indicator, which tells drivers in real time whether they are
practicing eco-driving.
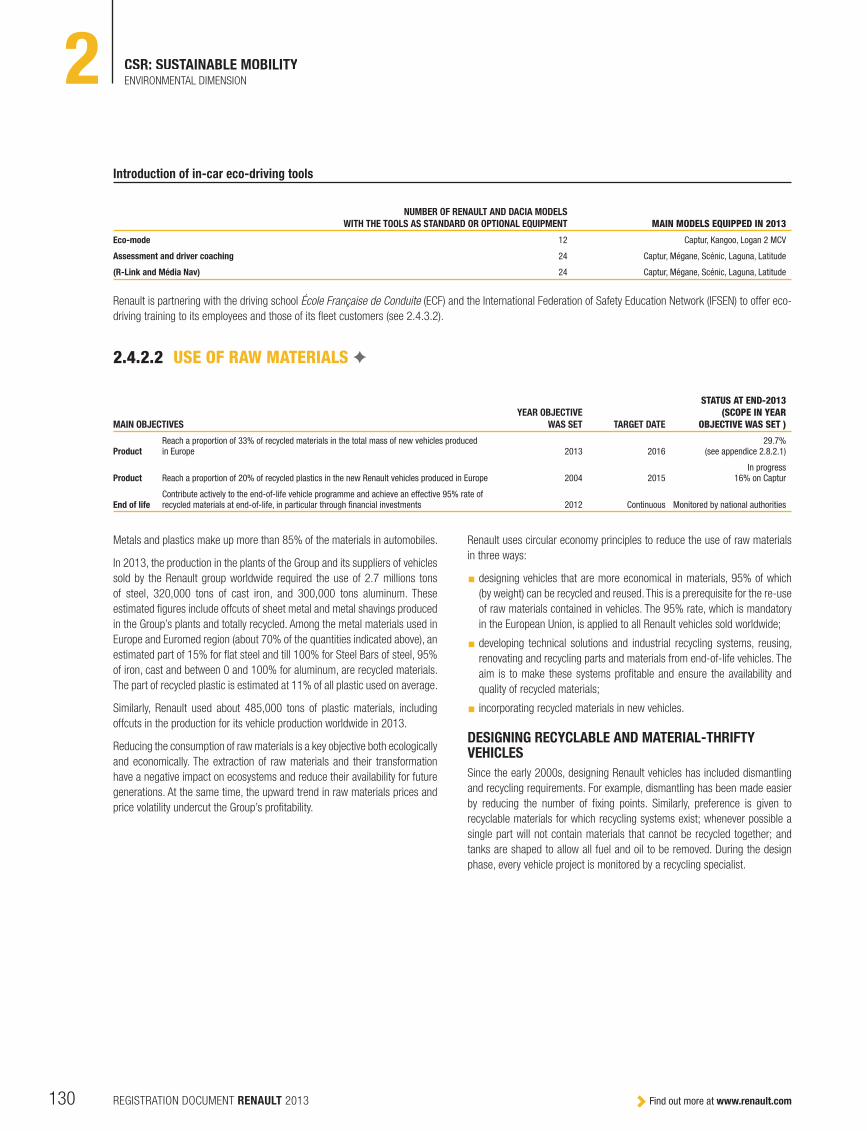
Find out more at www.renault.comREGISTRATION DOCUMENT RENAULT 2013130
CSR: SUSTAINABLE MOBILITY2 ENVIRONMENTAL DIMENSION
Introduction of in-car eco-driving tools
NUMBER OF RENAULT AND DACIA MODELS
WITH THE TOOLS AS STANDARD OR OPTIONAL EQUIPMENT MAIN MODELS EQUIPPED IN 2013
Eco-mode 12 Captur, Kangoo, Logan 2 MCV
Assessment and driver coaching 24 Captur, Mégane, Scénic, Laguna, Latitude
(R-Link and Média Nav) 24 Captur, Mégane, Scénic, Laguna, Latitude
Renault is partnering with the driving school École Française de Conduite (ECF) and the International Federation of Safety Education Network (IFSEN) to offer eco-
driving training to its employees and those of its fleet customers (see 2.4.3.2 ).
2.4.2.2 USE OF RAW MATERIALS ✦
MAIN OBJECTIVES
YEAR OBJECTIVE
WAS SET TARGET DATE
STATUS AT END-2013 (SCOPE IN YEAR
OBJECTIVE WAS SET )
ProductReach a proportion of 33% of recycled materials in the total mass of new vehicles produced in Europe 2013 2016
29.7%(see appendice 2.8.2.1)
Product Reach a proportion of 20% of recycled plastics in the new Renault vehicles produced in Europe 2004 2015In progress
16% on Captur
End of lifeContribute actively to the end-of-life vehicle programme and achieve an effective 95% rate of recycled materials at end-of-life, in particular through financial investments 2012 Continuous Monitored by national authorities
Metals and plastics make up more than 85% of the materials in automobiles.
In 2013, the production in the plants of the Group and its suppliers of vehicles
sold by the Renault group worldwide required the use of 2.7 millions tons
of steel, 320,000 tons of cast iron, and 300,000 tons aluminum. These
estimated figures include offcuts of sheet metal and metal shavings produced
in the Group’s plants and totally recycled . Among the metal materials used in
Europe and Euromed region (about 70% of the quantities indicated above), an
estimated part of 15% for flat steel and till 100% for Steel Bars of steel, 95%
of iron, cast and between 0 and 100% for aluminum, are recycled materials.
The part of recycled plastic is estimated at 11% of all plastic used on average.
Similarly, Renault used about 485,000 tons of plastic materials, including
offcuts in the production for its vehicle production worldwide in 2013.
Reducing the consumption of raw materials is a key objective both ecologically
and economically. The extraction of raw materials and their transformation
have a negative impact on ecosystems and reduce their availability for future
generations. At the same time, the upward trend in raw materials prices and
price volatility undercut the Group’s profitability.
Renault uses circular economy principles to reduce the use of raw materials
in three ways:
W designing vehicles that are more economical in materials, 95% of which
(by weight) can be recycled and reused. This is a prerequisite for the re-use
of raw materials contained in vehicles. The 95% rate, which is mandatory
in the European Union, is applied to all Renault vehicles sold worldwide;
W developing technical solutions and industrial recycling systems, reusing,
renovating and recycling parts and materials from end-of-life vehicles. The
aim is to make these systems profitable and ensure the availability and
quality of recycled materials;
W incorporating recycled materials in new vehicles.
DESIGNING RECYCLABLE AND MATERIAL-THRIFTY VEHICLES
Since the early 2000s, designing Renault vehicles has included dismantling
and recycling requirements. For example, dismantling has been made easier
by reducing the number of fixing points. Similarly, preference is given to
recyclable materials for which recycling systems exist; whenever possible a
single part will not contain materials that cannot be recycled together; and
tanks are shaped to allow all fuel and oil to be removed. During the design
phase, every vehicle project is monitored by a recycling specialist.

REGISTRATION DOCUMENT RENAULT 2013✦ Global Reporting Initiative (GRI) Directives 131
CSR: SUSTAINABLE MOBILITY 2
2
ENVIRONMENTAL DIMENSION
Renault also works on reducing the amount of materials used when designing
vehicles and production procedures. Concerning the steel used in vehicle
bodies, Renault has introduced two technological advances to reduce
consumption of sheet metal:
W the use of sheet metal with high elastic limits (including hot-pressed steel)
reduces the thickness and therefore the mass of parts;
W deep-drawing processes have been optimized to improve material
consumption, i.e. the ratio between the mass of the part and the initial
mass of the metal blank. These processes allow smaller blanks to be used
to make the same part and generate less metal waste.
Renault is also reducing its exposure to critical materials that present risks
of unavailability or supply shortages. A joint analysis was carried out with
Nissan to assess the risk level for metals used in vehicles. Criteria taken into
account included factors linked to the production of metals, the concentration
of production and the stability of producer countries, as well as factors linked
to their use by Renault, such as quantities purchased and the ability to replace
or recycle the materials. In 2013, Renault continued its efforts to reduce the
use of rare earths in its vehicles and started a similar programme for copper.
COLLECT, SORT, DISMANTLE, DIRECT
Collection is an essential step in the recycling of end-of-life products. Besides
its regulatory obligations (see 2.4.3.2), Renault is directly involved in collection
and dismantling activities to keep control economically and technically of the
flows of materials.
W Indra, a joint venture with Sita (a Suez Environnement subsidiary), manages
the collection in France of end-of-life vehicles in the Renault sales network
and their dismantling. As Renault’s home market, France accounts for 45%
of the Group’s end-of-life vehicles in Europe. The dismantling is done by
Indra or one of the 384 approved dismantlers in its network. The parts and
materials are then sent to the appropriate recycling system.
W The Gaia subsidiary collects unused parts in the sales network as well as
at the plants and suppliers’, sorts them and, depending on their condition,
resells them or sends them to the most appropriate recycling system.
Gaia also collects catalytic converters in Indra’s dismantlers network and
improves the recycling of the platinum-group metals in them from the
technical and economic standpoints.
REUSING
In addition to the reselling of unused parts (the Gaia subsidiary), Renault
launched a new after-sales range of refurbished parts in 2012. The Renault
sales network in France offers second-hand exterior parts (hoods, fenders,
headlamp units, etc.) collected from Indra’s network of dismantlers and
selected by Gaïa. This service is available to customers whose vehicles are
not economically repairable using new parts.
RE-MANUFACTURING
For more than 60 years, Renault has done re-manufacturing, i.e., the
refurbishment of mechanical parts. Used parts are collected in the sales
network, sorted and made new again. Since 1949, the renovation of engines
and gearboxes has been done at the Choisy-le-Roi (France) plant. This activity
adheres to a strict industrial process involving complete dismantling, sorting,
refurbishment and replacement of faulty or worn parts, cleaning, re-assembly
and inspection.
These renovated (“standard exchange”) parts are sold to Renault vehicle
owners at a lower price than new parts while satisfying the same quality
requirements. Far from being marginal, the standard exchange parts offering
covers a large portion of the new parts offering (70% of powertrain parts and
as much as 90% of ground contact parts).
RECYLCING: DEVELOPING INDUSTRIAL SYSTEMS, USING RECYCLED MATERIALS
In accordance with the principles of the circular economy, Renault’s objective
is to ensure not only that waste from the automotive industry is recycled but,
whenever possible, that it is recycled within the automotive industry itself.
The challenge is to maintain the technical qualities and economic value of
materials after recycling.
For several years Renault has carried out research projects in partnership
with ADEME, local authorities and manufacturers to set up systems to recover
waste and parts from end-of-life vehicles and other industries. The aim of
these collaborative projects is to create systems of supply for the automotive
industry. Projects focus particularly on the recovery of glass (Valver project),
polyamide (Pareo project), polypropylene, Noryl, foam rubber and textiles
(Valtex project), steel, copper and aluminium. The industry associations
Prorecyclage (www.prorecyclage.com) and RECORD (www.record-net.org),
to which Renault belongs, are helping to organize its collective programmes.
At the end of 2013, the “short-loop” processes set up by Renault included:
W the recycling of metal parts coming from vehicle maintenance and repair.
The first flow of parts sent for renovation, consisting of engines and
gearboxes, began in 2012. Any components removed during renovation
are sent to the Renault foundries for recycling. In 2013 used disk brakes
collected in the sales network were added to this recycling process;
W the recycling of copper. The wire bought back from the dismantlers of end-
of-life vehicles by Gaia is processed to recover the copper. The copper
is then sold either to the Fonderie de Bretagne (Renault group) for the
production of pearlitic cast iron or to auto industry suppliers for aluminum
processing. The copper recycled by Gaia is of high quality and can thus
meet demanding technical specifications and replace unused post-
manufacturing metal(1);
(1) Post-manufacturing material: Metal waste from the manufacturing process (production of wire), as opposed to a post-consumer material (i.e., contained in a finished product and recovered from the product at its end of life).
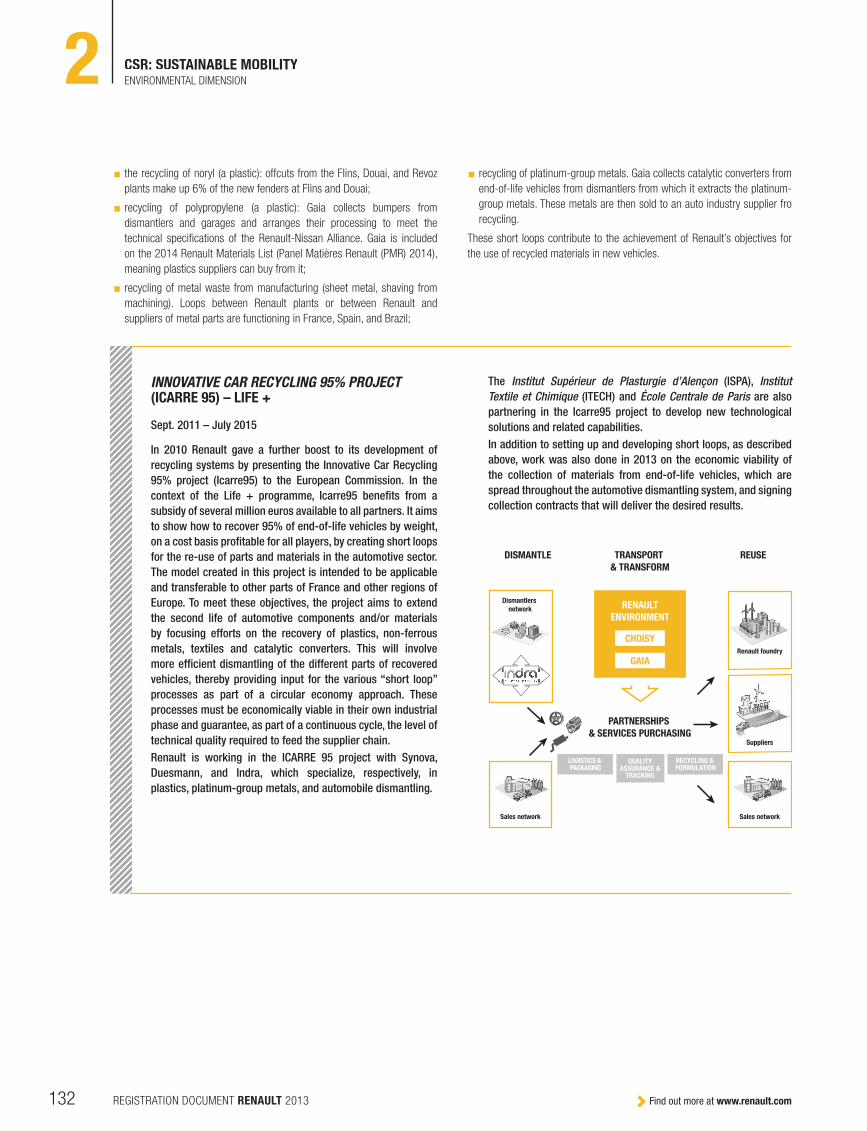
Find out more at www.renault.comREGISTRATION DOCUMENT RENAULT 2013132
CSR: SUSTAINABLE MOBILITY2 ENVIRONMENTAL DIMENSION
W the recycling of noryl (a plastic): offcuts from the Flins, Douai, and Revoz
plants make up 6% of the new fenders at Flins and Douai;
W recycling of polypropylene (a plastic): Gaia collects bumpers from
dismantlers and garages and arranges their processing to meet the
technical specifications of the Renault-Nissan Alliance. Gaia is included
on the 2014 Renault Materials List (Panel Matières Renault (PMR) 2014),
meaning plastics suppliers can buy from it;
W recycling of metal waste from manufacturing (sheet metal, shaving from
machining). Loops between Renault plants or between Renault and
suppliers of metal parts are functioning in France, Spain, and Brazil;
W recycling of platinum-group metals. Gaia collects catalytic converters from
end-of-life vehicles from dismantlers from which it extracts the platinum-
group metals. These metals are then sold to an auto industry supplier fro
recycling.
These short loops contribute to the achievement of Renault’s objectives for
the use of recycled materials in new vehicles.
INNOVATIVE CAR RECYCLING 95% PROJECT (ICARRE 95) – LIFE +
Sept. 2011 – July 2015
In 2010 Renault gave a further boost to its development of
recycling systems by presenting the Innovative Car Recycling
95% project (Icarre95) to the European Commission. In the
context of the Life + programme, Icarre95 benefits from a
subsidy of several million euros available to all partners. It aims
to show how to recover 95% of end-of-life vehicles by weight,
on a cost basis profitable for all players, by creating short loops
for the re-use of parts and materials in the automotive sector.
The model created in this project is intended to be applicable
and transferable to other parts of France and other regions of
Europe. To meet these objectives, the project aims to extend
the second life of automotive components and/or materials
by focusing efforts on the recovery of plastics, non-ferrous
metals, textiles and catalytic converters. This will involve
more efficient dismantling of the different parts of recovered
vehicles, thereby providing input for the various “short loop”
processes as part of a circular economy approach. These
processes must be economically viable in their own industrial
phase and guarantee, as part of a continuous cycle, the level of
technical quality required to feed the supplier chain.
Renault is working in the ICARRE 95 project with Synova,
Duesmann, and Indra, which specialize, respectively, in
plastics, platinum-group metals, and automobile dismantling.
The Institut Supérieur de Plasturgie d’Alençon (ISPA), Institut
Textile et Chimique (ITECH) and École Centrale de Paris are also
partnering in the Icarre95 project to develop new technological
solutions and related capabilities.
In addition to setting up and developing short loops, as described
above, work was also done in 2013 on the economic viability of
the collection of materials from end-of-life vehicles, which are
spread throughout the automotive dismantling system, and signing
collection contracts that will deliver the desired results.
TRANSPORT
& TRANSFORM
PARTNERSHIPS
& SERVICES PURCHASING
DISMANTLE REUSE
RENAULT
ENVIRONMENT
CHOISY
GAIA
Dismantlers
network
QUALITY ASSURANCE &
TRACKING
Suppliers
Renault foundry
Sales networkSales network
LOGISTICS & PACKAGING
RECYCLING & FORMULATION

REGISTRATION DOCUMENT RENAULT 2013✦ Global Reporting Initiative (GRI) Directives 133
CSR: SUSTAINABLE MOBILITY 2
2
ENVIRONMENTAL DIMENSION
Progress in using recycled plastics is being made with each generation,
notably owing to their greater availability. In 2013, this ratio rose to 16% for
Captur, with a target of 20% set for new vehicles produced in 2015 in Europe.
Besides the recycling of plastics, Renault has set an objective of having
recycled materials represent 33% of the total mass of new vehicles in Europe
in 2016. In 2013, the proportion was estimated at 29.7%. Renault and Nissan
are also working to identify recycling networks and to include more recycled
materials in the vehicles manufactured in Brazil and India.
Circular economy at Renault
Recycled materials (other industries)
RecyclersFoundries
Supplier chain Vehicleproduction
Vehicle maintenance
Reused parts and renovated parts
End-of-life vehicles and parts
Materials from the recycling
Scrap metal
Renault is applying the principles of circular economy by adopting a policy
of prevention aimed at reducing the quantities of waste and prioritizing
treatment methods. When the production of waste cannot be avoided, the
plants do what they can to recycle waste and reduce the quantities that are
sent to landfills.
W Prevention consists in reducing waste at the source. For example, the
systems to filter paint sludge cut the quantities of waste discharged.
Similarly, the separation of dry matter and oils in the sludge and the
shavings from milling reduces the tonnages of waste and enables the oils
to be reused in the manufacturing process. The level of performance of
these 2 practices is rather high for the Bursa plant in Turkey .
W Preparation for reuse consists in recovering materials and using them in
a similar way. At Renault’s French plants, this activity is conducted mainly
by Gaia, a subsidiary that recovers unused end-of-life parts, then sorts and
sells them. Raw materials are also reused. In the assembly plants, excess
protective waxes are recovered after application, filtered and put back in the
production system, thus yielding both environmental and economic gains.
At the Maubeuge plant, the solvents used to rinse the painting robots are
regenerated by a specialized supplier and reused. The Cléon plant collects
and regenerates oils from several French plants for use in machining
mechanical parts, thus avoiding the use of new oils. This approach is also
applied to the wooden transport pallets: after sorting, the ones in good
condition are resold for the same use. In 2013, an internal loop for the
reuse of pallets was set up: Sofrastock, an international logistics subsidiary,
bought pallets from French plants rather than new pallets.
W Recycling consists in recovering materials from a component or
consumable and using them as an alternative raw material for a different
purpose. This form of waste treatment can be applied to most recoverable
materials (cardboard, plastic, metal, etc.). Metal waste, which represents
70 % of production waste, is totally recycled. Renault’s environmental teams
are also working on the recycling of more complex wastes. Beginning in
2013, for example, the sludge from the wastewater at the Sandouville plant
is no longer incinerated, but instead recycled in a cement plant in place of
a raw material.
W Energy recovery consists in using waste as an alternative fuel (in cement
plants, for example) or recovering the energy produced by incineration (in
waste incineration facilities) to produce electricity or steam.
W Disposal consists in burning the waste or burying it in landfills. Renault
is seeking to minimize the use of this waste management method. Based
on an identical scale of operations, Renault has reduced the quantities of
manufacturing waste sent to landfills (except demolition waste and rubble)
by 17 % since 2008. At the end of 2013, 5 manufacturing sites were no
longer sending any waste to landfills (except demolition waste and rubble).
To ensure Group-wide coherence, Renault has drafted a waste table (a codified
list of waste produced by the sites). This makes it possible to standardize the
approach to hazardous and non-hazardous waste internationally.
2.4.2.3 WASTE ✦
MAIN OBJECTIVES
YEAR OBJECTIVE
WAS SET TARGET YEAR STATUS AT END-2013
ManufacturingReduce reliance on disposal in landfills: six manufacturing plants will no longer be disposing of waste in this way in 2016 2007 2016 5 plants
ManufacturingReduce by 20% the quantity of hazardous waste produced by the manufacturing plants between 2012 and 2016 2013 2016
total tonnage: +2.5%kg/vehicle (vs 2012): -8.6%
ManufacturingReduce by 20% the quantity of non-hazardous waste in mixtures produced by the manufacturing plants between 2012 and 2016 2013 2016
total tonnage: -3%kg/vehicle (vs 2012): -13%

Find out more at www.renault.comREGISTRATION DOCUMENT RENAULT 2013134
CSR: SUSTAINABLE MOBILITY2 ENVIRONMENTAL DIMENSION
Waste – types and treatment methods (tons/year) ✦
TOTAL RECYCLED INCINERATED LANDFILLED
MANUFACTURING SITES
Hazardous industrial waste* 2013 55,798 12,483 26,329 16,986
2012 54,413 11,520 25,947 16,946
2011 60,053 10,758 29,534 19,761
Non-hazardous industrial waste* 2013 1,78,059 1,29,524 7,768 40,766
2012 1,68,033 1,26,058 6,321 35,654
2011 1,48,284 1,16,088 5,137 27,059
Metalic waste 2013 6,52,698
2012 6,07,606
2011 6,95,601
ENGINEERING, LOGISTICS AND SUPPORT SITES
Other hazardous waste 2013 1,603 1,050 250 303
2012 1,821 965 372 484
2011 1,751 885 371 495
Other non-hazardous waste 2013 14,895 11,677 2,642 576
2012 16,247 12,819 2,563 864
2011 17,509 13,020 3,470 1,020
* Without metalic waste
Scope: all manufacturing plants and the main tertiary, logistics and engineering sites except those in the RRG sales network (the scope of reporting described in appendix 2.8.2.2 ). Quantities of construction waste that are unrelated to the activity are not reflected by this graph.
Waste per vehicle produced (kg/vehicle) ✦
2011 20122009 2010
Non Hazardous Waste(kg/vehicle produced)
Total waste(kg/vehicle produced)
Hazardous waste(kg/vehicle produced)
2013
356
333
23 21
328347
324
23
356
332
24 23
335358350
0
100
200
300
400
Scope: all manufacturing plants and the main tertiary, logistics and engineering sites except those in the RRG sales network (the scope of reporting described in appendix 2.8.2.2 ). Quantities of construction waste that are unrelated to the activity are not reflected by this graph.
2.4.2.4 WATER CONSUMPTION AND QUALITY ✦
MAIN OBJECTIVES OBJECTIVE SET TARGET
STATUS AT END–2013 (IDENTICAL SCOPE)
Manufacturing Reduce water consumption per vehicle (all sources included) by 45% compared with 2005 2012 2016– 38% in 2013
compared with 2005
ManufacturingReduce the quantity of heavy metals (METOX) in liquid effluents per vehicle by 60% compared with 2005 2012 2016
– 51% in 2013compared with 2005

REGISTRATION DOCUMENT RENAULT 2013✦ Global Reporting Initiative (GRI) Directives 135
CSR: SUSTAINABLE MOBILITY 2
2
ENVIRONMENTAL DIMENSION
Preserving water resources is an ongoing concern for Renault, both to
ensure long-term supply and to reduce the impact on ecosystems. Renault
is therefore aiming to reduce the impact of its activities by pursuing the
following five objectives:
1. reduce water consumption and the quantities of wastewater through
well-designed processes and effective management. For example, in the
surface treatment of vehicle bodies, adjusting rinse water throughput to the
body or installing rinse manifolds between stages reduces the amount of
water required and the corresponding discharges;
2. reuse water as much as possible for the same process: closed loops,
longer bath life, etc.;
3. recycle water for other compatible uses, with or without additional
treatment. For example, the Sofasa plant (Colombia) recycles saline
concentrates from reverse osmosis water production for flushing toilets
and for paint pits, thus consuming less water and also producing fewer
discharges;
4. minimize the impact of residual waste on the environment through
efficient and strictly controlled treatment processes. For example, new
biological treatment plants were set up at the Le Mans plant (France) in
2012 and at the Dacia plant (Romania) in 2013 to improve the quality of
discharged effluents;
5. control the risk of accidental pollution of water resources by installing
means to confine accidental spillage and water used for fire fighting.
ZERO INDUSTRIAL EFFLUENT DISCHARGE ✦
Among the means used by Renault to achieve its objectives of reducing water
consumption and the discharge of pollutants into the environment is the “zero
industrial effluent discharge” policy. This integrated approach is based on
recycling: aqueous liquids from manufacturing processes are treated so they
can be used again for the same purposes.
W In the powertrain plants, the zero industrial effluent discharges approach
consists in dealing with aqueous liquids from machining and washing
processes either as waste to be treated in the appropriate manner,
if volumes are small, or by evaporation in order to recycle the distilled
and purified water in the manufacturing processes. The concentrate (oily
residue from evaporation) is then transferred to an appropriate waste
treatment system. In 2013, nine out of the thirteen Renault powertrain
plants were applying the zero discharge approach, six for all their industrial
effluents and three for part of them;
W In the body assembly plants, the recycling technology is more complex
because the water used in the manufacturing process (surface treatment
and e-coating) must be of very high quality. In a zero-discharge plant, the
purified effluent is treated by reverse osmosis and evapo-concentration so
that it can be reused in the industrial process, thus minimizing the quantity
of waste produced.
The Tangiers body assembly plant in Morocco, which opened in
February 2012, is in an area where water is very scarce. As a result, it is
equipped with all the advanced technologies necessary to recycle wastewater
from the manufacturing process in order to obtain zero effluent discharges.
In 2013 the Tangiers plant was in the ramp up phase for the installations, the
functioning of the processes and equipments is still to be optimized. Almost
25% of water used during the year in the industrial process is already coming
from recycled effluent discharges from the plant.
Water supply by source ✦
8.8%
Industrial water from
external network
13.5%
Ground water
41.3%
Drinking water from
external network
1.2%
Rainwater
1.4%
Internal recycling of industrial
wastewater
33.8%
Surface water
Scope: all manufacturing plants and the main tertiary, logistics and engineering sites except those in the RRG sales network (the scope of reporting described in appendix 2.8.2.2 ).
Total water consumption per vehicle produced ✦
12 12 16
2010 201120092002 ... 2012 2013
Water consumption per vehicle produced(in m3 /vehicle)
Total water consumption(1,000 m3)
9.2
20,9
45
10,6
82
10,6
90
11,9
72
11,5
39
11,3
91
4.8
4.14.5 4.8
4.5
00
2
4
6
8
10
5,000
10,000
15,000
20,000
25,000
Water consumption corresponds to external water supply (drinking water from network, industrial, surface water, rainwater, groundwater).
Scope: all manufacturing plants and the main tertiary, logistics and engineering sites except those in the RRG sales network (the scope of reporting described in appendix 2.8.1.1).

Find out more at www.renault.comREGISTRATION DOCUMENT RENAULT 2013136
CSR: SUSTAINABLE MOBILITY2 ENVIRONMENTAL DIMENSION
Heavy metals ✦
12 12 16
2010 201120092002 ... 2012 2013
Heavy metals per vehicle produced Total Heavy metals
7.61
17.2
9
13.2
2
12.3
6
11.7
8.89
8.34
6.00
4.784.41
3.733.31
0
1
2
3
4
5
6
7
8
0
4
8
12
16
20
Values here above correspond to the emissions of the main heavy metals weighted by their toxcity, explaning why these values are superior to the physical measures (appendex 2.8.2.2)
Scope: all manufacturing plants and the main tertiary, logistics and engineering sites except those in the RRG sales network (the scope of reporting described in appendix 2.8.2.2 ).
Chemical Oxygen- Demand (COD) ✦
12 12 16
2010 201120092002 ... 2012 2013
COD per vehicle produced Total COD
0.78
1,76
3
1,73
0
1,87
2
2,17
3
1,89
8
11,3
91
0.7850.72
0.82 0.80
0.64
0.0
0.2
0.4
0.6
0.8
1,0
0
500
1,000
1,500
2,000
2,500
Scope: all manufacturing plants and the main tertiary, logistics and engineering sites except those in the RRG sales network (the scope of reporting described in appendix 2.8.2.2 ).
2.4.2.5 AIR QUALITY ✦
MAIN OBJECTIVES
YEAR OBJECTIVE
WAS SET TARGET YEAR
STATUS AT END-2013 (SCOPE IN THE YEAR
OBJECTIVE WAS SET)
ManufacturingReduce VOC emissions through continuous improvement and progressive replacement of obsolete installations 2012 2016
+1,4% in 2013 (vs 2012)
MANUFACTURING
Volatile organic compounds (VOC) ✦
Renault has made reducing emissions at the source a priority. Accordingly,
76 % of its production facilities are now equipped with booths using water-
based paint and 80% with incinerators designed to cut VOC emissions from
paint-drying operations. In 2012 Renault introduced two new processes for
reducing VOC emissions generated by the use of solvent-based primers.
The new plant in Tangiers is equipped with a water-based primers line. At
Valladolid, the layer of solvent-based primer has been replaced by an extra
water-based layer.
The Paint Engineering department and the Energy & Health, Safety
Environment department are piloting the initiative to roll out best practices,
dialogue and knowledge sharing between plants.
The increase in average emissions across the Group is due to the fact that a
larger portion of vehicles is produced in non-EU plants, where emissions are
generally higher. VOC emissions at 13 out of the Group’s 18 body assembly
and mixed plants either fell or remained stable between 2012 and 2013.
VOC emissions
g/m2
5451
4641 41 42 43.7
0
10
20
30
40
50
60
2010 201120092006 2007 2008 2012 2013
43.1
Scope: all body assembly and mixed plants (scope of reporting described in appendix 2.8.2.2 ). These emissions are related to the solvents used in the paint workshops; emissions from the painting of parts (eg, plastic bumpers) and accessories are not included.

REGISTRATION DOCUMENT RENAULT 2013✦ Global Reporting Initiative (GRI) Directives 137
CSR: SUSTAINABLE MOBILITY 2
2
ENVIRONMENTAL DIMENSION
Combustion emissions of SO2 and NO
x✦
Over the past few years Renault has been conducting a large-scale
programme to replace fuel oil by natural gas at its production plants. The aim
is to cut emissions of sulfur dioxide (SO2), nitrogen oxides (NO
x) and carbon
dioxide (CO2). The proportion of fuel oil in the thermal energy consumed by
Renault dropped from 14% in 1999 to less than 0.2% in 2013. This plan is
being taken further with the installation of boilers fitted with low-NOx burners.
VEHICLES IN USE
ICE vehicles
All passenger cars and LCVs sold in Europe since January 1, 2011, and
January 1, 2012, respectively, have to comply with the Euro 5 standard.
This means that all diesel engines must be equipped with a particulate filter.
For its other markets, Renault is adapting the technical specifications of
its powertrains to suit local conditions (fuel quality, climate, dust, etc.) and
applicable regulations.
SO2 EMISSIONS
12 12 160.0
0.2
0.4
0.6
0.8
1.0
1.2
1.4
1.6
2010 201120092002 ... 2012 2013
KG SO2 per vehicle producedTon SO
2
1.369
0
200
180
160
140
120
100
80
60
40
20
2.879
94
36
0.043 0.014 0.005 0.005 0.006
Scope: all assembly plants & main Logistical and Engineering Service Sites, without, the RRG Commercial Network. appendix 2.8.2.2 ).
NOx emissions
12 12 16
2010 201120091998 ... 2012 2013
Kg NOx per vehicle producedTon NO
x
0.30
636 513 597 506 513 534
0.23
0.23
0.19 0.220.21
0.00
0.05
0.10
0.15
0.20
0.25
0.30
0.35
0
100
200
300
400
500
600
700
800
Scope: all assembly plants & main Logistical and Engineering Service Sites, without, the RRG Commercial Network. appendix 2.8.2.2 ).
Emission reduction in line with passenger vehicle emissions standards (European Union)
START DATE (ALL TYPES)
EURO 1 EURO 2 EURO 3 EURO 4 EURO 5 EURO 6 % REDUCTION
ACHIEVED BY EURO 6
COMPARED WITH THE
FIRST LIMIT VALUE1993 1997 2001 2006 2011 2015
Diesel
Nitrogen oxides (NOx) - - 500 250 180 80 -84%
Carbon monoxide (CO) 2,720 1,000 640 500 500 500 -82%
Hydrocarbons and nitrogen oxides (HC+NOX) 970 900 560 300 230 170 -82%
Particles – by mass (PM) 140 100 50 25 5 4.5 -97%
Particles – by number (PN) - - - - 6×10¹¹ 6×10¹¹ -
Gasoline
Nitrogen oxides (NOx) - - 150 80 60 60 -60%
Carbon monoxide (CO) 2,720 2,200 2,200 1,000 1,000 1,000 -63%
Hydrocarbons (HC) - - 200 100 100 100 -50%
Non-methane hydrocarbons (NMHC) - - - - 68 68 -
Particles – by mass (PM) - - - - 5 4.5 -
Particles – by number (PN) - - - - - 6×10¹¹ -
All values are expressed in mg/km except PN, which is expressed in number of particles per km.

Find out more at www.renault.comREGISTRATION DOCUMENT RENAULT 2013138
CSR: SUSTAINABLE MOBILITY2 ENVIRONMENTAL DIMENSION
A key way to reduce pollutant emissions is by improving the energy efficiency
of vehicles (new Energy engines and Stop&Start). Renault’s NOx trap is part
of the brand’s efforts to cut pollutant emissions. This chemical system traps
nitrogen oxides and turns them into neutral gases. This after-treatment
system available to consumers since 2009 was introduced in 2013 on
Mégane Energy dCi 130 Euro 6 in the main European markets. In addition to
processing NOx, this catalytic converter helps oxidize the hydrocarbons and
carbon monoxide produced by partial combustion.
Electric vehicles
Once they reach a significant proportion of all vehicles on the road, electric
vehicles will contribute to improving air quality in urban areas because they do
not generate emissions during use. In 2012 Renault teamed up with the city
authorities in Rome and with Aria Technologies and Arianet, two companies
specialized in modeling atmospheric pollution, to quantify the health benefits
of electric vehicles in urban areas.
The study, which assesses both the reduction in emissions as a result of
electric vehicles and the increase in emissions due to the increase in
electricity generation, models the impact by 2020 of a proactive policy to
promote clean vehicles. In the scenario tested, electric vehicles make up 25%
of all vehicles in city center areas subject to existing traffic restrictions, and
clean vehicles are given preferential access by replacing the public fleet with
electric vehicles and promoting small electric LCVs for goods delivery to end
customers. The study’s findings show a clear health benefit from the proactive
scenario compared with the base scenario. Concentrations of nitrogen dioxide
(NO2) would be reduced by 9% to 25% depending on the seasons and up
to 45% on major arterial roads, and particle concentrations (PM10) by up
to 30%. Nearly 50% of the population of the historic city center would be
protected from exposure to benzene levels of more than 2μg/m3 (the level
recommended by France’s High Council for Public Health).
2.4.2.6 CHEMICALS
MAIN OBJECTIVES YEAR OBJECTIVE WAS SET TARGET
Manufacturing and product Replace potentially toxic chemical substances 2009 Ongoing
To safeguard the health of workers and consumers, and to protect ecosystems,
national and European legislators have imposed restrictions on the use of
hazardous substances in the workplace and in products. In the European
Union, the introduction of the Registration, Evaluation, Authorization and
restriction of CHemicals (REACH) regulation in 2007 heightened awareness
of chemical risks and prompted an increase in the number of restrictions and
usage precautions.
Renault has a structure dedicated to managing hazardous substances, with
three divisions:
W in collaboration with the departments responsible for occupational health
and working conditions, the Industrial Hygiene division manages workers’
exposure to chemical risks at all Renault production sites around the world.
It monitors the composition and labeling of chemicals used on-site and
coordinates research into technical solutions to eliminate priority hazardous
substances. This expert division was created in the 1960s;
W the Materials Engineering division monitors substances contained in
vehicles based on information declared by suppliers using the IMDS
system, shared with 35 international automotive manufacturers. The
division coordinates research into technical solutions to eliminate priority
hazardous substances;
W the After-sales Regulatory Compliance division checks with suppliers that
parts, accessories and other products sold by after-sales teams comply
with applicable regulations and make any substitutions, if required.
A REACH – Substance Management project team is also responsible for
establishing processes and information systems enabling the Company to
fulfill its information and transparency obligations under REACH. The team
works with a network of around 50 correspondents across Europe and
maintains a dialog with counterparts inside and outside the Alliance. Its brief
is to identify and supervise the work necessary to achieve compliance by the
98 Renault legal entities concerned, to anticipate the risks of failure ahead of
the supply chain, and to develop ideas for turning a regulatory constraint into
an economic and competitive opportunity.
Renault has carried out campaigns to replace toxic substances found in the
chemicals used at its plants since the 1960s and in materials since the early
2000s. Since the number of chemicals considered toxic to varying degrees
increases regularly due to improvements in scientific knowledge, Renault
has drawn up a list of priority substances. The priorities for substitution are
carcinogenic, mutagenic and reprotoxic (CMR) substances, substances of
very high concern subject to prior authorization (annex XIV of REACH), and
substances that are not currently restricted but for which Renault aims to
anticipate a potential ban.
In calls for tenders, Renault explicitly asks suppliers to comply with its
substances standard. This prohibits the use of hazardous substances
and substances of concern, lists priority substances for substitution, and
requires suppliers to declare the substances used to create their parts and
preparations. The standard is enforced by each of the competent divisions.
In line with regulations, Renault adheres to a policy of transparency towards
its professional and private customers.
As well as standard substances and those with identified risks, Renault is
aware of the potential health impact of technological innovations. Following the
emergence of industrial applications featuring manufactured nanomaterials,
Renault set up a multidisciplinary monitoring group responsible for assessing
the associated health risks. The inventory of nanomaterial applications
and analysis of employees’ and customers’ levels of exposure to these
nanomaterials revealed no examples of potentially harmful exposure in normal
conditions of use. Renault’s R & D objectives do not include expanding the use
of nanotechnologies. Their uses correspond to those commonly proposed by
automotive industry suppliers.

REGISTRATION DOCUMENT RENAULT 2013✦ Global Reporting Initiative (GRI) Directives 139
CSR: SUSTAINABLE MOBILITY 2
2
ENVIRONMENTAL DIMENSION
2.4.2.7 SOIL AND WATER TABLES
MAIN OBJECTIVE OBJECTIVE SET TARGET YEAR
Manage remediation work when there are known risks 2001 Ongoing
Pollution from past activities can potentially come into contact with humans
and the natural environment through the soil and water tables. Renault has
therefore implemented a policy to prevent pollution of the soil and water tables,
and implements specific management strategies when there is suspicion of
past pollution. This policy applies to operational production plants, former
production plants converted to other uses and the RRG distribution network.
Renault aims to maintain in-house skills in prevention of soil pollution and
remediation.
In 2013 Renault’s production plants, engineering and logistics sites, and head
office represented a total area of 28,069 acres, 50% of which are impervious
surfaces such as buildings, parking lots, roads, and paths. The proportion of
impervious surfaces did not change significantly from the previous year.
PREVENTION
The prevention policy at industrial sites is based on three key tools. A risk-rating
grid is used to assess the risk of pollution associated with existing facilities
and reinforce the level of protection by prioritizing required rehabilitation
work. In the case of new production facilities, the soil pollution prevention
guide sets out protection measures to apply to each type of facility. These
two tools are used at all Renault’s industrial sites worldwide. The prevention
policy ultimately relies on monitoring of the composition of groundwater. This
monitoring, which is mandatory for all industrial sites in France, is also carried
out voluntarily by Renault when potential sources of pollution have been
identified to ensure that pollutants are not moved to sensitive areas.
In 2010 and 2011 all French sites in the RRG distribution network were
equipped with long-term prevention tools, and oil and fuel are now stored
aboveground or in double-wall tanks fitted with alarms and safety trays. Priority
prevention methods such as neutralizing or removing simple underground
tanks and replacing them with aboveground or double-wall storage tanks
were completed in the European RRG network in 2013.
REMEDIATION
Management of past pollution of the subsoil is based on an assessment of
the state of the environment and aims to match impacts with uses. There are
three aspects to the pollution management policy:
W historic and documentary research, including an analysis of the site’s
vulnerability, has been carried out for operational production plants,
former production plants converted to other uses and the RRG distribution
network. Updated as required, this research identifies potential sources
of pollution and assesses the associated health and environmental risks;
W a physical diagnostic of soils is carried out on-site depending on the results
of historic and documentary research;
W remediation work is undertaken if the pollution sources and risks are
confirmed by the diagnostic. These operations are carried out by specialized
service providers with recognized expertise, under the supervision of the
Renault soil specialist.
RRG uses the same assessment method to clean contaminated soils on
former oil and fuel storage sites, even when this contamination is due to the
former owner. Between 2008 and the end of 2013, remediation work has
been completed or is ongoing at 20 sites.
2.4.2.8 NOISE
MANUFACTURING
Noise is a complex subject that involves a wide range of factors such as
weather, topography, type and power of noise sources by octave band,
directivity, attenuation, and the impact of buildings. For the comfort of
residents living near its production sites, Renault is making active efforts to
limit and reduce noise nuisance by working on noise management at both
existing facilities and new facilities. Soundproofing measures are focused on
stamping presses and extraction chimneys.
VEHICLE USE
In accordance with European regulations, ICE vehicles produced by Renault
generate maximum external noise of 74 dBA during driving.
With sound levels significantly below regulatory requirements, at between
68 dBA and 70.5 dBA, the vehicles in Renault’s electric range contribute to
reducing ambient noise and improving quality of life in urban areas. They also
provide a significant improvement in users’ acoustic comfort, since an electric
vehicle’s interior noise is around 10 dBA lower than that of an ICE vehicle.
2.4.2.9 BIODIVERSITY ✦Protecting the biodiversity of species and ecosystems requires specific
measures such as protecting habitats and combatting the overexploitation
of species, as well as reducing polluting emissions into the water, air and
soil making up the ecosystem. Renault’s continuous efforts to mitigate the
environmental impact of its activities and products (see previous chapters)
therefore help combat ecosystem depletion.
Renault also takes special measures to protect biodiversity. Industrial projects
involving the construction or extension of plants are assessed to measure
their impact on surrounding ecosystems. This assessment was carried out for
the Tangiers plant inaugurated in 2012. In Brazil, Renault went even further in
2008 when, with the agreement of the local authorities, it established a plan to
protect and manage biodiversity on part of the land acquired for its industrial
site in Curitiba. Out of a total area of 2.5 million m2, 60% is devoted to the
conservation of an area of virgin forest. This virgin forest, made up mainly of
araucarias, a species of pine threatened with extinction and protected under
Brazilian law, is home to more than 170 animal species.

Find out more at www.renault.comREGISTRATION DOCUMENT RENAULT 2013140
CSR: SUSTAINABLE MOBILITY2 ENVIRONMENTAL DIMENSION
2.4.3 CROSS-COMPANY MANAGEMENT OF ENVIRONMENTAL ISSUES ✦
MAIN OBJECTIVES
YEAR OBJECTIVE WAS
SET TARGET YEAR STATUS END–2013
Reduce the impact on the basis of the life-cycle analysis from generation to generation 2005 Ongoing Sandero/New Sandero
-10% to -16% reductions
Publish the life-cycle analyses for the electric vehicle range, with critical reviews by outside experts 2009 2013
Fluence Z.E. PublishedKangoo Z.E.
ZOETwizy first semester
2014 published
Conduct environmental and risk prevention audits at all manufacturing sites and the main tertiary and logistics sites (internal audits) 2003 Ongoing 100%
ISO 14001 certification for all Renault manufacturing sites 2012 Ongoing 100%
2.4.3.1 ORGANIZATION ET RESOURCESThe focuses of Renault’s environmental policy are debated and decided
by the Group Executive Committee (CEG) on the recommendation of the
Vice-President Environmental Strategy and Planning. The Environmental
Strategy and Planning department (DPE) prepares, deploys and monitors
the implementation of the environmental policy in the various sectors of the
Company.
The DPE relies on a network that spans all the Company’s functions.
For instance, the industrial environmental network is composed of a
specialized department at the Manufacturing and Supply Chain division and
correspondents in each plant. Likewise, the recycling network brings together
teams, supervised by a Group coordinator, that are active at the design,
manufacturing and after-sales phases. Since these are highly technical
issues, the members of the environmental network are often part of the
expertise areas set up by Renault since 2010. The DPE works closely with the
Group’s expert leaders, particularly in two fields: “energy, environment and
raw materials” and “vehicle CO2” .
RESOURCES ✦Renault spends nearly €2 billion each year on research and development.
Most of this money is for new-vehicle development, a phase that includes
improvement of environmental performance, which is inseparable from the
standard product renewal process. About €200 million are allocated yearly
to research and advanced engineering in the early stages of vehicle projects.
A substantial portion of research and advanced engineering expenditures go
for innovations intended specifically to reduce fuel consumption and vehicle
emissions, which is a factor of product appeal, a regulatory requirement
(particularly in Europe), and an important means of shrinking Renault’s
environmental footprint. In 2013, this portion was about 60% of spending
(research and advanced engineering only, excluding vehicle development).
In the area of manufacturing, Renault invests about 25 to 35 million a year
to maintain , upgrade and improve the performance of its installations for
the production and distribution of energy, compressed air, and water; for
ventilation; for treating and recycling liquid effluents; and for managing waste,
preventing soil pollution and fires, and measuring atmospheric discharges. In
addition to these investments are the operating costs related to activities to
prevent or reduce environmental impacts.
Renault also allocates financial resources to the development of partnerships
and equity investments in the area of the environment and sustainable
development through Renault Environnement, a wholly owned subsidiary of
Renault s.a.s. set up in 2008 and headed by the Vice-President, Environmental
Strategy and Planning.
ENVIRONMENTAL SKILLS AND TRAINING
Renault offers its employees environmental training and information adapted
to their role and their needs.
Plant employees receive workstation training, including environmental
aspects, particularly chemical risks arising from handling, storage and spills.
Awareness-raising initiatives in the form of poster campaigns and practical
workshops are organized regularly. Most plants, for example, use waste-
sorting Dojos, i.e., workshops providing an opportunity to practice sorting
rules with waste from day-to-day activities.
In the engineering functions, employees have access to training linked to
their business, provided in the form of standard modules (eg, training for
ISO 14001 auditors or recycling system design) or training provided by a
specialized external organization if a specific skill is required. In France,
Renault employees also have access to eco-driving training for ICE and
electric vehicles.

REGISTRATION DOCUMENT RENAULT 2013✦ Global Reporting Initiative (GRI) Directives 141
CSR: SUSTAINABLE MOBILITY 2
2
ENVIRONMENTAL DIMENSION
2.4.3.2 ACTION AT ALL STAGES OF THE LIFE CYCLE
LIFE CYCLE ANALYSIS (LCA)
To provide relevant and effective responses to environmental challenges, a
global approach must be adopted, avoiding as far as possible shifting the
impacts from one stage of the life cycle to another or taking counterproductive
steps (reducing one impact but increasing another). Aware of these issues,
Renault has set the objective of reducing its environmental footprint by taking
into account the entire life cycle of its vehicles. It does this with LCAs, which
are carried out by specialized teams:
W before the design cycle, to analyze the potential environmental impacts and
benefits of technological innovations. Solid data are thus available from
the first stages of the new-vehicle design cycle to aid in making decisions
about the introduction of innovation and the technical, environmental and
economic performance of new vehicles;
W after the design cycle, to confirm and measure the reduction of
environmental impacts from one generation of vehicle to another.
ECO-DESIGN ✦
To effectively reduce pollutants generated in the different stages of the
life cycle, it is important to take action from the design and development
stage. This takes place three to five years – depending on the innovations –
before the car is released on the market. Renault’s policy is to incorporate
the environment into the usual development processes which structure
designers’ work, as well as the work of components and materials suppliers.
Eco-design of Renault and Dacia vehicles particularly involves:
W cutting fuel consumption and emissions, which reduces environmental
impacts during use;
W recycling 85% of end-of-life vehicles by weight and reusing 95% of the
recycled material, in particular by extracting fluids and dismantling and
reusing parts;
W using recycled materials;
W controlling the mass of the vehicle;
W controlling the noise generated by the vehicle;
W eliminating potentially toxic substances when a technical alternative is
available;
W including eco-driving assistance tools in the vehicle.
Considering that 57% of a vehicle is made from purchased parts, eco-design
relies largely on our suppliers’ involvement and cooperation, managed by
the Purchasing department and the Renault-Nissan Purchasing Organization
(see 2.2.3 ).
LOGISTICS ✦
The organization introduced in Renault’s logistics function in 2010 to improve
environmental performance was given wider international scope in 2013.
It was also a pivotal year for expanding the use of tools to measure CO2
emissions. The environmental teams on Renault and Nissan’s logistics staffs
also worked together to align their calculation methods and performance
indicators.
Environmental management in the logistics area includes:
W measuring and monitoring greenhouse gas emissions;
W calculating the financial impact of environmental performance (heavy truck
ecotaxes, fuel costs);
W assessing the environmental performance of logistics suppliers and
ranking them;
W partnering with suppliers and all business lines concerned to carry out
actions to reduce emissions;
W tracking regulations and technologies to achieve continuous improvement
and ensure that solutions under study are relevant.
MANUFACTURING
Renault has decided to teach its departments and employees about ecology
through a networked organization. The environmental network is Company-
wide. It establishes ties between the environmental activities and the other
processes in the Company as well as between the sites. This integrated
organization is based on:
W training for all personnel in environmental protection issues and practices
and in how to take them into account in daily activities;
W a network of environmental correspondents integrated In the production
departments, where they also do another job;
W a team of specialists at each production site to coordinate environmental
improvement actions and compliance across the entire site;
W experts at the corporate level who define and deploy the Group’s technical
policies, provide assistance to the sites and projects, organize sharing of
best practices, and do the reporting of environmental data.
The environment network covers all Renault’s industrial sites and the
manufacturing functions. It comprises more than 200 people in 13 countries
and at 47 sites and subsidiaries. This management approach is original in that
it is based on the development of a cross-functional organization designed
to improve the exchange of information and skills between members of the
network. This enables Renault to implement actions and technologies that
allow all of those involved in environmental issues to move forward together.
Underpinning environmental management at Renault plants are six pillars ?
Eco-design of industrial processes
Each industrial project is overseen by an Energy & Health Safety Environment
(E&HSE) project manager, who ensures that all regulatory requirements and
Renault technical guidelines are taken into account in the site’s design.
Compliance is assessed at each milestone of the industrial project until the
expected performance or relevant exemptions are obtained.
The E&HSE technical guidelines, which were reviewed in 2013, cover the
design of the electrical, compressed air, heating and ventilation networks;
installations for treating water, atmospheric discharges, and waste; and
equipment for preventing soil pollution and the risk of fire. In each of these
areas, the defined standards are applicable to all the Group’s plants (only the
ventilation standards vary according to climatic conditions).

Find out more at www.renault.comREGISTRATION DOCUMENT RENAULT 2013142
CSR: SUSTAINABLE MOBILITY2 ENVIRONMENTAL DIMENSION
To ensure the flexibility necessary for projects along with the application of
the key principles for the prevention of risks and pollution, the priority level
of each item is specified. Exemptions for items with the highest priority level
must be validated by the Vice-President, Manufacturing and Logistics, and the
industrial director for the Region in question, on the recommendation of the
Lead Expert. No regulatory exemptions may be granted. Technical regulations
apply only when there is no regulation or when the regulation calls for a lower
prevention level.
Continuous improvement based on ISO 14001 ✦
Since 1999 Renault has pursued a process of continuous improvement based
on the ISO 14001 standard to achieve regulatory compliance and reduce its
environmental impacts. Renault has had ISO 14001 certification since 2008
for all its industrial activities, i.e. 32 manufacturing and 11 tertiary, logistics
and engineering sites.
Renault eco2 and Dacia eco2 labels, which span the entire vehicle life cycle,
are largely based on the ISO 14001 certification of their production plant.
Group-wide tools and standards
To ensure a minimum level of protection of people, property and the
environment everywhere in the Group, the environmental improvement and
risk prevention policy is based on tools and standards applied across the
Group and managed by expert functions. These tools and standards, which
apply mainly to industrial and logistics activities, are also extended to the
commercial and engineering functions when necessary. The main tools are:
W a process to monitor and track compliance with national and EU
environmental legislation;
W an expert system, Écorisques, that identifies the most significant
environmental impacts and the danger potential of installations to be
addressed as a priority in each plant’s environmental action plan;
W a reporting system for environmental impacts and energy consumption
(R2E);
W a corporate database called Chemis (for CHEMical Information System),
available across the Renault group in several languages, designed to
control hazardous substances and prevent chemical risk. Chemis is a key
tool in Renault’s chemical risk management process, which aims, from
an environmental and health standpoint, to introduce chemicals safely, to
prevent the risks associated with their use, and to anticipate technological
and regulatory changes;
To date, Chemis has gathered scientific and regulatory information on
more than 7,000 products and keeps a permanent watch over more than
6,000 substances.
W a documentary base of E&HSE (Energy & Health, Safety, Environment)
standards and best practices, accessible from any Group site.
Integrating environmental standards in the Renault production way
Renault decided in 2004 to include its environmental standards in the Renault
Production Way (SPR). Reflecting this objective, each worker implements
environmental requirements daily at his/her workstation through the SPR
process.
On the basis of standards for managing chemical products and treating waste
defined by the expert functions of production engineering, the plants have
included environmental and health requirements in the documentation for
each workstation and are providing training to the operators.
Anticipating industrial, regulatory and environmental developments
The E&HSE (Energy & Health, Safety, Environment) management plans
launched in 2002 describe the situation of each site and how it is likely to
evolve over the next ten years, factoring in external constraints such as the
ecological sensitivity of the environment and future regulatory requirements.
The plans contribute to the dialogue between industrial strategists, engineers,
building planners and plants by defining targets and levers for reducing
environmental impacts at the earliest stage of project development.
Inspection procedures
Renault has developed its own standard for internal environmental audits,
which incorporates the requirements of the ISO 14001 standard as well as
the Group’s own main internal standards on the protection of the environment,
people and installations. Internal audits have two objectives: first, to ensure that
the ISO 14001 standard is being applied, and second, to assess improvement
in environmental performance at all sites in terms of environmental protection
and risk prevention. An internal audit serves to inform plant management
of site performance, the status of their programme and its implementation,
thereby allowing them to take actions to achieve further improvement. Internal
audits are therefore conducted by members of the industrial environmental
network (environmental managers and business specialists), using joint audits
that encourage exchanges of best practice between plants and accelerate
consultation between different functions in order to improve environmental
performance. At the end of 2013, the network had approximately 70 internal
auditors trained and certified in Renault’s procedures.
VEHICLE USAGE
Life-cycle assessment studies show that more than 75% of greenhouse
gases emitted during the life of a vehicle concern the vehicle usage phase.
Renault can take action in a number of areas to reduce this figure, including
eco-design, driver behavior and sound ecological practices implemented by
the sales network for sales and services activities. However, the behavior of
vehicle users and how they use their vehicle are also sources of considerable
progress. Renault is therefore doing what it can to promote eco-driving and
car-sharing.
Eco-driving
In-car eco-driving assistance tools and eco-driving recommendations can
reduce fuel consumption (gasoline, diesel, electricity) by as much as 25%
depending on the style of driving. For an electric vehicle, this can mean about
a 30-km increase in range. That is why, in addition to providing in-car eco-
driving assistance tools (see 2.4.2 .1), Renault has developed eco-driving
training tools and programmes in recent years.

REGISTRATION DOCUMENT RENAULT 2013✦ Global Reporting Initiative (GRI) Directives 143
CSR: SUSTAINABLE MOBILITY 2
2
ENVIRONMENTAL DIMENSION
For example, the eco-driving simulators for ICE and electric vehicles
developed by Renault show users their potential for improvement and give
them helpful advice. Two of these simulators, which have been updated for the
latest vehicles (New Clio, Captur, Kangoo, and ZOE), will soon be available to
trainees at the Renault track at Saint-Just (France). This facility, inaugurated in
June 2013, has been designed for instruction in “positive driving,” i.e., safe,
economical and responsible driving. The daylong courses, which are open to
the public, combine theory and practice.
Training of Renault employees, which started in 2009, continued in 2013.
Since the programme began, nearly 1,000 employees have taken this
training. In partnership with the French driving school École de Conduite
Française (ECF) and the International Federation of Safety Education Network
(IFSEN), Renault offers Driving eco2 training on ICE and electric vehicles to its
corporate customers. In 2013, this training was available in France, Spain,
Morocco, Belgium, the Netherlands, Poland and Turkey.
In addition to the Driving eco2 training programme, Renault offers its corporate
customers an on-board telematics system called Fleet Asset Management.
Launched in France in 2012, Fleet Asset Management allows fleet managers
to obtain driving data from vehicles remotely to monitor the eco-driving
performance of employees and the emissions produced by their driving.
Car-sharing
Car-sharing, in particular for urban transport needs and with electric vehicles,
is a means to reduce the environmental and spatial impacts of vehicles. For
example, car-sharing reduces the amount of pointless driving involved in
looking for parking spaces, thus lowering atmospheric emissions and noise
pollution. Benefits are further enhanced when the vehicles being shared
produce no driving emissions, as is the case with electric vehicles. From the
space-saving standpoint, car-sharing reduces the amount of public parking
space that must be provided.
In 2012 and 2013, Renault conducted the Twizy Way trial programme in the
urban area of Saint-Quentin en Yvelines (France) to analyze the requirements
of a car-sharing system. Although Renault does not plan to be directly involved
as an operator (it sold the Twizy Way business in late 2013), this experiment is
helping it to meet the needs of car-sharing operators and users, thus making
it a facilitator of car-sharing.
Accordingly, Twizy and ZOE are available in a version specially adapted for
car-sharing. In addition to these two models, Renault is designing its future
vehicles from the start with the connection technology for sharing.
In 2013, discussions were begun with the Bolloré group concerning the joint
development of complete car-sharing solutions with electric vehicles in urban
areas.
Environmental management in the sales network ✦
The Renault eco2 label is the commercial facet of Renault’s commitment to
environmental protection. The sales network also provides the first contact
with customers in terms of products, values and brand identity. That is why
the primary sales network, comprising the sites of the Renault Retail group
subsidiary and private dealerships, is undertaking environmental management
in order to preserve the value of its assets as well as Renault’s brand.
RRG, the distributor of Renault, Dacia and Nissan brands in 13 European
countries, established an environmental management policy in 2007. An
RRG environment coordinator is responsible for training and coordinating a
network of environment correspondents in France and Europe. He provides
a set of environmental management procedures, which are available on the
RRG intranet. RRG has carried out reporting on the environmental impacts of
its sites (water and energy consumption and production of waste) since 2011
in France and 2013 in Europe.
Renault Retail group – envonmental impacts
FRANCE EUROPE OUTSIDE FRANCE MAIN MANAGEMENT AND IMPACT REDUCTION MEASURES
Number of sites 129 87
Rate of reporting coverage 100% 100%
Waste (tons) 9,751
n.a. P Water management contracts with specialized suppliers P Sorting guidelines
P o/w dangerous 2,657
P o/w not dangerous 7,094
Energy consumption (MWh LHV) 120,442 54,681 P Energy savings plan, particularly during closed periods
Greenhouse gas emissions (t eq CO2) 19,251 16,278 P Energy savings plan
P o/w from combustion 15,464 5,964
P o/w from electricity consumption 3,660 10,314
P o/w from gas coolants 127 n.a.
COV emissions (kg) 96 n.a.
Water consumption (m3) 161,118 171,685 P Controlling leaks on the basis of billing P Hydrocarbon separators used before discharge into purification network
Soil and water tables P Extraction or neutralization of buried, single-wall tanks P Preventive equipment (retention basins, double-wall tanks or above-ground tanks)

Find out more at www.renault.comREGISTRATION DOCUMENT RENAULT 2013144
CSR: SUSTAINABLE MOBILITY2 ENVIRONMENTAL DIMENSION
Renault also supports its network of dealerships and agents. In France, the
Sales & Marketing department (DCF) provides information and coordinates
exchange of best practice through annual Environment Club meetings in each
regional center. RRG environment coordinators participate and contribute to
these clubs.
The Sales & Marketing department assists the network by providing a panel
of national service providers for waste collection and treatment. Renault also
finances its sales network’s access to Autoeco.com, allowing sites to track the
amount of waste they produce. Renault is also a partner of the CNPA (National
Council of Motor Industry Professionals), which, as part of the “Environment
Challenge,” provides the sales network with technical support with the
implementation of environmental protection measures and the search for
financial assistance.
Since the business is small, the sales network has not applied for ISO 14001
certification. However, the Renault Sales & Marketing department in France
conducts environmental audits based on a reference system drawn up with
the RRG environment coordinator and the Renault group’s environment
specialists. In 2013 these audits covered 100% of the primary sales network,
including RRG and private dealerships.
END-OF-LIFE VEHICLES ✦
Starting in 2015, EU regulations will require that all vehicles be collected
and that 95% of their mass be recycled and reused. In accordance with
the principle of greater manufacturer responsibility, automakers will be
responsible for helping to organize and finance this process. Outside Europe,
other countries already have such regulations or are getting ready to institute
similar ones (South Korea, Turkey, and Russia).
Renault is helping to organize the collection and recycling of end-of-life
vehicles everywhere it is required. Its contribution takes different forms: the
setting up of its own network of authorized collection and recycling centers
for Renault vehicles or participation in a joint programme (manufacturers,
dismantlers, government agencies) for setting up such recycling networks.
Renault’s participation is in proportion to its share of the vehicle fleet, with
especially large involvement in France, Spain, Portugal, Romania, Italy and
Russia.
In all cases, the last owner of the end-of-life vehicle is informed, and the
vehicle is picked up at no cost to the owner. Information concerning the
methods for pollution removal, dismantling and recycling are supplied to
the recycling operators and energy recovery networks on the website of the
International Dismantling Information System (www.idis2.com).
Altogether, the markets in which Renault helped to collect and process end-
of-life vehicles represented 60 % of the Group’s global sales in 2013.
In France, the subsidiary Renault Environnement joined forces in 2008
with the group Sita/Suez Environnement to develop end-of-life vehicle
recycling by taking a majority stake in Indra, a company with more than
20 years’ experience in vehicle dismantling. Indra has a network of 350
approved vehicle dismantlers around France and works with them to meet
regulatory and environmental requirements as part of a progress-oriented
approach. Indra or its network handled 75,862 end-of-life vehicles in 2013.
This investment has three objectives:
W to meet Renault’s regulatory obligations concerning end-of-life vehicle
collection and recycling in France;
W to improve the network so that it performs the recycling better and more
economically, thereby achieving the goal of a 95% collection and recycling
rate at an optimal cost in 2015;
W to supply the short recycling loops so as to reduce dependence on and the
consumption of virgin raw materials (see 2.4.2.2 ).
Indra is designing and improving tools and processes for recycling end-of-life
vehicles. These are being developed and tested at its dismantling sites and
its development center at Romoratin. What Indra learns in this effort is being
widely disseminated in training programmes that it develops and conducts. In
2013, 327 people were trained.
2.4.3.3 ENVIRONMENT AND COMPETITIVENESS
The effort to reduce environmental impacts is frequently perceived as a source
of additional costs for companies. This is only part of the picture, however,
since it does not take into account the positive impact on operational costs,
product appeal and the diversification of activities.
LOWER OPERATING COSTS ✦Costs stemming from energy and water consumption and waste management
at Renault’s plants run into the hundreds of millions of euros each year.
Optimizing consumption and waste management is thus a means of both
reducing the environmental impact of operations and substantially lowering
production costs. The Drive To Five programme, whose aim is improve the
economic performance of Renault’s production system, takes into account
these factors, with high priority given to actions on energy consumption and
waste management.
In 2013, actions to cut back energy consumption at all the Group’s plants
achieved reductions of 280,000 MWh saving €14 millions . The reduction or
avoidance of natural gas consumption limited the financial impact of the EU
Emissions Trading Scheme in application at the Group’s 13 European plants.
Likewise, optimizing waste management through reuse and recycling helps to
control production costs. This is proven first in the case of scrap metal, whose
sale for recycling brought in about €175 million. The potential savings from
other materials are also substantial. For example, using recycled solvents
rather than virgin ones at the Maubeuge plant lowered their cost by 30%.
REGISTRATION DOCUMENT RENAULT 2013✦ Global Reporting Initiative (GRI) Directives 145
CSR: SUSTAINABLE MOBILITY 2
2
ENVIRONMENTAL DIMENSION
APPEAL OF PRODUCTS AND SERVICES
In an extremely competitive automobile market, maintaining attractive price-
positioning for vehicles is a major issue. Increased use of recycled materials
and efforts to reduce exposure to critical raw materials are part of the process
of keeping costs and prices low. For example, one ton of recycled plastic costs
substantially less than one ton of virgin plastic. Among the actions taken in
2013:
W reducing the quantities of copper and rare earths in the vehicles yielded a
saving of about €2.8 million;
W giving scrap metal from manufacturing to Renault foundries and suppliers
of metal parts reduced raw materials costs and enabled Renault to
negotiate lower prices for purchased parts, yielding a saving of about
€1 million in 2013;
W supplying the Fonderie de Bretagne with copper from end-of-life vehicles
reduced the amount spent on this metal by 5%.
Reducing exposure to virgin materials has become all the more important
given the volatility and upward trend of prices. When competition is very
intense, these hard-to-predict fluctuations can be only partially factored into
vehicle selling prices. They thus have a direct impact on the Group’s operating
profit. Between 2005 and 2012, this impact was consistently negative (except
in 2009).
Although the selling price has a big impact on a product’s attractiveness, it
is not the only factor in the decision to buy. For example, in Renault’s main
markets (except Russia), customer surveys reveal that fuel consumption is
one of the ten main reasons car buyers choose a Renault vehicle. Renault’s
resolute efforts to reduce fuel consumption and CO2 emissions – efforts that
enabled it to boast the passenger vehicle range with the lowest emissions
in Europe in 2013 – make a substantial positive contribution to the Group’s
sales results.
Likewise, by developing new options and service giving customers more
control over their fuel consumption (in-car aids for eco-driving, eco-driving
training) or extending the life span of their vehicle (reuse of parts), Renault is
aiming not only to reduce its environmental footprint, but also to secure its
customers’ loyalty by offering them new services and less-costly solutions.
NEW ACTIVITIES
Working to find ways to both reduce environmental impacts and optimize the
Group’s economic resources has led Renault to explore areas complementary
to its core business, which has opened up new business opportunities.
The Choisy plant has specialized in the renovation of powertrain components
for over 40 years. In 2008, the subsidiary Renault Environnement was created
to bolster its environmental capabilities. Through its subsidiaries, Renault
Environnement works in the following areas:
W recycling of end-of-life vehicles (Indra, a joint venture with Sita);
W managing industrial waste at the plants (a joint subsidiary with Sita);
W recycling parts and materials through recycling networks or selling parts
for reuse (the subsidiary Gaïa).
In 2013, these three activities of Renault Environnement generated revenues
of more than €370 million. Each of these activities also recorded a net
operating profit in 2013.

Find out more at www.renault.comREGISTRATION DOCUMENT RENAULT 2013146
CSR: SUSTAINABLE MOBILITY2 SOCIAL PERFORMANCE
2.5 SOCIAL PERFORMANCE ✦
The Renault group continually strives to improve all facets of its social
footprint, while limiting the negative impacts of its activities and products
and sharing the opportunities they create with the greatest number. In doing
so, it helps build its brand and enhance its appeal to all stakeholders. This
responsibility extends all along the value chain.
2.5.1 RENAULT, AN ACTIVE PARTICIPANT IN THE ECONOMIC GROWTH AND DEVELOPMENT OF ITS OPERATING REGIONS ✦
The Company, a key participant in economic development due to the
location and size of its operations, its procurement of parts and services and
its distribution network, has begun to play an ever-larger role in the social
development of its host countries. It is no longer seeking merely to limit the
harm caused by its facilities and activities but rather to become a leader
and partner in transforming the communities in which it operates. For the
Company, this means identifying the needs and expectations of its circle
of stakeholders and offering them solutions through its core business, the
introduction of innovative approaches and support for their individual and
collective development.
Renault’s largest economic contribution lies in the wages and local taxes
it pays and the services and purchases it subcontracts. According to
estimates published by the OICA (International Organization of Motor Vehicle
Manufacturers), every direct job in the automotive industry (vehicles and/or
parts) creates five more manufacturing and service provider jobs.
Renault also contributes by providing direct local assistance. Previously,
this contribution had generally taken the form of pure, ad hoc philanthropy
that still reflected the Company’s values. It has now become a longer-term
commitment involving strategic philanthropic actions that help the Company
meet its objectives while having real benefits for society. But, because business
isn’t everything, there is still room for pure philanthropy – unconditional
donations – through patronage actions taken by Renault to support local or
international initiatives.
Details on the main development and support, training, employment,
educational and patronage actions are provided in the relevant sections below.
2.5.1.1 SOCIAL COMMITMENTSIn line with its vision, values and core business, Renault carries out social
initiatives under the central management of its Corporate Social Responsibility
department (DRSE), reflecting the responsibility of an automobile manufacturer
linked to its activity, and its vision of sustainable development:
W sustainable mobility – Reduce the environmental footprint throughout the
vehicle’s lifecycle and make sustainable mobility solutions accessible to the
greatest number;
W road safety – Reduce the number of road accident victims and develop
this expertise in emerging countries;
W education – Develop the skills of the future and work towards greater
social equity;
W diversity – Promote talent diversification and equal opportunity for all,
especially as a means to optimize the Group’s appeal and performance.
These priorities were set in 2009 and remain equally valid today, having
proved both their relevance to society’s expectations for an economic actor
like Renault and their coherence with the Group’s core business.
To ensure its initiatives are coherent and in line with these themes, DRSE
coordinates them at the global level and relies on a network of representatives
in the main departments and the Groupe’s geographical regions, as well as a
cross-functional network of CSR correspondents in most countries in which
Renault operates.

REGISTRATION DOCUMENT RENAULT 2013✦ Global Reporting Initiative (GRI) Directives 147
CSR: SUSTAINABLE MOBILITY 2
2
SOCIAL PERFORMANCE
SUSTAINABLE MOBILITY FOR EVERYONE DIVERSITY
ROAD SAFETY EDUCATION
AUTO-RELATED SOCIAL CHALLENGES HUMAN CHALLENGES IN A GLOBAL COMPANY
These social initiatives, benefitting stakeholders outside the Company, are
balanced by initiatives aimed at employees and suppliers with a view to
protecting them or encouraging individual and collective development, as
well as improving Group performance. The latter initiatives complement the
commitments made by the Group in relation to sustainable mobility for all,
through its processes, products and services.
Social initiatives are carried out with local partners, working as closely as
possible to communities, helping the Group’s entities to develop local roots
and promoting the socially and economically responsible development of
its operating regions. This social aspect of the Renault group’s CSR policy
includes programmes and projects implemented on three levels:
W strategically and globally, with coordinated management and implementation
tailored to the environment by local representatives in subsidiaries;
W strategically and locally via subsidiaries and sites which adapt to specific
local challenges and expectations;
W on an ad hoc basis, in response to special requests from NGOs, charities
and volunteer organizations (see below).
To maximize the contribution these social initiatives make to the Group’s
challenges, as defined in the CSR strategy, Renault aims to allocate 80% of
its social expenditures to the four themes listed above. The remaining 20%
are used to support needs in other areas as identified locally.
All information about these initiatives is fed back to DRSE on an annual basis
for centralized reporting. The methodology is explained in 2.8.3.1.
2.5.1.2 KEY SOCIAL INITIATIVE FIGURES FOR 2013
W 329 initiatives were identified in 35 countries, covering Renault’s five
geographical regions;
W 85% of these initiatives address one of the Group’s four main social
responsibility themes;
W 87% of the initiatives supported relate to “community investment”; 5% to
“charitable gifts”; and 8% to “commercial” actions;
W the Europe region accounts for 66% of social investment;
W France represents 55% of the total amount, including the annual
contribution to the Renault Foundation.
A detailed breakdown is attached as appendix 2.8.3.2.

Find out more at www.renault.comREGISTRATION DOCUMENT RENAULT 2013148
CSR: SUSTAINABLE MOBILITY2 SOCIAL PERFORMANCE
Social investments breakdown
By Priority Theme
22%
Road safety
10%
Diversity
40%
Education
13%
Sustainable mobility
15%
Other
By Type Of Donation
87%
Territory
8%
Commercial
5%
Charity
2.5.1.3 SUPPORT FOR CHARITIES AND NGOSRenault is regularly approached by NGOs, associations, volunteer organizations
and employees seeking support for projects of general interest, solidarity or
good citizenship.
To respond to these demands, the Company drew up a standard procedure
in 2010 that can be used to collect and analyze these applications through a
single gateway accessible on www.renault.com.
This front office for submitting applications is open to external organizations
and Renault employees who belong to them. Applicants provide documentation
for the projects sponsored by their organization, including its goals,
quantitative indicators and budget breakdown. They have to demonstrate that
their initiatives are consistent with Renault’s CSR policy and fall within one of
the strategy’s four priorities (Diversity, Education, Sustainable Mobility, Road
Safety). In 2013 Renault received and processed 130 requests for support
for projects in France and the rest of the world. Details on the 14 projects
selected can be found in 2.8.3.3.
Funding decisions are made collegially by a jury comprising representatives
of the personnel from the committee of the Renault group, from the Legal,
Communications and CSR departments and from the different international
regions. They meet three times a year to select the initiatives that will be
funded. Country requests for support are always subject to local validation to
ensure they are passed along to the appropriate quarter. Other locally relevant
requests can be paid for directly out of the subsidiary’s budget.
This type of ad hoc patronage, whether resulting from the patronage portal
or initiated directly by the subsidiaries and sites, also gives the Company the
opportunity to conduct pilot projects with some of the recipient associations,
with the aim of establishing longer-term relationships.
Since 2010 Renault do Brasil has actively supported the Borda Viva
association, which works in the city of Curitiba, close to Renault’s plant.
It carries out initiatives that promote access to education. For example, it
founded a nursery school where 250 children can learn to read, opened a
public library and supported a center that seeks to integrate the disabled
through education, music and sports. In 2013, in collaboration with one
By Region
66%
Europe
4%
Asia-Pacific
1%
Eurasia
8%
Euromed Africa
21%
America
By Type
71%
Monetary
11%
Personnel
18%
In Kind

REGISTRATION DOCUMENT RENAULT 2013✦ Global Reporting Initiative (GRI) Directives 149
CSR: SUSTAINABLE MOBILITY 2
2
SOCIAL PERFORMANCE
of its suppliers, Renault do Brasil asked the women of the “Borda Vida”
sewing shop to make the anti-hail netting used to protect the new vehicle
fleet. The supplier provided the necessary equipment and trained two
young apprentices who were hired to cut the fabric. In June 2013, Renault
presented the association with a “CSR Award” in recognition of its efforts
and results (see 2.2.3).
Employees are also asked to get involved through a new collaborative
platform that allows them to contribute to social actions. Giving Corner is
an internal loyalty programme that converts money saved by employees on
travel expenses into loyalty points in euros. These points can then be donated
to charities that share our values and objectives or with which the Company’s
employees are involved.
2.5.2 PROGRAMMES AND INITIATIVES IMPLEMENTED FOR THE FOUR PRIORITY THEMES ✦
The examples listed below offer the best possible description of Renault’s
social policy and show how this message is backed by concrete actions. This
section highlights the Company’s commitment and provides an overview of
the programmes carried out at the global and/or national level and of the ad
hoc actions conducted locally. It is not intended as a comprehensive listing.
2.5.2.1 SUSTAINABLE MOBILITY“The challenge facing Renault, a responsible carmaker and a pioneer of
responsible mobility for all, is to develop mobility solutions accessible to the
greatest number, including economic and physical accessibility (see 2.5.2), to
design innovative technologies such as electric vehicles with zero emission
during use, and to ensure minimal consumption of energy and raw materials.
It also involves supporting changes in behavior and practices. Finally, it
involves inventing tailored economic models which contribute both to the
long-term future of the Company and also the creation of value-added for the
relevant stakeholders”.
DEVELOPMENT OF ECONOMIC MOBILITY
Renault is committed to making mobility accessible to the greatest number by
taking concrete steps to reduce the cost of vehicle use. For example, Renault
has developed the Motrio spare parts offer for vehicles that are more than five
years old. This offer is a lower-cost alternative to original parts designed to
last longer than the car. In combination with package offers, or even repairs
done at garages in the Garages Solidaires network supported by Renault as
part of its CSR policy, this can significantly reduce the total cost of use.
RENAULT MOBILIZ PROGRAMME
The Renault Mobiliz programme aims to
promote mobility as a way of entering and
returning to the employment market. It
was initiated in 2010 and launched in
France in July 2012.
Renault Mobiliz is a social business-
inspired programme designed to facilitate access to mobility for vulnerable
groups in society. It involves offering them services such as vehicle hire or
sale and maintenance at preferential rates. The programme was drawn up in
collaboration with partners from the non-profit sector, the academic world and
public agencies. It represents an innovative, long-term, strategic commitment
to invent and test mobility solutions for bottom-of-the-pyramid populations.
Renault demonstrated its commitment by setting up an investment company,
Mobiliz Invest s.a.s., to finance innovative structures developing mobility
solutions for people in difficulty. Renault invested €5 million in the Company’s
capital.
The corporate governance structure of Mobiliz Invest s.a.s. is made up of:
W a Supervisory and Guidance Committee. This committee is chaired by
Carlos Ghosn and 60% of its members are deemed independent; and
W a Management and Investment Committee. This committee is chaired
by the Executive Vice-President France and includes one employee
representative. Twenty percent of its members are deemed independent.
These two governance bodies engage in a permanent process of stakeholder
dialog and provide in-depth, long-term supervision and dissemination of the
programme’s initiatives within Renault.
From its first year, Renault Mobiliz carried out work in the following areas by
providing financial support for three initiatives:
1. Financing by Mobiliz invest s.a.s (by loanor investment) of entrepreneurial
actions:
W funding a two-fold increase in the number of mobility hubs managed by
the non-profit organization VOITURE & CO. (SOS group). These hubs assist
approximately 1,000 people looking for or returning to work each year,
offering them mobility solutions according to their specific needs. These
solutions range from individual support to low-cost hire of various means of
transport; in 2013, Renault financed five new mobility platforms, including
one for the city authorities of Saint-Quentin-en-Yvelines (CASQY), launched
in September by the Minister for the Social and Cooperative Economy. This
platform exemplifies the close ties developed between Renault and the
regions where its sites are located. A number of Technocentre employees
are involved in social actions for the CASQY;
W funding of MOBILECO, a Montpellier-based cooperative whose mission is
to use electric vehicles to develop urban mobility and intermodality. It is
also a work integration social enterprise;
W funding of CHAUFFEUR & GO, a Paris-based cooperative that provides car-
less drivers to clients who occasionally need someone to drive their own
car. More than half the drivers were formerly unemployed. They are trained
and reskilled and even created their community-based micro-franchise.
Renault has also approved Chauffeur & Go to provide services to the
Company;

Find out more at www.renault.comREGISTRATION DOCUMENT RENAULT 2013150
CSR: SUSTAINABLE MOBILITY2 SOCIAL PERFORMANCE
2. support for the “Enterprise & Poverty” Chair at HEC Paris, a business
school, to share knowledge about social business, and participation in the
Enterprise and Poverty Action Tank chaired by Martin Hirsch and Emmanuel
Faber (Danone) to discuss best practices with others committed to this
approach, and enhance development expertise in this field;
3. development of Garages Renault Solidaires services: at end-2013, some
60 garages (dealerships or agents) in the Renault network had volunteered
to help give people on low incomes affordable access to the Renault
network’s quality after-sales services. The network is expected to comprise
more than 200 garages by end-2014. The beneficiaries of the Garages
Renault Solidaires services are all referred by influencer organizations,
associations or public or semi-public entities.
T he Garages Renault Solidaires project will also give Diac, Renault’s financial
subsidiary, the opportunity to offer microcredit financing to Renault’s vulnerable
customers. GAIA, a Renault Environnement subsidiary, will also contribute
by providing these garages with select refurbished parts to further reduce
maintenance costs of the vehicles for customers in the Mobiliz programme.
Lastly, Motrio parts are still frequently used by the Garages Renault Solidaires
to help lower maintenance costs for these same customers.
Mobiliz (www.renault-mobiliz.com) aims to be widely implemented across
the Company. It is a strong source of motivation among employees, many of
whom are proud of Renault’s support for the least well-off.
Alongside the Mobiliz initiatives, Renault’s patronage programme supports and
provides financial assistance to initiatives undertaken by local associations.
In many instances, these associations need means of mobility to fulfill their
mission. Examples of initiatives supported can be found in the sections on
road safety, education and diversity below.
THE SUSTAINABLE MOBILITY INSTITUTE: A COMPREHENSIVE APPROACH
Renault, the Renault Foundation (see 2.5.2.3) and ParisTech decided in 2009
to team up to carry out research and teaching in relation to the massive
transformations in passenger transportation by founding the Sustainable
Mobility Institute.
Other French and international companies and university institutes that wish
to take part in the research may also partner with the Sustainable Mobility
Institute. Exchanges take place regularly with the VeDeCom Institute for
Energy Transition, which has a large number of industrial, academic and
local authority partners. The Sustainable Mobility Institute has also initiated
targeted partnerships with industrial companies (Grupo Antolin and Umicore),
the Observatoire du Véhicule d’Entreprise (a non-profit organization supported
by BNP-Paribas and Arval), non-ParisTech research teams (Institut des
Matériaux in Nantes, Observatoire des Émergents, University of California at
Berkeley, and Supelec) as well as chairs at ParisTech and its schools, including
the Chairs in sustainable development modeling and social business.
In 2013, it reinforced the strategy initiated in 2012 of expanding research
subjects to other countries. This mainly involves Renault’s teams in India, the
United States and China. Positive contacts have also been made in several
European countries.
The aim of the cooperation between Renault engineers, teacher/researchers
and students from ParisTech is to:
W promote research in the design of innovative systems, essentially for
electric vehicles and new concepts and business models targeting
sustainable mobility;
W train sufficient managers and researchers to meet the demands of the
transportation industry and the scientific and technological challenges
raised by the long-term development of sustainable transportation systems;
W the Sustainable Mobility Institute also offers ParisTech researchers and
students a special communication forum at www.mobilite-durable.org. This
website, launched by Renault in French and English in September 2009, is
now considered the go-to site for information on the means of transport of
the future. ParisTech researchers and students contribute to developing the
site’s contents by publishing the results of their discussions in the form of
blogs and articles, as well as by offering documentary resources.
The Sustainable Mobility Institute research programme has four parts:
THEME ACADEMIC PARTNER OBJECTIVE
System-based approach to electric mobility
Ponts ParisTechMines ParisTech
Polytechnique ParisTechTo understand interactions between the mass circulation of electric vehicles and
the regions where it occurs, as well as the infrastructure requirements
Business models for electric vehicles
Mines ParisTechPolytechnique ParisTech
Telecom ParisTechTo work out the business models that will guarantee the large-scale and
sustainable development of the electric vehicle industry
A global vision of the future markets for electric vehiclesMines ParisTechPonts ParisTech
To study, on an international scale, the conditions for moving from the current system of automotive transport to electric vehicles
Technology
Polytechnique ParisTechChimie ParisTechMines ParisTechEnsta ParisTech
To contribute to further progress in rapidly improving battery technologies, as well as some streamlining or architectural optimization technologies

REGISTRATION DOCUMENT RENAULT 2013✦ Global Reporting Initiative (GRI) Directives 151
CSR: SUSTAINABLE MOBILITY 2
2
SOCIAL PERFORMANCE
Each research area is managed as a project. The Institute organizes twice-
yearly seminars aimed at allowing everyone involved at ParisTech and
Renault to discuss research findings and at encouraging cross-fertilization
and exchanges of ideas. In addition to these activities, a founders’ committee
meets annually to assess work carried out and approve the programme for
the coming years. The Institute’s work during its first years makes it possible
to assess the contributions it can make to sustainable mobility. These include:
W a capacity to explore subjects of special importance through exchanges
with Renault’s top management;
W anticipation of changes in mobility practices while providing new ideas on
ways to work with stakeholders such as governments, local communities
and electricity suppliers;
W expertise that complements the Company’s competencies on technically
complex subjects.
Meeting in September 2013 the founders’ committee concluded that this
partnership between Renault and ParisTech was meeting the partners’
expectations.
The semi-annual seminars in March and October 2013 fostered discussion
between researchers, ParisTech students and Renault employees to generate
even greater research synergies and identify possible future projects and ways
to optimize the work. It was therefore agreed that the Sustainable Mobility
Institute would provide Renault with additional support for the large-scale
rollout of electric vehicles and the ramp-up of the connected vehicle theme.
At its October 2013 meeting, the founders’ committee asked the Institute’s
director to provide a quantified assessment and to indicate the extent to
which the research programme is able to tailor the cost, length and design
of research projects to the challenges facing Renault. This assessment
will include figures on the Institute’s value-creation levers. The committee
requested that a communications policy be developed and presented at
the March 2014 seminar for implementation in 2014, to coincide with the
Institute’s five-year anniversary. Regarding the opening of the Sustainably
Mobility Institute to other companies, the priority is the systematic exploration
of synergies between Nissan and Renault. Similar work will then be conducted
with Daimler, and opportunities for collaboration with companies operating in
the sustainable mobility ecosystem will also be considered.
2.5.2.2 ROAD SAFETY
ROAD SAFETY CHALLENGE ✦
Road safety is a global public health issue that concerns every continent.
According to the World Health Organization (WHO), some 1.3 million people
are killed and between 20 and 50 million injured on the world’s roads each
year. Unless concerted and effective action is taken, the WHO predicts that the
number of annual road fatalities will reach 1.9 million in 2020.
Addressing challenges internationally
The Renault group’s international expansion must be accompanied by the
design of vehicles meeting regulations and security requirements in these
new markets. Because the causes of accidents and injuries in these new
regions differ from the European market, Renault is expanding its accident
research beyond Europe, transferring its own know-how and gaining local
expertise from local laboratories and universities, and other key players in
road safety.
But, to fully assume its responsibilities, Renault has made a twofold
commitment:
W through its products: based on an analysis of observed risks, it incorporates
solutions and innovations into all its design, manufacturing and marketing
processes in order to protect vehicle occupants and others exposed to road
risks (pedestrians, cyclists, etc.);
W in society: it participates actively with governments and civil society
throughout the world to help improve road safety. Both alone or in
collaboration with other organizations, Renault works to raise awareness
of road safety and facilitate transfer of competencies among road users
and stakeholders.
The quantitative reporting on road safety initiatives (see 2.8.3.2) does not
include research and development expenses for vehicles and their safety
equipment.

Find out more at www.renault.comREGISTRATION DOCUMENT RENAULT 2013152
CSR: SUSTAINABLE MOBILITY2 SOCIAL PERFORMANCE
RENAULT’S ROAD SAFETY POLICY ✦
Renault’s road safety policy and actions are based on a five-pronged approach:
RAISE AWARENESSChanging the behavior of all stakeholders (public authorities, parents, drivers, children) over the long term and educating people from the
earliest age to the dangers on the road are key weapons in the battle to improve road safety.
RAISE AWARENESS
PREVENTPrevention involves helping drivers to anticipate risks. Part of the solution consists of helping the driver by assisting with the driving task
(driving aids). The other part lies in encouraging more responsible driving. Drivers need to understand the limits beyond which they will be
incapable of controlling their vehicles, and the situations in which they are putting themselves at risk.
PREVENT
CORRECTRoad holding and braking are the basic dynamic factors for a vehicle and the primary contributors to accident avoidance. Even so, there are
situations where technology has to intervene to compensate for driver error. This is the purpose of active safety systems which are activated
in difficult or emergency situations, without completely taking over from the driver.
CORRECT
PROTECTA top priority of Renault’s safety strategy is to protect all the car’s occupants according to the nature and severity of the impact, regardless
of their age, size or location in the vehicle, in small and large cars alike. Renault exceeds Euro NCAP standards by equipping the rear seats
of its vehicles with systems to provide optimal passenger protection. The protection of other road users (pedestrians, cyclists, etc.) is also
one of its goals.PROTECT
AIDSince early 2010, Renault has been working more closely with rescue services in France and abroad to improve the assistance provided to
persons injured in road accidents. These services receive guides explaining how to perform rescue operations on Renault vehicles. They are
also given late-model vehicles on which they can practice victim extraction methods.
AID
Raise awareness
Because it is important to learn the right habits from an early age, Renault
continued its “Safety and Mobility for All” international road safety programme
during the 2012-2013 school year, relying on its expertise in this field.
This educational programme is intended mainly for children and teenagers.
Launched in 2000 it has already reached more than 15 million young people,
and some 800,000 teaching kits have been distributed. Currently running in
some 15 countries, it is the biggest road safety awareness campaign ever
organized by a carmaker. By way of example, the “Kids on the Road” programme
intended for primary school children has been deployed in countries other
than France, including Morocco, Bulgaria, Poland, South Korea, Portugal,
Turkey, Brazil and Switzerland. To make them more accessible, and to protect
the environment, the teaching kits are now available as an application for
digital tablets.
Since the start of the 2011 school year, “Safety and Mobility for All” covers
the themes of environmental protection and eco-mobility. It continues to be
designed for elementary and middle-school children. The international “Your
Ideas Your Initiatives” competition invites children of all ages and nationalities
to take responsibility for their safety and mobility. The 2013 competition
shined the spotlight on some very specific initiatives implemented in countries
such as Russia, Serbia, Lebanon, India and Oman. The international meeting
in June 2013 saw the best projects rewarded.
RAISE AWARENESS

REGISTRATION DOCUMENT RENAULT 2013✦ Global Reporting Initiative (GRI) Directives 153
CSR: SUSTAINABLE MOBILITY 2
2
SOCIAL PERFORMANCE
THE “TKAYES PACT,” A RENAULT GROUP ACTION PLAN IN MOROCCO
In Morocco, the Renault group continues to deepen its
corporate citizenship commitment with its “Tkayes” road
safety programme, which appeals to the public to respect life
and other people. The goal is for this meaningful concept to
become ingrained and to encourage responsible behavior in a
firm yet friendly tone.
In November 2013, Renault Morocco organized the “Le Village
Tkayes” road safety circuit in Tangiers, the first of its kind,
in partnership with the Ministry of Equipment, Transport
and Logistics, the National Committee for the Prevention of
Road Traffic Accidents, the Moroccan Driving School and the
Delegations of the National Education Ministry in Tangier and
Fahs Anjra.
“Le Village Tkayes” ties in with the initiatives the Renault
Morocco group has carried out since 2007 as part of a national
road safety effort.
W “Tkayes Style Competition”: this competition to create posters
on road safety and accident prevention themes had more than
1,000 entries and more than 33,000 fans. The top 20 posters
were included in a traveling exhibit in the summer of 2013.
W “Tkayes Mix.” This summer, Renault Morocco produced and
distributed more than 20,000 CDs featuring a compilation of
songs from the national music scene dealing with road safety
themes. This initiative covered a number of hotspots, such as
gas stations through a partnership with Total Morocco, taxi
stands and the country’s main beaches. It targeted several
cities, including Casablanca, Rabat, Tangier, Tetouan, Salé and
Marrakech.
W “Safety and Mobility for All,” rolled out to 20,000 children in
150 schools in 13 cities in Morocco.
Since early 2013, in addition to initiatives targeting the general
public, programmes have also been developed for Renault
Morocco’s 7,000 employees and for professional drivers.
GRSP – GRSI ✦
To deal with the increased road safety challenges
that inevitably go hand in hand with access to
mobility and motorized transport, Renault has been
engaged in two major programmes since 2005: the
Global Road Safety Partnership (GRSP) and the
Global Road Safety Initiative (GRSI).
http://www.grsproadsafety.org
The GRSP is an NGO supported by the International
Federation of Red Cross and Red Crescent Societies, combining government
agencies, private-sector entities and civil society that work together to help
emerging countries develop their own road safety capabilities, deploy best
practices, and set up the multi-sector partnerships needed to effectively
promote road safety.
In 2013 the GRSP worked in 36 countries around the world, directly reaching
around 38 million people.
The GRSI is an international road safety programme supported by five of the
largest automobile and petroleum companies in the world: Renault, Toyota,
Michelin, Total, and Shell. It was set up by the GRSP to respond to challenges
identified in the “World report on road traffic injury prevention.”
In 2009 Renault confirmed its commitment to the second phase (2010-2014),
which builds on the work done in Brazil, China and the ASEAN countries, and
introduces projects from the GRSI and its members into Africa.
Renault continues to support the actions of the GRSP and the GRSI at the
corporate level, but also in the target countries through its decentralized
Engineering departments and sales subsidiaries. In 2013, Renault worked
with the GRSP on projects in Poland, Hungary, Romania, Brazil and Morocco.
Driver training
“The Renault Track, the Right Track,” a post-license driving school opened in
France (in the Eure department) in June 2013, is open to everyone: individual
and business customers, Renault employees, experienced drivers, seniors
looking for a refresher course and young people who are still learning, as well
as individuals with reduced mobility. The educational programme addresses
both accident prevention and eco-driving. It tries to give students a better
understanding of what causes accidents, helps them analyze their own
reactions (reflexes and fears) and become familiar with the possibilities and
limitations of the vehicle’s technology (ABS, EBA, etc.). It also explains the
principles of eco-driving (gear shifting, managing acceleration and braking by
anticipating traffic conditions) and teaches students how to make the most of
eco-driving functions (driving style indicator, journey report, eco-coaching and
eco-navigation) to reduce fuel consumption and therefore transport costs.
All of the profits generated will be earmarked for social initiatives that target
young people in difficulty, to help them re-enter the labor force.
A school like this was opened in Poland in 2004, and has already trained
more than 13,000 people from 280 different companies.

Find out more at www.renault.comREGISTRATION DOCUMENT RENAULT 2013154
CSR: SUSTAINABLE MOBILITY2 SOCIAL PERFORMANCE
Road Safety Management Chair and Master’s (MANSER) programme
To help road safety actors develop their own know-how, using global best
practices and taking regional characteristics into account, Renault co-
developed a master’s in road safety management (MANSER) for the Middle
East and North Africa, where road risk is acute. The objective is to produce
national and regional expert managers capable of creating and coordinating
road safety policies in their countries.
Prevention, correction, protection
PREVENT CORRECT PROTECT
Renault has played an active part in road safety for more than 50 years, long
before it became the familiar media topic we know today. Its history in this
field, from concept cars such as BRV and Epure, which were revolutionary in
their day, to its numerous publications at renowned conferences, has resulted
in an integrated approach to vehicle safety. Based on passive safety features
that exceed well-publicized demands, such as all-round protection, and anti-
submarining measures, the approach also includes assistance in normal
driving conditions (Renault was among the first to pioneer speed limiters in
Europe) so that drivers adopt appropriate on-the-road behavior.
These passive safety efforts will continue, particularly by stricter accident
testing around the world. In addition, the future of driver safety now involves
Advanced Driver Assistance Systems (ADAS), which Renault is encouraging
high-end manufacturers to make widely available.
Thanks in particular to the Renault-PSA Peugeot Citroën Laboratory for
Accidentology, Biomechanics and the Study of Human Behavior (LAB), as
well as contributions from numerous international working groups, Renault
has, for more than 40 years, built up an accident database that provides
extensive knowledge of what causes accidents and the ability to measure
the effectiveness of safety systems in terms of lives saved and injuries
prevented. It also helps identify the systems that need to be installed on
vehicles to maximize their real safety. This accident research-based approach
is supplemented and enriched by biomechanical research to gain a better
understanding of the lesional mechanisms that cause injuries and to
continually improve safety systems on Group vehicles.
In terms of general product safety, Renault has defined a general policy to be
followed, based on:
W a reference database of customer events considered by Renault to be
potentially safety-related. These events are addressed systematically at
dealership level or in the rare case of a recall. This system is updated
regularly;
W a structure with general product safety representatives in each of the large
entities involved in product safety, under the authority of a leader expert;
W creation of safety documentation for each project (“demonstration of safety
risk control” documentation), covering engineering, manufacture, sales
and after-sales. This documentation is created and validated according
to specific rules and processes and signed by the chief engineer of the
relevant project and by the Renault leader expert in product operational
safety and general safety;
W establishment and introduction of training/awareness-raising sessions for
relevant Renault employees.
In addition to factoring road safety into the design and marketing of a vehicle
and its accessories, Renault also works to make sure financially constrained
families stay safe. In 2013 Renault South Africa ran a car seat drive in its
dealership network. The seats were then refurbished and distributed to
disadvantaged families.
Aid
AID
In June 2012 Renault and the Fédération Nationale des
Sapeurs-Pompiers de France, the national firefighters’
federation, signed a partnership agreement. This sets out
Renault’s voluntary undertaking to work with the emergency
services to maximize their efficiency and safety whenever
they are called to an accident involving a Renault vehicle.
Several measures have been implemented under this agreement:
W in 2013, donation of 200 ICE and electric vehicles to firefighters to improve
their training in the extraction of accident victims;
W in 2013, free training for 150 French firefighter trainers on how to respond
to an accident involving Renault and Nissan electric vehicles;
W fire and extinction tests are regularly carried out on all our electric vehicles
with French firefighters, in open-air and confined environments. The
architecture of all electric vehicles currently being developed takes into
account firefighters’ specific needs. The knowledge acquired through this
testing has been shared with Nissan and Daimler;
W production of specific Extraction from Vehicle Procedures for electric
vehicles and written for the emergency services. These sheets have
been made available on the Internet free of charge in several of the
languages spoken in the countries in which electric vehicles are sold:
http://www.infotech.renault.com/fo/accueil.action.
All the decision support sheets for new Renault and Nissan have been
created and approved by the Ministry of the Interior. They can be found
online at http://www.infotech.renault.com/fo/accueil.action.
A free application for tablets and smartphones gives direct access to
these sheets at the accident site. It was developed in partnership with the
Desincar company and was made available to firefighters in October 2013.
Renault and PSA made a joint proposal for ISO standardization for these
decision-support sheets. The format for these new sheets will be decided
on at the end of 2013.
The experience gained in this area with French firefighters was shared with
German and Spanish firefighters in 2013.

REGISTRATION DOCUMENT RENAULT 2013✦ Global Reporting Initiative (GRI) Directives 155
CSR: SUSTAINABLE MOBILITY 2
2
SOCIAL PERFORMANCE
2.5.2.3 EDUCATION ✦Education has been a top priority of the Renault group’s CSR policy since
2009.
The Company recognizes that providing training on the careers of the future
and giving the neediest access to knowledge are key to the development
of society and of the Company. Renault therefore continues to deepen its
commitments in this area. These commitments take several forms and cover
social, environmental and labor-related issues.
This chapter provides an overview of the social commitments the Group made
in 2013 with respect to educating the younger generation and the least well-
off.
This concerns:
W relations with international schools/universities;
W financial support for access to education around the world;
W training through research to encourage innovation.
A. RELATIONS WITH INTERNATIONAL SCHOOLS AND UNIVERSITIES
How do we create a permanent link between the Company and academic
institutions, knowing that education is critical to value creation and to the
development of the next generation of future employees?
Over the years, the Renault group has sought to address this question by
taking action in partnership with schools, high-level colleges and universities
throughout the world.
1. The Renault Foundation www.fondation.renault.com
Operating on the principle of equal opportunity, the Renault Foundation,
founded in 2001, is the perfect embodiment of what the Company is doing
for education and CSR. It is designed to create a permanent link between
academic institutions (in France and the rest of the world) and the Company.
It thus demonstrates Renault’s strong commitment as a patron of higher
education.
The Foundation’s role, in collaboration with its academic partners and
Company management, is to anticipate new professional skills required.
It carries out three activities:
W financing and joint creation of academic programmes in partnership with
prestigious universities in France (Paris Dauphine University, Ecole des
Ponts ParisTech, Arts et Métiers ParisTech, etc.) and worldwide (Saint
Joseph University in Lebanon);
W the allocation of “foundation scholarships” (study and accommodation
costs) to French and foreign students selected in partnership with the
Foundation’s partner universities located in 12 countries worldwide;
W financial support to other foundations dedicated to research and higher
education (ParisTech Foundation) or to supporting deserving young French
students from underprivileged backgrounds (Georges Besse Foundation,
Un Avenir Ensemble Foundation).
The Renault Foundation’s operating agreement, signed in 2009, was renewed
for five years by resolution of the Board of Directors on June 5, 2013. A
multi-year action programme was presented at that time with a budget of
€14,560,000 (or an average annual budget of €2.8 million).
On the academic side, the Foundation supported and financed six training
courses in 2013:
W one professional degree in Electric Vehicles and Electromobility (LPVEE);
W three master’s degrees: Transport and Sustainable Development, Mobility
and Electric Vehicles, and Road Safety Management;
W one MBA in multicultural management;
W one doctoral student as part of the Zero Carbon Leader Programme, which
terminates at end-2013.
These programmes, developed jointly with its academic partners, are
particularly focused on three research themes that have real-world
consequences for the Company: multicultural management, sustainable
mobility and road safety.
The Foundation identifies young talents, then offers them training and
support. For example, it organizes and finances a complete year of study in
France for its scholarship students: a monthly grant, enrollment in schools
and universities in France, social security cover, the return trip between the
country of origin and France, trips of economic and cultural discovery.
Each year more than 80 scholarship students from 10 or more countries
where Renault operates obtain qualifications through these innovative
programmes linked to the promotion of sustainable mobility, multicultural
management and road safety.
2. Investing to bring schools into the corporate world
The Renault group works to develop ties between the corporate and academic
worlds because it believes this is the only way to improve the performance of
economic and social models in responsible market economies.
To do so, the Group carries out numerous actions and initiatives in France and
around the world:
Support for employees in the academic world: sharing knowledge is in the
Group’s DNA. Many employees spend some of their work time teaching
classes at different schools/universities through official partnerships such as
the Renault Foundation’s academic programmes, or speaking at schools and
universities in countries where Renault operates.
The Company makes appropriate expertise available to these institutions,
giving the employees involved a sense of satisfaction.
Equipment donations: beyond its employees’ expertise, the Renault group,
recognizing that knowledge is gained through the practical application of
academic knowledge, has donated a number of vehicles and tools to schools.
In Colombia, for example, under a cooperation agreement between the
National Training Service (SENA), the French National Ministry of Education
and Renault Sofasa, 13 vehicles were donated to the Technical and Higher
Education Institute to train qualified young technicians. This donation to

Find out more at www.renault.comREGISTRATION DOCUMENT RENAULT 2013156
CSR: SUSTAINABLE MOBILITY2 SOCIAL PERFORMANCE
training centers in Bogota, Medellin and Cali enabled teachers and students
to develop their practical skills.
In France, three electric vehicles were donated in 2013 to IUT Mantes La
Jolie to help students obtain the professional degree in Electric Vehicles and
Electromobility supported by the Renault Foundation. These vehicles, intended
for educational purposes, are also used in the Yvelines department to train
firefighters on the rescue techniques associated with these new types of
vehicles.
Bringing students into the Company and guiding them towards
the careers of the future: be it through apprenticeships, internships or
informational sessions about the business world, the Renault group is proud
to bridge the gap between the younger generation and the corporate world
on every continent.
In 2013, Renault Spain expanded its “Renault Experience” programme,
launched in 2012 with the local government of Castilla y Leon and the
University of Valladolid. There are now some 60 young people participating
in this programme, which involves a two-month training session on theory
and practice followed by a one-year internship in the Spanish subsidiary.
Admittance requires these potential Renault Spain engineers to have at least
two years of higher education. Once training is completed, 40% will be hired
by the subsidiary.
In France, for example, the Renault Foundation prepares young people for
the careers of the future through its professional degree in Electric Vehicles
and Electromobility programmes. In 2013, the Company offered students
in the first two classes of this professional degree programme around
30 apprenticeships in this new field. More than half of the 12 students in
the first class were able to remain with the Company for second year of
apprenticeship and work towards a vocational master’s degree. This is proof
positive of the close relationship between training and the Company.
Alongside the in-house internships and apprenticeships, many class trips are
organized to the Group’s sites with the aim of forging stronger ties between
the Group and the regions where it operates.
In Sandouville, one of Renault’s industrial sites in France, 120 junior high,
high school and college students in the region had the opportunity to attend
Industry Week. They met with employees who answered their questions about
the life-cycle of a vehicle, a typical work day at the plant and the trades
practiced.
At Renault’s Technocentre in Guyancourt, classes were held for junior high
school students. This programme, whose purpose was to strengthen the
link between Renault and young people from educational priority zones,
encouraged them to think about their futures.
In 2013, in the Netherlands, children from low-income areas who attend
Amsterdam’s Hindu “Shri Laksmi” school visited the subsidiary and learned
about its main activities and careers directly from its Chief Financial Officer.
In Colombia, the Sofasa subsidiary introduced young people to the automotive
trades through a different form of the “Renault Expérience” programme. The
processes implemented by the subsidiary for the industrial and commercial
development of the Renault Duster were explained to 450 students from the
Pontificia Bolivariana university in Medellin. In 2009, Renault do Brasil began
rolling this programme out to universities in Paraná and Argentina.
Bringing teachers into the Company: through a partnership between
the Renault Foundation and the Croissance Responsable Foundation, the
Company opened its doors to junior high and high school teachers and
guidance counselors. This innovative programme, which brings the education
system and the corporate world together, organizes three-day job shadowing
experiences for teachers and guidance counselors.
Taking on challenging projects at school level in conjunction with the
Company: in 2013, more than 140 junior high and high school students and
their teachers, from 24 different educational districts in France, participated
in the 7th F1 “Course en Cours” competition. The objective is to work as a
team to design, manufacture and test a reduced-scale model electric F1
car. The competition gives young people an opportunity to create an original
concept car with the professional tools used by the Company (CATIA, etc.).
Renault supports them with the know-how of its engineers. This extraordinary
experience allows young people to learn more about the automotive trades
and perhaps encourages them to pursue this avenue professionally.
B. SUPPORT FOR WORLDWIDE ACCESS TO EDUCATION
It is unfortunate that often only the most privileged, or even the elite, have
widespread access to education. Renault recognizes the importance of
education as a means of value creation for a state, country or company, which
is why the patronage actions designed to make education accessible to those
who deserve it most are the cornerstone of the Company’s CSR social policy.
1. Schooling and equal opportunity
Equal opportunity is a core CSR value and access to education is a natural fit.
Renault’s commitment to the most impoverished is evident in several of
its actions in this area. In Russia, for example, the “Début dans le métier”
programme enabled 30 young orphans aged 14 to 18 to learn all about the
Moscow plant during school vacation. The schedule included a tour of the
plant, but also an introduction to other professions with a tour of a firehouse,
hotel, print shop, bank, etc.
In Burkina Faso, the Renault group’s financial subsidiary, RCI, contributed to
a literacy campaign by supporting the creation of an educational center. Its
move to the Paris region enabled it to donate filing cabinets, cupboards and
other equipment to help make the center ready as quickly as possible.
In Brazil, in the suburbs of Curitiba, 80 children aged 2 to 5 will have the
chance, starting with the 2014 school year, to go to the free “Mundo para todo
Mundo” nursery school being built with the financial support of the Instituto
Renault do Brasil.
In Colombia, despite a high enrollment rate, inequalities persist between
regions due to out-of-pocket costs, such as textbooks, uniforms, transport,
and so on. Against this backdrop, the Colombian subsidiary developed the
“Camionetas Renault, para un pais imparable” programme. This is a 12-day
campaign in which Renault 4x4s head directly for the country’s most isolated
populations to deliver sports and technological equipment and musical
instruments to the schools.
But access to education is not just an issue affecting far-off regions. In France
as well, it may be difficult for the least well-off to get an education. Renault’s
actions in this area are reflected, in part, in the support the Renault Foundation

REGISTRATION DOCUMENT RENAULT 2013✦ Global Reporting Initiative (GRI) Directives 157
CSR: SUSTAINABLE MOBILITY 2
2
SOCIAL PERFORMANCE
decided to give in 2012, both financially and in the form of mentoring
programmes, to two other foundations working to give equal opportunities to
deserving young people from underprivileged families.
In 2013, Renault, via its Renault Foundation, donated €20,000 to the “Un
Avenir Ensemble” Foundation to help 24 deserving disadvantaged young
people. They are also being mentored by senior managers at the Company
who will support them throughout their schooling and until they enter the
workforce.
Similarly, the Renault Foundation is providing the Georges Besse Foundation
with €30,000/year through 2014, to educate some 20 deserving young
people with a demonstrated interest in the sciences.
2. Employee involvement
Renault’s humanitarian aid in this sector consists not only of financial or in-
kind assistance provided directly to charities and local schools, but also of the
efforts of its employees.
In Colombia, for example, after the torrential rains in 2011 that killed hundreds
and left thousands at risk, Renault Sofasa launched a fundraising drive among
its employees. These donations, which were matched by Sofasa, came to
€435,000 in total. The funds were presented to the Ministry of Education
and were used to build two schools in the cities of Majagual and Mompox. In
2013, 1,155 students were back at their desks.
In Brazil, employee volunteers spent some of their work time renovating a
nursery school. Through the “volunteer services” coordinated by the Instituto
Renault do Brasil, 22 employee volunteers spent four days repainting walls,
fixing up the vegetable garden and restoring benches in the playground.
C. TRAINING THROUGH RESEARCH TO ENCOURAGE INNOVATION
Through the support it provides for academic research, the Renault group has
set itself the challenge of bringing researchers and professionals together
to exchange ideas with a view to developing the technological solutions
and services of the future and understanding how and what tomorrow’s
consumers will purchase.
1. Support for academic institutions: ParisTech Foundation & Paris Dauphine University
Renault, through the Renault Foundation, earmarks a percentage of its budget
for financial support of academic research.
In 2013, it gave €200,000 to the ParisTech Foundation whose purpose is
to increase the visibility of and help develop French and European scientific
higher education and research.
The Renault Foundation also supports research on marketing, allocating
€50,000 a year for three years starting in 2013 to Paris Dauphine University
to conduct marketing research.
2. Sustainable Mobility Institute
In March 2009, Renault, the Renault Foundation and ParisTech founded the
Sustainable Mobility Institute to identify issues associated with the future of
passenger transportation and the design of innovative and environmentally
friendly mobility systems (primarily electric). Its research areas focus on
electric mobility systems, the relevant business models, the global vision
of the shift in transport to electric vehicles, and battery technologies (see
chapter 2.5.2.1).
2.5.2.4 DIVERSITY ✦Renault’s diversity policy has five priority areas for action: gender diversity,
disability, age, origin and nationality, and sexual orientation. The actions have
two key objectives: development of employees’ uniqueness and corporate
performance due to the diversity of the Company’s talent (see 2.3.2). This
commitment extends to the social sphere with a number of concrete gender
diversity and disability initiatives, including those listed below.
PROMOTING WOMEN IN THE COMPANY AND SOCIETY
In 2013, the Renault-Nissan Alliance was a partner of the Women’s Forum in
France for the sixth year in a row and renewed its partnership in Brazil for the
second edition of the event. The aim of these annual meetings of international
leaders is to establish a level playing field for women in industry, academia,
politics and society. This year, Renault organized a roundtable on the theme:
How to attract women to male-dominated industries?
Renault’s commitment extends to young women with its support of the
“Elles bougent” association, which aims to help them explore engineering
and technical careers. More specifically, Renault organizes plant visits
and meetings between female high school students and “Elles bougent”
mentors. The goal of these women mentors, which include Renault employee
volunteers, is to create a dialogue with these young women and encourage
them to consider careers in the sciences.
Renault supports the Observatoire de la Parentalité for the work/life
balance, which is a sustainable performance issue. This association develops
and coordinates a network of stakeholders that are concerned with issues
affecting working parents and that research the work/life balance. The
question of parenthood and the work/life balance features prominently in
Renault’s thinking and actions.
The Netexplo forum, organized by the Observatory of the same name since
2000, investigates how new technologies are used and reports on the latest
trends in the digital revolution. One topic addressed at the most recent event
is very close to Renault’s heart: “Women and social media: an asset for the
enterprise.” The panel included Véronique Morali, Virginie Abadie-Dalle,
Brigitte Dumont and Claire Martin, who came to present Women@Renault.
Founded in 2008 by Véronique Morali, Terrafémina is an innovative platform
that offers exclusive content for women and explores different aspects of their

Find out more at www.renault.comREGISTRATION DOCUMENT RENAULT 2013158
CSR: SUSTAINABLE MOBILITY2 SOCIAL PERFORMANCE
daily life: work, culture, economics, personal life and society. On International
Women’s Day on March 8th, Renault became the site’s partner for its “Mon
coach auto” column, which helps women drivers on a daily basis. Terrafémina
also published interviews with three Alliance employees during the Women’s
Forum in Deauville.
Dialogo is a Spanish-French friendship association created to strengthen
the economic and cultural ties between France and Spain. Since 2000,
the French federation Femmes 3000 has held an awards ceremony
in partnership with the Senate. The objective is to increase the visibility of
women in public, economic and social life. Maria-Luisa de Contès, who heads
Women@Renault in Spain, received the Responsible Entrepreneurship
Award for creating the “Diálogo Women’s Forum” collaborative platform in
2010.
The 61st International Congress of Women Entrepreneurs was held in
2013 in Marrakech. The theme was “Women Entrepreneurs: guaranteed
values for a sustainable performance.” The Renault group was represented by
Claire Martin, Senior Vice-President Corporate Social Responsibility and the
Renault Foundation, and Taja Maad, Director of Public Affairs and Corporate
Social Responsibility at Renault Morocco.
PLAN is an international development NGO that works in 50 countries to give
the most marginalized children and adolescents the resources to build their
future. Renault Colombia joined forces with this NGO through its “Because
I am a Girl” campaign, which aims to promote the rights of girls from
Cartagena’s vulnerable populations in order to improve their living conditions
and enable them to take control of their lives through a process of education.
INSPIRE is a leadership programme run by the Valued Citizens Initiative
association and supported by Renault South Africa. For the ninth year in
a row, this programme is focusing on educating young girls, who will play
an important role in the country’s development. As part of this initiative,
105 girls from schools in the Ekurhuleni District visited Renault South Africa’s
headquarters to present their local initiatives and talk with young South
African leaders.
RENAULT’S PARTNERSHIPS WITH KEY STAKEHOLDERS IN THE DISABILITY SECTOR
For 16 years, Renault has partnered with the French Federation of Disabled
Sports (FFH) to provide financial assistance and access to vehicles. In return,
the FFH assists Renault with its training and awareness-raising initiatives. In
2013, Renault formalized the creation of its “Disabled Sports Team” at the
IPC (International Paralympic Committee) World Athletics Championships. The
team is made up of three athlete ambassadors: Marie-Amélie Le Fur (track
and field), Élodie Lorandi (swimming) and Alim Latrèche (fencing). Renault will
support them through the Paralympic Games in Rio in 2016.
Renault has also partnered with Jaccede, an association which has created
a collaborative guide for accessibility and has audited over 26,000 sites
in France and 7,000 abroad. Renault and the association have begun an
accessibility audit of company sites carried out with staff.
Renault also works with the Arpejeh association to support disabled
youngsters from junior high through college.
Employees also initiate involvement in certain associations, such as the
Stade Parisien des Sourds, which encourages the hearing impaired to
play volleyball, Cheval Bonheur, which allows the disabled, mostly children,
to bond with horses, and Norm Handi Mer, which aims to make the sea
accessible to everyone by developing water-based activities for the able-
bodied and disabled.
Renault do Brasil and its Institute have regularly provided financial support
to the non-profit training organization UNILEHU (“Universidade livre para a
eficiência humana”) since 2005, to help the disabled obtain training and find
a job. Renault do Brasil also encourages the development of disabled sports
and has sponsored the Paralympic volleyball team since 2012.
Renault Spain has entered into several contracts for goods and services with
special employment centers for the disabled and also collaborates with the
AFANIAS NGO to train and employ the mentally disabled.
Paralympic athlete Teresa Perales was named Renault Spain’s sustainable
mobility ambassador for 2014 and 2015.
To help improve the lives of the disabled, Renault Netherlands donated an
all-electric Renault Z.E. to a school for guide dogs.
Working with the Blickkontakt association, Renault Austria organized a
meeting with some 30 blind or visually impaired people, accompanied by
their guide dogs, to familiarize them with the sounds of the ZOE.
Women@Renault Turkey organized a drive that collected 500kg of bottle
caps. These were delivered to the city authorities of Bursa on February 19,
2013 to provide electric wheelchairs to people with motor disabilities. The
drive continued till the end of 2013 .
Renault Tech, European leader in the conversion of vehicles for people with reduced mobility
It is not up to the world to adapt to the automobile; it is up to the automobile to
adapt to people. For more than 25 years, Renault Tech has designed, produced
and sold vehicles that have been converted for people with reduced mobility.
A European leader in this activity, Renault Tech uses its three production lines
at its Heudebouville plant to produce more than 1,000 customized vehicles a
year to transport people with reduced mobility. The driving aids designed by
Renault Tech provide mobility solutions to individuals with motor disabilities so
they are once again able to get around on their own.
The Heudebouville site was where Renault and Renault Tech handed over
the keys to a driving aid-equipped ZOE intended for people with disabilities
undergoing rehabilitation. It is being used to practice transferring patients at
the Sainte Marie Foundation from wheelchair to vehicle.

REGISTRATION DOCUMENT RENAULT 2013✦ Global Reporting Initiative (GRI) Directives 159
CSR: SUSTAINABLE MOBILITY 2
2
SOCIAL PERFORMANCE
CSR-FOCUSED PURCHASING ORGANIZATION
The Purchasing organization relies on its people and processes:
W an international network of some 100 local correspondents who are
quality experts in purchasing, trained in CSR and who all use the same
assessment methodology;
W processes shared by all buyers worldwide that incorporate CSR criteria into
supplier selection;
W performance indicators ;
W a central team tasked with providing the necessary support to suppliers to
help them lift their standards up to the required level;
W an effective tool (web platform) for communicating information to buyers
and discussing action plans with suppliers.
CUSTOMIZED SUPPORT
Renault supports its suppliers with a view to establishing long-term relations
in a climate of mutual respect, total transparency and trust, based on ongoing
dialog.
Renault helps its suppliers meet its CSR requirements by:
W working with them to develop a realistic work plan with priorities addressed
according to a negotiated timetable;
W providing them with the relevant expertise and advice;
W sharing best practices.
This support is offered by a central team providing ongoing support to supplier
action plans, assisted by local purchasing teams. In 2013, 12 supplier sites
and 16 groups were able to make progress once actions had been established
in the fields of safety, working conditions, human rights, the environment and
management of their own supply chain. Progress is systematically measured
with a further audit.
At end-2013 Sites: 97% of non-compliant sites had been
addressed, either through:
W progress (55%);
W blacklisting (29%) or termination (7%);
W ongoing action plan (7%).
Groups, out of 127 below-threshold groups, 26 had been
addressed, either through:
W progress (22);
W blacklisting (4).
The action plans can be onerous and take a long time to put
in place. This explains why we saw more modest results than
for the sites. We can nevertheless see that all the groups with
action plans in place have made progress.
Along with the quality and innovation awards, CSR awards have been
presented since 2012 to recognize:
W social and environmental performance;
W progress made following implementation of an environmental and/or social
action plan;
W skills development for the disabled or those seeking to re-enter the labor
market.
SME SUPPORT FUND
Renault also subscribes to the Modernization Fund for Automobile Equipment
Suppliers (FMEA), which provides equity or quasi-equity for automotive
equipment makers.
The purpose of the fund is to develop and consolidate large firms that are
profitable, strategic, competitive and able to provide automakers with R&D
capability and a stronger international base.
The FMEA operates on a medium- to long-term basis, usually for 7 or 8 years.
It invests in the following firms:
W equipment makers needing to increase their equity to fund business
growth and R&D programmes;
W companies capable of forming and consolidating more efficient entities
operating in different areas of auto equipment sectors (plastics, stamping
and metalwork, foundry, rubber, etc.);
W highly innovative fast-growing companies in need of equity.
INNOVATION
Renault also strengthens its supplier relationships through a partnership
approach that encourages them to innovate. Annual reviews are conducted
with the major suppliers’ top management to identify potential innovations.
This process has been expanded to innovative start-ups and SMEs, mainly
through the Moveo structure.
A policy has been in place for drafting co-innovation contracts with suppliers
since 2008. It defines both the technical content and the legal conditions for
sharing the results.
Since 2010, technology days have been organized by the Operational
departments and the Purchasing department, where suppliers are provided
an opportunity to present their innovations to Renault experts.
2.5.3 CSR IN THE VALUE CHAIN

Find out more at www.renault.comREGISTRATION DOCUMENT RENAULT 2013160
CSR: SUSTAINABLE MOBILITY2 SOCIAL PERFORMANCE
RESPONSIBLE PURCHASING OVERSIGHT
Renault adheres to a policy that encourages the purchase of responsible
parts and services, based primarily on increased recycling and reduced
CO2 emissions:
W purchasing of responsible and environmentally sound products,
whether original or replacement parts. Purchases of recycled plastics have
risen to meet the rapidly growing needs related to eco-design. In 2013
Renault was the first carmaker to offer air filters made with FSC-certified
paper, pending implementation in oil and diesel filters;
W incorporation of an eco indicator into packaging specifications designed to
ensure 75% recyclability;
W introduction in 1949 of the use of refurbished parts (injectors and
compressors) by the After-Sales department, reducing assembly costs,
improving availability for mass produced vehicles and reducing CO2
emissions by forgoing extraction of raw materials, eliminating process
stages, etc.
T he Purchasing department is also working with the logistics segment
to develop a tool that will suggest ways road hauliers can reduce fuel
consumption and CO2 emissions. It will be tested in 2014.
The organization and processes, combined with the objective of a roll-out
to the Purchasing department, based on the number of new projects with
the protected sector, have allowed new actions to be undertaken with the
protected sector for both auto parts and services:
W the Renault Purchasing department has already been involved for several
years in purchasing from the protected sector. That is why we support the
AMIPI-SLAMI Foundation, which helps cognitively impaired people develop
through learning in order to encourage labor market entry. The foundation
carries out tier-one industrial activities at seven French production sites
that produce wiring harnesses for the automotive industry. Since 2012,
SLAMI has supplied cabling for mass-produced vehicles;
W the Purchasing department has also arranged for personnel to be
transferred from the protected sector to the traditional sector with the
creation of reception desks at the Technocentre in the dedicated innovation
area and in the documentation center;
W Renault has also turned to sheltered entities and organizations that help
the disabled enter the workforce to source a number of its communications
campaigns: training materials, promotional wear and lunch boxes.

REGISTRATION DOCUMENT RENAULT 2013✦ Global Reporting Initiative (GRI) Directives 161
CSR: SUSTAINABLE MOBILITY 2
2
SUSTAINABILITY RATINGS AND INDEXES
2.6 SUSTAINABILITY RATINGS AND INDEXES
Sustainability rating agencies and specialized departments of financial
institutions assess companies on their commitments, policies and
performance in terms of labor relations, environmental protection and
corporate governance. These assessments, made using analytical and scoring
techniques, are designed to meet demand from socially responsible investors,
who use the findings to select the companies in which they invest (1).
Methods vary from agency to agency. Some agencies are specialized by
investment region (Europe, world, OECD, etc.) or asset class (large caps, small
caps), have a sector focus, or base their analyses on a basket of weighted
criteria, which can vary significantly depending on their targets.
Some of these rating agencies, usually working in partnership with providers
of equity indexes, have developed special benchmarks composed of the top-
rated companies for labor relations, environmental protection and corporate
governance.
(1) A socially responsible Investment means all financial investments made, not only depending on, financial performance criteria of the monitored values, but also on the behavior of the company versus its social, economical and environmental environment.
2.6.1 RENAULT’S RATINGS IN 2013
SAM (SUSTAINABLE ASSET MANAGEMENT)
SAM is an independent asset management company founded in 1995 and
based in Switzerland. It specializes in setting up investment strategies based
on economic, environmental and social criteria, analyzed in terms of long-
term value creation.
Results in 2013: Renault was not included in the Dow Jones Sustainability
World index (DJSI World), despite the Group’s outstanding performance,
particularly in the environmental field (83/100). Its global rating remains well
above the average in the automotive sector.
RENAULT’S SCORE LOWEST SCORE DJSI WORLD INDUSTRY AVERAGE (2)
TOTAL SCORE (1) 79 89 61
Economic dimension 78 86 65
Environmental dimension 83 88 59
Labor relations 74 89 58
(1) Score out of 100.
(2) Automotive industry.
OEKOM
Oekom, one of Germany’s leading rating agencies, analyzes 750 large
and midsized companies and more than 100 small enterprises within a
geographical universe that spans the OECD, new EU member states, Russia
and leading Asian markets. The agency thus covers 80% of the MSCI World
index, which measures stock market performance in developed countries .
Results in 2013: Renault scored a B rating overall, and the Group was again
ranked first out of the 16 leading global automakers analyzed.
RATING SCALE A+ TO D- OEKOM RATING RANKING AMONG CARMAKERS
Social and cultural B 1
Environment B 1
TOTAL CORE B 1
In 2007 Oekom created the Global Challenges index, a listing of 50 companies around the world that make substantial efforts to address major planetary issues
such as climate change, drinking water availability, deforestation, biodiversity, poverty, and global governance. Renault has been included in this index from the
start. More information can be found on www.gcindex.com.

Find out more at www.renault.comREGISTRATION DOCUMENT RENAULT 2013162
CSR: SUSTAINABLE MOBILITY2 SUSTAINABILITY RATINGS AND INDEXES
VIGEO
Vigeo is an independent rating agency founded in July 2002. The major
shareholder, Caisse des Dépôts et Consignations, contributed the assets of
Arese, which pioneered social and environmental rating in France. Vigeo is
owned by some 50 shareholders, organized into three sub-groups: institutional
investors, European trade unions, and multinational corporations. Vigeo’s
unique model is aimed both at investors, with investor-solicited ratings of Euro
STOXX 600 companies, and corporations, with corporate-solicited ratings.
Results February 2013: Renault is still rated by Vigeo. For more details, please
contact Vigeo.
CARBON DISCLOSURE PROJECT
The carbon disclosure project (CDP), founded in 2000, is mandated by a group
of institutional investors to enhance understanding of the potential impacts of
climate change on the value of the assets managed by its signatories.
Since 2002 the CDP has sent a regular information request to companies in
a standard format, asking them about their greenhouse gas emissions and
policy on climate change. Since CDP6, the CDP has included the FT Global
500 – the largest companies in the world by market capitalization.
After the 2007 report, as for the previous two versions, the CDP compiled
the Climate Leadership index, composed of the 50 companies in the FT500
assessed as having the best practices in terms of information on climate
change.
Results in 2013: Based on its responses to the CDP questionnaire, which are
available at www.cdproject.net, Renault was awarded a score of 96/100 and
a B performance rating according to the A-to-D rating system introduced in
2010.
Note:
W Scope 1 concerns direct greenhouse gas emissions from sources owned
or controlled by the company (boilers, furnaces, turbines, incinerators,
engines, etc.), fuel combustion as part of transportation operations by or
for the company (cars, commercial vehicles, aircraft, boats, trains, etc.) and
physical or chemical processes (e.g., in cement manufacturing, cracking
in petrochemical processing, aluminum smelting, etc.). More specifically at
Renault, it concerns heating, refrigerants in air conditioning systems (line
vehicles, plants), company cars (taxi pools), and vehicle trials on test tracks
and benches;
W Scope 2 concerns greenhouse gas emissions from the generation by
another party of electricity, heat, cooling or steam that is purchased
and consumed by the company. This is often described as “purchased
electricity,” as it represents the main source of scope 2 emissions.
Emissions generated by the electricity used for homeworking and data
processing are included in scope 2;
W Scope 3 covers all other indirect emissions that occur from GHG sources
that are not owned or controlled by the company.
2.6.2 INCLUSION IN SOCIALLY RESPONSIBLE INDEXES ✦
Renault is included in the following socially responsible indexes:
W Euronext-Vigéo Europe 120 lists companies that obtain the best aggregate
scores in their category. These scores are arrived at by weighting the global
score for each company’s overall performance on all risk factors taken
into account by Vigéo in the definition and assessment of corporate social
responsibility;
W Euronext Vigéo Eurozone 120 lists the 120 companies in the eurozone that
are most advanced in terms of social responsibility;
W ESI Excellence Europe, set up by the Ethibel agency, acquired by Vigeo. This
index lists pioneering companies as well as those whose performance is
average for their sector but that satisfy the financial criteria set out in the
screening methodology;
W ECPI E. Capital Partners Indices, developed by investment advisory firm
E. Capital Partners, list 150 of the most socially responsible companies
among Europe’s largest in terms of market capitalization;
W Global Challenges index, set up in 2007 by the German agency Oekom
Research, lists 50 companies worldwide recognized for their contribution
to sustainable development through their products and services and for
initiatives related to the development of their businesses.

REGISTRATION DOCUMENT RENAULT 2013✦ Global Reporting Initiative (GRI) Directives 163
CSR: SUSTAINABLE MOBILITY 2
2
GRENELLE II CROSS REFERENCE TABLE
2.7 GRENELLE II CROSS REFERENCE TABLE
INFORMATIONS SOCIALES, ENVIRONNEMENTALES ET SOCIÉTALES CONFORMÉMENT À LA LOI GRENELLE 2 (ART.225-102 DU CODE DU COMMERCE)
THEMES INDICATORS SCOPE
RESULTS AND
QUALITATIVE DATA
CORPORATE SOCIAL DATA
Employment
Employment
Total workforce and workforce breakdown by region, gender and age
Group workforce Group 2.3.1
Workforce by region Group 2.3.1
Workforce by gender Group 2.3.1
Workforce by age Group 2.3.1
Hires and redundancies
New hires Group 2.3.1
New hires by region Group 2.3.1
Redundancies Group 2.3.1
Payroll expenditure by region Group 2.3.1
Payroll expenditure to revenues Group 2.3.1
Average payroll costs by region Group 2.3.1
Performance appraisal, career development and pay Group 2.3.3
Payroll expenditure and trends Employee profit-sharing Group 2.3.3
Work organization
Work organization
Organization of work time Remote employees France 2.3.1
Absenteeism rate Absenteeism rate Group 2.3.3
Training
Training
Training policies
Dynamic competency management policy Group 2.3.1
Monitoring of jobs and skills management planning France 2.3.1
Expanding consultancy Group 2.3.1
Management quality Group 2.3.2
Talent development Group 2.3.2
Exchanges with Renault’s partners Group 2.3.2
Total training hours Total training hours 10 main countries 2.3.1
Equal opportunity
Equal opportunity
Promotion of diversity Group 2.3.2
Policies to promote gender equality
% of female managers Group 2.3.2
% of key positions held by women Talent@Renault 2.3.2
Policy on employment and integration of people with disabilities % of disabled employees 10 main countries 2.3.2
% of key positions held by international profiles Talent@Renault 2.3.2
Anti-discrimination policy Youth and senior employment policy Group 2.3.2

Find out more at www.renault.comREGISTRATION DOCUMENT RENAULT 2013164
CSR: SUSTAINABLE MOBILITY2 GRENELLE II CROSS REFERENCE TABLE
THEMES INDICATORS SCOPE
RESULTS AND
QUALITATIVE DATA
Health and safety
Health and safety
Occupational health and safety
Prevention of psycho-social risk and occupational stress Group 2.3.3
Ergonomic rating of workstations in manufacturing Group 2.3.3
Road accident risk management Group 2.3.3
Occupational health and safety management system certification Group 2.3.3
Monitoring of the workplace environment policy Group 2.3.3
Agreements with trade unions or employee representatives on occupational health and safety
Description of the policy on workplace health, safety and environmental risk prevention covered by the global framework agreement Group 2.3.4
Workplace accidents (frequency and severity) and occupational illnesses
Workplace accidents (F1) Group 2.3.3
Workplace accidents with work days lost (F2) Group 2.3.3
Work days lost due to workplace accidents (G) Group 2.3.3
Occupational illness rate Group 2.3.3
Industrial relations
Industrial relations
Organization of industrial relations, especially procedures on notification and consultation of employees and negotiations
Global framework agreement on social, societal and environmental responsibility Group 2.3.4
Internal communications Group 2.3.4
Collective agreements
No. of major agreements 10 main countries 2.3.4
No. of major agreements 10 main countries 2.3.4
Advancement of and compliance with fundamental conventions
Advancement of and compliance with the fundamental standards of the International Labor Organization
Freedom of association and the right to collective bargaining Global framework agreement on social, societal and environmental responsibility Group 2.3
Elimination of discrimination in employment and occupation Global framework agreement on social, societal and environmental responsibility Group 2.3
Elimination of forced labor Global framework agreement on social, societal and environmental responsibility Group 2.3
Elimination of child labor Global framework agreement on social, societal and environmental responsibility Group 2.3
ENVIRONMENTAL DATA
Overall policy
Integrating environmental issues into the company organization
Clio III / Clio IV comparative Life Cycle AssessmentZOE Life Cycle Assessment Group
2.4.2.1, 2.4.3.1, 2.4.3.2
Environmental assessment and certification processes
ManufacturingNo. and % of ISO 14001-certified manufacturing sites% of manufacturing sites covered annually by environmental and pollution prevention audits
Group Group Manufacturing
2.4.3.2
Vehicles% of 2013 sales that qualify for Eco2% of vehicles in the range that have had an LCA
Europe Vehicles
2.2.1.2
2.4.2
Environmental information and training for employees No. of employees trained in eco-driving France 2.4.3.1
Resources dedicated to preventing environmental risk and pollution
Human resources (no. of employees)Expenditure on Research and Advanced Engineering to reduce the environmental impact of the vehiclesExpenditure on reducing the environmental impact of the sites Group 2.4.3.1
Provisions and guarantees for environmental risks Amount of provisions Group
Note 20 on provisions - 4.2.7.3

REGISTRATION DOCUMENT RENAULT 2013✦ Global Reporting Initiative (GRI) Directives 165
CSR: SUSTAINABLE MOBILITY 2
2
GRENELLE II CROSS REFERENCE TABLE
THEMES INDICATORS SCOPE
RESULTS AND
QUALITATIVE DATA
Pollution and waste management
Pollution and waste management
Prevention, reduction and remediation of air, water and soil pollution with a severe environmental impact
ManufacturingCOV, NOx, SO2 emissions% of production capacity equipped with water-soluble painting facilities % of production capacity equipped with VOC incineratorsDischarges of toxic metals, organic compounds, suspended particulate matterNo. of powertrain sites with zero industrial wastewater
Group Group Group Group Group
Manufacturing2.4.2.5 (air), 2.4.2.7
(soil), 2.4.2.4 (water), 2.8.2.3 (appendice )
Vehicles2.4.2.5
Prevention, recycling and elimination of waste
ManufacturingQuantity of waste generated by the plants (NHIW, non-metal NHIW, metal HIW, HIW), total and relative to no. of vehicles producedWaste by treatment typeNo. of sites with zero waste to landfill
Group Manufacturing2.4.2.3, 2.8.2.3
(appendice )
Group
Group
VehiclesNo. of end-of-life vehicles (ELVs) dismantled by INDRA subsidiary% of sales in a country where Renault helps organize collection of end-of-life vehicles (ELVs) France
Vehicles2.4.3.2
Mitigation of noise and other types of pollution specific to an activity
Vehicles Approved noise pollution levels for the top-selling versions of each model in the range in Europe Europe
2.4.2.8 and 2.8.2.4 (appendice )
Sustainable resource use
Sustainable resource use
Water consumption Water consumption (total m3 and m3/vehicle produced)Water consumption by source Group
2.4.2.4, 2.8.2.3 (appendice )
Water supply depending on local constraints 2.4.2.4
Commodity consumption Quantity of steel, cast iron, aluminium and plastics used in vehicle production Group 2.4.2.2
Improving efficiency of resource use
Quantity of recycled steel, cast iron and aluminium used (Europe)Quantity of recycled plastics used (worldwide)% of recycled materials in vehicles produced in Europe% of recycled plastics in Captur
Europe
2.4.2.2
Group
Europe
Energy Consumption
ManufacturingEnergy consumption (total and per site)
Group
Manufacturing2.8.2.3 (appendice )
VehiclesFuel consumption by (1) the top-selling versions and (2) the most efficient versions of each model in the range in Europe Europe
Vehicles2.3.2.1 & 2.8.2.4
(appendice )
Improving energy efficiency
ManufacturingEnergy consumption per vehicle produced
Group
Manufacturing and vehicles
2.4.2.1 VehiclesNo. of models with embedded eco-driving aids
Renewable energy use
Manufacturing% of renewable energy (direct and indirect) in energy consumption of manufacturing sites
Group
Manufacturing and vehicles
2.4.2.1 VehiclesNo. of models with an LPG version
Land use % of water-tight areas Group 2.4.2.7
Climate change
Climate change
Greenhouse gas emissions
ManufacturingGreenhouse gas (GHG) emissions, total and per siteDirect and indirect GHG emissionsGHG emissions by source
Vehicles Average GHG emissions of the passenger-car rangeApproved emissions of (1) the top-selling versions and (2) the most efficient versions of each model in the range in Europe
Group Manufacturing
2.4.2.1 and 2.8.2.3 (appendice )
Group
Group
Europe Vehicles
2.4.2.1 and 2.8.2.4 (appendice ) Europe
Climate change adaptation 2.4.2.1
Biodiversity
Biodiversity Developing biodiversity 2.3.2.9

Find out more at www.renault.comREGISTRATION DOCUMENT RENAULT 2013166
CSR: SUSTAINABLE MOBILITY2 GRENELLE II CROSS REFERENCE TABLE
THEMES INDICATORS SCOPE
RESULTS AND
QUALITATIVE DATA
INFORMATION ON SOCIETAL COMMITMENTS TO SUSTAINABLE DEVELOPMENT:
Local impact
Regional development Group 2.5.1
Residents and local populations Group 2.2.5 & 2.5.1
Relations with stakeholders
Conditions for dialogue Group 2.2
Partnerships and sponorship Group 2.5.1 & 2.5.2
Relations with sub-contractors and suppliers
Inclusion of social and environmental issues in the purchasing policy Dissemination of CSR standards across purchasing processes Group 2.2.3
Importance of sub-contracting and inclusion of CSR in relations with sub-contractors and suppliers Monitoring suppliers’ CSR performance Group 1.5.2.1 & 2.5.3
Fair practices
Anti-corruption action Group 3.1.3
Consumer health and safety Group 2.5.2.2
Other actions implemented

REGISTRATION DOCUMENT RENAULT 2013✦ Global Reporting Initiative (GRI) Directives 167
CSR: SUSTAINABLE MOBILITY 2
2
APPENDICES
2.8 APPENDICES
2.8.1 APPENDICES CONCERNING LABOR RELATIONS
Group savings and collective retirement plan
NUMBER OF SUBSCRIBERS
AT DEC. 31, 2013
ASSETS
(€ million)
2013
PERFORMANCE (%)
Actions Renault Funds (Group savings plan)
Actions Renault Fund (1) (4) Almost 100% Renault shares 43,329 373.7 43.59
Renault Shares Fund (2) Almost 100% Renault shares 9,771 76.9 43.60
Renault Italia Fund (3) Almost 100% Renault shares 126 1.0 43.74
Diversified funds (Group savings plan and collective retirement savings plan)
Impact ISR Performance (4) 100% European shares 5,940 35.9 19.31
Impact ISR Équilibre (4)
50% diversified shares
11,509 129.5 10.8550% bonds
30% diversified shares
Impact ISR Rendement Solidaire (4)
Expansor Taux (ex compart. 3) (4)
30% bonds
30% cash
10% shared return 2,436 6.6 5.64
95% diversified bonds 10,287 76.0 0.98
Impact ISR Monétaire (4) 100% cash 6,217 23.2 0.10
Natixis Horizon Retraite (collective retirement savings plan) (4) (5)
2015 Diversified 552 2,4 1.02
2020 Diversified 579 2.3 7.36
2025 Diversified 308 1.0 13.74
2030 International shares 296 0.9 16.63
2035 International shares 211 0.6 17.39
2040 International shares 203 0.4 17.57
2045 International shares 63 0.1 17.53
2050 International shares 29 NS 16.72
(1) Actions Renault Fund for French tax residents.
(2) Renault Shares Fund for tax residents outside France and Italy.
(3) Renault Italia Fund for Italian tax residents.
(4) Fund open for payments throughout the year.
(5) Funds whose maturity date corresponds to the planned date of the employee’s departure.
Find out more at www.renault.comREGISTRATION DOCUMENT RENAULT 2013168
CSR: SUSTAINABLE MOBILITY2 APPENDICES
2.8.2 APPENDICES CONCERNING THE ENVIRONMENT
2.8.2.1 COMMENTS ON THE METHODOLOGIES FOR SELECTING ENVIRONMENTAL INDICATORS FOR PRODUCTS
LIFE CYCLE ANALYSIS
Life cycle analyses are carried out by Renault according to the ISO 14040 and
ISO 14044 standards. Renault uses the GaBi LCA (PE International) software
and databases.
The life-cycle inventory describes all the elements that are taken into account
in the life cycle analysis of a vehicle. These data are related to life-cycle
stages, the vehicle’s manufacture, its recycling, taking into account its usage
phase:
W raw materials and manufacturing: each vehicle is described in Renault’s
internal databases on the basis of the raw materials that compose it.
These data, coupled with those in the GaBi database, allow all phases of
the extraction and processing of raw materials to be incorporated in the
inventory. Data related to the manufacture of the vehicles in the life-cycle
inventory come from the annual environmental reporting from the industrial
sites, which is verified by Renault’s statutory auditors;
W usage and maintenance phase: the usage phase is calculated for a period
of ten years and for 150,000km. The certified emissions for the regulatory
cycle are taken into consideration. In addition, impacts related to fuel
consumption (diesel, gasoline or electric) are calculated from well to wheel,
i.e., factoring in the emissions given off during the production of the fuel.
In the usage phase, maintenance operations during the vehicle’s life (new
tires, etc.) are taken into account;
W end-of-life: emissions related to recycling processes are taken into account.
All potential impacts are calculated using the GaBi software.
CARBON FOOTPRINT
The purpose of determining Renault’s carbon footprint is to measure and
propel the reduction of greenhouse gas emissions in the Renault group. The
following methodologies have thus been chosen:
W the carbon footprint is calculated for a vehicle. Consequently, the emissions
from logistics and the powertrain plants are counted proportional to the
number of vehicles produced by the Group. (Renault sells engines and
gearboxes to other manufacturers and thus produces more mechanical
components than it does vehicles);
W in the event of sales or acquisitions, the reference value (2010) is corrected
to take into account the site’s emissions at that date;
W the carbon footprint is calculated for a constant scope of emissions (the
categories of emissions included do not change from one year to another,
even though continual improvement in the reporting broadens the range of
available data, particularly for scopes 1 and 2).
The carbon footprint for Renault doesn’t include a prospectif dimension. The
value retained for the carbon intensity of fuel and industrial processes is the
one from the year release of the vehicle and doesn’t vary during the lifecycle
of the vehicle (10 years, 150,000 km).
The table below indicates the scope of emissions covered by the Renault
Carbon Footprint indicator as well as the origin of the data used and the level
of external verification applied. To facilitate understanding, the categories of
the Renault Carbon Footprint are matched to those of the GHG Protocol.

REGISTRATION DOCUMENT RENAULT 2013✦ Global Reporting Initiative (GRI) Directives 169
CSR: SUSTAINABLE MOBILITY 2
2
APPENDICES
CATEGORIES GHG PROTOCOL
CATEGORY RENAULT
CARBON FOOTPRINT SCOPE SOURCE OF DATA
SCOPE 1 DIRECT EMISSIONS
Plants
WorldwideIndustrial, tertiary, logistics sites, monitored by Renault (see
appendix: Environmental indicators for the sites)Emissions from combustion of fuels only
Direct: Annual reporting by the sites (Emissions from powertrain plants are corrected in proportion to the
number of vehicles produced by the Group).
SCOPE 2 INDIRECT EMISSIONS
Plants
WorldwideIndustrial, tertiary, logistics sites, monitored by Renault (see
appendix: Environmental indicators for the sites)Emissions from electrical energy only
Direct: Annual reporting by the sites (Emissions from powertrain plants are corrected in proportion to the
number of vehicles produced by the Group).
SCOPE 3 OTHER RELATED EMISSIONS
Goods and services purchased Materials
Worldwide«Cradle to gate» emissions related to the extraction of materials
and fuels, to the transformation of materials into parts, and to the logistics between the extraction and the tier 1 supplier site, in
relation to the number of vehicles sold.Benefits from the use of recycled materials are deducted.
The GaBi LCA databases on the carbon intensity from materials and parts are the same between 2010 and 2013.To take into
account the progress made by the industry, we take the value of 1,4% per year for carbon intensity reduction for the production of
materials and parts. This ratio is based on the analysis from the International Energy Agency.
Indirect: Gabi LCA database (emissions related to materials parts).GaBi LCA database V5: report Energy Technology Perspectives
2010 from the International Energy Agency (improvement of the intensity of production carbon).
Direct: Renault design database (composition of vehicles, recycled materials)
Logistics and distribution (upstream) Logistics
WorldwideAll transport modes
Direct: Reporting on logistics activities(Emissions from powertrain plants are corrected in proportion to the
number of vehicles produced by the Group).
Business travel TravelWorldwide
All transport modesDirect: Travel agency reporting and consumption at Renault-owned
fuel stations
Daily transport for employees TravelFrance
Emissions avoided by teleworking are taken into account. Direct: Information provided by employees
Logistics and distribution (downstream) Logistics
WorldwideAll transport modes
Direct: Reporting on logistics activities(Emissions from powertrain plants are corrected in proportion to the
number of vehicles produced by the Group).
Use of products sold Usage
WorldwideAll vehicles sold (passenger and light commercial)
“Tank to wheel” emissions calculated for a 10-year life span/150,000km
Direct: Certification data technical definitions (for countries without CO2 certification)
Certification data are not corrected, regardless of the certification cycle used (the certification cycle chosen by each country is
assumed to correspond to majority use)
Processing end-of-life products sold End-of-life
WorldwideEmissions linked to the end of vehicle life.
The Recycling of materials from vehicles enables to avoid the use of virgin material and associated emissions. The emissions
avoided like this are subtracted from the carbon footprint.Direct: technical definitions (materials in the vehicles)
Indirect: Gabi LCA database (emissions by type of processing)
Leased vehicles (downstream) UsageIncluded in the category «Use of products sold» (vehicles under a
leasing contract with or without a purchase option)
Scope 3 GHG Protocol emissions not included in the Renault Carbon Footprint
Plant and equipment; Fuels and energy not included in scopes 1 and 2; Waste generated; Leased vehicles (downstream);
Franchises, Investments; Transformation of products sold (not significant)
OTHER INDIRECT EMISSIONS COUNTED IN THE RENAULT CARBON FOOTPRINT (OUTSIDE OF THE GHG PROTOCOL CATEGORIES)
Fuel
“Well to tank” emissions related to the production of fuels consumed by vehicles sold (extraction of oil, transport, refining;
production of the electricity consumed by electric vehicles) Indirect: JEC report
PART OF RECYCLED MATERIALS IN VEHICLES PRODUCED IN EUROPE
The indicator is calculated on the basis of a representative vehicle of the line-
up produced in Europe.
For 2013 this vehicle is a Renault Mégane with a 1,6 L fuel engine.
The rate is calculated from the break-down of the vehicle in materials and the
average rate of use of recycled materials with the European sector of material
production. When the same material presents variable rates of recycled
materials depending on the mode of production (flat steel versus long steel),
the material breakdown of the vehicle is fine-tuned to take this into account.

Find out more at www.renault.comREGISTRATION DOCUMENT RENAULT 2013170
CSR: SUSTAINABLE MOBILITY2 APPENDICES
2.8.2.2 METHOD USED FOR THE SITE ENVIRONMENTAL INDICATORS IN 2013 TABLE ✦
Reporting for the environmental indicators was conducted in accordance
with the stipulations of the 2013 Environmental Protocol for Renault Sites.
The following is an explanation of the main methodological choices of the
Protocol. This Protocol is available on request from the Energy & Health,
Safety, Environment department of Renault.
SCOPE
The scope of the reported data encompasses the industrial subsidiaries
(body assembly, final assembly, powertrain and foundry) and the support
sites (product and process design, logistics) in which Renault holds a stake
of at least 50%. All impacts are attributed to Renault, with the exception of
La Française de Mécanique (Douvrin site), a joint Renault/PSA subsidiary, in
which Renault holds a 50% stake. Here, 15.9% of impacts were attributed
to Renault in 2013 (compared with 16.4% in 2012), corresponding to the
breakdown of industrial activity at the site. Impacts of suppliers or third parties
present on site are not included, with the exception of the sites listed under
the “Site environmental indicators in 2013” table.
The data for sites included in the scope of reporting in year Y are presented
for information and are consolidated with those of other sites only from year
Y+1. The Tangiers site is consolidated for the first time in 2013.
Data from Gaia is taken into account at sites where Gaia operates, except
the site of Choisy-le-Roy (France), where the waste from Gaia is recorded
separately.
The drinking water production and Davidesti waste storage activity at the
Pitesti site (Dacia) was removed from the reporting scope. The data is shown
for information purposes.
PROCEDURES FOR CONTROLLING AND CONSOLIDATING DATA
Experts from the Production Engineering Department (Energy & Health,
Security, Environment office and the Painting department) check the
consistency of data at each site. These checks include a comparison with
data from previous years and an analysis of the impact of events occurring
on site during the year.
The environmental data as presented in the Registration document is also
verified by the statutory auditors, Ernst & Young Audit and Deloitte & Associés.
Their conclusions are set out in the report at the end of the document.
WATER CONSUMPTION ✦
Water consumption is expressed in thousands of cubic meters (m3).
Measured volumes include water obtained by pumping (underground and
surface water) and/or external networks (drinking water, industrial water).
Collected rainwater (RTR Titu, Giheung, Guyancourt, Maubeuge, Flins) is also
included.
At Busan, the Delivery Dispatch Center and employee housing have been
excluded from energy and water indicators.
LIQUID EFFLUENTS ✦
Data on pollutant flows are based on measurements of effluents after they
have been treated in the plants and before they are discharged to the outside.
Discharges from some plants may subsequently be treated in municipal
treatment plants (see plant codes).
Under the Reporting Protocol, the frequency of discharge analysis must
comply with the regulations applicable to the Renault sites.
The quantity of COD represents the flow of suspended solids discharged,
expressed in tons per year.
The quantity of OM represents the flow of oxidizable matter discharged,
expressed in tons per year.
The quantity of toxic metals is the total flow of toxic metals discharged,
weighted by a toxicity coefficient. This quantity, expressed in tons per year,
is calculated as follows:
Toxic metals = 5 flows (Ni+Cu)+10 flows (Pb+As)+1 flow (Cr+Zn)+50 flows
(Hg+Cd).
The data presented in the table take into account only those flows of metals,
SS and OM that by law must be measured.
Where regulations do not require such measurements, the reported value
is indicated as “not applicable”. There is no legal requirement to measure
the flows at Tangiers, Bursa, Casablanca (Somaca) sites or the Ayrton Senna
complex at Curitiba. However, in view of the significant contribution of these
plants’ emissions to the Group’s impacts, these flows have been measured
and included in the scope of the environmental reporting.
Black water discharges, for which there is no regulatory measurement and/or
reporting obligation, are not included in the water discharges. This exclusion
concerns around 29 % of employees, mainly from the engineering, logistics
and support sites.
The flow calculation methods are not applied to the Douvrin (FM), Moscow
(Avtoframos) and Factoria Santa Isabel sites, since they have special
characteristics.
The significant annual variations of these flows observed at certain
manufacturing sites (Curitiba, Sofasa, Somaca, Factoria Santa Isabel,
Choisy-le-Roi, Lardy and Ruitz) are due to the limited frequency of regulatory
measurement, which results in some uncertainty with regard to the reliability
of consolidated data, in particular for Suspended Solids (SS) and Oxidizable
Matter (OM).
ATMOSPHERIC EMISSIONS ✦
The atmospheric emissions of volatile organic compounds (VOC)
included in the data are the emissions produced when bodywork is painted
(body assembly plants). The painting of accessories is not taken into account;
to date the corresponding VOC emissions have not been measured.
The indicator shown corresponds to the ratio of VOC emissions per m2 of
painted vehicle. The consolidated figure for the Group is equivalent to the total
VOC emissions generated by the body assembly plants divided by the total
surface area painted.

REGISTRATION DOCUMENT RENAULT 2013✦ Global Reporting Initiative (GRI) Directives 171
CSR: SUSTAINABLE MOBILITY 2
2
APPENDICES
Atmospheric discharges of SO2 and NO
x not counted are the emissions
from the combustion of fossil fuels in installations at all sites, excluding on-
site transport.
Emissions generated by engine tests are not taken into account, since the
SO2 emissions are insignificant and NO
x emissions are difficult to calculate
(unreliable assessment method).
Greenhouse gas (GHG) discharges include the direct and indirect GHG
emissions and are expressed in metric tons of carbon dioxide equivalent.
Greenhouse gas (GHG) direct emissions are extracted from an inventory of
GHG sources conducted in 2004 and updated in 2011. Following this inventory,
Renault modified its guidelines to better reflect the total emissions of the
Renault group and to comply with the recommendations of the GHG Protocol
and the French protocol developed by Entreprises pour l’Environnement.
Emissions from the following sources were included:
W combustion of fossil fuels transported to the site and those transformed by
the site for third parties;
W coolant fill-up of the air conditioning systems fitted in vehicles produced
by the plant;
W fuel consumption during testing of engines, gearboxes and trials on the test
track and test benches of non-TCM vehicles;
W forklift trucks using compressed natural gas or propane;
W fuel consumption relating to Renault’s company vehicles (taxi pools,
shuttles, service vehicles, handling equipment, etc.);
W coolant leaks from air conditioning systems and processes on site (in the
European Union only).
These emissions make up more than 95% of the GHG direct emissions
produced by the Renault group.
The following emission sources have been excluded from the reporting scope,
since the corresponding emissions are not significant (less than 1% of total
GHG direct emissions):
W air conditioning on site (outside the European Union);
W solvent incineration;
W tests on TCM vehicles leaving the assembly line (roller bench tests).
It is not yet possible to correctly assess certain emissions, so the following are
not included in the reporting scope:
W emissions linked to onsite transport, excluding forklift trucks using
compressed natural gas, propane or diesel and excluding Renault’s
company vehicles (particularly deliveries from road hauliers external to the
Renault group);
W fugitive emissions occurring when tanks of coolant (for vehicle air
conditioning systems) are filled and emptied.
Greenhouse gas (GHG) indirect discharges are related to purchased
electricity, steam and hot water. The emission factors used for the 2013
reporting are:
W for electricity, International Energy Agency (IEA) data, last updated in
March 2013;
W for steam and hot water; data calculated on the basis of information
transmitted by the suppliers.
Certain emissions from the foundry activity are not reported, but emissions
from fossil fuel combustion in the foundries are taken into account.
The emission factors used to calculate SO2, NO
x and GHG emissions comply
with the French government Order of October 31, 2012, concerning the
inspection and measurement of emissions reported in the EU Emissions
Trading Scheme as well as in the CITEPA network’s OMINEA national inventory
report, updated in February 2013.
The emission factor from fixed combustion installations of low NOx Natural
Gas was calculated in 2011, based on an internal study of 88% of sites in
the scope having low NOx burners. The factor thus obtained (0.0266kg/MWh
NCV) is the average of the factors obtained at each site weighted by the power
of the installations.
WASTE ✦
The waste reported is the waste that leaves the site’s geographical scope; the
quantities are expressed in tons.
The waste reported includes hazardous waste (HW), non-hazardous waste
(OIW), and construction site waste.
For the sake of clarity, non-hazardous waste is presented in two sub-
categories:
W metallic waste from production processes (scrap metals, machining chips,
etc.);
W non-metallic waste (mixed ordinary waste, for example).
Construction waste from Renault sites is not reported unless a contractual
clause explicitly states that the construction company is not responsible for it.
ENERGY CONSUMPTION ✦
This metric represents the quantity of gas, heating oil, steam, hot water, and
electricity consumed at Renault sites, expressed in MWh LHV. However, the
data indicated does not include the propane used by forklift trucks or the fuel
consumed by the site (engine and gearbox testing, Company vehicles).
The primary or converted energy supplied to third parties is not included.
The purpose of the energy consumption indicators is to reflect the energy
performance of Renault’s manufacturing processes.
The lower heating values (LHV) are in line with the CITEPA network’s OMINEA
national inventory report (updated in February 2013) and the French
government Order of October 31, 2012, concerning verification, except for
the LHV of natural gas burnt in Spanish plants (Spanish national inventory of
greenhouse gases 1990-2009). The LHVs are consistent with the emissions
reported in the EU Emissions Trading Scheme.

Find out more at www.renault.comREGISTRATION DOCUMENT RENAULT 2013172
CSR: SUSTAINABLE MOBILITY2 APPENDICES
2.8.2.3 SITE ENVIRONMENTAL INDICATORS IN 2013 TABLE ✦
LIQUID DISCHARGES AIR EMISSIONS
WASTE, EXCLUDING WASTES FROM
CONSTRUCTION SITES (18) ENERGY
2013 ENVIRONMENTAL
INDICATORS (1)
WATER
CONSUMPTION
in thousands of m3
TREATMENT
PLANT
SS
in ton/
year
COD
in ton/
year
TOXIC
METALS
in ton/
year
GHG
in t CO² eq
VOC
in g/
m²
SO2
in
tons
NOX
in
tons
TOTAL NHW
in
tons
O/W NON
METALIC
WASTE
in tons
O/W METALLC
WASTE
in tons
TOTAL HW
in tons
ENERGY
CONSUMPTION
in MWH NCV
MANUFACTURING SITES
BODYWORK-ASSEMBLY PLANTS
Batilly (SOVAB) (2) 226.6 PB 1.4 9.4 0.2 39,666.8 47.4 0.3 33.15 2,426.7 1,896.7 530.0 1,633.9 230,207.4
Casablanca (Somaca) (17) 150.4 - 67.4 116.6 2.3 30,737.2 92.2 0.3 5.39 10,968.4 10,165.4 803.0 679.2 64,471.1
Cordoba Santa Isabel (14) 284.8 PU 5.0 13.9 0.2 43,853.2 86.0 0.2 21.31 22,297.7 9,976.9 12,320.8 1,077.6 143,657.3
Dieppe 7.0 U n/a n/a n/a 4,563.7 59.2 0.0 2.83 634.2 631.5 2.7 233.9 24,281.2
Douai (8) 349.2 PB 5.0 16.4 0.5 50,884.4 24.1 0.3 39.60 47,751.3 2,440.3 45,311.0 1,538.2 254,715.2
Flins (10) 996.1 PB 9.6 19.4 0.3 50,051.2 39.2 0.3 26.19 57,362.0 4,633.0 52,729.0 1,879.3 350,667.8
Maubeuge 257.1 PB 1.3 5.8 0.2 34,580.0 35.7 0.3 29.78 32,627.0 1,892.0 30,735.0 1,537.9 202,376.2
Envigado (Sofasa) 184.1 PU 4.6 65.4 0.3 10,053.9 66.1 0.0 4.82 11,430.9 11,023.0 407.9 361.3 39,985.4
Moscou (Avtoframos) 582.6 PU 49.1 138.5 0.5 74,939.8 71.5 0.2 30.26 23,569.2 22,884.8 684.4 2,368.1 280,944.0
Novo Mesto 160.6 PU 0.7 29.8 0.0 32,282.9 47.2 0.1 15.57 21,513.7 1,552.3 19,961.4 530.1 113,284.1
Palencia (11) 316.2 PB 1.3 11.0 0.2 34,597.5 25.9 0.2 24.76 24,616.4 1,657.9 22,958.5 1,138.5 153,371.6
Sandouville (13) 176.9 PB 0.8 7.3 0.1 23,048.2 41.9 0.2 18.47 5,833.0 1,187.0 4,646.0 1,067.0 170,415.3
Valladolid Carrosserie 86.8 PU 0.4 5.0 0.1 18,170.6 n/a 0.1 11.00 55,501.5 768.5 54,733.0 385.0 80,852.9
Valladolid Montage 302.441 PU 3.8 19.9 0.7 38,987.9 25.4 0.3 29.86 4,796.0 3,260.3 1,535.7 1,678.0 176,219.9
Tanger 337.622 PU n/a n/a n/a 3,636.4 36.7 0.1 2.01 32,460.8 5,934.8 26,526.0 2,144.2 165,256.5
POWERTAIN PLANTS
ACI Villeurbanne 8.0 U n/a n/a n/a 3,218.2 n/a 0.0 2.47 2,520.5 141.5 2,379.0 70.7 22,411.7
Cacia (5) 97.9 PB 3.3 17.1 0.0 14,440.9 n/a 0.0 0.54 6,016.0 616.0 5,400.0 1,032.2 55,595.6
Choisy-le-Roi (6) 15.0 PU 1.2 5.5 0.0 1,958.1 n/a 0.0 1.84 2,310.8 332.8 1,978.0 157.0 11,128.5
Cléon (7) 1,057.3 PU 5.8 188.4 0.1 44,071.2 n/a 0.2 23.97 23,726.3 2,747.3 20,979.0 5,394.8 350,405.2
Douvrin (FM) (9) 73.1 PU 1.2 33.8 0.0 4,444.8 n/a 0.0 2.15 2,626.7 241.7 2,385.0 258.1 38,719.3
Le Mans 1,968.0 P 33.6 42.7 0.1 31,018.8 n/a 0.2 12.18 33,151.9 18,117.9 15,034.0 1,165.3 232,063.2
Los Andes 21.9 U n/a n/a n/a 8,127.9 n/a 0.1 1.14 3,065.0 627.0 2,438.0 1,716.0 22,840.9
Ruitz (STA) 28.1 U 0.8 2.8 0.0 5,978.1 n/a 0.0 3.86 2,488.7 242.4 2,246.3 449.2 47,264.1
Séville 109.2 PU 1.3 36.3 0.0 25,588.7 n/a 0.0 5.50 7,610.5 603.5 7,007.0 3,318.1 96,082.0
Valladolid Motores (15) 149.9 PU n/a n/a n/a 43,924.9 n/a 0.1 10.76 23,513.0 2,206.0 21,307.0 3,284.0 183,766.4
MIXED PLANTS
Bursa (3) 484.6 PBU 34.1 30.2 1.0 96,247.7 35.3 0.3 30.71 68,432.8 9,360.8 59,072.0 2,327.9 283,258.5
Busan (RSM) (4) 472.5 PBU 0.5 5.4 0.3 75,593.0 29.4 0.2 20.22 21,578.6 3,873.6 17,705.0 1,606.2 218,757.7
Curitiba Complexe Ayrton Senna 592.708 PU 69.1 364.1 0.9 49,161.1 46.0 0.2 32.59 66,083.3 22,580.9 43,502.4 4,347.9 275,983.4
Dacia Automobile (12) 1,154.223 PU 109.0 402.0 0.3 183,874.5 39.6 3.2 53.43 192,477.4 20,061.4 172,416.0 7,344.8 553,582.1
FOUNDRIES
Cordoba Fonderie Aluminium 15.1 U n/a n/a n/a 5,787.7 n/a 0.0 4.05 242.5 221.6 20.9 4,387.3 22,809.7
Fonderie de Bretagne 105.5 PU 0.2 1.3 0.0 10,846.7 n/a 0.0 4.34 16,108.7 11,538.5 4,570.2 967.3 101,964.4
Tandil 46.303 U n/a n/a n/a 9,739.1 n/a 0.0 1.68 4,640.5 4,640.5 0.0 92.2 29,136.3
TOTAL 10, 818 410.6 1,587.9 8.3 1,104,075.4 43.7 7.6 506.4 830,381.8 178,057.6 652,324.2 56,171.2 4,996,474.8

REGISTRATION DOCUMENT RENAULT 2013✦ Global Reporting Initiative (GRI) Directives 173
CSR: SUSTAINABLE MOBILITY 2
2
APPENDICES
LIQUID DISCHARGES AIR EMISSIONS
WASTE, EXCLUDING WASTES FROM
CONSTRUCTION SITES (18) ENERGY
2013 ENVIRONMENTAL
INDICATORS (1)
WATER
CONSUMPTION
in thousands of m3
TREATMENT
PLANT
SS
in ton/
year
COD
in ton/
year
TOXIC
METALS
in ton/
year
GHG
in t CO² eq
VOC
in g/
m²
SO2
in
tons
NOX
in
tons
TOTAL NHW
in
tons
O/W NON
METALIC
WASTE
in tons
O/W METALLC
WASTE
in tons
TOTAL HW
in tons
ENERGY
CONSUMPTION
in MWH NCV
ENGINEERING, LOGISTICS AND SUPPORT SITES
Aubevoye 29.881 U n/a n/a n/a 16,621.9 n/a 0.0 1.22 1,360.7 246.7 1,114.0 75.3 25,991.5
Boulogne (head office and other entities) 52.592 U n/a n/a n/a 6,489.3 n/a 0.0 2.09 548.4 541.4 7.0 54.2 33,644.9
Cergy-Pontoise 13.001 U n/a n/a n/a 4,831.4 n/a 0.0 0.76 2,007.4 1,832.4 175.0 160.5 22,482.4
DACIA logistics centre CKD 6.051 U n/a n/a n/a 3,733.0 n/a 0.0 0.43 2,326.0 2,218.0 108.0 0.1 8,364.9
Giheung (RSM) 57.859 B n/a n/a n/a 14,293.8 n/a 0.0 0.87 390.0 296.0 94.0 426.4 29,652.6
Grand-Couronne 5.634 U n/a n/a n/a 3,055.8 n/a 7.6 5.20 1,097.5 952.5 145.0 39.2 11,021.2
Guyancourt 166.41 U n/a n/a n/a 26,989.3 n/a 0.1 7.17 1,939.0 1,690.8 248.2 222.1 148,454.8
Heudebouville (Renault Tech) 0.79 U n/a n/a n/a 356.1 n/a 0.0 0.26 127.2 113.7 13.5 3.3 1,795.5
Lardy 124.424 U 7.1 20.5 0.0 19,711.1 n/a 0.1 4.21 433.7 353.7 80.0 466.9 106,323.4
Rueil-Malmaison 13.969 U n/a n/a n/a 3,751.0 n/a 0.0 0.79 366.0 256.7 109.3 41.2 16,923.0
Saint-André-de-l'Eure 6.326 U 0.7 2.5 0.0 1,298.4 n/a 0.0 0.49 1,214.2 1,203.2 11.0 0.7 7,043.3
Titu 36.28 U n/a n/a n/a 8,764.1 n/a 0.0 0.71 302.3 166.3 136.0 25.6 21,695.4
Valladolid Central Services 42.525 U 0.3 0.4 0.0 5,885.2 n/a 0.1 2.59 547.1 422.9 124.2 68.1 19,942.5
Villeroy (DLPA) 7.964 U n/a n/a n/a 1,867.1 n/a 0.0 0.53 2,039.9 1,917.9 122.0 6.4 13,528.7
Villiers-Saint-Frédéric 9.683 U n/a n/a n/a 3,242.5 n/a 0.0 0.56 194.0 180.4 13.6 13.5 16,056.6
TOTAL 573.39 8.10 23.41 0.03 120,890.00 n/a 8.18 27.87 14,893.40 12,392.60 2,500.80 1,603.41 482,920.81
GROUP TOTAL 2013 11,391.2 418.7 1,611.3 8.3 1,224,965.4 43.7 15.8 534.3 845,275.2 190,450.2 654,825.0 57,774.6 5,479,395.6
GROUP TOTAL 2012(16) (18) 11,538.6 386.6 1,897.6 8.9 1,193,243.6 43.1 11.6 513.2 857,472.2 230,995.0 608,049.4 57,840.8 5,177,690.0
THE SITES NOT INCLUDED IN THE REPORTING SCOPE FOR INFORMATION PURPOSES:
Dacia Drinking water production site 208.7 U 4.50 0.58 0.01 615.09 n/a 0.00 0.02 n/a n/a n/a n/a 1,612.00
Dacia Davidesti waste storage facility 0.3 PB 0.08 0.28 0.00 17.33 n/a 0.00 0.00 n/a n/a n/a n/a 41.96
n/a: not applicable (see comments on methodology)
nm: not measured.
Plant codes (waste water treatment methods): P: Physical-chemical; B: Biological; U: Urban;
SS: Suspended Solids;
COD: Chemical Oxygen Demand;
Toxic Metals: total flow of metals to which a coefficient of toxicity is applied (arsenic 10, cadmium 50, copper 5, mercury 50, nickel 5, lead 10, zinc 1, chrome 1);
GHG: Greenhouse gases (direct and indirect);
VOC: volatile organic compounds;
NHW: non-hazardous waste;
HW: hazardous waste.
(1) All the impacts arising from employee catering facilities are included in the data for the Renault sites.
(2) Liquid discharges from the Batilly (SOVAB) plant include those of the Industrial Supplier Park and the Compagnie d’Affrètement et de Transport (CAT) as well as the waste of the Industrial Supplier Park.
(3) Water consumption at the Bursa site includes that of the Industrial Supplier Park.
(4) The Welfare Center of the Busan site is excluded from the impacts.
(5) All the impacts of the Industrial Supplier Park are included in Cacia plant data.
(6) For Choisy-le-Roi, the waste from Gaïa is excluded
(7) The Cléon site includes that of the Fonderie de Normandie (FDN)
(8) The liquid discharges from the Douai site include those of the Industrial Supplier Park and all the impacts of the Delivery Dispatch Center.
(9) The Douvrin (Française de Mécanique) site is a joint Renault/PSA subsidiary. The proportion of impacts attributed to Renault is calculated through a breakdown of the site’s industrial activity between Renault and PSA. Renault’ share was 15.9% in 2013.
(10) Water consumption at the Flins site includes that of the Spare Parts Distribution Center as well as the environmental impacts of Gaïa.
(11) Water consumption at the Palencia site includes that of the Industrial Supplier Park.
(12) Liquid discharges at the Pitesti site (Dacia) include those of the Industrial Supplier Park.
(13) Water consumption and liquid discharges at the Sandouville site includes those of the Industrial Supplier Park.
(14) Liquid discharges from the Santa Isabel Cordoba plant include those of the Compagnie d’Affrètement et de Transport (CAT), the Delivery Dispatch Center and the Parts and Accessories Department and the ILN (Logistics center).
(15) Liquid discharges from the Valladolid engine plant are aggregated with those from the Valladolid Montage.
(16) The total impacts for the previous year are mentioned for information on the certified scope of the year. The 2013 Group indicators take into account the Tangiers plant, reported in 2012 for probationary purposes only.
(17) Liquid discharges from the Casablanca (Somaca) plant include those of an industrial complex, not operated by Renault, close to the site.
(18) From FY 2013 on, the waste indicators do not take into account wastes from construction sites, which are not directly related to the activity of the Group. Because of this methodology change, the 2013 indicators cannot be diretly compared with previous year’s indicators. For an isoperimetric comparison, please refer to chapter 2.4.2.3.

Find out more at www.renault.comREGISTRATION DOCUMENT RENAULT 2013174
CSR: SUSTAINABLE MOBILITY2 APPENDICES
2.8.2.4 ENVIRONMENTAL INDICATORS FOR PRODUCTS ✦
ENVIRONMENTAL CARACTERISTICS FOR THE BEST-SELLING VEHICLES IN EUROPE (27 COUNTRIES) IN 2013
BEST SELLING VERSION LOWEST CO2 EMITTING VERSION
MODEL
G: GASOLINE
D : DIESEL
E85:
ETHANOL
E: ELECTRIC
EMISSION
STANDARDS
EXTERNAL
NOISE
DB (A) ENGINE
FUEL
COMSUMPTION
NEDC, L/100 KM EMISSION S SIGNATURE
EMISSION
STANDARDS ENGINE
FUEL
COMSUMPTION
NEDC, L/100 KM EMISSIONS SIGNATURE
RENAULT BRAND
Twingo 2 G Euro 5 71.4 1.2 16v 4.5 105 Eco² Euro 5 1.2 16v 4.5 102 Eco²
D Euro 5 71.8 dCi 85 3.3 85 Eco² Euro 5 dCi 85 3.3 85 Eco²
ZOÉ E 70.0 5AM 0.0 0.0 - 5AM 0.0 0.0 -
Wind G Euro 5 72.1 1.2 16v 6.0 139 - Euro 5 1.2 16v 6.0 139 -
Clio Campus G Euro 5 70.0 1.2 16v 5.7 133 - Euro 5 1.2 16v 5.7 133 -
Clio 3 G Euro 5 72.5 1.2 16v 5.8 135 - Euro 5 1.2 16v 5.1 119 Eco²
D Euro 5 71.4 dCi 75 3.8 99 Eco² Euro 5 dCi 90 3.4 89 Eco²
E85 Euro 5 73.2 1.2 16v 8.3 133 - Euro 5 1.2 16v 8.3 133 -
GPL Euro 5 73.2 1.2 16v 7.6 121 - Euro 5 1.2 16v 7.6 121 -
Clio 4 G Euro 5 72.3 1.2 16v 75 5.5 127 - Euro 5 Energy TCE 90 4.2 95 Eco²
D Euro 5 73.5 Energy dCi 90 3.4 90 Eco² Euro 5 Energy dCi 90 83g 3.2 83 Eco²
GPL Euro 5 72.0 1.2 16v 75 GPL 7.2 116 Eco² Euro 5 1.2 16v 75 GPL 7.2 116 Eco²
Captur G Euro 5 71.8 Energy TCE 90 4.9 113 Eco² Euro 5 Energy TCE 90 4.9 113 Eco²
D Euro 5 71.0 Energy dCi 90 3.6 95 Eco² Euro 5 Energy dCi 90 3.6 95 Eco²
Megane 3 G Euro 5 70.8 Energy TCE 115 5.3 119 Eco² Euro 5 Energy TCE 115 5.3 119 Eco²
D Euro 5 72.8 Energy dCi 110 3.5 90 Eco² Euro 5 Energy dCi 110 3.4 88 Eco²
Fluence G Euro 5 74.0 1.6 16v 110 6.8 155 - Euro 5 2.0 140 6.4 149 -
D Euro 5 69.5 dCi 110 EDC 4.40 114 Eco² Euro 5 dCi 110 4.4 114 Eco²
E Euro 5 69.0 5AM 0.0 0.0 - Euro 5 5AM 0.0 0.0 -
Scénic G Euro 5 70.8 Energy TCE 115 5.9 135 - Euro 5 Energy TCE 115 5.9 135 -
D Euro 5 71.0 Energy dCi 110 4.1 105 Eco² Euro 5 Energy dCi 110 4.1 105 Eco²
GPL Euro 5 73.5 1.6 16v 10.1 162 - Euro 5 1.6 16v 10.1 162 -
Laguna 3 G Euro 5 71.0 2.0 16v 7.5 173 - Euro 5 2.0 16v 7.5 173 -
D Euro 5 72.3 dCi 110 4.2 109 Eco² Euro 5 dCi 110 4.2 109 Eco²
E85 Euro 5 71.0 2.0 16v 10.7 171 - Euro 5 2.0 16v 10.7 171 -
Latitude D Euro 5 72.0 Energy dCi 150 5.0 129 - Euro 5 Energy dCi 150 4.7 125 -
E85 Euro 5 74.0 2.0 140 10.7 172 - Euro 5 2.0 140 10.7 172 -
Koleos G Euro 5 74.0 2.5 16v 9.5 220 - Euro 5 2.5 16v 9.3 214 -
D Euro 5 73.0 dCi 150 5.7 147 - Euro 5 dCi 150 5.7 147 -
Espace 4 G Euro 5 70.7 2.0 16v Turbo 8.5 198 - Euro 5 2.0 16v Turbo 8.5 198 -
D Euro 5 71.7 dCi 150 5.0 150 - Euro 5 dCi 150 5.0 150 -
Kangoo 2 G Euro 5 73.3 1.6 16v 7.7 180 - Euro 5 Energy TCE 115 6.1 140 -
D Euro 5 72.2 dCi 90 4.6 119 Eco² Euro 5 Energy dCi 90 4.3 112 Eco²
E85 Euro 5 73.3 1.6 16v 10.6 170 - Euro 5 1.6 16v 10.6 170 -
Trafic D Euro 5 72.8 dCi 115 7.3 190 - Euro 5 dCi 115 BVR 6.5 171 -
Master D Euro 5 72.9 2.3 dCi 7.2 190 - Euro 5 2.3 dCi 6.7 176 -

REGISTRATION DOCUMENT RENAULT 2013✦ Global Reporting Initiative (GRI) Directives 175
CSR: SUSTAINABLE MOBILITY 2
2
APPENDICES
BEST SELLING VERSION LOWEST CO2 EMITTING VERSION
MODEL
G: GASOLINE
D : DIESEL
E85:
ETHANOL
E: ELECTRIC
EMISSION
STANDARDS
EXTERNAL
NOISE
DB (A) ENGINE
FUEL
COMSUMPTION
NEDC, L/100 KM EMISSION S SIGNATURE
EMISSION
STANDARDS ENGINE
FUEL
COMSUMPTION
NEDC, L/100 KM EMISSIONS SIGNATURE
DACIA BRAND
Sandero 2 G Euro 5 72.1 1.2 16V 75 5.8 135 - Euro 5 TCE 90 5.0 116 Eco²
D Euro 5 72 dCi 90 4.0 105 Eco² Euro 5 dCi 75 3.8 99 Eco²
GPL Euro 5 72.1 1.2 16V 75 GPL 7.5 120 Eco² Euro 5 1.2 16V 75 GPL 7.5 120 Eco²
Logan 2 G Euro 5 72.1 1.2 16V 75 5.8 135 - Euro 5 TCE 90 5.0 116 Eco²
D Euro 5 71.5 dCi 90 3.8 99 Eco² Euro 5 dCi 90 3.8 99 Eco²
GPL Euro 5 72.1 1.2 16V 75 GPL 7.5 120 Eco² Euro 5 1.2 16V 75 GPL 7.5 120 Eco²
Logan 2 MPV G Euro 5 71.8 TCE 90 5.0 116 Eco² Euro 5 TCE 90 5.0 116 Eco²
D Euro 5 71.5 dCi 90 3.8 99 Eco² Euro 5 dCi 90 3.8 99 Eco²
Duster G Euro 5 73.2 1.6 16V 7.1 165 Euro 5 TCE 125 6.3 145 -
D Euro 5 72 dCi 110 5.0 130 - Euro 5 dCi 90 4.7 123 -
GPL Euro 5 73.2 1.6 16V 105 GPL 9.0 145 - Euro 5 1.6 16V 105 GPL 9.0 145 -
Lodgy G Euro 5 72.3 TCE 115 6.0 135 - Euro 5 TCE 115 5.7 131 -
D Euro 5 72.0 dCi 90 4.2 109 Eco² Euro 5 dCi 90 4.2 109 Eco²
Dokker G Euro 5 72.3 TCE 115 5.8 135 - Euro 5 TCE 115 5.8 135 -
D Euro 5 72.6 dCi 75 4.5 118 Eco² Euro 5 dCi 75 4.5 118 Eco²
Find out more at www.renault.comREGISTRATION DOCUMENT RENAULT 2013176
CSR: SUSTAINABLE MOBILITY2 APPENDICES
2.8.3 APPENDICES CONCERNING SOCIAL COMMITTMENT
2.8.3.1 METHODOLOGY USED FOR KEY SOCIAL REPORTING FIGURES
A. IDENTIFYING INITIATIVES
The information included in the comprehensive reporting of social initiatives
is collected from a network of correspondents covering all countries in which
Renault operates. This information:
W covers all four themes of the CSR policy: education, diversity, sustainable
mobility, road safety and “other” (humanitarian aid, culture, sports, health,
etc.);
W the purpose of each initiative determines the category to which it is
assigned. For example, donating a vehicle to help keep children from
dropping out of school would be classified under “education.”
W is segmented into three categories corresponding to the recommendations
of the LBG (London Benchmarking Group): charitable gifts, community
investment, commercial initiatives;
W Charitable gifts are a mostly intermittent response to the needs and
appeals of charitable and community organizations. They do not fit into
the community investment strategy (see below) because of the area they
target or their geographic scope,
W Community investment describes the involvement in local partnerships
to address a limited range of social issues chosen by the company to
protect its long-term interests and enhance its reputation,
W the contribution should address at least one of the four key focuses
(diversity, education, road safety, sustainable mobility) in a strategic
region (Group presence). There should be no direct commercial interest;
or
W the contribution addresses another issue viewed as strategic at the local
level, with no direct commercial interest.
W Commercial initiatives, in partnership with charities and/or community-
based organizations, aim to meet local needs or expectations, while
supporting the success of the company by promoting the brand and its
strategy.
W includes information resulting from the website which centralizes support
requests submitted by charities (see chapter 2.5.1).
B. ASSESSING THE INVESTMENT IN THE INITIATIVES
The following are included in the calculations:
W annual allocations to the Group’s Foundations for their CSR activities,
broken down by specific initiative;
W the budget for the corporate CSR department allocated to the programmes
relating to the four themes;
W the percentage of payroll costs associated with implementation of the
Foundation’s and Corporate department’s CSR programmes.
The investment associated with each initiative is calculated as follows:
W for items donated from inventory – their inventory value;
W for equipment that has been decommissioned or is to be scrapped – its
residual value (which in most cases will be zero);
W for a new vehicle donated from inventory – its cost;
W for the loan of a vehicle – application of an average monthly cost, all
vehicles combined (calculation below), times the number of months it is
made available;
W for time spent by group employees to organize and implement the identified
activities:
W t he amounts are reported in the country in which the expense is incurred.
W t he amounts reported do not incorporate any patronage-related tax
credits.
Calculation of the monthly rate for a vehicle loan:
The average length of time a vehicle is garaged by corporate management, the
entity tasked with managing the Company’s vehicles, including those supplied
to our commercial and non-profit partners, is estimated at 24 months.
Based on a B segment vehicle, a Renault Clio or equivalent, the Sales and
Marketing department France estimates the final cost to the Company at
€7,220 for this time period, or a monthly cost of €301.
The average cost of a vehicle’s Registration document is €500. Spread over
24 months, its monthly cost is €21.
The average company car tax paid by Renault is €870 per year per vehicle,
or €73 per month.
The average cost of supplying a vehicle is therefore €395 per month.
Calculation of daily rate for employees:
W number of days worked in the year = (average annual hours worked/length
of work week)* 5, or 230 days;
W average annual cost = Payroll costs (see chapter 2.3.1.2)/Total workforce
(see chapter 2.3.1.1);
W average daily rate applied = Average annual cost/no. of days worked, or
€197/day.
* Source: http://stats.oecd.org

REGISTRATION DOCUMENT RENAULT 2013✦ Global Reporting Initiative (GRI) Directives 177
CSR: SUSTAINABLE MOBILITY 2
2
APPENDICES
2.8.3.2 SUMMARY TABLES OF KEY SOCIAL REPORTING FIGURESIn the following tables, the “Other” theme covers social initiatives in the following fields: humanitarian aid, culture, health, sports and miscellaneous.
Number of initiatives by theme and by geographic region
THEME NO. OF ACTIONS
REGION
EUROPE AMERICAS ASIA-PACIFIC EURASIA EUROMED-AFRICA
TOTAL 329 177 74 33 10 35
Diversity 66 43 12 3 3 5
Education 58 28 14 3 0 13
Safety 77 43 14 9 3 8
Sustainable mobility 35 22 7 4 1 1
Other 93 41 27 14 3 8
Breakdown of social investments by theme and by geographic region
THEME
REGION
EUROPE AMERICAS ASIA-PACIFIC EURASIA EUROMED-AFRICA TOTAL
TOTAL (in€) 8,244,388 2,645,707 466,844 175,100 969,062 12,501,101
Diversity 529,119 728,679 3,484 18,059 58,765 1,338,106
Education 3,488,119 693,670 21,445 0 389,341 4,592,575
Safety 2,412,365 263,001 158,624 10,311 419,652 3,263,953
Sustainable mobility 1,157,741 80,833 194,642 2,500 3,930 1,439,645
Other 657,045 879,525 88,649 144,230 97,374 1,866,823
Breakdown of social investments by theme and by objective
THEME CHARITY COMMUNITY COMMERCIAL TOTAL
TOTAL (in €) 668,992 10,856,471 975,638 12,501,101
Diversity 81,538 1,233,375 23,194 1,338,106
Education 2,000 4,312,458 278,117 4,592,575
Safety 0 3,187,042 76,911 3,263,953
Sustainable mobility 48,854 1,299,695 91,096 1,439,645
Other 536,600 823,902 506,321 1,866,823
Breakdown of social investments by theme and by type of donation
THEME MONETARY IN KIND PERSONNEL TOTAL
TOTAL (in €) 8,858,706 2,285,962 1,356,434 12,501,101
Diversity 865,417 336,720 135,969 1,338,106
Education 3,530,429 562,899 499,247 4,592,575
Safety 1,951,182 1,006,829 305,941 3,263,953
Sustainable mobility 1,076,373 125,197 238,075 1,439,645
Other 1,435,304 254,317 177,202 1,866,823

Find out more at www.renault.comREGISTRATION DOCUMENT RENAULT 2013178
CSR: SUSTAINABLE MOBILITY2 APPENDICES
2.8.3.3 DETAIL OF THE 14 PROGRAMMES BENEFITING FROM PATRONAGE IN 2013 THROUGH THE RENAULT.COM WEBSITE
THEME PROJECT OBJECTIVE SUPPORT GIVEN €
Diversity
CAP SAAA – Coupe de France de rugby Fauteuil
Organizes the France wheelchair rugby cup, in line with the policy of encouraging the disabled to take up a sport. 10,000
EREA Jacques Brel GarchesAn in-hospital school in Garches for disabled children and those undergoing long-term hospitalization.
Supported by a Company employee and accepting children of employees. 25,000
YUMP Association whose aim is to help young people from disadvantaged neighborhoods start a business. 15,000
Femmes pour le dire - Femmes pour Agir
Association whose aim is to promote the role of disabled women in society and build their confidence when looking for a job. 8,000
Free Handi’se Trophy
Association that would like to change how companies look at disability to encourage the recruitment, retention and development of the disabled. An organized race with teams made up of four employees,
two able-bodied and two disabled, with the goal of covering 800km in eight days, by canoe and using a specially designed long-distance trek bicycle. 15,000
ATHAREP
Enable 20% of disabled graduates to find work. The association helps graduates, whether they have high school diplomas or Ph.D.s, write résumés, draft cover letters and decide on a career path. It also works
with them on their interviewing techniques. 27,000
NormhandimerAssociation whose aim is to help all people with disabilities enjoy water-based activities and to promote
sailing. It has a sailboat designed specifically for the disabled. 2,000
Cheval Bonheur The aim of the association is to encourage, organize and promote horseback riding by the disabled. 3,000
Mobility
Le ChêneletAssistance for people on “back-to-work” contracts from the tough neighborhoods of St-Omer so they can
work at the site, which is in a rural area. 20,000
Les chemins verts de l’emploiAn employment assistance association that puts people in difficulty to work restoring hiking trails through
individual social support. Also active in mobility assistance and environmental protection. 5,000
Médecins du Monde
Association that organizes visits to vulnerable individuals in Toulouse. Requires a vehicle to make these visits to establish contact, forge a relationship that might lead them to seek help and, more specifically,
restore health or body image. 7,000
Debout BEEBLOO
Association whose primary aim is to fight instability and help people find a way out. The goal is form social connections to give them control over their own lives and find solutions. The programme consists
of addressing their issues and providing solutions in a magazine created by experienced, committed, volunteer journalists. 20,000
Safety
Ecopole - MobilusThe Mobilus project involves raising children’s awareness of the environment and sustainable development
through the eco-mobility theme in elementary schools. 10,000
GNK – Apprends avec DoubyA programme to raise children’s and parents’ awareness of road safety in Lebanon to supplement our
Safety and Mobility for All programme. 15,000

REGISTRATION DOCUMENT RENAULT 2013✦ Global Reporting Initiative (GRI) Directives 179
CSR: SUSTAINABLE MOBILITY 2
2
APPENDICES
2.8.4 INDEPENDENT VERIFIER’S REPORT ON CONSOLIDATED SOCIAL, ENVIRONMENTAL AND SOCIETAL INFORMATION PRESENTED IN THE MANAGEMENT REPORT ✦
This is a free translation into English of the original report issued in the French language and it is provided solely for the convenience of English speaking users.
This report should be read in conjunction with, and construed in accordance with, French law and professional standards applicable in France.
To the shareholders,
In our quality as an independent verifier of which the admissibility of
the application for accreditation has been accepted by the COFRAC,
under the number n° 3-1048 and 3-1067, we present our report on the
consolidated social, environmental and societal information established for
the year ended on the 31/12/2013 , presented in the management report,
hereafter referred to as the “CSR Information,” pursuant to the provisions of
the article L.225-102-1 of the French Commercial Code (Code de commerce).
Responsibility of the company
It is the responsibility of the Board of Directors to establish a management
report including CSR Information referred to in the article R. 225-105-1 of
the French Commercial Code (Code de commerce), in accordance with the
protocols used by the company (hereafter referred to as the “Criteria”), and
of which a summary is included in chapter “2.8.2 Environmental appendices”
and in the methodological notes from chapter “2.3 Labor relations ” of the
management report and available on request at Plan Environnement, Human
Resources and Corporate Social Responsibility Directions of the company.
Independence and quality control
Our independence is defined by regulatory requirements, the Code of Ethics of
our profession as well as the provisions in the article L. 822-11 of the French
Commercial Code (Code de commerce). In addition, we have implemented
a quality control system, including documented policies and procedures
to ensure compliance with ethical standards, professional standards and
applicable laws and regulations.
Responsibility of the independent verifier
It is our role, based on our work:
W to attest whether the required CSR Information is present in the management
report or, in the case of its omission, that an appropriate explanation has
been provided, in accordance with the third paragraph of R. 225-105 of the
French Commercial Code (Code de commerce) (Attestation of presence of
CSR Information);
W to express a limited assurance conclusion, that the CSR Information,
overall, is fairly presented, in all material aspects, in according with the
Criteria;
W to express, at the request of the company, a reasonable assurance
conclusion that the information selected by the company and presented at
line “Group total 2013” of the “2013 site environmental indicators” table
in chapter 2.8.2.3 of the management report, has been established, in all
material aspects, in accordance with the Criteria.
Our verification work was undertaken by a team of sixteen people between
September 2013 and February 2014 for an estimated duration of twelve
weeks. To conduct the aforementioned procedures, we call on members of
our teams specialized in Corporate Social Responsibility.
We conducted the work described below in accordance with the professional
standards applicable in France and the Order of 13 May 2013 determining
the conditions under which an independent third-party verifier conducts
its mission, and in relation to the opinion of fairness and the reasonable
assurance report, in accordance with the international standard ISAE 30001.
1. Attestation of presence of CSR Information
We obtained an understanding of the company’s CSR issues, based on interviews
with the management of relevant departments, a presentation of the company’s
strategy on sustainable development based on the social and environmental
consequences linked to the activities of the company and its societal
commitments, as well as, where appropriate, resulting actions or programmes.
We have compared the information presented in the management report with
the list as provided for in the Article R. 225-105-1 of the French Commercial
Code (Code de commerce).
In the absence of certain consolidated information, we have verified that
the explanations were provided in accordance with the provisions in Article
R. 225-105-1, paragraph 3, of the French Commercial Code (Code de
commerce).
We verified that the information covers the consolidated perimeter, namely
the entity and its subsidiaries, as aligned with the meaning of the Article
L.233-1 and the entities which it controls, as aligned with the meaning of the
Article L.233-3 of the French Commercial Code (Code de commerce) with the
limitations specified in the Methodological Note in chapter “2.3 Labor relations ”
and in chapter “2.8.2 Environmental appendices” of the management report.
Based on this work, and given the limitations mentioned above we confirm the
presence in the management report of the required CSR information.
2. Limited assurance on CSR Information
Nature and scope of the work
We undertook approximately thirty interviews with forty people responsible for
the preparation of the CSR Information in the different departments, in charge
of the data collection process and, if applicable, the people responsible for
internal control processes and risk management, in order to:
W a ssess the suitability of the Criteria for reporting, in relation to their
relevance, completeness, reliability, neutrality, and understandability, taking
into consideration, if relevant, industry standards;
W v erify the implementation of the process for the collection, compilation,
processing and control for completeness and consistency of the CSR
Information and identify the procedures for internal control and risk
management related to the preparation of the CSR Information.
We determined the nature and extent of our tests and inspections based
on the nature and importance of the CSR Information, in relation to the
characteristics of the Company, its social and environmental issues, its
strategy in relation to sustainable development and industry best practices.
(1) ISAE 3000 – Assurance engagements other than audits or reviews of historical information

Find out more at www.renault.comREGISTRATION DOCUMENT RENAULT 2013180
CSR: SUSTAINABLE MOBILITY2 APPENDICES
For the CSR Information which we considered the most important (2):
W a t the level of the consolidated, we consulted documentary sources and
conducted interviews to corroborate the qualitative information (organisation,
policies, actions, etc.), we implemented analytical procedures on the
quantitative information and verified, on a test basis, the calculations and
the compilation of the information, and also verified their coherence and
consistency with the other information presented in the management report;
W a t the level of the representative selection of entities and sites that we
selected (3), based on their activity, their contribution to the consolidated
indicators, their location and a risk analysis, we undertook interviews to
verify the correct application of the and undertook detailed tests on the
basis of samples, consisting in verifying the calculations made and linking
them with supporting documentation. The sample selected therefore
represented on average 50% of the total workforce and between 19% and
82% of the quantitative environmental information.
For the other consolidated CSR information, we assessed their consistency in
relation to our knowledge of the company.
Finally, we assessed the relevance of the explanations provided, if appropriate,
in the partial or total absence of certain information.
We consider that the sample methods and sizes of the samples that we
considered by exercising our professional judgment allow us to express a
limited assurance conclusion; an assurance of a higher level would have
required more extensive verification work. Due to the necessary use of
sampling techniques and other limitations inherent in the functioning of
any information and internal control system, the risk of non-detection of a
significant anomaly in the CSR Information cannot be entirely eliminated.
Conclusion
Based on our work, we have not identified any significant misstatement that
causes us to believe that the CSR Information, taken together, has not been
fairly presented, in compliance with the Criteria.
3. Reasonable assurance on a selection of environmental information
Nature and scope of work
Regarding the information selected (4) by the Company and presented at
line “Group total 2013” of the “2013 site environmental indicators” table in
chapter 2.8.2.3 of the management report, we undertook work of the same
nature as those described in paragraph 2 above for the CSR Information
considered the most important, but in a more in-depth manner, in particular
in relation to the number of tests.
The sample selected represents between 49% and 82% of quantitative
environmental information selected and described in the above paragraph.
We consider that this work allows us to express a reasonable assurance
opinion on the information selected by company and presented at line “Group
total 2013” of the “2013 sites environmental indicators” table in chapter
2.8.2.3 of the management report.
Conclusion
In our opinion, the information selected by the company and presented at
line “Group total 2013” of the “2013 site environmental indicators” table
in chapter 2.8.1.2 of the management report has been established, in all
material aspects, in compliance with the Criteria.
(2) Industrial sites quantitative environmental information: water consumption, energy consumption, emissions into water (Suspended solid, CDO, METOX), Industrial hazardous and non-hazardous wastes, GHG direct and indirect emissions, SO
2, NOx and VOC emissions, benefits associated to industrial metallic wastes resell, savings due to plants reduced energy consumption.
Quantitative environmental information of the retail network (Renault Retail Group perimeter) : wastes, energy consumption, GHG emissions, VOC emissions, water consumption.
Other quantitative environmental information: Group carbon footprint (including CO2 emissions associated to the use of vehicles sold during the year and CO
2 emissions associated to the
production of the raw materials consumed by the Group), information linked to materials and circular economy, expenses affected to vehicles energy and emissions efficiency innovations.
Social quantitative information: headcounts and their split (age, sex, region), recruitments, lay off, personnel expenses per area, average cost per region, absenteeism rate, frequency rate without lost days (F1 rate) and with lost days (F2 rate), gravity rate (G rate), professional diseases rate, average number of critical competencies per plant, training hours number, percentage of women in management and in the most important positions of the Group, handicapped employment rate, number of collective agreements signed.
Qualitative societal information: transversal governance (chapter 2.1.3), relations with suppliers (chapter 2.2.3), societal engagements and key numbers of societal actions (in chapter 2.5.1), and Renault Mobiliz program (chapter 2.5.2.1).
(3) Regarding industrial sites quantitative environmental information, we have selected: ACI Le Mans (France), Aubevoye (France), Batilly (France), Bursa (Turquie), Cacia (Portugal), Cléon (France), Curitiba (Brazil), Dacia (Romania), Douai (France), Novo Mesto (Slovenia), Santa Isabel (Argentina), Tanger (Morocco), Titu (Romania), Valladolid Montage & Carrosserie (Spain).
Regarding retail network quantitative environmental information, we have selected: Paris area (Montreuil and Courbevoie garages).
Regarding quantitative health and safety information, we have selected: Santa Isabel (Argentina), Curitiba (Brazil), Batilly (France), Douai (France), Cléon (France), Tanger (Morocco), Cacia (Portugal), Valladolid (Spain), Pitesti (Romania).
Regarding quantitative social information linked to absenteeism, training, handicap, and collective agreements, we have selected: Argentina (Renault Argentina SA, Centro Automores SA, Centro del Norte SA), Spain (RESA et RECSA), France (Renault SAS) and Romania (Automobile Dacia SA, Matrite Dacia, Presate Dacia, Transporturi Dacia, Renault Mécanique Roumanie, Renault Commercial Roumanie et Renault Technologie Roumanie).
(4) Industrial sites quantitative environmental information: water consumption, energy consumption, emissions into water (Suspended solid, CDO, METOX), Industrial hazardous and non-hazardous wastes, GHG direct and indirect emissions, SO
2, NOx and VOC emissions.
Neuilly-sur-Seine and Paris-La Défense, the 28 February 2014
The independent verifiers
DELOITTE & ASSOCIES ERNST & YOUNG Audit

REGISTRATION DOCUMENT RENAULT 2013✦ Global Reporting Initiative (GRI) Directives 181
CSR: SUSTAINABLE MOBILITY 2
2
APPENDICES

Find out more at www.renault.comREGISTRATION DOCUMENT RENAULT 2013182
19 DIRECTORSOF THE BOARD WITH VARIOUS COMPETENCIES AT RENAULT'S SERVICE

REGISTRATION DOCUMENT RENAULT 2013✦ Global Reporting Initiative (GRI) Directives 183
3.1 REPORT OF THE CHAIRMAN OF THE BOARD ✦ AFR 184
3.1.1 Content, preparation and organization of the work of the Board of Directors ✦ 184
3.1.2 Principles and rules adopted by the Board of Directors for the remuneration of s enior e xecutives and corporate officers 201
3.1.3 Ethics: rules, procedures and organization ✦ 202
3.1.4 Internal control and risk management procedures ✦ 204
3.2 STATUTORY AUDITORS’ REPORT, PREPARED IN ACCORDANCE WITH ARTICLE L. 225-235 OF THE FRENCH COMPANY LAW (CODE DE COMMERCE), ON THE REPORT PREPARED BY THE CHAIRMAN OF THE BOARD OF DIRECTORS OF RENAULT AFR 209
3.3 REMUNERATION OF SENIOR EXECUTIVES AFR 210
3.3.1 Remuneration of the executive director ✦ 210
3.3.2 Directors’ fees ✦ 214
3.3.3 Remuneration of senior executives: performance shares 216
3.4 INTERNAL RULES OF THE BOARD OF DIRECTORS 219
3.4.1 Board of Directors ✦ 219
3.4.2 Rights and obligations of directors 220
3.4.3 Committees of the Board of Directors 221
3.4.4 Exercise of the General Management function 224
3CORPORATE GOVERNANCE
The elements of the annual fi nancial report are identifi ed by AFR sign.
Find out more at www.renault.comREGISTRATION DOCUMENT RENAULT 2013184
CORPORATE GOVERNANCE3 REPORT OF THE CHAIRMAN OF THE BOARD
Pursuant to Article L. 225-37 of the French Commercial Code, the Chairman of
the Board of Directors is required to submit an additional report, appended to
the management report, concerning the content, preparation and organization
of the work of the Board of Directors as well as the internal risk control and
management procedures.
This report was drawn up under the responsibility of the Chairman of the
Board of Directors, on the basis of information supplied by the Group’s senior
management, which is responsible for organization and internal control.
The report is based on the work of a multi-disciplinary group composed
of representatives from the Group Finance department, the Audit, Risk
Management and Organization department, and the Legal department.
The report was ratified by the Board of Directors at its meeting on February 12,
2014.
Renault also continually analyzes the best practices set out in the Afep-Medef
Code on the corporate governance of listed corporations. In accordance with
Article L. 225-37 of the Commercial Code, the Company refers to the Afep-
Medef Code in preparing this report. A table is included indicating the few
recommendations that have not been followed (see table, chapter 3.1.1.9 ).
The Afep-Medef Code is available for consultation at the Renault head office.
3.1 REPORT OF THE CHAIRMAN OF THE BOARD ✦
3.1.1 CONTENT, PREPARATION AND ORGANIZATION OF THE WORK OF THE BOARD OF DIRECTORS ✦
This chapter describes the management and administration methods used
by Renault SA, a publicly listed company and parent of the Renault group.
The methods also apply to Renault s.a.s., the lead holding company for
Renault’s automotive and financial businesses.
3.1.1.1 MEMBERS OF THE BOARD OF DIRECTORS ✦
The Renault Board of Directors chooses its members with an eye to balance,
competency and high ethical standards. It therefore takes the following into
consideration in assessing each candidate:
W the ownership structure and any changes to it;
W independence;
W the balance between women and men;
W the need for diverse and complementary competencies relevant to
Renault’s strategy and development;
W diversity of nationalities;
W knowledge of the markets in which Renault operates or wishes to do so.
The term of the directors is four years. In accordance with the recommendations
of the Afep-Medef Code, terms are renewed on a rotating basis to avoid
renewing all of them at the same time.
The process for selecting directors is described in greater detail in the internal
regulations, which are found in chapter 3.4.
The Company is administered by a Board of Directors with 19 members,
including four women:
W 13 directors appointed by the Annual General Meeting of Shareholders
(AGM);
W two directors appointed by administrative order, representing the French
State;
W three directors elected by employees;
W one director elected by the AGM on the recommendation of employee
shareholders.
In 2013, the new directors elected internally by employees in 2012,
Ms Mariette Rih and Messrs. Richard Gentil and Eric Personne, as well as the
director representing employee shareholders, Mr Benoit Ostertag, received
training so they could rapidly acquire the specific skills they will need to
fully perform their roles and missions as corporate directors. In addition,
their professional careers and their labor union activities in the Group give
them a good understanding of the Group’s organization and operations (their
biographies are found in chapter 3.1.1.2).
Women directors have sat on Renault’s Board since 2003. On April 30, 2013,
the Annual General Meeting appointed a new woman director, Ms Yuriko
Koike, who replaces Mr Takeshi Isayama as the representative of Nissan.
When directorships come up for renewal, Renault will comply with the
provisions of Act 2011-103 of January 27, 2011, relating to gender equality
and balanced representation of men and women on Boards of Directors and
Supervisory Boards.

REGISTRATION DOCUMENT RENAULT 2013✦ Global Reporting Initiative (GRI) Directives 185
CORPORATE GOVERNANCE 3
3
REPORT OF THE CHAIRMAN OF THE BOARD
Expiration of the terms of Board members
CURRENT TERM EXPIRES DIRECTOR
2014
Ms SourisseMr DelpitMr GhosnMr Ladreit de LacharrièreMr RiboudMr Saïkawa
2015Mr AzémaMr Lagayette
2016
Ms RihMr de CroissetMr DesmarestMr FaureMr GarnierMr GentilMr Personne
2017
Ms de La GaranderieMr BeldaMs KoikeMr Ostertag
3.1.1.2 TERMS OR FUNCTIONS OF THE DIRECTORS AS OF DECEMBER 31, 2013 ✦
DIRECTORS PROPOSED FOR RE-ELECTION
CARLOS GHOSNChairman of the Board of Directors
Birth date: 03/09/1954 (60 years old)
Nationality: French-Brazilian
Date of fi rst appointment: april 2002
Current term expires: 2014 AG
Number of registered shares held: 255,200
Biography - Professional experience
Carlos Ghosn was born in 1954 in Porto Vehlo, Brazil. Upon his arrival in Paris, he began his studies at the École des Mines and then went on to the École Polytechnique de Paris. Carlos Ghosn joined Michelin in 1978 to head up the plant in Puy (France). He then managed Michelin’s business in South America, based in Brazil.
In 1989, he was appointed Chairman and Chief Executive Officer of Michelin North America. Carlos Ghosn joined Renault in 1996 as Deputy Chief Executive Officer. In addition to managing Renault’s operations in the Mercosur Region, he was also head of automotive research, engineering and development, production, mechanical activities and purchasing.
He joined Nissan Motors as Managing Director in 1999, and was appointed Chairman and Chief Executive Officer in 2001.
Mr. Ghosn has been Chairman of Renault since May 2005, and remains the Chairman and Chief Executive Officer of Nissan Motor. He was appointed Chairman and Chief Executive Officer of Renault on May 6, 2009.
Offi ces and other functions in French and international companies
CURRENT OFFICES
Listed companies:
Chairman and Chief Executive Officer of Renault SA (France)Chairman and Chief Executive Officer of Nissan Motor Co. Ltd., (Japan)Chairman of the Board of Directors of AvtoVAZ (Russia)
Non listed companies:
Chairman of Renault s.a.s. (France)Chairman of the Board of Directors of Renault-Nissan b.v. (Netherlands)Chairman of the Board of Directors of Alliance Rostec Auto BV (Netherlands)
Other legal entities:
N/A
OFFICES IN OTHER COMPANIES IN THE PAST FIVE YEARS NO LONGER HELD: Term of offi ces expired
Director of Alcoa (Brazil) 2011

Find out more at www.renault.comREGISTRATION DOCUMENT RENAULT 2013186
CORPORATE GOVERNANCE3 REPORT OF THE CHAIRMAN OF THE BOARD
MARC LADREIT DE LACHARRIÈREDirector
Birth date: 11/6/1940 (73 years old)
Nationality: French
Chairman of the Appointments and Governance Committee
Member of the Compensation Committee
Date of fi rst appointment: october 2002
Current term expires: 2014 AG
Number of registered shares held: 1,020
Biography - Professional experience
Marc Ladreit de Lacharrière studied economics in Paris, and then graduated from the École Nationale d’Administration (ENA) in the “Robespierre” class (January 1968 to May 1970). He joined Banque Indosuez where he occupied a number of different management positions until 1976, before moving to the L’Oreal group where he was appointed Executive Vice-President, a position he held from 1984 to 1991. At the same time, he was a Director of Synthélabo (1986-1991), Crédit Lyonnais, Air France, France Télécom, and the musée du Louvre. In 1991, Marc Ladreit founded his own company, Financière Marc de Lacharrière (Fimalac), which made equity interests in a number of companies, notably in the culture and media sectors. Fimalac currently holds the financial ratings agency, Fitch Ratings, and previously held Algorithmics.Marc Ladreit de Lacharrière is co-founder of the French foundation to combat exclusion, Fondation Agir contre l’exclusion. He is a Director of Ca sino group, of L’Oréal, of Renault since 2000, and a member of the Advisory Committee of the Banque de France (since 1997). Marc Ladreit de Lacharrière is Chairman of the French intellectual journal, La Revue des Deux Mondes. He was elected to the Académie des Beaux-Arts in 2006 to the Gérald Van der Kemp Chair (free members section). That same year, he founded and finances the Fondation Culture & Diversité to assist young people from disadvantaged schools. In 2007, he was appointed Chairman of the Board of Directors of the Agence internationale des musées de France (France Museums), the agency with responsibility, notably, for the Louvre Abu Dhabi project. On December 31, 2010, he was awarded the honor of the Grand Cross of the French Legion of Honor (Grand-Croix de la Légion d’honneur).
Offi ces and other functions in French and international companies
CURRENT OFFICES
Listed companies:
Chairman and Chief Executive Officer of Fimalac (France)Director of Casino Group (France)Director of L’Oréal (France)Non listed companies:
Chairman of the Board of Directors of Groupe Marc de Lacharrière (France)Chairman of the Board of Directors of Agence France Museums (France)Chairman of the Board of Directors of Fitch Group (USA)Director of Fermière du Casino Municipal de Cannes (France)Director of Lucien Barrière SAS Group (France)Director of Gilbert Coullier Productions SAS (France)Manager of Fimalac Participations Sarl (Luxembourg)Other legal entities:
Member of the Institut Académie des Beaux-Arts
Honorary Chairman of the French national committee of foreign trade advisors (Comité national des Conseillers du Commerce extérieur de la France)Chairman of the Fondation Culture et DiversitéMember of general interest associations: Conseil artistique des musées nationaux - Fondation des sciences politiques - Musée des arts décoratifs - Fond de dotation Abbaye de Lubilhac
OFFICES IN OTHER COMPANIES IN THE PAST FIVE YEARS NO LONGER HELD: Term of offi ces expired
Chairman of the Board of Directors of Fitch Ratings (USA) 2012Director of Algorithmics (Canada) 2009

REGISTRATION DOCUMENT RENAULT 2013✦ Global Reporting Initiative (GRI) Directives 187
CORPORATE GOVERNANCE 3
3
REPORT OF THE CHAIRMAN OF THE BOARD
FRANCK RIBOUDDirector
Birth date: 11/07/1955 (58 years old)
Nationality: French
Date of fi rst appointment: december 2000
Current term expires: 2014 AG
Number of registered shares held: 331
Biography - Professional experience
Franck Riboud is a graduate of the École Polytechnique Fédérale de Lausanne. He joined the Danone Group in 1981, where he held a number of positions in Management Control, Marketing and Sales until 1989. After having served as Sales Director at Heudebert, in September 1989, he was appointed Head of the department responsible for the integration and development of new companies in the Biscuits branch. He took part in the largest acquisition made by a French company in the United States, namely, BSN’s acquisition of Nabisco’s European activities. In July 1990, he was appointed Chief Executive Officer of Eaux Minérales d’Evian. Franck Riboud took up the position of Director of Danone Group Development in 1992, at which point Danone launched its international expansion plan, accelerating the pace of development in Asia and Latin America, and creating an Export division. BSN changed its name to Danone in 1994 to position itself as a global brand. He was appointed Chairman and CEO of Danone on May 2, 1996. Since 2008, Mr. Riboud has been Chairman of the Board of Directors of the danone.communities mutual fund (SICAV), a financing entity aimed at promoting the development of profitable companies whose primary goal is to maximize socially responsible objectives as opposed to profit. He has also been Chairman of the Steering Committee of the Danone ecosystem fund, Fonds Danone pour l’Écosystème since 2009, and is a member of the Livelihoods fund Steering Committee since December 2011.
Offi ces and other functions in French and international companies
CURRENT OFFICES
Listed companies:
Chief Executive Officer of Danone SA (France)Non listed companies:
Director of Bagley Latinoamerica SA (Argentina)Chairman of the Steering Committee of Danone.Communities (mutual fund - SICAV) (France)Director of Danone Espagne SA (Spain)Director of Renault SAS (France)Director of Rolex SA (Switzerland)Director of Rolex Holding SA (Switzerland)Other legal entities:
Chairman of the Steering Committee of Fonds Danone pour l’ÉcosystèmeDirector of the French national agri-foods industry association (Association Nationale des Industries Agroalimentaires)
Director of the HEC International Advisory BoardMember of the Supervisory Board of the Fondation ELAMember of the Board of the Fondation EPFL PlusMember of the Steering Committee of the Livehoods Fund (mutual fund - SICAV)
OFFICES IN OTHER COMPANIES IN THE PAST FIVE YEARS NO LONGER HELD: Term of offi ces expired
Director of Accor SA 2012Director of Lacoste SA 2012Director of Omnium Nord Africain (ONA) 2010Director of Wadia BSN India Ltd. 2009Director of the GAIN Foundation (Global Alliance for Improved Nutrition) 2009

Find out more at www.renault.comREGISTRATION DOCUMENT RENAULT 2013188
CORPORATE GOVERNANCE3 REPORT OF THE CHAIRMAN OF THE BOARD
HIROTO SAIKAWADirector elected on proposal of Nissan
Birth date: 11/14/1953 (60 years old)
Nationality: Japanese
Member of the International Strategy Committee
Date of fi rst appointment: december 2006
Current term expires: 2014 AG
Number of registered shares held: 100
Biography - Professional experience
Hiroto Saikawa was born on November 14, 1953. He graduated from Tokyo University in 1977 with a degree in economics and joined Nissan Motor Co. Ltd. the same year. In 1999, he moved to Nissan Europe N.V., where he was appointed Deputy Vice President and the Vice President of Purchasing Strategy in April and October 2000, respectively. In April 2001, he assumed the position of Executive Vice-President of the Renault Nissan central purchasing organization, before being appointed Senior Vice-President of Nissan Motor Co. Ltd. in April 2003. Hiroto Saikawa became Executive Vice-President in April 2005, and was appointed to the Board of Directors in June of that year. He was appointed Deputy Managing Director in June 2011, and has also been Head of Competitiveness in Nissan since 2013. Since January 2014, he has also been overseeing research and development, construction, supply chain management, purchasing, TCSX (customer satisfaction), the purchasing Steering Committee and promotion of competitiveness.
Offi ces and other functions in French and international companies
CURRENT OFFICES
Listed companies:
Director of Nissan Motor Limited (Japan)Non listed companies:
Independent Director of NMKV Co., Ltd.Director of Nissan Investment Co., Ltd. (China)Director of Dongfeng Motor Co., LtdOther legal entities:
N/A
OFFICES IN OTHER COMPANIES IN THE PAST FIVE YEARS NO LONGER HELD: Term of offi ces expired
N/A

REGISTRATION DOCUMENT RENAULT 2013✦ Global Reporting Initiative (GRI) Directives 189
CORPORATE GOVERNANCE 3
3
REPORT OF THE CHAIRMAN OF THE BOARD
PASCALE SOURISSEDirector
Birth date: 03/07/1962 (52 years old)
Nationality: French
Member of the Audit, Risk and Ethics Committee
Date of fi rst appointment: april 2010
Current term expires: 2014 AG
Number of registered shares held: 1,000
Biography - Professional experience
Pascale Sourisse is a graduate of École Polytechnique and École Nationale Supérieure des Télécommunications (ENST). She began her career holding management positions within France Telecom, Jeumont-Schneider and Compagnie Générale des Eaux, as well as with the French Ministry of Industry, and then at Alcatel from 1995 to 2007. In 2007, Pascale Sourisse was appointed Senior Vice-President of Thalès, a member of the Executive Committee with responsibility for the Space Division, and Chairperson and CEO of Thalès Alenia Space. In 2008, she was appointed Senior Vice-President, Managing Director of the Land & Joint Systems Division, and in February 2010, became Senior Vice-President, Managing Director of Defense & Security C41 Systems. Pascale Sourisse was also Chairperson and CEO of Thalès Communications & Security and Chairperson of Thalès Services. She was appointed Senior Executive Vice-President of International Development within the Thalès Group in February 2013. She is also Chairperson of Thales International. Pascale Sourisse is an Officer of the French Legion of Honor (Officier de la Légion d’Honneur) and Commander of the French Order of Merit (Commandeur de l’Ordre du Mérite).
Offi ces and other functions in French and international companies
CURRENT OFFICES
Listed companies:
Director of Vinci (France)Non listed companies:
Director of Thalès International SAS (France)Chairperson of Thalès Europe SAS (France)Director of the l’Agence Nationale des Fréquences (France)Permanent representative and Director of SOFRESA (France)Permanent representative and Director of ODAS (France)Other legal entities:
Chairperson of the Board of École de Télécom Paris TechPermanent representative and Director of SOFRESA (France)Permanent representative and Director of ODAS (France)
OFFICES IN OTHER COMPANIES
IN THE PAST FIVE YEARS NO LONGER HELD: Term of offi ces expired
As a Director of the Thalès Group, Mrs. Sourisse has held many offices in the Group’s subsidiaries. In the interests of clarity and legibility, all of these offices are not listed separately here. This information is available on Renault.com.
BERNARD DELPITDirector
Birth date: 10/26/1964 (49 years old)
Nationality: French
Member of the International Strategy Committee
Date of fi rst appointment: april 2010
Current term expires: 2014 AG
Number of registered shares held: 1,000
Biography - Professional experience
Bernard Delpit holds a degree in law and is a graduate of the Institut d’Études Politiques in Paris. He also studied at the École Nationale d’Administration. Bernard Delpit began his career in 1990 at the French Treasury in the Audit department. Until 2000, he held a variety of positions at the Ministry of the Economy and Finance. In 2000, he joined the PSA Peugeot Citroën Group, where he was appointed Deputy Chief Executive Officer of Dong Feng Peugeot Citroën Automobiles (China) in 2001, before taking up the position of Head of Budget Control at the PSA Peugeot Citroën Group in 2004. In May 2007, Bernard Delpit joined the cabinet of the French President as Economic Adviser. From June 2009 to August 2011, he was Deputy Chief Executive Officer and Chief Financial Officer of the La Poste group. On August 29, 2011, Bernard Delpit joined Crédit Agricole S.A. as Chief Financial Officer.
Offi ces and other functions in French and international companies
CURRENT OFFICES
Listed companies:
Director of LCL (France) Non listed companies:
Director of CACEIS (France)Director of Crédit Agricole Assurances (France)Other legal entities:
N/A
OFFICES IN OTHER COMPANIES IN THE PAST FIVE YEARS NO LONGER HELD: Term of offi ces expired
Director of Sofiposte 2011Director of Géoposte 2011Director of Banque Postale de Prévoyance 2011Director of Poste Immo 2011Director of Emporiki 2012Member of the Supervisory Board of La Banque Postale 2011Member of the Supervisory Board of La Banque Postale Asset Management 2011

Find out more at www.renault.comREGISTRATION DOCUMENT RENAULT 2013190
CORPORATE GOVERNANCE3 REPORT OF THE CHAIRMAN OF THE BOARD
OTHER DIRECTORS WHO HOLD OFFICE AS OF FEBRUARY 12, 2014 (1)
DAVID AZÉMADirector appointed by the French State
Birth date: 11/22/1960 (53 years old)
Nationality: French
Member of the Audit, Risk and Ethics Committee
Member of the Industrial Strategy Committee
Member of the Appointments and Governance Committee
Date of fi rst appointment: october 2012
Current term expires: N/A
Number of registered shares held: N/A
Biography - Professional experience
David Azéma is a graduate of the Institut d’Études Politiques in Paris and of the École Nationale d’Administration (ENA). He began his career in 1987 in the Cour des Comptes as an auditor, before becoming chief adviser. From 1991 to 1993, he worked at the General Directorate of the National Police and then held several positions in the Office of Martine Aubry, Minister for Labor, Employment and Vocational Training. In 1993, he joined SNCF, the French railway company, where he served in the Strategy Division, before moving on to become Adviser to the Chairman and Group Director of SNCF Group’s Subsidiaries and Equity Holdings. David Azéma left for the United Kingdom in 1998 to take up the position of Chairman of Intercontinental and Regional Rail Ltd., which won the tender for the management of Eurostar UK. He was then appointed Chairman and CEO of Eurostar Group Ltd., jointly owned by SNCF, SNCB Belgian Railways and Eurostar UK, in charge of managing the Eurostar high-speed rail service. In 2002, he joined the Vinci Group as Chief Executive Officer of Vinci Concessions, and became a member of the Vinci Group Executive Committee in 2006.In June 2008, David Azéma returned to SNCF as Executive Vice-President of Strategy and Finance before being appointed Deputy CEO of the SNCF Group in October 2011.In June 2012, while remaining a member of the SNCF Group Executive Committee, he took up the position of Chief Executive Officer of Keolis, a subsidiary of SNCF specializing in passenger public transport in France, Europe and worldwide (EUR 4.4 billion in revenue, EUR 274 million in EBITDA and more than 50,000 employees at the end of 2011). On September 1, 2012, he was appointed Commissioner for the French state investment agency (APE) at the Ministry of Economy and Finance.He is a Director of BPI-Groupe, Bpifrance Participations – Bpifrance Investissement, EDF, Renault and Thalès.
Offi ces and other functions in French and international companies
CURRENT OFFICES
Listed companies:
Director of EDF (France)Director of Air France KLM (France)Member of the Supervisory Board of Aréva (France)Director of Thalès (France)Non listed companies:
Director of BPI France (PBI Groupe - formerly FSI) (France)Director of Bpifrance Participations (France)Director of Bpifrance Investissement (France)Other legal entities:
N/A
OFFICES IN OTHER COMPANIES IN THE PAST FIVE YEARS NO LONGER HELD: Term of offi ces expired
Chairman of the Board of Keolis Group 2012Deputy Chief Executive Officer of SNCF Group 2012Chairman of the Supervisory Board of Seafrance 2012Chairman and Chief Executive Officer of SNCF Participation 2012
ALAIN J.P BELDADirector
Birth date: 06/23/1943 (70 years old)
Nationality: American
Chairman of the Compensation Committee
Member of the Appointments and Governance Committee
Member of the International Strategy Committee
Date of fi rst appointment: may 2009
Current term expires: 2017 AG
Number of registered shares held: 1,000
Biography - Professional experience
Based in São Paulo, Alain J.P. Belda joined Warburg Pincus in 2009. He leads the Group’s investment decisions in Latin America and provides strategic counsel for the Group’s entire portfolio. Mr. Belda is also a member of executive management of Warburg Pincus. He retired from Alcoa in 2008, after having served as President and Chief Executive Officer from 1999 and as Chairman of the Board of Directors from 2001. Alain J.P. Belda spent 40 years of his career at Alcoa, having first joined the organization’s Brazilian affiliate, Alcoa Aluminio in 1969.
Offi ces and other functions in French and international companies
CURRENT OFFICES
Listed companies:
Director of IBM (USA)Director of Pet Center Marginal (Brazil)Director of Dudalina (Brazil)Non listed companies:
Executive Director of Warburg Pincus (USA)Director of Oméga Energia Renovavel SA (Brazil)Director of Banco Indusval & Partners (Brazil)Other legal entities:
Member of the Business Council
OFFICES IN OTHER COMPANIES IN THE PAST FIVE YEARS NO LONGER HELD: Term of offi ces expired
Director of Citibank 2012Director of Alcoa 2010
(1) Date of the Board Meeting convening the General Meeting.
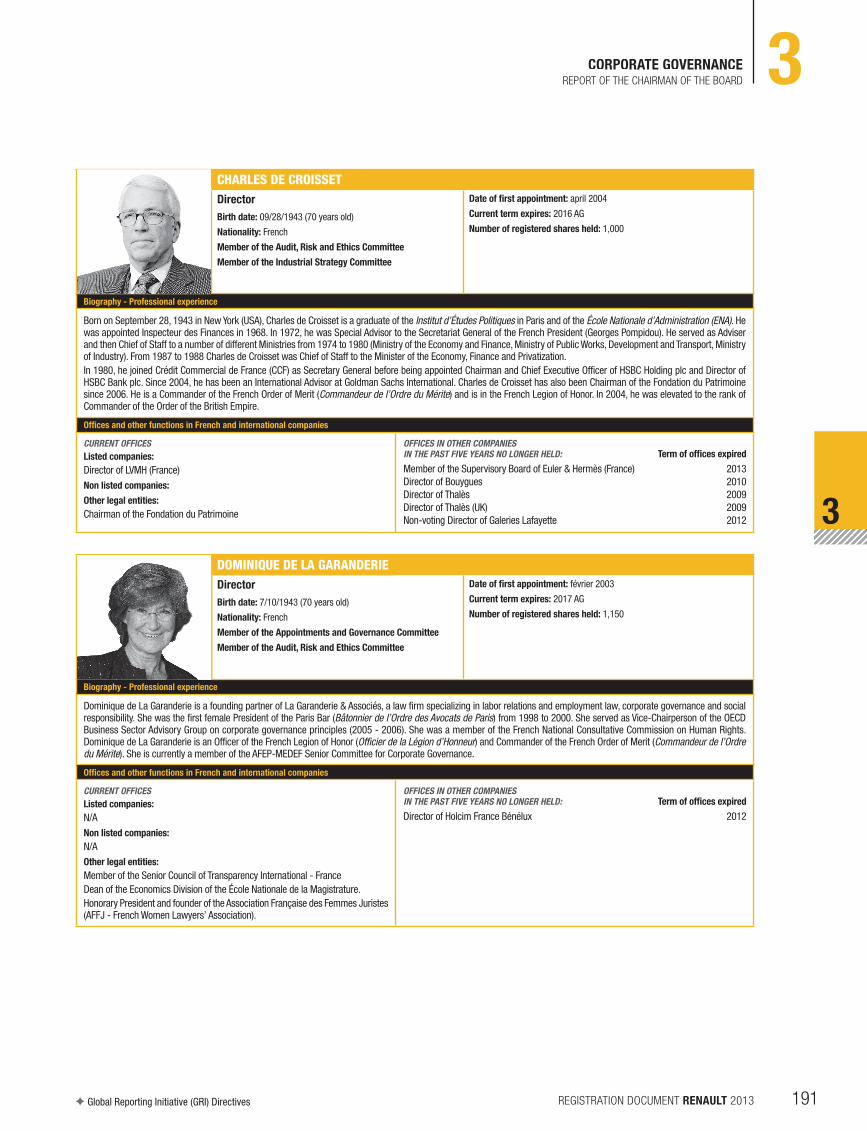
REGISTRATION DOCUMENT RENAULT 2013✦ Global Reporting Initiative (GRI) Directives 191
CORPORATE GOVERNANCE 3
3
REPORT OF THE CHAIRMAN OF THE BOARD
CHARLES DE CROISSETDirector
Birth date: 09/28/1943 (70 years old)
Nationality: French
Member of the Audit, Risk and Ethics Committee
Member of the Industrial Strategy Committee
Date of fi rst appointment: april 2004
Current term expires: 2016 AG
Number of registered shares held: 1,000
Biography - Professional experience
Born on September 28, 1943 in New York (USA), Charles de Croisset is a graduate of the Institut d’Études Politiques in Paris and of the École Nationale d’Administration (ENA). He was appointed Inspecteur des Finances in 1968. In 1972, he was Special Advisor to the Secretariat General of the French President (Georges Pompidou). He served as Adviser and then Chief of Staff to a number of different Ministries from 1974 to 1980 (Ministry of the Economy and Finance, Ministry of Public Works, Development and Transport, Ministry of Industry). From 1987 to 1988 Charles de Croisset was Chief of Staff to the Minister of the Economy, Finance and Privatization.In 1980, he joined Crédit Commercial de France (CCF) as Secretary General before being appointed Chairman and Chief Executive Officer of HSBC Holding plc and Director of HSBC Bank plc. Since 2004, he has been an International Advisor at Goldman Sachs International. Charles de Croisset has also been Chairman of the Fondation du Patrimoine since 2006. He is a Commander of the French Order of Merit (Commandeur de l’Ordre du Mérite) and is in the French Legion of Honor. In 2004, he was elevated to the rank of Commander of the Order of the British Empire.
Offi ces and other functions in French and international companies
CURRENT OFFICES
Listed companies:
Director of LVMH (France)Non listed companies:
Other legal entities:
Chairman of the Fondation du Patrimoine
OFFICES IN OTHER COMPANIES IN THE PAST FIVE YEARS NO LONGER HELD: Term of offi ces expired
Member of the Supervisory Board of Euler & Hermès (France) 2013Director of Bouygues 2010Director of Thalès 2009Director of Thalès (UK) 2009Non-voting Director of Galeries Lafayette 2012
DOMINIQUE DE LA GARANDERIEDirector
Birth date: 7/10/1943 (70 years old)
Nationality: French
Member of the Appointments and Governance Committee
Member of the Audit, Risk and Ethics Committee
Date of fi rst appointment: février 2003
Current term expires: 2017 AG
Number of registered shares held: 1,150
Biography - Professional experience
Dominique de La Garanderie is a founding partner of La Garanderie & Associés, a law firm specializing in labor relations and employment law, corporate governance and social responsibility. She was the first female President of the Paris Bar (Bâtonnier de l’Ordre des Avocats de Paris) from 1998 to 2000. She served as Vice-Chairperson of the OECD Business Sector Advisory Group on corporate governance principles (2005 - 2006). She was a member of the French National Consultative Commission on Human Rights. Dominique de La Garanderie is an Officer of the French Legion of Honor (Officier de la Légion d’Honneur) and Commander of the French Order of Merit (Commandeur de l’Ordre du Mérite). She is currently a member of the AFEP-MEDEF Senior Committee for Corporate Governance.
Offi ces and other functions in French and international companies
CURRENT OFFICES
Listed companies:
N/ANon listed companies:
N/AOther legal entities:
Member of the Senior Council of Transparency International - FranceDean of the Economics Division of the École Nationale de la Magistrature.Honorary President and founder of the Association Française des Femmes Juristes (AFFJ - French Women Lawyers’ Association).
OFFICES IN OTHER COMPANIES IN THE PAST FIVE YEARS NO LONGER HELD: Term of offi ces expired
Director of Holcim France Bénélux 2012

Find out more at www.renault.comREGISTRATION DOCUMENT RENAULT 2013192
CORPORATE GOVERNANCE3 REPORT OF THE CHAIRMAN OF THE BOARD
THIERRY DESMARESTDirector
Birth date: 12/18/1945 (68 years old)
Nationality: french
Chairman of the International Strategy Committee
Member of the Compensation Committee
Member of the Industrial Strategy Committe
Date of fi rst appointment: april 2008
Current term expires: 2016 AG
Number of registered shares held: 1,500
Biography - Professional experience
Born in 1945, Thierry Desmarest is a graduate of École Polytechnique, and an Engineer of the French Corps des Mines. He started his career in 1971 as an engineer in the Mines Department of New Caledonia before taking up the position of technical adviser to the Offices of the Minister for Industry (1975 to 1978) and the Minister for the Economy (1978 to 1980). Thierry Desmarest joined Total in 1981 to head up Total Algeria. He held a range of management positions within Total Exploration Production and became Chief Operating Officer of Total and a member of its Executive Committee in July 1989. In June 1995, he became Chairman and CEO of Total. Following the merger of Total and Petrofina in June 1999, he became Chairman and CEO of TotalFina. In March 2000, Thierry Desmarest was appointed Chairman and CEO of TotalFinaElf, and on May 6, 2003, Chairman and CEO of Total. He served as Chairman of the Board of Directors of Total from February 2007 to May 2010.On May 21, 2010, Mr. Desmarest was appointed Honorary Chairman and remains a Director of TOTAL and Chairman of the TOTAL Foundation.
Offi ces and other functions in French and international companies
CURRENT OFFICES
Listed companies:
Honorary Chairman and Director of Total S.A.Director of Air Liquide (France)Director of Sanofi (France)Director of Bombardier (Canada)Non listed companies:
N/AOther legal entities:
Chairman of the Total FoundationChairman of the Fondation de l’École PolytechniqueDirector of the Musée du LouvreDirector of the École Polytechnique
OFFICES IN OTHER COMPANIES IN THE PAST FIVE YEARS NO LONGER HELD: Term of offi ces expired
Member of the Supervisory Board of Areva 2010Chairman of the Board of Directors of Total S.A 2010

REGISTRATION DOCUMENT RENAULT 2013✦ Global Reporting Initiative (GRI) Directives 193
CORPORATE GOVERNANCE 3
3
REPORT OF THE CHAIRMAN OF THE BOARD
PASCAL FAUREDirector appointed by the State
Birth date: 02/01/1963 (51 years old)
Nationality: French
Member of the Industrial Strategy Committee
Member of the International Strategy Committee
Date of fi rst appointment: february 2013
Current term expires: N/A
Number of registered shares held: N/A
Biography - Professional experience
Born on February 1, 1963 in Nice (France). Pascal Faure is an engineering graduate from the École des Mines, and also holds degrees from the École polytechnique (1983) and the École nationale supérieure des télécommunications de Paris (1988). He started his career in R&D in Bell Labs (Pennsylvania, USA), and at Apple Computer (California, USA), before moving to the French National Telecommunications Research Center (France Télécom/CNET) as project leader in communication security and cryptology. From 1992 to 1995, he worked in the French Finance Ministry, specifically on administrative IT policy credits. He was then appointed Technical Advisor with responsibility for budget, fiscal, employment and development affairs in the Office of the Minister of Tourism, before moving to the office of the Minister of Regional Development, Urban Affairs and Integration. Pascal Faure served as Director of Development and Finance, and as Deputy Director of the Institut TELECOM from 1997 to 2001, before being appointed Deputy Technical Director at the Ministry of Defense. Concurrent offices during this time included his position as Chairman of the French Association of Telecommunications Engineers, from 2001 to 2006. From 2007 to 2012, Pascal FAURE was appointed Vice President of the French information technologies general council (CGTI - Conseil Général des Technologies de l’Information), Vice President of the general council for industry, energy and technologies (CGIET - Conseil général de l’industrie, de l’énergie et des technologies), and Vice President of the general council for the economy, industry, energy and technologies (CGEIET - Conseil Général de l’Economie, de l’Industrie, de l’Energie et des Technologies). On December 5, 2012, he was appointed to the position of Director General of competitiveness, industry and services. He is co-founder of the collection, Territoires de l’information; co-editor of Nouvelles technologies, nouvel état (1999), Éthique et société de l’information (2000) and Media@media (2001). Pascale Faure was awarded the French Legion of Honor (Chevalier de la Légion d’Honneur), the French Order of Merit (Officier de l’Ordre National du Mérite), and the French Academic Palms (Officier des Palmes Académiques).
Offi ces and other functions in French and international companies
CURRENT OFFICES
Listed companies:
Government Representative on the Board of La Poste (France)Member of the Supervisory Board of Aréva representing the French State (France)Non listed companies:
Director representing the French State at Bpifrance ParticipationsDirector representing the French State at Bpifrance InvestissementOther legal entities:
Government Representative on the Commission Nationale d’Aménagement Commercial
Member of the Atomic Energy CommissionGovernment Representative at GIP Guichet enterprisesDirector representing the French State at Mines Paris TechDirector representing the French State at the French Research Agency
OFFICES IN OTHER COMPANIES IN THE PAST FIVE YEARS NO LONGER HELD: Term of offi ces expired
Director representing the French State at the École Polytechnique 2013Director representing the French State at Française des Jeux 2013Director representing the French State at École Normale Supérieure 2013Director representing the French State at the Institut Mines-Télécom 2013Director representing the French State at France Télécom 2013
JEAN-PIERRE GARNIERDirector
Birth date: 10/31/1947 (66 years old)
Nationality: French, American
Chairman of the Industrial Strategy Committee
Member of the Compensation Committee
Member of the International Strategy Committee
Date of fi rst appointment: april 2008
Current term expires: 2016 AG
Number of registered shares held: 1,000
Biography - Professional experience
Jean-Pierre Garner holds a PhD in Pharmacology and a Masters in Pharmaceutical Sciences from the University Louis-Pasteur of Strasbourg. He earned an MBA from Stanford University (California) in 1974. Jean-Pierre Garnier joined the American pharmaceutical firm Schering-Plough where he held positions in Switzerland, Denmark and Portugal. In 1983, he was appointed Vice President, Marketing, before becoming Senior Vice-President and Chief Executive Officer of the over-the-counter drugs business line, and General Manager of Sales and Marketing for Schering-Plough’s US business. He then served as President of Schering-Plough. In 1990 he joined SmithKline Beecham as President of its North American Pharmaceuticals division. He was appointed President of Pharmaceuticals in 1994 and Chief Operating Officer the following year. He was elected Chairman and CEO of SmithKline Beecham in December 1999 and, in December 2000, headed up the new merged group, GlaxoSmithKline (GSK). July 2008 saw Jean-Pierre Garnier move to Laboratoires Pierre Fabre as Director of Pierre Fabre Participations. At the end of August 2008, he was appointed Chief Executive Officer of Laboratoires Pierre Fabre and in 2011 he became Chairman and CEO of Actélion. He is an Operating Partner of Advent International (USA). Mr. Garnier is an Officer of the French Legion of Honor (Officier de la Légion d’honneur) and a Knight Commander of the Order of the British Empire.
Offi ces and other functions in French and international companies
CURRENT OFFICES
Listed companies:
Chairman of the Board of Directors of Actélion (Switzerland)Director of United Technology Corp (USA)Non listed companies:
Chairman of the Board of Directors of Cérénis (France)
Other legal entities:
Director of the Paul Newman Foundation (USA)Director of the Max Planck Institute (Germany)
OFFICES IN OTHER COMPANIES IN THE PAST FIVE YEARS NO LONGER HELD: Term of offi ces expired
Director of Pierre Fabre Participations 2010

Find out more at www.renault.comREGISTRATION DOCUMENT RENAULT 2013194
CORPORATE GOVERNANCE3 REPORT OF THE CHAIRMAN OF THE BOARD
RICHARD GENTILDirector elected by employees
Birth date: 04/29/1968 (45 years old)
Nationality: French
Member of the Industrial Strategy Committee
Member of the International Strategy Committee
Date of fi rst appointment: november 2012
Current term expires: november 2016
Number of registered shares held: 1
Biography - Professional experience
A maintenance technician, Richard Gentil started at Renault in 1988 at the foundry, and is a hydraulics, pneumatics and gas specialist. He holds BEP/CAP electro-technical and electro-mechanical professional qualifications and a Baccalaureate in Automated Mechanical Systems Maintenance. He speaks and writes fluent English. Richard Gentil is a member of the Solidarity Committee of the Renault Cléon Works Council.
Offi ces and other functions in French and international companies
CURRENT OFFICES
Listed companies:
N/ANon listed companies:
N/AOther legal entities:
N/A
OFFICES IN OTHER COMPANIES IN THE PAST FIVE YEARS NO LONGER HELD: Term of offi ces expired
N/A
YURIKO KOIKEDirector proposed for election by Nissan
Birth date: 15/07/1952 (61 years old)
Nationality: Japanese
Date of fi rst appointment: april 2013
Current term expires: 2017 AG
Number of registered shares held: 100
Biography - Professional experience
Yuriko Koike and is currently a member of the Japanese House of Representatives, having served as Japanese Minister of the Environment from 2003 to 2006. She successfully promoted a new business model, known as “Coo Biz”, as well as a number of other policies aimed at changing the mindset of the general public and countering global warming. Mrs. Koike subsequently occupied two other ministerial posts. She was appointed Special Advisor to the Prime Minister on national security in 2006, before becoming the first female Minister of Defense in July 2007. She was also the first woman to put forward her candidacy to lead the ruling party in Japan, positions that automatically open up the possibility of a run for Prime Minister. Mrs. Koike began her career as a television personality and an expert on affairs in the Arab world. She has authored several books and articles on Japanese policies, international affairs and women’s professional networks.
Offi ces and other functions in French and international companies
CURRENT OFFICES
Listed companies: N/A
Non listed companies: N/A
Other legal entities: N/A
OFFICES IN OTHER COMPANIES IN THE PAST FIVE YEARS NO LONGER HELD: Term of offi ces expired
N/A

REGISTRATION DOCUMENT RENAULT 2013✦ Global Reporting Initiative (GRI) Directives 195
CORPORATE GOVERNANCE 3
3
REPORT OF THE CHAIRMAN OF THE BOARD
PHILIPPE LAGAYETTELead Independent Director
Birth date: 06/16/1943 (70 years old)
Nationality: French
Chairman of the Audit, Risk and Ethics Committee
Member of the Appointments and Governance Committee
Date of fi rst appointment: may 2007
Current term expires: 2015 AG
Number of registered shares held: 1,000
Biography - Professional experience
Philippe Lagayette is a graduate of the École Polytechnique and the École Nationale d’Administration (ENA). He began his career in 1970 in the General Inspectorate of Finance. In 1974, he joined the Treasury department at the French Ministry of Economy and Finance, and was promoted to Deputy Director in 1980. He was appointed Chief of Staff at the Ministry of Economy and Finance in 1981, before moving to the Banque de France as Deputy Governor in 1984. In 1992, Philippe Lagayette was appointed Chief Executive Officer of Caisse des Depots et Consignations, a post he held until December 1997. He headed up JP Morgan’s activities in France from 1998 to August 2008. He is currently Barclays’ Senior Advisor in France. Mr. Lagayette is a Commander of the French Legion of Honor (Commandeur de la Légion d’Honneur) and Commander of the French Order of Merit (Commandeur de l’Ordre du Mérite).
Offi ces and other functions in French and international companies
CURRENT OFFICES
Listed companies:
Director of Kering (formerly PPR) (France)Director of Fimalac (France)Non listed companies:
Chairman of PL Conseils (France)Other legal entities:
Chairman of the Fondation de France
Chairman of the scientific research foundation, the Fondation Plan Alzheimer
Chairman of the Institut des Hautes Études Scientifiques
OFFICES IN OTHER COMPANIES IN THE PAST FIVE YEARS NO LONGER HELD: Term of offi ces expired
Vice-Chairman of JP Morgan for the EMEA Region 2010Chairman of the French American Foundation 2010
BENOÎT OSTERTAGDirector elected on proposal of the employee shareholders
Birth date: 08/02/1965 (48 years old)
Nationality: French
Member of the Audit, Risk and Ethics Committee
Member of the Industrial Strategy Committee
Date of fi rst appointment: may 2011
Current term expires: 2017 AG
Number of registered shares held: 90 company mutual fund (FCPE) units
Biography - Professional experience
Engineering graduate from the École Centrale de Paris. Benoît Ostertag has worked at Renault for the past 23 years in mechanical engineering at the Lardy (91) and Rueil (92) plants in France, designing test benches, engine cooling systems and thermal measurements. He was a team leader until 2011, and currently manages processes in the Quality department. He was the elected CFDT representative on the Renault SAS Central Works Council from 2006 to 2011. Mr. Ostertag has represented employee shareholders on the Renault Group’s Board of Directors since May 2011.
Offi ces and other functions in French and international companies
CURRENT OFFICES
Listed companies:
N/ANon listed companies:
N/AOther legal entities:
N/A

Find out more at www.renault.comREGISTRATION DOCUMENT RENAULT 2013196
CORPORATE GOVERNANCE3 REPORT OF THE CHAIRMAN OF THE BOARD
ERIC PERSONNEDirector elected by employees
Birth date: 10/14/1962 (51 years old)
Nationality: French
Member of the International Strategy Committee
Member of the Compensation Committee
Date of fi rst appointment: november 2012
Current term expires: november 2016
Number of registered shares held: 20
Biography - Professional experience
Eric Personne began his career as a photographer, before becoming a Renault employee in 1988. In 2002, he joined the Renault Retail Group, where he held a number of positions, including: head of after-sales development and head of ISO Certification. Since 2007, Eric Personne has been Manager of Sales and Quality Reporting at RRG. He has a track record of more than 30 years in employer or employee collective action in his professional domain.
Offi ces and other functions in French and international companies
CURRENT OFFICES
Listed companies:
N/ANon listed companies:
N/AOther legal entities:
N/A
MARIETTE RIHDirector elected by employees
Birth date: 3/23/1967 (47 years old)
Nationality: French
Member of the International Strategy Committee
Member of the Industrial Strategy Committee
Date of fi rst appointment: november 2012
Current term expires: november 2016
Number of registered shares held: 8 company mutual fund (FCPE) units
Biography - Professional experience
Having obtained a BTS vocational training certificate as a trilingual secretary, Mariette Rih joined Renault Automation in 1990 as an assistant in the Export department. In December 1999, she joined the Renault-Nissan Alliance coordination office and then took up a position with the Nissan Europe Communication CEO, which she held until 2005. From 2005 to 2007, Mariete Rih returned to Renault, to L’Atelier, before taking over management of Renault Square Com. exhibitions. Since 2009, she has held the position of Project Manager for demonstrators and communication technology tools at Renault’s Brand Division.
Offi ces and other functions in French and international companies
CURRENT OFFICES
Listed companies:
N/ANon listed companies:
N/AOther legal entities:
N/A

REGISTRATION DOCUMENT RENAULT 2013✦ Global Reporting Initiative (GRI) Directives 197
CORPORATE GOVERNANCE 3
3
REPORT OF THE CHAIRMAN OF THE BOARD
The average age of incumbent directors is 58. The company’s by-laws
require that each director own at least one registered share (1). The Board’s
internal regulations, amended with reference to the revised Afep-Medef
Code, recommend, however, that directors own a significant number of
shares in view of the director’s fees paid to them, except for those directors
who do not receive fees personally. However, administrative regulations
forbid directors appointed by the French State from owning shares. Likewise,
the directors representing the staff or the shareholder employees who do
not personally receive director’s fees (which are paid directly to their trades
unions) are not required to held significant number of shares.
3.1.1.3 OTHER DISCLOSURES REFERRED TO IN ANNEX 1 OF EUROPEAN REGULATION 809/2004 ✦
To Renault’s knowledge, none of its directors or senior executives has been
convicted of fraud in the past five years. None of the directors has been
involved as an executive in bankruptcy, receivership or liquidation proceedings
in the past five years and none has been charged or punished by a statutory
or regulatory authority. None of the directors has been barred by a court
from serving as a member of the Board of Directors, Management Board
or Supervisory Board of a securities issuer or from serving as a manager or
officer of an issuer in the past five years.
To Renault’s knowledge, there are no conflicts of interest between the
directors’ private interests and their duties to the Company.
The directors are not related by family ties.
Corporate officers are not bound to Renault or any of its subsidiaries by
service agreements that provide for benefits.
3.1.1.4 PREPARATION OF THE BOARD’S WORK
The Board of Directors appoints one of its members as Chairman.
The Chairman, who must be a natural person, may be re-elected.
The Board of Directors meets as often as the interests of the Company
requires. M eetings are convened at least five days in advance by the
Chairman. Deliberations are based on papers sent out with the notification
to attend. Exceptionally, documents may be sent out at a later date, if the
matter is urgent, it is impossible to do otherwise, or if the documents are to be
examined by a committee meeting after the notification was sent out.
The minutes of the Board meetings are made available to directors within a
reasonable period of time before being approved at the next Board meeting.
3.1.1.5 THE BOARD OF DIRECTORS IN 2013 The Board of Directors met eight times in 2013. Two of the meetings were
devoted to the Group’s organization and governance following the departure
of the Chief Operating Officer and the appointment of a Chief Competitive
Officer and a Chief Performance Officer.
Meetings lasted an average of two hours, except for the meeting devoted
to strategy, which took place over an entire day. During this meeting, the
directors visited the Renault test center, where they had a much-appreciated
opportunity to try out a large part of the vehicle range.
The attendance rate was 88% (more details by director in chapter 3.3.2.2).
During the year, the Board gave its opinion on all business placed on its
agenda pursuant to legal and regulatory requirements in France.
On the main matters, the Board took the action described below:
ACCOUNTS AND BUDGET
In particular, the Board:
W approved the Group’s consolidated financial statements and the individual
financial statements of Renault and Renault s.a.s. for 2012;
W set the appropriation of 2012 income to be proposed to the AGM, which
included a dividend payout;
W examined the consolidated financial statements for first-half 2013;
W approved the budget for 2014.
GROUP STRATEGY
In particular, the Board:
W reviewed progress in the Renault 2016 – Drive the Change plan, presented
by senior management and approved in 2011 by the Board of Directors;
W discussed Renault’s strategy in China in relation to the creation of the
Renault-Dongfeng joint venture, and the strategy in South Korea;
W reviewed the development of activities in Russia;
W discussed the strategy for research, development and innovation as well as
issues related to top-of-the-range vehicles;
W determined strategic issues to be examined in 2014.
CORPORATE GOVERNANCE
In particular, the Board:
W conducted an assessment of its operating methods in 2013 and put a
discussion of this subject on its agenda for early 2014 (the conclusions of
this discussion are found in chapter 3.1.1.7 );
W drew up the list of independent directors (see chapter 3.1.1.8 );
W took official note of the appointment of a new director representing the
State, Mr Pascal Faure, replacing Mr Luc Rousseau;
W revised the composition of its specialized committees following the renewal
of the terms of some directors, the appointment of a new director, and the
revision of the Afep-Medef Code in 2013;
W discussed the number and missions of its specialized committees having
led to a modification of its internal regulations;
(1) Percentage of Renault’s capital owned by the directors: 0.09 %.

Find out more at www.renault.comREGISTRATION DOCUMENT RENAULT 2013198
CORPORATE GOVERNANCE3 REPORT OF THE CHAIRMAN OF THE BOARD
W approved the change in the Group’s organization following the departure of
the Chief Operating Officer;
W determined the remuneration of the Chairman and Chief Executive Officer;
W assessed the achievement of performance criteria specified in the stock-
options and bonus shares plan for 2012;
W adopted the Chairman’s report pursuant to Article L. 225-37 of the
Commercial Code;
W examined and approved answers to shareholders’ questions ahead of the
AGM.
REGULATED AGREEMENTS
On April 6, 2010, Renault SA, Nissan, Daimler and RNBV concluded the
Master Cooperation Agreement, which sets forth the terms and conditions of
cooperation among these companies (see chapter 1.1.4.3). On December 13,
2013, the Board of Directors authorized the signing of an amendment to the
Master Cooperation Agreement expanding the scope of cooperation.
3.1.1.6 SPECIALIZED COMMITTEES OF THE BOARD OF DIRECTORS ✦
Five specialized committees have been set up to conduct in-depth
examinations of specific topics relating to the Board of Directors’ role. The
Board is informed of the committees’ opinions in reports made by their
respective Chairmen at Board meetings.
1. AUDIT, RISK AND ETHICS COMMITTEE (CARE)
CARE has six members: Mr Lagayette in the chair, Ms de la Garanderie,
Ms Sourisse, Messrs. Azéma (replacing Mr Kohler), de Croisset and Ostertag.
Four of the six are independent directors.
The composition of CARE was reviewed to ensure that all its members have
the financial or accounting knowledge or professional background needed to
deal with these subjects (see the directors’ biographies in chapter 3.1.1.2).
Mr Lagayette, the Committee’s Chairman, has spent his career in the
economics and finance sector, working both in government and the private
sector.
Ms de La Garanderie, former President of the Paris Bar, is a lawyer whose
experience enables her to take an active part in the discussions of accounting
and financial matters in this committee. Her involvement with ethical issues
during her career makes her membership of this committee particularly
appropriate.
Ms Sourisse has held executive positions in several major companies in
France and abroad. Her experience enables her to participate actively in all
the committee’s discussions.
Mr Azéma, the director representing the State, began his career at the
Government Accounting Office. He is currently Commissioner for State
Investments.
Mr de Croisset has worked as an auditor at the Treasury and the Ministry of
Finance. He has also held management positions and served as an officer in
several credit institutions. He is currently the International Advisor at Goldman
Sachs.
Mr Ostertag is a director representing the employee shareholders. Like
the employee directors, he receives special training to serve as a director,
including in the accounting and financial aspects of corporate management.
Owing to his excellent knowledge of the company, he is able to easily grasp
and actively participate in this committee’s work.
CARE met six times in 2013, with an attendance rate of 91.6% (details in the
table in chapter 3.3.2.2).
In compliance with French legal and regulatory requirements and the Afep-
Medef Code, the Audit, Risk and Ethics Committee dealt with the following
matters in particular:
W the Group’s consolidated financial statements and Renault’s individual
financial statements for 2012 and first-half 2013, as well as the related
financial news releases;
W a review of the 2013 internal audit plan and presentation of the plan for
2014;
W the external audit plan conducted by the auditors as part of their legal
auditing task;
W the independence and renewal of the appointment of the statutory auditors;
W the monitoring of financial risks and notably the situation in Iran;
W the work of the Ethics department;
W the status of the main legal matters being dealt with by the Legal
department.
One of the responsibilities of CARE is to review the efficiency of internal
control and risk management systems, as set out in chapter 3.1.4 below.
On this point, the committee’s examination of the financial statements, in the
presence of the Chief Financial Officer, was accompanied by a presentation
from the auditors describing the key points of their work and their conclusions
regarding the accounting policies used and the main regulatory developments
in this area. In addition, the CFO submitted a memo describing the Company’s
risk exposures and off-balance sheet commitments.
CARE also heard a report from the company’s statutory auditors without the
company’s senior executives being present.
2. REMUNERATION COMMITTEE
This committee has four members, all of whom are independent directors:
Mr Belda in the chair, Messrs. Desmarest, Garnier and Ladreit de Lacharrière.
In accordance with the Afep-Medef Code, as revised in 2013, this committee’s
membership has been changed so as to include a director representing the
employees. Mr Eric Personne has thus been a member of this committee
since February 12, 2014.
This committee met three times in 2013, with an attendance rate of 100%
(details in chapter 3.3.2.2).

REGISTRATION DOCUMENT RENAULT 2013✦ Global Reporting Initiative (GRI) Directives 199
CORPORATE GOVERNANCE 3
3
REPORT OF THE CHAIRMAN OF THE BOARD
The main items on its agenda were:
W the remuneration of the Chairman and CEO;
W the performance requirements for the variable remuneration of the
Chairman and CEO in relation to the Renault 2016 – Drive the Change plan;
W the achievement of performance requirements related to stock-option and
bonus share plans for 2012 for all benificiaries .
3. APPOINTMENTS AND GOVERNANCE COMMITTEE
This committee had five members in 2013: Mr Ladreit de Lacharrière in the
chair, Ms de La Garanderie, Messrs. Lagayette, Belda, and Ghosn.
In compliance with the Afep-Medef Code, as revised in 2013, Mr Ghosn has
not been a member of the committee since February 12, 2014.
Mr Azéma became a member of the committee on February 12, 2014.
Four of the committee’s five members are independent directors.
The committee met twice in 2013. The attendance rate was 80% (for details,
se chapter 3.3.2.2).
The main items on its agenda were:
W the reappointment of Ms La Garanderie and Messrs. Belda and Ostertag;
W the appointment of a new director, Ms Koike, replacing Mr Isayama;
W application of the rules on the proportion of female directors in light of the
forthcoming reappointments to the Board;
W the annual review of the Board of Directors;
W review of the list of independent directors pursuant to the criteria set out in
the Afep-Medef report;
W strengthening the powers of the Senior Independent Director;
W revision of the Board’s internal regulations, in particular with regard to the
revised Afep-Medef Code.
4. INTERNATIONAL STRATEGY COMMITTEE
This committee has nine members: Mr Desmarest in the chair, Ms Rih,
Messrs. Belda, Delpit, Faure, Garnier, Gentil, Personne and Saïkawa.
Four of the nine committee members are independent directors.
The committee met twice in 2013. The attendance rate was 88.8% (for
details, see chapter 3.3.2.2).
The main items on its agenda were:
W the development of Renault’s activity in Russia in the AVTOVAZ partnership;
W Renault’s activities in China and South Korea;
W Renault’s development in Brazil.
5. INDUSTRIAL STRATEGY COMMITTEE
The committee had seven members in 2013: Mr Garnier in the chair,
Messrs. Azéma, de Croisset, Desmarest, Faure, Gentil and Ostertag.
Ms Rih joined the committee on February 12, 2014.
Three of the eight members of this committee are now independent directors.
The committee met twice in 2013, with an attendance rate of 100% (details
in chapter 3.3.2.2). It reviewed industrial strategy, with a particular focus on:
W the impact of economic conditions on manufacturing in Europe;
W competitiveness agreements in France.
3.1.1.7 ASSESSMENT OF THE BOARD OF DIRECTORS ✦
In accordance with common practices and the recommendations of the
Afep-Medef Code, the Board carried out a self-assessment concerning its
composition, organization and functioning at its meeting on February 12,
2014. This assessment was performed by the Appointments and Governance
Committee, chaired by Mr Ladreit de Lacharrière.
Broadly speaking, the members of the Board expressed satisfaction with the
organization, functioning and composition of the Board and committees. They
noted continued improvement since 2011 and commended the directors’
freedom of expression.
The directors noted that the suggestions for changes they had made in the
2012 assessment had been acted on. In particular, they praised the efforts
to keep the Board informed between meetings when events so warranted.
In the discussion of Renault’s governance, the Board of Directors, on the
recommendation of the Appointments and Governance Committee, decided
that as of 2014, the Board assessment would be done regularly every three
years with the assistance of an outside consulting firm. The aim will be to gain
new perspectives on the Board’s functioning and governance best practices.
3.1.1.8 MANAGEMENT METHODS ✦
FUNCTIONS OF CHAIRMAN OF THE BOARD COMBINED WITH THOSE OF CHIEF EXECUTIVE OFFICER
On May 6, 2009, acting on a proposal from the Appointments and Governance
Committee, the Renault Board of Directors combined the functions of
Chairman of the Board and Chief Executive Officer. Mr Ghosn was appointed
Chairman and CEO and reappointed in 2010.
LIMITATIONS ON THE POWERS OF THE CHIEF EXECUTIVE OFFICER
The balance of power is ensured in particular by:
W the presence of a majority of independent directors on the Board of
Directors;
W the presence since July 2009 of a Senior Independent Director, chosen
from among the independent directors, whose role is described hereafter;
W limitations on the powers of the Chief Executive Officer, specified in the
internal regulation of the Board of Directors.

Find out more at www.renault.comREGISTRATION DOCUMENT RENAULT 2013200
CORPORATE GOVERNANCE3 REPORT OF THE CHAIRMAN OF THE BOARD
Independence of the Board of Directors ✦
At its meeting on February 12, 2014, the Board of Directors reaffirmed its
commitment to complying with the Afep-Medef Code, which is the fullest
statement of corporate governance principles.
The Board of Directors assesses the independence of each director on the
basis of the following criteria set for in the code. Thus, a director may not:
1) be an employee or officer of the Company, an employee or director of the
parent company or of a company within its scope of consolidation, or have
been any of these within the preceding five years;
2) be an officer of a company in which the Company sits directly or indirectly
on the Board of Directors, or of which an employee designated as such
or a Company officer (serving currently or within the past five years) is a
director;
3) be a significant customer, supplier, merchant banker, investment banker:
W of the Company or its group,
W or for which the Company or its group represents a significant portion of
its business;
4) have close family ties with a Company officer;
5) have been an auditor of the Company within the past five years;
6) have been a director for more than twelve years(1); in addition,
7) the independence of directors representing major shareholders of the
Company (10% or more of the capital or voting rights) must be assessed
on a case-by-case basis.
Acting on a proposal of the Appointments and Governance Committee, the
Board of Directors has drawn up the following list of directors who qualify as
independent: Ms de La Garanderie and Ms Sourisse, Messrs. de Croisset,
Belda, Delpit, Desmarest, Garnier, Ladreit de Lacharrière, Lagayette and
Riboud.
The Board of Directors has closely examined the situations of Messrs.
Ladreit de Lacharrière and Riboud, whose terms are up for renewal by the
General Meeting of April 30, 2014, in relation to the Afep-Medef Code’s
recommendation that a person should not serve as a director for more than
twelve years.
In accordance with the “Comply or Explain” rule, the Board has decided not to
follow this recommendation in the case of these two directors and to explain
the reasons for this decision in the table for the non-application of Afep-Medef
Code recommendations in chapter 3.1.1.9.
In particular, the Board of Directors has made its decision in view of the Board’s
independence rate. Under the rules of the Afep-Medef Code, the Board’s
independence rate is 66.6% (10 directors out of 15). It will be recalled that
Article 9.2 of the Afep-Medef Code specifies that directors representing the
employees and employee shareholders, of which there are four on the Renault
Board of Directors, are not counted in the calculation of this percentage.
Senior Independent Director
Mr Lagayette has served as the Senior Independent Director since April 29,
2011, and will do so for the duration of his term.
The Senior Independent Director was appointed after the functions of Chairman
and CEO were combined. His role consists in coordinating the activities of the
independent directors and providing a link between the independent directors
and the Chairman and CEO in his capacity as Chairman of the Board.
The Senior Independent Director’s tasks were broadened following the
Board’s review in 2013 of policies concerning the balance of powers. On
February 12, 2014, the Board modified its internal regulations so as to assign
new tasks to the Senior Independent Director. His role henceforth includes:
W advising the Chairman of the Board and the Chairmen of the specialized
committees;
W seeing that the directors are able to perform their role under the best
possible conditions and in particular that they are well informed before
Board meetings;
W managing and preventing conflicts of interest;
W making decisions concerning the proposed agenda of Board meetings;
W chairing Board meetings where the Chairman and CEO is not present.
In particular, the Senior Independent Director chairs discussions of
the performance of the Chairman and CEO in order to determine his
remuneration;
W convening the Board of Directors in exceptional circumstances after
obtaining the opinions of all committee Chairmen.
The current Senior Independent Director, Mr Lagayette, is the Chairman of the
Audit, Risk and Ethics Committee (CARE) and a member of the Appointments
and Governance Committee.
Limitations set forth in the internal regulations of the Board of Directors
The Board’s internal regulations provide that the Board of Directors will
examine annually the Group’s strategic policies put forward by the Chairman
and CEO, including those related to the Alliance. The Board reviews any
changes to those policies and gives its opinion before any major decision
inconsistent with the Company’s strategy is made.
The Chairman and CEO must obtain authorization from the Board of Directors
for any external growth operations involving acquisitions and for the disposal
of holdings in any company, whether existing or to be formed, when the
amount exceeds €250 million (see the internal regulations, chapter 3.4) and
informs the Board when the amount exceeds €60 million.
(1) According to this recommendation, the director ceases to qualify as an independent director on the expiration of the term during which the 12-year limit is exceeded.

REGISTRATION DOCUMENT RENAULT 2013✦ Global Reporting Initiative (GRI) Directives 201
CORPORATE GOVERNANCE 3
3
REPORT OF THE CHAIRMAN OF THE BOARD
3.1.1.9 THE “COMPLY OR EXPLAIN” RULEIn exercising the “Comply or Explain” rule provided for by Article L. 225-37 of the Commercial Code and Article 25.1 of the Afep-Medef Code, Renault is
following the recommendations of the Afep-Medef Code for corporate governance of publicly listed companies. The recommendations of this code that have been
disregarded and the reasons for doing so are summarized in the following table.
RECOMMENDATION OF
THE AFEP-MEDEF CODE COMMENT
Independence of Directors:Art. 8.4: Criteria for determining director independence: Among the criteria, the code recommends “not being a Director for more than twelve years.”
At its meeting on February 12, 2014, the Board of Directors reviewed the situations of Messrs. Ladreit de Lacharrière and Riboud with regard to the director independence criteria of the Afep-Medef Code.The Board noted that Messrs. Ladreit de Lacharrière and Riboud meet all of the code’s criteria except the one relating to the duration of their terms. Specifically, these directors exercise no functions in the Group and have no particular interests or special relationships linking them to Renault.To ensure the independence of directors, Afep-Medef Code recommends limiting the period a director may sit on the Board to twelve years. The Board concluded, however, that if this twelve-year limit were to be exceeded by Messrs. Ladreit de Lacharrière and Riboud, it would not call into question their independence.This is because the automotive industry has very long business and investment cycles. Approximately t welve-year vehicle life cycles, decisions concerning advanced research (the choice of energies, connected vehicles, self-driving vehicles) and capital investments, in particular for the construction of new plants, must be considered from a very-long-term point of view ( b etween 12 and 14 years ) . As a consequence, the Board judged that it would be valuable to keep two directors who had sufficiently broad vision to put the Group’s major strategic decisions in perspective.In addition, Messrs. Ladreit de Lacharrière and Riboud have been involved since the beginning in the creation and development of the Alliance, which has become a key element of the Group’s strategy. At a time when Renault and Nissan are seeking more convergence and synergies, the Board considered it crucial to keep directors who have detailed knowledge of the Alliance’s history and development, its structures and its workings, and also fully appreciate the cultural sensitivity that has made the Alliance a success.Mr Ladreit de Lacharrière is a prominent business leader who has worked in major multinational groups (eg, L’Oréal, Casino, France Telecom, and Air France). Owing to the various directorships he has held, he has an overall perspective that enables him to make an extremely valuable contribution to the discussions of Renault’s Board of Directors.His detailed knowledge of how Boards of Directors function and his experience in corporate governance ensure independence in his thinking and opinions.Mr Riboud’s experience as a corporate officer at Danone is a guarantee of his business expertise and his capacity to make a significant contribution to the Board’s discussions. His experience in international development, particularly in Asia, is a major asset for Renault’s expansion.His experience and natural authority also allow Mr Riboud to speak and express his opinions freely. This authority and freedom have not been diminished by the years he has served as a director, but are, on the contrary, a guarantee of independence.Considering these two directorss profiles and their work on the Board, the Board deems that the limitation on a director’s term is not relevant to Messrs. Ladreit de Lacharrière and Riboud and has decided not to apply this recommendation.
Audit Committee:Art. 16.1: Membership: “The members of the Audit Committee should have financial or accounting competencies.”
Out of a concern for balance, the Board of Directors has decided to have the director representing employee shareholders sit on the Audit, Risk and Ethics Committee.This director did not have any particular accounting or financial competencies when he joined the Audit, Risks and Ethics Committee in December 2012.However, since taking a seat on the Board, this director has regularly received specific training related to his role on the Board, notably with regard to accounting and finance.In addition, because of his thorough knowledge of Renault, he is able to easily grasp the issues and participate actively in this committee’s work.
3.1.1.10 PROCEDURES FOR SHAREHOLDERS TO TAKE PART IN GENERAL MEETINGSArticle 21 of the Company’s Articles of Association sets forth the procedures for shareholders to take part in General Meetings. These procedures are summarized
in chapter 5, “Renault and i ts Shareholders” (see chapter 5.1.2.2).
Factors that may be material in the event of a public offering, as stipulated in Article L. 225-100-3, are described in chapter 5.2.6.2.
3.1.2 PRINCIPLES AND RULES ADOPTED BY THE BOARD OF DIRECTORS FOR THE REMUNERATION OF SENIOR EXECUTIVES AND CORPORATE OFFICERS
Acting on a proposal of the Remunerations Committee, the Board of Directors
has laid down the rules for the remuneration of Mr Carlos Ghosn.
The Remunerations Committee carried out this task with the assistance
of a specialized consulting firm, using as a reference remunerations in
comparable companies in the CAC40 and in foreign companies working in
the same sector.
This remuneration is made up of:
W a fixed portion;
W a variable portion equivalent to a percentage of the fixed portion, whose
amount will be calculated in relation to performance criteria. The Board
of Directors determines the performance criteria and assesses their
achievement.

Find out more at www.renault.comREGISTRATION DOCUMENT RENAULT 2013202
CORPORATE GOVERNANCE3 REPORT OF THE CHAIRMAN OF THE BOARD
The variable portion may be up to 150% of the fixed portion if all the
performance objectives are achieved. If all the objectives were to be exceeded,
the variable portion could be 180% of the fixed portion.
The performance criteria set by the Board of Directors are:
W return on equity;
W operating margin;
W free cash flow;
W managerial performance, assessed qualitatively.
Twenty-five percent of the variable portion is paid in cash. The balance (the
“deferred variable portion”) is paid in shares according to the terms and
conditions described below.
The shares received as the deferred variable portion may not be acquired until
four years after they are granted and on condition that:
W Mr Ghosn is still employed by Renault;
W performance criteria, assessed for a period of three years from the time the
shares are granted, are met.
The number of shares acquired by Mr Ghosn is determined by the amount
of the deferred variable portion, the risk of the non-payment of this deferred
variable portion, and the degree to which the performance criteria have been
achieved.
All detailed information concerning the remuneration of the Chairman and
Chief Executive Officer is found in chapter 3.3.1.
3.1.3 ETHICS: RULES, PROCEDURES AND ORGANIZATION ✦
The Group ethics manager, who was appointed in late 2011, reports directly
to the Chairman and CEO. He also informs the Board of Directors and the
Audit, Risk and Ethics Committee (CARE) of actions taken under his authority.
His three main objective are to:
W reinforce the Group’s body of ethical doctrine in order to contribute to the
application of all legal requirements, regulations, standards and obligations;
W put in place regulatory and organizational procedures:
W set up and coordinate the Ethics and Compliance Committee (CEC),
W manage through the personal data protection correspondent
(Correspondant informatique et liberté – CIL) issues related to the
regulations and recommendations of the French data protection authority
(Commission nationale de l’informatique et des libertés – CNIL),
W set up a whistleblowing procedure in compliance with regulatory
requirements, including those of the CNIL,
W create and support an ethics correspondents network in the countries;
W implement the ethics policy and represent Renault with official entities and
in meetings and seminars relating to ethical issues in order to affirm the
Group’s presence in this field, both inside and outside the company.
FIRST OBJECTIVE: THE BODY OF DOCTRINE
THE CHARTER OF ETHICS
The Charter of Ethics sets out the Group’s key principles and fundamental
values and is applicable worldwide.
It is intended for all 121 ,000 employees in the more than 120 countries where
the Group is present.
It has been translated into 14 languages and is distributed to each employee
by his or her management. The Charter of Ethics is also available from the
company’s intranet site in the Ethics section and from the Renault Web portal.
Employees must indicate that they are familiar with this Charter during their
annual performance appraisal.
THE “ETHICS IN PRACTICE” GUIDE
This guide is a practical interpretation of the Charter. Available in the Ethics
section of the company’s intranet site, it helps answer any questions that may
arise regarding ethical issues in one’s work.
One specific feature of this guide is that it can be adapted according to new
ethical issues reported by operational staff.
THE CODES OF GOOD CONDUCT
Six codes of good conduct have been drawn up for business functions with
major ethical requirements: safety, information technology, governance,
purchasing, stock exchange and sales. Their aim is to explicitly set out what
employees must do and, more particularly, what they must not do. They are
available in the Ethics section on the intranet.
The code of good conduct for Safety comprises nine technical sheets that
set forth the regulatory and ethical framework, related procedures, and the
codes of good conduct in the safety functions.
The code of good conduct for Information Technologies is intended for
everyone who works in the information technologies area and consists of four
technical sheets.
The code of good conduct for Governance, which exists in eleven
languages, is intended for the company’s top management. The Chairman
and CEO has formally stated its purpose: to set forth the values to which
Renault executives are to adhere. This code of good conduct has been given
individually to 150 members of the company’s top management.
The code of good conduct for Purchasing has been prepared for employees
who do purchasing for Renault. It goes along with the recommendations in the
Renault-Nissan CSR Guidelines for Suppliers.
The code of good conduct for the stock market, which pertains to the
Renault group’s financial communications policy and the prevention of
insider trading, is systematically given to everyone who may be privy to inside
information.

REGISTRATION DOCUMENT RENAULT 2013✦ Global Reporting Initiative (GRI) Directives 203
CORPORATE GOVERNANCE 3
3
REPORT OF THE CHAIRMAN OF THE BOARD
New codes of good conduct will be added to the body of doctrine of the
Renault group in 2014.
For example, the code of good conduction for Sales and Marketing is to
be validated by the end of the first quarter of 2014.
SECOND OBJECTIVE: REGULATORY AND ORGANIZATIONAL PROCEDURESIn 2013, the Ethics manager met regularly with the Chairman and CEO to
report on the progress in his work and on proposed actions. He also gave
a report on two occasions to the Board of Directors and six times to the
Chairman of the Audit, Risk and Ethics Committee (CARE), including twice
with the full committee present.
THE ETHICS AND COMPLIANCE COMMITTEE (CEC)
The Ethics and Compliance Committee is made up of representatives
from the following functions and departments: auditing, risk management
and organization, legal, human resources, corporate social responsibility,
environment, Group prevention and protection, finance, technical regulations
and homologation. It met four times in 2013.
This committee contributes to creating internal jurisprudence for the
processing of ethics-related cases and responds to all requests for assistance
and advice within this field of expertise. Over the past two years, it has dealt
with 65 ethics-related cases.
THE FRAUD AND CORRUPTION PREVENTION COMMITTEE (CAFC)
The Fraud and Corruption Prevention Committee is chaired by the Ethics
manager and composed of the following CEC members: legal, human
resources, safety and internal control. It met six times in 2013. In particular, it
monitored progress in a project begun in 2013 concerning the prevention of
fraud and corruption. The Ethics manager reported on the work of the CAFC
at the CEC meetings.
DATA PROTECTION CORRESPONDENT (CIL)
The CIL, who reports to the Ethics department, is responsible for seeing
that the company meets its legal obligations and for supporting Renault’s
commitment to respecting the private lives and personal data of its employees
and customers. This involves heightening employees’ awareness of these
issues, instituting procedures, leading a network of internal correspondents,
serving as a liaison to the CNIL, exchanging best practices with Nissan,
participating in working groups focused on new regulations, and preparing
professional codes and guidelines.
THE WHISTLEBLOWING PROCEDURE
The whistleblowing procedure, which is applicable worldwide, strictly complies
with the most recent regulatory requirements. It is combined with a procedure
involving the compulsory completion of a number of documents to avoid any
errors, oversights or shortcomings. These documents have been approved by
the CNIL. A description of this procedure is available to all employees in the
Ethics section of the intranet.
NETWORK OF COUNTRY ETHICS CORRESPONDENTS
Ethics correspondents approved by the Renault Ethics manager are being
progressively appointed in the countries. They will lead local Ethics and
Compliance Committees, which will ensure that laws and regulations
specific to the countries in which the Renault group operates are taken into
account. These committees will see to the implementation of the missions
and prerogatives of the Group Ethics and Compliance Committee, with the
agreement and support of the Ethics manager as the final authority. Five
country ethics correspondents were appointed in 2013, in Romania, Algeria,
Morocco, Colombia and India.
THIRD OBJECTIVE: DEPLOYMENT OF THE POLICY AND ENHANCEMENT OF THE GROUP IMAGEInternally: The Ethics department has developed materials for training in
ethical practices and the prevention of fraud and corruption. Some of these
materials have been prepared in cooperation with the NGO Transparency
International France.
Communicating the ethics policies to all employees calls first for enlisting
the involvement of top management through sessions to build awareness in
the Group’s governance bodies (regional management committees, executive
committees, etc.).
The business functions are progressively introducing the recommendations of
the codes of good conduct drawn up specifically for their employees. As part
of this process, the Group Prevention and Protection department (D2P) held
an internal convention during which the Group Safety Code was presented
and explained.
Externally: To enhance the Group’s image externally, the Ethics manager is
a member of the Board of Directors of the Cercle éthique des affaires, an
association of ethics and compliance professionals in France.
The Renault Ethics department is a member of the Ethics Commission
of the Institut français des administrateurs (IFA), whose role is to develop
recommendations for ethics best practices for corporate governance bodies.
The Ethics department has presented Renault’s ethics policy at conferences
and roundtables organized by universities, leading engineering and business
schools, public and semi-public organizations, and the press.
In its 2012 evaluation submitted to the Prime Minister and the Minister of
Justice, the Corporate Corruption Prevention department (SCPC) ranked
Renault among the top eight corporations in the CAC 40 for its corruption
prevention reporting.
ACTIONS IN 2014In 2014, the emphasis will be placed on communicating and firmly anchoring
ethics policies to reinforce an approach to ethics shared by everyone. The
creation of structures (CECP) to promote these policies at the local level will
be continued.

Find out more at www.renault.comREGISTRATION DOCUMENT RENAULT 2013204
CORPORATE GOVERNANCE3 REPORT OF THE CHAIRMAN OF THE BOARD
“Training packs” have been provided to the business functions and the
country ethics correspondents to aid in the dissemination of best practices
at the local level. Directives and recommendations related to the prevention
of fraud and corruption will be formalized and personnel informed of them.
In 2014, the CIL will be deploying the Group policy. This will include
broad promotion of a culture of personal data protection, the creation of
a special section on the intranet, the development of a network of country
correspondents, and support for Renault’s implementation of the European
regulation currently in preparation.
3.1.4 INTERNAL CONTROL AND RISK MANAGEMENT PROCEDURES ✦
3.1.4.1 GROUP OBJECTIVES AND STANDARDS FOR INTERNAL CONTROL AND RISK MANAGEMENT
INTERNAL CONTROL AND RISK MANAGEMENT OBJECTIVES
The Renault group has adopted organizational structures and procedures to
contain the risks inherent in its activities and to limit their negative impact.
This internal control system is implemented in all the Company’s businesses
and activities. Its primary objectives are to:
W identify and manage risks to which the Company is exposed;
W ensure compliance with laws, regulations and the Company’s by-laws;
W control quality, cost and delivery times in its activities;
W ensure that financial, accounting and management disclosures are reliable,
relevant and of a high standard.
These structures and procedures cannot, however, offer an absolute
guarantee that internal control objectives will be achieved.
REGULATORY FRAMEWORK FOR INTERNAL CONTROL
Since 2007, the Renault group has applied the reference framework and
implementation guidelines of the French securities regulator, AMF, which
were updated in July 2010, and the recommendations of the Audit Committee
working group published in July 2010.
In its sales financing activity, RCI Banque is subject to banking and financial
regulations. It accordingly applies the internal control framework specified by
Regulation 97-02, as discussed in chapter 3.1.4.4 (Sales Financing).
3.1.4.2 MANAGEMENT OF OPERATIONS AND INTERNAL CONTROL
ROLE OF THE EXECUTIVE BODIES
Management Committees operating at two levels oversee the Group’s
operations:
W level 1 committees, whose scope covers the entire Group, include (see
paragraph 1.1.5):
W the Group Executive Committee (GEC), which is in charge of strategic
orientations and decisions. Headed by the Chairman and Chief Executive
Officer, its members are: the Chief Competitive Officer; the Chief
Performance Officer; the Executive Vice-President (EVP), Group Sales
and Marketing; Executive Vice-President (EVP), Group Human Resources;
the EVP, Group Engineering, Quality and Information Technologies; the
EVP, Group Product, Programs and Light Commercial Vehicles; the EVP,
Group Manufacturing and Supply Chain; the EVP, Chairman of Europe
Region operations; the EVP, Chairman of France operations; the Group
Chief Financial Officer and Chairman and CEO of RCI Banque; and the
EVP, CEO Office. Its decisions are submitted to the Board of Directors
for approval when they fall under the Board’s authority, following the
recommendation, if need be, of the International Strategy Committee
and Industrial Strategy Committee. The Chairman and CEO reports to
the Board of Directors on their implementation. The Group Executive
Committee oversees operations and controls the execution of directives
by monitoring budget commitments and strategic objectives as well as
policies and operations in the Regions, programs and corporate functions,
W the monthly “O perational R eview” committee , headed by the Chairman
and Chief Executive Officer, is responsible for operational decisions. It
has the same members as the Group Executive Committee, with the
Chairmen of regional operations, the EVP, Purchasing, and the EVP, Group
Performance and Control,
W specialized committees (eg, Project Product Committees) headed by
either the Chairman and CEO or, by delegation, the Chief Competitive
Officer. They make decisions at Group level as well as in the Group’s
cooperative undertakings within the Renault-Nissan Alliance (including
with AVTOVAZ and Daimler);
W level 2 committees, which are specialized by general management area
or by function (for example, engineering and quality, planning, products,
programs, manufacturing and logistics, sales and marketing, purchasing,
design, legal, Office of the CEO, etc.) or by Region.
The operating rules and characteristics of these committees – Chairman and
membership, frequency, length and agenda of meetings, reporting methods,
communication of decisions, and the archiving of minutes – are formally
recorded in a standardized catalogue.
There is a Regional Management Committee (RMC) for each Region (Europe,
Euromed-Africa, Americas, Asia-Pacific and Eurasia). Each RMC is made up
of representatives of the corporate functions and vehicle programs as well as
managers from the main countries in each Region.
There are Programme departments for the automotive segments as well
as for the electric vehicle programs and the development of new mobility
offerings. The Programme departments are assigned long-term profitability
objectives for the life cycles of the products they develop, manufacture and
market. They receive support from the Regions and corporate functions.

REGISTRATION DOCUMENT RENAULT 2013✦ Global Reporting Initiative (GRI) Directives 205
CORPORATE GOVERNANCE 3
3
REPORT OF THE CHAIRMAN OF THE BOARD
In addition to command-line structures, the Group has set up a staff reporting
system so that support function managers can provide leadership for their
function correspondents throughout the Group.
Strategic decision-making, supervision of financial and legal matters, human
resources, and the Audit, Risk Management and Organization department
(DAMRO) are under the direct managerial authority of the Chairman and CEO.
The Chief Competitive Officer and the Chief Performance Officer are directly
responsible for operational decisions.
The decision-making process is based on a system of internal delegation
that determines in which areas and at which levels operational managers
may make decisions. All the rules for delegating decision-making authority
are communicated to the personnel over the intranet. When a decision is
required, a workflow chart specifies the persons involved, in accordance with
internal control procedures.
Decisions concerning certain transactions, and notably those related to the
capital of the subsidiaries, disposals/acquisitions, partnerships, cooperation,
and the hedging of raw materials and currency risks, along with general
policies, are made following a special review by a committee of experts, which
gives an opinion. The final decision is then made by the Chairman and Chief
Executive Officer.
RISK MANAGEMENT, INTERNAL CONTROL AND ETHICS SYSTEM
In 2011 the Group adopted a new organization for governance, ethics, internal
control and risk management. It is part of the ethics system described in
paragraph 3.1.3 and supplemented by the following:
W a Risk and Internal Control Committee (CRCI), whose role is to deploy the
risk and internal control system across all the Group’s operational activities
and entities;
W an Audit, Risk Management and Organization department (DAMRO),
reporting directly to the Chairman and CEO and comprising the
Organization department, the Risk Management department, the Internal
Control department and the Internal Audit department.
In addition to the information set out in paragraph 3.1.3 above, the following
points should be mentioned with regard to the multi-year action plan for the
deployment of this system:
W the Ethics and Compliance Committee focused on the following areas in
2013:
W the setting of policies and deployment of the system for fighting fraud
and corruption,
W the validation of regulatory compliance procedures in 16 areas;
W the Risks and Internal Control Committee addressed the following subjects:
W diagnosis by risk owners of the level of control of risks identified in the
risk mapping done in 2012,
W validation of additional plans proposed by risk owners to improve the
level or control,
W validation of the multi-year project to secure the main company
processes.
Last, the means for combatting fraud and corruption were strengthened
during the year. In addition to the work described in paragraph 3.1.3, risks
and categories were mapped, and the roles and responsibilities of those
involved were clarified.
MANAGEMENT OF INTERNAL CONTROL
In compliance with the AMF’s general rules for internal control, and respecting
the principle of the separation of tasks, Renault’s internal control system is
based on:
W the senior management, which determines the Group’s objectives in
agreement with the Board of Directors and its specialized committees. It
decides on the operating rules and procedures as well as the quantified
performance objectives;
W within DAMRO, the Internal Control department, which defines and
prescribes internal control principles, rules and techniques pertaining to
operational processes as well as accounting and management processes.
Implementation and management of the internal control system are
performed by:
W management, which adapts and applies within its scope of responsibility
the internal control rules and methods defined at Group level;
W employees, who are expected to comply with the internal control system
established for their work areas and with the Group code of ethics;
W management control, which ensures that all personnel comply with
management rules.
Permanent oversight to verify that the system is properly and effectively
applied is provided by:
W the Internal Control department, using internal control questionnaires in
self-assessment programs. It also sees that action plans are carried out if
any shortcomings are observed;
W the Risk and Internal Control Committee (CRCI), which assesses the
effectiveness of the risk control system;
W the Internal Audit department in DAMRO, which makes independent
and objective assessments of the degree of control over operational
performance, gives advice and recommends improvements to the control
system, gives senior management reasonable assurance of the degree of
control over operations via a summary report presented to the Audit, Risk
and Ethics Committee (CARE) and the GEC;
W the CARE, whose missions are defined in chapter 3.4.3 .1 .
As part of their mission, the statutory auditors assess the internal control of
the preparation and treatment of accounting and financial data and, when
necessary, issue reports and recommendations.
3.1.4.3 INTERNAL CONTROL OBJECTIVES
IDENTIFYING AND MANAGING RISKS
The global risk management system has been formally set out by the Risk
Management department (DMR) in a document that informs everyone of the
organization and methods used by the Company.

Find out more at www.renault.comREGISTRATION DOCUMENT RENAULT 2013206
CORPORATE GOVERNANCE3 REPORT OF THE CHAIRMAN OF THE BOARD
The Group applies a risk management method based partly on identifying
a wide range of risks, which are then mapped, and partly on carrying out
action plans to deal with risks by eliminating, preventing, guarding against
or transferring them. This method applies to the Group, entities and projects.
To carry out its duties, the Risk Management department relies on two
networks:
W o ne is made up of experts who manage a specific area of risks. These may
be risks common to any company or specific to Renault’s sector of activity.
These experts are the consultants for the standardized risk management
plans in their area of expertise;
W t he other network is made up of correspondents, chiefly from the
management control function for the entities and from the quality function
for projects. They liaise with the DMR in the operational implementation of
risk management approaches in entities and projects.
To draw up the audit plan for the Company’s major risks, which is validated by
senior management and approved by the CARE, the Internal Audit department
uses risk maps to identify the most pertinent audit themes and assess risk
coverage. Through its auditing task, the Internal Audit department provides
the DMR with insight on the effective level of management of major risks.
In 2013 the Risk Management department focused on:
W deploying risk maps for the main vehicle development projects;
W updating methodological standards to take into account feedback from
the deployment of risk management procedures in the Group’s operational
entities;
W strengthening processes to improve the management of major risks
identified in the mapping in 2012.
The risk factors to which the Group is exposed are described in chapter 1.5.
COMPLIANCE WITH LAWS, REGULATIONS AND COMPANY RULES
Compliance with laws and regulations is a major objective of internal control,
which must see that the means for assuring regulatory compliance are
available. This control is provided by the Ethics and Compliance Committee
(CEC). Within the Internal Control department, the Regulatory Compliance
department is responsible for working with the decision-making departments
(technical regulations, legal, human resources, environmental, etc.) to see
that reliable procedures are in place to guarantee regulatory compliance.
In 2012, the Regulatory Compliance department developed a method
to assess existing procedures, approved by the CEC. This method will be
gradually deployed in all areas subject to regulation to regularly assess the
level of control.
CONTROL OF OPERATIONS
Senior management updates and communicates Renault’s overall objectives,
in line with the multi-year plan and annual budgets, as well as the allocation
of resources to the Regions, businesses and programs. Group Management
Control draws up an instruction memorandum for each of the operational
sectors, Regions, businesses and programs. These memorandums include
macroeconomic assumptions to be taken into account (exchange rates,
interest rates, inflation rates, raw materials prices, etc.), financial and non-
financial indicators that will be measured over the course of the following
financial year, the calendar, and the segmentation of the activity scope.
Each Region sends these instructions to the subsidiaries within its scope of
responsibility after adding elements specific to business functions.
The management control function stimulates and measures economic
performance at the various levels of the organization (Group, operational
sectors, Regions, businesses, programs).
Management control is decentralized so as to take account of the specifics of
each business. Its mission is laid out in instructions prepared periodically by
the Corporate Control and Reporting department.
In the Group’s management model, its role consists in:
W adjusting the Company’s economic objectives and budget;
W coordinating the Group by measuring the performance of its entities,
Regions, businesses and vehicle programs and, in particular, monitoring
free cash flow indicators;
W coordinate the internal control system in the entities;
W making an economic analysis of proposed management decisions at every
level, checking compliance with standards, plans and budgets, assessing
economic relevance, and formulating an opinion and recommendation in
each recommendation.
Operating procedures and methods
The Group provides operational staff with a set of standard management
procedures for use in determining accounting and financial data.
All the documentation is available to staff in all the Group’s entities through
the intranet portal for the management, internal control and risk management
functions. Documentation includes:
W all standards, rules and instructions, whether they pertain to a specific
business or apply across the entire Group;
W an economics dictionary to help employees better understand the main
concepts and aggregates used to guide the Group’s business performance;
W internal control and risk management.
Information systems
The risk management and internal control systems of the Renault Information
Systems department (RI D) are managed as follows:
W general risks related to financial processes (investments, purchases,
profitability measurement, etc.) are monitored by the Economic
Performance department of the DI-R;
W specific risks related to operational IT processes (declining quality or
productivity in development activities, operations, support, skills, etc.) are
monitored by the Renault Information Systems – Organization department
(DI-RO). This department is responsible for defining and monitoring these
processes (project management, operational quality, support, etc.) at Group
level. It uses the DI-R performance indicators (incidents, results, etc.) and
a self-assessment questionnaire concerning DI-R procedures that is
completed by the sites, subsidiaries and Corporate departments;

REGISTRATION DOCUMENT RENAULT 2013✦ Global Reporting Initiative (GRI) Directives 207
CORPORATE GOVERNANCE 3
3
REPORT OF THE CHAIRMAN OF THE BOARD
W risks related to information systems security (interruptions of IT operations
due to malevolence, theft of confidential data or destruction of electronic
data) are also monitored by the Renault Information Security department
(DI-RS) through:
W a Group-level IT Risks Committee set up by the DI-R in collaboration with
the Protection and Prevention department (D2P), the Risk Management
department, and representatives of the main operational departments
and the Information Management Program,
W Security Monitoring Committees, which verify the application of IT security
procedures at operational level in accordance with our Information
Systems Security Policy (PSSI) and international best practice (ISO 27001
policy and approach),
W an organizational structure for approving the architecture and security
levels in projects,
W compliance reviews carried out by the DI-RS in addition to the controls
performed by DAMRO or the Group Prevention and Protection department
(D2P).
A training system to adapt skills
The main corporate business lines and functions have set up schools to raise
the professional standards of their staff. These schools reflect their strong
belief in employee training as a way to enhance performance and to better
satisfy management expectations.
Work on the internal control system
Key developments in 2013 included:
W completion of the development of the general internal control system
begun in 2012 specifying the structure and scope of the self-assessment
questionnaires at the Group level;
W review of the questionnaires on the distribution activities of Renault Retail
Group following organizational changes and the simplification of the
information systems questionnaire;
W continuation of a multi-year, Group-wide project aimed at bringing
together everyone involved in the company’s risk control processes. This
approach focusing on operational risks is crucial to securing processes
and performance.
QUALITY, RELIABILITY AND RELEVANCE OF ACCOUNTING, FINANCIAL AND MANAGEMENT INFORMATION
The internal control system for accounting and financial data is based on the
AMF reference framework updated in 2010. It covers not only the processes
for preparing financial data for the accounts, forecasting and financial
reporting, but also the operational processes upstream that go into the
production of this information.
The Group’s information systems enable it to simultaneously produce accounts
according to local accounting rules and those of the Group. This mechanism
ensures that data remain consistent even though they are centralized and
consolidated in short timeframes. The administrative and financial directors of
the subsidiaries, under the operational authority of the subsidiaries’ Chairmen
and CEOs and the functional authority of the director of Group Accounting
(DCgr), are responsible for preparing the financial statements.
The Group has a manual setting out presentation and evaluation standards.
This manual is updated annually and provided to all entities so that financial
information is reported in a uniform manner.
Principles applied in preparing the financial statements
The Renault group’s consolidated financial statements are prepared
under International Financial Reporting Standards (IFRS), published by the
International Accounting Standards Board (IASB) and endorsed for application
by a regulation published in the Official Journal of the European Union at
year-end close.
The Group Accounting department, which is under the direct authority of the
Group’s Chief Financial Officer, has an “Accounting Standards and Rules”
unit. The department has the authority to enforce prevailing accounting rules.
Company employees are regularly informed of changes and updates to IFRS.
The Renault group, whose activities are divided into two separate operational
sectors – Automotive and Sales Financing (RCI Banque) – prepares its
consolidated financial statements using a single consolidation system based
on an accounting Charter common to all consolidated entities.
The Group publishes half-yearly and annual statements. These statements
are prepared on the basis of two closing dates: May 31 for the end-
June statement and October 31 for end-December statement. Summary
meetings are organized with the statutory auditors and attended by senior
management as part of an ongoing process of dialogue with the latter. The
CARE is involved at every key stage of the approval process for financial and
accounting disclosures.
Key components of the process for controlling financial and accounting disclosures
The Renault group manages the decentralized operations of the subsidiaries
in its two business divisions in France and abroad by relying on two key
strategies that deliver high-quality accounting and financial information while
reducing the time needed to prepare the financial statements:
W operational systems upstream from accounting are standardized as far as
possible;
W ERP financial and accounting modules chosen by the Group are introduced
at industrial and/or commercial entities worldwide.
This highly structured software package ensures that processed data are
reliable and consistent. In particular, the definition and monitoring of user
profiles helps to ensure that the rules of task separation are respected.
Control of basic transactions handled by operational systems, where the
initial control takes place, is key to ensuring that accounting and financial
data are reliable. The operational systems feed data to the auxiliary
accounting systems through a number of interfaces. These interfaces, which
are continually monitored to ensure they capture all economic events for

Find out more at www.renault.comREGISTRATION DOCUMENT RENAULT 2013208
CORPORATE GOVERNANCE3 REPORT OF THE CHAIRMAN OF THE BOARD
each upstream process, then rapidly and regularly send these data to the
centralized accounting system.
The accounting teams have worked with IT staff to develop a security process
to protect the ERP in the event of a major malfunction. A business continuity
plan has been introduced at central level as well as at the subsidiaries that
use ERP.
Statutory Auditors’ Charter
In connection with legal audit, Renault took the initiative in 2004 of drafting
a Charter concerning the engagements and independence of the statutory
auditors and signing it with them. This Charter governs the relationship
between the Renault group (the parent company and the fully consolidated
French and foreign subsidiaries) and its statutory auditors. To renew the
appointment of the statutory auditors, a request for proposals was made in
2013. The Charter will be updated in 2014.
Financial communication
Given the growing importance of financial communication, its multiple forms,
and the vital need to provide a high standard of financial disclosure, the
Renault group has turned over all its financial communication to the Financial
Relations department in the Financial department and given it the resources
to supply the reliable, high-quality information required.
The Financial Relations department is in charge of:
W the preparation of the half-yearly and annual financial reports and quarterly
data as well as the filing of the RD with the AMF;
W communication with financial markets;
W relations with analysts and investors specialized in socially responsible
investments;
W relations with investors and individual shareholders;
W relations with the regulatory authority (AMF).
3.1.4.4 SALES FINANCING: RCI BANQUEIn compliance with Regulation 97-02 on internal control at credit institutions,
RCI Banque has set up an internal control system that also seeks to identify
and analyze the main risks that may compromise the Company’s objectives;
ensure that procedures are in place for managing those risks; and monitor
the corrective and preventive measures aimed at mitigating the likelihood of
their occurrence.
This special framework for credit institutions is described in RCI Banque’s
Internal Control Charter, which defines the target framework for the entire RCI
Banque group. It describes in particular:
W the general arrangements for managing internal control;
W the local arrangements for credit subsidiaries, branches and joint ventures;
W the special arrangements for various functional areas.
The RCI Banque group internal control system has three levels of audit:
W level 1 consists of self-inspection mechanisms for each department and
geographical location. These entities are responsible for, among other
things, applying existing procedures and performing all related controls
in their own area of operations. Being primarily operational, first-level
control is carried out by process owners in each subsidiary, who have been
specially trained for this purpose. It covers all main risks;
W level 2 is directed by the Permanent Control department and led by
local internal controllers independent of operating units, who ensure that
operations are lawful and compliant;
W level 3 is conducted by independent oversight bodies (supervisory
authorities, specially commissioned independent firms, etc.) and by the
Periodic Control department. In this respect, Renault’s Internal Audit
department supplies RCI Banque with additional resources under an
external service provider agreement to carry out its Level 3 audits either as
part of an annual audit plan approved by the Audit and Accounts Committee
or at the request of the Chairman and CEO of RCI Banque.
These arrangements are directed by:
W the RCI Banque Board of Directors, whose role is to implement internal
control. The Board devotes at least one meeting a year to a full review of
the internal control system in order to sign off on the annual report on
internal control, which is based on the work of the Audit and Accounts
Committee and submitted to the French Banking Authorities (Banque de
France);
W RCI Banque Audit and Accounts Committee, which operates under
the authority of the Board of Directors and is responsible for assessing
the standard of internal control and especially the systems used to
measure, supervise and manage risks. It examines the draft company and
consolidated financial statements and ensures that the methods used to
prepare them comply with standards. It reviews the statutory auditors’
summary report, gives its opinion of the statutory auditors’ work, and
sees that the rules guaranteeing their independence are adhered to. The
committee meets twice a year, and its members are appointed by the
Board of Directors from among its members;
W RCI Banque Internal Control Committee, which comprises all the
members of the Executive Committee and meets four times a year to
assess the quality of the internal control system and the related systems,
stays abreast of trends in operational risks and monitors the compliance
mechanism. It provides the Audit and Accounts Committee and the Board
of Directors with the information they need to carry out their tasks;
W special-purpose committees composed of members of the Executive
Committee regularly monitor the risk areas covered by Regulation 97-02:
i.e., they monitor the Group’s exposure to credit risk, analyze the overall
profitability of Group companies as well as the profitability of each type
of product; control the Group’s exposure to financial risks (interest rates,
liquidity, currencies, counterparties), and ensure that operations are
compliant in light of the list of authorized products.

REGISTRATION DOCUMENT RENAULT 2013✦ Global Reporting Initiative (GRI) Directives 209
CORPORATE GOVERNANCE 3
3
STATUTORY AUDITORS’ REPORT, PREPARED IN ACCORDANCE WITH ARTICLE L.
3.2 STATUTORY AUDITORS’ REPORT, PREPARED IN ACCORDANCE WITH ARTICLE L. 225-235 OF THE FRENCH COMPANY LAW (CODE DE COMMERCE), ON THE REPORT PREPARED BY THE CHAIRMAN OF THE BOARD OF DIRECTORS OF RENAULT
This is a free translation into English of the statutory auditor’s report issued in French prepared in accordance with article L.225-235 of French Company Law (Code
de Commerce) on the report prepared by the Chairman of the Board of Directors of Renault on the internal control and risk management procedures relating to the
preparation and processing of accounting and financial information issued in French and it is provided solely for the convenience of English speaking users. This
report should be read in conjunction with and construed in accordance with, French law and the relevant professional standards applicable in France.
Year ended December 31, 2013
To the Shareholders,
In our capacity as statutory auditors of Renault and in accordance with article L. 225-235 of the French company Law (Code de commerce), we hereby report on the report
prepared by the Chairman of your company in accordance with article L. 225-37 of French company Law (Code de commerce) for the year ended December 31, 2013.
It is the Chairman’s responsibility to prepare and submit to the Board of Directors for approval a report on internal control and risk management procedures
implemented by the company and to provide the other information required by article L. 225-37 of the French company Law (Code de commerce) particularly in
terms of corporate governance.
It is our responsibility:
W t o report to you on any matters as to the information contained in the Chairman’s report in respect of the internal control and risk management procedures
relating to the preparation and processing of the accounting and financial information, and
W t o attest that the report includes the other information required by article L. 225-37 of the French company law (Code de commerce). It should be noted that
we are not responsible for verifying the fairness of these disclosures.
We conducted our work in accordance with professional standards applicable in France.
Information on internal control and risk management procedures relating to the preparation and processing of accounting and financial information
The professional standards require that we perform the necessary procedures to assess the fairness of the information provided in the Chairman’s report in respect of the
internal control and risk management procedures relating to the preparation and processing of the accounting and financial information. These procedures consist mainly in:
W obtaining an understanding of the internal control and risk management procedures relating to the preparation and processing of the accounting and financial
information on which the information presented in the Chairman’s report is based and of the existing documentation;
W obtaining an understanding of the work involved in the preparation of this information and of the existing documentation;
W determining if any material weaknesses in the internal control procedures relating to the preparation and processing of the accounting and financial information
that we would have noted in the course of our work are properly disclosed in the Chairman’s report.
On the basis of our work, we have no matters to report on the information in respect of the company’s internal control and risk management procedures relating
to the preparation and processing of the accounting and financial information contained in the report prepared by the Chairman of the Board of Directors in
accordance with article L. 225-37 of the French company Law (Code de commerce).
Other information
We hereby attest that the report prepared by the Chairman of the Board of Directors also contains the other information required by article L. 225-37
of the French company law (Code de commerce).
Neuilly-sur-Seine and Paris-La Défense, February 19, 2014
French original signed by the statutory auditors
DELOITTE & ASSOCIE S ERNST & YOUNG Audit

Find out more at www.renault.comREGISTRATION DOCUMENT RENAULT 2013210
CORPORATE GOVERNANCE3 REMUNERATION OF SENIOR EXECUTIVES
3.3 REMUNERATION OF SENIOR EXECUTIVES
3.3.1 REMUNERATION OF THE EXECUTIVE DIRECTOR ✦
In accordance with the Afep-Medef recommendations and with the position
of the French securities regulator, Autorité des marchés financiers (AMF), the
executive director does not also hold an employment contract with Renault.
3.3.1.1 COMPONENTS OF REMUNERATION ✦The components of the remuneration due or attributed to the executive
director in respect of 2013, which will be submitted for a consultative opinion
to the shareholders at the General Meeting to be held on April 30, 2014,
are set forth in this chapter and summarized in a table in chapter 6 of the
Registration document.
FIXED AND VARIABLE REMUNERATION
It should be noted that the executive director is not remunerated for his
function as Chairman of the Board of Directors.
Acting on a proposal from the Remuneration Committee, the Board of Directors
chose the following principles to guide the remuneration of Mr Ghosn in his
capacity as Chief Executive Officer.
The Remuneration Committee worked with a specialized consultancy on the
basis of an analysis of remuneration practice at comparable French blue chip
companies and in foreign corporations operating in the same sector.
This remuneration comprises:
W a fixed portion;
W and a variable portion, representing a percentage of the fixed portion,
whose amount is set depending on performance criteria. The Board of
Directors sets performance targets and assesses their implementation.
The variable portion can total up to 150% of the fixed portion if all the
performance targets are reached. In exceptional cases, if all the targets were
to be exceeded, the variable portion could represent up to 180% of the fixed
portion.
The performance criteria set by the Board of Directors are as follows:
W ROE – Return on Equity ( up to 15% of the variable portion);
W operating margin (up to 25% of the variable portion);
W free cash flow (up to 50% of the variable portion);
W a qualitative element linked to management and strategy (up to 60% of the
variable portion), based on the following themes:
W implementation of industrial strategy: allocation of vehicle and powertrain
projects, application of competitiveness agreements in France, industrial
performance (manufacturing performance and sourcing strategy),
W environmental leadership: vehicle carbon emissions in Europe, Renault’s
carbon footprint,
W R&D strategy multi-year development: Common big Modules Families
(CMF) approach and continued implementation of the module policy,
rollout of the Research and Advanced Engineering Plan,
W CSR: verification of extra-financial data, visibility, social impact,
W Daimler: manufacturing, co-development, new cooperation agreements,
W Alliance synergies: increase the value of synergies.
Each of the six themes above is worth 10% of the qualitative element.
For reasons of confidentiality, Renault is not disclosing the target figures for
each of the criteria listed above. However, Renault will publish the percentage
achievement of these criteria.
The variable portion is paid in the following manner:
W 25% of the variable portion is paid in cash;
W the remainder is paid in shares, on a deferred basis, as follows.
The shares granted as part of the deferred variable portion will not be acquired
until 2018, and subject to the following conditions:
W the executive director is still at Renault in 2018;
W performance conditions based on the financial criteria for the variable
portion of the remuneration of the Chairman and CEO, which are assessed
for the years 2014, 2015 and 2016.
The number of shares acquired by the Chairman and CEO will be determined
on the basis of the amount of the deferred variable portion, of the risk of non-
payment of this deferred variable portion and of the Group’s performance over
the period from 2014 through 2016.
In respect of 2013, the Board of Directors meeting of February 12, 2014,
acting on a proposal from the Remuneration Committee, decided that the
extent to which the financial criteria had been achieved represented 60.6%
of the fixed portion and the extent to which the qualitative element had been
fulfilled represented 52% of the fixed portion.
Therefore, in respect of 2013, the Board of Directors set the variable portion
of the remuneration of the Chairman and CEO at 112.6% of the fixed portion,
which was €1,384,980 (compared with 117% of the fixed portion, or
€1,439,100 for 2012).
The Board of Directors meeting of February 12, 2014, acting on a proposal
from the Remuneration Committee, approved the payment of the variable
portion on the following terms:
W variable portion paid in cash (25% of the variable portion): €346,245;
W variable portion paid in shares on a deferred basis (75% of the variable
portion): €1,038,735.

REGISTRATION DOCUMENT RENAULT 2013✦ Global Reporting Initiative (GRI) Directives 211
CORPORATE GOVERNANCE 3
3
REMUNERATION OF SENIOR EXECUTIVES
MULTI-YEAR VARIABLE REMUNERATION
The executive director is not paid any multi-year variable remuneration.
EXCEPTIONAL VARIABLE REMUNERATION
The executive director was not paid any exceptional variable remuneration
in 2013.
LONG-TERM REMUNERATION
Starting in 2013, the Renault group decided not longer to implement stock-
option plans, but only performance share plans.
The executive director thus benefits from stock options in accordance with
the authorization granted by the General Meeting of April 29, 2011 and
performance shares in accordance with the authorization granted by the
General Meeting of April 29, 2013. The terms of these plans are described
in chapter 3.3.3.
Stock options (authorization granted by the General Meeting of April 29, 2011)
Under the authorization granted by the Extraordinary General Meeting of
April 29, 2011, the Board of Directors meeting of December 13, 2012, acting
on a proposal from the Remuneration Committee, allocated 150,000 stock
options to the Chairman and CEO for 2013.
That allocation represented 0.05% of the registered share capital. The
exercise of the options is subject to the following performance conditions:
W free cash flow, for 80% of the options;
W operating margin, for 20% of the options.
On February 12, 2014, acting on a proposal from the Remuneration
Committee, the Board of Directors decided that 88.48% of the 150,000
stock options allocated were exercisable, given the partial achievement of the
performance criteria above, namely 132,720 options.
These options can be exercised over a period of four years from their allocation,
following a lock-in period of the same length, i.e. from December 13, 2016
to December 12, 2020.
Under the authorization granted by the General Meeting of April 29, 2011,
the Board of Directors of April 29, 2011, acting on a proposal from the
Remuneration Committee, granted 100,000 stock options to the CEO for the
2011-2013 period(1). The exercise of these options was subject to a free cash
flow performance criterion.
On February 12, 2014, the Board of Directors, acting on a proposal from
the Remuneration Committee, decided that 100% of the 100,000 stock
options allocated for the period 2011-2013 would be exercisable since the
performance criteria had been achieved.
These options can be exercised over a period of four years from their
allocation, following a lock-in period of the same length, i.e. from April 30,
2015 until April 28, 2019.
For the record, the CEO is obliged to hold shares equivalent to 50% of the net
capital gain (net of tax and mandatory contributions) made on exercise of the
options for 2013 plan and the plan for the period 2011-2013 until such time
as he leaves his position.
Performance shares (authorization granted by the General Meeting of April 29, 2013)
The executive director was not granted any performance shares in 2013.
As a consequence of Renault decision to discontinue stock-option plans from
2013, the executive director has been granted performance shares for 2014,
on the same terms as other senior executives, with an additional performance
criterion reflecting his position as a corporate officer.
As authorized by the Extraordinary General Meeting of April 30, 2013, on
February 12, 2014, the Board of Directors, acting on a proposal from the
Remuneration Committee, granted the CEO 100,000 performance shares for
2014.
For whatever purpose it may serve, we list below the ceilings that apply to the
performance shares granted under the aforementioned authorization:
W the total number of performance shares allocated cannot exceed 1.5%
of the share capital over three years, i.e. on average 0.5% of the share
capital per annum;
W the Chairman and CEO cannot receive more than 15% of the total number
of performance shares allocated.
The number of shares vested will depend on the following performance
criteria, evaluated over the period 2014, 2015 and 2016:
W free cash flow for one-third of the shares;
W the percentage variation in the auto operating margin compared to a
sample group of auto manufactures with the same geographical and sector
drivers, for a third of the shares (PSA auto, Fiat auto EMEA, VW Brand et
Skoda Brand);
W an external criterion based on the total share return (TSR), in line with
CAC 40 practices, for a third of the shares.
With the exception of the last criterion (TSR), which applies only to the CEO,
the same criteria will apply to all recipients of performance shares.
For reasons of confidentiality, Renault is not disclosing the target figures for
each of the criteria listed above. However, Renault will publish the percentage
achievement of these criteria.
The CEO is obliged to retain 25% of the performance shares vested at the
end of the acquisition period for as long as he remains in his current position.
DIRECTORS’ FEES
The method of allotment of directors’ fees is reiterated in chapter 3.3.3.2 of
the Registration document. As a member of the Board of Directors, Mr Ghosn
received €48,000 gross for 2013.
(1) On April 29, 2011, the Board of Directors enacted the decision of the Chairman and CEO to refuse 50,000 stock options of the 150,000 initially proposed by the Board of Directors.

Find out more at www.renault.comREGISTRATION DOCUMENT RENAULT 2013212
CORPORATE GOVERNANCE3 REMUNERATION OF SENIOR EXECUTIVES
COMPENSATION FOR TERMINATION OF OFFICE AND NON-COMPETE INDEMNITY
Mr Ghosn is not entitled to any compensation for termination of office or non-
compete indemnity.
SUPPLEMENTARY PENSION PLAN
Mr Ghosn benefits from the collective supplementary pension scheme set up
for members of the Group Executive Committee.
This plan was approved by the Board of Directors meetings of October 28,
2004 and October 31, 2006 and by the General Meeting of April 30, 2010
(tenth resolution). The scheme was confirmed by the Board of Directors
meeting of February 12, 2014 and is subject to the approval of the General
Meeting of April 30, 2014 (seventh resolution).
The supplementary pension plan for the benefit of the Chairman and CEO
comprises:
W a defined contribution scheme equivalent to 8% (5% paid by the Company,
3% by the beneficiary) of the annual remuneration falling between eight
and sixteen times the upper earnings limit for social security contributions;
W a supplementary scheme with defined benefits.
Eligibility for this scheme is subject to a minimum length of service of five
years and at least two years as a GEC member.
The annual amount is equal to 10% of the reference compensation, plus
1.40% per year of service beyond five years as a member of the GEC and
0.40% per year outside GEC if the length of service at Renault exceeds
five years.
This amount is capped at 30% of the reference compensation.
The reference earnings used for calculating the amount of the pension
benefits under the defined-benefit plan is equal to the average of the three
highest annual earnings in the last ten years before retirement. The reference
earnings are capped at 65 times the annual social security ceiling. The total
amount of the Chairman and CEO’s pension is less than or equal to 45% of
his reference earnings.
3.3.1.2 SUMMARY TABLESThe tables below are based on the recommendations of the Afep-Medef and the French securities regulator.
TABLE 1
Summary table of remunerations, stock options and shares allocated to Mr Ghosn
2011 2012 2013
CARLOS GHOSN – Chairman and CEO
Remuneration owing in respect of the year (details in table 2) 2,890,104 2,728,356* 2,291,532
Value of options granted during the year (details in table 4) 1,489,000** 750,258** 0***
Value of performance shares granted during the year (details in table 6) 0 0 0
TOTAL 4,379,104 3,478,614 2,291,532
* Following the signing of the Competiveness Agreement, payment of 30% of the variable portion included in this amount is postponed and made conditional on Renault’s fulfillment of all the fixed-term commitments made under this Agreement.
** The valuation method adopted in the consolidated accounts follows a suitable binomial mathematical model, with exercise of the options anticipated and spread over the exercise period on a straight-line basis. The value of the options in this column corresponds to the total expenses that will be accounted for over the four-year period of exercise (see chapter 4 note 19-H of the notes to the consolidated financial statements).
*** No options have been granted during the year 2013 . Those granted for Fy 2013 have been executed on 12/13/2012. See table 4 hereafter.
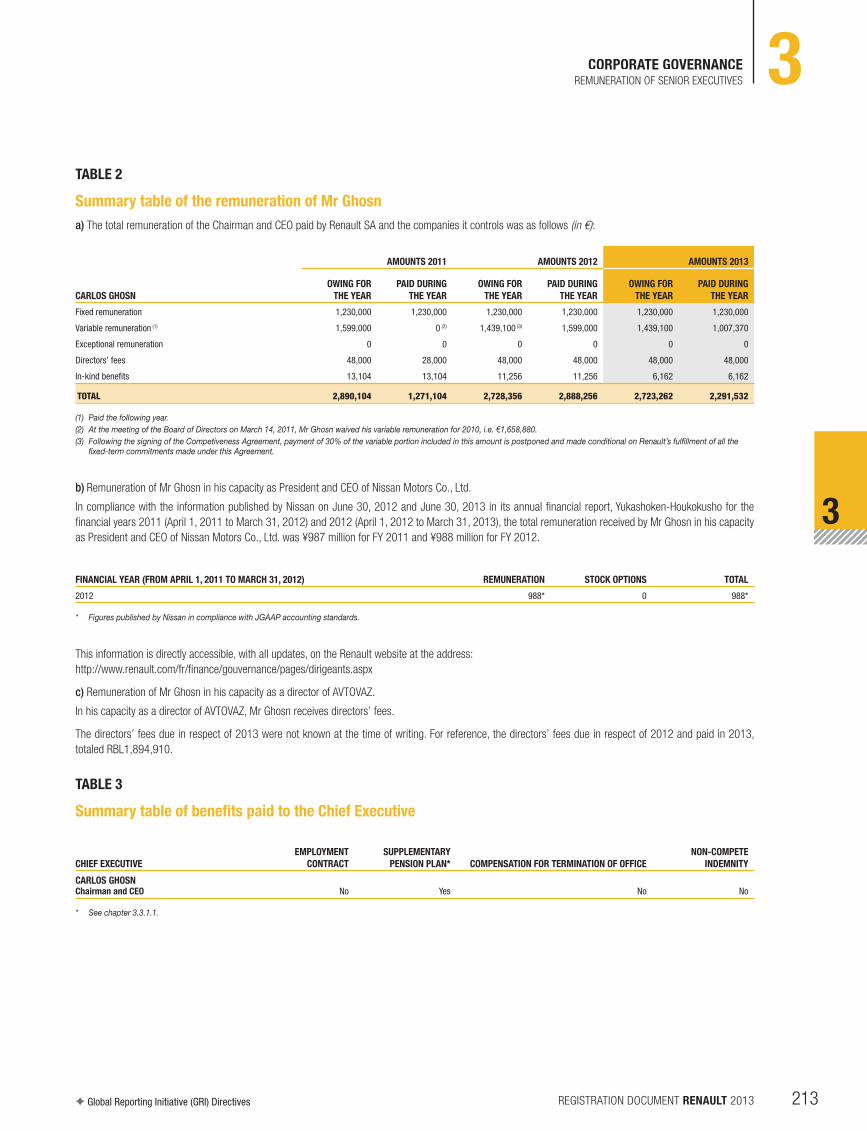
REGISTRATION DOCUMENT RENAULT 2013✦ Global Reporting Initiative (GRI) Directives 213
CORPORATE GOVERNANCE 3
3
REMUNERATION OF SENIOR EXECUTIVES
TABLE 2
Summary table of the remuneration of Mr Ghosn
a) The total remuneration of the Chairman and CEO paid by Renault SA and the companies it controls was as follows (in €):
CARLOS GHOSN
AMOUNTS 2011 AMOUNTS 2012 AMOUNTS 2013
OWING FOR
THE YEAR
PAID DURING
THE YEAR
OWING FOR
THE YEAR
PAID DURING
THE YEAR
OWING FOR
THE YEAR
PAID DURING
THE YEAR
Fixed remuneration 1,230,000 1,230,000 1,230,000 1,230,000 1,230,000 1,230,000
Variable remuneration (1) 1,599,000 0 (2) 1,439,100 (3) 1,599,000 1,439,100 1,007,370
Exceptional remuneration 0 0 0 0 0 0
Directors’ fees 48,000 28,000 48,000 48,000 48,000 48,000
In-kind benefits 13,104 13,104 11,256 11,256 6,162 6,162
TOTAL 2,890,104 1,271,104 2,728,356 2,888,256 2,723,262 2,291,532
(1) Paid the following year.
(2) At the meeting of the Board of Directors on March 14, 2011, Mr Ghosn waived his variable remuneration for 2010, i.e. €1,658,880.
(3) Following the signing of the Competiveness Agreement, payment of 30% of the variable portion included in this amount is postponed and made conditional on Renault’s fulfillment of all the fixed-term commitments made under this Agreement.
b) Remuneration of Mr Ghosn in his capacity as President and CEO of Nissan Motors Co., Ltd.
In compliance with the information published by Nissan on June 30, 2012 and June 30, 2013 in its annual financial report, Yukashoken-Houkokusho for the
financial years 2011 (April 1, 2011 to March 31, 2012) and 2012 (April 1, 2012 to March 31, 2013), the total remuneration received by Mr Ghosn in his capacity
as President and CEO of Nissan Motors Co., Ltd. was ¥987 million for FY 2011 and ¥988 million for FY 2012.
FINANCIAL YEAR (FROM APRIL 1, 2011 TO MARCH 31, 2012) REMUNERATION STOCK OPTIONS TOTAL
2012 988* 0 988*
* Figures published by Nissan in compliance with JGAAP accounting standards.
This information is directly accessible, with all updates, on the Renault website at the address:
http://www.renault.com/fr/finance/gouvernance/pages/dirigeants.aspx
c) Remuneration of Mr Ghosn in his capacity as a director of AVTOVAZ.
In his capacity as a director of AVTOVAZ, Mr Ghosn receives directors’ fees.
The directors’ fees due in respect of 2013 were not known at the time of writing. For reference, the directors’ fees due in respect of 2012 and paid in 2013,
totaled RBL1,894,910.
TABLE 3
Summary table of benefits paid to the Chief Executive
CHIEF EXECUTIVE
EMPLOYMENT
CONTRACT
SUPPLEMENTARY
PENSION PLAN* COMPENSATION FOR TERMINATION OF OFFICE
NON-COMPETE
INDEMNITY
CARLOS GHOSNChairman and CEO No Yes No No
* See chapter 3.3.1.1.

Find out more at www.renault.comREGISTRATION DOCUMENT RENAULT 2013214
CORPORATE GOVERNANCE3 REMUNERATION OF SENIOR EXECUTIVES
TABLE 4
Options granted during the year to the Chief Executive
PLAN NO.
AND DATE TYPE OF OPTIONS
VALUE OF OPTIONS BASED ON
THE METHODS ADOPTED FOR
THE CONSOLIDATED ACCOUNTS*
NBR OF OPTIONS GRANTED
DURING THE YEAR EXERCISE PRICE EXERCISE PERIOD
CARLOS GHOSNNo. 18
04/29/2011 PURCHASE 931,000 100,000*** €38.80From 04/30/2015
to 04/28/2019
No. 1912/08/2011 PURCHASE 558,000 100,000** €26.87
From 12/09/2015to 12/07/2019
No. 2012/13/2012 PURCHASE 750,258 150,000**** €37.43
From 13/12/2016 to 12/12/2020
* The valuation method adopted in the consolidated accounts follows a suitable binomial mathematical model, with exercise of the options anticipated and spread over the exercise period on a straight-line basis. The value of the options in this column corresponds to the total expenses that will be accounted for over the four-year period of exercise (see chapter 4 note 19-H of the notes to the consolidated financial statements).
** 50,000 after calculation of the achievement of the performance conditions.
*** 100,000 after calculation of the achievement of the performance conditions.
**** 132,720 after calculation of the achievement of the performance conditions.
TABLE 5
Options exercised during the year by Mr Ghosn
PLAN NO. AND DATE
NBR OF OPTIONS EXERCISED
DURING THE YEAR EXERCISE PRICE GRANT YEAR
CARLOS GHOSN - None - -
TABLE 6
Performance shares allocated during the year to Mr Ghosn
PLAN NO. AND
DATE
NUMBER OF
SHARES
VALUE OF SHARES (BASED
ON THE METHOD ADOPTED
FOR THE CONSOLIDATED ACCOUNTS)
DATE OF
ACQUISITION
DATE OF
AVAILABILITY
PERFORMANCE
CONDITIONS
CARLOS GHOSN - None - - - -
TABLE 7
Performance shares available to Mr Ghosn during the year
PLAN NO. AND DATE
NBR OF SHARES BECOMING
AVAILABLE DURING THE YEAR TERMS OF ACQUISITION
CARLOS GHOSN - None -
3.3.2 DIRECTORS’ FEES ✦
The Annual General Meeting may allocate directors’ fees, the amount of
which remains fixed until otherwise decided.3.3.2.1 AMOUNTThe Mixed General Meeting on April 29, 2011 voted an annual amount of
€1,200,000(1) to be apportioned among the directors for the current year and
subsequent years, until further notice. The Board is responsible for allotting
these fees.
(1) The amount of €1,200,000 is consistent with the median of directors’ fees paid by other CAC 40 companies.

REGISTRATION DOCUMENT RENAULT 2013✦ Global Reporting Initiative (GRI) Directives 215
CORPORATE GOVERNANCE 3
3
REMUNERATION OF SENIOR EXECUTIVES
3.3.2.2 METHOD OF ALLOTMENTThe Board of Directors meeting of April 29, 2011 apportioned the directors’
fees for FY 2013, and reiterated the breakdown on February 12, 2014,
according to the following criteria:
W a fixed portion, linked to the responsibilities arising from Board membership,
of up to €24,000;
W a variable portion, linked to directors’ actual attendance at the Board
meetings, of up to €24,000.
Two additional payments may also be made:
W one payment, of up to €7,500 per committee, for sitting on one of the
Board’s committees;
W one payment, of up to €7,500, for chairing a committee.
The above amounts are calculated on a time-apportioned basis depending on
the length of the director’s term of office, over a 365-day basis.
Total fees allocated to directors in 2013 amounted to €1,099,825(1 ) (compared
with €1,131,000 in 2012).
The Board of Directors has decided to review the method of allotment of
directors’ fees in 2014. In accordance with the Afep-Medef Code, the Board
would like the variable portion, paid for actual attendance of Board and
committee meetings, to be the larger portion of directors’ fees.
TABLE 8
Fees allotted to directors for the year based on attendance at Board and committee meetings
ATTENDANCE RATE, BOARD AND COMMITTEE MEETINGS IN 2013(1 )
TOTAL GROSS FEES RECEIVED
(in €)(2)
DIRECTORS BOARD
AUDIT, RISK AND
ETHICS COMMITTEE
REMUNERATION
COMMITTEE
APPOINTMENTS
AND GOVERNANCE
COMMITTEE
INTERNATIONAL
STRATEGY
COMMITTEE
INDUSTRIAL
STRATEGY
COMMITTEE 2012 2013
Mr Ghosn 100% - - 100% - - 48,000 48,000
Mr Azéma(3) 87.5% 100% - - - 100% 22,364 60,000
Mr Belda 75% - 100% 50% 100% - 75,000 72,000
Mr de Croisset 100% 83.3% - - - 100% 60,000 63,000
Mr Delpit 87.5% - - - 0% - 52,500 52,500
Mr Desmarest 75% - 100% - 100% 100% 75,000 72,000
Mr Faure(3)(4) 75% 100% 100% 52,512
Mr Garnier 87.5% - 100% - 100% 100% 75,000 75,000
Mr Gentil 100% - - - 100% 100% 14,770 63,000
Mr Isayama(4) 100% - - - - - 42,000 10,825
Miss Koike(4)(5) 50% - - - - - - -
Mr Ladreit de Lacharrière 100% - 100% 100% - - 70,500 70,500
Mrs. de La Garanderie 87.5% 100% - 50% - - 63,000 60,000
Mr Lagayette(6) 87.5% 100% - 100% - - 75,000 75,000
Mr Ostertag 100% 100% - - - 100% 63,000 63,000
Mr Personne 100% - - - 100% - 13,660 55,500
Mr Riboud 87.5% - - - - - 36,000 45,000
Mrs Rih 100% - - - 100% - 13,660 55,500
Mr Rousseau(3)(4) 100% - - - - - 57,000 7,488
Mr Saikawa 75% - - - 100% - 49,500 49,500
Mrs Sourisse 75% 66.6% - - - - 55,500 49,500
(1) For directors whose appointment to the Board or one of the committees began or ended during 2013, the attendance rate is calculated on the duration of their term of office, not the calendar year.
(2) Fees allocated for Board membership, attendance at Board meetings, membership and/or chairmanship of one of the Board Committees.
(3) Directors representing the French State.
(4) Directors whose appointment to the Board or one of the committees began or ended during 2014 .
(5) Miss Koike expressed her wish to waive the fees due to her for 2013, the year in which she was appointed as a director. The Board of Directors meeting of February 12, 2014 took note of this waiver.
( 6) For 2013, the Renault Board awarded double fees to Mr Lagayette for his work as Chairman of the Audit, Risks and Ethics Committee.

Find out more at www.renault.comREGISTRATION DOCUMENT RENAULT 2013216
CORPORATE GOVERNANCE3 REMUNERATION OF SENIOR EXECUTIVES
3.3.3 REMUNERATION OF SENIOR EXECUTIVES: PERFORMANCE SHARES
3.3.3.1 LEGAL FRAMEWORKIn its fourteenth resolution, the Mixed General Meeting of April 30, 2013,
authorized the Board of Directors to make one or more free grants of
“performance shares” (existing shares or shares to be issued in the future)
to the Chief Executive and some employees of the Company and its related
companies, on the terms set forth in Article L. 225-197-1 of the French
Commercial Code.
It is to be noted that performance shares granted under the abovementioned
authorization are capped as follows:
W the total number of performance shares granted shall not exceed 1.5%
of the share capital over three years, i.e. on average 0.5% of the share
capital per annum;
W the Chairman and CEO cannot receive more than 15% of the total number
of performance shares allocated;
W the members of the Executive Committee cannot receive more than 30%
of the total number of performance shares allocated, including those
allocated to the Chairman and CEO.
The meeting made the allocation of performance shares conditional on
achieving the performance criteria set during the budgeting process.
The allocation of performance shares pursuant to the fourteenth resolution
of the Mixed General Meeting of April 30, 2013 does not dilute the shares
owned by shareholders, since the performance shares are allocated from
treasury stock.
3.3.3.2 GENERAL POLICY ON PERFORMANCE SHARE PLANS
REMUNERATION COMMITTEE
The Board of Directors approves plans to allocate performance shares on the
basis of the report and recommendations of the Remuneration Committee.
The committee examines proposals from the Chairman to allocate shares to
certain Group employees, in compliance with the general arrangements set
by the Annual General Meeting.
AIMS OF PERFORMANCE SHARE PLANS
The main aim of allocations of performance shares is to involve Renault
executives worldwide, particularly the members of management bodies,
in building the value of the Group by allowing them to have an ownership
interest in the Company.
The plan is also a way to reward those executives who, by their actions, make
an especially positive contribution to the Group’s results.
In addition, the plan helps to secure the loyalty of those executives for whom
the Group has long-term ambitions, in particular “high-flyers”, i.e. young
executives with strong potential. Granting stock options and performance
shares helps to increase the commitment of these staff members and
motivate them to work for the Company’s advancement and growth.
The plan reinforces the role of the Group’s responsibility centers in Europe
and the rest of the world. In Automotive, it applies in particular to sales
subsidiaries, vehicle and powertrain engineering teams, managers of body
assembly and powertrain plants, industrial subsidiaries and all the heads of
vehicle and sub-system programs and projects. The plan also applies to Sales
Financing, and to the heads of the Group’s major support functions.
ALLOCATION POLICY
Allocations of shares vary according to the beneficiaries’ level of responsibility
and contribution to the Company, an appraisal of their performance and
results, and, for younger staff members, an assessment of their development
potential.
Beneficiaries are divided into three categories.
Senior executives
At March 1, 2013, the senior executives are the 28 members of the Renault
Management Committee, including the 10 members of the Group Executive
Committee.
The Chairman and CEO cannot receive more than 15% and the members of
the Executive Committee cannot receive more than 30% of the total number
of performance shares allocated.
Managing executives
Managing executives are granted a variable number of performance shares
each year, based on the same criteria as those applicable to senior executives,
namely levels of responsibility, performance and results. The quantity of
shares granted can vary, depending on individual appraisals. Some managing
executives may not be eligible for an award.
Other executives benefiting from the plan
The plan’s other beneficiaries are generally senior managers and high-flyers
with strong professional or managerial potential or expertise. An array of
complementary systems is used to assess and select beneficiaries (annual
performance and development review, Careers Committees, personal
monitoring for high-flyers, job-related variable remuneration). Taken together,
these systems form a comprehensive observation platform used to single out
the most deserving executives.
Altogether the three categories represent roughly 900 executives annually.
The total number of beneficiaries was 849 under the 2011 plan, 892 under
the 2012 plan, and 861 under the 2013 plan.

REGISTRATION DOCUMENT RENAULT 2013✦ Global Reporting Initiative (GRI) Directives 217
CORPORATE GOVERNANCE 3
3
REMUNERATION OF SENIOR EXECUTIVES
3.3.3.3 SUMMARY TABLES OF THE PLANS
TABLE 9
Stock-option and performance-share allocations
Plans 12 and 14 entitle the holder to subscribe for new issues, while Plans 17, 18, 19 and 20 give the right to buy existing shares.
Plans 17 b, 18 b, 19 b and 20 b cover allocations of free shares to which corporate officers are not entitled.
The total volume of plans underway at December 31, 2013 is equivalent to 2.69% of the number of shares making up the share capital.
Stock-option plans
DATE OF GRANT/BOARD
MEETING
TOTAL NBR
OF SHARES
THAT MAY BE
GRANTED OR
ACQUIRED
O/W FOR EXEC.
DIRECTOR
CARLOS GHOSN
OPTION
START DATE EXPIRY DATE
SUBSCRIPTION/
PURCHASE
PRICE (1)
NBR OF SHARES
SUBSCRIBED AT
12/31/2013
NBR OF
CANCELLED
OR LAPSED
OPTIONS AT
12/31/2013
OPTIONS
OUTSTANDING
AT 12/31/2013
AGM authorization granted on May 4, 2006
Plan 12 05/04/2006 1,674,700 100,000 05/05/2010 05/03/2014 87.98 3,000 391,147 1,280,553
Plan 14 12/05/2006 1,843,300 200,000 12/06/2010 12/04/2014 93.86 0 356,494 1,486,806
AGM authorization granted on April 29, 2011
Plan 17* 04/29/2011 176,000 0 04/30/2015 04/28/2019 38.80 0 176,000 0
Plan 18 04/29/2011 490,000 100,000 04/30/2015 04/28/2019 38.80 0 11,388 478,612
Plan 19** 12/08/2011 300,000 100,000 12/09/2015 12/07/2019 26.87 0 150,000 150,000
Plan 20 12/13/2012 447,800 150,000 12/13/2016 12/12/2020 37.43 0 0 447,800
(1) The subscription/purchase price is equal to the average share price quoted during the twenty trading days prior to the Board of Directors meeting.
* The Board of Directors meeting of February 15, 2012 noted that the 2011 target for operating margin was not reached. As a result, all the stock options corresponding to Plan 17 have been cancelled.
** For this 2011 plan, the grantees were informed in early 2012. The Board of Directors meeting of February 13, 2013 noted that the 2012 target for operational margin was not reached. As a result, 50% of the stock options corresponding to Plan n°19 have been cancelled.
Performance share plans
DATE OF GRANT/BOARD MEETING
TOTAL NBR OF
SHARES GRANTED
O/W FOR
EXEC. DIRECTOR
CARLOS GHOSN
FINAL
ACQUISITION DATE
HOLDING
PERIOD ENDS
SHARES CANCELLED
AT 12/31/2013
SHARES
OUTSTANDING
AT 12/31/2013
Plan 17 b Shares* ** 04/29/2011 544,300 0 04/30/2013**** 04/30/2015 544,300 0
Plan 18 b Shares* 04/29/2011 1,233,400 0 04/30/2014**** 04/30/2016 43,255 1,190,145
Plan 19 b Shares * *** 12/08/2011 609,900 0 12/09/2013**** 12/09/2015 310,750 299,150
Plan 20 b Shares* 12/13/2012 679,900 0 12/13/2014**** 12/12/2016 8,700 671,200
* Acquisition and holding periods are different for French tax residents and foreign tax residents, in order to take account of local tax regulations.
** The Board of Directors meeting of February 15, 2012 noted that the 2011 target for operating margin was not reached. As a result, all the shares corresponding to Plan 17b have been cancelled.
*** For this 2011 plan, the grantees were informed in early 2012. The Board of Directors meeting of February 13, 2013 noted that the 2012 target for operational margin was not reached. As a result, 50% of the shares corresponding to Plan n°19b have been cancelled.
**** French tax residents.

Find out more at www.renault.comREGISTRATION DOCUMENT RENAULT 2013218
CORPORATE GOVERNANCE3 REMUNERATION OF SENIOR EXECUTIVES
TABLE 10
Information on the ten employees other than corporate officers
STOCK OPTIONS GRANTED TO AND EXERCISED BY THE TEN EMPLOYEES, OTHER
THAN CORPORATE OFFICERS, RECEIVING THE HIGHEST NUMBER OF OPTIONS
TOTAL OPTIONS GRANTED /
SHARES ACQUIRED EXERCISE PRICE PLAN 18 PLAN 19* PLAN 20
Options granted during the year by the issuer, or any option-granting company to the ten employees of this issuer or any company within this scope, receiving the highest number of options (aggregate information) 478,800
Plan 18 = €38.80Plan 19 = €26.87Plan 20 = €37.43 240,000 62,000 176,800
Options on the shares of the issuer or the aforementioned companies exercised during the year by the ten persons of the issuer and these companies, acquiring or subscribing the largest number of options (aggregate information) None
* The Board of Directors meeting of February 13, 2013 noted that the 2012 target for operating margin was not reached. As a result, 50% of the stock options corresponding to Plan 19 have been cancelled.
PERFORMANCE SHARES GRANTED TO THE TEN EMPLOYEES OTHER THAN CORPORATE
OFFICERS AND SHARES DEFINITIVELY ACQUIRED BY THESE EMPLOYEES
TOTAL SHARES
GRANTED PLAN 18 B PLAN 19 B* PLAN 20 B
Shares granted during the year by the issuer, or any option-granting company to the ten employees of this issuer or any company within this scope, receiving the highest number of shares (aggregate information) 222,000 110,000 34,000 78,000
Shares held on the issuer or the aforementioned companies, and acquired during the year, by the ten persons of the issuer and these companies, acquiring the largest number of shares (aggregate information) None
* The Board of Directors meeting of February 13, 2013 noted that the 2012 target for operating margin was not reached. As a result, 50% of the stock options corresponding to Plan 19 have been cancelled.
3.3.3.4 ADDITIONAL INFORMATIONLoss of entitlement is governed by regulatory provisions, i.e. total loss in the event of resignation, and individual decision in the event of dismissal, by the Chairman
and CEO who informs the Remuneration Committee

REGISTRATION DOCUMENT RENAULT 2013✦ Global Reporting Initiative (GRI) Directives 219
CORPORATE GOVERNANCE 3
3
INTERNAL RULES OF THE BOARD OF DIRECTORS
3.4 INTERNAL RULES OF THE BOARD OF DIRECTORS
These Rules define the operating rules and procedures governing the
proceedings of the Board of Directors and its committees, and the rights and
obligations of the directors.
These rules were approved by the Board of Directors at its meeting on
September 10, 1996, and underwent several amendments, the latest of
which was passed by the Board of Directors at its meeting on February 12,
2014.
Certain provisions of these internal rules expressly reiterate the
recommendations of the Afep-Medef Code, which is the reference corporate
governance code for Renault.
3.4.1.1 COMPOSITION OF THE BOARD OF DIRECTORS
Through its composition, the Renault Board of Directors seeks balanced
representation, competence and ethical behaviour in its members. For this
purpose, it considers the following points when examining candidates for
membership:
W the composition of and changes in the share ownership pattern;
W independence;
W balanced representation of men and women;
W diversity of backgrounds and skills, their complementarity and relevance
with regard to the strategy and development of Renault;
W diversity of nationalities;
W knowledge of the markets in which Renault is or seeks to be established.
Each candidate’s profile is examined on the basis of each of the foregoing
criteria.
The candidates are then interviewed by the Nominations and Governance
Committee. Following these interviews, the Nominations and Governance
Committee makes recommendations to the Board of Directors.
The Board of Directors discusses the candidatures proposed by the committee
and votes to determine which of them will be submitted to the Shareholders’
General Meeting.
After this, the composition of the Board of Directors is:
W reviewed as part of the annual assessment of the Board’s organisation
and operation. Whenever it considers it necessary and at least every three
years, the Board of Directors conducts a formal assessment;
W described in the Chief Executive Officer’s report on the composition of
the Board of Directors and on the application of the principle of balanced
representation of men and women, the manner in which the Board’s
proceedings are prepared and organised, and the internal control and risk
management procedures implemented by the company.
3.4.1.2 MISSIONS OF THE BOARD OF DIRECTORS
The Board of Directors is a collegiate body.
It has the obligation to act in the corporate interests of the company under all
circumstances. It receives its powers from the shareholders as a body, and
also takes account of the expectations of other stakeholders.
On a proposal by the Chief Executive Officer, the Board of Directors
determines the company’s strategy. The Board discusses the company’s
strategic guidelines on a yearly basis, including those relating to the Alliance,
proposed by the Chief Executive Officer. It examines any amendments to those
guidelines. The Board gives its opinion beforehand on any major decision that
is not in line with the business strategy.
It is alerted promptly by the Chief Executive Officer in the event of any external
event or internal change radically affecting the company’s prospects or the
forecasts submitted to the Board of Directors.
Every year, the Board examines the medium-term plan and the budget.
It is regularly informed of the company’s results as reflected in the income
statement, balance sheet and cash flow; it is also informed of off-balance-
sheet commitments.
The Board oversees the quality of information supplied to shareholders and
markets, through its financial statements or whenever significant transactions
are carried out. It publicises its opinion on the conduct of transactions in the
company’s securities whenever warranted by the nature of those transactions.
The Board meets once a year, in the absence of the Chief Executive Officer, to
assess the latter’s performance and set his/her remuneration.
3.4.1.3 PROCEEDINGS OF THE BOARD OF DIRECTORS
The proceedings of the Board of Directors and the meetings of the Board
committees may be conducted using any technical means, provided they
guarantee effective participation by directors.
3.4.1 BOARD OF DIRECTORS ✦

Find out more at www.renault.comREGISTRATION DOCUMENT RENAULT 2013220
CORPORATE GOVERNANCE3 INTERNAL RULES OF THE BOARD OF DIRECTORS
Accordingly, the directors participating in the Board’s proceedings by the
aforementioned means are deemed attending, for calculation of the quorum
and majority, except for the meetings finalising the separate or consolidated
financial statements, appointing or dismissing the Chairman of the Board of
Directors, the Managing Director and the delegate Managing Directors, for
which proceedings the directors are required to attend in person.
The proceedings of the Board of Directors are conducted on the basis of
documents sent to each director not less than five (5) days before the meeting
of the Board of Directors.
However, where the aforementioned documents are submitted beforehand to
a committee of the Board within a shorter time limit, those documents shall
be forwarded to the directors at the close of the relevant meeting of that
committee.
In the event of urgency or where the time limit cannot be met, the agenda
and the documents relating to the matters for discussion by the Board of
Directors shall be transmitted not less than 24 hours before the Board of
Directors meets.
3.4.2 RIGHTS AND OBLIGATIONS OF DIRECTORS
3.4.2.1 KNOWLEDGE OF THE LAW GOVERNING SOCIÉTÉS ANONYMES (FRENCH PUBLIC LIMITED COMPANIES) AND OF THE COMPANY’S ARTICLES OF ASSOCIATION
Each director must, upon taking up his/her duties, be acquainted with the
general and particular obligations arising from his/her office. The director
must be acquainted with the legislation and regulations relevant to the
operation of sociétés anonymes, the recommendations of the Afep-Medef
Code which is the reference for Renault, the Renault Articles of Association,
these Internal Rules and any other relevant document.
Furthermore, each director may, where he/she considers it necessary, receive
additional training in the specific features of the company, its business lines
and the automotive industry.
Directors representing employees or employee shareholders receive
appropriate training to enable them to discharge their duties.
3.4.2.2 RIGHT TO DISCLOSURE AND DUTY TO KEEP INFORMED
Each director has the duty to keep him/herself informed. He/she must
make timely enquiry of the Chairman of the Board of Directors to obtain
the information he/she considers necessary to discharge his/her duties and
to contribute to discussion of the matters entered on the Board’s agenda.
Moreover, the Secretariat of the Board of Directors is available to each director
to provide documents evidencing such information.
3.4.2.3 DUTY OF DILIGENCEEach director must devote the time and attention necessary to the discharge
of his/her duties. A director must be diligent and, unless materially prevented,
attend all meetings of the Board of Directors and of the committees of which
he/she is a member.
As such, a director may not hold more than four (4) offices in listed companies
outside the Renault group, including foreign companies. A director must keep
the Board informed of any office held in other companies, including any
involvement in the proceedings of committees of those companies’ Boards
of Directors.
3.4.2.4 DUTY OF LOYALTYEach director has the duty to notify the Board of Directors of any potential or
actual conflict of interest with the company or with any company within its
group, and must refrain from voting with regard to said conflict(s) of interest.
3.4.2.5 PROFESSIONAL SECRECY & PRIVILEGED INFORMATION
Each director must, in addition to the obligation of discretion as provided
in Article L. 225-37 of the French Commercial Code, regard him/herself as
bound by professional secrecy regarding any information undisclosed to the
public of which he/she may be aware in the discharge of his/her duties as
director.
Furthermore, each director undertakes, on the same footing as any Group
senior executive, to comply with the Renault internal procedure concerning
the use and/or disclosure of privileged information relating to Renault and/or
Nissan, and with any legislative or regulatory provision governing privileged
information.
3.4.2.6 HOLDING OF SHARES IN THE COMPANY
It is recommended that each director hold a number of shares significantly
proportional to the directors’ fees received. Where a director does not hold
such shares upon taking up duties, he/she must use his/her directors’ fees to
purchase them. This rule shall not apply to directors appointed by the State or
to directors representing employees and employee shareholders, who do not
receive directors’ fees in a personal capacity.

REGISTRATION DOCUMENT RENAULT 2013✦ Global Reporting Initiative (GRI) Directives 221
CORPORATE GOVERNANCE 3
3
INTERNAL RULES OF THE BOARD OF DIRECTORS
These shares shall be held in registered form.
It should be noted that the law also requires directors’ spouses to register
the shares they hold or to deposit them with a bank, a financial institution
authorised to take deposits of securities by the public, or a stockbroker.
Moreover, since the company must disclose to the AMF all transactions
performed in shares – purchases, subscriptions, exchanges, etc. – by the
directors and any persons with whom they are closely connected, each
director undertakes to inform the Secretary of the Board of Directors within
twenty-four (24) hours of making such a transaction.
3.4.2.7 REFUND OF EXPENSESEach director is entitled, upon submitting vouchered evidence, to the refund
of travel and commuting expenses and any other expenditure contracted by
him/her in the interests of the company.
3.4.3 COMMITTEES OF THE BOARD OF DIRECTORS
In order to assist it in its missions and activities, the Board of Directors has
the following five committees:
W an Audit, Risks and Ethics Committee;
W a Remuneration Committee;
W a Nominations and Governance Committee;
W an International Strategy Committee;
W an Industrial Strategy Committee.
The Board of Directors decides on the composition of the committees and the
choice of their respective Chairmen based on a proposal of the Nominations
and Governance Committee.
The existence in the committees of cross-directorships – as understood by
the Afep-Medef Code – should be avoided.
The Chairmen of the committees may, if they wish, attend the meetings of the
other committees of which they are not members.
The Chairmen of the committees shall report on the activities and
recommendations of their respective committees at the meetings of the Board
of Directors. Where prevented from attending, the Chairman shall appoint a
member of the committee to deliver his/her report to the Board of Directors.
The Chief Executive Officer may consult the committees on any matter
relating to their missions.
The committees shall meet whenever they deem it necessary and at least
twice a year.
In any case, the committees shall meet ahead of the meetings of the Board
of Directors having on their agenda matters within those committees’ remit.
The committees shall meet no later than two (2) days before the meetings
of the Board of Directors scheduled to discuss matters examined in the
committees, except in cases of urgency or where prevented from meeting.
The documents intended for the following committees shall be sent to their
members not less than five (5) days before the committee meeting, except in
cases of urgency or where prevented:
W the Industrial Strategy Committee;
W the International Strategy Committee.
The documents intended for the following committees shall be sent to their
members not less than two (2) days before the committee meeting, except in
cases of urgency or where prevented:
W the Audit, Risks and Ethics Committee;
W the Nominations and Governance Committee;
W the Remuneration Committee.
In order to fulfil their missions, the committees may, at their option:
W meet staff in the divisions relevant to their duties;
W interview functional managers or those of operating entities;
W request company representatives to communicate any document or
information they consider necessary to the discharge of their mission;
W call upon organisations and service providers outside the company to
perform, at the company’s expense, any studies they consider conducive
to the fulfilment of their missions.
3.4.3.1 AUDIT, RISKS AND ETHICS COMMITTEE (“CARE”)
A) COMPOSITION
The composition of the CARE is as follows:
W at least two-thirds (2/3rds) of independent directors, excluding employee
directors or those representing employee shareholders;
W directors having accounting or financial skills;
W a committee Chairman is chosen with particular care from among the
independent directors;
W the Chief Executive Officer may not be a member of this committee.
The members of the CARE shall, upon their appointment, be informed
of the company’s specific accounting, financial and operating features.
Furthermore, each director may, where he/she considers it necessary, receive
additional training in the company’s specific features, its business lines and
the automotive industry. Directors representing employees or employee
shareholders shall receive appropriate training to enable them to discharge
their duties.
Find out more at www.renault.comREGISTRATION DOCUMENT RENAULT 2013222
CORPORATE GOVERNANCE3 INTERNAL RULES OF THE BOARD OF DIRECTORS
B) MISSIONS
The following are the missions of the CARE:
W monitoring the processes for generating financial information, supervising
the methods adopted for drawing up financial statements, drawn up in
compliance with prevailing standards and in accordance with the IFRS
accounting system;
W examining and analyzing the financial statements as prepared by the
company’s directors, and reporting on its findings in this respect to the
members of the Board of Directors;
W monitoring the effectiveness of schemes for risk control, internal control
and regulatory and operational compliance;
W ensuring compliance with ethical rules, particularly business ethics;
W ensuring the company has a good level of commitment to social and
environmental responsibility (SER).
As such, the CARE:
W examines – as part of its analysis of the financial statements – the
memorandum of the statutory auditors highlighting the salient points in
the results, the accounting options adopted, and a memorandum from the
Financial Director describing the risk exposure, and the off-balance-sheet
commitments of the business;
W proposes to the Board the procedure for selecting the statutory auditors,
manages the selection procedure, issues an opinion on the quality of
those auditors’ work and ensures compliance with the rules safeguarding
their independence; within this framework, it issues a recommendation
regarding the statutory auditors proposed for appointment by the
Shareholders’ General Meeting;
W regularly interviews the statutory auditors, who must submit their general
programme of work and the tests and samplings they have undertaken;
W is informed of the existence of a system for identifying and assessing the
Group’s risks and ensures that the system’s effectiveness is duly monitored;
W ensures that an internal control system exists, and monitors its
effectiveness;
W supervises the audit plan, monitors its execution and checks that the
recommendations are implemented;
W supervises the proper implementation and assesses the effectiveness of
the ethical scheme, and monitors the enforcement of the Group Code of
Conduct together with its related procedures;
W receives, from the Ethics Director, the company’s annual activity report
on ethics and compliance, together with the actions undertaken; this
committee examines and issues its opinion on the action programme for
the following year, and monitors the developments in it;
W interviews the Ethics Director and, if it considers it necessary, the Chairmen
of the Ethics and Compliance Committee and the Risks and Internal Control
Committee;
W examines relations with stakeholders regarding any issue relating to ethics
and to social and environmental responsibility;
W interviews the company’s Social Responsibility Director once a year on the
actions conducted in this area;
W examines the section of the report by the Chairman of the Board of
Directors referred to in Article L. 225-37 of the French Commercial Code
relating to internal control and risk management procedures;
W formulates any recommendation to the Board of Directors or the company’s
management bodies in the areas within its remit.
Within the scope of its authority, the CARE regularly interviews representatives
of the following entities:
W the Audit, Risk Control and Organisation department;
W the Group Protection and Risk Prevention department;
W the Ethics department;
W the Group Finance department;
W the statutory auditors.
3.4.3.2 REMUNERATION COMMITTEE
A) COMPOSITION
The composition of the Remuneration Committee is as follows:
W a majority of independent directors;
W one director representing the employees or employee shareholders;
W a Chairman appointed from among the independent directors;
W the Chief Executive Officer may not be a member of this committee.
B) MISSIONS
The Remuneration Committee’s mission is to enable the Board of Directors to
determine all the remunerations and benefits of the senior managers holding
corporate office.
As such, the Remuneration Committee:
W proposes to the Board of Directors the amount of the fixed portion of the
remuneration for the Chief Executive Officer;
W proposes to the Board of Directors the rules for setting the variable portion
of the remuneration for the Chief Executive Officer and the amount of that
variable portion;
W ensures the consistency of those rules with the annual or multi-year
assessment of the Chief Executive Officer’s performance, and with the
company’s medium-term strategy;
W supervises the annual application of those rules;
W makes all recommendations to the Board of Directors concerning the
remuneration, non-cash benefits and retirement benefits of the Chief
Executive Officer;
W assesses all the remunerations and benefits received including, where
applicable, those received from other Group companies, and by the main
senior managers not holding corporate office, particularly members of the
Executive Committee; the Remuneration Committee may, for this purpose,
enlist the help of the senior managers holding corporate office;
W examines the general policy for long-term incentive plans and formulates
proposals to the Board of Directors both on that policy and on long-term
incentive awards;
W reviews the information sent to shareholders for the purposes of consulting
them on the remuneration of a senior manager holding corporate office.

REGISTRATION DOCUMENT RENAULT 2013✦ Global Reporting Initiative (GRI) Directives 223
CORPORATE GOVERNANCE 3
3
INTERNAL RULES OF THE BOARD OF DIRECTORS
3.4.3.3 NOMINATIONS AND GOVERNANCE COMMITTEE
A) COMPOSITION
The composition of the Nominations and Governance Committee is as follows:
W a majority of independent directors;
W a Chairman appointed from among the independent directors;
W the Chief Executive Officer may not be a member of this committee.
B) MISSIONS
The missions of the Nominations and Governance Committee are as follows:
W drawing up a procedure for selecting directors, the Chairman of the Board
of Directors, the Managing Director (whether a separate person or not) and
the corporate officers;
W making all proposals to the Board of Directors regarding appointment of
the Chairman of the Board of Directors, the Managing Director (whether
a separate person or not) and the corporate officers in compliance with
that procedure;
W deciding whether to renew corporate officers whose terms of office are
expiring, taking into account in particular the pattern of shareholdings
in the company, the balance between men and women on the Board
of Directors and the need to maintain an appropriate proportion of
independent directors;
W proposing solutions to the Board ensuring the succession to senior
managers holding corporate office in the event of unforeseen vacancies,
in line with a succession plan developed beforehand by the committee;
W making all proposals concerning the chairmanship, composition and duties
of the different committees;
W monitoring corporate governance issues and enforcing compliance with
the Afep-Medef Code;
W pointing out, where applicable, the Afep-Medef Code recommendations
that have not been applied and explaining the reasons therefor in a clearly
stated, relevant and detailed manner;
W proposing referral to the High Committee in charge of monitoring
implementation of the Afep-Medef Code of any matter relating to a
provision or the interpretation of said code;
W examining the section of the report by the Chairman of the Board of
Directors referred to in Article L. 225-37 of the French Commercial Code
relating to the composition of the Board and to the application of the
principle of balanced representation of men and women on the Board,
and the manner of preparing and organising the proceedings of the Board;
W drawing up, each year, with the assistance (where necessary) of an
organisation outside the company, an assessment of the composition of the
Board, the manner of preparing and organising the Board’s proceedings,
and, where applicable, proposing amendments.
3.4.3.4 INTERNATIONAL STRATEGY COMMITTEE
A) COMPOSITION
The composition of the International Strategy Committee is as follows:
W directors chosen for their awareness of issues relating to the company’s
international development;
W a Chairman appointed from among the independent directors.
B) MISSIONS
The missions of the International Strategy Committee relate to the company’s
activity outside France and are as follows:
W studying the strategic development lines proposed by the Chief Executive
Officer regarding the international development of the company and the
Alliance;
W analysing and examining on behalf of the Board the company’s international
projects, and giving opinions on those projects;
W monitoring the company’s international projects and drawing up reports as
requested by the Board of Directors.
3.4.3.5 INDUSTRIAL STRATEGY COMMITTEE
A) COMPOSITION
The composition of the Industrial Strategy Committee is as follows:
W directors chosen for their competence in and awareness of industrial
issues;
W a Chairman appointed from among the independent directors.
B) MISSIONS
The following are the missions of the Industrial Strategy Committee:
W reviewing the major policy lines of the Group’s industrial strategy, including
the social and environmental impacts of those projects;
W reviewing industrial capacity projects;
W reviewing the main plants and the various projects for group expansion
and/or reduction;
W examining the competitiveness of the installed manufacturing sites and
their supplier base;
W examining strategic agreement plans, partnerships and external acquisition
or disposal transactions having a significant impact on the company’s
industrial strategy;
W examining the main strategic policy lines by preparing the decisions for
discussion by the Board of Directors;
W examining major vehicle and engine projects once a year, at the time when
those projects are undertaken.

Find out more at www.renault.comREGISTRATION DOCUMENT RENAULT 2013224
CORPORATE GOVERNANCE3 INTERNAL RULES OF THE BOARD OF DIRECTORS
3.4.4 EXERCISE OF THE GENERAL MANAGEMENT FUNCTION
3.4.4.1 CONCENTRATION OF FUNCTIONSThe Board of Directors appoints the Chairman of the Board of Directors
and the Managing Director. Since the Board has opted for concentration of
functions, the person vested with the relevant powers shall assume the title
of Chief Executive Officer. Thus, to simplify, these rules refer exclusively to
the position of the Chief Executive Officer, it being stated that this officer
acts, depending on the case, as Chairman of the Board of Directors or as
Managing Director.
He/she cannot hold more than two other corporate-office positions in listed
companies outside the Group, including foreign companies, and must seek
the opinion of the Board of Directors before accepting a new corporate-office
position in a listed company.
3.4.4.2 MISSIONS OF THE CHIEF EXECUTIVE OFFICER
The Chief Executive Officer must, for purposes of his/her duties as Chairman
of the Board of Directors, carry out the missions described below.
The Chief Executive Officer organises and leads the proceedings of the Board
of Directors, and reports on those proceedings to the Shareholders’ General
Meeting.
He/she ensures the proper operation of the company’s management bodies,
with particular emphasis on the committees of the Board of Directors. In
particular, in coordination with the referee director, the Chief Executive Officer
ensures that the Directors are able to fulfil their missions, particularly on the
committees on which they sit.
He/she ensures optimum implementation of the corporate governance
principles.
He/she ensures that the Board devotes adequate time to the matters affecting
the company’s future, with particular emphasis on its strategy, especially as
regards the Alliance.
The Chief Executive Officer may attend, in a consultative capacity, all the
meetings of the committees of the Board, subject to any conflicts of interest,
and may consult them on any matter falling within their remit.
3.4.4.3 BALANCE OF POWERSIn view of the concentration in one person of the functions of the Chairman of
the Board of Directors and the Managing Director, the Board of Directors shall
strive to institute mechanisms to safeguard the balance of powers.
A) INDEPENDENCE OF THE BOARD OF DIRECTORS
Renault’s Board of Directors must be comprised of at least 50% independent
directors.
A director is independent when he/she entertains no relationship
whatsoever with the company, its group or general management, such as
might compromise the exercise of his/her freedom of judgement. Thus, an
independent director shall be understood to mean not only a non-executive
director, i.e. one not performing management duties in the company or its
group, but also one devoid of any particular bonds of interest (significant
shareholder, employee or other) with these entities.
The Board of Directors shall determine each year the list of its members who
are regarded as independent, on the basis of the criteria laid down in the
Afep-Medef Code:
W not to be a customer, supplier, investment banker or commercial banker
that is material to the corporation or its group, or for which the corporation
or its group accounts for a significant part of its business;
W not to be related by close family ties to an executive director [company
officer];
W not to have been an auditor of the corporation within the previous five
years;
W not to have been a director of the corporation for more than twelve years.
The loss of independent-director status by reference to this criterion should
occur only at the expiry of the term of office during which such director
exceeds the term of twelve (12) years.
B) LEAD DIRECTOR
The Board of Directors must, in line with the decision to concentrate in the
same hands the functions of Chairman of the Board of Directors and of
Managing Director, appoint from among the members of the Board a “Lead
Director”.
The role of Lead Director shall consist of coordinating the activities of the
independent directors. The Lead Director also liaises between the Chief
Executive Officer and the independent directors.
The Lead Director is appointed by the Board of Directors on a proposal by the
Nominations and Governance Committee, from among the directors qualifying
as independent.
The duties of Lead Director may not be carried out for more than four
consecutive years.
The Lead Director has the following missions:
W advising the Chairman of the Board of Directors and the Chairmen of each
of the committees;
W ensuring that the directors are capable of fulfilling their missions under the
best possible conditions, and in particular that they are very well-informed
ahead of the meetings of the Board of Directors;
W managing and preventing conflicts of interest;

REGISTRATION DOCUMENT RENAULT 2013✦ Global Reporting Initiative (GRI) Directives 225
CORPORATE GOVERNANCE 3
3
INTERNAL RULES OF THE BOARD OF DIRECTORS
W giving opinions on proposed items for inclusion in the agenda for meetings
of the Board of Directors;
W chairing the meetings of the Board of Directors in the absence of the
Chief Executive Officer; in particular, the Lead Director chairs discussions
assessing the performance of the Chief Executive Officer and the setting of
the latter’s remuneration;
W calling a meeting of the Board of Directors in exceptional circumstances,
after having sought the opinion of all the committee Chairmen.
C) LIMITATION OF THE POWERS OF THE CHIEF EXECUTIVE OFFICER
The Chief Executive Officer must obtain authorisation from the Board of
Directors for any external-growth operation, acquisition or sale of any long-
term equity investment in any companies created or to be created where the
amount exceeds two hundred and fifty million euros (€250 million).
The Chief Executive Officer must inform the Board of Directors of any external
growth operation, acquisition or sale of any long-term equity investment in
any companies created or to be created where the amount exceeds 60 million
euros (€60 million).

Find out more at www.renault.comREGISTRATION DOCUMENT RENAULT 2013226
1,242 AND 3% OF REVENUES
GROUP OPERATING PROFIT IN 2013 MILLION EUROS

REGISTRATION DOCUMENT RENAULT 2013✦ Global Reporting Initiative (GRI) Directives 227
4.1 STATUTORY AUDITORS’ REPORT ON THE CONSOLIDATED FINANCIAL STATEMENTS A FR ✦ 228
4.2 CONSOLIDATED FINANCIAL STATEMENTS A FR 230
4.2.1 Consolidated income statement 230
4.2.2 Consolidated comprehensive income 231
4.2.3 Consolidated financial position 232
4.2.4 Changes in shareholders’ equity 234
4.2.5 Consolidated cash flows 235
4.2.6 Segment reporting 236
4.2.7 Notes to the consolidated financial statements 242
4.3 STATUTORY AUDITORS’ REPORT A FR 298
4.3.1 Statutory auditors’ report on the financial statements 298
4.3.2 Statutory auditors’ special report on related party agreements and commitments 300
4.4 RENAULT SA PARENT-COMPANY FINANCIAL STATEMENTS A FR 302
4.4.1 Financial statements 302
4.4.2 Notes to the financial statements 304
4FINANCIAL STATEMENTS
The elements of the annual fi nancial report are identifi ed by A FR sign.

Find out more at www.renault.comREGISTRATION DOCUMENT RENAULT 2013228
FINANCIAL STATEMENTS4 STATUTORY AUDITORS’ REPORT ON THE CONSOLIDATED FINANCIAL STATEMENTS �
4.1 STATUTORY AUDITORS’ REPORT ON THE CONSOLIDATED FINANCIAL STATEMENTS ✦
This is a free translation into English of the statutory auditors’ report on the
consolidated financial statements issued in French and it is provided solely for
the convenience of English-speaking users.
The statutory auditors’ report includes information specifically required by
French law in such reports, whether modified or not. This information is
presented below the audit opinion on the consolidated financial statements
and includes an explanatory paragraph discussing the auditors’ assessments
of certain significant accounting and auditing matters.
These assessments were considered for the purpose of issuing an audit
opinion on the consolidated financial statements taken as a whole and not to
provide separate assurance on individual account captions or on information
taken of outside of the finacial statements.
This report also includes information relating to the specific verification of
information given in the management report and in the documents addressed
to the shareholders.
This report should be read in conjunction with and construed in accordance
with French law and professional auditing standards applicable in France.
RENAULT
Year ended December 31, 2013
To the Shareholders,
In compliance with the assignment entrusted to us by your Annual General
Meeting, we hereby report to you, for the year ended December 31, 2013, on:
W the audit of the accompanying consolidated financial statements of Renault;
W the justification of our assessments;
W the specific verification required by law.
These consolidated financial statements have been approved by the Board
of Directors. Our role is to express an opinion on these consolidated financial
statements based on our audit.
I. OPINION ON THE CONSOLIDATED FINANCIAL STATEMENTSWe conducted our audit in accordance with professional standards applicable
in France; those standards require that we plan and perform the audit to
obtain reasonable assurance about whether the consolidated financial
statements are free of material misstatement. An audit involves performing
procedures, using sampling techniques or other methods of selection, to
obtain audit evidence about the amounts and disclosures in the consolidated
financial statements. An audit also includes evaluating the appropriateness
of accounting policies used and the reasonableness of accounting estimates
made, as well as the overall presentation of the consolidated financial
statements. We believe that the audit evidence we have obtained is sufficient
and appropriate to provide a basis for our audit opinion.
In our opinion, the consolidated financial statements give a true and fair view
of the assets and liabilities and of the financial position of the Group as at
December 31, 2013 and of the results of its operations for the year then
ended in accordance with International Financial Reporting Standards as
adopted by the European Union.
II. JUSTIFICATION OF OUR ASSESSMENTSIn accordance with the requirements of article L. 823-9 of the French company
Law (Code de commerce) relating to the justification of our assessments, we
bring to your attention the following matters:
W for the purpose of preparing the consolidated financial statements, Renault
group makes certain estimates and assumptions concerning, in particular,
the value of certain asset, liability, income and expense accounts, the main
items of which are summarized in note 2-B to the consolidated financial
statements. For all these items, we assessed the appropriateness of
the accounting rules and methods applied and disclosures provided in
the notes to the financial statements. We also reviewed the consistency
of the underlying assumptions, the quantified impact thereof and the
available documentation and assessed on this basis the reasonableness
of estimates made;
W as disclosed in note 13-A to the consolidated financial statements, the
group accounts for its investment in Nissan by the equity method; our
audit of the scope of consolidation included a review of the factual and
legal aspects of the Alliance which serve as the underlying basis for this
accounting policy;
W as part of our assessment of the accounting policies applied by your
company, we have reviewed the methodology adopted for the capitalization
of development costs as intangible assets, their amortization and the
verification of their recoverable amount and we verified that these methods
were properly disclosed in the notes 2-J and 11-A3;
W as disclosed in the note 8-B to the consolidated financial statements, the
group decided not to maintain the net deferred tax assets of French tax
group; we have reviewed the consistency of the underlying assumptions
for the forecasted taxable incomes and associated consumptions of
losses carried forward, the quantified impact thereof and the available
documentation and assessed on this basis the reasonableness of estimates
made.
These assessments were made as part of our audit of the consolidated
financial statements taken as a whole, and therefore contributed to the
opinion we formed which is expressed in the first part of this report.

REGISTRATION DOCUMENT RENAULT 2013✦ Global Reporting Initiative (GRI) Directives 229
FINANCIAL STATEMENTS 4
4
STATUTORY AUDITORS’ REPORT ON THE CONSOLIDATED FINANCIAL STATEMENTS �
III. SPECIFIC VERIFICATION
As required by law we have also verified, in accordance with professional
standards applicable in France, the information presented in the group’s
management report.
We have no matters to report as to its fair presentation and its consistency
with the consolidated financial statements.
Neuilly-sur-Seine and Paris-La Défense, February 19, 2014
The Statutory Auditors
French original signed by
DELOITTE & ASSOCIÉS ERNST & YOUNG Audit

Find out more at www.renault.comREGISTRATION DOCUMENT RENAULT 2013230
FINANCIAL STATEMENTS4 CONSOLIDATED FINANCIAL STATEMENTS
4.2 CONSOLIDATED FINANCIAL STATEMENTS
4.2.1 CONSOLIDATED INCOME STATEMENT
(€ million) 2013 2012
Revenues (note 4) 40,932 41,270
Cost of goods and services sold (33,611) (34,092)
Research and development expenses (note 11-A) (1,812) (1,915)
Selling, general and administrative expenses (4,267) (4,534)
Operating margin (note 5) 1,242 729
Other operating income and expenses (note 6) (1,276) (607)
Other operating income 222 224
Other operating expenses (1,498) (831)
Operating income (loss) (34) 122
Net interest income (expenses) (267) (267)
Interest income 183 184
Interest expenses (450) (451)
Other financial income and expenses (15) 1
Financial income (expenses) (note 7) (282) (266)
Gain on sale of AB Volvo shares (note 14) - 924
Share in net income (loss) of associates and joint ventures 1,444 1,504
Nissan (note 13) 1,498 1,234
Other associates and joint ventures (note 14) (54) 270
Pre-tax income 1,128 2,284
Current and deferred taxes (note 8) (433) (549)
NET INCOME 695 1,735
Net income – non-controlling interests’ share 109 (37)
Net income – parent company shareholders’ share 586 1,772
Basic earnings per share (1) (in €) (note 9) 2.15 6.51
Diluted earnings per share (1) (in €) (note 9) 2.14 6.50
Number of shares outstanding (in thousands) (note 9)
For basic earnings per share 272,290 272,256
For diluted earnings per share 274,096 272,393
(1) Net income – parent company shareholders’ share divided by number of shares stated.

REGISTRATION DOCUMENT RENAULT 2013✦ Global Reporting Initiative (GRI) Directives 231
FINANCIAL STATEMENTS 4
4
CONSOLIDATED FINANCIAL STATEMENTS
4.2.2 CONSOLIDATED COMPREHENSIVE INCOME
Other components of comprehensive income are reported net of tax effects, which are presented in note 10.
(€ million) 2013 2012
NET INCOME 695 1,735
Items that will not be reclassified subsequently to profit or loss 68 (268)
Actuarial gains and losses on defined-benefit pension plans 68 (268)
Items that have been or will be reclassified subsequently to profit or loss 215 48
Translation adjustments on foreign activities (1) (383) (99)
Partial hedge of the investment in Nissan (2) 209 35
Fair value adjustments on cash flow hedging instruments (3) 34 (20)
Fair value adjustments on available-for-sale financial assets (2) 355 132
Total other components of comprehensive income excluding associates and joint ventures (A) 283 (220)
Items that will not be reclassified subsequently to profit or loss 42 10
Actuarial gains and losses on defined-benefit pension plans 42 10
Items that have been or will be reclassified subsequently to profit or loss (4) (1,965) (1,111)
Translation adjustments on foreign activities (2,112) (1,164)
Fair value adjustments on cash flow hedging instruments 5 (19)
Fair value adjustments on available-for-sale financial assets 142 72
Share of associates and joint ventures in other components of comprehensive income (B) (1,923) (1,101)
OTHER COMPONENTS OF COMPREHENSIVE INCOME (A) + (B) (1,640) (1,321)
COMPREHENSIVE INCOME (945) 414
Parent company shareholders’ share (1,055) 450
Non-controlling interests’ share 110 (36)
(1) Including €9 million reclassified to profit or loss in 2013 (nil in 2012).
(2) There were no reclassifications to profit or loss for this item in 2013 or 2012.
(3) Including €25 million reclassified to profit or loss in 2013 (€31 million in 2012).
(4) Including €( 19) million reclassified to profit or loss in 2013 (€ (39) million in 2012).

Find out more at www.renault.comREGISTRATION DOCUMENT RENAULT 2013232
FINANCIAL STATEMENTS4 CONSOLIDATED FINANCIAL STATEMENTS
4.2.3 CONSOLIDATED FINANCIAL POSITION
(€ million) DECEMBER 31, 2013 DECEMBER 31, 2012
ASSETS
Non-current assets
Intangible assets (note 11-A) 3,282 3,482
Property, plant and equipment (note 11-B) 10,973 11,534
Investments in associates and joint ventures 14,874 15,562
Nissan (note 13) 14,068 14,788
Other associates and joint ventures (note 14) 806 774
Non-current financial assets (note 22) 1,530 1,032
Deferred tax assets (note 8) 396 416
Other non-current assets (note 18) 1,076 821
TOTAL NON-CURRENT ASSETS 32,131 32,847
Current assets
Inventories (note 15) 3,162 3,864
Sales financing receivables (note 16) 23,650 23,230
Automotive receivables (note 17) 970 1,144
Current financial assets (note 22) 1,098 989
Current tax assets 64 39
Other current assets (note 18) 2,256 2,121
Cash and cash equivalents (note 22) 11,661 11,180
TOTAL CURRENT ASSETS 42,861 42,567
TOTAL ASSETS 74,992 75,414

REGISTRATION DOCUMENT RENAULT 2013✦ Global Reporting Initiative (GRI) Directives 233
FINANCIAL STATEMENTS 4
4
CONSOLIDATED FINANCIAL STATEMENTS
(€ million) DECEMBER 31, 2013 DECEMBER 31, 2012
SHAREHOLDERS’ EQUITY AND LIABILITIES
Shareholders’ equity
Share capital 1,127 1,127
Share premium 3,785 3,785
Treasury shares (187) (201)
Revaluation of financial instruments 571 36
Translation adjustment (3,674) (1,386)
Reserves 20,629 19,159
Net income – parent company shareholders’ share 586 1,772
Shareholders’ equity – parent company shareholders’ share 22,837 24,292
Shareholders’ equity – non-controlling interests’ share 377 255
TOTAL SHAREHOLDERS’ EQUITY (NOTE 19) 23,214 24,547
Non-current liabilities
Deferred tax liabilities (note 8) 121 123
Provisions – long-term (note 20) 2,544 2,496
Non-current financial liabilities (note 23) 7,100 6,622
Other non-current liabilities (note 21) 1,119 844
TOTAL NON-CURRENT LIABILITIES 10,884 10,085
Current liabilities
Provisions – short-term (note 20) 1,095 889
Current financial liabilities (note 23) 2,921 3,094
Sales financing debts (note 23) 23,757 23,305
Trade payables 6,171 6,558
Current tax liabilities 126 131
Other current liabilities (note 21) 6,824 6,805
TOTAL CURRENT LIABILITIES 40,894 40,782
TOTAL SHAREHOLDERS’ EQUITY AND LIABILITIES 74,992 75,414

Find out more at www.renault.comREGISTRATION DOCUMENT RENAULT 2013234
FINANCIAL STATEMENTS4 CONSOLIDATED FINANCIAL STATEMENTS
4.2.4 CHANGES IN SHAREHOLDERS’ EQUITY
(€ million)
NUMBER
OF SHARES
(thousand)
SHARE
CAPITAL
SHARE
PREMIUM
TREASURY
SHARES
REVALUATION
OF FINANCIAL
INSTRUMENTS
TRANSLATION
ADJUSTMENT RESERVES
NET INCOME
(PARENT
COMPANY
SHARE-
HOLDERS’
SHARE)
SHARE-
HOLDERS’
EQUITY
(PARENT
COMPANY
SHARE-
HOLDERS’
SHARE)
SHARE-
HOLDERS’
EQUITY (NON-
CONTROLLING
ENTITIES’
SHARE)
TOTAL
SHARE-
HOLDERS’
EQUITY
BALANCE AT DECEMBER 31, 2011 295,722 1,127 3,785 (201) (129) (155) 17,567 2,092 24,086 481 24,567
2012 net income 1,772 1,772 (37) 1,735
Other components of comprehensive income (1) 165 (1,231) (256) (1,322) 1 (1,321)
2012 comprehensive income 165 (1,231) (256) 1,772 450 (36) 414
Allocation of 2011 net income 2,092 (2,092)
Dividends (316) (316) (68) (384)
(Acquisitions)/disposals of treasury shares and impact of capital increases
Impact of changes in the scope of consolidation with no loss of control (2) 57 57 (122) (65)
Cost of stock option plans 15 15 15
BALANCE AT DECEMBER 31, 2012 AS PUBLISHED 295,722 1,127 3,785 (201) 36 (1,386) 19,159 1,772 24,292 255 24,547
Restatements for application of IFRS 11 and IAS 19 (revised) (3) (2) 42 (23) 17 17
RESTATED BALANCE AT DECEMBER 31, 2012 295,722 1,127 3,785 (201) 36 (1,388) 19,201 1,749 24,309 255 24,564
2013 net income 586 586 109 695
Other components of comprehensive income (1) 535 (2,286) 110 (1,641) 1 (1,640)
2013 comprehensive income 535 (2,286) 110 586 (1,055) 110 (945)
Allocation of 2012 net income 1,749 (1,749)
Dividends (469) (469) (56) (525)
(Acquisitions)/disposals of treasury shares and impact of capital increases 14 14 14
Impact of changes in the scope of consolidation with or without loss of control (2) 19 19 68 87
Cost of stock option plans 19 19 19
BALANCE AT DECEMBER 31, 2013 295,722 1,127 3,785 (187) 571 (3,674) 20,629 586 22,837 377 23,214
(1) Changes in reserves correspond to actuarial gains and losses on defined-benefit pension funds during the period (€(258) million in 2012 and €110 million in 2013).
(2) Impacts of changes in the scope of consolidation comprise the treatment applied to acquisitions of non-controlling interests and put options for buyouts of non-controlling interests (note 2-C). In 2013, they also included the effects of Renault Pars deconsolidation (note 6-E) and transfer of control over Renault South Africa to the partner (note 6-B). In 2012, the main changes in the scope of consolidation concern Renault’s acquisitions of non-controlling interests in Avtoframos and Remosprom in Russia and Nissan’s acquisition of non-controlling interests in Aichi Kikai in Japan (note 13).
(3) The restatements resulting from retrospective application of IFRS 11 “Joint Arrangements” and IAS 19 (revised) “Employee benefits” are presented in note 2-A2.
Details of changes in consolidated shareholders’ equity in 2013 are given in note 19.

REGISTRATION DOCUMENT RENAULT 2013✦ Global Reporting Initiative (GRI) Directives 235
FINANCIAL STATEMENTS 4
4
CONSOLIDATED FINANCIAL STATEMENTS
4.2.5 CONSOLIDATED CASH FLOWS
(€ million) 2013 2012
Net income 695 1,735
Cancellation of dividends received from unconsolidated listed investments (1) (27) (34)
Cancellation of income and expenses with no impact on cash
Depreciation, amortization and impairment 3,169 3,307
Share in net (income) loss of associates and joint ventures (1,444) (1,504)
Other income and expenses with no impact on cash (note 26-A) 815 (788)
Dividends received from unlisted associates and joint ventures 6 3
Cash flow (2) 3,214 2,719
Dividends received from listed companies (3) 433 507
Net change in financing for final customers (534) (568)
Net change in renewable dealer financing (781) (896)
Decrease (increase) in sales financing receivables (1,315) (1,464)
Bond issuance by the Sales Financing segment (note 23-A) 2,958 3,509
Bond redemption by the Sales Financing segment (note 23-A) (2,465) (2,765)
Net change in other sales financing debts 917 652
Net change in other securities and loans of the Sales Financing segment (365) (69)
Net change in financial assets and debts of the Sales Financing segment 1,045 1,327
Change in capitalized leased assets (333) (210)
Decrease (increase) in working capital (note 26-B) 528 997
CASH FLOWS FROM OPERATING ACTIVITIES 3,572 3,876
Capital expenditure (note 26-C) (2,749) (2,847)
Disposals of property, plant and equipment and intangibles 198 162
Acquisitions of investments involving gain of control, net of cash acquired (5) (5)
Acquisitions of other investments, net of cash acquired (273) (112)
Disposals of investments involving loss of control, net of cash transferred 26 -
Disposals of other investments, net of cash transferred and other (4) 91 1,473
Net decrease (increase) in other securities and loans of the Automotive segment (12) (240)
CASH FLOWS FROM INVESTING ACTIVITIES (2,724) (1,569)
Transactions with non-controlling interests (5) (2) (91)
Dividends paid to parent company shareholders (note 19-D) (502) (338)
Dividends paid to non-controlling interests (48) (73)
(Acquisitions) sales of treasury shares - -
Cash flows with shareholders (552) (502)
Bond issuance by the Automotive segment (note 23-A) 1,716 1,952
Bond redemption by the Automotive segment (note 23-A) (1,152) (1,073)
Net increase (decrease) in other financial liabilities of the Automotive segment (24) 132
Net change in financial liabilities of the Automotive segment 540 1,011
CASH FLOWS FROM FINANCING ACTIVITIES (12) 509
INCREASE (DECREASE) IN CASH AND CASH EQUIVALENTS 836 2,816
(1) Dividends received from Daimler.
(2) Cash flow does not include dividends received from listed companies.
(3) Dividends from Daimler (€27 million) and Nissan (€406 million) in 2013. Dividends from Daimler (€34 million), AB Volvo (€47 million) and Nissan (€426 million) in 2012.
(4) AB Volvo shares were sold for €1,476 million in 2012.
(5) Acquisitions of additional investments in controlled companies (note 2-J).
(€ million) 2013 2012
Cash and cash equivalents: opening balance 11,180 8,672
Increase (decrease) in cash and cash equivalents 836 2,816
Effect of changes in exchange rate and other changes (355) (308)
Cash and cash equivalents: closing balance 11,661 11,180
Details of interest received and paid by the Automotive segment are given in note 26-D.
Current taxes paid by the Group are reported in note 8-A.

Find out more at www.renault.comREGISTRATION DOCUMENT RENAULT 2013236
FINANCIAL STATEMENTS4 CONSOLIDATED FINANCIAL STATEMENTS
4.2.6 SEGMENT REPORTING
A – INFORMATION BY OPERATING SEGMENT
A1 CONSOLIDATED INCOME STATEMENT BY OPERATING SEGMENT
(€ million) AUTOMOTIVE SALES FINANCING
INTERSEGMENT
TRANSACTIONS CONSOLIDATED TOTAL
2013
Sales of goods 36,964 33 36,997
Sales of services 1,811 2,124 3,935
External revenues 38,775 2,157 40,932
Intersegment sales (361) 400 (39) -
Sales by segment 38,414 2,557 (39) 40,932
Operating margin (1) 521 747 (26) 1,242
Operating income (loss) (744) 736 (26) (34)
Financial income (expenses) (2) (107) - (175) (282)
Share in net income (loss) of associates and joint ventures 1,430 14 - 1,444
Pre-tax income 579 750 (201) 1,128
Current and deferred taxes (203) (238) 8 (433)
Net income 376 512 (193) 695
2012
Sales of goods 37,227 - - 37,227
Sales of services 1,929 2,114 - 4,043
External revenues 39,156 2,114 - 41,270
Intersegment sales (297) 452 (155) -
Sales by segment 38,859 2,566 (155) 41,270
Operating margin (1) (15) 754 (10) 729
Operating income (loss) (615) 749 (12) 122
Financial income (expenses) (2) 85 - (351) (266)
Gain on sale of AB Volvo shares 924 - - 924
Share in net income (loss) of associates and joint ventures 1,495 9 - 1,504
Pre-tax income 1,889 758 (363) 2,284
Current and deferred taxes (313) (239) 3 (549)
Net income 1,576 519 (360) 1,735
(1) Details of amortization, depreciation and impairment are provided in the consolidated cash flow statements by operating segment.
(2) Sales financing dividends are included in the Automotive segment’s financial income and eliminated as an intersegment transaction.

REGISTRATION DOCUMENT RENAULT 2013✦ Global Reporting Initiative (GRI) Directives 237
FINANCIAL STATEMENTS 4
4
CONSOLIDATED FINANCIAL STATEMENTS
A2 CONSOLIDATED FINANCIAL POSITION BY OPERATING SEGMENT
DECEMBER 31, 2013
ASSETS (€ million) AUTOMOTIVE SALES FINANCING
INTERSEGMENT
TRANSACTIONS CONSOLIDATED TOTAL
Non-current assets
Property, plant and equipment and intangible assets 14,146 119 (10) 14,255
Investments in associates and joint ventures 14,859 15 14,874
Non-current financial assets – investments in non-controlled entities 4,036 55 (2,895) 1,196
Non-current financial assets – other securities, loans and derivatives on financing operations of the Automotive segment 368 (34) 334
Deferred tax assets and other non-current assets 1,301 206 (35) 1,472
TOTAL NON-CURRENT ASSETS 34,710 395 (2,974) 32,131
Current assets
Inventories 3,121 48 (7) 3,162
Customer receivables 1,031 23,997 (408) 24,620
Current financial assets 975 925 (802) 1,098
Current tax assets and other current assets 1,604 2,900 (2,184) 2,320
Cash and cash equivalents 10,704 1,201 (244) 11,661
TOTAL CURRENT ASSETS 17,435 29,071 (3,645) 42,861
TOTAL ASSETS 52,145 29,466 (6,619) 74,992
Shareholders’ equity 23,127 2,899 (2,812) 23,214
Non-current liabilities
Long-term provisions 2,277 267 2,544
Non-current financial liabilities 6,837 263 7,100
Deferred tax liabilities and other non-current liabilities 691 549 1,240
TOTAL NON-CURRENT LIABILITIES 9,805 1,079 10,884
Current liabilities
Short-term provisions 1,067 28 1,095
Current financial liabilities 3,449 (528) 2,921
Trade payables and sales financing debts 6,349 24,657 (1,078) 29,928
Current tax liabilities and other current liabilities 8,348 803 (2,201) 6,950
TOTAL CURRENT LIABILITIES 19,213 25,488 (3,807) 40,894
TOTAL SHAREHOLDERS’ EQUITY AND LIABILITIES 52,145 29,466 (6,619) 74,992

Find out more at www.renault.comREGISTRATION DOCUMENT RENAULT 2013238
FINANCIAL STATEMENTS4 CONSOLIDATED FINANCIAL STATEMENTS
DECEMBER 31, 2012
ASSETS (€ million) AUTOMOTIVE SALES FINANCING
INTERSEGMENT
TRANSACTIONS CONSOLIDATED TOTAL
Non-current assets
Property, plant and equipment and intangible assets 14,910 116 (10) 15,016
Investments in associates and joint ventures 15,514 48 - 15,562
Non-current financial assets – investments in non-controlled entities 3,433 - (2,645) 788
Non-current financial assets – other securities, loans and derivatives on financing operations of the Automotive segment 348 - (104) 244
Deferred tax assets and other non-current assets 1,047 238 (48) 1,237
TOTAL NON-CURRENT ASSETS 35,252 402 (2,807) 32,847
Current assets
Inventories 3,825 42 (3) 3,864
Customer receivables 1,195 23,649 (470) 24,374
Current financial assets 1,150 514 (675) 989
Current tax assets and other current assets 1,583 2,774 (2,197) 2,160
Cash and cash equivalents 10,072 1,338 (230) 11,180
TOTAL CURRENT ASSETS 17,825 28,317 (3,575) 42,567
TOTAL ASSETS 53,077 28,719 (6,382) 75,414
SHAREHOLDERS’ EQUITY AND LIABILITIES (€ million)
Shareholders’ equity 24,437 2,650 (2,540) 24,547
Non-current liabilities
Long-term provisions 2,262 234 - 2,496
Non-current financial liabilities 6,362 260 - 6,622
Deferred tax liabilities and other non-current liabilities 424 543 - 967
TOTAL NON-CURRENT LIABILITIES 9,048 1,037 - 10,085
Current liabilities
Short-term provisions 857 32 - 889
Current financial liabilities 3,716 - (622) 3,094
Trade payables and sales financing debts 6,663 24,199 (999) 29,863
Current tax liabilities and other current liabilities 8,356 801 (2,221) 6,936
TOTAL CURRENT LIABILITIES 19,592 25,032 (3,842) 40,782
TOTAL SHAREHOLDERS’ EQUITY AND LIABILITIES 53,077 28,719 (6,382) 75,414

REGISTRATION DOCUMENT RENAULT 2013✦ Global Reporting Initiative (GRI) Directives 239
FINANCIAL STATEMENTS 4
4
CONSOLIDATED FINANCIAL STATEMENTS
A3 CONSOLIDATED CASH FLOWS BY OPERATING SEGMENT
(€ million) AUTOMOTIVE SALES FINANCING
INTERSEGMENT
TRANSACTIONS CONSOLIDATED TOTAL
2013
Net income 376 512 (193) 695
Cancellation of dividends received from unconsolidated listed investments (1) (27) - - (27)
Cancellation of income and expenses with no impact on cash
Depreciation, amortization and impairment 3,164 5 - 3,169
Share in net (income) loss of associates and joint ventures (1,430) (14) - (1,444)
Other income and expenses with no impact on cash 825 (2) (8) 815
Dividends received from unlisted associates and joint ventures 6 - - 6
Cash flow (2) 2,914 501 (201) 3,214
Dividends received from listed companies (3) 433 - - 433
Decrease (increase) in sales financing receivables - (1,240) (75) (1,315)
Net change in financial assets and sales financing debts - 1,063 (18) 1,045
Change in capitalized leased assets (334) 1 - (333)
Decrease (increase) in working capital 790 (198) (64) 528
CASH FLOWS FROM OPERATING ACTIVITIES 3,803 127 (358) 3,572
Purchases of intangible assets (827) (4) - (831)
Purchases of property, plant and equipment (1,914) (4) - (1,918)
Disposals of property, plant and equipment and intangibles 198 - - 198
Acquisitions and disposals of investments involving gain or loss of control, net of cash acquired/transferred 24 (3) - 21
Acquisitions and disposals of other investments and other assets (183) 1 - (182)
Net decrease (increase) in other securities and loans of the Automotive segment (20) - 8 (12)
CASH FLOWS FROM INVESTING ACTIVITIES (2,722) (10) 8 (2,724)
Cash flows with shareholders (539) (188) 175 (552)
Net change in financial liabilities of the Automotive segment 461 - 79 540
CASH FLOWS FROM FINANCING ACTIVITIES (78) (188) 254 (12)
INCREASE (DECREASE) IN CASH AND CASH EQUIVALENTS (4) 1,003 (71) (96) 836
(1) Dividends received from Daimler.
(2) Cash flow does not include dividends received from listed companies.
(3) Dividends received from Daimler (€27 million) and Nissan (€406 million).
(4) Excluding the impact on cash of changes in exchange rate and other changes.
(€ million) AUTOMOTIVE SALES FINANCING
INTERSEGMENT
TRANSACTIONS CONSOLIDATED TOTAL
2013
CASH AND CASH EQUIVALENTS: OPENING BALANCE 10,072 1,338 (230) 11,180
Increase (decrease) in cash and cash equivalents 1,003 (71) (96) 836
Effect of changes in exchange rate and other changes (371) (66) 82 (355)
CASH AND CASH EQUIVALENTS: CLOSING BALANCE 10,704 1,201 (244) 11,661

Find out more at www.renault.comREGISTRATION DOCUMENT RENAULT 2013240
FINANCIAL STATEMENTS4 CONSOLIDATED FINANCIAL STATEMENTS
(€ million) AUTOMOTIVE SALES FINANCING
INTERSEGMENT
TRANSACTIONS CONSOLIDATED TOTAL
2012
Net income 1,576 519 (360) 1,735
Cancellation of dividends received from unconsolidated listed investments (1) (34) - - (34)
Cancellation of income and expenses with no impact on cash
Depreciation, amortization and impairment 3,299 8 - 3,307
Share in net (income) loss of associates and joint ventures (1,495) (9) - (1,504)
Other income and expenses with no impact on cash (772) (15) (1) (788)
Dividends received from unlisted associates and joint ventures 3 - - 3
Cash flow (2) 2,577 503 (361) 2,719
Dividends received from listed companies (3) 507 - - 507
Decrease (increase) in sales financing receivables - (1,562) 98 (1,464)
Net change in financial assets and sales financing debts - 1,483 (156) 1,327
Change in capitalized leased assets (228) 18 - (210)
Decrease (increase) in working capital 922 95 (20) 997
CASH FLOWS FROM OPERATING ACTIVITIES 3,778 537 (439) 3,876
Purchases of intangible assets (900) (2) - (902)
Purchases of property, plant and equipment (1,936) (9) - (1,945)
Disposals of property, plant and equipment and intangibles 162 - - 162
Acquisitions and disposals of investments involving gain or loss of control, net of cash acquired/transferred (5) - - (5)
Acquisitions and disposals of other investments and other assets (4) 1,363 (2) - 1,361
Net decrease (increase) in other securities and loans of the Automotive segment (252) - 12 (240)
CASH FLOWS FROM INVESTING ACTIVITIES (1,568) (13) 12 (1,569)
Cash flows with shareholders (493) (360) 351 (502)
Net change in financial liabilities of the Automotive segment 1,071 - (60) 1,011
CASH FLOWS FROM FINANCING ACTIVITIES 578 (360) 291 509
INCREASE (DECREASE) IN CASH AND CASH EQUIVALENTS (5) 2,788 164 (136) 2,816
(1) Dividends received from Daimler.
(2) Cash flow does not include dividends received from listed companies.
(3) Dividends from Daimler (€34 million), AB Volvo (€47 million) and Nissan (€426 million).
(4) AB Volvo shares were sold for €1,476 million in 2012.
(5) Excluding the effects on cash of changes in exchange rate and other changes.
(€ million) AUTOMOTIVE SALES FINANCING
INTERSEGMENT
TRANSACTIONS CONSOLIDATED TOTAL
2012
CASH AND CASH EQUIVALENTS: OPENING BALANCE 7,618 1,171 (117) 8,672
Increase (decrease) in cash and cash equivalents 2,787 165 (136) 2,816
Effect of changes in exchange rate and other changes (333) 2 23 (308)
CASH AND CASH EQUIVALENTS: CLOSING BALANCE 10,072 1,338 (230) 11,180

REGISTRATION DOCUMENT RENAULT 2013✦ Global Reporting Initiative (GRI) Directives 241
FINANCIAL STATEMENTS 4
4
CONSOLIDATED FINANCIAL STATEMENTS
B – INFORMATION BY REGIONThe Regions presented correspond to the geographic divisions used for Group management.
Consolidated revenues are presented by location of customers.
Property, plant and equipment and intangibles are presented by location of subsidiaries and joint operations.
(€ million) EUROPE (1) AMERICAS ASIA-PACIFIC
EUROMED-
AFRICA EURASIA
CONSOLIDATED
TOTAL
2013
Revenues 23,803 5,933 3,753 4,446 2,997 40,932
Property, plant and equipment and intangibles 10,285 639 475 2,214 642 14,255
2012
Revenues 24,661 6,141 4,010 3,992 2,466 41,270
Property, plant and equipment and intangibles 10,777 686 616 2,321 616 15,016
(1) Including the following for France:
(€ million) 2013 2012
Revenues 10,004 10,894
Property, plant and equipment and intangibles 8,613 9,180

Find out more at www.renault.comREGISTRATION DOCUMENT RENAULT 2013242
FINANCIAL STATEMENTS4 CONSOLIDATED FINANCIAL STATEMENTS
4.2.7 NOTES TO THE CONSOLIDATED FINANCIAL STATEMENTS
4.2.7.1 ACCOUNTING POLICIES AND SCOPE OF CONSOLIDATION ✦ 243
Note 1 – Approval of the financial statements 243
Note 2 – Accounting policies 243
Note 3 – Changes in the scope of consolidation 253
4.2.7.2 INCOME STATEMENT AND COMPREHENSIVE INCOME 253
Note 4 – Revenues 253
Note 5 – Operating margin: details of income and expenses by nature 254
Note 6 – Other operating income and expenses 254
Note 7 – Financial income 256
Note 8 – Current and deferred taxes 256
Note 9 – Basic and diluted earnings per share 257
Note 10 – Other components of comprehensive income 258
4.2.7.3 OPERATING ASSETS AND LIABILITIES, SHAREHOLDERS’ EQUITY 258
Note 11 – Intangible assets and property, plant and equipment 258
Note 12 – Impairment tests on fixed assets (other than leased assets) 261
Note 13 – Investment in Nissan 261
Note 14 – Investments in other associates and joint ventures 265
Note 15 – Inventories 269
Note 16 – Sales financing receivables 269
Note 17 – automotive receivables 270
Note 18 – Other current and non-current assets 271
Note 19 – Shareholders’ equity 271
Note 20 – Provisions 275
Note 21 – Other current and non-current liabilities 279
4.2.7.4 FINANCIAL ASSETS AND LIABILITIES, FAIR VALUE AND MANAGEMENT OF FINANCIAL RISKS 279
Note 22 – Financial assets – cash and cash equivalents 279
Note 23 – Financial liabilities and sales financing debts 281
Note 24 – Fair value of financial instruments and impact on net income 285
Note 25 – Derivatives and management of financial risks 287
4.2.7.5 CASH FLOWS AND OTHER INFORMATION 291
Note 26 – Cash flows 291
Note 27 – Related parties 292
Note 28 – Off-balance sheet commitments and contingent assets and liabilities 292
Note 29 – Fees paid to statutory auditors and their network 293
Note 30 – Subsequent events 293
Note 31 – Consolidated companies 294

REGISTRATION DOCUMENT RENAULT 2013✦ Global Reporting Initiative (GRI) Directives 243
FINANCIAL STATEMENTS 4
4
CONSOLIDATED FINANCIAL STATEMENTS
4.2.7.1 ACCOUNTING POLICIES AND SCOPE OF CONSOLIDATION ✦
NOTE 1 – APPROVAL OF THE FINANCIAL STATEMENTSThe Renault group’s consolidated financial statements for 2013 were finalized
at the Board of Directors’ meeting of February 12, 2014 and will be submitted
for approval by the shareholders at the General Shareholders’ Meeting.
NOTE 2 – ACCOUNTING POLICIESIn application of regulation 1606/2002 passed on July 19, 2002 by the
European Parliament and the Council of Europe, Renault’s consolidated
financial statements for 2013 are prepared under IFRS (International Financial
Reporting Standards) as issued by the lASB (International Accounting
Standards Board) at December 31, 2013 and adopted by the European Union
at the year-end.
A – Changes in accounting policies
A1 Changes in 2013
At December 31, 2013 the Group applies the new standards and amendments
shown below, which were published in the Official Journal of the European
Union and mandatory at the closing date.
STANDARD EFFECTIVE DATE
IFRS 13 Fair Value Measurement January 1, 2013
IAS 19 (revised) Employee Benefits January 1, 2013
Improvements to several standards Annual improvements – 2009-2011 cycle January 1, 2013
Amendment to IFRS 7 Financial instruments: Disclosure – Offsetting financial assets and financial liabilities January 1, 2013
Amendment to IAS 1 Presentation of financial statements – Presentation of other components of comprehensive income January 1, 2013
Amendment to IAS 12 Income Taxes – Deferred Tax: Recovery of Underlying Assets January 1, 2013
The amendment to IAS 1 requires other components of comprehensive income
to be presented in two separate categories: items that will be reclassified to
profit and loss in the future, and other items.
IAS 19 (revised) “Employee benefits” is applied retrospectively. The impact of
its first application is not significant at Group level, as shown in the tables of
restatements of 2012 figures presented in note 2-A2.
IFRS 13 “Fair Value Measurement” is applied prospectively. Its application has
no significant impact on book values.
The Group also opted for early application of the following standards and
amendments, which were published in the Official Journal of the European
Union but were not mandatory at the closing date.
STANDARD EFFECTIVE DATE
IFRS 10 Consolidated financial statements January 1, 2014
IFRS 11 Joint arrangements January 1, 2014
IFRS 12 Disclosure of interests in other entities January 1, 2014
Amendments to IFRS 10, IFRS 11 and IFRS 12
Consolidated financial statements, joint arrangements and disclosure of interests in other entities: Transition guidance January 1, 2014
Amendment to IAS 28 Investments in Associates and Joint Ventures January 1, 2014
IFRS 11 “Joint Arrangements”, which is applied retrospectively, has an impact
on the Group’s consolidated financial statements, but this impact is non-
significant, as shown in the tables of restatements of 2012 figures presented
in note 2-A2. IFRS 12 has an impact on the disclosures provided in the notes
to the financial statements.
The Group has not undertaken early application of the following amendments,
which have been published in the Official Journal of the European Union but
are not mandatory at January 1, 2013.

Find out more at www.renault.comREGISTRATION DOCUMENT RENAULT 2013244
FINANCIAL STATEMENTS4 CONSOLIDATED FINANCIAL STATEMENTS
STANDARD EFFECTIVE DATE
Amendment to IAS 32 Financial instruments: Presentation – Offsetting of financial assets and financial liabilities January 1, 2014
Amendment to IFRS 10, IFRS 12 and IAS 27 Investment entities January 1, 2014
Amendment to IAS 36 Recoverable amount disclosures for non-financial assets January 1, 2014
Amendment to IAS 39 Novation of derivatives and continuation of hedge accounting January 1, 2014
The Group does not currently expect adoption of these amendments to have
any significant impact on the consolidated accounts.
A2 First application of IFRS 11 and IAS 19 (revised)
APPLICATION OF IFRS 11 “JOINT ARRANGEMENTS”
IFRS 11 replaces IAS 31 “Interests in joint ventures” and interpretation SIC
13 “Jointly-controlled entities – Non-monetary contributions by venturers”.
IFRS 11 no longer allows the proportionate consolidation method for
jointly-controlled entities. The equity method must now be applied to joint
arrangements classified as joint ventures, and joint arrangements classified
as joint operations must be consolidated on the basis of the percentage share
specific to each balance sheet and income statement item.
The following Renault group companies have been classified as joint ventures:
Française de Mécanique, Indra Investissements, RCI Financial Services s.r.o.
and Renault Credit Car. These companies were proportionately consolidated
until December 31, 2012 and are accounted for under the equity method
from January 1, 2013. Française de Mécanique was deconsolidated at
December 31, 2013 after Renault’s investment was sold. RCI Financial
Services s.r.o. has been fully consolidated since October 2013 after the Group
acquired control.
RNTBCI has been classified as a joint operation, and is therefore consolidated
on the basis of the percentage share specific to each balance sheet and
income statement item in 2013.
The Group’s investments in joint ventures are presented on a specific line in
the consolidated statement of financial position, “Investments in associates
and joint ventures”. The share in the net income of these entities is reported
in the consolidated income statement as “Share in net income (loss) of
associates and joint ventures”.
APPLICATION OF IAS 19 (REVISED) “EMPLOYEE BENEFITS”
The main changes introduced by revision of IAS 19 were as follows:
W all actuarial gains and losses must be immediately recognized in other
components of comprehensive income; since the Group opted for this
accounting method in 2007, this change has no impact on the consolidated
financial statements at December 31, 2013;
W the past service cost resulting from an amendment or curtailment of a
plan must be recognized immediately in full in the income statement;
before revision of the standard, the past service cost was recorded in the
income statement on a straight-line basis over the average vesting period
for benefit entitlements;
W the expected return on plan assets must now be valued using the same
rate as the discount rate applied to the obligations.
The Group also modified the income statement presentation of the financial
component of employee benefits in 2013. The net interest on the net liability
(or asset) corresponds to the cost of unwinding the present value of the
obligation, and the expected return on plan assets. It is now included in
financial income, whereas it was previously included in the operating margin.
RESTATEMENT OF THE 2012 CONSOLIDATED FINANCIAL STATEMENTS FOLLOWING APPLICATION OF IFRS 11 AND IAS 19 (REVISED)
IFRS 11 and IAS 19 (revised) must be applied retrospectively. The impacts
of the restatements resulting from application of these standards on the key
items published in the consolidated financial statements for 2012 are as
follows:

REGISTRATION DOCUMENT RENAULT 2013✦ Global Reporting Initiative (GRI) Directives 245
FINANCIAL STATEMENTS 4
4
CONSOLIDATED FINANCIAL STATEMENTS
Restatements of the consolidated income statement for 2012
(€ million) YEAR 2012 AS PUBLISHED IFRS 11 RESTATEMENT IAS 19 R RESTATEMENT YEAR 2012 RESTATED
Revenues 41,270 (550) 40,720
Automotive 39,156 (544) 38,612
Sales Financing 2,114 (6) 2,108
Operating margin 729 (1) 54 782
Automotive (25) 5 54 34
Sales Financing 754 (6) 748
Other operating income and expenses (607) 8 (599)
Operating income (loss) 122 7 54 183
Financial income (expenses) (266) 1 (56) (321)
Gain on sale of AB Volvo shares 924 924
Share in net income (loss) of associates and joint ventures 1,504 (8) (21) 1,475
Nissan 1,234 (21) 1,213
Other associates and joint ventures 270 (8) 262
PRE-TAX INCOME 2,284 (23) 2,261
NET INCOME 1,735 (23) 1,712
Net income – parent company shareholders’ share 1,772 (23) 1,749
Basic earnings per share (in €) 6.51 (0.08) 6.43
Restatements of the consolidated statement of financial position at December 31, 2012
(€ million)
DECEMBER 31, 2012
AS PUBLISHED
IFRS 11
RESTATEMENT
IAS 19 R
RESTATEMENT
DECEMBER 31, 2012
RESTATED
Non-current assets
Investments in associates and joint ventures 15,562 36 15 15,613
Nissan 14,788 15 14,803
Other associates and joint ventures 774 36 810
Other non-current assets 17,285 (85) 17,200
Total non-current assets 32,847 (49) 15 32,813
Current assets
Sales financing receivables 23,230 (291) 22,939
Other current assets 19,337 (77) 19,260
Total current assets 42,567 (368) 42,199
TOTAL ASSETS 75,414 (417) 15 75,012
(€ million)
DECEMBER 31, 2012
AS PUBLISHED
IFRS 11
RESTATEMENT
IAS 19 R
RESTATEMENT
DECEMBER 31, 2012
RESTATED
Total shareholders’ equity 24,547 17 24,564
Non-current liabilities 10,085 (21) 10,064
Current liabilities
Sales financing debts 23,305 (254) 23,051
Other current liabilities 17,477 (142) (2) 17,333
Current liabilities 40,782 (396) (2) 40,384
TOTAL SHAREHOLDERS’ EQUITY AND LIABILITIES 75,414 (417) 15 75,012

Find out more at www.renault.comREGISTRATION DOCUMENT RENAULT 2013246
FINANCIAL STATEMENTS4 CONSOLIDATED FINANCIAL STATEMENTS
B – Estimates and judgments
In preparing its financial statements, Renault has to make estimates and
assumptions that affect the book value of certain assets and liabilities,
income and expense items, and the information disclosed in certain notes.
Renault regularly revises its estimates and assessments to take account of
past experience and other factors deemed relevant in view of the economic
circumstances. If changes in these assumptions or circumstances are not as
anticipated, the figures reported in Renault’s future financial statements could
differ from the estimates established at the time the financial statements were
finalized.
The main items in the financial statements that are sensitive to estimates and
judgments at December 31, 2013 are the following:
W fixed assets (note 2-L and 12);
W property, plant and equipment (leased vehicles) and inventories related to
used vehicles (notes 2-G, 11-B and 15);
W investments in associates, notably Nissan and AVTOVAZ (notes 2-L, 13
and 14);
W sales financing receivables (notes 2-G and 16);
W deferred taxes (notes 2-I and 8);
W provisions, particularly vehicle and battery warranty provisions (note 2-G),
provisions for pensions and other long-term employee benefit obligations
(note 20-C) and provisions for workforce adjustment measures (note 6-A);
W the value of assets in Iran, mainly comprising shares, a shareholder loan
and commercial receivables (note 6-E).
C – Consolidation principles
The consolidated financial statements include the financial statements of
all companies controlled exclusively by the Group either directly or indirectly
(subsidiaries). Jointly controlled companies are accounted for under the
equity method when they are classified as joint ventures and consolidated on
the basis of the percentage share specific to each balance sheet and income
statement item when they are classified as joint operations.
Companies in which the Group exercises significant influence (associates) are
included in the financial statements on an equity basis.
Significant intercompany transactions and unrealized internal profits are
eliminated.
Non-consolidated companies are recorded as other non-current assets even
when they fulfil the above criteria.
None of these companies’ individual contributions to consolidated figures
exceeds the following:
W revenues: €20 million;
W inventories: €20 million.
Their consolidation would have a negligible impact on the consolidated
financial statements, since they are Group-financed entities whose losses, if
any, are recognized via impairment losses, and which:
W acquire almost all their purchases from Group companies, most of these
companies being dealership-type establishments; or
W carry out almost all their sales transactions with Group companies.
Put options on non-controlling interests are carried at fair value and classified
in liabilities in the consolidated financial position, with a corresponding
adjustment to equity.
D – Presentation of the financial statements
Operating income and operating margin
Operating income includes all revenues and costs directly related to the
Group’s activities, whether recurrent or resulting from non-recurring decisions
or operations, such as restructuring costs.
The operating margin corresponds to the operating income before other
operating income and expenses, which cover:
W restructuring costs and costs relating to workforce adjustment;
W gains or losses on partial or total disposal of businesses or operating
entities, other gains and losses relating to changes in the scope of
consolidation, and direct acquisition costs;
W gains or losses on disposal of property, plant and equipment or intangible
assets (except vehicle sales);
W unusual items, i.e. income and charges that are unusual in their frequency,
nature or amount, particularly impairment of fixed assets.
Reporting by operating segment
The operating segments used by Renault are:
W the Automotive segment, comprising the production, sales, and distribution
subsidiaries for passenger and light commercial vehicles, automobile
service subsidiaries, and the subsidiaries in charge of the Automotive
segment’s cash management for the Group;
W the Sales Financing segment, which the Group considers as an operating
activity, carried out by RCI Banque and its subsidiaries for the distribution
network and final customers.
The information by operating segment is based on internal reporting to the
Group Executive Committee, identified as the “Chief Operating Decision-
Maker”. This information is prepared under the IFRSs applicable to the
consolidated financial statements. All Group financial data are assigned to the
operating segments. The “Intersegment transactions” column is reserved for
transactions between the two segments, which are carried out on near-market
terms. Dividends paid by the Sales Financing segment to the Automotive
segment are included in the Automotive division’s financial income.
The indicator used to evaluate segment performance is the operating margin.
Apart from taxes and the associates’ share in net income, income and
expenses relating to sales financing are recorded as operating items. The tax
effect inherent to the French consolidated taxation system is included in the
tax expense of the Automotive segment.
Assets and liabilities are specific to each segment. Receivables assigned
by the Automotive segment to the sales financing companies are treated as
operating assets by the assignee when the risks and benefits are substantially
transferred. These receivables are mostly receivables on the dealership
network.

REGISTRATION DOCUMENT RENAULT 2013✦ Global Reporting Initiative (GRI) Directives 247
FINANCIAL STATEMENTS 4
4
CONSOLIDATED FINANCIAL STATEMENTS
Vehicles and batteries for which the Automotive segment has a repurchase
commitment are included in the segment’s assets. When these assets are
financed by the Sales Financing segment, the Sales Financing segment
recognises a receivable on the Automotive segment.
Current and non-current assets and liabilities
Sales financing receivables, other securities, derivatives, loans and financial
liabilities of the Sales Financing segment (other than redeemable shares and
subordinated loans) are considered as current assets and liabilities, because
they are used in this operating segment’s normal business cycle.
For the Automotive segment, in addition to items directly related to the
business cycle, all assets and liabilities maturing within one year are classified
as current.
E – Translation of the financial statements of foreign companies
The Group’s presentation currency is the Euro.
For foreign companies, the functional currency is generally the local currency.
In cases where most transactions are carried out in a different currency, that
is adopted as the functional currency.
To determine whether a country is in hyperinflation, the Group refers to the
list published by the AICPA (American Institute of Certified Public Accountants)
Task Force. In 2013, this list included none of the countries where Renault has
significant business activity.
Foreign companies’ accounts are established in their functional currency, and
subsequently translated into the Group’s presentation currency as follows:
W financial position items other than components of shareholders’ equity,
which are stated at historical value, are translated at the closing rate of
exchange;
W income statement items are translated at the average exchange rate for
the period;
W the translation adjustment is one of the other components of comprehensive
income, and therefore has no impact on net income.
Goodwill and valuation adjustments generated by a business combination with
a foreign company are treated as an asset or liability of the entity acquired, as
appropriate. They are therefore expressed in the relevant entity’s functional
currency, and translated into Euros at the closing rate.
When a foreign company is sold, the accumulated translation adjustments on
its assets and liabilities are transferred to net income.
F – Translation of foreign currency transactions
Transactions undertaken in a currency other than the functional currency of
the entity concerned are initially translated to and recorded in the functional
currency, using the rate applicable at the transaction date.
For financial reporting purposes, monetary items in currencies other than
the functional currency are translated at the closing rate. All resulting foreign
exchange differences are recognized in the income statement, except for
foreign exchange gains and losses on financial instruments designated as
hedges of a net investment in a foreign entity (note 2-V).
The following impacts are therefore recorded in net income:
W translation adjustments related to financial operations by the Automotive
segment are included in the net financial income;
W other translation adjustments are included in the operating margin.
Derivatives are measured and recorded as described in note 2-V.
G – Revenues and margin
Revenues comprise all proceeds from sales of the Group’s automotive goods,
services related to these sales, and the various sales financing products
marketed by the Group’s companies to their customers.
Sales of goods and services and margin recognition
SA LES AND MARGIN RECOGNITION
Sales of automotive goods are recognized when the goods are made available
to the distribution network in the case of non-Group dealers, or upon delivery
to the end-user in the case of direct sales. The margin on sales is recognized
immediately for normal sales by the Automotive segment, including sales
with associated financing contracts that can be considered as finance leases
(long-term or with a purchase option). However, no sale is recognized when
an automotive item (vehicle or electric car battery) is covered by an operating
lease from a Group finance company or the Group has made a buy-back
commitment with a high probability of application, if the term of the contract
covers an insufficient portion of the item’s useful life.
In such cases, the transactions are recorded as operating leases and included
in sales of services. The difference between the price paid by the customer
and the buy-back price is treated as rental income, and spread over the
period the automotive item is at the customer’s disposal. The production cost
for the new automotive item concerned is recorded in inventories for contracts
of less than one year, or included in property, plant and equipment under
fixed assets leased to customers when the contracts exceed one year. The
sale of the automotive item as second-hand at the end of the lease gives
rise to recognition of sales revenue and the related margin. The forecast
resale value takes account of recent known developments on the second-
hand automotive market but also future anticipated developments over the
period in which the automotive goods will be sold, which may be influenced
by factors both external (economic situation, taxation) and internal (changes
in the range or the manufacturer’s pricing strategy). As soon as a loss is
expected on the resale, a provision (if the automotive item is in inventories)
or additional depreciation (if the automotive item is included in property, plant
and equipment) is recognized to cover the loss. When the overall position of
the lease contract (rental income and income on resale) shows a loss, an
additional provision is also recorded immediately to cover the future loss.
SALES INCENTIVE PROGRAMMES
When based on the volume or price of the products sold, the cost of these
programmes is deducted from revenues when the corresponding sales are
recorded. Otherwise, the cost is included in selling, general and administrative
expenses. If programmes are approved after the sales, a provision is
established when the decision is made.

Find out more at www.renault.comREGISTRATION DOCUMENT RENAULT 2013248
FINANCIAL STATEMENTS4 CONSOLIDATED FINANCIAL STATEMENTS
The Group sometimes organizes promotional campaigns offering reduced-
interest loans to end-users. The cost of these operations is recognized
immediately when the rates offered cannot cover refinancing and
administration costs, and charged to sales financing revenues over the
duration of the loan otherwise.
WARRANTY
The estimated or incurred costs relating to manufacturer’s product or part
warranties not covered by insurance are charged to expenses when the
sales are recorded. Provisions for costs to be borne by Renault are valued on
the basis of observed data by model and engine, i.e. the level of costs, and
their distribution over the periods covered by the manufacturer’s warranty. In
the event of product recalls following incidents that come to light after the
vehicle has been put on the market, provisions are established to cover the
costs involved as soon as the decision to undertake the recall campaign has
been made. Amounts claimed from suppliers are deducted from the warranty
expense when it is considered practically certain they will be recovered.
SERVICES RELATED TO SALES OF AUTOMOTIVE PRODUCTS
Renault offers its customers extended warranty and maintenance contracts,
the income and margin on which are recognized over the period covered by
the contract.
Sales financing revenues and margin recognition
SALES FINANCING REVENUES
Sales financing revenues are generated by financing operations for sales of
vehicles to dealers and end-users. These financing operations take the form
of loans from the Sales Financing segment companies, and are carried in
the balance sheet at amortized cost under the effective interest rate method,
less any impairment. Income on these contracts is calculated so as to give
a constant interest rate over the period, and is included in sales revenues.
SALES FINANCING COSTS
The costs of sales financing are considered as operating expenses and
included in the operating margin. They mainly comprise interest incurred
by sales financing companies to refinance their customer transactions,
other costs and revenues directly related to administration of this type of
refinancing (temporary investments, hedging and management of exchange
and interest rate risks), and the cost of risks other than those relating to
refinancing of receivables.
COMMISSIONS PAYABLE TO BUSINESS INTERMEDIARIES
Commissions are treated as external distribution costs, and therefore deferred
as contract acquisition costs, so as to give a constant interest rate over the
term of the financing contracts.
IMPAIRED RECEIVABLES
Impairment for credit risk is recognized to cover the risk of non-recovery of
receivables. When there is objective evidence of a loss of value (payments
overdue, deterioration in the financial position, litigation procedures, etc.)
for an individual receivable, impairment is determined on an individual basis
(using a statistical or case-by-case approach as appropriate). Otherwise, a
collectively based provision may be recorded (for example in the event of
unfavourable developments in a macro-economic and/or segment indicator
associated with otherwise sound receivables).
Impairment for country risk is determined based on assessment of the
systemic credit risk to which debtors are exposed in the event of long-term
continuous decline in the economic and general environment of the countries
included in the base.
H – Financial income (expenses)
Except for derivatives, interest income and expenses are recognized under
the effective interest rate method, whereby interest and transaction costs are
spread on an actuarial basis over the duration of the loan or borrowing.
Other interest income and expenses include accrued interest on interest rate
derivatives used in fair value and cash flow hedging (when this income or
expense is transferred from shareholders’ equity). Changes in the fair value
of interest rate derivatives, excluding accrued interest, are included in other
financial income and expenses.
Other financial income and expenses also include changes in the fair value
of Renault SA redeemable shares, the net interest expense on provisions for
pensions, and dividends from companies that are neither controlled nor under
significant influence, which are recognized in the year they are distributed.
I – Income tax
The Group recognizes deferred taxes for all temporary differences between
the tax and book values of assets and liabilities in the consolidated statement
of financial postion. Deferred taxes are calculated at the latest tax rate enacted
at the closing date applicable to the period when temporary differences are
reversed. Each individual fiscal entity (legal entity, establishment or group of
entities that pays tax to the tax administration) that is authorized to offset
its current tax assets and liabilities reports deferred tax assets and liabilities
net. Recognition of deferred tax assets depends on the probability of future
recovery.
For fully consolidated companies, a deferred tax liability is recorded in respect
of dividend distributions likely to be made by the Group.
For joint ventures and associates, a deferred tax liability on dividend
distributions is booked for all differences between the book value and tax
value of shares held.
Tax credits that can only be used against a taxable profit are recorded as
a deduction from the income tax payable. Tax credits that are recoverable
regardless of whether the Company makes a taxable profit are set against the
relevant nature of expense.
J – Intangible assets
Goodwill
Non-controlling interests (formerly called “minority interests”) are carried
at fair value (the full goodwill method) or at their share in the fair value of
assets acquired and liabilities transferred (the partial goodwill method). To
date Renault has only recognized goodwill valued under the partial goodwill
method. The choice of which method to use is made for each individual case.

REGISTRATION DOCUMENT RENAULT 2013✦ Global Reporting Initiative (GRI) Directives 249
FINANCIAL STATEMENTS 4
4
CONSOLIDATED FINANCIAL STATEMENTS
Goodwill is not amortized, but impairment tests are carried out at least
annually or whenever there is evidence of loss of value. After initial recognition,
goodwill is stated at cost less any accumulated impairment.
Goodwill relating to associates is included in the “investments in associates”
asset in the statement of financial position. In the event of impairment, an
impairment loss is booked and included in the consolidated income statement
via the share in net income (loss) of associates.
Acquisitions of additional investments concerning non-controlling interests
in companies controlled by the Group are treated as equity transactions.
The positive or negative difference between the cost of acquiring shares
and the book value of the non-controlling interests acquired is recorded in
shareholders’ equity.
Research and development expenses
Development expenses incurred between the decision to begin development
and implement production facilities for a new vehicle or part (eg engine or
gearbox) and the subsequent approval of the design for mass production
are capitalized as intangible assets. They are amortized on a straight-line
basis from the date of approval for production, over the expected market life
of the vehicle or part, which is initially no longer than seven years. Market
lives are regularly reviewed and subsequently adjusted if there is a significant
difference from the initial estimate. Capitalized development expenses mainly
comprise the cost of prototypes, the cost of studies invoiced by external
firms, the cost of personnel assigned to the project and a share of overheads
dedicated exclusively to development activities.
Borrowing costs directly attributable to the development of a project requiring
at least 12 months of preparation before commissioning are included in the
gross value of the asset, which is a “qualifying asset”. The capitalization rate
for borrowing costs is limited such that capitalized borrowing costs do not
exceed the total borrowing costs borne during the year. When a project is
financed through a specific borrowing, the capitalization rate is equal to the
interest rate on the borrowing.
Expenses incurred before the decision to begin product development are
recorded as costs in the period they are incurred, in the same way as research
expenses. Expenses incurred after the start of mass production are treated
as production costs.
K – Property, plant and equipment
The gross value of property, plant and equipment corresponds to historical
acquisition or production cost.
Design and preparation expenses are included in the asset’s production cost.
The production cost for property, plant and equipment also includes financing
costs borne during the construction phase, under the same method as for
intangible assets. When a project is financed through a specific borrowing, the
capitalization rate is equal to the interest rate on the borrowing.
Investment subsidies received are deducted from the gross value of the
assets concerned.
Subsequent expenses for property, plant and equipment, except those
incurred to increase productivity or prolong the life of an asset, are charged
to expenses as incurred.
Assets used by the Group under finance leases are treated as assets financed
by credit.
Fixed assets leased to customers are vehicles and batteries under a lease of
more than one year from a Group finance company, for which the Group has
a repurchase commitment, or vehicles sold under an agreement including a
buy-back clause (note 2-G).
Depreciation
Depreciation is calculated on a straight-line basis over the following estimated
useful lives:
Buildings (1) 15 to 30 years
Specific tools 2 to 7 years
Machinery and other tools (other than press lines) 5 to 15 years
Press lines 20 to 30 years
Other tangible assets (2) 4 to 6 years
(1) Buildings in use before 1987 are depreciated over a period of up to 40 years.
(2) Except for leased batteries, which are depreciated over periods of 8 to 10 years depending on the models.
Useful lives are regularly reviewed, and accelerated depreciation is recorded
when an asset’s useful life becomes shorter than the initially expected period
of use, particularly when it is decided to withdraw a vehicle or part from the
market.
L – Impairment
Impairment of fixed assets (other than leased assets)
Fixed assets are subjected to impairment tests as soon as there is any
indication of a loss of value, such as significant adverse changes in the market
in which the Company operates, or changes affecting the circumstances and
manner of use of the assets.
For the Automotive segment, impairment tests are carried out at two levels:
W At the level of vehicle-specific and component-specific assets
Vehicle-specific and component-specific assets are capitalized development
expenses and tools. Impairment tests are carried out by comparing the net
book value of the assets with the recoverable value, calculated based on
discounted future cash flows related to the vehicle or component.
W At the level of other cash-generating units
A cash-generating unit is defined as a coherent subset that generates largely
independent cash flows. Other cash-generating units may represent an
economic entity (plant or subsidiary) or the whole Automotive segment. Fixed
assets related to cash-generating units comprise goodwill, specific assets
and capacity assets.

Find out more at www.renault.comREGISTRATION DOCUMENT RENAULT 2013250
FINANCIAL STATEMENTS4 CONSOLIDATED FINANCIAL STATEMENTS
For each of the two levels, impairment tests are carried out by comparing the
net book value with the recoverable value. Recoverable value is defined as the
higher of value in use or fair value less selling costs.
Value in use is the present value of estimated future cash flows expected to
arise from the continuing use of an asset. Future cash flows derive from the
business plan drawn up and validated by the Management, plus a terminal
value based on discounted normative cash flows after application of a growth
rate to infinity. They also include the dividends paid by the Sales Financing
segment to the Automotive segment; these dividends represent, in cash
form, the Sales Financing segment’s contribution as taken into consideration
in internal assessments of project profitability. The assumptions underlying
the business plan include estimates of market developments in countries in
which the Group operates and its share of those markets, changes in the sale
price of products and the prices of purchased components and commodities.
The pre-tax discount rate used is the weighted average cost of capital as
determined by the Company.
When the recoverable value is lower than the net book value, impairment
equivalent to the difference is recorded against the assets concerned.
For the Sales Financing segment, an impairment test is carried out at least
once a year or whenever there is an indication of loss of value, by comparing
the book value and recoverable value of assets. Recoverable value is defined
as the higher of fair value (less selling costs) and value in use. Value in use
is the present value of future cash flows as determined in the most recent
5-year forecasts for each cash-generating unit group, consisting of legal
entities or groups of legal entities in a given country. The same discount rate
is used for all cash-generating units tested: a risk-free 10-year rate increased
by the average risk premium for the sector in which the cash-generating units
operate.
Impairment of investments in associates
Impairment tests of the value of investments in associates are carried out
as soon as there is any indication of a loss of value, essentially significant
adverse changes in the markets in which the Company operates, or a major
or long-term decline in stock market value.
Impairment tests are carried out in compliance with IAS 28 and IAS 36, by
comparing the book value of the investment in the associate with the share of
the present value of future estimated cash flows expected from the associate.
When the recoverable value is lower than the book value, impairment
equivalent to the difference is recorded against the relevant investment in
an associate.
M – Non-current assets or groups of assets held for sale
Assets held for sale are non-current assets or groups of assets that are
available for immediate sale and have a high probability of being sold.
Non-current assets or groups of assets considered to be held for sale are
measured and recorded at the lower of net book value or fair value less selling
costs. No further impairment or amortization is recorded once an asset is
classified as held for sale (or included in a group of assets held for sale).
These assets are reported on a specific line of the consolidated financial
position.
N – Inventories
Inventories are stated at the lower of cost or net realisable value. Cost
corresponds to acquisition cost or production cost, which includes direct and
indirect production expenses, and a share of manufacturing overheads based
on a normal level of activity. The normal level of activity is assessed site by
site, in order to determine the share of fixed costs to be excluded in the event
of below-normal activity.
Inventories are valued under the FIFO (First In First Out) method.
When the net realisable value is lower than the financial position value,
impairment equal to the difference is recorded.
O – Assignment of receivables
Receivables assigned to third parties (through securitization or discounting)
are removed from Group assets when the associated risks and benefits are
also substantially transferred to the third parties in question.
The same treatment applies to assignments between the Automotive and
Sales Financing segments.
P – Treasury shares
Treasury shares are shares held for the purposes of stock-option plans and
free share plans awarded to Group managers and Executives. They are
recorded at acquisition cost and deducted from Group shareholders’ equity
until the date of sale.
When these shares are sold, the sale price is directly included in consolidated
shareholders’ equity. Consequently, no gain or loss on treasury shares is
included in the net income for the period.
Q – Stock option plans/Free share attribution plans
The Group awards stock option plans (purchase and subscription options)
and share attribution plans, all for Renault shares. The grant date is the date
at which beneficiaries are informed of the decision to grant these options or
shares, and the terms of the relevant plans. For plans subject to performance
conditions, an estimate of achievement of those conditions is taken into

REGISTRATION DOCUMENT RENAULT 2013✦ Global Reporting Initiative (GRI) Directives 251
FINANCIAL STATEMENTS 4
4
CONSOLIDATED FINANCIAL STATEMENTS
account in determining the number of options or free shares attributed.
This estimate is reviewed annually based on changes in the probability of
performance condition achievement. The final fair value of services rendered
in return for attribution of options or free shares is measured by reference to
the fair value of those options or shares at their grant date, using a binomial
mathematical model. Entitlements to attribution of free shares are valued
based on the share value at grant date less dividends expected during the
vesting period. Where relevant, a discount is applied to reflect the fact that the
shares must be held for a certain period.
The fair value is spread on a straight-line basis over the vesting period for the
relevant plan. The cost is included in personnel expenses, with a corresponding
adjustment to consolidated reserves. When the option is exercised, the cash
amount received by the Group in settlement of the exercise price is booked in
cash and cash equivalents, with a corresponding adjustment to consolidated
reserves.
R – Provisions
Pensions and other long-term employee benefit obligations
The Group’s payments for defined-contribution benefit plans are recorded as
expenses for the relevant period.
For defined-benefit plans concerning post-employment benefits, the Group
uses the Projected Unit Credit Method to determine the present value of its
obligations. Under this method, benefits are attributed to periods of service
according to the plan’s benefit formula, principally on a straight-line basis
over the years of service.
The future payments for employee benefits are measured on the basis of
future salary increases, retirement age, mortality and length of employment
with the Company, and are discounted at a rate determined by reference to
yields on long-term high quality corporate bonds of a duration corresponding
to the estimated average duration of the benefit plan concerned.
The actuarial gains and losses resulting from revisions of the underlying
assumptions and experience-based adjustments are included in other
components of comprehensive income.
The net expense for the year, corresponding to the current period service cost
plus the past service cost where relevant, is charged to the operating margin.
The interest expense on the net defined-benefit liability (asset) is recorded in
the net financial income and expenses.
Restructuring measures/Termination benefits
The estimated cost of restructuring measures that are considered as an
employee benefit is covered by a provision over the estimated residual
employment period of the employees concerned.
The estimated cost of termination indemnities is recognized as soon as a
detailed plan has either been announced or is in progress.
S – Financial assets
The Group recognizes a financial asset when it becomes a party to the
contractual provisions of the instrument.
Financial assets comprise investments in non-controlled companies in
which Renault does not exercise significant influence, marketable securities,
negotiable debt instruments, loans, and derivative assets related to financial
transactions (note 2-V).
These instruments are presented as non-current assets, apart from those
maturing within 12 months of the closing date, which are classified as current
assets.
Investments in non-controlled companies in which Renault does not have significant influence
Investments in non-controlled companies in which Renault does not have
significant influence are classified as “available-for-sale” assets. The fair
values of such financial assets are determined in priority by reference to the
market price. If this is not possible, the Group uses a valuation method that is
not based on market data.
Changes in the fair value of “available-for-sale” assets are included in other
components of comprehensive income. If there is a significant or prolonged
decrease in the fair value such that it falls below the acquisition price,
impairment is recorded in the income statement. A decrease is considered
significant if it exceeds 40% of the amount and prolonged if it is observed in
more than four successive published financial reports.
Marketable securities and negotiable debt instruments
Short-term investments in the form of marketable securities and negotiable
debt instruments are undertaken for the management of cash surpluses, but
do not meet the requirements to qualify as cash equivalents.
These instruments are classified as “available-for-sale” assets and carried
at fair value.
Loans
Loans essentially include interbank loans for investment of cash surpluses
and loans to associates.
They are initially recognized at fair value, plus directly attributable transaction
costs.
Loans are valued at amortized cost. Impairment is recognized in the income
statement when there is objective evidence of depreciation in value caused by
an event arising after the initial recognition of the asset.
T – Cash and cash equivalents
Cash includes cash on hand, current accounts and other demand deposits,
with the exception of bank overdrafts, which are included in financial liabilities.
These instruments are stated at amortized cost.
Cash equivalents are investments held for the purpose of meeting short-
term cash commitments. For an investment to qualify as a cash equivalent,
it must be readily convertible for a known amount of cash and be subject to
an insignificant risk of change in value. Fixed or variable-income instruments
that are not listed on an active market are stated at amortized cost. Other
instruments are carried at fair value.
U – Financial liabilities of the Automotive segment and sales financing debts
The Group recognizes a financial liability (for the Automotive segment) or a
sales financing debt when it becomes a party to the contractual provisions
of the instrument.
Financial liabilities and sales financing debts comprise redeemable shares,
bonds, other debts represented by a certificate, borrowings from credit
institutions, other interest-bearing borrowings and derivative liabilities related
to financial transactions (note 2-V).

Find out more at www.renault.comREGISTRATION DOCUMENT RENAULT 2013252
FINANCIAL STATEMENTS4 CONSOLIDATED FINANCIAL STATEMENTS
Redeemable shares
In accordance with IAS 39, the Group considers that the variable interest
on redeemable shares is an embedded derivative which cannot be valued
separately. Consequently, the Group states all its redeemable shares at fair
value, which is equal to market value.
Changes in the fair value of Automotive segment redeemable shares are
recorded in financial income and expenses, while changes in the fair value
of Sales Financing segment redeemable shares are recorded in the operating
margin.
Bonds, other debts represented by a certificate, borrowings from credit institutions and other interest-bearing borrowings
Bonds, other debts represented by a certificate, borrowings from credit
institutions and other interest-bearing borrowings are initially stated at fair
value, less any directly attributable transaction costs.
At each reporting date, apart from specific hedge accounting methods
(note 2-V), these financial liabilities are generally restated at amortized cost
using the effective interest rate method. The financial expense calculated in
this way includes issuance expenses and issuance or redemption premiums,
together with the impact of debt renegotiations when the old and new terms
are not substantially different.
Renegotiations of the terms of borrowings and similar operations are recorded
as an extinction of the former liability with recognition of a new liability only if
there are substantial differences between the old and new terms. When this
is the case, the costs borne for renegotiation are included in the financial
expenses for the period during which the negotiation takes place.
V – Derivatives and hedge accounting
Measurement and presentation
Derivatives are initially stated at fair value. This fair value is subsequently
reviewed at each closing date.
W The fair value of forward exchange contracts is based on market conditions.
The fair value of currency swaps is determined by discounting future cash
flows, using closing-date market rates (exchange and interest rates).
W The fair value of interest rate derivatives is the amount the Group would
receive (or pay) to settle outstanding contracts at the closing date, taking
into account any unrealized gains or losses based on interest rates and the
quality of the counterparty to each contract at the closing date. This fair
value includes accrued interest.
W The fair value of commodity derivatives is based on market conditions.
The Automotive segment’s derivatives are reported in the financial position
as current if they mature within 12 months and non-current otherwise. All
Sales Financing segment derivatives are reported in the financial position as
current.
Hedge accounting
The treatment of derivatives designated as hedging instruments depends on
the type of hedging relationship:
W fair value hedge;
W cash flow hedge;
W hedge of a net investment in a foreign operation.
The Group identifies the hedging instrument and the hedged item as soon
as the hedge is set up, and documents the hedging relationship, stating the
hedging strategy, the risk hedged and the method used to assess the hedge’s
effectiveness. This documentation is subsequently updated, such that the
effectiveness of the designated hedge can be demonstrated.
Hedge accounting uses specific measurement and recognition methods for
each category of hedge.
W Fair value hedges: the hedged item is adjusted to fair value in view of the risk
hedged and the hedging instrument is recorded at fair value. As changes in
these items are recorded in the income statement simultaneously, only the
ineffective portion of the hedge has an impact on net income. It is recorded
in the same income statement item as changes in the fair value of the
hedged item and the hedging instrument.
W Cash flow hedges: no adjustment is made to the value of the hedged
item; only the hedging instrument is adjusted to fair value. Following this
adjustment, the effective portion of the change in fair value attributable
to the hedged risk is recorded, net of taxes, in other components of
comprehensive income, while the ineffective portion is included in net
income. The cumulative amount included in shareholders’ equity is
transferred to the income statement when the hedged item has an impact
on net income.
W Hedge of a net investment in a foreign operation: the hedging instrument
is adjusted to fair value. Following this adjustment, the effective portion
of the change in fair value attributable to the hedged exchange risk is
recorded, net of taxes, in other components of comprehensive income,
while the ineffective portion is included in net income. The cumulative
amount included in shareholders’ equity is transferred to net income at the
date of liquidation or sale of the investment. The interest rate component of
financial instruments used to hedge the investment in Nissan (forward sales
and fixed/fixed cross-currency swaps) is treated as an ineffective portion
and consequently recorded directly in financial income and expenses.
Derivatives not designated as hedges
Changes in the fair value of derivatives not designated as hedges are
recognized directly in financial income, except in the case of derivatives
entered into exclusively for reasons closely related to business operations. In
this case, changes in the fair value of derivatives are included in the operating
margin.

REGISTRATION DOCUMENT RENAULT 2013✦ Global Reporting Initiative (GRI) Directives 253
FINANCIAL STATEMENTS 4
4
CONSOLIDATED FINANCIAL STATEMENTS
NOTE 3 – CHANGES IN THE SCOPE OF CONSOLIDATION
AUTOMOTIVE SALES FINANCING TOTAL
Number of companies consolidated at December 31, 2012 127 37 164
Newly consolidated companies (acquisitions, formations, etc) 2 3 5
Deconsolidated companies (disposals, mergers, liquidations, etc) (6) (4) (10)
Number of companies consolidated at December 31, 2013 123 36 159
The main changes in the scope of consolidation were as follows:
W 2013
The following sales financing companies founded by the Group were first
included in the scope of consolidation in 2013:
W the Moroccan insurance brokerage subsidiary RDFM and the Russian
business agent subsidiary OOO RN FINANCE RUS are fully consolidated;
W the Turkish customer credit associate company Orfin Finansman Anonim
Sirketi is accounted for under the equity method.
Renault’s investments in the associates Française de Mécanique (a
manufacturer of automotive parts) and Nissan Renault Finance Mexico (a
sales financing company) were sold in 2013.
Société des Automobiles Alpine Caterham, which makes vehicles in France,
is consolidated based on the percentage in each balance sheet and income
statement item following the sale of a 50% stake to a new partner in
June 2013. It was fully consolidated in the first half-year of 2013.
Renault South Africa, an automobile importer in South Africa, was fully
consolidated until November 30, 2013, at which date the Group transferred
control to its partner. Renault South Africa has been accounted for under the
equity method since December 2013.
W 2012
ES Mobillity srl, a company formed in 2011 to lease batteries for electric
vehicles in Italy, has been fully consolidated since January 1, 2012.
In December 2012 Renault sold all the shares it held in the AB Volvo group,
which was consequently deconsolidated from October 1, 2012 onwards.
4.2.7.2 INCOME STATEMENT AND COMPREHENSIVE INCOME
NOTE 4 – REVENUES
A – 2012 revenues applying 2013 Group structure and methods
The consolidated revenues for 2013 and 2012 are calculated under identical Group structure and methods.
(€ million) AUTOMOTIVE SALES FINANCING TOTAL
2012 revenues as published 39,156 2,114 41,270
Restatement for application of IFRS 11 (1) (544) (6) (550)
2012 revenues, restated 38,612 2,108 40,720
Changes in scope of consolidation (172) (5) (177)
2012 revenues applying 2013 Group structure and methods 38,440 2,103 40,543
2013 REVENUES 38,775 2,157 40,932
(1) As a result of the IFRS 11 restatement, joint arrangements that qualify as joint ventures are accounted for under the equity method (previously, joint ventures were proportionately consolidated) (note 2-A2).

Find out more at www.renault.comREGISTRATION DOCUMENT RENAULT 2013254
FINANCIAL STATEMENTS4 CONSOLIDATED FINANCIAL STATEMENTS
B – Breakdown of revenues
(€ million) 2013 2012
Sales of goods – Automotive segment 36,964 37,227
Rental income on leased assets (1) 372 429
Interest income on sales financing receivables - -
Sales of other services 1,439 1,500
Sales of services – Automotive segment 1,811 1,929
Sales of goods – Sales Financing segment 33 -
Rental income on leased assets (1) 20 17
Interest income on sales financing receivables 1,496 1,519
Sales of other services (2) 608 578
Sales of services – Sales Financing segment 2,124 2,114
TOTAL REVENUES 40,932 41,270
(1) Rental income recorded by the Group on vehicle sales with a buy-back commitment or fixed asset rentals.
(2) Mainly income on services comprising insurance, maintenance, and replacement vehicles under a financing contract or otherwise.
NOTE 5 – OPERATING MARGIN: DETAILS OF INCOME AND EXPENSES BY NATURE
A – Cost of goods and services sold
The Group’s information systems are designed to present income statements by function, and cannot therefore supply the value of purchases consumed.
B – Personnel expenses
2013 2012
Personnel expenses (€ million) 5,494 5,801
Workforce at December 31 121,807 127,086
NOTE 6 – OTHER OPERATING INCOME AND EXPENSES
(€ million) 2013 2012
Restructuring and workforce adjustment costs (423) (110)
Gains and losses on total or partial disposal of businesses or operating entities, and other gains and losses related to changes in the scope of consolidation 13 -
Gains and losses on disposal of property, plant and equipment and intangible assets (except leased asset sales) 140 18
Impairment of fixed assets (488) (279)
Provisions related to operations in Iran (514) (304)
Other unusual items (4) 68
TOTAL (1,276) (607)
Details of pensions and other long-term employee benefit expenses are
presented in note 20-C.
The income recorded in 2013 in respect of the French “CICE” Tax Credit for
Competitivity and Employment amounted to €36 million.
C – Share-based payments
Share-based payments concern stock options and free shares granted to
personnel, and amounted to a personnel expense of €33 million for 2013
(€14 million in 2012).
The plan valuation method is presented in note 19-H.
D – Rental expenses
Rents amounted to €234 million in 2013 (€291 million in 2012).
E – Foreign exchange gains/losses
In 2013, the operating margin includes a net foreign exchange loss of
€120 million, partly related to movements in the Argentinian peso and the
Russian rouble against the Euro (compared to a net foreign exchange loss of
€63 million in 2012, notably related to movements in the Iranian rial).

REGISTRATION DOCUMENT RENAULT 2013✦ Global Reporting Initiative (GRI) Directives 255
FINANCIAL STATEMENTS 4
4
CONSOLIDATED FINANCIAL STATEMENTS
A – Restructuring and workforce adjustment costs
Restructuring costs and workforce adjustment measures mainly relate to
Europe in 2013 and in 2012, and Korea in 2012.
The costs for 2013 particularly include €327 million for the “Contract for
Renault’s new growth and labour development in France” agreement signed
in March 2013. This agreement is designed to roll out a set of balanced
measures which generates competitivity gains. One of the measures adopted
broadens the career-end work exemption arrangements. Under IAS 19
(revised), this is considered as an employee benefit and the cost must be
covered by a provision established over the residual forecast working life of the
employees concerned. The expense recorded for 2013 therefore covers the
total cost for employees who have already stopped working at December 31,
2013 and a share of the discounted cost for the population likely to sign up to
this arrangement between January 1, 2014 and January 1, 2017.
B – Gains and losses on total or partial disposal of businesses or operating entities, and other gains and losses related to changes in the scope of consolidation
In 2013, this item corresponds to the profits generated by the sale of shares
in Société des Automobiles Alpine Caterham and Renault South Africa which
the Group no longer controls.
C – Gains and losses on disposal of property, plant and equipment and intangible assets (except leased asset sales)
Most of the gain on disposal of property, plant and equipment and intangible
assets (except leased asset sales) results from sales of land and buildings
located in Europe in 2013 and 2012 and Korea in 2012.
D – Impairment of fixed assets
Impairment was booked on intangible assets (€153 million) and tangible
assets (€197 million) in 2013 (note 11), mainly following impairment tests on
electric and internal-combustion engine vehicles. A provision of €119 million
was also recorded in respect of the electric vehicle range, corresponding to
the estimated amount of indemnities payable for failure to meet expected
minimum purchase volumes.
In 2012, impairment of €243 million was booked in respect of intangible
assets and €36 million on tangible assets relating to the electric and internal-
combustion vehicle range.
E – Provisions related to operations in Iran
In Iran, Rena ult works with two local industrial partners, Iran Khodro and Pars
Khodro, which make the Logan and the Mégane using certain parts supplied
by Group entities. Parts for the Logan mainly transit through Renault Pars, a
fully-consolidated subsidiary owned 51% by Renault.
Due to the economic sanctions imposed on Iran, settlements of commercial
and financial debts in foreign currencies remained at a very low level in 2013.
The sanctions were extended in June 2013 and now specifically cover the
automobile sector. The gradual lifting of some of these sanctions under the
agreement reached in Geneva in November 2013 will not begin until 2014.
This situation is reflected as follows in the Group’s consolidated financial
statements for 2013:
W the subsidiary Renault Pars is now non-significant and is deconsolidated
as of June 30, 2013;
W the Group did not recognize any operating margin, financial income or free
cash flow on operations in Iran for the first half of 2013. In the second half
of 2013, the Group limited recognition of operating margin and free cash
flow to operations completed and settled during the half-year;
W the Group’s exposure to risks on business in Iran is materialized by all
the assets held (securities, shareholder loan and trade receivables). The
overall gross exposure at December 31, 2013 was €833 million (including
€729 million of receivables);
W given the tightening of economic sanctions, this exposure is fully covered
by provisions, leading to recognition of additional provision of €514 million
in 2013, recorded in other operating income and expenses.
In 2012, a foreign exchange loss of €304 million was recorded in other
income and expenses to reflect the effect of the rial’s devaluation on the
Group’s Iranian entities’ debts denominated in Euros to Renault s.a.s. and its
subsidiaries.
F – Other unusual revenues and expenses
In 2012, other unusual items of operating income and expenses include an
operating tax credit amounting to €94 million, which resulted from signature
in March 2012 of an agreement with a Brazilian local authority for a change
in the tax option regarding prior years’ import taxes.

Find out more at www.renault.comREGISTRATION DOCUMENT RENAULT 2013256
FINANCIAL STATEMENTS4 CONSOLIDATED FINANCIAL STATEMENTS
NOTE 7 – FINANCIAL INCOMEThe net interest expense for 2013 amounts to €267 million (€267 million in 2012).
Other financial income and expenses comprise:
(€ million) 2013 2012 RESTATED 2012
Change in fair value of redeemable shares (note 23-A) (65) (18) (18)
Foreign exchange gains and losses on financial operations 30 29 29
Net interest expense on the net defined-benefit liability (asset) corresponding to pension and other long-term employee benefit obligations (42) (56) -
Other 62 (10) (10)
TOTAL (15) (55) 1
From 2013, other financial income and expenses include the net interest
expense on the net defined-benefit liability (asset) corresponding to pension
and other long-term employee benefit obligations (note 20-C3), which was
previously recorded in the operating margin. This net expense amounted to
€42 million for 2013 (€56 million in 2012). This change of presentation is
described in note 2-A2.
Other items of financial income and expenses include dividends received from
Daimler at their gross value of €37 million in 2013 (€36 million in 2012).
They also include an impairment expense of €11 million (€46 million in
2012) on the shares in the Modernization Fund for Automotive Equipment
Manufacturers (Fonds de Modernisation des Équipementiers Automobiles –
FMEA) (note 22-A1).
NOTE 8 – CURRENT AND DEFERRED TAXESAs Renault SA elected to determine French income taxes under the domestic
tax consolidation regime when it was formed, this is the regime applicable to
the Group in which Renault SA is taxed in France.
The Renault group also applies other optional tax consolidation systems in
Germany, Italy, Spain, and the UK.
A – Current and deferred tax expense
Breakdown of the tax charge
(€ million) 2013 2012
Current income taxes (443) (493)
Deferred taxes income (expenses) 10 (56)
CURRENT AND DEFERRED TAXES (433) (549)
In 2013, €365 million of current income taxes were generated by foreign
entities (€413 million in 2012).
Current income taxes paid by the Group during 2013 totalled €356 million
(€345 million in 2012).
B – Breakdown of the tax charge
(€ million) 2013 2012
Income before taxes and share in net income of associates and joint ventures (316) 780
Statutory income tax rate in France, including the additional contribution (1) 38.0% 36.1%
Theoretical tax income (charge) 120 (282)
Effect of differences between local rates and the French rate (2) 222 93
Tax credits 53 39
Distribution taxes (209) (60)
Change in unrecognized deferred tax assets (486) (679)
Other impacts (3) (133) 340
Current and deferred tax income (charge) (433) (549)
(1) In France, the Group is liable for an exceptional 10% contribution in 2013 (5% in 2012) applicable until the end of the 2014 financial year. The theoretical tax rate including this exceptional contribution stands at 38.0% in 2013 compared to 36.1% in 2012.
(2) The main countries contributing to the tax rate differential in 2013 are Romania, Russia, Switzerland, and Turkey.
(3) Other impacts are primarily permanent differences, income subject to reduced tax rates, the cost of tax reassessments, and prior year adjustments. They also include the effect of the differential between the income tax rate including the exceptional contribution applicable in France (38.0%) used for the tax breakdown between theoretical and actual taxes, and the 34.43% tax rate used to calculate deferred taxes for the French tax consolidation group (unfavourable effect of €76 million for 2013 and €28 million for 2012). In 2012, other impacts included the effect of partial tax-exemption of the gain on sale of shares in Volvo that took place in December 2012 (favourable effect of €290 million).
As there was no prospect of reporting taxable income in the foreseeable
future, the Group has not recognized the net deferred tax assets of the French
tax consolidation group at December 31, 2013 or December 31, 2012. In the
second half of 2012, the Group stopped recognizing net deferred tax assets of
the French tax group that were previously recognized at December 31, 2011,
amounting to €215 million; this resulted in a negative impact of €138 million
on net income and €77 million on shareholders’ equity.
The effective tax rate across all foreign entities was 24% at December 31,
2013 (29% at December 31, 2012). The decrease compared to 2012
principally results from the favourable impact of differences between local
rates and the rates in force in France, and changes in recognition of deferred
taxes due to the improved results of the year and prospects for profits in
South Korea.

REGISTRATION DOCUMENT RENAULT 2013✦ Global Reporting Initiative (GRI) Directives 257
FINANCIAL STATEMENTS 4
4
CONSOLIDATED FINANCIAL STATEMENTS
C – Breakdown of net deferred taxes
C1 Change in deferred tax assets and liabilities
(€ million) 2013 2012
Deferred tax assets 416 566
Deferred tax liabilities (123) (135)
Net deferred tax assets (liabilities) at January 1 293 431
Deferred tax income (expense) for the period 10 (56)
Deferred tax income (expense) included in shareholders’ equity (10) -
Translation adjustments (25) (81)
Change in scope of consolidation and other 7 (1)
Net deferred tax assets (liabilities) at December 31 275 293
deferred tax assets 396 416
deferred tax liabilities (121) (123)
C2 Breakdown of net deferred tax assets by nature
(€ million)
DECEMBER 31, 2013
DECEMBER 31,
2012
Deferred taxes on:
Investments in associates and joint ventures (1) (136) (141)
Fixed assets (1,577) (1,732)
Provisions and other expenses or valuation allowances deductible upon utilization 847 1,047
Loss carryforwards (2) 4,190 4,060
Other 387 349
Net deferred tax assets (liabilities) 3,711 3,583
Unrecognized deferred tax assets (note 8-C3) (3,436) (3,290)
NET DEFERRED TAX ASSETS (LIABILITIES) REPORTED 275 293
(1) Including tax on future dividend distributions.
(2) Including €3,656 million for the French tax consolidation entities and €534 million for other entities at December 31, 2013 (respectively €3,451 million and €609 million December 31, 2012).
The residual unrecognized net deferred tax assets of entities included in the
French tax consolidation group amounted to €2,839 million at December 31,
2013 (€2,600 million at December 31, 2012). €589 million of these
unrecognized assets arose on items booked through shareholders’ equity
(chiefly the effects of the partial hedge of the investment in Nissan, revaluation
of financial instruments, and actuarial gains and losses), and €2,250 million
arose on items affecting the income statement (respectively €783 million and
€1,817 million at December 31, 2012).
Excluding the French tax consolidation group, unrecognized deferred tax
assets totalled €597 million (€690 million in 2012), and essentially related
to tax loss carryforwards generated by the Group in Brazil, and to a lesser
extent in South Korea.
C3 Breakdown of unrecognized net deferred tax assets, by expiry date
(€ million)
DECEMBER 31, 2013
DECEMBER 31,
2012
Net deferred tax assets that can be carried forward indefinitely (1) 3,286 3,159
Other net deferred tax assets expiring in more than 5 years 85 119
Other net deferred tax assets expiring between 1 and 5 years 43 10
Other net deferred tax assets expiring within 1 year 22 2
TOTAL UNRECOGNIZED NET DEFERRED TAX ASSETS 3,436 3,290
(1) Including €2,839 million at December 31, 2013 (€2,600 million at December 31, 2012) corresponding to unrecognized net deferred tax assets of entities included in the French tax consolidation group (note 8-C2), mainly corresponding to tax loss carryforwards.
NOTE 9 – BASIC AND DILUTED EARNINGS PER SHARE
(In thousands of shares) 2013 2012
Shares in circulation 295,722 295,722
Treasury shares (4,048) (4,059)
Shares held by Nissan x Renault’s share in Nissan (19,384) (19,407)
Number of shares used to calculate basic earnings per share 272,290 272,256
The number of shares used to calculate the basic earnings per share is the
weighted average number of ordinary shares in circulation during the period,
i.e. after neutralization of average number of treasury shares and Renault
shares held by Nissan.
(In thousands of shares) 2013 2012
Number of shares used to calculate basic earnings per share 272,290 272,256
Dilutive effect of stock options and free share attribution rights 1,806 137
Number of shares used to calculate diluted earnings per share 274,096 272,393
The number of shares used to calculate the diluted earnings per share is the
weighted average number of ordinary shares potentially in circulation during
the period, i.e. the number of shares used to calculate the basic earnings per
share plus the number of stock options and rights to free share attribution
that have a dilutive effect and fulfil the performance conditions at the year-end
when issuance is conditional.

Find out more at www.renault.comREGISTRATION DOCUMENT RENAULT 2013258
FINANCIAL STATEMENTS4 CONSOLIDATED FINANCIAL STATEMENTS
NOTE 10 – OTHER COMPONENTS OF COMPREHENSIVE INCOME
Tax effects of other components of comprehensive income
(€ million)
OTHER COMPONENTS OF COMPREHENSIVE INCOME
2013 2012
BEFORE TAX TAX AFTER TAX BEFORE TAX TAX(1) AFTER TAX
Items that will not be reclassified subsequently to profit or loss, excluding the share of associates and joint ventures 73 (5) 68 (271) 3 (268)
Actuarial gains and losses on defined-benefit pension plans 73 (5) 68 (271) 3 (268)
Items that have been or will be reclassified subsequently to profit or loss, excluding the share of associates and joint ventures 220 (5) 215 128 (80) 48
Translation adjustments on foreign activities (383) - (383) (99) - (99)
Partial hedge of the investment in Nissan 209 - 209 110 (75) 35
Cash flow hedges 39 (5) 34 (18) (2) (20)
Available-for-sale financial assets 355 - 355 135 (3) 132
TOTAL OTHER COMPONENTS OF COMPREHENSIVE INCOME EXCLUDING ASSOCIATES AND JOINT VENTURES (A) 293 (10) 283 (143) (77) (220)
SHARE OF ASSOCIATES AND JOINT VENTURES IN OTHER COMPONENTS OF COMPREHENSIVE INCOME (B) (1,923) - (1,923) (1,107) 6 (1,101)
OTHER COMPONENTS OF COMPREHENSIVE INCOME (A)+(B) (1,630) (10) (1,640) (1,250) (71) (1,321)
(1) Including an expense of €77 million in 2012 related to the non-recognition of the French tax group’s net deferred tax assets (note 8-B).
4.2.7.3 OPERATING ASSETS AND LIABILITIES, SHAREHOLDERS’ EQUITY
NOTE 11 – INTANGIBLE ASSETS AND PROPERTY, PLANT AND EQUIPMENT
A – Intangible assets
A1 Intangible assets at December 31
(€ million) DECEMBER 31, 2013 DECEMBER 31, 2012
Capitalized development expenses 8,657 8,362
Goodwill 222 243
Other intangible assets 596 557
Intangible assets, gross 9,475 9,162
Capitalized development expenses (5,781) (5,329)
Other intangible assets (412) (351)
Amortization and impairment (6,193) (5,680)
INTANGIBLE ASSETS, NET 3,282 3,482
Most goodwill is in Europe.

REGISTRATION DOCUMENT RENAULT 2013✦ Global Reporting Initiative (GRI) Directives 259
FINANCIAL STATEMENTS 4
4
CONSOLIDATED FINANCIAL STATEMENTS
A2 Changes during the year
(€ million) GROSS VALUE
AMORTIZATION AND
IMPAIRMENT NET VALUE
Value at December 31, 2011 8,483 (4,765) 3,718
Acquisitions (note 26-C)/(amortization) 897 (1,118) (221)
(Disposals)/reversals (216) 203 (13)
Translation adjustment (2) - (2)
Change in scope of consolidation and other - - -
Value at December 31, 2012 9,162 (5,680) 3 ,482
Acquisitions (note 26-C)/(amortization) 833 (1,005) (172)
(Disposals)/reversals (467) 466 (1)
Translation adjustment (25) 11 (14)
Change in scope of consolidation and other (28) 15 (13)
Value at December 31, 2013 9,475 (6,193) 3,282
Acquisitions of intangible assets in 2013 comprise €745 million of self-
produced assets and €88 million of purchased assets (respectively
€764 million and €133 million in 2012).
Amortization and impairment in 2013 include €153 million of impairment of
capitalized development expenses relating to electric and internal-combustion
vehicles (note 6-D), compared to €243 million of impairment in 2012.
A3 Research and development expenses included in income
(€ million) 2013 2012
Research and development expenses (1,793) (1,889)
Capitalized development expenses 732 764
Amortization of capitalized development expenses (751) (790)
TOTAL REPORTED IN INCOME STATEMENT (1,812) (1,915)
B – Property, plant and equipment
B1 Property, plant and equipment at December 31
(€ million) DECEMBER 31, 2013 DECEMBER 31, 2012
Land 565 593
Buildings 6,053 6,113
Specific tools 13,479 13,359
Machinery and other tools 10,046 10,007
Fixed assets leased to customers 2,090 2,040
Other tangibles 772 852
Construction in progress 1,625 1,653
Property, plant and equipment, gross 34,630 34,617
Land and buildings (3,320) (3,272)
Specific tools (11,433) (10,956)
Machinery and other tools (7,492) (7,421)
Fixed assets leased to customers (718) (690)
Other tangibles (694) (744)
Depreciation and impairment (23,657) (23,083)
PROPERTY, PLANT AND EQUIPMENT, NET 10,973 11,534
Depreciation and impairment in 2013 include impairment of €197 million on electric and internal-combustion vehicles (note 6-D), compared to €36 million of
impairment in 2012.

Find out more at www.renault.comREGISTRATION DOCUMENT RENAULT 2013260
FINANCIAL STATEMENTS4 CONSOLIDATED FINANCIAL STATEMENTS
B2 Changes during the year
Changes during 2013 in property, plant and equipment were as follows:
(€ million)
DECEMBER 31,
2012
ACQUISITIONS/
(DEPRECIATION
AND
IMPAIRMENT)
(DISPOSALS)/
REVERSALS
TRANSLATION
ADJUSTMENTS
CHANGE IN
SCOPE OF
CONSOLIDATION
AND OTHER (1)
DECEMBER 31, 2013
Land 593 9 (25) (7) (5) 565
Buildings 6,113 263 (113) (101) (109) 6,053
Specific tools 13,359 663 (273) (175) (95) 13,479
Machinery and other tools 10,007 620 (288) (170) (123) 10,046
Fixed assets leased to customers 2,040 622 (572) (1) 1 2,090
Other tangibles 852 39 (67) (17) (35) 772
Construction in progress (2) 1,653 85 (34) (26) (53) 1,625
Gross values 34,617 2,301 (1,372) (497) (419) 34,630
Land - - - - - -
Buildings (3,272) (234) 86 35 65 (3,320)
Specific tools (10,956) (1,009) 287 128 117 (11,433)
Machinery and other tools (7,421) (570) 279 106 114 (7,492)
Fixed assets leased to customers (3) (690) (307) 281 1 (3) (718)
Other tangibles (744) (52) 61 12 29 (694)
Construction in progress - - - - - -
Depreciation and impairment (23,083) (2,172) 994 282 322 (23,657)
Land 593 9 (25) (7) (5) 565
Buildings 2,841 29 (27) (66) (44) 2,733
Specific tools 2,403 (346) 14 (47) 22 2,046
Machinery and other tools 2,586 50 (9) (64) (9) 2,554
Fixed assets leased to customers 1,350 315 (291) - (2) 1,372
Other tangibles 108 (13) (6) (5) (6) 78
Construction in progress (2) 1,653 85 (34) (26) (53) 1,625
Net values 11,534 129 (378) (215) (97) 10,973
(1) Including a €90 million decrease in net value resulting from retrospective application of IFRS 11 “Joint Arrangements” (see note 2-A2).
(2) Items classified as “construction in progress” are transferred to completed asset categories via the “acquisitions/(depreciation and impairment)” column.
(3) Depreciation of assets leased to customers amounts to €227 million at December 31, 2013 (€248 million at December 31, 2012).
Changes during 2012 in property, plant and equipment were as follows:
(€ million) GROSS VALUE
DEPRECIATION AND
IMPAIRMENT NET VALUE
Value at December 31, 2011 33,306 (21,949) 11,357
Acquisitions/(depreciation and impairment) 2,935 (2,189) 746
(Disposals)/reversals (1,490) 941 (549)
Translation adjustments (153) 114 (39)
Change in scope of consolidation and other 19 - 19
Value at December 31, 2012 34,617 (23,083) 11,534

REGISTRATION DOCUMENT RENAULT 2013✦ Global Reporting Initiative (GRI) Directives 261
FINANCIAL STATEMENTS 4
4
CONSOLIDATED FINANCIAL STATEMENTS
NOTE 12 – IMPAIRMENT TESTS ON FIXED ASSETS (OTHER THAN LEASED ASSETS)The Group carried out impairment tests on its fixed assets under the approach
described in the section on accounting policies (note 2-L).
A – Impairment tests on vehicle-specific and component-specific assets
Following impairment tests of assets dedicated to specific vehicles or
components, impairment of €350 million was booked during 2013
(€279 million at December 31, 2012). This impairment concerns electric
and internal-combustion engine vehicles and was primarily recorded against
capitalized development expenses. A provision of €119 million was also
recorded in respect of electric vehicles, corresponding to the estimated
amount of indemnities payable for failure to meet expected minimum
purchase volumes.
Apart from vehicles for which impairment has been recorded, other vehicles
tested in previous half-years no longer display any evidence of impairment.
B – Impairment tests on other cash-generating units of the Automotive segment
In 2013, only the Korea cash-generating unit was subjected to an impairment
test, as there were no indications of impairment in the Group’s other
geographically-based cash-generating units.
The recoverable value used for the purposes of the impairment tests for Korea
is the value in use, determined under the discounted future cash flow method
on the basis of the following assumptions:
KOREA 2013 2012
Business plan duration 6 years 6 years
Growth rate to infinity 1.75% 1.75%
After-tax discount rate 8.8% 8.8%
In 2013 as in 2012, no impairment was recognized on assets included in this
cash-generating unit as a result of the impairment tests.
An impairment test was also carried out on the Automotive segment as a cash-
generating unit, following the same procedure as for tests of geographically-
based cash-generating units.
The assumptions used for the Automotive segment are as follows:
2013 2012
Business plan duration 6 years 6 years
Forecast sales volumes over the projected horizon (units) 3,344,000 3,432,000
Growth rate to infinity 1.8% 1.8%
After-tax discount rate 8.8% 8.8%
In 2013 as in 2012, no impairment was recognized on assets included in the
Automotive segment as a result of the impairment tests.
Changes in the assumptions underlying the calculations show that to cover
the assets, for each factor considered individually:
W the volume reduction over the projected horizon must not exceed 275,000
units (300,000 units in 2012);
W the after-tax discount rate must not exceed 14% (13% in 2012).
With a growth rate to infinity close to zero, the conclusions of the test are
unaffected.
NOTE 13 – INVESTMENT IN NISSAN
A – Nissan consolidation method
Renault and the Japanese automaker Nissan have chosen to develop a unique
type of alliance between two distinct companies with common interests,
uniting forces to achieve optimum performance. The Alliance is organized
so as to preserve individual brand identities and respect each company’s
corporate culture.
Consequently:
W Renault is not assured of holding the majority of voting rights in Nissan’s
Shareholders’ Meeting;
W the terms of the Renault-Nissan agreements do not entitle Renault to
appoint the majority of Nissan directors, nor to hold the majority of voting
rights at meetings of Nissan’s Board of Directors; Renault cannot unilaterally
appoint the President of Nissan; at December 31, 2013, Renault occupies
one of the nine seats on Nissan’s Board of Directors (compared to three at
December 31, 2012)*;
W Renault-Nissan b.v., owned 50% by Renault and 50% by Nissan, is the
Alliance’s joint decision-making body for strategic issues concerning either
group individually. Its decisions are applicable to both Renault and Nissan.
This decision-making power was conferred on Renault-Nissan b.v. to
generate synergies and bring both automakers worldwide economies of
scale. This entity does not enable Renault to direct Nissan’s financial and
operating strategies, which are governed by Nissan’s Board of Directors
and cannot therefore be considered to represent contractual control by
Renault over Nissan. The matters examined by Renault-Nissan b.v. since it
was formed have remained strictly within this contractual framework, and
are not an indication that Renault exercises control over Nissan;
W Renault can neither use nor influence the use of Nissan’s assets in the
same way as its own assets;
W Renault provides no guarantees in respect of Nissan’s debt.
In view of this situation, Renault is considered to exercise significant influence
over Nissan, and therefore uses the equity method to include its investment in
Nissan in the consolidation. The Group’s early application of the new standard
IFRS 10, “Consolidated financial statements”, as of January 1, 2013, has not
affected the conclusion that Renault has significant influence over Nissan.
* Erratum : At December 31, 2013, Renault occupies two, and not only one, of the nine seats on Nissan’s Board of Directors (compared to three at December 31, 2012).

Find out more at www.renault.comREGISTRATION DOCUMENT RENAULT 2013262
FINANCIAL STATEMENTS4 CONSOLIDATED FINANCIAL STATEMENTS
B – Nissan consolidated financial statements included under the equity method in the Renault consolidation
The Nissan accounts included under the equity method in Renault’s financial
statements are Nissan’s consolidated accounts published in compliance
with Japanese accounting standards (as Nissan is listed on the Tokyo
stock exchange), after adjustments for the requirements of the Renault
consolidation.
Nissan publishes consolidated financial statements quarterly, and annually at
March 31. For the purposes of the Renault consolidation, Nissan results are
included in line with the Renault calendar (the results for the period January to
December are consolidated in Renault’s annual financial statements).
Nissan held 0.68% of treasury shares at December 31, 2013 (0.68% at
December 31, 2012). Consequently, Renault’s percentage interest in Nissan
was 43.7% at December 31, 2013 (43.7% at December 31, 2012). Renault
held 43.4% of voting rights in Nissan at December 31, 2013 (43.4% at
December 31, 2012).
C – Changes in the investment in Nissan as shown in Renault’s statement of financial position
(€ million)
SHARE IN NET ASSETS NET GOODWILL TOTAL
BEFORE
NEUTRALIZATION
NEUTRALIZATION PROPORTIONAL
TO NISSAN’S INVESTMENT
IN RENAULT (1) NET
At December 31, 2012 14,948 (975) 13,973 815 14,788
2013 net income 1,498 1,498 1,498
Dividend distributed (405) (405) (405)
Translation adjustment (1,885) (1,885) (175) (2,060)
Other changes (2) 247 247 247
At December 31, 2013 14,403 (975) 13,428 640 14,068
(1) Nissan has held 15% of Renault since the acquisition in 2002, excluding the subsequent impacts of Renault’s treasury share repurchases.
(2) Other changes include the effect of Renault dividends received by Nissan, the change in actuarial gains and losses on pension obligations, the change in the financial instruments revaluation reserve, the change in Nissan treasury shares and a €15 million increase resulting from retrospective application of IAS 19 (revised) “Employee benefits” (see note 2-A2). Application of IFRS 11 “Joint arrangements” has no impact on Nissan net assets or net income restated for the purposes of the Renault consolidation.
D – Changes in Nissan equity restated for the purposes of the Renault consolidation
(¥ billion)
DECEMBER 31,
2012
2013 NET
INCOME DIVIDENDS
TRANSLATION
ADJUSTMENT
OTHER
CHANGES (1)
DECEMBER 31,
2013
Shareholders’ equity – Nissan share under Japanese GAAP 3,368 384 (115) 529 55 4,221
Restatements for compliance with IFRS:
Provision for pension and other long-term employee benefit obligations (2) (137) 24 (11) 28 (96)
Capitalization of development expenses 522 31 1 554
Deferred taxes and other restatements (105) (23) 26 (12) (114)
Net assets restated for compliance with IFRS 3,648 416 (115) 545 71 4,565
Restatements for Renault group requirements (3) 238 26 (8) (54) 3 205
Net assets restated for Renault group requirements 3,886 442 (123) 491 74 4,770
(€ million)
Net assets restated for Renault group requirements 34,206 3,428 (927) (4,311) 564 32,960
Renault’s share 43.7% 43.7%
(before neutralization effect described below) 14,948 1,498 (405) (1,885) 247 14,403
Neutralization of Nissan’s investment in Renault (4) (975) (975)
Renault’s share in the net assets of Nissan 13,973 1,498 (405) (1,885) 247 13,428
(1) Other changes include the effect of Renault dividends received by Nissan, the change in the actuarial gains and losses on pension obligations, the change in the financial instruments revaluation reserve, the change in Nissan treasury shares and the effect of retrospective application of IAS 19 (revised) “Employee benefits”(see note 2-A2). Application of IFRS 11 “Joint arrangements” has no impact on Nissan net assets or net income restated for the purposes of the Renault consolidation.
(2) Including actuarial gains and losses recognized in equity.
(3) Restatements for Renault group requirements essentially correspond to revaluation of fixed assets by Renault for the acquisitions undertaken between 1999 and 2002, and elimination of Nissan’s investment in Renault accounted for by the equity method.
(4) Nissan has held 15% of Renault since the acquisition in 2002, excluding the subsequent impacts of Renault’s treasury share repurchases.
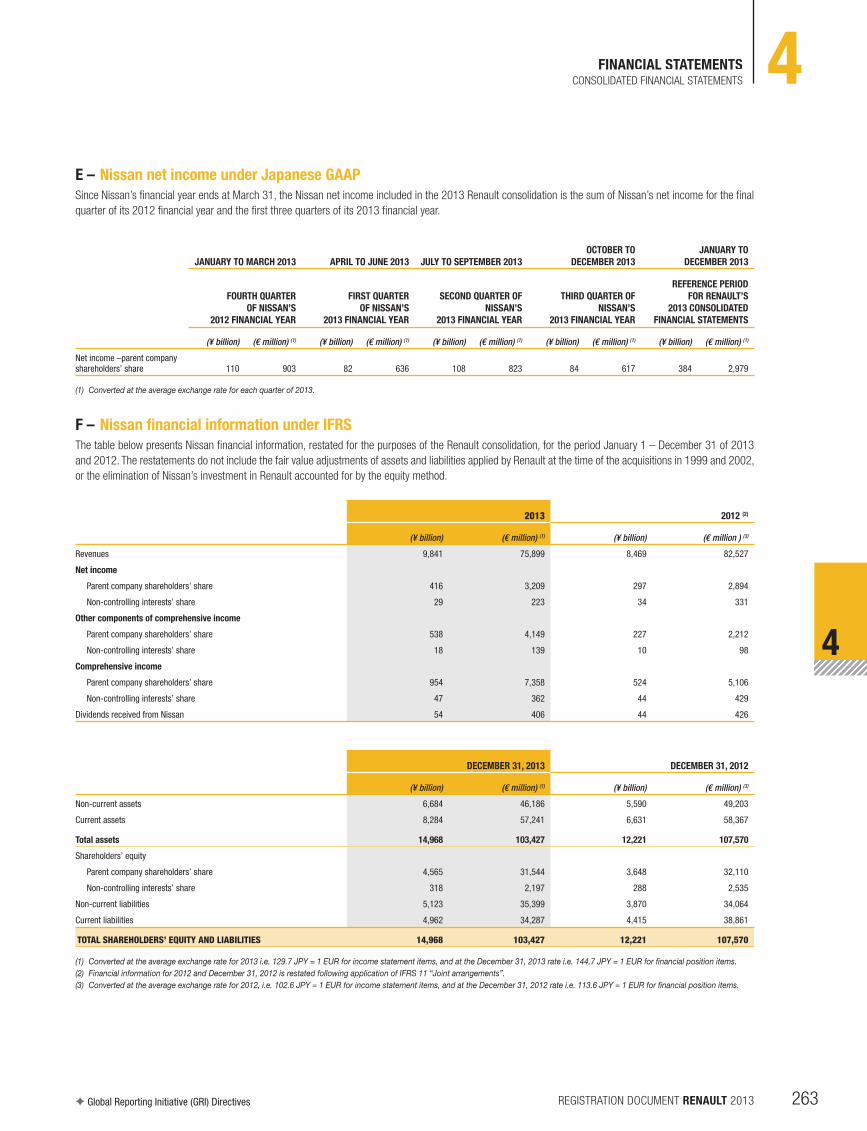
REGISTRATION DOCUMENT RENAULT 2013✦ Global Reporting Initiative (GRI) Directives 263
FINANCIAL STATEMENTS 4
4
CONSOLIDATED FINANCIAL STATEMENTS
E – Nissan net income under Japanese GAAP
Since Nissan’s financial year ends at March 31, the Nissan net income included in the 2013 Renault consolidation is the sum of Nissan’s net income for the final
quarter of its 2012 financial year and the first three quarters of its 2013 financial year.
JANUARY TO MARCH 2013 APRIL TO JUNE 2013 JULY TO SEPTEMBER 2013
OCTOBER TO
DECEMBER 2013
JANUARY TO
DECEMBER 2013
FOURTH QUARTER
OF NISSAN’S
2012 FINANCIAL YEAR
FIRST QUARTER
OF NISSAN’S
2013 FINANCIAL YEAR
SECOND QUARTER OF
NISSAN’S
2013 FINANCIAL YEAR
THIRD QUARTER OF
NISSAN’S
2013 FINANCIAL YEAR
REFERENCE PERIOD
FOR RENAULT’S
2013 CONSOLIDATED
FINANCIAL STATEMENTS
(¥ billion) (€ million) (1) (¥ billion) (€ million) (1) (¥ billion) (€ million) (1) (¥ billion) (€ million) (1) (¥ billion) (€ million) (1)
Net income –parent company shareholders’ share 110 903 82 636 108 823 84 617 384 2,979
(1) Converted at the average exchange rate for each quarter of 2013.
F – Nissan financial information under IFRS
The table below presents Nissan financial information, restated for the purposes of the Renault consolidation, for the period January 1 – December 31 of 2013
and 2012. The restatements do not include the fair value adjustments of assets and liabilities applied by Renault at the time of the acquisitions in 1999 and 2002,
or the elimination of Nissan’s investment in Renault accounted for by the equity method.
2013 2012 (2)
(¥ billion) (€ million) (1) (¥ billion) (€ million ) (3)
Revenues 9,841 75,899 8,469 82,527
Net income
Parent company shareholders’ share 416 3,209 297 2,894
Non-controlling interests’ share 29 223 34 331
Other components of comprehensive income
Parent company shareholders’ share 538 4,149 227 2,212
Non-controlling interests’ share 18 139 10 98
Comprehensive income
Parent company shareholders’ share 954 7,358 524 5,106
Non-controlling interests’ share 47 362 44 429
Dividends received from Nissan 54 406 44 426
DECEMBER 31, 2013 DECEMBER 31, 2012
(¥ billion) (€ million) (1) (¥ billion) (€ million) (3 )
Non-current assets 6,684 46,186 5,590 49,203
Current assets 8,284 57,241 6,631 58,367
Total assets 14,968 103,427 12,221 107,570
Shareholders’ equity
Parent company shareholders’ share 4,565 31,544 3,648 32,110
Non-controlling interests’ share 318 2,197 288 2,535
Non-current liabilities 5,123 35,399 3,870 34,064
Current liabilities 4,962 34,287 4,415 38,861
TOTAL SHAREHOLDERS’ EQUITY AND LIABILITIES 14,968 103,427 12,221 107,570
(1) Converted at the average exchange rate for 2013 i.e. 129.7 JPY = 1 EUR for income statement items, and at the December 31, 2013 rate i.e. 144.7 JPY = 1 EUR for financial position items.
(2) Financial information for 2012 and December 31, 2012 is restated following application of IFRS 11 “Joint arrangements”.
(3) Converted at the average exchange rate for 2012, i.e. 102.6 JPY = 1 EUR for income statement items, and at the December 31, 2012 rate i.e. 113.6 JPY = 1 EUR for financial position items.

Find out more at www.renault.comREGISTRATION DOCUMENT RENAULT 2013264
FINANCIAL STATEMENTS4 CONSOLIDATED FINANCIAL STATEMENTS
G – Hedging of the investment in Nissan
The Group has partially hedged the Yen/Euro exchange risk on its investment
in Nissan since 1999.
At December 31, 2013, the corresponding hedging operations totalled
¥112 billion (€773 million), comprising ¥27 billion (€187 million) of private
placements on the EMTN market and ¥85 billion (€586 million) in bonds
issued directly in yen on the Japanese Samurai bond market.
During 2013, these operations generated favourable net-of-tax foreign
exchange differences of €209 million (favourable net-of-tax difference
of €35 million in 2012), which were included in the Group’s translation
adjustment reserves (note 19-E).
H – Valuation of Renault’s investment in Nissan at stock market prices
Based on the quoted price at December 31, 2013 of JPY 884 per share,
Renault’s investment in Nissan is valued at €11,985 million (€14,006 million
at December 31, 2012 based on the price of JPY 811 per share).
I – Impairment test of the investment in Nissan
At December 31, 2013, the stock market value of the investment was 14.8%
lower than its book value in the assets of Renault’s statement of financial
position. In view of this, an impairment test was carried out in application of
the approach presented in the note on accounting policies (note 2-L).
As this investment is strategic, in compliance with IAS 36 the recoverable
value was determined based on the higher of stock market value, representing
“fair value”, and value in use, estimated on the basis of discounted cash flows
defined in the business plan drawn up by Nissan management. An after-tax
discount rate of 7.9% and a growth rate to infinity of 3.1% were used to
calculate value in use. The terminal value was calculated under profitability
assumptions consistent with Nissan’s past data and balanced medium-term
prospects.
The test results did not lead to recognition of any impairment on the
investment in Nissan in 2013.
A 200 base point increase in the discount rate associated with a 40 base
point decrease in the growth rate to infinity or a 100 base point decrease
in the operating margin would have no impact on the book value of the
investment in Nissan.
J – Operations between the Renault group and the Nissan group
Renault and Nissan follow joint strategies for vehicle and part development,
purchasing and production and distribution resources.
The cooperation between the two groups in 2013 principally takes the
following forms:
Joint investments
Renault and Nissan share development costs and investments for gearbox
and engine production.
The two groups have made joint investments since 2007 for production of
Logan vehicles. This type of cooperation now exists in South Africa, where the
Nissan group has manufactured the Sandero since 2009.
Since 2011, the Alliance’s Chennai plant in India has produced the first cross-
badged Renault Pulse, an adaptation of the Nissan Micra using a 1.5 dCi
diesel engine made at the Cleon plant in France.
Vehicle manufacturing
In Brazil, Renault supplies Nissan with assembly services for its Frontier pick-
up and Livina models at the Curitiba plant. 27,200 vehicles were assembled
during 2013.
Renault Samsung Motors produced 1,770 Nissan-badged SM3 vehicles in
2013, purchased by Nissan for sale through its own network (mainly in Russia
and the Middle East).
The Chennai plant has provided assembly services for the Fluence, Koleos,
Duster, Pulse and Scala vehicles sold on the Indian market by Renault dealers.
In 2013, the volume of assembled vehicles totalled 88,580 units.
Concerning light commercial vehicles, Nissan produced 67,970 Trafic vans
over the year at its Barcelona plant in Spain in 2013. 8.2% of these are sold
through the Nissan network. Renault, meanwhile, produced 3,610 Interstars
(Nissan-badged Masters), which are purchased by Nissan for sale through its
own network.
Part sales
In Europe, the Renault group produces engines common to the Alliance at
its Cléon plant in France, for use by Nissan’s Japanese and UK plants in the
Nissan Qashqai and X-Trail vehicles.
Renault also supplies gearboxes and engines manufactured at the plants in
Cacia in Portugal, Valladolid and Seville in Spain, Cléon in France and Pitesti in
Romania to Nissan’s plants in Sunderland in the UK, Barcelona in Spain, Saint
Petersburg in Russia and Chennai in India.
In South America, Renault supplies gearboxes made by Cormecanica to
Nissan plants located mostly in Mexico and Brazil.
In total Renault supplied 717,450 gearboxes and 305,130 engines during
2013.
In South Korea, Nissan supplies Renault Samsung Motors with parts used in
production of the SM3 (Fluence), the SM5 (Latitude), the SM7 and the Koleos.
Renault also uses Nissan’s pinions for the Mégane range, and automatic
gearboxes, with continuous variable transmissions for the Mégane and the
Espace. Renault also uses a 2.0 litre engine developed jointly with Nissan for
the Laguna. Nissan supplies rear axles for the Dacia Duster.
Sales
In Europe, Renault markets Nissan vehicles in Bulgaria, Croatia, Romania,
Serbia and Slovenia.
Conversely, Nissan markets Renault vehicles in Japan and Australia.

REGISTRATION DOCUMENT RENAULT 2013✦ Global Reporting Initiative (GRI) Directives 265
FINANCIAL STATEMENTS 4
4
CONSOLIDATED FINANCIAL STATEMENTS
Finance
From trading rooms in Lausanne and Singapore, Renault Finance acts as the
Nissan group’s counterparty in financial instruments trading to hedge foreign
exchange, interest rate and commodity risks, in addition to its business for
Renault. On the foreign exchange markets during 2013, Renault Finance
undertook foreign exchange transactions totalling approximately €20.3 billion
on behalf of Nissan. Foreign exchange, interest rate and commodity derivative
transactions, undertaken for Nissan, are recorded at market price and
included in the positions managed by Renault Finance.
Relations with the Sales Financing segment
The Sales Financing segment helps to attract customers and build loyalty
to the Nissan brands through a range of financing products and services
incorporated into its sales policy, principally in Europe. In 2013, the
consolidated RCI Banque subgroup recorded €149 million of income in the
form of commission and interest received from Nissan.
Total figures for 2013
Total sales by Renault to Nissan and purchases by Renault from Nissan
amounted to an estimated €2,100 million and €2,200 million respectively.
The joint policies for purchasing and other administrative functions such as
information systems departments are reflected directly in the Renault and
Nissan financial statements, and therefore generate no financial exchanges
between the two groups. The same applies to sales of powertrain parts by the
Alliance to partners such as Daimler and AVTOVAZ.
NOTE 14 – INVESTMENTS IN OTHER ASSOCIATES AND JOINT VENTURES
Details of investments in other associates and joint ventures are as follows:
W value in the Group’s statement of consolidated financial position was
€806 million at December 31, 2013 (€774 million at December 31, 2012);
W Renault’s share in the net income of other associates and joint ventures
was a loss of €54 million for 2013, including a negative €34 million
for AVTOVAZ’s contribution in 2013 (€270 million for 2012, including
€186 million from AVTOVAZ and €80 million from AB Volvo).
The investment in AB Volvo was so ld in December 2012. This sale generated
a profit of €924 million, which is reported on a specific line of the Group’s
consolidated income statement due to its significant, non-recurrent nature.
AVTOVAZ is now the most significant investment in other associates and joint
ventures.
A – AVTOVAZ
The Russian automaker AVTOVAZ’s financial year-end is December 31. For the
purposes of the Renault consolidation, given the existing time constraints for
production of financial information, the accounts of AVTOVAZ are consolidated
with a 3-month time-lag. Consequently, the AVTOVAZ net income included in
Renault’s 2013 consolidated financial statements is the sum of AVTOVAZ’s
net income for the final quarter of its 2012 financial year and the first three
quarters of its 2013 financial year.
A1 Changes in the value of Renault’s investment in AVTOVAZ as shown in Renault’s statement of financial position
Renault’s percentage interest in AVTOVAZ, through the entity Alliance
Rostec Auto B.V., is 35.91% at December 31, 2013 compared to 25% at
December 31, 2012. The increase results from application of the partnership
agreement signed in December 2012.
This agreement created a joint venture named Alliance Rostec Auto B.V.
between Renault, Nissan and the public Russian holding company Russian
Technologies. This joint venture was formed to hold all the interests in
AVTOVAZ owned by Renault, Nissan and Russian Technologies. Following the
equity operations undertaken during the first half of 2013, Alliance Rostec
Auto B.V. now holds 74.51% of the capital and the voting rights in the
Shareholders’ Meeting of AVTOVAZ.
In the first half of 2013, the Group undertook the following operations in
connection with this venture:
W contribution of its 25% stake in AVTOVAZ to Alliance Rostec Auto B.V.;
W subscription to a capital increase by Alliance Rostec Auto B.V. for
€113 million;
W acquisition of shares in Alliance Rostec Auto B.V. from Russian Technologies
for €77 million.
Since the end of the first half-year of 2013, Renault has held 48.2% of the
capital and the voting rights at the Shareholders’ Meeting and on the Board of
Directors of Alliance Rostec Auto B.V..
AVTOVAZ’s Board of Directors consists of eight members nominated by
Renault and Nissan and seven members nominated by Russian Technologies.
On June 27, 2013, the Chairman and CEO of Renault and President of Nissan
was elected Chairman of the Board of AVTOVAZ. As of December 31, 2013,
Renault occupies three seats.
The Renault group does not control Alliance Rostec Auto B.V. or AVTOVAZ,
because it does not hold the majority of voting rights in the governing bodies
of Alliance Rostec Auto B.V. or the Board of Directors of AVTOVAZ. All major
strategic and operating decisions must be approved by a majority shareholder
vote.
Alliance Rostec Auto B.V. and AVTOVAZ are accounted for by the equity method
in the Group financial statements. The table below reports consolidated
figures for Alliance Rostec Auto B.V. and the AVTOVAZ group.

Find out more at www.renault.comREGISTRATION DOCUMENT RENAULT 2013266
FINANCIAL STATEMENTS4 CONSOLIDATED FINANCIAL STATEMENTS
(€ million)
SHARE IN NET ASSETS NET GOODWILL TOTAL
BEFORE
NEUTRALIZATION
NEUTRALIZATION OF RENAULT’S
SHARE IN THE DEBT OF ALLIANCE
ROSTEC AUTO B.V. (1) NET
At September 30, 2012 429 - 429 - 429
Net income for the period October 1, 2012 to September 30, 2013 (2) (34) - (34) - (34)
Effects of the investment in Alliance Rostec Auto B.V. (3) 185 (58) 127 63 190
Translation adjustment, actuarial gains and losses and revaluation of financial instruments (49) 13 (36) - (36)
At September 30, 2013 531 (45) 486 63 549
(1) During the first half of 2013, Alliance Rostec Auto B.V. acquired the shares in AVTOVAZ held by Troika Dialog, which agreed to defer payment by the joint venture to June 2014.
(2) The share in net income of AVTOVAZ has been calculated by applying a 25% interest to the net income for the first two quarters of the period, and the rates of 32.98% and 35.91% for the final two quarters of the period.
(3) Renault invested €190 million during the first half of 2013 in equity securities of Alliance Rostec Auto B.V., raising its percentage interest in AVTOVAZ. This operation generated goodwill of 2,772 million roubles (€63 million at September 30, 2013). Renault’s contribution to Alliance Rostec Auto B.V. of its 25% stake in AVTOVAZ is considered as an ownership restructuring, with no impact on the value of the investment.
A2 Changes in AVTOVAZ and Alliance Rostec Auto B.V. shareholders’ equity restated for the purposes of the Renault consolidation
(€ million)
OCTOBER 1,
2012
NET INCOME
FOR THE PERIOD
OCTOBER 1,
2012 –
SEPTEMBER 30,
2013
CONTRIBUTION
OF AVTOVAZ
SHARES TO
ALLIANCE
ROSTEC AUTO
B.V.
EFFECTS OF THE
INVESTMENT
IN ALLIANCE
ROSTEC AUTO
B.V. (1)
TRANSLATION
ADJUSTMENT
AND OTHER
CHANGES
SEPTEMBER 30,
2013
Shareholders’ equity – parent company shareholders’ share 1,671 (113) - - (125) 1,433
Restatements for Renault group requirements (2) 43 2 - - 1 46
Net assets restated for Renault group requirements 1,714 (111) - - (124) 1,479
Contribution of AVTOVAZ shares to Alliance Rostec Auto B.V. (A) 429 - (429) - - -
Share in AVTOVAZ held by Alliance Auto Rostec B.V. (74.51%) - (70) 977 289 (94) 1,102
Net debt of Alliance Rostec Auto B.V. (3) - - (88) (26) 20 (94)
Restated net assets of Alliance Rostec Auto B.V. - (70) 889 263 (74) 1,008
Share in Alliance Rostec Auto B.V. held by Renault (48.2%) (B) - (34) 429 127 (36) 486
Goodwill on acquisitions of shares in AVTOVAZ and Alliance Rostec Auto B.V. (C) - - - 63 - 63
RENAULT’S SHARE IN THE NET ASSETS OF AVTOVAZ (A) + (B) + (C) 429 (34) - 190 (36) 549
(1) Renault invested €190 million during the first half of 2013 in equity securities of Alliance Rostec Auto B.V., raising its percentage interest in AVTOVAZ. Renault’s contribution to Alliance Rostec Auto B.V. of its 25% stake in AVTOVAZ is considered as an ownership restructuring, with no impact on the value of the investment.
(2) Restatements for Renault group requirements essentially correspond to valuation of intangible assets (the Lada brand) and fair value measurement of financial assets.
(3) During the first half of 2013, Alliance Rostec Auto B.V. acquired the shares in AVTOVAZ held by Troika Dialog, which agreed to defer payment by the joint venture to June 2014.
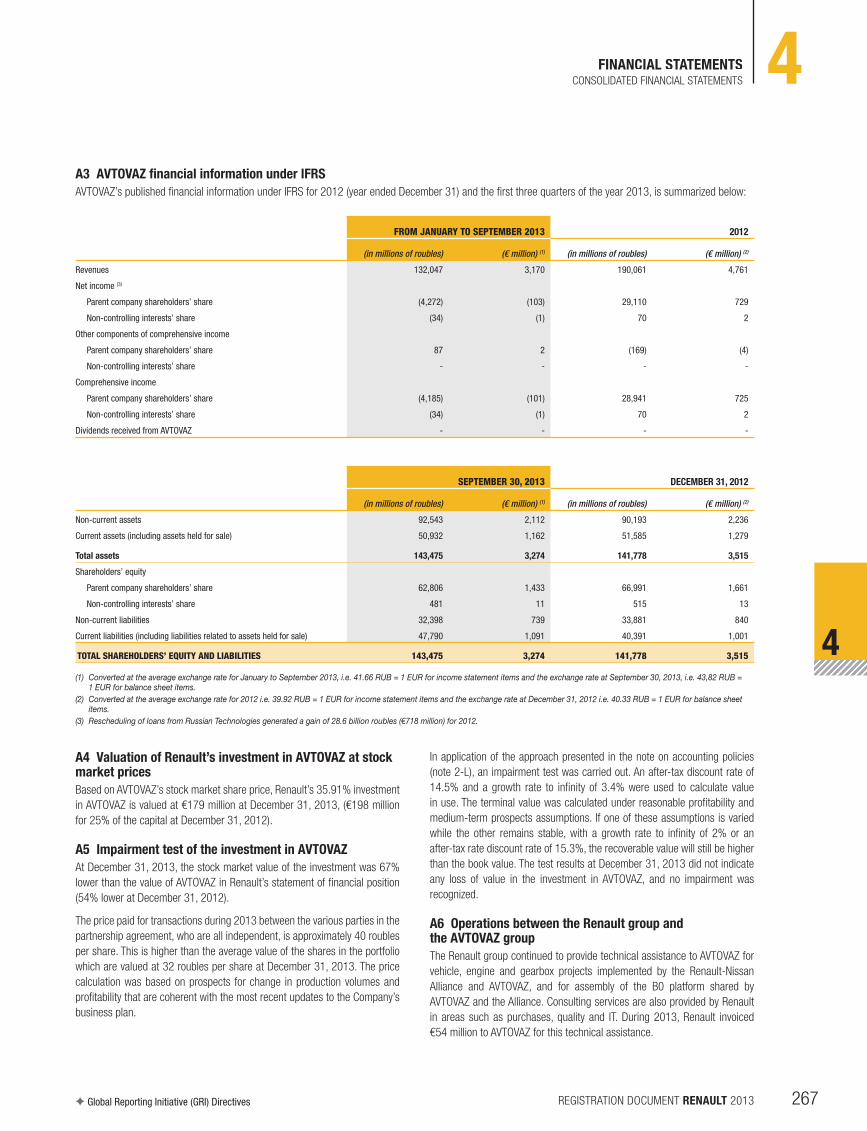
REGISTRATION DOCUMENT RENAULT 2013✦ Global Reporting Initiative (GRI) Directives 267
FINANCIAL STATEMENTS 4
4
CONSOLIDATED FINANCIAL STATEMENTS
A3 AVTOVAZ financial information under IFRS
AVTOVAZ’s published financial information under IFRS for 2012 (year ended December 31) and the first three quarters of the year 2013, is summarized below:
FROM JANUARY TO SEPTEMBER 2013 2012
(in millions of roubles) (€ million) (1) (in millions of roubles) (€ million) (2)
Revenues 132,047 3,170 190,061 4,761
Net income (3)
Parent company shareholders’ share (4,272) (103) 29,110 729
Non-controlling interests’ share (34) (1) 70 2
Other components of comprehensive income
Parent company shareholders’ share 87 2 (169) (4)
Non-controlling interests’ share - - - -
Comprehensive income
Parent company shareholders’ share (4,185) (101) 28,941 725
Non-controlling interests’ share (34) (1) 70 2
Dividends received from AVTOVAZ - - - -
SEPTEMBER 30, 2013 DECEMBER 31, 2012
(in millions of roubles) (€ million) (1) (in millions of roubles) (€ million) (2)
Non-current assets 92,543 2,112 90,193 2,236
Current assets (including assets held for sale) 50,932 1,162 51,585 1,279
Total assets 143,475 3,274 141,778 3,515
Shareholders’ equity
Parent company shareholders’ share 62,806 1,433 66,991 1,661
Non-controlling interests’ share 481 11 515 13
Non-current liabilities 32,398 739 33,881 840
Current liabilities (including liabilities related to assets held for sale) 47,790 1,091 40,391 1,001
TOTAL SHAREHOLDERS’ EQUITY AND LIABILITIES 143,475 3,274 141,778 3,515
(1) Converted at the average exchange rate for January to September 2013, i.e. 41.66 RUB = 1 EUR for income statement items and the exchange rate at September 30, 2013, i.e. 43,82 RUB = 1 EUR for balance sheet items.
(2) Converted at the average exchange rate for 2012 i.e. 39.92 RUB = 1 EUR for income statement items and the exchange rate at December 31, 2012 i.e. 40.33 RUB = 1 EUR for balance sheet items.
(3) Rescheduling of loans from Russian Technologies generated a gain of 28.6 billion roubles (€718 million) for 2012.
A4 Valuation of Renault’s investment in AVTOVAZ at stock market prices
Based on AVTOVAZ’s stock market share price, Renault’s 35.91% investment
in AVTOVAZ is valued at €179 million at December 31, 2013, (€198 million
for 25% of the capital at December 31, 2012).
A5 Impairment test of the investment in AVTOVAZ
At December 31, 2013, the stock market value of the investment was 67%
lower than the value of AVTOVAZ in Renault’s statement of financial position
(54% lower at December 31, 2012).
The price paid for transactions during 2013 between the various parties in the
partnership agreement, who are all independent, is approximately 40 roubles
per share. This is higher than the average value of the shares in the portfolio
which are valued at 32 roubles per share at December 31, 2013. The price
calculation was based on prospects for change in production volumes and
profitability that are coherent with the most recent updates to the Company’s
business plan.
In application of the approach presented in the note on accounting policies
(note 2-L), an impairment test was carried out. An after-tax discount rate of
14.5% and a growth rate to infinity of 3.4% were used to calculate value
in use. The terminal value was calculated under reasonable profitability and
medium-term prospects assumptions. If one of these assumptions is varied
while the other remains stable, with a growth rate to infinity of 2% or an
after-tax rate discount rate of 15.3%, the recoverable value will still be higher
than the book value. The test results at December 31, 2013 did not indicate
any loss of value in the investment in AVTOVAZ, and no impairment was
recognized.
A6 Operations between the Renault group and the AVTOVAZ group
The Renault group continued to provide technical assistance to AVTOVAZ for
vehicle, engine and gearbox projects implemented by the Renault-Nissan
Alliance and AVTOVAZ, and for assembly of the B0 platform shared by
AVTOVAZ and the Alliance. Consulting services are also provided by Renault
in areas such as purchases, quality and IT. During 2013, Renault invoiced
€54 million to AVTOVAZ for this technical assistance.

Find out more at www.renault.comREGISTRATION DOCUMENT RENAULT 2013268
FINANCIAL STATEMENTS4 CONSOLIDATED FINANCIAL STATEMENTS
Following the start of production on the Lada “Largus” minivan using the B0
platform in 2012, in 2013 Renault supplied AVTOVAZ with parts required for
assembly for a total amount of €356 million.
Renault’s share in the B0 platform investment is recorded in tangible assets
at the amount of €174 million at December 31, 2013.
In 2013, Renault paid AVTOVAZ €52 million in the form of 10-year loans.
The total amount of loans by the Group to AVTOVAZ at December 31, 2013
is €123 million.
B – Associates and joint ventures accounted for under the equity method, other than Nissan and AVTOVAZ
B1 Information on other associates and joint ventures accounted for under the equity method
NAME COUNTRY OF LOCATION MAIN ACTIVITY
PERCENTAGE OWNERSHIP AND VOTING
RIGHTS HELD THE GROUP
DECEMBER 31, 2013 DECEMBER 31, 2012
Entities under significant influence
Automotive
Boone Comenor France Metal trading 33 33
Maïs Turkey Automotive sales 49 49
Renault-Nissan Automotive India Private Limited (RNAIPL) India Automaker 30 30
Renault South Africa South Africa Automotive import 40 (1) 51 (1)
Sales Financing
Nissan Renault Finance Mexico Mexico Automotive sales financing - (2) 15
Joint ventures (3)
Automotive
Francaise de Mécanique France Production of automotive parts - (2) 50
Indra Investissements France Dismantling of end-of-life vehicles 50 50
Sales Financing
Renault Credit Car Belgium Automotive sales financing 50 50
RCI Financial Services s.r.o. Czech Republic Automotive sales financing 50 (4) 50
Orfin Finansman Anonim Sirketi Turkey Automotive sales financing 50 (5) -
(1) Renault South Africa was fully consolidated until November 30, 2013, at which date the Group transferred control to its partner.
(2) Investments sold in the final quarter of 2013.
(3) Partnerships classified as joint ventures were proportionately consolidated in 2012 prior to application of IFRS 11, “Joint arrangements” (see note 2-A2).
(4) The Group took control of RCI Financial Services s.r.o. on October 1, 2013 following signature of a new partnership agreement, and it is fully consolidated as of that date.
(5) First consolidated in 2013.
B2 Cumulative financial information on associates accounted for under the equity method
(€ million) DECEMBER 31, 2013 DECEMBER 31, 2012
Investments in associates 243 346
Share in income (loss) of associates (21) 3
Share of associates in other components of comprehensive income (11) (13)
Share of associates in comprehensive income (31) (10)
B3 Cumulative financial information on joint ventures accounted for under the equity method
(€ million) DECEMBER 31, 2013
Investments in joint ventures 15
Share in income (loss) of joint ventures 1
Share of joint ventures in other components of comprehensive income (6)
Share of joint ventures in comprehensive income (5)
In application of IFRS 11, “Joint arrangements”, joint ventures previously proportionately consolidated are accounted for under the equity method in 2013
(note 2-A2).

REGISTRATION DOCUMENT RENAULT 2013✦ Global Reporting Initiative (GRI) Directives 269
FINANCIAL STATEMENTS 4
4
CONSOLIDATED FINANCIAL STATEMENTS
NOTE 15 – INVENTORIES
(€ million)
DECEMBER 31, 2013 DECEMBER 31, 2012
GROSS VALUE IMPAIRMENT NET VALUE GROSS VALUE IMPAIRMENT NET VALUE
Raw materials and supplies 989 (214) 775 1,161 (208) 953
Work in progress 146 (1) 145 232 - 232
Used vehicles 926 (95) 831 1,079 (130) 949
Finished products and spare parts 1,540 (129) 1,411 1,860 (130) 1,730
TOTAL 3,601 (439) 3,162 4,332 (468) 3,864
NOTE 16 – SALES FINANCING RECEIVABLES
A – Sales financing receivables by nature
(€ million) DECEMBER 31, 2013 DECEMBER 31, 2012
Dealership receivables 7,277 6,736
Financing for end-customers 12,536 12,516
Leasing and similar operations 4,569 4,776
Gross value 24,382 24,028
Impairment (732) (798)
NET VALUE 23,650 23,230
FAIR VALUE 23,745 23,412
The fair value is estimated by discounting future cash flows at rates that would
be applicable to similar loans (conditions, maturity and debtor quality) at the
year-end. Receivables with a term of less than one year are not discounted,
as their fair value does not differ significantly from their net book value. This is
a level 3 fair value, as it uses recognized models for which certain significant
data, such as the credit risk associated with the portfolio of receivables, are
not based on observable market data.
B – Assignments and assets pledged as guarantees for management of the liquidity reserve
B1 Assignments of sales financing assets
(€ million)
DECEMBER 31, 2013 DECEMBER 31, 2012
BALANCE SHEET VALUE FAIR VALUE BALANCE SHEET VALUE FAIR VALUE
Assigned receivables carried in the balance sheet 7,680 7,792 8,814 8,842
Associated liabilities 3,602 3,643 3,902 3,949
The Sales Financing segment has undertaken several securitization
operations through special purpose vehicles and conduit financing operations
(in Germany, France, Italy and the United Kingdom) involving loans to final
customers and receivables on the dealership network. This does not lead
to derecognition of the receivables assigned, as all risks are retained by
the Group. The associated liabilities correspond to securities resulting from
the securitization operations, recognized in other debts represented by a
certificate.
The difference between the receivables assigned and the amount of the
associated liabilities corresponds to the higher credit necessary for these
operations, and the share of securities retained by RCI Banque to form a
liquidity reserve.
Securitized assets can no longer be assigned or pledged. Subscribers to debt
securities only have claims on the assets assigned.

Find out more at www.renault.comREGISTRATION DOCUMENT RENAULT 2013270
FINANCIAL STATEMENTS4 CONSOLIDATED FINANCIAL STATEMENTS
B2 Assets pledged as guarantees for management of the liquidity reserve
For management of its liquidity reserve, RCI Banque provided guarantees
of €3,394 million in 2013 (€2,933 million in 2012) to the Banque de
France: €2,479 million in the form of shares in securitization vehicles, and
€565 million in sales financing receivables (€2,773 million and €160 million
at December 31, 2012) and €350 million in short-term loans from the
Banque de France. This liquidity reserve was unused at December 31, 2013
(it was used to the extent of €400 million at December 31, 2012, classified as
borrowings from credit institutions in sales financing debts).
At December 31, 2013, RCI Banque had also provided guarantees to the Société
de Financement de l’Économie Française (SFEF) in the form of receivables
with book value of €380 million (€341 million at December 31, 2012), in
return for financing of €210 million (€210 million at December 31, 2012)
recorded in borrowings from credit institutions in debts of the Sales Financing
segment (note 23).
C – Sales financing receivables by maturity
(€ million)
DECEMBER 31, 2013
DECEMBER 31,
2012
-1 year 13,884 13,964
1 to 5 years 9,665 9,162
+5 years 101 104
TOTAL SALES FINANCING RECEIVABLES, NET 23,650 23,230
D – Breakdown of overdue sales financing receivables (gross values)
(€ million)
DECEMBER 31, 2013
DECEMBER 31,
2012
Receivables for which impairment has been recognized (1): overdue by 503 577
0 to 30 days 14 14
30 to 90 days 53 53
90 to 180 days 61 57
More than 180 days 375 453
Receivables for which no impairment has been recognized: overdue by 14 16
0 to 30 days 14 16
More than 30 days - -
(1) This only includes sales financing receivables partly or totally written off through impairment on an individual basis.
The maximum exposure to credit risk for the sales financing activity is
represented by the net book value of sales financing receivables plus the
amount of financing commitments for customers reported under off-balance
sheet commitments given (note 28-A).
This risk is reduced by guarantees provided by customers, as reported
in off-balance sheet commitments received (note 28-B). In particular,
guarantees held in connection with overdue or impaired sales financing
receivables amounted to €655 million at December 31, 2013 (€538 million
at December 31, 2012).
There is no indication at the year-end that the quality of sales financing
receivables not yet due or unimpaired has been adversely affected, nor
is there any significant concentration of risks within the sales financing
customer base.
E – Changes in impairment of sales financing receivables
(€ million)
Impairment at December 31, 2012 (798)
Impairment recorded during the year (326)
Reversals for use of impairment 209
Reversals of unused residual amounts 174
Translation adjustment and other (1) 9
Impairment at December 31, 2013 (732)
Net credit losses amounted to €65 million in 2013 (€61 million in 2012).
NOTE 17 – AUTOMOTIVE RECEIVABLES
(€ million)
DECEMBER 31, 2013
DECEMBER 31,
2012
Gross value 1,736 1,226
Impairment (766) (1) (82)
AUTOMOTIVE RECEIVABLES, NET 970 1,144
(1) Of which €(729) million related to Iran at December 31, 2013 as disclosed in note 6-E.
These receivables do not include accounts receivable assigned to the Group’s
sales financing companies or other non-Group entities when substantially
all the risks and benefits associated with ownership of the receivables are
transferred. The risk of dilution (essentially the risks of non-settlement after
a commercial dispute) is retained by the Group, but is considered negligible.
Receivables assigned in this way to Group sales financing companies are
included in sales financing receivables, principally dealership receivables.
When substantially all the risks and benefits are not transferred, although from
a legal standpoint receivables have been assigned to Group sales financing
companies or other non-Group entities, they remain in Automotive receivables
and a corresponding financial liability is recorded (in other interest-bearing
borrowings). The amount of assigned Automotive receivables that remain in
the balance sheet because the Group retains the credit risk or risk of late
settlement is not significant at December 31, 2013.
There is no significant concentration of risks within the Automotive customer
base, and no single non-Group customer accounts for more than 10% of the
Group’s total sales revenues.
The fair value of Automotive receivables is equal to their net book value
due to their short-term maturities. This is a level 3 fair value, as it involves
assessment of the credit risk associated with the portfolio of receivables that
is not based on observable market data.

REGISTRATION DOCUMENT RENAULT 2013✦ Global Reporting Initiative (GRI) Directives 271
FINANCIAL STATEMENTS 4
4
CONSOLIDATED FINANCIAL STATEMENTS
NOTE 18 – OTHER CURRENT AND NON-CURRENT ASSETS
(€ million)
DECEMBER 31, 2013 DECEMBER 31, 2012
NON- CURRENT CURRENT TOTAL NON-CURRENT CURRENT TOTAL
Prepaid expenses 120 224 344 90 194 284
Tax receivables (excluding current taxes) 412 906 1,318 274 996 1,270
Other receivables 473 925 1,398 338 599 932
Investments in controlled unconsolidated entities 71 - 71 119 - 119
Derivatives on operating transactions of the Automotive segment - - - - - -
Derivatives on financing transactions of the Sales Financing segment - 201 201 - 332 332
TOTAL 1,076 2,256 3,332 821 2,121 2,942
Gross value 1,183 2,309 3,492 959 2,193 3,152
Impairment (107) (53) (160) (138) (72) (210)
NOTE 19 – SHAREHOLDERS’ EQUITY
A – Share capital
The total number of ordinary shares issued and fully paid-up at December 31,
2013 was 295,722 thousand, with par value of €3.81 per share (unchanged
from December 31, 2012).
Treasury shares do not bear dividends. They accounted for 1.28% of Renault’s
share capital at December 31, 2013 (1.37% at December 31, 2012).
The Nissan group holds 15% of Renault through its wholly-owned subsidiary
Nissan Finance Co. Ltd. (the voting rights attached to these shares cannot be
exercised).
B – Capital management
In managing its capital, the Group’s objective is to guarantee continuity of
business in order to provide returns for shareholders and benefits for other
stakeholders, and to maintain optimum capital structure in order to optimize
its cost.
The Group actively manages its capital structure, making adjustments in view
of developments in economic conditions. To maintain or adjust the capital
structure, the Group may adjust dividend payments to shareholders, redeem
some of the capital or issue new shares.
The Group’s objectives are monitored in different ways in the different
operating segments.
The Group manages the Automotive segment’s capital by reference to a ratio
equal to the segment’s net indebtedness divided by the sum of shareholders’
equity (net indebtedness includes all non-operating interest-bearing financial
liabilities and commitments less cash and cash equivalents and other non-
operating financial assets such as marketable securities or the segment’s
loans). Shareholders’ equity is as reported in the Group’s financial position.
The Group had a net liquidity position at December 31, 2013 (net liquidity
position at December 31, 2012).
The Sales Financing segment must comply with regulatory ratios specific
to banking operations. The minimum solvency ratio (shareholders’ equity
including subordinated loans to total weighted risks) is 8%. RCI Banque’s
Core Tier 1 solvency ratio (excluding the Basel I floor effect) was 14.2% at
December 31, 2013 (13.7% at December 31, 2012).
The Group also partially hedges its investment in Nissan (note 13-G).
C – Renault treasury shares
In accordance with decisions approved at General Shareholders’ Meetings,
the Board of Directors decided to allocate all Renault treasury shares to
current stock option plans awarded to Group managers and executives.
DECEMBER 31, 2013
DECEMBER 31,
2012
Total value of treasury shares (€ million) 187 201
Total number of treasury shares 3,784,305 4,059,255
D – Distributions
At the General and Extraordinary Shareholders’ Meeting of April 30, 2013, it
was decided to distribute a dividend of €1.72 per share representing a total
amount of €502 million (€1.16 per share or a total of €338 million in 2012).
This dividend was paid during May.
E – Translation adjustment
The change in translation adjustment over the year is analysed as follows:
(€ million) 2013 2012
Change in translation adjustment on the value of the investment in Nissan (2,060) (1,120)
Impact, net of tax, of partial hedging of the investment in Nissan (note 13-H) 209 35
Total change in translation adjustment related to Nissan (1,851) (1,085)
Other changes in translation adjustment (435) (143)
TOTAL CHANGE IN TRANSLATION ADJUSTMENT (2,286) (1,228)
In 2013, other changes in the translation adjustment mostly resulted from
movements in the Argentinian peso, the Brazilian real, the Russian rouble
and the Korean won against the Euro. In 2012, they mostly resulted from
movements in the Brazilian real, the Argentinian peso, the Iranian rial and the
Korean won against the Euro.

Find out more at www.renault.comREGISTRATION DOCUMENT RENAULT 2013272
FINANCIAL STATEMENTS4 CONSOLIDATED FINANCIAL STATEMENTS
G1 Changes in the number of stock options held by personnel
2013 2012
QUANTITY
WEIGHTED AVERAGE
EXERCISE PRICE
(€)
WEIGHTED AVERAGE SHARE PRICE AT GRANT
AND EXERCISE DATES(€) QUANTITY
WEIGHTED
AVERAGE
EXERCISE PRICE
(€)
WEIGHTED AVERAGE SHARE
PRICE AT GRANT
AND EXERCISE DATES
(€)
Outstanding at January 1 5,156,196 76 - 8,595,407 70 -
Granted (1) 297,800 37 40 350,000 (1) 31 33
Exercised - - - - - -
Expired (1,610,225) 69 N/A (3,789,211) 59 N/A
Outstanding at December 31 3,843,771 76 - 5,156,196 76 -
(1) These stock option allocations correspond to plan 20 dating from December 13, 2012, which was announced to the beneficiaries in 2013.
F – Financial instrument revaluation reserve
F1 Change in the financial instrument revaluation reserve
The figures below are reported net of tax effects.
(€ million)
CASH FLOW
HEDGES
AVAILABLE-
FOR-SALE
FINANCIAL ASSETS TOTAL
At December 31, 2012 (1) (117) 153 (3) 36
Changes in fair value recorded in shareholders’ equity 10 524 534
Transfer from shareholders’ equity to the income statement (2) 28 (27) 1
At December 31, 2013 (1) (79) 650 (3) 571
(1) For the schedule of amounts related to cash flow hedges transferred to shareholders’ equity, see note F-3 below.
(2) For a breakdown of the amounts related to cash flow hedges transferred to shareholders’ equity, see note F-2 below.
(3) The revaluation reserve partly relates to Daimler shares (note 22-A).
F2 Breakdown of the amounts related to cash flow hedges transferred from the financial instrument revaluation reserve to the income statement
(€ million) 2013 2012
Operating margin 24 31
Other operating income and expenses 3 -
Net financial income (expense) 1 -
Share in net income of associates and joint ventures - 10
Current and deferred taxes - -
TOTAL TRANSFERRED TO THE INCOME STATEMENT FOR CASH FLOW HEDGES 28 41
F3 Schedule of amounts related to cash flow hedges transferred from the financial instruments revaluation reserve to the income statement
(€ million)
DECEMBER 31, 2013
DECEMBER 31,
2012
Within one year 3 (12)
After one year (34) (57)
Revaluation reserve for cash flow hedges excluding associates and joint ventures (31) (69)
Revaluation reserve for cash flow hedges – associates and joint ventures (48) (48)
TOTAL REVALUATION RESERVE FOR CASH FLOW HEDGES (79) (117)
This schedule is based on the contractual maturities of hedged cash flows.
G – Stock option and free share attribution plans
Since October 1996, the Board of Directors has periodically granted stock
options to Group executives and managers, with prices and exercise periods
specific to each plan.
No new stock-option or free share plans were introduced in 2013. All plans
introduced since 2006 include performance conditions which determine the
number of options or shares granted to beneficiaries.

REGISTRATION DOCUMENT RENAULT 2013✦ Global Reporting Initiative (GRI) Directives 273
FINANCIAL STATEMENTS 4
4
CONSOLIDATED FINANCIAL STATEMENTS
G2 Options and free share attribution rights outstanding at December 31, 2013
PLAN TYPE OF PLAN GRANT DATE
EXERCISE PRICE
(€) OUTSTANDING EXERCISE PERIOD
Plan 12 Stock subscription options May 4, 2006 87.98 1,280,553 May 5, 2010 – May 5, 2014
Plan 14 Stock subscription options December 5, 2006 93.86 1,486,806 December 6, 2010 – December 4, 2014
Plan 18 Stock purchase options April 29, 2011 38.80 478,612 April 30, 2015 – April 28, 2019
Plan 18 bis Attribution of free shares April 29, 2011 - 1,092,545 April 30, 2014 – April 30, 2016
94,800 April 30, 2015
Plan 19 Stock purchase options December 8, 2011 26.87 150,000 December 9, 2015 – December 7, 2019
Plan 19 bis Attribution of free shares December 8, 2011 - 27,000 December 8, 2013 – December 8, 2015
Plan 20 Stock purchase options December 13, 2012 37.43 447,800 December 13, 2016 – December 12, 2020
Plan 20 bis Attribution of free shares December 13, 2012 - 584,400 December 13, 2014 – December 12, 2016
86,800 December 13, 2016
H – Share-based payments
Share-based payments exclusively concern stock options and free shares
awarded to personnel.
Plan values
The options awarded under these plans only become vested after a period
of four years for plans 12 to 20. For stock option plans, the exercise period
then covers four years for plans 12 to 20. Loss of the benefit of these options
follows the applicable regulations: all options are forfeited in the event of
resignation, and a decision is made for each individual case when an
employee leaves at the Company’s instigation.
The plans have been valued as follows:
PLAN
INITIAL VALUE
(thousand of €)
UNIT FAIR
VALUE
EXPENSE
FOR 2013
(€ million)
EXPENSE
FOR 2012
(€ million)
SHARE PRICE
AT GRANT DATE
(€) VOLATILITY
INTEREST
RATE
EXERCISE
PRICE
(€)
DURATION
OF
OPTION
DIVIDEND
PER SHARE
(€)
Plan 12 (1) 17,324 16.20 - - 87.05 28.1% 3.90% 87.98 4-8 years 2.40 – 4.50
Plan 14 (1) 26,066 15.00 - - 92.65 26.7% 3.88% 93.86 4-8 years 2.40 – 4.50
Plan 18 3,422 9.31 (2) (1) 36.70 37.28% 2.28% 38.80 4-8 years 0.30 – 1.16
Plan 18 bis 28,711 31.04 (17) (9) 36.70 N/A 2.28% N/A 3-5 years 0.30 – 1.16
Plan 19 1,608 5.36 - - 27.50 42.24% 1.99% 26.87 4-8 years 1.19 – 1.72
Plan 19 bis 15,966 26.18 (4) (4) 34.18 N/A 1.68% N/A 2-4 years 1.17 – 1.73
Plan 20 2,708 6.87 (1) - 40.39 35% 0.71% 37.43 4-8 years 1.57 – 2.19
Plan 20 bis 21,767 36.38 (9) - 43.15 N/A 0.87% N/A 2-4 years 1.57 – 1.97
TOTAL 117,572 (33) (14)
(1) For these plans, options or free share attribution rights have been awarded at different dates within the stated period. The information reported may correspond to weighted averages based on quantities awarded per grant date.

274 Find out more at www.renault.comREGISTRATION DOCUMENT RENAULT 2013
FINANCIAL STATEMENTS4 CONSOLIDATED FINANCIAL STATEMENTS
I – Share of non-controlling interests
ENTITY
COUNTRY
OF LOCATION
PERCENTAGE OF OWNERSHIP
AND VOTING RIGHTS HELD BY
NON-CONTROLLING INTERESTS
NET INCOME – NON-
CONTROLLING INTERESTS’
SHARE
(€ million)
SHAREHOLDERS’ EQUITY –
NON-CONTROLLING
INTERESTS’ SHARE
(€ million)
DIVIDENDS PAID TO
NON-CONTROLLING
INTERESTS (MINORITY
SHAREHOLDERS)
(€ million)
DECEMBER 31,
2013
DECEMBER 31,
2012 2013 2012
DECEMBER 31,
2013
DECEMBER 31,
2012 2013 2012
Automotive
Renault Samsung Motors Korea 20% 20% 4 (31) 102 102 - -
Renault Pars (1) Iran N/A (1) 49% 1 (102) N/A (91) - -
Oyak Renault Otomobil Fabrikalari Turkey 49% 49% 54 47 230 216 (39) (51)
Other N/A N/A N/A 13 15 29 28 (5) (7)
TOTAL – AUTOMOTIVE 72 (71) 361 255 (44) (58)
Sales Financing
Companhia de Arrendamento Mercantil RCI do Brasil (2) Brazil 40% 40% 11 12 - - - (7)
Companhia de Credito, Financiamento e Investimento RCI do Brasil (2) Brazil 40% 40% 17 15 - - (12) (3)
Rombo Compania Financiera (2) Argentina 40% 40% 8 7 - - - -
Other N/A N/A N/A 1 - 16 - - -
TOTAL – SALES FINANCING 37 34 16 - (12) (10)
TOTAL 109 (37) 377 255 (56) (68)
(1) Renault Pars is deconsolidated as of June 30, 2013 (note 6-E).
(2) The Group has granted minority shareholders in these companies put options to sell their investments. A liability corresponding to these put options is included in other liabilities, amounting to €182 million for the two Brazilian subsidiaries and €22 million for the Argentinean subsidiary at December 31, 2013 (€181 million and €23 million respectively at December 31, 2012). A corresponding charge is made to shareholders’ equity, allocated in priority to the non-controlling interests’ share with any residual amount allocated to the parent company shareholders’ share. The liability is stated at fair value. Fair value is determined by estimating the potential purchase price, taking into account future results of the financing portfolio as it exists at the closing date and the provisions of the partnership contracts. This is a level 3 fair value, as it uses recognized models but their significant data are not based on observable market data.
J – Joint operations
ENTITY COUNTRY OF LOCATION MAIN ACTIVITY
PERCENTAGE OF OWNERSHIP HELD BY THE GROUP
DECEMBER 31, 2013 DECEMBER 31, 2012
Automotive
Société des Automobiles Alpine Caterham (1) France Automaker 50 100
Renault-Nissan Technology and Business Centre India Private Limited (RNTBCI) (2) India Shared service centre 67 67
(1) Société des Automobiles Alpine Caterham was previously controlled and fully consolidated until June 30, 2013.The percentage of voting rights is identical to the percentage of ownership.
(2) The Group holds 50% of voting rights in Renault-Nissan Technology and Business Center India Private Limited.
There are no significant restrictions on the Group’s capacity to access or use
its assets and settle its liabilities, other than restrictions that result from the
regulatory framework in which the subsidiaries operate. The local supervisory
authorities may require banking subsidiaries to keep a certain level of capital
and liquidities, limit their exposure to other Group parties, and comply with
other ratios.

275REGISTRATION DOCUMENT RENAULT 2013✦ Global Reporting Initiative (GRI) Directives
FINANCIAL STATEMENTS 4
4
CONSOLIDATED FINANCIAL STATEMENTS
NOTE 20 – PROVISIONS
A – Provisions at December 31
(€ million) DECEMBER 31, 2013 DECEMBER 31, 2012
Provisions for pension and other long-term employee benefit obligations (1) 1,558 1,649
Provisions (other than provisions for pension and other long-term employee obligations)
Provisions for restructuring and workforce adjustment costs 443 258
Provisions for warranty costs 702 688
Provisions for tax risks and litigation 366 336
Provisions related to insurance activities 191 161
Other provisions 379 293
Total provisions (other than provisions for pension and other long-term employee obligations) 2,081 1,736
TOTAL PROVISIONS 3,639 3,385
Provisions – long-term 2,544 2,496
Provision – short-term 1,095 889
(1) The impacts of application of IAS 19 (revised) “Employee benefits” are presented in note 2-A2.
B – Changes in provisions (other than provisions for pension and other long-term employee obligations)
(€ million)
RESTRUCTURING
PROVISIONS
WARRANTY
PROVISIONS
TAX RISKS AND
LITIGATION
PROVISIONS
INSURANCE
ACTIVITIES (1)
OTHER
PROVISIONS TOTAL
At December 31, 2012 258 688 336 161 293 1,736
Increases 331 435 119 44 178 1,107
Reversals of provisions for application (121) (380) (34) (14) (37) (586)
Reversals of unused balance of provisions (21) (17) (28) - (47) (113)
Changes in scope of consolidation (3) (3) (1) - (1) (8)
Translation adjustments and other changes (1) (21) (26) - (7) (55)
At December 31, 2013 443 702 366 191 379 2,081
(1) Mainly technical reserves established by the sales financing activity’s insurance companies.
Increases to restructuring provisions essentially comprise the effect of
workforce adjustment measures in Europe (note 6-A). Increases to other
provisions include the cost corresponding to the estimated amount of
indemnities payable for failure to meet expected minimum purchase volumes
for certain electric vehicles (note 6-D).
At December 31, 2013, the “other provisions” item included €30 million of
provisions established in application of environmental regulations (€28 million
at December 31, 2012). They include provisions to cover recycling obligations
for end-of-life vehicles and used batteries (note 28-A2), and environmental
compliance costs for industrial land that the Group intends to sell (particularly
on the Boulogne-Billancourt site). They also include €4 million for depollution
of commercial land belonging to Renault Retail Group (RRG) (€4 million at
December 31, 2012).
As greenhouse gases emissions were lower than the Group’s allocated
quotas, no associated provisions were booked at December 31, 2013.
C – Provisions for pensions and other long-term employee benefit obligations
C1 Pension and benefit plans
Pensions and other long-term employee benefit obligations essentially
concern active employees. These benefits are covered either by defined-
contribution plans or defined-benefit plans.
DEFINED-CONTRIBUTION PLANS
The Group makes earnings-related payments, in accordance with local
custom, to the national organizations responsible for paying pensions and
similar financial benefits. There is no actuarial liability concerning these
pension arrangements.
The total expense for defined-contribution plans was €579 million in 2013
(€578 million in 2012).
All known litigation in which Renault or Group companies are involved is examined at each closing. After seeking the opinion of legal advisors, any provisions
deemed necessary are set aside to cover the estimated risk.

276 Find out more at www.renault.comREGISTRATION DOCUMENT RENAULT 2013
FINANCIAL STATEMENTS4 CONSOLIDATED FINANCIAL STATEMENTS
DEFINED-BENEFIT PLANS
The accounting treatment of defined-benefit plans is described in note 2-R,
and involves establishment of provisions. These plans concern:
W indemnities payable upon retirement or departure, in application of
legislation or agreements in certain countries such as France, Korea and
Turkey;
W supplementary pensions providing employees with contractual income; the
countries applying this type of plan are in Europe (eg United Kingdom,
Germany, France, Netherlands, Switzerland);
W other long-term benefits, chiefly long-service awards, flexible holiday
entitlements, and additional career-end leave in France.
Defined-benefit supplementary pension plans are generally covered by
contracts with pension funds or insurance companies. In such cases, the
obligations and assets are valued separately. The difference between
the obligation and the fair value of the assets held to fund may indicate
underfunding or overfunding. In the event of underfunding, a provision is
booked. In the event of overfunding, an asset is recognized subject to certain
conditions.
PRINCIPAL DEFINED-BENEFIT PLANS OF THE GROUP
In France, the Group’s retirement indemnities result from agreements
negotiated with each French entity and employee representatives. They are
based on employees’ salaries and length of service; payment is conditional
on being in the Company’s employment at the time of retirement. Retirement
benefit obligations are entirely covered by provisions, and account for most of
the Group’s liabilities for retirement and termination indemnities.
The Group’s most significant supplementary pension plan is in the United
Kingdom, where two defined-benefit pension plans are managed as part
of a dedicated pension fund comprising two compartments: one concerns
Automotive subsidiaries, the other RCI Financial Services Ltd. This plan has
been closed to new beneficiaries since 2004, and concerns approximately
1,900 people.
This pension fund (a trust) is a legal entity in its own right. It is administered by
a Board of Trustees with equal representation for the participating companies
and their current and former employees. The fund is governed by local
regulations, which set the minimum funding requirements that can lead to
additional contributions being made by the Group. The asset investment policy
is defined for each section of the fund by a supervisory body which examines
the performance of investments quarterly. The risks associated with these
plans are the usual risks (lower future returns on fund assets, a decline in the
equities markets, longer life expectancy for beneficiaries, etc).
The fund compartment dedicated to the Automotive segment is underfunded
and the Group has made a commitment to cover the shortfall by 2022 through
payments amounting to £3 million maximum per year. The deficit is valued at
£15 million at September 30, 2013.
C2 Main actuarial assumptions used to calculate provisions and other data for the most significant plans
MAIN ACTUARIAL ASSUMPTIONS AND ACTUAL DATA FOR THE GROUP’S RETIREMENT INDEMNITIES IN FRANCE DECEMBER 31, 2013 DECEMBER 31, 2012
Retirement age 60 to 65 60 to 65
Discount rate (1) 2.8% – 3.2% 2.6% – 3.3%
Salary increase rate 2.2% – 3% 2.7% – 3%
Duration of plan 12 to 20 years 12 to 20 years
Gross obligation €1,137 million €1,225 million
(1) The rate most frequently used to value the Group’s obligations in France is 2.9% in 2013 (2.6% in 2012) However, the rate varies between companies depending on the maturities of obligations. The benchmark for the discount rate is the zero-coupon rate plus the average spread curve for issuers rated AA as published by Reuters at December 31, 2013 and 2012.
MAIN ACTUARIAL ASSUMPTIONS AND ACTUAL DATA FOR THE GROUP’S SUPPLEMENTARY PENSIONS IN THE UK DECEMBER 31, 2013 DECEMBER 31, 2012
Financial discount rate 4.7% – 4.8% 4.5% – 4.7%
Salary increase rate 2% – 3.3% 2% – 3%
Duration of plan 20 – 27 years 20 – 27 years
Actual return on fund assets 6.8% – 7.6% 11.2% – 14.3%
Gross obligation €258 million €248 million
Fair value of assets invested via pension funds €238 million €229 million

277REGISTRATION DOCUMENT RENAULT 2013✦ Global Reporting Initiative (GRI) Directives
FINANCIAL STATEMENTS 4
4
CONSOLIDATED FINANCIAL STATEMENTS
C3 Net expense for the year
(€ million) 2013 2012
Current service cost 109 93
Past service cost and gain/loss on settlement - (7)
Net interest on the net liability (asset) 42 57
Effects of workforce adjustment measures (1) -
Amortization of past service cost - (3)
Net expense (income) for the year recorded in the income statement 150 140
C4 Breakdown of the balance sheet provision
(€ million)
DECEMBER 31, 2013
PRESENT VALUE OF THE OBLIGATION
FAIR VALUE OF FUND ASSETS
NET DEFINED-BENEFIT LIABILITY (ASSET)
Retirement and termination indemnities
France 1,137 - 1,137
Europe (excluding France and the UK) 18 (1) 17
Americas 2 - 2
Asia-Pacific (1) 77 (16) 61
Euromed-Africa (2) 47 - 47
TOTAL RETIREMENT AND TERMINATION INDEMNITIES 1,281 (17) 1,264
Supplementary pensions
France 77 (44) 33
United Kingdom 258 (238) 20
Europe (excluding France and the UK) (3) 216 (154) 62
Americas 6 - 6
TOTAL SUPPLEMENTARY PENSIONS 557 (436) 121
Other long-term benefits
France (4) 171 - 171
Europe (excluding France and the UK) 2 - 2
TOTAL OTHER LONG-TERM BENEFITS 173 - 173
TOTAL 2,011 (453) 1,558
(1) Korea.
(2) Essentially Romania and Turkey.
(3) Essentially Germany, the Netherlands and Switzerland.
(4) Flexible holiday entitlements, additional career-end leave and long-service awards.

278 Find out more at www.renault.comREGISTRATION DOCUMENT RENAULT 2013
FINANCIAL STATEMENTS4 CONSOLIDATED FINANCIAL STATEMENTS
C5 Changes in obligations, fund assets and the provision
(€ million)
PRESENT VALUE OF
THE OBLIGATION (A)
FAIR VALUE
OF PLAN ASSETS (B)
ASSET CEILING
AND OTHER (C)
NET DEFINED-BENEFIT
LIABILITY (ASSET)
(A)+(B)+(C)
Balanced at December 31, 2012 (1) 2,084 (437) 2 1,649 (1)
Current service cost 109 - - 109
Past service cost and gain/loss on settlement - - - -
Net interest on the net liability (asset) 58 (16) - 42
Effects of workforce adjustment measures (1) - - (1)
Net expense (income) for 2013 recorded in the income statement (note 20-C3) 166 (16) - 150
Actuarial gains and losses on the obligation resulting from changes in demographic assumptions (3) - - (3)
Actuarial gains and losses on the obligation resulting from changes in financial assumptions (43) - - (43)
Actuarial gains and losses on the obligation resulting from experience effects (10) - - (10)
Net return on fund assets (not included in net interest above) - (12) - (12)
Change in asset ceiling (not included in net interest above) - - - -
Net expense (income) for 2013 recorded in other components of comprehensive income (56) (12) - (68)
Employer’s contributions to funds - (9) - (9)
Employees’ contributions to funds - (2) - (2)
Benefits paid under the plan (130) 17 - (113)
Effect of changes in exchange rates (18) 6 - (12)
Effect of changes in scope of consolidation (35) - (2) (37)
Balance at December 31, 2013 2,011 (453) - 1,558
(1) After restatement for retrospective application of IAS 19 (revised), the balance of the provision at December 31, 2012 amounts to €1,647 million (compared to €1,649 million before application of the revised standard). The restatement consists of immediate recognition of past service costs that were previously spread over the vesting period for benefit entitlements (note 2-A2).
Accumulated actuarial gains and losses, net of tax (excluding the associates’
share) recorded in other components of comprehensive income amounted
to an expense of €481 million at December 31, 2013 (€(546) million at
December 31, 2012).
A 50 base point decrease in discount rates used for each plan would result in
a €115 million increase in the amount of obligations at December 31, 2013.
The weighted average duration of plans is 14 years at December 31, 2013.
C6 Fair value of plan assets
Details of the assets invested via pension funds and insurance companies
are as follows:
(€ million)
DECEMBER 31, 2013
LISTED ON ACTIVE MARKETS UNLISTED TOTAL
Pension funds
Cash and cash equivalents - - -
Shares 72 - 72
Bonds 149 - 149
Real estate property - - -
Shares in mutual funds and other 19 3 22
TOTAL – PENSION FUNDS 240 3 243
Insurance companies
Cash and cash equivalents 19 - 19
Shares 9 - 9
Bonds 134 19 153
Real estate property 18 2 20
Shares in mutual funds and other 9 - 9
TOTAL – INSURANCE COMPANIES 189 21 210
TOTAL 429 24 453

279REGISTRATION DOCUMENT RENAULT 2013✦ Global Reporting Initiative (GRI) Directives
FINANCIAL STATEMENTS 4
4
CONSOLIDATED FINANCIAL STATEMENTS
Pension fund plan assets mainly relate to plans located in the United Kingdom
(52.8%). Insurance contracts principally concern Germany (5.5%), Korea
(3.5%), France (9.8%), the Netherlands (18%) and Switzerland (9.4%). The
actual returns on plan assets in the United Kingdom are shown in note 20-C2.
The weighted average actual rate of return on the Group’s main funds is 6.4%
in 2013 (8.1% in 2012).
At the date of this report, the best estimate of contributions that will be
payable to the funds in 2014 is approximately €11 million.
The Group’s pension funds plan assets do not include Renault group financial
instruments. Real estate investments do not include real estate properties
occupied by the Group.
NOTE 21 – OTHER CURRENT AND NON-CURRENT LIABILITIES
(€ million)
DECEMBER 31, 2013 DECEMBER 31, 2012
NON-CURRENT CURRENT TOTAL NON-CURRENT CURRENT TOTAL
Tax liabilities (excluding current taxes) 140 923 1,063 170 855 1,025
Social liabilities 19 1,470 1,489 17 1,555 1,572
Other liabilities 268 3,837 4,105 262 3,846 4,108
Deferred income 692 594 1,286 395 545 940
Derivatives on operating transactions of the Automotive segment - - - - 4 4
TOTAL 1,119 6,824 7,943 844 6,805 7,649
Other liabilities mainly correspond to deferred income recorded in connection with sales contracts including a buy-back commitment (€531 million at December 31,
2013 and €535 million at December 31, 2012).
4.2.7.4 FINANCIAL ASSETS AND LIABILITIES, FAIR VALUE AND MANAGEMENT OF FINANCIAL RISKS
NOTE 22 – FINANCIAL ASSETS – CASH AND CASH EQUIVALENTS
A – Current/non-current breakdown
(€ million)
DECEMBER 31, 2013 DECEMBER 31, 2012
NON-CURRENT CURRENT TOTAL NON-CURRENT CURRENT TOTAL
Investments in non-controlled entities 1,196 - 1,196 788 - 788
Marketable securities and negotiable debt instruments - 135 135 - 171 171
Loans 190 707 897 68 622 690
Derivatives on financing operations by the Automotive segment 144 256 400 176 196 372
TOTAL FINANCIAL ASSETS 1,530 1,098 2,628 1,032 989 2,021
Gross value 1,531 1,102 2,633 1,033 1,002 2,035
Impairment (1) (4) (5) (1) (13) (14)
Cash equivalents - 3,732 3,732 - 3,647 3,647
Cash on hand and bank deposits - 7,929 7,929 - 7,533 7,533
TOTAL CASH AND CASH EQUIVALENTS - 11,661 11,661 - 11,180 11,180
Information on the counterparty risks associated with financial assets and
cash and cash equivalents is provided in note 25-B6.
A1 Investments in non-controlled entities
Investments in non-controlled entities include €1,035 million (€680 million at
December 31, 2012) for the Daimler shares purchased under the strategic
partnership agreement.
These shares are classified as available-for-sale financial assets and their fair
value is determined by reference to the market price. At December 31, 2013,
the stock market price (€62.90 per share) was higher than the acquisition
price (€35.52 per share). The corresponding increase in value, amounting
to €355 million, is recorded in other components of comprehensive income
for 2013.
Investments in non-controlled entities also include €59 million at
December 31,2013 (€69 million at December 31, 2012) paid to the
Modernization Fund for Automotive Equipment Manufacturers (Fonds de
Modernisation des Equipementiers Automobiles - FMEA), as part of the
support plan for these suppliers introduced by the French authorities and
automakers. Renault has undertaken a commitment to pay a total of €200
million as funds are called.

280 Find out more at www.renault.comREGISTRATION DOCUMENT RENAULT 2013
FINANCIAL STATEMENTS4 CONSOLIDATED FINANCIAL STATEMENTS
The fair value of these securities is determined by reference to the most
recent net asset value reported by the FMEA’s management company, after
adjustment for any relevant information that becomes known afterwards.
In 2013, the decline in their fair value was considered durable, and was
recognized in other financial expenses in the amount of €11 million at
December 31, 2013.
A2 Non-available cash
The Group has liquidities in countries where repatriation of funds can be
complex for regulatory or political reasons. In most of these countries, such
funds are used locally for industrial or sales financing purposes, and so this
cash is available to the Group.
B – Breakdown by category of financial instruments and fair value
(€ million)
INSTRUMENTS HELD
FOR TRADING (1)
HEDGING
DERIVATIVES
AVAILABLE-
FOR-SALE
INSTRUMENTS
TOTAL INSTRUMENTS CARRIED
AT FAIR VALUELOANS AND
RECEIVABLES TOTAL
Investments in non-controlled entities - - 1,196 1,196 - 1,196
Marketable securities and negotiable debt instruments - - 135 135 - 135
Loans - - - - 897 897
Derivatives on financing operations by the Automotive segment 305 95 - 400 - 400
TOTAL FINANCIAL ASSETS AT DECEMBER 31, 2013 305 95 1,331 1,731 897 2,628
Cash equivalents - - 84 84 3,648 3,732
Cash - - - - 7,929 7,929
TOTAL CASH AND CASH EQUIVALENTS AT DECEMBER 31, 2013 - - 84 84 11,577 11,661
Investments in non-controlled entities - - 788 788 - 788
Marketable securities and negotiable debt instruments - - 171 171 - 171
Loans - - - - 690 690
Derivatives on financing operations by the Automotive segment 233 139 - 372 - 372
TOTAL FINANCIAL ASSETS AT DECEMBER 31, 2012 233 139 959 1,331 690 2,021
Cash equivalents - - 132 132 3,515 3,647
Cash - - - - 7,533 7,533
TOTAL CASH AND CASH EQUIVALENTS AT DECEMBER 31, 2012 - - 132 132 11,048 11,180
(1) Including derivatives not designated as hedges for accounting purposes.
No financial assets were reclassified between categories in 2013 (or 2012).

281REGISTRATION DOCUMENT RENAULT 2013✦ Global Reporting Initiative (GRI) Directives
FINANCIAL STATEMENTS 4
4
CONSOLIDATED FINANCIAL STATEMENTS
NOTE 23 – FINANCIAL LIABILITIES AND SALES FINANCING DEBTS
A – Current/non-current breakdown
(€ million)
DECEMBER 31, 2013 DECEMBER 31, 2012
NON-CURRENT CURRENT TOTAL NON-CURRENT CURRENT TOTAL
Renault SA redeemable shares 313 - 313 249 - 249
Bonds 4,506 1,538 6,044 4,525 1,249 5,774
Other debts represented by a certificate - 63 63 - 158 158
Borrowings from credit institutions (at amortized cost) 1,524 670 2,194 787 1,455 2,242
Borrowings from credit institutions (at fair value) - 218 218 220 - 220
Other interest-bearing borrowings 458 174 632 521 53 574
Financial liabilities of the Automotive segment (excluding derivatives) 6,801 2,663 9,464 6,302 2,915 9,217
Derivatives on financing operations of the Automotive segment 39 258 297 60 179 239
Total financial liabilities of the Automotive segment 6,840 2,921 9,761 6,362 3,094 9,456
Diac redeemable shares 10 - 10 9 - 9
Bonds - 11,643 11,643 - 11,513 11,513
Other debts represented by a certificate 250 4,315 4,565 251 6,785 7,036
Borrowings from credit institutions - 3,227 3,227 - 3,930 3,930
Other interest-bearing borrowings - 4,442 4,442 - 973 973
Total financial liabilities and debts of the Sales Financing segment (excluding derivatives) 260 23,627 23,887 260 23,201 23,461
Derivatives on financing operations of the Sales Financing segment - 130 130 - 104 104
Financial liabilities and debts of the Sales Financing segment 260 23,757 24,017 260 23,305 23,565
TOTAL FINANCIAL LIABILITIES AND SALES FINANCING DEBTS 7,100 26,678 33,778 6,622 26,399 33,021
Redeemable shares
The redeemable shares issued in October 1983 and April 1984 by Renault
SA are subordinated perpetual shares. They earn a minimum annual return of
9% comprising a 6.75% fixed portion and a variable portion that depends on
consolidated revenues and is calculated based on identical Group structure
and methods. The return on redeemable shares, amounting to €17 million for
2013 (€17 million for 2012), is included in interest expenses. These shares
are listed on the Paris Stock Exchange, and traded for €312 at December 31,
2012 and €392 at December 31, 2013 for par value of €153, leading to a
corresponding €65 million adjustment to the fair value of redeemable shares
recorded in other financial expenses (note 7).
The return on Diac redeemable shares issued in 1985 comprises a fixed
portion equal to the Annual Monetary Rate, and a variable portion calculated
by multiplying an amount equal to 40% of the Annual Monetary Rate by the
rate of increase in net consolidated profit of the Diac sub-group compared to
the prior year.
Changes in bonds
In 2013, Renault SA redeemed bonds issued between 2006 and 2011 for a
total of €1,152 million, and undertook new bond totalling €1,716 million and
maturing between 2015 and 2018, including €695 million on the Chinese
and Japanese markets.
RCI Banque also redeemed bonds for a total of €2,465 million in 2013 and
issued new bonds totalling €2,958 million and maturing between 2014 and
2018.
Loans from the European Investment Bank
During the first half of 2013, Renault SA redeemed the €400 million loan
issued by the European Investment Bank (EIB) in 2009 and issued two new
EIB loans with terms of 6 years and 3.5 years respectively, for a combined
total of €400 million.
Credit lines
At December 31, 2013, Renault SA had confirmed credit lines opened
with banks worth €3,435 million (€3,485 million at December 31, 2012).
The short-term portion amounted to €555 million at December 31, 2013
(€355 million at December 31, 2012). These credit lines were unused at
December 31, 2013 (and December 31, 2012).
Sales Financing’s confirmed credit lines opened in several currencies with
banks amounted to €4,661 million at December 31, 2013 (€4,696 million
at December 31, 2012). The short-term portion amounted to €874 million at
December 31, 2013 (€657 million at December 31, 2012). These credit lines
were unused at December 31, 2013 (and December 31, 2012).
The contractual documentation for financial liabilities and confirmed credit
lines contains no clause that could affect the continued supply of credit in the
event of any change in Renault’s credit rating or financial ratio compliance.

282 Find out more at www.renault.comREGISTRATION DOCUMENT RENAULT 2013
FINANCIAL STATEMENTS4 CONSOLIDATED FINANCIAL STATEMENTS
B – Breakdown by category of financial instrument and fair value
DECEMBER 31,2013(€ million)
INSTRUMENTS MEASURED AT FAIR VALUE
INSTRUMENTS MEASURED
AT AMORTIZED COST (2)
BALANCE
SHEET
VALUE
INSTRUMENTS HELD
FOR TRADING (1)
HEDGING
DERIVATIVES
INSTRUMENTS DESIGNATED
AS MEASURED AT FAIR VALUE
FROM INITIAL RECOGNITION
TOTAL INSTRUMENTS
MEASURED
AT FAIR VALUE
BALANCE
SHEET
VALUE FAIR VALUE
Renault SA redeemable shares - - 313 313 - - 313
Bonds - - - - 6,044 6,406 6,044
Other debts represented by a certificate - - - - 63 63 63
Borrowings from credit institutions - - 218 218 2,194 2,147 2,412
Other interest-bearing borrowings - - - - 632 646 632
Derivatives on financing operations of the Automotive segment 293 4 - 297 - - 297
TOTAL FINANCIAL LIABILITIES OF THE AUTOMOTIVE SEGMENT 293 4 531 828 8,933 9,262 9,761
Diac redeemable shares - - 10 10 - - 10
Bonds - - - - 11,643 11,924 11,643
Other debts represented by a certificate - - - - 4,565 4,607 4,565
Borrowings from credit institutions - - - - 3,227 3,268 3,227
Other interest-bearing borrowings - - - - 4,442 4,442 4,442
Derivatives on financing operations of the Sales Financing segment 37 93 - 130 - - 130
FINANCIAL LIABILITIES AND DEBTS OF THE SALES FINANCING SEGMENT 37 93 10 140 23,877 24,241 24,017
(1) Including derivatives not classified as hedges for accounting purposes.
(2) Including financial liabilities subject to fair value hedges.
DECEMBER 31,2012(€ million)
INSTRUMENTS MEASURED AT FAIR VALUE
INSTRUMENTS MEASURED
AT AMORTIZED COST (2)
BALANCE
SHEET
VALUE
INSTRUMENTS HELD
FOR TRADING (1)
HEDGING
DERIVATIVES
INSTRUMENTS DESIGNATED
AS MEASURED AT FAIR VALUE
FROM INITIAL RECOGNITION
TOTAL INSTRUMENTS
MEASURED
AT FAIR VALUE
BALANCE
SHEET
VALUE FAIR VALUE
Renault SA redeemable shares - - 249 249 - - 249
Bonds - - - - 5,774 6,015 5,774
Other debts represented by a certificate - - - - 158 158 158
Borrowings from credit institutions - - 220 220 2,242 2,194 2,462
Other interest-bearing borrowings - - - - 574 605 574
Derivatives on financing operations of the Automotive segment 236 3 - 239 - - 239
TOTAL FINANCIAL LIABILITIES OF THE AUTOMOTIVE SEGMENT 236 3 469 708 8,748 8,972 9,456
Diac redeemable shares - - 9 9 - - 9
Bonds - - - - 11,513 11,682 11,513
Other debts represented by a certificate - - - - 7,036 7,074 7,036
Borrowings from credit institutions - - - - 3,930 3,984 3,930
Other interest-bearing borrowings - - - - 973 973 973
Derivatives on financing operations of the Sales Financing segment 50 54 - 104 - - 104
FINANCIAL LIABILITIES AND DEBTS OF THE SALES FINANCING SEGMENT 50 54 9 113 23,452 23,713 23,565
(1) Including derivatives not classified as hedges for accounting purposes.
(2) Including financial liabilities subject to fair value hedges.
The fair value of financial liabilities and debts of the Sales Financing segment
measured at amortized cost is essentially determined by discounting future
cash flows at rates offered to Renault at December 31, 2013 and 2012 for
loans with similar conditions and maturities. The rates proposed to Renault
result from observable market data such as zero-coupon interest rate curves
and secondary market prices for bonds issued by the Group, and consequently
this is a level 2 fair value.

283REGISTRATION DOCUMENT RENAULT 2013✦ Global Reporting Initiative (GRI) Directives
FINANCIAL STATEMENTS 4
4
CONSOLIDATED FINANCIAL STATEMENTS
C – Breakdown by maturity
For financial liabilities including derivatives, contractual flows are similar to
the expected flows and correspond to the amounts to be paid.
For floating-rate financial instruments, interest is calculated using interest
rates as at December 31, 2013.
No contractual flows are reported for Renault and Diac redeemable shares as
they have no fixed redemption date.
C1 Financial liabilities of the Automotive segment
(€ million)
DECEMBER 31, 2013
BALANCE
SHEET
VALUE
TOTAL
CONTRACTUAL
FLOWS -1 YR 1 – 2 YRS 2 – 3 YRS 3 – 4 YRS 4 – 5 YRS +5 YRS
Bonds issued by Renault SA (by issue date)
2003 41 41 41 - - - - -
2006 28 28 28 - - - - -
2007 60 60 50 - - 10 - -
2009 749 750 750 - - - - -
2010 1,119 1,150 - 650 - 500 - -
2011 569 548 48 - 500 - - -
2012 1,577 1,600 431 69 250 850 - -
2013 1,855 1,848 246 605 97 - 900 -
Accrued interest, expenses and premiums 46 57 57 - - - - -
Total bonds 6,044 6,082 1,651 1,324 847 1,360 900 -
Other debts represented by a certificate 63 63 63 - - - - -
Borrowings from credit institutions 2,412 2,413 889 345 438 219 160 362
Other interest-bearing borrowings 632 784 92 34 15 16 16 611
Total other financial liabilities 3,107 3,260 1,044 379 453 235 176 973
Future interest on bonds and other financial liabilities - 902 229 209 152 115 51 146
Redeemable shares 313 - - - - - - -
Derivatives on financing operations 297 297 258 6 27 2 2 2
TOTAL FINANCIAL LIABILITIES OF THE AUTOMOTIVE SEGMENT 9,761 10,541 3,182 1,918 1,479 1,712 1,129 1,121
The portion of financial liabilities of the Automotive segment maturing within one year breaks down as follows:
(€ million)
DECEMBER 31, 2013
CONTRACTUAL FLOWS
MATURING WITHIN 1 YEAR -1 MONTH 1 – 3 MONTHS 3 MONTHS – 1 YEAR
Bonds 1,651 - - 1,651
Other financial liabilities 1,044 168 453 423
Future interest on bonds and other financial liabilities 229 7 28 194
Derivatives on financing operations 258 43 17 198
TOTAL FINANCIAL LIABILITIES MATURING WITHIN 1 YEAR 3,182 218 498 2,466

284 Find out more at www.renault.comREGISTRATION DOCUMENT RENAULT 2013
FINANCIAL STATEMENTS4 CONSOLIDATED FINANCIAL STATEMENTS
C2 Financial liabilities and debts of the Sales Financing segment
(€ million)
DECEMBER 31, 2013
BALANCE
SHEET
VALUE
TOTAL
CONTRACTUAL
FLOWS -1 YR 1 – 2 YRS 2 – 3 YRS 3 – 4 YRS 4 – 5 YRS +5 YRS
Bonds issued by RCI Banque (year of issue)
2005 10 10 - 10 - - - -
2006 12 12 - 12 - - - -
2010 1,327 1,300 - 600 700 - - -
2011 4,220 4,136 2,349 610 1,177 - - -
2012 3,019 3,039 947 1,176 195 721 - -
2013 2,833 2,883 68 163 1,133 113 1,406 -
Accrued interest, expenses and premiums 222 246 246 - - - - -
Total bonds 11,643 11,626 3,610 2,571 3,205 834 1,406 -
Other debts represented by a certificate 4,565 4,568 1,370 1,713 686 - 799 -
Borrowings from credit institutions 3,227 3,225 2,260 601 343 15 6 -
Other interest-bearing borrowings 4,442 4,441 3,798 223 186 143 91 -
Total other financial liabilities 12,234 12,234 7,428 2,537 1,215 158 896 -
Future interest on bonds and other financial liabilities - 1,286 300 526 328 87 39 6
Redeemable shares 10 - - - - - - -
Derivative liabilities on financing operations 130 95 16 12 4 20 6 37
TOTAL FINANCIAL LIABILITIES AND DEBTS OF THE SALES FINANCING SEGMENT 24,017 25,241 11,354 5,646 4,752 1,099 2,347 43
The portion of financial liabilities and debts of the Sales Financing segment maturing within one year breaks down as follows:
(€ million)
DECEMBER 31, 2013
CONTRACTUAL FLOWS
MATURING WITHIN 1 YEAR -1 MONTH 1 – 3 MONTHS 3 MONTHS – 1 YEAR
Bonds 3,610 920 114 2,576
Other financial liabilities 7,428 4,256 1,024 2,148
Future interest on bonds and other financial liabilities 300 13 29 258
Derivative liabilities on financing operations 16 9 2 5
TOTAL FINANCIAL LIABILITIES MATURING WITHIN 1 YEAR 11,354 5,198 1,169 4,987

285REGISTRATION DOCUMENT RENAULT 2013✦ Global Reporting Initiative (GRI) Directives
FINANCIAL STATEMENTS 4
4
CONSOLIDATED FINANCIAL STATEMENTS
NOTE 24 – FAIR VALUE OF FINANCIAL INSTRUMENTS AND IMPACT ON NET INCOME
A – Fair value of financial instruments by level
The following breakdown by level is presented for financial instruments
carried in the balance sheet at fair value:
W level 1: instruments whose fair values are derived from quoted prices in
an active market;
W level 2: instruments whose fair values are derived from observable market
prices and are not included in level 1;
W level 3: instruments whose fair values are derived from unobservable
inputs on the market.
(€ million)
DECEMBER 31, 2013
FAIR VALUE
IN BALANCE SHEET LEVEL 1 LEVEL 2 LEVEL 3
Investments in non-controlled entities 1,196 1,035 - 161
Marketable securities and negotiable debt instruments 135 77 58 -
Derivative assets on financing operations by the Automotive segment 400 - 400 -
Derivative assets on transactions undertaken for operating purposes by the Automotive segment - - - -
Derivative assets on financing operations by the Sales Financing segment 201 - 201 -
Cash equivalents 84 84 - -
Financial instruments stated at fair value in the balance sheet assets 2,016 1,196 659 161
Renault SA redeemable shares 313 313 - -
Borrowings from credit institutions by the Automotive segment 218 - 218 -
Derivative liabilities on transactions undertaken for financing purposes by the Automotive segment 297 - 297 -
Derivative liabilities on transactions undertaken for operating purposes by the Automotive segment - - - -
Diac redeemable shares 10 10 - -
Derivative liabilities on financing operations of the Sales Financing segment 130 - 130 -
Financial instruments stated at fair value in the balance sheet liabilities 968 323 645 -
Estimated fair values are based on information available on the markets and
determined at using valuation methods appropriate to the types of instrument
in question. However, the methods and assumptions used are by nature
theoretical, and judgment plays a major role in interpreting market data.
Fair values have been determined on the basis of information available at the
end of the year and do not therefore take account of subsequent movements.
In general, the valuation methods for each level are as follows:
W level 1: fair value is identical to the most recent quoted price;
W level 2: fair value is generally determined by recognized valuation models
that use observable market data, such as zero-coupon interest rate curves
and secondary market listed prices for securities issued by the Group;
W level 3: the fair value of investments in non-controlled companies is based
on the share of net assets.
In 2013 no financial instruments were transferred between Level 1 and Level
2, or into or out of Level 3.
The Group’s financial statements carry no assets or liabilities measured at fair
value on a non-recurring basis in the balance sheet.
B – Changes in Level 3 financial instruments
Level 3 financial instruments amounted to €161 million at December 31,
2013 (€108 million at December 31, 2012). They increased by €53 million
over the year, essentially due to subscription of €51 million of shares for
the capital increase by the unconsolidated company RN SF BV, the holding
company for the future bank that will handle sales financing for the Alliance in
Russia. These companies will be consolidated in 2014.

286 Find out more at www.renault.comREGISTRATION DOCUMENT RENAULT 2013
FINANCIAL STATEMENTS4 CONSOLIDATED FINANCIAL STATEMENTS
C – Impact of financial instruments on net income
2013(€ million)
FINANCIAL ASSETS
OTHER THAN DERIVATIVES
FINANCIAL LIABILITIES
OTHER THAN DERIVATIVES
DERIVATIVES
TOTAL IMPACT
ON NET INCOME
INSTRUMENTS
HELD FOR
TRADING
AVAILABLE-
FOR-SALE
INSTRUMENTS
LOANS AND
RECEIVABLES
INSTRUMENTS
DESIGNATED
AS MEASURED
AT FAIR VALUE
THROUGH PROFIT
AND LOSS
INSTRUMENTS
MEASURED AT
AMORTIZED
COST (1)
Interest income 1 - 142 - - 40 183
Interest expenses - - - (17) (414) (19) (450)
Change in fair value - (2) 24 (62) 81 (55) (14)
Impairment - (11) (540) - - - (551)
Dividends - 38 - - - - 38
Gains (losses) on sale - - 2 - - - 2
Net foreign exchange gains and losses 29 - 3 - (124) - (92)
TOTAL IMPACT ON NET INCOME - AUTOMOTIVE SEGMENT 30 25 (369) (79) (457) (34) (884)
Including:
- operating margin 1 - (26) - (118) - (143)
- other operating income and expenses - - (514) - - - (514)
- net financial income (expenses) 29 25 171 (79) (339) (34) (227)
Interest income - - 1,567 - - 107 1,674
Interest expenses - - - - (1,124) (38) (1,162)
Change in fair value - - - - 182 (184) (2)
Impairment - - (65) - - - (65)
Dividends - - - - - - -
Gains (losses) on sale - - - - - - -
Net foreign exchange gains and losses - - - - - - -
TOTAL IMPACT ON NET INCOME - SALES FINANCING SEGMENT IN OPERATING MARGIN - - 1,502 - (942) (115) 445
TOTAL GAINS AND LOSSES WITH IMPACT ON NET INCOME 30 25 1,133 (79) (1,399) (149) (439)
(1) Including financial liabilities subject to fair value hedges.
For the Automotive segment, the impact of financial instruments on net income mainly corresponds to foreign exchange gains and losses on operating transactions,
and impairment of operating receivables.
D – Fair value hedges
(€ million) 2013 2012
Change in fair value of the hedging instrument 307 51
Change in fair value of the hedged item (236) (22)
Net impact on net income of fair value hedges 71 29
This net impact of fair value hedges on net income corresponds to the ineffective portion of hedges. Hedge accounting methods are described in note 2-V.

287REGISTRATION DOCUMENT RENAULT 2013✦ Global Reporting Initiative (GRI) Directives
FINANCIAL STATEMENTS 4
4
CONSOLIDATED FINANCIAL STATEMENTS
NOTE 25 – DERIVATIVES AND MANAGEMENT OF FINANCIAL RISKS
The Renault group’s specialist subsidiary Renault Finance handles the
Automotive segment’s short-term interbank investments. It is also Nissan’s
counterparty in derivatives trading to hedge exchange, interest rate and
commodity risks.
The fair values of derivatives reported as financial assets and liabilities in
the Group’s consolidated financial position mainly relate to Renault Finance’s
business conducted on its own behalf and its transactions with Renault and
Nissan subsidiaries.
A – Derivatives
A1 Fair value of derivatives
The fair value of derivatives corresponds to their balance sheet value.
DECEMBER 31, 2013(€ million)
FINANCIAL ASSETS OTHER ASSETS
FINANCIAL LIABILITIES AND
SALES FINANCING DEBTS
OTHER
LIABILITIES
NON-CURRENT CURRENT CURRENT NON-CURRENT CURRENT CURRENT
Cash flow hedges - - - - - -
Fair value hedges - - 24 - 74 -
Hedge of the net investment in Nissan - - - - - -
Derivatives not classified as hedges and derivatives held for trading 6 252 3 - 263 -
TOTAL FOREIGN EXCHANGE RISK 6 252 27 - 337 -
Cash flow hedges 2 - 77 - 13 -
Fair value hedges 92 - 94 2 8 -
Derivatives not classified as hedges and derivatives held for trading 44 4 - 37 30 -
TOTAL INTEREST RATE RISK 138 4 171 39 51 -
Cash flow hedges - - 3 - - -
Fair value hedges - - - - - -
Derivatives not classified as hedges and derivatives held for trading - - - - - -
TOTAL COMMODITY RISK - - 3 - - -
TOTAL 144 256 201 39 388 -
DECEMBER 31, 2012(€ million)
FINANCIAL ASSETS OTHER ASSETS
FINANCIAL LIABILITIES AND
SALES FINANCING DEBTS
OTHER
LIABILITIES
NON-CURRENT CURRENT CURRENT NON-CURRENT CURRENT CURRENT
Cash flow hedges - - - - - 4
Fair value hedges - 70 - (1) -
Hedge of the net investment in Nissan - - - - - -
Derivatives not classified as hedges and derivatives held for trading - 109 15 - 175 -
TOTAL FOREIGN EXCHANGE RISK - 109 85 - 174 4
Cash flow hedges 3 - 70 3 55 -
Fair value hedges 116 20 177 - - -
Derivatives not classified as hedges and derivatives held for trading 57 67 - 57 54 -
TOTAL INTEREST RATE RISK 176 87 247 60 109 -
Cash flow hedges - - - - - -
Fair value hedges - - - - - -
Derivatives not classified as hedges and derivatives held for trading - - - - - -
TOTAL COMMODITY RISK - - - - - -
TOTAL 176 196 332 60 283 4
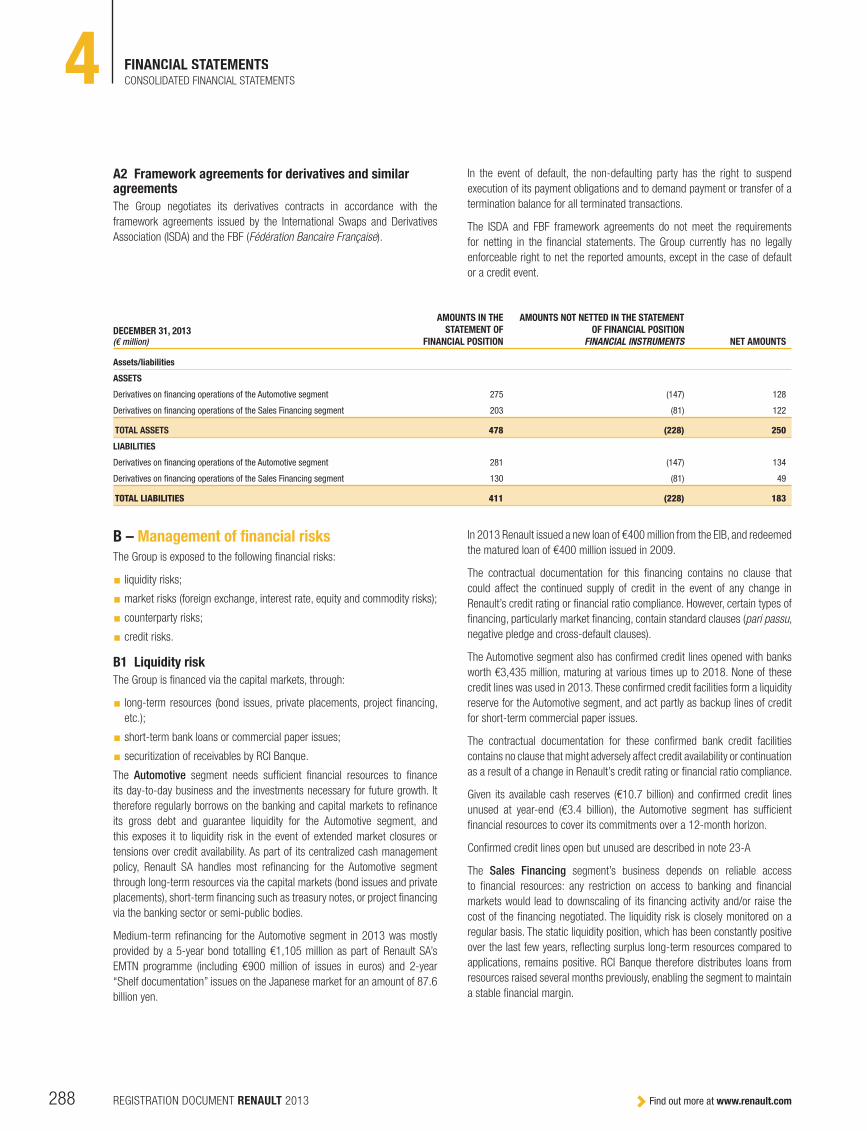
288 Find out more at www.renault.comREGISTRATION DOCUMENT RENAULT 2013
FINANCIAL STATEMENTS4 CONSOLIDATED FINANCIAL STATEMENTS
A2 Framework agreements for derivatives and similar agreements
The Group negotiates its derivatives contracts in accordance with the
framework agreements issued by the International Swaps and Derivatives
Association (ISDA) and the FBF (Fédération Bancaire Française).
In the event of default, the non-defaulting party has the right to suspend
execution of its payment obligations and to demand payment or transfer of a
termination balance for all terminated transactions.
The ISDA and FBF framework agreements do not meet the requirements
for netting in the financial statements. The Group currently has no legally
enforceable right to net the reported amounts, except in the case of default
or a credit event.
DECEMBER 31, 2013(€ million)
AMOUNTS IN THE
STATEMENT OF
FINANCIAL POSITION
AMOUNTS NOT NETTED IN THE STATEMENT
OF FINANCIAL POSITION
FINANCIAL INSTRUMENTS NET AMOUNTS
Assets/liabilities
ASSETS
Derivatives on financing operations of the Automotive segment 275 (147) 128
Derivatives on financing operations of the Sales Financing segment 203 (81) 122
TOTAL ASSETS 478 (228) 250
LIABILITIES
Derivatives on financing operations of the Automotive segment 281 (147) 134
Derivatives on financing operations of the Sales Financing segment 130 (81) 49
TOTAL LIABILITIES 411 (228) 183
B – Management of financial risks
The Group is exposed to the following financial risks:
W liquidity risks;
W market risks (foreign exchange, interest rate, equity and commodity risks);
W counterparty risks;
W credit risks.
B1 Liquidity risk
The Group is financed via the capital markets, through:
W long-term resources (bond issues, private placements, project financing,
etc.);
W short-term bank loans or commercial paper issues;
W securitization of receivables by RCI Banque.
The Automotive segment needs sufficient financial resources to finance
its day-to-day business and the investments necessary for future growth. It
therefore regularly borrows on the banking and capital markets to refinance
its gross debt and guarantee liquidity for the Automotive segment, and
this exposes it to liquidity risk in the event of extended market closures or
tensions over credit availability. As part of its centralized cash management
policy, Renault SA handles most refinancing for the Automotive segment
through long-term resources via the capital markets (bond issues and private
placements), short-term financing such as treasury notes, or project financing
via the banking sector or semi-public bodies.
Medium-term refinancing for the Automotive segment in 2013 was mostly
provided by a 5-year bond totalling €1,105 million as part of Renault SA’s
EMTN programme (including €900 million of issues in euros) and 2-year
“Shelf documentation” issues on the Japanese market for an amount of 87.6
billion yen.
In 2013 Renault issued a new loan of €400 million from the EIB, and redeemed
the matured loan of €400 million issued in 2009.
The contractual documentation for this financing contains no clause that
could affect the continued supply of credit in the event of any change in
Renault’s credit rating or financial ratio compliance. However, certain types of
financing, particularly market financing, contain standard clauses (pari passu,
negative pledge and cross-default clauses).
The Automotive segment also has confirmed credit lines opened with banks
worth €3,435 million, maturing at various times up to 2018. None of these
credit lines was used in 2013. These confirmed credit facilities form a liquidity
reserve for the Automotive segment, and act partly as backup lines of credit
for short-term commercial paper issues.
The contractual documentation for these confirmed bank credit facilities
contains no clause that might adversely affect credit availability or continuation
as a result of a change in Renault’s credit rating or financial ratio compliance.
Given its available cash reserves (€10.7 billion) and confirmed credit lines
unused at year-end (€3.4 billion), the Automotive segment has sufficient
financial resources to cover its commitments over a 12-month horizon.
Confirmed credit lines open but unused are described in note 23-A
The Sales Financing segment’s business depends on reliable access
to financial resources: any restriction on access to banking and financial
markets would lead to downscaling of its financing activity and/or raise the
cost of the financing negotiated. The liquidity risk is closely monitored on a
regular basis. The static liquidity position, which has been constantly positive
over the last few years, reflecting surplus long-term resources compared to
applications, remains positive. RCI Banque therefore distributes loans from
resources raised several months previously, enabling the segment to maintain
a stable financial margin.

289REGISTRATION DOCUMENT RENAULT 2013✦ Global Reporting Initiative (GRI) Directives
FINANCIAL STATEMENTS 4
4
CONSOLIDATED FINANCIAL STATEMENTS
In 2013, the Sales Financing segment made new issues equivalent to
€2.8 billion on the bond market. RCI Banque raised the equivalent of
€2.1 billion through its traditional markets (four new bonds and additional
issues in euros, and one issue in Swiss francs), undertook borrowings
in pounds sterling (£300 million) and issues in US dollars ($600 million).
The Group’s subsidiaries also undertook issues on their home markets in
Argentina, Korea and particularly Brazil (1.4 billion Brazilian reals).
A new French securitization fund placed €800 million of debt securities with
investors. RCI continues to issue self-subscribed securities which are eligible
as collateral for European Central Bank monetary policy operations.
After the launch in 2012 of a savings account intended for the general public
in France, the Group pursued this strategy in Germany. Savings collected thus
increased by €3.4 billion (€0.8 billion of which are term deposits).
In addition to these resources, the Sales Financing segment has €4.7 billion in
undrawn confirmed credit lines (€4.1 billion for RCI Banque) and €2.5 billion
of available liquid receivables that can be redeemed at the Banque de France
(this amount is after application of discounts and excludes receivables
already redeemed at the year-end). RCI Banque is thus able to fund ongoing
commercial business for nearly 12 months assuming a total lack of external
resources.
B2 Foreign exchange risks
MANAGEMENT OF FOREIGN EXCHANGE RISKS
The Automotive segment is exposed to foreign exchange risks in the course
of its industrial and commercial business. These risks are monitored and
centralized by Renault’s Cash and Financing department.
It is Renault’s general policy not to hedge operating future cash flows in foreign
currencies. As a result, the Group’s operating margin is exposed to foreign
exchange risks. The main exceptions authorized by the General Management
in 2013 concerned a foreign exchange hedge that partly hedges the risk of
the Argentinian peso against the US dollar, a partial hedge of purchases in
Turkish lira, and a partial hedge of purchases in yen against the won.
Subsidiaries’ financing and investing cash flows in foreign currencies are
usually hedged in the same currencies.
Most financial liabilities and debts of Sales Financing, after hedges, are in
Euros.
Equity investments are not hedged, apart from the investment in Nissan,
totalling 112 billion yen at December 31, 2013 (note 13-G).
Renault Finance undertakes operations unrelated to operating cash flows
on its own behalf. These operations are controlled daily and strict risk limits
apply. They have no significant impact on Renault’s consolidated results.
The Sales Financing segment has low exposure to foreign exchange risks
since its policy is to provide refinancing for subsidiaries in their own currencies.
At 31 December 2013, RCI Banque’s consolidated foreign exchange position
reached 1 million.
The Group made no major changes to its foreign exchange risk management
policy in 2013.
ANALYSIS OF THE SENSITIVITY OF FINANCIAL INSTRUMENTS TO FOREIGN EXCHANGE RISKS
This analysis concerns the sensitivity to foreign exchange risks of monetary
assets and liabilities (including intercompany balances) and derivatives in
a currency other than the currency of the entity that holds them. However,
it does not take into account items covered by fair value hedges (hedged
assets or liabilities and derivatives), for which changes in fair value of the
hedged item and the hedging instrument almost totally offset each other in
the income statement.
The Group has financial instruments denominated in Japanese yen, held
for the purposes of the policy to partially hedge its investment in Nissan
(note 13-G).
Impacts are estimated solely on the basis of instant conversion of the financial
assets and liabilities concerned at year-end after application of the 1%
variation in the Euro exchange rate.
The impact on equity concerns the 1% variation in the Euro against other
currencies applied to available-for-sale financial assets, cash flow hedges
and the partial hedge of the investment in Nissan. All other impacts affect
net income.
For the Automotive segment, the impact on shareholders’ equity (before taxes)
of a 1% rise in the Euro against the principal currencies, applied to financial
instruments exposed to foreign exchange risks, would have an unfavourable
effect of €7 million at December 31, 2013, chiefly resulting from yen bond
issues associated with the partial hedge of the investment in Nissan. This
impact should be offset by a symetrical, opposite variation in the translation
adjustment on the value of the investment in Nissan (note 19). The estimated
impact on net income at December 31, 2013 is expected be unfavourable at
€58 million.
CURRENCY DERIVATIVES
(€ million)
DECEMBER 31, 2013 DECEMBER 31, 2012
NOMINAL -1 YR 1 – 5 YRS +5 YRS NOMINAL -1 YR 1 – 5 YRS +5 YRS
Currency swaps – purchases 2,116 866 1,250 - 1,855 896 959 -
Currency swaps – sales 2,002 727 1,275 - 1,842 852 990 -
Forward purchases 17,970 17,970 - - 15,106 15,106 - -
Forward sales 17,979 17,979 - - 15,103 15,103 - -

290 Find out more at www.renault.comREGISTRATION DOCUMENT RENAULT 2013
FINANCIAL STATEMENTS4 CONSOLIDATED FINANCIAL STATEMENTS
B3 Interest rate risk
INTEREST RATE RISK MANAGEMENT
The Renault group’s exposure to interest rate risk mainly concerns the sales
financing business of RCI Banque and its subsidiaries. Customer loans are
generally issued at fixed interest rates, for durations of between 12 and 72
months. Dealer credit is issued at floating rates for durations of less than 12
months.
Interest rate risk is monitored using a methodology common to the entire
RCI Banque group, to allow overall management of interest rate risks
at consolidated group level. Exposure is assessed daily and hedging is
systematic, using swaps to convert floating-rate liabilities to fixed-rate
liabilities (cash flow hedges). The objective for each subsidiary is to hedge all
risks in order to protect the sales margin.
The Automotive segment’s interest rate risk management policy applies two
principles: long-term investments use fixed-rate financing, and investments
for cash reserves use floating-rate financing. In addition, the financing in yen
undertaken as part of the partial hedge of Nissan equity is fixed-rate.
Finally, Renault Finance carries out interest rate transactions on its own behalf,
within strictly defined risk limits. This arbitrage activity has no significant
impact on Renault’s consolidated net income.
The Group made no major changes to its interest rate risk management policy
in 2013.
ANALYSIS OF THE SENSITIVITY OF FINANCIAL INSTRUMENTS TO INTEREST RATE RISKS
The Group is exposed to the following interest rate risks:
W variations in the interest flows on floating-rate financial instruments stated
at amortized cost (including fixed-rate instruments swapped to floating
rate, and structured products);
W variations in the fair value of the fixed-rate financial instruments stated at
fair value;
W variations in the fair value of derivatives.
Impacts are estimated by applying a 100 base point rise in interest rates over
a one-year period to financial instruments reported in the closing statement
of financial position.
The impact on shareholders’ equity corresponds to the change in fair value of
available-for-sale fixed-rate financial assets and cash flow hedges after a 100
base point rise in interest rates. All other impacts affect net income.
Calculation of the individual segments’ sensitivity to interest rates includes
intersegment loans and borrowings.
For the Automotive segment, the impact on net income and shareholders’
equity (before taxes) of a 100 base point rise in interest rates applied to
financial instruments exposed to interest rate risks would be a positive
€55 million and €1 million respectively at December 31, 2013.
For the Sales Financing segment, the impact on net income and shareholders’
equity (before taxes) of a 100 base point rise in interest rates applied to
financial instruments exposed to interest rate risks would be a negative €51
million and a positive €33 million respectively at December 31, 2013. The
impact on equity results mainly from the change in the fair value of swaps
undertaken to hedge future cash flows.
FIXED RATE/FLOATING RATE BREAKDOWN OF FINANCIAL LIABILITIES AND SALES FINANCING DEBTS, AFTER THE EFFECT OF DERIVATIVES (EXCLUDING DERIVATIVES)
(€ million)
DECEMBER 31, 2013
DECEMBER 31,
2012
Fixed rate 16,895 19,085
Floating rate 16,456 13,593
TOTAL FINANCIAL LIABILITIES AND SALES FINANCING DEBTS (EXCLUDING DERIVATIVES) 33,351 32,678
INTEREST RATE DERIVATIVES
(€ million)
DECEMBER 31, 2013 DECEMBER 31, 2012
NOMINAL -1 YR 1 - 5 YRS +5 YRS NOMINAL -1 YR 1 - 5 YRS +5 YRS
Interest rate swaps 15,626 3,484 11,797 345 20,260 9,515 10,745 -
Other interest rate hedging instruments - - - - - - - -
B4 Equity risks
MANAGEMENT OF EQUITY RISKS
The Group’s exposure to equity risks essentially concerns the Daimler shares
acquired in connection with the cooperation agreements, and marketable
securities indexed to share prices. The Group does not use equity derivatives
to hedge this risk.
The Group made no major changes to its equity risk management policy in
2013.
ANALYSIS OF SENSITIVITY OF FINANCIAL INSTRUMENTS TO EQUITY RISKS
The sensitivity to equity risks resulting from application of a 10% decrease in
share prices to the financial assets concerned at the year-end would have an
unfavourable impact of €104 million on shareholders’ equity. The impact on
net income is not significant at December 31, 2013.
B5 Commodity risks
MANAGEMENT OF COMMODITY RISKS
Renault’s Purchases department may hedge part of its commodity risks using
financial instruments such as forward purchase contracts, purchase options
and tunnel contracts. These hedges are subject to volume, duration and price
limits.
Commodity hedging transactions in progress at December 31, 2013 include
forward purchases of aluminium, lead, copper, platinum and palladium. These
transactions are classified for accounting purposes as cash flow hedges, and
accordingly changes in their fair value are included in shareholders’ equity.
The Group had no outstanding commodity hedges at December 31, 2012.

291REGISTRATION DOCUMENT RENAULT 2013✦ Global Reporting Initiative (GRI) Directives
FINANCIAL STATEMENTS 4
4
CONSOLIDATED FINANCIAL STATEMENTS
ANALYSIS OF FINANCIAL INSTRUMENTS’ SENSITIVITY TO COMMODITY RISKS
Financial instruments’ accounting sensitivity to commodity risks results from
derivatives used to hedge the Group’s economic exposure to that risk.
A 10% increase in commodity prices for derivatives classified as hedging
derivatives would have a positive impact of €6 million on shareholders’ equity
at December 31, 2013.
COMMODITY DERIVATIVES
(€ million)
DECEMBER 31, 2013 DECEMBER 31, 2012
NOMINAL -1 YR 1 – 5 YRS +5 YRS NOMINAL -1 YR 1 – 5 YRS +5 YRS
Purchases of swaps 62 57 5 - - - - -
B6 Counterparty risk
All Group entities use a fully-coordinated counterparty risk management
procedure involving a scoring system, based principally on the counterparties’
long-term credit rating and equity level. For Group companies with significant
exposure, compliance with authorized limits is monitored on a daily basis
under strict internal control procedures.
The counterparties for deposits are subject to special monitoring, unless this
is impossible. Most deposits are with large network banks, as this allows a
good spread of the risk and lowers the systemic risk. They are almost all
overnight deposits, such that assets can be reallocated rapidly if there is
stress on any counterparty.
The Group is not subject to any significant risk concentration for its operations
on the financial and banking markets.
No losses were recorded in 2013 due to default by a banking counterparty.
4.2.7.5 CASH FLOWS AND OTHER INFORMATION
NOTE 26 – CASH FLOWS
A – Other income and expenses with no impact on cash
(€ million) 2013 2012
Net allocation to provisions 964 82
Net effects of sales financing credit losses (57) (63)
Net (gain) loss on asset disposals (1) (153) (928)
Change in fair value of redeemable shares 65 18
Change in fair value of other financial instruments (61) 30
Deferred taxes (10) 55
Other 67 18
OTHER INCOME AND EXPENSES WITH NO IMPACT ON CASH 815 (788)
(1) Including the €924 million gain on sale of the AB Volvo shares in 2012.
B – Change in working capital
(€ million) 2013 2012
Decrease (increase) in net inventories 477 495
Decrease (increase) in Automotive net receivables (92) (10)
Decrease (increase) in other assets (727) (406)
Increase (decrease) in trade payables 18 451
Increase (decrease) in other liabilities 852 467
INCREASE (DECREASE) IN WORKING CAPITAL 528 997
C – Capital expenditure
(€ million) 2013 2012
Purchases of intangible assets (829) (902)
Purchases of property, plant and equipment (other than assets leased to customers) (1,681) (2,274)
Total purchases for the period (2,510) (3,176)
Deferred payments (239) 329
TOTAL CAPITAL EXPENDITURE (2,749) (2,847)
D – Interest received and paid by the Automotive segment
(€ million) 2013 2012
Interest received 193 178
Interest paid (443) (391)
INTEREST RECEIVED AND PAID (250) (213)

292 Find out more at www.renault.comREGISTRATION DOCUMENT RENAULT 2013
FINANCIAL STATEMENTS4 CONSOLIDATED FINANCIAL STATEMENTS
NOTE 27 – RELATED PARTIES
A – Remuneration of Director s and Executives and Executive Committee members
A1 Remuneration of Directors and Executives
The Board of Directors has combined the functions of Chairman of the Board
of Directors and Chief Executive Officer. The Chairman and CEO receives no
remuneration for his duties as Chairman of the Board.
The table below reports the remuneration paid, pro rata to the periods in
which the functions were occupied:
(€ million) 2013 2012
Basic salary 1.2 1.2
Performance-related salary 1.4 1.0
Employer’s social security charges 0.7 0.8
Complementary pension 1.0 0.5
Other components of remuneration 0.2 0.1
Total remuneration excluding stock options 4.5 3.6
Stock-option plans 0.5 0.3
Stock-option plans – effect of cancellations - -
Total stock option plans 0.5 0.3
Chairman and Chief Executive Officer 5.0 3.9
Directors’ fees amounted to €1,099,825 in 2013 (€1,131,000 in 2012), of
which €48,000 were paid for the Chairman and CEO’s functions (€48,000
in 2012).
A2 Remuneration of Executive Committee members (other than the Chairman and Chief Executive Officer)
The remuneration and related benefits of members of the Executive Committee
(other than the Chairman and Chief Executive Officer), were recognized in
expenses as follows:
(€ million) 2013 2012
Basic salary 4.3 4.0
Retirement indemnities 0.0 1.0
Performance-related salary 4.0 2.6
Employer’s social security charges 3.6 3.1
Complementary pension 3.8 2.0
Other 1.0 0.5
Total remuneration excluding stock options 16.7 13.2
Stock option plans 2.6 1.6
Stock option plans – effect of cancellations - -
Total stock option plans 2.6 1.6
Executive Committee members (other than the Chairman and CEO) 19.3 14.8
B – Renault’s investments in associates
Details of Renault’s investments in Nissan and AVTOVAZ are provided in
notes 13 and 14-A respectively.
NOTE 28 – OFF-BALANCE SHEET COMMITMENTS AND CONTINGENT ASSETS AND LIABILITIES
Renault enters into a certain number of commitments in the course of its
business. When these commitments qualify as liabilities, they are covered
by provisions (e.g. retirement and other employee benefits, litigations, etc.).
Details of off-balance sheet commitments and contingent liabilities are
provided below (note 28-A).
Renault also receives commitments from customers (deposits, mortgages,
etc.) and may benefit from credit lines with credit institutions (note 28-B).
A – Off-balance sheet commitments given and contingent liabilities
A1 Ordinary operations
The Group is committed for the following amounts:
(€ million)
DECEMBER 31, 2013
DECEMBER 31,
2012
Sureties, endorsements and guarantees given 318 229
Financing commitments in favour of customers (1) 1,493 1,465
Firm investment orders 483 612
Lease commitments 369 396
Assets pledged, provided as guarantees or mortgaged, and other commitments (2) 110 124
(1) Confirmed credit lines opened for customers by the Sales Financing segment lead to a maximum payment of this amount within 12 months after the year-end.
(2) Assets pledged, provided as guarantees or mortgaged mainly concern guarantees of financial liabilities, provided by Renault Samsung Motors when it was acquired by Renault in 2000.
Lease commitments include rent from non-cancellable leases. The breakdown
is as follows:
(€ million)
DECEMBER 31, 2013
DECEMBER 31,
2012
Less than 1 year 35 26
Between 1 and 5 years 199 212
More than 5 years 135 158
TOTAL 369 396
A2 Specific operations
END-OF-LIFE VEHICLES
The Group establishes provisions for its recycling obligations on a country-
by-country basis, in accordance with regulatory requirements, as and when
the procedures for recycling operations are defined. These provisions are
regularly reviewed to ensure they take account of changes in each country's
situation.
For countries where the legislation is not yet complete, until the laws are in
existence, it is impossible to accurately determine whether the Group will
have to bear a residual cost.

293REGISTRATION DOCUMENT RENAULT 2013✦ Global Reporting Initiative (GRI) Directives
FINANCIAL STATEMENTS 4
4
CONSOLIDATED FINANCIAL STATEMENTS
OTHER COMMITMENTS
Disposals of subsidiaries or businesses by the Group generally include
representations and warranties in the buyer's favour. At December 31,
2013, Renault had not identified any significant risk in connection with these
operations.
Fo llowing partial sales of subsidiaries in previous years, Renault holds put
options covering some or all of the residual investment retained. The exercise
of these options would not have a significant impact on the Group’s financial
statements.
Group companies are periodically subject to tax inspections in the countries
in which they operate. Accepted tax adjustments are recorded as provisions
in the financial statements. Contested tax adjustments are recognized on
a case-by-case basis, taking into account the risk that the proceedings or
appeals undertaken may be unsuccessful.
B – Off-balance sheet commitments received and contingent assets
(€ million)
DECEMBER 31, 2013
DECEMBER 31,
2012
Sureties, endorsements and guarantees received 2,088 1,872
Assets pledged or mortgaged (1) 2,636 2,290
Buy-back commitments (2) 1,759 1,791
Other commitments 16 31
(1) The Sales Financing segment receives guarantees from its customers in the course of sales financing for new or used vehicles. Guarantees received from customers amount to €2,609 million at December 31, 2013 (€2,248 million at December 31, 2012).
(2) Commitments received by the Sales Financing segment for sale to a third party of rental vehicles at the end of the rental contract.
Off-balance sheet commitments received concerning confirmed opened
credit lines are presented in note 23-A.
NOTE 29 – FEES PAID TO STATUTORY AUDITORS AND THEIR NETWORKThe fees paid to the Group’s statutory auditors and their networks were as follows:
(€ thousands)
E&Y NETWORK DELOITTE NETWORK
AMOUNT % AMOUNT %
2013 2012 2013 2012 2013 2012 2013 2012
Audit
Statutory audit, certification, review of individual and consolidated accounts 6,785 5,073 93.5% 87.9% 6,708 6,841 91.7% 91.1%
P Renault SA and Renault s.a.s. 3,737 2,687 51.5% 46.6% 2,551 2,570 34.9% 34.2%
P Fully consolidated subsidiaries 3,048 2,386 42.0% 41.3% 4,157 4,271 56.8% 56.9%
Other work and services directly linked to the statutory auditor’s mission 409 618 5.6% 10.7% 376 544 5.1% 7.2%
P Renault SA and Renault s.a.s. 99 238 1.3% 4.1% 47 169 0.6% 2.2%
P Fully consolidated subsidiaries 310 380 4.3% 6.6% 329 375 4.5% 5.0%
SUBTOTAL 7,193 5,691 99.1% 98.6% 7,084 7,385 96.8% 98.3%
Other services
P Legal, tax, labour-related 63 83 0.9% 1.4% 209 125 2.9% 1.7%
P Other - - - - 26 - 0.3% -
SUBTOTAL 63 83 0.9% 1.4% 235 125 3.2% 1.7%
TOTAL 7,256 5,774 100% 100% 7,319 7,510 100% 100%
NOTE 30 – SUBSEQUENT EVENTSNo significant events have occurred since the year-end.
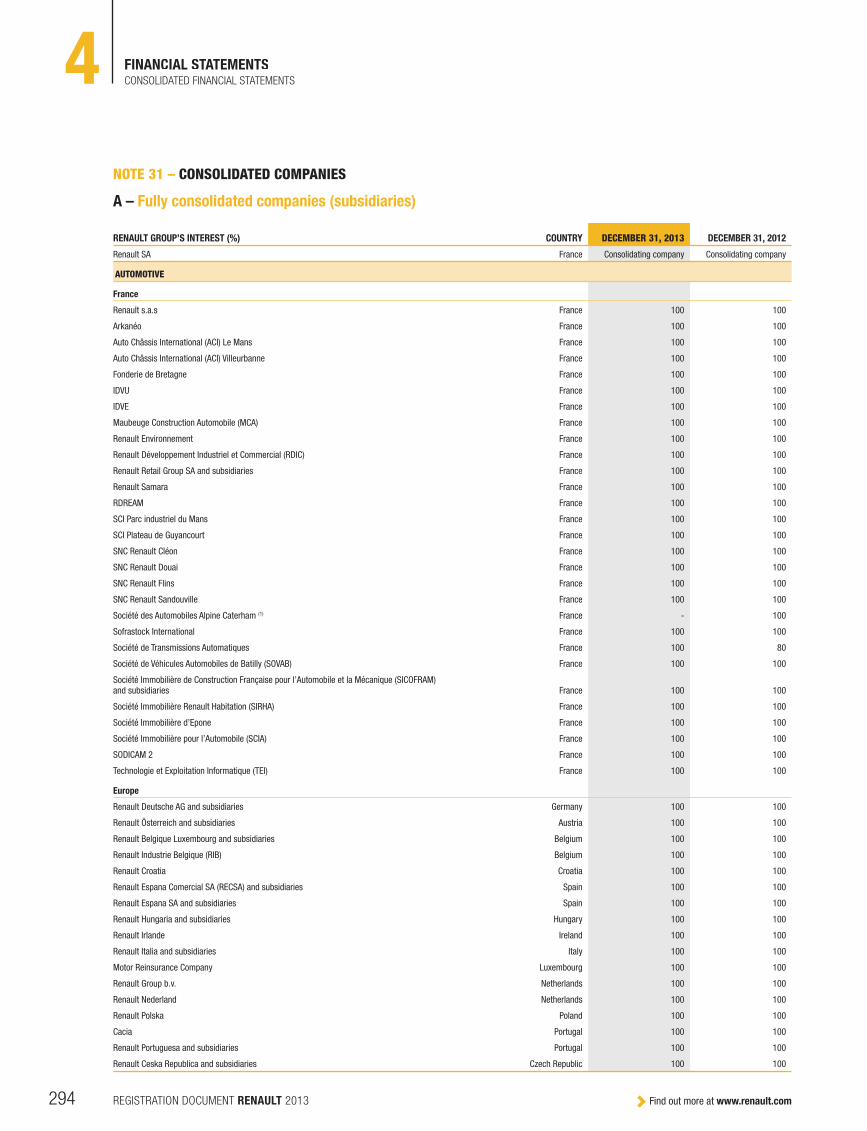
294 Find out more at www.renault.comREGISTRATION DOCUMENT RENAULT 2013
FINANCIAL STATEMENTS4 CONSOLIDATED FINANCIAL STATEMENTS
NOTE 31 – CONSOLIDATED COMPANIES
A – Fully consolidated companies (subsidiaries)
RENAULT GROUP’S INTEREST (%) COUNTRY DECEMBER 31, 2013 DECEMBER 31, 2012
Renault SA France Consolidating company Consolidating company
AUTOMOTIVE
France
Renault s.a.s France 100 100
Arkanéo France 100 100
Auto Châssis International (ACI) Le Mans France 100 100
Auto Châssis International (ACI) Villeurbanne France 100 100
Fonderie de Bretagne France 100 100
IDVU France 100 100
IDVE France 100 100
Maubeuge Construction Automobile (MCA) France 100 100
Renault Environnement France 100 100
Renault Développement Industriel et Commercial (RDIC) France 100 100
Renault Retail Group SA and subsidiaries France 100 100
Renault Samara France 100 100
RDREAM France 100 100
SCI Parc industriel du Mans France 100 100
SCI Plateau de Guyancourt France 100 100
SNC Renault Cléon France 100 100
SNC Renault Douai France 100 100
SNC Renault Flins France 100 100
SNC Renault Sandouville France 100 100
Société des Automobiles Alpine Caterham (1) France - 100
Sofrastock International France 100 100
Société de Transmissions Automatiques France 100 80
Société de Véhicules Automobiles de Batilly (SOVAB) France 100 100
Société Immobilière de Construction Française pour l’Automobile et la Mécanique (SICOFRAM) and subsidiaries France 100 100
Société Immobilière Renault Habitation (SIRHA) France 100 100
Société Immobilière d’Epone France 100 100
Société Immobilière pour l’Automobile (SCIA) France 100 100
SODICAM 2 France 100 100
Technologie et Exploitation Informatique (TEI) France 100 100
Europe
Renault Deutsche AG and subsidiaries Germany 100 100
Renault Österreich and subsidiaries Austria 100 100
Renault Belgique Luxembourg and subsidiaries Belgium 100 100
Renault Industrie Belgique (RIB) Belgium 100 100
Renault Croatia Croatia 100 100
Renault Espana Comercial SA (RECSA) and subsidiaries Spain 100 100
Renault Espana SA and subsidiaries Spain 100 100
Renault Hungaria and subsidiaries Hungary 100 100
Renault Irlande Ireland 100 100
Renault Italia and subsidiaries Italy 100 100
Motor Reinsurance Company Luxembourg 100 100
Renault G roup b.v. Netherlands 100 100
Renault Nederland Netherlands 100 100
Renault Polska Poland 100 100
Cacia Portugal 100 100
Renault Portuguesa and subsidiaries Portugal 100 100
Renault Ceska Republica and subsidiaries Czech Republic 100 100

295REGISTRATION DOCUMENT RENAULT 2013✦ Global Reporting Initiative (GRI) Directives
FINANCIAL STATEMENTS 4
4
CONSOLIDATED FINANCIAL STATEMENTS
RENAULT GROUP’S INTEREST (%) COUNTRY DECEMBER 31, 2013 DECEMBER 31, 2012
Grigny Ltd. United Kingdom 100 100
Renault Retail Group U.K. Ltd. United Kingdom 100 100
Renault U.K. United Kingdom 100 100
Renault Slovakia Slovakia 100 100
Renault-Nissan Slovenia d.o.o. Slovenia 100 100
Revoz Slovenia 100 100
Renault Nordic Sweden 100 100
Renault Finance Switzerland 100 100
Renault Suisse SA and subsidiaries Switzerland 100 100
Americas
Groupe Renault Argentina Argentina 100 100
Renault do Brasil LTDA Brazil 100 100
Renault do Brasil SA Brazil 100 100
Sociedad de Fabricacion de Automotores (Sofasa) and subsidiaries Colombia 100 100
Renault Corporativo SA de C.V. Mexico 100 100
Renault Mexico Mexico 100 100
Asia–Pacific
Renault Beijing Automotive Company China 100 100
Renault Samsung Motors South Korea 80 80
Renault Private Ltd India 100 100
Renault Pars Iran - 51
Euromed–Africa
Renault South Africa and subsidiaries (2) South Africa - 51
Renault Algérie Algeria 100 100
Renault-Nissan Bulgarie Bulgaria 100 100
Renault Maroc Morocco 80 80
Renault Maroc Service Morocco 100 100
Renault Tanger Exploitation Morocco 100 100
Renault Tanger Méditerranée Morocco 100 100
Société marocaine de construction automobile (Somaca) Morocco 77 77
Dacia and subsidiaries Romania 99 99
Renault Industrie Roumanie (3) Romania - 99
Renault Mécanique Roumanie Romania 100 100
Renault-Nissan Roumanie Romania 100 100
Renault Technologie Roumanie Romania 100 100
Oyak-Renault Otomobil Fabrikalari Turkey 52 52
Eurasia
AFM Industrie Russia 100 100
Avtoframos Russia 100 100
Remosprom Russia 100 100
Renault Ukraine Ukraine 100 100
SALES FINANCING
France
Cogéra (3) France - 100
Diac France 100 100
Diac Location France 100 100
RCI Banque and branches France 100 100
Sogesma France 100 100
Europe
RCI Versicherungs Service GmbH Germany 100 100
RCI Financial Services S.A. Belgium 100 100
Renault AutoFin S.A. Belgium 100 100

296 Find out more at www.renault.comREGISTRATION DOCUMENT RENAULT 2013
FINANCIAL STATEMENTS4 CONSOLIDATED FINANCIAL STATEMENTS
RENAULT GROUP’S INTEREST (%) COUNTRY DECEMBER 31, 2013 DECEMBER 31, 2012
Overlease Spain 100 100
ES Mobility SRL Italy 100 100
RCI Zrt Hongrie Hungary 100 100
RCI Insurance Ltd Malta 100 100
RCI Life Ltd Malta 100 100
RCI Services Ltd Malta 100 100
RCI Financial Services B.V. Netherlands 100 100
RCI Bank Polska Poland - 100
Renault Credit Polska Sp. Z.o.o. Poland 100 100
RCI Gest Instituiçao Financiora de Credito SA. Portugal 100 100
RCI Gest Seguros – Mediadores de Seguros Portugal 100 100
RCI Finance CZ s.r.o. Czech Republic 100 100
RCI Financial Services s.r.o. (4) Czech Republic 50 -
RCI Financial Services Ltd United Kingdom 100 100
Renault Acceptance Ltd (3) United Kingdom - 100
RCI Finance S.A. Switzerland 100 100
Americas
Courtage S.A. Argentina 100 100
Rombo Compania Financiera Argentina 60 60
Companhia de Arrendamento Mercantil RCI do Brasil Brazil 60 60
Companhia de Crédito, Financiamento e Investimento RCI do Brasil Brazil 60 60
Administradora de Consorcio Renault do Brasil Brazil 100 100
Corretora de Seguros RCI do Brasil Brazil 100 100
Asia–Pacific
RCI Financial Services Korea South Korea 100 100
Euromed–Africa
RCI Finance Maroc Morocco 100 100
RDFM Morocco 100 -
RCI Broker De Asigurare Romania 100 100
RCI Finantare Romania Romania 100 100
RCI Leasing Romania IFN Romania 100 100
Eurasie
OOO RN FINANCE RUS Russia 100 -
B – Companies consolidated based on the percentage share specific to each balance sheet and income statement item (joint operations) (5)
RENAULT GROUP’S INTEREST (%) COUNTRY DECEMBER 31, 2013 DECEMBER 31, 2012
AUTOMOTIVE
Société des Automobiles Alpine Caterham (1) France 50 -
Renault-Nissan Technology and Business Centre India Private Limited (RNTBCI) India 67 67

297REGISTRATION DOCUMENT RENAULT 2013✦ Global Reporting Initiative (GRI) Directives
FINANCIAL STATEMENTS 4
4
CONSOLIDATED FINANCIAL STATEMENTS
C – Companies accounted for by the equity method (associates and joint ventures) (5)
RENAULT GROUP’S INTEREST (%) COUNTRY DECEMBER 31, 2013 DECEMBER 31, 2012
AUTOMOTIVE
Boone Comenor France 33 33
Française de Mécanique (5) (6) France - -
Indra Investissements (5) France 50 -
Renault-Nissan Automotive India Private Limited India 30 30
Nissan group Japan 43,7 43,7
Alliance Rostec Auto B.V. Russia 48,2 -
AVTOVAZ group Russia 35,9 25
MAIS Turkey 49 49
Renault South Africa and subsidiaries (2) South Africa 40 -
SALES FINANCING
Renault Credit Car (5) Belgium 50 -
Nissan Renault Finance Mexico. (6) Mexico - 15
Orfin Finansman Anonim Sirketi Turkey 50 -
(1) Société des Automobiles Alpine Caterham: joint venture consolidated based on the percentage share specific to each balance sheet and income statement item since the sale of a 50% stake to the new partner in June 2013.
(2) Renault South Africa: associate accounted for under the equity method since transfer of control to Renault’s partner in December 2013.
(3) Cogera, Renault Acceptance Ltd and Renault Industrie Roumanie: subsidiaries absorbed in 2013 by fully consolidated companies.
(4) RCI Financial Services s.r.o.: fully consolidated since acquisition of control in October 2013.
(5) Française de Mécanique, Indra Investissements, Renault Credit Car and RCI Financial Services s.r.o.: in application of IFRS 11 “Joint Arrangements”, these joint ventures are accounted for under the equity method in 2013. They were proportionately consolidated in the 2012 financial statements (note 2-A2).
(6) Française de Mécanique and Nissan Renault Finance Mexico: these investments were sold in 2013.

298 Find out more at www.renault.comREGISTRATION DOCUMENT RENAULT 2013
FINANCIAL STATEMENTS4 STATUTORY AUDITORS’ REPORT
4.3 STATUTORY AUDITORS’ REPORT
4.3.1 STATUTORY AUDITORS’ REPORT ON THE FINANCIAL STATEMENTS
This is a free translation into English of the statutory auditors’ report on the
consolidated financial statements issued in French and it is provided solely for
the convenience of English-speaking users.
The statutory auditors’ report includes information specifically required by
French law in such reports, whether modified or not. This information is
presented below the audit opinion on the consolidated financial statements
and includes an explanatory paragraph discussing the auditors’ assessments
of certain significant accounting and auditing matters. These assessments
were considered for the purpose of issuing an audit opinion on the consolidated
financial statements taken as a whole and not to provide separate assurance
on individual account balances, transactions or disclosures.
This report also includes information relating to the specific verification of
information given in the Group’s management report.
This report should be read in conjunction with and construed in accordance
with French law and professional auditing standards applicable in France.
RENAULT
Year ended December 31, 2013
To t he Shareholders
In compliance with the assignment entrusted to us by your Annual General
Meeting, we hereby report to you, for the year ended December 31, 2013, on:
W the audit of the accompanying financial statements of Renault;
W the justification of our assessments;
W the specific verification and information required by law.
These financial statements have been approved by the Board of Directors. Our
role is to express an opinion on these financial statements based on our audit.
I. OPINION ON THE FINANCIAL STATEMENTSWe conducted our audit in accordance with professional standards applicable
in France; those standards require that we plan and perform the audit to
obtain reasonable assurance about whether the financial statements are free
of material misstatement. An audit involves performing procedures, using
sampling techniques or other methods of selection, to obtain audit evidence
about the amounts and disclosures in the financial statements. An audit also
includes evaluating the appropriateness of accounting policies used and
the reasonableness of accounting estimates made, as well as the overall
presentation of the financial statements. We believe that the audit evidence
we have obtained is sufficient and appropriate to provide a basis for our audit
opinion.
In our opinion, the financial statements give a true and fair view of the
assets and liabilities and of the financial position of the Company as at
December 31, 2013 and of the results of its operations for the year then
ended in accordance with French accounting principles.
II. JUSTIFICATION OF OUR ASSESSMENTSIn accordance with the requirements of article L. 823-9 of the French company
Law (Code de commerce) relating to the justification of our assessments, we
bring to your attention the following matters:
W a s disclosed in note 1.A to the financial statements and in accordance
with the recommendation no. 34 of the French national accounting body
(Conseil national de la comptabilité), your company has elected to use
the equity method to value its investments in subsidiaries over which
it exercises exclusive control. The equity value of these investments is
determined in accordance with the accounting rules and methods used
to draw up the consolidated financial statements of the Group. Our
assessment of this equity value is based on the result of the procedures
performed to audit the financial statements of the Renault Group for the
2013 fiscal year;
W t hese assessments were made as part of our audit of the financial
statements taken as a whole, and therefore contributed to the opinion we
formed which is expressed in the first part of this report.

299REGISTRATION DOCUMENT RENAULT 2013✦ Global Reporting Initiative (GRI) Directives
FINANCIAL STATEMENTS 4
4
STATUTORY AUDITORS’ REPORT
III - SPECIFIC PROCEDURES AND DISCLOSURES We have also performed, in accordance with professional standards applicable
in France, the specific verifications required by French law.
We have no matters to report as to the fair presentation and the consistency
with the financial statements of the information given in the management report
of the Board of Directors and in the documents addressed to the Shareholders
with respect to the financial position and the financial statements.
Concerning the information given in accordance with the requirements
of article L. 225-102-1 of the French company Law (Code de commerce)
relating to remunerations and benefits received by the directors and any other
commitments made in their favour, we have verified its consistency with the
financial statements, or with the underlying information used to prepare these
financial statements and, where applicable, with the information obtained by
your company from companies controlling your company or controlled by
it. Based on this work, we attest the accuracy and fair presentation of this
information.
In accordance with French law, we have verified that the required information
concerning the purchase of investments and controlling interests, the cross-
shareholdings and the identity of the shareholders and holders of the voting
rights has been properly disclosed in the management report.
Neuilly-sur-Seine and Paris-La Défense, February 19, 2014
The Statutory Auditors
French original signed by
DELOITTE & ASSOCIÉS ERNST & YOUNG Audit

300 Find out more at www.renault.comREGISTRATION DOCUMENT RENAULT 2013
FINANCIAL STATEMENTS4 STATUTORY AUDITORS’ REPORT
4.3.2 STATUTORY AUDITORS’ SPECIAL REPORT ON RELATED PARTY AGREEMENTS AND COMMITMENTS
General Meeting of Shareholders held to approve the financial
statements for the year ended December 31, 2013.
This is a free translation into English of the statutory auditors’ special report
on related party agreements and commitments that is issued in the French
language and is provided solely for the convenience of English speaking
readers. This report on related party agreements and commitments should
be read in conjunction with, and construed in accordance with, French
law and professional auditing standards applicable in France. It should be
understood that the agreements reported on are only those provided by the
French company Law and that the report does not apply to those related party
transactions described in IAS 24 or other equivalent accounting standards.
To the Shareholders,
In our capacity as statutory auditors of your Company, we hereby report to you
on related party agreements and commitments.
We are required to inform you, on the basis of the information provided to us, of
the terms and conditions of those agreements and commitments indicated to
us, or that we may have identified in the performance of our engagement. We
are not required to comment as to whether they are beneficial or appropriate
or to ascertain the existence of any such agreements and commitments. It
is your responsibility, in accordance with article R. 225-31 of the French
company Law (Code de commerce), to evaluate the benefits resulting from
these agreements and commitments prior to their approval.
In addition, we are required, where applicable, to inform you in accordance
with article R. 225-31 of the French company Law (Code de commerce)
concerning the implementation, during the year, of the agreements and
commitments already approved by the General Meeting of Shareholders.
We performed those procedures which we considered necessary to comply
with professional guidance issued by the national auditing body (Compagnie
nationale des commissaires aux comptes) relating to this type of engagement.
These procedures consisted in verifying that the information provided to us is
consistent with the documentation from which it has been extracted.
AGREEMENTS AND COMMITMENTS SUBMITTED TO THE APPROVAL OF THE GENERAL MEETING OF SHAREHOLDERS
AGREEMENTS AND COMMITMENTS AUTHORIZED DURING THE YEAR
In accordance with article L. 225-40 of the French company Law (Code de
commerce), we have been advised of certain related party agreements and
commitments which received prior authorization from your Board of Directors.
With Nissan Motor Co., Ltd.
Persons concerned
Mr Carlos Ghosn, Chairman-CEO of Renault SA, and of Nissan Motor Co.,
Ltd. and Chairman of Renault-Nissan b.v. ; Mr Hiroto Saikawa, director of
Renault SA and Executive Vice President of Nissan Motor Co., Ltd. ; Ms Yuriko
Koike, director of Renault SA, and representing Nissan.
Nature and purpose
Amendment to the Master Cooperation Agreement, entered into by Renault
SA, Nissan Motor Co., Ltd., Daimler AG and Renault-Nissan b.v.
Terms and conditions
On April 6, 2010, Renault SA, Nissan Motor Co., Ltd., Daimler AG and Renault-
Nissan b.v. have entered into the Master Cooperation Agreement which details
the terms and conditions of cooperations by and between these companies.
At its December 13, 2013 meeting, your Board of Directors authorized
the signature, on December 19, 2013, of an amendment to the Master
Cooperation Agreement, in order to extend the scope of these cooperations.
AGREEMENTS AND COMMITMENTS ALREADY APPROVED BY THE THE GENERAL MEETING OF SHAREHOLDERS
AGREEMENTS AND COMMITMENTS APPROVED IN PRIOR YEARS WHICH REMAINED IN FORCE DURING THE YEAR
In accordance with article R. 225-30 of the French company Law (Code de
commerce), we have been advised that the implementation of the following
agreements and commitments which were approved by the General Meeting
of Shareholders in prior years continued during the year.
With Nissan Motor Co., Ltd.
Persons concerned: Mr Carlos Ghosn, Chairman-CEO of Renault SA and
of Nissan Motor Co., Ltd.; Mr Hiroto Saikawa, director of Renault SA and
Executive Vice-President of Nissan Motor Co., Ltd.; Ms Yuriko Koike, director
of Renault SA and representing Nissan.
On March 28, 2002, Renault SA (“Renault”) and Nissan Motor Co., Ltd.
(“Nissan”) concluded the Restated Alliance Master Agreement, which governs
the capital relationship between Renault and Nissan and the Alliance’s current
method of governance. The agreement specifies the operational terms
and conditions of Renault-Nissan b.v. (“RNBV”) as the Alliance’s strategic
management entity. A first amendment to the Restated Alliance Master

301REGISTRATION DOCUMENT RENAULT 2013✦ Global Reporting Initiative (GRI) Directives
FINANCIAL STATEMENTS 4
4
STATUTORY AUDITORS’ REPORT
Agreement was signed on April 29, 2005 and submitted for approval to the
General Meeting of Shareholders’ of May 4, 2006.
At its October 3, 2012 meeting, your Board of Directors authorized the
signature, on November 7, 2012, of amendment no. 2 to the Restated Alliance
Master Agreement, that modified the composition of the RNBV Management
Board and as a result, the voting arrangements within the Management Board.
This agreement does not generate any financial flows.
With RCI Banque (100% indirectly-held subsidiary)
During its meeting of September 28, 2010, your Board of Directors has
authorized the signature of a credit facility agreement, in the framework of
the regulation relating to the control of the “Large Risks” ratio as defined in
Article 1.1 of French Banking and Financial Regulation Committee (Comité
de la réglementation bancaire et financière) regulation n°.93-05, with which
RCI Banque activity must comply as a credit institution, with RCI Banque for
an amount of €550,000,000, with a view to allowing to reduce its credit
exposure on Renault Retail Group, the Group’s business distribution network.
This agreement replaces the €450,000,000 credit facility agreement with
Cogera. In the 2013 fiscal year, the amount of interest income relating to this
credit facility agreement reached €2,847,640.
With Renault s.a.s (100% directly-held subsidiary)
Common directors: Mr Carlos Ghosn, Chairman-CEO of Renault SA and
Chairman of Renault s.a.s., as all of the members of the Board of Directors of
Renault SA who also sit on the Board of Renault s.a.s.
a) Contracting-out agreements
Contracting-out agreements were entered into between Renault SA and
Renault s.a.s. within the scope of an operation to refinance loans granted
under the “1% construction” scheme (French Social Construction Tax), in
particular, for the purpose of reinforcing the liquidity of these non-interest
bearing loans and to freeze the cost of refinancing at current, exceptionally
low interest rates up to the maturity date in 2020. In the 2013 fiscal year,
the amount of finance interest income concerning this agreement totaled
€251,144.
b) Agreement for the provision of services
As of October 23, 2002, and with retroactive effect to April 1, 2002, your
company entered into a contract with Renault s.a.s. under which the latter is
to provide a certain number of legal, accounting, tax, customs and financial
services to enable your company to meet its legal obligations in these matters.
In the 2012 fiscal year, the amount, excluding taxes, invoiced by Renault s.a.s.
to Renault SA concerning these services totaled €3,268,000.
Neuilly Sur Seine and Paris-La Défense, February 19, 2014
Th e Statutory Auditors
French original signed by
DELOITTE & ASSOCIÉS ERNST & YOUNG Audit

302 Find out more at www.renault.comREGISTRATION DOCUMENT RENAULT 2013
FINANCIAL STATEMENTS4 RENAULT SA PARENT-COMPANY FINANCIAL STATEMENTS
4.4 RENAULT SA PARENT-COMPANY FINANCIAL STATEMENTS
4.4.1 FINANCIAL STATEMENTS
INCOME STATEMENT
(€ million) 2013 2012
Operating expenses (35) (28)
Increases to provisions (3) (10)
NET OPERATING EXPENSE (38) (38)
Investment income 1,741 683
Increases to provisions related to investments 19
INVESTMENT INCOME AND EXPENSES (NOTE 2) 1,760 683
Foreign exchange gains 40 1
Foreign exchange losses (29) (83)
Reversals from provisions for exchange risks 24 114
FOREIGN EXCHANGE GAINS AND LOSSES (NOTE 3) 35 32
Interest and equivalent income 8 4
Interest and equivalent expenses (303) (292)
Reversals of provisions and transfers of charges 21 56
Expenses on sales of marketable securities (9)
Depreciation and provisions (8) (6)
OTHER FINANCIAL INCOME AND EXPENSES (NOTE 4) (291) (238)
NET FINANCIAL INCOME 1,504 477
PRE-TAX INCOME BEFORE EXCEPTIONAL ITEMS 1,466 439
Exceptional income on capital transactions 9
NET EXCEPTIONAL ITEMS 9
INCOME TAX (NOTE 5) 189 135
NET INCOME 1,664 574

303REGISTRATION DOCUMENT RENAULT 2013✦ Global Reporting Initiative (GRI) Directives
FINANCIAL STATEMENTS 4
4
RENAULT SA PARENT-COMPANY FINANCIAL STATEMENTS
BALANCE SHEET
ASSETS (€ million)
2013 2012
GROSS
DEPRECIATION, AMORTISATION &
PROVISIONS NET NET
Investments stated at equity 6,880 6,880 9,153
Other investments (Note 6) 7,255 38 7,217 7,217
Advances to subsidiaries and affiliates (Note 7) 11,287 2 11,285 10,043
FINANCIAL ASSETS 25,422 40 25,382 26,413
TOTAL FIXED ASSETS 25,422 40 25,382 26,413
RECEIVABLES (Note 9) 387 11 376 378
MARKETABLE SECURITIES (Note 8) 146 1 145 149
CASH AND CASH EQUIVALENTS 41 41 38
OTHER ASSETS (NOTE 9) 37 37 71
TOTAL ASSETS 26,033 52 25,981 27,049
SHAREHOLDERS' EQUITY AND LIABILITIES (€ million) 2013 2012
Share capital 1,127 1,127
Share premium 4,783 4,783
Revaluation surplus 9
Equity valuation difference 1,064 3,337
Legal and tax basis reserves 112 112
Retained earnings 6,439 6,367
Net income 1,664 574
SHAREHOLDERS' EQUITY (NOTE 10) 15,189 16,309
REDEEMABLE SHARES (NOTE 11) 129 129
PROVISIONS FOR RISKS AND LIABILITIES (NOTE 12) 92 122
Bonds 6,082 5,728
Borrowings from credit institutions 1,276 1,364
Other loans and financial debts 2,424 2,875
FINANCIAL LOANS AND BORROWINGS (NOTE 13) 9,782 9,967
OTHER LIABILITIES (NOTE 14) 487 428
DEFERRED INCOME (NOTE 15) 302 94
TOTAL SHAREHOLDERS' EQUITY AND LIABILITIES 25,981 27,049

304 Find out more at www.renault.comREGISTRATION DOCUMENT RENAULT 2013
FINANCIAL STATEMENTS4 RENAULT SA PARENT-COMPANY FINANCIAL STATEMENTS
STATEMENT OF CHANGES IN CASH
(€ million) 2013 2012
Cash flow (Note 19) 1,652 468
Change in working capital requirements 74
CASH FLOW FROM OPERATING ACTIVITIES 1,726 468
Net decrease/(increase) in other investments (33) (3)
Net decrease/(increase) in loans (1,227) (718)
Net decrease/(increase) in marketable securities 9
CASH FLOW FROM INVESTING ACTIVITIES (1,251) (721)
Bond issues 1,756 1,951
Bond redemptions (1,183) (993)
Net increase/(decrease) in other interest-bearing borrowings (547) (359)
Dividends paid to shareholders (502) (338)
Bond issuance expenses and redemption premiums (5) (6)
CASH FLOW FROM FINANCING ACTIVITIES (481) 255
CASH AND CASH EQUIVALENTS: OPENING BALANCE 11 9
Increase/(decrease) in cash and cash equivalents (6) 2
CASH AND CASH EQUIVALENTS: CLOSING BALANCE 5 11
4.4.2 NOTES TO THE FINANCIAL STATEMENTS
4.4.2.1 ACCOUNTING POLICIESRenault SA draws up its annual financial statements in accordance with French
law and accounting regulations as defined by the French chart of accounts
99-03 of April 29, 1999, amended by CRC (Comité de la Règlementation
Comptable) and ANC (Autorité des Normes Comptables) regulations.
The following methods were applied in valuing balance sheet and income
statement items:
A - Investments
As allowed by CNC (Conseil National de la Comptabilité) avis N°34 (July 1988),
as an alternative to the standard valuation method for investments carried
in the balance sheet, Renault SA has opted to state investments in wholly-
controlled companies at equity:
W this method is applied to all companies that are fully consolidated in the
Group's financial statements;
W the shareholders’ equity of these companies is determined under the
accounting policies applied in the consolidated financial statements; as
this is a valuation method, intercompany eliminations are not taken into
account;
W in valuing a subsidiary, its holdings in companies wholly controlled by the
Group are valued in the same way;
W the change during the year in the overall percentage of shareholders'
equity corresponding to these interests is not an income or loss item; it is
included in shareholders' equity under "Equity valuation difference". This
amount cannot be distributed or used to offset losses; when it is negative,
a provision for general depreciation is established as a charge against
income.
Investments in companies not wholly controlled by Renault SA are valued
at acquisition cost, less related expenses, or at their book value if this is
lower. The book value takes account of the share of net assets, profitability
prospects and commercial outlets. Provisions are established when the book
value of the investments is lower than the gross value.
B - Advances to subsidiaries and affiliates
Loans to related companies and advances to subsidiaries and affiliates are
recorded at historical cost. Impairment is recognised when there is a risk that
these loans will not be recovered.
C – Marketable securities
Marketable securities are valued at acquisition cost, excluding related
expenses and accrued interest for bonds, or at market value if this is lower.
Treasury shares held for the purposes of free share plans and stock option
plans are included in marketable securities. These shares are subject to a
provision for expenses, corresponding to the difference between the value of
shares (acquisition or net worth on the date of reassignment price) and the
exercice price of the options for beneficiaries, therefore the exercice price of
the option is less than the acquisition cost.
Treasury shares not allocated to a specific plan are also included in marketable
securities. Impairment is recorded if the stock market price falls below the
book value.

305REGISTRATION DOCUMENT RENAULT 2013✦ Global Reporting Initiative (GRI) Directives
FINANCIAL STATEMENTS 4
4
RENAULT SA PARENT-COMPANY FINANCIAL STATEMENTS
D – Loan costs and issuance expenses
Loan costs, including issuance expenses, and bond redemption premi ums,
which are recorded in Other Assets, are amortised on a straight-line basis
over the corresponding duration.
E - Translation of foreign currency receivables and liabilities
Receivables and liabilities denominated in foreign currencies are translated
as follows:
W all receivables and liabilities in foreign currencies are converted at the year-
end exchange rate;
W exchange differences arising between the date of transactions and
December 31 are recorded in Other assets and Deferred income
(translation adjustment);
W a provision for risk equal to the unrealised exchange losses is established
after determining an overall foreign exchange position for each currency
(including derivatives).
F - Provisions for risks and liabilities
Provisions for risks and liabilities are defined in accordance with CRC
regulation 2000-06. They are established for probable payment obligations
existing at the year-end. A contingent liability, in contrast, is an obligation
that is neither probable nor definite at the date the financial statements
are established, or a probable obligation that cannot be reliably estimated.
Provisions are not established for contingent liabilities, but an off-balance
sheet commitment is reported where relevant.
G - Derivatives
Gains and losses on derivatives designated as hedges are recorded in the
income statement in the same way as the revenues and expenses relating
to the hedged item.
Derivatives not designated as hedges are adjusted to fair value at each closing
date. Any resulting unrealised loss is recognised in the income statement,
while unrealised gains are not recognised in income.
The fair value of forward exchange contracts is based on market conditions.
The fair value of currency swaps is determined by discounting future cash
flows, using closing-date market rates (exchange and interest rates). The
fair value of interest rate derivatives is the amount the Group would receive
(or pay) to settle outstanding contracts at the closing date, taking year-end
market conditions into consideration. The market value of derivatives is not
recognised in the balance sheet.
H - Net exceptional items
Exceptional items are revenues and expenses resulting from events or
transactions that are clearly distinct from the company’s normal business
operations, and are not expected to recur on a frequent or regular basis.
4.4.2.2 INVESTMENT INCOME AND EXPENSES
Details are as follows:
(€ million) 2013 2012
Dividends received from Renault s.a.s. 1,095
Dividends received from Nissan Motor Co Ltd 405 426
Other dividends received 102 94
Interest on loans 139 163
Increases to provisions related to subsidiaries and affiliates 19
TOTAL 1,760 683
All interest on loans concerns Group subsidiaries.
4.4.2.3 FOREIGN EXCHANGE GAINS AND LOSSES
The net foreign exchange loss is chiefly attributable to operations in yen
undertaken by Renault SA. Since these operations are not classified as part
of the hedge of the net assets of Nissan in Renault SA’s individual financial
statements, they are included in financial income and expenses in the income
statement.
Foreign exchange gains and losses in 2013 mainly comprise the following:
W a foreign exchange loss of €10 million on redemption of the bond issued
on January 23, 2008 (nominal value 5 billion yen);
W a foreign exchange gains of €34 million on redemption of the bond issued
on December 20, 2011 (nominal value 15.4 billion yen);
W a foreign exchange gains of €3 million on redemption of the bond issued
on December 09, 2010 (nominal value 7 billion yen);
W a foreign exchange loss of €13 million on redemption of swap related to
the bond issued in Renminbi Yuan for €3 million and issued in yen for €10
million;
W a foreign exchange loss of €3 million on dividend payments in RON
(Romanian Leu) and COP (Colombian peso New);
W a provision of €2 million for unrealised foreign exchange losses concerning
diverse loans in yens and an amount of €26 million reversed from
provisions booked in 2012.
Foreign exchange gains and losses in 2012 included a net loss of €82 million.
4.4.2.4 OTHER FINANCIAL INCOME AND EXPENSES
Other financial income and expenses generated a net loss of €291 million in
2013 (compared to a loss of €238 million in 2012) and mainly comprise net
interest payments of €303 million on Renault borrowings after swaps and
€8 million reversed from impairment recorded in respect of treasury shares.

306 Find out more at www.renault.comREGISTRATION DOCUMENT RENAULT 2013
FINANCIAL STATEMENTS4 RENAULT SA PARENT-COMPANY FINANCIAL STATEMENTS
Details of interest paid and other similar expenses are as follows:
(€ million) 2013 2012
Net accrued interest after swaps on bonds * (217) (193)
Net accrued interest after swaps on borrowings from credit institutions (27) (40)
Accrued interest on termination of borrowings from subsidiaries (2) (7)
Accrued interest on redeemable shares (17) (17)
Other financial expenses (6)
Other (treasury notes and brokers commissions) (34) (35)
TOTAL (303) (292)
* The net interest on bonds comprises accrued and paid interest amounting to €331 million (€292 million in 2012), and accrued and received interest on swaps amounting to €114 million (€99 million in 2012).
In 2013, the €217 million of interest received and paid mainly comprise:
W €45 million on the bond issued on October 13, 2009;
W €28 million on the bond issued on March 23, 2010;
W €25 million on the bond issued on September 18, 2012;
W €17 million on the bond issued on June 30, 2010;
W €16 million on the bond issued on May 25, 2011;
W €14 million on the bond issued on September 20, 2010;
W €12 million on the bond issued on December 05, 2012.
The net interest receivable on the swapped portion of bonds and borrowings
from credit institutions amounted to €34 million: €132 million on the paying
leg and €98 million on the receiving leg.
4.4.2.5 INCOME TAXAs Renault SA elected to determine French income taxes under the domestic
tax consolidation regime when it was formed, this regime has applied to the
group in which Renault SA is taxed in France since January 1, 2004. French
subsidiaries that are more than 95% owned by Renault SA pay their income
taxes directly to the company under this regime. Each entity included in the
domestic tax consolidation records its theoretical taxes as if it was taxed
separately. The tax saving generated by this system is treated as income for
Renault SA, the company heading the group of entities concerned. The parent
company is not obliged to reimburse the subsidiaries for the tax savings
resulting from utilisation of their tax losses when the subsidiaries return to
profit or leave the tax consolidated group.
Tax losses can now only be carried forward against taxable income up to the
amount of €1 million plus 50% of the taxable income above that amount.
This rule is applicable:
W for determining the income/loss of the tax consolidation group;
W by convention, for determining the income/loss of each company included
in the tax consolidation.
The new rules on tax loss carryforwards apply to all losses existing, whatever
their origin.
In practice, although the new rules will have an impact on determination of
certain subsidiaries’ taxable income, they will have no immediate impact on
the taxable income of the group as a whole, which continues to report a tax
loss, amounting to €759 million (€210 million decrease than in 2012).
Section 16 of the Finance Law for 2014 raises the rate of exceptional
contribution to 10.7% of the amount of income tax by entities with sales
revenues of over €250 million. This measure is effective for periods ending
on or after December 31, 2013 until December 30, 2015. This contribution
is due:
W on income tax at the normal rate or reduced rate payable by the tax
consolidation group;
W by convention, on income tax at the normal rate or reduced rate payable
by the companies included in the tax consolidation group to Renault SA.
The income generated by income taxes for 2013 was €189 million including
the income tax proceeds paid by the subsidiaries of Renault SA as if they
were imposed separately for an amount of €195 million for the domestic tax
consolidation. Note that if the Renault SA was imposed separately, it would
have paid an amount of €28 million, an overall tax expense of €223 million
before deducting losses of the Group.
So, the income tax can be analyzed as follows:
(€ million)
PRE-TAX
INCOME
TAXES NET INCOME
THEORETICAL NETTING CREDIT GENERATED TAX CREDIT NET TAX DUE THEORETICAL AS BOOKED
Current income subject to normal rate 1,475 28 (28) 1,447 1,447
Tax consolidation 223 223
Impairment (9) (9)
Other 3 3
TOTAL 1,475 28 0 0 0 189 1,447 1,664

307REGISTRATION DOCUMENT RENAULT 2013✦ Global Reporting Initiative (GRI) Directives
FINANCIAL STATEMENTS 4
4
RENAULT SA PARENT-COMPANY FINANCIAL STATEMENTS
The deferred taxes Renault SA are as follows:
(€ million)
2013 2012 VARIATIONS
ASSETS (1) LIABILITIES (2) ASSETS (1) LIABILITIES (2) ASSETS LIABILITIES
Temporarily non-deductible expenses
Provisions for risks and liabilities 32 44 (12)
Expenses deducted (or taxed income) 28 16 12
Not yet recognised for accounting purposes 95 9 30 13 65 (4)
TOTAL 127 37 74 29 53 8
(1) i.e. future tax credit.
(2) i.e. future tax charge.
4.4.2.6 INVESTMENTSChanges during the year were as follows:
(€ million) AT START OF YEAR CHANGE OVER THE YEAR AT YEAR-END
Investment in Nissan Motor Co. Ltd. 6,622 6,622
Investment in RNBV 11 11
Investment in Daimler 584 584
Other investments 13 25 38
TOTAL BEFORE PROVISIONS 7,230 25 7,255
Impairment (13) (25) (38)
TOTAL NET 7,217 7,217
4.4.2.7 ADVANCES TO SUBSIDIARIES AND AFFILIATESChanges during the year were as follows:
(€ million) AT START OF YEAR INCREASES DECREASES AT YEAR-END
Capitalisable advances 5 (5)
Dividends receivable 1 1
Loans 10,053 2,820 (1,587) 11,286
TOTAL BEFORE PROVISIONS (1) 10,058 2,821 (1,592) 11,287
Impairment (15) 13 (2)
TOTAL NET 10,043 2,821 (1,579) 11,285
(1) Current portion (less than one year). 9,988 11,231
Long-term portion (over 1 year). 70 56
Loans include:
W €6,128 million in short-term investments with Renault Finance
(€6,106 million in 2012);
W €25 million in long-term loans to Renault s.a.s. (identical to 2012);
W €5,133 million in current accounts resulting from centralised cash
management agreements with Group subsidiaries (€3,922 million in 2012).
All loans relate to Group subsidiaries.

308 Find out more at www.renault.comREGISTRATION DOCUMENT RENAULT 2013
FINANCIAL STATEMENTS4 RENAULT SA PARENT-COMPANY FINANCIAL STATEMENTS
4.4.2 .8 MARKETABLE SECURITIESMarketable securities primarily include €145 million for Renault SA’s treasury shares.
Changes in treasury shares were as follows:
AT START OF YEAR
OPTIONS EXERCISED
AND AWARDS SHARES PURCHASED
TRANSFERS TO OTHER
FINANCIAL ASSETS
IMPAIRMENT
(REVERSALS) AT YEAR-END
Number of shares 4,059,255 274,950 3,784,305
Shares allocated 76 (9) 46 113
Shares not allocated 87 (55) 32
Gross value (€ million) 163 (9) (9) 145
Impairment (€ million) (14) 9 5
TOTAL 149 (9) 5 145
4.4.2.9 RECEIVABLES AND OTHER ASSETSReceivables mainly comprise:
W an unbilled receivable of €63 million for stock options (€46 million in 2012), under the reinvoicing agreement between Renault SA and Renault s.a.s. introduced
in 2012;
W tax receivables:
(€ million) AT START OF YEAR INCREASES DECREASES AT YEAR-END
RECEIVABLES TAX
Deposit: Income tax 10 (10)
CIR: Research tax credit 314 137 (188) 263
CICE: Competitive employment tax credit 36 36
Other receivables tax 15 10 25
TOTAL BEFORE PROVISIONS 339 183 (198) 324
IMPAIRMENT
CIR: Research tax credit (7) (7) 5 (9)
CICE: Competitive employment tax credit (2) (2)
(7) (9) 5 (11)
TOTAL NET 332 174 (193) 313
The decreases consist mainly of the partial assignment of the debt CIR (Research Tax Credit) for the years 2011 and 2012 to a value of €188 million.
The major components of Other Assets are:
(€ million) AT START OF YEAR INCREASES DECREASES AT YEAR-END
OTHER ASSETS
Deferred charges 23 5 (5) 23
Redemption premiums amounting 10 (5) 5
Unrealized losses 38 9 (38) 9
TOTAL 71 14 (48) 37
W deferred charges consist of final payments and issuance expenses on
various loans;
W redemption premiums, mainly on several long-term bonds (5 to 7 years);
W translation adjustments essentially resulting from unrealised foreign
exchange losses, covered by provision, on bonds swapped to yen.

309REGISTRATION DOCUMENT RENAULT 2013✦ Global Reporting Initiative (GRI) Directives
FINANCIAL STATEMENTS 4
4
RENAULT SA PARENT-COMPANY FINANCIAL STATEMENTS
4.4.2.10 SHAREHOLDERS’ EQUITYChanges in shareholders' equity were as follows:
(€ million)
BALANCE
AT START OF YEAR
ALLOCATION OF 2012
NET INCOME DIVIDENDS 2013 NET INCOME OTHER
BALANCE
AT YEAR-END
Share capital 1,127 1,127
Share premium 4,783 4,783
Revaluation surplus 9 (9)
Equity valuation difference 3,337 (2,273) 1,064
Legal and tax basis reserves 112 112
Retained earnings 6,367 574 (502) 6,439
Net income 574 (574) 1,664 1,664
TOTAL 16,309 (502) 1,664 (2,282) 15,189
Non-distributable reserves amounted to €1,176 million at December 31, 2013.
Renault SA's shareholding structure was as follows at December 31, 2013:
OWNERSHIP STRUCTURE VOTING RIGHTS
NUMBER OF
SHARES HELD % OF CAPITAL NUMBER %
French state 44,387,915 15,01% 44,387,915 17.93%
Employees 7,720,720 2,61% 7,720,720 3.12%
Treasury shares 3,784,305 1,28%
Nissan 44,358,343 15,00%
Daimler 9,167,391 3,10% 9,167,391 3.70%
Other 186,303,610 63,00% 186,303,610 75.25%
TOTAL 295,722,284 100% 247,579,636 100%
The par value of the Renault SA share is €3.81.
STOCK OPTION AND FREE SHARE ATTRIBUTION PLANS
Since October 1996, the Board of Directors has periodically granted stock
options to Group executives and managers, with prices and exercise periods
specific to each plan.
During 2013, no new stock option plan or bonus share has been established.
All plans introduced since 2006 include performance conditions which
determine the number of options or shares granted to beneficiaries.
A - Changes in the number of stock options held by personnel
2013 2012
QUANTITY
WEIGHTED AVERAGE
EXERCISE PRICE
(€)
WEIGHTED AVERAGE SHARE PRICE AT GRANT AND
EXERCISE DATES (€) QUANTITY
WEIGHTED
AVERAGE
EXERCISE PRICE
(€)
WEIGHTED AVERAGE SHARE
PRICE AT GRANT
AND EXERCISE DATES
(€)
Outstanding at January 1 5,156,196 76 8,595,407 70
Granted 297,800 37 40 350,000 31 33
Exercised - - - - - -
Expired (1,610,225) 69 N/A (3,789,211) 59 N/A
OUTSTANDING AT DECEMBER 31 3,843,771 76 5,156,196 76

310 Find out more at www.renault.comREGISTRATION DOCUMENT RENAULT 2013
FINANCIAL STATEMENTS4 RENAULT SA PARENT-COMPANY FINANCIAL STATEMENTS
B - Options and free share attribution rights yet to be exercised at December 31, 2013
PLAN TYPE OF PLAN GRANT DATE EXERCISE PRICE (€) OUTSTANDING EXERCISE PERIOD
Plan 12 Stock subscription options May 4, 2006 87.98 1,280,553 May 5, 2010 – May 5, 2014
Plan 14 Stock subscription options December 5, 2006 93.86 1,486,806 December 6, 2010 – December 4, 2014
Plan 18 Stock purchase options April 29, 2011 38.80 478,612 April 30, 2015 – April 28, 2019
Plan 18 bis Attribution of free shares April 29, 20111,092,545
94,800April 30, 2014 – April 30, 2016
April 30, 2015
Plan 19 Stock purchase options December 8, 2011 26.87 150,000 December 9, 2015 – December 7, 2019
Plan 19 bis Attribution of free shares December 8, 2011 27,000 December 8, 2015
Plan 20 Stock purchase options December 13, 2012 37,43 447,800 December 13, 2016 – December 12, 2020
Plan 20 bis Attribution of free shares December 13, 2012584,40086,800
December 13, 2014 – December 12, 2016December 13, 2016
4.4.2.11 REDEEMABLE SHARESThese shares, issued in October 1983 and April 1984 by Renault SA, can
be redeemed with a premium on the sole initiative of Renault SA. They earn
a minimum annual return of 9% comprising a fixed portion (6.75%) and
a variable portion, equal to at least 2.25%, that depends on consolidated
revenues and is calculated based on identical structure and methods.
797,659 redeemable shares remained on the market at December 31, 2013,
for a total of €129 million including accrued interest. These shares are listed
on the Paris Bourse. The market price for redeemable shares with par value of
€153 was €392.00 at December 31, 2013 (€312.05 at December 31, 2012).
The 2013 return on redeemable shares, amounting to €17 million (€17
million in 2012) is included in interest and equivalent expenses.
4.4.2.12 PROVISIONS FOR RISKS AND LIABILITIESProvisions for risks and liabilities break down as follows:
(€ million) 2012 INCREASES REVERSALS 2013
Foreign exchange losses 26 3 (26) 3
Provisions for expenses (1) 54 31 (10) 75
Other provisions for risks (2) 42 (28) 14
TOTAL 122 34 (64) 92
Current (less than 1 year) 59 8
Long-term (over 1 year) 63 84
(1) A provision of €75 million was booked at December 31, 2013 (€54 at December 31, 2012) after it was decided to allocate free shares and stock options. Under a reinvoicing agreement introduced between Renault SA and Renault s.a.s., a €63 million share of this provision is considered as an unbilled receivable on the subsidiary Renault s.a.s (€46 million in 2012).
(2) Other provisions mainly consist of provisions for risks related to investments.
Each known litigation in which Renault SA is involved is examined at year-end.
After seeking the opinion of legal and tax advisors, the provisions deemed
necessary are, where appropriate, established to cover the estimated risk.
4.4.2.13 FINANCIAL LOANS AND BORROWINGS
A - Bonds
Bonds amounted to €6,082 million at December 31, 2013 (€5,728 million at
December 31, 2012).
The principal changes in bonds over 2013 were as follows:
W issuance on April 04, 2013 of a 3-year bond with total nominal value of
7 billion yen, at the fixed rate of 2.15%;
W issuance on April 11, 2013 of a 3-year bond with total nominal value of
750 billion Renminbi Yuan, at the fixed rate of 4.65% (swapped to Euros at
the fixed rate of 3.17%);
W issuance on June 12, 2013 of a 2-year bond with total nominal value of 38
billion yen, at the fixed rate of 1.92%;
W issuance on September 19, 2013 of a 5-year bond with total nominal value
of €600 million, at the fixed rate of 3.625% (swapped to a floating rate of
Eonia +2.6465%);
W issuance on October 30, 2013 of a 3-year bond with total nominal value of
7 billion yen, at the fixed rate of 1.78%;
W issuance on November 15, 2013 of a 5-year bond with total nominal value
of €300 million, at the fixed rate of 3.625% (swapped to a floating rate of
3-mo nth Euribor +271.6 bp);

311REGISTRATION DOCUMENT RENAULT 2013✦ Global Reporting Initiative (GRI) Directives
FINANCIAL STATEMENTS 4
4
RENAULT SA PARENT-COMPANY FINANCIAL STATEMENTS
W issuance on November 28, 2013 of a 2-year bond with total nominal value
of 49.6 billion yen, at the fixed rate of 1.37%;
W redemption of the January 23, 2008 5-year bond totalling 5 billion yen at
the fixed rate of 2.09%;
W redemption of the February 4, 2010 3-year bond totalling 10 billion yen
at the fixed rate of 2.53%, swapped to Euros at the fixed rate of 4.28%;
W redemption of the April 16, 2008 5-year bond totalling €300 million at the
fixed rate of 4.375%;
W redemption of the May 24, 2006 7-year bond totalling €500 million at
the fixed rate of 4.375%, swapped to a floating rate of 3-month Euribor
+0.4744;
W redemption of the June 25, 2010 3-year bond totalling 7 billion yen at
the fixed rate of 2.76%, swapped to a floating rate of 3-month Euribor
+257.5 bp;
W redemption of the December 09, 2008 5-year bond totalling 7 billion yen
at the floating rate of 3-mo nth Libor +3.2%;
W redemption of the December 20, 2011 2-year bond totalling 15.4 billion
yen at the fixed rate of 3.43%.
Breakdown by maturity
(€ million)
DECEMBER 31, 2013
TOTAL - 1 YR 1 TO 2 YRS 2 TO 3 YRS 3 TO 4 YRS 4 TO 5 YRS +5 YRS
Nominal value 6,025 1,504 1,324 937 1,360 900 0
Accrued interest 57 57
TOTAL 6,082 1,561 1,324 937 1,360 900 0
(€ million)
DECEMBER 31, 2012
TOTAL - 1 YR 1 TO 2 YRS 2 TO 3 YRS 3 TO 4 YRS 4 TO 5 YRS +5 YRS
Nominal value 5,671 1,183 1,640 738 750 1,360 0
Accrued interest 57 57
TOTAL 5,728 1,240 1,640 738 750 1,360 0
Breakdown by currency
(€ million)
DECEMBER 31, 2013 DECEMBER 31, 2012
BEFORE DERIVATIVES AFTER DERIVATIVES BEFORE DERIVATIVES AFTER DERIVATIVES
Euro 4,561 4,809 4,461 4,760
Yen 1,273 1,273 1,111 968
CNY 248 156
TOTAL 6,082 6,082 5,728 5,728
Breakdown by interest rate type
(€ million)
DECEMBER 31, 2013 DECEMBER 31, 2012
AFTER DERIVATIVES AFTER DERIVATIVES
Fixed rate 3,656 3,284
Floating rate 2,426 2,444
TOTAL 6,082 5,728

312 Find out more at www.renault.comREGISTRATION DOCUMENT RENAULT 2013
FINANCIAL STATEMENTS4 RENAULT SA PARENT-COMPANY FINANCIAL STATEMENTS
B - Borrowings from credit institutions
Borrowings from credit institutions stood at €1,276 million at December 31,
2013 (€1,364 million at December 31, 2012) and are mainly contracted on
the market.
The principal changes in bonds over 2013 were as follows:
W subscription on March 28, 2013 of a 5-year bond with total nominal value
of €50 million at the fixed rate of 3.597%, swapped to the floating rate
Eonia +306.6 bp;
W subscription on April 19, 2013 of a 5-year bond with total nominal value of
€35 million at the floating rate of 3-month Euribor +270 bp;
W subscription on May 30, 2013 of a 6-year bond with total nominal value
of €300 million at the fixed rate of 2.156%, swapped to the floating rate
Eonia +171.5833 bp;
W subscription on May 30, 2013 of a 3-year bond with total nominal value
of €100 million at the fixed rate of 1.864%, swapped to the floating rate
Eonia +164.2 bp;
W subscription on August 30, 2013 of a 5-year bond with total nominal value
of €50 million at the floating rate of 3-month Euribor +240 bp;
W redemption on March 31, 2013 of a 4-year bond with total nominal value
of €400 million, at the fixed rate of 4.397%;
W redemption on June 19, 2013 of a 5-year bond with total nominal value of
€178 million, at the floating rate of 3-month Euribor +1.10%;
W redemption on November 22, 2013 of a 3-year bond with total nominal
value of $68 million, at the fixed rate of 3.04%, swapped to the floating
rate 3-month Euribor +185 bp.
Breakdown by maturity
(€ million)
DECEMBER 31, 2013
TOTAL - 1 YR 1 TO 2 YRS 2 TO 3 YRS 3 TO 4 YRS 4 TO 5 YRS + 5 YRS
Nominal value 1,265 266 122 293 137 141 306
Accrued interest 11 11
TOTAL 1,276 277 122 293 137 141 306
(€ million)
DECEMBER 31, 2012
TOTAL - 1 YR 1 TO 2 YRS 2 TO 3 YRS 3 TO 4 YRS 4 TO 5 YRS + 5 YRS
Nominal value 1,353 659 230 122 193 137 12
Accrued interest 11 11
TOTAL 1,364 670 230 122 193 137 12
Breakdown by currency
(€ million)
DECEMBER 31, 2013 DECEMBER 31, 2012
BEFORE DERIVATIVES AFTER DERIVATIVES BEFORE DERIVATIVES AFTER DERIVATIVES
Euro 1,276 1,276 1,314 1,364
Other currencies 50
TOTAL 1,276 1,276 1,364 1,364
Breakdown by interest rate type
(€ million)
DECEMBER 31, 2013 DECEMBER 31, 2012
AFTER DERIVATIVES AFTER DERIVATIVES
Fixed rate 41 450
Floating rate 1,235 914
TOTAL 1,276 1,364
Borrowings from credit institutions maturing within one year include €36 million in bank credit balances.

313REGISTRATION DOCUMENT RENAULT 2013✦ Global Reporting Initiative (GRI) Directives
FINANCIAL STATEMENTS 4
4
RENAULT SA PARENT-COMPANY FINANCIAL STATEMENTS
C - Other loans and financial debts
Other loans and financial debts amounted to €2,424 million at December 31,
2013 (€2,875 million in 2012), and principally comprise:
W borrowings from Group subsidiaries with surplus cash;
W treasury notes amounting to €64 million.
No loans or financial debts are secured.
D – Liquidity risk
The automotive operating segment needs sufficient financial resources to
finance its day-to-day business and the investments necessary for future
growth. It therefore regularly borrows on the banking and capital markets
to refinance its debt, and this exposes it to a liquidity risk in the event of
market closure or tensions over credit availability. As part of its centralised
cash management policy, Renault SA handles most refinancing automotive
operating segment through long-term resources via the capital markets (bond
issues, private placements), bank financing, or short-term financing such as
treasury notes.
Renault SA also has confirmed credit agreements with banking establishments
(see note 18).
The contractual documentation for these financing arrangements and credit
agreements contains no clause that might adversely affect credit availability
as a result of a change in Renault’s credit rating or financial ratio compliance.
Given the available cash reserves, confirmed credit lines unused at the year-
end, and the prospects for renewal of short-term financing, Renault SA has
sufficient financial resources to cover its commitments over a 12-month
horizon.
4.4.2.14 OTHER LIABILITIESChanges in other liabilities were as follows:
(€ million) 2013 2012 VARIATION 2013/2012
Tax liabilities 480 422 58
Liabilities related to other assets 5 5
Other liabilities 2 1 1
TOTAL 487 428 59
The €58 million change in tax liabilities results from a €23 million decrease in
tax liabilities and a €81 million increase in the liability for tax liabilities payable
to subsidiaries under the French domestic tax consolidation system.
4.4.2.15 DEFERRED INCOMEDeferred income mainly comprises unrealised foreign exchange gains on
borrowings issued in yen or swapped to yen, totalling €277 million.
4.4. 2.16 INFORMATION CONCERNING RELATED COMPANIES“Related companies” are all entities consolidated in the Group’s financial statements, whatever is the consolidation method.
INCOME STATEMENT
(€ million)
2013 2012
TOTAL RELATED COMPANIES TOTAL RELATED COMPANIES
Interest on loans 139 126 163 162
Interest and equivalent expenses (303) 45 (292) 24
Reversals of provisions and transfers of charges 91 205

314 Find out more at www.renault.comREGISTRATION DOCUMENT RENAULT 2013
FINANCIAL STATEMENTS4 RENAULT SA PARENT-COMPANY FINANCIAL STATEMENTS
BALANCE SHEET
(€ million)
2013 2012
TOTAL RELATED COMPANIES TOTAL RELATED COMPANIES
Loans 11,286 11,196 10,058 9,993
Receivables 387 63 385 46
Cash and cash equivalents 41 38
Borrowings from credit institutions 1,276 1,364
Loans and financial debts 2,424 2,336 2,875 2,645
Other liabilities 487 479 428 398
4.4.2.17 FINANCIAL INSTRUMENTS
A - Management of exchange and interest rate risk
The corresponding commitments, expressed in terms of notional amount where appropriate, are shown below:
AT DECEMBER 31
(€ million) 2013 2012
FOREIGN EXCHANGE RISKS
CURRENCY SWAPS
Purchases 246 297
with Renault Finance 246 297
Sales 240 302
with Renault Finance 240 302
OTHER FORWARD EXCHANGE CONTRACTS AND OPTIONS
Purchases 515 85
with Renault Finance 515 85
Sales 541 85
with Renault Finance 541 85
INTEREST RATE RISKS
Interest rate swaps 3,679 2,653
with Renault Finance 3,099 2,567
Currency risk:
Transactions undertaken to manage exchange rate exposure principally
comprise currency swaps and forward currency operations to hedge financing
contracted in foreign currencies, apart from financing in yen. Renault SA also
carries out forward currency sales to hedge loans to subsidiaries denominated
in foreign currencies.
Rate risk:
Renault SA carries most of the Group’s indebtedness. Its interest rate risk
management policy applies two basic principles: long-term investments use
fixed-rate financing, and investments for liquidity reserves use floating-rate
financing. The financing in yen undertaken as part of the hedge of Nissan
equity is fixed-rate.
Renault SA uses derivatives to implement the above interest rate and
exchange risk management policies. Most of its operations on the financial
instrument markets are undertaken via Renault Finance, a wholly-owned
Group subsidiary.

315REGISTRATION DOCUMENT RENAULT 2013✦ Global Reporting Initiative (GRI) Directives
FINANCIAL STATEMENTS 4
4
RENAULT SA PARENT-COMPANY FINANCIAL STATEMENTS
B - Fair value of financial instruments
The carrying amounts in the balance sheet and the estimated fair values of Renault SA's financial instruments are as follows:
AT DECEMBER 31 (€ million)
2013 2012
BALANCE SHEET VALUE FAIR VALUE BALANCE SHEET VALUE FAIR VALUE
ASSETS
Other gross financial fixed assets (1)
Marketable securities, gross (1) 146 221 164 165
Loans 11,286 11,307 10,053 10,071
Cash and cash equivalents 41 41 38 38
LIABILITIES
Redeemable shares 129 313 129 249
Bonds 6,082 6,359 5,728 6,015
Other interest-bearing borrowings (2) 3,700 3,604 4,239 4,189
(1) Including treasury shares.
(2) Excluding redeemable shares.
C - Estimated fair value of off-balance sheet financial instruments
AT DECEMBER 31 (€ million)
2013 2012
ASSETS LIABILITIES ASSETS LIABILITIES
Forward exchange contracts 539 (514) 102 (103)
with Renault Finance 539 (514) 102 (103)
Currency swaps 246 (249) 362 (351)
with Renault Finance 246 (249) 362 (351)
Interest rate swaps 76 (4) 134 (3)
with Renault Finance 76 (4) 131
Assumptions and methods adopted:
Estimated fair values are based on information available on the markets and
arrived at using valuation methods appropriate to the types of instrument in
question.
When the financial instrument is listed on an active and liquid market, the last
listed price is used to calculate the market value. For unlisted instruments,
market value is determined based on recognised valuation models that
refer to observable market parameters. If Renault SA has no valuation tools,
particularly for complex products, valuation is carried out by quality financial
institutions.
The main assumptions and valuation methods are as follows:
W Financial assets:
W Marketable securities: the fair value of securities is determined mainly
by reference to market prices,
W Loans and advances to subsidiaries and affiliates: for loans with
original maturity of less than three months, floating-rate loans and
advances to subsidiaries and affiliates, the value recorded in the balance
sheet is considered to be the fair value. Other fixed-rate loans have been
measured by discounting future cash flows using the risk-free rates
offered to Renault SA at December 31, 2013 and December 31, 2012
for loans with similar conditions and maturities.
W Liabilities: the fair value of financial liabilities is determined by discounting
future cash flows at risk-free rates plus the credit spread of the borrower at
December 31, 2012 and December 31, 2011 for borrowings with similar
conditions and maturities. The fair value of redeemable shares is based on
their year-end stock market value;
W Off-balance sheet foreign exchange instruments: The fair value of
forward contracts and of currency swaps is determined by discounting
future cash flows, using market curves (exchange and interest risk free
rate) respectively on December 31, 2012 and December 31, 2011 for the
contracts' residual terms;
W Off-balance sheet interest rate instruments: the fair value of interest
rate swaps represents the amount Renault SA would receive (or pay) if
it settled outstanding contracts at the end of the year. Unrealised capital
gains or losses, determined on the basis of prevailing interest rates to each
contract, are taken into account at December 31, 2013 and December 31,
2012.

316 Find out more at www.renault.comREGISTRATION DOCUMENT RENAULT 2013
FINANCIAL STATEMENTS4 RENAULT SA PARENT-COMPANY FINANCIAL STATEMENTS
4.4.2.18 OTHER COMMITMENTS AND CONTINGENCIESOff-balance-sheet commitments are as follows:
(€ million)
2013 2012
TOTALCONCERNING RELATED
COMPANIES TOTAL
CONCERNING RELATED
COMPANIES
COMMITMENTS RECEIVED
Unused credit lines 3,435 3,485
TOTAL 3,435 3,485
COMMITMENTS GIVEN
Guarantees and deposits 786 712 782 712
TOTAL 786 712 782 712
As part of the management of RCI Banque’s major risk ratio, Renault SA
entered into a pledging agreement in 2010 for a deposit of €550 million by
Renault SA with RCI Banque.
In 2011, Renault SA acted as guarantor, with joint and several liability,
against default by Renault Tanger Exploitation (the debtor) and undertook
a commitment to pay Renault Tanger Méditerranée (the beneficiary) all
the amounts due under the sublease, i.e. rents and charges for one year
(€81 million) and any penalties due for late delivery of the production unit
(€81 million).
When the European Bank for Reconstruction and Development (EBRD)
subscribed to the capital increase at Renault Technologie Romania SRL,
Renault s.a.s., Renault SA and the EBRD signed a put and call option on the
shares as relevant. In the event Renault s.a.s defaults on payment or fails
to comply with obligations, Renault SA would be obliged to repurchase the
shares in Renault Technologie Romania held by the EBRD (€59 million at
December 31, 2013).
There are no restrictive clauses on credit lines opened but unused.
The forward sales and swaps undertaken by Renault SA are described above
(note 17. A – Management of exchange and interest rate risk).
4.4.2.19 CASH FLOWCash flow is determined as follows:
(€ million) 2013 2012
Net income 1,664 574
Increases to provisions and deferred charges 9 11
Net increase to provisions for risks and liabilities (30) (61)
Net increases to impairment 9 (56)
TOTAL 1,652 468
4.4.2.20 WORKFORCERenault SA has no employees.
4.4.2.21 DIRECTORS’ FEESDi rectors’ fees amounted to €1,099,825 in 2013 (€1,070,563 paid for 2012), of which €48,000 were for the function of Chairman (€48,000 in 2012).

317REGISTRATION DOCUMENT RENAULT 2013✦ Global Reporting Initiative (GRI) Directives
FINANCIAL STATEMENTS 4
4
RENAULT SA PARENT-COMPANY FINANCIAL STATEMENTS
4.4.2.22 SUBSEQUENT EVENTSNo significant events have occurred since the year-end.
OTHER INFORMATION – INVESTMENTS STATED AT EQUITY (€ million)
COMPANIES SHARE CAPITAL
RESERVES AND
RETAINED EARNINGS % OF CAPITAL HELD
BOOK VALUE
OF SHARES OWNED
INVESTMENTS
Renault s.a.s. 534 4,223 100% 6,073
Dacia (1) 568 169 99.43% 783
Sofasa (2) 1 126 23.71% 24
TOTAL INVESTMENTS 6,880
(1) The exchange rate used for Dacia is 4, 471 Romanian lei = 1 euro.
(2) The exchange rate used for Sofasa is 2,658 Colombian pesos = 1 euro.
OTHER INFORMATION – INVESTMENTS STATED AT EQUITY (€ million)
COMPANIES
OUTSTANDING LOANS
AND ADVANCES
FROM RENAULT SA
SALES REVENUES
EXCLUDING TAXES 2013
NET INCOME (LOSS),
PRIOR YEAR
DIVIDENDS RECEIVED
BY RENAULT SA IN 2013
INVESTMENTS
Renault s.a.s. 2,479 33,590 (1,228) 1,095
Dacia (3) 4,164 75 58
Sofasa (4) 934 35 4
(3) The exchange rate used for Dacia is 4.4193 Romanian lei = 1 euro.
(4) The exchange rate used for Sofasa is 2,482.99 Colombian pesos = 1 euro.
ACQUISITION OF INVESTMENTS
See note 6.
F ive-year financial highlights
(€ million) 2009 2010 2011 2012 2013
YEAR-END FINANCIAL POSITION
Share capital 1,086 1,127 1,127 1,127 1,127
Number of shares and investment certificates outstanding 284,937,118 295,722,284 295,722,284 295,722,284 295,722,284
OVERALL INCOME FROM OPERATIONS
Income before tax, amortisation, depreciation and provisions (1) (1,179) 143 (51) 288 1,429
Income tax 92 163 164 135 189
Income after tax, amortisation, depreciation and provisions 49 168 277 574 1,664
Dividends paid 87 339 502
EARNINGS PER SHARE IN EUROS
Earnings before tax, amortisation, depreciation and provisions (1) (4.14) 0.48 (0.17) 0.97 4.83
Earnings after tax, amortisation, depreciation and provisions 0.17 0.57 0.94 1.94 5.63
Net dividend per share 0.30 1.16 1.72
EMPLOYEES (2)
(1) Provisions are those recorded during the year, less reversals and applications.
(2) No employees.

Find out more at www.renault.comREGISTRATION DOCUMENT RENAULT 2013318
FOR THE RENAULT SHARE OVER THE LAST 5 YEARS
+193%

REGISTRATION DOCUMENT RENAULT 2013✦ Global Reporting Initiative (GRI) Directives 319
5.1 GENERAL INFORMATION 320
5.1.1 Overview ✦ 320
5.1.2 Special provisions of the articles of incorporation 321
5.2 GENERAL INFORMATION ABOUT RENAULT’S SHARE CAPITAL 322
5.2.1 Capital and voting rights 322
5.2.2 Change in the share capital 322
5.2.3 Changes in capital ownership 322
5.2.4 Unissued authorized capital 323
5.2.5 Potential capital 323
5.2.6 Renault share ownership ✦ 325
5.3 MARKET FOR RENAULT SHARES ✦ 327
5.3.1 Renault shares 327
5.3.2 Renault and Diac redeemable shares ✦ 328
5.3.3 Dividends ✦ 328
5.4 INVESTOR RELATIONS POLICY ✦ 330
5.4.1 Individual shareholders 330
5.4.2 Institutional investors/socially responsible investors 330
5.4.3 2014 financial calendar 330
5.4.4 Contacts ✦ 330
5.4.5 Public documents 331
5RENAULT AND ITS SHAREHOLDERS
The elements of the annual fi nancial report are identifi ed by RFA sign.

Find out more at www.renault.comREGISTRATION DOCUMENT RENAULT 2013320
RENAULT AND ITS SHAREHOLDERS5 GENERAL INFORMATION
5.1 GENERAL INFORMATION
5.1.1 OVERVIEW ✦
5.1.1.1 BUSINESS NAME AND REGISTERED OFFICE ✦
Business name: Renault
Registered office: 13-15, quai le Gallo, 92100 Boulogne-Billancourt – France
5.1.1.2 LEGAL FORM ✦Organized as a société anonyme (public limited company).
5.1.1.3 DATE OF FORMATION AND DURATION OF THE COMPANY
The Company was formed on January 16, 1945 and will cease to exist on
December 31, 2088 except in the case of early termination or renewal.
5.1.1.4 PURPOSE RESUME ✦The Company’s corporate purpose includes the design, manufacture,
trade, repair, maintenance and leasing of motor vehicles (commercial,
light commercial and passenger vehicles, tractors, farm machinery and
construction equipment) as well as the design and manufacture of spare parts
and accessories used in connection with the manufacture and operation of
vehicles. It also encompasses all types of services relative to such operations
and, more generally, all industrial, commercial, financial, investment and real
estate transactions relating directly or indirectly, in whole or in part, to any of
the above purposes (see Article 3 of the articles of incorporation).
5.1.1.5 COMPANY’S REGISTRATION NUMBERRenault is registered with the Registrar of Companies in Nanterre under
the number 441 639 465 RCS Nanterre (APE code 6420 Z).
Siret code: 441.639.465.00018.
5.1.1.6 ACCESS TO LEGAL DOCUMENTSLegal documents such as the articles of incorporation, minutes of annual
general meetings, auditors’ reports and all other documents made
available to shareholders in accordance with law are available at the
company’s head office.
5.1.1.7 FISCAL YEAR ✦The company’s fiscal year runs for 12 months from January 1 to December 31.

REGISTRATION DOCUMENT RENAULT 2013✦ Global Reporting Initiative (GRI) Directives 321
RENAULT AND ITS SHAREHOLDERS 5
5
GENERAL INFORMATION
5.1.2 SPECIAL PROVISIONS OF THE ARTICLES OF INCORPORATION
5.1.2.1 APPROPRIATION OF NET INCOMENet income is appropriated in compliance with existing legislation.
Distributable income consists of the current year’s income, less previous losses
and amounts transferred to the legal reserves, plus retained earnings brought
forward from previous years as specified by law. Upon recommendation by
the Board of Directors, the General Meeting may then determine portions of
this income to be allocated to optional ordinary and special reserves or to be
carried over. The balance, if any, is divided among the shares in proportion to
their paid-up and unamortized value.
In accordance with legal provisions, the General Meeting has the authority to
offer shareholders the option of receiving all or part of the dividend payout in
cash or in shares.
Requests for the payment of scrip dividends must be submitted within the
time period established by the General Meeting, without exceeding three
months from the date of the meeting. The Board of Directors may choose to
suspend this period for up to three months if the share capital is increased.
5.1.2.2 GENERAL MEETINGS OF SHAREHOLDERS ✦
General Meetings are convened in accordance with legal and regulatory
provisions. The meetings are open to all shareholders who have registered
their shares under their own name at least three clear days before the
meeting. The right to attend the meeting is evidenced by a book entry in the
name of the shareholder or the registered intermediary acting on his or her
behalf, pursuant to Article L. 228-1 of the French Commercial Code. The
entry must be made by midnight (zero hours) CET on the third business day
before the General Meeting, either in the registered share account kept by the
Company or in the bearer share accounts held by an authorized intermediary.
Registration or book entry of bearer shares in the accounts held by the
authorized intermediary is evidenced by an attendance certificate issued by
said intermediary.
5.1.2.3 SHARES AND VOTING RIGHTSShares are registered in an account according to the provisions and terms
established by law. Fully paid-up shares are in either registered or bearer
form, at the discretion of their owner. However, shares that are not fully paid-
up must be in registered form.
Shares entitle the holder to vote, within the limits of French regulations.
5.1.2.4 IDENTIFIABLE BEARER SHARESThe Company is authorized to make use of the appropriate legal provisions
for identifying shareholders having immediate or future voting rights in its own
shareholders’ meetings.
5.1.2.5 SHAREHOLDING DISCLOSURESIn addition to the legal requirement that shareholders inform the Company
if they hold certain percentages of its share capital or voting rights, every
shareholder or fund management company that comes into possession of a
number of shares greater than 2% of the share capital or voting rights, or a
multiple of this percentage less than or equal to 5% of the share capital or
voting rights, shall inform the Company of the total number of shares held.
That disclosure shall be made by registered letter with return-receipt within
a time period set forth in a Conseil d’État decree, starting from the date of
registration of the shares that took the shareholder’s interest up to or beyond
the threshold. In excess of 5%, the aforementioned disclosure requirement
applies to 1% fractions of the share capital or voting rights. For the purposes
of determining the thresholds described above, indirectly held shares or
equity equivalents held as defined by the provisions of Articles L. 233-7 and
L. 233-9 of the Commercial Code will also be taken into account. The declarer
must certify that the said declaration includes all shares held or owned within
the meaning of the preceding paragraph, and must indicate the acquisition
date(s). The disclosure requirement applies in the same manner if the holding
falls below any of the aforementioned thresholds, 2% or 1% as applicable.
If the conditions described above are not respected, any shares exceeding
the fraction that should have been declared are stripped of voting rights
for all shareholders’ meetings for a period of two years after the required
disclosures are made, insofar as this is requested at the meeting by one or
more shareholders who together hold at least 1% of share capital.

Find out more at www.renault.comREGISTRATION DOCUMENT RENAULT 2013322
RENAULT AND ITS SHAREHOLDERS5 GENERAL INFORMATION ABOUT RENAULT’S SHARE CAPITAL
5.2 GENERAL INFORMATION ABOUT RENAULT’S SHARE CAPITAL
5.2.1 CAPITAL AND VOTING RIGHTS
At December 31, 2013, the share capital amounted to €1,126,701,902.04
(one billion one hundred and twenty six million seven hundred and one thousand
nine hundred and two euro and four cents) consisting of 295,722,284 shares
with a par value of €3.81. The shares are fully subscribed and paid in.
The theoretical number of voting rights is 295,722,284.
In view of the 3,784,305 shares of treasury stock and the 44,358,343 shares
held by Nissan Finance Co., Ltd., the total number of exercisable voting rights
at that date was 247,579,636.
5.2.2 CHANGE IN THE SHARE CAPITAL
The Extraordinary General Meeting may, as specified by law, increase or reduce the share capital and authorize the Board of Directors to carry out such
transactions, with the possibility of delegating them in accordance with law.
5.2.3 CHANGES IN CAPITAL OWNERSHIP
DATE TRANSACTION
RESULTING CAPITAL
In € no. of shares*
01/2001 Conversion of share capital to euro 913,632,540.27 239,798,567
12/2001 Capital increase reserved for employees: 2,397,983 shares issued at €3.81 (par) 922,768,855.50 242,196,550
03/2002 Capital increase reserved for Nissan Finance Co., Ltd.: 37,799,462 shares issued at €50.39 (par: €3.81) 1,066,784,805.72 279,996,012
05/2002 Capital increase reserved for Nissan Finance Co., Ltd.: 4,941,106 shares issued at €52.91 (par: €3.81) 1,085,610,419.58 284,937,118
04/28/2010 Capital increase reserved for Nissan Finance Co., Ltd.: 1,617,775 shares issued at €37 (par: €3.81) 1,091,774,142.33 286,554,893
04/28/2010 Capital increase reserved for Daimler AG: 9,167,391 shares issued at €37 (par: €3.81) 1,126,701,902.04 295,722,284
N.-B.: No changes in the share capital in FY 2000, 2003, 2004, 2005, 2006, 2007, 2008, 2009, 2011, 2012 and 2013
* Shares at €3.81.

REGISTRATION DOCUMENT RENAULT 2013✦ Global Reporting Initiative (GRI) Directives 323
RENAULT AND ITS SHAREHOLDERS 5
5
GENERAL INFORMATION ABOUT RENAULT’S SHARE CAPITAL
5.2.4 UNISSUED AUTHORIZED CAPITAL
5.2.4.1 OVERALL AUTHORIZATIONSThe General Meeting of Shareholders of April 27, 2012, gave the Board of
Directors authorizations to proceed with Miscellaneous financial transactions
to increase the Company’s share capital, with or without subscription rights.
The Board of Directors has been authorized by the General Meeting of
Shareholders of April 30, 2013 to issue shares to the benefit of its salaries
for a period of 26 months with a 1% maximum ceiling of the capital. To date,
these authorizations have not been used.
These authorizations are detailed hereafter.
New authorizations will be proposed at the General Meeting of Shareholders
of April 30, 2014 in order to allow the Board of Directors to proceed, on its
sole decision, to various financial operations with an increase in capital effect
with or without preferential subscription right.
5.2.4.2 TABLE OF CAPITAL INCREASE AUTHORIZATIONSThe following table summarizes the capital increase authorizations given by the General Meeting to the Board of Directors and that are currently in force:
DESCRIPTION OF AUTHORIZATION GIVEN TO THE BOARD OF DIRECTORS UTILIZATION
12th resolutionGM 2012
Issues of shares or financial securities giving access to capital with preferential subscription right.Valid 26 months, until the GM called to approve the 2013 financial statements.Capital increase capped at €350 million (around 30% of the share capital). N/A
13th resolutionGM 2012
Issues of shares or financial securities giving access to capital excluding the preferential subscription right.Valid 26 months, until the GM called to approve the 2013 financial statements.Capital increase capped at €120 million (around 10% of the share capital). N/A
14th resolutionGM 2012
Issues of shares or financial securities giving access to capital through private placement.Valid 26 months, until the GM called to approve the 2013 financial statements.Capital increase capped at €60 million (around 5% of the share capital). N/A
15th resolutionGM 2012
Issues of shares or financial securities giving access to capital through a public exchange offer.Valid 26 months, until the GM called to approve the 2013 financial statements.Capital increase capped at €120 million (around 10% of the share capital). N/A
16th resolutionGM 2012
Capital increase through issuance of shares by contribution in kind.Valid 26 months, until the GM called to approve the 2013 financial statements.Capital increase capped at €120 million (around 10% of the share capital). N/A
17th resolutionGM 2012
Capital increase through capitalization of reserves, bonuses, etc.Valid 26 months, until the GM called to approve the 2013 financial statements.Capital increase capped at €1 billion. N/A
16th resolutionGM 2013
Capital increase through issuance of shares reserved for employees.Valid 26 months until the GM called to approve the 2014 financial statements.Capital increase capped at 1% of the share capital. N/A
The total nominal amount of any capital increases that may be carried out by virtue of the twelfth, thirteenth, fourteenth, fifteenth and sixteenth resolutions
submitted to the General Meeting on April 27, 2012, may not exceed €350 million (three hundred and fifty million euros).
5.2.5 POTENTIAL CAPITAL
5.2.5.1 OPTIONSThe Company has decided not to grant any new stock option plans.
The latest delegation referring to has been adopted by the mixed General
Meeting of Shareholders of April 29, 2011 for a period of 38 months. It’s not
scheduled to ask the General Meeting of Shareholders of April 30, 2014 a
new authorization. For details of current grants and options, see table 8 in
chapter 3.3.2.2 of this Registration document.
5.2.5.2 BONUS SHARESPursuant to Article L. 225-197-1 of the Commercial Code, the Combined
General Meeting of April 30, 2013, authorized for a period of 38 months the
Board of Directors to grant bonus shares, either existing or to be issued, to
salaried employees of the Company or to certain categories of them and to
salaried employees of companies and groupings related to it, as provided for
by Article L. 225-197-2 of the Commercial Code. For details of grants and
shares in circulation, refer to table 8, chapter 3.3.2.2 of this Registration
document.

Find out more at www.renault.comREGISTRATION DOCUMENT RENAULT 2013324
RENAULT AND ITS SHAREHOLDERS5 GENERAL INFORMATION ABOUT RENAULT’S SHARE CAPITAL
5.2.5.3 SHARE BUYBACKS (1)
1) TRADING BY RENAULT IN ITS OWN SHARES IN 2013 AND ALLOCATION OF TREASURY STOCK
At December 31, 2013 Renault SA held 3,784,305 shares of €3.81 par value
and a book value of €144,880,436.
Pursuant to Article L. 225-209 of the Commercial Code, the thirteenth
resolution of the Combined General Meeting of April 30, 2013, authorized
the Company to deal in its own stock in order to make use of the possibilities
allowed by law for trading in own shares. The authorization is valid until
October 30, 2014, unless the General Meeting of April 30, 2014, authorizes
a new programme, as described in paragraph 2 below.
Renault acquired no shares in 2013 or as part of the share buyback programme
approved by the General Meeting of April 30, 2013. The 3,784,305 shares
held directly or indirectly by Renault SA at December 31, 2013, are allocated
as follows:
W 3,784,305 to cover buy-back options, bonus share plans, and to cover
stock option plans in order to offset dilution arising from the exercise of
options to subscribe new shares;
W zero shares remitted for the exercise of rights attached to financial securities
creating the right to an allotment of Company stock by conversion, exercise,
redemption, exchange, or any other method, in accordance with securities
regulations;
W zero shares to enable an investment services provider to maintain
a secondary market in or ensure the liquidity of Renault shares under a
liquidity contract compliant with an AMF-approved code of conduct;
W zero shares retained and subsequently remitted or as consideration for
possible acquisitions;
W zero shares cancelled.
Percentage of treasury stock held directly or indirectly at
December 31, 2013: 1.28%.
Number of shares cancelled over the 24 months preceding
December 31, 2013: zero shares.
Number of shares held in the portfolio at December 31, 2013:
3,784,305 shares .
Book net value of the portfolio at December 31, 2013:
€144,880,436.
Portfolio value at December 31, 2013*: €221,192,627.
* Based on a share price of €58.45 at December 31, 2013.
(1) This paragraph contains information that will appear in the programme description, pursuant with Article 241-2 of the AMF general regulations, and the information required pursuant to the measures stipulated in Article L. 225-211 of the Commercial Code.
OPERATIONS CARRIED OUT BY RENAULT ON ITS OWN SHARES AS PART OF THE PROGRAMMES AUTHORIZED BY THE COMBINED GENERAL MEETINGS OF APRIL 27, 2012 AND APRIL 30, 2013
TOTAL GROSS FLOWS AT DECEMBER 31, 2013 OPEN INTEREST AT DECEMBER 31, 2013
PURCHASES SALES LONG POSITIONS SHORT POSITIONS
Number of shares none none none none
Average sell, buy or strike price none none none none
Total none none none none
2) DESCRIPTION OF THE BUYBACK PROGRAMME SUBMITTED FOR APPROVAL TO THE AGM ON APRIL 30, 2014
Pursuant to Articles 241-1 to 242-7 of the AMF General Regulation and Article
L. 451-3 of the Monetary and Financial Code, this section describes the
purpose and arrangements for the new treasury stock buyback programme
organized by Renault SA (“the Company”), which will be submitted for
approval to the Combined General Meeting of Shareholders on April 30, 2014.
The objectives of the programme are to:
W use some or all of the acquired shares to cover a stock option purchase
plan or bonus share plan, or any other form of grant, allotment or disposal
intended for employees or senior managers of the Company and its Group
and to carry out any related hedging transactions in accordance with law;
W cancel such shares, in particular to offset dilution arising from the exercise
of share options or the acquisition of bonus shares, subject to the adoption
of the seventeenth resolution by the Combined General Meeting of
Shareholders on April 30, 2014;

REGISTRATION DOCUMENT RENAULT 2013✦ Global Reporting Initiative (GRI) Directives 325
RENAULT AND ITS SHAREHOLDERS 5
5
GENERAL INFORMATION ABOUT RENAULT’S SHARE CAPITAL
W remit some or all of the shares acquired by exercising the rights attached
to securities creating the right to an allotment of Company stock by
conversion, exercise, redemption, exchange or any other method, in
connection with securities regulations;
W enable an independent investment services provider to maintain a
secondary market in or ensure the liquidity of Renault shares under a
liquidity contract compliant with an AMF-approved code of conduct;
W retain and subsequently remit some or all of the acquired shares as
consideration for possible acquisitions;
W in general, carry out any transaction that are authorized, now or in future,
by law, prevailing regulation or the AMF.
These shares may be acquired, sold, transferred or exchanged by any means
permitted by regulations, including over the counter and by blocks of shares,
by the use of financial derivatives and options strategies by respecting
applicable regulations, at a time chosen by the Board of Directors.
The maximum purchase price shall be €120 per share (ISIN code:
FR0000131906) without transaction costs, and the number of shares
eligible for acquisition shall be no more than 10% of the share capital,
i.e. theoretically 29,572,228 shares. It should be noted that (A) this limit
applies to a capital amount that, where necessary, will be adjusted to reflect
any transactions carried out subsequent to the General Meeting; and that
(B) when the shares are purchased to promote liquidity, in accordance with
the AMF General Regulation, the number taken into account to calculate the
aforementioned 10% limit shall be the number of shares purchased less the
number resold during the authorized period. This limit of 10% of the capital
corresponded December 31, 2013 to 29,572,228 shares. The total amount
the Company could spend on the buyback of its own shares could not exceed
3,548. 7 million euros.
These operations may be carried out at any time, except during a public
tender offer concerning the Company, during the share buyback programme.
The number of shares acquired by the Company for retention or exchange
as part of a merger, partial merger or demerger shall not exceed 5% of its
capital.
If the share capital is increased by capitalization of reserves, the granting of
bonus shares, an increase of the par value of the share; or if shares are split
or merged or if any other transaction affecting the share capital is carried
out, the prices indicated above shall be adjusted using a multiplier coefficient
equal to the ratio between the number of shares making up the share capital
before the operation and the number after the operation.
Once approved by the General Meeting of April 30, 2014, this programme
shall be valid for a period that expires at the next Annual General Meeting
called to approve the 2014 financial statements and shall be no longer than
18 months, i.e. until October 30, 2015.
5.2.6 RENAULT SHARE OWNERSHIP ✦
5.2.6.1 RENAULT SHAREHOLDERS AT DECEMBER 31, 2013
OWNERSHIP OF SHARES AND VOTING RIGHTS FOR THE LAST THREE FISCAL YEARS
12/31/2013 12/31/2012 12/31/2011
NUMBER OF SHARES % OF CAPITAL
% OF VOTING RIGHTS
NUMBER OF
SHARES % OF CAPITAL
% OF VOTING
RIGHTS
NUMBER OF
SHARES % OF CAPITAL
% OF VOTING
RIGHTS
French State (2) 44,387,915 15.01% 17.93% 44,387,915 15.01% 17.95% 44,387,915 15.01% 17.95%
Nissan Finance. Co, Ltd 44,358,343 15.00% - 44,358,343 15.00% - 44,358,343 15.00% -
Daimler AG (2) 9,167,391 3.10% 3.70% 9,167,391 3.10% 3.71% 9,167,391 3.10% 3.71%
Employees (1) 7,720,720 2.61% 3.12% 8,770,185 2.97% 3.55% 9,038,110 3.06% 3.65%
Treasury stock 3,784,305 1.28% - 4,059,255 1.37% - 4,059,255 1.37% -
Public 186,303,610 63.00% 75.25% 184,979,195 62.55% 74.79% 184,711,270 62.46% 74.69%
TOTAL 295,722,284 100.00% 100.00% 295,722,284 100.00% 100.00% 295,722,284 100.00% 100.00%
(1) The employee-owned shares (present and former employees) counted in this category are those held in company savings schemes.
(2) The number of shares and voting rights hold by the French state and Daimler AG remains unchanged versus 2012. The variation of their % of voting rights is only explained by the variation of the total number of exercisable voting rights (see chapter 5.2.1 of this Registration document).
To the knowledge of the Company no other party other than mentioned here above holds more than 5% of the capital or voting rights, directly or indirectly or in
concert.

Find out more at www.renault.comREGISTRATION DOCUMENT RENAULT 2013326
RENAULT AND ITS SHAREHOLDERS5 GENERAL INFORMATION ABOUT RENAULT’S SHARE CAPITAL
The share capital is now €1,126,701,902.04 broken down into
295,722,284 shares and divided as follows:
W the French State’s holding is unchanged at 15.01%;
W the Nissan group, through its wholly-owned subsidiary Nissan Finance Co.,
Ltd., holds 15% of Renault’s capital, the same percentage as at
December 31, 2012). Nissan Finance Co., Ltd. is not entitled to exercise
the voting rights attached to these shares, owing to Renault’s ownership
interest in Nissan;
W the Daimler group holds 3.10% (9,167,391 shares);
W current and former Renault employees hold 2.61% of the capital in the
form of shares managed through collective investment schemes;
W the percentage of treasury stock is 1.28%. These shares do not carry
voting rights;
W in view of these changes, the free float is now 63.00% of the capital
(compared with 62.55% at December, 31 2012).
A survey of the holders of Renault bearer shares was carried out on
December 31, 2013 to obtain an estimated breakdown of the public’s
ownership interest by category of major shareholder. At that date, institutional
shareholders owned approximately 53% of the capital, with French institutions
holding 9.84% and foreign institutions 43.16%. The 10 largest French and
foreign institutional investors held approximately 18.6% of the capital. The
remaining capital - 10% - is held primarily by individual shareholders.
5.2.6.2 SHAREHOLDER AGREEMENTS ON SHARES MAKING UP THE AUTHORIZED CAPITAL
RESTRICTIONS ON THE TRANSFER OF SHARES AND THE EXERCISE OF VOTING RIGHTS
As part of the Master Cooperation Agreement on long-term strategic
cooperation signed on April 7, 2010 by Renault SA, Nissan Motor Co., Ltd.,
Renault-Nissan b.v., and Daimler AG, the Parties made the following
commitments in accordance with Article L. 225-100-3 of French Commercial
Code:
W lock-up commitment: for a five-year period beginning on the date of the
Master Cooperation Agreement signature, Daimler commits to not transfer
its holding in Renault without the prior agreement of the other parties.
However, providing the transfer concerns all Renault shares and that the
beneficiary is not a competitor of Renault, the lock-up commitment does
not apply to the following cases: (i) transfer to a subsidiary, (ii) a public
offer for Renault shares recommended by Renault’s Board of Directors,
(iii) a change in control of Renault. The commitment will end prematurely
if the Master Cooperation Agreement is terminated before the end of the
five-year period;
W right of first offer: if Daimler wants to transfer its Renault shares (either
at the end of the lock-up commitment or during that period providing it
has transfer authorization), Renault benefits from the right of first offer,
allowing it to acquire those shares. If Renault chooses not to exercise its
right, Daimler may sell its shares to third parties that are not competitors of
Renault or sell them in the market;
W commitment in the event of a hostile takeover bid: after the end of the
lock-up commitment, Daimler agrees to not tender its shares to a takeover
bid for Renault that has not received approval from Renault’s Board
of Directors. This commitment will end on termination of the Master
Cooperation Agreement.
ACTION IN CONCERT BETWEEN THE PARTIES
Renault and Daimler have represented and warranted that they are not
acting in concert, directly or indirectly, as defined in Article L. 233-10 of the
Commercial Code. To the best knowledge of the Company, and as at the
date of this Registration document, there are no shareholder pacts governing
relations between the Company's shareholders, and no actions in concert.

REGISTRATION DOCUMENT RENAULT 2013✦ Global Reporting Initiative (GRI) Directives 327
RENAULT AND ITS SHAREHOLDERS 5
5
MARKET FOR RENAULT SHARES
5.3 MARKET FOR RENAULT SHARES ✦
5.3.1 RENAULT SHARES
5.3.1.1 LISTING EXCHANGE AND STOCK INDEXES
Renault has been listed on Euronext Paris (formerly the Paris Bourse) since
November 17, 1994, when the Company was partially privatized. The issue
price was FRF165 (€25.15). Renault was added to the CAC 40 index on
February 9, 1995.
Renault shares (ISIN code FR0000131906, Symbol: RNO) are listed on
Euronext – compartment A and qualify for the deferred-settlement account
system (SRD) and for inclusion in French equity savings plans.
The share is also a component of the SBF, Euronext and Euro Stoxx Auto
indexes.
Furthermore, Renault receives annual ratings from sustainability agencies
for its performance in spheres such as risk management, labor relations
and environmental protection, and it is included in diverse indexes (see
chapter 2.6).
5.3.1.2 SHARE PRICE PERFORMANCE PAST 5 YEARS : + 193%
0
50
100
150
200
250
300
350
400
450
500
Renault CAC 40
Base 100
2010 2011 201320122009
Renault share price and markets performance
2013 2012 2011 2010 2009
Year high (€) 68.39 43.02 49. 45 45.60 36.78
Year low (€) 39.67 26.60 22.34 26.765 10.57
Closing price (€) 58.45 40.685 26.80 43.50 36.20
Change during the year (%) +44.09 +47.4 -39 .4 +13.87% +81.41%
CAC change during the year (%) +18.0 +15.2 -17.0 -3.3 +22.3
DJES Auto change during the year (%) +34.09 +35.25 -26 .88 +49 .19 +12.82
Number of shares exchanged during the year 283,176,634 440,033,635 544,887,488 629,829,836 744,070,260
Market capitalization (€ million) 17,285 12,031 7,925 12,864 10,315
The average share price in the last 30 trading days of 2013 was €60.70 (source: Reuters).

Find out more at www.renault.comREGISTRATION DOCUMENT RENAULT 2013328
RENAULT AND ITS SHAREHOLDERS5 MARKET FOR RENAULT SHARES
5.3.2 RENAULT AND DIAC REDEEMABLE SHARES ✦
5.3.2.1 RENAULT REDEEMABLE SHARES
CHARACTERISTICS
Renault issued a total of 2,000,000 redeemable shares with a par value
of FRF1,000/€152.45, in two fungible issues of 1,000,000 shares in
October 1983 and October 1984.
Renault redeemable shares are listed on Euronext Paris under ISIN
code FR0000140014.
The issue prospectus (in French) can be downloaded from the Finance section
of the renault.com site or obtained on request from the Investor Relations
department (toll-free number +33 (0) 800 650 650).
Between March and April 2004 Renault made a public buyback offer for its
redeemable shares at €450 per share. In all, 1,202,341 shares, or 60.12% of
the total, were bought back and cancelled. The number of shares outstanding
after the buyback was 797,659, unchanged at December 31, 2013.
PAYOUT
The gross interest on redeemable shares paid on October 24, 2013 in respect
of 2012 was €21.15 (€10.29 for the fixed portion and €10.86 for the variable
portion).
The interest on redeemable shares for FY 2013, payable on October 24,
2014, was €21.26 , comprising €10.29 for the fixed portion and €10.97 for
the variable portion, based on consolidated revenues of €40,932 million for
2013 and €41,270 million for 2012).
TRADING VOLUMES AND PRICES OF RENAULT REDEEMABLE SHARES OVER THE PAST 3 YEARS
2013 2012 2011
Year high (€) 420.00 347.95 374.95
Year low (€) 306.55 291.05 279.05
Closing price (€) 392.00 312.05 290.50
Number of redeemable shares exchanged during the year 149,827 116,918 83,224
Source Reuters
5.3.2.2 DIAC REDEEMABLE SHARESDiac, the French credit subsidiary of RCI Banque, issued 500,000 redeemable
shares with a par value of FRF1,000/€152.45 in 1985.
Diac redeemable shares are listed on Euronext Paris under ISIN
code FR0000047821.
At December 31, 2013, the number of redeemable shares issued by Diac
in 1985 and still outstanding was 60,269. At the closing price of €165, they
were worth a total of €9,944,385 (€9,188,009 at the par value of €152.45).
In the course of 2013, the share price fluctuated between €150 (Jan. 22) and
€166.50 (Aug. 19).
5.3.3 DIVIDENDS ✦
In the first phase of the Renault 2016 Drive the Change plan, the company
committed to pay out to shareholders the dividends received from
shareholdings in listed companies, with a one-year time lag.
The purpose of that policy was to raise the profile of the dividend while
achieving the debt reduction target. That target has now been reached so,
for the second phase of the plan, Renault is putting forward a pay-out policy
independent of the dividends received on holdings in listed companies.
The aim of this new policy is to offer returns at least equivalent to the average
of European automakers.
The dividend will be paid on May 15 (or the following working day).
Meeting on February 12, 2014 the Board of Directors proposed to pay a
dividend of €1.72 per share for FY2013. The dividend will be paid on May 15.

REGISTRATION DOCUMENT RENAULT 2013✦ Global Reporting Initiative (GRI) Directives 329
RENAULT AND ITS SHAREHOLDERS 5
5
MARKET FOR RENAULT SHARES
5.3.3.1 FIVE-YEAR DIVIDEND RECORDDividends are paid out at the times and places specified either by the Annual General Meeting or, failing this, by the Board of Directors.
YEAR
NO. SHARES IN AUTHORIZED CAPITAL
AT DECEMBER 31 DIVIDENDS PER SHARE (€) PAYABLE DATE
2009 284,937,118 0 -
2010 295,722,284 0.30 May 16, 2011
2011 295,722,284 1.16 May 15, 2012
2012 295,722,284 1.72 May 15, 2013
2013 (1) 295,722,284 1.72 May 15, 2014
(1) In accordance with the proposal of the Board of Directors and subject to the decision of the Combined General Meeting of April 30, 2014
5.3.3.2 UNCLAIMED DIVIDENDSDividends remaining unclaimed after the five-year validity period shall lapse, as specified by law. Unclaimed dividends are paid over to the French Treasury.

Find out more at www.renault.comREGISTRATION DOCUMENT RENAULT 2013330
RENAULT AND ITS SHAREHOLDERS5 INVESTOR RELATIONS POLICY
5.4 INVESTOR RELATIONS POLICY ✦
Since it was listed in November 1994, Renault has endeavored to provide its shareholders and investors with clear and transparent information on a regular basis.
5.4.1 INDIVIDUAL SHAREHOLDERS
Please see chapter 2.2.4.1
5.4.2 INSTITUTIONAL INVESTORS/SOCIALLY RESPONSIBLE INVESTORS
Please see chapter 2.2.4.2
5.4.3 2014 FINANCIAL CALENDAR
February 13 (before opening) 2013 annual results
April 24 (after close) 2014 Q1 revenues
April 30 (afternoon) Annual General Meeting 2014
July 29 (before opening) 2014 half-year results
October 29 (after close) 2014 nine-month results
5.4.4 CONTACTS ✦
INVESTOR RELATIONS DEPARTMENT
E-mail: [email protected]
Toll-free voicemail: 0 800 650 650
Shareholder hotline: +33 (0) 1 76 84 59 99
Fax: +33 (0) 1 76 89 13 30
Phone information for employee shareholders: +33 (0) 1 76 84 33 38
Website: www.renault.com/Finance
Contact:
Thierry Huon
Renault Investor Relations Director
Telephone: +33 (0) 1 76 84 53 09 – Fax: +33 (0) 1 76 89 13 30
Renault shares can be registered with:
BNP Paribas Securities Service – Shareholder Relations
9 rue du Débarcadère
93761 Pantin Cedex – France
T: 892 23 00 00 in France
+33 (0)1 40 14 11 16 from other countries
F: +33 (0)1 55 77 34 17

REGISTRATION DOCUMENT RENAULT 2013✦ Global Reporting Initiative (GRI) Directives 331
RENAULT AND ITS SHAREHOLDERS 5
5
INVESTOR RELATIONS POLICY
5.4.5 PUBLIC DOCUMENTS
The following documents are available in the Finance section of the website
www.renault.com:
W the articles of incorporation of the Company;
W financial press releases;
W the regulatory information that is published in full by electronic means
(including on the website of the Autorité des marchés financiers, AMF), in
accordance with the Transparency Directive, through a primary information
provider named on a list published by the AMF. This information includes
the Registration documents for 2012, 2011, 2010, 2009 and 2008, all
filed with the AMF.

Renseignements sur le site www.renault.comRENAULT DOCUMENT DE RÉFÉRENCE 2013332
VOTE ONLINE FOR THE AGM WITH VOTACCESS

RENAULT DOCUMENT DE RÉFÉRENCE 2013✦ Directives de la Global Reporting Initiative (GRI) 333
The elements of the annual fi nancial report are identifi ed by AFR
PRESENTATION OF THE RESOLUTIONS 334
Ordinary resolutions 334
Extraordinary resolutions 338
6MIXED GENERAL MEETING OF
APRIL 30, 2014

Renseignements sur le site www.renault.comRENAULT DOCUMENT DE RÉFÉRENCE 2013334
MIXED GENERAL MEETING OF APRIL 30, 2014 6 PRESENTATION OF THE RESOLUTIONS
PRESENTATION OF THE RESOLUTIONS
Approval of the financial statements and the consolidated financial statements and allocation of the results
The first two resolutions deal with the approval of Renault’s financial
statements and consolidated financial statements for financial year 2013.
The accounts presented have been drawn up, in accordance with the
regulations in force, using IFRS (International Financial Reporting Standards)
for the consolidated financial statements and in compliance with French
statutory and regulatory provisions for the Company’s own annual financial
statements.
The financial statements show a net profit of EUR 1,664,101,672.88.
The consolidated financial statements show a net profit of EUR 695,017,441.
The third resolution deals with the allocation of the results for financial year
2013 and the payment of dividends.
The dividend policy as defined for the “Renault-Drive the Change 2016”
plan is to distribute in year n+1 the dividends received from listed affiliates
(Nissan, Daimler, Avtovaz) during year n, plus potentially a percentage of year
n operational free cash flow.
The Board of Directors proposes the payment, as a dividend, of an amount of
EUR 508,642,328.48, equal to EUR 1.72 per share.
The ex-date for dividend payment would be May 12, 2014 and this dividend
would be paid as from May 15, 2014.
As a result of this payment, the retained earnings would amount to EUR
6,438,656,747.67.
Pursuant to Article 243 bis of the French General Tax Code, the table below
details the amounts of dividend per share, distributions eligible to the 40%
tax relief provided for in paragraph 3-2° of Article 158 of the French General
Tax Code for individuals who are French tax residents, and distributions
not eligible to the 40% tax relief, that were granted for the preceding three
financial years.
Regulated agreements
The fourth resolution relates to the approval of the so-called “regulated”
agreements as approved by your Board of Directors pursuant to Article L.
225-38 of the French Commercial Code. The regulated agreements are those
entered into during the financial year between the Company and its directors
or a company that shares one or more directors with the Company.
In this respect, it is proposed to the General Meeting to approve the only so
called new “regulated” agreement entered into during financial year 2013
which was approved by the Board of Directors at its meeting of December
12, 2013. This agreement is an amendment to the Master Cooperation
Agreement concluded in 2010 between Renault SA, Nissan Motor Co. Ltd,
Renault-Nissan B.V. and Daimler AG. This amendment aims at extending in
the commercial area the cooperation as previously established between the
parties.
This agreement is referred to in the special report of the statutory auditors
relating to the regulated agreements and commitments, presented to the
General Meeting for acknowledgement.
It is stated that, pursuant to applicable laws, the regulated commitments and
agreements already approved by the General Meeting during the preceding
financial years and which remain in effect are not submitted again to the vote
of the General Meeting. They are mentioned in the above-mentioned statutory
auditors’ special report.
This special report is reproduced in Section 4 of the 2013 Registration
Document of the Company.
FISCAL YEAR DIVIDEND
AMOUNT OF INCOME DISTRIBUTED
ELIGIBLE TO THE 40% ALLOWANCE
AMOUNT OF INCOME DISTRIBUTED
NOT ELIGIBLE TO THE 40% ALLOWANCE
201020112012
€0.30€1.16€1.72
€0.30 €1.16 €1.72
NoneNoneNone
ORDINARY RESOLUTIONS
Ladies and Gentlemen,
We have called a General Meeting in order to submit twenty-five resolutions to you:
W seventeen of them are being submitted to the Ordinary General Meeting;
W eight of them, the implementation of which may cause a change in the amount of the Company’s share capital, are being submitted to the Extraordinary General
Meeting.
In this report, we present the rationale behind each of the resolutions submitted to the vote of the General Meeting.
The course of business and the financial situation of the Company during the financial year ended on December 31, 2013 are described in the Registration
Document (“document de référence”) of the Company.

RENAULT DOCUMENT DE RÉFÉRENCE 2013✦ Directives de la Global Reporting Initiative (GRI) 335
MIXED GENERAL MEETING OF APRIL 30, 2014 6
6
PRESENTATION OF THE RESOLUTIONS
Statutory auditors’ report on redeemable shares
The fifth resolution proposes that the General Meeting takes formal note of
the statutory auditors’ report on elements used to determine the remuneration
of redeemable shares, including in particular its variable part, linked to the
development of Renault’s consolidated turnover in 2013, as determined by
constant methods with reference to a constant structure.
Renewal of Mr Carlos Ghosn term of office
The sixth resolution proposes to approve the renewal of the term of office of
Mr Carlos Ghosn, for a new period of four years. These duties would expire
at the end of the General Meeting which will resolve upon the financial
statements of the financial year ending on December 31, 2017.
The profile (including details of his functions and mandates) of Mr Carlos
Ghosn is set out in Section 3 of the 2013 Registration Document of the
Company.
If this resolution is approved, the Board of Directors has declared that
Mr Carlos Ghosn’s duties as Chairman and CEO would also be renewed.
It is pointed out that the Company’s governance structure is that of a Board
of Directors with one Chairman of the Board acting as Chief Executive. This
governance structure is adopted by a majority of French listed companies
with a Board of Directors. It is viewed as being well suited to the organization
and functioning of the Company, providing in particular responsiveness and
efficiency in the decision-making process and ensuring greater cohesion in
the entire organization.
Approval of the pension benefit in favor of the latter
The renewal of Mr Carlos Ghosn’s duties is connected to the seventh resolution,
relating to the approval of the pension benefit granted to his benefit.
During its meetings of October 28, 2004 and October 31, 2006, the Board
of Directors has authorized the agreement under which a supplementary
collective pension scheme was granted to senior executives, including
Mr Ghosn.
The General Meeting of April 30, 2010 approved this pension scheme.
The pension benefit is described in the table set out below, summarizing the
compensation due or granted to Mr Carlos Ghosn in respect of financial year
2013.
The pension benefit scheme is consistent with the provisions of the AFEP-
MEDEF Code as reviewed in June 2013.
It is pointed out that the supplementary pension scheme is also open to other
managers in the Group.
The Board of Directors, in his meeting held on February 12, 2014, confirmed
Mr Ghosn’s pension benefit, in the same conditions as previously approved
by the General Meeting.
Advisory opinion on the remunerations due or granted to Mr Carlos Ghosn in respect of financial year 2013
In accordance with recommendation 24.3 of the AFEP-MEDEF Corporate
Governance Code, to which the Company refers in accordance with article L.
225-37 of the French Commercial Code, the following elements of Mr Carlos
Ghosn’s remuneration, due or granted in respect of financial year 2013, are
submitted to the shareholders for their advisory opinion.
The relevant elements of remuneration relate to: (i) the fixed part, (ii) the
annual variable part and, as the case may be, the multiannual variable
part with the objectives contributing to the setting of this variable part, (iii)
exceptional compensations, (iv) share options, performance-based shares
and any other long-term element of compensation, (v) indemnities related to
the appointment or to the termination of office, (vi) the supplementary pension
plan and (vii) the benefits of any nature.
Components of Mr Carlos Ghosn’s, Chairman and CEO, remunerations due or granted in respect of financial year 2013
Elements of remuneration due or granted in respect of financial year 2013
Amounts or accounting valuation submitted to the vote Comments
Fixed remuneration € 1,230,000(amount paid)
This amount remains unchanged compared to the fixed remuneration granted in respect of financial year 2012. This remuneration was set by the Board of Directors on December 13, 2012, upon proposal of the Remuneration Committee.
Annual variable compensation
€ 1,384,980(112.6% of the fixed part)including:- € 346,245 paid in cash, and- € 1,038,735 to be received as a deferred payment in shares, as described in the section “Deferred variable compensation” hereafter.
The Board of Directors, on a proposal from the Remuneration Committee, set the following performance criteria on December 13, 2012, in respect of financial year 2013: P Return on equity rate (15% maximum); P Operating margin (25% maximum); P Free cash flow (50% maximum); P A qualitative criteria relating to managerial skills, which is based on the following items (60% maximum):* Implementation of the industrial strategy: assignments of vehicle and mechanical projects, implementation of
competitivity agreements in France, industrial performance (development of manufacturing performance and Sourcing strategy),
* leadership in respect of environment: vehicles’ CO2 emissions in Europe, Renault’s carbon footprin,* Development of a multi-annual R&D strategy: CMF (Common big Modules Families) approach and
development of modules deployment policy, deployment of the Research and Advanced Engineering Plan,* CSR: auditing of non-financial data, visibility, social impact,* Daimler: production, co-development, new forms of cooperation,* Synergies of the Alliance: increasing the amount of synergies.
Each of the six items set above accounts for 10% in achieving the qualitative criteria.

Renseignements sur le site www.renault.comRENAULT DOCUMENT DE RÉFÉRENCE 2013336
MIXED GENERAL MEETING OF APRIL 30, 2014 6 PRESENTATION OF THE RESOLUTIONS
Annual variable compensation
For confidentiality reasons, Renault does not communicate on the quantified target for each of the above criteria. Renault, however, communicates on the level of achievement of these criteria.
With respect to financial year 2013, the Board of Directors, on a proposal of the Remuneration Committee, decided that the level of achievement of the financial criteria is 60.6% and the level of achievement of the qualitative criteria is 52%.
Consequently, the variable compensation for financial year 2013 amounts to 112.6% of the fixed part, i.e. Euro 1,384,980 (compared to 117% of his fixed remuneration, i.e. Euro 1,439,100 for the 2012 financial year). The Board of Directors held on February 12th, 2014, on a proposal from the Remuneration Committee, also confirmed that the variable part of his compensation would be paid as follows: P 25% paid in cash in 2014, i.e. Euro 346,245 P the balance (“the Deferred Variable Compensation”), i.e. Euro 1,038,735, paid in shares, on a deferred basis, under the conditions described hereafter
Deferred variable compensation
€1,038,735(accounting valuation)
The vesting of the shares received under the Deferred Variable Compensation for financial year 2013 May not occur before 2018, subject to the following conditions:
i. a condition of presence within Renault in 2018,ii. performance conditions based on financial criteria regarding the CEO’s Variable Compensation and assessed for
the years 2014, 2015 and 2016.
The number of shares acquired by Mr Carlos Ghosn will be determined depending on the amount of the deferred variable part, the risk of non-payment of this deferred variable part and the Group’s performance over the 2014-2016 period.
Multi-annual variable compensation
NA No multi-annual variable compensation.
Exceptional compensation
NA No exceptional compensation.
Long-term element of compensation
Stock-options(accounting valuation: €750,258)
Under the authorization granted by the General Meeting of April 29, 2011 (11th resolution), the Board meeting of December 13, 2012, upon proposal of the Remuneration Committee, has decided to allocate:
150,000 stock options, subject to achievement of the following performance criteria: P free cash flow, for 80% of the options P the operating margin, for 20% of the options
This allocation represents 0.05% of the share capital.The potential exercise of these options will not result in any dilution for shareholders, the shares potentially acquired being shares held in treasury by the Company. These options do not give rise to any hedging transactions.
The Board of Directors held on February 12, 2014, found that the criteria were reached up to: 88.48%.132,720 stock options granted for 2013 will be exercisable.
The options may be exercised over a period of four years from their allocation, following a lock-in period of the same length, i.e. from 13 December 2016 until 12 December 2020.
The CEO is obliged to hold shares equivalent to 50% of the net capital gain (net of tax and mandatory contributions) made on exercise of the options for the 2013 plan and the plan for the period 2011-2013 until such time as he leaves his position.
Shares = NAOther element = NA
No allocation.
Attendance fees €48,000(amount paid)
This gross amount is paid in consideration of his duties as Director of Renault.
M. Carlos Ghosn receives attendance fees as a Director of Avtovaz. The amount received in 2013 for the 2012 financial year was 1,894,910 roubles.
Valuation of the benefits in kind
€6,162(accounting valuation)
These benefits in kind correspond to the provision of a company car.

RENAULT DOCUMENT DE RÉFÉRENCE 2013✦ Directives de la Global Reporting Initiative (GRI) 337
MIXED GENERAL MEETING OF APRIL 30, 2014 6
6
PRESENTATION OF THE RESOLUTIONS
Elements of compensation due or granted in respect of financial year 2013, which have been subject to the vote of the General Meeting pursuant to the regulated agreements procedure
Amounts submitted to the vote Presentation
Compensation for termination of office
NA No compensation clause for termination of office has been granted to the Chairman and CEO.
Non-compete indemnity NA No non-compete clause has been granted to the Chairman and CEO.Supplementary pension plan
No amount is due for the last financial year
Mr Carlos Ghosn benefits from the collective supplementary pension scheme set up for members of the Group Executive Committee.
This plan was approved by the Board meetings held on October 28, 2004 and October 31, 2006 and by the General Meeting of April 30, 2010 (10th resolution). This scheme has been confirmed by the Board meeting of February 12, 2014 and is subject to the approval of the General Meeting of April 30, 2014 (7th resolution).
The supplementary pension plan for the benefit of the Chairman and CEO includes: P a defined contribution scheme equivalent to 8% (5% paid by the Company and 3% by the beneficiary) of annual remuneration, comprised between eight and sixteen times the upper earnings limit for social security contributions; P a supplementary scheme with defined benefits.The benefit of this scheme is subject to a minimum length of service of 5 years and at least 2 years as GEC member.The annual amount is equal to 10% of the reference compensation, plus 1.40% per year of seniority as GEC member beyond 5 years and 0.40% per year outside GEC if the seniority within Renault exceeds 5 years.This amount is capped at 30% of the reference compensation.
The reference compensation used for calculating the amount of the pension benefits under the defined benefit plans is equal to the average of the three highest compensations in the past ten years before retirement.Compensation reference activity is capped at 65 times the annual social security ceiling.
The total amount of the CEO’s pension is less than or equal to 45% of his reference compensation.
In the event of a negative opinion, the Board of Directors shall meet as soon as possible to deliberate on the actions to be taken to follow-up the shareholders’
expectations and shall release the result of its resolutions on the Company’s website.
Appointment or renewals of directors’ term of ofFICE
The ninth, tenth, eleventh, twelfth and thirteenth resolutions deal with the
Board of Directors’ composition.
W The ninth resolution proposes to renew the term of office of Mr Marc
Ladreit de Lacharrière, for a period of four years, i.e. until the General
Meeting resolving upon the financial statements of the financial year
ending on December 31, 2017 Mr Marc Ladreit de Lacharrière(1) was
born on November 6, 1940 and is a French national. As of December 31,
2013, Mr Marc Ladreit de Lacharrière held 1,020 Renault shares.
W The tenth resolution proposes to renew the term of office of Mr Franck
Riboud, for a period of four years, i.e. until the General Meeting resolving
upon the financial statements of the financial year ending on December
31, 2017 Mr Franck Riboud(1) was born on November 7, 1955 and is a
French national. As of December 31, 2013, Mr Franck Riboud held 331
Renault shares.
W The eleventh resolution proposes to renew the term of office of Mr
Hiroto Saikawa, as Nissan’s Representative, for a period of four years,
i.e. until the General Meeting resolving upon the financial statements of the
financial year ending on December 31, 2017. Mr Hiroto Saikawa(1) was
born on November 14, 1953 and is a Japanese national. As of December
31, 2013, Mr Hiroto Saikawa held 100 Renault shares.
W The twelfth resolution proposes to renew the term of office of Mrs.
Pascale Sourisse, for a period of four years, i.e. until the General Meeting
resolving upon the financial statements of the financial year ending on
December 31, 2017 Mrs. Pascale Sourisse(1) was born on March 7,
1962 and is a French national. As of December 31, 2013, Mrs. Pascale
Sourisse held 1,000 Renault shares.
W The thirteenth resolution proposes to appoint Mr Patrick Thomas(1) as a
director, for a period of four years, i.e. until the General Meeting resolving
upon the financial statements of the financial year ending on December 31,
2017. Mr Patrick Thomas was born on June 16, 1947 and is a French
national.
The profiles of these candidates are provided hereafter in the section
“Composition of the Board of Directors”. The shareholders are also invited to
report to this section concerning the situation of these candidates as regards
the independence criteria set out by the AFEP MEDEF Corporate Governance
Code. Amongst the directors, ten are qualified as independent, namely Mrs.
de La Garanderie and Sourisse, Mrsrs. de Croisset, Belda, Delpit, Desmarest,
Garnier, Ladreit de Lacharrière, Lagayette and Riboud. Independent Directors
would thus represent 66.6% of the Board of Directors.
(1) See the profiles of the Directors on pages 40 to 43 of the 2013 shareholder’s meeting notice.
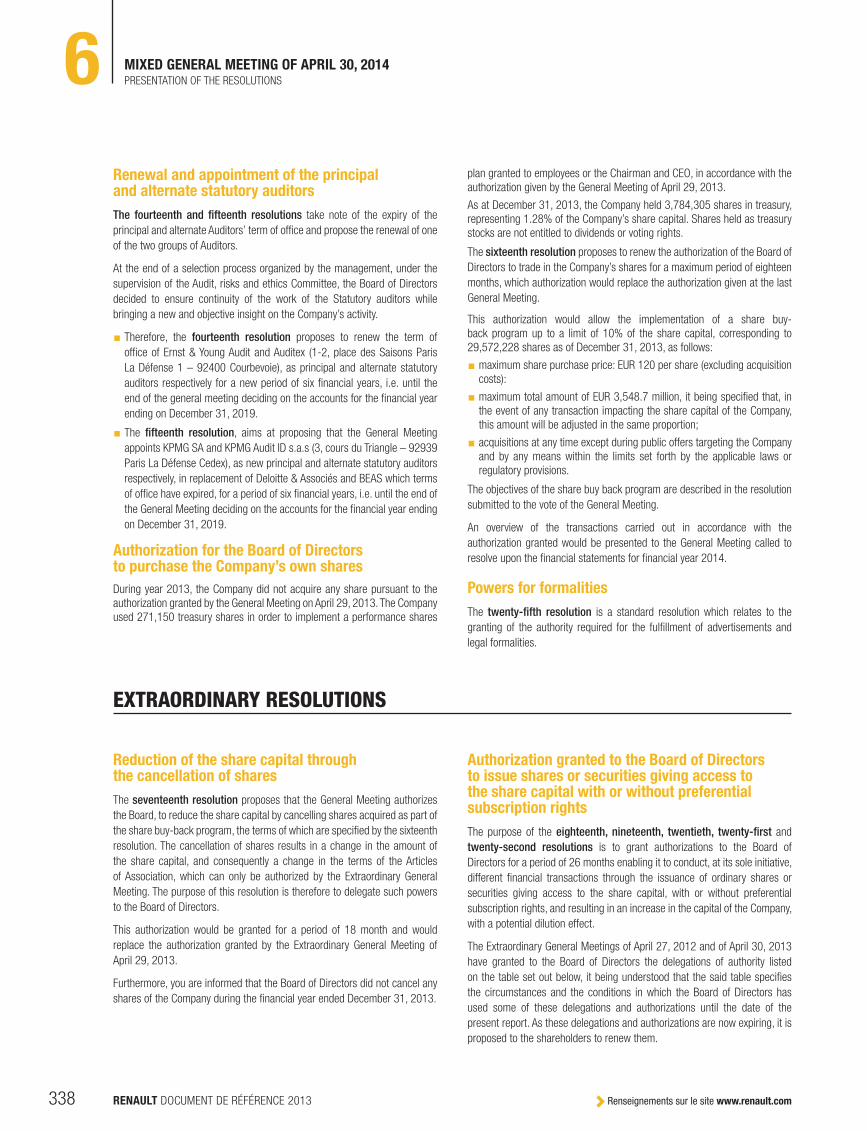
Renseignements sur le site www.renault.comRENAULT DOCUMENT DE RÉFÉRENCE 2013338
MIXED GENERAL MEETING OF APRIL 30, 2014 6 PRESENTATION OF THE RESOLUTIONS
Renewal and appointment of the principal and alternate statutory auditors
The fourteenth and fifteenth resolutions take note of the expiry of the
principal and alternate Auditors’ term of office and propose the renewal of one
of the two groups of Auditors.
At the end of a selection process organized by the management, under the
supervision of the Audit, risks and ethics Committee, the Board of Directors
decided to ensure continuity of the work of the Statutory auditors while
bringing a new and objective insight on the Company’s activity.
W Therefore, the fourteenth resolution proposes to renew the term of
office of Ernst & Young Audit and Auditex (1-2, place des Saisons Paris
La Défense 1 – 92400 Courbevoie), as principal and alternate statutory
auditors respectively for a new period of six financial years, i.e. until the
end of the general meeting deciding on the accounts for the financial year
ending on December 31, 2019.
W The fifteenth resolution, aims at proposing that the General Meeting
appoints KPMG SA and KPMG Audit ID s.a.s (3, cours du Triangle – 92939
Paris La Défense Cedex), as new principal and alternate statutory auditors
respectively, in replacement of Deloitte & Associés and BEAS which terms
of office have expired, for a period of six financial years, i.e. until the end of
the General Meeting deciding on the accounts for the financial year ending
on December 31, 2019.
Authorization for the Board of Directors to purchase the Company’s own shares
During year 2013, the Company did not acquire any share pursuant to the
authorization granted by the General Meeting on April 29, 2013. The Company
used 271,150 treasury shares in order to implement a performance shares
plan granted to employees or the Chairman and CEO, in accordance with the
authorization given by the General Meeting of April 29, 2013.
As at December 31, 2013, the Company held 3,784,305 shares in treasury,
representing 1.28% of the Company’s share capital. Shares held as treasury
stocks are not entitled to dividends or voting rights.
The sixteenth resolution proposes to renew the authorization of the Board of
Directors to trade in the Company’s shares for a maximum period of eighteen
months, which authorization would replace the authorization given at the last
General Meeting.
This authorization would allow the implementation of a share buy-
back program up to a limit of 10% of the share capital, corresponding to
29,572,228 shares as of December 31, 2013, as follows:
W maximum share purchase price: EUR 120 per share (excluding acquisition
costs):
W maximum total amount of EUR 3,548.7 million, it being specified that, in
the event of any transaction impacting the share capital of the Company,
this amount will be adjusted in the same proportion;
W acquisitions at any time except during public offers targeting the Company
and by any means within the limits set forth by the applicable laws or
regulatory provisions.
The objectives of the share buy back program are described in the resolution
submitted to the vote of the General Meeting.
An overview of the transactions carried out in accordance with the
authorization granted would be presented to the General Meeting called to
resolve upon the financial statements for financial year 2014.
Powers for formalities
The twenty-fifth resolution is a standard resolution which relates to the
granting of the authority required for the fulfillment of advertisements and
legal formalities.
EXTRAORDINARY RESOLUTIONS
Reduction of the share capital through the cancellation of shares
The seventeenth resolution proposes that the General Meeting authorizes
the Board, to reduce the share capital by cancelling shares acquired as part of
the share buy-back program, the terms of which are specified by the sixteenth
resolution. The cancellation of shares results in a change in the amount of
the share capital, and consequently a change in the terms of the Articles
of Association, which can only be authorized by the Extraordinary General
Meeting. The purpose of this resolution is therefore to delegate such powers
to the Board of Directors.
This authorization would be granted for a period of 18 month and would
replace the authorization granted by the Extraordinary General Meeting of
April 29, 2013.
Furthermore, you are informed that the Board of Directors did not cancel any
shares of the Company during the financial year ended December 31, 2013.
Authorization granted to the Board of Directors to issue shares or securities giving access to the share capital with or without preferential subscription rights
The purpose of the eighteenth, nineteenth, twentieth, twenty-first and
twenty-second resolutions is to grant authorizations to the Board of
Directors for a period of 26 months enabling it to conduct, at its sole initiative,
different financial transactions through the issuance of ordinary shares or
securities giving access to the share capital, with or without preferential
subscription rights, and resulting in an increase in the capital of the Company,
with a potential dilution effect.
The Extraordinary General Meetings of April 27, 2012 and of April 30, 2013
have granted to the Board of Directors the delegations of authority listed
on the table set out below, it being understood that the said table specifies
the circumstances and the conditions in which the Board of Directors has
used some of these delegations and authorizations until the date of the
present report. As these delegations and authorizations are now expiring, it is
proposed to the shareholders to renew them.

RENAULT DOCUMENT DE RÉFÉRENCE 2013✦ Directives de la Global Reporting Initiative (GRI) 339
MIXED GENERAL MEETING OF APRIL 30, 2014 6
6
PRESENTATION OF THE RESOLUTIONS
These authorizations are subject to a global cap of EUR 350 million in
respect of capital increases (which cap shall also apply to the capital increases
made pursuant to the twenty-fourth resolution as described below), and EUR
1 billion in respect of the debt portion of the issuance of securities giving
access to the capital (such as, for instance, convertible or exchangeable
bonds).
In addition to this global cap, individual caps in line with best market practices
apply depending on the type of transaction contemplated:
W the eighteenth resolution proposes to the shareholders to grant to the
Board of Directors the authorizations necessary to implement transactions
reserved to shareholders of the Company. These transactions would
cover the issuance of ordinary shares and/or securities giving access,
immediately or in the future, to ordinary shares of the Company or to debt
securities. The securities could be in the form of equity or debt securities.
Access to the share capital of the Company would result inter alia, from the
conversion or exchange of a security or by the presentation of a warrant
(bon). The maximum par value of ordinary shares to be issued as may be
decided upon by the Board of Directors, immediately and/or in the future,
while maintaining the preferential subscription right, would amount to
EUR 350 million; this amount would lead to the issuance of new shares
amounting to approximately 30% of the share capital existing at the
present date. The amount of debt securities would be limited to EUR 1
billion. Under this resolution, if irreducible subscriptions and any reducible
subscriptions do not absorb the entire issuance of shares or securities,
the Board of Directors may decide to offer to the public all or part of the
unsubscribed shares. The subscription price of shares and/or securities
which may be issued in application of this resolution would be set by the
Board of Directors, in accordance with market practices;
W the nineteenth resolution proposes to the General Meeting to grant
to the Board of Directors the authorizations necessary to implement
transactions through a public offering. These transactions would cover the
issuance of ordinary shares and/or securities giving access, immediately
or in the future, to ordinary shares of the Company or to debt securities.
The securities could be in the form of equity or debt securities. Access to
the share capital of the Company would result inter alia, in the conversion
or exchange of a security or by the presentation of a warrant (bon).The
maximum par value for issues that may be decided upon by the Board of
Directors, immediately and/or in the future, while cancelling the preferential
subscription right, by way of a public offering would amount to EUR 120
million; this amount would lead to the issuance of new shares amounting
to approximately 10% of the share capital existing at the present date. This
amount shall be subject to the overall cap of EUR 350 million mentioned
above. The amount of debt securities would be limited to EUR 1 billion.
Pursuant to this resolution, a priority right may be granted to shareholders,
upon decision of the Board of Directors. This resolution provides that the
share issuance price would be at least equal to the minimum amount
provided for by applicable laws and regulations in effect at the time of
the issuance (i.e., as at the date hereof, the volume-weighted average
price on the last three trading days preceding the fixing of the price, less a
maximum discount of 5%);
W the twentieth resolution proposes to the General Meeting to grant
to the Board of Directors the authorizations necessary to implement
transactions by way of private placements aimed at persons providing
investment services consisting in portfolio management for third parties,
qualified investors or a limited group of investors, in accordance with
the provisions of article L. 411-2 II of the French monetary and financial
Code. These transactions would cover the issuance of ordinary shares
and/or securities giving access, immediately or in the future, to ordinary
shares of the Company or to debt securities. The securities could be in
the form of equity or debt securities. Access to the share capital of the
Company would result inter alia, from the conversion or exchange of
a security or by the presentation of a warrant (bon). The maximum par
value for issues of ordinary shares that may be decided upon by the
Board of Directors, immediately and/or in the future, while cancelling
the preferential subscription right, in the context of private placements
addressed to persons providing investment services consisting in portfolio
management for third parties, qualified investors or to a restricted circle of
investors under the conditions of article L. 411-2 II of the French Financial
and Monetary Code, amounts to EUR 60 million, i.e up to a limit of
approximately 5% of the share capital at the date hereof. This amount
shall be subject to the above mentioned overall cap of EUR 350 million,
and the specific overall cap of EUR 120 million provided in the nineteenth
resolution for the issuances without preferential subscription rights. The
amount of debt securities would be limited to EUR 1 billion.
Furthermore, issuances of equity securities carried out by way of an offer
as defined in article L. 411-2 II of the French monetary and financial Code
are limited to 20% of the share capital of the Company per year.
The aim is to facilitate the use of this form of financing, which may be
faster and simpler than a capital increase by way of a public offering. This
resolution provides that the share issuance price would be at least equal to
the minimum price provided for by applicable laws and regulations in effect
at the time of the issuance (i.e., as at the date hereof, the volume-weighted
average price on the last three trading days preceding the fixing of the
price, less a maximum discount of 5%);
W the twenty-first resolution proposes to the shareholders to grant to
the Board of Directors the authorizations necessary to issue shares in
exchange for securities tendered to a public exchange offer initiated by
the Company on the securities of the Company or the securities of another
company listed on a regulated market. The issuance of ordinary shares,
immediately and/or in the future without preferential subscription right, that
can be made in case of a public exchange offer made by the Company are
limited to EUR 120 million. This amount shall be comprised in the above
mentioned overall cap of EUR 350 million, and the specific overall cap
of EUR 120 million provided in the nineteenth resolution for issuances
of shares without preferential subscription rights. The Board of Directors

Renseignements sur le site www.renault.comRENAULT DOCUMENT DE RÉFÉRENCE 2013340
MIXED GENERAL MEETING OF APRIL 30, 2014 6 PRESENTATION OF THE RESOLUTIONS
would have the power to determine the exchange ratios and, if required,
the amount of the cash adjustment to be paid;
W the twenty-second resolution proposes to the shareholders to grant
to the Board of Directors the authorizations necessary to issues shares
in consideration for contributions in kind made to Renault and consisting
of equity securities or securities giving access to the share capital. The
par value for issues of ordinary shares or securities giving access to the
share capital which may be carried out immediately and/or in the future in
exchange for contributions in kind, without preferential subscription rights,
are legally limited to 10% of the share capital existing at the present date,
and specifically to EUR 120 million. This amount shall be comprised in
the above mentioned overall cap of EUR 350 million, and the specific
overall cap of EUR 120 million provided for in the nineteenth resolution.
The Board of Directors would have the power necessary to decide any such
issuance on the basis of the contribution auditors’ report regarding the
valuation of the contributions in kind and the granting of special benefits.
These resolutions, which constitute standard authorizations in accordance
with market practices, have been specifically adjusted in order to give the
Board the greatest latitude to act in the best of the Company’s interests and
meet the requirements of the market, while taking the expectations and
concerns of the shareholders into account.
As every year, the shareholders shall be informed of any use of these
authorizations in the summary table of authorizations mentioned in chapter
5.2.4 of the 2014 Registration Document.
Authorization granted to the Board of Directors to increase the share capital through the capitalization of reserves, profits or premiums
Pursuant to the twenty-third resolution, capital increases which would result
from the capitalization of reserves, profits, premium or any other element
which may be incorporated into the capital would be capped at EUR 1 billion
(this amount being strictly identical to previous authorizations). The existence
of a distinct and individual cap is justified by the different nature of the
capitalization of reserves, profits or premium because this results either in
the award of free shares to shareholders, or in the increase in the par value of
existing shares, meaning that there is no dilution for the shareholders and no
effect on the volume of the Company’s equity.
The Board of Directors would have the power to determine the amount and
nature of the amounts to be capitalized, determine the number of new shares
to be issued and/or the amount by which the existing par value of the shares
of the Company will be increased.
Authorization granted to the Board of Directors to increase the share capital by issuing shares reserved to employees
The twenty-fourth resolution proposes to the General Meeting, in accordance
with the provisions of Article L. 225-129-6 of the French Commercial Code,
to approve a resolution allowing a capital increase reserved to employees of
the Company or of companies affiliated to the Group within the meaning of
Article L. 225-180 of the French Commercial Code and Article L. 3344-1
of the French Labor Code relating to employee shareholding, and Articles L.
225-138 and L. 225-138-1 of the French Commercial Code. This resolution
grants the Board powers to carry out, in one or more installments, without
preferential subscription rights, a capital increase reserved to employees who
are members of company savings schemes, through the issuance of new
shares and, where applicable, the award of performance shares, within a limit
of 1% of the amount of the shares making up the share capital.
This limit is in line with market practices which adjust the cap according to
the level of employees’ shareholdings. This amount shall be comprised in the
above mentioned overall cap of EUR 350 million, and the specific overall
cap of EUR 120 million provided in the nineteenth resolution relating to the
issuance of shares with preferential subscription rights.
This resolution provides that:
W the issuance price of ordinary shares cannot be above the weighted
average opening market price on the last twenty trading days preceding
the date on which the Board of Directors determines the opening date for
the subscriptions, nor less than 20% of such average, or 30%, respectively,
in the case of a savings plan;
W the characteristics of the issuances of other securities giving access to the
capital of the Company shall be determined by the Board of Directors in
accordance with applicable regulations.
This delegation is granted to the Board of Directors for 26 months as from
the date of the General Meeting of April 30, 2014 and replaces the previous
delegation authorized by the previous General Meeting.

RENAULT DOCUMENT DE RÉFÉRENCE 2013✦ Directives de la Global Reporting Initiative (GRI) 341
MIXED GENERAL MEETING OF APRIL 30, 2014 6
6
PRESENTATION OF THE RESOLUTIONS
DESCRIPTION OF THE DELEGATION GRANTED TO THE BOARD OF DIRECTORS IMPLEMENTATION
12th resolutionGM 2012
Issuance of ordinary shares or securities giving access to the share capital with preferential subscription rights of the shareholders.Duration of 26 month, i.e. until the General Meeting resolving upon the 2013 financial statements.Maximum cap for capital increases of EUR 350 million (about 30% of the share capital).
None
13th resolutionGM 2012
Issuance of ordinary shares or securities giving access to the share capital without preferential subscription rights of the shareholders.Duration of 26 month, i.e. until the General Meeting resolving upon the 2013 financial statements.Overall cap for capital increases of EUR 120 million (about 10% of the share capital).
None
14th resolutionGM 2012
Issuance of ordinary shares or securities giving access to the share capital by private placement.Duration of 26 month, i.e. until the General Meeting resolving upon the 2013 financial statements.Maximum cap for capital.
None
15th resolutionGM 2012
Issuance of ordinary shares or securities giving access to the share capital in the event of an exchange tender offer.Duration of 26 month, i.e. until the General Meeting resolving upon the 2013 financial statements.Maximum cap for capital increases of EUR 120 million (about 10% of the share capital).
None
16th resolutionGM 2012
Increase of the share capital by issuance of shares by contributions in kind.Duration of 26 month, i.e. until the General Meeting resolving upon the 2013 financial statements.Maximum cap for capital increases of EUR 120 million (about 10% of the share capital).
None
17th resolutionGM 2012
Increase of the share capital by capitalization of reserves, profits or premiums, etc.Duration of 26 month, i.e. until the General Meeting resolving upon the 2013 financial statements.Maximum cap for capital increases of EUR 1 billion.
None
16th resolutionGM 2013
Increase of the share capital by issuance of shares reserved for employees.Duration of 26 month, i.e. until the General Meeting resolving upon the 2014 financial statements.Maximum cap for capital increases of 1% of the share capital of the Company.
None
Table of delegations regarding capital increases
The table hereafter, reproduced in Section 5 of the Registration Document, details the delegations remaining in effect granted by the shareholders of the Company
to the Board of Directors regarding capital increases:

Find out more at www.renault.comREGISTRATION DOCUMENT RENAULT 2013342
RENAULT'S TECHNICAL LANGUAGE EXPLAINED

REGISTRATION DOCUMENT RENAULT 2013✦ Global Reporting Initiative (GRI) Directives 343
7.1 PERSON RESPONSIBLE FOR THE REGISTRATION DOCUMENT AFR ✦ 344
7.2 INFORMATION CONCERNING FY 2011 AND 2012 ✦ 345
7.2.1 FY 2011 ✦ 345
7.2.2 FY 2012 ✦ 345
7.3 STATUTORY AUDITORS AFR 346
7.3.1 Statutory auditors 346
7.3.2 Alternate auditors 346
7.3.3 Fees paid to statutory auditors 346
7.4 CROSS REFERENCE TABLES 347
7.4.1 Disclosure requirements – annex I/EC809/2004 ✦ 347
7.4.2 Annual financial report (art. L. 225-100 and L. 225-100-2 of French Company Law) ✦ 349
7.4.3 Global reporting initiative indicators and global compact principles 2013 350
7ADDITIONAL INFORMATION
The elements of the annual fi nancial report are identifi ed by AFR sign.

Find out more at www.renault.comREGISTRATION DOCUMENT RENAULT 2013344
ADDITIONAL INFORMATION7 PERSON RESPONSIBLE FOR THE REGISTRATION DOCUMENT
7.1 PERSON RESPONSIBLE FOR THE REGISTRATION DOCUMENT ✦
Person who accepts full responsibility for the Registration document and the related supplemental information:
Mr. Carlos Ghosn, Chairman and Chief Executive Officer.
I hereby declare that, to the best of my knowledge, the information in this
document is correct and that all reasonable measures have been taken to
that end. There are no omissions likely to alter the scope of this information.
I hereby declare that, to the best of my knowledge, the financial statements
have been prepared in accordance with the applicable set of accounting
standards and give a true and fair view of the assets, liabilities, financial
position and results of the Company and all the undertakings included in
the consolidation taken as a whole; and that the management report in
the Registration document includes a fair review of the development and
performance of the business, the results and the financial position of the
Company and all the undertakings in the consolidation taken as a whole,
together with a description of the principal risks and uncertainties that they
face.
I have received a completion letter from Renault’s statutory auditors stating
that they have verified the information concerning the financial situation and
the financial statements set forth in this Registration document, which they
have read in full.
Paris, March 13 , 2014
Chairman and Chief Executive Officer
Carlos Ghosn

REGISTRATION DOCUMENT RENAULT 2013✦ Global Reporting Initiative (GRI) Directives 345
ADDITIONAL INFORMATION 7
7
INFORMATION CONCERNING FY 2011 AND 2012
7.2 INFORMATION CONCERNING FY 2011 AND 2012 ✦
Pursuant to Article 28 of Commission regulation (EC) 809/2004, the following historical data is incorporated by reference in the 2013 Registration document:
7.2.1 FY 2011 ✦
The 2011 Registration document was filed with the Autorité des marchés
financiers on March 13, 2012 under No. D.12-0152 (French version).
The consolidated financial statements are outlined on pages 186 to 244
of chapter 4 and the corresponding audit report is on page 184 of chapter 4.
Financial information is on pages 54 to 57 of chapter 1.3.2.
Data not incorporated in this document is either not appropriate for investors
or covered in another chapter of the Registration document.
7.2.2 FY 2012 ✦
The 2012 Registration document was filed with the Autorité des marchés
financiers on March 13, 2013, under No. D.13-0128 (French version).
The consolidated financial statements are outlined on pages 196 to 254 of
chapter 4, and the corresponding audit report is on page 194 of chapter 4.
Financial information is on pages 51 to 54 of chapter 1.3.2.
Data not incorporated in this document is either not appropriate for investors
or covered in another chapter of the Registration document.

Find out more at www.renault.comREGISTRATION DOCUMENT RENAULT 2013346
ADDITIONAL INFORMATION7 STATUTORY AUDITORS
7.3 STATUTORY AUDITORS
7.3.1 STATUTORY AUDITORS
Deloitte & Associés
Represented by Thierry Benoit and Antoine de Riedmatten
185, avenue Charles-de-Gaulle
92200 Neuilly-sur-Seine
FRANCE
Deloitte & Associés was appointed by the French Finance Ministry on April 25,
1990. It was reappointed by the Joint General Meeting of June 7, 1996,
April 26, 2002 and April 29, 2008 for a period of six years. This term will
expire at the close of the Annual General Meeting convened to approve the
accounts for 2013.
7.3.2 ALTERNATE AUDITORS
BEAS
Alternate for Deloitte & Associés
7-9, villa Houssay
92200 Neuilly-sur-Seine
FRANCE
Auditex
Alternate for Ernst & Young Audit
Tour First
1-2, place des saisons
92400 Courbevoie – Paris La Défense 1
FRANCE
The alternate auditors were appointed by the Joint General Meeting of June 7,
1996 for a six-year term. They were reappointed by the Joint General Meeting
of June 7, 1996, April 26, 2002 and April 29, 2008 for a period of six years.
This term will expire at the close of the Annual General Meeting convened to
approve the accounts for 2013.
EY Audit
Represented by Mrs Jean-François Bélorgey and Bernard Heller
Tour First
1-2, place des saisons
92400 Courbevoie – Paris La Défense 1
FRANCE
Ernst & Young Audit was appointed by the French Finance Ministry on
March 27, 1979. It was reappointed by the Joint General Meeting of June 7,
1996, April 26, 2002 and April 29, 2008 for a period of six years. This term
will expire at the close of the Annual General Meeting convened to approve
the accounts for 2013.
7.3.3 FEES PAID TO STATUTORY AUDITORS
The fees paid to statutory auditors and their networks are presented in note 29 of the appendix to the consolidated financial statement.

REGISTRATION DOCUMENT RENAULT 2013✦ Global Reporting Initiative (GRI) Directives 347
ADDITIONAL INFORMATION 7
7
CROSS REFERENCE TABLES
7.4 CROSS REFERENCE TABLES
7.4.1 DISCLOSURE REQUIREMENTS – ANNEX I/EC809/2004 ✦
PAGES
1 Persons responsible 344
2 Statutory auditors 346
3 Selected financial information
3.1 Historical information 4; 230-240; 345
3.2 Interim information n.a.
4 Risk factors 70-88; 287-291
5 Information about the issuer
5.1 History and development of the issuer 4-7; 322
5.2 Investments 53-55; 239-240; 243; 291-292
6 Business overview
6.1 Principal activities 8-20; 42-51
6.2 Principal markets 42
6.3 Exceptional events n.a.
6.4 Dependency risk 58; 88
6.5 Basis for any statements made by the issuer regarding its competitive position 47-49
7 Organizational structure
7.1 Brief description 8; 21; 24-25
7.2 Significant subsidiaries 22-23; 294-297
8 Property, plant and equipment
8.1 Existing or planned material tangible fixed assets 14; 19 ; 40; 248-250; 258-261
8.2 Environmental issues that may influence the utilization of the tangible fixed assets 86
9 Operating and financial review
9.1 Financial condition52-55; 232-233; 237-238;
256-257; 279-284
9.2 Operating results 53; 253-257
10 Cash and capital resources
10.1 Issuer’s capital resources 233-234; 239; 271-274; 322-326
10.2 Source and amount of cashflows16; 70-76; 235; 239-240; 251;
279-284; 291
10.3 Borrowing requirements and funding structure 55; 251-252; 279-284; 328-329
10.4 Information on any restriction on the use of capital resources that have materially affected or could materially affect, directly or indirectly the issuer’s operations n.a.
10.5 Anticipated sources of funds
11 Research and Development, patents and licences 58-69; 34-35; 53; 55
12 Trend information 42
13 Profit forecasts or estimates n.a.
14 Administrative, management and supervisory bodies, and senior management
14.1 Administrative and management bodies 20-21; 184-202; 219-223
14.2 Conflicts of interest on the administrative, management and supervisory bodies and in senior management 197
15 Remuneration and benefits
15.1 Amount of compensation paid and benefits in-kind110; 167; 201-202; 210-218;
253-255; 292
15.2 Total amounts set aside or accrued by the issuer to provide pension, retirement or similar benefits 243-244; 251; 275-277; 292

Find out more at www.renault.comREGISTRATION DOCUMENT RENAULT 2013348
ADDITIONAL INFORMATION7 CROSS REFERENCE TABLES
PAGES
16 Board practices
16.1 Date of expiration of current terms of office 185-196
16.2 Service agreements binding the members of administrative bodies 197; 292
16.3 Information about the Audit Committee and the Remuneration Committee 221-222; 198-199
16.4 Corporate governance 20-21; 183-225
17 Employees
17.1 Number of employees 4; 109; 254
17.2 Shareholdings and stock-options 119-120; 167
17.3 Arrangements for involving employees in the capital of the issuer 272-273; 338-340
18 Major shareholders
18.1 Shareholders holding more than 5% of the share capital or voting rights 4; 17; 36-37; 325-326
18.2 Existence of different voting rights 322; 325-326
18.3 Corporate control 4; 271; 325-326
18.4 Agreement, known to the issuer, the operation of which could result in a change in control of the issuer at a later date 326
19 Related party transactions 17; 34-36; 37; 261-265; 300-301
20 Financial information concerning the issuer’s assets and liabilities, financial position and profits and losses
20.1 Historical financial information 4; 230-240; 345
20.2 Pro forma financial information 4; 41; 52; 53; 54; 55; 245; 256
20.3 Financial statements 230-297
20.4 Audit of annual historical financial information 228-229
20.5 Age of the latest financial information 230-241
20.6 Interim and other financial information n.a.
20.7 Dividend policy 4; 42; 321; 328; 334
20.8 Legal and arbitration proceedings 87-88; 275
20.9 Significant change in the financial or trading position 17; 19; 70-78
21 Additional information
21.1 Share capital 4; 271; 322-326
21.2 Articles of association 320-321
22 Material contracts 67-69; 300-301
23 Third party information and statements by experts and declarations of any interest n.a.
24 Documents on display 320-331
25 Information on holdings 17-19; 261-268; 304; 305

REGISTRATION DOCUMENT RENAULT 2013✦ Global Reporting Initiative (GRI) Directives 349
ADDITIONAL INFORMATION 7
7
CROSS REFERENCE TABLES
7.4.2 ANNUAL FINANCIAL REPORT (ART. L. 225-100 AND L. 225-100-2 OF FRENCH COMPANY LAW) ✦
MANAGEMENT REPORT PAGES
Business activity and trends 42-51
Results 41-42
Financial situation 52-55
Risk factors 70-88
Events since closing and outlook 91-92
Dividends 328-329
Share buybacks (Art. 225-211, paragraph 2 of French Commercial Code) 324
Capital structure and items likely to be important in the event of a takeover bid (Art. L. 225-100-3 of French Commercial Code) 321-326
Remuneration of corporate officers 210; 215-216
Labor relation, environmental and social information (Art. L. 225-102-1 of French Commercial Code) 94-181
Research and development 58-69
Payment times –
PERSON RESPONSIBLE FOR THE DOCUMENT 344
FEES PAID TO STATUTORY AUDITORS 293
CHAIRMAN’S REPORT ON INTERNAL CONTROL 184-208
Statutory auditors’ report on the Chairman’s report 209
FINANCIAL STATEMENTS 227
Statutory auditors’ report on the consolidated financial statements 228-229
Consolidated financial statements 230-297
Statutory auditors’ report on the parent company financial statements 298-299
Statutory auditors’ report on regulated agreements and commitments 300-301
Parent company financial statements 302-317
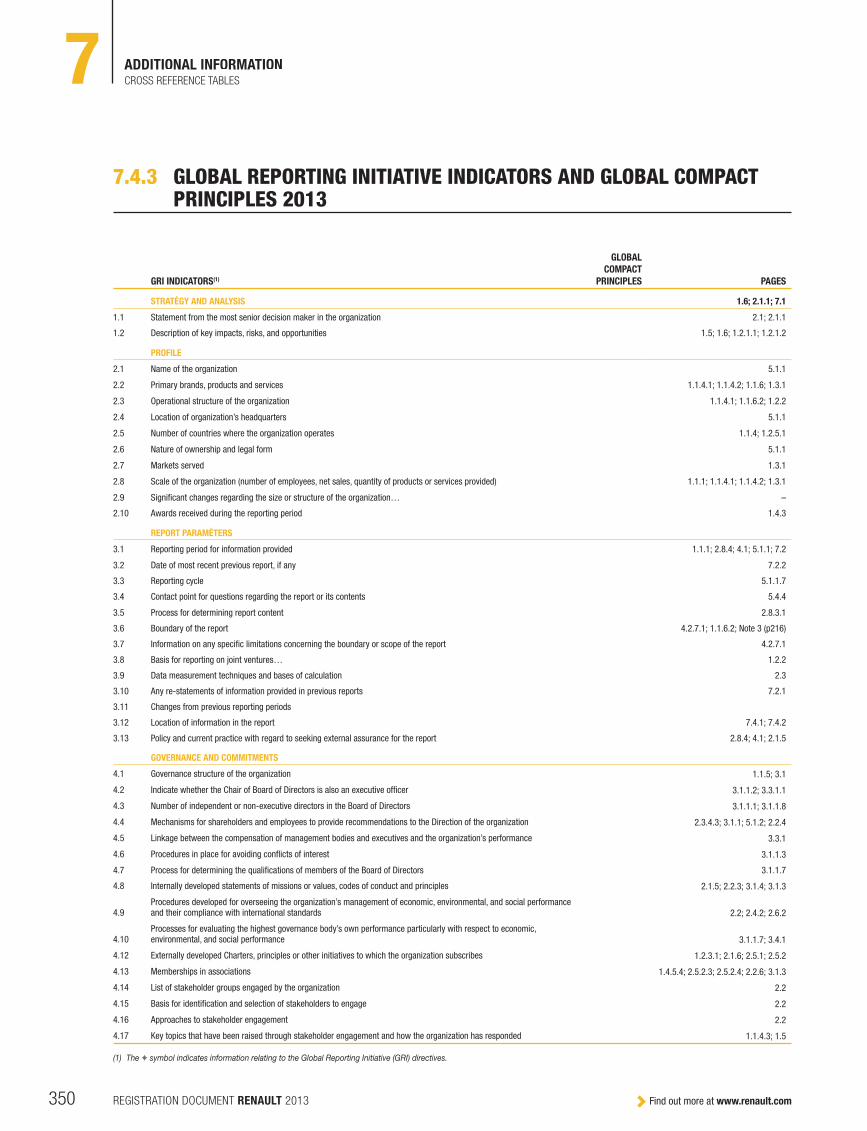
Find out more at www.renault.comREGISTRATION DOCUMENT RENAULT 2013350
ADDITIONAL INFORMATION7 CROSS REFERENCE TABLES
7.4.3 GLOBAL REPORTING INITIATIVE INDICATORS AND GLOBAL COMPACT PRINCIPLES 2013
GRI INDICATORS(1)
GLOBAL
COMPACT
PRINCIPLES PAGES
STRATÉGY AND ANALYSIS 1.6; 2.1.1; 7.1
1.1 Statement from the most senior decision maker in the organization 2.1; 2.1.1
1.2 Description of key impacts, risks, and opportunities 1.5; 1.6; 1.2.1.1; 1.2.1.2
PROFILE
2.1 Name of the organization 5.1.1
2.2 Primary brands, products and services 1.1.4.1; 1.1.4.2; 1.1.6; 1.3.1
2.3 Operational structure of the organization 1.1.4.1; 1.1.6.2; 1.2.2
2.4 Location of organization’s headquarters 5.1.1
2.5 Number of countries where the organization operates 1.1.4; 1.2.5.1
2.6 Nature of ownership and legal form 5.1.1
2.7 Markets served 1.3.1
2.8 Scale of the organization (number of employees, net sales, quantity of products or services provided) 1.1.1; 1.1.4.1; 1.1.4.2; 1.3.1
2.9 Significant changes regarding the size or structure of the organization… –
2.10 Awards received during the reporting period 1.4.3
REPORT PARAMÈTERS
3.1 Reporting period for information provided 1.1.1; 2.8.4; 4.1; 5.1.1; 7.2
3.2 Date of most recent previous report, if any 7.2.2
3.3 Reporting cycle 5.1.1.7
3.4 Contact point for questions regarding the report or its contents 5.4.4
3.5 Process for determining report content 2.8.3.1
3.6 Boundary of the report 4.2.7.1; 1.1.6.2; Note 3 (p216)
3.7 Information on any specific limitations concerning the boundary or scope of the report 4.2.7.1
3.8 Basis for reporting on joint ventures… 1.2.2
3.9 Data measurement techniques and bases of calculation 2 .3
3.10 Any re-statements of information provided in previous reports 7.2.1
3.11 Changes from previous reporting periods
3.12 Location of information in the report 7.4.1; 7.4.2
3.13 Policy and current practice with regard to seeking external assurance for the report 2.8.4; 4.1; 2.1.5
GOVERNANCE AND COMMITMENTS
4.1 Governance structure of the organization 1.1.5 ; 3.1
4.2 Indicate whether the Chair of Board of Directors is also an executive officer 3.1.1.2 ; 3.3.1.1
4.3 Number of independent or non-executive directors in the Board of Directors 3.1.1.1 ; 3.1.1.8
4.4 Mechanisms for shareholders and employees to provide recommendations to the Direction of the organization 2.3.4.3 ; 3.1.1 ; 5.1.2 ; 2.2.4
4.5 Linkage between the compensation of management bodies and executives and the organization’s performance 3.3.1
4.6 Procedures in place for avoiding conflicts of interest 3.1.1.3
4.7 Process for determining the qualifications of members of the Board of Directors 3.1.1.7
4.8 Internally developed statements of missions or values, codes of conduct and principles 2.1.5 ; 2.2.3 ; 3.1.4 ; 3.1.3
4.9 Procedures developed for overseeing the organization’s management of economic, environmental, and social performance and their compliance with international standards 2.2 ; 2.4.2 ; 2.6.2
4.10 Processes for evaluating the highest governance body’s own performance particularly with respect to economic, environmental, and social performance 3.1.1.7 ; 3.4.1
4.12 Externally developed Charters, principles or other initiatives to which the organization subscribes 1.2.3.1 ; 2.1.6 ; 2.5.1 ; 2.5.2
4.13 Memberships in associations 1.4.5.4 ; 2.5.2.3 ; 2.5.2.4 ; 2.2.6 ; 3.1.3
4.14 List of stakeholder groups engaged by the organization 2.2
4.15 Basis for identification and selection of stakeholders to engage 2.2
4.16 Approaches to stakeholder engagement 2.2
4.17 Key topics that have been raised through stakeholder engagement and how the organization has responded 1.1.4.3 ; 1.5
(1) The ✦ symbol indicates information relating to the Global Reporting Initiative (GRI) directives.

REGISTRATION DOCUMENT RENAULT 2013✦ Global Reporting Initiative (GRI) Directives 351
ADDITIONAL INFORMATION 7
7
CROSS REFERENCE TABLES
GRI INDICATORS(1)
GLOBAL
COMPACT
PRINCIPLES PAGES
ECONOMIC PERFORMANCE INDICATORS
EC1 Economic value generated and distributed 1.1.1 ; 1.3.2 ; 2.3.3.2 ; 2.5.2 ; 4.2.1 ; 5.3
EC6 Policy, practices and proportion of spending on locally-based suppliers 2.2.3 ; 1.1.4.3
EC8 Development and impact of infrastructure investments and services provided primarily for public benefit 2.2 ; 2.5.1.2 ; 2.5.2
ENVIRONMENTAL PERFORMANCE INDICATORS
EN1 Consumption of materials by weight and volume 2.4.2.2
EN2 % of materials used that are recycled input materials 8 & 9 2.4.2.2 & 2.4.2.3
EN3 Direct energy consumption by primary source 2.4.2.1
EN4 Indirect energy consumption by primary source 2.4.2.1
EN5 Energy saved due to conservation and efficiency improvements 8 & 9 2.4.3.3
EN8 Total water consumption, by source 2.4.2.4
EN10 % and volume of total water recycled and re-used
EN11 Strategies for managing impacts on biodiversity 8 2.4.2.9
EN12 Description of significant impacts on biodiversity 2.4.2.9
EN16 Greenhouse gas emissions 2.4.2.1
EN17 Other relevant indirect greenhouse gas emissions 2.4.2.1
EN18 Initiatives to reduce greenhouse gas emissions and reductions achieved 8 & 9 2.4.2.1
EN20 Emissions of NOx, SO2 and other significant pollutants by type and weight 2.4.2.5
EN21 Total water discharge by quality and destination 8 2.4.2.4
EN22 Total weight of waste by type and disposal method 8 2.4.2.3
EN26 Initiatives to mitigate environmental impacts of products and services and extent of impact mitigation 8 & 9 2.4.1 & 2.4.3.2
EN27 % of products sold and their packaging materials that are reclaimed by category 8 & 9 2.4.3.2
EN29 Significant environmental impacts of transporting products, other goods and materials 2.4.2.1 & 2.4.3.2
EN30 Total expenses and investments regarding environmental protections, per type.
LABOUR PRACTICES AND DECENT WORK INDICATORS
LA1 Total workforce by employment type, employment contract, and region 2.3.1.1
LA2 Total number and rate of employee turnover by age group, gender, and region 6 2.3.1.1
LA4 % of employees covered by collective bargaining agreements 3 2.3.1.2 ; 2.3.3.2
LA5 Minimum notice period regarding operational changes 2.3.4.2
LA7 Rates of injury, occupational diseases, lost days, absenteeism and work-related fatalities 2.3.3.1
LA8 Programs in place to assist workforce members, their families or community members regarding serious diseases 2.3.1.4 ; 2.3.2.1 ; 2.3.3.1
LA9 Health and safety topics covered in formal agreements with trade unions 2.3.4.1
LA10 Average hours of training per year per employee by employee category 6 2.3.1.4
LA11 Programs for skills management and lifelong learning 2.3.1.4
LA13 Composition of governance bodies and breakdown of employees per category according to indicators of diversity 6 2.3.2.3
HUMAN RIGHTS PERFORMANCE INDICATORS
HR1 % and total number of significant investment agreements that include human rights clauses 1 & 2 2.2.3
HR2 % of suppliers and contractors that underwent screening on human rights and actions taken 1 & 2 1.5.2.1 ; 2.2.3
HR5Operations identified in which the right to exercise freedom of association and collective bargaining may be at significant risk and actions taken 1 & 3 2.3.4.1
HR6 Operations identified as having significant risk for incidents of child labor, and actions taken 1 & 5 3.1.3
HR7 Operations identified as having significant risk for incidents of forced or compulsory labor, and actions taken 1 & 4 3.1.3
SOCIETAL PERFORMANCE INDICATORS
SO1 Programs and practices that assess and manage the impacts of operations on communities 2.5
SO2 Strategic business units analyzed for risks related to corruption 3.1.3 ; 3.1.4.2
SO3 Percentage of employees trained in anti-corruption policies and procedures 3.1.3
SO4 Actions taken in response to incidents of corruption 3.1.3
PRODUCT AND CUSTOMER SATISFACTION PERFORMANCE INDICATORS
PR1Life cycle stages where health and safety impacts of products and services are assessed for improvement and % of products and services subject to such procedures 2.4.2.6 ; 2.4.3.2 ; 2.4.2.8
PR3Type of product and service information required by procedures, and % of significant products and services subject to such information requirements 2.2.1.2
PR5 Practices related to customer satisfaction 2.2.1
PR6Adherence to laws, standards, and voluntary codes related to marketing communications, including advertising, promotion, and sponsorship 2.2.1
(1) The ✦ symbol indicates information relating to the Global Reporting Initiative (GRI) directives.

Find out more at www.renault.comREGISTRATION DOCUMENT RENAULT 2013352
GLOSSARY
GLOSSARY
A
AVES: Alliance Vehicle Evaluation System. A system of quality checks
conducted on new vehicles as they come off the assembly lines. AVES applies
a detailed method comprising a static/visual component and a dynamic
component to detect any visual or mechanical defects or abnormal noises.
C
CCT: Cross-Company Team. A team consisting of representatives from
Renault and Nissan who explore opportunities for synergy between the two
companies within the framework of the Alliance.
CVT: Continuously Variable Transmission. A gearbox technology that enable
the vehicle to run at optimum power. A CVT delivers better fuel economy
than a conventional automatic transmission. It provides a smoother, more
comfortable driving experience by shifting seamlessly through gear ratios with
no break in acceleration.
D
Downsizing: Reduction of engine size in cc, reducing consumption and gaz
emissions while keeping performance on same level.
DPF: Diesel Particulate Filter. A particulate filter removes diesel particulate
matter from exhaust gases by trapping them in a microporous honeycomb
structure. The filter is automatically regenerated every 500 km.
E
EBA: Emergency Brake Assist. A system that detects emergency braking
situations and instantaneously increases braking pressure to shorten the
distance the vehicle takes to stop.
Engine downsizing. A reduction in engine capacity and number of cylinders.
Downsizing fuel engines is one of the most economical ways to cut fuel
consumption and greenhouse gas emissions with no loss of power.
Euro NCAP: European New Car Assessment Program. Safety standards for
crash tests in Europe.
Euro NCAP performs crash tests to give consumers precise information about
the safety of their cars.
Since 2009, Euro NCAP has released a single overall rating for each vehicle
tested, which comprises assessments of Adult Occupant Protect, Child
Occupant Protection, Pedestrian Protection and Safety Assist. Euro NCAP
also publishes information about ESC fitment and the results of rear impact
(whiplash) tests in terms of seat design.
Euro 5 and Euro 6. European Union emissions standards that set limits on
emissions other than carbon dioxide (CO2) for passenger cars and other
vehicles. The Euro 5 emissions standard came into force in September 2009
for new type approvals and for all new cars in January 2011. In 2014,
Euro 5 will be superseded by Euro 6, which focuses on nitrogen oxides (NOx).
F
FCF: Free Cash Flow. FCF is the amount of cash generated by a company
after interest payments, tax and net investments. FCF is used to:
W reduce the Net Financial Debt of Automotive
W pay dividends
W buy back the company’s own shares and minority interests
W make acquisitions and take stakes in affiliates.
FTT: Functional Task Team. A team consisting of representatives from
Renault and Nissan who share their expertise in processes, standards and
management tools within the framework of the Alliance.
Fuel cell. Consisting of a nucleus and a single electron, hydrogen is the
simplest and lightest of the elements on the periodic table, fourteen times
lighter than air. In a fuel cell, hydrogen and oxygen are brought into contact
on either side of a polymer electrolyte membrane. They combine to produce
water, the only “emission” of the engine, which generates electricity and heat.
It is this electrical energy that powers the vehicle’s electric engine.
G
GEC: Group Executive Committee. The GEC is responsible for the company’s
key policies and strategic decisions.
K
KPI: Key Performance Indicator. KPIs are used to measure the company’s
performance. They provide an overview of the Group’s performance, which
is reported monthly to the GEC. KPIs are the main tool for performance
management in each geographical region or business line.
L
LAB: Laboratory of Accidentology, Biomechanics and Human Behavior. The
LAB reflects will to improve road safety by combining several scientific
disciplines at the crossroads between physics and human sciences. The
accidentology and driver behavior teams analyze the causes and effects of
road accidents with a view to improving prevention. The biomechanics team
works toward better occupant protection.
N
NEDC: New European Driving Cycle. The NEDC is a standardized driving cycle
and test procedure used to measure the emission levels and fuel economy
of all types of vehicles in Europe. The NEDC is thus an objective criterion
for assessing the performance of models by different manufacturers. The
vehicle is placed on a roller test bench and subjected to three urban (ECE-15)
cycles and one extra-urban driving cycle. The average of the four cycles is the
average fuel economy.

REGISTRATION DOCUMENT RENAULT 2013✦ Global Reporting Initiative (GRI) Directives 353
GLOSSARY
O
OYAK-Renault: Renault’s manufacturing partner in Turkey.
R
R&AE: Research and Advanced Engineering. R&AE activities are managed
across the company’s engineering departments using a shared, structured
plan. The plan covers all vehicle, powertrain, product, process and service
applications.
RMC: Regional Management Committee. The RMC represents most of the
company’s core business lines, meets monthly and works to improve volume
and market share in the markets of its region.
T
TAM: Total Automotive Market. The TAM is an aggregate figure representing
new registrations of all automotive makes in the same market. TAM is
frequently used in conjunction with Market Share (MS).
TCE: Turbo Control Efficiency. TCE engines are equipped with a low inertia
turbo that ensures minimal lag, thanks to its small-diameter turbine and
compressor. The marriage of small capacity and low inertia turbo ensures
lively response from low revs.

Find out more at www.renault.comREGISTRATION DOCUMENT RENAULT 2013354
GLOSSARY
INITIALS AND ACRONYMS
A
AAA: French automobile manufacturers’ association (Association auxiliaire
automobile)
ABS: Anti-lock Braking System
ADEME: Environment and energy management agency (Agence de
l’environnement et de la maîtrise de l’énergie)
AM: Asset Management
APP: EU Agency for the Protection of Programs
ARC: EU Accounting Regulatory Committee
ASFE: Alliance for Synthetic Fuels in Europe
AVES: Alliance Vehicle Evaluation System
AvtoVAZ: Renault’s subsidiary in Russia
B
BOT: Build Operate Transfer Agreements
C
CAE: Computer-Aided Engineering
CAFE: Corporate Average Fuel Economy (indicator)
CARE: Renault Audit, Risks and Ethics Committee, also responsible for
remuneration, international strategy, etc. (Comité de l’audit, des risques et
de l’éthique)
CCI: Chamber of Commerce and Industry
CCT: Cross-Company Team
CDC: Public infrastructure investment agency (Caisse des dépôts et
consignations)
CDP: Carbon Disclosure Project
CECC: Country Ethics and Compliance Committee
CESP: Company Employee Savings Plan
CMS: Constant Maturity Swap
CNC: National audit office (Conseil national de la comptabilité)
CNG: Compressed Natural Gas
CVT: Continuously Variable Transmission
D
DRIRE: Regional directorate for industry, research and the environment
(Direction régionale de l’industrie, de la recherche et de l’environnement)
E
EBIT: Earnings before Interest and Tax
EBS: Emergency Brake Assist
ECB: European Central Bank
EIB: European Investment Bank
EIG: Economic Interest Grouping
ELV: End-of-Life Vehicle
EMU: Economic and Monetary Union
Eonia: Euro Overnight Index Average (overnight interest rate)
EPE: Association of environmentally-concerned companies (Entreprises pour
l’Environnement)
ESP: Electronic Stability Program, also referred to as Electronic Stability
Control (ESC)
EU: European Union
F
Fed: Federal Reserve System (United States central banking system)
G
GESP: Group Employee Savings Plan
GHG: Greenhouse Gases
GmbH: Limited liability company in German-speaking countries (Gesellschaft
mit beschränkter Haftung)
GNP: Gross National Product
H
HMI: Human-Machine Interface
HR: Human Resources
I
IASB: International Accounting Standards Board
IBS: Identifiable Bearer Securities
ICPE: in France, environmentally-sensitive facilities, which must
undergo regular inspections (installations classées pour la protection de
l’environnement)
ICV: International Corporate Volunteer
IFA: French minimum turnover tax (imposition forfaitaire annuelle)
IFRS: International Financial Reporting Standards
ILO: International Labor Organization
ISO 9000: International Organization for Standardization quality management
standard
J
JV: Joint Venture
K
KPI: Key Performance Indicator

REGISTRATION DOCUMENT RENAULT 2013✦ Global Reporting Initiative (GRI) Directives 355
L
LAB: Laboratory of Accidentology, Biomechanics and Human Behavior
(Laboratoire d’accidentologie, de biomécanique et d’études du comportement
humain)
LCA: Life-Cycle Assessment
LCV: Light Commercial Vehicle
Libor: London Interbank Offered Rate
M
MCV: Multi-Convivial Vehicle
MOU: Memorandum of Understanding
MPV: Multi-Purpose Vehicle
N
NER: New Economic Regulations Act of 2001, requiring listed companies to
include environmental impact data in their annual reports (loi sur les nouvelles
régulations économiques)
NGO: Non-Governmental Organization
NGV: Natural Gas Vehicle
NOx: Nitrogen oxides
NV: New Vehicle
O
OBSAR: Warrant bond (Obligation à bons de souscription d’actions
remboursables)
OECD: Organisation for Economic Co-operation and Development
ONERA: French aerospace research agency (Office national d’études et de
recherches aérospatiales)
OOIE: Other Operating Income and Expense
OSCE: Organization for Security and Co-operation in Europe
P
PC: Passenger Car
PDCA: Plan, Do, Check, Act
PEA: Equity investment plan (plan d’épargne en actions)
PEL: Homebuyers’ savings plan (plan d’épargne-logement)
PERP: Retirement savings plan (plan d’épargne retraite personnalisé)
PIP: Practical Idea for Progress
PPM: Parts Per Million
R
R&D: Research and Development
R&AE: Research and Advanced Engineering
RCS: French business register (Registre du commerce et des societés)
REACH: Registration, Evaluation and Authorization of Chemicals
RGC: Renault Group Committee
RIA: Recyclability Index for Automobiles
ROCE: Return on Capital Employed
ROE: Return on Equity
S
SAM: Sustainable Asset Management, a sustainability rating agency
SRI: Socially Responsible Investing
SRP: Renault System for Restraint and Protection
SUV: Sport Utility Vehicle
T
TAM: Total Automotive Market
TCE: Turbo Control Efficiency
tCO2eq: metric tons of CO
2 equivalent
TFI: International French-language proficiency test (Test de Français
international)
TPAM: Third-Party Application Maintenance
U
UCITS: Undertakings for Collective Investment in Transferable Securities
UV: Used Vehicle
V
VAR: Value at Risk
W
WEF: World Economic Forum
WTO: World Trade Organization
Z
ZE: Zero Emissions
GLOSSARY

Find out more at www.renault.comREGISTRATION DOCUMENT RENAULT 2013356

Certifié FSC, à base de pates provenant de forêts gérées de façon responsable sur un plan environnemental, économique et social.
Cover: Eurokapi, Photo Credits: Anthony Bernier

Renault 13/15, quai Le Gallo - 92513 Boulogne-Billancourt Cedex France / Tél. : 33 (0) 1 76 84 04 04
Direction des relations fi nancières - Direction de la Communication du groupe Renault