Doconin 'mon - ERIC
127
ED 199 11194 AUTHOR TITLE INSTITUTION lmvala AGENCY PUBLpATE, GPM' NOTE 2DPS PRICE DESCRIPTORS 2 kb Doconin 'mon CG 014 509 Dusek, Jerome 8. The Aevelopment of the Self-Concept in tdolescence. . Final Report. Syracuse Oniv.'y.Y. Dept. of. Psychology. , National Inst. of Child Health and Human Development ' (NIHI, Bethesda, Rd% Jul 78 R01-HD-9094 127p. % .'8001/PC06 plus Postage.. Academic Achieliesent: *Adolescents: *Cognitive 'Prodesses: Cross Sectional Studies: Elementary Secondary Education: *Individual Differences: Longitudinal Studies: *Self Concept: Socioeconogic Status: *Student Development: *Stadent.Iaterests ABSfRACT. . Numerous stlidies'indicate age and sex differencei.in adolescent interests'and self-concept development: however, few longitudinal studies have been conducted outside the area of vocational interests. It was hypothedized thalt an examination of data 4 fres both cross-Sectional and longitudinal samples would:clarify age , and sex di/ferences in the development Of,sdolescent self-concapt. . lale and fessle.elementhry, .siddle, and high school stddents completed questionnaires, a self-concept'scale, intereSt assessments, - and instruments about the Aeurces 'of information used by adolescents.. Reisults indicated thht Cognitive functioning was primary determinant .of self-concept. Invironmental emcounters such as peer/family relationships, school, role-taking, and reactioli of 'ethers affected self-concept."The longitudinal data demonstrtited contistency it selfconcept measures over time. Cross-sectional coiparison data, showing grade-level dilferences, did not replicate each. other. Interest in interpersonal relationships, education, human ecology, and drugs was higher foi elder students than younger students. Social class end.academic achievement had little effectson telf-concept.development. (Author/HLN) . es 9 ft' .4 *************************************************************4********* . * Reprodtions supplied by MS are the best that can be made * )from the original octment. ***********************************************************************'
-
Upload
khangminh22 -
Category
Documents
-
view
0 -
download
0
Transcript of Doconin 'mon - ERIC
ED 199 11194
AUTHORTITLE
INSTITUTIONlmvala AGENCY
PUBLpATE,GPM'NOTE
2DPS PRICEDESCRIPTORS
2kb
Doconin 'monCG 014 509
Dusek, Jerome 8.The Aevelopment of the Self-Concept in tdolescence. .
Final Report.Syracuse Oniv.'y.Y. Dept. of. Psychology. ,
National Inst. of Child Health and Human Development' (NIHI, Bethesda, Rd%Jul 78R01-HD-9094127p.%
.'8001/PC06 plus Postage..Academic Achieliesent: *Adolescents: *Cognitive'Prodesses: Cross Sectional Studies: ElementarySecondary Education: *Individual Differences:Longitudinal Studies: *Self Concept: SocioeconogicStatus: *Student Development: *Stadent.Iaterests
ABSfRACT..
Numerous stlidies'indicate age and sex differencei.inadolescent interests'and self-concept development: however, fewlongitudinal studies have been conducted outside the area ofvocational interests. It was hypothedized thalt an examination of data 4
fres both cross-Sectional and longitudinal samples would:clarify age ,
and sex di/ferences in the development Of,sdolescent self-concapt. .
lale and fessle.elementhry, .siddle, and high school stddentscompleted questionnaires, a self-concept'scale, intereSt assessments, -
and instruments about the Aeurces 'of information used by adolescents..Reisults indicated thht Cognitive functioning was primarydeterminant .of self-concept. Invironmental emcounters such aspeer/family relationships, school, role-taking, and reactioli of'ethers affected self-concept."The longitudinal data demonstrtitedcontistency it selfconcept measures over time. Cross-sectionalcoiparison data, showing grade-level dilferences, did not replicateeach. other. Interest in interpersonal relationships, education, humanecology, and drugs was higher foi elder students than youngerstudents. Social class end.academic achievement had little effectsontelf-concept.development. (Author/HLN)
.
es
9
ft'
.4
*************************************************************4*********.*Reprodtions supplied by MS are the best that can be made
* )from the original octment.***********************************************************************'

I.
Final Report.
Glint No. R01.T.6 9094
Jerome B. DusekDepartment of-Psychology
Syracuse UniversitySyracuse, New York 13210 ,
U S DEPANTMEAT OF 14EALTH.EDUCATION IIMILPARENATIONAL INSTITUT OP
IOUCATIONT...s DOCUMtKIT a4AS BEEN REPRO-Duff.: D EXAt:TLY AS PECE!VED FROMTHE PEOSO/41 OR OkOANIZATIONAT ING IT POINTS Or VIEW OR OPINIONS\ TAT EO DO INOT NECESSAuflY RFPRESINT c ICIAL NATIONAL INSTITUTE OFFOLIC ATION POSI T ION OR POL. ICS, 4
The Development of the Self-concept in Adolescence
July, 1978I
U.S. DEPARIIMENT OF IlEALTH,'EDUCATION, AND WELFARE .
National Institutes of Health
National Institute of Child Heaith and Human Development
11 I.
JUN 2 1980
ta
a.
Agknowledgment
MY first acknowledgment.must go to the students who agreed to participatein this study. Their cooperation is most gratefully acknowledged -- 'without itwe would not have been able to make any contribution whatsoever.
. In thVs regatd I wish ilso,to-thank the school.personnel who assisted inmaking the trroject possible. Frowthe superintendeneto tRe classroom teacherwe received.coop'eration sometimes above and beyond the callr of duty. I sincerelyappreciate their efforts on'behalf bf the Vtoject and hope they find not onlypetsonal satisfaction in ,baming been a pirt of it but also educaiional tilityin the findings. ,\
A number of graduate students-worked hard:And diligentlx to collect, score, and analyze data. .My gratitude is extended to Thotas Alley, Edward Blatt, ScottBrown, Susan Kaplan, Or:.Marguerite Kermis, Dr. Alan Kraut, Dr. Nancy Mergler, and
. Dana Plude. They were.continually supportive and helOed the various phases'of*the ptoject'run smoothly. In their work they were ably assisted by two. under-graduates, Ms..Dierdre Kramer and. Mr.. Jeff Livingston. my thanks are eXtended tothem, too. I .
I also wish to thank the secretarial.staff who assisted in readying materialsand ably performing other duties. A special.thanks is.in order to Me. Karen Starr0o.auffered through the,typing of several drafts.of this final report.
A special mote of appreciatiOn.goes to Mr. Michael Markoff, who was respon7sible for coding and analyzing the data relating self-concept to.school achieve-ment. Mike did'this task with care and dexterity. His efforts on behalf of theproject are sincerely appreciated.
I am greatly indebted to.,Mr. John Flaherty. John was responsible forrcoor-dinating,all the data analyses that appear in.this report. He carried out his'duties with the highest degree of responsibility and somehow managed not only to
..'db his own research but also to 'meet the demands of the principal investigator. .
A.sincere thanks 'is extended to him for his significant contributions to.the pro-.
ject. '
Several of my colleagues at Syracuse University also deserve thanks. RolfMbnge and I had a number of productive discussicips about the resultL. WilliamMeyer, on more than'one occasion, listened And responded to interpretations ofdata. My thanks to these two colleagues for thel.r efforts..
J.B.D..
ii'

r.--r.rri.r
litle page .
'AcknowledgmentTable of,ContentsList of TablesList of Figures
A .
Table of Contents
#
,Page
4 Ihtroduction , 1....
Objectives 1: 0
.4Literature Review \ 3,
Review pf Self-.-C9acept Research. 3
.."`. -Review of Research on Adolescent Interests 7
.Self-Concept,and School Achievement 114
Focus of Research ,.
12Stethod , 14 '
. .
_Subjecte,
I 14,
.Materials 14
.
. Pfocedure, 14Analyses
I 18Reaults .
. 19a
Analyses of Self-Concept. Data 1 . . .19Analyses of Interests Data
., .34
The Relation of Self-Concept and Interests, t.' 61
. Social Class Differences iu Adolescent'd Self-Concept and Interests 73Relationships%Between Self-Cdhcept and School Achievement. ,
81. .
.
Discussion , 94Results from Adolescent Sdlf-Concept 4 94."
, ,Resultt f!Tom Adolescent Interests ..100°I
Results Relating Self-Concept to Interests. 105
Self-Concept and School Achievement . '4407Social Class and Self-Concept Development .
- 108Implications for Further Research 108
Footnotes. 111
,
References -,... ,.
. 112 .
. .-
:
-
4
if;)
04
II.
I.
!it-`
.
Vy"7. (- ' "_; , 2 - '!.
List of-Tablei/
.: .% ;/ - Lac::
114
4.., 4 Pak'Table 1: .Sampie Characteristics. .2: Bipolar AdjectiVes used to Meese Self-Concept
. "!..,X6'31.' Format used to Assess Rankings and Ratings .of Interests,A, '.17
-4: Vaasa,: FactOrs from:Analysis of 1975 Data 20:-_,- 5: Summary of Analyses of Variance-for 1975 Factor Scotes ' 22
A: MeAN 1975 Factor Scores goy Eadh Grade Level'" 22
, .:7:- Mean 1975 Factor Scoreeby Grade and Sex for the Adjustment Factor 23. ..8: .Varimax Factors from Anarysis of 1976 Data J . % 26
. 9: Summary df Analyses of Variance'for 1976 Factor Scores 2710: 'Mean Factor Scores-for 1976 2111: Mein 1976 Facto't Scores for Significant Grade Level x Sex 29
Interactions,-,
. '121 yikimax Factors from Analysis of 1977 Data . 3113: Summary of Analyses of Vaiiance for 1977 Factor Scores14: Mean Factor Scores for Each Grade . %15: 'lien factor Scenes for the Sex x Grade Interaction for the 32
. 'Congeniality/Sociability-Factor in.the 1977 9ata ,.-
- e16: Varimax Factors -from Analysis tf Self7concept.rata for . 35.
CP' ,. Subjectis Tested Each Year. 17:, Summary of Analyses of yariance of Factor Scores for Subjects 36
Tested EaCh Year.
,
181 Mean Achievempnt/Leaderahip Factor Scores for .the Sex x Years 36Ihteiaction ..
19: Mean Factor Scores for Retested Subjects for Each Year 3720: Mean Ranking of Bewh Topic for Each Grade for 1975 Data 3821: Mean Ranking of Each Topic.for Each Grade fy5`1976 Data 3922: Mean' Rankineof gdch-Topic-for Each Grade f_r 1977 Data 4023: Mean Ratinfrof EscA Topic.for Each Grade for 1975 Data . 4124: Mean Rating of Each Topic for Etch Grade fur 1976 liata 4225: Mean Rating of Xech Topic for Each Grade for 1977 Data. 4326: Correlations Between the Rankings and the Ratings for all Subjects 44
'Tested Ea& Year27: Correlations Among the Intereit Hierarchies Across Grades 46
and Between Sexes (m the Main Diagonal) for Interest Rankings28: Correlations Among the Interest Ratings Across Grade and 47
Between Sexes (on the Mein Diagonal): 29: Varimax Factors frti Analysis of Interest Ratings for 1975 Data 48
.; 30: Surmary of Analyses of Variance for 1975 Interest Factor Scores 49h: Mean Interest Factot Scores for 1975 Data 49
. 32: Varimax Factors from Analysis of Interest Ratings-for 1976 '. 5133: Summary of Analyses of Varianca for 1976 Interest Factor Scores 5234: Mean Grade Level Factor Scores for Factor II of 1976 Interest 52
Ratings.
35: Varimax'Factors from Analysis of Interest Ratings lor 1977 54 .
36: Summary of Analyses of Variance for 1977 Interest Factor.Scores 5537: Mean Interest Factor Scores for 1977 Data 55'38: .Means for the Sex a Grade Interaction in Analysis of Factor 111 55
of 1976 Interest Data39: Mean Ranking of Each Topic in Each Year for Retested Subjects 5740: Mean Rating of Each Topic in Each Year for Retested Subjects 5841: Varimax Factors from Analysis of Interest Ratings for 59
Subjects Tested all Three Years
5 5iv

. O.X
v1
4
0 11 Ul LeOTable 42: Summary of Analyses,of Variance of Interest Factor Scores 59'. lor Ratasted Subjects
43: &Mean Factor Scdres for Retested Subjects for EachYear 6U44:Means for the Group x Years Interaction'for Retested 60
Subjects for Factor I45: Varimax Factors from Analysis of Self-concept,and.Intirest f42
, Ratings-for 1975 Data. . .
.
4mt-,
146: Varimax Factors from Analysis of Self7concept and Interest 63Ratings for 1976 Data
47: V.arimax Factors from Analysis of Self-concept and Interest .64. Ratings foE 1977 Data
.
. 48: Varimax Faaiors from Factor Analysis of Self-concept ind 65,.
Interest Ratings for Subjects Tested Each P.:ar.
.
49: Significant Canonical Relationshipa from Analysis ofl, 66..1975 Data for the Total Sample
50: Significant Canonical Relatibnships from Analysis of' 671976 Data forthe Total Sample ,
,
...51: Significant Canonical Relationships from Ana14sis of 681977 Data for the Total Sample'
.
52: Significant CanonicarRelationsfLips between 1975 Self-cc.'indapt 70
-
Factor. Scores and Interest Rating Factor Scores forEach Year
53: Significant Canonical ReLationships betWeen 1976 Self=concept 71Factor Scores and Interest Rating Factor Scores forEach Year
54: gignificant Canonical Relationships between 1977 Self-concept 72Factor Scores and Interest Rating Factor Scores for : ,
Each.Year *.
55: Varimax Factorslrom Analysis of Lower Social Class Sub-jects in 1975 -
,
.
56: VarimaX Factors from'An'alysis Of Middle Social Class Sub7,
. jects in 1975*
5/: Coefficients of Congruence for.Factors of Self-Conceptfor Lower- and Middle-class Subjects for Each Year'
i jects in 1976LoWer Social Crass Sub- 0
.t
.59: VariTax Fa6tors from Analysis of Middle, Social Class Sub-jects in 1976
60: Varimax Factors from Analydis of'Lower Social Class'Sub-jects in 1977
t
61: Varimax.Factors from Analirsis of Middle Social Class Sub-jects in'1977
,
. 62: tarimax Factors from Anarysis of Interest Ratings for 1975Deka for Lower Social lass Subjects
.
63: Varimax Factors from Analysie of Interest Ratings for 1977Data for Middle Social Class Subjects
.. 64: Varimax Factors from Analysis Of Interest Ratings far-1976Data for Lower Social Class Subjects -.
. .
,65: Varimax Factors-from Analytis of,Interest Ratings for 1976Data for Middle Social Class Subjects %
66: Varimax Factors from Analysis ofrntereat Ratings.for 1977Data for Lower Social Class Subjects
67: Vaiimax Factors from Analysis of Interest Ratings fcer 1977416 plata for Middle.Social Class Subjects68: Coefficients of Congruence for Interest Factors for Lower-
and Middle-Class Subjects for Each Year.
74
75
76
58: Varimax Factors from Analysis of 77' .
78
79 4
80
82,
83.
84
85
86.
87 '
88
0 6
a
t. 0
Correlations Between Athievellent/Leaderdhip Factorand Achiewnent and.IQ Scores - Grades
, 70: Correlations Between Athievament/Leadership Factorand Achie;rement and,IQ Scores - Grades 9-12
yi
;
0
!cores
Scores
S.
t)

List of Figures
- I Nal
.Figure 1: Mean Factor Scores for Males and Females on Sex Appropriateness-of the SelfConcepefor 1975 Data.
2: Mean Factor Scorea for Males and Females pn Sex Appropriatenessof the SelfConcept for.1977 Data
toL,
IO
V
0
vii
o
tate_24
33
:.
;
.ef
".
a
IntroduCtion,
Perhaps no single concept has dominated thinking and theoriling about adolescenceas much as tU \prevalent view-thAt adolescence is a time of dramatic changqs in thelelf-concept. One"goOrily peruse dny undet,raddate text dr popular tr&d4 bookwritten for-parents or the public at large to find this view strohgly expressed. And,there are researChers, cited below., that provide.data, albeit limited, in scope, tosumrt'ehis view. ' It is no wonder, then, that ad'olescence has histoiicaily beenYibwed as a state.of transcient psychological disbrbance'to be Pput up with" byadults, in general; and "lived throughley adolescents. IndOed, much of everyday. adolescent behavior is Otribeted to "causes" indicative.of transient diaturbanceS.. As has been suggested elsewhere'(cf. Duseke1977), such views lead to the expec-tation of "Eiocially deviant" behavior from those we call adolescentp.4
. It is no surprise, then, thatiknmerous inveStigations haw been conducted to_assess relationship& between adolescenteself-concepts atiother measures of ado1-7
. escent development.: Foi example, a number of.studies, reviewed beldkr hive relatedself-concept to scholasticaachievement, often on the premise that improvements.in '
self-concept should result.inpiinproveMents in achievement. Similit comments may be .
made with regard to social class differences in self-concept. i.
q , ..
.:. .. e
.
: Other research (reviewed below).has been,focusedaon the explication of age(or grade) and_sex differences in adolescent self-concept. This research, too, islased oe the-view that changes, perhaps dramatic, occur in the self-Concept during'
,
adolescence. Whough age (4pr grade) and sex differences.in measures of self-conceptare frequently repOrted,ithe large majority of such differences'are from cross sec-
.tional studies. Results from longitudinal researches Ate much less .clear in indi-'caXing such differences.
t .i
( . ,, i' t .' Stmilar comenLs may be madeabout the it'udy of 'adolescent interests (cf.,,,Dusek
& Mon& 1974; Dusek, Kermis,.& Mionge.1979). Numerous researches, reviewed below, indi-1,
cate age an0r7s0( differences in adolescent interests.. However, few longitudinal stud-ies have been condiicted, especially outaide the confines of the vocational interest .
literature. Nonetheless, popular stereotypes about the natnre of adolescènt interests.,exist, e.g.,.that adolescents are preoccupied with interest in slexuality.1 Little,if any, concern has been demonstratedl for showing the adolescent's relative interest
\ in sexuality vs. other topics of interest, for example, or-1n stu0ing the relation-.' ' .ship of interests to individual difference variables; such as sex or.social class.
The data collected for this project'should clarify all these relationships.a
Objectives..
There were several general oblectives in the researc6-eported below. By pro-.
viding both-cross sectional and longitbdinal research it wes hoped that age (grade). and sex differences in the development of adolescent self-concept could be clarified.. ,
° Comparilne the redults from the three cross sectional samples with those from thelongitudinal sample studied over three year& should provide valuable evidence rele-,
Vant to these issues. \It was'also possible to assess the relationship between self-concept and several individAl difference variables, viz., social class and academicachievement. By proViding boti longitudinal and cross sectional comparisons lightshould be sheci.on these relationships.
-k
A second general objective was to kroyide data on the development of adoleacentinterests. Grade and sex comparisons foi-...the three cross sectional studies and the.
1 9
-longitudinal study provide.0ertinnt information about the development of adol-:escents' interests. Of major concern in this regard was the study of interests--. of more general sorts than those typically itudied with vocational interest in-ventotiei:
.There were, thea, seve'ral specific objectives in the research. One was totest the notion that the self-concept is selective and 'directive An nature, i.e.;that the self-concept has motivatidnal properties (e.g:, McCandless 1.970, p. 444).This objective was met by determining the relationship between self-concept devel-iopment and interesis, both cross sectionally anClongitudirially. A second specificobjective waerto proiide longiCudinal dsta regarding the developmene of the 'tlelf-concept tn adolescenceCthus making it possible to examine and explicate,age cflangesas well as.age differences-in the self-concept during this develapmental period. A-nother objective was the same as the Aecond but 44ith regard to adolescent' interests.These data are also relevant to understanding the so called "generation gap". Pin-thestudy was designeeiri such a way ap to allow the assessm9nt of the rela-tionship between social cladp,and self-concept and interests development during .
adolescence and the relattonshft of achieveMent to self-concept. Studying these'ineividual difference variations was.seen as a way to clarify eAsting literatureAid suggest future directions for researchr,
S.
T
2 1 0t,
S.

Literature Review
v-e e .
The literature review is divided ihto several sections for expository purposee.Referencts may be found.at the end of this report.
Reviewmf Self-Concept Research 0.
Perhaps more than any other developmental per1.6d adolescence has attracted re-search on the 'self-concept. Although ther0Aa undoubtedly a number of yeasons forthis, nearly,,every theprist;has attributed a Special importance for self-concept de-velopment to pnbescence and ihe emergence of therepioductiva,gapacity (Dusek, 1977;Erikson,.1968; Freud; 1969; Lewin,.1939; McCandlegs, 1970). Ai a result, a primary iconcern of investigations intolself-ooncept development has been to examine discon-
pubescence le.i., Carlsdn, 1965; Constantinople, 1969; Engel, 1959; Erikson, 1968;
tinUities in adolescent self-concept due to the theoretical upheaval accompanying :
Hamachek, 1076i Long, Ziller, & Henderson, 1968; Marcia., 1976,'1977; Monge, 1973; ,11
Simons, Rosenberg & Rosenberg, 1973).iA second major thrust of research into adoleeicent self-concept development-is
the determination of the factors or components that comprise the self-concept (e.g.,Monge, 19g3; Rosenkrantz, Vogel, Bee, Broverman, & Broverman, 1968;.Smith, 1962).The batic intent in muCH e this research is to determine the structure'of self-eoncept in order to understand its complexities and the balance.necessary among theseveral components for adequate adjustment (McCandless, 1970).
A third area in.which only little research has been conducted has.es its thrust'general issues regarding diffeténces in self-concept dne to the measurement techniques 7
employed (e.g., Crowne & Stephens, 1961; Katz & Zigler, 1967; Kokenel, 1974; Lowe,1961; Winne, Marx, & TaYlor, 19)7), analytis techniques (e.g.,'Smith, 1962); or'btliermethódological issues and assumptions involved in selif-concept research (e.g.,,Crowne'& Stephens, 1961; Sosenkrantz et al.,1968)" The relevant issues inifolved in this ".
. aria of research will be discussed within appropriate contexts of the followingliterature review.
Although the majority gf studies of the self-concept are attempts to relateself-concept to various aspects of social or personal adjustment (e.g., Coopersmith,1967; Crandall & Bellugi, 1954; Dittes, 1959; MacDonald, 1969; Montemayei & Eisen,.1977; Muisen & Porter, 1959; Ring, Lipinsky, & Bradinsky, 1965), there have been
-) several investigations in'ftwhich the primary concern was with age differences "and agechanges in self-concept. As these latter are most critical and relevant to the-re-search reported herein they will be reviewed in some detail.- In addition, ancillaryresearch clarifying sex differences in self-concept will be reviewed as it is alsodirectly pertinent.
There'are few longitudinal studies foctised on the explication of age-relatedchanges in self-concept during the adolescent years. (Although Long, Ziller,.andHenderson (1968) Investigated the self-:concept of boys and girls in grades sixthrough twelve their analyses did not Ncus on age changes in self-concept). Onewas a two-year,study conducted by Engel-(lM), who.used a Q-sort tO assess self-.
concept. At the first testing the 172 students were in the eighth- and tenth-grades'and at_the second testing in the tenth- and twelfth-grades, respectively. For thegeneral sample ihe correlation betWeen the scores of the two,Q-sorts was .78 (cor-rec'ted for ittenuation)*. In adglition, adolescents with high poOtive self-conceptson 'die first testing were more stable than adolescents with negative self-concepts on
3
1

0 II
,
the lirst tes ting. The stability of'the eelf.-concept aid not vary with the age, Igo,Oir sex of the subjects. Enge,les' data, then, suggest that the self-concept is rela-tively stable irregartiless of certain iedivtdual difference variablIka. However, thelarge time'span hetweee mepsurements and.the post7pdbescent age level 8f the subjectsmake kt unlikely'that sisnificant:changes id self-concept would be detected. Carlson(1965);noting Oese and other deficiencies in Engel's (1959) study, examined the sta-bilitY of two 'aspects of adolescent selfrconcept, social vs. personal orientationand self-esteem, over a si)i yeat period. The subjects, 16 males and 33 '.emales, com-pleted a lengthy seIf-descriptiye quedtfOnnaire in both the sixth- and cwelfth-grades,indicating items "most" and "least" characteristic of the self. Althcugh the details,of the data analyses were scantY, the data apparently indicated no sex, differencesat the preadolescent level (grede 6 data) but did reveal that boys ipereased in per-Sonal orientation and girls.in social,orienfationi as might be expected on the.basissof sex-role development, over the.six years of the etudy.' That there were no sexditferences in the level or stability bf self-esteem over the six year.period seemsto indicate it is an aspect Rf self-concept different from that assessed by the per-sonal-social orientation, which may be a reflection of sex role adjustment. Caution.must be exercised in generalizing these data, however, for, as Cfulson (1965) notes, .the,sample is' small and biased in certain respects, e.g., volunteer subjects.
A third study, a combination longitudinal and cross-sectional study of self-.'concept stability, was conducted by Constantinople (1969), whose primary cencern'wasan invegtigation, of Erfkson's (1959, 1963) psychosocial theory of development. Thesubjects were P'2 college students who were studied yearly for a three-year period.Part of the study involved a six week test-retest of self-concept on 150 of the sub-jects. The Q-sort was used to assess self-concept. For the 150 retested subjects
*
the stability arrelations ranged from .45 on the identity diffusion scale Co .81on the intimacy seale. The median correlation for all seales was .70. Stabilitywas somewhat, higher for males than for females, and the males seemed to show greater,positive increases in resolving identity confusion than the females, perhaps becauseof the cateeriorientation of college programs during.the time these datamere col-lected. Although these data indicate a degree-of stability they ar t particularly
. impressive for several reasons. First,-althougirehe small time sparT:tWeen test-ings is very reasonabole for assessing the reliability of the instrument it is pro-bably insufficient for assessing developmental change, which_takes place as a reseltof interactions with the-environment, broadly defined over a longer time period,Second, the subject-6 were not only, a select and biased sample, which was quite suit-able for Constantinople's primary purposes, but they were also all at the upper agerange of-adolescence, makiag it likely that little change in self-concept would bedetected because many of the hypothetical reasons, for example, the onset of puberty,for self-concept distufbance were long past.
.
It should be pointed out that there are other longitudinal 'investigations ofadolescent self-concept.or identity development. Marcia (1975, 1976, 1977), forexample, has reported a six-year follow up study of the identity status of a groupof college students first tested in 1967 and 1968 (Marcia, 1976). Hauser,(1976)has assessed longitudinally the self-images of late adolescent patient and non-patientsamples. In theseand other longitudinal researches,very small or select samples,usually of older adolescents, have been tested with highly sPecialized instruments.This combination of factors considerably limits the utility and generalizability ofthe findings with respect to the important issue of developmental changes in adol-escent self-concept.
There are several observations that can be drawn from the data presented above.One is that little has been done to study longitudinally the continuity or discontin7
4
1 2
'
a'
4
uity of adolescent selt-concept Oevelopment. 'Ai a result of the paucity of 'Long-. itudinal data theorizing aboat the aurse of adolescent self-concept develbpmerktmust rest Iargely.on cross sectional data. However, as Schaie (1965)- and iubsequentlyothers (e.g..) Baltes,"19684; Baltes & Nessdlroade, 1070) have pointed'out, relyingheavily on the results of cross.elctional research;tor mapping developmental changes'can leall to erroneous cionclusions.
I '4
11,0
Another obaervation is that in tloro of the longitudinal studies described indetail above noage changes were observed (Engel, 1959; Constantinople, 1969) .'44.:>How-.°ever, ihe age of subjects tested in the two stedies was such that the students warealready post-pubescent and, indeed, perhaps into late adoles,.ence in one of the
-studies (Consieatinop1e,,1969)0 thus making it UnLikely that discontinuities due to.the onset of pubescence or other factors would be detected. :In,the one study in which.'vounger subjects weres tested there was evidence of age-relateOtiange in selfconcept _1
as well as evidence of sex differences in self-conceptdeveloimeni for differing com-ponents of the self-concept.(Carlson, 1965). Carlson.'sidatst th4re is value
.
in studying the components o5 the self-concept as these tightchange ea's function ofage, sex, or other individual difference variables.
.
Several,of the early studies of the structure of the. Self-concept.were conductedby Smith (1960, 1962). Smith's 4962) primary concern:was a comparison of variousfactor sOlutions to subject's,(96 male hospital patients) self-ratings on 40 semantic
. differential scales, bipolar adjectives developed by-Osgood, Suci, and Tannenbaum(1957). There were two findings relevant to the research reported below. 'First, the
, results of all,three factofing methods indicated that the sel. concept, as assessed bythe semantic differential, was not unitary but rather was compcksed of, a er of cm-.ponents. Second, one method, Kaiserls (1959) varimax method of\-re. on to stmplestructure, provided the most-readily interpretable factor structurt, The six factorsidentified were: Self-Confidence-,--Social Worth, Corpulence, Potency, Independenceand Tension-Discomfort. These data suggedt-theyalue of studyingsdevelopmental trendsin adolescent 'self-concept as a function of its CaMp?nents. To the extent that age-related changes in self-concept are "factor specific', ehen global measures of self-concept, such as those Used by Engel (1959), will likely not detect important develop-aental changes. To date there,has been only one longitudinal study in which changesin the components of self-concept have been related to age SCarlson, 1965). However,there are a number of cross-sectional studies in which components of self-concept.,have been assessed for subjects of different ages or other indiVidual difference .var-iables. Several-of those that are directly re/event and.that are representative are
%4reviewed below.
Katz and Zigler (1967) reported sex and age differences in self-concept for fifth-,eighth-, and eleventh-grade males'and females (20 of each sex and grade level). -Self-.'concept was assessed through two methods - the_Coopersmith self-esteem inventory (Coo-.persmith, 1967) and a twenty adjective checklist camposed of ten socially delirable
'-and teh socially undesirable qualities. llbreover, the subjects completed the ques-.ionnaires under each of three sets of instructions: ideal self, social self, regu-lar self-concept instructions. The sample was divided-at each grade level into highana loi; IQ groups in order to investigate the relationship between intelligence andself-concept development. The discrepancies be'tween self-ideal self and self-sacialself increased across grade levels with the former showing greater differences thanthe latter for males than females: In addition, at the fifth grade level boys sawthemsetves being evaluated more negatively than girls with the reverse holding foreighth grade acid with no difference for the eleventh grade. The brighter (higher.IQ)
. children and the older children showed greater self-ideal self discrepancies than'the :
5
13

lower IQ and younger children. The older and brighter children also made fewer% extreue responses tln the younger and lesa-bright Children. To the extent that
. self, ideal self, aijd social seli represent different.components of the self-con-..
dept the data°of K 2.and Zigler (1967) demonstrate the yalne of investigating de-velopmental differinces in components of self-concept. In addition, theirr data
'clearly show relationships between LQ,and self-concept not previously reported.
Bohan (1973) studied age and sex differences in self-concept in fOurth-,/ °sixth-, eighth-i and tenth-grade students.with the Coppersmith self-esteem inven-. tory. The, tenth-grade girls showed a lower self-concept score but there were no
. other significant age or sex differences. Prewat (1976), who tested students'inKradea six, seven and eight with the short form of the Coopersmith self-esteem in-ventory, reported no significant grade or sex differences., .
However, a number of researchers using larger samples that span a wider rangeof the adolescent years:do report age and sex differences in adolescent self-concept.tSimmons et al. (1973) measured four dimensions of the self-image in 1,917 stu-
. dents in grades three through twelve. The four dimensions,of self-imake were:self-consciousness (the salience of the self to the individual), stability (theindividualts.surety of what he or she is like), self-esteem (the individual's globalpositive or negative attitude toward the'self), and perceived self (the individual'sperception of how others view him or her). The results indicated that the earlyadolescents (ages twelve to fourteen) had a higher level of, self-consciousness,greater instability of self-image, lower global self-esteem, And a moremegativeperceived-self than the younger children. These differences-showed a trend towarddissipating at the older adolescent levels. NOnetheless, even the older adolescentsevidenced greater self-consciousness and instability of self-image than the eight-to eleven-year-old children, Thp'older adolescents did hate a more positiye globalself-esteem'than eithet the young children or the early adolescents. :Ibis latter
. result replicates Engel's (1959) research reviewed above. Simmons et al. arguethat these data indicate a general pattern of self-image disturbance in early adol-escence, with a repair of this disturbance occurring in laxer adolescence. Furtheranalysis led the authors to conclude that the trensition into junior high schoolwas a primary causal agent in the onset of this disturbance. Only at this interval,between,ages,eleven and twelve, was there a.significant increase in disturbance onall four measures. Of course, pubertal changes are also occurring, alOng with cog-nitive changes, and no doubt'these all interact and increase disturbance in the'self-
,
Ln a very,comprehensive study of dpvelopme tal changes in components of self--'concept Monge (1973) examined the connotative factor structure of the self-concept of1035.males dnd 1027 females across grades six through twelve. The data were semanticdifferential.responses to 21 of Smith's (1962) pairs of Bipolar adjectives. FollowingSmith's recoMpendation the data were factor analyzed and rotated.to Kaiser's (1959)varimax criterion.. The analysis revealed four interpretable factors: I - Achievement/Leadership, II Congeniality/Sociability, III -,Adjustment, and IV - Sex Appropriate-ness of $elf-Concept. In genkrel, males had higher scores than lemales-on factors Iand III and females had higherscores than males on Factor II. In addition,to thesesex differences there were significant grade level differences for the first three fac-tors and a significant Grade Level x Sex,of Subject interaction for Factors I and IV.In general, males increased at a higher rate than females-on Factor 1 but females fie-creased on Factor IV while males remained relatively constant. On Factor both sexesgenerally showed an,increase and on Factor IV a decrease with age. Monge's (1973)research, then, demonstrated clear age and sex differences in the development of com-ponents of the self-concept, contrary to the general findings of the longitudinal re-msearch reported above.
S.Unlike the general findings of the longitudina .studies the cross-sectional
4esotarch does indicate age (e.g., Katz & Ziglers.1 67;.Monge, 1973), sex (Monge,,
1973),, intellectual level (Katz & Zigler, 1967) nd social/class (e;g., Soares &Soares, 1969)fdifferences in the developthent of/the self-concept in adolescents'.As nOted abo-e, the age levels studied in the/longitudinal research have tended iobe in the post pubescent range. In the one/longitudinal study in which younger Adol-escents were included (Carlson, 1965) different age trends were found. In addition .
none of the longitudinal studies conducted to data have been designed in such ,a man-ner as to allow ungthbiguous interpretations of the findings with respect to age, co-hort and time of measUrement (e.g. Schaie, 1965, 1970). It is clear, then, that thearea of self-concept development is fn need of well-designed research using a.sequent-ial strategy (Schaie, 1965) in order to clarify self-concept de4elopment. In addition,no previous research has investigated the longitudinal aspects of self-concept devel-opment as a function of the Components of aelf-concept or social claes. One goal ofthe research loported below was to provide data,pertinent to these issues.
Researchers in the area of self-concept have argued both that adequate self-concept is necessary for a.normal ana healthy personality and that'the self-conceptis g motivator in the sense of selective and directive functions Qf behaviov. Re-searth on this issue, particularly non-clinical research, ds extremely scarce (e.g.,see McCurdless, 1967 for a review). A-second objeCtive of the research was to in-vegtigate the nature of this motivational.function of the self-concept. In proposingthis research it was deCided that rather global (macro) meaaures would be more sensi-
. tive to the motivational aspects of self-concept than more specific (micro) measures.This decision was based on McCandlbss' (1970) suggestion that self-concept dlifferencesbetween individuals should relate to different vocational, recreational, and develop-_
mental interests in individuals, It was-decided that measures of adolescents' in-terests, as suggested by McCandlesg, would suit the purposes well.f-Research on adol-escent interests is reviewed next.
RevieW of Research on Adolescent Interests
Ibe analysis of interests and their significance to individuals has i'een theobject of study by educators and psychologists for a number of years. Most of theresearch in this area has involved the assessMent of adult interests in the'contextof vocational choice and adjustment. For.example, studies have been done using in-ventories such as the Strong Vocational Interest Blank (Strong, 1943). Studies ofthe interests of children and adolescents have been infrequent, and no cross-sectionalstudies comparing more than twq age levels have come to the authors' attention. The '-importance of developmental information on interests for a complete understanding ofchild qid adolescent development has been,discussed by Powell (1971), among others.Such information 'would apparently be particularly interesting in reaching an under-standing of adolescent life problems (e.g., Harris, 1959), adolescent cliques (e.4.,Markst 1957) and for understanding changes in aaolescent interest patterns (e.g.,..Fox, 1947; Hallinson & Crumrine, 1952)...
Early research on adolescent interests focused primarily on pragmatic issues ofvocational choice and decision making (e.g., Strong, 1931, 1943; Thorndike, 1930),and was aimed primarily at validating vocational interest tests and developing inter-ent schedules for use in yocational counseling. Neverthelessi some indication of therelative stten.gth or intensity of various adolescent'interests (the "hierarchy of
, interests") can be gleaneefrom the data. For example, Strong (1931) reported that,in general, interest in physical skill, daring, and strenuous activity decreased amongm4n as .they grew older; interest in solitary rather than group activities showed aconcurrent increase. Unfortunately, Strong's research was conducted primarily withmales and therefore tells us little about the interests of females.
7

Lehman and Witty (11924, using the Strong Vocational interest Blank, notedpat the greatest range of.interests occurred in those aged 9 through 22 years;- the variety of interests dropped 'yearly thereafter. They also prebetted dataindicating that brighter individuals had a greater number of intereststhan indi-'viduals of average intelligence at each age level, and that boys had a somewhatgreater rumber Of interests than girls. These data suggest a shift from breadth
'of interests to depth of interests across the adolescent years. ,
A second SpeCific area in which a considerable bidy Of research has accumu-lated on interests is recreational pursukts. Ai Pressey and Kuhlen (1957) demon-strated, recreational interests change dramatically.from age 6 to 21, with"childishplay.activities becoming less frequent over age. By age 15 or 16 adolescents begin.to show an increasing preference for heterosexual activities and activities re-quiring lower expenditures of.physical energies. For example, social affairs anddating are preferred over participation in sports. These qualitative changes inrecreational interests `reflect broad sociocultural factors, such as exposure as afunction Of age and sex tto different levels of recreational activities, but arealso.dependeneupon -physiological and intellectual development. AB noted above,bright adolescents engage in a greater number and larger. variety of recreational ac-tivities, nd dieir interests tend to be more similar to those of individuals whoare severa years older than to those of individuals of the game chronological age.
.Although!these data partially describe the developmental course of interestsand hint at some of the factors underlying this development, they are narrow inscope and leave'many questions unanswered. For example, they tell us little aboutthe relative salience of interests,.or how a hierarchy of interests might changeacross the adolescent years. Information on these issues is necessary for expli-cating the`'interaction between intareatsan-dcegrittion in adolescence.
Cross-slctional studies'of adolescent self-expressed or spontaneously generated,
interests give some indication of developmental trends in,relative levels of interestin various topics. Symonds (1936a, 19,36b) was among the first to study the relativeranking of topics of interest among male and female adolescents. Th9 topics whichhe asked'the subjects to,rank were gleaned from the subject's own recommendations.,Boys were most interested in recreation, health, money, and personal manners andwere least interested in civic affairs, love and marriake, mental hygiene and theirdaily schedule. Personal attractiveness, the first-ranked topic oflnterest forgirls, was closelY followed by recreation, manners, and health. Of least interestto girls were study hablts, love awl marriage, mental hygiene, and civic activities.Interest in safety, personal and moral qualities, home and family relationships,getting along with other people, and a basic philOsophy of life were included, inthe middle range of interests. Symonds felt that the social and economic conditionsof the society strongly influenced interests but he did not elaborate how these in-fluences might opbrate.
1Harris (1959) administered a reconstructed version of SyMonds' Inventory to1,165 adolescent male-a and females in 1957 and compared the results with Symonds'.This procedure allowed a time-lag assessment of changes in intereses Of adolescentsfrom 1935 to 1957. Although Harris' study was condActed on a different sample and22 yeays later than Symonds' research, the relative rankings of the 15 topics remainedquitofsimilar (boys' rankings on the two occasions correlated .761.while girls' rank-' ings correlatctd .55). There was also a moderately high degree of similarity betweenthe boys' and girls' rankingsoin both 1935 and 1957: in 1935 the rank order correla-tion between the rankings of the sexes was 0.80, and in 1957 it was 0.58.
.4
I.
Harris' research suggests the importance of studyingssex differences in in-.
tereets. The'significintacs differencesAn the rankinga)st both times of measure-ment picibably reflec.t differences in socialized sex-rore values (Braverman, Nogelet al., 1972; Kohlberg & Zigler, 1967). The differences due to tiMe of measurement- ' Probably reflect broad cultural chenges. Unfortunately, Harris. did notanalyze" his d4ta for age differences, lea4ing us somewhat in:the dark as,to pOsaible de-velopmental trends in-the nature of adolescent interests. Finally, it is impqrtantto-note that the similarities in rankinga.for both the two times of measurement andbetween..the sexes.indicate some .undOrlying factor(s) that might be responsible.for.the continuity .over 'time in the way adolescents view matter% that.are of inte'rest. to them. Altheughtheenature of these underlying,factors cannot be gleaned fromavailable data; it may be thatrcontinuiEies within a culture as well as commonalitiesof experience'among'adolescentsinany,generation '(such as physical growthand He-,velopment and changing cognitive capabilities) aight.lead o a'continuity of.inter-este across generatione.
,
r 4 )1to 4
.Amatora (1957, 1960a, 19600 used a'fruitfill and certainly unique strategy totubly adolescent interests. Rather than employing standardized instruMents, she.simply asked adolescent and pre-adolescent boystund girls to, lidethree interests',in,order of their greatest importance. This approadh-ellowed the'subjects thegreatest flexibility.in stating intereits and tt-efeby Oiminated the forced-choicec)f "uninterestingttopids. Seventhq- And eighth-grade boys and girls reported fie-,terests.011ing anto 8 ategoriesii education,,the good life, health,,money,.ebjeCts,relativea,'travel, and vocation (Amatora1.9 57). The fifth- and sixth-graders (Ama-tora,-1960a) listed ihe same 8 cetegories plus,.two others, sch6o1 and4arents. Al-
.
. though sex differences emerged in ,both studies.these Were not analved:.etatietically.Moreover, neither Within- nor between-study grade-level (age) differpn4s were ana-' lyzed, thds leaving open the question of developmental differencea'in the interestpatterns of adolesr.ents. Exam*nition of her.data,however.,..,suggests grade leveldifferences and.developmental.changes in the rankings of interests.
LongitudinAl stgdies would provide the optimal means of assessing developmentalchanges in the nature of interests. Unfortunately, with one exception (Freeberg &Rock, 1973) available longitudinal data are limited primarily to interests assessedby the Kudep Preference Record (Fox, 1947; Mallinson & Crumrine, 1952). Both Fox ,and Mallinson and CruMrine reported high test:retest correlations when using the KuderPreference Record. But'neither study was designed to examine specifically the fagtors.that might relatj to the interest choices,of adolescents.,
,Fteebetg and Rock (1973) administered a structured questionnaire assessing in-terest in Social, academic, and recreational Activities to 1,051 females and 1,019males when they were in the seventh-:, ninth7, and eleventh-grades. ,The factor analysisof the ..124-item questionnaire revealed eleven factorg. This was done sepasately forthe nales &ad females At each time of measurement thereby allowing the assessment ofage and sex d*fferences in factor patterns. Freeberg and Rock suggest that the signif-lcant sex.differences that emerged reflect existing cultural standards for sex rolesand that differential changes in interests as a function of sex may reflect differ-ential maturation rates.for females'and males. Certainly it is clear from the work ofStone anci Battker (1939) that maturation relates to interests; the interests of pre-- menarcheal and postmenarcheal girls of the same chronological age differ. Hence, phy-sical development, which occurs earlier for girls than for boys (Heald & Hung, 1973;Tanner, 1970), may be an important determinant of adolescent interests.
There was alsa a notable discontinuity in interests between the seventh- and
9
17
(I
I.
ninth-grades for both the males and females. The factor patterns'derived fron'th4seventh- and eleventh-grade data were much more similat than either in comparison -with the ninth-grade factor pattern. As Freeberg and Rock point out, this transiiionperiod,is closely associated with.not only the onset of pubertrbut else' with nevisocial experiences and changes in Nip social behaviors expected of en .adolescent.The transition is particularl notable in activitiessrelated to academi4 effortsand leisure time pursuits. We .dd that it is during this transition periodthat adolescent3 become facile with formal operational thinking (Inhelder & Piaget,1958; Riaget, 1952; Piaget Inhelder, 1969). These changes in cognittve abilitymaybe one of the factors producing changes in interests because of npw ways ofviewingathe social world (Flavell, 1977; Shantz, 1975),
The research reviewed above demonstrates age and sex differences in adolescentinterests eXist and that not only cultural but aleo physical growth and intellectual 'factors infruence interests and changes in interests as development proceeds. If,indeed, this is the case, it is necessary ihat interests be studied over a muchwider age range than has heretofore been done in order to insure the uncanfoundingof social transitions', such as occur when the child moves from middle or junior highschool to;the high school, and to be relatively certain of obtaining estigates ofearly interest patterns for comparison with 'patterns derived from later sge points.In addition,Dsince chronological age norms for the onset of important intelOctualchanges qre at best rough indicators,, it is necessary that interests be assessedfor a broad age range of adolescents.
This %.ias'done in a recent prOject by Dusek, Kermis, and Mange. (1979)1 An in-venlory of interests was constructed from the free responses of approximately 100students each from grades five, seven,,nine, eleven; and college., The studentswere asked to list.those things..about which they would like to hive more information.It was stressed that these topics could be anything that WAS of interest to-them.The responses were independently categorized by two-raters into 31 categories thatwere further reduced to 14 topics. This list of topics was then used to assess theinterests of approximately 50 students in each of,the grades 5-12. Firstthe studentsranked the topics from 1-44 in terns of how inportant they were,perceived to be tothem; then they rated their degree of interest in each topic on a 7-point rating scaLe.
The analysis ,of the rankings revealed two major findings. First, as expected,the correlations among the salience hierarchies tended to be highex for adjacentthan non-adjacent grade le1/4els; Second, and unexpectedly, the data indicate theninth grade as a transition point for the development of interests. The rankings- -of the ninfh graders correlated significantly and highly with the rankings of sub-jects in grades 10-12, but the correlations involving the lower grade levels didnot. A relatively high degree of stability in interests is reached by grade nine.
The principal 'components analysis.vf the interest ratings resulted in four com-ponents that were rotated to a varimalokriterion: I - Interpersonal Relations,II -.Human Ecology or Drugs, III - Education, and IV - Concern with the Future.The Grade Level x Sex analyses of variance for the component scores revealed a num-ber of significant differences associated with Grade Level-and Sex. The girls hada higher mean score than the boys on component I, with the reverse emerging for theremaining three components. In general, rhe significant grade level effects revealedgrade 5 as a transition for Component I and grade 9 as a transition for Component III.
these findings.replicate and extend the earlier research (reviewed 'above) andsuggest the utility'of the interest suxvey for studying adolescent social development.
r
a
10 /
1
0
As Duaek et al. (1979; Dusek & Monge, 1974) note, the data indicate that bothbroad sociocultural factors and cognitive/personality variables influence thedevelopment .of, and change in, interests. The survey previously developed bythe author seems appropriately sensitive to these idfluenees.
°- The influences that determine adolescent interests and chsnges in them are
,similar to the influences that.Underlie ado3escent self-concept (e.g., Brim; 1976;Piaget, 1972; Simmons et al., 1973; Symonds, 1936a, 1936b). Indeed, with respectto cognitive factors, Piaget (1972) has suggested the assessment of le4e1 of cog-nitive development within those areas in which the person has a high interestAnd, many theorists (e.g., Brim, 1976; Dusek, 1977; Epsteih, 1973; Montemeyer &Eisen, 1977),have discussed the relationship between cognition and. self-Ooncept.,If self-concept has a "motivating" influence, and if the self-concept and inter-ests are determined by the same or similar sets of factors, the iwo should belawfully related..
1
In the present research this possibility was tested by having the subjectii:cbmplete both a self-concept instrument and an inteiest inventory. The data werethen analyzed.to aetermine if any relationships existed between the measures.s.Since Monge's (1973) self-concept scale was used in conjunctionyith the author's(Dusek et ala, 1929) scale to survey inferests, it was possible to relate componentsof self-concept to compdhents of interests. In this way we could also determine-in combinations of components of self-concept related to specific combinations ofcomponents of interests. This advantage provides both for the assessment of therelation of personality types to interests and for some constrUct validity of thetwo measuret bbing employed.
'Self-Concept and School Achievement
Both the design of the study and,the information made available to the investi-gators fortuitously allowed for studying the relationship between self-concept and .1.
school achievement and IQ, although this was not built into the research proposal..
It is difficult to succinctly summarize the literature on.the relation beiween self-concept and school achievement and intelligence.because of the large number'of in-struments used and the, general inconsistency ,of research findings. Purkey (1970)has suTmarized this literature and the interested reader is referred to his bookfor a more thoiough treatment of the broad ranging issues than that presented here.
There are two major research questions that relate to the issue of self-conceptand school achievement. First, and most simply', is the question of whether or notmeasures of silf-.concept and measures of school achievement are related. Relevantquestions deal with the degree of relationship, sex differences and developmentaltrends in the relationship. 'The second.important'issue is much more difficult. Itrelates to the question of the direction of causation in relations between schoolachtevement and self-concept. Some argue that self-concept is the primary causeof school achievement (Cf., Calsyn & Kenny, 1977). These self-enhancement theor-ists believe that curricula in schools should initially enhance self-concept in,order to allow greater school achievement. The antithesis of this view is espOusedby the skill development/al theorists (cf., Calsyn & Kenny, 1977L These theoristsbelieve that 'academic achievement exerts a significant in,fluer/6 on the developmentof the self-concept. From.this perspective it is the task`m&the curriculum ro pro-mote learning and achievement which will then influence the self-concept and resultin improvements in it. Since achievement test data were graciouply offered the principal

investigator it was deemed'desirable to extend the !breadth ,of the research to includethe deparmination of relationships between self-concept and achievement twit perfor-
.. mance and IQ scores; Pt
A number of studies have investigated the relationship of adhievement measuresto either global self-concept or sdhe measure of a specific aspect of self-concepi,usually academic self-concept. In somp studies (e.g., Bledso, 1964; Piers & Parris,'1964 Trowbridge, 1974), developmental trends were assessed. In some studies (e.g.,Anas asious, 1964; Milgrim & Milgram, 1976) the sample was restricted to high IQ stu-
I. dent . Although variety of measures tempers any 'generalizations, the following summari ,
seem, 0.fair representation of the data.
At the elementary school level global measures of self-concept correlate signifi-%cantly and positively with measures_of-tchieyement. The.correlations range in magni-tude from about' .17 (Piers & Hartfk, 1964) tO .54 (Bruck & Bodwin, 1963), with mostbeing on the order of .30. Findings wi.th measures of.academic self-concept are muchless clear. Some (e.g., Jason & Dubn67, 1973) report correlations in the .2 - .3 rangebut others (e.g., Marx & Winne, 1974) report no relationship. Similir findings hav4been reported at the junior high school level. 'There is some evidence.(e.g., Brookover,1964) that for beasures of academic self-cOncept the correlations may be somewhat higherthan at the elementary school level. Brookover reported that for 1050 seventh gradersthe correlations between self-cOncept and various school grades ranged between .40 and
. .61, with .similar iesults for botkthe boyt and the.girls. Finally, the few studiesdone at the'high sdhool level indiatte little consistent relatiohship between globalself-concept measures and school achievement (e.g., Bruck & Bodwin, 1963; Merrit, 1971;
: Edmunds, 1968). However,"academic self-contept is.consistfntly and moderately related- to aqhievement'(e.g., Binder, 1960; Brookover, Lepers, et 'al., 1965), the correlations
rangiiirfttir low -.40s to the high..50s.
Since in thesubject& in gradat each grade 1to clarify thethe-measures e
present research the same self-concept measure was employed.for allfive through twelve, and since alchtevement measures were available'
vel, it was hoped that adding this componentkto the research would help,relationship between self-Concept and achievement. The consistency ofployed and the longitudinal.nature of the project will allow the assess-
.ment of trend not previously investigated.,
Focus of,Research
Because of the broad scope of the research project'it seems appropriate'to summarizethe issues to which the research is directed. This is done below in a series of broadlyphrased questions reflecting the major aspeCts of interest in the research.
1. Are there age differences in components of 'self-concept during adolescence?
2. What age changes occur in components of the adolescent's self-concept?
3. Are there age differences in adolescent's intereéts/
4. ,What age changes.occur in adolescents' interests?
5. Is self-concept related to interests during the'adolescent years?
6. To what degree do sex differences occur in the above assessments?
7. Are self-concept anci measures of achievement related?
12 20

,:
/ What\is the nature of social class influences on self-concept and interests, .
.durilig the adolescentyeat.ii...
-,
, .
tThe answers to these, and cutter questions related to them, will provide informationnecessary for gaining a more complete Understanding of the idolescent's development.
..
C
*
't9
,
IS
Il
tr
,
A .
r.
4.
"21
Subiects
4
Method"
./
ir
, .
The subjectetwore drawn from one.e1ementary 'school, one middleschool (grades61-6), one ninth-giade school, and one high school (grades 10-12) of a suburban up-state New York,schoOl district. The schoOl.dietrict serves largely middle- and lower--middle socioeconomic status families..
The initial 1975 sample of subjects conaisted of 81,1 males and females in°grades5-12 who agreed to participate in the research. The 1976'sample eonsisted, in part,of those subjeCts.who were tested in 1975, and who (a) were still enrolled in a par-ticipatin- school, (b) were.present on the day of testing, and (c) agreed to parti-cipate. if course,.the initial twelfth graders were no longer included'- no twelfth -grader 1975 who repeated the twelfth grade in 1976 lias included. In addition, anew group of.subjects who agreed to participate and who had not been tested previouslywere added to each.grade'leval, including an entirely new simple of fifth graders.The sample for the third year Of the study was construfted in a similar manner,'in-candinesubjects who were tested in 1.975 or 1976 or both years and a new sample ofsubjetts An eaphegrade level.
.
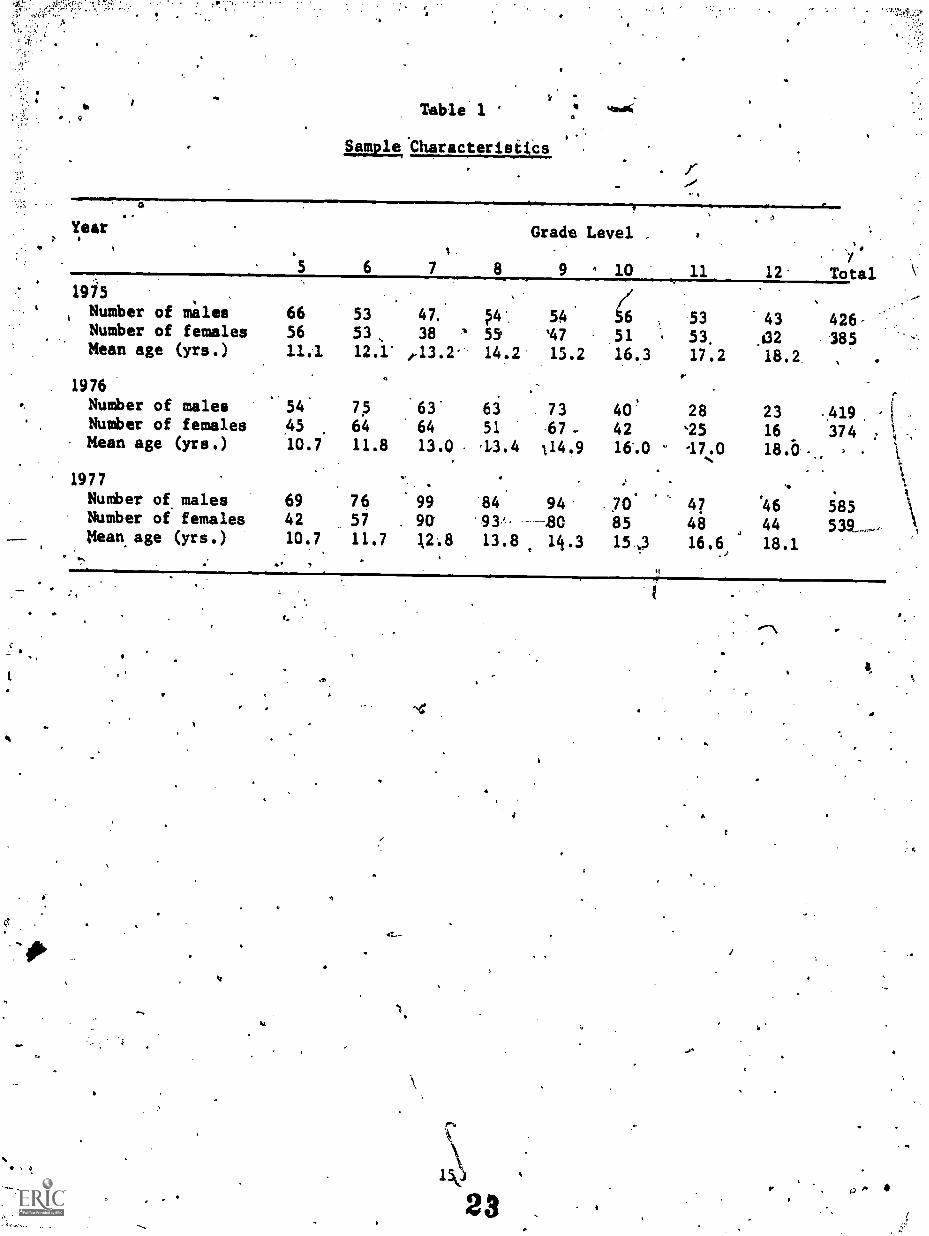
The number of males and females tested each year in each grade leyel are listedin Table 1 =along with the mean ages of each grade level sample. A total of 174 male,and 156.female subjects from the sample of 1975 subjects in grades 5-10 were tested .each of' the.thrie years of the study. This sample of 330 subjects composes the long-itudinal component of the research. Sample attvition at the lower grade.levels wasdue largely to movement out of the school,district. At.the upper gracieLlevels move-ment out of th e. district, dropping out of schoo4, and refusal to continue participa-. tion all contributed to subject.attrition.
S
, Materials
The questionnaire consited Of a cover sheet, then the self-concept scale, then)
the rankings and ratings form for assessing interests; and finelly a series of sheetsfor obtaining data about the sources of information adolescents use. These litterdata are extraneous to the major purposes of the proposal.
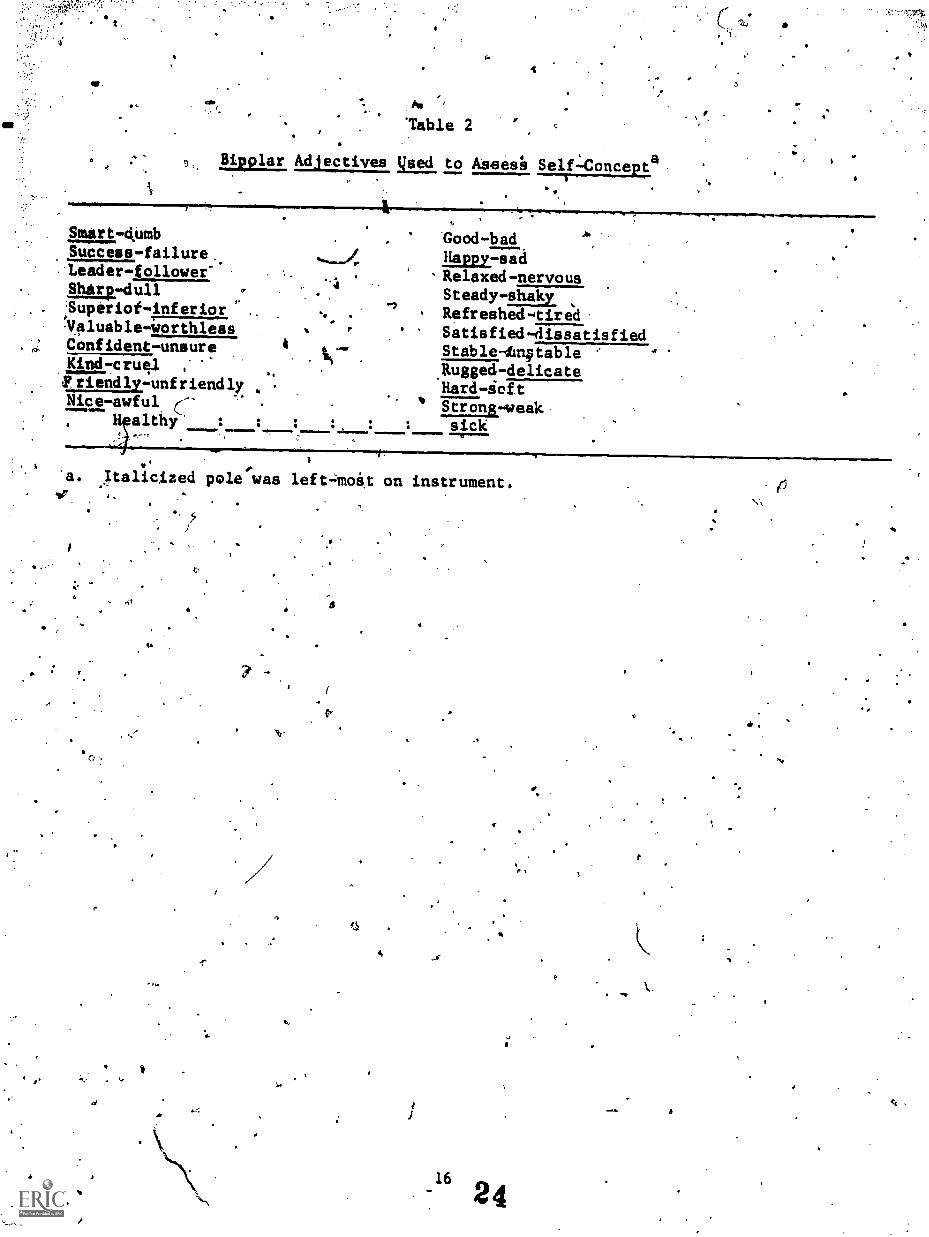
The itemarfor the assessment of self-concept were those previously used by Monge(1973), allowing an attempt to replicate his findings. The bipolar adjectives mayhe found in'Table 2. They Were randomly Ordered and placed on the endpoints Sf a'line containing seven discrete sectlions, as shown for the pair Healthy-sick in
',Table 2. .
The tOpics used to assess'age changes and.age Afferences in adolescent inter-bats are listed in Table 3. These topics were taken from earlier research (Dusek &Mange, 1974; Dusek, Kermis & Monge, 1979) showing that they covered a wide range ofadolescent interests. Using these topics allowed a replication of this earlier re-search.
Procedure
Thequestionnaire. took appr ximatel one class period (43 minutes) to complete.
1
a
.
Table 1
Samnla.Characteristics
'!7.4,
.
Year
.
5 6
%.
7 8.
Grade Level ,
9 ^ 10 11. 12-
. .'.. 7
Total1915 .
.Number of males 66 53 47. po'. 54 /6 53 43 426-
..Number of females 56 53 38 ' 55 147 51 . 53 02 385Mean age (yrs.) 11.1 12:1 '13.2-- 14.2. 15.2 16.3 17.2 18.2 ,
S.
1976
Number of males 54 75 63. 63 . 73 40 28 23 .419Number of females 45 64 64 51 .67 .. 42 *25 16 374Mean age (yrs.) 10.7 11.8 13.0 'L3.4 114,9 16.0 -17.0 18.6 -,, ,
1
1977 -..
:
. .
..
:
Number of. males 69 76 99 '84 94. .,70 4? 46 585Number of females 42 57 . 90 85 48 44 539--Mean. age (yrs.) 10.7 11.7 1,2:8 13.8 14.3 15,,3 16.6 18.1
.
s
hit
_ "Fable 2
4
0, Molar Adjectives used.to Aseesh Self:Concepta1-
3
§Mell'AumbSuccess-failure,.Leader-follower"ShsrrdullSuperiof-inferior)41luablei7a7gisConfident-unsurelint-cruel
.
friendly7unfriendlvNIErawful (--
1
H althy'
;
Good-bad
Happy-sad'Relaxed-nervous
S.
:
1/
:arm*. 4.0
Steady-shakyRefreshed-tiredSatisfied-dissatisfiedStable-twable.Rugged-delicateHard-ioftStrong-weaksick
a. jtalicized pole was left-,:moit on instrument.
6
e .
.11.

4a
Fo;rt used to Assess Rankings and-Ratings of Interests r
.
.i Not at all ..
interesting,
,
Mediuminteregt
Very highlyinteresting
Philosophy,and religion 1 ,. 2 e J 4..
.
5 6 7
Medicine and health 1 2 3 4 5 6 . 7
Science and. mixh1 2 3 4 5 6 7
Lo've and ma,rriage3. 2 3
,
4
,
5 6 7. .
c.-
.
Future work ,
1 2 't.3 4 5 6' 7
Arts, crafts and sports 1 2 3 4 5 6 7
Teachers and school1 2 3 4 5 6 7
Birth control1 2 3 4 5 6 7
-Undevetanding other-people 1 2 3 4 5 6 7
Venereal (social) disease 1 2 3 4 5 6 7
Sexual refitions and reproduction 1 2 3 4 5 6 7
r Drugs1- 2 3 4 5' 6 7
Dating and going steady 1 2 3 4 6 7
Ecology1 rA 2 ,3 4 5 6 7
II
.
Ne.
25,

The fifth graders were always tested in intact claisrooms. The sixth- throughtwelfth-graders were teemed in large groups.
qubjects were instructed 4o put their name on the cover sheet, along with theirbirth date, 'pada and sex. Next the subjects were instructed to complete the self-concept questionnaire by -reading.each of the bipolar adjective pairs and puttingchack on thi line to 'indicate their "characteristic seli" for each adjective pair.
Next the Subjects were instrutted to read each of the topics and rank them from 1to 14 in terms of importance in.the space to the left of each topic and rate themin terds of interest by dirciing a number to the right of each topic.
Analyses
The self-concept and interest rating"data collected each year were analyzed bycomponent anaiyses, the components being subjected to varimax rotation. Factor scoreswere ca:lculated and analyzed in a series of 8(Grades) x 2(Sex) analyses of variance.Similar proceciu6s were used to analyze the data for the 'longitudinal sople. Inthis case, factor scores were subjected to 6(Groups) x 2(Sex) analyses of variance,where Group I was compe4ed of those subjects initially tested as fifth graders in1975 and for yhOM complete data were available frbm the 1976 (Grade 6) and 1977
'(Grade 7) testings. Similarly, Groups 2-6 were composed of subjects initially inGrades 6.40, reipectively, in 1975 and for whom complete data were available fromeach sub.;uquent testing.
The factor analytic and canonical correlation approaches were both used to assess.the relationship between self-concept and interests. Separate analyses were'donefor each oross-section'al sample. For the longitudinal sample analyses were done tomeasure both within-year and acrosk-year relationships.
Social classdifferences in self-concept and ihterests were measured throughfactor analytic techniques. Separate component analyses were done on the data fromlower- and middle-class students. Social class ratings were made on the basis ofpaternal occupdtional level ratings based on U.S. Bureau of the Census (1960) class-ifications. Briefly, these levels may be characterized as follows: 0 us long-termunemployed, 1 us laborers, 2 m service workers, except priyate household, 3 m privatehoilsehold workers,'4 us operatives and,kindred.workers (e.g., apprentices), 5 is crafts-
.. men, foremen, and kindred workers, 6. is sales workers,-7 clerical and kindred work-ers, 8 managers, officials, proprietors, and farmers and farm managers, and 9professional, technical, and kindred workers. In order to maintain a sufficientlylarge sample for the factor analyses occupational groupings of 0-5 were consideredto represent the lower class and 6-9 to represent the middle class.
Achievement test and IQ scores were available for a large percentage of the sub-jects. For the fifth- through eighth-graders these scores came from the IOWA Achieve-ment Tests and Cognitive Abilities Tests. 'For the ninth- through twelfth-grades the.scores were from the Stanford Achievement Tests and the Otis-Lennin. Correlationsbetween factor achievement, IQ and factor scores were computeil; In addition, n anattempt to replicate the findings of earlier rePearch, analyses of variance were corn-
; puted on factor scores for groups selected on level (e.g., high vs. low) of achieve-ment test performance.

Results, 0
The results will be presented in several sections.. First, results of the ana-lyses of the Self-concipt data will be discussed separately for each year and thenfor changes across.Years. Second, the results of analyses of the interest rankinisand ratings will be presented separately for each year and for changes across years.The next section will be a discussion of the relations between thp self-concept.andbinterval data. cThe final section will present data on social'class effects on self-concepeand on the relationship be n.self-concept and academic achievement testpetformance.'
'
Ainalysea of Self-Concept Data
,The reaponses to the 21 items of the selfconcept scale were scored with a "7" .torthe space-closest to the positive or high end of the scale and a "1" for thespace closest to the negative or low end of the scale. (See Table 4 for the deter-mination of positive and negative poles of the sCales.) Using this scoring.proced-ure facilitated interpretation and the comparison of these data with that of others
Nonge,197-3; Smith 1962) who used similar.scales and procedures.9
The data for each year's'sample were submitted to a principal components ana-lysis of a.Scile it Scale (21 x 21) intercorrelation matrix with unities in the maindiagonal: . Only components with eigenvalues greater.than or equil'to one were ei-,tracted. .These components were then rotated to Kaiser's (1959) varimax criterionin ordef to facilitate interpretation (Smith 1962). Coefficients of'congruence(Harmon 1967) yere computed.to determine factor similarity. Analyses of variancei were carried oUt on factor scores.to assess age and sex differences.
1975 Data'. The, data for the 426 males and 385 females were first analyzed,sep-,
arately. For both males and females four factors emerged. Coefficients of congruencefor like-factors ranged from .80 to'.94, indicating a degree of factor structure simi-larity sufficiently high to combine the data from the two sexes and conduct an over-
. all analysia (see Monge 1973). .\
The components derived from the 'analysis of the data from ,the entire (N 1. 811)1975 sample are listed in Table 4. Coefficients of congruence for like-factors16Terecomputed between the factor patterns for the'individual sexes and the total sample.Thwoe ranged from 1.961 to 1.991 for the male-to-total-sample comparisons and /.941to 1..981 for the female-to-total-sample comptrisons. These data support the approp-riateness of combining the sexes for purposes of an overall analysis.
. ,
Factor I was defined primarily by the positive adjectives relaxed, steady, stable,rqreshed, healthy, happy, and satisfied. Monge (1973) labelecipthis fictor Adjustment.The positive adjectives indicate the individual has achieved a balance with the en-
.vironmeni. 'The negative adjectives indicate a lack of homeostatic balance and conveya Lense of helpless frustration.
Factor II, which Monge labeled Achievement/Leadership, was defined primarilY bythe adjectives smart,. sharp, valuable, success, superior, and confident. The positiveadjectives denote a sense of one's self as being capable and intelligent. The negatiyeadjectives 'convey a sense of the self as being not very intelligent and as being a"loser".
Factor III, defined primarily by the adjectives nice, kind, friendly and good, is
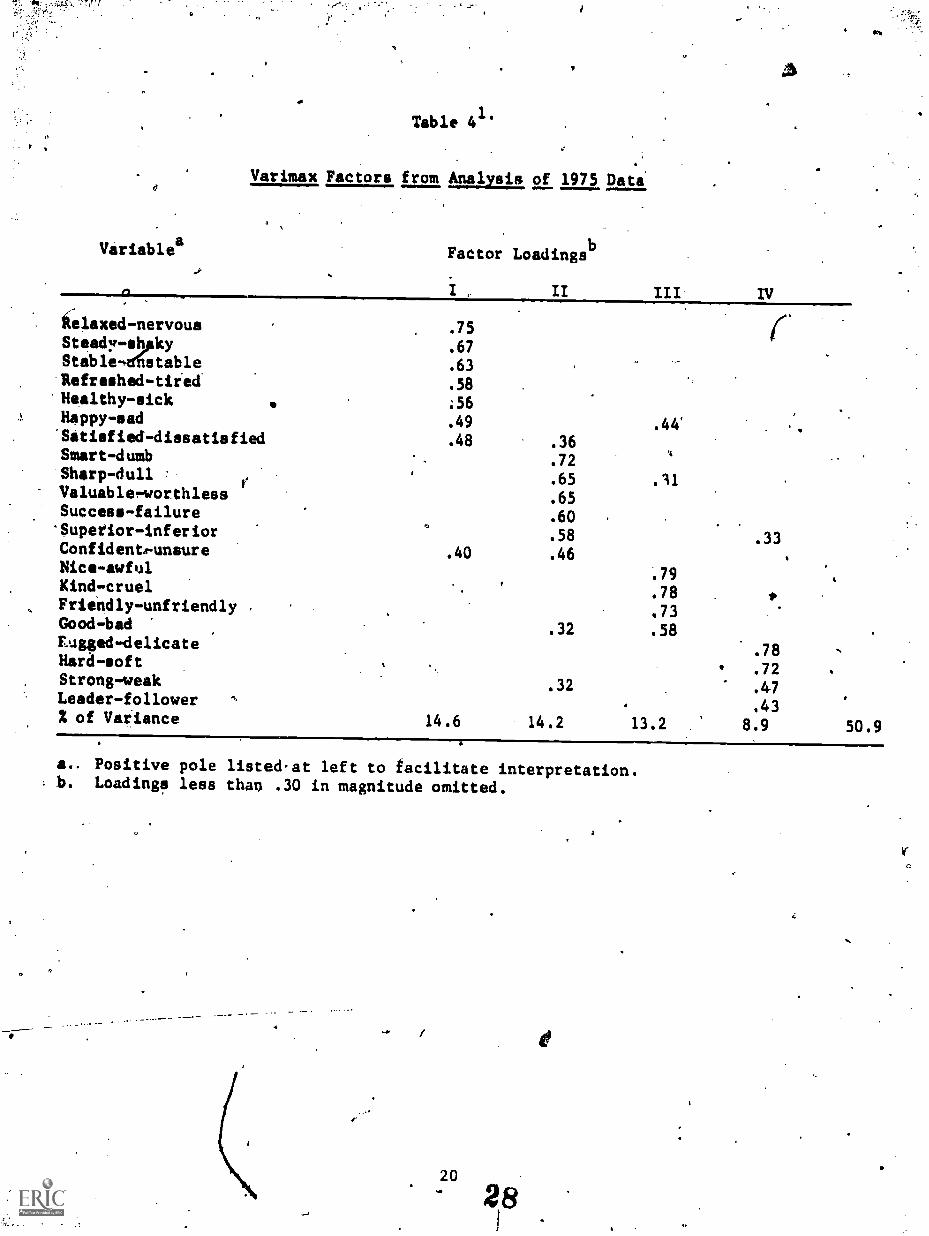
Table 41
Varimax Factors from Analysis of 1975 Data
Variablea Factor Loadingsb
I ,
i'elaxed-nervousSteadF-s4pkyStable,dfistable
Aefreshed-tire&'Healthy-sick
.75
.67
.63
.58
56Happy-sad .49 .44''Satisfied-dissatisfied .48 .36Smart-dumb .72Sharp-dull : .65 .11Valuablervorthless .65Success-failure .60'Superior-inferior .58 .33ConfidentR-unsure .40 .46Nice-awful .79Kind-cruel .78Friendly-unfriendly .73Good-bad .32 .58Fugged-delicate .78Hard-soft .72Strong-veak .32 .47Leader-follower .43of Variance 14.6 14.2 13.2 8.9 50.9
a.. Positive pole listed.at left to facilitate interpretation.b. Loadings less than .30 in magnitude omitted.
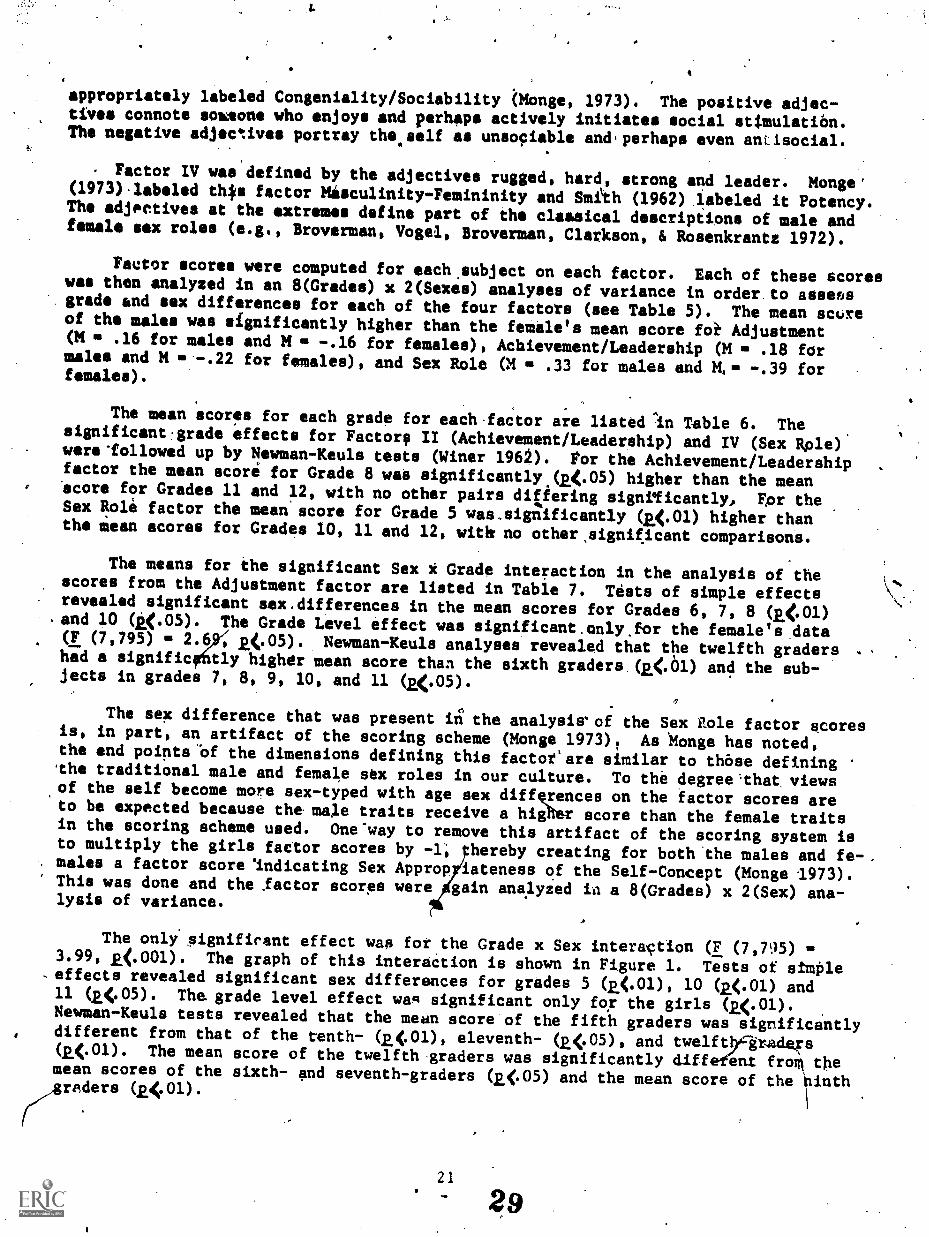
appropriately labeled Congeniality/Sociability (Monge, 1973). The positive adjec-tives connote soasone who enjoys and perhaps actively initiates social stimulatitin.The negative adjectives portray the.salf as unsociable and,perhaps even anLisocial.
Factor IV was defined by the adjectives rugged, hard, strong and leader. Monge'(1973).1abeled th*s factor Misculinity-Femininity and Smiih (1962) labeled it Potency.The adjectives at the extremes define part of the classical descriptions of male andfemale sex roles (e.g., Broverman, Vogel, Broverman, Clarkson, & Rosenkrantz 1972).
Factor scores were computed for each.subject on each factor. Each of these scoreswas then analyzed in an 8(Grades) x 2(Sexes) analyses of variance in order to assessgrade and sex differences for each of the four factors (see Table 5). The mean scureof the males was significantly higher than the female's mean score foi Adjustment(M m .16 for males and M -.16 for females), Achievement/Leadership (M .18 formales and M for females), and Sex Role (A m .33 for males and M,= -.39 forfemales).
The mean scores for each grade for each.factor are listed'in Table 6. Thesignificant:grade effects for Factor, II (Achievement/Leadership) and IV (Sex Bole)were-followed up by Newman-Keuls tests (Winer 1962). For the Achievement/Leadership
.factor the mean score for Grade 8 was significantly.(g.05) higher than the meanScore for Grades 11 and 12, with no other pairs differing signtficantly, For theSex Role factor the mean score for Grade 5 was.significantly (2(.01) higher thanthe Mean acores for Grades 10, 11 and 12, with no otherssignificant comparison's.
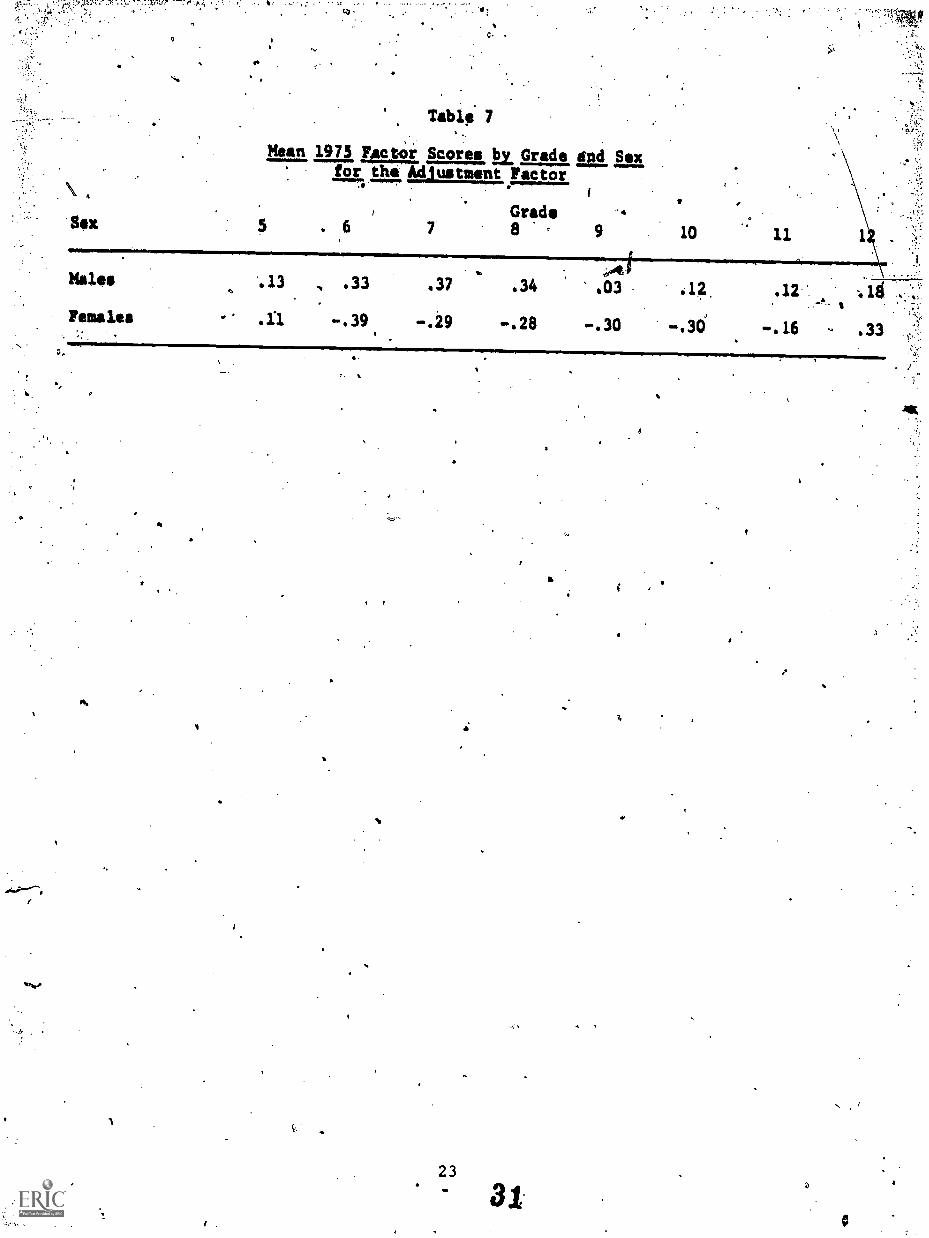
The means for the significant Sex 3t Grade interaction in the analysis of thescores from the Adjustment factor are listed in Table 7. Tests of simple effectsrevealed significant sex.differences in the mean scores for Grades 6, 7, 8 (2.01)
. and 10 (2(.05). The Grade Level effect was significant.only.for the female's,data(F (7,795) 2.6 , 2405). Newman-Keuls analyses revealed that the twelfth graders .had a signific tly higher mean score thaa the sixth graders (2.<.01) and the sub-jects in grades 7, 8, 9, 10, and 11 (2(.05).
The sex difference that was present in the analysirof the Sex Role factor scoresis, in part, an artifact of the scoring scheme (Monge 1973). As Monge has noted,the end points "of the dimensions defining this factor'are similar to thbse defining'the traditional male and female stx roles in our culture. To the degree'that viewsof the self become more sex-typed with age sex differences on the factor scores areto be expected because the male traits receive a higher score than the female traitsin the scoring scheme used. One'way to remove this artifact of the scoring system isto multiply the girls factor scores by -1; hereby creating for both the males and fe-.males a factor score 'indicating Sex Approp iateness of the Self-Concept (Monge 1973).This was done and the factor scores were gain analyzed i a 8(Grades) x 2(Sex) ana-
,
lysis of variance.
The only' significant effect was for the Grade x Sex interaction (F (7,7t.)5) =3.99, 2(.001). The graph of this interaction is shown in Figure 1. Tests of simple
,effects revealed significant sex differences for grades 5 (2(.01), 10 (2(.01) and11 (205). The. grade level effect wag significant only for the girls (2(.01).Newman-Keuls tests revealed that the mean score of the fifth graders was significantly
, different from that of the tenth- (2(.01), eleventh- (2(.05), and twelftV-04.1dars(2(.01). The mean score of the twelfth graders was significantly diffefint froA themean scores of the sixth- and seventh-graders (p(.05) and the mean score of the r.nthr,graders (201).

Fag tor.
Table 5
Summary Qf Analyses of Variance for 1975 Factor Scores
Mean Squares I
Grade Sex x Grade
I (Adjustment) 20.48*** 1.92 2.69**II (Achievement/Leadership) 31.31*** 2.03* 1.06III (Congeniality/Sociabi/ity) .17 ' 1.57 1.21IV (Sex Role) 103.62*** 1.40
Error
497.94
1.00.65
Note: The degrees of freedom were 1 for Sex and '7 for Grade;. error degrees of freedomwere 795.
* a4;.05**
*** a4L.001
Table 6
Mean 1975 Factor-Scores_for Each Grade tevel
Factor
5 6 7
Grade
8 9
I .12. -.03 .04 .03 -.16
II ,.04 .09 .03 .23 -.07
III -.01 -.26 -.U4 -.01 .03p.
IV .23 .10 .07 -.01 .08
lo ,11 12.
-.09 -.14 .26
-.09 -.20 -=..18
.10 .07 .16.
. -.24 -.21 -.25
22
qvil '. , .
41 s
0
A
Table' 7
Mean 1975 Facor Scores la Grade fak Sexfor the Adiustment ?actor
. 6Grade8 9 10 11
Moles '.13 , .33 .37 .34 .03
Females - .3:1 -.39 -.29 -.28 -.30,.
.12 .12.
-.16 - .33
23
31.
1.

0
Figure 1
kkan Fector.Scores for Males and Females
on Sex Appropriateness of the Sqlf-Conceilt
for 1975 Data
-'
Anibal. the aeparateAnd 374 females each resultedlike-fictors ranged-from 1.781to'incticate the &to from theoverall ccmponent analysis.
1.
component analyses of the data from the 419 malesin four components. Coefficients of congruence forto 1.921.° 'These coefficieMte are sufficientiy hikhtwo sexes may be combined,for purposes of doing an
-The varimax factors from the overall component analysis may be seen in Table8. The coefficienti of congruence for like-factors were computed for the factor
patterns of the indilidual sexes and the total sample. These ranged from 1.931to 1..991 for the miles-to-total-sample comparisons and from 1.911 to 1.981 for thefemales-to-total-sample comparisons.
The coefficients of Congruence computed on the factor loadings for the 1975(total dample) and 1976 (total sample) data ranged from 1.931 to 1.971 for like-factors, indicating a very high degree of.similarity in the factor structures. Hencethe labels placed on the factors deriv'ed from the 1975 sample are.retained for theappropriate factors derived from the 1976 sample.
In order to assdss the possibility ehat the retested subjects performed.ferently than the subjects tested for the first title in 1976, separate couponAnalyses were conducted on the data for retested and new subjects. The fourthat emerged from each of these analyses were the same as those reported forsample. And, the factor structures were highly similar in the two.analyses.'coefficients of congruence for like-factors ranged from 1.941 to 1.991.
dif-entfactorsthe 1975The
To,further assess any differences that might exist in the data due to retestingof some subjects; another set of analyses was done. First, the 1976 data for allchildren in grades 6-12 was subjected tl a component analydis. Children in.grade 5were omitted because all ofthemvere tested for the first time in 1916 and therefore'no retest.group was available for comparison purposes. Second, factor scores werecomputed ior all subjects. These scores were each analyzed in A 7(Groups) x. 2(Sex)x 2(Retested/New subjects) analysis of variance.3
The component analysis revealed fonr,factors,'the same in content as notedabove for the total sample Of subjects tested in 1976. The effects of interest ineach of the analyses of variance for the four factor scores are those that involvedifferences between retested and new subjects. Of the 16 effects involving this fac-.Ptor only one was signifj.cant. For the Antustment factor retested subjects had a sig.1°.nificantly (F (1;666). 4.30, 2.4(.05) higher thean,factor score (.03) than the subjectstested for the first time CM -.14). These analyses suggest that the retested andnew pubjects responded to the-testsin a similar fashion. Hence, no distinction be-tween these groups is made in the further'analyses of the 1976 data.
To assess sex and grade level diffeIences in the 1976 data, factor scores werecomputed for each of the four factors. Tase were then each.,analyzed in a 2(Sex) x8(Grade) analysis of variance. These analyses are summariaad in Table 9.
re^Significant Sex effects were present for the' Achievement/Leadership,Congeniality/Sociability, ind Sex Role factors. The mean score of the males was higher on the fac-tors labeled.Congeniality/Sociability (Ms - .23 and -:30 for males and females, respect-ively) and Sex Role Ois .32 and -4.38 for males and females, respectively). Thefeemles had a significantly higher mean score (.11) on the Achievement/Leadership fac-tor than did the mhles (M -.09).
The means for the significant Grade Level effects for the Adjustment and Sex Role

Variables
Table 8
Varimaix'F,a,....rs from Analysis of 1976 ate
SUccess-failure.Smart-dumbSupemior-inferior*Valuable-Wotthless-Sbarp-dullConfident-unsureLeader-followerRelaxed-nervousHappy-sadRsfreshed-tiredSteady-shakyHealthy-sickSatisfied-dissatisfiedStable-unstableNice-awfulIlnd-cruel.Friaidly-unfriendlyGood-bodRugged-delicateHard-.soft.
'Strong-weak% of Veriance
S.
eI I
- Factor Loadingsb
I ^ /I lit IV
.74
.68
.68
.65
.51
.50
.46
" 30
.35
.33 -
.34
.66
.63
.63.
.60
.59
.43
'
.
.32
.30
ms
S.
16.-1 14.0
.790.75
.' .68
.65
13.1
.75
.74
.61
9.2 50.9
A. _Positive pole listed at lett to facilitate interpretation.b. Loadings less than .30 in magnitude omitted.
5\
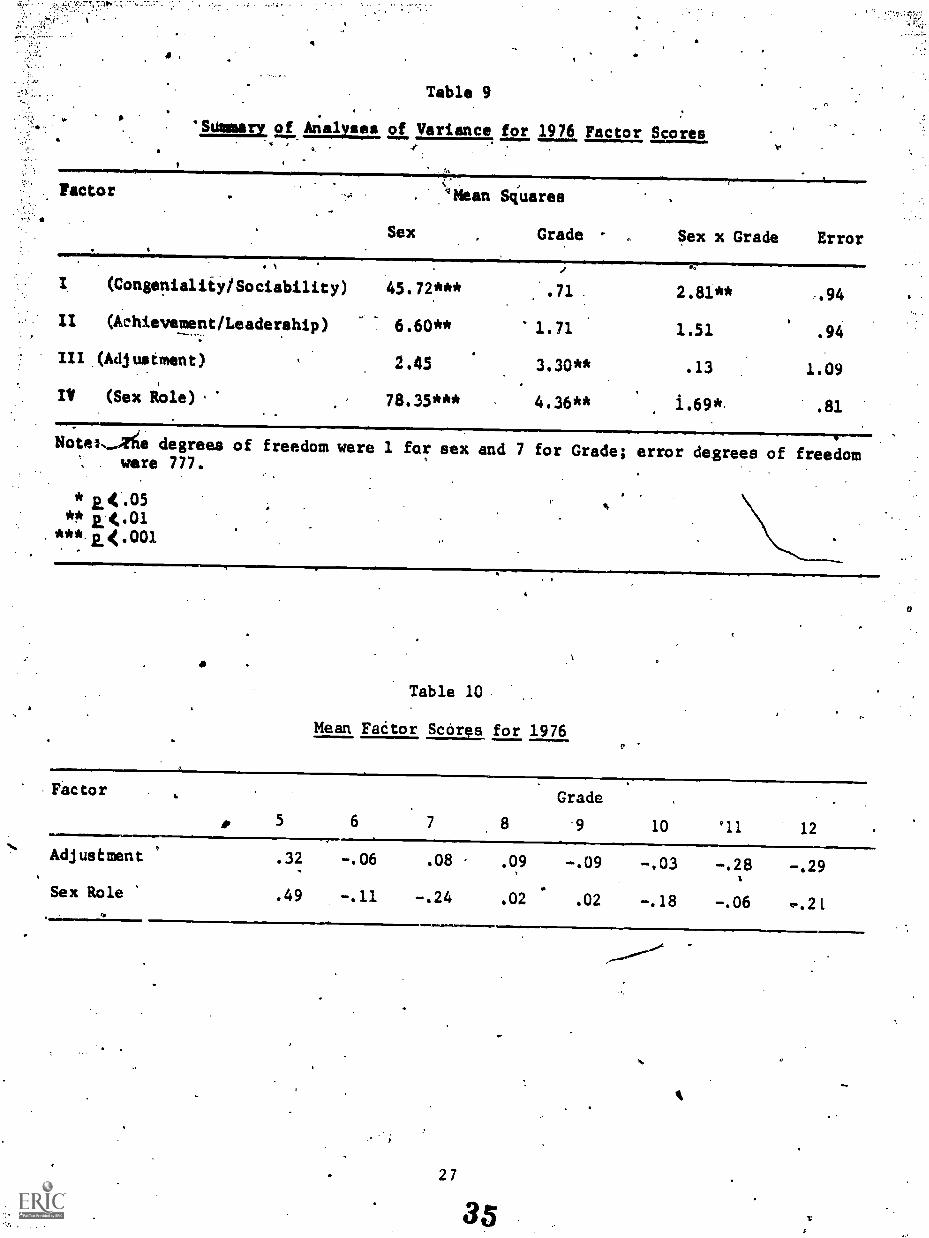
.
a ,
0
Table 9
*SUmmarv of Analyses, of Variance for 1976 Factor Scores. ,
Factor 'Mean Squares
. ,
I (Congemialiiy/Sociability)
II (Achievement/Leadership)
III (Adj mstment )
IV (Sex Role) '
Sex Grade
45.72***
.
.71 .
T 6.60** 1.71
2.45 3.30**
78.35*** 4.36**
Sex x Grade Error
..
2.81** ..94
1.51 .94
.13 1.09
1.69*.
Notel,....Me degrees of freedom were 1 for sex and 7 for Grade; error degrees of freedomwere 777.
***
4
Table 10
Mean FaCtor Scores for 1976
Factor Grade
5 6 7 8 9 10 11 12
Adj us t men t .32 -.06 .08 .09 -.09 -.03 -.28 -.29
Sex Role .49 -.11 -.24 .02 .02 -.18 -.06 ,.21.
27

,factors'are listed in Table 10. ,Newman-Aeuls,
'analyses revealed thilefor the Adjust-sent factor ths Man score of the 'fifth ggaders differed significatitly (2.44.ol) frosithat of the eleventh and twelfth.giaders. There were no'other significant effects.Tor the Sex Role factor the mean seore, of the fifth graders differed significantlyfrom the mean scores of subjects in grades 6, 7, 9, 10, and 12.at the 21.4,.01
',and from the mean scores of subjects in grpdes 8 and 11.at t1e,RA.05 level. Themean score of the tenth graders was signfficantiv different (2.4.01) from the meanscore of the eighth graders and from the mean score of the ninth", eleventh-, andtwelfth-graders (2.4L.05).
41.
The Grade Level x Sex interattion was signifidahi for the ConeenialitY/Socia-bility and Sex Role factors. The mean scores are gresented in Table 11. Significantsex differences on the Congeniality/Sociability factor occurred for grades five, six,eight and ten (114L.01), and for grade nine (114;.05) The simple effect of Grade Levelwas not significant for either'the males or females. For the Sex Role factor signif-.icant sex differences at the Lit':01 level for grades 5, 6, 7, 8, 9, 11, and 12. The
. Grade effect was significant.for both the males (F (7,777) 7.8810;.01) and the females(F (7,777) s.4.911 24,.01). .Newman-Keuls tests revealed that for the males the mean
-score of the 'fifth graders was significantly ticol) different fromothe mean dcoresof the.sixtiviT, seventh-, and tenth-graders. For the fetales the mean score of the.fifth-
.
graders was significantly (12.(.01) different from the'mean scores of the sevedth-,eleventh;-, and twelfth-graders. There were no other significant effects:
As-tras done.for the data composing the SextRole factor in 1975, the girle' scoreson the Sex Role factor for 1976 were multiplied by -1 and the 2(Sex) x 8(Grades) analy-sis of variance was recalculated. The only significant effect was the,Sex x trade
"- interaction (F (7,777) as 6.390 2.1(.001). The mean scores are the same'in Value'asthose listed in Table 11, -with the female's means reversed in sign. Tests of simpleeffects revealed significant (4(.001) sex-differences at grades 5 and .7. The simpleeffect of grade was significant fot both the (2.4.001) and females,(2.4.001),with the differences between grade level means thin each s4x as noted above.
1977' Data. The data.for the 589 males and 539 females were first analyzed separ-ately. 'For both the males and the'females four factors emerged-. Unlike the case forthe 1975 and 1976:data, the pattern of coefficients of congruehce indicated a degreeof factor dissimilarity. The coefficient of congruence wasp1.941 for the Congeniality/Sociability factor and 1.881 for the Adjustment factor. Items composing the AchievementtLeadersnip and Sex Role factors,were grouped differently in rhe two analyses, resultingin a coefficient of congruence of only 1.761 forsthe Achievement/Leadership factor.The coefficient of congruence between the male's Achievement/Leadership factor and thefemale's Sex Role factor was 1.551; the coefficient of ongruence between the.femalesAchievement/Leadership factor and the.male's..Sex Role'fa tor was 1.871. This iesui$,edin a coeffiCient of congruence for the two Sex Role fac ors of only 4.161.
In order-to further investigate these similarities and differences in the factorstructures underlyingthe male's and female's data, coefficients of congruince were com-puted between the 1975 and 1177 data and'1976 and 1977 data separately for each sex.Filar the males the coefficients,of congruence for like-factors ranged 1.861 to 1.951for the 1975 and 1977 comparisons and 1.841 to 1.951 Tor the 1976 and 1977 comparisons.For the females the coefficients of congruence for likenfactors ranged from 1.791 to1.981 for the 1975 and 1977 comparisons and 1.851 to 1.961 for the 1976 and 1977 com-parisons. These data indicate an acceptably high level of stability in factor struc-ture for the two sexes across the three years of the study. As a result, it seethedboth reasonable and, in order to compaie'the data for 1977 to that of the previous years1 .
important, to combine the date from the 1977 males and females and do an .overall analysis.
28
38

Table 11
Mean 1976 Factor Scores for Significant,1111.Grade Level x Six Interactions
'Factor
Congeniality/Sociability .26
,F.
Sex Role M .82'
F- .15
GradeIv
6 7 8 9
.13. .07 ,.32 .14
-.28 .12 '4..28 -.16
dir.'
1k.08 .05 '.42 .43
-.29 -4,9 -.57 -.38
10 11 12
.25 .42
-.42 -.20 -.84
- -.04 ..42 .36
-.31 -.53 -.711
es.4
0
1
,
4
=4.4111
S'1.
:63
'26
TI
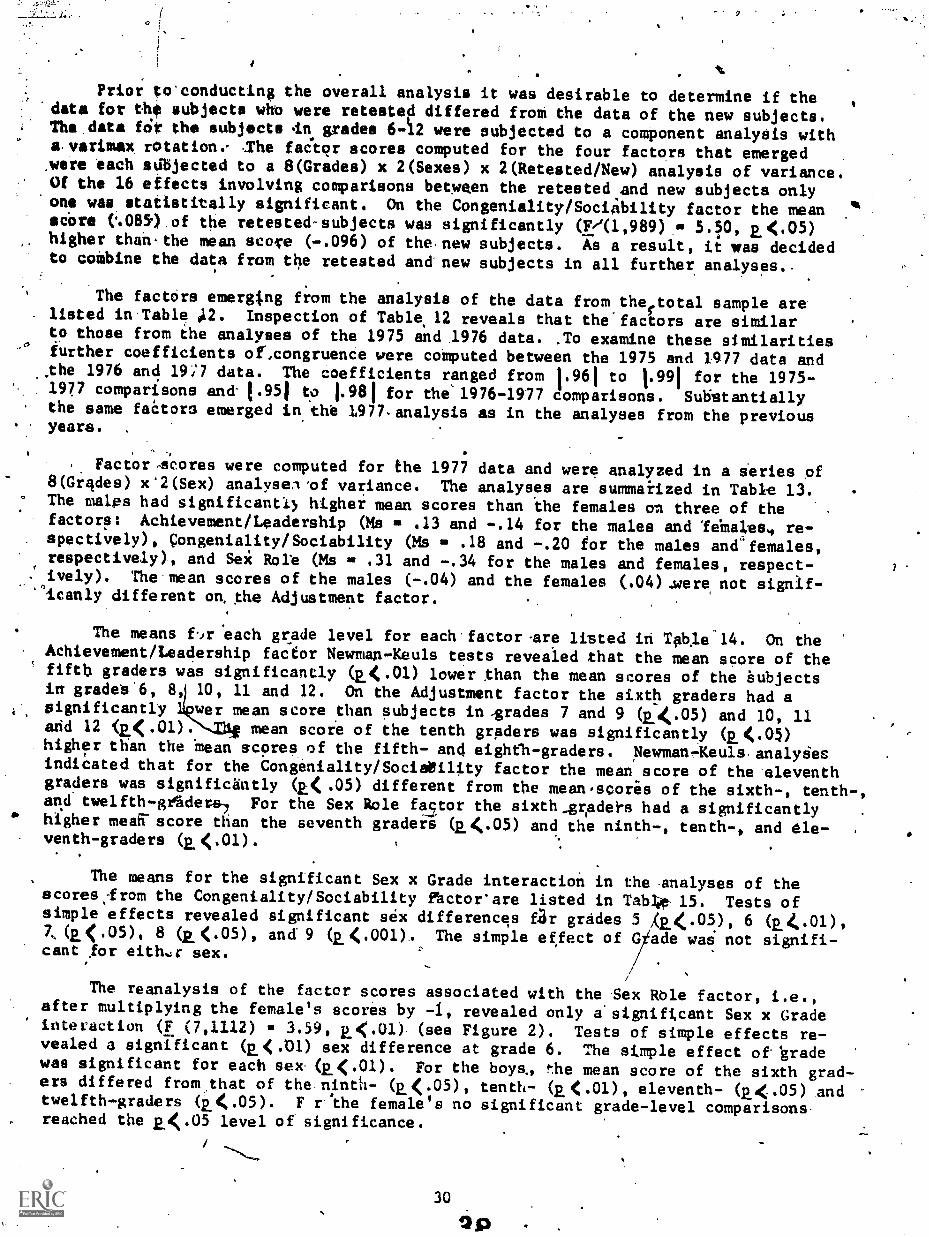
Prior to'conducting the overall analysis it was desirable to determine if the ,
*data for the subjects who were retested differed froth the data of the new subjects.The data flit the subjects in grades 6-12 were subjected to a component analysis withasvarimax rotation.- ..The fadior scores computed for the four factors that emerged,were each sajected to a 8(Grades) x 2(Sexes) x 2(Retested/New) analysis of variance.Of the 16 etfects involving comparisons betwen the retested and new subjects only
*one was statistically significant. On the Congeniality/Soci4bility factor the mean .score (%085) of the retested-subjects was significantly (F/(1,989).01 5.50, R..<.05)higher than-the mean score (-.096) of the.new subjects. Is a result, it was decidedto coibine the data from the retested and new subjects in all further analyses.-
The factors emergtng from the analysis of the data from theftotal sample arelisted in Table A2. Inspection of Table. 12 reveals that the'factors are similarto those from ihe analyses of the 1975 and 1976 data. .To examine these similaritiesfurther coefficients of,congruence were computed between the 1975 and 1977 data and
the 1976 and 197 data. The coefficients ranged from 1.961 to 1.991 for the 1975-1977 comparisons and- 1.951 to 1.981 for the'1976-1977 comparisons. Sulistantially
. the same faCtors emerged in2the 1977.analysis as in the analyses from the previousyeara.
,. Factor ,a,cores were computed for Elle 1977 data and were analyzed in a series of8(Gr.sides) x*2(Sex) analysel 'of variance. The analyses are summaiized in Table 13.
° The males had significanti) higher mean scores than ihe females on three of thefactors: Achievement/Leadership (MA .13 and -.14 for the males and 'fell:ales,. re-spectively), Congeniality/Sociability (Ms 10 .18 and -.20 ior the males and'females,respectively), and Sei Role (Ms se .31 and -.34 for the males and females, respect-
: ively). The mean scores of the males (-.04) and the females (.04).were not signif--
icanly different on,the Adjustment factor.,
The means U.,r each grade level for each.factor -are listed in TAble"14. On theAchievement/Leadership factor Newman-Keuls tests revealed that the mean score of thefiftb graders was significantly (11(.01) lower than the mean scores of the aubjectsin grades'6, 8 10, 11 and 12. On the Adjustment factor the sixth graders had asignificantly 1wer mean score than subjects in-grades 7 and 9 (2.4.05) and 10, 11and 12 (2.4:.01). N.Z11 mean score of the tenth graders was significantly (2.(.05)higher than the 'mean scores of the fifth- and eigheh-graders. Newman-Keuls.analyiesindicated that for the Congeniality/SociaNility factor the mean score of the eleventhgraders was significantly (k( .05) different from the mean,scores of the sixth-, tenth-,and twelfth-geaders, For the Sex Role fastor the sixth_griadei-s had a significantlyhigher meaff' score than the seventh graders (2.A05) and the ninth-, tenth-, and ele-venth-graders (2..01).
The means for the significant Sex x Grade interaction in the analyses of thescores:from the Congeniality/Sociability Pactor'are listed in Tablife 15. Tests ofsimple effects revealed significant sex differences far grades 5 ,(2.(05), 6 (11401),7,(px.05), 8 (E(.05), and' 9 (2.(.001). The simple effect of G ade wai not signifi-cant for eith.:r sex.
.,
The reanalysis of the factor scores associated with the Sex Role factor, i.e.,after multiplying the female's scores by -1, revealed only &significant Sex x Gradeinteraction (F (7,1112) 3.59, Ey(.0l) (see Figure 2). Tests of simple effects re-vealed a signiacant (a( .01) sex difference at grade 6. The simple effect of- 'gradewas significant for each sex. (11(.01). For the boys., the mean score of the sixth grad-ers differed from,that of the ninth- (2.(.o5), tenth- (2.(.01), eleventh- q1(.05) andtwelfth-graders (2.A.05). F r 'the female's no significant grade-level comparisonsreached the 114;.05 level of significance.

Table 12
Varlmax Factors frosoRnatysis. of 1977 Data
Variable Factor Loadlnasb
Smart,dumb k71Success-fallure. .65 .32Yaluable-Worthleis .64-Sharp-dull .63quPerior-lnferlor .59Confidantrunsure .51 .39Good-bad . .45 .41Relaxed-nervous .76Steady-shaky .66Healthy-sickStable-unstable . 30 .58Refreshed-tired .35 .58Happy-sad ..32 .54Satisfied-dissatisfied .46 .50Nice-awful .82Kind-cruel .81,Friendly-unfriendlyRugged-dellcate.Hard-soft.Stronspiweak
Leader-follower .36% of Variance 16.6 14.9 11..7MEMIINIMMr.
.76
.67
54
9.5 52.7
.a. Pcsitive pole listed at(left to facilitate'interrietation.b. Luadings less than .30 i magnitude omitted.'
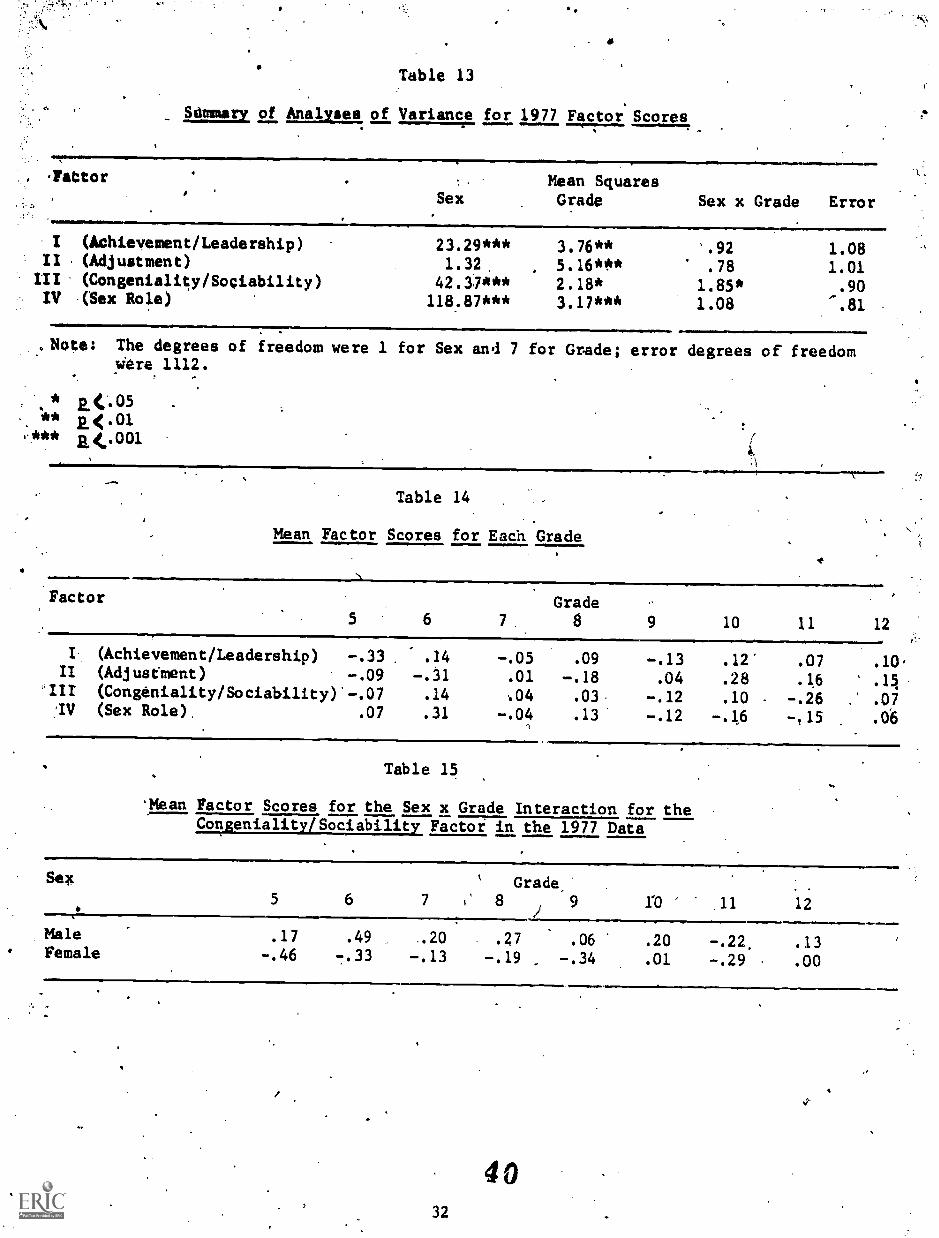
Table 13
Sdmmary of Analyses, of Variance for 1977 Factor Scores
Irattor Mean SquaresSex Grade Sex x Grade Error
I (Achievement/Leadership)II (Adjustment)
III (Congeniality/Sociability)IV (Sex Role)
23.29*** 3.76** .92 1.081.32
,758*
1.0142.37***
5.16***2.18* 18 .90
118.87*** 3.17*** 1.08 '-.81
. Note: The degrees of freedom were 1 for Sex and 7 for Grade; error degrees of freedomwere 1112.
* 2.(.05sesoo
.*** 2.4..001
Table 14 .
Mean Factor Scores for Each Grade
Factor
5 6 7
Grade8 9 10 11 12
I. (Achievement/Leadership) -.33 .24 -.05 .09 -.13 .12' .07 .10,II (Adjustment) -.09 -.31 .01 -.18 .04 .28 .16 .11
"III (Congeniality/Sociability).-.07 .14 ..04 .03- -.12 .10 -.26 .07:IV (Sex Role). .07 .31 -.04 .13 -.12 -.16 -,15 .06
Table 15
'Mean Factor Scores for the Sex x Grade Interaction for theCongeniality/Sociability Factor in the 1977 Data
Sex l,Grade,
5 6 7 8 9 1:0 11 12
MaleFemale
.17
-.46.49
7.33,20-.13
.27
-.19 ,
.06
-.34.20
.01
-.22,
-.29.13
.00
,
4 0

0 It
.70
.60
.50
.40
.20
.40
. 10
Figure 2
Men Factor Scores for Males
and Females
an Sex Appropriateness of the SelfjConcept
for 1977 Data
5
a
4
A/ '....
......
e/
,\
,
/...
..9
...,,,
I.
I'
\I
.#%
I'N
or-Males
\.
\/
.0"b441
AO
'
Females
0.4°.
.
78`
Grade Le4e1
910.
11-
12
Change in Self-Concept. A major purpose of the research Was to assess changes inadolesescent self-concept. The data on change in self-concept come from the 330 sub-.jects who were tested.each of the three years of the study and who had complete data.The data from each of the three years for these 330 subjects (990'data sets) were en-tered into a compnnent analysis. Factor scores were computed and'were subjected to a6(Groups) xelSex) x 3(Year's) analysis of variance, with repeated measures on the lastfactor.
The results of the varipax rotation of.the component) analysis are presented inTable 16. Four factors were present. The first is AdjAStment, the second Achieve-ment/Leadership, the third Congeniality/Sociability, and the fourth Sex Role.. Thisfactor structure is consistent with that repeatedly reported above for the analysisof the data the individual years.
The analyses of .ariance of the factor scores are summar-'.zed in Table lg. Theefferts of major iaterest are those from the within-subjects portion of the analyses.becauee they are associated with differences over time. Of the 16.effects involving
the ppeated meaiures factor only one was statistically significant, the Sex x Yearsinteraction in the analysfs of the Achievement/Leadership factor. The means for thiseffect are listed in Table 18. Although the males had higher mean scores than the fe-malis each year, only during 1975 was the difference statistically eignificant (a(.001).None of the Years main effects or Group x Years interactions (All F(1) was significant.These data indicate virtually no change in these aspects of self-concept over the threetesting periodS. This lack of change is shown in Table 19, in which the mean scoresfor each factor for each group for each year are listed. As mak be seen, the rangeof these mean scores is very Small, being only slightly more than half the stahdarddeviation (1.00) of factor scores.
Analysis of Interests Data
0 Two types of data were collected to assess adolescent's interests in a series of 14topics previously (Dusek et 'al. 1979) shown.to encompass a broad range of adolescent'sinterests. One type of data was a rank ordering of 14 topics in terra of how importantthey were perceived to be. The second was a rating of the degree of interest in eachtopic. This was done on a 7-point scale from "not at all interesting" to "very highly .interesting". The two.types of data provide somewhat different information about adol-escents' interests (Dusek et al. 1979). Whereas ranking data forte the subject to dif-*
ferentiate between the topics, ratings data allow the subject to indicate similaritiesin interests among topics. In addition, the ratings data may be subjected to multi-.ivariate analytic procedures which would not be appropriate to use with ranked data.The rankings data, then, provide a means of assessing the hierarchy of adolescent!sinterests. The ratings data allow the assessment of groupings and dimensions of inter-ests, for example, through factor analytic techniques.
The mean rankings of each topic are presented in Tables 20, 21, and 22, and meanratings for each topic in Tables 23, 24, and 25, for each grade level for each year ofthe Study.. Table 26 presents the correlations between the rankings and the ratings foreach topic for each year of the study. Three of the co-relations were between .20 and.30, six were between .31 and .40, 19 were in ,the range of .41 to .50, ane 14 were be-tween .51 and .60. Generally speaking, then, the correlations indicate the more impor-tant a topic is perceived the greater the greater the degree of interest in it. However,the correlations also indicate that the two meas.Ares are not so highly correlated as topreclude separate analyses of each.
Analysis of lanitiLs_s data. Examination of Tables 20, 21 and 22 reyeals that thesalience hierarchies of topics differ across the grade levels. To investigate these
34
4 2
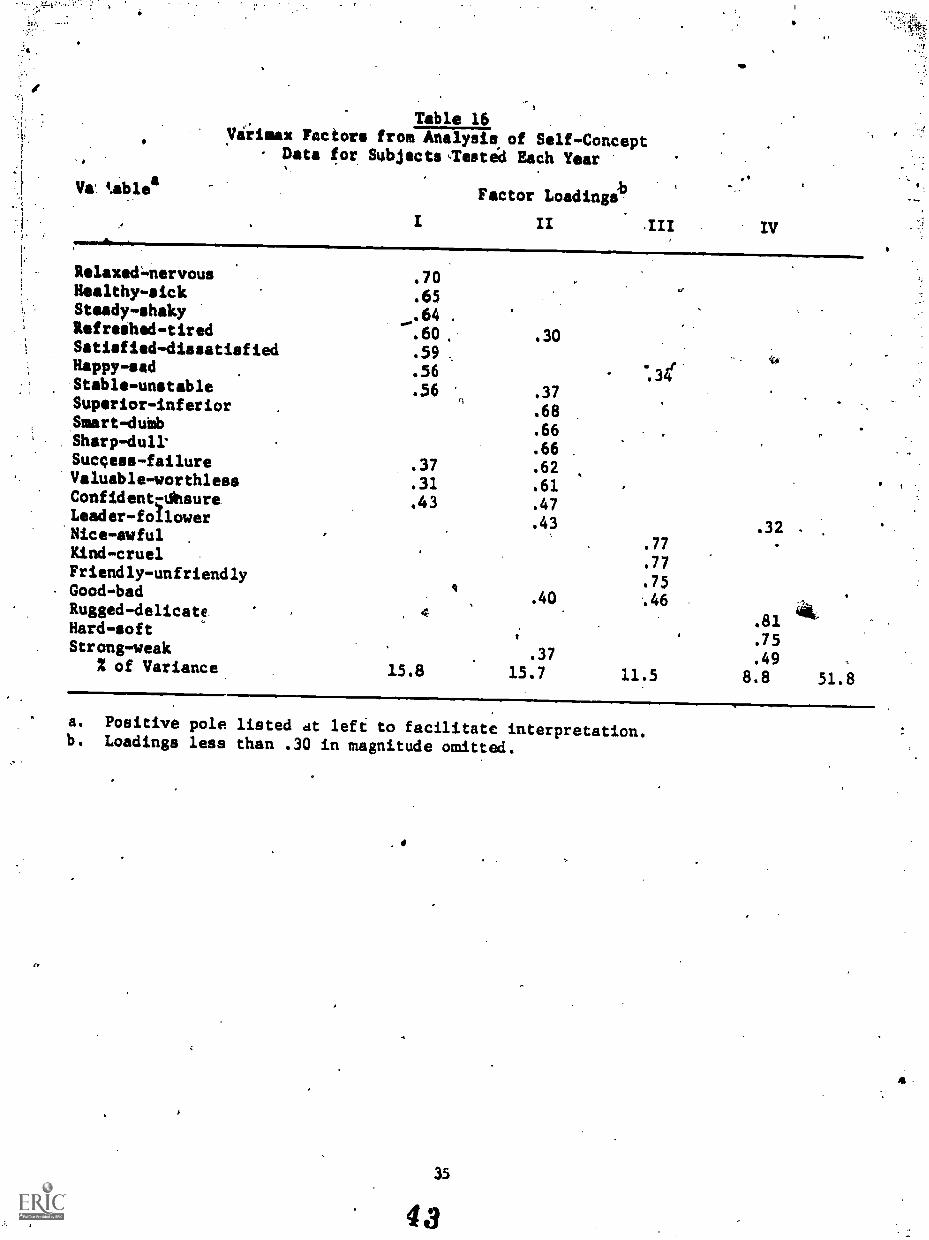
Table 16Virimax Factors from Analysis of Self-Concept
Data for Subjectsaested Each Year
Va. table Factor Loadings
IV
Relaxtd=mervous .70Healthy-sick .65Steady-shaky .64 .
Refreshed-tired .60 , .30Satisfied-dissatisfied .59 ,
Happy-sad .56Stable-unstable .56 .37Superior-inferior .68
.
Smart-duMb .66Sharp-dulr
.66 .
Sucqese-failure .37 .62Valuable-worthless .31 .61Confidentcdhsure .43 .47Leader-follower .43 .32 .Nice-awful
.77Kind-cruel
.77Friendly-unfriendly
.75Good-bad 9
.40Rugged-delicate ,
.81Hard-soft
.75Strong-weak .37 .49of Variance 15.8 15.7 11.5 8.8 51.8
a. Positive pole listed dt left to facilitate interpretation.b. Loadings less than .30 in magnitude omitted.
35
:
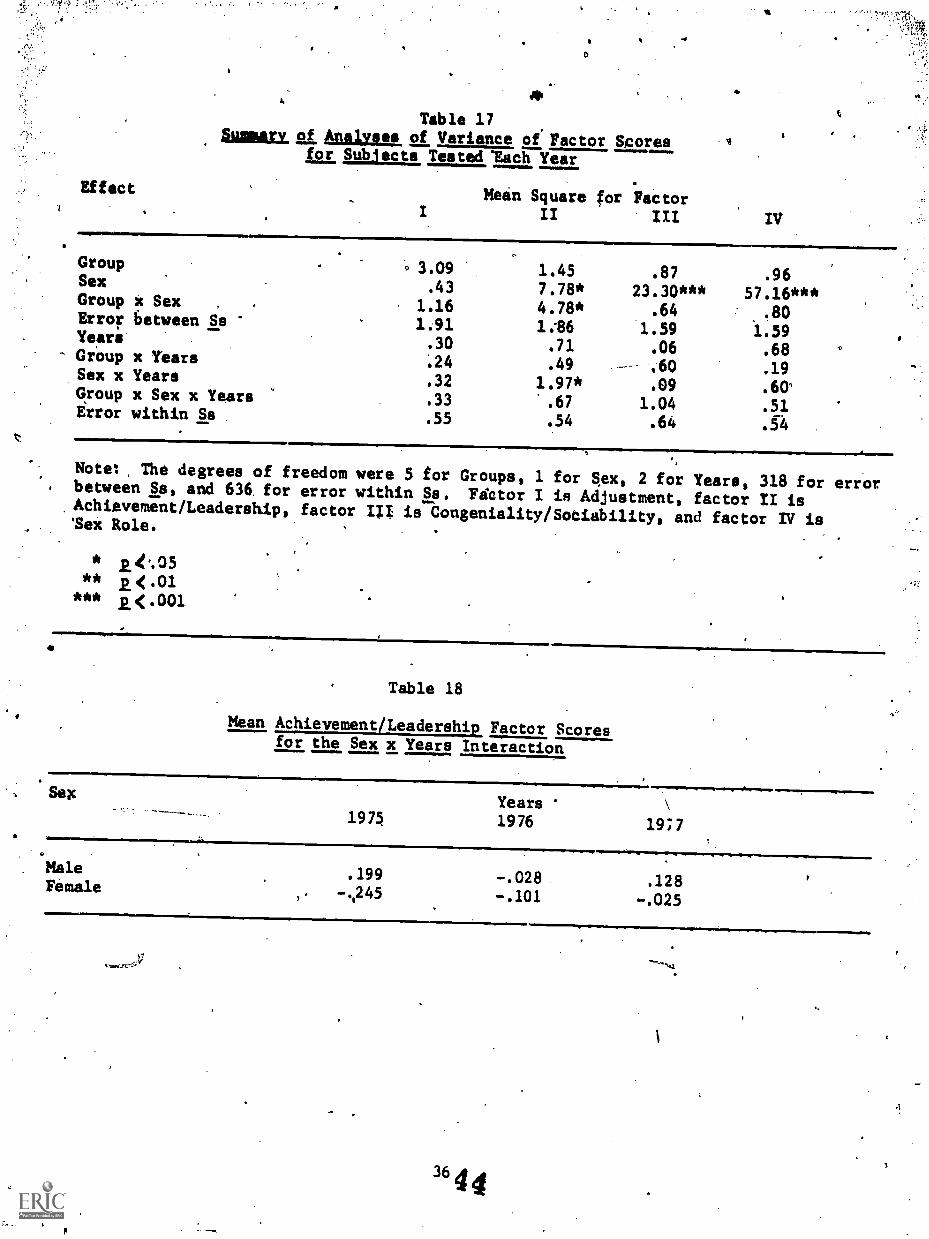
Table 17Summary of Amilyeas of Variance of Factor Scores
for Subjects Tested 'Each Year
a
EffectMein Square for Factor
IV=MUMMY
..
Group . 3.09 1.45 .87 .96Sex .43 7.78* 23.30*** 57.16***Group x Sex . . 1.16 4.78* .64 .80Error 6etween Ss 1.91 1:86 1.59 1.59Years .30 .71 .06 .68 -c
Group x Years :24 .49 -- .60 .19Sex x Years .32 1.97* .09 .60qGroup x Sex x Years .33 .67 1.04 .51Error within Ss .55 .54 .64 .54
Note: The degrees of freedom were 5 for Groups, 1 for Sex, 2 for Years, 318 for errorbetween Ss, and 636 for error within Ss. Fektor I is Adjustment, factor /I isAchievement/Leadership, factor III is-bongeniality/Sotiebility, and factor TV is'Sex Role.
2.4..05
p.< .01
k<.001
Table 18
Mean Achievement/Leadership Factor Scoresfor the Sex x Years Interaction
SexYears
1975 1976 19:7
Male .199 -.028 .128Female -.101 -.025
3644
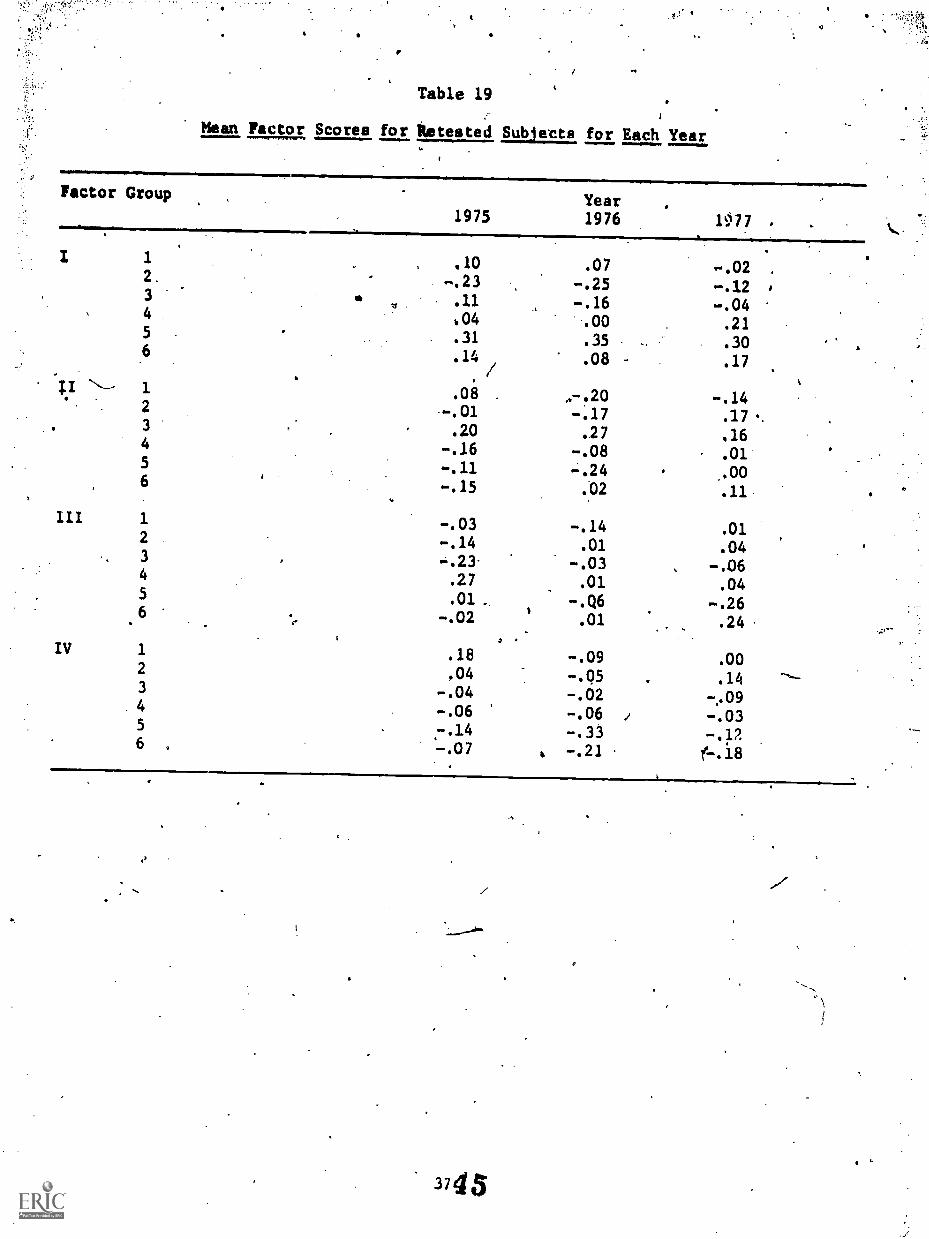
Table 194
Mean Factor Scores for in tested Subjects, for Each Year
Factor Group
1975Year1976 077
1 .10 .072. -.23 -.25 -.12 a
3 .11,
-.16 -.044
b 04 .00 .215 .31 .35 - .306 .14 .08 - .17
/1 .08 ,-.20 -.142 .-.01 -.17 .17 ..
3 .20 .27 .164 -.16 -.08 .015
006 -.15 .02 .11
ILL 1 -.03 -.14 .012 -.14 .01 .043 -.23 -.03 -.064 .27 .01 .045 .01 -.Q6 -.266
"' -.02
a
.01 .24
IV 1 .18 -.09 .002 .04 -.05 .143 -.04 -.024 -.06 -.06 1 -.035
-.33 -.126
.-.14
-.07 . -.21 .
3745
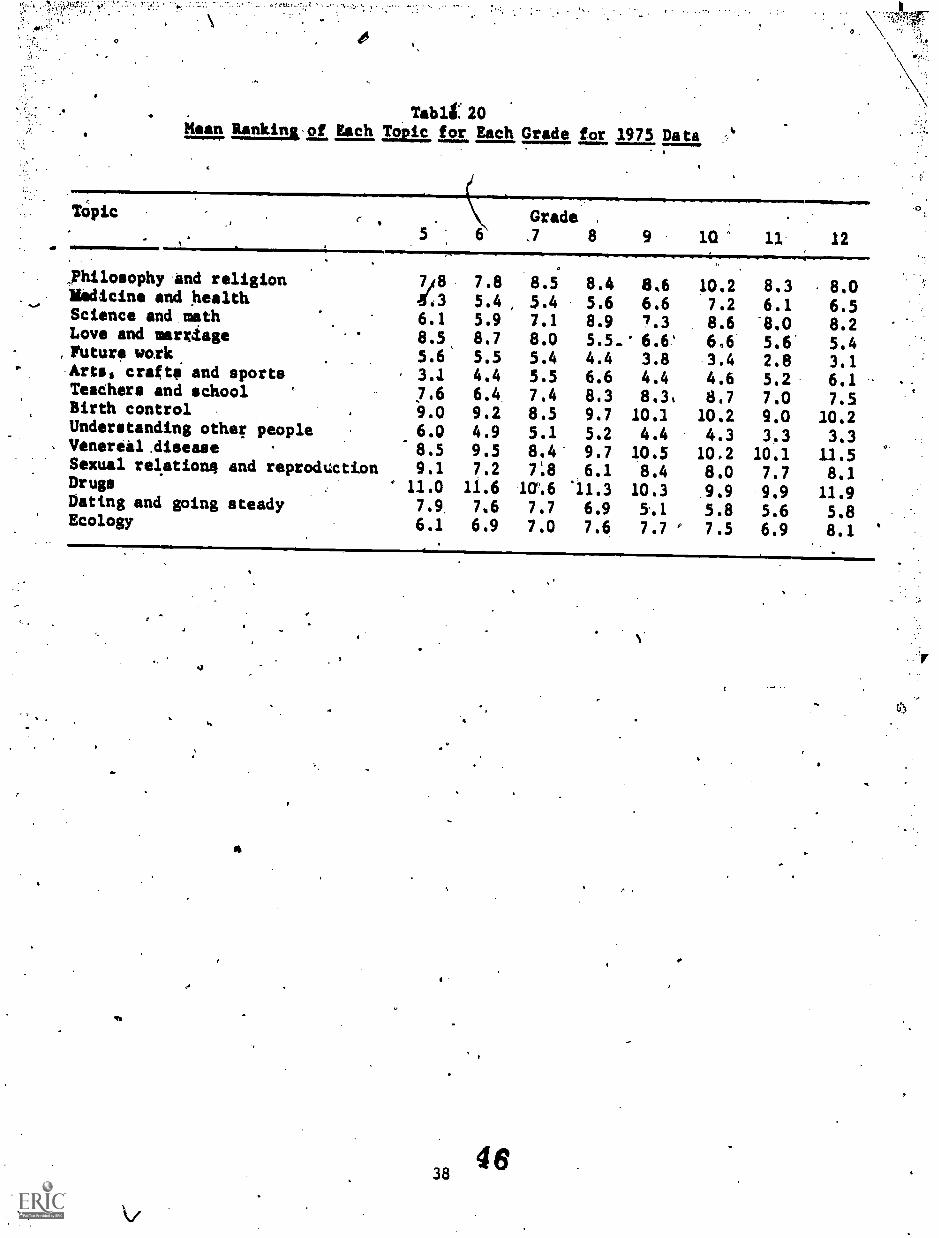
\
Tabli:20Mean Rankinkof Each Topic for Each Grade for 1975 Data
.
t
TOpic
a
r Grade .
5 6 .7 8 9 10:1' 11 12MrF=.=OpImWr+Mpmlimslm.wWqmwOMMirSP.P.......I.,P.a."............;..........P.....".
johilosophy amd religion
74/8
7.8 8.5 8.4 8,6 10.2 8.3 8.0Medicine and health .3 5.4, 5.4 5.6 6.6 7.2 6.1 6.5Science and math 6.1 5.9 7.1 8.9 7.3 8.6 8.0 8.2Love and maraage 8.5 8.7 8.0 5.5. 6.6 6.6 5.6 5.4,Future work. 5.6 5.5 5.4 4.4 3.8 3.4 2.8 3.1Arts, crafts and sports 3.4 4.4 5.5 6.6 4.4 4.6 5.2 6.1Teachers and school 7.6 6.4 7.4 8.3 8.3, 8.7 7.0 7.5Birth control 9.0 9.2 8.5 9.7 10.1 10.2 9.0 10.2Understanding other people 6.0 4.9 5.1 5.2 4.4 4.3 3.3 3.3Venereal disease 8.5 9.5 8.4 9.7 10.5 10.2 10.1 11.5Sexual relations and reproduction 9.1 7.2 7:8 6.1 8.4 8.0 7.7 8.1Drugs 11.0 11.6 1U.6 .11.3 10.3 9.9 9.9 11.9Dating and going steady 7.9 7.6 7.7 6.9 5.1 5.8 5.6 5.8Ecology 6.1 6.9 7.0 7.6 7.7 ° 7.5 6.9 8.1

Table'21
Mean Ranking of Each Topic, for Each*Grade for 1976 Data
Topic. . 5
'
6Grade7* 8 9 le 11 12=1IMINIIMPISIMIPPM
Philosophy and reiigioit 7.9 8.9 8.7 9.4 9.0 9.6 10.7 8.9Medicine and health 6.6 6.0 6.3 6.2 6;2 6.5 5.6 6.0Science and.math 6.9 6.6 8.0 8.4 7.7 8.3 8.1 7.9Love and marriage 8.3 7.2 .6.6 CO 6.0 6.2 5.5 . 5.8Future work 4.9 4-.9 4.2 4.3 2.7 3.6 3.5 2.9Arts,:crafts'and sports 3.4 4.2 5;5 5.1 4.6 5.4 5.6 '5.1Teachers and School 9.3- 8.1 8.8 8.2 7.9 8.2 8.7 8.3Birth control 1 8.7 9.6 9.6 10.3 9.4 9.6 9.4 9.7UnderstandNg other people 6.6 5.9' 5.3 5.4 4.4 .3.5' 4.1 3.6Venereal disease 8.7 9.0 9.3 9.0 9.6 10.5 10.5 11.1Sexual relations cind reproduction, 7.5 7.2 6.7 6.8 6.8 7e4 5.9 7.5'Drugs 12.4 11.7 12.0 10.9 10.8' 11.1 9.8 9.5Dating and going steady 5.9 5.9 5.4 4.8 5.2 5.9. 5.9 5.71 Ecology 7.6 8.5 8.4 8..3 7.9 7.8 8.1 7.4
o
7
3947
s-

0
Table 2214saallanking of Each Totilc,for Each Grade for 1977 Data
II
TOPIC
5 6Grade7 8 9 10 11 1/
-Phitoilophy and religion 7.9 8.7 -8.5 8.8 9.0 0.5 8.8 10.3Medicine and health 5.8 6.2 6.3 6.9 5.9 6.9 6.4Science and math 6.3 '7.4! 7.5 7.1 1.8 8.2 8.7 9.3Love and marriage &.7 6.6 6.5 5.4 6.0 6.0 6.5 5.3Future work . 44 4.9 4.3 4.0 2.8 2.9 3:2 3.0.Arta, crafts and sporta 4.1 4,.5 4.5 5;3 6.1 5.0 6.1 6.3Teachers and school 8.1 9.5 7.7 7.8 7.5 8.1 8.1 10.1Birth control - 9.2 8.7 9.5 9.4 10.0 10.5 9.9 8.8Understanding other peopke 6.8 6.6 5.8 5.3 45 4.9 3.9 3.9Venereal disease 8.9 8.7 9.6 .9.6 10.2'. 11.2 12.2 10.5Stxual relattions and reproduction 8.6 7.1 7.6 616 7.0 7.1 7.3 7.1Drugs 11.6 11.6 11.6 10.8 141.2 10.8 10.9 le.l.Dating and going steady 7.1 5.4 5.0 4.5 6.2 4.8 5.9 6.5Ecology 7.5 8.0 7.6 8e7 8.2 8.8 7.9 7.6
M
4 0
48
as,
4
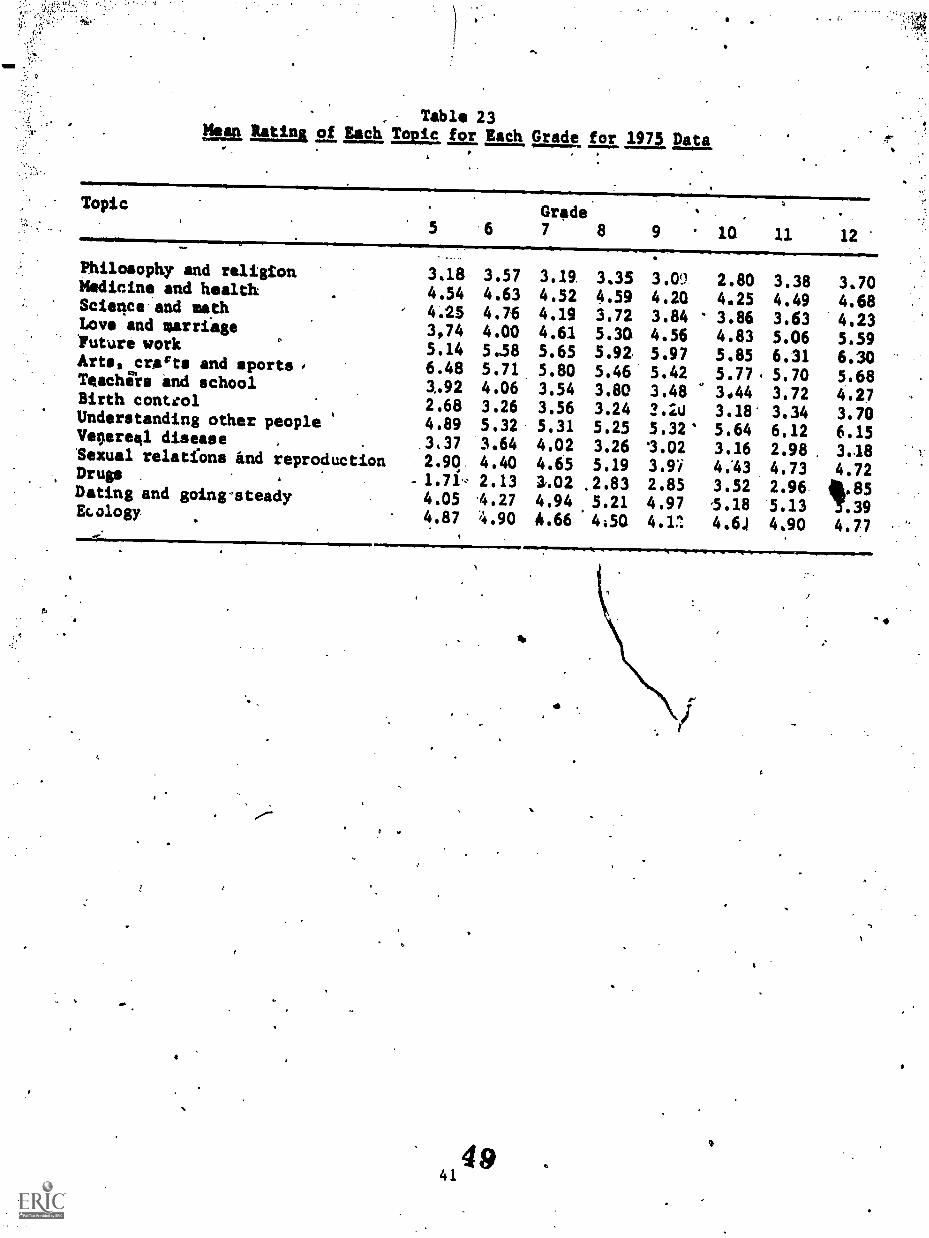
Table 23Mean Rating of Each Topic la Each Grade for 1975 Data
TopicGrade
5 6 7 8 9 10 11 12
Philosophy and religion 3.18 3.57 3.19 3.35 3.09 2.80 3.38 3.70Medicine and health 4.54 4.63 4.52 4.59 4.20 4.25 4.49 4.68Sciallce and math , 4.25 4.76 4.19 3.72 3.84 3.86 3.63 4.23Lov and marriege,.'Future work
3,745.14
4.005.38
4.615.65
5.305.92
4.565.97
4.835.85
5.066.31
5.596.30Arts, evicts and sports, 6.48 5.71 5.80 5.46 5.42 5.77, 5.70 5.68Teacheis end school 1.92 4.06 3.54 3.80 3.48 3.44 3.72 4.27Birth conteol 2.68 3.26 3.56 3.24 2.20 3.18 3.34 3.70Understanding other people 4.89 5.32 5.31 5.25 5.32' 5.64 6.12 6.15Ve9ere41 disease
,. 3,37 3.64 4.02 3.26 3.02 3.16 2.98 3.18Sexual relatfons And reproduction 2.90 4.40 4.65 5.19 3.9, 4.43 4.73 4.72Drugs . , 1.71- 2.13 1.02 .2.83 2.85 3.52 2.96 41.85Dating and going-steady 4.05 .27 4.94 5.21 4.97 5.18 5.13 3.39Ecology
. 4.87 4.90 4.66 4;50 4.1:1 4.6J 4.90 4.77
40
414 9

Tabie 24
Mean Bating for fach Topic 'for Each gait for 1976 Data'
Topic Grade5' 7 8 10 11 12
Philosophy and religion 3.50 1.19 3.32 3.16 3.15 3.24 2.55 3.36Medicine Lad health
t)4.41 4.49 4.50 4.54 4.43 4.43 4.57 4.67' '
Science and math -- _______3.84-4.-31----3-,86----4.25 3.86 3.89 3.79 3.82Love and marriage
\ 4.33 4.40 5.25 5.29 4.88 4.83 4.96 5.05g
Future work 5.17 5.55 5,98 5.82 6.01' 5.96 5.96 6.23Arts, crafts and spor'ts . 6.01 .5.71 5.66 5.53 5.46 5.67 1.34 5:72Teachers and schoOl is2.92 '3.68 3.46 . 3.82 3.75 3.79 3.24 3.90Birth control 3,54 3.4 3.59 3,11 3.23 3.23 3.13 3,33Understanding other people 4.32 .4.75 5.31 4.96 \5.23. 5.54 1.24 5.92Venereal disease', \ 3.44 >3.94 3.93 3.32 3.11 3.32 3.17 2.97Sexual relations and reproduction )4.50 4.66 $.15 4.85 .4.69 4.70 4.91 4.23Dtugs
. \ . 1.90 2.11 2.56 2.90 2.29 2.73 3.19 4.23Dating and going steady 4.86 4.99 5,53 5.52 5.19, 5,21 4,96 5.31Ecology . - 4.10 4:21 4.37 3.89 4.04 4.39 4.06 4.33
1.
42.
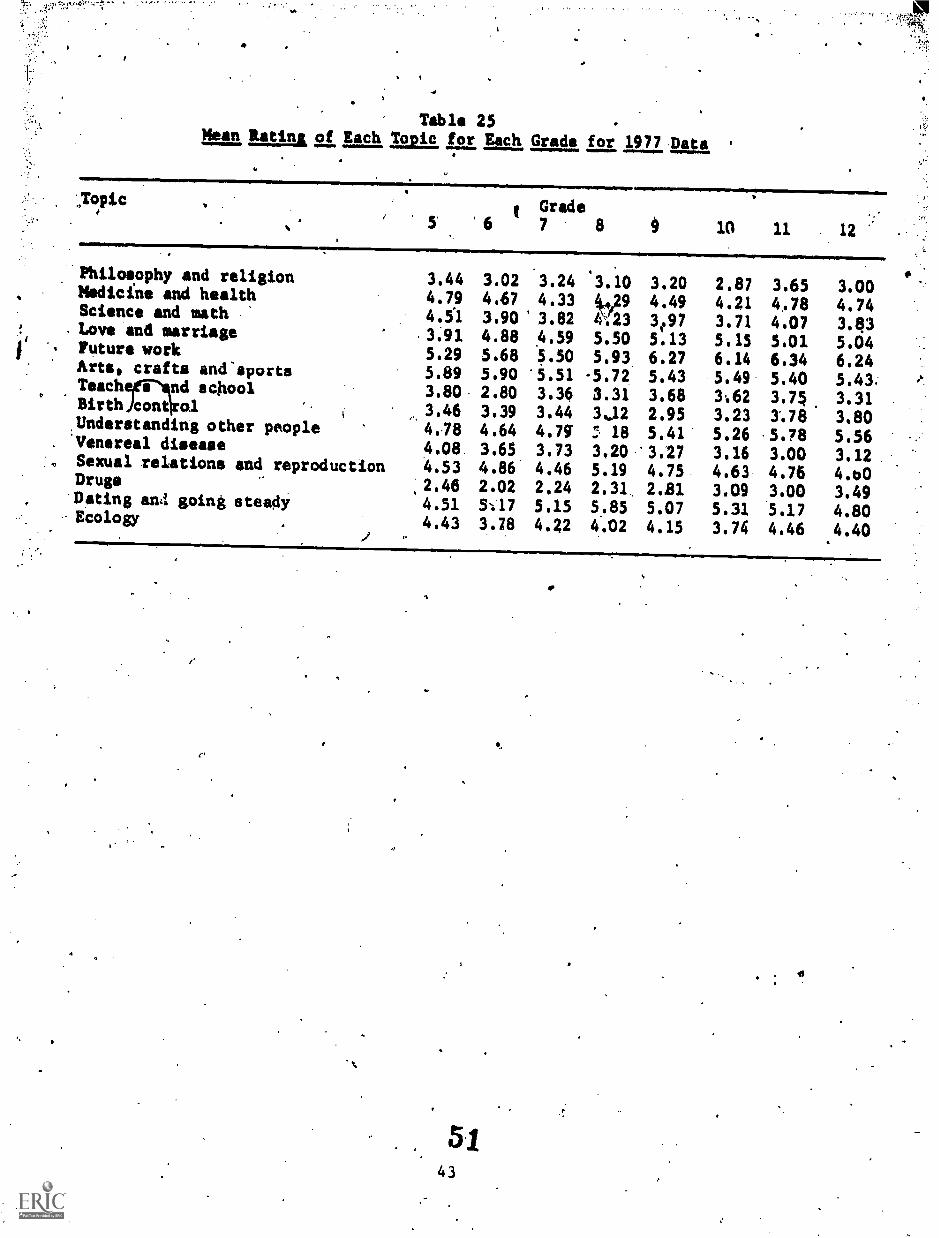
:
Table 25 -
Mean Rating, of Each iso,s, for Each Grads for 1977 Data
:ropic
'6Grade7 8
Philosophy and religion 3.44 3.02 3.24 '3.10Medicine and health 4.79 467 4.33 4129Science and math 4.51 3.90 3.82 4423Love and marriage .3.91 4.88 4.59 5.50Future work 5.29 5.68 5.50 5.93Arts, crafts and-sports 5.89 5.90 5.51 -5.72TeachOliNknd school 3.80 2.80 3.36 3.31Birthicontirol 3.46 3.39 3.44 3%12.Understanding other people 4.18 4.64 4.79 18
-340'Venereal disease 4.08 3.65 3.73Sexual relations and reproduction 4.53 4.86 4.46 5.19Drugs ,2.46 2.02 2.24 2.31Dating and going steady 4.51 517 5.15 5..85
-Ecology 4.43 3.78 4.22 4.02I*
0 10 11 . 12
3.20 2.87 3.65 3.004.49 4.21 4.78 4.743e97 3.71 4.07 3.1135.13 5.15 5.01 5.046.27 6.14 6.34 6.245.43 5.49 5.40 5.43.3.68 3:62 3.74 3.312.95 3.23 3.78 3.805.41 5.26 .5.78 5.563.27 3.16 3.00 3.124.75 4.63 4.76 4.02.81 3.09 3.00 3.495.07 5.31 5.17 4.804.15 3.74 4.46 4.40
C'
s
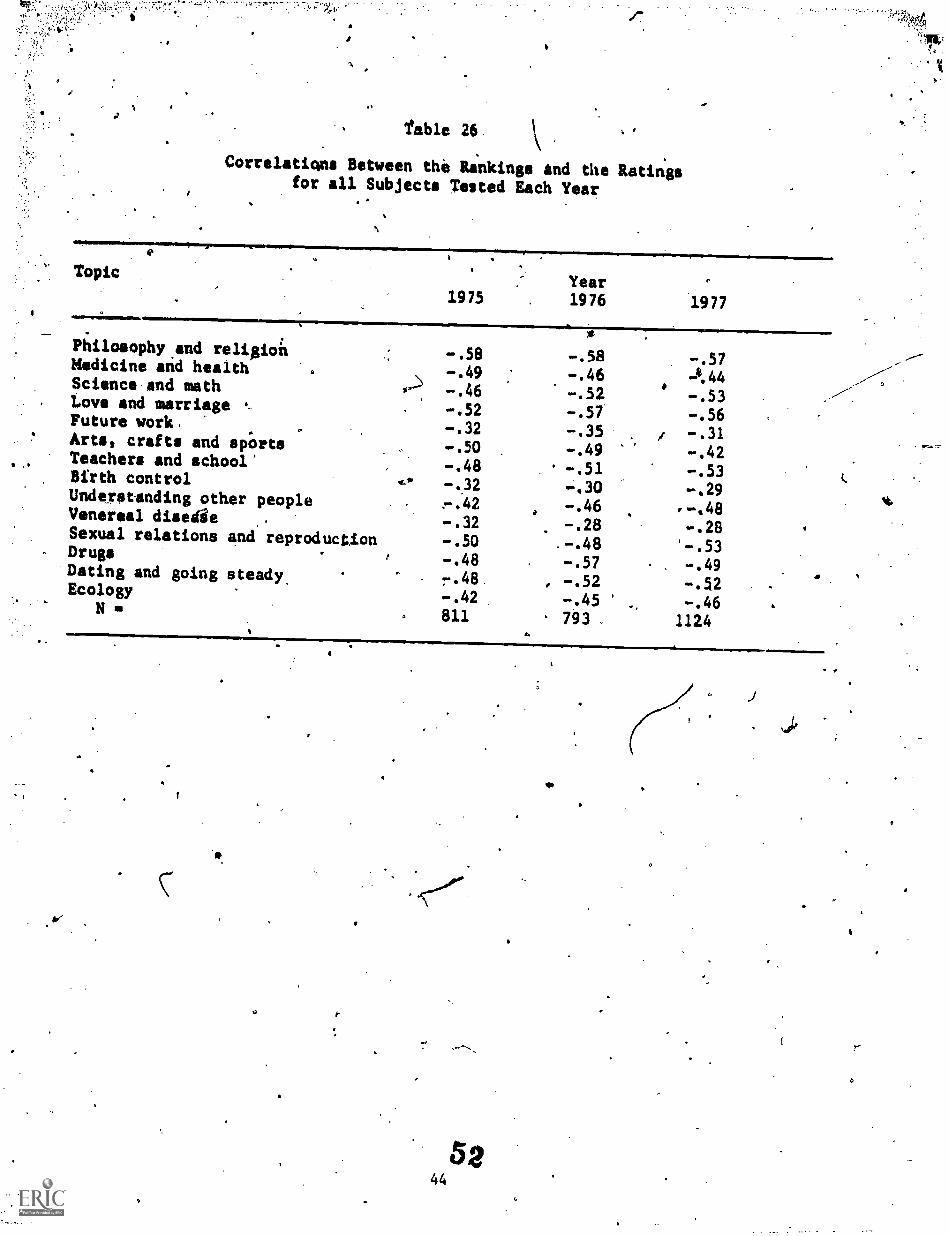
table 26
Correlations Between the Rankings and the Ratingsfor all Subjects Tested Each Year
.
40111001,1=P0 mjwImr.M11
Topic
1975Year1976 1977
Philosophy and religioh -.58 -.58 -.57Medicine and health , -.49 -.46 A44Science and math,
. .--.' -.46 -.52 -.53Love and marriage .. -.52 -.57 -.56Future work... -.32 -.35 -.31Arts, crafts and spOrts
., -.50 -.49 -.42Teachers and school'
, -.48 -.51 -.53I
Birth control .._. -.12 -.30 -.29Understanding other people -.42 -.46 ,..48Venereal disedie . -.32 -.28 -.28Sexual relations and reproduction -.50 .-.48Drugs
' -.48 -.57 -.49Dating and going steady% .
r.48 , -.52 -.52Ecology -.42 -.45 -.46N811 s 793 1124
a.
I. 0
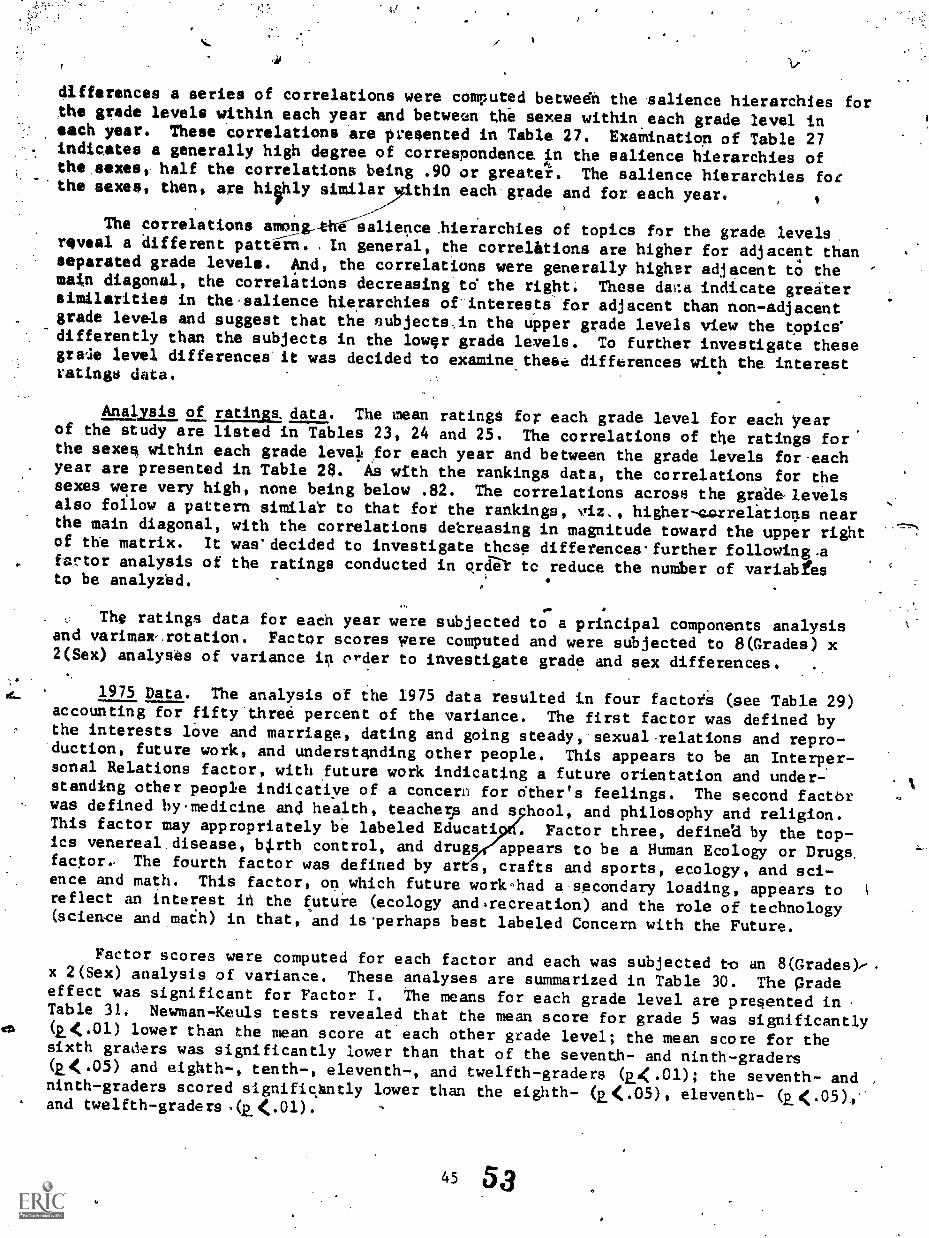
.
1975 Data. The analysis of the 1975 data resulted in four factots (see Table 29)accounting for fifty three percent of the variance. The first factor was defined bythe interests love and marriage, dating and going steady, sexual.relations and repro-duction, future work, and understanding other people. This appears to be an Interper-sonal Relations factor, with future work indicating a future orientation and under-standing other people indicatiye of a concern for dther's feelings. The second factorwas defined by.medicine and health, teachers and s hool, and philosophy and religion.This factor may appropriately be labeled Educatipif. Factor three, definet by the top-ics venereal disease, 14.rth control, and drugs appears to be a Human Ecology or Drugs.factor, The fourth factor was defined by arts, crafts and sports, ecology, and sci-ence and math. This factor, on which future work-had a secondary loading, appears toreflect an interest th the futuie (ecology andarecreation) and the role of technology(science and math) in that, and isTerhaps best labeled Concern with the Future.
.44
differences a series of correlations were computed betwedh the salience hierarchies forthe grade levels within each year and between the sexes within,each grade level ineach year. These correlations axe preaented in Table 27. Examination of Table 27indicates a generally high degree of correspondence kn the salience hierarchies ofthe sexes, half the correlations being .90 or greater. The salience hierarchies fotthe sexes, then, are hiply similar,yithin each grade and for each year.
---"The correlations among-t--ht salience illerarchies of topics for the grade levels
reveal a different pattiin.. in general, the correlations are higher for adjacent than
separated grade levels. And, the correlations were generally higher adjacent to the '
main diagonal, the correltions decreasing td the right. These dar.a indicate greetersimilarities in the-salience hierarchies of' interests for adjacent than non-adjacentgrade levels and suggest that the nubjects,in the upper grade levels view the topics'differently than the subjects in the lowqr grade levels. To further investigate thesegraie level differences it was decided to examine these differences with the interestratings data.
Analysis of rating& data. The mean ratings for each grade level for each yearof the study are listed in Tables 23, 24 and 25. The correlations of the ratings forthe sexes within each grade levelt for each year and between the grade levels for-eachyear are presented in Table 28. As with the rankings data, the correlations for thesexes were very high, none being below .82. The correlations across the graae levelsalso foilow a pattern similar to that for the rankings, viz., higher-correlStions nearthe main diagonal, with the correlations debreasing in magnitude toward ths upper rightof the matrix. It was*decided to investigate thcse differences-further following .afartor analysis of the ratings conducted in oral tc reduce the number of variabfesto be analyzed.
, The ratings data for each year were subjected to a principal components analysisand varimax-.rotation. Factor scores were computed and were subjected to 8(Grades) x2(Sex) analyses of variance in order to investigate grade and sex differences.
Factor scores were computed for each factor and each was subjected to an 8(Grades),-x 2(Sex) analysis of variance. These analyses are summarized in Table 30. The gradeeffect was significant for Factor I. The means for each grade level are presented inTable 31. Newman-Keuls tests revealed that the mean score for grade 5 was significantly
gel% (2.(.01) lower than the mean score at each other grade level; the mean score for thesixth graders was significantly lower than that of the seventh- and ninth-graders(2.(a5) and eighth-, tenth-, eleventh-, and twelfth-graders (14.01); the seventh- andninth-graders scored significuntly lower than the eighth- (11(.05), eleventh- (RoC.05),and twelfth-graders.(E(.01).
45 53
-N
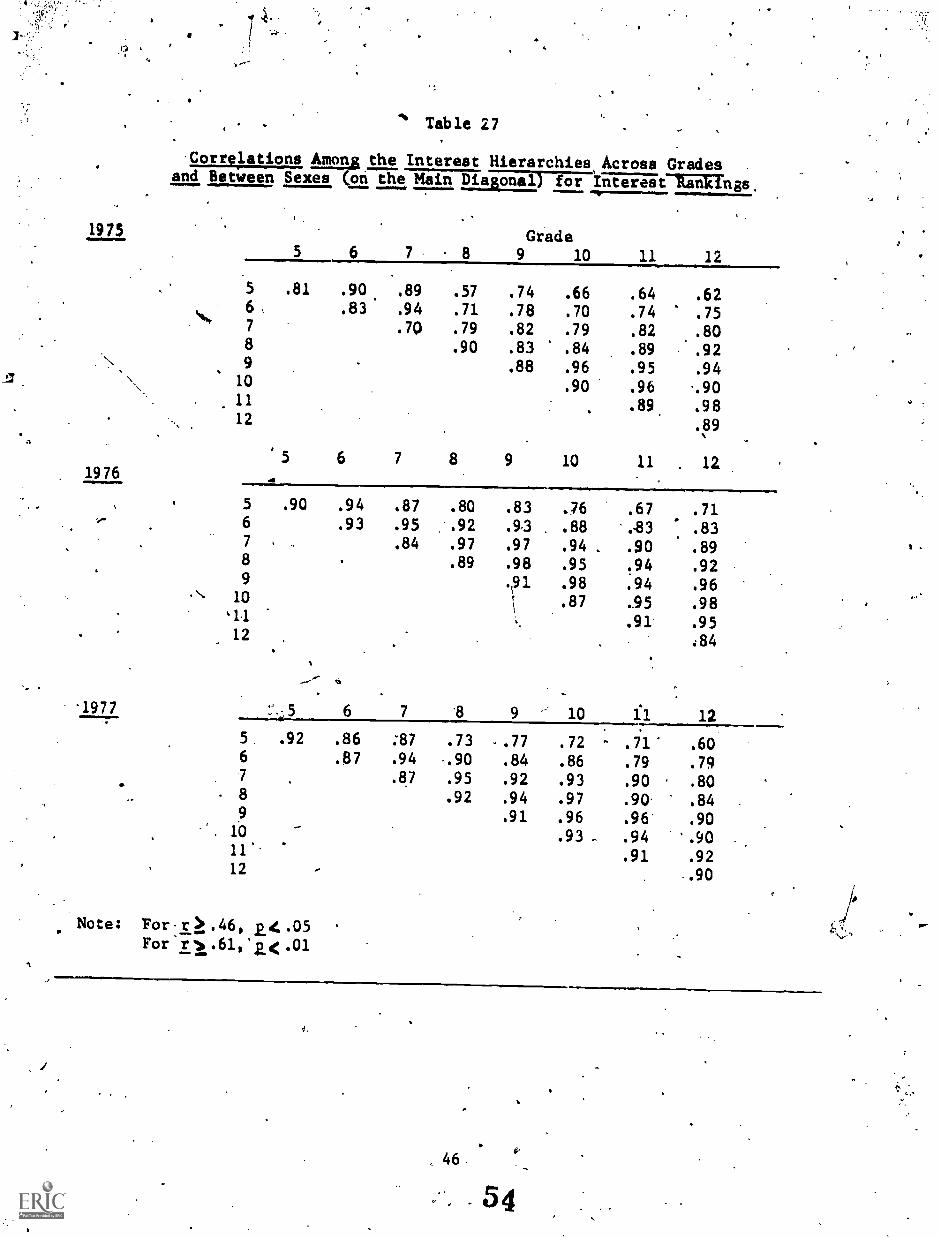
Table 27,
Correlations Among the Interest Hierarchies, Across Gradesand Between Sexes (on the Main piaiala) NT-Interest 'Rankings.
1975
5 6 7 8
Grade9 10 11 12
5 .81 .90. .89 .57 .74 .66 .64 .626, .83 .94 .71 .78 .70 .74 .757 .70 .79 .82 .79 .82 .808 .90 .83 .84 .89 .929 .88 .96 .95 .94
10 .90 .96 ..9011 .89 .9812 .89
5 6 7 8 9 10 11 . 121976 .
, 5 .90 .94 .87 .80 .83 .76 .67 .71, 6
7 ,
.93 .95
.84
.92
.97
.93
.97
, .88
.94
,83
.90
.83
.89 I.8 .89 .98 .95 194 .929 .191 .98 .94 .9610
'I
.87 .95 .98%II .91 .95
. 12 :84
.1977 6 7 9 ' 10 1.1 12
5 .92 .86 :87 .73 ..77 .72 .606 .87 .94 .90 .84 .86 .79 .797 .87 .95 .92 .93 .90 .808 .92 .94 .97 .90. .84
.91 .96 .96* .9010 .93 .94 .9011'. .91 .9212 .90
Note: For r .46,-For r .61 2.< .01
4.
46.
(.

RP`
4
'1975
0
Mt
.41
1977
Taile 28
Correlktions &cat s the Interest Ratings Across Gradeand Between Sexes (on the Math Diagonal)
5 6 7 8' 9Grade10 11 12
56789
1011
.90 .93.88
.83
.89
.88
.69.80.92.91
.79
.84
.94
.93
.88
.74
.78
.9.4
.92
.96..
.88
.74
.83.92.96.97196.88..
.75
.84.90.96..97.92.98
12 ".86
5 6 7 8 9 10 .11 12
.84 .94 .91 .86 .89 .88 .81 .68,56 .86 .94 .91 .94 .93 .86 .717 .91 .95 .97 .96 .94 .808 .92 .97 .96 .95 .869 .95 .99 .95 .86.
10 .83 .96 .9011 .91 .9112 .87
5 6 7 8 9 10 11 12
5 .82 :89 .90 .80 .82 .75 .78* .746 .94 .97 .95 .91 .90 .88 .867 .90 .95 .93 .91 .91 ..878 .97 .96 .95 .92 .889 .95 .98 .97 .94
10 .93 .95 .9511 .85 .9612 .88
Note: For r >.46, 24.05For r v.61, 2.< .01
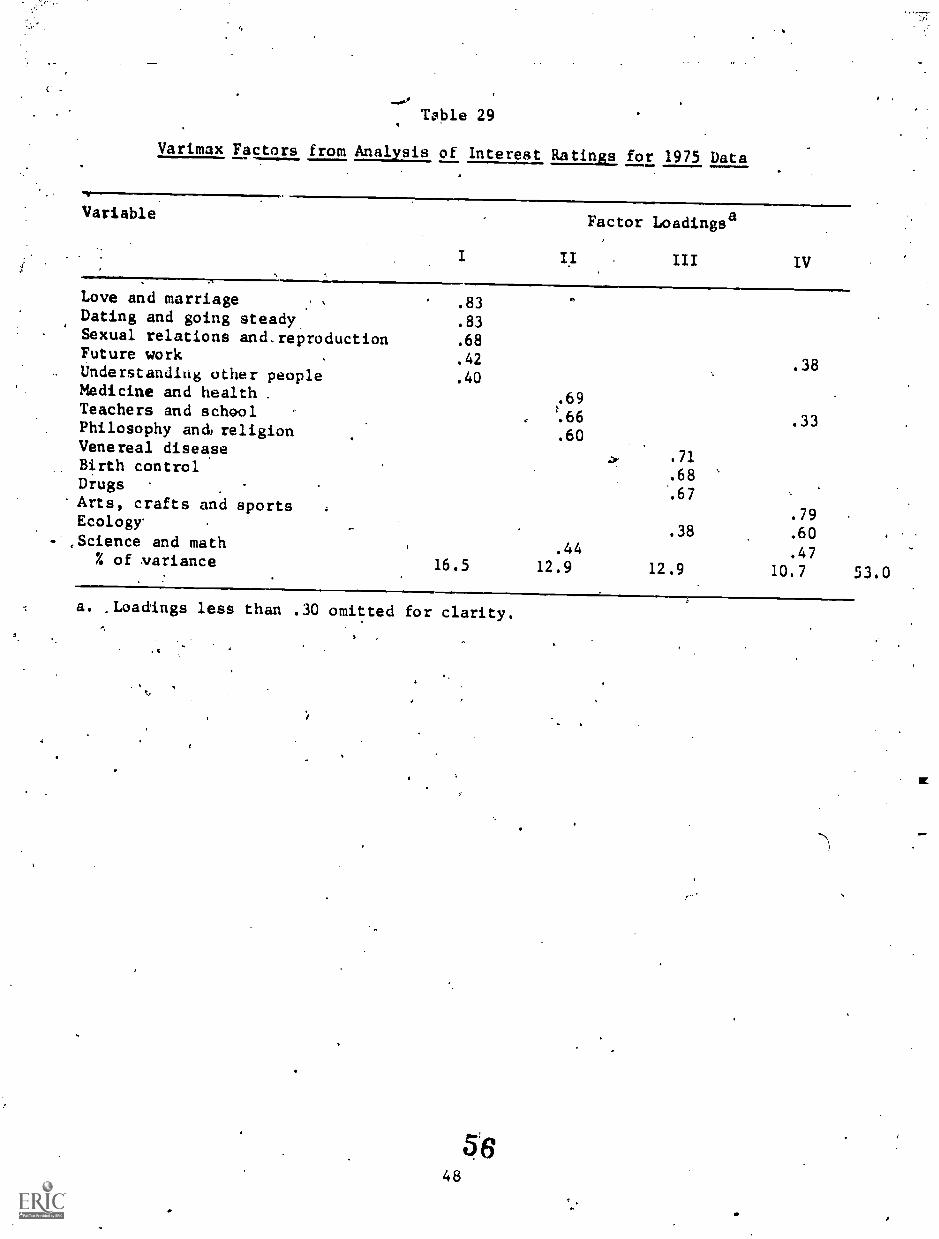
c
Toble 29
Varimax Factors from Analysis of Interest Ratings for 1975 Data
VariableFactor Loadingsa
IV
Love and marriage .83Dating and going steady. .83Sexual relations and,reproduction .68Future work .42 .38Understandiug other people .40Medicine and health . .69Teachers and school
.33Philosophy and) religion .60Venereal disease
.71Birth control
.68Drugs
Arts, crafts and sports.79Ecology
.38 .60- °Science and math .44 .47% of variance 16.5 12.9 12.9 10.7 53.0
a. °Loadings less than .30 omitted for clarity.
. c
48
56
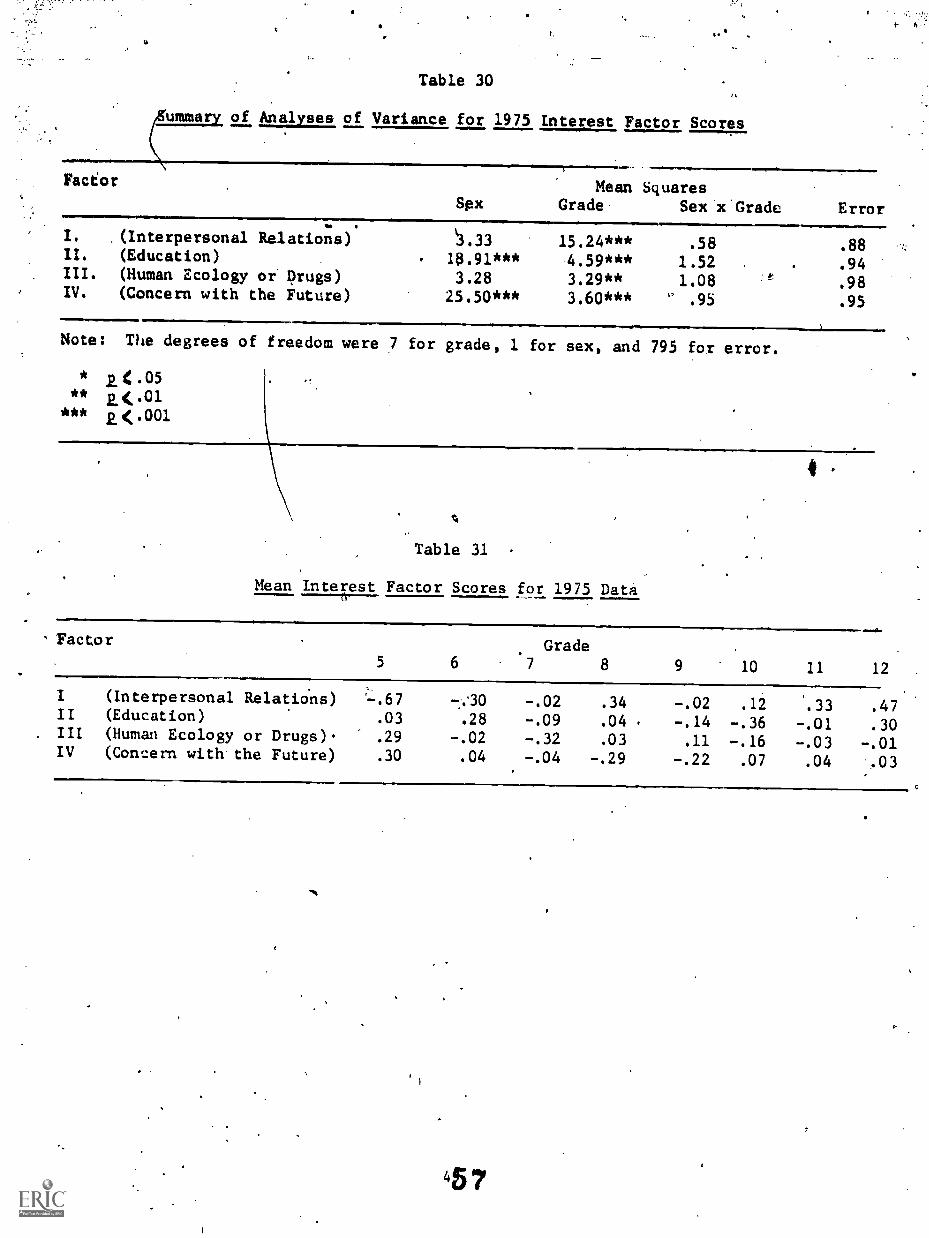
I.
Table 30
ummary of Analyses of Variance for 1975 Interest Factor Scores
(5\
Facior
SexMean Squares
Grade Sex x'Gradc Errorvo.
I. .(Interpersonal Relations) .33 15.24*** .58 .88II. (Education) 10.91*** 4.59*** 1.52 .94III. (Human Ecology or Drugs) 3.28 3.29** 1.08 .98IV. (Concern with the Future) 25.50*** 3.60*** .95 .95
Note: The degrees of freedom were 7 for grade, 1 for sex, and 795 for error.
* .24.05**
*** 2.1(.001
4
%
Table 31
Mean Interest Factor Scores for 1975 Data
Factor
5 6
Grade7 8 9 10 11 12
I (Interpersonal Relations) '-.67 7;30 -.02 .34 -.02 .12 .33 .47II (Education) .03 .28 -.09 .04 -.14 -.36 -.01 .30III (Human Ecology or Drugs). .29 -.02 -.32 .03 .11 -.16 -.03 -.01IV (Concern with the Future) .30 .04 -.04 -.29 -.22 .07 .04 .03
On Factor II the females (x .16)Alad a higher mean score than the males(X -.15). The grade level effect was also significant, with the tenth gradershaving a significantly lower mean score than the fifth-, eighth-, and eleventh-.graders qlo5) and the sixth- and twelfth-graders (2.4:.01). The seventh- andninth-graders had significantly (p_4L.05) lower mean scores than the eleventh- and-twelfth-graders.
The grade level effect was statistically significant in the analysis of'FactorIII. The seventh feraders had a lower mean score than the fifth- (2.4(.01) and ninth-graders (otan) and the tenth 'graders had a lower (2_(.05) mean score than the'twelfth.graders.
On Factor IV the males had a higher mean score (x = .17) than the females.(x -.19). 'The significant gtade level effect was due to the lower mean scores ofthe eighth.- and ninth-graders (114L.01) than the fifth-gradets.
1976 Data. Prior to conducting an analysis of the data from the complete 1976..sample, the-data from the sixth- through twelfth-graders was fActor analyzed andthe factor scores were subjected to 2(Six) x 7(Grade) x 2(New/Retested) analyses'of variance in order to assess retesting effects. Three factors emerged from the, .
varimaxanalysie. Of the 12 effects involving comparisons between the new and re-, tested subjects two were statistically significant. On Factor II (Human Relations)
the newly tested subjects had a significantly (F (1/666) = 4.88, 2(.05) higher. mean score (.10) than the retested subjects (A = -.06). The analysis of the laCtorscores for Factor III (Concern with the Future) resulted in a significaht Grade 'Levelx Retested/New. interaction (F (6,666) =.3.18, p.01)-.. Significant differences be-tween new and retested subjects appeared for grades seven and ten. .At the seventhgrade level the new subjects had a hisher mean Score (.48) than the retested sub-jects OM = 'At the tenth grade level the retested subjects harl'a.higher meanScore (.17) than the new subjects (A -.35). Since these two effects Seemed to re-present no consistent pattern it was decided to combine the data for the retestedand all the newly tested subjects for an overall tysis.
.
Th Necomponent thanalysis Rf e data for the eLcire 1976 sample re ulted inthree factors (See Table -32)4. The coefficients of congruence indica e that FactorII is the Interpersonal Reldtions factor that appeared in the 1975 data (coefficientof congruence equals .99), Factor III was the Human Ecology or Drugs factor from the1975 data (coefficient of congruence is .81), and the'first factor is a combinationof the Education and Concern.with the Future factors from the 1975 data (coefficientsof congruence were .76 between this factor and Factors II and III from the 1915 data).
The analyses of variance of the factor scores are summarized in_Table 33. Thefemales had i significantly higher mea score (.14) than the males (x-= -.12) onFactor I and the males had a significantly higher mean score (.12) than the fcmRles(x = -.13) on Factor II. These sex differences may reflect tr-ditional sex rolesocialization, especially since the Interpersonal Relations factor-has a heavy weight-ing on items indicative of sexual interest (Dusek & Monie 1974; Dusek et al. 1979)...
The significant Grade effect'in the analysis of the factor scores (see Table 34)from Factor II was due to the significantly (p_< .05) lower mean score of the seventh-than the fifth- and sixth-graders. The fifth graders had E. ...Ignificantly (p.A.05)higher mean score than the eighth graders.
1977 Data. Prior to analyzing the data from the entire 19,7 sample, the data from
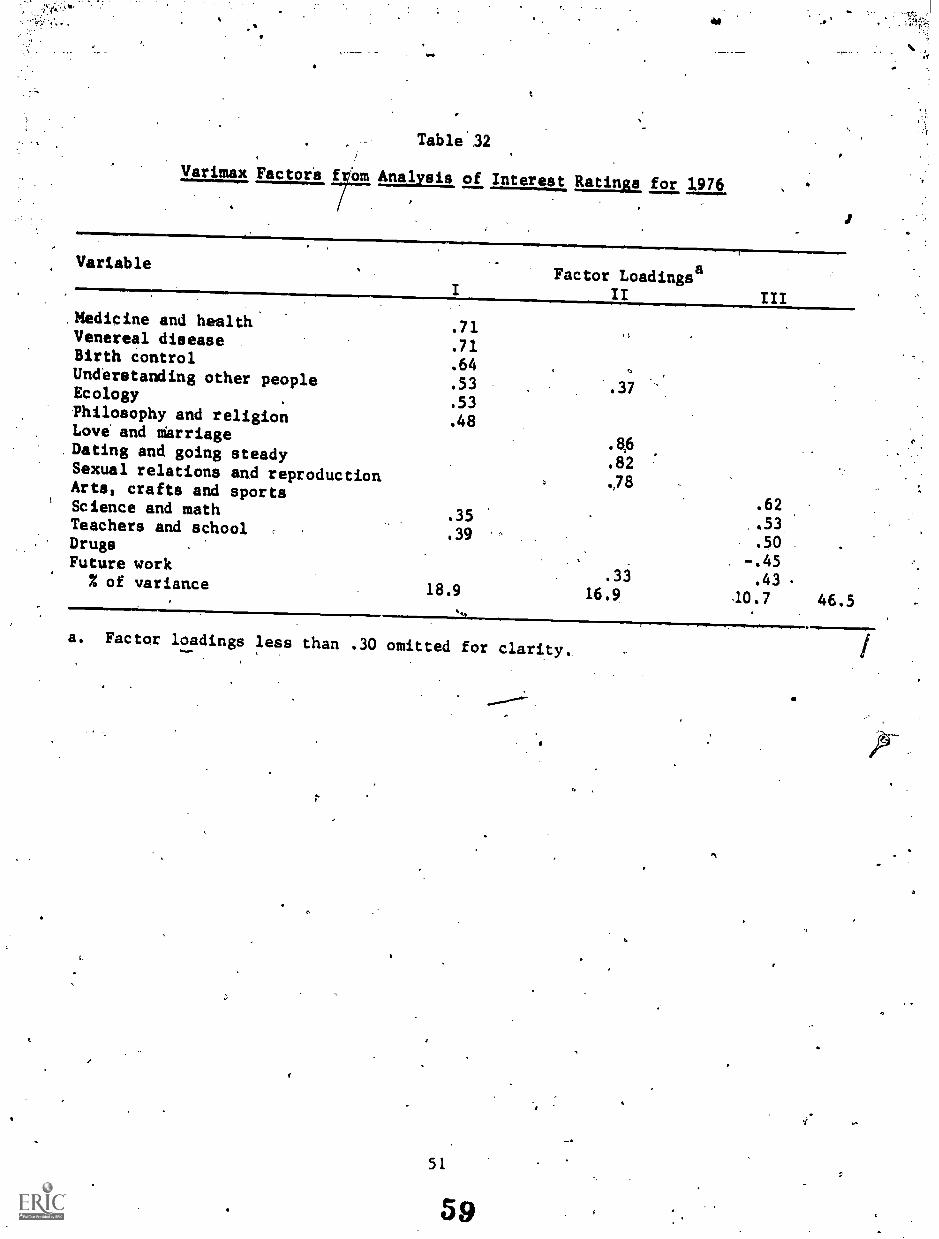
40
Table .32
Varimax Factori Analysis of Interest Ratings for 1976
.1 '
VariableFactor Loadingsa
II III
Medicine and health.71
Venereal disease.71
Birth control.64
Understanding other people .53 .37Ecology.53
Philosophy and religion .48Love and marriageDating and going steady
.82Sexual relations and reproduction ,78Arts, crafts and sports
.62Science and math.35
..53Teachers and school.39
.50Drugs-.45Future work
.3i .43% of variance18.9 16.9 40.7 46.5
a. Factor loadings less than .30 omitted for clarity.
r.
5 1
59
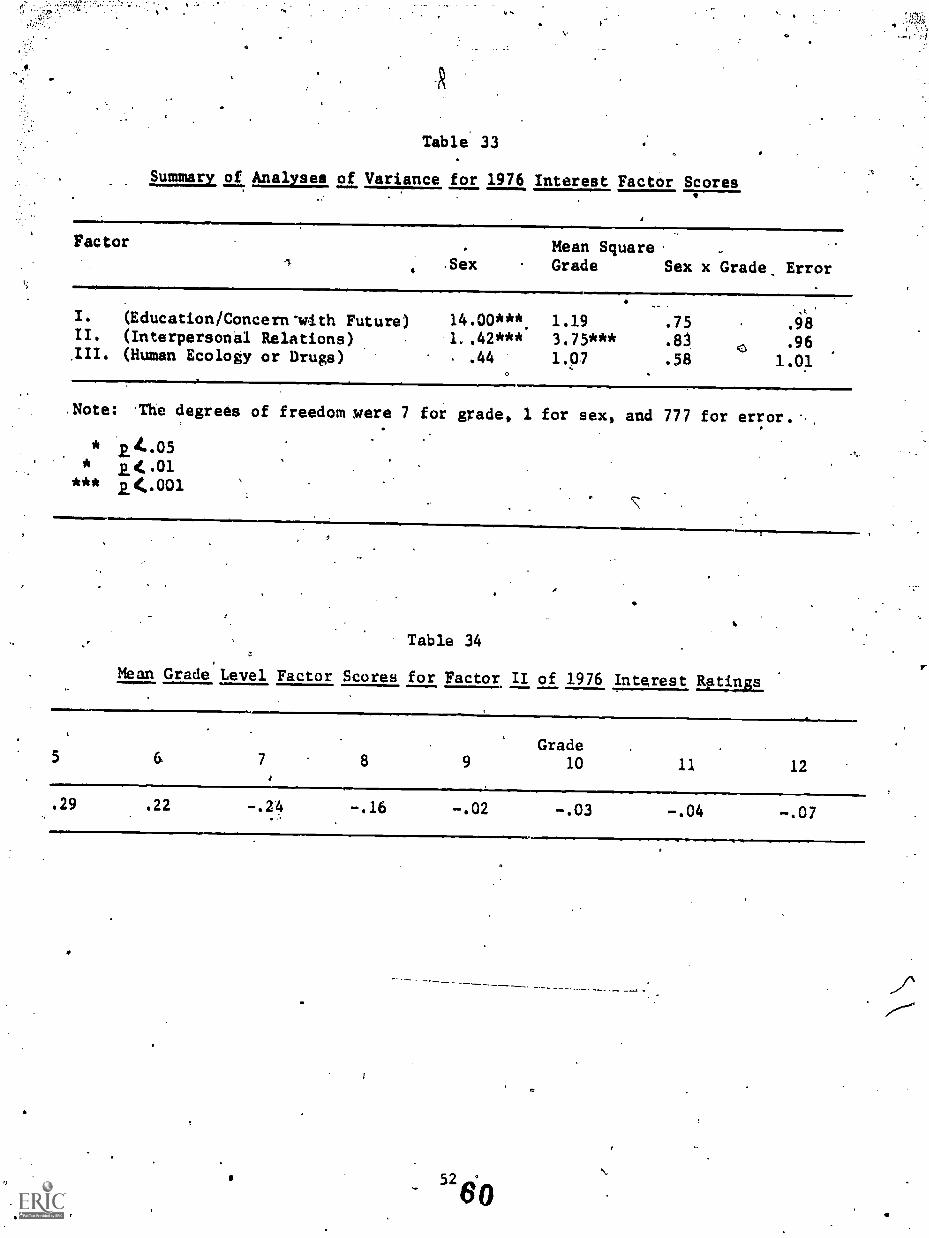
Table. 33
Summary of Analyses of Variance for 1976 Interest Factor Scores
Factor Mean Square..Sex Grade Sex x Grade Error
1. NINLII. (Education/Concern-with Future)
(Interpersonal Relations)III. (Human Ecology or Drugs)
14.00***, 1.191..42*** 3.75***
.44 1.07
.75 .98
.81 .96
.58 1.010
Note: The degrees of freedom were 7 for grade, 1 for sex, and 777 for error.
*
24.01*** 2.4,001
41111.1...s.r.
Table 34
Mean Grade Level Factor Scores for Factor II of 1976 Interest RtLns
5 6 7 8 9
Grade10 11 12
..29 .22 -.24 -.16 -.02 -.03 -.04 -.07
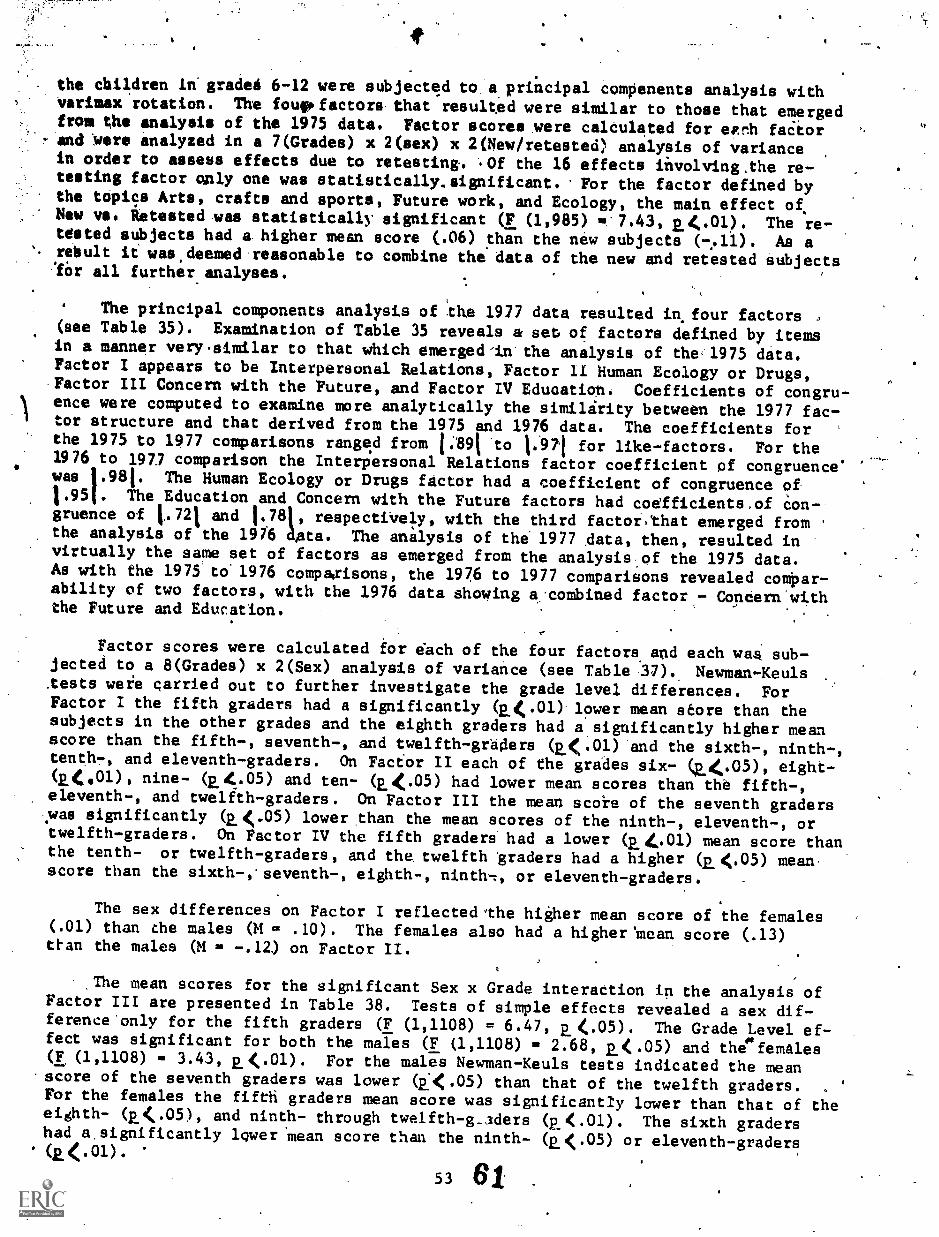
the children ln'graded 6-12 were subjected to a principal compenents analysis withvarimax rotation. The foupfactors that resulted were similar to those that emergedfrcm the analysis of the 1975 data. Factor scores were calculated for eArth faCior
- and 'wore analyzed in a 7(Grades) x 2(sex) x 2(New/retested) analysis of variancein order to assess effects due to retesting. .0f the 16 effects iitvolving.the re-testing factor oinly one was statistically.significant. For the factor defined bythe topics Arts, crafts and sports, Future work, and Ecology, the main effect ofNsw vs. ietested was statistically significant (F (1,985) o'7.43, 2,401) The re-tested subjects had a higher wean score (.06) than the new subjects (-,.11). As arebult it was.deemed reasonable to combine the data of the new and retested subjectslin all further analyses.
' The principal components analysis of the 1977 data resulted in.four factors ,
(see Table 35). Examination of Table 35 reveals a set, of factors defined by itemsin a manner very.similar to that which emerged-in the analysis of the 1975 data.Factor I appears to be Interpersonal Relations, Factor 11 Human Ecology or Drugs,'Factor III Concern with the Future, and Factor IV Education. Coefficients of congru-ence were computed to examine more analytically the similirity between the 1977 fac-
1 tor structure and that derived from the 1975 and 1976 data. The coefficients for
...-
the 1975 to 1977 comparisons ranged from 1:69t to 1.971 for like-factors. For the1976 to 1971 comparison the Interpersonal Relations factor coefficient pf congruence"
I
was .981. The'Human Ecology or Drugs factor had a coefficient of congruence of-1.95 . The Education and Concern with the Future factors had coefficients,of &m--gruence of t.721 and 1.71, respectiVely, with the third factor,that emerged from .
the analysis of the 1916 Ata. The analysis of the 1977 data, then,- resulted invirtually the same set of factors as emerged from the analysisof the 1975 data.As with the 1975 to1976 compairisons, the 1976 to 1977 comparisons revealed compar-ability of two factors, with the 1976 data showing a:combined factor.- Condern.withthe Future and Education.
.
Factor scores were calculated for iach of the four factors and each waa sub-jected to a 8(Grades) x 2(Sex) analysis of variance (see Table 37). Newman-Keuls.tests were carried out to further investigate the grade level differences. ForFactor I the fifth graders had a significantly (11(.01) lower mean store than thesubjects in the other grades and the eighth graders had a significantly higher meanscore than the fifth-, seventh-, and twelfth-graders (12.(4.01) and the sixth-, ninth-,tenth-, and eleventh-graders. On Factor II each of the grades six- (E(.05), eight-(E(01), nine- (2.4.(15) and ten- (2_(.05) had lower mean scores than the fifth-,eleventh-, and twelfth-graders. On Factor III the mean score of the seventh graderswas significantly (p..(.05) lower than the mean scores of the ninth-, eleventh-, ortwelfth-graders. On Factor IV the fifth graders had a lower (p..4.01) mean score thanthe tenth- or twelfth-graders, and the twelfth traders had a higher (2.'4.05) meanscore than the sixth-,seventh-, eighth-, ninth-.,, or eleventh-graders.
The sex differences on Factor I reflectedthe higher mean score of the females(.01) than the males (14 = .10). The females also had a higher 'mean score (.13)tt.an the males (Iki = -.12) on Factor II.
,The mean scores for the significant Sex x Grade interaction in the analysis ofFactor III are presented in Table 38. Tests of simple effects revealed a sex dif-ference*only for the fifth graders (F (1,1108) = 6.47, 2.(.05). The Grade Level ef-fect was significant for both the mares (F (1,1108) = 2.68, 2..( .05) and the"females(F, (1,1108) 3.43, p..(.01). For the mal-e-s Newman-Keuls tests indicated the meanscore of the seventh graders was lower (2.X.05) than that of the twelfth graders.For the females the fifth graders mean score was significantly lower than that of theeighth- (11(.o5), and ninth- through twelfth-g_aders (p_<.01). The sixth gradershad &significantly lower 'mean score than the ninth- (E(.05) or eleventh-graders(2.(. 01) .
53 .

0
,
Table 35
Varrmax haul front Analysis.of Interest-Ratings for 1977
5.
Variable) Factor Loadingsa
Love and marriageSeXual relations,and reproduction,Dating and-going steady
.88
.80
.78
. s
'
Venereal disease-.72
Birth control. .
-.69Understanding other people
.43 0 .41.Arts, crafts and sports. .,' .75Future work . .30 .66Ecology ' .44 .48Teachers and school -
Drugs,.40 .
Philoiophy and religionScience and .math
.36Medicine and health.45
% of yttriance 15.8. 13.5 11.6
a. Loadings less than .30 omitted for clarity.
.5482
,
Iv
..t,
,r''
.63
-.60.55
.50
.45
11.6 52.5
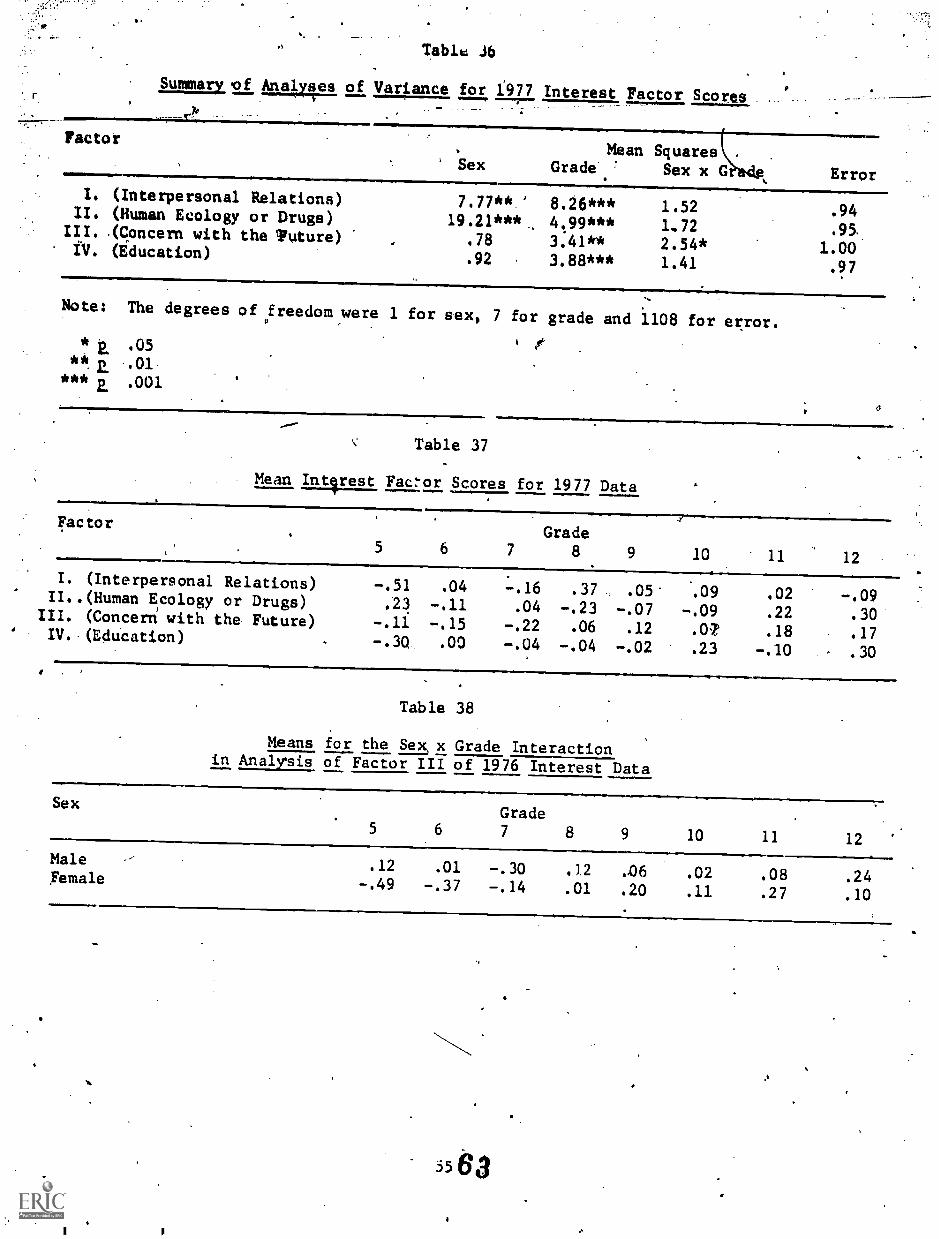
r.
0.
Tablc J6
Summary .of Analyses of Variance for 1977 Interest Factor Scoresr?'
Factor
111 SexMean Squares
Grade Sex x G Error
I. (Interpersonal Relations) 7.77** 8.26*** 1.52 .94II. (Human Ecology or Drugs) 19.21*** 4.99*** 1.72 .95III. .(concern with the Tuture) .78 3.41** 2.54* 1.00fV. (Education).92 3.88*** 1.41 .97
Note: The degrees of freedom were 1 for sex, 7 for grade and 1108 for error.
* 2, .05
** 2. ..01
*** 2. .001
Table 37
I e'
Mean Intlirest Fac:-or Scores for 1977 Data
FactorGrade
5 6 7 8 9 10 11 12
I. (Interpersonal Relations) -.51 .04 -.16 .37 , .05. .09 .02 -.09II..(Human Ecology or Drugs) .23 -.11 .04 -.23 -.07 -.09 .22 .30III. (Concerd with the Future) -.11 -.15 -.22 .06 .12 .07 .18 .17' IV. (Education) -.3Q, .00 -.04 -.04 -.02 .23 -.10 .30
Table 38
Means for the Sex, x Grade Interactionin Analysis of Factor III of 1976 Interest Data
Sex
5
Grade7 8 9 10 11 12
MaleFemale
.12
-.49.01
-.37-.30-.14
.12
.01,06
.20.02
.11.08.27
.24
.10
3563

Change in interests. Change in ini.trests was measured with both the tnterest'----rankings and interest.ratings for the 328 subjects tested each of the three years,for whom complete data were available. The mean rankings of the topics'for theaesubject& are presenteein Table 39. Th correlations among the rankings in Tabke 39were .95, .901 and' .98 for the 76, 1975-1977, and 1976-1977 isean rankings,respectively. Significant differences due to year of testing are also listed inTable 39. The mean rankings for the topics Philosophy and religion, Science andmath, Arts, crafts and sports, Understanding other people, and Ecology decreasedovei years of testiag. The rankings of-Love and marriage, Future work, and Datingand going steady increased over years, and the mean.ratingeof the topic SexUalrelations and reproduction peaked in 1976, being.lower in 1975 and 1977.
The mean ratings of each topic for each year for the retested sublects arelisted in Table,40. The correlations were .96, .94, and .98.for the 1975-1976,1975-1977, and 1976-1977 data, respectively. The mean ratings for the 'topics Phil-osophy and religion, Arts, crafts and sports, Venereal disease,and Ecology declinedover the years of ehe study (see Table 40). The mean interesvratinga for the topicsLove and marriage, Future work, and Dating and going steady generally increased.overthe years of the study. .Interest ratings for the topic Sexual relations and repro--duction peaked in 1976.
In order to further investigate changes in adolescent interests the ratingsof interests for the reteated subjects for each of the three years were subjectedto a principal components nalysis with varimax rotation.. Factor scores were COM"'4 puted and each was subjected to a 6(Group) x 2(Sex) x 3(Years) analysis of variance,yith repeated measures on the lasefactor.
The results of the factor analyais may be found in Table 41. Three factorsaccounting for 45.1% of the variance emerged. The-first factor is the InterpersonalRelations factor that appeared in the factor analyses reported above. Factor II isthe Human Ecology or Drugs factor that emerged in the previous analyses. The thirdfactor was a combination of the Education and Concern 'with the Future factora -thatare reported above.3
Table 42 presents a summaiy of the within subjects portion of the analyses ofvariance of the factor scores. Since.the between subjects portion of the analysisreflects effects averaged over the three testing periods of the study it is of littleinterest.
The mean factor scores for each factor are summarized in Table 43 for each year.'The main effect of Year was significant only for Factor I. As may be seen in Table43, interest in Interpersonal Relations declined over,the three years of the studyfor the lengitudinal sample. This finding is consistent with the grade level dif-ferences reported above. As may also be seen in Table 43.i the mean scores for Fac-tors II and III showed only small changes over the three testing periods.
The means for the significant Group x Years interaction for Factor I are reportedin Table 44. For Groups 1 and 2 there was a significant (lx.ol) drop in the meanscore from 1975 to 1976. A.similar decline occurred for-group 5. Inspection ofTable,044 reveals that, with the exception of Group 6, irkerest in Interpersonal Re-lations declined'over the three testing periods. The increase in interest in In-terpersonal Relations between 1976 and 1977 for Group 6 may reflect the approach of -marriage for many Of these subjects, who were.in twelfth grade in 19/1.
The only ether significant effect in these analyses was the interaction betweenGroup, Sex and Years in Factor II. Inspection of the means associated with this in-
56
64
... V.
`;',-..,-:.:,
-^
Table 39
Mean pinkinA 'of Each Topic, in Each-Year for Retested -Sub:facts
Topic
1975
Year
,1976 19772.
Philosophy .and religion 8.57 9.44 9.77 t .001Medicine and health 5.65 5.86 6.32fcience and math 7.08 7.62 7.96 4.01Love and marriage 7.36 6.60. 6.18 4.001Future work 4.90 3.77 3.02 4.001Art4, crafts and sports _4.53 4.82 5.32 4.05Teachers and School 7.73 8.18 8.16Birth control 9.35 9.74 9.84Understanding other people 4.79 4.72 4.82Venereal disease 9.20 9.52 10.58 ,14.001.Sexual relations 'and reproduction 7.82 7.00 7.51 4.05Drugs
10.80 11.32 10.76Dating and going steady 7.09 5.62 5.48 4.001Ecology7.07 7.74 8.23 4.001
Note: Degrees of freedom were 2 and 632 for the main effect of year of testing.
SI

,f
p
Table 40
Mean _Bating of Each Topip in Eadh Year foi. RetestecrSublects,
r
TopicYear
1975 ,.J.976 1977. E.
Philosophy and religion3.34 3.13Medicine and health 4.38 4.57
Science and math 4,30 4.184
Love and marriage 4.40 4.77Future work. 5.76 5.85
Arts, crafts and sports 5.94 5.69Teachers and schodl 3.83 3.75Birth control ,3.08 3.23Understanding other people 5.25 5.19Venereal disease - 3.54 3.55Sexual relations and reproduction . 4,08 4.73Drugs .
2.77 2.62Dating and going steady 4.60 5.10Ecology
+4.68 4.45
3.004.434.034.90
6.095.633.633.235.363.144.462.925.094.10
4.05
4.014 .054.05
4 .05
< .001
4.01eh .001
Note:- Degrees of freedom were 2 and 632 for the main effect of year-of testing.'
58
se
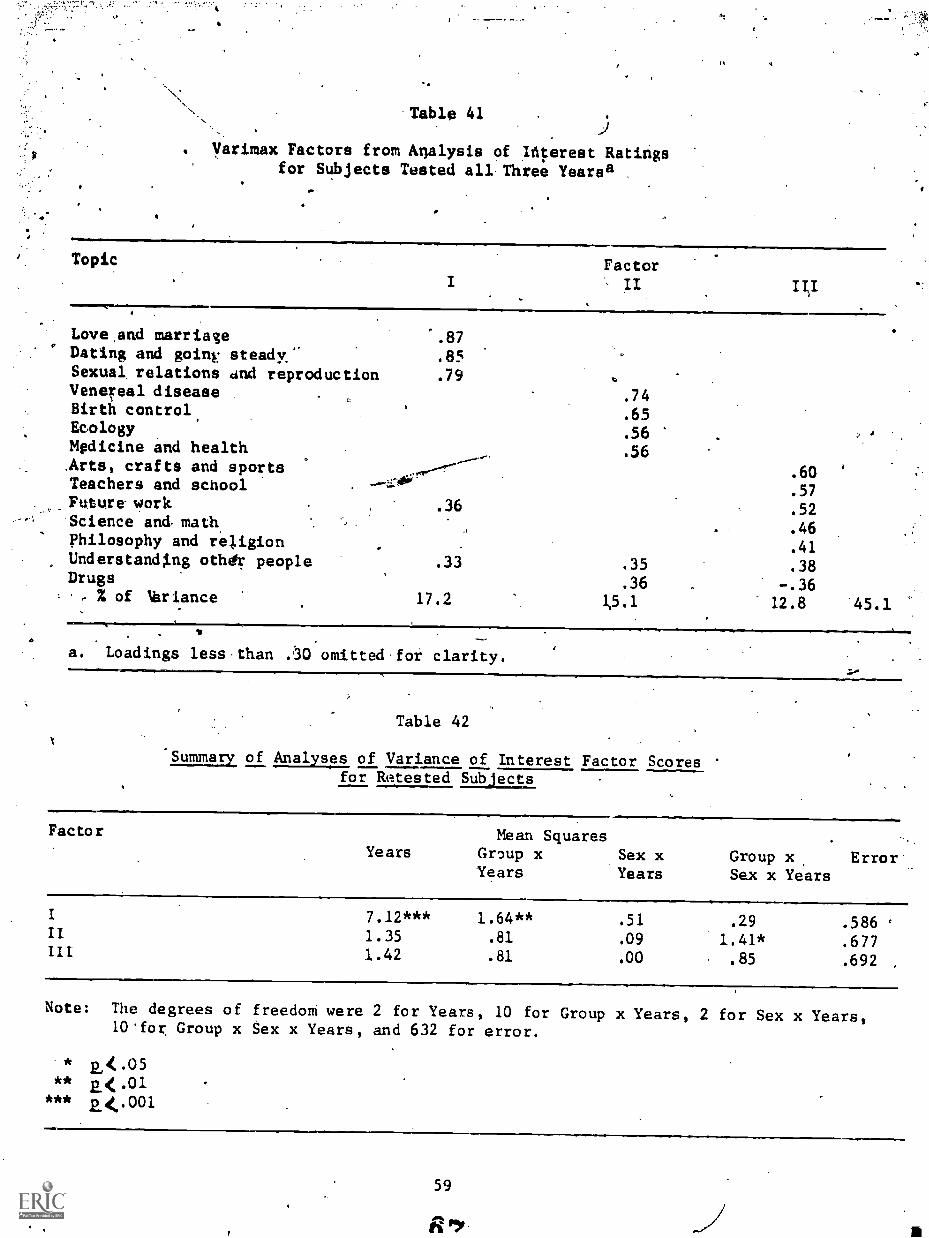
Table 41
. Varimax Factors from Atialysis of Interest Ratingsfor Subjects Tested all Three Yearsa
Topic FactorII
Love.and marriage .87Dating and goiny steady." .85Sexual, relations and reproduction .79Venereal disease .74Birth control. .65Ecology .56Mpdicine and health .56.Arts, crafts and sports .60Teachers and school
.57Future-work .36 .52-Science and. math .46philosophy and religion
.41Understandl.ng othdr people .33 .35 .38Drugs .36 -.36
% of Wriance 17.2 15.1 12.8 45.1
a. Loadings less than ..30 omitted for clarity.Zr.
Table 42
'Summary of Analyses_ of Variance of Interest Factor Scoresfor Retested Subjects
Factor
YearsMean Squares
Group x Sex x Group x, Error-Years Years Sex x Years
7.12*** 1.64** .51 .29 .5861.35 .81 .09 1.41* .6771.42 .81 .00 .85 .692
Note: The degrees of freedom were 2 for Years, 10 for Group x Years, 2 for Sex x Years,10.for Group x Sex x Years, and 632 for error.
* pmd< .05*****
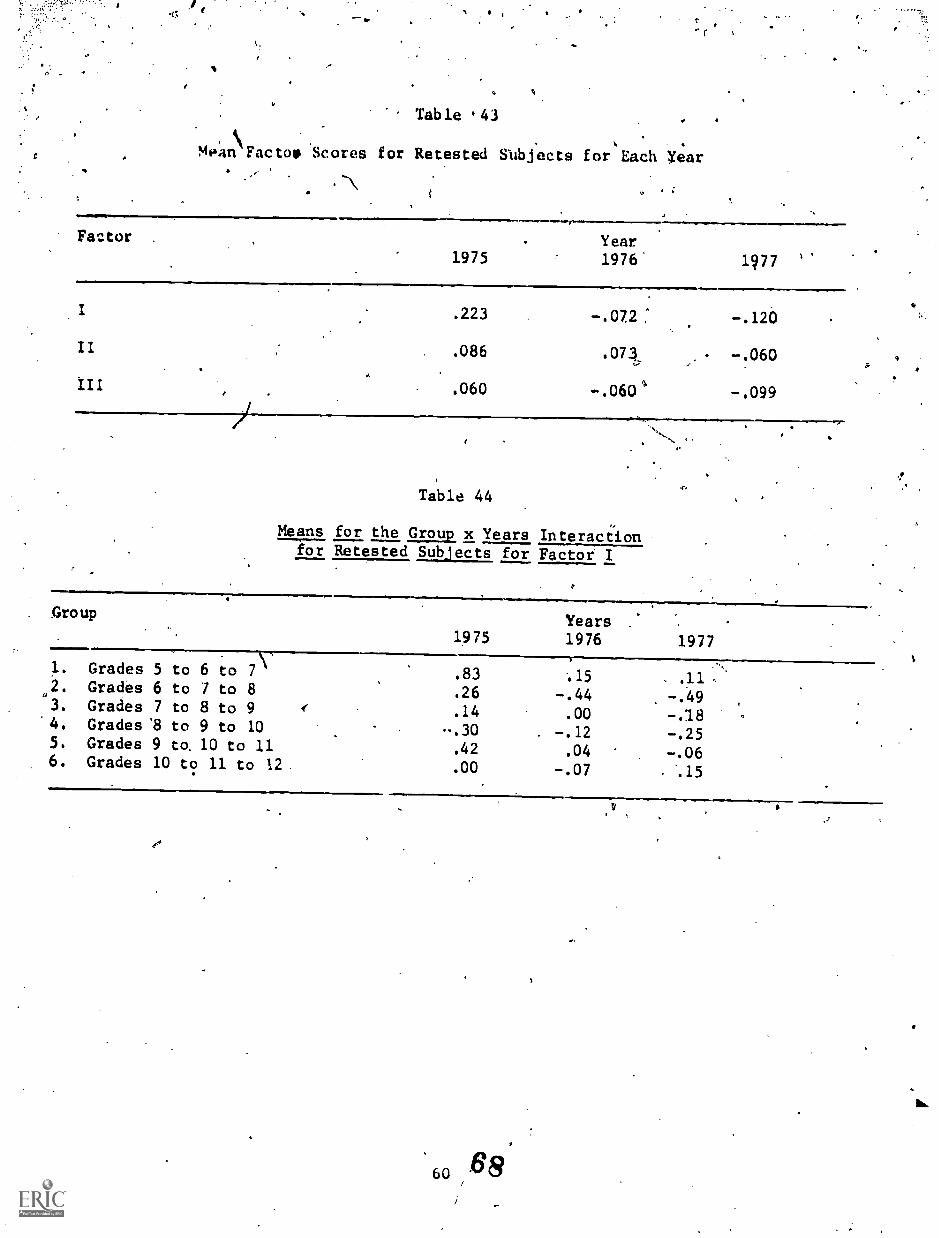
'. Table '43
,
Mean Facto* Scores for Retested Sbbjects for Each rear
T.11Factor .
=1,
1975
rYear1976' 3477
.223
.086
.060
.073
-.060
-.120
-.060
-.099
Table 44
Means for the Group x Years Interactionfor Retested Subjects for Factor I
...M1110#
. Group
1975Years .
1976 1977
I. Grades 5 to 6 to 7 .83 .112. Grades 6 to 7 to 8 .26 -.44 -.493. Grades 7 to 8 to 9 .14 .00 -.184. Grades'8 to 9 to 10 -.12 -.255. Grades 9 to. 10 to 11 .42 .04 -.066. Grades 10 to 11 to 12 .00 -.07 .15
,
60 88
!'
A

'.teraction did not.reveal any readily interpretable trends.
! The Retatton of Self-concept and Interests47'
One of the major purposes of the research was to examine the relation between4ado1eacent selfvedncept'and interests." This was seen as both a way to provide someconstruct validity'for;5te factors derived from the self-concept analyses and as away',to.begin to identif)vthe-antecedents of adolescent's interests and the person-ality correlates of the adolescents' interests.
Factor analytic analysps. One analytic strategy that was employed involvedsOmitting the.self-concept ratings and the ratings of interest in the various topics'to a component analysis and extracting varimax factors. This was done separatelyfor the data collected year of the study, and was also done for the longitudinalsaMple. -
The ,,laalyses done. for each year's data collection mayipe found in Tables 45, 46. and 47 for the 1975, 1976 and 1977 samples. In only=two instances.did an interest.topic appear with a primary loading on a self-concept factor. In the analysis ofKhe 1975 data Arts, crafts and sports loaded positivelyWith the Sex Role items- -(Hard: Strong and Rugged) In the 1976 data Drugs loaded negatively with the itemsdefining Adjustment (Refre81-fed, Happy, Relaxed, Satisfidd, Healthy, and Steady).Examination-of the secomiory loadings above the .30 level (chosen for clarity)'alsorevehla little association between the self-concept and interest items. These ana-lyses, then, indicate that tue adolescent's self-concept and interests do not devel-
, op interrelatedly.
The component 'analysis for the longitudinal sample (see Table 48) substantiates.Phe filadings reported above.. In only two instances did an interest have primary
, loading with the self-concept items. Science and math. loaded'positively with items.defining:Achievement/Leadership '(Smart, Superior, Sharp, Success, Valuable) and Art§,,.
crafts and sports loaded positively with items defining Sex Rote (Rugged, Hard, Strong.and Leaaer). Again, "condaty loadings above .30 in magnitude lend-no significant*support to self-concept and interests being meaningfully related ia a factor analy-tic sense.'
Canonical Correlation Analyses. In order to further investigate any possiblerelationships between self-concept and interests a series of canonical correlationswere computed between factor scores derived from separate analYses of the self-conceptand interest data. 'This was done separately for the data collected each year and forthe longitudinal sample, which allowed examination of trends fol both current rela-tionships and pre- and.post-diction of relationships across time. In effect, this '
procedure is comparable to longitudinal factor analysis.
Canonic'al correlation is a multivariate analysis by which we can identify thecomponents of one set of variables that are most highly related, in a linear. sense,to the components of another set of variables (Cooley & Lohnes 1976; Tatsuoka 1971).In our case, one.set of variables was composed of the factor scores from analysisof the self-concept data and the other set was comprised of the factor scores from
,the analysis of the interest ratings. The basic question, then, concerned deter-mining those combinations of self-concept and interest factor scores that were sig-nificantly linearly related. (See Tatsuoka (1971) for a discussion of significance
' tests for canonical correlation analysis).
The results of the canonical correlation analyses for the cross-sectional samplestested in 1975, 1976 and 1977 are presented in Tables 49, 50, and 51, respectively.Examination of these tables reveals seeral interesting findings. First, unlike the
61
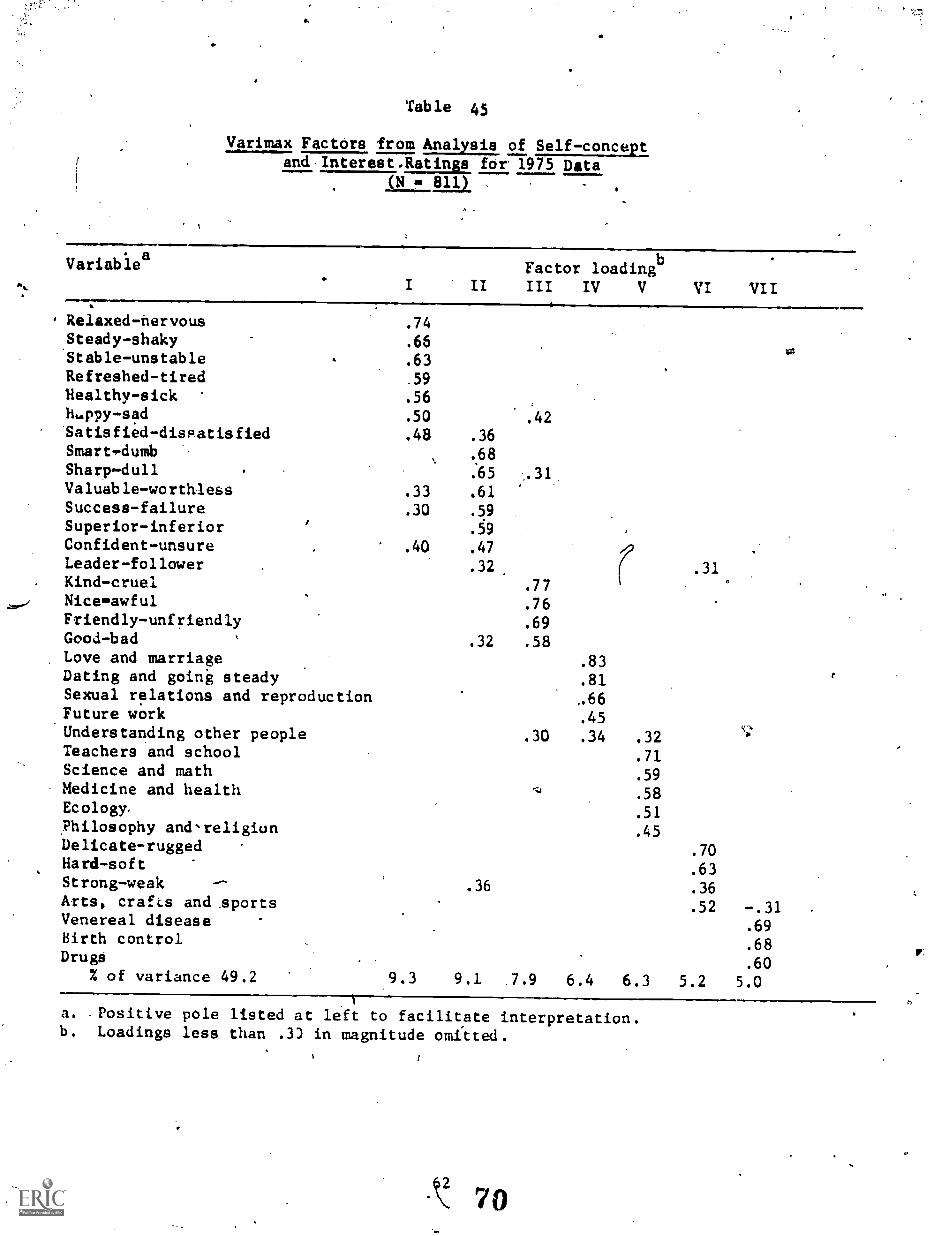
Table 45
Varimax Factors from Analysis of Self-conceptand 1nterest.Ratings for. 1975 Data
(N
Variablea Factor loadingb
II III IV V VI VII
, Relaxed-nervous .74.Steady-shaky .66Stable-unstable .63Refreshed-tired .59
Healthy-sick .56H.ppy-sad .50 :42.Satisfied-disPatisfied .48 .36Smart,dumb .68Sharp-dull .65 ..31
Valuable-worthless .33 .61Success-failure .30 .59
Superior-inferior .59
Confident-unsure .47
Leader-follower .32 .310Kind-cruel .77Niceawful .76Friendly-unfriendly .69Good-bad .32 ,58Love and marriage .83Dating and going steady .81Sexual relations and reproduction ,66Future work .45Understanding other people .30 .34 .32Teachers and school .71Science and math .59Medicine and health .58Ecology. .51Yhilosophy anchreligion .45Delicate-rugged .70Hard-soft .63Strong-weak .36 .36Arts, crafts and aports .52 -.31Venereal disease .69Birth control .68Drugs .60
% of variance 49.2 .9.3 9.1 .7.9 6.4 6.3 5.2 5.0
a. .Positive pole listed at left to facilitate interpretation.b. Loadings less than .33 in magnitude oraftted.
1
70
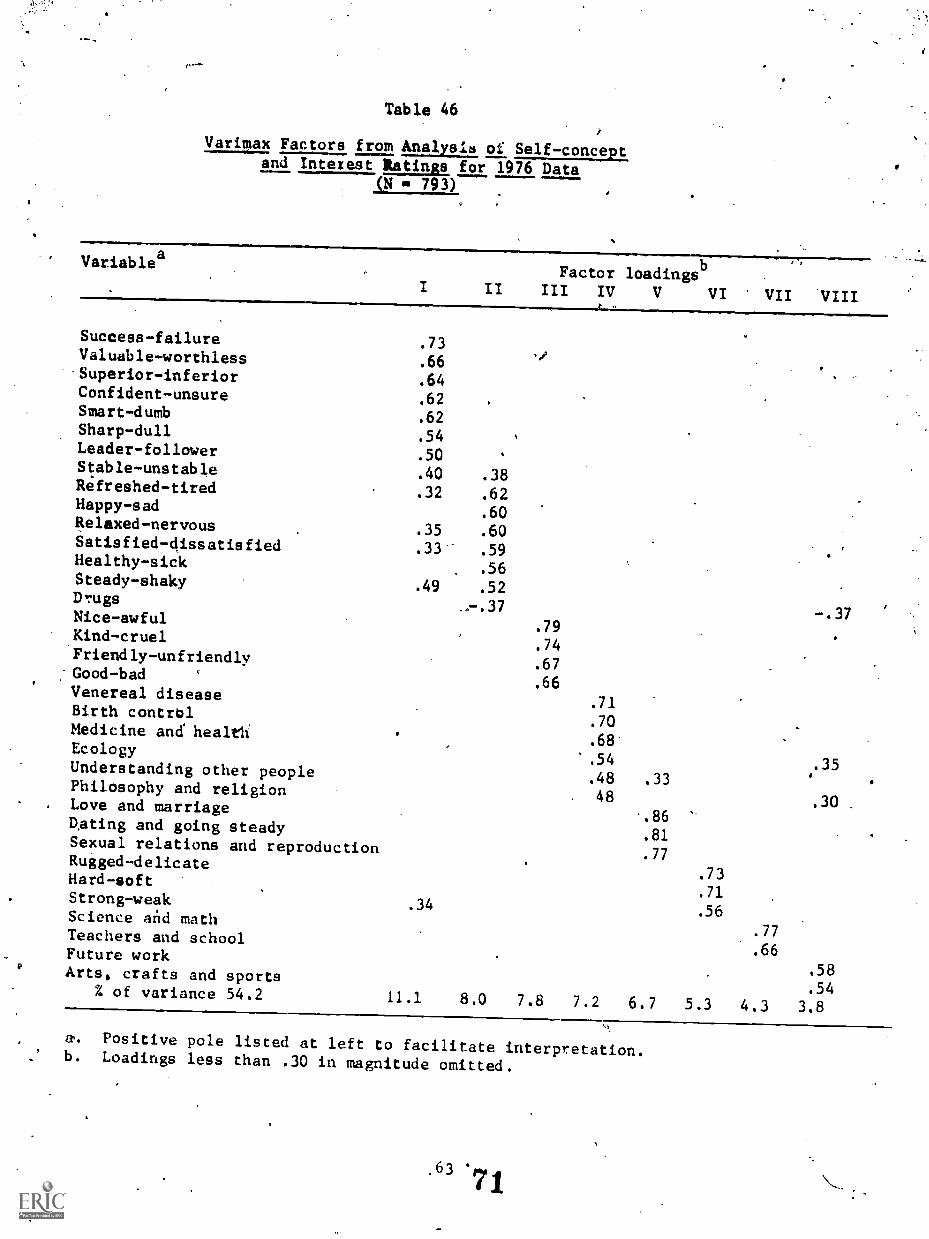
Table 46
Varimax Factors from Analysia of Self-conceptand Intetest Ratings for 1976 Data
(N 793)
Variablea
IIFactor loadings
b
III IV V VI VII VIII
Success-failureValuable-worthlessSuperior-inferiorConfident-unsureSmart-dumbSharp-dullLeader-follower
.73
.66
.64
.62
.62
.54
.50Stable-unstable .40 .38Refreshed-tired .32 .62Happy-sad .60Relaxed-nervous .35 .60Satisfied-dissatisfied .33 .59Healthy-sick .56Steady-shaky .49 .52Drugs
--.37 -.37Nice-awful.79
.74.Kind-cruel
Friendly-unfriendly.67
Good-bad.66
Venereal disease.71
Birth contrbl.70
-Medicine and health.68
Ecology 54 .35Understanding other people.48 .33
Philosophy and religion48 .30 .Love and marriage
..86Dating and going steady
.81Sexual relations and reproduction .77Rugged-delicate
.73Hard-soft
.71Strong-weak .34 .56Science and math.77Teachers and school.66Future work
.58Arts, crafts and sports
.54% of variance 54.2 11.1 8.0 7.8 7.2 6.7 5.3 4.3 3,8
a. Positive pole listed at left to facilitate interpretation.b. Loadings less than .30 in magnitude omitted.
.63 '71

Table 47
Varimax Factors from Analysid of Self-concept4 and Interest Ratings for.1977 Data
Variablea
(N 1123)
III
Factor loadingsbIV V VI VII VIII'I II
Sharp-dullSuccess Collum
. ..,
" Valuable-worthlessSuperior-inferiox .
Smarp..dumb
Strong-weakLeader7fo1lrwerConfidenti4nsure'
,Rugged-delicate,Relaxed..-nervous
Steady-shakyStable-unstable.Healthy-sickRefféshed-tired .
,
Happy-sad.
.
Satisfied-dissatisfied.-
NiceawfulKind-cruelFriendly:unfriendly ,
Good-bad 1
4,
Hard-softLove and marriageDating and going steadySexual relationsoand reproduction
.70
.64
.64
.63
.63
.60
.56
.53
.42
.30
.41
.31
.32
.30
.36
.
.31
..
.36
.78
.67
.58
-.55
.54
.52'
.48
,
-,30
.30
.80
.80
..72
.46
.41
..
.
.87
.79
.78
.38
.
-.35
:
,
,
%.33
..
..
(/
Birth controlVenereal dise-ase . .71
.4Medicine and health' ..60
Ecolbgy .48 .37Philosophy and religipn . . 43Understanding other people .40 .30Science and.math .70.0
Teachers ane school .67 .
Arts, crafts.and aports ., ;70
tLFuture work' .65Drugs -.82
% of variance 53.7 - 11.9 8.8% 7.8- 6.4 6.0 5.0 4.4 3.4
a. Positive Ole listed at left to facilitate interpretation.b. Loadings less.than .30 in magnitude omitted.
64 2
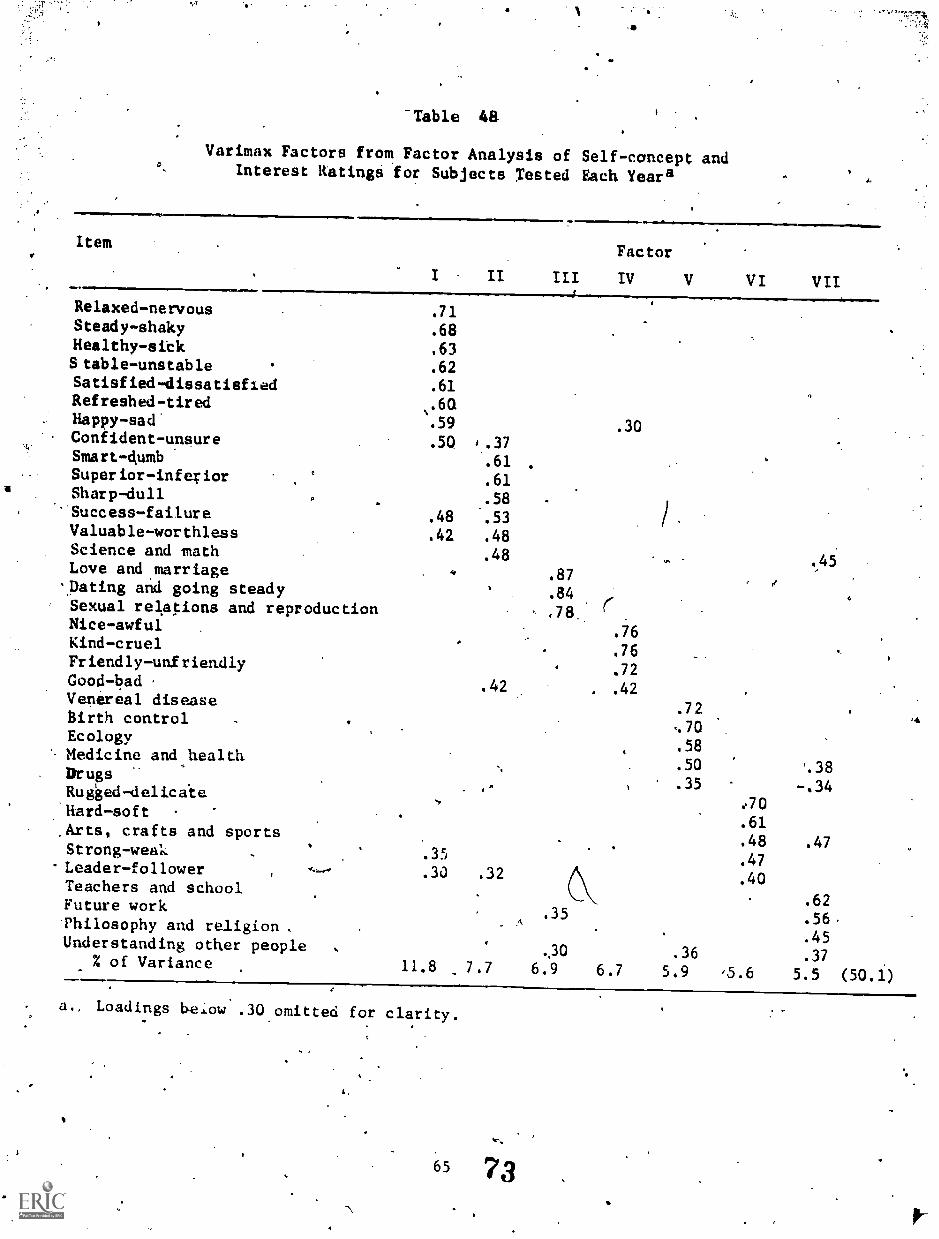
-Table 4&
Varimax Factors from Factor Analysis of Self-cancept andInterest Ratinga for Subjects Tested Each Yeara I.
{.
Item
I II III
Factor
TV V VI VII
Relaxed-nervous .71Steady-shaky .68Healthy-sick .63Stable-unstable .62Satisfied-dissatisfied .61Refreshed-tired .60Happy-sad' .59 .30Confident-unsure .50 '.37Smart-4umb .61Superior-inferior .61Sharp-dull .58
-Success-failure .48 .53Valuable-worthless .42 .48Science and math .48 .45Love and marriage
'pating and going steadySexual relations and reproductionNice-awfulKind-cruelFriendly-unfriendlyGood-bad
.87
.84
.78
. 76
. 76
.72
.42Venereal diseaseBirth controlEcology
*- Medicine and health
.72
.58
.50Drugs
.35 -.34Rugged-delicate.70Hard-soft.61
,Arts, crafts and sports.48 .47Strong-weak .35 .47
°Leader-follower .30 .32 .40Teachers and school
.62Future work.35 .56.Philosophy and religion, A
.45Understanding other people ,30 .36 .37% of Variance 11.8 7.7 6.9 6.7 5.9 '5.6 5.5 (50.1)
146
a., Loadings heiow .30 omitted for clarity.
p.
65 73
Ne
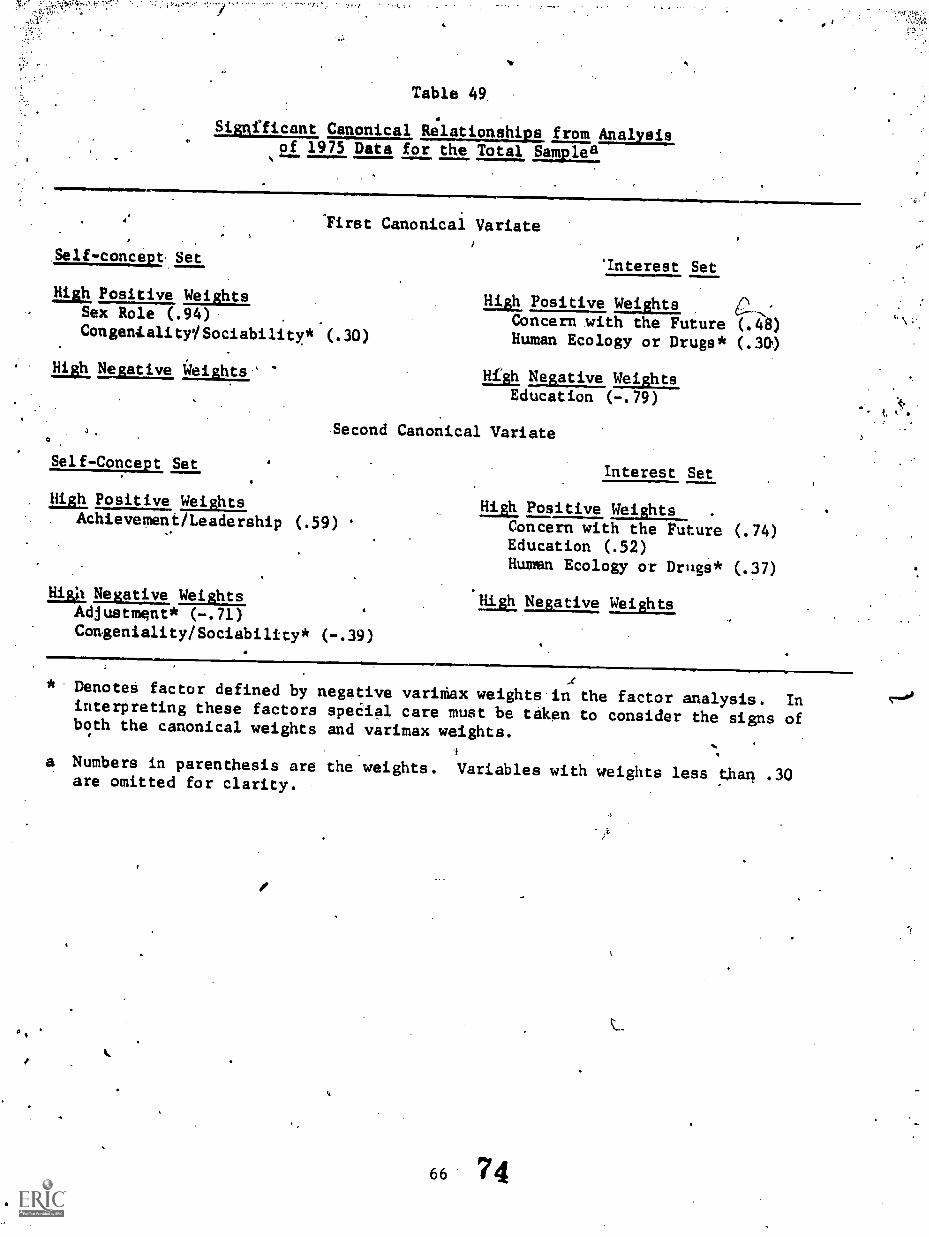
Table 49
Signfficant Canonical alatiglikiast from Analysisof 1975 Data for the Total Samplea
lirst Canonical Variate.
li-concept. Set
ugh Positive WeightsSex Role (.94)
.
Con gentali tr/ Sociability* (. 30 )
Hih Epgativs 1:leights
Self-Concept Set
'Interest Set
High Positive WeightekConcern vith the Future (.48)Human Ecology or Drugs* (.30)
Hfgh Negative WeightsEducation (-.79)
Second Canonical Variate
. Ugh Positive Weights. Achievement/Leadership (.59) '
Hig7A Nej EiLW....te Weights,
Adjustment* (-.71)
Congeniality/Sociability* (-.39)
Interest Set
High Positive Weights .
Concern with the Future (.74)Education (.52)Human Ecology or Drugs* (.37)
Lujin Negative Weights,O.
* Denote§ factor defined by negative variMax weights-in the factor analysis. Ininterpreting these factors speCial care must be taken to consider the signs ofboth the canonical weights and varimax weights.
a Numbers in parenthesis are the weights. Variables with weights less than .30are omitted for clarity.
66 74

.mr,
Table 50.
Significant Canonical Relationsfiips from Analysis of1976 Data for the Total Sample'
First Canonical Variate
Selfrconceot Set
High Positive Weights, Achievement/Leadership* (.57)
Congeniality/Sociability* (.40)
High Negative, WeightsAdjustment (-.67)
Q
4.
Interest Set
. High Positive Weights
'Ugh Nelatil.72. WeightsEducation, (7.96).
Second Canonical Vaiiate
Felf-concept, Set
lligh Positive Weighta
Congeniality/Sociability* (.71)Sex Role (.68)
Litgi Negative Weights,
Interest Set,
.High Positive Weights
Interpersonal Relations* (.46)
High Negative Wei#Its .
Human Ecology or Drugs (-.89)
* Denotes factor defined by negative varimax weights in the. factor analysis. Ininterpreting these factors special care must be taken to consider the signs ofboth the canonical weights and .varimax weights.
a. Numbers'in parenthesis are the weights. Variables with weights less than .30are omitted for clarity.
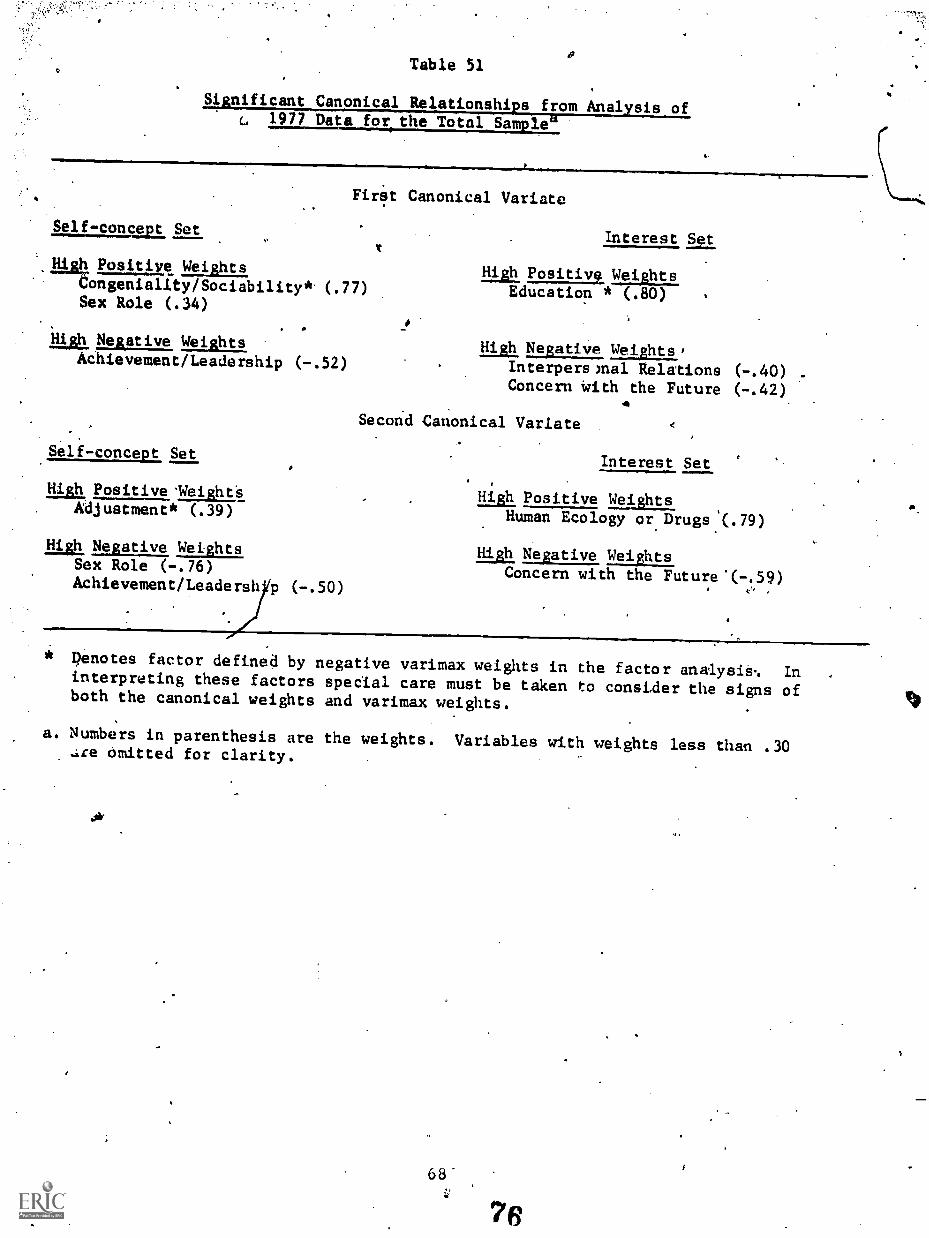
Table 51.
.S..tnt Canonical Relationships from al. sis oAn f
c, 1977 Data for. the Total Sample
4
Self-conces1 Set
Nil Positive Weights
ongeniality/Sociabilitys'u (.77)Sex Role (.34)
Firat Canonical Variate
Interest at.x
High Negative Weights
Achievement/Leadership (-.52)
.Self-concept, Set
High, Positive yeighta. Adjustment* (39)
High Negative WelghtsSex Role (-.76)
Achievement/Leadersh
High Positive WeightsEducation * (.80) b
High,Negative Weishts,Interpers mal Relations (-.40)Concern With the Future (-.42)
Second Canonical Varlate
Interest Set
High Positive Weights_Human Ecology or Drugs %(.79)
High Negative WeightsConcern with the Future "(-.59)
-.50)
penotes factor defined by negative varimax weights in the factor analysia-. In .interpreting these factors special care must be taken to consider the signs ofboth the canonical weights and varimax weights.
a. Numbers in parenthesis are the weights. Variables with weights less than .30-ire Omitted for clarity.
68
76
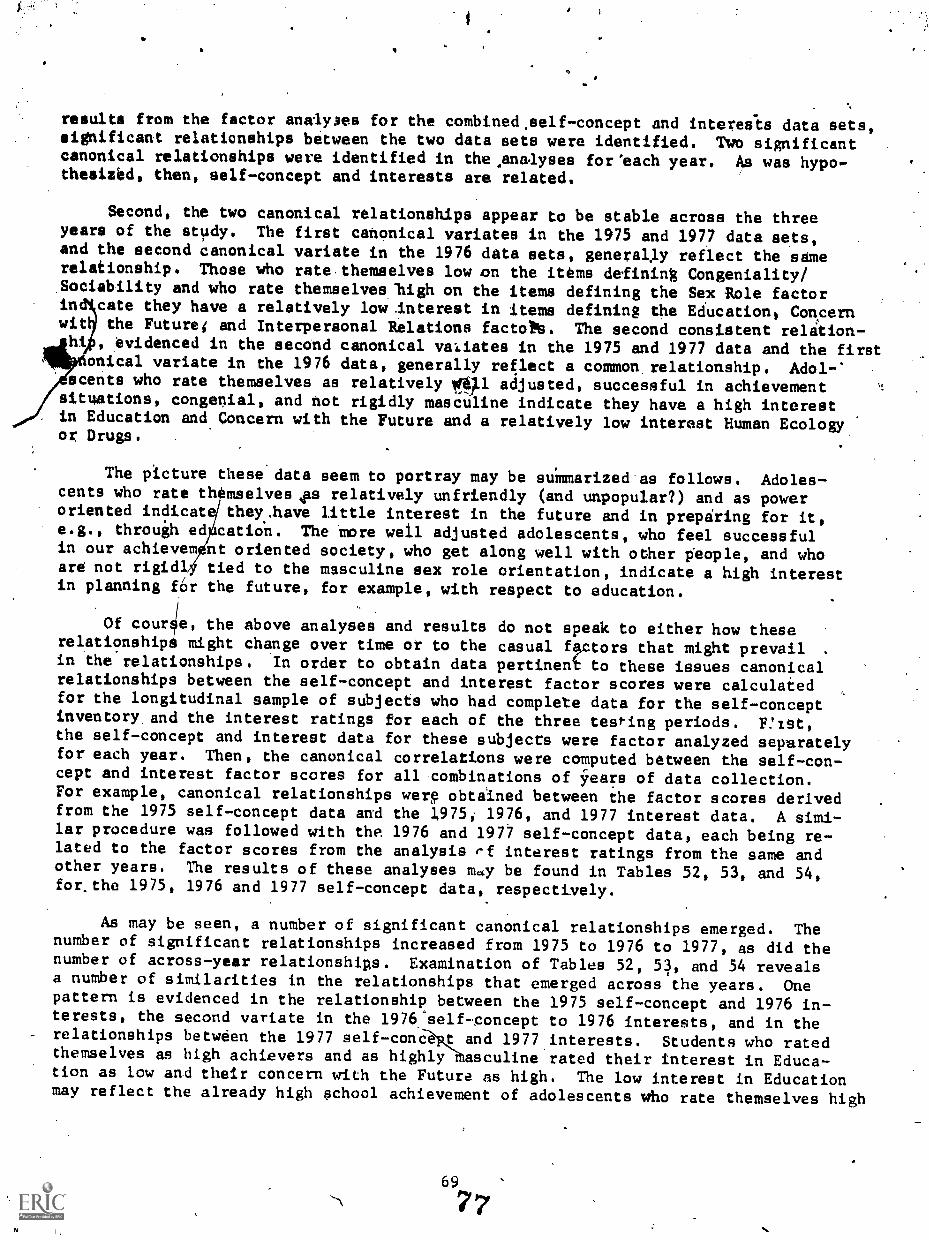
results from the factor analyses for the combined.self-concept and interesls data sets,significant relationships between the two data sets were identified. Wo significantcanonical relationships were identified in the.analyses for'each year. As was hypo-thesized, then, self-concept and interests are related.
Second, the two canonical relationships appear to be stable across the threeyears of the study. The first canonical variates in the 1975 and 1977 data sets,and the second canonical variate in the 1976 data sets, generally reflect the samerelationship. Those who rate.themselves low on the items defining Congeniality/Sociability and who rate themselves 'high on the items defining the Sex Role factortndicate they have a relatively lowinterest in items defining the Education, Concernwit the Future; and Interpersonal Relations factott. The second consistent relation-h1f, evidenced in the second canonical valiates in the 1975 and 1977 data and the firstonical variate in the 1976 data, generally reflect a common. relationship. Adol-'
scents who rate themselves as relatively #V.1 adjusted, successful in achievementsituations, congenial, and not rigidly masculine indicate they have a high interestin Education and Concern with the Future and a relatively low interest Human Ecologyor Drugs.
The picture these'data seem to portray may be su6marized as follaws. Adoles-cents who rate th mselves4as relatively unfriendly (and unpopular?) and as poweroriented indicatI they..have little interest in the future and in preparing for it,e.g., through ed cation. The more weil adjusted adolescents, who feel successfulin our achievem nt oriented society, who get along well with other geople, and whoare not rigidi, tied to the masculine sex role orientation, indicate a high interestin planning f6r the future, for example, with respect to education.
Of cour4, the above analyses and results do not speak to either how theserelationships might change over time or to the casual 4etors that might prevail
.
in the relationships. In order to obtain data pertinent to these issues canonicalrelationships between the self-concept and interest factor scores were calculatedfor the longitudinal sample of subjects who had complete data for the self-conceptinventory,and the interest ratings for each of the three testing periods. rtst,the self-concept and interest data for these subjects were factor analyzed separatelyfor each year. Then, the canonical correlations were computed between the self-con-cept and interest factor scores for all combinations of ir'ears of data collection.For example, canonical relationships werg obtained between the factor scores derivedfrom the 1975 self-concept data and the 1,975; 1976, and 1977 interest data. A simi-lar procedure was followed with the 1976 and 1977 self-concept data, each being re-lated to the factor scores from the analysis rf interest ratings from the same andother years. The results of these analyses 111,4y be found in Tables 52, 53, and 54,for.the 1975, 1976 and 1977 self-concept data, respectively.
AB may be seen, a number of significant canonical relationships emerged. Thenumber of significant relationships increased from 1975 to 1976 to 1977, as did thenumber of across-year relationships. Examination of Tables 52, 53, and 54 revealsa number of similarities in the relationships that emerged across the years. Onepattern is evidenced in the relationship between the 1975 self-concept and 1976 in-terests, the second variate in the 1976 'self-concept to 1976 interests, and in therelationships between the 1977 self-conCeRtand 1977.interests. Students who ratedthemselves as high achievers and as highly asculine rated their interest in Educa-tion as low and their concern with the Future as high. The low interest in Educationmay reflect the already high school achievement of adolescents yho rate themselves high

Table 52
Significant Canonical Relationships between 1975 Self-conceptFactor Scores and Interest Rating Factor Scores
for Each Year
1975,Interest Factor Scores
Self-concept Set
Vigh Positive Weights,Sex Role (.87)Adjustment* (.41)
High Negative Weights
1976 Interest Factor Scoresb
Self-concept Set
Hip,h Positive WeightsSex Role (.70)Achievement/Leadership (.62)Congeniality/Sociabidity* (.33)
Interest Set
High, Positive Weights
Concern with the Future (.34)Human Ecology or Drugs* (.33)
High Negative WeightsEducation (-.86)
oN
Interest Set
High Positive Wefghts.Concern with the Future (.48)
High, Negative Weights. High Negative Weights
Education (-.86)
1977 Interest Factor Scores
No signiftcant canonical relationships
Denotes factor defined by negative varimax weights in the factor analysis. Inin4erpreting these factors special care must be taken to consider the signs ofboth the canonical weights and varimax weights..
a. Numbers in parenthesis are the weights. Variables with weights less than .30are omitted for clarity.
b. p .06 for,this varieze.
70

Table 53
Significant.Canonical Relationships between 1976 Selfl-conceptFactor .Scores'and Interest Rating Factor Scores
for Each YeiraIS
1975 Interest;Factor ScoresNo significant canonical relationships
1976 Interest Factor. Scores
First Canonical Variate
.Self-coacept Set
Higb Pdsitive 'weightsAdjustment (.88)Congeniality/Sociability (.41)
Liigh_pegative Weiglas
Selfrconcept set
High Positive Weights .
.r
Interest Set
High Positive WeiffitsEducation (.68)Concem with the Future (.52) .
High Negative Weights
Interpersonal Relations * (-.42)Human Ecology or Drugs (-.31)
Second Canonical Vatiate
High Negative WeightsAchievement/Leadership (-..82)SeX Role (-.57).
1977 Interest Factor Scores
Self-concept,Set
Hish Positive Weiglits_Sex Role (.45)
High Negative Weights
Congeniality/Sociability (-.66)Adjustment (-.53)
Interest Set
Positive tits
'Education (.57)
High Negative WeightsConcern with the Future (-.79)
Interest Set
High Positive WeightsInterpersonal Relations* (.48).
High Negative WeightsEducation (-.76)Human Ecology or Drugs (-.43)
* Denotes factor defined by negative varimax weights in the factor analysis. Ininterpreting these factors special care must be taken to consider the signs of.both the' canonical weights and varimax weights.
a. Numbers in parenthesis are the weights. Variables with weights less than .30are omitted for clarity.
7971
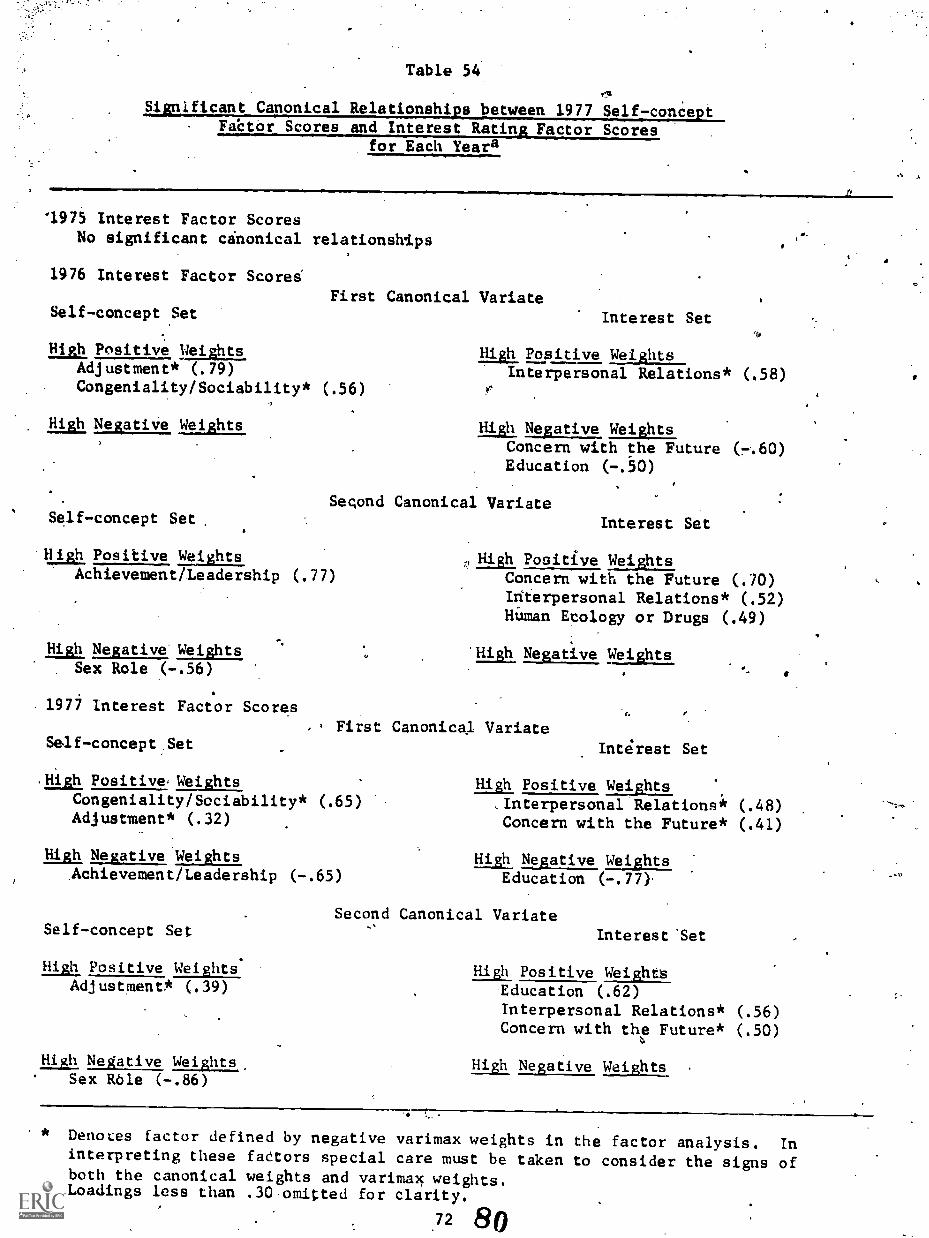
Table 54
Sielficant Canonical Relationshi s between 1977 Self-conce tFabtor Scores and Interest Rating Factor Scores
for Each.Yeara
1.975 Interest Factor ScoresNo significant canonical relationships
1976 Interest Factor Scorei
Self-concept SetFirst Canonical Variate
Ili& Positive .11e1_21Its
Adjustment* (.79)
Congeniality/Sociability* (.56)5
l.311 Negative Weights
Self-concept Set
Interest Setet,
High Positive Weights
Interpersonal Relations* (.58)
yawl Negative WeightsConcern with the Future (r,-.60)Education (-.50)
Second Canonical Variate
.High Positive WeigttsAchievement/Leadership (.77)
High Negative WeightsSex Role (-.56)
1977 Interest Factor Scores
Self-concept Set
Interest Set
, High Positive WeightsConcern with the Future (.70)Idterpersonal Relations* (.52)Human Ecology or Drugs (.49)
'High Negative sitiela
First Canonical Variate
.High, Positives HILBILtA
Congeniality/Sociability* (.65) '-Adjustment* (.32)
High Negative Weights
.Achievement/Leadership (-.65)
Self-concept Set
piA4 Positive Weights:Adjustment* (.39)
Interest Set
High Positive Weights,
,Interpersonal Relations* (.48)Concern with the Future* (.41)
High. Negative WeightsEducation (-.77).
Second Canonical Variate
Interest 'Set
High Positive WeightsEducation (.62)Interpersonal Relations* (.56)Concern with the Future* (.50)
High Negative Ektsts.2., High Negative aLgh_t2_Sex ROle (-.86)
* Denotes factor defined by negative varimax weights in the factor analysis. Ininterpreting these fadtors special care must be taken to consider the signs ofboth the canonical weights and varimax weights.
a. Loadings less than .30 omitted for clarity.
.72 80
on items defining the Achievement/Leadership factor (see below). The high interestin Concern with the Future probably indicates A, high interest in continued.success,vocation planning, and a career orientation. The picture one gets is of a striving,achievement oriented person. The pattern of results crYer the three years suggeststhat the ielf-views preceed the pattern of interests with which thty are associated.'
The second major pattern is discernable in the relationship between the 1976self-concept and interest data (first variate), the 1977 self-concept and 1976 inter-est data (second variate), and the first variate in the 1977 self-concept and 1977interest data. Adolescents who rate themselves as well adjusted and as congenialand friendly indicate they have-a relatively high interest in items defining theEducation Concern with the Future, and Interpersonal Relations fadtors. The imageone gets is of a generally well-adjusted person, interpersonally as well as indiVi-dually. These people seem to accept themselves and others and seem to be future andother oriented.
A third, though not as strong, pattern of relationships may be seen in.thevariates involving the 1976 self-concept and 1977 ratings and the first yariate inthe 1977 self-concept and 1977 ratings. Adolescents who rated themselves'low' on theitems defining the Congeniality/Sociability and Adjustment'factors indicated low in-terebt in the topics defining the Interpersonal Relations and Education factors..Adolescents who have adjustment problems and who are not particularlt socially ort-iented indicate low interest in Education and Interpersonal Relations. It appearsthat these adolescents are relatively 'unhappy with themselves and avoid contactwith othere and feel they have little hope for the future. Their interests indicate.they may be considered loners and perhaps as entering into escapist orientations.
Examination of the canonical re14tionships with an eye toward individual self-concept factors related to consistent patterns of interests is also revealing. HighSex Role is quite consistently related to low interest in Education and high ratingson Concern with the Future. High ratings-on items defining Adjustment 4re consist-ently related to high interest in items.defining Education and Concern with the Future.High ratings on Congeniality/Sociability relate to high interest in Education andConcern with the Future. There was also an indication that high Achievement/Leader-ship was associated. with high interest ih Education.
Social Class Differences in Adolescent's Self-concept and Interests
In'order to examlne social class differences in the structures of adolescentself-concept and interests for the samples tested each year separate factor analyseswere done for lower- and middle-class subjects. Social class was determined by pa-teknal occupation level, as described above (see Method). The samples for each yearwere divided at occupational level 5 in order to allow samples sufficiently large forfactor analytic techniques. Following the factor analyses coefficients of congfuencewere computed to compare factor structures across social class within each year andwithin social class across years.
Analysis of the 1975 seif-concept data resulted in five factors for the lowerclass subjects and four factors for the middle class subjects (see Tables 55 and 56).Examination of the cbefficients of. congruence for these data (see Table 57) indicatesa high degree of structural similarity.across social class,.with the responses of thelower class subjects perhaps evidencing a distinction between achievement and leader-ship and with the middle class subjects grouping leadership with the masculine sexrole. A similar set of findings emerged in the analyses of the 1976 data (see Tables58 and 59). The data for the 1977 samples (see Tables 60 .and 61) are less. clear.
4

4
Table 5
Varimax F'actors.from Analirsia of Lower Social Class Subjects, in 1475= 402)
VariableaFactor loadingsb '
II IV V.
Relaxed-nervous.71
Steady-shaky.68
't!Stable-unstable.68
Healthy-sick,55
Happy-sad.51 .47Refreshedntired
.9 .51Confident-unsure
.48.30Satisfied-dissatisfied .48
-.42Nice-awful.76Kind-cruel.76
Friendly-unfriendly.70Gpod-bad.62Smart-dumb
.82Valuable-worthless
.53 .37Success,failure.34
.52Sharp-dull.32 ° .5Q , .44Leader-follower
. .72Superior-inferior.32 .70Strong-weak
.32.49Hard-soft
.82Rugged-delicate
.72% of variance 54.4 15.1 13.3 9.8 9.4 6.8
a. Positive pole listed at left to facilitateinterpretationb. Loadings less than .30 in magnitude omitted.

Table 56
Varimax Factors from Analysis of Middle SociA. Class Subjects in 1975.Z1.1 773-5-5-
Variable_ 0 Factor loadingsb
IV
Success-failure'Smart-dumb
.71
.70Valuable-worthless .67 .47ShArp-Aull. .64Goo&bad .50 .47Confident-unsure .48 .37Superior-inferior .46 .34 .39Relaxed-nervous .80Steady,-shaky .66 .30Refreshed-tired .34 .65.Stable-unstableSatisfied-dissatisfied .46 .53Healthy-sick .51 .31Happy-sad .30 .47 .35Nice-awful .82Kind-cruel .82Friendly-unfriendly .68Rugged-delicate .79Hard-soft ./7Strong-weak .42 .46Leader-follower ..31 .40
% of variance 54.5 16.3 15.3 12.7 10.2
a. Positive pole listed at left to facilitate interpretation.b. Loadings less than .30'1n magnitude omitted.
C.
7563

no
Tabl 57
Coefficlenu; of ..ongruence tor Favtors,of Self-Conceptfor Lower- artd Midd1e-Cla4s Subjects for Each Year
Year Lower ClassFactor
Middle ClassFactor
1975 I II III IV
I .63 .96 -.44 -.33II .57 .49 -.93 .05.III -.89 :-.47f .37. .28IV -.67 -.51 -.93 .05V -.15 -.14 , -.05 .8?
1976 II III IVI .93 -.49 -.58 .50II .49 ' -.92 -.40 -.05III .47 .02 -.37 .88IV -.72 .35 .88 -.46V .53 '.. -.46 -.75 .23
1977III IV V
-.91 .79 .43 . :55 .24II .58 -.78 -.40 -.89 -.28III .31 -.44 -.95 -.33 .10IV -.52 .13 -.15 .40 -.15
84-76
11,

Table 58
Varimax Factors from analma of Lower Social Class Subjects in-1976(N 434)
VariableaFactor l?adings
b
IV V
Success-failureValuable-worthlessConfident-unsure
.75
.73
.64Smart-dumb ..54 .31Leader-follower .48 .35Sharp-dull .48 .39Refreshed-tired .67Relaxed-nervous
.65 .32Satisfied-dissatisfied .62 .37Superior-inferior .45 .58Steady-shaky .33 .52 .3GStable-unstable
.51 .37'Nice-awful.78.
Good-bad.74
kriendly-unfriendly.70
kind-cruel.68Hard-soft
.80Rugged-delicate
.75Strong-weak
.59,Healthy-sick.72Happy-sad
.31 .67% of variance 57.7 14.1 13.8 12.7 9.9 7.2
a. Positive pole listed at left to, facilitate interpretation.b. Loadings le, than .30 in MaAnitude omitted.
fl
7785

. /' Table 59
Varimax !actors from Analysis of Middle Social Class Subjects in,1976(N 291)
Variablea C Factor loadingsClV
4.V
Success-failure ,'Confident-unsureValuable-worthlessSmart-dumbSuperior-inferiorStable-unstable
-Sharp-dullNice-awful ,
Kind-cruelFrfendly-unfriendlyGood-badSatisfied-dissatisfiedRefreshed-tiredHealtli-sickRelaxed-nervousHappy-sadSteady-shakyLeader-followerRugged-delicateHard-soft ,
.
Strong-weak% of variance 54.9
:72.65
.65.
.62
.60
.55.
.40
.42
.35
.46
.37
.
16.5
.38
.32
.36
.78
.76
.74
.51,
.33
.46
14.2
.40
..68
.66
, ..64
.63
.59.
'.53
.38
14.2
,
.41
.39
7
.35
.76'
.69
.....63
10.0
'
4
a. Positive pole listed at left to facilitate interpretation.b. Loadings less than .30 in magnitude omitted.
7886
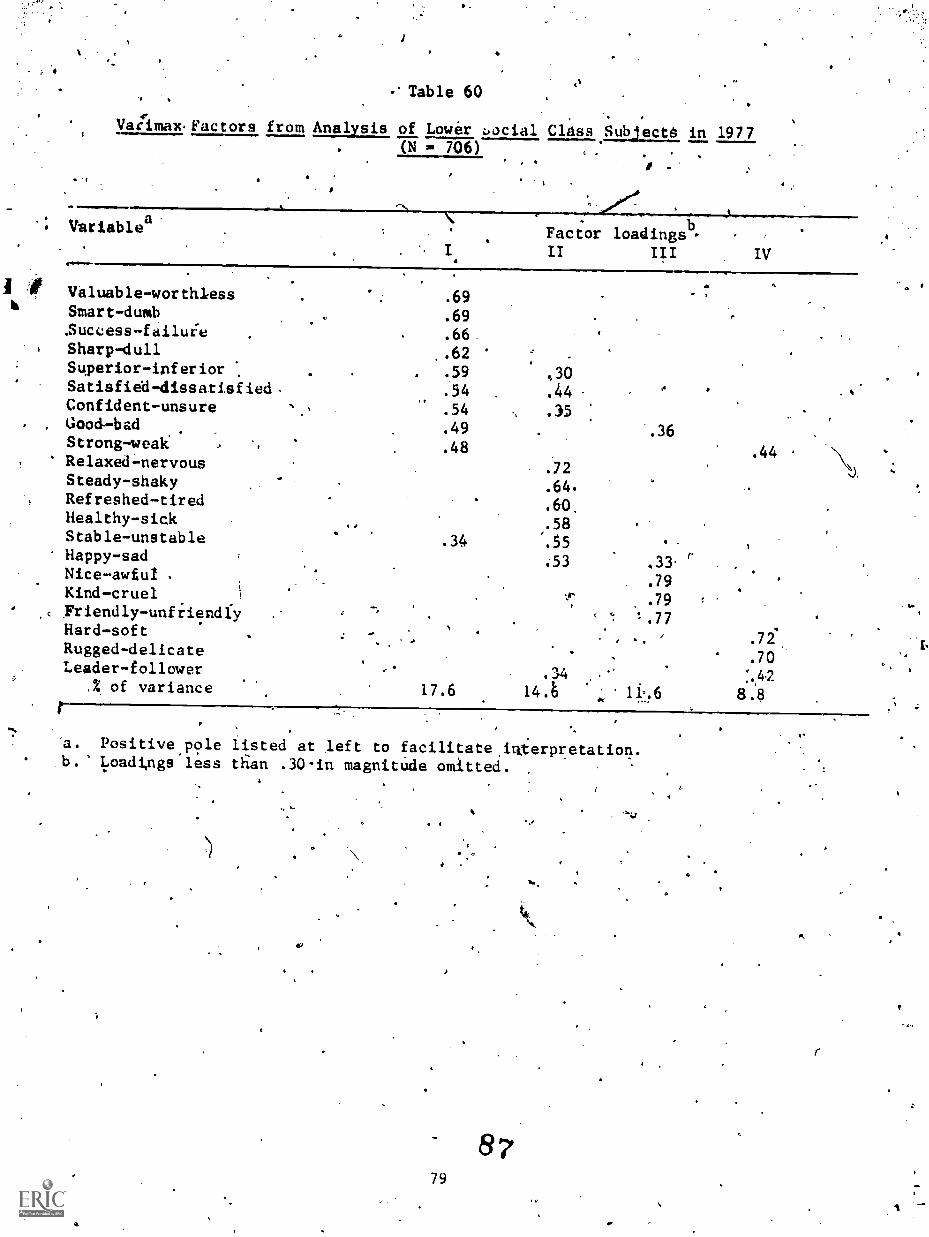
e .4
i
5.
Table 60,+
VaAmaxFactors from Analysis of Lower :,ocial Class SubjectS in 1977314.22§2
Variablea
'- I.
Factor loadingsII IV4.
Valuable-worthlessSmart-dumb
Success-failuieSharp-dull
.69
.69
.66
.62 4 -
Superior-inferior .59 ,30Satisfied-dissatisfied. .54 .44Confident-unsure .54 .35Good-bad .49 .36Strong-weak .48 .44Relaxed-nervous .72Steady-shaky .64.Refreshed-tired .60,Healthy-sick
# .58Stable-unstable .34 %55Happy-sad 133 r
Nice-awfu/. .79
Kind-cruel r .79 I
Ftiendly-unfriendry .77Hard-soft
r
Rugged-delicate.70
Leader-follower.; of variance
,
17.6.34
l4.
.."
11.6 8.8r-'a. Positive.pole listed at left to facilitate.interpretation.b. Loadings less tfian .30-in magnitude omitted.
,
. 5
s...
79
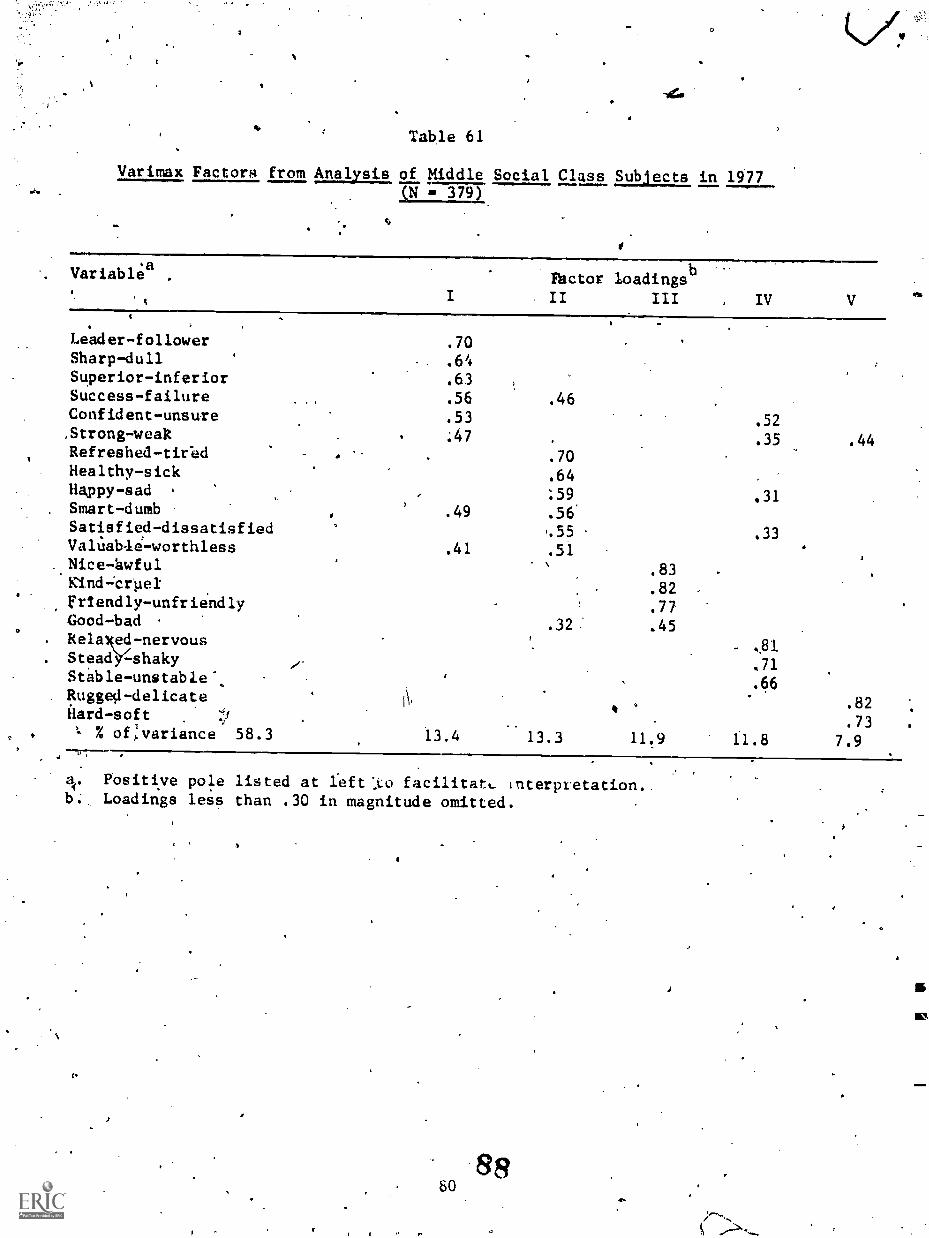
Table 61
Varimax Factors from Analysis of Middle Social Class Subjects in 1977(N 0 379)
Variabla . Pgctor loadingsb
II III IV V
,
Leader-follower .70Sharp-dull .64Superior-inferior .63
Success-failure .56 .46Confident-unsure .53 .52,Strong-weaR :47 . .35 .44Refreshed-tieed .. . .70Healthy-sick .64Happy-sad .
.., 59 .31
Smart-dumb, .49 .56'
Satisfied-dissatisfied ..55 .33Valuable-worthless .41 .51Nice-kwful .
.83 .
Kind-'crpel .82Friendly-unfriendly .77Good-bad . .32: .45Reloied-nervous
- ,81Steaeyshaky /- .71Stable-unstabie ..Rugge0-delicate
t °
.66.
.82fiard-soft ../
.73e '.. % of:variance 58.3 13.4 13.3 11.9 11.8 7.9
a4 . Positive pole listed at left,to facilitatt. interpretation..b:, Loadings less than .30 in magnitude omitted.
io
'The Achievement/Leadership, Congeniality/Soctability, and Adjustmera factors emergedin both the lower- end middle-class data, but Factor I.! in the middle-class data hadno counterpart in the lower class data.
The above data suggest only minimal, if any, social class differences in thefactor structure of the self-concept. And, the-dw:a suggest little change in thesefactor structures across the three testing periods. This latter implication wastested by computing.coefficients of congruence within.social classes across years.These coefficients indicated a moderate to high degree of similarity (coefficients 4cif congruence above .80) for both social classes across the three testing periods.
Similar procedures were employed to assess social'class effects in the factoritructure of adolescent interests. Analysis of the 1975 data (see Tabl?.s 62 and 63)resulted four factors for the lower class and five factors for the middle classsubjects. Analysis of the 1976 (see Tables 64 and 65), and 1977 (see Tables 66 and67.) data resulted in four factors for both the lower- and middle-class subjects ineach yeas.
Examination of Table 68, in which the coefficients of congruence are presentedfor the two social classes within each .year, indicates that for the 1975 r ' 1976 datathe.re is only a moderate degree of factor structure similarity for the tw c. socialclasses. The coefficients of congruence for the factor structures resulting from the1977.data were very high for the like-factors (see Table 68)
Coefficients of conogruence were calculated for similar social class levels. aci-ossthe three.times of testing. pi general, the cOefficients indicated a moder-
ately high degree of structural sialarity across ye rs of testing for both socialclasses. This was especially true for the Interpers nal Relations factor, the coef-ficients being above .90 for all comparisons.
Relationships Between Self-concept and School AchieveMent
Several types of comparisons were made to explore the relationship betweencomponents Of self-concept and the.various achievement test and IQ scores. Componentscores for the self-concept were obtained from a component analySis of the self-°
concept data. The data ror each subject for each time cf.testing were entered intoone globs' ccmponent analysis, with the components rotated to the varimax criterion.Col-ponent scores were then computed for each subject for each tine of testing. Forthe fifth- through eighth-graders the achievement test Scores used were the compositescores for the Reading, Language and Mathematics subtcfts from the IOWA AchievementTests. The Verbal, Quantitative, and Nonverbal tQ tests scores from the CognitiveAbilities Test were used as'measures of intelligence for the fif"rh- through eighth-:graders. Stanford Achievement Test composite scores for Reading, English, and Math-ematics and the IQ scores from the Otis-Lenon Mental Abilities Test were used for sub-
.jects in grades nine through twelve.
The self-concept factor scores were correlated with the achievement test and IQscores for each year for subjects with complete data only. .These correlational ana,lyses were conducted separately for each grade and sex combination in order to examinethe developmental trends and sex differences that may exist in these data as indicatedAst the literature review. In addition, correlations were computed for the total groupof subjects in each grade/sex.codbination collapsed oveL all three testings.
The only consistent findings that emerged were associated with the Achiev4meni/Leadership Factor score. The Congeniality/Sociability, Adjustment, and Sex Role Fac-tor scores were only sporadically significantley correlated with the achievement andIQ.measures.. Th4 cbrrelations between the AchievemenL/Leadership factor scores and
81 89
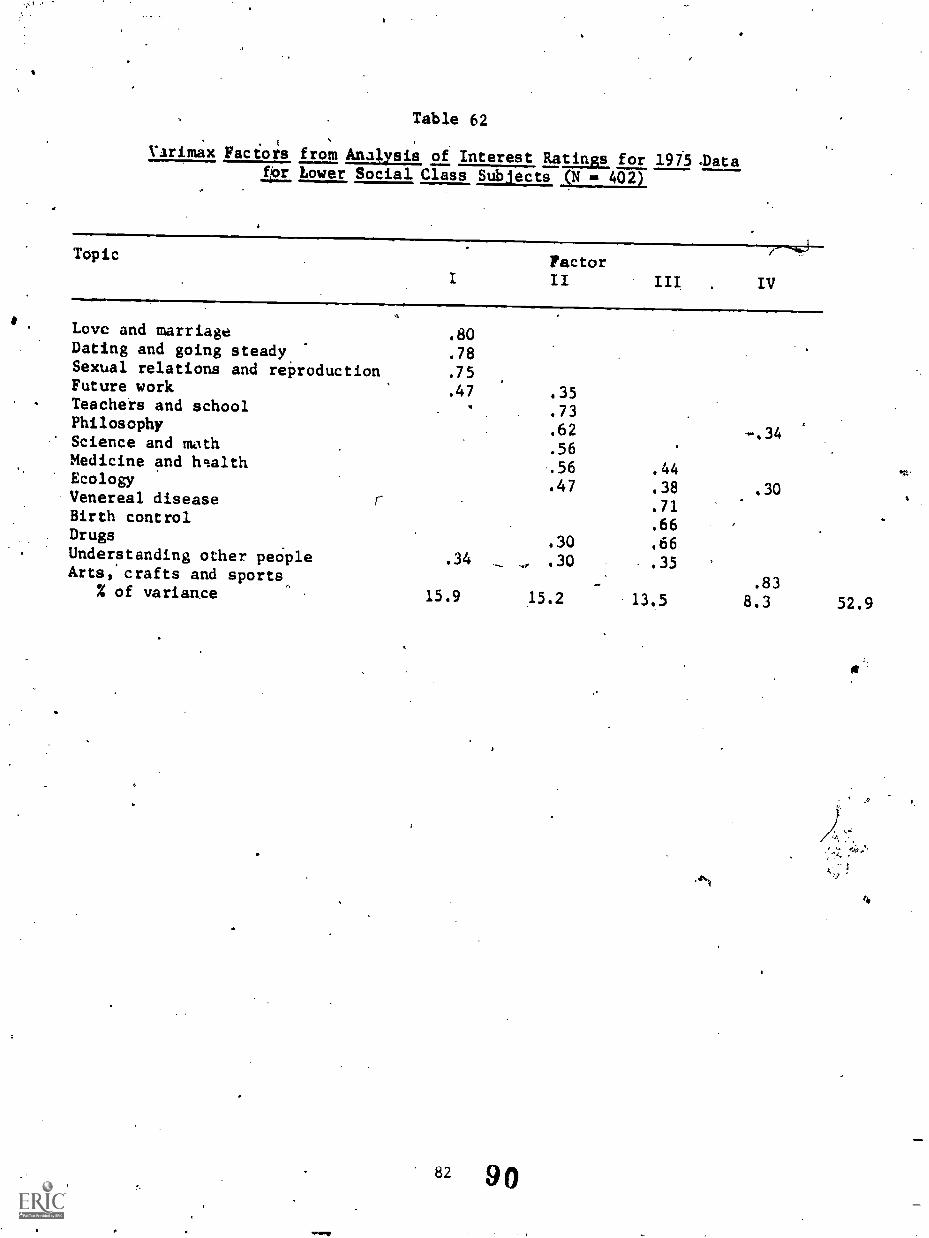
Table 62
. t
Varimax Factors from Analysis of Interest Ratings for 1975 .Datafbr Lower Social Class Subjects (N . 402)
TopicFactor
IV
A
Love and marriage .80Dating and going steady .78Sexual relations and reproduction .75
,Future work .47 .35Teachers and school .73Philosophy .62
-' Science and math .56Medicine and health ..56 .44Ecology .47 .38 .30
-Venereal disease r .71Birth control
.66Drugs
.30 .66Understanding other people .34 .., , .30 .35 ,
Arts,' crafts and sports, - .83% of varianee 15.9 15.2 13..5 8.3 52.9
82 9 0
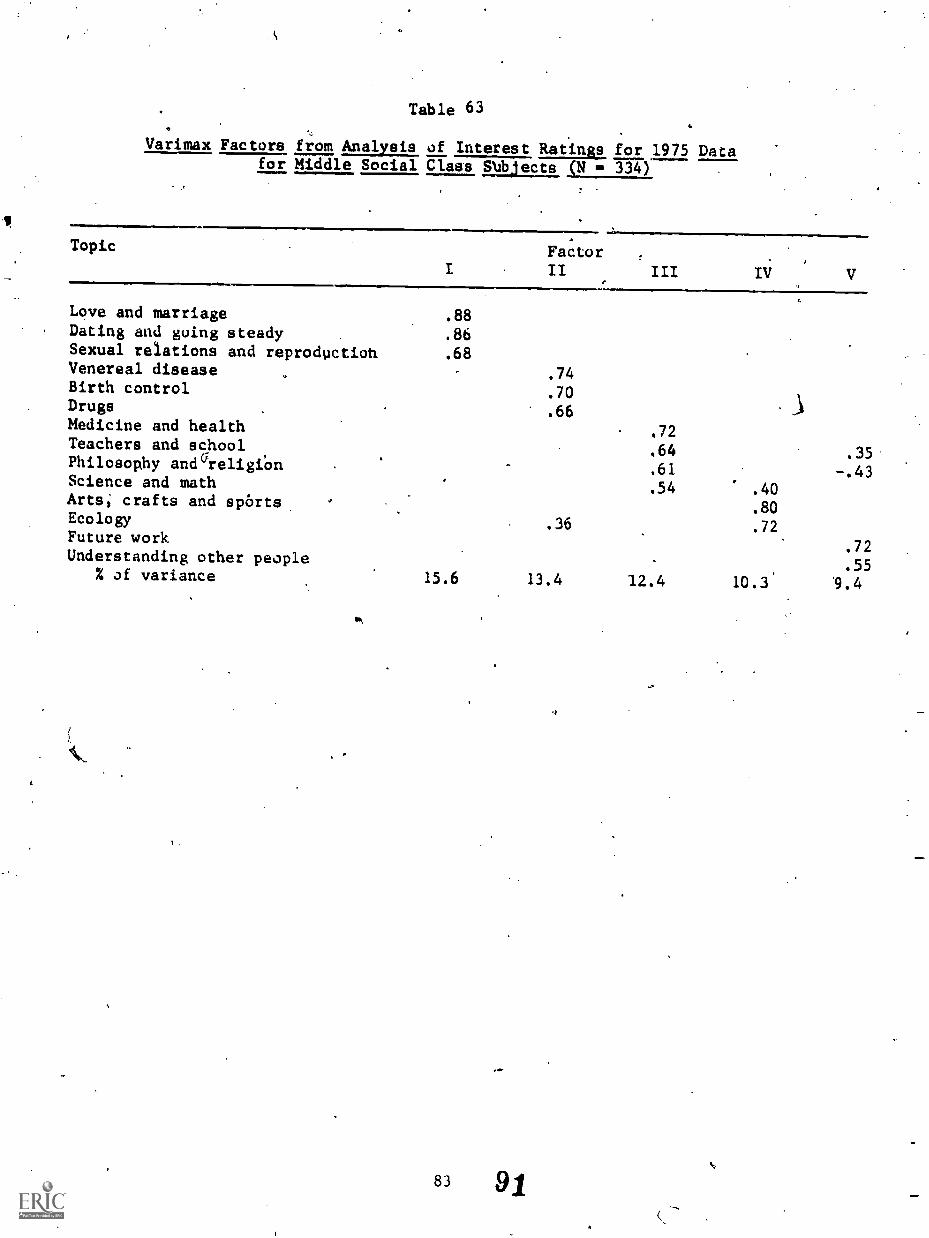
Table 63
Varimax Factors from Analysis of Interest Ratingp for 1975 Datafor Middle Social Class Dbjects (N .0 334)
Topic FactorII
4.IV
Love and marriage .88Dating and going steady .86Sexual relations and reprodpctioh .68Venereal disease .74Birth control .70Drugs .66Medicine and health .72Teachers and school .64 .35Philosophy and6re1igfonScience and math
.61
.54 .40
-.43
Arts; crafts and sports.80
Ecology .36 .72Future work
.72Understanding other people
.55% of variance 15.6 13.4 12.4 10.3' '9.4
83 91
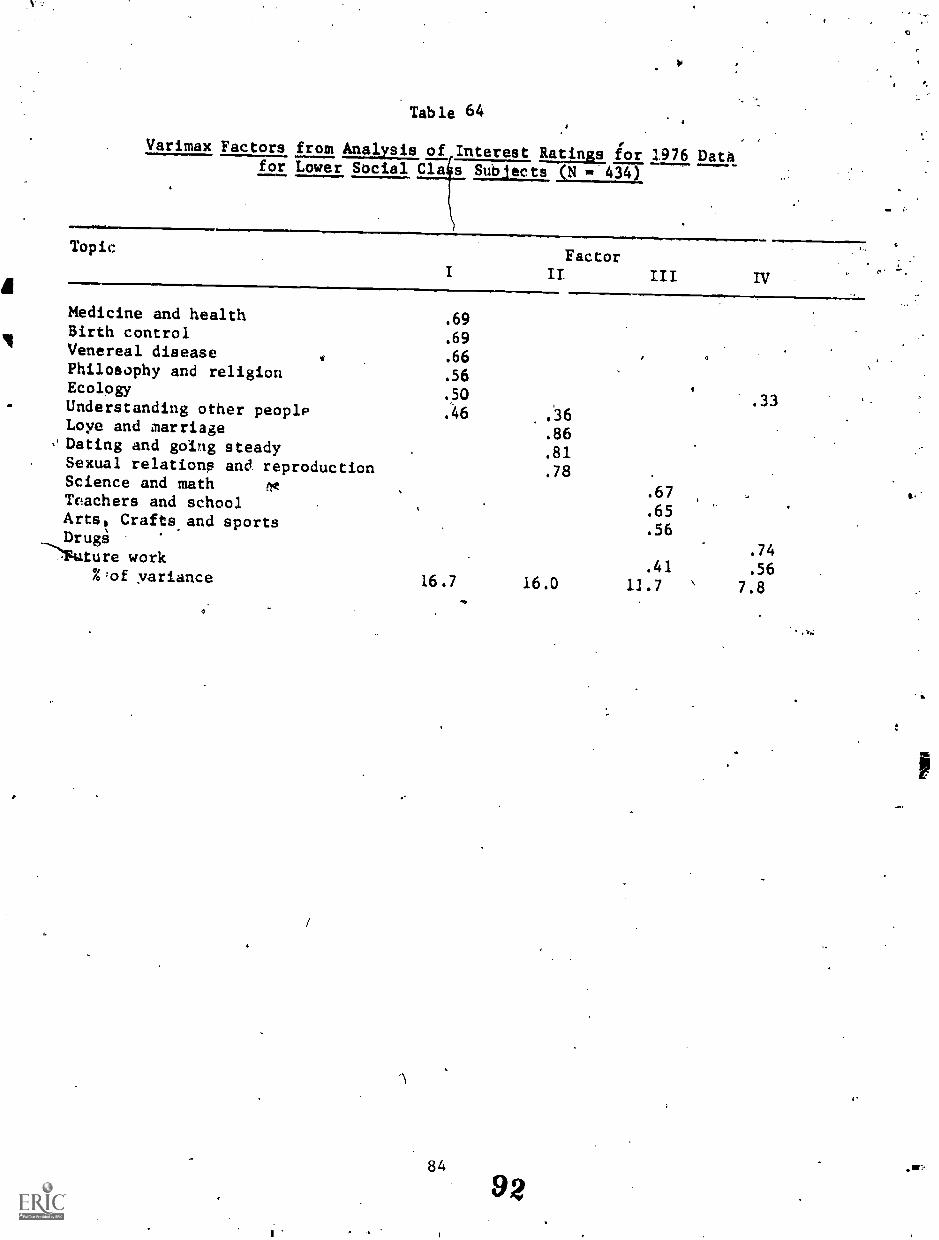
*Table 64
Varimax Factors from Analysis of Interest Ratings ior 1976 Datafor Lower Social. Cla s Subjects (N
TopicFactor
III IV
Medicine and health .69Birth control .69Venereal disease .66Philosophy and religion .56
4Ecology .50 .33Understanding other people .46Loye and marriage
.86s' Dating and going steady
.81Sexual relations and. reproduction .78Science and math ftt .67Teachers and school
.65Arts, Crafts and sports
.56Drugg.74ture work
.41 .56%:of yariance 16.7 16.0 11.7 7.8
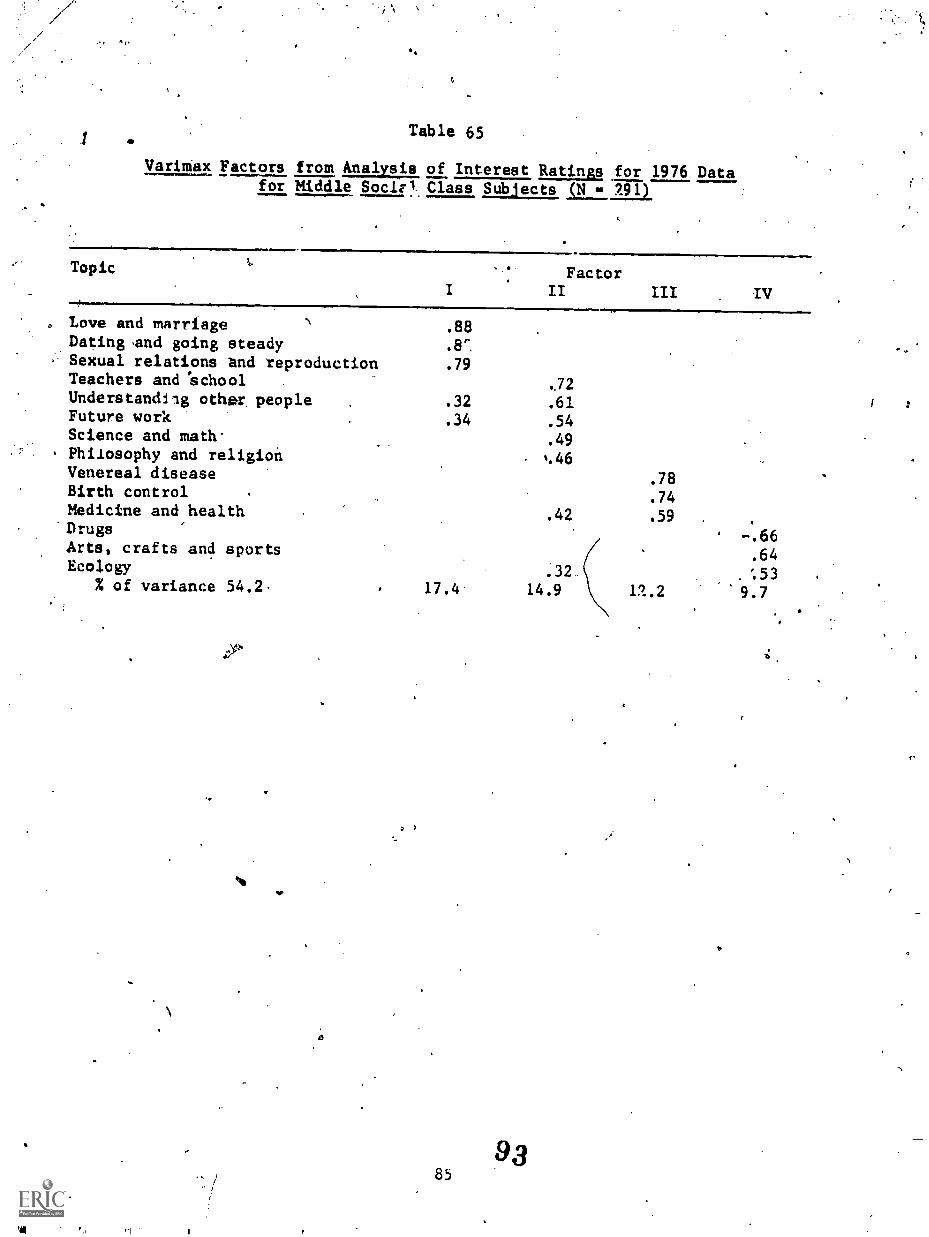
.
111
.1
Table 65
VariMax Factors from Analysis of Interest Ratinea.for 1976 Datafor Middle Socir?..Class Subjects (N 291)
Topic Factor
Love and marriage .88Dating ,and going steadySexual relations and reproduction .79Teachers and 'school
-
,72Understandilg other. people .32 .61Future work .34 .54Science and math. .49Philosophy and religion %.46Venereal disease .78Birth control .74Medicine and health .42 .59 .
Drugs -.66Arts, crafts and sports .64EcologY .32. :53
% of variance 54.2- 17.4 14.9 19..2
4,4
a
85
93
I.

table 66
Vakimax Factors from Analysis of InteresOtaangs for 1977 Datafor Lower'Social Class Subjecs (N 703)
Topic Factor: II III IV
1,ove and marriage .87Sexual relations and reproduction .81Dating and going steady .78Venereal disease .75Birth control .69Medicine and health .46 .44Under&tanding other people ,40 .36Teachers and sChool .66Science and math .57 .34Drugs .
, .42 -.54Philosophy and religion
.52Arts, crafts and sports
.77Future work .34 .64Ecology .43 .49
% c-f variance 53.1 16.1. 12.0 13.7 11.3
9486 1

Table 67
Varimax Factors from Analysis of Interest Ratings for 1977 Datafor Middle Social Class Subiects 378)
0,
lopicFactdrII III IV
Love and marriageSexual relations and reproductionDating and going steady'Philosophy and religionMedicine and healthTeachers and.schoolScience andv'mathArts, crafts and sports.Future workEcology
Understanding other peopleBirth controlDrugs
Venereal disease% of variance 53.1
.88'
'.81
.78
15.7
.64
.58
.57
.44
.55.33
13.4 4
.79
.70
.48
.48
12.8
.30
.43
.68
.58
.58
11.2
9587

1
Table 68
Coefficients of Congruence for Interest Factorsfor Lower- and Middle1Class Subjects for Each Year
S.1
Year' Lower Class
'Factor
tMiddle Class
Factor
1975: II III , IV
I .32 6.05 .07 -.44II. .04 1414t ".3 .48 -.39III =.26 .94 -.26 -.12 . .27IV -.01 -.17 -.09 .78 -.41
1976 II III IV
-.14 ,65 =.91 .09ES I
II -.97 .19 .00 S.
III -1.P6 .76 -.13 '.59IV -.26 .43 -,11
1977 II III IV
-.96 .06 -.18II .18 -.48 .27 .95III .01 .96 -.41 -.16IV , -.28 .97 .27
f
4.
96
0
ii
t .
4
the achievemert-and IQ 'scores,are presen:t_ed in Tables 69 (for grades 5-8) ricl 70(for grades 9-12). As may be seen in Table 69, with,increasing grade levelsthenuMberof significant correlations increased as did the magnitude of the correlations.Similar patterns of relationships Aftre observed for both the males and the females'.Correlations between IQ and AchievemeWLeadership factor scores showed trends simi-lar to those that occurred with the achievement test scores.
1The data for the ninth-throughtwelfthtgraders (Table 70) is not'as consi:Stenias the data from the earli6r grade levers. The correlations for the males are f.!somewhat stronger than those for the females at the ninth-grade level, with the re-verse being the case at the tenth- and.elevehth-grade levels. At the tWelftl'ogradelevel fgt./ correlations were significant for either sex. In generals the correlations
- that were statistically significant were as high Or. higher in magnitude as the Onesat the earl.ier grade levels. The correlations with IQ scores generally follOwed thesame pattlrn-as that for the achiel:rement test scores. ..
s.
V
89
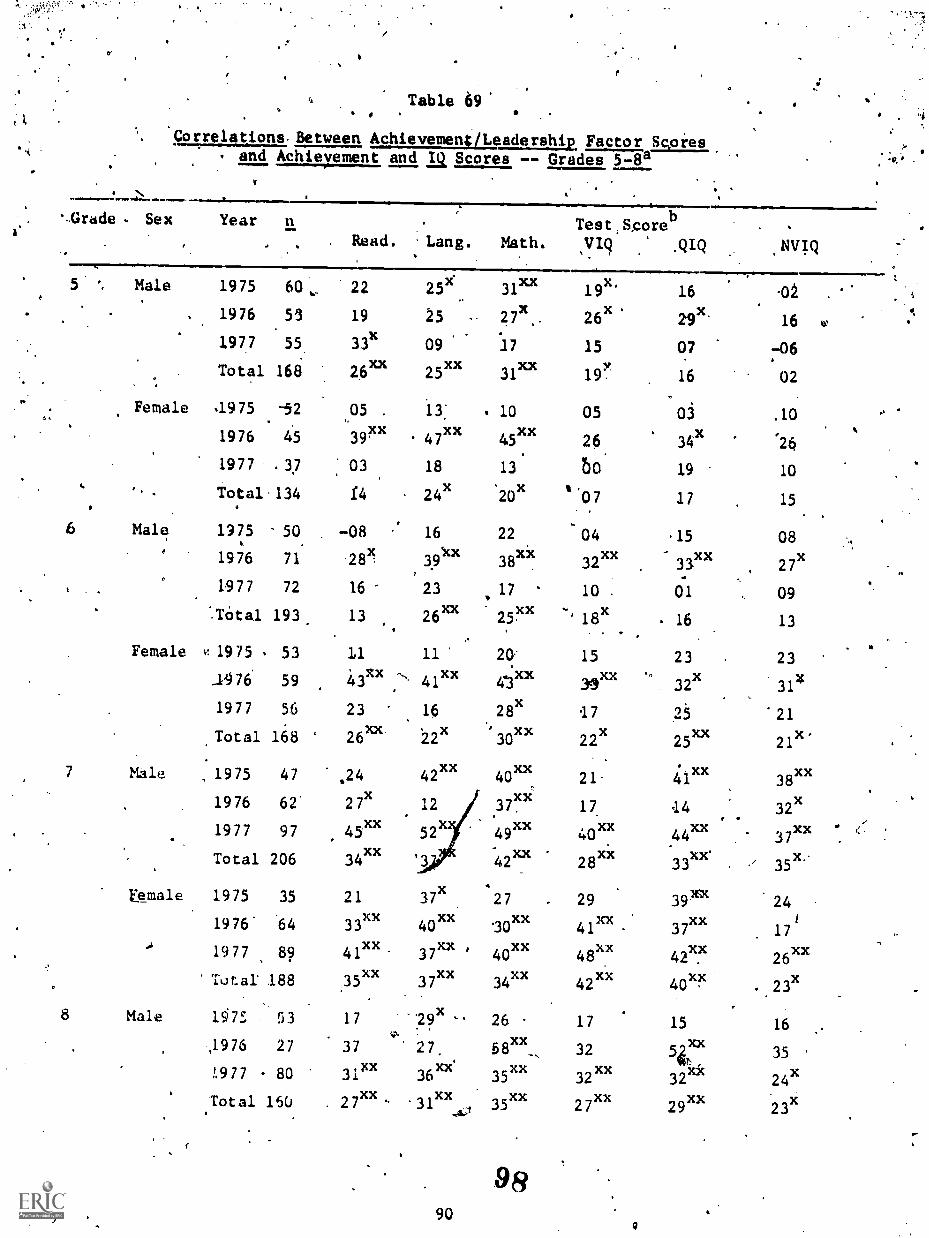
Table 69
Correlations. Between Achievetnenç/Leadership Factor Scpresand Achievement and Scores -- Grades
--Grade Sex Year
5 Male
Female
1976 53 19
1977 55. 3.3x
Total 168 26".1975 -52 .,05 .
1976 45 39xx
1977 . 37 03
Total 134 t4
1975 60 22
. Read.
11111111
IS
1977 97
o
Total 206
&male 1975 35
1976 '64
1977 89.4
"total .188
8 Male 197f. 53
,1976 27
1.977 80
Lang.
13:47xx
18
24x
45'xx 52
34xx '3
21 37x)oc
40XX41xx 37xx '.35(
37XX
29x17 ....v.
37 27,3ixx 36xx'
. ...-xx xx,Total 16U 2 / 31 _...4../
. 53 17 ... 26 17 15 16.v. 58xx,,1976 27 37 27, 32 54,37 351.977 80 3ixx 36xx' 35xx 32xx
32xx 24x. ...-xx xx xx 27xx 29xx .
,Total 16U 2 / 31 _ 35 23x...4../
. yt,--;
.17. .
:17
31xx
1045xx
13
'20x
5-8a
Test ,S,corebMath. VIQ QIQ NVIQ
1,
312(x 19x'
26x
0432xx
10 .
29x.
15 08
33-- 27x
01 09
16 13
16 .02 .
16 ir
15 07 -0616 02
05 Oj .10
26. 34x
rn
26
19 10
4 07 17 15
15 23 23
31xx 32xn
31x
17 25 21
22x 25xx 21x
41xx21 38XX
17 32x14.
40xx .44xx 37xx28xx 33xx 35x..
49
42xx
427 29 39Xx 24i30" 41xx 37XX 17
40xx 48" 42xx 26"34" 42" 40"26 17 15 1658xx,
32 54,37 3535xx 32xx
32xx 24xxx 27xx 29xx .
35 23x
I
1111
IS
1111
IS
1111
o
. yt,--;

V'
Grade Sex- tear n
a Ftmale 1975 51
1976 37
1977 90
Total 178
Table fe Continued,
Read. Lang.-Test Sdoreb*
Math. VIQ. QIQ
44
NVIQ
07 06
40x
32" 2?25' r -19x
.1
19
29
x34
x
25'x
.09
47xx
27xx
26xx,
08
4
23x
23x
31
24
07
16
a.' Decimal points omitted..b. Read. = Reading,'Lang. = Language, Math. = Mattiematics, VIQ Verbal 10,,
QIQ = Quantitative IQ, NVIQ Nonverbal IQ,
, X p4.05. ,
.xx p(.01a.
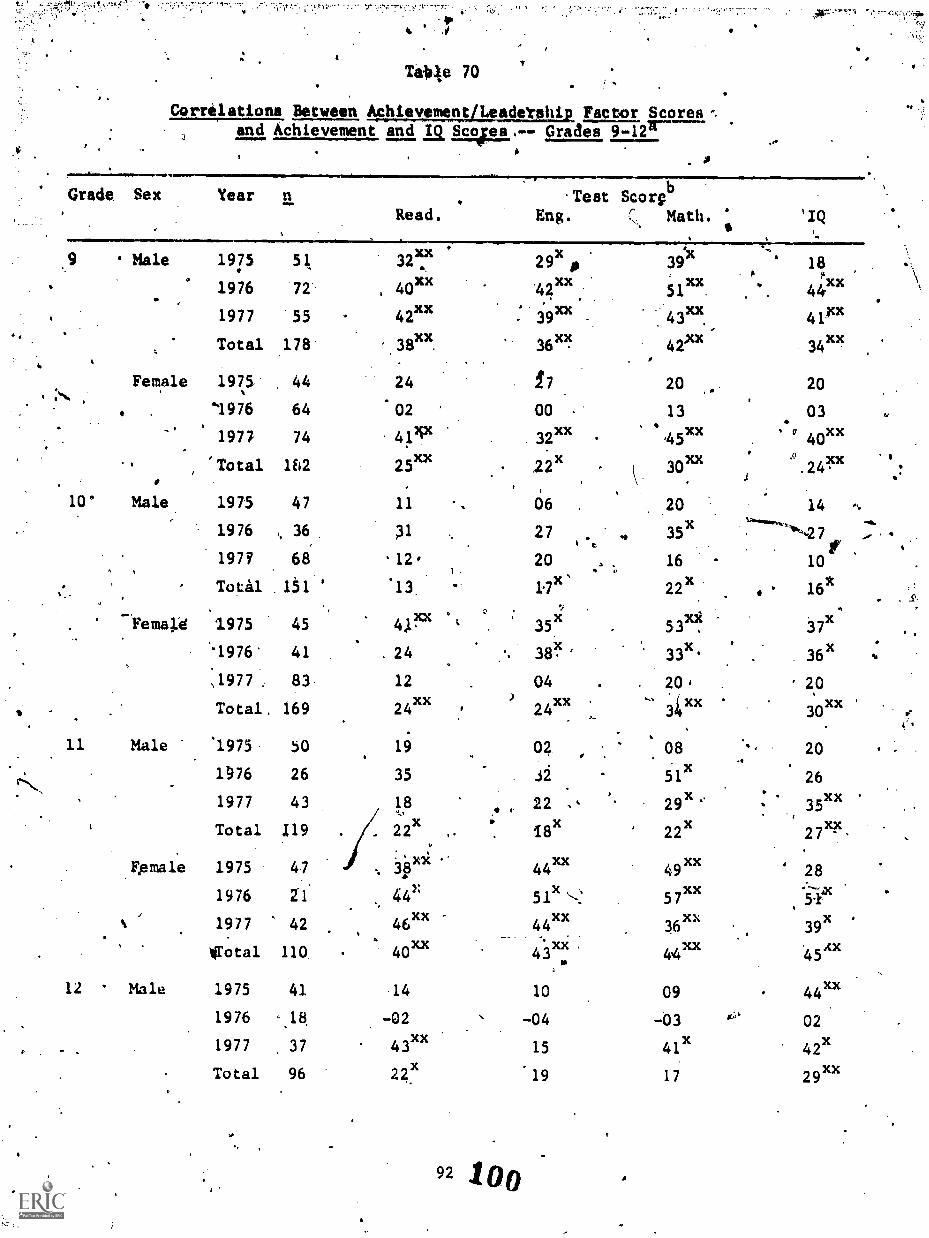
4.
4
Takle 70
Corrilatione Between CAtAktmjeteptileluillgtia Factor Scores -
and Achievement and ja Saves, Grades 9-1217-.
WM110.11=1011111111.114111.1111=e
Grade Sex
9 Male
Year n
1975
1976
1977
51,
72
55.,
.
Total 178
Female 1975 44. ..'N
. 1976 64
1977 74.
'Total 162.
10° Male 1975 47
' 1976 t. 36
197Y 68
Read..Test Scorg
b
Eng. C Math. 'IQ
32
403"42XX
39'tic
51XX.
43XX.
423x
24 17 20 20.
02.
00 - 13.
03
2511
11
31
.12,,
, Total .11 13,,.. '
.32xx
- 221 . 1
\.
. 06
27 .a*.
20 .., .
1. .
1,1x'
. 45xx ' ra 40X
1.
.
30mc 24,I
'Q XX. .
..
.
20 14 -.
u......, ....35x. '*--27 ....
ir16 10
22x. 6 161,
,-,,...
Femal4 1975 45 4,11x ''35x
5311,37x
°.
."1976 41 , 24 38133-St
* 36x .
:1977 83 12 04 . 20, . 2,0
Total, 169
11 Male 1975 b0
1576 26
1977 43
a Total 119
.Fpmale 1975 47
1976 21
1977 42%,
XXXX
) - 4 30xxxx.
*24 . 24 , 0'0.
19 04. 08 20..,
..
35 .3251x
.
26.
29135xx .18 22 , .
.., . .
221I8x
22x 2729c,
xli ..44411 4911 28
441' 51x57xx
:fia.,
.,
46 44 3639x .XX XX
11°
Irotal 110 .
12 Male 1975 41
1976 . 18. .
1977 37
Total 96
.
40xx
431x. 4411 .4541,
14 10 09 4411
-02 -04 -03 gLi.02
4311 15 41x 42x
242.( 19 1729xx
92 1 00

-
brao Sex
a.
Year n
: 7.1
It;
,... r . ¶ a
Table 70 Continued c.
'. 0 /Read.
0, =00 WOAMMINWP.=0.012 Female 19)5 '3Q 1,2U.
1976 .12.
i'61xa4. .
1977 27.
. . 0:. hip
. . Total 69 09',IS
a. Decim4 poihts omitEed.b. Read. u Reading, Eng. Engi:ish, Math.
x p<.05Xx
r
.4
t
0
4
I.
.M....,".0 ,11-04 -17 %...../ -04.
'71" 76" 83xx
t 38x O1 S'22 23x
. . .18
(
I b. . ,Test Scotto ,..
Eng.. MaCh. °. f
Mathematics.
IQ
91 O./ .
4
II
z:::
(
. Discussion'
The purpose of this research was to study grade level differences and changesin selteconcept and to relate these to grade level differences and.changes in in-terests during the adolescent years. The intent of these investigations was to pro-vide data pertinent to the issue of idenfity crises, or identity changes, that are'hypothesized to occur auring adolescence. Information relevant to shifts in inter-ests, ahd changes in the relation of self-concept to interests was also sought; Thedata collected also allowed the investigation of the relation of.self-concept andinterests. to Socioeconomic status and school achievement. The data'relevant to eachof these kssues are discussed-below; in relation both.to tne empiriCal stddy of self-concept and interests during adolescence and to theoretical conceptualizations re-garding the developmenX of ado4escent self-concept and interests.. The'final section
.of the discussion is an attempt to formulate meanihgful,questions,for further.re-.search programs aimed at clarifying self-concept in the context of adoleseence.
Results from Aftlescent Self-Concept,
The.semantic differeptial self-concept instrument used in the present researjhis the same as that used previously.by liking (1973, 1975),to study serf-cencept dur-. sing the adolescent and adulthood years. Nonge reported four varimax factors ip eachqf, his studied: Achievement/Leadership., Congeniality/Sociability., 'Adjustment, andSex Role. When the diata fnam each testing of the gurrent study were subjected tovarimax analysis four fac:-ors emerged. CogTficients of .ocingruence (Harmon, 1967)were calculated to compare the factor strlictures across'the three data sets.' Thesecoefficients ievealed to a high degree of stability in factor structure and indi-catad that thesCale used consistently measured the same components of seaf-conceptat each of the three testing points.. ftreover, when the Current data vere compared.to Mong's (1973) data the coefficients of congruence were equally high; indicating.that the fac5or structure found in the present stddy was virtualry identical to that.reported b!rMonge for an Adolescent sampletested between 15 and 18 years earlier.
711e particular semantic differenttal.sca;e used in the present study has now. '
been.used with eight samples of subjects. In each instance, vdrimax analysia ofthe data .sets resulted in the four factors listed abo,e. Crearly, the .scale has avery suitable degree of fact stahirity. The'growini list.of stlidies in which this,scaleyas used makes it incxfeasthgly acceptable far assessing coristruct validity ofthe scale (ef., Wylie, 1974), which Was a secondary purpose of the research. .Moreover,however, it is also possible to determiire if'pimilar developmenfaltrends hav,e emergedfrom comparable samples. We turn next to a disaussion of these issues.
Following each varimax analysis factor scores,were calCulated and were subjected-to analysis of variance in order to Asess grade level and Sex differences. The sexdifferences-gAerally replicated each other across the three testing periods. Maleshad higher sc(Nes on the Sek Role factor than females on each testing. Males alsoscored higher than.females on the 4chievement/Leadership factor 3-n.1975 and 1977,with the sex difference reversed for tte 106 data. Sex differenees dh the Adjustmentand Congeniality/Sociability factors indicated that in 1976 and 1977 males had,hiOlerscores than females on the,Congeniality/Sociability factor, with' no sex differenceson the Adjustment factor either year. Males had higher scores than females on theAdjustment factor tn 1975, with no sex differences on the Congeniality/Sociability'factor'emerging that year. Finally, when the females' scores on the Sex Role factorwere reanalyzed after being multiplied by -1 all main effect sex' differences disappeared,416 indicating that the initial sex differeaces.were an artifact of the scoring system(cf., Monge: 1973).
94 100
.
Generally spcsalcing,-the sex differences that emefged from the data collected-in this study replicate over times of testing. And,.thp sex ditferenets or the' Achievement/Leadership an0 Sex.Role factors replieafg! those'reliorted earlier 1.10Monge (1973) for a 14.milar adol'escent sample. The findings for the rescored fe- :male.data on the Sex' Role factor also replicate Mange's earlier findings.. It seemss'afe to conclude, then.'ttlat during adolescence- males perceive ther.'slves ad moreachievement oriented (than girls, with both sexes perceiving themsql s as approp-fiately sex typed. These findings are consistent with other literaLare deponstratinga higher achievement orientation amohg males than females during z,dolescence andwith literature indicating the stability.of sex-typed charActeristics during theAdolescent years (e.g., Brove'rman, Vogel et al., 1972; Rosenkrantz, Vogel et al.,1968),. The consistency of these findings, and the content of the items compoiingthe two factors, suggest that what may be 'measured by these two factors is two com-ponents of sex.roles as :generally conceiVed., .That is", the icems composing %lie SexRole factor may represent 7hyaical prowess, and the items composing thei. Actlivement/Leadership Lactor may represent a masculine orientationtoward achievement, withstress On a high degree of competenc6. To the degTee that this is true, the two.factors may both measure components of sex roles, thereby baking the instrument amuch narrower one for measuring self-concept than originally thought.
A Comparison o,the sex differences in factor, scores iiported in this studywith those reported by Monge-(1973) reveals several failures to replicate. Mongerepotted'that females had a higher mean score than males on the Congeniality/Socia-bility factor and that males had a higher mean score than the'females on the Adjust-.ment factor. In the presenestudy males had a higher mean score than feinales onthe Congeniality/Sociability factor in 1976 and 1977, With.no sex difference-in 1975.In 1975 males did have a higher mean score than females on the Adjustment factor, butno sex differences were evidenced in 1976 and'1977; The-ren)St ready explanation fgrthe failure of consisCency.in these sex differences is that they reflect relativelytransitory states of.the individual and.no long-term, stable differences in self-con-cepts. Although one may suspect that girls ought to be more conkenial and sociablethan boys because of sex differences in socialization (cf., Maccoby & Jacklin, 1974),it may be that the peer grouP is used as thevesference for indicating standing'ondiese-adjectives. If this is the.case, therd appears to be no ready theoretical
,o reason for sex differences ipCongeniality/Seciabilit.y. It As equally difficult to ..derive 'a Satisfactory explanation for sex differences in Adjustment, althOugh two, ofthe four relevant ComParisons rei.Yeal males with tile higher mean score. Although itis tempting to suggest that the adjectives defining the Adjustment factor. are sex-typed in the masculine role, perhaps in the sense of keeping a cool head under pres-sure, it is speculafion,that must'await further researph.
As mas noted in the,introduction and literature review of t,hls report, popularvieWs and theoretical conceptualizations of adolescence attribute a restructuringofthe self to the adolescent period c) derelopment. For scime (e.g., McCandless,1970; A. Tretid, 1948, 1958) this is the result of the emergence of a new drive - thesei drive - that emerges 'during adolescence as a.result of the physiological changesthat occur during puberty. For others (e.g., Erikson, 1963; Marcia, 1975, 1976) itis the result of a pswhosocial conflict reflecting adolescent independence strivingsand changing identities. Whatever the ettology, a'significantly large portion of theliterature on adolescent developmenf.deals with the concept of major identity changesas an important aspect of adolescence (cf., Wolf, Gedo, & Terman, 1972). The signif7,icant Grade Level effects that resulted from the analysis of the factor scores foreach year generally s.upport the concept of a restructuring of the self duping adoles-.cence.
-)
10395
ft
411.
11
However,'h perusal Of the Grade Lepel di fferences assOciated with each year'sdata reveals little of consistency in the,findingS. Although younger subjects tend ,to respond in a.more Masculine wayjthan older subjec s On those items defining theSex dle factorostrade levek differences emergin fr m analysis of the other factorficores revel's' no consisteat trends across the thr samples. It is of interest tonote further that with the exception of the differences'asadciated with Sex Role.factor, the other-grade level effects were not especially consistent with those re--perted by Hopp (1973). Nor are these data particularly consistent with other re-_search (e.g., Katz 6.Zigler, 1967; Simmons et al., 19734 in which grade level (orage) differences in adolescent self-concept hgve been reported.
. ".O .
0
a.
a.
. The failfure'ofitthe grade level differences reported for each of the,three sam-pleg of the present study to replicate each other or to replicate thefindings earlierreported by lionge (1973) have Several imOlications for the study of adolescent self-concepts First, the data suggest that,the semantic differehtial scale used is seme-what more snsitive to momentary states of the subjects than may be desirable. $inceall testing was done in all grade levels 4ithin a few days, and since differential..developmental differences.emerged fromthe analyses each year, it seems reasonable
.
to conclude that the differences reported were short-term as opposed to long-termfluctuations.in the selfSconcept. In other 4ords, although the scales used producefactorially stable dimensions of the self,,grade level differences and, as we ncitedabove, sex differences, seem to be the.product of .felatively immediate situationalvariables. These factors apparently outweigh any longsterm, stable sociecultural'factors tilat woeld'be reflected in consistent-age differences over the three timesof testipg. As a result, one muat interpret the develqpnental Implications of agedifference studies of self-cOncept with a:high degree of caution.
A second important aspect of the failure to replicate grade level differenceslies in a setof iisplications for data/lhat supposit the concept of significant
-changes in self-concept durine the adolescent years. Since the majority of researchfindings cited to support.th'e.concept oUsignificant and dramatic changes in self-.cohcept during the adolescent years come from cross-sectiona4 studies, the present .
findings cast doubt on the hypothesis that such changes occui in reality. If. the-.hypothesis of sigmificant change were true it would be expected that age differences.for each time of testing in this study.would be roughly comparable in'.the arialysesof the data from each testing time.. The'failure for this to occur indicates thatother factors influence grade level differences at any one testing time and that the,more salient findings of relevance to the hypothesis of significant changes in self-concept must.come from the longitudinal study,of self-concept during adolescence.
1
The longitudinal findings of the present.investigation may be summarized easily.For each of the six 4roups of subjects tested eash'of the three years df the studythere were no signiffcant differences due to time of measurement. Nor was there asignificant inzeraction hetween group and time of measurement for any of the factors_of selfsconcest. The results for the longitudinal sample, then,'indicate no signif-icant changes is any component of the self-concept during the adolescent years.Since the subjects in the various groups spanned the age period from about 11 to 18,these findings suggest that neither the broadranging-biological changes of adolescencenor the shiftsin school levels (i.e., elementary to middle to high school) resultin permsnent changes in the adolescent's selfsconcept. These findings replicate ear-lier research (e.g., Engel, 1959; Carlson, 1965; Constantinople,-1969).in which long-itudinal assessments of adolescents' self-Conceptsms made. In these.studies differ-pnt instruments and varying sge spans were represented. However, the findings point
a
96 1 04
.

.1
to stability, in adolesceilt self-concept, not to change and certilnly not to dramatic .change: The failure of'the prefient inveUtigation,and that of others, to dembnstrate..-.. significant arid wide-spread change in adolescentst self-c9ncept has a number of im-plications.
\.
. IFirst, the reiulteviewed in,the above parLjaph'sugkest that theoreticalviews of .asioldscen-Ee is a time of significant and wide-ranging shifts in.self-conceptare ihcorrect.- At4Least across the three year-intervals of the current study, nosuch ,ahanges wereapparent, Had these..same subjdcts been studied fol- seVeral moreyeira _it is pOssible that significant changes wobld have' been detected.- However,-"because of the cArerlapping 'nature ofle grade levels studi64 over the three yearsthis possibility seems ynlikely. The ailure to find significant grade'level x timeof measurement interactiOns Indieates that,siMilar magnitudes of -.development wereoccurring for all groups over the:three years. The-lack of changes over the three,yearg is entirely consiste4 with'the view that important influenbes on selfl-cdncept,such as puberty, changing grade,l'avels and schdols, the approach of school graduation,and the like do not signify a caplete iestructuring of the concept.of,the self.Rather, these inflaerices may affect a momentary change, as refleaped.in'the cross-sectional kta, fot example., that Was little impact on the consistency of self-viewsover time. The impact og.thgse changes is:not imMediate,l'ut 'an occurrende thattakes pl ce over dome time interval encompassing .several months or years. This time.interv allows the-integration crf the impending chafige-into.the existing structureof the self. This integration,too, takes place over *ome time interval, the resultbeing. hat it may have liltle if any impact on the individual's conceptualization of .self, hich sfiduld 4ave a significant degree of stability over time° (Erikson, 1963)1,The present findings, then,. as well as those of other longitudinal investigations,are entirely consistent,with the view that the selfs-concept must exhibit consistencyover-time. The "personlh.or "self" that enters. adolesrence is basically similar tothe "person" or "self" that emerges from it intoadulthpod.
.
1yhe view being expressed here,is also dobsistentwith the earlier statements :indicating that the semantic_differential scales of self-concept are sensitive toiMmediate,..elbeit momentary, environmental influences. The age differences reportedabove may reflect'the relatiNely iMmediate impabt of schogl changes, emergent puberty,failure or poor performance in school, and'other.influenceS close in time to thetesting, but do not necessarily reflect long-range influences.on development of con-' cipts of thd selt. Failure, in school or sports, is likely to have an important andsignificant immediate consequence. But,.as further exOrience ts accuM-lated, and/ore t as successes are achieved in the same or similar areas, the influence of the earliersuccess or failure is likely co be.altered. The result:is that oyer tiMe we willassess a balanced view of the self based on .a history.of interpreting social,asdwellastpersonal (e.g., pubertal) experiences changes, Measures of self-conceft, then,
,will reflect a balanced view of experiences, with.the weilghting;of poSitice and neg-,ative aspects 'of the self being based on.a cumulatiVe hisory.' The longitudinalstudies reported here and elsewheie apparently tap these 'aspects of views of the. self, while the cross-sectional studies apparently reflect the more short-term im--. pact of events more closely associated in time-with the measurement of self-concept.-
tTo the,degree that the above reasoning is sound and is a valid representation ofthe manner in which the self is,repiesented on tests of.self-concept, it points outthe importance of caution in relying on cross-sectional studies for describing de-velopmental change. The issues involved,here have been extensively discussed by others(e.g., Schate, 1965; Baltes, 1968; BaltelS & Nesselroade, 1970) and need only be men-tioned briefly here. Of major importafice is the fact that cross-sectional studieS
97106

4.
4q
measur* subjects of different cohorts;''To,che degree that cohort differences areconfounded with'age these studies will no:t present a veridical picture of reality.That seems, in part, to be.the case with studies of adolescent self!-concept. Thepicture-of self-concept development th.at emerges from the cross-sectional arid long-Studinal st4dies is very diiferent,-in part because of cohort changes. In addition;the longitudinal study is.confo'unded by time of measurement influences, By employ-ing new samples afdsubjects at 'each. grade level and demonstrating that these sub--Aicts performed .on ihe scales in'a corarable manner,to the retested subjects, the-longitudinal Componentof the present research represents a relatively 'realisticview of the course of self-concept development (Schaie, 1965).
One.:bisic conclu;ion fl-om the,current research, then; is that adolescence is .not a time 'bf dramatic upheaval in the self-concept. Although clinical studies(e.g.) see Wolf et al., 1972; A. Freud,. 1958) smay demonstrate sueh ehanges for sub-jects undergoing intensive analysighe representativeness of the subject samplewust be questioned. Our dsta suggest, and statistics (Rutter, Graham, Chadwick, &'Yule, 1976) on percentage -of adolescents seeking clinical help.bar out, that for 'most'adolescents' the.self isovrelhid in a continuous manner over time. As has alreadytTeen stated, this is a redSonable finding and4 perhaps, is tote expected if one con-1;iders .that the self that,emerge.s from adolescence is going to be basically the sameas the soy that entered adolescende. eur everyday experienceg most likely reflectmomentayyNalterations in the self.due tolthe immediate impaet, of some event that.haslittleflong-term consequence to how adolescents'view. themselves. Since these arehighly salient encounters we remember them and forget the many days during whichsuch changes do not accur. Hence, our everyday experiences and common sense evalu-ations belie the data on longitudinal changes'.
e The findings reported here for adolesCent self-concept development\have severalimplications for understanding the nature of adolescence. One set of inplications.deals with issues of "storm and stress" (Hall, 1904) conceptualizations of adolescence.Another set deals with current discussions of the importance and role of cognition inadoleacent self-concept development.
Adolescence has traditionally been viewed as a time of "storm and stress", aperiod of social, emotional, and personal upheaval and change (cf.v-Dusek, 1977).Erikson (1963) and Anna Freud (1948, 1958) are perhaps important current propoentsof this view, which was filrgt/proffered to modern-day psychologists by G.S. Hall'(1904). As a result of this view adolescence has been stereotyped to such a degreethat the concept of storni and stress is often applied as an .e.xplanatory concept withregard to, adoleScent behavior. Examination of data on adolescent development, includ-ing that on self-concept presented here, however, indicates that adolescence is nota period of stoem and stress or rapid and extensive change (e.g., Coleman, 1978).Rather, transitions in self-concept, relations with peers and parents, sexual relations,%moral thinking, and the like are gradual for the large majority of adolescents.' AsT Coleman (1978) points out, the popular conceptualization of adolescence is tibt welldocumented in the exveriences af most adolescents, although for-some the popular storm.andstress view mAy be veridical.
To explain the preponderence of evidence favoring the "empirical" over the "clas-.
sical," views of adolescence, Coleman (1978) has suggested a ",focal" theory of'adoles-cence. The essence of the focartheory Is that adolesc ats face and deal with conflicts,in effect,,one.at a time. Since conflicts in the areas of peer or parent relations,' .identity -diffusions, heterosexual relationships, cognitive development, and the Iiepeak at different age levels (Coleman, 1974) it is possible for them to be idapted to
1 0698

0
individuelly. No assumption is made A an,invariant sequence in,the emergence .ofthese problem areas. It. Ls assumed that-overlap in the various conflict areas may'occur, and that for some adolescents ehe overlap may produce severe conflitt. How-eVer; for the majority, of adolescents, the cbnflicts will not result in severechanges because (a) they peak at relatively disparate times and (b) .they reflectrelatively minor glterations from the,norm. For example, there is considerable evid-ence, reviewed by Coleman, George and HOlt,(1977),and Dusek (1977) indicating thatwhat is commonly called the "generation gal." between parents and their adolescents.is a misnomer 'unless'it ip 'applied to retativelygmendane instances of everydayinter-actions between parents an'd adolescents. The results reported and discussed abOveare consistent with, if not a, direct test of, this 'focal theory.
Ttle findings reported above also 'are consistent with, and supportive of, currentcommentary (e.g.,,,Brim, 1975, 1976; Epstein, 1973; -1,Wntemayer & Eisen, 1977) on theimportance of:considering cognitive functions in the formulation of self-concept...,.Brim and EPstein have both interpreted the self-concept as a'personal theory of theself, formulated c.cording to, and subject to, the same sets of procegses and,ruleSas any other theory.
. In this context, Brim has suggested that theories of the self-conceet,are,s"theories of self theory". Theories'pf the self depend upon what is avail-Mde in the eulture. Brim (1975, 1976) has disctbsed these issues in depth. Epstein(1973) tes made-similar observations and, further, has pointed out that a key aspect'of the process islcno*ledge acquisition about the self. Epstein goes on to point outthe importance of cognitive functioning in the formulation of theories of the self.Finally,'Dickstein (1977) has attempted to directly relate:advances in cognitive de-, velopment to-changing conceptions of the self. However, research on the relationbetween.measureS of self-concept and measures of,cognition 13 relatively rare.
Gwdo and Bohan (1971) tested the concept that the emergencel'of self-identityparalleled the stages 'of development pogtulated iay Piaget (1952). Piaget (196N ascontended thatyiews of identity, or seliviews, cAege as cognitive development pro-.ceeds to increasingly more sophisticated leyels. Children aged 6, 7, 8 and 9 wereinterviewed about their sense of self-identity and were asked to state their reasons .for,answering the'questions as they did. The results indicated that there were qual-itative differences in the sense of self-identity, with older children gibing respon-ses that were more sophisticatet developmentally. Younger children tended to give .yes or no answers to the questions about why they answered as they did; older childrenanswered in ways indicative of an advanced level of understanding of-caUsality.and thepermanence of identity.
.
Similar findings have been reported by Emmerich (1974), Koocher (1974), and Monte-mayer and Eisen (1977). In the lattersstudy, adolescents were shown to use more cate-gories than children in describing their self-image.' And, the categories used by 'adol-escents were qualitativelymore complex-than those used by 044.14ren. In contrast to
.ebildre7., adolescents respond6d in a manner suggesting that'thq perceive in themselves ,sets of underlying abilities', motives, and personalities. The adolescent, then, butnot the child, is able to infer a set of 'beliefs and personal styles that are unique.
D'ata.such.as these briefly revieyed above have seytral implicationg for the studyand understanding of axiolescent_seltgtOncept. Firgt, they begin to explain why identityconfusion and conflipt may be a more acute problem for younger than older adolescents(cf.,.Coleman, 1978). It is in early adolescen,...e that cognition changes to include whatPiaget (1952)11as called formal oPeracional thinking. These abstract thinking abilitiesallow the adolescent to structvre.concepts of self in more cemPlex,and personal' waysth'ad was previously possible. Hence, adolescence, and specifically later adolescence,.
991 07
r).
//%
may be a developmental period in which stability in the self-concept is reached.As a'result; little chenille in selt'conceiit measures should he expected. The long-itudinal data -of this and other studies are consisteet with this- view. The agedifferences in the cross-sectional stullies ih this and other studies likely re-flect the influence of bath cognitive growth ,andcultaral factors that relate tohow hdolescents,of different grades or agee rate their self-concept'. It appearsthat these latcer siUdies "dd not accurately,reflect the growth of sJlf-concept,
,7411k 41
4'Second, fhe current theorizing sugpasts that'although one may measure _onceptsorself In children or young adolescenti the measurs May have little predoctivevalidity. In effect, children's conceOtions of self may be better iTlicators ofcognitive growth than of perSonolity development. Although verification must awaitcfuture research, iC may be that., in effect, phildren do not have a concept ot selfin the sense that the.term ip typically used. Instruments such as that used inthe preuent.study and other 5esearch Monge,- 1913) may not pmduce construct-.ually valid assessments for young chi4dren.
anally, th liieraturg reviewed abbve points to the impartance of directlyassessing the relation between measures of cognition ane measures of self-concept.R4search aimed-at explicating this Telationship will go.far in clarifying the natureof.adolescent identity formation and development and is necessary for elaborating .ourunderstanding of adolescence-in general.
Results from,Adoles-mt Interests
Rankings of the 14 topics of interest were.obtained in order to assess the simi-larities in'interest hierarchies acress grades and-between the sexes withiavta grade. .
Interest ratings were obtained as a means of estimating the position of a topic amongall Interests the adolescent had. .For example, an adolescent Who ranked a topic oneor two in terms of importance conceivably might rate that topic very low in interestbecause the set of-topics does notjnclude many or most of those that are of high in-terest to the adolescent. If this:were the case we would see a low correlation be-
.tween the rankings and ratings. A. reported above (Table 26), however, the correla-tions among the rankings and the,ratings for each year of the study tended to be wellwithin the moderate range. Ibpics ehat were ranked high in salience were also ratedhigh in interest; topics ranked relatively low in salience were alslo.rated as lessinteresting.
These f indings replicate earlier research (Dusek & Monge, 1974; Dusek,,Kermis &Monge, 1979) in which the same instrument.and procedures Were used to measure adol-escent interests. As.in the earlier researcb then, the age.difference data arebased on a set of relatively inclusive categories.
The correlations among the salience hierarchies revealed two trends. First,the correlations tended to be somewhat higher fo?adjacent than nonadjacent gradelevels. In general, the correlations were higher along the main diagon4and de-creased to the right and in an upward direction in.the eorrelation,mat-rix for ,lachyear. Second, the correlations indicated a high degree of consistency in the topic sal-.
iencehierarchies for males and females within a grade level over each of the threeyears. Half of the corlelations were equal to or greater than .90. These data replicate
S.
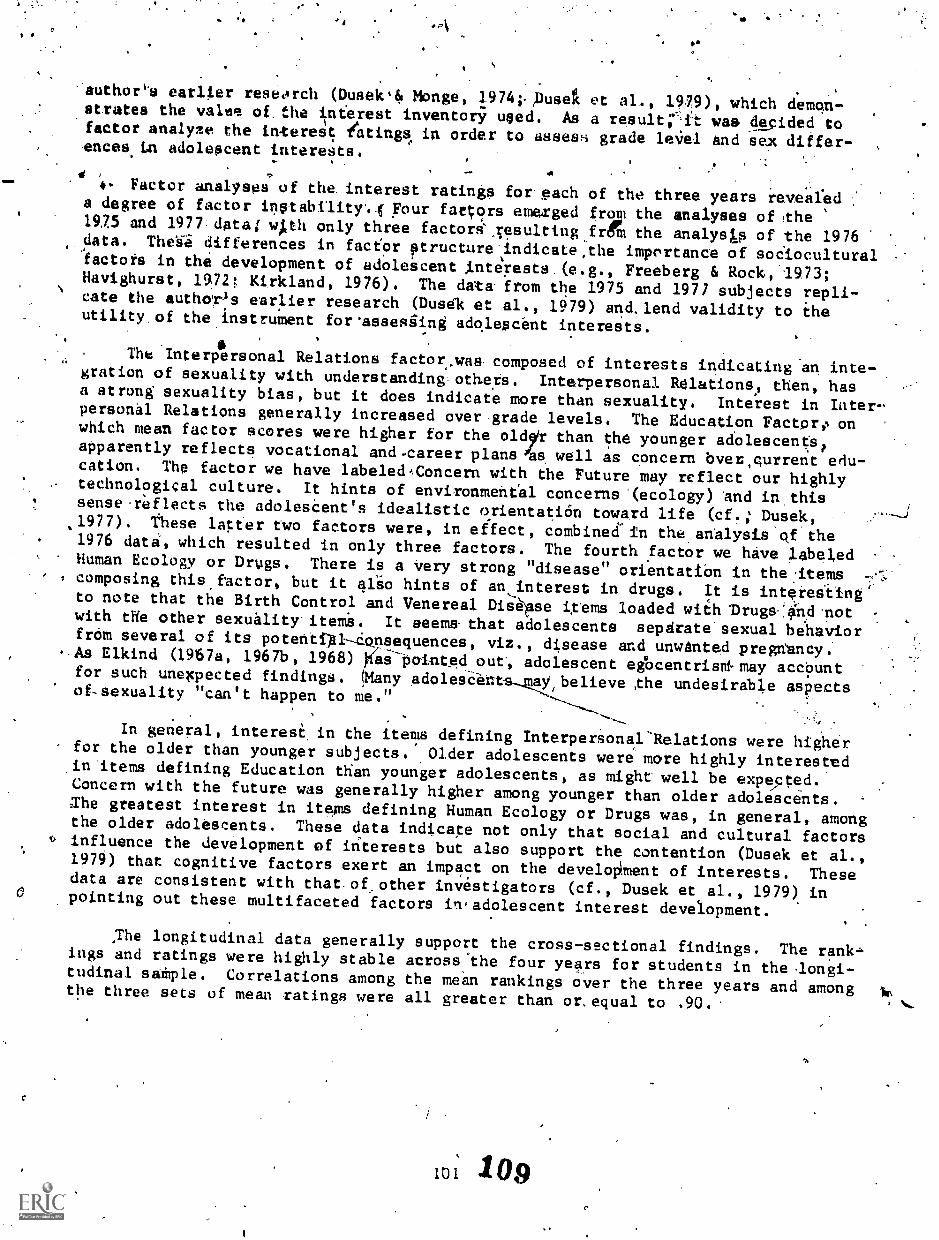
,
oa
,"author's earlier reseerch (Dusek'& Monge, 1974;-,Duseft et al., 19.79), which demon-strates the valae of.the interest inventory used. As a resultit was decided tofactor analyze the interest ?latings, in order to assess grade leVel and sex differ-ences.i.n adolescent interests.
., .
... .
, Factor analyses of the.interest ratings for each of the three years reveafeda degree of factor instability Four factors emerged from the analyses of the1925 and 1977datal wph only three factors' ,resultinvfre; the analysts of the 1976data. The'ii differences in factor atructure.indicate,the importance of soclocultural .factots in the development of adoleecent Piterests.(e.g., Freeberg & Rock, 1973;Havighurst, 1972; Kirkland, 1976). The daa. from the 1975 and 1977 subjects repli-\cue the authors's earlier research (Dusdk et al., 109) and,lend validity to iheutility, of the instrument for'assesiing adolescent interests.
.
The Interpe rsonal Relations factor,was- composed of interests indicating an inte-gration of sexuality with understanding:others. Interpersonal Relations,, then, hasa strong sexuality bias, but it does indicate more than sexuality. Interest in Inter-personal Relations generally increased over .grade levels. The Education Factoro onwhich mean factor scores were higher for the oldp than the younger adolescents?apparently reflects vocational and-career plansoke well as concern bver,qurrent edu-cation. The factor we have labeledAConcern with the Future may reflect our highly, technological culture. It hints of environmental concerns'(ecology) And in.thissense'reflects the adoleseent's idealistic orientation toward life (cf.; Dusek,1977). these latter two factors were, in effect, combined- in the analysis'qf the1976 data, which resulted in only three factors. The fourth factor we have labeledHuman Ecology or Dregs. There is a Very strong "disease" orientation in the:items
, composing this.factor, but it alio hints of anjnterest in drugs. It is interesting'to note that the Birth Control and Venereal Diskase items loaded with 'Druga!ind.notwith die other sexuality. iteme. It eeema that adolescents separate'sexual behaviorIrani several of its potentql-Consequences, viz., disease and unwanted pregnancy.'-As Elkind (1967a, 1967b, 1968) 7ii"s painted out, adolescent eiocentrisM- may acCountfor such unexpected findings. !Many adolee-Cent ay believe xhe undesirible aspectsof-sexuality "can't happen to me."
--In general, interest in the items defining Interpersonal"Relations were higherfor the older than younger subjects. ,Older adolescents were more highly interested.in 'items defining Education than younger adolescents, as might well be expected.Concern with the future was generally higher among younger than older adolescents.
lhe greatest interest in items defining Human Ecology or Drugs WAS, in general, amongthe older adolescents. These data indicate not only that social and cultural factors0 influence the development of interests but also support the contention (Dusek et al.,1979) that cognitive factors exert an impact on the develop6ent of interests. Thesedata are consistent with that.of,other investigators (cf., Dusek et al., 1979), in0 pointing out these multifaceted factors inpadolescent interest development.
The longitudinal data generally support the cross-sectional findings. The rank-,-ings and ratings were highly stable across'the four years for students in the.longi-tudinal sathple. Correlations among the mean rankings over the three years and amongthe three sets of mean ratings were all greater than or,equal to .90.
ioi 109
a
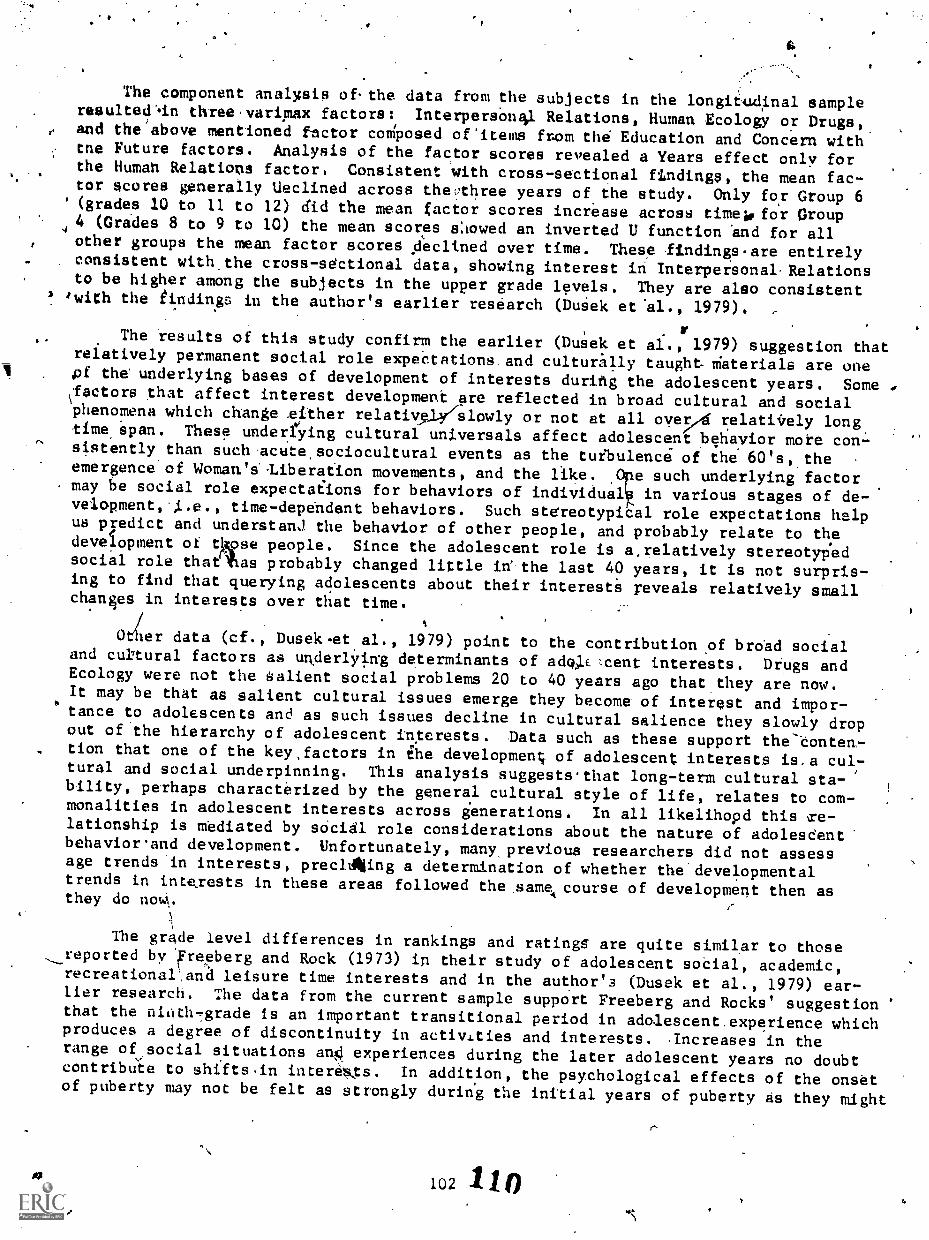
The component analysip of,the data from the subjects in the longitudinal sampleresultedAn three'varimax factors: Interperamq,1 Relations, Human Ecology or Drugs,.
, and the above mentioned factor coMposed of'items fuam the Education and Concern withtne Future factors. Analysis of the factor scores revealed a Years effect only forthe Humah Relations factor. Consistent with cross-settional findings, the mean fac-.
tor scores generally lleclined across thethree years of the study. Only far Group 6' (grades 10 to 11 to 12) did the mean factor scores increase across timeivfor Group4 (Grades 8 to 9 to 10) the mean scores s:Iowed an inverted U function and for allother groups the mean factor scores declined over time. These indings-are entirelyconsistent with.the cross-sectional data, showing interest in Interpersonal.Relationsto be higher amang the subjects in the upper grade levels. They are also consistent
! 'with the findings in the author's earlier research (DuSek et 'al., 1979). ,
r. . The results of this study confirm the earlier (Dusek et al., 1979) suggestion that
relatively permanent social role expettations.and culturally taught- Materials are onepf the underlying bases of development of interests durihg the adolescent years. Some .%factors that affect interest development are reflected in broad cultural and socialphenomena which change either relatively/-slowly or not at all ove5/6 relatiirely longtime,Span. These underfying cultural universals affect adolescent behavior more con:-sistently than such .acute,sociocultural events as the turbulence' of the 60's,.the
,
emergence'of Woman'alaberation movements, and the like. e such underlying factor°..may be social role expectaiions for behaviors of individual, in various stages of de-velopment,-,i,e., time-dependent behaviors. Such stereotypical role expectations helpus predict and understanJ the behavior of other people, and probably relate to thedevelopment of qppse people. Since the adolescent role is a.relatively stereotypedsocial role thatlhas probably changed little in'the last 40 years, it is not surpris-ing to find that querying adolescents about their interesta reveals relatively smallchanges in interests over that time.
Ot(ler data (cf., Dusek-et.al., 1979) point to the contribution af broad socialand cuktural factors as underlying determinants of adO.L:cent interests. Drugs andEcology were not the salient social problems 20 to 40 years ago that.they are now.It may be that as salient cultural issues emerge they become of interest and impor-tance to adolescents and as such issues decline in cultural salience they slowly dropout of.the hierarchy of adolescent interests. Data such as these support the-tonten-tion that one of the key,factors in ihe development of adolescent interests is.a cul-tural and social underpinning. This analysis suggests.that long-term cultural sta-bility, perhaps characterized by the general cultural style of life, relates to com-monalities in adolescent interests across generations. In all likelihopd this Te-lationship is mediated by sOcial role considerations about the nature of adolesdentbehavior.and development. Unfortunately, many, previous researchers did not assessage trends in interests, precldhing a determination of whether the'developmentaltrends in interests in these areas followed the same,,course of development then asthey do not..k..
;
The grade level differences in rankings and ratingg are quite similar to thosereported by Freeberg and Rock (1973) in their study of adolescent sotial, academic,recreationaland leisure time interests and in the author's (Dusek et al., 1979) ear-lier research. The data from the current sample support Freeberg and Rocks' suggestion
'that the niath,grade is an important transitional period in adalescent.experience whichproduces a degree of discontinuity in activities and interests. .Increases in therange of,social situations an4 experiences during the later adolescent years no doubtcontribUie to shiftsdn intereS.ts. In addition, the psychological effects of the onsttof puberty may not be felt as strongly during the initial years of puberty as they might
102 1 1 0

0
be during the'eighth- or ninth-gradeyears. In shor, the ninth-grade'seems to be' a period in the life course when social and biologi al factors combine to producea discontinuity in observable behavior.
.
W'e would add to that explanation .several otions concerning the developmentof ilte ict during the hdolescent years. AEy'a nnMber of theorists (Elkind, 1967a,l967b 1968; lnhelder & Piaget, 1958; Loof / I972;.Plaget, 1952; 1972; Piaget &,In-hel,der, 1969) have pointed.out, during adol scenCe the individuhl eaters the periodof formal-operational thinleng and this/inn ences the adolescent's interpretationof social encounters. Flavell (1963/1977) has addressed this issue with respect torole taking, particularly during the childhood years, -and Borke (1971, 1972), Chand-ler (1973; Chandler & Greenspan, 1972) aqd Shantz (1975) haVe reviewed data indica-ting important shifts in role taking.that are tied to cognitive.development. In ad-Ldition, Kohlberg (1969) has noted.shifts.in moral thinking that develop during mid-to late-adolescence that are also tied.to cognitive development an'd role ta ing:In all these instances; as well as others which we have not mentioned (see tantzfor a'review of the soCial-cognition literature)', the underlyinglactor of i ortanceis that with shifts in- cognitive capabilities the social environment becomes retnter-preted with a corresponding.new understanding of its nature-and function. This shiftin understanding allowg the individual to come to grips with social development inways.that were no previously possible. It is suggested here that as the adolescent'scogniEive competencies increase, there'is a shift in,InteresCpattems resultingfrom the new.awareness and interpretation.ol tfie environment. A specific examplemay be found,in the current study in the age differepces in Understanding Other People.
'..To.have this concern requtres cognitive skills that are-not highly used ot per4hapseven available to transcend ego-centric thinking. (Elkind, 1967a, 1967b, 1968; Looft,.1972) and mentally assume another's role. This type of thinking is'inherent in formaloperational thinking as described by Piaget (Inhelder &.Piaget, 1958; Piaget, 1912.1% .Piaget & Inhelder, 1969).
The observed sex differences in interests follow quite in line-with social and -sex-role expectations (Broverman, Vogel et al., 1972; Kohlberg & Zigler, 1967; Rosen-berg & Sutton-Smith, 1960). The data are entirely consistent with traditional sexrole orientations and suggest that they have not radically changed over recent years.Similar data have been reported by Broverman, Vogel, et al. (1972) who noted thatlittle.change in views of the female sex role,had occurred.
With respect to Sexual Relations and Reproduction and related topics there weresome surprising findings. First, as might be expected, interest tn.dating and goingsteady seenm to be the initial basis for interest in heterosexual interaction during .adolescence. Interpt in love and marriage is closely related. Interest in datingthen drops, presumibly because the subjects are qmite familiar with dating patternsAnd inarractions, but interest in love and nuarria6 remains relatively high, especiallyfor girls. Interest in sexual relations and'reproduction is highest in grade 12, andit is higher for boys than girls. Somewhat surisingly, howeVer, the interest rhnk-ings for birth control, though higher for girls than boys, were relatively low9for allsubjects. Concern about Venereal Diseasi remained low at all age levels. Examinationof the data for these topics on the 7-point rating scale revealed similar trends. Theaverage interest rating is only moderate fo'r venereal disease and the same trend isobservable for birth control. However, the ratings for sexual relations and reprodyc-tion are generally higher. In other words, the subjects were moi-e intereked in sexualrelations and reproduction than in several potential.consequences of sexual intercourse.In addition, sex differencis along traditional sex-role lines appeared for these topis.
103 111
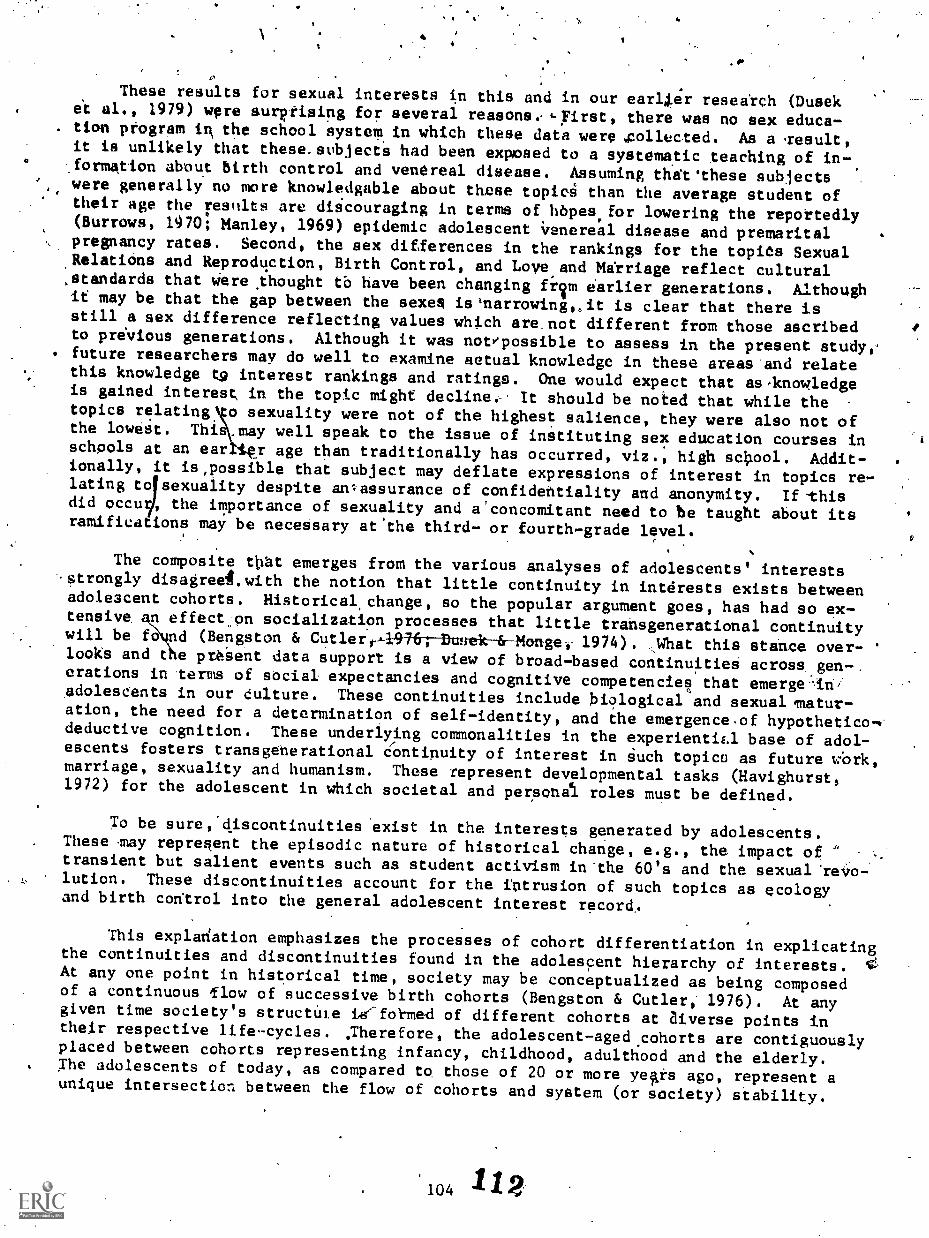
4
. ep
.
.These results fur sexual interests in this and in our earlier reseatch (Duseke't al., 1979) were surprising for several reasons.. ,First, there was no sex educe-
. tion program iR the school system in which these data were xollected. As a -tesult,it is unlikely that these.subjects had been exposed to a systematic teaching of in-.
.formation about birth control and venereal disease. Assuming thatethese subjects,
were generally no more knowledgable about thgse topicA than the average student of.
,
their age the results are diicouraging in terms of hopes,for lowering the repottedly(Burrows, 1470; Manley, 1969) epidemic adolescent innereal disease and premaritalpregnancy rates. Second, the sex differences in the rankings for the topics SexualRelations and Reproduction, Birth Control, and Love and Matriage reflect cultural,standards that Were thought tb have been changing fir earlier generations. Althoughif may be that the gap between the sexes is'narrowing,oit is clear that there isstill a sex difference reflecting values which are.not different from those ascribedto previous generations. Although it was notepossible to assess in the present study,'future researchers may do well to examine actual knowledge in these areas and relatethis knowledge to interest rankings and ratings. One would expect that as,knowledgeis gained interest in the topic might decline,. It should be noted that while thetopics relating o sexuality were not of the highest salience, they were also not ofthe lowest. Thi .may well speak to the issue of instituting sex education courses inscheols at an ear r age than traditionally has occurred, viz., high sclpol. Addit-ionally, it is,possible that subject may deflate expressions of interest in topics re-lating tof sexuality despite anlassurance of confidentiality and anonymity. If-thisdid occur, the importance of sexuality and a'concomitant need to he taught about itsramifications may be necessary at'the third- or fourth-grade level.
The composite ttAt emerges from the various analyses of adolescents' interestsstrongly disagreel.with the notion that little continuity in interests exists betweenadole3cent cohorts. Historical,change, so the popular argument goes, has had so
Aex-tensive. n effectjen socialization processes that little trahsgenerational continuitywill be fo nd (Bengston & Cutlere-197t; Dunek & Monge-,-1974). .yhat this stance over- 'looks and t e pre3ent data support is a view of broad-based continuitied across.gen-.
erations in tems of social expectancies and cognitive competencies, that emergein/adolescents in our dulture. These continuities include biological and sexual/matur-ation, the need for a determination of self-identity, and the emergence.of hypothetico...deductive cognition. These underlying commonalities in the experientia base of adol-escents fosters transgenerational continuity of interest in iuch topico as future wOrk,marriage, sexuality and humanism. These represent developmental tasks (Havighurst,1972) for the adolescent in which societal and personat roles must be defined.
To be sure,'discontinuities'exist in the interests generated by adolescents.These -may represent the episodic nature of historical change, e.g., the. impact of ' .-..
transient but salient events such as student activism in'the 60's and the sexual're-i.ro-. , lution. These discontinuities account for the intrusion of such topics as ecology
and birth control into the general adolescent interest record,.
This expladation emphasizes the processes of cohort differentiation in explicatingthe continuities and discontinuities found in the adolescent hierarchy of interests. C'2'At any one point in historical time, society may be conceptualized as being composedof a continuous 1low of successive birth cohorts (Bengston & Cutler, 1976). At anygiven time society's structUte terfotmed of different cohorts at aiverse points intheir respective life-cycles. ;Therefore, the adolescent-aged.cohorts are contiguouslyplaced between cohorts representing infancy, childhood, adulthood and the elderly.The adolescents of today, as compared to those of 20 or more ye0 ago, represent aunique intersection between the flow of cohorts and system (or society) stability.
119104

"*.
The behavioral orientation of the current adolescent cohorts is therefoie the.resuit. oft (a) particular birth cohorts, 'which are at a (b)-particular chronological ordevelopmental.age, in 4c) a uniquely structured soctety (Bengston 4 Cutler, 1976):Therefore, even.given'shared maturational and cognitive structures, one would expectthat the interest 'records of varying adolescent cohorts would reflect the topics ofhtgh salience to the events of their particular historical period. This asSumptionwas met in comparing the interest records of this current saMple of adolescents withtlioseltested eaflierqcf., liusek et al., 1979).
I
Tile role's of cognitive and social factors in the develOpment of the self-concept'"and interests seem to. be related._ That isliaterests and seif-concept both developas a resulf of.cognitive interpretations and evaluations of social encounters:. Ascognitive development proiresses increa9ingly morg sophisticated and complex self-concepts and 'interests emerge. It,appears, then,'that measures of self-concept.and
' interests should.be related and that self-concept may tn part direct,adolescents to, develop.certain inter'ests. We next turn to a discussion of the data bearing on.theseissued . `
r_Res,v1ts Relating, Self-Concept to Interests
A major putpose of this research was to assésa the relation between self-concept'.deVelopment and the development of interests. As ela&orated in the.introduction andliterature reviewi' this research was viewed as a test of the view that the self-con-
'cept has.a direcvive and motiVating.function (e.g., McCandless, 1967, 1970). Bx-,.using m ueasures of interest, hicrave been shown to relata to developmental_and,Sex\ differences and to personality; 'it was hoped that a,suitably sensitiv'e test would be
possible. Moreover, McCandless 41970) clearly suggested that interetd reflect de-.
velpOment of the self-concept. Tile present research,'then, is a direct.:test*of thisorelationspip. Two analytic techniques,-factor analysis and tanonical 'correlation,were employed to assess the relation between self-toncept and fnte'rests:
0
'When the delf-concept data and the interest ratings were entered in a cotmonanalysis he results indl_ated virtually no overlap in.the two instruments. In onlytwo instance's lid adinterest'item.appear with a primary loading on a self-conceptfactor in the dnree analyses for the cross-sectional samples. A .similar,result oc-
. turred in the analyses of the data from the longt.tudinal sample.- rh bile analysesfrom both ihe cross-sectional dnd longitudinal samples the data also in4icated littleoverlap in self-concepts and interests when sizeable (4.30)-Secondarvloadings forall items wire considered.' These data, then, indicated that self-concept and interestsdevelop lendependently.
,
. .
The 'lloniLal correlation analyses, however, reveale4 a quite different picture.Significant4irelationships between self-concept and interests emerged in the-data:fromthe cross-sectional and longitudinal samples. Two significant canonicalfrelationshipswere.stably preseilt in the analyses of the cross-sedtional.data from each year. Inaddition, the analyses of'the data from the longitudinal saple revealed changes inthe relation of self-concept to interests over timn. These data indicate that-measuresof self-concept and interests are related during the adolescent years, in support-of
...McCandless' (1970) suggestion.
Ond stable canonical,relationship was evidenced as the first significant .variate'inthe 1975 and 1977 data sets and the second significant variate in the,1976 data set.
s 1 1 3
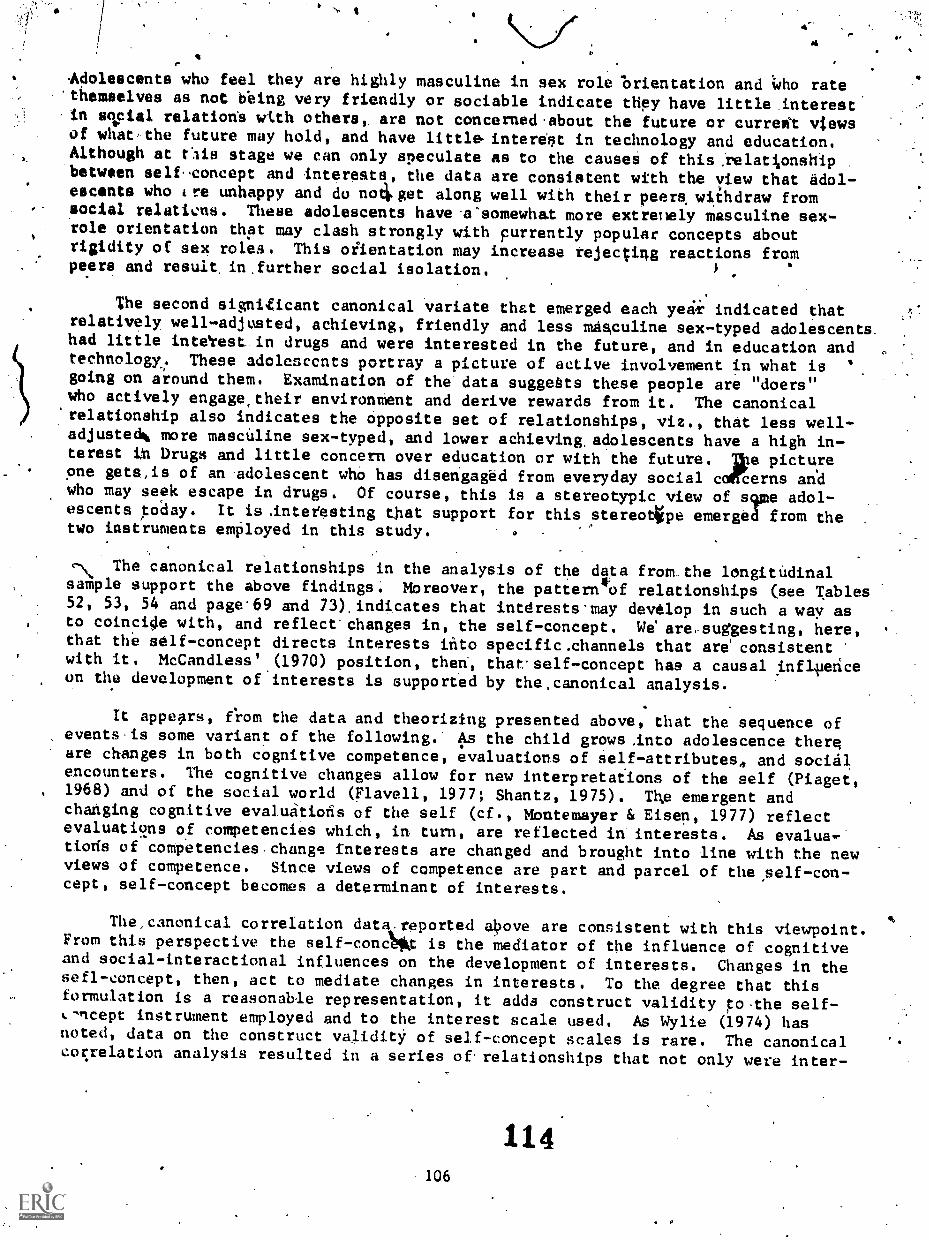
4F.
Adolescents who feel they are highly masculine in sex role Orientation and 14ho ratethemselves as not being very friendly or sociable indicate they have little Anterestin so* cial relation's with others,, are not concerned.about the future or curreat viewsof what,the future may hold, and have little- interdet in technology and education.Although at t'ais stage we can only speculate as to the causei of this .relattonship
.
between self-concept and interests, the data are consistent with the view that adol-escents who tee unhappy and do nofiget along well with their peers withdraw fromsocial relatiens. These adolescents have 1Csomewhat more extrenely masculine sex-role orientation thpt may clash strongly with Furrently popular concepts aboutrigidity of sex roles. This oiientation may increase rejecting reactions frompeers and result.in.further social isolation.
The second signUicant canonical variate that emerged each yeiii indicated thatrelatively well-adjusted, achieving, friendly and less masculine sex-typed adolescents.had little intetest in drugs and were interested in the future, and in education andtechnology.. These adolescents portray a picture of active involvement in what is '
going on around them. Examination of the'data suggests these people are "doers"who actively engage,their environnent and derive rewards from it. The canonicalrelationship also indicates the Opposite set of relationships, viz., that less well-adjusted% more masculine sex-typed, and lower achieving, adolescents have a high in-terest tn Drugs and little concern over education or with the future. De picturepne gets,is of an adolescent wile has disengaged from everyday social caircerns aridwho may seek escape in drugs. Of course, this is a stereotypic view of ssime adol-escents today. It is Anteresting that support for this stereo4pe emerged fram thetwo instruments emOloyed in this study. .
,\ The canonical relationships in the analysis of the data fromthe longitUdinal1sample support the above findings. Moreover, the pattern*of relationships (see Tables52, 53, 54 and page.69 and 73).indicates that interests'may develop in such a way asto coinci4e with, and reflect changes in, the self-concept. We'are,suggesting, here,that the self-concept directs interests into specific.channels that are' consistentwith it. McCandless'.(1970) position, then', that-self-concept has a causal inflpenceon the development of interests is supported by the,canonical analysis.
It appears, erom the data and theorizing presented above, that the sequence ofevents.is some variant of the following. As the child grows.into adolescence thereare changes in both cognitive competence, evaluations of Self-attributes4 and socialencounters. The cognitive changes allow for new interpretations of the self (Piaget,1968) and of the social world (Flavell, 1977; Shantz, 1975). The emergent andchanging cognitive evaluations of the self (cf., Montemayer & Eisen, 1977) reflectevaluatiens of competencies which, in turn, are reflected in interests. As evalua,tiods of competencies.change interests are changed and brought into line with the newviews of competence. since views of competence are part and parcel of the ,self-con-cept, self-concept becomes a determinant of interests.
The,canonical correlation data.reported Oove are consistent with this viewpoint.From this perspective the self-conA* is the mediator of the influence of cognitiveand social-interactional influences on the development of interests. Changes in thesefl-concept, then, act to mediate changes in interests. To the degree that thisformulation is a reasonable representation, it adds construct validity to.the self--ncept instrument employed and to the interest scale used. As Wylie (1974) hasnoted, data on the construct validitY of self-concept scales is rare. The canonicalcorrelation analysis resulted in a series of.relationships that not only were inter-
114106
1,
, 1,.4 ;1.1
pret,able but also were meaningful, at least in the context of the sCales used.These data suggest that the self-concept and interest scales are measuiing mean-ingful aspects of personality and social development, respectively. .
kaf-Concept.and School AChievement
As was pointed out in the literature review, there,are a number of studies(e.g., Piers & Harris, 1964; Bruck & Bodwin, 1963; Brookover, 1964) in which thecorrelations between self-concept and achievement have beenreported to4range as
: high as the .50s. Some have argued that these correlations reflect the impact ofschool achievement on the self-concept while others have argued the,reverse causalsequence ('tf.,'Calsyn & Kenny, 1977). The data fromthe present-study allowed for
. a test of the relationship between.compOnents of self-concept, as opposed to a. glo-bal measure of self-concept, and various measures of-AdademiC achievement and IQ.
-
. The results clearly shpport previous research.showing that self-concept iscorrelated with school achievement and 'IQ scores. However,' consistent patterns Ofrelations occurred only for the Achievement/Leadership factor. This finding, not,,,only provides further,construct validity for the self-concept instrument, bait iä%consistent with research (e.g., BrookoNer, 1964; BroOkoVer, Lepere, et al., 1965;Binder, 1960) indicating strohger correlations for measures of academic self-concept..than for .global self-concept:
. The data also showed a.developmental trend. .At the elementary school level,the magnitude and number of significant correlations tended to increase with in-creases in grade level. These data support the contention raised in the intro-duction of a developmental trend. It was not possible to assess whether the fessconsistent,relationships reported in the analysis of the data for the ninth- through
,
twelfth-graders was a continuation of the same development'sl processes because of .
the change in achievement tests used for this grade level. At best, we can only:°epeculate that at the upper grade levels'a different .set of relationships may emergebecause of individual differences in the perceived value of schoOl and in the natureand variety of.ways in which achievement and success may be obtained. Hence, theAchievement/Leadership factor may reflect different views of what the defining ad7-jectives mean for different grade levels. If the factor Achievement/Leadeiship re-'flects'such differences one might well expect a different pattern of relatiohshipsreflecting.these different views..
It`is of cbnsiderable interest that the patterns of correlations between theself-concept measures and the IQ scores were verY similar to those for the achieve-.ment test measures. As with.the achievement measures., the IQ tellsti changed at the
.
ninth'grade level. These data lend further support to the view that self-conceptmeasures stressing achievement do relate to intellectual competence, but that otheraspects of the self-concept, or.other types of measures, do not.
The relationships reported above also suggest that the academic performance of.the child has a somewhat narrow influence on the child's developing self-concept.
.School performance, as assessed with grades or achIevement test performance, may havelittle effect on the child's self-concept outside of components related to achievement.Further research should be aimed at clarifying these findings by assessing social,sex-role, and personality,characteristics related to the other components of self-con-cept.
107
0
115
)
6
"\\,..Social Class and Self-Concept pe/elgpment
)
Generally speakingi,lt has been held that adolescents from poverty.bickgrounds'have poorer or weaker self-concepts than adOlescents from the middle- or upper:
:social-classes (e.g., Collins & Burger, 1969;. Hauser, 1971; Iaddis, Hayman, & Hall,1971). Some data (e.g., Trowbridge:1070; Soares & Soares, 1969, 1971, 1972), how-ever, indicate this difference may not be as wide spread Or diamatic as it at firdt'appears.. Trowbridge, for exampit, rePorted thgt general, social, Ind academic self-concepts did not d4.ffer between middle- and lower-class black. and white males andfemales, although the middle-class grdups were more pasitive on measures of homeand parent relationehips. Soares and Soares arrived at a similar conclusion in theirextensive studies of advantaged and disadvantaged children and adolescents. They re- Jport Only few differences in eelf-concept.
,
In the present study it was possible-to assess the structure of the self-conèeptfor adolescents whO were tested edch-Year.. _The pertinent data (pages 7341). same-from factor analyses of the-aelf.-concept scales for groups of lower- and middleklassadolescents tested each year of the study.4 Althoagh he result's of the analyses foreaCh year's. data indicated some minor differences in factor structure, the major.eon-clusion.must be that the similarities in structure far outweigh the differences. As-may be seen in Table 57, coefficients of congruence reflect this faLtor.structuresimilarity. And, within-social-class coefficients. of congruence computed across thetheee years of data also indicate a high level of similarity in factor structure. /
This set of findings shoul4 nOt.be surprising. Ai we outlined above, the self-concept is based in large.part oh,cognitive evaluations of levels of competence.These levels vary as ajunction of widely ranging experiences, many of.which cutacross social class lines. As a result,.there is little a priori rationale to expectsocial class differences in the structure of the self-concept. 'Khese data extendearlier Tesearch (Trowbridge, 1972; Soares & Soares, 1969, 1971, 1972) and cautionagainst sweeping generalizations of differeftces in self-concept &tructure as a functionof social% class.
Implications for Future Researchk
In the discussion section above we.speculated about the role of both cognitiveand environmental factors on the adolescent's self-concept. After briefly explicatingthis view we shall draw on it and on the data presented above to derive several impli-cations of thia'research-pro:ject for future research endeavors.
The data from this and other research, as well as theorizing of others, clearlyimplicated cognitive functioning as one of the primary determinants of self-concept.Cognitive development may contrlbute to sdlf-concept formation and change in severalways. For example, cognitive development provides the individual with a basic set ofcompetencies for understanding knowledge. As cognition develops these skills changeand allow new kinds of knowledge to be gained and old knowledge to be understood innew and previously impossible ways. In addition, the individual learn to interpretand reinterpret environmental°, personal, and physical experienes in terms of th'e cog-hitive comp tence and knowledge available. -It is these evaluations, when directedtowar s own experiences in the personal and social world, that come to be inter--pre as the "self". . As Brim (1975, 1976), Epstein (1973) and othprs have noted, self-con pt may be viewed as a eheory of the self. From t,his theory we make predictionsabout how we.can or should behave in a particular circumstance. We then evaluate.ourperfcmnance, which leads to a restructuiing of our theory of the self. .As cognitive
.
:1.4,
..functioning progresseS we come to formillate increasingly more cOmplex and abstfacttheories ot the self (Dickstein, 1977). Hence, the theory of the self will changewith development, although we. would not t.Tect dramatic upheavals or rapid, per-vasive*changes.. Rather, change would be expetted to occur slowly because (a) cog-.nitive .changes.occur in a continuous, non-abrupt manner and (b).there is continuityof the self o./er tine. In sun% explicating the role of cognitive development inthe emergence'and development of the Self-concept,is crit&al to understanding theself-concept because cognitive processes underlie theories of.the self
\
At preseat,,only,little resech'has been conducted ou the relation betweenmeaSures of selfconcept and cognitive development. Koocher (1974) conducted a \.%study with children between the ageOf 6 and 15 years. Two findings are of primaryinterest. First, with increase& in cognitive functioning from preoperational to' .
normal operational development there;Was'increasing awareness .of a seParation of one'sown self-concept from the self-concept of others. Second, with,increases in cognitivtlevel there WA an increasingly positive ideal self-concept, with the variability ofthe ratings decreasing. With increases in level of cognitive development there wasan increase in the distance between one's self-concept and ideal self-concept and therewas increasing agreement on what the ideal self-concept should be. 'As Koocher points. .out, these findings are consistent With the view that cognitive operations underlieviews of the.self. We would add that the *data are also consistent with the concept-ualization of the self-concept as a theory of the .self. Further research on the typesof relationships discussed herd are *clearly called for in order to better,delineatethe relations between personality development-and cognitive functioning. These dataihowever,' lend credence to the view being*expressed,
The second set 9f major factors responsible foreelf-concept development may be''grouped for convenience under the heating of environmental encounters, including such.aspects as school, peer relationsorole taking; interactions with parents, the reac-tions of others towara the individual, and a. wide'ranging set of other environmentalinfluences. Theie encOunters are important far a number of reasons, several of which. ,
....are central to our interpretation of how the self-concept develops. First, theseencounters provide the basis on which cognitive competencies and understanding of-knowledge.can be tested. In other words, our cognitive abilities areeextended to.deel with our everyday interactions'in the environMent, which fdsters further cogni-tivegrowth. -As we evaluate'our environmental interactions we confirm or must qltexsome component of our self-theory, depending.on the evaluation of performance. Some.encounters will, have more long term effects on our emerging self-concept. For examOle,"cOntinual interaction with learning Situations in schOol form a. significant basis forour view of our "achieving self". The data reviewed abOve demonstrate positive cor-.relatiohi between Achievement/Leadership and measures of school achievement and IQ.
. .Some encounters will have a momentary effect on our self-concept but will not exertsuch an influence as to produce permanent change in it. For example, a good studentwho Sails a test is likely'to momentarily derogate the self, but that is likely topaig. In a similar way, a poor student.who gets an Arbn a test is likely to feel amomen'tary.increase in the self as an achiever, but is not likely to permanently radi-.cally alter the view Of the "achieving selt". It is a history of environmental en-coutaters.,that are cognitively evaluated that leads to some degree of permanence in
A'single test grade is unlikely to result in a long-term alteration ofthe srlf-concept because of the history of testing performance upon which that view
SI.Milar comments may be. made-regarding the other environmental encounters.mentioded above.- Self-concept views, then, are partially a result of cognitively eval-,"Uating our interactions with our environments. Theloariety of interactions availablecontributes to individual differences in self-concepts. .The commonality of experiencestontributes to continuities, as does the basic underlying cognitive developmental se-quence.
A
109
117

t.
' Environmental interactions can affect.self,concept iwanother important wayas well. These interactions provide opportunities for role playing various compon-ents of the self. Through role playingthe adolescen.ks Wale to test the suita-bility of-various roles and discover which "fit" better with the self (cf., Dusek,.1977). By evaluating the fit.of various roles the adolescent can find those that
- are most well suited to his/aer competence. In turn, this will lead'to-s type ofconsistency,in the self over time.
This perspective receives some support from the data collected in this project.As we noted in Ohe results, the longitudinal data demonstrated consistency in theself-concept measures over a three year.period.' The cross-sectional comparisons,which showed grade level diff rences, did hot replicate each other. This may be dueto differences in the experie ces of supjects at different grade levels wlien comparedat one point in time, to the's sitisiity of the semantic differential items to fact-tors Oat momentarily influence he ratings of the'selfi or to tlie different inter-pretations children of different sognitive.abilities place on the adjectival pairs(cf., Montameyer & Eisen, 077, for a discuseion of differences in'self-descriptorsas a function of Age), Of' courie, interadtions among these and other.factors mayaccount for these differences. Had a different instrument been imployed it is quitepossible that a different.set of findings would have emerged.
The measures of self-Concept did, however, relate in meaningful-ways to measuresgf intirests, and to achievenienetept and IQ scores. The semantic differential for-:mat, then,. is useful-for assessing long-term components of the self-concept, eventhough it maY be sensitive to momentary fluctudtions.
,'
The theoretical conceptua4zation offered here,-and above, and the data fromthe present,research suggest the value of further research on the adolescent's self-.concept. .Thist research should be aimed at better delineating the nature of-the con-tribution of cognitive processes to self-evalLation. For example, research on thetypes.of self-concept instruments that are best used for subjects differing in cog-nitive level would help clarify developmental Telationships by .specifying which testsare likely telaroduce unreliable results. Studies using,a.multi-trait, multi-methodformat will,help us better understand the relationships between various tests of self-'concept. The 'wide variety of available instruments makes this a necessary type ofresearch, a modest start of which may be found in Winne, Marx, and Taylor (1977).Very short term longitudinal studies should be. done to meaiure the impact of variO6environmental -encounters on the self and estimate the likelihood that they will exertlong-term.influences. Finally, research linking self-concept development to otheraspects of development that are mediated by cognitive functioning, such as moral de-velopment, shoUld be conducted. These studies will help bridge the gap between cog-nitiy, social, and personality development and will lead to an understanding of thehutan organfsms interrelated-comple-xity that has not heretofore been achieved.
.;

_Footnotes
Mcinge (1973) used the same procedure and set.of scalesin his study of adolesc
-
self-concept. He kindly provided the complete seeof factor loadings from hisoverall'analysis (Table 6; page 388 of Monge 1973)' for.comparison with the datacollected for this report. Coefficients of congruence for.115e-factors fromMange's study and the 1975 data ranged from .90 to .97, indicating a high degreeof similarity in factor structures for the tWo data setA. 'Coefficients of Con-gruence between the factors from the 1976 and 1977 data sets were equally high,when each was'compared to Monge's data. Discrepancies in age-and sex differet*sin mean factor scores, then, are not due to differences in the factors resultingfrom analyses of the two data sets;
2 A facto'r analysis e*tracting four factorsan eigenroot of .98 but on which the onlyitem is not sufficient to define a factoris presented.
resulted in a fourth factor deakined bymajor loading wag Drugs. Since one'the analysis resulting in three fattors'
3. Extracting four factors from the data Tor the retested subjects did not result.
in a factor structure more similar to.those reported for the individual yearanalyses.
4. For the 1975 data level of social class was entered' as'a variable along With the21 responses to the self-concept items in a factor analysis to.deternine whethersocial class-level would load on any specific factor. This analysis was done forthe total sample as well as separately.for the male and female samples. In allcases the.social ciaas.variable loaded by itself as a one Item factor. Therefore,it wawdecided to assess.the factor struCture of the selficoncept for groups ofsubjects divided according to social-class membershi0.
5
I.
1
119
1
References
Amatora, M. free expression oi ado1iscents' interests.1967, 55, 173-20.
AMatOtat M. Interests of pre-adolescent boissand gixls.Araphs, 1960, 610 77-113. (a)
Amatora, N. Expressed'intprests in,later childhood. Journal of Genetic Psxchology,1960, a, 327-342.
Genetic Pdychology Monographs,
Genetic Psychology Mono- .
. ,AnastaViow, N.J. qA report cin 'the self-concepts of the very gifted.'13uarterly., 1964, 8, 171-173.
.
Baltes, P.R. Longitudinil anrd cross-sectional sequences in the.study of age SndleneratiOn.effects. HuAzivEtytlomentj 1968r, 11, 14-171.
2
'4-Bsltes, R.B. 6
quencts forPs choló
Gifted Child
.-s
tiz
.Mu;tivariate'longitudinal and cross-aectional se"-analyzing generational change:.. Amethodological note. 'Developmental1970, 2, 163-148.
Bengston', V.L. 6.Citt1er N.E.,,Generations and intergener ational relations: Perspec--tives on,age'groups and.social change. In R.H. Binstock and E. ShanasRindbookof 'Aging and the Social Sciences. New Yokk: Van Nostrand Reinhold, Cot,1976.
aa
Binder, D.M.-Relationshj.ps'among self-expectations, self-concept and academic achieve-Ment,. Dissertation Abstracts International, 1960, 26, 5220.
4
Bledsoe, J.C4. Self-coftcepts oZ children and their intelligence, achievement, interests,'and eitxiety. Journal of Individual Psychology., 1964, 20, 55-58.
' Bohan, J. Age andhox.differences in self-concept. Adoles'cence, 1973, 8(31), 379:,
Borke, H. Interpersonal perception of yOung children: Egocentrism or empathy?Developmental Psychology, 1971, A, 263-269.
' NBorkei H. Chandler and Greenspan's. "ersatz egocentrise:, A rejoinder. Developmental
Psychology, 1972, 7, 107-109.
Brim, 0.G., Jr. Life span development of the'theory ofoneself. Invited Address to.-the international Society for the Study of Behivioral Development Biennial Confer-ence, University 0 Surrey, Guildford, Surrey, July 1975.
Brim, 0.G., Jr. Life-span development.of the theory of oneself: Implieations'forchild development. °In H.K. Reese (Ed.), Advances in child development and behavior.Vol. II. NeW,Yorkr AcademIc Press, 1976.
-A
Brookover. W.B. & Shailer, T. Self-:-concept of ability and sclAsiol achievement. Socr-iology of Education, 1964; 37, 271-278.
Brookover; Lepere, J.M., Hamachek, D.E.ThoMas, S., & Erickson, E.L. Self-, concept of ability and school achievement. '-East Lansing: Bureau of.Educational
,Research Services, College of.Education, Michigan State University, 1965.
t ,
Broverman, I.K., Vogel, S.R., Broverman, D.M., Clarkson, F.E. & Rosenktantz, P.S.Sex-role stereotypes: A current appraisal. Journal of Social Issuese 1972,
......-
- 21 59-78. .A
.
/
J.
;
Bruck, M.-& BodWin,' R.F. .Age.differences between SCS-DAP test results and dPA.... Journal of. Clinical Psychology, 1963, 19, 315316.
Burrows, M. .Human sexuality, a program for sex education in theepublic school system.psychosothatics; 1970, 11, 31-35.
Calsyn, R.J., & Kenny,'D..A. Self-concept of ability and,perceived evaluation of.oelers: Cause or effect of academic achievement. Journal of Educational Psychol-,
1977, 69, 136-145.
Carlson, R. Stability, and change in.the adolescent's 4elf-image. Child Development,1965, 10,, 659-666.
, Cbandler, M.J. Egocentrism and antisocial behavior:1 The sessment Ond training.of socialperspective-taking skilli. DeveloPmentttPsydhology, 1973, 9, 326-332.
Chandler, Greenspan, S. Ersatz egocentrism: A reply to H. Borke. Develop-mental Psychology, 1972, 7, 104-1041.
Coleman, J.C. Relationships in adolescence. 'Boston: Routledge & Kagan Paul, 1974.
Coleman-, J.C. Current contradictions in adolescent theory. Journal of Youth andAdoléscenZge .1978, 7, 1-11.
Coleman, J.C., George, R., & Holt, G. . Adolescents and their parents:. A study ofattitudes. ...lourhal of Genetic Psychology, 1977, 130, 239-245.
Colling, H.A. CBuiger, G.K. The self concept of inner city and suburban youth.National Catholic Guidance Conference Journal, 1969, 13, 10-17.
Constantinople, A. -An Eriksonian measure of personality development in college stu-dents. Developmental Psychology, 1969, 1, 351-372. .
ooley, W.W. & Lohnes, P.R. Evaluation research in education: ThSry, principles,and practice. -New York: Halsted Press, 1E6.
Coopersmith, S. The antecedents of self-esteem. San Francisco: W.H. Freeman, 1967.
Crandall, V.J. & Bellugi, U. Some relationships of interpersonal and intrapersonalconceptualizations*to personal-social adjustment. Journal of Personality, 1954,23, 224-232.
. .Crowne, & Stephens% M.W. Self-acceptance and self-evaluative behavior: A'critique of methodology. Psychological Bulletin, 1961, 58,-104-121.
Dickstein, E. Self and .self-esteem: Theoretical fcundations and their implication'sfor research. Human Development, 1977, 20, 129-140.
t
'Dittes, J.E. ,Attractiveness oi grdui) as function of self-esteem and acceptance bygroup. Journal of Abnormal and.Social Psychology., 1959, & 77-82.
,pusek, J.B. Adolescent 'development and behavior. Palo Alto, Ca.: Science ResearchAssociatesT-1;77-7.07.
Dusek; J.B., Kermis, M.D., & Monte, R.H. The hierarchy of adoXesnent interests: Afacial-cognitive approach. 'Genetic Psychology. Monographs, 1979, in press.,
Dusek, J.B. & Monge, R.H. 'Communicating population control facts to adolescents.Final report :for NLH Grant No. HD 06724, 1974.
Edmunds, B.R. 'The relationship between the self-image and the report card achieve-ment of. eleventh year English students. Dissertation Abstracts International,1968, 29, (3-4,N758:
,
Elkind, D. Cognitive structure and adolesáent experience. Adolescence, 1967a, 2(8),427-434.
in
Ilkind, D. Egocentrism in adolescente. Child Development, 1967b, 2E, 1025-1034.?
in adolescenca. In J.F. Adams (Ed.), UnderstandiBacon, 1948.,
Ukind, D. Cognitive developmentadoIesceve. Boston: Allyn &
Emmerich, W. Developmental trendsment. 1974, 45, 172-183.
in evaluations of single traits. Child Deltoo-
Enpel, M. The stability of the self-concept in adolescence.. Journal of Abnormr41and Social Psychology, 1959, 58, 211-215.
Wstein, S. The self-concept revisited: or a theoryof a theory. American Psychol-ogist, 1973; 28(5), 404-416.
E.H. Identity and the life-cycle. Psychological Issues, 1959, 1, 1-171.
'Erikson, E.H. Childhood and ElOciety(2nd Edition). New York: Norton, 1963.
Erikson, E.H. Identity., youth, and crisis. New York: Norton, 1968.
Flavell, J.H. The developmental psychology of Jean Piaget. Princeton, N.J.: VanNostrand, 1963.
Flavell, J.H. Cognitive Development.' Englewood Cliffs, N.J.: Prentice-Hall, 1977.
Fox, W. The stability of measured interests. Journal of Educational Research, 1947,41, 305-310.
.Freeberg, N.E. & Rock, D.A. Dimensional continuity of interests and activities duringadolescence. Human Development, 1973, 16, 304-316.
-Freud, A. The egg_ and the mechanisns of defense (C. Baines, trans.). New York: Inter-national Universities Press, 1948.
Freud, A. Adolescence. Psychoanalytic Study of the Child, 1958, 13, 255-278.
114
Freud, S. Some early unpubllshed letters of Freud.. International Journal of psycho7Atuatua, 1969, 50, 419-427.
Guardo, C.J & Bohan, J.B. Developmenttiof a 'sense of self-identity in children.Child bevelopment, 1971, 42, 190971921.
Hall, U.S. ,Adolescence (2 vols.). New Yotk: Appleton, 1904.
..Harmon, H.H. Modern factor analysis (2nd ed., rev.). Chicago:, University of Chicago. Prls,A.967.
Harrie, D. Sex differences in the life problems and interests of adolescents.Child 112.e_ent, 1959, 30,,453-459%
Hauser, S.T. Slack and white identity formAtion. New York: Wiley Inter-science,1971.
Hauser, S.T. SeJf-itage complexity and identity formation in adolescence: Long-itudinal studies. Journal of Youth and Adolescence, 1976; 5,' 161-177.
Havtghurst, R.J.- Develo mental tasks and 'eduation.(3rd ed,). 'New York: David'Maay,. 1972.
V
Heald, F.P. Si'llung, W. Endocrine control of the adolescent growth spurt. In F.Heald & W. Hung (Eds.),.Adolescent endocrinology. New York: Appleton-Century-%Crofts, 1973.,
Inhelder, B. & Piaget, J. The growth, of logicaLathinking from childhood to adol-i escence. kew York: Basic Books, 1958.
Jason, M.H. &-Dubnow, B. The relationship between self-perceptions ofand reddin'g achievement. In Assessment problems la. reading.
. Granite, ed. Newark, Delaware:- -International Reading Association,
Kaiser, H.F. Computer program for varimax rotation in,factor analysis.Ed Psychological Measurement, 1959, 22, 413-420.
A,Katz, P. & ZiglerAE. Self-image disparity: A developmen,tal approach. Journaa of
Personal EA Sodial Psychology; 1967, 5_, 186-195.
reading abil-W.H. Mac-1973.
Educational
Kirklanu, J. Interest: Phoenix in psychology. 'Bulletin of British Psychol. Soc.,1976, 29, 33-41.
Kohlberg, L,zation.
, Chicago:
Stage and sequence: The cognitive-developmental approach to sociali-In D.A. Goslin (Ed.),-Handbook of Socialization ig2siT and Research.
.
Rand McNally, 1969.
Kohlberg. L. & Zigler, E. Tht impact of cognitive maturity on sex-role attitudes. in the years four to eight.- Genetic Psychology Monographs, 1967, 75, 89-165.
Kokenes, B. Grade level differences in factors of self-esteem. Developmental Psychology,1914, 10, 954-458.
.Koocher, G.P. Emerging selfhood and cognitive development. The Journal of GenetAkayshology, 1974, 125, 79-88.
5
.4
1.23115
Landis, D., Hayman, J.L. & Hall, W.Smeasuring self-concept in povertychology, 1971, 62(2), 95-103.
Multidimensional analysis-procedures Siirarea classrooms. Journal of Educational pa-
Lehman, H.C. & Witty, P.A. The .psychology of play activities. New York: Barnes1927.
Lewin,rtanF=Intalle:rfy
SZo7.2=i7;1;psychology:/ toncepts
, 868-897.
Long, B.H., Ziller, R.C. & Hendersqn, E.H. Development changes in theduring adolescence. The School Review, 1968, 210-230.
Looft,OW.R.- Egocentrism and social interaction across the life sPan./- Bulletin 1972, a, 73-92.
and methods.
self-concept
Paychologicai
Lowe, C.M. The self-concept: Fact or artifact. Psychological Bulletin 1961, 38,325-336.
Maccoby, E.E. & Jackftn, C. The psychology of sex differences,University Press, 1974.
Stanfozd: Stanfórd
MacDonald A.P. Manifestations of differential levels of socialization-by birthorder. Developmental Psychology, 1969, 1, 485-492.
Mallinson, G. & Crumrine, W. An investigatiol of the stability of interest of highschool students. Journal of Educational Research, 1952, 41, 369-383.
Manley, H. Sex education: Where, when.and,G. Powers (Eds.), Sex Education:sophical Libraryi, 1969.
Marcia, J.E. Studies in ego ldentitx..,sity, 1975.
Marcia, J.E. Identity sex years after:Adolescence, 1976, 5, 145-160..
and how it should be taught. In W. Baskinissues and Directives. New York:* Philo-
Unpublished monographiSimon Fraser Univer-
A follow-up study. Journal of Youth and
Marcia, J.E. Identity and adolescent parenthood. Paper presented at the Conferenceof the.4tional Alliance Concerned with School Age Parents, Washington, D.C.,1977.
Marks, J. Ineerests and leadership among adolescentd. Journal of Genetic Psychology,1957, 91, 163-172.
Marx, R.W. & Winne, P.H. Self-concept and achievement: implications for educationalprograms. Integrated Education, 1975, 13(1), 30-31.
McCandless, B.R. Children: Behavior and cleieLlEmat. New York: Holt, Rinehartand Winston,,1967.
ifMcCandless,. kelt., _ Adolescents: Behavior and develo nt. Hinsda-111.: .The
- Dryden Press, 1970.-
124116
Merritt R. Self-concept-and achievement in home economics. Journal of Home. Econdmics, 1971,,63, 38-40.
Milgram, R.M. & Milgrim, N.A. Self-concept as a function of intelligencbrlicd Crea-tivity in giften Isr.seli children. Psychology in the Schools, 1965, 13, 91-96,
Menge, R.H. Developmental trends in factors of adolescent self-concept. Develov. mental Psychaogy, 1973, 8, 382-393.
Mange, R.H. Structure .of the self-concept from adolescence through old age. Exper-imental Agin& Research, 1975, 1, 281-291.
Montemayer, RI & Eisen, M. The development of self-conceptions from childhood toadolescence. Develo mental psychology, 1977, 13, 314-319.
Mussen, F.H. & Porter,' L.W. Personal motivations and self-conceptions associatedwith effectiveness and ineffectiveness in emergent grqups. Journal of Abnorthal'and Social Psychology, 1959, 59, 23-27.
Osgood, C.E., Suci, C.J. & Tannenbaum, B.H.:'The measurement of meaninp 'Urbana:University of Illinois Press, 1957.,
Piaget, J. The origins of intelligmczt in children (trans. M. Cook). New York:International Press, 1952.
Piaget, J. On the development of memory and identity., Barrg, Mass.: Clark Uni-versity Press, .1968.
Piaget, J. Intellectual evolution from adolescence to adulthood. Human Development,,1972, 15, 1-12.
Piaget, J. & Inhelder, B. The aycholou. of the child. New York: Basic Books, 1969.
Piers, E. & Harris, D.B. Age and other correlates of self-concept in children.Journal of Educational Psychology, 1964, 55, 91-95. -
0
Powell, J. The psychology of adolescence.. Indianapolis: Bobbs-Meltill Co., Inc.,1971.
Prawat, R.S. Mapping the effective domain in young adolescents. Journal of EducationalPsychology, 1976, 68, 566-572.
Pressey, S.L. & Kuhlen,.R.G. psyclalogical Development through the Life Span. New.YOrk: Harper ana Row, 1957.
fPurkey, W.W. Self-concept and school hveinent. Englewood Cliffs, N.J.: prenticeHall, 1970.
Ring, K., Lipinski, C.E., 6 Braginsky, D. The relationship of birth order to belt-evaluation, anxiety reduction, and susceptibility to emotional contagion. psycho712Lical. Monographt,, 1965, 79, (Whole No. 1603).
Rosenberg, B. & Sutton-Smith, B. A revised conception of masculine-fethinine differ-ences in play activities. Journal of Genetic Psiniiiogy, 1960, 96, 165-170./
1117
25
Rosenkranta, P., Vogel, S., Bee, H., Broverman, I. & BroverMan, D.M. Sex-role stereo-types and self-concepts in college students. Journal of Consultinkand Clinicalfushololy, 1968, 32, 287-295.
Rutter, M., Graham, P., Chadwick,
.chillPsycholoitY iDALIILOILEIEE
K.W. A general model forBulletin, 1965, 64,.92-107.
0$ & Yule, W. Adolescent iurmoil: Fact or fiction., 1976, lb 35-56.
the study of develaimental problems. Psychological
Innte.ntolillieotn&clerB21::"(E21.7eLitZEitdie7e1841:=Iep:14hJ1-92E: Research and theory. New York: Academic Press, 1970. Pp. 485-507.
Shantz, C.U. The development of aoCial cognttion. In E.M. Hetherington (Ed.), At-view of Child Development Research, Vol. 5. Chicago: University of Chicago Press1975.
Simnons, R.G., Rosenberg, r. & Rosenberg, M. Disturbance.in the self-image at adol-escence. American Sociological Review,,1973, 38, 553-568.
Smith, P.A. A factor analytic study of the self-concept. Journal of ConsultingPsychology, 1960, 24, 191.
Smith, P.A. A comparison of three sets of rotated factor analytic solutions of self:-concept data. Journal of Abnormal and Social Psychology, 1962, 64, 326-333.
Soares, A.T. & Soares, L.M. Self-perceptions of culturally disadvantaged children.American Educational Research Journal, 1969, 6, 31-45.
Soares, A.T. &.Soares, L.M. Comparative differences in the self-perceptions of dis- -
advantaged and advantaged students. Journal of'School psychology., 1971, 9, 424-429.
Soares, A.T. & Soaresvantaged students.
AssociAti_Mj.1 1972,
Stone, C.P. & Barker,Journal of.Genetic
, L.M. The self-concept in disadvantaged and ad-Proceedings_of the Annual Convention of the American Psychological
pt. 1, 195-196..
R.G. The attitudes and interests of premenarcheal girls.Psychology, 1939, 54, 27-71.
Strong, E.K. Change of interests with Stanford: Statford'University'Press, 1931.
Strong, E.K. Vocational interests of men and women. Stinford: Stanford JniversityTress, 1943.
Symonds, P. .Life interests and problems of adolescents. School Review, 1936ai506-518.
Symonds, P. Changes in problems and interests with increasing age. PsychologicalBulletin, 1936b, 33, 789.
Tanner; J. PhysiCa1 Growth. In P. Mussen (Ed.), Carmichael's manUal of child ay.-,chology. New York: John Wiley & Sons, Inc., 1970. Pp. 77-156.
!API? !
- --
TatsUoka, M.M. Multivarigite anialvsity Technigues for educational iand psychologicalresearch. New York: John Wiley & Sons, Inc., 1971.:
Thorndike E.L. Adult interests. New York:. Macmillan,1930.
\Trowbridge, N. Effects of socib-economic class on Belf-concept of children. Ear\chologr in the Schools, 1970, 7, 304-306.
1.
. \,
,Trowbridge, N. Self-concept and socio-economic Status in elementary school children.American Educational Research Journal, 1972, 9, 525-537.
..
.
\Trowb'ridge, N. Self-concept and IQ in-elementary school children. California JournS1ofIducationak Research% 1974, 25, 37-49.
Winer, B.J. Statistical princtpl in,experimental design. New York:. McGraw-, Hill, 1962.
Winne, P.J., Marx, R.W., & Taylor, T.D. A multitrait-multimethod study of three self-concept inventories. Child Development, 1977, 48, 893-901.
Wolf, E.S., Terman, D.M. On the adolescent process as a transformationpf the self. Journal of Youth and.Adolescence, 1972, 1, 257-272.
R.C. The self-concept. .Vc1. 1. Lincoln, Nebraska: University of Nebraskarress,.1974.
AA
I .1