doc completo clivar ingles 2010 1
85
&OLPDWH LQ 6SDLQ 3DVW SUHVHQW DQG IXWXUH 5HJLRQDO FOLPDWH FKDQJH DVVHVVPHQW UHSRUW 5(' 7(0È7,&$ &/,9$5(63$f$
-
Upload
concepta-net -
Category
Documents
-
view
0 -
download
0
Transcript of doc completo clivar ingles 2010 1

CLIMATE IN SPAIN: PAST,
PRESENT AND FUTURE
Regional climate change assessment report
Editors: Fiz F. Pérez and Roberta Boscolo
November 2010

Climate in Spain: Past, Present and Future
2
Authors Bladé Ileana, Cacho Isabel, Castro-Díez Yolanda, Gomis Damiá, González-Sampériz Penelope,
Miguez-Macho Gonzalo, Perez Fiz F, Rodríguez-Fonseca Belén, Rodríguez-Puebla Concepción, Sánchez Enrique, Sotillo Marcos G., Valero-Garcés Blas, Vargas-Yáñez Manuel.
Contributors Ayarzagüena B., Ábalos M., Altava-Ortiz V., Álvarez I., Ancell R., Argüeso D., Bao R., Barrera-
Escoda A., Benítez-Barrios V., Borja A., Brunet M., Calvo N., Cañellas B., Calafat F.M. , Catalán J., Cofiño AS., Crespo AJC., de Castro M., de la Cámara A., Doblas-Reyes FJ., Domínguez M., Errasti I., Esteban-Parra MJ., Estrela MJ., Fernández J., Ferrer I., Fortuny D., Francés G., Frías MD., Frigola J., Gallardo C., Gallego D., Gallego MC., Gallego Torres D., Gámiz-Fortis SR., García Merino JM., García-Herrera R., García-Martínez MC., Garcia-Serrano J., Gesteira JLG., Gómez-Gesteira M., Gonzalez B., González Reviriego N., González Rouco F., González-Pola C., Grimalt J., Guijarro JA., Gutierrez JM., Herrera S., Hidalgo-Muñoz JM., Iglesias I., Izaguirre C., Jiménez Espejo F., Jordá G., Lavín A., López Sáez JA., López-Moreno JI., Lorenzo MN., Losada T., Marcos M., Luna Y., Martín ML., Martínez Ruiz F., Martrat B., Menéndez M., Miró J., Mohino E., Montávez JP., Montoya M., Morellón M., Moreno A., Moya F., Ortega Montilla P., Paredes D., Pascual A., Pastor F., Pla S., Pérez B, Polo I., Polo IM., Pons MR., Pozo-Vázquez D., Rasilla D., Ribera P., Rico M., Rodrigo FS., Rodríguez E., Rodríguez J., Ruiz S., Sáenz J., Salat J., Saz Sánchez MA., Sánchez-Rodrigo F., Serrano E., Solé J., Somavilla R., Taboada JJ., Tel E., Valencia V., Valero F., Valiente JA., Vicente-Serrano SM., Vidal-Vijande E., Zahn R., Zazo C., Zunino P.
ISBN Pending Acronyms/Abbreviations
IP Iberian Peninsula CLIVAR CLImate VARiability AO Arctic Oscillation AR4 4th Assessment Report BP Before Present, means years before 1950. DTR Diurnal Temperature Range EAP Eastern Atlantic pattern EA/WRP Eastern Atlantic-West Russian pattern ENSEMBLES ENSEMBLES: ENSEMBLE-based predictions of climate changes and their impacts, GOCE-CT-2003-505539 ENSO El Niño/Southern Oscillation GCM General Circulation Model (Global Climate Model) HE Heinrich Events, events of massive iceberg discharge and debris rafting into the North Atlantic IPCC Intergovernmental Panel on Climate Change LGM Last Glacial Maximum LIA Little Ice Age, years 1300-1850 of our era or years AD MI “Mystery Interval”, the name given to the period from 17.5 to 14.4 Kyr BP MEDATLAS Mediterranean and Black Sea Database produced by the MEDAR group MWP Medieval Warm Period (Medieval Climate Anomaly) years 550-1300 of our era or years AD NAHS North Atlantic horseshoe NAM Northern Annular Mode NAO North Atlantic Oscillation IRHP Iberian-Roman Humid Period TCP TeleConnection Pattern PRUDENCE Prediction of Regional scenarios and Uncertainties for Defining EuropeaN Climate change risks and Effects EVK2-CT-2001-00132 RCM Regional Climate Model SCA Scandinavian Pattern SLP Sea Level Pressure SNA Subtropical North Atlantic SRES Special Report on Emissions Scenarios (IPCC, 2000) See appendix III. SST Sea Surface Temperature WCRP World Climate Research Project WeMO Western Mediterranean Oscillation

CLIVAR - Spain
3
FOREWORD
Climate change is nowadays a reality and one of the most important challenges that humanity has to face this century, because of the threat that it represents, among others, for the economy, health, food and safety. There are increasingly more scientific evidences that we are at a critical moment, although we can still tackle the negative consequences of climate change if we take decisive actions at a global level. One of the key actions needed to meet this challenge is to gain as detailed an understanding as possible of how the climate is changing, what the climate will be like in the next hundred years and how these changes are going to affect us. This is where the scientific community plays a central role, since the formulation of policies for mitigating and adapting to climate change depends on accurate scientific knowledge. The CLIVAR-Spain Committee and Thematic Network, whose activities I have been supporting since it was created in 2004, has built itself up over the course of the last five years as a network that seeks to promote climate research and advance scientific knowledge of climate change in Spain. Its first report, published in 2006, entitled “The state of the art of the Spanish contribution to the Climate Variability and Predictability (CLIVAR) study”, enabled us to gain a better understanding of the state of climate research in Spain. Now this second report comes at a key moment, just after the Copenhagen Summit in which, once again, the urgent need to take steps to face climate change and the importance of scientific knowledge as a guide to this process have been made clear. Structured in five sections, this report contains highly relevant information about climate variability and climate changes (both past and recent), future climate projections and projected variations in the frequency and intensity of extreme events in the Iberian Peninsula, which, as the IPCC indicates in its recent Fourth Assessment Report, is a region that is particularly vulnerable to climate changes. Undoubtedly, this information will be highly useful for planning actions in areas liable to be affected by climate change. As I did at the time of the presentation of the First Report, I would like once again to express my support to the CLIVAR-Spain committee and to encourage it to continue to publish periodic assessment reports. I also wish to extend my support to the Spanish scientists who comprise the CLIVAR-Spain Thematic Network, so that they continue to endeavour in their research on climate and climate change in Spain. Without a doubt, both efforts will help boost the research activities of other national and international initiatives in the field of climate variability and climate change and will promote greater participation of national research efforts and researchers at the international level.
Teresa Ribera Rodríguez Secretary of State for Climate Change

Climate in Spain: Past, Present and Future
4
CONTENT Chapter 0: Executive Summary and Introduction
Pages 5-8 Perez Fiz F, Boscolo Roberta, Bladé Ileana, Cacho Isabel, Castro-Díez Yolanda, Gomis Damiá, González-Sampériz Penelope, Miguez-Macho Gonzalo, Rodríguez-Fonseca Belén, Rodríguez-Puebla Concepción, Sánchez Enrique, Sotillo Marcos G., Valero-Garcés Blas, Vargas-Yáñez Manuel.
Chapter 1: Review of paleoclimate reconstructions in the Iberian Peninsula since the last
glacial period Pages 9-24 Isabel Cacho, Blas Valero Garcés, Penélope González Sampériz
Chapter 2: Atmospheric trends in the Iberian Peninsula during the instrumental period in the
context of natural variability Pages 25-41
Ileana Bladé and Yolanda Castro-Díez Chapter 3: Ocean Variability and sea level changes around the Iberian Peninsula
Pages 43-52 Manuel Vargas-Yáñez, Marcos García Sotillo and Damiá Gomis
Chapter 4: Climate teleconnections affecting Iberian Peninsula climate variability.
Predictability and expected changes
Pages 53-67 Belén Rodríguez-Fonseca and Concepción Rodríguez-Puebla
Chapter 5: Regional climate projections over the Iberian Peninsula: climate change scenarios
modeling
Pages 69-80
Enrique Sánchez, Gonzalo Miguez-Macho
APPENDIX I: The Little Ice Age (LIA) and the Medieval Warm Period (MWP)
Page 81
APPENDIX II: The North Atlantic Oscillation (NAO)
Page 82
APPENDIX III: Emissions scenarios
Page 83

CLIVAR - Spain
5
EXECUTIVE SUMMARY For over more than two decades, the international scientific community has been providing
compelling evidence of the anthropogenic influence on global climate. The latest report (AR4) of the Intergovernmental Panel on Climate Change (IPCC) reiterates, forcefully, the importance of the impact that humans are having on climate and alerts about its possible consequences for the planet.
This report by the CLIVAR-Spain Thematic Network summarizes and assesses the available information on the physical aspects of the changes that have been observed in the climate of the Iberian Peninsula (IP), both in current times and in the distant past, and tries to enhance our understanding of those changes in order to better predict the impacts of future changes.
The Climate of the IP in the Past
Studies of the evolution of climate in the past indicate that the IP was intensely affected by rapid climatic changes (on time scales ranging from decades to a few hundred years) that were associated with large-scale variability patterns typical of the North Atlantic region. Some of these events, which took place during the deglaciation (19000-11000 years BP), resulted in the most extreme climate conditions in terms of coldness and aridity, even exceeding those of the last glacial maximum (some 23000 years ago). During the current interglacial period, known as Holocene, which spans the last 11700 years, numerous climate oscillations have been documented that entailed relatively mild temperature changes but that significantly altered the water balance of the IP, providing a historical perspective of recent climate changes.
The Current Climate of the IP: Observations
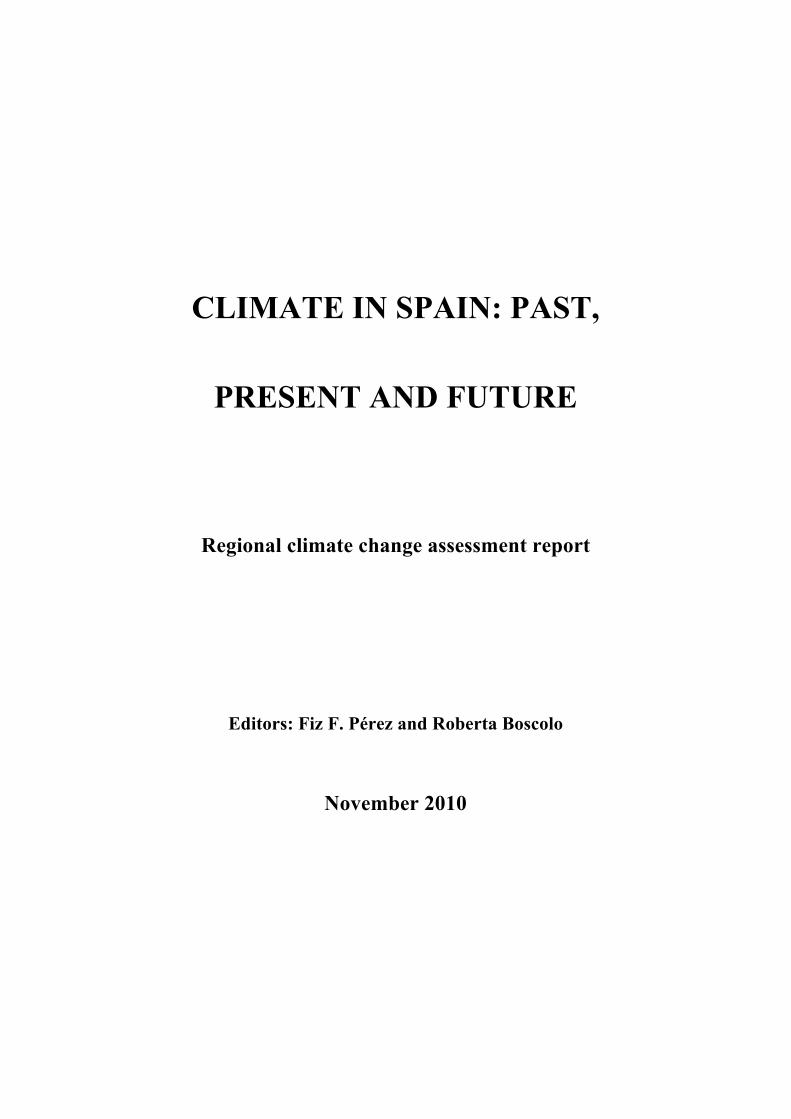
Temperature: The instrumental records of the 20th century show a progressive increase in temperature that has been particularly pronounced in the last three decades (1975–2005), with a rate of warming close to 0.5ºC/decade (50% higher than the Northern Hemisphere continental average and almost three times as large as the global average). When the entire 20th century is considered, the warming has affected all seasons evenly, but in the last 30 years the warming has been much more pronounced in spring and summer.
Precipitation: Annual precipitation in the last three decades has decreased significantly compared to the decades of the 60s and 70s, mostly due to rainfall reductions in late winter. The current decade may have been the driest since 1950. However, the strong interannual variability and the lack of data extending to the beginning of the century precludes a conclusive statement as to whether precipitation has diminished to a historical minimum. Overall, an anthropogenic signal in precipitation has not emerged in an unambiguous manner above the natural background noise. In particular, the pronounced decrease in summer precipitation projected by climate models for the end of the 21st century is not yet apparent in observations.
Marine Parameters: From 1985 to 2005, the sea surface temperature in the Bay of Biscay increased by 0.12ºC/decade in the southwest and by 0.35ºC/decade in the northwest, consistent with the average increase of 0.19 ± 0.13ºC/decade estimated for the Northern Hemisphere from 1979 to 2005 (IPCC). This warming has affected to the entire water column, with temperature rises during the 90s between 0.15ºC and 0.30 ºC/decade in the first 1000 meters. In the western Mediterranean basin, a rise in temperature and salinity in deep layers has been recorded during the second half of the 20th century, as well as a rise in salinity at intermediate layers (~0.00013 psu/year). From 1967, a drop of 30% has been observed in the intensity of the upwelling at the Atlantic coast, which has decreased primary productivity and has slowed down the renewal of coastal waters.
Sea Level: On the Atlantic coast, tide gauges have recorded a sustained sea level rise of around 1.4 mm/year when the entire 20th century is considered, and of more than 2 mm/year for the second half of the century. On the Mediterranean coast, on the other hand, the sea level trends observed during the second half of the century are smaller or even negative. Evidently, the atmospheric pressure, which has been abnormally high in this area between the 60s and the 90s, and the increase in salinity have partly compensated for the steric sea level rise observed on a global scale. Nevertheless, tide gauge records in the western Mediterranean that span the entire 20th century exhibit positive sea level trends of 1.2 mm/year.

Climate in Spain: Past, Present and Future
6
The Current Climate of the IP: natural variability mechanisms
The Northern Hemisphere pattern of atmospheric circulation variability that most influences the climate of the IP is the North Atlantic Oscillation (NAO)1, which is closely associated with precipitation (and, to a lesser extent, temperature) variations on interannual and decadal timescales. Climate simulations for the 21st century project an upward NAO trend, which would result in a reduction of precipitation in the IP, particularly in the southern half. The influence of ENSO2 on the IP is less clear but appears to be significant in autumn and spring for both temperature and precipitation.
The Climate of the IP in the Future: anthropogenic impacts
Regional climate model projections for the end of the 21st century indicate pronounced increases in mean seasonal temperature, larger in summer (6ºC in scenarios with the greatest anthropogenic impact3) than in winter (2-3ºC). A decrease in precipitation throughout the entire year, again larger in summer than in winter, is also predicted. On average the models project increasingly arid conditions in most of the IP. With greater uncertainty, the models suggest an increase in extreme precipitation events, for both dry spells and intense precipitation episodes. An increase in extreme high-temperature events (>30ºC) is also predicted, particularly in the south.
1 See Appendix II for a brief description. 2 ENSO: El Niño/Southern Oscillation. The influence on the IP is mostly observed during the negative phase of ENSO, known as La Niña. 3 See Appendix III for more information.

CLIVAR - Spain
7
INTRODUCTION After the success of the first seminar held in February 2005 and the publication of the report “State of
the art of the Spanish contribution to the Climate Variability and Predictability (CLIVAR) study”, the CLIVAR-Spain Thematic Network (http://clivar.iim.csic.es/) held a second seminar in February 2009, entitled "Climate in Spain: Past, Present and Future”, which was attended by more than a hundred researchers. The main goal of the seminar was to bring together the Spanish scientific community working in the field of climate with the ultimate purpose of generating a synthesis assessment report on the physical aspects of climate change in the Iberian Peninsula (IP) and its possible causes. This document was to be an open, revised, consensus report, that would assess the existing evidence of changes in the climate of the IP (past and present), analyze and critically compare the results going above and beyond a simple compilation of findings, and provide specific and rigorous conclusions. The report would be intended both for scientists who wished to acquire a comprehensive picture of the state of the art of climate research in Spain and for political leaders who needed accurate information on climate changes recorded in the IP.
The present document is the result of this collaborative work between the CLIVAR-Spain Thematic Network and the community of climate scientists4. It is based on the contributions of a large number of researchers (>100) and has been revised both by the contributors themselves and by external reviewers. In addition to these contributions, the report includes findings from many other national and international scientists, with the aim of documenting all relevant results. It is also important to point out that the information contained in this report is based in its entirety on peer-reviewed publications listed in the Science Citation Index (SCI).
The IP is situated in an area of climatic transition between temperate and subtropical latitudes. The existence of semi-desertic, Mediterranean, Atlantic and mountainous environments gives rise to pronounced spatial variations in temperature and precipitation, which are compounded by an also large temporal variability. In the latest IPCC report, southern Europe is signaled as an area particularly vulnerable to climate change, and one for which large increases in temperature, decreases in precipitation and increases in extreme events are expected in the future (IPCC, AR4). The hydrological deficit in a large part of the IP, the known fragility of Mediterranean ecosystems and the societal dependence on water (both for direct consumption and for farming and industrial activities) make the IP particularly sensitive to rapid climate changes. The costs associated with future climate change scenarios are high and include large economic losses owing to the increase in the frequency and intensity of extreme events (such as droughts and torrential rains), loss of biodiversity, etc. For all these reasons it is fundamental to understand and anticipate future climate changes in the IP in order to be able to implement adaptation and mitigation strategies.
Understanding the causes and effects of climate variations as well as the multiple interactions that take place within the climate system is a complex scientific challenge. In order to understand climate change at a regional scale it is necessary to adopt a wide perspective and acquire a detailed knowledge of the internal dynamics of climate and its natural variability. For this reason, this report on the climate of the IP is structured in five chapters, ranging from past climates to current climate changes to future climate projections, and includes two chapters dealing with climate variability in the IP.
In chapter I, “Review of paleoclimate reconstructions in the Iberian Peninsula since the last glacial period”, the state of affairs in paleoclimate research in the IP is presented. This chapter provides a reference framework for viewing the magnitude and pace of current climate changes. The best marine and continental records are used to provide an estimate of the sensitivity of the IP to past climate changes. Some of these changes had a direct impact on human communities, causing migrations, changes in occupation patterns and even triggering the development or collapse of some civilizations of the IP. The synchronization between the regional climate changes that took place in the IP and global and/or hemispheric changes is discussed and evidences of past abrupt climate changes are assessed.
4 This report was supported by the Spanish Ministry of Science and Innovation (MICINN), through Acción Complementaria Internacional (ACI2006-A5-0518). We would like to express our appreciation to the dozen international experts who reviewed the manuscript and to Paula C. Pardo, Trinidad Rellán and Marcos Campos who edited the report.

Climate in Spain: Past, Present and Future
8
In order to be able to detect climate changes of an anthropogenic nature that may be occurring at present, it is necessary to compare current trends with the natural climate evolution that took place in the more recent past. In chapter 2, “Atmospheric trends in the Iberian Peninsula during the instrumental period in the context of natural variability”, recent changes in the main atmospheric variables (temperature and precipitation) are discussed and compared to the range of variability observed during the instrumental period. Through an analysis of precipitation trends on a peninsular scale, the problems associated with the large internal variability and with the short length of the observational record are illustrated.
The ocean is an important regulator of climate. Chapter 3, “Ocean Variability and sea level changes around the Iberian Peninsula”, examines changes in the temperature and salinity of the waters of the different basins that surround the IP, as well as sea level variations. The chapter also discusses how changes in ocean salinity and temperature and in ocean-atmosphere heat fluxes can affect sea level and coastal and oceanic currents. Other aspects considered are the amount of heat absorbed by the sea, changes in the formation rate of water masses and in their thermohaline properties, and the rate of ventilation of the deep sea. The effects of ocean-atmosphere interactions on the coastal system, such as decreased upwelling induced by a weakening of the trade winds, are commented on as well.
The next chapter, “Climate teleconnections affecting Iberian Peninsula climate variability. Predictability and expected changes”, is devoted to the atmospheric teleconnections that influence the climate of the Euro-Atlantic sector on seasonal to decadal timescales, focusing on the NAO and ENSO. Knowledge of teleconnections between remote regions aids in understanding regional climate variations and may be used to predict climate changes in a given region. Through the analysis of observations and experiments with general circulation models, regions of oceanic forcing for the climate of the IP are identified, the impacts of oceanic teleconnections on the temperature and precipitation of the IP are examined, and possible underlying mechanisms are proposed. Finally, expected changes in teleconnections in future climate scenarios are discussed.
In the last chapter, “Regional climate projections over the Iberian Peninsula: climate change scenarios modeling”, the different downscaling techniques employed to project climate scenarios in the IP are described. Regional modeling, in particular, is a key tool for predicting future climate. The IPCC AR4 report establishes several hypothetical scenarios of greenhouse gas emissions5 to conduct experiments with global climate models. Using these scenarios as a starting point and building on the results from global climate models, regional climate models have been implemented to fine tune climate projections in area-limited domains that include the IP. Changes in the mean state of the climate, changes in interannual variability and changes in the frequency of extreme phenomena are examined. Because the IP is a highly complex region, its sensitivity to changes in climate conditions is very high and uncertainties should be considered carefully. Consequently, a validation of the different downscaling techniques is presented to identify the most robust aspects of the projections and a quantification of the various sources of uncertainty is provided.
The report also identifies gaps in knowledge and major uncertainties that need to be resolved in order to increase our confidence in short and long term predictions of future climate and be able to better predict the impacts of future climate changes.
5 See Appendix III for a brief description of them.

CLIVAR – Spain Paleoclimate
9
Chapter 11 REVIEW OF PALEOCLIMATE RECONSTRUCTIONS
IN THE IBERIAN PENINSULA SINCE THE LAST GLACIAL PERIOD
Authors: Isabel Cacho1, Blas Valero Garcés2, Penélope González Sampériz2 1 Dept. of Stratigraphy, Paleontology and Marine Geosciences, Faculty of Geology, University of Barcelona 2 Pyrenean Institute of Ecology, (CSIC).
Contributors: Roberto Bao3, Jordi Catalán4, Guillermo Francés5, Jaume Frigola6, David Gallego Torres7, J. M. García Merino8, Fidel González Rouco9, Joan Grimalt10, Francisco Jiménez Espejo11, José Antonio López Sáez12, Francisca Martínez Ruiz13, Belén Martrat10, Melisa Menéndez14, Marisa Montoya15, Mario Morellón2, Ana Moreno2, Pablo Ortega Montilla15, Sergi Pla4, Mayte Rico2, Julio Rodríguez16, Miguel Ángel Saz Sánchez17, Rainer Zahn18, Caridad Zazo19. 3 Faculty of Science, University of A Coruña 4 Blanes Centre for Advanced Studies (CSIC) 5 Department of Marine Geosciences, University of Vigo 6 Marine Geosciences Consolidated Research Group (GRC), Department of Stratigraphy, University of Barcelona 7 Andalusian Institute of Earth Sciences, Faculty of Sciences, University of Granada 8 Department of Civil Engineering and Construction, Higher Technical School of Civil Engineering, Castilla La Mancha University 9 Department of Earth Physics, Astronomy and Astrophysics II, Complutense University of Madrid 10 Institute of Environmental Assessment and Water Research (CSIC) 11 Institute of Biogeosciences, Japan Agency for Marine-Earth Science and Technology (JAMSTEC), Japan 12 Institute of History, Centre for Human and Social Sciences (CSIC), 13 Andalusian Institute of Earth Sciences, Granada (CSIC) 14 Higher Technical School of Civil Engineering, University of Santander 15 Department of Astrophysics and Atmospheric Sciences, Complutense University of Madrid 16 Department of Stratigraphy and Paleontology, University of the Basque Country 17 Department of Geography and Land Planning, University of Zaragoza 18 Catalan Institute for Research and Advanced Studies (ICREA), Autonomous University of Barcelona 19 National Museum of Natural Science (CSIC)
TABLE OF CONTENTS
1.- Introduction 2.- Impact of the last large climate changes in Iberia 2.1.- Climate conditions during the Last Glacial Maximum (LGM) 2.2.- The climate changes during the deglaciation 2.3.- Can we identify a ‘Holocene Climatic Optimum’ in Iberia? 2.4.- Late Holocene: when and how did the largest Holocene transition take place? 3.- Impact of rapid climate variability in Iberia 3.1.- Glacial variability: Heinrich events and Dansgaard-Oeschger cycles 3.2.- Was there a Younger Dryas in Iberia? 3.3.- The 8.2 kyr event and abrupt Holocene climate variability 3.4.- The last 3000 years 4.- Conclusions 5.- References
Citation: Cacho I., Valero Garcés B. and González Sampériz P., 2010. Review of paleoclimate reconstructions in the Iberian Peninsula since the last glacial period. Report: Climate in Spain: Past, present and future (Editors: Pérez F. Fiz and Boscolo Roberta) pp. 9-24.

Climate in Spain: Past, Present and Future
10
1.- Introduction The climate history of our planet offers unique opportunities for gaining insight into the sensitivity of
a specific region to climate variability and enables us to analyse the processes and forcing mechanisms responsible for regional climate conditions. In the last few decades, there has been intense scientific activity focused on the study of the past climate of the Iberian Peninsula (IP) and its surrounding seas. The importance of this paleoclimate research lies in its capacity to evaluate climate variability beyond the changes recorded during the instrumental period. This chapter aims to give a brief picture of the state of knowledge in paleoclimatology and to summarise the main research results. The first conclusion that can be drawn from this review is that the IP is particularly sensitive to global climate variability at different time scales, both at millennial (glacial-interglacial cycles) and at submillenial (decades-centuries). The paleoclimate reconstructions reviewed in this chapter demonstrated that the climate system can significantly reorganise itself in periods spanning a few human generations. In general, the available reconstructions show that the climate of the Iberian Peninsula has been particularly conditioned by the climate dynamics of the North Atlantic and the synergies between fluctuations of the criosphere (ice volume, meridional limit of sea ice and icebergs), hydrosphere (temperatures of marine currents patterns) and atmosphere (position and intensity of the Azores anticyclone and related wind systems). However, it is worth noting that some detected patterns in the IP climate variability, particularly during the Holocene, appear to be linked with the climatic evolution of North Africa. This suggests a clear influence in the IP of medium and low latitude processes controlled by the dynamics of the tropics. Changes in the precipitation-evaporation balance were particularly significant, even in the Holocene, and some of those fluctuations had a strong impact on human occupation patterns and the development of some civilisations in the IP.
2.- Impact of the last large climate changes in Iberia 2.1.- Climate conditions during the last glacial maximum (LGM) The last glacial maximum (LGM)2, defined as a period of time with a eustatic minimum of 130 m
below current sea level due to the great development of polar ice caps, took place from 19 to 23 kyr BP1 [Mix et al., 2001]. However, in our latitudes this period did not correspond with the most extreme climate conditions (in terms of temperature, aridity or maximum extension of mountain glaciers). Similarly to other mountain systems in southern Europe [Hughes and Woodward, 2008], the LGM does not coincide with the maximum advance of peninsular glaciers [García-Ruiz et al, in press], either in the Pyrenees (> 30,000 cal years BP) [García-Ruiz et al., 2003; González-Sampériz et al., 2006] or in the Cantabrian Mountains (> 35,000 cal years BP3) [Jiménez Sánchez y Farias Arquer, 2002; Moreno et al. 2009a].
The sea surface temperatures of the western Mediterranean Sea during the LGM were about 12.7ºC, that is to say about 6ºC colder than nowadays [Cacho et al., 2001; Martrat et al., 2004], but the maximum cooling conditions during the last 50,000 years occurred during the Heinrich events (HE2) (Fig. 1; see Subsection 4.1). The LGM in the western Mediterranean Sea can be described as a period with glacial temperatures relatively warm and stable; these conditions must have increased the meridional thermal gradients and, coherently, the transport of moisture to higher latitudes with the consequent growth of the ice sheets [Cacho et al., 2001].
Several pollen sequences in the IP show cold and/or arid conditions during the LGM (e.g. Padul [Pons and Reille, 1988]; Banyoles [Pérez-Obiol and Julia, 1994]; Lagoa de Lucenza [Muñoz Sobrino et al., 2001]; Laguna Sanguijuela [Muñoz Sobrino et al., 2004]; Navarrés [Carrión and Van Geel, 1999]; El Portalet [González-Sampériz et al., 2006]). These data from the continent are consistent with the pollen data obtained in marine sequences, showing a development of arid taxa, although less intense than during the HEs (Fig. 1) [Fletcher and Sánchez Goñi, 2008]. Other lacustrine records suggest that although hydrological conditions were relatively arid during this period, the maximum aridity occurred later [Morellón et al., in press] or
2 Last Glacial Maximum, last period of maximum extension of the continental ice caps. 3 BP: Before Present means years before 1950. All the ages presented in this chapter are calendar ages, which means to say that the ages estimated on the basis of 14C datings have been corrected to express them in calendar ages.

CLIVAR – Spain Paleoclimate
11
previously (El Cañizar de Villarquemado, [Valero-Garcés et al., 2007]). Some salt pans in the centre of the Ebro Valley (Table 1) [Valero-Garcés et al., 2000a,b; González-Sampériz et al., 2005] even record phases of greater moisture availability during the LGM, with sediment accumulation and preservation, in contrast to periods of extreme aridity that accentuate eolian erosion and cause sedimentary hiatuses in this type of deposits [González-Sampériz et al., 2008].
Table 1.- Pollen sequences in the IP and their location. Location Geographical Area Bibliographical reference
Banyoles NE – Girona [Pérez-Obiol and Julia, 1994] Cañada del Gitano S – Granada [Carrión et al., 2007] Cueva de Gorham S – Gibraltar [Carrión et al., 2008] El Cañizar de Villarquemado NE – Teruel [Valero-Garcés et al., 2007] El Portalet NE - Huesca – Central Pyrenees
centrales [González-Sampériz et al., 2006]
Enol NW – Asturias [Moreno et al.2009a; c] Hoyos de Iregua N - La Rioja – Iberian System [Gil-García et al., 2002] La Carihuela S – Granada [Carrión et al., 1998: Fernández et al, 2007] Lago Estaña NE – Huesca [Morellón et al. 2008, 2009; in press] Lagoa de Lucenza NW – Lugo [Muñoz Sobrino et al., 2001; Santos et al., 2000] Lagoa Marinho NW – Portugal [Ramil-Rego et al., 1993] Laguna de Villena S – Alicante [Yll et al., 2003] Laguna Sanguijuela NW – Zamora [Muñoz Sobrino et al., 2004] MD95-2043 S – Alboran Sea [Fletcher and Sánchez Goñi, 2008] Navarrés E – Valencia [Carrión and Van Geel, 1999] Padul S- Granada [Pons and Reille, 1988] Quintanar de la Sierra N – Burgos – Iberian System
Ibérico [Peñalba et al., 1997]
Salada de Mediana NE - Zaragoza -Ebro Valley [Valero-Garcés et al., 2000a, b; González-Sampériz et al., 2005] San Rafael S – Almería [Pantaleón-Cano et al., 2003] Sanabria NW – Zamora [Allen et al., 1996] Siles S – Jaén [Carrión, 2002] Tramacastilla NE – Huesca – Central Pyrenees
Centrales [Montserrat-Martí, 1992]
The significant sea level decreased occurred in the Mediterranean basin during the LGM, favored a higher sensitivity to aridity in the region. These marine conditions increased evaporation-precipitation rates, favouring the formation of more saline and dense water masses [Sierro et al., 2005; Cacho et al., 2006], which permitted a good ventilation of the deep western Mediterranean [Jiménez-Espejo et al., 2008]. This increase in density of the Mediterranean masses during the LGM was reflected in an increase in the density and speed of the waters flowing out of the Mediterranean into the Atlantic, as documented by the sedimentary record of the Gulf of Cadiz contourite depositional system [Llave et al., 2006].
2.2.- The climate changes during the deglaciation The last deglaciation brought about the last climate change at a planetary scale, with a widespread
increase in temperatures and in atmospheric concentrations of greenhouse-effect gases, as well as numerous oceanic and atmospheric changes. At regional level, the impact of these changes and their timing were very different, and their precise characterisation is important for identifying the atmospheric and/or marine processes responsible for transfering global climate signatures. In the marine context, the warming associated with the last deglaciation was about 5ºC in the surface waters of the Atlantic margin of the Iberian Peninsula [Cacho et al., 2001; Pailler and Bard, 2002; Martrat et al., 2007] and higher in the Mediterranean basin: about 8ºC in the surface waters of the Alboran Sea (Fig. 1) [Cacho et al., 2001; Martrat et al., 2004] and even greater in central Mediterranean basins such as the Balearic basin [Jiménez-Espejo et al., 2008] or the Tyrrhenian Sea [Cacho et al., 2001]. The deep ocean warmed up as well, some 4ºC in intermediate waters of the North Atlantic and 2ºC in deep Atlantic waters [Rodríguez-Lázaro and Cronin, 1999], as a result of a reorganisation of the deep Atlantic circulation with climate consequences at a global-scale [Martínez-Méndez et al., 2008 and 2009]. It should be stressed that in the IP the onset of the warming associated with the last deglaciation took place at 15.5 kyr BP, in parallel with the warming detected in Greenland and in other North Atlantic records.

Climate in Spain: Past, Present and Future
12
Figure 1. Comparison of different paleoclimate records for the IP and western Mediterranean Sea spanning
most of the last glacial period and the deglaciation. The vertical grey bands highlight the position of the Heinrich and Younger Dryas events. LGM indicates the last glacial maximum. From top to bottom: Oxygen isotopes measured in Greenland in the GISP2 core [Grootes et al., 1993]. Sea surface temperatures of Alboran Sea estimated in the MD95-2043 core [Cacho et al., 1999]. Oxygen isotopes measured in benthic foraminifers in the MD99-2343 core in the north of Menorca [Sierro et al., 2005]. Percentage of pollen from semi-desert vegetation measured in the Alboran Sea MD95-2043 core [Fletcher and Sánchez Goñi, 2008].
Pollen sequences, from both continental and marine records, corroborate this synchrony between the deglaciation in the IP and in the North Atlantic, as they show rapid forest development associated with this transition. The arboreal taxa that characterise these changes are dominated by both conifers and by deciduous trees, which confirms that the rise in temperatures was accompanied by an increase in humidity. This climate pattern appeared in both the north and the south of the IP, and on the Mediterranean and Atlantic sides (Table 1) [Pons and Reille, 1988; Pérez-Obiol and Julia, 1994; Carrión et al., 1998; Muñoz Sobrino et al., 2001; Carrión, 2002; González-Sampériz et al., 2006; Fernández et al., 2007; Fletcher and Sánchez Goñi, 2008]. The increase in humidity during the last deglaciation is also indicated by other sedimentological and geochemical data showing a lake level rise in some sites (Portalet, Estanya, Salada de Mediana) [Morellón et al., 2008] and the dominance of flooding conditions in saline lakes [Valero-Garcés et al., 2000 a and b]. Some studies also indicate that this increase in humidity was accompanied by a warming of the lacustrine waters (El Portalet [González-Sampériz et al., 2006]).
However, a detailed analysis of the pollen records suggests that the characteristics of the warming were not homogeneous all over the Peninsula. In the interior of Iberia, under a more continental climate, the pollen association indicates a relative persistence of arid conditions during the deglaciation and a slow temperature increase [Peñalba et al., 1997; Muñoz Sobrino et al., 2001]. In the south of the Peninsula the pollen spectra reflect a larger and more rapid rise in temperatures [Pons and Reille, 1988; Carrión, 2002;
10 20 30 40 50
-44
-42
-40
-38
-36
-34
8
10
12
14
16
18
20
0
20
40
60
804.8
4.4
4
3.6
3.2
2.8
Albo
ran
Sea
Tem
pera
ture
s (º
C)
Gre
enla
ndIc
e!1
8 OM
inor
cam
argi
nbe
nthi
cfo
ram
inife
rs!1
8 O
Albo
ran
Sea
Polle
nse
mi-d
eser
ticve
geta
tion
Age (Ka BP)
H1 H2 H3 H4 H5YD LGM
Warmertemperatures in
Greenland
Less salty/warmerWestern
MediterraneanDeep Waters
Enhanced aridity in the Southern
Iberian Peninsula
Warmertemperatures in the
Alboran Sea
10 20 30 40 50
-44
-42
-40
-38
-36
-34
8
10
12
14
16
18
20
0
20
40
60
804.8
4.4
4
3.6
3.2
2.8
Albo
ran
Sea
Tem
pera
ture
s (º
C)
Gre
enla
ndIc
e!1
8 OM
inor
cam
argi
nbe
nthi
cfo
ram
inife
rs!1
8 O
Albo
ran
Sea
Polle
nse
mi-d
eser
ticve
geta
tion
Age (Ka BP)
H1 H2 H3 H4 H5YD LGMLGM
Warmertemperatures in
Greenland
Less salty/warmerWestern
MediterraneanDeep Waters
Enhanced aridity in the Southern
Iberian Peninsula
Warmertemperatures in the
Alboran Sea

CLIVAR – Spain Paleoclimate
13
Pantaleón-Cano et al., 2003; Carrión et al., 2008]. In the north and north east of the Peninsula, the reconstructions of the vegetation cover suggest an intermediate situation with a fairly rapid rise in temperatures and in humidity [Pérez-Obiol y Julia, 1994; Montserrat-Martí, 1992; González-Sampériz et al., 2006].
The ventilation of the western Mediterranean Sea is governed by the deep-water formation system in the Gulf of Lion, which is very sensitive to Mediterranean climate conditions. During the last deglaciation, a sharp drop in the ventilation of the western Mediterranean seabed started some 15 kyr ago, and became notably more pronounced at 11 kyr BP [Cacho et al., 2002 and 2006; Jiménez-Espejo et al., 2008]. The increase in humidity probably decreased the evaporation-precipitation rates of the basin thus contributing to a more pronounced water stratification [Frigola et al., 2008], also induced to a large extent by the sea level rise [Rogerson et al., 2008].
2.3.- Did a ‘Holocene climatic optimum’ exist in Iberia? Our current interglacial period, known as Holocene, began 11.7 kyr BP [Walker et al., 2009]. Marine
records around the IP indicate that maximum sea surface temperatures were recorded during the early Holocene, specifically 10–9 kyr BP, with values of 19ºC in the Atlantic margin [Pailler and Bard, 2002; Martrat et al., 2007] and of almost 20ºC in the Alboran Sea [Cacho et al., 2001; Martrat et al., 2004]. These records all indicate that the maximum temperatures were reached at the onset of the Holocene, and since then they have dropped progressively by about 1ºC, but without marking a clear limit that can be defined as a climatic optimum from the point of view of temperature (Fig. 2). In the terrestrial realm it is by far more complicated to establish a precise evolution of Holocene temperatures. Some attempts have been made to reconstruct atmospheric temperatures on the basis of pollen records at European level, but these reconstructions are not representative of peninsular conditions given the scarce number of sites included from this region [Davis et al., 2003]. One reconstruction of high-mountain climate conditions (Lake Redó, Pyrenees) based on chrysophyte stomatocysts as indicators of ‘the altitude anomaly’ that reflects changes in winter - spring climate conditions [Pla and Catalán, 2005] shows numerous oscillations on a scale of hundreds of years during the Holocene but does not single out a Holocene optimum The Lake Redo record shows a relatively stable Holocene temperatures with a slight tendency to warming (Fig. 2) and with maximum values during two events of millenary-scale, one in the early Holocene, around 8.2 kyr BP, and another during Mediaeval climate anomaly (see subsections 3.3 and 3.4).
The existence of a Holocene climatic optimum does seem to have a better definition from the hydrological point of view. Numerous sea and land records suggest that climate conditions at the start of the Holocene were significantly more humid than during the late Holocene. However, it appears that that optimum was not simultaneous all over the Peninsula. In the northern half of Iberia, the most humid moment occurred prior to 8 kyr BP [Allen et al., 1996; González-Sampériz et al., 2006; Montserrat-Martí, 1992; Moreno et al., 2009c; Muñoz Sobrino et al., 2001; Peñalba et al., 1997; Pérez-Obiol and Julia, 1994]. However, in the east (Levante) and south (Mediterranean Iberia) the humidity maximum is somewhat later, from between 7 and 6 kyr BP [Pons and Reille, 1988; Carrión, 2002; Fernández et al., 2007; Carrión et al., 2007 y 2008]. In addition, the onset of the humid conditions of the early Holocene was not simultaneous across the Iberian Peninsula. In some NE areas occurred at 9.5 kyr BP [Morellón et al., 2009] but in south-eastern Spain occurred later, around 8 kyr BP [Pantaleón-Cano et al., 2003].
2.4.- Late Holocene: when and how did the largest Holocene transition take place?
Throughout the Holocene there has been a progressive decrease in seasonal insolation caused by periodical changes in the Earth’s orbit (precession, obliquity and eccentricity parameters). These fluctuations in solar radiation were accompanied by major hydrologic changes in several regions of the planet, mainly associated with changes in the monsoon dynamics. In particular, they have been precisely characterised on the African continent [deMenocal et al., 2000; Kropelin et al., 2008]. In the Mediterranean region, a Holocene transition phase from humid to arid conditions occurred from 7 to 5.5 kyr BP [Jalut et al., 2009], coinciding with the end of the so-called Humid African Period [deMenocal et al., 2000]. Numerous sea and land records

Climate in Spain: Past, Present and Future
14
reflect similar Holocene transition in the context of the IP, but the duration and chronology of that transitional period have significant regional variations.
Western Mediterranean marine records that reflect changes in the intensity of river inputs mark a transition towards more arid conditions at 4 kyr BP [Frigola et al., 2007]. The large majority of continental records have also detected this general aridification of the climate, but there are increasing evidences to indicate that it could have started earlier. For example, the scant preservation of lacustrine records from 7 to 5 kyr BP and the practical absence of them between 5 and 2 kyr BP in Ebro Valley saline lakes deposits, indicates a period of prolonged aridity and intense eolian action during the mid Holocene [González-Sampériz et al., 2008]. The Lake Enol record (NW Spain) indicates well developed and relatively stable forest vegetation in the area during most of the Holocene. However some minor vegetation changes point to more arid conditions at 8.6 kyr BP, and increasing aridity at around 7.5 until 4.6 kyr BP [Moreno et al., 2009c]. This record fits in with other sequences from lakes, peat bogs and soils in the north west of the Peninsula that indicate a major deterioration in vegetative cover and increase in erosive activity between 7 and 5.5 kyr BP. Although it is possible that these changes were amplified by anthropogenic activity and its consequent alteration of the landscape in the region [Martínez-Cortizas et al., 2009], all the records suggest that the dominant climate was dryer and colder between 5.5 and 3.3 kyr BP [Martínez-Cortizas et al., 2009]. In the Pyrenees, Tramacastilla and El Portalet lakes point to an onset of more arid conditions at 8 – 7.5 kyr BP [Montserrat-Martí, 1992; González-Sampériz et al., 2006]. The impact of anthropogenic activity on the landscape in the Pyrenees started at around 4 kyr BP [Montserrat-Martí, 1992], much later than in the case of the Cantabrian region. Coastal archives from the south of the Peninsula also indicate a transition to more arid conditions over the period from 7 to 5 kyr BP [Zazo et al., 2008]. Pollen sequences from Alboran marine cores show the decline of the forest in the south of the peninsula around 5.4 kyr BP, later than previously discussed records [Fletcher and Sánchez Goñi, 2008]. This aridification phase is also detected in continental pollen sequences in the south of Spain, and in some areas it may have been amplified by the human action (Cañada del Gitano, [Carrión et al., 2007]). This Late Holocene transition gave way to relatively arid conditions which reached their maximum expression in the south of the Peninsula between 4.5 and 2.8 kyr BP [Martín-Puertas et al., 2008]. This aridity crisis could have been a significant factor triggering, together with the overexploitation of natural resources, the collapse of the Argaric culture [Carrión et al., 2007].
3.- Impact of rapid climate variability in Iberia 3.1.- Glacial variability: Heinrich Events and Dansgaard-Oeschger Cycles The Dansgaard-Oeschger (D-O) cycles and the HE4, originally described in Greenland and the North
Atlantic, had a strong impact on the oceanography of the western Mediterranean Sea and on the climate of Iberia. The rapid teleconnection existing between the Mediterranean and the North Atlantic, associated with these rapid climate changes, was first identified in the Alboran Sea marine record from a reconstruction of sea-surface temperatures [Cacho et al., 1999]. The HEs are characterized in this record as extremely cold intervals, even colder than the LGM, reaching minimum temperatures of 9ºC [Cacho et al., 1999; Martrat et al., 2004]. The cooling and warming phases of the D-O cycles are represented in the Alboran record as rapid oscillations of up to 4ºC in a few hundred years (Fig. 1).
The morphological and sedimentary characteristics of the Iberian margin are ideal for the formation of high-resolution climate archives thus making possible the obtention of outstanding records to analyse the rapid climate variability of the past, both in the Mediterranean margin and in the Atlantic [Shackleton et al., 2000; Tzedakis et al., 2004; Martrat et al., 2007]. Numerous studies demonstrated that discharges of icebergs from the North Atlantic reached the Atlantic margin of the Iberian Peninsula during the HEs [Eynaud et al., 2009 and references included in this paper]. These discharges of sediments transported by the icebergs have even been identified in the Gulf of Cadiz [Cacho et al., 2001] but not yet in the Mediterranean. However, the presence of polar-origin plankton associated to those cold HEs was evident in the Alboran Sea record [Cacho et al., 1999]. Moreover, the studied salinity proxies confirm the presence of low salinity waters associated to ice-sheet melting that have been traced from the Alboran Sea to the Balearic Sea and the Gulf of Lion
4 HE: Heinrich Events, massive iceberg discharge events and sedimentation of detritus in the North Atlantic.

CLIVAR – Spain Paleoclimate
15
[Rohling et al., 1998; Cacho et al., 1999; Pérez-Folgado et al., 2003; Colmenero-Hidalgo et al., 2004; Sierro et al., 2005].
Figure 2. Comparison of different Holocene paleoclimate records from the IP and western Mediterranean
region. The vertical grey bands highlight some of the rapid climatic events identified in the records, see text in sub-section 3.3. From top to bottom: UP10 index measured in the MD99-2343 marine core north of Minorca and indicator of the intensity of deep-water currents [Frigola et al., 2007]. Salinity index based on the composition of the sediments of Lake Estanya [Morellón et al., 2008]. Altitude index calculated on the basis of the record of remains of crysophytes from Lake Redó in the Eastern Pyrenees [Pla and Catalán, 2005]. Temperatures of Alboran Sea surface waters estimated in the MD95-2043 core [Cacho et al., 2001].
Detailed analysis of the marine sequences has made possible to demonstrate that the rapid changes in the Mediterranean oceanography were accompanied by important atmospheric changes. HEs have been associated with periods of greater transport intensity of African-origin dust, one of the first pieces of evidence of the sensitivity of subtropical areas to the climate variability of the North Atlantic [Moreno et al., 2002]. And rapid changes in primary productivity patterns of the Alboran Sea have also been related with maxima during the warm phases of the D-O. Higher productivity intervals were associated with an increase in the gradient of atmospheric pressures among both sides of the Gibraltar Stait, and the consequent intensification of the marine currents and regional winds [Moreno et al., 2004]. The pollen sequences recovered in these marine cores have produced some exceptionally long and continuous reconstructions of the evolution of vegetation cover in different parts of Iberia and provide the opportunity to establish direct comparison between changes in land and in the ocean. Those studies have shown rapid transformations in the vegetation dynamics in just a few hundred years, in parallel with changes in the ocean (Fig. 1). These cores confirm that, both in the Atlantic and in the Mediterranean margin, during the cold phases of the D-Os and particularly in those associated with the HEs, the steppe vegetation was dominant, reflecting extremely arid and cold conditions [Sánchez Goñi et al., 2000; Roucoux et al., 2001; Sánchez Goñi et al., 2002; Combourieu-Nebout et al., 2002; Roucoux et al., 2005; Fletcher and Sánchez Goñi, 2008].
Min
orca
mar
gin
ÍInde
x of
dee
p cu
rrent
s
Enhanced formation of Western
Mediterranean Deep Water
Enhanced humidity in Northeastern
Iberian Peninsula
Warmer temperatures in the
Northeastern Iberian Peninsula
Warmer temperatures in the
Alboran Sea
Lago
Red
ó (P
yren
ees)
Altit
ude
Anom
alyLa
goEs
tany
a (H
uesc
a)Sa
linity
Inde
xAl
bora
n Se
aTe
mep
ratu
res
(ºC
)
Age (Ka BP)
8.2
0 2 4 6 8 10
17.5
18
18.5
19
19.5
20
200
100
0
-100
-200
20
30
40
50
60
70
-2
-1
0
1
2

Climate in Spain: Past, Present and Future
16
These rapid changes, both in the properties of the surface waters flowing in through the Gibraltar Strait and in the climatic conditions of the Mediterranean basin, also had an effect on the capacity of deep Mediterranean water formation and, hence, on the ventilation rates of the seafloor (Fig. 1). There are now several records that confirm that during the cold phases of the D-Os there was a more intense deep-water formation, and that deep waters were considerably denser than during the warm phases [Cacho et al., 2000; Sierro et al., 2005; Cacho et al., 2006; Frigola et al., 2008]. These changes are associated with variations in the intensity of the north-westerly winds (Tramontana and Mistral) over the Gulf of Lion. This pattern was a little more complex during the HEs due to the entrance of fresh surface waters that reduced the salinity in an extremely arid Mediterranean, thus giving rise to an intermediate model of formation of intermediate waters [Frigola et al., 2008]. Reconstructions from the Gulf of Cadiz indicate that during the cold intervals of D-O cycles the outflow of Mediterranean water was stronger [Llave et al., 2006; Voelker et al., 2006]. These observations lead to hypothesize that the consequent increase in the transfer of salts from the Mediterranean to the Atlantic might have contributed to the re-intensification of the deep Atlantic circulation.
The pollen reconstructions in marine cores provide continuous records of continental climate covering different climatic periods with relatively robust dating precision, usually better constrained that some terrestrial deposits such as lakes, peatbogs or cave formations. However, because pollen is collected from a wide geographical area, these marine sequences mask possible regional differentiations that are better identified from continental records. At present, land records that cover the last glacial period with sufficient resolution and chronological control to identify rapid glacial climate variability are very limited. The El Portalet sequence is perhaps one of the sequences with the highest resolution, although it does not cover the entire glacial period. This sequence confirms that arid and cold conditions predominated in the Pyrenees during the HEs [González-Sampériz et al., 2006]. It is worth noting that records from the Pyrenees and from the Cantabrian mountains, including new data on speleothems, indicate that the period of maximum aridity during the last 30 kyr was associated with the so-called ‘Mystery Interval’5 that includes the HE1 [Morellón et al., in press; Moreno et al., 2009c]. These data are consistent with reconstructions of denser deep Mediterranean waters during this interval, just before the influence of melting waters associated to the HE1 reached the Mediterranean [Cacho et al., 2006].
3.2.- Was there a Younger Dryas in Iberia? The Younger Dryas (YD), which occurred from 13 to 11.5 kyr BP, is perhaps the most widely studied
period of rapid climate change in the world. The YD had the peculiarity of interrupting the warming associated with the last deglaciation, provoking semi-glacial conditions, just at a time when the insolation received in the Northern Hemisphere was maximum due to the combination of orbital parameters. Although there are still many uncertainties about the YD, it is clear that it was associated with a rapid reorganisation in the North Atlantic circulation pattern [Hughen et al., 2000]. Although some paleoclimate record from the IP and the Mediterranean have not identified any change associated with the YD, the constant increase in the sampling resolution together with the improvement in chronostratigraphies have demonstrated that the YD event did have a notable impact, albeit with significant regional variations. In many aspects, the changes associated with the YD were similar in nature to those that took place during the HEs, but with some clear differences.
The YD has been identified in pollen records from practically all over the Peninsula: i) in the north and west mountains [Allen et al., 1996; Ramil-Rego et al., 1998; Santos et al., 2000; Muñoz Sobrino et al., 2001; Vegas et al., 2003; Moreno et al., 2009c]; ii) in the Iberian Range [Peñalba et al., 1997; Gil-García et al., 2007]; iii) the Pyrenees and north east regions [Pérez-Obiol and Julia, 1994; González-Sampériz et al., 2006]; iv) the east and south [Pons and Reille, 1988; Carrión and Van Geel, 1999; Yll et al., 2003]. In general, these records indicate conditions of relative aridity, and possibly colder temperatures as well, but of a lower intensity to those detected during HE1 and other previous HEs [Fletcher and Sánchez Goñi, 2008; Morellón et al., 2009]. The studied continental records present a high variability in the vegetation response, which is not always synchronic. That may be due to the different sampling resolution, the existence of vegetation refuges
5 “Mystery Interval”, the name that has been given to the period 17.5—14.4 kyr BP which stretches from the end of the last glacial maximum to the start of the deglaciation in Greenland. This period includes HE 1 [Denton et al., 2006].

CLIVAR – Spain Paleoclimate
17
near the sequence studied, or to a different sensitivity of the local vegetation that would determine a variable response in the signal to the same disturbance.
The arid nature of the YD also shows up in the marine records, as is the case of the Alghero-Provençal basin [Jiménez-Espejo et al., 2007 and 2008]. Some indicators suggest that this period was associated with a high variability in river transport, with peaks that would indicate higher erosion, when arid conditions were dominant. The YD is represented by a 3ºC cooling in the record of Alboran SST [Cacho et al., 2001] and by an increase in primary productivity, both in the Alboran Sea [Bárcena et al., 2001] and in the Alghero-Provençal basin [Jiménez-Espejo et al., 2008]. These changes have been associated with a strengthening of the water influx from the Atlantic caused by an intensification of local winds, a situation that gave rise to vertical mixing and fertilisation of the surface waters.
In the mountains of the Peninsula, post-LGM morainic sequences have been described and some of them have been ascribed to the YD. However, there are still no absolute chronologies that confirm that this phase of glacier advance really corresponds to the YD. The available records seem to indicate that the duration of the YD had a considerable diachrony at regional level, with several internal phases. However, higher resolution records with accurate chronologies are necessary to better characterise these differences.
3.3.- The 8.2 kyr event and abrupt Holocene climate variability Most Holocene climate records show rapid oscillations, from decades to hundreds of years, that
significantly altered climate conditions although, again, with marked regional differences [Mayewski et al., 2004]. The oscillation that has attracted most interest is the so-called 8.2 event, the most intense Holocene event in the Greenland record but with large regional variability in terms of timing and impacts. [Rohling and Palike, 2005]. In the context of the IP, this event is not evident in most of the continental pollen sequences. However, in some examples an increase in the aridity associated with the 8.2 event has been suggested, as observed in Laguna Medina, Cadiz [Reed et al., 2001] in the south or Lake Estanya [Morellón et al., 2009] in the northeast. In the Pyrenees it appears as an arid and cold event [González-Sampériz et al., 2006] although the colder temperatures are not evident for at least the winter and spring seasons according to the Lake Redó record [Pla and Catalán, 2005]. Despite the relative scarcity of paleoclimate records that show the impact of the 8.2 event, there are archaeological evidences that indicate a change in the distribution of prehistoric settlements in the Ebro Valley at this time. At around 8.2 kyr BP, a widespread depopulation of the low land areas of the SE Ebro valley (the region known as ‘Bajo Aragón’) occurred, synchronous to the appearance of new settlements at higher altitude in nearby mountainous areas. This evolution has been associated with an increase in the aridity that forced the groups of hunter-gatherers to move to areas less limited in water resources [González-Sampériz et al., 2009]. This example highlights the significantimpact that a relatively modest climate oscillation can have on the development of human societies.
The 8.2 event can be identified more clearly in the marine records. Reconstructions of Alboran sea surface temperatures indicate a cooling of about 1ºC [Cacho et al., 2001] (Fig. 2). This event has also been associated with a drop in the marine productivity of the Alghero-Balearic basin [Jiménez-Espejo et al., 2008]. But the greatest change in the western Mediterranean Sea associated with the 8.2 event is a phase of bottom water ventilation, thus ending the last great phase of relative stagnation that had started with the deglaciation [Cacho et al., 2002; Rogerson et al., 2008]. These marine data would confirm that the 8.2 event would have been accompanied by a change in the regional climate towards greater aridity and cooler temperatures which would potentially strengthen the formation of western deep waters.
More recent research papers point out that the 8.2 is not the only Holocene rapid climate variability event, but that a whole series of events took place. Some of them are evident with greater intensity than others and seem to be easier to correlate between different records (Fig. 2). For example, there are three Holocene events that stand out in the Alboran Sea record because of their intense cooling (8.2 kyr, 5.5 kyr and 1.3 kyr BP) and they occurred during relatively arid phases (Fig. 2). However these three cold events are not the most intense in other records more sensitive to aridity fluctuations, showing other Holocene events with comparable or even greater aridity. That is an indicator that the intensification of the cooling and of the aridity were not proportional, and that some aridification phases occurred in periods with relatively high temperatures (Fig. 2). In any case, more high resolution and well-dated sequences would be necessary to establish regional climate change patterns with precision during the Holocene.

Climate in Spain: Past, Present and Future
18
3.4.- The last 3000 years The last 3000 years6 are particularly relevant since paleoclimate records can be compared with historic
or even instrumental records. During the last three millennia a series of global climatic oscillations have been described on a scale of centuries and decades [Verschuren et al., 2000; Mann and Jones, 2003; Osbom, 2006; Valero-Garcés et al., 2006]. Among these oscillations, the Iberian-Roman Humid Period7, the Mediaeval Climate Anomaly8 and the Little Ice Age9 had a strong impact on the hydrological cycle, although their influence at regional scale has only just started to be characterised [Cheddadi et al., 1997; González-Sampériz et al., 2008]. This kind of climate variability has been associated with changes in solar activity and, currently, a relation with changes in the interannual climate variability patterns such as the NAO (North Atlantic Oscillation) is under discussion [Shindell et al., 2001; Kirov and Georgieva, 2002; Bard and Frank, 2006].
In the context of the IP, it has been possible to obtain records for the last two millennia from peatbogs [Martínez-Cortizas et al., 1999], from river deposits [Benito et al., 2003], the Tagus Prodelta and Galician Rías [Desprat et al., 2003; Álvarez et al., 2005; Abrantes et al., 2005; Lebreiro et al., 2006; Bérnardez et al., 2008 a and b], coastal sediments [Bao et al., 2007], the Mediterranean Sea [Frigola et al., 2007], geomorphological studies in the Ebro Basin [Gutiérrez-Elorza y Peña-Monné, 1998], and numerous studies of lakes: Estanya [Morellón et al., 2008; Riera et al., 2004], Redó [Pla y Catalán, 2005], Las Tablas de Daimiel [Gil- García et al., 2007], Sanabria [Luque y Julià, 2002], Doñana National Park [Sousa and García-Murillo, 2003], Archidona [Luque et al., 2004], Chiprana [Valero-Garcés et al., 2000c], Zoñar [Valero-Garcés et al., 2006; Martín-Puertas et al., 2008], and Taravilla [Moreno et al., 2008; Valero-Garcés et al., 2008].
In general, the records available show great variability at a decadal scale during the last 2000 years. The Iberian-Roman Humid Period is especially well characterised in a lacustrine record from the south (Zoñar) [Martín-Puertas et al., 2009] where it has been possible to identify its structure in a varved sequence: (i) a transition with progressive increase in humidity from 2600 to 2460 BP; (ii) the most humid interval from 2460 to 2140 BP; (iii) an arid interval that corresponds with the imperial Roman epoch from 2140 to 1800 BP; and (iv) a final humid period from 1800 to 1600 BP. This latter period was the most humid period in the last 3500 years in the IP. The Mediaeval Climate Anomaly (IX- XV centuries) has been detected in various records as a relatively arid period, for example in Estanya, [Morellón et al., 2009]) and Zoñar lakes [Martín-Puertas et al., 2009]. In addition, geochemical data obtained in a peatbog from the IP northwest indicate relatively warm temperatures [Martínez-Cortizas et al., 1999] and in the Pyrenees the warmest winters of the Holocene [Pla and Catalán, 2005].
The transition bewteen the Mediaeval Climate Anomaly and the Little Ice Age (from 1400 to 1600 years BP) is well marked in Atlantic marine records (Vigo and Muros Rías, Tagus prodelta), although there seem to be significant latitudinal differences, or interference between marine factors (upwelling of deep waters and productivity) and land factors (changes in river input) [e.g. Abrantes et al., 2005; Diz et al., 2002]. The onset of the Little Ice Age is characterised in the continental records by an increase in water availability [Moreno et al., 2008; Benito et al., 2003]. Although the drop in temperatures that occurred during the Little Ice Age should have provoked a decrease in the evaporation rates in Mediterranean areas during the summertime, the significant increase in aquifer recharge indicated by several records from karstic lakes (Lake La Cruz [Julià et al., 1998]; Taravilla [Moreno et al., 2008]; Zoñar [Martín-Puertas et al., 2008]; Estanya [Morellón et al., in press]), suggests an increase in winter precipitation. Such a situation could be a consequence of the increase in westerly winds and a prevalence of negative NAO conditions. These lacustrine records are coherent with the others obtained from the upper basin of the River Tagus (Taravilla Lake) and from its mouth (Tagus Prodelta), which reveal an increase in the frequency of paleoflood events in the Little Ice Age, consistently with the predominance of negative values of the NAO index [Moreno et al., 2008; Lebreiro et al., 2006]. The record from Lake Redó (Pyrenees) [Pla and Catalán, 2005] also shows cold but oscillating temperature during the Little Ice Age. And advance of the glaciers in the Pyrenees [Chueca Cía et al., 2005] and also in Sierra Nevada [Gómez Ortiz et al., 1996] occurred during the LIA.
6 The last 3000 years refer to years BP and it correspond to the time from the year 1050 BC to the present day. 7 Iberian-Roman Humid Period: 2600-1600 year BP. 8 Mediaeval Climate Anomaly (Mediaeval Warm Period) years 550-1300 of our era or years AD. 9 Little Ice Age, years 1300-1850 of our era or years AD.

CLIVAR – Spain Paleoclimate
19
Climate variability in the last millennia has also been correlated with changes in solar activity: periods of maximum aridity coincide with phases of maximum solar activity as during the Mediaeval Climate Anomaly, and more humid conditions correspond with periods of less solar activity as during the Little Ice Age10 [Magny et al., 2008; Martín-Puertas et al., 2008; Morellón et al., in press].
Instrumental temperature records during the last 150 years, historical documents and dendrochronological data show the recent changes in the frequency of extreme events [Brunet et al., 2006], [Barriendos and Martín-Vide, 1998] [Saz, 2003]) and the influence of the NAO on droughts in the NE of the Peninsula from 1600 [Vicente-Serrano and Cuadrat, 2007]. These records show increases in temperature and precipitation during the 14th century11 and an increase in the precipitation on the Mediterranean coast towards the end of the 16th, 18th centuries12 and during the second half of the 19th century13.
4.- Conclusions The last glaciation and deglaciation had a great impact on the climate of the Iberian Peninsula and
adjacent seas. Sea surface temperatures during the last glacial maximum were about 6ºC colder than at present, and the dominant climate was far more arid. However, this was neither the period of maximum extent of the mountain glaciers of the IP, or the more extreme climate conditions. Instead, the lowest temperatures and the most arid conditions were reached during the HEs, particularly during HE1 and the so-called ‘Mystery Interval’. The deglaciation produced widespread warming and an increase in humidity, albeit with different intensities and timing all over the Iberian Peninsula. Available records suggest that southern Iberia was the region where the warming was faster and more intense.
Although the thermal variability was relatively small, at least in the ocean (about 1 to 1.5ºC), the maximum temperatures during the Holocene were reached in its initial phase. The most pronounced Holocene climate changes in the Peninsula were related to moisture fluctuations. The Early Holocene in Iberia was a relatively humid period, in contrast to the more arid mid Holocene. Despite the fact that a mid Holocene humid-arid transition occurred in most Iberian records, the timing and intensity have a clear regional variability. In the north, the humidity began to decrease at 8.6 kyr BP, while in the south it took place later, between 7 and 5 kyr BP. Most Iberian paleoclimate reconstructions indicate that around 4 kyr BP, widespread conditions of relative aridity were already installed. In in the southern regions of the IP there are evidences of a major environmental crisis associated with the extinction of the Argaric culture during a period of increase aridity and overexploitation of natural resources.
Many studies indicate that the IP and the western Mediterranean Sea were both intensely affected by rapid past climate changes (a few hundred years) particularly intense during the last glacial period and following the North Atlantic patterns and cycles of climate variation. That evidences the strong climatic connection between these two regions that occurred both via ocean processes (for example, changes in SST temperatures, and interchange of waters through the Gibraltar Strait) as well as via atmosphere (changes in westerlies intensity and location). Many marine and continental records emphasize that the HEs were the most extreme climatic periods in terms of cold and aridity, even more than the last glacial maximum.
Rapid climate variability has also been present during the Holocene, albeit with less intensity and hence, with a signal harder to identify. The Holocene event of 8.2 kyr BP has been identified in few continental records as an increase in aridity and slight cooling, whereas in marine records it is characterized by significant changes in the circulation patterns and marine productivity. Despite the relatively modest impact of the 8.2 event on continental climate, archaeological data indicate that it might have had a great impact on the distribution of human settlements in some regions of the Peninsula such as the Ebro Valley. Besides the 8.2 event, a number of Holocene rapid climate change periods have been identified in the IP. Particularly during
10 Wolf (1282-1342 AD), (onset of the Little Ice Age), Sporer (1460-1550 AD), Maunder (1645-1715 AD), and Dalton (1790-1830 AD) minima 11 14th century: 650-550 years BP; 1300-1400 years AD. 12 16th century: 450-350 years BP; 1500-1600 years AD. 18th century: 250-150 years BP; 1700-1800 years AD. 13 Second half of the 19th century: 100-50 years BP; 1850-1900 years AD.

Climate in Spain: Past, Present and Future
20
the Iberian-Roman Humid Period, the Mediaeval Warm Period and the Little Ice large hydrological impacts have occurred in the IP.
The paleoclimate research summarized in this chapter demonstrate the variability of the Iberian Peninsula climate in a wide range of past climate scenarios. The results highlight the high sensitivity of the regional climate and the rapid response of the land and marine ecosystems to changes in the North Atlantic region, particularly in the oceanic circulation, SST temperatures and atmospheric circulation patterns. The main potential of the palaeoclimatic research lies, therefore, in the discovery and identification of the primary processes, forcings and associated feedback mechanisms that controlled the climate of the IP in the past. In order to fully exploit this potential, the integration of palaeo-data with numerical models and instrumental data in the IP are needed. Such an integrated endeavour will eventually help to better evaluate climate scenarios that are simulated with numerical models and gain a better understanding of possible future climates changes and regional impact in the IP.
5.- References: Abrantes, F., Lebreiro, S., Rodrigues, T., Gil, I., Bartels-Jónsdóttir, H., Oliveira, P., Kissel, C., and Grimalt, J.O. (2005), Shallow-
marine sediment cores record climate variability and earthquake activity off Lisbon (Portugal) for the last 2000 years, Quaternary Science Reviews, 24, 2477.
Álvarez, M. C., Flores, J.A., Sierro, F. J., Diz, P., Francés, G., Pelejero, C., and Grimalt, J. (2005), Millennial surface water dynamics in the Ría de Vigo during the last 3000 years as revealed by coccoliths and molecular biomarkers, Palaeogeography, Palaeoclimatology, Palaeoecology, 218, 1.
Allen, J. R. M., Huntley, B., and Watts, W. A. (1996), The vegetation and climate of northwest Iberia over the last 14,000 years, Journal of Quaternary Science, 11, 125-147.
Bao, R., Alonso, A., Delgado, C., and Pages, J. L. (2007), Identification of the main driving mechanisms in the evolution of a small coastal wetland (Traba, Galicia, NW Spain) since its origin 5700 cal yr BP, Palaeogeography, Palaeoclimatology, Palaeoecology, 247, 296-312.
Bárcena, M. A., Cacho, I., Abrantes, F., Sierro F. J., Grimalt, J. O., and Flores J. A. (2001), Paleoproductivity variations related to climatic conditions in the Alboran Sea (Western Mediterranean) during the last Glacial-Interglacial transition. Diatom record, Palaeogeography, Palaeoclimatology, Palaeoecology, 167, 337-357.
Bard, E., and Frank, M. (2006), Climate change and solar variability: What's new under the sun? Earth and Planetary Science Letters, 248, 1.
Barriendos, M., and Martín-Vide, J. (1998), Secular Climatic Oscillations as Indicated by Catastrophic Floods in the Spanish Mediterranean Coastal Area (14th–19th Centuries), Climatic Change, 38, 473–491.
Benito, G., Díez-Herrero, A., and Fernández de Villalta, M. (2003), Magnitude and Frequency of Flooding in the Tagus Basin (Central Spain) over the Last Millennium, Climatic Change, 58, 171.
Bernárdez, P., González-Alvarez, R., Francés, G., Prego, R., Bárcena, M. A., and Romero, O. E. (2008a), Palaeoproductivity changes and upwelling variability in the Galicia Mud Patch during the last 5000 years: geochemical and microfloral evidence, The Holocene, 18, 1207-1218.
Bernárdez, P., González-Álvarez, R., Francés G., Prego, R., Bárcena, M. A., and Romero, O. E. (2008b), Late Holocene history of the rainfall in the NW Iberian peninsula--Evidence from a marine record, Journal of Marine Systems, 72, 366.
Brunet, M., Saladié, O., Jones, P., Sigró J., Aguilar E., Moberg A., Lister, D., Walther, A. M., Lopez, D., and Almarza, C. (2006), The development of a new dataset of Spanish daily adjusted temperature series (SDATS) (1850-2003), International Journal of Climatology, 26, 1777-1802.
Cacho, I., Grimalt, J. O., and Canals, M. (2002), Response of the western Mediterranean Sea to the rapid climatic variability that occurred during the last 50,000 years. A molecular biomarker approach, Journal of Marine Systems, 33-34, 253-272.
Cacho, I., Grimalt, J. O., Canals, M., Sbaffi L., Shackleton, N. J., Schönfeld J., and Zahn R. (2001), Variability of the western Mediterranean Sea surface temperatures during the last 25,000 years and its connection with the northern hemisphere climatic changes, Paleoceanography, 16, 40-52.
Cacho, I., J. O. Grimalt, Pelejero, C., Canals, M., Sierro, F. J., Flores, J. A., and Shackleton, N. J. (1999), Dansgaard-Oeschger and Heinrich event imprints in the Alboran Sea paleotemperatures, Paleoceanography, 14, 698-705.
Cacho, I., Grimalt, J. O., Sierro, F. J., Shackleton, N. J., and Canals, M. (2000), Evidence of enhanced Mediterranean thermohaline circulation during rapid climatic coolings, Earth and Planetary Science Letters, 183, 417-429.
Cacho, I., Shackleton, N., Elderfield, H., Sierro, F. J., and Grimalt, J. O. (2006), Glacial rapid variability in deep-water temperature and !18O from the Western Mediterranean Sea, Quaternary Science Reviews, 25, 3294-3311.
Carrión, J., Munuera, M., and Navarro, C. (1998), The palaeoenvironment of Carihuela Cave (Granada, Spain): a reconstruction on the basis of palynological investigations of cave sediments, Review of Palaeobotany and Palynology, 99, 317.
Carrión, J. S. (2002), Patterns and processes of Late Quaternary environmental change in a montane region of southwestern Europe, Quaternary Science Reviews, 21, 2047-2066.
Carrión, J. S., Finlayson, C., Fernández, S., Finlayson, G., Allué, E., López-Sáez, J. A., López-García, P., Gil-Romera, G., Bailey, G., and González-Sampériz, P. (2008), A coastal reservoir of biodiversity for Upper Pleistocene human populations: palaeoecological investigations in Gorham's Cave (Gibraltar) in the context of the Iberian Peninsula, Quaternary Science Reviews, 27, 2118.

CLIVAR – Spain Paleoclimate
21
Carrión, J. S., Fuentes, N., Gonzalez-Sampériz, P., Sánchez Quirante, L., Finlayson, J. C., Fernández, S., and Andrade, A. (2007), Holocene environmental change in a montane region of southern Europe with a long history of human settlement, Quaternary Science Reviews, 26, 1455.
Carrión, J. S., and Van Geel, B. (1999), Fine-resolution Upper Weichselian and Holocene palynological record from Navarrés (Valencia, Spain) and a discussion about factors of Mediterranean forest succession, Review of Palaeobotany and Palynology, 106, 209.
Colmenero-Hidalgo, E., Flores, J.-A., Sierro, F. J., Bárcena, M. Á., Löwemark, L., Schönfeld, J., and Grimalt, J. O. (2004), Ocean surface water response to short-term climate changes revealed by coccolithophores from the Gulf of Cadiz (NE Atlantic) and Alboran Sea (W Mediterranean), Palaeogeography, Palaeoclimatology, Palaeoecology, 205, 317-336.
Combourieu-Nebout, N., Turon, J., Zahn, R., Capotondi, L., Londeix, L., and Pahnke, K. (2002), Enhanced aridity and atmospheric high-pressure stability over the western Mediterranean during the North Atlantic cold events of the past 50 k.y., Geology, 30, 863-866.
Cheddadi, R., Yu, G., Guiot, J., Harrison, S. P., and Prentice, I. C. (1997), The climate of Europe 6000 years ago, Climate Dynamics, 13, 1-9.
Chueca Cía, J., Julián Andrés, A., Saz Sánchez, M. A., Creus Novauc, J., and López-Moreno, J. I. (2005), Responses to climatic changes since the Little Ice Age on Maladeta Glacier (Central Pyrenees), Geomorphology, 68, 167-182.
Davis, B. A. S., Brewer, S., Stevenson, A. C., and Guiot, J. (2003), The temperature of Europe during the Holocene reconstructed from pollen data, Quaternary Science Reviews, 22, 1701.
deMenocal, P., Ortiz, J., Guilderson, T. P., Adkins, J., Sarnthein, M., Baker, L., and Yarusinsky, M. (2000), Abrupt onset and termination of the African Humid Period: rapid climate responses to gradual insolation forcing, Quaternary Science Reviews, 19, 347-361.
Denton, G., Broecker, W. S., and Alley, R. (2006), The mystery interval 17.5 to 14.5 kyrs ago, PAGES News, 14, 14-16. Desprat, S., Sánchez Goñi, M. F., and Loutre, M.-F. (2003), Revealing climatic variability of the last three millennia in northwestern
Iberia using pollen influx data, Earth and Planetary Science Letters, 213, 63. Diz, P., Francés, G., Pelejero, C., Grimalt, J. O., and Vilas, F. (2002), The last 3000 years in the Ria de Vigo (NW Iberian Margin):
climatic and hydrographic signals, The Holocene, 12, 459-468. Eynaud, F., de Abreu, L. c., Voelker, A., Schönfeld, J., Salgueiro, E., Turon, J.-L., Penaud, A. l., Toucanne, S., Naughton, F., Sánchez
Goñi, M. F., Malaizé, B., and Cacho, I. (2009), Position of the Polar Front along the western Iberian margin during key cold episodes of the last 45 ka, Geochem. Geophys. Geosyst., 10, Q07U05, doi:10.1029/2009GC002398.
Fernández, S., Fuentes, N., Carrión, J. S., González-Sampériz, P., Montoya, E., Gil, G., Vega-Toscano, G., and Riquelme, J. A. (2007), The Holocene and Upper Pleistocene pollen sequence of Carihuela Cave, southern Spain, Geobios, 40, 75.
Fletcher, W. J. and Sánchez Goñi, M. F. (2008), Orbital- and sub-orbital-scale climate impacts on vegetation of the western Mediterranean basin over the last 48,000 yr, Quaternary Research, 70, 451.
Frigola, J., Moreno, A., Cacho, I., Canals, M., Sierro, F. J., Flores, J. A., and Grimalt, J. O. (2008), Evidence of abrupt changes in Western Mediterranean Deep Water circulation during the last 50 kyr: A high-resolution marine record from the Balearic Sea, Quaternary International, 181, 88-104.
Frigola, J., Moreno, A., Cacho, I., Canals, M., Sierro, F. J., Flores, J. A., Grimalt, J. O., Hodell, D. A., and Curtis, J. H. (2007), Holocene climate variability in the Western Mediterranean Sea from a deep-water sediment record, Paleoceanography, 22, doi:10.1029/2006PA001307.
García-Ruiz, J. M., Moreno, A., González-Sampériz, P., Valero-Garcés, B., and Martí-Bono, C. (2010), La cronología del último ciclo glaciar en las montañas del sur de Europa. Una revisión., Cuaternario y Geomorfología. 24(1-2), 35-46.
García-Ruiz, J. M., Valero-Garcés, B. L., Martí-Bono, C., and González-Sampériz, P. (2003), Asynchroneity of maximum glacier advances in the central Spanish Pyrenees, Journal of Quaternary Science, 18, 61-72.
Gil-García, M.J., Dorado, M., Valdeolmillos, A., Ruiz-Zapata, M. B., 2002. Late-glacial and Holocene palaeoclimatic record from Sierra de Cebollera (northern Iberian Range, Spain). Quaternary International 93/94, 13-18.
Gil-García, M., Ruiz Zapata, M., Santisteban, J., Mediavilla, R., López-Pamo, E., and Dabrio, C. (2007), Late holocene environments in Las Tablas de Daimiel (south central Iberian peninsula, Spain), Vegetation History and Archaeobotany, 16, 241-250.
Gómez Ortiz, A., Schulte, L., and Salvador Franch, F. (1996), Contribución al conocimiento de la deglaciación reciente y morfología asociada del Corral del Veleta (Sierra Nevada), Cadernos Laboratorio Xeológico de Laxe, 21, 543-558.
González-Sampériz, P., Valero-Garcés, B.L., Carrión, J.S., Peña-Monné, J.L., García-Ruiz, J.M., Martí-Bono, C., (2005). Glacial and Lateglacial vegetation in northeastern Spain: New data and a review. Quaternary International 140/141, 4-20.
González-Sampériz, P., Utrilla, P., Mazo, C., Valero-Garcés, B., Sopena, M. C., Morellón, M., Sebastián, M., Moreno, A., and Martínez-Bea, M. (2009), Patterns of human occupation during the early Holocene in the Central Ebro Basin (NE Spain) in response to the 8.2 ka climatic event, Quaternary Research, 71, 121.
González-Sampériz, P., Valero-Garces, B. L., Moreno, A., Jalut, G., Garcia-Ruiz, J. M., Marti-Bono, C., Delgado-Huertas, A., Navas, A., Otto, T., and Dedoubat, J. J. (2006), Climate variability in the Spanish Pyrenees during the last 30,000 yr revealed by the El Portalet sequence, Quaternary Research, 66, 38.
González-Sampériz, P., Valero-Garcés, B. L., Moreno, A., Morellón, M., Navas, A., Machín, J., and Delgado-Huertas, A. (2008), Vegetation changes and hydrological fluctuations in the Central Ebro Basin (NE Spain) since the Late Glacial period: Saline lake records, Palaeogeography, Palaeoclimatology, Palaeoecology, 259, 157.
Grootes, P. M., Stuiver, M., White, J. W. C., Johnsen, S., and Jouzel, J. (1993), Comparison of oxygen isotope records from the GISP2 and GRIP Greenland ice cores, Nature, 366, 552-554.
Gutiérrez-Elorza, M., and J. L. Peña-Monné (1998), Geomorphology and late Holocene climatic change in Northeastern Spain, Geomorphology, 23, 205-217.
Hughen, K. A., Southon, J., Lehman, S. J., and Overpeck, J. T. (2000), Synchronous radiocarbon and climate shifts during the last deglaciation, Science, 290, 1951-1954.

Climate in Spain: Past, Present and Future
22
Hughes, P. D. and Woodward, J. C. (2008), Timing of glaciation in the Mediterranean mountains during the last cold stage, Journal of Quaternary Science, 23, 575-588.
Jalut, G., Dedoubat, J. J., Fontugne, M., and Otto, T. (2009), Holocene circum-Mediterranean vegetation changes: Climate forcing and human impact, Quaternary International, 200, 4.
Jiménez-Espejo, F. J., Martínez-Ruiz, F., Rogerson, M., González-Donoso, J. M., Romero, O. E., Linares, D., Sakamoto, T., Gallego-Torres, D., Rueda Ruiz, J. L., Ortega-Huertas, M., and Pérez Claros, J. A. (2008), Detrital input, productivity fluctuations, and water mass circulation in the westernmost Mediterranean Sea since the Last Glacial Maximum, Geochem. Geophys. Geosyst., 9.
Jiménez-Espejo, F. J., Martínez-Ruiz, F., Sakamoto, T., Iijima, K., Gallego-Torres, D., and Harada, N. (2007), Paleoenvironmental changes in the western Mediterranean since the last glacial maximum: High resolution multiproxy record from the Algero-Balearic basin, Palaeogeography, Palaeoclimatology, Palaeoecology, 246, 292.
Jiménez Sánchez, M., and Farias Arquer, P. (2002), New radiometric and geomorphologic evidences of a last glacial maximum older than 18 ka in SW European mountains: the example of Redes Natural Park (Cantabrian Mountains, NW Spain), Geodinamica Acta, 15, 93.
Julià, R., Burjachs, F., Dasí, M. J., Mezquita, F., Miracle, M. R., Roca, J. R., Seret, G., and Vicente, E. (1998), Meromixis origin and recent trophic evolution in the Spanish mountain lake La Cruz, Aquatic Sciences - Research Across Boundaries, 60, 279-299.
Kirov, B., and Georgieva, K. (2002), Long term variations and interrelations of ENSO, NAO and solar activity, Physics and Chemistry of the Earth, 27, 441–448.
Kropelin, S., Verschuren, D., Lezine, A. M., Eggermont, H., Cocquyt, C., Francus, P., Cazet, J. P., Fagot, M., Rumes, B., Russell, J. M., Darius, F., Conley, D. J., Schuster, M., von Suchodoletz, H., and Engstrom, D. R. (2008), Climate-Driven Ecosystem Succession in the Sahara: The Past 6000 Years, Science, 320, 765-768.
Lebreiro, S. M., Francés, G., Abrantes, F. F. G., Diz, P., Bartels-Jonsdottir, H. B., Stroynowski, Z. N., Gil, I. M., Pena, L. D., Rodrigues, T., Jones, P. D., Nombela, M. A., Alejo, I., Briffa, K. R., Harris, I., and Grimalt, J. O. (2006), Climate change and coastal hydrographic response along the Atlantic Iberian margin (Tagus Prodelta and Muros Ria) during the last two millennia, The Holocene, 16, 1003-1015.
Luque, J. A., and Julià, R. (2002), Lake sediment response to land-use and climate change during the last 1000 years in the oligotrophic Lake Sanabria (northwest of Iberian Peninsula), Sedimentary Geology, 148, 343-355.
Luque, J. A., Julià, R., Riera, S., Marqués, M. A., López-Sáez, J. A., Mezquita, F. (2004), Respuesta sedimentológica a los cambios ambientales de épocas históricas en el sur de la Península Ibérica: La secuencia de la Laguna Grande de Archidona (Málaga), Geotemas, 6, 113-116.
Llave, E., Schonfeld, J., Hernández-Molina, F. J., Mulder, T., Somoza, L., Diaz del Río, V., and Sánchez-Almazo, I. (2006), High-resolution stratigraphy of the Mediterranean outflow contourite system in the Gulf of Cadiz during the late Pleistocene: The impact of Heinrich events, Marine Geology, 227, 241-262.
Magny, M., Gauthier, E., Vanniere, B., and Peyron, O. (2008), Palaeohydrological changes and human-impact history over the last millennium recorded at Lake Joux in the Jura Mountains, Switzerland, The Holocene, 18, 255-265.
Mann, M. E., and Jones, P. D. (2003), Global surface temperatures over the past two millennia, Geophysical Research Letters, 30, doi:10.1029/2003GL017814.
Martín-Puertas, C., Valero-Garcés, B. L., Brauer, A., Mata, M. P., Delgado-Huertas, A., and Dulski, P. (2009), The Iberian-Roman Humid Period (2600-1600 cal yr BP) in the Zoñar Lake varve record (Andalucía, southern Spain), Quaternary Research, 71, 108-120.
Martín-Puertas, C., Valero-Garces, B. L., Pilar Mata, M., Gonzalez-Sampériz, P., Bao, R., Moreno, A., and Stefanova, V. (2008), Arid and humid phases in southern Spain during the last 4000 years: the Zonar Lake record, Cordoba, The Holocene, 18, 907-921.
Martínez-Cortizas, A., Costa-Casais, M., and López-Sáez, J. A. (2009), Environmental change in NW Iberia between 7000 and 500 cal BC, Quaternary International, 200, 77.
Martínez-Cortizas, A., Pontevedra-Pombal, X., García-Rodeja, E., Nóvoa-Muñoz, J. C., and Shotyk, W. (1999), Mercury in a Spanish Peat Bog: Archive of Climate Change and Atmospheric Metal Deposition, Science, 284, 939-942.
Martínez-Méndez, G., Molyneux, E.G., Hall, I.R., Zahn, R. (2009), Variable water column structure of the South Atlantic on glacial–interglacial time scales, Quaternary Science Reviews, 27 (19-20), 1886-1908.
Martínez-Méndez, G., Zahn, R., Hall, I. R., Pena, L. D., and Cacho, I. (2008), 345,000-year-long multi-proxy records off South Africa document variable contributions of Northern versus Southern Component Water to the Deep South Atlantic, Earth and Planetary Science Letters, 267, 309-321.
Martrat, B., Grimalt, J., López-Martínez, C., Cacho, I., Sierro, F. J., Flores, J. A., Zahn, R., Canals, M., Curtis, J. H., and Hodell, D. A. (2004), Abrupt temperature changes in the Western Mediterranean over the last 250,000 years, Science, 306, 1762-1765.
Martrat, B., Grimalt, J. O., Shackleton, N. J., de Abreu, L., Hutterli, M. A., and Stocker, T. F. (2007), Four Climate Cycles of Recurring Deep and Surface Water Destabilizations on the Iberian Margin, Science, 317, 502-507.
Mayewski, P. A., Rohling, E. E., Curt Stager, J., Karlen, W., Maasch, K. A., David Meeker, L., Meyerson, E. A., Gasse, F., van Kreveld, S., and Holmgren, K. (2004), Holocene climate variability, Quaternary Research, 62, 243.
Mix, A. C., Bard, E., and Schneider, R. (2001), Environmental processes of the ice age: land, oceans, glaciers (EPILOG), Quaternary Science Reviews, 20, 627-657.
Montserrat-Martí, J. (1992), Evolución glaciar y postglaciar del clima y la vegetación en la vertiente sur del Pirineo: estudio palinológico., 147 pp., Zaragoza.
Morellón, M., Valero-Garcés, B., Moreno, A., González-Sampériz, P., Mata, P., Romero, O., Maestro, M., and Navas, A. (2008), Holocene palaeohydrology and climate variability in northeastern Spain: The sedimentary record of Lake Estanya (Pre-Pyrenean range), Quaternary International, 181, 15.
Morellón, M., Valero-Garcés, B., Vegas, T., González-Sampériz, P., Delgado-Huertas, A., Mata, P., Moreno, A., Rico, M., and Corella, J. P. (2009), Late glacial and Holocene palaeohydrology in the western Mediterranean region: the Lake Estanya record (NE Spain), Quaternary Science Reviews, 28, 2582–2599.

CLIVAR – Spain Paleoclimate
23
Morellón, M., Valero-Garcés, B., González-Sampériz, P., Vegas-Vilarrúbia, T., Rubio, E., Rieradevall, M., Delgado-Huertas, A., Mata, P., Romero, O., Engstrom, D. R., López-Vicente, M., Navas, A. & Soto, J. (in press). Climate changes and human activities recorded in the sediments of Lake Estanya (NE Spain) during the Medieval Warm Period and Little Ice Age. Journal of Paleolimnology, doi: 10.1007/s10933-009-9346-3.
Moreno, A., Cacho, I., Canals, M., Grimalt, J. O., and Sánchez-Vidal, A. (2004), Millennial-scale variability in the productivity signal from the Alboran Sea record, Western Mediterranean Sea, Palaeogeography, Palaeoclimatology, Palaeoecology, 211, 205-219.
Moreno, A., Cacho, I., Canals, M., Prins, M. A., Sánchez Goñi, M. F., Grimalt, J. O., and Weltje, G. J. (2002), Saharan dust transport and high-latitude glacial climatic variability: the Alboran Sea record, Quaternary Research, 58, 318-328.
Moreno, A., Stoll, H., Jiménez-Sánchez, M., Cacho, I., Valero-Garcés, B., and Edwards, L. R. (2009b), A speleothem record of glacial rapid climatic changes from Northern Iberian Peninsula, Global and Planetary Change.
Moreno, A., Valero-Garcés, B. L., González-Sampériz, P., and Rico, M. (2008), Flood response to rainfall variability during the last 2000 years inferred from the Taravilla Lake record (Central Iberian Range, Spain), Journal of Paleolimnology, DOI 10.1007/s10933-008-9209-3.
Moreno, A., Valero-Garcés, B. L., Jiménez-Sánchez, M., Domínguez, M. J., Mata, P., Navas, A., González-Sampériz, P., Stoll, H., Farias, P., Morellón, M., Corella, J. P., and Rico, M. (2009a), The last deglaciation in the Picos de Europa National Park (Cantabrian Mountains, Northern Spain), Journal of Quaternary Science DOI: 10.1002/jqs.
Moreno, A., López-Merino, L., Leira, M., Marco Barba, J., González-Sampériz, P., Valero-Garcés, B.L., López-Sáez, J.A., Santos, L., Mata, P., Ito, E., 2009c. Revealing Holocene environmental history from the multiproxy record of a mountain lake (Lago Enol, N Iberian Peninsula). Journal of Paleolimnology.
Muñoz Sobrino, C., Ramil-Rego, P., and Gómez-Orellana, L. (2004), Vegetation of the Lago de Sanabria area (NW Iberia) since the end of the Pleistocene: a palaeoecological reconstruction on the basis of two new pollen sequences, Vegetation History and Archaeobotany, 13, 1.
Muñoz Sobrino, C., Ramil-Rego, P., and Rodríguez Guitián, M. A. (2001), Vegetation in the mountains of northwest Iberia during the last glacial-interglacial transition, Vegetation History and Archaeobotany, 10, 7.
Osborn, T. J. (2006), Recent variations in the winter North Atlantic Oscillation, Weather, 61, 353-355. Pailler, D., and Bard, E. (2002), High frequency palaeoceanographic changes during the past 140 000 yr recorded by the organic
matter in sediments of the Iberian Margin, Palaeogeography, Palaeoclimatology, Palaeoecology, 181, 431-452. Pantaleón-Cano, J., Yll, E.-I., Pérez-Obiol, R., and Roure, J. M. (2003), Palynological evidence for vegetational history in semi-arid
areas of the western Mediterranean (Almeria, Spain), The Holocene, 13, 109-119. Peñalba, C., Arnold, M., Guiot, J., Duplessy, J. C., and Beaulieu, J.-L. (1997), Termination of the last glaciation in the Iberian
peninsula inferred from the pollen sequence of Quintanar de la Sierra, Quaternary Research, 48, 205-214. Pérez-Folgado, M., Sierro, F. J., Flores, J. A., Cacho, I., Grimalt, J. O., Zahn, R., and Shackleton, N. (2003), Western Mediterranean
planktonic foraminifera events and millennial climatic variability during the last 70 kyr, Marine Micropaleontology, 28, 49-70. Pérez-Obiol, R., and Julia, R. (1994), Climatic Change on the Iberian Peninsula Recorded in a 30,000-Yr Pollen Record from Lake
Banyoles, Quaternary Research, 41, 91. Pla, S., and Catalán, J. (2005), Chrysophyte cysts from lake sediments reveal the submillennial winter/spring climate variability in the
northwestern Mediterranean region throughout the Holocene, Climate Dynamics, 24, 263. Pons, A., and Reille, M. (1988), The Holocene and upper Pleistocene pollen record from Padul (Granada, Spain): a new study,
Palaeogeography, Palaeoclimatology, Palaeoecology, 66, 243-263. Ramil-Rego, P., Muñoz-Sobrino, C., Rodríguez-Guitián, M., and Gómez-Orellana, L. (1998), Differences in the vegetation of the
North Iberian Peninsula during the last 16,000 years, Plant Ecology, 138, 41-62. Reed, J. M., Stevenson, A. C., and Juggins, S. (2001), A multi-proxy record of Holocene climatic change in southwestern Spain: the
Laguna de Medina, Cádiz, The Holocene, 11, 707-719. Riera, S., Wansard, G., and Julià, R. (2004), 2000-year environmental history of a karstic lake in the Mediterranean Pre-Pyrenees: the
Estanya lakes (Spain), Catena, 55, 293-324. Rodríguez-Lázaro, J., and Cronin, T. M. (1999), Quaternary glacial and deglacial Ostracoda in the thermocline of the Little Bahama
Bank (NW Atlantic): palaeoceanographic implications, Palaeogeography, Palaeoclimatology, Palaeoecology, 152, 339. Rogerson, M., Cacho, I., Jiménez-Espejo, F., Reguera, M. I., Sierro, F. J., Martínez-Ruiz, F., Frigola, J., and Canals, M. (2008), A
dynamic explanation for the origin of the western Mediterranean organic-rich layers, Geochemistry, Geophysics and Geosystems, 9, Q07U01, doi:10.1029/2007GC001936.
Rohling, E. J., Hayes, A., De Rijk, S., Kroon, D., Zachariasse, W. J., and Eisma, D. (1998), Abrupt cold spells in the northwest Mediterranean, Paleoceanography, 13, 316-322.
Rohling, E. J., and Palike, H. (2005), Centennial-scale climate cooling with a sudden cold event around 8,200 years ago, Nature, 434, 975-979.
Roucoux, K. H., de Abreu, L., Shackleton, N. J., and Tzedakis, P. C. (2005), The response of NW Iberian vegetation to North Atlantic climate oscillations during the last 65 kyr, Quaternary Science Reviews, 24, 1637.
Roucoux, K. H., Shackleton, N. J., de Abreu, L., Schönfeld, J., and Tzedakis, P. C. (2001), Combined marine proxy and pollen analyses reveal rapid Iberian vegetation response to North Atlantic millennial-scale climate oscillations, Quaternary Research, 56, 128-132.
Sánchez Goñi, M. F., Cacho, I., Turon, J. L., Guiot, J., Sierro, F. J., Peypouquet, J.-P., Grimalt, J. O., and Shackleton, N. J. (2002), Synchroneity between marine and terrestrial responses to millennial scale climatic variability during the last glacial period in the Mediterranean region, Climate Dynamics, 19, 95-105.
Sánchez Goñi, M. F., Turon, J. L., Eynaud, F., and Gendreau, S. (2000), European climatic response to millenial-scale changes in the atmosphere-ocean system during the last glacial period, Quaternary Research, 54, 394-403.
Santos, L., Vidal-Romaní, J. R., and Jalut, G. (2000), History of vegetation during the Holocene in the Courel and Queixa Sierras, Galicia, northwest Iberian Peninsula, Journal of Quaternary Science, 15, 621-632.

Climate in Spain: Past, Present and Future
24
Saz, M. A. (2003), Temperaturas y precipitaciones en la mitad norte de España desde el siglo XV, 293 pp., Consejo de Protección de la Naturaleza de Aragón, Zaragoza.
Shackleton, N. J., Hall, M. A., and Vincent, E. (2000), Phase relationship between millennial-scale events 64,000-24,000 years ago, Paleoceanography, 15, 565-569.
Shindell, D. T., Schmidt, G. A., Mann, M. E., Rind, D., and Waple, A. (2001), Solar Forcing of Regional Climate Change During the Maunder Minimum, Science, 294, 2109-2111.
Sierro, F. J., Hodell, D. A., Curtis, J. H., Flores, J. A., Reguera, I., Colmenero-Hidalgo, E., Bárcena, M. Á., Grimalt, J., Cacho, I., Frigola, J., and Canals, M. (2005), Impact of iceberg melting on Mediterranean thermohaline circulation during Heinrich events, Paleoceanography, 20, doi:10.1029/2004PA001051.
Sousa, A., and García-Murillo, P. (2003), Changes in the Wetlands of Andalusia (Doñana Natural Park, SW Spain) at the End of the Little Ice Age, Climatic Change, 58, 193-217.
Tzedakis, P. C., Roucoux, K. H., de Abreu, L., and Shackleton, N. J. (2004), The Duration of Forest Stages in Southern Europe and Interglacial Climate Variability, Science, 306, 2231-2235.
Valero-Garcés, B. L., Delgado-Huertas, A., Navas, A., Machín, J., Gonzalez-Sampériz, P., and Kelts, K. (2000a), Quaternary palaeohydrological evolution of a playa lake: Salada Mediana, central Ebro Basin, Spain, Sedimentology, 47, 1135-1156.
Valero-Garcés, B. L., González-Sampériz, P., Delgado-Huertas, A., Navas, A., Machín, J., and Kelts, K. R. (2000b), Lateglacial and late Holocene environmental and vegetational change in Salada Mediana, central Ebro Basin, Spain, Quaternary International, 73-74, 29-46.
Valero-Garcés, B. L., González-Sampériz, P., Navas, A., Machín, J., Mata, P., Delgado-Huertas, A., Bao, R., Moreno, A., Carrión, J. S., Schwalb, A., and González-Barrios, A. (2006), Human impact since Medieval times and recent ecological restoration in a Mediterranean lake: the laguna Zoñar (Spain), Journal of Paleolimnology, 35, 24-49.
Valero-Garcés, B. L., Moreno, A., Navas, A., Machín, J., Delgado-Huertas, A., González-Sampériz, P., Schwalb, A., Morellón, M., and Edwards, R. L. (2008), The Taravilla Lake and Tufa Deposits (Central Iberian Range, Spain) as paleohydrological and paleoclimatic indicators, Palaeogeography, Palaeoclimatology, Palaeoecology, 259, 136-156.
Valero-Garcés, B. L., Navas, A., Machín, J., Stevenson, T., and Davis, B. (2000c), Responses of a saline lake ecosystem in a semiarid region to irrigation and climate variability, Ambio, 29, 344-350.
Valero-Garcés, B., González-Sampériz, P. , Morellón, M., Rico, M., Moreno, A., Navas, A., Machín, J., Mata, P., and Rubio, J.C. (2007), The Villarquemado Lacustrine Record (Iberian Range, Spain, Teruel): Climate and Tectonics for the last 100 kyr in NE Spain, Geophysical Research Abstracts, Vol. 9, 06679 (SRef-ID: 1607-7962/gra/EGU2007-A-06679)
Vegas, J., Pérez-González, A., Ruiz Zapata, B., Gil-García, M. J., Dorado, M., Valdeolmillos, A., and López-García, M. J. (2003), The GS-1/Younger Dryas Event in the Laguna Grande lacustrine record. Lateglacial-Holocene transition in the NW Iberian Range, Spain, in Limnogeology in Spain: a tribute to Kerry Kelts, Biblioteca de Ciencias. C.S.I.C., edited by B. Valero-Garcés, pp. 284-304, Madrid.
Verschuren, D., Laird, K. R., and Cumming, B. F. (2000), Rainfall and drought in equatorial east Africa during the past 1,100 years, Nature, 403, 410-414.
Vicente-Serrano, S., and Cuadrat, J. M. (2007), North Atlantic Oscillation control of droughts in north-east Spain: evaluation since 1600 A.D, Climatic Change, 85, 357-379.
Voelker, A. H. L., Lebreiro, S. M., Schonfeld, J., Cacho, I., Erlenkeuser, H., and Abrantes, F. (2006), Mediterranean outflow strengthening during northern hemisphere coolings: A salt source for the glacial Atlantic? Earth and Planetary Science Letters, 245, 39-55.
Walker, M., Johnsen, S. J., Rasmussen, S. O., Popp, T., Steffensen, J. P., Gibbard, P., Hoek, W. Z., Lowe, J., Andrews, J. T., Björck, S., Cwynar, L. C., Hughen, K., Kershaw, P., Kromer, B., Litt, T., Lowe, D. J., Nakagawa, T., Newnham, R., and Schwander, J. (2009), Formal definition and dating of the GSSP (Global Stratotype Section and Point) for the base of the Holocene using the Greenland NGRIP ice core, and selected auxiliary records, Journal of Quaternary Science, 24, 3-17.
Yll, E. I., Carrión, J. S., Pantaleón, J., Dupré, M., La Roca, N., Roure, J. M., and Pérez-Obiol, R. (2003), Palinología del Cuaternario reciente en la Laguna de Villena (Alicante), Anales de Biología, 25, 65-72.
Zazo, C., Dabrio, C. J., Goy, J. L., Lario, J., Cabero, A., Silva, P. G., Bardají, T., Mercier, N., Borja, F., and Roquero, E. (2008), The coastal archives of the last 15 ka in the Atlantic-Mediterranean Spanish linkage area: Sea level and climate changes, Quaternary International, 181, 72.

CLIVAR – Spain Atmospheric trends
25
Chapter 2 ATMOSPHERIC TRENDS IN THE IBERIAN PENINSULA
DURING THE INSTRUMENTAL PERIOD IN THE CONTEXT OF NATURAL VARIABILITY1
Authors: Ileana Bladé1 and Yolanda Castro-Díez2
1 Departament d'Astronomia i Meteorologia, Facultat de Física, Universitat de Barcelona, 08028 Barcelona 2 Departamento de Física Aplicada, Facultad de Ciencias, Universidad de Granada, 18071 Granada
Contributors: V. Altava-Ortiz1, R. Ancell3, D. Argüeso3, A. Barrera-Escoda1, M. Brunet4, N. Calvo5, I. Errasti6, M.J. Esteban-Parra2, J. Fernández7, D. Fortuny1, M.D. Frías7, M.C. Gallego8, D. Gallego9, S.R. Gámiz-Fortis2, R. García-Herrera5, J.A. Guijarro10, J.M. Gutiérrez11, S. Herrera11, C. Izaguirre12, J.M. Hidalgo-Muñoz2, J.I. López-Moreno13, M.L Martín14, M.R. Pons3, D. Rasilla15, P. Ribera9, F.S. Rodrigo16, C. Rodríguez-Puebla17, S.M. Vicente-Serrano13.
3 Agencia Estatal de Meteorología, AEMET CMT/CAS, Santander. 4 Centre on Climate Change (C3), Universidad Rovira i Virgili, Tarragona 5 Departamento de Física de la Tierra I, Facultad de Ciencias Físicas, Universidad Complutense de Madrid 6 Depto de Ingeniería Nuclear y Mecánica de Fluidos, Escuela Univ. de Ingeniería de Vitoria-Gasteiz, Universidad País Vasco 7 Departamento de Matemática Aplicada y Ciencias de la Computación. Universidad de Cantabria. Santander 8 Departamento de Física, Universidad de Extremadura, Badajoz 9 Facultad de Ciencias Experimentales, Universidad Pablo de Olavide, Sevilla 10 Agencia Estatal de Meteorología, Delegación Territorial en Illes Balears, Palma de Mallorca 11 Instituto de Física de Cantabria, CSIC-Universidad de Cantabria, Santander 12 Instituto de Hidráulica Ambiental, Universidad de Cantabria, Santander 13 Instituto Pirenaico de Ecología, CSIC, Zaragoza 14 Departamento de Matemática Aplicada, Campus de Segovia, Universidad de Valladolid 15 Departamento de Geografía, Urbanismo y OT, Universidad de Cantabria, Santander 16 Departamento de Física Aplicada, Universidad de Almería 17 Departamento de Física General y de la Atmósfera, Universidad de Salamanca
TABLE OF CONTENTS 1.- Introduction
2.- Temperature
3.- Precipitation
3.1.- Recent precipitation trends in the Iberian Peninsula
3.2.- Reconciling discrepancies between published studies
3.3.- Changes in temporal characteristics and precipitation extremes
3.4.- Other precipitation-related atmospheric variables
4.- Summary and conclusions
5.- References
Citation: Bladé I. and Castro Díez Y., 2010. Atmospheric trends in the Iberian Peninsula during the instrumental period in the context of natural variability. Report: Climate in Spain: Past, Present and Future (Editors: Pérez F. Fiz and Boscolo Roberta) pp. 25–41.

Climate in Spain: Past, Present and Future
26
1.- Introduction
One of the main goals of this report is to provide as comprehensive and general an answer as possible to the question of whether the climate of the Iberian Peninsula (IP) has undergone significant variations during the 20th century and beginning of the 21st century. On the one hand, the aim is to describe how much and in what ways the climate has changed and, on to the other hand, to assess the extent to which the recent observed changes can be distinguished from natural variability. These changes will also be compared with projections from climate model simulations. Climate varies naturally on all time scales, so that time series of climatic variables may display strong natural variations ranging from highly unusual “peaks” to prolonged changes, particularly on small spatial scales. These fluctuations are superimposed onto any potential long-term climate trend of anthropogenic origin. Thus, detecting this anthropogenic signal and separating it from the climatic “noise” requires the application of statistical methods.
This chapter describes the observed changes in the atmospheric climate of the IP over the instrumental period, with particular emphasis on the last 60 years. The word “trend” will be used in this chapter to refer to a highly significant linear change (e.g. with a confidence level greater than 95%) in the value of a particular variable. The results focus on temperature and precipitation changes and a small subsection is devoted to other variables.
2.- Temperature !
The study of climate and its variations over the last millennium provides the necessary context for assessing the recent observed changes. Through this analysis, the range of natural variability can be estimated, allowing for a subsequent detection of the effects of human activities, climate model simulations can be validated and the sensitivity of the climate system may (possibly) be constrained. The last millennium in the IP is roughly characterized, as in the rest of Europe, by a warm period that includes the Medieval Warm Anomaly (MWP), a period of cooling, or Little Ice Age (LIA), a return to warmer temperatures (beginning in the middle of the 19th century) and, lastly, the recent and current warming period [NRC, 2006]. This recent warming is global in nature and has been particularly strong since the 70’s. An anthropogenic origin is highly probable [IPCC, 2007]. Except for 1996, the last 15 years (1995-20092) have been the warmest years on record since the beginning of the instrumental period [Copenhagen Diagnosis, 2009, hereafter cited as CD2009]. In contrast, the climatic changes that characterize the MWP and the LIA do not appear to have occurred in a synchronous manner across the planet [Jones and Mann, 2004]. Furthermore, most paleoclimatic reconstructions suggest that the warming observed during the MWP was weaker and not as widespread as the warming of the last few decades [Crowley and Lowery, 2000; Bradley et al., 2003; Luterbacher et al., 2004; Osborn and Briffa, 2006], though there is substantial uncertainty concerning temperatures of the first half of the millennium (see Chapter 1). Thus, the last IPCC report states that global mean Northern Hemisphere temperatures in the second half of the 20th century were “very likely” the warmest of the last 500 years and that the 20th century was “likely” the warmest of the last 1300 years [IPCC, 2007].
Some studies suggest that major changes in the atmospheric and oceanic circulation took place during the MWP and the LIA [Trouet et al., 2009; Lund et al., 2006; Keigwin and Boyle, 2000]. This would imply that the climate system is able to reorganize itself abruptly in response to a relatively modest radiative forcing. At the same time, these results suggest that some aspects of the climate sensitivity of our planet, including climate feedbacks, are not well understood.
To establish a reference framework for assessing temperature changes in the IP, we recall that the [IPCC, 2007] reports the following principal findings regarding the observed changes in the earth’s surface climate (see Chapter 3, “Observations”; these data were updated in CD2009): !
2 Values for 2009 were estimated at the time of the report but were confirmed by year’s end.

CLIVAR – Spain Atmospheric trends
27
• Global mean surface temperature has increased by about 0.74°C ± 0.18°C, according to an estimation of the linear trend over the last 100 years (1906-2005). The warming rate over the last 50 years is almost twice as large (0.13°C ± 0.03°C). In the last 25 years this trend has increased to 0.19ºC ± 0.05°C per decade.
• The changes and trends in extreme temperatures are consistent with a general warming. The daily temperature range (DTR) dropped by 0.07°C/decade in the period 1950-2004 [Vose et al., 2005]. However, since 1979 the DTR does not appear to have changed, as maximum and minimum temperatures have risen at similar rates.
• Urban heat island effects are real but locally limited; they have not generated a bias in the large-scale trends.
The observed rise in global temperature is not uniformly distributed but displays large spatial variability. Changes in climate extremes and in the DTR also exhibit strong regional variations: while the DTR trend is negative in many regions of the globe, other areas exhibit changes of the opposite sign or non-significant changes [Heino et al., 1999; Bonsal et al., 2001].
Whereas numerous studies have investigated recent precipitation trends in the IP (see Section 3), only a few studies have attempted to quantify the regional warming in the IP and to assess whether all temperature-related variables and all seasons have been equally affected. Given the general lack of coincidence between analyzed periods, variables, regional domain, measurement stations and time scales (daily, monthly, seasonal and annual), and the fact that results can be highly sensitive to these factors, it proves difficult to compare temperature trend results across studies.
[Brunet et al., 2006] compiled the Spanish Daily Adjusted Temperature Series (SDATS) dataset, which contains the 22 longest time series of daily mean, maximum, and minimum temperatures (Tmean, Tmax, Tmin) in Spain, covering the period 1850-20053. Analysis of this dataset indicates that, during the period 1901-2005, average annual-mean daily-mean temperatures rose significantly at a rate of 0.13ºC/decade, though this warming did not occur in a linear manner ([Brunet et al., 2007], Fig. 1). As is the case for global temperatures, the general rising trend is interrupted by a short interval, from 1950 to 1972, during which annual temperatures did not rise and even exhibit a slight but non significant decline. Of the two warm periods of the 20th century (1901-1949 and 1973-2005), the stronger warming rates have occurred in the more recent interval (0.22 ºC/decade versus 0.48 ºC/decade, respectively). This recent regional warming rate is about 50% greater than the corresponding rate for mean Northern Hemisphere continental surface temperature [IPCC, 2007; see Table 3.24].
The calculation of seasonal trends reveals that all seasons have contributed with similar warming rates to the increase in annual temperatures over the entire 20th century. For the recent warming period, however, spring and summer have contributed more strongly to the overall annual warming, while the temperature increase in autumn and winter has been weak and non-significant (see table in Fig.1).
A study of changes in temperature extremes based on the same dataset indicates that the frequency of cold days (Tmax < 10th percentile) has decreased at a rate of 0.85 days/decade and that the frequency of warm days (Tmax > 90th percentile) has increased at a similar rate (0.83 days/decade). The frequency of cold nights (Tmin < 10th percentile) has declined by 0.51 days/decade and that of warm nights (Tmin > 90th percentile) has increased by 0.59 days/decade [Brunet et al., 2007]. In the recent period (1973-2005), the stronger warming has also been accompanied by more frequent warm nights and days (increases of 3.74 and 3.11 days/decade, respectively) and fewer cold nights and days (decreases of 2.70 and 2.04 days/decade, respectively). A separate analysis by [Prieto et al., 2004], based on twice as many temperature stations (45) for the period 1955-1998, confirms the decreasing trend in the frequency of extreme winter minimum temperatures. A regional study for Andalusia corroborates that maximum and minimum temperatures have increased along with the number of warm days and nights, particularly in summer [Esteban-Parra et al., 2009].
3 The SDATS dataset consists of 22 series but only two of them begin in the decade 1850-60 and only half of the time series begin before 1890. Hence, only results for the 20th century are referred to in this report. 4 This table displays Northern Hemisphere continental temperatures trends for the period 1979-2005, not 1973-2005, the period chosen by [Brunet et al., 2007]. Nevertheless we have verified that this hemispheric trend is almost identical for both periods (0.3 ºC/decade).
Climate in Spain: Past, Present and Future
28
!
1901-2005 1973-2005
Annual 0.13 0.48
Winter 0.14 0.27
Spring 0.12 0.77
Autumn 0.13 0.67
Fall 0.12 0.29
Figure 1. Annual (bottom) and seasonal (top) variations in daily mean temperatures in Spain for the period 1850-2005, expressed as anomalies (in ºC) with respect to the mean for the period 1961-1990 (SDATS dataset). These values are calculated as an average over 22 stations. The blue curve shows the smoothed evolution, obtained by applying a 13-year Gaussian filter. The table displays temperature trends (in ºC/decade) over the 20th century (1901-2005) and in the recent period of strong warming (1973-2005). The trends marked in bold (italics) are significant at the 99% (95%) confidence level [adapted from Brunet et al., 2007].
[Prieto et al., 2004] also investigated the possible influence of urban heat island effects on temperature trends. Of the stations examined by these authors, 11 were located in cities with a population of over 10,000 inhabitants. Yet, the trends in these places did not differ significantly from those at the other stations. Therefore, it can be concluded that there is no substantial urban bias in these trends (the IPCC obtained similar results at a global scale).
Regarding the trends in daily extreme temperatures (Tmax and Tmin), [Brunet et al., 2007] conclude that annual mean daily maximum temperatures in the IP have risen more quickly than the corresponding minimum temperatures (0.17 ºC/decade vs. 0.09 ºC/decade) during the XXth century – a result that is replicated in all
ºC
-4
-2
0
2
4
1850
1875
1900
1925
1950
1975
2000
1850
1875
1900
1925
1950
1975
2000
-4
-2
0
2
4
1850
1875
1900
1925
1950
1975
2000
1850
1875
1900
1925
1950
1975
2000
ºC -3
-1,5
0
1,5
3
1850
1880
1910
1940
1970
2000
-3
-1,5
0
1,5
3
ºC
ANNUAL
WINTER SUMMER
AUTUMN SPRING

CLIVAR – Spain Atmospheric trends
29
seasons, except in winter. This difference between the diurnal and nocturnal warming implies5 an increase in the DTR, in sharp contrast with the global decline in the DTR observed over the period 1950-2004 [IPCC, 2007]. However, neither are the periods of study the same nor is the DTR behaviour spatially uniform. In fact, the spatial distribution of DTR variations in Europe reveals a regionally variable pattern that includes increases in parts of the continent [Folland et al., 2001].
In addition, it should be mentioned that the estimated DTR trends in the recent warming period (1973-2005) in the IP differ markedly from those in the preceding period (1901-1972). Indeed, the aforementioned annual DTR increase appears to have ceased, since the increase in Tmax only very slightly exceeds the corresponding increase in Tmin (0.51 versus 0.47 ºC/decade). This result, however, masks a decrease in autumn DTR (due to a stagnation of the Tmax values) that is not observed in the earlier period and that cancels out a DTR increase in winter (due to stagnating Tmin values). In spring and summer, both Tmax and Tmin have increased at similar rates and exhibit the clearest trends (~0.6-0.8 ºC/decade). Note also that the finding that the annual DTR in the IP has not varied during the last 30 years is consistent with the lack of recent trends in global DTR (period 1979-2005; [IPCC, 2007]). No explanations have been proposed for the differential DTR behaviour in the IP prior to 1973.
The above results show that the time evolution of Tmax and Tmin (and therefore of the DTR) does not exhibit a uniform behaviour but has varied over the course of the 20th century and from season to season. Hence, trend results will be very sensitive to the period and season analyzed. Nevertheless, the results of [Brunet et al., 2007] have been confirmed by several other studies (most of which are limited to the second half of the 20th century). For example, the recent increase in winter DTR in the IP has also been reported by [Rodrigo, 2006; personal communication]. The differential behaviour of extreme autumn temperatures during the last 30 years has been particularly pronounced in Catalonia, where [Martínez et al., 2009] even found a decrease in Tmax
6. In Castilla-León, the autumn DTR may also have decreased, though this result is not statistically significant [del Río et al., 2007]. This region also stands out for its modest increases in annual mean Tmax and Tmin temperatures (0.2 and 0.1 ºC/decade, respectively) compared to the overall results for the IP (0.5 ºC/decade). In Andalusia, maximum temperatures have increased more strongly in summer than in winter and winter minimum temperatures have stagnated [Esteban-Parra et al., 2009]. In the interior part of the Valencia region, [Miró et al., 2006] detected similar increases in Tmax and Tmin in summer (~ 0.3-0.4 ºC/decade), although the warming in this area is weaker than in the rest of the IP. All of these results agree qualitatively with [Brunet et al., 2007].
The only discrepancies with that study are found in summer and may be due to differences in analyzed periods or may reflect geographical peculiarities. In the Valencia coastal area, maximum temperatures have not increased significantly [Miró et al., 2006], while in Andalusia the increase has been less pronounced than that for temperature minima [Esteban-Parra et al., 2009]. Both results, however, refer to the second half of the 20th century, whereas [Brunet et al., 2007] investigated the recent 1973-2005 period of strongest warming.
In contrast with the study of [Esteban-Parra et al., 2009], who found that the warming in Andalusia during the second half of the 20th century has been stronger in summer than in winter, [Gallego et al., 2007] report that, in the city of Cádiz, where instrumental data for the years 1825-1852 is available, temperature has risen more during the cold part of the year between that period and 1971-2000. From September to May, the change is temperature is very pronounced, with maximum warming values around 2.5˚C from December to February. Yet summer temperatures hardly differ between these two time intervals. This result would imply a decrease in the amplitude of the seasonal cycle in this city, but the lack of data from intermediate periods hampers any conclusion as to whether a sustained trend or a multi-decadal oscillation in winter temperatures has occurred. It should be mentioned, however, that [Jones et al., 2003] have found similar asymmetries in long-term temperature records of other European cities.
5 The DTR trend was not directly calculated because of possible inhomogeneities in the (Tmax – Tmin) time series [Brunet, 2009, personal communication]. 6 See, however, the comment of [Toretti et al., 2009] questioning the temporal homogeneity of the temperature series analyzed.

Climate in Spain: Past, Present and Future
30
3.- Precipitation
Global warming is expected to cause permanent changes in the hydrologic cycle of the planet and, consequently, changes in the spatial distribution of precipitation, with increases in some areas and decreases in others. Even if the total amount of precipitation does not change, variations in the frequency of rainy days or in precipitation rates will likely occur, in response to the enhanced concentration of atmospheric water vapour. Moreover, even a small shift in mean precipitation can generate major changes in the distributions of extreme values. Hence, it is also necessary to analyze variations in the frequency of extreme precipitation events. Another complicating factor is the strong spatial variability of precipitation, so that changes in local precipitation do not necessarily represent changes at larger spatial scales (and vice versa).
As a general result, it can be anticipated that precipitations in the Mediterranean region will decrease in response to global warming, mostly as a result of enhanced water vapour divergence, which causes a general tendency towards decreased precipitation in the subtropics [Held and Soden, 2006]. In addition, because of the northward migration of the Hadley cell, the subtropical dry zones will extend further north, leading to increased subsidence and enhanced dry conditions in regions located at the poleward edges of the subtropics, such as the Mediterranean region. Theoretical arguments also exist for why global warming will intensify extreme precipitation events [Groisman et al., 1999 and Trenberth et al., 2003]. Consistent with these theoretical predictions, climate simulations of the 21st century with numerical models predict a sharp precipitation decrease in the Mediterranean region, particularly in summer and in the IP, where this decline is predicted to reach 50% by the end of the 21st century [Meehl et al., 2007]. The agreement between models is very good for this region, which makes this projection particularly reliable (though only in a multi-model signal-to-noise-ratio sense) and emphasizes the enhanced vulnerability of the Mediterranean area (already a semi-arid region) to the impacts of global warming.
As of yet, however, no widespread, statistically significant decrease in precipitation has been observed in the Mediterranean region as a whole or in the IP (see Figure 3.13 in [Trenberth et al., 2007] or Panel 1 in [New et al., 2001]; see also [Giorgi, 2002; Douguédroit and Norrant, 2003; Norrant and Douguédroit, 2003 and 2006]). A possible explanation is that the anthropogenic signal has not yet emerged from the considerable background noise of natural variability7,8. For that reason it is imperative to critically evaluate the statistical significance of the obtained trends and the sensitivity of the results to the time period analyzed (beginning and end points, see Liebmann et al, 2010). A careful analysis requires long precipitation series, with reference periods during which anthropogenic forcing can be deemed negligible, but this requirement is not met in most cases. On the other hand, the climate system also possesses natural variability on decadal and multi-decadal time scales and so can generate low-frequency oscillations or persistent anomalies that may falsely portray themselves as trends [Giorgi, 2002].
Discrepancies and contradictions abound in studies of precipitation trends in the IP, even when the calculations apply to the same period. The disagreements can often be traced to the existence of numerous regional rain-gauge precipitation datasets, with variable spatial density and length, often unpublished or with restricted access. As a result, many studies are based on unique precipitation data and can seldom be replicated by others. Other sources of discrepancies may be differences in the statistical methods employed, including how to deal with missing observations, problems with the quality and homogenization of the data and the lack of a unified methodology for their remediation9.
7 This variability is mostly due to internal fluctuations, though changes in precipitation may also arise from external forcing such as volcanic eruptions or variations in solar irradiance [Allen and Ingram, 2002; Trenberth and Dai, 2007]. 8 Even on a global scale, the anthropogenic precipitation signal is difficult to detect, because global precipitation in a CO2-warmed atmosphere does not increase at the same rate as the water vapor storing capacity (which follows the Clausius-Clapeyron equation). This is because the efficiency of radiative cooling decreases if the warming is due to CO2, which reduces the increase in radiative cooling that needs to be balanced by an increase in latent heat, thus offsetting the precipitation increase [Allen and Ingram 2002]. 9 There is no consensus concerning the advantages of homogenizing precipitation time series. [González-Rouco et al., 2001] analyzed the impact of inhomogeneities and outliers in precipitation series and concluded that the spatial patterns of the trends vary strongly depending on whether or not corrections are applied to the original series. On the other hand, [Guijarro, 2009; personal communication] concludes that applying homogenization methods to a dense network of stations reduces the spatial dispersion of the trends but that the effect is weaker for rainfall data, because of the inherently large spatial variability (particularly in the Mediterranean region), which hampers detection of inhomogeneities. This same researcher has

CLIVAR – Spain Atmospheric trends
31
Because of the lack of a readily available, high-resolution, regularly updated, global (IP) precipitation dataset10, most studies on precipitation trends have focused on particular regions of the IP and produced maps of regional precipitation trends, often with very fine detail [Romero et al., 1998; de Luis et al., 2008; López-Moreno et al., 2009a]. Unfortunately, the utility of these results is limited if one seeks to gain an understanding of precipitation evolution at a peninsular scale. On the other hand, those studies that have considered precipitation changes in the IP as a whole [e.g. Goodess and Jones, 2002; Rodrigo and Trigo, 2007] have used a very limited number of stations (typically around 20), presumably representative of the entire IP. These studies, however, have yielded non-uniform trends that cannot be extrapolated to the rest of the peninsula. Furthermore, neither type of study appears adequate for validating simulations with global or regional climate models.
In seasonal precipitation studies, an additional difficulty arises when variations in precipitation (natural or anthropogenic) occur in the form of a shift in the annual distribution. A change in seasonal (or monthly) precipitation in a given season (month) may then simply be due to a shift in the rainy season and be compensated by a change of the opposite sign in the previous or following season (or month). Finally, it should be pointed out that, when trends are not robust, results from past studies can easily become outdated.
3.1.- Recent precipitation trends in the Iberian Peninsula
The aforementioned problems complicate verification of published results, intercomparison between similar studies and also comparison of observational data with climate simulations. Synthesizing results from past studies becomes more difficult as well. To provide and up-to-date and comprehensive picture of recent observed precipitation changes in the IP, which will also serve as a framework in which to view published results, we have computed trends for the entire IP using two large-scale, gridded, publicly available, precipitation datasets. Although this procedure allows for ready verification of results and comparison with subsequent analyses, it is also subject to certain limitations. Gridded datasets (compiled by research centers such as the Climate Research Unit or the National Climatic Data Center) are obtained via spatial interpolation of data from rain gauges using weighted means, where the emphasis is placed on obtaining spatially and temporally continuous fields and optimal estimations of the instantaneous spatial distribution of precipitation. For this reason, time series at a given grid-point cannot be considered homogeneous because each interpolated value is based on those station time series that were available at that particular time11. Temporal changes at a certain grid-point may then reflect real climatic changes but may also appear due to fluctuations in the network of measuring stations. Hence, these datasets are not the optimal tool to calculate trends, particularly for the first half of the century and in regions with sparse data coverage. Moreover, trend analyses based on a dense network of stations often reveal strong small-scale spatial variability in the amplitude and even sign of trends [López-Moreno et al., 2009a], which raises doubts about the validity of trend results based on gridded data that have been interpolated from a small number of data stations (see Figure 1 in [Haylock et al., 2008]).
Taking these limitations into account, in this report we will use gridded data with caution and for illustrative purposes. Trends will be calculated only for the second half of the 20th century (when the quality and uniformity of the original time series is higher and the risk of inhomogeneities in the interpolated series lower). Bearing in mind that discrepancies may appear between results obtained with different datasets (due to differences in interpolation methods and in the station network), two different precipitation datasets will be employed: CRU TS3.0 [Mitchell and Jones, 2005] and E-OBS [Haylock et al., 2008]. The latter dataset has
created a software routine within the “Climatol” package (version 2.0) for homogenizing monthly temperature and precipitation data. This package is freeware and can be downloaded at the website http://webs.ono.com/climatol/climatol.html. See also [Guijarro, 2004]. 10 This situation is about to come to an end. The Meteorology group at the University of Santander has developed the first high-resolution, gridded, interpolated precipitation and temperature dataset in Spain (0.2º, approximately 20 km), called "SpainHR" (Spain High Resolution, [Herrera et al., 2010]). The method employed is similar to that used in the ENSEMBLES project to construct a gridded precipitation dataset over Europe. The resulting Spanish grid is based on approximately 2000 precipitation stations and 1000 temperature stations (by comparison, the E-OBS/ENSEMBLES grid has about 50 stations in the IP). Although this dataset is not appropriate to analyze trends, the authors plan to produce another gridded dataset focused on trend analysis in the near future. 11 See CRU TS 2.0 and time series analysis: advice for users. http://www.cru.uea.ac.uk/~timm/grid/CRU_TS_2_1.html

Climate in Spain: Past, Present and Future
32
higher resolution (0.25ºx0.25º) than the former (0.5ºx0.5º), incorporates more stations and applies better interpolation techniques, and is updated to 200912. On the other hand, the E-OBS dataset begins in 1950, whereas the CRU TS3.0 set (hereafter called CRU3) covers the entire 20th century (1900-2006). The use of two datasets based on different interpolation methods will increase confidence in those results that are consistent across datasets. ! To illustrate some of the aforementioned complications, we have computed annual precipitation trends in the IP for two different periods (1950-2008 and 1960-2008) with both datasets (Fig. 2). The trend is computed as a simple linear regression and the statistical significance is assessed with the Mann-Kendall test [Kendall, 1970], assuming independently distributed data (i.e. neglecting the small serial correlation). For the 1960-2008 period, E-OBS trends are negative and statistically significant throughout most of the IP (Fig. 2b) and are accompanied by a general decline in precipitation over the entire Mediterranean region (particularly northwest Africa, Italy, the Balkans and Turkey). Results for the CRU3 dataset reveal essentially the same, albeit weaker, pattern (Fig. 2d)13. In the IP, the most pronounced reductions in annual precipitation have occurred in the northern regions, in Catalonia/Aragon, in Andalusia/Extremadura and in Portugal (only for E-OBS data). The only region where precipitation has not decreased is the southeastern Mediterranean coast.
!
Figure 2. Trends in annual mean precipitation (in mm/day/year), computed using E-OBS data (top) and CRU TS 3.0 data (bottom) for the periods 1950-2006 (left; 2008 for E-OBS) and 1960-2006 (right; 2008 for E-OBS). The black dots indicate statistically significant trends with a confidence level of 95% (p<0.05), calculated with the Mann-Kendall test (without adjusting for serial autocorrelations which are low for annual precipitation data). The white regions represent areas with insufficient data to calculate trends (to calculate an annual mean, all daily values must be available; to compute a trend, only three missing years are allowed and two successive missing years are not permitted). Note that the CRU3 dataset has no missing data because holes have been filled by interpolation.
12 This report was completed in November 2009; annual results are updated to only 2008. 13 This decrease in annual precipitation in the IP since 1960 can also be detected in the Hulme dataset [Hulme, 1998]. This dataset has a much coarser resolution and ends in 1998, but it is more appropriate to study trends (see the footnote 11).

CLIVAR – Spain Atmospheric trends
33
For both datasets, the negative trends in the IP (and the Mediterranean in general) are weaker and less significant when the analysis period begins in 1950 (Fig. 2a-c) or 1970 (not shown). To assess the evolution of annual precipitation in the 20th century and to better compare the two datasets, we constructed a time series of annual mean precipitation averaged over the entire Iberian Peninsula (36ºN-43.5ºN, 10ºW-3ºE) for both datasets (Fig. 3). The validity of this regional average to estimate precipitation variability in the IP may be questioned but here it is justified by the fact that precipitation trends exhibit the same sign throughout the IP (Fig.2). Strictly speaking, however, this averaged time series can only be considered representative of annual precipitation in the two western thirds of the IP.14
Figure 3. Time series of annual mean precipitation anomalies (in mm/day) over the IP (36ºN-43.5ºN, 10ºW-3ºE), based on CRU TS3 data (top; period 1900-2006) and E-OBS data (bottom; period 1950-2008). The red line indicates a 9-year running mean. The tables show mean absolute precipitation values for each decade (mm/day). The rainiest (driest) decades are highlighted in blue (yellow). The green and blue lines show linear precipitation trends for the periods 1950-2006 (2008 for E-OBS) and 1960-2006 (2008 for E-OBS). The CRU-based trends are not statistically significant, but the E-OBS-based trends exceed the 95% confidence level for the period 1950-2008 and the 99% level for the period 1960-2008 (the amplitude of this trend is -0.15 mm/day/decade).
Although the E-OBS and CRU time series are strongly correlated (r = 0.93), they differ in many details, particularly in the recent period: the last 16-18 years are much drier in the E-OBS dataset. Both datasets indicate that the decades of the 60’s and 70’s were very wet (particularly the 60’s in E-OBS), simultaneously with a global peak in precipitation [Dai et al., 1997; New et al., 2001], whereas the following period (1980-2008) has been comparatively drier. Nonetheless, mean precipitation in the 80’s and 90’s is comparable to that of the 50’s in both datasets (see table in Fig. 3). Only the last decade (available only for E-OBS data) 15 appears as unusually dry, but it is important to consider that the reference period is rather limited (50 years).
14 This regionally averaged time series coincides with the first principal component of annual precipitation in the IP (VAR = 64%) and explains at least 50% of the local precipitation variance in the two western thirds of the IP (r > 0.7). In the eastern third (under Mediterranean influence), the correlation between this regional average and local precipitation drops to values on the order of r = 0.4-0.6. 15 Although the value in the table was computed for the 9-year period 2000-2008, the same conclusion holds for the full 2000-2009 decade.
decade
mean
memedio 1900 1.71 1910 1.79 1920 1.61 1930 1.80 1940 1.70 1950 1.70 1960 1.92 1970 1.83 1980 1.67 1990 1.71
decade mean 1950 1.63 1960 2.07 1970 1.93 1980 1.67 1990 1.63 2000-
2008
1.44

Climate in Spain: Past, Present and Future
34
The CRU data evolution, however, tells quite a different story, provided one accepts as valid precipitation estimates for the period 1900-1950. Based on this data, one would conclude that the recent period has not been remarkable in terms of precipitation compared to the rest of the century, because precipitation in the period 1980-1999 is comparable to that at the beginning of the century (1900-1929). If anything it is the decades of the 60’s and 70’s that appear as abnormally wet. Note, however, that the lack of precipitation anomalies greater than 0.25 mm/day prior to 1930, compared to their relatively high frequency of occurrence thereafter, may indicate possible inhomogeneities in this time series11. Hence we cautiously refrain from making conclusive statements based on this data.
In summary, the impression given by the E-OBS time series that precipitation in the IP has declined since 1980 is strongly conditioned by the absence of a sufficiently long reference period to compare with16. Although the current decade seems to support the existence of a sustained negative trend in precipitation (Fig. 3), confirmation that this trend is real and not simply due to natural variability on decadal timescales (climatic “noise”) must await further evidence (i.e., more dry years in the future). In this context, it is important to bear in mind that some long precipitation records display decadal fluctuations in the XIXth and XXth centuries with similar amplitude to the variations observed during the last 50 years [Rodrigo et al., 2000; Barrera-Escoda, 2008]
16 This comment would be relevant even if a change point around the year 1980 had been objectively detected.
Figure 4. Monthly precipitation trends for the period 1960-2008 computed with the E-OBS dataset and expressed as percentages of the local monthly climatological mean for the period 1950-2000. The black dots indicate significant trends at the 95% confidence level (p<0.05), using the Mann-Kendall test (without correcting for the autocorrelation of the series). The diagram on the right hand side depicts the mean annual precipitation cycle for the whole region (in mm/day).

CLIVAR – Spain Atmospheric trends
35
To assess whether the precipitation decrease from 1960 to 2008 has been uniformly distributed among all calendar months or whether it involves mainly a particular season, we calculated trends in monthly precipitation (relative to the climatological mean for each month) using the E-OBS dataset (Fig. 4). The results suggest that precipitation in the IP has declined mostly during the winter season (February and, to a lesser degree, March) and in June. In February, this decrease is very pronounced and statistically significant almost everywhere, except in the Mediterranean coastal area, where the most visible reduction has occurred in June. In the remaining months, no uniform or significant change pattern can be detected17. Nevertheless the trends tend to be negative in all months, so that almost all months have contributed to the annual precipitation decrease. In summer, the trend pattern varies from month to month, except for the northeast quadrant and Cantabria, where decreases are found from July to September. Consequently, summer mean precipitation (July-August-September) in those regions has decreased significantly (see additional Fig. 118). In general, however, we find no evidence of a widespread decrease in summer precipitation, except in June. Since the contribution of this month to the annual total is relatively modest (see lower right panel in Fig. 4), we will only examine the temporal evolution of mean precipitation in the IP in February and March.
!!!!!!!!!!!!!
Figure 5 shows that, in these two months, the negative precipitation trend is related to a discrete change that occurred around 1980. Since that year, mean precipitation has fallen markedly (about 40%) and significantly (p<0.001), with respect to the three preceding decades (see table in Fig. 5). The contrast between these two sub-periods and the succession of dry years since 1980 is particularly noticeable in March, though, March precipitation values appear to have recovered slightly since 2000 (in 2001, a record amount of rainfall was measured), unlike February precipitation. As a result, the March and February trends for the period 1950-
17 Note that even in purely random time series we would expect to find, on average, 5% of trend values that exceed the 95% confidence level. 18 http://clivar.iim.csic.es/files/figuras_suplementarias.pdf. This site will also post updated figures to 2010.
Figure 5. Monthly-mean precipitation anomalies (in mm/day), averaged over the entire IP (36ºN-43.5ºN, 10ºW-3ºE) for February (top) and March (bottom), computed with the E-OBS dataset for the period 1950-2009. The red curve represents the 9-year moving average. The table in the right compares the average absolute precipitation (mm/day) for the periods 1950-1979 and 1980-2009 as well as the linear trends for the periods 1950-1999, 1950-2009, and 1960-2009 (in mm/day/year). Trends that exceed the 95%, 99% and 99.9% confidence levels are indicated with one, two, and three asterisks, respectively. For the mean values, three asterisks indicate significant differences at the 99. 9% level between the average values of the two 30-year sub-periods considered.
Month February March
mean 1950-1979 2.65 2.28
mean 1980-2009 1.62*** 1.34***
trend 1950-1999 -0.016 -0.036***
trend 1950-2009 -0.022* -0.024**
trend 1960-2009 -0.046*** -0.027*

Climate in Spain: Past, Present and Future
36
2009 are similar (see table in Fig. 5). If, however, we compute the trends by omitting the last 10 years (as in most published studies, since the updated CRU3 data and E-OBS data are quite recent), we find that the March trend is twice as strong as the February trend, and that the latter is not significant (Fig. 5). This finding explains why, in the literature, much more attention has been paid to the decrease in March precipitation (see Section 3.2). In contrast, when the first 10 years are left out and only the period 1960-2009 is considered, the February trend turns out to be the most pronounced and the most significant one. In any case, it is clear that both February and March trends are more robust than the annual precipitation trends and so it can be asserted that precipitation in late winter in the IP has decreased in the last three decades.
Note that for both months (but particularly for February), the decrease in precipitation is not a local phenomenon. Rather, it is part of a large-scale pattern that resembles the annual trend pattern (Fig. 2b) and is characterize by reduced precipitation in the Mediterranean region and increased precipitation on the Atlantic facade of the British Isles and Scandinavia (see additional Fig. 218 and Fig. 7 in [Paredes et al., 2006]).
!
3.2.- Reconciling discrepancies between published studies
Having examined the temporal and spatial characteristics of precipitation trends in the IP with an updated gridded dataset, we are now in position to not only review literature results on precipitation trends (based on station data) but also provide an interpretation of these results and attempt to reconcile discrepancies between studies.
For instance, given that the decreasing annual trends have resulted chiefly from the succession of a very wet period (the decades of the 60’s and 70’s) and a very dry period (the decades of the 80’s and 90’s and the present decade, Fig. 3), one can understand why those studies that did not include the last 15 years (when the decrease has been most pronounced) and/or included the decade of the 50’s (when precipitation amounts were similar to those recorded in recent decades) did not yield conclusive results. For example, [Goodess and Jones, 2002] investigated the period 1958-1997 and found statistically significant decreases in only 6 of the 18 IP stations considered. Likewise, [Rodrigo and Trigo, 2007] analysed daily precipitation time series for the period 1951-2002 and detected significant reductions in annual precipitation in only 3 out of 22 sites19. As we might also expect from Fig. 3, analysis of those few precipitation records that extend to the beginning of the XXth century (or even earlier) have not detected any appreciable changes in annual precipitation on centennial timescales [Lana and Burgueño, 2000; Llasat and Quintas, 2004; Saladié, 2004; Barrera-Escoda, 2008]. Only at a very few stations does precipitation appear to have dropped to historically unprecedented values. For example, [Altava-Ortiz et al., 2009] found out that annual precipitation in the city of Barcelona in the decade 1995-2004 was the lowest on record since the mid-XIXth century. Likewise, the Gibraltar record, one of the longest available instrumental series, indicates that annual precipitation has been steadily declining in this city and that mean precipitation in the 80’s and 90’s was the lowest of the past two centuries [Rodrigo et al., 1999].
! The remaining studies on precipitation trends have focused on particular regions and have been based on regional networks of precipitation stations, in some cases with very high spatial density, e.g. [de Luis et al., 2008]. The most recent of these studies (covering a period that extends to year 2000 or longer) indicate that annual precipitation has decreased significantly during the second half of the 20th century in the northeast quadrant of the IP and in the Andalusian-Mediterranean coastal area, but not in the southeast (Alicante, Murcia and Almería) [de Luis et al., 2008; López-Moreno et al., 2009a]. The agreement between these results, based on rainfall stations, and our analysis using E-OBS data (Fig. 2b) validates the use of these gridded interpolated data in this report (Section 3.1).
19 Annual mean precipitation in the IP, computed with the new high-resolution SpainHR dataset for the period 1970-2000 (the most reliable period for trend analysis because there is a constant network of stations) exhibits no trend [Herrera et al., 2010]. This finding is also consistent with our gridded analysis.

CLIVAR – Spain Atmospheric trends
37
With regard to seasonal and monthly precipitation trends, the most frequently reported statistically significant result is the strong negative trend in March since about 1950 or 1960, consistent with our analysis [Zhang et al., 1997; Serrano et al., 1999; Trigo and DaCamara, 2000; Del Río et al., 2005; Norrant and Douguédroit, 2006; Paredes et al., 2006, López-Moreno et al., 2009a]20. This negative trend can be detected in most of the IP, including the Mediterranean coastal area, except the Murcia region [González-Hidalgo et al., 2008]. Because this trend is very strong, its detection is not sensitive to the choice of study period, which explains the consistency between studies. On the other hand, the negative trend that we have detected in February (Figs. 4, 5) is only significant when the recent decade 2000-2009 is included in the analysis, which is why this result cannot yet be found in the literature. [Paredes et al., 2006] have attributed the precipitation decrease in March (and the corresponding increase in northern Europe) to a change in the large-scale circulation that has resulted in a northward displacement of the storm-tracks. Nevertheless, the annual precipitation distribution does not appear to have been greatly modified by the February and March decrease [López-Moreno et al., 2009b].
In the remaining months of the year, the only detected, significant, recent, seasonal or monthly trends are generally negative and are found primarily in winter (DJF) or spring (MAM), in agreement with the trends depicted in Fig. 4 [Xoplaki et al., 2004; Gallego et al., 2006; López-Bustins et al., 2008; López-Moreno et al., 2009a]21. The only reported significant positive trends are very localized which explains why they cannot be clearly detected in our analysis of gridded data (Section 3.1). For instance, several studies [de Luis et al., 2008 and González-Hidalgo, 2008] indicate that winter precipitation has increased in the Mediterranean area, particularly in February in the Murcia region – the only region that does not exhibit a significant decrease in this month (Fig. 4) – and in January in Catalonia (this trend is actually barely visible in Fig. 4). Even though the field significance [Livezey and Chen, 1983] of these positive trends has not been assessed, the absence of negative winter precipitation trends in Alicante and Murcia is in agreement with the results of other studies [Goodess and Jones, 2002; Rodrigo and Trigo, 2007 and López-Bustins et al., 2008]. Furthermore, this finding is consistent with the distinctive character of rainfall in the Mediterranean region, which is mostly of convective origin and characterized by maximum values in the fall and modest values in winter (for this very reason a possible rainfall increase in winter would not cause a substantial change in annual precipitation).
3.3.- Changes in temporal characteristics and precipitation extremes
As we have seen, most available rainfall time series are too short to confidently analyze trends in precipitation and for these trends to be distinguished from climatic noise on multidecadal time scales. The problem is exacerbated when one attempts to detect changes in precipitation extremes or in the temporal characteristics of precipitation (variability, daily rate, frequency of rainy days, maximum number of consecutive dry days, etc). Nevertheless, several studies report that in most of the IP, except once again in the southeastern Mediterranean coastal region (Alicante, Murcia and Almería), the daily precipitation rate and the number of days with large rainfall amounts has decreased since 1950, while the number of days with small amounts of precipitation has increased [Goodess and Jones, 2002; Rodrigo and Trigo, 2007; García et al., 2007; Barrera-Escoda, 2008; Rodrigo, 2010]. The statistical significance of these results is higher in the more recent studies. Only one of these studies [García et al., 2007] concludes that the number of rainy days has also declined.
With regard to dry extremes, the frequency of dry spells in Catalonia [Serra et al., 2006] and the severity of droughts in the northeastern IP [Vicente-Serrano and Cuadrat-Prats, 2007] have increased. The recent drought of 2004-2008 has been the most persistent and severe of the XXth century [Altava-Ortiz, 2010].
20 This trend is also documented in several national publications that are not included in the SCI. 21 A recent reconstruction for Andalusia also suggests that the average winter precipitation amount (30-year mean) has decreased since pre-instrumental times [Rodrigo, 2008].

Climate in Spain: Past, Present and Future
38
3.4.- Other precipitation-related atmospheric variables
Very little attention has been devoted to changes in the frequency of snowfall and in snowpack depth. [López-Moreno, 2005] analyzed short time series (1985-1999) of spring snowpack depth (March and April) in the central Pyrenees and found a statistically significant decrease, which he attributed to decreasing February and March snowfall rather than higher temperatures, though the timeseries is much too short for any interpretation of this result. On the other hand, [Pons et al., 2010] examined variations in the frequency of snowfall events in the second half of the 20th century and concluded that the number of snowfall days per year has declined some 50% since 1970 in all stations, concomitant to an increase in atmospheric temperature.
4.- Summary and conclusions
In the Iberian Peninsula, the temperature has increased during the 20th century. The warming trend is strongest in the most recent period, reaching a rate of 0.5ºC/decade from 1973 to 2005. This value is almost three times as large as the global warming rate22. For the 20th century as a whole, all seasons have made similar contributions to the annual warming. In the recent period, however, the warming has been concentrated in spring and summer. Maximum temperatures have risen more than minimum temperatures over the XXth century, which implies an increase in the diurnal temperature range, though this behaviour is no longer observed in the recent period. The frequency of cold days and nights has decreased while the frequency of warm days and nights has increased. The only discordant results are found in autumn, when maximum temperatures do not appear to have risen, and in summer in the coastal region of Valencia, where the same stagnation in maximum temperatures has been observed.
In contrast, no widespread precipitation decline has been observed in the IP during the 20th century. The large natural interannual variability and the short length of the instrumental record complicate detection and interpretation of possible trends. Annual precipitation appears to have decreased significantly, but only compared to the decades of the 60’s and 70’s. This reduction in rainfall has occurred mostly in later winter (February-March) and to a lesser degree in June. The current decade may have been the driest since 1950, which suggests a change in the precipitation regime of the IP in response to anthropogenic warming. However, the lack of long timeseries extending to the early 20th century (and including the recent period also) prevents any definitive statements as to whether precipitation has declined to historically unprecedented values. Except for the southeastern Mediterranean coast, the daily precipitation rate has decreased in the last 50 years, the number of days with small rainfall amounts has increased and the number of days with large amounts has decreased. In summary, the anthropogenic precipitation signal in this region predicted by climate models has not yet emerged in an unambiguous way from the natural background noise of precipitation. In particular, the pronounced decrease in summer precipitation anticipated by the majority of climate models for the end of the 21st century cannot be detected in observational data at this time.
This finding does not necessarily reduce the credibility of climate models, because in many models the precipitation response to anthropogenic climate forcing does not become clearly detectable until well into the XXIst century23, but it cannot be used to strengthen our confidence in those climate predictions. Conversely, the fact that climate models (generally speaking) do not reproduce the recent (1960-2010) observed pattern of negative precipitation trends in the Mediterranean region (including the IP)23 prevents any attempt at attribution of this precipitation signal. With regard to temperatures, the agreement between observations and models is much better for all models qualitatively reproduce the observed 20th century warming23 in the IP, though models may be underestimating the temperature rise in the last decades, at least in the IP23 and in western Europe [Oldenborgh et al., 2009].
22 The global surface temperature trend over the period 1979-2005 is 0.17ºC/decade. Over land in the Northern Hemisphere, this trend increases to 0.32ºC/decade [IPCC, 2007]. The latter value is that used in Section 2 for comparison with trends in the IP. 23 See additional Figures in http://clivar.iim.csic.es/files/figuras_suplementarias.pdf.

CLIVAR – Spain Atmospheric trends
39
Acknowledgments:
We thank project EU-FP6 ENSEMBLES (http://www.ensembles-eu.org) and the data providers of the ECA&D project (http://eca.knmi.nl) for the use of the E-OBS dataset. We are also grateful to Geert Jan Van Oldenborgh for access to the ESSENCE-simulations and for the use of his software “Climate Explorer”, which was used in the preliminary analysis and some of the additional figures. We also thank the two anonymous reviewers for their helpful comments and suggestions.
5.- References
Allen, M. R., and W. J. Ingram (2002), Constraints on future changes in climate and the hydrologic cycle, Nature, 419, 224-232. Altava-Ortiz, V., Llasat, M.-C., Ferrari, E., Atencia, A. and Sirangelo, B. , Monthly rainfall changes in Central and Western
Mediterranean basins, at the end of the 20th and beginning of the 21st centuries. International Journal of Climatology, n/a. doi: 10.1002/joc.2204
Altava-Ortiz, V. (2009), Caracteritzaciò i monitoratge de les sequeres a Catalunya i nord del País Valencià. Càlcul d’escenaris climàtics per al segle XXI (Characterising and monitoring droughts in Catalonia and Northern Valencian Country. Calculation of climate scenarios for the 21st century), Ph.D. Thesis, Internal Tesis Doctoral. Universidad de Barcelona.
Barrera-Escoda, A. (2008), Evolución de los extremos hídricos en Catalunya en los últimos 500 años y su modelización regional, Tesis Doctoral. Universidad de Barcelona, 319 pp.
Bonsal, B.R., X. Zhang, L.A. Vincent, W.D. Hogg and W.D. (2001), Characteristics of daily and extreme temperatures over Canada, Journal of Climate, 14, 1959– 1976.
Bradley, R.S., K.R. Briffa, J.E. Cole, M.K. Hughes and T.J. Osborn (2003), The climate of the last millennium, in Paleoclimate, Global Change and the Future. Alverson, K., R.S. Bradley and T.F. Pedersen (eds.). Springer Verlag, Berlin, Heidelberg, New York, pp. 105–141.
Brunet, M., O. Saladié, P.D. Jones, P.D., J. Sigró, E. Aguilar, A. Moberg, D. Lister, A. Walther, D. López and C. Almarza (2006), The development of a new dataset of Spanish daily adjusted temperature series (SDATS) (1850-2003), International Journal of Climatology, 26 (13): 1777-1802, doiI: 10.1002/joc.1338.
Brunet, M., P.D. Jones, J. Sigró, O. Saladié, E. Aguilar, A. Moberg, P. Della-Marta, D. Lister, A. Walther and D. López (2007), Temporal and spatial temperature variability and change over Spain during 1850-2005, Journal of Geophysical Research, 112, D12117, doi:10.1029/2006JD008249.
Copenhagen Diagnosis: Updating the world on the Latest Climate Science (2009). The University of New South Wales Climate Change Research Centre (CCRC), Sydney, Australia, 60pp.
Crowley, T.J. and T.S. Lowery (2000), How warm was the Medieval Warm Period, Ambio, 29, 51–54. Dai, A., I.Y. Fung and A.D. Del Genio (1997), Surface observed global land precipitation variations during 1900-1988,. Journal of
Climate, 10, 2943-2962, doi:10.1175/1520-0442(1997)010<2943:SOGLPV>2.0.CO;2. de Luis, M., J. C. González-Hidalgo, L. A. Longares and P. !tepánek (2008) Seasonal precipitation trends in Mediterranean Iberian
Peninsula in second half of XX century, International Journal of Climatology, doi: 10.1002/joc.1778. del Río, S., A. Penas and R. Fraile (2005), Analysis of recent climatic variations in Castile and Leon (Spain), Atmospheric Research,
73, 69–85 del Río, S., R. Fraile, L. Herrero and A. Penas (2007), Analysis of recent trends in mean maximum and minimum temperatures in a
region of the NW of Spain (Castilla y León), Theoretical and Applied Climatology, 90, 1-12, doi: 10.1007/s00704-006-0278-9. Douguedroit, A. and C. Norrant (2003), Annual and seasonal trends of the precipitation in the Mediterranean during the twentieth
century, in H.-J. Bolle (ed.), Mediterranean climate variability and trends, Springer Publishing Company, 159-163. Esteban-Parra, M.J., S.R. Gámiz-Fortis and Y. Castro-Díez (2009), The evolution of temperature extreme events in the south of the
Iberian Peninsula, Submitted to Intenational Journal of Climatology. Folland, CK., Karl, TR., Christy, JR., Clarke, RA., Gruza GV., Jouzel, J., Mann, ME., Oerlemans, J., Salinger, MJ., Wang SW. and
140 contributing authors (2001): Observed Climate Variability and Change, in Houghton JT. et al. Climate Change 2001: The Scientific Basis, Contribution of Working Group I to the Third Assessment Report of the IPCC, Cambridge University Press, Cambridge: 99-181.
Gallego, D., R. Garcia-Herrera, N. Calvo and P. Ribera (2007), A new meteorological record for Cádiz (Spain) 1806–1852: Implications for climatic reconstructions, Journal of Geophysical Research, 112, D12108, doi:10.1029/2007JD008517.
Gallego, M. C., J. A. García, J. M. Vaquero and V. L. Mateos (2006), Changes in frequency and intensity of daily precipitation over the Iberian Peninsula, J. Geophys. Res., 111, D24105, doi:10.1029/2006JD007280.
García, J.A., M.C. Gallego, A. Serrano and J.M. Vaquero (2007), Trends in Block-Seasonal Extreme Rainfall over the Iberian Peninsula in the Second Half of the Twentieth Century, Journal of Climate, 20, 113–130.
Giorgi, F. (2002), Variability and trends of sub-continental scale surface climate in the twentieth century. Part I: Observations, Climate Dynamics, 18, 675-691.
Goodess C.M. and P.D. Jones (2002), Links between circulation and changes in the characteristic of Iberian rainfall, International Journal of Climatology, 22, 1593-1615, doi: 10.1002/joc.810.
González-Hidalgo J.C., J.A. López-Bustins, P. !tepánek , J. Martín-Vide and M. de Luis (2008), Monthly precipitation trends on the Mediterranean fringe of the Iberian Peninsula during the second half of the 20th century (1951-2000), International Journal of Climatology, doi: 10.1002/joc.1780.
González-Rouco J. F., J.L. Jiménez, V. Quesada and F. Valero (2001), Quality Control and Homogenization of Monthly Precipitation Data in the Southwest of Europe, Journal of Climate, 14, 964-978, 2001.

Climate in Spain: Past, Present and Future
40
Groisman, P. Y. and Coauthors (1999), Changes in the probability of heavy precipitation: Important indicators of climate change, Climate Change, 42, 243–283.
Guijarro Pastor, J.A. (2004), CLIMATOL: Software libre para la depuración y homogeneización de datos climatológicos, en García Codron, J.C., C. Diego Liaño, P. Fernández de Arróyabe, C. Garmendia y D. Rasilla (Eds.), El Clima, entre el Mar y la Montaña, AEC-Universidad de Cantabria, Serie A, nº 4, 493-502.
Haylock, M.R., N. Hofstra, A.M.G. Klein Tank, E.J. Klok, P.D. Jones and M. New (2008), A European daily high-resolution gridded data set of surface temperature and precipitation for 1950-2006, Journal of Geophysical Research, 113, D20119, doi:10.1029/2008JD010201.
Heino, R., R. Brazdil, E. Forland, H. Tuomenvirta, H. Alexandersson, M. Beniston, C. Pfister, M. Rebetez, G. Rosenhagen, S. Rosner and J. Wibig (1999), Progress in the study of climate extremes in northern and central Europe, Climate Change, 42, 151–181.
Held I. M. and B. J. Soden (2006), Robust responses of the hydrological cycle to global warming, J. Climate, 19, 5686–5699 Herrera S., J. M. Gutiérrez, R. Ancell, M. R. Pons, M. D. Frías & J. Fernández (2010) Development and Analysis of a 50 year high-
resolution daily gridded precipitation dataset over Spain (Spain02). International Journal of Climatology. DOI: 10.1002/joc.2256. In press.
Hulme M., T.J. Osborn and T.C. Johns (1998), Precipitation sensitivity to global warming: comparison of observations with HadCM2 simulations, Geophysical Research Letters, 25, 3379–3382.
IPCC (2007), Climate Change 2007: The Physical Science Basis. Contribution of Working Group I to the Fourth Assessment Report of the Intergovernmental Panel on Climate Change. Cambridge University Press, Cambridge, United Kingdom and New York, NY, USA, 996 pp.
Jones, P.D., K.R. Briffa and T.J. Osborn (2003), Changes in the Northern Hemisphere annual cycle: Implications for paleoclimatology?, Journal of Geophysical Research, 108, 4588, doi:10.1029/2003JD003695.
Jones, P.D., Mann, M.E. (2004), Climate Over Past Millennia, Reviews of Geophysics, 42. Kendall, M.G. (1970), Rank Correlation Methods (4th ed). Griffin and Co. Ltd., London. Keigwin, L.D. and E.A. Boyle (2000), Detecting Holocene changes in thermohaline circulation, PNAS, vol. 97, no. 4, 1343-1346. Lana, X. and A.Burgueño (2000), Some statistical characteristics of monthly and annual pluviometric irregularity for the Spanish
Mediterranean Coast, Theoretical and Applied Climatology, 65, 79–97. Liebmann B., R. M. Dole, C. Jones, I. Bladé and D. Allured, 2010: Influence of Choice of Time Period on Global Surface Temperature
Trend Estimates. Bull. Amer. Meteor. Soc., 91, 1485-1491. Llasat, M. C. and L. Quintas (2004),.Stationarity of Monthly Rainfall Series since the Middle of the XIXth Century. Application to the
Case of Peninsular Spain, Natural Hazards, 31,. 613-622. López-Bustins, J.A., J. Martín-Vide and A. Sanchez-Lorenzo (2008), Iberia winter rainfall trends based upon changes in
teleconnection and circulation patterns, Global and Planetary Change, 63, 171-176. López-Moreno, J.I. (2005). Recent variations of snowpack depth in the Central Spanish Pyrenees, Artic, Antartic, and Alpine
Research, 37 (2), 253-260. López-Moreno, J.I. , S. M. Vicente-Serrano, M. Angulo-Martínez, S. Beguería and A. Kenawy (2009a), Trends in daily precipitation
on the northeastern Iberian Peninsula, 1955-2006, International Journal of Climatology, doi: 10.1002/joc.1945. López-Moreno, J. I., S. M. Vicente-Serrano, L. Gimeno and R. Nieto (2009b), Stability of the seasonal distribution of precipitation in
the Mediterranean region: Observations since 1950 and projections for the 21st century, Geophysical Research Letters, 36(L10703).
Luterbacher J, Dietrich D, Xoplaki E, Grosjean M and Wanner H (2004), European seasonal and annual temperature variability, trends and extremes since 1500. Science, 303, 1499-1503.
Livezey, R.E. and W.Y. Chen (1983), Statistical field significance and its determination by Monte Carlo techniques, Mon. Weather Rev., 111, pp. 46–59.
Lund, D.C., J. Lynch-Stieglitz and W.B. Curry (2006), Gulf Stream density structure and transport during the past millennium, Nature, 444, doi:10.1038/nature05277.
Martínez, M.D., C. Serra, A. Bargueño and X. Lana (2009), Time trends of daily maximum and minimum temperaturas in Catalonia (ne Spain) for the period 1975-2004, International Journal of Climatology, doi: 10.1002/joc.1884.
Meehl, G.A., T.F. Stocker, W.D. Collins, P. Friedlingstein, A.T. Gaye, J.M. Gregory, A. Kitoh, R. Knutti, J.M. Murphy, A. Noda, S.C.B. Raper, I.G. Watterson, A.J. Weaver and Z.-C. Zhao (2007), Global Climate Projections, in Climate Change 2007: The Physical Science Basis, Contribution of Working Group I to the Fourth Assessment Report of the Intergovernmental Panel on Climate Change, Cambridge University Press.
Miró, J.J., M.J. Estrela and M. Millán (2006), Summer temperature trends in a Mediterranean area (Valencia region), International Journal of Climatology, 26, 1051-1073.
Mitchell, T.D. and P.D. Jones (2005), An improved method of constructing a database of monthly climate observations and associated high-resolution grids, International Journal of Climatology, 25, 693-712, doi:10.1002/joc.1181.
NRC (National Research Council) (2006), “Surface Temperature Reconstructions for the Last 2,000 Years Committee on Surface Temperature Reconstructions for the Last 2,000 Years” , ISBN: 0-309-66144-7.
New, M., M. Todd, M. Hulme and P.Jones (2001), Precipitation measurements and trends in the twentieth century, International Journal of Climatology, 21, 1899-1922.
Norrant C. and A. Douguedroit (2003), Tendances récentes des précipitations et des pressions de surface dans le Bassin méditerranéen, Annales de Géographie, 631, 298-305.
Norrant, C. and A. Douguedroit (2006), Monthly and daily precipitation trends in the Mediterranean (1950-2000), Theoretical and Applied Climatology, 83, 89-106.
Oldenborgh, G.J. van, S.S. Drijfhout, A. van Ulden, R. Haarsma, A. Sterl, C. Severijns, W. Hazeleger and H. Dijkstra (2009), Western Europe is warming much faster than expected Climate of the Past, 5, 1, 1-12.
Osborn, Timothy J. and Keith R. Briffa (2006), The Spatial Extent of 20th-Century Warmth in the Context of the Past 1200 Years, Science 311, 831-834.

CLIVAR – Spain Atmospheric trends
41
Paredes, D., R.M. Trigo, R. Garcia-Herrera and I.F. Trigo (2006), Understanding precipitation changes in Iberia in early Spring: weather typing and storm-tracking approaches, Journal of Hydrometeorology, 7, 101-113.
Pons, M.R., D. San-Martín, S. Herrera and J.M. Gutiérrez (2010), Snow Trends in Northern Spain. Analysis and simulation with statistical downscaling methods, International Journal of Climatology, 30: 17951806, DOI: 10.1002/joc.2016.
Prieto, L., R. García Herrera, J. Díaz, E. Hernández and T. del Teso (2004), Minimum extreme temperatures over peninsular Spain, Global and Planetary Change, 44, 59-71.
Rodrigo, F.S., M.J. Esteban-Parra, D. Pozo-Vázquez, Y. Castro-Díez (1999), A 500-year precipitation record in southern Spain, International Journal of Climatology, 19, 1233-1253.
Rodrigo, F.S., M.J. Esteban-Parra, F. Pozo-Vázquez, Y. Castro-Díez (2000), On the variability of rainfall in southern Spain in decadal to centennial time scales, International Journal of Climatology, 20, 721-732.
Rodrigo, F.S. and R.M. Trigo (2007), Trends in daily rainfall in the Iberian Peninsula from 1951 to 2002, International Journal of Climatology, 27, 513-519.
Rodrigo, F.S. (2008), A new method to reconstruct low-frequency climatic variability from documentary sources: application to winter rainfall series in Andalusia (Southern Spain) from 1501 to 2000, Climatic Change, 87, 471-487.
Rodrigo, F.S. (2010), Changes in the probability of extreme daily precipitation observed from 1951 to 2002 in the Iberian Peninsula, International Journal of Climatology, 30: 1512-1525. Doi:10.1002/joc.
Romero, R, J.A. Guijarro and S. Alonso (1998), A 30-year (1964-1993) daily rainfall data base for the Spanish Mediterranean regions: first exploratory study, International Journal of Climatology ,18, 541-560.
Saladié, O. (2004), Variaciones y tendencia secular de la precipitación en el Sector Nororiental de la Península Ibérica (1850-2000), Tesis de Doctorado Inédita, Universitat de Barcelona, Barcelona, 496 pp.
Serra B., A. Burgueño, M. Martinez and X. Lana (2006), Trends in dry spells across Catalonia (NE Spain) during the second half of the 20th century, Theoretical and Applied Climatology, 85 (3), 165-183.
Serrano A., A. J. Garcia, V. L.. Mateos, M. L. Cancillo and J. Garrido (1999), Monthly modes of variation of precipitation over the Iberian Peninsula. Journal of Climate, 12, 2894–2919.
Trenberth, K., A. Dai, R. Rasmussen and D. Parsons (2003), The changing character of precipitation, Bulletin of the American Meteorological Society, 84, 1205–1217.
Trenberth, K.E., P.D. Jones, P. Ambenje, R. Bojariu, D. Easterling, A. Klein Tank, D. Parker, F. Rahimzadeh, J.A. Renwick, M. Rusticucci, B. Soden and P. Zhai (2007), Observations: Surface and Atmospheric Climate Change, in Climate Change 2007: The Physical Science Basis. Contribution of Working Group I to the Fourth Assessment Report of the Intergovernmental Panel on Climate Change, Cambridge University Press.
Trenberth, K. E. and A. Dai (2007), Effects of Mount Pinatubo volcanic eruption on the hydrological cycle as an analog of geoengineering, Geophys. Res. Lett., 34, L15702, doi:10.1029/2007GL030524.
Trigo, R. M. and C. C. DaCamara (2000), Circulation weather types and their impact on the precipitation regime in Portugal, Int. J. Climatol, 20, 1559–1581.
Trouet, V., J. Esper, N.E. Graham, A. Baker, J.D. Scourse, and D.C. Frank (2009), Persistent positive North Atlantic Oscillation mode dominated the Medieval Climate Anomaly, Science, 324, 78-80.
Vicente-Serrano, S. M. and J.M. Cuadrat-Prats (2007), Trends in drought intensity and variability in 30 the middle Ebro valley (NE of the Iberian Peninsula) during the second half of the twentieth century, Theoretical and Applied Climatology, 88, 247–258.
Vose, R.S., D.R. Easterling, and B. Gleason (2005), Maximum and minimum temperature trends for the globe: An update through 2004, Geophysical Research Letters, 32, L23822, doi:10.1029/2004GL024379.
Xoplaki, E., J.F. González-Rouco, J. Luterbacher, and H. Wanner (2004), Wet season Mediterranean precipitation variability: influence of large-scale dynamics and predictability. Clim. Dyn. 23, 63-78, DOI: 10.1007/s00382-004-0422-0.
Zhang X., X. L. Wang and J. Corte-Real (1997), On the relationships between daily circulation patterns and precipitation in Portugal, Journal of Geophysical Research, 102, 13495–13507.

Climate in Spain: Past, Present and Future
42

CLIVAR – Spain Ocean Variability
43
Chapter 31 OCEAN VARIABILITY AND SEA LEVEL CHANGES AROUND
THE IBERIAN PENINSULA Authors: Manuel Vargas-Yáñez1, Marcos García Sotillo2 and Damià Gomis3 1 Instituto Español de Oceanografía (IEO) 2 Puertos del Estado (PdE) 3 Instituto Mediterráneo de Estudios Avanzados (Universitat de les Illes Balears - CSIC) Contributors: Inés Álvarez4, Verónica Benítez-Barrios5, Francisco M. Calafat3, Bartolomeu Cañellas3, Maite de Castro4, Alejandro J.C. Crespo4, Inmaculada Ferrer2, Mª Carmen García-Martínez1, José Luis G. Gesteira6, Moncho Gómez-Gesteira4, César González-Pola7, Gabriel Jordá3 , Alicia Lavín8, Nieves Lorenzo4, Marta Marcos3, Francina Moya1, Ananda Pascual3, Begoña Pérez2, Irene Polo9, Simón Ruiz3, Jordi Salat10, Jordi Solé3, Raquel Somavilla8, Elena Tel11, Victoriano Valencia12, Enrique Vidal-Vijande3, Patricia Zunino1. 4 Environmental Physics Laboratory, Facultad de Ciencias, Universidad de Vigo, Ourense. 5 Facultad de Ciencias del Mar, Universidad de Las Palmas de Gran Canaria. 6 Área de control y gestión del medio marino y los recursos marinos. Fundación CETMAR, Vigo. 7 Instituto Español de Oceanografía. Centro Oceanográfico de Gijón. Gijón. 8 Instituto Español de Oceanografía. Centro Oceanográfico de Santander. Santander. 9 Depto de Física de la Tierra, Astronomía y Meteorología I. Universidad Complutense de Madrid. 10 Institut de Ciencias del Mar de Barcelona (CSIC). 11 Instituto Español de Oceanografía. IEO. Madrid. 12 AZTI-Tecnalia, Unidad de Investigación Marina, Pasaia, Guipúzcoa.
TABLE OF CONTENTS 1. Introduction
2. Ocean variability
2.1. Summary
2.2. Variations in temperature and salinity
2.3. Heat fluxes
3. Sea level
3.1. Sea level: From a global to a regional approach
3.2. Observations
3.3. Extreme events and their variability
3.4. Mechanisms driving the observed changes
3.5. Modeling
3.6. Prospects of progress in the knowledge on regional sea level variability
4. References
Citation: Vargas-Yáñez M., García Sotillo M. and Gomis D., 2010. Ocean Variability and sea level changes around the Iberian Peninsula. Report: Climate in Spain: Past, present and future (Editors: Pérez F. Fiz and Boscolo Roberta) pp. 43-52.
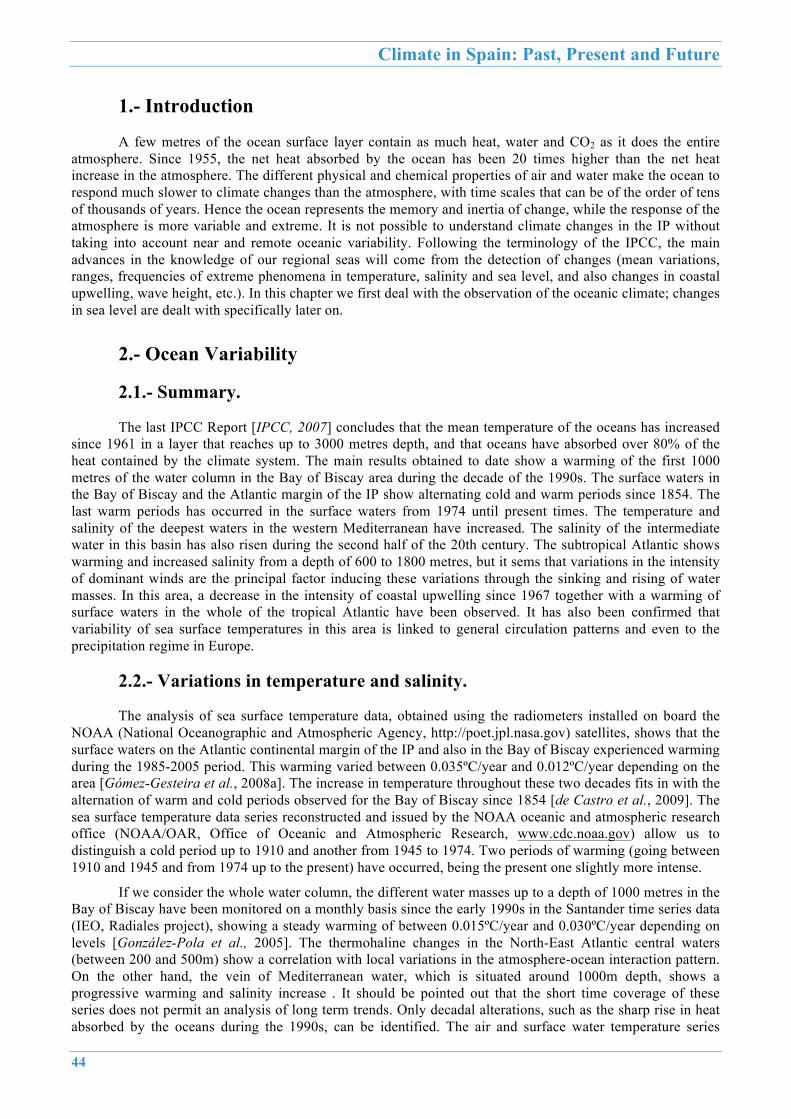
Climate in Spain: Past, Present and Future
44
1.- Introduction
A few metres of the ocean surface layer contain as much heat, water and CO2 as it does the entire atmosphere. Since 1955, the net heat absorbed by the ocean has been 20 times higher than the net heat increase in the atmosphere. The different physical and chemical properties of air and water make the ocean to respond much slower to climate changes than the atmosphere, with time scales that can be of the order of tens of thousands of years. Hence the ocean represents the memory and inertia of change, while the response of the atmosphere is more variable and extreme. It is not possible to understand climate changes in the IP without taking into account near and remote oceanic variability. Following the terminology of the IPCC, the main advances in the knowledge of our regional seas will come from the detection of changes (mean variations, ranges, frequencies of extreme phenomena in temperature, salinity and sea level, and also changes in coastal upwelling, wave height, etc.). In this chapter we first deal with the observation of the oceanic climate; changes in sea level are dealt with specifically later on.
2.- Ocean Variability
2.1.- Summary.
The last IPCC Report [IPCC, 2007] concludes that the mean temperature of the oceans has increased since 1961 in a layer that reaches up to 3000 metres depth, and that oceans have absorbed over 80% of the heat contained by the climate system. The main results obtained to date show a warming of the first 1000 metres of the water column in the Bay of Biscay area during the decade of the 1990s. The surface waters in the Bay of Biscay and the Atlantic margin of the IP show alternating cold and warm periods since 1854. The last warm periods has occurred in the surface waters from 1974 until present times. The temperature and salinity of the deepest waters in the western Mediterranean have increased. The salinity of the intermediate water in this basin has also risen during the second half of the 20th century. The subtropical Atlantic shows warming and increased salinity from a depth of 600 to 1800 metres, but it sems that variations in the intensity of dominant winds are the principal factor inducing these variations through the sinking and rising of water masses. In this area, a decrease in the intensity of coastal upwelling since 1967 together with a warming of surface waters in the whole of the tropical Atlantic have been observed. It has also been confirmed that variability of sea surface temperatures in this area is linked to general circulation patterns and even to the precipitation regime in Europe.
2.2.- Variations in temperature and salinity.
The analysis of sea surface temperature data, obtained using the radiometers installed on board the NOAA (National Oceanographic and Atmospheric Agency, http://poet.jpl.nasa.gov) satellites, shows that the surface waters on the Atlantic continental margin of the IP and also in the Bay of Biscay experienced warming during the 1985-2005 period. This warming varied between 0.035ºC/year and 0.012ºC/year depending on the area [Gómez-Gesteira et al., 2008a]. The increase in temperature throughout these two decades fits in with the alternation of warm and cold periods observed for the Bay of Biscay since 1854 [de Castro et al., 2009]. The sea surface temperature data series reconstructed and issued by the NOAA oceanic and atmospheric research office (NOAA/OAR, Office of Oceanic and Atmospheric Research, www.cdc.noaa.gov) allow us to distinguish a cold period up to 1910 and another from 1945 to 1974. Two periods of warming (going between 1910 and 1945 and from 1974 up to the present) have occurred, being the present one slightly more intense.
If we consider the whole water column, the different water masses up to a depth of 1000 metres in the Bay of Biscay have been monitored on a monthly basis since the early 1990s in the Santander time series data (IEO, Radiales project), showing a steady warming of between 0.015ºC/year and 0.030ºC/year depending on levels [González-Pola et al., 2005]. The thermohaline changes in the North-East Atlantic central waters (between 200 and 500m) show a correlation with local variations in the atmosphere-ocean interaction pattern. On the other hand, the vein of Mediterranean water, which is situated around 1000m depth, shows a progressive warming and salinity increase . It should be pointed out that the short time coverage of these series does not permit an analysis of long term trends. Only decadal alterations, such as the sharp rise in heat absorbed by the oceans during the 1990s, can be identified. The air and surface water temperature series

CLIVAR – Spain Ocean Variability
45
recorded in San Sebastian Bay do not show significant trends for the 1947-2005 period [Fontán et al., 2008; Goikoetxea, et al., 2009] becoming evident that observed trends depend heavily on the study period.
The decade of the 1990s shows a very pronounced surface warming in the Mediterranean., Nevertheless, an analysis of data obtained from the MEDATLAS database [MEDAR group 2002] shows that throughout the 1965-1998 period there is some inter-annual and decennial variability without significant trends. These results coincide with those obtained by the ORCA-R025 G70 [Vidal-Vijande, 2009] numerical simulation. However, for a more extensive period (1943-2000), a positive trend in temperature is observed, being this accentuated from the early 1980s onwards [Rixen et al., 2005; Vargas-Yáñez et al. 2008 and 2009a]. This change in trend or rate of increase in temperature coincides with what was observed in the l'Estartit temperature series where a sharp rise in water temperature has been recorded since 1974 with trends of around 0.03ºC/year up until 2008 (Fig. 1) and an increase in air temperature higher than the one obtained for the water [Salat and Pascual, 2006]. These authors have also confirmed that the start of the period in which the sea is colder than the air now occurs 41 days earlier, and this could reduce effective evaporation and bring lower rainfall in spring, which represents 30% of the annual total. The springtime trends observed in local precipitation show, in fact, an insignificant statistical reduction on account of precipitation irregularity.
The temperature of intermediate waters in the western Mediterranean does not show significant trends, but simply decennial swings, reiterating the results obtained using the MEDATLAS [MEDAR group 2002] data analysis and ORCA-R025 G70 [Vidal-Vijande, 2009] modeling. These results were obtained when analysing the changes in temperature on isobaric levels. However, ST changes on pressure or depth levels can be broken down into those related to alterations in heat fluxes and fresh water with the atmosphere, and those associated with vertical displacements of the isopycnals, neutral surfaces or simply material surfaces. This type of breakdown performed by [Zunino et al., 2009] shows that the intermediate waters in the western Mediterranean could have increased their temperature and salinity from 1943 to 2000, although an ascent of isopycnals would have masked this warming. Lastly, deep waters show an increase in temperature for the 1943-2000 period, although there are decennial swings with periods of stagnation (Fig.1). Once again, the analyses of the MEDATLAS databases [MEDAR group 2002] and the ORCA numerical simulation reproduce this warming in the deep layers. The salinity of intermediate and deep layers have increased at a rate of 1.3 x 10!
4 year-1 and 9.2 x 10!4 year!
1, respectively [Vargas-Yáñez et al., 2009b], but in this case the models are not capable of reproducing this conduct [Vidal-Vijande, 2009]. It must be pointed out that both the increase in salinity of the intermediate and deep layers, and warming of the latter, are robust results that are not affected by the systematic errors recently detected in temperature measurements made using bathythermographs [Vargas-Yáñez et al., 2009b].
In the subtropical Atlantic, the repetition of transatlantic sections from Africa to America in 1957 (oceanographic bottles), 1981, 1992, 1998, 2004 (CTDs) plus the use of ARGO buoys reveal warming and increased salinity at a depth of between 600 and 1800m. However, the main factor governing this increase in temperature and salinity is the sinking of the isopycnals, which is related to variations in the curl of the wind [Vélez-Belchí et al., 2009].
A more local analysis restricted to the northern area of the Canary Islands performed using CTD sections obtained between 1997 and 2006, shows a statistically significant increase in temperature and salinity in isobars between 1500 and 2300 dbar, linked once again to a sinking of the neutral surfaces [Benítez-Barrios et al., 2008], and also a cooling and freshening of the waters in the main thermocline that, according to these authors, is associated with changes in the fresh water balance in the regions where these water masses are formed. The trade winds that flow along the coast, from the north or north-west, generate a coastal upwelling through Ekman transport. The time variability of this upwelling and its possible teleconnections with general atmospheric circulation patterns and even rainfall in Europe have been analysed since the 1970s [Polo et al., 2005; Rodríguez-Fonseca et al., 2006; García-Serrano et al., 2008; Polo et al., 2008a]. These authors have studied sub-surface sea temperature data from the TAOSTA (Tropical Atlantic Ocean Subsurface Temperature Atlas) database, NOAA/OAR extended reconstructed sea surface temperature and also wind data obtained in the framework of the PIRATA-CLIVAR Project. These analysis have revealed that in the 1979-2002 period the variability in the intensity of the Mauritania/Senegal upwelling was a key factor in the persistence of the SST anomalies in the subtropical North Atlantic, while turbulent heat flows tended to restore normal conditions. The SST anomalies over the subtropical North Atlantic are, in turn, associated with an atmospheric pattern that indicates a north-south bipolar precipitation structure in Europe. A lowering in

Climate in Spain: Past, Present and Future
46
intensity of the coastal upwelling from 1967 to 2005 is a well known fact [Gómez-Gesteira et al., 2008b]. The variability of the upwelling system in Angola/Benguela has also been the subject of study in relation to rainfall in Europe [Polo et al., 2008a; García-Serrano et al., 2008]. The thermal variations of this upwelling are associated with SST anomalies in the equatorial Atlantic through ocean waves and heat flows [Polo et al., 2008a] that teleconnect to variations in extra-tropical precipitation [García-Serrano et al., 2008]. Besides this, at intra-seasonal scales these ocean waves are capable of transporting anomalies throughout the basin and affecting the variability of the sea height on the West African coast [Polo et al., 2008b].
2.3.- Heat fluxes.
Heat fluxes in the Mediterranean Basin show no constant trends, but rather an alternation between a period of heat loss from 1958 to 1975 and another period in which heat was gained from this date until 2001 [Ruiz et al., 2008]. The variability range was of ± 10 W/m2 for the net heat flux. The most recent estimations derived from the HIPOCAS database indicate that the spatio-temporal mean for the 1958-2001 period is !1 W/m2 [Ruiz et al., 2008]. This heat loss mean is lower than the heat advected towards the Mediterranean through the Gibraltar Strait (estimated at between 8.5 W/m2 and 5 W/m2), which would lead to an energy unbalance in the basin, marked by a warming of the Mediterranean, consistent with the aforementioned temperature measurements. However, the uncertainties associated with the fluxes calculation do not allow us to be conclusive in this respect (earlier estimates obtained by other authors fluctuate between 29 W/m2 and !11 W/m2).
In the Bay of Biscay, atmospheric circulation patterns can lead to exceptional oceanographic processes such as the heavy loss of heat in the winter of 2004/2005 that causes the formation of thick winter mixed layers [Somavilla et al., 2009] which affects regional climate. This phenomenon also affects the formation of deep waters in the western Mediterranean, favouring existence of exceptionally cold waters and "cascading" phenomena associated with the heavy loss of heat and floatability [Font et al., 2007; López-Jurado et al., 2005].
3.- Sea level.
3.1.- Sea level: from a global to a regional approach.
The latest IPCC Report concludes that the mean temperature of the oceans has increased, causing an expansion of sea water that contributes to increasing sea level. According to that report, observations show a global sea level increase of about 1.8±0.5 mm/year for the period 1961-2000, although more recent estimates rate it at 1.5±0.4 mm/year [Domingues et al., 2008]. On the other hand, the rate of elevation obtained for 1993-2003, a period already covered by satellite altimetry data, is 3.1±0.7 mm/year. As regards the future, projections based on numerical models indicate that by the end of the 21st century (2090-2099 decade) sea level will be between 0.18 and 0.26 metres higher than for the control period (1980-1998). These projections do not include a contribution with high uncertainty (but which we know for sure is positive) such as the rate of increased mass associated with the melting of continental ice, which makes it possible to forecast that the sea level increase will be more pronounced. All these results included in the IPCC report refer to changes in global sea level. It must be noted, however, that there may be notable differences in terms of trend and variability when global values are compared with the evolution of sea level in a specific region of the globe. The present knowledge on the variability and trends of sea level in the neighbouring basins of the IP is presented in the following.

CLIVAR – Spain Ocean Variability
47
Figure 1. Upper panel: Evolution of the net heat flux between the ocean and the atmosphere in the north-western Mediterranean and evolution of the temperature, salinity and potential density in the Majorca Channel (CIRBAL project, IEO). Lower panel: Absorbed heat and surface temperature at the l'Estartit station (ICM/CSIC) and average absorbed heat and temperature for the deep layer and for the whole of the western Mediterraneanas obtained from the MEDATLAS data base. The total temperature increase for the analysed period is shown in the right-hand column.

Climate in Spain: Past, Present and Future
48
3.2.- Observations.
On its Atlantic side, the IP shows an acceptable, but improvable, coverage of long series (longer than 45 years) thanks to the tide gauges of the Instituto Español de Oceanografía in Santander, Vigo and Coruña and to some Portuguese stations (Cascais and Lagos). On the Mediterranean coast of the IP the longest series corresponds to the tide gauge located in Alicante and managed by the Instituto Geográfico Nacional. Other rather long series are available in Cadiz, Tarifa, Ceuta and Malaga, but all of them are influenced by local processes that make them not to be very representative of the average behaviour of sea level. The described long records are complemented by the REDMAR Network of Puertos del Estado, which consists of 34 stations with a time coverages of up to 17 years.
Regarding long-term variability, the available observations indicate that the annual sea level cycle shows la arge spatio-temporal variability, with amplitudes that range from 3 to 7 cm and a peak located between October and November in the Atlantic coasts and on September in the Mediterranean coast [Marcos and Tsimplis, 2007]. As for sea level trends, the Cascais and Lagos records cover the whole of the 20th century and show trends of 1.3±0.1 and 1.5±0.1 mm/year, respectively. The Santander, Vigo and Coruña stations cover the last 60 years and their trends are all slightly above 2 (±0.2) mm/year (similar values to those recorded on the French Atlantic coast). In the Mediterranean, the Alicante record, which started in 1960, shows a negative trend (!0.3±0.2 mm/year) that contrasts with the positive trends (1.2±0.1 mm/year) of the Marseille and Genoa records, which cover the whole of the 20th century (Fig.2; [Marcos and Tsimplis, 2008]). On the other hand, altimetry data obtained from 1993 onwards give a trend slightly larger than 3 mm/year, both in the Mediterranean and in the Atlantic [Cazenave et al., 2002]. The apparent disparity of the results, which is particularly marked in the Mediterranean Sea, can be explained by quantifying the contribution of the different processes driving sea level variability (see section 3.4).
In order to go beyond the partial view offered by tide gauges (which have produced long series, but all located at the coast and none at open sea) and altimetry (that has a suitable spatial coverage, but only spans the period from 1993 onwards), [Calafat and Gomis, 2009] have combined both data sources to generate a reconstruction of sea level fields that cover the period 1945-2000. For the whole period, the reconstruction shows a trend of 0.7±0.2 mm/year in the Mediterranean mean sea level (on the Mediterranean coast of the IP the trends vary between 0.3 and 0.7 mm/year).
3.3.- Extreme events and their variability Extremes in sea level are the result of different processes, the most common being the interaction
between tides and surges produced by atmospheric disturbances (through the mechanical forcing of wind and atmospheric pressure). [Marcos et al., 2009] have recently presented a study that combines hourly records (from 1940 onwards) from 73 tide gauges located in southern Europe and the HIPOCAS database [Ratsimandresy et al., 2007], which resulted from the output of a high-resolution barotropic model forced with atmospheric pressure and wind fields [Sotillo et al, 2005]. Bearing in mind the different tidal systems, the observations show values of up to 250 cm at the Atlantic stations, while extreme values in the Mediterranean are generally lower than 60 cm (all values referred to mean level). HIPOCAS data are proved to be consistent with observations and show the same spatial distribution as the meteorological residuals obtained from tide gauges, though with a certain underestimation (less than 10 cm for two thirds of the stations and between 10 and 35 cm for the others). Using the longest tide gauge records, it has also been proved that both long-term trends and the inter-annual variability of extreme episodes are consistent with the behaviour of mean sea level; that is to say there is no evidence of change in the intensity or the number of atmospheric disturbances observed in the vicinity of the IP during the last four decades of the 20th century.
3.4.- Mechanisms driving the observed changes.
As stated above, the variability of global mean sea level is determined by the steric component (changes in volume derived from changes in the temperature and salinity of the water) and the mass component (changes in the mass of the ocean due to the melting or increase of continental ice). On a regional scale, however, also the atmospheric pressure and wind play an important role, as does the redistribution of mass through changes in the ocean circulation. These regional processes can explain that while the trend of

CLIVAR – Spain Ocean Variability
49
global mean sea level is of the order of 1.5mm/year for the 1961-2000 period [Domingues et al., 2008], in the Mediterranean Sea it has been estimated in only 0.5mm/year for the same period [Calafat and Gomis, 2009]. The main reason is that during the period from 1960 to 1993 there was a significant increase in atmospheric pressure in southern Europe, whose contribution in terms of sea level trend has been quantified in !1 mm/year (!0.4 mm/year if the whole of the second half of the 20th century is considered [Gomis et al., 2008]). That atmospheric contribution has a clear seasonal component, as the atmospheric pressure increase manifested only in the winter. Lastly, it should be mentioned that the inter-annual sea level variations observed both on the Atlantic coasts of the IP and in the Mediterranean Sea show a significant correlation with the NAO atmospheric index, which reinforces the importance of the mechanical atmospheric forcing on the variability of sea level on a regional scale.
Regarding the steric contribution, the available observations indicate that it is positive in the Atlantic, while in the Mediterranean there are differrent results on its impact during the last four decades. While most models point to steric increases a few mm/year in the western Mediterranean, the MEDATLAS data point to a slightly negative contribution [Tsimplis and Rixen, 2002]. One of the factors that explain the difference with respect to the IP Atlantic coasts is that despite the temperature seems to have slight increased in the Mediterranean Sea, its effect would have been compensated by an increase in salinity. This fact, which can only be glimpsed with difficulty using current observations (due to their poor spatio-temporal coverage), is clearly shown in the predictions drawn up for the 21st century: an increase in the water deficit of the basin (due to higher evaporation and lower rainfall and river inflows) would cause an increase in salinity that could compensate for the increase in temperature, giving a small sea level steric component (of one sign or another, depending on the models and scenarios). In other words, the differences in sea level trends observed between the Atlantic and Mediterranean coasts of the IP during the last decades appear to extend into the 21st century.
Figure 2: Sea level series (annual values) obtained using the longest tide gauge records located in the vicinity of the IP. Each record is displaced 20 cm in the verticalwith respect to the previous one.

Climate in Spain: Past, Present and Future
50
During the last decade of the 20th century, the 'anomalous' behaviour of Mediterranean mean sea level with respect to the global mean appeared to have reversed, as both the atmospheric and steric components showed clearly positive trends. During that period Mediterranean mean sea level rised at a rate of up to 10 mm/year, partly due to the decrease in atmospheric pressure but mainly due to an increase in the temperature of the sea (an increase that seems to have slowed down from 2001 onwards). The fact that the period covered by altimetric data is largely influenced by that decade explains why altimetric trends are large.
The mass contribution can be estimated directly from gravimetry data. These observations are only available from 2002 onwards, but they have made it possible to demonstrate that by subtracting the atmospheric and steric contributions from the total sea level, a good approximation to the mass component is obtained [Calafat et al., 2010]. Using this result, [Calafat et al., 2010] have shown that the mass of the Mediterranean Sea has increased regularly at a rate of 1.2±0.3 mm/year during the last half of the 20th century.
3.5.- Modeling Numerical modeling of the processes driving sea level variability is an essential tool for understanding
and predicting this variability. The effect of the mechanical forcing of atmospheric pressure and wind is simulated using 2-D barotropic models. This type of model has been used with excellent results in operational systems aimed to predict short-term storm surges. The HIPOCAS reanalysis [Ratsimandresy et al., 2008] was generated using a barotropic model and has resulted in a high quality database that covers the whole Mediterranean Sea and a sector of the north-eastern Atlantic that includes the coasts of the IP. The HIPOCAS data base made possible for instance to understand key mechanisms that governed the sea level changes observed in the Mediterranean Sea during the second half of the 20th century [Gomis et al., 2008; Pascual et al., 2008] as well as to characterise the distribution of extreme events [Marcos et al., 2009].
However, barotropic models can reproduce neither the steric contribution nor changes in the mass of the ocean; the use of 3-D baroclinic models is necessary for that purpose, as they not only describe the ocean circulation but also the evolution of temperature and salinity and the inflows from continental waters. Significant efforts are presently devoted to the use of 3D baroclinic models for regional climate simulation. At a national level, a baroclinic integration of 44 years that covers a domain similar to the HIPOCAS barotropic reanalysis has been carried out in the framework of the VANIMEDAT project. It must be pointed out that, at present, regional baroclinic reanalyses are less reliable than barotropic reanalyses, mainly due to the greater complexity and memory of the physical processes they describe. Baroclinic regional reanalyses usually show important discrepancies with respect to observations [Tsimplis et al., 2008]. However, initiatives such as the VANIMEDAT project serve for the identification and potential rectification of shortcomings in these simulations, while laying the foundations for achieving, with guarantees, future regional sea level projections based on climate change scenarios.
3.6.- Prospects of progress in the knowledge on regional sea level variability.
As regards observations, the coasts of the IP are presently well covered with tide gauges. The most important prospects of progress will come from keeping up these records and extending them over time, as well as from the progressive extension in time of altimetry and gravimetry data. As for quantifying the steric component of sea level, progress will come associated with the increase in hydrographical data (e.g. ARGO buoys, vessels of opportunity and oceanographic cruises) and from the maintenance of the existing temperature and salinity series (e.g. those colected by in the framework of the IEO Radiales project). It is also important to gain a better knowledge of the hydrological budget, in order to get a better estimate of mass variations at a basin level.
In relation to numerical modeling, the basic problem is that global models do not have sufficient resolution at regional level, while regional models still present significant problems (solving of fluxes at straits, mixing processes and formation of dense water, interaction with global changes through boundary conditions, etc.). The main European commitment, as regards ocean modeling, is the development of a free surface common model (NEMO). At a national level, the most ambitious initiative is possibly the climate

CLIVAR – Spain Ocean Variability
51
scenario generation promoted by AEMET, in which NEMO applications will be used. This initiative, which started in September 2009, is expected to produce its first results in 2010 and 2011.
It is also essential to improve the atmospheric forcings, both in resolution and offshore data quality, in parallel to some improvements in the formulation of the models. Current atmospheric databases generated by dynamic downscaling (e.g. HIPOCAS, [Sotillo et al., 2005]; ARPERA, [Herrman and Somot, 2008]) are extremely useful for modeling sea level. It is hoped that atmospheric forcings of this type but with higher resolution and realism will continue to be generated in the near future, and that this improvement in the forcings will have an effect on a better and more precise knowledge of sea level. Lastly, another improvement may come from the incorporation of multi-sensorial systems (gliders, ARGO buoys, teledetection, etc.) through data assimilation techniques in ocean circulation models.
4.- References
Benítez-Barrios, V.M., Hernández-Guerra, A., Vélez-Belchí, P., Machín, F. and Friale-Nuez, E. (2008), Recent changes in subsurface temperature and salinity in the Canary region, Geophys. Res. Lett., 35, L07603, doi: 10.1029/2008GL033329.
Calafat, F.M. and Gomis, D. (2009) Reconstruction of Mediterranean sea level fields for the period 1945-2000. Global and Planetary Change, 66 (3-4), 225-234.
Calafat, F.M., Marcos, M. and Gomis, D. (2010), Mass contribution to Mediterranean Sea level variability for the period 1948-2000, Global and Planetary Change, 73 (3-4), 193-201.
Cazenave, A., Bonnefond, P., Mercier, F., Dominh, K. and Tomazou, V. (2002), Sea level variations in the Mediterranean Sea and Black Sea from satellite altimetry and tide gauges, Global and Planetary Change, 34, 59-86.
de Castro, M., Gómez-Gesteira, M., Álvarez, I. and Gesteira, J.L.G. (2009), Present warming within the context of cooling-warming cycles observed since 1854 in the Bay of Biscay, Cont. Shelf. Res., 29, 1053-1059.
Domingues, C.M., Church, J.A., White, N.J., Glecker, P.J., Wijffels, S.E., Barker, P.M. and Dunn, J.R. (2008) Improved estimates of upper-ocean warming and multi-decadal sea-level rise, Nature, 453, 1090-1094, doi: 10.1038/nature07080.
Font, J., Puig, P., Salat, J., Palanques, A. and Emelianov, M. (2007), Sequence of hydrographic changes in NW Mediterranean deep water due to the exceptional winter of 2005, Scientia Marina, 7(2), 339-346.
Fontán, A., Valencia, V., Borja, A. and Goikoetxea, N. (2008), Ocean-meteorological conditions and coupling in the south-eastern Bay of Biscay, for the period 2001-2005: A comparison with the past two decades, J. Mar. Syst., 72, 167-177.
Garcia-Serrano, J., Losada, T., Rodríguez-Fonseca, B. and Polo, I. (2008), Tropical Atlantic Variability modes (1979-2001). Part II: Time-evolving atmospheric circulation related to SST-forced tropical convection, Journal of Climate, 21, 6476-6497. doi: 10.1175/2008JCLI2191.1.
Goikoetxea, N., Borja, A., Fontán, A., González, M. and Valencia, V. (2009), Trends and anomalies in sea-surface temperature, observed over the last 60 years, within the south-eastern Bay of Biscay, Continental Shelf Research, 29, 1060-1069.
Gómez-Gesteira, M., de Castro, M., Álvarez, I. and Gesteira, J.L.G. (2008a), Coastal sea surface temperature warming trend along the continental part of the Atlantic Arc (1985-2005), J. Geophys. Res., 113, C04010, doi: 10.1029/2007JC004315.
Gómez-Gesteira, M., de Castro, M., Álvarez, I., Lorenzo, M.N., Gesteira, J.L.G., and Crespo,A.J.C. (2008b), Spatio-temporal upwelling trends along the Canary upwelling system (1967-2006), Trends and directions in climate research,: Ann. N.Y. Acad. Sci. 1146: 320-337.
Gomis, D., Ruiz, S., Sotillo, M.G., Álvarez-Fanjul, E. and Terradas, J. (2008), Low frequency Mediterranean sea level variability: the contribution of atmospheric pressure and wind, Global and Planetary Change, 63 (2-3), 215-229.
González-Pola, C., Lavín, A. and Vargas-Yáñez, M. (2005), Intense warming and salinity modification of intermediate water masses in the south-eastern corner of the Bay of Biscay for the period 1992-2003, J. Geophys. Res. 110, C05020, doi: 10.1029/2004JC002367.
Herrmann, M. and Somot, S. (2008), Relevance of ERA40 dynamical downscaling for modelling deep convection in the Mediterranean Sea. Geophys. Res. Lett. 35 pp 1-5. DOI: 10.1029/2007GL032669.
IPCC, (2007), Working Group I Contribution to the Fourth Assessment Report of the IPCC. "The Physical Science Basis", Cambridge University Press. Published October 2007 ISBN-13:9780521705967.
Levitus, S., Antonov, J., Boyer, T. 2005. Warming of the World ocean, 1955-2003. Geophys. Res. Lett., 32, L02604, doi: 10.1029/2004GL021592.
Levitus, S., Antonov, J.I., Boyer, T.P., Locarnini, R.A., García, H.E., Mishonov, A.V., 2009. Global ocean heat content 1955-2008 in light of recently revealed instrumentation problems. Geophys. Res. Lett., 36, L07608, doi: 10.1029/2008GL037155.
López-Jurado, J.L., González-Pola, C. and Vélez-Belchí, P. (2005), Observations of an abrupt disruption of the long-term warming trend at the Balearic Sea, Western Mediterranean Sea in summer 2005, Geophys. Res. Lett. 32, L24606, doi: 10.1029/2005GL024430.
Marcos, M. and Tsimplis, M.N. (2007), Variations of the seasonal sea level cycle in southern Europe, J. Geophys. Res., 112, C12011. Marcos, M. and Tsimplis,M.N. (2008), Coastal sea level trends in southern Europe, Geophysical Journal International, 175, 70-82. Marcos, M., Tsimplis, M.N. and Shaw, A.G.P. (2009), Sea level extremes in southern Europe, J. Geophys. Res., 114, C01007,
doi:10.1029/2008JC004912. MEDAR Group (2002), MEDATLAS/2002 database: Mediterranean and Black Sea database of temperature salinity and biochemical
parameters, in Climatological Atlas [CD-ROM], Fr. Res. Inst. For Exploit. of Sea, Issy-les-Moulineaux, France. Pascual, A., Marcos, M. and Gomis, D. (2008), Comparing the sea level response to pressure and wind forcing of two barotropic
models: Validation with tide gauge and altimetry data. Journal of Geophysical Research-Oceans, 113(C7).

Climate in Spain: Past, Present and Future
52
Polo, I., Rodríguez-Fonseca, B., García Serrano, J. and Losada, T. (2008a), Tropical Atlantic Variability modes (1979-2001), Part I: time-evolving SST modes related to West African rainfall, Journal of Climate, 21, 6457-6475. doi: 10.1175/2008JCLI2607.1.
Polo I., Lazar, A., Rodriguez-Fonseca, B. and Arnault, S. (2008b), Oceanic Kelvin waves and tropical Atlantic intra-seasonal variability: 1. Kelvin wave characterization, Journal of Geophysical Research, 113, C07009, doi: 10.1029/2007JC004495.
Polo I., Rodríguez-Fonseca, B. and Sheinbaum, J. (2005) North-west Africa upwelling and the Atlantic climate variability, Geophysical Research Letters, 32, DOI: 10.1029/2005GL023883.
Ratsimandresy, A.W., Sotillo, M.G., Álvarez-Fanjul, E., Carretero Albiach, J.C., Perez, B.and Hajji, H. (2007), A 44-year (1958-2001) sea-level residual hindcast over the Mediterranean Basin, Physics and Chemistry of the Earth, 33, iss. 3-4, 250-259, doi:10.1016/j.pce.2007.02.002.
Ratsimandresy, A.W., Sotillo, M.G., Carretero Albiach, J.C., Álvarez-Fanjul, E. and Hajji, H. (2008) A 44-year high-resolution ocean and atmospheric hindcast for the Mediterranean Basin developed within the HIPOCAS Project, Coastal Eng., 55, 827–842, doi:10.1016/j.coastaleng.2008.02.025.
Rixen, M., Bakers, J-M., Levitus, S., Antonov, J., Boyer, T., Maillard, C., Fichaut, M., Balopoulos, E., Iona, S., Dooley, H., García, M.J., Manca, B., Giorgetti, A., Mazella, G., Mikhailov, N., Pinardi, N. and Zavatarelli, M. (2005), The Western Mediterranean Deep Water: A proxy for climate change, Geophys. Res. Lett., 32, L12608, doi: 10.1029/2005GL022702.
Rodríguez-Fonseca B., Polo, I., Serrano, E. and de Castro, M. (2006), Evaluation of the North Atlantic SST forcing on the European and Northern African winter climate, International Journal of Climatology, 25, 179-191. DOI: 10.1002/7joc.1234.
Ruiz, S., Gomis, D., Sotillo, M.G. and Josey, S.A. (2008), Characterization of surface heat fluxes in the Mediterranean Sea from a 44- year high-resolution atmospheric data set, Global and Planetary Change, 63, 258-274.
Salat J. and Pascual, J. (2006), Principales tendencias climatológicas en el Mediterráneo Noroccidental, a partir de más de 30 años de observaciones oceanográficas en la costa catalana. In: Clima, sociedad y Medio Ambiente, J.M. Cuadrat Prats, M.A. Saz Sánchez, S.M. Vicente Serrano, S. Lanjeri, N. de Luis Arrillaga and J.C González-Hidalgo (eds.), publications of the Asociación Española de Climatología (AEC), series A, issue 5: 284-290.
Somavilla, R., González-Pola, C., Rodríguez, C., Josey, S.A., Sánchez, R.F. and Lavín, A. (2009), Large changes in the hydrographic structure of the Bay of Biscay after the extreme mixing of winter 2005, J. Geophys. Res., 114, C01001, doi: 10.1029/2008JC004974.
Sotillo M.G., Ratsimandresy, A.W., Carretero Albiach, J.C., Valero, F., González-Rouco, J.F. and Bentamy, A. (2005), A high-resolution 44-year atmospheric hindcast for the Mediterranean basin: Contribution to the regional improvement of global reanalysis, Climate Dymamics. 2005. 25: 219-236. DOI 10.1007/s00382-005-0030-7.
Tsimplis, M. and Rixen, M. (2002), Sea level in the Mediterranean: The contribution of temperature and salinity changes, Geophys. Res. Lett., 29(3), 2136, doi:10.1029/2002GL015870.
Tsimplis, M.N., Marcos, m. and Somot, s. (2008), 21st century Mediterranean sea level rise. Regional model predictions, Global and Planetary Change, 63, 105-111.
Vargas-Yáñez, M., Moya, F., Tel, E., García-Martínez, M.C., Guerber, E. and Bourgeon, M. (2009a), Warming and salting of the Western Mediterranean during the second half of the 20th century: Inconsistencies, unknowns and the effect of data processing, Scientia Marina, 73(1), 7-28, doi: 10.3989/scimar.2009.73n1007.
Vargas-Yáñez, M., Zunino, P., Benali, A., Delpy, M., Pastre, F., Moya, F., García-Martínez, M.C., Tel, E. (2009b), How much is the Western Mediterranean really warming and salting?, J. Geophys. Res. (115 C04001), doi: 10.1029/2009JC005816.
Vargas Yáñez, M., García Martínez, M.C., Moya, F., Tel, E., Parrilla, G., Plaza, F., Lavín, A., García, M.J., Salat, J., Pascual, J., García Lafuente, J., Gomis, D., Álvarez, E., García Sotillo, M., González-Pola, C., Polvorino F. and Fraile, E. (2008), Cambio Climático en el Mediterráneo español, 171 pp. Published by Instituto Español de Oceanografía, Madrid, ISBN: 84 95877 39 2.
Vélez-Belchí, P., Hernández-Guerra, A. and Fraile-Nuez, E. (2009), Changes in the temperature and salinity tendencies of the upper subtropical ocean at 24.5ºN, Sent to Geophys. Res,.Lett.
Vidal-Vijande, E. (2009). Analysis of a 44-year hindcast for the Mediterranean: Comparison with Altimetry and in situ observations. Tesis D.E.A, ULPGC. Supervisor Ananda Pascual.
Zunino, P., Vargas-Yáñez, M., Moya, F., García-Martínez, M.. and Plaza, F. (2009), Deep and intermediate warming in the western Mediterranean: Water mass changes and heaving, Geophys. Res. Lett. (36, doi: 10.1029/2009GL039578)

CLIVAR – Spain Teleconnections
53
Chapter 41
CLIMATE TELECONNECTIONS AFFECTING IBERIAN PENINSULA
CLIMATE VARIABILITY. PREDICTABILITY AND EXPECTED CHANGES
Authors: Belén Rodríguez-Fonseca1 and Concepción Rodríguez-Puebla2
1 Department of Geophysics and Meteorology, Complutense University of Madrid. 2 Department of General and Atmospheric Physics, University of Salamanca
Contributors: Marta Ábalos1, Inés Álvarez4, Blanca Ayarzagüena1, Angel Borja14, Maite de Castro4, Alvaro de la Cámara1, Yolanda Castro-Díez3, Antonio Cofiño5, Alejandro J. Cabrera Crespo4, Maria José Esteban Parra3, María José Estrela6, María Dolores Frías5, Sonia Raquel Gámiz-Fortis3, Ricardo García-Herrera1, Javier García-Serrano1, Moncho Gómez-Gesteira4, Beatriz González1, Nube González Reviriego2, Jesús Fidel González Rouco1, Jose Manuel Gutiérrez5, Sixto Herrera5, Isabel Iglesias12, Juán Ignacio López-Moreno8, Maria de las Nieves Lorenzo4, Teresa Losada1, Yolanda Luna11, María Luisa Martín13, Juan Javier Miró6, Elsa Mohino1, Daniel Paredes1, Francisco Pastor6, Irene Polo1, David Pozo-Vázquez9, Fernando Sánchez Rodrigo10, Jon Sáenz7, Encarnación Serrano1, Juán José Taboada12, Francisco Valero1, Jose Antonio Valiente6, Sergio Vicente-Serrano 8.
3 Departmentamento of Applied Physics, Universidad de Granada 4 Faculty of Science, Universidad de Vigo, Orense 5 School of Engineering, Universidad de Cantabria 6 Mediterranean Centre for Environmental Studies, Unidad Mixta CEAM-UVEG, Valencia 7 Department of Applied Physics II, Universidad del País Vasco 8 Instituto Pirenaico de Ecología Zaragoza (CSIC) 9 Department of Applied Physics, Universidad de Jaen 10 Department of Applied Physics, Universidad de Almeria 11 Agencia Estatal de Meteorología(AEMET) 12 Meteogalicia, Regional Government of Galicia 13 Department of Applied Mathematics, Campus de Segovia, Universidad de Valladolid 14 AZTI Tecnalia, Marine Research Division
TABLE OF CONTENTS
1. Introduction
2. The North Atlantic Oscillation and climate variability over the Iberian Peninsula
2.1. Contributions of other teleconnection patterns on the Iberian Peninsula climate variability
2.2. Ocean influence on the North Atlantic Oscillation
3. The El Niño and Southern Oscillation (ENSO) and the Iberian Peninsula climate variability
4. What are the teleconnection pattern changes expected in future climates?
5. Conclusions
6. References
Citation: Rodríguez-Fonseca B. and Rodríguez-Puebla C., 2010. Climate teleconnections affecting Iberian Peninsula climate variability. Predictability and expected changes. Report Climate in Spain: Past, Present and Future (Editors: Pérez F. Fiz and Boscolo Roberta) pp. 53-67.

Climate in Spain: Past, Present and Future
54
1.- Introduction
The subject of teleconnections in the atmosphere and oceans has given rise many research in recent years. The main motivations for this interest are the effects of teleconnections on climate and their use to improve predictions. Teleconnections refer to remote climate anomalies, related to each other that, at large distances, govern spatial and temporal climate variability. They reflect important aspects of the internal variability of the atmospheric system and, also, the interactions between the atmosphere and other components, such as the oceans. A teleconnection pattern (TCP) is the spatial configuration of atmospheric circulation and the associated time series, called teleconnection index, represents the time evolution of the corresponding pattern [Wallace and Gutzler, 1981; Barnston and Livezey, 1987]. The teleconnection indices (TCI) include different scales of low frequency variability and, therefore, they can be used for seasonal and inter-annual prediction [Frankignoul and Hasselmann, 1977]. Besides of the potential predictive application of TC, they can explain the occurrence of anomalous climate phenomena such as droughts, floods or temperature extremes.
TC studies are of great interest because of their application in varied fields such as agriculture, health, energy, food, security etc. In the case of the IP, there is a broad range of studies that have related TCPs with properties such as solar radiation [Pozo Vázquez et al., 2004], river flow and water resources [Trigo et al.,2004; de Castro et al., 2006; Gámiz-Fortis et al., 2008], droughts [Vicente-Serrano and Cuadrat, 2007], convective activity [Soriano et al., 2004], salinity [Pérez et al., 2000], agricultural production [Rodríguez-Puebla et al., 2007], fishing [Borja et al., 2008], and so on.
Corti et al. [1999] found that the spatial atmospheric responds to the anthropogenic forcing project, mainly, onto natural climate variability modes, represented by some TCPs. These TCPs could be altered under climate change scenarios, affecting regional climate variability, as indicated in the last IPCC report [Solomon et al., 2007]. In fact, some of the climate changes observed in the 20th century can be described through the variability of the TCPs [Trenberth et al., 2007].
Over our latitudes, the most prominent TCP is the North Atlantic Oscillation (NAO), which is able to explain a high percentage of the IP rainfall variability [Trigo and Palutikof, 2001], since the IP lies between the centres of action of this pattern. Other TCPs that influence IP climate variability are the East Atlantic (EA) pattern, the East Atlantic and West Russia (EAWR) pattern, the Scandinavian (SCA) pattern and the Western Mediterranean Oscillation (WeMO).
The oceans are an important key when one tries to explain the persistence of atmospheric TCPs. Therefore, Sea Surface Temperature changes are related to variations in the TCPs, this is the case of the tropical ocean influence on the NAO configuration [Hoerling et al., 2001]. The anomalies over the tropical Atlantic, the Mediterranean Sea and the El Niño phenomenon in the Pacific are important tools for the predictability of atmospheric TCPs that affect climate variability over the IP. Regarding climate change, different authors [Knutson et al., 1998; 1999] have demonstrated the anthropogenic contribution of the tropical ocean warming.
In this chapter we will try to synthesize, in a coherent way, the state of the art of the TCPs studies that affect the IP climate variability, including those related to climate change scenarios.
2.- The North Atlantic Oscillation and climate variability over the Iberian Peninsula
The predominant TCP in the North Atlantic sector is the NAO, which is a dipolar structure of mean sea level pressure anomalies (SLP), with two centres of action: one over Iceland and the other one over western Portugal [Wallace and Gutzler, 1981; Barnston and Livezey, 1987; Hurrell, 1995]. This north-south SLP dipole over the North Atlantic (Fig. 1a) is closely linked with the winter northern hemisphere annular mode (NAM), also called Arctic Oscillation (AO) [Thompson and Wallace, 1998; Wallace, 2000]. However, the NAO is more related to processes that occur on the Atlantic sector while the NAM is linked with
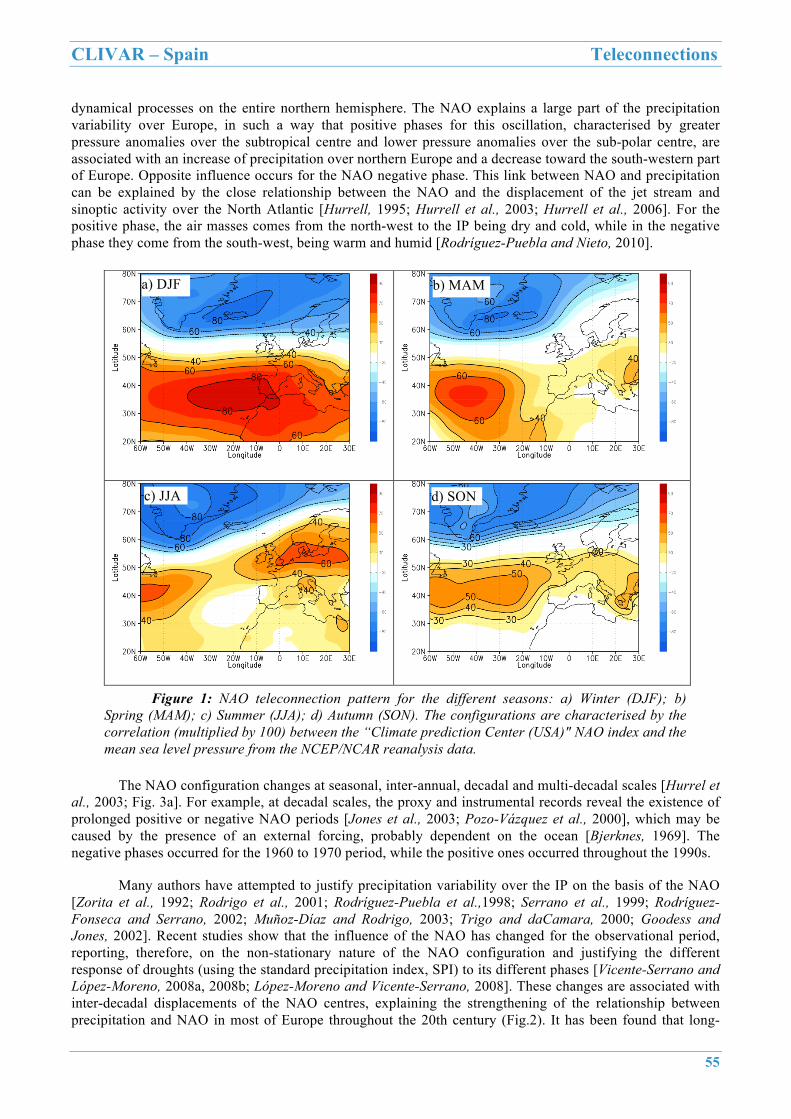
CLIVAR – Spain Teleconnections
55
dynamical processes on the entire northern hemisphere. The NAO explains a large part of the precipitation variability over Europe, in such a way that positive phases for this oscillation, characterised by greater pressure anomalies over the subtropical centre and lower pressure anomalies over the sub-polar centre, are associated with an increase of precipitation over northern Europe and a decrease toward the south-western part of Europe. Opposite influence occurs for the NAO negative phase. This link between NAO and precipitation can be explained by the close relationship between the NAO and the displacement of the jet stream and sinoptic activity over the North Atlantic [Hurrell, 1995; Hurrell et al., 2003; Hurrell et al., 2006]. For the positive phase, the air masses comes from the north-west to the IP being dry and cold, while in the negative phase they come from the south-west, being warm and humid [Rodríguez-Puebla and Nieto, 2010].
The NAO configuration changes at seasonal, inter-annual, decadal and multi-decadal scales [Hurrel et al., 2003; Fig. 3a]. For example, at decadal scales, the proxy and instrumental records reveal the existence of prolonged positive or negative NAO periods [Jones et al., 2003; Pozo-Vázquez et al., 2000], which may be caused by the presence of an external forcing, probably dependent on the ocean [Bjerknes, 1969]. The negative phases occurred for the 1960 to 1970 period, while the positive ones occurred throughout the 1990s.
Many authors have attempted to justify precipitation variability over the IP on the basis of the NAO [Zorita et al., 1992; Rodrigo et al., 2001; Rodríguez-Puebla et al.,1998; Serrano et al., 1999; Rodríguez-Fonseca and Serrano, 2002; Muñoz-Díaz and Rodrigo, 2003; Trigo and daCamara, 2000; Goodess and Jones, 2002]. Recent studies show that the influence of the NAO has changed for the observational period, reporting, therefore, on the non-stationary nature of the NAO configuration and justifying the different response of droughts (using the standard precipitation index, SPI) to its different phases [Vicente-Serrano and López-Moreno, 2008a, 2008b; López-Moreno and Vicente-Serrano, 2008]. These changes are associated with inter-decadal displacements of the NAO centres, explaining the strengthening of the relationship between precipitation and NAO in most of Europe throughout the 20th century (Fig.2). It has been found that long-
Figure 1: NAO teleconnection pattern for the different seasons: a) Winter (DJF); b) Spring (MAM); c) Summer (JJA); d) Autumn (SON). The configurations are characterised by the correlation (multiplied by 100) between the “Climate prediction Center (USA)" NAO index and the mean sea level pressure from the NCEP/NCAR reanalysis data.
a) DJF b) MAM
c) JJA d) SON

Climate in Spain: Past, Present and Future
56
term changes in the NAO can explain the decrease in winter precipitation in the early 20th century, its progressive increase until the peak of the 1960s, and also the decrease in the following period [Xoplaki et al., 2004; 2006]. There is consensus on the greatest contribution of the NAO on the western part of the Peninsula, as can be seen in Fig. 3 [Rodríguez-Puebla et al., 2001], although the long-term changes mentioned have been found to affect the whole Mediterranean basin [Xoplaki et al., 2004; 2006]. The IPCC AR4 report indicates that the NAO can explain 33% of the decrease in precipitation that occurred in the IP for the 1968 to 1997 period [Trenberth et al., 2007, Paredes et al., 2006, González-Rouco et al., 2000]. In this way, the recorded drought in the hydrological year 2004-05 was associated with the positive phase of the NAO but the change of phase in 2005 was not accompanied by the corresponding change in expected precipitation, because the drought remained along the year [García-Herrera et al., 2007].
Figure 2: Non-stationary behaviour of the NAO and its influence on precipitation in Europe throughout the 20th century. Right: spatial distribution of correlations between winter precipitation and the NAO index during the 20th century. The year indicated on each map represents the midpoint of each 31-year period. Units are Pearson coefficients of correlation (r). Dotted lines enclose areas with significant correlations (p < 0.05).
Left column: leading principal components of winter SLPs obtained using T-mode PCA. The leading principal components were obtained using moving-window periods of 31 years, centred on the year indicated in each plot. It is shown the percentage of variance explained by the leading mode in each period. Since the sign of the PC pattern is arbitrary and to make easier the comparison, a common sign of the NAO was selecting for plotted (negative in the North and positive in the South). From Vicente-Serrano and López Moreno [2008].
Regarding temperature, various studies have demonstrated that the NAO and temperature in southern Europe are related in a non-linear way [Castro-Díez et al., 2002; Pozo-Vázquez et al., 2001]. Chapter 11 of the IPCC AR4 report [Christensen et al., 2007] indicates how an increase in wintertime temperature in northern Europe between the 1960s and the 1990s was affected by a tendency towards a positive phase of the NAO.

CLIVAR – Spain Teleconnections
57
During the last period, the summer temperature in the IP has significantly increased, of up to 3ºC/50 years in some regions [Xoplaki et al., 2003; 2006], although the dynamical causes of the associated patterns (TCP) or trend can depend on other large-scale circulation modes and not only on the NAO (see next section).
2.1.- Contributions of other teleconnection patterns to climate variability patterns
As stated previously, there are other teleconnection patterns that affect the IP climate variability. For example, the East Atlantic (EA2, Fig. 3b) pattern explains a large part of the variability in precipitation and temperature to the western part of the IP [Lorenzo et al., 2008; Rodrigo and Trigo, 2007; Vicente-Serrano and López-Moreno, 2006; Sáenz et al., 2001a]. The EA pattern plays a very important role in the seasonal predictability of the IP air temperature [Sáenz et al., 2001a; Frías et al., 2005]. Moreover, the trend in the frequency of warm days and cold nights have been associated with this TCP [Rodríguez-Puebla et al., 2010].
Other TCPs, based on the geopotential height at mid tropospheric levels are the East Atlantic/West Russia (EA/WR) pattern and the Scandinavian pattern (SCA), which can explain part of the IP precipitation variability [Serrano et al., 1999; Rodríguez-Fonseca and Serrano, 2002; Lorenzo and Taboada, 2005; Lorenzo et al., 2008]. Figure 3c and 3d show their influence for winter precipitation. The WeMO is related to the anomalous IP precipitation in autumn (Fig. 3e).
Figures. 4a to 4d, show the mean sea level pressure and wind anomalies during the positive phases of the EA and SCA patterns and during the negative phases of the EA/WR and WeMO patterns. From these , the mechanism that causes rainfall anomalies over the IP can be inferred. In spring, the EAJet teleconnection pattern has been identified in high tropospheric levels as the first atmospheric variability mode related to precipitation, accounting for more than 50% of the precipitation variability in the western Mediterranean [Martín et al., 2004; Luna et al., 2004].
Figure 3: Correlation between precipitation and teleconnection indices for winter (DJF): a) NAO, b)EA, c) SCA d) EA/WR and e) correlation with the WeMO index in SON
The NAO and EA indices dominate variability toward Atlantic areas of the Peninsula, while the north-west Mediterranean region is influenced by the EA/WR [Menéndez et al., 2009; Romero et al. 1999; Valero et al. 2004; Rodríguez-Fonseca and Serrano, 2002; Xoplaki et al., 2003; 2004; 2006]. The West Mediterranean
2 EA: Acronym of the English term East Atlantic Pattern. The configuration of the EA is that of a north-south pressure dipole displaced towards the south-east in respect of the NAO. For further information about teleconnection patterns and their indices, consult the following webpage: http://www.cpc.ncep.noaa.gov/data/teledoc/telecontents.shtml
a) NAO b) EA
e) WeMO d)EA/WR
c) SCA

Climate in Spain: Past, Present and Future
58
Oscillation (WeMO3), explains autumn precipitation toward the Mediterranean part of the IP [Martín-Vide and López-Bustins, 2006; López-Bustins et al., 2008; see Fig. 4b).
Figure 4: Phase for: a) positive EA; b) positive SCA; c) negative EA/WR and d) negative WeMO in the form of maps comprising SLP anomalies and surface wind (m/s) in winter.
2.2.- Ocean influence on the North Atlantic Oscillation
Although most of the NAO variability can be explained by internal fluctuations in the atmosphere, produced by the interaction between the mean flow and the extra-tropical storms, there are some external influences that, at inter-annual and decadal time scales, come from the interaction of the atmosphere and the ocean [Cassou et al., 2004; Losada et al., 2007; Visbeck et al., 2003].
It is established that, particularly in winter, the NAO appears together with an anomalous oceanic structure characterised by a tripole in the SST (Surface Sea Temperature) field over the North Atlantic, which is called the Atlantic Tripole [Sutton and Allen, 1997]. This structure comes from the response of the ocean to the NAO and, because it is produced by the NAO, it has no predictive skill. However, different studies have found that the SST anomalies in the Atlantic region are capable to determine the NAO phase [Palmer and Sun, 1985; Rodwell et al., 1999, Robertson et al., 2000]. In fact, it has been shown how a warming of the subtropical region of the Atlantic Tripole (SNA region) in summer goes together with a weakening of the anticyclonic nature of the Azores subtropical high and, therefore, with the development of a negative phase of the NAO in the following winter [Rodwell et al., 1999; Czaja and Frankignoul, 2002] and vice versa. This configuration also produces important impacts on winter precipitation in the Euro-Atlantic sector [Polo et al., 2005; Rodríguez-Fonseca et al.,2006] and, specifically, in the south-west of the IP and north of Africa [Rodríguez-Fonseca and Castro, 2002, see Fig. 5], contributing to the predictability of the precipitation in our region of study [Lorenzo et al., 2009].
3 WeMO: Acronym of the English term Western Mediterranean Oscillation, defined as a pressure dipole with one centre in San Fernando ( Cadiz,Spain) and another centre in Padua (Italy).
b) SCA+
c) EA/WR- d) WeMO-
a) EA+
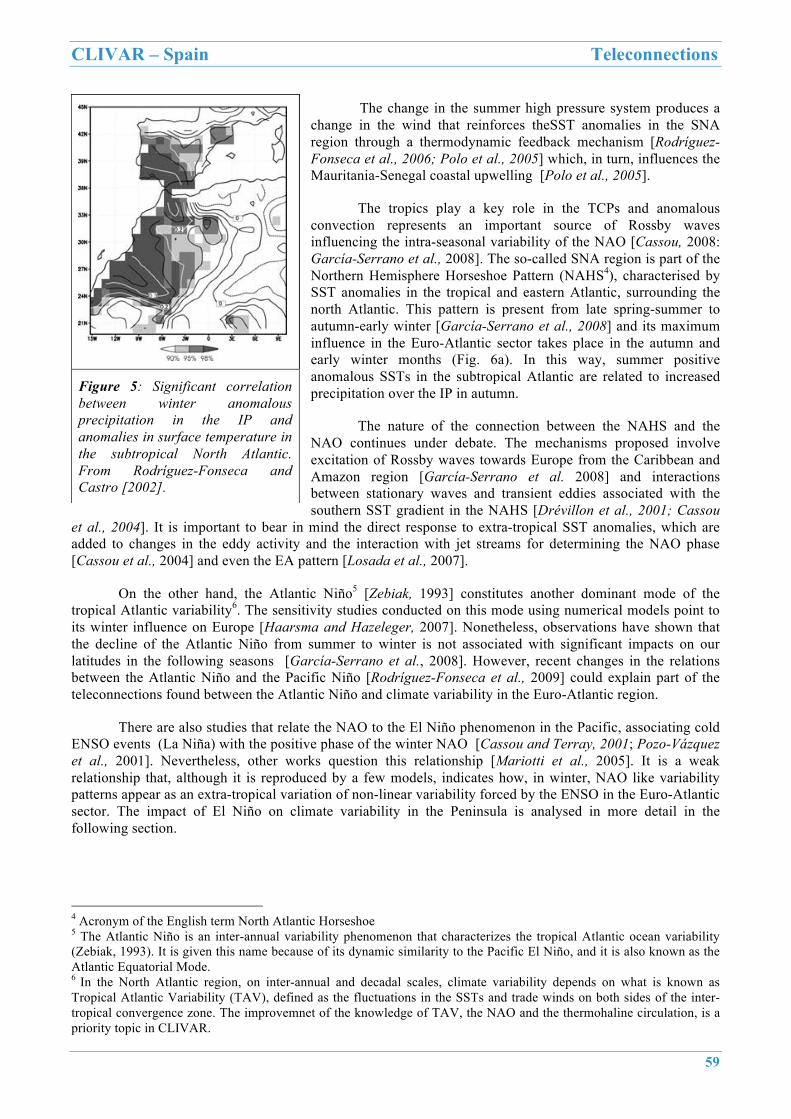
CLIVAR – Spain Teleconnections
59
The change in the summer high pressure system produces a change in the wind that reinforces theSST anomalies in the SNA region through a thermodynamic feedback mechanism [Rodríguez-Fonseca et al., 2006; Polo et al., 2005] which, in turn, influences the Mauritania-Senegal coastal upwelling [Polo et al., 2005].
The tropics play a key role in the TCPs and anomalous convection represents an important source of Rossby waves influencing the intra-seasonal variability of the NAO [Cassou, 2008: García-Serrano et al., 2008]. The so-called SNA region is part of the Northern Hemisphere Horseshoe Pattern (NAHS4), characterised by SST anomalies in the tropical and eastern Atlantic, surrounding the north Atlantic. This pattern is present from late spring-summer to autumn-early winter [García-Serrano et al., 2008] and its maximum influence in the Euro-Atlantic sector takes place in the autumn and early winter months (Fig. 6a). In this way, summer positive anomalous SSTs in the subtropical Atlantic are related to increased precipitation over the IP in autumn.
The nature of the connection between the NAHS and the NAO continues under debate. The mechanisms proposed involve excitation of Rossby waves towards Europe from the Caribbean and Amazon region [García-Serrano et al. 2008] and interactions between stationary waves and transient eddies associated with the southern SST gradient in the NAHS [Drévillon et al., 2001; Cassou
et al., 2004]. It is important to bear in mind the direct response to extra-tropical SST anomalies, which are added to changes in the eddy activity and the interaction with jet streams for determining the NAO phase [Cassou et al., 2004] and even the EA pattern [Losada et al., 2007].
On the other hand, the Atlantic Niño5 [Zebiak, 1993] constitutes another dominant mode of the tropical Atlantic variability6. The sensitivity studies conducted on this mode using numerical models point to its winter influence on Europe [Haarsma and Hazeleger, 2007]. Nonetheless, observations have shown that the decline of the Atlantic Niño from summer to winter is not associated with significant impacts on our latitudes in the following seasons [García-Serrano et al., 2008]. However, recent changes in the relations between the Atlantic Niño and the Pacific Niño [Rodríguez-Fonseca et al., 2009] could explain part of the teleconnections found between the Atlantic Niño and climate variability in the Euro-Atlantic region.
There are also studies that relate the NAO to the El Niño phenomenon in the Pacific, associating cold ENSO events (La Niña) with the positive phase of the winter NAO [Cassou and Terray, 2001; Pozo-Vázquez et al., 2001]. Nevertheless, other works question this relationship [Mariotti et al., 2005]. It is a weak relationship that, although it is reproduced by a few models, indicates how, in winter, NAO like variability patterns appear as an extra-tropical variation of non-linear variability forced by the ENSO in the Euro-Atlantic sector. The impact of El Niño on climate variability in the Peninsula is analysed in more detail in the following section.
4 Acronym of the English term North Atlantic Horseshoe 5 The Atlantic Niño is an inter-annual variability phenomenon that characterizes the tropical Atlantic ocean variability (Zebiak, 1993). It is given this name because of its dynamic similarity to the Pacific El Niño, and it is also known as the Atlantic Equatorial Mode. 6 In the North Atlantic region, on inter-annual and decadal scales, climate variability depends on what is known as Tropical Atlantic Variability (TAV), defined as the fluctuations in the SSTs and trade winds on both sides of the inter-tropical convergence zone. The improvemnet of the knowledge of TAV, the NAO and the thermohaline circulation, is a priority topic in CLIVAR.
Figure 5: Significant correlation between winter anomalous precipitation in the IP and anomalies in surface temperature in the subtropical North Atlantic. From Rodríguez-Fonseca and Castro [2002].

Climate in Spain: Past, Present and Future
60
Figure 6: Dominant co-variability mode between the SST anomaly in the tropical Atlantic in summer (a) and rainfall in Europe in autumn (b). The percentage of explained variance is 93% between summer SST series and autumnal precipitation. The colour bar in (a) opposite to (b). From García-Serrano et al. [2008].
3.- El Niño and the Southern Oscillation (ENSO) and climate in the IP
El Niño and the Southern Oscillation (ENSO), characterised by fluctuations in the ocean-atmosphere system of the tropical Pacific, is the most important natural variability phenomenon in the global climate at inter-annual scales [Philander, 2000]. El Niño (La Niña) refers to anomalous warming (cooling) of the sea surface over the tropical Pacific that takes place in the northern winter, while the Southern Oscillation [SO7, Bjerknes 1969] is represented by the anomalous surface pressure field, also over the tropical Pacific. Because of the strong oceanic signal that characterises ENSO, together with its impacts all over the globe [Kiladis and Diaz, 1989; Ropelewski and Halpert, 1987], its understanding is essential for seasonal prediction [Zebiak and Cane, 1987].
The ENSO fluctuates with a quasi-periodicity between 3 and 7 years, in which the positive phases or warm events (El Niño) alternate with negative phases or cold events (La Niña). These fluctuations are associated with changes in atmospheric circulation, winds, jet stream, tropical convective systems, etc.
The most significant relationship between the ENSO and precipitation in the western Mediterranean takes place in autumn and spring [Mariotti et al., 2002; van Oldenborgh, 2005]. To be specific, the influence of ENSO on the IP, which was initially researched by Rodó et al. [1997], is described through significant connections with precipitation, negative in spring in the east and positive in autumn in the whole of the Peninsula (see Fig. 7, upper panel). The study by Esteban-Parra et al. [1998] on long series of precipitation in the IP indicates the need to take the ENSO into account for explaining precipitation variations in the IP. Regarding autumn, the results of predictions conditioned to El Niño or La Niña events improve after applying downscaling techniques [Frías et al., 2009].
The mechanisms explaining teleconnections with the ENSO in autumn are not linear [Mathieu et al., 2004]. For La Niña, the PNA pattern modulated by the influence of the NAO appears to be involved, while for El Niño, Rossby wave refraction processes are found [Mariotti et al., 2005]. The underlying mechanisms in spring continue to be a debated subject [van Oldenborgh, 2005]. With regard to spring, connections have been found between La Niña and the droughts in the north-west of the Peninsula, although it appears that El Niño does not bring wet spring seasons [Lorenzo et al., 2010].
7 Southern Oscillation refers to an east-west anomalous pressure dipole with centres of action in Tahiti and Darwin.
a)
b)

CLIVAR – Spain Teleconnections
61
Figure 7: Upper panel: Influence of El Niño on Europe in autumn (a) and spring (b) in terms of the correlation between El Niño 3 index and anomalous precipitation in the region portrayed. The lower figure indicates changes in the influence of El Niño (in terms of sliding correlation) on the Western Mediterranean throughout the 20th century. From Mariotti et al. [2002]
The ENSO is also related to winter precipitation in the east of the Peninsula [van Oldenborgh et al., 2000], and surface pressure at the south-western IP is oppositely related to the Southern Oscillation index [Trenberth et al., 2007, see Fig. 3.27]. This relationship is explained by some authors on the basis of the NAO [Pozo-Vázquez, 2005a and b], establishing that there is a trend towards relative high Azores pressure in winter coincidence with La Niña events, causing a significant decrease of winter precipitation (December-January-February) over the IP. On the other hand, no significant signal is detected during El Niño events. This connection between dry winters and La Niña events is maximum in the north-east of the IP [Sordo et al., 2008].
Despite the above-mentioned statistical relationships, many authors state that the association between the ENSO and climate in the Euro-Atlantic sector is insignificant and even uncertain [Rogers, 1997; Ropelewski and Halpert, 1987; Trenberth and Caron, 2000; Quadrelli et al., 2001]. Other authors such as Moron and Gouirand [2003] and Gouirand and Moron [2003] have shown that Euro-Atlantic circulation is intra-seasonally modulated in winter by the ENSO, being weaker at the begining of winter [Toniazzo and Scaife, 2006] and much stronger at the end of winter. The propagation of Rossby waves over Europe has also been suggested in relation to the ENSO [Trenberth et al., 1998; Toniazzo and Scaife, 2006]. The active role of the stratosphere is essential for achieving successful simulations of teleconnections in winter between the ENSO and circulation in the Euro-Atlantic sector [Cagnazzo and Manzini, 2009; Ineson and Scaife, 2008]. This fact emphasises the improvement in knowledge about stratospheric variability, and also its role in the Euro-Atlantic climate [Ayarzagüena and Serrano, 2009].
In a similar way that the influence of the NAO has not been stationary, the influence of El Niño in the Mediterranean region has changed throughout the 20th century. In this way,significant correlations have been found, both in spring and autumn, at the beginning of the century, whilst after the 1970s and in the 1920's (Mariotti et al., 2002; see Fig. 7, lower panel), there is an absence of significant relationships. This result could be related to the recent finding that shows that since the 1970s, the Atlantic Niño (Niña) is capable of favouring the development of a Niña (Niño) in the Pacific during the following winter, therefore affecting the circulation associated with ENSO [Rodríguez-Fonseca et al., 2010]. The change in climate variability since
b) a)

Climate in Spain: Past, Present and Future
62
the 1970s could be due to natural multi-decadal oscillations (such as the Atlantic Multidecadal Oscillation) or anthropogenic changes, as appears to be indicated in Baines and Folland [2007] in relation to aerosol emissions.
4.- What changes are expected for teleconnection patterns in future climates?
Forward-looking projections indicate an increase in atmospheric pressure at sea level over the subtropics and middle latitudes in relation to a northward expansion and weakening of the Hadley cell. This comes together with a northward displacement of the North-Atlantic storm tracks [Yin, 2005] and the resulting increase in cyclonic circulation over Arctic latitudes [Trenberth and Hurrell, 1994; McCabe 2001]. The change would imply an increase in winds from the west over the western part of the continents and could contribute to an increase in mean precipitation and its intensity [Meehl et al., 2006]. In fact, a narrowing of the circumpolar vortex from 1970 to 2000 has been demonstrated [Fraunenfeld and Davis, 2003].
These changes in circulation are going to influence the future configuration and intensity of the TCPs [Branstator, 2002; Quadrelli et al., 2001; Barriopedro et al., 2006]. The results provided by the models (CMIP3 WCRP8) participating in IPCC AR4 indicate that both the NAM and the NAO indices show a tendency for increase in the positive phases, with higher values the higher the concentration of greenhouse gases [Stephenson et al., 2006]. In their model intercomparisonstudy for extra-tropical climate, Rauthe et al. [2004] find that there is no clear answer from all the models simulations done for the 21st century. As regards the AO, most of the models reproduce a strengthening of this atmospheric pattern, while the pattern for NAO scarcely seems to be sensitive in the different models. The greatest difference for the 21st century is the northward displacement of its centres of action. An answer to changes in the tropical SSTs involve the stratosphere and also land surface forcings [Czaja et al., 2003, Zhou et al., 2001; Hurrell, 2004; Bojariu et al., 2003]. External changes caused by intensification of the greenhouse-gas effect [Gillett et al., 2003] are brought in as possible mechanisms for this positive trend. Kuzmina et al. [2005] find that, on average, the new generation of climate models reproduces the principal characteristics of the SLP observed in winter and its variability, contrary to what occurred in previous generations [Zorita and González-Rouco, 2000]. However, none of the models are able to reproduce such marked decadal trends as those observed in the NAO index in 1970-1995.
Recently, Handorf and Dethloff [2009] analyse the influence of climate change on natural variability patterns and on atmospheric flow systems. Their results show the ability of the models to reproduce the characteristics of low-frequency variability in the middle troposphere for the present-day conditions and A1B future climate scenario. The variability patterns found for the 20th century are, except for small differences, the same as for the future A1B scenario. The most pronounced changes are a strengthening of the centres of action in the Pacific with an increase of the variance explained in the first two EOFs and a slight eastward displacement of the North Atlantic centres of action.
In the chapter on climate trends in the IP, it has been shown that precipitation has a tendency to decrease. In order to explain this decrease, Lorenzo and Taboada [2005] and Lorenzo et al. [2008] have conducted different works on the variability of precipitation in climate change conditions and in the TCPs that affect climate in Galicia (NAO, EA, EA/WR and SCA). The results obtained in relation to possible trends in teleconnection indices indicate that, so far, only natural inter-decadal variability is noticeable, with no trends associated with climate change being observed. Nieto and Rodríguez-Puebla [2006] and Rodríguez-Puebla and Nieto [2010] compare the connections between the NAO and precipitation for current climate and in climate change conditions. The results show that in warmer climates, precipitation in the IP tends to decrease because there is an increase in the positive phases of the NAO and, moreover, the significance of the precipitation response to the NAO increases. These results have been corroborated through the application of regional models [Rodríguez-Fonseca et al., 2005], thereby increasing their precision.
8 Coupled Model Intercomparison Project phase 3, World Climate Research Program) http://www-pcmdi.llnl.gov/ipcc/about_ipcc.php
CLIVAR – Spain Teleconnections
63
Changes in the dynamics of El Niño appear in future scenarios, pointing to an evolution of El Niño depending on the feedback between wind and the thermocline. This mode is similar to the one that has taken place since the 1970s (known as "climate shift"), [Fedorov and Philander, 2000]). According to the IPCC AR4 report, it seems that the ENSO teleconnections are going to weaken over North America due, to a certain extent, to a mean change in the basic state of atmospheric circulation in middle latitudes [Meehl et al., 2006]. Walker circulation appears to be displaced towards the east and it does not exert an influence on the Indian monsoon during El Niño in future climate. However, the influence of El Niño on climate variability in Europe does not seems to change in future projections.
5.- Conclusions
Air and sea temperatures have increased since the end of the 19th century and that has repercussions on atmospheric and oceanic circulation. The consequences of changes in the climate of the IP can be justified through its link with different TCPs, changes in ocean surface temperatures, tropical convection and stratosphere-troposphere connections. The results of the research work mentioned in this chapter have applications for improving seasonal, inter-annual and decadal predictions. Details of the most relevant conclusions are shown below:
• Precipitation on the south-western edge of the IP is closely linked with the NAO so that a high NAO index goes hand in hand with a decrease in precipitation, and vice versa. The influence of the NAO throughout the 20th century has not been stationary. Future climate projections with increased greenhouse gases announce an increase in the positive phases of the NAO with dramatic consequences for precipitation, mainly in the southern half of the Peninsula.
• The influence of the tropical Atlantic on the NAO is explained by a warming of the subtropical North Atlantic in summer linked with negative NAO events at the end of fall with increased precipitation in the south-west of the Peninsula. The influence of the Atlantic Niño appears to have little significance, although its connections found with the Pacific Niño at the end of the 20th century have to be taken into account.
• Rainfall variability in the different regions of the Peninsula is not only justified by the NAO but by the contribution of other teleconnection indices such as WeMO, EA, EA/WR, EAJet, etc. Temperature variability in the IP is related to the EA TCP.
• The teleconnections associated with ENSO are clear in spring and autumn. Although the impacts and mechanisms of teleconnections are non-linear, positive correlations have been found with precipitation in autumn with maximums in the south of the Peninsula, and negative correlations in spring with maximums in the east.
• The teleconnections associated with the ENSO in winter are weaker and negative in the east, although the associated mechanisms are subject to debate. It is important to consider the stratospheric influence for improving the knowledge about teleconnections with the ENSO in this season.
• The teleconnections between the ENSO and precipitation in the western Mediterranean are not stationary. Changes have been found in the configuration of El Niño and tropical convective cells in future scenarios.
6.- References
Ayarzagüena, B.; Serrano, E. (2009) Monthly characterization of the tropospheric circulation over the Euro-Atlantic area in relation with the timing of stratospheric final warmings. Journal of Climate, 22, 6313-6324.
Baines, P.G., Folland, C.K. (2007): Evidence for a rapid global climate shift across the late 1960s. Journal of Climate 20:2721-2744. Barnston, A.G., Livezey, R.E. (1987) Classification, seasonality and persistence of low-frequency atmospheric circulation patterns.
Monthly Weather Review 115:1083-1126. Barriopedro, D., García-Herrera, R., Lupo, A.R., Hernández, E. (2006) A climatology of northern hemisphere blocking. Journal of
Climate 19:1042-1063. Bjerknes, J. (1969) Atmospheric teleconnections from the equatorial Pacific. Mon. Wea. Rev., 97, 163–172. Bojariu, R., García-Herrera, R., Gimeno, L., Zhang, T., Frauenfeld, O.W. (2008) Cryosphere-Atmosphere Interaction Related to
Variability and Change of Northern Hemisphere Annular Mode. Trends and Directions in Climate Research 1146:50-59.

Climate in Spain: Past, Present and Future
64
Borja, A., Fontan, A., Saenz, J., Valencia, V. (2008) Climate, oceanography, and recruitment: the case of the Bay of Biscay anchovy (Engraulis encrasicolus). Fisheries Oceanography 17:477-493.
Branstator, G. (2002) Circumglobal teleconnections, the jet stream waveguide, and the North Atlantic oscillation. Journal of Climate 15:1893-1910.
Cagnazzo, C., and Manzini, E. (2009) Impact of the stratosphere on the winter tropospheric teleconnections between ENSO and the North Atlantic and European region. Journal of Climate, 22, 1223-1238.
Cassou, C., Terray, P. (2001) Oceanic forcing of wintertime low-frequency atmospheric variability in the North Atlantic European sector: a study with the ARPEGE model. Journal of Climate, 14, 4266-4291.
Cassou, C., Deser, C., Terray, L., Hurrell, J.W. and Drévillon, M. (2004) Summer Sea Surface Temperature Conditions in the North Atlantic and Their Impact upon the Atmospheric Circulation in Early Winter. Journal of Climate, 17, 3349–3363.
Cassou, C. (2008) Intraseasonal interaction between the Madden-Julian Oscillation and the North Atlantic Oscillation. Nature 455:523-527.
Castro-Díez, Y., Pozo-Vázquez, D., Rodrigo, F.S., Esteban-Parra, M.J. (2002) NAO and winter temperature variability in southern Europe. Geophysical Research Letters, 29, doi: 10.1029/2001GL014042.
Christensen, J.H., Hewitson, B., Busuioc, A., Chen, A., Gao, X., Held, I., Jones, R., Kolli, R.K., Kwln, W.-T., Laprise, R., Magaña Rueda, V., Mearns, L., Menéndez, C.J., Räisänen, J., Rinke, A., Sarr, A. and Whetton, P. (2007) Regional Climate Projections. In: Climate Change 2007: The Physical Science Basis. Contribution of Working Group I to the Fourth Assessment Report of the Intergovernmental Panel on Climate Change [Solomon, S., D. Qin, M. Manning, Z. Chen, M. Marquis, K.B. Averyt, M. Tignor and H.L. Miller (eds.)]. Cambridge University Press, Cambridge, United Kingdom and New York, NY, USA.
Corti, S., Molteni, F., Palmer, T., (1999) Signature of recent climate change in frequencies of natural atmospheric circulation regimes. Nature 398, 799-802, doi:10.1038/19745;
Czaja, A., and Frankignoul, C. (2002) Observed Impact of Atlantic SST Anomalies on the North Atlantic Oscillation. J. Climate, 15, 606–623.
de Castro, M., Lorenzo, N., Taboada, J.J., Sarmiento, M., Alvarez, I., Gomez-Gesteira, M. (2006) Influence of teleconnection patterns on precipitation variability and on river flow regimes in the Mino River basin (NW Iberian Peninsula). Climate Research 32:63-73.
Drévillon, M., Terray, L., Rogel, P., Cassou, C. (2001) Mid latitude Atlantic SST influence on European winter climate variability in the NCEP reanalysis. Climate Dynamics, 18, 331-344.
Drévillon, M., Cassou, C. and Terray, L. (2003) Model study of the North Atlantic region atmospheric response to autumn tropical Atlantic sea-surface-temperature anomalies. Quarterly Journal of the Royal Meteorological Society., 129, 2591–2611.
Esteban-Parra, M.J., Rodrigo, F.S., Castro-Díez, Y. (1998) Spatial and temporal patterns of precipitation in Spain for the period 1880-1992. International Journal of Climatology 18:1557-1574.
Fedorov, A., and Philander, S. (2000) Is El Niño changing? Science, 288, 1997–2002. Frankignoul, C., Hasselmann, K. (1977) Stochastic climate models .2. Application to sea-surface temperature anomalies and
thermocline variability. Tellus 29:289-305. Frauenfeld, O.W., Davis, R.E. (2003) Northern Hemisphere circumpolar vortex trends and climate change implications. Journal of
Geophysical Research-Atmospheres 108, doi: 10.1029/2002JD002958. Frías, M.D., Fernández, J., Saenz, J., Rodríguez-Puebla, C. (2005) Operational predictability of monthly average maximum
temperature over the Iberian Peninsula using DEMETER simulations and downscaling. Tellus Series a-Dynamic Meteorology and Oceanography 57:448-463.
Frías, M.D., Herrera, S, Cofiño, A.S., Gutiérrez, J.M. (2009) Assessing the Skill of Precipitation and Temperature seasonal Forecasts in Spain. Windows of Opportunity Related to ENSO Events. Journal of Climate doi:10.1175/2009JCLI2824.1.
Gámiz-Fortis, S., Pozo-Vázquez, D., Trigo, R.M., and Castro-Díez, Y. (2008) Quantifying the Predictability of Winter River Flow in Iberia. Part I: Interannual Predictability. Journal of Climate, 21, 2484–2502.
Gámiz-Fortis, S., Pozo-Vázquez, D., Trigo, R.M. and Castro-Díez, Y. (2008) Quantifying the Predictability of Winter River Flow in Iberia. Part II: Seasonal Predictability. Journal of Climate, 21, 2503–2518.
García-Herrera, R., Paredes, D., Trigo, R.M., Trigo, I.F., Hernández, E., Barriopedro, D., Mendes, M.A. (2007) The outstanding 2004/05 drought in the Iberian Peninsula: Associated atmospheric circulation. Journal of Hydrometeorology 8:483-498.
García-Serrano, J., Losada, T., Rodríguez-Fonseca, B., Polo, I. (2008) Tropical Atlantic Variability Modes (1979-2002). Part II: Time-Evolving Atmospheric Circulation Related to SST-Forced Tropical Convection. Journal of Climate 21:6476-6497.
Gillett, N.P., Zwiers, F.W., Weaver, A.J., Stott, P.A. (2003) Detection of human influence on sea-level pressure. Nature 422:292-294 González-Rouco, J.F, Heyen, H.H., Zorita, E. and Valero, F. (2000) Agreement between observed rainfall trends and climate change
simulations in the South-west of Europe. Journal of Climate, 13, 3057-3065. González-Rouco, J.F., Heyen, H., Zorita, E., Valero, E. (2000) Agreement between observed rainfall trends and climate change
simulations in the south-west of Europe. Journal of Climate 13:3057-3065. Goodess, C.M., Jones, P.D. (2002) Links between circulation and changes in the characteristics of Iberian rainfall. International
Journal of Climatology 22:1593-1615. Gouirand, I., Moron, V. (2003) Variability of the impact of El Niño-southern oscillation on sea-level pressure anomalies over the
North Atlantic in January to March (1874-1996) International Journal of Climatology 23 (13) 1549 – 1566. Haarsma, R.J., Hazeleger, W. (2007) Extratropical atmospheric response to equatorial Atlantic cold tongue anomalies. Journal of
Climate 20:2076-2091. Handorf, D., Dethloff, K. (2009) Atmospheric teleconnections and flow regimes under future climate projections. European Physical
Journal-Special Topics 174:237-255. Hoerling , J., Hurrell, W. and Xu, T. (2001) Tropical origins for recent North Atlantic climate change. Science, 292, 90–92 Hoerling, M.P., Hurrell, J.W., Xu, T., Bates, G.T., Phillips, A.S. (2004) Twentieth century North Atlantic climate change. Part II:
Understanding the effect of Indian Ocean warming. Climate Dynamics 23:391-405. Hurrell, J.W. (1995) Decadal trends in the North-Atlantic Oscillation - regional temperatures and precipitation. Science 269:676-679.

CLIVAR – Spain Teleconnections
65
Hurrell, J.W., Kushnir, Y., Ottersen, G. and Visbeck. M. (2003) An overview of the North Atlantic Oscillation. In: The North Atlantic Oscillation (Eds. Hurrell, J.W., Kushnir Y., Ottersen G. and Visbeck M.). Geophysical Monograph 134, American Gephysical Union 1-35.
Hurrell, J.W., Visbeck, M., Busalacchi, A., Clarke, R.A., Delworth, T.L., Dickson ,R.R., Johns, W.E., Koltermann, K.P., Kushnir, Y., Marshall, D., Mauritzen, C., McCartney, M.S., Piola, A., Reason, C., Reverdin, G., Schott, F., Sutton ,R., Wainer, I., Wright, D. (2006) Atlantic climate variability and predictability: A CLIVAR perspective. Journal of Climate 19:5100-5121.
Ineson, S. and Scaife, A.A. (2009) The role of the stratosphere in the European climate response to El Niño. Nature Geoscience 2, 32 - 36 doi:10.1038/ngeo381
Jones, P.D., Osborn, T., Briffa, K.R. (2003) Pressure-based measures of the North Atlantic Oscillation (NAO): A comparison and an assessment of changes in the strength of the NAO and in its influence on surface climate parameters Geophysical monograph 134, 51-62, American Geophysical Union .
Kiladis, G.N., and Diaz, H.F. (1989) Global Climatic Anomalies Associated with Extremes in the Southern Oscillation. J. Climate, 2, 1069–1090.
Knutson, T.R., Manabe, S. (1998) Model assessment of decadal variability and trends in the tropical Pacific Ocean. Journal of Climate 11:2273-2296.
Knutson, T.R., Delworth, T.L., Dixon, K.W, Stouffer, R.J. (1999) Model assessment of regional surface temperature trends (1949-1997). Journal of Geophysical Research-Atmospheres 104:30981-30996.
Kuzmina, S.I., Bengtsson, L., Johannessen, O.M., Drange, H., Bobylev, L.P., Miles, M.W. (2005) The North Atlantic Oscillation and greenhouse-gas forcing. Geophysical Research Letters 32: L04703, DOI:10.1029/2004GL021064.
López-Bustins, J.A., Martin-Vide, J., Sánchez-Lorenzo, A. (2008) Iberia winter rainfall trends based upon changes in teleconnection and circulation patterns. Global and Planetary Change 63:171-176.
López-Moreno, J.I., Vicente-Serrano, S.M. (2008) Positive and negative phases of the wintertime north Atlantic oscillation and drought occurrence over Europe: A multitemporal-scale approach. Journal of Climate 21:1220-1243.
Lorenzo, M.N. and Taboada, J..J. (2005) Influences of atmospheric variability on freshwater input in Galician Rías in winter. Journal of Atmospheric and Ocean Science 10: 377-387.
Lorenzo, M.N., Taboada, J.J., Gimeno, L. (2008) Links between circulation weather types and teleconnection patterns and their influence on precipitation patterns in Galicia (NW Spain). International Journal of Climatology 28:1493-1505.
Lorenzo, M.N., Iglesias, I., Taboada, J..J. and Gómez-Gesteira, M. (2009) Relationship between monthly rainfall in NW Iberian Peninsula and North Atlantic sea surface temperature. International Journal of Climatology DOI. 10.1002/joc.1959
Lorenzo, M.N., Taboada, J..J., Iglesias, I. and Gómez-Gesteira, M. (2010) Predictability of the spring rainfall in northwestern Iberian Peninsula from sea surface temperatures of ENSO areas. Climatic Change 108 399-422, DOI: 10.1007/s10584-010-9991-6.
Losada, T., Rodríguez-Fonseca, B., Mechoso, C.R., Ma HY (2007) Impacts of SST anomalies on the North Atlantic atmospheric circulation: a case study for the northern winter 1995/1996. Climate Dynamics 29:807-819.
Luna, M.; Morata, M., Martín, M.L. and Valero, F. (2004) Influencia de los patrones de teleconexión del Atlántico Norte en la precipitación primaveral del Mediterráneo occidental Física de la Tierra 16, 137-148.
Mariotti, A., Zeng, N., Lau, K.-M., (2002) Euro-Mediterranean rainfall and ENSO - a seasonally varying relationship. Geophysical Research Letters, 29 (12) 10.1029/2001GL014248.
Mariotti, A, Ballabrera-Poy, J., Zeng, N. (2005) Tropical influence on Euro-Asian autumn rainfall variability. Clim.Dyn. 24: 511–521 DOI 10.1007/s00382-004-0498-6.
Martín, M.L., Luna, M.Y., Morata, A., Valero (2004) North Atlantic teleconnection patterns of low-frequency variability and their links with springtime precipitation in the Western Mediterranean. International Journal of Climatology 24: 213-230. DOI: 10.1002/joc.993.
Martín-Vide, J., López-Bustins, J.A., 2006. The Western Mediterranean Oscillation and Rainfall in the Iberian Peninsula. International Journal of Climatology, 26 (11), 1455-1475.
Mathieu, P. P., Sutton, R.T., Dong, B.W. and Collins, M. (2004) Predictability of winter climate over the North Atlantic European region during ENSO events, Journal of Climate 17, 1953–1974.
McCabe, G.J., Clark, M.P., Serreze, M.C. (2001) Trends in Northern Hemisphere surface cyclone frequency and intensity. Journal of Climate 14:2763-2768.
Meehl, G.A., Washington, W.M., Santer, B., Collins, W.D., Arblaster, J.M., Hu, A., Lawrence, D.M., Teng, H., Buja, L.E. and Strand, W.G. (2006) Climate change in the 20th and 21st centuries and climate change commitment in the CCSM3. Journal of Climate, 19, 2597-2616.
Menéndez, M., Méndez, F.J., Losada, I.J. (2009) Forecasting seasonal to interannual variability in extreme sea levels. Ices Journal of Marine Science 66:1490-1496.
Merkel, U.; Latif, M. (2002) A high resolution AGCM study of the El Niño impact on the North Atlantic/European sector. Geophysical Research Letters, 29. DOI:10.1029/200GL013726
Moron and Gouirand (2003) Seasonal modulation of the El Niño-southern oscillation relationship with sea level pressure anomalies over the North Atlantic in October-March 1873-1996. International Journal of Climatology 23 2, 143 - 155
Muñoz-Diaz D., Rodrigo, F.S. (2003) Effects of the North Atlantic oscillation on the probability for climatic categories of local monthly rainfall in southern Spain. International Journal of Climatology 23:381-397.
Nieto, S., Rodríguez-Puebla, C. (2006) Comparison of precipitation from observed data and general circulation models over the Iberian Peninsula. Journal of Climate 19:4254-4275.
Palmer, T.N. and Sun, Z. (1985) A modeling and observational study relationship between sea surface temperature in the North West Atlantic and the atmospheric general circulation. Quarterly Journal of the Royal Meteorological Society, 111, 947-975.
Paredes, D., Trigo, R.M., García-Herrera, R., Trigo, I.F. (2006) Understanding precipitation changes in Iberia in early spring: Weather typing and storm-tracking approaches. Journal of Hydrometeorology 7:101-113.
Perez, F.F., Pollard, R.T., Read, J.F., Valencia, V., Cabanas, J.M., Rios, A.F. (2000) Climatological coupling of the thermohaline decadal changes in Central Waters of the Eastern North Atlantic. Scientia Marina 64:347-353.
Philander, S.G., Holton, J.R., Dmowska, R. (1989) El Niño, La Niña and the Southern Oscillation. Academic Press.

Climate in Spain: Past, Present and Future
66
Polo, I., Rodríguez-Fonseca, B., Sheinbaum, J. (2005) North-west Africa upwelling and the Atlantic climate variability. Geophys. Res. Lett., 32, L23702, doi:10.1029/2005GL023883.
Polo, I., Rodríguez-Fonseca, B., Losada, T. and García-Serrano, J. (2008) Tropical Atlantic Variability modes (1979-2002). Part I: time-evolving SST modes related to West African rainfall. Journal of Climate, 21 (24), 6457-6475.
Pozo-Vázquez, D., Esteban-Parra, M.J., Rodrigo, F.S., Castro-Díez, Y. (2000) An analysis of the variability of the North Atlantic Oscillation in the time and the frequency domains. International Journal of Climatology 20:1675-1692.
Pozo-Vázquez, D., Esteban-Parra, M.J., Rodrigo, F.S., Castro-Díez, Y. (2001) A study of NAO variability and its possible non-linear influences on European surface temperature. Climate Dynamics 17:701-715.
Pozo-Vázquez, D., Tovar-Pescador, J., Gámiz-Fortis, S.R., Esteban-Parra, M.J. and Castro-Díez, Y. (2004) NAO and Solar radiation variability in the European North Atlantic region. Geophysical Research Letters, 31, 5, L05201, doi: 10.1029/2003GL018502.pdf
Pozo-Vázquez D, Gamiz-Fortis, S.R., Tovar-Pescador, J., Esteban-Parra, M.J., Castro-Díez, Y. (2005a) El Niño Southern oscillation events and associated European winter precipitation anomalies. International Journal of Climatology 25:17-31.
Pozo-Vázquez, D., Gamiz-Fortis, S.R., Tovar-Pescador, J., Esteban-Parra, M.J., Castro-Díez, Y. (2005b) North Atlantic winter SLP anomalies based on the autumn ENSO state. Journal of Climate 18:97-103.
Quadrelli, R., Pavan, V. and Molteni, F. (2001) Wintertime variability of Mediterranean precipitation and its links with large-scale circulation anomalies, Climate Dynamics, 17, 457–466.
Rauthe, M., Hense, A., Paeth, H. (2004) A model intercomparison study of climate change-signals in extratropical circulation. International Journal of Climatology 24:643-662.
Robertson, A. W., Mechoso, C.R. and Kim, Y.-J. (2000) The influence of Atlantic sea surface temperature anomalies on the North Atlantic Oscillation. Journal of Climate, 13, 122-138.
Rodó, X., Baert, E., Comin, F.A. (1997) Variations in seasonal rainfall in southern Europe during the present century: Relationships with the North Atlantic Oscillation and the El Nino Southern Oscillation. Climate Dynamics 13:275-284.
Rodrigo, F.S, Pozo-Vázquez, D., Esteban-Parra, M.J., Castro-Díez, Y. (2001) A reconstruction of the winter North Atlantic Oscillation index back to AD 1501 using documentary data in southern Spain. Journal of Geophysical Research-Atmospheres 106:14805-14818.
Rodrigo, F.S, Trigo, R.M. (2007) Trends in daily rainfall in the Iberian Peninsula from 1951 to 2002. International Journal of Climatology 27:513-529.
Rodríguez-Fonseca, B., Serrano, E. (2002) Winter 10-day coupled patterns between geopotential height and Iberian Peninsula rainfall using the ECMWF precipitation reanalysis. Journal of Climate 15:1309-1321.
Rodríguez-Fonseca, B, de Castro, M. (2002) On the connection between winter anomalous precipitation in the Iberian Peninsula and North West Africa and the summer subtropical Atlantic sea surface temperature. Geophysical Research Letters 29, doi: 10.1029/2001GL014421
Rodríguez-Fonseca, B, Sánchez, E., Arribas, A. (2005) Winter climate variability changes over Europe and the Mediterranean region under increased greenhouse conditions. Geophysical Research Letters 32, L13702, doi:1029/2005GL022800.
Rodríguez-Fonseca, B., Polo, I., Serrano, E., de Castro, M. (2006) Evaluation of the North Atlantic SST forcing on the European and northern African winter climate. International Journal of Climatology 26:179-191.
Rodríguez-Fonseca, B., Polo, I., García-Serrano, J., Losada, T., Mohíno, E., Mechoso, C.R., Kucharski, F. (2009) Have Atlantic Niños been leading Pacific ENSO events in recent decades? Geophysical Research Letters, 36, L2705, doi:10.1029/2009GL040048.
Rodríguez-Puebla, C., Encinas, A.H., Nieto, S., Garmendia, J. (1998) Spatial and temporal patterns of annual precipitation variability over the Iberian Peninsula. International Journal of Climatology 18:299-316.
Rodríguez-Puebla, C., Encinas, A.H., Saenz, J. (2001) Winter precipitation over the Iberian peninsula and its relationship to circulation indices. Hydrology and Earth System Sciences 5:233-244.
Rodríguez-Puebla, C., Ayuso, S.M., Frías, M.D., García-Casado, L.A. (2007) Effects of climate variations on winter cereal production in Spain. Climate Research 34:223-232.
Rodríguez-Puebla, C. and Nieto, S. (2010) Trends of Precipitation over the Iberian Peninsula and the North Atlantic Oscillation under Climate Change Conditions. International Journal of Climatology. 30, 1807-1815, doi: 10.1002/joc.2035
Rodríguez-Puebla, C., Encinas, A.H, García-Casado, L.A. and Nieto, S. (2010) Trends in warm days and cold nights over the Iberian Peninsula: relationships to large-scale variables. Climatic Change, 100, 667-684. DOI 10.1007/s10584-009-9721-0
Rodwell, M.J., Rowell, D.P, and Folland, C.K. (1999). Oceanic forcing of the wintertime North Atlantic Oscillation and European climate. Nature , 398, 320-324.
Rogers, J.C. (1997) North Atlantic storm track variability and its association to the North Atlantic Oscillation and climate variability of northern Europe. Journal of Climate , 10, 1635-1647.
Romero, R., Sumner, G., Ramis, C., Genovés, A. (1999) A classification of the atmospheric circulation patterns producing significant daily rainfall in the Spanish Mediterranean area. International Journal of Climatology 19:765-785.
Ropelewski, C.F. and Halpert, M.S. (1987), Global and regional scale precipitation patterns associated with the El Niño/Southern Oscillation (ENSO), Monthly Weather Review, 115, 1606–1626.
Saénz, J., Rodríguez-Puebla, C., Fernández, J., Zubillaga, J. (2001a) Interpretation of interannual winter temperature variations over south-western Europe. Journal of Geophysical Research-Atmospheres 106:20641-20651.
Saénz, J., Zubillaga, J., Rodríguez-Puebla, C. (2001b) Baroclinic activity and interannual variability of winter precipitation in the northern Iberian Peninsula. Detecting and Modelling Regional Climate Change:405-416.
Serrano, A., García, J.A., Mateos, V.L., Cancillo, M.L., Garrido, J. (1999) Monthly modes of variation of precipitation over the Iberian peninsula. Journal of Climate 12:2894-2919.
Solomon, S.D. et al., 2007. Technical Summary. In: Climate Change 2007: The Physical Science Basis. Contribution of Working Group I to the Fourth Assessment Report of the Intergovernmental Panel on Climate Change [Solomon, S., Qin, D., Manning, M., Chen, Z., Marquis, M., Averyt, K.B., Tignor, M. and Miller, H.L. (eds.)]. Cambridge University Press, Cambridge, United Kingdom and New York, NY, USA.
Sordo, C., Frías, M.D., Herrera, S., Cofino, A.S., Gutiérrez, J.M. (2008) Interval-based statistical validation of operational seasonal forecasts in Spain conditioned to El Nino-Southern Oscillation events. Journal of Geophysical Research-Atmospheres 113.
CLIVAR – Spain Teleconnections
67
Soriano, L.R., De Pablo, F., Tomas, C. (2004) Impact of the North Atlantic oscillation on winter convection: Convective precipitation and cloud-to-ground lightning. International Journal of Climatology 24:1241-1247.
Stephenson, D.B., Pavan, V., Collins, M., Junge, M.M., Quadrelli, R. (2006) North Atlantic Oscillation response to transient greenhouse gas forcing and the impact on European winter climate: a CMIP2 multi-model assessment Climate. Dynamics 27: 401–420 DOI 10.1007/s00382-006-0140-x
Sutton, R.T. and Allen, M.R. (1997) Decadal predictability of North Atlantic sea surface temperature and climate. Nature, 388, 563-567.
Thompson, D.W.J, and Wallace, J.M. (1998) The Arctic Oscillation signature in the wintertime geopotential height and temperature fields. Geophysical Research Letters, 25, 1297-1300.
Thompson, D.W.J. (2003) Stratospheric connection to northern hemisphere wintertime weather: Implications for prediction (vol. 15, p. 1421, 2002). Journal of Climate 16:2433-2433.
Toniazzo, T. and Scaife, A.A. (2006), The influence of ENSO on winter North Atlantic climate, Geophys. Res. Lett., 33, L24704, doi:10.1029/2006GL027881.
Trenberth, K.E. et al. (2007) Observations: Surface and Atmospheric Climate Change. In: Climate Change 2007: The Physical Science Basis. Contribution of Working Group I to the Fourth Assessment Report of the Intergovernmental Panel on Climate Change [Solomon, S., D. Qin, M. Manning, Z. Chen, M. Marquis, K.B. Averyt, M. Tignor and H.L. Miller (eds.)]. Cambridge University Press, Cambridge, United Kingdom and New York, NY, USA.
Trenberth, K.E. and Caron, J.M. (2000) The Southern Oscillation revisited: Sea level pressures, surface temperatures and precipitation, Journal of Climate 13, 4358–4365.
Trenberth, K.E, Hurrell, J.W. (1994) decadal atmosphere-ocean variations in the Pacific. Climate Dynamics 9:303-319. Trenberth, K.E., et al. (1998) Progress during TOGA in understanding and modeling global teleconnections associated with tropical
sea surface temperatures, Journal of Geophysical Research, 103, 14,291–14,324. Trigo, R.M., daCamara, C.C. (2000) Circulation weather types and their influence on the precipitation regime in Portugal.
International Journal of Climatology 20:1559-1581. Trigo, R.M., Palutikof, J.P. (2001) Precipitation scenarios over Iberia: A comparison between direct GCM output and different
downscaling techniques. Journal of Climate 14:4422-4446. Trigo, R.M., Pozo-Vázquez, D., Osborn, T.J., Castro-Díez, Y., Gamiz-Fortis, S., Esteban-Parra, M.J. (2004) North Atlantic oscillation
influence on precipitation, river flow and water resources in the Iberian peninsula. International Journal of Climatology 24:925-944. Valero, F., Luna, M.Y., Martin, M.L., Morata, A., González-Rouco, F. (2004) Coupled modes of large-scale climatic variables and
regional precipitation in the western Mediterranean in autumn. Climate Dynamics 22:307-323. van Oldenborgh, G.J., Burgers, G. and Klein Tank, A. (2000) ‘On the El Niño teleconnection to spring precipitation in Europe’,
International Journal of Climatology, 20, 565–574. van Oldenborgh, G.J. (2005) Comment on 'Predictability of winter climate over the North Atlantic European region during ENSO
events' by P.-P. Mathieu, R. T. Sutton, B. Dong and M. Collins Journal of Climate 18, 14, 2770-2772. Vicente-Serrano, S.M., López-Moreno, J.I. (2006) The influence of atmospheric circulation at different spatial scales on winter
drought variability through a semi-arid climatic gradient in Northeast Spain. International Journal of Climatology 26:1427-1453. Vicente-Serrano, S.M., Cuadrat, J.M. (2007) North Atlantic oscillation control of droughts in north-east Spain: evaluation since 1600
A. D. Climatic Change 85:357-379. Vicente-Serrano, S.M., López-Moreno, J.I. (2008a) Differences in the non-stationary influence of the North Atlantic Oscillation on
European precipitation under different scenarios of greenhouse gas concentrations. Geophysical Research Letters 35, doi: 10.1029/2008GL034832
Vicente-Serrano, S.M., López-Moreno, J.I. (2008b) Non-stationary influence of the North Atlantic Oscillation on European precipitation. Journal of Geophysical Research-Atmospheres 113, doi: 10.1029/2008JD010382
Visbeck, M., Chassignet, E.P., Curry, R.G. and Delworth, T.L. (2003) The Ocean response to North Atlantic Oscillation variability. In: The North Atlantic Oscillation (Eds. Hurrell, J.W., Kushnir Y., Ottersen G. and Visbeck M.) Geophysical Monograph 134, American Gephysical Union.
Wallace, J.M., Gutzler, D.S. (1981) Teleconnections in the geopotential height field during the Northern Hemisphere winter. Monthly Weather Review 109:784-812.
Wallace, J.M. (2000) North Atlantic oscillation/annular mode: Two paradigms-one phenomenon. Quarterly Journal of the Royal Meteorological Society, 126, 791-805.
Xoplaki, E., González-Rouco, J.F., Luterbacher, J., Wanner, H. (2003) Mediterranean summer air temperature variability and its connection to the large-scale atmospheric circulation and SSTs. Climate Dynamics 20:723-739.
Xoplaki, E., González-Rouco, J.F., Luterbacher, J., Wanner, H. (2004) Wet season Mediterranean precipitation variability: influence of large-scale dynamics and trends. Climate Dynamics 23:63-78.
Xoplaki, E, Luterbacher, J., González-Rouco, J.F. (2006) Mediterranean summer temperature and winter precipitation, large-scale dynamics, trends. Nuovo Cimento Della Societa Italiana Di Fisica C-Geophysics and Space Physics 29:45-54.
Yin, J.H. (2005) A consistent poleward shift of the storm tracks in simulations of 21st century climate. Geophysical Research Letters 32, doi: 10.1029/2005GL023684
Zebiak, S.E. (1993) Air-sea interaction in the equatorial Atlantic region. Journal of Climate 6:1567-1568. Zebiak, S.E., Cane, M.A. (1987) A model el-Nino Southern Oscillation. Monthly Weather Review 115:2262-2278. Zhou, S., Miller, A.J., Wang, J. and Angell, J.K. (2001) Trends of NAO and AO and their associations with stratospheric processes.
Geophys. Res. Lett., 28, 4107-4110. Zorita, E., Kharin, V., Von Storch, H. (1992) The atmospheric circulation and sea-surface temperature in the North-Atlantic area in
winter - their interaction and relevance for Iberian precipitation. Journal of Climate 5:1097-1108. Zorita, E., González-Rouco, F. (2000) Disagreement between predictions of the future behavior of the Arctic Oscillation as simulated
in two different climate models: implications for global warming. Geophysical Research Letters 27: 1755–1758.

Climate in Spain: Past, Present and Future
68

CLIVAR – Spain Regional Projections
69
Chapter 51
REGIONAL CLIMATE PROJECTIONS OVER THE IBERIAN PENINSULA: CLIMATE CHANGE SCENARIOS MODELING
Authors Enrique Sánchez1, Gonzalo Miguez-Macho2
1 University of Castilla-La Mancha. (Faculty of Environmental Sciences) 2 University of Santiago de Compostela. (Faculty of Physics) Contributors: Daniel Argüeso3, Francisco Javier Doblas-Reyes4, Marta Domínguez5, Jesús Fernández6, Clemente Gallardo5, José Manuel Gutiérrez6, Juan Ignacio López-Moreno7, Juan Pedro Montávez8, Ernesto Rodríguez9
3 Department of Applied Physics, University of Granada 4 European Centre for Medium-Range Weather Forecasts, Reading, United Kingdom 5 Institute of Environmental Sciences, University of Castilla-La Mancha 6 Department of Applied Mathematics and Computer Sciences. University of Cantabria 7 Pyrenean Institute of Ecology, Zaragoza (CSIC) 8 Department of Physics, University of Murcia 9 Spanish Meteorological Agency (AEMET)
TABLE OF CONTENTS
1. Introduction
2. Dynamical downscaling: regional climate models (RCMs)
2.a. General aspects
2.b. Validation of regional models for present climate
2.c. Projected changes in temperature and precipitation on seasonal scales
2.d. Projected changes in other climatic magnitudes and processes
2.e. Projected changes in extreme climatic events
2.f. Projections sensitivity to physical parameterizations
3. Statistical downscaling
4. Other aspects of climate modeling: decadal and long-term prediction
5. Conclusions
6. References
Citation: Sánchez E. and Miguez-Macho, G. 2010. Regional climate projections over the Iberian Peninsula: climate change scenarios modeling. Report: Climate in Spain: Past, Present and Future (Editors: Pérez F. Fiz and Boscolo Roberta) pp. 69-80.

Climate in Spain: Past, Present and Future
70
1.- Introduction
The climate in the IP shows great complexity and diversity, both in terms of the spatial distribution of temperature (with mean annual differences of over 18oC between the semi-desert areas and high mountain regions) and in precipitation (accumulated annual values from 150 mm in the south-eastern part up to 2500 mm in the north-west), and also a pronounced intra-annual time variability (typically dry summers and more rainy autumn-winter or spring) and inter-annual variability (sequences of consecutive years with heavy rain deficits (droughts), followed by other years with much more precipitation) [Rodríguez-Puebla et al.,1998; Romero et al., 1999; Serrano et al., 1999; Martín-Vide., 2004; Castro et al., 2007b]. These characteristics correspond to the Mediterranean climate that is predominant in a large part of this region and which, together with the semidesertic, Atlantic or Alpine conditions also present there [Castro et al., 2007b], represents a great challenge for numerical climate models description. In the latest report by the Intergovernmental Panel on Climate Change [IPCC; Christensen et al., 2007b], the results of the global climate models (GCMs) over Europe pointed to the Mediterranean area as one of the most sensitive in Europe to increases in temperature and decreases in precipitation. Details of the IP are not shown, as the resolution of these models (around 200 km) is insufficient for fully capturing the large spatial and time variability of the Iberian climate because inadequate representation of the climatic modulation produced by the mountains, the different land covers, coastal processes, etc., whose spatial scales are much smaller. This issue represents a major limitation when considering their application for describing the impacts of the possible climate change scenarios projected by these models.
In order to get round with this problem and make regional downscaling of the results without having to simulate the climate of the entire globe at high resolution, strategies that are based on global simulation results are used and greater detail is added to them. These techniques are known as downscaling or regionalization since, based on the large-scale data that results from a global model, smaller detailed scales are re-created either due to the interaction of the atmosphere with an heterogeneous and complex terrain or processes on regional scales in the atmosphere. Basically speaking, there are two downscaling methods: dynamical and statistical.
The term dynamic downscaling [Machenhauer et al., 1998; Giorgi and Mearns, 1999] refers to the technique of making numerical simulations that are much more detailed than those of a GCM by using a procedure similar to that of short-term weather forecasts, that is, using a limited area model to a small portion of the globe with boundary conditions taken from the global model: these are regional climate models (RCMs). The regional nature of the domain makes it possible to obtain higher resolution with a similar computational cost and, therefore, simulate the small dynamic scales that are not present in the original global simulation, thereby making it possible to study in more detail the climate characteristics and their possible patterns of change for the region of interest. These regional models usually also have more precise parameterizations (numerical approximations of the principal physical climate processes involved) than those of a global model for describing regional atmospheric mechanisms, since these parameterizations depend to a certain extent on the spatial resolution of the numerical model.
Statistical downscaling methods are an alternative to regional climate models for regional projections of climate change scenarios. These methods combine the historical reanalysis information and/or predictions from global climate models with regional observations in the area of interest for the same period (isolated observations and/or grids with interpolated observations). In this way, statistical models relate large-scale, low resolution atmospheric variables with high resolution surface historical records (mainly temperature and precipitation). Many studies have been made over the IP [Goodess and Palutikof, 1998; Zorita and Von Storch, 1999; Frías et al., 2006]. There are particularly relevant those related to the European projects STARDEX [Goodess et al., 2008] or ENSEMBLES [Cofiño et al., 2007], where different methodologies on several sub-regions in Europe, including the IP, are analyzed. Future projections are made by applying statistical models calibrated for present-day climate and, therefore, assuming that the relations obtained between the GCM outputs and regional observations are robust for climate change [San-Martín et al., 2009].
One the rest of the chapter, different aspects of dynamic and statistical downscaling techniques, including their involved uncertainties, together with the results of several studies referring to climate change
CLIVAR – Spain Regional Projections
71
projections for the IP, are shown in detail. Lastly, a brief comment is made on the use of GCMs as seasonal and decadal climate prediction tools which, among other things, allows the identification of processes that need to be better represented, the dependence on the initial conditions, and also the better quantification of the reliability of the long-term climate projections they produce which are the basis of all downscaling or regionalization studies.
2.- Dynamical downscaling: regional climate models (RCMs)
2.a.- General aspects
Regional climate models are a powerful tool for describing regional climate and its possible changes for future conditions, but they also involve some limitations and aspects that have to be taken into account when analysing their results. A key aspect is the knowledge and limits of the different uncertainty levels related to these studies. A first level of uncertainty comes from greenhouse gases emission scenarios, that is, from estimates of socio-economic humanity development and the associated greenhouse gas emissions. Climate models use the most probable or the most extreme scenarios, for attempting to delimit the maximum range of possible changes. The next level of uncertainty is due to the limitations of the global and regional models, particularly those related with the parameterizations used to describe the physical processes. The chaotic nature of the climate system adds another level of uncertainty. In the case of regional models, the boundary conditions provided by the global models adds another degree of uncertainty. These different levels of uncertainty are analysed in several studies. For example, in summer higher dispersion in climate change projections can be obtained from several RCMs than among corresponding forcing GCMs, indicating that summer climate is mainly controlled by physical processes and/or the used spatial resolution [Déqué et al., 2005]. Validation of models is made by comparing their ability to reproduce different aspects of present-day climate compared with the available observational databases, assuming that a model that represents present-day climate can also describe future climate conditions correctly. In general, not all the climate characteristics (seasonal means, inter-annual variability, extremes) nor all the variables (temperature, precipitation, etc.) present the same degree of reliability for each model or for all regional models. This aspect, together with the difficulties for model validation due the limited amount of climate observations available for the IP, and the large climatic heterogeneity of the region, make it difficult to determine a RCM that accurately represents the present Iberian climate. The use of a group of RCMs simulating the same climate conditions (forced by the same GCM), as well as the simulation using the same RCM forced by several GCMs (finally giving rise to a matrix of GCMs/RCMs) is the procedure used for minimising these uncertainties, and which has been carried out in the recent years in the European projects (PRUDENCE, ENSEMBLES) on which many of the results shown in this document are based. Due to the high computational cost of the RCMs, the studies that point out that the variance of these models it largely dependent on the GCM used [Déqué et al., 2005, Déqué et al., 2007] would suggest as a the suitable strategy the use of several GCMs for the same RCM. The disadvantage is that most of the published papers corresponding to this method analyse Europe as a whole, so the IP specific aspects description is quite simple. Finally, the nesting or fitting of the regional models from global models introduces additional uncertainties that are usually attenuated or reduced by using different numerical techniques [Von Storch et al., 2000; Miguez-Macho et al., 2004, 2005].
The European PRUDENCE project [Christensen et al., 2007a] with a group of RCMs modeling most of Europe for present-day and future climate, including the IP, was the basis of two recent reports on regional climate change focusing on the IP: The ECCE Project (Assessment of the impacts of climate change in Spain) [Castro et al., 2007b] and the AEMET project [Brunet et al., 2008]. (http://www.mma.es/portal/secciones/cambio_climatico/areas_tematicas/impactos_cc/eval_impactos.htm)
The European ENSEMBLES project [Hewitt, 2005] extends the work of the PRUDENCE project, proposing a strategy to analyze the projections for future climate scenarios over Europe in a probabilistic way. In this project, the use of weights for each model is proposed for analysing a group of RCMs on the basis of their ability to describe different aspects of present climate over different regions of Europe [Christensen et al., 2008; Sánchez et al., 2009], in order to use them later in future ensemble climate projections.

Climate in Spain: Past, Present and Future
72
2.b.- Validation of regional models for present climate
The PRUDENCE RCMs ensemble widely used on this report shows reasonable agreement in terms of temperature and seasonal precipitation [Jacob et al., 2007] against CRU observational database [New et al., 1999]. However, some specific details show a mean annual deviation of 1ºC for the RCMs over the Pyrenees [López-Moreno et al., 2008a], with also larger deviations for high temperature and precipitation values [Christensen et al., 2008]. Monthly seasonal precipitation distribution functions show good agreement with the observations for all the percentiles, being greater in winter than in summer [Sánchez et al., 2009]. A key aspect in the validation work is the availability of observational databases interpolated to a common grid to be used by the models, but there is no important deficit in this respect. A database with daily observational data [Haylock et al., 2008] was developed recently in the ENSEMBLES project, although it was based on a small amount of observed data, which may be a problem when processes related to extreme events are analysed [Hofstra et al., 2010]. Another database interpolated over the Peninsula is also being developed at the University of Cantabria with a much higher amount of meteorological stations [Herrera et al., 2010].
2.c.- Projected changes in temperature and precipitation on seasonal scales
2.c.1.- Temperature
[Gallardo et al., 2001], for a doubling CO2 scenario, show a structure of maximum increase of mean daily temperature in summer (up to 5ºC for mid-21st century) with a structure of greater increase in the centre of the IP, decreasing as it goes to the coast. Further studies based on the results of individual models [Gibelin and Déqué, 2003; Giorgi et al., 2004; Räisänen et al., 2004; Sánchez et al., 2004; Schär et al., 2004; Rowell, 2005; Castro et al., 2007b; Giorgi and Lionello, 2008], all of them with resolutions around 50 km, and for A2 and/or B2 emissions scenarios [Nakicenovic and Swart, 2000], show similar spatial patterns of change for the end of the 21st century. A maximum increase of 6ºC on mean daily temperature in summer with a decreasing gradient structure from the interior of the IP towards the coast, and around 3ºC in winter (the season with least increase), under the A2 emissions scenario (one of those that project a greater increase in greenhouse gases, duplicating the concentrations of end of the 20th century, reaching over 800 ppm in CO2 concentration by the end of the 21st century) is obtained. For a scenario with more moderate increases in greenhouse gases (B2, around 600 ppm by the end of the century), the results are 1-2ºC lower. When an analysis of the ensemble of RCMs forced by the same GCM, the HadCM3 [Pope et al., 2000] averaged in PRUDENCE is made for the whole IP, as in table 1 below, it can be seen the high degree of agreement among the models.
Projections show a maximum temperature increase in summer (5.41ºC on average, with a dispersion between 4.78ºC and 5.83ºC for the RCMs forced with the same GCM), and a minimum in winter (2.97ºC, with 2.46ºC to 3.13ºC between maximum and minimum increases) for the end of the 21st century under the A2 emissions scenario. The probability distribution of change in annual temperature shows a range between 2.8 and 5.7oC (1 and 99 percentiles). Intermediate increases are obtained in autumn and spring, being the autumn (3.96ºC on average) higher than those of spring (3.42ºC). The spread among RCMs is therefore clearly lower than the climate change response [Déqué et al., 2005]. Similar results are obtained with another emissions scenario (B2) and two more GCMs added to this ensemble of RCM simulations [Déqué et al., 2007]. In these future projections a temperature variance mainly dependent on the GCM used, being greater in winter (61%) than in summer (47%) [Déqué et al., 2007].
These changes by degree of increase in temperature in the global model are, on annual average, clearly higher than 1 (between 1.2 and 1.7, [Ekström et al., 2007, Hingray et al., 2007]). Over the Pyrenees area, the RCMs ensemble from PRUDENCE projects a mean annual increase of 2.8 to 4ºC in temperature for scenarios B2 and A2, respectively, with pronounced seasonal variations, being maximum in summer [López-Moreno et al., 2008a]. The mean daily temperature interannual variability, although it shows more discrepancy than the mean values, seems to show an increase both in summer and in winter [Giorgi et al., 2004, Rowell, 2005, Lenderink et al., 2007, Giorgi and Lionello, 2008).

CLIVAR – Spain Regional Projections
73
Table 1: Seasonal changes (future climate (2071-2100) compared with present-day climate (1961-1990)) in temperature (in oC) and precipitation (relative change) for each of the PRUDENCE project regional models, together with the ensemble of models. Additional simulations at higher resolution (25, 12 km) and forced by the ECHAM5 GCM are also shown
Temperature Precipitation
DJF MAM JJA SON DJF MAM JJA SON HIRHAM-50 3.13 3.46 5.38 4.12 -0.02 -0.28 -0.39 -0.17 HIRHAM-25 3.05 3.34 5.27 3.98 -0.02 -0.28 -0.38 -0.17 HIRHAM-12 3.05 3.36 5.19 3.96 -0.02 -0.27 -0.36 -0.16 CHRM 2.46 3.05 4.90 3.48 -0.08 -0.39 -0.72 -0.26 CLM 2.64 2.87 5.00 3.53 -0.04 -0.29 -0.46 -0.20 HadRM3H 3.44 3.98 5.70 4.24 -0.08 -0.29 -0.44 -0.19 RegCM 2.73 3.28 4.93 3.83 -0.01 -0.27 -0.39 -0.12 RACMO 3.08 3.60 5.83 4.07 -0.05 -0.32 -0.60 -0.21 REMO 3.12 3.43 5.42 4.18 -0.04 -0.31 -0.50 -0.23 RCAO-50 3.06 3.35 5.73 3.96 -0.02 -0.28 -0.50 -0.17 RCAO-25 3.09 3.41 5.59 4.00 -0.01 -0.29 -0.49 -0.16 PROMES 3.05 3.73 5.82 4.21 -0.02 -0.28 -0.45 -0.16 HadAM3H 3.59 4.09 6.30 4.41 -0.03 -0.31 -0.44 -0.20 ARPEGE 3.05 3.61 4.78 3.88 -0.01 -0.24 -0.48 -0.25 HIRHAM-
ECH
3.90 5.08 4.51 5.43 0.03 -0.26 -0.26 -0.25 RCAO-ECH 4.15 5.99 7.83 5.54 -0.07 -0.50 -0.43 -0.33 Ensemble 2.97 3.42 5.41 3.96 -0.04 -0.30 -0.48 -0.19
Maximum and minimum daily temperatures show similar seasonal changes behaviour: larger increases in summer than in winter and with the same spatial pattern for summer. However, an increase in maximum temperatures around 1ºC higher than the minimum temperatures all along the year is obtained, particularly in summer, which would indicate an increase in the amplitude of daily temperature range [Sánchez et al., 2004]. Something similar occurs for the B2 scenario [Giorgi et al., 2004]. The timeseries for the whole 21st century for the increase in maximum and minimum mean annual temperatures averaged for the whole of the IP obtained by different regionalization methods (including the 10 RCMs of the PRUDENCE project), different GCMs, and for several emissions scenarios (Fig. 1, [Brunet et al., 2008]), indicates a clear increase in both temperatures. A greater increase in maximum temperatures compared with minimum temperatures is projected from 2070.
Figure 1: Timeseries of mean annual maximum and minimum temperature change for the whole
IP (Brunet et al., 2008) during the 21st century for A2 and B2 scenarios from the different regionalization techniques, GCMs and emissions scenarios related to the 1961-1990 mean value. The shaded area represents 1 deviation from the mean value (10-year running mean) represented by a continuous line.
Climate in Spain: Past, Present and Future
74
2.c.2.- Precipitation
The changes in seasonal precipitation shown by several studies using individual models [Gibelin and Déqué, 2003; Giorgi et al., 2004; Räisänen et al., 2004; Sánchez et al., 2004; Rowell, 2005; Castro et al., 2007b; Giorgi and Lionello, 2008] show a decrease in summer for all the IP, presenting a north-south structure in winter with slight increases in the northern half and decreases in the southern part. However, the discrepancies among the results with the different models are larger than those obtained when comparing temperatures. A decrease is also obtained in the total number of rainy days in all seasons and for the whole region [Sánchez et al., 2009b]. When the ensemble of RCMs forced by the same GCM from PRUDENCE is analyzed (Table 1, [Christensen y Christensen, 2007]), a high degree of agreement among them is seen, with a negative change in relative precipitation average for the whole IP in all seasons, being maximum in summer (-0.48 on average for all the models, between -0.39 and -0.72) and minimum, almost negligible, in winter (-0.04) for the end of the 21st century under the A2 emissions scenario. In contrast to what happens with temperature, the RCMs show an important bias for present-day climate that can double the climate change response. However, the all RCM precipitation projections have a similar behaviour for the A2 emissions scenario, slightly different from the GCM, meanwhile systematic biases are more scattered [Déqué et al., 2005]. The percentage change in annual precipitation by degree of increase in temperature in the global model ranges between -9.7 and -3.1 K-1, which is the largest for the whole of Europe. This result is important, even from a political point of view, in relation to the proposed possible stabilization scenarios based on certain temperature thresholds (2, 3 or 4 degrees centigrades). The probability distribution functions of changes in annual precipitation indicate a decrease between 18 and 0.4% for the 1 and 99 percentiles [Ekström et al., 2007, Hingray et al., 2007]. The daily precipitation distribution function points towards a decrease of light precipitation amounts (up to 15 mm/day) [Boberg et al., 2009]. The strength (peak in the standard frequency spectrum) of the annual precipitation cycle in the north-west region of the IP appears to increase for all RCMs, which could be related to changes in frontal activity in that area [Tapiador and Sánchez, 2008]. This result could be related to a northward move of the low pressure winter systems obtained in the global model projections (IPCC 2007, Chapter 10 [Meehl et al., 2007]), and also the north-eastward displacement of the principal low frequency variability patterns [Rodríguez-Fonseca et al., 2005]. Regarding more specific regions in the IP, a maximum decrease is obtained over the Ebro basin in summer, with much smaller changes, and even slight increases for some models in winter [Blenkinsop and Fowler, 2007]. Over the Pyrenees area, the models project a decrease of 10 and 15% in annual precipitation for B2 and A2 scenarios, respectively, being the maximum decrease in summer [López-Moreno et al., 2008a].
2.d.- Projected changes in other climatic magnitudes and processes
Other aspects of climate change projected by the RCMs over the IP show an intensification of the typical summer thermal lows in the centre of the IP and an increase in sea breezes for the 2071-2100 period [Hoinka et al., 2007], corresponding to an increase in annual turbulent kinetic energy (as a measurement of turbulent activity in the lower layers of the atmosphere), mainly in summer and in the centre of the Peninsula. The Bowen ratio (ratio of sensible to latent heat fluxes over a surface) shows a change for the end of the 21st century whose spatial pattern presents a north-south gradient, being maximum on the southern part, that would point to an increased aridity and a tendency towards the desertification of that area [Sánchez et al., 2007a,b].
A significative jump of an important fraction of points towards more arid climates is obtained over the IP in respect of present-day climate (top figures) both if the climate change projections are analysed (bottom left figure) or if the change climate signal is added to the observed climatology (bottom right figure) [Castro et al., 2007a]. Although winter precipitation variability patterns are related to large scale mechanisms, and their change for future climate conditions is similar, with a north-eastward displacement in these structures both for the GCM and the RCM, the more regional modes show discrepancies in their projected change for the 21st century [Rodríguez-Fonseca et al., 2005]. There is also evidence that the magnitude of the projected changes has an important effect on the evolution of the snow mantle [López-Moreno et al, 2008b].
The construction of climate types in the Köppen-Trewartha classification from the 10 RCMs of the PRUDENCE project and their changes for future climate conditions is shown in Fig. 2.

CLIVAR – Spain Regional Projections
75
2.e.- Projected changes in extreme climatic events
The added value of regional projections becomes more relevant related of the GCMs in the analysis of extreme events and, in particular, those related to changes in precipitation. Since they are more unusual phenomena, the uncertainty associated with them will also be larger than when analysing mean magnitudes [Frei et al., 2006]. Results with individual models show possible increases in torrentiality [Christensen and Christensen, 2003, Sánchez et al., 2004], and particularly over the Pyrenees area [López-Moreno and Beniston, 2009]. An increase in the return period is also projected for accumulated precipitations from 1 to 30 mm over most of the IP [Buonomo et al., 2007]. In the Cantabric coast, an increase in summer droughts and winter periods with no rainfall on the Mediterranean coast are also projected [Gao et al., 2006]. The drought indices over the Ebro basin region show a trend towards an increased length and severity, despite the uncertainties associated with the used GCM [Blenkinsop and Fowler, 2007]. This increase in dry spells, in particular over the south-west of the IP, is also obtained using the ensemble of PRUDENCE RCMs [Beniston et al., 2007], which also shows a clear increase in the number of days with maximum temperature above 30ºC in the IP, being particularly noteworthy in the southern part. The results of the RCMs even point to the possibility of the development of cyclones of tropical-like characteristics in the Mediterranean for the end of the 21st century [Gaertner et al., 2007].
!
Figure 2: Köppen-Trewartha climate classification for present-day climate (top left, according to the CRU observational base; top right, according to the average of the PRUDENCE RCMs) according to Castro et al. (2007a). In the lower part, the change on this climate classification for the ensemble of models for future climate (2071-2100) for the A2 emissions scenario (left),and projections of change from the RCMs added to the CRU observed climatology (right).

Climate in Spain: Past, Present and Future
76
2.f.- Projections sensitivity to physical parameterizations
The climate description of the IP has been shown to be highly sensitive to the parameterization of the soil and vegetation processes used by the regional models, both for local and remote effects [Schär et al., 1999, Gaertner et al., 2001; Vidale et al., 2003; Arribas et al., 2003; Seneviratne et al., 2006; Sánchez et al., 2007c, Fischer et al., 2007]. In transition areas from dry to wet climates, a more advanced parameterization of the soil-atmosphere exchanges, together with improvements in the description of convective processes, shows clearly positive effects for reproducing regional climate [Domínguez et al., 2010]. [Fernández et al., 2007] analyzes the sensitivity of an RCM to radiation, convection and boundary layer parameterizations to describe the annual cycle of temperature and precipitation, without obtaining a better combination for all sub-regions of the IP and seasons. The coupling of an ocean model and a RCM could influence the description of climate in the IP temperature and precipitation, although [Somot et al., 2008] did not obtain statistically significant differences.
3.- Statistical downscaling
The analysis of changes in precipitation for future climate conditions shows a high degree of agreement between the changes obtained by the GCM and the downscaling methods. These studies show a tendency towards decrease in total precipitation [Von Storch et al., 1993, González-Rouco et al., 2000, Trigo and Palutikof, 2001, Sumner et al., 2003], with a few subtles: slight increases in winter for 2041-2090 [Trigo and Palutikof, 2001] or increases in the southern area [González-Rouco et al., 2000]. Shorter and more intense periods of precipitation are also obtained [Hertig and Jacobeit, 2008], or an absence of changes in the intensity but with changes in the annual cycle over Zaragoza [Abaurrea and Asin, 2005]. In relation with other magnitudes, for example, it is projected an increase in maximum temperature events in the Ebro Valley for the mid-21st century [Abaurrea et al., 2007]. [Murphy, 2000] compares both downscaling techniques, showing increases in temperature and decreases in precipitation from the regional model closer to the forcing global model than with statistical downscaling.
4.- Other aspects of climate modeling: decadal and long-term prediction
Recently it has started the development of medium-range climate variability predictions, also known as decadal prediction, attempting to satisfy a growing demand of climate information for the next few years. Decadal prediction explores the ability of the climate models participating in the IPCC to predict regional climate changes in a relatively near future using both available information on the initial conditions of the simulations and on the expected changes in the atmospheric composition. Decadal prediction is focused on time scales from several years up to a few decades [Smith et al., 2007], that is an extension of the long-term prediction or climate variability up to one year in the future, e.g. [Doblas-Reyes et al., 2009]. As an answer to the growing demand of this kind of information, the Coupled Model Intercomparison Experiment IPCC project (CMIP5) (http://www.clivar.org/organization/wgcm/references/Taylor_CMIP5.pdf) includes the computation of decadal predictions. Due to the vulnerability of the IP to the anthropogenic climate change, and also to the natural climate variability, it is hoped that the community will accept the challenge of analysing this new type of simulations. In particular, the downscaling over the IP is justified essentially by two reasons: on the one hand, because the remarkable ability of the GCMs to simulate temperature trends over the western Mediterranean, on the other hand, decadal predictions has shown its higher predictive capacity over the North Atlantic [Smith et al., 2007; Keenlyside et al., 2008]. Given the important systematic error of the current decadal prediction systems, which is similar to what is found in the GCMs used for long-term climate change projections, and to the fact that the decadal predictions seem to predict much better the ocean state, downscaling methods must, on the one hand, eliminate the systematic error in the predictions and, on the other, extract the maximum available information from the GCMs variables in order to obtain useful predictions for precipitation and temperature, using similar approximations to the ones used on seasonal prediction [Frias et al., 2005].

CLIVAR – Spain Regional Projections
77
5.- Conclusions
Despite the intrinsic limitations of the different regionalization methods described in this report and, therefore, the associated uncertainty levels, together with those of the projections for increase in greenhouse gases, and the scarcity of studies focused specifically on projections in the IP, there are several results with a large degree of agreement. The regional projections over the IP for the end of the 21st century obtained mainly on the basis of regional climate models show an important increase in mean seasonal temperature, being maximum in summer (with up to 6ºC for scenarios with larger emissions), and minimum in the winter (around 2-3ºC). A decrease in precipitation is also projected for the whole year, this being larger in summer than in winter. Intermediate values between both extreme changes are obtained in spring and autumn. From a more general climate perspective, the analysis of these regional projections shows a trend towards more aridity conditions for most of the IP. Although the level of uncertainty is higher, the studies indicate that an increase in the extreme events associated with precipitation can occur both related to dry spells and to intense precipitation events. A clear increase in high temperatures events (above 30ºC) is also shown during a larger number of days, particularly in the southern part of the IP.
Looking at the next IPCC report, the regional climate modeling scientific community is making a huge effort to include its studies, particularly through CORDEX programme (COordinated Regional climate Downscaling EXperiment programme, http://wcrp.ipsl.jussieu.fr/RCD_Projects/CORDEX/CORDEX.html). Among the different regions proposed on that study, the ones with special relevance to the IP will be Europe (mainly included in the ENSEMBLES project) and the Mediterranean (MED-CORDEX). Regarding the IP, the Spanish national project ESCENA (Generation of regionalized climate change scenarios in Spain using high resolution models. http://www.meteo.unican.es/es/node/72776, 2008-2011) will provide high resolution results from RCM simulations.

Climate in Spain: Past, Present and Future
78
6.- References Abaurrea, J. and Asín, J. (2005), Forecasting local daily precipitation patterns in a climate change scenario, Climate Research, 28, 183-
197. Abaurrea, J., Asín, J., Cebrián, A.C. and Centelles, A. (2007), Modeling and forecasting extreme hot events in the central Ebro valley,
a continental-Mediterranean area, Global and Planetary Change, 57, 43–58. Arribas, A., Gallardo, C., Gaertner, M.A. and Castro, M. (2003), Sensitivity of the Iberian Peninsula climate to a land degradation,
Clim. Dyn., 20, 477–489. Beniston, M., Stephenson, D.B., Christensen, O., Ferro, C., Frei, C., Goyette, S., Halsnaes, K., Holt, T., Jylha, K., Koffi, B., Palutikof,
J., Scholl, R., Semmler, T. and Woth, K. (2007), Future extreme events in European climate: An exploration of regional climate model projections,. Climatic Change, 81(S1), 71–95.
Blenkinsop, S. and Fowler, H. J. (2007), Changes in European drought characteristics projected by the PRUDENCE regional climate models,. Int. J. Climatol., 27, 1595–1610.
Boberg, F., Berg, P., Thejll, P., Gutowski, W.J. and Christensen, J.H. (2009), Improved confidence in climate change projections of precipitation evaluated using daily statistics from the PRUDENCE ensemble, Clim. Dyn., 32, 1097–1106.
Brunet, M., Casado, M., Castro, M., Galán, P., López, J., Martín, J., Pastor, A., Petisco, E., Ramos, P., Ribalaygua, J., Rodríguez, E., Sanz, I. and Torres, L. (2008), Generación de escenarios regionalizados de cambio climático para España, Technical report, Agencia Estatal de Meteorología (AEMET), Ministerio de Medio Ambiente y Medio Rural y Marino.
Buonomo, E., Jones, R., Huntingford, C. and Hannaford, J. (2007), On the robustness of changes in extreme precipitation over Europe from two high resolution climate change simulations, Q. J. R. Meteorol. Soc., 133, 65–81.
Castro, M., Gallardo, C., Jylhä, K. and Tuomenvirta, H. (2007a), The use of a climate-type classification for assessing climate change effects in Europe from an ensemble of nine regional climate models, Climatic Change, 81 (S1), 329–341.
Castro, M., Martín-Vide, J. and Alonso, S. (2007b), 1. El clima de España: pasado, presente y escenarios de clima para el siglo XXI, Technical report, Oficina Española de Cambio Climático (ECCE). Universidad de Castilla-La Mancha (UCLM).
Christensen, J.H. and Christensen, O.B. (2003), Severe summertime flooding in Europe, Nature, 421, 805–806. Christensen, J.H. and Christensen, O.B. (2007), A summary of the PRUDENCE model projections of changes in European climate
during this century, Climatic Change 81 (S1), 7–30. Christensen, J.H., Carter, T.R., Rummukainen, M. and Amanatidis, G. (2007a), Evaluating the performance and utility of regional
climate models: the PRUDENCE project, Climatic Change, 81 (S1), 1–6. Christensen, J.H., Hewitson, B., Busuioc, A., Chen, A., Gao, X., Held, I., Jones, R., Kolli, R.K., Kwon, W.-T., Laprise, R., Rueda,
V.M, Mearns, L., Menéndez, C., Räisänen, J., Rinke, A., Sarr, A. and Whetton, P. (2007b), Regional climate projections, in: Climate change 2007: The physical science basis. contribution of working group I to the Fourth Assessment Report of the Intergovernmental Panel on Climate Change. Technical report, IPCC, WMO.
Christensen, J.H., Boberg, F., Christensen, O.B. and Lucas-Picher, P. (2008), On the need for bias correction of regional climate change projections of temperature and precipitation, Geophys. Res.Lett. 35(L20709). DOI:10.1029/2008GL034949.
Cofiño, A.S., San-Martín, D., Gutiérrez, J.M: (2007), A web portal for regional projection of weather forecast using GRID middleware, Lecture Notes in Computer Science, 4489, 82–89.
Déqué, M., Jones, R.G., Wild, M., Giorgi, F., Christensen, J.H., Hassell, D.C., Vidale, P.L., Rockel, B., Jacob, D., Kjellstrom, E., Castro, M., Kucharski, F. and Van den Hurk, B. (2005), Global high resolution versus limited area model climate change projections over Europe: quantifying confidence level from PRUDENCE results, Clim. Dyn. 25, 653–670.
Déqué, M., Rowell, D., Lüthi, D., Giorgi, F., Christensen, J., Rockel, B., Jacob, D., Kjellström, E., Castro, M. and Van den Hurk, B. (2007), An intercomparison of regional climate simulations for Europe: assessing uncertainties in model projections, Climatic Change, 81 (S1), 53–70.
Doblas-Reyes, F.J., Weisheimer, A., Déqué, M., Keenlyside, N., McVean, M., Murphy, J.M., Rogel, P., Smith, D. and Palmer, T.N. (2009), Addressing model uncertainty in seasonal and annual dynamical seasonal forecasts, Q. J. Royal Met. Soc, 135, 1538-1559.
Domínguez, M., Gaertner, M.A., de Rosnay, P. and T. Losada (2010), A regional climate model simulation over West Africa: parameterization tests and analysis of land surface fields, Clim. Dyn., 35, 249-265. DOI 10.1007/s00382-010-0769-3.
Ekström, M., Hingray, B., Mezghani, A. and Jones, P.D. (2007), Regional climate model data used within the SWURVE project 2: addressing uncertainty in regional climate model data for five European case study areas, Hydrol. Earth Syst. Sci. 11, 1085–1096.
Fernández, J., Montávez, J..P., Sáenz, J., González-Rouco, J.F. and Zorita, E. (2007), Sensitivity of the MM5 mesoscale model to physical parameterizations for regional climate studies: Annual cycle, J. Geophys. Res. 112(D04101). DOI: 10.1029/2005JD006649.
Fischer, E.M., Seneviratne, S.I., Lüthi, D. and Schär, C. (2007), Contribution of land-atmosphere coupling to European summer heat waves, Geophys. Res. Lett. 34(L06707). DOI:10.1029/2006GL029068.
Frei, C., Schöll, R., Fukutome, S., Schmidlli, J. and Vidale, P.L. (2006), Future change of precipitation extremes in Europe: Intercomparison of scenarios from regional climate models, J. Geophys. Res. 111(D06105). DOI: 10.1029/2005JD005965.
Frías, M.D., Zorita, E.,. Fernández, J. and Rodríguez-Puebla, C. (2006), Testing statistical downscaling methods in simulated climates, Geophys. Res. Lett., 33:L19807
Frías, M.D., Fernández, J., Saenz, J. and Rodríguez-Puebla, C. (2005), Operational predictability of monthly average maximum temperature over the Iberian Peninsula using DEMETER simulations and downscaling, Tellus A, 57, 448-463, doi:10.1111/j.1600-0870.2005.00105.x.
Gaertner, M., Christensen, O., Prego, J., Polcher, J., Gallardo, C. and Castro, M. (2001), The impact of deforestation on the hydrological cycle in the western Mediterranean: an ensemble study with two regional climate models, Clim. Dyn. 17, 857–873.
Gaertner, M.A., Jacob, D., Gil, V., Domínguez, M., Padorno, E., Sánchez, E. and Castro, M. (2007), Tropical cyclones over the Mediterranean Sea in climate change simulations, Geophys. Res. Lett. 34(L14711). DOI: 10.1029/2007GL029977.
Gallardo, C., Arribas, A., Prego, J., Gaertner, M.A. and Castro, M. (2001), Multi-year simulations using a regional climate model over the Iberian Peninsula: current climate and 2xCO2 scenario, Q. J. R. Meteorol. Soc. 126, 1659–1682.

CLIVAR – Spain Regional Projections
79
Gao, X., Pal, J.S. and Giorgi, F. (2006), Projected changes in mean and extreme precipitation over the Mediterranean region from a high resolution double nested RCM simulation, Geophys. Res. Lett. 33(L03706). DOI: 10.1029/2005GL024954.
Gibelin, A.L. and Déquém N, (2003), Anthropogenic climate change over the Mediterranean region simulated by a global variable resolution model, Clim. Dyn., 20, 327–339.
Giorgi, F., Bi, X. and Pal, J. (2004), Mean, interannual variability and trends in a regional climate change experiment over Europe: II. climate change scenario (2071-2100), Clim. Dyn., 23, 839–858.
Giorgi, F. and Lionello, P. (2008), Climate change projections for the Mediterranean region, Global. Planet. Change, 63, 90–104. Giorgi, F. and Mearns, L.O. (1999), Regional climate modeling revisited. an introduction to the special issue, J. Geophys. Res., 104,
6335–6352. González-Rouco, J.F., Heyen, H., Zorita, E. and Valero, F. (2000), Agreement between observed rainfall trends and climate change
simulations in the South-west of Europe, J. Climate, 13, 3057–3065 Goodess, C.M. and Palutikof , J.P. (1998), Development of daily rainfall scenarios for South-east Spain using a circulation-type
approach to downscaling, Int. J. Climatol., 10, 1051–1083 Goodess, C.M., Anagnostopoulo, C., Bardossy, A., Frei, C., Harpham, C., Haylock, M.R., Hundecha, Y., Maheras, P., Ribalaygua, J.,
Schmidli, J., Schmith, T., Tolika, K., Tomozeiu, R. and Wilby, R.L. (2008), An intercomparison of statistical downscaling methods for Europe and European regions - assessing their performance with respect to extreme temperature and precipitation events, Climatic Change (in press).
Gutiérrez, J.M., Cofiño, A.S., Ancell, R., Rodríguez, M.A. (2004), Clustering Methods for Statistical Downscaling in Short-Range Weather Forecast, Mon. Wea. Rev.,132, 2169–2183.
Haylock, M.R., Hofstra, N., Klein Tank, A.M.G., Klok, E.J., Jones, P.D. and New, M. (2008), A European daily high-resolution gridded data set of surface temperature and precipitation for 1950-2006. J. Geophys. Res., 113, D20119, doi: 10.1029/2008JD010201.
Herrera S., J. M. Gutiérrez, R. Ancell, M. R. Pons, M. D. Frías & J. Fernández (2010) Development and Analysis of a 50 year high-resolution daily gridded precipitation dataset over Spain (Spain02). International Journal of Climatology. DOI: 10.1002/joc.2256. In press.
Hertig, E. and Jacobeit, J. (2008), Assessments of Mediterranean precipitation changes for the 21st century using statistical downscaling techniques, Int. J. Climatol., 28, 1025–1045
Hewitt, C. (2005),The ENSEMBLES project: Providing ensemble-based predictions of climate changes and their impacts. EGGS newsletter, 13, 22–25.
Hingray, B., Mezghani, A. and Buishand, T.A. (2007), Development of probability distributions for regional climate change from uncertain global mean warming and an uncertain scaling relationship, Hydrol. Earth Syst. Sci. 11, 1097–1114.
Hoinka, K.P., Gaertner, M.A. and Castro, M. (2007), The Iberian thermal lows in a changed climate, Q. J. R. Meteorol. Soc. 133, 1113–1126.
Hofstra, N., New, M. and McSweeney, C. (2010). The influence of interpolation and station network density on the distribution and trends of climate variables in gridded daily data. Climate Dynamics. 35:841-858. DOI 10.1007/s00382-009-0698-1.
Jacob, D., Barring, L., Christensen, O., Christensen, J., de Castro, M., Deque, M., Giorgi, F., Hagemann, S., Hirschi, M., Jones, R., Kjellström, E., Lenderink, G., Rockel, B., Sánchez, E., Schär, C., Seneviratne, S., Somot, S., Ulden, A.V. and Von den Hurk, B. (2007)., An intercomparison of regional climate models for Europe: model performance in present-day climate, Climatic Change 81 (S1), 31–52.
Keenlyside N.S, Latif, M., Jungclaus, J., Kornblueh, L., and Roeckner, E. (2008), Advancing decennial-scale climate prediction in the North Atlantic sector. Nature, 453, 84–88, doi:10.1038/nature06921.
Lenderink, G., Ulden, A.V., Von den Hurk, B. and Meijgaard, E.V. (2007), Summertime inter-annual temperature variability in an ensemble of regional model simulations: analysis of the surface energy budget, Climatic Change 81 (S1), 233–247.
López-Moreno, J.I., Goyette, S. and Beniston, M. (2008a), Climate change prediction over complex areas: spatial variability of uncertainties and predictions over the Pyrenees from a set of regional climate models, Int. J. Climatol. 28, 1535–1550.
López-Moreno, J.I., Goyette, S., Beniston, M. and Alvera, B. (2008b), Sensitivity of the snow energy balance to climatic changes: prediction of snowpack in the Pyrenees in the 21st century. Clim. Res. 36, 203–217.
López-Moreno, J.I. and Beniston, M. (2009). Daily precipitation intensity projected for the 21st century: seasonal changes over the Pyrenees, Theor. Appl. Climatol. 95, 375–384.
Machenhauer, B., Windelband, M., Botzet, M., Christensen, J.H., Déqué, M., Jones, R.G., Ruti, P.M. and Visconti, G. (1998), Validation and analysis of regional present-day climate and climate change simulations over Europe, Technical Report 275, Max-Planck Institut für Meteorologie.
Martín-Vide, J. (2004), Spatial distribution of a daily precipitation concentration index in Peninsular Spain, Int. J. Climatol., 24, 959–971.
Míguez-Macho, G., Stenchikov, G.L. and Robock, A. (2004), Spectral nudging to eliminate the effects of domain position and geometry in regional climate model simulation, J. Geophys. Res., 109, D13104, doi:10.1029/2003JD004495
Míguez-Macho, G., Stenchikov, G. and Robock, A. (2005), Regional Climate Simulations over North America: Interaction of Local Processes with Improved Large-Scale Flow, J. Climate, 18, 1227–1246.
Murphy, J. (2000), Predictions of climate change over Europe using statistical and dynamical downscaling techniques, Int. J. Climatol. 20, 489–501.
New, M., Hulme, M. and Jones, P. (1999), Representing twentieth-century space-time climate variability. Part I: Development of a 1961-90 mean monthly terrestrial climatology, J. Climate, 12, 829–856.
Nakicenovic, N. and Swart, R. (Eds.) (2000), Emissions Scenarios. A special report of Working Group III of the Intergovernmental Panel on Climate Change, Cambridge University Press.
Pope, V., Gallani, M., Rowntree, P. and Statton, R. (2000), The impact of new physical parameterizations in the Hadley Centre climate model: HadAM3, Clim. Dyn. 16, 123–146.

Climate in Spain: Past, Present and Future
80
Räisänen, J., Hansson, U., Ullerstig, A., Döscher, R., Graham, L., Jones, C., Meier, H., Samuelson, P. and Willen, U. (2004), European climate in the late twenty-first century: regional simulations with two driving global models and two forcing scenarios, Clim. Dyn. 22, 13–31.
Rodríguez-Fonseca, B., Sánchez, E. and Arribas, A. (2005), Winter climate variability changes over Europe and the Mediterranean region under increased greenhouse conditions, Geophys. Res. Lett. 32. DOI: 10.1029/2005GL022800.
Rodríguez-Puebla, C., Encinas, A.H., Nieto, S. and Garmendia, J. (1998), Spatial and temporal patterns of annual precipitation variability over the Iberian Peninsula, Int. J. Climatol., 18, 299–316.
Romero, R., Ramis, C and Guijarro, J.A. (1999), Daily rainfall patterns in the Spanish Mediterranean area: an objective classification, Int. J.Climatol., 19, 95–112.
Rowell, D.P. (2005), A scenario of European climate change for the late twenty-first century: seasonal means and interannual variability, Clim. Dyn., 25, 837–849.
Sánchez, E., Gallardo, C., Gaertner, M.A., Arribas, A. and Castro, M. (2004), Future climate extreme events in the Mediterranean simulated by a regional climate model: a first approach, Global. Planet. Change 44, 163–180.
Sánchez, E., Yagüe, C. and Gaertner, M.A. (2007a), Planetary boundary layer energetics simulated from a regional climate model over Europe for present climate and climate change conditions, Geophys. Res. Lett., 34. DOI: 10.1029/2006GL028340.
Sánchez, E., Yagüe, C. and Gaertner, M.A. (2007b), Turbulent kinetic energy climatology for present and future climate conditions over the Iberian Peninsula as obtained from a TKE closure scheme in a regional climate model, Física de la Tierra 19, 163–173. ISSN: 0214-4557.
Sánchez, E., Gaertner, M.A., Gallardo, C., Padorno, E., Arribas, A. and Castro, M. (2007c), Impacts of a change in vegetation description on simulated European summer present-day and future climates, Clim. Dyn., 29, 319–332.
Sánchez, E., Romera, R., Gaertner, M.A., Gallardo, C. and Castro, M. (2009a), A weighting proposal for an ensemble of regional climate models over Europe driven by 1961-2000 ERA40 based on monthly precipitation probability density functions, Atmos. Sci. Lett. 10, 241–248 pp.
Sánchez, E., Gaertner, M.A. and Gallardo, C. (2009b), Dynamical downscaling of daily precipitation over the Iberian Peninsula: a spatial resolution analysis for present and future climate conditions, Física de la Tierra, 21. ISSN: 0214-4557, pp. 207–218
San-Martín, D., Sordo, C., Herrera, S. and Gutiérrez, J.M. (2009), ENSEMBLES Deliverable 2B.27: Assessment of the robustness of statistical downscaling techniques using GCM and RCM output. http://ensembles-eu.metoffice.com/deliverables.html
Schär, C., Lüthi, D., Beyerle, U. and Heise, E. (1999), The soil-precipitation feedback: a process study with a regional climate model, J. Climate 12, 722–741.
Seneviratne, S.I., Lüthi, D., Litschi, M. and Schär, C. (2006), Land-atmosphere coupling and climate change in Europe, Nature 443, 205–209.
Serrano, A., García, J.A., Mateos, V.L., Cancillo, M.L. and Garrido, J. (1999), Monthly Modes of Variation of Precipitation over the Iberian Peninsula, J.Climate, 12, 2894–2919
Smith, D.M. and Murphy, J.M. (2007), An objective ocean temperature and salinity analysis using covariances from a global climate model, J. Geophys. Res., 112, C02022, doi:10.1029/2005JC003172.
Smith, D.M, Cusack, S., Colman, A.W., Folland, C.K., Harris, G.R., Murphy, J.M. (2007), Improved surface temperature prediction for the coming decade from a global climate model, Science, 317, 796–799, doi:10.1126/science.1139540
Somot, S., Sevault, F., Déqué, M. and Crépon, M. (2008), 21st century climate change scenario for the Mediterranean using a coupled atmosphere-ocean regional climate model, Global. Planet. Change 63, 112–126.
Sumner, G.N., Romero, R., Homar, V., Ramis, C., Alonso, S. and Zorita, E. (2003), An estimate of the effects of climate change on the rainfall of the Mediterranean Spain by the late twenty-first century, Clim. Dyn. 20, 789–805.
Tapiador, F.J. and Sánchez, E. (2008), Changes in the European precipitation climatologies as derived by an ensemble of regional models, J. Climate 21, 2540–2557.
Trigo, R.M. and Palutikof, J.P. (2001), Precipitation scenarios over Iberia: A comparison between direct GCM output and different downscaling techniques, J. Climate 14, 4422–4446.
Vidale, P.L., Lüthi, D., Frei, C., Seneviratne, S. and Schär, C. (2003), Predictability and uncertainty in a regional climate model, J. Geophys. Res. 108, 10.1029/2002JD002810
Von Storch, H., Zorita, E. and Cubasch, U. (1993), Downscaling of climate change estimates to regional scales: An application to Iberian winter rainfall in winter time, J. Climate, 6, 1161–1171.
Von Storch, H., Langenberg, H. and Feser, F. (2000), A spectral nudging technique for dynamical downscaling purposes, Mon. Wea. Rev., 128, 3664–3673.
Zorita, E. and Von Storch, H. (1999), The analog method as a simple statistical downscaling technique: comparison with more complicated methods, J. Climate, 12, 2474–2489.

CLIVAR - Spain
81
APPENDIX I: The Little Ice Age (LIA) and the Medieval Warm Period (MWP).
Medieval Warm Period (MWP).
The Medieval Warm Period, also know as the Medieval Climate Anomaly or the Medieval Climate Optimum, covers the period between the years 550 and 1300 of our era. This period is characterised by the predominance of a relatively warm climate in northern Europe, which for example, made possible wine production in the centre and north of Europe and enabled Greenland and other northern lands to be colonised by the Vikings. However, this period is not only characterised by a change in temperatures but other modifications in the climate were also significant. For example, in the south of Europe, including the Iberian Peninsula (IP), and in other regions of America and Asia, climate conditions were significantly more arid than in previous or subsequent periods, whereas the temperature response was not as clear. With the available data, the Medieval Climate Anomaly seems to be asynchronous in nature, that is to say, the onset and the response to this event does not take place at the same time in all regions of the globe. This hampers research and comparison between regions of the planet, but it is likely a reflection of the climate complexity of this period and the need of better chronological models.
Little Ice Age (LIA)
The Little Ice Age covers the period from 1300 to 1850 AD, although there is not a total consensus on the onset and termination and some authors suggest that they vary according to local conditions. It was a relatively cold period that occurred after the Medieval Climate Anomaly, with at least three periods of maximum cooling centred around of the years 1650, 1770 and 1850. These periods seem to be associated with minimums in solar activity, coinciding with the least number of solar spots (Maunder, Spörer and Dalton minima). However, other factors may have influenced the dynamics of the Little Ice Age, as some of the cooling periods also coincide with some of the most important volcanic eruptions in history, which might have considerably decreased sunlight for several months (e.g. the eruption of Tambora volcano in Indonesia in 1815). The cooling is particularly documented on the European continent and in North America with clear advances of the glaciers, while other areas of the planet seem to respond to the Little Ice Age with an increase in humidity, as has been detected in tropical regions of Africa and South America. In the IP the LIA has a complex structure with evidence of colder temperatures, higher frequency of climate extremes, significant increase in Pyrenean glaciers extent and river flooding and some periods of greater water availability.

Climate in Spain: Past, present and future
82
APPENDIX II: The North Atlantic Oscillation (NAO). The North Atlantic Oscillation (NAO) is the dominant mode of winter climate variability in the North
Atlantic ranging from North America to Europe. The NAO is a large scale seesaw in the displacement of the masses of atmospheric air in the corridor situated between the subtropical gyre, the Azores’ anticyclone, and the polar low, situated near Iceland. The index varies from year to year, but also displays a tendency to remain in a phase for intervals that last for several years. The positive phase of the NAO is characterised by stronger pressure than normal in the Azores’ Anticyclone area and lower pressure than normal in the Islandic low. The increase in the pressure gradient creates stronger storms and situates the corridor at positions further north than usual. This creates wetter and warmer winters in Northern Europe and colder and dryer winters in Canada and Greenland. In the Iberian Peninsula, on the other hand, the winds veer from the north generating cold, dry winters. During the negative phases of the NAO the pattern reverses, the Azores’ Anticyclone and the Icelandic low weakening, the corridor that the storms pass through moving southwards, which brings wetter and milder winters in the Iberian Peninsula.
-6
-4
-2
0
2
4
6
1900 1910 1920 1930 1940 1950 1960 1970 1980 1990 2000
Indi
ce N
AO
Año
Upper panels: Negative and positive phases of the NAO. Lower panel: Evolution of the NAO index in the 20th century. http://www.ldeo.columbia.edu/res/pi/NAO/
There are diverse NAO indices. One of the first definitions of the NAO was due to Hurrel (1995, http://www.cgd.ucar.edu/cas/jhurrell/nao.stat.winter.html), who evaluates this oscillation on the basis of the standard monthly difference (dividing the value by the typical deviation of the whole series) between the atmospheric pressures at sea level between the Azores and Iceland (Punta Delgada / Lisbon and Stykkisholmur / Reykjavik). This index shows a certain decadal periodicity and it can be observed that the index drawn up with the average for the winter months (winter NAO: December – March mean) relates with annual hydroclimatic variability as regards wind, precipitation and temperature over Western Europe and North America.

CLIVAR - Spain
83
APPENDIX III: EMISSIONS SCENARIOS
In the Special Report on Emissions Scenarios, SRES (IPCC, 2000), a team of experts developed four plausible hypotheses about the demographic and economic development conditions of humanity will be in the near future to estimate global emissions of CO2 in the 21st century. Roughly speaking, the four alternatives are as follows:
A1: A future with very fast economic growth, slow increase in the population and quick new and more efficient technologies introduction. Economic convergence between the different regions of the globe, with social and cultural increase in the interactions and a substantial reduction in regional per-capita income differences. This family of A1 scenarios is subdivided into three groups depending on different directions of technological change in the energy production system: A1FI (intensive use of fossil fuels), A1T (use of non-fossil sources of energy) and A1B (balance between different sources of energy usage).
A2: A very heterogeneous world, with the preservation of local identities and peculiarities. Fertility patterns converge very slowly between the different regions and a still rapid growth in the global scale population. Economic growth takes place on regional scales and the increase in per-capita income and the technological change is more fragmented and slower than in other scenarios.
B1: A converging world with the same slow population growth on the line of A1 scenarios, but with fast changes in economic structures towards an information- and services-based economy, with the introduction of clean technologies. There are global solutions for economic and social environmental sustainability, with a decrease in inequalities, but without additional climate initiatives.
B2: A world in which local solutions for environmental, economic and social sustainability are emphasized. Moderate population growth, intermediate levels of economic development and slower and more diverse technological change than in lines B1 and A1. This scenario is also oriented towards environmental protection and the elimination of social inequalities, but with more focus at local and regional levels.
These hypotheses or development patterns are translated into emissions scenarios, that is, the amount of greenhouse gases that are going to be added to the atmosphere is quantified in each of them, using mathematical models developed on the basis of the previous known history. In particular, six models from different research groups from all over the world were used to develop the four families of general scenarios into 40 emissions scenarios. These can be grouped into six pattern scenarios, three characterising each of the families A2, B1, B2 together with another three for family A1 (A1FI, A1B, A1T), which are sufficient to represent the variability associated with the 40 original scenarios, many of which result in similar emissions patterns despite coming from different human development hypotheses.
The Special Report on Emissions Scenarios (SRES) does not assign a priori occurrence probabilities to the different scenarios; however, due to the impossibility to contemplate all of them, general circulation atmosphere model studies choose among the six representative scenarios mentioned above. A frequently repeated scenario is A1B, belonging to the A1 family of scenarios. Global CO2 emissions in this scenario increase rapidly in the first half of the 21st century to reach a maximum in around 2050 after which they decrease. The total quantity of emissions of greenhouse gases for A1B scenario stands at an intermediate level among the other scenarios, as is reflected in Fig. 1. Another scenario with an intermediate level of emissions is B2, while A2 and A1FI on the one hand and B1 and A1T on the other would represent respectively the maximum and the minimum of the range of plausible emissions hypotheses.