
Do Well Do Good - Register of AIs & LROs
151
Do Well Do Good Creating Sustainable Value for our Shareholders, Customers, Employees, Community and our Environment Annual Report 2019
-
Upload
khangminh22 -
Category
Documents
-
view
1 -
download
0
Transcript of Do Well Do Good - Register of AIs & LROs

Oversea-C
hinese Banking Corp
oration Limited
A
nnual Report 2019
Do Well Do GoodCreating Sustainable Value for our Shareholders, Customers, Employees, Community and our Environment
Annual Report 2019

Do Well Do GoodWhat is featured on the cover this year are fruits of the Dipterocarp Condorensis tree. Wings on the fruit help to spread the seeds further away from the parent tree to ensure its survival.
These endangered trees are the ‘green lungs’ of Asia and are super-storers of carbon dioxide – which is known as the biggest climate changer.
We have planted a forest of 2,000 Dipterocarps at the OCBC Arboretum located at the Singapore Botanic Gardens. This conservation project is an important component of OCBC’s commitment to fighting climate change in a world where carbon emissions are the biggest threat to mankind. These trees will store as much as 80 million kg of CO2 in their lifetimes. The ground-breaking research done at the OCBC Arboretum will contribute to forestation projects in the future and further CO2 storage.
As a bank, we have been at the forefront of various efforts that support the environment. Our engagement includes increasing support for renewable energy projects and funding ground-up climate change solutions as we move towards a low-carbon economy. Please refer to pages 30, 48 and 54 for details of the work we have done.
The impact of climate change will be far-reaching and we must all do our part for the planet we live in.
Tomorrow’s ours to save.
ContentsGroup Overview Message from Chairman and CEO 2Strong Focus on Executing Our Corporate
Strategy to Create Sustainable Value10
Board of Directors 12Management Committee 16
Our Year in ReviewAsk Sam – CEO’s Q&A 18Ask Darren – CFO’s Q&A
Financial Highlights Creating Investor Value
24
Ask Vincent – CRO’s Q&A 28Caring for Our Community and
the Environment30
Ask Wei Hong – Global Wealth Management andConsumer Banking
38
Ask Kun Kin – Global Treasury 42Ask Linus – Group Commercial Banking 44Ask Elaine – Group Corporate Banking 48Ask Jason – Group Human Resources 50
Sustainability Report 2019 54
GovernanceCorporate Governance 84Additional Information Required under
SGX-ST Listing Manual102
Capital Management 103Risk Management 105Pillar 3 Disclosures 117
FinancialsFinancial Report 121
Management Discussion and AnalysisFinancial StatementsGroup’s Major Properties
Shareholding Statistics 280Five-Year Ordinary Share Capital History 282
Additional InformationGRI Standards Content Index 283Further Information on Management
Committee288
International Network 292Financial Calendar 294
Corporate Profile andCorporate Information
Inside Back Cover

“Do Well and Do Good” – this succinctly encapsulates our values of doing well to deliver consistent and sustainable business performance and doing good by employing fair and socially-responsible business practices.
DOING WELL FOR THE LONG TERM
Dear Shareholders,
The Board places utmost importance on its stewardship role as the guardian of the interests of OCBC’s stakeholders. OCBC has continued to deliver long-term shareholder value through our diversified franchise and business model, solid balance sheet, strong risk culture and ethical business practices. In 2019, the Board and Management maintained a sharp focus on the fast-evolving risk profile arising from the deterioration in the global macro environment and trade
Delivering Strong Results 2019 was a challenging year. Global economic growth slowed as we entered 2019. It was weighed down further during the course of the year by the escalating trade conflict between the United States and China, disputes between the United States and its trading partners in Europe, the uncertain outcome of Britain’s exit from the European Union, social unrest in Hong Kong and instability in the Middle East. The re-ordering of the well-established international trading system and disruption to the global supply chain led to a sharp slowdown in trade, erosion of consumer confidence and postponement of investment. The result was growth of global GDP of 2.9% and global trade of 1.2%, the slowest recorded in a decade. The rapid weakening of global economic conditions prompted the US Federal Reserve to pivot towards monetary accommodation with three successive reductions in interest rates in the second half of 2019. Many Asian central banks
war between the United States and China. The heightened geopolitical tension between the United States and China, and the challenges posed by the retreat of the multilateral rules-based institutional agreements which had successfully governed global trade, finance and economic engagements over the past decades, will significantly alter the operating environment for businesses and financial institutions in the years ahead. The rapidly-changing financial landscape, advances in the application of digital technology and the attendant cyber security risks, together with the entry of global e-commerce platform and Fintech companies offering financial services,
require us to strengthen our fundamentals and resiliency. Yet these developments also mean that we must be highly adaptable and responsive to the new demands and competition. They also underpin the need for us to continuously lay stronger strategic foundations for OCBC, anchored on financial strength, ethical business practices, robust risk management, a broad spectrum of product offerings and a talented workforce. The Board’s agenda during the year was thus deeply focused on fortifying, deepening and growing our diversified franchise while ensuring we have the flexibility and capacity to capture new business opportunities as they arise.
followed suit. Global equities responded positively to the interest rate cuts and delivered stellar performances in the second half of the year. The banking sector, however, was negatively impacted by the narrowing interest margins, and the weaker operating environment added further pressure on loan growth and asset quality.
Despite the challenging environment, OCBC maintained its solid track record of delivering sustainable earnings through economic cycles. Our diversified franchise across businesses and geographies, deep presence in our core Asian markets which is linked globally to our highly-connected network of international branches, and sound strategic positioning have allowed us to deliver another consecutive year of record earnings.
For 2019, the Group’s net profit rose 8% to a record S$4.87 billion, driven by robust performances across our banking, wealth
management and insurance businesses. We further strengthened our capital, funding and liquidity base and enhanced our prudent risk management practices. The loan portfolio quality remained sound and non-performing assets were lower year-on-year. We accelerated our digital transformation journey to enhance customer engagement and achieve greater operational efficiency, and augmented our system of robust defences and controls to address cyber security threats. Further investments were made to upskill and reskill our talented employees to be future-ready. We deepened our culture of ethical conduct and refreshed OCBC’s corporate core values to firmly emphasise the importance of honesty and integrity in the conduct of our business. These achievements underpinned our resiliency and reinforced the strong foundation we have laid – the critical building blocks for our long-term sustainability.
(1) Excluding a one-time item.
In 2019, OCBC reported another year of record net profit and we are pleased to reward shareholders with a higher dividend of 53 cents per share.
Customer Loans(S$ billion)
3% 2019
2652018
258
Customer Deposits(S$ billion)
3% 2019
3032018
295
Non-Performing Loans Ratio(%)
Common Equity Tier 1 Capital Adequacy Ratio(%)
0.9 2019
14.92018
14.0
percentage points0.04
2019
1.452018
1.49
percentage points
Core Net Profit (1)
(S$ billion)
10% 2019
4.962018
4.49
Core Return on Equity (1)
(%)
0.1 2019
11.42018
11.5
Core Earnings Per Share (1)(S$)
8% 2019
1.142018
1.06
Dividend Per Share(cents)
23% 2019
532018
43
percentage points
From left
Mr Samuel N. Tsien Group Chief Executive Officer
Mr Ooi Sang Kuang Chairman
Message from Chairman and CEO2 OCBC Annual Report 2019 3Group Overview

Chairman Ooi Sang Kuang (second from right) accepted the Best Managed Board (Gold) award from Deputy Prime Minister and Finance Minister Heng Swee Keat.
Sustainable and Progressive Returns to ShareholdersOur capital position strengthened further with the Common Equity Tier 1 capital adequacy ratio rising to 14.9% at year end, providing a comfortable buffer to insulate us against cyclical economic downturns, while also positioning the Group to leverage on market opportunities. We achieved a core return on equity of 11.4% for the year and core earnings per share were 8% higher at S$1.14. These healthy fundamentals have allowed us to return higher dividends to our shareholders, which are sustainable and progressive, and consistent with our long-term growth. The Board is pleased to recommend, subject to shareholders’ approval at the 2020 Annual General Meeting, a final tax-exempt dividend of 28 cents per share. This will bring the total dividend for 2019 to 53 cents per share, a 23% rise from 43 cents in 2018, and translates into a higher dividend payout ratio of 47% against 2019’s core earnings as compared to 40% a year ago.
Upholding Ethical and Professional ConductThe Board is committed to achieving the highest standards of ethical and professional conduct, and we recognise
allow us to deliver on our Brand Promise, pledging to be ‘Simply Spot On’ for our customers, which entails listening to them, truly understanding them, and introducing the most appropriate solutions to meet their needs. To uphold our Brand Promise, we nurture our employees to consistently conduct themselves according to the highest standards of ethics and integrity throughout the course of their work. The fact that we received the most number of customer service excellence awards in the industry in 2019 testifies to how deeply our values are practised in our day-to-day interaction with customers.
the importance of setting the tone from the top to shape the culture of the Group.
In 2019, we established a Board Ethics and Conduct Committee to provide direct oversight of policies and guidelines that inculcate a deep-seated culture of responsible banking and fair dealing, which are the cornerstones of the OCBC brand. This is of particular importance today, at a time when banks must live up to the expectations of society that we responsibly apply the highest levels of ethical practices in the daily conduct of business. We believe a strong performance culture should be closely aligned to the Group’s values as they form the basis of trust and sustainable long-term customer relationships.
During the year, we refreshed our corporate core values, dubbed “LIFRR”, which stand for Lasting Value, Integrity, Forward-Looking, Respect and Responsibility. These values clearly articulate how we must take responsibility for our work, respect our stakeholders, honour our promises to them and always act in their best interests. At the same time, we must also be forward looking in how we provide value-added solutions and advice to our customers. Our corporate core values
A Digitally-Empowered Bank We are a digitally-empowered bank, focused on redefining the banking experience for our customers and driving bank-wide transformation. The operating environment is rapidly advancing towards a knowledge-driven and highly-connected society led by digital innovations and applications. Digital technology and its creative applications have spread across all facets of social and economic activities, and they redefine how people interact, change the way businesses are conducted and remodel the manner entire industries are organised. The liberalisation of the banking sector and competition from a broader spectrum of new digital and
Best Managed Bank in Singaporeawarded by The Asian Banker
Best Bank in Asia Pacificawarded by Global Finance
Best Managed Board (Gold)awarded by Singapore Corporate Awards
World’s Best Consumer Bankawarded by Global Finance
Best Bank for SMEs in Singapore and Indonesiaawarded by Asiamoney(OCBC Bank and OCBC NISP)
ASEAN SME Bank of the Yearawarded by Asian Banking & Finance
SME Bank of the Year in Indonesiaawarded by Asian Banking & Finance (OCBC NISP)
Service Excellence Champion Awardfor three consecutive yearsawarded by Association of Banks in Singapore (ABS)
Highest Number of Excellent Service Awards (EXSA) winners and EXSA Star Award winnersacross all financial institutions in Singaporeawarded by ABS
Message from Chairman and CEO
4 OCBC Annual Report 2019 5Group Overview

virtual service providers will dramatically reshape the whole financial landscape. At OCBC, we recognise the importance of strengthening our digital foundation to ensure long-term sustainability and growth of our banking franchise in the face of fast and intense change brought about by digital competitors and technological applications in finance. We continuously innovate our business model to productively engage our customers as a reliable and trusted partner. We use digital technology to drive sustainable growth and enhance risk management and compliance systems across the organisation. Our employees play a vital role in our digital transformation. Thus, we have rolled out programmes to constantly reskill and upskill our employees to be digitally savvy and versatile to assume new roles.
Digital Innovation to Maximise Customer ExperienceThis year saw sustained momentum from our digitalisation initiatives across the entire organisation to provide customers with innovative and seamless solutions to assist them to achieve their financial goals across all stages of their life journey with us. We launched a wide spectrum of digitally-enabled products for our retail and corporate customers with many first-in-markets. Today, close to 8 in 10 of our digital Consumer customers bank on their mobile devices and nearly two-thirds of our SME and Corporate customers perform their transactions on our digital platform; overall, more than 90% of our
total volume of financial transactions in Singapore were performed digitally. Our dedication to always putting the customer first has been recognised with many awards accorded to us, including World’s Best Consumer Bank by Global Finance.
Digital Transformation for Greater Efficiency and ProductivityThe success of our digital transformation comes from our efforts to enhance our digital capabilities across the whole organisation. We built data science and data lake platforms, and deployed solutions supported by Artificial Intelligence (AI) across our wealth advisory, risk management, cyber security and compliance units. Our core technology architecture has also been redefined, led by a shift from a monolithic infrastructure to a more nimble microservices platform. We employed Robotic Process Automation to raise productivity across functions, increased the number of Cloud applications across the Group and collaborated with more than 30 major API partners. The Open Vault at OCBC (our Fintech unit) and AI Lab continue to drive our digital journey and serve as launchpads for our innovative solutions.
Maximising the Potential of Our EmployeesTalent management is an agenda deeply embraced by the Board and Management. Our philosophy is that employees must be given every opportunity to develop and realise their full potential. Our goal towards a customer-centric, innovative
and digital organisation can only succeed if it is driven by a highly-engaged, empowered and diverse workforce. We continued to invest in our learning ecosystem that encourages lifelong learning and being future ready in the new digital age. We are pleased that our efforts and commitment to be an employer of choice have been constantly recognised through the many industry awards conferred on us.
DOING GOOD FOR A SUSTAINABLE FUTURE
The financial system is the lynchpin of the real economy and society. As a responsible financial institution, we act as a catalyst to influence change. We attach great importance to contributing towards a more sustainable future for our community. We made great strides in progressing our sustainability agenda in 2019, ensuring that sustainable and responsible practices are embedded deeply and widely into the core of our business and practices.
Responsible Financing As a financial institution, we are in an advantageous position to positively influence our customers. We thus design our business practices to achieve positive outcomes for society and the environment. We support the UN’s Sustainable Development Goals, and ensured that sustainable business practices are embedded across all our
operations. We continued to make good progress in addressing the environmental challenges facing the planet and the increasingly urgent agenda of climate change. We have rolled out numerous initiatives to ensure sound Environmental, Social and Governance (ESG) practices are in place. OCBC was the first bank in Southeast Asia to announce that it would stop financing new coal-fired power plants, and redirect our focus on financing the development of renewable energy projects. By the end of 2019, our sustainable finance assets totalled more than S$8 billion, with close to S$4 billion in 2019 alone, including clean and renewable energy projects using solar and wind. These bring us very close to achieving – and likely exceeding – our declared intention to build a sustainable finance portfolio of S$10 billion by 2022. Our efforts in pioneering innovative solutions to support our customers’ sustainability journeys have seen OCBC top the sustainable finance league tables in our key markets.
Our Sustainability Report on page 54 of this Annual Report provides a comprehensive overview of OCBC’s sustainability agenda and actions.
Caring for Our Community The #OCBCCares Programme demonstrates our commitment to the community and the environment. We supported the less fortunate, provided financial assistance for families in need and rolled out financial literacy classes to help raise their level of financial knowledge and awareness. As part of our climate action initiatives, we opened the OCBC Arboretum in the Singapore Botanic Gardens. The OCBC Arboretum will grow and conserve highly-endangered dipterocarp trees, which are excellent for absorbing and storing carbon dioxide throughout their lifetimes. Research at the OCBC Arboretum could help re-forestation efforts and contribute to nature-based climate solutions.
Honorary Mention Award for the Best Transformation Project under 90 Daysawarded by Global OPEX Awards
Best Digital Banking Initiative – Instant Approval and Use of Banking Productsawarded by The Digital Banker’s Global Retail Banking Innovation Awards 2019
Best Internet Banking Initiativeawarded by The Digital Banker’s Global Retail Banking Innovation Awards 2019
Best Self Service Banking and ATM Innovation– Smart ATMs and Service Kiosksawarded by The Digital Banker’s Global Retail Banking Innovation Awards 2019
Digitally Powered
33% growth
in mobile transactions in the last year 9 in 10new SME business accounts are opened digitally
7x growth
in financial transactions performed digitally compared to 7 years ago
1st
in Singapore to enable cash withdrawals using QR codes at ATMs
Launched
MyWellnessa digital one-stop benefits app to empower employees to create their own wellness journey
>7,000learning and development programmes
>23,000 employees
worldwide completed digital and fintech skills learning programmes
Best Employer in Singapore and Malaysiaawarded by Kincentric Best Employers Awards (OCBC Bank)
Employer of Choice Awardawarded by Job Market (OCBC Wing Hang Bank)
Best Practice Award on People Developmentawarded by Universal Ideas (OCBC Wing Hang China)
Message from Chairman and CEO
6 OCBC Annual Report 2019 7Group Overview

Ooi Sang Kuang Samuel N. TsienChairman Group Chief Executive Officer
10 March 2020
Comprehensive Covid-19 SupportAs a key pillar of our society, OCBC has the responsibility to help our employees, customers and communities overcome the challenges posed by the Covid-19 outbreak.
Our foremost priority has been to safeguard the health and safety of our employees and ensure business continuity. We engaged and provided customised financial assistance to customers whose operations are impacted by Covid-19. These relief solutions do not have a programme cap. Our insurance subsidiary, Great Eastern Holdings, also rolled out support packages for its policyholders and their families. In addition, we have introduced initiatives to support the community and healthcare workers through various channels, including financial assistance and donations, and will continue to render help throughout this challenging period.
THE WAY FORWARD
2020 began on a hopeful note following the phase 1 agreement between the United States and China, an important step forward in the journey to resolve the trade conflict. This positive development was however quickly reversed by the sudden onset and rapid spread of Covid-19. The outlook for 2020 is now
heavily clouded by the severe disruptions in the global supply chain and growing scale and magnitude of the impact from the outbreak as it manifested itself across the globe, creating a sharp fall-off in demand across many industries and businesses. Key sectors such as retail, travel, hospitality and transportation have been badly hit. In response, major central banks have promptly acted with sizable monetary easing, supported by fiscal stimulus to soften the impact on targeted sectors. The severity of the cascading negative multiplier impact on the global economy will depend on the scale and longevity of the outbreak. Frequent volatilities in financial markets and large swings in commodity prices can be expected. At this point, the negative impact on global growth remains highly uncertain. The Organisation for Economic Co-operation and Development (OECD) estimated global growth for 2020 to be 2.4%, a downward revision from its previous projection of 2.9% made in November 2019. Although this will be the lowest growth since the 2008 global recession, recent developments indicate that the OECD forecast could have more downside.
Beyond the Covid-19 outbreak, other downside risks remain. The United States enters a presidential election year amid a
divisive political climate. The arrangement towards phase 2 trade negotiations between the United States and China remains distant. Uncertainties lay ahead on the new agreement between the United Kingdom and the European Union, and the social issues in Hong Kong remain unresolved. Longer term, the impact of climate change and the increased risks of natural disasters to businesses cannot be underestimated. The impact on OCBC’s business is constantly being re-assessed. During this difficult period, the strong foundation that we have built in our people, capital and client franchise will enable us to weather the storms buffeting the world and allow OCBC to sustain its Do Well and Do Good mission for our shareholders, customers, employees and the community. Although we are hopeful that a gradual recovery of consumer confidence and sentiments will start to set in towards the end of 2020, a stronger and steady economic recovery will likely to be a 2021 event.
Our confidence in our ability to address the challenges ahead is well anchored on our past record of sustainable performance, the strength and resilience of our diverse and highly-interconnected franchise, solid capital base and stable funding and liquidity position. We have a committed and talented workforce, a robust risk management framework and we are deeply grateful to the loyal customer base we have solidly built over the years. We will continue to exercise heightened vigilance over our credit
portfolio, and monitor for early signs of weaknesses while proactively engaging and supporting our customers. Digital transformation across the Group will forge ahead as we expand our digital platform and partnerships to advance the creation of a vibrant ecosystem with our partners. We will continue to uphold and cement our core values, and are firmly committed to doing our part for the community and the environment.
In closing, we wish to firmly reassure all our stakeholders that OCBC will be there to support and assist them as we navigate Covid-19 together. We will leverage on our business strengths and resources to stand by our commitment to serve all of you.
IN APPRECIATION
We are thankful to our highly-dedicated Board members for their support and guidance. We give special thanks and bid a fond farewell to Mr Lai Teck Poh who retired as a director in December 2019 after nine years of invaluable contribution to OCBC. The Board warmly welcomes Mr Koh Beng Seng and Ms Tan Yen Yen, who joined us as directors.
We also extend our sincere appreciation to our management team and all our employees for their dedication, drive, resourcefulness and unrelenting focus on putting the customer first.
It is equally important for us to express our gratitude to our customers for their continued trust and confidence in us. To our shareholders, we remain committed to deliver high-quality returns and long-term value to you.
1st Bankin Southeast Asia to rule out funding new coal-fired power plants
>20green and sustainability-linked loan transactions completed in 2019
1st Green Bondissued for financing green assets and projects
No. 12019 Asia Pacific (ex-Japan) Green/Renewable Energy Loans Mandated Lead Arranger League Table – Bloomberg
No. 1 2019 Asia Pacific (ex-Japan) Green/Sustainability-linked Loans Mandated Lead Arranger League Table – Debtwire
S$10btarget to build our sustainable finance portfolio to this size by 2022
Message from Chairman and CEO
8 OCBC Annual Report 2019 9Group Overview

Our Values
How We Create ValueOur Purpose
Lasting ValueWe focus on long-term value creation for our shareholders,
customers, people and the communities we serve. We adopt
prudent risk-taking in all our dealings and investments. Only
then can we achieve growth and sustainability for our business.
IntegrityWe hold ourselves to the highest
ethical standards and assume that everything we do is in full public view. Fair dealing is the foundation of our business. That way, the trust in us that was built by our predecessors
and us will never be eroded.
Forward-lookingWe embrace technological advances,
economic conditions and social institutions, progressing with time and the market. Together, we break new ground through our thinking,
actions and decisions.
RespectWe treat all our stakeholders with respect and humility. We care by listening to, understanding and
supporting one another, working as one team regardless of differences to achieve our common Purpose.
ResponsibilityWe are committed to being
reliable and fulfilling our promises. Each of us individually takes ownership of doing the right
things, giving the right advice and developing the right solutions.
Our Corporate Strategy
Our Purpose
We help individuals and businesses across
communities achieve their aspirations by providing
innovative financial services that meet their needs.
Our Unique PropositionShareholders
We conduct business taking a long-term view to deliver sustainable returns to our
shareholders.
CustomersWe commit to living our Brand Promise every day, delivering Simply Spot On
solutions and experiences to our customers consistently.
EmployeesWe take a long-term view of
our employees and continue to invest in their personal and
professional growth. We show that we care by respecting,
understanding and supporting each other. We work as a team to
achieve our common purpose.
CommunityBy engaging and supporting the
community we operate in, we help to shape a more sustainable
society. Sustainability means to build and invest for a better future
for our business and make a lasting impact on society.
EnvironmentWe promote the climate change agenda, support our customers in adopting low-carbon projects and fund community initiatives that make meaningful impact
for the environment.
Our presence in North and Southeast Asia is attractive to customers who seek to capture opportunities both within and beyond their home markets. In Southeast Asia, we are present in eight out of 10 ASEAN countries and have deep local market knowledge as well as strong network connectivity. We have close to 50 branches in Singapore, more than 40 branches in Malaysia and more than 280 branches across over 60 cities in Indonesia. In Greater China, we are well represented with more than 80 branches.
Our standing as one of the largest foreign banks in the Greater Bay Area, combined with our extensive reach in Southeast Asia, means we are uniquely placed to capture the flows within and between the two regions. Beyond Asia, we have a presence in Australia, the Middle East, the United Kingdom and the United States to support our customers’ growth beyond the region.
Broad Geographical Footprint
collaboration with fintech companies through The Open Vault at OCBC, and we harness new technologies— from biometrics to artificial intelligence (AI) —in a discerning manner.
We have a longstanding track record of first-to-market solutions by taking a two-pronged approach towards digital transformation: First, we invest in developing our internal resources, including a digitally-empowered workforce and robust data and technology platforms, and we incubate internal employee ideas at our Innovation Lab. Additionally, we embrace external
Digital Innovation
Our goal is to deliver long-term benefits to the communities where we operate, with a focus on the more vulnerable segments of society and protecting the environment. Besides sponsoring large-scale community projects such as the Singapore Sports Hub and the OCBC Skyway at Gardens by the Bay to promote national identity and bonding,
our employees actively volunteer in social work across Singapore, Malaysia, China, Hong Kong and Indonesia. We rally behind families, including children and youths, the elderly and special needs persons and also champion environmental sustainability.
Corporate Social Responsibility
The culture of OCBC is predicated upon our values, with special emphasis placed on forging lasting customer relationships based on trust and respect.
Trusted AdvisorThis trust is hard earned and we aim to consistently uphold and surpass the ethical standards that we are expected to live up to.
Deepen Presence In Core MarketsA leading Asian financial services group with a broad
geographical footprint in North and Southeast Asia. A resilient and diversified business that generates sustainable long-term value for
shareholders, customers, staff and the community.
Dominant market position at home
Strong presence with focus on cross border
trade, wealth and capital flows
Extensive national presence with
comprehensive financial services
offering
Entrenched banking and
insurance franchise
Singapore Malaysia Indonesia Greater China
Leading insurance presence in Singapore
and Malaysia, and growing franchise
in Indonesia
“Asia’s Global Private Bank”. Regional Premier Platform.
Integrated model across private, premier private and premier
banking, bancassurance, securities brokerage and
asset management
Comprehensive consumer, retail and commercial
banking franchise across well-connected
business and geographical network
Banking InsuranceWealth Management
Core Competencies
Core Businesses
Disciplined Risk Management
Diversified Funding Base
Digital Transformation
Future-Smart Talent
Core Environmental, Social and Governance Pillars
Putting Customers First
Being Environmentally
and Socially Responsible
Acting with Integrity
Valuing Our People
Engaging Communities
Well-Positioned to Ride on Key Global Megatrends Shaping Asia’s Growth
Rising Asian Wealth
Increasing Dominance
of China
Growing Silver and Gig
Economies
Digital Prominence and Threats
Rising Protectionism and Populism
Focus on Sustainability
Who We Create Value For
Strong Focus on Executing Our Corporate Strategy to Create Sustainable Value
10 OCBC Annual Report 2019 11Group Overview

Mr Koh Beng SengNon-Executive and Non-Independent Director
Mr Koh was appointed to the Board on 1 October 2019. He has extensive experience in the financial services sector and is presently the Chief Executive Officer of Octagon Advisors Pte Ltd and serves as Chairman of Great Eastern Holdings Ltd and its principal insurance subsidiaries. He served 24 years with the Monetary Authority of Singapore (MAS) where his last appointment was Deputy Managing Director, Banking and Financial Institution Group. After leaving MAS in 1998, he held key positions in many notable organisations. Age 70.
Mr Koh will be seeking election at the Bank’s 2020 Annual General Meeting. Please refer to the footnote at the end of this section for additional information required under Rule 720(6) of the Listing Manual.
Other Directorships and Principal Commitments/Appointments (as at 17 March 2020)Octagon Advisors Pte Ltd, Chief Executive Officer • Great Eastern General Insurance Ltd, Board Chairman • Great Eastern Holdings Ltd*, Board Chairman • The Great Eastern Life Assurance Company Ltd, Board Chairman • Bank of China (Hong Kong) Ltd, Board Director • BOC Hong Kong (Holdings) Ltd*, Board Director • China Banking Association in China, Expert Committee, Member • Lien Ying Chow Legacy Fellowship Council, Member • Lingnan (University) College, Sun Yat-sen University in China, International Advisory Board, Member* Listed companies
Directorships and Principal Commitments/Appointments for the past 5 years Hon Sui Sen Endowment CLG Ltd, Board Director • Sing-Han International Financial Services Ltd, Hong Kong, Board Director • Singapore Technologies Engineering Ltd, Board Director • United Engineers Ltd, Board Director
Academic and Professional QualificationsMaster of Business Administration, Columbia University, USABachelor of Commerce (First Class Honours), Nanyang Technological University (formerly Nanyang University), Singapore
OCBC Board Committees Served OnChairman, Risk Management CommitteeMember, Remuneration Committee
Length of Service as a Director 6 months
Country of Principal Residence Singapore
The Board’s Comments on the ElectionMr Koh’s knowledge and experience in the financial services sector will strengthen Board capabilities.
Mr Chua Kim ChiuNon-Executive and Independent Director
Mr Chua was appointed to the Board on 20 September 2017 and elected as a Director on 30 April 2018. He is a chartered accountant and currently holds the position of Professor (Practice) in Accounting, National University of Singapore (NUS) Business School. He had a long and distinguished career in PricewaterhouseCoopers (PwC) Singapore where he served as a partner from 1990, headed the banking and capital markets group as well as the China desk, and was appointed a member of the firm’s leadership team in 2005. He retired in 2012, but was retained as senior advisor for PwC Hong Kong until June 2016 when he left to join NUS. Age 65.
Other Directorships and Principal Commitments/Appointments (as at 17 March 2020)Department of Accounting, NUS Business School, National University of Singapore, Employee • Greenland (Singapore) Trust Management Pte. Ltd., Board Director • ACRA Financial Reporting Technical Advisory Panel, Member • National University Health System Pte Ltd, Audit and Risk Committee, Member • NUS Business School, Executive Education Advisory Board, Member
Directorships and Principal Commitments/Appointments for the past 5 years Jurong Health Services Pte Ltd, Board Director • Accounting Standards Council, Singapore, Council Member • MOH Holdings Pte Ltd, Audit and Risk Committee, Member
Academic and Professional QualificationsBachelor of Commerce and Administration with Honours, Victoria University of Wellington, New ZealandBachelor of Commerce, Nanyang Technological University (formerly Nanyang University), SingaporeFellow Chartered Accountant of SingaporeMember of Chartered Accountants Australia and New ZealandFellow Chartered Certified Accountant, United Kingdom
OCBC Board Committees Served OnChairman, Audit CommitteeMember, Risk Management Committee
Length of Service as a Director 2 years 7 months
Country of Principal Residence Singapore
Mr Ooi Sang KuangChairman Non-Executive and Independent Director
Mr Ooi was first appointed to the Board on 21 February 2012 and last re-elected as a Director on 30 April 2018. He assumed the role of Chairman on 1 September 2014. He was Special Advisor in Bank Negara Malaysia until he retired on 31 December 2011. Prior to this, he was Deputy Governor and Member of the Board of Directors of Bank Negara Malaysia, from 2002 to 2010. Age 72.
Mr Ooi will be seeking re-election at the Bank’s 2020 Annual General Meeting. Please refer to the footnote at the end of this section for additional information required under Rule 720(6) of the Listing Manual.
Other Directorships and Principal Commitments/Appointments (as at 17 March 2020)OCBC Management Services Pte Ltd, Board Director • OCBC Wing Hang Bank Ltd, Board Director • Xeraya Capital Labuan Ltd, Board Chairman • Xeraya Capital Sendirian Berhad, Board Chairman • Target Value Fund, Board Director
Directorships and Principal Commitments/Appointments for the past 5 yearsOCBC Al-Amin Bank Berhad, Board Chairman • OCBC Bank (Malaysia) Berhad, Board Chairman • Cagamas Berhad, Board Chairman • Cagamas Holdings Berhad, Board Chairman • Cagamas MBS Berhad, Board Chairman • Cagamas SRP Berhad, Board Chairman
Academic and Professional QualificationsBachelor of Economics (Honours), University of MalayaMaster of Arts (Development Finance), Boston University, USAFellow Member of the Asian Institute of Chartered Bankers
OCBC Board Committees Served OnChairman, Ethics and Conduct CommitteeChairman, Executive CommitteeMember, Audit CommitteeMember, Nominating CommitteeMember, Remuneration CommitteeMember, Risk Management Committee
Length of Service as a Director 8 years 1 month
Country of Principal ResidenceSingapore
The Board’s Comments on the Re-electionMr Ooi’s financial industry and leadership experience will continue to be needed by the Board.
Dr Lee Tih ShihNon-Executive and Non-Independent Director
Dr Lee was first appointed to the Board on 4 April 2003 and last re-elected as a Director on 28 April 2017. He is presently an Associate Professor at the Duke-NUS Medical School in Singapore. He has previously served in senior positions at both OCBC Bank from 1993 to 1998 and the Monetary Authority of Singapore from 1998 to 2000. Age 56.
Dr Lee will be seeking re-election at the Bank’s 2020 Annual General Meeting. Please refer to the footnote at the end of this section for additional information required under Rule 720(6) of the Listing Manual.
Other Directorships and Principal Commitments/Appointments (as at 17 March 2020)Duke-NUS Medical School (Singapore), Employee • Lee Foundation, Singapore, Board Director • Selat (Pte) Ltd, Board Director • Singapore Investments (Pte) Ltd, Board Director
Directorships and Principal Commitments/Appointments for the past 5 yearsNeuropsychiatry Associates Pte Ltd, Board Director
Academic and Professional QualificationsMBA with Distinction, Imperial College, LondonMD and PhD, Yale University, New HavenFellow, Royal College of Physicians of Edinburgh
OCBC Board Committees Served OnMember, Ethics and Conduct CommitteeMember, Executive Committee
Length of Service as a Director 17 years
Country of Principal ResidenceSingapore
The Board’s Comments on the Re-electionIn addition to being the representative of a substantial shareholder, Dr Lee will continue to be of value to the Board with his qualification and experience.
Ms Christina OngNon-Executive and Independent Director
Ms Ong was first appointed to the Board on 15 February 2016 and last re-elected as a Director on 29 April 2019. She is presently Senior Partner and Chairman of Allen & Gledhill LLP as well as the Co-Head of its Financial Services Department. Ms Ong is a lawyer and has been in Allen & Gledhill since 1987. She provides corporate and corporate regulatory and compliance advice, particularly to listed companies. Her areas of practice include banking, securities offerings, securities regulations, investment funds, capital markets, and corporate finance. Age 68.
Other Directorships and Principal Commitments/Appointments (as at 17 March 2020) Allen & Gledhill LLP, Chairman and Senior Partner • Allen & Gledhill Regulatory & Compliance Pte Ltd, Board Director • Eastern Development Holdings Pte Ltd, Board Director • Eastern Development Pte Ltd, Board Director • Epimetheus Ltd, Board Director • Hongkong Land Holdings Ltd*, Board Director • SIA Engineering Company Ltd*, Board Director • Singapore Telecommunications Ltd*, Board Director • ABF Singapore Bond Index Fund, Supervisory Committee, Member • MAS Corporate Governance Advisory Committee, Member • SGX Catalist Advisory Panel, Member • The Stephen A Schwarzman Scholars Trust, Trustee*Listed companies
Directorships and Principal Commitments/Appointments for the past 5 years Singapore Tourism Board, Board Member • Trailblazer Foundation Ltd, Board Director
Academic and Professional QualificationsBachelor of Laws (Second Upper Class Honours), University of SingaporeMember, Law Society of SingaporeMember, International Bar Association
OCBC Board Committees Served OnMember, Ethics and Conduct CommitteeMember, Nominating CommitteeMember, Remuneration Committee
Length of Service as a Director 4 years 2 months
Country of Principal ResidenceSingapore
Mr Quah Wee GheeNon-Executive and Independent Director
Mr Quah was first appointed to the Board on 9 January 2012 and last re-elected as a Director on 29 April 2019. He began his career at IBM and in 1987, joined the Government of Singapore Investment Corporation (GIC), where he last held the position of President of Public Markets. He also served as a Director of GIC and was the Managing Director and President of GIC Asset Management Pte Ltd from 2007 to 2011. Age 59.
Other Directorships and Principal Commitments/Appointments (as at 17 March 2020) Avanda LLP Singapore, Partner/ Managing Member • Avanda Investment Management Pte Ltd, Executive Director • Bank of Singapore Ltd, Board Director • Cypress Holdings Pte Ltd, Board Director • Grand Alpine Enterprise Ltd, Board Director • Great Eastern General Insurance Ltd, Board Director • The Great Eastern Life Assurance Co Ltd, Board Director • Wah Hin & Company (Pte) Ltd, Investment Committee, Advisor
Directorships and Principal Commitments/Appointments for the past 5 years MOH Holdings Pte Ltd, Investment and Evaluation Committee, Chairman • EDBI Pte Ltd, Board Director • Singapore Exchange Ltd, Board Director
Academic and Professional QualificationsBachelor of Engineering (Civil), National University of SingaporeChartered Financial AnalystAlumni Member of the Stanford Graduate Business School
OCBC Board Committee Served OnMember, Executive Committee
Length of Service as a Director8 years 3 months
Country of Principal ResidenceSingapore
Board of Directors12 OCBC Annual Report 2019 13Group Overview

Mr Pramukti SurjaudajaNon-Executive and Non-Independent Director
Mr Pramukti was first appointed to the Board on 1 June 2005 and last re-elected as a Director on 30 April 2018. He has been with PT Bank OCBC NISP Tbk for 32 years, holding key positions, including President Director, and is presently President Commissioner of the bank. Age 57.
Other Directorships and Principal Commitments/Appointments (as at 17 March 2020)PT Bank OCBC NISP Tbk*, Board President Commissioner • PT Biolaborindo Makmur Sejahtera, Board Commissioner • Indonesian Overseas Alumni, Board of Supervisors, Deputy Chairman • Insead, Southeast Asia, Council Member • Karya Salemba Empat Foundation, Board of Trustees, Member • Parahyangan Catholic University, Board of Advisors, Member* Listed company
Directorships and Principal Commitments/Appointments for the past 5 yearsSBR Capital Ltd, Board Director • President University, Board of Trustees, Member
Academic and Professional QualificationsBachelor of Science (Finance & Banking), San Francisco State UniversityMaster of Business Administration (Banking), Golden Gate University, San FranciscoParticipant in Special Programs in International Relations, International University of Japan
OCBC Board Committees Served OnMember, Ethics and Conduct CommitteeMember, Nominating Committee
Length of Service as a Director 14 years 10 months
Country of Principal Residence Indonesia
Mr Tan Ngiap JooNon-Executive and Independent Director
Mr Tan was first appointed to the Board on 2 September 2013 and last re-elected as a Director on 29 April 2019. He had a long career of 37 years as a banker. He spent 20 years in Citibank NA serving in various capacities, including Senior Risk Manager of Citibank Australia and postings overseas prior to joining the OCBC Group in August 1990, where he held senior positions over the years, including Chief Executive of OCBC’s Australian operations, and Head, Group Business Banking and was appointed Deputy President in December 2001. He retired in December 2007. Age 74.
Other Directorships and Principal Commitments/Appointments (as at 17 March 2020)OCBC Al-Amin Bank Berhad, Board Chairman • OCBC Bank (Malaysia) Berhad, Board Chairman • MASCOT Private Trust, Investment Committee, Chairman • Mapletree India China Fund Ltd, Investment Committee, Chairman • Gemstone Asset Holdings Pte Ltd, Board Director • OCBC Management Services Pte Ltd, Board Director
Directorships and Principal Commitments/Appointments for the past 5 yearsBanking Computer Services Pte Ltd, Board Chairman • United Engineers Ltd, Board Chairman • BCS Information Systems Pte Ltd (now known as NETS Solutions Pte Ltd), Board Director • China Fishery Group Ltd, Board Director • Mapletree Logistics Trust Management Ltd, Board Director • Tan Chong International Ltd, Board Director • Breast Cancer Foundation, Executive Committee, Member
Academic and Professional QualificationsBachelor of Arts, University of Western Australia
OCBC Board Committees Served OnChairman, Remuneration CommitteeMember, Audit CommitteeMember, Executive CommitteeMember, Nominating Committee
Length of Service as a Director6 years 7 months
Country of Principal ResidenceSingapore
Ms Tan Yen YenNon-Executive and Independent Director
Ms Tan was appointed to the Board on 1 January 2020. She is presently the President (Asia Pacific) of Vodafone Enterprise Singapore Pte Ltd (1). She is also Chairman of the Singapore Science Centre and a Director of Singapore Press Holdings Ltd, among other appointments. Her past experiences included IT and IT-related positions in SAS Institute Inc, Oracle Corporation and Hewlett-Packard Singapore, and she has played an active role in Singapore’s infocomm industry. Age 54.
Ms Tan will be seeking election at the Bank’s 2020 Annual General Meeting. Please refer to the footnote at the end of this section for additional information required under Rule 720(6) of the Listing Manual.
Other Directorships and Principal Commitments/Appointments (as at 17 March 2020)Vodafone Enterprise Singapore Pte Ltd, Employee (1) • key subsidiaries of Vodafone in Asia Pacific, Board Director (1) • ams AG*, Board Director • Galboss Asia Pte Ltd, Board Director • Singapore Press Holdings Ltd*, Board Director • XY Maxwell Pte Ltd, Board Director • Ministry of Culture, Community and Youth (High Performance Sports), SpexBusiness Network Advisory Board, Chairman • Singapore Science Centre, Chairman • TNF Ventures Pte Ltd, Advisor Mentor • National University of Singapore (School of Computing), Board of Advisors, Member* Listed companies
Directorships and Principal Commitments/Appointments for the past 5 years Bold & Beautiful Global Pte Ltd, Board Director • Cap Vista Pte Ltd, Board Director • Gemalto NV, Board Director • Singapore Institute of Directors, Board of Advisors, Member
Academic and Professional QualificationsExecutive MBA, Helsinki School of Economics Executive Education Bachelor of Science (Computer Science), National University of Singapore
OCBC Board Committees Served OnMember, Audit CommitteeMember, Remuneration Committee
Length of Service as a Director 3 months
Country of Principal ResidenceSingapore
The Board’s Comments on the Election Ms Tan’s background and experience in technology will enhance Board competencies.
Mr Samuel N. TsienGroup Chief Executive OfficerExecutive and Non-Independent Director
Mr Tsien was first appointed to the Board on 13 February 2014 and last re-elected as a Director on 29 April 2019. He was appointed Group Chief Executive Officer on 15 April 2012. He joined OCBC Bank in July 2007 as Senior Executive Vice President, managing the Group’s corporate and commercial banking business. In 2008, he assumed the position as Global Head of Global Corporate Bank with added responsibilities of overseeing the financial institution and transaction banking businesses. He has 42 years of banking experience. Prior to joining OCBC Bank, he was the President and Chief Executive Officer of China Construction Bank (Asia) when China Construction Bank acquired Bank of America (Asia). From 1995 to 2006, he was President and Chief Executive Officer of Bank of America (Asia), and Asia Consumer and Commercial Banking Group Executive of Bank of America Corporation. Age 65.
Other Directorships and Principal Commitments/Appointments (as at 17 March 2020)Bank of Singapore Ltd, Board Director • Dr Goh Keng Swee Scholarship Fund, Board Director • Great Eastern Holdings Ltd*, Board Director • International Monetary Conference, Board Director • Mapletree Investments Pte Ltd, Board Director • OCBC Bank (Malaysia) Berhad, Board Director • OCBC Overseas Investments Pte Ltd, Board Director • OCBC Wing Hang Bank Ltd, Board Director • OCBC Wing Hang Bank (China) Ltd, Board Director • PT Bank OCBC NISP Tbk*, Board Commissioner • ASEAN Bankers Association, Director • Association of Banks in Singapore, Chairman • MAS Steering Committee for SGD Swap Offer Rate (SOR) Transition to Singapore Overnight Rate Average (SORA), Chairman • Institute of Banking & Finance Singapore, Vice Chairman, and Chairman of Standards Committee • Advisory Board of the Asian Financial Leaders Programme, Member • Financial Sector Tripartite Committee, Member • MAS Financial Centre Advisory Panel, Member • MAS Payments Council, Member* Listed companies
Directorships and Principal Commitments/Appointments for the past 5 yearsAsean Finance Corporation Ltd, Board Director • OCBC Al-Amin Bank Berhad, Board Director • ABS Benchmarks Administration Co Pte Ltd, Oversight Committee, Member • Advisory Council on Community Relations in Defence (ACCORD) (Employer & Business), Member • Malaysia-Singapore Business Council, Member • Singapore Business Federation, Finance & Investment Committee, Council Member
Academic and Professional QualificationsBachelor of Arts with Honours in Economics, University of California, Los Angeles
OCBC Board Committees Served OnMember, Executive CommitteeMember, Risk Management Committee
Length of Service as a Director 6 years 2 months
Country of Principal ResidenceSingapore
Mr Wee Joo YeowNon-Executive and Independent Director
Mr Wee was first appointed to the Board on 2 January 2014 and last re-elected as a Director on 28 April 2017. He has more than 39 years of corporate banking experience. He was Managing Director & Head of Corporate Banking Singapore with United Overseas Bank Ltd until his retirement in June 2013. Prior to that, he was Executive Vice President & Head of Corporate Banking with Overseas Union Bank Ltd, and Head Credit & Marketing with First National Bank of Chicago (Singapore). Age 72.
Mr Wee will be seeking re-election at the Bank’s 2020 Annual General Meeting. Please refer to the footnote at the end of this section for additional information required under Rule 720(6) of the Listing Manual.
Other Directorships and Principal Commitments/Appointments (as at 17 March 2020)Frasers Property Ltd*, Board Director • Great Eastern Holdings Ltd*, Board Director • WJY Holdings Pte Ltd, Board Director • WTT Investments Pte Ltd, Board Director* Listed companies
Directorships and Principal Commitments/Appointments for the past 5 years Mapletree Industrial Trust Management Ltd, Board Director • OCBC Management Services Pte Ltd, Board Director • PACC Offshore Services Holdings Ltd, Board Director
Academic and Professional QualificationsBachelor of Business Administration (Honours), University of SingaporeMaster of Business Administration, New York University, USA
OCBC Board Committees Served OnChairman, Nominating CommitteeMember, Executive CommitteeMember, Remuneration CommitteeMember, Risk Management Committee
Length of Service as a Director 6 years 3 months
Country of Principal Residence Singapore
The Board’s Comments on the Re-election Mr Wee’s banking knowledge and experience will continue to be of value to the Board.
The Directors seeking re-election at the 83rd Annual General Meeting, namely, Mr Ooi Sang Kuang, Dr Lee Tih Shih, Mr Wee Joo Yeow, Mr Koh Beng Seng and Ms Tan Yen Yen, have each:• Provided an undertaking in the format set out in Appendix 7.7 under Rule 720(1) of the Listing Manual of the Singapore Exchange Securities Trading Limited (Listing Manual).• Confirmed that, save for Dr Lee Tih Shih who is a director of Lee Foundation and Selat (Pte) Ltd, both substantial shareholders of the Bank, he/she has no relationship (including
immediate family relationships) with an existing Director, existing executive officer, the Bank and/or any substantial shareholder of the Bank or of any of its principal subsidiaries.• Confirmed that he/she has no, and for Mr Koh Beng Seng, no significant, conflict of interest (including any competing business).• Confirmed that: (a) for Mr Ooi Sang Kuang, Mr Wee Joo Yeow, Mr Koh Beng Seng and Ms Tan Yen Yen, there is no change to his/her responses previously disclosed (on 21 February 2012, 2 January 2014,
30 September 2019, and 31 December 2019 respectively) under items (a) to (k) of Appendix 7.4.1 of the Listing Manual*, which were all “No”, save that Mr Wee Joo Yeow’s response to item (k) of Appendix 7.4.1, which was originally “No”, is now “Yes” as the Monetary Authority of Singapore had on 6 February 2014 issued a supervisory warning to him to comply with Section 133 of the Securities and Futures Act (Chapter 289) of Singapore and other applicable laws and regulations at all times as, due to an inadvertent oversight, he had, on his appointment on 2 January 2014 to the board of the Bank, omitted to disclose some of his interest in shares in the Bank within the prescribed time period; and
(b) for Dr Lee Tih Shih, there is no change to his responses previously disclosed (on 4 April 2003) under items 1 to 9 of the then applicable Appendix 2.4 of the Listing Manual* which were all “No”, and his responses to items (a) to (k) of the current Appendix 7.4.1 of the Listing Manual are also all “No”.
* The Appendix 7.4.1 information was announced on 21 February 2012 (Mr Ooi Sang Kuang), 2 January 2014 (Mr Wee Joo Yeow), 30 September 2019 (Mr Koh Beng Seng) and 31 December 2019 (Ms Tan Yen Yen), when these Directors were first appointed as Directors of the Bank. The Appendix 2.4 information was announced on 4 April 2003 (Dr Lee Tih Shih), when Dr Lee Tih Shih was first appointed as a Director of the Bank. Save for the changes as disclosed above and updates on age, date of last re-appointment, country of principal residence, principal commitments including directorships, working experience and occupation(s) during the past 10 years, job title, and shareholding in the Bank and its subsidiaries as disclosed elsewhere in this Annual Report, there is no change to the Appendix 7.4.1/Appendix 2.4 information previously announced in relation to these Directors.
The shareholding interest in the Bank and its subsidiaries (if any) of each of these Directors are disclosed in the “Directors’ Statement” on pages 136 to 141.
(1) Directorships and principal commitments/appointments will cease on 1 April 2020.
Board of Directors
14 OCBC Annual Report 2019 15Group Overview

Mr Samuel N. TsienGroup Chief Executive Officer
Mr Ching Wei HongDeputy President, Global Wealth Management and Consumer Banking
Ms Helen WongDeputy President, Global Wholesale Banking
Mr Darren TanChief Financial Officer
Mr Lam Kun KinGlobal Treasury
Mr Vincent ChooGroup Risk Management
Mr Linus GohGlobal Commercial Banking
Ms Elaine LamGlobal Corporate Banking
Mr Na Wu BengCEO, OCBC Wing Hang Bank
Mr Wang KeCEO, OCBC Wing Hang Bank (China) Limited
Mr Bahren ShaariCEO, Bank of Singapore
Mr Tan Wing MingRegional General Manager for Northeast Asia
Mr Ong Eng BinCEO, OCBC Bank Malaysia
Ms Parwati SurjaudajaPresident Director and CEO, Bank OCBC NISP
Mr Gan Kok KimGlobal Investment Banking
Mr Tan Chor SenGlobal Enterprise Banking – International
Mr Sunny QuekConsumer Financial Services Singapore
Mr Jason HoGroup Human Resources
Mr Lim Khiang TongGroup Operations and Technology
Ms Goh Chin YeeGroup Audit
Ms Loretta YuenGroup Legal and Regulatory Compliance
Mr Peter YeohGroup Secretariat
Mr Vincent SohGroup Property Management
Mr Melvyn LowGlobal Transaction Banking
Ms Koh Ching ChingGroup Brand and Communications
Management Committee16 OCBC Annual Report 2019 17Group Overview

Our underlying values of integrity and honesty must never change so that we never erode the trust that our customers have in us.Samuel Tsien Group Chief Executive Officer
Q: With new digital banking licences being issued in Singapore and Hong Kong, is OCBC able to face the competition from new players?
A: Competition has always been intense for the banking industry. We will always invest, innovate and stay relevant to meet the evolving needs of our customers.
In a way, we welcome our new peers operating under the new digital licences to join us. We are partners and peers. We make financial services more complete for the community. A digital bank can serve segments which may currently be underserved. Outside of Singapore, they may even play a bigger role. Globally, 1.7 billion adults are estimated to be unbanked.
The cost model is very different for a digital bank than a conventional bank. The infrastructure set-up of a conventional bank has to be very comprehensive as it offers total relationship banking, deals with all types of customers and offers a wide variety of products. If one just focuses on a specific segment, the requirements would be less complex and, when supported by technology, it can be more cost efficient but the breadth of coverage will be narrower.
At OCBC, we are very clear – we want to serve the entire community. We deploy technology to digitalise our processes
and channels to enhance customer experience, but we will not “digitise” our customers. Our banking is relationship based.
We are a bank, a digitally-empowered bank, centred on our customers, not a technology company.
To support our customers better, we have accelerated our digital transformation journey through innovations and by forging new partnerships and ventures. Today, nine in 10 of our new SME business accounts are opened digitally. We now enable start-ups to open an account immediately after incorporation, and not even have to wait one day. We actively support the use of PayNow in Singapore, and as a result, about half of all PayNow corporate registrations are with us.
The application process for our consumer banking products is now entirely digitalised, paperless and fuss-free. Customers can now apply for and instantly use credit cards, debit cards, personal loans, bank accounts and lines of credit after their applications via digital channels.
Q: What do you see are the other major trends that will disrupt the banking industry?
A: In addition to changes prompted by digitalisation and technological advancements, businesses, and banks, are no longer impacted only by economic cycles, but also by the increasing number of unanticipated geo- and social-political events. These event risks are the unintended consequences of globalisation and technological advancements which led to social and economic imbalances across the world. These developments also led to increased emergence of nationalism, populism and protectionism in many regions. They have caused significant impact not just on economies, but societies at large.
Unfortunately, Asia also faced another event risk recently, the outbreak of the novel coronavirus Covid-19. Although it is expected that the pandemic will be contained later in the year, the impact on consumer sentiments and investment confidence will last longer. Several of the geo- and socio-political developments will also continue to pose new challenges for us as they drag on into this year, and will take some time before normalcy can be restored.
We are a bank, a digitally-empowered bank, centred on our customers, not a technology company.
Sustained Growth from Our Core Businesses
Total Income
12% growth
2019: S$10.87b2018: S$9.7b
Operating Profit
13% growth
2019: S$6.2b2018: S$5.5b
Customer Loans
3% growth
December 2019: S$265bDecember 2018: S$258b
Customer Deposits
3% growth
December 2019: S$303bDecember 2018: S$295b
New Business Embedded Value from Insurance
15% growth
2019: S$616m2018: S$536m
Wealth Management Income
20% growth
2019: S$3.397b2018: S$2.842b
Growing Base of Digital Customers in Home Market*
53%of retail customers are also digital customers2014: 36%2018: 49%2023 target: 60%
65%of business customers are also digital customers2014: 36%2018: 62%2023 target: 70%
9 in 10financial transactions are now performed digitally
33% growth
in number of mobile transactions
9 in 10new SME business accounts are opened digitally2018: 3 in 10
* Digital customers are those who have used internet or mobile banking at least once in the last three months
Ask Sam18 OCBC Annual Report 2019 19Our Year in Review
Strong Growth in Greater China Business since Acquisition of Wing Hang Bank in 2014:
More than doubled total profit before tax originating from Greater China
S$1.15b2013: S$0.48b
Earning contributions from Greater China to the Group
3x more than 2013
Expanded customer base in Greater China by 20x
555,0002013: 28,000
More than tripled total income generated from Greater China*
S$2.5b2013: S$0.7b
* Based on internal management reports for the Group’s Greater China franchise
We set a five-year target in 2018 to grow our GBA business
Achieve 2x growth in profit from 2017
S$1bby 2023
Investment
S$200mby 2023
Number of employees
4,200by 2023
GBA Growth Targets
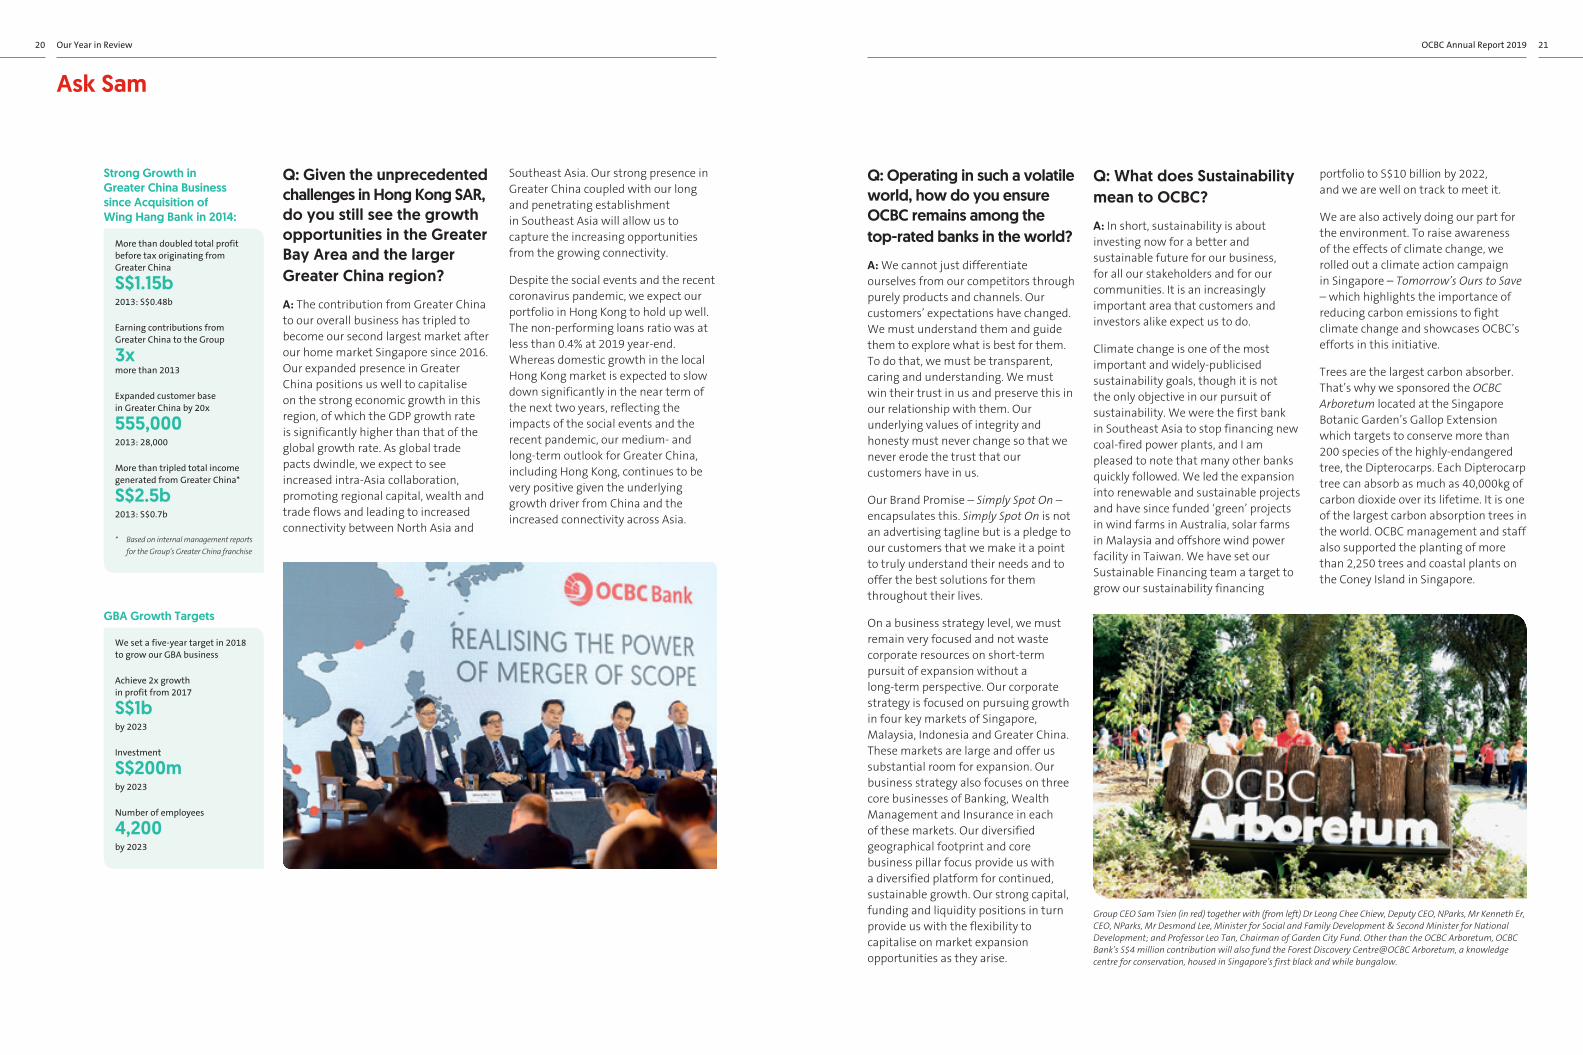
Q: Given the unprecedented challenges in Hong Kong SAR, do you still see the growth opportunities in the Greater Bay Area and the larger Greater China region?
A: The contribution from Greater China to our overall business has tripled to become our second largest market after our home market Singapore since 2016. Our expanded presence in Greater China positions us well to capitalise on the strong economic growth in this region, of which the GDP growth rate is significantly higher than that of the global growth rate. As global trade pacts dwindle, we expect to see increased intra-Asia collaboration, promoting regional capital, wealth and trade flows and leading to increased connectivity between North Asia and
Southeast Asia. Our strong presence in Greater China coupled with our long and penetrating establishment in Southeast Asia will allow us to capture the increasing opportunities from the growing connectivity.
Despite the social events and the recent coronavirus pandemic, we expect our portfolio in Hong Kong to hold up well. The non-performing loans ratio was at less than 0.4% at 2019 year-end. Whereas domestic growth in the local Hong Kong market is expected to slow down significantly in the near term of the next two years, reflecting the impacts of the social events and the recent pandemic, our medium- and long-term outlook for Greater China, including Hong Kong, continues to be very positive given the underlying growth driver from China and the increased connectivity across Asia.
Q: Operating in such a volatile world, how do you ensure OCBC remains among the top-rated banks in the world?
A: We cannot just differentiate ourselves from our competitors through purely products and channels. Our customers’ expectations have changed. We must understand them and guide them to explore what is best for them. To do that, we must be transparent, caring and understanding. We must win their trust in us and preserve this in our relationship with them. Our underlying values of integrity and honesty must never change so that we never erode the trust that our customers have in us.
Our Brand Promise – Simply Spot On – encapsulates this. Simply Spot On is not an advertising tagline but is a pledge to our customers that we make it a point to truly understand their needs and to offer the best solutions for them throughout their lives.
On a business strategy level, we must remain very focused and not waste corporate resources on short-term pursuit of expansion without a long-term perspective. Our corporate strategy is focused on pursuing growth in four key markets of Singapore, Malaysia, Indonesia and Greater China. These markets are large and offer us substantial room for expansion. Our business strategy also focuses on three core businesses of Banking, Wealth Management and Insurance in each of these markets. Our diversified geographical footprint and core business pillar focus provide us with a diversified platform for continued, sustainable growth. Our strong capital, funding and liquidity positions in turn provide us with the flexibility to capitalise on market expansion opportunities as they arise.
Q: What does Sustainability mean to OCBC?
A: In short, sustainability is about investing now for a better and sustainable future for our business, for all our stakeholders and for our communities. It is an increasingly important area that customers and investors alike expect us to do.
Climate change is one of the most important and widely-publicised sustainability goals, though it is not the only objective in our pursuit of sustainability. We were the first bank in Southeast Asia to stop financing new coal-fired power plants, and I am pleased to note that many other banks quickly followed. We led the expansion into renewable and sustainable projects and have since funded ‘green’ projects in wind farms in Australia, solar farms in Malaysia and offshore wind power facility in Taiwan. We have set our Sustainable Financing team a target to grow our sustainability financing
Group CEO Sam Tsien (in red) together with (from left) Dr Leong Chee Chiew, Deputy CEO, NParks, Mr Kenneth Er, CEO, NParks, Mr Desmond Lee, Minister for Social and Family Development & Second Minister for National Development; and Professor Leo Tan, Chairman of Garden City Fund. Other than the OCBC Arboretum, OCBC Bank’s S$4 million contribution will also fund the Forest Discovery Centre@OCBC Arboretum, a knowledge centre for conservation, housed in Singapore’s first black and while bungalow.
portfolio to S$10 billion by 2022, and we are well on track to meet it.
We are also actively doing our part for the environment. To raise awareness of the effects of climate change, we rolled out a climate action campaign in Singapore – Tomorrow’s Ours to Save – which highlights the importance of reducing carbon emissions to fight climate change and showcases OCBC’s efforts in this initiative.
Trees are the largest carbon absorber. That’s why we sponsored the OCBC Arboretum located at the Singapore Botanic Garden’s Gallop Extension which targets to conserve more than 200 species of the highly-endangered tree, the Dipterocarps. Each Dipterocarp tree can absorb as much as 40,000kg of carbon dioxide over its lifetime. It is one of the largest carbon absorption trees in the world. OCBC management and staff also supported the planting of more than 2,250 trees and coastal plants on the Coney Island in Singapore.
Ask Sam
20 OCBC Annual Report 2019 21Our Year in Review

Best Managed Bankawarded by The Asian Banker (2017–2019)
Best Bank in Asia Pacificawarded by Global Finance
>20green and sustainable loan related transactions completed in 2019
1st Bankin Southeast Asia to rule out funding new coal-fired power plants
Supported the development of
OCBCArboretuma forest of 2,000 Dipterocarps that can store 80 million kg of CO2 in their lifetimes
Dedicating talent, resources, time and service to sustainably improve lives
11,347 staff volunteers
across our core markets contributed 52,513 hours to support 138,988 individuals
Q: How has OCBC helped to mitigate the impact of the novel coronavirus (Covid-19)?
A: Covid-19 has caused significant uncertainties. We saw consumer confidence and sentiments dwindle, and companies delay their investment and expansion plans. With the virus spreading worldwide, the economic effects are still emerging. The stresses to the global supply chains could be much larger than the 2003 Sars outbreak. The financial market has become more volatile and defensive. However, we should recognise that this is after all still only an event risk which will go away. The authorities are responding with relief measures and fiscal plans, and central banks are reacting with interest rate cuts. With coordinated efforts, better hygiene discipline and the arrival of the warmer season, I am hopeful the virus will be contained later in the year, and gradual recovery of investment spending and consumer sentiments will commence soon thereafter, starting with China. The recovery will be slow in the beginning but will accelerate as it continues. Our strong foundations in our people, capital and client franchise will put us in a good position to capitalise on the market recovery which may come stronger and sooner than most expect.
As a key pillar of society, we have the responsibility to help our customers and communities – many of whom have banked with us for many years – to overcome the challenges as they weather through this difficult period.
Safeguarding our employees:Our first priority is to safeguard our employees. We have implemented split operations, allowed pregnant and vulnerable employees to work from home, and imposed restrictions on business travels. We shortened operating hours in some branches in Hong Kong and China and also closed
some for use as back-up branches in case of affected branches needing to suspend their services. We have made available protective supplies including face masks and hand sanitisers for our staff. In some locations, we have re-arranged working hours to avoid peak periods of travelling and delivered packed meals to employees to avoid their exposure to lunch crowds.
Supporting our customers:We have extended targeted relief measures to support impacted customers, including principal moratorium, bridging loans and additional working capital lines. We did not put a monetary cap on our relief programme as we want to extend as much financial assistance as necessary to affected customers, and not on a first-come, first-serve basis. We have been reaching out to customers so that they understand that help is available and can be provided quickly. We also work closely with government agencies to help bring our affected customers back to their normal state in 6-12 months’ time after the end of the outbreak.
Caring for our community:In Singapore, to show our appreciation to our healthcare workers who have been working so diligently on safeguarding our people, our staff sent them bottles of bird’s nest supplements, packets of drinks and snacks, and also treated them to 14,000 cups of bubble tea – items which hospital staff had wished for. I joined our 7,000 colleagues in Singapore to pen individual appreciation cards to show our support for these workers.
When we heard that our charity partners were short of food for their beneficiaries such as the elderly and the sick due to a drop in corporate volunteerism and support, we donated S$110,000 worth of food packages to vulnerable seniors; provided vitamins and cleaning kits for needy households; and increased the frequency of cleaning at homes and centres.
We had also donated RMB1 million – in support of the Singapore Government’s initiative – to buy medicine, medical supplies and equipment to help impacted communities in China. Our insurance subsidiary Great Eastern also pledged S$1 million and RM1 million respectively to support its customers affected by Covid-19, and contributed S$200,000 to the Courage Fund.
Q: Carrying out OCBC’s strategy and plans need a strong pool of talent and good leaders. How do you ensure there is no talent gap in OCBC?
A: People are our most important resource. We invest and develop our people to ensure they can realise their fullest potential. On the other hand, we also expect our people to be committed to their own development in aptitude and attitude. A person can only be developed if one wants to be developed, in terms of both technical competencies and soft skills. We need organisational facilitation and self-discovery to complete staff development. This has always been our approach. We have a comprehensive staff learning and development programme to groom and develop our people’s potential across the Group.
And when a senior position opens up, we will always evaluate internal candidates first to recognise their loyalty and their familiarity with the culture of the organisation. This does not
exclude external candidates and we always welcome new talents to bring in new experiences and external insights into our organisation. After they have joined our workforce, we provide them with the same learning and development opportunities against the same criteria to allow further advancements.
Q: OCBC has been around for 90 years. How do you see OCBC in the next 90 years?
A: To continue to excel in the next 90 years, we need to always bear in mind that in addition to Doing Well, we must also Do Good for all our stakeholders – our customers, shareholders, employees, the community, the environment and our future generations. To be able to continue to Do Well and Do Good, we must anchor whatever we do on our corporate core values and ensure that our core values are deeply entrenched in our organisational culture.
BOLD is a new leadership training programme implemented in 2019 to groom future leaders of the organisation. The nine-month long programme focuses on key themes such as agility, sustainability, digital transformation and legacy building. It exposes them to global thought leaders and different business cultures and practices, helping them gain insights on how best to implement successful and sustainable initiatives.
To reflect the evolving expectations of our stakeholders, we refreshed our corporate core values in 2019 to LIFRR, which stands for Lasting Value, Integrity, Forward-looking, Respect and Responsibility. These values emphasise that we must take a long-term view and continue to uphold ourselves to the highest ethical standards and put our customers’ interest above that of our own. This is the only way to earn and preserve their trust in us and will set us apart from other institutions. It will also ensure the promotion of sustainable, long-term value for multiple generations to come.
Ask Sam
22 OCBC Annual Report 2019 23Our Year in Review

The adage “hoping for the best, prepared for the worst and unsurprised by anything in between” is particularly apt in the current phase of the economic cycle.Darren Tan Chief Financial Officer
Q: 2019 has been an eventful year, can you share your reflections?
A: Indeed, 2019 has been a year of two halves. The first half was very much a late cycle rally and we saw an increase in business volume. The market was somewhat optimistic and projected a continuation for the rest of the year. However, as we entered the second half of the year, sentiments reversed dramatically, from a combination of a slowdown in global growth and an increase in geopolitical and trade tensions.
Fortunately, for us, different engines of our business portfolio fired up at different times. Businesses driven by market sentiments such as Wealth Management did comparatively better in the first half, while businesses driven by real economic activities such as loans (from improved margins on a higher base) did comparatively better in the second half.
These developments underscore the importance of a diversified portfolio of businesses that collectively would continue to perform well across economic cycles.
Q: What do you see as key trends which will shape the banking industry landscape?
A: Regulations and technology continue to impact the way banks do business.
Regulations necessitate more capital, more liquidity and more funding for banks to run our operations. Further, increased compliance to prevent abuse of the banking system and to ensure good conduct and fair dealing by the banking community also add to the higher operational costs. Nonetheless, these regulatory costs are what makes banks trustworthy and keeps us relevant in the long term.
Similarly, technology could help us become more efficient in meeting regulatory and compliance objectives. However, technology also adds a layer of investments in order to meet customers’ needs and demands. Additionally, technology also introduces new competition in the form of Fintechs and digital banks.
It is imperative for us to continuously balance the competing demands of regulations and technology so that OCBC remains competitive and relevant, now and in the future.
Q: Given the challenging outlook for 2020, what are your top priorities?
A: We are fortunate to be based in Asia, where economic growth potential remains positive in the long term. Given the expected global slowdown, Asia will also be affected in the near term. As such, our near-term priority to navigate the slower economy is the effective management of costs, not just in expenses but also in resource utilisation, to reduce wastage.
Investor Community Engagement
Coverage by over
20research analysts
Held more than
600meetings and conference calls with investors, rating agencies and analysts
Organised
OCBC Investor Dayin Hong Kong SAR and Macau SAR – Realising the Power of Merger of Scope
Annual General Meeting in April 2019 with all resolutions passed with average approval rate of more than
98%
Asia’s Best CFOawarded by Corporate Governance Asia to Mr Darren Tan, Chief Financial Officer(OCBC Bank)
Best Investor Relations Company (Singapore)awarded by Corporate Governance Asia (OCBC Bank)
We also need to maintain a strong capital level to better prepare us for the downturn and better position us for any opportunities arising. The adage “hoping for the best, prepared for the worst and unsurprised by anything in between” is particularly apt in the current phase of the economic cycle.
Q: How do we create sustainable value for shareholders?
A: The framework used by analysts to assess a bank can be simplified to the acronym CAMEL – Capital needs to be strong and well managed; Assets need to be of high quality with good risk-adjusted
returns; Management needs to be effective and strategic; Earnings need to be consistent and diversified; Liquidity needs to be stable and readily accessible. All these factors are crucial for us to create sustainable value for shareholders.
To create a strong CAMEL, we need diversity in businesses, assets and liabilities. Further, we need to run our operations efficiently, deploy our resources optimally and take risks prudently.
Finally, as trust is the raison d’être of a bank, we need to systematically inculcate a positive culture of doing things right and a strong fair dealing conduct of doing the right thing.
Delivering Superior and Sustainable Returns
5-Year Share Price
+5%Dividend Per Share 53 cents (2018: 43 cents)
Core Net Profit (1)
+10%
Core Return on Equity (1) from 11.5% in 2018
11.4%Dividend Payout Ratiofrom 40% in 2018
47%5-Year Total Shareholder Returns
+26%
+23%
(1) Excluding a one-time item.
Ask Darren24 OCBC Annual Report 2019 25Our Year in Review

2015 2016 2017 2018 2019
Share Price (S$)Highest 10.90 9.45 12.59 13.96 12.14Lowest 8.54 7.45 8.98 10.40 10.51Average 9.85 8.60 10.68 12.05 11.16Last Done 8.80 8.92 12.39 11.26 10.98
Market Capitalisation (S$b) (based on last done price) 36.2 37.3 51.9 47.9 48.3
Ratios (1)
Price-to-earnings ratio (2) 10.35 10.46 11.24 11.37 9.96Price-to-earnings ratio (based on core earnings) (2) 10.35 10.46 11.24 11.37 9.79Price-to-NAV (number of times) (2) 1.23 1.01 1.19 1.26 1.08 Dividend yield (%) 3.66 4.19 3.46 3.57 4.75
(1) Price ratios and dividend yield are based on average share prices. (2) 2017 figures were restated with the adoption of Singapore Financial Reporting Standards (International).
Group Five-Year Summary2019 2018 2017 (1) 2016 2015
Selected Income statement Items (S$ million)Total income 10,871 9,701 9,528 8,489 8,722 Operating expenses 4,644 4,214 4,043 3,788 3,664 Operating profit 6,227 5,487 5,485 4,701 5,058 Amortisation of intangible assets 103 102 104 96 98 Allowances for loans and other assets 890 288 671 726 488 Profit before tax 5,800 5,552 5,099 4,275 4,825 Reported net profit attributable to equity holders of the Bank 4,869 4,492 4,045 3,473 3,903 Cash basis net profit attributable to equity holders of the Bank (2) 4,972 4,594 4,149 3,569 4,001
Selected Balance sheet Items (S$ million)Non-bank customer loans (net of allowances) 262,045 255,193 234,141 216,830 208,218 Non-bank customer deposits 302,851 295,412 283,642 261,486 246,277 Total assets 491,691 467,543 452,693 409,884 390,190 Assets excluding life insurance fund investment assets 404,353 390,676 378,766 347,911 333,207 Total liabilities 443,088 424,151 410,900 370,242 353,079 Ordinary shareholders’ equity 45,662 40,637 37,528 35,507 33,053 Equity attributable to equity holders of the Bank 47,162 42,137 39,028 37,007 34,553
Per ordinary share (S$)Basic earnings 1.12 1.06 0.95 0.82 0.95Dividend (cents) 53.0 43.0 37.0 36.0 36.0Net asset value 10.38 9.56 8.96 8.49 8.03
Ratios (%)Return on ordinary shareholders' equity 11.2 11.5 11.0 10.0 12.3Return on assets (3) 1.23 1.17 1.11 1.03 1.14Dividend cover (times) 2.08 2.46 2.57 2.27 2.62Cost-to-income 42.7 43.4 42.4 44.6 42.0Capital adequacy ratios (4)
Common Equity Tier 1 14.9 14.0 13.9 14.7 14.8Tier 1 15.6 14.8 14.9 15.1 14.8Total 16.8 16.4 17.2 17.1 16.8
(1) 2017 figures were restated with the adoption of Singapore Financial Reporting Standards (International).(2) Excluding amortisation of intangible assets.(3) The computation of return on assets excludes life insurance fund investment assets.(4) The Group’s capital adequacy ratios for 2019 and 2018 were computed based on MAS’ fully-phased in Basel III rules. Prior to 2018, the Group’s capital adequacy ratios were computed based on
MAS’ transitional Basel III rules.Strong Credit Ratings with Stable Outlook
Aa1Moody’s
AA-Fitch
AA-S&P
Five-Year Share PerformanceOCBC Share Price (S$)
2015 2016 2017 2018 2019
Source: Bloomberg
14
12
10
8
0
Financial Highlights Creating Investor Value26 OCBC Annual Report 2019 27Our Year in Review
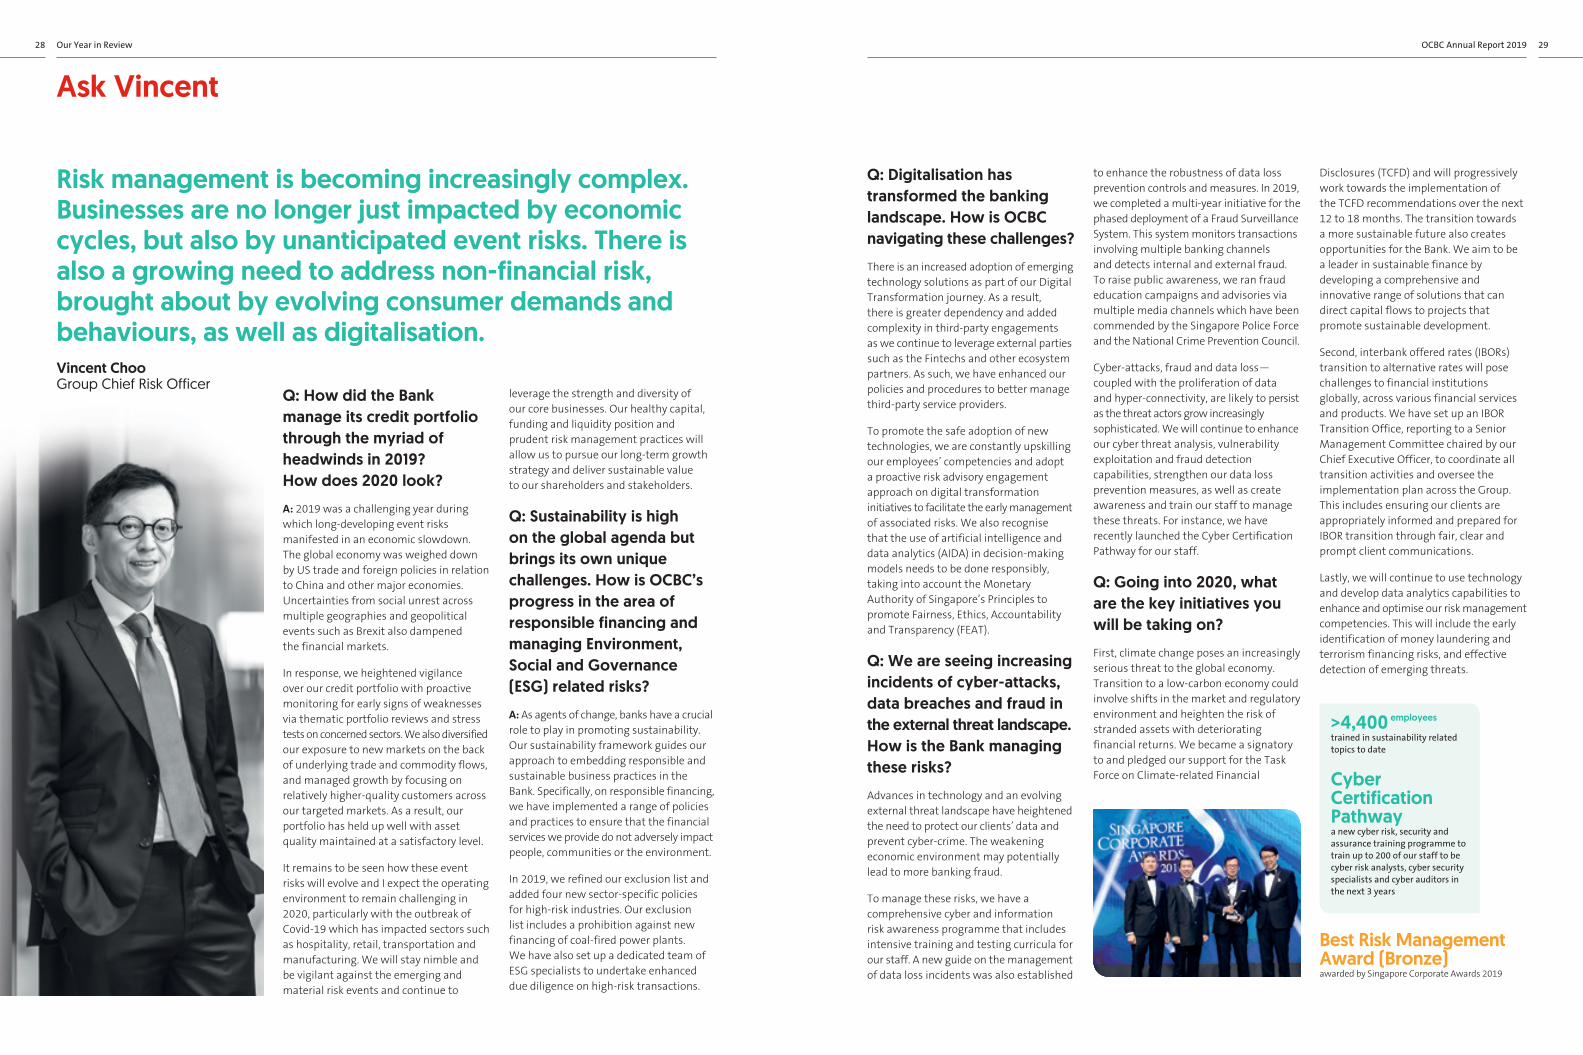
leverage the strength and diversity of our core businesses. Our healthy capital, funding and liquidity position and prudent risk management practices will allow us to pursue our long-term growth strategy and deliver sustainable value to our shareholders and stakeholders.
Q: Sustainability is high on the global agenda but brings its own unique challenges. How is OCBC’s progress in the area of responsible financing and managing Environment, Social and Governance (ESG) related risks?
A: As agents of change, banks have a crucial role to play in promoting sustainability. Our sustainability framework guides our approach to embedding responsible and sustainable business practices in the Bank. Specifically, on responsible financing, we have implemented a range of policies and practices to ensure that the financial services we provide do not adversely impact people, communities or the environment.
In 2019, we refined our exclusion list and added four new sector-specific policies for high-risk industries. Our exclusion list includes a prohibition against new financing of coal-fired power plants. We have also set up a dedicated team of ESG specialists to undertake enhanced due diligence on high-risk transactions.
Q: Digitalisation has transformed the banking landscape. How is OCBC navigating these challenges?
There is an increased adoption of emerging technology solutions as part of our Digital Transformation journey. As a result, there is greater dependency and added complexity in third-party engagements as we continue to leverage external parties such as the Fintechs and other ecosystem partners. As such, we have enhanced our policies and procedures to better manage third-party service providers.
To promote the safe adoption of new technologies, we are constantly upskilling our employees’ competencies and adopt a proactive risk advisory engagement approach on digital transformation initiatives to facilitate the early management of associated risks. We also recognise that the use of artificial intelligence and data analytics (AIDA) in decision-making models needs to be done responsibly, taking into account the Monetary Authority of Singapore’s Principles to promote Fairness, Ethics, Accountability and Transparency (FEAT).
Q: We are seeing increasing incidents of cyber-attacks, data breaches and fraud in the external threat landscape. How is the Bank managing these risks?
Advances in technology and an evolving external threat landscape have heightened the need to protect our clients’ data and prevent cyber-crime. The weakening economic environment may potentially lead to more banking fraud.
To manage these risks, we have a comprehensive cyber and information risk awareness programme that includes intensive training and testing curricula for our staff. A new guide on the management of data loss incidents was also established
to enhance the robustness of data loss prevention controls and measures. In 2019, we completed a multi-year initiative for the phased deployment of a Fraud Surveillance System. This system monitors transactions involving multiple banking channels and detects internal and external fraud. To raise public awareness, we ran fraud education campaigns and advisories via multiple media channels which have been commended by the Singapore Police Force and the National Crime Prevention Council.
Cyber-attacks, fraud and data loss— coupled with the proliferation of data and hyper-connectivity, are likely to persist as the threat actors grow increasingly sophisticated. We will continue to enhance our cyber threat analysis, vulnerability exploitation and fraud detection capabilities, strengthen our data loss prevention measures, as well as create awareness and train our staff to manage these threats. For instance, we have recently launched the Cyber Certification Pathway for our staff.
Q: Going into 2020, what are the key initiatives you will be taking on?
First, climate change poses an increasingly serious threat to the global economy. Transition to a low-carbon economy could involve shifts in the market and regulatory environment and heighten the risk of stranded assets with deteriorating financial returns. We became a signatory to and pledged our support for the Task Force on Climate-related Financial
Risk management is becoming increasingly complex. Businesses are no longer just impacted by economic cycles, but also by unanticipated event risks. There is also a growing need to address non-financial risk, brought about by evolving consumer demands and behaviours, as well as digitalisation.Vincent Choo Group Chief Risk Officer
Q: How did the Bank manage its credit portfolio through the myriad of headwinds in 2019? How does 2020 look?
A: 2019 was a challenging year during which long-developing event risks manifested in an economic slowdown. The global economy was weighed down by US trade and foreign policies in relation to China and other major economies. Uncertainties from social unrest across multiple geographies and geopolitical events such as Brexit also dampened the financial markets.
In response, we heightened vigilance over our credit portfolio with proactive monitoring for early signs of weaknesses via thematic portfolio reviews and stress tests on concerned sectors. We also diversified our exposure to new markets on the back of underlying trade and commodity flows, and managed growth by focusing on relatively higher-quality customers across our targeted markets. As a result, our portfolio has held up well with asset quality maintained at a satisfactory level.
It remains to be seen how these event risks will evolve and I expect the operating environment to remain challenging in 2020, particularly with the outbreak of Covid-19 which has impacted sectors such as hospitality, retail, transportation and manufacturing. We will stay nimble and be vigilant against the emerging and material risk events and continue to
Disclosures (TCFD) and will progressively work towards the implementation of the TCFD recommendations over the next 12 to 18 months. The transition towards a more sustainable future also creates opportunities for the Bank. We aim to be a leader in sustainable finance by developing a comprehensive and innovative range of solutions that can direct capital flows to projects that promote sustainable development.
Second, interbank offered rates (IBORs) transition to alternative rates will pose challenges to financial institutions globally, across various financial services and products. We have set up an IBOR Transition Office, reporting to a Senior Management Committee chaired by our Chief Executive Officer, to coordinate all transition activities and oversee the implementation plan across the Group. This includes ensuring our clients are appropriately informed and prepared for IBOR transition through fair, clear and prompt client communications.
Lastly, we will continue to use technology and develop data analytics capabilities to enhance and optimise our risk management competencies. This will include the early identification of money laundering and terrorism financing risks, and effective detection of emerging threats.
Best Risk Management Award (Bronze)awarded by Singapore Corporate Awards 2019
>4,400 employees
trained in sustainability related topics to date
Cyber Certification Pathway a new cyber risk, security and assurance training programme to train up to 200 of our staff to be cyber risk analysts, cyber security specialists and cyber auditors in the next 3 years
Ask Vincent28 OCBC Annual Report 2019 29Our Year in Review

Giving back to the community is an integral part of our corporate culture. By supporting the community, we help to shape a more sustainable society. Through our #OCBCCares Programme, we offer sustainable support where it is most needed and do our part to tackle the climate crisis.
Strategic Initiatives
We contributed S$4 million to help set up the OCBC Arboretum at the Singapore Botanic Gardens – as a climate action initiative. The forest of 2,000 highly endangered dipterocarp trees can store as much as 80 million kg of CO2 in their lifetimes.
This first-of-its-kind high-tech arboretum taps on an Internet of Things (IoT) system to monitor tree growth. 200 staff volunteer and their families helped plant the first 160 trees.
We launched the OCBC-NTUC First Campus Bridging Programme in Singapore to help make preschool education free for children from low-income families. OCBC Bank and staff contributed S$1 million to fund two years of childcare fees, after government subsidy.
The five-year programme, from 2020 to 2024, can help 2,500 children.
Wang Ke, CEO of OCBC Wing Hang China and Loh Tuck Wai, Singapore’s Consul-General in Shanghai, presented prizes to the winning team from Pudong District Experimental Primary School at the Little Inventor Programme 2019. The annual competition, organised by OCBC Wing Hang China, teaches children to care about protecting the environment. Students from migrant schools had to come up with innovative ideas on climate action solutions after hearing from environmental protection and innovative thinking experts.
OCBC Bank put its signature OCBC Cycle Singapore 2019 event through a rigorous green audit process, and became the first event to earn the Singapore Environment Council’s Eco Event certification. The event saw one tree planted for every 50 participants. Single-use plastics were not used for this year’s event packs, as participants received their event bibs in wood-free paper envelopes, and took home their event medals wrapped in tracing paper.
Donations
S$1.8mTo fund projects that address critical unmet needs in society and to support ground-up projects that enhance sustainability.
Volunteers
52,513 hours
Contributed by 11,347 volunteers over 982 community activities, led by 1,555 employees who were able to hone their leadership skills.
Impacting lives
138,988 individuals
Have been helped under our #OCBCCares Programme.
We support vulnerable seniors, children and youths, people with special needs and low-income families.
OCBC Cycle
9,100 cyclists
Took part in OCBC Cycle in Singapore and Kuala Lumpur, which promotes a healthy, active and environmentally-friendly lifestyle.
Caring for the Environment
80m kg of CO2
Will be stored in the lifetimes of 2,000 highly endangered trees planted at the OCBC Arboretum in the Singapore Botanic Gardens.
We planted close to 3,000 trees across Singapore, Malaysia and Shanghai.
How OCBC is Supporting the Community during Covid-19
1 7,000 staff in Singapore, including our Chairman and Group CEO, penned individual appreciation cards to show support for healthcare staff at Tan Tock Seng Hospital and the National Centre for Infectious Diseases.
2 In the spirit of #OCBCCares, we gave the hospital staff what they wished for, in the form of 20,000 bottles of bird’s nest supplements and more than 45,000 packets of drinks and snacks.
1 2
3 4
3 Healthcare staff were also treated to 14,000 cups of bubble tea as they worked tirelessly to keep Singapore safe.
4 We contributed S$110,000 to support 3,280 individuals from our five charity partners – providing food packages for vulnerable seniors; vitamins and cleaning kits for needy households; and increasing cleaning frequency for Homes and Centres.
5 We donated RMB 1 million (S$200,000) to buy medicine, medical supplies and equipment for communities in China that are affected by the Covid-19 outbreak. Our donation was made through the Singapore Red Cross.
6 Our staff volunteers in Hong Kong SAR made 3,200 bottles of hand sanitisers and 300 fabric face masks, which were distributed to our charity partners.
Caring for Our Community and the Environment
30 OCBC Annual Report 2019 31Our Year in Review

1
2
43
Singapore
1 Supporting the OCBC-NTUC First Campus Bridging Programme, staff volunteers from our Wealth Management team conducted a financial literacy workshop for parents, to help them understand how to manage their finances effectively. Armed with good money management habits, parents can better plan and provide for their families’ needs.
20 similar workshops will be conducted for parents whose children are enrolled in our OCBC-NTUC First Campus Bridging Programme over the next five years.
2 We conducted a coding and cybersecurity workshop for underprivileged youths.
This involved in-house development of an augmented reality (AR) app, videos
and games to make understanding of cybersecurity threats and coding fun and engaging for the students.
3 Staff volunteers shared their life experiences to help disadvantaged youths understand that their lives are not defined by grades alone. Through various activities, the youths learnt the importance of perseverance when facing challenges and disappointments.
1
How OCBC is Addressing Gaps in Society
2
3
Malaysia
1 Staff volunteers dedicated 330 hours over three months to help 45 children from indigenous families to improve their English and financial literacy proficiencies.
The lessons were taught using interactive board games and online tools.
2 Staff volunteers partnered the Rotary Club to mobilise 1,000 members of the Batu Pahat community to raise funds to provide polio vaccines for over 4,100 children; and treatment subsidies for 20 renal patients.
1 2
1 OCBC volunteers helped furbish the newly launched OCBC Wing Hang China Little Library in a boarding school in Inner Mongolia.
Volunteers donated and purchased books, stationery and learning materials for preschool children from disadvantaged families.
2 Staff volunteers conducted a photography session for vulnerable seniors to encourage them to continue to take pride in their personal grooming. We presented each of them with their portrait photos as keepsakes.
3 Our volunteers helped children with autism to improve their cognitive and mobility skills.
4 Staff volunteers organised an art jamming party for children with special needs, to help improve their motor and cognitive skills.
Indonesia
2 We helped build a community centre providing public toilets, learning space and health services for close to 500 families who were affected by the earthquakes that hit Lombok on 29 July and 5 August 2018.
1 Supporting a national initiative to raise the country’s financial literacy index to 75%, staff volunteers conducted financial literacy workshops for close to 2,560 participants including students, housewives, employees and entrepreneurs across Jakarta, Bandung, Tangerang, Depok and Cirebon.
1 2
Greater China
Caring for Our Community and the Environment
32 OCBC Annual Report 2019 33Our Year in Review

1 Staff volunteers collected more than 340 kg of plastic bottles, straws, fishing nets and general waste in a coastal clean-up activity along Pantai Kelanang in Selangor.
2 100 staff volunteers planted 580 mangrove saplings at the Kuala Selangor Nature Park, as part of our climate action efforts.
2
Malaysia1
1 We kicked off our climate action campaign—focusing on carbon storage and recapture, and what OCBC has done to help fight climate change.
2 The #OCBCCares Environment Fund, introduced in 2017, supported four projects ranging from plastics reduction, recycling to aquaponics.
We held our inaugural Green Pitch event which attracted 50 members of the public to present their climate action solutions. Five winning
solutions received funding for implementation from the #OCBCCares Environment Fund.
3 To make the Lunar New Year tradition of giving red packets more sustainable, we switched to using FSC-certified paper; and the plastic holders for red packets were changed to recyclable ones. We incorporated design elements featuring forestation, clean waters and quality air to drive the climate change message of reducing carbon emissions.
In Singapore, we went one step further by encouraging customers to drop any used or excess red packets —not just OCBC ones—into recycling boxes located at all our branches. These were pulped for a second lease of use. The pulp generated from more than 4,000 kg of red packets collected can be used to make 10,411 cardboard boxes.
We will progressively extend the recycling of red packets to our other markets.
How OCBC is Supporting Climate Action Fight
2
3
1 To combat climate change, 40 volunteers planted trees at the Dongtan Wetland Park, Chongming Island.
2 14 volunteers and their family members planted 20 tree saplings in the Qingcheng district of Qingyuan, Guangdong to support carbon recapture. Over the next 10 years, these trees can store as much as 1,240 kg of CO2.
3 Staff volunteers embarked on a marine sustainability visit with 18 students to better understand the impact of climate change and how they can adopt climate-friendly lifestyle changes.
4 We organised a bank-wide fashion recycling week and collected close to 200 pieces of good-as-new clothes which were donated to the St James Settlement organisation. Diverting the clothes away from the incinerator helped reduce waste and carbon emissions.
1
Singapore
1
Indonesia1 Staff volunteers from Bank OCBC NISP
and OCBC Singapore installed solar panels to provide renewable-energy lighting for 100 needy households in South Bandung.
2 Staff volunteers from Bank OCBC NISP and Great Eastern Indonesia partnered the local community in a clean-up activity along the Ciliwung River in the Jagakarsa, South Jakarta area – collecting more than 1,164 kg of waste. They also planted more than 100 trees to help prevent soil erosion.
2
Greater China1 2
43
Caring for Our Community and the Environment
34 OCBC Annual Report 2019 35Our Year in Review

Nine Southeast Asian teams, 15 local cycling club teams and six corporate teams competed in the fifth edition of the OCBC Cycle Speedway Championships.
OCBC Cycle entered its eleventh edition and saw many participants signing up for more than one category. Close to 6,800 cyclists were out in full force at Singapore Sports Hub for The Straits Times Ride, The Sportive Ride, Speedway Championships and Mighty Savers Kids Ride categories of the event.
The Philippines rode a near-perfect race in the OCBC Cycle Speedway Southeast Asia Championship as they beat the strongest field to date with Malaysia and Vietnam finishing second and third respectively.
The GlaxoSmithKline cycling team executed an excellent strategy in the OCBC Cycle Speedway Corporate Championship to launch a powerful sprint in the final lap. Lendlease Retail narrowly missed out on the top spot, finishing in second place. Advanced Micro Devices Singapore took third place on the podium.
The event was flagged off by KL Mayor Dato’ Nor Hisham Dahlan along with Dato’ Ong Eng Bin, CEO, OCBC Bank (Malaysia) Berhad and Chairman of the KL OCBC Cycle 2019 Implementation Committee Datuk Naim Mohamad.
21% of the 2,300 participants were women, marking an increase from the 19% last year. This increase resulted from a conscious effort to increase female participation, which included the introduction of a new 21km category, alongside the regular 42km category.
The OCBC Cycle Speedway Club Championship also played host to an action-packed finale, as Specialized Roval Mavericks Team B managed to squeeze past their opponents in the final stretch and successfully held off a spirited challenge from Matador Racing and debutantes CyclingTraining.cc who finished second and third respectively.
Minister for Culture, Community and Youth, Ms Grace Fu, was the Guest-of-Honour at The Straits Times Ride. Joining her in the flag-off party were Deputy Chief Executive Officer, Sport Singapore, Dr Chiang Hock Woon; Chief Financial Officer, OCBC Bank, Mr Darren Tan; and Executive Editor, The Straits Times, Ms Sumiko Tan. After flagging off The Straits Times Ride, Ms Fu also joined participants in the morning ride.
Thirteen companies took part in The Business Times Corporate Rally, which offered two ride categories: The OCBC Cycle Speedway Corporate Championship
and the OCBC Cycle Corporate Chase. The inaugural OCBC Cycle Speedway Corporate Championship allowed eight amateur competitive corporate teams to experience the same route as professional cyclists from Southeast Asia’s national teams. The OCBC Cycle Corporate Chase, which was into its second year, saw 14 corporate teams compete in the same 42km route used for The Sportive Ride.
Building on the green efforts implemented during the previous edition, the OCBC Cycle 2019 introduced an expanded suite of initiatives. Most notably, the event saw one tree planted for every 50 participants. Additionally, single-use plastics were not used for this year’s event packs, as participants received their event bibs in wood-free paper envelopes, and took home their event medals wrapped in tracing paper. OCBC Cycle is the first Singapore event to earn the Singapore Environment Council’s Eco Event certification.
OCBC Cycle Singapore Kuala Lumpur OCBC Cycle
Kuala Lumpur OCBC Cycle
2,300 participants
26 countries
450 staff
Featured an environmental theme for the first time, which saw several environmentally-friendly practices being undertaken including reducing or eradicating plastic packaging and composting waste products
OCBC Cycle Singapore in Numbers
6,800 participants
788 staff
140 trees planted
40,000 +
single-use platics removed from our event packs
183 kg
of banana peels composted
196 kg
of plastic materials recycled
212 kg
of metal cans recycled
Bonding on Wheels – OCBC Cycle Singapore and Kuala Lumpur
36 OCBC Annual Report 2019 37Our Year in Review

Q: Wealth management is one of OCBC’s key business pillars. How has the wealth management franchise fared despite the uncertainties in the market?
A: The growth of our wealth management business has been strong despite the market volatility and uncertainty in 2019. The gross wealth management fees came in at a new record of S$1.036 billion and assets under management (AUM) (1) hit S$227.44 billion at the end of the year.
The wealth management business in OCBC comprises the affluent segment under the OCBC Premier Banking platform, the high net worth segment under OCBC Premier Private Client, and Bank of Singapore. While Asia’s growing wealth presents lots of opportunities in these segments, it’s our strategy of combining superior market research, wealth advisory and customer experience with strong digital capabilities that has made OCBC the leading player.
Staying true to meeting customers’ needs, being relevant and focusing on what is right and appropriate for them is key. Unfortunately
there is a lot of product pushing in this industry, so we have long taken a different approach not to do that and, instead, focus on customers’ needs and life goals. That’s where conversations with our financial advisers start. Only after that are the appropriate products and solutions recommended. Many banks claim they do this, but not many truly do it. For us, this is something we are deeply committed to.
We officially launched an Accredited-Investor platform in 2019 – OCBC Premier Private Client, to serve the high net worth individuals who have more sophisticated investment needs. This new business segment has achieved very good results as it complements Bank of Singapore in serving clients who prefer an alternative business and service model.
The other engine of growth in our wealth management business is Bank of Singapore. Bank of Singapore has operations in four regions – Southeast Asia, Greater China, Europe and the Middle East. All regions performed well, particularly the Asian markets.
Bank of Singapore’s franchise is no longer seen as a regional franchise but is recognised as a global one. It has lived up to our tagline of being Asia’s Global Private Bank.
Bank of Singapore clients trust the brand name, recognise our strong credit ratings, and enjoy the benefits of being part of the OCBC Group. Clients not only have access to the broad range of best-in-class wealth and financial products, with many of them
being business owners themselves, they are supported by OCBC’s business banking and investment banking services.
This year, Bank of Singapore made strategic inroads into one of the fastest growing economies in the world, India. We formed a strategic partnership with Edelweiss Group, one of India’s largest diversified financial services groups. This partnership gives clients of both entities access to Bank of Singapore’s wide range of global investment solutions, and Edelweiss’ wealth solutions and investment opportunities in India.
In April 2019, Bank of Singapore officially established its wealth management subsidiary, BOS Wealth Management Europe, in Luxembourg (and branch office in London). This further positions us to capture opportunities in Europe.
Q: How have your digital transformation efforts made a difference to customers?
A: We always start with our customers. We ask ourselves every day how we can better interact with and serve our customers.
Today, consumers engage a wide range of services largely through their mobile phones. Hence everything we create is ‘mobile first’—making our mobile banking services simple, easy and convenient to use. We revamped our mobile banking app to
I see tremendous wealth being created here in Asia. There are a lot of surprising opportunities, despite geopolitical tensions.Ching Wei Hong Deputy President andHead of Global Wealth Management and Consumer Banking
(1) Includes the AUM of OCBC Premier Banking, OCBC Premier Private Client, Bank of Singapore and OCBC Wing Hang Premier Banking.
Bank of Singapore’s subsidiary in Luxembourg and London will capture opportunities in Europe.
Delivering Greater Customer Value
>2xincrease in monthly investments via OCBC RoboInvest
15,000sign-ups over two months on STACK, a new digital multi-party, real-time points exchange loyalty platform
OCBC Pay Anyone users will be able to access
1.7mmerchants in Thailand and Japan on Singtel’s VIA mobile payments network
19% growth
in OCBC Securities revenue from collaboration across the OCBC Group
World’s Best Consumer Bankawarded by Global Finance to OCBC Bank
Best Private Bank in Singaporeawarded by Professional Wealth Management and The Banker to Bank of Singapore
Best Retail Bank Macauawarded by Global Banking & Finance Review to OCBC Wing Hang Bank (Macau)
Best Retail Brokerawarded by Securities Investors’ Association of Singapore’s Investors’ Choice Award to OCBC Securities
Top ASEAN SGX-ST Member (Top 5)awarded by Singapore Exchange to OCBC Securities
Ask Wei Hong38 OCBC Annual Report 2019 39Our Year in Review

to choose note denominations, and making simultaneous notes and coins deposits. Digital service kiosks, located in our branches and supported by our digital ambassadors, also help to speed up the delivery of high-demand services such as activating overseas card usage and updating personal and account details.
Q: How has 2019 been for the banking business?
A: The consumer banking business achieved another record performance year. The wealth management business was the largest contributor with strong numbers in both interest income and fees. OCBC Premier Banking and OCBC Premier Banking Private Client, as well as Bank of Singapore, were able to successfully tap the rising wealth creation in Asia.
Despite intense competition in the Singapore home loans market, we saw a significant lift of 30% in new loans bookings in 2019 compared to the previous year. We also noted very encouraging response from our digital channels such as our chatbot, Emma, OneAdvisor Home and other online sources with four times increase in loan take-up.
In the digital space, the OCBC OneAdvisor Home portal is an important enabler for us to better serve our customers and our real estate ecosystem partners. This digital portal, launched in 2018, now hosts the largest residential property listing in Singapore with more than 150,000 properties. Through this portal, consumers can assess their affordability for their home purchase and select their dream home. At the same time, our agents benefit with tools which we have built and customised for seamless connectivity to us.
We don’t compete on interest rates alone. Our mortgage specialists are equipped with digital tools and trained to provide the most appropriate advice to deliver the best customer service.
include a new user interface and experience, making it simple, intuitive and at the same time, a delight to use. What’s new and a first in the market is the ability of our customers to have a consolidated view of their account transactions and cards spending to help them manage their finances. Leveraging AI, our customers can have ‘digital conversations’ with the app to pay bills, check account transactions, track and manage expenses. Another first is the ability to scan a QR code using the OCBC Pay Anyone app to withdraw cash at our ATMs in Singapore, enabling customers the convenience of going cardless.
While we roll out market leading digital capabilities, we do not neglect the experiences our branches deliver to our customers. I still believe that the human touch in consumer banking cannot be replaced entirely by digital channels. Having warm, friendly and engaging frontline staff at our branches remains a strategic component. We have also enabled our staff with digital tools and solutions to increase efficiency and convenience.
Our next generation ATMs were rolled out to 23 branches in 2019. These ATMs allow us to migrate high volume counter services to a self-service channel, thus helping customers save time. Some of these services include cash withdrawals of up to S$200,000 at one go, the ability
Branch Manager Jaslyn Low (second from left) won the Service Excellence Champion award by the Association of Banks in Singapore (ABS), the third consecutive year that our representative has won the top service award industry. And for the fifth year running, we had the highest number of service winners out of all the financial institutions with 2,279 employees being recognised.
Head of Wealth Management Singapore, Tan Siew Lee (left) offers advice to parents to help them better manage their family’s finances.
Making Financial Literacy Available to All
Our Wealth Management team in Singapore will continue to conduct financial literacy workshops every three months for low-income parents to help them better understand and manage their family finances. This added support is part of our OCBC-NTUC First Campus Bridging Programme that will make preschool education free for
children from these low-income families over the next five years from 2020 to 2024. OCBC Bank will fund an average of two years of childcare fees – after the government subsidy, for children of union members with monthly household incomes below S$4,500, who are new enrolments and commence classes at My First Skool from 1 January 2020. An estimated 2,500 children will benefit from the five-year programme.
Helping Young Customers
We launched the first FRANK by OCBC survey, the FRANKly Asked Questions, to understand and track psychographic variables of millennials such as their values,
attitudes, interests and desired experiences. A total of 866 students and young working adults were surveyed and the results will help in developing more comprehensive programmes on financial literacy and beyond to meet millennials’ holistic needs.
Q: What were some of your biggest challenges in 2019?
A: We are determined to continue innovating and to constantly push the boundaries in our digital transformation journey. To do this, we have to change the way we operate and how we develop our staff. It is very important for us not to leave any customer or staff behind in today’s fast evolving digitalised world. In our branches, we converted many bank tellers to become digital ambassadors to assist customers with the new digital channels and services. In the workplace, we continue to train our staff in new disciplines such as design thinking, digital technology, data analytics and artificial intelligence. All product managers are today conversant with API management and customer experiential design. Agile squads are formed, comprising staff with a mix of expertise and domain knowledge, to get new products to the market in a very short span of time.
Q: What will be your focus for 2020?
A: We will accelerate our digital agenda, centred around customers, and drive our wealth management business anchored on our corporate values of fair dealing and integrity. We are starting 2020 from a position of strength. We will continue to innovate to deliver digital firsts that are embedded in customers’ day to day life even as we make the ‘click-and-mortar’ experience at our branches highly differentiated and best-in-class.
We will forge more partnerships to create relevant ecosystems that will deepen our relationship with our customers, thus creating strong brand loyalty towards OCBC Bank.
Geographically, OCBC Premier Banking will continue to grow our offshore franchise; Bank of Singapore will deepen its presence in Greater China and Europe.
Driving Digital Banking
Enabled voice banking on the AI-powered
OCBC Banking Assistant Eliminated physical hardware tokens with digital
OCBC OneTokenRolled out
instant digital applications and approvalsfor cards and personal loans
QR code cash withdrawalsat ATMs with OCBC Pay Anyone
Branch Digitalisation
Transformed
76branch service staff to perform digital roles
Migrated
31%of over-the-counter services to new ATMs
100%of banking relationships at branches started digitally
Ask Wei Hong
40 OCBC Annual Report 2019 41Our Year in Review

House of the Year, Singapore awarded by Asia Risk
Best Derivatives House, Southeast Asiaawarded by Alpha Southeast Asia
Best FX Bank for Corporates & FIs, Singaporeawarded by Alpha Southeast Asia
Best FX Bank for CCS, IRS, Forward & Options Hedging (Corporate, FIs & SMEs) Singaporeawarded by Alpha Southeast Asia
Singapore Bond Houseawarded by IFR Asia
Best Loan Adviser, Malaysiaawarded by The Asset Country
Q: What were the bright sparks for you in 2019?
A: Despite the numerous economic headwinds in 2019, Global Treasury performed very well with total revenue increasing by 20 per cent, buoyed by higher Sales and Trading income. Strong focus on widening the structured investment products offering delivered good results. Business diversification improved with key overseas Treasury Centres growing by 33 per cent, contributing to total overseas revenue reaching 52 per cent of overall treasury results.
Our Global Investment Banking arm also registered strong growth with 36 per cent growth in revenue. Strong investment appetite in high-grade credits and our high standing among corporate issuers enabled us to successfully launch long-dated and perpetual bond issuances, helping us to gain significant share of the SGD bond market.
Through in-depth customer analytics and comprehensive product understanding, we are able to provide customers with bespoke solutions and ideas to optimise their investment returns or financing costs and capture opportunities across jurisdictions. We actively leverage technology to equip each and every one of our sales staff with data analytics tools to achieve better customer service and engagement. Our customers get a faster turnaround time in transactions and receive timely and relevant market information that best suits their needs.
Q: What is your outlook for 2020?
A: Market nuancing for 2020 has shifted towards greater expectation of economic green shoots. Global monetary policy easing and targeted fiscal stimulus have provided some stabilisation to the manufacturing sector, coupled with expected increase in activity from the Phase One US-China trade deal.
Geopolitical risk and tension will likely pick up in 2020. US election manoeuvrings may result in unexpected US government policy stance or military action in geopolitical hotspots like the Middle East, North Korea and even Hong Kong SAR or Taiwan. Geopolitical differences could result in bouts of sudden market volatility and caution should be exercised against market exuberance.
Financial markets are likely to stay mildly positive as investors continue to hunt for yield in bonds, equities and private markets amidst a low interest rate environment. Corporate flows will however remain challenging if trade volume does not turn around.
Q: What are the key challenges ahead?
A: Banking and markets industry faces numerous disruptive challenges and changes. The award of digital bank licenses in increasing number of countries will increase competition significantly including the financial market product
Deals
Refinancing and additional expansion funding package of S$8.7billion for Marina Bay Sands – the largest syndicated loan financing transaction in Singapore to date.
Acted as financial advisor on S$3.5billion of M&A transactions, including the $203million sale by Chuan Hup Holdings Ltd of PCI Ltd to Platinum Private Equity, and the merger of OUE Commercial REIT and OUE Hospitality Trust to create an enlarged REIT with market capitalisation of S$2.9billion.
Acted as Sukuk Sustainability Framework Adviser, Sole Lead Arranger, Joint Lead Manager, Joint Bookrunner and Shariah Adviser for Edra Solar Sdn Bhd’s first solar plant Sukuk, Malaysia’s first ASEAN Sustainability Sustainable and Responsible Investment Sukuk and first Solar Socio-Agricultural Sukuk.
onboard more digital clients and transform the Institutional Sales business to focus more on structured solutions. Our Trading unit aims to avail all financial products on digital platforms by 2021 and build intelligent systems to price and execute optimally for our clients.
Importantly, we are working to upgrade and train our employees to acquire the key competencies needed to thrive in the challenging environment ahead.
Q: Apart from doing well in business, how is your team doing good?
A: We believe strongly in giving back to our communities and it is important to do well and do good. We have been supporting MINDS since 2015, from spending time with the beneficiaries via movie outings to raising funds for the purchase of hearing aids. In 2019, we helped to decorate the fence around the MINDS-Woodlands Gardens School to mark World Down Syndrome Day. On separate occasions, we also brought beneficiaries to watch the Disney movies Abominable as well as The Secret Life of Pets 2. One of the big highlights for the volunteering staff was bringing the beneficiaries to play at the Suntec SuperPark. It was very heart-warming to see so many beneficiaries enjoying themselves trying different activities such as street basketball, bowling, pinball, soccer and even the flying fox.
fronts. Greater innovation and differentiation through smart adoption of Fintech are critical in improving both product proposition and service level.
Commercial and financial activities will go through fundamental changes with imminent transition of rate benchmarks towards risk free transacted rates. Banks and all spectrum of customer segments from retail, private bank, corporate to institutional investors have to step up and manage legal, accounting, operational and system changes which impact businesses across derivatives, loans, debt issuances and liquidity management.
Medium-term growth drivers like Environmental, Social and Governance (ESG) parameters will increasingly play an important role in the global marketplace. Strong alignment from banks and their customers to champion ESG supportive investments and financing activities will provide important impetus to promoting long-term sustainability.
Q: What are your targets for 2020?
A: Apart from our core markets in South East Asia, we are looking to further strengthen our capabilities and presence in treasury and investment banking in the GBA region.
We target to optimise our liability management with pro-active repo and collateral optimisation, attract and
Through in-depth customer analytics and comprehensive product understanding, we are able to provide customers with bespoke solutions and ideas to optimise their investment returns or financing costs and capture opportunities across jurisdictions.Lam Kun KinHead of Global Treasury
Ask Kun Kin42 OCBC Annual Report 2019 43Our Year in Review

We focus on building our capabilities to support the transformation and growth of SMEs, which are the backbone of our core markets.Linus Goh Head of Global Commercial Banking
Q: How are you helping SMEs embrace the sustainability agenda?
A: Sustainable businesses are redefining the corporate ecosystem and many small and medium-sized enterprises (SMEs), as part of regional or global supply chains, are beginning to examine how they can remain relevant and economically viable for the long term.
Our approach is to understand how our SME customers are addressing sustainability within their businesses. We want to work with them to identify initiatives which can bring about meaningful change towards sustainability. This is not a simple task because of the wide range of industries that our SMEs participate in and the varying levels of readiness across the markets that they operate in.
That is why we have identified 100 companies that we believe have the potential to be early movers which can lead the change within their respective industries. We are working with them to define how we can support them through green financing and advisory services to establish precedents for each industry which would encourage their peers to follow suit.
Tiong Seng Holding’s S$70 million green loan from us, a first for a construction and civil engineering company in Southeast Asia, is one such example. This loan was to finance construction projects that have clear environmental benefits leveraging their capabilities in pre-cast building and sustainable building materials.
We have also taken this effort beyond Singapore. Our Yangon branch partnered Shwe Taung Group on a US$44 million green loan—the first green loan in Myanmar—for the refinancing of their Junction City Shopping Centre in Yangon’s downtown. This landmark transaction
signals an important shift towards sustainability in the country at this crucial stage of economic development, and we believe it will spur other businesses to join us in this journey.
In our work with start-ups, we are happy to note a growing number of newly incorporated businesses setting out with a clear sustainability-based purpose and business model. Sustainability, to them, is not an afterthought. An example is Third Wave Power, which was established to develop solar-powered products to provide viable alternative energy sources for off-grid locations in countries like India, Africa, the Philippines and Indonesia.
Strong Regional Growth
18% growth
in business in regional healthcare and education services
>$500min new government-backed loans to SMEs in Singapore, Malaysia and Hong Kong SAR representing21% growth
26% growth
in business in Hong Kong SAR
2x growth
in business venture loans to support fast-growing and innovative businesses
Growth in Digitalisation
Proportion of business customers who are digital customers
65%2018: 62% 2023 target: 70%
>90%of new bank accounts are opened digitally
4x growth
in the number of customers transacting trade online
Lighting Up Rural Regions with Solar PowerElectricity supply can be unreliable or even non-existent in some regions, and that is where Singapore-based Third Wave Power, helmed by Mr V S Hariharan, has done a world of good. The company’s clean, solar-powered solutions have lit up off-grid locations in India, Africa, the Philippines and Indonesia, improving lives and increasing productivity in the process. Prices are affordable
and Third Wave Power even works with micro-financing institutions so that its customers can pay in instalments. It is also a pioneer in combining solar and the Internet of Things – two strong, interconnected trends – which the company will use to develop smart solar-powered applications. In recognition of and to further support its efforts, a special Sustainability Award was given to Third Wave Power at the Emerging Enterprise Awards 2019 which we co-organised with The Business Times.
Ask Linus44 OCBC Annual Report 2019 45Our Year in Review

Tailored Covid-19 Relief Measures for SMEsAround 20% of the 4,000 SMEs that we reached out to as at mid-March 2020 indicated that they may need some assistance amid the Covid-19 outbreak. Declining revenue particularly for tourism and retail-related businesses from a drop in footfall was the initial concern, especially when coupled with the need to manage high operating costs.
Q: How are you helping SMEs in their digital transformation journey?
A: Our digital strategy starts with delivering solutions that address the pain-points and needs of entrepreneurs and their businesses. We worked with our customers to overhaul the account opening experience by enabling them to open a business account instantly online, and further, to combine the online incorporation of their business with the online business account opening on the same day–both firsts in Singapore.
This enables start-ups and SMEs to get their businesses started as quickly as possible, following which we support them with ‘beyond banking’ services to run their businesses. We were the first to introduce a one-stop digital business dashboard to SMEs in Singapore that is anchored on data analytics and artificial intelligence, providing business owners
with a holistic view of their business performance. This integrates information from multiple business applications covering the core functions from accounting to marketing, enabling them to make more timely and informed decisions on the go. There is a lot more potential for us to develop in the ‘beyond banking’ space. E-invoicing and cashflow forecasting are two areas that we are working on so that we can help SMEs better manage their working capital.
We have also begun to deliver more tailored industry-based solutions. In the healthcare and education industries, we have helped customers with solutions around how they collect, how they pay, and how they manage their invoicing and reporting. One example is how we have partnered our SME customer Taidii to enable digital student enrolment, record management for regulatory reporting and fee collection on a cloud-based preschool management platform for their network of early childcare businesses.
Q: How would you rate the progress of internationalisation by SMEs?
A: Almost half of our SME customers today have expanded beyond their home markets. Across industries, we have found start-ups and small businesses looking towards expansion even in the early stages of growth. Increasingly, businesses start with an international business model from day one.
The push into overseas markets is growing in importance especially in the services
industry. Our customers in the education and healthcare industries have had strong cross-border flows in 2019. For instance, we worked with MindChamps PreSchool, one of Singapore’s leading premium preschools, to finance its acquisition of early learning centres in Australia.
Younger and smaller companies, especially fast-growth companies, venturing overseas need a lot more support. Our ability to work with this segment, understand their ambitions, advise them and support them in going overseas has led to us being the leading provider in business venture loans.
(From left) Mr Wong Wei Kong, editor of The Business Times; Mr Linus Goh, head of global commercial banking at OCBC Bank; Mr Heng Swee Keat, Deputy Prime Minister and Minister for Finance; and Mr Ong Pang Thye, managing partner of KPMG Singapore; cutting a cake in celebration of the 25th anniversary of the Enterprise 50 Awards.
The S$332.5 million green club loan to Hoi Hup Realty was used to part finance their acquisition of luxury hotel Andaz Singapore.
Asia’s Best Bank for SMEsawarded by Euromoney
ASEAN SME Bank of the Yearawarded by Asian Banking & Finance – 9th year in a row
Best SME Bank in Southeast Asiaawarded by Alpha Southeast Asia – 5th year in a row
Best Transactional Banking Online Platformawarded by Alpha Southeast Asia– 2nd year in a row
Best Digital Trade Finance Platform Initiative, Application or Programmeawarded by The Asian Banker
Celebrating SMEs’ Successes
>800 SMEs
have celebrated their successes with us over the years at the Entrepreneur of the Year Award, Enterprise 50 Awards and Emerging Enterprise Award which we sponsor
2 in 5Emerging Enterprise Award finalists and winners from the last three years have received funding from institutional investors
Industry Firsts
Enabled customers of Josiah Montessori to pay their bills
via PayNow through SGQR— a first for early learning centres
Availed to Hoi Hup Realty the
first green loan(S$332.5 million club loan) in Southeast Asia’s hospitality industry
First to enable start-ups to open a bank account on the
same daythat they incorporate their business
SMEs in manufacturing, wholesale trade and distribution, logistics, construction and services also cited disruption to global supply chains and demand. Besides extending targeted relief measures such as principal moratoriums, bridging loans and additional working capital, we are helping our SME customers to tap on digital solutions to manage their cash flow better and to improve their access to new customers and markets.
Ask Linus
46 OCBC Annual Report 2019 47Our Year in Review

For instance, we partnered Republic Polytechnic on the first PayNow initiative for an educational institution to enable its students to pay their school fees through the funds transfer service. CPF Board also launched the Contribute-As-You-Earn scheme, which enables self-employed persons to make small, regular contributions to their Medisave accounts, as and when they earn a service payment. We are proud to be an integral part of these digital transformation efforts.
As a leading player in this space and in support of Singapore’s Smart Nation initiatives, we will continue to develop innovative first-to-market solutions for our customers that leverage on cutting edge technology to deliver superior and secure e-payment services to their customers.
Showcasing our growing digital capabilities, our inaugural Public Sector Day event in August 2019 was very well received by 100 attendees across more than 30 government agencies.
Notably, sustainable financing is set to further pick up pace; it is no longer a niche activity, but a mainstream one. Building on our strong track record, we will continue to encourage more customers to join us on the sustainable journey and support them in drawing up their sustainability frameworks and strategies.
Another area we want to focus on is to structure deals through more collaborative partnerships. One such example is how we partnered China Export & Credit Insurance Corporation (Sinosure) on sustainable projects under the Belt and Road Initiative (BRI). In 2019, we closed three deals to support Chinese corporates’ exports into the ASEAN region under this partnership.
Q: How can technology make an impact on large corporations?
A: Digital transformation is gathering pace amongst large organisations, both in the private and public space, to drive efficiency and enhance customer experience. We see a growing need for more partnerships to offer new solutions amidst emergence of digital platforms and enablers such as mobile authentication, APIs (Application Programme Interfaces), QR (Quick Response) codes and PayNow that facilitate new business opportunities.
We continue to build strong partnerships with our customers and support them across the OCBC network.Elaine Lam Head of Global Corporate Banking
Q: How did you help large corporations cope with the geopolitical tensions of 2019?
A: Many large corporations remained cautious amid trade tensions and rising geopolitical concerns spilled over from 2018. Global and regional trade activities slowed down, impacting our trade finance businesses.
Despite this climate, we registered strong growth and continued to onboard new banking relationships. We strengthened our partnerships with existing customers and supported them across the OCBC network as they expanded into new markets.
Leveraging our sector expertise, we facilitated regional trade and investment flows along the active China-ASEAN corridor, primarily across Malaysia, Indonesia, Thailand and Vietnam. We also assisted customers in their ventures outside of Asia into developed markets such as the United States, Australia and the United Kingdom.
Our commodities business deftly navigated global headwinds to be ranked among the top three commodities banks in Asia Pacific (ex-Japan) in Refinitiv’s Commodities Bookrunner league table in 2019.
Q: What opportunities lie ahead?
A: We see growth opportunities in infrastructure-related sectors such as power, transportation and telecommunications.
We topped two sustainable finance league tables, rounding up a year that has seen us strengthen our commitment to sustainability, and helping more customers go green.
Ms Elaine Lam, Head of Global Corporate Banking of OCBC Bank, and Mr Zha Weimin, Executive Vice President of China Export & Credit Insurance Corporation (Sinosure), inked the Framework Agreement of Cooperation in April 2019, to formalise a partnership that will see both companies assessing BRI projects and investment opportunities, and collaborating to boost trade and investment cooperation between both countries. Sinosure will provide insurance coverage for OCBC’s financing activities of sustainable projects or other BRI developments.
To build a sustainable finance portfolio of
S$10bby 2022
Our Target
Leader in Sustainable Finance
1st Bankin Southeast Asia to stop financing new coal-fired power plants
No. 12019 Asia Pacific (ex-Japan) Green/Renewable Energy Loans Mandated Lead Arranger League Table by Bloomberg
No. 12019 Asia Pacific (ex-Japan) Green/Sustainability-linked Loans Mandated Lead Arranger League Table by Debtwire
>S$5bin new commitments to sustainable finance in 2019
>20green and sustainability-linked loans completed in 2019
Financed renewable energy projects to provide generation capacity of more than
2,000 MW
of cleaner energy in 2019
Read more about this on page 66
Ask Elaine48 OCBC Annual Report 2019 49Our Year in Review

We empower employees to take charge of their own careers and create their own futures.Jason HoHead of Group Human Resources
Q: What is at the core/heart of OCBC’s HR philosophy?
A: Our purpose is to contribute to the vision, mission and financial success of the business by investing in our human capital, technology and HR processes to drive new value and experiences for our employees more effectively. This supports the OCBC Employer Brand Promise of being caring, progressive and being able to deliver a difference.
We take a long-term view and invest in upskilling and reskilling our people for the future so that we are well prepared for the ever-changing economy. Taking care of people, for now and the foreseeable future, is our business. The more relevant their skills are, the more successful the business will be.
We are committed to investing in each person’s career, and not just for their time with us. By equipping our people with key skill sets that prepare them for the future, we are developing a talent pool not just for our company, but for the community at large.
Q: What is your HR strategy for developing people?
A: The rise of data and technology brings about significant implications for both businesses and workers, as the skillsets needed will change. Still, beyond technology, our strategy revolves around what we do best–to look after people
from all aspects of HR, from recruitment and selection to learning and development; from performance management to workplace culture and rewards.
Our stand is that it is our responsibility to provide employees with the necessary tools and skills for the transition into the future. We work collectively with our ecosystem of government agencies, educational institutions and business providers to create opportunities and possibilities for our employees.
We have embarked on the Future Workforce Initiative, a bank-wide workforce transformation to re-imagine the future of work within which job role transformation will take place.
To date, we have reviewed more than 150 roles in Singapore-based entities. This covers nearly 9,000 people, of which one-third of roles have a high potential to be transformed to be more efficient or to capture value that new technology now affords us.
Concurrently, we launched Future Smart, a S$20 million, global three-year learning initiative to equip our employees in competencies needed to thrive in the future world. Under Future Smart, we have partnered industry experts to create the Data Certification Pathway and the Cyber Certification Pathway. The tools and techniques imparted deepen the skillsets of our people. This development of the right skills and mindset will enable the organisation to stay agile and relevant in the changing business landscape.
To support our employees, we also ensure that the right environment and infrastructure are created to enable a collaborative digital culture. One of the ways we do this is by creating an agile and collaborative workspace where offices are redesigned to incorporate more open spaces and opportunities for collaboration. This is one of the many things we do to start changing the way we work, while we embrace the changes that the world brings.
Data Certification PathwayLaunched in July 2019, the pathway aims to raise the overall data literacy of our employees and double the number of data scientists and analysts we have. Sheihu, who works in Global Treasury’s Business Process Transformation Unit, took the initiative to be part of the pathway and has completed the first module – Programming in Python I under the Data Analyst track. He aims to complete the remaining 10 modules under the Pathway in three years’ time and receive his certification to become a data analyst. “When I first joined the workforce 25 years ago, the buzzword was how to collect data. Today, with data being an integral part of our lives, we have to deepen our skillsets so that we are able to remain relevant and contribute to the society.”
Sheihu Abdul Khadar Asan Abdul Kader, 50, is one of 96 pioneer employees who has taken the first steps on a new Data Certification Pathway.
Nurturing more than
30,000 employees
globally
>23,000 employees
worldwide completed digital and fintech learning programmes
>7,000curated learning and development programmes
Average
6.03 days
of learning for each employee
About
1 in 9jobs filled internally
Launched
MyWellness, a digital one-stop benefits portal and app, to empower employees to create a wellness journey that best suits them
Singapore
>2,500 employees
participated in the activities showcasing the future of work and innovation at work
MalaysiaThe Learning Festival featured subject-matter experts on all things digital and innovation booths to showcase the bank’s latest innovation
Indonesia
637 employees
in Indonesia attended the OCBC NISP Learning Festival 2019
Hong Kong SAREmployees attended talks and experienced VR games at the inaugural OCBC Wing Hang Digital Carnival 2019
2019 Annual Future Smart Future Workforce Learning Festival
Ask Jason50 OCBC Annual Report 2019 51Our Year in Review

Q: In 2019, OCBC won the Excellence in Leadership Development award at the HR Excellence Awards. What is your strategy for providing your leaders with skills and development opportunities that allow them to shine?
A: For key objectives to be achieved, leadership is key. Our philosophy for workforce development is that everyone is a leader and has the capacity to lead. Among the important skills needed is the ability to collaborate and articulate strategy.
From a development perspective, we focus on building and preparing future-ready talents for the sustainable growth of the organisation. We develop people-centric programmes that support new ways of working and our comprehensive suite of development programmes cater to staff at different levels. Through these learning programmes, we develop people holistically, with an eye towards honing leadership skills that are all-encompassing.
We are here to build leaders for the long term, not just the near future.
Q: How does HR adopt digitisation to its best advantage?
A: We adopt digitisation to enhance the employee experience so that we deliver a high service level to our employees, whom we look upon as our main ‘customers’.
Having the right digital tools and processes is key so that we can serve our people better. Our In-house employee app – HR In My Pocket (HIP) is instrumental in reducing manual processes by allowing us to adopt automated IT solutions. Employees use the app to select their benefits, file claims, apply for leave, view internal job opportunities and staff promotions and retrieve a whole range of information on the go. With each new release, we add more services to match the functionality and expectations created by consumer technology, allowing employees to exercise even more control over their HR tools and applications.
Such solutions allow for a much more efficient HR. Alongside these capabilities, we use data to drive more efficiencies while uncovering the needs and wants of our people.
With data, we have uncovered our employees’ preferences and been able to enhance existing schemes. For example, when we analysed our employees’ spending patterns on medical expenses, we found that older employees were putting in more claims for their parents’ medical expenses. We then extended medical coverage to parents of all employees. A third of our staff in total have enroled in this medical benefits plan to date.
With such insights, we developed MyWellness, a benefits portal and app that empowers employees to choose the best coverage for themselves and their families, creating a wellness journey that best suits their life stages and personal goals.
Q: OCBC has a history of giving back to the community. What role does HR play in that?
A: Giving back to the community is part of our heritage and core values. Learning and development fall under HR’s purview and we constantly look to offer ground-breaking initiatives that create lasting value and make a sustained positive difference to our customers, colleagues and the communities we operate in.
Since the launch of our bond-free OCBC Scholarship programme about 20 years ago, we have been providing financial assistance to support young Singaporeans in their pursuits, from garnering tertiary education, to realising their dreams and passions. This is our contribution to those who represent the future of our country.
In 2019, we introduced two new scholarship programmes. The OCBC Regional Undergraduate Scholarship is reflective of OCBC’s growing regional presence. It is our aim to develop more talents who have regional exposure and aspirations. The OCBC AI Scholarship for postgraduates is the first AI scholarship to be offered by any bank in Asia. It is another step we are taking to proactively grow the AI talent pool to harness technology as a strategic capability to bring even greater value to our customers and staff.
Further strengthening the OCBC ‘giving back’ culture are programmes like the ongoing MentorMe, which has women going through nine months of mentorship with senior staff in the bank.
The OCBC team being recognised at the HR Excellence Awards 2019 for their effort in creating high impact leadership programmes.
Former Cabinet minister George Yeo shared his insights and perspectives on global issues affecting nations and corporations at a dialogue session for more than 100 senior leaders in the bank, including those in the first batch of a new group-wide senior leadership programme, BOLD. The programme aims to provide our experienced leaders insights and perspectives into global issues affecting corporations and countries.
Best Employer Awardawarded by Kincentric Best Employers Awards (OCBC Bank)
Gold – Excellence in Leadership Developmentawarded by Human Resources OnlineHR Excellence Awards 2019(OCBC Bank)
Gold – Most Innovative and Sustainable Office Design (SG)awarded by Human Resources Online Asia Recruitment Awards 2019(OCBC Bank)
IBF Workforce Transformation Awardawarded by Workforce Singapore (WSG)IBF Distinction Evening 2019(OCBC Bank)
Grand – Best Employee Wellness Awardawarded by CT goodjobsBest HR Awards 2019 (OCBC Wing Hang Bank)
Best Practice Award on People Developmentawarded by China Annual Learning & Development Conference(OCBC Wing Hang China)
1st Indonesia Best Companies in Creating Leadersfrom Within 2019awarded by SWA Magazine(OCBC NISP)
Gold – Employer of the Yearawarded by Human Resources OnlineHR Excellence Awards 2019(Bank of Singapore)
Launched
OCBC Regional Undergraduate Scholarshipto develop more talents who have regional exposure and aspirations
Launched
Data Certification Pathwayin partnership with Ngee Ann Polytechnic to groom 200 data scientists/analysts over the next three years
Launched
Cyber Certification Pathwayin partnership with Temasek Polytechnic to train 200 Cyber Risk Analysts and Cyber Security Specialists in the next three years
Ask Jason
52 OCBC Annual Report 2019 53Our Year in Review

ContactWe welcome your feedback and suggestions at [email protected]
ContentsBoard Statement 56
2019 Key Achievements 57
Our Approach to SustainabilityOur Sustainability Framework 58Our Sustainability Governance
Structure 59
Stakeholder Engagement 59Our Materiality Assessment Process 59Delivering on the Sustainable
Development Goals (SDGs)60
Putting Customers FirstFinancial Inclusion 61Digitalisation 62Customer Experience 64
Being Environmentally and Socially ResponsibleResponsible and Sustainable
Financing66
Environmental Footprint 70
Acting with Integrity Strong Governance 72Fair Dealing 73Combating Financial Crimes and
Cyber Threats74
Valuing Our PeopleInclusive Workforce 76Talent Management and Retention 78
Engaging CommunitiesCommunity Development 82Economic Contributions 83
GRI Standards Content Index 283
About This ReportScope of the ReportThis report covers the operations of OCBC Group globally except for Great Eastern Holdings, a separately listed subsidiary that publishes an independent sustainability report. The content of this report focuses primarily on activities carried out within the financial year ending 31 December 2019. Where applicable, data from previous financial years was included for comparison.
Reporting FrameworkWe have adopted the Global Reporting Initiative (GRI) Standards as our reporting framework. This report has been prepared in accordance with GRI Standards: Core option and GRI G4 Financial Services Sector Disclosures. This includes adhering to the GRI principles for defining report content:
• Sustainability context• Stakeholder inclusiveness • Materiality • Completeness
Details on our approach to stakeholder inclusiveness and materiality can be found in this report and on our website. We have also referenced the primary components detailed in the Singapore Exchange (SGX) Listing Rule guide for sustainability reporting.
Data and External AssuranceWhile we have not sought external assurance this year, the data included in this report has undergone rigorous review and approval as part of our internal processes.
The winged fruits of the Dipterocarp tree help scatter the seeds to ensure its survival. These endangered trees are the ‘green lungs’ of Asia and are super-storers of carbon dioxide.
Sustainability Report54 OCBC Annual Report 2019 55Sustainability Report 2019

OCBC has created value for our customers and stakeholders for more than 87 years. Indeed, we are the longest established bank in Singapore. Throughout our history, we have long believed that businesses do well by doing good. Today, this belief has never been more relevant. Climate change, social and economic inequality and unfair business practices are some of the issues creating unprecedented impacts that pose a risk to the long-term sustainability of our business and threaten the well-being of future generations.
As a bank, we have an important role to play not only to support economic growth, but also be a catalyst for sustainable development. Sustainable development is about investing now for a better future for our business, for our stakeholders and for the communities we serve. Therefore, we are committed to taking a long-term view on how we create and sustain value.
Creating a more sustainable future will require change and in some cases, trade-offs to move away from a short-term mindset. Our Sustainability Framework guides our approach to embedding responsible and sustainable business practices in everything we do at OCBC. Through our Sustainability Framework, we are committed to Putting Customers First, Being Environmentally and Socially Responsible, Acting with Integrity, Valuing our People and Engaging Communities. It embodies our aspiration to be the leading bank for responsible and sustainable finance in Asia.
Driving Change for the Long Term In 2019, we made several strides towards this aspiration and the targets that we set ourselves. We were the first Singaporean bank to stop financing any new coal-fired power plants, as a material update to our Climate Change Statement. This reflects the urgency and importance we place on taking action to avoid catastrophic climate change. We remain committed to supporting the necessary transition to a low carbon economy and the 2030 sustainable development agenda as set out by the UN Sustainable Development Goals (SDGs). In this regard, we have set a target to build a sustainable finance portfolio of S$10 billion by 2022.
The SDGs set out the world’s most pressing priorities and also present an opportunity for businesses to align with societal needs. Over the last year, we are very proud to have supported more than 20 green and sustainability-linked loans, which contribute to our selected focus SDGs. In addition, we have also financed renewable energy projects in countries such as Australia, China, Malaysia and the United Kingdom. We added more than S$5 billion in commitments to our Sustainable Finance portfolio in 2019 alone.
In the same vein, we continue to look for ways to partner and support environmental initiatives that enhance sustainability. In 2019, we launched the OCBC Arboretum at the Singapore Botanic Gardens. The Arboretum will enable the study and conservation of Dipterocarp trees. These trees are the backbone of rainforests and a vital ingredient in the fight against climate change, absorbing and storing more CO2 than other species.
We also continue to transform ourselves through technology. Digitalisation has been a catalyst for growth across our business, bringing new capabilities and enabling us to create a Bank of the Future. Central to our digital transformation is the OCBC Future Smart Programme, building the digital competencies of our people and weaving innovation into our DNA. We launched a cyber certification pathway to train relevant employees to become cyber risk analysts and cybersecurity specialists in the next three years.
Banking is all about trust. In the wake of several controversies involving ethical misconduct in the global financial
community, this year OCBC established a new Board Ethics and Conduct Committee. We are the first bank in Singapore to do so. We believe that this will help us to continue forging a strong culture of responsible banking and ethical conduct, meeting the expectations of our stakeholders and creating lasting value.
Looking AheadWe are very proud of the strong progress that we have made on our journey so far. However, we are cognisant of the challenges that still lie ahead if we are to fulfil our aspirations. As such, we will continue to drive performance across our material Environmental, Social and Governance (ESG) factors and the targets we have set. We also recognise that sustainable development and tackling climate change require collective action. Therefore, we are committed to collaborating and partnering with others to drive change systemically.
As we move forward on our journey, the Board of Directors continues to exercise oversight over the management and monitoring of sustainability at OCBC. It considers the material ESG factors facing our business as part of its strategy formulation and decision-making. This includes assessing the environmental risks across our lending portfolio and implementing the recommendations put forward by the Task Force on Climate-related Financial Disclosures (TCFD).
Together with the Executive Management Team, the Board is committed to transforming the Bank to ensure that we stay relevant, build resilience and create sustainable long-term value. Our success is interwoven with the success of all our stakeholders.
In 2019, we made steady progress in our sustainability efforts, setting stretched targets for each material ESG factor. We wove sustainability more deeply into our corporate culture and rolled out initiatives that create sustainable value for our customers, community and employees. We focused some of our efforts on supporting the environment and doing our part in battling climate change. Here are the key achievements of 2019. We will continue to drive performance to move forward our sustainability agenda.
>4,400 Employeestrained in sustainability related topics to-date
>S$5b new commitments to sustainable finance
4 New Policiesdeveloped for high risk sectors defined by the ABS Responsible Financing Guidelines
The Green PitchBringing together like-minded individuals to pitch ground-up climate action solutions.Winning solutions were funded by the #OCBCCares Environment Fund
OCBC Arboretum At the Singapore Botanic Gardens.A forest of 2,000 endangered Dipterocarp trees that can store carbon emissions, to help fight climate change Stop Coal-Fired
Power Plant Financing1st bank in Southeast Asia
No.1 MLAMandated Lead Arranger (MLA) in APAC (excluding Japan) (1)
1st Green Bondissued A$500 million of senior floating-rate green notes
Apart from doing what is right, we are committed to do more and to go beyond. We go beyond not only by creating sustainable value for our customers, our employees and our shareholders, we must also create sustainable value for the community we operate in and maintain a sustainable environment for our future generations.– Samuel Tsien in his 2019 Year-End Personal Note of Appreciation to OCBC employees
(1) OCBC was ranked number 1 Mandated Lead Arranger (MLA), APAC ex Japan in 2019 by Bloomberg (Green UoP Loans) and Debtwire (Green and Sustainability-Linked Loans).(2) Digital customers are customers who have used internet/mobile banking at least once in the last three months.(3) Individual beneficiaries helped, ranging from vulnerable seniors, children and youth, to people with special needs and low-income families.
World’s Best Consumer Bankawarded by Global Finance
53%of consumers and
65%of SME customers in Singapore are digital (2)
>S$500mnew government-assisted loans to SMEs in Singapore, Malaysia and Hong Kong SAR
Child Development Accounts No.1 provider in Singapore
>11,300 volunteersdedicated more than 52,500 hours of time and talents to community services
>138,900beneficiaries helped (3)
S$1.8mdonated by Bank and staff to support the community and the environment
Board Ethics and Conduct Committee1st bank in Singapore to set up committee to ensure responsible banking
A rating
by Morgan Stanley Capital International (MSCI) ESG Research
S$15.1mstopped from falling into the hands of fraudsters through our anti-fraud programme
Best Employer Awardin Singapore and Malaysia
Women in Leadershippositions increased from 38% to 40%
IBF Workforce Transformation Award by The Institute of Banking and Finance Singapore
2019 Key AchievementsBoard Statement56 OCBC Annual Report 2019 57Sustainability Report 2019

At OCBC, our purpose is to help individuals and businesses across communities achieve their aspirations by providing innovative financial services that meet their needs today and tomorrow. Embedding responsible and sustainable business practices into everything we do is integral to our purpose and how we create long-term value for our stakeholders. Our approach is guided by our Sustainability Framework which comprises five Sustainability Pillars and 12 material ESG factors to support the delivery of our five selected United Nations Sustainable Development Goals (SDGs). This defines our most important priorities as an organisation.
Our Sustainability Framework
Our 12 Material ESG Factors
Our 5 Sustainability Pillars
Pillar 2
Being Environmentally and Socially ResponsibleContributing to responsible economic growth and sustainable development through our financing solutions, as well as managing the environmental footprint of our own operations.
Pillar 1
Putting Customers FirstProviding innovative financial services and a seamless banking experience for our customers. This is at the heart of our brand promise— Simply Spot On.
Pillar 3
Acting with Integrity Embedding responsible business practices to safeguard trust and protect value for our stakeholders over the long term.
Pillar 4
Valuing Our PeopleCreating a nurturing and engaging work environment that welcomes diversity and enables our people to realise their full potential.
Pillar 5
Engaging CommunitiesContributing to healthy, thriving and inclusive communities through our core business, corporate giving, employee volunteering and partnerships.
Delivering on Our 5 Selected SDGs
3. Good Health and Well-being7. Affordable and Clean Energy8. Decent Work and Economic Growth9. Industry, Innovation and Infrastructure13. Climate Action
• Financial Inclusion• Digitalisation• Customer Experience
• Responsible and Sustainable Financing
• Environmental Footprint
• Strong Governance• Fair Dealing• Combating Financial
Crimes and Cyber Threats
• Inclusive Workforce• Talent Management
and Retention
• Community Development
• Economic Contributions
Stakeholder Engagement
At OCBC, we recognise the importance of understanding and being responsive to stakeholder expectations and interests. Stakeholder engagement is carried out on a regular basis and at every level of
the business. Continuous, constructive and open dialogue is key to ensuring that we not only understand stakeholder expectations, but also that stakeholders gain a better understanding of our
business. The outcomes of our interactions with stakeholders inform our approach to managing sustainability, including the identification of our material ESG factors.
To achieve our aspirations and embed responsible and sustainable practices into our business, a robust governance structure is important. The Board has ultimate responsibility for overseeing all aspects of sustainability at OCBC. It is supported by the Sustainability Council and the Sustainability Working Group.
Our Sustainability Governance Structure
Board The Board has the ultimate responsibility and oversight for sustainability at OCBC. In this regard, the Board takes our material ESG factors into account when setting the strategic direction of the company.
Sustainability Council
The Sustainability Council is responsible for the identification, management and monitoring of our material ESG factors under our Sustainability Framework. It is chaired by the Group Chief Executive Officer and comprises other Senior Management Team members.
Sustainability Working Group
The Sustainability Working Group is responsible for implementing initiatives, engaging internal and external stakeholders on sustainability matters and driving performance across our material ESG factors through the setting and measurement of Key Performance Indicators (KPIs) and targets. Its members include representatives from across all our main business units.
Our Materiality Assessment Process
The sustainability agenda presents a broad range of potential topics of relevance. While we monitor and manage several topics, we focus our strategies and efforts on the material sustainability risks and opportunities that reflect our most significant impacts and are of greatest importance to our key stakeholders.
We regularly undertake an assessment to identify the most material ESG factors facing our business. Our last review was undertaken in 2018. The 12 material
ESG factors from this review remain relevant in 2019. Our Board considers the material ESG factors facing our business as part of its strategy formulation and decision-making.
As we progress on our sustainability journey and our business context changes, we will continue to evolve and update our understanding of materiality through stakeholder engagements and in consultation with management across our operations globally.
Our material ESG factors are managed through our policies, procedures and programmes. We monitor our performance and drive improvement through a set of KPIs and targets that are embedded into management objectives across our different business units and functions. We report our progress and performance on each material ESG factor on pages 61 to 83 of this report that follow.
For more details on our approach towards sustainability governance structure, stakeholder engagement and materiality, please visit our website.
Our Approach to Sustainability58 OCBC Annual Report 2019 59Sustainability Report 2019

Financial Inclusion
Why this is Material to UsProviding innovative and accessible financial products and services is in line with our goal of helping individuals and businesses across communities achieve their aspirations.
Our Management ApproachWe provide products and services that cater to the needs of various groups in society, including children and young families (Child Development Accounts), youth between 16 and 29 years old (FRANK by OCBC) and pre-retirees and retirees (Silver Years by OCBC Life Goals).
In 2019, we launched a number of innovative financial services to provide start-ups and small businesses with improved access to finance:
First to Market Same-day Online Business Incorporation and Instant Account Opening for ‘Born Digital’ Start-ups in Singapore• Building on strong momentum with
over 90% of new SME accounts opened digitally, we offer added value to entrepreneurs by enabling them to open business accounts at point of business incorporation, delivered in partnership with digital corporate secretaries.
Leading SME Bank to Support Innovative and High Growth SMEs• Business Venture loans for SMEs with
innovative business models or those which adopt emerging technologies.
Extending Loans to Small Business in Collaboration with P2P Lending Partners• Launch of pilot to provide short-term
transactional financing to meet the underserved needs of SMEs.
Asia’s Best Bank for SMEs awarded by Euromoney
Best SME Bank in Singapore and Indonesiaawarded by Alpha Southeast Asia
Best Trade Finance Bank in Singaporeawarded by Alpha Southeast Asia
Financial Literacy Classes for Low-income FamiliesAs part of our newly launched OCBC-NTUC First Campus Bridging Programme, the Bank will organise financial literacy workshops for parents to help them better manage their family finances. These workshops will be conducted by staff volunteers from our Wealth Management team on a quarterly basis from 2020–2024.
OCBC Group CEO Samuel Tsien with parents and children at the launch of the OCBC-NTUC First Campus Bridging Programme on 23 September 2019.
Maintain
No.1market share of Child Development Accounts in Singapore in 2020
S$550mnew government-assisted loans to SMEs in Singapore, Malaysia and Hong Kong SAR in 2020
40%of new business loans through digital platforms in 2020
Our Targets
Our Performance
No.1provider of Child Development Accounts in Singapore
>S$500mnew government assisted loans to SMEs in Singapore, Malaysia and Hong Kong representing 21% growth
1 We met the target of S$500m in new loans, but the overall loan growth is at 21% (vs 2019 target 25%) due to a more challenging Hong Kong market
Delivering on the Sustainable Development Goals (SDGs)
Our Sustainability Framework supports the delivery of the United Nations Sustainable Development Goals (SDGs).
As a bank, the main way we can make a difference is by providing financial solutions that support sustainable development. We have selected five focus SDGs, where we can make the biggest contribution to sustainable development
in the markets where we operate. They are:• SDG 3: Good Health and Well-being• SDG 7: Affordable and Clean Energy• SDG 8: Decent Work and Economic
Growth• SDG 9: Industry, Innovation and
Infrastructure• SDG 13: Climate Action
We also recognise that the SDGs are a set of interrelated goals and that we touch all 17 SDGs in different ways. Therefore, we will continuously seek new ways to contribute to the whole sustainable development agenda where relevant.
For more case studies on how we are contributing to the SDGs, please refer to the chapter on Responsible and Sustainable Financing on page 66. For more details on how OCBC is contributing to the specific targets related to each of our focus SDGs, please visit our website.
Supporting Carbon Capture and StorageIn a world where carbon emissions are at their highest, we believe that carbon capture and storage is essential to reducing CO2 emissions. In our effort to support SDG 13, we partnered NParks to create the OCBC Arboretum at the Singapore Botanic Gardens to grow and conserve more than 2,000 endangered Dipterocarp trees.
The OCBC Arboretum is an important component of our commitment to fighting climate change as carbon emissions are at their highest and will increasingly cause potentially disastrous events for mankind. Each Dipterocarp tree can store as much as 40,000kg of CO2 in its lifetime. An Internet of Things (IoT) system is deployed in the OCBC Arboretum to remotely and continuously monitor the trees and their environment.
Financing Offshore Wind Power One of the key steps to achieving emissions reduction is the shift to renewable energy. OCBC is therefore proud to be a Mandated Lead Arranger for the financing of a 640 MW, 80-turbine offshore wind power facility project in Taiwan. The project is majority-owned by wpd AG, a German developer and operator of onshore and offshore wind farms. This project marks OCBC’s inaugural financing of an offshore wind power project, scheduled for completion in December 2021.
The project supports the Taiwan government’s plan to install 5.5GW of offshore wind generation capacity under the “Thousand Wind Turbines Project”, and to develop a 20% generation share for renewable energy by 2025. This project is aligned with one of our core SDGs – SDG7, to enable access to clean and affordable energy.
Enabling a Low-Carbon FutureA report published by the Intergovernmental Panel on Climate Change (IPCC) in 2018 highlighted the need to keep global temperature rise to
1.5°C above pre-industrial levels to avoid catastrophic impacts from climate change. This requires urgent action by governments, businesses and civil society. In line with our support of SDG 13 and recognising the need to
take urgent climate action, OCBC became the first bank in Southeast Asia to stop new financing of coal-fired power plants. Some of our other initiatives to support climate action include the following:
Sustainability Pillar 1:Putting Customers First
Our Approach to SustainabilityDelivering on Our SDGs
60 OCBC Annual Report 2019 61Sustainability Report 2019

Best ATM Innovationawarded by the Digital Banker at the Global Retail Banking Innovation Awards
Best Self-Service Bankingawarded by the Digital Banker at the Global Retail Banking Innovation Awards
Best Digital Banking Initiativeawarded by the Digital Banker at the Global Retail Banking Innovation Awards
Best Internet Banking Initiativeawarded by the Digital Banker at the Global Retail Banking Innovation Awards
Best Transactional Banking Online Platform awarded by Alpha Southeast Asia
Best API Initiative, Application or Programme awarded by The Asian Banker at the Business Achievement Awards
Best Digital Trade Finance Platform Initiativeawarded by the The Asian Banker at the Business Achievement Awards
Winner of Digital Transformation and Modern Application Developmentat the Red Hat APAC Innovation Awards
Digitalisation
Why this is Material to UsTechnology is advancing at a rapid pace and the needs and expectations of our customers are changing accordingly. As such, digitalisation is mission-critical for OCBC. We must continue to provide innovative and seamless solutions that meet our customer needs across all stages of their journey with us.
Our Management ApproachDigital transformation is an integral part of OCBC’s corporate strategy. We are focused on driving bank-wide digital transformation to create the Bank of the Future.
Our digital strategy cuts across every aspect of the Bank. We are focused on redefining digital banking to provide innovative new value propositions for our customers and a next-generation user experience.
Transforming our business to foster innovation and embrace agile ways of working at scale, establishing ecosystem partnerships and leveraging artificial intelligence are key tenets of our strategy.
Our digitalisation strategy is led by our Group CEO, who is supported by dedicated digital teams in Singapore as well as our core markets. Each business unit is responsible for the execution of its part in the strategy.
The Open Vault at OCBC, Carpe Diem and AI Lab continue to be flagship drivers for our digital journey. For more information on these programmes, please visit our website. We also continue to roll out OCBC Future Smart across the Group, as we build a future-ready workforce. For more information on OCBC Future Smart Programme, please refer to page 78.
Some of our new initiatives in 2019 included:
Reinvented Mobile Banking• To offer proactive, personalised and
automated money management, next generation segmented customer journeys and AI-powered voice banking.
Democratising Wealth Management• First bank to launch a full suite of
goal-based advisory and financial planning solution on digital platforms leveraging on OCBC Life Goals.
Instant Customer Onboarding• First bank to enable instant approval
and use for everyday banking products including credit cards, personal loans and bank accounts.
• This leverages on a strategic partnership with GovTech and a proprietary eKYC platform.
Innovative Services on ATMs• First in Singapore to enable cardless cash
withdrawals at ATMs using QR codes via OCBC Pay Anyone app.
• Rolled out new ATMs to migrate teller transactions like high value cash withdrawals and deposits to digital self-service.
Payments and Ecosystem• Launched STACKTM , a digital loyalty
platform powered by OCBC, for tracking and exchanging rewards points across multiple rewards programmes.
• Enabled contactless transit payments in coordination with LTA and NETS.
Pivoted Our Operating Model to Deliver Agile at Scale• Transition from a silo-ed project-based
delivery structure to a co-created platform-based approach, built using co-located, cross-functional teams with common metrics.
Our Performance
Digital Customers in Singapore 1
53%2 consumers
(from 36% in 2014)
65% SMEs
(from 36% in 2014)
92%of financial transactions 3
conducted digitally by consumer customers
77%of digital consumer customers bank on mobile
1 Digital customers are customers who have used internet/mobile banking at least once in the last three months.
2 The number of digital active customers showed strong growth with 9% year-on-year increase, bringing the total digital active penetration rate to 53%. The absolute number of digitally active customers grew according to plan with a 2% variation in digital penetration rate due to a higher than forecasted jump in active customers. We remain on track to hit the committed 60% target by 2023.
3 Financial transactions refer to fund transfers and payments which are non-cash in nature.
Increase the Number of Digital Customers in Singapore
Consumers:
56%by 2020 and 60% by 2023
SMEs:
67%by 2020 and 70% by 2023
>90%financial transactions conducted digitally by 2020
>75%of digital customers bank on mobile by 2020
Our Targets
Empowering Our SME CustomersOCBC continues to support SMEs on their digital transformation journey:
• First to market same-day online business incorporation and instant account opening.
• Online Business Loans, offering SME customers 24/7 self-service loan application capability and approval.
• OCBC Start Digital Programme, which helps SME customers to go digital in areas beyond banking, including HR, Accounting, Digital Marketing, Digital Transactions and Cyber Security.
• OCBC Malaysia appointed as the exclusive transaction enabler on B2B online platform DaiGor for cross-border electronic trade settlements, enabling local SMEs’ increased participation in global trade.
To grow in Singapore today, small companies like us need to make effective use of technology to improve our productivity. As an SME, our strength lies in how we can adapt more quickly to changes, and we need to capitalise on opportunities like OCBC Start Digital.
– Faisal Asri, founder of 3D Brand Agency
Facilitating our customers’ transition to digital payment.
Facilitating Our Customers’ Transition to Digital Payment This year, OCBC became the first Singapore bank to join Singtel’s VIA mobile payment alliance. By the first quarter of 2020, OCBC Bank customers will be able to go cashless when they
This long-term partnership with Singtel is another key milestone in our journey to drive digital payment adoption among our customers, and address their digital payments needs.
– Ching Wei Hong, Deputy President and Head of Global Wealth Management and Consumer Banking
travel to Thailand or Japan. Using the OCBC Pay Anyone app, they will be able to make QR code payments at more than 1.7 million merchant partners on VIA’s network in Singapore dollars at competitive and transparent exchange rates.
Sustainability Pillar 1:Putting Customers First
Delivering on Our SDGs
62 OCBC Annual Report 2019 63Sustainability Report 2019

We launched Singapore’s first Financial Wellness Index, a comprehensive study of the state of Singaporeans’ financial health. We aim to continue the Index every year and extend it over the next few years to our core regional markets.
Introducing Singapore’s First Financial Wellness Index In 2019, OCBC launched Financial Wellness Index, the most comprehensive study of Singaporeans’ financial health conducted to date. By engaging over 2,000 working adults, it was the first study to research how Singaporeans fare across 10 pillars of financial wellness.
The deep insights gained enabled us to develop products and services to better meet customer needs in different segments. The results were made public and are available online for individuals to understand their own strengths and weaknesses in financial wellness. To address the gaps revealed by the Index, a structured financial literacy course, OCBC Financial Masterclass, was also launched to offer practical tips.
Customer Experience
• Prototyping and testing concepts to validate and understand effectiveness.
• Refining and aligning the objectives of the organisation with the needs of the customers.
Scaling design practices were achieved by coaching selected teams and by embedding employees with design proficiency and expertise within those teams. This resulted in an overall wider sensitivity towards customers’ needs, an increased capability to collaborate as well as an improved speed of execution.
We further refined our practice of monitoring and measuring the quality of the delivered experience. This was done by systematically and rigorously measuring the levels of customer satisfaction, the number of customer complaints (the fewer, the better) and the willingness of customers to recommend the Bank (Net Promoter Score).
In addition, we view complaints as opportunities for the Bank to learn and improve our people, systems and processes in order to retain customers and grow new business. All complaints received are reviewed and tracked to resolution. We analyse the data and trends of all complaints resolved. Learning and improvements are obtained during investigation of root causes and resolution lead by a Complaint Management Council comprising representatives across businesses and operations. Complaint data and issues are shared with senior management and the Board.
Most number of winners for the
Excellence Service Award (EXSA)awarded by The Association of Banks in Singapore
World’s Best Consumer BankGlobal Bank Award 2019 by Global Finance
FRANK Stores at Key Tertiary InstitutionsFRANK was designed primarily to connect with youths in a sustainable way. In addition to the ones at NTU and SMU,
the latest store at NUS University Town presented an opportunity to challenge conventional thinking and develop a radical approach—to create a space that adheres to the principle of human-centred design.
To achieve this, it was necessary to work with students and the school administration. Ethnographic studies and co-creation sessions were at the heart of design activities. Speaking to students, the following became clear:
• With ample spaces for students to study and revise, there was an opportunity to create a dedicated space where students can slow down and relax.
• Equipped with WIFI and charging ports, the store has hosted various activities, from lunch-time talks on financial literacy to networking events for student clubs.
• The store goes beyond a 9-to-5 bank and is available 24/7, to be in sync with the rhythms of campus life.
Inspired by the university’s green drive, the store features an innovative cooling system that cools hot ambient air without coolants, at 20% of the cost of traditional air-conditioning.
Launched in March 2019, the Frank store at University Town, National University of Singapore resonates well with its target audience—youths. This was made possible with a human-centred design approach, where we engaged youths during the design process.
To maintain internal E-B score of at least
68%for our Singapore Retail Banking in 2020
Our Target
Our Performance
Achieved internal E-B score (1) by
74%for our Singapore Retail Banking, exceeding our target set in 2019
Improvement of
1%in Net Promoter Score from 2018
87%of all customers complaints resolved within three working days of receiving the complaint (Singapore)
100%of the 80 personal data-related complaints closed successfully; all 15 valid complaints filed with the PDPC were resolved
(1) Refers to our internal – Exceed Expectation – Below Expectation – (E-B) score that tracks the level of satisfaction across the various touchpoints and interactions that customers have with our staff and the Bank.
We are obsessed with developing an in-depth understanding of our customers in order to create products that are user-friendly and meaningful. This is behind our success and in particular the success of our digital capabilities in internet and mobile banking.– Ching Wei Hong, Deputy President and Head of Global Wealth Management
and Consumer Banking
Raymond Chee, General Manager of our New York Agency, receiving the World’s Best Consumer Bank Award in Washington DC.
Why this is Material to UsThe most significant impact we have on society is through our core business—providing our customers with financial solutions that meet their needs and improve their lives. Deepening engagement and forging enduring relationships with our customers are fundamental to our long-term success.
Our Management ApproachWe have embraced the practice of Human-Centred Design (HCD) to build products and services that are functional, easy to understand and emotionally engaging. This led to the development of a structured design approach that starts with a deep understanding of the customers’ needs and ends with experiences that matter to them.
Key activities to achieve that were the refinement of the design training programmes (Great Design Bootcamp and Masterclass) and the systematic application and scaling of design practices across the organisation, which is setting the standard of the OCBC customer experience.
The training programmes’ primary objective was to equip the staff responsible for the creation and development of our products with a whole new set of tools and skills that allows them to discover, prioritise and execute innovative services. The participants’ training was built around the following themes:• Re-framing problems to foster the
ideation of new ways of banking.
Sustainability Pillar 1:Putting Customers First
Delivering on Our SDGs
64 OCBC Annual Report 2019 65Sustainability Report 2019
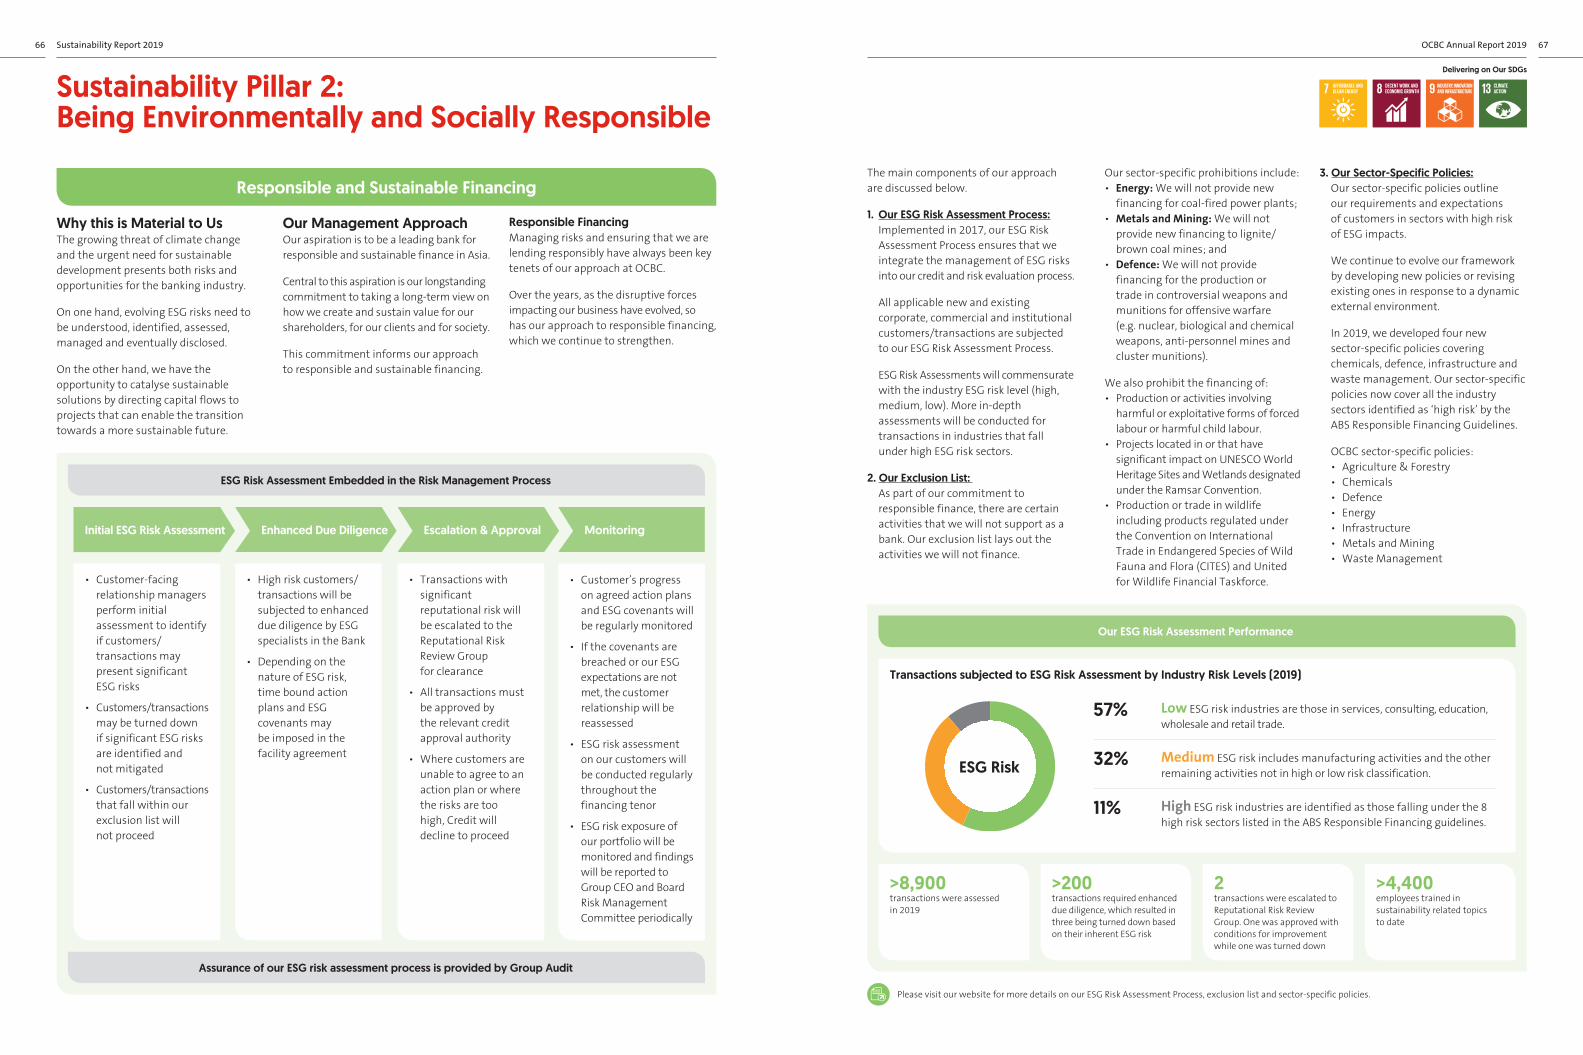
Responsible and Sustainable Financing
Why this is Material to UsThe growing threat of climate change and the urgent need for sustainable development presents both risks and opportunities for the banking industry.
On one hand, evolving ESG risks need to be understood, identified, assessed, managed and eventually disclosed.
On the other hand, we have the opportunity to catalyse sustainable solutions by directing capital flows to projects that can enable the transition towards a more sustainable future.
Our Management ApproachOur aspiration is to be a leading bank for responsible and sustainable finance in Asia.
Central to this aspiration is our longstanding commitment to taking a long-term view on how we create and sustain value for our shareholders, for our clients and for society.
This commitment informs our approach to responsible and sustainable financing.
Responsible Financing Managing risks and ensuring that we are lending responsibly have always been key tenets of our approach at OCBC.
Over the years, as the disruptive forces impacting our business have evolved, so has our approach to responsible financing, which we continue to strengthen.
ESG Risk Assessment Embedded in the Risk Management Process
Assurance of our ESG risk assessment process is provided by Group Audit
• Customer’s progress on agreed action plans and ESG covenants will be regularly monitored
• If the covenants are breached or our ESG expectations are not met, the customer relationship will be reassessed
• ESG risk assessment on our customers will be conducted regularly throughout the financing tenor
• ESG risk exposure of our portfolio will be monitored and findings will be reported to Group CEO and Board Risk Management Committee periodically
• Customer-facing relationship managers perform initial assessment to identify if customers/transactions may present significant ESG risks
• Customers/transactions may be turned down if significant ESG risks are identified and not mitigated
• Customers/transactions that fall within our exclusion list will not proceed
• High risk customers/ transactions will be subjected to enhanced due diligence by ESG specialists in the Bank
• Depending on the nature of ESG risk, time bound action plans and ESG covenants may be imposed in the facility agreement
• Transactions with significant reputational risk will be escalated to the Reputational Risk Review Group for clearance
• All transactions must be approved by the relevant credit approval authority
• Where customers are unable to agree to an action plan or where the risks are too high, Credit will decline to proceed
MonitoringEscalation & ApprovalEnhanced Due DiligenceInitial ESG Risk Assessment
The main components of our approach are discussed below.
1. Our ESG Risk Assessment Process: Implemented in 2017, our ESG Risk
Assessment Process ensures that we integrate the management of ESG risks into our credit and risk evaluation process.
All applicable new and existing corporate, commercial and institutional customers/transactions are subjected to our ESG Risk Assessment Process.
ESG Risk Assessments will commensurate with the industry ESG risk level (high, medium, low). More in-depth assessments will be conducted for transactions in industries that fall under high ESG risk sectors.
2. Our Exclusion List: As part of our commitment to
responsible finance, there are certain activities that we will not support as a bank. Our exclusion list lays out the activities we will not finance.
Our sector-specific prohibitions include:• Energy: We will not provide new
financing for coal-fired power plants; • Metals and Mining: We will not
provide new financing to lignite/brown coal mines; and
• Defence: We will not provide financing for the production or trade in controversial weapons and munitions for offensive warfare (e.g. nuclear, biological and chemical weapons, anti-personnel mines and cluster munitions).
We also prohibit the financing of: • Production or activities involving
harmful or exploitative forms of forced labour or harmful child labour.
• Projects located in or that have significant impact on UNESCO World Heritage Sites and Wetlands designated under the Ramsar Convention.
• Production or trade in wildlife including products regulated under the Convention on International Trade in Endangered Species of Wild Fauna and Flora (CITES) and United for Wildlife Financial Taskforce.
3. Our Sector-Specific Policies: Our sector-specific policies outline
our requirements and expectations of customers in sectors with high risk of ESG impacts.
We continue to evolve our framework by developing new policies or revising existing ones in response to a dynamic external environment.
In 2019, we developed four new sector-specific policies covering chemicals, defence, infrastructure and waste management. Our sector-specific policies now cover all the industry sectors identified as ‘high risk’ by the ABS Responsible Financing Guidelines.
OCBC sector-specific policies:• Agriculture & Forestry • Chemicals• Defence• Energy• Infrastructure• Metals and Mining• Waste Management
Please visit our website for more details on our ESG Risk Assessment Process, exclusion list and sector-specific policies.
>8,900transactions were assessed in 2019
>200transactions required enhanced due diligence, which resulted in three being turned down based on their inherent ESG risk
2transactions were escalated to Reputational Risk Review Group. One was approved with conditions for improvement while one was turned down
>4,400employees trained in sustainability related topics to date
Our ESG Risk Assessment Performance
32% Medium ESG risk includes manufacturing activities and the other remaining activities not in high or low risk classification.
57% Low ESG risk industries are those in services, consulting, education, wholesale and retail trade.
High ESG risk industries are identified as those falling under the 8 high risk sectors listed in the ABS Responsible Financing guidelines.
11%
Transactions subjected to ESG Risk Assessment by Industry Risk Levels (2019)
ESG Risk
Delivering on Our SDGs
Sustainability Pillar 2: Being Environmentally and Socially Responsible
66 OCBC Annual Report 2019 67Sustainability Report 2019

Addressing Climate ChangeThe threat of climate change is one of the greatest challenges facing society today. Tackling climate change is a complex challenge that requires collective action and collaboration across industries.
As a financier, it is imperative that we play our part. In 2019, we took three key steps in our efforts to address climate change:• First bank in Singapore to announce
that we will no longer provide new financing for coal-fired power plants in any country.
• Became a signatory to and expressed our support for the Task Force on
Climate-related Financial Disclosures (TCFD). We have set up an internal working group that will lead our efforts in implementing the recommendations set out by TCFD.
• Updated our Climate Change Statement to reflect our new commitments.
Contributing to the Growth of the Green Bond Market In December 2019, we became the first Singaporean bank to issue a green bond in the Australian Market through our Sydney Branch, raising AUD 500 million. The net proceeds were used to finance or refinance new or existing qualifying assets which meet the Eligibility Criteria for Green Bonds under the OCBC Sustainability Bond Framework, which is consistent with the Green Bond Principles issued by the International Capital Market Association. The transaction was well received by green investors, with strong support from Australian domestic and offshore high quality institutional investors.
OCBC Al-Amin Partners Edra Solar in Breaking New Ground with Malaysia’s First ASEAN Sustainability Sri SukukIn a first for Malaysia, OCBC Al-Amin, acting as Edra Solar Sdn Bhd’s Sukuk Sustainability Framework Adviser and Lead Arranger, created new benchmarks in the Sukuk market by successfully pricing Malaysia’s first
ASEAN Sustainable and Responsible Investment (SRI) Sukuk of RM245 million on 30 September 2019.
With Edra Solar allocating more than 15% of the Plant’s buffer zone to the local communities for farming without deriving any economic benefit from this agriculture, the project is anticipated to create both environmental and social benefits.
Solar Power Plant in Kuala Ketil, Malaysia.
Sustainable Financing As a bank, OCBC aims to partner with like-minded customers that contribute to sustainable development in society, by offering bespoke and credible sustainable financing solutions.
In particular, we understand the important role banks need to play to support the transition to a low carbon and sustainable economy. In this regard, we are excited about emerging opportunities in the renewable energy and green buildings sectors as well as other sectors that contribute to sustainable development.
Led by our dedicated Sustainable Finance Team, OCBC completed more than 20 green loans and sustainability-linked loans in 2019 and has been ranked number 1 Mandated Lead Arranger for green financing league tables in the region. We also strengthened our commitment to sustainable finance by setting a target to build a sustainable finance portfolio of S$10 billion by 2022.
As the concept of sustainable financing evolves, OCBC will continue to develop a comprehensive and innovative range of solutions targeted to meet the changing needs and opportunities in the markets where our customers are active in.
Our Performance
>20green and sustainability-linked loans completed
>S$5bin new commitments to sustainable finance
No.1Mandated Lead Arranger in APAC (excluding Japan) (1)
To build a sustainable finance portfolio of
S$10b by 2022
Our Target
Financing Solutions
Focus Industries
Green Loans and Green Bonds
Green Buildings
Sustainability-Linked Loans
Water Management
Green Capital Instruments
Clean Transportation
Project Finance
Renewable Energy
Pollution Control
(1) OCBC was ranked number 1 Mandated Lead Arranger (MLA), APAC ex Japan in 2019 by Bloomberg (Green UoP Loans) and Debtwire (Green and Sustainability-Linked Loans).
Providing Green Financing for Our Property Development CustomersOCBC Hong Kong Branch is the first bank extending a green loan facility to Hang Lung Properties Limited (“Hang Lung”), a leading property developer headquartered in Hong Kong SAR. The proceeds of HKD 1 billion green loan will be used to finance commercial property development projects in mainland China which have received gold certifications or pre-certifications issued
by the US Green Building Council of Leadership in Energy and Environmental Design (“LEED”). This green loan is issued under Hang Lung’s Green Finance Framework, which outlines the criteria and guidelines that will be used in the allocation of the green finance proceeds in line with the 2018 Green Bond Principles and the 2018 Green Loan Principles. The framework has been reviewed and confirmed by Sustainalytics, a global provider of ESG research and ratings, to be credible and impactful.
Spring City 66, Kunming–Hang Lung’s first project in the Southwest region of Mainland China, has received LEED Gold pre-certification for Core and Shell Development issued by the US Green Building Council.
Phoenix Transport and Survitec, one of the state-of-art facilities owned by Frasers Logistics & Industrial Trust, has received 6 star Green Star As-Built ratings from the Green Building Council of Australia (GBCA) since June 2018.
Providing Green Financing Solutions for Our CustomersAccording to the International Energy Agency (IEA), the building and construction sectors combined are responsible for 36% of global energy consumption and nearly 40% of total direct and indirect CO2 emissions.
By building more resilient infrastructures, OCBC has the opportunity to support
our businesses and assets in becoming more sustainable. Frasers Property Group (1) embarked on a green financing journey in 2018 and OCBC supported Frasers Property Group in four out of its five 2018/2019 green loans, including OCBC acting as the green loan coordinator for a AUD 170 million green loan to Frasers Logistics & Industrial Trust in June 2019.
(1) Frasers Property Limited and its subsidiaries
Delivering on Our SDGs
Sustainability Pillar 2: Being Environmentally and Socially Responsible
68 OCBC Annual Report 2019 69Sustainability Report 2019
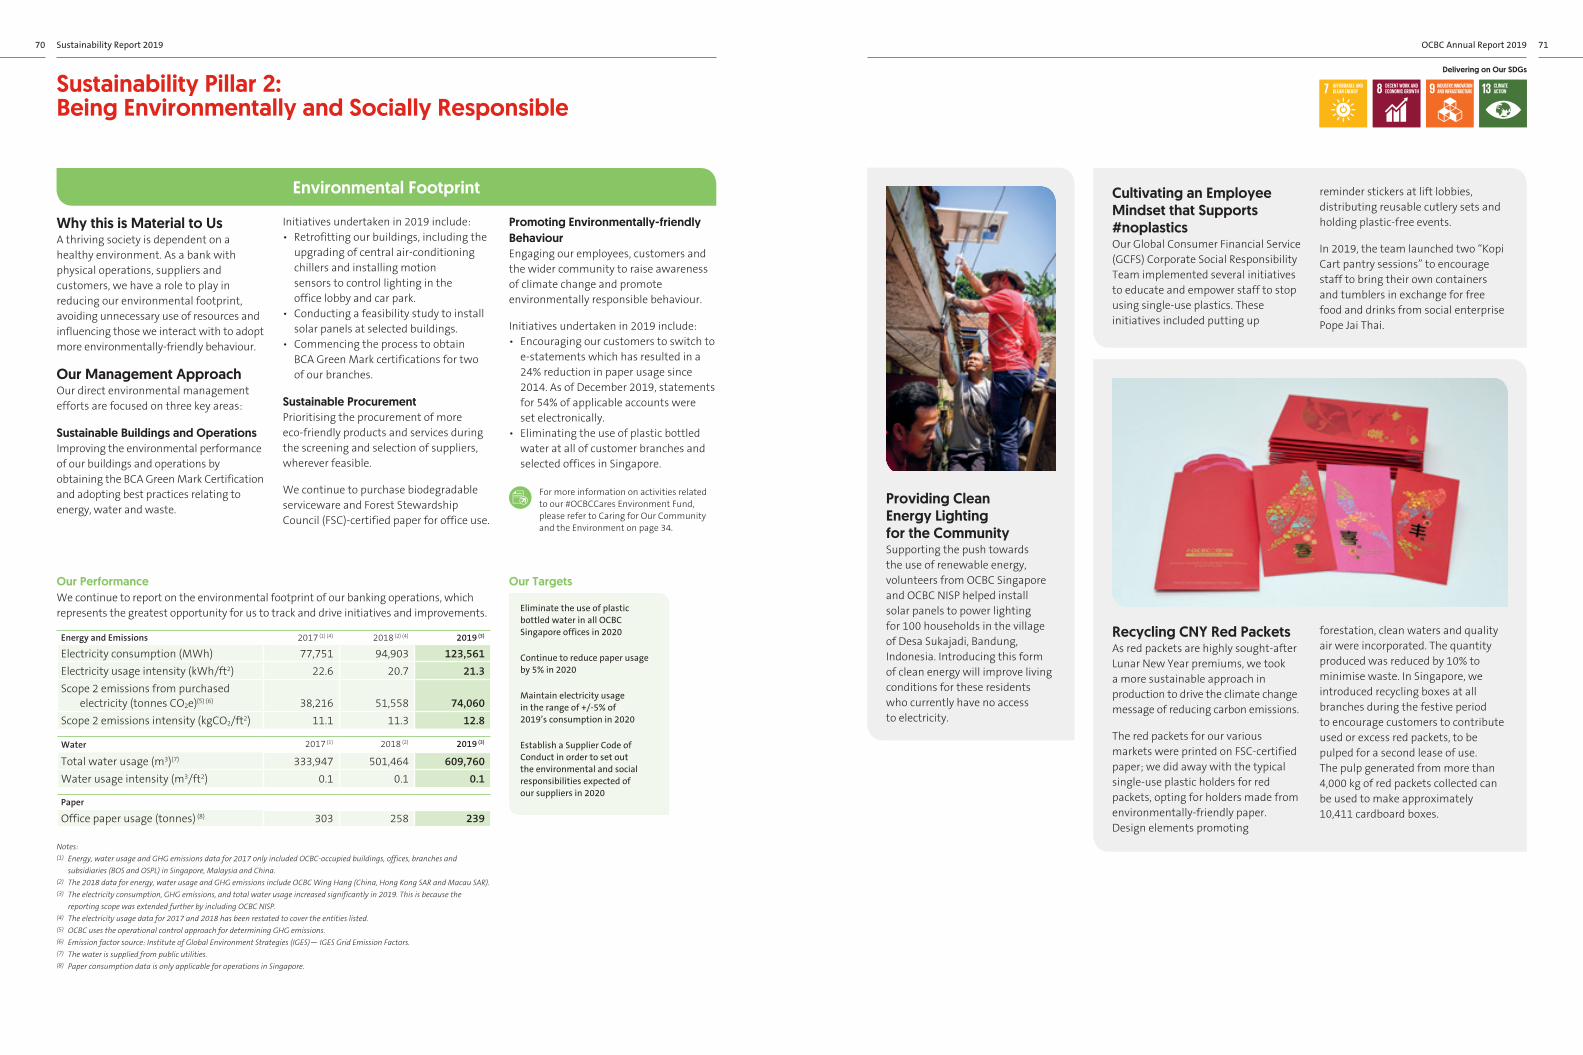
Environmental Footprint
Why this is Material to UsA thriving society is dependent on a healthy environment. As a bank with physical operations, suppliers and customers, we have a role to play in reducing our environmental footprint, avoiding unnecessary use of resources and influencing those we interact with to adopt more environmentally-friendly behaviour.
Our Management ApproachOur direct environmental management efforts are focused on three key areas:
Sustainable Buildings and OperationsImproving the environmental performance of our buildings and operations by obtaining the BCA Green Mark Certification and adopting best practices relating to energy, water and waste.
Initiatives undertaken in 2019 include: • Retrofitting our buildings, including the
upgrading of central air-conditioning chillers and installing motion sensors to control lighting in the office lobby and car park.
• Conducting a feasibility study to install solar panels at selected buildings.
• Commencing the process to obtain BCA Green Mark certifications for two of our branches.
Sustainable ProcurementPrioritising the procurement of more eco-friendly products and services during the screening and selection of suppliers, wherever feasible.
We continue to purchase biodegradable serviceware and Forest Stewardship Council (FSC)-certified paper for office use.
Promoting Environmentally-friendly BehaviourEngaging our employees, customers and the wider community to raise awareness of climate change and promote environmentally responsible behaviour.
Initiatives undertaken in 2019 include:• Encouraging our customers to switch to
e-statements which has resulted in a 24% reduction in paper usage since 2014. As of December 2019, statements for 54% of applicable accounts were set electronically.
• Eliminating the use of plastic bottled water at all of customer branches and selected offices in Singapore.
For more information on activities related to our #OCBCCares Environment Fund, please refer to Caring for Our Community and the Environment on page 34.
Energy and Emissions 2017 (1) (4) 2018 (2) (4) 2019 (3)
Electricity consumption (MWh) 77,751 94,903 123,561Electricity usage intensity (kWh/ft2) 22.6 20.7 21.3Scope 2 emissions from purchased
electricity (tonnes CO2e) (5) (6) 38,216 51,558 74,060Scope 2 emissions intensity (kgCO2/ft2) 11.1 11.3 12.8
Water 2017 (1) 2018 (2) 2019 (3)
Total water usage (m3)(7) 333,947 501,464 609,760Water usage intensity (m3/ft2) 0.1 0.1 0.1
Paper
Office paper usage (tonnes) (8) 303 258 239
Notes:(1) Energy, water usage and GHG emissions data for 2017 only included OCBC-occupied buildings, offices, branches and
subsidiaries (BOS and OSPL) in Singapore, Malaysia and China. (2) The 2018 data for energy, water usage and GHG emissions include OCBC Wing Hang (China, Hong Kong SAR and Macau SAR). (3) The electricity consumption, GHG emissions, and total water usage increased significantly in 2019. This is because the
reporting scope was extended further by including OCBC NISP. (4) The electricity usage data for 2017 and 2018 has been restated to cover the entities listed. (5) OCBC uses the operational control approach for determining GHG emissions. (6) Emission factor source: Institute of Global Environment Strategies (IGES)— IGES Grid Emission Factors. (7) The water is supplied from public utilities.(8) Paper consumption data is only applicable for operations in Singapore.
We continue to report on the environmental footprint of our banking operations, which represents the greatest opportunity for us to track and drive initiatives and improvements.
Our Performance
Eliminate the use of plastic bottled water in all OCBC Singapore offices in 2020
Continue to reduce paper usage by 5% in 2020
Maintain electricity usage in the range of +/-5% of 2019’s consumption in 2020
Establish a Supplier Code of Conduct in order to set out the environmental and social responsibilities expected of our suppliers in 2020
Our Targets
Providing Clean Energy Lighting for the Community Supporting the push towards the use of renewable energy, volunteers from OCBC Singapore and OCBC NISP helped install solar panels to power lighting for 100 households in the village of Desa Sukajadi, Bandung, Indonesia. Introducing this form of clean energy will improve living conditions for these residents who currently have no access to electricity.
Cultivating an Employee Mindset that Supports #noplastics Our Global Consumer Financial Service (GCFS) Corporate Social Responsibility Team implemented several initiatives to educate and empower staff to stop using single-use plastics. These initiatives included putting up
reminder stickers at lift lobbies, distributing reusable cutlery sets and holding plastic-free events.
In 2019, the team launched two “Kopi Cart pantry sessions” to encourage staff to bring their own containers and tumblers in exchange for free food and drinks from social enterprise Pope Jai Thai.
Recycling CNY Red PacketsAs red packets are highly sought-after Lunar New Year premiums, we took a more sustainable approach in production to drive the climate change message of reducing carbon emissions.
The red packets for our various markets were printed on FSC-certified paper; we did away with the typical single-use plastic holders for red packets, opting for holders made from environmentally-friendly paper. Design elements promoting
forestation, clean waters and quality air were incorporated. The quantity produced was reduced by 10% to minimise waste. In Singapore, we introduced recycling boxes at all branches during the festive period to encourage customers to contribute used or excess red packets, to be pulped for a second lease of use. The pulp generated from more than 4,000 kg of red packets collected can be used to make approximately 10,411 cardboard boxes.
Delivering on Our SDGs
Sustainability Pillar 2: Being Environmentally and Socially Responsible
70 OCBC Annual Report 2019 71Sustainability Report 2019

Fair DealingStrong Governance
Why this is Material to UsStrong governance is the bedrock of our success. Establishing checks and balances enable the Board to have appropriate control and oversight of responsibilities. This is essential to building and safeguarding the trust that stakeholders place in us. Furthermore, fostering good stewardship is key to creating long-term and sustainable value for all our stakeholders.
Our Management ApproachTo meet our commitment to the highest standards of corporate governance and ethical conduct, we go beyond legal compliance to establish best practices consistently across the Bank.
The expected standards of behaviour for all employees, including a zero tolerance approach to any form of fraud, bribery and corruption, are set out in the OCBC Code of Conduct and our Group policies. These standards are then implemented through staff communication, engagement, training and assessment.
To promote a culture of strong governance across the Group, some of our key initiatives in 2019 included:
Refreshed Core Values: Lasting Value, Integrity, Forward-Looking, Responsibility and Respect• Refreshed our core values in 2019 to
build a new culture based on long-term thinking and responsible banking, aligned with the Bank’s purpose and new brand promise.
New Board Ethics and Conduct Committee• First Singapore bank to set up an ethics
committee to ensure responsible banking. The Board Ethics and Conduct Committee, supported by the Culture and Conduct governance structure, provides oversight to ensure OCBC Group’s core values are strongly embedded in our corporate culture and
anchor the way employees conduct ourselves. During the year, Ernst & Young was engaged to develop the Bank’s culture and conduct programme. Recommendations where relevant have been and will be implemented.
New Culture and Conduct Management Committee• The new Culture and Conduct
Management Committee, chaired by our Group CEO, will strengthen existing policies and programmes within OCBC group, and drive implementation of new initiatives relating to ethics, culture and conduct.
New Group Ethics, Culture and Conduct Department (GECC)• A new department set up within
the Group Legal and Regulatory Compliance Division has been established to support the design and implementation of a Culture and Conduct Programme at both Singapore and Group levels. The GECC will also assist to monitor concerns relating to culture and conduct.
Employee Conduct Triggers (ECT)• Introduced in 2018, this comprises a
set of indicators that monitor employee conduct which was developed as an integral supplement to the existing suite of human resource management tools. In 2019, we extended the ECT programme to key subsidiaries and continue to review it on a regular basis to include more bank-wide and business-specific indicators where necessary.
Internal Control and Fraud Awareness Assessment (ICFAA)• An annual exercise that the Bank
uses to assess employees’ level of understanding on internal control, fraud reporting, whistleblowing and cyber and information risk.
Whistleblowing Programme• Provides a transparent channel for
employees and the public to raise concerns.
For further information on our approach to strong governance, please refer to our Corporate Governance on pages 84 – 101.
Our Performance
100%completion of mandatory Fair Dealing e-learning module 1
100% attendance in product suitability training and assessment for Product Managers 2
No significant case of mis-selling from a regulatory breach perspective
Maintain
100%completion rates for mandatory staff training in 2020
Maintain zero significant cases of mis-selling in 2020
Our Targets
1 Statistics include employees in Singapore and Malaysia only.
2 Statistics include Product Managers in Singapore only.A personal financial consultant ensuring a customer understands the features and risks of an
investment product.
Refreshed Core Values – Creating Sustainable Value for Our StakeholdersThe Bank’s refreshed core values were rolled out in May 2019, reflecting a broader and deeper commitment to
create value that is truly sustainable for shareholders, employees and the communities we serve. Integrity remains a key value, underlining the Bank’s commitment to conducting our business fairly.
The Best Risk Management Awardat the Singapore Corporate Awards 2019
Maintain
100%completion rates for mandatory staff training in 2020 (on fraud awareness, whistleblowing, anti-bribery and anti-corruption)
Our Targets
Our Performance
Maintained
100%completion of mandatory staff training (fraud awareness, whistleblowing, anti-bribery, anti-corruption) 1
98%of employees in Singapore exhibit the right behaviours in accordance with the indicators tracked, as revealed by ECT
96%of employees have a good level of awareness on internal control, fraud reporting, whistleblowing and cyber and information risk, as revealed by the ICFAA
1 The training performance includes employees in Singapore, China and other international branches.
The channels for reporting include: Website: www.ocbcgroup.ethicspoint.com; Hotline: 800-110-1967
• In 2019, a total of 24 anonymous and non-anonymous whistleblowing reports were received by Group Audit through the various reporting channels. The investigations into the whistleblowing reports are independently undertaken by Group Audit and the findings have been and will be reported to the Board Audit Committee.
Why this is Material to UsOur continued success as a financial services group is dependent on our ability to build enduring relationships with our customers. This involves treating our customers with respect and integrity, and consistently dealing with them in a fair and professional manner.
Our Management ApproachFair Dealing has always featured prominently in our core values. Specifically, our value of ‘Integrity’ underscores Fair Dealing as the basis of our business.
In line with our pledge to customers to be Simply Spot On in meeting their needs, we are committed to dealing with them by:• Providing them with clear, relevant and
timely information to help them make informed decisions.
• Recommending only products that are aligned with their financial objectives and risk profiles.
• Training and certifying our sales employees so that they are equipped to give appropriate advice and recommendations.
• Treating customer feedback and complaints seriously, and ensuring that issues are addressed in an effective and prompt manner.
Some of our key initiatives include:
Fair Dealing Committee and Framework• Oversees strategic initiatives and
measurement to ensure Fair Dealing outcomes, including quarterly reviews of the state of fair dealing at the Bank and its subsidiaries. In 2019, no adverse issues were encountered in its reviews.
• To measure and monitor the achievement of the Fair Dealing outcomes, a Monitoring Programme has been put in place. The results of the Monitoring Programme covering both quantitative and qualitative aspects form the basis for the committee to ascertain the Fair Dealing performance of the Bank.
• The quantitative components in the Monitoring Programme include the number of misconduct cases reported to MAS, audit results, compensation
amount arising from mis-sellings and the MAS Balanced Scorecard results, covering financial, operational and business areas. The final quantitative grade of Green, Amber or Red is ascertained from the numeric results of these components.
• The qualitative assessment of misconduct cases found to be of a systemic nature can affect the final grade.
• The ‘traffic light’ system of measurement is a comprehensive and independent approach to identify gaps quickly and ensure that they are addressed appropriately.
Product Suitability Committee, Policy and Framework• Governs the approval of new investment
products, ensuring that they are offered appropriately to the Bank’s target customer segments. 56 new investment products were approved in 2019.
Delivering on Our SDGs
Sustainability Pillar 3:Acting with Integrity
72 OCBC Annual Report 2019 73Sustainability Report 2019

Combating Financial Crimes and Cyber Threats
(1) Partnerships include the Association of Banks in Singapore Standing Committee on Cyber Security (ABS SCCS), the Financial Services Information Sharing and Analysis Centre (FS-ISAC) and the Alliance of Public Private Cybercrime Stakeholders (APPACT).
Why this is Material to UsFinancial crimes and cyber threats have the potential to disrupt our banking services and result in financial losses impacting our customers, our organisation and the wider economy. As banks provide greater digital convenience and products, digital platforms will increasingly become a target for cyber-attacks, fraud, money laundering and the financing of terrorism. To uphold the trust of our stakeholders, it is vital for us to be resilient against these risks.
Our Management ApproachWe adopt a holistic approach to combating financial crimes and cyber threats, ensuring that all our products and services have security built-in by design.
We have instituted a comprehensive framework of policies and practices, realised through active corporate risk governance.
We are continuously investing in new technologies to protect customers’ information and money, while providing a frictionless banking experience.
Furthermore, combating financial crimes and cyber threats require collaboration and partnership. At the industry level, we work with partners (1) to raise standards and actively share information on cyber and fraud threats.
We regularly validate the effectiveness of the safeguards established and promptly resolve any issues that arise. We monitor our networks for cyber threats through a 24-hour Cybersecurity Operations Centre.
Some of our key initiatives in 2019 included:
Anti-Fraud Measures • Further enhanced anti-fraud measures
protecting our customers’ online transactions.
• Deployed a new system which detects compromised devices interacting with OCBC online banking platforms.
• Disseminated public education messages on cyber fraud and scams.
• Enhanced detection systems and processes to protect customers who may be victims of scams.
• Collaborated with the police and other financial institutions.
Anti-Money Laundering (AML) and Countering the Financing of Terrorism (CFT)• Member of the AML/CFT Industry
Partnership (ACIP).• Continued to leverage Artificial
Intelligence (AI) and machine learning to enhance the detection of suspicious activity.
Cyber Resilience • Enhanced preventive, detective and
response capabilities to manage advanced cyber threats.
• Issued guides to promote safe adoption of specific emerging technologies such as Robotics Process Automation (RPA) and Internet of Things (IoT).
• Organised and conducted various emerging technology forums to foster bank-wide learning and sharing.
Our Performance
S$15.1mstopped from falling into the hands of fraudsters through our anti-fraud programme
34awards received from the Singapore Police Force in recognition of our fraud prevention efforts
100%completion of mandatory biennial AML and CFT training and assessment
100%completion of Annual Cyber and Information Risk Awareness Online Training and Assessment Course
100%of employees included in the Social Engineering Test Programme
Maintain
100%completion of mandatory AML and CFT training and assessment in 2020
Maintain
100%inclusion of employees in the Social Engineering Test Programme in 2020
Maintain
100%completion of Annual Cyber and Information Risk Awareness Online Training and Assessment course in 2020
Our Targets
For more information on our Cyber Resilience strategy and policy, please visit our website.
Sustaining Trust in Our Banking EnvironmentProtecting our customers against fraudsters who target them through various scams has been the Bank’s focus for many years although such cases are extremely difficult to detect.
In recognition of its efforts, the Bank received 34 awards from the Singapore Police Force for detecting and preventing customers from falling victim to scams. One such case involved a customer who transferred S$205,000 to an account in Malaysia after receiving an email purportedly from his supplier. The transaction was flagged by the Bank’s fraud detection system and our fraud analyst then escalated the incident. Upon confirmation by the customer that this was indeed a case of fraud, the Bank then worked with its counterparts to freeze and subsequently returned the money to the grateful customer. As customer awareness is the best defence against such scams, the Bank, with the Singapore Police Force, actively carries out public awareness campaigns with messages that appear in the mainstream news media. Efforts in this area strengthen the Bank’s brand and maintain trust in the banking environment.
Appreciation plaque awarded by the Singapore Police Force to the Bank for preventing a scam on a customer.
Enhancing Industry’s Technology Risk Management PracticesOCBC technology risk professionals volunteered to lead and participate in an industry-level Working Group, comprising more than 70 professionals
Regular brainstorming sessions to co-create the new Technology Risk Management Guidelines.
across 16 organisations, to co-create a new set of Technology Risk Management Guidelines with MAS. The revised Guidelines aim to promote the adoption of sound practices for the management of technology risk, and will supersede the current version once finalised by the MAS.
Launch of the OCBC Cyber Certification Pathway as part of OCBC’s Future Smart Programme.
At OCBC, we strongly believe that people will be the most important line of defence against potential threats. The Bank takes great efforts to ensure that our people are aware of and trained to deal with existing and emerging risks. – Vincent Choo, Group Chief Risk Officer
Training Employees to Become Cyber Security SpecialistsThis year, in addition to our existing comprehensive awareness training and testing regime, we launched a new cyber risk, security and assurance training programme. The programme
was created in partnership with Temasek Polytechnic to train up to 200 of the Bank’s employees to be cyber risk analysts, cyber security specialists and cyber auditors in the next three years. This Cyber Certification Pathway is part of OCBC’s Future Smart Programme.
Delivering on Our SDGs
Sustainability Pillar 3:Acting with Integrity
74 OCBC Annual Report 2019 75Sustainability Report 2019

Inclusive Workforce
Why this is Material to UsWe believe in the importance of creating an inclusive workplace, building a culture that embraces differences and recognises the value and contributions of individuals at all levels of employees.
Our Management ApproachOur approach ensures that we cultivate a workplace culture where all employees are provided with equal opportunities and different views are valued. This includes policies on issues such as:• Learning and Development: We offer
a compelling work experience and a wide range of relevant training and development programmes to empower employees to realise their full potential and take charge of their learning journey. For more information, please refer to pages 78 and 79.
• Diversity and Inclusion: The OCBC Employer Brand articulates our programmes and policies, which are anchored on three Employer Brand pillars: Caring, Progressive and Delivering a Difference.
• Work-Life Integration: We support our employees’ aspiration to succeed in both their careers and personal lives, offering flexible work arrangements for working parents who need to juggle demands both at home and at work. We also provide childcare centres with full facilities at three of our sites.
• Anti-Bullying and Harassment: Our Code of Conduct has guidelines for our employees concerning anti-bullying and harassment. We have a robust grievance handling procedure in place for employees to share their concerns without any fear of retaliation.
It is also important for us to ensure that we continue to be a learning organisation, with adaptable employees who are willing to step up and share with their peers. Some of our key initiatives this year included:
Expansion of Mentorship Opportunities for Female Employees• In its second year, half of the mentors
volunteered to return in the MentorMe programme and the number of mentor-mentee pairs increased to 26. This nine-month mentorship programme allows senior leaders within the Bank to provide support to female employees to help them achieve personal and professional success.
LifeRefresh@OCBC Programme for Older Employees• This year, our lifelong programme for
employees aged 50 and above centred
around four main pillars – strengths building, financial planning, health and wellness and digital learning. The 2019 programme included workshops to help them understand their strengths better and build social networks for the next life stage, financial planning to help them better plan for retirement and ageing simulation and longevity optimisation to raise awareness on healthy ageing.
We also invest heavily in upskilling our employees so they can embrace digitalisation. These initiatives are highlighted on page 78.
I went to the TCM booth at MyWellness Fiesta and it inspired me to see a senior TCM doctor to understand my overall health in greater detail. She gave me an accurate diagnosis and I was given medication and great advice on how to take care of my body. Within days, I felt the strongest this year so I am glad that the TCM booth was a catalyst for this.– Luanna Teo, Assistant Vice
President, OCBC Securities
MyWellness Fiesta 2019 was organised by Group Human Resources to offer all our employees the opportunity to explore, learn and find how they can best enhance their personal health and wellness.
MyWellness FiestaOur inaugural employee wellness day, MyWellness Fiesta, was held on 14 October 2019 featuring a variety of activities for employees to enhance their health and wellness. During the one-day programme, employees were offered complimentary services including chiropractic screenings, genetic test kits and consultations on Traditional Chinese Medicine (TCM). We also organised talks on sleep apnea, nutrition, workplace injuries and mental health.
We launched Telehealth for our employees to provide them with the option of having GP consultations virtually.
Virtual GP Consultation for EmployeesTogether with DoctorAnywhere, we launched Telehealth to provide virtual GP consultations at the convenience
of our employees. Employees will now be able to have appointments with GPs registered with the Singapore Medical Council within minutes and have medication delivered to them.
Best Employer Singapore & Malaysia awarded by KINCENTRIC
Family Champion Award (Corporate) awarded by Focus on the Family Singapore
IBF WorkforceTransformation Awardawarded by The Institute of Banking and Finance Singapore
Achieve
42% of women in leadership positions over the next 3 years
Maintain a balanced gender mix across our workforce in 2020
Our Targets
Our Performance 1
Maintained a balanced gender ratio, with
41% male and
59%female employees
40%of women in leadership positions
1 Statistics include employee at OCBC Group, excluding PT OCBC Sekuritas Indonesia, OCBC Capital Malaysia Berhad and BOS Wealth Management Malaysia Berhad.
Sustainable Employment PledgeIn 2019, OCBC Bank was one of the early adopters of the Singapore Business Federation’s (SBF) Sustainable Employment Pledge. Together with more than 60 companies to date, OCBC Bank has pledged to make at least one improvement to our practices in sustainable employment every
12 months. With this pledge, OCBC also supports the six key recommendations in the SBF’s “Sustainable Employment – Achieving Purposeful Business Success Together”. These six key recommendations are aimed to nurture a more inclusive society in Singapore by addressing the employment needs of the elderly, the less well-off, and those vulnerable to job disruption.
Ageing Simulation Exercise for EmployeesTo raise awareness on aging, we held a new programme this year where employees put on ageing simulation suits and completed daily activities.
This helped to raise awareness on how aging feels physically and mentally, to encourage them to take better care of their health. In addition, it allowed them to empathise and communicate better with seniors.
The course allowed us to be more aware of the signs of ageing from two perspectives. I am able to put myself in the shoes of an elderly person to understand what it feels like to age through ageing simulation and empathise deeply with them as they can’t see or hear as clearly as younger individuals.– Low Bee Hong, Manager, Group Human Resources Division
Delivering on Our SDGs
Sustainability Pillar 4:Valuing Our People
76 OCBC Annual Report 2019 77Sustainability Report 2019

Talent Management and Retention
Why this is Material to UsThe needs of society continue to evolve with changing demographics and advancements in technology. As employees are critical assets of the Bank, it is imperative that we continue to attract, retain and invest in the best talent to ensure that our business is future-ready.
Our Management ApproachWe are committed to developing our employees throughout their career at the Bank, helping them to realise their full potential to thrive in the rapidly-changing economy.
For our employees to thrive in the future world, more than 150 job roles were reviewed. We identified one-third to have high transformation potential and ensured development plans are in place. In 2018, OCBC launched the Future Smart initiative, our largest scale and most ambitious digital transformation initiative to date, where we committed to invest S$20 million in the development of our employees over three years.
This year, we continue to move employee development forward with our strategic thrust, with a focus on upskilling and reskilling our employees in key digital competencies. Future Smart is a group wide initiative and is rolled out to all key markets and entities in OCBC Group.
OCBC Future Smart Programme is focused on seven skillset and mindset pillars and four proficiency levels, from awareness to mastery levels.
First Bank in Asia to Launch AI Scholarship• Launched the postgraduate OCBC AI
Scholarship in partnership with the National University of Singapore (NUS), Nanyang Technological University (NTU) and Singapore Management University (SMU).
• The OCBC Regional Undergraduate Scholarship was also launched to support talent with regional aspirations to study overseas and gain regional exposure.
New Digital Internship Programme – ProDiGi• OCBC NISP launched ProDiGi, a new
digital internship programme that aims to nurture talent through intensive mentorship, workshops and an opportunity to gain work experience in Singapore.
• In 2019, 123 students applied and competed to be one of the top three winning ideas, the Best Prototype award and a coveted spot in the internship.
Launch of Two Certification Pathways• Launched a data certification pathway in
collaboration with Ngee Ann Polytechnic to grow the pool of data scientists and data analysts in Singapore. All 13 modules were developed in consultation with OCBC subject matter experts and industry practitioners. The courses are also funded under Skills Future and are available to the general public in Singapore through Ngee Ann Polytechnic.
• Launched the Cyber Certification Pathway comprising 16 modules and simulation hacks to develop up to 200 Cyber Risk Analysts and/or Cyber Security Specialists.
In addition, we revamped our suite of executive development programmes (EDPs) to ensure they remain relevant to the needs of the business:
• New Senior Leaders Programme (BOLD) A flagship 9-month programme in partnership with IESE to help senior leaders overcome the increasingly complex challenges of a fast-changing world, tackling topics such as sustainability and digital transformation.
• New OCBC Nanyang Technological University Executive Development Programme (OCBC NTU EDP) Co-developed with Nanyang
Technological University, the programme saw employees from various countries and subsidiaries (1), participating in the inaugural one-week programme which focused on developing leadership skillsets and transforming mindsets from “I” to We”.
• Graduate Talent Programme Extended from one to two years, incorporating compulsory attachments at Branch, Compliance and Operations, to provide young talents with a holistic experience of the Bank.
OCBC Group CEO Samuel Tsien conversing with Nadine the social robot. She is powered by intelligent personal assistant software and recognises facial expressions and emotions. She reminded him about his upcoming appointments, retrieved his speech and shared a report with key market insights for his meeting happening the next day.
Future Smart Future Workforce Learning FestivalThe Bank organised the Future Smart Future Workforce Learning Festival in four countries, encouraging employees to take charge of their own development. Employees across the OCBC Group took part in various activities including attending lunch talks and panel discussions by industry experts, as well as visiting booths showcasing innovations from across the business.
Talent Development Awardawarded by Hong Kong Institute of Bankers (HKIB)
Excellence In Leadership Development (Gold)HR Excellence Awards 2019
Maintain employee engagement score above
70% in 2020 Employee Engagement Survey (results to be published in 2021)
Ensure all employees continue to have access to career development opportunities within the Bank through internal channels and programmes
Our Targets
Our Performance
Maintained an average of
6 days
of learning and development for employees
Continued our investment of
S$20mover three years (from 2018 – 2020) to equip all employees with digital skills
(1) Countries include Singapore, Malaysia, Indonesia, China (including Hong Kong SAR). Subsidiaries include Bank of Singapore, Great Eastern Life and Lion Global Investors.
2019 2018 2017
Male 47.19 51.60
Female 47.43 49.23
Total
47.33 50.20
Average Training Hours by Gender2017
Total44.16
Female43.71
Male44.81
Average Training Hours by Age Group (years old)
2019
2019 2018 2017
<30 60.93 63.72
30 – 49 43.52 44.65
≥50 32.23 36.12≥50
30-49
<30 59.95
39.89
32.45
Lorem ipsum
(1) Statistics include permanent staff at OCBC Group, excluding PT OCBC Sekuritas Indonesia, OCBC Capital Malaysia Berhad and BOS Wealth Management Malaysia Berhad.
Our Performance (1)
2019 2018 2017
VP and above 45.04 47.71
AVP and Management Associates 46.23 52.91
Managers and Associates 55.18 58.04
Non-executives 29.42 30.13
Average Training Hours by Employee Category
VP and above
AVP and Management Associates
Managers and Associates
Non-executives
45.61
44.53
47.63
34.68
Delivering on Our SDGs
Sustainability Pillar 4:Valuing Our People
78 OCBC Annual Report 2019 79Sustainability Report 2019
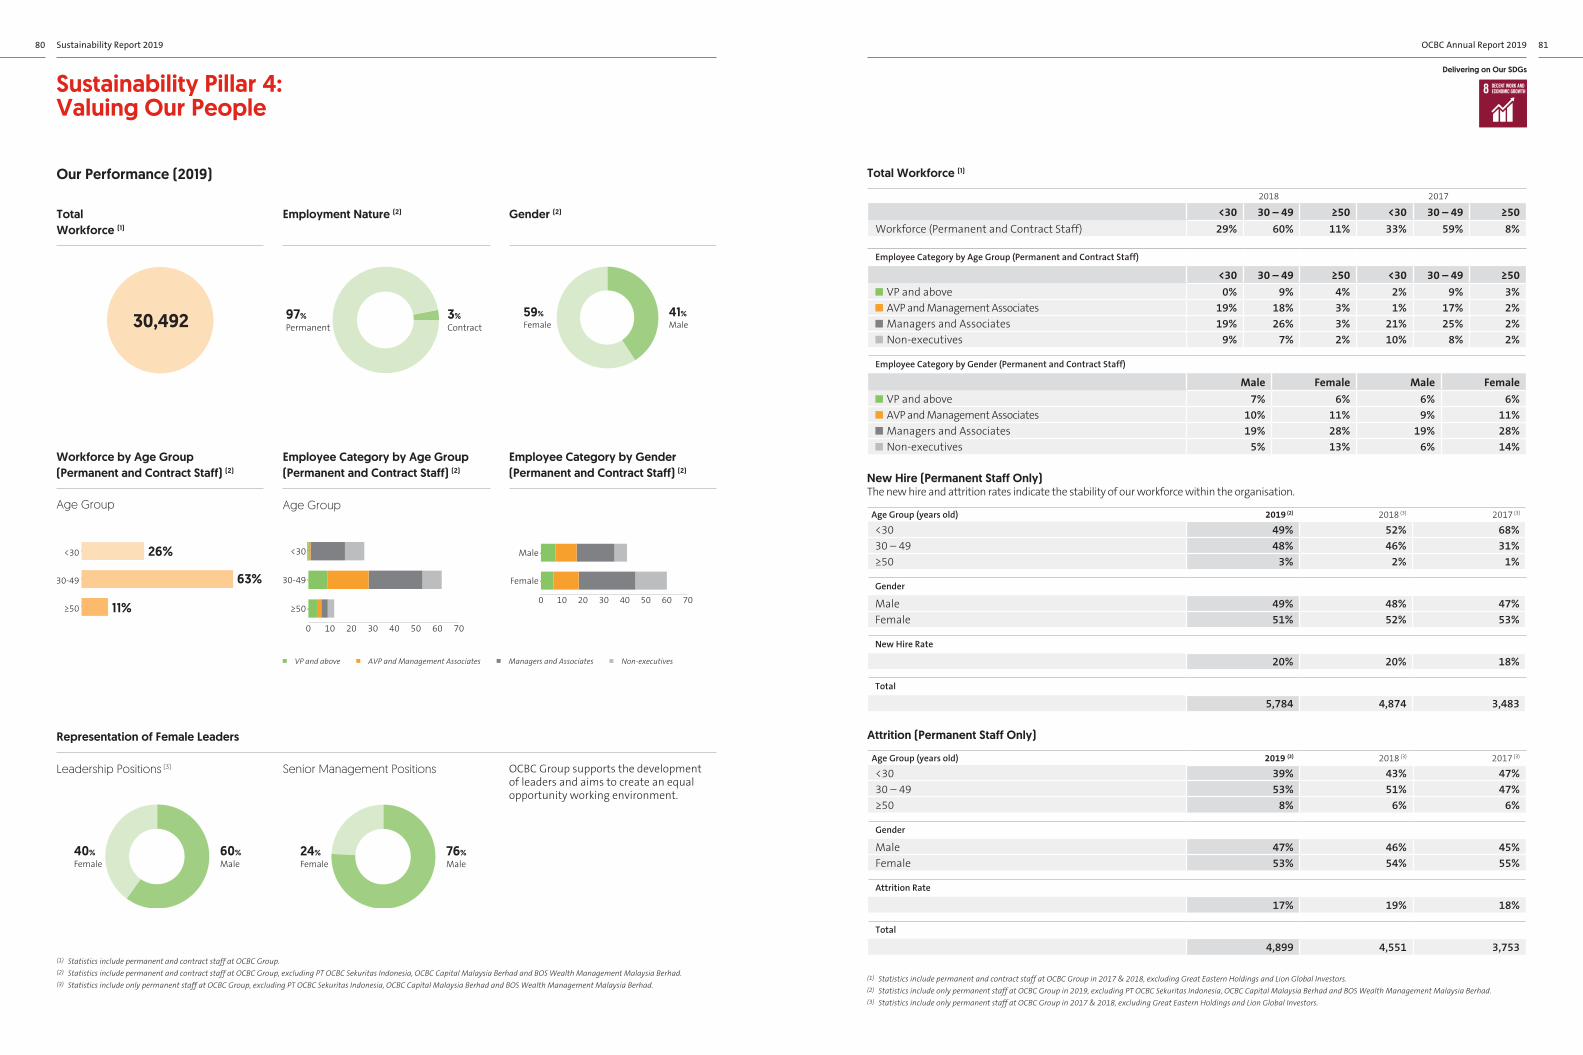
Our Performance (2019)
Attrition (Permanent Staff Only)
Age Group (years old) 2019 (2) 2018 (3) 2017 (3)
<30 39% 43% 47%30 – 49 53% 51% 47%≥50 8% 6% 6%
Gender
Male 47% 46% 45%Female 53% 54% 55%
Attrition Rate
17% 19% 18%
Total
4,899 4,551 3,753
New Hire (Permanent Staff Only)The new hire and attrition rates indicate the stability of our workforce within the organisation.
Age Group (years old) 2019 (2) 2018 (3) 2017 (3)
<30 49% 52% 68%30 – 49 48% 46% 31%≥50 3% 2% 1%
Gender
Male 49% 48% 47%Female 51% 52% 53%
New Hire Rate
20% 20% 18%
Total
5,784 4,874 3,483
(1) Statistics include permanent and contract staff at OCBC Group in 2017 & 2018, excluding Great Eastern Holdings and Lion Global Investors.(2) Statistics include only permanent staff at OCBC Group in 2019, excluding PT OCBC Sekuritas Indonesia, OCBC Capital Malaysia Berhad and BOS Wealth Management Malaysia Berhad.(3) Statistics include only permanent staff at OCBC Group in 2017 & 2018, excluding Great Eastern Holdings and Lion Global Investors.
Total Workforce (1)
2018 2017
<30 30 – 49 ≥50 <30 30 – 49 ≥50Workforce (Permanent and Contract Staff) 29% 60% 11% 33% 59% 8%
Employee Category by Age Group (Permanent and Contract Staff)
<30 30 – 49 ≥50 <30 30 – 49 ≥50 VP and above 0% 9% 4% 2% 9% 3% AVP and Management Associates 19% 18% 3% 1% 17% 2% Managers and Associates 19% 26% 3% 21% 25% 2% Non-executives 9% 7% 2% 10% 8% 2%
Employee Category by Gender (Permanent and Contract Staff)
Male Female Male Female VP and above 7% 6% 6% 6% AVP and Management Associates 10% 11% 9% 11% Managers and Associates 19% 28% 19% 28% Non-executives 5% 13% 6% 14%
(1) Statistics include permanent and contract staff at OCBC Group.(2) Statistics include permanent and contract staff at OCBC Group, excluding PT OCBC Sekuritas Indonesia, OCBC Capital Malaysia Berhad and BOS Wealth Management Malaysia Berhad. (3) Statistics include only permanent staff at OCBC Group, excluding PT OCBC Sekuritas Indonesia, OCBC Capital Malaysia Berhad and BOS Wealth Management Malaysia Berhad.
Senior Management Positions OCBC Group supports the development of leaders and aims to create an equal opportunity working environment.
Leadership Positions (3)Leadership Positions
2019
40%Female
60%Male
Senior Management Positions
2019
24%Female
76%Male
Representation of Female Leaders
Gender
2019
59%Female
41%Male
Gender (2)
Employment Nature
2019
97%Permanent
3%Contract
Employment Nature (2)Total Workforce (1)
30,492
0 10 20 30 40 50 60 70
Female
Male
Employee Category by Gender(Permanent and Contract Staff) (2)
≥50
30-49
<30 26%
63%
11%
Workforce by Age Group (Permanent and Contract Staff) (2)
Age Group
Employee Category by Age Group (Permanent and Contract Staff) (2)
Age Group
0 10 20 30 40 50 60 70
≥50
30-49
<30
VP and above AVP and Management Associates Managers and Associates Non-executives
Delivering on Our SDGs
Sustainability Pillar 4:Valuing Our People
80 OCBC Annual Report 2019 81Sustainability Report 2019

Our Performance
11,347volunteers stepped up
52,513hours of service
138,988individual beneficiaries helped, ranging from vulnerable seniors, children and youth, to people with special needs and low-income families
S$1.8mdonated
982activities organised across geographies
>3,000trees planted across Singapore, Malaysia and Shanghai to absorb and store CO2, the biggest climate changer
Boost employee support for the community and target to increase volunteer hours by
10%
Progressively enhance our support for the community through an increasingly sustainable and strategic approach
Our Targets
Why this is Material to UsGiving back to society is an integral part of OCBC’s corporate culture. By engaging and supporting the communities where we operate, and by doing our part to protect the environment, we help to shape a more sustainable society.
Our Management ApproachWe continue to give back through our #OCBCCares Programme, helping the more vulnerable in society and meeting unmet needs.
Across our markets, we make a difference through targeted programmes across four themes, in line with our commitment to the SDGs:• Families: Supporting cohesive and
healthy communities• The Elderly: Meeting the health and social
interaction needs of an ageing population• Persons with Special Needs: Encouraging
social inclusion and acceptance• Environmental Sustainability:
Promoting environmentally responsible behaviour and supporting conservation efforts to fight climate change
This year, our key initiatives include:
OCBC-NTUC First Campus Bridging Programme—Making Preschool Education Accessible to Children from Low-Income Families OCBC Bank and staff contributed S$1 million to kickstart this five-year
Community Development
Economic Contributions (1) 2017 (2) 2018 2019
Group Total Income S$9.53b S$9.70b S$10.87bGroup Income Tax S$803m S$877m S$778mGroup Dividends Paid S$1.55b S$1.82b S$2.31bRetained Earnings S$21.88b S$23.44b S$25.78bGroup Staff Compensation S$2.47b S$2.61b S$2.84bGroup Number of Employees 29,174 29,706 30,492
Supply Chain Spending 2017 2018 (3) 2019
Total Supply Chain Spending S$1.18b S$1.89b S$1.79bLocal Spending 92% 92% 92%Total Vendors 9,380 10,552 10,741Local (4) Vendors 90% 90% 90%
Notes:(1) To be consistent with our financial statements, we have included the performance of Great Eastern Holdings in this table. (2) Figures for 2017 have been restated with the adoption of Singapore Financial Reporting Standards (International) (SFRS(I)).(3) Figures for 2018 have been restated due to data refinements. (4) Local is defined as registered in same country.
Our Performance
Continue to support the growth of the local economy wherever possible
Our Target
Why this is Material to UsEconomic growth should be a positive force in society that creates lasting and inclusive benefits. This is imperative for sustainable development. To build and maintain public trust, we must be transparent about the value we create and how this is distributed to our stakeholders.
Our Management ApproachAs a business, our stakeholders rely on us to create value. Therefore, we undertake a disciplined pursuit of growth, supported by responsible and sustainable business practices.
Our main economic contributions are:• Compensation that goes to our employees• Taxes to the authorities• Retained earnings and dividends to
our shareholders• Financing our customers to help
them grow and create employment• Payment to our suppliers
Economic Contributions
programme to fund an average of two years of preschool education for children from low-income families who enrol at MyFirstSkool.
The programme will help an estimated 2,500 children from 2020 to 2024.
As added support, our staff volunteers from the wealth management team will conduct financial literacy workshops to help parents better manage their finances. These workshops will be held every quarter during our five-year programme.
Project Belanja!—Hot Meals from Neighbourhood Stalls for Vulnerable SeniorsWe funded Food from the Heart’s (FFTH) launch of Project Belanja!—a fuss-free move that allows seniors to redeem free and nutritious meals at selected food stalls in their neighbourhood by scanning a QR code. Besides minimising administration and paper work, Project Belanja! encourages these seniors to step out of their homes to socialise. The redemption system can also flag individuals who stop redeeming meals, promoting FFTH staff to follow up and check on their well-being.
A Snapshot of #OCBCCares Programmes in 2019:
Volunteers organised an afternoon of games and craft activities to encourage seniors from the AWWA Senior Community Home to exercise their motor and cognitive skills.
Our volunteers and students from the MINDS-Woodlands Garden School marked World Down Syndrome Day with different expressions of colour to make a statement—that everyone can do their part to celebrate uniqueness, inclusion and acceptance.
Staff volunteers, including Group CEO Samuel Tsien, invited seniors and special needs youths to the first preview of “From Singapore to Singaporean: The Bicentennial Experience” which showcased Singapore’s 200-year history.
Delivering on Our SDGs
Sustainability Pillar 5:Engaging Communities
82 OCBC Annual Report 2019 83Sustainability Report 2019

Disclosures made pursuant to the Bank’s corporate governance practices are summarised on pages 100 and 101 of this Annual Report.
Board MattersPrinciple 1: The Board’s Conduct of AffairsThe Board is elected by the shareholders to supervise the management of the business and affairs of the Bank. The prime stewardship responsibility of the Board is to ensure the viability of the Bank and to ensure that it is managed in the best interests of the Bank as a whole while taking into account the interests of shareholders and other stakeholders. The Bank has a board charter approved by the Board.
Broadly, the responsibilities of the Board include the following:
• reviewing and approving overall business strategy as well as organisation structure, as developed and recommended by management;
• ensuring that decisions and investments are consistent with long-term strategic goals;
• ensuring that the Bank operates in such a way as to preserve its financial integrity and in accordance with policies approved by the Board;
• overseeing, through the Audit Committee, the quality and integrity of the accounting and financial reporting systems, disclosure controls and procedures and internal controls; and, through the Risk Management Committee, the quality of the risk management processes and systems;
• providing oversight in ensuring that the Bank’s risk appetite and activities are consistent with its strategic intent, the operating environment and effective internal controls, as well as capital sufficiency and regulatory standards;
• overseeing, through the Risk Management Committee, the establishment and operation of an independent risk management system for managing risks on an enterprise-wide basis, the adequacy of the risk management function (including ensuring that it is sufficiently resourced to monitor risk by the various risk categories and that it has appropriate independent reporting lines), and the quality of the risk management processes and systems;
• reviewing any transaction for the acquisition or disposal of assets that is material to the Bank;
• ensuring that the necessary human resources are in place for the Bank to meet its objectives;
• reviewing management performance and ensuring that management formulates policies and processes to promote fair practices and high standards of business conduct by staff;
• establishing corporate values and standards, emphasising integrity, honesty and proper conduct at all times with respect to internal dealings and external transactions, including situations where there are potential conflicts of interest;
• overseeing, through the Nominating Committee, the appointments, re-election, resignation and retirement of Directors of the Bank as well as the appointment, dismissal, resignation and retirement of senior management, ensuring that principles of transparency and meritocracy are observed;
• overseeing, through the Remuneration Committee, the design and operation of an appropriate remuneration framework, and ensuring that remuneration practices are aligned to and in accord with the remuneration framework;
• providing a balanced and understandable assessment of the Bank’s performance, position and prospects, including interim and other price-sensitive public reports as well as reports to regulators;
• ensuring that obligations to shareholders and others are understood and met;
• maintaining records of all meetings of the Board and Board Committees, particularly records of discussion on key deliberations and decisions taken;
• identifying the key stakeholder groups, recognising that perceptions affect the Bank’s reputation; and
• considering sustainability issues, e.g. environmental and social factors, as part of strategy formulation.
Directors with conflicts of interests are required under the Bank’s Constitution to recuse themselves from meetings and decisions involving issues of conflicts.
Board ApprovalThe Bank has documented internal guidelines for matters that require Board approval. These guidelines are communicated to management in writing. Matters which are specifically reserved for Board approval, amongst others, are:• material acquisition and disposal
of assets;• corporate or financial restructuring; and• share issuance, dividends and other
returns to shareholders.
The Board approves transactions exceeding certain threshold limits, while delegating authority for transactions below those limits to the Board Committees and management to optimise operational efficiency.
Board Access to InformationAs a general rule, Directors are provided with complete information related to agenda items about seven days before each meeting to allow adequate time for review. Directors are also equipped with electronic tablets that allow secured access to Board and Board Committee meeting materials. Information provided includes background information on matters to be addressed by the Board, copies of disclosure documents, monthly internal financial statements, risk management reports, operating plans, forecasts, and reports of variances from operating plans and forecasts.
The Board and its committees have unfettered access to information which the Bank is in possession of and to the Bank’s senior management and Company Secretary. The Directors, individually or as a group, can also take independent professional advice from legal firms at the Bank’s expense. The role of the Company Secretary is defined. The Company Secretary attends all board meetings and ensures that board procedures and applicable regulations are complied with. Under the direction of the Chairman, the Company Secretary ensures good information flows within the Board and its committees and
between senior management and non-executive Directors, and facilitates the orientation of new Directors and professional development of Directors, as required. The appointment and removal of the Company Secretary is considered to be a matter for the Board as a whole.
Board CommitteesWhile the Board has ultimate responsibility for the affairs of the Bank, various Board Committees have been established to assist the Board in discharging its duties more effectively. The Board Committees have clearly-defined terms of reference and changes to the terms require Board approval. The Board and its committees maintain records of all meetings setting out in detail key deliberations and decisions taken. The minutes of each committee meeting are also circulated to members of the Board who are not members of that particular committee. The composition and summary terms of reference of each of these committees are as follows.
• Executive Committee The Executive Committee comprises Mr
Ooi Sang Kuang (Chairman), Dr Lee Tih Shih, Mr Quah Wee Ghee, Mr Tan Ngiap Joo, Mr Samuel N. Tsien and Mr Wee Joo Yeow. A majority of the Committee, i.e. Mr Ooi Sang Kuang, Mr Quah Wee Ghee, Mr Tan Ngiap Joo and Mr Wee Joo Yeow, are independent Directors.
The Committee has written terms of reference that describe the responsibilities of its members.
The Executive Committee oversees – within the parameters delegated by the Board – the management of the business and affairs of the Bank and the Group. It reviews the Bank’s policies, principles, strategies, values, objectives and performance targets. These include investment and divestment policies. It also endorses such other matters and initiates such special reviews and actions as are appropriate for the prudent management of the Bank.
• Nominating Committee The Nominating Committee comprises
Mr Wee Joo Yeow (Chairman), Mr Ooi Sang Kuang, Ms Christina Ong, Mr Pramukti Surjaudaja and Mr Tan Ngiap Joo. A majority of the Committee, i.e. Mr Wee Joo Yeow, Mr Ooi Sang Kuang, Ms Christina Ong and Mr Tan Ngiap Joo, are independent Directors.
The Committee has written terms of reference that describe the responsibilities of its members.
The Nominating Committee plays a vital role in reinforcing the principles of transparency and meritocracy at the Bank. It plans for board succession and ensures that only the most competent individuals capable of contributing to the success of the organisation are appointed. This includes reviewing all nominations for the appointment, election or re-election – as well as resignations or retirement – of Directors of the Bank and members of the Executive Committee, Remuneration Committee, Audit Committee, Risk Management Committee and Ethics and Conduct Committee. The Nominating Committee is also charged with determining annually whether or not a Director is independent, capable of carrying out the relevant duties and qualified to remain in office. In addition, it reviews nominations for and dismissals or resignations or retirement of senior management positions in the Bank, including the Chief Executive Officer (CEO), Deputy President, Chief Financial Officer, Chief Risk Officer and Chief Information Officer (Head, Group Operations and Technology). It makes recommendations to the Board on all such appointments, including the compensation package for offer of employment, promotion and cessation of employment. The Nominating Committee reviews obligations arising in the event of the termination of the contracts of service of executive Directors and senior management, to ensure such contracts contain fair and reasonable termination clauses.
OCBC Bank is fully committed to living its core values and fair dealing in all its activities. The Bank’s core values are captured as LIFRR which stands for Lasting Values, Integrity, Forward-looking, Respect and Responsibility. The Bank upholds the highest standards of corporate governance and complies in all material aspects with corporate governance regulations, code and guidelines established in Singapore.
Corporate Governance84 OCBC Annual Report 2019 85Governance

• Audit Committee The Audit Committee comprises
Mr Chua Kim Chiu (Chairman), Mr Ooi Sang Kuang, Mr Tan Ngiap Joo and Ms Tan Yen Yen. All the Committee members are independent Directors. Three members, including the Chairman, have recent and relevant accounting or related financial management expertise or experience. The members have not been partners or directors of KPMG LLP, the external auditors for the financial year 2019, and none of them hold any financial interest in KPMG LLP.
The Audit Committee performs the functions specified in the Companies Act, the Code of Corporate Governance 2018 (the Code), the Singapore Exchange Securities Trading Limited (SGX-ST) Listing Manual, and the corporate governance regulations and guidelines issued by the Monetary Authority of Singapore (MAS).
The Committee has written terms of reference that describe the responsibilities of its members. The Board approves the terms of reference of the Audit Committee. The Committee may meet at any time and no fewer than four times a year. It has full access to and co-operation from management, and has the discretion to invite any Director and executive officer to attend its meetings. It has explicit authority to investigate any matter within its terms of reference.
Further information on the Audit Committee is provided under Principle 10 on pages 96 to 98.
• Remuneration Committee The Remuneration Committee
comprises Mr Tan Ngiap Joo (Chairman), Mr Ooi Sang Kuang, Mr Koh Beng Seng, Ms Christina Ong, Ms Tan Yen Yen and Mr Wee Joo Yeow. A majority of the Committee are independent Directors. All are well versed in executive compensation matters, given their extensive experience in senior corporate positions and major appointments.
The Committee has written terms of reference that describe the responsibilities of its members.
The Remuneration Committee recommends to the Board a framework for determining the remuneration of executive officers, and reviews the remuneration practices to ensure that they are aligned with the approved framework. It is empowered to review the human resource management policies and the policies governing the compensation of executive officers of the Bank and its subsidiaries, as well as the remuneration of senior executives and Directors. In addition, the Remuneration Committee administers the various employee share ownership schemes. In its deliberations, the Remuneration Committee takes into account remuneration principles, practices and standards that may be specified by MAS from time to time.
• Risk Management Committee The Risk Management Committee,
which supports the Board in performing its risk oversight responsibilities, comprises Mr Koh Beng Seng (Chairman), Mr Ooi Sang Kuang, Mr Chua Kim Chiu, Mr Samuel N. Tsien and Mr Wee Joo Yeow. All the Committee members, except Mr Samuel N. Tsien, are non-executive Directors. Members of the Committee have relevant technical financial understanding in risk disciplines or business experience. Mr Ooi Sang Kuang and Mr Chua Kim Chiu also serve on the Audit Committee. The common membership helps to facilitate communication and foster the sharing of information and knowledge between the two committees.
The Committee has written terms of reference that describe the responsibilities of its members.
The Committee sets the overall risk management philosophy, approves risk management frameworks and major policies, as well as reviews the risk profile, risk tolerance level and risk strategy of the Bank for effective risk management. The Committee reviews
the scope, effectiveness and objectivity of Group Risk Management, the risk reports that monitor and control risk exposures, and risk disclosure policy and risk management principles for the approval of the Board. It also oversees the establishment and operation of an independent risk management system for identifying, measuring, monitoring, controlling and reporting risks on an enterprise-wide basis, including ensuring the adequacy of risk management practices for material risks. The Chief Risk Officer has a direct reporting line to the Committee as well as to the CEO.
Activities performed by the Risk Management Committee are also described under the section on Risk Management on pages 105 to 116.
• Ethics and Conduct Committee The Ethics and Conduct Committee
supports the Board in overseeing ethics and conduct within the Bank. The Committee comprises Mr Ooi Sang Kuang (Chairman), Dr Lee Tih Shih, Ms Christina Ong and Mr Pramukti Surjaudaja. All the Committee members are non-executive Directors.
The Committee has written terms of reference that describe the responsibilities of its members.
The Committee reviews and assesses the state and implementation of ethics and conduct programmes and initiatives, including matters relating to fair dealing with customers, to ensure proper behaviour within the Bank in respect of ethics and conduct. It also reviews policies and guidelines pertaining to ethics and conduct to ensure they are relevant and up to date, and reviews communications to stakeholders on ethics and conduct and their effectiveness with regard to the reputation of the Bank. During the year, Ernst & Young was engaged to develop the Bank’s culture and conduct programme. Recommendations where relevant have been made and will be implemented. The Committee supports a strong and responsible organisation culture firmly founded on the Bank’s core values.
Directors’ Attendance at Board and Board Committee Meetings in 2019Directors attend and actively participate in Board and Board Committee meetings. Their contributions go beyond attendance at meetings. They individually or collectively engage with other Board members and Management outside formal meetings in their oversight of the affairs of the Bank.
In 2019, the Board and its committees held a total of 30 meetings. The Bank’s Constitution provides for Directors to participate in Board and Board Committee meetings by means of conference telephone, video conferencing or audio-visual equipment.
Board Orientation and DevelopmentA formal appointment letter and a director’s handbook are provided to every
new Director. The handbook sets out, along with other corporate information, the time commitment required and the duties and obligations of Directors, as well as relevant rules and regulations such as those relating to the Banking Act and SGX-ST Listing Manual. The Bank conducts a focused orientation programme, presented by the CEO and senior management, to
Directors’ Attendance at Board and Board Committee Meetings in 2019
Board Executive Committee Audit CommitteeName of Director Scheduled Meeting Scheduled Meeting Scheduled Meeting
Held (1) Attended Held (1) Attended Held (1) Attended
Ooi Sang Kuang (2) 5 5 3 3 – –Chua Kim Chiu 5 5 – – 5 5Koh Beng Seng (3) 1 1 – – – –Lai Teck Poh 5 5 – – 5 5Lee Tih Shih (4) 5 5 3 3 – –Christina Ong (5) 5 5 – – 5 5Quah Wee Ghee (6) 5 5 3 3 – –Pramukti Surjaudaja (7) 5 5 – – – –Tan Ngiap Joo 5 5 3 3 5 5Samuel N. Tsien 5 5 3 3 – –Wee Joo Yeow 5 5 3 3 – –
Nominating Committee
Remuneration Committee
Risk Management Committee
Ethics and Conduct Committee AGM
Name of Director Scheduled Meeting Ad hoc Meeting
Scheduled Meeting Scheduled Meeting Scheduled Meeting
Held (1) Attended Attended Held (1) Attended Held (1) Attended Held (1) Attended
Ooi Sang Kuang (2) 2 2 4 3 3 6 6 2 2 1Chua Kim Chiu – – – – – 6 6 – – 1Koh Beng Seng (3) – – – 1 1 1 1 – – –Lai Teck Poh 2 2 3 – – 6 6 – – 1Lee Tih Shih (4) 2 2 2 – – – – 2 2 1Christina Ong (5) – – – 3 3 – – 2 2 1Quah Wee Ghee (6) – – – 3 3 – – – – 1Pramukti Surjaudaja (7) – – – – – 6 6 – – 1Tan Ngiap Joo 2 2 3 3 3 – – – – 1Samuel N. Tsien – – – – – 6 6 – – 1Wee Joo Yeow 2 2 3 3 3 6 5 – – 1
Notes:(1) Reflects the number of meetings held during the time the Director held office.(2) Mr Ooi Sang Kuang was appointed to Ethics and Conduct Committee on 17 January 2019 and Audit Committee on 10 December 2019.(3) Mr Koh Beng Seng was appointed to the Board, Remuneration Committee and Risk Management Committee on 1 October 2019.(4) Dr Lee Tih Shih was appointed to Ethics and Conduct Committee on 17 January 2019 and stepped down from Nominating Committee on 10 December 2019.(5) Ms Christina Ong was appointed to Ethics and Conduct Committee on 17 January 2019 and Nominating Committee on 10 December 2019, and stepped down from Audit Committee
on 10 December 2019.(6) Mr Quah Wee Ghee stepped down from Remuneration Committee on 10 December 2019.(7) Mr Pramukti Surjaudaja was appointed to Nominating Committee and Ethics and Conduct Committee on 10 December 2019, and stepped down from Risk Management Committee
on 10 December 2019.
Corporate Governance
86 OCBC Annual Report 2019 87Governance

familiarise new Directors with its business and governance practices. The programme also enables the new Directors to be acquainted with senior management, thereby facilitating the latter’s interaction with and access to the Directors. Arrangements are made for new Directors to visit the Bank’s operations and facilities.
On a continuing basis, the Directors receive appropriate development to perform their roles on the Board and its committees. This includes updates on global trends and regulatory developments as well as their impact on business, new business and products, accounting and finance, corporate governance, risk management and anti-money laundering issues as well as fintech and cyber security, which are provided by subject matter experts from within and outside the Bank. When deciding on the scope of the development to be provided, the knowledge and skills required to enable Directors to properly discharge their duties as members of the Board and its committees are taken into account.
The Directors participate in external courses and learning experience as and when needed. The Bank funds the training and development programmes that it arranges for existing and new Directors. During the year, the Directors visited several notable technology companies to gain insights into new technological developments. There is a formal record of all attendance at training sessions.
Training and updates provided to Directors in 2019 were on subjects that included:• Market Developments and Emerging
Trends on New Technologies• Digital Advancements in Banking• Open Banking Framework• API Marketplace / Financial Planning
Digital Service• Anti-money Laundering
• Countering the Financing of Terrorism• Technology Risks• Culture & Conduct
Principle 2: Board Composition and GuidanceThe Bank has majority representation of independent Directors on its Board.
An independent Director in OCBC Bank is one who is independent of any management, substantial shareholder and business relationship with the Bank, and who has not served for more than nine years on the Board. The Board at present comprises 11 Directors of whom seven, a majority, are independent Directors. They are Mr Ooi Sang Kuang, Mr Chua Kim Chiu, Ms Christina Ong, Mr Quah Wee Ghee, Mr Tan Ngiap Joo, Ms Tan Yen Yen and Mr Wee Joo Yeow.
Ms Christina Ong is senior partner and chairman of Allen & Gledhill LLP (A&G), one of several law firms which provides legal services to and receives fees from the Bank. She did not involve herself in the selection and appointment of legal counsels for OCBC Group. Her interest in A&G is less than 5% and the fees paid by the Group does not form a significant portion of A&G’s revenue. She is also an independent director of Singapore Telecommunications Limited which provides telecommunication services to and receives payments from the Bank, not unlike many organisations in Singapore. The Nominating Committee is of the view that these business relationships do not affect her disposition to act independently.
Dr Lee Tih Shih is not independent of a substantial shareholder. Mr Samuel N. Tsien and Mr Pramukti Surjaudaja are not independent of management. Mr Samuel N. Tsien is executive Director and CEO. Mr Pramukti Surjaudaja has an immediate family member, a sister, who is chief executive of the Bank’s subsidiary, PT Bank OCBC NISP Tbk.
Mr Koh Beng Seng is considered not independent of banking relationship with the Bank as he is the chief executive officer of Octagon Advisors Pte Ltd which provides consultancy and advisory services and receives fees from the Bank.
The Board reviews the size of Board and Board Committees annually and it considers the current number of Board and Board Committee members to be appropriate given the size of the Group and its business complexity. It also assesses the diversity of members’ profiles and determines the collective skills required to discharge its responsibilities effectively. A Board Diversity Policy, setting out the approach to diversify the appointment of members and composition of the Board is published on the Bank’s website. The policy embraces the diversity of skills, knowledge, experience including familiarity in the Bank’s core markets, age, gender and length of service as well as merit and independence. Steps are taken to improve effectiveness where necessary. It is assessed that the members of the Board as a group provide the appropriate balance and mix of skills, knowledge, experience, competencies and other aspects of diversity such as gender and age that foster constructive debate and ensure the effectiveness of the Board and its committees. Skills, knowledge and experience include banking, insurance, accounting, finance, law, strategy formulation, business acumen, management experience, risk management, understanding of industry and customer, familiarity with regulatory requirements and knowledge of cybersecurity risks. Details of the Directors’ professional qualifications, background and age can be found on pages 12 to 15.
The non-executive Directors on the Board constructively challenge and help develop proposals on strategy, review the performance of management in meeting agreed goals and objectives, and monitor the reporting of performance.
They meet during the year, without the presence of management, to discuss the effectiveness of management.
Separate sessions are also arranged for the independent Directors to meet at least once a year to ensure effective corporate governance in managing the affairs of the Board and the Bank.
The Board and senior executives meet as frequently as necessary to develop or refresh strategies for the Group.
Principle 3: Chairman and Chief Executive OfficerThe Chairman and CEO are not related.
The roles of the Chairman and the CEO are separated, which is consistent with the principle of instituting an appropriate balance of power and authority. The Chairman’s responsibilities, to name a few, include leading the Board to ensure its effectiveness in all aspects of its role; setting its meeting agenda; ensuring that Directors receive accurate, timely and clear information; ensuring effective communication with shareholders; encouraging constructive relations between the Board and management; facilitating the effective contribution of non-executive Directors; ensuring constructive relations between executive and non-executive Directors; and promoting high standards of corporate governance. The Bank does not appoint a Lead Independent Director as the Chairman is an independent Director.
Principle 4: Board MembershipAs a principle of good corporate governance, all Directors are subject to re-nomination and re-election at regular intervals and at least every three years. The Bank’s Constitution provides for the retirement of Directors by rotation and all appointments and re-appointments of Directors have to be approved by MAS.
The Board establishes a Nominating Committee to make recommendations to the Board on matters relating to board membership. The Committee reviews the independence of Directors at least annually in accordance with internal due diligence procedures and the Directors’ declarations. It also reviews the succession plans for Directors, including the appointment and/or replacement of the Chairman and executive Director, and ensures that only the most competent individuals capable of contributing to the success of the organisation are appointed. It reviews all nominations for the appointment, election or re-election – as well as resignations or retirement – of Directors of the Bank and members of the Executive Committee, Remuneration Committee, Audit Committee, Risk Management Committee and Ethics and Conduct Committee. It is also charged with determining annually whether or not a Director is independent, capable of carrying out relevant duties and qualified to remain in office.
The Nominating Committee establishes annually the profile required of Board members, having regard to the competencies and skills required, and makes recommendations to the Board on the appointment of new Directors, when necessary. When the need for a new Director is identified, the Nominating Committee will prepare a shortlist of candidates with the appropriate profile and qualities for nomination. The Nominating Committee may engage external search consultants to search for the Director. The Board reviews the recommendation of the Nominating Committee and appoints the new Director, subject to the approval of MAS. In accordance with the Bank’s Constitution, the new Director will hold office until the next Annual General Meeting (AGM) and, if eligible, may then stand for re-election.
Mr Koh Beng Seng and Ms Tan Yen Yen were appointed to the Board on 1 October 2019 and 1 January 2020, respectively. Mr Lai Teck Poh retired from the Board on 1 January 2020 after having served for more than nine years on the Board, the maximum period to be deemed an independent Director.
The Bank does not, as a matter of practice, appoint alternate directors.
Directors are aware of their duties and obligations and the expectation to set aside adequate time for their oversight of matters relating to the Bank. They attend and actively participate in Board and Board Committee meetings. The number of such meetings and each director’s attendances at such meetings are disclosed in the annual report. They must provide declarations of any changes in their other appointments and principal commitments, which are disseminated to all Board members. The Bank has guidelines on meeting attendance and the extent of other appointments that a Director can assume. The Nominating Committee, based on the guidelines established, assesses annually each Director’s attendance record and degree of participation at meetings to determine if a Director is able to and has been adequately carrying out his or her duties as a Director of the Bank. In respect of other appointments, it takes into account – among various factors – the nature of an appointment (full-time or otherwise), number of meetings to attend, complexity of organisation and degree of participation in sub-committees. Generally, a Director who has full-time employment in any organisation shall have appointments in no more than three other listed companies, while a Director who has no full-time employment shall have appointments in no more than six other listed companies.
Key information on the Directors’ qualifications, working experience, and
Corporate Governance
88 OCBC Annual Report 2019 89Governance

other directorships and principal commitments/appointments are provided on pages 12 to 15 while information on their shareholdings in the Bank and its related corporations are provided in the Directors’ Statement on pages 136 to 141.
Principle 5: Board PerformanceThe Board has an annual performance evaluation process, carried out by the Nominating Committee, Nominating Committee Chairman and Board Chairman, to assess the effectiveness of the Board, Board Committees and each Director’s contribution. The purpose of the evaluation process is to increase the overall effectiveness of the Board.
An external party is engaged after every three years to facilitate the Board evaluation process and to provide the Board with an independent perspective of the Board’s performance, including benchmarking against peer boards and industry best practices. In accordance with internal policy, the 2019 Board evaluation was conducted internally.
The Directors participate in the evaluation. Each Director evaluates the performance of the Board and Board Committees whilst the Chairman and Nominating Committee Chairman evaluate the performance of each Director and meet to discuss the matter. The assessments are made against pre-established criteria which are derived from the Board’s charter and responsibilities. The results of the evaluation are used constructively to discuss improvements to the Board and ensure that each Director remains qualified for office. The Chairman and/or Nominating Committee Chairman acts on the results of the evaluation, and if appropriate, proposes new Directors or seeks the resignation or retirement of Directors, in consultation with the Nominating Committee.
Remuneration MattersPrinciple 6: Procedures for Developing Remuneration PoliciesThe objective of the Bank’s remuneration policy is to attract, motivate, reward and retain talented and competent staff globally. The Board ensures that remuneration policies are in line with the strategic objectives and corporate values of the Bank, and do not give rise to conflicts between the objectives of the Bank and the interests of individual Directors or key executives.
The Remuneration Committee is tasked to review and recommend to the Board the general remuneration framework as well as the specific remuneration for each Director and for each key executive. The composition and summary terms of reference of the Remuneration Committee are provided on page 86. No member of the Remuneration Committee is involved in the deliberations regarding any remuneration, compensation, options or any form of benefits to be granted to himself or herself.
In its review of the Bank’s remuneration practices, the Remuneration Committee can seek expert advice, if necessary. In 2019, the Remuneration Committee engaged Willis Towers Watson to provide independent advice on the remuneration framework to ensure greater alignment of pay policies and practices with market and regulatory standards. The Bank also used salary surveys conducted by external compensation consultants, McLagan (a business unit of Aon Hewitt), Mercer and Willis Towers Watson for the purpose of benchmarking employee salaries in Singapore and overseas. McLagan, Mercer and Willis Towers Watson and their consultants are independent and are not related to the Bank or its subsidiaries or any of their directors. The Bank’s compensation practices are also reviewed annually by McLagan against the Financial Stability Forum’s principles and
implementation standards for Sound Compensation Practices for significant financial institutions.
The Bank’s remuneration policy is applied to all OCBC overseas branches and the following subsidiaries:• Bank of Singapore Ltd• OCBC Management Services Pte Ltd• OCBC Securities Pte Ltd• OCBC Investment Research Pte Ltd• BOS Trustee Ltd• e2 Power Pte Ltd• e2 Power Sendirian Berhad• OCBC Bank (Malaysia) Berhad• OCBC Al-Amin Bank Berhad• OCBC Wing Hang Bank Ltd• OCBC Wing Hang Bank (China) Ltd
The Bank does not provide for any termination, retirement or post-employment benefits to executive Directors or the top five key management personnel.
Principle 7: Level and Mix of RemunerationCompensation for Non-Executive DirectorsOCBC’s remuneration for non-executive Directors is intended to attract capable individuals to the Board, as well as retain and motivate them in their roles as non-executive Directors. It aligns their interests with those of shareholders, is competitive in the region and recognises individual contributions. The remuneration for non-executive Directors is subject to shareholder approval at the AGM.
The Remuneration Committee has considered market practices for non-executive director compensation. On its recommendation, the Board has decided to maintain the fee structure unchanged from the previous year.
The fee structure is as follows:
• Board chairman’s fee S$1,400,000
• Retainer fee S$45,000
• Committee chairperson’s fee for the Audit, Risk Management and Executive Committees
S$70,000
• Committee chairperson’s fee for the Nominating, Remuneration, and Ethics and Conduct Committees
S$40,000
• Committee member’s fee for the Audit, Risk Management and Executive Committees (committee chairpersons are not awarded these fees)
S$40,000
• Committee member’s fee for the Nominating, Remuneration, and Ethics and Conduct Committees (committee chairpersons are not awarded these fees)
S$20,000
• Attendance fee per meeting S$3,000
The resolution proposing the fee for non-executive Directors will be presented to shareholders at the 2020 AGM.
In the previous year, shareholders had approved the grant of 6,000 remuneration shares to each non-executive Director. The remuneration shares align the interests of non-executive Directors with the interests of shareholders. At the recommendation of the Remuneration Committee, the Board has decided to continue with the granting of 6,000 new ordinary shares to each non-executive Director. Any non-executive Director who has served on the Board for less than a full financial year will be awarded shares on a pro-rated basis, depending on the length of service. The resolution proposing these share grants will be presented to shareholders at the 2020 AGM.
Compensation for Executive DirectorsThe compensation for an executive Director is formulated and reviewed annually by the Remuneration Committee to ensure that it is market-competitive and
that the rewards are commensurate with the contributions made. The compensation package comprises basic salary, benefits-in-kind, performance bonus, share awards and compensation in the event of early termination where service contracts are applicable. Performance bonus relate directly to the financial performance of the Group and the contributions of the executive Director. The guidelines on the granting of share awards to the executive Director are similar to those for the executives of the Bank.
Employee RemunerationThe total compensation packages for employees comprise basic salary, fixed bonus, variable performance bonus, allowances and deferred share awards for eligible executives, as well as benefits. Compensation is tied to the achievement of business and performance objectives based on a balanced scorecard approach and adherence to core values. Where relevant, financial measurements – adjusted as appropriate for the various types of risk (such as market, credit and operational risks) – include:• Operating efficiency measures covering
revenue, direct and allocated costs and operating profits, net profits as well as efficiency indicators such as unit costs.
• Economic efficiency measures such as cost of capital. Capital is attributed to each business based on the amount of risk-weighted assets used and the return on capital.
• Liquidity is factored into the performance measurement of each business through the application of liquidity premiums charged or credited according to the behavioural maturity of each type of asset and liability booked.
There were no significant changes to the above measures during 2019.
In the Bank’s continuous efforts to create sustainable value for stakeholders, relevant performance measures are set
for each business unit. These objectives which include broad-based growth across its core markets, delivering sustained earnings momentum from core businesses, driving core competencies of disciplined risk management, diversified funding base and continued investments in technology and people, and ensuring sustainable business practices are also consistent with the Group’s risk appetite. In the determination of remuneration of senior executives, risk and control indicators as well as audit findings and compliance issues are taken into account when assessing business performance. Executives are remunerated based on the achievements of their own performance measures, and the demonstration of core values and competencies, while taking into account market compensation data for their respective job roles.
The performance of risk and compliance functions is measured independently of the businesses they oversee. Employees in these functions are assessed based on achievement related to their respective performance measures. Market compensation data on risk and compliance functions is also taken into account for remuneration.
In determining the composition of compensation packages, the Bank takes into account the time horizon of risk and includes, in the total compensation for executives, a significant portion of deferred payment in the form of deferred shares. All awards of deferred shares or share options (granted in previous years) are subject to cancellation and clawback if it is determined that they were granted on the basis of materially inaccurate financial statements and/or that the employee has engaged in conduct that results in financial loss, reputational harm, restatement of financial results and/or adverse changes to the Bank’s risk profile/rating. To ensure that its remuneration packages are competitive, the Bank
Corporate Governance
90 OCBC Annual Report 2019 91Governance

regularly reviews salary levels and benefits packages based on market data provided by recognised consultants who conduct surveys on comparative groups in the financial sector. The determination of the Bank’s variable bonus pool is fully discretionary and the factors taken into consideration include financial and non-financial metrics like the Bank’s performance, audit ratings, risk indicators and compliance issues, market conditions and competitive market practices.
The Bank adopts a performance-driven approach to compensation. Compensation packages are linked to personal performance, the performance of each business unit, and the overall performance of the Bank. Compensation is reviewed each year based on information from market surveys provided by reputable management consultants.
As a consequence of the last financial crisis, the Financial Stability Forum developed principles and implementation standards for Sound Compensation Practices for significant financial institutions. The Remuneration Committee made changes to the Bank’s compensation structure to increase the proportion of the deferred remuneration component for senior executives. The Bank’s compensation practices are reviewed annually by McLagan which has confirmed for 2019 that the Bank had met the Financial Stability Forum principles and implementation standards.
The Bank has identified a group of senior executives whose authority and actions are deemed to have a major influence on the long-term performance of the Bank. This group, identified as “Material Risk Takers” comprises senior management (the CEO and his direct reports), employees of Senior Vice President rank and above, key personnel at business units, senior control staff, and employees
who had been awarded significant variable performance bonuses. For the “Material Risk Takers” with bonuses exceeding S$100,000, at least 40% of their variable performance bonuses are deferred in the form of shares. The Board approves the compensation of the CEO, Deputy President, Chief Financial Officer, Chief Risk Officer, Chief Information Officer (Head, Group Operations and Technology) and Head, Global Treasury, and the Remuneration Committee approves the compensation of all other senior executives of Senior Vice President rank and above, as well as the top five employees who had been awarded significant variable performance bonuses who are below the rank of Senior Vice President.
The performance evaluation for senior executives in 2019 has been conducted in accordance with the above objectives and considerations.
The remuneration practices for staff in bargainable positions are established through negotiation with the Bank’s unions.
Share Schemes• OCBC Share Option Scheme 2001 The Bank has ceased granting share
options under the OCBC Share Option Scheme 2001 (the Scheme) effective from financial year 2018 remuneration. Share options granted in prior years continue to be outstanding until the options lapse or are exercised by the recipients.
The cumulative total number of new ordinary shares issued by the Bank in respect of options granted under the Scheme has not exceeded 10% of the Bank’s total number of issued ordinary shares.
The acquisition price for each ordinary share in respect of which the option is exercisable was determined by the Remuneration Committee to be the
price equal to the average of the last dealt price of the shares for the five consecutive trading days immediately prior to the date of grant. No options have been granted at a discount to the price as determined above since the commencement of the Scheme.
The validity period of the options granted is subject to legislation applicable on the date of grant. Based on current legislation, options granted to Group executives are exercisable for up to 10 years, while options granted to non-executive Directors are exercisable for up to five years. The options may be exercised after the first anniversary of the date of grant, in accordance with a vesting schedule to be determined by the Remuneration Committee on the date of grant of the respective options. The Committee has adopted the following vesting schedule:
Percentage of shares for which an option is exercisable
On or before the first anniversary of the date of grant
Nil
After the first anniversary but on or before the second anniversary of the date of grant
33%
After the second anniversary but on or before the third anniversary of the date of grant
33%
After the third anniversary but before the date of expiry of the exercise period
34%
The options granted will lapse immediately upon termination of employment or appointment, except in the event of retirement, redundancy or death, or where approved by the Remuneration Committee, in which case the Committee may allow the options to be retained and exercisable
within the relevant option periods or such option periods as may be determined by the Remuneration Committee. Shares granted upon the exercising of options are allocated from treasury shares or from new ordinary shares issued by the Bank.
All grants are subject to cancellation and clawback if it is determined that they were made on the basis of materially inaccurate financial statements and/or that the employee has engaged in conduct that results in financial loss, reputational harm, restatement of financial results and/or adverse changes to the Bank’s risk profile/rating.
• OCBC Deferred Share Plan The OCBC Deferred Share Plan (the
Plan) aims to increase the performance-orientation and retention factor in compensation packages of executives, and foster an ownership culture within the organisation. It also aligns the interests of executives with the sustained business performance of the Bank. Group executives holding the rank or equivalent rank of Assistant Manager and above, and any Group Executive Director selected by the Remuneration Committee, are eligible to participate in the Plan. In 2019, the participants are executives of the Bank, selected overseas locations and subsidiaries.
Share awards are granted annually to eligible executives who are paid variable performance bonuses exceeding S$100,000. The share awards form 20% to 40% of their total variable performance bonus for the year. Half (50%) of the share awards will vest after two years with the remaining 50% vesting at the end of three years in accordance with the guidelines established under the Plan. Prior to the
vesting date, the executives will not be accorded voting rights for the shares.
Shares granted are allocated from treasury shares or acquired from the market in accordance with guidelines established under the Plan. The unvested deferred share grants will be adjusted to take into account dividends declared by the Bank. The additional shares granted in respect of this adjustment may be acquired from the market in accordance with guidelines established under the Plan.
The awards will lapse immediately upon termination of employment or appointment, except in the event of retirement, redundancy or death, or where approved by the Remuneration Committee, in which case the Committee may allow the awards to be retained and vested within the relevant vesting periods or such periods as may be determined by the Remuneration Committee.
All awards are subject to cancellation and clawback if it is determined that they were granted on the basis of materially inaccurate financial statements and/or that the employee has engaged in conduct that results in financial loss, reputational harm, restatement of financial results and/or adverse changes to the Bank’s risk profile/rating.
During the financial year, an aggregate of 9,322,563 ordinary shares were granted to eligible executives of the Group pursuant to the Plan.
• OCBC Employee Share Purchase Plan The OCBC Employee Share Purchase
Plan (ESPP) was implemented for all employees of the participating companies in the Group, including executive Directors, to inculcate in all
participants a stronger and more lasting sense of identification with the Group.
The ESPP is a saving-based share ownership plan to help employees own ordinary shares in the Bank through their monthly contributions via deductions from payroll and/or CPF funds. The employees have the option to convert the contributions to ordinary shares after one year or to withdraw the contributions at any time. As a further incentive to employees to enrol in the ESPP, the Bank pays interest on the amounts saved at a preferential interest rate.
The duration of the offering period is 24 months and the share acquisition price is fixed before the offering period based on the average of the last traded prices over the five consecutive trading days immediately preceding the price fixing date. Shares granted upon conversions in accordance with the rules of the ESPP are allocated from treasury shares or from new ordinary shares issued by the Bank.
The aggregate number of new ordinary shares issued by the Bank pursuant to the ESPP, together with the aggregate number of any new ordinary shares issued pursuant to the Scheme, cannot exceed 15% of the Bank’s total number of issued ordinary shares. Notwithstanding the limits allowed under the relevant rules, the Bank had been applying a lower aggregate limit of 5% instead of 15% as a matter of conservative practice.
Principle 8: Disclosure on RemunerationThe following disclosures should be read in conjunction with the remuneration policies, practices and share plans as described under Principles 6 and 7.
Corporate Governance
92 OCBC Annual Report 2019 93Governance

Remuneration of Top Five Key Management Personnel in 2019The Code recommends the disclosure of the individual remuneration of the Bank’s top five key management personnel as well as their aggregate remuneration. The Board considered this matter carefully and has decided against such a disclosure for the time being as it is not standard business practice to do so, having taken into account the highly competitive conditions for talent in the industry.
Remuneration of Directors’ and CEO’s Immediate FamilyMr Pramukti Surjaudaja, a Director of the Bank, has a sister, Ms Parwati Surjaudaja, who is chief executive of the Bank’s subsidiary, PT Bank OCBC NISP Tbk. Her personal remuneration in 2019 exceeds S$100,000 but for reasons stated above, her individual remuneration is not disclosed. Apart from Ms Parwati Surjaudaja, none of the Group’s employees was an immediate family member of a Director or the CEO in 2019.
Remuneration of Substantial Shareholder’s Immediate FamilyA disclosure on remuneration to employees who are immediate family members is not applicable as none of the Bank’s substantial shareholders are individuals.
Directors’ Remuneration in 2019
Bank
Director Fees Shares (a) Other Benefits (b) Total
S$ S$ S$ S$
Ooi Sang Kuang 1,592,411 50,160 54,454 1,697,025Chua Kim Chiu 203,000 50,160 4,237 257,397Koh Beng Seng 35,465 12,640 – 48,105Lai Teck Poh 238,000 50,160 4,237 292,397Lee Tih Shih 168,795 50,160 4,237 223,192Christina Ong 168,794 50,160 4,237 223,191Quah Wee Ghee 136,795 50,160 353 187,308Pramukti Surjaudaja 117,999 50,160 – 168,159Tan Ngiap Joo 248,000 50,160 4,237 302,397Wee Joo Yeow 248,000 50,160 4,237 302,397
3,157,259 464,080 80,229 3,701,568
Director & CEO Salary Bonus Deferred Shares Other Benefits (b) Total
S$ S$ S$ S$ S$
Samuel N. Tsien 1,242,400 5,841,000 3,894,000 102,157 11,079,557
Notes:(a) Value of remuneration shares was estimated based on closing price of ordinary shares on 20 March 2020, i.e. S$8.36 per share.(b) Non-cash component such as club and car benefits for Mr Ooi Sang Kuang and Mr Samuel N. Tsien and carparks for Directors.
Subsidiaries
Director Fees
S$
Ooi Sang Kuang 91,733 (c)
Koh Beng Seng 525,000 (d)
Lai Teck Poh 236,479 (e)
Quah Wee Ghee 192,000 (f)
Pramukti Surjaudaja 789,642 (g)
Tan Ngiap Joo 172,553 (h)
Wee Joo Yeow 141,000 (i)
Notes:(c) Fees from OCBC Wing Hang Bank.(d) Fees from Great Eastern Holdings and subsidiaries.(e) Fees from OCBC Bank (Malaysia) and PT Bank OCBC NISP.(f) Fees from Bank of Singapore, The Great Eastern Life Assurance Co and Great Eastern General Insurance. (g) Fees from PT Bank OCBC NISP for being President Commissioner, a capacity in Indonesia with critical supervisory responsibilities over the organisation.(h) Fees from OCBC Bank (Malaysia) and OCBC Al-Amin Bank.(i) Fees from Great Eastern Holdings.
Remuneration Disclosure for Senior Management and Material Risk Takers
Remuneration Awarded during the Financial YearSenior
ManagementOther Material
Risk Taker
Fixed remuneration Number of employees 17 348Total fixed remuneration 24% 49%
of which: cash-based 24% 49% of which: deferred 0% 0%of which: shares and other share-linked instruments 0% 0% of which: deferred 0% 0%of which: other forms 0% 0% of which: deferred 0% 0%
Variable Number of employees 17 340Total variable remuneration 76% 51%
of which: cash-based 46% 31% of which: deferred 0% 0%of which: shares and other share-linked instruments 30% 20% of which: deferred 30% 20%of which: other forms 0% 0% of which: deferred 0% 0%
Total remuneration 100% 100%
Special Payments
Guaranteed Bonuses Sign-on Awards Severance PaymentsNumber ofEmployees
TotalAmount (S$)
Number ofEmployees
TotalAmount (S$)
Number ofEmployees
TotalAmount (S$)
Senior management 1 Not disclosed* 0 0 0 0Other material risk-takers 7 671,126 0 0 0 0
* Due to confidentiality reason
Deferred Remuneration
Deferred andRetained Remuneration
Total outstandingdeferred remuneration
Of which: Totaloutstanding deferred
and retainedremuneration exposed
to ex post explicit and/orimplicit adjustments
Total amendmentduring the year dueto ex post explicit
adjustments (1)
Total amendmentduring the year dueto ex post implicit
adjustments (2)
Total deferredremuneration paid out
in the financial year
Senior management 100% 100% 0% 0% 52%Cash 0% 0% 0% 0% 0%Shares 100% 100% 0% 0% 52%Share-linked instruments 0% 0% 0% 0% 0%Other 0% 0% 0% 0% 0%
Other material risk-takers 100% 100% 0% 0% 44%Cash 0% 0% 0% 0% 0%Shares 100% 100% 0% 0% 44%Share-linked instruments 0% 0% 0% 0% 0%Other 0% 0% 0% 0% 0%
Notes:(1) Examples of ex post explicit adjustments include malus, clawbacks or similar reversal or downward revaluation of awards.(2) Examples of ex post implicit adjustments include fluctuation in the value of shares performance or performance units.
Corporate Governance
94 OCBC Annual Report 2019 95Governance

Accountability and AuditPrinciple 9: Risk Management and Internal ControlsThe Board is responsible for the governance of risk and sets the tone for the Bank’s risk culture. It oversees, through the Risk Management Committee, the establishment and operation of an independent risk management system for managing risks on an enterprise-wide basis, the adequacy and effectiveness of the internal controls and risk management processes and systems (including ensuring that the risk management function is sufficiently resourced to monitor risk by the various risk categories and that it has appropriate independent reporting lines). The Board approves the Bank’s risk appetite and has oversight of the risk activities to ensure that these are consistent with the Bank’s strategic intent and operating environment, as well as capital sufficiency and regulatory standards.
Further details on risk management are described under the section on Risk Management Committee on page 86.
The Board is also responsible for ensuring that the Bank’s internal controls adequately safeguard shareholders’ interests and the Bank’s assets. The Bank has in place self-assessment processes for all business units to assess the adequacy and effectiveness of their internal controls, and their level of compliance with applicable rules and regulations. The results of evaluations are reviewed by senior management. The Board has received assurance from the CEO (which includes assurances provided by key management personnel to the CEO) on the effectiveness of the Bank’s risk management and internal control systems. The Board has also received assurances from the CEO and Chief Financial Officer that the financial records have been properly maintained and the financial statements give a true and fair view of the Bank’s operations and finances.
Based on the internal controls established and maintained by the Group, work performed by the internal and external auditors, and reviews performed by management and various Board Committees, the Board – with the concurrence of the Audit and Risk
Management Committees – is of the view that the system of internal controls, including financial, operational, compliance and information technology controls, and risk management policies and systems, were adequate and effective as at 31 December 2019, to address the risks which the Group considers relevant and material to its operations.
The system of internal controls provides reasonable but not absolute assurance that the Bank will not be adversely affected by any event that could be reasonably foreseen as it strives to achieve its business objectives. However, the Board also notes that no system of internal controls can provide absolute assurance in this regard, or absolute assurance against the occurrence of material errors, poor judgement in decision-making, human error, losses, fraud or other irregularities.
Principle 10: Audit CommitteeThe composition and summary terms of reference of the Audit Committee are provided under the section on Audit Committee on page 86 and the Committee’s summary activities are also provided in the Directors’ Statement on page 141. The Audit Committee adopts, where appropriate, relevant best practices set out in the Guidebook for Audit Committees in Singapore.
In addition to the review of the Group Financial Statements, which includes reviewing the assurances provided by the CEO and Chief Financial Officer on the financial records and statements, the Audit Committee reviews and evaluates, with the external auditors and internal auditor, the adequacy and effectiveness of the system of internal controls including financial, operational, compliance and information technology controls, and risk management policies and systems. It reviews the scope and results of the audits, the cost-effectiveness of the audits and the independence and objectivity of the external auditors and internal auditor. When the external auditors provide non-audit services to the Bank, the Committee keeps the nature, extent and costs of such services under review. This is to balance the objectivity of the external auditors against its ability to provide value-for-money services. The Audit Committee members keep abreast
of changes to accounting standards and development of related significant accounting policies which have a direct impact on financial statements and Group accounting policies through briefings provided by internal or external subject matter experts. The Audit Committee also reviews significant financial reporting issues and judgements to ensure the integrity of the financial statements. The Committee reviews announcements relating to financial performance.
The Audit Committee is also responsible for the review of the Bank’s whistleblowing policy as well as any concerns, including anonymous complaints, which staff may in confidence raise about possible improprieties in matters of financial reporting or other matters. The whistleblowing policy and procedures for raising such concerns are disclosed and clearly communicated to employees. The Committee will ensure such concerns are independently investigated and followed up on. If it is found that there has been fraud, appropriate remedial action will be taken and the Audit Committee updated regularly on its status. The whistleblower’s interests will be safeguarded at all times, including a right to appeal to the Audit Committee if reprisals are taken against him.
The Audit Committee meets at least once a year with the external auditors and internal auditor in separate sessions and without the presence of management, to consider any matters which may be raised privately. In addition, the Chairman of the Audit Committee meets the head of internal audit on a regular basis to discuss the work undertaken, key findings and any other significant matters arising from the Group’s operations. Formal reports are sent to the Audit Committee on a regular basis.
External AuditThe Audit Committee has received the requisite disclosures from the current external auditors evidencing its independence. It is satisfied that the financial, professional and business relationships between the Group and the external auditors will not prejudice the independence and objectivity of the external auditors. The aggregate amount of fees paid to the external auditors for financial year 2019, and the breakdown of
total fees paid for audit and non-audit services, are shown in the Notes to the Financial Statements.
The Audit Committee assesses the quality of OCBC’s external auditors before its first appointment and at least annually thereafter. The selection of external auditors is made through a tender process based on an established framework for the selection/appointment of OCBC’s external auditors. This framework lists the considerations and criteria for the external auditors and provides a robust tender process. Considerations include having global reach as well as technical and industry expertise, skills, resources and reputation, and quality of service delivery.
Exercising oversight over the external audit function, the Audit Committee is responsible for making recommendations to the Board in relation to the appointment, re-appointment and removal of the external auditors. The Audit Committee also considers the annual fee proposals presented by the external auditors and reviews the scope of the audit plan, the level of materiality, areas of focus and significant risks to be addressed.
For re-appointment of external auditors, the Audit Committee considers the length of the external auditor’s tenure and the risk this may pose to objectivity and independence. The Audit Committee also takes into consideration the external auditors’ compliance with SGX-ST Listing Rules which require the lead engagement partner to be rotated every five years.
The Audit Committee noted that the current external auditors, KPMG LLP, has served as external auditors of the Bank since 2006.
In line with good corporate governance practice, the Audit Committee is of the view that a change of external auditors is in the best interests of the Bank and its shareholders. Taking into consideration the requirements of the revised MAS Notice 615 to Banks and the SGX Listing Manual, the Audit Committee initiated an audit tender exercise in 2018. Information on the tender exercise and subsequent decision and rationale for recommending PricewaterhouseCoopers LLP for nomination as external auditors commencing financial year ending 31 December 2020 were disclosed in
OCBC’s Annual Report 2018. The scope of audit services to be provided by PricewaterhouseCoopers LLP will be comparable to those currently provided by KPMG LLP. The proposed appointment of PricewaterhouseCoopers LLP as external auditors of the Bank will be presented for shareholders’ approval at the 2020 AGM.
The Audit Committee is responsible for monitoring the performance, objectivity and independence of the external auditors. In its evaluation process, the Audit Committee takes into consideration the following:• the experience and expertise of senior
members of the engagement team;
• the audit plan agreed with the external auditors, the areas of audit focus and the external auditors’ approach to materiality;
• the quality of reports and findings presented by the external auditors;
• the external auditors’ presentation of its Audit Quality Framework and its confirmation of independence pursuant to its policies and processes for maintaining independence and objectivity;
• the external auditors’ report to the Audit Committee on main findings on audit quality reviews of the Bank’s audit;
• the key highlights or findings on the external auditors’ quality control systems by audit oversight bodies and, where relevant, the appropriate steps taken by the external auditors; and
• feedback through an annual evaluation exercise from senior management across geographical regions to gather internal perceptions as to the knowledge, competence, independence, efficiency and effectiveness – as well as communications by and with – the external auditors.
As part of its assurance process on the objectivity and independence of the external auditors, the Audit Committee has in place a policy that lists the non-audit services which may not be provided by the external auditors and sets out the circumstances in which the external auditors may be permitted to
undertake non-audit services. Permitted non-audit services exceeding S$250,000 require the approval of the Audit Committee before the auditor can be engaged. In addition, the Audit Committee reviews reports on non-audit services undertaken by the external auditors to satisfy itself as to the nature of non-audit services being provided and the fees incurred. The nature of the non-audit services provided during the financial year ended 31 December 2019 is shown in the Notes to the Financial Statements.
To reinforce the Audit Committee’s effectiveness and enhance the quality of the audit, the Audit Committee meets regularly with the external auditors. The external auditors discuss its audit plan with the Audit Committee and present its engagement teams and its audit fee proposals. It reports to the Audit Committee on audit focus areas, the support rendered by management, key audit findings, quantitative and qualitative aspects of financial statement disclosures, any unadjusted audit differences (or review differences in the case of a half-yearly or a quarterly review) and any other matters relevant to its engagement. Discussions may be held privately without the presence of management. The external auditors also discuss with the Audit Committee key changes to regulatory requirements and reporting as well as developments in accounting standards.
In the review of the 2019 financial statements, the Audit Committee discussed with management the accounting principles applied and significant judgements affecting the financial statements. Matters raised by Group Audit and the external auditors in respect of governance, risk management, accounting and internal controls over financial reporting were also reviewed. The following key audit matters highlighted in the Independent Auditors’ Report on pages 142 to 148 of the Annual Report were discussed with management and the external auditors:
• Impairment of loans and bills receivable The Audit Committee reviewed
management’s assessment and justification of allowances for impaired loans and non-impaired loans, including the appropriateness of
Corporate Governance
96 OCBC Annual Report 2019 97Governance

forward-looking assumptions and scenarios adopted, in accordance with Singapore Financial Reporting Standards (International) 9 Financial Instruments and approved framework. The adequacy of allowances for impaired loans set aside for key loan accounts was also discussed with the external auditors. Additionally, the Audit Committee also considered the input from Group Audit’s independent assessment of the Group’s credit portfolio quality and credit risk management process.
• Valuation of financial instruments held at fair value
The Audit Committee with the input of the Risk Management Committee, reviewed management’s valuation of financial instruments framework and their control, monitoring and issue escalation processes. In addition, the Committee reviewed both Group Audit’s and the external auditors’ assessment of the controls over valuation which included independent verification of price and validation of valuation models.
• Valuation of insurance contract liabilities
The Audit Committee reviewed the approach and methodology applied to the valuation of insurance contract liabilities of Great Eastern Holdings Limited (Great Eastern) in their review of Great Eastern’s financial results together with the Group’s financial performance. In considering the valuation of insurance contract liabilities, the Committee considered external auditors’ assessment of the valuation methodology and assumptions adopted by Great Eastern and its subsidiaries.
• Impairment of goodwill The Audit Committee reviewed
management’s goodwill impairment testing methodology and results, including the appropriateness of the cash flow forecasts and discount rates used. The Committee also considered the external auditors’ assessment of the methodology and testing results.
The Audit Committee believes that the financial statements are fairly
presented in conformity with the relevant Singapore Financial Reporting Standards (International) in all material aspects, based on its review and discussions with management and the external auditors.
Internal AuditThe Audit Committee approves the terms of reference of internal audit (Group Audit) and reviews the adequacy and effectiveness of the internal audit function, at least annually. In line with leading practice, Group Audit’s mission statement and charter requires it to provide independent and reasonable, but not absolute, assurance that the Group’s governance, risk management and internal control processes – as designed and implemented by senior management – are adequate and effective. Group Audit reports on the adequacy and effectiveness of the system of internal controls to the Audit Committee and management, but does not form any part of the system of internal controls. Group Audit meets or exceeds the International Standards for the Professional Practice of Internal Auditing of The Institute of Internal Auditors.
Group Audit adopts a risk-based approach where audit work is prioritised and scoped according to an assessment of current and emerging risks, including financial, operational, technology, cyber, compliance and strategic risks. The work undertaken by Group Audit involves the assessment of the adequacy and effectiveness of the Group’s governance, risk management and internal control processes in meeting its strategic objectives and operating within the risk appetite established. In addition, Group Audit provides an independent assessment of the Group’s credit portfolio quality and credit risk management process. Without assuming management responsibility, Group Audit may provide consultative services to line management on certain business initiatives as well as system developments and enhancements where the objective is to add value and improve governance, risk management and controls.
The Audit Committee is responsible for the adequacy and independence of the internal audit function, its resources, and its standing and effectiveness. The Committee ensures that processes are in place for recommendations raised in
internal audit reports to be dealt with in a timely manner and for outstanding exceptions or recommendations to be closely monitored. Group Audit is staffed with individuals with the relevant qualifications and experience. It reports functionally to the Audit Committee and administratively to the CEO, has unfettered access to the Audit Committee, Board and senior management, and has the right to seek information and explanations. Currently, the number of internal audit staff in the Group is 323. The division is organised into departments that are aligned with the structure of the Group. The Audit Committee approves the appointment, resignation, retirement, removal and remuneration of the Head of Group Audit.
Shareholder Rights and EngagementPrinciple 11: Shareholder Rights and Conduct of General MeetingsAt the AGM, the Group’s financial performance for the preceding year is presented to shareholders.
Shareholders are given the opportunity to participate effectively at the general meetings of OCBC Bank, where they can ask questions and communicate their views. They are allowed to vote in person or by proxy. The Bank’s Constitution currently allows a shareholder to appoint up to two proxies to attend, speak and vote in his place at general meetings. Under the multiple proxies regime introduced pursuant to the Companies (Amendment) Act 2014, “relevant intermediaries” such as banks, capital markets services licence holders which provide custodial services for securities and the Central Provident Fund (CPF) Board are allowed to appoint more than two proxies to attend, speak and vote at general meetings. This will enable indirect investors, including CPF investors, to be appointed as proxies to participate at general meetings.
All the Directors attended the 2019 AGM together with the external auditors and senior management to address any relevant queries raised by shareholders. Independent scrutineers are also present at the AGM to review the voting process and address shareholders’ queries on the voting procedures.
To ensure authenticity of shareholder identity and due to other related security issues, the Bank currently does not allow voting in absentia by mail, email or fax. The Bank conducts voting by poll for all resolutions proposed at the general meetings, for greater transparency in the voting process. Following the meetings, it announces the detailed results of the votes, showing the number of votes cast for and against each resolution and the respective percentages.
The Bank provides for separate resolutions at general meetings on each substantially separate issue. It does not “bundle” resolutions, unless the resolutions are interdependent and linked so as to form one significant proposal.
The Company Secretary prepares minutes of general meetings, which reflect responses from the Board and management to queries and comments from shareholders. The minutes are made available on the Bank’s website.
Principle 12: Engagement with ShareholdersThe Bank has a shareholders communication policy approved by the Board. OCBC Bank recognises the importance of communicating regularly and effectively with its shareholders so that they can better understand its operations, strategies and directions. One of the key roles of the Group’s Investor Relations and Group Brand and Communications units is to keep the market and investors apprised of the Group’s major corporate developments and financial performance through regular media releases, briefings and meetings with the investment community and media. Live webcasts of the Bank’s half-year and full-year financial results presentation are available for viewing on the Bank’s corporate website. The Bank’s dividend policy is also disclosed in the Capital Management section on pages 103 and 104 of this Annual Report. In 2019, OCBC Bank held more than 600 meetings and conference calls with the investment community including investors, rating agencies and analysts. In addition, shareholders and the public can access the Group’s media releases, financial results, presentation materials used at briefings and other corporate information via the Bank’s website.
Material information is also announced through the stock exchange.
Investors can submit feedback and queries to OCBC’s Investor Relations Unit through the contact details provided on the corporate website.
Managing Stakeholders RelationshipsPrinciple 13: Engagement with StakeholdersOCBC Bank recognises the importance in maintaining positive stakeholder relationships, and adopts an inclusive approach in the management and engagement of its stakeholders – namely customers, investors, communities, regulators and employees. The Sustainability Report on pages 58 and 59 of this Annual Report sets out the Bank’s approach to stakeholder engagement including key areas of focus and how it responds to stakeholder concerns.
The Bank maintains a corporate website – OCBC.com – to communicate and engage with its stakeholders.
Related Party TransactionsOCBC Bank has established policies and procedures on related party transactions. These include definitions of relatedness, limits applied, terms of transactions, and the authorities governing and procedures for approving and monitoring the transactions. The Audit Committee reviews material related party and interested person transactions and keeps the Board informed of such transactions, if any. Measures are taken to ensure that terms and conditions for related party lendings are not more favourable than those granted to non-related obligors under similar circumstances. The Bank also complies with the SGX-ST Listing Manual Rules on interested person transactions.
Ethical StandardsThe Bank has adopted the SGX-ST Listing Manual’s guidelines on dealings in securities and has a policy against insider trading. Directors and officers are prohibited from dealing in the securities of the Bank and its listed subsidiary, Great Eastern Holdings Limited (GEH) during the period commencing two weeks before the announcement of the Bank’s and GEH’s
quarterly or half-yearly financial results, and one month before the announcement of year-end results (the black-out period) and any time they are in possession of unpublished material price-sensitive information. The Bank will notify Directors and employees of the commencement date for each blackout period. The policy also states that employees are not to deal in the Bank’s securities on short-term considerations. In addition, employees are instructed to conduct all their personal securities transactions through the Group’s stockbroking subsidiary.
The Bank’s insider trading policy also includes instructions pertaining to dealings in the listed securities of customers of the Group.
The Bank has a code of conduct that applies to all employees and reinforces the core values expected of employees. The code covers all aspects of the business operations of the Bank and sets out principles to guide employees in carrying out their duties and responsibilities while adhering to the highest standards of personal and corporate integrity.
Employees are required to observe and comply with laws and regulations as well as company policies, along with the ABS Code of Conduct for Banks and Bank Staff.
The Bank has a suite of policies in place for proper governance and management that staff have to comply with. All policies, including those related to vendor management and procurement, are subject to the Bank’s risk management and internal control systems and processes, including management self-assessment and independent audits.
The Bank also has a policy to manage or eliminate any actual or potential conflicts of interest which may impact the impartiality of research analyses or research reports issued by research analysts in OCBC Bank or its financial subsidiaries. These include prohibitions on business units attempting to influence research analyses or recommendations by research analysts, as well as on securities trading by staff who receive information on research analyses or recommendations in unissued research reports.
Corporate Governance
98 OCBC Annual Report 2019 99Governance

Summary of DisclosuresExpress disclosure requirements in the Code of Corporate Governance issued by the Monetary Authority of Singapore on 6 August 2018.
ProvisionsPage Reference In OCBC Annual Report 2019
Provision 1.2The induction, training and development provided to new and existing directors.
Pages 87 and 88
Provision 1.3Matters that require Board approval. Page 85
Provision 1.4Names of the Board Committee members, the terms of reference, delegation of the Board’s authority to make decisions, and a summary of each Board Committee’s activities.
Pages 85 and 86
Provision 1.5The number of Board and Board Committee meetings and the directors’ attendance at such meetings. Page 87
Provision 2.1(a) The Board should identify in the Company’s Annual Report each director it considers to be
independent(b) Where the Board considers a director, who has served on the Board for more than nine years
from the date of his/her first appointment, to be independent, the reasons for considering him/her as independent should be disclosed.
Pages 12 to 15 and 88
Not applicable
Provision 2.4The board diversity policy and progress made towards implementing the board diversity policy, including objectives.
Page 88
Provision 3.1Relationship between the Chairman and the CEO if they are immediate family members. Not applicable
Provision 4.3Process for the selection, appointment and re-appointment of directors to the Board, including the criteria used to identify and evaluate potential new directors and channels used in searching for appropriate candidates.
Pages 88 and 89
Provision 4.4If the Board determines that a director is independent notwithstanding the existence of a relationship with the Company, its related corporations, its substantial shareholders or its officers, which may affect his/her independence, the relationships and the Board’s reasons for considering him/her as independent should be disclosed.
Page 88
Provision 4.5(a) Listed company directorships and principal commitments of each director should be disclosed(b) If a director holds significant number of directorships and principal commitments, the
Nominating Committee and Board should disclose reasoned assessment of the director’s ability to diligently discharge his/her duties.
Pages 12 to 15 and 89
Provision 5.2The Board should state in the Company’s Annual Report how the assessments of the Board, its Board Committees and each director have been conducted, including the identity of any external facilitator and its connection (if any) with the Company or any of its directors.
Page 90
Provision 6.4The Company should disclose the engagement of any remuneration consultants and their independence in the Annual Report.
Page 90
Provision 8.1Disclose the policy and criteria for setting remuneration, as well as names, amounts and breakdown of remuneration of:(a) Each individual director and the CEO(b) At least the top five key management personnel (who are not directors or the CEO) in bands no wider
than S$250,000 and in aggregate the total remuneration paid to these key management personnel.
For CEO and Management: Pages 91 to 95
For the Company’s Directors: Pages 90, 91 and 94
ProvisionsPage Reference In OCBC Annual Report 2019
Provision 8.2Names and remuneration of employees who are substantial shareholders of the Company, or are immediate family members of a director, the CEO or a substantial shareholder of the Company, and whose remuneration exceeds S$100,000 during the year, in bands no wider than S$100,000. The Company should also state clearly the employee’s relationship with the relevant director or the CEO or substantial shareholder.
Page 94
Provision 8.3Disclose all forms of remuneration and other payments and benefits, paid by the Company and its subsidiaries to directors and key management personnel of the Company. The Company should also disclose details of employee share schemes.
Pages 92 to 95
Provision 9.2The Board should disclose that it has received assurance from:(a) the CEO and the CFO that the financial records have been properly maintained and the financial
statements give a true and fair view of the Company’s operations and finances(b) the CEO and other key management personnel who are responsible, regarding the adequacy and
effectiveness of the Company’s risk management and internal control systems.
Page 96
Provision 10.1The Company should publicly disclose, and clearly communicate to employees, the existence of a whistleblowing policy and procedures for raising concerns.
Page 96
Provision 11.3Directors’ attendance at general meetings of shareholders held during the financial year. Pages 87 and 98
Provision 12.1The steps the Board has taken to solicit and understand the views of shareholders. Pages 98 and 99
Provision 13.2Disclose the Company’s strategy and key areas of focus in relation to the management of stakeholder relationships during the reporting period.
Page 99
Express disclosure requirements in the supplementary guidelines prescribed by the MAS under MAS Guidelines on Corporate Governance for Financial Holding Companies, Banks, Direct Insurers, Reinsurers and Captive Insurers Incorporated in Singapore issued on 3 April 2013.
Supplementary GuidelinesPage Reference In OCBC Annual Report 2019
Guideline 1.16An assessment of how the induction, orientation and training provided to new and existing directors meet the requirements as set out by the Nominating Committee to equip the Board and the respective Board Committees with relevant knowledge and skills in order to perform their roles effectively.
Pages 87, 88 and 96
Guideline 2.13Names of the members of the Executive Committee and the key terms of reference of the Executive Committee, explaining its role and the authority delegated to it by the Board.
Page 85
Guideline 4.13Resignation or dismissal of key appointment holders. Page 89
Guideline 4.14Deviation and explanation for the deviation from the internal guidelines on time commitment referred to in Guidelines 4.4 and 4.10.
Not applicable
Guideline 11.14Names of the members of the Risk Management Committee and the key terms of reference of the Risk Management Committee, explaining its role and the authority delegated to it by the Board.
Page 86
Guideline 17.4Material related party transactions. Page 99
Corporate Governance
100 OCBC Annual Report 2019 101Governance

Capital PolicyThe key objective of the Group’s capital management policy is to maintain a strong capital position to support business growth and strategic investments, and to sustain investor, depositor, customer and market confidence. In line with this, OCBC targets a minimum credit rating of “A” and ensures that its capital ratios are comfortably above the regulatory minima, while balancing shareholders’ desire for sustainable returns and high standards of prudence. OCBC actively manages its capital composition with an optimal mix of capital instruments in order to keep our overall cost of capital low.
Capital Monitoring and PlanningOCBC Group’s capital is closely monitored and actively managed to ensure that there is sufficient capital to support business growth, and to pursue strategic business and investment opportunities that will create value for our stakeholders, while taking into consideration the Group’s risk appetite. OCBC Group’s internal capital adequacy assessment process (ICAAP) involves a comprehensive assessment of all material risks that the Group is exposed to and an evaluation of the adequacy of the Group’s capital in relation to those risks. This includes an annual capital planning exercise to forecast capital demands and assess the Group’s capital adequacy over a 3-year period. This process takes into consideration OCBC’s business strategy, operating environment, regulatory changes, target capital ratios and composition, as well as expectations of its various stakeholders. In addition, capital stress tests are conducted to understand the sensitivity of the key assumptions in the
capital plan to the effects of plausible stress scenarios, and to evaluate how the Group can continue to maintain adequate capital under such scenarios.
Within OCBC Group, excess capital will be centralised as far as possible at the parent (i.e. OCBC Bank) level to ensure easy deployment across the Group. Whilst the transfer of capital resources within the Group is generally subject to regulations in local jurisdictions, where applicable, OCBC has not faced significant impediments on the flow of capital within the Group.
Dividend Our dividend policy aims to provide shareholders with a progressive and sustainable dividend that is consistent with our long-term growth. The dividends are payable on a half-yearly basis. For the financial year ended 31 December 2019, the Board of Directors has recommended a final dividend of 28 cents per share. This brings the full year 2019 dividend to 53 cents per share, or an estimated total dividend payout of S$2,312 million.
Share Buyback and Treasury SharesShares purchased under the share buyback programme are held as treasury shares. These are recorded as a deduction against share capital, and may be subsequently cancelled, sold or used to meet delivery obligations under employee share schemes. During the financial year ended 31 December 2019, the Bank purchased 17.1 million ordinary shares for S$191 million as part of its share buyback programme, while 16.3 million treasury shares were delivered to meet obligations under its employee share schemes.
Capital Adequacy Ratios On 14 September 2012, the Monetary Authority of Singapore (MAS) revised the MAS Notice 637 to implement the Basel III capital adequacy framework for Singapore. The Basel III capital standards came into effect on 1 January 2013 and are being progressively phased in on 1 January each year, from 2013 to 2019. Singapore-incorporated banks are required to meet minimum Common Equity Tier 1 (CET1), Tier 1, and total capital adequacy ratios of 6.5%, 8.0%, and 10.0%, respectively.
To ensure that banks build up adequate capital buffer outside periods of stress, a Capital Conservation Buffer (CCB) of 2.5 percentage points above the minimum capital adequacy requirements was introduced. The CCB is to be maintained in the form of CET1 capital, and will begin at 0.625% on 1 January 2016, and increase by 0.625 percentage point on 1 January each year, to reach 2.5% on 1 January 2019. Including the CCB, Singapore-incorporated banks will be required to meet CET1 CAR, Tier 1 CAR and total CAR of 9.0%, 10.5% and 12.5%, respectively, from 1 January 2019.
In addition, OCBC will be subject to a Countercyclical Buffer requirement if this buffer is applied by regulators in countries which the Group has credit exposures to. Generally in the range of 0% to 2.5% of risk-weighted assets, the Countercyclical Buffer is not an ongoing requirement but it may be applied by regulators to limit excessive credit growth in their economy.
1. Interested Person Transactions
Interested person transactions carried out during the financial year under review:
Aggregate value of all interested person
transactions during the financial year under review (excluding transactions less
than S$100,000 and transactions conducted under
shareholders’ mandate pursuant to Rule 920)
Aggregate value of all interested person
transactions conducted under shareholders’
mandate pursuant to Rule 920 (excluding
transactions less than S$100,000)
Name of interested person Nature of relationship2019
S$’000 2019
S$’000
Dasar Sentral (M) Sdn Bhd– Lease of premises at Wisma
Lee Rubber, Kuala Lumpur to subsidiaries of OCBC Bank
An associate of Dr Lee Tih Shih,director of OCBC Bank 993 –
PT Suryasono Sentosa– Incorporation of PT OCBC NISP
Ventura by PT Suryasono Sentosa and PT Bank OCBC NISP Tbk, a 85.08%-owned subsidiary of OCBC Bank
An associate of Mr Pramukti Surjaudaja,director of OCBC Bank 8,330 –
2. Material Contracts
Since the end of the previous financial year, no material contract involving the interest of any Director or controlling shareholder of the Bank has been entered into by the Bank or any of its subsidiary companies, and no such contract subsisted as at 31 December 2019.
3. Appointment of Auditors
The Group has complied with Rules 712, 715 and 716 of the Listing Manual issued by Singapore Exchange Securities Trading Limited in relation to its auditors.
Additional Information Requiredunder the SGX-ST Listing Manual
Capital Management102 OCBC Annual Report 2019 103Governance

Risk is inherent in the business activities of OCBC and managing risks is critical to what we do. Our overall goal is to manage our businesses and the risks associated with them in a manner that creates balanced and sustainable value for our customers, employees, shareholders and the community.
We have established a risk management framework that encompasses good governance, sound policies, robust lines of defence, right expertise as well as significant investments in technology, underpinned by a corporate culture that demands accountability and ownership as well as high ethical standards. This ensures that the risks being taken are:
• consistent with our corporate strategy and within established risk appetite;
• well-understood, evaluated and supported by robust quantitative analyses and stress testing;
• adequately compensated for by expected returns;
• managed holistically by evaluating risk interactions across the different risk types;
• efficiently and comprehensively captured, aggregated and reported upon;
• reviewed by an independent risk function with adequate resources, authority and expertise; and
• accompanied by contingency plans to ensure resilience against potential crises or unexpected events.
Risk ownership is a shared responsibility between the business and risk functions as elaborated in the Risk Governance and Organisation section.
While the categorisation of risks can be complex and interrelated, we generally categorise the risks we take into five principal risk types.
Each principal risk type is governed by an appropriate risk framework and supported by robust risk management and reporting
At OCBC, our corporate values—Lasting Value, Integrity, Forward-looking, Respect and Responsibility—together with our risk principles guide the approach in the management of our risk exposures. We adopt agile, holistic and prudent risk management to support our strategic goals across our core markets and create sustainable value for our customers, employees, shareholders and the community.
Please refer to the respective sections for details of our risk management approach for each of the principal risk types.
Principal Risks Definition
Credit Risk Credit risk is the risk of losing principal and/or income due to the failure of an obligor or counterparty to meet its financial or contractual obligations as originally scheduled or a change in the credit profile of the obligor or counterparty.
Market Risk Market risk is the risk of losing income and/or market value due to fluctuations in factors such as interest rates, foreign exchange rates, credit spreads, equity and commodity prices or changes in volatilities, or correlation of such factors.
Liquidity Risk Liquidity risk is the risk arising from the inability to meet financial obligations as they fall due without incurring unacceptable costs or losses through fundraising and asset liquidation.
Interest Rate Risk in the Banking Book
Interest rate risk in the banking book is the risk to earnings and capital arising from exposure to adverse changes in the interest rate environment.
Operational Risk Operational risk is the risk of loss resulting from inadequate or failed internal processes and systems, poor management, human error or external events. This category includes compliance risk, legal risk, cyber risk and reputational risk.
S$ millionBasel III
2019Basel III
2018
Tier 1 CapitalOrdinary shares 17,261 15,750Disclosed reserves/others 21,452 19,219Regulatory adjustments (6,913) (6,901)Common Equity Tier 1 Capital 31,800 28,068
Additional Tier 1 capital 1,531 1,572Regulatory adjustments – –Tier 1 Capital 33,331 29,640
Tier 2 capital 2,661 3,347Regulatory adjustments – (1)Total Eligible Capital 35,992 32,986
Credit 183,439 171,487Market 14,751 14,669Operational 15,166 14,092Risk Weighted Assets 213,356 200,248
Capital Adequacy RatiosCommon Equity Tier 1 14.9% 14.0%Tier 1 15.6% 14.8%Total 16.8% 16.4%
The table below shows the composition of the Group’s regulatory capital and its capital adequacy ratios as of 31 December 2019. The capital adequacy ratios were determined in accordance with the requirements of MAS Notice 637, which included the definitions for CET1, Tier 1 and Tier 2 capital, the required regulatory adjustments against capital (including goodwill, intangible assets, deferred tax assets and investments in unconsolidated financial institutions in which the Bank holds a major stake), and the methodologies available for computing risk-weighted assets. As per the requirements of MAS Notice 637, OCBC’s insurance subsidiaries were not consolidated for the computation of the capital adequacy ratios, i.e. capital investments in these insurance subsidiaries were deducted from OCBC’s capital and their assets were excluded from the computation of OCBC’s risk-weighted assets.
A description of the key terms and conditions of the regulatory capital instruments can be found in Notes 13, 14 and 21 of the financial statements, and the approaches adopted by OCBC for the computation of risk-weighted assets can be found in the “Pillar 3 Disclosures” chapter.
OCBC’s banking and insurance subsidiaries are subject to capital adequacy requirements of the jurisdiction in which they operate. As of 31 December 2019, the capital adequacy ratios of these subsidiaries were above their respective local requirements.
systems. These are regularly reviewed to assess their effectiveness. We also leverage on technology to continuously enhance our systems, risk reporting and processes.
Our risk management approach is a disciplined approach to identify, assess, measure, control, monitor and report our risk positions at the granular and aggregate levels. Assessments of potential shifts in risk drivers and the impact on risk types are regularly made and risk mitigation strategies are taken where necessary. There are multiple drivers of risks. They emanate from factors such as the economic, business and physical environment, business decisions, market positions, geopolitical shifts, regulatory changes, data loss, cyber threats, fraud and human error. These drivers impinge on one or more of the risk types mentioned above with consequential impact to earnings and asset quality as
well as to reputation, customer franchise, and ability to do business.
Our banking subsidiaries are required to implement their own risk management framework and policies, and these conform to the stricter of the Group’s risk standards or local regulations. Their approving authority and limit structure are also consistent with those of the Group, which are designed to ensure proper ownership and accountability.
Great Eastern Holdings (GEH) and Bank OCBC NISP are listed companies. Their annual reports contain information on their risk management framework and practices. Their risk management framework, policies and practices are aligned with the Group’s risk standards as appropriate. (For information on GEH’s risk management, please refer to Note 39 in the Group’s Financial Statements).
Risk ManagementCapital Management
104 OCBC Annual Report 2019 105Governance

Group Risk Management headed by CRO
Group Audit
Functional Risk Departments Subsidiary Functional Risk Departments
Risk and Control Oversight
Independent Assurance
Board Risk Management Committee (BRMC)
Board of DirectorsBoard Governance
Other Board Committees
Group Chief Risk Officer (CRO) reports to the BRMC and CEO
Risk Committees
Credit Risk Management Committee
chaired by CRO
Operational Risk Management Committee
chaired by CRO
Market Risk Management Committee
chaired by CRO
Asset Liability Management Committee
chaired by CEO
Group Chief Executive Officer (CEO)Senior Management
Senior Management Committees
Business and Support Heads
Other Management Committees
The Board Risk Management Committee (BRMC) is the designated board committee to ensure that the Group’s overall risk management philosophy and principles are aligned with the corporate strategy and within the approved risk appetite. It also ensures that the overall risk management organisation is implemented and effective. Based on the approved risk appetite, BRMC approves various quantitative guidance and qualitative expectations and these are cascaded to major business units and risk functions to guide risk-taking. Risk drivers, risk profiles across major lines of business and risk types, as well as major risk policies and compliance matters are regularly reviewed by the senior management, Group Chief Executive Officer (CEO) and BRMC. These matters are reviewed and discussed in greater detail at the dedicated risk committees for major risk types.
The Bank has an independent risk management function, Group Risk
Three Lines of Defence
First Line Second Line Third Line
Day-to-day Risk Management Risk and Control Oversight Independent Assurance
Business and Support Units own and manage risks generated from their business activities on a day-to-day basis. They execute business activities which are consistent with our Group’s strategy and risk appetite and operate within the approved boundaries of our policies, limits and ensure compliance with applicable laws and regulations.
The Risk and Control Function independently assesses the risk-taking activities undertaken by the first line of defence. It establishes relevant risk management frameworks, policies, processes and risk systems, and provides independent identification, assessment, monitoring and reporting of the Group’s risk profiles, portfolio concentrations and material risk issues.
Group Audit independently assures the CEO, Audit Committee and the Board of the adequacy and effectiveness of our risk management, and internal control systems by evaluating the overall risk awareness and control consciousness of the management in discharging its supervisory and oversight responsibilities.
Management Division (GRM), headed by the Group Chief Risk Officer (CRO), who reports to the BRMC and CEO. GRM is an independent risk and control oversight function that principally executes the risk management framework and principles. It provides risk committees, the BRMC and the Board regular risk reports and updates on material information with regard to risks. Functions in GRM are primarily organised by major risk types. Risk management staff work closely with the business and other support units to ensure that risks are well managed. GRM also oversees the Group’s data management via a framework that comprises data policies, standards and controls. The objective is to ensure the quality of critical risk data and the ability of the Bank to effectively aggregate such data for accurate and timely risk reporting. In addition, it oversees the New Product Approval Process (NPAP) to ensure that all inherent
risks associated with new products and services are comprehensively identified, managed and mitigated, including compliance with regulatory requirements and adequacy of resources to support the new product and services.
Our subsidiaries have local committees, where appropriate, to ensure that their risk taking remain within limits set by the Group committees, and to approve local risk policies. Local risk management teams in subsidiaries implement the Group’s risk management framework in their respective subsidiaries and where necessary, adapt them to the local regulatory environment.
Three Lines of Defence All employees are responsible for identifying and managing risk—an accountability that is embedded in our corporate culture and robust internal control environment. This is operationalised through a three-line defence structure.
The chart below illustrates the risk governance and oversight structure in OCBC. The Board of Directors (Board) has the ultimate responsibility for the effective management of risk and establishes the corporate strategy and approves the risk appetite within which senior management should execute the strategy.
Risk Governance and Organisation
Risk Management
106 OCBC Annual Report 2019 107Governance

Credit Risk Management
Credit risk arises from our lending activities to retail, corporate and institutional customers. It also includes counterparty and issuer credit risks arising from our trading and investment banking activities.
Credit Risk Management ApproachOur credit risk management framework captures the complete credit risk management cycle. It is operationalised
through policies and procedures covering the identification, assessment, measurement, monitoring and control of credit risk at the enterprise level.
We also have a Responsible Financing framework and supporting policies that integrate Environmental, Social and Governance (ESG) considerations into our credit risk evaluation and approval process. Through the framework, sustainability is integrated across our
corporate lending activities from strategic and portfolio to transaction level. Please refer to our Sustainability Report for more information on responsible financing.
Our credit risk management approach varies according to the characteristics and nature of the portfolios or customer segments. Please refer to Table 1 on the following page for more information. There are specific policies and procedures for major customer segments.
Risk Appetite
The Board sets the Group’s risk appetite, which defines the level and nature of risks that we are willing to take on behalf of shareholders in the conduct of our business, while maintaining our commitments to customers, debt holders, employees, regulators, and other stakeholders. Our objective is to manage risks prudently for the long-term viability of the Group while balancing the interests of all stakeholders.
Our risk appetite takes into account the forward-looking operating environment
and any downside risks. Business plans are guided by our risk appetite through policies, limits and processes to ensure that we operate within our available risk capacity.
Senior business and risk managers participate in regular forums to discuss the operating environment, event risks and potential “dark clouds” that may have a significant impact on our earnings or solvency. These are quantified via stress tests as well as segment-specific and ad hoc event-specific portfolio reviews
to assess the potential impact of alternative scenarios on the Bank’s earnings and capital, and the vulnerabilities of material portfolios.
An annual Internal Capital Adequacy Assessment Process (ICAAP) incorporating stress tests is conducted to evaluate if our business plans allow us to maintain sound capital levels under both the forward-looking operating environment and severe stress scenarios. Appropriate risk-mitigating actions are taken to manage downside risks.
Risk Appetite
Risk Capacity
Bus iness Pl an
Risk AppetiteLevel and nature of risk deemed acceptable while ensuring sufficient buffer in the Risk and Financial Resources
Business PlanDemand for Risk and Financial Resources such as Funding and Capital
Risk CapacitySupply of Risk and Financial Resources such as Funding and Capital
Managing Counterparty Credit Risk Counterparty Credit Risk (CCR) is the risk that the counterparty may default on its obligations in a financial contract. CCR management covers credit exposures to counterparties in both the banking and trading books which typically arise from our trading, derivatives and debt securities activities. Counterparty risk exposures are measured using the Current Exposure Method, with regulatory prescribed add-ons that represent the potential future exposures, in addition to the net replacement cost of the Over-the-Counter (OTC) derivatives.
Credit limits are established for each counterparty based on our assessment of the counterparty’s creditworthiness, the suitability and appropriateness of the product offered and alignment with approved trading mandates and investment strategies. Credit risk mitigation tools are also used to
manage CCR where appropriate. Please refer to Credit Risk Mitigation section for details.
Credit exposures are independently managed through daily limit monitoring, excess escalation and approval, and timely risk reporting. We also have an established policy and process to manage wrong-way risk which can occur when the credit exposure to a counterparty is adversely correlated with the credit quality of the counterparty.
Credit Portfolio Management Credit portfolio management focuses on managing the ‘collective or aggregate risk’ of our credit portfolios, rather than the credit risk of individual borrowers. We have developed and implemented a range of capabilities to better understand, measure and monitor credit risk at the portfolio level. These capabilities include:
• Portfolio Segmentation: This is the process of grouping credit exposures that are similar in nature. It involves the use of attributes that represent common business drivers such as location, industry and product type, as well as common risk drivers such as exposure to material downside risks like a property bubble. We have invested substantially to standardise the way credit exposures are grouped using consistent taxonomy and improving data quality.
• Portfolio Modelling: This includes the use of internal rating models to quantify the exposure risk, default risk and potential losses of our borrowers. Please refer to Table 2 for information on our internal rating models. We also use stress test models to simulate the potential increase in our credit losses and credit risk-weighted assets under stressed scenarios.
Table 1: Credit Risk Management Approach for Major Customer Segments
Consumers and Small Businesses Corporate and Institutional Customers Private Banking Customers
• Credit risks are managed on a portfolio basis.
• Credits are extended through credit programmes with predefined portfolio and transaction limits, acquisition strategy, product structure, as well as customer selection, lending and collateral criteria.
• Application models in the credit decision process enable efficient, objective and consistent risk evaluation.
• Bankruptcy and credit bureau checks, systems and processes such as source identification of credit origination and independent verification of documentation are used to detect fraud.
• Comprehensive risk management information systems (MIS) track and monitor the performance of the portfolios.
• Behavioural models help to identify problem loans early.
• Credits extended are individually assessed, risk-rated and further evaluated by experienced credit officers.
• Credit extensions are guided by predefined target market and risk acceptance criteria.
• Credit decisions are made after comprehensive qualitative and quantitative risk assessment, including a thorough understanding of the customer and customer group’s interdependencies.
• Credits are jointly approved by business and credit risk units to ensure objectivity and shared risk ownership.
• Credits extended are subject to comprehensive credit assessment, availability of acceptable collateral and compliance with loan advance ratio and margin requirement.
• Credits are jointly approved by business and credit risk units to ensure objectivity and shared risk ownership.
• Advance ratios are dependent on the liquidity, volatility and diversification of the collateralised portfolio under stressed conditions. Marketable securities taken as collateral are subject to daily valuation and independent price verification controls.
• Timely and disciplined execution of margin calls, top-up provisions, stop-loss and force-selling are strictly managed in accordance with approved procedures.
Risk Management
108 OCBC Annual Report 2019 109Governance

Table 2: Internal Rating Models
Internal credit rating models and their parameters—probability of default (PD), loss given default (LGD) and exposure at default (EAD)—are used in limit setting, credit approval, portfolio monitoring and reporting, remedial management, stress testing, internal assessment of the capital adequacy and impairment allowances.
Our Model Risk Management framework and Credit Rating Model framework govern the development, validation, application and performance monitoring of rating models. Approval for the adoption and continued use of material models rests with the BRMC. The models are developed with the active participation of credit experts from risk-taking and risk-control units and subject to independent validation before implementation to ensure that all aspects of the model development process have met our internal standards. In addition, Group Audit conducts an annual independent review of the rating assignment process, the effectiveness of the independent validation and the accuracy of the rating system operations. All rating models are assessed against internal and regulatory requirements and approved by regulators for use in capital assessment.
While our internal risk grades are not explicitly mapped to external credit ratings, they may correlate with external credit ratings in terms of the PD ranges, as factors used to rate obligors would be similar—an obligor rated poorly by an external credit rating agency is likely to have a weak internal risk rating.
The table below describes the approach used to estimate the key parameters for Advanced Internal Ratings Based (A-IRB) and Foundation Internal Ratings Based (F-IRB) credit risk models used to calculate Credit Risk Weighted Assets (CRWA).
Key Components of Internal Ratings Based (IRB) Models
IRB Models and Portfolios PD LGD and EAD
A-IRB approach includes major retail portfolios such as residential mortgages, credit cards, auto loans, small businesses and margin lending
• Estimated based on the application and behaviour scores of obligors.
• The PD models are calibrated to the expected long-term average one-year default rate over an economic cycle.
• Product, collateral and geographical characteristics are major factors.
• LGD models are calibrated to reflect the economic loss under downturn conditions.
• EAD models are calibrated to reflect the long-run average or economic downturn conditions, if relevant.
F-IRB (Non-Supervisory Slotting) approach includes major wholesale portfolios such as Sovereign, Bank, Non-Bank Financial Institutions, Corporate Real Estate (including Income Producing Real Estate) and General Corporate
• PD models are statistics- based or expert judgement models that use both quantitative and qualitative factors to assess an obligor’s repayment capacity and are calibrated to the expected long-term average one-year default rate over an economic cycle.
• Expert judgement models based on inputs from internal credit experts are typically used for portfolios with low default rates.
• Estimated based on rules prescribed in MAS Notice 637 on Risk Based Capital Adequacy Requirements for Banks incorporated in Singapore (MAS Notice 637).
F-IRB (Supervisory Slotting) approach includes other specialised lending portfolios such as Project Finance, Object Finance and Commodities Finance
• Risk grades derived from internal models are mapped to the five supervisory slotting categories prescribed in MAS Notice 637.
• Estimated based on rules prescribed in MAS Notice 637.
• Portfolio Reporting: This includes internal and external reporting of portfolio risk information to the respective stakeholders. These reports provide a better understanding of how the quality of our credit portfolios is evolving in response to the changing
operating environment and downside risks. Regular risk reports covering detailed credit exposures, credit migration, expected losses and risk concentrations by business segment and geography are provided to the Credit Risk Management Committee, CEO, BRMC and the Board
for review and making timely, better-informed decisions.
With the insights provided by portfolio modelling and reporting, we appropriately allocate risk and financial resources (such as funding and capital) to support growth
opportunities. We also use these insights to set credit concentration limits that manage the downside risk from adverse changes in the operating environment. The design of such credit concentration limits takes into consideration direct risk drivers (such as economic sector, industry, geographic location) and indirect risk drivers (such as collateral type or credit protection by a single counterparty) arising from credit risk mitigation.
Credit Risk Mitigation Credit risk mitigation techniques are used to reduce credit risk exposures. Where possible, we take collateral from the borrower as a secondary recourse to mitigate credit risk. However, risk mitigation is not a substitute to the proper assessment of the obligor’s ability to repay, which remains the primary repayment source.
The key considerations for eligible credit risk mitigants are set out in our credit policies. These criteria include legal certainty and enforceability, correlation, liquidity, marketability, counterparty risk of the protection provider and collateral-specific minimum operational requirements. Eligible physical and financial collateral types include cash, real estate, marketable securities, standby letters of credit and credit insurances.
Appropriate discount is applied to the market values of the collateral to reflect its underlying nature, quality, liquidity and volatility. Collateral is independently valued on a regular basis with frequency determined by its type, liquidity and volatility. Collateral holdings are regularly monitored to avoid concentration risk as the Bank seeks to diversify across asset classes and markets. Guarantees from individuals, corporates and institutions are accepted as a form of support. Where guarantees are recognised as credit risk mitigants via the PD substitution approach, eligibility criteria and guidelines are in place.
Netting, collateral arrangements, early termination options and central clearing
mechanisms are common risk mitigation tools for managing counterparty credit risk. The credit risk associated with contractual obligations is reduced by netting agreements in legally approved jurisdiction where all amounts with the counterparty are settled on a net basis in the event of a default. Collateral arrangements, typically covered under market standard documentation such as International Swaps and Derivatives Association (ISDA) and Credit Support Annexes (CSA), include a minimum threshold amount where additional collateral is to be posted by either party if the mark-to-market exposures exceed the agreed threshold. A discount is applied to the value of the eligible collateral to cover potential adverse market volatility and the minimum threshold amount may be subject to regulatory margin requirements where applicable. Agreements may also contain rating triggers to allow for termination of the transactions or require posting of additional collateral in the event of a rating downgrade. However, given our investment grade rating, there is minimal increase in collateral posting under a one-notch rating downgrade occurrence. Where available, we also clear OTC derivatives through approved Central Clearing Counterparties (CCP) to replace the counterparty’s credit risk with a highly regulated and relatively better credit rated CCP.
Remedial Management The Bank safeguards its position through proactive and regular monitoring of its credit portfolios. We have a robust process to detect vulnerable borrowers with signs of potential credit deterioration at an early stage via the Early Warning Review Forum.
Our credit exposures are categorised into “Pass”, “Special Mention” or “Non-performing assets” (NPA). NPA are further categorised into “Substandard”, “Doubtful” or “Loss” in accordance with MAS Notice 612 on Credit Files, Grading and Provisioning (MAS Notice 612). The categorisation of credit exposures is based
on our assessment of borrowers’ ability to repay their financial obligations from normal sources of income. We categorise retail borrowers into the respective MAS loan grades at facility level in line with MAS Notice 612. NPA may be upgraded to performing status when there is an established trend of credit improvement, supported by an assessment of the borrower’s repayment capability, cash flows and financial position.
Credit exposures are classified as restructured assets when the Bank grants concessions to borrowers who are unable to meet their original repayment obligations. A restructured credit exposure is classified into the appropriate non-performing grade based on our assessment of the borrower’s financial condition and ability to repay under the restructured terms. Such credit exposure must comply fully with the restructured terms for a reasonable period before it can be restored to performing status in accordance with MAS Notice 612.
Dedicated remedial management units manage the restructuring, work-out and recovery of NPA for wholesale portfolios. The objective is to rehabilitate NPA where possible or maximise recoveries for NPA that are on an exit strategy. For retail portfolios, we develop appropriate risk-based and time-based collections strategies to maximise recoveries. We use data such as delinquency buckets and adverse status tags for delinquent consumer loans to constantly analyse, fine-tune and prioritise our collection efforts.
Impairment Allowances for Loans We maintain sufficient impairment allowances to absorb credit losses inherent in our loan portfolios. Allowance for Expected Credit Losses (ECL) is recognised for credit-impaired and non credit-impaired exposures in accordance with Singapore Financial Reporting Standard (International) 9: Financial Instruments (SFRS(I) 9) and MAS Notice 612 through a forward-looking ECL model. ECL allowances are assessed based on the stages of asset quality.
Risk Management
110 OCBC Annual Report 2019 111Governance

Market Risk Management
Market risks arise mainly from our trading, client servicing and balance sheet management activities.
Market Risk Management ApproachOur market risk management framework covers the identification, assessment, measurement, monitoring and control of risks. Group-level market risk policies and procedures are established to provide common guidelines and standards for managing market risks. Our market risk management strategy and limits are regularly reviewed and established within
the Group’s risk appetite and business strategies, taking into account prevailing macroeconomic and market conditions.
Market Risk Identification Our internal New Product Approval Process (NPAP) identifies risk at product inception. Likewise, our risk managers identify market risks from their ongoing interactions with the business units.
Market Risk Measurements Value-At-RiskValue-at-Risk (VaR) – as a key market risk measure for our trading activities – is a component of aggregate market risk
appetite. VaR is measured and monitored by individual market risk components, namely interest rate risk, foreign exchange risk, equity risk and credit spread risk, as well as at the consolidated level. Our VaR model is based on a historical simulation at a 99% confidence level, and over a one-day holding period. The defined confidence threshold of 99% means that statistically, losses on a single trading day may exceed VaR, on average, once every 100 days. Table 3 provides a summary of the Group’s trading VaR profile by risk types as at 31 December 2019 and 31 December 2018.
Table 3: VaR by Risk Type – Trading Portfolio
2019 2018
S$ million End of the period
Average Minimum Maximum End of the period
Average Minimum Maximum
Interest Rate VaR 3.28 3.28 2.03 5.20 3.29 4.31 2.39 6.60Foreign Exchange VaR 1.35 2.53 0.95 5.25 2.50 2.93 1.07 5.82Equity VaR 2.88 1.48 0.37 3.14 1.49 1.33 0.45 3.99Credit Spread VaR 1.17 1.76 0.85 4.28 1.99 2.94 0.88 4.67Diversification Effect (1) -4.58 -4.55 NM (2) NM (2) -4.86 -5.87 NM (2) NM (2)
Aggregate VaR 4.11 4.51 2.65 7.42 4.40 5.65 3.79 8.97
Notes:(1) Diversification effect is computed as the difference between Aggregate VaR and the sum of asset class VaRs.(2) Not meaningful as the minimum and maximum VaR may have occurred on different days for different asset classes.
Stages of Asset Quality and Expected Credit Losses (ECL)
Non Credit-Impaired Credit-Impaired
Stage 3Non-performing exposures
Lifetime ECL
Stage 2Performing exposures with significant increase in credit risk since initial recognition
Lifetime ECL
Stage 1Performing exposures with no significant increase in credit risk since initial recognition
12-month ECL
Please refer to Note 2 in the Group’s Financial Statements for more information on impairment allowances.
Other Risk MeasuresAs our main market risk arises from interest rate movements, Present Value of a Basis Point (PV01) – which measures the change in value of interest rate-sensitive exposures resulting from a one basis point increase across the entire yield curve – is an important measure that is monitored on a daily basis. Other than VaR and PV01, we use risk metrics like notional positions, Profit & Loss (P&L) for One Basis Point Move in Credit Spreads (CS01) and other risk variables for specific exposure types.
Stress Testing and Scenario AnalysisWe perform stress testing and scenario analysis to quantify and assess potential losses arising from low probability but plausible extreme market conditions. The stress scenarios are regularly reviewed and fine-tuned to ensure that they remain relevant to our trading activities and risk profile as well as prevailing and forecasted economic conditions. These analyses determine if potential losses from such extreme market conditions are within our
risk tolerance. Besides the regular stress scenarios, ad hoc event-specific stress scenarios are also used to assess the potential impact of specific market conditions to the Bank’s market risk exposures.
Risk Monitoring and Control LimitsTrading units may only undertake authorised trading activities for approved products. All trading risk positions are monitored on a daily basis against approved and allocated limits. Trading activities are conducted within approved mandates and dynamically hedged to remain within limits. Hedge effectiveness is implicit in ensuring compliance with market risk limits and enforced through independent limit monitoring. Limits are approved to reflect available and anticipated trading opportunities, with clearly defined exception escalation procedures. Exceptions, including any temporary breaches, are promptly reported and escalated to senior management for resolution.
Multiple risk limits (VaR and risk sensitivities), P&L stop-loss and other measures are also used to manage market risk exposures holistically.
Model ValidationModel validation is an integral part of our risk control process. Financial models are used to price financial instruments and to calculate VaR. We ensure that the models used are fit for their intended purposes through internal independent validation and periodic reviews. We source market rates independently for risk measurement and valuation to enhance the integrity of the trading P&L and risk measures generated by these models.
Back-testingTo ensure the continued integrity of our VaR model, we regularly back-test the VaR estimates against actual daily trading P&Ls and hypothetical P&Ls to confirm that the model does not underestimate market risk exposures. Please refer to the charts below for the Frequency Distribution of Group Trading Book’s Daily Total VaR and P&L.
Frequency Distribution of Group Trading Book DailyP&L for FY 2019Number ofTrading Days
S$ millions
0
20
40
60
80
120
100
(6) -
(4)
(4) -
(2)
(2) -
0
0 - 2
2 - 4 4 - 6 6 - 8
8 - 1
0
10 - 1
2
12 - 1
4
Frequency Distribution of Group Trading Book DailyTotal VaR for FY 2019Number ofTrading Days
0 – 2 2 – 4 4 – 6 6 – 8 8 – 10
S$ millions
0
20
40
60
80
160
140
120
100
Risk Management
112 OCBC Annual Report 2019 113Governance

Asset liability management is the strategic management of our balance sheet structure and liquidity requirements. It covers liquidity sourcing and diversification as well as interest rate and structural foreign exchange management.
Asset Liability Management Approach Our asset liability management framework focuses on managing the exposures arising from the Bank’s balance sheet. We monitor our liquidity risk, interest rate risk in the banking book (IRRBB) and structural foreign exchange risk profiles against approved risk limits under both business-as-usual and stressed scenarios. These are based on the standards established in our framework, policies and procedures which are subject to regular reviews to ensure that they remain relevant in the context of the prevailing market conditions and practices.
Liquidity RiskThe objective of liquidity risk management is to ensure that we have sufficient funds to meet contractual and regulatory financial obligations and to undertake new transactions.
Liquidity monitoring is performed daily within a framework for projecting cash flows on both contractual and behavioural bases. Indicators such as liquidity and deposit concentration ratios are used to establish the level of optimal funding mix
and asset composition. Funding strategies are established to provide effective diversification and stability in funding sources across tenors, products and geographies. Simulations of liquidity exposures under stressed market scenarios are performed and the results are used to adjust liquidity risk management strategies, policies and positions, as well as to develop contingency funding plans. We maintain liquid assets in excess of regulatory requirements to strengthen our ability to meet liquidity needs during a crisis. These liquid assets comprise central bank reserves and marketable securities.
Interest Rate Risk in the Banking BookThe primary goal of the management of IRRBB is to ensure that interest rate risk exposures are maintained within defined risk tolerances and are consistent with our risk appetite. The material sources of IRRBB are repricing risk, yield curve risk, basis risk and optionality risk.
We use a range of techniques to measure IRRBB from both earnings and economic value perspectives on a monthly basis. One method involves the simulation of the impact of various interest rate scenarios on our net interest income and economic value of equity (EVE). Other measures include interest rate sensitivity measures such as PV01 and repricing gap profile analysis. Behavioural models are used to assess interest rate risks in relation to loan prepayment, time
deposit early redemption and the profile of non-maturity deposits. These measurements are used to adjust IRRBB management and hedging strategies, policies and positions.
Structural Foreign Exchange RiskStructural foreign exchange exposure arises primarily from our net investment in overseas branches, subsidiaries as well as other strategic and property assets. We manage structural foreign exchange risk through hedges and matched funding for foreign currency investments where appropriate.
Other Risks Non-structural foreign exchange exposures in our banking book are largely transferred to our trading book for foreign exchange risk management. We are exposed to credit spread risk with the holding of high-quality liquid assets (HQLA) in our banking book to comply with the Liquidity Coverage Ratio (LCR). While HQLA have low default risk, their values could be sensitive to changes in credit spreads. This risk is monitored against approved CS01 limits on a daily basis and subject to historical and anticipatory stress testing. The other risk residing in our banking book is non-strategic equity price risk arising from our equity investment in listed and non-listed companies. Non-strategic equity investment forms an insignificant portion of our overall securities portfolio, excluding GEH.
Asset Liability Management Operational Risk Management
Operational risk is inherent in all banking products, activities, processes and systems. Effective management of operational risk is a fundamental element of our risk management programme that enhances our corporate culture.
Operational Risk Management Approach Our operational risk management framework ensures operational risks are properly identified, managed, monitored, mitigated and reported in a structured and consistent manner. It enables us to fulfil our fiduciary duties, comply with legal and regulatory requirements, mitigate other risk factors and manage any reputational risk impact. We aim to manage both expected and
unexpected losses, including those caused by catastrophic events. These twin objectives act as parameters to manage our risk as we pursue new business opportunities.
Each business unit undertakes self-assessments on a regular basis by evaluating the robustness of its risk and control environment, including compliance with legal and regulatory requirements. Performance metrics are also used to detect early warning signals and drive appropriate management actions before the risks result in material losses. Operational risk data is also analysed and reported regularly to senior management.
Senior management attests annually to the CEO, BRMC and Audit Committee on the adequacy and effectiveness of the internal controls and risk management systems and highlights accompanying remedial plans to address any outstanding key control deficiencies.
To mitigate operational losses, we have insurance programmes to protect the Bank and our employees against adverse events. These programmes cover losses relating to crime, cyber risks, professional indemnity, directors’ and officers’ liability, property damage and public liability.
In addition, the subject-specific key risks that we focus on and risk mitigation measures we put in place include but are not limited to the following:
Key Risks How is Risk Managed?
Technology, Information and Cyber Risk • Through framework and programmes which adopt a defence-in-depth approach to manage technology, information and cyber risks. The framework and programmes comprise:
– Guidelines to promote the safe adoption of emerging technologies. – Appropriate controls to ensure the confidentiality, integrity and availability of our
information assets, including regular security reviews and audits to test the control effectiveness.
– Robust cyber defence capabilities, cyber risk vigilance and awareness, social engineering testing, incident response, crisis management and business continuity and insurance protection. They also include active senior management involvement to prevent, detect and respond to the evolving cyber threat landscape.
• By actively engaging and sharing cyber threat information with industry players in the Association of Banks in Singapore (ABS) Standing Committee on Cyber Security and the Financial Services Information Sharing and Analysis Centre.
Please refer to our Sustainability Report for more information on cyber resilience.
Anti-Money Laundering (AML)/ Countering the Financing of Terrorism (CFT) and Sanctions Risk
• Through a robust groupwide AML/CFT and sanctions framework and programme that are aligned with MAS AML/CFT and sanctions regulations, as well as with international organisations, such as the Financial Action Task Force (FATF), Basel Committee and Wolfsberg Group. The framework and programme comprise:
– AML/CFT & Sanctions policy, guidelines and procedures covering key pillars such as customer due diligence, transaction monitoring, escalation protocol and investigation process.
– Dedicated AML/CFT committee with members from senior management to oversight AML/CFT matters.
– Risk assessment methodologies leveraging our existing monitoring and screening platform, data analytics to assess customer, product and geographical risks, as well as risk surveillance platform to monitor emerging financial crime trends and typologies.
– Building staff competency and vigilance through targeted specialised training, including certified courses recognised by the Institute of Banking and Finance (IBF).
Risk Management
114 OCBC Annual Report 2019 115Governance

Key Risks How is Risk Managed?
Legal and Regulatory Risk • Through a legal and regulatory compliance risk management framework which defines the required environment and organisational components to ensure compliance with relevant laws, regulations, rules and standards. The framework is complemented by stringent and robust compliance policies, procedures and guidelines based on international best practices which are adapted to our requirements, and regular training to staff.
Fraud Risk • Through fraud risk management and whistleblowing programmes to prevent and detect fraud or misconduct. These programmes comprise:
– Internal and external whistleblowing channels for employees and the public. – Independent investigations into fraud incidents with regular reporting (including root
cause analysis, extent of damage, remedial actions and recovery steps for major incidents) to the Operational Risk Management Committee and BRMC.
– Fraud awareness for staff and customers.• Via robust anti-fraud detection systems to monitor transactions and detect any
compromised devices interacting with our online banking platforms.
• By having Group Audit independently review all fraud and whistleblowing cases. The outcomes are reported to the Audit Committee.
Third-Party Risk • Through a programme which sets the control expectations to manage the risk arising from the use of third-party service providers, including the oversight by a multi-disciplinary management group.
• By actively sharing practices and keeping abreast of industry developments via the ABS Outsourcing Advisory Committee.
Business Continuity Risk • Through a programme to minimise the interruption to essential business activities and services during a crisis. The programme comprises:
– Robust recovery strategies and business recovery plans which are reviewed and tested annually.
– Regular exercises to enhance awareness and the robustness of the programme. – Annual attestation by senior management to the BRMC on the business continuity
readiness, extent of alignment with MAS guidelines and declaration of acceptable residual risk.
Physical and People Security Risk • Through a programme to address the physical and security risks to people and assets. This programme comprises:
– Active monitoring of external events that may pose a threat to OCBC locations, people and assets.
– Provision of advisories and response procedures to better prepare the Bank and our employees to handle risk events, including risks posed to staff on business travel.
Fiduciary Risk • Through a fiduciary risk management programme to manage risks associated with fiduciary relationships arising from managing funds or providing other agency services. The programme provides guidelines on identification, assessment, monitoring and mitigation of fiduciary risk exposures to ensure compliance with applicable corporate standards.
Reputational Risk • Through a reputational risk management policy which focuses on understanding and managing our responsibilities towards our stakeholders and protecting our reputation. This includes the identification, assessment, monitoring and mitigation of reputational risk exposures, as well as effective information sharing and engagement with our stakeholders.
Overview of DisclosuresTo read the quantitative and qualitative Pillar 3 disclosures, please refer to this table:
Disclosure Requirement Location of Disclosure
Overview of Risk Management and Risk Weighted Assets (RWA)
Key Metrics Pillar 3 Disclosures Report Section 4
Risk Management Approach OCBC Annual Report 2019 – Risk Management Chapter – Corporate Governance Chapter – Capital Management Chapter
Overview of RWA Pillar 3 Disclosures Report Section 11
Linkages between Financial Statements and Regulatory Exposures
Differences between Accounting and Regulatory Scopes of Consolidation and Mapping of Financial Statement Categories with Regulatory Risk Categories
Pillar 3 Disclosures Report Section 7.1
Main Sources of Differences between Regulatory Exposure Amounts and Carrying Amounts in Financial Statements
Pillar 3 Disclosures Report Section 7.2
Qualitative Disclosure of Differences between Carrying Amounts in Financial Statements and Regulatory Exposure Amounts
Pillar 3 Disclosures Report Sections 3 and 7OCBC Annual Report 2019 – Notes to Financial Statements, Fair Values of Financial Instruments:
Valuation Governance Framework (1) and Fair values– Notes to Financial Statements, Summary of Significant
Accounting Policies: Critical Accounting Estimates and Judgements, Fair Value Estimation
Prudent Valuation Adjustments Pillar 3 Disclosures Report Section 7.3
(1) Valuation Governance Framework does not apply to Great Eastern Holdings Limited and its insurance subsidiaries.
IntroductionIn accordance with Pillar 3 disclosure requirements under Monetary Authority of Singapore (MAS) Notice 637 on Risk Based Capital Adequacy Requirements, Notice 651 on Liquidity Coverage Ratio Disclosure and Notice 653 on Net Stable Funding Ratio Disclosure for Banks incorporated in Singapore, relevant quantitative and qualitative disclosures have been included in the Stand-alone Pillar 3 Disclosures Report and this Annual Report under the Risk Management, Corporate Governance,
Capital Management Chapters and the Notes to Financial Statements. The Pillar 3 disclosures are to enable market participants to better understand and compare capital adequacy and risk profiles across banks via improved consistency in public disclosure.
Scope of ConsolidationThe consolidation basis used for regulatory capital computation is similar to that used for financial reporting except for Great Eastern Holdings Limited and its insurance subsidiaries, which are excluded from regulatory consolidation and are
treated as investments in unconsolidated major stake companies that are financial institutions in accordance with MAS Notice 637’s definition of an insurance subsidiary. The regulatory adjustments applied to these investments are in accordance with MAS Notice 637 paragraphs 6.1.3(p), 6.2.3(e) and 6.3.3(e).
The Stand-alone Pillar 3 Disclosures Report is located in the Capital and Regulatory section of OCBC’s website under Fourth Quarter and Full Year 2019 (http://www.ocbc.com/group/investors/cap_and_reg_disclosures.html).
Risk Management Pillar 3 Disclosures(OCBC Group – As at 31 December 2019)
116 OCBC Annual Report 2019 117Governance

Disclosure Requirement Location of Disclosure
Credit Risk
General Qualitative Disclosures about Credit Risk OCBC Annual Report 2019 – Risk Management Chapter, Credit Risk Management
Credit Quality of Assets Pillar 3 Disclosures Report Section 9.1
Changes in Stock of Defaulted Loans and Debt Securities Pillar 3 Disclosures Report Section 9.2
Additional Disclosures Related to the Credit Quality of Assets
Pillar 3 Disclosures Report Sections 9.3, 9.4 and 9.5OCBC Annual Report 2019 – Risk Management Chapter, Credit Risk Management:
Remedial Management– Notes to Financial Statements, Summary of Significant
Accounting Policies: Impairment of Assets– Notes to Financial Statements, Risk Management: Credit Risk
Qualitative Disclosures Related to Credit Risk Mitigation (CRM) Techniques
OCBC Annual Report 2019– Risk Management Chapter, Credit Risk Management:
Credit Risk Mitigation– Risk Management Chapter, Credit Risk Management:
Credit Portfolio Management– Notes to Financial Statements, Risk Management:
Credit Risk, Collaterals– Notes to Financial Statements, Offsetting Financial Assets
and Financial Liabilities
Overview of CRM Techniques Pillar 3 Disclosures Report Section 13.5
Qualitative Disclosures on the Use of External Credit Ratings under the Standardised Approach (SA) Credit Risk (CR)
Pillar 3 Disclosures Report Section 10
(SA)(CR) and (SA) Equity Exposures (EQ) – Credit Risk Exposure and CRM Effects
Pillar 3 Disclosures Report Section 13.1
(SA)(CR) and (SA)(EQ) – Exposures by Asset Classes and Risk Weights
Pillar 3 Disclosures Report Section 13.2
Qualitative Disclosures for Internal Ratings-Based Approach (IRBA) Models
OCBC Annual Report 2019– Risk Management Chapter, Credit Risk Management:
Internal Credit Rating Models– Risk Management Chapter, Credit Risk Management:
Key Components of Internal Ratings Based (IRB) Models
IRBA – Credit Risk Exposures by Portfolio and Probability of Default (PD) Range
Pillar 3 Disclosures Report Sections 13.3 and 13.4
IRBA – Effect on RWA of Credit Derivatives used as CRM Pillar 3 Disclosures Report Section 13.6
IRBA – RWA Flow Statement for Credit Risk Exposures Pillar 3 Disclosures Report Section 12
IRBA – Backtesting of PD per Portfolio Pillar 3 Disclosures Report Section 14
IRBA - Specialised Lending and Equities under the Simple Risk Weight Method
Pillar 3 Disclosures Report Section 15
Disclosure Requirement Location of Disclosure
Counterparty Credit Risk (CCR)
Qualitative Disclosures Related to CCR OCBC Annual Report 2019– Risk Management Chapter, Credit Risk Management:
Managing Counterparty Credit Risk– Risk Management Chapter, Credit Risk Management:
Credit Risk Mitigation
Analysis of CCR Exposure by Approach Pillar 3 Disclosures Report Section 16.1
Credit Valuation Adjustments (CVA) Risk Capital Requirements
Pillar 3 Disclosures Report Section 16.2
Exposures to Central Counterparties Pillar 3 Disclosures Report Section 16.3
Standardised Approach – CCR Exposures by Portfolio and Risk Weights
Pillar 3 Disclosures Report Section 16.4
IRBA – CCR Exposures by Portfolio and PD Range Pillar 3 Disclosures Report Sections 16.5 and 16.6
Composition of Collateral for CCR Exposure Pillar 3 Disclosures Report Section 16.7
Credit Derivative Exposures Pillar 3 Disclosures Report Section 16.8
RWA Flow Statements under the CCR Internal Models Method
Pillar 3 Disclosures Report Section 2
Securitisation
Qualitative Disclosure Related to Securitisation Exposures
Securitisation Exposures in the Banking and/or Trading Book
Securitisation Exposures in the Banking Book and Associated Regulatory Capital Requirements – A Reporting Bank acting as Originator/ Sponsor/ Investor
Pillar 3 Disclosures Report Sections 10 and 17
Market Risk
Qualitative Disclosure Related to Market Risk Pillar 3 Disclosures Report Section 10OCBC Annual Report 2019– Risk Management Chapter, Market Risk Management
Qualitative Disclosures Related to Internal Models Approach (IMA)
Market Risk under Standardised Approach
Pillar 3 Disclosures Report Section 18
RWA Flow Statements of Market Risk Exposures under IMA
Pillar 3 Disclosures Report Section 2
IMA Values for Trading Portfolios Pillar 3 Disclosures Report Section 18
Comparison of VaR Estimates with Gains or Losses OCBC Annual Report 2019– Risk Management Chapter, Market Risk Management:
Market Risk Measurements– Risk Management Chapter, Market Risk Management:
Risk Monitoring and Control
Pillar 3 Disclosures(OCBC Group – As at 31 December 2019)
118 OCBC Annual Report 2019 119Governance

Disclosure Requirement Location of Disclosure
Operational Risk
Operational Risk Pillar 3 Disclosures Report Section 10OCBC Annual Report 2019– Risk Management Section, Operational Risk Management
Interest Rate Risk in the Banking Book
Interest Rate Risk in the Banking Book Pillar 3 Disclosures Report Section 19OCBC Annual Report 2019– Risk Management Chapter, Asset Liability Management:
Interest Rate Risk in the Banking Book– Notes to Financial Statements, Risk Management:
Market Risk and Asset Liability Management, Interest Rate Risk
Remuneration
Remuneration OCBC Annual Report 2019– Corporate Governance Chapter related to Remuneration
Composition of Capital
Reconciliation of Regulatory Capital to Balance Sheet Pillar 3 Disclosures Report Section 6.1
Composition of Regulatory Capital Pillar 3 Disclosures Report Section 6.2
Main Features of Regulatory Capital Instruments Pillar 3 Disclosures Report Section 6.3
Leverage Ratio
Leverage Ratio Summary Comparison Table Pillar 3 Disclosures Report Section 8.1
Leverage Ratio Common Disclosure Table Pillar 3 Disclosures Report Section 8.2
Macroprudential Supervisory Measures
Disclosure of Global Systemically Important Bank (G-SIB) Indicators
Pillar 3 Disclosures Report Section 5.1
Geographical Distribution of Credit Exposures Used in the Countercyclical Capital Buffer
Pillar 3 Disclosures Report Section 5.2
Liquidity Coverage Ratio
Liquidity Coverage Ratio Pillar 3 Disclosures Report Section 20
Net Stable Funding Ratio
Net Stable Funding Ratio Pillar 3 Disclosures Report Section 21
Others
Attestation Statement Pillar 3 Disclosures Report Sections 1 and 2
Overview of Disclosure Policy Pillar 3 Disclosures Report Section 2
Pillar 3 Disclosures(OCBC Group – As at 31 December 2019)
120 Governance
Financial Report
Management Discussion and Analysis 122
Financial StatementsDirectors’ Statement 136Independent Auditors’ Report 142Income Statements 149Statements of Comprehensive Income 150Balance Sheets 151Statement of Changes in Equity – Group 152Statement of Changes in Equity – Bank 154Consolidated Cash Flow Statement 155Notes to the Financial Statements 156
Group’s Major Properties 279

Overview
2019S$ million
2018S$ million
+/(-)%
Selected Income Statement ItemsNet interest income 6,331 5,890 7 Non-interest income 4,540 3,811 19 Total income 10,871 9,701 12 Operating expenses (4,644) (4,214) 10 Operating profit before allowances and amortisation 6,227 5,487 13Amortisation of intangible assets (103) (102) 1Allowances for loans and other assets (746) (288) 160 Operating profit after allowances and amortisation 5,378 5,097 6 Share of results of associates, net of tax 566 455 24 Core profit before income tax 5,944 5,552 7
Core net profit attributable to equity holders of the Bank 4,960 4,492 10One-time items (1)
Allowances (144) – –Tax 36 – –Non-controlling interest 17 – –
Reported net profit attributable to equity holders of the Bank 4,869 4,492 8 Cash basis net profit attributable to equity holders of the Bank (2) 4,972 4,594 8
Selected Balance Sheet ItemsOrdinary equity 45,662 40,637 12 Equity attributable to equity holders of the Bank 47,162 42,137 12 Total assets 491,691 467,543 5 Assets excluding life insurance fund investment assets 404,353 390,676 4 Net customer loans 262,045 255,193 3 Deposits of non-bank customers 302,851 295,412 3
Per Ordinary Share (S$)Basic earnings (3)(4) 1.14 1.06 Diluted earnings (3)(4) 1.14 1.06 Net asset value 10.38 9.56
Key Financial Ratios (%)Return on equity (3)(4)(5) 11.4 11.5Return on assets (3)(6) 1.26 1.17
Net interest margin 1.77 1.70 Net interest income to total income 58.2 60.7 Non-interest income to total income 41.8 39.3 Cost-to-income 42.7 43.4 Loans-to-deposits 86.5 86.4 Non-performing loans ratio 1.5 1.5
Total capital adequacy ratio (CAR) (7) 16.8 16.4Tier 1 CAR (7) 15.6 14.8Common Equity Tier 1 CAR (7) 14.9 14.0Leverage ratio (7)(8) 7.7 7.2Singapore dollar liquidity coverage ratio (7)(9) 273 244All-currency liquidity coverage ratio (7)(9) 155 143Net stable funding ratio (7)(10) 111 109
(1) One-time items arose from a refinement in the Group’s Expected Credit Loss (ECL) modelling approach for its Indonesian banking subsidiary, Bank OCBC NISP, relating to allowances for non-impaired assets as it prepared for the introduction of International Financial Reporting Standard 9 Financial Instruments.
(2) Excludes amortisation of intangible assets.(3) Exclude one-time items.(4) Calculated based on core net profit less distributions on other equity instruments paid and estimated to be due at the end of the financial year.(5) Preference equity, other equity instruments and non-controlling interests are not included in the computation for return on equity.(6) Computation of return on assets excludes life insurance fund investment assets.(7) Public disclosures required under MAS Notice 637, MAS Notice 651 and MAS Notice 653 can be found in the Capital and Regulatory Disclosures section of the Bank’s Investor Relations website
(http://www.ocbc.com/group/investors/Cap_and_Reg_Disclosures.html).(8) The Group’s leverage ratio is computed based on MAS Notice 637.(9) The Group’s liquidity coverage ratios (LCR) are computed based on MAS Notice 649 and reported based on the average LCR for the respective years.(10) The Group’s net stable funding ratio is computed based on MAS Notice 652.
Management Discussion and Analysis
Overview (continued)The Group reported a record net profit after tax of S$4.87 billion for the financial year ended 31 December 2019, 8% higher than S$4.49 billion a year ago. The resilient performance was driven by sustained earnings growth across the Group’s banking, wealth management and insurance franchise.
Net interest income increased 7% to a new high of S$6.33 billion from S$5.89 billion in the previous year, underpinned by asset growth and a rise in net interest margin (NIM). NIM expanded 7 basis points to 1.77%, mainly in Singapore and Greater China, as higher asset yields outpaced the rise in funding costs.
Non-interest income climbed 19% year-on-year from S$3.81 billion to S$4.54 billion in 2019, driven by broad-based income growth. Net fee income rose 5% to a record S$2.12 billion, led by higher wealth management and credit card fees, as well as increased fees from loan, trade and investment banking activities. Net trading income grew substantially to S$977 million from S$508 million a year ago, mainly attributable to an 18% increase in customer flow income and mark-to-market gains in Great Eastern Holdings’ (GEH) investment portfolio. Net gains from the sale of investment securities were higher at S$171 million as compared to S$16 million in the previous year.
Income from life and general insurance rose 7% to S$976 million. Total weighted new sales of S$1.26 billion and new business embedded value (NBEV) of S$616 million at GEH were both higher year-on-year, by 1% and 15% respectively. NBEV margin improved to 48.8% from 43.0% a year ago as a result of GEH’s product and distribution strategy to optimise its product mix.
The Group’s wealth management income, comprising income from insurance, private banking, asset management, stockbroking and other wealth management products, rose 20% to a new high of S$3.40 billion in 2019, up from S$2.84 billion a year ago. This represented 31% of the Group’s total income for the year, higher than the 29% in the previous year. Bank of Singapore’s assets under management (AUM) expanded 15% year-on-year to a record US$117 billion (S$158 billion) from US$102 billion (S$139 billion) in the previous year, driven by sustained net new money inflows and positive market valuations.
Operating expenses of S$4.64 billion for the year were 10% higher than 2018, largely attributable to an increase in staff costs linked to headcount growth, including at GEH which saw a more substantial rise in staff expenses as it positioned for higher volume growth. The Group’s cost-to-income ratio (CIR) declined to 42.7%, from 43.4% in the previous year. Net allowances for loans and other assets were higher at S$746 million as compared to S$288 million a year ago.
Share of profits from associates rose 24% to S$566 million, from S$455 million in the previous year.
Core return on equity (ROE) of 11.4% in 2019 was marginally below 11.5% a year ago, attributable to the enlarged share capital base as a result of the application of the Scrip Dividend Scheme. Core earnings per share was higher at S$1.14 against S$1.06 in the previous year.
Allowances and Asset QualityAsset quality remained satisfactory as the Group continued to exercise prudence in the current operating environment, and stayed proactive in managing its loan portfolio.
As at 31 December 2019, total non-performing assets (NPA) were S$3.88 billion, down from S$3.94 billion a year ago. The decline in NPAs was led by the upgrades and recoveries from accounts in the oil and gas support vessels and services (OSV) industry as well as write-offs in that sector. The non-performing loans ratio of 1.45% was lower as compared to 1.49% in the previous year. Total cumulative allowances represented 250% of unsecured NPAs as at 31 December 2019.
Net allowances for loans and other assets in 2019 were higher year-on-year at S$746 million. This excluded the one-time charge of S$144 million in 2019 arising from a refinement in the Group’s ECL modelling approach for its Indonesian banking subsidiary, Bank OCBC NISP, relating to allowances for non-impaired assets as it prepared for the introduction of International Financial Reporting Standard 9 Financial Instruments. Excluding the one-time item, the year-on-year increase was largely attributable to allowances made for the non-performing loans in the OSV sector where vessels coming off charter were not able to secure term renewals. Consistent with past practices, the collateral valuation of vessels pending employment were written down to scrap value. The Group also set aside additional allowances for non-impaired loans resulting from the adjustment to the macro economic variables in the ECL model to reflect the weaker market outlook in the region.
122 OCBC Annual Report 2019 123Financials
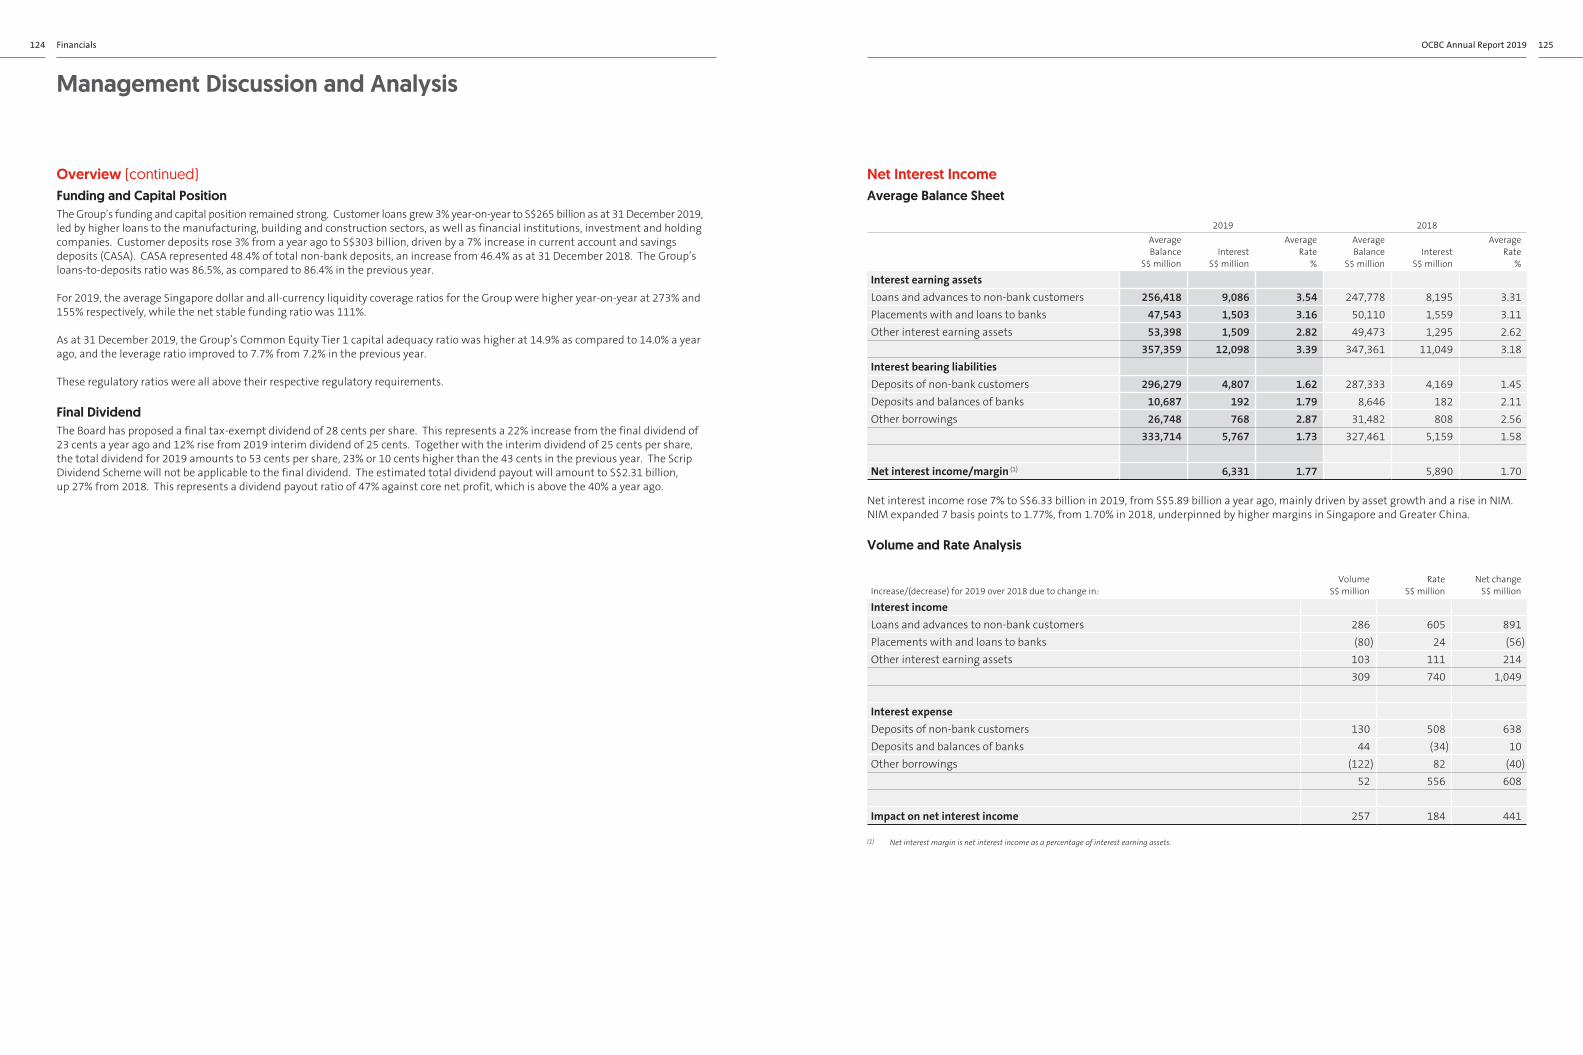
Overview (continued)Funding and Capital Position The Group’s funding and capital position remained strong. Customer loans grew 3% year-on-year to S$265 billion as at 31 December 2019, led by higher loans to the manufacturing, building and construction sectors, as well as financial institutions, investment and holding companies. Customer deposits rose 3% from a year ago to S$303 billion, driven by a 7% increase in current account and savings deposits (CASA). CASA represented 48.4% of total non-bank deposits, an increase from 46.4% as at 31 December 2018. The Group’s loans-to-deposits ratio was 86.5%, as compared to 86.4% in the previous year.
For 2019, the average Singapore dollar and all-currency liquidity coverage ratios for the Group were higher year-on-year at 273% and 155% respectively, while the net stable funding ratio was 111%. As at 31 December 2019, the Group’s Common Equity Tier 1 capital adequacy ratio was higher at 14.9% as compared to 14.0% a year ago, and the leverage ratio improved to 7.7% from 7.2% in the previous year.
These regulatory ratios were all above their respective regulatory requirements.
Final DividendThe Board has proposed a final tax-exempt dividend of 28 cents per share. This represents a 22% increase from the final dividend of 23 cents a year ago and 12% rise from 2019 interim dividend of 25 cents. Together with the interim dividend of 25 cents per share, the total dividend for 2019 amounts to 53 cents per share, 23% or 10 cents higher than the 43 cents in the previous year. The Scrip Dividend Scheme will not be applicable to the final dividend. The estimated total dividend payout will amount to S$2.31 billion, up 27% from 2018. This represents a dividend payout ratio of 47% against core net profit, which is above the 40% a year ago.
Net Interest IncomeAverage Balance Sheet
2019 2018AverageBalance
S$ millionInterest
S$ million
Average Rate
%
AverageBalance
S$ millionInterest
S$ million
Average Rate
%
Interest earning assets Loans and advances to non-bank customers 256,418 9,086 3.54 247,778 8,195 3.31Placements with and loans to banks 47,543 1,503 3.16 50,110 1,559 3.11Other interest earning assets 53,398 1,509 2.82 49,473 1,295 2.62
357,359 12,098 3.39 347,361 11,049 3.18Interest bearing liabilitiesDeposits of non-bank customers 296,279 4,807 1.62 287,333 4,169 1.45Deposits and balances of banks 10,687 192 1.79 8,646 182 2.11Other borrowings 26,748 768 2.87 31,482 808 2.56
333,714 5,767 1.73 327,461 5,159 1.58
Net interest income/margin (1) 6,331 1.77 5,890 1.70
Net interest income rose 7% to S$6.33 billion in 2019, from S$5.89 billion a year ago, mainly driven by asset growth and a rise in NIM. NIM expanded 7 basis points to 1.77%, from 1.70% in 2018, underpinned by higher margins in Singapore and Greater China.
Volume and Rate Analysis
Increase/(decrease) for 2019 over 2018 due to change in: Volume
S$ millionRate
S$ millionNet change
S$ million
Interest incomeLoans and advances to non-bank customers 286 605 891Placements with and loans to banks (80) 24 (56)Other interest earning assets 103 111 214 309 740 1,049
Interest expenseDeposits of non-bank customers 130 508 638Deposits and balances of banks 44 (34) 10Other borrowings (122) 82 (40)
52 556 608
Impact on net interest income 257 184 441
(1) Net interest margin is net interest income as a percentage of interest earning assets.
Management Discussion and Analysis
124 OCBC Annual Report 2019 125Financials

Non-Interest Income
2019S$ million
2018S$ million
+/(-)%
Gross fee and commission incomeBrokerage 82 105 (22)Wealth management 1,036 958 8Fund management 115 113 2Credit card 348 351 (1)Loan-related 307 300 2Trade-related and remittances 254 239 6Guarantees 16 18 (7)Investment banking 106 102 4Service charges 99 100 (1)Others 44 40 9
2,407 2,326 3Fee and commission expense (284) (295) (4)Fees and commissions (net) 2,123 2,031 5
Dividends 92 128 (28)Rental income 80 79 1
Income from life and general insuranceProfit from life insurance 779 740 5Premium income from general insurance 197 171 14Sub-total 976 911 7
Other incomeNet trading income 977 508 92Net gain from investment securities 171 16 955Net gain from disposal of subsidiaries and associate 1 8 (91)Net gain from disposal of properties 83 47 77Others 37 83 (55)Sub-total 1,269 662 92
Total non-interest income 4,540 3,811 19
Non-interest income was 19% higher at S$4.54 billion in 2019 as compared to S$3.81 billion a year ago. Net fees and commissions rose 5% to S$2.12 billion, driven by higher wealth management and credit card fees, as well as increased fees from loan, trade and investment banking activities. Net trading income was higher at S$977 million, as compared to S$508 million in the previous year, mainly attributable to an 18% rise in customer flow income and mark-to-market gains in GEH’s investment portfolio. Income from life and general insurance rose 7% to S$976 million, while net gains from the sale of investment securities of S$171 million were higher than the S$16 million a year ago. Net gains from the sale of properties were S$83 million as compared to S$47 million in 2018.
Operating Expenses
2019S$ million
2018S$ million
+/(-)%
Staff costs 2,840 2,606 9
Property and equipmentDepreciation 397 317 25Maintenance 136 124 9Rental expenses 24 100 (76)Others 301 271 11
858 812 6
Other operating expenses 946 796 19Total operating expenses 4,644 4,214 10
Group staff strength Year end 30,492 29,706 3Average 30,220 29,549 2
Operating expenses rose 10% to S$4.64 billion in 2019, up from S$4.21 billion a year ago. Staff costs were up 9% to S$2.84 billion, from S$2.61 billion in the previous year, largely from a rise in staff costs linked to headcount growth, including at GEH which saw a more substantial increase in staff expenses as it positioned for higher volume growth. Property and equipment-related expenses were S$858 million, an increase of 6% from S$812 million in the previous year. With the adoption of Singapore Financial Reporting Standard (International) 16 Leases, depreciation for right-of-use assets in 2019 was S$78 million, replacing the rental expenses.
The cost-to-income ratio was lower at 42.7% in 2019, as compared to 43.4% a year ago.
Allowances for Loans and Other Assets (1)
2019S$ million
2018S$ million
+/(-)%
Allowances/(write-back): Impaired loans Singapore 320 219 46Malaysia 99 64 56Indonesia 304 125 143Greater China 88 34 155Others 45 (45) 201
856 397 116
Impaired other assets 2 5 (61)
Non-impaired loans (109) (90) (20)
Non-impaired other assets (3) (24) 89Allowances for loans and other assets 746 288 160
(1) Excluding a one-time item.
Allowances for loans and other assets were S$746 million in 2019, as compared to S$288 million a year ago. The year-on-year increase was largely attributable to allowances made for the non-performing loans in the oil and gas support vessels and services industry, as well as additional allowances for non-impaired loans resulting from the adjustment to the macro economic variables in the Expected Credit Loss model to reflect the weaker market outlook in the region.
Management Discussion and Analysis
126 OCBC Annual Report 2019 127Financials

Customer Loans
2019S$ million
2018S$ million
+/(-)%
By IndustryAgriculture, mining and quarrying 8,963 8,894 1Manufacturing 17,074 16,493 4Building and construction 64,686 53,511 21Housing loans 62,069 64,753 (4)General commerce 31,823 34,408 (8)Transport, storage and communication 13,311 13,510 (1)Financial institutions, investment and holding companies 24,542 23,916 3Professionals and individuals 30,322 30,373 –Others 11,983 11,847 1
264,773 257,705 3
By Currency Singapore Dollar 93,559 91,640 2United States Dollar 65,163 67,248 (3)Malaysian Ringgit 20,878 20,870 –Indonesian Rupiah 9,222 8,695 6Hong Kong Dollar 34,355 35,195 (2)Chinese Renminbi 4,933 4,502 10Others 36,663 29,555 24
264,773 257,705 3
By Geography (1)
Singapore 108,981 108,169 1Malaysia 28,585 29,649 (4)Indonesia 19,680 19,660 –Greater China 65,358 64,404 1Other Asia Pacific 15,674 13,595 15Rest of the World 26,495 22,228 19
264,773 257,705 3
(1) Loans by geography are based on where the credit risks reside, which may be different from the borrower’s country of residence or the booking location of the loans.
Gross loans to customers were S$265 billion as at 31 December 2019, and were higher from a year ago. By industry, the year-on-year loan growth was led by higher loans to the manufacturing, building and construction sectors, as well as financial institutions, investment and holding companies. In constant currency terms, customer loans grew 3% from the previous year.
Non-Performing Assets
Total NPAs S$ million
(1) Substandard S$ million
Doubtful S$ million
Loss S$ million
Secured NPAs/Total NPAs
%NPLs
S$ million(2) NPL Ratio
%(2)
Singapore31 Dec 2019 1,717 1,309 237 171 79.2 1,685 1.531 Dec 2018 1,540 923 433 184 65.0 1,456 1.3
Malaysia31 Dec 2019 738 372 321 45 60.1 726 2.531 Dec 2018 806 395 369 42 70.9 803 2.7
Indonesia31 Dec 2019 678 289 222 167 49.7 677 3.431 Dec 2018 619 406 95 118 75.0 618 3.1
Greater China31 Dec 2019 230 54 133 43 51.7 230 0.431 Dec 2018 262 120 106 36 49.9 261 0.4
Other Asia Pacific31 Dec 2019 101 77 23 1 58.8 101 0.631 Dec 2018 176 158 18 0 57.3 165 1.2
Rest of the World 31 Dec 2019 419 229 183 7 56.4 419 1.631 Dec 2018 535 354 180 1 66.5 535 2.4
Group 31 Dec 2019 3,883 2,330 1,119 434 65.8 3,838 1.531 Dec 2018 3,938 2,356 1,201 381 66.7 3,838 1.5
(1) Comprise non-bank loans, debt securities and contingent liabilities.(2) Exclude debt securities and contingent liabilities.
Asset quality remained satisfactory as the Group continued to exercise prudence and stayed proactive in managing its loan portfolio. Non-performing assets (NPAs) were S$3.88 billion as at 31 December 2019, a 1% decline from S$3.94 billion a year ago.
The Group’s NPL ratio was 1.5%, unchanged from the previous year. Of the total NPAs, 60% were in the substandard category and 66% were secured by collateral.
Management Discussion and Analysis
128 OCBC Annual Report 2019 129Financials

Non-Performing Assets (continued)
2019 2018
S$ million% of
gross loans S$ million% of
gross loans
NPLs by Industry Loans and advancesAgriculture, mining and quarrying 468 5.2 555 6.2Manufacturing 468 2.7 395 2.4Building and construction 155 0.2 143 0.3Housing loans 435 0.7 429 0.7General commerce 555 1.7 676 2.0Transport, storage and communication 1,563 11.7 1,328 9.8Financial institutions, investment and holding companies 25 0.1 38 0.2Professionals and individuals 123 0.4 118 0.4Others 46 0.4 156 1.3Total NPLs 3,838 1.5 3,838 1.5Classified debt securities 2 2Classified contingent liabilities 43 98Total NPAs 3,883 3,938
2019 2018S$ million % S$ million %
NPAs by Period Overdue Over 180 days 1,770 46 1,225 31Over 90 to 180 days 173 4 397 1030 to 90 days 530 14 396 10Less than 30 days 474 12 164 4Not overdue 936 24 1,756 45
3,883 100 3,938 100
Cumulative Allowances for Assets (1)
Total cumulative allowances
S$ million
Allowances for impaired assets
S$ million
Allowances for non-impaired
assetsS$ million
Allowances for impaired assets
as % of total NPAs
%
Cumulative allowances
as % of total NPAs
%
Singapore31 Dec 2019 1,476 679 797 39.6 86.031 Dec 2018 1,160 483 677 31.3 75.4
Malaysia31 Dec 2019 597 308 289 41.7 80.831 Dec 2018 552 333 219 41.3 68.5
Indonesia31 Dec 2019 571 237 334 34.9 84.131 Dec 2018 407 200 207 32.2 65.7
Greater China31 Dec 2019 382 47 335 20.5 166.531 Dec 2018 390 61 329 23.4 148.9
Other Asia Pacific31 Dec 2019 94 32 62 31.2 92.531 Dec 2018 45 2 43 1.4 25.8
Rest of the World 31 Dec 2019 201 94 107 22.5 48.031 Dec 2018 215 142 73 26.6 40.1
Group 31 Dec 2019 3,321 1,397 1,924 36.0 85.531 Dec 2018 2,769 1,221 1,548 31.0 70.3
(1) Included regulatory loss allowance reserve.
As at 31 December 2019, the Group’s total cumulative allowances for assets were S$3.32 billion. This comprised S$1.40 billion in allowances for impaired assets and S$1.92 billion in allowances for non-impaired assets. The cumulative allowances represented 250% of unsecured NPAs and 86% of total NPAs.
Management Discussion and Analysis
130 OCBC Annual Report 2019 131Financials

Deposits2019
S$ million2018
S$ million+/(-)
%
Deposits of non-bank customers 302,851 295,412 3Deposits and balances of banks 8,250 7,576 9
311,101 302,988 3
Total Deposits by MaturityWithin 1 year 307,522 297,702 31 to 3 years 1,792 2,749 (35)Over 3 years 1,787 2,537 (30)
311,101 302,988 3
Non-Bank Deposits by ProductFixed deposits 128,989 131,610 (2)Savings deposits 57,465 52,796 9Current account 89,024 84,295 6Others 27,373 26,711 2
302,851 295,412 3
Non-Bank Deposits by Currency Singapore Dollar 107,278 105,327 2United States Dollar 102,800 91,036 13Malaysian Ringgit 22,827 23,297 (2)Indonesian Rupiah 10,221 9,474 8Hong Kong Dollar 25,905 28,428 (9)Chinese Renminbi 6,679 7,674 (13)Others 27,141 30,176 (10)
302,851 295,412 3
Non-bank customer deposits as at 31 December 2019 were S$303 billion, up 3% from S$295 billion a year ago. The year-on-year growth was mainly attributable to an increase in current account and savings deposits (CASA), and the ratio of CASA to total non-bank deposits was higher at 48.4%, as compared to 46.4% a year ago. The Group’s loans-to-deposits ratio was 86.5% as at 31 December 2019.
Performance by Business Segment OCBC Group’s businesses are presented in the following customer segments and business activities: Global Consumer/Private Banking, Global Corporate/Investment Banking, Global Treasury and Markets, OCBC Wing Hang and Insurance.
Operating Profit after Allowances and Amortisation by Business Segment (1)
2019S$ million
2018S$ million
+/(-)%
Global Consumer/Private Banking 1,445 1,313 10Global Corporate/Investment Banking 1,653 2,051 (19)Global Treasury and Markets 590 492 20OCBC Wing Hang 423 497 (15)Insurance 1,068 811 32Others 199 (67) (398)Operating profit after allowances and amortisation 5,378 5,097 6
(1) Excluding a one-time item.
Performance by Business Segment (continued)Global Consumer/Private BankingGlobal Consumer/Private Banking provides a full range of products and services to individual customers. At Global Consumer Banking, the products and services offered include deposit products (checking accounts, savings and fixed deposits), consumer loans (housing loans and other personal loans), credit cards, wealth management products (unit trusts, bancassurance products and structured deposits) and brokerage services. Private Banking caters to the specialised banking needs of high net worth individuals, offering wealth management expertise, including investment advice and portfolio management services, estate and trust planning, and wealth structuring.
Global Consumer/Private Banking’s operating profit after allowances was S$1.45 billion in 2019, a year-on-year increase of 10%. The operating profit growth was led by higher net interest income and fee income, partly offset by higher expenses.
Global Corporate/Investment BankingGlobal Corporate/Investment Banking serves institutional customers ranging from large corporates and the public sector to small and medium enterprises. The products and services offered include long-term loans such as project financing, short-term credit such as overdrafts and trade financing, deposit accounts and fee-based services such as cash management and custodian services. Investment Banking offers a comprehensive range of financing solutions, syndicated loans and advisory services, corporate finance services for initial public offerings, secondary fund-raising, takeovers and mergers, as well as customised and structured equity-linked financing.
Global Corporate/Investment Banking’s operating profit after allowances fell 19% to S$1.65 billion in 2019. The drop in operating profit was attributable to higher allowances, which more than offset revenue growth.
Global Treasury and MarketsGlobal Treasury and Markets is responsible for the management of the Group’s asset and liability interest rate positions, engages in foreign exchange activities, money market operations, fixed income and derivatives trading, and offers structured treasury products and financial solutions to meet customers’ investment and hedging needs. Income from treasury products and services offered to customers of other business segments, such as Global Consumer/Private Banking and Global Corporate/Investment Banking, is reflected in the respective business segments.
Global Treasury’s operating profit after allowances rose 20% to S$590 million in 2019. The year-on-year increase in operating profit was largely contributed by higher gains from its fixed income portfolio, partly offset by a drop in net interest income.
OCBC Wing HangOCBC Wing Hang offers a comprehensive range of commercial banking and related financial services such as consumer financing, share brokerage and insurance.
OCBC Wing Hang’s operating profit after allowances fell 15% to S$423 million in 2019, largely from a one-time gain of S$40 million from the forfeiture of deposit received in relation to the sale of Hong Kong Life in 2018. Excluding this one-time item, operating profit fell 7% from a year ago, as higher expenses and allowances offset the increase in net interest income.
InsuranceThe Group’s insurance business, including its fund management activities, is undertaken by 87.9%-owned subsidiary GEH and its subsidiaries, which provide both life and general insurance products to its customers mainly in Singapore and Malaysia.
GEH recorded strong growth in operating profit after allowances in 2019 led by positive performance in its investment portfolio. Operating profit rose 32% year-on-year to S$1.07 billion. The operating profit growth was mainly attributable to higher mark-to-market gains in equities, and a rise in insurance income led by strong investment performance as a result of narrowing credit spreads, partly offset by an increase in expenses.
After tax and non-controlling interests, GEH’s contribution to the Group’s net profit was S$832 million in 2019, compared with S$604 million in the previous year.
OthersOthers comprise mainly property holding, investment holding and items not attributable to the business segments described above.
Management Discussion and Analysis
132 OCBC Annual Report 2019 133Financials

Performance by Geographical Segment
2019 2018S$ million % S$ million %
Total income Singapore 6,552 60 5,552 57Malaysia 1,469 13 1,457 15Indonesia 849 8 769 8Greater China 1,494 14 1,477 15Other Asia Pacific 224 2 212 2Rest of the World 283 3 234 3
10,871 100 9,701 100
Profit before income tax (1)
Singapore 3,221 54 2,975 54Malaysia 830 14 913 16Indonesia 418 7 354 6Greater China 1,154 19 1,037 19Other Asia Pacific 156 3 158 3Rest of the World 165 3 115 2
5,944 100 5,552 100
Total assetsSingapore 287,129 58 271,142 58Malaysia 65,584 13 66,173 14Indonesia 17,900 4 16,481 4Greater China 81,684 17 80,917 17Other Asia Pacific 16,264 3 14,114 3Rest of the World 23,130 5 18,716 4
491,691 100 467,543 100
(1) Excluding a one-time item.
The geographical segment analysis is based on the location where assets or transactions are booked. For 2019, Singapore accounted for 60% of total income and 54% of pre-tax profit, while Malaysia contributed 13% of total income and 14% of pre-tax profit. Indonesia accounted for 8% of total income and 7% of pre-tax profit. Greater China made up for 14% of total income and 19% of pre-tax profit.
Pre-tax profit for Singapore was S$3.22 billion in 2019, up 8% from S$2.98 billion a year ago, driven by broad-based income growth. Malaysia’s pre-tax profit fell 9% to S$830 million, from S$913 million in 2018, as a result of higher allowances. Indonesia’s pre-tax profit of S$418 million in 2019 was higher compared to S$354 million a year ago, mainly attributable to a rise in net interest income and trading income. Pre-tax profit for Greater China rose 11% to S$1.15 billion, from S$1.04 billion in 2018, led by an increase in share of associates’ profits and higher interest income.
Capital Adequacy RatiosThe Group remained strongly capitalised. Common Equity Tier 1 capital adequacy ratio (CAR), Tier 1 CAR and Total CAR as at 31 December 2019 were 14.9%, 15.6% and 16.8% respectively, higher than the corresponding ratios of 14.0%, 14.8% and 16.4% a year ago. These ratios were all above their respective regulatory requirements.
Management Discussion and Analysis
134 OCBC Annual Report 2019 135Financials

Directors’ StatementFor the financial year ended 31 December 2019
The directors present this statement to the members of the Bank together with the audited consolidated financial statements of the Group and the income statement, statement of comprehensive income, balance sheet and statement of changes in equity of the Bank for the financial year ended 31 December 2019.
In our opinion:
(a) the financial statements set out on pages 149 to 278 are drawn up so as to give a true and fair view of the financial position of the Group and of the Bank as at 31 December 2019, the financial performance and changes in equity of the Group and of the Bank for the financial year ended on that date, and cash flows of the Group for the financial year ended on that date, in accordance with the provisions of the Singapore Companies Act, Chapter 50 (the Act) and Singapore Financial Reporting Standards (International); and
(b) at the date of this statement, there are reasonable grounds to believe that the Bank will be able to pay its debts as and when they fall due.
The Board of Directors has, on the date of this statement, authorised these financial statements for issue.
DirectorsThe directors of the Bank in office at the date of this statement are as follows:
Ooi Sang Kuang, Chairman Samuel N. Tsien, Chief Executive Officer Christina Hon Kwee Fong (Christina Ong) Chua Kim ChiuKoh Beng Seng (Appointed on 1 October 2019) Lee Tih Shih Pramukti SurjaudajaQuah Wee Ghee Tan Ngiap Joo Tan Yen Yen (Appointed on 1 January 2020)Wee Joo Yeow
Ooi Sang Kuang, Lee Tih Shih and Wee Joo Yeow will retire by rotation under Article 98 of the Constitution at the forthcoming annual general meeting of the Bank and, being eligible, will offer themselves for re-election thereat.
Koh Beng Seng and Tan Yen Yen will retire under Article 104 of the Constitution at the forthcoming annual general meeting of the Bank and, being eligible, will offer themselves for re-election thereat.
Arrangements to Enable Directors to Acquire Shares and Debentures Neither at the end of, nor at any time during the financial year, was the Bank a party to any arrangement whose objects are, or one of whose objects is, to enable the directors of the Bank to acquire benefits by means of the acquisition of shares in, or debentures of, the Bank or any other body corporate, other than as disclosed in this statement.
Directors’ Interests in Shares or DebenturesAccording to the register of directors’ shareholdings, the directors holding office at the end of the financial year had interests in shares in the Bank and its related corporations, as follows:
Direct interest Deemed interest (1)
At 31 December 2019At 1 January 2019/
Date of appointment At 31 December 2019At 1 January 2019/
Date of appointment
BANKOrdinary shares Ooi Sang Kuang 47,311 39,122 – –Samuel N. Tsien 1,758,786 1,378,675 – –Christina Hon Kwee Fong (Christina Ong) 18,333 11,484 – –Chua Kim Chiu 8,103 1,727 – –Koh Beng Seng – – – –Lai Teck Poh (4) – 945,209 – – Lee Tih Shih 11,267,591 10,740,454 – –Pramukti Surjaudaja 73,050 63,671 – –Quah Wee Ghee 48,249 40,016 632 601Tan Ngiap Joo 1,366,312 1,325,528 – – Wee Joo Yeow 69,000 59,808 4,794 4,794
Options/ rights/ awards in respect of ordinary shares
Samuel N. Tsien 5,725,276 (2) 5,649,371 (3) – –
(1) Ordinary shares held by spouse.(2) Comprises: (i) options to acquire 5,034,060 ordinary shares granted under the OCBC Share Option Scheme 2001; (ii) rights to acquire 6,283 ordinary shares granted under the OCBC Employee
Share Purchase Plan; and (iii) 684,933 unvested shares granted under the OCBC Deferred Share Plan.(3) Comprises: (i) options to acquire 5,034,060 ordinary shares granted under the OCBC Share Option Scheme 2001; (ii) rights to acquire 6,445 ordinary shares granted under the OCBC Employee
Share Purchase Plan; and (iii) 608,866 unvested shares granted under the OCBC Deferred Share Plan.(4) Mr Lai Teck Poh resigned from the Board of Directors of the Bank on 1 January 2020.
136 OCBC Annual Report 2019 137Financials

Directors’ StatementFor the financial year ended 31 December 2019
Directors’ Interests in Shares or Debentures (continued)Save as disclosed above, no director holding office at the end of the financial year had any interest in shares in, or debentures of, the Bank or any of its related corporations either at the beginning of the financial year, date of appointment, or at the end of the financial year. There were no changes to any of the above mentioned interests between the end of the financial year and 21 January 2020.
Ms Tan Yen Yen, who was appointed as a director of the Bank on 1 January 2020, did not have any interests in the Bank’s shares as at 21 January 2020.
Share-Based Compensation PlansThe Bank’s share-based compensation plans are administered by the Remuneration Committee, which as at the date of this statement comprises:
Tan Ngiap Joo, ChairmanChristina Hon Kwee Fong (Christina Ong)Ooi Sang Kuang Koh Beng SengTan Yen Yen (Appointed on 1 January 2020)Wee Joo Yeow
Under the share-based compensation plans, no options or rights have been granted to controlling shareholders of the Bank or their associates, nor has any participant received 5% or more of the total number of options or rights available under each respective scheme or plan during the financial year. No options or rights were granted at a discount during the financial year. The persons to whom the options or rights were issued have no right by virtue of these options or rights to participate in any share issue of any other company. The disclosure requirement in Rule 852(1)(c) of the SGX Listing Manual relating to the grant of options to directors and employees of the parent company and its subsidiaries is not applicable to the Bank’s share-based compensation plans.
The Bank’s share-based compensation plans are as follows:
(a) OCBC Share Option Scheme 2001
The OCBC Share Option Scheme 2001 (2001 Scheme), which was implemented in 2001, was extended for another 10 years from 2011 to 2021, with the approval of shareholders. Executives of the Group ranked Manager and above and non-executive directors of the Group are eligible to participate in this scheme. The Bank will either issue new shares or transfer treasury shares to the participants upon the exercise of their options.
Particulars of Options 2009, 2010, 2011, 2012, 2013, 2014, 2015, 2015CT, 2015JL, 2016, 2016A, 2017, 2017SL, 2017DM and 2018 were set out in the Directors’ Reports/Directors’ Statements for the financial years ended 31 December 2009 to 2018.
No share options were granted under the 2001 Scheme during the financial year.
Share-Based Compensation Plans (continued)(a) OCBC Share Option Scheme 2001 (continued)
Details of unissued ordinary shares under the 2001 Scheme, options exercised during the financial year and options outstanding and exercisable at 31 December 2019 are as follows:
Acquisition OptionsTreasury
shares At 31 December 2019Options Exercise period price ($) exercised transferred Outstanding Exercisable
2009 17.03.2010 to 15.03.2019 4.024 410,953 410,953 – –2010 16.03.2011 to 14.03.2020 8.521 123,220 123,220 535,065 535,065 2011 15.03.2012 to 13.03.2021 9.093 58,793 58,793 799,434 799,434 2012 15.03.2013 to 13.03.2022 8.556 116,881 116,881 1,518,102 1,518,102 2013 15.03.2014 to 13.03.2023 10.018 179,148 179,148 3,931,175 3,931,1752014 15.03.2015 to 13.03.2024 9.169 155,557 155,557 2,900,104 2,900,1042015 16.03.2016 to 15.03.2025 10.378 287,955 284,821 4,481,856 4,481,856 2015CT 30.06.2016 to 29.06.2025 10.254 – – 31,779 31,7792015JL 16.11.2016 to 15.11.2025 9.030 19,999 19,999 – –2016 16.03.2017 to 15.03.2026 8.814 1,055,520 1,049,265 6,382,102 6,382,102 2016A 16.03.2017 to 15.03.2026 8.814 – – 85,202 85,2022017 23.03.2018 to 22.03.2027 9.598 731,490 726,652 7,986,369 4,909,1342017SL 04.08.2018 to 03.08.2027 11.378 – – 18,943 12,5022017DM 29.12.2018 to 28.12.2027 12.316 – – 5,673 3,7442018 22.03.2019 to 21.03.2028 13.340 2,000 2,000 6,477,931 2,136,241
3,141,516 3,127,289 35,153,735 27,726,440
(b) OCBC Employee Share Purchase Plan
The OCBC Employee Share Purchase Plan (ESP Plan), which was implemented in 2004, was extended for another 10 years from 2014 to 2024, with the approval of shareholders. Employees of the Group who have attained the age of 21 years and been employed for not less than six months are eligible to participate in the ESP Plan.
At an extraordinary general meeting held on 17 April 2009, alterations to the ESP Plan were approved to enable two (but not more than two) Offering Periods to be outstanding on any date. Since each Offering Period currently consists of a 24-month period, these alterations will enable the Bank to prescribe Offering Periods once every 12 months (instead of once every 24 months as was previously the case).
In June 2019, the Bank launched its fourteenth offering under the ESP Plan, which commenced on 1 July 2019 and will expire on 30 June 2021. Under the fourteenth offering, 7,210 employees enrolled to participate in the ESP Plan to acquire 8,905,273 ordinary shares at S$11.32 per ordinary share. The acquisition price is equal to the average of the last traded price of the ordinary shares of the Bank on the Singapore Exchange over five consecutive trading days immediately preceding the price fixing date. Particulars of the first to thirteenth offerings under the ESP Plan were set out in the Directors’ Reports/Directors’ Statements for the financial years ended 31 December 2004 to 2018. During the financial year, 5,635,288 ordinary shares were delivered to participants under the ESP Plan. As at the end of the financial year, there were (i) rights to acquire 6,104,232 ordinary shares at S$11.60 per ordinary share granted under the thirteenth offering (which will expire on 30 June 2020) outstanding, and (ii) rights to acquire 8,220,750 ordinary shares at S$11.32 per ordinary share granted under the fourteenth offering (which will expire on 30 June 2021) outstanding. Further details on the ESP Plan can be found in Note 13.3 of the Notes to the Financial Statements.
138 OCBC Annual Report 2019 139Financials

Directors’ StatementFor the financial year ended 31 December 2019
Share-Based Compensation Plans (continued)(b) OCBC Employee Share Purchase Plan (continued)
Details of options granted under the 2001 Scheme and acquisition rights granted under the ESP Plan to directors of the Bank are as follows:
Name of director
Options/rights granted during the financial year
ended 31 December 2019
Aggregate number of options/ rights granted since
commencement of scheme/plan to
31 December 2019
Aggregate number of options
exercised/rights converted since
commencement of scheme/plan to
31 December 2019
Aggregate number of
options/rights outstanding at
31 December 2019 (1)
2001 SchemeSamuel N. Tsien – 5,746,795 712,735 5,034,060
ESP PlanSamuel N. Tsien 3,180 45,867 31,608 (2) 6,283
(1) These details have already been disclosed in the section on “Directors’ interests in shares or debentures” above. (2) Excludes 4,114 rights and 3,862 rights which were not converted into shares upon expiry of the fifth offering and ninth offering respectively as the average market price at that time
was lower than the acquisition price. This was in line with the terms and conditions of the ESP Plan.
There were no changes to any of the above mentioned interests between the end of the financial year and 21 January 2020.
(c) OCBC Deferred Share Plan
The Bank implemented the OCBC Deferred Share Plan (DSP) in 2003. The DSP is a discretionary incentive and retention award programme extended to executives of the Group at the absolute discretion of the Remuneration Committee.
Awards over an aggregate of 8,506,920 ordinary shares (including awards over 339,880 ordinary shares granted to a director of the Bank) were granted to eligible executives under the DSP during the financial year ended 31 December 2019. In addition, existing awards were adjusted following the declarations of final dividend for the financial year ended 31 December 2018, and interim dividend for the financial year ended 31 December 2019, resulting in an additional 815,643 ordinary shares being subject to awards under the DSP (including an additional 31,681 ordinary shares being subject to awards held by a director of the Bank holding office as at the end of the financial year). During the financial year, 6,430,261 deferred shares were released to grantees, of which 295,494 deferred shares were released to a director of the Bank who held office as at the end of the financial year.
Except as disclosed above, there were no unissued shares of the Bank or its subsidiaries under options granted by the Bank or its subsidiaries as at the end of the financial year.
Audit CommitteeThe members of the Audit Committee as at the date of this statement are:
Chua Kim Chiu, Chairman Ooi Sang Kuang (Appointed on 11 December 2019)Tan Ngiap Joo Tan Yen Yen (Appointed on 1 January 2020)
The Audit Committee performed the functions specified in the Act, the SGX Listing Manual, the Banking (Corporate Governance) Regulations 2005, the MAS Guidelines for Corporate Governance and the Code of Corporate Governance 2018. In performing these functions, the Audit Committee met with the Bank’s external and internal auditors, and reviewed the audit plans, the internal audit programme, as well as the results of the auditors’ examination and their evaluation of the system of internal controls.
The Audit Committee also reviewed the following:
(a) response of the Bank’s management and the assistance provided by officers of the Bank to the external and internal auditors; (b) the financial statements of the Group and the Bank and the auditors’ report thereon prior to their submission to the Board of
Directors; and(c) the independence and objectivity of the external auditors including its tenure.
The Audit Committee has full access to, and the cooperation of, the management and has been given the resources required for it to discharge its functions. It has full authority and discretion to invite any director and executive officer to attend its meetings.
As disclosed in the Directors’ Statement for the last financial year, the Audit Committee noted that KPMG LLP have served as the Bank’s external auditors since 2006. As part of good corporate governance, the Audit Committee, following a tender process based on an established framework for the selection of external auditors, has nominated PricewaterhouseCoopers LLP for appointment as the external auditors of the Bank in place of the retiring auditors, KPMG LLP, at the forthcoming annual general meeting.
AuditorsThe retiring auditors, KPMG LLP, will not be seeking re-appointment at the forthcoming annual general meeting. PricewaterhouseCoopers LLP has expressed its willingness to accept appointment as the auditors.
On behalf of the Board of Directors,
Ooi Sang Kuang Samuel N. TsienDirector Director
Singapore20 February 2020
140 OCBC Annual Report 2019 141Financials

Independent Auditors’ ReportTo The Members Of Oversea-Chinese Banking Corporation Limited
Report on the Audit of the Financial StatementsOpinionWe have audited the financial statements of Oversea-Chinese Banking Corporation Limited (the Bank) and its subsidiaries (the Group), which comprise the consolidated balance sheet of the Group and the balance sheet of the Bank as at 31 December 2019, the consolidated income statement, consolidated statement of comprehensive income, consolidated statement of changes in equity and consolidated cash flow statement of the Group and the income statement, statement of comprehensive income and statement of changes in equity of the Bank for the year then ended, and notes to the financial statements, including a summary of significant accounting policies as set out on pages 149 to 278.
In our opinion, the accompanying consolidated financial statements of the Group and the balance sheet, income statement, statement of comprehensive income and statement of changes in equity of the Bank are properly drawn up in accordance with the provisions of the Companies Act, Chapter 50 (the Act) and Singapore Financial Reporting Standards (International) (SFRS(I)s) so as to give a true and fair view of the consolidated financial position of the Group and the financial position of the Bank as at 31 December 2019 and of the consolidated financial performance, consolidated changes in equity and consolidated cash flows of the Group and the financial performance and changes in equity of the Bank for the year ended on that date.
Basis for OpinionWe conducted our audit in accordance with Singapore Standards on Auditing (SSAs). Our responsibilities under those standards are further described in the Auditors’ responsibilities for the audit of the financial statements section of our report. We are independent of the Group in accordance with the Accounting and Corporate Regulatory Authority (ACRA) Code of Professional Conduct and Ethics for Public Accountants and Accounting Entities (ACRA Code) together with the ethical requirements that are relevant to our audit of the financial statements in Singapore, and we have fulfilled our other ethical responsibilities in accordance with these requirements and the ACRA Code. We believe that the audit evidence we have obtained is sufficient and appropriate to provide a basis for our opinion.
Key Audit MattersKey audit matters are those matters that, in our professional judgement, were of most significance in our audit of the financial statements of the current period. These matters were addressed in the context of our audit of the financial statements as a whole, and in forming our opinion thereon, and we do not provide a separate opinion on these matters.
Impairment of Loans and Bills Receivable (Refer to Notes 9, 26, 28 and 30 to the financial statements)
The key audit matter How the matter was addressed in our audit
At 31 December 2019, the Group’s loans and bills receivable comprised 54% of Total Assets.
The Group has developed quantitative models to determine the expected credit loss (ECL) allowances for credit exposures, in accordance with the requirements of SFRS(I) 9 “Financial Instruments”. Significant judgement is applied in developing the models and in determining the relevant model inputs and applicable assumptions.
Non credit-impaired exposuresWe tested the design, implementation and operating effectiveness of key controls around the determination of ECL allowances. These controls include:
• general IT controls over the ECL system, comprising user access rights and change management controls, as well as IT application controls over the completeness and accuracy of data flows from source systems to the ECL system;
• the existence of an independent model validation function; and
• the effective monitoring of the macroeconomic variables used in the models and, the review and approval of scenarios and probabilities.
Impairment of Loans and Bills Receivable(Refer to Notes 9, 26, 28 and 30 to the financial statements) (continued)
The key audit matter How the matter was addressed in our audit
In respect of non credit-impaired exposures, management judgement and estimation are required in areas including:
• development of ECL model parameters, including the probability of default (PD), loss given default (LGD) and exposure at default (EAD) for each portfolio across different locations;
• selection of criteria to assess whether a credit exposure has exhibited a “significant increase in credit risk” and thus requiring lifetime ECL allowance; and
• determination of relevant macroeconomic factors to incorporate into the models and the probability weighting to apply to a range of possible scenarios.
In respect of credit-impaired exposures, management judgement and estimation are applied in, amongst others:
(i) identifying impaired exposures;
(ii) estimating the related recoverable cash flows; and
(iii) where applicable, determining collateral values and timing of realisation.
Geopolitical developments and weak global economic growth in 2019 added complexity to the estimation of ECL allowances. The consequence of these events are difficult to predict and the impact is therefore difficult to model.
Given the significance of loans and bills receivable and the related estimation uncertainty over ECL allowances, the impairment of loans and bills receivable is considered a key audit matter.
For a sample of models, we involved our valuation specialists in the:
• evaluation of the appropriateness of the PD, LGD and EAD modelling methodology against the requirements of SFRS(I) 9;
• review of results of the model performance testing and model validation conducted by the Group’s model validation function;
• performance of statistical techniques on PD curves to assess the reasonableness of the calibrations; and
• in respect of forward looking assumptions, review of the appropriateness of management’s macroeconomic forecast assumptions against external sources.
We assessed the reasonableness of the criteria used in determining a “significant increase in credit risk”. We also assessed the reasonableness of the probability weighting of the economic scenarios applied.
For a sample of credit exposures, we independently re-calculated the ECL allowance to test the mathematical accuracy of the ECL system output.
Credit-impaired exposuresWe tested the design, implementation and operating effectiveness of key controls in place over credit grading, credit reviews and monitoring of credit-impaired exposures.
In relation to key economic and geopolitical developments, we assessed the Group’s response in identifying credit-impaired exposures.
For a sample of exposures, we performed credit file reviews to assess the appropriateness of credit grading. We also challenged the Group’s assumptions of the expected future cash inflows of the borrowers, including cash flows from operations, the realisable value of collaterals and time to sell based on our understanding of the counterparties, the business environment and other externally derived evidence.
We found that the ECL allowances were within an acceptable range of estimates.
142 OCBC Annual Report 2019 143Financials

Independent Auditors’ ReportTo The Members Of Oversea-Chinese Banking Corporation Limited
Valuation of Financial Instruments Held at Fair Value(Refer to Notes 18, 22, 24, 25, 29 and 41 to the financial statements)
The key audit matter How the matter was addressed in our audit
The Group’s financial instruments held at fair value comprised mainly debt and equity securities, government treasury bills and securities, investment funds and derivative contracts.
Of the financial instruments carried at fair value in the Group’s balance sheet as at 31 December 2019, the significant majority is classified as Level 1 or Level 2 financial instruments. These instruments were valued using prices that were observable in financial markets or estimated based on financial models using market observable inputs, resulting in a lower valuation risk.
The remaining financial instruments classified as Level 3 comprised mainly unlisted debt and equity investments and derivatives. The valuation of these Level 3 instruments could involve complex valuation techniques and the application of unobservable inputs, such as projected cash flows, discount rates and measures of volatility. As such, there is a greater degree of estimation uncertainty in the determination of the fair value of these instruments.
The valuation of financial instruments held at fair value is considered a key audit matter in view of the degree of management judgement and inherent subjectivity, increasing the risk of misstatement of the Group’s financial statements.
We obtained an understanding of the key controls over the measurement of financial instruments at their fair values. We tested the operating effectiveness of the following key controls:
• general IT controls over key valuation systems, including access rights and change management controls;
• specific IT application controls over the capture of complete and accurate external market data within the Group’s valuation systems and, the interface between transaction processing systems, valuation systems and financial reporting systems;
• controls over governance of valuation models, including model validation; and
• controls over independent price verification and month-end valuation adjustments.
For a sample of valuation models, we assessed the reasonableness of the valuation methodology, and the inputs and assumptions used. We also considered alternative valuation methods and assessed sensitivities to key factors.
For a selection of pricing inputs, we checked that the inputs used were appropriately sourced (by comparing to independent market data) and accurately input into the valuation models and systems.
We independently valued a sample of the Group’s financial instruments held at fair value and compared the values to the Group’s valuations. Additionally, we recalculated a sample of valuation adjustments as at year-end.
For the financial instruments held by GEH, we assessed, through a review of GEH’s auditors’ working papers, whether the valuation methods used were appropriate.
We found that the fair values of the Group’s financial instruments were within an acceptable range of estimates.
Valuation of Insurance Contract Liabilities (Refer to Notes 4, 22, 39 and 41 to the financial statements)
The key audit matter How the matter was addressed in our audit
The Group’s insurance operations are conducted through Great Eastern Holdings Limited and its subsidiaries (GEH).
GEH’s insurance operations comprise life and general insurance contracts. The valuation of insurance contract liabilities involves significant judgement over uncertain future outcomes, including the timing and occurrence of the ultimate settlement of insurance contract liabilities.
The valuation of life insurance contract liabilities is dependent on the valuation method adopted and key assumptions such as prevailing interest rates of government securities, investment returns and estimates of mortality, disability, persistency, dread disease, expenses, lapse and surrenders based on GEH’s historical experience studies and publicly available data.
The valuation of general insurance contract liabilities is dependent on estimates such as the provision for unexpired risk, ultimate settlement cost of claims reported, and claims incurred but not yet reported at the reporting date.
Given that changes in the assumptions used in the valuation of insurance contract liabilities could result in a material impact to the carrying amount of insurance contract liabilities and the related movements in the income statement, the valuation of insurance contract liabilities is considered a key audit matter.
We planned, scoped and issued group audit instructions to GEH’s auditors to obtain an independent auditors’ report of the significant component. The scope of reporting included valuation of insurance contract liabilities.
We reviewed GEH’s auditors’ work performed in relation to the design and operating effectiveness of GEH’s controls over the valuation of insurance contract liabilities, including the determination and approval of actuarial assumptions.
We involved our actuarial specialists in our discussions with GEH’s auditors in the following areas:
• assessed that GEH’s auditors challenged management’s methodologies and assumptions used in the valuation of insurance contract liabilities and where applicable, benchmarked the assumptions to other similar insurers;
• assessed that GEH’s auditors reviewed the assumptions used by management against historical experiences; and
• reviewed the appropriateness of the actuarial valuation methodologies, models and assumptions used against regulatory requirements and industry practices.
We found that the valuation methods and assumptions used by the Group in the valuation of insurance contract liabilities were reasonable, and the values of insurance contract liabilities were within an acceptable range of outcomes.
144 OCBC Annual Report 2019 145Financials
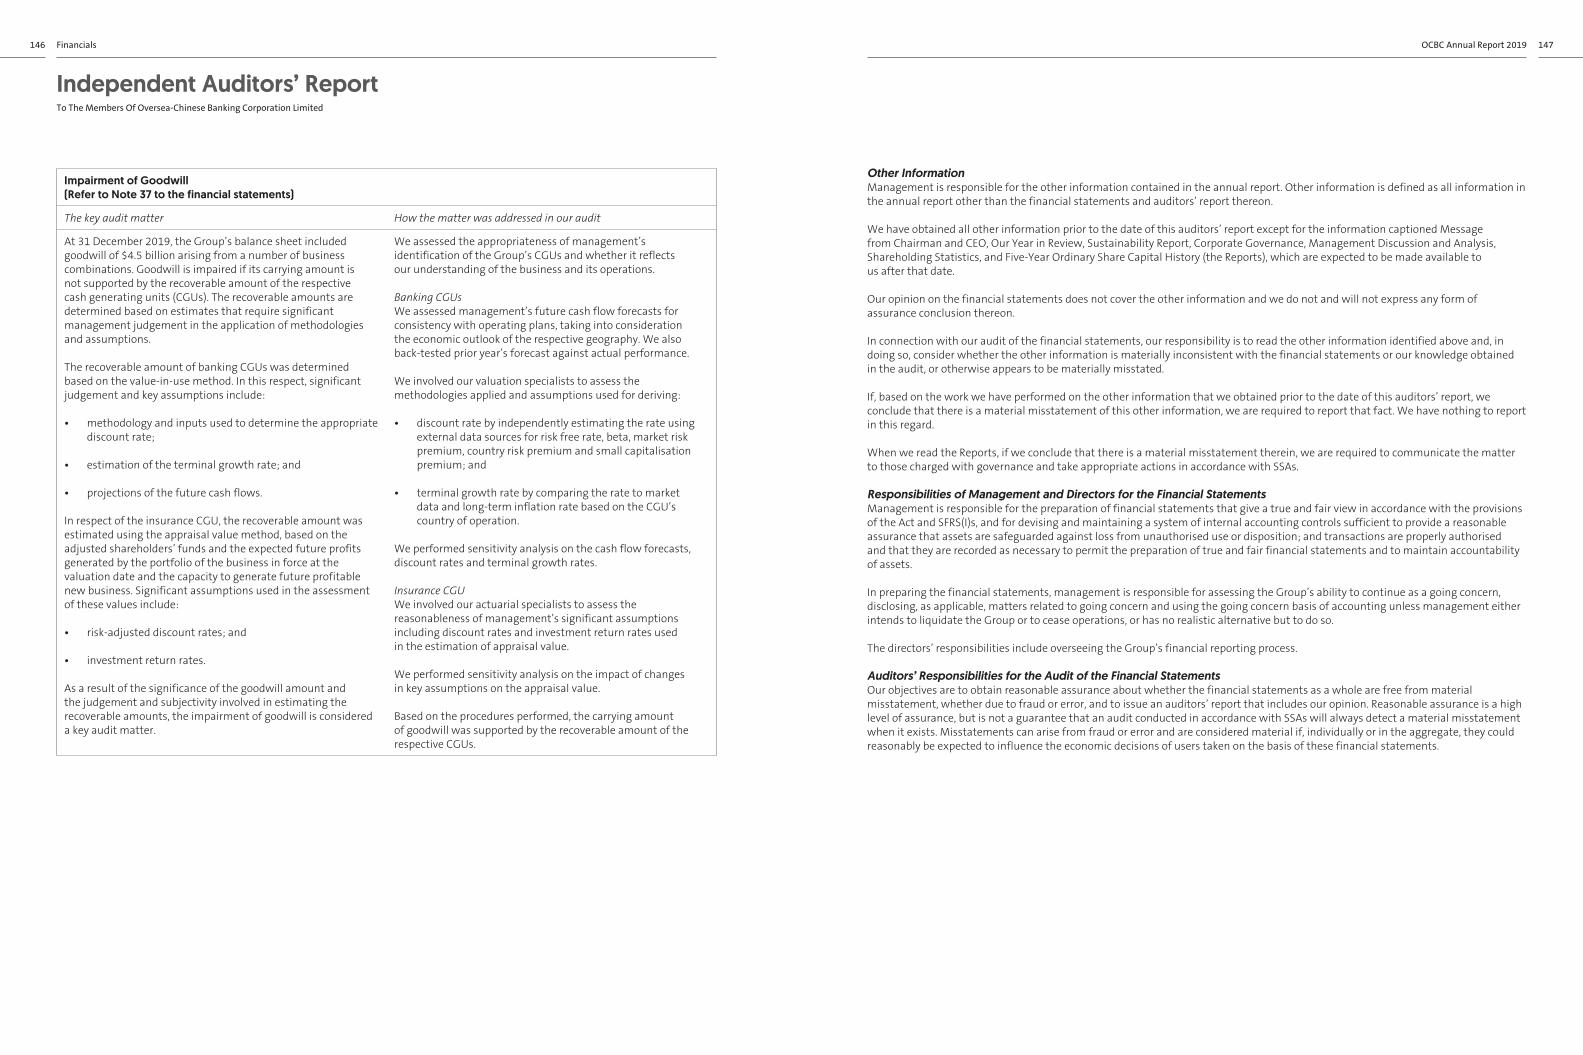
Independent Auditors’ ReportTo The Members Of Oversea-Chinese Banking Corporation Limited
Impairment of Goodwill (Refer to Note 37 to the financial statements)
The key audit matter How the matter was addressed in our audit
At 31 December 2019, the Group’s balance sheet included goodwill of $4.5 billion arising from a number of business combinations. Goodwill is impaired if its carrying amount is not supported by the recoverable amount of the respective cash generating units (CGUs). The recoverable amounts are determined based on estimates that require significant management judgement in the application of methodologies and assumptions.
The recoverable amount of banking CGUs was determined based on the value-in-use method. In this respect, significant judgement and key assumptions include:
• methodology and inputs used to determine the appropriate discount rate;
• estimation of the terminal growth rate; and
• projections of the future cash flows.
In respect of the insurance CGU, the recoverable amount was estimated using the appraisal value method, based on the adjusted shareholders’ funds and the expected future profits generated by the portfolio of the business in force at the valuation date and the capacity to generate future profitable new business. Significant assumptions used in the assessment of these values include:
• risk-adjusted discount rates; and
• investment return rates.
As a result of the significance of the goodwill amount and the judgement and subjectivity involved in estimating the recoverable amounts, the impairment of goodwill is considered a key audit matter.
We assessed the appropriateness of management’s identification of the Group’s CGUs and whether it reflects our understanding of the business and its operations.
Banking CGUsWe assessed management’s future cash flow forecasts for consistency with operating plans, taking into consideration the economic outlook of the respective geography. We also back-tested prior year’s forecast against actual performance.
We involved our valuation specialists to assess the methodologies applied and assumptions used for deriving:
• discount rate by independently estimating the rate using external data sources for risk free rate, beta, market risk premium, country risk premium and small capitalisation premium; and
• terminal growth rate by comparing the rate to market data and long-term inflation rate based on the CGU’s country of operation.
We performed sensitivity analysis on the cash flow forecasts, discount rates and terminal growth rates.
Insurance CGUWe involved our actuarial specialists to assess the reasonableness of management’s significant assumptions including discount rates and investment return rates used in the estimation of appraisal value.
We performed sensitivity analysis on the impact of changes in key assumptions on the appraisal value.
Based on the procedures performed, the carrying amount of goodwill was supported by the recoverable amount of the respective CGUs.
Other InformationManagement is responsible for the other information contained in the annual report. Other information is defined as all information in the annual report other than the financial statements and auditors’ report thereon.
We have obtained all other information prior to the date of this auditors’ report except for the information captioned Message from Chairman and CEO, Our Year in Review, Sustainability Report, Corporate Governance, Management Discussion and Analysis, Shareholding Statistics, and Five-Year Ordinary Share Capital History (the Reports), which are expected to be made available to us after that date.
Our opinion on the financial statements does not cover the other information and we do not and will not express any form of assurance conclusion thereon.
In connection with our audit of the financial statements, our responsibility is to read the other information identified above and, in doing so, consider whether the other information is materially inconsistent with the financial statements or our knowledge obtained in the audit, or otherwise appears to be materially misstated.
If, based on the work we have performed on the other information that we obtained prior to the date of this auditors’ report, we conclude that there is a material misstatement of this other information, we are required to report that fact. We have nothing to report in this regard.
When we read the Reports, if we conclude that there is a material misstatement therein, we are required to communicate the matter to those charged with governance and take appropriate actions in accordance with SSAs.
Responsibilities of Management and Directors for the Financial StatementsManagement is responsible for the preparation of financial statements that give a true and fair view in accordance with the provisions of the Act and SFRS(I)s, and for devising and maintaining a system of internal accounting controls sufficient to provide a reasonable assurance that assets are safeguarded against loss from unauthorised use or disposition; and transactions are properly authorised and that they are recorded as necessary to permit the preparation of true and fair financial statements and to maintain accountability of assets.
In preparing the financial statements, management is responsible for assessing the Group’s ability to continue as a going concern, disclosing, as applicable, matters related to going concern and using the going concern basis of accounting unless management either intends to liquidate the Group or to cease operations, or has no realistic alternative but to do so.
The directors’ responsibilities include overseeing the Group’s financial reporting process.
Auditors’ Responsibilities for the Audit of the Financial StatementsOur objectives are to obtain reasonable assurance about whether the financial statements as a whole are free from material misstatement, whether due to fraud or error, and to issue an auditors’ report that includes our opinion. Reasonable assurance is a high level of assurance, but is not a guarantee that an audit conducted in accordance with SSAs will always detect a material misstatement when it exists. Misstatements can arise from fraud or error and are considered material if, individually or in the aggregate, they could reasonably be expected to influence the economic decisions of users taken on the basis of these financial statements.
146 OCBC Annual Report 2019 147Financials

Income StatementsFor the financial year ended 31 December 2019
Independent Auditors’ ReportTo The Members Of Oversea-Chinese Banking Corporation Limited
As part of an audit in accordance with SSAs, we exercise professional judgement and maintain professional scepticism throughout the audit. We also:
• Identify and assess the risks of material misstatement of the financial statements, whether due to fraud or error, design and perform audit procedures responsive to those risks, and obtain audit evidence that is sufficient and appropriate to provide a basis for our opinion. The risk of not detecting a material misstatement resulting from fraud is higher than for one resulting from error, as fraud may involve collusion, forgery, intentional omissions, misrepresentations, or the override of internal controls.
• Obtain an understanding of internal controls relevant to the audit in order to design audit procedures that are appropriate in the circumstances, but not for the purpose of expressing an opinion on the effectiveness of the Group’s internal controls.
• Evaluate the appropriateness of accounting policies used and the reasonableness of accounting estimates and related disclosures made by management.
• Conclude on the appropriateness of management’s use of the going concern basis of accounting and, based on the audit evidence obtained, whether a material uncertainty exists related to events or conditions that may cast significant doubt on the Group’s ability to continue as a going concern. If we conclude that a material uncertainty exists, we are required to draw attention in our auditors’ report to the related disclosures in the financial statements or, if such disclosures are inadequate, to modify our opinion. Our conclusions are based on the audit evidence obtained up to the date of our auditors’ report. However, future events or conditions may cause the Group to cease to continue as a going concern.
• Evaluate the overall presentation, structure and content of the financial statements, including the disclosures, and whether the financial statements represent the underlying transactions and events in a manner that achieves fair presentation.
• Obtain sufficient appropriate audit evidence regarding the financial information of the entities or business activities within the Group to express an opinion on the consolidated financial statements. We are responsible for the direction, supervision and performance of the group audit. We remain solely responsible for our audit opinion.
We communicate with the directors regarding, among other matters, the planned scope and timing of the audit and significant audit findings, including any significant deficiencies in internal controls that we identify during our audit.
We also provide the directors with a statement that we have complied with relevant ethical requirements regarding independence, and to communicate with them all relationships and other matters that may reasonably be thought to bear on our independence, and where applicable, related safeguards.
From the matters communicated with the directors, we determine those matters that were of most significance in the audit of the financial statements of the current period and are therefore the key audit matters. We describe these matters in our auditors’ report unless the law or regulations preclude public disclosure about the matter or when, in extremely rare circumstances, we determine that a matter should not be communicated in our report because the adverse consequences of doing so would reasonably be expected to outweigh the public interest benefits of such communication.
Report on Other Legal and Regulatory RequirementsIn our opinion, the accounting and other records required by the Act to be kept by the Bank and by those subsidiaries incorporated in Singapore of which we are the auditors have been properly kept in accordance with the provisions of the Act.
The engagement partner on the audit resulting in this independent auditors’ report is Leong Kok Keong.
KPMG LLPPublic Accountants andChartered Accountants
Singapore20 February 2020
GROUP BANK
Note2019
$’0002018
$’0002019
$’0002018
$’000
Interest income 12,097,662 11,049,278 7,236,104 6,455,902Interest expense (5,766,417) (5,159,168) (3,645,551) (3,259,426)Net interest income 3 6,331,245 5,890,110 3,590,553 3,196,476
Premium income 10,965,048 11,673,592 – –Investment income 6,911,439 68,978 – –Net claims, surrenders and annuities (6,404,434) (6,265,554) – –Change in life insurance fund contract liabilities (8,556,660) (3,183,414) – –Commission and others (2,136,095) (1,553,920) – –
Profit from life insurance 4 779,298 739,682 – –Premium income from general insurance 196,298 171,545 – –Fees and commissions (net) 5 2,122,917 2,030,927 1,017,892 942,760Dividends 6 92,111 127,564 1,031,804 1,414,441Rental income 80,165 79,560 59,855 53,877Other income 7 1,269,133 661,513 476,420 548,706Non-interest income 4,539,922 3,810,791 2,585,971 2,959,784
Total income 10,871,167 9,700,901 6,176,524 6,156,260
Staff costs (2,839,922) (2,606,231) (1,000,534) (929,749)Other operating expenses (1,804,280) (1,608,034) (1,098,761) (977,609)Total operating expenses 8 (4,644,202) (4,214,265) (2,099,295) (1,907,358)
Operating profit before allowances and amortisation 6,226,965 5,486,636 4,077,229 4,248,902
Amortisation of intangible assets 37 (102,819) (102,176) – –Allowances for loans and other assets 9 (890,352) (287,513) (595,623) (154,503)
Operating profit after allowances and amortisation 5,233,794 5,096,947 3,481,606 4,094,399
Share of results of associates, net of tax 566,625 455,463 – –
Profit before income tax 5,800,419 5,552,410 3,481,606 4,094,399Income tax expense 10 (778,296) (877,184) (375,534) (417,696)Profit for the year 5,022,123 4,675,226 3,106,072 3,676,703
Attributable to:Equity holders of the Bank 4,869,379 4,491,994Non-controlling interests 152,744 183,232
5,022,123 4,675,226
Earnings per share ($) 11Basic 1.12 1.06Diluted 1.12 1.06
The accompanying notes form an integral part of these financial statements.
148 OCBC Annual Report 2019 149Financials

Statements of Comprehensive IncomeFor the financial year ended 31 December 2019
Balance SheetsAs at 31 December 2019
GROUP BANK2019
$’0002018
$’0002019
$’0002018
$’000
Profit for the year 5,022,123 4,675,226 3,106,072 3,676,703Other comprehensive income:Items that may be reclassified subsequently to income statement:Financial assets, at FVOCI (1)
Fair value gains/(losses) for the year 983,766 (288,434) 246,421 (62,715)Reclassification of (gains)/losses to income statement– on disposal (295,114) (11,605) (72,617) (10,754)– on impairment (5,033) (25,926) 43 (26,154)Tax on net movements (98,666) 45,794 (6,085) 3,728
Cash flow hedges (1,326) 841 (383) (322)Currency translation on foreign operations (42,691) (133,611) (16,678) (27,380)Other comprehensive income of associates (12,177) 15,594 – –
Items that will not be reclassified subsequently to income statement:Financial assets, at FVOCI (1), net change in fair value 315,887 (264,419) 36,638 (22,664)Defined benefit plans remeasurements (702) 5,979 (83) 17Own credit 767 (5,570) 767 (5,570)Total other comprehensive income, net of tax 844,711 (661,357) 188,023 (151,814)Total comprehensive income for the year, net of tax 5,866,834 4,013,869 3,294,095 3,524,889
Total comprehensive income attributable to:Equity holders of the Bank 5,646,005 3,910,373Non-controlling interests 220,829 103,496
5,866,834 4,013,869
(1) Fair value through other comprehensive income.
GROUP BANK
Note2019
$’0002018
$’0002019
$’0002018
$’000
EQUITYAttributable to equity holders of the BankShare capital 13 17,261,345 15,750,417 17,261,345 15,750,417Other equity instruments 14 1,496,974 1,496,974 1,496,974 1,496,974Capital reserves 15 1,253,193 930,432 985,705 638,887Fair value reserves 918,667 (66,541) 113,692 (81,047)Revenue reserves 16 26,231,721 24,025,592 14,142,233 13,491,053
47,161,900 42,136,874 33,999,949 31,296,284Non-controlling interests 1,440,893 1,254,842 – –Total equity 48,602,793 43,391,716 33,999,949 31,296,284LIABILITIESDeposits of non-bank customers 17 302,851,095 295,412,049 189,419,872 183,600,010Deposits and balances of banks 17 8,249,680 7,576,453 5,938,069 6,350,256Due to subsidiaries – – 21,434,654 20,937,784Due to associates 347,232 366,088 138,204 141,863Trading portfolio liabilities 91,804 214,168 91,804 214,168Derivative payables 18 7,686,885 7,104,590 6,743,364 5,251,769Other liabilities 19 6,944,579 5,812,662 2,085,870 1,824,498Current tax payables 1,189,227 1,013,756 435,193 367,314Deferred tax liabilities 20 1,893,055 1,451,016 238,194 181,343Debt issued 21 29,388,263 30,272,111 28,225,780 28,811,694
358,641,820 349,222,893 254,751,004 247,680,699Life insurance fund liabilities 22 84,445,914 74,928,381 – –Total liabilities 443,087,734 424,151,274 254,751,004 247,680,699Total equity and liabilities 491,690,527 467,542,990 288,750,953 278,976,983
ASSETSCash and placements with central banks 23 23,201,554 18,748,084 17,823,699 13,740,086Singapore government treasury bills and securities 24 11,042,814 9,610,553 9,891,733 8,972,764Other government treasury bills and securities 24 17,619,964 18,165,395 7,644,251 8,259,151Placements with and loans to banks 25 35,812,651 39,034,945 28,056,142 29,063,987Loans and bills receivable 26 262,044,957 255,193,115 164,563,925 156,896,636Debt and equity securities 29 28,533,166 25,542,507 14,209,744 11,972,610Assets pledged 46.1 1,165,727 1,104,573 122,458 1,007,348Assets held for sale 47 2,811 1,831 1,669 –Derivative receivables 18 7,349,317 7,200,942 6,323,779 5,331,188Other assets 31 4,408,876 3,475,256 2,442,577 1,657,504Deferred tax assets 20 86,669 105,512 20,949 28,305Associates 33 3,637,756 3,182,814 1,460,396 1,386,715Subsidiaries 34 – – 33,159,013 37,691,985Property, plant and equipment 35 3,628,316 3,337,436 683,792 576,943Investment property 36 838,798 880,488 479,650 524,585Goodwill and intangible assets 37 4,979,899 5,092,538 1,867,176 1,867,176
404,353,275 390,675,989 288,750,953 278,976,983Life insurance fund investment assets 22 87,337,252 76,867,001 – –Total assets 491,690,527 467,542,990 288,750,953 278,976,983
The accompanying notes form an integral part of these financial statements. The accompanying notes form an integral part of these financial statements.
150 OCBC Annual Report 2019 151Financials

Statement of Changes in Equity – GroupFor the financial year ended 31 December 2019
Attributable to equity holders of the Bank
In $’000
Sharecapital and
other equityCapital
reserves (1)
Fair value reserves
Revenuereserves Total
Non-controlling
interestsTotal
equityBalance at 1 January 2019 17,247,391 930,432 (66,541) 24,025,592 42,136,874 1,254,842 43,391,716Total comprehensive income for the yearProfit for the year – – – 4,869,379 4,869,379 152,744 5,022,123Other comprehensive incomeItems that may be reclassified
subsequently to income statement:Financial assets, at FVOCI
Fair value gains for the year – – 913,835 – 913,835 69,931 983,766Reclassification of (gains)/losses to
income statement– on disposal – – (276,136) – (276,136) (18,978) (295,114)– on impairment – – (4,654) – (4,654) (379) (5,033)Tax on net movements – – (89,539) – (89,539) (9,127) (98,666)
Cash flow hedges – – – (1,326) (1,326) – (1,326)Currency translation on foreign operations – – – (52,013) (52,013) 9,322 (42,691)Other comprehensive income of associates – – 65,517 (77,694) (12,177) – (12,177)Items that will not be reclassified
subsequently to income statement:Financial assets, at FVOCI, net change in
fair value – – 376,185 (77,607) 298,578 17,309 315,887Defined benefit plans remeasurements – – – (709) (709) 7 (702)Own credit – – – 767 767 – 767Total other comprehensive income,
net of tax – – 985,208 (208,582) 776,626 68,085 844,711Total comprehensive income for the year – – 985,208 4,660,797 5,646,005 220,829 5,866,834Transactions with owners, recorded
directly in equityContributions by and distributions
to ownersTransfers 8,319 337,102 – (345,421) – – –Acquisition of subsidiaries – – – – – 2,033 2,033Buy-back of shares held as treasury shares (191,348) – – – (191,348) – (191,348)Dividends and distributions – – – (601,793) (601,793) (34,385) (636,178)DSP reserve from dividends on
unvested shares – – – 8,342 8,342 – 8,342Share-based payments for staff costs – 15,138 – – 15,138 – 15,138Shares issued in lieu of ordinary
dividends 1,514,726 – – (1,514,726) – – –Shares issued to non-executive directors 654 – – – 654 – 654Shares transferred to DSP Trust – (8,340) – – (8,340) – (8,340)Shares vested under DSP Scheme – 69,912 – – 69,912 – 69,912Treasury shares transferred/sold 178,577 (91,051) – – 87,526 – 87,526Total contributions by and distributions
to owners 1,510,928 322,761 – (2,453,598) (619,909) (32,352) (652,261)Changes in interests in subsidiaries that
do not result in loss of control – – – (1,070) (1,070) (2,426) (3,496)Total changes in interests in subsidiaries – – – (1,070) (1,070) (2,426) (3,496)Balance at 31 December 2019 18,758,319 1,253,193 918,667 26,231,721 47,161,900 1,440,893 48,602,793Included in the balances:Share of reserves of associates – – 91,039 1,561,409 1,652,448 – 1,652,448
(1) Including regulatory loss allowance reserve of $534 million at 1 January 2019 and $876 million at 31 December 2019.
An analysis of the movements in each component within ‘Share capital’, ‘Other equity instruments’, ‘Capital reserves’ and ‘Revenue reserves’ is presented in Notes 12 to 16.
Attributable to equity holders of the Bank
In $’000
Share capital and
other equityCapital
reserves (1)
Fair value reserves
Revenuereserves Total
Non-controlling
interestsTotal
equityBalance at 1 January 2018 15,635,490 361,443 352,071 22,679,463 39,028,467 2,765,500 41,793,967Effect of adopting SFRS(I) 9 and revised
MAS 612, net of tax – 353,667 (100,455) (13,643) 239,569 69 239,638Adjusted balance at 1 January 2018 15,635,490 715,110 251,616 22,665,820 39,268,036 2,765,569 42,033,605
Total comprehensive income for the yearProfit for the year – – – 4,491,994 4,491,994 183,232 4,675,226Other comprehensive incomeItems that may be reclassified
subsequently to income statement:Financial assets, at FVOCI
Fair value losses for the year – – (252,988) – (252,988) (35,446) (288,434)Reclassification of (gains)/losses to
income statement– on disposal – – (12,221) – (12,221) 616 (11,605)– on impairment – – (25,422) – (25,422) (504) (25,926)Tax on net movements – – 39,696 – 39,696 6,098 45,794
Cash flow hedges – – – 841 841 – 841Currency translation on foreign operations – – – (116,841) (116,841) (16,770) (133,611)Other comprehensive income of associates – – 100,262 (84,668) 15,594 – 15,594Items that will not be reclassified
subsequently to income statement:Financial assets, at FVOCI, net change in
fair value – – (188,207) (41,599) (229,806) (34,613) (264,419)Defined benefit plans remeasurements – – – 5,096 5,096 883 5,979Own credit – – – (5,570) (5,570) – (5,570)Total other comprehensive income,
net of tax – – (338,880) (242,741) (581,621) (79,736) (661,357)Total comprehensive income for the year – – (338,880) 4,249,253 3,910,373 103,496 4,013,869Transactions with owners, recorded
directly in equityContributions by and distributions
to ownersTransfers 13,599 208,511 – (222,110) – – –Buy-back of shares held as treasury shares (214,693) – – – (214,693) – (214,693)Dividends and distributions – – – (1,014,834) (1,014,834) (116,632) (1,131,466)DSP reserve from dividends on
unvested shares – – – 6,611 6,611 – 6,611Perpetual capital securities issued 997,831 – – – 997,831 – 997,831Redemption of preference shares issued – – – (1,000,000) (1,000,000) (1,500,000) (2,500,000)Share-based payments for staff costs – 19,883 – – 19,883 – 19,883Shares issued in lieu of ordinary dividends 637,929 – – (637,929) – – –Shares issued to non-executive directors 735 – – – 735 – 735Shares transferred to DSP Trust – (6,124) – – (6,124) – (6,124)Shares vested under DSP Scheme – 62,976 – – 62,976 – 62,976Treasury shares transferred/sold 176,500 (69,924) – – 106,576 – 106,576Others – – 20,723 (23,991) (3,268) 2,855 (413)Total contributions by and distributions
to owners 1,611,901 215,322 20,723 (2,892,253) (1,044,307) (1,613,777) (2,658,084)Changes in interests in subsidiaries that
do not result in loss of control – – – 2,772 2,772 (446) 2,326Total changes in interests in subsidiaries – – – 2,772 2,772 (446) 2,326Balance at 31 December 2018 17,247,391 930,432 (66,541) 24,025,592 42,136,874 1,254,842 43,391,716Included in the balances:Share of reserves of associates – – 25,522 1,166,869 1,192,391 – 1,192,391
(1) Including regulatory loss allowance reserve of $342 million at 1 January 2018 and $534 million at 31 December 2018.
An analysis of the movements in each component within ‘Share capital’, ‘Other equity instruments’, ‘Capital reserves’ and ‘Revenue reserves’ is presented in Notes 12 to 16.
The accompanying notes form an integral part of these financial statements. The accompanying notes form an integral part of these financial statements.
152 OCBC Annual Report 2019 153Financials

Statement of Changes in Equity – BankFor the financial year ended 31 December 2019
Consolidated Cash Flow StatementFor the financial year ended 31 December 2019
In $’000
Share capital and
other equityCapital
reserves (1)
Fair value reserves
Revenuereserves
Totalequity
Balance at 1 January 2019 17,247,391 638,887 (81,047) 13,491,053 31,296,284
Profit for the year – – – 3,106,072 3,106,072Other comprehensive income – – 194,739 (6,716) 188,023Total comprehensive income for the year (2) – – 194,739 3,099,356 3,294,095
Transfers 8,319 331,680 – (339,999) –Buy-back of shares held as treasury shares (191,348) – – – (191,348)Dividends and distributions – – – (601,793) (601,793)DSP reserve from dividends on unvested shares – – – 8,342 8,342Share-based payments for staff costs – 15,138 – – 15,138Shares issued in lieu of ordinary dividends 1,514,726 – – (1,514,726) –Shares issued to non-executive directors 654 – – – 654Treasury shares transferred/sold 178,577 – – – 178,577Balance at 31 December 2019 18,758,319 985,705 113,692 14,142,233 33,999,949
Balance at 1 January 2018 15,635,490 98,794 11,536 13,016,975 28,762,795Effect of adopting SFRS(I) 9 and revised MAS 612,
net of tax – 122,855 28,329 (114,617) 36,567Adjusted balance at 1 January 2018 15,635,490 221,649 39,865 12,902,358 28,799,362
Profit for the year – – – 3,676,703 3,676,703Other comprehensive income – – (120,912) (30,902) (151,814)Total comprehensive income for the year (2) – – (120,912) 3,645,801 3,524,889
Transfers 13,599 397,355 – (410,954) –Buy-back of shares held as treasury shares (214,693) – – – (214,693)Dividends and distribution – – – (1,014,834) (1,014,834)DSP reserve from dividends on unvested shares – – – 6,611 6,611Perpetual capital securities issued 997,831 – – – 997,831Redemption of preference shares issued – – – (1,000,000) (1,000,000)Share-based payments for staff costs – 19,883 – – 19,883Shares issued in lieu of ordinary dividends 637,929 – – (637,929) –Shares issued to non-executive directors 735 – – – 735Treasury shares transferred/sold 176,500 – – – 176,500Balance at 31 December 2018 17,247,391 638,887 (81,047) 13,491,053 31,296,284
(1) Including regulatory loss allowance reserve of $534 million at 1 January 2019 (1 January 2018: $123 million) and $874 million at 31 December 2019 (31 December 2018: $534 million).(2) Refer to Statements of Comprehensive Income for detailed breakdown.
An analysis of the movements in each component within ‘Share capital’, ‘Other equity instruments’, ‘Capital reserves’ and ‘Revenue reserves’ is presented in Notes 12 to 16.
In $’000 2019 2018Cash flows from operating activitiesProfit before income tax 5,800,419 5,552,410Adjustments for non-cash items:
Allowances for loans and other assets 890,352 287,513Amortisation of intangible assets 102,819 102,176Change in hedging transactions, fair value through profit or loss securities and debt issued (226,017) 392,087Depreciation of property and equipment and interest expense on lease liabilities 401,940 316,644Net gain on disposal of government, debt and equity securities (171,541) (16,256)Net gain on disposal of property and equipment (81,989) (45,791)Net gain on disposal of interests in subsidiaries and associate (757) (7,982)Share-based costs 69,345 65,802Share of results of associates, net of tax (566,625) (455,463)Items relating to life insurance fund Surplus before income tax 854,256 790,605 Surplus transferred from life insurance fund (779,298) (739,682)
Operating profit before change in operating assets and liabilities 6,292,904 6,242,063Change in operating assets and liabilities:
Deposits of non-bank customers 7,419,962 11,915,531Deposits and balances of banks 673,227 91,025Derivative payables and other liabilities 1,066,477 453,624Trading portfolio liabilities (122,364) (407,363)Restricted balances with central banks 222,263 394,947Government securities and treasury bills (741,945) (344,692)Fair value through profit or loss securities (486,773) 586,621Placements with and loans to banks 3,295,963 10,411,652Loans and bills receivable (7,742,925) (20,807,039)Derivative receivables and other assets (1,402,410) (1,161,136)Net change in investment assets and liabilities of life insurance fund 463,653 448,747
Cash provided by operating activities 8,938,032 7,823,980Income tax paid (753,943) (1,084,642)Net cash provided by operating activities 8,184,089 6,739,338
Cash flows from investing activitiesAcquisitions, net of cash acquired (Note 34.3) 16,445 –Dividends from associates 22,586 88,491Investments in associates – (88,586)Purchases of debt and equity securities (14,878,177) (13,970,842)Purchases of property and equipment (368,271) (297,197)Proceeds from disposal of debt and equity securities 13,315,752 11,941,263Proceeds from disposal of interests in associates – 8,744Proceeds from disposal of property and equipment 127,546 59,741
Net cash used in investing activities (1,764,119) (2,258,386)
Cash flows from financing activitiesAcquisition of non-controlling interests (3,496) (50)Buy-back of shares held as treasury shares (191,348) (214,693)Dividends and distributions paid (636,178) (1,134,534)Net issuance/(redemption) of other debt issued (Note 21.6) 695,909 (634,574)Net proceeds from perpetual capital securities issued – 997,831Payment of lease liabilities (81,296) –Proceeds from treasury shares transferred/sold under the Bank’s employee share schemes 87,526 106,576Redemption of preference shares issued – (2,500,000)Redemption of subordinated debt issued (Note 21.6) (1,503,534) (1,314,217)
Net cash used in financing activities (1,632,417) (4,693,661)
Net currency translation adjustments (113,368) (236,367)
Net change in cash and cash equivalents 4,674,185 (449,076)Cash and cash equivalents at 1 January 13,385,521 13,834,597Cash and cash equivalents at 31 December (Note 23) 18,059,706 13,385,521
The accompanying notes form an integral part of these financial statements. The accompanying notes form an integral part of these financial statements.
154 OCBC Annual Report 2019 155Financials
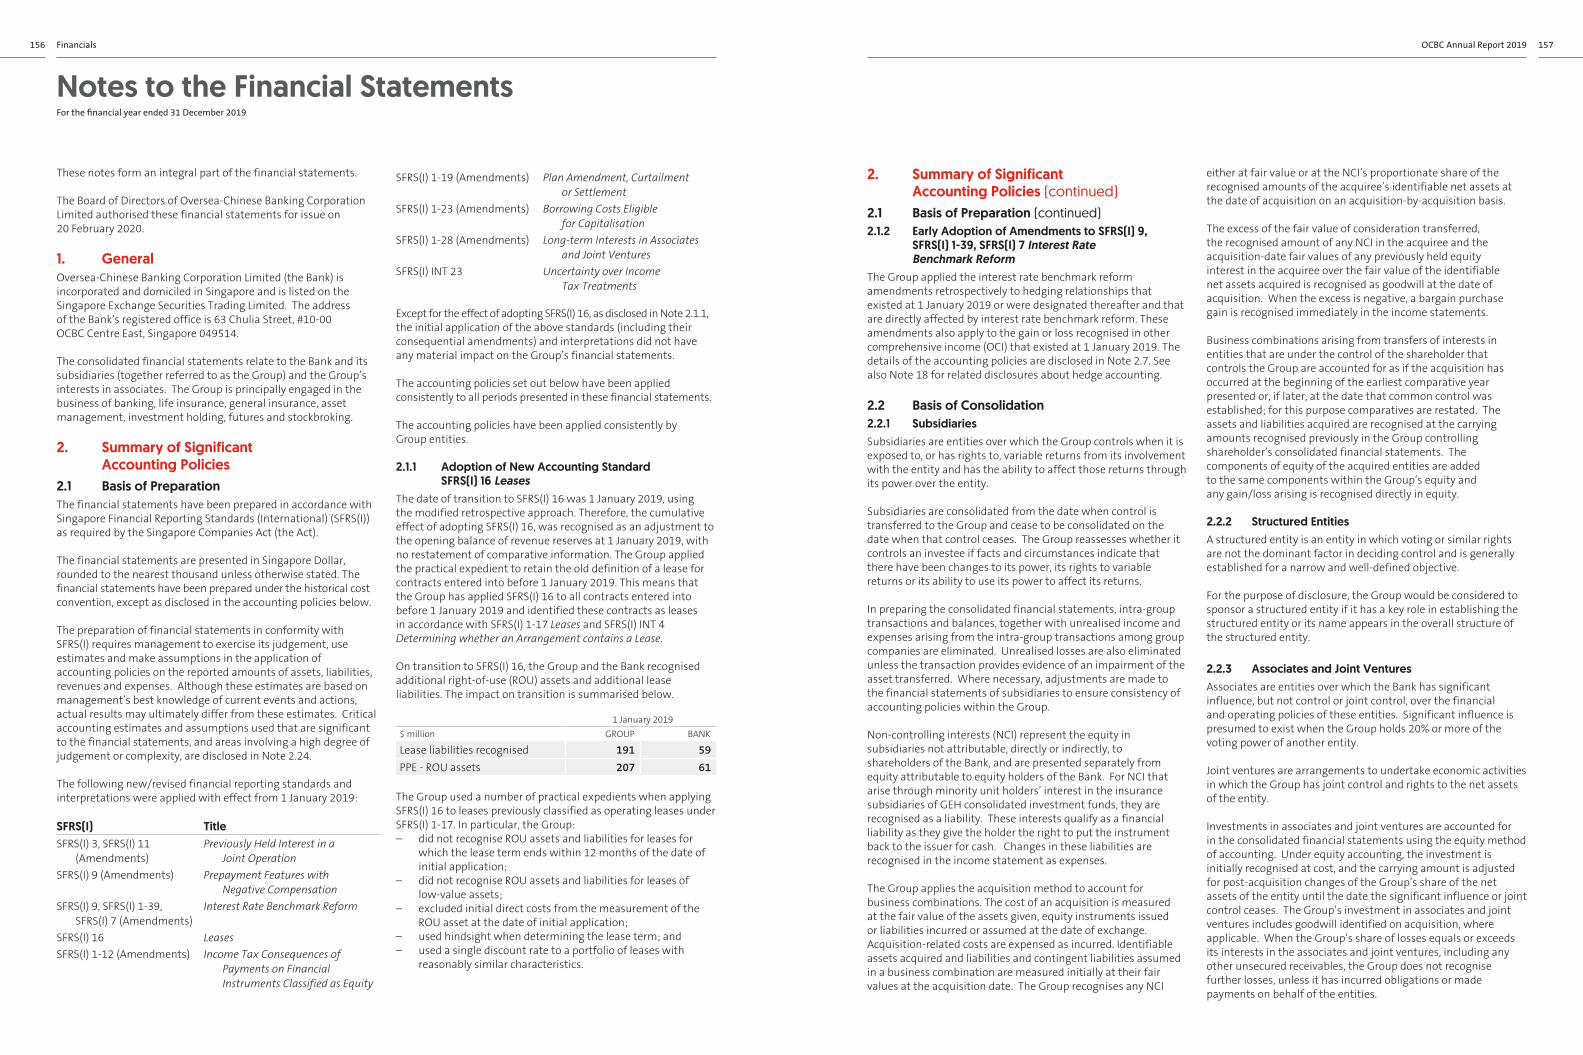
Notes to the Financial Statements For the financial year ended 31 December 2019
These notes form an integral part of the financial statements.
The Board of Directors of Oversea-Chinese Banking Corporation Limited authorised these financial statements for issue on 20 February 2020.
1. GeneralOversea-Chinese Banking Corporation Limited (the Bank) is incorporated and domiciled in Singapore and is listed on the Singapore Exchange Securities Trading Limited. The address of the Bank’s registered office is 63 Chulia Street, #10-00 OCBC Centre East, Singapore 049514.
The consolidated financial statements relate to the Bank and its subsidiaries (together referred to as the Group) and the Group’s interests in associates. The Group is principally engaged in the business of banking, life insurance, general insurance, asset management, investment holding, futures and stockbroking.
2. Summary of Significant Accounting Policies
2.1 Basis of PreparationThe financial statements have been prepared in accordance with Singapore Financial Reporting Standards (International) (SFRS(I)) as required by the Singapore Companies Act (the Act).
The financial statements are presented in Singapore Dollar, rounded to the nearest thousand unless otherwise stated. The financial statements have been prepared under the historical cost convention, except as disclosed in the accounting policies below.
The preparation of financial statements in conformity with SFRS(I) requires management to exercise its judgement, use estimates and make assumptions in the application of accounting policies on the reported amounts of assets, liabilities, revenues and expenses. Although these estimates are based on management’s best knowledge of current events and actions, actual results may ultimately differ from these estimates. Critical accounting estimates and assumptions used that are significant to the financial statements, and areas involving a high degree of judgement or complexity, are disclosed in Note 2.24.
The following new/revised financial reporting standards and interpretations were applied with effect from 1 January 2019:
SFRS(I) TitleSFRS(I) 3, SFRS(I) 11
(Amendments)Previously Held Interest in a
Joint OperationSFRS(I) 9 (Amendments) Prepayment Features with
Negative CompensationSFRS(I) 9, SFRS(I) 1-39,
SFRS(I) 7 (Amendments)Interest Rate Benchmark Reform
SFRS(I) 16 LeasesSFRS(I) 1-12 (Amendments) Income Tax Consequences of
Payments on Financial Instruments Classified as Equity
SFRS(I) 1-19 (Amendments) Plan Amendment, Curtailment or Settlement
SFRS(I) 1-23 (Amendments) Borrowing Costs Eligible for Capitalisation
SFRS(I) 1-28 (Amendments) Long-term Interests in Associates and Joint Ventures
SFRS(I) INT 23 Uncertainty over Income Tax Treatments
Except for the effect of adopting SFRS(I) 16, as disclosed in Note 2.1.1, the initial application of the above standards (including their consequential amendments) and interpretations did not have any material impact on the Group’s financial statements.
The accounting policies set out below have been applied consistently to all periods presented in these financial statements.
The accounting policies have been applied consistently by Group entities.
2.1.1 Adoption of New Accounting Standard SFRS(I) 16 Leases
The date of transition to SFRS(I) 16 was 1 January 2019, using the modified retrospective approach. Therefore, the cumulative effect of adopting SFRS(I) 16, was recognised as an adjustment to the opening balance of revenue reserves at 1 January 2019, with no restatement of comparative information. The Group applied the practical expedient to retain the old definition of a lease for contracts entered into before 1 January 2019. This means that the Group has applied SFRS(I) 16 to all contracts entered into before 1 January 2019 and identified these contracts as leases in accordance with SFRS(I) 1-17 Leases and SFRS(I) INT 4 Determining whether an Arrangement contains a Lease.
On transition to SFRS(I) 16, the Group and the Bank recognised additional right-of-use (ROU) assets and additional lease liabilities. The impact on transition is summarised below.
1 January 2019$ million GROUP BANK
Lease liabilities recognised 191 59PPE - ROU assets 207 61
The Group used a number of practical expedients when applying SFRS(I) 16 to leases previously classified as operating leases under SFRS(I) 1-17. In particular, the Group:– did not recognise ROU assets and liabilities for leases for
which the lease term ends within 12 months of the date of initial application;
– did not recognise ROU assets and liabilities for leases of low-value assets;
– excluded initial direct costs from the measurement of the ROU asset at the date of initial application;
– used hindsight when determining the lease term; and– used a single discount rate to a portfolio of leases with
reasonably similar characteristics.
2. Summary of Significant Accounting Policies (continued)
2.1 Basis of Preparation (continued)2.1.2 Early Adoption of Amendments to SFRS(I) 9,
SFRS(I) 1-39, SFRS(I) 7 Interest Rate Benchmark Reform
The Group applied the interest rate benchmark reform amendments retrospectively to hedging relationships that existed at 1 January 2019 or were designated thereafter and that are directly affected by interest rate benchmark reform. These amendments also apply to the gain or loss recognised in other comprehensive income (OCI) that existed at 1 January 2019. The details of the accounting policies are disclosed in Note 2.7. See also Note 18 for related disclosures about hedge accounting.
2.2 Basis of Consolidation2.2.1 SubsidiariesSubsidiaries are entities over which the Group controls when it is exposed to, or has rights to, variable returns from its involvement with the entity and has the ability to affect those returns through its power over the entity.
Subsidiaries are consolidated from the date when control is transferred to the Group and cease to be consolidated on the date when that control ceases. The Group reassesses whether it controls an investee if facts and circumstances indicate that there have been changes to its power, its rights to variable returns or its ability to use its power to affect its returns.
In preparing the consolidated financial statements, intra-group transactions and balances, together with unrealised income and expenses arising from the intra-group transactions among group companies are eliminated. Unrealised losses are also eliminated unless the transaction provides evidence of an impairment of the asset transferred. Where necessary, adjustments are made to the financial statements of subsidiaries to ensure consistency of accounting policies within the Group.
Non-controlling interests (NCI) represent the equity in subsidiaries not attributable, directly or indirectly, to shareholders of the Bank, and are presented separately from equity attributable to equity holders of the Bank. For NCI that arise through minority unit holders’ interest in the insurance subsidiaries of GEH consolidated investment funds, they are recognised as a liability. These interests qualify as a financial liability as they give the holder the right to put the instrument back to the issuer for cash. Changes in these liabilities are recognised in the income statement as expenses.
The Group applies the acquisition method to account for business combinations. The cost of an acquisition is measured at the fair value of the assets given, equity instruments issued or liabilities incurred or assumed at the date of exchange. Acquisition-related costs are expensed as incurred. Identifiable assets acquired and liabilities and contingent liabilities assumed in a business combination are measured initially at their fair values at the acquisition date. The Group recognises any NCI
either at fair value or at the NCI’s proportionate share of the recognised amounts of the acquiree’s identifiable net assets at the date of acquisition on an acquisition-by-acquisition basis.
The excess of the fair value of consideration transferred, the recognised amount of any NCI in the acquiree and the acquisition-date fair values of any previously held equity interest in the acquiree over the fair value of the identifiable net assets acquired is recognised as goodwill at the date of acquisition. When the excess is negative, a bargain purchase gain is recognised immediately in the income statements.
Business combinations arising from transfers of interests in entities that are under the control of the shareholder that controls the Group are accounted for as if the acquisition has occurred at the beginning of the earliest comparative year presented or, if later, at the date that common control was established; for this purpose comparatives are restated. The assets and liabilities acquired are recognised at the carrying amounts recognised previously in the Group controlling shareholder’s consolidated financial statements. The components of equity of the acquired entities are added to the same components within the Group’s equity and any gain/loss arising is recognised directly in equity.
2.2.2 Structured EntitiesA structured entity is an entity in which voting or similar rights are not the dominant factor in deciding control and is generally established for a narrow and well-defined objective.
For the purpose of disclosure, the Group would be considered to sponsor a structured entity if it has a key role in establishing the structured entity or its name appears in the overall structure of the structured entity.
2.2.3 Associates and Joint Ventures Associates are entities over which the Bank has significant influence, but not control or joint control, over the financial and operating policies of these entities. Significant influence is presumed to exist when the Group holds 20% or more of the voting power of another entity.
Joint ventures are arrangements to undertake economic activities in which the Group has joint control and rights to the net assets of the entity.
Investments in associates and joint ventures are accounted for in the consolidated financial statements using the equity method of accounting. Under equity accounting, the investment is initially recognised at cost, and the carrying amount is adjusted for post-acquisition changes of the Group’s share of the net assets of the entity until the date the significant influence or joint control ceases. The Group’s investment in associates and joint ventures includes goodwill identified on acquisition, where applicable. When the Group’s share of losses equals or exceeds its interests in the associates and joint ventures, including any other unsecured receivables, the Group does not recognise further losses, unless it has incurred obligations or made payments on behalf of the entities.
156 OCBC Annual Report 2019 157Financials

Notes to the Financial Statements For the financial year ended 31 December 2019
2. Summary of Significant Accounting Policies (continued)
2.2 Basis of Consolidation (continued)2.2.3 Associates and Joint Ventures (continued) In applying the equity method of accounting, unrealised gains on transactions between the Group and its associates and joint ventures are eliminated to the extent of the Group’s interests in these entities. Unrealised losses are also eliminated unless the transaction provides evidence of an impairment of the asset transferred. Where necessary, adjustments are made to the financial statements of associates and joint ventures to ensure consistency of accounting policies with those of the Group.
The results of associates and joint ventures are taken from audited financial statements or unaudited management accounts of the entities concerned, made up to dates of not more than three months prior to the reporting date of the Group.
The investment in an associate or joint venture is derecognised when the Group ceases to have significant influence or joint control over the investee. Amounts previously recognised in OCI in respect of the investee are transferred to the income statement. Any retained interest in the entity is re-measured at its fair value. The difference between the carrying amount of the retained interest at the date when significant influence or joint control ceases, and its corresponding fair value, is recognised in the income statement.
2.2.4 Life Insurance CompaniesCertain subsidiaries of the Group engaged in life insurance business are structured into one or more long-term life insurance funds, and shareholders’ funds. All premiums received, investment returns, claims and expenses, and changes in liabilities to policyholders are accounted for within the related life insurance fund. Any surplus, which is determined by the appointed Actuary after taking into account these items, may either be distributed between the shareholders and the policyholders according to a predetermined formula or retained within the life insurance funds. The amount allocated to shareholders is reported as “Profit from life insurance” in the consolidated income statement.
2.2.5 Accounting for Subsidiaries and Associates by the Bank
Investments in subsidiaries and associates are stated in the Bank’s balance sheet at cost less any impairment in value after the date of acquisition.
2.3 Currency Translation 2.3.1 Foreign Currency TransactionsTransactions in foreign currencies are recorded in the respective functional currencies of the Bank and its subsidiaries at the
exchange rates prevailing on the transaction dates. Monetary items denominated in foreign currencies are translated to the respective entities’ functional currencies at the exchange rates prevailing at the balance sheet date. Exchange differences arising on settlement and translation of such items are recognised in the income statement.
Non-monetary items denominated in foreign currencies that are measured at fair value are translated at the exchange rate on the date the fair value is determined. Exchange differences on non-monetary items such as equity investments classified as fair value through other comprehensive income (FVOCI) financial assets are recognised in OCI and presented in the fair value reserve within equity.
2.3.2 Foreign OperationsThe assets and liabilities of foreign operations, including goodwill and fair value adjustment arising on the acquisition of a foreign operation, are translated to Singapore Dollar at exchange rates prevailing at the balance sheet date. The income and expenses of foreign operations are translated to Singapore Dollar at average exchange rates for the year, which approximate the exchange rates at the dates of the transactions.
Differences arising from the translation of a foreign operation are recognised in OCI and presented in the currency translation reserve within equity. When a foreign operation is disposed of, in part or in full, the relevant amount in the currency translation reserve is included in the gain or loss on disposal of the operation.
2.4 Cash and Cash EquivalentsIn the consolidated cash flow statement, cash and cash equivalents comprise cash on hand, balances, money market placements and reverse repo transactions with central banks which are generally short-term financial instruments or repayable on demand.
2.5 Financial Instruments2.5.1 RecognitionThe Group initially recognises loans and advances, deposits and debts issued on the date of origination. All other financial instruments, including regular way purchases and sales of financial assets with delivery of assets within the time period established by regulation or market convention, are recognised on the settlement date.
2.5.2 De-RecognitionFinancial assets are de-recognised when the Group’s contractual rights to the cash flows from the financial assets expire or when the Group transfers the financial asset to another party without retaining control or transfers substantially all the risks and rewards of ownership of the asset. Financial liabilities are de-recognised when the Group’s obligations specified in the contract expire or are discharged or cancelled.
2. Summary of Significant Accounting Policies (continued)
2.5 Financial Instruments (continued)2.5.3 ModificationThe original terms of a financial asset may be renegotiated or otherwise modified, resulting in changes to the contractual cash flows of the financial asset. Financial assets that are renegotiated or otherwise modified will be accounted based on the nature and extent of changes that is expected to arise as a result of the modification or renegotiation.
2.5.4 OffsettingFinancial assets and liabilities are offset and the net amount presented in the balance sheet when there is a legally enforceable right to offset the amounts and an intention to settle on a net basis or realise the asset and settle the liability simultaneously. Income and expenses are presented on a net basis only when permitted by the accounting standards.
2.5.5 Sale and Repurchase Agreements (Including Securities Lending and Borrowing)
Repurchase agreements (repos) are regarded as collateralised borrowing. The securities sold under repos are treated as pledged assets and remain as assets on the balance sheets. The amount borrowed is recorded as a liability. Reverse repos are treated as collateralised lending and the amount of securities purchased is included in placements with central banks, loans to banks and non-bank customers. The difference between the amount received and the amount paid under repos and reverse repos is amortised as interest expense and interest income respectively.
Securities lending and borrowing transactions are generally secured, with collaterals taking the form of securities or cash. The transfer of securities to or from counterparties is not reflected on the balance sheet. Cash collateral advanced or received is recorded as an asset or a liability respectively.
2.6 Non-Derivative Financial AssetsClassification and Measurement of Financial AssetsA non-derivative financial asset is initially recognised at fair value plus transaction costs (if any) and is measured either at amortised cost, fair value through other comprehensive income (FVOCI) or fair value through profit or loss (FVTPL).
(a) Business Model AssessmentThe Group makes an assessment of the objective of a business model in which an asset is held at a portfolio level because this best reflects the way the business is managed, and information is provided to management. The information considered includes:• the stated policies and objectives for the portfolio and
the operation of those policies in practice. In particular,
whether management’s strategy focuses on earning contractual interest income, maintaining a particular interest rate profile, matching the duration of the financial assets to the duration of the liabilities that are funding those assets or realising cash flows through the sale of the assets;
• how the performance of the portfolio is evaluated and reported to the Group’s management;
• the risks that affect the performance of the business model (and the financial assets held within that business model) and its strategy of how those risks are managed;
• how managers of the business are compensated (e.g. whether compensation is based on the fair value of the assets managed or the contractual cash flows collected); and
• the frequency, volume and timing of sales in prior periods, the reasons for such sales and its expectations about future sales activity. However, information about sales activity is not considered in isolation, but as part of an overall assessment of how the Group’s stated objective for managing the financial assets is achieved and how cash flows are realised.
Financial assets that are held for trading and whose performance is evaluated or managed on a fair value basis are measured at FVTPL because they are neither within the business model to hold to collect contractual cash flows, nor within the business model to hold both to collect contractual cash flows and to sell financial assets.
(b) Assessment of Whether Contractual Cash Flows are Solely Payments of Principal and Interest
For the purposes of this assessment, ‘principal’ is defined as the fair value of the financial asset on initial recognition. ‘Interest’ is defined as consideration for the time value of money and for the credit risk associated with the principal amount outstanding during a particular period of time and for other basic lending risks and costs (e.g. liquidity risk and administrative costs), as well as profit margin.
2.6.1 Debt Instruments Measured at Amortised CostA debt financial instrument is measured at amortised cost if it meets both of the following conditions and is not designated at FVTPL: • it is held within a business model whose objective is to
hold the asset until maturity to collect contractual cash flows; and
• its contractual terms give rise to cash flows that are solely payments of principal and interest on the principal outstanding.
Debt instruments classified as amortised cost are subject to the expected credit loss requirements in accordance with SFRS(I) 9 Financial Instruments. Interest earned whilst holding the financial assets is included in interest income.
158 OCBC Annual Report 2019 159Financials

Notes to the Financial Statements For the financial year ended 31 December 2019
2. Summary of Significant Accounting Policies (continued)
2.6 Non-Derivative Financial Assets (continued)Classification and Measurement of Financial Assets (continued) (b) Assessment of Whether Contractual Cash Flows are
Solely Payments of Principal and Interest (continued)2.6.2 Debt Instruments Measured at FVOCIA debt financial instrument is measured at FVOCI if it meets both of the following conditions and is not designated at FVTPL: • it is held within a business model whose objective is
achieved by both collecting contractual cash flows and selling the financial asset; and
• its contractual terms give rise to cash flows that are solely payments of principal and interest on the principal outstanding.
Debt instruments classified as FVOCI are subject to the expected credit loss requirements in accordance with SFRS(I) 9. Interest earned whilst holding the financial assets is included in interest income.
At the balance sheet date, the Group recognises unrealised fair value gains and losses on revaluing these assets in OCI and presents the cumulative gains and losses in fair value reserve within equity, except for the recognition of impairment gains or losses, interest income and foreign exchange gains and losses, which are recognised in the income statement. At maturity or upon disposal, the cumulative gain or loss previously recognised in OCI is reclassified from fair value reserve to income statement.
2.6.3 Debt Instruments Measured at FVTPLDebt instruments that do not meet the requirements to be measured at amortised cost or at FVOCI are measured at FVTPL. At the balance sheet date, the Group recognises realised and unrealised gains and losses as trading income in the income statement. Interest earned while holding the assets are included in interest income.
2.6.4 Designation at FVTPLOn initial recognition, the Group may irrevocably designate a financial asset at FVTPL notwithstanding that it would otherwise meet the requirements to be measured at amortised cost or at FVOCI, if doing so, it eliminates or significantly reduces an accounting mismatch that would otherwise arise. Upon designation, financial assets are measured at fair value on each balance sheet date until maturity or derecognition. Realised and unrealised fair value changes are recognised in the income statement.
2.6.5 Equity InstrumentsEquity instruments held for trading are classified as FVTPL. Equity instruments that are not held for trading may be classified as FVOCI based on an irrevocable election on initial recognition on an investment-by-investment basis.
At the balance sheet date, realised and unrealised fair value gains or losses on revaluing the equity instruments classified as FVTPL are recognised in the income statement. Realised and unrealised fair value gains or losses on revaluing the equity instruments classified as FVOCI are recognised in OCI and are never reclassified to the income statement.
Dividend earned whilst holding the equity instruments classified as FVTPL is recognised as dividend income in the income statement. Dividend from equity instruments classified as FVOCI is recognised as dividend income in the income statement unless the dividend clearly represents a recovery of part of the cost of the investment.
2.6.6 ReclassificationFinancial assets are not reclassified subsequent to their initial recognition, except in the period when the Group changes its business model for managing its financial assets.
2.7 Derivative Financial InstrumentsAll derivative financial instruments are recognised at fair value on the balance sheet and classified as derivative receivables when their fair value is favourable and as derivative payables when their fair value is unfavourable. Fair values reflect the exit price of the instrument and include adjustments to take into account the credit risk of the Group and the counterparty where appropriate. An embedded derivative is not separated from the host contract that is a financial asset. However, it is separated from the host contract that is a financial liability or a non-financial item for grouping with other stand-alone financial derivatives.
The Group enters into hedging derivative transactions to manage exposures to interest rate, foreign currency and credit risks arising from its core banking activities of lending and accepting deposits. The Group applies fair value, cash flow or net investment hedge accounting when the transactions meet the specified criteria for hedge accounting. For derivative transactions entered into for trading or any other purposes, the realised and unrealised gains and losses from subsequent measurements are recognised in profit or loss.
Before the Group applies any hedge accounting, the Group determines whether an economic relationship exists between the hedged item and the hedging instrument by considering qualitative characteristics of these items and wherever necessary, supported by quantitative analysis. In its qualitative assessment, the Group considers whether the critical terms of its hedged item and the hedging instrument are closely aligned and evaluates whether the hedged item and hedging instrument respond similarly to similar risks. For all hedge accounting of the Group, where economic hedge relationships meet the hedge accounting criteria, the Group establishes its hedge ratio by aligning the principal amount of the hedging instrument to the extent of its hedged item.
2. Summary of Significant Accounting Policies (continued)
2.7 Derivative Financial Instruments (continued)In a fair value hedging relationship, the Group mainly uses interest rate swaps and cross currency swaps to hedge its exposure to changes in the fair value of fixed rate instruments and its foreign currency risk exposure. For qualifying fair value hedges, changes in the fair values of the derivative and of the hedged item relating to the hedged risk are recognised in the income statement. If the hedge relationship is terminated, the fair value adjustment to the hedged item continues to be reported as part of the carrying amount of the asset or liability and is amortised to the income statement as a yield adjustment over the remaining maturity of the asset or liability. For fair value portfolio hedge of interest rate exposure, adjustment will be on the straight-line method if amortisation using a re-calculated effective interest rate is not practicable.
The risk exposure for cash flow hedge is managed similarly to that for fair value hedges. In a cash flow hedge relationship, the Group mainly uses interest rate swaps to hedge the variability in the cash flows that is related to a variable or fixed rate asset or liability resulting from changes in interest rates. For qualifying cash flow hedges, the effective portion of the change in fair value of the derivative is recognised in the hedge reserve in equity. The gain or loss relating to the ineffective portion is recognised immediately in the income statement. Amounts accumulated in the hedge reserve remain in equity until the hedged cash flows is recognised in the income statement. When the hedged cash flows are no longer expected to occur, the cumulative gain or loss in the hedge reserve is immediately transferred to the income statement.
“Hedge ineffectiveness” represents the amount by which the changes in the fair value of the hedging instrument differ from changes in the fair value of a benchmark hedging instrument that is a perfect match. The amount of ineffectiveness is recognised immediately in profit or loss. The sources of ineffectiveness for both fair value hedges and cash flow hedges include imperfect relationship or matching between the hedging instrument and the risk being hedged as well as the effect of credit risk existing in the hedging instrument.
The hedged risk in the Group’s net investment hedges is the foreign currency exposure that arises from a net investment in subsidiaries and foreign operations that have a different functional currency from that of the Group. The risk arises from the fluctuation in spot exchange rates between the functional currency of the subsidiaries and the Bank’s functional currency. The Group uses a mixture of derivative financial instruments and liabilities to manage its foreign currency exposure in its net investment hedges. For hedges of net investments in foreign operations which are accounted in a similar way as cash flow hedges, the gain or loss relating to the effective portion of the hedging instrument is recognised in equity and that relating to the ineffective portion is recognised in the income statement. Gains and losses accumulated in equity are transferred to income
statement on disposal of the foreign operations. The source of ineffectiveness for the Group’s net investment hedge is the use of a hedging instrument denominated in a proxy currency that is not perfectly correlated to the actual currency to which the Group is exposed.
The Group early adopted the amendments to SFRS(I) 9, SFRS(I) 1-39 and SFRS(I) 7 Interest Rate Benchmark Reform issued in December 2019 as part of its project on interest rate benchmark reform. For the purpose of evaluating whether the hedging relationship is expected to be highly effective (i.e. prospective effectiveness assessment), the Group assumes that the benchmark interest rate is not altered as a result of Interbank Offered Rates (IBOR) reform. The Group will cease to apply the amendments to its retrospective and prospective effectiveness assessment of the hedging relationship when the uncertainty arising from interest rate benchmark reform is no longer present with respect to the timing and the amount of the interest rate benchmark-based cash flows of the hedged item or hedging instrument, or when the hedging relationship is discontinued.
2.8 Property, Plant and Equipment Property, plant and equipment are stated at cost less accumulated depreciation and impairment losses. The cost of an item of property, plant and equipment includes the purchase price and costs directly attributable to bringing the asset to the location and condition necessary for it to be capable of operating in the manner intended by management.
Subsequent expenditure relating to property, plant and equipment is added to the carrying amount of the asset when it is probable that future economic benefits, in excess of the standard of performance of the asset before the expenditure was made, will flow to the Group and the cost can be reliably measured. Other subsequent expenditure is recognised in the income statement during the financial year in which the expenditure is incurred.
The residual values, useful lives and depreciation methods of property, plant and equipment are reviewed and adjusted as appropriate, at each balance sheet date, to ensure that they reflect the expected economic benefits derived from these assets.
Property, plant and equipment are depreciated on a straight-line basis over their estimated useful lives as follows: Furniture and fixtures – 5 to 10 yearsOffice equipment – 5 to 10 yearsComputers – 3 to 10 yearsRenovation – 3 to 5 yearsMotor vehicles – 5 years
Freehold land and leasehold land with leases of more than 100 years to expiry are not depreciated. Buildings and other leasehold land are depreciated over 50 years or the period of the lease, whichever is shorter.
160 OCBC Annual Report 2019 161Financials

Notes to the Financial Statements For the financial year ended 31 December 2019
2. Summary of Significant Accounting Policies (continued)
2.8 Property, Plant and Equipment (continued)An item of property, plant and equipment is de-recognised upon disposal or when no future economic benefit is expected from its use. Any gain or loss arising on de-recognition of the asset is included in the income statement in the year the asset is de-recognised.
2.9 Investment PropertyInvestment property is property held either for rental income or for capital appreciation or for both. Investment properties, other than those held under the Group’s life insurance funds, are stated at cost less accumulated depreciation and impairment losses. Freehold land and leasehold land with leases of more than 100 years to expiry are not depreciated. Buildings and other leasehold land are depreciated over 50 years or the period of the lease, whichever is shorter.
Investment property held under the Group’s life insurance fund is stated at fair value at the balance sheet date and collectively form an asset class which is an integral part of the overall investment strategy for the asset-liability management of the life insurance business. The fair value of the investment property is determined based on objective valuations undertaken by independent valuers at the reporting date. Changes in the carrying amount resulting from revaluation are recognised in the income statement of the life insurance fund.
2.10 Goodwill and Intangible Assets2.10.1 Goodwill Goodwill on acquisition of subsidiaries represents the excess of the consideration transferred, the amount of any non-controlling interest in the acquiree and the acquisition-date fair value of any previously held equity interest over the fair value of the identifiable net assets acquired.
Goodwill is stated at cost less impairment loss. Impairment test is carried out annually, or when there is indication that the goodwill may be impaired.
Gains or losses on disposal of subsidiaries and associates include the carrying amount of goodwill relating to the entity sold.
2.10.2 Intangible AssetsIntangible assets are separately identifiable intangible items arising from acquisitions and are stated at cost less accumulated amortisation and impairment losses. Intangible assets with finite useful lives are amortised over their estimated useful lives. The estimated useful lives range from 6 to 20 years. The useful life of an intangible asset is reviewed at least at each financial year end.
2.11 Non-Current Assets Held for SaleNon-current assets that are expected to be recovered through sale rather than through continuing use are classified as held for sale. Immediately before classification as held for sale, the assets are measured in accordance with the Group’s accounting policies. Thereafter, the assets are generally measured at the lower of their carrying amount and fair value less cost to sell.
2.12 Impairment of Assets(I) Financial AssetsImpairment allowances for financial assets are assessed using a forward-looking expected credit loss (ECL) model in accordance with the requirements of SFRS(I) 9.
2.12.1 ScopeUnder SFRS(I) 9, except for equity investments, the ECL model is applied to debt financial assets measured at amortised cost or FVOCI and most off-balance sheet loan commitments and financial guarantees.
2.12.2 Expected Credit Loss Impairment ModelUnder SFRS(I) 9, credit loss allowances are measured on each reporting date according to a three-stage expected credit loss impairment model:• Stage 1 – On initial recognition, expected credit loss will be
that resulting from default events that are possible over the next 12 months.
• Stage 2 – Following a significant increase in credit risk of the financial assets since its initial recognition, the credit loss allowance will be that resulting from default events that are possible over the expected life of the asset.
• Stage 3 – When a financial asset exhibits objective evidence of impairment and is considered to be credit-impaired, the credit loss allowance will be the full lifetime expected credit loss.
2.12.3 MeasurementECLs are a probability-weighted estimate of credit losses. They are measured as follows:(a) financial assets that are not credit-impaired at the
reporting date: as the present value of all cash shortfalls (i.e. the difference between the cash flows due to the entity in accordance with the contract and the cash flows that the Group expects to receive);
(b) financial assets that are credit-impaired at the reporting date: as the difference between the gross carrying amount and the present value of estimated future cash flows;
(c) undrawn loan commitments: as the present value of the difference between the contractual cash flows that are due to the Group if the commitment is drawn down and the cash flows that the Group expects to receive; and
(d) financial guarantee contracts: the expected payments to reimburse the holder less any amounts that the Group expects to recover.
2. Summary of Significant Accounting Policies (continued)
2.12 Impairment of Assets (continued)(I) Financial Assets (continued)2.12.3 Measurement (continued)The key inputs used in the measurement of ECL are:• Probability of default (PD) – This is an estimate of the
likelihood of default over a given time horizon• Exposure at default (EAD) – This is an estimate of the
exposure at a future default date, taking into account expected changes in the exposure after the reporting date, including repayments of principal and interest as well as expected drawdowns on committed facilities
• Loss given default (LGD) – This is an estimate of the loss arising on default. It is based on the difference between the contractual cash flows due and those that the Group would expect to receive, including from any collateral.
ECL for exposures in Stage 1 is calculated by multiplying the 12-month PD by LGD and EAD. Lifetime ECL is calculated by multiplying lifetime PD by LGD and EAD.
Loans and bills receivable that are collectively assessed are grouped on the basis of shared credit risk characteristics such as account loan type, industry, geographical location of the borrower, collateral type and other relevant factors.
All key inputs (PD, LGD and EAD) used to estimate Stage 1 and Stage 2 credit loss allowances are modelled based on three macroeconomic scenarios (or changes in macroeconomic variables) that are most closely correlated with credit losses in the relevant portfolio.
The three macroeconomic scenarios represent a most likely “Base” outcome, and two other less likely “Upside” and “Downside” scenarios. These scenarios are probability-weighted and underlying key macroeconomic assumptions are based on independent external and in-house views. The assumptions are subject to regular management reviews to reflect current economic situations.
Each macroeconomic scenario used in the expected credit loss calculation includes a projection of all relevant macroeconomic variables used in the models for the lifetime period, reverting to long-run averages generally after 3 to 5 year periods. Depending on their usage in the models, macroeconomic variables are projected at a country or more granular level which differ by portfolio. The primary macroeconomic variables adopted are Gross Domestic Product, Unemployment rate, Property Price Index and Interest rate.
The definition of default used in the measurement of expected credit losses is consistent with the definition of default used for credit risk management purposes. The default definition has been applied consistently to model the PD, LGD and EAD throughout Group’s expected credit loss calculations.
The Group considers a financial asset to be in default by assessing both quantitative and qualitative criteria such as days past due and the terms of financial covenants. A default occurs when the borrower or bond issuer is unlikely to pay its credit obligations to the Group in full, without recourse by the Group to actions such as realising security (if any is held) or when the financial asset is more than 90 days past due.
The maximum period considered when estimating ECLs is the maximum contractual period over which the Group is exposed to credit risk.
Financial assets are written off against their related impairment allowances when all feasible recovery actions have been exhausted or when the recovery prospects are considered remote.
2.12.4 Movement Between StagesMovements between Stage 1 and Stage 2 are based on whether an instrument’s credit risk as at the reporting date has increased significantly since its initial recognition.
In accordance with SFRS(I) 9, financial assets are classified in Stage 2 where there is a significant increase in credit risk since initial recognition, where the credit loss allowance will be measured using lifetime ECL.
The Group considers both qualitative and quantitative parameters in the assessment of whether this is a significant increase in credit risk. These include the following:(a) The Group has established thresholds for significant
increases in credit risk based on both a relative and absolute change in lifetime PD relative to initial recognition.
(b) The Group conducts qualitative assessment to ascertain if there has been significant increase in credit risk.
(c) The Group uses days past due as a further indication of significant increase in credit risk.
Movements between Stage 2 and Stage 3 are based on whether financial assets are credit-impaired as at the reporting date. The determination of whether a financial asset is credit-impaired under SFRS(I) 9 will be based on objective evidence of impairment.
The assessments for a significant increase in credit risk since initial recognition and credit-impairment are performed independently as at each reporting period. Assets can move in both directions through the stages of the impairment model. After a financial asset has migrated to Stage 2, if it is no longer considered that credit risk has significantly increased relative to initial recognition in a subsequent reporting period, it will move back to Stage 1. A modification of the terms of a financial asset that does not result in derecognition will result in the financial asset being transferred out of Stage 3 if the indicators of it being identified as credit-impaired is no longer met and that the evidence for its transfer out of Stage 3 solely relates to events such as up-to-date and timely payment occurring in the subsequent periods.
162 OCBC Annual Report 2019 163Financials

Notes to the Financial Statements For the financial year ended 31 December 2019
2. Summary of Significant Accounting Policies (continued)
2.12 Impairment of Assets (continued)(I) Financial Assets (continued)2.12.4 Movement Between Stages (continued)If a modified financial asset results in derecognition, the new financial asset will be recognised under Stage 1, unless it is assessed to be credit-impaired at time of the modification.
2.12.5 Regulatory FrameworkUnder MAS 612 requirement, the Group is required to maintain a minimum regulatory loss allowance (MRLA) of 1% of the gross carrying amount of selected credit exposures, net of collateral. Where the accounting loss allowance of selected non credit-impaired exposures computed under SFRS(I) 9 is less than the MRLA, the Group shall maintain the difference in a non-distributable regulatory loss allowance reserve (RLAR) account through the appropriation of revenue reserves to meet the minimum 1% amount. Where the aggregated accounting loss allowance and RLAR exceeds the MRLA, the Group may transfer the excess amount in the RLAR to revenue reserves.
(II) Other Assets2.12.6 GoodwillFor the purpose of impairment testing, goodwill is allocated to each of the Group’s Cash Generating Units (CGU) expected to benefit from synergies of the business combination. The Group’s CGUs correspond with the business segments identified in the primary segment report.
An impairment loss is recognised in the income statement when the carrying amount of the CGU, including the goodwill, exceeds the recoverable amount of the CGU. The CGU’s recoverable amount is the higher of its fair value less cost to sell and its value in use. Impairment loss on goodwill cannot be reversed in subsequent periods.
2.12.7 Investments in Subsidiaries and Associates Property, Plant and Equipment Investment Property Intangible Assets
Investments in subsidiaries and associates, property, plant and equipment, investment property and intangible assets, are reviewed for impairment on the balance sheet date or whenever there is any indication that the carrying amount of an asset may not be recoverable. If such an indication exists, the carrying amount of the asset is written down to its recoverable amount (i.e. the higher of the fair value less cost to sell and the value in use).
The impairment loss is recognised in the income statement, and is reversed only if there has been a change in the estimates used to determine the asset’s recoverable amount since the last
impairment loss was recognised. The carrying amount of an asset is increased to its revised recoverable amount, provided that this amount does not exceed the carrying amount that would have been determined (net of amortisation or depreciation) had no impairment loss been recognised for the asset in prior years.
2.13 Insurance ReceivablesInsurance receivables are recognised when due. They are measured at initial recognition at the fair value received or receivable. Subsequent to initial recognition, insurance receivables are measured at amortised cost, using the effective interest method. A loss allowance is measured at an amount equal to lifetime expected credit losses, with the impairment loss recognised in the income statement. Insurance receivables are derecognised when the derecognition criterion for financial assets has been met.
2.14 Financial LiabilitiesA non-derivative financial liability is initially recognised at fair value less transaction costs and is subsequently measured at amortised cost using the effective interest method except where it is designated as FVTPL.
For financial liabilities designated at fair value, gains and losses arising from changes in fair value are recognised in the net trading income line in the income statement except for changes in fair value attributable to the Group’s own credit risk where it is presented directly within other comprehensive income. Amounts recorded in OCI related to this credit risk are not subject to recycling in profit or loss, but are transferred to unappropriated profit when realised. Financial liabilities are held at fair value through profit or loss when:(a) they are acquired or incurred for the purpose of selling or
repurchasing in the near term;(b) the fair value option designation eliminates or significantly
reduces accounting mismatch that would otherwise arise; or(c) the financial liability contains an embedded derivative that
would otherwise need to be separately recorded.
2.15 Provisions and Other LiabilitiesProvisions are recognised when there is a present legal or constructive obligation as a result of past events, it is probable that an outflow of resources will be required to settle the obligation, and a reliable estimate of the amount can be made. Where a provision is expected to be reimbursed, for example under an insurance contract, the reimbursement is recognised as a separate asset only when it is virtually certain that reimbursement will be received.
Provision for insurance agents’ retirement benefits, including deferred benefits, is calculated according to terms and conditions stipulated in the respective agent’s agreement. The deferred/retirement benefit accumulated at the balance sheet date includes accrued interest.
2. Summary of Significant Accounting Policies (continued)
2.15 Provisions and Other Liabilities (continued)Policy benefits are recognised when a policyholder exercises the option to deposit the survival benefits with the life insurance subsidiaries when the benefit falls due. Policy benefits are interest bearing at rates adjusted from time to time by the life insurance subsidiaries. Interest payable on policy benefits is recognised in the income statements as incurred.
2.16 Insurance Contracts Insurance contracts are those contracts where the Group, mainly the insurance subsidiaries of GEH, has accepted significant insurance risk from the policyholders by agreeing to compensate the policyholders if a specified uncertain future event (the insured event) adversely affects the policyholders. As a general guideline, the Group determines whether it has significant insurance risk, by comparing benefits paid with benefits payable if the insured event did not occur. Insurance contracts can also transfer financial risk.
Once a contract has been classified as an insurance contract, it remains an insurance contract for the remainder of its lifetime, even if the insurance risk reduces significantly during this period, unless all rights and obligations are extinguished or expired.
For the purpose of SFRS(I) 4 Insurance Contracts, the Group adopts maximum policy benefits as the proxy for insurance risk and cash surrender value as the proxy for realisable value of the insurance contract on surrender. The Group defines insurance risk to be significant when the ratio of the insurance risk over the deposit component is not less than 105% of the deposit component at inception of the insurance contract. Based on this definition, all policy contracts issued by insurance subsidiaries within the Group are considered insurance contracts as at the balance sheet date.
Certain subsidiaries within the Group, primarily GEH and its subsidiaries (GEH Group), write insurance contracts in accordance with insurance regulations prevailing in their respective jurisdictions. Disclosures on the various insurance contract liabilities are classified into the principal components, as follows:(a) Life insurance contract liabilities, comprising – Participating Fund contract liabilities; – Non-participating Fund contract liabilities; and – Investment-linked Fund contract liabilities.(b) Non-life insurance contract liabilities(c) Reinsurance contracts
Life Insurance Contract LiabilitiesInsurance contracts are recognised and measured in accordance with the terms and conditions of the respective contracts and are based on guidelines laid down by the respective insurance
regulations. Premiums, claims and benefit payments, acquisition and management expenses and valuation of future policy benefit payments or premium reserves as the case may be, are recognised in the income statements of the respective insurance funds.
Life insurance liabilities are recognised when contracts are entered into and premiums are charged. These liabilities are measured by using the gross premium valuation method. The liability is determined as the sum of the present value of future guaranteed and, where relevant, appropriate level of non-guaranteed benefits, less the present value of future gross considerations arising from the policy discounted at the appropriate discount rate. The liability is based on best estimate assumptions and with due regard to significant recent experience. An appropriate risk margin allowance for adverse deviation from expected experience is made in the valuation of non-participating life policies, the guaranteed benefit liabilities of participating life policies and liabilities of non-unit investment-linked policies.
The liability in respect of participating insurance contract is based on the higher of the guaranteed benefit liabilities or the total benefit liabilities at the contract level derived as stated above.
In the case of life policies where part of, or all the premiums are accumulated in a fund, the accumulated amounts, as declared to policyholders are shown as liabilities if the accumulated amounts are higher than the amounts as calculated using the gross premium valuation method.
In the case of short-term life policies covering contingencies other than death or survival, the liability for such life insurance contracts comprises the provision for unearned premiums and unexpired risks, together with provision for claims outstanding, which includes an estimate of the incurred claims that have not yet been reported to the Group.
Adjustments to liabilities at each reporting date are recorded in the respective income statements. Profits originating from margins for adverse deviations on run-off contracts are recognised in the income statements over the lives of the contracts, whereas losses are fully recognised in the income statements during the first year of run-off.
The liability is extinguished when the contract expires, is discharged or is cancelled.
The Group issues a variety of short and long duration insurance contracts which transfer risks from the policyholders to the Group to protect policyholders from the consequences of insured events such as death, disability, illness, accident, including survival. These contracts may transfer both insurance and investment risk or insurance risk alone, from the policyholders to the Group.
164 OCBC Annual Report 2019 165Financials

Notes to the Financial Statements For the financial year ended 31 December 2019
2. Summary of Significant Accounting Policies (continued)
2.16 Insurance Contracts (continued) Life Insurance Contract Liabilities (continued)For non-participating policy contracts, both insurance and investment risks are transferred from policyholders to the Group. For non-participating policy contracts other than medical insurance policy contracts, the payout to policyholders upon the occurrence of the insured event is pre-determined and the transfer of risk is absolute. For medical insurance policy contracts, the payout is dependent on the actual medical costs incurred upon the occurrence of the insured event.
Contracts which transfer insurance risk alone from policyholders to the Group are commonly known as investment-linked policies. As part of the pricing for these contracts, the insurance subsidiaries within the Group include certain charges and fees to cover for expenses and insured risk. The net investment returns derived from the variety of investment funds as selected by the policyholders accrue directly to the policyholders.
A significant portion of insurance contracts issued by subsidiaries within the Group contain discretionary participating features. These contracts are classified as participating policies. In addition to guaranteed benefits payable upon insured events associated with human life such as death or disability, the contracts entitle the policyholder to receive benefits, which could vary according to investment performance of the fund. The Group does not recognise the guaranteed components separately from the discretionary participating features.
Profits to shareholders from the participating fund are allocated from the surplus or surplus capital, determined from the results of the annual actuarial valuation (such valuation also determines the liabilities relating to all the policyholders’ benefits of the participating fund). Parameters for the valuation are set out in the insurance regulations governing the Group’s insurance subsidiaries in the respective jurisdictions in which they operate. The provisions in the Articles of Association of the Group’s insurance subsidiaries are applied in conjunction with the prescriptions in the respective insurance regulations, such that the distribution for any year to policyholders of the participating fund and shareholders approximate 90% and 10% respectively of total distribution from the participating fund. The annual declaration of the quantum of policyholders’ bonus and correspondingly the profits to shareholders to be distributed out of the participating fund is approved by the board of directors of each insurance subsidiary under the advice of the Appointed Actuary of the respective subsidiary, in accordance with the insurance regulations and the Articles of Association of the respective subsidiaries.
The valuation of insurance contract liabilities is determined according to:(a) Singapore Insurance Act (Chapter 142), Insurance (Valuation
and Capital) Regulations 2004 for insurance funds regulated in Singapore (MAS Regulations); and
(b) Risk-based Capital Framework for Insurers for insurance funds regulated in Malaysia.
Each insurance subsidiary within the Group is required under the respective insurance regulations and accounting standards to carry out a liability adequacy test using current estimates of future cash flows relating to its insurance contracts; the process is referred to as the gross premium valuation or bonus reserve valuation, depending on the jurisdiction in which the insurance subsidiary operates.
The liability adequacy test is applied to both the guaranteed benefits and the discretionary participating features; the assumptions are based on best estimates, the basis adopted is prescribed by the insurance regulations of the respective jurisdiction in which the insurance subsidiary operates. The Group performs liability adequacy tests on its actuarial reserves to ensure that the carrying amount of provisions is sufficient to cover estimated future cash flows. When performing the liability adequacy test, the Group discounts all contractual cash flows and compares this amount against the carrying amount of the liability. Any deficiency is charged to the income statement.
The Group issues investment-linked contracts as insurance contracts which insure human life events such as death or survival over a long duration; coupled with an embedded derivative linking death benefit payments on the contract to the value of a pool of investments within the investment-linked fund set up by the insurance subsidiary. As this embedded derivative meets the definition of an insurance contract, it need not be separately accounted for from the host insurance contract. The liability valuation for such contracts is adjusted for changes in the fair value of the underlying assets at frequencies in accordance with the terms and conditions of the insurance contracts.
2. Summary of Significant Accounting Policies (continued)2.16 Insurance Contracts (continued)Life Insurance Contract Liabilities (continued)The table below provides the key underlying assumptions used for valuation of life insurance contract liabilities.
Singapore Malaysia
Valuation method (1) Gross premium valuation
For Participating Fund, the method that produces the higher reserves of:(i) Total assets backing policy benefits;
(ii) Guaranteed and non-guaranteed cash flows discounted at the appropriate rate of return reflecting the strategic asset allocation; and
(iii) Guaranteed cash flows discounted using the interest rate outlined under ‘Interest rate’ item (i) below.
Gross premium valuation
For Participating Fund, the method that produces the higher reserves of: (i) Guaranteed and non-guaranteed cash flows
discounted at the appropriate rate of return reflecting the strategic asset allocation; and
(ii) Guaranteed cash flows discounted using Malaysia Government Securities (MGS) zero coupon spot yields (as outlined below).
Interest rate (1) (i) Singapore Government Securities (SGS) zero coupon spot yields for cash flows up to year 15, an interpolation of the 15-year Singapore Government Securities zero coupon spot yield and the Long Term Risk Free Discount Rate (LTRFDR) for cash flows between 15 and 20 years, and the LTRFDR for cash flows year 20 and after.
(ii) For Universal Life policies denominated in US Dollar:
a) Observable market yields of US Treasury Yield Curve Rates for cash flows up to year 30;
b) Ultimate forward rate (UFR) of 3.5% applicable for cash flows beyond 60 years; and
c) Extrapolated yields in between.
Data source: Bloomberg
Malaysia Government Securities yields determined based on the following:(i) For cash flows with duration less than 15
years, Malaysia Government Securities zero coupon spot yields of matching duration.
(ii) For cash flows with duration 15 years or more, Malaysia Government Securities zero coupon spot yields of 15 years to maturity.
Data source: Bond Pricing Agency Malaysia
Mortality, Disability, Dread disease, Expenses, Lapse and surrenders (1)
Participating Fund:(i) Best estimates for Gross Premium Valuation
method (ii);
(ii) Best estimates plus provision for adverse deviation (PAD) for Gross Premium Valuation method (iii).
Non-participating and Non-unit reserves of Investment-linked Fund:Best estimates plus provision for adverse deviation (PAD).
Data source: Internal experience studies
Participating Fund:(i) Best estimates for Gross Premium Valuation
method (i);
(ii) Best estimates plus provision for risk of adverse deviation (PRAD) for Gross Premium Valuation method (ii).
Non-participating and Non-unit reserves of Investment-linked Fund: Best estimates plus provision for risk of adverse deviation (PRAD).
Data source: Internal experience studies
(1) Refer to Note 2.24 on Critical Accounting Estimates and Judgements.
166 OCBC Annual Report 2019 167Financials
Notes to the Financial Statements For the financial year ended 31 December 2019
2. Summary of Significant Accounting Policies (continued)
2.16 Insurance Contracts (continued) Non-Life Insurance Contract LiabilitiesThe Group issues short term property and casualty contracts which protect the policyholders against the risk of loss of property premises due to fire or theft in the form of fire or burglary insurance contracts and/or business interruption contracts; risk of liability to pay compensation to a third party for bodily harm or property damage in the form of public liability insurance contracts. The Group also issues short term medical and personal accident non-life insurance contracts.
Non-life insurance contract liabilities include premium liabilities and claim liabilities.
Claim LiabilitiesClaim liabilities are based on the estimated ultimate cost of all claims incurred but not settled at the balance sheet date, whether reported or not, together with related claims handling costs and reduction for the expected value of salvage and other recoveries. Delays can be experienced in the notification and settlement of certain types of claims, therefore, the ultimate cost of these claims cannot be known with certainty at the balance sheet date. The liabilities are calculated at the reporting date using a range of standard actuarial claim projection techniques based on empirical data and current assumptions that may include a margin for adverse deviation. The liabilities are not discounted for the time value of money. No provision for equalisation or catastrophe reserves is recognised. The liabilities are derecognised when the contracts expire, are discharged or are cancelled.
The valuation of non-life insurance claim liabilities at the balance sheet date is based on best estimates of the ultimate settlement cost of claims plus a provision for adverse deviation. The provision for adverse deviation is set at 75% level of sufficiency for Singapore, Malaysia and Indonesia. The valuation methods used include the Paid and Incurred Loss Development methods (also known as the Link Ratio methods), the Paid and Incurred Bornhuetter-Ferguson methods and the Expected Loss Ratio Method. For Singapore and Malaysia, the claim liabilities are not discounted for the time value of money. However, for Indonesia, the claim liabilities are discounted for the time value of money as per preacquisition practice. Discounting is expected to be applied consistently in line with the implementation of SFRS(I) 17. No provision for equalisation or catastrophe reserves is recognised.
Premium LiabilitiesPremium liabilities are the provision of unearned premiums representing premiums received for risks that have not yet expired at the reporting date. The provision is recognised when contracts are entered into and premiums are charged. The provision is released over the term of the contract and is recognised as premium income. Further provisions are made
if expected future cash flow of unexpired insurance contracts exceed the unearned premiums of these contracts.
Reinsurance ContractsThe Group cedes insurance risk in the normal course of business for all of its businesses. Reinsurance assets represent balances due from reinsurers. These amounts are estimated in a manner consistent with the outstanding claims provision or settled claims associated with the reinsurer’s policies and are in accordance with the related reinsurance contract.
Reinsurance assets are reviewed for impairment at each reporting date or more frequently when an indication of impairment arises during the financial year. Impairment occurs when there is objective evidence as a result of an event that occurred after initial recognition of the reinsurance asset that the Group may not receive part or all outstanding amounts due under the terms of the contract. The impairment loss is recorded in the income statements. Gains or losses on reinsurance are recognised in the income statements immediately at the date of contract and are not amortised. Ceded reinsurance arrangements do not relieve the Group from its obligations to policyholders.
The Group also assumes reinsurance risk in the normal course of business for life insurance and non-life insurance contracts where applicable. Premiums and claims on assumed reinsurance are recognised as revenue or expenses in the same manner as they would be if the reinsurance were considered direct business, taking into account the product classification of the reinsured business. Reinsurance liabilities represent balances due to reinsurance companies. Amounts payable are estimated in a manner consistent with the related reinsurance contract. Premiums and claims are presented on a gross basis for both ceded and assumed reinsurance. Reinsurance assets or liabilities are derecognised when the contractual rights are extinguished or expire or when the contract is transferred to another party.
2.17 Share Capital and DividendOrdinary shares, non-cumulative non-convertible preference shares and perpetual capital securities are classified as equity on the balance sheet.
Incremental costs directly attributable to the issue of new capital securities are shown in equity as a deduction from the proceeds.
Where share capital recognised as equity is repurchased (treasury shares), the amount of the consideration paid, including directly attributable costs, is presented as a deduction from equity. Treasury shares which are subsequently reissued, sold or cancelled, are recognised as changes in equity.
Interim dividends on ordinary shares and dividends on preference shares are recorded in the year in which they are declared payable by the Board of Directors. Final dividends are recorded in the year when the dividends are approved by shareholders at the annual general meeting.
2. Summary of Significant Accounting Policies (continued)
2.18 LeasesPolicy Applicable Before 1 January 2019Payments made under operating leases (net of any incentives received from the lessor) are taken to the income statement on a straight-line basis over the term of the lease. When a lease is terminated before its expiry, any payment required to be made to the lessor by way of penalty is recognised as an expense in the period when the termination takes place.
Minimum lease payments made under finance leases are apportioned between the finance expense and the reduction of the outstanding liability. The expense is allocated to each period over the lease term so as to produce a constant periodic rate of interest on the remaining balance of the liability.
Policy Applicable From 1 January 2019
2.18.1 As LesseeAt the inception of a contract, the Group assesses if the contract contains a lease. A contract contains a lease if the contract conveys the right to control the use of an identified asset for a period of time in exchange for consideration. Reassessment is only required when the terms and conditions of the contract are changed.
Right-of-Use AssetsThe Group recognises a ROU asset and lease liability at the date which the underlying asset is available for use. ROU assets are measured at cost which comprises the initial measurement of lease liabilities adjusted for any lease payments made at or before the commencement date and lease incentive received. Any initial direct costs that would not have been incurred if the lease had not been obtained are added to the carrying amount of the ROU assets.
These ROU assets are subsequently depreciated using the straight-line method from the commencement date to the earlier of the end of the useful life of the ROU asset or the end of the lease term.
ROU assets are presented within “Property, plant and equipment”.
Lease LiabilitiesThe initial measurement of lease liability is measured at the present value of the lease payments discounted using the implicit rate in the lease, if the rate can be readily determined. If that rate cannot be readily determined, the Group shall use its incremental borrowing rate.
Lease liability is subsequently measured at amortised cost using the effective interest method. Lease liability shall be remeasured when there is modification in the scope or the consideration of the lease that was not part of the original term.
Short Term Leases and Low-Value AssetsThe Group has elected to not recognise ROU assets and lease liabilities for short-term leases that have lease terms of 12 months or less and leases of low-value leases, except for sublease arrangements. Lease payments relating to these leases are expensed to profit or loss on a straight-line basis over the lease term.
2.18.2 As LessorThe accounting policy applicable to the Group as a lessor in the comparative period were the same as that under SFRS(I) 16.
Rental income on tenanted areas of the buildings owned by the Group is recognised in the income statement on a straight line basis over the term of the lease. Lease incentives granted are recognised as an integral part of the total rental income, over the term of the lease.
2.19 Recognition of Income and Expense2.19.1 Interest Income and ExpenseInterest income or expense is recognised using the effective interest method.
The effective interest rate is the rate that exactly discounts estimated future cash payments or receipts through the expected life of the financial instrument to the gross carrying amount of the financial asset or amortised cost of the financial liability.
In calculating the interest income and expense, the effective interest rate is applied to the gross carrying amount of the asset (when the asset is not credit-impaired) or to the amortised cost of the liability. However, for financial assets that have become credit-impaired subsequent to initial recognition, interest income is calculated by applying the effective interest rate to the amortised cost of the financial asset. If the asset is no longer credit-impaired, then the calculation of interest income reverts to the gross basis.
2.19.2 Premiums and Commissions from Insurance Business
Life Insurance BusinessFirst year premiums of insurance policies are recognised from inception date and subsequent renewal premiums are recognised when due. Single premiums are recognised on the dates on which the policies are effective. Premiums from the investment-linked business, universal life and certain Takaful non-participating products are recognised as revenue when payment is received.
Non-Life Insurance BusinessPremiums from the non-life insurance business are recognised as revenue upon commencement of insurance cover. Premiums pertaining to periods after the balance sheet date are adjusted through the movement in premium liabilities. Commission is recognised as an expense when incurred, typically upon the risk underwritten as reflected in the premium recognised.
168 OCBC Annual Report 2019 169Financials

Notes to the Financial Statements For the financial year ended 31 December 2019
2. Summary of Significant Accounting Policies (continued)
2.19 Recognition of Income and Expense (continued)
2.19.2 Premiums and Commissions from Insurance Business (continued)
Non-Life Insurance Business (continued)Premiums ceded out and the corresponding commission income from non-life insurance contracts are recognised in the income statement upon receipt of acceptance confirmation from the ceding company or in accordance with provisions incorporated in the treaty contracts. Premiums ceded out pertaining to periods after the balance sheet date are adjusted through the movement in unexpired risk reserve.
2.19.3 Fees and CommissionsThe Group earns fees and commissions from a range of services rendered to its customers. Fees and commissions are recognised when the Group has satisfied its performance obligations in providing the services to the customer. Transaction based fees and commissions are generally recognised upon the completion of a transaction. For services provided over a period of time or credit risk undertaken, fees and commissions are amortised over the relevant period.
Expenses are offset against gross fees and commissions in the income statement only when they are directly related.
2.19.4 DividendsDividends from equity securities, subsidiaries and associates are recognised when the right to receive payment is established.
2.19.5 Employee Benefits The Group’s compensation package for staff consists of base salaries, allowances, defined contribution plans such as the Central Provident Fund, defined benefit plans, commissions, cash bonuses, and share-based compensation plans. These are recognised in the income statement when incurred. Employee leave entitlements are estimated according to the terms of employment contract and accrued on the balance sheet date.
For defined benefit plans, the liability recognised in the balance sheet is the present value of the defined benefit obligation at the balance sheet date less the fair value of plan assets, adjusted for unrecognised actuarial gains or losses and past service costs. Remeasurements of defined benefit plans are recognised in OCI in the period in which they arise.
Share-based compensation plans include the Bank’s Share Option Schemes, the Employee Share Purchase Plan (ESP Plan) and the Deferred Share Plan (DSP). Equity instruments granted are recognised as expense in the income statement based on the fair value of the equity instrument at the date of the grant. The
expense is recognised over the vesting period of the grant, with corresponding entries to equity.
At each balance sheet date, the Group revises its estimates of the number of equity instruments expected to be vested, and the impact of the change to the original estimates, if any, is recognised in the income statement, with a corresponding adjustment to equity over the remaining vesting period.
The Group accrues for interest on the monthly contributions made by employees to the savings-based ESP Plan. For the DSP, a trust is set up to administer the shares. The DSP Trust is consolidated in the Group’s financial statements.
Proceeds received upon the exercise of options and acquisition rights, net of any directly attributable transaction costs, are credited to share capital.
2.20 Income Tax Expense Income tax expense is recognised in the income statement except to the extent that it relates to items recognised directly in equity, in which case it is recognised in equity or in other comprehensive income.
Current tax is the expected tax payable on the taxable income for the year, using tax rates enacted or substantively enacted at the reporting date, and any adjustment to tax payable in respect of previous years.
Deferred tax is recognised using the balance sheet method, on temporary differences between the carrying amounts of assets and liabilities for financial reporting purposes and the amounts used for tax computation. Deferred tax is not recognised for the following temporary differences: the initial recognition of goodwill, the initial recognition of assets or liabilities in a transaction that is not a business combination and that does not affect accounting or taxable profit, and differences relating to investments in subsidiaries, associates and joint ventures to the extent that they probably will not reverse in the foreseeable future. Deferred tax is measured at the tax rates that are expected to be applied to the temporary differences when they reverse, based on the laws that have been enacted or substantively enacted by the reporting date.
A deferred tax asset is recognised to the extent that it is probable that future taxable profits will be available for utilisation against the temporary differences. Deferred tax assets are reviewed at each reporting date and are reduced to the extent that it is no longer probable that the related tax benefit will be realised.
Unrecognised deferred tax assets are reassessed at each reporting date and recognised to the extent that it has become probable that future taxable profits will be available against which they can be used.
2. Summary of Significant Accounting Policies (continued)
2.20 Income Tax Expense (continued) In determining the amount of current and deferred tax, the Group takes into account the impact of uncertain tax positions and whether additional taxes and interest may be due. The Group believes that its accruals for tax liabilities are adequate for all open tax years based on its assessment of many factors, including interpretations of tax law and prior experience. This assessment relies on estimates and assumptions and may involve a series of judgements about future events. New information may become available that causes the Group to change its judgement regarding the adequacy of existing tax liabilities; such changes to tax liabilities will impact tax expense in the period that such a determination is made.
2.21 Fiduciary ActivitiesThe Group acts as trustees and in other fiduciary capacities that result in the holding or placing of assets on behalf of individuals, trusts, retirement benefit plans and other institutions. The assets and income from these assets do not belong to the Group, and are therefore excluded from these financial statements.
2.22 Earnings Per ShareThe Group presents basic and diluted earnings per share data for its ordinary shares. Basic earnings per share is calculated by dividing the profit or loss attributable to ordinary shareholders of the Bank by the weighted-average number of ordinary shares outstanding during the year, adjusted for own shares held. Diluted earnings per share is determined by adjusting the profit or loss attributable to ordinary shareholders and the weighted-average number of ordinary shares outstanding, adjusted for own shares held, for the effects of all dilutive potential ordinary shares, which comprise share options granted to employees.
2.23 Segment ReportingThe Group’s business segments represent the key customer and product groups, as follows: Global Consumer/Private Banking, Global Corporate/Investment Banking, Global Treasury and Markets, Insurance and OCBC Wing Hang. All operating segments’ results are reviewed regularly by the senior management to make decisions about resources to be allocated to the segment and to assess its performance, and for which discrete financial information is available. In determining the segment results, balance sheet items are internally transfer priced and revenues and expenses are attributed to each segment based on internal management reporting policies. Transactions between business segments are recorded within the segment as if they are third party transactions and are eliminated on consolidation.
A geographical segment engages in providing products and services within a particular economic environment that is subject to different risks from those of other economic
environments. Geographical segment information is prepared based on the country in which the transactions are booked and presented after elimination of intra-group transactions and balances.
2.24 Critical Accounting Estimates and JudgementsCertain estimates are made in the preparation of the financial statements. These often require management judgement in determining the appropriate methodology for valuation of assets and liabilities. A brief description of the Group’s critical accounting estimates is set out below.
2.24.1 Impairment of Financial AssetsIn determining whether the credit risk of the Group’s financial exposures has increased significantly since initial recognition, the Group will consider reasonable and supportable information that is readily available without undue cost or effort. This includes both quantitative and qualitative information such as the Group’s historical credit assessment experience and available forward-looking information. ECL estimates are produced for all relevant instruments based on probability-weighted forward-looking economic scenarios. The measurement of ECL is primarily calculated based on the probability of default, loss given default and exposure at default. These are parameters derived from internal rating models adjusted by forward-looking information. Where internal rating models are not available, such estimates are based on comparable internal rating models after adjusting for portfolio differences.
The PD, LGD and EAD models which support these determinations are reviewed regularly in light of differences between loss estimates and actual loss experience. Given that SFRS(I) 9 requirements are relatively recent, the underlying models and their calibration, including how they react to forward-looking economic conditions, remain subject to review and refinement.
2.24.2 Fair Value EstimationFair value is derived from quoted market prices or valuation techniques which maximise the use of relevant observable inputs and minimise the use of unobservable inputs. The fair values of financial instruments that are not traded in an active market (for example, over-the-counter derivatives) are determined by using valuation techniques. Where unobservable data inputs have a significant impact on the value obtained from the valuation model, such a financial instrument is initially recognised at the transaction price, which is the best indicator of fair value. The difference between the transaction price and the model value, commonly referred to as “day one profit and loss” is not recognised immediately in the income statement.
The timing of recognition of deferred day one profit and loss is determined individually. It is amortised over the life of the transaction, released when the instrument’s fair value can be determined using market observable inputs, or when the transaction is derecognised.
170 OCBC Annual Report 2019 171Financials

Notes to the Financial Statements For the financial year ended 31 December 2019
2. Summary of Significant Accounting Policies (continued)
2.24 Critical Accounting Estimates and Judgements (continued)
2.24.3 Liabilities of Insurance BusinessThe estimation of the ultimate liabilities arising from claims made under life and non-life insurance contracts is one of the Group’s critical accounting estimates. There are several sources of uncertainty that need to be considered in the estimation of the liabilities that the Group will ultimately be required to pay as claims.
Life Insurance ContractsFor life insurance contracts, estimates are made for future deaths, morbidity, disabilities, lapses, voluntary terminations, investment returns and administration expenses. The Group relies on standard industry reinsurance and national mortality and morbidity tables which represent historical experience, and makes appropriate adjustments for its respective risk exposures and portfolio experience in deriving the mortality and morbidity estimates. These estimates provide the basis for the valuation of the future benefits to be paid to policyholders, and to ensure adequate provisions which are monitored against current and future premiums. For those contracts that insure risk on longevity and disability, estimates are made based on recent past experience and emerging trends. Epidemics and changing patterns of lifestyle could result in significant changes to the expected future exposures. Each year, these estimates are assessed for adequacy and changes will be reflected as adjustments to the insurance fund contract liabilities.
Non-Life Insurance ContractsFor non-life insurance contracts, estimates have to be made for both the expected ultimate cost of claims reported at the balance sheet date and for the expected ultimate cost of claims incurred but not yet reported at the balance sheet date (IBNR).
It can take a significant time before the ultimate claims costs can be established with certainty and for some type of policies, IBNR claims form the majority of the insurance subsidiaries’ balance sheet liability. The ultimate cost of outstanding claims is estimated using a range of standard actuarial claims projection techniques such as Chain Ladder and Bornhuetter-Ferguson methods.
The main assumption underlying these techniques is that a company’s past development experience can be used to project future claims development and hence, ultimate claim costs. As such, these methods extrapolate the development of paid and incurred losses, average costs per claim and claim numbers based on the observed development of earlier years and expected loss ratios. Historical claims development is mainly analysed by accident years but can also be further analysed by significant business lines and claims type. Large claims are usually separately addressed, either by being reserved at the face
of loss adjustor estimates or separately projected in order to reflect their future development. In most cases, no explicit assumptions are made regarding future rates of claims inflation or loss ratios. Additional qualitative judgement is used to assess the extent to which past trends may not apply in future (for example, to reflect one-off occurrences, changes in external or market factors, economic conditions as well as internal factors such as portfolio mix, policy features and claims handling procedures) in order to arrive at the estimated ultimate cost of claims that present the likely outcome from the range of possible outcomes, taking account of all uncertainties involved.
2.24.4 Impairment of Goodwill and Intangible AssetsThe Group performs an annual review of the carrying amount of its goodwill and intangible assets, against the recoverable amounts of the CGU to which the goodwill and intangible assets have been allocated. Recoverable amounts of banking CGUs are determined based on the present value of estimated future cash flows expected to arise from the respective CGUs’ continuing operations. The recoverable amount of insurance CGU is determined using the appraisal value method. Management exercises its judgement in estimating the future cash flows, growth rates and discount rates used in computing the recoverable amounts of the CGUs.
2.24.5 Income TaxesThe Group is subject to income taxes in several jurisdictions. Significant judgement is required in determining the capital allowances and deductibility of certain expenses in estimating the income tax liabilities. There are many transactions and calculations for which the ultimate tax determination is uncertain during the ordinary course of business. The Group recognises liabilities for anticipated tax issues based on estimates of whether additional taxes will be due. Where the final tax outcome of these matters is different from the amounts that were initially recorded, such differences will impact the income tax and deferred tax balances in the period in which the determination is made.
2.24.6 Insurance Contract ClassificationContracts are classified as insurance contracts where significant insurance risk is transferred from the policyholder to the Group. The Group exercises judgement about the level of insurance risk transferred. The level of insurance risk is assessed by considering whether upon the occurrence of the insured event, the Group is required to pay significant additional benefits. These additional benefits include claims liability and assessment costs, but exclude the loss of the ability to charge the policyholder for future services. The assessment covers the whole of the expected term of the contract where such additional benefits could be payable. Some contracts contain options for the policyholder to purchase insurance risk protection at a later date; these insurance risks are deemed not significant.
3. Net Interest IncomeGROUP BANK
2019 $’000
2018$’000
2019 $’000
2018 $’000
Interest incomeLoans to non-bank customers 9,086,228 8,195,095 5,119,462 4,418,527Placements with and loans to banks 1,503,052 1,558,672 1,441,122 1,416,910Other interest-earning assets 1,508,382 1,295,511 675,520 620,465
12,097,662 11,049,278 7,236,104 6,455,902Interest expenseDeposits of non-bank customers (4,807,024) (4,169,140) (2,495,744) (2,123,358)Deposits and balances of banks (191,633) (182,513) (452,819) (346,835)Other borrowings (767,760) (807,515) (696,988) (789,233)
(5,766,417) (5,159,168) (3,645,551) (3,259,426)
Analysed by classification of financial instrumentsIncome – Assets at amortised cost 10,175,178 9,241,688 6,280,114 5,562,889Income – Assets at FVOCI 1,528,131 1,424,795 662,277 593,696Income – Assets mandatorily measured at FVTPL 394,353 382,795 293,713 299,317Expense – Liabilities not at fair value through profit or loss (5,760,556) (5,139,107) (3,639,742) (3,239,445)Expense – Liabilities mandatorily measured at FVTPL (5,861) (20,061) (5,809) (19,981)Net interest income 6,331,245 5,890,110 3,590,553 3,196,476
Included in interest income were interest of $53.3 million (2018: $33.7 million) and $45.7 million (2018: $25.7 million) on impaired assets for the Group and Bank respectively.
The Group’s and Bank’s interest expenses on lease liabilities were not significant for the financial year ended 31 December 2019.
172 OCBC Annual Report 2019 173Financials

Notes to the Financial Statements For the financial year ended 31 December 2019
4. Profit from Life InsuranceGROUP
2019$ million
2018$ million
IncomeAnnual 7,372.0 6,720.5Single 4,041.1 5,220.9Gross premiums 11,413.1 11,941.4Reinsurance (448.0) (267.8)Premium income (net) 10,965.1 11,673.6Investment income (net) 6,911.4 69.0Total income 17,876.5 11,742.6
ExpensesGross claims, surrenders and annuities (6,636.5) (6,430.5)Claims, surrenders and annuities recovered from reinsurers 232.1 164.9Net claims, surrenders and annuities (6,404.4) (6,265.6)Change in life insurance contract liabilities (Note 22) (8,556.7) (3,183.4)Commission and agency expenses (1,061.8) (957.1)Depreciation – property, plant and equipment (Note 35) (65.1) (50.7)Other expenses (934.0) (494.7)Total expenses (17,022.0) (10,951.5)
Surplus from operations 854.5 791.1Share of results of associates (0.3) (0.5)Income tax expense (74.9) (50.9)Profit from life insurance 779.3 739.7
Profit from life insurance is presented net of tax in the income statement as the tax liability is borne by the respective life funds.
5. Fees and Commissions (Net)GROUP BANK
2019 $’000
2018$’000
2019 $’000
2018 $’000
Gross fee and commission income Brokerage 81,852 104,654 876 296Credit card 347,880 350,755 297,525 275,413Fund management 114,729 113,026 985 41Guarantees 16,380 17,664 6,879 9,415Investment banking 105,624 102,010 89,638 84,978Loan-related 307,158 300,425 230,897 224,462Service charges 99,148 100,154 73,545 78,312Trade-related and remittances 254,111 238,778 179,621 171,209Wealth management 1,035,823 958,453 291,722 236,213Others 44,274 40,541 6,920 5,026
2,406,979 2,326,460 1,178,608 1,085,365Fee and commission expense (284,062) (295,533) (160,716) (142,605)Fees and commissions (net) 2,122,917 2,030,927 1,017,892 942,760
6. DividendsGROUP BANK
2019 $’000
2018$’000
2019 $’000
2018 $’000
Subsidiaries – – 913,982 1,369,198Associates – – 86,235 25,317FVTPL securities 49,362 39,114 29,139 18,477FVOCI securities 42,749 88,450 2,448 1,449
92,111 127,564 1,031,804 1,414,441
7. Other IncomeGROUP BANK
2019 $’000
2018$’000
2019 $’000
2018 $’000
Foreign exchange (1) 463,412 542,933 123,140 193,557Hedging activities (2)
Hedging instruments (92,729) (194,394) (45,525) (185,547)Hedged items 95,239 193,259 47,578 183,933Net gain/(loss) from fair value hedge ineffectiveness 2,510 (1,135) 2,053 (1,614)
Net gain/(loss) from interest rate and other derivative financial instruments (3) (82,664) 299,022 (126,995) 249,944
Net gain/(loss) from non-derivative financial instruments (4) 591,807 (333,391) 290,315 (243,573)Others 1,502 277 910 31Net trading income 976,567 507,706 289,423 198,345Disposal of debt securities classified as FVOCI 171,541 16,256 72,617 10,754Disposal of interests in subsidiaries and associate 757 7,982 6,566 262,338Disposal of plant and equipment (680) (817) (305) (652)Disposal of property 82,669 46,608 74,098 41,321Property-related income 11,024 11,190 305 362Others 27,255 72,588 33,716 36,238
1,269,133 661,513 476,420 548,706
(1) “Foreign exchange” includes gains and losses from spot and forward contracts and translation of foreign currency denominated assets and liabilities.(2) “Hedging activities” arise from the use of derivatives to hedge exposures to interest rate and foreign exchange risks, which are inherent in the underlying “Hedged items”.(3) “Interest rate and other derivatives” include gains and losses from interest rate derivative instruments, equity options and other derivative instruments.(4) “Net gain/(loss) from financial instruments” include trading gains and losses from fair value financial instruments which are either designated at initial recognition or mandatorily measured
at FVTPL.
174 OCBC Annual Report 2019 175Financials

Notes to the Financial Statements For the financial year ended 31 December 2019
8. Staff Costs and Other Operating ExpensesGROUP BANK
2019 $’000
2018$’000
2019 $’000
2018 $’000
8.1 Staff CostsSalaries and other costs 2,553,596 2,337,643 883,165 819,426Share-based expenses 68,691 65,068 25,650 26,885Contribution to defined contribution plans 201,840 188,594 77,607 70,026
2,824,127 2,591,305 986,422 916,337Directors’ emoluments: Remuneration of Bank’s directors 10,462 9,777 10,285 9,607Fees of Bank’s directors (1) 5,333 5,149 3,827 3,805
15,795 14,926 14,112 13,412Total staff costs 2,839,922 2,606,231 1,000,534 929,749
8.2 Other Operating ExpensesProperty and equipment: (2)
Depreciation 396,749 316,644 168,982 142,778Maintenance and hire (3) 135,657 124,029 40,104 39,675Rental expenses (3) 24,249 99,976 60,657 85,987Others 301,280 270,912 138,766 118,103
857,935 811,561 408,509 386,543Auditors’ remuneration:Payable to auditors of the Bank 3,862 3,803 2,739 2,891Payable to associated firms of auditors of the Bank 3,157 3,001 396 381Payable to other auditors 1,673 1,397 38 62
8,692 8,201 3,173 3,334Other fees:Payable to auditors of the Bank (4) 2,020 2,817 365 1,660Payable to associated firms of auditors of the Bank 646 733 241 191
2,666 3,550 606 1,851
Hub processing charges – – 252,779 229,425General insurance claims 106,985 91,520 – –Others (5) 828,002 693,202 433,694 356,456
934,987 784,722 686,473 585,881
Total other operating expenses 1,804,280 1,608,034 1,098,761 977,609
8.3 Staff Costs and Other Operating Expenses 4,644,202 4,214,265 2,099,295 1,907,358
(1) Includes remuneration shares amounting to $0.7 million (2018: $0.7 million) issued to directors.(2) Direct operating expenses on leased investment property for the Group and the Bank amounted to $15.8 million (2018: $19.1 million) and $4.1 million (2018: $3.0 million) respectively.
Direct operating expenses on vacant investment property for the Group and the Bank amounted to $1.0 million (2018: $0.6 million) and $0.4 million (2018: $0.3 million) respectively.(3) Includes expenses relating to short-term leases of $28.7 million and $13.5 million for the Group and the Bank respectively, and low-value assets of $6.2 million and $0.7 million for the Group
and the Bank respectively.(4) Other fees payable to auditors of the Bank relate mainly to engagements in connection with the Bank’s note issuances, taxation compliance and advisory services, miscellaneous attestations
and audit certifications.(5) Included in other expenses were printing, stationery, communication, advertisement and promotion expenses, legal and professional fees and changes in third-party interests in consolidated
investment funds.
9. Allowances for Loans and Other AssetsGROUP BANK
2019 $’000
2018$’000
2019 $’000
2018 $’000
Allowances/(write-back):Impaired loans (Note 28) 855,785 396,963 593,151 267,226Impaired other assets 1,992 5,089 2,960 36,907Non-impaired loans 39,435 (90,127) 13 (120,208)Non-impaired other assets (6,860) (24,412) (501) (29,422)
Allowances for loans and other assets 890,352 287,513 595,623 154,503
10. Income Tax ExpenseGROUP BANK
2019 $’000
2018$’000
2019 $’000
2018 $’000
Current tax expense 829,252 756,634 342,608 313,973Deferred tax (credit)/expense (Note 20) (2,627) 132,108 57,685 117,750
826,625 888,742 400,293 431,723Over provision in prior years (48,329) (11,558) (24,759) (14,027)Charge to income statements 778,296 877,184 375,534 417,696
The tax on operating profit differs from the amount that would arise using the Singapore corporate tax rate as follows:
GROUP BANK2019
$’0002018
$’0002019
$’0002018
$’000
Operating profit after allowances and amortisation 5,233,794 5,096,947 3,481,606 4,094,399
Prima facie tax calculated at tax rate of 17% 889,745 866,481 591,873 696,048Effect of:Different tax rates in other countries 104,719 125,980 21,069 43,666Income not subject to tax (37,491) (36,434) (180,847) (308,237)Income taxed at concessionary rates (87,798) (76,241) (70,070) (47,239)Singapore life insurance funds (65,745) (48,852) – –Non-deductible expenses and losses 35,358 20,432 20,555 2,982Others (12,163) 37,376 17,713 44,503
826,625 888,742 400,293 431,723
The deferred tax expense/(credit) comprised:Accelerated tax depreciation 5,053 (6,972) 7,918 (3,327)Depreciable assets acquired in business combinations (16,308) (10,313) (7,464) (1,873)Tax losses 4,287 (2,082) 9,816 (2,076)Unrealised (losses)/gains on financial assets (7,522) 49,597 (11,140) 11,747Write-back on allowances for assets 1,989 103,255 50,178 114,888Other temporary differences 9,874 (1,377) 8,377 (1,609)
(2,627) 132,108 57,685 117,750
176 OCBC Annual Report 2019 177Financials
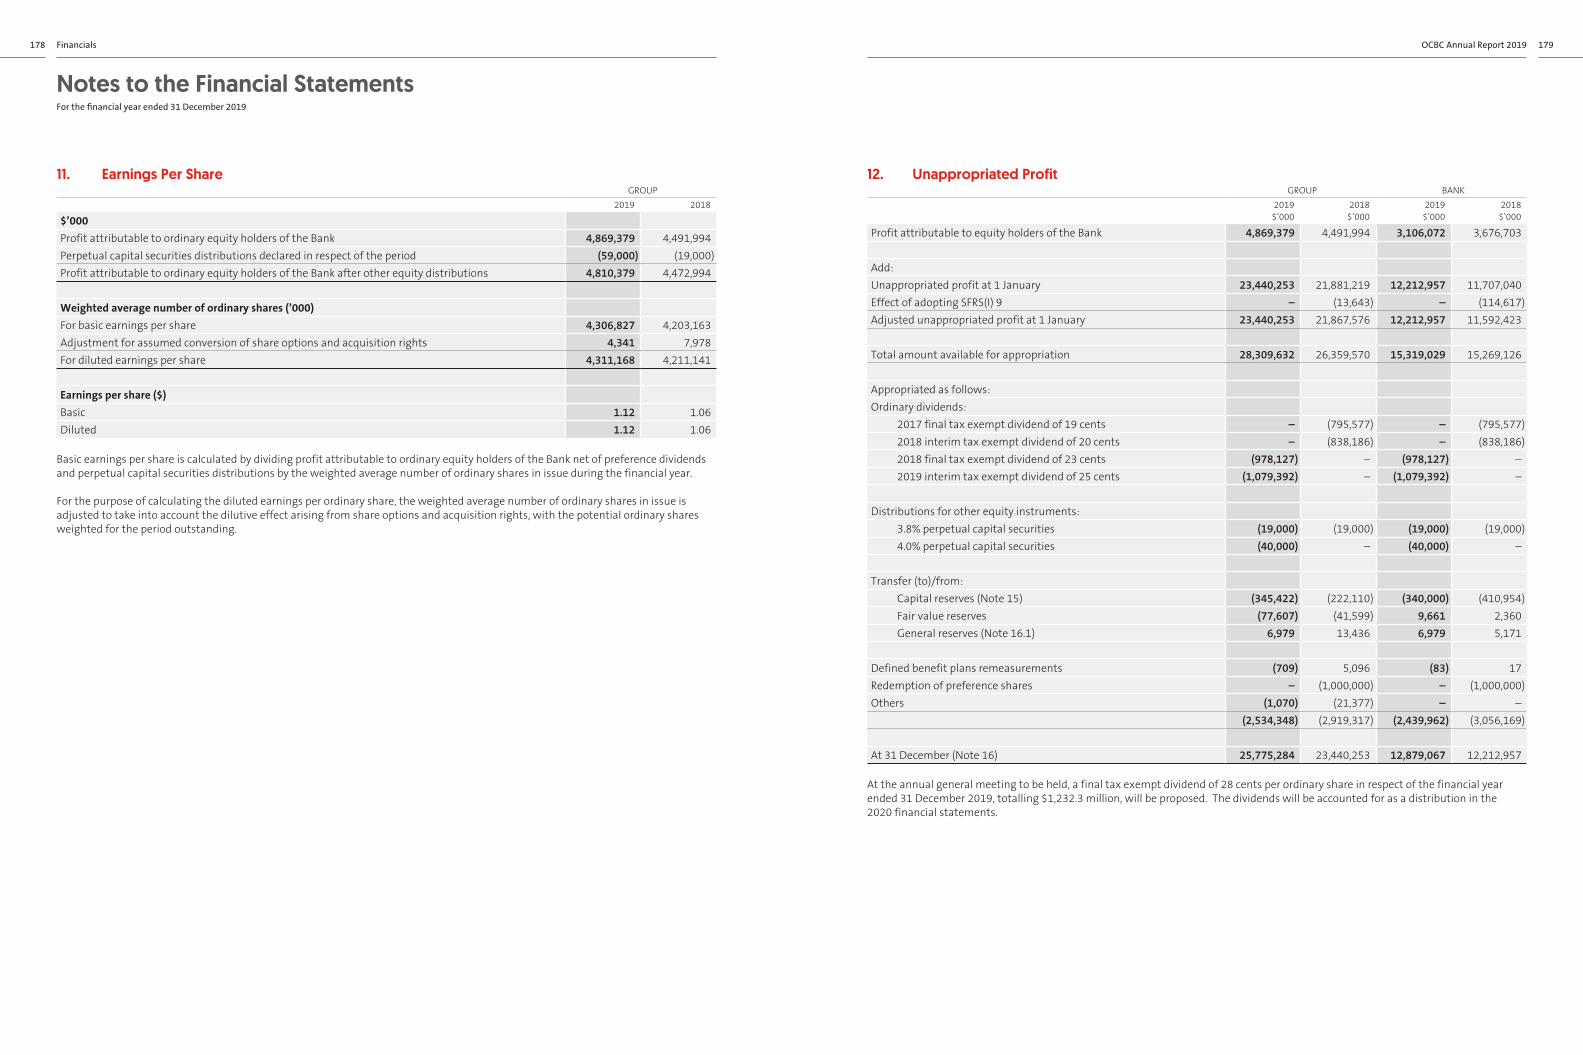
Notes to the Financial Statements For the financial year ended 31 December 2019
11. Earnings Per ShareGROUP
2019 2018
$’000Profit attributable to ordinary equity holders of the Bank 4,869,379 4,491,994Perpetual capital securities distributions declared in respect of the period (59,000) (19,000)Profit attributable to ordinary equity holders of the Bank after other equity distributions 4,810,379 4,472,994
Weighted average number of ordinary shares (’000)For basic earnings per share 4,306,827 4,203,163Adjustment for assumed conversion of share options and acquisition rights 4,341 7,978For diluted earnings per share 4,311,168 4,211,141
Earnings per share ($) Basic 1.12 1.06Diluted 1.12 1.06
Basic earnings per share is calculated by dividing profit attributable to ordinary equity holders of the Bank net of preference dividends and perpetual capital securities distributions by the weighted average number of ordinary shares in issue during the financial year.
For the purpose of calculating the diluted earnings per ordinary share, the weighted average number of ordinary shares in issue is adjusted to take into account the dilutive effect arising from share options and acquisition rights, with the potential ordinary shares weighted for the period outstanding.
12. Unappropriated ProfitGROUP BANK
2019 $’000
2018$’000
2019 $’000
2018 $’000
Profit attributable to equity holders of the Bank 4,869,379 4,491,994 3,106,072 3,676,703
Add:Unappropriated profit at 1 January 23,440,253 21,881,219 12,212,957 11,707,040Effect of adopting SFRS(I) 9 – (13,643) – (114,617)Adjusted unappropriated profit at 1 January 23,440,253 21,867,576 12,212,957 11,592,423
Total amount available for appropriation 28,309,632 26,359,570 15,319,029 15,269,126
Appropriated as follows:Ordinary dividends:
2017 final tax exempt dividend of 19 cents – (795,577) – (795,577) 2018 interim tax exempt dividend of 20 cents – (838,186) – (838,186) 2018 final tax exempt dividend of 23 cents (978,127) – (978,127) – 2019 interim tax exempt dividend of 25 cents (1,079,392) – (1,079,392) –
Distributions for other equity instruments: 3.8% perpetual capital securities (19,000) (19,000) (19,000) (19,000) 4.0% perpetual capital securities (40,000) – (40,000) –
Transfer (to)/from: Capital reserves (Note 15) (345,422) (222,110) (340,000) (410,954) Fair value reserves (77,607) (41,599) 9,661 2,360 General reserves (Note 16.1) 6,979 13,436 6,979 5,171
Defined benefit plans remeasurements (709) 5,096 (83) 17Redemption of preference shares – (1,000,000) – (1,000,000)Others (1,070) (21,377) – –
(2,534,348) (2,919,317) (2,439,962) (3,056,169)
At 31 December (Note 16) 25,775,284 23,440,253 12,879,067 12,212,957
At the annual general meeting to be held, a final tax exempt dividend of 28 cents per ordinary share in respect of the financial year ended 31 December 2019, totalling $1,232.3 million, will be proposed. The dividends will be accounted for as a distribution in the 2020 financial statements.
178 OCBC Annual Report 2019 179Financials

Notes to the Financial Statements For the financial year ended 31 December 2019
13. Share Capital 13.1 Share Capital
GROUP AND BANK2019
Shares (’000)2018
Shares (’000)
Ordinary sharesAt 1 January 4,256,770 4,193,784Shares issued in lieu of ordinary dividends 151,770 62,933Shares issued to non-executive directors 54 53At 31 December 4,408,594 4,256,770
Treasury sharesAt 1 January (6,739) (7,071)Share buyback (17,130) (17,225)Share Option Schemes 3,127 4,553Share Purchase Plan 5,635 7,635Shares sold for cash – 47Treasury shares transferred to DSP Trust 7,523 5,322At 31 December (7,584) (6,739)
Preference sharesClass MAt 1 January – 1,000,000Redemption of preference shares – (1,000,000)At 31 December – –
GROUP AND BANK2019
$’0002018
$’000
Issued share capital, at 31 December 17,261,345 15,750,417
The holders of ordinary shares (excluding treasury shares) are entitled to receive dividends as declared from time to time and to one vote per share at meetings of the Bank. All shares (excluding treasury shares) rank equally with regard to the Bank’s residual assets.
The issued ordinary shares qualify as Common Equity Tier 1 capital for the Group, while the Class M non-cumulative non-convertible preference shares qualify as Additional Tier 1 capital for the Group. The 4.0% Class M non-cumulative non-convertible preference shares were fully redeemed by the Bank on 17 January 2018.
All issued shares were fully paid. Associates of the Group did not hold shares in the capital of the Bank as at 31 December 2019 and 31 December 2018.
13. Share Capital (continued)13.2 Share Option SchemeFor the financial year ended 31 December 2019, there was no options granted under the OCBC Share Option Scheme 2001.
For the financial year ended 31 December 2018, the Bank granted options to acquire 6,868,764 ordinary shares, including options granted to an executive director of the Bank to acquire 409,643 ordinary shares in the Bank. The fair value of options granted, determined using the binomial valuation model, was $16.9 million. Significant inputs to the valuation model are set out below:
2018
Acquisition price ($) 13.34Share price ($) 13.73Expected volatility based on last 250 days historical volatility as of acceptance date (%) 17.29Risk-free rate based on SGS bond yield at acceptance date (%) 2.54Expected dividend yield (%) 2.62Exercise multiple (times) 1.52Option life (years) 10
Movements in the number of shares under options and the average acquisition prices are as follows:
2019 2018Number
of shares under options
Averageprice
Number of shares
under optionsAverage
price
At 1 January 38,622,528 $10.067 36,584,962 $9.323Granted and accepted – – 6,868,764 $13.340Exercised (3,141,516) $8.588 (4,573,422) $8.939Forfeited/lapsed (327,277) $11.702 (257,776) $11.814At 31 December 35,153,735 $10.183 38,622,528 $10.067
Exercisable options at 31 December 27,726,440 $9.754 22,698,061 $9.400Average share price underlying the options exercised $11.344 $12.956
At 31 December 2019, the weighted average remaining contractual life of outstanding share options was 5.8 years (2018: 6.7 years). The aggregate number of shares under outstanding options held by an executive director of the Bank was 5,034,060 (2018: 5,034,060).
180 OCBC Annual Report 2019 181Financials

Notes to the Financial Statements For the financial year ended 31 December 2019
13. Share Capital (continued)13.3 Employee Share Purchase PlanIn June 2019, the Bank launched its fourteenth offering of ESP Plan for Group employees, which commenced on 1 July 2019 and expire on 30 June 2021. Under the offering, the Bank granted rights to acquire 8,905,273 (2018: 8,051,064) ordinary shares in the Bank, including rights granted to an executive director of the Bank to acquire 3,180 (2018: 3,103) ordinary shares in the Bank. The fair value of rights, determined using the binomial valuation model was $7.4 million (2018: $12.2 million). Significant inputs to the valuation model are set out below:
2019 2018
Acquisition price ($) 11.32 11.60Share price ($) 10.78 12.13Expected volatility based on last 250 days historical volatility as of acceptance date (%) 17.57 18.45Risk-free rate based on 2-year swap rate (%) 1.72 1.96Expected dividend yield (%) 3.62 2.97
Movements in the number of acquisition rights of the ESP Plan are as follows:
2019 2018Number of acquisition
rightsAverage
price
Number of acquisition
rightsAverage
price
At 1 January 13,371,082 $11.233 14,584,083 $9.576Exercised and conversion upon expiry (5,635,288) $10.773 (7,635,418) $8.568Forfeited (2,316,085) $11.409 (1,628,647) $10.704Subscription 8,905,273 $11.320 8,051,064 $11.600At 31 December 14,324,982 $11.439 13,371,082 $11.233
Average share price underlying acquisition rights exercised/converted $11.539 $11.568
At 31 December 2019, the weighted average remaining contractual life of outstanding acquisition rights was 1.1 years (2018: 1.1 years). There were 6,283 (2018: 6,445) rights held by an executive director of the Bank.
13.4 Deferred Share Plan Total awards of 8,506,920 (2018: 5,924,046) ordinary shares, which included 339,880 (2018: 189,135) ordinary shares to an executive director of the Bank, were granted to eligible executives under the DSP for the financial year ended 31 December 2019. The fair value of the shares at grant date was $96.2 million (2018: $78.7 million).
During the year, 6,430,261 (2018: 6,509,474) deferred shares were released to employees, of which 295,494 (2018: 309,912) deferred shares were released to an executive director of the Bank who held office as at the end of the financial year. At 31 December 2019, an executive director of the Bank had deemed interest in 684,933 (2018: 608,866) deferred shares.
The nature, general terms and conditions of Share Option Scheme, Employee Share Purchase Plan and Deferred Share Plan are provided in the Directors’ Statement and the Corporate Governance section of the Annual Report.
The accounting treatment of share-based compensation plan is set out in Note 2.19.5.
14. Other Equity Instruments
GROUP AND BANK
Note2019
$’0002018
$’000
SGD500 million 3.8% non-cumulative non-convertible perpetual capital securities (3.8% Capital Securities) (a) 499,143 499,143
SGD1,000 million 4.0% non-cumulative non-convertible perpetual capital securities (4.0% Capital Securities) (b) 997,831 997,831
1,496,974 1,496,974
(a) The 3.8% Capital Securities issued by the Bank on 25 August 2015 are non-cumulative non-convertible perpetual capital securities. They qualify as Additional Tier 1 Capital under the Monetary Authority of Singapore (MAS) Notice on Risk Based Capital Adequacy Requirements for Banks Incorporated in Singapore (MAS Notice 637) on the basis that the Bank is subject to the application of MAS Notice 637.
The 3.8% Capital Securities may, subject to MAS approval, be redeemed at the option of the Bank on or after 25 August 2020 (First Reset Date). Their terms include a non-viability loss-absorbing feature. Under this feature, OCBC must write off the securities when: (1) the MAS notifies the Bank in writing that it is of the opinion that a write-off is necessary, without which the Bank would become non-viable; or (2) a decision by the MAS to make a public sector injection of capital, or equivalent support, without which the Bank would have become non-viable, as determined by the MAS. The Bank will, in consultation with or as directed by MAS, determine the amount to be written off in order for the non-viability event to cease to continue. In addition to the first call in 2020, the 3.8% Capital Securities may also be redeemed if a qualifying tax event or a change of qualification event occurs.
The 3.8% Capital Securities bear a fixed distribution rate of 3.8% per annum from the issue date to the First Reset Date and will be reset every 5 years thereafter to a fixed rate equal to the then-prevailing 5-year SGD Swap Offer Rate plus 1.51%. The non-cumulative distributions may only be paid out of distributable reserves semi-annually in February and August, unless cancelled by the Bank at its option. The 3.8% Capital Securities constitute unsecured and subordinated obligations, ranking senior only to shareholders of the Bank.
(b) The 4.0% Capital Securities issued by the Bank on 24 August 2018 are non-cumulative non-convertible perpetual capital securities. They qualify as Additional Tier 1 capital of the Bank under the requirements of MAS.
The 4.0% Capital Securities may, subject to MAS approval, be redeemed at the option of the Bank: (i) on 24 August 2023 (the First Reset Date) or any distribution payment date falling after the First Reset Date; (ii) upon the occurrence of a tax event; or (iii) if the 4.0% Capital Securities would no longer qualify as eligible capital. The terms of the 4.0% Capital Securities may also be varied, subject to MAS approval, so that the 4.0% Capital Securities remain as Additional Tier 1 capital of the Bank. If the Bank is determined by the MAS to be non-viable, the 4.0% Capital Securities will be written off in whole or in part.
The 4.0% Capital Securities pay distributions to holders semi-annually in arrear in February and August at a fixed rate of 4.0% per annum from the issue date to the First Reset Date. If the 4.0% Capital Securities are not redeemed on the First Reset Date, the distribution rate will be reset on the First Reset Date and every five years thereafter to a fixed rate per annum equal to the aggregate of the then-prevailing five-year SGD Swap Offer Rate and the initial spread of 1.811%. Distributions may be cancelled by the Bank at its sole discretion, subject to the provisions of the 4.0% Capital Securities. The Bank is also not obliged to pay distributions to holders under certain circumstances. Any distributions which are not paid, in accordance with the terms and conditions of the 4.0% Capital Securities, are non-cumulative and will not compound.
182 OCBC Annual Report 2019 183Financials

Notes to the Financial Statements For the financial year ended 31 December 2019
15. Capital ReservesGROUP BANK
2019 $’000
2018$’000
2019 $’000
2018 $’000
At 1 January 930,432 361,443 638,887 98,794Effect of adopting SFRS(I) 9 and revised MAS 612 – 353,667 – 122,855Adjusted balance at 1 January 930,432 715,110 638,887 221,649Share-based payments for staff costs 15,138 19,883 15,138 19,883Shares transferred to DSP Trust (99,391) (76,048) – –Shares vested under DSP Scheme 69,912 62,976 – –Transfer from unappropriated profit (Note 12) 345,422 222,110 340,000 410,954Transfer to share capital (8,320) (13,599) (8,320) (13,599)At 31 December 1,253,193 930,432 985,705 638,887
Capital reserves include regulatory loss allowance reserve and statutory reserves set aside by the Group’s banking and stockbroking entities in accordance with the respective laws and regulations. Capital reserves also include the Bank’s employee share schemes’ reserves and deferred shares held by DSP Trust.
16. Revenue ReservesGROUP BANK
2019$’000
2018$’000
2019$’000
2018$’000
Unappropriated profit (Note 12) 25,775,284 23,440,253 12,879,067 12,212,957General reserves 1,335,350 1,333,987 1,385,930 1,384,567Cash flow hedge reserves (560) 765 (704) (322)Currency translation reserves (873,550) (743,843) (117,257) (100,579)Own credit reserves (4,803) (5,570) (4,803) (5,570)At 31 December 26,231,721 24,025,592 14,142,233 13,491,053
16.1 General ReservesGROUP BANK
2019 $’000
2018$’000
2019 $’000
2018 $’000
At 1 January 1,333,987 1,340,812 1,384,567 1,383,127DSP reserve from dividends on unvested shares 8,342 6,611 8,342 6,611Transfer to unappropriated profit (Note 12) (6,979) (13,436) (6,979) (5,171)At 31 December 1,335,350 1,333,987 1,385,930 1,384,567
The general reserves have not been earmarked for any specific purpose, and include merger reserves arising from common control transactions, as well as dividends on unvested shares under the DSP.
16. Revenue Reserves (continued)16.2 Cash Flow Hedge ReservesThe cash flow hedge reserves comprise the effective portion of the cumulative net change in the fair value of hedging instruments used in cash flow hedges pending subsequent recognition of the hedged cash flow. The cash flow hedges principally consist of interest rate contracts that are used to hedge against the variability in cash flows of certain floating rate liabilities.
16.3 Currency Translation Reserves GROUP BANK
2019 $’000
2018$’000
2019 $’000
2018 $’000
At 1 January (743,843) (542,492) (100,579) (73,192)Movements for the year (177,846) (93,611) (17,520) (40,915)Effective portion of hedge 48,139 (107,740) 842 13,528At 31 December (873,550) (743,843) (117,257) (100,579)
Currency translation reserves comprise differences arising from the translation of the net assets of foreign operations and the effective portion of the hedge on exposure in foreign operations.
Refer to Note 39.3 Currency risk – Structural foreign exchange risk for management of structural foreign exchange risk.
184 OCBC Annual Report 2019 185Financials

Notes to the Financial Statements For the financial year ended 31 December 2019
17. Deposits and Balances of Non-Bank Customers and Banks
GROUP BANK2019
$’0002018
$’0002019
$’0002018
$’000
Deposits of non-bank customersCurrent accounts 89,023,826 84,295,484 44,545,996 45,180,038Savings deposits 57,465,084 52,795,875 46,151,289 42,832,452Term deposits 123,333,475 124,865,986 70,342,583 67,170,566Structured deposits 5,655,788 6,743,504 2,176,845 2,889,427Certificates of deposit issued 20,402,457 21,615,824 19,976,694 21,250,681Other deposits 6,970,465 5,095,376 6,226,465 4,276,846
302,851,095 295,412,049 189,419,872 183,600,010Deposits and balances of banks 8,249,680 7,576,453 5,938,069 6,350,256
311,100,775 302,988,502 195,357,941 189,950,266
17.1 Deposits of Non-Bank CustomersAnalysed by currencySingapore Dollar 107,278,249 105,327,557 102,313,276 100,313,074US Dollar 102,800,274 91,035,834 67,616,102 60,217,704Malaysian Ringgit 22,826,569 23,296,808 – –Indonesian Rupiah 10,220,877 9,473,599 – –Japanese Yen 1,194,231 1,462,544 168,752 520,314Hong Kong Dollar 25,905,568 28,428,124 3,990,333 3,596,038British Pound 8,825,406 10,181,650 6,306,210 7,945,937Australian Dollar 10,548,273 11,382,188 6,352,474 6,876,510Euro 2,846,738 2,961,727 626,153 893,839Chinese Renminbi 6,678,713 7,673,803 1,210,023 2,127,261Others 3,726,197 4,188,215 836,549 1,109,333
302,851,095 295,412,049 189,419,872 183,600,010
17.2 Deposits and Balances of BanksAnalysed by currencySingapore Dollar 800,618 537,641 798,108 536,806 US Dollar 4,286,596 4,104,352 3,581,757 3,652,391 Malaysian Ringgit 184,498 217,903 – – Indonesian Rupiah 273,018 112,468 – – Japanese Yen 34,606 63,316 28,886 58,342 Hong Kong Dollar 282,058 649,064 260,057 570,431 British Pound 23,905 11,696 16,049 9,608 Australian Dollar 516,082 543,181 476,486 536,718 Euro 287,343 791,068 285,953 790,692 Chinese Renminbi 1,105,005 356,821 40,120 6,420 Others 455,951 188,943 450,653 188,848
8,249,680 7,576,453 5,938,069 6,350,256
18. Derivative Financial Instruments The derivative financial instruments shown in the following tables are held for both trading and hedging purposes. The contractual or underlying principal amounts of these derivative financial instruments and their corresponding gross positive (derivative receivables) and negative (derivative payables) fair values at the balance sheet date are analysed below.
2019 2018
GROUP ($’000)
Principalnotional amount
Derivativereceivables
Derivative payables
Principalnotional amount
Derivativereceivables
Derivative payables
Foreign exchange derivatives (FED)Forwards 60,247,428 327,553 399,778 67,791,872 628,144 611,112 Swaps 315,598,950 2,343,589 2,482,731 313,680,568 2,413,279 2,415,591 OTC options 61,469,051 187,839 194,876 76,699,359 827,480 812,528
437,315,429 2,858,981 3,077,385 458,171,799 3,868,903 3,839,231Interest rate derivatives (IRD)Swaps 510,395,666 4,203,315 4,237,497 540,403,026 2,859,510 2,803,691 OTC options 3,484,976 19,508 40,456 3,760,306 16,242 33,737Exchange traded options 754,298 147 100 4,100,383 232 873Exchange traded futures 13,809,368 445 569 18,691,993 961 4,949
528,444,308 4,223,415 4,278,622 566,955,708 2,876,945 2,843,250Equity derivativesSwaps 3,196,383 63,991 131,509 2,077,197 205,784 192,488 OTC options 4,594,792 81,679 79,394 3,944,941 168,952 141,448Exchange traded futures 285,598 1,720 308 200,008 5 1,708Others 2,034 8 7 35 4 –
8,078,807 147,398 211,218 6,222,181 374,745 335,644 Credit derivativesSwaps – protection buyer 2,411,820 6,882 40,450 3,801,266 24,593 37,448 Swaps – protection seller 2,053,489 39,805 6,882 3,161,530 33,099 24,507
4,465,309 46,687 47,332 6,962,796 57,692 61,955Other derivativesPrecious metals 913,414 13,028 13,350 309,751 5,094 5,781OTC options 4,795,940 58,965 58,965 2,122,402 17,508 17,508Futures 10,150 197 – 5,020 – 4 Commodity swaps 12,562 646 13 8,862 55 1,217
5,732,066 72,836 72,328 2,446,035 22,657 24,510
Total 984,035,919 7,349,317 7,686,885 1,040,758,519 7,200,942 7,104,590
Included items designated for hedges:Fair value hedge – FED 727,606 – 14,763 – – –Fair value and cash flow hedge – IRD 13,975,763 88,272 115,468 9,631,425 36,978 35,583 Hedge of net investments – FED 3,118,955 42,000 198,347 3,844,725 56,202 168,768
17,822,324 130,272 328,578 13,476,150 93,180 204,351
For the fair value hedges, the carrying amount at 31 December 2019 relating to the assets and liabilities designated as hedged items were $7,994 million and $7,173 million (2018: $3,125 million and $5,829 million) respectively. The hedged items were mainly fixed rate debt securities held (financial assets) and debt securities issued (financial liabilities).
For the cash flow hedges, the carrying amount at 31 December 2019 relating to the assets and liabilities designated as hedged items were $2,017 million and $2,017 million (2018: $2,898 million and $2,898 million) respectively. The hedged items were mainly variable rate loans (financial assets) and deposits (financial liabilities).
186 OCBC Annual Report 2019 187Financials

Notes to the Financial Statements For the financial year ended 31 December 2019
18. Derivative Financial Instruments (continued)2019 2018
BANK ($’000)
Principalnotional amount
Derivativereceivables
Derivative payables
Principalnotional amount
Derivativereceivables
Derivative payables
Foreign exchange derivatives (FED)Forwards 36,561,307 176,836 246,930 34,192,396 304,902 297,395Swaps 276,330,317 1,853,792 2,137,199 280,808,610 1,905,954 1,911,588OTC options 7,867,641 51,428 59,289 14,057,745 120,868 107,247
320,759,265 2,082,056 2,443,418 329,058,751 2,331,724 2,316,230Interest rate derivatives (IRD)Swaps 434,510,184 4,110,881 4,083,246 502,147,797 2,702,682 2,651,294OTC options 3,400,514 19,213 40,161 3,677,500 15,961 33,372Exchange traded options 754,298 147 100 4,100,382 232 873Exchange traded futures 13,110,346 372 542 18,528,480 898 4,505
451,775,342 4,130,613 4,124,049 528,454,159 2,719,773 2,690,044Equity derivativesSwaps 2,932,054 58,509 126,026 2,005,364 201,925 188,629OTC options 1,067,194 11,194 8,910 1,151,644 44,137 16,623Exchange traded futures 257,493 1,628 14 200,004 – 1,620Others 2,034 8 7 35 4 –
4,258,775 71,339 134,957 3,357,047 246,066 206,872Credit derivativesSwaps – protection buyer 2,255,043 – 40,392 3,594,253 526 37,446Swaps – protection seller 1,896,675 39,746 – 2,956,791 33,099 440
4,151,718 39,746 40,392 6,551,044 33,625 37,886Other derivativesPrecious metals 34,323 25 548 23,681 – 737
Total 780,979,423 6,323,779 6,743,364 867,444,682 5,331,188 5,251,769
Included items designated for hedges:Fair value hedge – FED 3,476,395 41,213 190,056 2,932,118 54,123 149,399Fair value hedge – IRD 9,710,920 87,737 57,652 5,054,585 26,376 14,420Hedge of net investments – FED 284,481 787 20,148 418,862 655 17,495
13,471,796 129,737 267,856 8,405,565 81,154 181,314
18. Derivative Financial Instruments (continued)GROUP BANK
2019$’000
2018$’000
2019$’000
2018$’000
Derivative receivables:Analysed by counterpartyBanks 2,694,489 2,922,337 2,304,388 2,122,679Other financial institutions 3,259,280 3,210,477 2,949,984 2,563,907Corporates 1,121,223 471,488 1,014,181 403,668Individuals 253,251 542,700 34,499 186,994Others 21,074 53,940 20,727 53,940
7,349,317 7,200,942 6,323,779 5,331,188
Analysed by geographySingapore 930,121 1,042,006 923,488 1,004,997Malaysia 262,865 264,104 81,077 45,885Indonesia 184,397 78,361 126,553 24,113Greater China 913,029 1,333,831 449,588 419,357Other Asia Pacific 443,796 411,441 377,698 265,274Rest of the World 4,615,109 4,071,199 4,365,375 3,571,562
7,349,317 7,200,942 6,323,779 5,331,188
The analysis by geography is determined based on where the credit risk resides.
19. Other Liabilities GROUP BANK
2019$’000
2018$’000
2019$’000
2018$’000
Bills payable 379,844 321,970 256,604 238,385 Interest payable 932,149 913,634 589,820 500,602 Lease liabilities 293,184 – 67,245 –Sundry creditors 4,034,423 3,419,950 611,048 600,353 Others 1,304,979 1,157,108 561,153 485,158
6,944,579 5,812,662 2,085,870 1,824,498
At 31 December 2019, reinsurance liabilities and third-party interests in consolidated investment funds included in “Others” amounted to $51.7 million (2018: $38.6 million) and $27.9 million (2018: $27.6 million) respectively for the Group.
20. Deferred Tax GROUP BANK
2019 $’000
2018 $’000
2019 $’000
2018 $’000
At 1 January 1,345,504 1,372,617 153,038 (10,462)Effect of adopting SFRS(I) 9 – 47,323 – 50,958Adjusted balance at 1 January 1,345,504 1,419,940 153,038 40,496Acquisitions (4,668) – – –Currency translation and others (2,468) 27,781 (420) 104Net (credit)/charge to income statements (Note 10) (2,627) 132,108 57,685 117,750(Over)/under provision in prior years (438) 429 79 (34)Net charge/(credit) to equity 160,047 (115,074) 6,863 (5,278)Net change in life insurance fund tax 311,036 (119,680) – –At 31 December 1,806,386 1,345,504 217,245 153,038
188 OCBC Annual Report 2019 189Financials
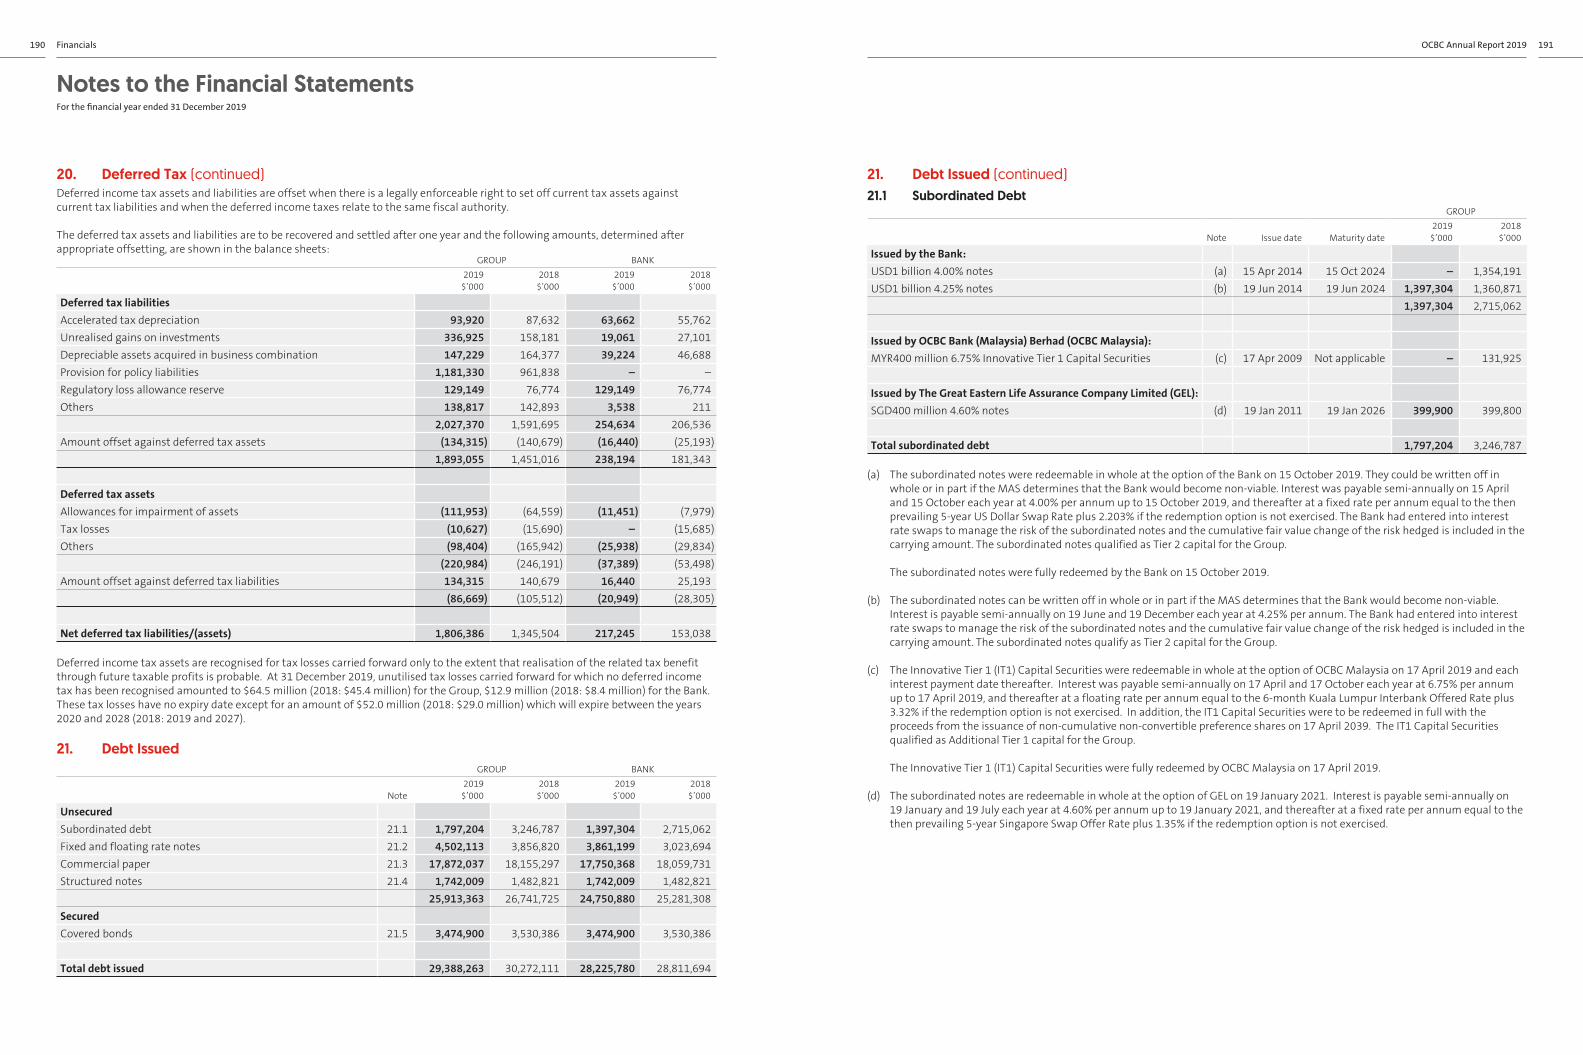
Notes to the Financial Statements For the financial year ended 31 December 2019
20. Deferred Tax (continued)Deferred income tax assets and liabilities are offset when there is a legally enforceable right to set off current tax assets against current tax liabilities and when the deferred income taxes relate to the same fiscal authority.
The deferred tax assets and liabilities are to be recovered and settled after one year and the following amounts, determined after appropriate offsetting, are shown in the balance sheets:
GROUP BANK2019
$’0002018
$’0002019
$’0002018
$’000
Deferred tax liabilitiesAccelerated tax depreciation 93,920 87,632 63,662 55,762Unrealised gains on investments 336,925 158,181 19,061 27,101Depreciable assets acquired in business combination 147,229 164,377 39,224 46,688Provision for policy liabilities 1,181,330 961,838 – –Regulatory loss allowance reserve 129,149 76,774 129,149 76,774Others 138,817 142,893 3,538 211
2,027,370 1,591,695 254,634 206,536Amount offset against deferred tax assets (134,315) (140,679) (16,440) (25,193)
1,893,055 1,451,016 238,194 181,343
Deferred tax assetsAllowances for impairment of assets (111,953) (64,559) (11,451) (7,979)Tax losses (10,627) (15,690) – (15,685)Others (98,404) (165,942) (25,938) (29,834)
(220,984) (246,191) (37,389) (53,498)Amount offset against deferred tax liabilities 134,315 140,679 16,440 25,193
(86,669) (105,512) (20,949) (28,305)
Net deferred tax liabilities/(assets) 1,806,386 1,345,504 217,245 153,038
Deferred income tax assets are recognised for tax losses carried forward only to the extent that realisation of the related tax benefit through future taxable profits is probable. At 31 December 2019, unutilised tax losses carried forward for which no deferred income tax has been recognised amounted to $64.5 million (2018: $45.4 million) for the Group, $12.9 million (2018: $8.4 million) for the Bank. These tax losses have no expiry date except for an amount of $52.0 million (2018: $29.0 million) which will expire between the years 2020 and 2028 (2018: 2019 and 2027).
21. Debt IssuedGROUP BANK
Note2019
$’0002018
$’0002019
$’0002018
$’000
UnsecuredSubordinated debt 21.1 1,797,204 3,246,787 1,397,304 2,715,062Fixed and floating rate notes 21.2 4,502,113 3,856,820 3,861,199 3,023,694Commercial paper 21.3 17,872,037 18,155,297 17,750,368 18,059,731Structured notes 21.4 1,742,009 1,482,821 1,742,009 1,482,821
25,913,363 26,741,725 24,750,880 25,281,308SecuredCovered bonds 21.5 3,474,900 3,530,386 3,474,900 3,530,386
Total debt issued 29,388,263 30,272,111 28,225,780 28,811,694
21. Debt Issued (continued)21.1 Subordinated Debt
GROUP
Note Issue date Maturity date2019
$’0002018
$’000
Issued by the Bank:USD1 billion 4.00% notes (a) 15 Apr 2014 15 Oct 2024 – 1,354,191USD1 billion 4.25% notes (b) 19 Jun 2014 19 Jun 2024 1,397,304 1,360,871
1,397,304 2,715,062
Issued by OCBC Bank (Malaysia) Berhad (OCBC Malaysia):MYR400 million 6.75% Innovative Tier 1 Capital Securities (c) 17 Apr 2009 Not applicable – 131,925
Issued by The Great Eastern Life Assurance Company Limited (GEL):SGD400 million 4.60% notes (d) 19 Jan 2011 19 Jan 2026 399,900 399,800
Total subordinated debt 1,797,204 3,246,787
(a) The subordinated notes were redeemable in whole at the option of the Bank on 15 October 2019. They could be written off in whole or in part if the MAS determines that the Bank would become non-viable. Interest was payable semi-annually on 15 April and 15 October each year at 4.00% per annum up to 15 October 2019, and thereafter at a fixed rate per annum equal to the then prevailing 5-year US Dollar Swap Rate plus 2.203% if the redemption option is not exercised. The Bank had entered into interest rate swaps to manage the risk of the subordinated notes and the cumulative fair value change of the risk hedged is included in the carrying amount. The subordinated notes qualified as Tier 2 capital for the Group.
The subordinated notes were fully redeemed by the Bank on 15 October 2019.
(b) The subordinated notes can be written off in whole or in part if the MAS determines that the Bank would become non-viable. Interest is payable semi-annually on 19 June and 19 December each year at 4.25% per annum. The Bank had entered into interest rate swaps to manage the risk of the subordinated notes and the cumulative fair value change of the risk hedged is included in the carrying amount. The subordinated notes qualify as Tier 2 capital for the Group.
(c) The Innovative Tier 1 (IT1) Capital Securities were redeemable in whole at the option of OCBC Malaysia on 17 April 2019 and each interest payment date thereafter. Interest was payable semi-annually on 17 April and 17 October each year at 6.75% per annum up to 17 April 2019, and thereafter at a floating rate per annum equal to the 6-month Kuala Lumpur Interbank Offered Rate plus 3.32% if the redemption option is not exercised. In addition, the IT1 Capital Securities were to be redeemed in full with the proceeds from the issuance of non-cumulative non-convertible preference shares on 17 April 2039. The IT1 Capital Securities qualified as Additional Tier 1 capital for the Group.
The Innovative Tier 1 (IT1) Capital Securities were fully redeemed by OCBC Malaysia on 17 April 2019.
(d) The subordinated notes are redeemable in whole at the option of GEL on 19 January 2021. Interest is payable semi-annually on 19 January and 19 July each year at 4.60% per annum up to 19 January 2021, and thereafter at a fixed rate per annum equal to the then prevailing 5-year Singapore Swap Offer Rate plus 1.35% if the redemption option is not exercised.
190 OCBC Annual Report 2019 191Financials

Notes to the Financial Statements For the financial year ended 31 December 2019
21. Debt Issued (continued)21.2 Fixed and Floating Rate Notes
GROUP
Note Issue date Maturity date2019
$’0002018
$’000
Issued by the Bank:AUD300 million floating rate notes (a) 6 Mar 2015 6 Jun 2019 – 289,199AUD300 million floating rate notes (b) 17 Mar 2016 17 Mar 2020 282,944 289,119AUD500 million floating rate notes (c) 6 Oct 2017
– 6 Nov 20176 Oct 2020 471,534 481,898
AUD600 million floating rate notes (d) 23 Apr 2018 23 Apr 2021 565,689 578,050AUD500 million floating rate notes (e) 6 Sep 2018 6 Sep 2021 471,360 481,661AUD100 million floating rate notes (f) 28 Nov 2018 24 Feb 2020 94,318 96,400AUD200 million floating rate notes (g) 8 Apr 2019 6 Apr 2020 188,634 –AUD550 million floating rate notes (h) 23 May 2019 23 May 2022 518,393 –AUD500 million floating rate notes (i) 5 Dec 2019 5 Dec 2022 471,181 –CNY500 million 3.50% fixed rate notes (k) 5 Feb 2013 5 Feb 2020 96,556 99,156HKD1.403 billion 1.59% fixed rate notes (l) 25 Sep 2017 25 Sep 2020 242,817 244,503USD340 million floating rate notes (j) 17 May 2018 17 May 2021 457,773 463,708
3,861,199 3,023,694
Issued by OCBC NISP:IDR783 billion 8.25% fixed rate bonds (m) 11 May 2016 11 May 2019 – 73,566IDR300 billion 7.30% fixed rate bonds (m) 22 Aug 2017 22 Aug 2019 – 28,174IDR454 billion 7.70% fixed rate bonds (n) 22 Aug 2017 22 Aug 2020 44,010 42,610IDR175 billion 6.75% fixed rate bonds (m) 12 Dec 2017 12 Dec 2019 – 16,428IDR609 billion 7.20% fixed rate bonds (n) 12 Dec 2017 12 Dec 2020 59,019 57,141IDR525 billion 6.00% fixed rate bonds (m) 11 Apr 2018 20 Apr 2019 – 49,306IDR535 billion 6.90% fixed rate bonds (n) 11 Apr 2018 10 Apr 2021 47,952 46,425IDR655 billion 6.75% fixed rate bonds (m) 6 Jul 2018 16 Jul 2019 – 61,408IDR3 billion 7.25% fixed rate bonds (n) 6 Jul 2018 6 Jul 2020 291 281IDR342 billion 7.75% fixed rate bonds (n) 6 Jul 2018 6 Jul 2021 33,087 32,014
184,359 407,353
Issued by Pac Lease Berhad:MYR85 million 4.40% fixed rate notes (k) 13 Nov 2018 13 May 2020 27,969 28,034MYR80 million 3.80% fixed rate notes (k) 23 Sep 2019 23 Mar 2021 26,324 –MYR50 million 3.80% fixed rate notes (k) 26 Sep 2019 26 Mar 2021 16,453 –
70,746 28,034
Issued by OCBC Wing Hang Bank (China):CNY2 billion 4.06% fixed rate bonds (l) 28 Nov 2018 28 Nov 2021 385,809 397,739
Total fixed and floating rate notes 4,502,113 3,856,820
(a) Interest was payable quarterly at the 3-month Bank Bill Swap reference rate plus 0.81% per annum. The notes were fully redeemed on the maturity date.
(b) Interest is payable quarterly at the 3-month Bank Bill Swap reference rate plus 1.20% per annum.
(c) Interest is payable quarterly at the 3-month Bank Bill Swap reference rate plus 0.60% per annum.
(d) Interest is payable quarterly at the 3-month Bank Bill Swap reference rate plus 0.70% per annum.
(e) Interest is payable quarterly at the 3-month Bank Bill Swap reference rate plus 0.72% per annum.
21. Debt Issued (continued)21.2 Fixed and Floating Rate Notes (continued) (f) Interest is payable quarterly at the 3-month Bank Bill Swap reference rate plus 0.48% per annum.
(g) Interest is payable quarterly at the 3-month Bank Bill Swap reference rate plus 0.38% per annum.
(h) Interest is payable quarterly at the 3-month Bank Bill Swap reference rate plus 0.62% per annum.
(i) Interest is payable quarterly at the 3-month Bank Bill Swap reference rate plus 0.63% per annum.
(j) Interest is payable quarterly at the 3-month US Dollar London Interbank Offer Rate plus 0.45% per annum.
(k) Interest is payable semi-annually.
(l) Interest is payable annually.
(m) Interest was payable quarterly. The bonds were fully redeemed on their respective maturity dates.
(n) Interest is payable quarterly.
21.3 Commercial PaperGROUP
Note2019
$’0002018
$’000
Issued by the Bank (a) 17,750,368 18,059,731Issued by Pac Lease Berhad (b) 121,669 95,566Total commercial paper issued 17,872,037 18,155,297
(a) The Bank issued the commercial paper under its USD10 billion ECP programme and USD15 billion USCP programme. The notes outstanding as at 31 December 2019 (2018: 31 December 2018) were issued between 19 February 2019 (2018: 11 January 2018) and 20 December 2019 (2018: 17 December 2018), and mature between 3 January 2020 (2018: 3 January 2019) and 5 November 2020 (2018: 18 October 2019), yielding between 0.81% and 2.09% (2018: 0.42% and 3.01%).
(b) Pac Lease Berhad issued the commercial paper under its MYR1 billion 7-year CP/MTN programme. The notes outstanding as at 31 December 2019 (2018: 31 December 2018) were issued between 4 December 2019 (2018: 30 October 2018) and 19 December 2019 (2018: 26 December 2018), and mature between 3 January 2020 (2018: 4 January 2019) and 20 January 2020 (2018: 25 January 2019), with interest rate at 3.55% (2018: 3.90% to 4.10%).
21.4 Structured Notes GROUP
Issue date Maturity date2019
$’0002018
$’000
Issued by the Bank:Credit linked notes 1 Oct 2012 – 23 Dec 2019 15 Jan 2020 – 15 Apr 2025 1,093,913 904,054Fixed rate notes 9 Oct 2012 – 27 Dec 2012 9 Oct 2037 – 28 Dec 2037 107,737 109,166Bond linked notes 12 Oct 2016 – 21 Nov 2019 5 Jun 2020 – 12 Nov 2027 342,149 336,680Index linked notes 12 Feb 2018 – 15 Mar 2019 20 Feb 2020 – 30 Jul 2020 59,696 92,877Fund linked notes 16 Jul 2018 – 14 Nov 2019 4 Mar 2021 – 16 May 2024 38,847 40,044Participation notes 14 Jun 2019 – 17 Dec 2019 16 Jun 2020 – 16 Jul 2024 99,667 –
1,742,009 1,482,821
The structured notes were issued by the Bank under its Structured Note and Global Medium Term Notes Programmes and were measured at amortised cost, except for $968.9 million (2018: $738.5 million) included under credit linked notes and $342.1 million (2018: $336.7 million) included under bond linked notes as at 31 December 2019 which were measured at fair value through profit or loss.
192 OCBC Annual Report 2019 193Financials

Notes to the Financial Statements For the financial year ended 31 December 2019
21. Debt Issued (continued)21.4 Structured Notes (continued)In accordance with SFRS(I) 9, to the extent that the underlying economic characteristics and risks of the embedded derivatives were not closely related to the economic characteristics and risks of the host contract, and where such embedded derivatives would meet the definition of a derivative, the Group bifurcated such embedded derivatives and recognised these separately from the host contracts. The bifurcated embedded derivatives were fair valued through profit or loss, and were included as part of the Group’s derivatives in the financial statements.
21.5 Covered Bonds GROUP
Issue date Maturity date2019
$’0002018
$’000
Issued by the Bank:EUR1 billion 0.25% fixed rate bonds 21 Mar 2017 – 5 Oct 2017 21 Mar 2022 – 5 Oct 2022 1,510,330 1,550,803EUR500 million 0.375% fixed rate bonds 1 Mar 2018 1 Mar 2023 759,470 778,013EUR500 million 0.625% fixed rate bonds 18 Apr 2018 18 Apr 2025 763,716 769,489GBP250 million floating rate bonds 14 Mar 2018 14 Mar 2023 441,384 432,081
3,474,900 3,530,386
The covered bonds were issued by the Bank under its USD10 billion Global Covered Bond Programme. The Covered Bond Guarantor, Red Sail Pte. Ltd., guarantees the payments of interest and principal. The guarantee is secured by a portfolio of Singapore home loans transferred from OCBC Bank to Red Sail Pte. Ltd. (Note 46.2). Interest is payable annually in arrears.
21.6 Reconciliation of Movements of Liabilities to Cash Flow Arising from Financing Activities
GROUP ($’000)Subordinated
debt
Fixed and floating rate
notesCommercial
paperStructured
notesCovered
bonds Total
At 1 January 2018 4,556,224 3,424,298 21,380,796 1,289,133 1,584,295 32,234,746Cash flows (1,314,217) 551,435 (3,428,339) 179,917 2,062,413 (1,948,791)Non-cash changes
Currency translation 32,686 (210,191) 43,008 8,191 55,247 (71,059)Others (27,906) 91,278 159,832 5,580 (171,569) 57,215
At 31 December 2018/1 January 2019 3,246,787 3,856,820 18,155,297 1,482,821 3,530,386 30,272,111Cash flows (1,503,534) 703,385 (241,124) 233,648 – (807,625)Non-cash changes
Currency translation (11,011) (58,973) (188,348) 26,034 (22,917) (255,215)Others 64,962 881 146,212 (494) (32,569) 178,992
At 31 December 2019 1,797,204 4,502,113 17,872,037 1,742,009 3,474,900 29,388,263
22. Life Insurance Fund Liabilities and Investment AssetsGROUP
2019$ million
2018$ million
Life insurance fund liabilitiesMovements in life insurance fundAt 1 January 68,260.2 65,151.0Effect of adopting SFRS(I) 9 – (3.2)Adjusted balance at 1 January 68,260.2 65,147.8
Currency translation (44.5) (70.1)Changes due to transfer of Eldershield portfolio (1) (1,572.3) –Fair value reserve movements 4.2 (0.9)Change in life insurance contract liabilities (Note 4) 8,556.7 3,183.4
At 31 December 75,204.3 68,260.2Policy benefits 4,672.1 4,192.0Others (1) 4,569.5 2,476.2
84,445.9 74,928.4Life insurance fund investment assetsDeposits with banks and financial institutions 4,380.3 3,736.7Loans 1,064.3 1,321.8Securities 75,786.5 66,261.4Investment property 1,785.5 1,771.3Others (2) 4,320.7 3,775.8
87,337.3 76,867.0
Life insurance fund balances included under the following balance sheet items: LiabilitiesCurrent tax 285.1 270.5Deferred tax 1,507.7 1,127.5Other liabilities 98.7 –
AssetsCash and placements with central banks # #Placements with and loans to banks 1,256.6 1,261.1Property, plant and equipment 683.9 569.1
The following contracts were entered into under the life insurance fund:Operating lease commitments – 60.5Capital commitment authorised and contracted 172.6 125.3Derivative financial instruments (principal notional amount) 27,915.7 19,566.8Derivative receivables 400.4 219.8Derivative payables 191.0 289.7Minimum lease rental receivables under non-cancellable operating leases 60.8 59.9
(1) On 28 December 2018, The Great Eastern Life Assurance Company Limited entered into an Agreement to Transfer with Ministry of Health (MOH) for the Government to take over the administration of the ElderShield scheme. Following the enactment of Careshield Life and Long-Term Care Act 2019, The Great Eastern Life Assurance Company Limited has derecognised the liabilities of the Eldershield portfolio as at 31 December 2019. The Great Eastern Life Assurance Company Limited is expected to transfer the amount due to MOH and corresponding assets backing these liabilities to MOH at a later date.
(2) Others mainly comprise interest receivable, deposits collected, prepayments, investment debtors and sundry debtors.(3) # represents amounts less than $0.5 million.
194 OCBC Annual Report 2019 195Financials
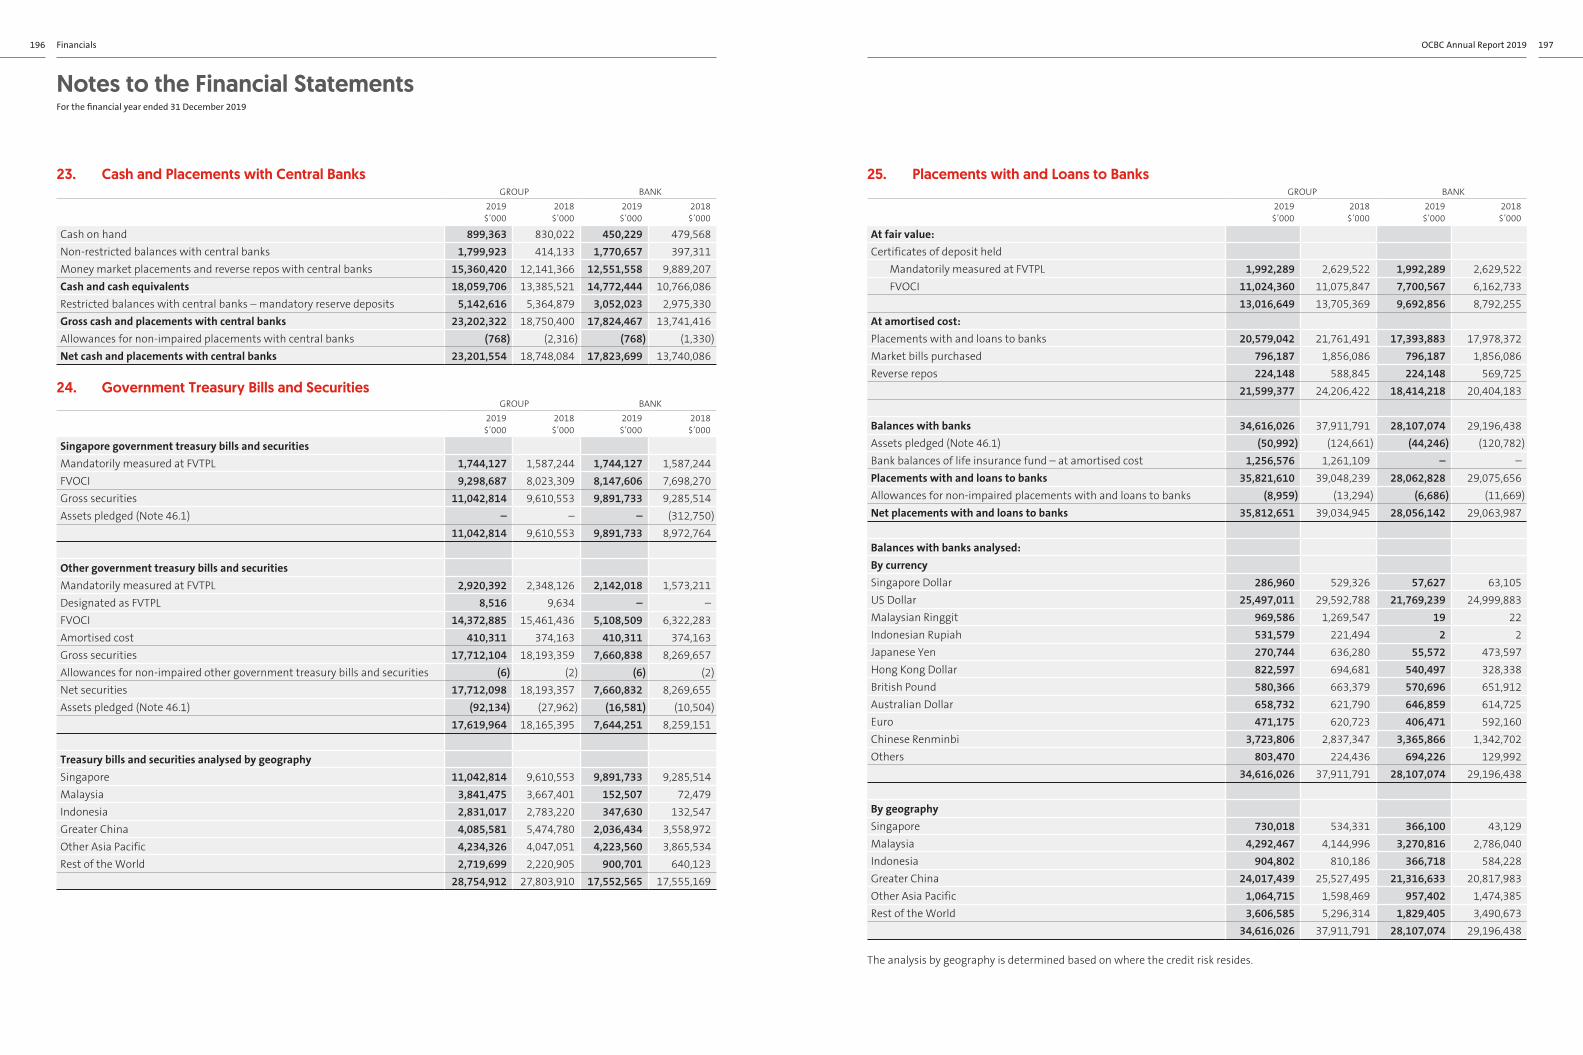
Notes to the Financial Statements For the financial year ended 31 December 2019
23. Cash and Placements with Central Banks GROUP BANK
2019 $’000
2018 $’000
2019 $’000
2018 $’000
Cash on hand 899,363 830,022 450,229 479,568Non-restricted balances with central banks 1,799,923 414,133 1,770,657 397,311Money market placements and reverse repos with central banks 15,360,420 12,141,366 12,551,558 9,889,207Cash and cash equivalents 18,059,706 13,385,521 14,772,444 10,766,086Restricted balances with central banks – mandatory reserve deposits 5,142,616 5,364,879 3,052,023 2,975,330Gross cash and placements with central banks 23,202,322 18,750,400 17,824,467 13,741,416Allowances for non-impaired placements with central banks (768) (2,316) (768) (1,330)Net cash and placements with central banks 23,201,554 18,748,084 17,823,699 13,740,086
24. Government Treasury Bills and SecuritiesGROUP BANK
2019 $’000
2018 $’000
2019 $’000
2018 $’000
Singapore government treasury bills and securitiesMandatorily measured at FVTPL 1,744,127 1,587,244 1,744,127 1,587,244FVOCI 9,298,687 8,023,309 8,147,606 7,698,270Gross securities 11,042,814 9,610,553 9,891,733 9,285,514Assets pledged (Note 46.1) – – – (312,750)
11,042,814 9,610,553 9,891,733 8,972,764
Other government treasury bills and securitiesMandatorily measured at FVTPL 2,920,392 2,348,126 2,142,018 1,573,211Designated as FVTPL 8,516 9,634 – –FVOCI 14,372,885 15,461,436 5,108,509 6,322,283Amortised cost 410,311 374,163 410,311 374,163Gross securities 17,712,104 18,193,359 7,660,838 8,269,657Allowances for non-impaired other government treasury bills and securities (6) (2) (6) (2)Net securities 17,712,098 18,193,357 7,660,832 8,269,655Assets pledged (Note 46.1) (92,134) (27,962) (16,581) (10,504)
17,619,964 18,165,395 7,644,251 8,259,151
Treasury bills and securities analysed by geographySingapore 11,042,814 9,610,553 9,891,733 9,285,514Malaysia 3,841,475 3,667,401 152,507 72,479Indonesia 2,831,017 2,783,220 347,630 132,547Greater China 4,085,581 5,474,780 2,036,434 3,558,972Other Asia Pacific 4,234,326 4,047,051 4,223,560 3,865,534Rest of the World 2,719,699 2,220,905 900,701 640,123
28,754,912 27,803,910 17,552,565 17,555,169
25. Placements with and Loans to BanksGROUP BANK
2019 $’000
2018 $’000
2019 $’000
2018 $’000
At fair value:Certificates of deposit held
Mandatorily measured at FVTPL 1,992,289 2,629,522 1,992,289 2,629,522FVOCI 11,024,360 11,075,847 7,700,567 6,162,733
13,016,649 13,705,369 9,692,856 8,792,255At amortised cost:Placements with and loans to banks 20,579,042 21,761,491 17,393,883 17,978,372Market bills purchased 796,187 1,856,086 796,187 1,856,086Reverse repos 224,148 588,845 224,148 569,725
21,599,377 24,206,422 18,414,218 20,404,183
Balances with banks 34,616,026 37,911,791 28,107,074 29,196,438Assets pledged (Note 46.1) (50,992) (124,661) (44,246) (120,782)Bank balances of life insurance fund – at amortised cost 1,256,576 1,261,109 – –Placements with and loans to banks 35,821,610 39,048,239 28,062,828 29,075,656Allowances for non-impaired placements with and loans to banks (8,959) (13,294) (6,686) (11,669)Net placements with and loans to banks 35,812,651 39,034,945 28,056,142 29,063,987
Balances with banks analysed:By currencySingapore Dollar 286,960 529,326 57,627 63,105US Dollar 25,497,011 29,592,788 21,769,239 24,999,883Malaysian Ringgit 969,586 1,269,547 19 22Indonesian Rupiah 531,579 221,494 2 2Japanese Yen 270,744 636,280 55,572 473,597Hong Kong Dollar 822,597 694,681 540,497 328,338British Pound 580,366 663,379 570,696 651,912Australian Dollar 658,732 621,790 646,859 614,725Euro 471,175 620,723 406,471 592,160Chinese Renminbi 3,723,806 2,837,347 3,365,866 1,342,702Others 803,470 224,436 694,226 129,992
34,616,026 37,911,791 28,107,074 29,196,438
By geographySingapore 730,018 534,331 366,100 43,129Malaysia 4,292,467 4,144,996 3,270,816 2,786,040Indonesia 904,802 810,186 366,718 584,228Greater China 24,017,439 25,527,495 21,316,633 20,817,983Other Asia Pacific 1,064,715 1,598,469 957,402 1,474,385Rest of the World 3,606,585 5,296,314 1,829,405 3,490,673
34,616,026 37,911,791 28,107,074 29,196,438
The analysis by geography is determined based on where the credit risk resides.
196 OCBC Annual Report 2019 197Financials

Notes to the Financial Statements For the financial year ended 31 December 2019
26. Loans and Bills ReceivableGROUP BANK
2019 $’000
2018 $’000
2019 $’000
2018 $’000
Gross loansAmortised cost 264,592,905 257,432,456 165,989,306 158,152,944Mandatorily measured at FVTPL 180,406 272,284 171,472 250,324
264,773,311 257,704,740 166,160,778 158,403,268Allowances
Impaired loans (Note 28) (1,394,721) (1,218,428) (1,034,719) (949,044)Non-impaired loans (Note 30) (1,029,993) (984,042) (562,134) (557,588)
Net loans 262,348,597 255,502,270 164,563,925 156,896,636Assets pledged (Note 46.1) (303,640) (309,155) – –
262,044,957 255,193,115 164,563,925 156,896,636
Bills receivable 7,462,320 9,360,743 6,135,663 7,842,766Loans 254,886,277 246,141,527 158,428,262 149,053,870Net loans 262,348,597 255,502,270 164,563,925 156,896,636
26.1 Analysed by CurrencySingapore Dollar 93,559,170 91,640,431 90,528,980 88,198,585US Dollar 65,163,128 67,248,176 41,950,663 43,946,869Malaysian Ringgit 20,877,926 20,870,139 90 77Indonesian Rupiah 9,221,577 8,695,113 – –Japanese Yen 2,758,743 2,217,464 364,048 314,799Hong Kong Dollar 34,354,533 35,194,442 10,083,614 8,565,138British Pound 12,408,528 8,132,166 9,014,868 5,551,822Australian Dollar 9,142,859 7,643,615 7,695,590 6,502,973Euro 7,999,722 7,384,950 3,121,670 2,505,969Chinese Renminbi 4,933,483 4,501,640 1,456,114 706,886Others 4,353,642 4,176,604 1,945,141 2,110,150
264,773,311 257,704,740 166,160,778 158,403,268
26.2 Analysed by ProductOverdrafts 4,155,151 4,647,930 656,374 761,101Short-term and revolving loans 66,516,691 65,151,098 26,420,871 25,767,520Syndicated and term loans 93,724,709 82,626,139 78,386,985 67,750,716Housing and commercial property loans 71,414,267 73,372,488 42,733,801 43,507,846Car, credit card and share margin loans 5,323,848 5,402,136 3,270,684 3,062,877Others 23,638,645 26,504,949 14,692,063 17,553,208
264,773,311 257,704,740 166,160,778 158,403,268
26. Loans and Bills Receivable (continued)GROUP BANK
2019 $’000
2018 $’000
2019 $’000
2018 $’000
26.3 Analysed by IndustryAgriculture, mining and quarrying 8,963,197 8,893,658 5,736,387 5,616,792Manufacturing 17,073,573 16,494,130 9,388,021 8,598,398Building and construction 64,686,363 53,510,574 51,985,297 42,239,673Housing 62,069,239 64,753,306 40,915,934 41,466,082General commerce 31,822,903 34,407,724 23,110,586 25,494,839Transport, storage and communication 13,311,002 13,509,451 10,528,535 11,100,684Financial institutions, investment and holding companies 24,542,020 23,915,474 4,780,102 4,719,325Professionals and individuals 30,321,718 30,373,342 10,694,191 10,104,165Others 11,983,296 11,847,081 9,021,725 9,063,310
264,773,311 257,704,740 166,160,778 158,403,268
26.4 Analysed by Interest Rate SensitivityFixedSingapore 12,341,952 6,539,937 12,303,230 6,503,468Malaysia 3,072,869 2,993,547 – –Indonesia 1,290,982 1,316,923 – –Greater China 6,560,349 7,564,856 2,856,539 3,463,554Other Asia Pacific 159,895 159,583 159,895 159,583Rest of the World 38 10,121 38 10,121
23,426,085 18,584,967 15,319,702 10,136,726VariableSingapore 147,250,290 149,474,230 119,195,815 120,778,492Malaysia 25,227,675 26,129,536 4,770,719 5,819,001Indonesia 10,328,930 9,860,402 – –Greater China 38,572,321 38,338,821 6,906,532 6,352,265Other Asia Pacific 9,781,685 8,066,327 9,781,685 8,066,327Rest of the World 10,186,325 7,250,457 10,186,325 7,250,457
241,347,226 239,119,773 150,841,076 148,266,542
Total 264,773,311 257,704,740 166,160,778 158,403,268
The analysis by interest rate sensitivity is based on whether fixed or variable rate pricing, further categorised by where the transactions are booked.
26.5 Analysed by GeographySingapore 108,980,624 108,168,765 98,419,426 97,308,133Malaysia 28,584,748 29,648,843 4,071,565 5,197,628Indonesia 19,679,831 19,659,690 6,502,853 6,669,618Greater China 65,358,727 64,404,247 26,398,736 25,405,101Other Asia Pacific 15,673,860 13,595,538 12,672,475 10,429,773Rest of the World 26,495,521 22,227,657 18,095,723 13,393,015
264,773,311 257,704,740 166,160,778 158,403,268
The analysis by geography is based on where the credit risk resides.
198 OCBC Annual Report 2019 199Financials

Notes to the Financial Statements For the financial year ended 31 December 2019
27. Non-Performing AssetsNon-performing assets (NPAs) comprise non-performing loans, debt securities and contingents that are classified as Substandard, Doubtful and Loss in accordance with MAS Notice 612.
$ million Substandard Doubtful Loss
Gross loans, securities and
contingents
Allowances for impaired
assets
Net loans, securities and
contingents
GROUP2019Classified loans 2,310 1,094 434 3,838 (1,388) 2,450Classified debt securities – 2 – 2 (2) –Classified contingents 20 23 # 43 (5) 38Total classified assets 2,330 1,119 434 3,883 (1,395) 2,488
2018Classified loans 2,312 1,145 381 3,838 (1,211) 2,627Classified debt securities – 2 # 2 (2) #Classified contingents 44 54 – 98 (6) 92Total classified assets 2,356 1,201 381 3,938 (1,219) 2,719
BANK2019Classified loans 1,780 705 186 2,671 (1,031) 1,640Classified debt securities – – – – – –Classified contingents 19 13 # 32 (4) 28Total classified assets 1,799 718 186 2,703 (1,035) 1,668
2018Classified loans 1,758 925 184 2,867 (944) 1,923Classified debt securities – – # # – #Classified contingents 44 51 – 95 (5) 90Total classified assets 1,802 976 184 2,962 (949) 2,013
(1) # represents amounts less than $0.5 million.
GROUP BANK2019
$ million2018
$ million2019
$ million2018
$ million
27.1 Analysed by Period OverdueOver 180 days 1,770 1,225 1,229 691Over 90 days to 180 days 173 397 77 28230 days to 90 days 530 396 452 332Less than 30 days 474 164 203 21No overdue 936 1,756 742 1,636
3,883 3,938 2,703 2,962
27.2 Analysed by Collateral TypeProperty 863 855 277 318Fixed deposit 6 5 2 1Stock and shares 128 6 125 2Motor vehicles 4 3 1 1Secured – Others 1,554 1,756 1,497 1,656Unsecured – Corporate and other guarantees 491 759 491 685Unsecured – Clean 837 554 310 299
3,883 3,938 2,703 2,962
27. Non-Performing Assets (continued) GROUP BANK
2019 $ million
2018 $ million
2019 $ million
2018 $ million
27.3 Analysed by IndustryAgriculture, mining and quarrying 470 567 449 537Manufacturing 468 398 94 231Building and construction 165 143 37 73Housing 435 429 226 239General commerce 556 727 285 428Transport, storage and communication 1,592 1,358 1,538 1,269Financial institutions, investment and holding companies 27 42 – 1Professionals and individuals 123 118 42 49Others 47 156 32 135
3,883 3,938 2,703 2,962
27.4 Analysed by Geography
$ million Singapore Malaysia IndonesiaGreater
ChinaRest of
the World Total
GROUP 2019Substandard 1,309 372 289 54 306 2,330Doubtful 237 321 222 133 206 1,119Loss 171 45 167 43 8 434
1,717 738 678 230 520 3,883Allowances for impaired assets (679) (308) (235) (47) (126) (1,395)
1,038 430 443 183 394 2,488
2018Substandard 923 395 406 120 512 2,356Doubtful 433 369 95 106 198 1,201Loss 184 42 118 36 1 381
1,540 806 619 262 711 3,938Allowances for impaired assets (483) (333) (197) (61) (145) (1,219)
1,057 473 422 201 566 2,719
BANK2019Substandard 1,309 61 133 14 282 1,799Doubtful 234 193 7 84 200 718Loss 171 – 3 4 8 186
1,714 254 143 102 490 2,703Allowances for impaired assets (677) (173) (36) (28) (121) (1,035)
1,037 81 107 74 369 1,668
2018Substandard 923 104 285 14 476 1,802Doubtful 430 252 57 39 198 976Loss 184 – – # – 184
1,537 356 342 53 674 2,962Allowances for impaired assets (480) (203) (94) (28) (144) (949)
1,057 153 248 25 530 2,013
(1) # represents amounts less than $0.5 million.
NPAs by geography are determined based on where the credit risk resides.
200 OCBC Annual Report 2019 201Financials

Notes to the Financial Statements For the financial year ended 31 December 2019
27. Non-Performing Assets (continued) 27.5 Restructured/Renegotiated LoansNon-performing restructured loans by loan classification and the related allowances are shown below. The restructured loans as a percentage of total non-performing loans were 42.7% (2018: 24.3%) and 47.9% (2018: 27.4%) for the Group and the Bank respectively.
2019 2018Amount
$ millionAllowance
$ millionAmount
$ millionAllowance
$ million
GROUPSubstandard 1,099 498 765 113Doubtful 515 279 157 99Loss 44 18 33 12
1,658 795 955 224BANKSubstandard 986 463 663 107Doubtful 292 216 131 78Loss 17 # 17 #
1,295 679 811 185
(1) # represents amounts less than $0.5 million.
28. Allowances for Impaired Loans and Bills ReceivableGROUP BANK
2019 $ million
2018 $ million
2019 $ million
2018 $ million
At 1 January 1,219 1,236 949 947Effect of adopting SFRS(I) 9 (1) – (#) – –Adjusted balance at 1 January 1,219 1,236 949 947Currency translation (12) 11 (10) 19Write-offs (642) (413) (478) (279)Allowances 929 460 638 305Recovery (73) (63) (45) (38)Net allowances (Note 9) 856 397 593 267Interest recognition on impaired loans (53) (34) (46) (26)Transfers 27 22 27 21At 31 December (Note 26) 1,395 1,219 1,035 949
(1) As first-time adopter of SFRS(I) 9, the Group and the Bank were required to recognise the cumulative effect in revenue reserves as at 1 January 2018.(2) # represents amounts less than $0.5 million.
28. Allowances for Impaired Loans and Bills Receivable (continued)Analysed by Industry
Cumulative allowances for impaired loans
Net allowances for impaired loans charged to income statements
2019$ million
2018$ million
2019$ million
2018$ million
GROUPAgriculture, mining and quarrying 159 146 20 69Manufacturing 132 64 107 33Building and construction 36 17 19 6Housing 47 39 69 5General commerce 174 272 90 185Transport, storage and communication 726 499 366 7Financial institutions, investment and holding companies 46 74 134 51Professionals and individuals 63 68 37 26Others 12 40 14 15
1,395 1,219 856 397BANKAgriculture, mining and quarrying 157 145 13 20Manufacturing 37 27 28 25Building and construction 4 3 1 (1)Housing 8 7 – –General commerce 48 159 23 123Transport, storage and communication 696 462 346 4Financial institutions, investment and holding companies 44 72 133 50Professionals and individuals 37 42 19 16Others 4 32 30 30
1,035 949 593 267
202 OCBC Annual Report 2019 203Financials

Notes to the Financial Statements For the financial year ended 31 December 2019
29. Debt and Equity Securities GROUP BANK
2019$’000
2018 $’000
2019$’000
2018 $’000
Mandatorily measured at FVTPLQuoted debt securities 2,356,299 1,831,030 1,602,667 1,351,660Unquoted debt securities 1,757,564 1,946,771 1,469,763 1,586,508Quoted equity securities 696,542 786,867 398,593 273,253Unquoted equity securities 454,476 428,149 374,444 370,946Quoted investment funds 956,435 759,162 511,650 191,001Unquoted investment funds 797,383 407,969 127,000 15,624
7,018,699 6,159,948 4,484,117 3,788,992
Designated as FVTPLUnquoted debt securities 15,142 17,179 – –
FVOCI Quoted debt securities 15,737,007 13,840,166 6,739,391 5,820,756Unquoted debt securities 5,091,900 4,547,781 2,814,215 2,684,965Quoted equity securities 851,204 1,163,164 83,616 27,040Unquoted equity securities 416,239 306,342 28,100 63,447Unquoted investment funds 57,136 58,418 57,136 58,418
22,153,486 19,915,871 9,722,458 8,654,626
Amortised costQuoted debt securities 64,812 74,731 64,812 74,731Unquoted debt securities – 17,594 – 17,594
64,812 92,325 64,812 92,325Allowances for non-impaired debt securities at amortised cost (12) (21) (12) (21)
64,800 92,304 64,800 92,304
Total debt and equity securitiesDebt securities 25,022,724 22,275,252 12,690,848 11,536,214Equity securities 2,418,461 2,684,522 884,753 734,686Investment funds 1,810,954 1,225,549 695,786 265,043Total securities 29,252,139 26,185,323 14,271,387 12,535,943Allowances for non-impaired debt securities at amortised cost (12) (21) (12) (21)
29,252,127 26,185,302 14,271,375 12,535,922Assets pledged (Note 46.1) (718,961) (642,795) (61,631) (563,312)
28,533,166 25,542,507 14,209,744 11,972,610
29. Debt and Equity Securities (continued)GROUP BANK
2019$’000
2018 $’000
2019$’000
2018 $’000
Debt securities analysis:By credit ratingInvestment grade (AAA to BBB) 16,350,623 14,737,228 9,453,571 8,768,008Non-investment grade (BB to C) 270,165 216,511 270,042 208,849Non-rated 8,401,924 7,321,492 2,967,223 2,559,336
25,022,712 22,275,231 12,690,836 11,536,193
By credit qualityPass 24,989,017 22,237,592 12,657,141 11,500,247Special mention 33,707 35,967 33,707 35,967Doubtful – 1,693 – –
25,022,724 22,275,252 12,690,848 11,536,214Allowances for non-impaired debt securities at amortised cost (12) (21) (12) (21)
25,022,712 22,275,231 12,690,836 11,536,193
Debt and equity securities – Concentration risks:By industryAgriculture, mining and quarrying 538,510 648,563 298,837 322,098Manufacturing 1,232,649 1,501,931 847,650 945,079Building and construction 1,388,767 1,596,253 621,423 614,604General commerce 558,137 674,432 447,960 543,486Transport, storage and communication 1,849,059 1,720,419 1,117,538 940,481Financial institutions, investment and holding companies 19,965,036 16,192,145 8,970,506 7,842,610Others 3,719,969 3,851,559 1,967,461 1,327,564
29,252,127 26,185,302 14,271,375 12,535,922
By issuerPublic sector 2,306,761 1,795,822 1,635,823 993,881Banks 9,300,432 8,664,383 4,361,079 4,088,931Corporations 16,965,943 14,303,717 7,824,297 7,214,696Others 678,991 1,421,380 450,176 238,414
29,252,127 26,185,302 14,271,375 12,535,922
By geographySingapore 3,399,479 3,020,257 824,076 851,944Malaysia 1,381,972 2,007,275 149,142 288,324Indonesia 1,521,038 1,126,214 806,815 598,531Greater China 9,102,916 8,349,933 3,959,898 3,620,168Other Asia Pacific 4,924,917 4,808,329 3,638,820 3,469,807Rest of the World 8,921,805 6,873,294 4,892,624 3,707,148
29,252,127 26,185,302 14,271,375 12,535,922
The analysis by geography is determined based on country of incorporation.
204 OCBC Annual Report 2019 205Financials
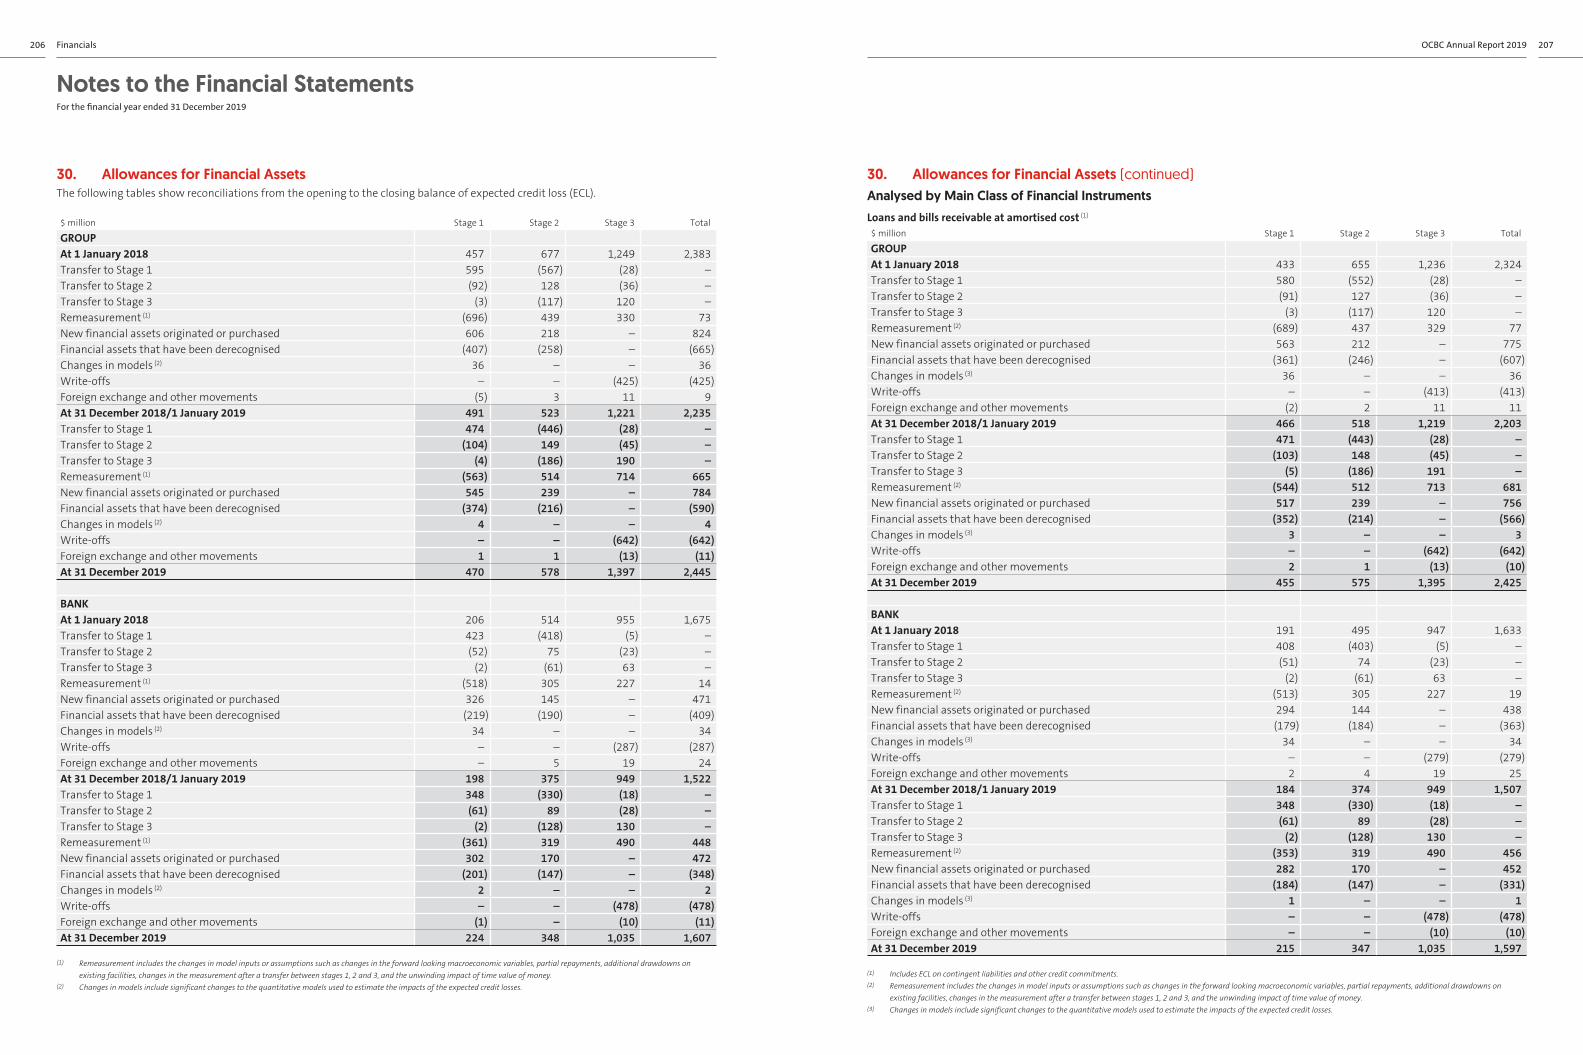
Notes to the Financial Statements For the financial year ended 31 December 2019
30. Allowances for Financial Assets The following tables show reconciliations from the opening to the closing balance of expected credit loss (ECL).
$ million Stage 1 Stage 2 Stage 3 Total
GROUPAt 1 January 2018 457 677 1,249 2,383Transfer to Stage 1 595 (567) (28) –Transfer to Stage 2 (92) 128 (36) –Transfer to Stage 3 (3) (117) 120 –Remeasurement (1) (696) 439 330 73New financial assets originated or purchased 606 218 – 824Financial assets that have been derecognised (407) (258) – (665)Changes in models (2) 36 – – 36Write-offs – – (425) (425)Foreign exchange and other movements (5) 3 11 9At 31 December 2018/1 January 2019 491 523 1,221 2,235Transfer to Stage 1 474 (446) (28) –Transfer to Stage 2 (104) 149 (45) –Transfer to Stage 3 (4) (186) 190 –Remeasurement (1) (563) 514 714 665New financial assets originated or purchased 545 239 – 784Financial assets that have been derecognised (374) (216) – (590)Changes in models (2) 4 – – 4Write-offs – – (642) (642)Foreign exchange and other movements 1 1 (13) (11)At 31 December 2019 470 578 1,397 2,445
BANKAt 1 January 2018 206 514 955 1,675Transfer to Stage 1 423 (418) (5) –Transfer to Stage 2 (52) 75 (23) –Transfer to Stage 3 (2) (61) 63 –Remeasurement (1) (518) 305 227 14New financial assets originated or purchased 326 145 – 471Financial assets that have been derecognised (219) (190) – (409)Changes in models (2) 34 – – 34Write-offs – – (287) (287)Foreign exchange and other movements – 5 19 24At 31 December 2018/1 January 2019 198 375 949 1,522Transfer to Stage 1 348 (330) (18) –Transfer to Stage 2 (61) 89 (28) –Transfer to Stage 3 (2) (128) 130 –Remeasurement (1) (361) 319 490 448New financial assets originated or purchased 302 170 – 472Financial assets that have been derecognised (201) (147) – (348)Changes in models (2) 2 – – 2Write-offs – – (478) (478)Foreign exchange and other movements (1) – (10) (11)At 31 December 2019 224 348 1,035 1,607
(1) Remeasurement includes the changes in model inputs or assumptions such as changes in the forward looking macroeconomic variables, partial repayments, additional drawdowns on existing facilities, changes in the measurement after a transfer between stages 1, 2 and 3, and the unwinding impact of time value of money.
(2) Changes in models include significant changes to the quantitative models used to estimate the impacts of the expected credit losses.
30. Allowances for Financial Assets (continued)Analysed by Main Class of Financial InstrumentsLoans and bills receivable at amortised cost (1)
$ million Stage 1 Stage 2 Stage 3 Total
GROUPAt 1 January 2018 433 655 1,236 2,324Transfer to Stage 1 580 (552) (28) –Transfer to Stage 2 (91) 127 (36) –Transfer to Stage 3 (3) (117) 120 –Remeasurement (2) (689) 437 329 77New financial assets originated or purchased 563 212 – 775Financial assets that have been derecognised (361) (246) – (607)Changes in models (3) 36 – – 36Write-offs – – (413) (413)Foreign exchange and other movements (2) 2 11 11At 31 December 2018/1 January 2019 466 518 1,219 2,203Transfer to Stage 1 471 (443) (28) –Transfer to Stage 2 (103) 148 (45) –Transfer to Stage 3 (5) (186) 191 –Remeasurement (2) (544) 512 713 681New financial assets originated or purchased 517 239 – 756Financial assets that have been derecognised (352) (214) – (566)Changes in models (3) 3 – – 3Write-offs – – (642) (642)Foreign exchange and other movements 2 1 (13) (10)At 31 December 2019 455 575 1,395 2,425
BANKAt 1 January 2018 191 495 947 1,633Transfer to Stage 1 408 (403) (5) –Transfer to Stage 2 (51) 74 (23) –Transfer to Stage 3 (2) (61) 63 –Remeasurement (2) (513) 305 227 19New financial assets originated or purchased 294 144 – 438Financial assets that have been derecognised (179) (184) – (363)Changes in models (3) 34 – – 34Write-offs – – (279) (279)Foreign exchange and other movements 2 4 19 25At 31 December 2018/1 January 2019 184 374 949 1,507Transfer to Stage 1 348 (330) (18) –Transfer to Stage 2 (61) 89 (28) –Transfer to Stage 3 (2) (128) 130 –Remeasurement (2) (353) 319 490 456New financial assets originated or purchased 282 170 – 452Financial assets that have been derecognised (184) (147) – (331)Changes in models (3) 1 – – 1Write-offs – – (478) (478)Foreign exchange and other movements – – (10) (10)At 31 December 2019 215 347 1,035 1,597
(1) Includes ECL on contingent liabilities and other credit commitments. (2) Remeasurement includes the changes in model inputs or assumptions such as changes in the forward looking macroeconomic variables, partial repayments, additional drawdowns on
existing facilities, changes in the measurement after a transfer between stages 1, 2 and 3, and the unwinding impact of time value of money. (3) Changes in models include significant changes to the quantitative models used to estimate the impacts of the expected credit losses.
206 OCBC Annual Report 2019 207Financials

Notes to the Financial Statements For the financial year ended 31 December 2019
30. Allowances for Financial Assets (continued)The following tables set out information about the credit quality of financial assets.
2019 2018$ million Stage 1 Stage 2 Stage 3 Total Stage 1 Stage 2 Stage 3 Total
GROUPCash and placements with central banks (Note 23)Pass 22,267 36 – 22,303 17,846 74 – 17,920Loss allowances (#) (1) – (1) (1) (1) – (2)Carrying amount 22,267 35 – 22,302 17,845 73 – 17,918
Government treasury bills and securities – Amortised cost (Note 24)
Pass 410 – – 410 374 – – 374Loss allowances (#) – – (#) (#) – – (#)Carrying amount 410 – – 410 374 – – 374
Government treasury bills and securities – FVOCI (1) (Note 24)
Pass 23,672 – – 23,672 23,485 – – 23,485
Loss allowances (#) – – (#) (#) – – (#)
Placements with and loans to banks – Amortised cost (Note 25)
Pass 22,719 137 – 22,856 25,139 328 – 25,467Loss allowances (8) (1) – (9) (12) (1) – (13)Carrying amount 22,711 136 – 22,847 25,127 327 – 25,454
Placements with and loans to banks – FVOCI (1) (Note 25)
Pass 11,024 – – 11,024 10,391 685 – 11,076
Loss allowances (1) – – (1) (1) (1) – (2)
Loans and bills receivable – Amortised cost (Note 26)
Pass 244,135 14,070 – 258,205 236,831 14,236 – 251,067Special mention – 2,550 – 2,550 – 2,527 – 2,527Substandard – – 2,310 2,310 – – 2,312 2,312Doubtful – – 1,094 1,094 – – 1,145 1,145Loss – – 434 434 – – 381 381
244,135 16,620 3,838 264,593 236,831 16,763 3,838 257,432Loss allowances (317) (436) (1,390) (2,143) (319) (405) (1,213) (1,937)Carrying amount 243,818 16,184 2,448 262,450 236,512 16,358 2,625 255,495
Debt securities – Amortised cost (Note 29)Pass 65 – – 65 92 – – 92Loss allowances (#) – – (#) (#) – – (#)Carrying amount 65 – – 65 92 – – 92
(1) In accordance with SFRS(I) 9, for financial asset measured at FVOCI, any impairment is recognised in profit or loss together with a credit to fair value reserves within equity (without adjusting the carrying amount of the financial asset).
(2) # represents amounts less than $0.5 million.
30. Allowances for Financial Assets (continued)
2019 2018$ million Stage 1 Stage 2 Stage 3 Total Stage 1 Stage 2 Stage 3 Total
GROUP (continued)Debt securities – FVOCI (1) (Note 29)Pass 20,570 257 – 20,827 18,221 165 – 18,386Doubtful – – 2 2 – – 2 2
20,570 257 2 20,829 18,221 165 2 18,388
Loss allowances (6) (1) (2) (9) (11) (2) (2) (15)
For loan commitments and financial guarantee contracts, the amounts in the table represent the amounts committed or guaranteed, respectively.
Loan commitments and contingent liabilitiesPass 87,145 4,909 – 92,054 97,859 4,286 – 102,145Special mention – 557 – 557 – 466 – 466Substandard – – 881 881 – – 657 657Doubtful – – 429 429 – – 402 402Loss – – 254 254 – – 304 304
87,145 5,466 1,564 94,175 97,859 4,752 1,363 103,974
Allowances for contingent liabilities and credit commitments (138) (139) (5) (282) (147) (113) (6) (266)
(1) In accordance with SFRS(I) 9, for financial asset measured at FVOCI, any impairment is recognised in profit or loss together with a credit to fair value reserves within equity (without adjusting the carrying amount of the financial asset).
208 OCBC Annual Report 2019 209Financials

Notes to the Financial Statements For the financial year ended 31 December 2019
30. Allowances for Financial Assets (continued)
2019 2018$ million Stage 1 Stage 2 Stage 3 Total Stage 1 Stage 2 Stage 3 Total
BANKCash and placements with central banks (Note 23)Pass 17,339 35 – 17,374 13,188 74 – 13,262Loss allowances (#) (1) – (1) (#) (1) – (1)Carrying amount 17,339 34 – 17,373 13,188 73 – 13,261
Government treasury bills and securities – Amortised cost (Note 24)
Pass 410 – – 410 374 – – 374Loss allowances (#) – – (#) (#) – – (#)Carrying amount 410 – – 410 374 – – 374
Government treasury bills and securities – FVOCI (1) (Note 24)
Pass 13,256 – – 13,256 14,021 – – 14,021
Loss allowances (#) – – (#) (#) – – (#)
Placements with and loans to banks – Amortised cost (Note 25)
Pass 18,277 137 – 18,414 20,240 164 – 20,404Loss allowances (6) (#) – (6) (11) (#) – (11)Carrying amount 18,271 137 – 18,408 20,229 164 – 20,393
Placements with and loans to banks – FVOCI (1) (Note 25)
Pass 7,701 – – 7,701 6,014 149 – 6,163
Loss allowances (1) – – (1) (#) (#) – (#)
Loans and bills receivable – Amortised cost (Note 26)
Pass 152,568 9,075 – 161,643 145,918 7,509 – 153,427Special mention – 1,675 – 1,675 – 1,859 – 1,859Substandard – – 1,780 1,780 – – 1,758 1,758Doubtful – – 705 705 – – 925 925Loss – – 186 186 – – 184 184
152,568 10,750 2,671 165,989 145,918 9,368 2,867 158,153Loss allowances (138) (247) (1,035) (1,420) (118) (288) (944) (1,350)Carrying amount 152,430 10,503 1,636 164,569 145,800 9,080 1,923 156,803
Debt securities – Amortised cost (Note 29)Pass 65 – – 65 92 – – 92Loss allowances (#) – – (#) (#) – – (#)Carrying amount 65 – – 65 92 – – 92
(1) In accordance with SFRS(I) 9, for financial asset measured at FVOCI, any impairment is recognised in profit or loss together with a credit to fair value reserves within equity (without adjusting the carrying amount of the financial asset).
(2) # represents amounts less than $0.5 million.
30. Allowances for Financial Assets (continued)
2019 2018$ million Stage 1 Stage 2 Stage 3 Total Stage 1 Stage 2 Stage 3 Total
BANK (continued)Debt securities – FVOCI (1) (Note 29)Pass 9,462 92 – 9,554 8,506 # – 8,506
Loss allowances (2) (#) – (2) (3) (#) – (3)
For loan commitments and financial guarantee contracts, the amounts in the table represent the amounts committed or guaranteed, respectively.
Loan commitments and contingent liabilitiesPass 76,088 3,735 – 79,823 68,923 2,640 – 71,563Special mention – 443 – 443 – 337 – 337Substandard – – 869 869 – – 633 633Doubtful – – 342 342 – – 385 385Loss – – 248 248 – – 260 260
76,088 4,178 1,459 81,725 68,923 2,977 1,278 73,178
Allowances for contingent liabilities and credit commitments (77) (100) – (177) (66) (86) (5) (157)
(1) In accordance with SFRS(I) 9, for financial asset measured at FVOCI, any impairment is recognised in profit or loss together with a credit to fair value reserves within equity (without adjusting the carrying amount of the financial asset).
(2) # represents amounts less than $0.5 million.
210 OCBC Annual Report 2019 211Financials

Notes to the Financial Statements For the financial year ended 31 December 2019
31. Other AssetsGROUP BANK
2019 $’000
2018 $’000
2019 $’000
2018 $’000
Interest receivable 1,151,295 1,162,341 709,198 725,009Sundry debtors (net) 654,413 553,941 72,128 57,999Deposits and prepayments 1,610,687 931,349 1,253,445 581,469Others 992,481 827,625 407,806 293,027
4,408,876 3,475,256 2,442,577 1,657,504
At 31 December 2019, reinsurance assets included in “Others” amounted to $204.5 million (2018: $177.3 million) for the Group.
32. Allowances for Other Impaired Assets
GROUP ($ million) Associates
Property, plant and
equipmentInvestment
propertyOtherassets Total
At 1 January 2018 – 64 2 5 71Currency translation – (#) – (#) (#)Amounts written off (13) (#) – (1) (14)Impairment charge/(write-back) to income statements 13 # (#) (3) 10Impairment charge to profit from life insurance – # – – #Transfers from other accounts – – – 3 3At 31 December 2018/1 January 2019 – 64 2 4 70Currency translation – (#) – (#) (#)Amounts written off – (#) – (#) (#)Impairment charge/(write-back) to income statements – # (1) 3 2Transfers from other accounts – – – # #At 31 December 2019 – 64 1 7 72
(Note 35) (Note 36)(1) # represents amounts less than $0.5 million.
BANK ($ million)
Associates and
subsidiaries
Property, plant and
equipmentInvestment
property Otherassets Total
At 1 January 2018 26 1 2 1 30Currency translation 1 – – – 1Amounts written off (50) – – (#) (50)Impairment charge/(write-back) to income statements 37 – (#) (#) 37At 31 December 2018/1 January 2019 14 1 2 1 18Currency translation (#) – – – (#)Amounts written off – – – (1) (1)Impairment charge/(write-back) to income statements 4 – (1) # 3At 31 December 2019 18 1 1 # 20
(Notes 33-34) (Note 35) (Note 36)(1) # represents amounts less than $0.5 million.
33. AssociatesGROUP BANK
2019$’000
2018 $’000
2019$’000
2018 $’000
Quoted equity security, at cost 1,765,594 1,459,670 1,321,618 1,015,694Unquoted equity securities, at cost 144,709 145,218 65,096 65,096
1,910,303 1,604,888 1,386,714 1,080,790
Share of post-acquisition reserves 1,652,448 1,192,391 – –
Net carrying amount 3,562,751 2,797,279 1,386,714 1,080,790
Unquoted convertible securities, at cost – 305,924 – 305,924
Amounts due from associates (unsecured) 75,019 79,612 73,694 1Allowances for non-impaired amounts due from associates (14) (1) (12) –
75,005 79,611 73,682 1
Investments in and amounts due from associates 3,637,756 3,182,814 1,460,396 1,386,715
33.1 List of Principal AssociatesThe Group applied equity method for all its investments in associates.
The Group’s principal associates are as follows:
Name of associates
Country of incorporation/Principal place
of business Nature of the relationship with the GroupEffective % interest held (3)
2019 2018
QuotedBank of Ningbo Co., Ltd. (1) People’s Republic
of ChinaA commercial bank, which enables the Group to expand its bilateral business in offshore financing, trade finance and private banking.
20 20
UnquotedMaxwealth Fund Management Company Limited (1)
People’s Republic of China
A privately held asset manager that manufactures and distributes mutual funds in Greater China.
29 29
Network for Electronic Transfers (Singapore) Pte Ltd (2)
Singapore Provides electronic payment services, which enables the Group to extend funds transfer services to its broad customer base.
33 33
(1) Audited by Ernst & Young.(2) Audited by KPMG LLP.(3) Rounded to the nearest percentage.
During the financial year, the Group subscribed to 84 million Bank of Ningbo shares arising from the exercise of the option under the convertible bond with carrying amount of $306 million.
As at 31 December 2019, the fair value (Level 1 of the fair value hierarchy) of the investments in Bank of Ningbo was $6.12 billion (2018: $3.36 billion). The carrying amount of the Group’s interests was $3.30 billion (2018: $2.57 billion).
As Bank of Ningbo is listed on the Shenzhen Stock Exchange, the entity’s ability to transfer funds to the Group is subject to local listing and statutory regulations.
212 OCBC Annual Report 2019 213Financials

Notes to the Financial Statements For the financial year ended 31 December 2019
33. Associates (continued)33.2 Financial Information of Material AssociateThe table below provides the financial information of the Group’s material associate:
Bank of Ningbo Co., Ltd.$ million 2019 2018
Selected income statement informationRevenue 6,928 5,896
Net profit from continuing operations 2,723 2,284Other comprehensive income 546 565Total comprehensive income 3,269 2,849
Selected balance sheet informationCurrent assets 187,980 160,857Non-current assets 60,482 61,381Current liabilities (213,767) (176,634)Non-current liabilities (15,246) (29,424)Net assets 19,449 16,180Non-controlling interests (82) (70)Preference shares/other equity instruments issued (2,860) (3,233)Net assets attributable to ordinary shareholders 16,507 12,877
Reconciliation of associate’s total ordinary shareholders’ equity to the carrying amount in the Group’s financial statements
Group’s interests in net assets of investee at beginning of the year 2,565 2,070Group’s share of:
– net profit from continuing operations 533 447– other comprehensive income (17) 27– total comprehensive income 516 474
Dividends (86) (81)Conversion of convertible securities 306 102Carrying amount of interest in investee at end of the year 3,301 2,565
Dividends received/receivable during the year 86 81
In addition to the interests in associate disclosed above, the Group also has interests in individually immaterial associates that are accounted for using the equity method.
$ million 2019 2018
At 31 December:Aggregate carrying amount of individually immaterial associates 262 232
For the year ended:Aggregate amounts of the Group's share of:
Net profit from continuing operations 34 9Other comprehensive income 4 (12)Total comprehensive income 38 (3)
Dividends received during the year # 9
(1) # represents amounts less than $0.5 million.
The Group’s share of contingent liabilities in respect of all its associates is as follows:
$ million 2019 2018
At 31 December:Share of contingent liabilities incurred jointly with other investors of associates 7,084 5,612
34. SubsidiariesBANK
2019 $’000
2018 $’000
Investments in subsidiaries, at costQuoted securities 1,970,185 1,970,185Unquoted securities 13,134,224 12,927,879
Allowance for impairment (Note 32) (18,033) (14,189)Net carrying amount 15,086,376 14,883,875
Amount due from subsidiariesTerm to maturity of one year or less 10,417,361 15,115,453Term to maturity of more than one year 7,655,276 7,692,657
18,072,637 22,808,110Of which:
Unsecured 17,431,637 22,214,110Secured 641,000 594,000
18,072,637 22,808,110
Investments in and amount due from subsidiaries 33,159,013 37,691,985
At 31 December 2019, the fair values (Level 1 of the fair value hierarchy) of the Group’s interests in its quoted subsidiaries, Great Eastern Holdings Limited and PT Bank OCBC NISP Tbk, were $9.01 billion (2018: $10.29 billion) and $1.60 billion (2018: $1.56 billion) respectively.
34.1 List of Principal SubsidiariesPrincipal subsidiaries of the Group are as follows:
Name of subsidiaries
Country of incorporation/Principal place
of business
Proportion of ownership interests and voting rights held by
the Group (%) (3)
Proportion of ownership interests and voting rights held by
non-controlling interests (%) (3)
2019 2018 2019 2018
BankingBanco OCBC Weng Hang, S.A. Macau SAR 100 100 – –Bank of Singapore Limited Singapore 100 100 – –OCBC Al-Amin Bank Berhad Malaysia 100 100 – –OCBC Bank (Malaysia) Berhad Malaysia 100 100 – –OCBC Wing Hang Bank (China) Limited People’s Republic
of China100 100 – –
OCBC Wing Hang Bank Limited Hong Kong SAR 100 100 – –PT Bank OCBC NISP Tbk (1) Indonesia 85 85 15 15
InsuranceGreat Eastern General Insurance Limited (2) Singapore 88 88 12 12Great Eastern General Insurance (Malaysia) Berhad (2) Malaysia 88 88 12 12Great Eastern Life Assurance (Malaysia) Berhad (2) Malaysia 88 88 12 12The Great Eastern Life Assurance Company Limited (2) Singapore 88 88 12 12
Asset management and investment holdingLion Global Investors Limited (2) Singapore 92 92 8 8Great Eastern Holdings Limited (2) Singapore 88 88 12 12
StockbrokingOCBC Securities Private Limited Singapore 100 100 – –
Unless otherwise indicated, the principal subsidiaries listed above are audited by KPMG LLP Singapore and its associated firms.(1) Audited by PricewaterhouseCoopers.(2) Audited by Ernst & Young.(3) Rounded to the nearest percentage.
214 OCBC Annual Report 2019 215Financials

Notes to the Financial Statements For the financial year ended 31 December 2019
34. Subsidiaries (continued)34.1 List of Principal Subsidiaries (continued)The Group’s subsidiaries do not have significant restrictions on its ability to access or use its assets and settle its liabilities other than those resulting from their respective local statutory, regulatory, supervisory and banking requirements within which its subsidiaries operate. These requirements require the Group’s subsidiaries to maintain minimum levels of regulatory capital, liquid assets, and exposure limits. In addition, Great Eastern Holdings Limited and other insurance subsidiaries are subject to their respective local insurance laws and regulations, while the Group’s banking subsidiaries are subject to prudential regulatory requirements imposed by local regulators.
34.2 Non-Controlling Interests in SubsidiariesThe following table summarises the financial information, before intercompany eliminations, relating to principal subsidiaries with material NCI.
PT Bank OCBC NISP Tbk Great Eastern Holdings Limited$ million 2019 2018 2019 2018
Net assets attributable to NCI 383 338 1,031 911Total comprehensive income attributable to NCI 46 21 133 30Dividends paid to NCI during the year – – 34 40 Summarised financial information Total assets 17,071 15,831 96,506 85,042Total liabilities (14,504) (13,570) (87,804) (77,520)Total net assets 2,567 2,261 8,702 7,522 Revenue 832 762 18,640 12,095
Profit 208 269 1,022 750Other comprehensive income 25 (128) 454 (502)Total comprehensive income 233 141 1,476 248
Cash flows provided by/(used in) operating activities 449 782 3,693 4,137Cash flows provided by/(used in) investing activities 286 (714) (2,829) (3,382)Cash flows provided by/(used in) financing activities (237) 32 (306) (340)Effect of currency translation reserve adjustment (#) 19 (47) (75)Net changes in cash and cash equivalents 498 119 511 340
(1) # represents amounts less than $0.5 million.
34.3 Acquisition of SubsidiaryOn 2 May 2019 (the acquisition date), GEH Group’s subsidiary company, Great Eastern General Insurance Limited (GEG) acquired 95% of the share capital of PT QBE General Insurance Indonesia (PT QBE), a general insurance company in Indonesia, for a cash consideration of USD29.9 million (approximately S$40.7 million). Upon the acquisition, PT QBE became a subsidiary of GEH Group.
On 17 May 2019, PT QBE changed its name to PT Great Eastern General Insurance Indonesia (GEGI).
GEH Group has acquired GEGI to be better positioned to comprehensively provide both general and life insurance solutions to the business community and consumers and deepen its footprint in Indonesia.
34. Subsidiaries (continued)34.3 Acquisition of Subsidiary (continued)GEH Group has elected to measure the non-controlling interest at the non-controlling interest’s proportionate share of GEGI’s net identifiable assets.
The fair value of the identifiable assets and liabilities of GEGI as at the acquisition date were:
$ million 2019
Identifiable assets and liabilitiesCash and placements with central banks 57.2Investments 16.0Deferred tax assets 4.7Other assets 37.3Property, plant and equipment 1.3Total assets 116.5
Current tax liabilities (0.6)Other liabilities (75.4)
(76.0)Net identifiable assets acquired 40.5Less: Non-controlling interests (2.0)
38.5Goodwill (Note 37) 2.3Cost of acquisition 40.8Less: Cash and cash equivalents in GEGI (57.2)Net cash inflow arising from business combination 16.4
34.4 Consolidated Structured Entities The Bank has established a USD10 billion Global Covered Bond Programme (the Programme). Under the Programme, the Bank may from time to time issue covered bonds (the Covered Bonds). The payments of interest and principal under the Covered Bonds are guaranteed by the Covered Bond Guarantor, Red Sail Pte. Ltd. (the CBG). The Covered Bonds issued under the Programme will predominantly be backed by a portfolio of Singapore home loans transferred from the Bank to the CBG. Integral to the Programme structure, the Bank provides funding and hedging facilities to the CBG.
216 OCBC Annual Report 2019 217Financials
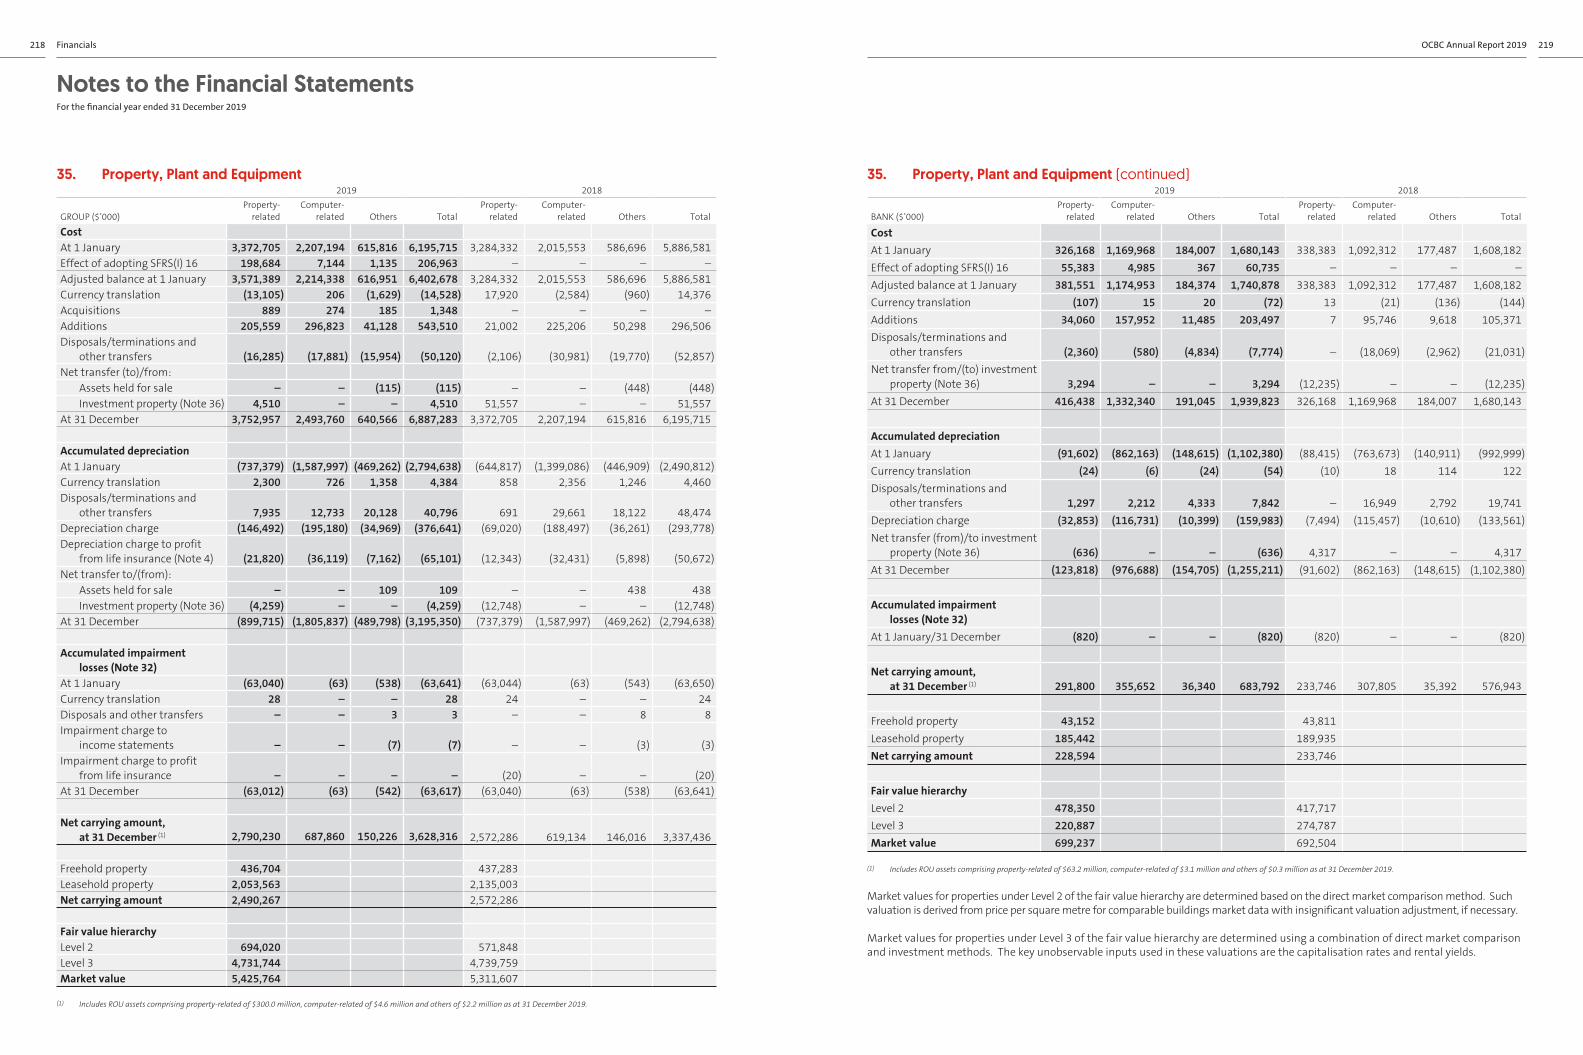
Notes to the Financial Statements For the financial year ended 31 December 2019
35. Property, Plant and Equipment 2019 2018
GROUP ($’000)Property-
relatedComputer-
related Others TotalProperty-
relatedComputer-
related Others Total
CostAt 1 January 3,372,705 2,207,194 615,816 6,195,715 3,284,332 2,015,553 586,696 5,886,581Effect of adopting SFRS(I) 16 198,684 7,144 1,135 206,963 – – – –Adjusted balance at 1 January 3,571,389 2,214,338 616,951 6,402,678 3,284,332 2,015,553 586,696 5,886,581Currency translation (13,105) 206 (1,629) (14,528) 17,920 (2,584) (960) 14,376Acquisitions 889 274 185 1,348 – – – –Additions 205,559 296,823 41,128 543,510 21,002 225,206 50,298 296,506Disposals/terminations and
other transfers (16,285) (17,881) (15,954) (50,120) (2,106) (30,981) (19,770) (52,857)Net transfer (to)/from:
Assets held for sale – – (115) (115) – – (448) (448)Investment property (Note 36) 4,510 – – 4,510 51,557 – – 51,557
At 31 December 3,752,957 2,493,760 640,566 6,887,283 3,372,705 2,207,194 615,816 6,195,715
Accumulated depreciationAt 1 January (737,379) (1,587,997) (469,262) (2,794,638) (644,817) (1,399,086) (446,909) (2,490,812)Currency translation 2,300 726 1,358 4,384 858 2,356 1,246 4,460Disposals/terminations and
other transfers 7,935 12,733 20,128 40,796 691 29,661 18,122 48,474Depreciation charge (146,492) (195,180) (34,969) (376,641) (69,020) (188,497) (36,261) (293,778)Depreciation charge to profit
from life insurance (Note 4) (21,820) (36,119) (7,162) (65,101) (12,343) (32,431) (5,898) (50,672)Net transfer to/(from):
Assets held for sale – – 109 109 – – 438 438Investment property (Note 36) (4,259) – – (4,259) (12,748) – – (12,748)
At 31 December (899,715) (1,805,837) (489,798) (3,195,350) (737,379) (1,587,997) (469,262) (2,794,638)
Accumulated impairment losses (Note 32)
At 1 January (63,040) (63) (538) (63,641) (63,044) (63) (543) (63,650)Currency translation 28 – – 28 24 – – 24Disposals and other transfers – – 3 3 – – 8 8Impairment charge to
income statements – – (7) (7) – – (3) (3)Impairment charge to profit
from life insurance – – – – (20) – – (20)At 31 December (63,012) (63) (542) (63,617) (63,040) (63) (538) (63,641)
Net carrying amount, at 31 December (1) 2,790,230 687,860 150,226 3,628,316 2,572,286 619,134 146,016 3,337,436
Freehold property 436,704 437,283Leasehold property 2,053,563 2,135,003Net carrying amount 2,490,267 2,572,286
Fair value hierarchyLevel 2 694,020 571,848Level 3 4,731,744 4,739,759Market value 5,425,764 5,311,607
(1) Includes ROU assets comprising property-related of $300.0 million, computer-related of $4.6 million and others of $2.2 million as at 31 December 2019.
35. Property, Plant and Equipment (continued)2019 2018
BANK ($’000)Property-
relatedComputer-
related Others TotalProperty-
relatedComputer-
related Others Total
CostAt 1 January 326,168 1,169,968 184,007 1,680,143 338,383 1,092,312 177,487 1,608,182Effect of adopting SFRS(I) 16 55,383 4,985 367 60,735 – – – –Adjusted balance at 1 January 381,551 1,174,953 184,374 1,740,878 338,383 1,092,312 177,487 1,608,182Currency translation (107) 15 20 (72) 13 (21) (136) (144)Additions 34,060 157,952 11,485 203,497 7 95,746 9,618 105,371Disposals/terminations and
other transfers (2,360) (580) (4,834) (7,774) – (18,069) (2,962) (21,031)Net transfer from/(to) investment
property (Note 36) 3,294 – – 3,294 (12,235) – – (12,235)At 31 December 416,438 1,332,340 191,045 1,939,823 326,168 1,169,968 184,007 1,680,143
Accumulated depreciationAt 1 January (91,602) (862,163) (148,615) (1,102,380) (88,415) (763,673) (140,911) (992,999)Currency translation (24) (6) (24) (54) (10) 18 114 122Disposals/terminations and
other transfers 1,297 2,212 4,333 7,842 – 16,949 2,792 19,741Depreciation charge (32,853) (116,731) (10,399) (159,983) (7,494) (115,457) (10,610) (133,561)Net transfer (from)/to investment
property (Note 36) (636) – – (636) 4,317 – – 4,317At 31 December (123,818) (976,688) (154,705) (1,255,211) (91,602) (862,163) (148,615) (1,102,380)
Accumulated impairment losses (Note 32)
At 1 January/31 December (820) – – (820) (820) – – (820)
Net carrying amount, at 31 December (1) 291,800 355,652 36,340 683,792 233,746 307,805 35,392 576,943
Freehold property 43,152 43,811Leasehold property 185,442 189,935Net carrying amount 228,594 233,746
Fair value hierarchyLevel 2 478,350 417,717Level 3 220,887 274,787Market value 699,237 692,504
(1) Includes ROU assets comprising property-related of $63.2 million, computer-related of $3.1 million and others of $0.3 million as at 31 December 2019.
Market values for properties under Level 2 of the fair value hierarchy are determined based on the direct market comparison method. Such valuation is derived from price per square metre for comparable buildings market data with insignificant valuation adjustment, if necessary.
Market values for properties under Level 3 of the fair value hierarchy are determined using a combination of direct market comparison and investment methods. The key unobservable inputs used in these valuations are the capitalisation rates and rental yields.
218 OCBC Annual Report 2019 219Financials

Notes to the Financial Statements For the financial year ended 31 December 2019
36. Investment PropertyGROUP BANK
2019$’000
2018 $’000
2019$’000
2018 $’000
Cost At 1 January 1,116,857 1,180,548 657,732 654,338Currency translation (2,650) (1,419) – 79Additions 18,161 691 4,056 1,015Disposals and other transfers (64,334) (9,385) (62,839) (9,935)Net transfer (to)/from:
Property, plant and equipment (Note 35) (4,510) (51,557) (3,294) 12,235Assets held for sale (7,594) (2,021) (3,158) –
At 31 December 1,055,930 1,116,857 592,497 657,732
Accumulated depreciationAt 1 January (234,152) (228,685) (130,930) (121,686)Currency translation 699 348 – (35)Disposals and other transfers 28,354 4,104 25,930 4,325Depreciation charge (20,108) (22,866) (8,999) (9,217)Net transfer to/(from):
Property, plant and equipment (Note 35) 4,259 12,748 636 (4,317)Assets held for sale 4,789 199 1,489 –
At 31 December (216,159) (234,152) (111,874) (130,930)
Accumulated impairment losses (Note 32)At 1 January (2,217) (2,397) (2,217) (2,397)Write-back to income statement 1,244 180 1,244 180At 31 December (973) (2,217) (973) (2,217)
Net carrying amountFreehold property 570,255 613,006 162,525 195,780Leasehold property 268,543 267,482 317,125 328,805At 31 December 838,798 880,488 479,650 524,585
Fair value hierarchyLevel 2 1,056,832 1,160,663 288,455 384,901Level 3 1,804,951 1,797,621 1,130,435 1,099,433Market value 2,861,783 2,958,284 1,418,890 1,484,334
A description of the valuation methods is provided in Note 35.
37. Goodwill and Intangible AssetsGROUP BANK
2019$’000
2018 $’000
2019$’000
2018 $’000
Goodwill At 1 January 4,478,591 4,450,790 1,867,176 1,867,176Acquisition (Note 34.3) 2,309 – – –Currency translation (12,824) 27,801 – –At 31 December 4,468,076 4,478,591 1,867,176 1,867,176
Intangible assetsAt 1 January 613,947 709,050Acquisition 3,453 –Amortisation charged to income statements: − Core deposit relationships (1) (41,203) (40,757)− Customer relationships (2) (14,936) (14,783)− Distribution platform (44) –− Life insurance business (3) (46,636) (46,636)Currency translation (2,758) 7,073At 31 December 511,823 613,947
Total goodwill and intangible assets 4,979,899 5,092,538 1,867,176 1,867,176
Analysed as follows:Goodwill from acquisition of subsidiaries/business 4,468,076 4,478,591 1,867,176 1,867,176Intangible assets, at cost 1,569,658 1,572,055 – –Accumulated amortisation for intangible assets (1,057,835) (958,108) – –
4,979,899 5,092,538 1,867,176 1,867,176
(1) Core deposit relationships, arising from the acquisition of OCBC Wing Hang, are determined to have an estimated useful life of 10 years. At 31 December 2019, these have a remaining useful life of 4.5 years (2018: 5.5 years).
(2) Customer relationships, arising from the acquisition of Bank of Singapore Limited and Barclays WIM, are determined to have an estimated useful life of 10 years. At 31 December 2019, these have a remaining useful life of up to 7 years (2018: 8 years).
(3) The value of in-force insurance business of the Group is amortised over a useful life of 20 years. At 31 December 2019, the intangible asset has a remaining useful life of 5 years (2018: 6 years).
220 OCBC Annual Report 2019 221Financials

Notes to the Financial Statements For the financial year ended 31 December 2019
37. Goodwill and Intangible Assets (continued)Impairment Tests for GoodwillFor impairment testing, goodwill is allocated to the Group’s CGU identified mainly to business segments as follows:
Carrying amount
Cash Generating UnitsBasis of determining
recoverable value2019
$’0002018
$’000
Goodwill attributed to Banking CGUGlobal Consumer Financial Services 844,497 844,497Global Corporate Banking 570,000 570,000Global Treasury 524,000 524,000
Value-in-use 1,938,497 1,938,497Great Eastern Holdings Limited Appraisal value 427,460 427,460Bank of Singapore Limited Value-in-use 811,470 822,239Lion Global Investors Limited Value-in-use 29,635 29,635OCBC Wing Hang Bank Limited Value-in-use 1,072,519 1,080,060PT Bank OCBC NISP Tbk Value-in-use 178,913 173,412Others Value-in-use 9,582 7,288
4,468,076 4,478,591
The value-in-use calculations apply a discounted cash flow model using cash flow projections based on financial budgets and forecasts approved by management covering a five-year period. The cash flow projections are discounted at a pre-tax discount rate that includes a reasonable risk premium at the date of assessment of the respective CGU. Cash flows beyond the fifth year are extrapolated using the estimated terminal growth rates (weighted average growth rate to extrapolate cash flows beyond the projected years). The terminal growth rate for each CGU used does not exceed management’s expectation of the long term average growth rate of the respective industry and country in which the CGU operates. The discount rates and terminal growth rates used are tabulated below for applicable CGUs.
Banking CGU Bank of Singapore LimitedOCBC Wing Hang
Bank LimitedPT Bank OCBC
NISP Tbk2019 2018 2019 2018 2019 2018 2019 2018
Discount rate 7.7% 8.8% 9.8% 11.3% 8.8% 10.0% 12.8% 12.7%Terminal growth rate 2.0% 2.0% 2.0% 2.0% 2.6% 3.0% 4.0% 4.0%
For the insurance CGU, the Group applies the appraisal value technique for its value-in-use calculation. This technique is commonly used to determine the economic value of an insurance business, which comprises two components: embedded value of in-force business and existing structural value (value of future sales). The embedded value of the life insurance business is the present value of projected distributable profits (cash flows) of the in-force business. The cash flows represent a deterministic approach based on assumptions as to future operating experience discounted at a risk adjusted rate of 7.00% (2018: 7.00%) and 8.75% (2018: 8.75%) for Singapore and Malaysia respectively. The assumptions take into account the recent experience of, and expected future outlook for the life insurance business of the CGU. Investment returns assumed are based on long term strategic asset mix and their expected future returns. The existing structural value is the value of projected distributable profits from new businesses, which is calculated based on new businesses sold for the nine months ended up to 30 September and applying a new business multiplier to the value of future sales.
38. Segment Information38.1 Business Segments
$ million
Global Consumer/
Private Banking
Global Corporate/Investment
Banking
Global Treasury
and Markets
OCBC Wing Hang Insurance Others Group
Year ended 31 December 2019Net interest income 2,087 2,708 589 850 112 (15) 6,331Non-interest income 1,653 910 276 265 1,358 78 4,540Total income 3,740 3,618 865 1,115 1,470 63 10,871
Operating profit before allowances and amortisation 1,496 2,454 587 523 1,115 52 6,227Amortisation of intangible assets (15) – – (41) (47) – (103)Allowances for loans and other assets (36) (801) 3 (59) (#) 3 (890)Operating profit after allowances and amortisation 1,445 1,653 590 423 1,068 55 5,234
Other information:Capital expenditure 113 8 1 35 183 222 562Depreciation 85 11 2 75 8 216 397
At 31 December 2019Segment assets 112,959 148,224 82,198 52,406 97,158 18,365 511,310Unallocated assets 1,727Elimination (21,346)Total assets 491,691
Segment liabilities 136,795 115,353 57,095 43,552 85,703 22,853 461,351Unallocated liabilities 3,083Elimination (21,346)Total liabilities 443,088
Other information:Gross non-bank loans 93,268 141,616 1,258 33,050 9 (4,428) 264,773NPAs (include debt securities) 548 3,258 – 133 2 (58) 3,883
(1) # represents amounts less than $0.5 million.
222 OCBC Annual Report 2019 223Financials

Notes to the Financial Statements For the financial year ended 31 December 2019
38. Segment Information (continued)38.1 Business Segments (continued)
$ million
Global Consumer/
Private Banking
Global Corporate/Investment
Banking
Global Treasury
and Markets
OCBC Wing Hang Insurance Others Group
Year ended 31 December 2018Net interest income 1,909 2,587 622 823 79 (130) 5,890Non-interest income 1,513 827 137 302 993 39 3,811Total income 3,422 3,414 759 1,125 1,072 (91) 9,701
Operating profit before allowances and amortisation 1,367 2,316 494 570 852 (112) 5,487Amortisation of intangible assets (15) – – (41) (46) – (102)Allowances for loans and other assets (39) (265) (2) (32) 5 45 (288)Operating profit after allowances and amortisation 1,313 2,051 492 497 811 (67) 5,097
Other information:Capital expenditure 58 4 # 20 58 157 297Depreciation 42 8 1 64 6 196 317
At 31 December 2018Segment assets 111,730 139,597 78,818 56,693 85,745 19,045 491,628Unallocated assets 1,292Elimination (25,377)Total assets 467,543
Segment liabilities 128,106 113,058 58,609 48,236 75,879 23,175 447,063Unallocated liabilities 2,465Elimination (25,377)Total liabilities 424,151
Other information:Gross non-bank loans 94,128 132,028 2,195 33,998 15 (4,659) 257,705NPAs (include debt securities) 568 3,309 – 211 2 (152) 3,938
(1) # represents amounts less than $0.5 million.
OCBC Group’s businesses are presented in the following customer segments and business activities: Global Consumer/Private Banking, Global Corporate/Investment Banking, Global Treasury and Markets, OCBC Wing Hang and Insurance.
Global Consumer/Private BankingGlobal Consumer/Private Banking provides a full range of products and services to individual customers. At Global Consumer Banking, the products and services offered include deposit products (checking accounts, savings and fixed deposits), consumer loans (housing loans and other personal loans), credit cards, wealth management products (unit trusts, bancassurance products and structured deposits) and brokerage services. Private Banking caters to the specialised banking needs of high net worth individuals, offering wealth management expertise, including investment advice and portfolio management services, estate and trust planning, and wealth structuring.
Global Corporate/Investment BankingGlobal Corporate/Investment Banking serves institutional customers ranging from large corporates and the public sector to small and medium enterprises. The products and services offered include long-term loans such as project financing, short-term credit such as overdrafts and trade financing, deposit accounts and fee-based services such as cash management and custodian services. Investment Banking offers a comprehensive range of financing solutions, syndicated loans and advisory services, corporate finance services for initial public offerings, secondary fund-raising, takeovers and mergers, as well as customised and structured equity-linked financing.
38. Segment Information (continued)38.1 Business Segments (continued)Global Treasury and MarketsGlobal Treasury and Markets is responsible for the management of the Group’s asset and liability interest rate positions, engages in foreign exchange activities, money market operations, fixed income and derivatives trading, and offers structured treasury products and financial solutions to meet customers’ investment and hedging needs. Income from treasury products and services offered to customers of other business segments, such as Global Consumer/Private Banking and Global Corporate/Investment Banking, is reflected in the respective business segments.
OCBC Wing HangOCBC Wing Hang offers a comprehensive range of commercial banking and related financial services such as consumer financing, share brokerage and insurance.
InsuranceThe Group’s insurance business, including its fund management activities, is undertaken by the Bank’s subsidiary Great Eastern Holdings Limited and its subsidiaries, which provide both life and general insurance products to its customers mainly in Singapore and Malaysia.
Others Others comprise mainly property holding, investment holding and items not attributable to the business segments described above.
The business segment information is prepared based on internal management reports, which are used by senior management for decision-making and performance management. The following management reporting methodologies are adopted:(a) income and expenses are attributable to each segment based on the internal management reporting policies;(b) in determining the segment results, balance sheet items are internally transfer priced; and(c) transactions between business segments are recorded within the segment as if they are third party transactions and are
eliminated on consolidation.
Where there are material changes in the organisational structure and management reporting methodologies, segment information for prior periods is restated to allow comparability. There are no material items of income or expense between the business segments.
38.2 Geographical Segments
$ millionTotal
incomeProfit before
income taxCapital
expenditureTotal
assetsTotal
liabilities
2019Singapore 6,552 3,221 397 287,129 283,312Malaysia 1,469 830 56 65,584 54,387Indonesia 849 274 28 17,900 14,639Greater China 1,494 1,154 59 81,684 54,544Other Asia Pacific 224 156 4 16,264 9,426Rest of the World 283 165 18 23,130 26,780
10,871 5,800 562 491,691 443,088
2018Singapore 5,552 2,975 189 271,142 266,595Malaysia 1,457 913 43 66,173 52,732Indonesia 769 354 32 16,481 13,945Greater China 1,477 1,037 30 80,917 53,711Other Asia Pacific 212 158 1 14,114 8,788Rest of the World 234 115 2 18,716 28,380
9,701 5,552 297 467,543 424,151
The Group’s operations are in six main geographical areas. The geographical information is prepared based on the country in which the transactions are booked. It would not be materially different if it is based on the country in which the counterparty or assets are located. The geographical information is stated after elimination of intra-group transactions and balances.
224 OCBC Annual Report 2019 225Financials

Notes to the Financial Statements For the financial year ended 31 December 2019
39. Risk Management 39.1 OverviewThe Group’s risk management framework encompasses good governance, sound policies, robust lines of defence, right expertise as well as significant investments in technology, underpinned by a corporate culture that demands accountability and ownership as well as high ethical standards. This ensures that the risks being taken are:• consistent with our corporate strategy and within established risk appetite;• well-understood, evaluated and supported by robust quantitative analyses and stress testing; • adequately compensated by expected returns; • managed holistically by evaluating risk interactions across the different risk types; • reviewed by an independent risk function with adequate resources, authority and expertise; and• accompanied by contingency plans to ensure resilience against potential crises or unexpected events.
The Board of Directors (Board) has the ultimate responsibility for the effective management of risk and establishes the corporate strategy and approves the risk appetite within which senior management should execute the strategy.
The Board Risk Management Committee (BRMC) is the designated board committee to ensure that the Group’s overall risk management philosophy and principles are aligned with the corporate strategy and within the approved risk appetite. It also ensures that the overall risk management organisation is implemented and effective. Based on the approved risk appetite, BRMC approves various quantitative guidance and qualitative expectations and these are cascaded to major business units and risk functions to guide risk-taking. Risk drivers, risk profiles across major lines of business and risk types, as well as major risk policies and compliance matters are regularly reviewed by the senior management, Chief Executive Officer (CEO) and BRMC. These matters are reviewed and discussed in greater detail at the dedicated risk committees for major risk types.
The Bank has an independent risk management function, Group Risk Management Division (GRM), headed by the Group Chief Risk Officer (CRO), who reports to the BRMC and CEO. GRM is an independent risk and control oversight function that principally executes the risk management framework and principles. It provides risk committees, the BRMC and the Board regular risk reports and updates on material information with regard to risks. Functions in GRM are primarily organised by major risk types. Risk management staff work closely with the business and other support units to ensure that risks are well managed. GRM also oversees the Group’s data management via a framework that comprises data policies, standards and controls. The objective is to ensure the quality of critical risk data and the ability of the Bank to effectively aggregate such data for accurate and timely risk reporting. In addition, it oversees the New Product Approval Process (NPAP) to ensure that all inherent risks associated with new products and services are comprehensively identified, managed and mitigated, including compliance with regulatory requirements and adequacy of resources to support the new product and services.
39. Risk Management (continued)39.2 Credit RiskCredit risk is the risk of loss of principal and/or income due to the failure of an obligor or counterparty to meet its financial or contractual obligations as originally scheduled or a change in the credit profile of the obligor or counterparty. Credit risk arises from the Group’s lending activities to retail, corporate and institutional customers. It also includes counterparty and issuer credit risks arising from the Group’s trading and investment banking activities.
Maximum Exposure to Credit Risk The following table presents the Group’s maximum exposure to credit risk of on-balance sheet and off-balance sheet financial instruments, without taking into account of any collateral held or other credit enhancements. For on-balance sheet assets, the exposure to credit risk equals their carrying amount. For contingent liabilities, the maximum exposure to credit risk is the maximum amount that the Group would have to pay if the obligations of the instruments issued are called upon. For credit commitments, the maximum exposure to credit risk is the full amount of the undrawn credit facilities granted to customers.
Gross Average$ million 2019 2018 2019 2018
Credit risk exposure of on-balance sheet assets:Loans and bills receivable 262,045 255,193 256,141 247,290Placements with and loans to banks 35,813 39,035 36,495 40,078Government treasury bills and securities 28,663 27,776 28,934 27,014Debt securities 24,304 21,632 23,132 21,247Amounts due from associates 75 80 31 147Assets pledged 1,166 1,105 1,863 2,002Derivative receivables 7,349 7,201 15,882 8,110Other assets, comprising interest receivables and sundry debtors 1,806 1,716 2,100 921
361,221 353,738 364,578 346,809
Credit risk exposure of off-balance sheet items:Contingent liabilities 13,944 11,964 12,333 11,517Credit commitments 153,799 142,714 148,326 135,963
167,743 154,678 160,659 147,480
Total maximum credit risk exposure 528,964 508,416 525,237 494,289
CollateralsThe main types of collaterals obtained by the Group are as follows:• Personal housing loans Mortgages over residential properties• Commercial property loans Mortgages over commercial properties • Derivatives Cash and securities• Car loans Charges over the vehicles financed• Share margin financing Charges over listed securities including those of Singapore, Malaysia and Hong Kong• Other loans Securities and charges over business assets such as premises, inventories, trade receivables
or deposits
226 OCBC Annual Report 2019 227Financials

Notes to the Financial Statements For the financial year ended 31 December 2019
39. Risk Management (continued)39.2 Credit Risk (continued)Total Loans and Advances – Credit Quality In addition to the credit grading of facilities under MAS Notice 612, loans and advances are categorised into “neither past due nor impaired”, “past due but not impaired” and “impaired”. Impaired loans are classified loans with specific allowances made.
Bank loans Non-bank loans$ million 2019 2018 2019 2018
Neither past due nor impaired 34,616 37,912 259,662 251,002Non-impaired – – 1,818 3,731Impaired – – 2,550 1,592
Past due loans – – 4,368 5,323Impaired but not past due – – 743 1,380Gross loans 34,616 37,912 264,773 257,705Allowances
Impaired loans – – (1,395) (1,219)Non-impaired loans (9) (13) (1,030) (984)
Net loans 34,607 37,899 262,348 255,502
Loans Neither Past Due Nor ImpairedAnalysis of loans and advances that are neither past due nor impaired analysed based on the Group’s internal credit grading system is as follows:
Bank loans Non-bank loans$ million 2019 2018 2019 2018
GradesPerforming 34,616 37,912 259,482 250,671Non-performing – – 180 331Neither past due nor impaired 34,616 37,912 259,662 251,002
Past Due LoansAnalysis of past due loans by industry and geography are as follows:
Bank loans Non-bank loans
$ million 2019 2018 2019 2018
By industry Agriculture, mining and quarrying – – 243 108Manufacturing – – 520 734Building and construction – – 160 271General commerce – – 646 1,217Transport, storage and communication – – 1,149 496Financial institutions, investment and holding companies – – 136 295Professionals and individuals (include housing) – – 1,444 1,935Others – – 70 267
– – 4,368 5,323
By geography Singapore – – 1,846 1,847Malaysia – – 863 757Indonesia – – 848 1,719Greater China – – 652 680Rest of the World – – 159 320
– – 4,368 5,323
39. Risk Management (continued)39.2 Credit Risk (continued)Loans Past Due But Not ImpairedCertain loans and advances are past due but not impaired as the collateral values of these loans are in excess of the principal and interest outstanding. Allowances for these loans may have been set aside. The Group’s non-bank loans which are past due but not impaired are as follows:
$ million 2019 2018
Past due Less than 30 days 1,017 2,79530 to 90 days 444 474Over 90 days 357 462Past due but not impaired 1,818 3,731
Collateral and Other Credit Enhancements ObtainedAssets amounting to $49 million (2018: $69 million) were obtained by the Group during the year by taking possession of collateral held as security, or by calling upon other credit enhancements and held at the reporting date.
Repossessed properties are made available for sale in an orderly fashion, with the proceeds used to reduce or repay the outstanding indebtedness. The Group generally does not occupy the premises repossessed for its business use.
Country RiskThe Group’s country risk framework covers the assessment and rating of countries, as well as the maximum cross-border transfer risk limit granted to any one country based on its risk rating. The risk covers all cross-border transactions including onshore non-local currency transactions. Limits are allocated into maturity time-bands and vary according to the risk rating of the country and the political and economic outlook. The Group’s main cross-border transfer risk exposures during the financial year were in Hong Kong SAR, People’s Republic of China and Malaysia.
228 OCBC Annual Report 2019 229Financials

Notes to the Financial Statements For the financial year ended 31 December 2019
39. Risk Management (continued)39.3 Market Risk and Asset Liability ManagementMarket risk is the risk of losing income and/or market value due to fluctuations in factors such as interest rates, foreign exchange rates, credit spreads, equity and commodity prices or changes in volatilities, or correlation of such factors. Market risks arise mainly from the Group’s trading, client servicing and balance sheet management activities.
The Group’s market risk management framework covers the identification, assessment, measurement, monitoring and control of risks. Group-level market risk policies and procedures are established to provide common guidelines and standards for managing market risks. The Group’s market risk management strategy and limits are regularly reviewed and established within the Group’s risk appetite and business strategies, taking into account prevailing macroeconomic and market conditions.
Asset liability management is the strategic management of the Group’s balance sheet structure and liquidity requirements. It covers liquidity sourcing and diversification as well as interest rate and structural foreign exchange management.
The Group’s asset liability management framework focuses on managing the exposures arising from the Bank’s balance sheet. The Group monitors its liquidity risk, interest rate risk in the banking book (IRRBB) and structural foreign exchange risk profiles against approved risk limits under both business-as-usual and stressed scenarios. These are based on the standards established in the Group’s framework, policies and procedures which are subject to regular reviews to ensure that they remain relevant in the context of the prevailing market conditions and practices.
Interest Rate RiskIRRBB is the risk to earnings and capital arising from exposure to adverse changes in the interest rate environment.
The primary goal of the management of IRRBB is to ensure that interest rate risk exposures are maintained within defined risk tolerances and are consistent with the Group’s risk appetite. The material sources of IRRBB are repricing risk, yield curve risk, basis risk and optionality risk.
A range of techniques are used to measure IRRBB from both earnings and economic value perspectives. One method involves the simulation of the impact of various interest rate scenarios on the Group’s net interest income and economic value of equity (EVE). Other measures include interest rate sensitivity measures such as PV01 and repricing gap profile analysis. Behavioural models are used to assess interest rate risks in relation to loan prepayment, time deposit early redemption and the profile of non-maturity deposits. These measurements are used to adjust IRRBB management and hedging strategies, policies and positions.
The significant market risk faced by the Group is interest rate risk arising from the re-pricing mismatches of assets and liabilities from its banking businesses. These are monitored using a variety of risk metrics. The impact on net interest income of the banking book is simulated under various interest rate scenarios and assumptions. Based on a 100 bp parallel rise in yield curves on the Group’s exposure to major currencies i.e. Singapore Dollar, US Dollar, Hong Kong Dollar and Malaysian Ringgit, net interest income is estimated to increase by $681 million (2018: $744 million), or approximately +10.8% (2018: +12.6%) of reported net interest income. The corresponding impact from a 100 bp decrease is an estimated reduction of $681 million (2018: $744 million) in net interest income, or approximately -10.8% (2018: -12.6%) of reported net interest income.
The 1% rate shock impact on net interest income is based on the Group’s interest rate risk profile as at reporting date. It does not take into account actions that would be taken by Global Treasury or the business units to mitigate the impact of this interest rate risk. In reality, Global Treasury seeks proactively to change the interest rate risk profile to minimise losses and maximise net revenues. The projections also assume a constant balance sheet position and that all positions run to maturity.
39. Risk Management (continued)39.3 Market Risk and Asset Liability Management (continued)Interest Rate Risk (continued)The table below summarises the Group’s financial instruments at carrying amounts, categorised by the earlier of contractual re-pricing or maturity dates, except for trading portfolio liabilities which is in accordance with the Group’s trading strategies.
$ millionWithin 1 week
1 week to1 month
1 to 3months
3 to 12months
1 to 3 years
Over3 years
Non-interest
sensitive Total2019Cash and placements with
central banks 8,454 4,007 3,171 – – 836 6,734 23,202Placements with and loans to banks 3,535 3,161 8,745 15,495 – – 3,671 34,607Loans and bills receivable (1) 46,298 80,419 90,587 30,561 9,168 2,386 2,930 262,349Securities (2) 1,210 3,672 9,334 10,281 14,222 13,873 5,415 58,007Derivative receivables – – – – – – 7,349 7,349Other assets 235 75 335 119 9 # 3,636 4,409Amounts due from associates – – 22 – – – 53 75Financial assets 59,732 91,334 112,194 56,456 23,399 17,095 29,788 389,998
Deposits of non-bank customers 72,608 68,644 50,161 38,006 37,908 916 34,608 302,851Deposits and balances of banks 2,885 1,250 1,005 54 271 – 2,785 8,250Trading portfolio liabilities – – 90 – – – 2 92Derivative payables – – – – – – 7,687 7,687Other liabilities (3) 73 72 93 106 1 – 6,848 7,193Debt issued 1,397 2,410 7,896 10,072 3,480 4,073 60 29,388Financial liabilities 76,963 72,376 59,245 48,238 41,660 4,989 51,990 355,461
On-balance sheet sensitivity gap (17,231) 18,958 52,949 8,218 (18,261) 12,106Off-balance sheet sensitivity gap (625) 480 (3,577) 1,936 1,529 257Net interest sensitivity gap (17,856) 19,438 49,372 10,154 (16,732) 12,363
2018Cash and placements with
central banks 6,828 3,222 2,569 – – 889 5,240 18,748Placements with and loans to banks 4,480 4,693 9,357 15,279 – – 4,089 37,898Loans and bills receivable (1) 46,290 81,671 87,445 28,349 6,210 2,343 3,194 255,502Securities (2) 442 2,968 8,183 12,431 12,394 12,181 5,390 53,989Derivative receivables – – – – – – 7,201 7,201Other assets 170 8 259 # # 36 3,002 3,475Amounts due from associates – – 79 – – – 1 80Financial assets 58,210 92,562 107,892 56,059 18,604 15,449 28,117 376,893
Deposits of non-bank customers 69,703 67,900 52,244 34,623 35,278 865 34,799 295,412Deposits and balances of banks 1,862 851 1,757 58 143 – 2,905 7,576Trading portfolio liabilities – – 214 – – – – 214Derivative payables – – – – – – 7,105 7,105Other liabilities (3) 64 72 121 100 # – 5,822 6,179Debt issued 1,551 4,080 9,886 6,843 1,701 5,718 493 30,272Financial liabilities 73,180 72,903 64,222 41,624 37,122 6,583 51,124 346,758
On-balance sheet sensitivity gap (14,970) 19,659 43,670 14,435 (18,518) 8,866Off-balance sheet sensitivity gap (137) 93 (5,868) 5,774 (1,301) 1,439Net interest sensitivity gap (15,107) 19,752 37,802 20,209 (19,819) 10,305
(1) Net of allowances for loans. (2) Securities comprise government, debt and equity securities (including assets pledged).(3) Other liabilities include amounts due to associates.(4) # represents amounts less than $0.5 million.
230 OCBC Annual Report 2019 231Financials
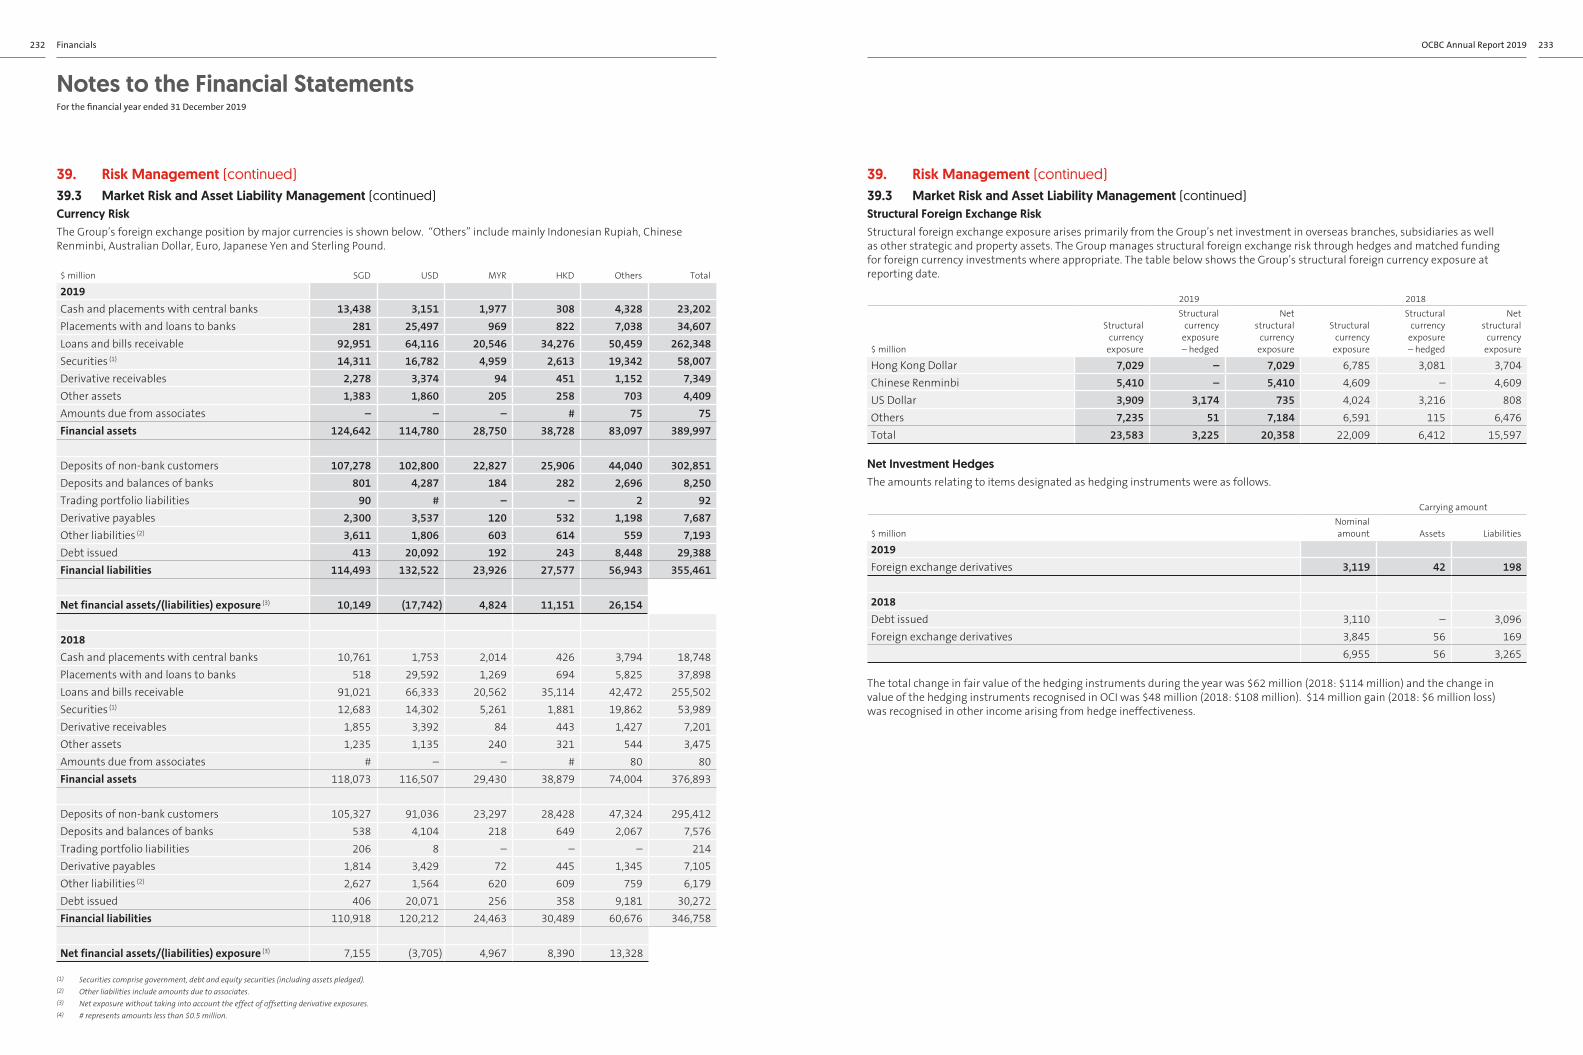
Notes to the Financial Statements For the financial year ended 31 December 2019
39. Risk Management (continued)39.3 Market Risk and Asset Liability Management (continued)Currency RiskThe Group’s foreign exchange position by major currencies is shown below. “Others” include mainly Indonesian Rupiah, Chinese Renminbi, Australian Dollar, Euro, Japanese Yen and Sterling Pound.
$ million SGD USD MYR HKD Others Total
2019Cash and placements with central banks 13,438 3,151 1,977 308 4,328 23,202Placements with and loans to banks 281 25,497 969 822 7,038 34,607Loans and bills receivable 92,951 64,116 20,546 34,276 50,459 262,348Securities (1) 14,311 16,782 4,959 2,613 19,342 58,007Derivative receivables 2,278 3,374 94 451 1,152 7,349Other assets 1,383 1,860 205 258 703 4,409Amounts due from associates – – – # 75 75Financial assets 124,642 114,780 28,750 38,728 83,097 389,997
Deposits of non-bank customers 107,278 102,800 22,827 25,906 44,040 302,851Deposits and balances of banks 801 4,287 184 282 2,696 8,250Trading portfolio liabilities 90 # – – 2 92Derivative payables 2,300 3,537 120 532 1,198 7,687Other liabilities (2) 3,611 1,806 603 614 559 7,193Debt issued 413 20,092 192 243 8,448 29,388Financial liabilities 114,493 132,522 23,926 27,577 56,943 355,461
Net financial assets/(liabilities) exposure (3) 10,149 (17,742) 4,824 11,151 26,154
2018Cash and placements with central banks 10,761 1,753 2,014 426 3,794 18,748Placements with and loans to banks 518 29,592 1,269 694 5,825 37,898Loans and bills receivable 91,021 66,333 20,562 35,114 42,472 255,502Securities (1) 12,683 14,302 5,261 1,881 19,862 53,989Derivative receivables 1,855 3,392 84 443 1,427 7,201Other assets 1,235 1,135 240 321 544 3,475Amounts due from associates # – – # 80 80Financial assets 118,073 116,507 29,430 38,879 74,004 376,893
Deposits of non-bank customers 105,327 91,036 23,297 28,428 47,324 295,412Deposits and balances of banks 538 4,104 218 649 2,067 7,576Trading portfolio liabilities 206 8 – – – 214Derivative payables 1,814 3,429 72 445 1,345 7,105Other liabilities (2) 2,627 1,564 620 609 759 6,179Debt issued 406 20,071 256 358 9,181 30,272Financial liabilities 110,918 120,212 24,463 30,489 60,676 346,758
Net financial assets/(liabilities) exposure (3) 7,155 (3,705) 4,967 8,390 13,328
(1) Securities comprise government, debt and equity securities (including assets pledged).(2) Other liabilities include amounts due to associates.(3) Net exposure without taking into account the effect of offsetting derivative exposures.(4) # represents amounts less than $0.5 million.
39. Risk Management (continued)39.3 Market Risk and Asset Liability Management (continued)Structural Foreign Exchange RiskStructural foreign exchange exposure arises primarily from the Group’s net investment in overseas branches, subsidiaries as well as other strategic and property assets. The Group manages structural foreign exchange risk through hedges and matched funding for foreign currency investments where appropriate. The table below shows the Group’s structural foreign currency exposure at reporting date.
2019 2018
$ million
Structural currency
exposure
Structural currency
exposure – hedged
Net structural
currency exposure
Structural currency
exposure
Structural currency
exposure – hedged
Net structural
currency exposure
Hong Kong Dollar 7,029 – 7,029 6,785 3,081 3,704Chinese Renminbi 5,410 – 5,410 4,609 – 4,609US Dollar 3,909 3,174 735 4,024 3,216 808Others 7,235 51 7,184 6,591 115 6,476Total 23,583 3,225 20,358 22,009 6,412 15,597
Net Investment HedgesThe amounts relating to items designated as hedging instruments were as follows.
Carrying amount
$ millionNominal amount Assets Liabilities
2019Foreign exchange derivatives 3,119 42 198
2018Debt issued 3,110 – 3,096Foreign exchange derivatives 3,845 56 169
6,955 56 3,265
The total change in fair value of the hedging instruments during the year was $62 million (2018: $114 million) and the change in value of the hedging instruments recognised in OCI was $48 million (2018: $108 million). $14 million gain (2018: $6 million loss) was recognised in other income arising from hedge ineffectiveness.
232 OCBC Annual Report 2019 233Financials

Notes to the Financial Statements For the financial year ended 31 December 2019
39. Risk Management (continued)39.3 Market Risk and Asset Liability Management (continued)Liquidity RiskLiquidity risk is the risk arising from the inability to meet financial obligations as they fall due without incurring unacceptable costs or losses through fundraising and assets liquidation.
The objective of liquidity risk management is to ensure that the Group has sufficient funds to meet contractual and regulatory financial obligations and to undertake new transactions.
Liquidity monitoring is performed daily within a framework for projecting cash flows on both contractual and behavioural bases. Indicators such as liquidity and deposit concentration ratios are used to establish the level of optimal funding mix and asset composition. Funding strategies are established to provide effective diversification and stability in funding sources across tenors, products and geographies. Simulations of liquidity exposures under stressed market scenarios are performed and the results are used to adjust liquidity risk management strategies, policies and positions, as well as develop contingency funding plans.
The table below analyses the carrying amount of assets and liabilities of the Group into maturity time bands based on the remaining term to contractual maturity as at the balance sheet date.
$ millionWithin 1 week
1 week to 1 month
1 to 3 months
3 to 12 months
1 to 3 years
Over3 years
Nospecific
maturity Total
2019Cash and placements with central banks 10,666 4,113 3,181 99 – – 5,143 23,202Placements with and loans to banks 5,688 2,314 6,472 17,596 2,537 # – 34,607Loans and bills receivable 19,689 33,501 24,789 26,535 42,735 115,099 – 262,348Securities (1) 753 2,362 4,538 9,810 18,455 17,859 4,230 58,007Derivative receivables 7,090 2 # # 82 175 – 7,349Other assets (2) 1,570 1,089 729 375 81 74 578 4,496Associates 1 29 22 23 # – 3,563 3,638Property, plant and equipment and
investment property (3) # – 2 1 – – 3,783 3,786Goodwill and intangible assets – – – – – – 4,980 4,980Total 45,457 43,410 39,733 54,439 63,890 133,207 22,277 402,413Total life insurance fund assets 89,278Total assets 491,691
Deposits of non-bank customers 165,089 40,877 50,555 42,751 1,792 1,787 – 302,851Deposits and balances of banks 5,872 1,318 1,006 54 – – – 8,250Trading portfolio liabilities – – 90 – – – 2 92Derivative payables 7,409 1 # 9 55 213 – 7,687Other liabilities (4) 2,944 1,232 1,055 2,044 169 160 878 8,482Debt issued 737 1,845 6,492 10,738 5,503 4,073 – 29,388Total 182,051 45,273 59,198 55,596 7,519 6,233 880 356,750Total life insurance fund liabilities 86,338Total liabilities 443,088
Net liquidity gap (136,594) (1,863) (19,465) (1,157) 56,371 126,974
(1) Securities comprise government, debt and equity securities (including assets pledged).(2) Other assets include deferred tax assets.(3) Property, plant and equipment and investment property include assets held for sale.(4) Other liabilities include amounts due to associates, current tax and deferred tax liabilities.(5) # represents amounts less than $0.5 million.
39. Risk Management (continued)39.3 Market Risk and Asset Liability Management (continued)Liquidity Risk (continued)
$ millionWithin 1 week
1 week to 1 month
1 to 3 months
3 to 12 months
1 to 3 years
Over3 years
Nospecific
maturity Total
2018Cash and placements with central banks 7,320 3,474 2,569 20 – – 5,365 18,748Placements with and loans to banks 6,622 3,375 6,887 20,218 451 345 – 37,898Loans and bills receivable 19,565 37,045 23,081 26,606 41,075 108,130 – 255,502Securities (1) 449 1,900 4,570 13,644 14,594 14,922 3,910 53,989Derivative receivables 7,027 2 # 3 6 163 – 7,201Other assets (2) 900 1,182 633 354 46 88 378 3,581Associates – – 79 – 1 – 3,103 3,183Property, plant and equipment and
investment property (3) – – 2 – – – 3,649 3,651Goodwill and intangible assets – – – – – – 5,093 5,093Total 41,883 46,978 37,821 60,845 56,173 123,648 21,498 388,846Total life insurance fund assets 78,697Total assets 467,543
Deposits of non-bank customers 156,168 42,765 52,937 38,256 2,749 2,537 – 295,412Deposits and balances of banks 4,885 849 1,739 103 – – – 7,576Trading portfolio liabilities – – 214 – – – # 214Derivative payables 6,901 1 1 10 3 189 – 7,105Other liabilities (4) 2,651 1,001 1,067 1,501 35 84 907 7,246Debt issued 1,551 3,020 8,822 7,133 3,628 6,118 – 30,272Total 172,156 47,636 64,780 47,003 6,415 8,928 907 347,825Total life insurance fund liabilities 76,326Total liabilities 424,151
Net liquidity gap (130,273) (658) (26,959) 13,842 49,758 114,720
(1) Securities comprise government, debt and equity securities (including assets pledged).(2) Other assets include deferred tax assets.(3) Property, plant and equipment and investment property include assets held for sale.(4) Other liabilities include amounts due to associates, current tax and deferred tax liabilities.(5) # represents amounts less than $0.5 million.
As contractual maturities may not necessarily reflect the timing of actual cash flows of assets and liabilities, cash flows for liquidity risk analysis are based on a contractual and behavioural basis.
234 OCBC Annual Report 2019 235Financials

Notes to the Financial Statements For the financial year ended 31 December 2019
39. Risk Management (continued)39.3 Market Risk and Asset Liability Management (continued)Contractual Maturity for Financial Liabilities The table below shows the undiscounted cash outflows of the Group’s financial liabilities by remaining contractual maturities, except for trading portfolio liabilities which is in accordance with the Group’s trading strategies. Information on cash outflow of gross loan commitments is set out in Note 44. The expected cash flows of these liabilities could vary significantly from what is shown in the table. For example, deposits of non-bank customers included demand deposits, such as current and savings (Note 17) which are expected to remain stable, and unrecognised loan commitments are not all expected to be drawn down immediately.
$ millionWithin 1 week
1 week to1 month
1 to 3 months
3 to 12 months
1 to 3 years
Over3 years Total
2019Deposits of non-bank customers (1) 165,175 41,105 50,946 43,455 1,910 1,841 304,432Deposits and balances of banks (1) 5,873 1,347 1,010 54 – – 8,284Trading portfolio liabilities – – 92 – – – 92Other liabilities (2) 2,836 699 1,013 833 186 145 5,712Debt issued 738 1,857 6,522 10,881 5,718 4,229 29,945Net settled derivatives
Trading 436 149 329 979 1,491 1,691 5,075Hedging # # 3 9 23 15 50
Gross settled derivativesTrading – Outflow 42,545 54,296 63,445 76,443 28,268 17,524 282,521Trading – Inflow (42,508) (54,315) (63,506) (76,495) (28,324) (17,503) (282,651)Hedging – Outflow 5 107 10 56 1,636 1,717 3,531Hedging – Inflow – (101) (5) (2) (1,522) (1,513) (3,143)
175,100 45,144 59,859 56,213 9,386 8,146 353,848
2018Deposits of non-bank customers (1) 156,296 42,937 53,344 39,020 2,956 2,651 297,204Deposits and balances of banks (1) 4,887 851 1,750 104 1 – 7,593Trading portfolio liabilities – – 214 – – – 214Other liabilities (2) 2,456 555 952 507 13 83 4,566Debt issued 1,553 3,033 8,859 7,350 3,918 6,494 31,207Net settled derivatives
Trading 484 309 372 1,288 1,026 1,049 4,528Hedging # 15 2 (3) 3 2 19
Gross settled derivativesTrading – Outflow 46,495 59,600 64,082 65,093 27,251 19,729 282,250Trading – Inflow (46,473) (59,823) (64,090) (65,102) (27,419) (19,676) (282,583)Hedging – Outflow 6 169 13 81 195 3,373 3,837Hedging – Inflow – (162) (5) (2) (14) (3,153) (3,336)
165,704 47,484 65,493 48,336 7,930 10,552 345,499
(1) Interest cash flows of bank and non-bank deposits are included in the respective deposit lines based on interest payment dates.(2) Other liabilities include amounts due to associates.(3) # represents amounts less than $0.5 million.
39. Risk Management (continued)39.4 Insurance-Related Risk Management This note sets out the risk management information of GEH Group.
Governance FrameworkManaging risk is an integral part of GEH Group’s core business. As stated in the Enterprise Risk Management (ERM) Framework, GEH Group shall operate within parameters and limits that have been set based on the risk appetite approved by the GEH Board, and pursue appropriate risk-adjusted returns.
GEH Group Risk Management department spearheads the development and implementation of the ERM Framework for GEH Group.
GEH Board is responsible to provide oversight on the risk management initiatives. GEH Board may delegate this responsibility to the Risk Management Committee (RMC). At GEH Group level, detailed risk management and oversight activities are undertaken by the following group management committees chaired by the Group Chief Executive Officer and comprising key Senior Management Executives, namely: Group Management Committee (GMC), Group Asset-Liability Committee (Group ALC), Group Investment Committee (Group IC), Group Product Management and Approval Committee (Group PMAC) and Group Technology Strategy Committee (Group TSC).
GMC is responsible for providing leadership, direction and functional oversight with regards to all matters of GEH Group. The GMC is also responsible for ensuring compliance and alignment with Group Governance and Oversight Framework, i.e. Group standards and guidelines. The GMC is supported by the Group IC, Group ALC, Group PMAC, Group TSC, Local Senior Management Team (SMT), Local ALC, Local Product Development Committee (PDC) and Local TSC.
Group IC is responsible for the oversight of all investment management activities of the company with added oversight to ensure that for the insurance funds, the interests and rights of policyholders are not compromised. Group ALC is responsible for balance sheet management. Specifically, Group ALC reviews and formulates technical frameworks, policies and methodologies relating to balance sheet management. Group ALC is also responsible for ensuring compliance and alignment with Group Governance and Oversight Framework, i.e. Group standards and guidelines. Group ALC is supported by the local ALC.
Group TSC is responsible for assisting GMC in providing the overall strategic direction and approval of all IT related issues and initiatives to support GEH Group strategic growth into the future. Group TSC is supported by local TSC.
Group PMAC is responsible for reviewing, approving and managing new and existing products, ensuring the business operates within the risk appetite to deliver the annual business targets. Local PDC is responsible for reviewing and endorsing new products at the local operating subsidiaries.
Regulatory FrameworkInsurers are required to comply with the Insurance Act and Regulations, as applicable, including guidelines on investment limits. The responsibility for the formulation, establishment and approval of the investment policy rests with the respective Board of Directors (Board) of the insurance subsidiaries. The Board exercises oversight on investments to safeguard the interests of policyholders and shareholders.
Capital Management The objectives of GEH’s capital management policy are to create shareholder value, deliver sustainable returns to shareholders, maintain a strong capital position with sufficient buffer to meet policyholders’ obligations and regulatory requirements and make strategic investments for business growth.
GEH Group had no significant changes in the policies and processes relating to its capital structure during the year.
Regulatory CapitalThe insurance subsidiaries of GEH Group are required to comply with capital ratios prescribed by the insurance regulations of the jurisdiction in which the subsidiaries operate. The Capital Adequacy Ratios of GEH Group’s insurance subsidiaries in both Singapore and Malaysia remained well above the regulatory minimum ratios under the Risk based Capital Frameworks established by the Monetary Authority of Singapore (MAS) and Bank Negara, Malaysia (BNM) respectively.
236 OCBC Annual Report 2019 237Financials

Notes to the Financial Statements For the financial year ended 31 December 2019
39. Risk Management (continued)39.4 Insurance-Related Risk Management (continued)Capital Management (continued) Regulatory Capital (continued)GEH Group’s approach to capital management aims to maintain an adequate level of capital to meet regulatory requirements, including any additional amounts required by the respective regulators. This involves managing assets, liabilities and risks in a coordinated way by assessing and monitoring available and required capital (by each regulated entity) on a regular basis and, where appropriate, taking suitable actions to influence the capital position of GEH Group in light of changes in economic conditions and risk characteristics.
The primary sources of capital of GEH Group are shareholders’ equity and issued subordinated debt. GEH Group defines available capital as the amount of assets in excess of liabilities measured in accordance with the insurance regulations of the respective jurisdictions in which the insurance subsidiaries operate. Available capital of the consolidated Singapore insurance subsidiaries as at 31 December 2019 amounted to $13.9 billion (2018: $11.5 billion) while available capital of the consolidated Malaysia insurance subsidiaries as at 31 December 2019 amounted to $7.9 billion (2018: $8.0 billion).
DividendGEH’s dividend policy aims to provide shareholders with a predictable and sustainable dividend return, payable on a half-yearly basis.
Financial Risk ManagementThe following sections provide details regarding GEH Group’s exposure to insurance and key financial risks and the objectives, policies and processes for the management of these risks.
There has been no change to GEH Group’s exposure to these insurance and key financial risks or the manner in which it manages and measures the risks.
Insurance RiskThe principal activity of GEH Group is the provision of insurance products and related financial advisory services. The products cover risks such as mortality, morbidity (health, disability, critical illness, personal accident), and property and casualty, and meet customer needs in investment and retirement provision.
GEH Group’s underwriting strategy is designed to ensure that risks are well diversified across the types of risk and level of insured benefits. This is largely achieved through diversification across industry sectors and geography, the use of medical screening in order to ensure that pricing takes account of current health conditions and family medical history, regular review of actual claims experience, as well as detailed claims handling procedures. Underwriting limits are also set in place to enforce appropriate risk selection criteria. For example, GEH Group has the right not to renew individual policies, it can impose deductibles and it has the right to reject the payment of fraudulent claims.
Risks inherent in GEH Group’s activities include but are not limited to the risks discussed below.
Insurance Risks of Life Insurance ContractsInsurance risks arise when GEH Group underwrites insurance contracts. While insurance risks do not vary significantly across the geographical locations in which GEH Group currently operates, the types of risks insured, assumptions used in pricing the insurance products as well as subsequent setting aside of the technical provisions may give rise to potential shortfalls in provision for future claims and expenses when actual experience is different from the underlying assumptions. Assumptions that may cause insurance risks to be underestimated include assumptions on policy lapses, mortality, morbidity and expenses.
GEH Group utilises reinsurance to manage the mortality and morbidity risks. GEH Group’s reinsurance management strategy and policy are reviewed annually by RMC and Group ALC. Reinsurance structures are set based on the type of risk insured. Catastrophe reinsurance is procured to limit catastrophic losses. GEH Group’s exposure to group insurance business is not significant and there is no material concentration risk.
In general, reinsurers must have a minimum credit rating of S&P A- or equivalent to be considered for reinsurance business. GEH Group limits its risk to any one reinsurer by ceding different products to different reinsurers or to a panel of reinsurers.
Group ALC reviews the actual experience of mortality, morbidity, lapses and surrenders, and expenses to ensure that the policies, guidelines and limits put in place to manage the risks remain adequate and appropriate.
39. Risk Management (continued)39.4 Insurance-Related Risk Management (continued)Insurance Risk (continued)Insurance Risks of Life Insurance Contracts (continued)A substantial portion of GEH Group’s life insurance funds is participating in nature. In the event of volatile investment climate and/or unusual claims experience, the insurer has the option of revising the bonus and dividends payable to policyholders.
For non-participating funds, the risk is that the guaranteed policy benefits must be met even when investment markets perform below expectations, or claims experience is higher than expected.
For investment-linked funds, the risk exposure for GEH Group is limited only to the underwriting aspect as all investment risks are borne by the policyholders.
Stress Testing (ST) is performed at least once a year. The purpose of the ST is to test the solvency of the life fund under various scenarios according to prescribed statutory valuation basis, simulating drastic changes in major parameters such as new business volume, investment scenarios, expense patterns, mortality/morbidity patterns and lapse rates.
Table 39.4(A):The table below sets out the distribution of the various categories of the life insurance risk as at the balance sheet date.
Life insuranceInsurance liabilities ($ million) 2019 2018
(a) By class of businessWhole life 40,933 36,350Endowment 28,504 25,368Term 499 452Accident and health 372 1,804Annuity 507 520Others 1,248 1,099Total 72,063 65,593
(b) By countrySingapore 50,918 45,584Malaysia 20,359 19,384Others 786 625Total 72,063 65,593
The sensitivity analysis below shows the impact of change in key parameters on the value of policy liabilities, and hence on the income statements and shareholders’ equity.
Sensitivity analysis produced are based on parameters set out as follows:
Change in assumptions(a) Scenario 1 – Mortality and Major Illness + 25% for all future years(b) Scenario 2 – Mortality and Major Illness – 25% for all future years(c) Scenario 3 – Health and Disability + 25% for all future years(d) Scenario 4 – Health and Disability – 25% for all future years(e) Scenario 5 – Lapse and Surrender Rates + 25% for all future years(f) Scenario 6 – Lapse and Surrender Rates – 25% for all future years(g) Scenario 7 – Expenses + 30% for all future years
238 OCBC Annual Report 2019 239Financials

Notes to the Financial Statements For the financial year ended 31 December 2019
39. Risk Management (continued)39.4 Insurance-Related Risk Management (continued)Insurance Risk (continued)Insurance Risks of Life Insurance Contracts (continued)Table 39.4(B1): Profit/(Loss) After Tax and Shareholders’ Equity Sensitivity for the Singapore Segment
Impact on 1-Year’s Profit/(Loss) After Tax and Shareholders’ Equity
$ million Scenario 1 Scenario 2 Scenario 3 Scenario 4 Scenario 5 Scenario 6 Scenario 7
2019Gross impact (177.8) 97.8 (87.0) 35.5 68.7 (79.1) (12.0)Reinsurance ceded – – – – – – –Net impact (177.8) 97.8 (87.0) 35.5 68.7 (79.1) (12.0)
2018Gross impact (100.3) 23.1 34.7 (77.1) 55.9 (65.4) (26.0)Reinsurance ceded – – – – – – –Net impact (100.3) 23.1 34.7 (77.1) 55.9 (65.4) (26.0)
Table 39.4(B2): Profit/(Loss) After Tax and Shareholders’ Equity Sensitivity for the Malaysia Segment
Impact on 1-Year’s Profit/(Loss) After Tax and Shareholders’ Equity
$ million Scenario 1 Scenario 2 Scenario 3 Scenario 4 Scenario 5 Scenario 6 Scenario 7
2019Gross impact (95.0) 85.9 (17.8) 13.1 1.2 1.5 (28.1)Reinsurance ceded – – – – – – –Net impact (95.0) 85.9 (17.8) 13.1 1.2 1.5 (28.1)
2018Gross impact (76.9) 67.2 (15.3) 11.9 (4.4) 6.1 (24.8)Reinsurance ceded – – – – – – –Net impact (76.9) 67.2 (15.3) 11.9 (4.4) 6.1 (24.8)
The above tables demonstrate the sensitivity of GEH Group’s profit and loss after tax to a possible change in actuarial valuation assumptions on an individual basis with all other variables held constant.
The effect of sensitivity analysis on reinsurance ceded for the Singapore and Malaysia segments are not material.
The method used, including the significant assumptions made, for performing the above sensitivity analysis did not change from the previous year.
Insurance Risk of Non-Life Insurance ContractsRisks under non-life insurance policies usually cover a twelve-month duration. The risk inherent in non-life insurance contracts is reflected in the insurance contract liabilities which include the premium and claims liabilities. The premium liabilities comprise reserve for unexpired risks, while the claims liabilities comprise the loss reserves which include both provision for outstanding claims notified and outstanding claims incurred but not reported.
39. Risk Management (continued)39.4 Insurance-Related Risk Management (continued)Insurance Risk (continued)Insurance Risk of Non-Life Insurance Contracts (continued)Table 39.4(C1): The table below sets out the distribution of the various categories of the non-life insurance risk as at the balance sheet date:
2019 2018
Non-life insurance contracts $ million
Gross premiumliabilities
Reinsured premiumliabilities
Net premium liabilities
Gross premium liabilities
Reinsured premium liabilities
Net premium liabilities
(a) By class of businessFire 27 (10) 17 19 (6) 13Motor 38 (2) 36 35 (2) 33Marine and aviation 11 (6) 5 3 (3) #Workmen’s compensation 27 (11) 16 16 (4) 12Personal accident and health 24 (2) 22 24 (2) 22Miscellaneous 52 (33) 19 50 (34) 16Total 179 (64) 115 147 (51) 96
(b) By countrySingapore 95 (43) 52 78 (35) 43Malaysia 71 (19) 52 69 (16) 53Indonesia 13 (2) 11 – – –Total 179 (64) 115 147 (51) 96
2019 2018
Non-life insurance contracts$ million
Gross claims
liabilities
Reinsured claims
liabilities
Net claims
liabilities
Gross claims
liabilities
Reinsured claims
liabilities
Net claims
liabilities
(a) By class of businessFire 50 (33) 17 29 (19) 10Motor 56 (5) 51 55 (5) 50Marine and aviation 51 (36) 15 25 (22) 3Workmen’s compensation 29 (11) 18 26 (9) 17Personal accident and health 22 (3) 19 18 (2) 16Miscellaneous 72 (44) 28 84 (64) 20Total 280 (132) 148 237 (121) 116
(b) By countrySingapore 111 (61) 50 123 (74) 49Malaysia 127 (55) 72 114 (47) 67Indonesia 42 (16) 26 – – –Total 280 (132) 148 237 (121) 116
(1) # represents amounts less than $0.5 million.
240 OCBC Annual Report 2019 241Financials

Notes to the Financial Statements For the financial year ended 31 December 2019
39. Risk Management (continued)39.4 Insurance-Related Risk Management (continued)Insurance Risk (continued)Insurance Risk of Non-Life Insurance Contracts (continued)Table 39.4(C2): Cumulative Claims Estimates and Cumulative Payments To-DateThe tables below show the cumulative claims estimates, including both claims notified and IBNR for each successive accident year, at each balance sheet date, together with cumulative payments to date.
(i) Gross non-life insurance contract liabilities for 2019
$ million 2012 2013 2014 2015 2016 2017 2018 2019 Total
(a) Estimate of cumulative claimsAccident Year 93 138 127 166 178 169 163 214One year later 100 131 119 162 178 166 141 –Two years later 97 117 116 134 173 147 – –Three years later 94 116 112 140 169 – – –Four years later 89 120 107 139 – – – –Five years later 87 123 108 – – – – –Six years later 85 122 – – – – – –Seven years later 84 – – – – – – –Current estimate of cumulative claims 84 122 108 139 169 147 141 214
(b) Cumulative paymentsAccident Year 37 38 39 52 82 64 55 91One year later 64 79 87 105 138 107 101 –Two years later 75 91 96 114 154 121 – –Three years later 81 95 99 128 158 – – –Four years later 83 112 100 130 – – – –Five years later 84 121 102 – – – – –Six years later 84 121 – – – – – –Seven years later 84 – – – – – – –Cumulative payments 84 121 102 130 158 121 101 91
(c) Non-life gross claim liabilities # 1 6 9 11 26 40 123 216Reserve for prior years 22Estimated cumulative claims of
PT Great Eastern General Insurance, gross 42Non-life insurance contract liabilities, gross 280
(1) # represents amounts less than $0.5 million.
39. Risk Management (continued)39.4 Insurance-Related Risk Management (continued)Insurance Risk (continued)Insurance Risk of Non-Life Insurance Contracts (continued)(ii) Non-life insurance contract liabilities, net of reinsurance of liabilities, for 2019
$ million 2012 2013 2014 2015 2016 2017 2018 2019 Total
(a) Estimate of cumulative claimsAccident Year 64 93 80 83 91 93 106 119One year later 70 74 77 79 85 92 98 –Two years later 66 72 76 75 83 90 – –Three years later 65 71 75 72 81 – – –Four years later 63 69 72 70 – – – –Five years later 61 67 72 – – – – –Six years later 60 66 – – – – – –Seven years later 60 – – – – – – –Current estimate of cumulative claims 60 66 72 70 81 90 98 119
(b) Cumulative paymentsAccident Year 32 30 32 30 41 44 47 54One year later 49 55 59 56 66 72 78 –Two years later 56 61 65 62 72 79 – –Three years later 58 63 67 64 75 – – –Four years later 59 64 69 65 – – – –Five years later 60 65 69 – – – – –Six years later 60 65 – – – – – –Seven years later 60 – – – – – – –Cumulative payments 60 65 69 65 75 79 78 54
(c) Non-life net claim liabilities # 1 3 5 6 11 20 65 111Reserve for prior years 11Estimated cumulative claims of
PT Great Eastern General Insurance, net 26Non-life insurance contract liabilities, net 148
(1) # represents amounts less than $0.5 million.
Key AssumptionsNon-life insurance contract liabilities are determined based on previous claims experience, existing knowledge of events, the terms and conditions of the relevant policies and interpretation of circumstances. Of particular relevance is past experience with similar cases, historical claims development trends, legislative changes, judicial decisions, economic conditions and claims handling procedures. The estimates of the non-life insurance contract liabilities are therefore sensitive to various factors and uncertainties. The actual future premium and claims liabilities will not develop exactly as projected and may vary from initial estimates.
Insurance risk of non-life insurance contracts is mitigated by achieving diversification across a large portfolio of insurance contracts and geographical areas. The variability of risks is improved by careful selection and implementation of underwriting strategies, which are designed to ensure that risks are diversified in terms of type of risk and level of insured benefits. This is largely achieved through diversification across industry sectors and geography. Further, thorough claim review policies to assess all new and ongoing claims, regular detailed review of claims handling procedures and frequent investigation of possible fraudulent claims are put in place to reduce the risk exposure of GEH Group. GEH Group further enforces a policy of active management and prompt pursuit of claims, in order to reduce its exposure to unpredictable future developments that can negatively impact the GEH Group.
GEH Group has also limited its exposure by imposing maximum claim amounts on certain contracts as well as the use of reinsurance arrangements in order to limit exposure to catastrophic events, e.g. hurricanes, earthquakes and flood damages.
242 OCBC Annual Report 2019 243Financials

Notes to the Financial Statements For the financial year ended 31 December 2019
39. Risk Management (continued)39.4 Insurance-Related Risk Management (continued)Insurance Risk (continued)Insurance Risk of Non-Life Insurance Contracts (continued)The sensitivity analysis below shows the impact of changes in key assumptions on gross and net liabilities, profit before tax and equity.
Impact on
$ millionChange in
assumptionsGross
liabilitiesNet
liabilitiesProfit
before tax Equity
2019Provision for adverse deviation margin +20% 7 2 (2) (2)Loss ratio (1) +20% 67 41 (41) (32)Claims handling expenses +20% 2 1 (1) (1)
2018Provision for adverse deviation margin +20% 6 3 (3) (2)Loss ratio (1) +20% 76 51 (51) (39)Claims handling expenses +20% 2 2 (2) (1)
(1) Best estimate reserves and current accident year payments.
The method used and significant assumptions made for deriving sensitivity information above did not change from the previous year.
Market and Credit RiskMarket risk arises when the market values of assets and liabilities do not move consistently as financial markets change. Changes in interest rates, foreign exchange rates, equity prices and alternative investment prices can impact present and future earnings of the insurance operations as well as shareholders’ equity.
GEH Group is exposed to market risk in the investments of the Shareholders’ Fund as well as in the mismatch risk between the assets and liabilities of the Insurance Funds. In the case of the third-party funds managed by its asset management subsidiary, Lion Global Investors Limited, investment risks are borne by investors and GEH Group does not assume any liability in the event of occurrence of loss or write-down in market valuation.
GEH Group ALC, Group IC and local ALCs actively manage market risks through setting of investment policy and asset allocation, approving portfolio construction and risk measurement methodologies, approving hedging and alternative risk transfer strategies. Investment limits are monitored at various levels to ensure that all investment activities are conducted within GEH Group’s risk appetite and in line with GEH Group’s management principles and philosophies. Compliance with established limits forms an integral part of the risk governance and financial reporting framework. The approach adopted by GEH Group in managing the various types of risk, including interest rate risk, foreign exchange risk, equity price risk, credit risk, alternative investment risk and liquidity risk, is briefly described below.
(a) Interest Rate Risk (Including Asset Liability Mismatch)GEH Group is exposed to interest rate risk through (i) investments in fixed income instruments and (ii) policy liabilities in the Insurance Funds. Since the Shareholders’ Fund has exposure to investments in fixed income instruments but no exposure to insurance policy liabilities, it will incur an economic loss when interest rates rise. Given the long duration of policy liabilities and the uncertainty of the cash flows of the Insurance Funds, it is not possible to hold assets that will perfectly match the policy liabilities. This results in a net interest rate risk or asset liability mismatch risk which is managed and monitored by GEH Group ALC and the local ALCs. The Insurance Funds will incur an economic loss when interest rates drop since the duration of policy liabilities is generally longer than the duration of the fixed income assets.
Under Singapore regulations governed by the MAS, the liability cash flows with durations less than 20 years are discounted using zero-coupon spot yield of SGS while liability cash flows with duration more than 20 years for Singapore funds are discounted using the Long Term Risk Free Discount Rate (LTRFDR). As a result, the Singapore Non Participating funds could have negative earnings impact when the LTRFDR decreases.
39. Risk Management (continued)39.4 Insurance-Related Risk Management (continued)Market and Credit Risk (continued)(a) Interest Rate Risk (Including Asset Liability Mismatch) (continued)Under Malaysia regulations governed by BNM, the liability cash flows with durations less than 15 years are discounted using zero-coupon spot yield of MGS with matching duration while the liability cash flows with durations of 15 years or more are discounted using zero-coupon spot yield of MGS with 15 years term to maturity. As a result, the Malaysia non-participating fund could have negative earnings impact when the zero-coupon spot yield of MGS decreases.
(b) Foreign Currency RiskHedging through currency forwards and swaps is typically used for the foreign currency denominated fixed income portfolio. Portfolios are mostly hedged where practical and cost-effective. Foreign exchange instruments are also used for efficient portfolio management.
GEH Group is also exposed to foreign exchange risk on the net investment in its foreign subsidiaries. Such risk mainly arises from GEH Group’s subsidiaries in Malaysia. The Insurance and Shareholders’ Funds in Malaysia are predominantly held in Malaysian Ringgit, as prescribed by BNM.
Limits are set on the total amount of foreign currency (net of liabilities) to cap GEH Group’s foreign currency risk.
The following table shows the foreign exchange position of GEH Group’s financial and insurance-related assets and liabilities by major currencies.
$ million SGD MYR USD Others Total
2019Financial assets at FVOCI
Equity securities 364 221 – 1,004 1,589Debt securities 4,834 816 2,616 401 8,667
Financial assets at FVTPLEquity securities 1,435 7,017 1,161 3,629 13,242Debt securities 16,433 14,352 9,993 5,629 46,407Other investments 5,646 213 4,375 1,852 12,086
Financial assets at amortised costDebt securities – – 112 15 127
Derivative financial assets 375 – 25 17 417Loans 608 443 2 19 1,072Insurance receivables 1,118 1,859 14 41 3,032Other debtors 754 240 33 50 1,077Cash and cash equivalents 3,768 1,761 295 392 6,216Financial and insurance-related assets 35,335 26,922 18,626 13,049 93,932
Other creditors 3,469 298 96 36 3,899Insurance payables 1,621 3,565 3 16 5,205Derivative financial liabilities 19 – 68 109 196Provision for agents’ retirement benefits – 294 – – 294Debt issued 400 – – – 400Insurance contract liabilities 49,214 20,557 2,130 621 72,522Financial and insurance-related liabilities 54,723 24,714 2,297 782 82,516
244 OCBC Annual Report 2019 245Financials

Notes to the Financial Statements For the financial year ended 31 December 2019
39. Risk Management (continued)39.4 Insurance-Related Risk Management (continued)Market and Credit Risk (continued)(b) Foreign Currency Risk (continued)
$ million SGD MYR USD Others Total
2018Financial assets at FVOCI
Equity securities 535 192 – 1,125 1,852Debt securities 3,730 695 2,305 229 6,959
Financial assets at FVTPLEquity securities 1,696 6,005 911 3,586 12,198Debt securities 13,511 14,045 8,967 4,422 40,945Other investments 4,559 199 3,290 1,520 9,568
Derivative financial assets 217 – 8 2 227Loans 510 818 2 – 1,330Insurance receivables 1,115 1,675 # 4 2,794Other debtors 604 247 132 32 1,015Cash and cash equivalents 3,505 1,387 541 272 5,705Financial and insurance-related assets 29,982 25,263 16,156 11,192 82,593
Other creditors 1,168 324 98 22 1,612Insurance payables 1,359 3,244 4 12 4,619Derivative financial liabilities 6 2 121 166 295Provision for agents’ retirement benefits – 276 – – 276Debt issued 400 – – – 400Insurance contract liabilities 44,142 19,567 1,764 503 65,976Financial and insurance-related liabilities 47,075 23,413 1,987 703 73,178
(1) # represents amounts less than $0.5 million.
GEH Group has no significant concentration of foreign currency risk.
(c) Equity Price RiskExposure to equity price risk exists in both assets and liabilities. Asset exposure exists through direct equity, equity derivatives and fund investments, where GEH Group, through investments, bears all or most of the volatility in returns and investment performance risk. Equity price risk also exists in investment-linked products where the revenues of the insurance operations are linked to the value of the underlying equity funds since this has an impact on the level of fees earned. Limits are set for single security holdings as a percentage of equity holdings.
(d) Credit Spread Risk Exposure to credit spread risk exists in GEH Group’s investments in bonds. Credit spread is the difference between the quoted rates of return of two different investments of different credit quality. When spreads widen between bonds with different quality ratings, it implies that the market is factoring more risk of default on lower grade bonds. A widening in credit spreads will result in a fall in the values of GEH Group’s bond portfolio.
(e) Alternative Investment RiskGEH Group is exposed to alternative investment risk through investments in direct real estate that it owns in Singapore and Malaysia and through real estate, private equity, infrastructure and hedge funds for exposures in other countries. A monitoring process is in place to manage foreign exchange, country and manager concentration risks. This process and the acquisition or divestment of alternative investments are reviewed and approved by RMC and GEH Group IC.
(f) Commodity RiskGEH Group does not have any direct exposure to commodity risk.
39. Risk Management (continued)39.4 Insurance-Related Risk Management (continued)Market and Credit Risk (continued)(g) Liquidity RiskLiquidity risk arises when a company is unable to meet the cash flow needs of its financial liabilities, or if the assets backing the liabilities cannot be sold quickly enough without incurring unreasonable losses. For an insurance company, the greatest liquidity needs typically arise from its insurance liabilities. Demands for funds can usually be met through ongoing normal operations, premiums received, sale of assets or borrowings. Unexpected demands for liquidity may be triggered by negative publicity, deterioration of the economy, reports of problems in other companies in the same or similar lines of business, unanticipated policy claims, or other unexpected cash demands from policyholders.
Expected liquidity demands are managed through a combination of treasury, investment and asset-liability management practices, which are monitored on an ongoing basis. Actual and projected cash inflows and outflows are monitored and a reasonable amount of assets are kept in liquid instruments at all times. The projected cash flows from the in-force insurance policy contract liabilities consist of renewal premiums, commissions, claims, maturities and surrenders. Renewal premiums, commissions, claims and maturities are generally stable and predictable. Surrenders can be more uncertain although these have been quite stable over the past several years.
Unexpected liquidity demands are managed through a combination of product design, diversification limits, investment strategies and systematic monitoring. The existence of surrender penalty in insurance contracts also protects GEH Group from losses due to unexpected surrender trends as well as reduces the sensitivity of surrenders to changes in interest rates.
The following tables show the expected recovery or settlement of financial and insurance-related assets and maturity profile of GEH Group’s financial and insurance contract liabilities which are presented based on contractual undiscounted cash flow basis, except for insurance contract liabilities which are presented based on net cash outflows resulting from recognised liabilities.
$ millionLess than
1 year1 to 5 years
Over 5 years
No specific maturity Total
2019Financial assets at FVOCI
Equity securities – – – 1,589 1,589Debt securities 516 3,817 7,638 – 11,971
Financial assets at FVTPLEquity securities – – – 13,242 13,242Debt securities 3,862 14,369 41,666 2,330 62,227Other investments – – – 12,086 12,086
Financial assets at amortised costDebt securities 7 27 235 – 269
Loans 291 796 103 – 1,190Insurance receivables 643 2 – 2,387 3,032Other debtors 1,055 – 18 4 1,077Cash and cash equivalents 6,216 – – – 6,216Financial and insurance-related assets 12,590 19,011 49,660 31,638 112,899
Other creditors 3,775 # – 28 3,803Lease liabilities 14 51 45 – 110Insurance payables 5,180 13 – 12 5,205Provision for agents’ retirement benefits 115 59 120 – 294Debt issued 19 409 – – 428Insurance contract liabilities 12,270 15,466 44,776 10 72,522Financial and insurance-related liabilities 21,373 15,998 44,941 50 82,362
(1) # represents amounts less than $0.5 million.
246 OCBC Annual Report 2019 247Financials

Notes to the Financial Statements For the financial year ended 31 December 2019
39. Risk Management (continued)39.4 Insurance-Related Risk Management (continued)Market and Credit Risk (continued)(g) Liquidity Risk (continued)
$ millionLess than
1 year1 to 5 years
Over 5 years
No specific maturity Total
2018Financial assets at FVOCI
Equity securities – – – 1,852 1,852Debt securities 331 2,077 8,283 – 10,691
Financial assets at FVTPLEquity securities – – – 12,198 12,198Debt securities 2,453 15,359 37,799 2,225 57,836Other investments – – – 9,568 9,568
Loans 533 738 216 – 1,487Insurance receivables 385 3 – 2,406 2,794Other debtors 952 11 18 34 1,015Cash and cash equivalents 5,705 – – – 5,705Financial and insurance-related assets 10,359 18,188 46,316 28,283 103,146
Other creditors 1,580 4 # 28 1,612Insurance payables 3,571 1,044 – 4 4,619Provision for agents’ retirement benefits 100 59 117 – 276Debt issued 18 428 – – 446Insurance contract liabilities 7,935 14,988 43,033 20 65,976Financial and insurance-related liabilities 13,204 16,523 43,150 52 72,929
(1) # represents amounts less than $0.5 million.
39. Risk Management (continued)39.4 Insurance-Related Risk Management (continued)Market and Credit Risk (continued)(g) Liquidity Risk (continued)The following tables show the current/non-current classification of assets and liabilities:
$ million Current* Non-current Unit-linked Total
2019Cash and cash equivalents 5,901 – 315 6,216Other debtors 1,017 47 61 1,125Insurance receivables 1,546 1,486 – 3,032Loans 217 855 – 1,072Derivative financial assets 241 171 5 417Investments 11,195 64,645 6,278 82,118Associates – 2 – 2Intangible assets – 32 – 32Property, plant and equipment – 709 – 709Investment properties – 1,786 – 1,786Assets 20,117 69,733 6,659 96,509
Insurance payables 5,188 17 – 5,205Other creditors 3,750 113 83 3,946Derivative financial liabilities 93 98 5 196Income tax payable 554 – 4 558Provision for agents’ retirement benefits 115 179 – 294Deferred tax – 1,541 2 1,543Debt issued – 400 – 400Insurance contract liabilities 5,399 63,023 7,242 75,664Liabilities 15,099 65,371 7,336 87,806
2018Cash and cash equivalents 5,170 – 535 5,705Other debtors 948 64 62 1,074Insurance receivables 385 2,409 – 2,794Loans 483 847 – 1,330Derivative financial assets 94 129 4 227Investments 14,207 52,046 5,268 71,521Associates – 2 – 2Intangible assets – 27 – 27Property, plant and equipment – 591 – 591Investment properties – 1,771 – 1,771Assets 21,287 57,886 5,869 85,042
Insurance payables 3,571 1,048 – 4,619Other creditors 1,527 33 87 1,647Derivative financial liabilities 51 242 2 295Income tax payable 501 – 7 508Provision for agents’ retirement benefits 100 176 – 276Deferred tax – 1,131 1 1,132Debt issued – 400 – 400Insurance contract liabilities 1,839 60,628 6,176 68,643Liabilities 7,589 63,658 6,273 77,520
(1) * represents expected recovery or settlement within 12 months from the balance sheet date.
248 OCBC Annual Report 2019 249Financials

Notes to the Financial Statements For the financial year ended 31 December 2019
39. Risk Management (continued)39.4 Insurance-Related Risk Management (continued)Market and Credit Risk (continued)(h) Credit Risk Credit risk is the risk that one party to a financial instrument will cause financial loss to the other party by failing to discharge an obligation. GEH Group is mainly exposed to credit risk through (i) investments in cash and bonds, (ii) corporate lending activities and (iii) exposure to counterparty’s credit in derivative transactions and reinsurance contracts. For all three types of exposures, financial loss may materialise as a result of a credit default by the borrower or counterparty. For investments in bonds, financial loss may also materialise as a result of the widening of credit spreads or a downgrade of credit rating.
The task of evaluating and monitoring credit risk is undertaken by the local ALCs. GEH group wide credit risk is managed by GEH Group ALC. GEH Group has internal limits by issuer, counterparty and investment grade. These limits are actively monitored to manage the credit and concentration risk. These limits are reviewed on a regular basis. The creditworthiness of reinsurers is assessed on an annual basis by reviewing their financial strength through published credit ratings and other publicly available financial information.
Reinsurance is placed with counterparties that have a good credit rating and concentration of risk is mitigated through counterparty limits that are reviewed and approved on an annual basis. Credit risk in respect of customer balances incurred on non-payment of premiums or contributions will only persist during the grace period specified in the policy document or trust deed until expiry, when the policy is either paid up or terminated. GEH Group issues unit-linked investment policies. In the unit-linked business, the policyholder bears the investment risk on the assets held in the unit-linked funds as the policy benefits are directly linked to the value of the assets in the fund. Therefore, GEH Group has no material credit risk on unit-linked financial assets.
The loans in GEH Group’s portfolio are generally secured by collateral, with a maximum loan to value ratio of 70%. The amount and type of collateral required depend on an assessment of the credit risk of the counterparty. Guidelines on the eligibility of collateral have been established, and all collaterals are revalued on a regular basis. GEH management monitors the market value of the collateral, requests additional collateral when needed and performs an impairment valuation when applicable. The fair value of collateral, held by GEH Group as lender, for which it is entitled to sell or pledge in the event of default is as follows:
2019 2018
$ million Type of collateralCarrying amount Fair value
Carrying amount Fair value
Policy loans Cash value of policies 2,387 4,862 2,345 4,806Secured loans Properties 731 1,343 605 1,033Secured loans Others 100 (1) 1 430 (1) 8
3,218 6,206 3,380 5,847
(1) This includes secured loans which are guaranteed by the government although there is no collateral held.
There were no securities lending arrangements as at 31 December 2019 (2018: nil).
As at the balance sheet date, no investments (2018: nil) were placed as collateral for currency hedging purposes.
Transactions are conducted under standard terms and conditions for securities borrowing and lending activities.
39. Risk Management (continued)39.4 Insurance-Related Risk Management (continued)Market and Credit Risk (continued)(h) Credit Risk (continued)The following table sets out information about the credit quality of loans and debt securities measured at amortised cost and debt securities measured at FVOCI. The maximum exposure is shown gross, before the effect of mitigation through the use of master netting or collateral agreements and the use of credit derivatives. For loan commitments, the amounts in the table represent the amounts committed.
$ million 12-month ECLLifetime ECL not credit-impaired
Lifetime ECL credit-impaired Total
2019Loans at amortised costInvestment grade* (BBB to AAA) 717 – – 717Non investment grade* (C to BB) 67 225 109 401Not rated 1 – – 1
785 225 109 1,119Loss allowance (1) (5) (42) (48)Carrying amount 784 220 67 1,071
Debt securities at amortised cost Investment grade* (BBB to AAA) 122 – – 122Non investment grade* (C to BB) 6 – – 6
128 – – 128Loss allowance (1) – – (1)Carrying amount 127 – – 127
Debt securities at FVOCI Investment grade* (BBB to AAA) 7,893 19 – 7,912Non investment grade* (C to BB) 714 41 – 755
8,607 60 – 8,667
2018Loans at amortised costInvestment grade* (BBB to AAA) 862 44 – 906Non investment grade* (C to BB) 40 292 110 442Not rated 3 – – 3
905 336 110 1,351Loss allowance (1) (6) (14) (21)Carrying amount 904 330 96 1,330
Debt securities at FVOCI Investment grade* (BBB to AAA) 6,581 26 – 6,607Non investment grade* (C to BB) 294 56 2 352
6,875 82 2 6,959
Loan commitmentsInvestment grade* (BBB to AAA) 26 1 – 27
(1) * Based on internal ratings grades which are equivalent to grades of external rating agencies.
250 OCBC Annual Report 2019 251Financials
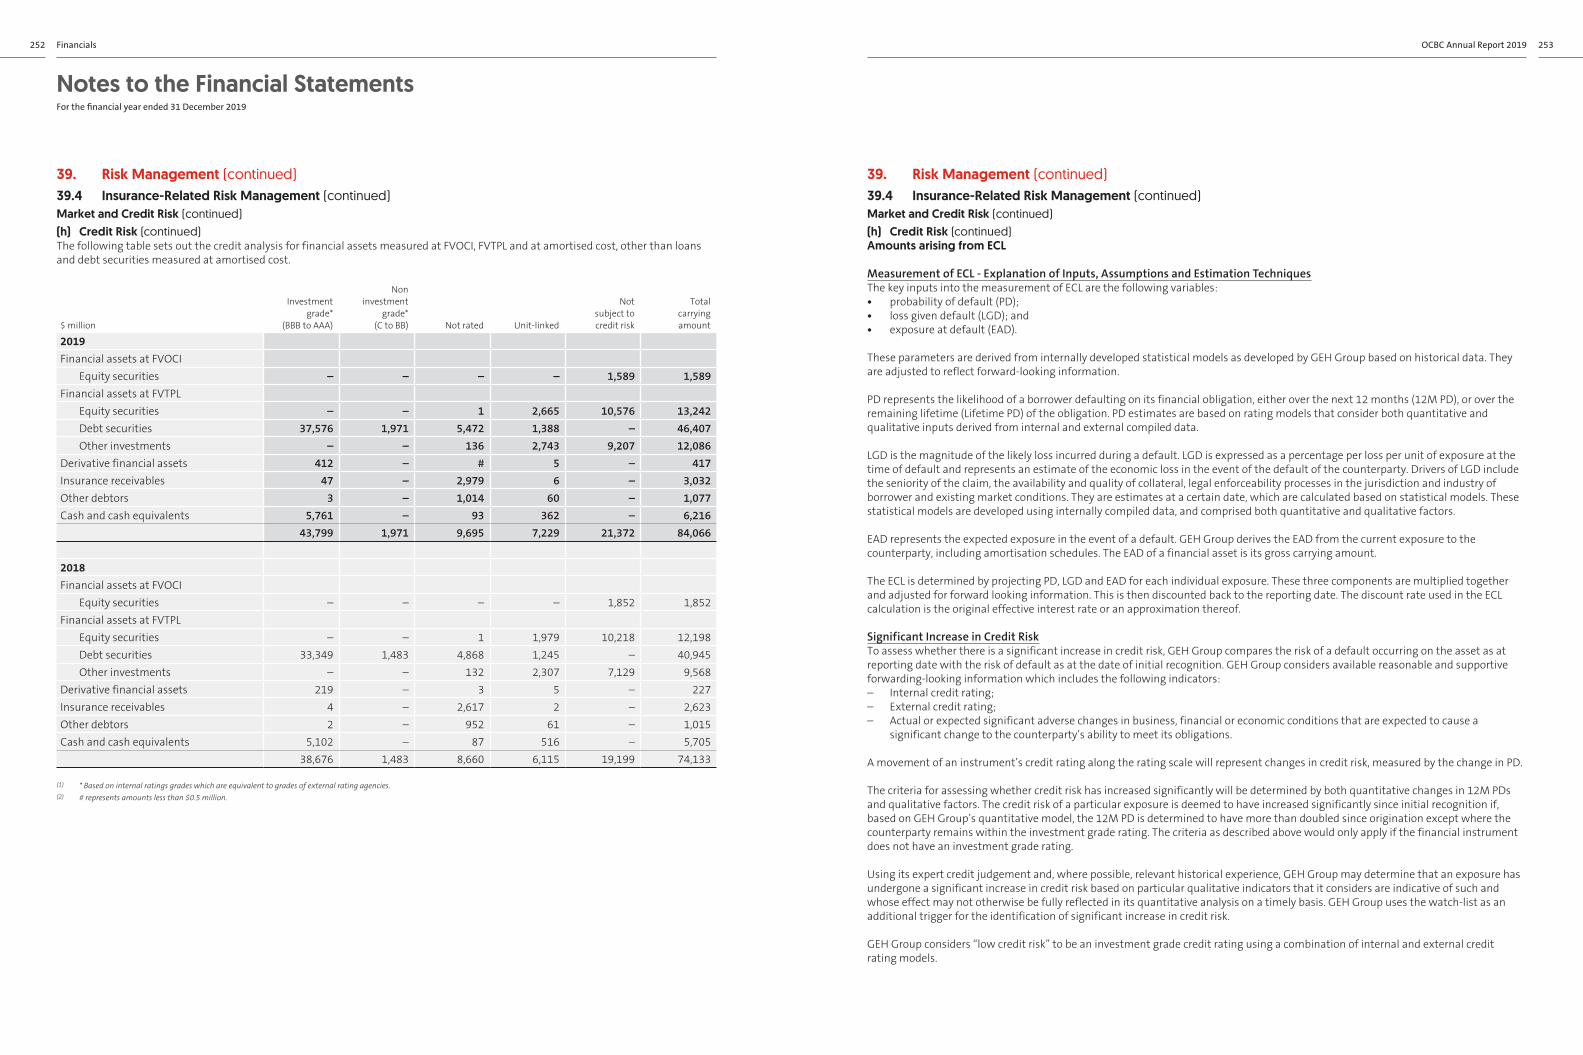
Notes to the Financial Statements For the financial year ended 31 December 2019
39. Risk Management (continued)39.4 Insurance-Related Risk Management (continued)Market and Credit Risk (continued)(h) Credit Risk (continued)The following table sets out the credit analysis for financial assets measured at FVOCI, FVTPL and at amortised cost, other than loans and debt securities measured at amortised cost.
$ million
Investment grade*
(BBB to AAA)
Non investment
grade* (C to BB) Not rated Unit-linked
Not subject to credit risk
Total carrying amount
2019Financial assets at FVOCI
Equity securities – – – – 1,589 1,589Financial assets at FVTPL
Equity securities – – 1 2,665 10,576 13,242Debt securities 37,576 1,971 5,472 1,388 – 46,407Other investments – – 136 2,743 9,207 12,086
Derivative financial assets 412 – # 5 – 417Insurance receivables 47 – 2,979 6 – 3,032Other debtors 3 – 1,014 60 – 1,077Cash and cash equivalents 5,761 – 93 362 – 6,216
43,799 1,971 9,695 7,229 21,372 84,066
2018Financial assets at FVOCI
Equity securities – – – – 1,852 1,852Financial assets at FVTPL
Equity securities – – 1 1,979 10,218 12,198Debt securities 33,349 1,483 4,868 1,245 – 40,945Other investments – – 132 2,307 7,129 9,568
Derivative financial assets 219 – 3 5 – 227Insurance receivables 4 – 2,617 2 – 2,623Other debtors 2 – 952 61 – 1,015Cash and cash equivalents 5,102 – 87 516 – 5,705
38,676 1,483 8,660 6,115 19,199 74,133
(1) * Based on internal ratings grades which are equivalent to grades of external rating agencies.(2) # represents amounts less than $0.5 million.
39. Risk Management (continued)39.4 Insurance-Related Risk Management (continued)Market and Credit Risk (continued)(h) Credit Risk (continued)Amounts arising from ECL
Measurement of ECL - Explanation of Inputs, Assumptions and Estimation TechniquesThe key inputs into the measurement of ECL are the following variables:• probability of default (PD);• loss given default (LGD); and• exposure at default (EAD).
These parameters are derived from internally developed statistical models as developed by GEH Group based on historical data. They are adjusted to reflect forward-looking information.
PD represents the likelihood of a borrower defaulting on its financial obligation, either over the next 12 months (12M PD), or over the remaining lifetime (Lifetime PD) of the obligation. PD estimates are based on rating models that consider both quantitative and qualitative inputs derived from internal and external compiled data.
LGD is the magnitude of the likely loss incurred during a default. LGD is expressed as a percentage per loss per unit of exposure at the time of default and represents an estimate of the economic loss in the event of the default of the counterparty. Drivers of LGD include the seniority of the claim, the availability and quality of collateral, legal enforceability processes in the jurisdiction and industry of borrower and existing market conditions. They are estimates at a certain date, which are calculated based on statistical models. These statistical models are developed using internally compiled data, and comprised both quantitative and qualitative factors.
EAD represents the expected exposure in the event of a default. GEH Group derives the EAD from the current exposure to the counterparty, including amortisation schedules. The EAD of a financial asset is its gross carrying amount.
The ECL is determined by projecting PD, LGD and EAD for each individual exposure. These three components are multiplied together and adjusted for forward looking information. This is then discounted back to the reporting date. The discount rate used in the ECL calculation is the original effective interest rate or an approximation thereof.
Significant Increase in Credit RiskTo assess whether there is a significant increase in credit risk, GEH Group compares the risk of a default occurring on the asset as at reporting date with the risk of default as at the date of initial recognition. GEH Group considers available reasonable and supportive forwarding-looking information which includes the following indicators:– Internal credit rating;– External credit rating;– Actual or expected significant adverse changes in business, financial or economic conditions that are expected to cause a
significant change to the counterparty’s ability to meet its obligations.
A movement of an instrument’s credit rating along the rating scale will represent changes in credit risk, measured by the change in PD.
The criteria for assessing whether credit risk has increased significantly will be determined by both quantitative changes in 12M PDs and qualitative factors. The credit risk of a particular exposure is deemed to have increased significantly since initial recognition if, based on GEH Group’s quantitative model, the 12M PD is determined to have more than doubled since origination except where the counterparty remains within the investment grade rating. The criteria as described above would only apply if the financial instrument does not have an investment grade rating.
Using its expert credit judgement and, where possible, relevant historical experience, GEH Group may determine that an exposure has undergone a significant increase in credit risk based on particular qualitative indicators that it considers are indicative of such and whose effect may not otherwise be fully reflected in its quantitative analysis on a timely basis. GEH Group uses the watch-list as an additional trigger for the identification of significant increase in credit risk.
GEH Group considers “low credit risk” to be an investment grade credit rating using a combination of internal and external credit rating models.
252 OCBC Annual Report 2019 253Financials

Notes to the Financial Statements For the financial year ended 31 December 2019
39. Risk Management (continued)39.4 Insurance-Related Risk Management (continued)Market and Credit Risk (continued)(h) Credit Risk (continued)Credit Risk GradesGEH Group assigns each exposure to a credit risk grade reflecting the PD of the counterparty and applying experienced credit judgement. Credit risk grades are established based on qualitative and quantitative factors that are indicative of risk of default. These factors vary depending on the nature of the exposure and the type of counterparty.
Credit risk grades are defined and calibrated such that the risk of default occurring increases as the credit risk deteriorates. Each exposure is allocated to a credit risk grade at initial recognition based on available information about the borrower. Exposures are subject to ongoing monitoring, which may result in an exposure being moved to a different credit risk grade. The monitoring typically involves the use of information obtained during periodic review, including published financial statements, external rating (where available), qualitative information about an obligor’s industry characteristics, competitive positioning, management, financial policy and financial flexibility.
Definition of DefaultGEH Group considers a financial asset to be in default by assessing the following criteria:
Quantitative CriteriaFor insurance receivables, the counterparty fails to make contractual payments within 12 months when they fall due. For bonds and loans, the instrument is considered as default if it is in overdue status and there are non-payments on another debt obligation of the same issuer to GEH Group.
Qualitative CriteriaThe counterparty is in bankruptcy or has indications of potentially significant financial difficulty such as lawsuits or similar actions that threaten the financial viability of the counterparty; distressed exchange, merger or amalgamation without assumption or breach of material loan covenants not rectified within a given timeframe, restructuring with expected principal haircut or a breach in material loan covenant that is not rectified within given timeframe.
The criteria above have been applied to all financial instruments held by GEH Group and are consistent with the definition of default used for credit risk management purposes. The default definition has been applied consistently to model the PD, EAD and LGD throughout GEH Group’s expected loss calculations.
Incorporating of Forward-Looking InformationGEH Group incorporates forward-looking information into both its assessment of whether the credit risk of an instrument has increased significantly since its initial recognition and its measurement of ECL. GEH Group has performed historical analysis and identified key economic variables impacting credit risk and expected credit losses for each portfolio.
These economic variables and their associated impact on the PD, EAD and LGD vary by financial instrument. Expert judgement has also been applied in this process. Forecasts of these economic variables (the base economic scenario) are obtained from publicly available economic databases published on a quarterly basis and provide the best estimate view of the economy over the next four to five years, after which, to project the economic variables for the full remaining lifetime of each instrument, a mean reversion approach is used. The impact of these economic variables on the PD, EAD and LGD has been determined by performing statistical regression analysis to understand the impact changes in these variables have had historically on default rates and the components of LGD and EAD.
In addition to the base economic scenario, GEH Group uses multiple scenarios to ensure non-linearities are captured. The number of scenarios and their attributes are reassessed at each reporting date. At 31 December 2019, for all portfolios, GEH Group concluded that two scenarios appropriately captured non-linearities. The scenario weightings are determined by expert credit judgement, taking into account the range of possible outcomes the chosen scenario is representative of. The assessment of significant increase in credit risk is performed using the 12M PD under each of the base, and the other scenario, multiplied by the associated scenario weighting. This determines whether the whole financial instrument is in Stage 1, Stage 2 or Stage 3 and hence whether 12M or lifetime ECL should be recorded. Following this assessment, GEH Group measures ECL as either a probability weighted 12M ECL (Stage 1), or a probability weighted lifetime ECL (Stages 2 and 3). These probability-weighted ECLs are determined by running each scenario through the relevant ECL model and multiplying it by the appropriate scenario weighting (as opposed to weighting the inputs).
As with any economic forecasts, the projections and likelihoods of occurrence are subject to a high degree of inherent uncertainty and the actual outcomes may be significantly different from those projected. GEH Group considers these forecasts to represent its best estimate of the possible outcomes and has analysed the non-linearities and asymmetries within GEH Group’s different portfolios to establish that the chosen scenarios are appropriately representative of the range of possible scenarios.
The sensitivity of the ECL to the economic variable assumptions affecting the calculation of ECL was not material to GEH Group for the year ended 31 December 2019.
39. Risk Management (continued)39.4 Insurance-Related Risk Management (continued)Market and Credit Risk (continued)(h) Credit Risk (continued)Loss AllowanceThe following tables show reconciliations from the opening to the closing balance of the loss allowance by class of financial instrument.
$ million 12-month ECL
Lifetime ECL not credit-
impaired
Lifetime ECL credit-
impaired Total
Loans at amortised costAt 1 January 2018 – – 47.3 47.3Effect of adopting SFRS(I) 9 0.3 9.2 – 9.5Adjusted balance at 1 January 0.3 9.2 47.3 56.8Net remeasurement of loss allowance 0.2 0.3 (33.5) (33.0)New financial assets purchased 0.1 – – 0.1Financial assets that have been derecognised (0.2) (2.9) – (3.1)Foreign exchange and other movements 0.1 (0.1) (0.1) (0.1)At 31 December 2018/1 January 2019 0.5 6.5 13.7 20.7Net remeasurement of loss allowance – (0.9) 28.6 27.7New financial assets purchased 0.3 – – 0.3Financial assets that have been derecognised (0.2) (1.1) – (1.3)Changes in models/risk parameters 0.1 0.1 – 0.2At 31 December 2019 0.7 4.6 42.3 47.6
Debt securities at amortised costAt 1 January 2019 – – – –New financial assets purchased 0.6 – – 0.6Changes in models/risk parameters 0.1 – – 0.1At 31 December 2019 0.7 – – 0.7
Debt securities at FVOCI At 1 January 2018 – – 64.0 64.0Effect of adopting SFRS(I) 9 3.5 3.5 (57.4) (50.4)Adjusted balance at 1 January 3.5 3.5 6.6 13.6Transfer to 12-month ECL 0.2 (0.2) – –New financial assets purchased 2.0 0.2 – 2.2Financial assets that have been derecognised (1.1) (1.7) (3.9) (6.7)Changes in models/risk parameters 0.1 – – 0.1Foreign exchange and other movements (0.1) 0.1 0.1 0.1At 31 December 2018/1 January 2019 4.6 1.9 2.8 9.3Additional loss due to transfer – 0.3 – 0.3Net remeasurement of loss allowance – (0.3) – (0.3)New financial assets purchased 2.0 – – 2.0Financial assets that have been derecognised (1.7) (0.3) – (2.0)Changes in models/risk parameters 0.9 – – 0.9At 31 December 2019 5.8 1.6 2.8 10.2
Increase/(decrease) in provision for impairment of financial assets for the year 31 December 2019 2.1 (2.2) 28.6 28.531 December 2018 1.1 (4.1) (37.4) (40.4)
The carrying amount of outstanding premiums as at 31 December 2019 is $416.7 million (2018: $261.5 million). The ECL relating to outstanding premiums as at 31 December 2019 was $4.7 million (2018: $2.7 million) for GEH Group. The changes in credit loss recognised in the income statement during the year was positive $1.6 million (2018: negative $1.7 million).
254 OCBC Annual Report 2019 255Financials

Notes to the Financial Statements For the financial year ended 31 December 2019
39. Risk Management (continued)39.4 Insurance-Related Risk Management (continued)Market and Credit Risk (continued)(i) Sensitivity Analysis on Financial RisksThe sensitivity analysis below shows the impact on GEH Group’s net profit after tax by applying possible shocks to each key variable, with all other variables constant. While the co-movement of key variable can significantly affect the fair values and/or amortised cost of financial assets, but to demonstrate the impact due to changes in each key variable, the variables are changed individually. The impact on net profit after tax represents the effect caused by changes in fair value of financial assets whose fair values are recorded in the income statement, and changes in valuation of insurance contract liabilities. The equity sensitivity represents the impact on net profit after tax and the effect on changes in fair value of financial assets measured at FVOCI.
Market Risk Sensitivity Analysis
Impact on profit after tax Impact on equity$ million 2019 2018 2019 2018
Change in variables:(a) Interest rate
+100 basis points 38.6 62.4 (482.1) (383.2)–100 basis points (238.8) (160.4) 371.8 365.9
(b) LTRFDR (1)
+10 basis points 19.9 41.0 19.9 41.0–10 basis points (21.0) (43.6) (21.0) (43.6)
(c) Foreign currency5% increase in market value of foreign currency denominated assets 50.4 22.8 94.3 71.25% decrease in market value of foreign currency denominated assets (50.4) (22.8) (94.3) (71.2)
(d) Equity 20% increase in market indices
STI 51.3 67.9 111.0 156.0KLCI 6.0 27.5 30.7 49.1
20% decrease in market indicesSTI (51.3) (67.9) (111.0) (156.0)KLCI (6.0) (27.5) (30.7) (49.1)
(e) Credit Spread +100 basis points (204.2) (164.8) (605.8) (490.0)Spread –100 basis points 221.9 177.5 693.6 558.7
(f) Alternative investments (2)
10% increase in market value of all alternative investments 69.9 49.1 71.6 53.510% decrease in market value of all alternative investments (69.9) (49.1) (71.6) (53.5)
(1) LTRFDR refers to Long Term Risk Free Discount Rate formulated under the Singapore regulations governed by the Monetary Authority of Singapore. (2) Alternative investments comprise investments in real estate, private equity, infrastructure and hedge funds.
The method for deriving sensitivity information and significant variables did not change from the previous year.
39. Risk Management (continued)39.4 Insurance-Related Risk Management (continued)Market and Credit Risk (continued)(j) Concentration RiskAn important element of managing both market and credit risks is to actively manage concentration to specific issuers, counterparties, industry sectors, countries and currencies. Both internal and regulatory limits are put in place to manage concentration risk. These limits are reviewed on a regular basis by the respective management committees. GEH Group’s exposures are within the concentration limits set by the respective local regulators.
GEH Group actively manages its investment mix to ensure that there is no significant concentration of market and credit risk.
Operational and Compliance RiskOperational risk is an event or action that may potentially impact partly or completely the achievement of the organisation’s objectives resulting from inadequate or failed internal processes and systems, human factors, or external events and compliance risk is a similar event or action resulting from its failure to comply with the following applicable laws, regulations and standards:– local laws, regulations and rules governing licensed activities undertaken by GEH Group;– foreign laws, regulations and rules that have extraterritorial jurisdiction over GEH Group’s licensed activities;– codes of practice promoted by industry associations of which GEH Group are members of; and– any other applicable regulations which do not specifically govern the licensed activities undertaken by GEH Group but can expose
the organisation to legal, regulatory or reputational loss.
The day-to-day management of operational and compliance risk is through the maintenance of comprehensive internal control frameworks, supported by an infrastructure of systems and procedures to monitor processes and transactions. GMC reviews operational and compliance issues on a GEH Group basis at its monthly meetings while local level issues are managed and monitored by the local SMTs. GEH Group Internal Audit team reviews the systems of internal controls to assess their ongoing relevance and effectiveness, and reports at least quarterly to GEH Group Audit Committee.
Technology, Information and Cyber RisksTechnology risk is defined as risk related to any potential adverse outcome, damage, loss, disruption, violation, system/hardware failure, capacity deficiency arising from the use of technologies such as electronic hardware/devices, software, online networks and telecommunications systems.
Information risk is defined as risk related to confidentiality, integrity and availability of information (in physical or digital form).
Cyber risk is defined as risk related to acts perpetrated by malicious threat actors including internal sabotage, espionage, malicious attacks, hacking incidents, fraudulent conduct using information and communication technologies.
GEH Group adopts a risk based approach in managing technology, information and cyber risks relating to cyber-attacks, data loss/leakage, deficiency in change management, emerging technology, inadequate vendor management, inferior system acquisition and development, network security vulnerability, privilege access misuse, system security vulnerability, system unavailability and technology obsolescence. Key risk indicators related to technology, information and cyber risks are reported to GEH Group Board on a regular basis. Independent assessment is performed by GEH Group Internal Audit for its adequacy and effectiveness.
256 OCBC Annual Report 2019 257Financials

Notes to the Financial Statements For the financial year ended 31 December 2019
40. Financial Assets and Financial Liabilities Classification
GROUP
$ million
Mandatorily measured at
FVTPLDesignated
as FVTPLAmortised
cost FVOCIInsurance contracts Total
2019Cash and placements with central banks – – 23,202 – – 23,202Singapore government treasury bills
and securities 1,744 – – 9,299 – 11,043Other government treasury bills and securities 2,862 9 410 14,339 – 17,620Placements with and loans to banks 1,992 – 22,847 10,974 – 35,813Loans and bills receivable 180 – 261,865 – – 262,045Debt and equity securities 7,018 15 65 21,435 – 28,533Assets pledged 61 – 304 801 – 1,166Derivative receivables 7,349 – – – – 7,349Other assets – – 3,713 – 205 3,918Amounts due from associates – – 75 – – 75Financial assets 21,206 24 312,481 56,848 205 390,764Non-financial assets 13,590
404,354Life insurance fund investment financial assets 27,337 42,692 9,338 6,159 – 85,526Life insurance fund investment
non-financial assets 1,811Total assets 491,691
Deposits of non-bank customers – – 302,851 – – 302,851Deposits and balances of banks – – 8,250 – – 8,250Trading portfolio liabilities 92 – – – – 92Derivative payables 7,687 – – – – 7,687Other liabilities (1) – – 6,288 – 511 6,799Debt issued – 1,311 28,077 – – 29,388Financial liabilities 7,779 1,311 345,466 – 511 355,067Non-financial liabilities 3,575
358,642Life insurance fund financial liabilities 191 – 8,998 – 72,063 81,252Life insurance fund non-financial liabilities 3,194Total liabilities 443,088
(1) Other liabilities include amounts due to associates.
40. Financial Assets and Financial Liabilities Classification (continued)
GROUP
$ million
Mandatorily measured at
FVTPLDesignated
as FVTPLAmortised
cost FVOCIInsurance contracts Total
2018Cash and placements with central banks – – 18,748 – – 18,748Singapore government treasury bills
and securities 1,587 – – 8,024 – 9,611Other government treasury bills and securities 2,348 10 374 15,433 – 18,165Placements with and loans to banks 2,630 – 25,455 10,950 – 39,035Loans and bills receivable 272 – 254,921 – – 255,193Debt and equity securities 6,160 17 92 19,274 – 25,543Assets pledged – – 309 796 – 1,105Derivative receivables 7,201 – – – – 7,201Other assets – – 3,026 – 177 3,203Amounts due from associates – – 80 – – 80Financial assets 20,198 27 303,005 54,477 177 377,884Non-financial assets 12,792
390,676Life insurance fund investment financial assets 23,290 37,794 8,583 5,398 – 75,065Life insurance fund investment
non-financial assets 1,802Total assets 467,543
Deposits of non-bank customers – – 295,412 – – 295,412Deposits and balances of banks – – 7,576 – – 7,576Trading portfolio liabilities 214 – – – – 214Derivative payables 7,105 – – – – 7,105Other liabilities (1) – – 5,174 – 422 5,596Debt issued – 1,075 29,197 – – 30,272Financial liabilities 7,319 1,075 337,359 – 422 346,175Non-financial liabilities 3,048
349,223Life insurance fund financial liabilities 289 – 6,351 – 65,593 72,233Life insurance fund non-financial liabilities 2,695Total liabilities 424,151
(1) Other liabilities include amounts due to associates.
258 OCBC Annual Report 2019 259Financials

Notes to the Financial Statements For the financial year ended 31 December 2019
40. Financial Assets and Financial Liabilities Classification (continued)
BANK
$ million
Mandatorily measured at
FVTPLDesignated
as FVTPLAmortised
cost FVOCI Total
2019Cash and placements with central banks – – 17,824 – 17,824Singapore government treasury bills and securities 1,744 – – 8,148 9,892Other government treasury bills and securities 2,142 – 410 5,092 7,644Placements with and loans to banks 1,992 – 18,408 7,656 28,056Loans and bills receivable 171 – 164,393 – 164,564Debt and equity securities 4,484 – 65 9,661 14,210Placements with and advances to subsidiaries – – 18,073 – 18,073Assets pledged – – – 122 122Derivative receivables 6,324 – – – 6,324Other assets – – 2,209 – 2,209Amounts due from associates – – 74 – 74Financial assets 16,857 – 221,456 30,679 268,992Non-financial assets 19,759Total assets 288,751
Deposits of non-bank customers – – 189,420 – 189,420Deposits and balances of banks – – 5,938 – 5,938Deposits and balances of subsidiaries – – 21,435 – 21,435Trading portfolio liabilities 92 – – – 92Derivative payables 6,743 – – – 6,743Other liabilities (1) – – 1,904 – 1,904Debt issued – 1,311 26,915 – 28,226Financial liabilities 6,835 1,311 245,612 – 253,758Non-financial liabilities 993Total liabilities 254,751
(1) Other liabilities include amounts due to associates.
40. Financial Assets and Financial Liabilities Classification (continued)
BANK
$ million
Mandatorily measured at
FVTPLDesignated
as FVTPLAmortised
cost FVOCI Total
2018Cash and placements with central banks – – 13,740 – 13,740Singapore government treasury bills and securities 1,587 – – 7,386 8,973Other government treasury bills and securities 1,573 – 374 6,312 8,259Placements with and loans to banks 2,629 – 20,393 6,042 29,064Loans and bills receivable 250 – 156,647 – 156,897Debt and equity securities 3,789 – 92 8,092 11,973Placements with and advances to subsidiaries – – 22,808 – 22,808Assets pledged – – – 1,007 1,007Derivative receivables 5,331 – – – 5,331Other assets – – 1,617 – 1,617Amounts due from associates – – # – #Financial assets 15,159 – 215,671 28,839 259,669Non-financial assets 19,308Total assets 278,977
Deposits of non-bank customers – – 183,600 – 183,600Deposits and balances of banks – – 6,350 – 6,350Deposits and balances of subsidiaries – – 20,938 – 20,938Trading portfolio liabilities 214 – – – 214Derivative payables 5,252 – – – 5,252Other liabilities (1) – – 1,772 – 1,772Debt issued – 1,075 27,737 – 28,812Financial liabilities 5,466 1,075 240,397 – 246,938Non-financial liabilities 743Total liabilities 247,681
(1) Other liabilities include amounts due to associates. (2) # represents amounts less than $0.5 million.
260 OCBC Annual Report 2019 261Financials
Notes to the Financial Statements For the financial year ended 31 December 2019
41. Fair Values of Financial Instruments (continued)41.2 Fair ValuesFinancial instruments comprise financial assets, financial liabilities and off-balance sheet financial instruments. The fair value of a financial instrument is the price that would be received to sell an asset or paid to transfer a liability in an orderly transaction between market participants. For financial assets and liabilities not carried at fair value on the financial statements, the Group has determined that their fair values were not materially different from the carrying amounts at the reporting date. The carrying amounts and fair values of financial instruments of the Group are described below.
Financial Assets Fair values of cash and balances with central banks, placements with banks, interest and other short term receivables are expected to approximate their carrying amounts due to their short tenor or frequent re-pricing.
Securities held by the Group, comprising government securities and debt and equity securities are substantially carried at fair value on the balance sheet. Non-bank customer loans are mainly carried at amortised cost on the balance sheet, net of allowances for impaired and non-impaired loans. The Group deems that the carrying amounts of non-bank loans approximate their fair values as substantially all the loans are subject to frequent re-pricing.
Financial Liabilities Fair value of certain financial liabilities, which include mainly customer deposits with no stated maturity, interbank borrowings and borrowings under repurchase agreements, are expected to approximate their carrying amounts due to their short tenor. For non-bank customer term deposits, contractual or derived cash flows are discounted at market rates as at reporting date to estimate the fair values, which approximate the carrying amounts.
The fair values of the Group’s subordinated term notes and covered bonds are determined based on quoted market prices and independent broker offer prices. For other debts issued which are usually short term, the fair values approximate the carrying amounts.
41.3 Fair Value HierarchyThe Group determines the fair values of its financial assets and liabilities using various measurements. The different levels of fair value measurements are as follows:• Level 1 – quoted prices (unadjusted) in active markets for identical assets or liabilities;• Level 2 – inputs other than quoted prices included within Level 1 that are observable market data either directly (i.e. as prices) or
indirectly (i.e. derived from observable market data). The valuation techniques that use market parameters as inputs include, but are not limited to, yield curves, volatilities and foreign exchange rates; and
• Level 3 – inputs for the valuation that are not based on observable market data.
41. Fair Values of Financial Instruments41.1 Valuation Governance FrameworkThe Group has an established governance framework with respect to the measurement of fair values, which includes formalised processes for the review and validation of fair values independent of the businesses entering into the transactions.
The Market Risk Management (MRM) function within the GRM is responsible for the model validation process. Financial models are used to price financial instruments and to calculate value-at-risk (VaR). MRM ensure that the models used are fit for their intended purposes through internal independent validation and periodic review. MRM source market rates independently for risk measurement and valuation.
The Treasury Financial Control and Advisory – Valuation Control function within the Group Finance Division is responsible for the establishment of the overall valuation control framework. This includes, but is not limited to, reviewing and recommending appropriate valuation adjustment methodologies, independent price testing, and identifying valuation gaps.
Valuation policies are formulated and reviewed annually by the Valuation Control function, and approved by the Market Risk Management Committee, the CEO and BRMC. Valuation adjustments are applied to account for input parameter uncertainties, known model deficiencies and other factors that may affect valuation. The main valuation adjustments are described below.
Bid Offer AdjustmentsWhen the position is marked at mid-price, bid offer adjustment is applied to account for close out cost.
Model AdjustmentsModel adjustments are applied when there are inherent limitations in the valuation models used by the Bank.
Day 1 Profit or Loss AdjustmentsDay 1 profit or loss adjustments are applied when the valuation technique involves the use of significant inputs which are not readily observable. The difference between the fair value at initial recognition and the transaction price is deferred as an adjustment.
Credit and Funding AdjustmentsCredit and funding adjustments are applied to account for the expected losses due to counterparty default and the cost of funding above the risk-free rate of return of uncollateralised derivatives.
Parameter Uncertainty AdjustmentsThese valuation adjustments mainly include adjustments for illiquid prices or internal methodologies used to derive model inputs.
The Group’s internal audit provides independent assurance on the respective divisions’ compliance with the policy.
262 OCBC Annual Report 2019 263Financials

Notes to the Financial Statements For the financial year ended 31 December 2019
41. Fair Values of Financial Instruments (continued)41.3 Fair Value Hierarchy (continued)The following table summarises the Group’s assets and liabilities measured at fair values subsequent to initial recognition by level of the fair value hierarchy:
2019 2018$ million Level 1 Level 2 Level 3 Total Level 1 Level 2 Level 3 Total
Recurring fair value measurementsGROUPFinancial assets measured at fair valuePlacements with and loans to banks 2,588 10,429 – 13,017 – 13,705 – 13,705Debt and equity securities 25,573 2,589 1,025 29,187 21,714 3,496 883 26,093Loans and bills receivable – – 180 180 – – 272 272Derivative receivables 31 7,257 61 7,349 109 7,021 71 7,201Government treasury bills and securities 25,917 2,428 – 28,345 23,960 3,470 – 27,430Life insurance fund investment assets 59,719 14,705 1,764 76,188 47,551 17,582 1,350 66,483Total 113,828 37,408 3,030 154,266 93,334 45,274 2,576 141,184
Non-financial assets measured at fair valueLife insurance fund investment properties – – 1,786 1,786 – – 1,771 1,771Total – – 1,786 1,786 – – 1,771 1,771
Financial liabilities measured at fair valueDerivative payables 41 7,603 43 7,687 94 6,985 26 7,105Trading portfolio liabilities 92 – – 92 214 – – 214Debt issued – 1,311 – 1,311 – 1,075 – 1,075Life insurance fund financial liabilities 3 188 – 191 3 286 – 289Total 136 9,102 43 9,281 311 8,346 26 8,683
BANKFinancial assets measured at fair valuePlacements with and loans to banks 2,328 7,365 – 9,693 – 8,792 – 8,792Debt and equity securities 12,050 1,715 442 14,207 10,161 1,737 546 12,444Loans and bills receivable – – 171 171 – – 250 250Derivative receivables 5 6,266 53 6,324 7 5,277 47 5,331Government treasury bills and securities 15,437 1,705 – 17,142 14,068 3,113 – 17,181Total 29,820 17,051 666 47,537 24,236 18,919 843 43,998
Financial liabilities measured at fair valueDerivative payables 11 6,699 33 6,743 23 5,227 2 5,252Trading portfolio liabilities 92 – – 92 214 – – 214Debt issued – 1,311 – 1,311 – 1,075 – 1,075Total 103 8,010 33 8,146 237 6,302 2 6,541
During the financial year, the Group transferred financial assets from Level 2 to Level 1 as prices became observable arising from increased market activity and from Level 1 to Level 2 due to reduced market activity.
41. Fair Values of Financial Instruments (continued)41.3 Fair Value Hierarchy (continued)Valuation Techniques and Unobservable Inputs for Level 3 Instruments
GROUP$ million
Fair value at 31 December 2019 Classification Valuation techniques Unobservable inputs
Financial assetsEquity securities 1,025 FVTPL/FVOCI Net asset value/
MultiplesValue of net asset/
Earnings and multiples
Loans and bills receivable 180 FVTPL Discounted cash flows Credit spreadsDerivative receivables 61 FVTPL Option pricing model Volatility/CorrelationLife insurance fund investment assets 1,764 FVTPL/FVOCI Net asset value Value of net assetTotal 3,030
Financial liabilitiesDerivative payables 43 FVTPL Option pricing model Volatility/CorrelationTotal 43
Management considers that any reasonably possible changes to the unobservable inputs will not result in a significant financial impact.
Movements in Level 3 Financial Assets and Liabilities
2019
GROUP $ million
Debt and equity
securities
Loans and bills
receivableDerivative
receivables
Life insurance fund
investment assets Total
Financial assets measured at fair valueAt 1 January 883 272 71 1,350 2,576Purchases 96 4 1 654 755Settlements/disposals (88) (95) – (227) (410)Transfers (out of)/in to Level 3 (#) (1) – 1 (2) – 1Gains/(losses) recognised in– profit or loss 8 (1) (12) (15) (20)– other comprehensive income 126 (#) (#) 2 128At 31 December 1,025 180 61 1,764 3,030
Unrealised gains/(losses) included in profit or loss for assets held at the end of the year 9 (1) 169 19 196
(1) Relates to transfers from Level 3 to Level 2 due to use of inputs based on market observable data.(2) Relates to transfers from Level 2 to Level 3 due to use of inputs not based on market observable data.(3) # represents amounts less than $0.5 million.
264 OCBC Annual Report 2019 265Financials

Notes to the Financial Statements For the financial year ended 31 December 2019
41. Fair Values of Financial Instruments (continued)41.3 Fair Value Hierarchy (continued)Movements in Level 3 Financial Assets and Liabilities (continued)
2018
GROUP $ million
Debt and equity
securities
Loans and bills
receivableDerivative
receivables
Life insurance fund
investment assets Total
Financial assets measured at fair valueAt 1 January 738 – 28 1,239 2,005Effect of adopting SFRS(I) 9 – 259 – – 259Adjusted balance at 1 January 738 259 28 1,239 2,264Purchases 156 113 3 281 553Settlements/disposals (155) (118) (#) (221) (494)Transfers in to Level 3 (1) 15 18 – 4 37Gains/(losses) recognised in– profit or loss 42 (1) 41 21 103– other comprehensive income 87 1 (1) 26 113At 31 December 883 272 71 1,350 2,576
Unrealised gains/(losses) included in profit or loss for assets held at the end of the year 34 (1) 79 82 194
(1) Relates to transfers from amortised cost to Level 3 due to use of inputs not based on market observable data.(2) # represents amounts less than $0.5 million.
Gains/(losses) included in profit or loss are presented in the income statement as follows:
2019 2018
GROUP $ million
Net interest income
Trading income
Other income Total
Net interest income
Trading income
Other income Total
Total gains/(losses) included in profit or loss for the year ended – (5) (15) (20) # 82 21 103
Unrealised gains included in profit or loss for assets held at the end of the year – 177 19 196 – 112 82 194
(1) # represents amounts less than $0.5 million.
41. Fair Values of Financial Instruments (continued)41.3 Fair Value Hierarchy (continued)Movements in Level 3 Financial Assets and Liabilities (continued)
2019 2018
BANK $ million
Debt and equity
securities
Loans and bills
receivableDerivative
receivables Total
Debt and equity
securities
Loans and bills
receivableDerivative
receivables Total
Financial assets measured at fair valueAt 1 January 546 250 47 843 565 – 22 587Effect of adopting SFRS(I) 9 – – – – – 231 – 231Adjusted balance at 1 January 546 250 47 843 565 231 22 818Purchases 12 1 1 14 114 113 3 230Settlements/disposals (88) (79) – (167) (120) (92) – (212)Gains/(losses) recognised in– profit or loss (9) (1) 5 (5) (2) (2) 22 18– other comprehensive income (19) (#) – (19) (11) # – (11)At 31 December 442 171 53 666 546 250 47 843
Unrealised gains/(losses) included in profit or loss for assets held at the end of the year (8) (1) 162 153 (10) (2) 58 46
(1) # represents amounts less than $0.5 million.
Gains/(losses) included in profit or loss are presented in the income statement as follows:
2019 2018
BANK $ million
Net interest income
Trading income
Other income Total
Net interest income
Trading income
Other income Total
Total gains/(losses) included in profit or loss for the year ended – (5) – (5) # 18 – 18
Unrealised gains included in profit or loss for assets held at the end of the year – 153 – 153 – 46 – 46
(1) # represents amounts less than $0.5 million.
266 OCBC Annual Report 2019 267Financials

Notes to the Financial Statements For the financial year ended 31 December 2019
41. Fair Values of Financial Instruments (continued)41.3 Fair Value Hierarchy (continued)Movements in Level 3 Financial Assets and Liabilities (continued)
GROUP BANK2019 2018 2019 2018
$ millionDerivative
payables TotalDerivative
payables TotalDerivative
payables TotalDerivative
payables Total
Financial liabilities measured at fair valueAt 1 January 26 26 14 14 2 2 8 8Issues 18 18 11 11 18 18 11 11Settlements/disposals – – (#) (#) – – – –Transfers in to Level 3 (1) 1 1 – – – – – –Losses/(gains) recognised in– profit or loss (2) (2) 2 2 13 13 (17) (17)– other comprehensive income (#) (#) (1) (1) – – – –At 31 December 43 43 26 26 33 33 2 2
Unrealised losses included in profit or loss for liabilities held at the end of the year (193) (193) (38) (38) (184) (184) (18) (18)
(1) Relates to transfers from Level 2 to Level 3 due to use of inputs not based on market observable data. (2) # represents amounts less than $0.5 million.
Gains/(losses) included in profit or loss are presented in the income statements as follows:
GROUP BANK2019 2018 2019 2018
$ millionTrading income Total
Trading income Total
Trading income Total
Trading income Total
Total gains/(losses) included in profit or loss for the year ended 2 2 (2) (2) (13) (13) 17 17
Unrealised losses included in profit or loss for liabilities held at the end of the year (193) (193) (38) (38) (184) (184) (18) (18)
Movements in Level 3 Non-Financial Assets
GROUP2019 2018
$ million
Life insurance fund investment
properties Total
Life insurance fund investment
properties Total
Non-financial assets measured at fair valueAt 1 January 1,771 1,771 1,553 1,553Purchases/transfers 1 1 180 180Sales – – (1) (1)
Gains/(losses) recognised in– profit or loss 14 14 40 40– other comprehensive income (#) (#) (1) (1)At 31 December 1,786 1,786 1,771 1,771
(1) # represents amounts less than $0.5 million.
42. Offsetting Financial Assets and Financial LiabilitiesThe Group enters into master netting arrangements with counterparties. The credit risk associated with favourable contracts is reduced by the master netting arrangement to the extent that if an event of default occurs, all amounts with the counterparty are settled on a net basis. These arrangements do not qualify for net presentation on the balance sheet as the right to offset is enforceable only on the occurrence of future events such as default or other credit events.
The disclosures set out in the tables below pertain to financial assets and financial liabilities that are not presented net in the Group’s balance sheet but are subject to enforceable master netting agreement or similar arrangement that covers similar financial instruments. The disclosures enable the evaluation on the potential effect of netting arrangements as well as provide additional information on how such credit risk is mitigated.
Related amounts not offset on balance sheet
Types of financial assets/liabilitiesGROUP ($ million)
Carrying amounts on
balance sheet(A)
Amount not subject
to netting agreement
(B)
Amount subject to
netting agreement
(A – B = C + D + E)
Financial instruments
(C)Collateral
(D)
Net amounts in scope
(E)
2019Financial assetsDerivative receivables 7,349 2,090 5,259 4,183 193 883Reverse repurchase agreements 2,564 (1) 557 2,007 1,994 – 13Securities borrowings 21 (2) – 21 6 – 15Total 9,934 2,647 7,287 6,183 193 911
Financial liabilitiesDerivative payables 7,687 1,726 5,961 4,183 684 1,094Repurchase agreements 1,628 (3) 1,533 95 95 – –Securities lendings 402 (4) 402 – – – –Total 9,717 3,661 6,056 4,278 684 1,094
2018Financial assetsDerivative receivables 7,201 2,575 4,626 3,558 289 779Reverse repurchase agreements 4,686 (1) 1,196 3,490 3,490 – –Securities borrowings 29 (2) – 29 23 – 6Total 11,916 3,771 8,145 7,071 289 785
Financial liabilitiesDerivative payables 7,105 1,861 5,244 3,558 1,101 585Repurchase agreements 1,466 (3) 836 630 630 – –Securities lendings 323 (4) 323 – – – –Total 8,894 3,020 5,874 4,188 1,101 585
(1) Reverse repurchase agreements shown above are the aggregate of transactions recorded in separate line items on the balance sheet, namely placements with central banks, loans to banks and non-bank customers and other assets. These transactions are measured either at fair value or amortised cost.
(2) Cash collateral placed under securities borrowings are presented under placements with and loans to banks and other assets on the balance sheet, and are measured at amortised cost.(3) Repurchase agreements shown above are the aggregate of transactions recorded in separate line items on the balance sheet, namely deposits of banks and non-bank customers and other
liabilities, and are measured at amortised cost.(4) Cash collateral placed under securities lendings are presented under other liabilities, and are measured at amortised cost.
268 OCBC Annual Report 2019 269Financials

Notes to the Financial Statements For the financial year ended 31 December 2019
42. Offsetting Financial Assets and Financial Liabilities (continued)
Related amounts not offset on balance sheet
Types of financial assets/liabilitiesBANK ($ million)
Carrying amounts on
balance sheet(A)
Amount not subject
to netting agreement
(B)
Amount subject to
netting agreement
(A – B = C + D + E)
Financial instruments
(C)Collateral
(D)
Net amounts in scope
(E)
2019Financial assetsDerivative receivables 6,324 1,251 5,073 4,108 174 791Reverse repurchase agreements 2,511 (1) 513 1,998 1,985 – 13Securities borrowings 4 (2) – 4 4 – –Total 8,839 1,764 7,075 6,097 174 804
Financial liabilitiesDerivative payables 6,743 1,153 5,590 4,108 525 957Repurchase agreements 95 (3) – 95 95 – –Total 6,838 1,153 5,685 4,203 525 957
2018Financial assetsDerivative receivables 5,331 1,259 4,072 3,275 165 632Reverse repurchase agreements 4,660 (1) 1,176 3,484 3,484 – –Securities borrowings 13 (2) – 13 13 – –Total 10,004 2,435 7,569 6,772 165 632
Financial liabilitiesDerivative payables 5,252 852 4,400 3,275 752 373Repurchase agreements 630 (3) – 630 630 – –Total 5,882 852 5,030 3,905 752 373
(1) Reverse repurchase agreements shown above are the aggregate of transactions recorded in separate line items on the balance sheet, namely placements with central banks, loans to banks and non-bank customers and other assets. These transactions are measured either at fair value or amortised cost.
(2) Cash collateral placed under securities borrowings are presented under placements with and loans to banks on the balance sheet, and are measured at amortised cost.(3) Repurchase agreements shown above are the aggregate of transactions recorded in separate line items on the balance sheet, namely deposits of banks and non-bank customers and other
liabilities, and are measured at amortised cost.
43. Contingent LiabilitiesThe Group conducts businesses involving acceptances, guarantees, documentary credits and other similar transactions. Acceptances are undertakings by the Group to pay on receipt of bills of exchange drawn. The Group issues guarantees on the performance of customers to third parties. Documentary credits commit the Group to make payments to third parties on presentation of stipulated documents. As the Group will only be required to meet these obligations in the event of customer’s default, the cash requirements of these instruments are expected to be considerably below their nominal contractual amounts.
GROUP BANK2019
$’0002018
$’0002019
$’0002018
$’000
Guarantees and standby letters of credit:Term to maturity of one year or less 4,610,301 4,319,456 3,411,718 3,350,701Term to maturity of more than one year 2,691,041 2,357,153 1,789,204 1,474,099
7,301,342 6,676,609 5,200,922 4,824,800Acceptances and endorsements 1,448,285 1,095,812 930,235 466,834Documentary credits and other short term trade-related transactions 5,194,781 4,192,013 4,309,226 3,273,579
13,944,408 11,964,434 10,440,383 8,565,213
43.1 Analysed by IndustryAgriculture, mining and quarrying 229,299 77,630 17,662 99,805Manufacturing 1,127,002 1,560,800 359,542 480,407Building and construction 2,197,505 1,757,310 1,262,733 736,127General commerce 7,532,137 5,387,832 6,645,473 4,590,359Transport, storage and communication 512,522 576,778 435,088 457,566Financial institutions, investment and holding companies 787,927 697,767 543,776 611,443Professionals and individuals 301,972 228,573 45,990 55,523Others 1,256,044 1,677,744 1,130,119 1,533,983
13,944,408 11,964,434 10,440,383 8,565,213
43.2 Analysed by GeographySingapore 9,706,317 7,085,359 9,496,753 7,050,382Malaysia 1,193,565 1,267,939 6,359 6,126Indonesia 1,001,632 1,159,064 – –Greater China 1,615,035 1,932,685 499,143 978,912Other Asia Pacific 220,073 256,498 230,342 266,904Rest of the World 207,786 262,889 207,786 262,889
13,944,408 11,964,434 10,440,383 8,565,213
Contingent liabilities analysed by geography is based on the country where the transactions are recorded.
270 OCBC Annual Report 2019 271Financials

Notes to the Financial Statements For the financial year ended 31 December 2019
44. CommitmentsCommitments comprise mainly agreements to provide credit facilities to customers. Such credit facilities (cancellable and non-cancellable) can either be made for a fixed period, or have no specific maturity.
GROUP BANK2019
$’0002018
$’0002019
$’0002018
$’000
44.1 Credit Commitments Undrawn credit facilities:Term to maturity of one year or less 131,992,359 124,392,476 56,893,865 54,734,471Term to maturity of more than one year 21,806,350 18,321,731 32,429,837 30,057,578
153,798,709 142,714,207 89,323,702 84,792,049
44.2 Other CommitmentsOperating lease (non-cancellable) commitments: (1)
Within 1 year – 82,059 – 81,364After 1 year but within 5 years – 126,565 – 35,113Over 5 years – 8,746 – 4,499
– 217,370 – 120,976Capital commitment authorised and contracted 199,019 204,703 239,702 125,767Forward deposits and assets purchase 2,295,183 647,045 5,774,445 626,272
2,494,202 1,069,118 6,014,147 873,015
44.3 Total Commitments 156,292,911 143,783,325 95,337,849 85,665,064
(1) From 1 January 2019, the Group has recognised ROU assets for these leases, except for short-term leases and low-value assets.
44.4 Credit Commitments Analysed by Industry Agriculture, mining and quarrying 1,260,274 1,370,865 476,816 661,424Manufacturing 9,435,030 9,601,792 4,212,356 4,412,119Building and construction 15,685,078 16,555,823 11,330,932 12,808,761General commerce 23,394,029 21,370,428 18,867,490 17,041,989Transport, storage and communication 4,098,990 2,971,927 3,142,068 2,465,552Financial institutions, investment and holding companies 42,604,791 37,254,422 33,076,752 30,745,810Professionals and individuals 49,543,725 46,872,065 13,014,202 12,337,125Others 7,776,792 6,716,885 5,203,086 4,319,269
153,798,709 142,714,207 89,323,702 84,792,049
44.5 Credit Commitments Analysed by Geography Singapore 113,241,431 103,743,918 74,391,796 69,127,914Malaysia 7,847,993 7,629,720 125,812 280,771Indonesia 5,024,606 4,210,361 – –Greater China 21,924,023 22,754,690 9,026,378 10,994,426Other Asia Pacific 2,197,245 2,035,039 2,198,754 2,036,581Rest of the World 3,563,411 2,340,479 3,580,962 2,352,357
153,798,709 142,714,207 89,323,702 84,792,049
Credit commitments analysed by geography is based on the country where the transactions are recorded.
45. Unconsolidated Structured EntitiesUnconsolidated structured entities refer to structured entities that are not controlled by the Group. The Group’s transactions in these structured entities are for investment opportunities as well as to facilitate client transactions. The Group’s maximum exposure to loss is primarily limited to the carrying amount on its balance sheet and loan and capital commitments to these structured entities.
The following table summarises the carrying amount of the assets and liabilities recognised in the Group’s financial statements relating to the interests in unconsolidated structured entities undertaken by business segments.
GROUP ($million)
Global investment
banking Insurance Others Total
2019FVOCI investments 57 – # 57FVTPL investments – 85 – 85Other assets – 7 – 7Total assets 57 92 # 149
Other liabilities – – # #Total liabilities – – # #
Other commitmentsLoan and capital commitments authorised and contracted (1) 23 – – 23
Income earned from sponsored structured entities (2) 1 48 36 85
Assets of structured entities 445 5,069 2,593 8,107
2018FVOCI investments 58 – # 58FVTPL investments – 132 – 132Other assets – 8 – 8Total assets 58 140 # 198
Other liabilities – 1 # 1Total liabilities – 1 # 1
Other commitmentsLoan and capital commitments authorised and contracted (1) 23 – – 23
Income earned from sponsored structured entities (2) – 53 11 64
Assets of structured entities 448 3,851 1,329 5,628
(1) These were also included in the Group’s capital commitments authorised and contracted in Note 44.(2) The income earned relates primarily to management fee, interest income or fair value gains or losses recognised by the Group arising from the interests held by the Group in the
unconsolidated investment funds.(3) # represents amounts less than $0.5 million.
The amount of assets transferred to sponsored entities during 2019 and 2018 were not significant.
272 OCBC Annual Report 2019 273Financials

Notes to the Financial Statements For the financial year ended 31 December 2019
46. Financial Assets Transferred 46.1 Assets Pledged
GROUP BANK2019
$’0002018
$’0002019
$’0002018
$’000
Government treasury bills and securities (Note 24) – Singapore – – – 312,750 – Others 92,134 27,962 16,581 10,504
Placements with and loans to banks (Note 25) 50,992 124,661 44,246 120,782Loans and bills receivable (Note 26) 303,640 309,155 – –Debt securities (Note 29) 718,961 642,795 61,631 563,312
1,165,727 1,104,573 122,458 1,007,348
Obligations to repurchase assets pledged 759,326 721,321 94,654 941,472
(a) The amounts received from repurchase transactions are recognised as collaterised borrowings, “obligations to repurchase assets pledged”, measured at amortised cost and included in deposits of banks and non-bank customers and other liabilities on the balance sheet. The above assets pledged as collateral for repurchase transactions are not derecognised but are presented separately on the balance sheet.
(b) The amounts paid in reverse repurchase transactions are recognised as collaterised lendings, measured at amortised cost and included in loans to banks and non-bank customers as appropriate. The financial assets accepted as collateral for reverse repurchase transactions are not recognised as assets on the balance sheet. The fair value of financial assets accepted as collateral, which the Group is permitted to sell or re-pledge in the absence of default is $2.35 billion (2018: $4.03 billion), of which $0.03 billion (2018: $0.31 billion) have been sold or re-pledged. The Group is obliged to return equivalent assets.
(c) Transactions are conducted under terms and conditions that are usual and customary to standard securities lending (equivalent to repurchase transactions) and securities borrowing (equivalent to reverse repurchase transactions).
46.2 Assets Assigned as Security for Covered Bonds Issued (Note 21.5)Pursuant to the Bank’s Global Covered Bond Programme, selected pools of Singapore home loans originated by the Bank have been assigned to a bankruptcy-remote structured entity, Red Sail Pte. Ltd. (Note 34.4). These home loans continue to be recognised on the Bank’s balance sheet as the Bank remains exposed to the risks and rewards associated with them.
As at 31 December 2019, the carrying amounts of the covered bonds in issue was $3.47 billion (2018: $3.53 billion), while the carrying amounts of assets assigned was $6.91 billion (2018: $6.00 billion). The difference in values is attributable to an intended over-collateralisation required to maintain the credit ratings of the covered bonds in issue, and additional assets assigned to facilitate future issuances.
47. Assets Held for SaleAssets held for sale comprise properties which the Group is disposing of, subject to terms that are usual and customary in the completion of the sale. The transactions are not expected to have a material impact on the Group’s net earnings and net assets for the financial year ending 31 December 2020.
48. Minimum Lease Rental ReceivableThe future minimum lease rental receivable under non-cancellable operating leases by remaining period to lease expiry is as follows:
GROUP BANK2019
$’0002018
$’0002019
$’0002018
$’000
Within 1 year 43,480 48,640 16,132 17,962After 1 year but within 5 years 66,771 36,556 8,421 9,099Over 5 years 2,224 – – –
112,475 85,196 24,553 27,061
The Group leases retail, commercial and hotel space to third parties with varying terms including variable rent, escalation clauses and renewal rights.
49. Related Party TransactionsLoans and deposits transactions with related parties arise from the ordinary course of business and are not treated any differently from loans and deposits transactions with other customers of the Group. Credit facilities granted are subject to the same credit evaluation, approval, monitoring and reporting processes. All transactions with related parties are conducted on commercial terms.
49.1 Material related party balances at the balance sheet date and transactions during the financial year were as follows:
GROUP BANK
$ million Associates
Life insurance
fund Subsidiaries Associates
Life insurance
fund
(a) Loans, placements and other receivablesAt 1 January 2019 80 141 22,808 # –Net change (5) 269 (4,735) 74 104At 31 December 2019 75 410 18,073 74 104
(b) Deposits, borrowings and other payablesAt 1 January 2019 366 1,340 20,938 142 653Net change (19) (346) 497 (4) (221)At 31 December 2019 347 994 21,435 138 432
(c) Off-balance sheet credit facilities (1)
At 1 January 2019 – 4 16,932 – 4Net change – 2 2,725 – 2At 31 December 2019 – 6 19,657 – 6
(d) Income statement transactionsYear ended 31 December 2019Interest income 1 10 363 # #Interest expense 6 18 472 2 3Rental income – 2 27 – #Fee and commission and other income – 225 57 – 167Rental and other expenses 25 37 359 25 #
Year ended 31 December 2018Interest income 7 7 363 # #Interest expense 4 14 416 2 3Rental income – 2 23 – –Fee and commission and other income – 197 57 – 142Rental and other expenses 20 12 312 20 #
(1) Off-balance sheet credit facilities refer to transaction-related and trade-related contingencies and commitments.(2) # represents amounts less than $0.5 million.
During the financial year, the Group had banking transactions with director-related and key management-related entities and personnel of the Group. These transactions were not material.
274 OCBC Annual Report 2019 275Financials

Notes to the Financial Statements For the financial year ended 31 December 2019
49. Related Party Transactions (continued)49.2 Key Management Personnel Compensation
BANK2019
$ million2018
$ million
Key management personnel compensation is as follows:Short-term employee benefits 44 41Share-based benefits 16 16
60 57
Certain performance-related payments to key management personnel of the Bank in relation to the performance year 2019 included in the above table are subject to the approval of the Remuneration Committee.
50. Capital Management The key objective of the Group’s capital management policy is to maintain a strong capital position to support business growth and strategic investments, and to sustain investor, depositor, customer and market confidence. In line with this, OCBC targets a minimum credit rating of “A” and ensures that its capital ratios are comfortably above the regulatory minima, while balancing shareholders’ desire for sustainable returns and high standards of prudence. OCBC actively manages its capital composition with an optimal mix of capital instruments in order to keep our overall cost of capital low.
A description of the key terms and conditions of the regulatory capital instruments can be found in Notes 13, 14 and 21 of the financial statements, and the approaches adopted by OCBC for the computation of risk-weighted assets can be found in the “Pillar 3 Disclosures” chapter.
The table below shows the composition of the Group’s regulatory capital and its capital adequacy ratios as of 31 December 2019.
$ millionBasel III
2019Basel III
2018
Tier 1 CapitalOrdinary shares 17,261 15,750Disclosed reserves/others 21,452 19,219Regulatory adjustments (6,913) (6,901)Common Equity Tier 1 Capital 31,800 28,068
Additional Tier 1 capital 1,531 1,572Regulatory adjustments – –Tier 1 Capital 33,331 29,640
Tier 2 capital 2,661 3,347Regulatory adjustments – (1)Total Eligible Capital 35,992 32,986
Credit 183,439 171,487Market 14,751 14,669Operational 15,166 14,092Risk Weighted Assets 213,356 200,248
Capital Adequacy RatiosCommon Equity Tier 1 14.9% 14.0%Tier 1 15.6% 14.8%Total 16.8% 16.4%
51. New Accounting Standards and Interpretations As of the balance sheet date, certain new standards, amendments and interpretations to existing accounting standards have been published. The Group has not adopted the following relevant new/revised financial reporting standards and interpretations that have been issued but not yet effective.
SFRS(I) TitleEffective for financial year beginning on or after
Various Amendments to References to the Conceptual Framework in SFRS(I) Standards
1 January 2020
SFRS(I) 3 (Amendments) Definition of a Business 1 January 2020SFRS(I) 1-1 and SFRS(I) 1-8 Definition of Material 1 January 2020(Amendments)SFRS(I) 17 Insurance Contracts 1 January 2021SFRS(I) 10, SFRS(I) 1-28 (Amendments)
Sale or Contribution of Assets between an Investor and its Associate or Joint Venture
To be determined
Based on the Group’s preliminary analysis, the initial application of the above standards (including their consequential amendments) and interpretations are not expected to have a significant impact on the Group’s financial statements, except for SFRS(I) 17.
SFRS(I) 17 Insurance ContractsSFRS(I) 17 was issued in May 2017 as replacement for SFRS(I) 4 Insurance Contracts. It is a comprehensive new accounting standard for insurance contracts covering recognition and measurement, presentation and disclosure. SFRS(I) 17 requires a general model where estimates are re-measured in each reporting period. Contracts are measured using the building blocks of:• discounted probability-weighted cash flows;• an explicit risk adjustment; and• a contractual service margin representing the unearned profit of the contract which is recognised as revenue over the
coverage period.
The general model is supplemented by:• a simplified approach (the premium allocation approach) mainly for short duration contracts; and• a modification of the general measurement model (the variable fee approach) for contracts with direct participation features.
SFRS(I) 17 is effective for annual periods beginning on or after 1 January 2021(1), with comparative figures required. Retrospective application is required. However, if full retrospective application for a group of insurance contracts is impracticable, then the entity is required to choose either a modified retrospective approach or a fair value approach. GEH Group plans to adopt SFRS(I) 17 on the required effective date and a Project Steering Committee was formed to oversee the implementation of the standard. GEH Group expects that SFRS(I) 17 will result in an important change to the accounting policies for insurance contract liabilities of GEH Group and is likely to have a significant impact on profit and total equity together with GEH Group’s financial statements’ presentation and disclosures.
(1) The International Accounting Standards Board published an exposure draft Amendments to IFRS 17 in June 2019 which proposes that the effective date of IFRS 17 Insurance Contracts be deferred by one year, such that it would apply to entities with annual periods beginning on or after 1 January 2022.
276 OCBC Annual Report 2019 277Financials

Notes to the Financial Statements For the financial year ended 31 December 2019
52. Subsequent Events52.1 National B40 Protection Trust FundOn 9 November 2018 and 24 January 2019, GEH Group announced that as part of its corporate social responsibility efforts and in line with the objectives of the Malaysian authorities, GEH Group has opted to make a contribution of MYR2 billion (approximately S$0.7 billion) to the National B40 Protection Trust Fund in satisfaction and in lieu of the local shareholder requirement imposed on its subsidiary, Great Eastern Life Assurance (Malaysia) Berhad. Subsequent to the financial year end, GEH Group has received the necessary approval from the relevant authorities and is currently finalising the details of the contribution.
52.2 Coronavirus OutbreakThe coronavirus outbreak since early 2020 has brought about uncertainties to key markets in which the Group operate. The Group has been closely monitoring the impact of the developments on the Group’s businesses. As the situation is rapidly evolving, the effect of the outbreak is subject to significant levels of uncertainty, with the full range of possible effects presently unknown.
Group’s Major PropertiesAs at 31 December 2019
Purpose
Effective stake
(%)
Gross floor area
(sq ft)
Carrying value
S$’000
Marketvalue(1)
S$’000
Singapore65 Chulia Street, OCBC Centre Office 100 993,089 18,620 1,140,000 63 Chulia Street, OCBC Centre East Office 100 242,385 91,650 387,300 18 Church Street, OCBC Centre South Office 100 118,909 65,724 178,660 63 Market Street, Bank Of Singapore Centre Office 100 248,996 270,076 492,000 11 Tampines Central 1 Office 100 115,824 51,261 113,000
31 Tampines Avenue 4 Office 100 97,572 38,891 87,000 260 Tanjong Pagar Road Office 100 44,940 7,449 67,40070 Loyang Drive Office 100 134,287 114,149 177,000 Block 9 & 13 Tanjong Rhu Road, The Waterside Residential 100 251,889 33,776 285,920 2 Mt Elizabeth Link Residential 100 104,377 19,041 193,000 6, 6A to 6H, 6J to 6N, 6P to 6U Chancery Hill Road,
The Compass at Chancery Residential 100 54,739 11,044 56,000 277 Orchard Road, Orchardgateway Retail and Hotel 100 535,698 508,058 955,000
1,229,739 4,132,280
Malaysia18 Jalan Tun Perak, Kuala Lumpur, Menara OCBC Office 100 243,262 16,546 39,157
IndonesiaJl Dr. Satrio, Casablanca, Jakarta, Bank NISP Tower Office 85 362,313 4,276 64,811
Greater China1155 Yuanshen Road, Pudong Shanghai, 华侨银行大厦 Office 100 249,161 147,950 205,450 161-169 Queen’s Road Central, Hong Kong SAR Office 100 95,169 194,826 342,772
342,776 548,222
Other properties inSingapore 72,005 577,755Malaysia 12,973 88,623 Indonesia 49,794 156,384 Greater China 1,143,449 1,732,243 Other Asia Pacific 10,956 87,717 Rest of the World 1,511 16,367
1,290,688 2,659,089
Properties classified as held-for-sale 2,811 20,642
Total (2) 2,886,836 7,464,201
(1) Valuations were made by independent firms of professional valuers.(2) Does not include properties held by GEH Group’s insurance subsidiaries under their life assurance funds.
278 OCBC Annual Report 2019 279Financials

Shareholding StatisticsAs at 9 March 2020
Class of Shares Ordinary Shares
Voting Rights One vote per share (other than treasury shares and subsidiary holdings, which are treated as having no voting rights)
Distribution of Shareholders
Size of HoldingsNumber of
Shareholders % Number of Shares Held %
1 – 99 8,501 8.33 327,336 0.01100 – 1,000 23,526 23.07 13,228,747 0.301,001 – 10,000 53,652 52.61 189,814,266 4.3010,001 – 1,000,000 16,161 15.85 734,469,577 16.661,000,001 and above 146 0.14 3,470,754,469 78.73Total 101,986 100.00 4,408,594,395 100.00
Number of issued shares (including treasury shares): 4,408,594,395Number of treasury shares held: 8,325,600Number of subsidiary holdings held: NilPercentage of the aggregate number of treasury shares and subsidiary holdings held against the total number of issued shares: 0.19%
Note: “Subsidiary holdings” is defined in the Listing Manual to mean shares referred to in Sections 21(4), 21(4B), 21(6A) and 21(6C) of the Companies Act, Chapter 50.
Twenty Largest Shareholders
ShareholdersNumber of
Shares Held %*
1. Citibank Nominees Singapore Pte Ltd 672,748,863 15.292. DBS Nominees Pte Ltd 520,995,884 11.843. Selat Pte Limited 493,975,279 11.234. DBSN Services Pte Ltd 284,070,314 6.465. HSBC (Singapore) Nominees Pte Ltd 230,744,057 5.246. Lee Foundation 194,255,503 4.417. Singapore Investments Pte Ltd 157,007,526 3.578. Lee Rubber Company Pte Ltd 138,829,991 3.169. Raffles Nominees (Pte) Limited 67,743,926 1.5410. Lee Latex Pte Limited 59,940,381 1.3611. BPSS Nominees Singapore (Pte.) Ltd. 50,240,264 1.1412. Herald Investment Pte Ltd 45,153,163 1.0313. United Overseas Bank Nominees Pte Ltd 44,950,964 1.0214. Kallang Development (Pte) Limited 43,129,685 0.9815. Lee Pineapple Company Pte Ltd 29,985,519 0.6816. Kew Estate Limited 27,447,750 0.6217. DB Nominees (Singapore) Pte Ltd 25,559,282 0.5818. Island Investment Company Pte Ltd 18,200,411 0.4119. Lee Plantations Pte Limited 16,696,206 0.3820. OCBC Nominees Singapore Pte Ltd 15,637,965 0.36Total 3,137,312,933 71.30
* Percentage is calculated based on the total number of issued shares, excluding treasury shares.
Approximately 72.1% of the issued shares (excluding treasury shares) are held in the hands of the public. Rule 723 of the Listing Manual of the Singapore Exchange Securities Trading Limited has accordingly been complied with.
Substantial Shareholders (As shown in the Register of Substantial Shareholders)
Substantial shareholdersDirect interest
No. of SharesDeemed interest
No. of SharesTotal
No. of Shares %*
Lee Foundation 189,310,098 (1) 31,835,411 (2) 221,145,509 5.03Selat (Pte) Limited 481,399,533 (3) 45,153,163 (4) 526,552,696 11.97
* Percentage is calculated based on the total number of issued shares, excluding treasury shares.
(1) Does not include shares acquired pursuant to OCBC’s Scrip Dividend Scheme in October 2019. As the acquisition did not result in an overall percentage level change in Lee Foundation’s total interest in OCBC, no notification of the change was required to be given under the Securities and Futures Act, Chapter 289 (SFA).
(2) Represents Lee Foundation’s deemed interest in (a) the 29,222,140 shares held by Lee Pineapple Company (Pte) Limited, and (b) the 2,613,271 shares held by Peninsula Plantations Sendirian Berhad.
(3) Does not include shares acquired pursuant to OCBC’s Scrip Dividend Scheme in October 2019. As the acquisition did not result in an overall percentage level change in Selat (Pte) Limited’s total interest in OCBC, no notification of the change was required to be given under the SFA.
(4) Represents Selat (Pte) Limited’s deemed interest in the 45,153,163 shares held by Herald Investment Pte Ltd.
280 OCBC Annual Report 2019 281Additional Information

Five-Year Ordinary Share Capital History(OCBC Group – As at 31 December 2019)
Number of ordinary shares (’000)
Year Particulars Issued Held in Treasury In circulation
2015 Shares issued to non-executive directors 68
Shares issued in lieu of dividend 128,564
Share buyback (11,750)
Issue of shares pursuant to Share Option Schemes 4,176
Issue of shares pursuant to Employee Share Purchase Plan 5,743
Issue of shares pursuant to Deferred Share Plan 4,788
Year end balance 4,121,561 (6,086) 4,115,475
2016 Shares issued to non-executive directors 58
Shares issued in lieu of dividend 72,110
Share buyback (13,614)
Issue of shares pursuant to Share Option Schemes 1,497
Issue of shares pursuant to Employee Share Purchase Plan 26
Issue of shares pursuant to Deferred Share Plan 7,155
Year end balance 4,193,729 (11,022) 4,182,707
2017 Shares issued to non-executive directors 55
Share buyback (20,560)
Issue of shares pursuant to Share Option Schemes 13,133
Issue of shares pursuant to Employee Share Purchase Plan 6,302
Issue of shares pursuant to Deferred Share Plan 5,076
Year end balance 4,193,784 (7,071) 4,186,713
2018 Shares issued to non-executive directors 53
Shares issued in lieu of dividend 62,933
Share buyback (17,225)
Issue of shares pursuant to Share Option Schemes 4,553
Issue of shares pursuant to Employee Share Purchase Plan 7,635
Issue of shares pursuant to Deferred Share Plan 5,322
Shares sold for cash 47
Year end balance 4,256,770 (6,739) 4,250,031
2019 Shares issued to non-executive directors 54
Shares issued in lieu of dividend 151,770
Share buyback (17,130)
Issue of shares pursuant to Share Option Schemes 3,127
Issue of shares pursuant to Employee Share Purchase Plan 5,635
Issue of shares pursuant to Deferred Share Plan 7,523
Year end balance 4,408,594 (7,584) 4,401,010
GRI Standards Content Index
Disclosure Number Disclosure Title Page Reference and Remarks
General DisclosuresOrganisational Profile
102-1 Name of the organisation Oversea-Chinese Banking Corporation Limited
102-2 Activities, brands, products and services Strong focus on executing our corporate strategy, 10-11
102-3 Location of headquarters 63 Chulia Street, #10-00 OCBC Centre East, Singapore 049514
102-4 Location of operations More than 600 branches and representative offices in 18 countries and regions https://www.ocbc.com/group/who-we-are/group-business.html
102-5 Ownership and legal form Public limited company listed on the Singapore Exchange
102-6 Markets served Key markets are Singapore, Malaysia, Indonesia and Greater China
102-7 Scale of the organisation 10–11, 80–81, 121–282
102-8 Information on employees and other workers 80–81
102-9 Supply Chain 83 OCBC engages external service providers in IT, advertising and event management, outsourcing, HR recruitment, legal, real estate/ facilities maintenance and other services.
102-10 Significant changes to the organisation and its supply chain
OCBC confirms that there have been no significant changes to the organisation and its supply chain.
102-11 Precautionary Principle or approach OCBC does not explicitly refer to the precautionary principle or approach in its Risk Management principles. We seek to create sustainable value for our stakeholders. Please see our approach to responsible finance on pages 66–69 or Risk Management on page 105.
102-12 External initiatives We have been signatory to the United Nations Global Compact (UNGC) since April 2008 and observe its ten principles in the areas of human rights, labour, the environment and anti-corruption.
We became signatory to the United for Wildlife Financial Taskforce in 2018.
In 2019, we became signatory to and expressing our support for the Task Force on Climate-related Financial Disclosures (TCFD).
102-13 Membership of associations OCBC’s key memberships include The Association of Banks in Singapore (ABS), The Association of Banks in Malaysia (ABM), The Hong Kong Association of Banks (HKAB), Indonesian Bank Association (Perbanas) and China Banking Association (CBA)
OCBC became a pioneer member of Global Compact Network Singapore (GCNS) which is a local chapter of the UNGC in 2006. We are one of the founding members of the National Volunteer & Philanthropy Centre (NVPC) Company of Good in 2016
282 OCBC Annual Report 2019 283Additional Information

Disclosure Number Disclosure Title Page Reference and Remarks
Strategy
102-14 Statement from senior decision-maker 56
Ethics and Integrity
102-16 Values, principles, standards, and norms of behaviour
https://www.ocbc.com/group/who-we-are/purpose-values.html
102-17 Mechanisms for advice and concerns about ethics 72
Governance
102-18 Governance structure 59
Stakeholder Engagement
102-40 List of stakeholder groups Reference to website on stakeholder engagement
102-41 Collective bargaining agreements In Singapore, the Banking & Financial Services Union (BFSU), Singapore Bank Employees’ Union (SBEU) and Singapore Manual and Mercantile Workers’ Union (SMMWU) represent the applicable cohort on collective bargaining.
In West Malaysia, the Association of Bank Officers, Peninsular Malaysia (ABOM) and National Union of Bank Employees, States of Malaya (NUBE) and in East Malaysia, the Sabah Banking Employees’ Union and Sarawak Bank Employees’ Union represent the applicable cohorts on collective bargaining.
The data for percentage of employees covered under collective bargaining is currently unavailable. OCBC aims to provide the data in our next sustainability report.
102-42 Identifying and selecting stakeholders Reference to website on stakeholder engagement
102-43 Approach to stakeholder engagement 59
102-44 Key topics and concerns raised Reference to website on stakeholder engagement
Reporting Practice
102-45 Entities included in the consolidated financial statements
55
102-46 Defining report content and topic Boundaries 55
102-47 List of material topics 58
102-48 Restatements of information 70, 83
102-49 Changes in reporting No changes in reporting
102-50 Reporting period 55
102-51 Date of most recent report Apr 2019
102-52 Reporting cycle Annual
Disclosure Number Disclosure Title Page Reference and Remarks
Reporting Practice (continued)
102-53 Contact point for questions regarding the report We welcome your feedback and suggestions at [email protected]
102-54 Claims of reporting in accordance with GRI standards 55
102-55 GRI Content Index 283–287
102-56 External assurance 55
Financial Inclusion103-1 Explanation of the material topic and its boundary 61
103-2 The management approach and its components 61
103-3 Evaluation of the management approach 61
FS14 Initiatives to improve access to financial services for disadvantaged people
61
Former FS16 Initiatives to enhance financial literacy by type of beneficiary
61
Digitalisation103-1 Explanation of the material topic and its boundary 62–63
103-2 The management approach and its components 62–63
103-3 Evaluation of the management approach 62–63
203-2 Significant Indirect economic impacts 62–63
Non-GRI % of digital customers in Singapore 62–63
Customer Experience103-1 Explanation of the material topic and its boundary 64–65
103-2 The management approach and its components 64–65
103-3 Evaluation of the management approach 64–65
Responsible and Sustainable Financing103-1 Explanation of the material topic and its boundary 66–69
103-2 The management approach and its components 66–69
103-3 Evaluation of the management approach 66–69
Former FS1 Policies with specific environmental and social components applied to business lines
66–69
Former FS2 Procedures for assessing and screening environmental and social risks in business lines
66–69
Former FS4 Process(es) for improving staff competency to implement the environmental and social policies and procedures as applied to business lines
Reference to website https://www.ocbc.com/group/who-we-are/responsible-financing.html
GRI Standards Content Index
284 OCBC Annual Report 2019 285Additional Information
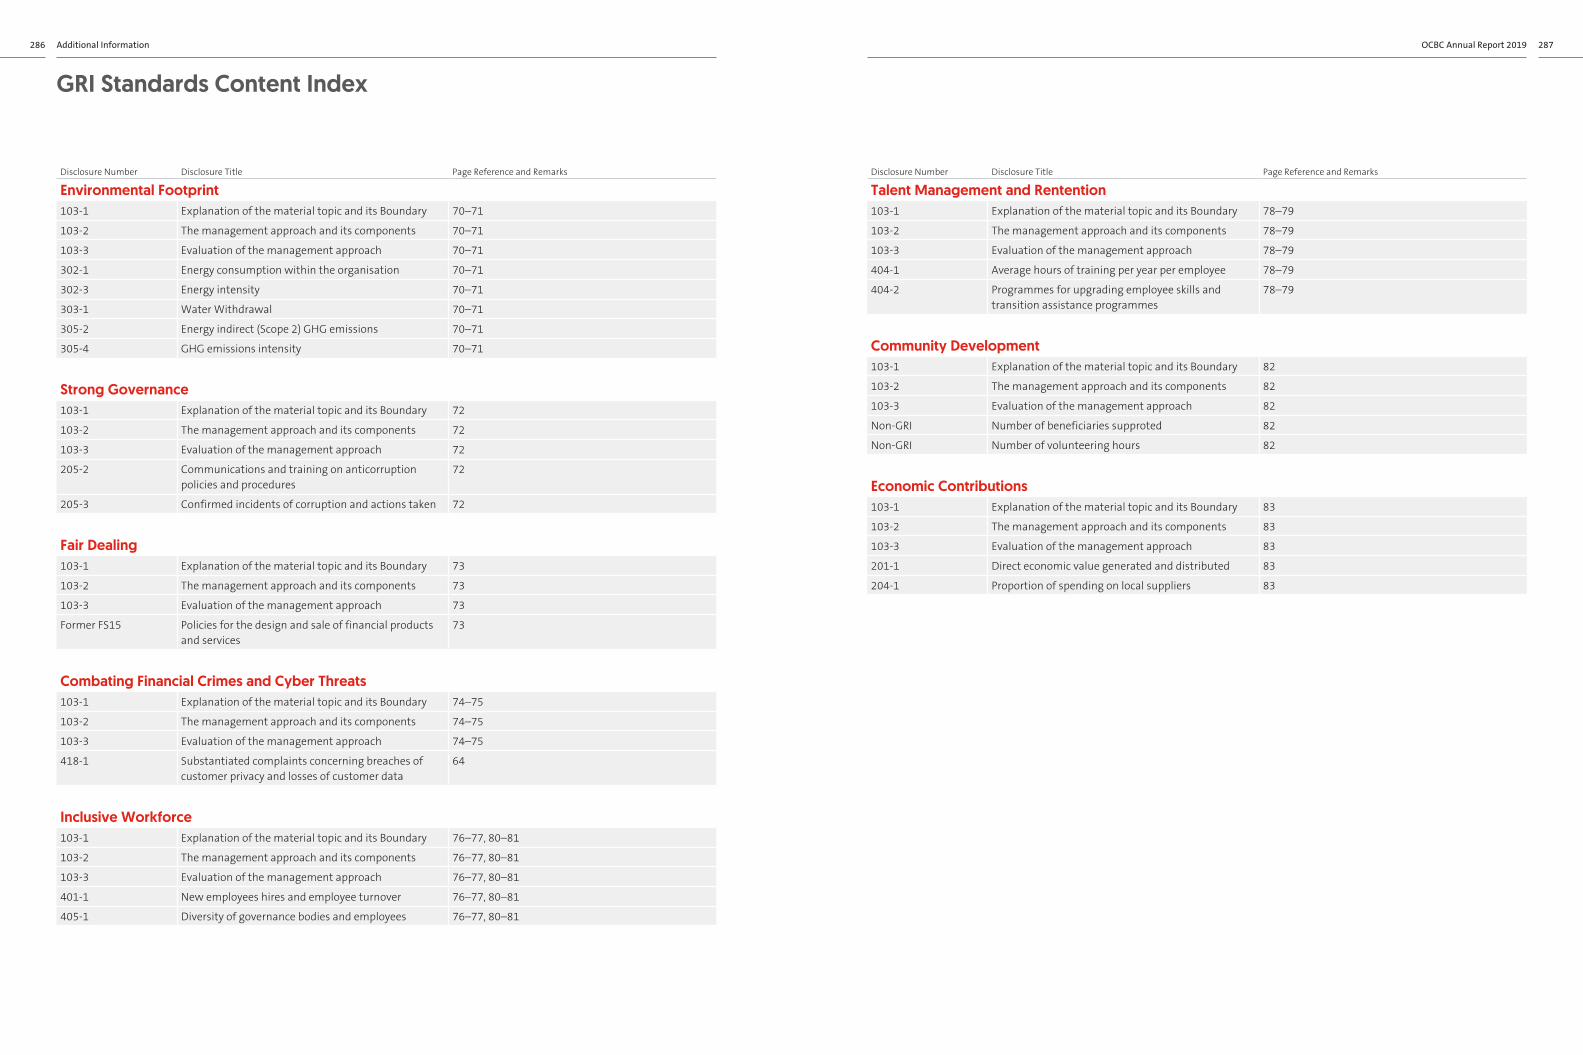
Disclosure Number Disclosure Title Page Reference and Remarks
Environmental Footprint103-1 Explanation of the material topic and its Boundary 70–71
103-2 The management approach and its components 70–71
103-3 Evaluation of the management approach 70–71
302-1 Energy consumption within the organisation 70–71
302-3 Energy intensity 70–71
303-1 Water Withdrawal 70–71
305-2 Energy indirect (Scope 2) GHG emissions 70–71
305-4 GHG emissions intensity 70–71
Strong Governance103-1 Explanation of the material topic and its Boundary 72
103-2 The management approach and its components 72
103-3 Evaluation of the management approach 72
205-2 Communications and training on anticorruption policies and procedures
72
205-3 Confirmed incidents of corruption and actions taken 72
Fair Dealing103-1 Explanation of the material topic and its Boundary 73
103-2 The management approach and its components 73
103-3 Evaluation of the management approach 73
Former FS15 Policies for the design and sale of financial products and services
73
Combating Financial Crimes and Cyber Threats103-1 Explanation of the material topic and its Boundary 74–75
103-2 The management approach and its components 74–75
103-3 Evaluation of the management approach 74–75
418-1 Substantiated complaints concerning breaches of customer privacy and losses of customer data
64
Inclusive Workforce103-1 Explanation of the material topic and its Boundary 76–77, 80–81
103-2 The management approach and its components 76–77, 80–81
103-3 Evaluation of the management approach 76–77, 80–81
401-1 New employees hires and employee turnover 76–77, 80–81
405-1 Diversity of governance bodies and employees 76–77, 80–81
Disclosure Number Disclosure Title Page Reference and Remarks
Talent Management and Rentention103-1 Explanation of the material topic and its Boundary 78–79
103-2 The management approach and its components 78–79
103-3 Evaluation of the management approach 78–79
404-1 Average hours of training per year per employee 78–79
404-2 Programmes for upgrading employee skills and transition assistance programmes
78–79
Community Development103-1 Explanation of the material topic and its Boundary 82
103-2 The management approach and its components 82
103-3 Evaluation of the management approach 82
Non-GRI Number of beneficiaries supproted 82
Non-GRI Number of volunteering hours 82
Economic Contributions103-1 Explanation of the material topic and its Boundary 83
103-2 The management approach and its components 83
103-3 Evaluation of the management approach 83
201-1 Direct economic value generated and distributed 83
204-1 Proportion of spending on local suppliers 83
GRI Standards Content Index
286 OCBC Annual Report 2019 287Additional Information

Further Information on Management Committee
Mr Samuel N. TsienGroup Chief Executive Officer
Mr Tsien was first appointed to the Board on 13 February 2014 and last re-elected as a Director on 29 April 2019. He was appointed Group Chief Executive Officer on 15 April 2012. He joined OCBC Bank in July 2007 as Senior Executive Vice President, managing the Group’s corporate and commercial banking business. In 2008, he assumed the position as Global Head of Global Corporate Bank with added responsibilities of overseeing the financial institution and transaction banking businesses. He has 42 years of banking experience. Prior to joining OCBC Bank, he was the President and Chief Executive Officer of China Construction Bank (Asia) when China Construction Bank acquired Bank of America (Asia). From 1995 to 2006, he was President and Chief Executive Officer of Bank of America (Asia), and Asia Consumer and Commercial Banking Group Executive of Bank of America Corporation.
Mr Ching Wei HongDeputy President Global Wealth Management and Consumer Banking
Mr Ching Wei Hong was appointed Deputy President on 9 January 2020 and was previously the Chief Operating Officer from April 2012. He is also currently the Chairman of Bank of Singapore, OCBC Securities, Network for Electronic Transfers (Singapore) as well as Deputy Chairman of Lion Global Investors. In his capacity as Deputy President of OCBC Bank, he is responsible for the Global Wealth Management and Consumer Banking Division, focusing on building the OCBC Group’s consumer banking franchise, wealth management, and private banking business in its key markets in Asia. Mr Ching also oversees Group Customer Experience and OCBC Bank’s fintech and innovation unit, The Open Vault at OCBC. In his tenure with OCBC Bank, he has held senior management responsibilities across various roles including Chief Financial Officer, Head of Group Operations and Technology and Head of Transaction Banking. Mr Ching has more than 35 years of experience in regional finance, corporate banking and
cash management. Before joining OCBC, he was Director of Corporate Finance, Philips Electronics Asia Pacific. He also held senior regional assignments in Bank of America and was Treasurer of Union Carbide Asia Pacific. Mr Ching holds a Bachelor of Business Administration from the National University of Singapore.
Ms Helen WongDeputy PresidentGlobal Wholesale Banking
Ms Helen Wong was appointed as Deputy President on 3 February 2020. As the Head of Global Wholesale Banking, she has global responsibility for all banking relationships with small- and medium-sized enterprises, large corporates and financial institutions; two product groups – cash management and trade under the transaction banking business; as well as the investment banking business. Ms Wong has more than 35 years of banking experience, having started out as a Management Trainee in OCBC Bank and was its first China Desk Manager, based at the Hong Kong Branch. She has vast experience in Greater China, covering a wide range of roles in capital markets, syndicated finance and corporate banking. Before returning to OCBC Bank, Ms Wong spent 27 years at HSBC, where her last role was as its Chief Executive for Greater China, which she was appointed to in 2015. She became the President and CEO of HSBC China based in Shanghai in 2010, and was promoted to be Group General Manager in 2011 to recognise her responsibility for the entire business operations and strategic expansion in China. She also held non-executive directorships at Baoshan Iron & Steel from 2012 to 2015, and at Bank of Communications from 2016 to 2019. Ms Wong holds a Bachelor of Social Sciences from the University of Hong Kong.
Mr Darren TanChief Financial Officer
Mr Darren Tan was appointed Executive Vice President and Chief Financial Officer (CFO) in December 2011. As CFO, he oversees financial, regulatory and management accounting and advisory, treasury financial control and advisory,
corporate treasury, funding and capital management, corporate planning and development and investor relations. He joined OCBC Bank in March 2007 as Head of Asset Liability Management in Global Treasury and assumed the role of Deputy CFO in May 2011. Prior to joining OCBC, Mr Tan worked for 13 years in the Government of Singapore Investment Corporation (GIC) with his last position in GIC as Head of Money Markets. He serves as a board member of the Inland Revenue Authority of Singapore (IRAS Board). He is also a council member of the Institute of Singapore Chartered Accountants (ISCA) and an Adjunct Professor at Nanyang Business School. Mr Tan graduated with First Class Honours in Accountancy from Nanyang Technological University and is a Chartered Financial Analyst and a Fellow Chartered Accountant of Singapore.
Mr Lam Kun KinGlobal Treasury
Mr Lam Kun Kin was appointed Head of Global Treasury in January 2007 and Senior Executive Vice President in April 2011. He has global responsibility for OCBC Bank’s financial market businesses and asset liability management in Singapore, Malaysia, Indonesia, Hong Kong, China and seven other overseas centres. From 2012 to early 2020, he also held additional responsibility of overseeing the Bank’s Global Investment Banking division covering capital markets, corporate finance and mezzanine capital business. Mr Lam has more than 32 years of banking and investment management experience covering global fund management, global markets sales and trading, global investment banking and Asian financial market businesses. Currently, he serves on the boards of Bank of Singapore, OCBC Securities, AVIC Trust and REACH Community Services Society. Mr Lam also serves on Great Eastern Group’s Asset/Liability Committee and Investment Committee, the Government of Singapore Investment Corporation’s (GIC) Board Risk Committee and the Association of Banks Singapore (ABS) Benchmark Administration Oversight Committee. Prior to joining OCBC Bank, Mr Lam held various senior management positions in GIC, Citibank and Temasek Holdings. In September 2014, he was
appointed by the Monetary Authority of Singapore as Co-Chairman of the Singapore Foreign Exchange Market Committee and concurrently chaired the SIBOR benchmark working committee since 2018. He holds a Bachelor of Accountancy with Honours from the National University of Singapore and is a Chartered Financial Analyst, Fellow Chartered Accountant of Singapore, IBF Distinguished Fellow and member of the Singapore Institute of Directors.
Mr Vincent ChooGroup Risk Management
Mr Vincent Choo was appointed Head of Group Risk Management on 1 August 2014. As Chief Risk Officer, he covers the full spectrum of risk, including Credit, Technology and Information Security, Liquidity, Market and Operational Risk Management. He reports jointly to both Group CEO and the Board Risk Management Committee of OCBC Bank. Mr Choo joined OCBC Bank from Deutsche Bank AG where his last appointment was Managing Director and Chief Risk Officer for Asia Pacific. In his 20 years at Deutsche Bank AG, he served in a number of senior roles including Head of Market Risk Management for Asia Pacific, with additional responsibilities for Traded Credit Products, and Head of New Product Approval for Asia. He holds a Master of Arts in Economics from University of Akron.
Mr Linus GohGlobal Commercial Banking
Mr Linus Goh was appointed the Head of Global Commercial Banking in April 2012. In this capacity, he has global responsibility for OCBC Bank’s commercial, institutional and transaction banking businesses. He joined OCBC Bank in April 2004 as Executive Vice President and Head of International, and in August 2008, he assumed responsibility for Global Enterprise Banking and Financial Institutions. Mr Goh has over 30 years of banking experience, including 17 years at Citibank, N.A. Singapore, where he held several senior management positions overseeing corporate banking, financial institutions, e-business and transaction banking. Mr Goh serves as a board member
of the investment arm of Enterprise Singapore, Seeds Capital Private Limited. He also sits on the Pro-Enterprise Panel under the Ministry of Trade and Industry and the SME Committee under the Singapore Business Federation where he chairs the sub-committee on SME Financing and Cost Competitiveness. Mr Goh holds a Bachelor of Arts (Philosophy) with Honours from the National University of Singapore and is an IBF Distinguished Fellow.
Ms Elaine LamGlobal Corporate Banking
Ms Elaine Lam was appointed Head of Global Corporate Banking in April 2016. She is responsible for OCBC Bank’s corporate banking business which spans Real Estate, Wholesale Corporate Marketing, Global Commodities Finance as well as the Bank’s corporate banking business in all overseas offices. With more than 20 years of experience in corporate banking, Ms Lam also serves in the Institute of Banking and Finance’s (IBF) Corporate Banking Workgroup and the Financial Industry Competency Standards’ Corporate Banking Working Group. Ms Lam holds a Bachelor of Accountancy (Honours) from the Nanyang Technological University and is an IBF Fellow (Corporate Banking).
Mr Na Wu BengCEO, OCBC Wing Hang Bank
Mr Na Wu Beng was appointed Chief Executive Officer of OCBC Wing Hang Bank in August 2014. Prior to this appointment, he was Deputy President Director of Bank OCBC NISP for 10 years. Mr Na assumed the role of Chairman of OCBC Wing Hang Bank (China) in February 2020. Mr Na joined OCBC Bank in 1990 as the General Manager of OCBC Bank’s Hong Kong branches. He returned to Singapore in 1999 to take on the role of Head of North Asia overseeing the bank’s operations in Hong Kong, China, Taiwan, Korea and Japan. From 2000 to 2004, before his posting to Bank OCBC NISP, he headed OCBC Bank’s international banking division and was responsible for branches across eight countries. Mr Na was appointed Executive Vice President in 2001. Before joining OCBC Bank, he was at International Bank of Singapore for 11 years,
where he was based in Taiwan for seven years. He holds a Bachelor of Arts (Economics) with Honours from Coventry University in the United Kingdom.
Mr Wang KeCEO, OCBC Wing Hang Bank (China) Limited
Mr Wang Ke was appointed Chief Executive Officer of OCBC Wing Hang Bank (China) on 9 December 2019. He joined OCBC Wing Hang Bank (China) Limited [previously the OCBC Bank (China) Limited] as Chief Information Officer and Head of IT Department in 2012, and assumed the expanded role as Head of Operations and Technology afterwards. Prior to his current role, Mr Wang was the Regional General Manager of the Pearl River Delta region and was appointed as the Deputy President of OCBC Wing Hang China in March 2015. Mr Wang is conversant with foreign companies’ business models in China and has intimate knowledge of the local market and regulations. As an indispensable member of bank’s top management, he participated in the strategy formulating, led the implementation of many strategic projects and achieved fruitful results. He has over 20 years of international banking working experience spanning a wide spectrum of fields in China, United States and Singapore. Before joining OCBC Wing Hang Bank (China) Limited, Mr Wang held several senior positions in JPMorgan Chase & Co., McKinsey & Company and United Overseas Bank (China) Limited, where he oversaw the operations, technology and Risk Management and accumulated rich and comprehensive experience in the international financial business management and people engagement. Mr Wang holds a Master of Business Administration degree from Kellogg School of Management at Northwestern University and a bachelor’s degree in Computer Science from Peking University.
Mr Bahren ShaariCEO, Bank of Singapore
Mr Bahren Shaari was appointed Chief Executive Officer of Bank of Singapore in February 2015. Prior to this appointment,
288 OCBC Annual Report 2019 289Additional Information

he was the Senior Managing Director and Global Market Head of South East Asia. He has more than 30 years of banking experience. Bahren has been a non-executive and independent director of Singapore Press Holdings since April 2012. He is a member of the Council of Presidential Advisers. Bahren was conferred the Public Service Star Medal in 2018 and the Public Service Medal in 2008. Bahren is an IBF Distinguished Fellow and holds a Bachelor of Accountancy degree from the National University of Singapore.
Mr Tan Wing MingRegional General Manager for North East Asia
Mr Tan Wing Ming was appointed Regional General Manager of North East Asia and the Chief Executive of OCBC Bank Hong Kong branch since September 2009. In this role, he assumes oversight of the bank’s branches in Hong Kong, Japan, Korea and Taiwan. In November 2016, he was promoted to Executive Vice President. Mr Tan joined OCBC Bank in January 2005 as Senior Vice President and Country Head of OCBC Bank’s operations in China. Following the local incorporation of OCBC Bank in China in July 2007, he was appointed Director and President of OCBC Bank (China) Limited until his current role. Mr Tan had worked for major American and European investment and commercial banks in Singapore for 10 years. He then started and managed his own private business in China for 11 years before joining OCBC Bank. Mr Tan holds a Bachelor of Arts (Economics) with Honours from Georgetown University and a Master of Business Administration (Finance) from the University of Chicago.
Mr Ong Eng BinCEO, OCBC Bank Malaysia
Mr Ong Eng Bin was appointed Chief Executive Officer of OCBC Malaysia in August 2014 and currently oversees the OCBC Group’s Malaysian franchise. Prior to this appointment, he was its Head of Business Banking, a role he assumed in 2012 with responsibilities covering corporate and commercial, emerging business and transaction banking. He
joined the bank as a management trainee in 1988 and was appointed Head of Corporate Banking and Large Corporates in 2000. Mr Ong holds a Bachelor of Accounting and Finance from the University of Manchester.
Ms Parwati SurjaudajaPresident Director and CEO, Bank OCBC NISP
Ms Parwati Surjaudaja was appointed the President Director and CEO of Bank OCBC NISP in December 2008. She joined Bank OCBC NISP as a Director in 1990 and served as a Deputy President Director from 1997. She was appointed President Director and CEO of the bank at end-2008 and was re-elected in 2011, 2014 and 2017 for her current position. She is currently a Board Member of Perbanas and Indonesian Bankers Association. Prior to joining Bank OCBC NISP, Ms Surjaudaja had three years of corporate experience with SGV Utomo – Arthur Andersen. Ms Surjaudaja holds a Master of Business Administration (Accounting) and a Bachelor of Science Cum Laude (Accounting and Finance) from San Francisco State University.
Mr Gan Kok KimGlobal Investment Banking
Mr Gan Kok Kim was appointed Executive Vice President and Head of Global Investment Banking in February 2012. As the Head of Global Investment Banking, he oversees OCBC Bank’s debt capital markets, corporate finance, merger and acquisition and mezzanine investment businesses. Mr Gan joined OCBC Bank in 2004 as the Head of Treasury at OCBC Bank (Malaysia). In February 2011, he was also appointed Head of International Treasury. In August 2011, he was given the additional role of Head of Asset Liability Management in Singapore and gave up his Malaysian role. Mr Gan has more than 29 years of trading, investment banking, and management experience and has held various positions in Citibank N.A. He holds a Bachelor of Science in Economics from the Massachusetts Institute of Technology.
Mr Sunny QuekConsumer Financial Services Singapore
Mr Sunny Quek was appointed Head of Consumer Financial Services Singapore on 13 November 2019. He joined OCBC Bank in December 2012 as Head of Branch and Premier Banking. In the six years, Mr Quek was responsible for formulating and executing the sales and distribution strategy for the consumer banking branch network in Singapore, and supporting the OCBC Premier Banking network in the region. He made significant contributions to the transformation and growth of the retail banking business and led the OCBC Premier Banking business to become a leader in the affluent segment space. In 2018, he spearheaded the transformation of the OCBC Premier Private Client segment to launch an Accredited Investor (AI) platform that offers bespoke wealth solutions to high net worth individuals in Singapore and the region. Mr Quek started his banking career as a trader with Tokai Bank in 1997. He joined Citibank Singapore in 2000 as a Treasury Sales Officer and was appointed Branch Banking Director in 2006. Mr Quek graduated with a Bachelor of Science in Economics from the National University of Singapore.
Mr Tan Chor SenGlobal Enterprise Banking – International
Mr Tan Chor Sen was appointed the Head of Global Enterprise Banking-International in 2012. In addition to overseeing the growth of the emerging business segment in OCBC Bank’s core markets, he is also in charge of developing cross-border capabilities and business within the region, leveraging the OCBC network and partner banks in key markets. Mr Tan joined OCBC Bank in 2005 as Head of Emerging Business. He is a council member of the Singapore-Shandong Business Council and Singapore-Tianjin Economic and Trade Council under Enterprise Singapore. Mr Tan has over 30 years of banking experience where he began his career in commercial banking, with postings in consumer banking. He later held several positions in corporate and offshore banking. Mr Tan holds a Bachelor of Business Administration from the National University of Singapore and is an IBF Fellow (Corporate Banking).
Mr Jason HoGroup Human Resources
Mr Jason Ho joined OCBC Bank in January 2013 as Head of Asset Liability Management. He assumed the role of Head of Group Human Resources in July 2015, following his appointment as Deputy Head, effective January 2015. He has more than 30 years of banking experience and has held senior level positions at KBC Bank, Standard Chartered Bank and Volvo Group Treasury Asia Limited. Mr Ho holds a Bachelor of Business Administration from the National University of Singapore and a Masters in Applied Finance from Macquarie University. He also serves as a Director of the Institute for Human Resource Professionals and is a member of the HR Industry Transformation Advisory Panel.
Mr Lim Khiang TongGroup Operations and Technology
Mr Lim Khiang Tong joined OCBC Bank in September 2000 and took on the role of Head of IT Management in January 2002. He was appointed Executive Vice President and Head of Group Information Technology in December 2007. In May 2010, he assumed the role of Head of Group Operations and Technology. He has more than 30 years of management experience in strategic technology development, information technology and banking operations. This includes driving regional processing operations, strategic technology initiatives and project management. Since August 2016, he has also assumed oversight of the bank’s Quality and Service Excellence and Group Property Management divisions. He holds a Bachelor of Science (Computer Science and Economics) from the National University of Singapore.
Ms Goh Chin YeeGroup Audit
Ms Goh Chin Yee was appointed Head of Group Audit in March 2013 and Executive Vice President in April 2014. She oversees the full spectrum of internal audit activities for OCBC Bank and its subsidiaries. She reports directly to the Audit Committee and administratively to the Group CEO. Prior to this appointment, Ms Goh has worked in diverse functions in the OCBC Group, covering strategic
management, investment research, fund management, finance, risk management and treasury business management. Ms Goh holds a Bachelor of Engineering (Civil) with First Class Honours from the National University of Singapore and is a Chartered Financial Analyst.
Ms Loretta YuenGroup Legal and Regulatory Compliance
Ms Loretta Yuen was appointed General Counsel and Head of Group Legal and Regulatory Compliance in September 2010 and Executive Vice President in June 2015. She oversees the full spectrum of legal and regulatory risks, including anti-money laundering, across OCBC Bank and its subsidiaries, and provides advice on regulatory risks and legal issues involved in decisions to management, so that management can make informed strategic choices within an acceptable legal and regulatory risk profile. Ms Yuen has over 19 years of legal and regulatory experience in banking and finance. She graduated with Second Class Honours in Law from the National University of Singapore and is an IBF Distinguished Fellow.
Mr Peter YeohGroup Secretariat
Mr Peter Yeoh joined OCBC Bank in January 1984. Since joining the Bank, he has held responsibilities in finance, accounting, management information services and strategic projects. He was appointed Company Secretary in August 2002, a role that includes responsibilities for corporate governance and board affairs. He holds a Bachelor of Commerce from the University of Western Australia, and is a Member of the Institute of Chartered Accountants in Australia and Institute of Singapore Chartered Accountants.
Mr Vincent SohGroup Property Management
Mr Vincent Soh was appointed Head, Group Property Management, and Managing Director of OCBC Property Services Pte Ltd, a wholly-owned subsidiary of OCBC Bank, in June 2004. He is responsible for managing the Group’s
real estate portfolio. He has held senior-level positions in the public and private sectors. Mr Soh holds a Master of Science (Property & Maintenance Management) and Master of Public Policy, both from the National University of Singapore. He is also an Associate Member of the Royal Institution of Chartered Surveyors in the United Kingdom.
Mr Melvyn LowGlobal Transaction Banking
Mr Melvyn Low is an industry veteran with more than 26 years of experience and has held senior positions in sales and product management, cash management, trade, and securities services in regional and global banks. Mr Low also served as Director of the Singapore Clearing House Association from 2010 to 2013, where he was a key contributor to the launch of Fast and Secure Transfers, or FAST, platform. In conjunction with the National University of Singapore Business School, he developed the world’s first full-credit course on transaction banking for undergraduates in 2012. As a member of the corporate banking workgroup of the Institute of Banking and Finance (IBF), he launched the IBF certification for transaction banking in 2019. Mr Low is an IBF Distinguished Fellow and holds a Master of Business Administration from the University of British Columbia, Canada.
Ms Koh Ching ChingGroup Brand and Communications
As the Head of Group Brand and Communications, Ms Koh Ching Ching oversees OCBC Bank’s branding and communications initiatives with the media, employees, customers, shareholders and the general public across its core markets. She has been heading the division since November 2004 and was appointed Executive Vice President in March 2012. Prior to her current role, she led OCBC Bank’s franchise expansion efforts in trade finance in Malaysia. Ms Koh had 16 years of corporate and retail banking experience, having held various senior customer and product positions in local and foreign financial institutions. She graduated with First Class Honours in Business Administration from the National University of Singapore.
Further Information on Management Committee
290 OCBC Annual Report 2019 291Additional Information

International Network
Southeast Asia
Singapore
OCBC Bank Limited Head Office 63 Chulia Street#10-00 OCBC Centre EastSingapore 049514Tel: (65) 6363 3333Fax: (65) 6534 3986www.ocbc.com
OCBC Bank has 47 branches in Singapore.
Bank of Singapore Limited Head Office 63 Market Street#22-00Bank of Singapore CentreSingapore 048942Tel: (65) 6559 8000Fax: (65) 6559 8180www.bankofsingapore.com
Great Eastern Holdings Limited The Great Eastern Life Assurance Company Limited Great Eastern General Insurance Limited Head Office 1 Pickering Street#01-01 Great Eastern CentreSingapore 048659Tel: (65) 6248 2000Fax: (65) 6532 2214www.greateasternlife.com
Great Eastern Financial Advisers Private Limited 1 Pickering Street#01-01 Great Eastern CentreSingapore 048659Tel: (65) 6248 2121Fax: (65) 6327 3073www.greateasternfa.com.sg
Lion Global Investors Limited 65 Chulia Street#18-01 OCBC CentreSingapore 049513Tel: (65) 6417 6800Fax: (65) 6417 6801www.lionglobalinvestors.com
OCBC SecuritiesPrivate Limited 18 Church Street#01-00 OCBC Centre SouthSingapore 049479Tel: (65) 6338 8688Fax: (65) 6538 9115www.iocbc.com
BOS Trustee Limited 63 Market Street #14-00Bank of Singapore CentreSingapore 048942Tel: (65) 6818 6478Fax: (65) 6818 6487
OCBC Property Services Private Limited 18 Cross Street#11-01/03Cross Street ExchangeSingapore 048423Tel: (65) 6533 0818www.ocbcproperty.com.sg
Brunei
The Great Eastern Life Assurance Company Limited Units 17/18, Block B Bangunan HabzaSpg 150, Kpg. Kiarong Bandar Seri Begawan BE 1318Negara Brunei DarussalamTel: (673) 223 3118Fax: (673) 223 8118www.greateasternlife.com/bn
Lion Global Investors Limited Brunei Branch Unit 3A, Level 5,Retail ArcadeThe Empire Hotel & Country ClubJerudong BG3122Negara Brunei DarussalamTel: (673) 261 0925/261 0926Fax: (673) 261 1823
Indonesia
PT Bank OCBC NISP Tbk Head Office OCBC NISP TowerJl Prof. Dr. Satrio Kav. 25Jakarta 12940IndonesiaTel: (62) 21 2553 3888Fax: (62) 21 5794 4000www.ocbcnisp.com
PT Bank OCBC NISP Tbk has283 offices in Indonesia.
PT Great Eastern Life Indonesia Head Office Menara Karya 5th FloorJl H.R. Rasuna Said Blok X-5Kav.1-2Jakarta Selatan 12950IndonesiaTel: (62) 21 2554 3888www.greateasternlife.com/id
PT Great Eastern General Insurance IndonesiaMidPlaza 2, 23rd Floor, Jalan Jenderal Sudirman Kav. 10-11Jakarta 10220IndonesiaTel: (62) 21 5723737Fax: (62) 21 5710547www.greateasterngeneral.com/id
PT Great Eastern General Insurance Indonesia has 12 branches and/or servicing offices in Indonesia.
PT OCBC Sekuritas Indonesia Head Office Indonesia Stock ExchangeBuilding Tower 229th FloorSuite 2901Jl Jend. Sudirman Kav. 52-53Jakarta 12190IndonesiaTel: (62) 21 2970 9300Fax: (62) 21 2970 9393www.ocbcsekuritas.com
Malaysia
OCBC Bank (Malaysia) Berhad Head Office Menara OCBC18 Jalan Tun Perak50050 Kuala LumpurMalaysiawww.ocbc.com.my
OCBC Contact Centre: Tel: (603) 8317 5000
(Personal)Tel: (603) 8317 5200
(Corporate)
OCBC Bank (Malaysia) Berhad has 33 branches in Malaysia.
OCBC Al-Amin Bank Berhad Head Office 25th floor Wisma Lee Rubber1 Jalan Melaka50100 Kuala LumpurMalaysia
General Enquiries: Within Malaysia Tel: (603) 8314 9310
(Personal) Tel: 1300 88 0255
(Corporate)
Outside Malaysia Tel: (603) 8314 9310
(Personal) Tel: (603) 8314 9090
(Corporate)
OCBC Al-Amin Bank Berhad has 11 branches in Malaysia.
OCBC Bank Limited Labuan BranchLicensed Labuan Bank(940026C) Level 8 (C)Main Office TowerFinancial Park LabuanJalan Merdeka87000 LabuanFederal TerritoryMalaysiaTel: (60-87) 423 381/82Fax: (60-87) 423 390
BOS Wealth Management Malaysia Berhad1001 Level 10 Uptown 1No. 1 Jalan SS21/58 Damansara Uptown47400 Petaling Jaya,MalaysiaTel: (603) 7712 3000Fax: (603) 7712 3001www.boswealthmanagement.com.my
Great Eastern Life Assurance (Malaysia) Berhad Head Office Menara Great Eastern303 Jalan Ampang50450 Kuala LumpurMalaysiaTel: (603) 4259 8888Fax: (603) 4259 8000www.greateasternlife.com
Great Eastern Life Assurance(Malaysia) Berhad has 21 branch offices in Malaysia.
Great Eastern General Insurance (Malaysia) Berhad Head Office Level 18Menara Great Eastern303 Jalan Ampang50450 Kuala LumpurMalaysiaTel: (603) 4259 8888Fax: (603) 4813 0055www.greateasterngeneral.com
Great Eastern General Insurance (Malaysia) Berhad has 13 branches and six servicing offices in Malaysia.
Great Eastern Takaful Berhad 201001032332 (916257-H) Level 3Menara Great Eastern303 Jalan Ampang50450 Kuala LumpurMalaysiaTel: (603) 4259 8338Fax: (603) 4259 8808www.greateasterntakaful.com
Great Eastern Takaful Berhad has two agency offices.
OCBC Advisers (Malaysia) Sdn Bhd 13th Floor Menara OCBC18 Jalan Tun Perak50050 Kuala LumpurMalaysiaTel: (603) 2034 5696Fax: (603) 2691 6616
Pac Lease Berhad Level 12 & 13, Menara Haw ParJalan Sultan Ismail50250 Kuala Lumpur MalaysiaTel: (603) 2035 1000Fax: (603) 2032 3300
OCBC Properties (Malaysia) Sdn Bhd27th Floor, Wisma Lee Rubber1 Jalan Melaka50100 Kuala LumpurMalaysiaTel: (603) 2054 3844Fax: (603) 2031 7378
Myanmar
OCBC Bank Limited Yangon Branch Suite Nos.#21-01 to 50, Junction City Tower, No. 3/A, Corner of Bogyoke Aung San Road and 27th street,Pabedan Township Yangon, MyanmarTel : (951) 925 3488
The Great Eastern Life Assurance Company Limited Great Eastern General Insurance LimitedMyanmar Representative OfficeLevel 3, Unit No 03-09Union Business CentreNat Mauk RoadBo Cho QuarterBahan Township YangonMyanmarTel/Fax: (951) 860 3384www.greateasternlife.com
Philippines
Bank of Singapore Limited Philippine Representative Office 22/F Tower One andExchange PlazaAyala Triangle Ayala Avenue1226 Makati CityPhilippinesTel: (632) 8479 8988Fax: (632) 8848 5223
Thailand
OCBC Bank LimitedBangkok Branch Unit 2501-2 25th Floor Q House Lumpini 1 South Sathorn Road Tungmahamek Sathorn Bangkok 10120 Thailand Tel: (66) 2 287 9888Fax: (66) 2 287 9898
Vietnam
OCBC Bank LimitedHo Chi Minh BranchUnit 708-709 Level 7Saigon Tower29 Le Duan StreetDistrict 1Ho Chi Minh CityVietnamTel: (84) 8 3823 2627Fax: (84) 8 3823 2611
East Asia
Japan
OCBC Bank LimitedTokyo BranchSanno Park Tower5th Floor 11-1Nagata-cho 2 chomeChiyoda-ku Tokyo 100-6105JapanTel: (81) 3 5510 7660Fax: (81) 3 5510 7661
South Korea
OCBC Bank LimitedSeoul BranchTaepyung-ro 1-ka25th FloorSeoul Finance Center136 Sejong-daeroJung-gu Seoul 04520Republic of KoreaTel: (82) 2 2021 3900Fax: (82) 2 2021 3908
Greater China
China
OCBC Wing Hang Bank (China) LimitedHead OfficeOCBC Bank TowerNo. 1155 Yuanshen RoadPudong New DistrictShanghai 200135People’s Republic of ChinaTel: (86) 21 5820 0200Fax: (86) 21 5830 1925www.ocbc.com.cn
Including its head office, OCBC Wing Hang China has 24 branches and sub-branches in 14 cities namely Beijing, Shanghai, Xiamen, Tianjin, Chengdu, Guangzhou, Shenzhen, Chongqing, Qingdao, Shaoxing, Suzhou, Zhuhai, Foshan,and Huizhou.
The Great Eastern LifeAssurance Company LimitedBeijing Representative Office Room 901China Garments MansionNo.99 Jianguo RdBeijing 100020People’s Republic of ChinaTel: (86) 10 6581 5501Fax: (86) 10 6583 8727
Bank of Ningbo Co., LtdHead OfficeNo. 345, Ning Dong RoadNingbo Zhejiang 315042People’s Republic of ChinaTel: (86) 574 8705 0028Fax: (86) 574 8705 0027www.nbcb.com.cn
Bank of Ningbo is OCBC Bank’s strategic partner in China.
As at end December 2019, it had 374 branches, sub-branches and offices, covering the cities of Ningbo, Shanghai,Hangzhou, Nanjing, Shenzhen, Suzhou, Wenzhou, Beijing, Wuxi, Jinhua, Shaoxing, Taizhou, Jiaxing and Lishui.
Hong Kong SAR
OCBC Bank LimitedHong Kong Branch9/F Nine Queen’s RoadCentralHong Kong SARTel: (852) 2840 6200Fax: (852) 2845 3439
Bank of Singapore LimitedHong Kong Branch34/F One InternationalFinance Centre1 Harbour View StreetCentralHong Kong SARTel: (852) 2846 3980Fax: (852) 2295 3332
OCBC Wing Hang Bank Limited Head Office161 Queen’s Road CentralHong Kong SARTel: (852) 2852 5111Fax: (852) 2541 0036www.ocbcwhhk.com
OCBC Wing Hang BankLimited has a total of36 branches in Hong Kong.
OCBC Wing Hang Credit Limited Head Office14/F Tai Yau Building181 Johnston RoadWanchaiHong Kong SARTel: (852) 2251 0321Fax: (852) 2907 6323www.ocbcwhcr.com
OCBC Wing Hang Credit Limited has a total of15 offices in Hong Kong.
Macau SAR
OCBC Wing Hang Bank Limited Head Office241 Avenida de AlmeidaRibeiroMacauTel: (853) 2833 5678Fax: (853) 2857 6527www.ocbcwhmac.com
OCBC Wing Hang Bank Limited has a total of 11 branchesin Macau.
Taiwan
OCBC Bank LimitedTaipei Branch41 Floor, No.68, Sec.5, Zhongxiao East Road, Xinyi District,Taipei City 11065Taiwan (R.O.C)Tel: (886) 2 8726 8100Fax: (886) 2 2722 8908
North America
United States of America
OCBC Bank LimitedLos Angeles Agency801 South Figueroa StreetSuite 970Los Angeles CA 90017United States of AmericaTel: (1) 213 624 1189Fax: (1) 213 624 1386
OCBC Bank LimitedNew York Agency1700 Broadway 18/F New York NY 10019United States of AmericaTel: (1) 212 586 6222Fax: (1) 212 586 0636
Oceania
Australia
OCBC Bank LimitedSydney BranchLevel 275 Castlereagh StreetSydney NSW 2000AustraliaTel: (61) 2 9235 2022Fax: (61) 2 9221 5703
Europe
United Kingdom
OCBC Bank LimitedLondon BranchThe Rex Building 3rd Floor62 Queen StreetLondon EC4R 1EBUnited KingdomTel: (44) 20 7653 0900Fax: (44) 20 7489 1132
Bank of Singapore is the trading name of Oversea-Chinese Banking Corporation Limited’s private banking business in London.
BOS Wealth Management Europe S.A., UK BranchThe Rex Building 3rd Floor62 Queen StreetLondon EC4R 1EBUnited KingdomTel: (44) (0) 207 029 5850
Luxembourg
LuxembourgBOS Wealth Management Europe S.A.33, rue Ste ZitheL-2763 LuxembourgTel: (352) 28 57 32 2000
Middle East
United Arab Emirates
Bank of Singapore Limited(DIFC Branch)Office 30-34, Level 28,Central Park Tower,Dubai International Financial CentreP.O. Box 4296Dubai U.A.ETel: (971) 4427 7100
292 OCBC Annual Report 2019 293Additional Information

Financial Calendar
Please refer to OCBC website, www.ocbc.com for dates of Annual General Meeting, results announcement and relevant corporate actions.
294 Additional Information
This page is intentionally left blank.

This page is intentionally left blank.
Corporate Profile Corporate Information
OCBC Bank is the longest established Singapore bank, formed in 1932 from the merger of three local banks, the oldest of which was founded in 1912. It is now the second largest financial services group in Southeast Asia by assets and one of the world’s most highly-rated banks, with an Aa1 rating from Moody’s. Recognised for its financial strength and stability, OCBC Bank is consistently ranked among the World’s Top 50 Safest Banks by Global Finance and has been named Best Managed Bank in Singapore by The Asian Banker.
OCBC Bank and its subsidiaries offer a broad array of commercial banking, specialist financial and wealth management services, ranging from consumer, corporate, investment, private and transaction banking to treasury, insurance, asset management and stockbroking services.
OCBC Bank’s key markets are Singapore, Malaysia, Indonesia and Greater China. It has more than 540 branches and representative offices in 19 countries and regions. These include over 280 branches and offices in Indonesia under subsidiary Bank OCBC NISP, and over 80 branches and offices in Mainland China, Hong Kong SAR and Macau SAR under OCBC Wing Hang.
OCBC Bank’s private banking services are provided by its wholly-owned subsidiary Bank of Singapore, which operates on a unique open-architecture product platform to source for the best-in-class products to meet its clients’ goals.
OCBC Bank’s insurance subsidiary, Great Eastern Holdings, is the oldest and most established life insurance group in Singapore and Malaysia. Its asset management subsidiary, Lion Global Investors, is one of the largest private sector asset management companies in Southeast Asia.
For more information, please visit www.ocbc.com.
Board of DirectorsMr Ooi Sang KuangChairman
Mr Chua Kim ChiuMr Koh Beng SengDr Lee Tih ShihMs Christina OngMr Quah Wee GheeMr Pramukti SurjaudajaMr Tan Ngiap JooMs Tan Yen YenMr Samuel N. TsienMr Wee Joo Yeow
Nominating CommitteeMr Wee Joo YeowChairman
Mr Ooi Sang KuangMs Christina OngMr Pramukti SurjaudajaMr Tan Ngiap Joo
Executive CommitteeMr Ooi Sang KuangChairman
Dr Lee Tih ShihMr Quah Wee GheeMr Tan Ngiap JooMr Samuel N. TsienMr Wee Joo Yeow
Audit CommitteeMr Chua Kim ChiuChairman
Mr Ooi Sang KuangMr Tan Ngiap JooMs Tan Yen Yen
Remuneration CommitteeMr Tan Ngiap JooChairman
Mr Ooi Sang KuangMr Koh Beng SengMs Christina OngMs Tan Yen YenMr Wee Joo Yeow
Risk Management CommitteeMr Koh Beng SengChairman
Mr Ooi Sang KuangMr Chua Kim ChiuMr Samuel N. TsienMr Wee Joo Yeow
Ethics and Conduct CommitteeMr Ooi Sang KuangChairman
Dr Lee Tih ShihMs Christina OngMr Pramukti Surjaudaja
SecretariesMr Peter YeohMs Sherri Liew
Registered Office63 Chulia Street#10-00 OCBC Centre EastSingapore 049514Tel: (65) 6363 3333 (Personal Banking)
(65) 6538 1111 (Business Banking)Fax: (65) 6534 3986Website: www.ocbc.com
Share Registration OfficeM & C Services Private Limited112 Robinson Road #05-01Singapore 068902Tel: (65) 6228 0505
AuditorsKPMG LLP16 Raffles Quay #22-00Hong Leong BuildingSingapore 048581Tel: (65) 6213 3388
Partner in charge of the AuditMr Leong Kok Keong(Year of Appointment: 2016)
Investor RelationsEmail: [email protected]

Oversea-C
hinese Banking Corp
oration Limited
A
nnual Report 2019
Oversea-Chinese Banking Corporation Limited(Incorporated in Singapore)
Company Registration Number: 193200032W