Annual Report - Register of AIs & LROs
372
FETP FETP 外匯領航王 外匯領航王 FETP 外匯領航王 2018 Annual Report Stock Code:2845 www.feib.com.tw mops.twse.com.tw Published Date: April 22, 2019
-
Upload
khangminh22 -
Category
Documents
-
view
1 -
download
0
Transcript of Annual Report - Register of AIs & LROs

FETPFETP
外匯領航王
外匯領航王
FETP外匯領航王
2018Annual Report
Stock Code:2845www.feib.com.twmops.twse.com.twPublished Date: April 22, 2019

SpokespersonName: Jiann Jong LinTitle: Chief Executive Vice PresidentTel.:(02) 2378-6868Email: [email protected]
Proxy SpokespersonName: Shin Hwa ChouTitle: Senior Deputy Executive Vice PresidentTel.:(02) 2378-6868Email: [email protected]
Headquarter and branches address and telephoneAdd.: 26, 27F, No. 207, Sec.2, Dunhua S. Rd., Daan Dist., Taipei City, TaiwanTel.: (02) 2378-6868Branches address refer to context
Share Transfer InstitutionName: Oriental Securities CorporationAdd.: 3F, No.86, Chongqing S. Rd., Sec. 1, Zhongzheng Dist., Taipei, TaiwanTel.:(02) 2361-8608Website: http://www.osc.com.tw
Credit Rating InstitutionName: Fitch Australia Pty Ltd., Taiwan BranchAdd.: Suite 1306, 13F, 205, Tun Hwa N. Rd., Taipei, TaiwanTel: (02) 8175-7600
Recent Annual Financial Statement AuditorName: Deloitte & ToucheCPA: Shih-Tsung Wu, Chen-Hsiu YangAdd.: 20F, Taipei Nan Shan Plaza, No. 100, Songren Rd., Xinyi Dist., Taipei, TaiwanTel.: (02) 2725-9988
Name of the exchange of Oversea Debenture and Inquiry for that Oversea DebentureLuxembourg Stock ExchangeWebsite: https://www.bourse.lu/ISIN: US30733T2069, US30733T1079
Our websitehttps://www.feib.com.tw

Far Eastern International Bank
2018 Annual Report 2
CONTENTS I. Chairperson’s Message 5
II. Company Profile 12
1. Date of Establishment............................................................................................... 12 2. Company History ...................................................................................................... 12
III. Corporate Governance Report 15
1. Organization Structure .............................................................................................. 15 2. Information on Directors, Management Team, Department Heads and Branch
Managers ............................................................................................................... 18 3. Implementation of Corporate Governance .................................................................. 41 4. Information on CPA audit fees ................................................................................... 82 5. Replacement of CPAs ................................................................................................ 83 6. Chairman, President, and Managers in Charge of Finance or Accounting who
holds any positions in the Bank’s Independent Auditing Firm or its Affiliates within the recent year .............................................................................................. 84
7. The Changes in Shareholding .................................................................................... 84 8. Relationship among the Top Ten Shareholders ............................................................ 91 9. Shareholding in Affiliated Enterprises ......................................................................... 92
IV. Fund Raising Status 93
1. Capital and Shares ................................................................................................... 93 2. Bonds ..................................................................................................................... 99 3. Issuance of Preferred Stock ....................................................................................... 102 4. Issuance of Global Depository Receipt ........................................................................ 103 5. Issuance of Employee Stock Options .......................................................................... 103 6. Issuance of New Restricted Shares to Employee ......................................................... 103 7. Mergers and Acquisitions ........................................................................................... 104 8. The Execution of Fund Utilization Plan ........................................................................ 104
V. Operation Highlights 105
1. Business Activities .................................................................................................... 105 2. Human Resources .................................................................................................... 116 3. Corporate Social Responsibility .................................................................................. 120 4. Non-Executive Employees, Annual Employee Welfare Costs and the Difference
from the Previous Year ............................................................................................. 121 5. IT Equipment ........................................................................................................... 122 6. Labor Relations ........................................................................................................ 123 7. Important Contracts ................................................................................................. 126 8. Securitization ........................................................................................................... 128

Far Eastern International Bank
2018 Annual Report 3
CONTENTS VI. Financial Information 129
1. Five-Year Financial Summary ..................................................................................... 129 2. Five-Year Financial Analysis ....................................................................................... 135 3. The Audit committee’s Review Report ........................................................................ 140 4. 2018 Non-Consolidated Financial Statement ............................................................... 141 5. 2018 Audited Consolidated Financial Statement .......................................................... 141 6. The Bank should disclose the financial impacts to the Company and its affiliated
companies have incurred any financial or cash flow difficulties in 2017 and as of the date of the publication of the annual report .......................................................... 141
VII. Review of Financial Conditions, Financial Performance, and Risk Management 142
1. Analysis of Financial Status ....................................................................................... 142 2. Analysis of Financial Performance .............................................................................. 143 3. Analysis of Cash Flow ............................................................................................... 143 4. Major Capital Expenditure in Recent Years .................................................................. 144 5. Investment Policy in Last Year, Main Causes of Profits or Losses, and
Improvement and Investment Plans for the Coming Year ............................................ 144 6. Analysis of Risk Management .................................................................................... 145 7. Crisis Management Mechanism .................................................................................. 158 8. Other Important Items ............................................................................................. 158
VIII. Special Disclosure 159
1. Summary of affiliated companies ............................................................................... 159 2. Private Placement Securities and Financial Bonds: ....................................................... 161 3. The Shares in the Company Held or Disposed of by Subsidiaries in the Most
Recent Years ........................................................................................................... 161 4. Other Important Supplementary Information .............................................................. 161 5. Events Occurred in the Previous Year and Up to the Publication of this Annual
Report, which Significantly Affect Shareholders’ Equity or Price of Shares Pursuant to Item 2, paragraph 3 of Article 36 of the Securities and Exchange Act ......................................................................................................................... 161
VIIII. Memorabilia 162
Headquarters and Domestic Branches 163

4Far Eastern International Bank2018 Annual Report
Chairperson Ms. Ching-Ing Hou

Far Eastern International Bank
2018 Annual Report 5
Chairperson’s Message Reflecting on the 2018, the global economy continued recovering in the first half of the
year, pushing up Taiwan's economic growth. In the second half of the year, although the global economy was affected by US-China trade war and the violent fluctuations in the international financial market, Taiwan’s economy GDP remained at 2.63%. Looking forward to 2019, global economic and geopolitical uncertainty is rising, economic growth momentum is slowing, and Taiwan's GDP forecast that will be slow down to 2.27%. Nonetheless, for financial industry, FSC fully supports Fintech development, encourages digital transformation in banking industry, and applies AI to create a new economy.
In 2018, Far Eastern International Bank (FEIB)’s overall profitability was strong. The net profit after tax was NT$3.524 billion, increased 23% from last year. EPS was NT$1.08, which was also 24% higher than last year. The growth rate was the highest in eight years. Total assets exceeded NT$600 billion. The asset quality remained good, as NPL ratio fell to 0.237%, and the NPL coverage ratio increased to 574%, both of which were better than industry.
FEIB continued long-term steady growth strategy in 2018, led the market with niche products and drove innovation with digital technology. In digital banking, the transaction automation was improved, with off-counter rate of 89.5%. As the first social bank, “Bankee” was launched with online banking applications. As to the credit card business, the active card exceeded 1 million and market share of spending amount was also increased. Consumer loan business has experienced double-digit growth for three years. The strategic car loan has consolidated its market leadership position. The wealth management business was awarded the "Best Wealth Manager of Taiwan Award – Rising Star" by Asset magazine. The number of wealth management customers and investment assets are actively growing. Corporate finance has expanded overseas markets which accounted for 40% of corporate banking’s profits. The financial market increased the investment position, and the foreign exchange trading turned loss into gain.
FEIB combined social resources to engage public welfare activities and practice corporate social responsibility. Eden Social Welfare Foundation was sponsored through the public welfare platform, and FEIB donated money to assist post-disaster reconstruction. The corporate social responsibility report was published and won the Silver Award in Taiwan Sustainable Report and the Outstanding Perpetual Award of the British Standards Institution. The 2019 calendar introduced Taiwanese writers and artists' former residences to promote humanistic spirit and historical heritage of Taiwan. FEIB is selected as one of the constituent companies of "Taiwan RAFI EMP 99 Index" and the "Taiwan HC 100 Index” for several years. FEIB is the only bank who was rewarded training subsidy by Ministry of Labor for 16 consecutive years in recognition of focusing on employee welfare, talent cultivation and the human capital accumulation.
Looking into 2019, FEIB will launch AI transformation, integrate virtual and reality channels, and create new profit-making opportunity. The key operational strategies include digital financial sub-brands, AI banking, and hosting FE Group's payment services. The number of FE Group cards and the market share of spending amount will be increased. New overseas offices in Singapore and Vietnam are established for building a multinational financial network. New financial product will be created for increasing diversified investment profit. Re-organization project will be executed to enhance productivity. Through long-term steady growth strategy, FEIB will demonstrate leading-market innovation capacity, deepen profitability of niche products, and take corporate social responsibility into account to create win-win for its shareholders, customers, employees and the society.

6Far Eastern International Bank2018 Annual Report
Vice Chairman Mr. Douglas Tong Hsu

Far Eastern International Bank
2018 Annual Report 7
Operating Results for 2018 and Business Outlook for 2019 are Summarized as Follows:
Operating Results for 2018
1. Business Plan and Operating Results Changes in Operations Overview
(NT$MM) Year
Item 2018 2017 Change Rate
Deposits and Remittance 508,648 472,621 7.6%
Corporate Loans 164,174 146,282 12.2%
Consumer Loans 220,749 209,659 5.3%
Total Loans 384,923 355,941 8.1%
Revolving Credit Cards Balance 10,406 10,575 -1.06%
Securities Investment 168,875 148,652 13.06%
Equity-Method Long Term Investment 2,795 2,759 1.3%
Total Trust Assets 67,979 59,980 13.3%
2. Business Overview
(1) Budget Achievement
In 2017, FEIB’s total assets stood at NT$626.2 billion, achieving 101% of target; total deposits and loans amounted to NT$508.6 billion and NT$384.9 billion, which achieved 100% and 102% of target, respectively.
(2) Analysis of Profitability
FEIB’s revenue in 2018 grew 7% (YoY) to NT$10.9 billion where net interest income was NT$5. 653 billion, raised 5% (YoY), and revenue excluding NII was NT$5.286 billion, grew 10% (YoY).
Net income was NT$3.524 billion, increased 23% (YoY), and EPS was NT$1.08, grew 24% (YoY).
3. Ratings
FEIB’s investment grade rating result was released in June 05, 2018, which was assessed by Fitch Ratings Limited as follows:
National Long-term Rating: A (twn), National Short-term Rating: F1 (twn), Foreign Currency Long-term Rating: BBB-, and Foreign Currency Short-term Rating: F3, Outlook: stable; FEIB is considered a stable financial institution of investment grade.

8Far Eastern International Bank2018 Annual Report
President Mr.Thomas Chou
Far Eastern International Bank
2018 Annual Report 9
4. Research and Development
Facing development of internet-only bank, FEIB continues innovating and developing digital products and platforms. The bank launched the first social-bank in Taiwan called “Bankee” which adopted the teenager’s favored commercial business model, and explored the opportunities of sharing economic. FEIB credit card is now available in Taiwan Pay, Line Pay, JKOPAY and other digital wallets to enhance the digitalization of credit card. Also, the bank upgraded i-Win Wealth Management System, launched i-Smart branch teller system and i-Robo smart investment system to provide intelligent wealth management services and improve financial management services.
5. Structural Changes
(1)To improve the information security level, the "Information Security Department" is set up for formulating the Bank's security strategy and the related planning, promoting, managing and checking information security.
(2)Three department of the Financial Strategy Centre were renamed as "Financial Control Department", "Administrative Management Department" and "Strategic Planning Department".
(3)The department functions under Digital Banking BU were readjusted and renamed to include “Financial Technology Unit”, “Digital Service Development Unit”, “Digital Marketing Unit”, “Business Intelligence Unit” and “General Administration Unit”.
6. Impact of External Competitions, Legal and Overall Operating Environment
In the external competitive environment, FInTech has developed rapidly, and FSC has promoted financial innovation policies. It increased the investment of FinTech in the financial industry, and actively promoted digital transformation. Furthermore, financial industry is facing competition of non-financial industry entering financial markets with innovated application. In response to the implementation of “General Data Protection Regulation (GDPR)” of the European Union, the Bank has appointed external consultants to verify the revision of the BS10012 personal information management system and introduce GDPR to enhance the protection of customer personal data. For overall business environment, the global economy was affected by the US-China trade war, global financial market turmoil and slowing economic growth in 2018. The banking industry is hard to grow and business risks are increasing. Facing the uncertainty of market environment and competitive challenges of financial technology industry, FEIB will engage reorganization, continue innovation and development, be abided by the regulations and strengthen the internal control management to maintain long-term steady growth of profitability.

Far Eastern International Bank
2018 Annual Report 10
Operating Plans for 2019
1. Operating Goals
Major Operating Goals for 2019 are summarized as follows:
(1) Total asset: NT$660.5 billion
(2) Total deposit: NT$533.9 billion
(3) Total loan: NT$402.3 billion
2. Policies and Major Strategies
(1) Individual Banking Business:
Upgrade niche products, cultivate professional financial management teams and expand the scale of wealth management AUM; Integrate FE Groups’ VIP offers, deepen the loyalty of the Group, and share the Group’s selling channels and customer resources; Focus on family financial services, combine product introduction with tax seminars and marketing activities to deeply cultivate the second generation of customers; Cooperate with Yuan Ze University to hold an “Elderly Finance School” program for retired customers; Develop mobile and AI wealth management system, build digital interaction zone in branch, and optimize digital financial experience.
(2) Consumer Banking and Credit Cards Business:
A. Consumer Banking Business
Adopt digital financial technologies, enhance risk management capability, include high risk groups for increase of spread income; Continuously optimize the operation process, maintain competitive advantage and market leading position, and stabilize asset scale and profitability; Strengthen digital media cooperation, increase sales promotion via E&M channels, integrate virtual and real channels, and enhance business performance and brand image.
B. Credit Card Business
Connect to the FE Group's retail channel resources and upgrade the FEIB Happy Credit Card to expand issuance scale and payment amount; Leverage Happy Go's bonus point to increase spending in FE Group; Use Big Data's target marketing to motivate new and existing customers for card usage, effectively increasing the active cards; Ally with FE companies, domestic and foreign strategic partners to jointly create multiple applications of payment and expand the scale of digital payment; Strengthen online application functions, actively operate digital media, and expand access of digital channels.
(3) Corporate Banking Business
Leverage three major niche products (CF/GTS/TMU) to push business in three markets (Taiwan/China+Hong Kong/Asia Pacific), continue developing new businesses, and build long-term business operation blue-prints; Develop trade finance business, optimize

Far Eastern International Bank
2018 Annual Report 11
deposit structure, and maintain stable net interest spreads; Implement proactive risk management and strictly control the quality of credit assets; Expand the second-generation corporate internet banking and B2B2C service model, digitalize cash management services, and deepen the loyalty and contribution from corporate customers; Lead syndicated loans, provide structured and customized financing products, and create high value-added income; Complete set up of the representative office in Singapore and Ho Chi Minh City, actively expand in ASEAN market, and continue expanding overseas assets and profit contribution.
(4) Financial Markets Business:
Consolidate the leading position in foreign exchange margin trading, differentiate target customer relations, and develop new customers by using multi-digital channels; Augment financial engineering ability for self-pricing derivatives and develop strategic trading; Develop structured notes to meet customer’s needs; Continue expanding TMU customers and professional investors; Expand investment and trading portfolio, diversify investment targets and markets to stabilize earning contribution.
(5) Digital Banking Business:
Integrate digital, automation, and physical service channels to develop "AI banking"; Use OPEN API technology to develop APPs, and construct a "Retail Payment Settlement Center" based on the "FE Mobile Payment Integrated Service"; Analyze big data information, develop smart scoring model, set up AI RM services and VTM cloud branch to extend physical services; Provide acute digital financial services to complement physical service gaps and increase number of customers.
(6) Insurance Agency Business:
Cooperate with Individual Banking, Consumer Banking, and Corporate Banking BUs and subsidiaries, select prudent insurance companies as partners, and introduces bank insurance products meeting the needs of internal and external customers for full coverage of insurance products; Adopt the development of Fintech, promote mobile device insurance with Far EasTone Telecom to catch the opportunities of online insurance.
Chairman

Far Eastern International Bank
2018 Annual Report 12
II. Company Profile
1. Date of Establishment:
January 11, 1992.
2. Company History
The Far Eastern International Bank (FEIB) was established by entrepreneur Mr. Y. Z. Hsu, founder of various renowned enterprises including Far Eastern New Century Corp., Far Eastern Department Stores, Asia Cement Corp., etc. with significant contributions to Taiwan’s economic developments.
In 1989, Far Eastern Group founder Y. Z. Hsu established a bank organizing committee with a view to establish a private bank in responding to the government’s amendment of the Bank Law and policy to liberalize private banks, which aimed to modernize and globalize Taiwan’s financial sector. With founding mottos and service guidelines of “Sincerity, Diligence, Thrift and Prudence”, the Convokers’ Meeting was held on May 14, 1990 and then application was submitted to the Ministry of Finance in October for approval to establish a new bank with capital of NT$10 billion.
On August 1, 1991, the Ministry of Finance approved the establishment of FEIB. After conducting public offer shares, the Establishment Meeting was held on December 9, which passé the article of incorporation and elected nine Directors and three Supervisors for the Board. On January 11, 1992, the Ministry of Economic Affairs approved FEIB’s registration and issued a company license; thereafter on April 9 the Ministry of Finance issued an operating license. Soon on April 11, 1992, the Business Department, Saving Department and Taipei Yisen Branch of FEIB began operations. In the early start, FEIB was authorized to operate general banking and saving businesses, then the trust and international banking departments were inaugurated to offer trust, investment, asset management, finance consulting and foreign exchange services. With continuous expansions of operations, the Bank is able to provide clients with new and diversified financial services. At the same time, new branches from north to south of Taiwan were set up at the selected areas with growth potential to build up an island-wide network of service channels.
In November 1995, FEIB went public by listed on the Over the Counter (OTC) market of the Republic of China. In November 1998, the Bank was listed on the Taiwan Stock Exchange. FEIB’s investment grade ratings were assessed by world renowned ratings companies and the Bank has been considered a stable financial institution of investment grade. To cope with its enlarging foreign exchange asset and the need for diversified and international portfolio, FEIB was approved by the Ministry of Finance to issue in July 2003 US$110 million worth of Unsecured Convertible Bonds overseas.
Responding to the growing businesses and dynamic market, FEIB underwent several restructurings. In 1999, it was the first bank in Taiwan to set up three major independent Business Groups – Administration, Consumer Banking, and Corporate Banking. Till 2006,

Far Eastern International Bank
2018 Annual Report 13
FEIB integrated its business units into four Banking Groups – Corporate Banking, Financial Markets, Individual Banking, and Consumer Banking & Credit Cards, and added three management units – Administration & Support Group, Risk Management and IT Management. Then E-banking Business Units were formed under Corporate Banking and Individual Banking Groups specifically responsible for offering borderless, real-time, and 24/7 online banking services. Operating separately and independently, the Bank’s respective business groups continue to bring forth innovative products and services, enhance their expertise, and elevate their efficiency, enabling many businesses to rank first in their respective categories.
While seeking business growth and offering professional services, in order to enhance operating efficiency FEIB established in 2008 “Operations & Technology (O&T) Service Center” as the high-efficiency support to the Bank’s front desk financial services, which not only saved costs with centralized operations, but also streamlined processing by setting up various efficiency indicators.
Recently, FEIB has engaged in various financial services cooperating with world-class financial institutions. In 2008 FEIB formed alliance with Deutsche Bank AG to establish Deutsche Far Eastern Asset Management Company Limited, in 2009 acquired AIG’s credit cards and accounts receivable business, and in 2011 acquired 100% in ING Securities Company Limited from ING Insurance International B.V. which was renamed in the same year as Far Eastern International Securities Company Ltd. after completion of the transaction.
To expand both physical and virtual branches, FEIB launched FE Direct internet-banking service in early 2010, completed the acquisition of Chin-Fon Bank with 19 domestic operating units in April, established in May 2010 the “Small and Medium-sized Enterprise Banking Unit” under Individual Banking Group to implement Big Branch Plan as well as cultivate wealth management and small & medium-sized enterprise financing business in this segment. The Bank launched fully integrated mobile apps in both Android and IOS versions in 2011 to establish digital and mobile banking platform so as to optimize channel efficiency and offer dedicated services. In 2013, the Bank led in launching “FETP FX Margin Trading Online Platform” to satisfy the diversified demands of its customers, opened Taipei 101 Branch, the affiliated Far Eastern International Securities Company offers global investments and private banking services to high net-worth customers. In addition, FEIB was granted approval to operate cross-border third-party payment in 2014, led in launching FX margin trading and convertible bond option online trading platforms, the varieties of currencies for FX Margin Trading were also increased to enlarge business scale. Yuan Hsin Digital Payment Co., Ltd. was established to seize the booming digital payment and mobile-payment businesses. The newly opened Hsinchu Big City Branch and Banqiao Chungben Branch are boutique branches within shopping malls that offer wealth management services to customers as well as shopping lifestyle destination.
In 2015, in response to the recent trend of mobile communication, social media, Big Data, and cloud computing, FEIB strived to develop various digital financial platforms, and led in issuing the first iCloud credit card in the market, launched online application platform for credit cards and personal loans. To seize the trend of FinTech banking, in 2016 the Bank integrated its digitalized technology and launched varieties of digital financial services
Far Eastern International Bank
2018 Annual Report 14
including O2O cloud financing, Inter-bank ATM deposit and cash withdraw without ATM cards, and mobile shopping platform of foreign exchange margin trading. The Bank was granted to operate domestic and cross-border third-party payments to enhance product diversity and convenience, it also built up the Enterprise Content Management (E3CM) system, apply Score Cards, Business Intelligence (BI), and Test & Learn solutions to manage loan risk via data analytic tools. Furthermore, to comply with the world’s ever increasing attention on anti-money laundering and combating terrorism financing, FEIB introduced the anti-money laundering and countering terrorism financing guidelines to systematically prevent them.
In 2017, to integrate resources, streamline business management and elevate operation synergy, Far Eastern Life Insurance Agency Co., Ltd. and Far Eastern Property Insurance Agency Co., Ltd. were merged into FEIB to establish the Insurance Agency Group. To expedite the promotion of digital transformation, FEIB joined forces with the Far Eastern Group to launch “FE Mobile Payment Integrated Service,” develop integrated mPOS, seize mobile payment business opportunities, also adopt innovative FinTech, revise mobile banking APP, launch brand new website, offer innovative services such as mobile online application of credit cards, cross-bank cardless cash withdrawal, and enterprise e-customer service remote support system. In addition, the Bank leads in acquiring information security patent of online application “Dual Track” identity check and “Hidden Code Token Encryption Service” ; established the new generation high-end smart Dun-nan Branch focusing on cashless digital banking services and wealth management with smart technology to satisfy the wealth management needs of high net worth customers.
In 2018, to improve the information security level, the "Information Security department" is set up for formulating the Bank's security strategy and the related planning, promoting, managing and checking. FEIB continue innovating and developing digital product and platforms, launched the first social-bank in Taiwan called “Bankee” which adopted the teenager’s favor commercial business model, to explore the opportunities of sharing economic. FEIB credit card is now able to binding with Taiwan Pay, Line Pay, JKOPAY and other digital wallets to enhance the digitalization of credit card. Also, the bank upgraded i-Win Wealth Management System, launched i-Smart branch teller system and i-Robo smart investment system to provide customer intelligent wealth management services and improve financial management services.
After continuous growth and developments, operating with 56 domestic branches (Business Department included) and the Hong Kong Branch, FEIB is committed to enhance the efficiency of its capital flow and financial transactions and thus contributing to the nation’s economy and financial market.

Far Eastern International Bank
2018 Annual Report 15
III. Corporate Governance Report
1. Organization Structure
(1) FEIB’s Organization Chart
Shareholders’ Meeting
Chief Auditor President
Audit Committee
Auditing D
ept.
Individual B
anking Grou
p
Operatio
ns & Techn
ology G
roup
Risk M
anagem
ent Dept.
Remuneration
Committee
Chairperson
Board of Directors
Board of Managing Directors
Assets and Lia
bilities
Mana
geme
nt Com
mittee
Credit C
omm
ittee
Person
nel Review
Com
mitte
e
Investment C
omm
ittee
Trust A
ssets Com
mittee
IT S
teering Co
mm
ittee
Risk M
anagem
ent Com
mittee
Chief Executive Vice President
Insurance Age
ncy Group
Hum
an R
esources D
ept.
Legal C
omplia
nce De
pt.
Financial S
trategy Ce
nter
Consum
er Ban
king & C
redit C
ards Group
Financial M
ma
rkets Group
Corp
orate Ba
nking G
roup
Digita
l Bankin
g G
roup

Far Eastern International Bank
2018 Annual Report 16
(2) Major Business Function of Each Department
A. Individual Banking Group
Handle branch operations and wealth management business, including the planning, sales, and performance management of deposit, investment, trust, insurance, small and medium-sized enterprise financing products; as well as the management and operation of branch channels.
B. Consumer Banking and Credit Cards Group
Handle consumer banking products such as mortgage, credit loan, car loan, installment and credit cards business, including their planning, marketing, sales, management, and customer service.
C. Financial Markets Group
Handle operating capital movement, FX and derivative transaction, bond investment and transaction, planning and execution of the whole Bank’s asset and liability management, financial advisory service, the stipulating, execution, and performance review and management of mid and long-term investment strategy, review of mid and long-term project investment as well as other relevant advisory and consultation.
D. Corporate Banking Group
Draw corporate banking operation guideline, strategy, select target market and handle the marketing, promotion, and performance review of corporate banking products, optimize operating process, upgrade and establish relevant systems to satisfy corporate banking accounts’ financial needs, and also manage overseas branch’s corporate banking business.
E. Digital Banking Group
Engage in practical Fintech development strategy, promote FEIB’s various innovative banking services, and strive to provide to customers the most safe, smart, and warm digital banking experience.
F. Insurance Agency Business Group
Select bank insurance related insurance companies to join forces with FEIB, introduce adequate bank insurance products, and offer staff training courses on insurance products and sales, thus provide quality bank insurance wealth management services to cope with the needed risk control, asset allocation, tax planning, and wealth inheritance of different customer groups through life/property insurances. Also assist each banking group to jointly promote bank insurance business, and help each business group to proceed with the required training courses, and sales activities, and provide follow-up related services after insurance sales.
G. Operations & Technology Group
Formulate operational policies and regulations, control and improve operational procedures, and process operation for each department. Plan, develop, and promote information operation strategies and system, and provide related consulting services. Formulate and implement information security strategy for whole bank, set stardard of

Far Eastern International Bank
2018 Annual Report 17
information security technology, and responsible for planning, promotion, management and verification of information security matters.
H. Financial Strategy Center
Responsible for FEIB's financial planning, performance analysis, accounting and taxation. Manage corporate governance, land & equipment management and corporate social responsibility promotion. Handle FEIB's medium to long-term strategy planning, strategic long-term investment analysis and evaluation, and coordination and communication with government.
I. Risk Management Department
Formulate and establish risk management policies, principles, systems, relevant regulation, risk assessments and countermeasures.
J. Human Resources Department
Handle personnel appointments, attendance, compensation, benefits, performance, rewards and punishments, promotion, rotation, resignation, employee relations, education and training, and career development.
K. Legal Compliance Department
Handle compliance planning, management and execution, legal advice, legal document review, litigation, anti-money laundering and anti-terrorism related operations, outsourcing operations management, major non-performing-loan assistance, and other legal compliance and legal related issues.
L. Auditing Department
Plan and implement auditing system of FEIB, supervise and review the self-evaluation of each unit, supervise bidding and examine of construction and procurement, tracking and checking the improvement listed in internal control system implement statement and regularly submit audit report to the board.

Far Eastern International Bank
2018 Annual Report 18
2. Information on Directors, Management Team, Department Heads and Branch Managers
(1) Directors
A. Directors’ Shareholding and Major Educational (professional) Background April 22, 2019
Title Nationality/
Place of Incorporation
Name Gender
Date elected Tem
(years)
Shareholding when elected
Current shareholding
Spouse & Minor Shareholding
Shareholding by NomineeArrangement Experience(Education) Other Position
Executives, Directors or Supervisors Who are
Spouses or within Two Degrees of Kinship
Date firstelected Share % Share % Share % Share % Title Name Relationship
Chairperson R.O.C.
Yue Ding Industry Co., Ltd. Representative: Ms. Ching-Ing Hou
Female
107.6.20
3 9,700,697
*16,324
0.3048
*0.0005
9,963,585
*16,766
0.3048
*0.0005
0
*0
0
*0
0
*0
0
*0
Master’s degree in Economics, Vanderbilt University, U.S.A.
BA & Master’s degree in Economics, National Taiwan University
Former Professor, Dept. of Money and Banking, National Chengchi University
Former Chairperson, Taiwan Academy of Banking and Finance
Supervisor, Far Eastern New Century Corp.
Director,Southern Taiwan University of Science and Technology
None None None
84.5.19
Vice Chairman R.O.C. Douglas Tong
Hsu Male
107.6.20
3 6,051,816 0.1901 6,215,820 0.1901 0 0 0 0
Honorary Doctorate of Management from National Chiao Tung University in Taiwan
MA & BA, University of Notre Dame, U. S. A.
Post-graduate studies in Economics at Columbia University, U. S. A.
Chairman, Far Eastern New Century Corp.
Chairman, Far Eastern New Century Corp.
Chairman, Asia Cement Corp.
Chairman, Far Eastern Department Stores Ltd.
Chairman, Far EasTone Telecommunications Co., Ltd.
Chairman, U-Ming Marine Transport Corp.
Chairman, Orient Union Chemical Corp.
Director, Everest Textile Ltd.
None None None
80.12.09
Executive Director R.O.C.
Far Eastern New Century Corp. Representative: Shaw Y. Wang
Male
107.6.20
3 83,245,165
*1,605,585
2.6154
*0.0504
85,501,108
*1,649,096
2.6154
*0.0504
0
*0
0
*0
0
*0
0
*0
BA, Dept. of Business Administration, National Chung Hsing University
EMBA Courses, National Taiwan University
Director & First Senior Executive Vice President, Far Eastern New Century Corp.
Foundation Executive Director of Far Eastern Group
Director, Far Eastern New Century Corp.
Director, Far Eastern Asset Management Corp.
Director, Yuan Ze University
None None None
80.12.09

Far Eastern International Bank
2018 Annual Report 19
Title Nationality/
Place of Incorporation
Name Gender
Date elected Tem
(years)
Shareholding when elected
Current shareholding
Spouse & Minor Shareholding
Shareholding by NomineeArrangement Experience(Education) Other Position
Executives, Directors or Supervisors Who are
Spouses or within Two Degrees of Kinship
Date firstelected Share % Share % Share % Share % Title Name Relationship
Executive Director R.O.C.
Asia Cement Corp. Representative: Tsung-Ming Chung
Male
107.6.20
3 74,814,783
*0
2.3505
*0
76,842,263
*0
2.3505
*0
0
*0
0
*0
0
*0
0
*0
MBA, National Chengchi University
CPA, Deloitte & Touche
Chairman, DynaPack Corp.
Independent Director, Chroma Ate Inc.
Director, Unity Opto Technology Co., Ltd.
None None None
92.5.29
Director R.O.C.
Far Eastern New Century Corp. Representative::Humphrey Cheng
Male
107.6.20
3 83,245165
*0
2.6154
*0
85,501,108
*0
2.6154
*0
0
*0
0
*0
0
*0
0
*0
EMBA, Graduate Institute of International Business, National Taiwan University
BA, Dept. of Law, National Chung Hsing University
Former Executive Vice President, Far Eastern New Century Corp.
President, Far Eastern New Century Corp.
Chairman, Deutsche Far Eastern Asset Management Company Limited
Director, Oriental Union Chemical Corporation
Director, Ding Ding Integrated Marketing Service Co.
Supervisor, Far Eastern Asset Management Corp.
None None None
95.6.27
Director R.O.C.
Far Eastern New Century Corp. Representative:James Wu
Male
107.6.20
3 83,245,165
*0
2.6154
*0
85,501,108
*0
2.6154
*0
0
*86,430
0
*0.0026
0
*0
0
*0
MBA, University of Missouri, U.S.A.
Bachelor of Laws, National Taiwan University
Former Taiwan Country Chief Officer of Deutsche Bank
Former Vice Chairman of Corporate and Investment Banking in Taiwan, Citigroup
Former President, Taipei Fubon Bank
Chief Country Officer, Fidelity Investments in Taiwan
Former Taiwan Country Chief Officer, Bankers Trust New York Corporation
Former Tokyo Branch Chief Officer, Bankers Trust New York Corporation
Former Vice President, Bankers Trust New York Corporation
Former President, Bankers Trust Securities
Former Assistant Vice President, Chase Bank Hong Kong and Taipei Area
Independent Director, Primax Electronics Ltd.
None None None
106.6.15

Far Eastern International Bank
2018 Annual Report 20
Title Nationality/
Place of Incorporation
Name Gender
Date elected Tem
(years)
Shareholding when elected
Current shareholding
Spouse & Minor Shareholding
Shareholding by NomineeArrangement Experience(Education) Other Position
Executives, Directors or Supervisors Who are
Spouses or within Two Degrees of Kinship
Date firstelected Share % Share % Share % Share % Title Name Relationship
Director R.O.C.
Asia Cement Corp. Representative: Shi-Chun Hsu
Male
107.6.20
3 74,814,783
*0
2.3505
*0
76,842,263
*0
2.3505
*0
0
*0
0
*0
0
*0
0
*0
Ph.D., University of Michigan, U.S.A.
Founding Dean, College of Management, National Taiwan University
Former Chairman, Bank of Kaohsiung
Former Chair Professor of Management, Yuan Ze University
Independent Director, Eslite Corporation
Director, Far Eastern Toll Collection Co., Ltd.
Director, FETC International Co., LTD.,
Mr. Kao Jen-Yen Chair Professor, Feng Chia University
None None None
89.5.21
Director R.O.C.
U-Ming Marine Transport Corp. Representative: Min-Teh Yu
Male
107.6.20
3 74,760,942
*0
2.3488
*0
76,786,963
*0
2.3488
*0
0
*0
0
*0
0
*0
0
*0
Ph.D., Ohio State University, U.S.A.
Former Dept. Chairman of Financial Management, National Central University
Former Dean, National Chiao Tung University College of Management
Former President, Providence University
Former Professor, Dept. of Finance, National Taiwan University
Former Commissioner, Resolution Trust Corporation (RTC), Executive Yuan
Former Commissioner, National Development Fund, Executive Yuan
Former Advisor, Asian Development Bank
President, China University of Technology
Independent Director, JMicron Technology Corporation
Independent Director, Gourmet Master Co., Ltd.
None None None
89.5.21
Independent Director,
Managing Director
R.O.C. Hsiao Hui Wang Female 107.6.20 3 0 0 0 0 0 0 0 0
BA, National Chengchi University, Taiwan
CPA,Deloitte Touche Supervisor, CTCI
Advanced systems Inc.
Independent Director, Les enphants Co. Ltd.
Director,TN Soong Foundation
Member Of Executive Committee,Taiwan Corporate Governance Association
None None None
Independent Director R.O.C. Bing Shen Male
107.6.20
3 0 0 0 0 0 0 0 0
MBA, Harvard Business School, U.S.A.
Former Vice President, Morgan Stanley
Former Executive Director, Morgan Stanley
Former Executive Vice President, China Development Industrial Bank
Former President of CDIB & Partners Investment Holding
Independent Director, Far Eastern New Century Corp.
Independent Director, Elite Material Co., Ltd.
Director and Convener of Corporate Governance, CTCI Corporation
None None None
99.1.19

Far Eastern International Bank
2018 Annual Report 21
Title Nationality/
Place of Incorporation
Name Gender
Date elected Tem
(years)
Shareholding when elected
Current shareholding
Spouse & Minor Shareholding
Shareholding by NomineeArrangement Experience(Education) Other Position
Executives, Directors or Supervisors Who are
Spouses or within Two Degrees of Kinship
Date firstelected Share % Share % Share % Share % Title Name Relationship
Independent Director R.O.C. Susan S. Chang Female
107.6.20
3 0 0 0 0 0 0 0 0
MA, Dept. of Economics, National Taiwan University
BA, Dept. of Economics, National Taiwan University
Former Chairperson, Bank of Taiwan
Former Chairperson, Taiwan Financial Holdings
Former Vice Chairperson, Financial Supervisory Commission
Former Administrative Deputy Minister, Ministry of Finance
Former Director-General, National Treasury Administration, Ministry of Finance
Former Vice Commissioner, Bureau of Monetary Affairs
Former Deputy Chief, Dept. of Monetary Affairs
Former Deputy Director, Economic Research Dept., Council for Economic Planning And Development, Executive Yuan
Director, Jinniujin Business Co., Ltd.
Chairman, UBI Pharma Co., Ltd.
Director, Bio Ware Technology Co., Ltd.
Director, Grace Technology Co., Ltd.
Supervisor, Entie Tech-engineering Co., Ltd.
None None None
104.6.16
*Number of shares owned by the individual representative.

Far Eastern International Bank
2018 Annual Report 22
Table 1: Major Shareholders of Institutional Shareholders April 22, 2019
Name of institutional shareholders Major shareholders (%)
Yue Ding Industry Co., Ltd.
Fu Da Transportation Co., Ltd. (26.95)、Yue-Tung Investment Corp. (25.36)、An Ho Garment Co.,Ltd. (15.66)、Ding Yuan International Investment Corp. (13.20)、Ton Fu Investment Corp. (4.61)、Ta Chu Chemical Fiber Co., Ltd. (3.89)、Ya Li Precast Prestressed Concrete Industries Corp.(3.89)、Yuan Ding Co., Ltd. (2.59)、Bai Ding Investment Co., Ltd. (2.31)、Yu Ming Trading Corp. (1.53)
Far Eastern New Century Corp.
Asia Cement Corp. (23.77)、Oriental Institute of Technology (4.81)、Far Eastern Medical Foundation (3.61)、Far Eastern Memorial Foundation (3.42)、Yuan-Ze University (2.74)、Nan Shan Life Insurance Co. , Ltd. (2.60)、Cathay Life Insurance Co., Ltd. (1.98)、Douglas Tong Hsu (1.71)、China Life Insurance Co., Ltd. (1.58)、Der Ching Investment Corp.(1.55)
Asia Cement Corp.
Far Eastern New Century Corp. (22.33)、Far Eastern Medical Foundation (5.40)、Shin Kong Life Insurance Co., Ltd. (2.12)、New Labor Pension Fund (1.77)、Labor Pension Fund Committee of Far Eastern New Century Corporation (1.51)、Far Eastern Department Stores Co., Ltd. (1.49)、China Life Insurance Co., Ltd. (1.43)、Yuan-Ze University (1.41)、Far Eastern Memorial Foundation (1.31)、Yu Yuan Investment Co., Ltd (1.29)
U-Ming Marine Transport Corp.
Asia Cement Corp. (39.25)、Cathay Life Insurance Co., Ltd. (3.95)、Fubon Life Insurance Co., Ltd. (2.26)、Management Board of the Public Service Pension Fund (1.97)、ransGlobe Life Insurance Co., Ltd. (1.21)、Ding Shen Investment Co., Ltd. (1.06)、Yuan Ding Investment Co., Ltd. (1.05) 、 Yu Yuan Investment Co., Ltd. (0.94) 、 Asia Investment Corp.(0.92)、Vanguard Emerging Markets Stock Index Fund account in custody of J.P. Morgan Chase Bank (0.92)
Table 2: Major Shareholders of the Bank’s Major Institutional Shareholders
April 22, 2019 Name of
Institutional shareholders Major shareholders (%)
Fu Da Transportation Co., Ltd. Fu Ming Transportation Co., Ltd.(99.87)、Asia Investment Corp.(0.03)
Yue-Tung Investment Corp. U-Ming Marine Transport Corp.(73.54) 、 U-Ming Marine Transport (Singapore) Private Ltd.(26.46)
An Ho Garment Co.,Ltd. Far Eastern New Century Corp.(100.00)Ding Yuan International
Investment Corp. Far Eastern New Century Corp.(100.00)
Ton Fu Investment Corp. Oriental Union Chemical Corp.(100.00)
Ta Chu Chemical Fiber Co., Ltd. Yuan Ding Investment Co., Ltd.(41.86)、Yue Ding Industry Co., Ltd. (38.76)、Yue Li Investment Corp.(19.38)
Ya Li Precast Prestressed Concrete Industries Corp.
Asia Cement Corp.(83.81) 、 Far-Eastern Construction Engineering Co.,Ltd.(16.03)
Yuan Ding Co., Ltd. Far Eastern New Century Corp.(37.13)、Asia Cement Corp.(35.50)、Der Ching Investment Corp.(14.50)、Yuan Ding Investment Co., Ltd.(12.86)
Bai Ding Investment Co., Ltd. Far Eastern Department Stores Co., Ltd.(66.66)、Bai Yang Investment Corp.(33.34)
Yu Ming Trading Corp.
Bai Ding Investment Co., Ltd.(47.00)、Yuan Ding Investment Co., Ltd. (45.50)、Yue Ding Industry Co., Ltd.(5.00)、Ding & Ding Management Consultants Co., Ltd.(1.00)、Yuan Ding Co., Ltd.(1.00)、Yuan Ding Leasing Corp.(0.50)
Asia Cement Corp.
Far Eastern New Century Corp.(22.33) 、 Far Eastern Medical Foundation(5.40)、Shin Kong Life Insurance Co., Ltd.(2.12)、New Labor Pension Fund(1.77)、Labor Pension Fund Committee of Far Eastern New Century Corporation(1.51)、Far Eastern Department Stores Co., Ltd.

Far Eastern International Bank
2018 Annual Report 23
Name of Institutional shareholders Major shareholders (%)
(1.49)、China Life Insurance Co., Ltd.(1.43)、Yuan-Ze University(1.41)、Far Eastern Memorial Foundation(1.31)、Yu Yuan Investment Co., Ltd (1.29)
Nan Shan Life Insurance Co. , Ltd.
First Commercial Bank Trustee Account For Representative of Ruen Chen Investment Holding Co., Ltd.(68.17)、Ruen Chen Investment Holding Co., Ltd.(22.46) 、 Y. T. Du(3.25) 、 Ruen Hua Dyeing & Weaving Co., Ltd.(0.28) 、 Ruentex Leasing Co., Ltd.(0.13) 、 Chi-Pin Investment Company(0.11)、Boon-Teik Koay(0.10)、Pou Chi Investments Co.,Ltd. (0.05)、Pou Yih Investments Co.,Ltd.(0.05)、Pou Huei Investments Co.,Ltd.(0.05)、Pou Hwang Investments Co.,Ltd.(0.05)
Cathay Life Insurance Co., Ltd. Cathay Financial Holding Co., Ltd.(100.00)
China Life Insurance Co., Ltd.
China Development Financial Holding Corp.(25.33)、KGI Securities Co., Ltd(9.63)、Cathay Life Insurance Co. , Ltd.(3.34)、Videoland Inc. (2.35)、Citi as Trustee For The Government Of Singapore Investment Corp. (1.73)、Labor Pension Fund(1.34)、Linglang Zhan(1.27)、Citibank Taiwan in its Capacity as Master Custodian for Investment account of the Central Bank of Norway(1.19)、Funds of Saudi Arabia Central Bank at the discretionary account of Morgan Stanley Asset Management, in custody of JP Morgan Chase Bank(1.13)、JPMorgan Chase Bank N.A. Taipei Branch in Custody for Vanguard Emerging Markets Stock Index Fund Investor Shares (1.08)
Der Ching Investment Corp. Asia Cement Corp.(99.99)、Asia Investment Corp.(0.001)、Peter Hsu (0.001)
Far Eastern New Century Corp.
Asia Cement Corp.(23.77)、Oriental Institute of Technology(4.81)、Far Eastern Medical Foundation(3.61)、Far Eastern Memorial Foundation (3.42)、Yuan-Ze University(2.74)、Nan Shan Life Insurance Co. , Ltd. (2.60)、Cathay Life Insurance Co., Ltd.(1.98)、Douglas Tong Hsu(1.71)、China Life Insurance Co., Ltd. (1.58)、Der Ching Investment Corp.(1.55)
Shin Kong Life Insurance Co., Ltd. Shin Kong Financial Holding Co., Ltd. (100.00)
Far Eastern Department Stores Co., Ltd.
Far Eastern New Century Corp.(17.06)、Asia Cement Corp. (5.65)、Yuan-Ze University(4.75)、Yuan Tong Investment Co., Ltd.(2.80)、he committee of Employee Pension Fund of Far Eastern Department Stores Co., Ltd.(2.11)、Yu Yuan Investment Co., Ltd(2.06)、Special Account for Investment of the Central Bank of Norway in custody of Citibank(Taiwan) (2.00)、Tranquil Enterprise Ltd.(1.88)、Far Eastern Memorial Foundation (1.71)、Yuan Ding Investment Co., Ltd.(1.66)
Yu Yuan Investment Co., Ltd.
Asia Cement Corp.(29.92)、Yuan Ding Co., Ltd.(25.02)、Yuan Ding Investment Co., Ltd.(18.96)、U-Ming Marine Transport Corp.(17.66)、Ding Shen Investment Co., Ltd.(6.50)、Yue-Tung Investment Corp.(1.84)、Yue Ding Industry Co., Ltd.(0.10)
Fubon Life Insurance Co., Ltd. Fubon Financial Holding Co., Ltd.(100.00)TransGlobe Life Insurance Co.,
Ltd. Chung Wei I Co., Ltd.(100.00)
Ding Shen Investment Co., Ltd.
Yue-Tung Investment Corp.(18.00)、Asia Investment Corp. (18.00)、Bai Ding Investment Co., Ltd.(18.00)、Ton Fu Investment Corp.(18.00)、Yuan Tong Investment Co., Ltd.(18.00)、Yue Ding Industry Co., Ltd.(5.00)、Ta Chu Chemical Fiber Co., Ltd.(5.00)
Yuan Ding Investment Co., Ltd. Far Eastern New Century Corp.(99.40)、An Ho Garment Co.,Ltd.(0.30)、Ta Chu Chemical Fiber Co., Ltd.(0.30)
Asia Investment Corp. Asia Cement Corp.(100.00)

Far Eastern International Bank
2018 Annual Report 24
B. Directors’ Professional Qualifications and Independence Analysis
Qualifications Name
Possession of over five-year working experience and the following professional qualifications Compliance with independence (Note)
Number of other
companies of public offering
where the board director or supervisor
serves as independent
director
Instructor or higher
teaching positions at
college departmentsof commerce,
legal affairs, finance,accounting, or
others related to the
bank’s operation
Judge, prosecutor,
lawyers, public certified
accountant, or other
professionals or technicians
with national licenses related to the
bank’s operation
Working experience
in commerce, legal affairs,
finance, accounting,
or other fields related
to the bank’s
operation
1 2 3 4 5 6 7 8 9 10
Ching-Ing Hou - 0
Douglas Tong Hsu - - 0
Shaw Y. Wang - - 0
Tsung-Ming Chung - 1
Humphrey Cheng - - 0
James Wu - - 1
Shi-Chun Hsu - 1
Min-Teh Yu - 2
Hsiao Hui Wang - - 1
Bing Shen - - 2
Susan S. Chang - - 0 Note: Mark with a check (✓) under the code number for conformance to the following conditions: ( 1 ) Not an employee of another bank or its affiliates. ( 2 ) Not a director or supervisor of another bank or its affiliates. ( 3 ) Not owning, along with his/her spouse and offspring before the age of majority or in others’ names, over 1% stake in
another bank including stake in others’ names, or one of the 10 largest individual shareholders in the bank. ( 4 ) Not a spouse, relative within second-degree kinship, or relative within fifth-degree kinship of direct lineage of the
persons specified in the three items above. ( 5 ) Not a director, supervisor, or employee of an institutional shareholder with over 5% stake in another bank or being one
of the five largest institutional share-holders in the bank. ( 6 ) Not a director, supervisor, manager, or shareholder with over 5% stake of a company or institution which has financial
or business exchange with another bank. ( 7 ) Not a professional, or owner, partner, director, supervisor, manager, or spouse of one with such position of companies
or institutions offering business, legal, financial, accounting, or consulting services to another bank or its affiliates; however, this excludes remuneration committee members who exercise their duties in accordance with Article 7 of Regulations Governing the Appointment and Exercise of Powers by the Remuneration Committee of a Company Whose Stock is Listed on the Stock Exchange or Traded Over the Counter.
( 8 ) Not a spouse or a relative within second-degree kinship of one of other directors. ( 9 ) Not an offender of items stipulated in article 30 of the Company Law. (10) Not a representative of government or corporate body elected via method specified in article 27 of Company Law.
Far Eastern International Bank
2018 Annual Report 25
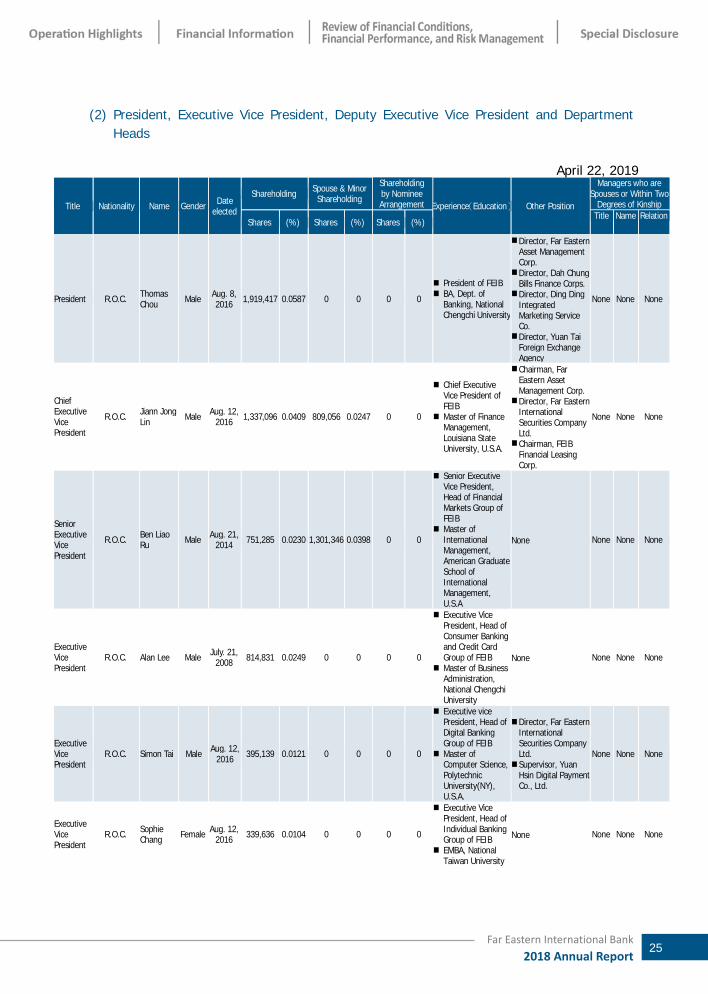
(2) President, Executive Vice President, Deputy Executive Vice President and Department Heads
April 22, 2019
Title Nationality Name Gender Dateelected
Shareholding Spouse & Minor Shareholding
Shareholdingby Nominee Arrangement Experience(Education) Other Position
Managers who are Spouses or Within Two
Degrees of Kinship
Shares (%) Shares (%) Shares (%)Title Name Relation
President R.O.C. Thomas Chou Male Aug. 8,
2016 1,919,417 0.0587 0 0 0 0
President of FEIB BA, Dept. of
Banking, National Chengchi University
Director, Far Eastern Asset Management Corp. Director, Dah Chung
Bills Finance Corps. Director, Ding Ding
Integrated Marketing Service Co. Director, Yuan Tai
Foreign Exchange Agency
None None None
Chief Executive Vice President
R.O.C. Jiann Jong Lin Male Aug. 12,
2016 1,337,096 0.0409 809,056 0.0247 0 0
Chief Executive Vice President of FEIB
Master of Finance Management, Louisiana State University, U.S.A.
Chairman, Far Eastern Asset Management Corp. Director, Far Eastern
International Securities Company Ltd. Chairman, FEIB
Financial Leasing Corp.
None None None
Senior Executive Vice President
R.O.C. Ben Liao Ru Male Aug. 21,
2014 751,285 0.0230 1,301,346 0.0398 0 0
Senior Executive Vice President, Head of Financial Markets Group of FEIB
Master of International Management, American Graduate School of International Management, U.S.A
None None None None
Executive Vice President
R.O.C. Alan Lee Male July. 21, 2008 814,831 0.0249 0 0 0 0
Executive Vice President, Head of Consumer Banking and Credit Card Group of FEIB
Master of Business Administration, National Chengchi University
None None None None
Executive Vice President
R.O.C. Simon Tai Male Aug. 12, 2016 395,139 0.0121 0 0 0 0
Executive vice President, Head of Digital Banking Group of FEIB
Master of Computer Science, Polytechnic University(NY), U.S.A.
Director, Far Eastern International Securities Company Ltd. Supervisor, Yuan
Hsin Digital Payment Co., Ltd.
None None None
Executive Vice President
R.O.C. Sophie Chang Female Aug. 12,
2016 339,636 0.0104 0 0 0 0
Executive Vice President, Head of Individual Banking Group of FEIB
EMBA, National Taiwan University
None None None None

Far Eastern International Bank
2018 Annual Report 26
Title Nationality Name Gender Dateelected
Shareholding Spouse & Minor Shareholding
Shareholdingby Nominee Arrangement Experience(Education) Other Position
Managers who are Spouses or Within Two
Degrees of Kinship
Shares (%) Shares (%) Shares (%)Title Name Relation
Executive Vice President
R.O.C. May Ling Liu Female Feb. 6,
2017 0 0 0 0 0 0
Executive Vice President, Head of Insurance Agency Group of FEIB
Bachelor of Business Administration, The University of West Florida, U.S.A.
None None None None
Executive Vice President
R.O.C. Steve Chi Male Aug. 14, 2018 159,465 0.0049 0 0 0 0
Executive Vice President, Head of Corporate Banking Group of FEIB
Master of Business Administration, University of Minnesota, U.S.A.
Director, Far Eastern International Securities Company Ltd.
None None None
Executive Vice President
R.O.C. Lonnie Liu Male Mar. 20, 2013 732,228 0.0224 0 0 0 0
Executive Vice President, Head of Operations & Technology Group of FEIB
Master of Information Management, New York University, U.S.A.
Director, FEIB Financial Leasing Corp.
None None None
Executive Vice President
R.O.C. James Dai Male Aug. 14, 2018 488,039 0.0149 0 0 0 0
Executive Vice President, Head of Risk Management Department of FEIB
Master of Economics, Feng Chia University
Director, FEIB Financial Leasing Corp.
None None None
Chief Auditor R.O.C. Chih Wei
Huang Male Mar. 11, 2014 152,045 0.0047 0 0 0 0
Chief Auditor of FEIB
Master of Information Management, University of North Texas, U.S. A.
None None None None
Chief Compliance Officer of the Head Office
R.O.C. Elaine Yeh Female Apr. 11, 2019 3,508 0.0001 1,164 0.0000 0 0
Chief Compliance Officer of the Head Office of FEIB
EMBA, National Taiwan University
None None None None
Senior Deputy Executive Vice President
R.O.C. Shin Hwa Chou Female Aug.12,
2016 119,403 0.0037 0 0 0 0
Senior Deputy Executive Vice President, Head of Financial Strategy Center of FEIB
Master of Financial and Accounting, Case Western Reserve University, U.S.A
Director, DWS Ltd. Supervisor , FEIB
Financial Leasing Corp
None None None
Senior Deputy Executive Vice President
R.O.C. Daphne Huang Female Apr.15,
2009 211,869 0.0065 0 0 0 0
Senior Deputy Executive Vice President of FEIB
Master of Institutional Management, Purdue University, U.S.A.
None None None None

Far Eastern International Bank
2018 Annual Report 27
Title Nationality Name Gender Dateelected
Shareholding Spouse & Minor Shareholding
Shareholdingby Nominee Arrangement Experience(Education) Other Position
Managers who are Spouses or Within Two
Degrees of Kinship
Shares (%) Shares (%) Shares (%)Title Name Relation
Senior Deputy Executive Vice President
R.O.C. Ying Ching Hu Male Mar. 16,
2010 423,331 0.0129 0 0 0 0
Senior Deputy Executive Vice President of FEIB
EMBA, National Chengchi University
Director, anfong Company Ltd. None None None
Senior Deputy Executive Vice President
R.O.C. Sam Tsai Male Mar. 27, 2012 258,501 0.0079 0 0 0 0
Senior Deputy Executive Vice President of FEIB
Master of Financial Management, Syracuse University, U.S.A.
None None None None
Senior Deputy Executive Vice President
R.O.C. Lionel Chen Male Aug. 21,
2014 232,663 0.0071 0 0 0 0
Senior Deputy Executive Vice President of FEIB
Master of Business Administration, Tamkang University
None None None None
Senior Deputy Executive Vice President
R.O.C. Hui Ling Chen Female Sep. 1,
2015 23,185 0.0007 0 0 0 0
Senior Deputy Executive Vice President of FEIB
BA, Dept. of Insurance, Tamkang University
None None None None
Senior Deputy Executive Vice President
R.O.C. Veichou Chih Male Dec. 24,
2015 0 0 0 0 0 0
Senior Deputy Executive Vice President of FEIB
Master of Business Administration, George Washington University, U.S.A.
None None None None
Senior Deputy Executive Vice President
R.O.C. Roger Lo Male Aug. 12, 2016 32,509 0.0010 0 0 0 0
Senior Deputy Executive Vice President of FEIB
Master of Business Administration, National Chung Hsing University
None None None None
Senior Deputy Executive Vice President
R.O.C. Vincent Liu Male Aug. 14, 2018 337,342 0.0103 0 0 0 0
Senior Deputy Executive Vice President of FEIB
Master of Economics, Soochow University
Director, FEIB Financial Leasing Corp.
None None None
Senior Deputy Executive Vice President
R.O.C. Yueh Hua Wu Male Aug. 14,
2018 38,278 0.0012 48,344 0.0015 0 0
Senior Deputy Executive Vice President of FEIB
BA, Dept. of Economics, National Chung Hsing University
None None None None
Senior Deputy Executive Vice President
R.O.C. Bob Chen Male Aug. 14, 2018 145,794 0.0045 0 0 0 0
Senior Deputy Executive Vice President of FEIB
Master of Business Administration, University of Dallas, U.S.A.
None None None None

Far Eastern International Bank
2018 Annual Report 28
Title Nationality Name Gender Dateelected
Shareholding Spouse & Minor Shareholding
Shareholdingby Nominee Arrangement Experience(Education) Other Position
Managers who are Spouses or Within Two
Degrees of Kinship
Shares (%) Shares (%) Shares (%)Title Name Relation
Senior Deputy Executive Vice President
R.O.C. Chen Chen Ma Female Aug. 14,
2018 53,117 0.0016 0 0 0 0
Senior Deputy Executive Vice President of FEIB
BA, Dept. of Business Administration, Chinese Culture University
None None None None
Senior Deputy Executive Vice President
R.O.C. Isabel Chen Female Aug. 14,
2018 40,661 0.0012 0 0 0 0
Senior Deputy Executive Vice President of FEIB
Master of Business Administration, University of North Texas, U.S.A.
None None None None
Deputy Executive Vice President
R.O.C. Wen Chang Male Oct. 19,
2006 583 0.0000 0 0 0 0
Deputy Executive Vice President of FEIB
BA, Dept. of Business, National Open University
None None None None
Deputy Executive Vice President
R.O.C. Brucelo Lo Male May 17, 2010 148,442 0.0045 0 0 0 0
Deputy Executive Vice President of FEIB
BA, Dept. of Accounting, National Chung Hsing University
None None None None
Deputy Executive Vice President
R.O.C. Margaret Du Female Aug 23,
2012 301,841 0.0092 0 0 0 0
Deputy Executive Vice President of FEIB
BA, Dept. of Banking, Tamkang University
None None None None
Deputy Executive Vice President
R.O.C. Ines Hong Female Dec. 21, 2012 822 0.0000 0 0 0 0
Deputy Executive Vice President of FEIB
BA, Dept. of Advertising, Chinese Culture University
None None None None
Deputy Executive Vice President
R.O.C. Chiung Yu Song Female Dec. 21,
2012 437,816 0.0134 0 0 0 0
Deputy Executive Vice President of FEIB
BA, Dept. of Banking, National Chengchi University
None None None None
Deputy Executive Vice President
R.O.C. Civi Tsai Female Dec. 21, 2012 23,449 0.0007 0 0 0 0
Deputy Executive Vice President of FEIB
EMBA, National Chengchi University
None None None None
Deputy Executive Vice President
R.O.C. Emily Chou Female Aug. 15, 2013 215,262 0.0066 0 0 0 0
Deputy Executive Vice President of FEIB
EMBA, National Chengchi University
None None None None
Deputy Executive Vice President
R.O.C. Robin Chiu Male Aug. 21, 2014 221,996 0.0068 1,289 0.0000 0 0
Deputy Executive Vice President of FEIB
BA, Dept. of Transportation and Communication Management, National Cheng Kung University
None None None None

Far Eastern International Bank
2018 Annual Report 29
Title Nationality Name Gender Dateelected
Shareholding Spouse & Minor Shareholding
Shareholdingby Nominee Arrangement Experience(Education) Other Position
Managers who are Spouses or Within Two
Degrees of Kinship
Shares (%) Shares (%) Shares (%)Title Name Relation
Deputy Executive Vice President
R.O.C. Elaine Lin Female Aug. 21, 2014 225,201 0.0069 0 0 0 0
Deputy Executive Vice President of FEIB
BA, Dept. of Computer Science, TungHai University
None None None None
Deputy Executive Vice President
R.O.C. Baker Lin Male Aug. 21, 2014 254,628 0.0078 0 0 0 0
Deputy Executive Vice President of FEIB
Master of Business Administration, Yuan Ze University
None None None None
Deputy Executive Vice President
R.O.C. Cindy Chen Female Aug. 21,
2014 258,613 0.0079 0 0 0 0
Deputy Executive Vice President of FEIB
Master of Accounting, National Chengchi University
Supervisor, Far Eastern Asset Management Corp. Supervisor, Far
Eastern International Securities Company Ltd.
None None None
Deputy Executive Vice President
R.O.C. Joy Tien Female Jun. 16, 2015 3,590 0.0001 0 0 0 0
Deputy Executive Vice President of FEIB
Master of Business Administration, Cleveland State University, U.S.A.
None None None None
Deputy Executive Vice President
R.O.C. An Li Ma Female Aug. 12, 2015 182,421 0.0056 0 0 0 0
Deputy Executive Vice President of FEIB
Master of Risk Management, Temple University, U.S.A.
None None None None
Deputy Executive Vice President
R.O.C. Gloria Hsieh Female Aug. 12,
2015 102,593 0.0031 0 0 0 0
Deputy Executive Vice President of FEIB
Master of Business Administration, Aalto University, Finland
None None None None
Deputy Executive Vice President
R.O.C. Senh Sing Pei Male Aug. 12,
2015 160,684 0.0049 0 0 0 0
Deputy Executive Vice President of FEIB
Master of Money and Banking, National Chengchi University
None None None None
Deputy Executive Vice President
R.O.C. Teresa Lo Female May. 3, 2016 0 0 0 0 0 0
Deputy Executive Vice President of FEIB
Master of Management Science, National Chiao Tung University
None None None None
Deputy Executive Vice President
R.O.C. Frank Song Male Aug. 12,
2016 6,014 0.0002 0 0 0 0
Deputy Executive Vice President of FEIB
Master of Money and Banking, National Kaohsiung First University of Science and Technology
None None None None

Far Eastern International Bank
2018 Annual Report 30
Title Nationality Name Gender Dateelected
Shareholding Spouse & Minor Shareholding
Shareholdingby Nominee Arrangement Experience(Education) Other Position
Managers who are Spouses or Within Two
Degrees of Kinship
Shares (%) Shares (%) Shares (%)Title Name Relation
Deputy Executive Vice President
R.O.C. Shu Yun Cheng Female Aug. 12,
2016 138,475 0.0042 0 0 0 0
Deputy Executive Vice President of FEIB
Master of Finance, University of Illinois at Urbana-Champaign, U.S.A.
None None None None
Deputy Executive Vice President
R.O.C. Chingh Siang Chen
Male Aug. 9, 2017 1,330 0.0000 0 0 0 0
Deputy Executive Vice President of FEIB
EMBA, National Taiwan University
None None None None
Deputy Executive Vice President
R.O.C. Kuo Ying Huang Female Aug. 9,
2017 224,374 0.0069 0 0 0 0
Deputy Executive Vice President of FEIB
BA, Dept. of Statistics, Tamkang University
None None None None
Deputy Executive Vice President
R.O.C. Felicia Tseng Female Dec. 1,
2017 0 0 0 0 0 0
Deputy Executive Vice President of FEIB
Master of Business Administration, University of North Alabama, U.S.A.
None None None None
Deputy Executive Vice President
R.O.C. Warren Ko Male Dec. 18, 2017 0 0 0 0 0 0
Deputy Executive Vice President of FEIB
EMBA, National Sun Yat-sen University
None None None None
Deputy Executive Vice President
R.O.C. Starsky Chiang Male Feb. 1,
2018 0 0 0 0 0 0
Deputy Executive Vice President of FEIB
BA, Dept. of International Trade, TungHai University
None None None None
Deputy Executive Vice President
R.O.C. Wen Ming Yang Male Aug. 14,
2018 27,714 0.0008 0 0 0 0
Deputy Executive Vice President of FEIB
Master of Business Administration, Chinese Culture University
None None None None
Deputy Executive Vice President
R.O.C. Audrey Lin Female Aug. 14, 2018 1,004 0.0000 0 0 0 0
Deputy Executive Vice President of FEIB
EMBA, National Chengchi University
None None None None
Deputy Executive Vice President
R.O.C. Karry Tsai Female Aug. 14, 2018 123,764 0.0038 0 0 0 0
Deputy Executive Vice President of FEIB
Master of Business Administration, University of North Alabama, U.S.A.
None None None None
Deputy Executive Vice President
R.O.C. Yi Chen Wang Male Aug. 14,
2018 133,950 0.0041 86,710 0.0027 0 0
Deputy Executive Vice President of FEIB
Master of Management, Yuan Ze University
None None None None

Far Eastern International Bank
2018 Annual Report 31
Title Nationality Name Gender Dateelected
Shareholding Spouse & Minor Shareholding
Shareholdingby Nominee Arrangement Experience(Education) Other Position
Managers who are Spouses or Within Two
Degrees of Kinship
Shares (%) Shares (%) Shares (%)Title Name Relation
Deputy Executive Vice President
R.O.C. Alex Kao Male Aug. 14, 2018 287 0.0000 0 0 0 0
Deputy Executive Vice President of FEIB
Master of Business Administration, National Chengchi University
None None None None
Deputy Executive Vice President
R.O.C. Justice Chang Male Aug. 14,
2018 0 0 0 0 0 0
Deputy Executive Vice President of FEIB
Master of Money and Banking, National Chengchi University
None None None None
Deputy Executive Vice President
R.O.C. Alex Chien Male Aug. 14, 2018 901 0.0000 0 0 0 0
Deputy Executive Vice President of FEIB
Master of Money and Banking, Tamkang University
None None None None
Senior Vice President R.O.C. Allen Li Male Aug. 12,
2015 146,099 0.0045 0 0 0 0
Senior Vice President of FEIB
Master of Business Adiministration, Yuan Ze University
None None None None
Senior Vice President R.O.C. Mag Chen Female Aug. 12,
2015 95,863 0.0029 0 0 0 0
Senior Vice President of FEIB
Master of Agricultural Economics, National Chung Hsing University
None None None None
Senior Vice President R.O.C. Amber
Tseng Female Aug. 12, 2015 133,211 0.0041 0 0 0 0
Senior Vice President of FEIB
BA, Dept. of Finance, Seattle University, U.S.A.
None None None None
Senior Vice President R.O.C. Shu Hui
Lee Female Mar. 24, 2016 342,035 0.0105 0 0 0 0
Senior Vice President of FEIB
BA, Dept. of Cooperative Economics, National Chung Hsing University
None None None None
Senior Vice President R.O.C. Allen Lu Male Aug. 12,
2016 533 0.0000 0 0 0 0
Senior Vice President of FEIB
Master of Business Administration, Tiffin University, U.S.A.
None None None None
Senior Vice President R.O.C. Olive Yin Female Aug. 12,
2016 96,816 0.0030 0 0 0 0
Senior Vice President of FEIB
Master of Economics, National Taiwan University
None None None None
Senior Vice President R.O.C. Chia Wei
Hsiao Male Aug. 12, 2016 98,353 0.0030 0 0 0 0
Senior Vice President of FEIB
BA, Dept. of History, National Taiwan University
None None None None
Senior Vice President R.O.C. Sofia Hsu Female Aug.9,
2017 51,363 0.0016 0 0 0 0
Senior Vice President of FEIB
BA, Dept. of Bank Insurance, Feng Chia University
None None None None
Far Eastern International Bank
2018 Annual Report 32
Title Nationality Name Gender Dateelected
Shareholding Spouse & Minor Shareholding
Shareholdingby Nominee Arrangement Experience(Education) Other Position
Managers who are Spouses or Within Two
Degrees of Kinship
Shares (%) Shares (%) Shares (%)Title Name Relation
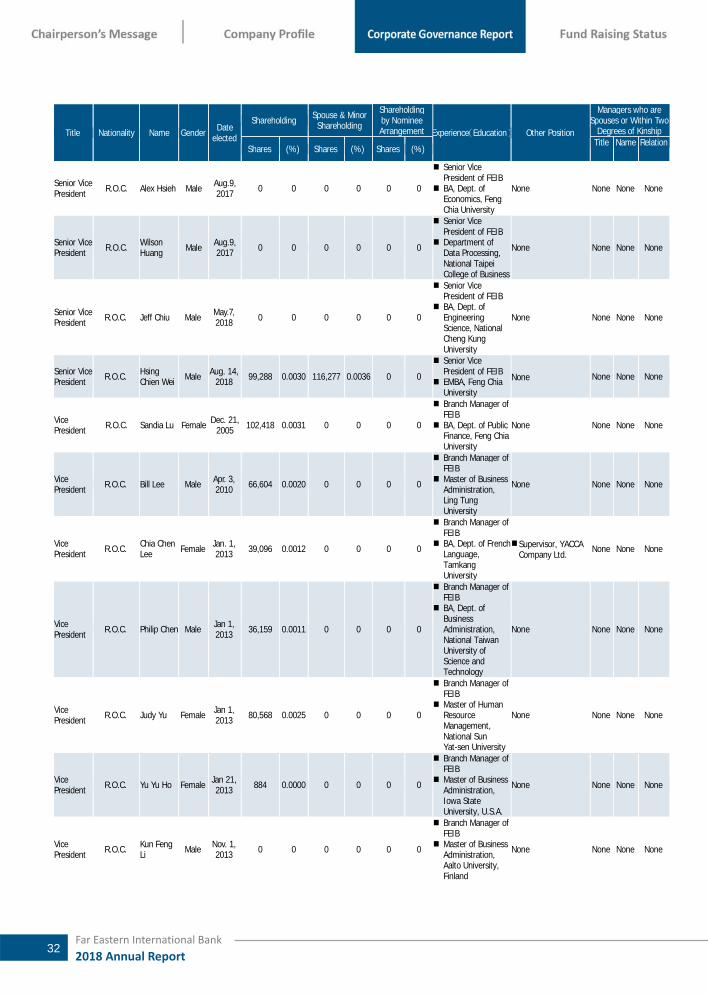
Senior Vice President R.O.C. Alex Hsieh Male Aug.9,
2017 0 0 0 0 0 0
Senior Vice President of FEIB
BA, Dept. of Economics, Feng Chia University
None None None None
Senior Vice President R.O.C. Wilson
Huang Male Aug.9, 2017 0 0 0 0 0 0
Senior Vice President of FEIB
Department of Data Processing, National Taipei College of Business
None None None None
Senior Vice President R.O.C. Jeff Chiu Male May.7,
2018 0 0 0 0 0 0
Senior Vice President of FEIB
BA, Dept. of Engineering Science, National Cheng Kung University
None None None None
Senior Vice President R.O.C. Hsing
Chien Wei Male Aug. 14, 2018 99,288 0.0030 116,277 0.0036 0 0
Senior Vice President of FEIB
EMBA, Feng Chia University
None None None None
Vice President R.O.C. Sandia Lu Female Dec. 21,
2005 102,418 0.0031 0 0 0 0
Branch Manager of FEIB
BA, Dept. of Public Finance, Feng Chia University
None None None None
Vice President R.O.C. Bill Lee Male Apr. 3,
2010 66,604 0.0020 0 0 0 0
Branch Manager of FEIB
Master of Business Administration, Ling Tung University
None None None None
Vice President R.O.C. Chia Chen
Lee Female Jan. 1, 2013 39,096 0.0012 0 0 0 0
Branch Manager of FEIB
BA, Dept. of French Language, Tamkang University
Supervisor, YACCA Company Ltd. None None None
Vice President R.O.C. Philip Chen Male Jan 1,
2013 36,159 0.0011 0 0 0 0
Branch Manager of FEIB
BA, Dept. of Business Administration, National Taiwan University of Science and Technology
None None None None
Vice President R.O.C. Judy Yu Female Jan 1,
2013 80,568 0.0025 0 0 0 0
Branch Manager of FEIB
Master of Human Resource Management, National Sun Yat-sen University
None None None None
Vice President R.O.C. Yu Yu Ho Female Jan 21,
2013 884 0.0000 0 0 0 0
Branch Manager of FEIB
Master of Business Administration, Iowa State University, U.S.A.
None None None None
Vice President R.O.C. Kun Feng
Li Male Nov. 1, 2013 0 0 0 0 0 0
Branch Manager of FEIB
Master of Business Administration, Aalto University, Finland
None None None None

Far Eastern International Bank
2018 Annual Report 33
Title Nationality Name Gender Dateelected
Shareholding Spouse & Minor Shareholding
Shareholdingby Nominee Arrangement Experience(Education) Other Position
Managers who are Spouses or Within Two
Degrees of Kinship
Shares (%) Shares (%) Shares (%)Title Name Relation
Vice President R.O.C. Michael
Huang Male Nov. 1, 2013 82,512 0.0025 0 0 0 0
Branch Manager of FEIB
Master of Business Administration, National Taiwan University of Science and Technology
None None None None
Vice President R.O.C. Wei Cheng
Chen Male Jan. 22, 2014 639 0.0000 0 0 0 0
Branch Manager of FEIB
Master of History, Tunghai University
None None None None
Vice President R.O.C. Wei Li
Chuang Male Jan 1, 2015 16,939 0.0005 0 0 0 0
Branch Manager of FEIB
Master of Finance, Feng Chia University
None None None None
Vice President R.O.C. Lisa Hsu Female Mar. 20,
2015 91,657 0.0028 0 0 0 0
Branch Manager of FEIB
BA, Dept. of Finance, Ming Chuan University
None None None None
Vice President R.O.C. Jane Tsai Female Mar. 20,
2015 49,766 0.0015 39,758 0.0012 0 0
Branch Manager of FEIB
BA, Dept. of Business Administration, National Cheng Kung University
None None None None
Vice President R.O.C. Chun Yen
Kuo Male Aug. 24, 2015 14,121 0.0004 0 0 0 0
Branch Manager of FEIB
BA, Dept. of Business Administration, Tamkang University
Director, HONORTRUST Company Ltd.
None None None
Vice President R.O.C. Kuoh
Siung Lin Male Nov. 13, 2015 0 0 0 0 0 0
Branch Manager of FEIB
BA, Dept. of International Trade, Tunghai University
None None None None
Vice President R.O.C. Wen Feng
Tu Male Dec. 7, 2015 0 0 0 0 0 0
Branch Manager of FEIB
Department of Banking and Insurance, Shih Chien College
None None None None
Vice President R.O.C. Hui Li Tsai Female Jun. 1,
2016 0 0 0 0 0 0
Branch Manager of FEIB
Department of Accounting and Statistics, National Taipei College of Business
None None None None
Vice President R.O.C. Alen Lin Male Aug. 12,
2016 49,481 0.0015 0 0 0 0
Branch Manager of FEIB
BA, Dept. of Finance, Shih Chien University
None None None None
Vice President R.O.C. Shang Fu
Lin Male Aug. 12, 2016 16,037 0.0005 0 0 0 0
Branch Manager of FEIB
Master of International Business Management, University of South Australia, Australia
None None None None

Far Eastern International Bank
2018 Annual Report 34
Title Nationality Name Gender Dateelected
Shareholding Spouse & Minor Shareholding
Shareholdingby Nominee Arrangement Experience(Education) Other Position
Managers who are Spouses or Within Two
Degrees of Kinship
Shares (%) Shares (%) Shares (%)Title Name Relation
Vice President R.O.C. Chiang
Ming Chen Male Aug. 12, 2016 48,608 0.0015 0 0 0 0
Branch Manager of FEIB
EMBA, National Cheng Kung University
None None None None
Vice President R.O.C. Shou Te
Weng Male Aug. 12, 2016 0 0 0 0 0 0
Branch Manager of FEIB
BA, Dept. of Finance, Tamkang University
None None None None
Vice President R.O.C. Kuang
Jung Fan Male Sep. 29, 2016 29,301 0.0009 0 0 0 0
Branch Manager of FEIB
BA, Dept. of Business Administration, Chung Yuan Christian University
None None None None
Vice President R.O.C. Jui Chen
Hsu Female May. 2, 2017 0 0 0 0 0 0
Branch Manager of FEIB
Master of Business Administration, Texas A&M University, U.S.A.
None None None None
Vice President R.O.C. Tsung Min
Cheng Male May. 2, 2017 0 0 0 0 0 0
Branch Manager of FEIB
Master of International Business, Tamkang University
None None None None
Vice President R.O.C. Chen I
Wang Female May. 2, 2017 0 0 0 0 0 0
Branch Manager of FEIB
Master of Business Administration, Lincoln University, U.S.A.
None None None None
Vice President R.O.C. Pi Yun
Peng Female May. 15, 2017 0 0 0 0 0 0
Branch Manager of FEIB
Department of Business Tourism, Nanya Institute of Technology
None None None None
Vice President R.O.C. Chia Jung
Chang Male May. 15, 2017 0 0 0 0 0 0
Branch Manager of FEIB
BA, Dept. of Economics, Northeastern University, U.S.A.
None None None None
Vice President R.O.C. Allen
Chang Male Nov. 3, 2017 0 0 0 0 0 0
Branch Manager of FEIB
BA, Dept. of Business Administration, National Cheng Kung University
None None None None
Vice President R.O.C. Kuan I Li Male Jan. 1,
2018 0 0 0 0 0 0
Branch Manager of FEIB
Department of Mechanical Engineering, Oriental Institute of Technology
None None None None
Vice President R.O.C. Vicky Yang Female May. 7,
2018 24,777 0.0008 0 0 0 0
Branch Manager of FEIB
EMBA, National Taiwan Normal University
None None None None

Far Eastern International Bank
2018 Annual Report 35
Title Nationality Name Gender Dateelected
Shareholding Spouse & Minor Shareholding
Shareholdingby Nominee Arrangement Experience(Education) Other Position
Managers who are Spouses or Within Two
Degrees of Kinship
Shares (%) Shares (%) Shares (%)Title Name Relation
Vice President R.O.C. Vivian Lee Female May. 7,
2018 0 0 0 0 0 0
Branch Manager of FEIB
Master of Global Entrepreneurial Management, Fu Jen University
None None None None
Vice President R.O.C. Wen Hao
Shih Male May. 29, 2018 0 0 0 0 0 0
Branch Manager of FEIB
BA, Dept. of International Trade, Ming Chuan University
None None None None
Vice President R.O.C. Eason
Song Male Feb. 6, 2017 0 0 0 0 0 0
Vice President of FEIB
BA, Dept. of Finance, Kaoshiung Polytechnic Institute
None None None None
Vice President R.O.C. Ring Tsai Female Apr. 1,
2019 0 0 0 0 0 0
Branch Manager of FEIB
BA, Department of Economics, National Taipei University
None None None None
Vice President R.O.C. James
Hsieh Male Apr. 1, 2019 0 0 0 0 0 0
Branch Manager of FEIB
BA, Department of Social Psychology, Shih Hsin University
None None None None
Vice President R.O.C. Rich Liu Male Apr. 1,
2019 0 0 0 0 0 0
Branch Manager of FEIB
Department of Industrial Engineering and Management, Lien Ho Junior College of Technology
None None None None
Deputy Vice President
R.O.C. Winnie Chiang Female Mar. 20,
2015 7,425 0.0002 0 0 0 0
Branch Manager of FEIB
Master of Business Administration, Taiwan University of Science and Technology
None None None None
Deputy Vice President
R.O.C. Yu Shui Chen Male Apr. 1,
2019 0 0 0 0 0 0
Branch Manager of FEIB
Master of International Finance, National Taipei University
None None None None
(3) Data of Chairperson & President Retires from The Bank or Be Consultants
Information of Chairperson & President retire to be consultants
Title Nationality Name SexPre-retirement position Be
consultant date
Hire Purpose
Authority and Responsibility
Remuneration Ratio of
Remuneration as a % of Net Income (%)
Organization &Position
Retire Date
None

36
Far Eastern In
tern
ation
al Ban
k
20
18 A
nn
ua
l Re
po
rt
(4) Remuneration of Directors, President, and Vice Presidents
A. Remuneration of Directors (including Independent Directors)
Unit: NT$ Thousands December 31, 2018
Title Name
Remuneration Ratio of Total Remuneration
(A+B+C+D) to Net Income (%)
Relevant Remuneration Received by Directors Who are Also Employees
Ratio of Total Compensation
(A+B+C+D+E+F+G) to Net Income
(%)
Compensation Paid to Directors from an invested Company
Other than the
Company’s Subsidiary
Base Compensation (A) Severance Pay (B) Directors
Compensation (C) Allowances (D) Salary, Bonuses, and Allowances
(E) Severance Pay (F) Employee
Compensation (G)
The Bank
All companies
in the consolidated
financial statements
The Bank
All companies
in the consolidated
financial statements
The Bank
All companies
in the consolidated
financial statements
The Bank
All companies in the
consolidated financial
statements
The Bank
All companies
in the consolidated
financial statements
The Bank
All companies
in the consolidated
financial statements
The Bank
All companies in the
consolidated financial
statements
The Bank
All companies
in the consolidated
financial statements
The Bank
All companies
in the consolidated
financial statementscash stock cash stock
Chairperson
Yue Ding Industry Co., Ltd. Representative: Ching-Ing Hou
13,839 13,839 - - 8,524 8,524
135(note: car rental 438; Driver's compensation: 816)
135 (note: car rental 438;Driver's compensation 816) 2.361 2.363
- - - - - - - -
2.361 2.363
-
Vice Chairman
Douglas Tong Hsu 11,489 11,489 - - 6,393 6,393 115 115 - - - - - - - - 970
Directors (refer as follow) 6,580 6,628 - - 35,897 35,897 240 240 - - - - - - - - -
Relevant Remuneration Received by Directors who are also service all companies in the consolidated financial statements (such as consultants who are not employees): None.The list of directors: 1. Far Eastern New Century Corp. Representatives: Shaw Y. Wang / Executive Director, Humphrey Cheng / Director, James Wu / Director 2. Asia Cement Corp. Representatives: Tsung-Ming Chung / Executive Director, Shi-Chun Hsu / Director 3. U-Ming Marine Transport Corp. Representative: Min-Teh Yu / Director 4. Independent Director & managing Director: Ben C.B. Chang released & Hsiao Hui Wang newly elected on June 20, 2018. 5. Independent Director: Bing Shen / Susan S. Chang

37 Far Easte
rn In
tern
ation
al Ban
k
20
18 A
nn
ua
l Re
po
rt
Remuneration Range of Directors December 31, 2018
Range of Remuneration
Name of Directors Total Remuneration (A+B+C+D) Total Remuneration (A+B+C+D+E+F+G)
The Bank All companies in the consolidated financial statements
The Bank All companies in the consolidated financial statements
Under NT$2,000,000 Ben C.B. Chang; Hsiao Hui
Wang Ben C.B. Chang; Hsiao Hui
Wang Ben C.B. Chang; Hsiao Hui
Wang Ben C.B. Chang; Hsiao Hui
Wang
NT$2,000,000 (inclusive)~ NT$5,000,000 (non-inclusive)
Asia Cement Corp. Representative:Shi-Chun Hsu
U-Ming Marine Transport Corp. Representative: Min-Teh Yu
Bing Shen; Susan S. Chang
Asia Cement Corp. Representative:Shi-Chun Hsu
U-Ming Marine Transport Corp. Representative: Min-Teh Yu
Bing Shen; Susan S. Chang
Asia Cement Corp. Representative:Shi-Chun Hsu
U-Ming Marine Transport Corp. Representative: Min-Teh Yu
Bing Shen; Susan S. Chang
Asia Cement Corp. Representative:Shi-Chun Hsu U-Ming Marine Transport Corp. Representative: Min-Teh Yu Bing Shen; Susan S. Chang
NT$5,000,000 (inclusive)~ NT$10,000,000 (non-inclusive)
Far Eastern New Century Corp. Representatives: Shaw Y. Wang; Humphrey Cheng; James Wu
Asia Cement Corp. Representative:Tsung-Ming Chung
Far Eastern New Century Corp. Representatives: Shaw Y. Wang; Humphrey Cheng; James Wu
Asia Cement Corp. Representative:Tsung-Ming Chung
Far Eastern New Century Corp. Representatives: Shaw Y. Wang; Humphrey Cheng; James Wu
Asia Cement Corp. Representative:Tsung-Ming Chung
Far Eastern New Century Corp. Representatives: Shaw Y. Wang; Humphrey Cheng; James Wu
Asia Cement Corp. Representative:Tsung-Ming Chung
NT$10,000,000(inclusive)~ NT$15,000,000 (non-inclusive) - - - -
NT$15,000,000 (inclusive) ~ NT$30,000,000 (non-inclusive)
Yu Ding Industrial Co., Ltd. Representative:Ching-Ing Hou
Douglas Tong Hsu
Yu Ding Industrial Co., Ltd. Representative:Ching-Ing Hou
Douglas Tong Hsu
Yu Ding Industrial Co., Ltd. Representative:Ching-Ing Hou
Douglas Tong Hsu
Yu Ding Industrial Co., Ltd. Representative:Ching-Ing Hou
Douglas Tong Hsu NT$30,000,000~(inclusive) NT$50,000,000 (non-inclusive) - - - -
NT$50,000,000 (inclusive)~ NT$100,000,000 (non-inclusive)
- - - -
Over NT$100,000,000 - - - - Total 12 12 12 12
*Independent Director & managing Director: Ben C.B. Chang released & Hsiao Hui Wang newly elected on June 20, 2018.

38
Far Eastern In
tern
ation
al Ban
k
20
18 A
nn
ua
l Re
po
rt
B. Remuneration of the President and Vice Presidents
Unit: NT$ Thousands December 31, 2018
Title Name
Salary(A) Severance or Retirement
Payment (B) Bonus and Special Allowance (C) Dividends (D)
Ratio of Total Compensation
(A+B+C+D) to Net Income(%)
Remuneration from Investee Companies Excluding
SubsidiariesThe bank
All companies
in the financial
statement
The bank
All companies in the financial
statement The bank
All companies in the financial statement
The bank All companiesin the financial
statement The bank
All companies
in the financial
statementCash
dividend Stock
dividendCash
dividendStock
dividend
President Thomas Chou
35,934 36,006 - -
39,694 (Car rental:2,570;Driver compensation:2,600)
39,910 (Car rental:2,570;Driver compensation:2,600)
9,382 - 9,382 - 2.412% 2.420%
250
Chief Executive VicePresident Jiann Jong Lin
Senior Executive Vice President Ben Liao Ru
Executive Vice President Alan Lee
Executive Vice President Lonnie Liu
Executive Vice President Sophie Chang
Executive Vice President Simon Tai
Executive Vice President May Ling Liu
Executive Vice President
Steve Chi ( Took up office on
Aug. 14, 2018)
Executive Vice President
James Dai ( Took up office on
Aug. 14, 2018)
Chief Auditor Chih Wei Huang
Chief Compliance Officer of the Head
Office
Josephine Chen (Resigned on Jan. 12, 2019)
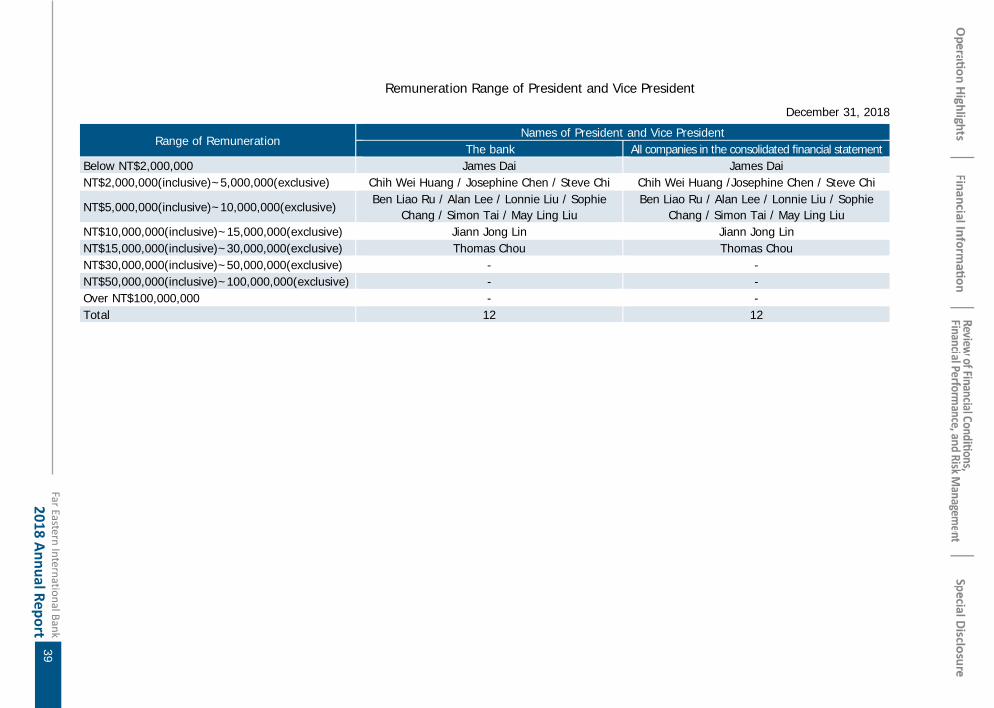
39 Far Easte
rn In
tern
ation
al Ban
k
20
18 A
nn
ua
l Re
po
rt
Remuneration Range of President and Vice President
December 31, 2018
Range of Remuneration Names of President and Vice President
The bank All companies in the consolidated financial statementBelow NT$2,000,000 James Dai James Dai NT$2,000,000(inclusive)~5,000,000(exclusive) Chih Wei Huang / Josephine Chen / Steve Chi Chih Wei Huang /Josephine Chen / Steve Chi
NT$5,000,000(inclusive)~10,000,000(exclusive) Ben Liao Ru / Alan Lee / Lonnie Liu / Sophie
Chang / Simon Tai / May Ling Liu Ben Liao Ru / Alan Lee / Lonnie Liu / Sophie
Chang / Simon Tai / May Ling Liu NT$10,000,000(inclusive)~15,000,000(exclusive) Jiann Jong Lin Jiann Jong Lin NT$15,000,000(inclusive)~30,000,000(exclusive) Thomas Chou Thomas Chou NT$30,000,000(inclusive)~50,000,000(exclusive) - - NT$50,000,000(inclusive)~100,000,000(exclusive) - - Over NT$100,000,000 - - Total 12 12

Far Eastern International Bank
2018 Annual Report 40
C. Remuneration of Managers April 22, 2019
Tile Name
Employee Compensation
- in Stock (Fair Market
Value)
Employee Compensation
- in Cash Total
Ratio of Total Amount to Net Income (%)
Managers Please refer Page 25 to Page 35. 0 25,517,834 25,517,834 0.72%
(5) Comparison of Remuneration for Directors, President and Vice Presidents in the Most Recent
Two Fiscal Years and Remuneration Policy for Directors, President and Vice Presidents
A.The ratio of total remuneration paid by the Company and by all companies included in the consolidated financial statements for the two most recent fiscal years to directors, president and vice presidents of the Company, to the net income.
Unit: %
Title
2017 2018
The Bank All companies in the
consolidated financial statements
The Bank
All companies in the consolidated
financial statements
Directors 2.585 2.586 2.361 2.363 President,
Vice Presidents 3.046 3.058 2.412 2.420
Total 5.631 5.644 4.773 4.783
B. The policies, standards, and portfolios for the payment of remuneration, the procedures for determining remuneration, and the correlation with risks and business performance.
The compensations for directors include compensations, expense for business execution, compensations from distribution of earnings. According to the article 25 of the Articles of Incorporation, if there be net income before income tax, remuneration of directors and employees’ compensation, the Bank should retain a remuneration of directors no greater than 1.5%. The procedures for determining remuneration are based on the comparable level as offered by the other companies in the same trade and the performance evaluation results of the board of directors, and taken into account the Bank's operating performance and the expected or actual risks that have occurred, and are subject to the “Regulations for Directors’ Remuneration Distribution”. After the Remuneration Committee is passed, it shall be reported to the board of directors for approval.
Based on the reasonable correlation between individual performance, business performance, and future risks, the policies, standards, and portfolios of remuneration for president and vice presidents are established and reviewed regularly during the

Far Eastern International Bank
2018 Annual Report 41
Remuneration Committee. The board of directors will determine the result after taking into account the Remuneration Committee’s suggestions to ensure it’s reasonable to risk management and general pay levels in the industry.
3. Implementation of Corporate Governance
(1) Information on the Operation of the Board of Directors
A. The 9th Board of Directors convened 2 meetings in 2018, and the records of attendance by directors and independent directors are shown as follows:
Title Name Attendance in Person
Attendance by Proxy
Actual Attendance Rate (%)
Remarks
Chairperson Yue Ding Industry Co., Ltd. Representative: Ching-Ing Hou
2 0 100% -
Vice Chairman Douglas Tong Hsu 2 0 100% -
Executive Director
Far Eastern New Century Corp. Representative: Shaw Y. Wang
2 0 100% -
Executive Director
Asia Cement Corp. Representative: Tsung-Ming Chung
2 0 100% -
Director Far Eastern New Century Corp. Representative: Humphrey Cheng
1 1 50% -
Director Far Eastern New Century Corp. Representative: James Wu
2 0 100% -
Director Asia Cement Corp. Representative: Shi-Chun Hsu
2 0 100% -
Director U-Ming Marine Transport Corp. Representative: Min-Teh Yu
2 0 100% -
Independent Director, Managing Director
Ben C. B. Chang 2 0 100% -
Independent Director
Bing Shen 2 0 100% -
Independent Director
Susan S. Chang 2 0 100% -
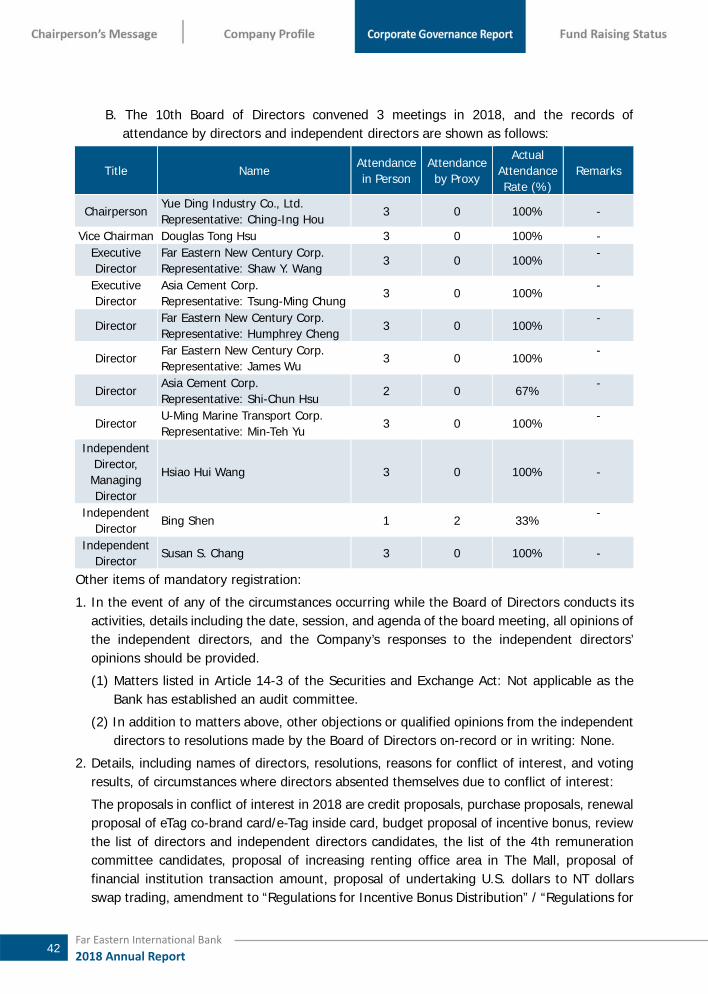
Far Eastern International Bank
2018 Annual Report 42
B. The 10th Board of Directors convened 3 meetings in 2018, and the records of attendance by directors and independent directors are shown as follows:
Title Name Attendance in Person
Attendance by Proxy
Actual Attendance Rate (%)
Remarks
Chairperson Yue Ding Industry Co., Ltd. Representative: Ching-Ing Hou
3 0 100% -
Vice Chairman Douglas Tong Hsu 3 0 100% - Executive Director
Far Eastern New Century Corp. Representative: Shaw Y. Wang
3 0 100% -
Executive Director
Asia Cement Corp. Representative: Tsung-Ming Chung
3 0 100% -
Director Far Eastern New Century Corp. Representative: Humphrey Cheng
3 0 100% -
Director Far Eastern New Century Corp. Representative: James Wu
3 0 100% -
Director Asia Cement Corp. Representative: Shi-Chun Hsu
2 0 67% -
Director U-Ming Marine Transport Corp. Representative: Min-Teh Yu
3 0 100% -
Independent Director, Managing Director
Hsiao Hui Wang 3 0 100% -
Independent Director
Bing Shen 1 2 33% -
Independent Director
Susan S. Chang 3 0 100% -
Other items of mandatory registration:
1. In the event of any of the circumstances occurring while the Board of Directors conducts its activities, details including the date, session, and agenda of the board meeting, all opinions of the independent directors, and the Company’s responses to the independent directors’ opinions should be provided.
(1) Matters listed in Article 14-3 of the Securities and Exchange Act: Not applicable as the Bank has established an audit committee.
(2) In addition to matters above, other objections or qualified opinions from the independent directors to resolutions made by the Board of Directors on-record or in writing: None.
2. Details, including names of directors, resolutions, reasons for conflict of interest, and voting results, of circumstances where directors absented themselves due to conflict of interest:
The proposals in conflict of interest in 2018 are credit proposals, purchase proposals, renewal proposal of eTag co-brand card/e-Tag inside card, budget proposal of incentive bonus, review the list of directors and independent directors candidates, the list of the 4th remuneration committee candidates, proposal of increasing renting office area in The Mall, proposal of financial institution transaction amount, proposal of undertaking U.S. dollars to NT dollars swap trading, amendment to “Regulations for Incentive Bonus Distribution” / “Regulations for

Far Eastern International Bank
2018 Annual Report 43
Employees’ Compensation Distribution” / “Regulations for Directors’ Remuneration Distribution” / “Corporate Governance Principles”. When the proposals are in progress, the names of directors, resolutions, reasons for conflict of interest are stated, Chairperson Ching-Ing Hou, Vice Chairman Douglas Tong Hsu, Executive Director Shaw Y. Wang, Executive Director Tsung-Ming Chung, Director Humphrey Cheng, Director James Wu, Director Shi-Chun Hsu, Director Min-Teh Yu, Independent Director Hsiao Hui Wang, Independent Director Bing Shen, Independent Director Susan S. Chang were excused from discussion of the aforementioned proposals to avoid conflict of interest, and other directors in the meeting passed the proposals as stated.
3. Targets for strengthening the function of the board of directors in current year and the recent years and the evaluation of the execution:
(1) For strengthening the function of the board of directors, Rules of Procedure for Board of Directors Meetings of Far Eastern International Bank was established on February 23, 2005, and the eighth amendment was made on March 22, 2018.
(2) In order to prevent insider trading and ensure sound operation, Regulations Preventing Insider Trading of Far Eastern International Bank and Re-investment Business was established on December 31, 2009, and the second amendment was made on February 14, 2017.
(3) In order to establish sound corporate governance, independent director and executive director systems, Rules Governing the Scope of Powers of Independent Directors of Far Eastern International Bank and Rules Governing the Scope of Powers of Executive Directors of Far Eastern International Bank were established on May 27, 2010, and the first amendment of Rules Governing the Scope of Powers of Independent Directors was made on November 3, 2017.
(4) In accordance with Paragraph I of Article 14-6 of Securities and Exchange Act, Organizational Rules for the Remuneration Committee of Far Eastern International Bank and the remuneration committee were established on August 5, 2011, and the first amendment was made on May 7, 2015.
(5) In accordance with Paragraph I of Article 14-4 of Securities and Exchange Act, Organizational Rules for the Audit Committee of Far Eastern International Bank was established on May 5, 2015, the audit committee was established on June 16, 2015, and the first amendment was made on November 3, 2017.
(6) In order to strengthen corporate governance system, Corporate Governance Principles of Far Eastern International Bank was established on November 6, 2015, and the second amendment was made on November 2, 2018.
(7) In order to strengthen corporate governance effectiveness, Procedures for Performance Evaluation of the Board of Directors of Far Eastern International Bank was established on August 12, 2016, and the first amendment was made on March 22, 2018 and evaluated the operation in accordance with the procedures, and relevant information is disclosed on the Bank's website.

Far Eastern International Bank
2018 Annual Report 44
(2) Information on the Operation of Audit Committee
A. In accordance with Article 14-4 of Securities and Exchange Act, the audit committee is composed of the entire number of independent directors.
B. In accordance with Article 6 of Organizational Rules for the Audit Committee of Far Eastern International Bank, the authorities and responsibilities of the audit committee are as follows:
To establish or amend the company’s internal control policies pursuant to Article 14-1 of the Securities and Exchange Act.
To evaluate the effectiveness of internal control policies.
To pursuant to Article 36-1 of the Securities and Exchange Act, establish or amend procedures relating to asset acquisition/disposal, derivative transactions, and major financial conducts.
Matters concerning the personal interests of directors.
Major asset transactions or derivatives.
Offering, issuance, or private placement of securities with equity characteristics.
Appointment, dismissal, or compensation of the certifying CPAs.
Appointment and removal of the financial, accounting, or internal auditing officers.
Annual and semi-annual financial reports.
Other significant issues regulated by the Company or competent authorities.
C. The 1th Audit Committee convened 2 meetings in 2018, and the records of attendance by independent directors are shown as follows:
Title Name Attendance in
Person Attendance by Proxy
Actual Attendance Rate (%)
Remarks
Independent Director, Managing Director
Ben C. B. Chang 2 0 100% -
Independent Director Bing Shen 2 0 100% - Independent Director Susan S. Chang 2 0 100% -
D. The 2th Audit Committee convened 2 meetings in 2018, and the records of attendance by independent directors are shown as follows:
Title Name Attendance in
Person Attendance by Proxy
Actual Attendance Rate (%)
Remarks
Independent Director,Managing Director
Hsiao Hui Wang 2 0 100% -
Independent Director Bing Shen 2 0 100% - Independent Director Susan S. Chang 2 0 100% -
Other items of mandatory registration: 1. In the event of any of the circumstances occurring while the Audit Committee conducts its
activities, details including the date, session, and agenda of the board meeting, all resolutions of the Audit Committee, and the Company’s responses to the Audit Committee’s opinions should be provided. (1) Matters listed in Article 14-5 of the Securities and Exchange Act
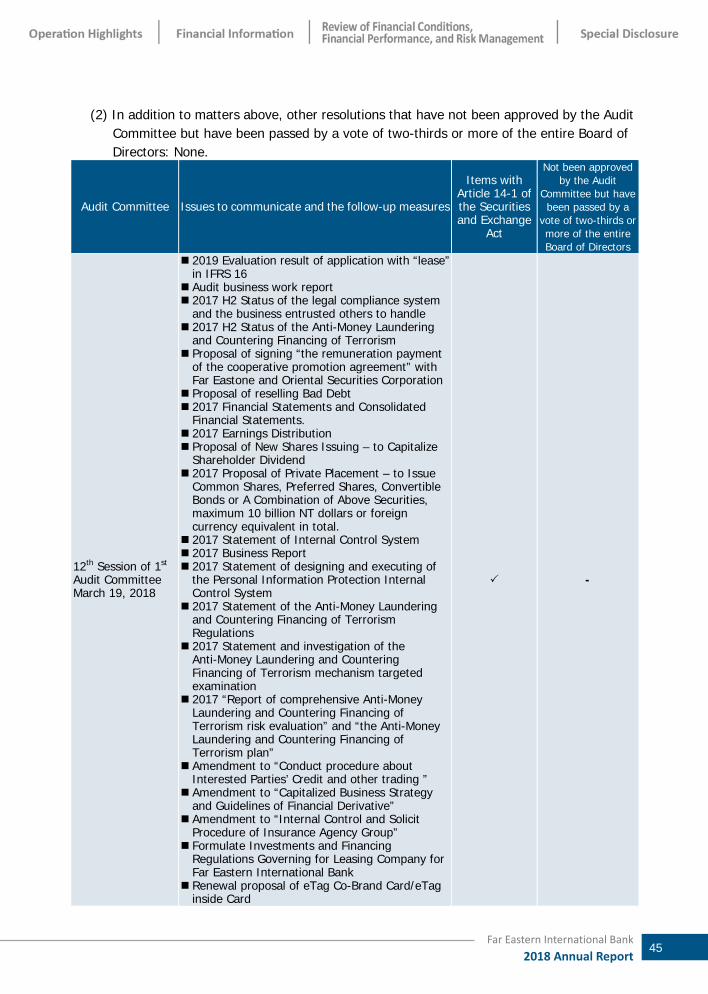
Far Eastern International Bank
2018 Annual Report 45
(2) In addition to matters above, other resolutions that have not been approved by the Audit Committee but have been passed by a vote of two-thirds or more of the entire Board of Directors: None.
Audit Committee Issues to communicate and the follow-up measures
Items with Article 14-1 of the Securities and Exchange
Act
Not been approved by the Audit
Committee but have been passed by a
vote of two-thirds or more of the entire Board of Directors
12th Session of 1st Audit Committee March 19, 2018
2019 Evaluation result of application with “lease” in IFRS 16
Audit business work report 2017 H2 Status of the legal compliance system
and the business entrusted others to handle 2017 H2 Status of the Anti-Money Laundering
and Countering Financing of Terrorism Proposal of signing “the remuneration payment
of the cooperative promotion agreement” with Far Eastone and Oriental Securities Corporation
Proposal of reselling Bad Debt 2017 Financial Statements and Consolidated
Financial Statements. 2017 Earnings Distribution Proposal of New Shares Issuing – to Capitalize
Shareholder Dividend 2017 Proposal of Private Placement – to Issue
Common Shares, Preferred Shares, Convertible Bonds or A Combination of Above Securities, maximum 10 billion NT dollars or foreign currency equivalent in total.
2017 Statement of Internal Control System 2017 Business Report 2017 Statement of designing and executing of
the Personal Information Protection Internal Control System
2017 Statement of the Anti-Money Laundering and Countering Financing of Terrorism Regulations
2017 Statement and investigation of the Anti-Money Laundering and Countering Financing of Terrorism mechanism targeted examination
2017 “Report of comprehensive Anti-Money Laundering and Countering Financing of Terrorism risk evaluation” and “the Anti-Money Laundering and Countering Financing of Terrorism plan”
Amendment to “Conduct procedure about Interested Parties’ Credit and other trading ”
Amendment to “Capitalized Business Strategy and Guidelines of Financial Derivative”
Amendment to “Internal Control and Solicit Procedure of Insurance Agency Group”
Formulate Investments and Financing Regulations Governing for Leasing Company for Far Eastern International Bank
Renewal proposal of eTag Co-Brand Card/eTag inside Card
-

Far Eastern International Bank
2018 Annual Report 46
Audit Committee Issues to communicate and the follow-up measures
Items with Article 14-1 of the Securities and Exchange
Act
Not been approved by the Audit
Committee but have been passed by a
vote of two-thirds or more of the entire Board of Directors
Sign “Consigned Trading of Foreign Securities contract”
Credit Proposal Result:The proposal was passed by a unanimous vote and no objection. Dealing with result of Audit Committee:None
13th Session of 1st Audit Committee May 07, 2018
2018 Consolidated Financial Statements for the three months Ended March 31
Audit business work report Procedure of Foreign Exchange Margin trading
business about understanding client and risk attribute investigation
Proposal of reselling Bad Debt Review the list of Directors and Independent
Directors Candidates Proposal of undertaking U.S. dollars to NT dollars
swap trading Amendment to “Regulations Governing the
Procedures to Evaluate Assets, set aside Loss Reserves, and handle Non-Performing Credit, Non-Accrual Loans and Bad Debt”
Purchase proposal Credit Proposal
-
Result:The proposal was passed by a unanimous vote and no objection. Dealing with result of Audit Committee:None
1st Session of 2nd Audit Committee August 10, 2018
Audit business work report 2018 H1 Status of the legal compliance system
and business entrusting others to handle 2018 H1 Status of the Anti-Money Laundering
and Countering Financing of Terrorism Proposal of reselling Bad Debt Submission of the company’s 2018 H1 Financial
Statements and Consolidated Financial Statements
Amendment to “Precautions of dealing with illegal, immoral and dishonest behavior report”
Amendment to “Enforcement Regulations Governing the legal compliance system”
Amendment to “Conduct Business Strategy and Guidelines of Financial Derivative”
Amendment to “Standard Specification of Internal Control System for Concurrently Operating Government Bonds Dealer”
Issued Mobile Credit Card Proposal of Hsinchu Jinguo Building’s Continued
disposal plan. Proposal of increasing renting office area in The
Mall Credit Proposal
-
Result:1.11th proposal (Credit Proposal):Add Credit Proposal available cash but not exceed the borrowers’ net value 2. Other Issues:The proposal was passed by a unanimous vote and no objection.

Far Eastern International Bank
2018 Annual Report 47
Audit Committee Issues to communicate and the follow-up measures
Items with Article 14-1 of the Securities and Exchange
Act
Not been approved by the Audit
Committee but have been passed by a
vote of two-thirds or more of the entire Board of Directors
Dealing with result of Audit Committee:The proposal was according to a unanimous vote and submitted to the board of directors.
2nd Session of 2nd Audit Committee November 01,2018
2018 Consolidated Financial Statements for the nine months Ended September 30
Audit business work report Proposal of reselling Bad Debt 2019 Internal Audit Plan Strengthen oversight of the Anti-Money
Laundering and Countering Financing of Terrorism
Risk evaluated report of the Anti-Money Laundering and Countering Financing of Terrorism for the Insurance Agency Business
Amendment to “Internal Control and Solicit Procedure of Insurance Agency Group for Far Eastern International Bank”
Amendment to “Corporate Governance Principles for Far Eastern International Bank”
Amendment to “ Regulations Governing of detecting operating risk”
Amendment to “Conduct Business Strategy and Guidelines of Financial Derivative”
Proposal of Financial institution transaction limit Credit Proposal
-
Result:The proposal was passed by a unanimous vote and no objection. Dealing with result of Audit Committee:None.
2. Details, including names of independent directors, resolutions, reasons for conflict of interest,
and voting results, of circumstances where independent directors absented themselves due to conflict of interest: The proposals in conflict of interest in 2018 are credit proposals, proposal of signing “the remuneration payment of the cooperative promotion agreement” with Far Eastone and Oriental Securities Corporation, the list of the 4th remuneration committee candidates, proposal of undertaking U.S. dollars to NT dollars swap trading, proposal of increasing renting office area in The Mall, proposal of financial institution transaction amount. When the proposals are in progress, the names of independent directors, resolutions, reasons for conflict of interest are stated, Independent Director Bing Shen and Independent Director Susan S. Chang were excused from discussion of the aforementioned proposals to avoid conflict of interest, and other independent directors in the meeting passed the proposals as stated.
3. Communications among Independent Directors and the Bank's Chief Auditor and CPA (1) Communication Methods of Independent Directors with the Chief Auditor and CPA:
i. The CPA fully communicates with the Independent Directors on the first half financial statement, annual financial statement, and annual audit planning.
ii. Internal auditors engage independent directors in yearly meetings to present internal audit reports and to discuss fully any major issues, which are summarized in the meeting minutes to the Board of Directors for report.

Far Eastern International Bank
2018 Annual Report 48
iii. The Audit Committee is composed of all members of independent directors, to which the chief auditor reports on a quarterly basis on the progress of ongoing audits.
(2) Outlines of communication by Independent Directors to the chief auditor and CPAs: i. Communication of Independent Directors with CPA
Date Highlights of Communication Result
The 12th meeting of the 1st Audit Committee held on March 19, 2018
CPA reported the results of auditing 2017 financial statements, and responded the questions from Independent Directors.
Noted
The 1st meeting of the 2nd Audit Committee held on August 10, 2018
CPA reported the results of auditing the second quarter of 2018 financial statements, and responded the questions from Independent Directors.
Conference between Board of Directors and CPAs on November 1, 2018
1. Significant audit risk for auditing 2018 financial statements.
2. Key audit matters for auditing 2018 financial statements.
3. Audit planning for auditing 2018 financial statements.
The 3rd meeting of the 2nd Audit Committee held on March 7, 2019
CPA reported the results of auditing 2018 financial statements, and responded the questions from Independent Directors.
ii. Communication between independent directors and auditors:
Date Highlights of Communication Result March 19, 2018 The 12th meeting of the 1st Audit Committee March 21, 2018 The 15th meeting of the 9th Board of Directors
Audit report for the fourth quarter of 2017
Noted
May 7, 2018 The 13th meeting of the 1st Audit Committee May 7, 2018 The 16th meeting of the 9th Board of Directors
Audit report for the first quarter of 2018
August 10, 2018 The 1st meeting of the 2nd Audit Committee August 14, 2018 The 2nd meeting of the 10th Board of Directors
Audit report for the second quarter of 2018
November 1, 2018 The 2nd meeting of the 2nd Audit Committee November 2, 2018 The 3rd meeting of the 10th Board of Directors
1. Audit report for the third quarter of 2018
2. 2019 Audit Plan
November 2, 2018 Talks between the independent directors and auditors
1. Correction of 2018 audit comment by FSC
2. 2018 major audit comment and material adverse event
3. 2018 major penalty cases fined by FSC
(3) Items to be disclosed according to the Corporate Governance Best-Practice Principles for the Banking Industry
Please refer to the Bank’s webs7ite: https://www.feib.com.tw/ and http://mops.twse.com.tw/

Far Eastern International Bank
2018 Annual Report 49
(4) FEIB Corporate Governance Implementation Status and Deviations
Evaluation Item
Implementation Status Deviations, from “Corporate Governance
Best-Practices for Banks” and Reasons
Yes No Abstract Illustration
1. Shareholding structure and shareholders’ interest (1) Does the Bank establish an
internal operating procedure to deal with shareholders’ suggestions, doubts, disputes and litigations, and implement based on the procedure?
(2) Does the Bank possess the list of its major shareholders as well as the ultimate owners of those shares?
(3) Does the Bank establish
and execute risk management and firewall mechanisms within affiliated businesses?
The Bank has enacted "Corporate
Governance Principle" which included a chapter of "Protecting Shareholders' Rights". Accordingly, the Bank has spokesperson, acting spokesperson, and stock agency "Oriented Securities Co., Ltd" to handle related issues and suggestions of shareholder. If any legal issue is involved, it will pass to the Legal Compliance Department.
The Bank has a clear list of the major shareholders and their ultimate control entities, and declares the transaction information in accordance with relevant laws and regulations.
Risk control of the bank and its related companies complied with Banking Act, and monitored by the system set by risk management department. According to Banking Act, lending to stakeholder or the same concerned party should have full guarantee, credit limit, conditions, credit approval procedures and norm.
The Bank formulated “FEIB's procedures for handling credit and other transactions with stakeholder”. “Acquisition and Disposal Asset Handling Guidelines” is in accordance when dealing with related companies. Risk cost management and firewall has been properly established between FEIB and related companies.
None
2. Composition and Responsibilities of the Board of Directors (1) Does the Bank voluntarily
establish other functional committees in addition to the Remuneration Committee and the Audit Committee?
(2) Does the Bank regularly
The Bank has Personnel Review
Committee, Remuneration Committee and Audit Committee.
Audit committee is established on June 16,2015. "Organization Rules for the Audit Committee" was formulated which is based on Article 14(4) of the Securities Exchange Act and Article 3 of the “Regulations Governing the Exercise of Powers by Audit Committees of Public Companies”. Audit committee meetings were held four times in the 2018.
The Bank regularly evaluated the
None

Far Eastern International Bank
2018 Annual Report 50
Evaluation Item
Implementation Status Deviations, from “Corporate Governance
Best-Practices for Banks” and Reasons
Yes No Abstract Illustration
evaluate the independence of CPAs?
(3) Does the Board of
independence of certified public accountants every year which based on No.10 Bulletin of Code of Professional Ethics for Certified Public Accountant of the Republic of China and Article 27, Item 5 of the Guidelines for the Bank's Corporate Governance.
This year assessments are as follows: 1. At last audit, no violations of the
Bank for seven years did not replace the CPA.
2. At last audit, CPA received no punishment of violations.
3. Members of the audit team and their spouses and dependents are not involved in the following: a. Directly or indirectly hold
significant financial interests in the Bank.
b. Have business relations with our Bank or directors and managerial officers at the Bank, where such relations may affect their independence
4. During the audit, members of the audit team, their spouses and dependents do not serve as directors or managerial officers at the Bank or do not assume positions that may directly and significantly affect the auditing process.
5. Members of the audit team do not have spouses, immediate family members or relatives within the second degree of kinship who serve as directors or managerial officers at the Bank.
6. Members of the audit team have not received gifts or presents of significant value (where their values have not exceeded the general etiquette standards) from our Bank or directors, managerial officers or major shareholders at the Bank.
The Statement of Independence has been issued by the CPA, and the result has been approved by the 4th Board of Directors of the 10th term. After evaluation, the CPA is in accordance with the independence standards of the Bank.
The Bank has enacted "Corporate

Far Eastern International Bank
2018 Annual Report 51
Evaluation Item
Implementation Status Deviations, from “Corporate Governance
Best-Practices for Banks” and Reasons
Yes No Abstract Illustration
Directors make diversifying guidelines for member composition and implement them precisely?
Governance Principle" and has a policy of diversifying board members in Chapter 4 “Enhancing the Functions of the Board of Directors”. Among the 10th directors, the proportion of independent directors is 27%, the proportion of female directors is 27%. The term of independent directors less than 3 years is 1 person, the term of independent directors in 4-6 years is 1 person, and the term of independent directors over 6 years is 1 person. 5 directors are over 70 years old, 5 directors are 60 to 70 years old, and 1 director is under 60 years old. The Bank focused on the gender equality of the composition of the board of directors. The current female directors increased by one seat from the previous session, achieving the goal of exceeding 25% of the board of directors for each gender. The professional knowledge, skills and capabilities of each director refer to table one.
3. A TWSE/TPEx listed bank may set up a full- (or part-) time corporate governance unit or personnel to be in charge of corporate governance affairs (including but not limited Furnishing information required for business execution by directors and supervisors, handling matters relating to board meetings and shareholders meetings according to laws, handling corporate registration and amendment registration and producing minutes of board meetings and shareholders meetings)?
The board passed the resolution on November 3, 2017 to assign Lin Jian-Zhong, the Chief Executive Vice President, as the head of corporate governance to supervising the implementation of the corporate governance of the Bank. The administrative department as a part-time unit of corporate governance, handling matters relating to board meetings and shareholders meetings according to laws, producing minutes of board meetings and shareholders meetings, assisting in onboarding and continuous development of directors, furnishing information required for business execution by directors, assisting directors with legal compliance, and other matters set out in the articles or corporation or contracts.
The status of Corporate Governance implementation as follow: 1. Shareholder meeting: ‐ Registering the date of
shareholder meeting under regulation
‐ Uploading the notice and handbook of the meeting on 30
None

Far Eastern International Bank
2018 Annual Report 52
Evaluation Item
Implementation Status Deviations, from “Corporate Governance
Best-Practices for Banks” and Reasons
Yes No Abstract Illustration
days before the meeting.‐ Uploading the minutes to the
MOPS within 20 days after the meeting
2. Board Meeting, Managing Director Meeting, and Audit Committee Meeting:
‐ Providing the needed information to directors, managing directors and audit committees.
‐ Providing notices and agendas of the meeting on 7 days before the meeting
‐ Providing the minute within 20 days after the meeting.
‐ Consolidating the resolutions and speeches of the meeting
‐ Tracking the follow-up implementation status and report to the chairman's office.
3. Assisting in onboarding of the 10th directors and providing the information of training courses.
4. Providing compliance brochure for directors/ independent directors of TWSE, directions concerning securities market regulatory matters for TWSE listed companies and their directors, and major shareholders. Disseminating the regulation of interested party in Article 32, 33 of the Banking Act semiannually.
5. Handling company’s change registration when amendment of article of incorporation or transferring capital to issue new shares.
6. Evaluating the operation in accordance with “Board Performance Evaluation Method” of the Bank, and relevant information is also disclosed on the Bank's website.
4. Does the Bank established communication channels for stakeholders (including but not limited to shareholders, employees, and customers)?
The Bank has set up the “Stakeholder Zone” on the company's website, which is divided different channels for investors, customers, suppliers, employees and community members/non-profit organizations. Contact person and methods are also available on the website if needed.
None

Far Eastern International Bank
2018 Annual Report 53
Evaluation Item
Implementation Status Deviations, from “Corporate Governance
Best-Practices for Banks” and Reasons
Yes No Abstract Illustration
5. Information Disclosure (1) Does the Bank have a
corporate website to disclose both financial standings and the status of corporate governance?
(2) Does the Bank have other information disclosure channels (e.g. building an English website, appointing designated people to handle information collection and disclosure, creating a spokesman system, webcasting investor conferences)?
The bank disclosed the relevant
information on the website.
The bank set up English website. Designated employee is responsible to collect and disclosure company information. The information and video record of investor conference is posted on the website.
None
6. Is there other important information to facilitate a better understanding of the Bank’s corporate governance practices (including but not limited to employee rights and interests, employee care, investor relations, rights and interests of interested parties, records of training for directors and supervisors, implementation of risk management policy and risk evaluation criteria, implementation of customer relations policy, purchases of professional indemnity insurance for directors and supervisors, and donations to political parties, stakeholders, and charitable groups)?
Employee rights and employee wellness: Please refer to the “ Employee Behavior and Ethics Standards” section on pages 118-120, and “Labor Relations” section on pages 123-125 of this annual report.
CSR: Referred to page 120-121
Investor Relations The bank not only has specialist employee to responsible for investor's suggestion, doubts or disputes, but also has spokesperson, acting spokesperson, and stock agency "Oriented Security Co., Ltd" to handle related issues and suggestions of shareholder. Orientation will be held if needed.
Stakeholder rights: The Bank's disclose their financial, business-related corporate governance information on the website for stakeholders. Both Chinese and English information are available on MOPS for foreign investors.
Directors' training: The directors irregularly attended training courses which in accordance with “Directions for the Implementation of Continuing Education for Directors and Supervisors of TWSE Listed and TPEx Listed Companies” issued by the Taiwan Stock Exchange Co., Ltd.
Risk management policy and risk measurement standard: In addition to the strict control of the
None

Far Eastern International Bank
2018 Annual Report 54
Evaluation Item
Implementation Status Deviations, from “Corporate Governance
Best-Practices for Banks” and Reasons
Yes No Abstract Illustration
risk management department, the credit granting cases are handled in accordance with the law, and the risk management policy is detailed in the risk management disclosure on page 145.
The Bank also has a special person to handle the customer complaint line to protect consumers or customers; the spokesperson regularly and irregularly hold briefings for legal persons and media
Liability insurance purchased for directors: The Bank insures liability insurance for all directors to reduce the legal risks and financial risks of the directors and to protect against possible damages caused by the execution of duties.
Donations to political parties, stakeholder and charities: ‐ Donated to NT$3,000,000 to
Hualien County Government for 0206 Earthquake recovering
‐ Donated NT$1,871,342 to Eden Social Welfare Foundation (rebate of Eden Love Credit Card)
‐ Sponsoring NT$72,394 to the "Green Belt and Sidewalk" project of Dunhua South Road in front of THE MALL. The relevant information has been disclosed on the Bank's website.
7. Please describe the status of improvement already made based on the results of the Corporate Governance Evaluation System released by the Taiwan Stock Exchange Corporate Governance Center in the most recent year, as well as priority matters and measures in areas where improvement has yet to be made:
Improvement of Corporate Governance Assessment in 2018 1. The Bank revised the “Articles of Incorporation” on the 15th board meeting on March 21, 2018.
The revision included stock dividend distribution ratio. And the dividend policy was disclosed in the 2017 annual report.
2. The Bank has established a policy of diversity of board members. According to the assessment requirement, the policy detail is disclosed in 2017 annual report and the Bank's website.
3. The Bank introduced the greenhouse gas examination (ISO 14064-1) in 2018, and acquired the ISO 14064-1:2006 certification. The implementation status was disclosed on the Bank's website.
Priority matters and measures: 1. The bank has established Audit Committee in June 16, 2015. According to the assessment
requirement, and operation status and key emphasis in work is detailed disclosed in 2018 annual report and the bank’s website.
2. The bank has established Remuneration Committee in August 5, 2011. According to the assessment requirement, the discussion and resolutions in the committee meeting, and comment from the bank are disclosed in 2018 annual report and the bank’s website.

55 Far Easte
rn In
tern
ation
al Ban
k
20
18 A
nn
ua
l Re
po
rt
Table 1: Board Membership Diversification Policy and Results
Name Gender
Professional knowledge and skills Ability
Professional background
Professional qualifications
Financial industry
experience
Operationaljudgement
analysis of Accounting
and financial
Operationalmanagement
Risk Management
crisis management
Industrialknow-how
Internationalprospective
Leadership &decision-making
Ching-Ing Hou Female Finance Bank / Finance Professor v v v v v v v v v
Douglas Tong Hsu Male Operating v v v v v v v v vShaw Y. Wang Male Operating v v v v v v v v vTsung-Ming
Chung Male Technology Accountant v v v v v v v v v
Humphrey Cheng Male Operating Law v v v v v v v v vJames Wu Male Finance Law v v v v v v v v v
Shi-Chun Hsu Male management Business
management professor
v v v v v v v v v
Min-Teh Yu Male Finance Financial professor v v v v v v v v v
Hsiao Hui Wang Female accounting Accountant v v v v v v v v
Bing Shen Male Finance v v v v v v v v vSusan S. Chang Female Finance v v v v v v v v v
Table 2: Directors and Independent Director Training Status
Title Name Date elected
Training Date Organizer Courses HoursStart End
Chairperson Ching-Ing Hou Jun 20,2018
Oct 04,2018 Oct 04,2018 Wbcsd global network partner Corporate Social Responsibility and Trade Linkage - Sustainable Supply Chain Management 3
Jul 24,2018 Jul 24,2018 Taiwan Academy of Banking andFinance
Board Operations and CorporateGovernance 3
Vice Chairman Douglas Tong Hsu Jun 20,2018
Dec 24,2018 Dec 24,2018 Taiwan Academy of Banking andFinance
Board Operations and CorporateGovernance 3
Jul 24,2018 Jul 24,2018 Taiwan Academy of Banking andFinance
Board Operations and CorporateGovernance 3
Executive Director
Shaw Y. Wang Jun 20,2018
Dec 24,2018 Dec 24,2018 Taiwan Academy of Banking andFinance
Board Operations and CorporateGovernance 3
Jul 24,2018 Jul 24,2018 Taiwan Academy of Banking andFinance
Board Operations and CorporateGovernance 3
Executive Director
Tsung-Ming Chung Jun 20,2018
Dec 24,2018 Dec 24,2018 Taiwan Academy of Banking andFinance
Board Operations and CorporateGovernance 3
Jul 24,2018 Jul 24,2018 Taiwan Academy of Banking andFinance
Board Operations and CorporateGovernance 3

56
Far Eastern In
tern
ation
al Ban
k
20
18 A
nn
ua
l Re
po
rt
Title Name Date elected
Training Date Organizer Courses HoursStart End
Director Humphrey Cheng Jun 20,2018
Dec 24,2018 Dec 24,2018 Taiwan Academy of Banking andFinance
Board Operations and Corporate Governance 3
Jul 24,2018 Jul 24,2018 Taiwan Academy of Banking andFinance
Board Operations and Corporate Governance 3
Director James Wu Jun 20,2018 Dec 24,2018 Dec 24,2018 Taiwan Academy of Banking and
FinanceBoard Operations and Corporate Governance 3
Jul 24,2018 Jul 24,2018 Taiwan Academy of Banking andFinance
Board Operations and Corporate Governance 3
Director Shi-Chun Hsu Jun 20,2018
Oct 02,2018 Oct 02,2018 Taiwan Corporate GovernanceAssociation Issue And Unfinished Business of Company Act 3
Jul 03,2018 Jul 03,2018 Taiwan Institute of Directors 2018 Annual Forum of Taiwan Institute of Directors 3
Jul 03,2018 Jul 03,2018 Taiwan Institute of Directors 2018 Board of Directors Annual Forum Banquet- Facing theNew Global Economic and Trade Map,Taiwan in Transition 3
Director Min-Teh Yu Jun 20,2018
Dec 24,2018 Dec 24,2018 Taiwan Academy of Banking andFinance Board Operations and Corporate Governance 3
Oct 31,2018 Oct 31,2018 Taiwan Corporate GovernanceAssociation Latest revision trend and analysis of Company Act 3
Oct 31,2018 Oct 31,2018 Taiwan Corporate GovernanceAssociation Response of anti-tax avoidance policies and measures 3
Independent Director,
Managing Director
Hsiao Hui Wang Jun 20,2018
Dec 24,2018 Dec 24,2018 Taiwan Academy of Banking andFinance Board Operations and Corporate Governance 3
Nov 30,2018 Nov 30,2018 Taiwan Corporate GovernanceAssociation
Director Responsibility and Risk Management under the Latest Corporate Governance Blueprint 3
Nov 09,2018 Nov 09,2018 Taiwan Corporate GovernanceAssociation
A course for the directors and supervisors-Analysis of business operating risks 3
Jul 04,2018 Jul 24,2018 Taiwan Academy of Banking andFinance Board Operations and Corporate Governance 3
Independent Director Bing Shen Jun 20,2018
Aug 03,2018 Aug 03,2018 Taiwan Corporate GovernanceAssociation
Enterprise's anti-corruption and security propaganda from the evolution of bitcoin 3
May 08,2018 May 08,2018 Taiwan Stock Exchange Corporation
Listed company's new corporate governance blueprint summit forum 3
May 04,2018 May 04,2018 Taiwan Institute for Sustainable Energy
Sustainable development and strategy of engineering service industry 3
Independent Director
Susan S. Chang Jun 20,2018
Oct 15,2018 Oct 15,2018 Financial Supervisory Commission The 12th Taipei Corporate Governance Forum 6
Jul 24,2018 Jul 24,2018 Taiwan Academy of Banking andFinance Board Operations and Corporate Governance 3

Far Eastern International Bank
2018 Annual Report 57
(5)Composition, Responsibilities and Operations of the Remuneration Committee
A.Composition of the Remuneration Committee:
Professional Qualifications and Independence Analysis of Remuneration Committee Members
Title
Criteria Name
Meets One of the Following Professional Qualification Requirements, Together with
at Least Five Years’ Work Experience
Independence Criteria (Note)
Number of Other Public Companies in
Which the Individual is Concurrently Serving as an Remuneration
Committee Member
Remarks
An instructor or higher position in a department of commerce, law, finance, accounting, or other academic department related to the business needs of the Bank in a public or private junior college, college or university
A judge, public prosecutor, attorney, Certified Public Accountant, or other professional or technical specialist who has passed a national examination and been awarded a certificate in a profession necessary for the business of the Bank
Has work experience in the areas of commerce, law, finance, or accounting, or otherwise necessary for the business of the Bank
1 2 3 4 5 6 7 8
Independent Director
Hsiao Hui Wang - V V V V V V V V V V 1 -
Independent Director Bing Shen - - V V V V V V V V V 2 -
others Patrick P. Y. Wu - - V V V V V V V V V 0 -
Note: Please tick the corresponding boxes that apply to a member during the two years prior to being elected or during the term(s) of office. 1. Not an employee of the Bank or any of its affiliates. 2. Not a director or supervisor of affiliated companies. Not applicable in cases where the person is an independent
director of the parent company, or any subsidiary as appointed in accordance with the Act or with the laws of the country of the parent or subsidiary.
3. Not a natural-person shareholder who holds shares, together with those held by the person’s spouse, minor children, or held by the person under others’ names, in an aggregate amount of 1% or more of the total number of outstanding shares of the Bank, or ranking in the top 10 in holdings.
4. Not a spouse, relative within the second degree of kinship, or lineal relative within the third degree of kinship, of any of the persons in the preceding three sub-paragraphs.
5. Not a director, supervisor, or employee of a corporate shareholder who directly holds 5% or more of the total number of outstanding shares of the Bank, or who holds shares ranking in the top five holdings.
6. Not a director, supervisor, officer, or shareholder holding 5% or more of the shares of a specified company or institution which has a financial or business relationship with the Bank.
7. Not a professional individual, who is an owner, partner, director, supervisor, or officer of a sole proprietorship, partnership, company, or institution that provides commercial, legal, financial, accounting services or consultation to the Bank or to any affiliate of the Bank, or a spouse thereof.
8. Not a person of any conditions defined in Article 30 of the company Law.
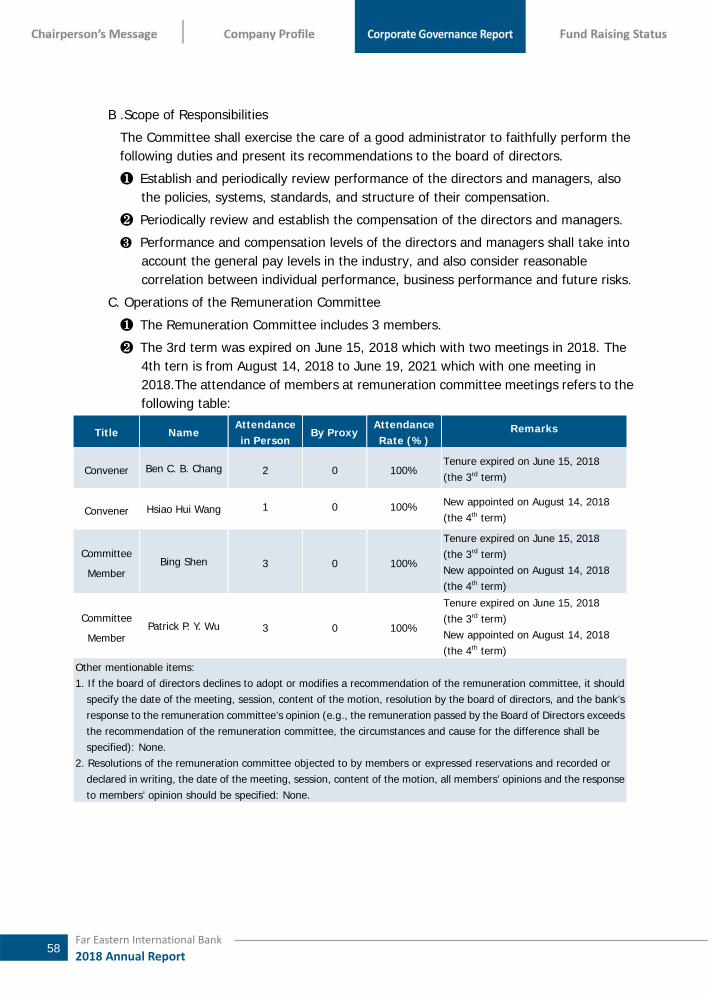
Far Eastern International Bank
2018 Annual Report 58
B .Scope of Responsibilities
The Committee shall exercise the care of a good administrator to faithfully perform the following duties and present its recommendations to the board of directors.
❶ Establish and periodically review performance of the directors and managers, also the policies, systems, standards, and structure of their compensation.
❷ Periodically review and establish the compensation of the directors and managers.
❸ Performance and compensation levels of the directors and managers shall take into account the general pay levels in the industry, and also consider reasonable correlation between individual performance, business performance and future risks.
C. Operations of the Remuneration Committee
❶ The Remuneration Committee includes 3 members.
❷ The 3rd term was expired on June 15, 2018 which with two meetings in 2018. The 4th tern is from August 14, 2018 to June 19, 2021 which with one meeting in 2018.The attendance of members at remuneration committee meetings refers to the following table:
Title Name Attendance in Person
By ProxyAttendance Rate (%)
Remarks
Convener Ben C. B. Chang 2 0 100% Tenure expired on June 15, 2018 (the 3rd term)
Convener Hsiao Hui Wang 1 0 100% New appointed on August 14, 2018 (the 4th term)
Committee
Member Bing Shen 3 0 100%
Tenure expired on June 15, 2018 (the 3rd term) New appointed on August 14, 2018 (the 4th term)
Committee
Member Patrick P. Y. Wu 3 0 100%
Tenure expired on June 15, 2018 (the 3rd term) New appointed on August 14, 2018 (the 4th term)
Other mentionable items: 1. If the board of directors declines to adopt or modifies a recommendation of the remuneration committee, it should
specify the date of the meeting, session, content of the motion, resolution by the board of directors, and the bank’s response to the remuneration committee’s opinion (e.g., the remuneration passed by the Board of Directors exceeds the recommendation of the remuneration committee, the circumstances and cause for the difference shall be specified): None.
2. Resolutions of the remuneration committee objected to by members or expressed reservations and recorded or declared in writing, the date of the meeting, session, content of the motion, all members’ opinions and the response to members’ opinion should be specified: None.

Far Eastern International Bank
2018 Annual Report 59
❸ The Remuneration Committee convened three meetings in 2018 with an attendance rate of 100% for each member. The agenda refers to the following table:
The Remuneration
Committee Issue Result The Follow-Up Measures
the 9th meeting of the 3rd term
February 27, 2018
1.Contributions for Employees’ and Directors’ Remuneration of 2017
2.Budget for Performance Bonus of2017
3.Allocation Guidelines for Employees’ remuneration and Performance Bonus
The proposals were passed by all members of the Remuneration Committee.
The proposals were approved by all members of the Board of Directors.
the 10th meeting of the 3rd term April 19, 2018
1.Allocation Guidelines for Directors’ Remuneration
2.Allocation Guidelines for Performance Bonus
3.Standard Table of Salaries
The proposals were passed by all members of the Remuneration Committee.
The proposals were approved by all members of the Board of Directors.
the 1st meeting of the 4th term
October 18, 2018
Business Units’ Implementation Schemes of Incentives of 2019
Except for some parts of Individual Banking Business Unit should be revised. The proposal was passed by all members of the Remuneration Committee.
The proposal was revised as the Remuneration Committee’s opinions and approved by all members of the Board of Directors.
(6) Corporate Social Responsibility
Evaluation Item
Implementation Status Deviations from “the Corporate Social Responsibility
Best-Practice Principles for TWSE/TPEx Listed
Companies” and Reasons
Yes No Abstract Illustration
1. Corporate Governance Implementation (1) Does the bank declare its
corporate social responsibility policy and examine the results of the implementation?
For practicing corporate social responsibility, promoting the balance of economic and society, protecting environmental ecology and being sustainable development, the bank formulate “Corporate Social Responsibility Best Practice Principles of Far Eastern International Commercial Bank Co., Ltd.” in 2015. And each department promotes the corporate social responsibility according to their duty under this principle
None
(2) Does the bank provide educational training on corporate social responsibility on a regular basis?
Directors and managers of the bank regularly attended corporate governance educational and training programs.
(3) Does the bank establish exclusively (or concurrently) dedicated first-line managers authorized by the board to be in charge of proposing the corporate social responsibility policies and reporting to the board?
The Bank's corporate social responsibility was handled part-time by the Public Affairs unit of the Administrative Management Department. The Corporate Social Responsibility Committee was officially operated at the end of 103. It is an inter-departmental organization composed of middle and high-level managers of all units, responsible for compiling corporate social responsibility reports and so on. “Corporate Social Responsibility Best Practice Principles of Far Eastern International Commercial Bank Co., Ltd.” has been formulated and approved by the board of directors. The CSR committee meeting

Far Eastern International Bank
2018 Annual Report 60
Evaluation Item
Implementation Status Deviations from “the Corporate Social Responsibility
Best-Practice Principles for TWSE/TPEx Listed
Companies” and Reasons
Yes No Abstract Illustration
is held annually to continue reviewing the status and implementation effect of the Bank's corporate social responsibility policy. The concept of sustainability is passed to all colleagues through the direct participation and continuous communication of the committee. So that the policies and actions of corporate social responsibility are gradually integrated into the operating system. Furthermore, The CSR implementation status is reported to the senior management and the board of directors annually.
(4) Does the bank declare a reasonable salary remuneration policy, and integrate the employee performance appraisal system with its corporate social responsibility policy, as well as establish an effective reward and disciplinary system?
The remuneration policy is determined by the board of directors after discussed by the remuneration committee. It takes into account pay level in the industry, business performance and future risks. The remuneration committee gives suggestions to the board of directors after periodically reviewing. In addition, the bank calculates each employee’s bonus in accordance with business performance, individual performance, and potential. Employee performance appraisal is implemented fairly, and helps those poor performance employees to reach goals by Performance Improvement Plan. Also, cases of rewards and disciplinary sanctions are discussed and resolved by Personnel Review Committee based on “Codes of Rewards and Disciplinary Sanctions”.
2. Sustainable Environment Development (1) Does the bank endeavor
to utilize all resources more efficiently and use renewable materials which have low impact on the environment?
The Bank is improving the efficiency of all resources as follows:
1. Launched E-Learning platform to replace the traditional classroom training. It can reduce the transportation time, the air pollution and carbon emission from the traffic, and also the waste of paper.
2. Promoted paperless operations in the office and branch, such as: adopting electronic document system, electronic workflows, and etc. The bank also optimizes its digital platforms to continuously increase its usage rate. Due to that, the clients will more willing to use the platform instead of going to branch in person, it will reduce the carbon footprint and paper use for operation of the branch.
3. Replaced high-energy-consuming devices year by year, and purchases green energy products with energy saving, green building material, environmental protection and water saving certification logos. The amount on Green procurement of 2018 was 1.6 million, and it was 1.4 times higher than 2017. In this year, the bank received public recognition from the Taipei Environmental Protection Bureau as “Green Procurement Standard Unit of 2018”.
4. Popularized waste separation and reduction, resources recycling, energy conservation and carbon reduction.
None
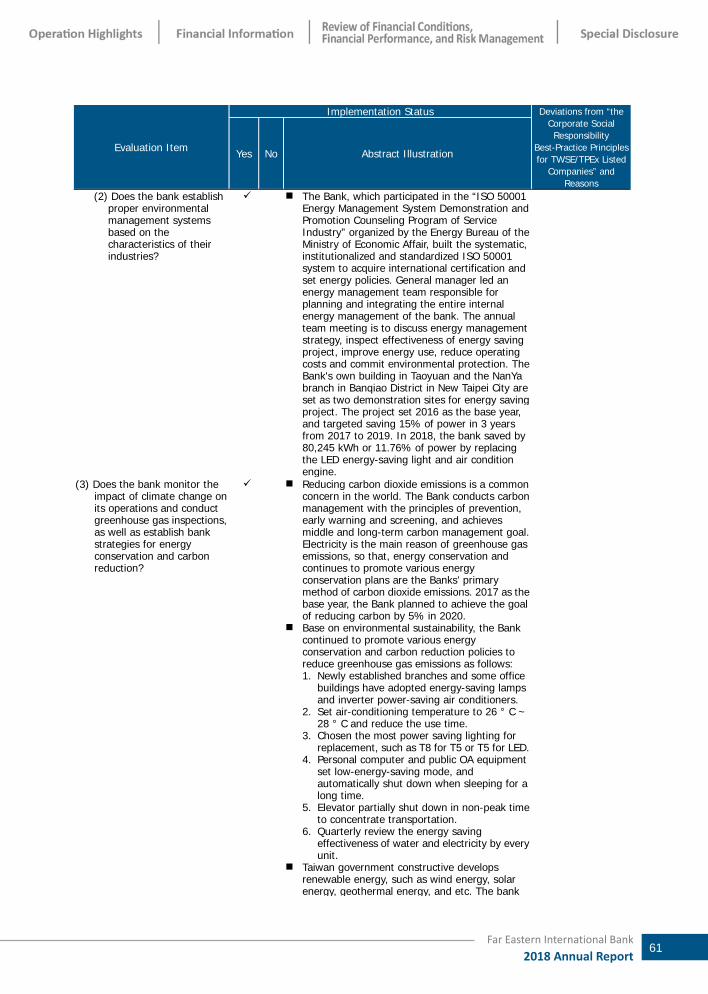
Far Eastern International Bank
2018 Annual Report 61
Evaluation Item
Implementation Status Deviations from “the Corporate Social Responsibility
Best-Practice Principles for TWSE/TPEx Listed
Companies” and Reasons
Yes No Abstract Illustration
(2) Does the bank establish proper environmental management systems based on the characteristics of their industries?
The Bank, which participated in the “ISO 50001 Energy Management System Demonstration and Promotion Counseling Program of Service Industry” organized by the Energy Bureau of the Ministry of Economic Affair, built the systematic, institutionalized and standardized ISO 50001 system to acquire international certification and set energy policies. General manager led an energy management team responsible for planning and integrating the entire internal energy management of the bank. The annual team meeting is to discuss energy management strategy, inspect effectiveness of energy saving project, improve energy use, reduce operating costs and commit environmental protection. The Bank's own building in Taoyuan and the NanYa branch in Banqiao District in New Taipei City are set as two demonstration sites for energy saving project. The project set 2016 as the base year, and targeted saving 15% of power in 3 years from 2017 to 2019. In 2018, the bank saved by 80,245 kWh or 11.76% of power by replacing the LED energy-saving light and air condition engine.
(3) Does the bank monitor the impact of climate change on its operations and conduct greenhouse gas inspections, as well as establish bank strategies for energy conservation and carbon reduction?
Reducing carbon dioxide emissions is a common concern in the world. The Bank conducts carbon management with the principles of prevention, early warning and screening, and achieves middle and long-term carbon management goal. Electricity is the main reason of greenhouse gas emissions, so that, energy conservation and continues to promote various energy conservation plans are the Banks’ primary method of carbon dioxide emissions. 2017 as the base year, the Bank planned to achieve the goal of reducing carbon by 5% in 2020.
Base on environmental sustainability, the Bank continued to promote various energy conservation and carbon reduction policies to reduce greenhouse gas emissions as follows: 1. Newly established branches and some office
buildings have adopted energy-saving lamps and inverter power-saving air conditioners.
2. Set air-conditioning temperature to 26 ° C ~ 28 ° C and reduce the use time.
3. Chosen the most power saving lighting for replacement, such as T8 for T5 or T5 for LED.
4. Personal computer and public OA equipment set low-energy-saving mode, and automatically shut down when sleeping for a long time.
5. Elevator partially shut down in non-peak time to concentrate transportation.
6. Quarterly review the energy saving effectiveness of water and electricity by every unit.
Taiwan government constructive develops renewable energy, such as wind energy, solar energy, geothermal energy, and etc. The bank
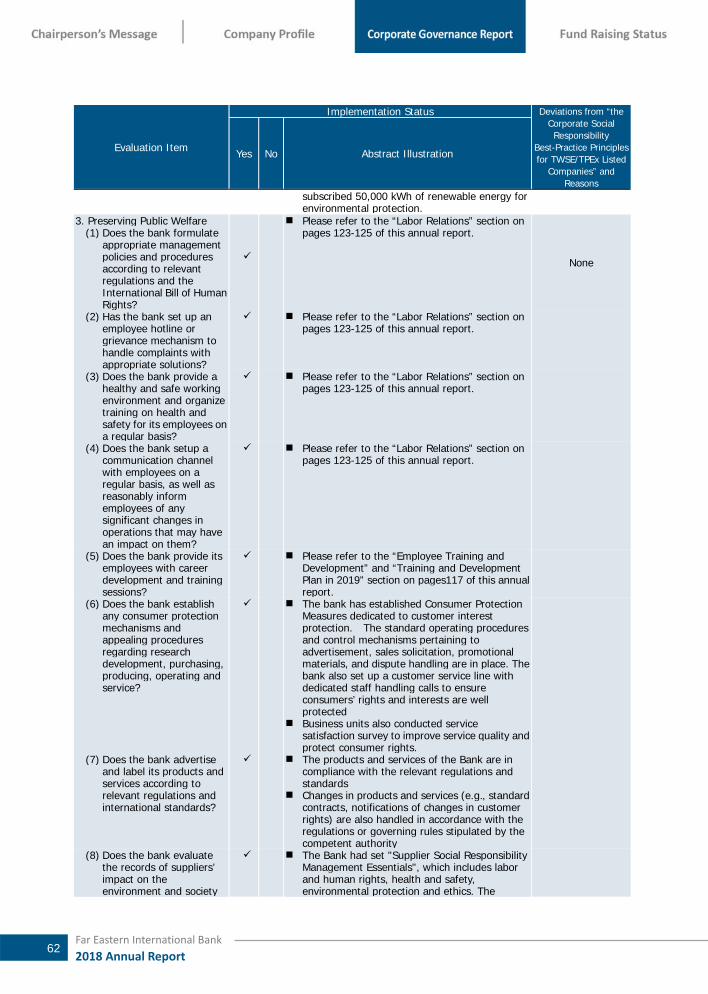
Far Eastern International Bank
2018 Annual Report 62
Evaluation Item
Implementation Status Deviations from “the Corporate Social Responsibility
Best-Practice Principles for TWSE/TPEx Listed
Companies” and Reasons
Yes No Abstract Illustration
subscribed 50,000 kWh of renewable energy for environmental protection.
3. Preserving Public Welfare(1) Does the bank formulate
appropriate management policies and procedures according to relevant regulations and the International Bill of Human Rights?
Please refer to the “Labor Relations” section on pages 123-125 of this annual report.
None
(2) Has the bank set up an employee hotline or grievance mechanism to handle complaints with appropriate solutions?
Please refer to the “Labor Relations” section on pages 123-125 of this annual report.
(3) Does the bank provide a healthy and safe working environment and organize training on health and safety for its employees on a regular basis?
Please refer to the “Labor Relations” section on pages 123-125 of this annual report.
(4) Does the bank setup a communication channel with employees on a regular basis, as well as reasonably inform employees of any significant changes in operations that may have an impact on them?
Please refer to the “Labor Relations” section on pages 123-125 of this annual report.
(5) Does the bank provide its employees with career development and training sessions?
Please refer to the “Employee Training and Development” and “Training and Development Plan in 2019” section on pages117 of this annual report.
(6) Does the bank establish any consumer protection mechanisms and appealing procedures regarding research development, purchasing, producing, operating and service?
The bank has established Consumer Protection Measures dedicated to customer interest protection. The standard operating procedures and control mechanisms pertaining to advertisement, sales solicitation, promotional materials, and dispute handling are in place. The bank also set up a customer service line with dedicated staff handling calls to ensure consumers’ rights and interests are well protected
Business units also conducted service satisfaction survey to improve service quality and protect consumer rights.
(7) Does the bank advertise and label its products and services according to relevant regulations and international standards?
The products and services of the Bank are in compliance with the relevant regulations and standards
Changes in products and services (e.g., standard contracts, notifications of changes in customer rights) are also handled in accordance with the regulations or governing rules stipulated by the competent authority
(8) Does the bank evaluate the records of suppliers’ impact on the environment and society
The Bank had set "Supplier Social Responsibility Management Essentials", which includes labor and human rights, health and safety, environmental protection and ethics. The

Far Eastern International Bank
2018 Annual Report 63
Evaluation Item
Implementation Status Deviations from “the Corporate Social Responsibility
Best-Practice Principles for TWSE/TPEx Listed
Companies” and Reasons
Yes No Abstract Illustration
before taking on business partnerships?
suppliers need to comply with the essentials and sign the “Supplier Social Responsibility Commitment” before signing the contract or making transaction. The purchasing unit will set up different evaluation criteria by case, and contained in the contract to ensure that the suppliers meet the requirements (e.g., ISO qualification, etc.). In 2018, the bank did not find any negative news related to human rights and labor rights of its suppliers.
Besides evaluating the quality, technology and finance of major suppliers which have signed the Supplier Social Responsibility Commitment, the Bank also evaluated environmental protection, social responsibility, labor conditions and environmental protection. The evaluation result is published on the official website.
(9) Do the contracts between the bank and its major suppliers include termination clauses which come into force once the suppliers breach the corporate social responsibility policy and cause appreciable impact on the environment and society?
The Bank's contract with major suppliers may terminate at any time if the suppliers involves any violation of their corporate social responsibility policy and has significant impact on the environment and society.
4. Enhancing Information Disclosure Does the bank disclose relevant and reliable information regarding its corporate social responsibility on its website and the Market Observation Post System (MOPS)?
The Bank set up a Corporate Social Responsibility Zone on the company's website to expose information about promoting corporate social responsibility. And through the investment orientation, shareholders meeting, investor relations and other channels to closely communicate with stakeholders such as shareholders / investors.
The Bank has prepared a corporate social responsibility report and announced it on the company's website to expose the status of company’s social responsibility promotion. All interested parties can download the company's corporate social responsibility report on the website.
None
5. If the Bank has established the corporate social responsibility principles based on “the Corporate Social Responsibility Best-Practice Principles for TWSE/TPEx Listed Companies”, please describe any discrepancy between the Principles and their implementation: None.
6. Other important information to facilitate better understanding of the bank’s corporate social responsibility practices: Please refer to page 120-121.
7. A clear statement shall be made below if the corporate social responsibility reports were verified by external certification institutions:
The Bank's 2017 Annual Corporate Social Responsibility Report was verified by The British Standard Institution (BSI) in June 2018 against the AA 1000 Assurance Standard and the GRI Standard guideline (2016) on materiality, inclusivity and responsiveness.

Far Eastern International Bank
2018 Annual Report 64
(7) Ethical Corporate Management
Evaluation Item
Implementation Status Deviations from “the Ethical Corporate
Management Best-Practice Principles for TWSE/TPEx Listed
Companies” and Reasons
Yes No Summary description
1. Establishment of ethical corporate management policies and programs (1)Does the bank declare its ethical
corporate management policies and procedures in its guidelines and external documents, as well as the commitment from its board to implement the policies?
(2)Does the bank establish policies to prevent unethical conduct with clear statements regarding relevant procedures, guidelines of conduct, punishment for violation, rules of appeal, and the commitment to implement the policies?
(3) Does the bank establish appropriate precautions against high-potential unethical conducts or listed activities stated in Article 2, Paragraph 7 of the Ethical Corporate Management Best-Practice Principles for TWSE/TPEx Listed Companies?
The Bank's 3rd meeting of the 9th Board of Directors on November 6, 2015 adopted the “Ethical Corporate Management Best-Practice Principles”, which clearly stated the policies and practices of the Bank's integrity management. And the commitment of the Board of Directors and the management to actively implement. More than that, the bank adopted "Employee Service and Behavior Standard" and the "Ethical Behavior Standard" to clarify the integrity of employees' behavior. The bank regularly provided regulation education and compliance tests to employees.
The board of directors and management also actively implement the company's integrity management in accordance with company law, securities trading law, other relevant laws and regulations and internal procedures of the company.
Please refer to the “Employee Behavior and Ethics Standards” section on pages118-120, and “Labor Relations” section on pages 123-125 of this annual report.
The Bank formulated "Ethical Corporate Management Best-Practice Principles", which clearly regulated the behavior of business activities. In addition, we regularly educate employees and supervise them to sign the “Employee Service Rules and Conduct Code” every year to prevent the occurrence of business activities with a higher risk of dishonest behavior.
None
2. Fulfill operations integrity policy (1) Does the bank evaluate
business partners’ ethical records and include ethics-related clauses in business contracts?
(2) Does the Bank establish an exclusively (or concurrently) dedicated unit supervised by the Board to be in charge of corporate integrity?
When entering into contracts with the
trading counterparties, the Bank has included in such contract terms requiring ethical conducts if practicable. And the suppliers need to sign the "Supplier Social Responsibility Commitment" before signing the contract or making transaction. In the Commitment, suppliers are required to adhere to the highest standards of integrity in all business interactions.
The Bank formulated “Ethical Corporate Management Best-Practice Principles” and "Ethical Behavior Standard". Integrity Management is handled part-time by Human Resource Department.
Compliance Department formulated "Employee Service and Behavior Standard"
None

Far Eastern International Bank
2018 Annual Report 65
Evaluation Item
Implementation Status Deviations from “the Ethical Corporate
Management Best-Practice Principles for TWSE/TPEx Listed
Companies” and Reasons
Yes No Summary description
(3) Does the Bank establish policies to prevent conflicts of interest and provide appropriate communication channels, and implement it?
(4) Has the Bank established effective systems for both accounting and internal control to facilitate ethical corporate management, and are they audited by either internal auditors or CPAs on a regular basis?
(5) Does the bank regularly hold internal and external educational trainings on operational integrity?
and supervised employee's duty regularly. Then, the department reports the statues to the Board semiannually (reported on Q1 and Q3 Board meeting in 2018).
The Bank regularly provide educational training courses: (1) “Employee Service and Behavior
Standard ": Held quarterly. Total participation in 2018: 10,143 Total number of hours in 2018: 1,044
(2) "Awareness of Capital Security and Personal Protection": Held annually. Total participation in 2018: 2,546 Total number of hours in 2018: 7,638
Directors not only conduct the loyalty and shall exercise the due care of a good administrator with highly self-discipline and prudence to supervise the bank’s operation and financial performance but also ensure that the integrity management policy has executed properly.
Directors avoided discussing or voting on any interest-of-conflict proposal. They also cannot exercise the voting right on behalf of other directors in this case.
Regarding to “Employee Service and Behavior Standard", employee cannot handle any case related to themselves, their spouse, or their third-degree relatives.
The Bank has been established accounting policies in accordance with accounting principles and the template set of by the bankers association.
All business transactions must be recorded in the accounting system based on the substance.
The accounting system is regularly audited by CPAs and carried out self-checking plans without significant anomalies.
The bank carries out legal training and exams for employees regularly. All employees are required to attend Information Security and Personal Data Protection courses every year, and required to sign for Employee Code of Conduct yearly and attend its courses quarterly.
3. Operation of the integrity channel (1)Does the bank establish both a
reward/punishment system and an integrity hotline? Can the accused be reached by an appropriate person for follow-up?
Please refer to the “Labor Relations”
section on pages 123-125 of this annual report.
None

Far Eastern International Bank
2018 Annual Report 66
Evaluation Item
Implementation Status Deviations from “the Ethical Corporate
Management Best-Practice Principles for TWSE/TPEx Listed
Companies” and Reasons
Yes No Summary description
(2)Does the bank establish standard operating procedures for confidential reporting on investigating accusation cases?
(3)Does the bank provide proper whistleblower protection?
Please refer to the “Labor Relations” section on pages 123-125 of this annual report.
Please refer to the “Labor Relations”
section on pages 123-125 of this annual report.
4. Strengthening information disclosure Does the Bank disclose its ethical corporate management policies and the results of its implementation on the company’s website and MOPS?
The Bank formulated “Ethical Corporate Management Best-Practice Principles”. The context of the principles and results of our implementation have been published on the official website.
None
5. If the Bank has established the ethical corporate management policies based on the Ethical Corporate Management Best-Practice Principles for TWSE/TPEx Listed Companies, please describe any discrepancy between the policies and their implementation. None.
6. Other important information to facilitate a better understanding of the company’s ethical corporate management policies (e.g., review and amend its policies). “Ethic Corporate Social Responsibility Best-Practice Principles” is formulated. And it will continue reviewing and revising in response to the integrity management needs. For sustainable development, the bank applied integrity management into its corporate culture.
(8) Corporate Governance Guidelines and Regulations
The Bank’s "Corporate Governance Principle" was formulated based on “Best Corporate Governance Practices of Banks” and “Best Corporate Governance Practices of TWSE/TPEx”. Please refer to the Bank’s website (https://www.feib.com.tw/).
(9) Other Important Information Regarding Corporate Governance
The Bank has set up “Statutory Public Disclosure” section on the Bank's website to disclose information on operations, dividends, stock price, corporate governance, spokesperson contact, etc. The Bank dedicates to enhance transparency of information and protection of investor rights. In addition, The Bank has set up “Rule of Preventing Insider Trading of the Bank and Its Invested Entities” as the basis for the Bank's major information processing and disclosure mechanism and reviewed these measures from time to time to meet current legal and practical management needs. The rule is posted in the internal document management system for all employees’ checking. The Bank also issues “The Noticeable Issues of Shareholding Change of the Bank’s Insiders “as reminder to related parties.

Far Eastern International Bank
2018 Annual Report 67
(10)Internal Control System
A.Statement of Internal Control system of FEIB
Far Eastern International Bank Co., Ltd Statement on Internal Control System
Date: March 26, 2019 1. On behalf of Far Eastern International Bank Co., Ltd., we hereby certify that in the period from January
1, 2018 to December 31, 2018, the Bank duly complied with the "Implementation Rules of Internal Audit and Internal Control System of Financial Holding Companies and Banking Industries" in establishing its internal control system, conducting risk management, designating an independent audit department to conduct audits, and presenting reports to the Board of Directors and Audit Committee on a regular basis. With regard to the securities business, the Bank assessed the effectiveness of the design and implementation of its internal control system based on the evaluation criteria set forth in the "Regulations Governing the Establishment of Internal Control Systems by Service Enterprises in Securities and Futures Markets" promulgated by the Securities and Futures Bureau, Financial Supervisory Commission. After prudent evaluation, we hereby certify that the internal control and legal compliance systems of all departments were effectively implemented during the year.
2. Run concurrently Insurance Agent Business part: (1)The bank evaluates the effectiveness of the design and implementation of its internal control system
based on the criteria provided in the "Regulations Governing the Implementation of Internal Control and Audit System and Business Solicitation System of Insurance Agent Companies and Insurance Broker Companies"(hereafter the "Regulations") promulgated by the Financial Supervisory Commission. According to the criteria set forth in the Regulations, there are five absolutely essential items: 1. controlled environment, 2. risk assessment, 3. controlled operations, 4. information and communication, and 5. supervision operations.
(2)The bank already evaluated the effectiveness of the design and implementation of its internal control system based on the aforesaid criteria.
(3)Based on the results of the foregoing evaluation, the Bank regards the design and implementation of its internal control system (including affirmation of the soundness of business operations, reliability of reporting, and compliance with applicable laws and regulations) during the aforesaid period as effective, thereby providing reasonable assurance for achieving the goals cited above.
(4)This Statement was approved by the Board of Directors on March 26, 2019. 3. This Statement will be included as a major component of the Bank’s annual report and other
prospectuses and disclosed to the public. Any information contained in this Statement that is found to involve falsification, concealment, or other illegalities shall be subject to legal liabilities prescribed in Articles 20, 32, 171, and 174 of the Securities and Exchange Act.
The Statement is submitted to the Financial Supervisory Commission Declarant Chairman:Hou, Ching Ing President:Chou, Thomas Chief Auditor:Huang, Chih Wei Chief Compliance Officer:Tseng, Wen Wen (agent) Date: March 26, 2019

Far Eastern International Bank
2018 Annual Report 68
Far Eastern International Bank Co., Ltd Improvement Plan of Internal Control System
(Base Date:December 31, 2018)
Item for Improvement Improvement Measures Scheduled Date of Completion
The Mandatory requirement to remedy defects determined in Full Scope Examination conducted by Financial Supervisory Commission, R.O.C (Taiwan) in 2017. 1. Marketing activities for wealth
management business were not fully in compliance with the regulations set by FSC.
2. Hadn't submitted the registration to the Bankers Association before the qualified staffs introduced the derivative financial products to customers.
3. About mutual funds online transactions, lack of control mechanism cause the system to fail to detect the operations of the unrelated customers using the same mobile device or the same IP address.
1. A checklist to ensure marketing proposals and advertising items are in line with the check points. The checklist shall then be submitted to Legal Compliance Department for endorsement of the deeds so as to proceed further.
2. (1) Information of Relevant certifications required
for Wealth Management has been subsumed in the employee orientation program.
(2)Have new recruits complete the application form for registration of Certification Test for Financial Derivatives Sales Personnel with The Bankers Association of The Republic of China upon first reporting for duty. In addition, notify the administrator to withdraw the registration with Bankers Association of The Republic of China upon completion of resignation procedure with the approval of resignation form from Head of Wealth Management Department of Individual Banking Group.
(3)Have professional certificates from new recruits be registered with The Bankers Association of The Republic of China within 5 working days upon reporting for duty. Regular examinations in the procedure described above will be executed by Wealth Management Department on a monthly basis. Furthermore a list of registration status for each of branch manager and recruit shall be provided to Branch Heads.
(4)Any recruit fails to complete the registration of professional certificates with The Bankers Association of The Republic of China will be precluding from engaging in all financial services by supervisory control systems.
3. With regard to online trading in mutual funds, enhance the efficacy of supervisory control systems through inputting extra monitoring parameters:
(1)The original parameter was to identify if sales force shared the same IP address with clients. By inputting extra monitoring parameters, the supervisory control systems shall be able to detect whether the same mobile device or IP address is shared in mutual funds online trading with one another.
1. Completed. 2. Completed.

Far Eastern International Bank
2018 Annual Report 69
Item for Improvement Improvement Measures Scheduled Date of Completion
(2)Extend the period of supervisory control from one to five working days.
(3)Extend supervisory control from mutual funds purchasing to mutual funds trading (inclusive of purchasing, transferring and redeeming) in case of sales misconduct.
(4)Internal control principles on penalty in case of reoccurrence of the above have been established.
3. Completed.
The Mandatory requirement from Financial Supervisory Commission, R.O.C (Taiwan) to remedy defects in misconducts of our former clerk from Taipei Nanjing East Road Branch including misappropriation of client’s funds and forgery of bank statements.
1. Enhance the standard operating procedure of making a deposit and a withdrawal by adjusting internal control principles that regardless of deposit or withdrawal amount, clients shall be requested to verify the specific amount deposited or withdrawn at the deposits and remittances counter prior to departure.
2. Warning messages shall be conveyed via a bank statement delivered by client’s preferable means on the 7th day after opening an account.
3.Warning messages of “Clients shall keep bankbooks, certificates of deposit、chequebooks or seals with great caution” are revealed inside the bankbook、Account Opening Application and official website, which have been printed in bold, black type in order to further emphasize their importance.
Completed.
The findings of deficiencies of FEIB included anti-money laundering, financial business marketing campaigns and online banking operations, and the Financial Supervisory Commission ordered a correction. 1.The management of anti-money
laundering and counter-terrorism financing operations has not been perfected, including the account opening operation of legal entity customer, account opening due diligence on high-risk customer, reviewing and adjusting the risk level of the customer who has material changes in customer identity and information, and the warning function of suspicious transaction red flags.
2. Marketing activities for financial
1. The following improvements have been taken: (1) Legal entity customer account opening
operation – Enhanced system functions and created the “Beneficial Owner Checklist".
(2) Account opening due diligence on high-risk customers - Revised the "General Banking Business Anti-Money Laundering and Counter-Terrorism Financing Operation Procedure" and the "Opening Account Operation Checklist".
(3) Review and adjust the risk level of the customer who has material changes in customer identity and information - Established the relevant notification process and strengthened the risk score adding mechanism of AML system.
(4) Warning signs for suspicious transactions: a. Revised the related operating procedures
for deposit. b. Verified those of “A large number of
customers sharing the same address, frequent address change, or wrong
1. Completed.

Far Eastern International Bank
2018 Annual Report 70
Item for Improvement Improvement Measures Scheduled Date of Completion
business were not fully in compliance with related regulations.
3. About mutual funds online transactions, lack of control mechanism cause the system to fail to detect the operations of the unrelated customers belonged the same financial consultant using the same IP address in a short time.
address. ", and monthly verify those according to “Abnormal Email/Communication Address Verification Operation Procedure".
2. A checklist to ensure marketing proposals and advertising items are in line with the check points. The checklist shall then be submitted to Legal Compliance Department for endorsement of the deeds so as to proceed further.
3.With regard to online trading in mutual funds, enhance the efficacy of supervisory control systems through inputting extra monitoring parameters:
(1)The original parameter was to identify if sales force shared the same IP address with clients. By inputting extra monitoring parameters, the supervisory control systems shall be able to detect whether the same mobile device or IP address is shared in mutual funds online trading with one another.
(2)Extend the period of supervisory control from one to five working days.
(3)Extend supervisory control from mutual funds purchasing to mutual funds trading (inclusive of purchasing, transferring and redeeming) in case of sales misconduct.
(4)Internal control principles on penalty in case of reoccurrence of the above have been established.
2. Completed. 3. Completed.

Far Eastern International Bank
2018 Annual Report 71
B.CPA Report
Engagement to Perform Agreed-Upon Procedures
To Far Eastern International Bank Co., Ltd.:
With regard to the accuracy of statements and reports for 2018 that Far Eastern International Bank Co., Ltd. Submitted to the competent authority, status of its implementing internal control and legal compliance systems, and appropriateness of its NPL provisions policy, I have followed procedures agreed upon by both parties in completing my job. As the said procedures were finalized by your esteemed company, I will not express any opinion on whether or not they are sufficient. This undertaking was conducted pursuant to SAS No.34 on Engagements to Perform Agreed-Upon Procedures Regarding Financial Information with a view to assisting your esteemed company in assessing its status of complying with the "Implementation Rules of Internal Audit and Internal Control System of Financial Holding Companies and Banking Industries" promulgated by the Financial Supervisory Commission. Ensuring compliance with the aforesaid rules is the responsibility of your esteemed company’s management. During the accountant's spot checking, the procedures performed the number of spot checks and the facts found are separately presented as the appendix.
As the audit in question was not conducted in accordance with generally accepted auditing principles, I am not providing assurance of any extent to the accuracy of statements and reports for 2018 that your esteemed company submitted to the competent authority, status of its implementing internal control and legal compliance systems, and appropriateness of its NPL provisions policy. If additional procedures had been adopted for this audit or it had been conducted in accordance with generally accepted auditing principles, I might have uncovered other facts worth reporting.
This report shall be offered to your esteemed company only for the purpose described in the first paragraph and shall not be used otherwise or distributed to other parties.
Jimmy Wu Deloitte & Touche Taipei, Taiwan Republic of China March 26, 2019

Far Eastern International Bank
2018 Annual Report 72
(11) Law Violations Resulting in Punishment, Major Deficiencies and Rectification Measures Adopted during the Most Recent Fiscal Two Years and Up to the Publication Date of the Annual Report
A. Prosecution against the responsible person or employee for criminal conduct
Regarding the convertible bond asset swap business issued by the XPEC Entertainment Inc., the Taipei District Prosecutors Office filed a charge against the deputy executive vice president for violation of the Securities and Exchange Act and breach of trust, , and the officer was acquitted in the second instance by the Taiwan High Court.
B. Fines imposed by the FSC for violations. (during the most recent fiscal two years and up to the publication date of the annual report)
❶ Major deficiencies and disciplinary actions (January 05, 2017):
a. When handling the TWD convertible bond asset swap business, the option side entered into a transaction with the prohibited party, and the fixed income side did not properly establish internal control and risk control measures, which were in violation of item 4 of Article 45-1 of the Banking Act, and the FSC imposed a fine of NT$10 million accordingly. And pursuant to the subparagraph 1 of Article 61-1 of the same act, the Bank was banned to conduct new transactions of the NTD convertible bond asset swap business, which did not include the existing customer’s exercise or early exercise of the transaction under the agreement.
Improvement measures:
For NTD Convertible Bond Asset Swap:
The option side: Ask customers to ensure and emphasize that they are neither a restrict party of the issuing company, nor held on behalf of others; the bank strictly examines whether the customer of the transaction is a related party through the system and uses a designated account to ensure that customer’s funds are provided by the customer.
The fixed income side: Clearly regulate that traders are not allowed to engage in negative inventory transactions, and use monitoring system to prevent from negative inventory. More strict control over asset exchange transactions.
b. Invested in a target which was not an investment target of the“Limitations on the Types and Amounts of the Securities in Which a Commercial Bank May Invest”.”, which violated Article 74 of the Banking Act, and was fined NT$1 million by the FSC
Improvement measures:
For investment in securities: The Bank has revised the "Guidelines for Investment in Foreign Currency Securities".

Far Eastern International Bank
2018 Annual Report 73
❷ Major deficiencies and disciplinary actions (December 15, 2017):
a. Regarding the SWIFT system, the internal control system of information security was not established or implemented properly as follows:
‐ The information security defense mechanism was not fully established
‐ Improper management use of system administrator account management
‐ The emergency response procedures for IT information security incidents were inadequate
‐ Enforcement for strengthening SWIFT system security was not implemented and enforced
‐ Did not effectively convey rules and regulations resulting in ineffective legal compliance
‐ Failed third line of defense
In violation of the subparagraph 1 of Article 45-1 of the Banking Act, the FSC imposed a fined of NT$8 million.
Improvement measures:
The information security defense mechanism was not fully established:
AD and SWIFT system servers are independent network segments and establish firewall access rules to enhance the network security.
Expand the scope of storage of the information security incident analysis platform system, including SWIFT system logs and database monitoring system logs, and set the warning threshold for real-time monitoring.
Improper management of the use of system administrator account:
The system administrator account of the SWIFT server has been limited to inquiry access and administrator accounts of each host system are reduced to 2-3 accounts. Appoint external consultants to comprehensively evaluate and improve the management structure of privileged accounts.
Behavior control management of system management administrators who log into the system during business and non-business hours to promptly notice system administrators and security personnel such login behavior.
The emergency response procedures for information security incidents were inadequate :
Amend the "Emergency Response Procedures for Information Security Incidents" and add personal data security verification procedures for information security incidents.
Reinforcement of SWIFT system security was not implemented and enforced :

Far Eastern International Bank
2018 Annual Report 74
SWIFT system server has been separated to an independent network segment, and set firewall access rules to control.
Add a daily check on the number of telegram messages before and after the SWIFT billing; SWIFT system logs are included in the information security event analysis platform or other monitoring platforms for monitoring to establish mechanisms for SWIFT system security and detecting suspicious transactions.
An application has been sent to the SWIFT organization for adding transmission to the information security department officer’s e-mail address, and let the officer coordinate and handle abnormal events of information security alerts according to the notification and handling procedures for information security incident.
Did not effectively convey rules and regulations, to ensure the implementation of regulatory :
The Administrative Management Office has once again notified the each unit. The original document of the official document should accurately determine the purpose of the official document. If you need other unit processing, Should be notified by yourself, Communicate official information in a complete manner.
The third line of defense in internal control was failed:
The Auditing Department has incorporated the SWIFT system security into the key points of audit items and conducted a special audit. In addition to operational aspects of security management such as workstations, the audit scope also including regulatory compliance regarding SWIFT system management enhancement according to the Banking Bureau's letter on September 05, 2016.
C. Disciplinary actions taken by the FSC pursuant to Article 61-1 of the Banking Act
❶ Major deficiencies and disciplinary actions (June 01, 2017):
a. When conducting derivative business, it was found to offer a template of board of directors meeting minutes with company seal by bank’s staff, which may result in related disputes, and the FSC ordered a correction against the Bank.
Improvement measures:
Provide compliance training to associated persons to prevent from any misconduct of derivative businesses.
Announced the minutes of board of directors’ or the shareholders’ meeting was not a contract document of the Bank and was not an annex attached to the general agreement.
❷ Major deficiencies and disciplinary actions (January 18, 2019):

Far Eastern International Bank
2018 Annual Report 75
a. Deficiencies in marketing activities for wealth management business, promotion for derivatives and operations of online fund trading, were corrected by the FSC.
Improvement measures:
Improvement plan for marketing project activity’s content in wealth management business:
Integrate "Recommended Wealth Management to Friends and Family and Wealth Management", "Membership Promotion, etc." and "Digital Activities" with the "Fortune Points-Collection Set Plan", and do not recommend single financial product only in campaign.
Strengthen the application process for project activities and add a system of filling out the "Checklist for Marketing Project Activities and Gifts and Prizes Advertisements " when proposing.
Improvement plan for register on the association of operations personnel of handling the recommendation of financial derivatives:
The new wealth management commissioner shall register on the day of employment. When the wealth management commissioner resigns, the system flow of the resignation application form will submit to the responsible staff for cancellation.
Every month, regularly review whether new wealth management commissioners registered on the Bankers Association within 5 business days after the employment.
Plan to be controlled by the system. Before registering on the Bankers Association, shall not perform any related business.
Improvement Plan for Online Fund Trading Operations:
The Bank's external IP check report has been produced for examination.
The branch manager will call non-related accounts by phone to know the reasons and keep records. If there is an unusual situation, it will be further checked and included in the score deduction item for business reward of internal control and customer disputes.
Major deficiencies and disciplinary actions (January 18, 2019):
a. A former staff appropriated customer’s funds and provided fraudulent bank statements to customers, and was corrected by the FSC. The FSC also ordered the Bank to discharge that staff.
Improvement measures:
Cash deposit and withdrawal practices: Cash withdrawal transactions regardless of the amounts, customers require to count and receive cash at the counter in person; if the cash deposit transaction is NT$500,000 or more, the customer needs to count and receive cash at the counter; if the cash

Far Eastern International Bank
2018 Annual Report 76
deposit transaction is less than NT$500,000, the customer shall use cash deposit slip, and after being accounted by the Bank's staff, deliver the receipt with relevant stamps to the customer in person.
Satisfaction Survey on Wealth Management Commissioners: Include taking care of customer’s transaction content of deposit and investment accounts by phone.
Related Warning: When printing documents for account opening and passbooks, the Bank has printed related warnings in bold black typeface, sent a message to inform the customer within 7 days after opening the account and announced related warnings on the Bank's official website and bank statements.
To confirm that other customers’ interests have not been affected, the Bank had contacted those customers by E-mail, post or telephone, and the accounts had no errors.
Major deficiencies and disciplinary actions (March 05, 2019):
a. Deficiencies in handling anti-money laundering operations, financial business marketing activities and online fund trading operations, were corrected by the FSC.
Improvement measures:
Special Audit:
Account opening operations for corporate clients:
Increase self-checking project about opening deposit account.
Increase review function for the login numbers of beneficial owners.
Add “Beneficial Owners Checklist" to improve the documents requesting and identification.
Account opening review operations for high-risk customer:
Amend the Bank's "General Banking Prevention of Money Laundering and Anti-Terrorism Operation Procedures".
Increase the review requirements for customers of high-risk factors to the “Account Opening Checklist.
Modify the case management system, and increase fool-proof mechanism for handling and reviewing the content.
Review of significant changes in customer’s identity and information and adjust the risk level:
Recorded negative news from the media by responsible personnel, keep the document in the archives check whether the system has an account opening and name scanning and keep records of inquiries and confirmation results.
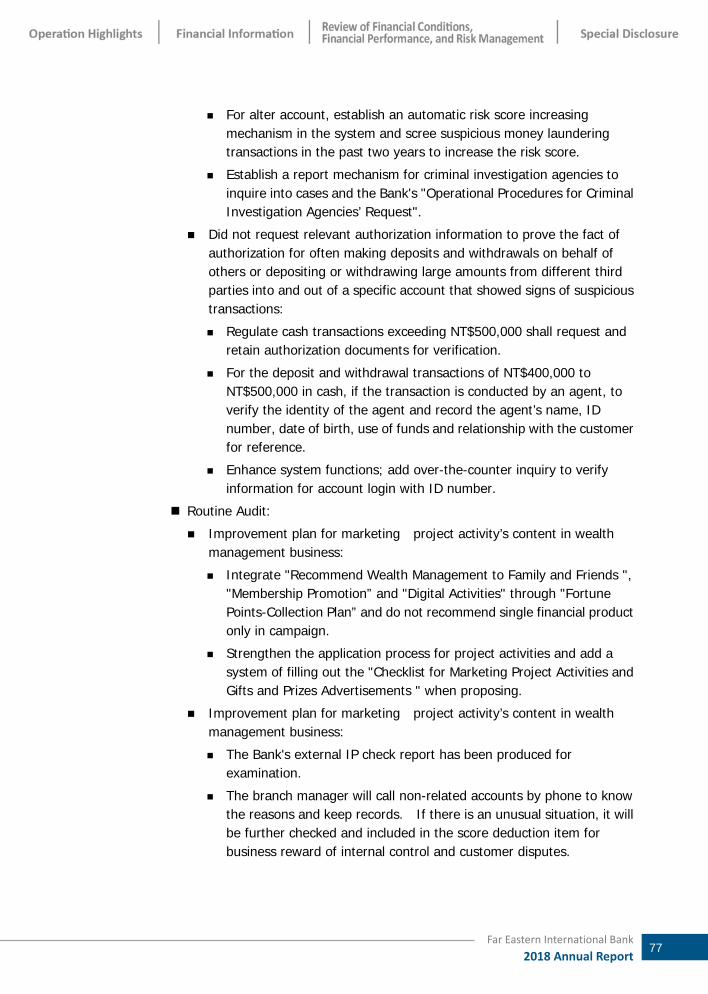
Far Eastern International Bank
2018 Annual Report 77
For alter account, establish an automatic risk score increasing mechanism in the system and scree suspicious money laundering transactions in the past two years to increase the risk score.
Establish a report mechanism for criminal investigation agencies to inquire into cases and the Bank's "Operational Procedures for Criminal Investigation Agencies’ Request".
Did not request relevant authorization information to prove the fact of authorization for often making deposits and withdrawals on behalf of others or depositing or withdrawing large amounts from different third parties into and out of a specific account that showed signs of suspicious transactions:
Regulate cash transactions exceeding NT$500,000 shall request and retain authorization documents for verification.
For the deposit and withdrawal transactions of NT$400,000 to NT$500,000 in cash, if the transaction is conducted by an agent, to verify the identity of the agent and record the agent’s name, ID number, date of birth, use of funds and relationship with the customer for reference.
Enhance system functions; add over-the-counter inquiry to verify information for account login with ID number.
Routine Audit:
Improvement plan for marketing project activity’s content in wealth management business:
Integrate "Recommend Wealth Management to Family and Friends ", "Membership Promotion” and "Digital Activities" through "Fortune Points-Collection Plan” and do not recommend single financial product only in campaign.
Strengthen the application process for project activities and add a system of filling out the "Checklist for Marketing Project Activities and Gifts and Prizes Advertisements " when proposing.
Improvement plan for marketing project activity’s content in wealth management business:
The Bank's external IP check report has been produced for examination.
The branch manager will call non-related accounts by phone to know the reasons and keep records. If there is an unusual situation, it will be further checked and included in the score deduction item for business reward of internal control and customer disputes.

Far Eastern International Bank
2018 Annual Report 78
D.Disclosures of a total loss exceeding NT$50 million in each fiscal year due to corruptions of employees,, major incidental cases or safety accidents caused by failure to actually perform safety maintenance work.
None.
E.Other disclosures assigned by FSC:
None.
(12) Major Resolutions of Shareholders’ Meeting and Board Meetings
A.Major resolutions of Shareholders’ Meeting
Session Date Major resolutions Execution
2018 Shareholders’
Meeting
Jun 20,2018
2017 Business Report and Financial Statements On August 14, 2018, The Board of Directors
approved the ex-right date of stock dividends on September 12, 2018, and all dividends were paid on October 5, 2018.(Cash dividend per share is NT$0.439, Stock dividend per share is NT$0.271)
Proposal of 2017 Earnings Distribution
Proposal of Issuing New Shares –to Capitalize Shareholder
Dividends Amendments to “Articles of Incorporation of Far Eastern
International Bank”
The changes have been approved by the Minister of Economic Affairs on August 1, 2018 and published on the official website.
Proposal of Private Placement - to Issue Common Shares, Preferred Shares, Convertible Bonds or a Combination of above Securities
to Specific Parties
Per resolution, the notion is yet to be actually implemented, pending locating the strategic alliance.
Election of Directors (Including Independent Directors)
The changes have been approved by the Minister of Economic Affairs on August 1, 2018 and published on the official website.
Waiver of Non-Competition Binding to Directors None.

Far Eastern International Bank
2018 Annual Report 79
B.Major Resolutions of Board Meetings
Session Date Major resolutions
15th Session of 9th Board of Directors
Mar 21, 2018
2018 Operating Budget 2017 Financial Statements and Consolidated Financial
Statements 2017 Earnings Distribution 2017 Proposal of Issuing New Shares – to Capitalize Shareholder
Dividend Proposal of Private Placement – to Issue Common Shares,
Preferred Shares, Convertible Bonds or A Combination of Above Securities, maximum 10 billion NT dollars or foreign currency equivalent in total
Election of the 10th Board of Directors. Waiver of Article 209 of the Company Act related to
non-competition binding to Directors The 2018 Shareholders’ Meeting was held on June 20,2018 and
the proposal period of the 2018 shareholders' meeting was from April 13,2018 to April 23,2018 (including candidates for nomination of directors)
Donate for 2018 Hualien Earthquake disaster Amendment to “the Articles of Incorporation of Far Eastern
International Bank” Amendment to “Organizational Charters of Far Eastern
International Bank” Amendment to “Conduct procedure about Interested Parties’
Credit and other trading ” Amendment to “Regulations Governing Anti-Money Laundering
and Countering the Financing of Terrorism"and “Precautions of Anti-Money Laundering and Countering the Financing of Terrorism”
Amendment to “Conduct Business Strategy and Guidelines of Financial Derivative”
Amendment to “Internal Control and Solicit Procedure of Insurance Agency Group”
Amendment to “Regulations Governing Wealth Management to know –your-customer”
Formulate Investments and Financing Regulations Governing for Leasing Company
Amendment to “Regulations for incentive bonus"and “ Regulations for Employees’ Compensation”
16th Session of 9th Board of Directors
May 07,2018
2018 Q1 Consolidated Financial Statements Amendment to “Regulations Governing the suspension and
resume stock trading application” Formulate “Business Crisis response measures” Amendment to “Regulations Governing the Procedures to Evaluate
Assets, and Deal with Non-performing/Non-accrual Loans” Amendment to “Regulations for incentive bonus” Amendment to “Regulations for Directors’ Remuneration” Review the list of Directors and Independent Directors Candidates

Far Eastern International Bank
2018 Annual Report 80
Session Date Major resolutions
1st Session of 10th Board of Directors
Jun 20,2018
Director Ms. Ching-Ing Hou, Director Mr. Douglas Tong Hsu, and Independent Director Ms. Hsiao Hui Wang were elected as Managing Directors, and Director Ms. Ching-Ing Hou was eleceted as Chairperson, Director Mr. Douglas Tong Hsu was elected as Vice Chairman.
Director Mr. Shaw Y Wang and Director Mr. Tsung-Ming Chung were elected as Executive Directors.
2nd Session of 10th Board of Directors
Aug 14,2018
Submission of the company’s 2018 H1 Financial Statements and Consolidated Financial Statements
Decisions to set the ex-right date and ex-dividend date for the Company’s 2017 Earnings Distribution
Proposal of Hsinchu Jinguo Building’s Continued disposal plan Amendment to “Precautions of dealing with illegal, immoral and
dishonest behavior report” Formulate “Strategies of Anti-Money Laundering and Countering
Financing of Terrorism for Far Eastern Group” Amendment to “Enforcement Regulations Governing the legal
compliance system” Amendment to “Conduct Business Strategy and Guidelines of
Financial Derivative” Amendment to “Standard Specification of Internal Control
System for Concurrently Operating Government Bonds Dealer”
3rd Session of 10th Board of Directors
Nov 02, 2018
2018 Consolidated Financial Statements Amendment to “ Regulations Governing the Security Maintenance
and Administration” Amendment to “Corporate Governance Principles” Formulate “(Concurrently Operating Insurance Agency Business)
Precautions of Anti-Money Laundering and Countering the Financing of Terrorism”
Amendment to “Regulations Governing Anti-Money Laundering and Countering the Financing of Terrorism"and “Precautions of Anti-Money Laundering and Countering the Financing of Terrorism”
Amendment to “Conduct Business Strategy and Guidelines of Financial Derivative”
Amendment to “Regulations Governing the Financial Markets Proprietary Trading Business authorization”
Amendment to Internal Control and Solicit Procedure of Insurance Agency Group
Formulate “ Regulations Governing the Designated Foreign Exchange Branches promote foreign exchange-related structured goods business authorization”
Amendment to “Management Policies of using social media” Amendment to “Management Regulations and Enforcement Rules
of credit card credit” Amendment to “ Regulations Governing of detecting operating
risk”

Far Eastern International Bank
2018 Annual Report 81
Session Date Major resolutions
4rd Session of 10th Board of Directors
Mar 26, 2019
2018 Financial Statements and Consolidated Financial Statements 2018 Earnings Distribution 2018 Proposal of Issuing New Shares – to Capitalize Shareholder
Dividend Proposal of Private Placement – to Issue Common Shares,
Preferred Shares, Convertible Bonds or A Combination of Above Securities, maximum 10 billion NT dollars or foreign currency equivalent in total
Amendment to “Regulations Governing the Procedures to Acquisition or Disposal of Assets” for Far Eastern Group.
The 2019 Shareholders’ Meeting is held on June 19, 2019 and the proposal period of the 2019 shareholders' meeting is from April 15, 2019 to April 24, 2019.
Change of the accountant for certifying financial statements and update of independence evaluation on the new CPA.
Amendment to “Management of Operation of Board Meetings” Amendment to “Enforcement Regulations Governing Internal
Audit System of Insurance Agency Group” Amendment to “Strategies of Anti-Money Laundering and
Countering Financing of Terrorism for Far Eastern Group” and “Regulations Governing Anti-Money Laundering and Countering the Financing of Terrorism"
Amendment to “Internal Control and Solicit Procedure of Insurance Agency Group”
Relocation case for Taipei 101 Mini Branch Relocation case for Taipei Hsiang Yang Branch Relocation case for Changhua Branch
(13) Major Issues of Record or Written Statements Made by Any Director or Supervisor
Dissenting to Important Resolutions Passed by the Board of Directors:
None.
(14) Resignation or Dismissal of the Bank’s Key Individuals, Including the Chairman, CEO, and Heads of Accounting, Finance, and Internal Audit.
None.

Far Eastern International Bank
2018 Annual Report 82
4. Information on CPA audit fees
CPA Audit Fees Bracket
Accounting Firm Name of CPA Audit Period Remarks
Deloitte & Touche Shih-Tsung Wu Chen-Hsiu Yang 2018 None
Unit: NT$ Thousands Fees Item
Fee Range Audit Fees
Non-audit
Fees Total
1 Under 2,000
2 2,000 (incl.) ~4,000
3 4,000 (incl.) ~6,000
4 6,000 (incl.) ~8,000 V
5 8,000 (incl.) ~10,000
6 10,000 and above V V
(1) Non-Audit Fee Exceeded 25% of Audit Fee:
Unit: NT$ Thousands
Accounting Firm
Name of CPA
AuditFees
Non-Audit Fees Audit Period Remarks
System Design
Business Registration
Human Resources
Others (Note1) Subtotal
Deloitte & Touche
Shih-Tsung Wu
Chen-Hsiu Yang 6,420 - - - 10,531 10,531 2018 -
Note:Other non-audit fees include internal control review, AML/CFT project review, personal information protection project review, APP detection, and so on.
(2) Changed Accounting Firm with Less Audit Fee Paid Compared to the Previous Year:
Not applicable.
(3) Audit fee Decreased Over 15% Compared to the Previous Year:
Not applicable.

Far Eastern International Bank
2018 Annual Report 83
5. Replacement of CPAs
(1) Regarding the former CPA
Replacement Date Approved by the Board of Directors on March 26, 2019
Replacement reasons and explanations
Due to the internal job adjustment from Deloitte & Touche, CPA will be changed from Chen-Hsiu Yang to Ying-Chou Chen from the first quarter of 2019.
Describe whether the Company terminated or the CPA did not accept the appointment
PartiesCase
CPA The Bank
Termination of appointment
Not applicable Not applicable
No longer accepted (continued) appointment
Not applicable Not applicable
Other issues (except for unqualified issues) in the audit reports within the last two years
Not applicable
Differences with the company Yes
Accounting principles or practices Financial report disclosure Auditing scope or procedure Others
No V Description
Other Revealed Matters (Matters that should be disclosed in accordance with Item 1-4, Subparagraph 6, Article 10 of these guidelines)
Not applicable
(2) Regarding the successor CPA
Name of accounting Firm Deloitte & Touche Name of CPA Ying-Chou Chen Date of appointment Approved by the Board of Directors on
March 26, 2019 Consultation results and opinions on accounting treatments or principles with respect to specified transactions and the company's financial reports that the CPA might issue prior to the engagement.
None
Succeeding CPA’s written opinion of disagreement toward the former CPA
None

Far Eastern International Bank
2018 Annual Report 84
6. Chairman, President, and Managers in Charge of Finance or Accounting who holds any positions in the Bank’s Independent Auditing Firm or its Affiliates within the recent year
None.
7. The Changes in Shareholding
(1) Article 11 of the " Guiding principles governing directors, managers or their related parties, if holding more than certain percentage of the same bank's shares with voting rights" stipulates that any shareholding changes to the aforementioned shareholders shall be reported
Unit: share
Title Name
2018 As of April 22, 2019
Holding Increase
(Decrease)
PledgedHolding Increase
(Decrease)
Holding Increase
(Decrease)
Pledged Holding Increase
(Decrease)
Chairperson Yue Ding Industry Co., Ltd.Representative:Ching-Ing Hou
*262,888442
--
- -
- -
Vice Chairman Douglas Tong Hsu 164,004 - - -
Executive Director Far Eastern New Century Corp.Representative:Shaw Y. Wang
*2,255,94343,511
--
- -
- -
Executive Director Asia Cement Corp. Representative:Tsung-Ming Chung
*2,027,480-
--
- -
- -
Director Far Eastern New Century Corp.Representative:Humphrey Cheng
*2,255,943-
--
- -
- -
Director Far Eastern New Century Corp.Representative:James Wu
*2,255,943-
--
- -
- -
Director Asia Cement Corp. Representative:Shi-Chun Hsu
*2,027,480-
--
- -
- -
Director U-Ming Marine Transport Corp. Representative:Min-Teh Yu
*2,026,021-
--
- -
- -
Independent Director,
Managing Director Hsiao Hui Wang - - - -
Independent Director Bing Shen - - - -
Independent Director Susan S. Chang - - - -
President Thomas Chou 50,643 - - - Chief Executive Vice President Jiann Jong Lin 35,279 - - -
Senior Executive Vice President Ben Liao Ru 19,822 - - -
Executive Vice President Alan Lee 21,499 - - -
Executive Vice President Simon Tai 10,425 - - -
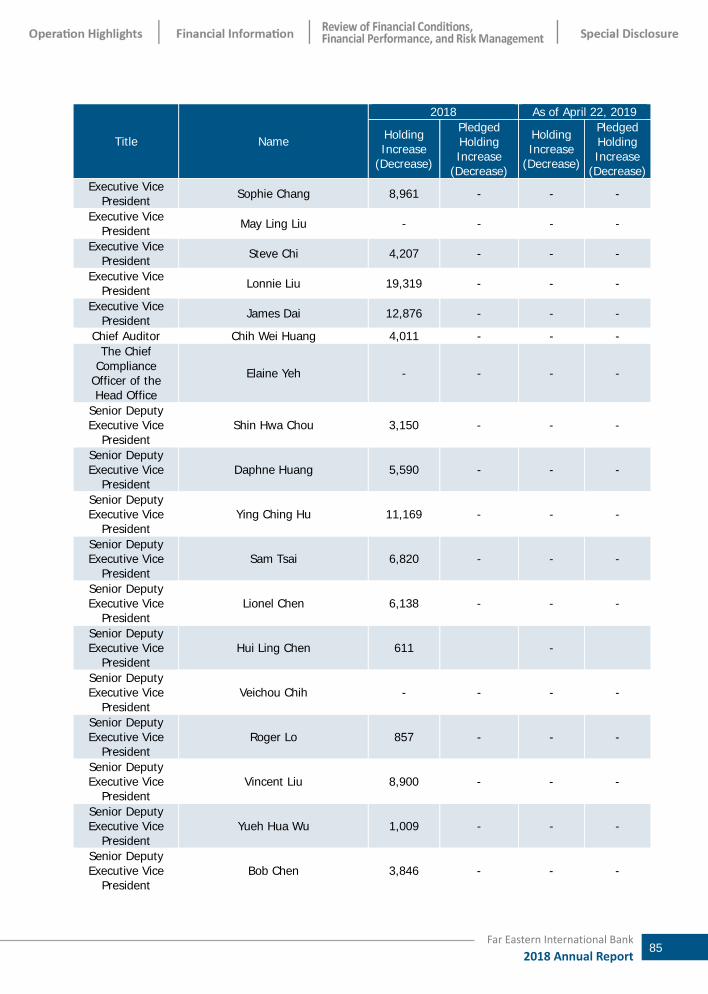
Far Eastern International Bank
2018 Annual Report 85
Title Name
2018 As of April 22, 2019
Holding Increase
(Decrease)
PledgedHolding Increase
(Decrease)
Holding Increase
(Decrease)
Pledged Holding Increase
(Decrease) Executive Vice
President Sophie Chang 8,961 - - -
Executive Vice President May Ling Liu - - - -
Executive Vice President Steve Chi 4,207 - - -
Executive Vice President Lonnie Liu 19,319 - - -
Executive Vice President James Dai 12,876 - - -
Chief Auditor Chih Wei Huang 4,011 - - - The Chief
Compliance Officer of the Head Office
Elaine Yeh - - - -
Senior Deputy Executive Vice
President Shin Hwa Chou 3,150 - - -
Senior Deputy Executive Vice
President Daphne Huang 5,590 - - -
Senior Deputy Executive Vice
President Ying Ching Hu 11,169 - - -
Senior Deputy Executive Vice
President Sam Tsai 6,820 - - -
Senior Deputy Executive Vice
President Lionel Chen 6,138 - - -
Senior Deputy Executive Vice
President Hui Ling Chen 611 -
Senior Deputy Executive Vice
President Veichou Chih - - - -
Senior Deputy Executive Vice
President Roger Lo 857 - - -
Senior Deputy Executive Vice
President Vincent Liu 8,900 - - -
Senior Deputy Executive Vice
President Yueh Hua Wu 1,009 - - -
Senior Deputy Executive Vice
President Bob Chen 3,846 - - -

Far Eastern International Bank
2018 Annual Report 86
Title Name
2018 As of April 22, 2019
Holding Increase
(Decrease)
PledgedHolding Increase
(Decrease)
Holding Increase
(Decrease)
Pledged Holding Increase
(Decrease) Senior Deputy Executive Vice
President Chen Chen Ma 1,401 - - -
Senior Deputy Executive Vice
President Isabel Chen 1,072 - - -
Deputy Executive Vice President Wen Chang (428,985) - - -
Deputy Executive Vice President Brucelo Lo 3,916 - - -
Deputy Executive Vice President Margaret Du 7,964 - - -
Deputy Executive Vice President Ines Hong 21 - - -
Deputy Executive Vice President Chiung Yu Song 11,551 - - -
Deputy Executive Vice President Civi Tsai 618 - - -
Deputy Executive Vice President Emily Chou 5,679 - - -
Deputy Executive Vice President Robin Chiu 5,857 - - -
Deputy Executive Vice President Elaine Lin 5,941 - - -
Deputy Executive Vice President Baker Lin 6,718 - - -
Deputy Executive Vice President Cindy Chen 6,823 - - -
Deputy Executive Vice President Joy Tien 94 - - -
Deputy Executive Vice President An Li Ma 4,813 - - -
Deputy Executive Vice President Gloria Hsieh 2,706 - - -
Deputy Executive Vice President Senh Sing Pei 4,239 - - -
Deputy Executive Vice President Teresa Lo - - - -
Deputy Executive Vice President Frank Song 158 - - -
Deputy Executive Vice President Shu Yun Cheng 3,653 - - -
Deputy Executive Vice President Chingh Siang Chen 35 - - -
Deputy Executive Vice President Kuo Ying Huang 5,920 - - -
Deputy Executive Vice President Felicia Tseng - - - -

Far Eastern International Bank
2018 Annual Report 87
Title Name
2018 As of April 22, 2019
Holding Increase
(Decrease)
PledgedHolding Increase
(Decrease)
Holding Increase
(Decrease)
Pledged Holding Increase
(Decrease) Deputy Executive
Vice President Warren Ko - - - -
Deputy Executive Vice President Starsky Chiang - - - -
Deputy Executive Vice President Wen Ming Yang 731 - -
Deputy Executive Vice President Audrey Lin 26 - -
Deputy Executive Vice President Karry Tsai 3,265 - -
Deputy Executive Vice President Yi Chen Wang 3,534 - -
Deputy Executive Vice President Alex Kao 7 - -
Deputy Executive Vice President Justice Chang - - - -
Deputy Executive Vice President Alex Chien 23 - - -
Senior Vice President Allen Li 3,854 - - -
Senior Vice President Mag Chen 2,529 - - -
Senior Vice President Amber Tseng 3,514 - - -
Senior Vice President Shu Hui Lee 9,024 - - -
Senior Vice President Allen Lu 14 - - -
Senior Vice President Olive Yin 2,554 - - -
Senior Vice President Chia Wei Hsiao 2,595 - - -
Senior Vice President Sofia Hsu 1,355 - - -
Senior Vice President Alex Hsieh - - - -
Senior Vice President Wilson Huang - - - -
Senior Vice President Jeff Chiu - - - -
Senior Vice President Hsing Chien Wei 2,619 - - -
Vice President Sandia Lu 2,702 - - - Vice President Bill Lee 1,757 - - - Vice President Chia Chen Lee 1,031 - - - Vice President Philip Chen 954 - - - Vice President Judy Yu 2,125 - - - Vice President Yu Yu Ho 23 - - -

Far Eastern International Bank
2018 Annual Report 88
Title Name
2018 As of April 22, 2019
Holding Increase
(Decrease)
PledgedHolding Increase
(Decrease)
Holding Increase
(Decrease)
Pledged Holding Increase
(Decrease) Vice President Kun Feng Li - - - - Vice President Michael Huang 2,177 - - - Vice President Wei Cheng Chen (1,984) - - - Vice President Wei Li Chuang 446 - - - Vice President Lisa Hsu 2,418 - - - Vice President Jane Tsai 1,313 - - - Vice President Chun Yen Kuo 372 - - - Vice President Kuoh Siung Lin - - - - Vice President Wen Feng Tu - - - - Vice President Hui Li Tsai - - - - Vice President Alen Lin 1,305 - - - Vice President Shang Fu Lin 423 - - - Vice President Chiang Ming Chen 1,282 - - - Vice President Shou Te Weng - - - - Vice President Kuang Jung Fan 773 - - - Vice President Jui Chen Hsu - - - - Vice President Tsung Min Cheng - - - - Vice President Chen I Wang - - - - Vice President Pi Yun Peng - - - - Vice President Chia Jung Chang - - - - Vice President Allen Chang - - - - Vice President Kuan I Li - - - - Vice President Vicky Yang 653 - - - Vice President Vivian Lee - - - - Vice President Wen Hao Shih - - - - Vice President Eason Song - - - - Vice President Ring Tsai - - - - Vice President James Hsieh - - - - Vice President Rich Liu - - - - Deputy Vice President Winnie Chiang 195 - - -
Deputy Vice President Yu Shui Chen - - - -
Same Related Party Yi Jiu Investment Corp. 204,203 - - -
Same Related Party Ta Chu Chemical Fiber Co., Ltd. 601,060 - - -
Same Related Party An Ho Garment Co.,Ltd. 567,902 - - -
Same Related Party Bai Yang Investment Corp. 583,168 - - -
Same Related Party Chin Feng Investment Corp. 249,198 - - -
Same Related Party K.Y. Lee 16,759 - - -
Same Related Party Mei Mei Lee 20 - - -

Far Eastern International Bank
2018 Annual Report 89
Title Name
2018 As of April 22, 2019
Holding Increase
(Decrease)
PledgedHolding Increase
(Decrease)
Holding Increase
(Decrease)
Pledged Holding Increase
(Decrease) Same Related
Party Chin Hsin Lee 7 - - -
Same Related Party Ya Li Transportation Corp. 77,647 - - -
Same Related Party Oriental Securities Corporation 262,168 - - -
Same Related Party Asia Cement Corp. 2,027,480 - - -
Same Related Party Asia Investment Corp. 3,473,848 - - -
Same Related Party Ton Fu Investment Corp. 755,365 - - -
Same Related Party Peter Hsu 16,012 - - -
Same Related Party Douglas Tong Hsu 164,004 - - -
Same Related Party Alice Hsu 16,012 - - -
Same Related Party Nancy Hsu 16,012 - - -
Same Related Party Connie Hsu 16,012 - - -
Same Related Party Hsiu-Neng Chen 8 - - -
Same Related Party Hui Kang Investment Corp. 17,164 - - -
Same Related Party
Kai Yuan International Investment Co., Ltd. 2,768,729 - - -
Same Related Party Richard Yang 19,109 - - -
Same Related Party Frederica Yan 51,604 - - -
Same Related Party Yu Yuan Investment Co., Ltd. 4,271,811 - - -
Same Related Party U-Ming Marine Transport Corp. 2,026,021 - - -
Same Related Party Yue Li Investment Corp. 3,783,304 - - -
Same Related Party Yue-Tung Investment Corp. 3,356,267 - - -
Same Related Party
Ydt Technology International Co., Ltd. 75,496 - - -
Same Related Party Tranquil Investment Ltd. 1,448,812 - - -
Same Related Party
Ding Yuan International Investment Corp. 2,280,587 (10,000,000) - -
Same Related Party Far Eastern New Century Corp. 2,255,943 - - -

Far Eastern International Bank
2018 Annual Report 90
Title Name
2018 As of April 22, 2019
Holding Increase
(Decrease)
PledgedHolding Increase
(Decrease)
Holding Increase
(Decrease)
Pledged Holding Increase
(Decrease) Same Related
Party Yuan Faun Co., Ltd. 120,340 - - -
Same Related Party Yuan Tong Investment Co., Ltd. 2,763,187 - - -
Same Related Party Yuan Ding Investment Co., Ltd. 3,069,112 - - -
Same Related Party Yuan Ding Co., Ltd. 214,686 - - -
Same Related Party Yuan Ding Leasing Corp. 90,908 - - -
Same Related Party Der Ching Investment Corp. 3,473,430 - - -
Same Related Party Tranquil Enterprise Ltd. 154,255 - - -
* Number of shares owned by the institutional shareholders.
(2) Shares Trading with Related Parties:
None.
(3) Shares Pledge with Related Parties:
None.
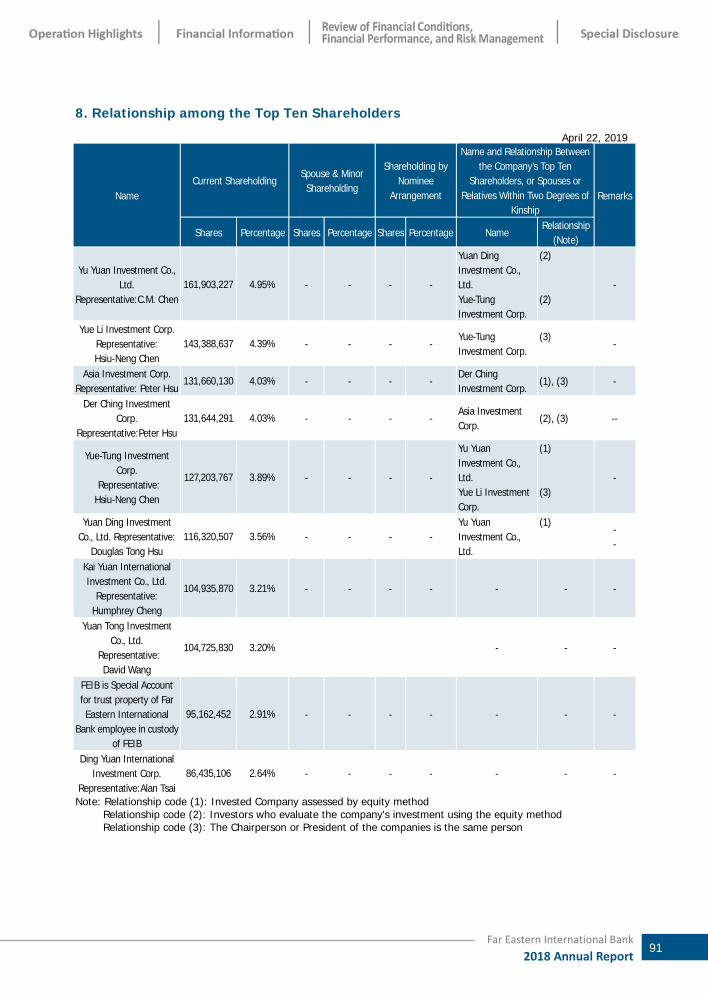
Far Eastern International Bank
2018 Annual Report 91
8. Relationship among the Top Ten Shareholders
April 22, 2019
Name Current Shareholding
Spouse & Minor Shareholding
Shareholding by Nominee
Arrangement
Name and Relationship Between the Company’s Top Ten
Shareholders, or Spouses or Relatives Within Two Degrees of
Kinship Remarks
Shares Percentage Shares Percentage Shares Percentage Name Relationship
(Note)
Yu Yuan Investment Co., Ltd.
Representative:C.M. Chen 161,903,227 4.95% - - - -
Yuan Ding Investment Co., Ltd. Yue-Tung Investment Corp.
(2) (2)
-
Yue Li Investment Corp. Representative: Hsiu-Neng Chen
143,388,637 4.39% - - - - Yue-Tung Investment Corp.
(3)
-
Asia Investment Corp. Representative: Peter Hsu
131,660,130 4.03% - - - - Der Ching Investment Corp.
(1), (3) -
Der Ching Investment Corp.
Representative:Peter Hsu 131,644,291 4.03% - - - -
Asia Investment Corp.
(2), (3) --
Yue-Tung Investment Corp.
Representative: Hsiu-Neng Chen
127,203,767 3.89% - - - -
Yu Yuan Investment Co., Ltd. Yue Li Investment Corp.
(1) (3)
-
Yuan Ding Investment Co., Ltd. Representative:
Douglas Tong Hsu 116,320,507 3.56% - - - -
Yu Yuan Investment Co., Ltd.
(1)
- -
Kai Yuan International Investment Co., Ltd.
Representative: Humphrey Cheng
104,935,870 3.21% - - - - - - -
Yuan Tong Investment Co., Ltd.
Representative: David Wang
104,725,830 3.20% - - -
FEIB is Special Account for trust property of Far Eastern International
Bank employee in custody of FEIB
95,162,452 2.91% - - - - - - -
Ding Yuan International Investment Corp.
Representative:Alan Tsai 86,435,106 2.64% - - - - - - -
Note: Relationship code (1): Invested Company assessed by equity method Relationship code (2): Investors who evaluate the company's investment using the equity method Relationship code (3): The Chairperson or President of the companies is the same person

Far Eastern International Bank
2018 Annual Report 92
9. Shareholding in Affiliated Enterprises
Unit: share; % December 31, 2018
Affiliated
Enterprises (Note 1)
Shareholding by the
Company
Direct or Indirect
Shareholding by
Directors and
Managers
Total Shareholding
share % share % share % Far Eastern Asset Management Corp. 68,400,000 100.00% - - 68,400,000 100.00%
Far Eastern International Securities Company Ltd. 20,000,000 100.00% - - 20,000,000 100.00%
DWS Far Eastern Investments Limited Global Client Group 12,000,000 40.00% - - 12,000,000 40.00%
Dah Chung Bills Finance Corp. 99,407,708 22.06% 32,479 0.01% 99,440,187 22.07% Financial Information Service Co.,Ltd. 5,937,750 1.14% - - 5,937,750 1.14%
Taipei Forex Inc. 80,000 0.40% - - 80,000 0.40% Sunny Asset Management Corporation 207,304 3.46% - - 207,304 3.46%
An Feng Entreprises Co., Ltd. 300,000 10.00% - - 300,000 10.00% Yuan Hsin Digital Payment Co.,Ltd 5,094,204 4.99% - - 5,094,204 4.99%
Note 1: Investments under Bank Articles 74

Far Eastern International Bank
2018 Annual Report 93
IV. Fund Raising Status
1. Capital and Shares
(1) Sources of Capital
A. Issued Shares
Unit: share, NT$ million April 22,2018
Month/ Year
Issuing price (NTD)
Authorized Capital Paid-in Capital Remarks
Shares Amount Shares Amount Source Others
Founded in 1992
10 1,000,000,000 10,000 1,000,000,000 10,000 Public offering Tai-Tsai-Rong-No.801625101(Aug.1, 1991)
Oct 1995
10
25,000,000 250
25,000,000 250 Retained earnings (84)Tai-Tsai-Cheng(1) No.49420(Sep.4, 1995)
Jul 1997
10
29,750,000 297
28,700,0001,050,000
28710
Retained earningsEmployee bonus
(85)Tai-Tsai-Cheng(1) No.41665 (Jul.06, 1996)
Aug 1997
15 10
135,250,000 1,353
99,170,000 34,806,750
1,273,250
99234813
Rights offering Retained earningsEmployee bonus
(86)Tai-Tsai-Cheng(1) No.53095(Jul.25,1997) (86)Tai-Tsai-Cheng(1) No. 60585(Jul.30,1997)
Aug 1998
12.5 10 10 10
211,023,500 2,110
150,000,00041,650,0001,523,500
17,850,000
1,50041615
179
Rights offering Retained earningsEmployee bonusCapital reserve
(87)Tai-Tsai-Cheng(1) No.59533(Jul.21,1998)
Jul 1999
10
78,696,500 787
44,832,7521,640,208
26,619,4465,604,094
44817
26656
Retained earningsEmployee bonusCapital reserve Special reserve
(88)Tai-Tsai-Cheng(1) No.57434(Jun.23,1999)
Jul 2000
10 10 10
45,095,400 451
19,236,360703,800
22,195,8002,959,440
1927
22230
Retained earningsEmployee bonusCapital reserve Special reserve
(89)Tai-Tsai-Cheng(1) No.56443 (Jun.30, 2000)
Jul 2003 10 475,184,600 4,752
New authorized capital
Jing-Shou-Shang Tze No. 09201231510(Jul 28, 2003)
Aug 2004
10 10
10,407,594(26,579,000)
104 (266)
ECB Conversion Treasury stock cancellation
Jing-Shou-Shang Tze No. 09301158130(Aug 23, 2004)
Mar 2005 10 78,056,834 781 ECB Conversion Jing-Shou-Shang Tze No. 09401042910(Mar 29, 2005)
Jun 2005 10 47,914,226 479 ECB Conversion Jing-Shou-Shang Tze No. 09401103960(Jun 14, 2005)
Jul 2005 10 102,854,5956,707,909
1,02967
Retained earningsEmployee bonus
Jin-Kuan-Cheng(1)No.0940122142 (Jun. 9, 2005)
Aug 2005 10 4,958,329 50 ECB Conversion Jing-Shou-Shang Tze No. 09401173340(Sep 13, 2005)
Nov 2005 10 37,038,723 370 ECB Conversion Jing-Shou-Shang Tze No. 09401226730(Nov 14, 2005)

Far Eastern International Bank
2018 Annual Report 94
Month/ Year
Issuing price (NTD)
Authorized Capital Paid-in Capital Remarks
Shares Amount Shares Amount Source Others
Mar 2006 10 5,075,280 51 ECB Conversion Jing-Shou-Shang Tze No. 09501068660(Apr 14, 2006)
Sep 2006 10 64,094,0414,180,047
18,312,584
64142
183
Retained earningsEmployee bonusCapital reserve
Jin-Kuan-Cheng(1)No.0950132205 (Jul. 31, 2006)
Mar 2007 10 215,969 2 ECB Conversion
Jing-Shou-Shang Tze No. 09601073730(Apr 13, 2007)
Jun 2007 10 500,000,000 5,000 New authorized capital
Jing-Shou-Shang Tze No. 09601152250(Jul 4, 2007)
Jun 2007 10 647,907 6 ECB Conversion Jing-Shou-Shang Tze No. 09601152250(Jul 19, 2007)
Dec 2007 10 1,079,849 11 ECB Conversion Jing-Shou-Shang Tze No. 09601322290(Jan 4, 2008)
Jun 2008 10 1,000,000,000 10,000 New authorized capital
Jing-Shou-Shang Tze No. 09701146020(Jun 27, 2008)
Dec 2008 6.5 (Note)
461,538,000 4,615 Rights offering Jing-Shou-Shang Tze No. 09801009420(Jan 17, 2009)
Jun 2009 10
1,000,000,000 10,000 New authorized capital
Jing-Shou-Shang Tze No. 09801132000(Jun 26, 2009)
Jun 2009 10
(407,520,824) (4,075) Capital Deduction Jin-Kuan-Cheng No.0980031255 (Jun. 30, 2009)
Jul 2010 10
67,489,5325,861,971
67559
Retained earningsEmployee bonus
Jin-Kuan-Cheng No.0990038736 (Jul. 30, 2010)
Jul 2011 10
103,368,1728,043,315
1,03480
Retained earningsEmployee bonus
Jin-Kuan-Cheng No.1000033885 (Jul. 27, 2011)
Aug 2012 10
113,131,12910,568,089
1,131106
Retained earningsEmployee bonus
Jin-Kuan-Cheng No.1010036357 (Aug. 24, 2012)
Jul 2013 10
110,543,4029,315,191
1,10593
Retained earningsEmployee bonus
Jin-Kuan-Cheng No.1020028949 (Jul. 31, 2013)
Jan 2014 11.25 365,000,000 3,650 Rights offering Jin-Kuan-Cheng No.1020046424 (Nov. 26, 2013) Jin-Kuan-Cheng No.1030002514 (Jan. 23, 2014)
Jul 2014 10
122,447,61012,260,455
1,224123
Retained earningsEmployee bonus
Jin-Kuan-Cheng No.1030026505 (Jul. 18, 2014)
Aug 2015 10
153,680,07417,736,559
1,537177
Retained earningsEmployee bonus
Jin-Kuan-Cheng No.1040026417(Aug. 3, 2015)
Sep 2016 10
60,664,85917,459,348
607175
Retained earningsEmployee bonus
Jing-Shou-Shang Tze No. 10501227730(Sep 22, 2016)
Sep 2017 10 71,561,445 716 Retained earnings Jing-Shou-Shang Tze No. 10601133330(Sep 18, 2017)
Sep 2018 10 86,257,365 863 Retained earnings Jing-Shou-Shang Tze No. 10701121570(Sep 19, 2018)
Total 4,500,000,000 45,000 3,269,185,979 32,692
Note: The price was NT$6.5 per share in private placement.

Far Eastern International Bank
2018 Annual Report 95
B. Authorized Capital April 22, 2019
Share Type Authorized Capital
Remarks Outstanding Unissued Total
Common Shares
3,269,185,979 Shares 1,230,814,021 Shares 4,500,000,000 Shares Listed shares
(2) Shareholder Structure April 22, 2019
Shareholder Structure
Quantity
GovernmentAgencies
Financial Institutions
Other JuridicalPersons Individuals
Foreign Institutions
and Foreigners
Total
Accounts 4 19 199 74,595 245 75,062 Shares 18,380,656 117,730,172 1,675,342,583 1,013,184,023 444,548,545 3,269,185,979 Percentage 0.56% 3.60% 51.25% 30.99% 13.60% 100.00%
(3) Shares Distribution Status
A. Common Shares
Per Value: NT$10 April 22, 2019
Shareholding Segment
(Unit: Share)
Number of
Shareholders
Shareholding
(Shares) Percentage
1 ~ 999 27,763 7,500,063 0.23%
1,000 ~ 5,000 23,055 50,446,594 1.54%
5,001 ~ 10,000 7,508 52,605,321 1.61%
10,001 ~ 15,000 4,961 59,982,147 1.83%
15,001 ~ 20,000 3,114 53,528,579 1.64%
20,001 ~ 30,000 2,741 66,336,025 2.03%
30,001 ~ 50,000 2,150 81,979,894 2.51%
50,001 ~ 100,000 1,809 124,906,013 3.82%
100,001 ~ 200,000 1,058 141,596,378 4.33%
200,001 ~ 400,000 474 128,494,350 3.93%
400,001 ~ 600,000 143 69,956,653 2.14%
600,001 ~ 800,000 71 48,030,599 1.47%
800,001 ~ 1,000,000 51 45,662,990 1.40%
1,000,001 or over 164 2,338,160,373 71.52%
Total 75,062 3,269,185,979 100.00% B. Preferred Shares: None.

Far Eastern International Bank
2018 Annual Report 96
(4) List of Major Shareholders
Unit: shares April 22, 2019 Shareholding
Shareholder’s Name Number of Shares Percentage
Yu Yuan Investment Co., Ltd. 161,903,227 4.95% Yue Li Investment Corp. 143,388,637 4.39% Asia Investment Corp. 131,660,130 4.03% Der Ching Investment Corp. 131,644,291 4.03% Yue-Tung Investment Corp. 127,203,767 3.89% Yuan Ding Investment Co., Ltd. 116,320,507 3.56% Kai Yuan International Investment Co., Ltd. 104,935,870 3.21% Yuan Tong Investment Co., Ltd. 104,725,830 3.20% Special Account for trust property of Far Eastern International Bank employee in custody of FEIB
95,162,452 2.91%
Ding Yuan International Investment Corp. 86,435,106 2.64% Note: Listed above are the Bank’s top ten shareholders.
(5) Market Price, Net Worth, Earnings, and Dividends per Share Unit: NT$
YearItem
2017 2018 As of
April 22, 2019
Market Price Per Share
Highest 10.05 11.30 11.30 Lowest 9.08 9.26 9.93 Average (Note2) 9.59 10.23 10.81
Net Worth Per Share
Before Distribution 13.44 13.69 14.14(Note6) After Distribution 12.66 (Note1) (Note1)
Earnings Per Share
Weighted Average Shares (Thousand Shares)
3,182,929 3,269,186 3,269,186 (Note6)
Earnings Per Share Original 0.90 1.08 0.35(Note 6) Adjusted 0.87 (Note 1) (Note 1)
Dividends Per Share
Cash Dividends 0.439 0.450 0.450
Stock Dividends
Dividends from Retained Earning
0.271 0.265 -
Dividends from CapitalReserve
- - -
Accumulated Undistributed Dividends - - -
Return on Investment
Price/ Earnings Ratio(Note3) 10.57 9.32 - Price/ Dividend Ratio(Note4) 21.66 22.38 - Cash Dividend Yield Ratio (%) (Note5) 4.62 4.47 -
Note1: Earnings distribution yet to be approved by the 2019 shareholders' meeting. Note2: The average market price calculated by taking into accounts each year’s market turnover value and amount. Note3: Price / Earnings ratio = Average Market Price / Earnings per Share. Note4: Price / Dividend ratio = Average Market Price / Cash dividends per Share. Note5: Cash Dividend Yield Rate = Cash Dividend per Share / Average Market Price.
The average market prices were NT$9.51 and NT$10.07 in 2017 and 2018, respectively. Note6: They were calculated based on the Bank’s March 31, 2019 preliminary financial reports.

Far Eastern International Bank
2018 Annual Report 97
(6) Dividend Policy and Implementation Status
A. Dividend Policy In case of net income after settlement of accounts for each fiscal year, the Bank shall recover all the losses incurred in the previous years, if any, before setting aside a legal reserve of 30% of the net profit and appropriating, according to law and regulations, a special reserve shall be retained, and shall first be distributed to the dividends of Preferred Stock. The remaining amount together with the accumulated retained profits of the last year and the reversals of special reserves are available for distribution as dividends for Common Stock. The dividends for Common Stock shall be distributed at least 30% of the remaining amount. The Board of Directors shall prepare the earnings distribution in accordance with the existing circumstances at the time, taking into account the future development plan of the Bank. Any allocation of cash dividend shall, in principle, be no less than 10% of the total dividends to be distributed that year. Before the above-mentioned legal reserve reaches the amount of total paid-in capital, the maximum appropriation of cash dividends shall not exceed 15% of the total paid-in capital.
B. Proposed Distribution of Dividend in 2019 Shareholders’ Meeting The cash dividend of NT$0.450 per share, and the stock dividend of NT$0.265 per share (26.5 shares for every thousand shares) or NT$ 0.715 per share, collectively is proposed for resolution in AGM.
(7) Impact of Stock Dividends Distribution on Operating Results, Earnings per Share and Shareholders’ Return on Investment:
Unit: NT$ Thousands Year
Item Year2019 (Forecast)
Beginning Paid-In Capital 32,691,859
Dividends distribution
Cash Dividend per share(NT$) 0.4500(Note1) Stock dividends per share, from earnings distribution (number of shares) 0.0265(Note1) Stock dividends per share, from capital surplus (number of shares) - (Note1)
Changes in business results
Operating Profit
Not Applicable (Note2)
Increase (decrease) % of operating. profit from last year Net income Increase (decrease)% of net income from last year Earnings per share (EPS) (with retroactive adjustment) Increase (decrease) % of EPS from last year Annually averaged return on investment % (reverse of annually averaged price-earnings (P/E) ratio)
Pro forma Earnings per Share and P/E Ratio
If stock dividends from earning is paid fully by cash dividends
Pro forma earnings per share (EPS) Pro forma annually averaged return on investment
If no stock dividends from capital surplus Pro forma earnings per share (EPS) Pro forma annually averaged return on investment
If no stock dividends from capital surplus and from earnings are paid fully by cash dividends
Pro forma earnings per share (EPS) Pro forma annually averaged return on investment
Note1:By board resolution on March 26, 2019, cash dividends of NT$0.45 and stock dividends of NT$0.265 is approved for allocation, where the actual distribution is subject to resolution in 2019 shareholders’ meeting.
Note2:The Bank’s 2019 financial forecast is not disclosed to general public, hence the info is not available.

Far Eastern International Bank
2018 Annual Report 98
(8) Compensation of Employees and Directors
A.Percentage or scope of employees’ compensation, remuneration of directors and supervisors in the Articles of Incorporation:
If there be net income before income tax, remuneration of directors and employees’ compensation, the Bank should retain an employees' compensation of 3.5%-4.5% and a remuneration of directors no greater than 1.5%. Should there be accumulated loss; the Bank shall retain earnings to cover the loss in advance.
Employees' compensation may be distributed in the form of stocks or in cash. The amount distributable as employees' compensation and remuneration of directors shall be decided by a resolution adopted by a majority vote at a meeting of board of directors attended by two-thirds of the total number of directors; and in addition there to a report of such distribution shall be submitted to the shareholders' meeting.
B.In the event current bases of estimation for employees’ compensation and remuneration of directors, share number calculation bases for allotment of stock compensation and actual allotted amounts are at variance with estimated amounts:
The estimated amount for employees’ compensation and remuneration of directors in this period is based on the net income before income tax and the Bank's Articles of Incorporation. If there is a change in the amounts after the financial statements for the year ended were authorized for issue, the differences are recorded as a change in the accounting estimate.
C.Board of directors approved proposals for the allocation of employees’ compensation and remuneration of directors:
❶Allocation of employee cash compensation, employee stock compensation, and the amount for remuneration of directors:
Employee cash compensation is NT$ 152,444,000, employee stock compensation is zero per share and the amount for remuneration of directors is NT$ 50,814,000. There was no difference between the actual amounts of employees’ compensation and remuneration of directors paid and the amounts recognized in the financial statements for the year ended.
❷The ratio of the employees’ stock compensation to the net income after income tax in the individual financial report for the current period and the total amount of employees’ compensation: Not Applicable
D.Actual allocations of employee compensation and remuneration of directors paid for the preceding fiscal year:
❶Employee cash compensation is NT$ 126,300,000, employee stock compensation is zero per share and the amount for remuneration of directors is NT$ 42,100,000 for the year ended December 31, 2017.
❷There was no difference between the actual amounts of employees’ compensation and remuneration of directors paid.
(9) Buyback of Treasury Stock:
2018: None.
As of Apr 22, 2019: None.

Far Eastern International Bank
2018 Annual Report 99
2. Bonds
To maintain capital adequacy ratio and the medium-term to long-term working capital, the Bank had applied and obtained approval from the Financial Supervisory Commission to issue bank debentures. The outstanding balances of bank debentures as of December 31, 2018 are summarized as follows:
Issuance of bank debenture
Types of bank debentures 1st subordinated bank debenture in 2012
1st subordinated bank debenture in 2013
Date and serial No. approved by authority
FSC No. 10100164700, May 25, 2012
FSC No. 10200123360, May 8, 2013
Issuing date June 27, 2012 November 6, 2013 Face value NT$ 10 million NT$ 10 million
Issuing and trading ROC ROC Currency New Taiwan dollar New Taiwan dollar
Issuing price At par value At par value Total amount NT$3.0 billion NT$4.0 billion
Coupon Fixed interest rate at 1.75% per annum
Fixed interest rate at 2.10% per annum
Maturity 7 years from the issue date. Maturity on June 27, 2019
7 years from the issue date. Maturity on November 6, 2020
Rank Subordinated to deposit holders and other general creditors
Subordinated to deposit holders and other general creditors
Guarantor None None Trustee None None
Underwriter KGI, Master Link, Yuanta, Cathay and Grand Cathay securities
Master Link, Yuanta and Capital securities
Certified lawyer None None Certified CPA Chen, Junhon Chen, Junhon
Certified financial institution None None
Repayment By self-owned capital or refinancing bank debentures
By self-owned capital or refinancing bank debentures
Outstanding balance NT$ 3.0 billion NT$ 4.0 billion Paid-in capital in the previous year NT$21,185,604 (thousand) NT$22,422,596 (thousand)
Net book value on the date of balance sheet in the previous fiscal
year
NT$24,124,738 (thousand) NT$26,085,624 (thousand)
Default status Normal Normal The terms and conditions for
redemption or early liquidation None None
Conditions for conversion or exchange
None None
Restrictive terms Subordinated Subordinated
Use of proceeds
To finance the Bank's long term funding needs and enhance the
Bank's capital structure for support of future growth of loans and
investments.
To finance the Bank's long term funding needs and enhance the
Bank's capital structure for support of future growth of loans and
investments. The total amount of the issuance
and outstanding bonds in the percentage of the book value of
previous year (%)
94.92 104.78
Eligible capital and type Tier II Tier II
Name of rating agency, issue date, and the rating
“A-(twn)” issued by Fitch Ratings, Taiwan Branch on June 27, 2012.
“BBB+(twn)” issued by Fitch Ratings, Taiwan Branch on
November 6, 2013.

Far Eastern International Bank
2018 Annual Report 100
Issuance of bank debenture
Types of bank debentures 1st subordinated bank debenture in 2014
1st subordinated bank debenture in 2015
Date and serial No. approved by authority
FSC No. 10300105790, April 23, 2014
FSC No. 10400126510, June 5, 2015
Issuing date December 23, 2014 September 30, 2015 Face value NT$ 10 million NT$ 10 million Issuing and trading ROC ROCCurrency New Taiwan dollar New Taiwan dollar Issuing price At par value At par valueTotal amount NT$1.1 billion NT$3.0 billion
Coupon Fixed interest rate at 2.05% per annum
Fixed interest rate at 1.95% per annum
Maturity 7 years from the issue date. Maturity on December 23, 2021
7 years from the issue date. Maturity on September 30, 2022
Rank Subordinated to deposit holders and other general creditors
Subordinated to deposit holders and other general creditors
Guarantor None NoneTrustee None None
Underwriter KGI, Master Link and Capital securities
Master Link, Yuanta, GKI, SinoPac and Taiwan Cooperative securities
Certified lawyer None NoneCertified CPA Chen, Junhon Chen, Junhon Certified financial institution None None
Repayment By self-owned capital or refinancing bank debentures
By self-owned capital or refinancing bank debentures
Outstanding balance NT$ 1.1 billion NT$ 3.0 billion Paid-in capital in the previous year
NT$23,621,182 (thousand) NT$28,618,263(thousand)
Net book value on the date of balance sheet in the previous fiscal year
NT$32,347,065 (thousand) NT$35,118,001(thousand)
Default status Normal NormalThe terms and conditions for redemption or early liquidation
None None
Conditions for conversion or exchange
None None
Restrictive terms Subordinated Subordinated
Use of proceeds
To finance the Bank's long term funding needs and enhance the Bank's capital structure for support of future growth of loans and investments.
To finance the Bank's long term funding needs and enhance the Bank's capital structure for support of future growth of loans and investments.
The total amount of the issuance and outstanding bonds in the percentage of the book value of previous year (%)
78.62 57.52
Eligible capital and type Tier II Tier II
Name of rating agency, issue date, and the rating
“BBB+(twn)” issued by Fitch Ratings, Taiwan Branch on December 23, 2014.
“BBB+(twn)” issued by Fitch Ratings, Taiwan Branch on September 25, 2015.

Far Eastern International Bank
2018 Annual Report 101
Issuance of bank debenture
Types of bank debentures 1st subordinated bank debenture in 2016
1st perpetual non-cumulative unsecured subordinated debenture in 2018
Date and serial No. approved by authority FSC No. 10500130430, June 3, 2016 FSC No. 10702142020, July 20, 2018
Issuing date September 27, 2016 September 18, 2018 Face value NT$ 10 million NT$ 10 millionIssuing and trading ROC ROCCurrency New Taiwan dollar New Taiwan dollar Issuing price At par value At par valueTotal amount NT$4.0 billion NT$2.9 billion
Coupon Fixed interest rate at 1.55% per annum
Fixed interest rate at 3.2% per annum
Maturity 7 years from the issue date. Maturity on September 27, 2023
Prepetural (issuer with call right)
Rank
Subordinated to deposit holders and other general creditors
Senior to the right on distribution of remaining property for shareholders, and junior to those for holders of Tier II capital instruments, depositors and other general creditors to the Bank.
Guarantor None NoneTrustee None None
Underwriter Master Link, Yuanta, GKI and Taiwan Cooperative securities
KGI and Master Link securities
Certified lawyer None NoneCertified CPA Wu, Shizong Wu, ShizongCertified financial institution None None
Repayment By self-owned capital or refinancing bank debentures
By self-owned capital or refinancing bank debentures
Outstanding balance NT$ 4.0 billion NT$ 2.9 billionPaid-in capital in the previous year
NT$30,332,430(thousand) NT$31,829,286 (thousand)
Net book value on the date of balance sheet in the previous fiscal year
NT$37,764,349 (thousand) NT$41,389,366 (thousand)
Default status Normal Normal
The terms and conditions for redemption or early liquidation
None FEIB may redeem the debts in whole at their aggregate principal amount, together with any interest payment five years after the issuing date subject to regulators’ approval, provided that the bank’s post-redemption BIS is above legal requirement.
Conditions for conversion or exchange
None None

Far Eastern International Bank
2018 Annual Report 102
Types of bank debentures 1st subordinated bank debenture in 2016
1st perpetual non-cumulative unsecured subordinated debenture in 2018
Restrictive terms Subordinated
The bank may not pay interest if there is no earnings and dividends in previous year (including cash and stock dividends); however this restriction does not apply in circumstances where the balance of cumulative undistributed earnings less amortized losses on sale of non-performing loans is greater than the amount of payable interest, and provided that the payment results in no changes to the terms of interest. Non- payment of interest due to the above will not be accumulated or deferred in later periods. The bank shall defer interest and principal payments in situations where its capital adequacy ratio fails to meet the minimum level specified in Article 5, Paragraph 1 of the Regulations Governing the Capital Adequacy and Capital Category of Banks; in which case, deferred interest may not accrue any late interest.
Use of proceeds
To finance the Bank's long term funding needs and enhance the Bank's capital structure for support of future growth of loans and investments.
To finance the Bank's long term funding needs and enhance the Bank's capital structure for support of future growth of loans and investments.
The total amount of the issuance and outstanding bonds in the percentage of the book value of previous year (%)
64.09 43.49
Eligible capital and type Tier II Tier I
Name of rating agency, issue date, and the rating
“A(twn)” issued by Fitch Ratings, Taiwan Branch on September 25, 2015.
“A(twn)” issued by Fitch Ratings, Taiwan Branch on July 2, 2018.
3. Issuance of Preferred Stock
None.

Far Eastern International Bank
2018 Annual Report 103
4. Issuance of Global Depository Receipt
Date of Issue Item
Jan. 28, 2014
Date of Issue Jan. 28, 2014 Issuance and Listing Luxembourg Stock Exchange Total Amount US$135,050,000 Issue Price per GDR US$7.4
Total units issued 1. The original issue of 18,250,000 units.
2. The total number of depositary receipts was 18,383,333 units as of December 31, 2018.
Type of underlying securities FEIB's newly issued common shares Amount of underlying securities 367,666,685 shares Rights and obligations of subscribers Same as common share holders Trustee None Depositary Bank Citibank N.A. Custodian Bank Citibank Taiwan Number of outstanding units 714,972 units(As of December 2018) Bearers of related charges incurred during issuance and holding period Shall be borne by the Bank
Key Provision in Deposit/Custodian Agreements None
Market Price
per unit
2018
Highest US$7.156
Lowest US$6.231
Average US$6.557
As of April 22, 2019
Highest US$7.350
Lowest US$6.450
Average US$6.975
5. Issuance of Employee Stock Options
None.
6. Issuance of New Restricted Shares to Employee
None.

Far Eastern International Bank
2018 Annual Report 104
7. Mergers and Acquisitions
(1) Any opinions by accountants that should be disclosed regarding the reasonable share swap ratio
Not applicable.
(2) Mergers & Acquisitions or Receiving of Other Financial Insitiutions in the past five years
None.
(3) Where a financial institution was merged or acquired by way of new share issuance, the lead underwriter’s evaluation and opinions must be disclosed
Not applicable.
(4) In the most recent financial year and up to the printing of this annual report, disclosure of the basic data of mergers & acquisitions or sale of other financial institutions in which the Board of Directors has approved such M&A or sale that involves the issuance of new shares:
Not applicable.
8. The Execution of Fund Utilization Plan
(1) Contents of the plan
The Bank issued bank debentures to obtain long term funding, and to enhance the Bank's capital structure for future growth of loans and investments.
(2) Implementation description
Subject Use of proceeds The condition of execution
The comparison of the results with
the desired- results
The date of the material
information announced in MOPS (note)
The Board approved the issuing plan of perpetual non-cumulative unsecured subordinated debenture up to NT$2.9 billion.
To finance the Bank's long term funding needs and enhance the Bank's Tier I capital.
The issue of perpetual non-cumulative unsecured subordinated debenture of NT$2.9 billion was completed on September 18, 2018.
The outcome achieved the desired results.
November 3, 2017
The Board approved the issuing plan of subordinated debentures up to NT$ 4 billion and senior unsecured financial debentures up to NT$ 6 billion (or the equivalent in other currencies).
To finance the Bank's long term funding needs and enhance the Bank's capital structure.
The issue of 5-year senior unsecured financial debentures of NT$2.5 billion was completed on February 21, 2019.
The outcome achieved the desired results.
November 2, 2018
Note: Posted per board resolution

Far Eastern International Bank
2018 Annual Report 105
V. Operation Highlights
1. Business Activities
(1) Business Scope
A. Core-business
Individual Banking:Responsible for branch operations and financial management, including: planning, sales and performance management of products such as deposits, investments, trusts, insurance, tax consulting, and SME Loan, etc. and manage branch access.
Consumer Banking and Credit Cards:Provide credit facility for consumer banking products, such as mortgage, personal loan, car loan, consumer finance, and credit cards. And responsible for product planning, marketing, sales, management and customer service.
Corporate Banking:Corporate banking businesses are driven by corporate customers’ needs of different industries to satisfy them with integrated financial solutions such as corporate deposits, loans, FOREX businesses (foreign exchange, import and export), factoring, e-financing, supply-chain financing, financial hedge and structured products, etc.
Financial Market:Financial Trading business covers fixed income, foreign exchange, equity, credit and derivatives. Focus on the financial institutions to provide solutions with financing, TMU transaction, automatic clearing house, etc. Execute TWD and foreign currencies funding and asset management policies of the Asset and Liability Management Committee (“ALCO”), including asset/liability, liquidity risk and interest rate sensitivity risk management.
Digital Banking: Enhance customer experiences with technology, optimizes the application process, and creates new business models. We provide customers with safe, intelligent and touching digital banking services and continue to initiate digital transformation in various financial applications.
Insurance Agency : Professionally select high-quality insurance companies to cooperate in Bancassurance business, assist bank colleagues to develop professional knowledge in insurance products, marketing and sales services. Facing the increasingly diverse needs of customers, the Bank includes various and comprehensive products to fulfill different customer groups and offer comprehensive financial planning through Bancassurance.
B. Weightings to Net Revenue and Changes YOY of the Respective Business Units
BU Weightings to Net Revenue Growth Rate
(YoY) 2018 2017 Individual Banking 22% 21% 2% Consumer Banking 25% 24% 4% Credit Cards 12% 12% 2% Corporate Banking 27% 25% 10% Financial Market 13% 16% -22% Insurance Agency 1% 2% -32%
Far Eastern International Bank
2018 Annual Report 106
(2) Business Plan for 2018
A. Individual Banking
Wealth Management: Strengthen customer relationships and raise product penetration rate through enhancement of KYC and financial consultation skills for the purpose of expanding assets under management AUM) and wealth management business
Customer-relationship management: Collaborate with FEIB affiliates to launch Privilege Scheme, granting special offers to our VIPs with aim of enhancing customer loyalty and affiliate-relationships. As a result of which resources integration and sharing with FEIB affiliates customers shall be achieved; Furthermore our recent milestone, the initiation of happy plus project for the elderly with Yuan Ze University, has encompassed courses of smart management of assets, aesthetic education, digital technology, health education and appreciation of Chinese classics.
AI-advisor: the applications of innovative technology such as upgrading wealth management system to provide AI-advisor services and establishing an AI and digital zone in the branches to offer the experience of innovative digital service for the purpose of enhancing efficiency and convenience of banking transactions.
Trust business: Caring trust planning for the retired through investments in accumulated funds and advanced trust service in response to the arrival of aging society and decreasing birth rate.
Financing service for small and medium enterprises: make a great use of resources that each branch has possessed to enhance the relationships with small and medium enterprises and vendors nearby in order to increase customer base; search for enterprises with solid credit history and enhance post-loan management with the intention of achieving profit growth and risk control.
Branch operations: the aim is to increase AUM and hence achieve profit growth; search for potential areas with high-end customers and re-allocate the branches corresponsively and together with the resources obtained from the vendors nearby and FEIB affiliates to build branches with unique value. Furthermore create digital brand identity by building AI and digital zone in all branches in response to FINTECH wave.
B. Consumer Banking and Credit Cards
Consumer Banking
Mortgage Loan: Increase the high-margin product shares via better risk differentiation. Diversify the sales channels, integrate online and offline service to enrich customer experience and strengthen competitiveness.
Personal Loan: Provide credit facility to both low-risk and high-risk customers via reinforcement of risk segmentation. Enhance online platform to reach into different customer segment. Offline application processes are streamlined to optimize the sales efficiency and effectiveness.
Consumer Finance: Strengthen the cooperation with the existing strategic alliances and expand the Account Receivable product to boost business volume. Enhance E&M platform to modernize the application process and service.

Far Eastern International Bank
2018 Annual Report 107
Car Loan and Motorcycle Loan: Upgrade the operating process to strengthen banks’ competiveness. Balance business volume and profitability to pursue steady business growth.
Credit Card:
Card issuance: Focuse on Happy Go credit card. Leverage FE Group's cross-industry advantages to ally with department stores, discount stores, telecom, online shopping, hotels, and other retail channels. Intensify the brand image of FE Happy Go credit card as FE Group card. Diversify the application channels for eParking payment with FE credit cards to penetrate the commuter group. Introduce original marketing campaigns to better serve the existing customers.
Spending: Target on big ticket size spending, such as department stores, travel, and overseas consumption. Work with NCCC merchants to launch hire purchase as to boost spending volume and fee revenue. FE Group synergy is leveraged to enrich Happy Go cardholders' privilege. Provide overall service to uplift card usage and number of active cards.
Digitalization: In response to dynamical changes, enhance the infrastructure of digital services for Happy Go credit card. Promote the mobile payment participation and usage. Co-work with international payment services and key e- wallet providers to expand the digital payment channels.
C. Corporate Banking
Expand asset scale, enforce strict control of asset quality, and maintain steady profit growth.
Continue to promote preferential demand deposit program, focus on absorbing operating funds from customers, and enlarge the deposit account base for the bank; take into account capital cost, engage in dynamic adjustment of portfolio, increase capital return and fund utilization efficiency; periodically monitor liquidity ratios (LCR & NSFR), and strengthen the risk management of liquidity
Aggressively develop corporate finance businesses, proactively take the mandated lead arranger and book runner of syndicated facility, provide structured financing and corporate trust, and manage leading brand, and increase loan spreads and commission income.
Focus on KYC and after-loan management to maintain high revenues, high growth, and high profits.
Cope with digital business development model, promote cash management and e-banking, and expand customer base of operating bank.
Proactive deployment of Asia Pacific financial service platform, through international syndicated loans and cross-border financing structure, continue to operate in Greater China and ASEAN markets, thus enlarge overseas assets and profits.
D. Financial Market
Proprietary Trading: To develop the capability of in-house derivative product warehousing and provide variety of financial products to create synergy among trading, sales and customer services. Our mission are to expand investment and trading position, set up diversified asset allocation, flexible trading strategy and

Far Eastern International Bank
2018 Annual Report 108
create new source of profit.
Corporate Treasury Sales: Our goal is to maintain awareness of policy and risk of products including robust KYC measures and adequate limit control to be in line with customer risk capability. Ensure seamless support for corporate clients with holistic FX instruments, including derivative products and a variety of interest rate tools to meet or exceed customer expectations. To strengthen functions of the electronic trading platform - FETP and to apply artificial intelligence (AI) in the business is the main task for FX Margin Trading this year.
FI Client:
Deposit: Macro-control of deposits of FI client according to the bank policy. Developing and growing long-term source of funds from Non-banking organizations
Credit Financing: Expand credit line into subsidiaries of domestic financial institutions including securities and broker, non-banking financing, venture capitals, and asset management, etc. Actively pursuing the role of international syndicate loan based on discreet measurement of sovereign risk, financial soundness, loan spread
Crossing selling: Offer hedge solutions to overseas investment for IC, SC, and FC
AML Asset and Liability Management: Strengthen liquidity risk management. Improve bank deposit structure to meet the supervision target with LCR above 100%
E. Digital Banking
AI transformation
We aggressively promoted the digitalization of financial services and continued to upgrade digital processes.
Far Eastern International Bank developed our own AI trilogy with progressive planning. First, we continue to optimize new official website and mobile banking APP, design Intelligent Assistants which will provide financial information at the right time; leverage Artificial Intelligence technology to provide smart service which can promote appropriate financial products according to customer profile.
We integrated cross-border big data to analyze the consumption behavior and risk of each segment, and planned to build intelligence credit scoring models.
R&D innovation
Far Eastern International Bank focused on innovation in the fintech fields. We are now looking for breakthroughs in patentable applications based on the development process of various digital projects, accumulating research and development innovation energy for the competitive edge.
We developed the mobile payment ecosystem with the QR code Payment Gateway as the core, helped large retail channels to quickly introduce mobile code-scanning payment and multi-wallet services and will further develop the cash flow management OPEN API.
Digital Marketing
We proposed new concepts to create public interests (Bankee, off-counter ratio, etc.),

Far Eastern International Bank
2018 Annual Report 109
and successfully shaped the leading Digital Bank image of Far Eastern International Bank.
With a customer-centric mindset, Far Eastern International Bank built our owned media plans, and continued to expand the number of Facebook fans and VIP Line@ members. We created and operated digital platforms with scene applications, and continued to cultivate digital customers.
We used big data technology to predict customer needs and to provide appropriate financial services.
F. Insurance Agency
Will launch an automation system of "Insurance sales certification registration and basic individual data sharing agreement management" to strengthen the internal control and legal compliances check, which ensures the Bank meets government’s regulation requirements, also cutting the usage of paper for reducing waste of resources.
To in line with the trend of InsurTech (Insurance Technology), planning to develop the capabilities of purchasing insurance policies through internet web or mobile phone’s application for providing customers with most convenient, flexible and handy access in anytime, and anywhere.
To cross-sell overall banking services such as savings/checking accounts and time deposits, or TMU/ACH etc, to deepen customers’ relationship and enlarge the Bank’s profitability.
Actively respond to the rapid changes in the insurance market, and cope with the technological progress, to brokerage needs-base insurance products to keep the Bank at competitive edge of Bancassurance businesses.
(3) Market Analysis
A. Business Operation Areas and Market prospective and growth
FEIB has branches in domestic urban areas and Hong Kong. The business operation scope extends to serve Greater China and Asian regions.
The U.S-China trade war is still negotiating and may not come up with a quick fix. Facing this uncertainty of US-China trade war and worldwide economic slowdown. The domestic property market maintain conservative this year as the real estate inventory keeps at high level and market demands are upheld by self-use residence. The personal loan borrowers with investment demands decrease but the needs for operating capital remain flat with intensive pricing competition. Car loan's business priority transfers to asset quality improvement, leading to a flat sales volume forecast. Motorcycle loan transaction is downward. To expand the product lines, credit facility to cash out business and refitted motorcycles will be introduced.
FSC announced Internet-Only Banks application. It encourages domestic banks to have more financial innovations. In the face of challenges from the Internet-Only Bank, FEIB combined community strength, multi-products and intelligent services to develop a dedicated service to young generations - Bankee.
FEIB is keep monitoring the changes of global economy and financial markets and the trends of international trade & industrial developments in both domestic and overseas.

Far Eastern International Bank
2018 Annual Report 110
Upon the strategies of steady growth and asset portfolio management, FEIB is consistently to meet customers’ financial needs and to keep the core competitiveness for the better performance.
B. Competiveness, development of advantages & disadvantages and remedial strategies
FEIB has entered medium-sized bank ranking, with balanced core business development and niche products leading the market. In order to continuously enhance competitiveness, we focus on asset portfolio adjustment, implement a rigorous risk management, and ensure asset quality, process digitalization to improve operational efficiency, foster quality talents and use flexible organizational adjustments to grasp market opportunities. We also have different strategic plans for long-term and short-term business development to respond to rapidly changing market challenges.
Facing competitive financial environment, favorable and unfavorable factors and strategies of future business development of FEIB are analyzed as follow:
Strengths:
The government has invested resources to promote mobile payment. The attitude of the public for the new payment methods has been upgraded from being untrustworthy to being willing to try with full expectations.
Leveraging the FEG background and resources for group synergy
Recruiting int’l financial professionals and optimizing human capital for int’l business team building
Strengthening post-loan management for excellent asset quality and operation efficiency
Diversifying multiple financial products and offering the tailor-made services with overall financial solutions for market differentiation
Completed the capital injection to FEIB Leasing Company in Shanghai and enlarged the platform of Greater China
Executive Yuan Consumer Protection Office published the standardized contract for supplementary education. Performance bonds provided by supplementary education companies are mandatory. New contract protects consumer rights to certain extent and reduce the risk of financial institutions.
The years- long dispute of TRF transactions was coming to an end, which is a positive factor for a normal business
As Common Reporting Standard(CRS) are going to be put into practice, all transactions associated with banks would be allowed for exchange within participating governments and as a result it would induce repatriation of overseas funds from China which would be encouraged to be invested in the forward-looking infrastructure development program, the 5+2 industrial transformation plan and new ventures. Not only would the overseas funds increase the size of AUM for banks, it would also benefit banks in financing service.
The government is continuously striving to promote financing service for small and medium enterprises and create business opportunities by expanding the scope of financing on projects ,supported by investments from small and medium business credit guarantee fund, related to the forward-looking infrastructure development

Far Eastern International Bank
2018 Annual Report 111
program, green energy technology, New Southbound Policy and guaranteed financing for new ventures.
Weaknesses:
Financial industry will face new challenges that are different from previous competitors and competition is more intense
Fierce competition of lending businesses among domestic banks with limited spread
Under the influence of Globalization, advanced technology innovations, change of customer behavior and evolution of governmental laws and regulations, The Competent Authority has implemented stricter regulations on financial products and for sales channels to follow, for instance conduct a thorough background and credit check on Offshore Banking Units(OBUs) in order to comply with the mutual evaluation criteria imposed by members of the Asia/Pacific Group on Money Laundering (APG) and CRS which is going to be in force in the near future. It enforced supervisory regulations and compliances on financial products restrict the business developments
The implemented liquidity management index constrains efficiency of funding usage
The global economy is facing a confluence of risks, including the uncertainty of US-China trade war, China's economic slowdown, and weak growth of European market.
The regulations on revolving credit and cash in advance strict the operation of credit card business
There are far too many competitors in Banking business, selling and providing similar products and services respectively. Therefore, how to charge fees reasonably and correctly on the products recommended and services provided in order to remain profitable shall be the prime focus. Furthermore, since the implementation of 2.0 version of loss-loading in insurance by Financial Supervisory Commission R.O.C (Taiwan), it has decrease investors’ willingness to purchase traditional life insurance.
Apart from offering financing service to certain small and medium business, enterprises in general have less intention in investing. As a result, there would be low demand for capital and low Interest rate environment shall continue to prevail. Furthermore, due to slow decline in Domestic real estate market, there are stricter restrictions of capping maximum mortgages on homes which pose more challenges to find enterprises with solid credit history.
Strategies:
We continue to develop the "FE QR code Payment Gateway", expand the cooperative retail channels, increase multi-wallet partners, develop the cash flow management OPEN API, achieve the economies of scale, and create a complete mobile payment ecosystem.
New generation customers love digital financial products, and Far Eastern International Bank launches the sub-brand “Bankee”, which actively attracts the attention of Y- generation young customers and effectively expands our customer base.

Far Eastern International Bank
2018 Annual Report 112
Leveraging the corporate finance and TMU products and innovating financial services for more niche and diversified products
Copying the business model of B2B2C to provide digitalized financial services and leveraging new technology & cash flows to develop new business opportunities
Deepening the business developments in Greater China region, coping with south-bound policy to enlarge overseas markets and customer base through participating int’l syndication facilities
Improve our professional skills with the aim of raising contribution rate. Provide the suitable product portfolio and the best wealth management service through the use of KYC skills and diverse product lines. Furthermore, with the introduction of AI-advisor, asset rebalancing and risk control could be dealt with instantly.
Revise internal control principles and create mistake-proofing mechanism for systems in order to lower the operational risks. Regular revision of ISO and constant compliance and risk control trainings are essential for being in compliance with code of practice required and set up by The Competent Authority and our Legal Compliance Department
Establish AI and digital zone in every branch and deliver a tour for our customers to experience the smart service. Convey the core value of happy plus concept in wealth management through Line@ and e-marketing.
(4) Research and Development
A. R&D Results in Last Two Years and Future Directions:
Major Financial Product:
a. Mobile payment development:The “FE QR code Payment Gateway " provides a multi-transaction platform for merchants and consumers to deliver the cross-channel, cross-wallet and cross-consumption application transactions to fulfills customers’ mobile payment needs
b. Integrated Payment Service Provider:Far Eastern International Bank will develop the OPEN API based on the “FE QR code Payment Gateway "
c. Bankee:Far Eastern International Bank designs Bankee with the community as the core, combines a number of innovative patents, and integrates many creative elements such as community, games and AR.
d. FX Margin trading: FX Margin Trading launched mobile trading platform. Annual trading volume over USD 4,010 million and profits around NTD 75 million
New established department and profit and loss:
None.
B. R&D expenditures and result
R&D expenditures
Year 2018 2017
Amount 260,720 365,069 The R&D results is detailed in “implementation of the staff training program” and the
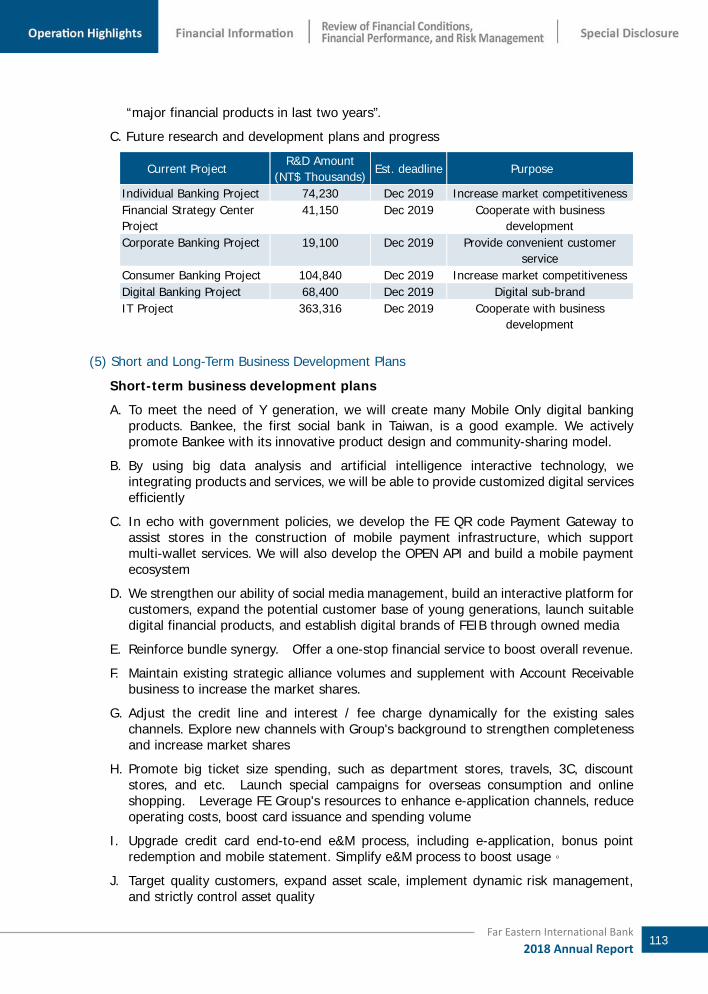
Far Eastern International Bank
2018 Annual Report 113
“major financial products in last two years”.
C. Future research and development plans and progress
Current Project R&D Amount
(NT$ Thousands)Est. deadline Purpose
Individual Banking Project 74,230 Dec 2019 Increase market competitiveness Financial Strategy Center Project
41,150 Dec 2019 Cooperate with business development
Corporate Banking Project 19,100 Dec 2019 Provide convenient customer service
Consumer Banking Project 104,840 Dec 2019 Increase market competitiveness Digital Banking Project 68,400 Dec 2019 Digital sub-brand IT Project 363,316 Dec 2019 Cooperate with business
development
(5) Short and Long-Term Business Development Plans
Short-term business development plans
A. To meet the need of Y generation, we will create many Mobile Only digital banking products. Bankee, the first social bank in Taiwan, is a good example. We actively promote Bankee with its innovative product design and community-sharing model.
B. By using big data analysis and artificial intelligence interactive technology, we integrating products and services, we will be able to provide customized digital services efficiently
C. In echo with government policies, we develop the FE QR code Payment Gateway to assist stores in the construction of mobile payment infrastructure, which support multi-wallet services. We will also develop the OPEN API and build a mobile payment ecosystem
D. We strengthen our ability of social media management, build an interactive platform for customers, expand the potential customer base of young generations, launch suitable digital financial products, and establish digital brands of FEIB through owned media
E. Reinforce bundle synergy. Offer a one-stop financial service to boost overall revenue.
F. Maintain existing strategic alliance volumes and supplement with Account Receivable business to increase the market shares.
G. Adjust the credit line and interest / fee charge dynamically for the existing sales channels. Explore new channels with Group's background to strengthen completeness and increase market shares
H. Promote big ticket size spending, such as department stores, travels, 3C, discount stores, and etc. Launch special campaigns for overseas consumption and online shopping. Leverage FE Group's resources to enhance e-application channels, reduce operating costs, boost card issuance and spending volume
I. Upgrade credit card end-to-end e&M process, including e-application, bonus point redemption and mobile statement. Simplify e&M process to boost usage。
J. Target quality customers, expand asset scale, implement dynamic risk management, and strictly control asset quality

Far Eastern International Bank
2018 Annual Report 114
K. Fully adopt enterprise e-banking cash flow platform, provide account integration in Greater China and Omni cash management services in domestic and cross-border transfers/remittances, making FEIB customers’ operating bank
L. Develop corporate finance products and manage regional asset portfolio to satisfy middle and jumbo corporate customers’ needs
M. Proactively expand overseas offices or branches and currently apply to establish Ho Chi Minh and Singapore Rep. Offices
N. Establish AI Branches with happy plus concept to provide customers with space for LOHAS and with access to digital financial services. Furthermore launch mobile financial services to improve the convenience for banking transactions. Create business opportunities and gain easier access to high-end customers through upgrades of wealth management system and enhancement of KYC skills
O. Launch AI-advisor to achieve 3P goals, Protection for customer investments, Preservation for customer assets, and Profit-making through algorithm and constant rebalancing of product portfolios
P. Build relationships with customers’ offspring by providing family finance planning service through asset allocation and tax filing seminars
Q. Introduce retirement scheme in combination through the management of caring trust account and continuously initiate happy plus project for the elderly for the purpose of providing customers with long-term asset planning service
R. Continually to focus on developing Bancassurance businesses via cooperate with selected market leading insurance companies to brokerage the most suitable Bancassurance products for providing the best risk management solution both in life and property to the Bank’s clients for protecting their potential damage loss
Long-term business development plans
A. We use financial innovation technology to integrate channels, services and products, and transform the bank into a "smart service + life style" complex that can provide customers with the financial services they need immediately
B. We continue to promote e/M services, and integrate O2O online/offline to create Omni Channel intelligent services, which provide consumers with the best user experience
C. Continue to accumulate our fintech R&D capabilities, and find innovative opportunities in various digital projects and apply for FinTech patents。
D. Keep up with economic landscape worldwide, discreet participation in international syndicate loan, flexible credit policy, take an edge in financial opportunity of Taiwan, China, and Hong Kong, diversify credit risk taking part in “go west” policy to expand revenue scope and company visibility
E. Integrate Group's e-wallets. Implement instant accumulation/redemption for HAPPY GO bonus points. Improve group synergy with digital footprint and create a win-win operating performance.
F. Provide customers a comprehensive financial products and services. Expand the business scope and deepen customer relationship
G. Search target customers along with industry trend, proactively deploy overseas market,

Far Eastern International Bank
2018 Annual Report 115
and expand overseas asset scale and profit ratio
H. Develop trading financial business, explore deposit customer base, optimize deposit structure, and maintain steady interest rate spread
I. Copy the successful overseas business model and consistently penetrate the markets in Greater China and ASEAN through int’l syndication facilities and structured products for more profits
J. Convey the spirit of FEIB wealth management through the promotion of the core value of happy plus concept and the spirit of which would be assisting customers in achievement of financial freedom through preservation for and appreciation of assets.
K. Enhance personnel’s KYC skills and finance, tax and retirement planning abilities, to satisfy the needs for individual or family financial management and legacy planning
L. Set up Financial Consumer Protection Act and ISO-Financial Service in Wealth Management and Risk Control over customer accounts for the Prevention of mis-selling and Implementation of sales guidelines. Enhance risk-control mechanism through multi-dimensional risk control management with automatic warning system for investment portfolios to build trust in our wealth management with customers
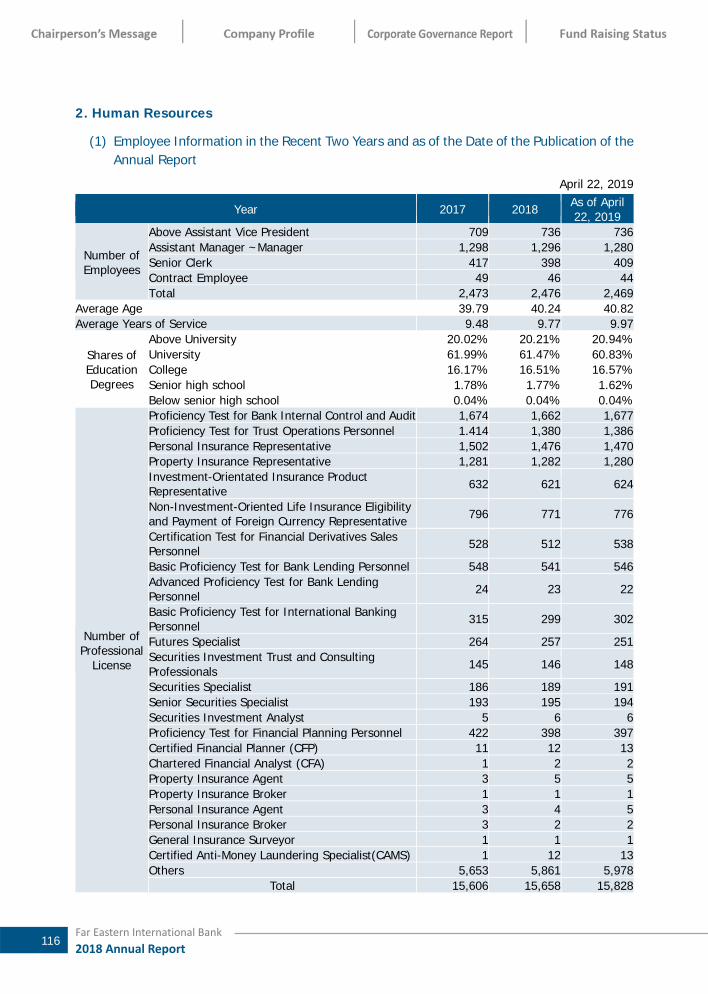
Far Eastern International Bank
2018 Annual Report 116
2. Human Resources
(1) Employee Information in the Recent Two Years and as of the Date of the Publication of the Annual Report
April 22, 2019
Year 2017 2018 As of April 22, 2019
Number of Employees
Above Assistant Vice President 709 736 736Assistant Manager ~Manager 1,298 1,296 1,280Senior Clerk 417 398 409Contract Employee 49 46 44Total 2,473 2,476 2,469
Average Age 39.79 40.24 40.82Average Years of Service 9.48 9.77 9.97
Shares of Education Degrees
Above University 20.02% 20.21% 20.94%University 61.99% 61.47% 60.83%College 16.17% 16.51% 16.57%Senior high school 1.78% 1.77% 1.62%Below senior high school 0.04% 0.04% 0.04%
Number of Professional
License
Proficiency Test for Bank Internal Control and Audit 1,674 1,662 1,677Proficiency Test for Trust Operations Personnel 1.414 1,380 1,386Personal Insurance Representative 1,502 1,476 1,470Property Insurance Representative 1,281 1,282 1,280Investment-Orientated Insurance Product Representative 632 621 624
Non-Investment-Oriented Life Insurance Eligibility and Payment of Foreign Currency Representative 796 771 776
Certification Test for Financial Derivatives Sales Personnel 528 512 538
Basic Proficiency Test for Bank Lending Personnel 548 541 546Advanced Proficiency Test for Bank Lending Personnel 24 23 22
Basic Proficiency Test for International Banking Personnel 315 299 302
Futures Specialist 264 257 251Securities Investment Trust and Consulting Professionals 145 146 148
Securities Specialist 186 189 191Senior Securities Specialist 193 195 194Securities Investment Analyst 5 6 6Proficiency Test for Financial Planning Personnel 422 398 397Certified Financial Planner (CFP) 11 12 13Chartered Financial Analyst (CFA) 1 2 2Property Insurance Agent 3 5 5Property Insurance Broker 1 1 1Personal Insurance Agent 3 4 5Personal Insurance Broker 3 2 2General Insurance Surveyor 1 1 1Certified Anti-Money Laundering Specialist(CAMS) 1 12 13Others 5,653 5,861 5,978
Total 15,606 15,658 15,828

Far Eastern International Bank
2018 Annual Report 117
(2) Employee Training and Development
The bank’s training quality has been recognized by the Ministry of Labor and received silver medal for TTQS (Talent Quality-management System). For 16 years in a row, the bank has received subsidies that accumulate 8.4 million under its “Enterprises Talent Skill Progressive Program”. Training result in the recent three years is summarized as below:
Unit: NT$ Thousands
Training Year
Internal Program External Program Total
ExpenseNo. of
EmployeesNo. of Classes
ExpenseNo. of
EmployeesNo. of Classes
Expense No. of
Employees No. of Classes
2016 10,414 22,810 1,108 1,937 1,181 499 12,351 23,991 1,607 2017 10,284 19,506 941 4,707 1,454 474 14,991 20,960 1,415 2018 17,180 22,723 1,024 3,828 1,523 704 21,008 24,246 1,728
In 2018, total online courses reached over one hundred thousand employees and 442 classes. Classroom training and online training courses are summarized as below:
Category Summary No. of
Employees No. of Classes
No. of Hours
Classroom Training
ProfessionalProfessional knowledge to execute business and knowledge of digital finance.
17,988
1,728 103,527
Fundamental New employee orientation, productivity enhancement and self- management skills.
442
Management Strengthening management skills for potential talents and managers.
935
Language Toastmasters and English classes 1,594
Regulatory
Legally required courses such as information security, anti-money laundering, and occupational safety and health training.
3,287
Online Training Courses such as product training, legal knowledge, and sales skills.
103,082 442 114,036
(3) Training and Development Plan in 2019.
1. Solidify core-competency training and build legal compliance culture.
2. Cultivate FinTech and information security talents.
3. Promote mobile learning and make learning anytime and anywhere.
4. Develop talent and bilingual learning – foster international talent through MA (Management Associate) and HPT (High Potential Talent) training program along with English education.

Far Eastern International Bank
2018 Annual Report 118
(4) Employee Behavior and Ethics Standards
The bank has established “Ethical Corporate Management Best Practice Principles, ”Codes of Ethical Conduct” and ”Codes of Informing against Illegal, Unmoral and Lacking in Sincere Conduct” to comply with. These regulations have been unveiled in the bank’s website, and announced at meetings held by each department in order to be understood by employees.
The following contents are articles of “Codes of Ethical Conduct of FEIB”
Article 1 Purpose and basis
In order to guide the Company’s directors, managers, and employees to behave in accordance with ethical standards and improve stakeholders’ understanding of the Company’s ethical standards, the Company has stipulated the Codes of Ethical Conduct (the “Code”) for them to comply.
Article 2 Applicable parties
The applicable parties of the Code are the Company’s directors, managers, and employees. (the “Applicable parties”)
Article 3 Principle of ethically conducting business
When conducting business, the Applicable parties shall comply with ethical standards and insist on honesty, trust, and job duties.
Article 4 Prevention of conflicts of interest
The Applicable parties shall conduct business in an objective and efficient way and are not allowed to obtain any illegitimate benefit for themselves, their spouses, parents, children or relatives within the second degree of kinship through their position in the Company.
When the Company has lending or borrowing agreements with, or gives guarantee for, or has material asset transactions with an affiliated enterprise of any person mentioned in the preceding paragraph, the relevant Applicable parties shall voluntarily elaborate any potential conflicts of interest between the Company and himself / herself, and shall be handled in accordance with the Company’s codes relevant to these cases to prevent conflicts of interest.
Employees whose job is handling lending business should get the permission of avoiding to deal with lending cases of themselves, their spouses, or relatives within the third degree of kinship.
If employee’s spouses or relatives by blood or by marriage within the third degree of kinship are employees of the Company, these persons shall comply with the principle of preventing conflicts of interest.
Article 5 Prohibition against coveting private profit
The Applicable parties are prohibited from:
1. Obtaining personal benefit through using the Company’s properties, information or through their positions in the Company;
2. Competing with the Company
When the Company has an opportunity for profit, it is the responsibility of the

Far Eastern International Bank
2018 Annual Report 119
Applicable parties to maximize the reasonable and proper benefits that can be obtained by the Company.
Article 6 Responsibility of confidentiality
The Applicable parties are obligated to maintain the confidentiality of any information regarding the Company itself or customers, except when authorized or required by law to disclose such information. Confidential information includes any undisclosed information that, if exploited by a competitor or disclosed, could result in damage to the Company or customers.
Article 7 Fair trade
The Applicable parties shall treat all customers, competitors, and employees fairly, and may not obtain improper benefits through manipulation, nondisclosure, or misuse of the information learned by virtue of their positions, or through misrepresentation of important matters, or through other unfair trading practices.
Article 8 Protection and proper use of the Company's assets
The Applicable parties shall protect the Company’s assets, reduce expenses, and ensure that assets are legally and effectively used for the business purpose of the Company to avoid theft, negligence or wasting.
Article 9 Legal compliance
The Applicable parties shall comply with the Banking Act, Securities and Exchange Act, and other applicable laws and regulations. The Company shall strengthen promotion of ethics internally.
Article 10 Reporting
When a director discovers that the Company is in danger of sustaining material loss or damage, the director should promptly take appropriate actions and immediately notify the Audit Committee or independent director members of the Audit Committee, and report to the board of directors, and supervise the Company to report to the competent authority.
When the Applicable parties suspect or find any fact of violation of laws and regulations or the Code, they shall actively report such fact to the Audit Committee, managers, chief auditor, head office chief compliance officer, or other appropriate personnel and provide the Company with sufficient information for proper follow-up by the Company.
All of reports shall be kept confidential and investigated by independent channels by the Company to protect informants.
Article 11 Punishment
If any of the Applicable parties violate the Code, the Company will handle the case in accordance with relevant punishment regulations; the Company may claim compensation for any loss or damage resulting from such violation pursuant to the Civil Code. When a director or managerial officer violates the Code, the Company shall promptly disclose on the Market Observation Post System (the “MOPS”) the date of the violation, reasons for the violation, the provisions of the Code violated, and the actions taken by the Company.

Far Eastern International Bank
2018 Annual Report 120
Before making a resolution of punishment, the suspected violator is able to make a defense or complaint in accordance with related regulations.
Article 12 Procedures for exemption
If the Applicable parties require any exemption from compliance with the Code, it shall be resolved with approval by the board of directors, and the information on the date of exemption approved by the board of directors, objections or reservations opinions of independent directors, and the period of, reasons for, and basis of exemption shall be disclosed immediately on the MOPS, in order that the shareholders may evaluate the appropriateness of the board resolution to forestall any arbitrary or dubious exemption from the Code, and to safeguard the interests of the Company by ensuring appropriate mechanisms for controlling any circumstance under which such an exemption occurs.
Article 13 Way of disclosure
The Company shall disclose the Code on its web site, annual report, prospectuses and the MOPS. The same requirement applies for revision.
Article 14 Implementation
The Code shall enter into force after being approved by the board of directors, and the same shall also be reported at the shareholders’ meeting. The same procedure shall be followed when the Code has been amended.
3. Corporate Social Responsibility
(1) Caring for Social Welfare
A. Eden Honor Cards were issued since 1997 with Eden Social Welfare Foundation . The Bank developed it as a core platform for diversified, convenient fund raising mechanism. Accumulated funds from FEIB and heartwarming people to donate Eden till year end of 2018 reached NT$82 million.
B. FEIB donated NT$3 million as part of the Far Eastern Group’s NT$30 million donation in total for victims of the earthquake striking Hualien in early 2018. The disaster caused huge damages with tumbling buildings and casualties.
C. The 2017 CSR Report with BSI’s certificate won both the silver medal and outstanding sustainability award of “2017 Taiwan Corporate Sustainability Awards.”
(2) LOHAS Aesthetics
A. FEIB published 2019 calendar titled “Time Sings with Humanities in Bloom” with the collection of former residences of 12 local writers and artists. It shows these masters’ spirits for watering literature and art to rich land of Taiwan.
B. Sponsored a competition named “Dress Runway” for encouraging young designers. The event aims to create a stage for designers under 30 and offer them opportunities to make connection with fashion world in Europe. By the competition, FEIB cooperated with the Far Eastern Plaza Hotel and the Marie Claire Magazine and hope to discover outstanding design talents in Taiwan.

Far Eastern International Bank
2018 Annual Report 121
C. Co-sponsored a learning program for VIPs above 55 with the Yuan Ze University for promoting the elderly to enjoy happy life by means of embracing new technology and knowledge.
D. FEIB co-sponsored “New Taipei Merry Christmas City”, Taiwan Lantern Festival and etc with the Far Eastern Group to spread the warm and grateful atmosphere of Christmas and New Year.
E. Co-sponsored the “FUERZA BRUTA WAYZA” with the Far Eastern Group for leading the world's creative performances into Taiwan.
(3) Environmental Protection
To save energy, reduce carbon emission, and be gearing toward international standard, FEIB established ISO 50001 and received international certification. Action are to stipulate energy policy, set up energy management team by the President to plan and integrate the Bank’s internal energy operation, convoke annual meeting to discuss energy management strategy, examine and evaluate execution performance, seek efficient improvement and elevation of energy efficiency, lower operating cost, and be committed to protecting the environment.
In response to the trend of climate change and the development of international greenhouse gas reduction, the Bank introduced greenhouse gas emissions verification (ISO 14064-1) in 2018. In the first year, the Bank conducted a cross-check with the representative building of the head office and obtained the British Standards Association (BSI). ) Passed the verification and obtained ISO 14064-1:2006 certification.
(4) Going Concern and Shareholder Value
FEIB has long been dedicated to improve corporate governance, and demonstrated momentum via selling by all staffs to seek better operating performance, continue to elevate asset quality and competitiveness, strengthen portfolio, and create maximum value for all shareholders. FEIB was in the top 6~20% of the listed companies in the fourth “Corporate Governance Evaluation” conducted by Taiwan Stock Exchange.
4. Non-Executive Employees, Annual Employee Welfare Costs and the Difference from the Previous Year
Unit: NT$ Thousands
year 2017 2018
Number of Non-Managers 2,370 2,370
Average Employee Welfare Expenses 1,291 1,327

Far Eastern International Bank
2018 Annual Report 122
5. IT Equipment
(1) Major Information System Hardware, Software Configuration and Maintenance
Information System Hardware Operating System
Core Banking System Unisys Libra 750 MCP
Mutual Fund and Trust System IBM AS/400 OS/400
Trade Finance System IBM RS/6000 AIX
Credit Card System IBM Mainframe OS/390
Data Warehouse System IBM RS/6000 AIX
Individual Internet Banking system、
Mobile Banking system IBM RS/6000 AIX
Corporate Internet Banking system IBM RS/6000
Windows Server AIX
Windows
Financial Markets System
Windows Server Windows
FX Margin Trading System
Corporate CRM System
eLoan System
Hong Kong Branch System
Wealth Management System Linux Server Linux
The software and hardware of the Bank’s information system are maintained by the FEIB Information Technology Department or by professional vendors.
(2) Future Development or Acquisition Plans
A. Continue to build financial product online application platform to simplify customer applying process and enhance customer experience.
B. Base on mobile payment, continue to develop off-line payment platform to support customer on variety financial service scenarios.
C. Continuously optimize the FEIB official website, online banking and mobile banking services to provide convenient and useful banking services.
D. For the new brand of digital social banking - "Bankee", continuously optimize related function services.
E. Build Robo advisory service to support sales and customer ROI.
F. Build mobile wealth management service for sales.
G. Establish Web chat (Robot & Live) Customer Service System to improve customer service efficiency.
H. Establish and provide online insurance services for customers.
I. The Core Banking mainframe upgrades for the business expansion.
J. The Financial Markets System upgrades for the business expansion.

Far Eastern International Bank
2018 Annual Report 123
(3) Emergency backup and security protection measures
A. Information security has been continuously verified by BSI through biannual reviews. The objective is to implement the various information security operation systems in the ISO 27001 international standards to guarantee the quality and safety of customers’ transaction services.
B. The personal information security management system has been continuously verified by BSI through biannual reviews. The objective is to implement the various information security operation systems in the BS 10012 international standard to guarantee the customers’ personal information.
C. Main core systems have been set up with networks, local backup, and off-site backup servers, as well as media off-site storage mechanisms. Regular drills are conducted to ensure the comprehensiveness and feasibility of the plan. The goal is to guarantee the rights of customers and to maintain sustainable management.
E. The security protection measures have been set up with networks and web application firewalls, anti-virus, anti-malware, anti-spam, intrusion prevention, web behavior management, information security event detection and warning management systems. The protection measures centralize control operating systems and vulnerability patches, as well as regularly implement information system security evaluations, vulnerability scanning and penetration tests to ensure stability of the information system and network security.
6. Labor Relations
(1) Various Employee Welfare Measures, Retirement System and its Execution, Labor-Management Agreements, and Various Employee Interest Protection Measures Are Listed in the Following:
A. Employee Welfare Measures
(1) Preferential Interest Rate
(2) Preferential Loan Rate
(3) Financial Transaction Fee / Remittance Offer
(4) Establish the Employee Welfare Committee. Employees are entitled to apply for different subsidies, such as marriage, funeral, birth, travel, club, and children.
(5) Employee Stock Ownership and Employee Remuneration
(6) Employee Stock Ownership Trust
(7) Pension
(8) Annual Leaves
(9) Group Insurance, Labor Insurance and Health Insurance
(10) Friendly Parenting Measures:
a. Sign a concession contract with the child care institution.
b. Leave for family care, pregnancy checkups, maternity, accompanying maternity
Far Eastern International Bank
2018 Annual Report 124
and implementing unpaid parental leave for raising children.
c. Under the normal working hours of the day, the staff can flexibly adjust the starting and ending time of work within 2 hours.
(11) Tuition Reimbursement Program
(12) Reward Program for Professional Certification
(13) Regular Employee Health Examination
B. Employee Retirement System
❶ The Bank contributes labor pension according to the labor pension system and related laws/regulations. Especially for the employees who staffed before July 1, 2005, the bank shall appropriate labor pension reserve funds with 2% of the total monthly wages of the employees and deposit such amount in a designated account. Before the end of each year, the bank shall assess the balance in the designated labor pension reserve funds account. As yet, the amount is adequate to pay pensions for workers retired in the same year.
❷ There’s a Supervisory Committee of Labor Retirement Reserve to supervise and ensure employees’ rights. The 7th term of the committee was found since April, 2016 and approval for reference by Department of Labor, Taipei City Government.
C. Labor-Management Agreements and Various Employee Interest Protection Measures Are Listed in the Following:
❶ The bank proclaims internal meeting minutes and publishes newsletters (Happy Reader) quarterly to deliver significant management decisions and messages on the regular basis. Meanwhile, it implements mailbox to serve as communication channel with employees. Also, it holds Labor-Management Meeting regularly every three months to promote mutual communication between employers and employees.
❷ Be abided by various labor laws and international human rights conventions, formulate "work rules" and personnel regulations, regularly carry out publicity courses and implement compliance, so as to protect employees' labor rights and maintain gender equality in workplace.
❸ Policies of reporting, appealing and disciplinary actions:
The bank establishes “Codes of Informing against Illegal, Unmoral and Lacking in Sincere Conduct”,” Procedures of Preventing, Appealing and Punishing Sex Harassment”, and” Points for Attention of Dealing with Employee’s grievances ” for the bank to comply with. Channels-hotline, fax and e-mail address for informing illegal and expressing complaints about their work are installed. These cases are investigated by designated departments.
Informers and details offered by informers are kept confidential, and informers are well protected in order to avoid them suffering from inappropriate retaliation.
If designated departments make sure someone who acts inappropriately after investigating, to comply with “Codes of Rewards and Disciplinary Sanctions”, the person involved will be punished according to the seriousness of his inappropriate

Far Eastern International Bank
2018 Annual Report 125
behavior.
❹ In order to share profits with employees, the bank increases employees’ salaries every year. It takes into account the general pay levels in the industry and individual performance. For 2018, the average rate of increasing salary was 3%.
❺ There’s a Supervisory Committee of Labor Retirement Reserve to supervise the labor pension deposited such amount in a designated account.
❻ In order to ensure member’s rights of employee stock ownership trust, there’s a committee to operate supervision.
(2) Workplace Safety and Employee Psychology Health Maintenance
A. According to the regulations and guidelines of central governing authority, the bank establishes ”Code of Practice of Safety and Health”, “Occupational Safety and Health Management Plan”, ”Illegal Harassment in the Workplace when Staff Performing their duties Prevention Plan”, “Abnormal Workload Triggers Disease Prevention Plan”, “Ergonomics Plan for Prevention of Musculoskeletal Disorders”, “Workplace Maternal Health Protection Plan”, and “Employee Health Service Program” to promote occupational safety and health business for prevention of occupational disease.
B. The bank establishes the Occupational Safety and Health Management Organization. Also it sets occupational safety and health affair managers, field first aid personnel and fire prevention supervisor, and provides them training courses. Employee self-defense group is set up, which conduct anti-robbery, self-defense and fire-fighting exercise every six months. In addition, it holds occupational safety and health e-learning training courses for employees, at least 3 hours every 3 years.
C. In order to ensure the health of employees, the frequency and budget of employee health examinations provided by the bank are superior to the mandatory requirement. With regard to employee health management, the bank arranges occupational medicine physicians available to provide medical consultation service at workplace and hires professional nurses to watch for employee psychology health maintenance. In addition, it holds various health promotion activities, including health lectures, sports club, health management competitions, etc., to create healthy workplace. The bank’s implementation result has been recognized by the HPA (Health Promotion Administration, Ministry of Health and Welfare) and received 2 badges of Accredited Healthy Workplace in 2018.
D. For providing safe and comfortable working environment to employee, the Bank measures working environment every six months in accordance with Occupational Safety and Health Act. The fire safety inspection reports are announced every year by the Fire Services Act. According to Building Act, buildings are examined for public safety every two year.
(3) Specify Loss Resulting from Labor-Management Disputes(Including Labor Inspection Results in Violation of the Labor Standards Act)in 2018 and as of Date of the Publication of the Annual Report and Disclose the Value of Current and Possible Future Loss and Countermeasures, as well as Reasons for Inability to Estimate Loss
None.

Far Eastern International Bank
2018 Annual Report 126
7. Important Contracts
April 22, 2019 Contract Signing Party Covering Period Main Content Restrictions
Credit Card System maintenance
DXC Technology Taiwan Limited
Jan 1,2017~Dec 31,2021
Computer system professional maintenance service
None
Microsoft EA maintenance
Acer Incorporated Sep 01,2016~Aug 31,2019
Computer system professional maintenance service
None
Financial Markets System maintenance
Finastra International Limited
Jan 01,2017~May 31,2027
Computer system professional maintenance service
None
IBM computer software and hardware equipment maintenance
IBM Taiwan Corporation
Apr 01,2019~Mar 31,2020
Computer system professional maintenance service
None
Network equipment maintenance
Datacraft Taiwan Limited
Aug 01,2018~Jul 31,2019
Computer system professional maintenance service
None
Unisys computer software and hardware equipment maintenance
Unisys Taiwan Limited
Jan 01,2019~Dec 31,2019
Computer system professional maintenance service
None
Computer room maintenance
YEON SHEN TECHNOLOGY CO., LTD.
Jan 01,2019~Dec 31,2019
Computer room professional maintenance service
None
Cooperation Agreement
Hotai Finance Corporation
Aug 03,2018~Aug 03,2020
Strategic alliance for car loan None
Cooperation Agreement
Taiwan Acceptance Corporation
Apr 13,2018~Apr 03,2020 Strategic alliance e for car
loan None
Cooperation Agreement
Shinshih Credit Corporation
Oct 13,2017~Oct 13,2019
Strategic alliance for car loan None
Cooperation Agreement
Fina Finance & Trading Co., Ltd
Aug 03,2018~Aug 03,2020
Strategic alliance for car loan None
Cooperation Agreement
Chailease Consumer Finance Co., Ltd
May 30,2018~May 30,2020
Strategic alliance for motorcycle loan None
Cooperation Agreement
Far Trust International Finance
Sep 30,2017~Sep 30,2019
Strategic alliance for motorcycle loan None
Collection of receivables
Apex Credit Solutions Co.,Ltd
Mar 19,2018~Mar 18,2020
Collection of debt receivables
None
Collection of receivables
Justor Collection Management Co.,Ltd
Mar 19,2018~Mar 18,2020
Collection of debt receivables
None
Collection of receivables
Unistar Asset Management Co.,Ltd
Mar 19,2018~Mar 18,2020
Collection of debt receivables
None

Far Eastern International Bank
2018 Annual Report 127
Contract Signing Party Covering Period Main Content Restrictions Collection of receivables
Sunrise Consultancy Co.,Ltd
Mar 19,2018~Mar 18,2020
Collection of debt receivables
None
Collection of receivables
United Credit Services Co.,Ltd
Mar 19,2018~Mar 18,2020
Collection of debt receivables
None
Collection of receivables
Jungshin Assets Management Co.,Ltd
Mar 19,2018~Mar 18,2020
Collection of debt receivables
None
Collection of receivables
Chung Yu Collection Management Co.,Ltd
Mar 19,2018~Mar 18,2020
Collection of debt receivables
None
Collection of receivables
Lian Li Asset Management Co.,Ltd
Mar 19,2018~Mar 18,2020
Collection of debt receivables
None
Outsourcing Agreement
Crown Van Lines Co., Ltd
Mar 01,2006~Feb 28,2020 Document Storage None
Outsourcing Agreement
National Credit Card Center
Sep 08,1992~Sep 07,2019
Information system registration, processing, and output operations.
None
Outsourcing Agreement
TUNG KUAN SYSTEM CO. LTD.
Jan 02,2006~Dec 20,2019
Data processing: Including the data entry, processing, and output of information system
None
Outsourcing Agreement
DING DING INTEGRATED MARKETING SERVICE CO., LTD.
Aug 31,2006~Dec 31,2019
Data processing: Including the data entry, processing, and output of information system
None
Outsourcing Agreement
FOONGTONE TECHNOLOGY CO., LTD.
Feb 27,2006~Feb 28,2020
1. Data processing: Including the data entry, processing, and output of information system
2. Including the opartion processing.
3. Card personalization printing
4. Mailing job processing
None
Outsourcing Agreement
TAWIWAN NAME PLATE CO., LTD.
Apr 01,2016~Mar 31,2020
1. Data processing: Including the data entry, processing, and output of information system
2. Including the operation processing.
3. Card personalization printing
4. Mailing job processing
None
Outsourcing Agreement
FUCO TECHNOLOGY CO.,LTD
Dec 10,2001~Dec 09,2019
1. The operation of bill printing and sealing
2. Mailing job processing
None
Outsourcing Agreement
Han Yeh Business Form Corporation
Mar 01,2004~Aug 31,2019
Data processing: Including the processing, and output of information system
None
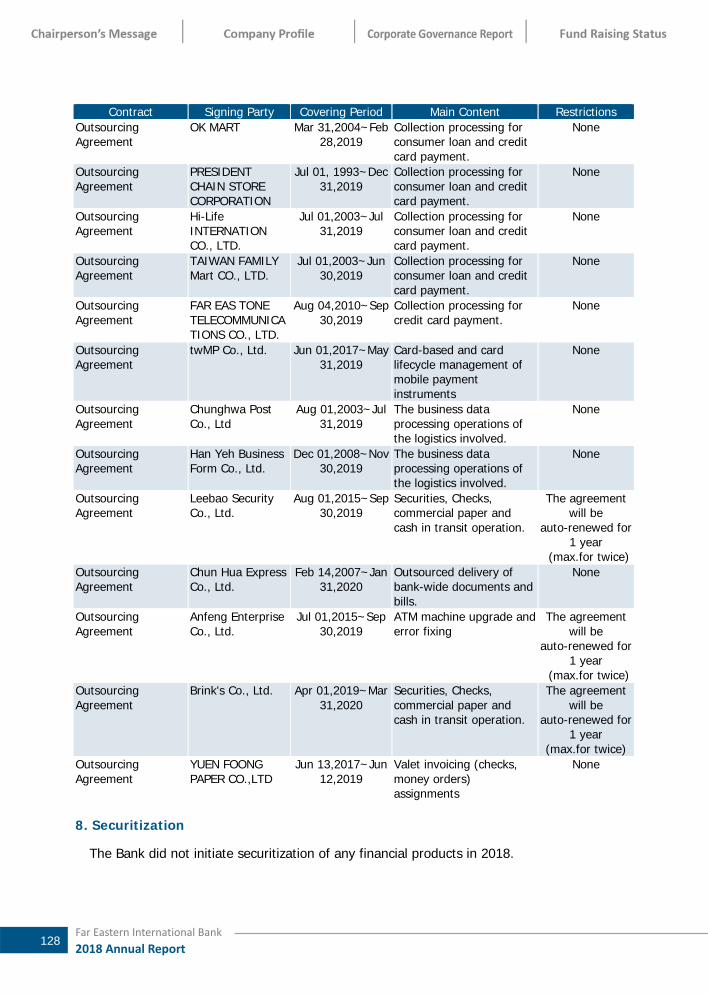
Far Eastern International Bank
2018 Annual Report 128
Contract Signing Party Covering Period Main Content Restrictions Outsourcing Agreement
OK MART Mar 31,2004~Feb 28,2019
Collection processing for consumer loan and credit card payment.
None
Outsourcing Agreement
PRESIDENT CHAIN STORE CORPORATION
Jul 01, 1993~Dec 31,2019
Collection processing for consumer loan and credit card payment.
None
Outsourcing Agreement
Hi-Life INTERNATION CO., LTD.
Jul 01,2003~Jul 31,2019
Collection processing for consumer loan and credit card payment.
None
Outsourcing Agreement
TAIWAN FAMILY Mart CO., LTD.
Jul 01,2003~Jun 30,2019
Collection processing for consumer loan and credit card payment.
None
Outsourcing Agreement
FAR EAS TONE TELECOMMUNICATIONS CO., LTD.
Aug 04,2010~Sep 30,2019
Collection processing for credit card payment.
None
Outsourcing Agreement
twMP Co., Ltd. Jun 01,2017~May 31,2019
Card-based and card lifecycle management of mobile payment instruments
None
Outsourcing Agreement
Chunghwa Post Co., Ltd
Aug 01,2003~Jul 31,2019
The business data processing operations of the logistics involved.
None
Outsourcing Agreement
Han Yeh Business Form Co., Ltd.
Dec 01,2008~Nov 30,2019
The business data processing operations of the logistics involved.
None
Outsourcing Agreement
Leebao Security Co., Ltd.
Aug 01,2015~Sep 30,2019
Securities, Checks, commercial paper and cash in transit operation.
The agreement will be
auto-renewed for 1 year
(max.for twice) Outsourcing Agreement
Chun Hua Express Co., Ltd.
Feb 14,2007~Jan 31,2020
Outsourced delivery of bank-wide documents and bills.
None
Outsourcing Agreement
Anfeng Enterprise Co., Ltd.
Jul 01,2015~Sep 30,2019
ATM machine upgrade and error fixing
The agreement will be
auto-renewed for 1 year
(max.for twice) Outsourcing Agreement
Brink's Co., Ltd. Apr 01,2019~Mar 31,2020
Securities, Checks, commercial paper and cash in transit operation.
The agreement will be
auto-renewed for 1 year
(max.for twice) Outsourcing Agreement
YUEN FOONG PAPER CO.,LTD
Jun 13,2017~Jun 12,2019
Valet invoicing (checks, money orders) assignments
None
8. Securitization
The Bank did not initiate securitization of any financial products in 2018.

Far Eastern International Bank
2018 Annual Report 129
VI. Financial Information
1. Five-Year Financial Summary
(1) Condensed Balance Sheets
Condensed Consolidated Balance Sheets Unit: NT$ Thousands
Year (Note1)Item
2014 2015 2016 2017 2018
Cash, Cash Equivalents, Due from Central Bank and Due from Banks
86,210,099 85,132,512 40,106,638 30,943,984 37,566,952
Financial Assets at Fair Value Through Profit or Loss
25,944,211 39,672,053 33,830,105 30,208,333 46,507,501
Financial Assets at Fair Value Through Other Comprehensive Income
- - - - 119,779,052
Available-for-Sale Financial Assets 30,518,170 27,478,135 79,594,706 109,631,578 -
Derivative Financial Assets for Hedging 40,439 - - - -
Securities Purchased under Resale Agreements
14,385,710 15,344,855 6,396,656 11,071,393 8,289,275
Receivables, net 19,664,258 20,853,418 22,847,242 22,750,869 21,484,377
Current Tax Assets 35,024 3,085 4,117 7,372 93
Assets held for Sale, net - - - - -
Loans and Discounts, net 319,176,466 334,063,822 355,963,672 351,056,762 379,688,118
Investment in Debt Instruments at Amortized Cost, net
- - - - 2,588,654
Hold-to-Maturity Financial Assets 3,991,084 3,125,209 2,630,635 2,135,246 -
Investment accounted for using equity method, net
1,592,014 1,658,037 1,702,220 1,774,066 1,776,350
Restricted Assets - - - - -
Other Financial Assets, net 14,811,608 13,739,260 12,841,547 10,445,556 4,695,376
Properties and Equipment, net (Note2) 2,785,884 2,840,692 2,889,674 2,889,392 2,732,431
Investment Properties, net - - - - -
Intangible Assets, net 1,801,534 1,776,051 1,750,568 1,725,085 1,699,602
Deferred Tax Assets, net 864,280 631,541 635,104 584,502 372,184
Other Assets 157,136 236,211 222,399 200,142 171,185
Total Assets 521,977,917 546,554,881 561,415,283 575,424,280 627,351,150
Due to Central Bank and Other Banks 11,496,870 13,194,889 7,432,194 6,960,774 15,726,723
Funds borrowed from the Central Bank and other banks
- - - - -
Financial Liabilities at Fair Value Through Profit or Loss
11,055,294 9,588,248 7,954,542 4,319,121 2,752,479
Derivative Financial Liabilities for Hedging 5,204 - - - -
Securities Sold under Repurchase Agreements
4,391,451 3,743,155 13,711,223 12,921,364 14,665,794
Payables 5,596,002 3,964,144 5,799,874 6,488,285 7,265,222

Far Eastern International Bank
2018 Annual Report 130
Year (Note1)Item
2014 2015 2016 2017 2018
Current Tax Liabilities 243,366 422,618 405,097 254,446 201,032
Liabilities directly associates with assets held for sale
- - - - -
Deposits and Remittances 423,242,417 451,294,909 452,720,460 472,392,183 508,407,972
Bank Debentures 25,479,749 20,312,370 24,309,357 20,216,664 18,001,900
Preferred Stock Liabilities - - - - -
Other Financial Liabilities 2,874,070 3,030,963 6,385,369 7,416,775 13,915,274
Provisions 985,437 1,127,306 1,240,278 1,127,116 1,194,774
Deferred Tax Liabilities - - - - -
Other Liabilities 530,549 898,631 506,012 540,880 475,240
Total Liabilities Before Distribution 485,900,409 507,577,233 520,464,406 532,637,608 582,606,410
After Distribution 487,045,139 508,790,530 521,771,180 534,034,914 (Note3)
Equity Attributable to Owners of The Bank
36,077,508 38,977,648 40,950,877 42,786,672 44,744,740
Capital Before Distribution 28,618,263 30,332,430 31,113,672 31,829,286 32,691,859
After Distribution 30,155,064 30,939,079 31,829,286 32,691,859 (Note3)
Capital Surplus 462,400 459,918 456,426 456,426 456,426
Retained Earnings Before Distribution 7,199,140 8,300,405 9,609,340 10,486,758 11,649,127
After Distribution 4,517,609 6,480,459 7,586,952 8,226,879 (Note3)
Other Equity (202,295) (115,105) (228,561) 14,202 (52,672)
Treasury stock - - - - -
Non-controlling interests - - - - -
Total Equity Before Distribution 36,077,508 38,977,648 40,950,877 42,786,672 44,744,740
After Distribution 34,932,778 37,764,351 39,644,103 41,389,366 (Note3)
Independent Auditors’ Report Unqualified
OpinionUnqualified
OpinionUnqualified
OpinionUnqualified
Opinion Unqualified
Opinion
Names of Auditors
Chun-Hung Chen
Cheng-Hsiu Yang
Shih-Tsung Wu
Cheng-Hsiu Yang
Shih-Tsung Wu
Cheng-Hsiu Yang
Shih-Tsung Wu
Cheng-Hsiu Yang
Shih-Tsung Wu
Cheng-Hsiu Yang
Note 1: The financial data had been audited by CPA. Note 2: Asset revaluation had not been processed in each year. Note 3: Earnings distribution yet to be approved by the 2019 shareholders’ meeting

Far Eastern International Bank
2018 Annual Report 131
Condensed Individual Balance Sheets Unit: NT$ Thousands
Year (Note1) Item
2014 2015 2016
(Note4) 2017 2018
Cash, Cash Equivalents, Due from Central Bank and Due from Banks
86,143,744 85,019,897 40,022,544 30,882,208 37,529,613
Financial Assets at Fair Value Through Profit or Loss
25,430,620 39,672,053 33,830,105 30,208,333 46,507,501
Financial Assets at Fair Value Through Other Comprehensive Income
- - - - 119,779,052
Available-for-Sale Financial Assets 30,518,170 27,478,135 79,594,706 109,631,578 -
Derivative Financial Assets for Hedging 40,439 - - - -
Securities Purchased under Resale Agreements
14,385,710 15,344,855 6,396,656 11,071,393 8,289,275
Receivables, net 18,738,407 19,622,717 21,124,237 21,534,556 19,660,289
Current Tax Assets 33,890 2,707 3,936 7,263 -
Assets held for Sale, net - - - - -
Loans and Discounts, net 319,176,466 334,063,822 355,963,672 351,056,762 379,688,118
Investment in Debt Instruments at Amortized Cost, net
- - - - 2,588,654
Hold-to-Maturity Financial Assets 3,991,084 3,125,209 2,630,635 2,135,246 -
Investment accounted for using equity method, net
2,609,533 3,026,485 2,568,315 2,758,906 2,794,977
Restricted Assets - - - - -
Other Financial Assets, net 14,724,568 13,650,590 12,761,117 10,172,871 4,460,520
Properties and Equipment, net (Note2) 2,781,602 2,833,396 2,883,105 2,882,032 2,725,364
Investment Properties, net - - - - -
Intangible Assets, net 1,801,534 1,776,051 1,750,568 1,725,085 1,699,602
Deferred Tax Assets, net 860,360 630,181 631,415 546,064 334,706
Other Assets 146,649 226,885 214,718 190,336 161,958
Total Assets 521,382,776 546,472,983 560,375,729 574,802,633 626,219,629
Due to Central Bank and Other Banks 11,496,870 13,194,889 7,432,194 6,960,774 15,726,723
Funds borrowed from the Central Bank and other banks
- - - - -
Financial Liabilities at Fair Value Through Profit or Loss
11,055,294 9,588,248 7,954,542 4,319,121 2,752,479
Derivative Financial Liabilities for Hedging 5,204 - - - -
Securities Sold under Repurchase Agreements
4,391,451 3,743,155 13,711,223 12,921,364 14,665,794
Payables 5,537,456 3,895,944 5,719,222 6,420,726 7,187,730
Current Tax Liabilities 225,465 338,563 401,086 250,254 179,348
Liabilities directly associates with assets held for sale
- - - - -
Deposits and Remittances 423,765,479 452,068,088 452,904,998 472,621,114 508,647,889
Bank Debentures 25,479,749 20,312,370 24,309,357 20,216,664 18,001,900
Preferred Stock Liabilities - - - - -
Other Financial Liabilities 1,844,152 2,341,145 5,265,429 6,657,217 12,649,950
Provisions 985,437 1,127,306 1,240,278 1,127,116 1,194,774
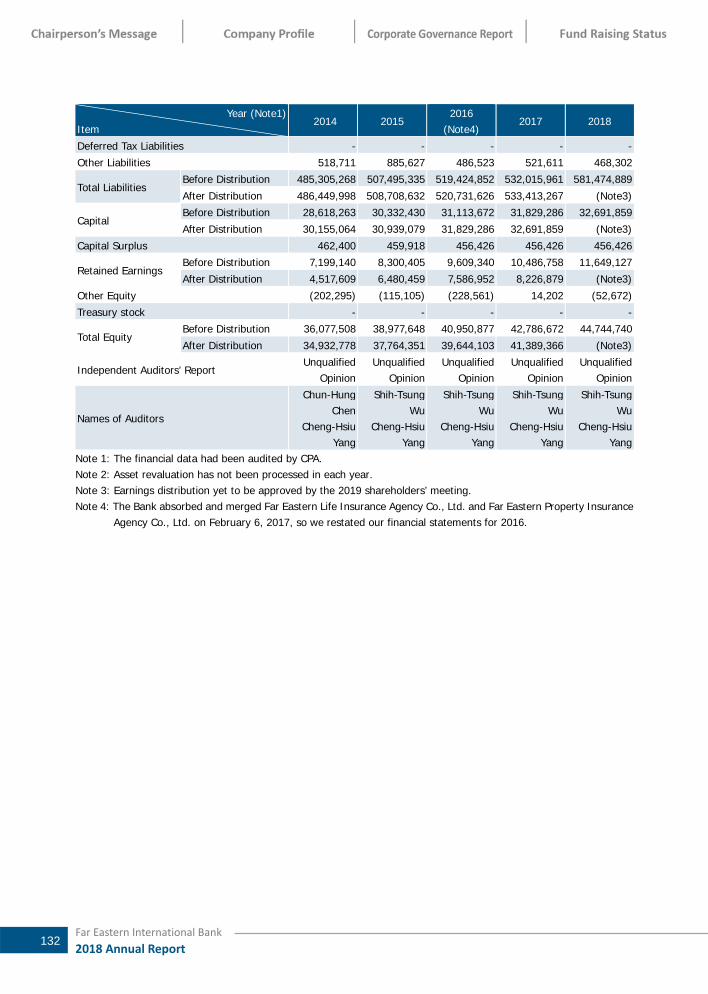
Far Eastern International Bank
2018 Annual Report 132
Year (Note1) Item
2014 2015 2016
(Note4) 2017 2018
Deferred Tax Liabilities - - - - -
Other Liabilities 518,711 885,627 486,523 521,611 468,302
Total Liabilities Before Distribution 485,305,268 507,495,335 519,424,852 532,015,961 581,474,889
After Distribution 486,449,998 508,708,632 520,731,626 533,413,267 (Note3)
Capital Before Distribution 28,618,263 30,332,430 31,113,672 31,829,286 32,691,859
After Distribution 30,155,064 30,939,079 31,829,286 32,691,859 (Note3)
Capital Surplus 462,400 459,918 456,426 456,426 456,426
Retained Earnings Before Distribution 7,199,140 8,300,405 9,609,340 10,486,758 11,649,127
After Distribution 4,517,609 6,480,459 7,586,952 8,226,879 (Note3)
Other Equity (202,295) (115,105) (228,561) 14,202 (52,672)
Treasury stock - - - - -
Total Equity Before Distribution 36,077,508 38,977,648 40,950,877 42,786,672 44,744,740
After Distribution 34,932,778 37,764,351 39,644,103 41,389,366 (Note3)
Independent Auditors’ Report Unqualified
OpinionUnqualified
OpinionUnqualified
OpinionUnqualified
Opinion Unqualified
Opinion
Names of Auditors
Chun-Hung Chen
Cheng-Hsiu Yang
Shih-Tsung Wu
Cheng-Hsiu Yang
Shih-Tsung Wu
Cheng-Hsiu Yang
Shih-Tsung Wu
Cheng-Hsiu Yang
Shih-Tsung Wu
Cheng-Hsiu Yang
Note 1: The financial data had been audited by CPA. Note 2: Asset revaluation has not been processed in each year. Note 3: Earnings distribution yet to be approved by the 2019 shareholders’ meeting. Note 4: The Bank absorbed and merged Far Eastern Life Insurance Agency Co., Ltd. and Far Eastern Property Insurance
Agency Co., Ltd. on February 6, 2017, so we restated our financial statements for 2016.
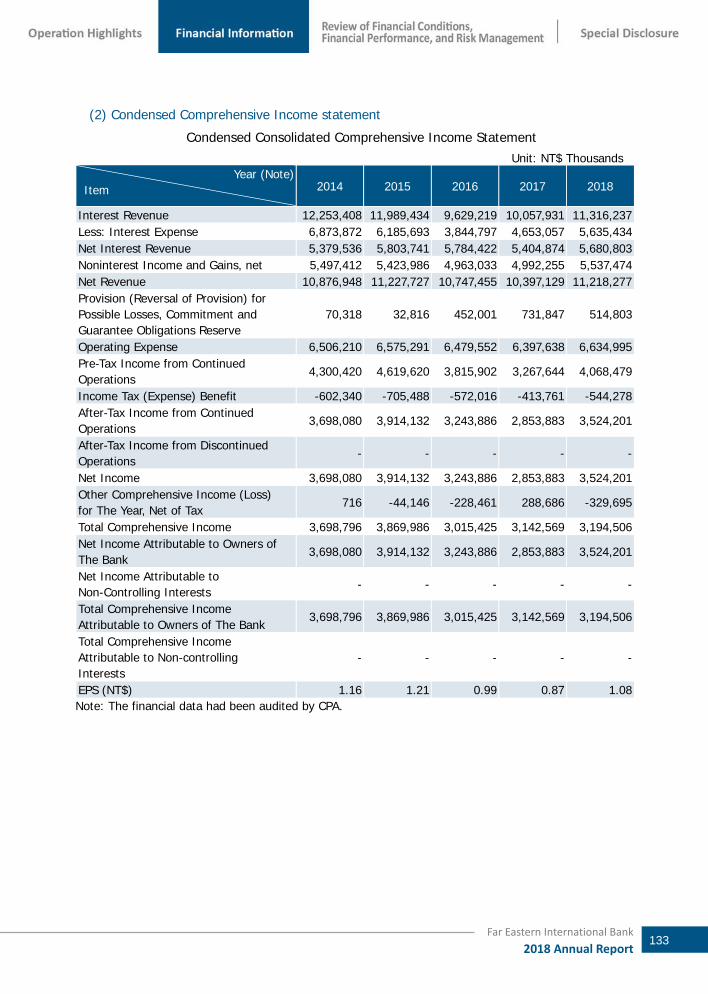
Far Eastern International Bank
2018 Annual Report 133
(2) Condensed Comprehensive Income statement
Condensed Consolidated Comprehensive Income Statement Unit: NT$ Thousands
Year (Note) Item 2014 2015 2016 2017 2018
Interest Revenue 12,253,408 11,989,434 9,629,219 10,057,931 11,316,237 Less: Interest Expense 6,873,872 6,185,693 3,844,797 4,653,057 5,635,434 Net Interest Revenue 5,379,536 5,803,741 5,784,422 5,404,874 5,680,803 Noninterest Income and Gains, net 5,497,412 5,423,986 4,963,033 4,992,255 5,537,474 Net Revenue 10,876,948 11,227,727 10,747,455 10,397,129 11,218,277 Provision (Reversal of Provision) for Possible Losses, Commitment and Guarantee Obligations Reserve
70,318 32,816 452,001 731,847 514,803
Operating Expense 6,506,210 6,575,291 6,479,552 6,397,638 6,634,995 Pre-Tax Income from Continued Operations
4,300,420 4,619,620 3,815,902 3,267,644 4,068,479
Income Tax (Expense) Benefit -602,340 -705,488 -572,016 -413,761 -544,278 After-Tax Income from Continued Operations
3,698,080 3,914,132 3,243,886 2,853,883 3,524,201
After-Tax Income from Discontinued Operations
- - - - -
Net Income 3,698,080 3,914,132 3,243,886 2,853,883 3,524,201 Other Comprehensive Income (Loss) for The Year, Net of Tax
716 -44,146 -228,461 288,686 -329,695
Total Comprehensive Income 3,698,796 3,869,986 3,015,425 3,142,569 3,194,506 Net Income Attributable to Owners of The Bank
3,698,080 3,914,132 3,243,886 2,853,883 3,524,201
Net Income Attributable to Non-Controlling Interests
- - - - -
Total Comprehensive Income Attributable to Owners of The Bank
3,698,796 3,869,986 3,015,425 3,142,569 3,194,506
Total Comprehensive Income Attributable to Non-controlling Interests
- - - - -
EPS (NT$) 1.16 1.21 0.99 0.87 1.08 Note: The financial data had been audited by CPA.

Far Eastern International Bank
2018 Annual Report 134
Condensed Non-Consolidated Comprehensive Income Statement Unit: NT$ Thousands
Year (Note1) Item
2014 2015 2016
(Note2) 2017 2018
Interest Revenue 12,251,873 11,984,430 9,612,481 10,015,147 11,261,208 Less: Interest Expense 6,876,102 6,180,139 3,833,195 4,632,022 5,608,761 Net Interest Revenue 5,375,771 5,804,291 5,779,286 5,383,125 5,652,447 Noninterest Income and Gains, net 5,194,981 5,038,200 4,739,637 4,794,618 5,286,289 Net Revenue 10,570,752 10,842,491 10,518,923 10,177,743 10,938,736 Provision (Reversal of Provision) for Possible Losses, Commitment and Guarantee Obligations Reserve
70,361 30,609 449,158 729,425 506,522
Operating Expense 6,236,507 6,299,060 6,259,739 6,164,989 6,381,959 Pre-Tax Income from Continued Operations
4,263,884 4,512,822 3,810,026 3,283,329 4,050,255
Income Tax (Expense) Benefit -565,804 -598,690 -566,140 -429,446 -526,054 After-Tax Income from Continued Operations
3,698,080 3,914,132 3,243,886 2,853,883 3,524,201
After-Tax Income from Discontinued Operations
- - - - -
Net Income 3,698,080 3,914,132 3,243,886 2,853,883 3,524,201 Other Comprehensive Income (Loss) for The Year, Net of Tax
716 -44,146 -228,461 288,686 -329,695
Total Comprehensive Income 3,698,796 3,869,986 3,015,425 3,142,569 3,194,506 EPS (NT$) 1.16 1.21 0.99 0.87 1.08
Note 1: The financial data had been audited by CPA. Note 2: The Bank absorbed and merged Far Eastern Life Insurance Agency Co., Ltd. and Far Eastern
Property Insurance Agency Co., Ltd. on February 6, 2017, so we restated our financial statements for 2016.

Far Eastern International Bank
2018 Annual Report 135
2. Five-Year Financial Analysis
(1) Financial Analysis & Key Performance Index(KPI)
Consolidated Financial Analysis Year(Note1)
Item(Note3) 2014 2015 2016 2017 2018
Operating Ability
Loans to deposits ratio (%) 76.54 75.03 79.74 75.40 75.72 Ratio of NPL* 0.395 0.252 0.192 0.287 0.237 Interest expense to average total deposits 0.84 0.83 0.68 0.78 0.89
Interest revenue to average total loans 3.00 2.74 2.53 2.49 2.62
Total asset turnover (times) 0.02 0.02 0.02 0.02 0.02 Average net revenue peremployee(NT$1000) 4,204 4,360 4,265 4,159 4,516
Average net income per employee(NT$1000) 1,429 1,520 1,287 1,142 1,419
Profitability
Return on tier 1 capital(%) 14.46 13.32 10.28 8.40 9.66 Return on total assets (%)* 0.73 0.73 0.59 0.50 0.59 Return on equity(%)* 11.37 10.43 8.12 6.82 8.05 Net income ratio (%) 34.00 34.86 30.18 27.45 31.41
EPS (NT$)(Note5)*
Before Distribution 1.31 1.30 1.04 0.90 1.08
After Distribution 1.16 1.21 0.99 0.87 -
Financial Structure
Liabilities to assets ratio 93.06 92.83 92.67 92.53 92.83 Property, plant, and equipment as a percentage of equity
7.72 7.29 7.06 6.75 6.11
Growth Ratio
Asset growth ratio 6.05 4.71 2.72 2.50 9.02 Income growth ratio 20.69 7.42 (17.40) (14.37) 24.51
Cash Flow Cash flow ratio (Note2) 38.84 (Note2) 33.47 12.23 Cash flow adequacy ratio (Note2) 144.64 (Note2) (Note2) (Note2) Cash flow satisfied ratio (Note2) 1,225.24 (Note2) (Note2) (Note2)
Liquidity Reserve Ratio 31.10 30.19 28.20 31.72 30.30 Total Secured Loans to interested parties (NT$1000) 7,144,352 7,706,256 8,208,646 5,896,869 6,112,931
Total Secured Loans to interested parties as a Percentage of Total Loans 2.11 2.17 2.18 1.58 1.50
Operating Scale
Market share of asset 1.06 1.07 1.07 1.06 1.10 Market share of equity 1.15 1.14 1.14 1.14 1.12 Market share of deposits 1.23 1.23 1.16 1.17 1.20 Market share of loans 1.22 1.24 1.23 1.15 1.16
Reasons for the changes in financial ratios over the last two years (Up to 20%):1. The increase of average net income per employee was due to the increase of net income after tax. 2. The increase of EPS was due to the increase of net income after tax. 3. The increase of asset growth ratio was due to the increase of loans and financial assets at fair value
through profit or loss. 4. The increase of income growth ratio was due to the increase of net income before tax. 5. The decrease of cash flow ratio was due to the decrease of net cash flow from operating activities.

Far Eastern International Bank
2018 Annual Report 136
Non-consolidated Financial Analysis Year(Note1)
Item(Note3) 2014 2015 2016 2017 2018
Operating Ability
Loans to deposits ratio (%) 76.45 74.90 79.71 75.37 75.68 Ratio of NPL* 0.395 0.252 0.192 0.287 0.237 Interest expense to average total deposits
0.84 0.83 0.68 0.78 0.89
Interest revenue to average total loans
3.00 2.74 2.53 2.49 2.62
Total asset turnover (times) 0.02 0.02 0.02 0.02 0.02 Average net revenue per employee(NT$1000)
4,261 4,390 4,309 4,221 4,569
Average net income per employee(NT$1000)
1,491 1,585 1,329 1,184 1,472
Profitability
Return on tier 1 capital (%) 14.60 13.24 10.47 8.57 9.73 Return on total assets (%)* 0.73 0.73 0.59 0.50 0.59 Return on equity(%)* 11.37 10.43 8.12 6.82 8.05 Net income ratio (%) 34.98 36.10 30.84 28.04 32.22
EPS (NT$)(Note5)*
Before Distribution
1.31 1.301.04
0.90 1.08
After Distribution
1.16 1.210.99
0.87 -
Financial Structure
Liabilities to assets ratio 93.05 92.83 92.66 92.52 92.81 Property, plant, and equipment as a percentage of equity
7.71 7.27 7.04 6.74 6.09
Growth Ratio
Asset growth ratio 5.95 4.81 2.64 2.57 8.95 Income growth ratio 20.91 5.84 (15.57) (13.82) 23.36
Cash Flow Cash flow ratio (Note2) 37.72 (Note2) 32.19 14.05 Cash flow adequacy ratio (Note2) 146.71 (Note2) (Note2) (Note2) Cash flow satisfied ratio (Note2) 958.23 (Note2) 82,916.57 (Note2)
Liquidity Reserve Ratio 31.10 30.19 28.20 31.72 30.30 Total Secured Loans to interested parties (NT$1000)
7,144,352 7,706,256 8,208,646 5,896,869 6,112,931
Total Secured Loans to interested parties as a Percentage of Total Loans
2.11 2.17 2.18 1.58 1.50
Operating Scale
Market share of asset 1.06 1.07 1.07 1.06 1.10 Market share of equity 1.15 1.14 1.14 1.14 1.12 Market share of deposits 1.23 1.23 1.16 1.17 1.20 Market share of loans 1.22 1.21 1.23 1.15 1.16
Reasons for the changes in financial ratios over the last two years (Up to 20%): 1. The increase of average net income per employee was due to the increase of net income after tax. 2. The increase of EPS was due to the increase of net income after tax. 3. The increase of asset growth ratio was due to the increase of loans and financial assets at fair value
through profit or loss. 4. The increase of income growth ratio was due to the increase of net income before tax. 5. The decrease of cash flow ratio was due to the decrease of net cash flow from operating activities. The mark “*” are Key Performance Index for the Bank.

Far Eastern International Bank
2018 Annual Report 137
Note1: The annual financial data has been audited by independent auditors. Note2: The ratio associated with cash flow is negative, and therefore not included in the analysis herein. Note3: The aforementioned ratios are calculated as follows:
1. Operating Ability (1) Loans to deposits ratio = Total loans / Total deposits. (2) Ratio of NPL = Total non-performing loans / Total loans. (3) Interest expense to average total deposits = Deposits related interest expense/ Average total deposits (4) Interest revenue to average total loans = Loans related interest revenue/ Average total loans (5) Total assets turnover = Net revenue / Average total assets. (6) Average net revenue per employee (Note7) = Net operating revenue/ Total number of employees. (7) Average net income per employee = Net income after tax/ Total number of employees.
2. Profitability (1) Return on Tier 1 capital = Net income before tax/ Average total Tier 1 capital. (2) Return on total assets = Net income after tax/ Average total assets. (3) Return on equity = Net income after tax/ Average shareholders’ equity. (4) Net income ratio = Net income after tax/ Net profit. (5) EPS = (Net income attributable to owners of the bank– preferred shares dividend)/ Average issued shares
(Note5) 3. Financial Structure
(1) Liabilities to assets ratio = Total liabilities (Note4) / Total assets. (2) Property and equipment as a percentage of equity = Property and equipment / Net equity.
4. Growth Ratio (1) Asset growth ratio = (Current total asset – Last year total asset) / Last year total asset. (2) Income growth ratio = (Current income before income tax– Last year income before income tax)/Last year
income before income tax. 5. Cash Flow (Note8)
(1) Cash flow ratio = Cash flows from operating activities / (Due to banks and drafts + commercial bills payable + financial liabilities at fair value through profit or loss + securities purchased under resale agreements + accounts payable in 1 year).
(2) Cash flow adequacy ratio = Cash flows from operating activities in the last 5 Years / (Capital expenditure + cash dividends) in the last 5 Years.
(3) Cash flow satisfied ratio = Cash flows from operating activities / Cash flows from investing activities. 6. Liquidity Reserve Ratio = Liquid assets stipulated by CBC / Reserves appropriated for various types of liabilities 7. Operating Scale
(1) Market share of asset = Total assets / Total assets of all financial institutions available for deposits and loans (Note6)
(2) Market share of equity = Total equities / Total equities of all financial institutions available for deposits and loans
(3) Market share of deposits = Total deposits / Total deposits of all financial institutions available for deposits and loans
(4) Market share of loans = Total loans / Total loans of all financial institutions available for deposits and loans Note4: Total liabilities refer to the amount of liabilities after deducting performance guarantee reserve, contingency
reserve and loan commitment provision. Note5: The calculation formula for EPS mentioned above shall meet the following requirements during measurements:
1. Measurement should be based on the weighted average number of common shares, not the number of issued shares at year end.
2. In any case where there is a cash capital increase or treasury stock transaction, the period of time in circulation shall be considered in calculating the weighted average number of shares.
3. In the case of capital increase out of earnings or capital surplus, the calculation of earnings per share for the past fiscal year and the fiscal half-year shall be retrospectively adjusted based on the capital increase ratio, without the need to consider the issuance period for the capital increase.
4. If the preferred shares are non-convertible cumulative preferred shares, the dividend of the current year (whether issued or not) shall be subtracted from the net profit after tax, or added to the net loss after tax.
5. In the case of non-cumulative preferred shares, if there is net profit after tax, dividend on preferred shares shall be subtracted from the net income after tax; no adjustment is required to be made if the result of operation is a net loss.
Noet6:All financial institutions that can provide deposit and loan services including local banks, Chinese mainland bank branches in Taiwan, branches of foreign banks in Taiwan, credit unions, credit departments of fishermen’s associations and farmers associations, and trust investment companies.
Noet7: Revenue refers to the sum of interest income and non-interest income. Note8: The following notes apply when conducting cash flow analysis:
1. Net cash flow from operating activities means net cash in-flows from operating activities listed in the statement of cash flows.
2. Capital expenditures means the amounts of cash out-flows for annual capital investment. 3. Cash dividend includes cash dividends from both common shares and preferred shares.

Far Eastern International Bank
2018 Annual Report 138
(2) Capital Adequacy
Consolidated Capital Adequacy
Unit: NT$ Thousands Year
Items 2014 2015 2016 2017 2018
Regulatory capital
Common equity 33,243,204 36,095,275 38,122,066 39,698,325 42,076,829 Additional Tier I capital - - - - 2,448,097 Tier II capital 14,018,501 13,273,278 14,947,886 12,185,406 9,544,444 Total regulatory capital 47,261,705 49,368,553 53,069,952 51,883,731 54,069,370
Risk-weighted assets
Credit risk
Standardized approach 324,818,191 340,251,117 358,837,133 322,187,276 369,490,534
Internal rating-based approach
- - - - -
Asset securitization 317,180 - - - 215,318
Operational risk
Basic indicator approach 14,223,250 19,072,988 19,910,475 19,646,350 19,686,600
Standardized approach/ alternative standardized approach
- - - - -
Advanced measurement approach
- - - - -
Market risk
Standardized approach 19,804,188 22,448,425 16,796,650 14,948,088 11,098,400
Internal models approach - - - - -
Total risk-weighted assets 359,162,809 381,772,530 395,544,258 356,781,714 400,490,852 Capital adequacy ratio 13.16% 12.93% 13.42% 14.54% 13.50% Ratio of Tier I capital to risk-weighted assets 9.26% 9.45% 9.64% 11.13% 11.12% Ratio of common equity to risk-weighted assets 9.26% 9.45% 9.64% 11.13% 10.51%
Leverage ratio 5.58% 5.85% 5.97% 6.12% 6.19% Please explain the reason of Capital adequacy ratio change in past two years. (Variation is less than 20%) Note:1、Regulatory capital,risk-weighted assets and Exposure Measurement are calculated under the“Regulations Governing
the Capital Adequacy and Capital Category of Banks”and“The Methods for Calculating Bank's regulatory Capital and Risk Weighted Assets”
2、Formulas used were as follows: (1)Regulatory capital = Common equity + Additional Tier I capital + Tier II capital (2)Total risk-weighted assets = Risk-weighted assets for credit risk + (Capital requirements for operational risk and
market risk) × 12.5 (3)Capital adequacy ratio = Total regulatory capital/Total risk-weighted assets (4)Ratio of Tier I capital to risk-weighted assets = (Common equity + Additional Tier I capital)/Total risk-weighted
assets (5)Ratio of common equity to risk-weighted assets = Common equity/Total risk-weighted assets (6)Leverage ratio = Net Tier I capital/Exposure Measurement

Far Eastern International Bank
2018 Annual Report 139
Individual Capital Adequacy
Unit: NT$ Thousands Year
Items 2014 2015 2016 2017 2018
Regulatory capital
Common equity 32,736,013 35,411,051 37,403,214 39,236,233 41,848,384 Additional Tier I capital - - - - 2,193,441 Tier II capital 13,504,626 12,581,780 14,218,654 11,680,665 9,014,910 Total regulatory capital 46,240,639 47,992,831 51,621,868 50,916,898 53,056,735
Risk-weighted assets
Credit risk
Standardized approach
323,785,850 338,888,812 356,944,620 320,791,287 367,484,931
Internal rating-based approach
- - - - -
Asset securitization 317,180 - - - 215,318
Operational risk
Basic indicator approach
14,442,463 18,490,750 19,249,288 19,112,088 19,200,700
Standardized approach/alternative standardized approach
- - - - -
Advanced measurement approach
- - - - -
Market risk
Standardized approach
19,759,250 22,448,425 16,796,650 14,948,088 11,098,400
Internal models approach
- - - - -
Total risk-weighted assets 358,304,743 379,827,987 392,990,558 354,851,463 397,999,349 Capital adequacy ratio 12.91% 12.64% 13.14% 14.35% 13.33% Ratio of Tier I capital to risk-weighted assets 9.14% 9.32% 9.52% 11.06% 11.07% Ratio of common equity to risk-weighted assets 9.14% 9.32% 9.52% 11.06% 10.51% Leverage ratio 5.50% 5.74% 5.87% 6.06% 6.14% Please explain the reason of Capital adequacy ratio change in past two years. (Variation is less than 20%) Note:1、Regulatory capital,risk-weighted assets and Exposure Measurement are calculated under the“Regulations Governing
the Capital Adequacy and Capital Category of Banks”and “The Methods for Calculating Bank's regulatory Capital and Risk Weighted Assets”
2、Formulas used were as follows: (1) Regulatory capital = Common equity + Additional Tier I capital + Tier II capital (2) Total risk-weighted assets = Risk-weighted assets for credit risk + (Capital requirements for operational risk and
market risk) × 12.5 (3) Capital adequacy ratio = Total regulatory capital/Total risk-weighted assets (4) Ratio of Tier I capital to risk-weighted assets = (Common equity + Additional Tier I capital)/Total risk-weighted
assets (5) Ratio of common equity to risk-weighted assets = Common equity/Total risk-weighted assets (6) Leverage ratio = Net Tier I capital/Exposure Measurement

Far Eastern International Bank
2018 Annual Report 140
3. The Audit committee’s Review Report
Far Eastern International Bank
2018 Annual Report 141
4. 2018 Non-Consolidated Financial Statement
Please refer to page 269 to 369.
5. 2018 Audited Consolidated Financial Statement
Please refer to page 165 to 268.
6. The Bank should disclose the financial impacts to the Company and its affiliated
companies have incurred any financial or cash flow difficulties in 2017 and as of the date of the publication of the annual report:
None.

Far Eastern International Bank
2018 Annual Report 142
VII. Review of Financial Conditions, Financial Performance, and Risk Management
1. Analysis of Financial Status
Unit: NT$ Thousands Year
Item Dec. 31, 2018 Dec. 31, 2017
Difference Amount %
Cash and Cash Equivalents, Due from the Central Bank and Other Banks
37,529,613 30,882,208 6,647,405 22
Financial Assets at Fair Value Through Profit or Loss
46,507,501 30,208,333 16,299,168 54
Financial Assets at Fair Value Through Other Comprehensive Income
119,779,052 - 119,779,052 100
Available-for-Sale Financial Assets - 109,631,578 (109,631,578) (100) Loans and Discounts, net 379,688,118 351,056,762 28,631,356 8 Receivables, net 19,660,289 21,534,556 (1,874,267) (9) Other Financial Assets 15,338,449 23,379,510 (8,041,061) (34) Other Assets 7,716,607 8,109,686 (393,079) (5) Total Assets 626,219,629 574,802,633 51,416,996 9 Deposits and remittance 508,647,889 472,621,114 36,026,775 8 Other Liabilities 72,827,000 59,394,847 13,432,153 23 Total Liabilities 581,474,889 532,015,961 49,458,928 9 Capital 32,691,859 31,829,286 862,573 3 Capital Surplus 456,426 456,426 - 0 Retained Earnings 11,649,127 10,486,758 1,162,369 11 Other Equity (52,672) 14,202 (66,874) 471 Total Equity 44,744,740 42,786,672 1,958,068 5 Notes (Changes of more than 20% and more than $10,000 thousands): 1.The increase of Cash and Cash Equivalents, Due from the Central Bank and Other Banks was due to the
increase of NT$7.6 billions in due from other banks, the increase of NT$1.5 billions in cash and cash equivalents, and the decrease of NT$2.4 billion in due from the central bank.
2. The increase of Financial Assets at Fair Value Through Profit or Loss was due to the increase of NT$15.2 billion in credit derivative instruments, the increase of NT$3.1 billion in commercial paper, the increase of NT$3.1 billion in government bond, and the decrease of NT$5.1 billion in convertible bond.
3. The increase of Financial Assets at Fair Value Through Other Comprehensive Income was due to the new item according to IFRS 9.
4. The decrease of Available-for-Sale Financial Assets was due to deleting the item according to IFRS 9. 5. The decrease of Other Financial Assets was due to the decrease of NT$6.7 billion in Debt Investments
with no active market, and the decrease of NT$2.8 billion in Securities Purchased under Resale Agreements.
6. The increase of Other Liabilities was due to the increase of NT$8.8 billion in Due to banks, the increase of NT$1.7 billion in Securities Sold under Resale Agreements, the increase of NT$6 billion in Principal received on structured notes, and the decrease of NT$2.2 billion in Bank debentures.
7. The decrease of Other Equity was due to the decrease in Unrealized gains on financial assets at fair value through other comprehensive income.
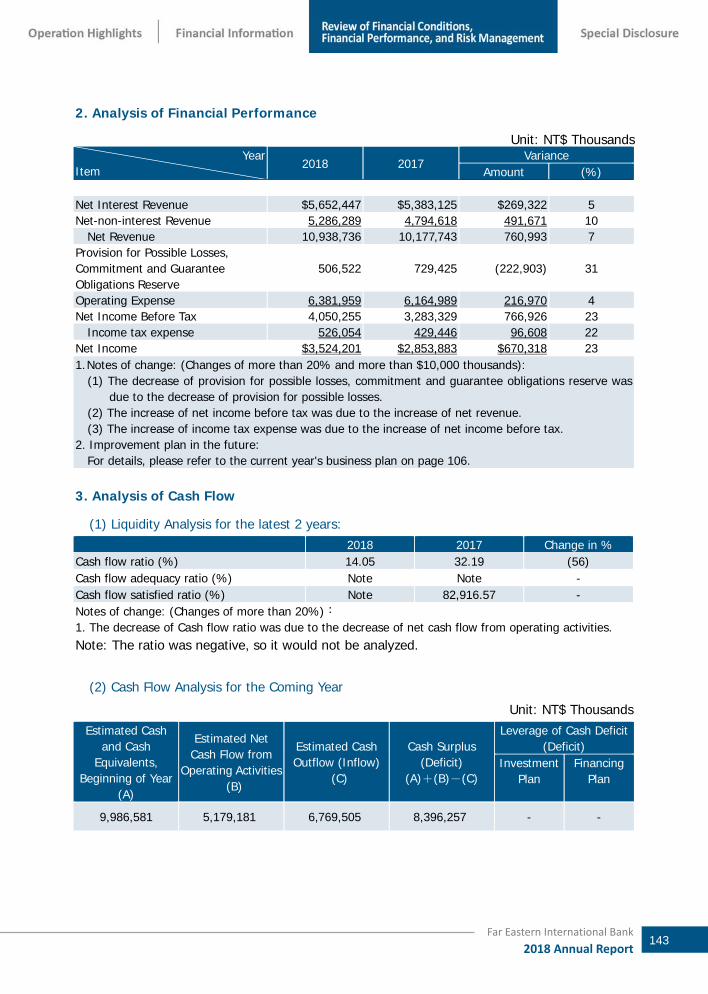
Far Eastern International Bank
2018 Annual Report 143
2. Analysis of Financial Performance
Unit: NT$ Thousands Year
Item 2018 2017
Variance Amount (%)
Net Interest Revenue $5,652,447 $5,383,125 $269,322 5 Net-non-interest Revenue 5,286,289 4,794,618 491,671 10
Net Revenue 10,938,736 10,177,743 760,993 7 Provision for Possible Losses, Commitment and Guarantee Obligations Reserve
506,522 729,425 (222,903) 31
Operating Expense 6,381,959 6,164,989 216,970 4 Net Income Before Tax 4,050,255 3,283,329 766,926 23
Income tax expense 526,054 429,446 96,608 22 Net Income $3,524,201 $2,853,883 $670,318 23 1. Notes of change: (Changes of more than 20% and more than $10,000 thousands):
(1) The decrease of provision for possible losses, commitment and guarantee obligations reserve was due to the decrease of provision for possible losses.
(2) The increase of net income before tax was due to the increase of net revenue. (3) The increase of income tax expense was due to the increase of net income before tax.
2. Improvement plan in the future: For details, please refer to the current year's business plan on page 106.
3. Analysis of Cash Flow
(1) Liquidity Analysis for the latest 2 years: 2018 2017 Change in % Cash flow ratio (%) 14.05 32.19 (56) Cash flow adequacy ratio (%) Note Note - Cash flow satisfied ratio (%) Note 82,916.57 - Notes of change: (Changes of more than 20%): 1. The decrease of Cash flow ratio was due to the decrease of net cash flow from operating activities. Note: The ratio was negative, so it would not be analyzed.
(2) Cash Flow Analysis for the Coming Year
Unit: NT$ Thousands Estimated Cash
and Cash Equivalents,
Beginning of Year (A)
Estimated Net Cash Flow from
Operating Activities (B)
Estimated Cash Outflow (Inflow)
(C)
Cash Surplus (Deficit)
(A)+(B)-(C)
Leverage of Cash Deficit (Deficit)
Investment Plan
Financing Plan
9,986,581 5,179,181 6,769,505 8,396,257 - -

Far Eastern International Bank
2018 Annual Report 144
4. Major Capital Expenditure in Recent Years:
None.
5. Investment Policy in Last Year, Main Causes of Profits or Losses, and
Improvement and Investment Plans for the Coming Year
(1) Far Eastern International Securities Company Ltd A. Main causes of profit or losses
The company recorded net income of NT$ 43,196 thousands for the year ended December 31, 2018. The Revenue, NT$ 286,788 thousands in 2018 compared to NT$ 276,704 thousands in the prior year period was increased by NT$ 10,084 thousands. This increase was due to the transaction volume growth and boosted by the productivity of sales teams. In 2018, the proportion of brokerage service charges to total revenue decreased from 9% to 8% as the broker lowered the transaction cost of trades. Other operating expenses increased mainly due to growth in the business that, as a result, reflected to the increased of the incentive compensation expense and continuous investment in the construction of IT, but the overall operating expenses can still be controlled within the budget.
B. Improvement and Investment Plans for the Coming Year
❶ Wealth Management Department
a. Set up a Taichung branch to expand the business into local market.
b. Expand the wealth management team through multiple sourcing channels.
c. Adjust the sales incentive program of wealth management department to attract and retain top sales.
d. Increase the variety of product types and venders to provide customers with multi-financial products and achieve customer asset appreciation.
e. Host customer MGM events and enhance customer relationships.
❷ Securities Brokerage Department
a. Increase the commission income of the stock market by increasing the custodian.
b. Develop and promote electronic trading systems to improve the efficiency of trading and delivery operations.
c. Increase customer familiarity with bond products and strengthen investment willingness.
e. Organize investment seminars to strengthen customer relationship services and enhance the development of banking channels.
❸ Implementing the company's internal control system and regulatory compliance, and enhance the company's overall risk control ability.
❹ Recruiting, training and retaining capable employees.
❺ Controlling and reducing operating expenses.

Far Eastern International Bank
2018 Annual Report 145
(2) Far Eastern Asset Management Corp A. Main causes of profit or losses
Mainly due to purchase of bad debts and return on investment from joint venture projects.
B. Improvement and Investment Plans for the Coming Year
❶ Continue to purchase new NPL to gain service fee income.
❷ Purchase through various market channels new court auction real estates, and dispose of these assets to increase revenues.
6. Analysis of Risk Management
(1) Risk management structure and policy A. Policy
❶ To foster a sound and prudent risk management culture, the Bank has employed both qualitative and quantitative measures (such as operational procedures and the ratio of asset quality), which are in compliance with the internal and external regulatory guidelines, as a reference for the Bank’s business strategy.
❷ Build up an independent risk management department to implement and monitor the risk management mechanism.
❸ Effectively identify, measure, monitor and control all existing and potential risks within acceptable risk appetite, and achieve the annual budget by balancing the risk and reward.
B. Organization Structure
❶ Board of Directors:
The Board of Directors steers FEIB's risk management, and is responsible for reviewing the Bank's risk management policies, reinforcing a risk management culture and taking full responsibility for overall risk management.
❷ Assets and Liabilities Management Committee & Risk Management Committee:
The President of the Bank shall be the Chairman of the Committee(s), appoint relevant senior managers as the Committee Members, and calls regular meetings. The Committee(s) shall be responsible for supervising and reviewing the Bank’s level of risk-taking and compliance results of the risk management framework.
❸ Risk Management Department:
There are two divisions under the Risk Management Department: Corporate Banking Division and Consumer Banking Division. Both divisions are responsible for the risk management of the relevant Business Unit(s) and regular reporting to the Risk Management Committee and the Board of the Directors. The responsibilities of each division are stated below.
a. The Corporate Banking Division integrates five functions, Credit Appraisal, Account Receivable Review, Financial Market Middle Office, Credit Policy Management, Midterm Credit Management. Collectively, the division is in charge

Far Eastern International Bank
2018 Annual Report 146
of assessment of credit application and post-lending management, formulate credit policies and monitor asset quality, mark to market of trading position via daily market value and limitation of trading volume, respectively.
b. The Consumer Banking and Credit Card Division is divided into 6 functions: Credit Policy, Consumer Lending Approval, Credit Card Approval, Debt collection, Management Information, and Customer Complaint Management/ Self-Assessment. They are responsible respectively for establishing lending policies of both consumer banking and credit card products, approving loans and credit card, collection of delinquent and non-performing assets, providing portfolio management information and internal control.
❹ Auditing Department:
The Auditing Department is responsible for regularly auditing the implementation of risk management framework, including risk management structure, processing, and shall provide suggestions for improvement.
(2) Qualitative and Quantitative Information of Various Risks
A. Credit risk management system and capital requirement
❶ Credit risk management system
2018 Item Context
1.Strategies, goals, policies, and procedures of credit risk management
1. Develop a sound credit risk management mechanism to effectively identify, measure, monitor and control credit risk, and balance the credit risk-assumed and the reasonable return
2. Corporate Banking (including small and medium enterprises), Consumer Banking and Credit Card Business: (1) Corporate Banking
1. Strategy and goal Establish a prudent and specific procedure for lending and post-lending process to ensure a sound asset quality
2. Policy To maintain a diversified loan portfolio, the Bank shall set up credit risk proportion limits for each industry and conglomerate group. The Bank shall review those limits according to the economy trend, industry trend and the Bank’s business strategy on a regular basis or whenever it is necessary.
3. Process (1) The loan approval hierarchy is based on the Bank’s “Credit Authorization
Guidelines”. The authorized credit officer is empowered the right of approval to the loan case. For the specific credit line application, it must be approved by certain credit approval level after evaluation of the Credit Committee.
(2) Establish a post-lending management system, and regularly review the credit status of borrowers, including the change of credit entity and collateral. Additionally, through the watch-list system, take counter action in time towards potential, doubtful loans.
(2) Consumer Banking and Credit Cards Business: 1. Strategy and goal
To formalize lending guidelines and procedures to ensure good portfolio quality with steady revenue in achieving the growth targets of lending assets.
2. Policy

Far Eastern International Bank
2018 Annual Report 147
Item Context To structure the retail asset portfolio adequately in terms of diversification and optimization of risk and reward. To adapt to market changes and portfolio developments by enforcing effective credit quality maintenance management which supported by business intelligent information and ad-hoc analysis and followed by policy modification wherever deems appropriate.
3. Process To manage credit cycle which starts from asset product design, through credit cost assessment, credit terms formalizing, credit approval guidelines and procedures establishment, debt collection management then back to product modification if needed. An effective credit maintenance mechanism with process is established within the cycle to ensure quality is soundly secured.
2. Organization and structure of credit risk management.
1. Board of Directors: The highest decision-making unit of the Bank's credit risk, based on the overall operating strategy and operating environment. Approve the credit risk management strategy to ensure the effective operation of credit risk management and review it regularly.
2. Risk Management Committee: In compliance with the credit risk strategy approved by the Board of Directors, it manages the credit risk management mechanism, reviews credit risk norms, communicates and coordinates cross-department related credit risk management issues, and continuously monitors execution performance.
3. Credit Committee: Review the Bank’s specific credit line application according to the Bank’s “Credit Committee Procedures”
4. Risk Management Department: Corporate Banking Division: Responsible for the credit review of corporate lending cases, the establishment and control of post-lending management and credit-related regulations, and the implementation of credit risk management monitoring Consumer Banking Division: The Consumer Credit Division comprises functions of Credit Policy, Consumer Lending Approval, Credit Card Approval, Debt collection, Management Information, and Customer Complaint management/ Self-Assessment. It is responsible for establishing lending policies of consumer banking and credit card products, approving loans and credit card, debts collection, portfolio management information, internal self-assessment and customer complaint handling
3. Scope and characteristics of credit risk report and evaluation system
1. Corporate Banking: The credit risk report includes credit risk limits, risk exposure, post-lending management and asset quality. It shall be solicited to the Board of Directors after reporting to the Risk Management Committee quarterly. (1) Group
1. Avoid excessive concentration of credit risk in conglomerate companies 2. The credit limit of the group is determined based on the needs of the case
(2) Industry Review the proportion of credit exposures among industries at the end of each quarter
(3) Watch-list system Continue to observe the changes in the credit status and business activities of the borrowers and take early action when the warnings are identified
(4) Asset quality classification In addition to the normal credit assets, the non-performing assets are evaluated, classified and special provision according to the collateral valuation

Far Eastern International Bank
2018 Annual Report 148
Item Context and the length of the overdue period
2. Consumer Banking and Credit Cards Business: Report quarterly to Risk Management Committee with content of portfolio structure, asset quality status, and credit policy strategy etc. Credit measurements include concentration risk, key assets quality indicators, risk grades and industry environment changes and impacts.
4. Policies for credit risk hedging or risk mitigation, as well as strategies and processes for monitoring and risk mitigation tools continuous effectiveness
1. Evaluate the probability of default and net credit loss of asset, stipulate the appropriate credit terms and conditions, and mitigate the credit risk by levying a substantial valuable collateral or guarantor, including bank deposit slips, securities (such as treasury bills, government bonds, bank debentures, stocks, corporate bonds guaranteed by financial institutions), land and other real estate, etc., with a view to effectively reduce the risk exposures. Among them, the listed and over the counter stocks are re-evaluated daily, and the value of the collateral is monitored continuously; the value of collateral such as real estate is appraised on a case-by-case basis at each renewal.
2. Reduce the acceptance rate of the loan applications from the non-target customers to avoid credit risk.
3. The asset quality is secured by policy mechanisms ,such as establishing credit limits and loan regulation before lending and via post-lending management ,concentration analysis, mid-term lending and credit review tracing mechanisms to examine asset quality and obligor adverse change and to control, monitor risk in real-time basis. To report risk management regularly and feed-back to related business units, and to promptly control overall risk to make sure risk mitigation is effective in a continuous way.
5. Approach applied to Regulatory Capital Charge
Standardized Approach
❷ Risk Exposure after Mitigating Risks from the Standardized Approach of the Credit Risk and Capital Requirement
March 31, 2019
Unit: NT$ thousands
Exposure Type Exposure after Risk
Mitigant Capital Requirement
Sovereign states 111,983,263 0
Non-central government public sections 500,880 8,014
Bank (including multilateral development banks) 41,555,697 1,256,873
Enterprises (including securities and insurance companies)
215,424,788 15,837,691
Retail credit 75,447,486 4,751,861
Residential real estate 173,777,974 7,400,951
Equity Investment 1,200,131 96,010
Other assets 10,151,491 433,358
Total 630,041,710 29,784,758

Far Eastern International Bank
2018 Annual Report 149
B.Securitization risk management system, risk exposure, and capital requirement
❶ Securitization Risk Management Framework
2018
Item Context 1. Strategies and procedures of securitization management Not Applicable 2. Organization and structure of securitization management 3. Scope and characteristics of the securitization risk report and measurement
system. 4. Policies for securitization hedging or risk mitigation, as well as strategies and
processes for monitoring and risk mitigation tools continuous effectiveness5. Approach applied to Regulatory Capital Charge Standardized Approach 6. Overall qualitative disclosure requirements, included:
1) The purpose of engaging in securitization activities and the types of risks undertaken and retained by banks in re-securitization activities
2) Other risks implied by securitized assets (e.g. liquidity risk) 3) Different roles played by banks in the process of securitization, and the
degree of participation of banks in each process 4) The monitoring process for credit and market risk in securitization 5) The risk management policy in mitigating the risks retained by
securitization and re-securitization
Not Applicable
7. Overview of accounting policies for bank securitization 8. In the banking book, the name of the external rating agency (ECAI) used in
securitization, and the risk exposure in which it is used in each type of asset securitization
9. Any significant changes in quantity since the last reporting period (e.g. assets transferred between banking book and trading book)
Note: Items 6 to 9 are only required to be filled out by the founding bank that is currently in circulation.
❷ Engagement of Asset Securitization: None.

Far Eastern International Bank
2018 Annual Report 150
❸ Risk Exposure and Capital Requirement for Asset Securitization - by Transaction Type
March 31, 2019 Unit: NT$ thousands
Risk Exposure Category
Book type
Bank Category
Type of
assets
Traditional Synthetic Total
Risk Exposure Amount Capital
Requirement(2)
Risk Exposure Amount Capital
Requirement(4)
Risk Exposure Amount
(5)=(1)+(3)
Capital Requirement (6)=(2)+(4)
Capital Requirement
Before Securitization Retained or
Purchased
For Liquidity Facility
For Credit Enhancement
Sub-total(1)
Retained or Purchased
(3)
Non- Founding Bank
Banking book CMO 2,629,465 - - 2,629,465 42,071 - - 2,629,465 42,071
-
Trading book - - - - - -
Sub-total CMO 2,629,465 - - 2,629,465 42,071 - - 2,629,465 42,071
Founding Bank
Banking book - - - - - - - - - - -
Trading book - - - - - - - - - - -
Sub-total - - - - - - - - - - - Total CMO 2,629,465 - - 2,629,465 42,071 - - 2,629,465 42,071 - Note: 1. The column “Type of assets” is subdivided as securitized asset (such as credit card, home equity loan, auto loan), or the
securities invested (such as mortgage-backed securities, commercial mortgage backed securities, asset-backed securities, and collateralized debt obligation), etc.
2. The risk exposure amount of the banking book should be booked after risk mitigation. 3. The column “Liquidity facility”should be included the exposure of drawdown and undrawn portion.
❹ Information on Securitized Products
a. Summarized Information on Investment in Securitized Products
March 31, 2019
Unit: NT$ thousands
Item (Note 1)
Listed accounting items Original CostAccumulated
valuation gain(loss)
Accumulated loss on
impairment Book Value
CMO Financial assets at fair
value through OCI 2,591,671 38,541 (747) 2,629,465
Note 1: This table contains domestic and foreign securitized products, which are registered according to the following categories and listed accounting items: (1) Mortgage-backed securities (MBS): including beneficiary certificate for securitized claims on
housing-mortgaged loans or asset-backed securities (RMBS) beneficiary certificates for securitized claims on commercial property-mortgaged loans or asset-backed securitized(CMBS), collateralized mortgage obligation (CMO), and other realty-mortgage securities.
(2) Beneficiary certificates or asset-backed securities (ABS): including beneficiary certificates for corporate-loan claims or asset- backed securitized (collateralized loan, obligation, or CLO) beneficiary certificates for securitized bond assets or asset- backed securities (collateralized bond obligation , or CBO) beneficiary certificates for securitized claims on credit card debts or asset-backed securities, beneficiary certificates by securitized claims on auto loans or asset-backed securities, beneficiary certificates for securitized claims on consumption loans/cash-card debts or asset-backed securities, beneficiary certificates for securitized leasing claims or assets-backed securities, and other securitized beneficiary certificates or asset-backed securities.
(3) (ABCP) Short-term beneficiary certificates or short-term asset-backed securities (asset-backed commercial paper).
(4) Collateralized debt obligation (CDO). (5) Realty securitization: It refers to real estate asset trust (REAT). (6) Bills and bonds issued as structured investment vehicles (SIV). (7) Other securitized products.
Note 2: The table includes beneficiary certificates of asset-backed securities held by the bank with the bank serving as an originating institution.

Far Eastern International Bank
2018 Annual Report 151
b. a) Information of each Securitization Products Investment with Original Cost of NT$300Mn or above (excluding those held for credit enhancing purpose as a founder bank):
Name of Securities (Note 2)
Listed accounting
items Currency Issuer &
locationPurchase
Date Maturity
Date Coupon
Rate
CreditRating
(Note 3)
Payment method for principal
and interest
Original Cost
Accumulated valuation gain(loss)
Accumulated loss on
impairment
Book Value
Attachment Point
(Note 4)
Contents of assets
pool (Note 5)
US38380YK530 Financial assets
at fair value through OCI
USDGENNIE
MAE /US
2019/1/16 2048/8/1 3.5% Moody's Aaa Monthly 300,649 1,064 (51) 301,662 - -
US38381AYP55 Financial assets
at fair value through OCI
USDGENNIE
MAE /US
2019/1/162019/2/21 2048/5/1 3% Moody's
Aaa Monthly 601,030 12,881 (102) 613,809 - -
US38381BHT44 Financial assets
at fair value through OCI
USDGENNIE
MAE /US
2018/12/21 2049/1/1 4% Moody's Aaa Monthly 618,189 17,870 (105) 635,954 - -
US38381RYD50 Financial assets
at fair value through OCI
USDGENNIE
MAE /US
2019/3/13 2049/3/1 3.5% Moody's Aaa Monthly 621,064 (4,459) (105) 616,500 - -
Note 1: The table includes domestic and foreign products. Note 2: Full names should be provided for same securities product in difference issuance. Note 3: Provide result of the latest credit rating. Note 4: Attachment point refers to share of sub-issuance value with compensation priority lower than that for securities held by the bank
in the total issuance value of the securitized product. Assuming, for example, a bank purchases A security of a certain CDO (collateralized debt obligation), the security has sub-security BBB and sub -equity security with compensation priority lower than A security. The total issuance value of BBB and sub-equity security amounts to 12% of the total value of the CDO. Then the attachment point for A security is 12%.
Note 5: Assets pool refers to assets portfolio handed by originating institution to trustee or other company with a special purpose. Specify kind of assets In the portfolio (denote primary lien or subordinated status), details, value on book in original currency and number.
b) Held for the purpose of enhancing credit as a securitization founder bank: None.
c) The Bank acting as a credit impaired asset purchase institution or a settlement purchase institution of securitization products: None.
c. The Bank acting as a guarantee agency or providing liquidity facilities:
None.

Far Eastern International Bank
2018 Annual Report 152
C. Operational risk management system and capital requirement
❶ Operational risk management system
2018
Item Context 1. Strategies and
procedures of operational risk management
1. Establish an operational risk management mechanism to enhance the risk awareness of the Bank's personnel, examine the operational risks involved in daily business activities and management processes, and take appropriate countermeasures against existing and potential risks to reduce operational risk losses
2. Through the management of risk self-assessment and loss event notification, a tracking mechanism for improvements should be established, and the operational risk management status should be reviewed by an independent audit department, and the results of the verification should be reported to the Board of Directors in due course.
2. Organization and structure of operational risk management
1. Board of DirectorsThe highest decision-making unit of the Bank's operational risk management, based on the overall operating strategy and environment. Approve the Bank's operational risk management strategy, supervise the effective operation of the operational risk management mechanism, and review it regularly
2. Risk Management Committee: According to the operational risk management strategy approved by the Board of Directors, it manages and supervises the risk management mechanism of the Bank.
3. Risk Management Department: Develop operational risk management procedures, establish a database of risk-loss incidents for the Bank, collect risk information and implementation status of the Bank, and report to the Board of Directors on a regular basis
4. Auditing Department: The business related to the operational risk should be audited at least once a year and suggestions for improvement should be provided in due course
3. Scope and characteristics of the operational risk reporting and measurement system
1. Every aspect of daily business activities and management processes is regularly self-assessed to mitigate operational risk. In addition, the Bank shall establish a regular and immediate notification mechanism for the financial or other loss events caused by improper system operation, staff misconduct, fraud and accidental disasters, and report the causes and improvement measures of each operational risk event to the senior management.
2. To strengthen the Bank’s internal controls and prevent misconducts, the Auditing Department shall implement "general auditing" and "special auditing". The Bank also employs a "Compliance Officer" system to ensure that the Bank strictly abides by all regulations.
4. Policies for operational risk hedging or risk mitigation, as well as strategies and processes for monitoring and risk mitigation tools for continuous effectiveness.
1. Per evaluation of the frequency and seriousness of operational risks in daily operations and management process, the Bank transfers or offsets the loss and impact by insurance, outsourcing, etc.
2. With measures such as the Implementation of KYC (Know Your Customer) and anti-money laundry, internal control and compliance system, , employee codes of conduct and trainings, the Bank aims to lower the possibility of risk occurrence.
3. The Bank has also set up information safety control guidelines conforming to the requirements of (ISO27001), including IT safety policies, process, supervision audit and training to mitigate information risk.
5. Approach applied to Regulatory Capital Charge
Basic Indicator Approach

Far Eastern International Bank
2018 Annual Report 153
❷ Operational Risk Capital Requirement
March 31, 2019 Unit: NT$ thousands
Year Gross profit Capital requirement
2016 10,194,958 - 2017 9,956,648
2018 10,569,507
Total 30,721,113 1,536,056
D. Market risk management system and capital requirement
❶ Market Risk Management system
2018
Item Context 1. Strategies and procedures
of market risk management.
1. The Bank shall develop a sound market risk management mechanism to effectively identify, measure, evaluate, monitor market risk, and take both risk and reasonable return into consideration simultaneously
2. The Bank’s “Financial Market Proprietary Trading Authorization Policy” sets up position limits and stop loss limits for each financial instrument by dealing room and dealers. The Bank’s position shall be monitored by the designated risk management team on a daily basis. If the stop loss limits are reached, dealers shall take prompt action to adjust positions to reduce market risk.
3. All products and services launched are subject to proper market risk assessment before launch. The assessment shall include the market risk and exposure incurred by the new product/service, and its impact to the Bank.
2. Organization and structure of market risk management
Market risk shall be monitored by the Middle Office Team of Risk Management Department, which is independent from risk-taking function (i.e. dealing room/front office) and operational function (i.e. back office), and shall directly report to the non-dealing Senior Management
3. Scope and characteristics of market risk report and valuation system
1. All the Bank’s positions shall be appraised by marking to market/model to ensure a fair valuation of profit and loss
2. Risk Management Department shall report to the Senior Management regarding to the Bank’s market risk positions, level of risk-taking, profit and loss, limits usage and compliance results of the market risk related regulatory policies and procedures.
3. A sound information system shall be established to ensure all the trading positions are monitored effectively and correctly.
4. Policies of market risk hedging or mitigation, and strategies and procedures of monitoring the continuous effectiveness of risk hedging and mitigation
1. Position limits and stop loss limits for each financial instrument are set up by dealing room and dealers to control the market risk within a reasonable range.
2. All the Bank’s trading positions shall be appraised independently by Risk Management Department by marking to market (real time or daily market price) once on a daily basis (In case of the positions for hedging purpose, at least twice on a monthly basis). Positon limits and stop loss limits shall also be monitored by Risk Management Department.
5. Approach applied to Regulatory Capital Charge
Standardized Approach

Far Eastern International Bank
2018 Annual Report 154
❷ Market Risk Capital Requirement
March 31, 2019 Unit: NT$ thousands
Type of risk Capital requirement
Interest rate risk 975,228
Equity securities risk 22,768
Foreign exchange risk 93,649
Product risk 0
Total 1,091,645
E. Evaluation of liquidity risk includes a maturity analysis of assets and liabilities and an
explanation of the methods adopted to manage asset liquidity gap and funding gap:
To manage the Bank’s deposit to meet loan and financial transaction growth. The Bank would adeptly adjust its funding strategy depending on market liquidity situation and the Central Bank’s policies to optimize fund usage and lower liquidity risk. The Bank would manage the maturities of long-term and short-term securities to match the timing of loan drawdowns and repayments. The stability and allocation of deposits are emphasized to manage funding liquidity. The Bank follows capital liquidity control index to monitor and manage liquidity risk. The Capital liquidity control index and relevant analysis are regularly reported to the Asset and Liability Management Committee (“ALCO”) and the Board of directors.
Maturity Analysis of Assets and Liabilities For New Taiwan dollar items
December 31, 2018 Unit: NT$ Thousands
Total Amount for Remaining Period to Maturity
0 to 10 Days 11 to 30 Days31 Days to 90
Days 91 Days to 180 Days
181 Days to One Year
Over One Year
Main capital inflow on maturity
657,048,134 108,223,432 83,033,715 99,353,166 67,996,227 60,087,823 238,353,771
Main capital outflow on maturity
793,951,803 46,921,837 80,819,341 163,285,185 146,268,581 190,698,533 165,958,326
Gap (136,903,669) 61,301,595 2,214,374 (63,932,019) (78,272,354) (130,610,710) 72,395,445 Note: This table refers to the New Taiwan dollar amounts held by the Bank.
FOR U.S. DOLLAR ITEMS December 31, 2018 Unit: US$ thousands
Total
Amount for Remaining Period to Maturity
0 to 30 Days 31 Days to 90 Days
91 Days to 180 Days
181 Days to One Year Over One Year
Main capital inflow on maturity 10,744,093 4,099,117 2,644,604 1,443,831 567,614 1,988,927
Main capital outflow on maturity 11,435,866 5,053,597 3,122,668 1,643,749 747,525 868,327
Gap ( 691,773) ( 954,480) ( 478,064) ( 199,918) ( 179,911) 1,120,600 Note: This table refers to the U.S. dollar amounts held by the Bank.

Far Eastern International Bank
2018 Annual Report 155
(3) Effect of Changes in Important Local and Foreign Policies and Laws on Bank’s Business and Responding Measures A. In response to the requirements of the FSC to strengthen the supervision mechanism
of banks and financial holding companys invested in financial leasing subsidiary (sub-subsidiary), the Bank has amended its“Management Rules for Transferring Investment Finance Leasing Companies”and“Procedures in Engaging Credit Extension and Transactions Other Than Credit Extension with Interested Parties" to establish a specific and effective supervision and management mechanism.
B. In coordination with the amendments of the“Regulations Governing Internal Operating Systems and Procedures for Banks Conducting Financial Derivatives Business” on February 1, 2018, the Bank has amended its internal regulations under “Management Strategies and Operational Guidelines for Derivative Financial Products Business” accordingly.
C. In coordination with FSC’s interpretation order to Article 72-2 of the Banking Act on August 31, 2018, the Bank has amended the relevant internal regulations accordingly.
D. In response to the amendments of the "Company Act" promulgated on August 01, 2018 and implemented on November 01, 2018, the Bank has posted the announcement, promoted the main points of the amendments, and examined the relevant operational procedures accordingly.
E. The "General Data Protection Regulation" (GDPR) officially came into force on May 25, 2018. To strengthen the protection of customers' personal data and maintain the effectiveness of BS10012 Personal Information Management System, the Bank appointed external consultants to complete the BS10012 revision and implement the GDPR.
(4) Effect of Change in Technology and Industry on Bank’s Business and Responding Measures A. The rapid development of information technology, in addition to changing the habits of
customer transactions, has also changed the bank's business model. In addition to using IT to develop internet banking, mobile banking, mobile payment, third-party payment, banking online service platform, foreign exchange margin trading internet banking, intelligent wealth management service and intelligent customer service, the Bank also provides complete customer services. By updating information equipment, developing new types of businesses, applying business analytics technologies, building various risk assessment systems or models, and strengthening information security equipment to create product differentiation and gain market pioneers, and increase customer convenience. Improve customer service efficiency and reduce overall operating costs
B. Information security risk evaluation analysis:
FEIB has established an information security risk management structure. In 2018, it established a dedicated security department (Information Security Division) to formulate an information security policy and is responsible for the planning, implementation, management and audit of information security matters. In the first quarter of each year, the overall implementation of information security will be reported to the Board of Directors. The specific management plans and risk prevention measures for the overall implementation of information security are as follows:

Far Eastern International Bank
2018 Annual Report 156
❶ Information security and the personal information protection management system:
FEIB's information security management system architecture has been certified to the international standard ISO 27001, and the personal information protection management system architecture is also certified by the international standard BS 10012. Set up the Information Security Implementation Team (Information Security Committee) and the Personal Information Management Team under the management structure. The management review meeting is held every six months, and the information security policy and all management system documents are reviewed at least once a year to continue to be verified by BSI through biannual reviews, and ensure the implementation of various information security operations systems and protect customer personal information.
❷ Information security testing and audit:
In 2018 FEIB commissioned a qualified third-party consultation company to implement the information system security evaluation. Assessment projects include information system architecture review, network activity review, compliance review, vulnerability scanning, penetration tests, Mobile App security testing, SWIFT Customer Security Program (CSP) audit, and e-mail phishing exercise. The low-risk issues discovered during the period have been improved. In addition, FEIB commissioned an accountant to complete the personal information protection audit for the previous year, the audit result conformed to all relevant specifications. The implementation of FEIB's information security has met the specifications and requirements for testing and verification.
❸ Improving the information security protection architecture:
FEIB conduct a comprehensive inspection of FEIB’s network architecture, and evaluate each system’s importance and risk level. Plan and establish the overall network security area architecture. Also evaluate and strengthen the privileged account management architecture, and introduce privileged management system increased control mechanism. In addition, strengthen the security monitoring of important systems and networks, and conduct correlation analysis of information to strengthen the defense-in-depth defense mechanism.
❹ Emergency response plan:
Completed distributed denial of service (DDoS) attack response drill, ATM accident response procedure drill, and information system backup drill. The drill result conformed to expectations to confirm the effectiveness of mechanisms and procedures.
Although FEIB has not yet invested in security insurance, the management plans and preventive measures in items (1) to (4) above have effectively controlled the security risks.
(5) Effect of a Change in Bank’s Image and Responding Measures Based on the business philosophy of “Sincerity, Diligence, Thrift, Prudence, and Innovation”, the Bank is committed to becoming a professional and sophisticated financial services company in Greater China and ASEAN markets, providing customers with the best modern investment and financial solutions, focusing on safeguarding consumer rights. At the same time, corporate social responsibility is regarded as one of the core values of the Bank. We are committed to sponsoring philanthropic events based on the concept of “Take

Far Eastern International Bank
2018 Annual Report 157
from society, Give back to society ” and have maintained a good corporate image for a long time.
(6) Expected Benefits, Possible Risks and Responding Measures for M&As No merger or acquisition in 2018
(7) Expected Benefits, Possible Risks and Responding Measures for Network Expansion Domestic base
A. Anticipated Benefits
❶ Enhancing access convenience of branches would result in higher customers’ willingness to do business with us and would also encourage our personnel to explore more potential areas with high-end customers and to enhance relationships with customers.
❷ Through creating the best financial service space for customers and cross banking groups’ corporations, the branch offers customers one stop service with a sense of worth.
B. Possible risks
❶ It takes time for a new branch to attract customers and AUM, thus the growth curve would be flat in the beginning.
❷ The depreciation cost of the refurbishment for the new branch would be high in the beginning and would result in a drop in profit.
C. Corresponding measures:
❶ Recruit experienced sales personnel with the aim of swiftly raising the size of AUM.
❷ Provide customers with diverse services through e-marketing and by making the use of Big data analysis for SME financing service, deposits and financial products in order to enhance the relationships with customers and hence lead to increase in profits.
Oversea base
The Bank is applying to establish Ho Chi Minh and Singapore rep. offices to extend the Greater China platform and to build the foundation of ASEAN markets. The investments and operation risks of establishing rep. offices are lower than branches. So far setting-up the rep. offices is of limited impact on FEIB earnings and financial structure.
(8) Risks and Responding Measures of Business Concentration A. Consumer Banking and Credit Cards:Continue to leverage digital services and big data
to create better customer experience, expand multi-business model and develop new strategic partnership. Balance the business growth among mortgage, car loans and unsecured loans. Reinforce compliance and ensure operating procedures are fully complied with internal and external policies. Upgrade risk differentiation tools to guarantee a healthy portfolio growth.
B. Corporate Banking:By internal SOP and supervisory regulation, Corporate banking group (CBG) conducts corporate credit line business. CBG periodically examines the controlling mechanism focused on the credit lines of same industry, conglomerate, affiliated enterprise and identical customer. CBG has complied with the line

Far Eastern International Bank
2018 Annual Report 158
management of targeted industrial proportion. There is no over- concentrated industry or region for the business development, and no any competitive disadvantage of risk dispersion. The line management is comprehensively sound.
(9) Effect, Risks and Responding Measures to Ownership Changes No ownership changes in 2018
(10) Impact, risks and countermeasures if any board directors or shareholders who own more than 1% shares of the Bank make a significant share transfer or replacement None.
(11) Litigation or non-litigation cases None.
(12) Other Important Risks and Responsive Procedures None.
7. Crisis Management Mechanism
(1) FEIB not only formulates “Guidelines on major events occurring” and “Guidelines on Emergency Response Plan”, but also set Emergency Response Center. When crisis happens, FEIB can predominate immediate data effectively and integrate them timely to adopt response measures, ensuring our business to be normal.
(2) Build Duty Officer System in weekday and assign a general duty officer to coordinate sudden crisis and circulate crisis events as required.
(3) All business units should carry out crisis response measures according to FEIB’s “Emergency Response Notice”, “Employee Fire and Anti-robbing group exercise Plan” and “Operations of Major Crisis response”.
(4) All business units should execute disaster drill and education training twice per year to reduce disaster accident losses.
8. Other Important Items:
None.

Far Eastern International Bank
2018 Annual Report 159
VIII. Special Disclosure
1. Summary of affiliated companies
(1) Organization chart
Note:Affiliated companies of the Bank do not hold each other's shares
(2) Backgrounds of Affiliated Companies
Unit:NT$ Thousands December 31, 2018 Company Name Established Date Address Paid-in Capital Main Business
Far Eastern Asset Management Corp.
Jan 29, 2004 1st Floor, 4th Floor, No. 267, Section 2, Dunhua South Road, Taipei
684,000 Financial institutions buy, evaluate, auction and manage services for money claims. Accounts receivable purchase business. Overdue accounts receivable management services.
Far Eastern International Securities Company Ltd.
Jun 26, 2008 51F, No.7, Sec. 5, Xinyi Road, Taipei.11049, Taiwan.
200,000 Foreign securities brokerage and wealth management business.
FEIB Financial Leasing Co.
Apr 27, 2015 Rm. 2806, Tower 1 Grand Gateway 66, 1 Hong Qiao Rd., Xuhui District, Shanghai, China
USD 10,000(eqv.
NT$305,110 thousands)
Financial Leasing Business , Leasing Business ,Purchase of leasing property from domestic and foreign ,Consultation and Guarantee of Leasing Transactions, Factoring Business related to main business
FEIB
Far Eastern Asset
Management Corp.
100.00%
FEIB Financial
Leasing Co.
100.00%
Far Eastern International
Securities Company Ltd.
100.00%

Far Eastern International Bank
2018 Annual Report 160
(3) Backgrounds of directors, supervisors and presidents of affiliated companies December 31 ,2018
Company Name Title Name of
Representatives Shareholding
No.of Shares Ratio% Far Eastern Asset Management Corp.
Chairman LIN, JIANN-JONG (representative of FEIB)
68,400,000 100.00%
Director CHOU,TIEN-TSAI (representative of FEIB)
68,400,000 100.00%
Director DAI,GUANG JENG (representative of FEIB)
68,400,000 100.00%
Director WANG , SHAW Y. (representative of FEIB)
68,400,000 100.00%
Director CHENG,CHAN-FONG (representative of FEIB)
68,400,000 100.00%
Supervisor CHEN,YUN-YI (representative of FEIB)
68,400,000 100.00%
Supervisor CHENG , HUM PHREY (representative of FEIB)
68,400,000 100.00%
Far Eastern International Securities Company Ltd.
Chairman LIAO,GUO-DONG (representative of FEIB)
20,000,000 100.00%
Director LIN, JIANN-JONG (representative of FEIB)
20,000,000 100.00%
Director TAI, SUNGCHIH (representative of FEIB)
20,000,000 100.00%
Director LIU,MAY-LING (representative of FEIB)
20,000,000 100.00%
Director CHOU, SHIN-HWA (representative of FEIB)
20,000,000 100.00%
Director YANG,YA-SEN (representative of FEIB)
20,000,000 100.00%
Supervisor CHEN,YUN-YI (representative of FEIB)
20,000,000 100.00%
FEIB Financial Leasing Co. Chairman LIN, JIANN-JONG (representative of Far Eastern
Asset Management Corp )
No securities issued
100% holding
Director Chi, Steve ( representative of Far Eastern Asset Management Corp )
Director DAI,GUANG JENG ( representative of Far Eastern
Asset Management Corp ) Director Liu, Vincent
( representative of Far Eastern Asset Management Corp )
Director CIOU,KUN-LONG ( representative of Far Eastern Asset Management Corp )
Supervisor CHOU, SHIN-HWA (representative of Far Eastern
Asset Management Corp )

Far Eastern International Bank
2018 Annual Report 161
(4) Performance of Affiliated Companies
Unit:NT$ Thousands December 31, 2018
Company Name Paid-in capital
Assets Liabilities Net valueOperating revenue
Operating income
Income before tax
EPS (before tax)
Far Eastern Asset Management Corp.
684,000 1,195,927 512,004 683,923 52,262 25,828 34,977 0.51
Far Eastern International Securities Company Ltd.
200,000 404,426 69,721 334,705 286,788 46,259 47,155 2.36
FEIB Financial Leasing Co.
305,110 1,098,519 792,479 306,040 72,191 17,121 12,830 -
2. Private Placement Securities and Financial Bonds:
Private Placement of Securities: None.
Private Placement of Financial Debentures: None.
3. The Shares in the Company Held or Disposed of by Subsidiaries in the Most Recent Years
None.
4. Other Important Supplementary Information
None.
5. Events Occurred in the Previous Year and Up to the Publication of this Annual Report, which Significantly Affect Shareholders’ Equity or Price of Shares Pursuant to Item 2, paragraph 3 of Article 36 of the Securities and Exchange Act:
None.

Far Eastern International Bank
2018 Annual Report 162
VIIII. Memorabilia
Significant Events in 2018
Launched Far Eastern Happy Card built-in Easy Card version
Insurance Agency Business Group completed the BSI certification and introduced the ISO27001 information security management system. Mobile Bank APP launched the "Happy Red Packet" online community transfer service. Online banking service obtained the accessibility conformance level A from the National Communications and Communications Commission(NCCC) i applied for the platform to add " Optical Character Recognition (OCR)" function. Received “Best Customer Recommendation Award” and “Best Video Marketing Award” by Wealth Magazine in 2018. Mobile Bank APP launched the "Happy cash gift" online community transfer service. Corporate Internet Banking launched the "AP to AP Connected Payment" service FEIB was in the top 6~20% of the listed companies in the fourth “Corporate Governance Evaluation” conducted by Taiwan Stock Exchange. Mobile Bank APP launched "Instant Message Notification" service to provide account instant push notifications Received “Contact Center Award” and “High Speed Customer Service Award” by APCSC. The shareholders' meeting resoluted dividend distribution of NT$0.71 per share and elected 11 seats for the 10th board of directors. Published 2017 FEIB CSR Report. Launched physical credit card binding Taiwan mobile payment service. Received 2018 “Best Wealth Management Award” and “Best Brand Image Award” by Excellence Magazine. Received “Assistant Group Best Insurance Professional Award” and “Best Pathway Strategy Award” by RMIM Magazine. Received “Best Wealth Manager, Rising Star - Taiwan Award” by 《The Asset》Magazine. Co-sponsored a learning program for VIPs above 55 with the Yuan Ze University for promoting the elderly. Conducted ISO 14064-1 checking in headquarter building Launched “Bankee's official website”. "FE QR code Payment Gateway" worked with LINE Pay, Xpress, and WeChat Payment to provide cross-border payment services in many department stores. Received “Outstanding CSR Sustainability Report” by BSI Standards annual conference. Received “Taiwan Corporate Sustainability Award Bronze Silver Medal” by TCSA. Published 2019 calendar titled “Time Sings with Humanities in Bloom” with the theme of the former residences of writers and artists. Received a subsidy of NT$950,000 from the Ministry of Labor's "Enterprise Human Resources Improvement Plan - Individual Type" Received “Badge of Healthy Workplace” by Health Promotion Administration, Ministry of Health and Welfare. As the lead bank of “Lei Shing Hong Credit Limited”, three-year USD3.1 billion syndicated loans.
Jan
Mar
Feb
Apr
May
June
July
Aug
Oct
Nov
Dec

Far Eastern International Bank
2018 Annual Report 163
Headquarters and Domestic Branches Operating Unit Address Telephone Number
Headquarter 27F, No. 207, Dunhua S. Rd., Sec. 2, Da-an Dist., Taipei City 106,Taiwan
(886-2) 2378-6868
Taipei Chung Hsiao BranchNo. 112, Zhongxiao E. Rd., Sec. 1, Zhongzheng Dist., Taipei City 100, Taiwan
(886-2) 2327-8898
Taipei Tungmen Branch No. 135, Sinyi Rd., Sec. 2, Zhongzheng Dist., Taipei City 100, Taiwan (886-2) 2356-7711 Taipei Hsiang Yang Branch No. 1, Hsiang yang Rd., Zhongzheng Dist., Taipei City 100, Taiwan (886-2) 2381-4567
Taipei Nanmen Branch No. 40, Roosevelt Rd., Sec. 1, Zhongzheng Dist., Taipei City 100, Taiwan
(886-2) 2392-6955
Taipei Guting Branch No. 50, Roosevelt Rd., Sec. 3, Zhongzheng Dist., Taipei City 100, Taiwan
(886-2) 2369-5600
Taipei Dadaocheng Branch No. 86, Yanping N. Rd., Sec. 2, Datong Dist. , Taipei City 103, Taiwan (886-2) 2558-6186
Taipei Chungching BranchNo. 30, Chungching N. Rd., Sec. 1, Datong Dist., Taipei City 103, Taiwan
(886-2) 2550-6600
International Banking Department
2F, No. 30, Chungching N. Rd., Sec. 1, Datong Dist., Taipei City 103, Taiwan
(886-2) 2550-8811
Taipei Chungshan BranchNo. 70, Minsheng E. Rd., Sec. 1, Chungshan Dist., Taipei City 104, Taiwan
(886-2) 2523-8899
Taipei Sungchiang Branch No. 59, Sungchiang Rd., Chungshan Dist., Taipei City 104, Taiwan (886-2) 2505-5533 Taipei Nanjing East Road Branch
No. 101, Nanjing E. Rd., Sec. 3, Chungshan Dist., Taipei City 104, Taiwan
(886-2) 7702-9766
Taipei Nungan Mini Branch No. 12-1, Nungan St., Chungshan Dist., Taipei City 104, Taiwan (886-2) 2592-2255
Taipei Sungshan Branch No. 171, Nanjing E. Rd., Sec. 5, Sungshan Dist., Taipei City 105, Taiwan
(886-2) 8787-6668
Head Office Branch 1F, No. 207, Dunhua S. Rd., Sec. 2, Da-an Dist., Taipei City 106, Taiwan
(886-2) 2378-6868
Taipei Dun Nan Branch 13F, No. 207, Dunhua S. Rd., Sec. 2, Da-an Dist., Taipei City 106, Taiwan
(886-2) 7732-0086
Trust Department 20F, No. 207, Dunhua S. Rd., Sec. 2, Da-an Dist., Taipei City 106, Taiwan
(886-2) 2312-3636
Taipei Yungji Branch No. 7, Zhongpo N. Rd., Shinyi Dist., Taipei City 110, Taiwan (886-2) 8785-5788 Taipei Shinyi Branch No. 505, Guangfu S. Rd., Shinyi Dist., Taipei City 106, Taiwan (886-2) 2720-7755
Taipei 101 Mini Branch 51-1 Floor, Taipei 101 Tower, No. 7, Shinyi Rd, Sec. 5, Taipei City 110, Taiwan
(886-2) 8101-0168
Taipei Yihsien Branch No. 200-3, Keelung Rd., Sec. 1, Shinyi Dist., Taipei City 110, Taiwan (886-2) 2722-9558 Shipai Branch No. 112, Shipai Rd., Sec. 2, Beitou Dist., Taipei City 112, Taiwan (886-2) 2826-5688 Taipei Jinhu Mini Branch No. 495, Minquan E. Rd., Sec. 6, Neihu Dist., Taipei City 114, Taiwan (886-2) 2630-5788
Credit Card Department No. 33, Aly. 3, Ln 182, Wenhua Rd., Sec. 2, Panchiao City, New Taipei City 220, Taiwan
(886-2) 8073-1166
Panchiao Wenhua BranchNo. 1, Wenhua Rd., Sec. 2, Panchiao Dist., New Taipei City 220, Taiwan
(886-2) 2255-6499
Panchiao Nanya Branch No. 172, Nanya S. Rd., Sec. 2, Panchiao Dist., New Taipei City 220, Taiwan
(886-2) 8966-3339
Panchiao Chungcheng Branch
No. 228, Chungcheng Rd., Panchiao Dist., New Taipei City 220, Taiwan (886-2) 2272-6088
Panchiao Mega City Branch 2F, No. 18, Xinzhan Rd., Panchiao Dist., New Taipei City 220, Taiwan (886-2) 7729-0616 Shindian Branch No. 98, Beixin Rd., Sec. 3, Shindian Dist., New Taipei City 231, Taiwan (886-2) 2910-6060 Yungho Branch No. 222, Fuhe Rd., Yongho Dist., New Taipei City 234, Taiwan (886-2) 2232-6500 Shuangho Branch No. 535, Zhonghe Rd., Yongho Dist., New Taipei City 234, Taiwan (886-2) 7717-6668 Chungho Branch No. 3, Heping St., Chungho Dist., New Taipei City 235, Taiwan (886-2) 2945-1800 Sanchung Branch No. 46, Fude N. Rd., Sanchung Dist., New Taipei City 241, Taiwan (886-2) 8973-1133

Far Eastern International Bank
2018 Annual Report 164
Operating Unit Address Telephone Number
Taipei Shinchuang BranchNo. 209, Fuxing Rd., Sec. 1, Shinchuang Dist., New Taipei City 242, Taiwan
(886-2) 8991-3366
Shinchuang Fu Guo Branch No. 6, Fuguo Rd., Shinchuang Dist., New Taipei City 242, Taiwan (886-2) 2901-6868 Luzhou Branch No. 38, Sanmin Rd., Luzhou Dist. New Taipei City 247, Taiwan (886-2) 7730-6978 Chungli Branch No. 372, Yanping Rd., Chungli Dist., Taoyuan City 320, Taiwan (886-3) 427-9696 Taoyuan Branch No. 78, Nanhua St., Taoyuan Dist., Taoyuan City 330, Taiwan (886-3) 339-6339 Taoyuan Tashing Branch No. 6, Tashing W. Rd., Sec. 2, Taoyuan Dist., Taoyuan City 330, Taiwan (886-3) 301-8966 Taoyuan Dayou Branch No. 480, Dayou Rd., Taoyuan District, Taoyuan City 330, Taiwan (886-3) 346-9688 Lin Kou Branch No. 227, Fuxing 1st Rd., Guishan Dist., Taoyuan City 333, Taiwan (886-3) 397-3888 Hsinchu Jinguo Branch No. 100, Jinguo Rd., Sec. 2, Hsinchu City 300, Taiwan (886-3) 533-3131 Hsinchu Scientific Park Branch
3F, No. 11, Yuanqu 2nd Rd., Hsinchu City 300, Taiwan (886-3) 579-8833
Hsinchu Big City Branch No. 243, Zhongyang Rd., East Dist., Hsinchu City 300, Taiwan (886-3) 533-8168 Chupei Branch No. 41, Guangming 6th Rd., Chupei city, Hsinchu County 302, Taiwan (886-3) 553-6699 Taichung Jihyu Branch No. 131, Jihyu Rd., Sec. 2, Central Dist., Taichung City 400, Taiwan (886-4) 2225-2008 Taichung Kungyi Branch No. 367, Kungyi Rd., West Dist., Taichung City 403, Taiwan (886-4) 2328-8666 Taichung Daya Branch No. 180, Wenshing Rd., Sec. 4, North Dist., Taichung City 404, Taiwan (886-4) 2297-3266 Taichung Wenshing Branch No. 698, Wenshin Rd., Sec. 4, Beitun Dist., Taichung City 406, Taiwan (886-4) 2230-6689 Dali Branch No. 121, Yimin Rd., Sec. 2, Dali Dist., Taichung City 412, Taiwan (886-4) 2482-3899 Changhua Branch No. 233, Minsheng Rd., Changhua City, Changhua County 500, Taiwan (886-4) 728-9188 Nantou Branch No. 11, Sanhe 2nd Rd., Nantou City, Nantou County 540, Taiwan (886-49) 222-3311 Chiayi Branch No. 272, Wenhua Rd., East Dist., Chiayi City 600, Taiwan (886-5) 278-5911 Tainan Branch No. 2, Dongmen Rd., Sec. 2, East Dist., Tainan City 701, Taiwan (886-6) 208-9898 Chungde Branch No. 87, Chongdao Rd., East Dist., Tainan City 701, Taiwan (886-6) 290-7290 Yungkang Branch No. 37, Zhongzheng N. Rd., Yungkang Dist., Tainan City 710, Taiwan (886-6) 253-0400 Kaohsiung Chungcheng Branch
No. 49, Chungcheng 4th Rd., Xinxing Dist., Kaohsiung City 800, Taiwan (886-7) 251-8199
Kaohsiung Culture Center Branch
No. 96, Siwei 2nd Rd., Lingya Dist., Kaohsiung City 802, Taiwan (886-7) 715-5678
Kaohsiung Wufu Branch No. 106, Dayong Rd., Yancheng Dist., Kaohsiung City 803, Taiwan (886-7) 533-3820
Fengshan Branch No. 201, Qingnian Rd., Sec. 2, Fengshan Dist., Kaohsiung City 830, Taiwan
(886-7) 777-8600
Hong Kong Branch 20F, No. 8, Queen’s Road, Central, Hong Kong ( 852) 2167-8183

Far Eastern International Bank Ltd. and Subsidiaries
Consolidated Financial Statements for the Years Ended December 31, 2018 and 2017 and Independent Auditors’ Report
165

INDEPENDENT AUDITORS’ REPORT
The Board of Directors and the Shareholders Far Eastern International Bank Ltd.
Opinion
We have audited the accompanying consolidated financial statements of Far Eastern International Bank Ltd. (the “Bank”) and its subsidiaries, which comprise the consolidated balance sheets as of December 31, 2018 and 2017, and the consolidated statements of comprehensive income, changes in equity and cash flows for the years then ended, and the notes to the consolidated financial statements, including a summary of significant accounting policies.
In our opinion, the accompanying consolidated financial statements present fairly, in all material respects, the consolidated financial position of the Bank and its subsidiaries as of December 31, 2018 and 2017, and its consolidated financial performance and its consolidated cash flows for the years then ended in accordance with the Regulations Governing the Preparation of Financial Reports by Public Banks and International Financial Reporting Standards (IFRS), International Accounting Standards (IAS), IFRIC Interpretations (IFRIC), and SIC interpretations (SIC) endorsed and issued into effect by the Financial Supervisory Commission of the Republic of China (FSC).
Basis for Opinion
We conducted our audits in accordance with the Rules Governing the Audit of Financial Statements of Financial Institutions by Certified Public Accountants and auditing standards generally accepted in the Republic of China. Our responsibilities under those standards are further described in the Auditors’ Responsibilities for the Audit of the Consolidated Financial Statements section of our report. We are independent of the Bank and its subsidiaries in accordance with The Norm of Professional Ethics for Certified Public Accountant of the Republic of China, and we have fulfilled our other ethical responsibilities in accordance with these requirements. We believe that the audit evidence we have obtained is sufficient and appropriate to provide a basis for our opinion.
Key Audit Matters
Key audit matters are those matters that, in our professional judgment, were of most significance in our audit of the consolidated financial statements for the year ended December 31, 2018. These matters were addressed in the context of our audit of the consolidated financial statements as a whole, and in forming our opinion thereon, and we do not provide a separate opinion on these matters.
Key audit matters related to the Bank and its subsidiaries’ consolidated financial statements for the year ended December 31, 2018 for the Bank and its subsidiaries, which are described as follows:
Allowance for Expected Credit Losses on Loans and Receivables
As of December 31, 2018, the balances of loans and receivables in the aggregate amounted to $401,172,495 thousand, accounted for 64% of the total assets of the consolidated financial statements; an amount that is deemed to be significant to the consolidated financial statements. To the allowance for expected credit losses on loans and receivables, the Bank has assessed according to IFRS 9 and comply with relevant regulations issued
166
by authorities, whichever is higher. As the assessment on the impairment of loans and accounts receivables involved the management’s critical judgments in accounting estimation and the underlying assumption, related disclosures refer to Notes 5 to the consolidated financial statements, we deemed to the allowance for expect credit losses on loans and receivables was a key audit matter. Refer to Notes 4, 5, 13, 14 and 45 to the consolidated financial statements for disclosures related to impairment on loans and receivables. In response to the abovementioned key audit matter, the audit procedures we performed are as follows: 1. Understand and perform tests on the Bank’s internal controls relevant to loans and receivables impairment
assessment; 2. Identity the potential risk of loans and receivables customers from public information, and confirm that
whether to include in the appropriate assessment stage; 3. Verify whether the methodology, main assumptions and parameters (consider the probability of default,
probability of loss given default and exposure at default on forward-looking information) adopted by the impairment model of expected credit losses adequately reflect the actual position and compliance with IFRS 9, and recalculate the amount of impairment; and
4. Sample and review credit files to evaluate whether the loans and receivables are reasonably categorized per
regulatory stipulation and recalculate for the correctness of the allowance. Evaluation of Impairment on Intangible Asset - Operation Rights As of December 31, 2018, the balance of intangible asset - operating rights amounted to $1,538,210 thousand. The amount is the cost for the Bank to acquire business from other financial institutions, acquisition cost that results from the allocation of the fair value to corresponding assets and liabilities. According to IAS 36, management should evaluate the impairment on intangible asset - operating rights annually or whenever there is an indication that the asset may be impaired. For the assessment in determining the value in use of operating rights, the management requires an estimate of future cash flow of relevant cash-generating unit. As its assessment involves the management’s critical judgments and estimates, the impairment of intangible asset - operating rights is deemed to be a key audit matter. Refer to Notes 4, 5 and 21 to the consolidated financial statements for disclosures related to impairment on intangible asset. In response to the abovementioned key audit matter, we have consulted with our internal financial experts for their help to perform audit procedures as follows: 1. Evaluate and verify the qualification of the valuation personnel employed by the management in terms of
their professional experience, competency, and independence. 2. Evaluate the reasonableness of critical parameters (such as future cash-flow forecast, discount rate, and
sustainable growth rate) and perform sensitivity analysis. 3. Verify the raw data adopted (including the average amounts, the growth rates, interest rates, etc., of deposits
and loans) to evaluate its accuracy and completeness. Other Matter We have also audited the parent company only financial statements of the Bank as of and for the years ended December 31, 2018 and 2017 on which we have issued an unmodified opinion.
167
Responsibilities of Management and Those Charged with Governance for the Consolidated Financial Statements
Management is responsible for the preparation and fair presentation of the consolidated financial statements in accordance with the Regulations Governing the Preparation of Financial Reports by Public Banks and International Financial Reporting Standards (IFRS), International Accounting Standards (IAS), interpretations of IAS (SIC) endorsed and issued into effect by the Financial Supervisory Commission of the Republic of China, and for such internal control as management determines is necessary to enable the preparation of consolidated financial statements that are free from material misstatement, whether due to fraud or error. In preparing the consolidated financial statements, management is responsible for assessing the Bank and its subsidiaries’ ability to continue as a going concern, disclosing, as applicable, matters related to going concern and using the going concern basis of accounting unless management either intends to liquidate the Bank and its subsidiaries or to cease operations, or has no realistic alternative but to do so. Those charged with governance, including the audit committee, are responsible for overseeing the Bank and its subsidiaries’ financial reporting process. Auditors’ Responsibilities for the Audit of the Consolidated Financial Statements Our objectives are to obtain reasonable assurance about whether the consolidated financial statements as a whole are free from material misstatement, whether due to fraud or error, and to issue an auditors’ report that includes our opinion. Reasonable assurance is a high level of assurance, but is not a guarantee that an audit conducted in accordance with the auditing standards generally accepted in the Republic of China will always detect a material misstatement when it exists. Misstatements can arise from fraud or error and are considered material if, individually or in the aggregate, they could reasonably be expected to influence the economic decisions of users taken on the basis of these consolidated financial statements. As part of an audit in accordance with the auditing standards generally accepted in the Republic of China, we exercise professional judgment and maintain professional skepticism throughout the audit. We also: 1. Identify and assess the risks of material misstatement of the consolidated financial statements, whether due
to fraud or error, design and perform audit procedures responsive to those risks, and obtain audit evidence that is sufficient and appropriate to provide a basis for our opinion. The risk of not detecting a material misstatement resulting from fraud is higher than for one resulting from error, as fraud may involve collusion, forgery, intentional omissions, misrepresentations, or the override of internal control.
2. Obtain an understanding of internal control relevant to the audit in order to design audit procedures that are
appropriate in the circumstances, but not for the purpose of expressing an opinion on the effectiveness of the Bank and its subsidiaries’ internal control.
3. Evaluate the appropriateness of accounting policies used and the reasonableness of accounting estimates
and related disclosures made by management. 4. Conclude on the appropriateness of management’s use of the going concern basis of accounting and, based
on the audit evidence obtained, whether a material uncertainty exists related to events or conditions that may cast significant doubt on the Bank and its subsidiaries’ ability to continue as a going concern. If we conclude that a material uncertainty exists, we are required to draw attention in our auditors’ report to the related disclosures in the consolidated financial statements or, if such disclosures are inadequate, to modify our opinion. Our conclusions are based on the audit evidence obtained up to the date of our auditors’ report. However, future events or conditions may cause the Bank and its subsidiaries to cease to continue as a going concern.
168

5. Evaluate the overall presentation, structure and content of the consolidated financial statements, including the disclosures, and whether the consolidated financial statements represent the underlying transactions and events in a manner that achieves fair presentation.
6. Obtain sufficient and appropriate audit evidence regarding the financial information of entities or business
activities within the Bank and its subsidiaries to express an opinion on the consolidated financial statements. We are responsible for the direction, supervision, and performance of the Bank and its subsidiaries audit. We remain solely responsible for our audit opinion.
We communicate with those charged with governance regarding, among other matters, the planned scope and timing of the audit and significant audit findings, including any significant deficiencies in internal control that we identify during our audit. We also provide those charged with governance with a statement that we have complied with relevant ethical requirements regarding independence, and to communicate with them all relationships and other matters that may reasonably be thought to bear on our independence, and where applicable, related safeguards. From the matters communicated with those charged with governance, we determine those matters that were of most significance in the audit of the consolidated financial statements for the year ended December 31, 2018 and are therefore the key audit matters. We describe these matters in our auditors’ report unless law or regulation precludes public disclosure about the matter or when, in extremely rare circumstances, we determine that a matter should not be communicated in our report because the adverse consequences of doing so would reasonably be expected to outweigh the public interest benefits of such communication. The engagement partners on the audit resulting in this independent auditors’ report are Shih-Tsung Wu and Chen-Hsiu Yang. Deloitte & Touche Taipei, Taiwan Republic of China March 26, 2019
Notice to Readers The accompanying consolidated financial statements are intended only to present the consolidated financial position, financial performance and cash flows in accordance with accounting principles and practices generally accepted in the Republic of China and not those of any other jurisdictions. The standards, procedures and practices to audit such consolidated financial statements are those generally applied in the Republic of China. For the convenience of readers, the independent auditors’ report and the accompanying consolidated financial statements have been translated into English from the original Chinese version prepared and used in the Republic of China. If there is any conflict between the English version and the original Chinese version or any difference in the interpretation of the two versions, the Chinese-language independent auditors’ report and consolidated financial statements shall prevail.
169

FAR EASTERN INTERNATIONAL BANK LTD. AND SUBSIDIARIES
CONSOLIDATED BALANCE SHEETS DECEMBER 31, 2018 AND 2017 (In Thousands of New Taiwan Dollars)
2018 2017ASSETS Amount % Amount %
Cash and cash equivalents (Note 6) $ 10,023,920 2 $ 8,592,901 2
Due from the central bank and other banks (Notes 7 and 38) 27,543,032 4 22,351,083 4
Financial assets at fair value through profit or loss (Notes 4, 5, 8 and 43) 46,507,501 7 30,208,333 5
Financial assets at fair value through other comprehensive income (Notes 4, 5, 9, 11, 29, 39
and 43) 119,779,052 19 - -
Investment in debt instruments at amortized cost, net (Notes 4, 5, 10, 11 and 43) 2,588,654 - - -
Securities purchased under resale agreements (Notes 4, 12 and 38) 8,289,275 1 11,071,393 2
Receivables, net (Notes 4, 5, 13, 14, 38 and 43) 21,484,377 4 22,750,869 4
Current tax assets (Note 4) 93 - 7,372 -
Discounts and loans, net (Notes 4, 5, 14, 38 and 43) 379,688,118 61 351,056,762 61
Available-for-sale financial assets (Notes 4, 15, 29, 39 and 43) - - 109,631,578 19
Held-to-maturity financial assets (Notes 4, 16 and 43) - - 2,135,246 -
Investment accounted for using equity method (Notes 4, 17 and 29) 1,776,350 - 1,774,066 -
Debt investments with no active market (Notes 4, 18 and 43) - - 6,677,076 1
Other financial assets, net (Notes 4, 19, 39 and 43) 4,695,376 1 3,768,480 1
Property and equipment, net (Notes 4 and 20) 2,732,431 1 2,889,392 1
Intangible assets, net (Notes 4, 5 and 21) 1,699,602 - 1,725,085 -
Deferred tax assets (Notes 4 and 36) 372,184 - 584,502 -
Other assets 171,185 - 200,142 -
TOTAL $ 627,351,150 100 $ 575,424,280 100
LIABILITIES AND EQUITY
LIABILITIES Due to the central bank and other banks (Note 22) $ 15,726,723 3 $ 6,960,774 1 Financial liabilities at fair value through profit or loss (Notes 4, 5, 8, 26, 38 and 43) 2,752,479 1 4,319,121 1 Securities sold under repurchase agreements (Notes 4 and 23) 14,665,794 2 12,921,364 3 Payables (Note 24) 7,265,222 1 6,488,285 1 Current tax liabilities (Note 4) 201,032 - 254,446 - Deposits and remittances (Notes 25, 38 and 43) 508,407,972 81 472,392,183 82 Bank debentures (Notes 8, 26 and 43) 18,001,900 3 20,216,664 4 Principal received on structured notes 12,479,170 2 6,482,513 1 Other miscellaneous financial liabilities 1,436,104 - 934,262 - Provisions (Notes 4, 27 and 38) 1,194,774 - 1,127,116 - Other liabilities 475,240 - 540,880 -
Total liabilities 582,606,410 93 532,637,608 93
EQUITY ATTRIBUTABLE TO OWNERS OF THE BANK (Notes 4, 9, 15, 17 and 30)
Share capital 32,691,859 5 31,829,286 5Capital surplus 456,426 - 456,426 -Retained earnings
Legal reserve 7,400,808 1 6,544,643 1 Special reserve 36,411 - 250,703 - Unappropriated earnings 4,211,908 1 3,691,412 1
Total retained earnings 11,649,127 2 10,486,758 2Other equity (52,672) - 14,202 -
Total equity 44,744,740 7 42,786,672 7
TOTAL $ 627,351,150 100 $ 575,424,280 100
The accompanying notes are an integral part of the consolidated financial statements.
170

FAR EASTERN INTERNATIONAL BANK LTD. AND SUBSIDIARIES CONSOLIDATED STATEMENTS OF COMPREHENSIVE INCOME FOR THE YEARS ENDED DECEMBER 31, 2018 AND 2017 (In Thousands of New Taiwan Dollars, Except Per Share Amounts)
Percentage
Increase 2018 2017 (Decrease) Amount % Amount % % INTEREST REVENUES (Notes 4, 30
and 38) $ 11,316,237 101 $ 10,057,931 97 13 INTEREST EXPENSES (Notes 4, 30
and 38) 5,635,434 50 4,653,057 45 21 NET INTERESTS 5,680,803 51 5,404,874 52 5 NET REVENUES OTHER THAN
INTEREST Net service fee income (Notes 4, 31
and 38) 3,130,773 28 3,129,200 30 - Net gains on financial assets and
liabilities at fair value through profit or loss (Notes 4, 5, 8, 32, 38 and 43) 1,505,960 13 1,732,217 17 (13)
Net realized gains on available-for-sale financial assets (Notes 4 and 29) - - 86,718 1 (100)
Net realized gains on financial assets at fair value through other comprehensive income (Notes 4 and 29) 138,491 1 - - -
Net foreign exchange gains (loss) (Note 4) 263,801 2 (293,168) (3) 190
Shares of profit of associates for using equity method (Notes 4 and 17) 92,467 1 103,337 1 (11)
Gains on disposal of property (Note 4) 174,804 2 45 - 388,353 Others (Note 19) 231,178 2 233,906 2 (1)
Total net revenues other than
interest 5,537,474 49 4,992,255 48 11 CONSOLIDATED NET REVENUES 11,218,277 100 10,397,129 100 8 PROVISION FOR LOSSES ON BAD
DEBTS EXPENSE, COMMITMENT AND GUARANTEE (Notes 4, 14 and 38) 514,803 5 731,847 7 (30)
(Continued)
171

FAR EASTERN INTERNATIONAL BANK LTD. AND SUBSIDIARIES CONSOLIDATED STATEMENTS OF COMPREHENSIVE INCOME FOR THE YEARS ENDED DECEMBER 31, 2018 AND 2017 (In Thousands of New Taiwan Dollars, Except Per Share Amounts)
Percentage
Increase 2018 2017 (Decrease) Amount % Amount % % OPERATING EXPENSES
Employee benefits expense (Notes 4, 28, 33 and 38) $ 3,838,158 34 $ 3,667,799 35 5
Depreciation and amortization (Notes 4 and 34) 250,039 2 248,142 3 1
Other general and administrative expenses (Notes 35 and 38) 2,546,798 23 2,481,697 24 3
Total operating expenses 6,634,995 59 6,397,638 62 4
INCOME BEFORE INCOME TAX 4,068,479 36 3,267,644 31 25 INCOME TAX EXPENSE (Notes 4, 5
and 36) 544,278 5 413,761 4 32 NET INCOME FOR THE YEAR 3,524,201 31 2,853,883 27 23 OTHER COMPREHENSIVE INCOME
(LOSS) (Notes 4, 5, 9, 11, 15, 17, 29 and 36) Items that will not be reclassified
subsequently to profit or loss: Remeasurement of defined benefit
plans (46,657) (1) 55,828 1 (184)Losses on valuation of investments
in equity instruments at fair value through other comprehensive income (37,126) - - - -
Share of other comprehensive loss of associates for using equity method (4,832) - (414) - (1,067)
Income tax relating to items that will not be reclassified subsequently to profit or loss 23,181 - (9,491) - 344 (65,434) (1) 45,923 1 (242)
(Continued)
172

FAR EASTERN INTERNATIONAL BANK LTD. AND SUBSIDIARIES CONSOLIDATED STATEMENTS OF COMPREHENSIVE INCOME FOR THE YEARS ENDED DECEMBER 31, 2018 AND 2017 (In Thousands of New Taiwan Dollars, Except Per Share Amounts)
Percentage
Increase 2018 2017 (Decrease) Amount % Amount % %
Items that may be reclassified subsequently to profit or loss Exchange differences on translating
foreign operations $ 60,367 1 $ (128,795) (1) 147 Unrealized gain on
available-for-sale financial assets - - 357,804 3 (100)Share of other comprehensive
income of associates for using equity method (17,788) - 9,528 - (287)
Losses on valuation of investments in debt instruments at fair value through other comprehensive income (308,014) (3) - - -
Gains on reversal of investments in debt instruments at fair value through other comprehensive income (929) - - - -
Income tax relating to items that may be reclassified subsequently to profit or loss (Note 37) 2,103 - 4,226 - (50) (264,261) (2) 242,763 2 (209)
Other comprehensive income
(loss) for the year (329,695) (3) 288,686 3 (214) TOTAL COMPREHENSIVE INCOME
FOR THE YEAR $ 3,194,506 28 $ 3,142,569 30 2 NET INCOME ATTRIBUTABLE TO:
Owners of the Bank $ 3,524,201 31 $ 2,853,883 27 23 TOTAL COMPREHENSIVE INCOME
ATTRIBUTABLE TO: Owners of the Bank $ 3,194,506 28 $ 3,142,569 30 2
EARNINGS PER SHARE (Note 37)
Basic $1.08 $0.87 Diluted $1.07 $0.84
The accompanying notes are an integral part of the consolidated financial statements. (Concluded)
173

FAR
EA
STE
RN
INT
ER
NA
TIO
NA
L B
AN
K L
TD
. AN
D S
UB
SID
IAR
IES
CO
NSO
LID
AT
ED
ST
AT
EM
EN
TS
OF
CH
AN
GE
S IN
EQ
UIT
Y
FOR
TH
E Y
EA
RS
EN
DE
D D
EC
EM
BE
R 3
1, 2
018
AN
D 2
017
(In
Tho
usan
ds o
f New
Tai
wan
Dol
lars
)
Unr
ealiz
ed G
ain
(L
oss)
on
Fina
ncia
l Ass
ets a
t
Exc
hang
e
Unr
ealiz
ed L
oss o
n
Fair
Val
ue
D
iffer
ence
s on
A
vaila
ble-
for-
sale
Thr
ough
Oth
er
T
rans
latin
g
Fina
ncia
l Ass
ets
C
ompr
ehen
sive
Shar
e C
apita
l
Cap
ital S
urpl
us
Una
ppro
pria
ted
Fore
ign
Ope
ratio
ns
(Not
es 4
, 13,
15
In
com
e(N
otes
4,
(N
ote
30)
(N
ote
30)
Leg
al R
eser
ve
Spec
ial R
eser
ve
Ear
ning
s (N
ote
4)
an
d 30
)
15 a
nd 2
9)
Tot
al E
quity
BA
LA
NC
E A
T J
AN
UA
RY
1, 2
017
$ 3
1,11
3,67
2
$
45
6,42
6
$
5,57
1,47
7
$
121,
028
$
3,
916,
835
$
11
5,91
6
$
(3
44,4
77)
$
-
$ 4
0,95
0,87
7
App
ropr
iati
on o
f th
e 20
16 e
arni
ngs
L
egal
res
erve
-
-
97
3,16
6
-
(973
,166
)
-
-
-
- S
peci
al r
eser
ve
-
-
-
12
9,67
5
(1
29,6
75)
-
-
-
-
Cas
h di
vide
nds
- N
T$0
.420
dol
lars
per
sha
re
-
-
-
-
(1,3
06,7
74)
-
-
-
(1
,306
,774
) S
tock
div
iden
ds -
NT
$0.2
30 d
olla
rs p
er s
hare
715,
614
-
-
-
(715
,614
)
-
-
-
-
71
5,61
4
-
97
3,16
6
12
9,67
5
(3
,125
,229
)
-
-
-
(1,3
06,7
74)
N
et in
com
e fo
r th
e ye
ar e
nded
Dec
embe
r 31
, 201
7
-
-
-
-
2,
853,
883
-
-
-
2,
853,
883
O
ther
com
preh
ensi
ve in
com
e (l
oss)
for
the
year
end
ed D
ecem
ber
31, 2
017
-
-
-
-
45,9
23
(124
,569
)
367,
332
-
288,
686
T
otal
com
preh
ensi
ve in
com
e (l
oss)
for
the
year
end
ed D
ecem
ber
31, 2
017
-
-
-
-
2,89
9,80
6
(1
24,5
69)
36
7,33
2
-
3,
142,
569
B
AL
AN
CE
AT
DE
CE
MB
ER
31,
201
7
31,8
29,2
86
45
6,42
6
6,
544,
643
250,
703
3,69
1,41
2
(8
,653
)
22,8
55
-
42,7
86,6
72
E
ffec
ts o
f re
tros
pect
ive
appl
icat
ion
-
-
-
-
(12,
342)
-
(2
2,85
5)
19
6,06
5
16
0,86
8
BA
LA
NC
E A
T J
AN
UA
RY
, 201
8 A
S A
PP
LIE
D R
ET
RO
SP
EC
TIV
EL
Y
31
,829
,286
456,
426
6,54
4,64
3
25
0,70
3
3,
679,
070
(8,6
53)
-
19
6,06
5
42
,947
,540
A
ppro
pria
tion
of
the
2017
ear
ning
s
Leg
al r
eser
ve
-
-
856,
165
-
(8
56,1
65)
-
-
-
-
Rev
ersa
l of
spec
ial r
eser
ves
-
-
-
(2
14,2
92)
214,
292
-
-
-
-
Cas
h di
vide
nds
- N
T$
0.43
9 d
olla
rs p
er s
hare
-
-
-
-
(1
,397
,306
)
-
-
-
(1,3
97,3
06)
Sto
ck d
ivid
ends
- N
T$
0.27
1 d
olla
rs p
er s
hare
862,
573
-
-
-
(862
,573
)
-
-
-
-
86
2,57
3
-
85
6,16
5
(2
14,2
92)
(2,9
01,7
52)
-
-
-
(1
,397
,306
)
Net
inco
me
for
the
year
end
ed D
ecem
ber
31, 2
018
-
-
-
-
3,52
4,20
1
-
-
-
3,52
4,20
1
Oth
er c
ompr
ehen
sive
loss
for
the
year
end
ed D
ecem
ber
31, 2
018
-
-
-
-
(24,
080)
62
,470
-
(368
,085
)
(3
29,6
95)
T
otal
com
preh
ensi
ve in
com
e (l
oss)
for
the
year
end
ed D
ecem
ber
31, 2
018
-
-
-
-
3,50
0,12
1
62
,470
-
(368
,085
)
3,
194,
506
D
ispo
sal o
f in
vest
men
ts in
equ
ity
inst
rum
ents
-
-
-
-
(6
5,53
1)
-
-
65,5
31
-
BA
LA
NC
E A
T D
EC
EM
BE
R 3
1, 2
018
$ 3
2,69
1,85
9
$
45
6,42
6
$
7,40
0,80
8
$
36,4
11
$
4,
211,
908
$
53
,817
$
-
$
(106
,489
)
$ 4
4,74
4,74
0
The
acc
ompa
nyin
g no
tes
are
an in
tegr
al p
art o
f th
e co
nsol
idat
ed f
inan
cial
sta
tem
ents
.
174

FAR EASTERN INTERNATIONAL BANK LTD. AND SUBSIDIARIES CONSOLIDATED STATEMENTS OF CASH FLOWS FOR THE YEARS ENDED DECEMBER 31, 2018 AND 2017 (In Thousands of New Taiwan Dollars) 2018 2017 CASH FLOWS FROM OPERATING ACTIVITIES
Income before income tax $ 4,068,479 $ 3,267,644Adjustments for:
Depreciation 222,608 220,196Amortization 27,431 27,946Provision for losses on bad debts expense, commitment and
guarantee 973,684 1,215,343Net valuation loss (gain) on financial assets and liabilities at fair
value through profit or loss 220,958 (160,180)Interest expenses 5,635,434 4,653,057Interest revenues (11,316,237) (10,057,931)Dividends revenue (124,637) (63,321)Shares of profit from associates (92,467) (103,337)Loss (gain) on disposal and retirement of property and equipment (173,729) 2,939Gain on disposal financial assets carried at cost - (1,490)Unrealized net loss (gain) on foreign currency exchange (222,021) 395,728Other adjustments (81,687) (103,934)Changes in operating assets and liabilities
Decrease (increase) in due from the central bank and other banks (1,135,766) 7,092,056Decrease (increase) in financial assets at fair value through profit
or loss (6,101,228) 3,781,946Increase in financial assets at fair value through other
comprehensive income (10,572,357) -Increase in investments in debt instruments at amortized cost (385,871) -Decrease (increase) in receivables 2,061,824 (1,776,592)Decrease (increase) in discounts and loans (31,530,667) 551,765Increase in available-for-sale financial assets - (30,236,113)Decrease in held-to-maturity financial assets - 306,249Decrease in debt investments with no active market - 919,160Increase in due to the central bank and other banks 8,330,844 137,136Decrease in financial liabilities at fair value through profit or loss (1,566,648) (3,635,415)Increase in payables 516,816 456,277Increase in deposits and remittances 34,057,100 25,778,208Increase in principal received on structured products 6,177,186 1,543,857
Cash generated from (used in) operations (1,010,951) 4,211,194Interest received 11,236,728 9,933,372Dividends received 124,637 63,321Interest paid (5,461,669) (4,338,543)Income tax paid (341,818) (486,615)
Net cash generated from operating activities 4,546,927 9,382,729
(Continued)
175

FAR EASTERN INTERNATIONAL BANK LTD. AND SUBSIDIARIES CONSOLIDATED STATEMENTS OF CASH FLOWS FOR THE YEARS ENDED DECEMBER 31, 2018 AND 2017 (In Thousands of New Taiwan Dollars) 2018 2017 CASH FLOWS FROM INVESTING ACTIVITIES
Acquisition of financial assets carried at cost $ - $ (24,950)Proceeds from disposal of financial assets carried at cost - 51,496Acquisition of investments accounted for using equity method - (28,980)Acquisition of property and equipment (280,235) (224,462)Proceeds from disposal of property and equipment 370,883 45Increase in other financial assets (1,156,229) (29,336)Decrease in other assets 45,389 19,794Dividends received from subsidiaries and associates 71,573 69,585
Net cash used in investing activities (948,619) (166,808)
CASH FLOWS FROM FINANCING ACTIVITIES
Redemption of Euro Convertible Bond (1,586,434) -Proceeds from the issuance of bank debentures 2,900,000 -Redemption of bank debentures (3,500,000) (4,000,000)Increase (decrease) in securities sold under repurchase agreements 2,030,599 (434,630)Increase (decrease) in other financial liabilities 501,842 (339,255)Increase (decrease) in other liabilities (50,545) 30,605Cash dividends (1,397,306) (1,306,774)
Net cash used in financing activities (1,101,844) (6,050,054)
EFFECTS OF EXCHANGE RATE CHANGES ON CASH AND CASH
EQUIVALENTS 77,201 53,011 NET INCREASE IN CASH AND CASH EQUIVALENTS 2,573,665 3,218,878 CASH AND CASH EQUIVALENTS, BEGINNING OF THE YEAR 31,536,618 28,317,740 CASH AND CASH EQUIVALENTS, END OF THE YEAR $ 34,110,283 $ 31,536,618 Reconciliation of the amounts in the consolidated statements of cash flows with the equivalent items reported in the consolidated balance sheets is as follows: December 31 2018 2017 Cash and cash equivalents in consolidated balance sheets $ 10,023,920 $ 8,592901Due from the Central Bank and other banks that meet the IAS 7 definition
of “cash and cash equivalents” 15,797,088 11,872,324Securities purchased under resale agreements that meet the IAS 7
definition of “cash and cash equivalents” 8,289,275 11,071,393Cash and cash equivalents in consolidated statements of cash flows $ 34,110,283 $ 31,536,618 The accompanying notes are an integral part of the consolidated financial statements. (Concluded)
176

FAR EASTERN INTERNATIONAL BANK LTD. AND SUBSIDIARIES NOTES TO CONSOLIDATED FINANCIAL REPORTS FOR THE YEARS ENDED DECEMBER 31, 2018 AND 2017 (In Thousands of New Taiwan Dollars, Unless Stated Otherwise) 1. GENERAL INFORMATION
Far Eastern International Bank Ltd. (the “Bank”) obtained its license on January 11, 1992 and started its business on April 11, 1992. The Bank (a) accepts deposits and extends loans and guarantees; (b) issues letters of credit, handles domestic and foreign remittances, and accepts commercial drafts; (c) invests in securities and acts as an agent for trading government bonds, corporate bonds and bank debentures; and (d) conducts relevant businesses that are authorized by the relevant authorities. The operations of the Bank’s Trust Department include pecuniary trust, securities trust, real estate trust, creditor’s right of money or guarantee, movable property trust and ground right trust and related operations. These operations are regulated under the Banking Act and Trust Enterprise Act. As of December 31, 2017, the Bank’s operating units included the Business Department, International Banking Department, Trust Department, Credit Card Department, Offshore Banking Unit (OBU), and 55 domestic branches, as well as an overseas branch in Hong Kong. The Bank’s shares are listed on the Taiwan Stock Exchange. Global depositary receipts, which represent ownership of ordinary shares of the Bank, have been listed on the Luxembourg Stock Exchange since January 2014. To integrate resources and produce maximum benefit from the business, the Bank absorbed and merged Far Eastern Life Insurance Agency Co., Ltd. (“FELIA”) and Far Eastern Property Insurance Agency Co., Ltd. (“FEPIA”) on February 6, 2017; the entities were wholly-owned subsidiaries of the Bank, and the merger did not have effect on the equity of the shareholders. The Bank accepted generally all assets, liabilities and all rights and obligations of FELIA and FEPIA that were valid as of the merger date.
2. APPROVAL OF FINANCIAL REPORTS
The consolidated financial statements were approved by the Bank’s Board of Directors on March 26, 2019.
177

3. APPLICATION OF NEW, AMENDED AND REVISED STANDARDS AND INTERPRETATIONS
a. Initial application of the amendments to the Regulations Governing the Preparation of Financial Reports by Securities Issuers and the International Financial Reporting Standards (IFRS), International Accounting Standards (IAS), Interpretations of IFRS (IFRIC) and Interpretations of IAS (SIC) (collectively, the “IFRSs”) endorsed and issued into effect by the Financial Supervisory Commission (FSC). Except for IFRS 9 “Financial Instruments” and related amendments, whenever applied, the initial application of the amendments to the Regulations Governing the Preparation of Financial Reports by Securities Issuers and the IFRSs endorsed and issued into effect by the FSC would not have any material impact on the Bank accounting policies: IFRS 9 supersedes IAS 39 “Financial Instruments: Recognition and Measurement”, with consequential amendments to IFRS 7 “Financial Instruments: Disclosures” and other standards. IFRS 9 sets out the requirements for classification, measurement and impairment of financial assets and hedge accounting. Refer to Note 4 for information relating to the relevant accounting policies. 1) Classification, measurement and impairment of financial assets
On the basis of the facts and circumstances that existed as of January 1, 2018, the Bank has performed an assessment of the classification of recognized financial assets and has elected not to restate prior reporting periods. The following table shows the original measurement categories and carrying amount under IAS 39 and the new measurement categories and carrying amount under IFRS 9 for each class of the Bank’s and its subsidiaries’ financial assets and financial liabilities as of January 1, 2018.
Measurement Category Carrying Amount Financial Assets IAS 39 IFRS 9 IAS 39 IFRS 9
Hybrid contract Debt instruments with no active
market Mandatorily at fair value through
profit or loss (i.e. FVTPL) $ 6,677,076 $ 6,669,817
Loans and receivables Mandatorily at FVTPL 3,161,799 3,186,456 Financial assets at FVTPL Mandatorily at FVTPL 5,680,038 5,680,038Derivatives Financial assets at FVTPL Mandatorily at FVTPL 3,061,166 3,061,166Equity securities Financial assets at FVTPL Mandatorily at FVTPL 347,783 347,783 Available-for-sale Fair value through other
comprehensive income (i.e. FVTOCI) - equity instruments
709,311 709,311
Financial assets measured at cost FVTOCI- equity instruments 113,636 309,655Long-term equity
investment Equity investments under the
equity method Equity investments under the
equity method 1,774,066 1,778,071
Mutual funds Financial assets at FVTPL Mandatorily at FVTPL 50,473 50,473 Available-for-sale Mandatorily at FVTPL 49,400 49,400Debt securities Securities purchased under resale
agreements Securities purchased under resale
agreements 11,071,393 11,071,268
Financial assets at FVTPL Mandatorily at FVTPL 21,068,873 21,068,873 Available-for-sale FVTOCI - debt instruments 108,872,867 108,872,867 Held-to-maturity Debt instruments at amortized
cost 2,135,246 2,134,976
Others Refundable deposits Refundable deposits 2,312,331 2,311,735Loan commitment
provision Provision Provision 1,127,116 1,182,684
178
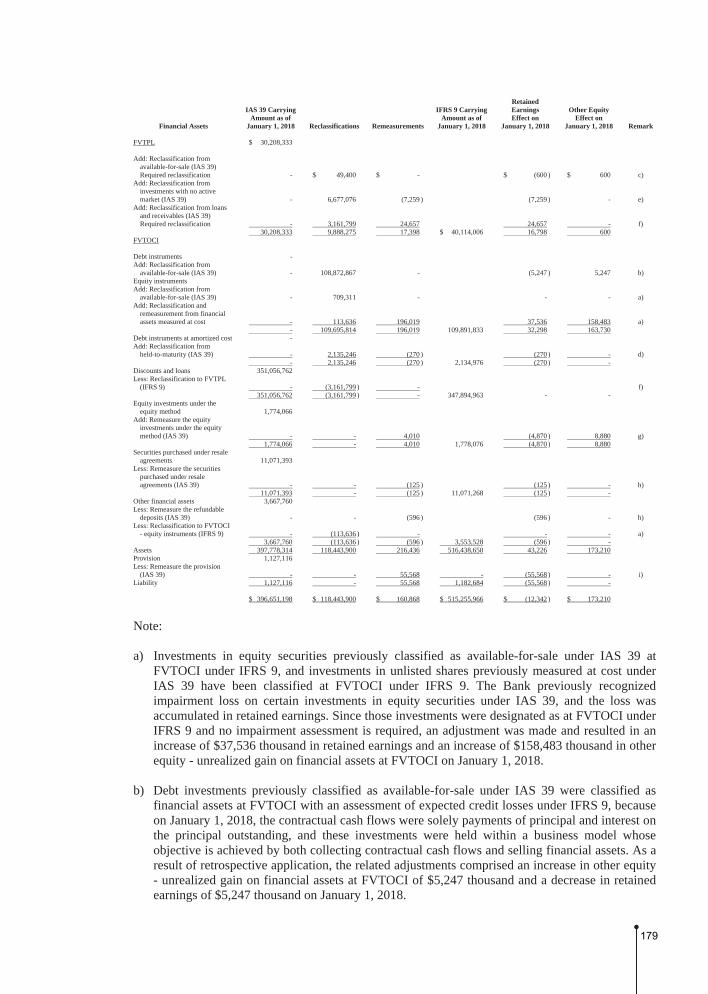
Financial Assets
IAS 39 CarryingAmount as of
January 1, 2018 Reclassifications Remeasurements
IFRS 9 CarryingAmount as of
January 1, 2018
Retained Earnings Effect on
January 1, 2018
Other Equity Effect on
January 1, 2018 Remark FVTPL $ 30,208,333 Add: Reclassification from
available-for-sale (IAS 39)
Required reclassification - $ 49,400 $ - $ (600 ) $ 600 c) Add: Reclassification from
investments with no active market (IAS 39)
- 6,677,076 (7,259 ) (7,259 ) - e) Add: Reclassification from loans
and receivables (IAS 39)
Required reclassification - 3,161,799 24,657 24,657 - f)
30,208,333 9,888,275 17,398 $ 40,114,006 16,798 600 FVTOCI Debt instruments - Add: Reclassification from
available-for-sale (IAS 39)
- 108,872,867 - (5,247 ) 5,247 b) Equity instruments Add: Reclassification from
available-for-sale (IAS 39)
- 709,311 - - - a) Add: Reclassification and
remeasurement from financial assets measured at cost
- 113,636 196,019 37,536 158,483 a) - 109,695,814 196,019 109,891,833 32,298 163,730 Debt instruments at amortized cost - Add: Reclassification from
held-to-maturity (IAS 39)
- 2,135,246 (270 ) (270 ) - d) - 2,135,246 (270 ) 2,134,976 (270 ) - Discounts and loans 351,056,762 Less: Reclassification to FVTPL
(IFRS 9)
- (3,161,799 ) - f) 351,056,762 (3,161,799 ) - 347,894,963 - - Equity investments under the
equity method
1,774,066 Add: Remeasure the equity
investments under the equity method (IAS 39)
- - 4,010 (4,870 ) 8,880 g) 1,774,066 - 4,010 1,778,076 (4,870 ) 8,880 Securities purchased under resale
agreements
11,071,393 Less: Remeasure the securities
purchased under resale agreements (IAS 39)
- - (125 ) (125 ) - h) 11,071,393 - (125 ) 11,071,268 (125 ) - Other financial assets 3,667,760 Less: Remeasure the refundable
deposits (IAS 39)
- - (596 ) (596 ) - h) Less: Reclassification to FVTOCI
- equity instruments (IFRS 9)
- (113,636 ) - - - a) 3,667,760 (113,636 ) (596 ) 3,553,528 (596 ) - Assets 397,778,314 118,443,900 216,436 516,438,650 43,226 173,210 Provision 1,127,116 Less: Remeasure the provision
(IAS 39)
- - 55,568 - (55,568 ) - i) Liability 1,127,116 - 55,568 1,182,684 (55,568 ) - $ 396,651,198 $ 118,443,900 $ 160,868 $ 515,255,966 $ (12,342 ) $ 173,210
Note: a) Investments in equity securities previously classified as available-for-sale under IAS 39 at
FVTOCI under IFRS 9, and investments in unlisted shares previously measured at cost under IAS 39 have been classified at FVTOCI under IFRS 9. The Bank previously recognized impairment loss on certain investments in equity securities under IAS 39, and the loss was accumulated in retained earnings. Since those investments were designated as at FVTOCI under IFRS 9 and no impairment assessment is required, an adjustment was made and resulted in an increase of $37,536 thousand in retained earnings and an increase of $158,483 thousand in other equity - unrealized gain on financial assets at FVTOCI on January 1, 2018.
b) Debt investments previously classified as available-for-sale under IAS 39 were classified as
financial assets at FVTOCI with an assessment of expected credit losses under IFRS 9, because on January 1, 2018, the contractual cash flows were solely payments of principal and interest on the principal outstanding, and these investments were held within a business model whose objective is achieved by both collecting contractual cash flows and selling financial assets. As a result of retrospective application, the related adjustments comprised an increase in other equity - unrealized gain on financial assets at FVTOCI of $5,247 thousand and a decrease in retained earnings of $5,247 thousand on January 1, 2018.
179
c) Mutual funds were classified as available-for-sale under IAS 39. The contractual cash flows at the time of original recognition which were not classified as equity instrument were not solely used to pay for the interest on the principal and the amount of the outstanding principal. Therefore, the investments are measured at FVTPL in accordance with IFRS 9. Due to the retrospective application, the Bank decreased the retained earnings and a increase in other equity of $600 thousand on January 1, 2018.
d) Bond investments were classified as held-to-maturity at amortized cost under IAS 39. The
contractual cash flows at the time of original recognition were totally used to pay for the interest on the principal and the amount of the outstanding principal. And the Bank assessed that the business model is for the purpose of collecting contractual cash flow under the current facts and circumstances existing as of January 1, 2018; therefore, such investments are measured at amortized cost in accordance with IFRS 9, and the Bank assessed the expected credit loss. Due to the retrospective application, the Bank decreased the retained earnings on January 1, 2018 by $270 thousand.
e) Investments in debt instrument without active market were classified as financial assets at
amortized cost under IAS 39 and were the master contract of the hybrid contract. The classification is determined in accordance with the entire hybrid contract under IFRS 9 and classified as financial assets at FVTPL. Due to the retrospective application, the Bank decreased the retained earnings on January 1, 2018 by $7,259 thousand.
f) Some of discounts and loans were classified as financial assets at amortized cost under IAS 39
and were the master contract of the hybrid contract. The classification is determined in accordance with the entire hybrid contract under IFRS 9 and classified as financial assets at FVTPL. Due to the retrospective application, the Bank increased the retained earnings on January 1, 2018 by $24,657 thousand.
g) Due to a retrospective application with associates under IFRS 9, the Bank comprised a decrease
in retained earnings of $4,870 thousand and an increase in other equity - unrealized gain and loss on financial assets at FVTPL of $8,800 thousand on January 1, 2018.
h) The assessment of expected credit loss with securities purchased under resale agreements and
refundable deposits in accordance with IFRS 9 were same as investments in debt instrument. As a result of retrospective application, the Bank comprised a decrease in retained earnings of $125 thousand and $596 thousand separately on January 1, 2018.
i) With the assessment of expected credit loss on irrevocable loan commitments under IFRS 9, the
Bank comprised a decrease in retained earnings of $55,568 thousand on January 1, 2018.
180

2) First-time application to reconciliation of the allowance for impairment under IFRS 9 The Bank reconcile the allowance for impairment from occurrence impairment model under IAS 39 to expected impairment model under IFRS 9. The reconciliation on January 1, 2018 is as followed:
Measurement Categories
Allowance for Impairment
under IAS 39 and the Account
under IAS 37 Reclassification Remeasurements
Allowance for Impairment
under IFRS 9 Loans and receivables (IAS 39)/
financial assets at amortized cost(IFRS 9)
Receivables and other financial assets $ 1,006,495 $ - $ 4,491 $ 1,010,986
Discount and loans 1,642,959 - 34,688 1,677,647 Account the impairment with
“Regulations Governing the Procedures for Banking Institutions to Evaluate Assets and Deal with Non-performing/ Non-accrual Loans” 3,390,655 (31,937) (39,179) 3,319,539
6,040,109 (31,937) - 6,008,172 Available for sale(IAS 39)/financial
assets at FVTOCI(IFRS 9) - - 5,247 5,247 Financial Assets at cost(IAS 39)/
financial assets at FVTOCI (IFRS 9) 37,536 - (37,536) -
Held to maturity(IAS 39)/financial assets at amortized cost(IFRS 9) - - 270 270
Loan Commitments - - 55,568 55,568 Securities purchased under resell
agreements - - 125 125 Refundable deposits - - 596 596 $ 6,077,645 $ (31,937) $ 24,270 $ 6,069,978
b. The Regulations Governing the Preparation of Financial Reports by Public Banks and the IFRSs endorsed by the FSC for application starting from 2019.
New, Amended or Revised Standards and Interpretations
(the “New IFRSs”) Effective Date
Announced by IASB (Note 1) Annual Improvements to IFRSs 2015-2017 Cycle January 1, 2019 Amendments to IFRS 9 “Prepayment Features with Negative
Compensation” January 1, 2019 (Note 2)
IFRS 16 “Leases” January 1, 2019 Amendments to IAS 19 “Plan Amendment, Curtailment or
Settlement” January 1, 2019 (Note 3)
Amendments to IAS 28 “Long-term Interests in Associates and Joint Ventures”
January 1, 2019
IFRIC 23 “Uncertainty over Income Tax Treatments” January 1, 2019
Note 1: Unless stated otherwise, the above New IFRSs are effective for annual periods beginning on or after their respective effective dates.
Note 2: The FSC permits the election for early adoption of the amendments starting from 2018. Note 3: The Bank and its subsidiaries shall apply these amendments to plan amendments, curtailments
or settlements occurring on or after January 1, 2019.
181

Except for the above IFRS 16 “Leases”, as of the date the financial statements were authorized for issue, the Bank is continuously assessing that the application of other standards and interpretations won’t have material impact on the Bank’s financial position and financial performance. IFRS 16 “Leases” IFRS 16 sets out the identification of lease agreements and the accounting standards for lessor and lessee that will supersede IAS 17“Leases” IFRIC 4“Determining Whether an Arrangement Contains a Lease” and a number of related interpretations. Definition of leases When applying IFRS 16 for the first time, the Bank will choose whether a contract signed or changed on or after January 1, 2019 will be assessed as a lease according to IFRS 16. Currently, lease contracts under IAS 17 and IFRIC 4 are not allowed to be reassessed, which should be processed in accordance with the transitional provisions of IFRS 16. The Bank as lessee When IFRS 16 is applied for the first time, except for the low-value target asset leases and short-term lease options, which are recognized under a straight-line basis, other leases will be recognized as the right-of-use assets and lease liabilities in the consolidated balance sheets. The consolidated comprehensive income statements will represent the depreciation expense of the right-of-use assets and the interest expense arising from the effective interest method on the lease liabilities separately. In the consolidated cash flow statements, the principal amount of lease liabilities is expressed as financing activities, and the interest payment portion is classified as operating activities. The identified right-of-use assets will be subject to an IAS 36 impairment assessment. The Bank planned to adjust the cumulative effects of the retroactive application of IFRS 16 to the retained earnings on January 1, 2019, without restating the comparative information. At present, in accordance with the agreement of IAS 17 for operating leases, the measurement of lease liabilities on January 1, 2019 will be discounted by the remaining lease payments at the increased borrowing rate of the lessee at that date. All assets with use rights will be measured at the amount of lease liabilities on that date. Anticipated impact on assets, liabilities and equity of January 1, 2019 is set out below:
Carrying Amount as of December 31,
2018
Adjustments Arising from
Initial Application
Adjusted Carrying
Amount as of January 1, 2019
Prepaid lease $ 3,294 $ (3,294) $ -Right-of-use assets - 902,034 902,034 Total effect on assets $ 898,740 Lease liabilities - $ 915,878 915,878 Total effect on liabilities $ 915,878 Retained earning 11,649,127 $ (17,138) 11,631,989
182

c. New IFRSs in issue but not yet endorsed and issued into effect by the IASB
New IFRSs Effective Date
Announced by IASB (Note 1) Amendments to IFRS 3 “Definition of a Business” January 1, 2020 (Note 2) Amendments to IFRS 10 and IAS 28 “Sale or Contribution of Assets
between An Investor and Its Associate or Joint Venture” To be determined by IASB
IFRS 17 “Insurance Contracts” January 1, 2021 Amendments to IAS 1 and IAS 8 “Definition of Material” January 1, 2020 (Note 3) Note 1: Unless stated otherwise, the above New IFRSs are effective for annual periods beginning on
or after their respective effective dates. Note 2: The Bank and its subsidiaries shall apply these amendments to business combinations for
which the acquisition date is on or after the beginning of the first annual reporting period beginning on or after January 1, 2020 and to asset acquisitions that occur on or after the beginning of that period.
Note 3: The Bank and its subsidiaries shall apply these amendments prospectively for annual reporting
periods beginning on or after January 1, 2020. As of the date the consolidated financial statements were authorized for issue, the Bank and its subsidiaries are continuously assessing the possible impact that the application of other standards and interpretations will have on the financial position and financial performance and will disclose the relevant impact when the assessment is completed.
4. SUMMARY OF SIGNIFICANT ACCOUNTING POLICIES Statement of Compliance The consolidated financial reports have been prepared in accordance with the Regulations Governing the Preparation of Financial Reports by Public Banks. Basis of Preparation The consolidated financial reports have been prepared on the historical cost basis except for financial instruments and net benefit liabilities which are measured at the present value of the defined benefit obligation less the fair value of plan assets. Historical cost is generally based on the fair value of the consideration given in exchange for assets. Current and Noncurrent Assets and Liabilities Accounts included in the consolidated balance sheets are not classified as current or noncurrent since the major components of the financial reports are from the banking sector, whose operating cycle cannot be reasonably identified. Nevertheless, accounts are properly categorized in accordance with their nature and sequenced by their liquidity. Refer to Note 45 for the maturity analysis of liabilities. Basis of Consolidation a. Principles of preparing consolidated financial reports
The consolidated financial reports incorporate the financial reports of the Bank and its subsidiaries.
183

Intercompany transactions, balances, income and expenses between the Bank and its subsidiaries have been eliminated upon consolidation.
b. Entities included in consolidated financial reports Entities included in consolidated financial reports were as follows:
% of Ownership December 31
Investor Company Investee Company Nature of Businesses 2018 2017 The Bank Far Eastern Asset Management
Co., Ltd. (“FEAMC”) Purchase, evaluation, auction and
management of rights of financial institution creditors
100 100
Far Eastern International Securities Co., Ltd. (“FEIS”)
Foreign securities broker, wealth management and offshore fund consulting
100 100
Far Eastern Asset Management Co., Ltd. (“FEAMC”)
FEIB Financial Leasing Co., Ltd. (“FEIL”)
Leasing operation 100 100
Foreign Currency Foreign-currency assets and liabilities are recorded in their original currencies. Foreign-currency items in net income of domestic operating units are translated into New Taiwan dollars at prevailing exchange rates at the dates of the transactions. For overseas branches (including the OBU), foreign-currency items in net income from transactions settled in currencies other than the entity’s functional currency are translated into the entity’s functional currency at prevailing exchange rates at the dates of the transactions. At the balance sheet date, foreign-currency monetary assets and liabilities are translated at prevailing exchange rates, and the exchange differences are recognized as gain or loss. When foreign-currency assets and liabilities are settled, exchange differences arising from the application of different exchange rates are recognized as gain or loss for the current year. The financial statements of foreign branches (including foreign branches, the OBU and foreign subsidiaries) are translated into New Taiwan dollars at the following exchange rates: Assets and liabilities - at exchange rates prevailing on the balance sheet date. The beginning balance of current year’s earnings of foreign branches and the OBU not yet remitted to the head office - the same as the ending balance of the prior years’ earnings; and Income and expenses - at average exchange rates for the period. Exchange differences arising from the translation of the financial statements of foreign branches are recognized as other comprehensive income-exchange differences on translating foreign operations. Investment Accounted for Using Equity Method Investments in associates are accounted for using the equity method of accounting. An associate is an entity over which the Bank and its subsidiaries have significant influence and that is not a subsidiary. Significant influence is the power to participate in the financial and operating policy decisions of the investee without having control or joint control over those policies. An investment in an associate is initially recognized at cost and adjusted thereafter to recognize the Bank and its subsidiaries’ share of the profit or loss and other comprehensive income of the associate. The Bank and its subsidiaries also recognize the changes in the Bank and its subsidiaries’ share of equity of associates.
184

Property and Equipment Property and equipment are stated at cost, less accumulated depreciation and accumulated impairment loss. Depreciation is recognized so as to write off the cost of assets less their residual values over their estimated useful lives, using the straight-line method. The estimated useful lives, residual values and depreciation method are reviewed at the end of each year, with the effect of any changes in estimate accounted for on a prospective basis. Any gain or loss arising on the disposal or retirement of an item of property and equipment is determined as the difference between the sales proceeds and the carrying amount of the asset and is recognized in profit or loss. Intangible Assets Intangible assets acquired in a business combination are initially recognized at their fair value at the acquisition date. Subsequent to initial recognition, intangible assets with finite useful lives are reported at cost less accumulated amortization and accumulated impairment loss. Amortization is recognized on a straight-line basis. The estimated useful life, residual value, and amortization method are reviewed at the end of each reporting period, with the effect of any changes in estimate accounted for on a prospective basis. The residual value of an intangible asset with a finite useful life shall be assumed to be zero unless the Bank expects to dispose of the intangible asset before the end of its economic life. Intangible assets with indefinite useful lives are measured at cost less accumulated impairment loss. Impairment of Tangible and Intangible Assets At the end of each reporting period, the Bank and its subsidiaries review the carrying amounts of their tangible and intangible assets to determine whether there is any indication that those assets have suffered an impairment loss. If any such indication exists, the recoverable amount of the asset is estimated in order to determine the extent of the impairment loss. When it is not possible to estimate the recoverable amount of an individual asset, the Bank and its subsidiaries estimate the recoverable amount of the cash-generating unit to which the asset belongs. Corporate assets are allocated to the smallest group of cash-generating units under a reasonable and consistent basis. Intangible assets with indefinite useful lives are tested for impairment at least annually, and whenever there is an indication that the asset may be impaired. Recoverable amount is the higher of fair value less costs to sell and value in use. If the recoverable amount of an asset or cash-generating unit is estimated to be less than its carrying amount, the carrying amount of the asset or cash-generating unit is reduced to its recoverable amount. When the recoverable amount increases in a subsequent period, the reversal of an impairment loss is recognized immediately in profit or loss. The carrying amount of the asset or cash-generating unit is increased to the revised estimate of its recoverable amount, but only to the extent of the carrying amount that would have been determined had no impairment loss been recognized for the asset or cash-generating unit in prior years. Securities Purchased/Sold Under Resale/Repurchase Agreements Securities purchased under resale agreements and securities sold under repurchase agreements are generally treated as collateralized financing transactions. Interest expenses and interest revenues are recognized on the accrual basis.
185

Financial Instruments Financial assets and financial liabilities are recognized when the Bank and its subsidiaries become a party to the contractual provisions of the instruments. Transaction costs that are directly attributable to the acquisition or issue of financial assets and financial liabilities (other than financial assets and financial liabilities at FVTPL) are added to or deducted from the fair value of the financial assets or financial liabilities, as appropriate, on initial recognition. Transaction costs directly attributable to the acquisition of financial assets or financial liabilities at FVTPL are recognized immediately as expense. Financial assets All regular way purchases or sales of financial assets are recognized and derecognized on a trade date basis. a. The Bank owns financial assets which are classified into the following specified categories:
2018 1) Financial assets at FVTPL
A financial asset is classified as at FVTPL when the financial asset is mandatorily classified as at FVTPL. Financial assets mandatorily classified as at FVTPL include investments in equity instruments which are not designated as at FVTOCI and debt instruments that do not meet the amortized cost criteria or the FVTOCI criteria. Financial assets at FVTPL are subsequently measured at fair value, with any gains or losses arising on re-measurement recognized in profit or loss. Fair value is determined in the manner described in Note 43.
2) Financial assets at amortized cost Financial assets that meet the following conditions are subsequently measured at amortized cost: a) The financial asset is held within a business model whose objective is to hold financial assets in
order to collect contractual cash flows; and b) The contractual terms of the financial asset give rise on specified dates to cash flows that are
solely payments of principal and interest on the principal amount outstanding. Subsequent to initial recognition, financial assets are measured at amortized cost, which equals to gross carrying amount determined using the effective interest method less any impairment loss. Any exchange difference is recognized in profit or loss. Interest revenue is calculated by applying the effective interest rate to the gross carrying amount of a financial asset, except for: a) Purchased or originated credit-impaired financial assets, for which interest revenue is calculated
by applying the credit-adjusted effective interest rate to the amortized cost of such a financial asset; and
b) Financial assets that have subsequently become credit-impaired, for which interest revenue is
calculated by applying the effective interest rate to the amortized cost of such a financial asset.
186

3) Investments in debt instruments at FVTOCI Debt instruments that meet the following conditions are subsequently measured at FVTOCI: a) The financial asset is held within a business model whose objective is achieved by both the
collecting of contractual cash flows and the selling of the financial assets; and b) The contractual terms of the financial asset give rise on specified dates to cash flows that are
solely payments of principal and interest on the principal amount outstanding. Investments in debt instruments at FVTOCI are subsequently measured at fair value. Changes in the carrying amounts of these debt instruments relating to changes in foreign currency exchange rates, interest revenue calculated using the effective interest method and impairment losses or reversals are recognized in profit or loss. Other changes in the carrying amount of these debt instruments are recognized in other comprehensive income and will be reclassified to profit or loss when the investment is disposed of.
4) Investments in equity instruments at FVTOCI On initial recognition, the Bank and its subsidiaries may make an irrevocable election to designate investments in equity instruments as at FVTOCI. Designation at FVTOCI is not permitted if the equity investment is held for trading or if it is contingent consideration recognized by an acquirer in a business combination. Investments in equity instruments at FVTOCI are subsequently measured at fair value with gains and losses arising from changes in fair value recognized in other comprehensive income and accumulated in other equity. The cumulative gain or loss will not be reclassified to profit or loss on disposal of the equity investments; instead, they will be transferred to retained earnings. Dividends on these investments in equity instruments at FVTOCI are recognized in profit or loss when the Bank’s right to receive the dividends is established, unless the dividends clearly represent a recovery of part of the cost of the investment.
2017 1) Financial assets at FVTPL
Include financial assets at FVTPL and available-for-sale financial assets. Financial asset may be designated as at FVTPL upon initial recognition if: a) Such designation eliminates or significantly reduces a measurement or recognition
inconsistency that would otherwise arise; or b) The financial asset forms part of a group of financial assets or financial liabilities or both, which
is managed and has performance evaluated on a fair value basis in accordance with the Bank’s documented risk management or investment strategy, and information about the portfolio is provided internally on that basis; or
c) The contract contains one or more embedded derivatives so that the entire hybrid (combined)
contract can be designated as at FVTPL. Financial assets at FVTPL are subsequently measured at fair value, with any gains or losses, dividends or interest arising on re-measurement recognized in profit or loss.
187
2) Held-to-maturity investments Held-to-maturity financial assets are non-derivative financial assets with fixed or determinable payments and fixed maturity dates that the Bank and its subsidiaries have the positive intent and ability to hold to maturity. Subsequent to initial recognition, held-to-maturity financial assets are measured at amortized cost using the effective interest method less any impairment.
3) Available-for-sale financial assets Available-for-sale financial assets are non-derivatives that are either designated as available-for-sale or are not classified as loans and receivables, held-to-maturity financial assets or financial assets at FVTPL. Available-for-sale financial assets are measured at fair value. Interest revenues of available-for-sale bond investments calculated using the effective interest method and dividends on available-for-sale equity investments are recognized in profit or loss. Other changes in the fair value of available-for-sale financial assets are recognized in other comprehensive income and will be reclassified to profit or loss when the investment is disposed of or is determined to be impaired. Dividends on available-for-sale equity instruments are recognized in profit or loss when the Bank’s right to receive the dividends is established. Available-for-sale equity investments that do not have a quoted market price in an active market and whose fair value cannot be reliably measured are measured at cost less any identified impairment loss and are recognized in a separate line item as financial assets measured at cost. If, in a subsequent period, the fair value of the financial assets can be reliably measured, the financial assets are remeasured at fair value. The difference between carrying amount and fair value is recognized in other comprehensive income on financial assets. Any impairment losses are recognized in profit or loss.
4) Loans and receivables Loans and receivables (including receivables, discounts and loans, nonaccrual loans other than discounts and loans, and debt investments with no active market) are measured at amortized cost using the effective interest method, less any impairment.
b. Impairment of financial assets 2018 The Bank recognizes an allowance for loss for expected credit losses on financial assets at amortized cost, investments in debt instruments that are measured at FVTOCI. For such financial assets, the Bank recognizes lifetime expected credit losses (i.e. ECLs) when there has been a significant increase in credit risk since initial recognition. If, on the other hand, the credit risk on a financial instrument has not increased significantly since initial recognition, the Bank measures the allowance for loss for that financial instrument at an amount equal to 12-month ECLs. Expected credit losses reflect the weighted average of credit losses with the respective risks of default occurring as the weights. Lifetime ECLs represent the expected credit losses that will result from all possible default events over the expected life of a financial instrument. In contrast, 12-month ECLs represent the portion of lifetime ECLs that is expected to result from default events on a financial instrument that are possible within 12 months after the reporting date.
188

The Bank recognizes an impairment gain or loss in profit or loss for all financial instruments with a corresponding adjustment to their carrying amount through an allowance for loss account, except for investments in debt instruments that are measured at FVTOCI, for which the allowance for loss is recognized in other comprehensive income and does not reduce the carrying amount of such a financial asset. 2017 Financial assets, other than those at FVTPL, are assessed for indicators of impairment at the end of each reporting period. Financial assets are considered to be impaired when there is objective evidence that, as a result of one or more events that occurred after the initial recognition of the financial asset, the estimated future cash flows of the investment have been affected. For all financial assets, objective evidence of impairment could include significant financial difficulty of the issuer or counterparty, breach of contract (such as a default or delinquency in interest or principal payments), is becoming probable that the borrower will undergo bankruptcy or financial reorganization or disappearance of an active market for that financial asset because of financial difficulties. 1) Financial assets measured at amortized cost
For discounts and loans and receivables, assets are assessed for impairment on a collective basis even if they were assessed as not impaired individually. Objective evidence of impairment for a portfolio of loans and receivables could include the Bank’s past experience of collecting payments, an increase in the number of delayed payments in the portfolio, as well as observable changes in national or local economic conditions that correlate with default on loans and receivables. For financial assets measured at amortized cost, the amount of the impairment loss recognized is the difference between the asset’s carrying amount and the present value of estimated future cash flows, discounted at the asset’s original effective interest rate. If the amount of the impairment loss decreases in a subsequent period and the decrease can be related objectively to an event occurring after the impairment was recognized, the previously recognized impairment loss is reversed through profit or loss to the extent that the carrying amount of the investment at the date the impairment is reversed does not exceed what the amortized cost would have been had the impairment not been recognized.
2) Available-for-sale financial assets For available-for-sale equity investments, a significant or prolonged decline in the fair value of the security below its cost is considered to be objective evidence of impairment. When an available-for-sale financial asset is considered to be impaired, cumulative gains or losses previously recognized in other comprehensive income are reclassified to profit or loss in the period. In respect of available-for-sale equity securities, impairment loss previously recognized in profit or loss are not reversed through profit or loss. Any increase in fair value subsequent to an impairment loss is recognized in other comprehensive income. In respect of available-for-sale debt securities, impairment loss is subsequently reversed through profit or loss if an increase in the fair value of the investment can be objectively related to an event occurring after the recognition of the impairment loss.
3) Financial assets measured at cost For financial assets that are measured at cost, the amount of the impairment loss is measured as the difference between the asset’s carrying amount and the present value of the estimated future cash flows discounted at the current market rate of return for a similar financial asset. Such impairment loss will not be reversed in subsequent periods.
189
The carrying amount of the financial asset is reduced by the impairment loss directly for all financial assets with the exception of discounts and loans, receivables and nonaccrual loans other than discounts and loans, where the carrying amount is reduced through an allowance account. The Bank evaluates possible losses on specific loans on the basis of the borrowers’ financial situation, their ability to repay principals and interests, and the values of collaterals in accordance with “Regulations Governing the Procedures for Banking Institutions to Evaluate Assets and Deal with Nonperforming/Nonaccrual Loans” (the “Regulations”). The Regulations require that loans should be categorized by collectability and specify the minimum allowance for possible losses and reserve for guarantee obligations using prescribed percentages. When a loan or receivable is considered uncollectable, it may be written off on the approval of the Bank’s Board of Directors or Managing Directors. The subsequent collections of written-off loans are credited against provision for possible losses.
c. Derecognition of financial assets The Bank and its subsidiaries derecognize a financial asset only when the contractual rights to the cash flows from the asset expire, or when it transfers substantially all the risks and rewards of ownership of the financial asset to another party Before 2017, on derecognition of a financial asset in its entirety, the difference between the asset’s carrying amount and the sum of the consideration received and receivable and the cumulative gain or loss which had been recognized in other comprehensive income is recognized in profit or loss. Starting from 2018, on derecognition of a financial asset at amortized cost in its entirety, the difference between the asset’s carrying amount and the sum of the consideration received and receivable is recognized in profit or loss. On derecognition of an investment in a debt instrument at FVTOCI, the difference between the asset’s carrying amount and the sum of the consideration received and receivable and the cumulative gain or loss which had been recognized in other comprehensive income is recognized in profit or loss. However, on derecognition of an investment in an equity instrument at FVTOCI, the difference between the asset’s carrying amount and the sum of the consideration received and receivable is recognized in profit or loss, and the cumulative gain or loss which had been recognized in other comprehensive income is transferred directly to retained earnings, without recycling through profit or loss.
Equity instruments Debt and equity instruments issued by the Bank are classified as either financial liabilities or as equity in accordance with the substance of the contractual arrangements and the definitions of a financial liability and an equity instrument. Financial liabilities a. Subsequent measurement
Except the following situation, all the financial liabilities are measured at amortized cost using the effective interest method: 1) Financial liabilities at FVTPL
Financial liabilities are classified as at FVTPL when the financial liability is held for trading. Any gains or losses arising on remeasurement, including interest paid on the financial liability, are recognized in profit or loss.
190

2) Financial guarantee contracts 2018 The financial guarantee contracts issued by the Bank and not measured at FVTPL are measured at the higher of the allowance for the expected credit losses and the amortized amount after original recognition. 2017 Financial guarantee contracts issued by the Bank are initially measured at their fair values and, if not designated as at FVTPL, are subsequently measured at the higher of the best estimate of the obligation under the contract and the amount initially recognized less the cumulative amortization recognized.
b. Derecognition of financial liabilities The difference between the carrying amount of the financial liability derecognized and the consideration paid, and any non-cash assets transferred or liabilities assumed, is recognized in profit or loss.
Derivative financial instruments Derivatives are initially recognized at fair value at the date the derivative contracts are entered into and are subsequently remeasured to their fair value at the end of each reporting period. The resulting gain or loss is recognized in profit or loss. Derivative financial instruments do not apply hedge accounting are recognized as financial assets or liabilities held for trading. When the fair value of derivative financial instruments is positive, the derivative is recognized as a financial asset; when the fair value of derivative financial instruments is negative, the derivative is recognized as a financial liability. Derivatives embedded in derivative host contracts 2018 Derivatives embedded in hybrid contracts that contain financial asset hosts that is within the scope of IFRS 9 are not separated; instead, the classification is determined in accordance with the entire hybrid contract. 2017 Derivatives embedded in non-derivative host contracts were treated as separate derivatives when they met the definition of a derivative; their risks and characteristics were not closely related to those of the host contracts; the contracts were not measured at FVTPL. Levies A levy imposed by a government is accrued as payables when the transaction or activity that triggers the payment of the levy occurs. Provisions Provisions are recognized when the Bank and its subsidiaries have a present obligation as a result of a past event, it is probable that the Bank and its subsidiaries will be required to settle the obligation, and a reliable estimate can be made of the amount of the obligation.
191

Provisions are measured at the best estimate of the consideration required to settle the present obligation at the end of the reporting period, taking into account the risks and uncertainties surrounding the obligation. When a provision is measured using the cash flows estimated to settle the present obligation, its carrying amount is the present value of those cash flows (where the effect of the time value of money is material). When some or all of the economic benefits required to settle a provision are expected to be recovered from a third party, a receivable is recognized as an asset if it is virtually certain that reimbursement will be received and the amount of the receivable can be measured reliably. Revenue Recognition Interest revenues from discounts and loans is recorded on the accrual basis. For nonaccrual loans, interest revenues are recognized only when collections on these obligations are made. Under the regulations of the Banking Bureau under the Financial Supervisory Commission, the interest revenues on credits covered by agreements that extend their maturity is recorded as deferred income and recognized upon collection. Service fee income is recognized as loans are provided or services have been completed. The gain or loss on the disposal or recovery of acquired receivables is accounted for by the effective interest method. When the Bank acquires non-performing loans from other financial institutions, revenue related to recovery of non-performing loans is recognized using the cost-recovery method. Retirement Benefit Payments to defined contribution retirement benefit plans are recognized as an expense when employees have rendered service entitling them to the contributions. Defined benefit costs (including service cost, net interest and remeasurement) under the defined benefit retirement plans are determined using the projected unit credit method. Service cost (including current service cost and net interest) are recognized as employee benefits expense in the period they occur. Remeasurement, comprising actuarial gains and losses, and the return on plan assets (excluding interest), is recognized in other comprehensive income in the period they occur. Remeasurement recognized in other comprehensive income is reflected immediately in retained earnings and will not be reclassified to profit or loss. Net defined benefit liability (asset) represents the actual deficit (surplus) in the Bank’s defined benefit plan. Any surplus resulting from this calculation is limited to the present value of any refunds from the plans or reductions in future contributions to the plans. Income Tax Income tax expense represents the sum of current tax expense and deferred tax expense. a. Current tax expense
Current tax is the amount of income taxes payable (recoverable) in respect of the taxable profit (tax loss) for a period. An additional tax of unappropriated earnings is provided for as income tax in the year the shareholders approve to retain the earnings. Adjustments of prior years’ tax liabilities are added to or deducted from the current year’s tax expense.
192

b. Deferred tax expense Deferred tax expense represents adjustments to deferred tax assets and liabilities. Deferred tax assets or liabilities are recognized on temporary differences between the carrying amounts of assets and liabilities in the financial statements and the corresponding tax bases used in the computation of taxable profit. The measurement of deferred tax liabilities and assets reflects the tax consequences that would follow from the manner in which the Bank and its subsidiaries expect, at the end of the reporting period, to recover or settle the carrying amount of its assets and liabilities. Deferred tax liabilities are generally recognized for all taxable temporary differences. Deferred tax assets are generally recognized for all deductible temporary differences and unused loss carryforwards that it is probable that taxable profits will be available against which those deductible temporary differences can be utilized. Deferred tax liabilities and assets are measured at the tax rates that are expected to apply in the period in which the liability is settled or the asset realized, based on tax rates (and tax laws) that have been enacted or substantively enacted by the end of the reporting period. The carrying amount of deferred tax assets is reviewed at the end of each reporting period and recognized to the extent that it has become probable that future taxable profit will allow the deferred tax assets to be recovered.
c. Current and deferred tax for the period
Current and deferred tax are recognized in profit or loss, except when they relate to items that are recognized in other comprehensive income or directly in equity, in which case, the current and deferred tax are also recognized in other comprehensive income or directly in equity respectively.
5. CRITICAL ACCOUNTING JUDGMENTS AND KEY SOURCES OF ESTIMATION UNCERTAINTY In the application of accounting policies, management is required to make essential judgments, estimates and assumptions about the carrying amounts of assets and liabilities that are not readily apparent from other sources. The estimates and associated assumptions are based on historical experience and other factors that are considered to be relevant. Actual results may differ from these estimates. The estimates and underlying assumptions are reviewed on an ongoing basis. Revisions to accounting estimates are recognized in the period in which the estimate is revised if the revision affects only that period or in the period of the revision and future periods if the revision affects both current and future periods. a. Estimating impairment of financial assets (application to 2108)
The estimate of impairment for receivables, discount and loans and investments in debt instruments is based on the assumptions about the probability of default and loss given default. The Bank uses judgement in making these assumptions and in selecting the inputs to the impairment calculation, based on the Bank’s past history, existing market conditions as well as forward looking estimates at the end of each reporting period. For details of the key assumptions and inputs used, see Note 44 where the actual future cash inflows are less than expect, a material impairment loss may arise.
b. Estimating impairment of discounts and loans and receivables (application to 2017) When there is objective evidence of impairment loss, the Bank and its subsidiaries take into consideration the estimation of future cash flows. The amount of the impairment loss is measured as the difference between the asset’s carrying amount and the present value of estimated future cash flows (excluding future credit losses that have not been incurred) discounted at the financial asset’s original
193
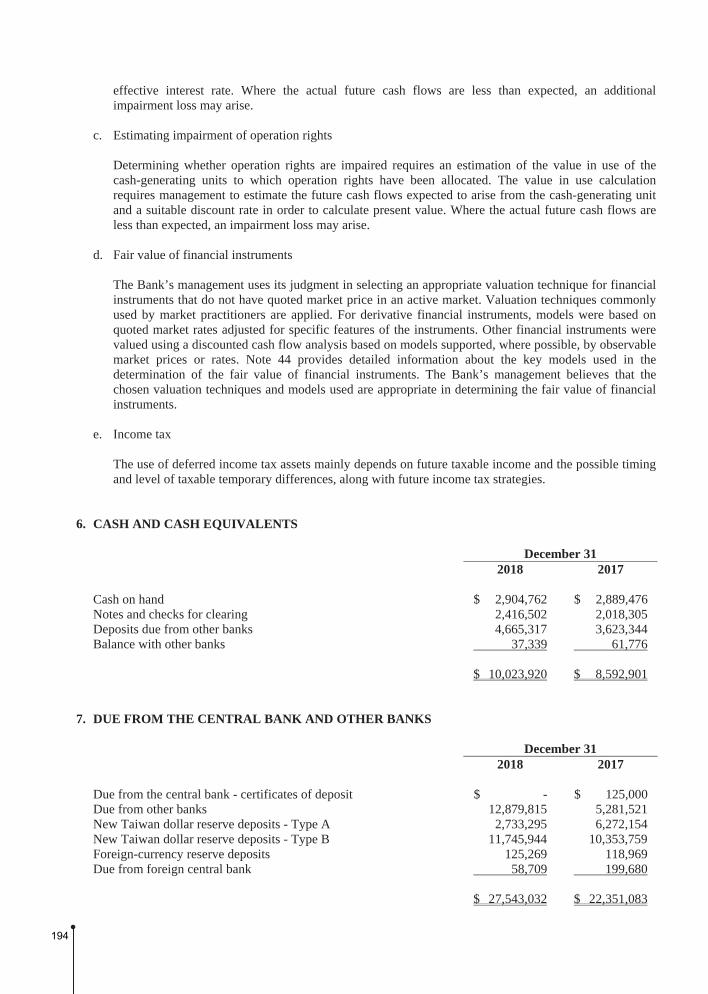
effective interest rate. Where the actual future cash flows are less than expected, an additional impairment loss may arise.
c. Estimating impairment of operation rights Determining whether operation rights are impaired requires an estimation of the value in use of the cash-generating units to which operation rights have been allocated. The value in use calculation requires management to estimate the future cash flows expected to arise from the cash-generating unit and a suitable discount rate in order to calculate present value. Where the actual future cash flows are less than expected, an impairment loss may arise.
d. Fair value of financial instruments The Bank’s management uses its judgment in selecting an appropriate valuation technique for financial instruments that do not have quoted market price in an active market. Valuation techniques commonly used by market practitioners are applied. For derivative financial instruments, models were based on quoted market rates adjusted for specific features of the instruments. Other financial instruments were valued using a discounted cash flow analysis based on models supported, where possible, by observable market prices or rates. Note 44 provides detailed information about the key models used in the determination of the fair value of financial instruments. The Bank’s management believes that the chosen valuation techniques and models used are appropriate in determining the fair value of financial instruments.
e. Income tax The use of deferred income tax assets mainly depends on future taxable income and the possible timing and level of taxable temporary differences, along with future income tax strategies.
6. CASH AND CASH EQUIVALENTS
December 31 2018 2017 Cash on hand $ 2,904,762 $ 2,889,476Notes and checks for clearing 2,416,502 2,018,305Deposits due from other banks 4,665,317 3,623,344Balance with other banks 37,339 61,776 $ 10,023,920 $ 8,592,901
7. DUE FROM THE CENTRAL BANK AND OTHER BANKS
December 31 2018 2017 Due from the central bank - certificates of deposit $ - $ 125,000Due from other banks 12,879,815 5,281,521New Taiwan dollar reserve deposits - Type A 2,733,295 6,272,154New Taiwan dollar reserve deposits - Type B 11,745,944 10,353,759Foreign-currency reserve deposits 125,269 118,969Due from foreign central bank 58,709 199,680 $ 27,543,032 $ 22,351,083
194

The reserve deposits are required by law and determined at a prescribed percentage of the monthly average balances. The Type B reserve deposits can be withdrawn only when the balances are adjusted monthly. The Type A and foreign-currency reserve deposits can be withdrawn on demand but bear no interest. Due from foreign Central Bank is the clearing settlement account which the Bank’s Hong Kong branch opened in Hong Kong Monetary Authority. The account can be withdrawn on demand but bear no interest. As of December 31, 2018 and 2017, due from the central bank and other banks falling in the definition of IAS 7 “cash and cash equivalents” (i.e. short-term, highly liquid investments, readily convertible to known amounts of cash and subject to an insignificant risk of changes in value); amounted to $15,797,088 thousand and $11,872,324 thousand, respectively, and were included in cash and cash equivalents in the consolidated statements of cash flows.
8. FINANCIAL ASSETS AND LIABILITIES AT FVTPL
December 31,
2018 Financial assets mandatorily classified as at FVTPL (application to 2018) Non-derivative financial assets
Commercial paper $ 17,068,878Government bond 8,324,585Negotiable certificates of deposit 1,487,146Stock listed on TWSE and TPEx 64,115
26,944,724Derivative financial assets
Foreign-currency swap contracts 2,292,356Interest rate swap contracts 853,399Currency option contracts 354,604Others 282,755
3,783,114Hybrid contract
Asset swap fixed-income contracts 9,345,266Credit linked loan contracts 3,829,179Credit linked bond contracts 2,060,823Convertible (exchangeable) bonds 544,395
15,779,663 Total financial assets mandatorily classified as at FVTPL $ 46,507,501
195

December 31,
2017 Financial assets mandatorily classified as at FVTPL (application to 2017) Financial assets held for trading
Non-derivative financial assets Commercial paper $ 13,979,621Government bond 5,238,586Negotiable certificates of deposit 1,850,666Stock listed on TWSE and TPEx 347,783Beneficiary certificates 50,473
21,467,129Derivative financial assets
Foreign-currency swap contracts 950,685Convertible (exchangeable) bond asset swap contracts 766,433Interest rate swap contracts 721,496Currency option contracts 296,384Forward exchange contracts 149,661Others 176,507
3,061,166Financial assets designated as at FVTPL Convertible (exchangeable) bonds 5,680,038 Total financial assets at FVTPL $ 30,208,333 December 31 2018 2017 Financial liabilities at FVTPL Non-derivative financial liabilities
Settlement coverage bonds payable of short sale $ - $ 50,241 Derivative financial liabilities
Foreign-currency swap contracts 1,159,611 1,161,278 Interest rate swap contracts 758,670 545,246 Currency option contracts 355,293 283,706 Forward exchange contracts 225,459 80,710 Convertible (exchangeable) bond option contracts 122,750 2,125,712 Others 130,696 72,228 2,752,479 4,268,880 Total financial liabilities at FVTPL $ 2,752,479 $ 4,319,121
The Bank engages in derivative transactions mainly to trade, to accommodate customers’ needs and to manage exposures due to exchange rate and interest rate fluctuations. The Bank’s financial risk management strategy is to hedge most of its exposure to market risk.
196

Outstanding derivative contract (notional) amounts were as follows: December 31 2018 2017 Foreign-currency swap contracts $ 383,201,438 $ 312,727,831Interest rate swap contracts 134,879,271 121,214,106Currency option contracts 54,427,257 57,406,578Credit default swap contracts 32,750,274 18,028,192Forward exchange contracts 21,234,471 16,842,966Asset swap fixed-income contracts 9,355,595 5,337,816Cross-currency swap contracts 4,428,940 8,413,280Interest rate option contracts 1,000,000 4,492,400Convertible (exchangeable) bond option contracts 683,300 8,122,800Domestic convertible (exchangeable) bond asset swap contracts 317,000 4,015,800Commodity forward contracts 111,303 -Bond futures 225,755 1,295,168Non-deliverable forward contracts 61,617 356,566
9. FINANCIAL ASSETS AT FVTOCI - 2018
December 31,
2018 Investments in equity instruments Stock listed on TWSE and TPEx $ 930,492Stock unlisted on TWSE and TPEx 335,330 1,265,822Investments in debt instruments Negotiable certificates of deposit from the central bank 62,950,846Government bonds 31,436,956Bank debentures 20,548,214Corporate bonds 2,500,626Mortgage backed securities 1,076,588 118,513,230 Total financial assets at FVTOCI $ 119,779,052 The above investments in equity instrument in the form of ordinary shares for medium- and long-term strategic purposes and expects to make a profit through long-term investments. Therefore, the designated investments are selected to be measured at FVTOCI. These investments were originally classified as available-for-sale financial assets and financial assets measured at cost under IAS 39. For reclassification and other information of 2017, refer to Notes 3, 15 and 19. The above investments in debt instrument were originally classified as available-for-sale financial assets under IAS 39. For reclassification and other information of 2017, refer to Notes 3 and 15. For the information of credit risk management and impairment assessment on investments in debt instruments at FVTOCI, refer to Note 11. For the information of mortgage backed securities, refer to Note 40.
197

Part of the bank debentures and government bonds have been issued under repurchase agreements. The book value were as follows. Refer to Note 23 for related information.
December 31,
2018 Bank debentures $ 12,745,196Government bonds $ 2,702,559
10. DEBT INSTRUMENT INVESTMENT MEASURED AT AMORTIZED COST - 2018
December 31,
2018 Bank debentures $ 1,974,153 Corporate bonds 614,660 2,588,813 Less: Allowance for loss 159 $ 2,588,654 For the information on financial assets’ related credit risk management and impairment at amortized cost, see Note 11.
11. CREDIT RISK MANAGEMENT OF INVESTMENTS IN DEBT INSTRUMENTS - 2018 The investments in debt instruments are classified as financial assets at FVTOCI and financial assets at amortized cost, respectively: December 31, 2018
At FVTOCI At Amortized
Cost Total Total carrying amount $ 118,563,978 $ 2,588,813 $ 121,152,791Less: Allowance for loss 4,318 159 4,477 Amortized cost 118,559,660 $ 2,588,654 121,148,314Fair value adjustment (46,430) (46,430) $ 118,513,230 $ 121,101,884 The policy which the Bank implements is to invest only in debt instruments with credit ratings above (and including) investment grade and with impairment low in credit risk. The Bank continued to track external rating information to monitor changes in credit risk of the investments in debt instruments and to review other information such as the bond yield curve and the debtor’s material information to assess whether the credit risk of the debt instrument investments has increased significantly since the original recognition.
198
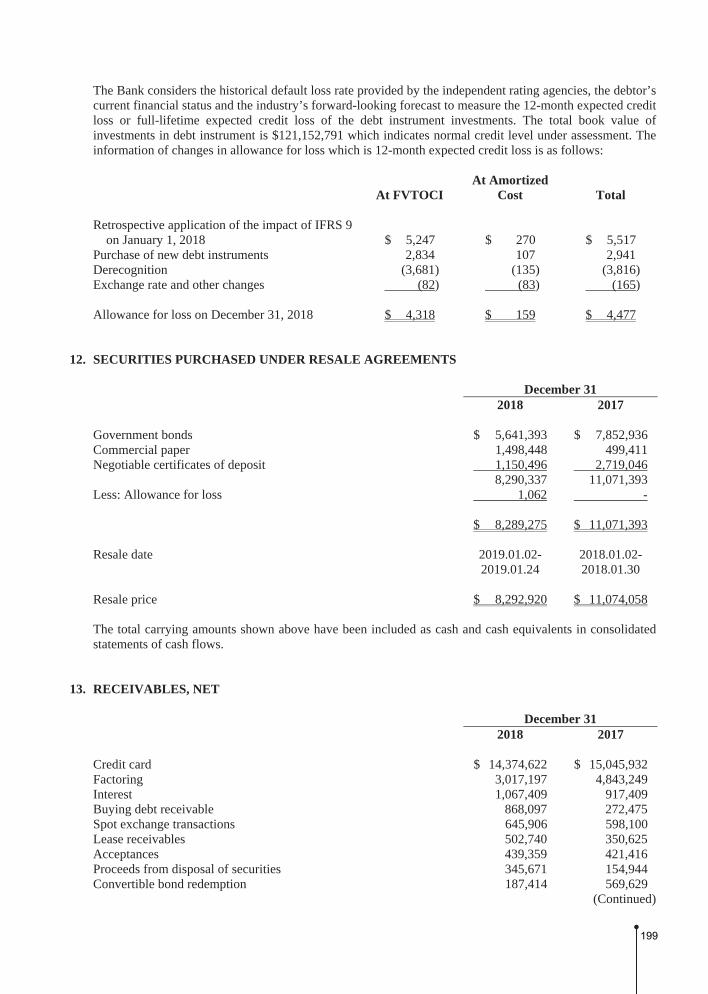
The Bank considers the historical default loss rate provided by the independent rating agencies, the debtor’s current financial status and the industry’s forward-looking forecast to measure the 12-month expected credit loss or full-lifetime expected credit loss of the debt instrument investments. The total book value of investments in debt instrument is $121,152,791 which indicates normal credit level under assessment. The information of changes in allowance for loss which is 12-month expected credit loss is as follows:
At FVTOCI At Amortized
Cost Total Retrospective application of the impact of IFRS 9
on January 1, 2018 $ 5,247 $ 270 $ 5,517 Purchase of new debt instruments 2,834 107 2,941 Derecognition (3,681) (135) (3,816) Exchange rate and other changes (82) (83) (165) Allowance for loss on December 31, 2018 $ 4,318 $ 159 $ 4,477
12. SECURITIES PURCHASED UNDER RESALE AGREEMENTS
December 31 2018 2017 Government bonds $ 5,641,393 $ 7,852,936Commercial paper 1,498,448 499,411Negotiable certificates of deposit 1,150,496 2,719,046 8,290,337 11,071,393Less: Allowance for loss 1,062 - $ 8,289,275 $ 11,071,393 Resale date 2019.01.02-
2019.01.24 2018.01.02-
2018.01.30 Resale price $ 8,292,920 $ 11,074,058
The total carrying amounts shown above have been included as cash and cash equivalents in consolidated statements of cash flows.
13. RECEIVABLES, NET December 31 2018 2017 Credit card $ 14,374,622 $ 15,045,932Factoring 3,017,197 4,843,249Interest 1,067,409 917,409Buying debt receivable 868,097 272,475Spot exchange transactions 645,906 598,100Lease receivables 502,740 350,625Acceptances 439,359 421,416Proceeds from disposal of securities 345,671 154,944Convertible bond redemption 187,414 569,629
(Continued)
199

December 31 2018 2017 Entrustment loans $ 175,789 $ 175,574Others 390,204 557,580 22,014,408 23,906,933Less: Allowance for possible losses (Note 14) 530,031 1,156,064 $ 21,484,377 $ 22,750,869
(Concluded) The changes in the total carrying amount of receivables and other financial assets in 2018 are as follows: Stage 1 (Note1) Stage 2 (Note2) Stage 3 (Note3) Total Beginning on January 1, 2018 $ 19,954,137 $ 75,443 $ 2,123,312 $ 22,152,892Changes due to financial assets
recognized at the beginning of the period: Transfer to Stage2 (56,753) 59,977 (111) 3,113 Transfer to Stage3 (117,060) (20,729) 152,911 15,122Transfer to Stage1 8,504 (11,871) (269) (3,636)Financial assets derecognized
in the current period (9,075,785) (13,015) (345,091) (9,433,891)Purchased or original financial
assets 8,021,749 10,727 55,100 8,087,576Write-offs (83,437) (27,894) (657,815) (769,146)Exchange rate and other changes 1,111 (696) 14,849 15,264 Balance on December 31, 2018 $ 18,652,466 $ 71,942 $ 1,342,886 $ 20,067,294 Note 1: 12-Month ECLs Note 2: Lifetime ECLs Note 3: Lifetime ECLs (Non-Purchase or Original Credit Impairment on Financial Assets)
200

The changes in the allowance of receivables and other financial assets in 2018 are as follows:
12-Month Expected Credit
Loss (Stage 1)
Lifetime ECLs(Stage 2)
Lifetime ECLs (Non-Purchase or Original Credit Impairment on
Financial Assets)(Stage 3)
Impairment Under the
Guidelines of IFRS 9
The Difference of Impairment
under the “Regulations
Governing the Procedures for
Banking Institutions to
Evaluate Assets and Deal with
Non-performing/Non-accrual
Loans” Total January 1, 2018 $ 46,393 $ 13,104 $ 951,489 $ 1,010,986 $ 145,266 $ 1,156,252 Changes due to financial assets
recognized at the beginning of the period: Transfer to Stage2 (69 ) 5,136 (25 ) 5,042 - 5,042 Transfer to Stage3 (144 ) (3,792 ) 40,046 36,110 - 36,110 Transfer to Stage1 3 (1,922 ) (53 ) (1,972 ) - (1,972 )Financial assets derecognized in
the current period (26,252 ) (1,916 ) (51,209 ) (79,377 ) - (79,377 )Purchased or original financial assets 8,227 952 21,392 30,571 - 30,571 The difference of impairment under
the ‘Regulations Governing the Procedures for Banking Institutions to Evaluate Assets and Deal with Non-performing/ Non-accrual Loans’ - - - - (22,463 ) (22,463 )
Write-offs (83,437 ) (27,894 ) (657,815 ) (769,146 ) - (769,146 )Exchange rate and other changes 83,060 22,480 69,509 175,049 - 175,049 December 31, 2018 $ 27,781 $ 6,148 $ 373,334 $ 407,263 $ 122,803 $ 530,066
14. DISCOUNTS AND LOANS, NET December 31 2018 2017 Negotiations, discounts and overdraft $ 189,594 $ 100,576Short-term loans 73,855,519 69,042,425Medium-term loans 140,748,897 124,489,833Long-term loans 169,517,735 161,806,758Overdue receivable 611,272 501,027 384,923,017 355,940,619Less: Allowance for possible losses 5,234,899 4,883,857 $ 379,688,118 $ 351,056,762 The details of the provision for possible losses were as follows: For the Year Ended December 31 2018 2017 Provision for possible losses - discounts and loans $ 833,097 $ 373,153 Provision for possible losses - others 122,026 830,783 Provision for possible losses - reserve for guarantee obligations 18,561 11,407 Amounts recovered - discounts and loans (229,379) (257,773) Amounts recovered - others (229,502) (225,723) $ 514,803 $ 731,847
201

The changes in the total carrying amount of discounts and loan in 2018 are as follows: Stage 1 (Note1) Stage 2 (Note2) Stage 3 (Note3) Total Beginning on January 1, 2018 $ 347,782,666 $ 1,423,658 $ 3,540,559 $ 352,746,883Changes due to financial assets
recognized at the beginning of the period: Transfer to Stage2 (392,867) 363,684 (58) (29,241)Transfer to Stage3 (604,008) (370,042) 821,752 (152,298)Transfer to Stage1 97,281 (113,824) (1,292) (17,835)Financial assets derecognized
in the current period (86,740,476) (815,201) (815,269) (88,370,946)Purchased or original financial
assets 120,569,098 48,464 273,091 120,890,653Write-offs (96,709) (40,686) (396,228) (533,623)Exchange rate and other changes 384,855 696 3,873 389,424 Balance on December 31, 2018 $ 380,999,840 $ 496,749 $ 3,426,428 $ 384,923,017 Note 1: 12-Month ECLs Note 2: Lifetime ECLs Note 3: Lifetime ECLs (Non-Purchase or Original Credit Impairment on Financial Assets) The changes in the allowance of discounts and loan in 2018 are as follows:
12-Month Expected Credit
Loss (Stage1)
Lifetime ECLs(Stage2)
Lifetime ECLs (Non-Purchase or Original Credit Impairment on
Financial Assets)(Stage3)
Impairment Under the
Guidelines of IFRS 9
The Difference of Impairment
under the “Regulations
Governing the Procedures for
Banking Institutions to
Evaluate Assets and Deal with
Non-performing/Non-accrual
Loans” Total January 1, 2018 $ 617,108 $ 67,265 $ 993,274 $ 1,677,647 $ 3,174,273 $ 4,851,920 Changes due to financial assets
recognized at the beginning of the period: Transfer to Stage2 (1,341 ) 55,586 (49 ) 54,196 - 54,196 Transfer to Stage3 (1,090 ) (2,964 ) 179,929 175,875 - 175,875 Transfer to Stage1 100 (12,961 ) (678 ) (13,539 ) - (13,539 )Financial assets derecognized in
the current period (252,878 ) (30,940 ) (82,132 ) (365,950 ) - (365,950 )Purchased or original financial assets 235,269 27,805 85,284 348,358 - 348,358 The difference of impairment under
the ‘Regulations Governing the Procedures for Banking Institutions to Evaluate Assets and Deal with Non-performing/ Non-accrual Loans’. - - - - 468,488 468,488
Write-offs (96,709 ) (40,686 ) (396,228 ) (533,623 ) - (533,623 )Exchange rate and other changes (96,719 ) 23,604 128,851 249,174 - 249,174 December 31, 2018 $ 597,178 $ 86,709 $ 908,251 $ 1,592,138 $ 3,642,761 $ 5,234,899
202

Movements of allowance for possible losses on discounts and loans and others (including receivables and other financial assets) in 2017 were as follows:
Discounts and Loans Others Total
Balance, January 1, 2017 $ 5,031,824 $ 1,118,674 $ 6,150,498 Provision for possible losses 373,153 830,783 1,203,936 Amounts written-off (466,510) (743,155) (1,209,665)Effects of exchange rate changes (54,610) (50,050) (104,660) Balance, December 31, 2017 $ 4,883,857 $ 1,156,252 $ 6,040,109 For the years ended December 31, 2018 and 2017, the Bank and its subsidiaries had no written-off credits for which legal proceedings had not been initiated. The Bank and its subsidiaries’ financial assets were assessed for impairment loss on the basis of credit risk characteristics (Not application in 2018) of financial assets. The results were as follows: Discounts and loans
Item December 31, 2017
Discounts and Loans
Allowance for Possible Losses
With objective evidence of individual impairment
Assessed individually $ 1,603,535 $ 563,826Assessed by portfolio 1,937,024 441,292
Without objective evidence of individual impairment
Assessed individually 3,193,736 31,937Assessed by portfolio 349,206,324 3,846,802
Total $ 355,940,619 $ 4,883,857 Others (including receivables, other financial assets and debt investments with no active market)
Item December 31, 2017
Others Allowance for Possible Losses
With objective evidence of individual impairment
Assessed individually $ 657,574 $ 580,751Assessed by portfolio 1,465,738 493,309
Without objective evidence of individual impairment
Assessed individually 9,533,501 7,210Assessed by portfolio 18,842,391 74,982
Total $ 30,499,204 $ 1,156,252 15. AVAILABLE-FOR-SALE FINANCIAL ASSETS-2017
December 31,
2017 Negotiable certificates of deposit issued by the central bank $ 62,523,204Government bonds 25,343,404Bank debentures 21,006,259Stocks listed on TWSE and TPEx 709,311Beneficiary certificates 49,400 $ 109,631,578
203

Some of the available-for-sale foreign bank debentures and foreign government bonds were traded with repurchase agreements, and the carrying amounts were as follows (refer to Note 23 for the related information on repurchase agreements):
December 31,
2017 Bank debentures $ 12,366,170Government bonds $ 1,162,801 The assets pledged as collaterals are disclosed in Note 40.
16. HELD-TO-MATURITY FINANCIAL ASSETS-2017
December 31,
2017 Bank debentures $ 1,479,602 Government bonds 655,644 $ 2,135,246
17. INVESTMENT ACCOUNTED FOR USING EQUITY METHOD
December 31 2018 2017
Amount % of
Ownership Amount % of
Ownership Dah Chung Bills Finance Corp. $ 1,667,505 22.06 $ 1,646,555 22.06 Deutsche Far Eastern Asset Management
Co., Ltd. 108,845 40.00 127,511 40.00 $ 1,776,350 $ 1,774,066 Deutsche Far Eastern Asset Management Co., Ltd. reduced its capital to cover accumulated deficit and increased capital by cash in September 2017; the Bank participated in the capital increase and invested $28,980 thousand according to the proportion of shares held. The above associates are individually immaterial to the Bank and its subsidiaries; the shares of the Bank and its subsidiaries in these associates’ financial performance are summarized as follows: For the Year Ended December 31 2018 2017 Net income from continuing operation $ 92,467 $ 103,337 Other comprehensive income (22,620) 9,114 Total comprehensive income $ 69,847 $ 112,451
204

18. DEBT INVESTMENTS WITH NO ACTIVE MARKET - 2017
December 31,
2017 Foreign convertible bond asset swap contracts - master agreement $ 5,337,816 Convertible bonds 742,300 Credit-linked bond - master agreement 596,960 $ 6,677,076
19. OTHER FINANCIAL ASSETS, NET
December 31 2018 2017 Nonaccrual loans other than discounts and loans $ 70 $ 261 Less: Allowance for possible losses (Note 13 and Note 14) 35 188 35 73 Refundable deposits 2,945,944 2,312,331 Less: Allowance for loss 446 - 2,945,533 2,312,404 Deposits with original maturity more than 3 months 894,600 549,239 Interbank clearing account 700,805 600,941 Restricted assets 154,438 192,260 Financial assets carried at cost - 2017 - 113,636 $ 4,695,376 $ 3,768,480
The above restricted assets are margin and collection payment charged form customer in specified current deposit by FEIL. The assets pledged as collaterals are disclosed in Note 40. Financial assets carried at cost consist of the following domestic unlisted common stocks in 2017:
December 31,
2017 Yuan Hsin Digital Payment Co., Ltd. $ 62,263 Financial Information Service Co., Ltd. 45,500 An Feng Enterprise Co., Ltd. 3,000 Sunshine Asset Management Co., Ltd. 2,073 Taipei Forex Inc. 800 $ 113,636 The above equity investments, which had no quoted prices in active market or fair values that could be reliably measured, were measured at cost. The Bank disposed of ERA Communications Co., Ltd. in July, 2017; the disposal price was $51,496 thousand and the disposal gain was $1,490 thousand.
205

The Bank recognized an impairment loss of $17,009 thousand on Yuan Hsin Digital Payment Co., Ltd. in September 2017 and participated in its cash capital increase with the amount of $24,950 thousand in September 2017.
20. PROPERTY AND EQUIPMENT, NET
For the Year Ended December 31, 2018
Land Buildings and Improvements
Computer Equipment
Transportation Equipment
Miscellaneous Equipment
Equipment Prepayment Total
Cost Beginning balance $ 1,581,625 $ 1,247,852 $ 1,714,492 $ 2,542 $ 1,507,341 $ 16,565 $ 6,070,417 Additions - 4,605 161,038 79 74,573 39,940 280,235 Disposals (134,192 ) (118,134 ) (27,916 ) (218 ) (57,298 ) - (337,758 )Others - (3,760 ) (9,564 ) - 4,438 (7,760 ) (16,646 )Ending balance 1,447,433 1,130,563 1,838,050 2,403 1,529,054 48,745 5,996,248 Accumulated depreciation Beginning balance - 624,555 1,225,695 2,420 1,328,355 - 3,181,025 Depreciation - 22,438 134,448 81 65,641 - 222,608 Disposals - (56,166 ) (27,914 ) (218 ) (56,284 ) - (140,582 )Others - (3,584 ) 1,423 - 2,927 - 766 Ending balance - 587,243 1,333,652 2,283 1,340,639 - 3,263,817 Net ending balance $ 1,447,433 $ 543,320 $ 504,398 $ 120 $ 188,415 $ 48,745 $ 2,732,431
For the Year Ended December 31, 2017
Land Buildings and Improvements
Computer Equipment
Transportation Equipment
Miscellaneous Equipment
Equipment Prepayment Total
Cost Beginning balance $ 1,581,625 $ 1,247,533 $ 1,584,981 $ 3,364 $ 1,530,469 $ 31,495 $ 5,979,467 Additions - 1,130 143,251 67 53,143 26,871 224,462 Disposals - (811 ) (57,083 ) (889 ) (69,125 ) - (127,908 )Others - - 43,343 - (7,146 ) (41,801 ) (5,604 )Ending balance 1,581,625 1,247,852 1,714,492 2,542 1,507,341 16,565 6,070,417 Accumulated depreciation Beginning balance - 601,642 1,151,444 3,202 1,333,505 - 3,089,793 Depreciation - 23,721 129,477 106 66,892 - 220,196 Disposals - (808 ) (56,979 ) (888 ) (66,249 ) - (124,924 )Others - - 1,753 - (5,793 ) - (4,040 )Ending balance - 624,555 1,225,695 2,420 1,328,355 - 3,181,025 Net ending balance $ 1,581,625 $ 623,297 $ 488,797 $ 122 $ 178,986 $ 16,565 $ 2,889,392
The above items of property and equipment are depreciated on a straight-line basis over the following estimated useful lives: Buildings and improvements 5 to 55 yearsComputer equipment 3 to 7 yearsTransportation equipment 3 to 7 yearsMiscellaneous equipment 2 to 20 years
21. INTANGIBLE ASSETS, NET
December 31 2018 2017 Operation rights $ 1,538,210 $ 1,538,210 Fair value of core deposits 428,887 428,887 1,967,097 1,967,097 Less: Accumulated amortization 267,495 242,012 $ 1,699,602 $ 1,725,085
206

In April 2010, the Bank acquired the assets and liabilities of Chinfon Bank, classified as Package B of Chinfon Bank, through a bidding process. The acquired management and operation rights of Chinfon Bank’s branches have indefinite useful life, while the fair value of core deposits is amortized over 4 to 15 years. The Bank assessed the operation rights of branches have indefinite useful life, and the operation rights are expected to generate net cash flows continuously; therefore, the operation rights are not amortized annually. The Bank’s operation rights are tested for impairment at the end of the annual reporting period in 2018 and 2017 and the recoverable amount is determined based on the value in use. To reflect risks specific to the operation right, the value in use was then calculated using the discounted cash flows based on the Bank’s financial forecast, and no impairment after tasted. For the years ended December 31, 2018 and 2017, the Bank did not recognize any impairment loss on its operation rights.
22. DUE TO THE CENTRAL BANK AND OTHER BANKS
December 31 2018 2017 Call loans to banks $ 15,665,915 $ 6,601,520Due to banks 60,808 231,834Overdraft - 127,420 $ 15,726,723 $ 6,960,774
23. SECURITIES SOLD UNDER REPURCHASE AGREEMENTS
December 31 2018 2017 Bank debentures (Notes 9 and 15) $ 12,015,591 $ 11,785,554Government bonds (Notes 9 and 15) 2,650,203 1,135,810 $ 14,665,794 $ 12,921,364 Repurchase date 2019.01.07-
2019.01.29 2018.01.08-
2018.01.29 Repurchase price $ 14,704,830 $ 12,943,304
207
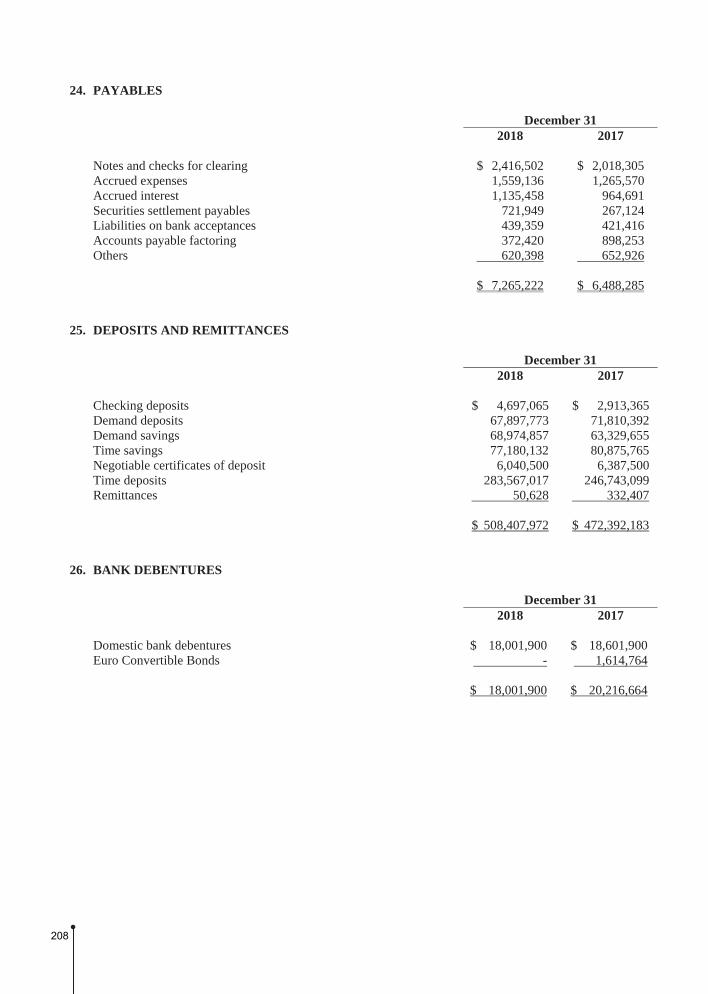
24. PAYABLES December 31 2018 2017 Notes and checks for clearing $ 2,416,502 $ 2,018,305 Accrued expenses 1,559,136 1,265,570 Accrued interest 1,135,458 964,691 Securities settlement payables 721,949 267,124 Liabilities on bank acceptances 439,359 421,416 Accounts payable factoring 372,420 898,253 Others 620,398 652,926 $ 7,265,222 $ 6,488,285
25. DEPOSITS AND REMITTANCES
December 31 2018 2017 Checking deposits $ 4,697,065 $ 2,913,365Demand deposits 67,897,773 71,810,392Demand savings 68,974,857 63,329,655Time savings 77,180,132 80,875,765Negotiable certificates of deposit 6,040,500 6,387,500Time deposits 283,567,017 246,743,099Remittances 50,628 332,407 $ 508,407,972 $ 472,392,183
26. BANK DEBENTURES
December 31 2018 2017 Domestic bank debentures $ 18,001,900 $ 18,601,900Euro Convertible Bonds - 1,614,764 $ 18,001,900 $ 20,216,664
208

Domestic Bank Debentures
Issuance December 31 Item Period Note 2018 2017
Subordinated bank debentures - seven-year
maturity; first issue in 2011 2011.11.10-
2018.11.10 Interest payable on November 10 each
year; fixed interest rate at 1.95% $ - $ 3,500,000
Subordinated bank debentures - seven-year maturity; first issue in 2012
2012.06.27- 2019.06.27
Interest payable on June 27 each year; fixed interest rate at 1.75%
3,000,000 3,000,000
Subordinated bank debentures - seven-year maturity; first issue in 2013
2013.11.06- 2020.11.06
Interest payable on November 6 each year fixed interest rate at 2.10%
4,000,000 4,000,000
Subordinated bank debentures - seven-year maturity; first issue in 2014
2014.12.23- 2021.12.23
Interest payable on December 23 each year fixed interest rate at 2.05%
1,100,000 1,100,000
Subordinated bank debentures - seven-year maturity; first issue in 2015
2015.09.30- 2022.09.30
Interest payable on September 30 each year fixed interest rate at 1.95%
3,000,000 3,000,000
Subordinated bank debentures - seven-year maturity; first issue in 2016
2016.09.27- 2023.09.27
Interest payable on September 27 each year fixed interest rate at 1.55%
4,000,000 4,000,000
Subordinated bank debentures - perpetual; first issue in 2018
2018.09.18-
Interest payable on September 18 with fixed interest rate at 3.2% per annum
2,900,000 -
Subordinated bank debentures - seven-year maturity; 1-1 issue in 2005; acquired from Chinfon Bank
Matured on 2012.06.28
- 1,660 1,660
Subordinated bank debentures - seven-year maturity; 1-1 issue in 2002; acquired from Chinfon Bank
Matured on 2009.06.28
- 240
240
Total bank debentures $ 18,001,900 $ 18,601,900 The Bank issued the first issuance of perpetual non-cumulative subordinated bank debentures in 2018 in the amount of $2,900,000 thousand in September 18, 2018 with an interest rate of 3.20% and the interest is paid once a year under the interest payment condition. After five years of issuance, the Bank has the right to redeem in advance under the regulation of issuance and the permission by authorities. Euro Convertible Bonds On February 7, 2013 (the “Issuance Date”), the Bank issued five-year unsecured zero coupon convertible bonds (the “Bonds”) with a principal aggregating to US$150,000 thousand; these bonds were listed on the Singapore Exchange Securities Trading Limited. The minimum lot size for the Bonds trading is US$200 thousand. On the Issuance Date, the liability component of the Bonds amounted to $4,009,661 thousand net of a discount of $471,589 thousand but including transaction costs of $38,252 thousand. The initial effective interest rate of the liability component was 2.63%. The derivative components of the Bonds (i.e. conversion right and redemption option) amounted to $433,337 thousand. From August, 2015, the issuance balance decreased to US$54,200 thousand because some bondholders had put the right to require the Bank to redeem the Bonds after 30 months from issue date. As 10th calendar day prior to the Maturity Date, conversion price have been adjusted from NT$15.24 per share to NT$10.57 per share annually according to the original issue conditions. No one applied for conversion during the period. The Bank redeemed the Bonds at 101.89% of their principal amount in U.S. dollars on February 7, 2018, which was the Maturity Date.
27. OTHER FINANCIAL LIABILITIES
December 31 2018 2017 Deposit received $ 343,862 $ 373,195 Bank loan - December 31, 2018: 1.18% - 6.50%; December 31, 2017: 1.20% - 6.50% 1,012,313 561,067 Commercial paper 79,929 - $ 1,436,104 $ 934,262
209

The status of commercial paper was as follows: (2017: Nil)
December 31,
2018 International Bills Finance Corp. $ 50,000 Mega Bills Finance Corp. 30,000 Less: Unamortized discount on commercial paper 71 $ 79,929 Interest rates 1.18% - 1.20%
28. PROVISIONS
December 31 2018 2017 Reserve for employee benefits liability - defined benefit plans
(Note 29) $ 933,914 $ 940,747 Reserve for obligations guarantee 212,903 186,369 Reserve for financing commitment (Note 3) 47,957 - $ 1,194,774 $ 1,127,116
29. RETIREMENT BENEFIT PLANS
a. Defined contribution plans The pension plan under the Labor Pension Act (the “LPA”) is a defined contribution plan. For employees subjected to LPA, the Bank makes contributions to their individual pension accounts in the Department of Labor at 6% of their monthly salaries and wages.
b. Defined benefit plans The Bank adopted the defined benefit plan under the Labor Standards Law, under which pension benefits are calculated on the basis of the length of service and average monthly salaries of the six months before retirement. The Bank contributes amounts equal to 2% of total monthly salaries and wages to a pension fund administered by the pension fund monitoring committee. Pension contributions are deposited in the Bank of Taiwan in the committee’s name. Before the end of each year, the Bank assesses the pension fund balance. If the balance is inadequate to pay retirement benefits for employees who conform to retirement requirements in the next year, the Bank is required to fund the difference in one appropriation before the end of March of the next year. The pension fund is managed by the Bureau of Labor Funds (the “Bureau”) under the Ministry of Labor; the Bank has no right to influence the investment policy and strategy.
210

The amounts of employee benefits included in the consolidated balance sheets were as follows: December 31 2018 2017 Present value of defined benefit obligation $ 1,276,052 $ 1,259,285 Fair value of plan assets (342,138) (318,538) Reserve for employee benefits liability $ 933,914 $ 940,747 Movements in defined benefit plan were as follows:
Present Value of the Defined
Benefit Obligation
Fair Value of the Plan Assets
Employee Benefit
Balance at January 1, 2018 $ 1,259,285 $ (318,538) $ 940,747 Service cost
Current service cost 9,295 - 9,295 Net interest expense (revenue) 21,406 (5,609) 15,797
Recognized in profit or loss 30,701 (5,609) 25,092 Remeasurement
Return on plan assets (excluding amounts included in net interest) - (7,266) (7,266)
Actuarial benefit - experience adjustments (662) - (662)Actuarial loss - changes in financial
assumptions 62,571 - 62,571 Actuarial benefit - changes in demographic
assumptions (7,986) - (7,986)Recognized in other comprehensive income 53,923 (7,266) 46,657 Contributions from the employer - (18,715) (18,715)Contributions from plan assets (7,990) 7,990 - Contributions from provisions (59,867) - (59,867) Balance at December 31, 2018 $ 1,276,052 $ (342,138) $ 933,914 Balance at January 1, 2017 $ 1,381,862 $ (317,031) $ 1,064,831 Service cost
Current service cost 12,016 - 12,016 Net interest expense (revenue) 16,651 (4,002) 12,649
Recognized in profit or loss 28,667 (4,002) 24,665 Remeasurement
Return on plan assets (excluding amounts included in net interest) - 936 936
Actuarial loss - experience adjustments 17,769 - 17,769 Actuarial benefit - changes in financial
assumptions (74,533) - (74,533)Recognized in other comprehensive income (56,764) 936 (55,828)
Contributions from the employer - (18,013) (18,013)Contributions from merged FELIA and
FEPIA - (3,120) (3,120)Contributions from plan assets (22,692) 22,692 - Contributions from provisions (71,788) - (71,788) Balance at December 31, 2017 $ 1,259,285 $ (318,538) $ 940,747
211
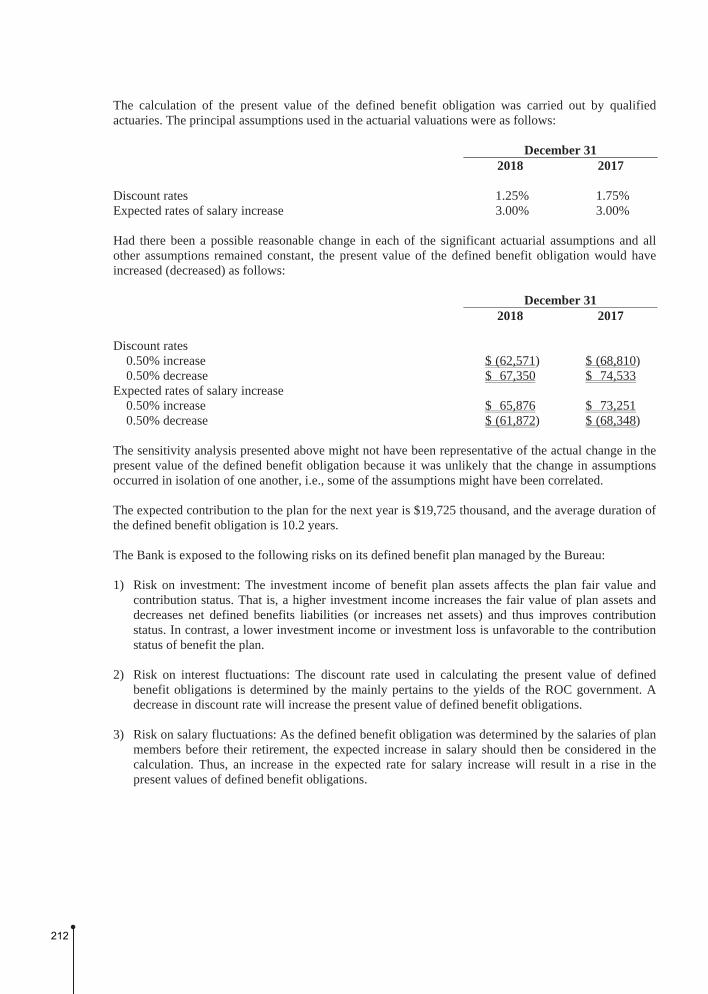
The calculation of the present value of the defined benefit obligation was carried out by qualified actuaries. The principal assumptions used in the actuarial valuations were as follows: December 31 2018 2017 Discount rates 1.25% 1.75% Expected rates of salary increase 3.00% 3.00% Had there been a possible reasonable change in each of the significant actuarial assumptions and all other assumptions remained constant, the present value of the defined benefit obligation would have increased (decreased) as follows: December 31 2018 2017 Discount rates
0.50% increase $ (62,571) $ (68,810) 0.50% decrease $ 67,350 $ 74,533
Expected rates of salary increase 0.50% increase $ 65,876 $ 73,251 0.50% decrease $ (61,872) $ (68,348)
The sensitivity analysis presented above might not have been representative of the actual change in the present value of the defined benefit obligation because it was unlikely that the change in assumptions occurred in isolation of one another, i.e., some of the assumptions might have been correlated. The expected contribution to the plan for the next year is $19,725 thousand, and the average duration of the defined benefit obligation is 10.2 years. The Bank is exposed to the following risks on its defined benefit plan managed by the Bureau: 1) Risk on investment: The investment income of benefit plan assets affects the plan fair value and
contribution status. That is, a higher investment income increases the fair value of plan assets and decreases net defined benefits liabilities (or increases net assets) and thus improves contribution status. In contrast, a lower investment income or investment loss is unfavorable to the contribution status of benefit the plan.
2) Risk on interest fluctuations: The discount rate used in calculating the present value of defined
benefit obligations is determined by the mainly pertains to the yields of the ROC government. A decrease in discount rate will increase the present value of defined benefit obligations.
3) Risk on salary fluctuations: As the defined benefit obligation was determined by the salaries of plan
members before their retirement, the expected increase in salary should then be considered in the calculation. Thus, an increase in the expected rate for salary increase will result in a rise in the present values of defined benefit obligations.
212

30. EQUITY
a. Share capital Ordinary shares December 31 2018 2017 Authorized shares (in thousands) 4,500,000 4,500,000Authorized capital $ 45,000,000 $ 45,000,000Issued and paid shares (in thousands) 3,269,186 3,182,929Issued capital $ 32,691,859 $ 31,829,286 Issued ordinary shares with par value of $10 are entitled to the right to vote and to receive dividends At the shareholders’ meeting held on June 20, 2018, the Bank resolved to increase its capital by using its undistributed earnings of $862,573 thousand. As a result, the Bank issued 86,257 thousand ordinary shares at a par value of NT$10. After the issuance, the share capital of the Bank amounted to $32,691,859 thousand. The meeting of the Bank’s shareholders on June 15, 2017 resolved to increase the Bank’s capital by declaring a stock dividend of $715,614 thousand. As a result, the Bank issued additional 71,561 thousand ordinary shares at a par value of NT$10. After the issuance, the share capital of the Bank amounted to $31,829,286 thousand.
b. Capital surplus The capital surplus arising from shares issued in excess of par and treasury stock transactions may be used to offset a deficit, or, if the Bank has no deficit, distributed as cash dividends or transferred to capital (limited to a certain percentage of the Bank’s paid-in capital and once a year). However, capital surplus arising from investment accounted for using equity method may not be used for any purpose.
c. Retained earnings and dividend policy
The appropriations of earnings were approved in the shareholders’ meetings held on June 20, 2018. In case of net income after settlement of accounts for each fiscal year, the Bank shall recover all the losses incurred in the previous years, if any, before setting aside a legal reserve of thirty percent (30%) of the net profit and appropriating, according to law and regulations, a special reserve shall be retained, and shall first be distributed to the dividends of Preferred Stock. The remaining amount together with the accumulated retained profits of the last year and the reversals of special reserves are available for distribution as dividends for Common Stock. The dividends for Common Stock shall be distributed at least thirty per cent (30%) of the remaining amount. The Board of Directors shall prepare the earnings distribution in accordance with the existing circumstances at the time, taking into account the future development plan of the Bank. Any allocation of cash dividend shall, in principle, be no less than 10% of the total dividends to be distributed that year. The Banking Law provides that, unless legal reserve reached the Bank’s paid-in capital, cash dividends are limited to 15% of paid-in capital. Under the Company Law, legal reserve should be appropriated until it has reached the Bank’s paid-in capital. This reserve may be used to offset a deficit. According to an amendment to the Company Law, when the Bank has no deficit and its legal reserve has exceeded 25% of its paid-in capital, the excess may be distributed in the form of stocks or cash.
213

An amount equal to the net debit balance of other items of shareholders’ equity (including exchange differences on translating foreign operations, gains (losses) on valuation of investments in equity instruments measured at FVTOCI) shall be transferred from unappropriated earnings to a special reserve before any appropriation of earnings. Any special reserve appropriated may be reversed to the extent of the decrease in the net debit balance. According to Rule No. 10510001510 issued by the FSC on May 25, 2016, a special reserve accounted for 0.5% to 1.0% of the Bank’s annual earnings should be made when making the appropriations of earnings for the years from 2016 to 2018 to cope with the staff transformation due to financial technology development. The Bank may reverse the special reserve at the same amount with the actual spending on transitioning or settling its employees since 2017. When foreign shareholders are entitled to the distribution of dividends and the dividends’ amount includes the previous year’s profit-seeking enterprise income tax, the tax amount can be entitled to tax credit. The appropriations of earnings for the 2018 and 2017, which were approved in the shareholders’ meetings on June 20, 2018 and June 15, 2017, respectively, were as follows:
Appropriation of Earnings Dividends Per Share
(Dollars) 2017 2016 2017 2016 Legal reserve $ 856,165 $ 973,166 Appropriate (reversal) of special
reserve (214,292) 129,675 Cash dividends 1,397,306 1,306,774 $ 0.439 $ 0.420 Stock dividends 862,573 715,614 0.271 0.230 $ 2,901,752 $ 3,125,229 The appropriations of earnings for 2018 had been proposed by the Bank’s Board of Directors on March 26, 2019. The appropriations and dividends per share were as follows:
Appropriation
of Earnings Dividends Per Share (NT$)
Legal reserve $ 1,057,260 Special reserve 39,804 Cash dividends 1,471,134 $0.450 Stock dividends 866,334 0.265 $ 3,434,532 The appropriations of earnings for 2018 are subject to the resolution of the shareholders’ meeting to be held on June 19, 2019.
214
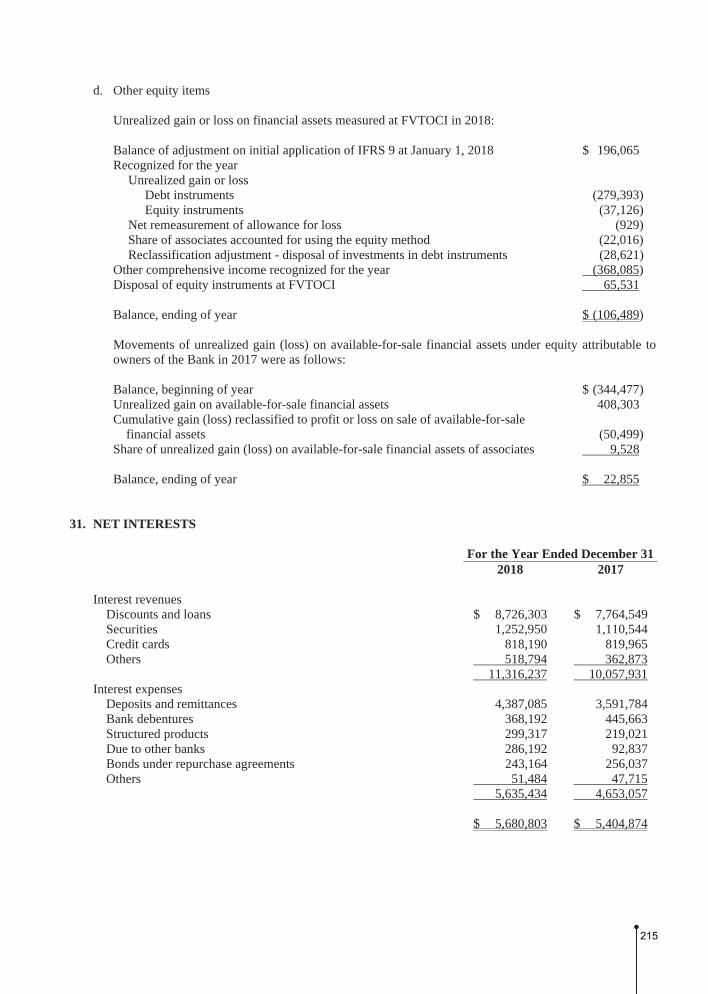
d. Other equity items Unrealized gain or loss on financial assets measured at FVTOCI in 2018: Balance of adjustment on initial application of IFRS 9 at January 1, 2018 $ 196,065 Recognized for the year
Unrealized gain or loss Debt instruments (279,393) Equity instruments (37,126)
Net remeasurement of allowance for loss (929) Share of associates accounted for using the equity method (22,016) Reclassification adjustment - disposal of investments in debt instruments (28,621)
Other comprehensive income recognized for the year (368,085) Disposal of equity instruments at FVTOCI 65,531 Balance, ending of year $ (106,489) Movements of unrealized gain (loss) on available-for-sale financial assets under equity attributable to owners of the Bank in 2017 were as follows: Balance, beginning of year $ (344,477) Unrealized gain on available-for-sale financial assets 408,303 Cumulative gain (loss) reclassified to profit or loss on sale of available-for-sale
financial assets (50,499) Share of unrealized gain (loss) on available-for-sale financial assets of associates 9,528 Balance, ending of year $ 22,855
31. NET INTERESTS
For the Year Ended December 31 2018 2017 Interest revenues
Discounts and loans $ 8,726,303 $ 7,764,549Securities 1,252,950 1,110,544Credit cards 818,190 819,965Others 518,794 362,873
11,316,237 10,057,931Interest expenses
Deposits and remittances 4,387,085 3,591,784Bank debentures 368,192 445,663Structured products 299,317 219,021Due to other banks 286,192 92,837Bonds under repurchase agreements 243,164 256,037Others 51,484 47,715
5,635,434 4,653,057 $ 5,680,803 $ 5,404,874
215

32. NET SERVICE FEE INCOME
For the Year Ended December 31 2018 2017 Service fee income
Wealth management $ 1,383,464 $ 1,405,341 Credit business 1,045,171 1,022,157 Credit cards 978,553 951,500 Service fee, brokering 265,140 261,619 Others 218,285 207,110 3,890,613 3,847,727
Service fee expense Benefit and chargeback fee 199,360 196,669 Visa and Master 157,537 152,078 Agency service fee 72,938 73,154 National credit card center fee 64,684 65,927 Credit investigation 46,522 45,994 Interbank service fee 46,122 42,091 Others 172,677 142,614
759,840 718,527 $ 3,130,773 $ 3,129,200
33. NET GAINS ON FINANCIAL ASSETS AND LIABILITIES AT FVTPL
For the Year Ended December 31 2018 2017 Realized gains $ 1,354,054 $ 1,433,686 Valuation gains (loss) (220,958) 160,180 Net interests 350,232 127,548 Dividends 22,632 10,803 $ 1,505,960 $ 1,732,217
34. EMPLOYEE BENEFITS EXPENSE
For the Year Ended December 31 2018 2017 Salaries $ 3,095,932 $ 3,030,685 Labor and health insurance 218,586 218,636 Post-employment benefits (Note 29) 150,633 143,343 Others 373,007 275,135 $ 3,838,158 $ 3,667,799
216

According to the Articles that if there be net income before income tax, remuneration of directors and employees’ compensation, the Bank should retain an employees' compensation of 3.5%-4.5% and a remuneration of directors no greater than 1.5%. On March 26, 2019 the Bank’s Board of Directors resolved to pay employees’ compensation of $152,444 thousand and remuneration of directors of $50,814 thousand for the year ended December 31, 2018, both in cash. On March 21, 2018 the Bank’s Board of Directors resolved to pay employees’ compensation of $126,300 thousand and remuneration of directors of $42,100 thousand for the year ended December 31, 2017, both in cash. If there is a change in the amounts after the financial statements for the year ended December 31, 2018 were authorized for issue, the differences are recorded as a change in the accounting estimate. There was no difference between the actual amounts of employees’ compensation and remuneration of directors paid and the amounts recognized in the financial statements for the year ended December 31, 2017. Information on the employees’ compensation and remuneration of directors resolved by the Bank’s Board of Directors in 2019 and 2018 is available at the Market Observation Post System website of the Taiwan Stock Exchange.
35. DEPRECIATION AND AMORTIZATION
For the Year Ended December 31 2018 2017 Depreciation (Note 20) $ 222,608 $ 220,196 Amortization $ 27,431 $ 27,946
36. OTHER GENERAL AND ADMINISTRATIVE EXPENSES
For the Year Ended December 31 2018 2017 Tax and government fees $ 605,600 $ 578,778 Rental 444,482 440,427 Marketing and advertising 405,262 403,685 Software 188,957 184,352 Telecommunications 165,201 164,686 Others 737,296 709,769 $ 2,546,798 $ 2,481,697
217

37. INCOME TAX EXPENSE a. Income tax expense recognized in profit or loss
The major components of tax expenses were as follows: For the Year Ended December 31 2018 2017 Current tax expense
Current period $ 319,342 $ 367,768 Prior years (772) (3,607) 318,570 364,161
Deferred tax expense Current period 318,458 50,823 Effect of change in tax rate (91,040) - Prior years (1,710) (1,223)
Deferred tax expense 225,708 49,600 Income tax expense recognized in profit or loss $ 544,278 $ 413,761 A reconciliation of accounting income and income tax expense recognized in profit or loss is as follows: For the Year Ended December 31 2018 2017 Income before income tax $ 4,068,479 $ 3,267,644 Income tax expense calculated at the statutory rate $ 836,802 $ 580,792 Income from offshore banking unit (OBU) (281,594) (153,740)Tax-exempted investment income (314,653) (373,349)Tax-exempted other items (64,470) 77,010 Unrecognized loss carryforwards (11,696) (69,413)Unrecognized deductible temporary differences 181,124 - Additional income tax under the Alternative Minimum Tax Act 254,199 324,786 Income tax on unappropriated earnings - 365 Overseas branch income tax 38,088 29,482 Adjustments for prior years’ tax (2,482) (4,830)Effect of change in tax rate (91,040) - Others - 2,658 Income tax expense recognized in profit or loss $ 544,278 $ 413,761 The tax rate applicable to the Bank were 17% and 20% in 2017 and 2018, respectively. In addition, the rate of the corporate surtax applicable to the 2018 unappropriated earnings will be reduced from 10% to 5%. 2019 appropriation of earnings is subject to the shareholders’ meeting in June, 2019, and the income tax rate of the unappropriated earnings in 2018 will be 5%.
218
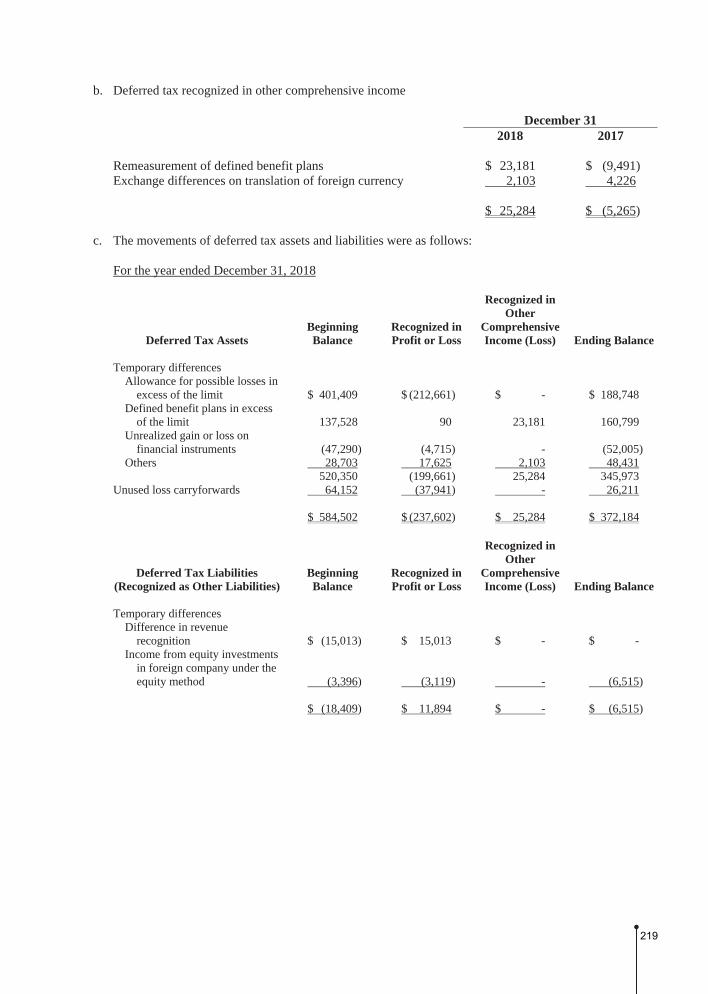
b. Deferred tax recognized in other comprehensive income December 31 2018 2017 Remeasurement of defined benefit plans $ 23,181 $ (9,491) Exchange differences on translation of foreign currency 2,103 4,226 $ 25,284 $ (5,265)
c. The movements of deferred tax assets and liabilities were as follows:
For the year ended December 31, 2018
Deferred Tax Assets Beginning Balance
Recognized in Profit or Loss
Recognized in Other
Comprehensive Income (Loss) Ending Balance
Temporary differences
Allowance for possible losses in excess of the limit $ 401,409 $ (212,661) $ - $ 188,748
Defined benefit plans in excess of the limit 137,528 90 23,181 160,799
Unrealized gain or loss on financial instruments (47,290) (4,715) - (52,005)
Others 28,703 17,625 2,103 48,431 520,350 (199,661) 25,284 345,973 Unused loss carryforwards 64,152 (37,941) - 26,211 $ 584,502 $ (237,602) $ 25,284 $ 372,184
Deferred Tax Liabilities (Recognized as Other Liabilities)
Beginning Balance
Recognized in Profit or Loss
Recognized in Other
Comprehensive Income (Loss) Ending Balance
Temporary differences
Difference in revenue recognition $ (15,013) $ 15,013 $ - $ -
Income from equity investments in foreign company under the equity method (3,396) (3,119) - (6,515)
$ (18,409) $ 11,894 $ - $ (6,515)
219

For the year ended December 31, 2017
Deferred Tax Assets Beginning Balance
Recognized in Profit or Loss
Recognized in Other
Comprehensive Income (Loss) Ending Balance
Temporary differences
Allowance for possible losses in excess of the limit $ 402,565 $ (1,156) $ - $ 401,409
Defined benefit plans 158,608 (11,589) (9,491) 137,528 Unrealized gain or loss on
financial instruments (43,551) (3,739) - (47,290) Others 29,503 (5,026) 4,226 28,703
547,125 (21,510) (5,265) 520,350 Unused loss carryforwards 87,979 (23,827) - 64,152 $ 635,104 $ (45,337) $ (5,265) $ 584,502
Deferred Tax Liabilities (Recognized as Other Liabilities)
Beginning Balance
Recognized in Profit or Loss
Recognized in Other
Comprehensive Income (Loss) Ending Balance
Temporary differences
Difference in revenue recognition $ (14,058) $ (955) $ - $ (15,013)
Income from equity investments in foreign company under the equity method (88) (3,308) - (3,396)
$ (14,146) $ (4,263) $ - $ (18,409)
d. Items not recognized as deferred tax assets
December 31 2018 2017 Loss carryforwards The Bank
Expire in 2018 $ - $ 2,044,870 Expire in 2021 133,968 133,968
$ 133,968 $ 2,178,838 FEIS
Expire in 2021 $ 4,942 $ 4,942 Expire in 2022 22,380 22,380 Expire in 2023 10,626 10,626 Expire in 2024 1,920 1,920 $ 39,868 $ 39,868
Deductible temporary differences Allowance for possible losses in excess of the limit $ 905,618 $ -
220

e. Information about unused loss carryforwards As of December 31, 2018, loss carryforwards comprised: Expiry Year Unused Amount The Bank 2021 $ 133,968 (assessed) FEIS 2019 44,350 (assessed) 2020 53,563 (assessed) 2021 38,085 (assessed) 2022 22,380 (assessed) 2023 10,626 (assessed) 2024 1,920 (assessed) $ 170,924
f. Income tax assessments
The income tax returns of the Bank through 2014 had been assessed by the tax authorities. The income tax returns of FEAMC, and FEIS through 2016 had been assessed by the tax authorities.
38. EARNINGS PER SHARE
The earnings per share (EPS) disclosed in the consolidated income statement are based on net income attributable to owners of the Bank.
Unit: NT$ Per Share For the Year Ended December 31 2018 2017 Basic EPS $ 1.08 $ 0.87 Diluted EPS $ 1.07 $ 0.84 The net income and weighted average number of ordinary shares outstanding for EPS calculation were as follows: Net Income for the Year For the Year Ended December 31 2018 2017 Net income attributable to owners of the Bank $ 3,524,201 $ 2,853,883 Effect of dilutive potential ordinary shares
Euro Convertible Bonds 3,420 44,029 Net income used in the computation of diluted EPS $ 3,527,621 $ 2,897,912
221

Number of Ordinary Shares (In Thousand Shares) For the Year Ended December 31 2018 2017 Weighted average number of ordinary shares in the computation of
basic EPS 3,269,186 3,269,186 Effect of dilutive potential ordinary shares
Euro Convertible Bonds 15,785 151,621 Employees’ compensation 18,516 16,289
Weighted average number of ordinary shares used in the
computation of diluted EPS 3,303,487 3,437,096 The weighted average number of ordinary shares outstanding for 2017 EPS calculation was retroactively adjusted to the issuance of stock dividends. The basic and diluted after-tax EPS were adjusted retrospectively as follows:
Before
Adjustment After
Adjustment Basic EPS $ 0.90 $ 0.87 Diluted EPS $ 0.86 $ 0.84 Employees’ compensation for the current year should be considered in calculating the weighted-average number of shares outstanding used for calculating diluted EPS. The dilutive effect of the potential shares should be included in the calculation of diluted EPS until the board meeting resolves the number of shares to be distributed as employees’ compensation at their board meeting in the following year.
39. RELATED-PARTY TRANSACTIONS The Bank and its subsidiaries had significant business transactions with the following related parties:
Related Party Relationship with the Bank and Its Subsidiaries Dah Chung Bills Finance Corp. Association Ding Ding Integrated Marketing Service Co. Chairman is the vice-chairman of the Bank Asia Cement Corp. Chairman is the vice-chairman of the Bank Far Eastern Department Store Corp. Chairman is the vice-chairman of the Bank Yuan Ding Co., Ltd. Chairman is the vice-chairman of the Bank Ding Ding Hotel Co., Ltd. Chairman is the vice-chairman of the Bank New Century InfoComm Tech Co., Ltd. Chairman is the vice-chairman of the Bank U-Ming Marine Transport Corp. Chairman is the vice-chairman of the Bank Oriental Union Chemical Corporation Chairman is the vice-chairman of the Bank Far Eastern New Century Corp. Chairman is the vice-chairman of the Bank Far EasTone Telecommunications Corporation Chairman is the vice-chairman of the Bank U-Ming Marine Transport (Singapore) Private, Ltd. Chairman of parent company is the vice-chairman of
the Bank Everest Textile Co., Ltd. Chairman is a second-degree relative of the vice
chairman of the Bank Yuan Long Stainless Steel Co. Substantive related party since September 2017 Pacific SOGO Department Stores Corporation Substantive related party since September 2017 Others The Bank’s chairman, vice-chairman, managers,
their second-degree relatives or substantive related party
222

The significant transactions and account balances with the above parties (in addition to those disclosed in other notes) are summarized as follows: a. Loans to other banks
Related Party
Highest Balance in
Current YearEnding Balance
Interest Revenues
Interest Rates
Dah Chung Bills Finance Corp. For the year ended December 31
2018 $ 1,600,000 $ - $ 1,153 0.34%-0.41%2017 $ 2,300,000 $ 500,000 $ 2,095 0.20%-0.42%
b. Loans
Number of Accounts and Highest Balance
in Current Ending Nonperforming
Transactions Terms
Different from Those
for Unrelated
Category Related Party Year Balance Normal Loans Loans Collateral Parties For the year ended December 31, 2018
Consumer loans Five individuals $ 1,847 $ 801 $ 801 $ - Unsecured loan Note 2Loans for residential
mortgage Twenty five individuals 281,695 254,190 254,190 - Real estate Note 2
Others Yuan Long Stainless Steel Co. 1,706,572 1,706,000 1,706,000 - Real estate Note 2 Asia Cement Corp. 600,000 400,000 400,000 - Stock listed on TWSE Note 2 Far Eastern New Century Corp. 390,000 300,000 300,000 - Machinery Note 2 Others(Note 1) 1,889,065 86,000 86,000 - Real estate, ship and Note 2 certificates of deposit, $ 2,746,991 $ 2,746,991 $ - unquoted stock, and
listed on TWSE
For the year ended December 31, 2017
Consumer loans Three individuals $ 1,885 $ 1,645 $ 1,645 $ - Unsecured loan Note 2 Loans for residential
mortgage Twenty one individuals 207,796 193,154 193,154 - Real estate Note 2
Others Yuan Long Stainless Steel Co. 1,740,000 1,520,000 1,520,000 - Real estate Note 2 Asia Cement Corp. 600,000 600,000 600,000 - Stock listed on TWSE Note 2 Others(Note 1) 3,050,000 75,000 75,000 - Unquoted stock, ship Note 2 and certificates of $ 2,389,799 $ 2,389,799 $ - deposit, machinery,
real estate, and stock listed on TWSE and list stock
Note 1: The individual amount does not exceed 10% of the total disclosure amount. Note 2: The terms of the loans were no superior to those for unrelated parties.
Interest Rate Interest
Revenues Provision for
Possible Losses For the year ended December 31
2018 0.99% - 3.68% $ 30,835 $ 3,877 2017 0.90% - 2.24% $ 18,138 $ 7,809
Balances of related allowance for possible losses were $28,741 thousand and $24,864 thousand as of December 31, 2018 and 2017, respectively.
223

c. Guarantees
Highest Balance in Current Ending
Reserve for Guarantee
Related Party Year Balance Obligations Interest Rate Collateral For the year ended December 31, 2018 Yuan Long Stainless Steel Co. $ 60,000 $ 30,000 $ 300 0.60% Machinery Ding Ding Hotel Co., Ltd. 20,000 20,000 200 0.80% Unquoted stock Yuan Ding Investment Co. 13,000 13,000 130 0.80% Unquoted stock Others(Note) 749,835 - - 0.45%-0.80% Real estate, unquoted stock, ship and $ 63,000 $ 630 certificates of deposit For the year ended December 31, 2017 Oriental Union Chemical Corporation 130,000 $ 130,000 $ 1,300 0.50% Unquoted stock Yuan Long Stainless Steel Co. 30,000 30,000 300 0.60% Machinery Ding Ding Hotel Co., Ltd. 70,000 20,000 200 0.50%-0.80% Unquoted stock Others(Note) 33,935 32,835 328 0.50%-0.80% Real estate, unquoted stock, and certificates $ 212,835 $ 2,128 of deposit
Note: The individual amount does not exceed 10% of the total disclosure amount.
d. Letters of credit issued
December 31 2018 2017 Yuan Long Stainless Steel Co. $ 8,664 $ - Everest Textile Co., Ltd. 3,331 10,537 Far Eastern Department Store Corp. - 17,908 $ 11,995 $ 28,445
e. Security transactions - buy and sell
Resale Repurchase Held for Trading Short Sales Agreement - Agreement - Buy Sell Buy Sell Bonds Bonds Dah Chung Bills Finance Corp. For the year ended
December 31 2018 $ - $ 100,000 $ - $ - $ 9,977,023 $ -2017 $ 150,000 $ 150,000 $ 150,000 $ 50,000 $ 39,362,203 $ -
224

f. Derivative instruments Derivative Contract Nominal Valuation Balance Sheet
Related Party Instrument Period Amount Gain (Loss) Account Balance For the year ended December 31, 2018
U-Ming Marine Transport
Corp. Cross-currency swap
contracts 2018.12.03 -
2019.01.07 $ 307,330 $ (805 ) Financial liabilities at FVTPL $ 335
U-Ming Marine Transport (Singapore) Private, Ltd.
Interest rate swap contracts
2012.09.27 - 2027.09.30
3,489,425 15,320 Financial assets at FVTPL 16,413
Financial liabilities at FVTPL 13,051 Far Eastern New Century
Corp. Forward exchange
contracts 2018.11.27 -
2019.03.27 439,107 3,354 Financial assets at FVTPL 4,194
Financial liabilities at FVTPL 840 New Century InfoComm
Tech Co., Ltd. Foreign-currency
swap contracts 2018.10.29 -
2019.01.31 537,828 (928 ) Financial assets at FVTPL 30
Financial liabilities at FVTPL 958 Asia Cement Corp. Cross-currency swap
contracts 2018.12.25 -
2021.09.15 460,995 489 Financial assets at FVTPL 2,244
Dah Chung Bills Finance Corp.
Domestic convertible
2016.01.19 - 2019.06.16
20,000 (14,405 ) Financial assets at FVTPL 450
(exchangeable) bond asset swap contracts
Financial liabilities at FVTPL 69
For the year ended December 31, 2017
U-Ming Marine Transport
Corp. Cross-currency swap
contracts 2017.06.16 -
2018.06.28 5,671,120 (8,066 ) Financial assets at FVTPL $ 48,734
U-Ming Marine Transport (Singapore) Private, Ltd.
Interest rate swap contracts
2012.09.27 - 2022.10.25
966,329 (112 ) Financial liabilities at FVTPL 11,959
Far Eastern New Century Corp.
Forward exchange contracts
2017.11.06 - 2018.02.26
1,007,212 5,651 Financial assets at FVTPL 7,391
Financial liabilities at FVTPL 1,740 New Century InfoComm
Tech Co., Ltd. Foreign-currency
swap contracts 2017.12.27 -
2018.02.26 298,480 (458 ) Financial liabilities at FVTPL 458
Dah Chung Bills Finance Corp.
Domestic convertible
2015.05.18 - 2019.06.16
225,000 (30,224 ) Financial assets at FVTPL 15,416
(exchangeable) bond asset swap contracts
Financial liabilities at FVTPL 630
g. Deposits
December 31 2018 2017 Deposits of related parties (each account balance did not exceed
5% of total deposits) $44,743,009 $44,426,319 Interest rate 0% - 6.08% 0% - 6.08%
For the Year Ended December 31 2018 2017 Interest expenses $ 473,588 $ 228,739
h. Service fee expense
For the Year Ended December 31 2018 2017 Ding Ding Integrated Marketing Service Co. $ 128,252 $ 144,650 Far EasTone Telecommunications Corporation 21,418 - Far Eastern Department Store Corp. 19,465 18,534 $ 169,135 $ 163,184
225

i. Operating expenses For the Year Ended December 31 2018 2017 Marketing and advertising - Pacific SOGO Department Stores
Corp. $ 86,303 $ 44,663 Rental - Yuan Ding Co., Ltd. 84,617 79,068 Marketing and advertising - Far Eastern Department Store Corp. 84,393 116,629 Marketing and advertising - Ding Ding Hotel Co., Ltd. 13,422 16,801 $ 268,735 $ 257,161 Note: Pacific SOGO Department Stores Corp. has been a related party since September 2017, as a result, the prior period accounts were prepared for comparison with the same period. The Bank rented part of its office premises from Yuan Ding Co., Ltd. Based on the lease agreements, the rents were payable monthly.
j. Compensation of key management personnel
For the Year Ended December 31 2018 2017 Short-term employee benefits $ 177,647 $ 166,913 Post-employment benefits 2,189 2,618 $ 179,836 $ 169,531
40. PLEDGED ASSETS
December 31 2018 2017 FVTOCI - 2018
Government bonds $ 3,586,922 $ - Negotiable certificates of deposits issued by the central bank 3,306,146 -
Available-for-sale financial assets - 2017 Government bonds - 3,602,186 Negotiable certificates of deposits issued by the central bank - 3,003,045
Other financial assets - deposits with original maturity more than 3 months 894,600 549,240
$ 7,787,668 $ 7,154,471 The negotiable certificates of deposits issued by the Central Bank and deposits with original maturity more than 3 months have been pledged as collaterals to back the extension of intraday credit in the Central Bank’s real-time gross settlement system. The balance of intraday credit and the amount of collateral may vary at any time. The government bonds had been provided as the reserve for compensation of trust department as well as security bond for provisional seizures of the debtors’ properties.
226

41. SIGNIFICANT CONTINGENT LIABILITIES AND UNRECOGNIZED COMMITMENTS
In addition to those mentioned in Note 44, the Bank and its subsidiaries’ contingent liabilities and commitments resulting from operating activities as of December 31, 2018 and 2017 are summarized as follows: a. Operating leases commitment
The maturity analysis of rental payments under non-cancellable operating leases was as follows: December 31 2018 2017 Within one year $ 374,568 $ 366,779 After one year but within five years 528,106 687,092 After five years 49,598 69,942 $ 952,272 $ 1,123,813
b. Balance sheets and income statements of trust accounts and the trust assets lists were as follows:
Balance Sheets of Trust Accounts
December 31 2018 2017 Assets Deposits in banks $ 5,397,051 $ 5,495,110Accounts receivable 17,043 14,672Funds 41,006,506 38,592,345Equity stocks 4,955,244 5,175,789Bond investments 5,468 5,434Real estate, net 3,878,851 1,240,973Marketable securities in custody 10,924,845 7,942,426Others 1,793,961 1,513,200 $ 67,978,969 $ 59,979,949 Liabilities Accounts payable $ 1,920 $ 3,158Income tax payable 196 189Marketable securities in custody payable 10,924,845 7,942,426Trust capital 56,058,747 50,359,002Reserve and earnings 993,261 1,675,174 $ 67,978,969 $ 59,979,949
227

Income Statements of Trust Accounts
For the Year Ended December 31 2018 2017 Trust revenue
Interest $ 37,404 $ 35,618 Cash dividends 1,870,890 1,640,769 Unrealized investment gain - 4,851 Revenue from stock lending 16 75 Others 159 19,075
1,908,469 1,700,388 Trust expenses
Management 41,951 48,014 Supervision 487 477 Service charges 8,743 16,259 Taxes 33,976 2,177 Service fee for stock affairs - 1 Service fee for stock lending 1 2 Realized investment loss 569,646 366,599 Unrealized investment loss 89,346 - 744,150 433,529
Income before tax 1,164,319 1,266,859 Income tax 396 391 Net income $ 1,163,923 $ 1,266,468
Trust Asset Lists
December 31 2018 2017 Deposits in banks $ 5,397,051 $ 5,495,110Accounts receivable 17,043 14,672Funds 41,006,506 38,592,345Equity stocks 4,955,244 5,175,789Bonds investments 5,468 5,434Real estate, net
Land 2,766,640 591,940Building 39,743 25,211Construction in progress 1,072,468 623,822
Marketable securities in custody 10,924,845 7,942,426Others 1,793,961 1,513,200 $ 67,978,969 $ 59,979,949 As of December 31, 2018 and 2017, funds amounting to $1,393,772 thousand and $1,183,824 thousand, respectively, had been recognized in the OBU’s books as investment in overseas securities through Non-discretionary Pecuniary Trust of the OBU.
228

42. UNSETTLED LITIGATION EVENTS Regarding the claims of the Bank against Allied Material Technology Co., in October 2017, the Taiwan High Court ruled that the Bank shall pay $244,563 thousand plus interest to other banks (the amount was derived from the reorganization of Allied Material Technology Co.). The Bank has appealed in accordance with laws and regulations. The Supreme Court remanded the case to the Taiwan High Court on December 20, 2018. Based on attorney’s assessment of the remand, the probability of winning the litigation may be high. Accordingly, the Bank hasn’t evaluated related liabilities.
43. EXCHANGE RATE OF FINANCIAL ASSETS AND LIABILITIES DENOMINATED IN
FOREIGN CURRENCIES The significant financial assets and liabilities denominated in foreign currencies were as follows:
December 31 2018 2017
Foreign
Currencies Exchange RateNew Taiwan
Dollars Foreign
Currencies Exchange Rate New Taiwan
Dollars Financial assets Monetary items
USD $ 3,847,847 30.733 $ 118,255,874 $ 3,349,475 29.848 $ 99,975,133HKD 3,129,424 3.924 12,279,860 2,978,848 3.819 11,376,220AUD 457,217 21.670 9,907,900 506,770 23.260 11,787,470CNY 928,509 4.473 4,153,219 1,174,009 4.577 5,373,440JPY 12,639,326 0.278 3,518,788 8,504,053 0.265 2,253,574ZAR 1,316,853 2.130 2,804,897 1,034,693 2.421 2,504,990EUR 64,066 35.210 2,255,778 53,261 35.700 1,901,434SGD 36,216 22.480 814,145 1,643 22.320 36,675GBP 7,840 38.880 304,813 7,809 40.210 314,007CAD 10,243 22.580 231,284 16,429 23.780 390,683NZD 7,251 20.620 149,518 9,076 21.200 192,406
Financial liabilities Monetary items
USD 3,728,931 30.733 114,601,236 3,115,598 29.848 92,994,369HKD 3,086,761 3.924 12,112,450 2,934,977 3.819 11,208,676AUD 456,347 21.670 9,889,048 503,348 23.260 11,707,874CNY 932,046 4.473 4,169,043 1,181,070 4.577 5,405,758JPY 12,397,679 0.278 3,451,514 8,156,806 0.265 2,161,554ZAR 1,319,968 2.130 2,811,532 1,082,688 2.421 2,621,187EUR 66,480 35.210 2,340,753 53,705 35.700 1,917,278SGD 36,159 22.480 812,851 1,698 22.320 37,889GBP 7,782 38.880 302,562 7,929 40.210 318,839CAD 10,244 22.580 231,300 15,874 23.780 377,478NZD 7,326 20.620 151,067 9,527 21.200 201,970
44. FINANCIAL INSTRUMENTS
a. Information of fair value 1) Overview
Fair value is defined as the price the trader collected or paid in an ordinary transaction for disposal or acquisition of assets or transfer of liabilities on the measurement date. Financial instruments are initially recognized at fair value which is the transaction price in general terms. All financial instruments are subsequently measured at fair value except for financial instruments which are valued at amortized cost.
229

2) The definition of three levels of fair value information a) Level 1
Level 1 inputs are observable inputs that reflect quoted prices for identical financial instruments in an active market. A market is active if it has these characteristics: Products traded in the market are homogeneous; willing buyers and sellers can be found immediately and the price information is publicly available.
b) Level 2
Level 2 inputs are observable inputs other than quoted prices for identical assets or liabilities in active markets, including direct inputs (such as market prices) or indirect inputs (such as prices derived from market prices).
c) Level 3
Level 3 inputs are unobservable items such as inputs derived through extrapolation or interpolation and thus cannot be corroborated by observable market data.
b. Fair value information - Financial instrument measured at fair value under repetitive basis
1) Information of the financial instruments measured at fair value categorized by level is as follows:
December 31, 2018 Repetitive Financial Instruments Total Level 1 Level 2 Level 3
Non-derivative financial assets and liabilities Assets Mandatorily at FVTPL
Bonds investments $ 8,324,585 $ 8,324,585 $ - $ -Equity investments 64,115 64,115 - -Bills investments 18,556,024 - 18,556,024 -
FVTOCI Equity instruments 1,265,822 930,492 - 335,330Debt instruments
Bonds investments 55,562,384 55,562,384 - -Bills investments 62,950,846 - 62,950,846 -
Derivative financial assets and liabilities Assets Mandatorily at FVTPL 3,783,114 351 3,698,910 83,853 Liabilities Financial liabilities at FVTPL (2,752,479) (161) (2,685,579) (66,739) Hybrid contract Mandatorily at FVTPL 15,779,663 544,395 15,235,268 - $ 163,534,074 $ 65,426,161 $ 97,755,469 $ 352,444
230

December 31, 2017
Repetitive Financial Instruments Total Level 1 Level 2 Level 3 Non-derivative financial assets and liabilities Assets Financial assets at FVTPL
Held for trading Bonds investments $ 5,238,586 $ 5,238,586 $ - $ -Equity investments 347,783 347,783 - -Bills investments 15,830,287 - 15,830,287 -Beneficiary certificates 50,473 50,473 - -
Financial assets designated as at FVTPL Convertible (exchangeable) bonds 5,680,038 5,680,038 - -
Available-for-sale Bonds investments 46,349,663 46,349,663 - -Equity investments 758,711 758,711 - -Bill investments 62,523,204 - 62,523,204 -
Liabilities Financial liabilities at FVTPL
Settlement coverage bonds payable of short sale (50,241) (50,241) - -
Derivative financial assets and liabilities Assets Financial assets at FVTPL
Held for trading 3,061,166 477 2,950,088 110,601 Liabilities Financial liabilities at FVTPL (4,268,880) (1,668) (4,263,385) (3,827) $ 135,520,790 $ 58,373,822 $ 77,040,194 $ 106,774
2) Valuation techniques for fair value measurement
When the Bank and its subsidiaries determine the fair value of financial instruments, they consider the market. If the market is active, then the fair value of the instruments will be consistent with quoted market prices. If the market is not active, then the fair value will be estimated by using a valuation model that is widely adopted by market participants or by referring to counterparties’ parameters or to parameters based on conditions and characteristics of financial instruments that are similar to those of the Bank and its subsidiaries’ instruments. The parameters of valuation model used to measure fair value of financial instruments are usually observable data from market, such as OTC, Reuters and Bloomberg’s offering price. The valuation department determines the scope of valuation model and assesses any uncertainty and its impact. In its assessment, the valuation department ensures the following: a) The consistency and adequacy of the market parameters used in the valuation; b) The appropriateness of the valuation model in light of the assumptions to be used, the internal
control and risk management framework, and the degree of mathematical expertise required for an independent unit to make the valuation;
231

c) Reliability of price information and other parameters used in the valuation and any model adjustments to be made on the basis of current market conditions.
3) Credit risk valuation adjustment
Credit risk valuation adjustment is for financial instrument transactions made outside the stock exchange, namely the transactions made over-the-counter, which could be mainly divided into credit value adjustment and debit value adjustment. The definition is as follows: a) Credit Value Adjustment (the “CVA”) is the reflection of possibility that counterparty is likely
to default and the possible loss that the counter party may not be able to reimburse entire market value.
b) Debit Value Adjustment (the “DVA”) is the reflection of possibility that the Bank is likely to
default and the uncertainly that the Bank may not be able to reimburse for the entire market value. The CVA is calculated by multiplying the probability of default (the “PD”), loss given default (the “LGD”) and exposure at default (the “EAD”) of counterparty together. In contrast, DVA is calculated by multiplying PD (under zero default rate of the counterparty), LGD and EAD of the Bank together. To take into account all risk factors involved in model-based fair value measurements, the Bank uses the disclosure guidelines issued by the TWSE on CVA and DVA, which are marked to market, using appropriate ratios such as LGD, PD, and EAD. This way, the credit risks on counterparties in OTC-derivative transactions as well as the Bank’s credit quality can be considered.
4) Transfers between Levels 1 and level 2 There was no transfer between Level 1 and Level 2 for the years ended December 31, 2018 and 2017.
5) Level 3 financial instruments
a) Movement of Level 3 financial assets
December 31, 2018
Item Beginning Balance
Valuation Increase in the Current Year Decrease in the Current Year
Ending Balance Included in
Profit or Loss
Included in Other
Comprehen-sive Income
Purchase or Issue
Transfer-in(Note)
Sale, Disposition or
Settlement
Transfer-out from Level 3
Mandatorily at FVTPL $ 110,601 $ (18,265 ) $ - $ 8,321 $ - $ (16,804 ) $ - $ 83,853
Financial assets at FVTOCI - - 25,675 309,655 - - 335,330
Total $ 110,601 $ (18,265 ) $ 25,675 $ 8,321 $ 309,655 $ (16,804 ) $ - $ 419,183
Note: Due to retroactive classification IFRS 9 in beginning balance of 2018.
December 31, 2017
Item Beginning Balance Valuation
Increase in the Current Year Decrease in the Current YearEnding Balance Purchase or
Issue Transfer-inSale,
Disposition or Settlement
Transfer-out from Level 3
Financial assets at FVTPL Held for trading - derivative
financial assets $ 92,774 $ 32,470 $ 48,024 $ - $ (62,667 ) $ - $ 110,601
232

b) Movements of Level 3 financial liabilities
December 31, 2018
Item Beginning Balance Valuation
Increase in the Current Year Decrease in the Current YearEnding Balance Purchase or
Issue Transfer-inSale,
Disposition or Settlement
Transfer-out from Level 3
Financial liabilities at FVTPL Derivative financial
liabilities $ 3,827 $ (1,675 ) $ 66,739 $ - $ (2,152 ) $ - $ 66,739
December 31, 2017
Item Beginning Balance Valuation
Increase in the Current Year Decrease in the Current YearEnding Balance Purchase or
Issue Transfer-inSale,
Disposition or Settlement
Transfer-out from Level 3
Financial liabilities at FVTPL Derivative financial
liabilities $ 6,818 $ (1,198 ) $ 3,481 $ - $ (5,274 ) $ - $ 3,827
c) Quantitative information of significant unobservable parameters used in fair value measurement
(Level 3 financial instruments)
Level 3 financial instruments mainly consist of credit default swap and investment in equity instrument at FVTOCI which have single major unobservable parameters; quantitative information is as follows:
Measured at Fair Value Based on Repetition
Fair Value as of December 31,
2018
Valuation Techniques
Significant Unobservable Parameters
Interval (Weighted-
average)
Relationship Between Parameters and Fair
Value Derivative financial assets December 31, 2018 $ 83,853 Default probability
model Credit separation 0.40%-3.50% The increase of credit
separation decreases its fair value.
December 31, 2017 110,601 Default probability model
Credit separation 0.80%-3.65% The increase of credit separation decreases its fair value.
Investments in equity December 31, 2018 299,678 Income approach -
cash dividend discount method
Without open market marketable discount
20.16% The increase of discount decreases its fair value.
24,809 Market approach - analogy company law
Without open market marketable discount
10.00% The increase of discount decreases its fair value.
10,843 Net asset value method
N/A N/A N/A
Derivative financial liabilities December 31, 2018 66,739 Default probability
model Credit separation 0.40%-3.50% The increase of credit
separation decreases its fair value.
December 31, 2017 3,827 Default probability model
Credit separation 0.80%-3.65% The increase of credit separation decreases its fair value.
d) Valuation procedures for Level 3 fair value
Valuation of Level 3 financial instruments is executed by a specific department and external expert responsible for fair value measurement which is independent from operating department. The Bank uses data from independent source to make valuation results close to market status, confirms whether the data source is independent, reliable and consistent with other data, inspects valuation parameters on a regular basis, updates parameters of the valuation model and makes any other necessary fair value adjustments in order to ensure proper valuation results.
233

e) The sensitivity analysis of reasonably possible alternative assumptions for fair value measurements categorized within Level 3 Had the valuation parameters for financial instruments categorized within Level 3 been 0.01% higher/lower, the impact on the profit or loss for the year would have been as follows:
Item Impact on Gains and Losses
December 31, 2018 December 31, 2017 Favorable Unfavorable Favorable Unfavorable
Assets Mandatorily at FVTPL $ 2,892 $ (2,893) $ 2,706 $ (2,706) Liabilities Financial liabilities at
FVTPL 4,300 (4,302) 958 (958) Had the valuation parameters for financial instruments categorized within Level 3 been 0.01% higher/lower, the impact on other comprehensive income or loss for the current year would have been as follows:
Item Impact on Other Comprehensive Income and LossesDecember 31, 2018 December 31, 2017
Favorable Unfavorable Favorable UnfavorableAssets Financial assets at FVTOCI $ 59 $ (59) $ - $ - The favorable and unfavorable movement refers to the fluctuation of fair values, which is calculated on the basis of valuation techniques involving the use of input parameters. However, the table above does not reflect the correlation between input parameters and their volatility.
c. Fair Value information - financial instruments not measured at fair value
The Bank and its subsidiaries consider that the book value of financial assets and liabilities which not measured at fair value is close to fair value, except for the book value of those measured at cost and of the items below:
2018 The fair value hierarchy of
financial instruments Book Value Fair Value Level 1 Level 2 Financial asset Investments in debt instrument
at amortized cost $ 2,588,654 $ 2,577,856 $ 2,577,856 $ -
2017 The fair value hierarchy of
financial instruments Book Value Fair Value Level 1 Level 2 Financial asset Held-to-maturity financial
assets $ 2,135,246 $ 2,135,189 $ 2,135,189 $ -Debt investments with no active
market 6,677,076 6,669,817 - 6,669,817234

The evaluation methods and assumptions for Level 2 financial instruments above are quoted from the offering price of Bloomberg and Reuters.
45. FINANCIAL RISK MANAGEMENT
a. Overview
The Bank’s risk management policy is to form a risk management-oriented culture, and to use both qualitative and quantitative indexes from internal and external risk management regulations in developing operating strategies. The Bank has set up an independent risk control department to implement and monitor risk management policies. The Bank’s risk management policies are established to identify and measure the risks faced by the Bank, to set appropriate risk limits and controls, to monitor risks and adherence to limits, and to achieve the target profit.
b. Risk management framework
The Board of Directors, the highest decision-making body of the Bank, has overall responsibility for the establishment and oversight of the Bank’s risk management framework. Asset and Liability Management Committee and Risk Management Committee have been formed to examine and manage the Bank’s risks, to assess the execution of risk management policies and to evaluate risk tolerance. The general manager is the convener, and is responsible for appointing members of committees. Risk Management Department comprising of corporate banking and consumer banking groups which directly manage credit extension risks with regard to their respective areas, and present risk management report to Risk Management Committee and the Board of Directors, regularly. The Internal Audit Department undertakes regular reviews of risk management controls and procedures, including risk management framework, operating procedures of risk management, and provides timely suggestion and improvement.
c. Credit risk 1) Definition and scope of credit risk
Credit risk is the risk of financial loss to the Bank if a borrower, issuer or counterparty to a financial instrument fails to meet its contractual obligations due to its credit deterioration or other factors, such as a dispute between the borrower and its counterparty. Credit risk includes all risks derived from on- and off-balance sheet business, and all credit risk related to products, businesses and positions.
235

2) Management policies on credit risk The Bank shall identify risk factors and consider appropriate risk evaluation and control process prior to taking the existing or new business. For all credit risks identified on- and off-balance sheet, adequate credit limits are set based on the same borrower, counterparty, related party, group, or industry. The Bank shall establish review mechanism to track and assess changes in each borrower’s or issuer’s financial position; regularly assess and manage asset quality, also strengthen the management of unusual borrowers and make appropriate allowance for possible losses if applicable.
3) The credit risk management processes and valuation methods for credit extension are as follows: 2018 a) The credit risk has increased significantly after original recognition
The Bank assesses the change in the risk of default over the expected duration of each type of credit asset on each reporting date in order to determine whether the credit risk has increased significantly since original recognition. For this assessment, the Bank's considerations show that the credit risk has increased significantly since original recognition and can be corroborated. The main considerations include the following: Qualitative Index The debtor’s payment is overdue for 30 - 89 days. Quantitative Index i. Unfavorable changes in current or projected operating, financial or economic conditions that
are expected to result in significant changes in the ability of the debtor to perform its debt obligations.
ii. Significant changes in actual or expected results of the debtor’s operations. iii. The credit risk of other financial instruments of the same debtor has increased significantly.
b) The definition of default and credit impairment on financial assets
The Bank's definition of default on financial assets is the same as the judgment of credit impairment on financial assets. If one or more of the following conditions are met, the Bank determines that the financial assets have defaulted and have credit impairment: Qualitative Index The debtor’s payment is overdue for more than 90 days. Quantitative Index If there is any evidence indicates that the debtor can not pay the contract, or the debtor is in a material financial difficulties as follows: i. The debtor has become bankrupt or may file for bankruptcy or financial restructuring. ii. The debtor has conformed to a non-performed loan by authorities. iii. The debtor has conducted a negotiation of debts or self-negotiating.
236

iv. The active market of the financial assets disappeared due to financial difficulties.
The aforementioned default and credit impairment definitions apply to all financial assets held by the Bank and are consistent with the definitions used for the internal credit risk management purposes of the financial assets and are applied to the relevant impairment assessment model. If the financial assets have not conformed to the definition of default and credit impairment on financial assets for 6 consecutive months, it would not be classified as a default and credit impairment on financial assets.
c) Write off policy
When the Bank can not reasonably expect the recoverable from the entire or partial financial assets, the entire or partial financial assets will be written off. The index of unexpected reasonably recoverable amount includes the following: i. The recovery of debt has stopped. ii. The debtor doesn’t have enough assets or income resource to pay the debt after assessment. Financial asset which has been written-off can do the recovery of debt and institute legal proceedings continuously under related policies.
d) Measurement of expected credit loss
i. Loan and receivables
The Bank considers both the 12-month and lifetime probability of default (“PD”) of the borrower with the loss given default (“LGD”), multiplying, the exposure at default (“EAD”), as well as the impact of time value, to calculate the 12-month ECLs and lifetime ECLs, respectively. The above “PD” and ”LGD” are applied to the credit business according to each group’s historical information (such as credit loss experience) from internal statistical data, and adjust historical data based on current observable and forward-looking macroeconomic information (such as GDP and unemployment rate), then calculate by applying the progressive one factor model respectively. When the Bank measured the credit loss of assets combination, the forward-looking information were taken into the PD’s consideration. Among them, the index of forward-looking adjustment in PD is predicted by the Corporate banking Sector which adopted the growth rate of real GDP in Taiwan and the Consumer banking Sector which adopted the unemployment rate in Taiwan. According to the measurement of predict loss in IFRS 9, the forward-looking adjustment in PD is requested to assess any consequences (at least 2 circumstances) and expresses with weighted-average probability. As a result, the Bank took the prediction authorities’ consensus forecasting into consideration and adopted the prediction value by at least 2 macroeconomic prediction authorities as the index of forward-looking adjustment. The Bank considered the estimate on credit loss with the forward-looking information by the above methods.
237
ii. The investments in debt instrument at amortized cost and at FVTOCI The measurement of predict credit loss consider the information of PD and LGD which is announced from the external credit ratings and Moody’s to calculate. The international credit rating authority has considered the forward-looking information when assessed the credit rating which is taken consideration to measure the predict credit loss by the Bank consequently.
2017 a) Classification of credit assets
Credit assets are grouped into 5 different categories according to the “Regulations Governing the Procedures for Banking Institutions to Evaluate Assets and Deal with Nonperforming/Non-accrual Loans.” Normal credit assets shall be classified as “Category One”, the remaining credit assets shall be further classified based on the collateral for loans and past due status as follows: Category Two-Special Mention loans; Category Three-Substandard; Category Four-Doubtful, and Category Five-Unrecoverable. Moreover, the Bank establishes internal requirements, such as the “Principles Governing the Procedures to Evaluate Assets and Deal with Nonperforming/Non-accrual Loans,” to manage problematic credit extension and credit collection and management.
b) Credit quality
Discounts and loans and receivables The Bank sets credit quality grades according to product features, business types, operating conditions, collaterals and credit rating. Credit risk from corporate banking is categorized according to the business types, collaterals, credit rating and financial position of borrowers; credit risk from consumer banking is assessed on a case-by-case basis, except for unsecured loans and credit card products, which are assessed by internal credit rating models. Interbank facilities, derivative financial instruments and investments in debt instruments Total trading limits are determined each year by reference to financial institutions’ operating results, credit rating, rating on THE BANKER, net worth and background of shareholders, with summaries submitted to the Credit Committee, and to the Managing Directors for approval. In each quarter, view the transaction limits for each financial institution in the Risk Management Committee. Derivative financial instruments transactions entered into counterparties from banking sectors are those categorized as investment grade, and they are controlled using relevant transaction limits for each counterparty. For individual counterparty, credit exposure is controlled using the limits placed on derivative instruments by both amounts and terms in the general credit approval process. Credit risk on debt instruments is evaluated by identifying the risk using the credit rating obtained from external institutions, credit quality, geographic situations and counterparty credit risk.
238

4) Credit risk hedging and mitigation policies a) The terms of credit facilities are determined in the light of assessments of probability and
amounts of default and collateral and guarantees are obtained, including bank deposit receipts, securities (such as treasury securities, government bonds, bank debentures, stocks and bonds guaranteed by financial institutions) and real estate such as land and buildings. Stocks listed on TWSE and TPEx are marked to market day to day, and changes in the value of their collaterals are monitored all the time; values of land and buildings are examined every time the contract is renewed.
b) Reduce loans to non-target customers to mitigate credit risk. c) Through policy mechanism, such as credit limits and credit regulation prior to the credit being
committed to customers, to control the quality of credit assets. Via post-loan management, concentration analysis, midway credit and review tracking to view assets quality and changes of each case. Master and monitor risk in time. Periodic reports and feedbacks to understand credit portfolios and overall credit risks, ensure risk offsets for continued effectiveness.
d) According to the Bank’s “Principles for Acceptance and Disposal of Collaterals,” collateral of
nonperforming loans secured through compulsory enforcement or participating distribution, if the minimum auction price or liquidation price of the collateral is too low and damage the Bank’s credit right, the Bank will participate in the auction or declare to undertake, for example, the minimum auction price is too low to compensate the principal and interest of loans but the collateral must not be difficult to dispose in the future. For collaterals tendered or undertaken, the Bank should actively seek buyers, and if the collateral is real estate, the Bank should dispose of it within the period prescribed under the Banking Law.
e) Other credit enhancements
If there are guarantee, strategic alliance or collaterals provided in the terms of the loan contracts which the Bank recognized as unsecured loan, when default events occur, the Bank will demand compensation from the guarantor, strategic alliance, transfer of credits to the Bank or disposal of collaterals to decrease credit risk.
5) The maximum credit risk exposure
The carrying amount represents the Bank’s maximum exposure to credit risk of the on-balance sheet assets, without taking into account the collaterals held or other credit enhancements. The amounts of the maximum credit exposure of the irrevocable off-balance commitments and guarantees, without taking into account the collaterals held or other credit enhancements, were as follows: December 31 2018 2017 Unused portion of credit card lines $ 179,890,598 $ 171,589,511Guarantees and standby L/Cs 19,271,353 17,455,518Irrevocable loan commitments 15,866,641 12,171,019
239

The breakdown of maximum credit risk exposure of the Bank according to whether collaterals are held or other credit enhancements exist is as follows: December 31, 2018 Maximum Credit Risk Exposure
With Collaterals Other Credit
Enhancements Without
Collaterals Total Balance sheet items Discounts and loans $ 248,098,498 $ 60,682,444 $ 76,142,075 $ 384,923,017Receivables - credit card - - 14,417,111 14,417,111Receivables - acceptances - 98,272 341,087 439,359 Off-Balance sheet items Unused portion of credit card
lines - - 179,890,598 179,890,598Guarantee 5,843,474 6,147,476 6,609,086 18,600,036Letters of credit issued 11,995 220,265 439,057 671,317Irrevocable loan commitments 798,815 - 15,067,826 15,866,641 $ 254,752,782 $ 67,148,457 $ 292,906,840 $ 614,808,079 December 31, 2017 Maximum Credit Risk Exposure
With Collaterals Other Credit
Enhancements Without
Collaterals Total Balance sheet items Discounts and loans $ 234,344,356 $ 52,712,990 $ 68,883,273 $ 355,940,619Receivables - credit card - - 14,786,253 14,786,253Receivables - acceptances - 175,516 245,900 421,416 Off-Balance sheet items Unused portion of credit card
lines - - 171,589,511 171,589,511Guarantee 4,592,188 5,387,303 6,529,898 16,509,389Letters of credit issued 35,601 244,973 665,555 946,129Irrevocable loan commitments 1,795,770 - 10,375,249 12,171,019 $ 240,767,915 $ 58,520,782 $ 273,075,639 $ 572,364,336 The Bank set the procedure for the range of available to classify as collaterals and estimation of collaterals with collaterals assessed management and estimation loans of collaterals which is in order to check the nonperforming loans. When loan contracts set the security of nonperforming loans, article of collaterals and definition of credit event occurrence, the quota and the repayment period can be reduced or regard as maturity to reduce the credit risk.
240
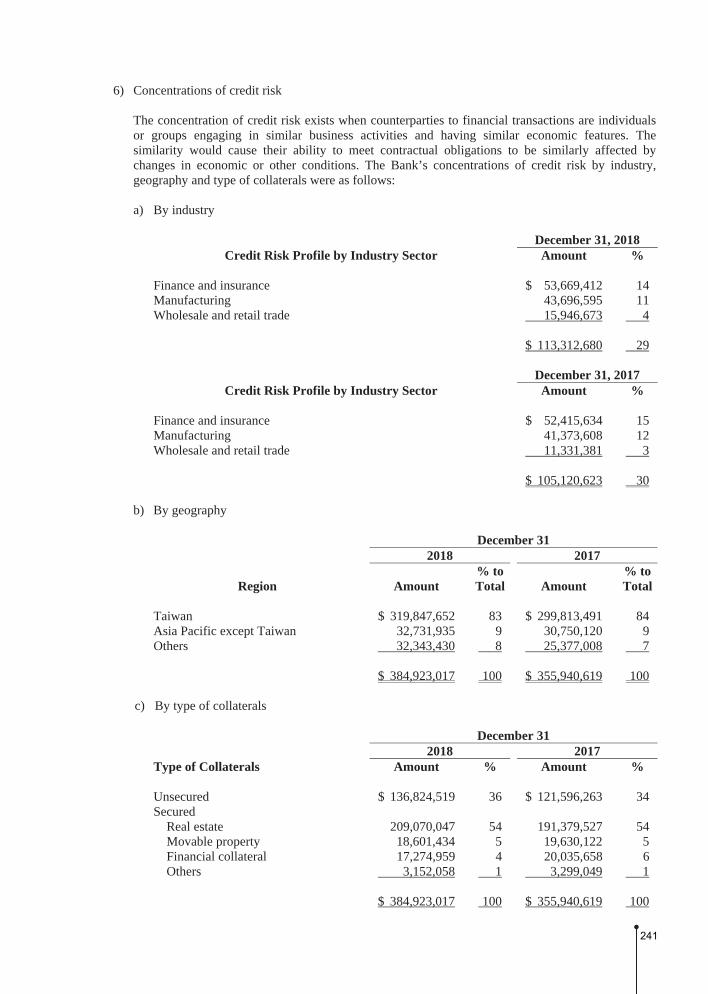
6) Concentrations of credit risk The concentration of credit risk exists when counterparties to financial transactions are individuals or groups engaging in similar business activities and having similar economic features. The similarity would cause their ability to meet contractual obligations to be similarly affected by changes in economic or other conditions. The Bank’s concentrations of credit risk by industry, geography and type of collaterals were as follows: a) By industry
December 31, 2018
Credit Risk Profile by Industry Sector Amount % Finance and insurance $ 53,669,412 14Manufacturing 43,696,595 11Wholesale and retail trade 15,946,673 4 $ 113,312,680 29
December 31, 2017 Credit Risk Profile by Industry Sector Amount %
Finance and insurance $ 52,415,634 15Manufacturing 41,373,608 12Wholesale and retail trade 11,331,381 3 $ 105,120,623 30
b) By geography
December 31 2018 2017
Region Amount % to Total Amount
% to Total
Taiwan $ 319,847,652 83 $ 299,813,491 84Asia Pacific except Taiwan 32,731,935 9 30,750,120 9Others 32,343,430 8 25,377,008 7 $ 384,923,017 100 $ 355,940,619 100
c) By type of collaterals December 31 2018 2017 Type of Collaterals Amount % Amount % Unsecured $ 136,824,519 36 $ 121,596,263 34Secured
Real estate 209,070,047 54 191,379,527 54Movable property 18,601,434 5 19,630,122 5Financial collateral 17,274,959 4 20,035,658 6Others 3,152,058 1 3,299,049 1 $ 384,923,017 100 $ 355,940,619 100
241

7) Continuing assessment of credit quality and any impairment of financial assets Some of the financial assets held by the Bank and its subsidiaries, such as cash and cash equivalents, due from the central bank and other banks, financial assets at FVTPL, securities purchased under resale agreements, refundable deposits and operating deposits, are assessed with low credit risk due to the good credit rating of the counterparties. An analysis of credit quality of financial assets other than those listed above is shown below:
242

a)
Cre
dit q
ualit
y an
alys
is o
f dis
coun
ts a
nd lo
ans a
nd re
ceiv
able
s - D
ecem
ber 3
1, 2
017
Dec
embe
r 31
, 201
7
Nei
ther
Pas
t due
Nor
Impa
ired
Past
Due
But
N
ot Im
pair
ed
(B)
Impa
ired
(C)
Tot
al
(A)+
(B)+
(C)
Allo
wan
ce fo
r Po
ssib
le L
osse
s (D
)
Net
Am
ount
(A
)+(B
)+(C
)-(D
) E
xcel
lent
G
ood
Mod
erat
e Sp
ecia
l Men
tion
Subt
otal
(A)
With
Obj
ectiv
e E
vide
nce
of
Indi
vidu
al
Impa
irm
ent
With
out
Obj
ectiv
e E
vide
nce
of
Indi
vidu
al
Impa
irm
ent
Dis
coun
ts a
nd lo
ans
$ 2
02,1
27,0
29 $
91
,546
,163
$
53,6
57,1
11 $
1,
464,
776
$ 3
48,7
95,0
79
$
3,60
4,98
1 $
3,
540,
559
$ 3
55,9
40,6
19 $
1,
005,
118
$
3,87
8,73
9 $
351
,056
,762
R
ecei
vabl
es
C
redi
t car
d
5,55
3,26
3
2,52
5,40
9
4,67
6,78
3
14,3
47
12,7
69,8
02
57
4,60
4
1,44
1,84
7
14,7
86,2
53
469,
259
2,
209
14
,314
,785
O
ther
s
1,28
5,40
6
686,
972
4,
203,
354
-
6,
175,
732
2,
572
67
0,90
9
6,84
9,21
3
579,
375
68
,084
6,20
1,75
4
243

b) An analysis of credit quality of discounts and loans neither past due nor impaired by business types-December 31, 2017
Neither Past Due Nor Impaired
Excellent Good Moderate Special Mention Total Corporate banking
Secured $ 24,577,665 $ 19,672,117 $ 4,307,119 $ 30,498 $ 48,587,399 Unsecured 9,855,194 39,597,169 45,050,962 1,107,894 95,611,219
Consumer banking Housing mortgage 156,815,282 9,900,793 617,144 - 167,333,219 Credit loans 6,506,427 7,654,052 2,574,079 326,384 17,060,942 Others 4,372,461 14,722,032 1,107,807 - 20,202,300
Total $ 202,127,029 $ 91,546,163 $ 53,657,111 $ 1,464,776 $ 348,795,079 c) Loans and receivables past due but not impaired-December 31, 2017
Financial assets past due 90 days or less are not considered impaired unless there is objective evidence that an impairment loss has been incurred. Financial assets might become past due but not impaired by reasons of borrowers’ late processing or other administrative delays. The aging analysis of loans and receivables past due but not impaired was as follows:
Past Due Items December 31, 2017
Up to 1 Month Over 1 Month to 3 Months Total
Discounts and loans Corporate banking $ 80,944 $ 154,465 $ 235,409 Consumer banking
Housing mortgage 2,116,878 283,789 2,400,667 Credit loans 485,657 114,219 599,876 Others 344,203 24,826 369,029
Total 3,027,682 577,299 3,604,981 Receivables
Credit card 505,595 69,009 574,604 Others - 2,572 2,572
244

d)
An
anal
ysis
of c
redi
t qua
lity
of se
curit
y in
vest
men
ts-D
ecem
ber 3
1, 2
017
D
ecem
ber
31, 2
017
Nei
ther
Pas
t Due
Nor
Impa
ired
Pa
st D
ue B
ut
Not
Impa
ired
(B
) Im
pair
ed (C
) T
otal
(A
)+(B
)+(C
)
Allo
wan
ce fo
r Po
ssib
le L
osse
s (D
)
Net
Am
ount
(A
)+(B
)+(C
)-(D
) E
xcel
lent
G
ood
Mod
erat
e Sp
ecia
l Men
tion
Subt
otal
(A)
Ava
ilabl
e-fo
r-sa
le fi
nanc
ial a
sset
s
B
ond
inve
stm
ents
$ 46
,349
,663
$
-
$ -
$
-
$ 46
,349
,663
$ -
$
-
$ 46
,349
,663
$
-
$ 46
,349
,663
B
ill in
vest
men
ts
62,5
23,2
04
-
-
-
62,5
23,2
04
-
-
62,5
23,2
04
-
62,5
23,2
04
Hel
d-to
-mat
urity
fina
ncia
l ass
ets
Bon
d in
vest
men
ts
2,13
5,24
6
-
-
-
2,13
5,24
6
-
-
2,
135,
246
-
2,
135,
246
Deb
t inv
estm
ents
with
no
activ
e m
arke
t
4,
009,
518
2,66
7,55
8
-
-
6,
677,
076
-
-
6,67
7,07
6
-
6,67
7,07
6 To
tal
$
115,
017,
631
$
2,66
7,55
8
$ -
$
-
$ 11
7,68
5,18
9
$ -
$
-
$ 11
7,68
5,18
9
$ -
$
117,
685,
189
The
anal
ysis
abo
ve e
xclu
des e
quity
inve
stm
ents
.
245
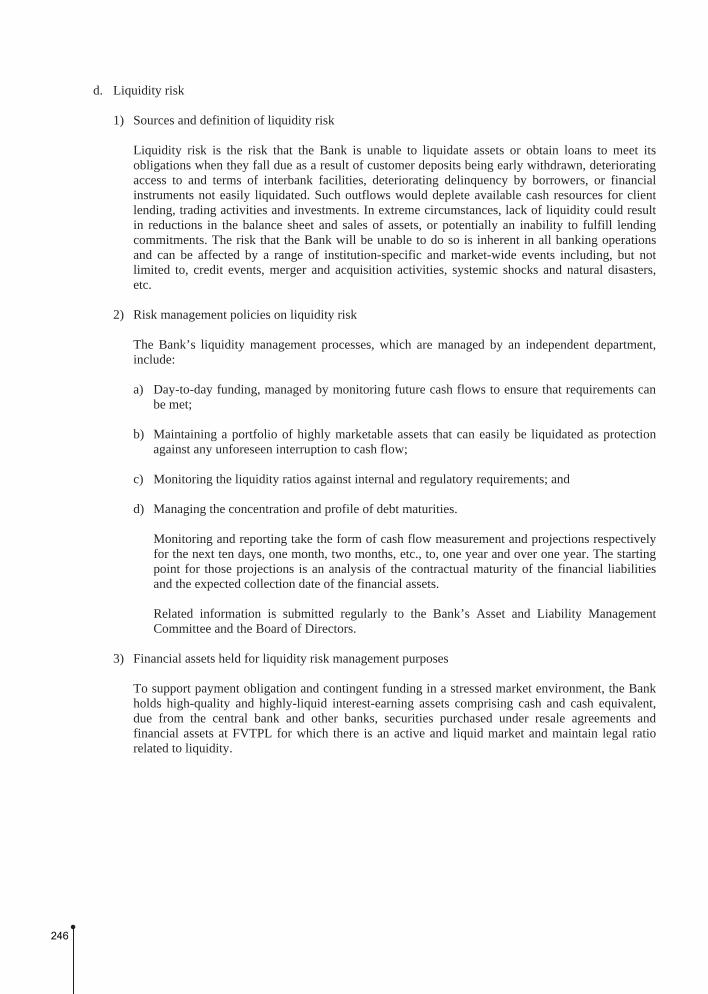
d. Liquidity risk 1) Sources and definition of liquidity risk
Liquidity risk is the risk that the Bank is unable to liquidate assets or obtain loans to meet its obligations when they fall due as a result of customer deposits being early withdrawn, deteriorating access to and terms of interbank facilities, deteriorating delinquency by borrowers, or financial instruments not easily liquidated. Such outflows would deplete available cash resources for client lending, trading activities and investments. In extreme circumstances, lack of liquidity could result in reductions in the balance sheet and sales of assets, or potentially an inability to fulfill lending commitments. The risk that the Bank will be unable to do so is inherent in all banking operations and can be affected by a range of institution-specific and market-wide events including, but not limited to, credit events, merger and acquisition activities, systemic shocks and natural disasters, etc.
2) Risk management policies on liquidity risk
The Bank’s liquidity management processes, which are managed by an independent department, include: a) Day-to-day funding, managed by monitoring future cash flows to ensure that requirements can
be met; b) Maintaining a portfolio of highly marketable assets that can easily be liquidated as protection
against any unforeseen interruption to cash flow; c) Monitoring the liquidity ratios against internal and regulatory requirements; and d) Managing the concentration and profile of debt maturities.
Monitoring and reporting take the form of cash flow measurement and projections respectively for the next ten days, one month, two months, etc., to, one year and over one year. The starting point for those projections is an analysis of the contractual maturity of the financial liabilities and the expected collection date of the financial assets. Related information is submitted regularly to the Bank’s Asset and Liability Management Committee and the Board of Directors.
3) Financial assets held for liquidity risk management purposes
To support payment obligation and contingent funding in a stressed market environment, the Bank holds high-quality and highly-liquid interest-earning assets comprising cash and cash equivalent, due from the central bank and other banks, securities purchased under resale agreements and financial assets at FVTPL for which there is an active and liquid market and maintain legal ratio related to liquidity.
246

4) Maturity analysis of non-derivative financial liabilities The table below presents the cash flows payable by the Bank under non-derivative financial liabilities by remaining contractual maturities at the date of the consolidated balance sheet.
December 31, 2018 Due in 30 Days Due Between 31 Days and
90 Days
Due Between 91 Days and
180 Days
Due Between 181 Days and
One Year
Due After One Year Total
Due to the central bank and other banks $ 8,715,791 $ 55,32,147 $ 1,382.985 $ 59,800 $ - $ 15,726,723 Securities sold under repurchase agreement 14,704,830 - - - - 14,704,830 Payables 3,975,153 1,254,124 672,467 619,621 743,857 7,265,222 Deposits and remittances 196,945,980 92,549,698 68,393,781 136,525,003 13,993,510 508,407,972 Bank debentures 1,900 - 3,000,000 - 15,000,000 18,001,900 Principal received on structured products 65,452 16,965 71,214 - 12,325,539 12,479,170 Other financial liabilities 480,000 134,190 39,909 92,791 689,285 1,436,175 Total $ 224,925,106 $ 99,487,124 $ 73,560,356 $ 137,297,215 $ 42,752,191 $ 578,021,992
December 31, 2017 Due in 30 Days
Due Between 31 Days and
90 Days
Due Between 91 Days and
180 Days
Due Between 181 Days and
One Year
Due After One Year Total
Due to the central bank and other banks $ 3,005,470 $ 3,731,384 $ 200,000 $ 23,920 $ - $ 6,960,774 Settlement coverage bonds payable of short sale 50,241 - - - - 50,241 Securities sold under repurchase agreement 12,943,304 - - - - 12,943,304 Payables 3,487,254 1,270,370 604,546 450,368 675,747 6,488,285 Deposits and remittances 193,355,538 85,621,816 64,791,402 105,119,158 23,504,269 472,392,183 Bank debentures 1,900 1,617,762 - 3,500,000 15,100,000 20,219,662 Principal received on structured products 277,530 70,989 193,172 41,586 5,899,236 6,482,513 Other financial liabilities 110,000 27,821 125,609 134,582 536,250 934,262 Total $ 213,231,237 $ 92,340,142 $ 65,914,729 $ 109,269,614 $ 45,715,502 $ 526,471,224
Note: The amounts disclosed in the tables are the contractual undiscounted cash flows, some of
which may not reconcile to the corresponding items in the consolidated balance sheet. In the maturity analysis of “deposits and remittance” disclosed in the above table, it is assumed that demand deposits are expected to be drawn down in the earliest period.
5) Maturity analysis of derivative financial liabilities
a) Derivative instruments settled on a net basis are include foreign exchange derivatives (foreign exchange options, non-deliverable forwards) and interest rate derivatives (interest rate swap options, interest rate swaps and other interest rate contracts settled on net cash flow). Maturity analysis of derivative financial liabilities that will be settled on a net basis is as follows:
December 31, 2018 Due in 30 Days
Due Between 31 Days and
90 Days
Due Between 91 Days and
180 Days
Due Between 181 Days and
One Year
Due After One Year Total
Derivative financial liabilities at FVTPL Foreign exchange derivatives $ 382 $ 558 $ 199 $ - $ - $ 1,139Interest rate derivatives 3,675 6,361 8,378 5,375 552,531 576,320
Total $ 4,057 $ 6,919 $ 8,577 $ 5,375 $ 552,531 $ 577,459
December 31, 2017 Due in 30 Days
Due Between 31 Days and
90 Days
Due Between 91 Days and
180 Days
Due Between 181 Days and
One Year
Due After One Year Total
Derivative financial liabilities at FVTPL Foreign exchange derivatives $ 4,098 $ 2,077 $ 425 $ 615 $ - $ 7,215Interest rate derivatives 1,894 7,571 312,944 29,936 405,449 757,794
Total $ 5,992 $ 9,648 $ 313,369 $ 30,551 $ 405,449 $ 765,009
Note: The amounts disclosed in the table are the contractual undiscounted cash flows, some of
which may not reconcile to the corresponding items in the consolidated balance sheet.
247

b) Derivative instruments settled on a gross basis are include foreign exchange derivatives (foreign exchange swaps, foreign exchange options), interest rate derivatives (cross currency swaps) and credit derivates (credit default swap). Maturity analysis of derivative financial liabilities that will be settled on a gross basis is as follows:
December 31, 2018 Due in 30 Days Due Between 31 Days and
90 Days
Due Between 91 Days and
180 Days
Due Between 181 Days and
One Year
Due After One Year Total
Derivative financial liabilities at FVTPL Foreign exchange derivatives
Cash outflow $ 66,817,020 $ 66,620,982 $ 43,980,954 $ 14,101,278 $ 1,363,279 $ 192,883,513 Cash inflow 66,388,975 66,181,803 43,707,316 14,043,361 1,386,102 191,707,557
Interest rate derivatives Cash outflow 921,990 - - - 614,660 1,536,650 Cash inflow 903,800 - - - 603,750 1,507,550
Credit derivatives Cash outflow - - - - - - Cash inflow 3,299 20,218 28,563 45,507 292,691 390,278
Subtotal of cash outflow 67,739,010 66,620,982 43,980,954 14,101,278 1,977,939 194,420,163 Subtotal of cash inflow 67,296,074 66,202,021 43,735,879 14,088,868 2,282,543 193,605,385 Net cash flow $ (442,936 ) $ (418,961 ) $ (245,075 ) $ (12,410 ) $ 304,604 $ (814,778 )
December 31, 2017 Due in 30 Days
Due Between 31 Days and
90 Days
Due Between 91 Days and
180 Days
Due Between 181 Days and
One Year
Due After One Year Total
Derivative financial liabilities at FVTPL Foreign exchange derivatives
Cash outflow $ 64,250,569 $ 74,585,209 $ 37,070,197 $ 20,639,148 $ 304,920 $ 196,850,043 Cash inflow 63,978,148 74,429,371 37,137,723 20,870,950 298,480 196,714,672
Interest rate derivatives Cash outflow - - - 1,498,750 - 1,498,750 Cash inflow - - - 1,492,400 - 1,492,400
Credit derivatives Cash outflow - - - - - - Cash inflow 2,232 9,058 11,665 23,331 144,496 190,782
Subtotal of cash outflow 64,250,569 74,585,209 37,070,197 22,137,898 304,920 198,348,793 Subtotal of cash inflow 63,980,380 74,438,429 37,149,388 22,386,681 442,976 198,397,854 Net cash flow $ (270,189 ) $ (146,780 ) $ 79,191 $ 248,783 $ 138,056 $ 49,061
Note: The amounts disclosed in the table are the contractual undiscounted cash flows, some of
which may not reconcile to the corresponding items in the consolidated balance sheet.
6) Maturity analysis of off-balance sheet items Maturity analysis of the off-balance sheet items that are requested to pay or realize the guarantee on the basis of their earliest possible contractual maturity is as follows:
December 31, 2018 Due in 30 Days Due Between 31 Days and
90 Days
Due Between 91 Days and
180 Days
Due Between 181 Days and One Year
Due After One Year Total
Developed and irrevocable loan commitments $ 15,866,641 $ - $ - $ - $ - $ 15,866,641 Irrevocable credit card commitments 179,890,598 - - - - 179,890,598 Issued but unused letters of credit 671,317 - - - - 671,317 Other guarantees 13,012,636 5,117,400 20,000 - 450,000 18,600,036 Total $ 209,441,192 $ 5,117,400 $ 20,000 $ - $ 450,000 $ 215,028,592
December 31, 2017 Due in 30 Days
Due Between 31 Days and
90 Days
Due Between 91 Days and
180 Days
Due Between 181 Days and One Year
Due After One Year Total
Developed and irrevocable loan commitments $ 12,171,019 $ - $ - $ - $ - $ 12,171,019 Irrevocable credit card commitments 171,589,511 - - - - 171,589,511 Issued but unused letters of credit 946,129 - - - - 946,129 Other guarantees 9,977,989 5,751,100 102,000 200,000 478,300 16,509,389 Total $ 194,684,648 $ 5,751,100 $ 102,000 $ 200,000 $ 478,300 $ 201,216,048
e. Market risk
1) Definition and scope of market risk Market risk is the risk that unfavorable changes in market prices, such as interest rates, foreign exchange rates, equity prices and commodity prices will affect the Bank’s income or its holdings of on- and off-balance sheet positions. The Bank’s market risk mainly comes from equity investment securities, interest rates and foreign exchange rates. Equity investment securities risk positions include stocks listed on TWSE and TPEx and convertible (exchangeable) bonds; interest rate risk positions include bonds and interest rate derivative instruments, such as fixed and floating interest rate swap; foreign exchange rate risk positions include foreign currencies and related derivative instruments, such as spot exchange, forward exchange, foreign currency swap and option.
248

2) Management policies of market risk
The Bank develops appropriate management process to identify, measure and monitor market risk, and to effectively manage and control credit limits, valuation of profits and losses, sensitivity analysis and stress tests of each financial instrument position. Besides, the Bank takes appropriate management strategy while facing market risk in its daily operating activities and management processes. The Bank separates its exposure to market risk in banking book and trading book, which are managed, monitored and disclosed by the Risk Management Department. A summary report, including suggestion, is submitted regularly to the Risk Management Committee and the Board of Directors.
3) Market risk management process a) Recognition and measurement
The Group’s operation and risk management sections both identify market risk factors of exposure positions, which are used to measure market risks. Market risk factors include interest rates, foreign exchange rates and market price of equity securities, and exposures, gains and losses and sensitivity (PVO1, Delta, Beta) etc. Measurement of investment portfolio is affected by interest rate risk, foreign exchange risk and price of equity securities.
b) Monitoring and reporting The Group’s risk management department regularly reviews market risk management objective, positions and control of gains and losses, sensitivity analysis and pressure test and reports to the Board of Directors. Therefore, the Board of Directors could well understand market risk control. The Group has established explicit notification process, the limit and stop-loss regulation for various transactions. Stop-loss order must be taken when the limit is reached, otherwise the trading department’s reasons and plans must be approved by the management, and the department should report to relevant committee regularly.
4) Management process of interest risk
Interest rate risk is the risk of loss or changes in the fair value resulting from interest rate or credit spread fluctuations. It includes interest rates or credit spread related to securities and derivative instruments. The Bank separates the interest rate risk positions between trading book and banking book. Financial instruments and commodity positions held for trading purpose or to hedge against trading book positions are carried in trading book. Positions held for trading purpose are those held with the intention of profiting from actual or forecast spread. Positions not belonging to trading book are carried in banking book. Management of interest rate risk in trading book a) Management process
To limit the loss within acceptable range, the Bank imposes trading limits and stop loss limits on trading room, traders and commodity; it also imposes monthly maximum loss limit on trading positions.
249

b) Valuation methods Securities are marked-to-market, and the risk of interest rate related derivative instruments are measured using DV01 and Vega. Both stop loss limits are controlled on a daily basis.
Management of interest rate risk in banking book Interest rate risk management of banking book is to improve interest risk management, capital efficiency and business operations. a) Strategies
To improve its capacity to adapt to changes, the Bank measures, manages and hedges changes in its profits and losses and economic values of balance sheet items arising from interest rate fluctuations.
b) Management process
Prior to undertaking interest rates related business, the Bank identifies re-pricing and yield curve risks, and measures the possible impact of changes in interest rate on profits and losses. The Bank analyzes and monitors position limits and various risk management objectives in respect of interest rates on a quarterly basis, and the results are submitted regularly to the Asset and Liability Management Committee and the Board of Directors. If the risk management objectives are found to be in excess of designated limits during the monitoring process, the Bank will report to the Asset and Liability Management Committee and propose remedial action to be taken.
c) Valuation methods Interest rate risk measures the re-pricing risk arising from different maturity or re-pricing dates of assets and liabilities carried in the banking book. To stabilize long-term profitability taking into account business growth, the Bank sets up various monitoring indexes, such as the ratio of interest rate sensitivity gap over total assets, for key holding periods. Those indexes are reported to and reviewed by management periodically.
5) Management of foreign exchange risk a) Definition of foreign exchange risk
Foreign exchange risk is the risk of loss or changes in fair value arising from open positions in currency due to exchange rate fluctuations. Foreign exchange transactions include spot exchange, forward exchange, non-deliverable forward and foreign currency option between New Taiwan dollars and a foreign currency or between two foreign currencies.
b) Foreign exchange risk management policies, process and valuation methods To manage foreign exchange risk and limit the loss within acceptable range, the Bank imposes trading limits and stop loss limits on trading room, traders and commodity; it also imposes monthly maximum loss limit on trading positions. Spot exchange, forward exchange, non-deliverable forward and foreign currency option are controlled collectively using Delta; foreign currency option is controlled using Vega. The stop loss limits are controlled on a daily basis.
250

6) Management of equity securities market risk a) Definition of equity market risk
Equity market risk is the risk arising from open positions in equity securities as a result of fluctuations in the market prices of individual securities.
b) Management processes of equity market risk
The Bank sets gross limits on overall positions, by industries, and by groups. For stock listed on TWSE and TPEx and beneficiary certificates, the Bank sets the limit of investment in each stock and stop loss/gain limits on overall and particular positions, which are monitored daily. A stop loss/gain order would be executed once a given stop price has been reached; otherwise, traders should report to the manager of its department, including reasons for not executing stop loss/gain order.
c) Measurement
The Bank manages market risk on the basis of closing prices of equity securities.
7) Valuation techniques of market risk a) Stress tests
Stress tests are performed by the Risk Management Department at least once a year to assess the impact of risk factors that have become extremely volatile on asset portfolios and risk tolerance, and to ensure that the Bank will be able to handle potential losses incurred during extreme, but plausible, events. The Bank applies market risk factors sensitivity analysis to analyze the impact on asset that could arise under extreme scenarios: i. Interest rate: Evaluate impacts on the values of interest-rate-based securities if yield curves
move in parallel manner. ii. Foreign exchange: Evaluate impacts on changes in foreign exchange rates. iii. Equity securities: Evaluate impacts on volatility of changes in stock prices and its related
derivatives. iv. Commodity: Evaluate impacts on volatility of changes in commodity prices and its related
derivatives. The Bank will submit the results of stress tests to the Board of Directors and Risk Management Committee as a reference of the Bank’s ability to counter adverse economic conditions.
b) Sensitivity analysis
i. Interest rate sensitivity Interest rate factor sensitivity (“DV01” or “PVBP”) measured at the balance sheet date is the impact on the discounted future cash flows of bonds and interest-rate-based derivative instruments for 1 basis points (“bps”) parallel shift in all yield curves or credit spread.
251

Assuming all other variables remain constant, where the interest rate increases/decreases by 1 bps, there would be a decrease of $10,472 thousand and an increase of $10,462 thousand in income before income tax for the year ended December 31, 2018. There would be a decrease of $1,811 thousand and an increase of $1,810 thousand in income before income tax for the year ended December 31, 2017. There would be a decrease/increase of $18,572 thousand and $12,268 thousand in other comprehensive income for the years ended December 31, 2018 and 2017, respectively.
ii. Foreign exchange sensitivity Foreign exchange rate factor sensitivity (“FX Delta”) measured at the balance sheet date is the impact on the values of foreign exchange positions for a 1% change in foreign exchange rates. Where the foreign exchange increases/decreases by 1%, assuming all other variables remain constant, there would be an increase/decrease of $169,021 thousand and $374,288 thousand in income before income tax for the year ended December 31, 2018 and 2017, respectively.
iii. Equity securities market risk Equity securities market factor sensitivity measured at the balance sheet date is the impact on the values of open positions in equity securities for a 1% change in stock market prices. Where the securities prices increases/decreases by 1%, assuming all other variables remain constant, there would be an increase/decrease of $6,085 thousand and $60,783 thousand in income before income tax for the year ended December 31, 2018 and 2017 respectively. There would be an increase/decrease of $12,658 thousand and $7,587 thousand in other comprehensive income for the years ended December 31, 2018 and 2017, respectively.
8) Concentration of foreign exchange risk
Information on concentration of foreign currency exposures at the balance sheet date is shown in Note 42.
f. Transfer of financial assets In the daily transactions of the Bank, most of the transferred financial assets not eligible for derecognition in full are notes and bonds under repurchase agreement. The cash flows of those financial assets have been transferred to outsiders and the liabilities of repurchasing the transferred financial assets in an agreed amount have been recognized. The Bank is not eligible to conduct, sell, or pledge the transferred financial assets during the effective period. However, the Bank is still exposed to interest rate risks and credit risks. As a result, the transferred financial assets are not derecognized. The following tables show the transferred financial assets not eligible for derecognition in full and related amounts.
Types of Financial Assets
Book Value of Transferred
Financial Assets
Book Value of Related
Financial Liabilities
Fair Value of Transferred
Financial Assets
Fair Value of Related
Financial Liabilities
Net Position of Fair Value
FVTOCI- transactions under repurchase agreements
December 31, 2018 $ 15,447,755 $ 14,665,794 $ 15,447,755 $ 14,665,794 $ 781,961Available-for-sale financial assets -
transactions under repurchase agreements December 31, 2017 $ 13,528,971 $ 12,921,364 $ 13,528,971 $ 12,921,364 $ 607,607
252
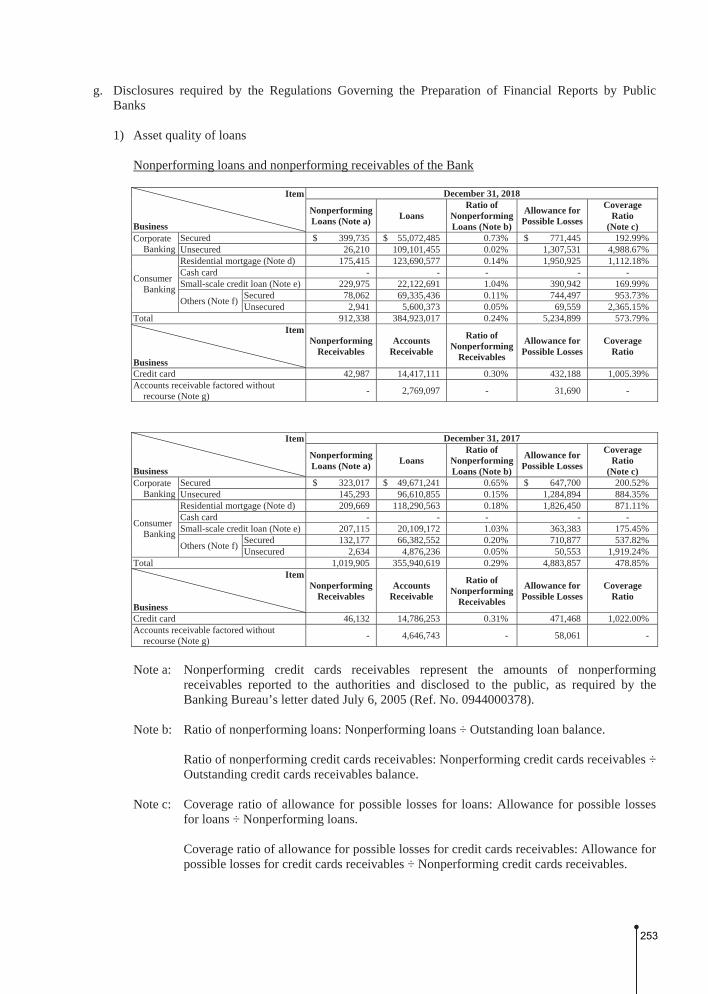
g. Disclosures required by the Regulations Governing the Preparation of Financial Reports by Public Banks 1) Asset quality of loans
Nonperforming loans and nonperforming receivables of the Bank
Item
Business
December 31, 2018
Nonperforming Loans (Note a) Loans
Ratio of Nonperforming Loans (Note b)
Allowance for Possible Losses
Coverage Ratio
(Note c) Corporate
Banking Secured $ 399,735 $ 55,072,485 0.73% $ 771,445 192.99%Unsecured 26,210 109,101,455 0.02% 1,307,531 4,988.67%
Consumer Banking
Residential mortgage (Note d) 175,415 123,690,577 0.14% 1,950,925 1,112.18%Cash card - - - - - Small-scale credit loan (Note e) 229,975 22,122,691 1.04% 390,942 169.99%
Others (Note f) Secured 78,062 69,335,436 0.11% 744,497 953.73%Unsecured 2,941 5,600,373 0.05% 69,559 2,365.15%
Total 912,338 384,923,017 0.24% 5,234,899 573.79%Item
Business
Nonperforming Receivables
Accounts Receivable
Ratio of Nonperforming
Receivables
Allowance for Possible Losses
Coverage Ratio
Credit card 42,987 14,417,111 0.30% 432,188 1,005.39%Accounts receivable factored without
recourse (Note g) - 2,769,097 - 31,690 -
Item
Business
December 31, 2017
Nonperforming Loans (Note a) Loans
Ratio of Nonperforming Loans (Note b)
Allowance for Possible Losses
Coverage Ratio
(Note c) Corporate
Banking Secured $ 323,017 $ 49,671,241 0.65% $ 647,700 200.52%Unsecured 145,293 96,610,855 0.15% 1,284,894 884.35%
Consumer Banking
Residential mortgage (Note d) 209,669 118,290,563 0.18% 1,826,450 871.11%Cash card - - - - - Small-scale credit loan (Note e) 207,115 20,109,172 1.03% 363,383 175.45%
Others (Note f) Secured 132,177 66,382,552 0.20% 710,877 537.82%Unsecured 2,634 4,876,236 0.05% 50,553 1,919.24%
Total 1,019,905 355,940,619 0.29% 4,883,857 478.85%Item
Business
Nonperforming Receivables
Accounts Receivable
Ratio of Nonperforming
Receivables
Allowance for Possible Losses
Coverage Ratio
Credit card 46,132 14,786,253 0.31% 471,468 1,022.00%Accounts receivable factored without
recourse (Note g) - 4,646,743 - 58,061 -
Note a: Nonperforming credit cards receivables represent the amounts of nonperforming
receivables reported to the authorities and disclosed to the public, as required by the Banking Bureau’s letter dated July 6, 2005 (Ref. No. 0944000378).
Note b: Ratio of nonperforming loans: Nonperforming loans ÷ Outstanding loan balance.
Ratio of nonperforming credit cards receivables: Nonperforming credit cards receivables ÷ Outstanding credit cards receivables balance.
Note c: Coverage ratio of allowance for possible losses for loans: Allowance for possible losses
for loans ÷ Nonperforming loans. Coverage ratio of allowance for possible losses for credit cards receivables: Allowance for possible losses for credit cards receivables ÷ Nonperforming credit cards receivables.
253

Note d: Residential mortgage is a loan given to the borrower who provides a house, to be purchased (or already owned) by the borrower or the spouse or the minor children of the borrower, as a mortgage to the Bank and will use the loan for house purchase or refurbishment.
Note e: Small-scale credit loans refer to the loans under the Banking Bureau’s regulation, dated
December 19, 2005 (Ref. No. 09440010950), but excluding small-scale unsecured loans obtained through credit cards and cash cards.
Note f: Other loans of consumer banking refer to secured or unsecured loans, excluding
residential mortgage, cash card, small-scale credit loans and credit card. Note g: As required by the Banking Bureau’s letter dated July 19, 2005 (Ref. No. 0945000494),
factoring without recourse is disclosed as nonperforming receivables in three months upon the factors’ or insurance companies’ rejection of claims.
Nonperforming loans and nonperforming receivables excluded from the information stated above
Item Business
December 31, 2018 December 31, 2017
Nonperforming Loans Excluded
Nonperforming Receivables Excluded
Nonperforming Loans Excluded
Nonperforming Receivables Excluded
Loans not classified as NPL upon debt restructuring and performed as agreed (Note a) $ 64,037 $ 184,939 $ 88,969 $ 250,530
Loans upon performance of a debt discharge program and rehabilitation program (Note b) 791,658 1,005,612 721,064 1,076,306
Total 855,695 1,190,551 810,033 1,326,836 Note a: Supplementary disclosure related to the loans which need not be classified as NPL upon
debt restructuring and performed as agreed, as stipulated in the Banking Bureau’s letter dated April 25, 2006 (Ref. No. 09510001270).
Note b: About the Bank disclosures information and enumerates credit for case of pre-negotiation,
pre-mediation, debt settlement proceedings and liquidation under Statute for Consumer Debt Clearance, as stipulated in the Banking Bureau’s letter dated September 15, 2008 (Ref. No. 09700318940) and dates September 20, 2016 (Ref. No. 10500134790).
254

2) Concentration of credit extensions
Ranking (Note a)
December 31, 2018
Group Entity (Note b) Industry and Code (Note a)
Total Balances of Credit
Extensions (Note c)
Ratio of Credit
Extensions to Net Worth
(%) 1 A Group - 6700 - real estate development $ 9,501,000 21% 2 B Group - 6499 - non-categorized and other financial
services 3,831,176 9%
3 C Group - 6496 - private financing industry 3,725,413 8% 4 D Group - 4841 - retail of motor vehicles 3,027,281 7% 5 E Group - 6700 - real estate development 2,971,350 7% 6 F Group - 4210 - road engineering 2,820,240 6% 7 G Group - 5260 - air transportation assistance 2,815,985 6% 8 H Group - 2411 - smelting and refining of iron and
steel 2,469,000 6%
9 I Group - 2630 - bare Printed Circuit Boards Manufacturing
2,225,583 5%
10 J Group - 2859 - other household appliances manufacturing
2,161,075 5%
Ranking (Note a)
December 31, 2017
Group Entity (Note b) Industry and Code (Note a)
Total Balances of Credit
Extensions (Note c)
Ratio of Credit
Extensions to Net Worth
(%) 1 B Group - 6499 - non-categorized and other financial
services $ 4,194,556 10%
2 J Group - 2859 - other household appliances manufacturing
3,614,918 8%
3 C Group - 6496 - private financing industry 3,119,667 7% 4 K Group - 3010 - manufacture of motor vehicles 2,743,460 6% 5 L Group - 6499 - non-categorized and other financial
services 2,655,873 6%
6 M Group - 0850 - manufacture of dairy products 2,566,960 6% 7 I Group - 2630 - printed circuit board manufacturing 2,359,822 6% 8 F Group - 4210 - ocean freight transportation
forwarding services 2,333,686 5%
9 H Group - 2411 - smelting and refining of iron and steel
2,332,835 5%
10 N Group - 6499 - non-categorized and other financial services
2,279,666 5%
255

Note a: The rankings above represent the top 10 corporate entities except for government or state-owned enterprises, based on the total balance of credit extension granted by the Bank. The amount of credit extensions should be disclosed in aggregate for each group entity, the code and industry of which are also required. The industry of the group entities is designated as the industry of the individual group entity with the greatest risk exposure. The lines of industry should conform to the industry sub-categorization of the Standard Industrial Classification System of the Republic of China published by the Directorate-General of Budget, Accounting and Statistics under the Executive Yuan.
Note b: “Group Entity” is defined in Article 6 of “Supplementary Provisions to the Taiwan Stock
Exchange Corporation Rules for Review of Securities Listings.” Note c: Credit extension balance includes various loans (import and export negotiations, discounts,
overdrafts, unsecured and secured short-term loans, margin loans receivable, unsecured and secured medium-term loans, unsecured and secured long-term loans; and nonaccrual loans), bills purchased, factored accounts receivable without recourse, acceptances and guarantees.
3) Interest rate sensitivity
Table 1: For New Taiwan dollar items
Interest Rate Sensitivity Analysis December 31, 2018
Items 1 to 90 Days 91 to 180 Days 181 Days to One Year
Over One Year Total
Interest rate-sensitive assets $ 290,024,783 $ 146,052,263 $ 5,650,758 $ 30,665,306 $ 472,393,110Interest rate-sensitive liabilities 152,122,187 152,884,130 102,738,671 18,929,935 426,674,923Interest rate sensitivity gap 137,902,596 (6,831,867 ) (97,087,913 ) 11,735,371 45,718,187Net worth 44,744,740Ratio of interest rate-sensitive assets to liabilities 110.71%Ratio of interest rate-sensitivity gap to net worth 102.18%
Interest Rate Sensitivity Analysis
December 31, 2017
Items 1 to 90 Days 91 to 180 Days 181 Days to One Year
Over One Year Total
Interest rate-sensitive assets $ 268,141,068 $ 143,810,222 $ 6,514,486 $ 24,444,616 $ 442,910,392Interest rate-sensitive liabilities 139,781,032 157,548,328 82,244,155 19,628,693 399,202,208Interest rate sensitivity gap 128,360,036 (13,738,106 ) (75,729,669 ) 4,815,923 43,708,184Net worth 42,786,672Ratio of interest rate-sensitive assets to liabilities 110.95%Ratio of interest rate-sensitivity gap to net worth 102.15% Note a: The New Taiwan dollar amounts held by the Bank. Note b: Interest rate-sensitive assets and liabilities refer to interest-earning assets and
interest-bearing liabilities that were affected by interest rate changes. Note c: Interest rate sensitivity gap = Interest rate-sensitive assets - Interest rate-sensitive
liabilities. Note d: Ratio of interest rate-sensitive assets to liabilities = Interest rate-sensitive assets ÷ Interest
rate-sensitive liabilities.
256

Table 2: For U.S. dollar items
Interest Rate Sensitivity Analysis December 31, 2018
(In Thousands of U.S. Dollars)
Items 1 to 90 Days 91 to 180 Days 181 Days to One Year
Over One Year Total
Interest rate-sensitive assets $ 2,920,039 $ 202,692 $ 35,945 $ 99,853 $ 3,258,529Interest rate-sensitive liabilities 2,483,940 1,112,830 159,579 - 3,756,349Interest rate sensitivity gap 436,099 (910,138) (123,634) 99,853 (497,820)Net worth 1,455,918Ratio of interest rate-sensitive assets to liabilities 86.75%Ratio of interest rate-sensitivity gap to net worth (34.19%)
Interest Rate Sensitivity Analysis December 31, 2017
(In Thousands of U.S. Dollars)
Items 1 to 90 Days 91 to 180 Days 181 Days to One Year
Over One Year Total
Interest rate-sensitive assets $ 2,188,090 $ 289,348 $ 6,968 $ 480 $ 2,484,886Interest rate-sensitive liabilities 1,996,952 1,022,244 132,994 - 3,152,190Interest rate sensitivity gap 191,138 (732,896) (126,026) 480 (667,304)Net worth 1,433,485Ratio of interest rate-sensitive assets to liabilities 78.83%Ratio of interest rate-sensitivity gap to net worth (46.55%) Note a: The total U.S. dollar amounts held by the Bank, excluding contingent assets and liabilities. Note b: Interest rate-sensitive assets and liabilities refer to interest-earning assets and
interest-bearing liabilities that were affected by interest rate changes. Note c: Interest rate sensitivity gap = Interest rate-sensitive assets - Interest rate-sensitive
liabilities. Note d: Ratio of interest rate-sensitive assets to liabilities = Interest rate-sensitive assets ÷ Interest
rate-sensitive liabilities. 4) Profitability
Items For the Year Ended December 31, 2018
For the Year Ended December 31, 2017
Return on total assets Before tax 0.68% 0.57% After tax 0.59% 0.50%
Return on equity Before tax 9.30% 7.80% After tax 8.05% 6.82%
Net income ratio 31.41% 27.45% Note a: Return on total assets = Income before (after) income tax ÷ Average total assets. Note b: Return on equity = Income before (after) income tax ÷ Average equity. Note c: Net income ratio = Income after income tax ÷ Total net profit.
257

5) Maturity analysis of assets and liabilities a) For New Taiwan dollar items
December 31, 2018
Total Amount for Remaining Period to Maturity
0 to 10 Days 11 to 30 Days 31 Days to 90 Days
91 Days to 180 Days
181 Days to One Year
Over One Year
Main capital inflow on maturity $ 657,048,134 $ 108,223,432 $ 83,033,715 $ 99,353,166 $ 67,996,227 $ 60,087,823 $ 238,353,771
Main capital outflow on maturity 793,951,803 46,921,837 80,819,341 163,285,185 146,268,581 190,698,533 165,958,326
Gap (136,903,669 ) 61,301,595 2,214,374 (63,932,019 ) (78,272,354 ) (130,610,710 ) 72,395,445
December 31, 2017
Total Amount for Remaining Period to Maturity
0 to 10 Days 11 to 30 Days 31 Days to 90 Days
91 Days to 180 Days
181 Days to One Year
Over One Year
Main capital inflow on maturity $ 615,404,461 $ 109,522,593 $ 69,866,772 $ 108,263,448 $ 54,146,537 $ 59,583,162 $ 214,021,949
Main capital outflow on maturity 748,567,793 48,174,540 69,271,164 157,563,789 138,649,895 162,691,952 172,216,453
Gap (133,163,332 ) 61,348,053 595,608 (49,300,341 ) (84,503,358 ) (103,108,790 ) 41,805,496
Note: This table refers to the New Taiwan dollar amounts held by the Bank.
b) For U.S. dollar items
December 31, 2018
(In Thousands of U.S. Dollars)
Total Amount for Remaining Period to Maturity
1 to 30 Days 31 Days to 90 Days
91 Days to 180 Days
181 Days to One Year
Over One Year
Main capital inflow on maturity $ 10,744,093 $ 4,099,117 $ 2,644,604 $ 1,443,831 $ 567,614 $ 1,988,927
Main capital outflow on maturity 11,435,866 5,053,597 3,122,668 1,643,749 747,525 868,327
Gap (691,773 ) (954,480 ) (478,064 ) (199,918 ) (179,911 ) 1,120,600
December 31, 2017
(In Thousands of U.S. Dollars)
Total Amount for Remaining Period to Maturity
1 to 30 Days 31 Days to 90 Days
91 Days to 180 Days
181 Days to One Year
Over One Year
Main capital inflow on maturity $ 9,004,471 $ 3,082,670 $ 2,617,797 $ 1,172,558 $ 689,521 $ 1,441,925
Main capital outflow on maturity 9,398,646 3,748,072 3,377,047 881,325 750,334 641,868
Gap (394,175 ) (665,402 ) (759,250 ) 291,233 (60,813 ) 800,057 Note: This table refers to the U.S. dollar amounts held by the Bank.
46. CAPITAL MANAGEMENT
a. Objective of capital management
1) Unconsolidated regulatory capital and the consolidated regulatory capital should meet the requirements of the related regulations. The basic goal of the Bank’s capital management is to meet the minimum ratio of regulatory capital and risk assets (the “capital adequacy ratio”) according to the “Regulations Governing the Capital Adequacy and Capital Category of Banks” enacted based on the “Banking law.”
258

2) In order to maintain an adequate level of capital to bear various risks, the Bank makes capital planning based on the operating plans and budget, the development strategies, dividend policy and stress tests and forecasts of capital adequacy which are approved by the Board of Directors. The objective is to optimize assets allocation and strengthen capital structure.
b. Procedure of capital management
1) The calculation of the Bank’s capital adequacy ratio is based on the “Regulations Governing the
Capital Adequacy and Capital Category of Banks” enacted by the Financial Supervisory Commission and the related information is reported to the competent authority on a regular basis.
2) In order to monitor capital adequacy ratio, the execution and changes in the parameters of the
capital planning are reviewed quarterly by the Bank’s Assets and Liabilities Management Committee. The committee assesses whether the Bank’s capital is able to respond to various risks and whether the objective of capital management is met.
The calculations of regulatory capital, risk-weighted assets and capital adequacy ratio were as follows:
December 31, 2018
Unconsolidated Consolidated
Regulatory capital
Common equity $ 41,848,384 $ 42,076,829Additional Tier capital 2,193,441 2,448,097Tier II capital 9,014,910 9,544,444Total common capital 53,056,735 54,069,370
Risk-weighted assets
Credit risk Standardized approach 367,484,931 369,490,534Internal rating-based approach - -Asset securitization 215,318 215,318
Operational risk
Basic indicator approach 19,200,700 19,686,600Standardized approach/alternative
standardized approach - -
Advanced measurement approach - -
Market risk Standardized approach 11,098,400 11,098,400Internal models approach - -
Total risk-weighted assets 397,999,349 400,490,852Capital adequacy ratio 13.33% 13.50%Ratio of common equity to risk-weighted assets 10.51% 10.51%Ratio of Tier I capital to risk-weighted assets 11.07% 11.12%Leverage ratio 6.14% 6.19%
259

December 31, 2017
Unconsolidated Consolidated
Regulatory capital
Common equity $ 39,236,233 $ 39,698,325Additional Tier capital - -Tier II capital 11,680,665 12,185,406Total common capital 50,916,898 51,883,731
Risk-weighted assets
Credit risk Standardized approach 320,791,287 322,187,276Internal rating-based approach - -Asset securitization - -
Operational risk
Basic indicator approach 19,112,088 19,646,350Standardized approach/alternative
standardized approach - -
Advanced measurement approach - -
Market risk Standardized approach 14,948,088 14,948,088Internal models approach - -
Total risk-weighted assets 354,851,463 356,781,714Capital adequacy ratio 14.35% 14.54%Ratio of common equity to risk-weighted assets 11.06% 11.13%Ratio of Tier I capital to risk-weighted assets 11.06% 11.13%Leverage ratio 6.06% 6.12% Note a: Regulatory capital, risk-weighted assets and exposure measurement are calculated under the
“Regulations Governing the Capital Adequacy and capital category of Banks” and the “The Methods for Calculating the Bank’s regulatory Capital and Risk-weighted Assets amended by the FSC on November 16, 2017.
Note b: An annual report should include both the current year’s and prior year’s capital adequacy ratio,
but a semiannual report should include the capital adequacy ratio of the most recent year. Note c: Formulas used were as follows:
1) Regulatory capital = Common equity + Additional Tier I capital + Tier II capital. 2) Total risk-weighted assets = Risk-weighted assets for credit risk + (Capital requirements for
operational risk and market risk) × 12.5. 3) Capital adequacy ratio = Regulatory capital/Total risk-weighted assets. 4) Ratio of Common equity to risk-weighted assets = Common equity/Total risk-weighted assets. 5) Ratio of Tier I capital to risk-weighted assets = (Common equity + Additional Tier I
capital)/Total risk-weighted assets. 6) Leverage ratio = Net Tier I capital/Exposure measurement.
47. SEGMENT INFORMATION
Information provided to the Bank’s and its subsidiaries’ chief operating decision makers for resource allocation and segment performance assessment focuses on nature of operation and profits. Based on IFRS 8 - “Operating Segments,” the reportable segments were as follows: a. Individual banking: Mainly includes consumer banking loans such as mortgages, credit loans, car loans,
installment, etc.; credit cards; individual deposits; and wealth management;
260

b. Corporate banking: Mainly includes corporate-related business, foreign-currency business and financial market business;
c. Others: Any business not included in individual and corporate banking. The accounting policies of the reportable segments are the same as those stated in Note 4 to the consolidated financial reports. Segment Income and Operating Results The income and operating results of the reportable segments of the Bank and its subsidiaries were as follows:
Individual Banking
Corporate Banking
(Including Overseas Branches) Others Total
For the year ended December 31, 2018 Net interests $ 4,536,177 $ 2,500,350 $ (1,355,724) $ 5,680,803Net revenues other than interest
Net service fee income 2,173,824 713,603 243,346 3,130,773Other net income 262,960 1,387,386 756,355 2,406,701
Consolidated net revenues 6,972,961 4,601,339 (356,023) 11,218,277Provision for possible losses (158,110) (280,608) (76,085) (514,803)Operating expenses (4,721,871) (1,349,304) (563,820) (6,634,995) Segment income before income tax $ 2,092,980 $ 2,971,427 $ 995,928 () $ 4,068,479 For the year ended December 31, 2017 Net interests $ 4,361,617 $ 2,579,276 $ (1,536,019) $ 5,404,874Net revenues other than interest
Net service fee income 2,202,360 691,003 235,837 3,129,200Other net income 291,567 1,441,747 129,741 1,863,055
Consolidated net revenues 6,855,544 4,712,026 (1,170,441) 10,397,129Provision for possible losses (112,037) (616,342) (3,468) (731,847)Operating expenses (4,739,977) (1,315,019) (342,642) (6,397,638) Segment income before income tax $ 2,003,530 $ 2,780,665 $ (1,516,551) $ 3,267,644
48. ADDITIONAL DISCLOSURES
a. Information about significant transactions: 1) Marketable securities acquired and disposed of at cost or prices at least NT$300 million or 10% of
the paid-in capital: Nil 2) Acquisition of individual real estate at cost of at least NT$300 million or 10% of the paid-in capital:
Nil 3) Disposal of individual real estate at prices of at least NT$300 million or 10% of the paid-in capital:
Table 1 (attached)
261

4) Service charge discounts on transactions with related parties in aggregated amount of at least NT$5 million: Nil
5) Receivables from related parties amounting to at least NT$300 million or 10% of the paid-in
capital: Nil 6) Sale of nonperforming loans: Nil 7) The type and related information of any securitization product that has been approved in accordance
with the Financial Asset Securitization Act or the Real Estate Securitization Act: Nil 8) Intercompany relationships and significant intercompany transactions: Table 2 (attached) 9) Other significant transactions which may have effects on decision making of financial statement
users: Nil
b. Information of subsidiaries’ financings provided, endorsement/guarantee provided, marketable securities held, marketable securities acquired and disposed of at cost or prices at least NT$300 million or 10% of the paid-in capital and derivative transactions: Table 3 and Table 4 (attached)
c. Related information of investees on which the Bank and its subsidiaries exercises significant influence: Table 5 (attached)
d. Information about branches and investments in mainland China: Table 6 (attached)
262

TA
BL
E 1
FAR
EA
STE
RN
INT
ER
NA
TIO
NA
L B
AN
K L
TD
. AN
D S
UB
SID
IAR
IES
Dis
posa
l of i
ndiv
idua
l rea
l est
ate
at p
rice
s of a
t lea
st N
T$3
00 m
illio
n or
20%
of t
he p
aid-
in c
apita
l
FOR
TH
E Y
EA
R E
ND
ED
DE
CE
MB
ER
31,
201
8 (I
n T
hous
ands
of N
ew T
aiw
an D
olla
rs)
Com
pany
Nam
e T
ype
of A
sset
T
rans
actio
nD
ate
Acq
uisi
tion
Dat
eB
ook
Val
ue
Tra
nsac
tion
Am
ount
Rec
eipt
Sta
tus
Dis
posi
tion
of
Ben
efits
Cou
nter
-par
tyN
atur
e of
R
elat
ions
hip
Purp
ose
Ref
eren
ce o
f the
Pr
ice
Oth
erA
ppoi
ntm
ents
F
ar E
aste
rn I
nter
nati
onal
B
ank
Ltd
. H
sinc
hu J
ingg
uo b
uild
ing
and
land
20
18/9
/27
2010
/4/3
$
196,
255
$
385,
166
R
ecei
pt in
ful
l
$
174,
755
(Not
e)
A c
ompa
ny
Nil
A
ctiv
ated
ass
ets
Val
uati
on r
epor
tN
/A
Not
e:
Has
ded
ucte
d tr
ansa
ctio
n co
sts
of $
14,1
56 th
ousa
nd.
263

TA
BL
E 2
FAR
EA
STE
RN
INT
ER
NA
TIO
NA
L B
AN
K L
TD
. AN
D S
UB
SID
IAR
IES
INT
ER
CO
MPA
NY
RE
LA
TIO
NSH
IPS
AN
D S
IGN
IFIC
AN
T IN
TE
RC
OM
PAN
Y T
RA
NSA
CT
ION
S FO
R T
HE
YE
AR
EN
DE
D D
EC
EM
BE
R 3
1, 2
018
(In
Tho
usan
ds o
f New
Tai
wan
Dol
lars
)
No.
C
ompa
ny N
ame
Cou
nter
part
yFl
ow o
f Tra
nsac
tion
Tra
nsac
tion
Det
ails
Fina
ncia
l Sta
tem
ent A
ccou
nt
Am
ount
T
erm
s
Perc
enta
ge o
f C
onso
lidat
edN
et P
rofit
or
Con
solid
ated
Tot
al A
sset
s (N
ote
b)
0 F
ar E
aste
rn I
nter
nati
onal
Ban
k L
td.
Far
Eas
tern
Ass
et M
anag
emen
t Co.
, Ltd
. F
rom
par
ent c
ompa
ny to
sub
sidi
ary
Dep
osit
s an
d re
mit
tanc
es
$
9,
163
Not
e 3
-
F
ar E
aste
rn I
nter
nati
onal
Sec
urit
ies
Co.
, Ltd
. F
rom
par
ent c
ompa
ny to
sub
sidi
ary
Dep
osit
s an
d re
mit
tanc
es
230,
754
Not
e 3
0.04
Far
Eas
tern
Int
erna
tion
al S
ecur
itie
s C
o., L
td.
Fro
m p
aren
t com
pany
to s
ubsi
diar
y S
ervi
ce c
harg
e
11
,455
N
ote
3 0.
10
1 F
ar E
aste
rn A
sset
Man
agem
ent C
o., L
td.
Far
Eas
tern
Int
erna
tion
al B
ank
Ltd
. F
rom
sub
sidi
ary
to p
aren
t com
pany
C
ash
and
cash
equ
ival
ents
9,
163
N
ote
3 -
2 F
ar E
aste
rn I
nter
nati
onal
Sec
urit
ies
Co.
, Ltd
. F
ar E
aste
rn I
nter
nati
onal
Ban
k L
td.
Fro
m s
ubsi
diar
y to
par
ent c
ompa
ny
Cas
h an
d ca
sh e
quiv
alen
ts
230,
754
N
ote
3 0.
04
Far
Eas
tern
Int
erna
tion
al B
ank
Ltd
. F
rom
sub
sidi
ary
to p
aren
t com
pany
S
ervi
ce f
ee
11,4
55
Not
e 3
0.
10
Not
e 1:
T
rans
acti
ng p
arti
es a
re id
enti
fied
as
foll
ows:
Num
ber
0 -
pare
nt c
ompa
ny; a
nd n
umbe
r 1
and
the
foll
owin
g nu
mbe
rs -
sub
sidi
arie
s.
Not
e 2:
T
he r
atio
is c
alcu
late
d as
fol
low
s: F
or a
sset
and
liab
ilit
y ac
coun
ts =
Tra
nsac
tion
am
ount
/Con
soli
date
d to
tal a
sset
s; a
nd f
or in
com
e an
d ex
pens
es =
Tra
nsac
tion
am
ount
/Con
soli
date
d ne
t pro
fit.
Not
e 3:
T
he te
rms
of in
terc
ompa
ny tr
ansa
ctio
ns a
re n
ot s
igni
fica
ntly
dif
fere
nt f
rom
thos
e to
thir
d pa
rtie
s.
264

TA
BL
E 3
FAR
EA
STE
RN
INT
ER
NA
TIO
NA
L B
AN
K L
TD
. AN
D S
UB
SID
IAR
IES
SUB
SID
IAR
IES’
FIN
AN
CIN
G P
RO
VID
ED
TO
OT
HE
RS
FOR
TH
E Y
EA
R E
ND
ED
DE
CE
MB
ER
31,
201
8 (I
n T
hous
ands
of N
ew T
aiw
an D
olla
rs, I
n T
hous
and
Shar
es)
No.
(Not
e 1)
L
ende
r B
orro
wer
Fi
nanc
ial
Stat
emen
tA
ccou
nt
Rel
ated
Part
ies
Hig
hest
Bal
ance
for
the
Peri
od
End
ing
Bal
ance
Act
ual
Bor
row
ing
Am
ount
In
tere
st R
ate
Nat
ure
of
Fina
ncin
g(N
ote
2)
Bus
ines
sT
rans
actio
nA
mou
nt
Rea
sons
for
Shor
t-te
rmFi
nanc
ing
Allo
wan
ce fo
r Im
pair
men
tL
oss
Col
late
ral
Fina
ncin
g L
imit
for
Eac
h B
orro
wer
(N
ote
3)
Agg
rega
teFi
nanc
ing
Lim
it (N
ote
3)
Item
V
alue
1 F
EIB
Fin
anci
al
Lea
sing
Co.
, Ltd
. A
com
pany
E
ntru
sted
loan
re
ceiv
able
s N
o
$
134,
190
$
13
4,19
0
$
99,7
48
6%-1
0%
a
$
4,02
6 -
$
99
7 R
eal e
stat
e
$
301,
455
$
30
6,04
0
$
306,
040
B c
ompa
ny
Ent
rust
ed lo
an
rece
ivab
les
No
26,8
38
26,8
38
26,8
38
6%-1
0%
a
80
5 -
268
Rea
l est
ate
51,2
57
306,
040
306,
040
C c
ompa
ny
Ent
rust
ed lo
an
rece
ivab
les
No
26,8
38
26,8
38
26,8
38
6%-1
0%
a
80
5 -
268
Sto
ck
379,
526
306,
040
306,
040
D c
ompa
ny
Ent
rust
ed lo
an
rece
ivab
les
No
22,3
65
22,3
65
22,3
65
6%-1
0%
a
92
6 -
224
Rea
l est
ate
33,7
48
306,
040
306,
040
Not
e 1:
N
o. c
olum
n is
cod
ed a
s fo
llow
s:
a.
The
Iss
uer
is c
oded
“0”
. b.
T
he in
vest
ees
are
code
d co
nsec
utiv
ely
begi
nnin
g fr
om “
1” in
the
orde
r pr
esen
ted
in th
e ta
ble
abov
e.
Not
e 2:
T
he n
atur
e of
fin
anci
ng is
des
crib
ed a
s fo
llow
s:
a.
Bus
ines
s tr
ansa
ctio
n is
cod
ed “
1”.
b.
Sho
rt-t
erm
fin
anci
ng is
cod
ed “
2”.
Not
e 3:
T
he li
mit
s on
fin
anci
ng a
re a
s fo
llow
s:
a.
Fin
anci
ng li
mit
for
eac
h bo
rrow
er
1)
In th
e ca
se o
f le
ndin
g fu
nds
to c
ompa
nies
or
firm
s w
ho h
ave
a bu
sine
ss r
elat
ions
hip
wit
h th
e le
nder
, the
tota
l len
ding
am
ount
to a
n in
divi
dual
bor
row
er s
hall
not
exc
eed
two
tim
es o
f th
e ne
t val
ue o
f th
e le
nder
as
show
n in
the
late
st f
inan
cial
rep
ort a
udit
ed o
r re
view
ed b
y a
CP
A.
2)
In th
e ca
se o
f le
ndin
g fu
nds
to th
e co
mpa
nies
or
firm
s in
nee
d of
sho
rt-t
erm
fin
anci
ng, t
he to
tal l
endi
ng a
mou
nt to
an
indi
vidu
al b
orro
wer
sha
ll n
ot e
xcee
d 40
% o
f th
e ne
t val
ue o
f th
e le
nder
as
show
n in
the
late
st f
inan
cial
rep
ort a
udit
ed o
r re
view
ed b
y a
CPA
.
b.
Agg
rega
te f
inan
cing
lim
it
1)
In th
e ca
se o
f le
ndin
g fu
nds
to c
ompa
nies
or
firm
s w
ho h
ave
a bu
sine
ss r
elat
ions
hip
wit
h th
e le
nder
, the
tota
l acc
umul
atio
n le
ndin
g am
ount
to a
n in
divi
dual
bor
row
er s
hall
not
exc
eed
two
tim
es o
f th
e ne
t val
ue o
f th
e le
nder
as
show
n in
the
late
st f
inan
cial
rep
ort a
udit
ed o
r re
view
ed b
y a
CP
A.
2)
In th
e ca
se o
f le
ndin
g fu
nds
to th
e co
mpa
nies
or
firm
s in
nee
d of
sho
rt-t
erm
fin
anci
ng, t
he to
tal a
ccum
ulat
ion
lend
ing
amou
nt to
an
indi
vidu
al b
orro
wer
sha
ll n
ot e
xcee
d 40
% o
f th
e ne
t val
ue o
f th
e le
nder
as
show
n in
the
late
st f
inan
cial
rep
ort a
udit
ed o
r re
view
ed b
y a
CP
A.
265
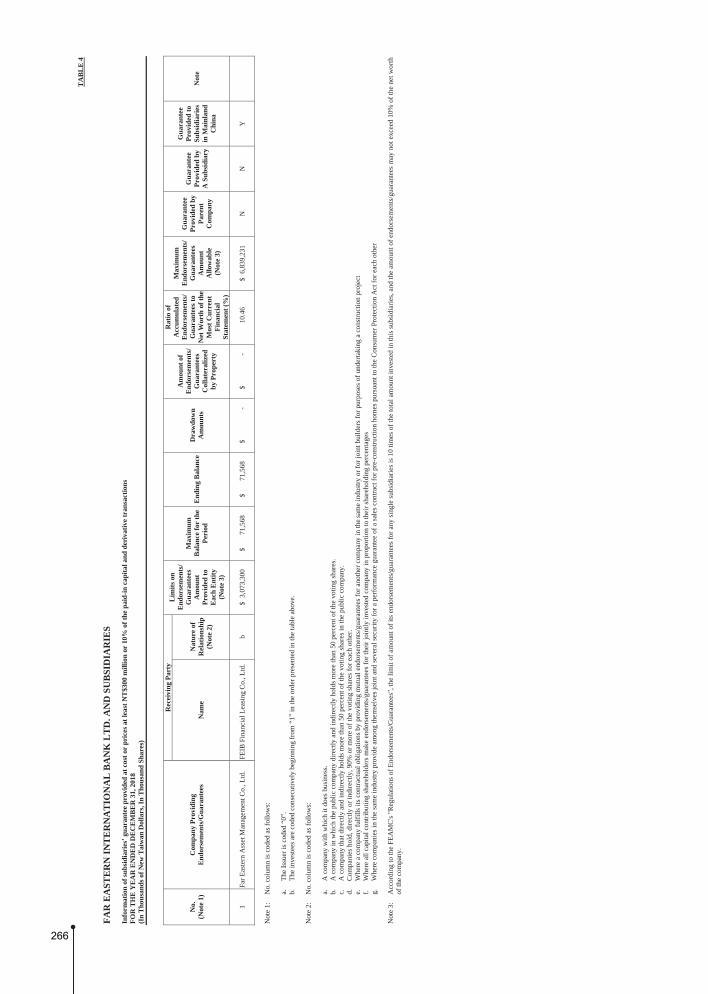
TA
BL
E 4
FAR
EA
STE
RN
INT
ER
NA
TIO
NA
L B
AN
K L
TD
. AN
D S
UB
SID
IAR
IES
Info
rmat
ion
of su
bsid
iari
es’ g
uara
ntee
pro
vide
d at
cos
t or
pric
es a
t lea
st N
T$3
00 m
illio
n or
10%
of t
he p
aid-
in c
apita
l and
der
ivat
ive
tran
sact
ions
FO
R T
HE
YE
AR
EN
DE
D D
EC
EM
BE
R 3
1, 2
018
(I
n T
hous
ands
of N
ew T
aiw
an D
olla
rs, I
n T
hous
and
Shar
es)
No.
(Not
e 1)
C
ompa
ny P
rovi
ding
E
ndor
sem
ents
/Gua
rant
ees
Rec
eivi
ng P
arty
L
imits
on
End
orse
men
ts/
Gua
rant
ees
Am
ount
Pr
ovid
ed to
E
ach
Ent
ity
(Not
e 3)
Max
imum
Bal
ance
for
the
Peri
odE
ndin
g B
alan
ceD
raw
dow
n A
mou
nts
Am
ount
of
End
orse
men
ts/
Gua
rant
ees
Col
late
raliz
edby
Pro
pert
y
Rat
io o
f A
ccum
ulat
edE
ndor
sem
ents
/G
uara
ntee
s to
Net
Wor
th o
f the
M
ost C
urre
nt
Fina
ncia
lSt
atem
ent (
%)
Max
imum
End
orse
men
ts/
Gua
rant
ees
Am
ount
A
llow
able
(N
ote
3)
Gua
rant
eePr
ovid
ed b
y Pa
rent
C
ompa
ny
Gua
rant
eePr
ovid
ed b
y A
Sub
sidi
ary
Gua
rant
eePr
ovid
ed to
Subs
idia
ries
in M
ainl
and
Chi
na
Not
eN
ame
Nat
ure
of
Rel
atio
nshi
p(N
ote
2)
1
Far
Eas
tern
Ass
et M
anag
emen
t Co.
, Ltd
. F
EIB
Fin
anci
al L
easi
ng C
o., L
td.
b
$ 3
,073
,300
$
71,5
68
$
71
,568
$
-
$
- 10
.46
$
6,8
39,2
31
N
N
Y
Not
e 1:
N
o. c
olum
n is
cod
ed a
s fo
llow
s:
a.
The
Iss
uer
is c
oded
“0”
. b.
T
he in
vest
ees
are
code
d co
nsec
utiv
ely
begi
nnin
g fr
om “
1” in
the
orde
r pr
esen
ted
in th
e ta
ble
abov
e.
Not
e 2:
N
o. c
olum
n is
cod
ed a
s fo
llow
s:
a.
A c
ompa
ny w
ith
whi
ch it
doe
s bu
sine
ss.
b.
A c
ompa
ny in
whi
ch th
e pu
blic
com
pany
dir
ectl
y an
d in
dire
ctly
hol
ds m
ore
than
50
perc
ent o
f th
e vo
ting
sha
res.
c.
A
com
pany
that
dir
ectl
y an
d in
dire
ctly
hol
ds m
ore
than
50
perc
ent o
f th
e vo
ting
sha
res
in th
e pu
blic
com
pany
. d.
C
ompa
nies
hol
d, d
irec
tly
or in
dire
ctly
, 90%
or
mor
e of
the
voti
ng s
hare
s fo
r ea
ch o
ther
. e.
W
here
a c
ompa
ny f
ulfi
lls
its
cont
ract
ual o
blig
atio
ns b
y pr
ovid
ing
mut
ual e
ndor
sem
ents
/gua
rant
ees
for
anot
her
com
pany
in th
e sa
me
indu
stry
or
for
join
t bui
lder
s fo
r pu
rpos
es o
f un
dert
akin
g a
cons
truc
tion
pro
ject
f.
W
here
all
cap
ital
con
trib
utin
g sh
areh
olde
rs m
ake
endo
rsem
ents
/gua
rant
ees
for
thei
r jo
intl
y in
vest
ed c
ompa
ny in
pro
port
ion
to th
eir
shar
ehol
ding
per
cent
ages
g.
W
here
com
pani
es in
the
sam
e in
dust
ry p
rovi
de a
mon
g th
emse
lves
join
t and
sev
eral
sec
urit
y fo
r a
perf
orm
ance
gua
rant
ee o
f a
sale
s co
ntra
ct f
or p
re-c
onst
ruct
ion
hom
es p
ursu
ant t
o th
e C
onsu
mer
Pro
tect
ion
Act
for
eac
h ot
her
Not
e 3:
A
ccor
ding
to th
e F
EA
MC
's "
Reg
ulat
ions
of
End
orse
men
ts/G
uara
ntee
s", t
he li
mit
of
amou
nt o
f it
s en
dors
emen
ts/g
uara
ntee
s fo
r an
y si
ngle
sub
sidi
arie
s is
10
tim
es o
f th
e to
tal a
mou
nt in
vest
ed in
this
sub
sidi
arie
s, a
nd th
e am
ount
of
endo
rsem
ents
/gua
rant
ees
may
not
exc
eed
10%
of
the
net w
orth
of
the
com
pany
.
266

TA
BL
E 5
FAR
EA
STE
RN
INT
ER
NA
TIO
NA
L B
AN
K L
TD
. AN
D S
UB
SID
IAR
IES
RE
LA
TE
D IN
FOR
MA
TIO
N O
F IN
VE
STE
ES
FOR
TH
E Y
EA
R E
ND
ED
DE
CE
MB
ER
31,
201
8
(In
Tho
usan
ds o
f New
Tai
wan
Dol
lars
)
Inve
stee
Com
pany
L
ocat
ion
Mai
n B
usin
ess a
nd P
rodu
ct
Perc
enta
geof
Ow
ners
hip
(%)
Car
ryin
g A
mou
nt
Inve
stm
ent
Inco
me
(Los
s)
Rec
ogni
zed
The
Pro
port
iona
te S
hare
of t
he B
ank,
Its S
ubsi
diar
ies a
nd
The
ir A
ffili
ates
in In
vest
ees
Not
ePr
esen
t Sha
res
(In
Tho
usan
ds)
Pro
Form
a Sh
ares
Tot
al
Shar
es
(In
Tho
usan
ds)
Perc
enta
geof
Ow
ners
hip
(%)
H
eld
by th
e B
ank
F
inan
cial
bus
ines
s
D
euts
che
Far
Eas
tern
Ass
et M
anag
emen
t Co.
, L
td.
7F, N
o. 2
07 D
un H
wa
Sou
th R
oad,
Sec
. 2, T
aipe
i, T
aiw
an
Sec
urit
ies
inve
stm
ent t
rust
fun
ds
40.0
0
$ 10
8,84
5
$ (1
8,59
5)
12,0
00
-
12
,000
40.0
0
Dah
Chu
ng B
ills
Fin
ance
Cor
p.
4F, 4
F-1
, 4F
-2, 4
F-3
, Np.
88
Dun
Hw
a N
orth
Roa
d, T
aipe
i, T
aiw
an
Und
erw
riti
ng, d
eali
ng a
nd b
roke
ring
of
shor
t-te
rm b
ills
22
.06
1,66
7,50
5
11
1,06
2
99
,440
-
99,4
4022
.07
Far
Eas
tern
Ass
et M
anag
emen
t Co.
, Ltd
.
Roo
m B
, 17F
, No.
207
, Dun
Hw
a S
outh
Roa
d, S
ec. 2
, Tai
pei,
Tai
wan
P
urch
ase,
eva
luat
ion,
auc
tion
and
man
agem
ent o
f cr
edit
or’s
ri
ghts
to f
inan
cial
inst
itut
ions
10
0.00
68
3,92
2
24
,926
68
,400
-
68,4
0010
0.00
Far
Eas
tern
Int
erna
tion
al S
ecur
itie
s C
o., L
td.
51F
, No.
7, X
inyi
Roa
d, S
ec. 5
, Tai
pei,
Tai
wan
Fo
reig
n se
curi
ties
bro
ker,
wea
lth
man
agem
ent a
nd o
ffsh
ore
fund
con
sult
ing
100.
00
334,
705
43,1
96
20,0
00
-
20
,000
100.
00
Tai
pei F
orei
gn E
xcha
nge
Age
ncy
Co.
, Ltd
. 8F
., N
o. 4
00, B
ade
Roa
d, S
ec. 2
, Tai
pei,
Tai
wan
F
orei
gn e
xcha
nge,
cro
ss-c
urre
ncy
swap
s, e
tc.
0.
40
3,80
2
-
80
-
80
0.40
Sun
shin
e A
sset
Man
agem
ent C
o., L
td.
15F
., N
o. 2
18, D
un H
wa
Sou
th R
oad,
Sec
. 2, T
aipe
i, T
aiw
an
Man
agem
ent o
f cr
edit
or’s
rig
hts
and
rend
erin
g of
com
mer
cial
de
tect
ive
serv
ices
3.
46
2,61
6
-
207
-
20
73.
46
Fin
anci
al I
nfor
mat
ion
Ser
vice
Co.
, Ltd
. N
o. 8
1, K
angn
ing
Roa
d, S
ec. 3
, Tai
pei,
Tai
wan
D
ata
proc
essi
ng s
ervi
ce a
nd e
lect
roni
c in
form
atio
n su
pply
1.
14
299,
678
-
5,
938
-
5,
938
1.14
Yua
n H
sin
Dig
ital
Pay
men
t Co.
, Ltd
. R
oom
A, 5
F.,
No.
1, Y
uand
ong
Roa
d, B
anqi
ao D
ist.,
New
T
aipe
i Cit
y, T
aiw
an
Issu
ing
elec
tron
ic ti
cket
s an
d si
gnin
g co
ntra
cted
inst
itut
ions
4.
99
24,8
09
-
5,09
4
-
5,09
44.
99
Non
fina
ncia
l bus
ines
s
A
n F
eng
Ent
erpr
ise
Co.
, Ltd
. 3F
., N
o. 1
39, J
heng
jhou
Roa
d, T
aipe
i, T
aiw
an
AT
M m
aint
enan
ce, r
epla
cem
ent a
nd r
epai
r 10
.00
4,42
5
-
300
-
30
010
.00
Hel
d by
Far
Eas
tern
Ass
et M
anag
emen
t Co.
, Ltd
.
Fin
anci
al b
usin
ess
FE
IB F
inan
cial
Lea
sing
Co.
, Ltd
. R
oom
280
6, T
ower
1,G
rand
Gat
eway
66,
No.
1 H
ong
Qia
o R
oad,
Xuh
ui D
istr
ict,
Sha
ngha
i, C
hina
L
easi
ng o
pera
tion
10
0.00
30
6,04
0
12
,598
N
/A
-
N
/A10
0.00
267

TA
BL
E 6
FAR
EA
STE
RN
INT
ER
NA
TIO
NA
L B
AN
K L
TD
. AN
D S
UB
SID
IAR
IES
INV
EST
ME
NT
IN M
AIN
LA
ND
CH
INA
FO
R T
HE
YE
AR
EN
DE
D D
EC
EM
BE
R 3
1, 2
018
(In
Tho
usan
ds o
f New
Tai
wan
Dol
lars
, Unl
ess S
tate
d O
ther
wis
e)
Inve
stee
Com
pany
N
ame
Mai
n B
usin
ess
and
Prod
uct
Tot
al P
aid-
in
Cap
ital
(Not
e 4)
Inve
stm
ent
Typ
e(N
ote
1)
Acc
umul
ated
O
utflo
w o
f In
vest
men
t as
of
Dec
embe
r 31
, 20
17
Inve
stm
ent F
low
(Not
e 4)
A
ccum
ulat
ed
Out
flow
of
Inve
stm
ent
as o
f D
ecem
ber
31,
2018
(Not
e 4)
Net
Inco
me
(Los
s) o
f In
vest
ee(N
ote
5)
% O
wne
rshi
p of
Dir
ect o
r In
dire
ctIn
vest
men
t
Inve
stm
ent
Gai
n (L
oss)
(N
otes
2 a
nd 5
)
Car
ryin
g V
alue
as
of
Dec
embe
r 31
, 20
18 (N
ote
2)
Acc
umul
ated
In
war
dR
emitt
ance
of
Ear
ning
s as o
f D
ecem
ber
31,
2018
Not
eO
utflo
w
Inflo
w
F
EIB
Fin
anci
al
Lea
sing
Co.
, Ltd
. L
easi
ng o
pera
tion
$
30
5,11
0 (
US
$ 10
,000
thou
sand
)
a $
30
5,11
0 (
US
$ 10
,000
thou
sand
)
$
- $
-
$
305,
110
(U
S$
10,0
00
thou
sand
)
$
12,5
98 (
CN
Y
2,82
5
thou
sand
)
100%
$
12
,598
(
CN
Y
2,82
5
thou
sand
)
$
306,
040
$
-
Acc
umul
ated
Inve
stm
ent i
n M
ainl
and
Chi
na a
s of D
ecem
ber
31, 2
018
(Not
e 4)
In
vest
men
t Am
ount
Aut
hori
zed
by
Inve
stm
ent C
omm
issi
on, M
OE
A (N
ote
4)
Lim
it on
Inve
stm
ent A
utho
rize
d by
In
vest
men
t Com
mis
sion
MO
EA
(N
ote
3)
$3
05,1
10
(US
$10,
000
thou
sand
) $3
05,1
10
(US
$10,
000
thou
sand
) $4
10,3
54
Not
e 1:
R
oute
s of
inve
stm
ent i
n M
ainl
and
Chi
na a
re li
sted
bel
ow:
a.
Dir
ect i
nves
tmen
t. b.
In
vest
men
t via
thir
d pl
ace
com
pany
(st
ate
thir
d pl
ace
inve
stm
ent c
ompa
ny).
c.
O
ther
s.
Not
e 2:
C
alcu
lati
on b
ased
on
inve
stee
com
pany
’s f
inan
cial
sta
tem
ents
aud
ited
by
a lo
cal C
PA
and
cov
erin
g th
e sa
me
repo
rtin
g pe
riod
as
that
of
Far
Eas
tern
Int
erna
tion
al B
ank.
Not
e 3:
U
nder
the
“R
egul
atio
ns G
over
ning
the
App
rova
l of
Inv
estm
ent
or T
echn
ical
Coo
pera
tion
in
Mai
nlan
d C
hina
” an
noun
ced
by I
nves
tmen
t C
omm
issi
on,
MO
EA
, up
per
lim
it i
s ca
lcul
ated
by
appl
ican
t co
mpa
ny -
Far
Eas
tern
Ass
et
Man
agem
ent C
o., L
td.
Not
e 4:
C
alcu
late
d us
ing
the
exch
ange
rat
e at
rem
itta
nce
date
.
Not
e 5:
C
alcu
late
d us
ing
the
aver
age
exch
ange
rat
e fo
r th
e ye
ar e
nded
201
8.
268

Far Eastern International Bank Ltd. Financial Statements for the Years Ended December 31, 2018 and 2017 and Independent Auditors’ Report
269
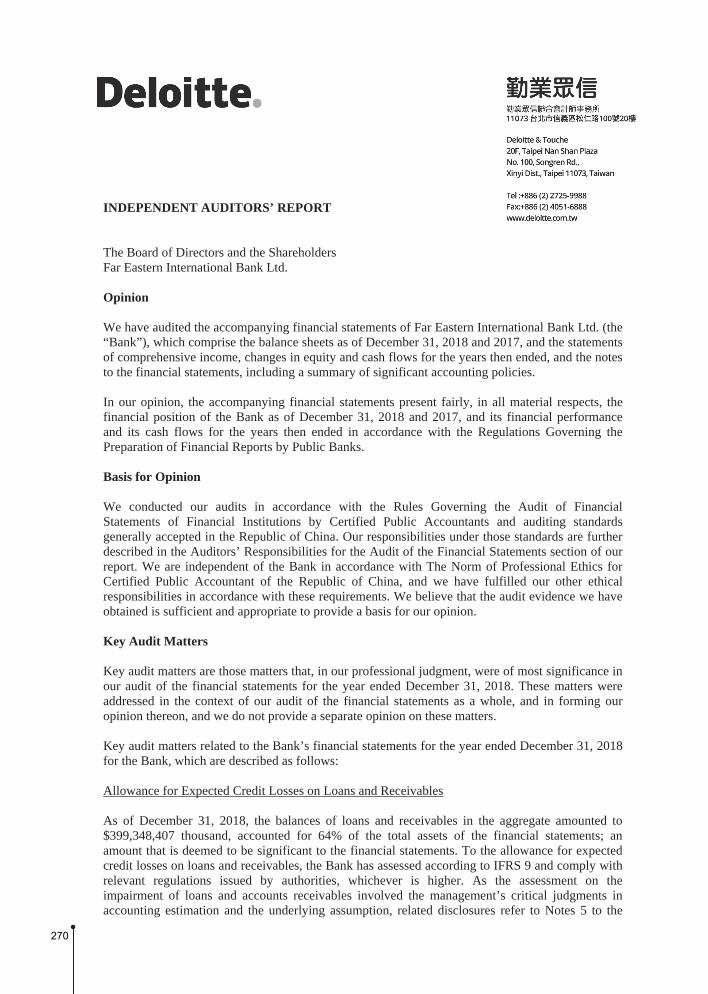
INDEPENDENT AUDITORS’ REPORT
The Board of Directors and the Shareholders Far Eastern International Bank Ltd.
Opinion
We have audited the accompanying financial statements of Far Eastern International Bank Ltd. (the “Bank”), which comprise the balance sheets as of December 31, 2018 and 2017, and the statements of comprehensive income, changes in equity and cash flows for the years then ended, and the notes to the financial statements, including a summary of significant accounting policies.
In our opinion, the accompanying financial statements present fairly, in all material respects, the financial position of the Bank as of December 31, 2018 and 2017, and its financial performance and its cash flows for the years then ended in accordance with the Regulations Governing the Preparation of Financial Reports by Public Banks.
Basis for Opinion
We conducted our audits in accordance with the Rules Governing the Audit of Financial Statements of Financial Institutions by Certified Public Accountants and auditing standards generally accepted in the Republic of China. Our responsibilities under those standards are further described in the Auditors’ Responsibilities for the Audit of the Financial Statements section of our report. We are independent of the Bank in accordance with The Norm of Professional Ethics for Certified Public Accountant of the Republic of China, and we have fulfilled our other ethical responsibilities in accordance with these requirements. We believe that the audit evidence we have obtained is sufficient and appropriate to provide a basis for our opinion.
Key Audit Matters
Key audit matters are those matters that, in our professional judgment, were of most significance in our audit of the financial statements for the year ended December 31, 2018. These matters were addressed in the context of our audit of the financial statements as a whole, and in forming our opinion thereon, and we do not provide a separate opinion on these matters.
Key audit matters related to the Bank’s financial statements for the year ended December 31, 2018 for the Bank, which are described as follows:
Allowance for Expected Credit Losses on Loans and Receivables
As of December 31, 2018, the balances of loans and receivables in the aggregate amounted to $399,348,407 thousand, accounted for 64% of the total assets of the financial statements; an amount that is deemed to be significant to the financial statements. To the allowance for expected credit losses on loans and receivables, the Bank has assessed according to IFRS 9 and comply with relevant regulations issued by authorities, whichever is higher. As the assessment on the impairment of loans and accounts receivables involved the management’s critical judgments in accounting estimation and the underlying assumption, related disclosures refer to Notes 5 to the
270

financial statements, we deemed to the allowance for expect credit losses on loans and receivables was a key audit matter. Refer to Notes 4, 5, 13, 14 and 44 to the financial statements for disclosures related to impairment on loans and receivables. In response to the abovementioned key audit matter, the audit procedures we performed are as follows: 1. Understand and perform tests on the Bank’s internal controls relevant to loans and receivables
impairment assessment; 2. Identity the potential risk of loans and receivables customers from public information, and
confirm that whether to include in the appropriate assessment stage; 3. Verify whether the methodology, main assumptions and parameters (consider the probability
of default, probability of loss given default and exposure at default on forward-looking information) adopted by the impairment model of expected credit losses adequately reflect the actual position and compliance with IFRS 9, and recalculate the amount of impairment; and
4. Sample and review credit files to evaluate whether the loans and receivables are reasonably
categorized per regulatory stipulation and recalculate for the correctness of the allowance. Evaluation of Impairment on Intangible Asset - Operation Rights As of December 31, 2018, the balance of intangible asset - operating rights amounted to $1,538,210 thousand. The amount is the cost for the Bank to acquire business from other financial institutions, acquisition cost that results from the allocation of the fair value to corresponding assets and liabilities. According to IAS 36, management should evaluate the impairment on intangible asset - operating rights annually or whenever there is an indication that the asset may be impaired. For the assessment in determining the value in use of operating rights, the management requires an estimate of future cash flow of relevant cash-generating unit. As its assessment involves the management’s critical judgments and estimates, the impairment of intangible asset - operating rights is deemed to be a key audit matter. Refer to Notes 4, 5 and 21 to the financial statements for disclosures related to impairment on intangible asset. In response to the abovementioned key audit matter, we have consulted with our internal financial experts for their help to perform audit procedures as follows: 1. Evaluate and verify the qualification of the valuation personnel employed by the management
in terms of their professional experience, competency, and independence. 2. Evaluate the reasonableness of critical parameters (such as future cash-flow forecast, discount
rate, and sustainable growth rate) and perform sensitivity analysis. 3. Verify the raw data adopted (including the average amounts, the growth rates, interest rates,
etc., of deposits and loans) to evaluate its accuracy and completeness.
271
Responsibilities of Management and Those Charged with Governance for the Financial Statements
Management is responsible for the preparation and fair presentation of the financial statements in accordance with the Regulations Governing the Preparation of Financial Reports by Public Banks and for such internal control as management determines is necessary to enable the preparation of financial statements that are free from material misstatement, whether due to fraud or error. In preparing the financial statements, management is responsible for assessing the Bank’s ability to continue as a going concern, disclosing, as applicable, matters related to going concern and using the going concern basis of accounting unless management either intends to liquidate the Bank or to cease operations, or has no realistic alternative but to do so. Those charged with governance, including the audit committee, are responsible for overseeing the Bank’s financial reporting process. Auditors’ Responsibilities for the Audit of the Financial Statements Our objectives are to obtain reasonable assurance about whether the financial statements as a whole are free from material misstatement, whether due to fraud or error, and to issue an auditors’ report that includes our opinion. Reasonable assurance is a high level of assurance, but is not a guarantee that an audit conducted in accordance with the auditing standards generally accepted in the Republic of China will always detect a material misstatement when it exists. Misstatements can arise from fraud or error and are considered material if, individually or in the aggregate, they could reasonably be expected to influence the economic decisions of users taken on the basis of these financial statements. As part of an audit in accordance with the auditing standards generally accepted in the Republic of China, we exercise professional judgment and maintain professional skepticism throughout the audit. We also: 1. Identify and assess the risks of material misstatement of the financial statements, whether due
to fraud or error, design and perform audit procedures responsive to those risks, and obtain audit evidence that is sufficient and appropriate to provide a basis for our opinion. The risk of not detecting a material misstatement resulting from fraud is higher than for one resulting from error, as fraud may involve collusion, forgery, intentional omissions, misrepresentations, or the override of internal control.
2. Obtain an understanding of internal control relevant to the audit in order to design audit
procedures that are appropriate in the circumstances, but not for the purpose of expressing an opinion on the effectiveness of the Bank’s internal control.
3. Evaluate the appropriateness of accounting policies used and the reasonableness of accounting
estimates and related disclosures made by management. 4. Conclude on the appropriateness of management’s use of the going concern basis of
accounting and, based on the audit evidence obtained, whether a material uncertainty exists related to events or conditions that may cast significant doubt on the Bank’s ability to continue as a going concern. If we conclude that a material uncertainty exists, we are required to draw attention in our auditors’ report to the related disclosures in the financial statements or, if such disclosures are inadequate, to modify our opinion. Our conclusions are based on the audit evidence obtained up to the date of our auditors’ report. However, future events or conditions may cause the Bank to cease to continue as a going concern.
272

5. Evaluate the overall presentation, structure and content of the financial statements, including the disclosures, and whether the financial statements represent the underlying transactions and events in a manner that achieves fair presentation.
6. Obtain sufficient and appropriate audit evidence regarding the financial information of entities
or business activities within the Bank to express an opinion on the financial statements. We are responsible for the direction, supervision, and performance of the Bank audit. We remain solely responsible for our audit opinion.
We communicate with those charged with governance regarding, among other matters, the planned scope and timing of the audit and significant audit findings, including any significant deficiencies in internal control that we identify during our audit. We also provide those charged with governance with a statement that we have complied with relevant ethical requirements regarding independence, and to communicate with them all relationships and other matters that may reasonably be thought to bear on our independence, and where applicable, related safeguards. From the matters communicated with those charged with governance, we determine those matters that were of most significance in the audit of the financial statements for the year ended December 31, 2018 and are therefore the key audit matters. We describe these matters in our auditors’ report unless law or regulation precludes public disclosure about the matter or when, in extremely rare circumstances, we determine that a matter should not be communicated in our report because the adverse consequences of doing so would reasonably be expected to outweigh the public interest benefits of such communication. The engagement partners on the audit resulting in this independent auditors’ report are Shih-Tsung Wu and Chen-Hsiu Yang. Deloitte & Touche Taipei, Taiwan Republic of China March 26, 2019
Notice to Readers The accompanying financial statements are intended only to present the financial position, financial performance and cash flows in accordance with accounting principles and practices generally accepted in the Republic of China and not those of any other jurisdictions. The standards, procedures and practices to audit such financial statements are those generally applied in the Republic of China. For the convenience of readers, the independent auditors’ report and the accompanying financial statements have been translated into English from the original Chinese version prepared and used in the Republic of China. If there is any conflict between the English version and the original Chinese version or any difference in the interpretation of the two versions, the Chinese-language independent auditors’ report and financial statements shall prevail.
273

FAR EASTERN INTERNATIONAL BANK LTD.
BALANCE SHEETS DECEMBER 31, 2018 AND 2017 (In Thousands of New Taiwan Dollars)
2018 2017ASSETS Amount % Amount %
Cash and cash equivalents (Note 6) $ 9,986,581 2 $ 8,531,125 2
Due from the central bank and other banks (Notes 7 and 38) 27,543,032 4 22,351,083 4
Financial assets at fair value through profit or loss (Notes 4, 5, 8, 38 and 43) 46,507,501 7 30,208,333 5
Financial assets at fair value through other comprehensive income (Notes 4, 5, 9, 11, 29, 39 and
43) 119,779,052 19 - -
Investment in debt instruments at amortized cost, net (Notes 4, 5, 10, 11 and 43) 2,588,654 - - -
Securities purchased under resale agreements, net (Notes 4, 12 and 38) 8,289,275 1 11,071,393 2
Receivables, net (Notes 4, 5, 13, 14, 38 and 43) 19,660,289 3 21,534,556 4
Current tax assets (Note 4) - - 7,263 -
Discounts and loans, net (Notes 4, 5, 14, 38 and 43) 379,688,118 61 351,056,762 61
Available-for-sale financial assets (Notes 4, 15, 29, 39 and 43) - - 109,631,578 19
Held-to-maturity financial assets (Notes 4, 16 and 43) - - 2,135,246 -
Investment accounted for using equity method (Notes 4, 17 and 29) 2,794,977 1 2,758,906 -
Debt investments with no active market (Notes 4, 18 and 43) - - 6,677,076 1
Other financial assets, net (Notes 4, 19, 39 and 43) 4,460,520 1 3,495,795 1
Property and equipment, net (Notes 4 and 20) 2,725,364 1 2,882,032 1
Intangible assets, net (Notes 4, 5 and 21) 1,699,602 - 1,725,085 -
Deferred tax assets (Notes 4 and 36) 334,706 - 546,064 -
Other assets 161,958 - 190,336 -
TOTAL $ 626,219,629 100 $ 574,802,633 100
LIABILITIES AND EQUITY
LIABILITIES Due to the central bank and other banks (Note 22) $ 15,726,723 3 $ 6,960,774 1 Financial liabilities at fair value through profit or loss (Notes 4, 5, 8, 26, 38 and 43) 2,752,479 1 4,319,121 1 Securities sold under repurchase agreements (Notes 4 and 23) 14,665,794 2 12,921,364 3 Payables (Note 24) 7,187,730 1 6,420,726 1 Current tax liabilities (Note 4) 179,348 - 250,254 - Deposits and remittances (Notes 25, 38 and 43) 508,647,889 81 472,621,114 82 Bank debentures (Notes 8, 26 and 43) 18,001,900 3 20,216,664 4 Principal received on structured notes 12,479,170 2 6,482,513 1 Other miscellaneous financial liabilities 170,780 - 174,704 - Provisions (Notes 4, 27 and 38) 1,194,774 - 1,127,116 - Other liabilities 468,302 - 521,611 -
Total liabilities 581,474,889 93 532,015,961 93
EQUITY (Notes 4, 9, 15, 17 and 29)
Share capital 32,691,859 5 31,829,286 5Capital surplus 456,426 - 456,426 -Retained earnings
Legal reserve 7,400,808 1 6,544,643 1 Special reserve 36,411 - 250,703 - Unappropriated earnings 4,211,908 1 3,691,412 1
Total retained earnings 11,649,127 2 10,486,758 2Other equity (52,672) - 14,202 -
Total equity 44,744,740 7 42,786,672 7
TOTAL $ 626,219,629 100 $ 574,802,633 100
The accompanying notes are an integral part of the financial statements.
274

FAR EASTERN INTERNATIONAL BANK LTD. STATEMENTS OF COMPREHENSIVE INCOME FOR THE YEARS ENDED DECEMBER 31, 2018 AND 2017 (In Thousands of New Taiwan Dollars, Except Per Share Amounts)
Percentage
Increase 2018 2017 (Decrease) Amount % Amount % % INTEREST REVENUES (Notes 4, 30
and 38) $ 11,261,208 103 $ 10,015,147 98 12 INTEREST EXPENSES (Notes 4, 30
and 38) 5,608,761 51 4,632,022 45 21 NET INTERESTS 5,652,447 52 5,383,125 53 5 NET REVENUES OTHER THAN
INTEREST Net service fee income (Notes 4, 31
and 38) 2,859,767 26 2,870,149 28 - Net gains on financial assets and
liabilities at fair value through profit or loss (Notes 4, 5, 8, 32, 38 and 43) 1,504,371 14 1,732,217 17 (13)
Net realized gains on available-for-sale financial assets (Notes 4 and 29) - - 86,718 1 (100)
Net realized gains on financial assets at fair value through other comprehensive income (Notes 4 and 29) 138,491 1 - - -
Net foreign exchange gains (loss) (Note 4) 275,464 2 (296,415) (3) 193
Shares of profit of subsidiaries and associates for using equity method (Notes 4 and 17) 160,589 1 220,435 2 (27)
Gains on disposal of property (Note 4) 174,804 2 45 - 388,353 Others (Note 19) 172,803 2 181,469 2 (5)
Total net revenues other than
interest 5,286,289 48 4,794,618 47 10 NET REVENUES 10,938,736 100 10,177,743 100 7 PROVISION FOR LOSSES ON BAD
DEBTS EXPENSE, COMMITMENT AND GUARANTEE (Notes 4, 14 and 38) 506,522 5 729,425 7 (31)
(Continued)
275

FAR EASTERN INTERNATIONAL BANK LTD. STATEMENTS OF COMPREHENSIVE INCOME FOR THE YEARS ENDED DECEMBER 31, 2018 AND 2017 (In Thousands of New Taiwan Dollars, Except Per Share Amounts)
Percentage
Increase 2018 2017 (Decrease) Amount % Amount % % OPERATING EXPENSES
Employee benefits expense (Notes 4, 28, 33 and 38) $ 3,658,016 33 $ 3,499,119 34 5
Depreciation and amortization (Notes 4 and 34) 245,832 2 244,536 3 1
Other general and administrative expenses (Notes 35 and 38) 2,478,111 23 2,421,334 24 2
Total operating expenses 6,381,959 58 6,164,989 61 4
INCOME BEFORE INCOME TAX 4,050,255 37 3,283,329 32 23 INCOME TAX EXPENSE (Notes 4, 5
and 36) 526,054 5 429,446 4 22 NET INCOME FOR THE YEAR 3,524,201 32 2,853,883 28 23 OTHER COMPREHENSIVE INCOME
(LOSS) (Notes 4, 5, 9, 11, 15, 17, 29 and 36) Items that will not be reclassified
subsequently to profit or loss: Remeasurement of defined benefit
plans (46,657) (1) 55,828 1 (184)Losses on valuation of investments
in equity instruments at fair value through other comprehensive income (37,126) - - - -
Share of other comprehensive loss of associates for using equity method (4,832) - (414) - (1,067)
Income tax relating to items that will not be reclassified subsequently to profit or loss 23,181 - (9,491) - 344 (65,434) (1) 45,923 1 (242)
(Continued)
276
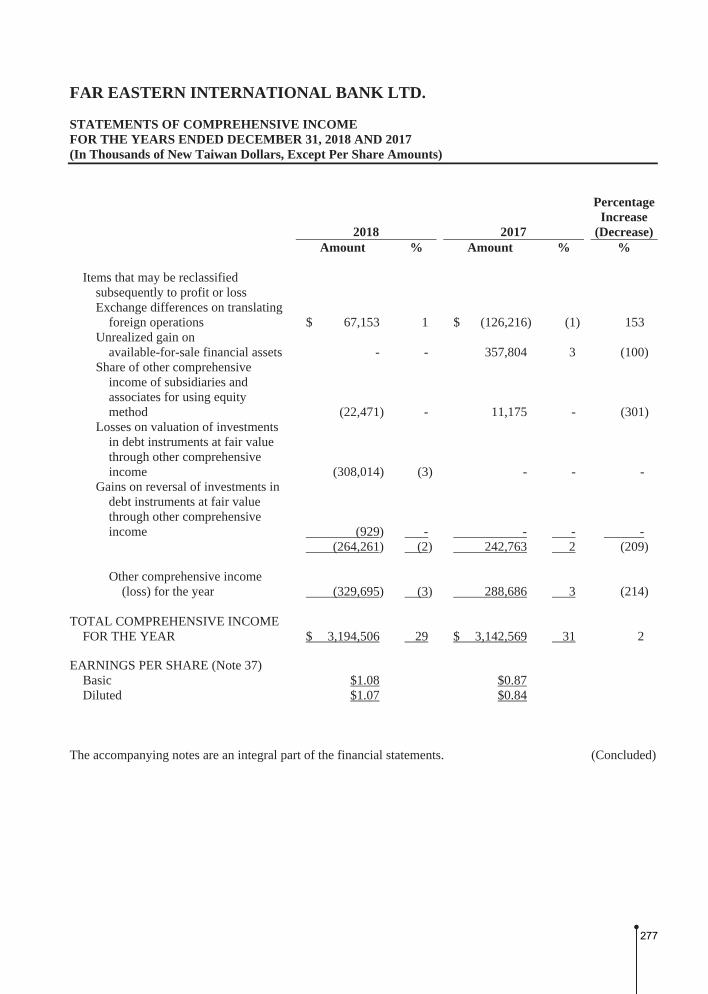
FAR EASTERN INTERNATIONAL BANK LTD. STATEMENTS OF COMPREHENSIVE INCOME FOR THE YEARS ENDED DECEMBER 31, 2018 AND 2017 (In Thousands of New Taiwan Dollars, Except Per Share Amounts)
Percentage
Increase 2018 2017 (Decrease) Amount % Amount % %
Items that may be reclassified subsequently to profit or loss Exchange differences on translating
foreign operations $ 67,153 1 $ (126,216) (1) 153 Unrealized gain on
available-for-sale financial assets - - 357,804 3 (100)Share of other comprehensive
income of subsidiaries and associates for using equity method (22,471) - 11,175 - (301)
Losses on valuation of investments in debt instruments at fair value through other comprehensive income (308,014) (3) - - -
Gains on reversal of investments in debt instruments at fair value through other comprehensive income (929) - - - - (264,261) (2) 242,763 2 (209)
Other comprehensive income
(loss) for the year (329,695) (3) 288,686 3 (214) TOTAL COMPREHENSIVE INCOME
FOR THE YEAR $ 3,194,506 29 $ 3,142,569 31 2 EARNINGS PER SHARE (Note 37)
Basic $1.08 $0.87 Diluted $1.07 $0.84
The accompanying notes are an integral part of the financial statements. (Concluded)
277

FAR
EA
STE
RN
INT
ER
NA
TIO
NA
L B
AN
K L
TD
.
STA
TE
MEN
TS
OF
CH
AN
GE
S IN
EQ
UIT
Y
FOR
TH
E Y
EA
RS
EN
DED
DE
CEM
BE
R 3
1, 2
018
AN
D 2
017
(In
Tho
usan
ds o
f New
Tai
wan
Dol
lars
)
Oth
er E
quity
Unr
ealiz
ed
G
ain
(Los
s) o
n
Exc
hang
e
Unr
ealiz
ed
Fi
nanc
ial A
sset
s
Diff
eren
ces o
n
Gai
n (L
oss)
on
at
Fai
r V
alue
Tra
nsla
ting
A
vaila
ble-
for-
Thr
ough
Oth
er
R
etai
ned
Ear
ning
s (N
ote
29)
Fore
ign
sa
le F
inan
cial
Com
preh
ensi
ve
Shar
e C
apita
l
C
apita
l Sur
plus
Una
ppro
pria
ted
Ope
ratio
ns
A
sset
s (N
otes
4,
In
com
e(N
otes
4,
(N
ote
29)
(N
ote
29)
Leg
al R
eser
ve
Spec
ial R
eser
veE
arni
ngs
(Not
e 4)
15 a
nd 2
9)
9
and
29)
Tot
al E
quity
BA
LA
NC
E A
T J
AN
UA
RY
1, 2
017
$ 3
1,11
3,67
2
$
45
6,42
6
$
5,57
1,47
7
$
121,
028
$
3,
916,
835
$
11
5,91
6
$
(3
44,4
77)
$
-
$ 4
0,95
0,87
7
App
ropr
iati
on o
f th
e 20
16 e
arni
ngs
L
egal
res
erve
-
-
97
3,16
6
-
(973
,166
)
-
-
-
- Sp
ecia
l res
erve
-
-
-
129,
675
(129
,675
)
-
-
-
- C
ash
divi
dend
s -
NT
$0.4
20 d
olla
rs p
er s
hare
-
-
-
-
(1
,306
,774
)
-
-
-
(1,3
06,7
74)
Sto
ck d
ivid
ends
- N
T$0
.230
dol
lars
per
sha
re
71
5,61
4
-
-
-
(7
15,6
14)
-
-
-
-
715,
614
-
973,
166
129,
675
(3,1
25,2
29)
-
-
-
(1
,306
,774
)
Net
inco
me
for
the
year
end
ed D
ecem
ber
31, 2
017
-
-
-
-
2,85
3,88
3
-
-
-
2,85
3,88
3
Oth
er c
ompr
ehen
sive
inco
me
(los
s) f
or th
e ye
ar e
nded
Dec
embe
r 31
, 201
7
-
-
-
-
45
,923
(1
24,5
69)
36
7,33
2
-
28
8,68
6
Tot
al c
ompr
ehen
sive
inco
me
(los
s) f
or th
e ye
ar e
nded
Dec
embe
r 31
, 201
7
-
-
-
-
2,
899,
806
(124
,569
)
367,
332
-
3,14
2,56
9
BA
LA
NC
E A
T D
EC
EM
BE
R 3
1, 2
017
31
,829
,286
456,
426
6,54
4,64
3
25
0,70
3
3,
691,
412
(8,6
53)
22
,855
-
42
,786
,672
Eff
ects
of
retr
ospe
ctiv
e ap
plic
atio
n
-
-
-
-
(1
2,34
2)
-
(22,
855)
196,
065
160,
868
B
AL
AN
CE
AT
JA
NU
AR
Y 1
, 201
8 A
S A
PPL
IED
RE
TR
OS
PE
CT
IVE
LY
31,8
29,2
86
45
6,42
6
6,
544,
643
250,
703
3,67
9,07
0
(8
,653
)
-
196,
065
42,9
47,5
40
App
ropr
iati
on o
f th
e 20
17 e
arni
ngs
L
egal
res
erve
-
-
85
6,16
5
-
(856
,165
)
-
-
-
- R
ever
sal o
f sp
ecia
l res
erve
s
-
-
-
(214
,292
)
21
4,29
2
-
-
-
- C
ash
divi
dend
s -
NT
$0.4
39 d
olla
rs p
er s
hare
-
-
-
-
(1
,397
,306
)
-
-
-
(1,3
97,3
06)
Sto
ck d
ivid
ends
- N
T$0
.271
dol
lars
per
sha
re
86
2,57
3
-
-
-
(8
62,5
73)
-
-
-
-
862,
573
-
856,
165
(214
,292
)
(2
,901
,752
)
-
-
-
(1,3
97,3
06)
N
et in
com
e fo
r th
e ye
ar e
nded
Dec
embe
r 31
, 201
8
-
-
-
-
3,
524,
201
-
-
-
3,
524,
201
O
ther
com
preh
ensi
ve lo
ss f
or th
e ye
ar e
nded
Dec
embe
r 31
, 201
8
-
-
-
-
(2
4,08
0)
62,4
70
-
(3
68,0
85)
(329
,695
)
Tot
al c
ompr
ehen
sive
inco
me
(los
s) f
or th
e ye
ar e
nded
Dec
embe
r 31
, 201
8
-
-
-
-
3,
500,
121
62,4
70
-
(3
68,0
85)
3,19
4,50
6
Dis
posa
l of
inve
stm
ents
in e
quit
y in
stru
men
ts a
t fai
r va
lue
thro
ugh
othe
r co
mpr
ehen
sive
inco
me
(los
s)
-
-
-
-
(65,
531)
-
-
65
,531
-
B
AL
AN
CE
AT
DE
CE
MB
ER
31,
201
8
$
32,
691,
859
$
456,
426
$
7,
400,
808
$
36
,411
$
4,21
1,90
8
$
53,8
17
$
-
$
(1
06,4
89)
$
44,
744,
740
The
acc
ompa
nyin
g no
tes
are
an in
tegr
al p
art o
f th
e fi
nanc
ial s
tate
men
ts.
278

FAR EASTERN INTERNATIONAL BANK LTD. STATEMENTS OF CASH FLOWS FOR THE YEARS ENDED DECEMBER 31, 2018 AND 2017 (In Thousands of New Taiwan Dollars) 2018 2017 CASH FLOWS FROM OPERATING ACTIVITIES
Income before income tax $ 4,050,255 $ 3,283,329Adjustments for:
Depreciation 220,349 218,094Amortization 25,483 26,442Provision for losses on bad debts expense, commitment and
guarantee 965,403 1,212,921Net valuation loss (gain) on financial assets and liabilities at fair
value through profit or loss 220,958 (160,180)Interest expenses 5,608,761 4,632,022Interest revenues (11,261,208) (10,015,147)Dividends revenue (124,637) (63,321)Shares of profit from associates (160,589) (220,435)Loss (gain) on disposal and retirement of property and equipment (173,729) 2,939Gain on disposal financial assets carried at cost - (1,490)Unrealized net loss (gain) on foreign currency exchange (217,180) 395,746Other adjustments (79,831) (94,863)Changes in operating assets and liabilities
Decrease (increase) in due from the central bank and other banks (1,135,766) 7,092,056Decrease (increase) in financial assets at fair value through profit
or loss (6,101,228) 3,781,946Increase in financial assets at fair value through other
comprehensive income (10,572,357) -Increase in investments in debt instruments at amortized cost (385,871) -Decrease (increase) in receivables 2,665,236 (2,280,507)Decrease (increase) in discounts and loans (31,530,667) 551,765Increase in available-for-sale financial assets - (30,236,113)Decrease in held-to-maturity financial assets - 306,249Decrease in debt investments with no active market - 919,160Increase in due to the central bank and other banks 8,330,844 137,136Decrease in financial liabilities at fair value through profit or loss (1,566,648) (3,635,415)Increase in payables 507,702 469,910Increase in deposits and remittances 34,068,086 25,822,601Increase in principal received on structured products 6,177,186 1,543,857
Cash generated from (used in) operations (469,448) 3,688,702Interest received 11,182,540 9,890,215Dividends received 124,637 63,321Interest paid (5,435,815) (4,318,048)Income tax paid (332,024) (481,138)
Net cash generated from operating activities 5,069,890 8,843,052
CASH FLOWS FROM INVESTING ACTIVITIES
Acquisition of financial assets carried at cost - (24,950)Proceeds from disposal of financial assets carried at cost - 51,496
(Continued)
279

FAR EASTERN INTERNATIONAL BANK LTD. STATEMENTS OF CASH FLOWS FOR THE YEARS ENDED DECEMBER 31, 2018 AND 2017 (In Thousands of New Taiwan Dollars) 2018 2017
Acquisition of investments accounted for using equity method $ - $ (28,980)Acquisition of property and equipment (278,229) (221,460)Proceeds from disposal of property and equipment 370,883 45Decrease (increase) in other financial assets (1,194,058) 141,506Decrease in other assets 46,758 23,423Dividends received from subsidiaries and associates 101,225 69,585
Net cash generated from (used in) investing activities (953,421) 10,665
CASH FLOWS FROM FINANCING ACTIVITIES
Redemption of Euro Convertible Bond (1,586,434) -Proceeds from the issuance of bank debentures 2,900,000 -Redemption of bank debentures (3,500,000) (4,000,000)Increase (decrease) in securities sold under repurchase agreements 2,030,599 (434,630)Increase (decrease) in other financial liabilities (3,924) 21,127Increase (decrease) in other liabilities (38,485) 35,088Cash dividends (1,397,306) (1,306,774)
Net cash used in financing activities (1,595,550) (5,685,189)
EFFECTS OF EXCHANGE RATE CHANGES ON CASH AND CASH
EQUIVALENTS 77,183 51,255 NET INCREASE IN CASH AND CASH EQUIVALENTS 2,598,102 3,219,783 CASH AND CASH EQUIVALENTS, BEGINNING OF THE YEAR 31,474,842 28,255,059 CASH AND CASH EQUIVALENTS, END OF THE YEAR $ 34,072,944 $ 31,474,842 Reconciliation of the amounts in the statements of cash flows with the equivalent items reported in the balance sheets is as follows: December 31 2018 2017 Cash and cash equivalents in balance sheets $ 9,986,581 $ 8,531,125Due from the Central Bank and other banks that meet the IAS 7 definition
of “cash and cash equivalents” 15,797,088 11,872,324Securities purchased under resale agreements that meet the IAS 7
definition of “cash and cash equivalents” 8,289,275 11,071,393Cash and cash equivalents in statements of cash flows $ 34,072,944 $ 31,474,842 The accompanying notes are an integral part of the financial statements. (Concluded)
280

FAR EASTERN INTERNATIONAL BANK LTD. NOTES TO FINANCIAL REPORTS FOR THE YEARS ENDED DECEMBER 31, 2018 AND 2017 (In Thousands of New Taiwan Dollars, Unless Stated Otherwise) 1. GENERAL INFORMATION
Far Eastern International Bank Ltd. (the “Bank”) obtained its license on January 11, 1992 and started its business on April 11, 1992. The Bank (a) accepts deposits and extends loans and guarantees; (b) issues letters of credit, handles domestic and foreign remittances, and accepts commercial drafts; (c) invests in securities and acts as an agent for trading government bonds, corporate bonds and bank debentures; and (d) conducts relevant businesses that are authorized by the relevant authorities. The operations of the Bank’s Trust Department include pecuniary trust, securities trust, real estate trust, creditor’s right of money or guarantee, movable property trust and ground right trust and related operations. These operations are regulated under the Banking Act and Trust Enterprise Act. As of December 31, 2017, the Bank’s operating units included the Business Department, International Banking Department, Trust Department, Credit Card Department, Offshore Banking Unit (OBU), and 55 domestic branches, as well as an overseas branch in Hong Kong. The Bank’s shares are listed on the Taiwan Stock Exchange. Global depositary receipts, which represent ownership of ordinary shares of the Bank, have been listed on the Luxembourg Stock Exchange since January 2014. To integrate resources and produce maximum benefit from the business, the Bank absorbed and merged Far Eastern Life Insurance Agency Co., Ltd. (“FELIA”) and Far Eastern Property Insurance Agency Co., Ltd. (“FEPIA”) on February 6, 2017; the entities were both wholly-owned subsidiaries of the Bank, and the merger did not have effect on the equity of the shareholders. The Bank accepted generally all assets, liabilities and all rights and obligations of FELIA and FEPIA that were valid as of the merger date.
2. APPROVAL OF FINANCIAL REPORTS
The financial statements were approved by the Bank’s board of Directors on March 26, 2019.
281

3. APPLICATION OF NEW, AMENDED AND REVISED STANDARDS AND INTERPRETATIONS
a. Initial application of the amendments to the Regulations Governing the Preparation of Financial Reports by Securities Issuers and the International Financial Reporting Standards (IFRS), International Accounting Standards (IAS), Interpretations of IFRS (IFRIC) and Interpretations of IAS (SIC) (collectively, the “IFRSs”) endorsed and issued into effect by the Financial Supervisory Commission (FSC) Except for IFRS 9 “Financial Instruments” and related amendments, whenever applied, the initial application of the amendments to the Regulations Governing the Preparation of Financial Reports by Securities Issuers and the IFRSs endorsed and issued into effect by the FSC would not have any material impact on the Bank accounting policies: IFRS 9 supersedes IAS 39 “Financial Instruments: Recognition and Measurement”, with consequential amendments to IFRS 7 “Financial Instruments: Disclosures” and other standards. IFRS 9 sets out the requirements for classification, measurement and impairment of financial assets and hedge accounting. Refer to Note 4 for information relating to the relevant accounting policies. 1) Classification, measurement and impairment of financial assets
On the basis of the facts and circumstances that existed as of January 1, 2018, the Bank has performed an assessment of the classification of recognized financial assets and has elected not to restate prior reporting periods. The following table shows the original measurement categories and carrying amount under IAS 39 and the new measurement categories and carrying amount under IFRS 9 for each class of the Bank’s financial assets and financial liabilities as of January 1, 2018.
Measurement Category Carrying Amount Financial Assets IAS 39 IFRS 9 IAS 39 IFRS 9
Hybrid contract Debt instruments with no active market Mandatorily at fair value through profit or
loss (i.e. FVTPL) $ 6,677,076 $ 6,669,817
Loans and receivables Mandatorily at FVTPL 3,161,799 3,186,456 Financial assets at FVTPL Mandatorily at FVTPL 5,680,038 5,680,038Derivatives Financial assets at FVTPL Mandatorily at FVTPL 3,061,166 3,061,166Equity securities Financial assets at FVTPL Mandatorily at FVTPL 347,783 347,783 Available-for-sale Fair value through other comprehensive
income (i.e. FVTOCI) - equity instruments
709,311 709,311
Financial assets measured at cost FVTOCI - equity instruments 113,636 309,655Long-term equity
investment Equity investments under the equity
method Equity investments under the equity
method 2,758,906 2,762,916
Mutual funds Financial assets at FVTPL Mandatorily at FVTPL 50,473 50,473 Available-for-sale Mandatorily at FVTPL 49,400 49,400Debt securities Securities purchased under resale
agreements Securities purchased under resale
agreements 11,071,393 11,071,268
Financial assets at FVTPL Mandatorily at FVTPL 21,068,873 21,068,873 Available-for-sale FVTOCI - debt instruments 108,872,867 108,872,867 Held-to-maturity Debt instruments at amortized cost 2,135,246 2,134,976Others Refundable deposits Refundable deposits 2,231,905 2,231,309Loan commitment
provision Provision Provision 1,127,116 1,182,684
282

Financial Assets
IAS 39 CarryingAmount
as of January 1, 2018 Reclassifications Remeasurements
IFRS 9 CarryingAmount as of
January 1, 2018
Retained Earnings Effect on
January 1, 2018
Other Equity
Effect on January 1,
2018 Remark FVTPL $ 30,208,333 Add: Reclassification from
available-for-sale (IAS 39)
Required reclassification - $ 49,400 $ - $ (600 ) $ 600 c) Add: Reclassification from
investments with no active market (IAS 39)
- 6,677,076 (7,259 ) (7,259 ) - e)
Add: Reclassification from loans and receivables (IAS 39)
Required reclassification - 3,161,799 24,657 24,657 - f) 30,208,333 9,888,275 (17,398 ) $ 40,114,006 16,798 600 FVTOCI Debt instruments - Add: Reclassification from
available-for-sale (IAS 39) - 108,872,867 - (5,247 ) 5,247 b)
Equity instruments Add: Reclassification from
available-for-sale (IAS 39) - 709,311 - - - a)
Add: Reclassification and remeasurement from financial assets measured at cost
- 113,636 196,019 37,536 158,483 a)
- 19,695,814 196,019 109,891,833 32,898 163,730 Debt instruments at amortized cost - Add: Reclassification from
held-to-maturity (IAS 39) - 2,135,246 (270 ) (270 ) - d)
- 2,135,246 (270 ) 2,134,976 (270 ) - Discounts and loans 351,056,762 Less: Reclassification to FVTPL
(IFRS 9) - (3,161,799 ) - f)
351,056,762 (3,161,799 ) - 347,894,963 - - Equity investments under the
equity method 2,758,906
Add: Remeasure the equity investments under the equity method (IAS 39)
- - 4,010 (4,870 ) 8,880 g)
2,758,906 - 4,010 2,762,916 (4,870 ) 8,880 Securities purchased under resale
agreements 11,071,393
Less: Remeasure the securities purchased under resale agreements (IAS 39)
- - (125 ) (125 ) - h)
11,071,393 - (125 ) 11,071,268 (125 ) - Other financial assets 3,495,795 Less: Remeasure the refundable
deposits (IAS 39) - - (596 ) (596 ) - h)
Less: Reclassification to FVTOCI - equity instruments (IFRS 9)
- (113,636 ) - - - a)
3,495,795 (113,636 ) (596 ) 3,381,563 (596 ) - Assets 398,591,189 118,443,900 216,436 517,251,525 43,226 173,210 Provision 1,127,116 Less: Remeasure the provision
(IAS 39) - - 55,568 1,182,684 (55,568 ) - i)
Liability 1,127,116 - 55,568 1,182,684 (55,568 ) - $ 37,464,073 $ 118,443,900 $ 160,868 $ 516,068,841 $ (12,342 ) $ 173,210
Note: a) Investments in equity securities previously classified as available-for-sale under IAS 39 at
FVTOCI under IFRS 9, and investments in unlisted shares previously measured at cost under IAS 39 have been classified at FVTOCI under IFRS 9. The Bank previously recognized impairment loss on certain investments in equity securities under IAS 39, and the loss was accumulated in retained earnings. Since those investments were designated as at FVTOCI under IFRS 9 and no impairment assessment is required, an adjustment was made and resulted in an increase of $37,536 thousand in retained earnings and an increase of $158,483 thousand in other equity - unrealized gain on financial assets at FVTOCI on January 1, 2018.
b) Debt investments previously classified as available-for-sale under IAS 39 were classified as
financial assets at FVTOCI with an assessment of expected credit losses under IFRS 9, because on January 1, 2018, the contractual cash flows were solely payments of principal and interest on the principal outstanding, and these investments were held within a business model whose objective is achieved by both collecting contractual cash flows and selling financial assets. As a result of retrospective application, the related adjustments comprised an increase in other equity - unrealized gain on financial assets at FVTOCI of $5,247 thousand and a decrease in retained earnings of $5,247 thousand on January 1, 2018.
283

c) Mutual funds were classified as available-for-sale under IAS 39. The contractual cash flows at the time of original recognition which were not classified as equity instrument were not solely used to pay for the interest on the principal and the amount of the outstanding principal. Therefore, the investments are measured at FVTPL in accordance with IFRS 9. Due to the retrospective application, the Bank decreased the retained earnings and a increase in other eqity of $600 thousand on January 1, 2018.
d) Bond investments were classified as held-to-maturity at amortized cost under IAS 39. The
contractual cash flows at the time of original recognition were totally used to pay for the interest on the principal and the amount of the outstanding principal. And the Bank assessed that the business model is for the purpose of collecting contractual cash flow under the current facts and circumstances existing as of January 1, 2018; therefore, such investments are measured at amortized cost in accordance with IFRS 9, and the Bank assessed the expected credit loss. Due to the retrospective application, the Bank decreased the retained earnings on January 1, 2018 by $270 thousand.
e) Investments in debt instrument without active market were classified as financial assets at
amortized cost under IAS 39 and were the master contract of the hybrid contract. The classification is determined in accordance with the entire hybrid contract under IFRS 9 and classified as financial assets at FVTPL. Due to the retrospective application, the Bank decreased the retained earnings on January 1, 2018 by $7,259 thousand.
f) Some of discounts and loans were classified as financial assets at amortized cost under IAS 39
and were the master contract of the hybrid contract. The classification is determined in accordance with the entire hybrid contract under IFRS 9 and classified as financial assets at FVTPL. Due to the retrospective application, the Bank increased the retained earnings on January 1, 2018 by $24,657 thousand.
g) Due to a retrospective application with associates under IFRS 9, the Bank comprised a decrease
in retained earnings of $4,870 thousand and an increase in other equity - unrealized gain and loss on financial assets at FVTPL of $8,800 thousand on January 1, 2018.
h) The assessment of expected credit loss with securities purchased under resale agreements and
refundable deposits in accordance with IFRS 9 were same as investments in debt instrument. As a result of retrospective application, the Bank comprised a decrease in retained earnings of $125 thousand and $596 thousand separately on January 1, 2018.
i) With the assessment of expected credit loss on irrevocable loan commitments under IFRS 9, the
Bank comprised a decrease in retained earnings of $55,568 thousand on January 1, 2018.
284

2) First-time application to reconciliation of the allowance for impairment under IFRS 9 The Bank reconcile the allowance for impairment from occurrence impairment model under IAS 39 to expected impairment model under IFRS 9. The reconciliation on January 1, 2018 is as followed:
Measurement Categories
Allowance for Impairment
Under IAS 39 and the Account
Under IAS 37 Reclassification Remeasurements
Allowance for Impairment
Under IFRS 9 Loans and receivables (IAS 39)/
financial assets at amortized cost (IFRS 9)
Receivables and other financial assets $ 994,174 $ - $ 4,491 $ 998,665 Discount and loans 1,642,959 - 34,688 1,677,647 Account the impairment with
“Regulations Governing the Procedures for Banking Institutions to Evaluate Assets and Deal with Non-performing/Non-accrual Loans” 3,390,655 (31,937) (39,179) 3,319,539
6,027,788 (31,937) - 5,995,851 Available for sale (IAS 39)/financial
assets at FVTOCI (IFRS 9) - - 5,247 5,247 Financial Assets at cost (IAS 39)/
financial assets at FVTOCI (IFRS 9) 37,536 - (37,536) -
Held to maturity (IAS 39)/financial assets at amortized cost (IFRS 9) - - 270 270
Loan commitments - - 55,568 55,568 Securities purchased under resell
agreements - - 125 125 Refundable deposits - - 596 596 $ 6,065,324 $ (31,937) $ 24,270 $ 6,057,657
b. The Regulations Governing the Preparation of Financial Reports by Public Banks and the IFRSs
endorsed by the FSC for application starting from 2019.
New, Amended or Revised Standards and Interpretations (the “New IFRSs”)
Effective Date Announced by IASB (Note 1)
Annual Improvements to IFRSs 2015-2017 Cycle January 1, 2019 Amendments to IFRS 9 “Prepayment Features with Negative
Compensation” January 1, 2019 (Note 2)
IFRS 16 “Leases” January 1, 2019 Amendments to IAS 19 “Plan Amendment, Curtailment or
Settlement” January 1, 2019 (Note 3)
Amendments to IAS 28 “Long-term Interests in Associates and Joint Ventures”
January 1, 2019
IFRIC 23 “Uncertainty over Income Tax Treatments” January 1, 2019 Note 1: Unless stated otherwise, the above New IFRSs are effective for annual periods beginning on
or after their respective effective dates. Note 2: The FSC permits the election for early adoption of the amendments starting from 2018. Note 3: The Bank shall apply these amendments to plan amendments, curtailments or settlements
occurring on or after January 1, 2019.
285

Except for the above IFRS 16 “Leases”, as of the date the financial statements were authorized for issue, the Bank is continuously assessing that the application of other standards and interpretations won’t have material impact on the Bank’s financial position and financial performance. IFRS 16 “Leases” IFRS 16 sets out the identification of lease agreements and the accounting standards for lessor and lessee that will supersede IAS 17 “Leases”, IFRIC 4 “Determining Whether an Arrangement Contains a Lease” and a number of related interpretations. Definition of leases When applying IFRS 16 for the first time, the Bank will choose whether a contract signed or changed on or after January 1, 2019 will be assessed as a lease according to IFRS 16. Currently, lease contracts under IAS 17 and IFRIC 4 are not allowed to be reassessed, which should be processed in accordance with the transitional provisions of IFRS 16. The Bank as lessee When IFRS 16 is applied for the first time, except for the low-value target asset leases and short-term lease options, which are recognized under a straight-line basis, other leases will be recognized as the right-of-use assets and lease liabilities in the balance sheets. The comprehensive income statements will represent the depreciation expense of the right-of-use assets and the interest expense arising from the effective interest method on the lease liabilities separately. In the cash flow statements, the principal amount of lease liabilities is expressed as financing activities, and the interest payment portion is classified as operating activities. The identified right-of-use assets will be subject to an IAS 36 impairment assessment. The Bank planned to adjust the cumulative effects of the retroactive application of IFRS 16 to the retained earnings on January 1, 2019, without restating the comparative information. At present, in accordance with the agreement of IAS 17 for operating leases, the measurement of lease liabilities on January 1, 2019 will be discounted by the remaining lease payments at the increased borrowing rate of the lessee at that date. All assets with use rights will be measured at the amount of lease liabilities on that date. Anticipated impact on assets, liabilities and equity of January 1, 2019 is set out below:
Carrying Amount as of December 31,
2018
Adjustments Arising from
Initial Application
Adjusted Carrying
Amount as of January 1, 2019
Prepaid lease $ 3,294 $ (3,294) $ -Investment in the equity method 2,794,977 289 2,795,266Right-of-use assets - 832,364 832,364 Total effect on assets $ 829,359 Lease liabilities - $ 846,497 846,497 Total effect on liabilities $ 846,497 Retained earning 11,649,127 $ (17,138) 11,631,989
286

c. New IFRSs in issue but not yet endorsed and issued into effect by the IASB
New IFRSs Effective Date
Announced by IASB (Note 1) Amendments to IFRS 3 “Definition of a Business” January 1, 2020 (Note 2) Amendments to IFRS 10 and IAS 28 “Sale or Contribution of Assets
between An Investor and Its Associate or Joint Venture” To be determined by IASB
IFRS 17 “Insurance Contracts” January 1, 2021 Amendments to IAS 1 and IAS 8 “Definition of Material” January 1, 2020 (Note 3) Note 1: Unless stated otherwise, the above New IFRSs are effective for annual periods beginning on
or after their respective effective dates. Note 2: The Bank shall apply these amendments to business combinations for which the acquisition
date is on or after the beginning of the first annual reporting period beginning on or after January 1, 2020 and to asset acquisitions that occur on or after the beginning of that period.
Note 3: The Bank shall apply these amendments prospectively for annual reporting periods beginning
on or after January 1, 2020. As of the date the financial statements were authorized for issue, the Bank is continuously assessing the possible impact that the application of other standards and interpretations will have on the financial position and financial performance and will disclose the relevant impact when the assessment is completed.
4. SUMMARY OF SIGNIFICANT ACCOUNTING POLICIES Statement of Compliance The financial reports have been prepared in accordance with the Regulations Governing the Preparation of Financial Reports by Public Banks. Basis of Preparation The financial reports have been prepared on the historical cost basis except for financial instruments and net benefit liabilities which are measured at the present value of the defined benefit obligation less the fair value of plan assets. Historical cost is generally based on the fair value of the consideration given in exchange for assets. The measurement of investment in subsidiaries and investment in associates were classified at equity method when the Bank was compiling the financial report. The net income, other comprehensive income, equity of the financial report and the net income, other comprehensive income and equity of the consolidated financial report which were attributed to the parent company. Current and Noncurrent Assets and Liabilities Accounts included in the balance sheets are not classified as current or noncurrent since the operating characteristics of the Bank, whose operating cycle cannot be reasonably identified. Nevertheless, accounts are properly categorized in accordance with their nature and sequenced by their liquidity. Refer to Note 44 for the maturity analysis of liabilities.
287
Foreign Currency Foreign-currency assets and liabilities are recorded in their original currencies. Foreign-currency items in net income of domestic operating units are translated into New Taiwan dollars at prevailing exchange rates at the dates of the transactions. For overseas branches (including the OBU), foreign-currency items in net income from transactions settled in currencies other than the entity’s functional currency are translated into the entity’s functional currency at prevailing exchange rates at the dates of the transactions. At the balance sheet date, foreign-currency monetary assets and liabilities are translated at prevailing exchange rates, and the exchange differences are recognized as gain or loss. When foreign-currency assets and liabilities are settled, exchange differences arising from the application of different exchange rates are recognized as gain or loss for the current year. The financial statements of foreign branches (including OBU) are translated into New Taiwan dollars at the following exchange rates: Assets and liabilities - at exchange rates prevailing on the balance sheet date. The beginning balance of current year’s earnings of foreign branches and the OBU not yet remitted to the head office - the same as the ending balance of the prior years’ earnings; and Income and expenses - at average exchange rates for the period. Exchange differences arising from the translation of the financial statements of foreign branches and OBU are recognized as other comprehensive income-exchange differences on translating foreign operations. Investment Accounted for Using Equity Method Investments in subsidiaries and associates are accounted for using the equity method of accounting. Subsidiaries are the entity which were controlled by the Bank. An associate is an entity over which the Bank have significant influence and that is not a subsidiary. Significant influence is the power to participate in the financial and operating policy decisions of the investee without having control or joint control over those policies. An investment in a subsidiary and associate is initially recognized at cost and adjusted thereafter to recognize the Bank’s share of the profit or loss and other comprehensive income of the associate. The Bank also recognize the changes in the Bank’s share of equity of associates. Property and Equipment Property and equipment are stated at cost, less accumulated depreciation and accumulated impairment loss. Depreciation is recognized so as to write off the cost of assets less their residual values over their estimated useful lives, using the straight-line method. The estimated useful lives, residual values and depreciation method are reviewed at the end of each year, with the effect of any changes in estimate accounted for on a prospective basis. Any gain or loss arising on the disposal or retirement of an item of property and equipment is determined as the difference between the sales proceeds and the carrying amount of the asset and is recognized in profit or loss.
288

Intangible Assets Intangible assets acquired in a business combination are initially recognized at their fair value at the acquisition date. Subsequent to initial recognition, intangible assets with finite useful lives are reported at cost less accumulated amortization and accumulated impairment loss. Amortization is recognized on a straight-line basis. The estimated useful life, residual value, and amortization method are reviewed at the end of each reporting period, with the effect of any changes in estimate accounted for on a prospective basis. The residual value of an intangible asset with a finite useful life shall be assumed to be zero unless the Bank expects to dispose of the intangible asset before the end of its economic life. Intangible assets with indefinite useful lives are measured at cost less accumulated impairment loss. Impairment of Tangible and Intangible Assets At the end of each reporting period, the Bank review the carrying amounts of their tangible and intangible assets to determine whether there is any indication that those assets have suffered an impairment loss. If any such indication exists, the recoverable amount of the asset is estimated in order to determine the extent of the impairment loss. When it is not possible to estimate the recoverable amount of an individual asset, the Bank estimate the recoverable amount of the cash-generating unit to which the asset belongs. Corporate assets are allocated to the smallest group of cash-generating units under a reasonable and consistent basis. Intangible assets with indefinite useful lives are tested for impairment at least annually, and whenever there is an indication that the asset may be impaired. Recoverable amount is the higher of fair value less costs to sell and value in use. If the recoverable amount of an asset or cash-generating unit is estimated to be less than its carrying amount, the carrying amount of the asset or cash-generating unit is reduced to its recoverable amount. When the recoverable amount increases in a subsequent period, the reversal of an impairment loss is recognized immediately in profit or loss. The carrying amount of the asset or cash-generating unit is increased to the revised estimate of its recoverable amount, but only to the extent of the carrying amount that would have been determined had no impairment loss been recognized for the asset or cash-generating unit in prior years. Securities Purchased/Sold Under Resale/Repurchase Agreements Securities purchased under resale agreements and securities sold under repurchase agreements are generally treated as collateralized financing transactions. Interest expenses and interest revenues are recognized on the accrual basis. Financial Instruments Financial assets and financial liabilities are recognized when the Bank become a party to the contractual provisions of the instruments. Transaction costs that are directly attributable to the acquisition or issue of financial assets and financial liabilities (other than financial assets and financial liabilities at FVTPL) are added to or deducted from the fair value of the financial assets or financial liabilities, as appropriate, on initial recognition. Transaction costs directly attributable to the acquisition of financial assets or financial liabilities at FVTPL are recognized immediately as expense.
289

Financial assets All regular way purchases or sales of financial assets are recognized and derecognized on a trade date basis. a. The Bank owns financial assets which are classified into the following specified categories:
2018 1) Financial assets at FVTPL
A financial asset is classified as at FVTPL when the financial asset is mandatorily classified as at FVTPL. Financial assets mandatorily classified as at FVTPL include investments in equity instruments which are not designated as at FVTOCI and debt instruments that do not meet the amortized cost criteria or the FVTOCI criteria. Financial assets at FVTPL are subsequently measured at fair value, with any gains or losses arising on re-measurement recognized in profit or loss. Fair value is determined in the manner described in Note 43.
2) Financial assets at amortized cost Financial assets that meet the following conditions are subsequently measured at amortized cost: a) The financial asset is held within a business model whose objective is to hold financial assets in
order to collect contractual cash flows; and b) The contractual terms of the financial asset give rise on specified dates to cash flows that are
solely payments of principal and interest on the principal amount outstanding. Subsequent to initial recognition, financial assets are measured at amortized cost, which equals to gross carrying amount determined using the effective interest method less any impairment loss. Any exchange difference is recognized in profit or loss. Interest revenue is calculated by applying the effective interest rate to the gross carrying amount of a financial asset, except for: a) Purchased or originated credit-impaired financial assets, for which interest revenue is calculated
by applying the credit-adjusted effective interest rate to the amortized cost of such a financial asset; and
b) Financial assets that have subsequently become credit-impaired, for which interest revenue is
calculated by applying the effective interest rate to the amortized cost of such a financial asset.
3) Investments in debt instruments at FVTOCI Debt instruments that meet the following conditions are subsequently measured at FVTOCI: a) The financial asset is held within a business model whose objective is achieved by both the
collecting of contractual cash flows and the selling of the financial assets; and b) The contractual terms of the financial asset give rise on specified dates to cash flows that are
solely payments of principal and interest on the principal amount outstanding.
290

Investments in debt instruments at FVTOCI are subsequently measured at fair value. Changes in the carrying amounts of these debt instruments relating to changes in foreign currency exchange rates, interest revenue calculated using the effective interest method and impairment losses or reversals are recognized in profit or loss. Other changes in the carrying amount of these debt instruments are recognized in other comprehensive income and will be reclassified to profit or loss when the investment is disposed of.
4) Investments in equity instruments at FVTOCI On initial recognition, the Bank may make an irrevocable election to designate investments in equity instruments as at FVTOCI. Designation at FVTOCI is not permitted if the equity investment is held for trading or if it is contingent consideration recognized by an acquirer in a business combination. Investments in equity instruments at FVTOCI are subsequently measured at fair value with gains and losses arising from changes in fair value recognized in other comprehensive income and accumulated in other equity. The cumulative gain or loss will not be reclassified to profit or loss on disposal of the equity investments; instead, they will be transferred to retained earnings. Dividends on these investments in equity instruments at FVTOCI are recognized in profit or loss when the Bank’s right to receive the dividends is established, unless the dividends clearly represent a recovery of part of the cost of the investment.
2017 1) Financial assets at FVTPL
Include financial assets at FVTPL and available-for-sale financial assets. Financial asset may be designated as at FVTPL upon initial recognition if: a) Such designation eliminates or significantly reduces a measurement or recognition
inconsistency that would otherwise arise; or b) The financial asset forms part of a group of financial assets or financial liabilities or both, which
is managed and has performance evaluated on a fair value basis in accordance with the Bank’s documented risk management or investment strategy, and information about the portfolio is provided internally on that basis; or
c) The contract contains one or more embedded derivatives so that the entire hybrid (combined)
contract can be designated as at FVTPL. Financial assets at FVTPL are subsequently measured at fair value, with any gains or losses, dividends or interest arising on re-measurement recognized in profit or loss.
2) Held-to-maturity investments
Held-to-maturity financial assets are non-derivative financial assets with fixed or determinable payments and fixed maturity dates that the Bank have the positive intent and ability to hold to maturity. Subsequent to initial recognition, held-to-maturity financial assets are measured at amortized cost using the effective interest method less any impairment.
3) Available-for-sale financial assets Available-for-sale financial assets are non-derivatives that are either designated as available-for-sale or are not classified as loans and receivables, held-to-maturity financial assets or financial assets at FVTPL.
291

Available-for-sale financial assets are measured at fair value. Interest revenues of available-for-sale bond investments calculated using the effective interest method and dividends on available-for-sale equity investments are recognized in profit or loss. Other changes in the fair value of available-for-sale financial assets are recognized in other comprehensive income and will be reclassified to profit or loss when the investment is disposed of or is determined to be impaired. Dividends on available-for-sale equity instruments are recognized in profit or loss when the Bank’s right to receive the dividends is established. Available-for-sale equity investments that do not have a quoted market price in an active market and whose fair value cannot be reliably measured are measured at cost less any identified impairment loss and are recognized in a separate line item as financial assets measured at cost. If, in a subsequent period, the fair value of the financial assets can be reliably measured, the financial assets are remeasured at fair value. The difference between carrying amount and fair value is recognized in other comprehensive income on financial assets. Any impairment losses are recognized in profit or loss.
4) Loans and receivables Loans and receivables (including receivables, discounts and loans, nonaccrual loans other than discounts and loans, and debt investments with no active market) are measured at amortized cost using the effective interest method, less any impairment.
b. Impairment of financial assets 2018 The Bank recognizes an allowance for loss for expected credit losses on financial assets at amortized cost, investments in debt instruments that are measured at FVTOCI. For such financial assets, the Bank recognizes lifetime expected credit losses (i.e. ECLs) when there has been a significant increase in credit risk since initial recognition. If, on the other hand, the credit risk on a financial instrument has not increased significantly since initial recognition, the Bank measures the allowance for loss for that financial instrument at an amount equal to 12-month ECLs. Expected credit losses reflect the weighted average of credit losses with the respective risks of default occurring as the weights. Lifetime ECLs represent the expected credit losses that will result from all possible default events over the expected life of a financial instrument. In contrast, 12-month ECLs represent the portion of lifetime ECLs that is expected to result from default events on a financial instrument that are possible within 12 months after the reporting date. The Bank recognizes an impairment gain or loss in profit or loss for all financial instruments with a corresponding adjustment to their carrying amount through an allowance for loss account, except for investments in debt instruments that are measured at FVTOCI, for which the allowance for loss is recognized in other comprehensive income and does not reduce the carrying amount of such a financial asset. 2017 Financial assets, other than those at FVTPL, are assessed for indicators of impairment at the end of each reporting period. Financial assets are considered to be impaired when there is objective evidence that, as a result of one or more events that occurred after the initial recognition of the financial asset, the estimated future cash flows of the investment have been affected.
292

For all financial assets, objective evidence of impairment could include significant financial difficulty of the issuer or counterparty, breach of contract (such as a default or delinquency in interest or principal payments), is becoming probable that the borrower will undergo bankruptcy or financial reorganization or disappearance of an active market for that financial asset because of financial difficulties. 1) Financial assets measured at amortized cost
For discounts and loans and receivables, assets are assessed for impairment on a collective basis even if they were assessed as not impaired individually. Objective evidence of impairment for a portfolio of loans and receivables could include the Bank’s past experience of collecting payments, an increase in the number of delayed payments in the portfolio, as well as observable changes in national or local economic conditions that correlate with default on loans and receivables. For financial assets measured at amortized cost, the amount of the impairment loss recognized is the difference between the asset’s carrying amount and the present value of estimated future cash flows, discounted at the asset’s original effective interest rate. If the amount of the impairment loss decreases in a subsequent period and the decrease can be related objectively to an event occurring after the impairment was recognized, the previously recognized impairment loss is reversed through profit or loss to the extent that the carrying amount of the investment at the date the impairment is reversed does not exceed what the amortized cost would have been had the impairment not been recognized.
2) Available-for-sale financial assets For available-for-sale equity investments, a significant or prolonged decline in the fair value of the security below its cost is considered to be objective evidence of impairment. When an available-for-sale financial asset is considered to be impaired, cumulative gains or losses previously recognized in other comprehensive income are reclassified to profit or loss in the period. In respect of available-for-sale equity securities, impairment loss previously recognized in profit or loss are not reversed through profit or loss. Any increase in fair value subsequent to an impairment loss is recognized in other comprehensive income. In respect of available-for-sale debt securities, impairment loss is subsequently reversed through profit or loss if an increase in the fair value of the investment can be objectively related to an event occurring after the recognition of the impairment loss.
3) Financial assets measured at cost For financial assets that are measured at cost, the amount of the impairment loss is measured as the difference between the asset’s carrying amount and the present value of the estimated future cash flows discounted at the current market rate of return for a similar financial asset. Such impairment loss will not be reversed in subsequent periods. The carrying amount of the financial asset is reduced by the impairment loss directly for all financial assets with the exception of discounts and loans, receivables and nonaccrual loans other than discounts and loans, where the carrying amount is reduced through an allowance account. The Bank evaluates possible losses on specific loans on the basis of the borrowers’ financial situation, their ability to repay principals and interests, and the values of collaterals in accordance with “Regulations Governing the Procedures for Banking Institutions to Evaluate Assets and Deal with Nonperforming/Nonaccrual Loans” (the “Regulations”). The Regulations require that loans should be categorized by collectability and specify the minimum allowance for possible losses and reserve for guarantee obligations using prescribed percentages.
293

When a loan or receivable is considered uncollectable, it may be written off on the approval of the Bank’s Board of Directors or Managing Directors. The subsequent collections of written-off loans are credited against provision for possible losses.
c. Derecognition of financial assets
The Bank derecognize a financial asset only when the contractual rights to the cash flows from the asset expire, or when it transfers substantially all the risks and rewards of ownership of the financial asset to another party Before 2017, on derecognition of a financial asset in its entirety, the difference between the asset’s carrying amount and the sum of the consideration received and receivable and the cumulative gain or loss which had been recognized in other comprehensive income is recognized in profit or loss. Starting from 2018, on derecognition of a financial asset at amortized cost in its entirety, the difference between the asset’s carrying amount and the sum of the consideration received and receivable is recognized in profit or loss. On derecognition of an investment in a debt instrument at FVTOCI, the difference between the asset’s carrying amount and the sum of the consideration received and receivable and the cumulative gain or loss which had been recognized in other comprehensive income is recognized in profit or loss. However, on derecognition of an investment in an equity instrument at FVTOCI, the difference between the asset’s carrying amount and the sum of the consideration received and receivable is recognized in profit or loss, and the cumulative gain or loss which had been recognized in other comprehensive income is transferred directly to retained earnings, without recycling through profit or loss.
Equity instruments Debt and equity instruments issued by the Bank are classified as either financial liabilities or as equity in accordance with the substance of the contractual arrangements and the definitions of a financial liability and an equity instrument. Financial liabilities a. Subsequent measurement
Except the following situation, all the financial liabilities are measured at amortized cost using the effective interest method: 1) Financial liabilities at FVTPL
Financial liabilities are classified as at FVTPL when the financial liability is held for trading. Any gains or losses arising on remeasurement, including interest paid on the financial liability, are recognized in profit or loss.
2) Financial guarantee contracts 2018 The financial guarantee contracts issued by the Bank and not measured at FVTPL are measured at the higher of the allowance for the expected credit losses and the amortized amount after original recognition.
294

2017 Financial guarantee contracts issued by the Bank are initially measured at their fair values and, if not designated as at FVTPL, are subsequently measured at the higher of the best estimate of the obligation under the contract and the amount initially recognized less the cumulative amortization recognized.
b. Derecognition of financial liabilities The difference between the carrying amount of the financial liability derecognized and the consideration paid, and any non-cash assets transferred or liabilities assumed, is recognized in profit or loss.
Derivative financial instruments Derivatives are initially recognized at fair value at the date the derivative contracts are entered into and are subsequently remeasured to their fair value at the end of each reporting period. The resulting gain or loss is recognized in profit or loss. Derivative financial instruments do not apply hedge accounting are recognized as financial assets or liabilities held for trading. When the fair value of derivative financial instruments is positive, the derivative is recognized as a financial asset; when the fair value of derivative financial instruments is negative, the derivative is recognized as a financial liability. Derivatives embedded in derivative host contracts 2018 Derivatives embedded in hybrid contracts that contain financial asset hosts that is within the scope of IFRS 9 are not separated; instead, the classification is determined in accordance with the entire hybrid contract. 2017 Derivatives embedded in non-derivative host contracts were treated as separate derivatives when they met the definition of a derivative; their risks and characteristics were not closely related to those of the host contracts; the contracts were not measured at FVTPL. Levies A levy imposed by a government is accrued as payables when the transaction or activity that triggers the payment of the levy occurs. Provisions Provisions are recognized when the Bank have a present obligation as a result of a past event, it is probable that the Bank will be required to settle the obligation, and a reliable estimate can be made of the amount of the obligation. Provisions are measured at the best estimate of the consideration required to settle the present obligation at the end of the reporting period, taking into account the risks and uncertainties surrounding the obligation. When a provision is measured using the cash flows estimated to settle the present obligation, its carrying amount is the present value of those cash flows (where the effect of the time value of money is material). When some or all of the economic benefits required to settle a provision are expected to be recovered from a third party, a receivable is recognized as an asset if it is virtually certain that reimbursement will be received and the amount of the receivable can be measured reliably.
295

Revenue Recognition Interest revenues from discounts and loans is recorded on the accrual basis. For nonaccrual loans, interest revenues are recognized only when collections on these obligations are made. Under the regulations of the Banking Bureau under the Financial Supervisory Commission, the interest revenues on credits covered by agreements that extend their maturity is recorded as deferred income and recognized upon collection. Service fee income is recognized as loans are provided or services have been completed. When the Bank acquires non-performing loans from other financial institutions, revenue related to recovery of non-performing loans is recognized using the cost-recovery method. Retirement Benefit Payments to defined contribution retirement benefit plans are recognized as an expense when employees have rendered service entitling them to the contributions. Defined benefit costs (including service cost, net interest and remeasurement) under the defined benefit retirement plans are determined using the projected unit credit method. Service cost (including current service cost and net interest) are recognized as employee benefits expense in the period they occur. Remeasurement, comprising actuarial gains and losses, and the return on plan assets (excluding interest), is recognized in other comprehensive income in the period they occur. Remeasurement recognized in other comprehensive income is reflected immediately in retained earnings and will not be reclassified to profit or loss. Net defined benefit liability (asset) represents the actual deficit (surplus) in the Bank’s defined benefit plan. Any surplus resulting from this calculation is limited to the present value of any refunds from the plans or reductions in future contributions to the plans. Income Tax Income tax expense represents the sum of current tax expense and deferred tax expense. a. Current tax expense
Current tax is the amount of income taxes payable (recoverable) in respect of the taxable profit (tax loss) for a period. An additional tax of unappropriated earnings is provided for as income tax in the year the shareholders approve to retain the earnings. Adjustments of prior years’ tax liabilities are added to or deducted from the current year’s tax expense.
b. Deferred tax expense Deferred tax expense represents adjustments to deferred tax assets and liabilities. Deferred tax assets or liabilities are recognized on temporary differences between the carrying amounts of assets and liabilities in the financial statements and the corresponding tax bases used in the computation of taxable profit. The measurement of deferred tax liabilities and assets reflects the tax consequences that would follow from the manner in which the Bank expect, at the end of the reporting period, to recover or settle the carrying amount of its assets and liabilities. Deferred tax liabilities are generally recognized for all taxable temporary differences. Deferred tax assets are generally recognized for all deductible temporary differences and unused loss carryforwards that it is probable that taxable profits will be available against which those deductible temporary differences can be utilized.
296

Deferred tax liabilities and assets are measured at the tax rates that are expected to apply in the period in which the liability is settled or the asset realized, based on tax rates (and tax laws) that have been enacted or substantively enacted by the end of the reporting period. The carrying amount of deferred tax assets is reviewed at the end of each reporting period and recognized to the extent that it has become probable that future taxable profit will allow the deferred tax assets to be recovered.
c. Current and deferred tax for the period
Current and deferred tax are recognized in profit or loss, except when they relate to items that are recognized in other comprehensive income or directly in equity, in which case, the current and deferred tax are also recognized in other comprehensive income or directly in equity respectively.
5. CRITICAL ACCOUNTING JUDGMENTS AND KEY SOURCES OF ESTIMATION UNCERTAINTY In the application of accounting policies, management is required to make essential judgments, estimates and assumptions about the carrying amounts of assets and liabilities that are not readily apparent from other sources. The estimates and associated assumptions are based on historical experience and other factors that are considered to be relevant. Actual results may differ from these estimates. The estimates and underlying assumptions are reviewed on an ongoing basis. Revisions to accounting estimates are recognized in the period in which the estimate is revised if the revision affects only that period or in the period of the revision and future periods if the revision affects both current and future periods. a. Estimating impairment of financial assets (application to 2108) The estimate of impairment for receivables, discount and loans and investments in debt instruments is based
on the assumptions about the probability of default and loss given default. The Bank uses judgement in making these assumptions and in selecting the inputs to the impairment calculation, based on the Bank’s past history, existing market conditions as well as forward looking estimates at the end of each reporting period. For details of the key assumptions and inputs used, see Note 44 where the actual future cash inflows are less than expect, a material impairment loss may arise.
b. Estimating impairment of discounts and loans and receivables (application to 2017)
When there is objective evidence of impairment loss, the Bank take into consideration the estimation of future cash flows. The amount of the impairment loss is measured as the difference between the asset’s carrying amount and the present value of estimated future cash flows (excluding future credit losses that have not been incurred) discounted at the financial asset’s original effective interest rate. Where the actual future cash flows are less than expected, an additional impairment loss may arise.
c. Estimating impairment of operation rights Determining whether operation rights are impaired requires an estimation of the value in use of the cash-generating units to which operation rights have been allocated. The value in use calculation requires management to estimate the future cash flows expected to arise from the cash-generating unit and a suitable discount rate in order to calculate present value. Where the actual future cash flows are less than expected, an impairment loss may arise.
297

d. Fair value of financial instruments The Bank’s management uses its judgment in selecting an appropriate valuation technique for financial instruments that do not have quoted market price in an active market. Valuation techniques commonly used by market practitioners are applied. For derivative financial instruments, models were based on quoted market rates adjusted for specific features of the instruments. Other financial instruments were valued using a discounted cash flow analysis based on models supported, where possible, by observable market prices or rates. Note 44 provides detailed information about the key models used in the determination of the fair value of financial instruments. The Bank’s management believes that the chosen valuation techniques and models used are appropriate in determining the fair value of financial instruments.
e. Income tax The use of deferred income tax assets mainly depends on future taxable income and the possible timing and level of taxable temporary differences, along with future income tax strategies.
6. CASH AND CASH EQUIVALENTS
December 31 2018 2017 Cash on hand $ 2,904,762 $ 2,889,476 Notes and checks for clearing 2,416,502 2,018,305 Deposits due from other banks 4,665,317 3,623,344 $ 9,986,581 $ 8,531,125
7. DUE FROM THE CENTRAL BANK AND OTHER BANKS
December 31 2018 2017 Due from the central bank - certificates of deposit $ - $ 125,000Due from other banks 12,879,815 5,281,521New Taiwan dollar reserve deposits - Type A 2,733,295 6,272,154New Taiwan dollar reserve deposits - Type B 11,745,944 10,353,759Foreign-currency reserve deposits 125,269 118,969Due from foreign central bank 58,709 199,680 $ 27,543,032 $ 22,351,083 The reserve deposits are required by law and determined at a prescribed percentage of the monthly average balances. The Type B reserve deposits can be withdrawn only when the balances are adjusted monthly. The Type A and foreign-currency reserve deposits can be withdrawn on demand but bear no interest. Due from foreign Central Bank is the clearing settlement account which the Bank’s Hong Kong branch opened in Hong Kong Monetary Authority. The account can be withdrawn on demand but bear no interest. As of December 31, 2018 and 2017, due from the central bank and other banks falling in the definition of IAS 7 “cash and cash equivalents” (i.e. short-term, highly liquid investments, readily convertible to known amounts of cash and subject to an insignificant risk of changes in value); amounted to $15,797,088 thousand and $11,872,324 thousand, respectively, and were included in cash and cash equivalents in the statements of cash flows.
298

8. FINANCIAL ASSETS AND LIABILITIES AT FVTPL
December 31,
2018 Financial assets mandatorily classified as at FVTPL (application to 2018) Non-derivative financial assets
Commercial paper $ 17,068,878Government bond 8,324,585Negotiable certificates of deposit 1,487,146Stock listed on TWSE and TPEx 64,115
26,944,724Derivative financial assets
Foreign-currency swap contracts 2,292,356Interest rate swap contracts 853,399Currency option contracts 354,604Others 282,755
3,783,114Hybrid contract
Asset swap fixed-income contracts 9,345,266Credit linked loan contracts 3,829,179Credit linked bond contracts 2,060,823Convertible (exchangeable) bonds 544,395
15,779,663 Total financial assets mandatorily classified as at FVTPL $ 46,507,501
December 31,
2017 Financial assets mandatorily classified as at FVTPL (application to 2017) Financial assets held for trading
Non-derivative financial assets Commercial paper $ 13,979,621Government bond 5,238,586Negotiable certificates of deposit 1,850,666Stock listed on TWSE and TPEx 347,783Beneficiary certificates 50,473
21,467,129Derivative financial assets
Foreign-currency swap contracts 950,685Convertible (exchangeable) bond asset swap contracts 766,433Interest rate swap contracts 721,496Currency option contracts 296,384Forward exchange contracts 149,661Others 176,507
3,061,166Financial assets designated as at FVTPL Convertible (exchangeable) bonds 5,680,038 Total financial assets at FVTPL $ 30,208,333
299
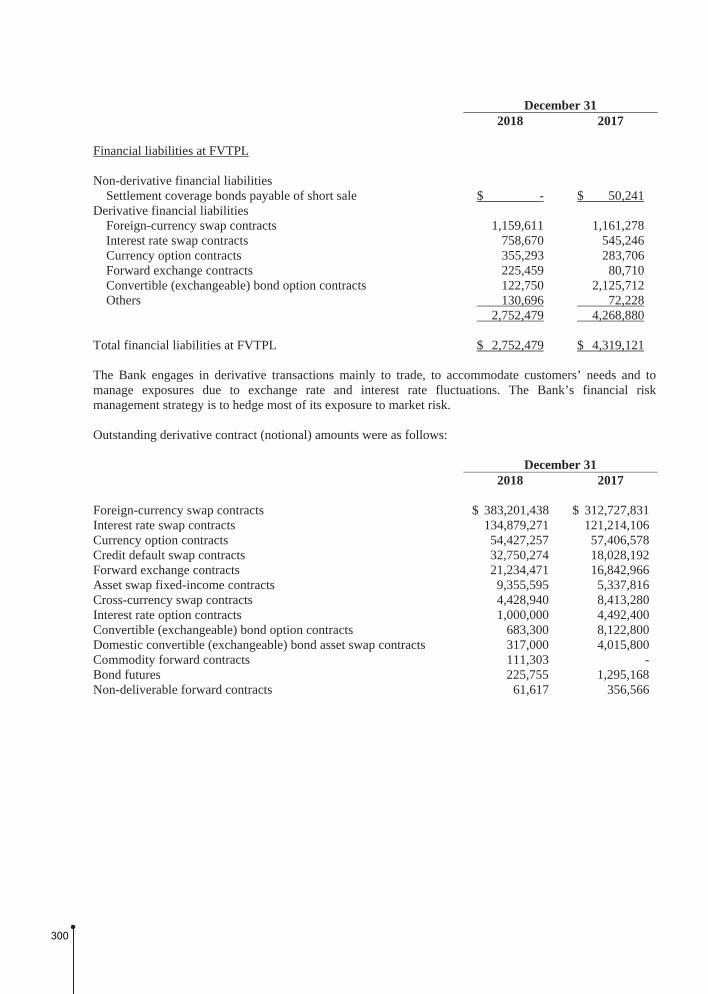
December 31 2018 2017 Financial liabilities at FVTPL Non-derivative financial liabilities
Settlement coverage bonds payable of short sale $ - $ 50,241 Derivative financial liabilities
Foreign-currency swap contracts 1,159,611 1,161,278 Interest rate swap contracts 758,670 545,246 Currency option contracts 355,293 283,706 Forward exchange contracts 225,459 80,710 Convertible (exchangeable) bond option contracts 122,750 2,125,712 Others 130,696 72,228 2,752,479 4,268,880
Total financial liabilities at FVTPL $ 2,752,479 $ 4,319,121 The Bank engages in derivative transactions mainly to trade, to accommodate customers’ needs and to manage exposures due to exchange rate and interest rate fluctuations. The Bank’s financial risk management strategy is to hedge most of its exposure to market risk. Outstanding derivative contract (notional) amounts were as follows: December 31 2018 2017 Foreign-currency swap contracts $ 383,201,438 $ 312,727,831Interest rate swap contracts 134,879,271 121,214,106Currency option contracts 54,427,257 57,406,578Credit default swap contracts 32,750,274 18,028,192Forward exchange contracts 21,234,471 16,842,966Asset swap fixed-income contracts 9,355,595 5,337,816Cross-currency swap contracts 4,428,940 8,413,280Interest rate option contracts 1,000,000 4,492,400Convertible (exchangeable) bond option contracts 683,300 8,122,800Domestic convertible (exchangeable) bond asset swap contracts 317,000 4,015,800Commodity forward contracts 111,303 -Bond futures 225,755 1,295,168Non-deliverable forward contracts 61,617 356,566
300

9. FINANCIAL ASSETS AT FVTOCI - 2018
December 31,
2018 Investments in equity instruments Stock listed on TWSE and TPEx $ 930,492Stock unlisted on TWSE and TPEx 335,330 1,265,822Investments in debt instruments Negotiable certificates of deposit from the central bank 62,950,846Government bonds 31,436,956Bank debentures 20,548,214Corporate bonds 2,500,626Mortgage backed securities 1,076,588 118,513,230 Total financial assets at FVTOCI $ 119,779,052 The above investments in equity instrument in the form of ordinary shares for medium- and long-term strategic purposes and expects to make a profit through long-term investments. Therefore, the designated investments are selected to be measured at FVTOCI. These investments were originally classified as available-for-sale financial assets and financial assets measured at cost under IAS 39. For reclassification and other information of 2017, refer to Notes 3, 15 and 19. The above investments in debt instrument were originally classified as available-for-sale financial assets under IAS 39. For reclassification and other information of 2017, refer to Notes 3 and 15. For the information of credit risk management and impairment assessment on investments in debt instruments at FVTOCI, refer to Note 11. For the information of mortgage backed securities, refer to Note 39. Part of the bank debentures and government bonds have been issued under repurchase agreements. The book value were as follows. Refer to Note 23 for related information.
December 31,
2018 Bank debentures $ 12,745,196Government bonds $ 2,702,559
10. DEBT INSTRUMENT INVESTMENT MEASURED AT AMORTIZED COST - 2018
December 31,
2018 Bank debentures $ 1,974,153 Corporate bonds 614,660 2,588,813 Less: Allowance for loss 159 $ 2,588,654 For the information on financial assets’ related credit risk management and impairment at amortized cost, see Note 11.
301

11. CREDIT RISK MANAGEMENT OF INVESTMENTS IN DEBT INSTRUMENTS - 2018
The investments in debt instruments are classified as financial assets at FVTOCI and financial assets at amortized cost, respectively: December 31, 2018
At FVTOCI At Amortized
Cost Total Total carrying amount $ 118,563,978 $ 2,588,813 $ 121,152,791Less: Allowance for loss 4,318 159 4,477 Amortized cost 118,559,660 $ 2,588,654 121,148,314Fair value adjustment (46,430) (46,430) $ 118,513,230 $ 121,101,884 The policy which the Bank implements is to invest only in debt instruments with credit ratings above (and including) investment grade and with impairment low in credit risk. The Bank continued to track external rating information to monitor changes in credit risk of the investments in debt instruments and to review other information such as the bond yield curve and the debtor’s material information to assess whether the credit risk of the debt instrument investments has increased significantly since the original recognition. The Bank considers the historical default loss rate provided by the independent rating agencies, the debtor’s current financial status and the industry’s forward-looking forecast to measure the 12-month expected credit loss or full-lifetime expected credit loss of the debt instrument investments. The total book value of investments in debt instrument is $121,152,791, which indicates normal credit level under assessment. The information of changes in allowance for loss which is 12-month expected credit loss is as follows:
At FVTOCI At Amortized
Cost Total Retrospective application of the impact of IFRS 9
on January 1, 2018 $ 5,247 $ 270 $ 5,517 Purchase of new debt instruments 2,834 107 2,941 Derecognition (3,681) (135) (3,816) Exchange rate and other changes (82) (83) (165) Allowance for loss on December 31, 2018 $ 4,318 $ 159 $ 4,477
302

12. SECURITIES PURCHASED UNDER RESALE AGREEMENTS
December 31 2018 2017 Government bonds $ 5,641,393 $ 7,852,936Commercial paper 1,498,448 499,411Negotiable certificates of deposit 1,150,496 2,719,046 8,290,337 11,071,393Less: Allowance for loss 1,062 - $ 8,289,275 $ 11,071,393 Resale date 2019.01.02-
2019.01.24 2018.01.02-
2018.01.30 Resale price $ 8,292,920 $ 11,074,058 The total carrying amounts shown above have been included as cash and cash equivalents in statements of cash flows.
13. RECEIVABLES, NET
December 31 2018 2017 Credit card $ 14,374,622 $ 15,045,932Factoring 2,769,097 4,646,743Interest 1,064,989 915,830Spot exchange transactions 645,906 598,100Acceptances 439,359 421,416Proceeds from disposal of securities 345,671 154,944Convertible bond redemption 187,414 569,629Others 343,042 325,705 20,170,100 22,678,299Less: Allowance for possible losses (Note 14) 509,811 1,143,743 $ 19,660,289 $ 21,534,556
303

The changes in the total carrying amount of receivables and other financial assets in 2018 are as follows:
Stage 1 (Note 1)
Stage 2 (Note 2)
Stage 3 (Note 3) Total
Beginning on January 1, 2018 $ 18,760,901 $ 75,443 $ 2,118,201 $ 20,954,545Changes due to financial assets
recognized at the beginning of the period: Transfer to Stage 2 (56,753) 59,977 (111) 3,113Transfer to Stage 3 (117,060) (20,729) 152,911 15,122Transfer to Stage 1 8,504 (11,871) (269) (3,636)Financial assets derecognized in
the current period (8,354,188) (13,015) (345,091) (8,712,294)Purchased or original financial
assets 6,685,390 10,727 55,100 6,751,217Write-offs (83,437) (27,894) (657,591) (768,922)Exchange rate and other changes 16,939 (696) 14,847 31,090 Balance on December 31, 2018 $ 16,860,296 $ 71,942 $ 1,337,997 $ 18,270,235 Note 1: 12-Month ECLs. Note 2: Lifetime ECLs. Note 3: Lifetime ECLs (Non-Purchase or Original Credit Impairment on Financial Assets). The changes in the allowance of receivables and other financial assets in 2018 are as follows:
12-Month Expected Credit
Loss (Stage 1)
Lifetime ECLs(Stage 2)
Lifetime ECLs(Non-Purchase
or Original Credit
Impairment on Financial Assets)
(Stage 3)
Impairment Under the
Guidelines of IFRS 9
The Difference of Impairment
Under the “Regulations
Governing the Procedures for
Banking Institutions to
Evaluate Assets and Deal with
Non-performing/Non-accrual
Loans” Total January 1, 2018 $ 39,183 $ 13,104 $ 946,378 $ 998,665 $ 145,266 $ 1,143,931 Changes due to financial assets
recognized at the beginning of the period: Transfer to Stage 2 (69 ) 5,136 (25 ) 5,042 - 5,042 Transfer to Stage 3 (144 ) (3,792 ) 40,046 36,110 - 36,110 Transfer to Stage 1 3 (1,922 ) (53 ) (1,972 ) - (1,972 ) Financial assets derecognized in the
current period (22,770 ) (1,916 ) (51,209 ) (75,895 ) - (75,895 ) Purchased or original financial assets 2,559 952 15,296 18,807 - 18,807 The difference of impairment under the
“Regulations Governing the Procedures for Banking Institutions to Evaluate Assets and Deal with Non-performing/ Non-accrual Loans” - - - - (22,463 ) (22,463 )
Write-offs (83,437 ) (27,894 ) (657,591 ) (768,922 ) - (768,922 ) Exchange rate and other changes 83,219 22,480 69,509 175,208 - 175,208 December 31, 2018 $ 18,544 $ 6,148 $ 362,351 $ 387,043 $ 122,803 $ 509,846
304

14. DISCOUNTS AND LOANS, NET
December 31 2018 2017 Negotiations, discounts and overdraft $ 189,594 $ 100,576Short-term loans 73,855,519 69,042,425Medium-term loans 140,748,897 124,489,833Long-term loans 169,517,735 161,806,758Overdue receivable 611,272 501,027 384,923,017 355,940,619Less: Allowance for possible losses 5,234,899 4,883,857 $ 379,688,118 $ 351,056,762 The details of the provision for possible losses were as follows: For the Year Ended December 31 2018 2017 Provision for possible losses - discounts and loans $ 833,097 $ 373,153 Provision for possible losses - others 113,745 828,361 Provision for possible losses - reserve for guarantee obligations 18,561 11,407 Amounts recovered - discounts and loans (229,379) (257,773) Amounts recovered - others (229,502) (225,723) $ 506,522 $ 729,425 The changes in the total carrying amount of discounts and loan in 2018 are as follows: Stage 1 (Note 1) Stage 2 (Note 2) Stage 3 (Note 3) Total Beginning on January 1, 2018 $ 347,782,666 $ 1,423,658 $ 3,540,559 $ 352,746,883Changes due to financial assets
recognized at the beginning of the period: Transfer to Stage 2 (392,867) 363,684 (58) (29,241)Transfer to Stage 3 (604,008) (370,042) 821,752 (152,298)Transfer to Stage 1 97,281 (113,824) (1,292) (17,835)Financial assets derecognized in the
current period (86,740,476) (815,201) (815,269) (88,370,946)Purchased or original financial assets 120,569,098 48,464 273,091 120,890,653Write-offs (96,709) (40,686) (396,228) (533,623)Exchange rate and other changes 384,855 696 3,873 389,424 Balance on December 31, 2018 $ 380,999,840 $ 496,749 $ 3,426,428 $ 384,923,017 Note 1: 12-Month ECLs. Note 2: Lifetime ECLs. Note 3: Lifetime ECLs (Non-Purchase or Original Credit Impairment on Financial Assets).
305

The changes in the allowance of discounts and loan in 2018 are as follows:
12-Month Expected Credit
Loss (Stage 1)
Lifetime ECLs(Stage 2)
Lifetime ECLs(Non-Purchase
or Original Credit
Impairment on Financial Assets)
(Stage 3)
Impairment Under the
Guidelines of IFRS 9
The Difference of Impairment
Under the “Regulations
Governing the Procedures for
Banking Institutions to
Evaluate Assets and Deal with
Non-performing/Non-accrual
Loans” Total January 1, 2018 $ 617,108 $ 67,265 $ 993,274 $ 1,677,647 $ 3,174,273 $ 4,851,920 Changes due to financial assets
recognized at the beginning of the period:
Transfer to Stage 2 (1,341 ) 55,586 (49 ) 54,196 - 54,196 Transfer to Stage 3 (1,090 ) (2,964 ) 179,929 175,875 - 175,875 Transfer to Stage 1 100 (12,961 ) (678 ) (13,539 ) - (13,539 ) Financial assets derecognized in the
current period
(252,878 ) (30,940 ) (82,132 ) (365,950 ) - (365,950 ) Purchased or original financial assets 235,269 27,805 85,284 348,358 - 348,358 The difference of impairment under the
‘Regulations Governing the Procedures for Banking Institutions to Evaluate Assets and Deal with Non-performing/Non-accrual Loans’.
- - - - 468,488 468,488 Write-offs (96,709 ) (40,686 ) (396,228 ) (533,623 ) - (533,623 ) Exchange rate and other changes 96,719 23,604 128,851 249,174 - 249,174 December 31, 2018 $ 597,178 $ 86,709 $ 908,251 $ 1,592,138 $ 3,642,761 $ 5,234,899
Movements of allowance for possible losses on discounts and loans and others (including receivables and other financial assets) in 2017 were as follows:
Discounts and Loans Others Total
Balance, January 1, 2017 $ 5,031,824 $ 1,108,757 $ 6,140,581 Provision for possible losses 373,153 828,361 1,201,514 Amounts written-off (466,510) (743,155) (1,209,665)Effects of exchange rate changes (54,610) (50,032) (104,642) Balance, December 31, 2017 $ 4,883,857 $ 1,143,931 $ 6,027,788 For the years ended December 31, 2018 and 2017, the Bank had no written-off credits for which legal proceedings had not been initiated. The Bank’ financial assets were assessed for impairment loss on the basis of credit risk characteristics (Not application in 2018) of financial assets. The results were as follows: Discounts and loans
Item December 31, 2017
Discounts and Loans
Allowance for Possible Losses
With objective evidence of individual impairment
Assessed individually $ 1,603,535 $ 563,826 Assessed by portfolio 1,937,024 441,292
Without objective evidence of individual impairment
Assessed individually 3,193,736 31,937 Assessed by portfolio 349,206,324 3,846,802
Total $ 355,940,619 $ 4,883,857
306

Others (including receivables, other financial assets and debt investments with no active market)
Item December 31, 2017
Others Allowance for Possible Losses
With objective evidence of individual impairment
Assessed individually $ 652,463 $ 575,640 Assessed by portfolio 1,465,738 493,309
Without objective evidence of individual impairment
Assessed individually 8,340,265 - Assessed by portfolio 18,842,391 74,982
Total $ 29,300,857 $ 1,143,931 15. AVAILABLE-FOR-SALE FINANCIAL ASSETS - 2017
December 31,
2017 Negotiable certificates of deposit issued by the central bank $ 62,523,204Government bonds 25,343,404Bank debentures 21,006,259Stocks listed on TWSE and TPEx 709,311Beneficiary certificates 49,400 $ 109,631,578 Some of the available-for-sale foreign bank debentures and foreign government bonds were traded with repurchase agreements, and the carrying amounts were as follows (refer to Note 23 for the related information on repurchase agreements):
December 31,
2017 Bank debentures $ 12,366,170Government bonds $ 1,162,801 The assets pledged as collaterals are disclosed in Note 39.
16. HELD-TO-MATURITY FINANCIAL ASSETS - 2017
December 31,
2017 Bank debentures $ 1,479,602 Government bonds 655,644 $ 2,135,246
307

17. INVESTMENT ACCOUNTED FOR USING EQUITY METHOD
December 31 2018 2017 Investment in subsidiaries $ 1,018,627 $ 984,840 Investments in associates 1,776,350 1,774,066 $ 2,794,977 $ 2,758,906 a. Investment in subsidiaries
December 31 2018 2017
Amount % of
Ownership Amount % of
Ownership Far Eastern Asset Management Co.,
Ltd. $ 683,922 100.00 $ 663,679 100.00 Far Eastern International Securities
Co., Ltd. 334,705 100.00 321,161 100.00 $ 1,018,627 $ 984,840 Far Eastern Asset Management Co., Ltd has reduced its capital to cover accumulated deficit of $516,000 in September 2018. It withdraw 51,600 thousand outstanding shares and increased cash capital by $1,000,000 thousand in January 2019. The Bank purchased a total of 100,000 thousand ordinary shares with a par value of $10 per share.
b. Investments in associates
December 31 2018 2017
Amount % of
Ownership Amount % of
Ownership Dah Chung Bills Finance Corp. $ 1,667,505 22.06 $ 1,646,555 22.06 Deutsche Far Eastern Asset
Management Co., Ltd. 108,845 40.00 127,511 40.00 $ 1,776,350 $ 1,774,066 Deutsche Far Eastern Asset Management Co., Ltd. reduced its capital to cover accumulated deficit and increased capital by cash in September 2017; the Bank participated in the capital increase and invested $28,980 thousand according to the proportion of shares held. The above associates are individually immaterial to the Bank; the shares of the Bank in these associates’ financial performance are summarized as follows: For the Year Ended December 31 2018 2017 Net income from continuing operation $ 92,467 $ 103,337 Other comprehensive income (22,620) 9,114 Total comprehensive income $ 69,847 $ 112,451
308

18. DEBT INVESTMENTS WITH NO ACTIVE MARKET - 2017
December 31,
2017 Foreign convertible bond asset swap contracts - master agreement $ 5,337,816 Convertible bonds 742,300 Credit-linked bond - master agreement 596,960 $ 6,677,076
19. OTHER FINANCIAL ASSETS, NET
December 31 2018 2017 Nonaccrual loans other than discounts and loans $ 70 $ 261 Less: Allowance for possible losses (Note 13 and Note 14) 35 188 35 73 Refundable deposits 2,865,526 2,231,905 Less: Allowance for loss 446 - 2,865,115 2,231,978 Deposits with original maturity more than 3 months 894,600 549,240 Interbank clearing account 700,805 600,941 Financial assets carried at cost - 2017 - 113,636 $ 4,460,520 $ 3,495,795 The assets pledged as collaterals are disclosed in Note 39. Financial assets carried at cost consist of the following domestic unlisted common stocks in 2017:
December 31,
2017 Yuan Hsin Digital Payment Co., Ltd. $ 62,263 Financial Information Service Co., Ltd. 45,500 An Feng Enterprise Co., Ltd. 3,000 Sunshine Asset Management Co., Ltd. 2,073 Taipei Forex Inc. 800 $ 113,636 The above equity investments, which had no quoted prices in active market or fair values that could be reliably measured, were measured at cost. The Bank disposed of ERA Communications Co., Ltd. in July 2017; the disposal price was $51,496 thousand and the disposal gain was $1,490 thousand. The Bank recognized an impairment loss of $17,009 thousand on Yuan Hsin Digital Payment Co., Ltd. in September 2017 and participated in its cash capital increase with the amount of $24,950 thousand in September 2017.
309

20. PROPERTY AND EQUIPMENT, NET
For the Year Ended December 31, 2018
Land Buildings and Improvements
Computer Equipment
Transportation Equipment
Miscellaneous Equipment
Equipment Prepayment Total
Cost Beginning balance $ 1,581,625 $ 1,247,852 $ 1,714,492 $ 2,542 $ 1,454,224 $ 16,565 $ 6,017,300Additions - 4,605 161,038 79 72,567 39,940 278,229Disposals (134,192 ) (118,134 ) (27,916 ) (218 ) (57,103 ) - (337,563 )Others - (3,760 ) (9,564 ) - 4,479 (7,760 ) (16,605 )Ending balance 1,447,433 1,130,563 1,838,050 2,403 1,474,167 48,745 5,941,361 Accumulated depreciation Beginning balance - 624,555 1,225,695 2,420 1,282,598 - 3,135,268Depreciation - 22,438 134,448 81 63,382 - 220,349Disposals - (56,166 ) (27,914 ) (218 ) (56,111 ) - (140,409 )Others - (3,584 ) 1,423 - 2,950 - 789Ending balance - 587,243 1,333,652 2,283 1,292,819 - 3,215,997 Net ending balance $ 1,447,433 $ 543,320 $ 504,398 $ 120 $ 181,348 $ 48,745 $ 2,725,364
For the Year Ended December 31, 2017
Land Buildings and Improvements
Computer Equipment
Transportation Equipment
Miscellaneous Equipment
Equipment Prepayment Total
Cost Beginning balance $ 1,581,625 $ 1,247,533 $ 1,584,981 $ 3,364 $ 1,480,245 $ 31,495 $ 5,929,243Additions - 1,130 143,251 67 50141 26,871 221,460Disposals - (811 ) (57,083 ) (889 ) (69,125 ) - (127,908 )Others - - 43,343 - (7,037 ) (41,801 ) (5,495 )Ending balance 1,581,625 1,247,852 1,714,492 2,542 1,454,224 16,565 6,017,300 Accumulated depreciation Beginning balance - 601,642 1,151,444 3,202 1,289,850 - 3,046,138Depreciation - 23,721 129,477 106 64,790 - 218,094Disposals - (808 ) (56,979 ) (888 ) (66,249 ) - (124,924 )Others - - 1,753 - (5,793 ) - (4,040 )Ending balance - 624,555 1,225,695 2,420 1,282,598 - 3,135,268 Net ending balance $ 1,581,625 $ 623,297 $ 488,797 $ 122 $ 171,626 $ 16,565 $ 2,882,032
The above items of property and equipment are depreciated on a straight-line basis over the following estimated useful lives: Buildings and improvements 5 to 55 yearsComputer equipment 3 to 7 yearsTransportation equipment 3 to 7 yearsMiscellaneous equipment 2 to 20 years
21. INTANGIBLE ASSETS, NET
December 31 2018 2017 Operation rights $ 1,538,210 $ 1,538,210 Fair value of core deposits 428,887 428,887 1,967,097 1,967,097 Less: Accumulated amortization 267,495 242,012 $ 1,699,602 $ 1,725,085
310

In April 2010, the Bank acquired the assets and liabilities of Chinfon Bank, classified as Package B of Chinfon Bank, through a bidding process. The acquired management and operation rights of Chinfon Bank’s branches have indefinite useful life, while the fair value of core deposits is amortized over 4 to 15 years. The Bank assessed the operation rights of branches have indefinite useful life, and the operation rights are expected to generate net cash flows continuously; therefore, the operation rights are not amortized annually. The Bank’s operation rights are tested for impairment at the end of the annual reporting period in 2018 and 2017 and the recoverable amount is determined based on the value in use. To reflect risks specific to the operation right, the value in use was then calculated using the discounted cash flows based on the Bank’s financial forecast, and no impairment after tasted. For the years ended December 31, 2018 and 2017, the Bank did not recognize any impairment loss on its operation rights.
22. DUE TO THE CENTRAL BANK AND OTHER BANKS
December 31 2018 2017 Call loans to banks $ 15,665,915 $ 6,601,520Due to banks 60,808 231,834Overdraft - 127,420 $ 15,726,723 $ 6,960,774
23. SECURITIES SOLD UNDER REPURCHASE AGREEMENTS
December 31 2018 2017 Bank debentures (Note 9 and 15) $ 12,015,591 $ 11,785,554Government bonds (Note 9 and 15) 2,650,203 1,135,810 $ 14,665,794 $ 12,921,364 Repurchase date 2019.01.07-
2019.01.29 2018.01.08-
2018.01.29 Repurchase price $ 14,704,830 $ 12,943,304
311

24. PAYABLES December 31 2018 2017 Notes and checks for clearing $ 2,416,502 $ 2,018,305 Accrued expenses 1,485,636 1,205,134 Accrued interest 1,133,327 963,379 Securities settlement payables 721,949 267,124 Liabilities on bank acceptances 439,359 421,416 Accounts payable factoring 372,420 898,253 Others 618,537 647,115 $ 7,187,730 $ 6,420,726
25. DEPOSITS AND REMITTANCES
December 31 2018 2017 Checking deposits $ 4,697,065 $ 2,913,365Demand deposits 67,909,690 71,829,323Demand savings 68,974,857 63,329,655Time savings 77,180,132 80,875,765Negotiable certificates of deposit 6,040,500 6,387,500Time deposits 283,795,017 246,953,099Remittances 50,628 332,407 $ 508,647,889 $ 472,621,114
26. BANK DEBENTURES
December 31 2018 2017 Domestic bank debentures $ 18,001,900 $ 18,601,900Euro Convertible Bonds - 1,614,764 $ 18,001,900 $ 20,216,664
312

Domestic Bank Debentures
Issuance December 31 Item Period Note 2018 2017
Subordinated bank debentures -
seven-year maturity; first issue in 2011
2011.11.10- 2018.11.10
Interest payable on November 10 each year; fixed interest rate at 1.95%
$ - $ 3,500,000
Subordinated bank debentures - seven-year maturity; first issue in 2012
2012.06.27- 2019.06.27
Interest payable on June 27 each year; fixed interest rate at 1.75%
3,000,000 3,000,000
Subordinated bank debentures - seven-year maturity; first issue in 2013
2013.11.06- 2020.11.06
Interest payable on November 6 each year fixed interest rate at 2.10%
4,000,000 4,000,000
Subordinated bank debentures - seven-year maturity; first issue in 2014
2014.12.23- 2021.12.23
Interest payable on December 23 each year fixed interest rate at 2.05%
1,100,000 1,100,000
Subordinated bank debentures - seven-year maturity; first issue in 2015
2015.09.30- 2022.09.30
Interest payable on September 30 each year fixed interest rate at 1.95%
3,000,000 3,000,000
Subordinated bank debentures - seven-year maturity; first issue in 2016
2016.09.27- 2023.09.27
Interest payable on September 27 each year fixed interest rate at 1.55%
4,000,000 4,000,000
Subordinated bank debentures - perpetual; first issue in 2018
2018.09.18- Interest payable on September 18 with fixed interest rate at 3.2% per annum
2,900,000 -
Subordinated bank debentures - seven-year maturity; 1-1 issue in 2005; acquired from Chinfon Bank
Matured on 2012.06.28
- 1,660 1,660
Subordinated bank debentures - seven-year maturity; 1-1 issue in 2002; acquired from Chinfon Bank
Matured on 2009.06.28
- 240
240
Total bank debentures $ 18,001,900 $ 18,601,900 The Bank issued the first issuance of perpetual non-cumulative subordinated bank debentures in 2018 in the amount of $2,900,000 thousand in September 18, 2018 with an interest rate of 3.20% and the interest is paid once a year under the interest payment condition. After of five years of issuance, the Bank has the right to redeem in advance under the regulation of issuance and the permission by authorities. Euro Convertible Bonds On February 7, 2013 (the “Issuance Date”), the Bank issued five-year unsecured zero coupon convertible bonds (the “Bonds”) with a principal aggregating to US$150,000 thousand; these bonds were listed on the Singapore Exchange Securities Trading Limited. The minimum lot size for the Bonds trading is US$200 thousand. On the Issuance Date, the liability component of the Bonds amounted to $4,009,661 thousand net of a discount of $471,589 thousand but including transaction costs of $38,252 thousand. The initial effective interest rate of the liability component was 2.63%. The derivative components of the Bonds (i.e. conversion right and redemption option) amounted to $433,337 thousand. From August 2015, the issuance balance decreased to US$54,200 thousand because some bondholders had put the right to require the Bank to redeem the Bonds after 30 months from issue date. As 10th calendar day prior to the Maturity Date, conversion price have been adjusted from NT$15.24 per share to NT$10.57 per share annually according to the original issue conditions. No one applied for conversion during the period. The Bank redeemed the Bonds at 101.89% of their principal amount in U.S. dollars on February 7, 2018, which was the Maturity Date.
313
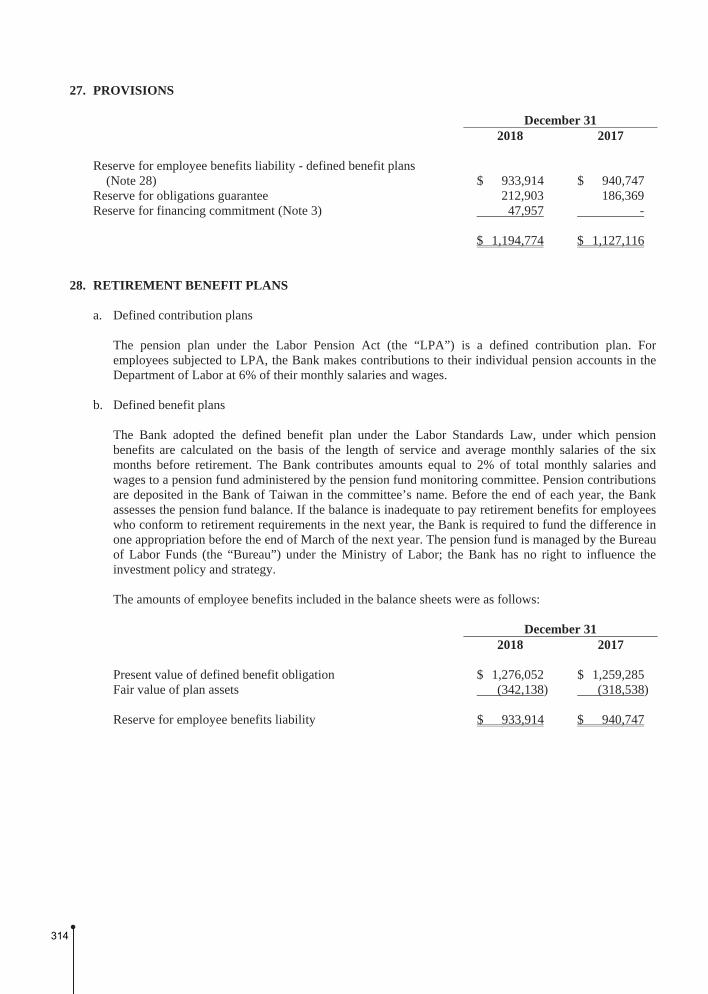
27. PROVISIONS December 31 2018 2017 Reserve for employee benefits liability - defined benefit plans
(Note 28) $ 933,914 $ 940,747 Reserve for obligations guarantee 212,903 186,369 Reserve for financing commitment (Note 3) 47,957 - $ 1,194,774 $ 1,127,116
28. RETIREMENT BENEFIT PLANS
a. Defined contribution plans
The pension plan under the Labor Pension Act (the “LPA”) is a defined contribution plan. For employees subjected to LPA, the Bank makes contributions to their individual pension accounts in the Department of Labor at 6% of their monthly salaries and wages.
b. Defined benefit plans
The Bank adopted the defined benefit plan under the Labor Standards Law, under which pension benefits are calculated on the basis of the length of service and average monthly salaries of the six months before retirement. The Bank contributes amounts equal to 2% of total monthly salaries and wages to a pension fund administered by the pension fund monitoring committee. Pension contributions are deposited in the Bank of Taiwan in the committee’s name. Before the end of each year, the Bank assesses the pension fund balance. If the balance is inadequate to pay retirement benefits for employees who conform to retirement requirements in the next year, the Bank is required to fund the difference in one appropriation before the end of March of the next year. The pension fund is managed by the Bureau of Labor Funds (the “Bureau”) under the Ministry of Labor; the Bank has no right to influence the investment policy and strategy. The amounts of employee benefits included in the balance sheets were as follows: December 31 2018 2017 Present value of defined benefit obligation $ 1,276,052 $ 1,259,285 Fair value of plan assets (342,138) (318,538) Reserve for employee benefits liability $ 933,914 $ 940,747
314

Movements in defined benefit plan were as follows:
Present Value of the Defined
Benefit Obligation
Fair Value of the Plan Assets
Employee Benefit
Balance at January 1, 2018 $ 1,259,285 $ (318,538) $ 940,747 Service cost
Current service cost 9,295 - 9,295 Net interest expense (revenue) 21,406 (5,609) 15,797
Recognized in profit or loss 30,701 (5,609) 25,092 Remeasurement
Return on plan assets (excluding amounts included in net interest) - (7,266) (7,266)
Actuarial benefit - experience adjustments (662) (662)Actuarial loss - changes in financial
assumptions 62,571 - 62,571 Actuarial benefit - changes in demographic
assumptions (7,986) - (7,986)Recognized in other comprehensive income 53,923 (7,266) 46,657
Contributions from the employer - (18,715) (18,715)Contributions from plan assets (7,990) 7,990 - Contributions from provisions (59,867) - (59,867) Balance at December 31, 2018 $ 1,276,052 $ (342,138) $ 933,914 Balance at January 1, 2017 $ 1,381,862 $ (317,031) $ 1,064,831 Service cost
Current service cost 12,016 - 12,016 Net interest expense (revenue) 16,651 (4,002) 12,649
Recognized in profit or loss 28,667 (4,002) 24,665 Remeasurement
Return on plan assets (excluding amounts included in net interest) - 936 936
Actuarial loss - experience adjustments 17,769 - 17,769 Actuarial benefit - changes in financial
assumptions (74,533) - (74,533)Recognized in other comprehensive income (56,764) 936 (55,828)
Contributions from the employer - (18,013) (18,013)Contributions from merged FELIA and
FEPIA - (3,120) (3,120)Contributions from plan assets (22,692) 22,692 - Contributions from provisions (71,788) - (71,788) Balance at December 31, 2017 $ 1,259,285 $ (318,538) $ 940,747
315

The calculation of the present value of the defined benefit obligation was carried out by qualified actuaries. The principal assumptions used in the actuarial valuations were as follows: December 31 2018 2017 Discount rates 1.25% 1.75% Expected rates of salary increase 3.00% 3.00% Had there been a possible reasonable change in each of the significant actuarial assumptions and all other assumptions remained constant, the present value of the defined benefit obligation would have increased (decreased) as follows: December 31, 2018 2017 Discount rates
0.50% increase $ (62,571) $ (68,810) 0.50% decrease $ 67,350 $ 74,533
Expected rates of salary increase 0.50% increase $ 65,876 $ 73,251 0.50% decrease $ (61,872) $ (68,348)
The sensitivity analysis presented above might not have been representative of the actual change in the present value of the defined benefit obligation because it was unlikely that the change in assumptions occurred in isolation of one another, i.e., some of the assumptions might have been correlated. The expected contribution to the plan for the next year is $19,725 thousand, and the average duration of the defined benefit obligation is 10.2 years. The Bank is exposed to the following risks on its defined benefit plan managed by the Bureau: 1) Risk on investment: The investment income of benefit plan assets affects the plan fair value and
contribution status. That is, a higher investment income increases the fair value of plan assets and decreases net defined benefits liabilities (or increases net assets) and thus improves contribution status. In contrast, a lower investment income or investment loss is unfavorable to the contribution status of benefit the plan.
2) Risk on interest fluctuations: The discount rate used in calculating the present value of defined
benefit obligations is determined by the mainly pertains to the yields of the ROC government. A decrease in discount rate will increase the present value of defined benefit obligations.
3) Risk on salary fluctuations: As the defined benefit obligation was determined by the salaries of plan
members before their retirement, the expected increase in salary should then be considered in the calculation. Thus, an increase in the expected rate for salary increase will result in a rise in the present values of defined benefit obligations.
316

29. EQUITY
a. Share capital Ordinary shares December 31 2018 2017 Authorized shares (in thousands) 4,500,000 4,500,000Authorized capital $ 45,000,000 $ 45,000,000Issued and paid shares (in thousands) 3,269,186 3,182,929Issued capital $ 32,691,859 $ 31,829,286 Issued ordinary shares with par value of $10 are entitled to the right to vote and to receive dividends At the shareholders’ meeting held on June 20, 2018, the Bank resolved to increase its capital by using its undistributed earnings of $862,573 thousand. As a result, the Bank issued 86,257 thousand ordinary shares at a par value of NT$10. After the issuance, the share capital of the Bank amounted to $32,691,859 thousand. The meeting of the Bank’s shareholders on June 15, 2017 resolved to increase the Bank’s capital by declaring a stock dividend of $715,614 thousand. As a result, the Bank issued additional 71,561 thousand ordinary shares at a par value of NT$10. After the issuance, the share capital of the Bank amounted to $31,829,286 thousand.
b. Capital surplus
The capital surplus arising from shares issued in excess of par and treasury stock transactions may be used to offset a deficit, or, if the Bank has no deficit, distributed as cash dividends or transferred to capital (limited to a certain percentage of the Bank’s paid-in capital and once a year). However, capital surplus arising from investment accounted for using equity method may not be used for any purpose.
c. Retained earnings and dividend policy
The appropriations of earnings were approved in the shareholders’ meetings held on June 20, 2018. In case of net income after settlement of accounts for each fiscal year, the Bank shall recover all the losses incurred in the previous years, if any, before setting aside a legal reserve of thirty percent (30%) of the net profit and appropriating, according to law and regulations, a special reserve shall be retained, and shall first be distributed to the dividends of Preferred Stock. The remaining amount together with the accumulated retained profits of the last year and the reversals of special reserves are available for distribution as dividends for Common Stock. The dividends for Common Stock shall be distributed at least thirty per cent (30%) of the remaining amount. The Board of Directors shall prepare the earnings distribution in accordance with the existing circumstances at the time, taking into account the future development plan of the Bank. Any allocation of cash dividend shall, in principle, be no less than 10% of the total dividends to be distributed that year. The Banking Law provides that, unless legal reserve reached the Bank’s paid-in capital, cash dividends are limited to 15% of paid-in capital. Under the Company Law, legal reserve should be appropriated until it has reached the Bank’s paid-in capital. This reserve may be used to offset a deficit. According to an amendment to the Company Law, when the Bank has no deficit and its legal reserve has exceeded 25% of its paid-in capital, the excess may be distributed in the form of stocks or cash.
317
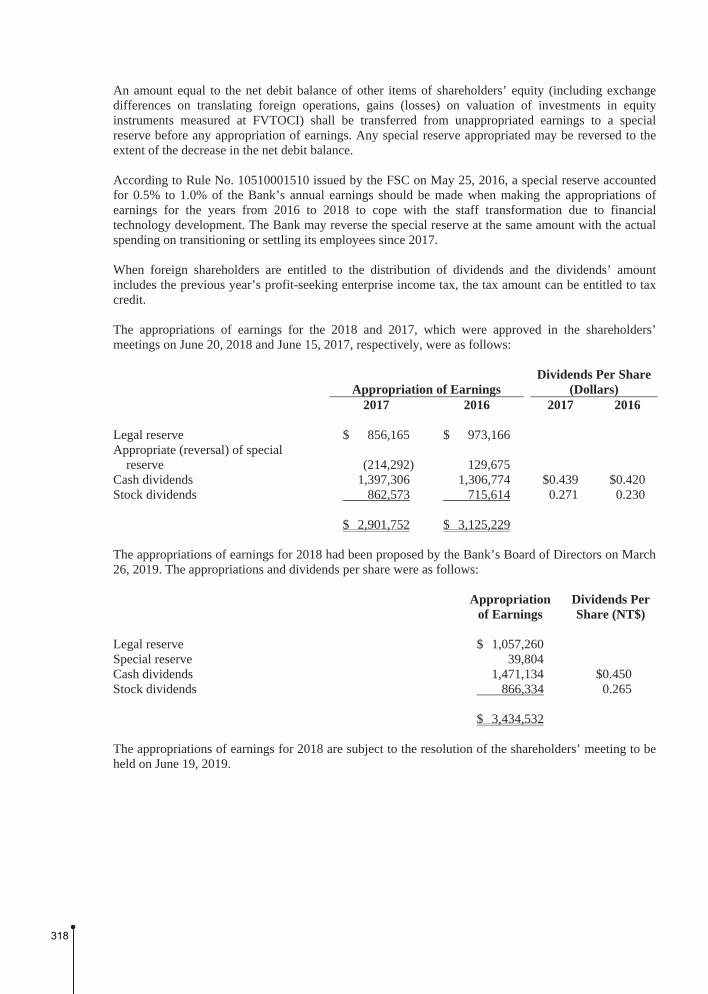
An amount equal to the net debit balance of other items of shareholders’ equity (including exchange differences on translating foreign operations, gains (losses) on valuation of investments in equity instruments measured at FVTOCI) shall be transferred from unappropriated earnings to a special reserve before any appropriation of earnings. Any special reserve appropriated may be reversed to the extent of the decrease in the net debit balance. According to Rule No. 10510001510 issued by the FSC on May 25, 2016, a special reserve accounted for 0.5% to 1.0% of the Bank’s annual earnings should be made when making the appropriations of earnings for the years from 2016 to 2018 to cope with the staff transformation due to financial technology development. The Bank may reverse the special reserve at the same amount with the actual spending on transitioning or settling its employees since 2017. When foreign shareholders are entitled to the distribution of dividends and the dividends’ amount includes the previous year’s profit-seeking enterprise income tax, the tax amount can be entitled to tax credit. The appropriations of earnings for the 2018 and 2017, which were approved in the shareholders’ meetings on June 20, 2018 and June 15, 2017, respectively, were as follows:
Appropriation of Earnings Dividends Per Share
(Dollars) 2017 2016 2017 2016 Legal reserve $ 856,165 $ 973,166 Appropriate (reversal) of special
reserve (214,292) 129,675 Cash dividends 1,397,306 1,306,774 $0.439 $0.420 Stock dividends 862,573 715,614 0.271 0.230 $ 2,901,752 $ 3,125,229 The appropriations of earnings for 2018 had been proposed by the Bank’s Board of Directors on March 26, 2019. The appropriations and dividends per share were as follows:
Appropriation
of Earnings Dividends Per Share (NT$)
Legal reserve $ 1,057,260 Special reserve 39,804 Cash dividends 1,471,134 $0.450 Stock dividends 866,334 0.265 $ 3,434,532 The appropriations of earnings for 2018 are subject to the resolution of the shareholders’ meeting to be held on June 19, 2019.
318

d. Other equity items
Unrealized gain or loss on financial assets measured at FVTOCI in 2018: Balance of adjustment on initial application of IFRS 9 at January 1, 2018 $ 196,065 Recognized for the year
Unrealized gain or loss Debt instruments (279,393) Equity instruments (37,126)
Net remeasurement of allowance for loss (929) Share of associates accounted for using the equity method (22,016) Reclassification adjustment - disposal of investments in debt instruments (28,621)
Other comprehensive income recognized for the year (368,085) Disposal of equity instruments at FVTOCI 65,531 Balance, ending of year $ (106,489) Movements of unrealized gain (loss) on available-for-sale financial assets under equity attributable to owners of the Bank in 2017 were as follows: Balance, beginning of year $ (344,477) Unrealized gain on available-for-sale financial assets 408,303 Cumulative gain (loss) reclassified to profit or loss on sale of
available-for-sale financial assets (50,499) Share of unrealized gain (loss) on available-for-sale financial
assets of associates 9,528 Balance, ending of year $ 22,855
30. NET INTERESTS
For the Year Ended December 31 2018 2017 Interest revenues
Discounts and loans $ 8,726,303 $ 7,764,549Securities 1,252,950 1,110,544Credit cards 818,190 819,965Others 463,765 320,089
11,261,208 10,015,147Interest expenses
Deposits and remittances 4,388,049 3,592,592Bank debentures 368,192 445,663Structured products 299,317 219,021Due to other banks 286,192 92,837Bonds under repurchase agreements 243,164 256,037Others 23,847 25,872
5,608,761 4,632,022 $ 5,652,447 $ 5,383,125
319

31. NET SERVICE FEE INCOME
For the Year Ended December 31 2018 2017 Service fee income
Wealth management $ 1,383,464 $ 1,405,341 Credit business 1,042,326 1,018,169 Credit cards 978,553 951,500 Others 204,147 196,494 3,608,490 3,571,504
Service fee expense Benefit and chargeback fee 199,360 196,669 Visa and Master 157,537 152,078 Agency service fee 72,938 73,154 National credit card center fee 64,684 65,927 Credit investigation 46,522 45,994 Interbank service fee 46,122 42,091 Others 161,560 125,442
748,723 701,355 $ 2,859,767 $ 2,870,149
32. NET GAINS ON FINANCIAL ASSETS AND LIABILITIES AT FVTPL
For the Year Ended December 31 2018 2017 Realized gains $ 1,352,465 $ 1,433,686 Valuation gains (loss) (220,958) 160,180 Net interests 350,232 127,548 Dividends 22,632 10,803 $ 1,504,371 $ 1,732,217
33. EMPLOYEE BENEFITS EXPENSE
For the Year Ended December 31 2018 2017 Salaries $ 2,941,983 $ 2,891,155 Labor and health insurance 209,610 209,816 Post-employment benefits (Note 28) 144,633 137,544 Others 361,790 260,604 $ 3,658,016 $ 3,499,119 According to the Articles that if there be net income before income tax, remuneration of directors and employees’ compensation, the Bank should retain an employees' compensation of 3.5%-4.5% and a remuneration of directors no greater than 1.5%. On March 26, 2019 the Bank’s board of directors resolved to pay employees’ compensation of $152,444 thousand and remuneration of directors of $50,814 thousand for the year ended December 31, 2018, both in cash. On March 21, 2018 the Bank’s board of directors resolved to pay employees’ compensation of $126,300 thousand and remuneration of directors of $42,100 thousand for the year ended December 31, 2017, both in cash
320

If there is a change in the amounts after the financial statements for the year ended December 31, 2018 were authorized for issue, the differences are recorded as a change in the accounting estimate. There was no difference between the actual amounts of employees’ compensation and remuneration of directors paid and the amounts recognized in the financial statements for the year ended December 31, 2017. Information on the employees’ compensation and remuneration of directors resolved by the Bank’s Board of Directors in 2019 and 2018 is available at the Market Observation Post System website of the Taiwan Stock Exchange.
34. DEPRECIATION AND AMORTIZATION
For the Year Ended December 31 2018 2017 Depreciation (Note 20) $ 220,349 $ 218,094 Amortization $ 25,483 $ 26,442
35. OTHER GENERAL AND ADMINISTRATIVE EXPENSES
For the Year Ended December 31 2018 2017 Tax and government fees $ 594,366 $ 572,816 Rental 417,156 412,911 Marketing and advertising 403,850 403,007 Software 180,829 177,660 Telecommunications 162,891 162,669 Others 719,019 692,271 $ 2,478,111 $ 2,421,334
36. INCOME TAX EXPENSE
a. Income tax expense recognized in profit or loss
The major components of tax expenses were as follows: For the Year Ended December 31 2018 2017 Current tax expense
Current period $ 292,287 $ 357,293 Prior years (772) (3,707) 291,515 353,586
Deferred tax expense Current period 318,761 76,983 Effect of change in tax rate (82,512) - Prior years (1,710) (1,123)
Deferred tax expense 234,539 75,860 Income tax expense recognized in profit or loss $ 526,054 $ 429,446
321

A reconciliation of accounting income and income tax expense recognized in profit or loss is as follows: For the Year Ended December 31 2018 2017 Income before income tax $ 4,050,255 $ 3,283,329 Income tax expense calculated at the statutory rate $ 810,050 $ 558,166 Income from offshore banking unit (OBU) (281,594) (153,740)Tax-exempted investment income (314,653) (373,349)Tax-exempted other items (64,470) 76,999 Unrecognized loss carryforwards (11,696) (31,091)Unrecognized deductible temporary differences 181,124 - Additional income tax under the Alternative Minimum Tax Act 254,199 324,786 Income tax on unappropriated earnings - 365 Overseas branch income tax 38,088 29,482 Adjustments for prior years’ tax (2,482) (4,830)Effect of change in tax rate (82,512) - Others - 2,658 Income tax expense recognized in profit or loss $ 526,054 $ 429,446 The tax rate applicable to the Bank were 17% and 20% in 2017 and 2018, respectively. In addition, the rate of the corporate surtax applicable to the 2018 unappropriated earnings will be reduced from 10% to 5%. 2019 appropriation of earnings is subject to the shareholders’ meeting in June 2019, and the income tax rate of the unappropriated earnings in 2018 will be 5%.
b. Deferred tax recognized in other comprehensive income December 31 2018 2017 Remeasurement of defined benefit plans $ 23,181 $ (9,491)
322

c. The movements of deferred tax assets and liabilities were as follows: For the year ended December 31, 2018
Deferred Tax Assets Beginning Balance
Recognized in Profit or Loss
Recognized in Other
Comprehensive Income (Loss) Ending Balance
Temporary differences
Allowance for possible losses in excess of the limit $ 398,739 $ (213,278) $ - $ 185,461
Defined benefit plans in excess of the limit 137,528 90 23,181 160,799
Unrealized gain or loss on financial instruments (47,290) (4,715) - (52,005)
Others 23,265 17,186 - 40,451 512,242 (200,717) 23,181 334,706 Unused loss carryforwards 33,822 (33,822) - - $ 546,064 $ (234,539) $ 23,181 $ 334,706 For the year ended December 31, 2017
Deferred Tax Assets Beginning Balance
Recognized in Profit or Loss
Recognized in Other
Comprehensive Income (Loss) Ending Balance
Temporary differences
Allowance for possible losses in excess of the limit $ 400,496 $ (1,757) $ - $ 398,739
Defined benefit plans in excess of the limit 158,608 (11,589) (9,491) 137,528
Unrealized gain or loss on financial instruments (43,551) (3,739) - (47,290)
Others 28,463 (5,198) - 23,265 544,016 (22,283) (9,491) 512,242 Unused loss carryforwards 87,399 (53,577) - 33,822 $ 631,415 $ (75,860) $ (9,491) $ 546,064
d. Items not recognized as deferred tax assets December 31 2018 2017 Loss carryforwards
Expire in 2018 $ - $ 2,044,870 Expire in 2021 133,968 133,968
$ 133,968 $ 2,178,838 Deductible temporary differences
Allowance for possible losses in excess of the limit $ 905,618 $ -
323

e. Information about unused loss carryforwards As of December 31, 2018, loss carryforwards comprised: Expiry Year Unused Amount 2021 $133,968 (assessed)
f. Income tax assessments
The income tax returns of the Bank through 2014 had been assessed by the tax authorities.
37. EARNINGS PER SHARE
Unit: NT$ Per Share For the Year Ended December 31 2018 2017 Basic EPS $ 1.08 $ 0.87 Diluted EPS $ 1.07 $ 0.84 The net income and weighted average number of ordinary shares outstanding for EPS calculation were as follows: Net Income for the Year For the Year Ended December 31 2018 2017 Net income attributable to owners of the Bank $ 3,524,201 $ 2,853,883 Effect of dilutive potential ordinary shares
Euro Convertible Bonds 3,420 44,029 Net income used in the computation of diluted EPS $ 3,527,621 $ 2,897,912 Number of Ordinary Shares (In Thousand Shares) For the Year Ended December 31 2018 2017 Weighted average number of ordinary shares in the computation of
basic EPS 3,269,186 3,269,186 Effect of dilutive potential ordinary shares
Euro Convertible Bonds 15,785 151,621 Employees’ compensation 18,516 16,289
Weighted average number of ordinary shares used in the
computation of diluted EPS 3,303,487 3,437,096
324

The weighted average number of ordinary shares outstanding for 2017 EPS calculation was retroactively adjusted to the issuance of stock dividends. The basic and diluted after-tax EPS were adjusted retrospectively as follows:
Before
Adjustment After
Adjustment Basic EPS $ 0.90 $ 0.87 Diluted EPS $ 0.86 $ 0.84 Employees’ compensation for the current year should be considered in calculating the weighted-average number of shares outstanding used for calculating diluted EPS. The dilutive effect of the potential shares should be included in the calculation of diluted EPS until the board meeting resolves the number of shares to be distributed as employees’ compensation at their board meeting in the following year.
38. RELATED-PARTY TRANSACTIONS The Bank had significant business transactions with the following related parties:
Related Party Relationship with the Bank Far Eastern Asset Management Co., Ltd. Subsidiary company Far Eastern International Securities Co., Ltd. Subsidiary company FEIB Financial Leasing Co., Ltd. Subsidiary company of Far Eastern Asset
Management Co., Ltd. Dah Chung Bills Finance Corp. Association Ding Ding Integrated Marketing Service Co. Chairman is the vice-chairman of the Bank Asia Cement Corp. Chairman is the vice-chairman of the Bank Far Eastern Department Store Corp. Chairman is the vice-chairman of the Bank Yuan Ding Co., Ltd. Chairman is the vice-chairman of the Bank Ding Ding Hotel Co., Ltd. Chairman is the vice-chairman of the Bank New Century InfoComm Tech Co., Ltd. Chairman is the vice-chairman of the Bank U-Ming Marine Transport Corp. Chairman is the vice-chairman of the Bank Oriental Union Chemical Corporation Chairman is the vice-chairman of the Bank Far Eastern New Century Corp. Chairman is the vice-chairman of the Bank Far EasTone Telecommunications Corporation Chairman is the vice-chairman of the Bank U-Ming Marine Transport (Singapore) Private, Ltd. Chairman of parent company is the vice-chairman of
the Bank Everest Textile Co., Ltd. Chairman is a second-degree relative of the vice
chairman of the Bank Yuan Long Stainless Steel Co. Substantive related party since September 2017 Pacific SOGO Department Stores Corporation Substantive related party since September 2017 Others The Bank’s chairman, vice-chairman, managers,
their second-degree relatives or substantive related party
325

The significant transactions and account balances with the above parties (in addition to those disclosed in other notes) are summarized as follows: a. Loans to other banks
Related Party
Highest Balance in
Current YearEnding Balance
Interest Revenues
Interest Rates
Dah Chung Bills Finance Corp. For the year ended December 31
2018 $ 1,600,000 $ - $ 1,153 0.34%-0.41%2017 $ 2,300,000 $ 500,000 $ 2,095 0.20%-0.42%
b. Loans
Number of Accounts and Highest Balance
in Current Ending Nonperforming
Transactions Terms
Different from Those
for Unrelated
Category Related Party Year Balance Normal Loans Loans Collateral Parties For the year ended December 31, 2018
Consumer loans Five individuals $ 1,847 $ 801 $ 801 $ - Unsecured loan Note 2 Loans for residential
mortgage Twenty five individuals 281,695 254,190 254,190 - Real estate Note 2
Others Yuan Long Stainless Steel Co. 1,706,572 1,706,000 1,706,000 - Real estate Note 2 Asia Cement Corp. 600,000 400,000 400,000 - Stock listed on TWSE Note 2 Far Eastern New Century Corp. 390,000 300,000 300,000 - Machinery Note 2 Others (Note 1) 1,889,065 86,000 86,000 - Real estate, ship and Note 2 certificates of deposit, $ 2,746,991 $ 2,746,991 $ - unquoted stock stock,
and listed on TWSE
For the year ended December 31, 2017
Consumer loans Three individuals $ 1,885 $ 1,645 $ 1,645 $ - Unsecured loan Note 2 Loans for residential
mortgage Twenty one individuals 207,796 193,154 193,154 - Real estate Note 2
Others Yuan Long Stainless Steel Co. 1,740,000 1,520,000 1,520,000 - Real estate Note 2 Asia Cement Corp. 600,000 600,000 600,000 - Stock listed on TWSE Note 2 Others (Note 1) 3,050,000 75,000 75,000 - Unquoted stock, ship Note 2 and certificates of $ 2,389,799 $ 2,389,799 $ - deposit, machinery,
real estate, and stock listed on TWSE and list stock
Note 1: The individual amount does not exceed 10% of the total disclosure amount. Note 2: The terms of the loans were no superior to those for unrelated parties.
Interest Rate Interest
Revenues Provision for
Possible Losses For the year ended December 31
2018 0.99% - 3.68% $ 30,835 $ 3,877 2017 0.90% - 2.24% $ 18,138 $ 7,809
Balances of related allowance for possible losses were $28,741 thousand and $24,864 thousand as of December 31, 2018 and 2017, respectively.
326

c. Guarantees
Highest Balance in Current Ending
Reserve for Guarantee
Related Party Year Balance Obligations Interest Rate Collateral For the year ended December 31, 2018 Yuan Long Stainless Steel Co. $ 60,000 $ 30,000 $ 300 0.60% Machinery Ding Ding Hotel Co., Ltd. 20,000 20,000 200 0.80% Unquoted stock Yuan Ding Investment Co. 13,000 13,000 130 0.80% Unquoted stock Others (Note) 749,835 - - 0.45%-0.80% Real estate, unquoted stock, ship and $ 63,000 $ 630 certificates of deposit For the year ended December 31, 2017 Oriental Union Chemical Corporation $ 130,000 $ 130,000 $ 1,300 0.50% Unquoted stock Yuan Long Stainless Steel Co. 30,000 30,000 300 0.60% Machinery Ding Ding Hotel Co., Ltd. 70,000 20,000 200 0.50%-0.80% Unquoted stock Others (Note) 33,935 32,835 328 0.50%-0.80% Real estate, unquoted stock, and certificates $ 212,835 $ 2,128 of deposit Note: The individual amount does not exceed 10% of the total disclosure amount.
d. Letters of credit issued
December 31 2018 2017 Yuan Long Stainless Steel Co. $ 8,664 $ - Everest Textile Co., Ltd. 3,331 10,537 Far Eastern Department Store Corp. - 17,908 $ 11,995 $ 28,445
e. Security transactions - buy and sell
Resale Repurchase Held for Trading Short Sales Agreement - Agreement - Buy Sell Buy Sell Bonds Bonds Dah Chung Bills Finance Corp. For the year ended
December 31 2018 $ - $ 100,000 $ - $ - $ 9,977,023 $ -2017 $ 150,000 $ 150,000 $ 150,000 $ 50,000 $ 39,362,203 $ -
327

f. Derivative instruments Derivative Contract Nominal Valuation Balance Sheet
Related Party Instrument Period Amount Gain (Loss) Account Balance For the year ended December 31, 2018
U-Ming Marine Transport
Corp. Cross-currency swap
contracts 2018.12.03 -
2019.01.07 $ 307,330 $ (805 ) Financial liabilities at FVTPL $ 335
U-Ming Marine Transport (Singapore) Private, Ltd.
Interest rate swap contracts
2012.09.27 - 2027.09.30
3,489,425 15,320 Financial assets at FVTPL 16,413
Financial liabilities at FVTPL 13,051Far Eastern New Century
Corp. Forward exchange
contracts 2018.11.27 -
2019.03.27 439,107 3,354 Financial assets at FVTPL 4,194
Financial liabilities at FVTPL 840New Century InfoComm
Tech Co., Ltd. Foreign-currency
swap contracts 2018.10.29 -
2019.01.31 537,828 (928 ) Financial assets at FVTPL 30
Financial liabilities at FVTPL 958Asia Cement Corp. Cross-currency swap
contracts 2018.12.25 -
2021.09.15 460,995 489 Financial assets at FVTPL 2,244
Dah Chung Bills Finance Corp.
Domestic convertible
2016.01.19 - 2019.06.16
20,000 (14,405 ) Financial assets at FVTPL 450
(exchangeable) bond asset swap contracts
Financial liabilities at FVTPL 69
For the year ended December 31, 2017
U-Ming Marine Transport
Corp. Cross-currency swap
contracts 2017.06.16 -
2018.06.28 $ 5,671,120 $ (8,066 ) Financial assets at FVTPL $ 48,734
U-Ming Marine Transport (Singapore) Private, Ltd.
Interest rate swap contracts
2012.09.27 - 2022.10.25
966,329 (112 ) Financial liabilities at FVTPL 11,959
Far Eastern New Century Corp.
Forward exchange contracts
2017.11.06 - 2018.02.26
1,007,212 5,651 Financial assets at FVTPL 7,391
Financial liabilities at FVTPL 1,740New Century InfoComm
Tech Co., Ltd. Foreign-currency
swap contracts 2017.12.27 -
2018.02.26 298,480 (458 ) Financial liabilities at FVTPL 458
Dah Chung Bills Finance Corp.
Domestic convertible
2015.05.18 - 2019.06.16
225,000 (30,224 ) Financial assets at FVTPL 15,416
(exchangeable) bond asset swap contracts
Financial liabilities at FVTPL 630
g. Deposits
December 31 2018 2017 Deposits of related parties (each account balance did not exceed
5% of total deposits) $44,982,925 $44,655,250 Interest rate 0% - 6.08% 0% - 6.08%
For the Year Ended December 31 2018 2017 Interest expenses $ 474,553 $ 229,547
h. Service fee expense
For the Year Ended December 31 2018 2017 Ding Ding Integrated Marketing Service Co. $ 128,252 $ 144,650 Far EasTone Telecommunications Corporation 21,418 - Far Eastern Department Store Corp. 19,465 18,534 Far Eastern International Securities 11,455 9,314 $ 180,590 $ 172,498
328

i. Operating expenses
For the Year Ended December 31 2018 2017 Marketing and advertising - Pacific SOGO Department Stores
Corp. $ 86,303 $ 44,663 Rental - Yuan Ding Co., Ltd. 84,617 79,068 Marketing and advertising - Far Eastern Department Store Corp. 84,393 116,629 Marketing and advertising - Ding Ding Hotel Co., Ltd. 13,422 16,801 $ 268,735 $ 257,161 Note: Pacific SOGO Department Stores Corp. has been a related party since September 2017, as a result, the prior period accounts were prepared for comparison with the same period. The Bank rented part of its office premises from Yuan Ding Co., Ltd. Based on the lease agreements, the rents were payable monthly.
j. Compensation of key management personnel For the Year Ended December 31 2018 2017 Short-term employee benefits $ 177,335 $ 166,789 Post-employment benefits 2,189 2,619 $ 179,524 $ 169,408
39. PLEDGED ASSETS
December 31 2018 2017 FVTOCI - 2018
Government bonds $ 3,586,922 $ - Negotiable certificates of deposits issued by the central bank 3,306,146 -
Available-for-sale financial assets - 2017 Government bonds - 3,602,186 Negotiable certificates of deposits issued by the central bank - 3,003,045
Other financial assets - deposits with original maturity more than 3 months 894,600 549,240
$ 7,787,668 $ 7,154,471 The negotiable certificates of deposits issued by the Central Bank and deposits with original maturity more than 3 months have been pledged as collaterals to back the extension of intraday credit in the Central Bank’s real-time gross settlement system. The balance of intraday credit and the amount of collateral may vary at any time. The government bonds had been provided as the reserve for compensation of trust department as well as security bond for provisional seizures of the debtors’ properties.
329

40. SIGNIFICANT CONTINGENT LIABILITIES AND UNRECOGNIZED COMMITMENTS In addition to those mentioned in Note 43, the Bank’ contingent liabilities and commitments resulting from operating activities as of December 31, 2018 and 2017 are summarized as follows: a. Operating leases commitment
The maturity analysis of rental payments under non-cancellable operating leases was as follows: December 31 2018 2017 Within one year $ 348,320 $ 342,253 After one year but within five years 477,638 613,042 After five years 49,598 69,942 $ 875,556 $ 1,025,237
b. Balance sheets and income statements of trust accounts and the trust assets lists were as follows:
Balance Sheets of Trust Accounts
December 31 2018 2017 Assets Deposits in banks $ 5,397,051 $ 5,495,110Accounts receivable 17,043 14,672Funds 41,006,506 38,592,345Equity stocks 4,955,244 5,175,789Bond investments 5,468 5,434Real estate, net 3,878,851 1,240,973Marketable securities in custody 10,924,845 7,942,426Others 1,793,961 1,513,200 $ 67,978,969 $ 59,979,949 Liabilities Accounts payable $ 1,920 $ 3,158Income tax payable 196 189Marketable securities in custody payable 10,924,845 7,942,426Trust capital 56,058,747 50,359,002Reserve and earnings 993,261 1,675,174 $ 67,978,969 $ 59,979,949
330

Income Statements of Trust Accounts
For the Year Ended December 31 2018 2017 Trust revenue
Interest $ 37,404 $ 35,618 Cash dividends 1,870,890 1,640,769 Unrealized investment gain - 4,851 Revenue from stock lending 16 75 Others 159 19,075
1,908,469 1,700,388 Trust expenses
Management 41,951 48,014 Supervision 487 477 Service charges 8,743 16,259 Taxes 33,976 2,177 Service fee for stock affairs - 1 Service fee for stock lending 1 2 Realized investment loss 569,646 366,599 Unrealized investment loss 89,346 - 744,150 433,529
Income before tax 1,164,319 1,266,859 Income tax 396 391 Net income $ 1,163,923 $ 1,266,468
Trust Asset Lists
December 31 2018 2017 Deposits in banks $ 5,397,051 $ 5,495,110Accounts receivable 17,043 14,672Funds 41,006,506 38,592,345Equity stocks 4,955,244 5,175,789Bonds investments 5,468 5,434Real estate, net
Land 2,766,640 591,940Building 39,743 25,211Construction in progress 1,072,468 623,822
Marketable securities in custody 10,924,845 7,942,426Others 1,793,961 1,513,200 $ 67,978,969 $ 59,979,949 As of December 31, 2018 and 2017, funds amounting to $1,393,772 thousand and $1,183,824 thousand, respectively, had been recognized in the OBU’s books as investment in overseas securities through Non-discretionary Pecuniary Trust of the OBU.
331

41. UNSETTLED LITIGATION EVENTS Regarding the claims of the Bank against Allied Material Technology Co., in October 2017, the Taiwan High Court ruled that the Bank shall pay $244,563 thousand plus interest to other banks (the amount was derived from the reorganization of Allied Material Technology Co.). The Bank has appealed in accordance with laws and regulations. The Supreme Court remanded the case to the Taiwan High Court on December 20, 2018. Based on attorney’s assessment of the remand, the probability of winning the litigation may be high. Accordingly, the Bank hasn’t evaluated related liabilities.
42. EXCHANGE RATE OF FINANCIAL ASSETS AND LIABILITIES DENOMINATED IN FOREIGN CURRENCIES The significant financial assets and liabilities denominated in foreign currencies were as follows:
December 31 2018 2017
Foreign
Currencies Exchange RateNew Taiwan
Dollars Foreign
Currencies Exchange Rate New Taiwan
Dollars Financial assets Monetary items
USD $ 3,846,562 30.733 $ 118,216,382 $ 3,348,542 29.848 $ 99,947,285HKD 3,129,424 3.924 12,279,860 2,978,848 3.819 11,376,220AUD 457,123 21.670 9,905,863 506,714 23.260 11,786,167CNY 928,509 4.473 4,153,219 1,174,009 4.577 5,373,440JPY 12,639,326 0.278 3,518,788 8,504,053 0.265 2,253,574ZAR 1,315,093 2.130 2,801,148 1,033,761 2.421 2,502,734EUR 64,066 35.210 2,255,778 53,261 35.700 1,901,434SGD 36,216 22.480 814,145 1,643 22.320 36,675GBP 7,840 38.880 304,813 7,809 40.210 314,007CAD 10,243 22.580 231,284 16,429 23.780 390,683NZD 7,251 20.620 149,518 9,076 21.200 192,406
Financial liabilities Monetary items
USD 3,723,220 30.733 114,425,720 3,106,626 29.848 92,726,574HKD 3,086,761 3.924 12,112,450 2,934,977 3.819 11,208,676AUD 456,347 21.670 9,889,048 503,321 23.260 11,707,251CNY 932,046 4.473 4,169,043 1,181,070 4.577 5,405,758JPY 12,397,679 0.278 3,451,514 8,156,806 0.265 2,161,554ZAR 1,319,035 2.130 2,809,545 1,082,141 2.421 2,619,863EUR 66,480 35.210 2,340,753 53,705 35.700 1,917,278SGD 36,159 22.480 812,851 1,698 22.320 37,889GBP 7,782 38.880 302,562 7,929 40.210 318,839CAD 10,244 22.580 231,300 15,874 23.780 377,478NZD 7,326 20.620 151,067 9,527 21.200 201,970
43. FINANCIAL INSTRUMENTS
a. Information of fair value 1) Overview
Fair value is defined as the price the trader collected or paid in an ordinary transaction for disposal or acquisition of assets or transfer of liabilities on the measurement date. Financial instruments are initially recognized at fair value which is the transaction price in general terms. All financial instruments are subsequently measured at fair value except for financial instruments which are valued at amortized cost.
332
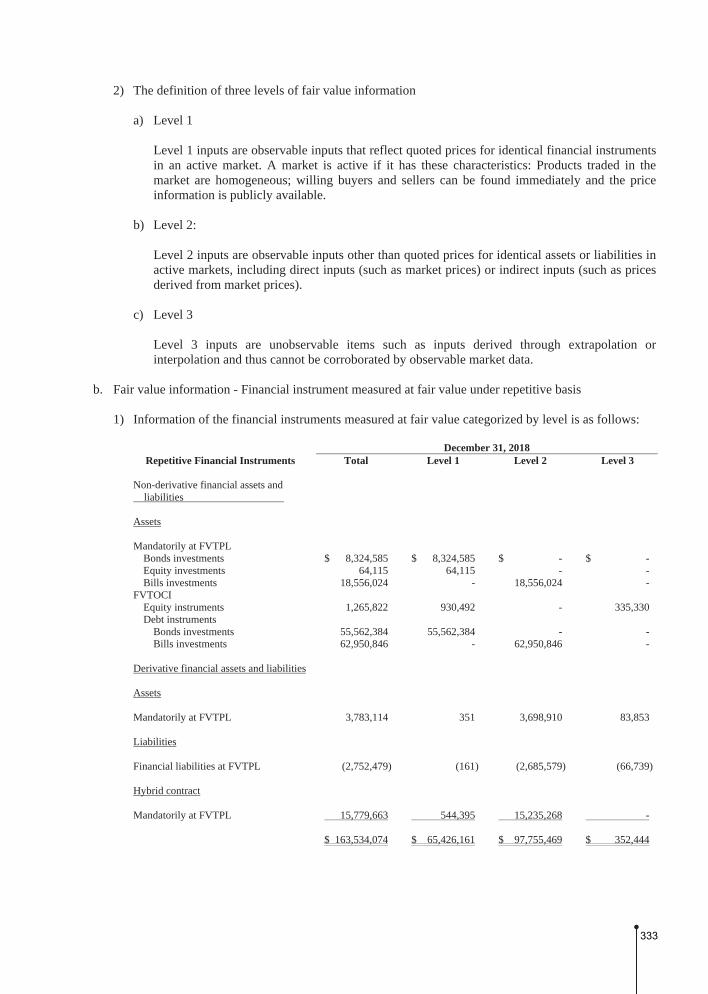
2) The definition of three levels of fair value information a) Level 1
Level 1 inputs are observable inputs that reflect quoted prices for identical financial instruments in an active market. A market is active if it has these characteristics: Products traded in the market are homogeneous; willing buyers and sellers can be found immediately and the price information is publicly available.
b) Level 2:
Level 2 inputs are observable inputs other than quoted prices for identical assets or liabilities in active markets, including direct inputs (such as market prices) or indirect inputs (such as prices derived from market prices).
c) Level 3 Level 3 inputs are unobservable items such as inputs derived through extrapolation or interpolation and thus cannot be corroborated by observable market data.
b. Fair value information - Financial instrument measured at fair value under repetitive basis 1) Information of the financial instruments measured at fair value categorized by level is as follows:
December 31, 2018 Repetitive Financial Instruments Total Level 1 Level 2 Level 3
Non-derivative financial assets and liabilities Assets Mandatorily at FVTPL
Bonds investments $ 8,324,585 $ 8,324,585 $ - $ -Equity investments 64,115 64,115 - -Bills investments 18,556,024 - 18,556,024 -
FVTOCI Equity instruments 1,265,822 930,492 - 335,330Debt instruments
Bonds investments 55,562,384 55,562,384 - -Bills investments 62,950,846 - 62,950,846 -
Derivative financial assets and liabilities Assets Mandatorily at FVTPL 3,783,114 351 3,698,910 83,853 Liabilities Financial liabilities at FVTPL (2,752,479) (161) (2,685,579) (66,739) Hybrid contract Mandatorily at FVTPL 15,779,663 544,395 15,235,268 - $ 163,534,074 $ 65,426,161 $ 97,755,469 $ 352,444
333

December 31, 2017
Repetitive Financial Instruments Total Level 1 Level 2 Level 3 Non-derivative financial assets and liabilities Assets Financial assets at FVTPL
Held for trading Bonds investments $ 5,238,586 $ 5,238,586 $ - $ -Equity investments 347,783 347,783 - -Bills investments 15,830,287 - 15,830,287 -Beneficiary certificates 50,473 50,473 - -
Financial assets designated as at FVTPL Convertible (exchangeable) bonds 5,680,038 5,680,038 - -
Available-for-sale Bonds investments 46,349,663 46,349,663 - -Equity investments 758,711 758,711 - -Bill investments 62,523,204 - 62,523,204 -
Liabilities Financial liabilities at FVTPL
Settlement coverage bonds payable of short sale (50,241) (50,241) - -
Derivative financial assets and liabilities Assets Financial assets at FVTPL
Held for trading 3,061,166 477 2,950,088 110,601 Liabilities Financial liabilities at FVTPL (4,268,880) (1,668) (4,263,385) (3,827) $ 135,520,790 $ 58,373,822 $ 77,040,194 $ 106,774
2) Valuation techniques for fair value measurement
When the Bank determine the fair value of financial instruments, they consider the market. If the market is active, then the fair value of the instruments will be consistent with quoted market prices. If the market is not active, then the fair value will be estimated by using a valuation model that is widely adopted by market participants or by referring to counterparties’ parameters or to parameters based on conditions and characteristics of financial instruments that are similar to those of the Bank’ instruments. The parameters of valuation model used to measure fair value of financial instruments are usually observable data from market, such as OTC, Reuters and Bloomberg’s offering price. The valuation department determines the scope of valuation model and assesses any uncertainty and its impact. In its assessment, the valuation department ensures the following: a) The consistency and adequacy of the market parameters used in the valuation; b) The appropriateness of the valuation model in light of the assumptions to be used, the internal
control and risk management framework, and the degree of mathematical expertise required for an independent unit to make the valuation;
c) Reliability of price information and other parameters used in the valuation and any model
adjustments to be made on the basis of current market conditions.
334

3) Credit risk valuation adjustment
Credit risk valuation adjustment is for financial instrument transactions made outside the stock exchange, namely the transactions made over-the-counter, which could be mainly divided into credit value adjustment and debit value adjustment. The definition is as follows: a) Credit Value Adjustment (the “CVA”) is the reflection of possibility that counterparty is likely
to default and the possible loss that the counter party may not be able to reimburse entire market value.
b) Debit Value Adjustment (the “DVA”) is the reflection of possibility that the Bank is likely to
default and the uncertainly that the Bank may not be able to reimburse for the entire market value. The CVA is calculated by multiplying the probability of default (the “PD”), loss given default (the “LGD”) and exposure at default (the “EAD”) of counterparty together. In contrast, DVA is calculated by multiplying PD (under zero default rate of the counterparty), LGD and EAD of the Bank together. To take into account all risk factors involved in model-based fair value measurements, the Bank uses the disclosure guidelines issued by the TWSE on CVA and DVA, which are marked to market, using appropriate ratios such as LGD, PD, and EAD. This way, the credit risks on counterparties in OTC-derivative transactions as well as the Bank’s credit quality can be considered.
4) Transfers between Levels 1 and Level 2 There was no transfer between Level 1 and Level 2 for the years ended December 31, 2018 and 2017.
5) Level 3 financial instruments
a) Movement of Level 3 financial assets
December 31, 2018
Item Beginning Balance
Valuation Increase in the Current Year
Decrease in the Current Year
Ending Balance Included in
Profit or Loss
Included in Other
Compre- hensive Income
Purchase or Issue
Transfer-in (Note)
Sale, Disposition
or Settlement
Transfer-out from Level 3
Mandatorily at FVTPL $ 110,601 $ (18,265 ) $ - $ 8,321 $ - $ (16,804 ) $ - $ 83,853Financial assets at FVTOCI - - 25,675 309,655 - - 335,330Total $ 110,601 $ (18,265 ) $ 25,675 $ 8,321 $ 309,655 $ (16,804 ) $ - $ 419,183
Note: Due to retroactive classification per IFRS 9 in the beginning balance of 2018.
December 31, 2017
Item Beginning Balance Valuation
Increase in the Current Year Decrease in the Current YearEnding Balance Purchase or
Issue Transfer-inSale,
Disposition or Settlement
Transfer-out from Level 3
Financial assets at FVTPL Held for trading - derivative
financial assets $ 92,774 $ 32,470 $ 48,024 $ - $ (62,667 ) $ - $ 110,601
335

b) Movements of Level 3 financial liabilities
December 31, 2018
Item Beginning Balance Valuation
Increase in the Current Year Decrease in the Current YearEnding Balance Purchase or
Issue Transfer-inSale,
Disposition or Settlement
Transfer-out from Level 3
Financial liabilities at FVTPL Derivative financial
liabilities $ 3,827 $ (1,675 ) $ 66,739 $ - $ (2,152 ) $ - $ 66,739
December 31, 2017
Item Beginning Balance Valuation
Increase in the Current Year Decrease in the Current YearEnding Balance Purchase or
Issue Transfer-inSale,
Disposition or Settlement
Transfer-out from Level 3
Financial liabilities at FVTPL Derivative financial
liabilities $ 6,818 $ (1,198 ) $ 3,481 $ - $ (5,274 ) $ - $ 3,827
c) Quantitative information of significant unobservable parameters used in fair value measurement
(Level 3 financial instruments)
Level 3 financial instruments mainly consist of credit default swap and investment in equity instrument at FVTOCI which have single major unobservable parameters; quantitative information is as follows:
Measured at Fair Value
Based on Repetition
Fair Value as of December 31,
2018
Valuation Techniques
Significant Unobservable Parameters
Interval (Weighted-
average)
Relationship Between Parameters and Fair
Value Derivative financial assets
December 31, 2018 $ 83,853 Default probability model
Credit separation 0.40%-3.50% The increase of credit separation decreases its fair value.
December 31, 2017 110,601 Default probability model
Credit separation 0.80%-3.65% The increase of credit separation decreases its fair value.
Investments in equity December 31, 2018 299,678 Income approach -
cash dividend discount method
Without open market marketable discount
20.16% The increase of discount decreases its fair value
24,809 Market approach - analogy company law
Without open market marketable discount
10.00% The increase of discount decreases its fair value
10,843 Net asset value method
N/A N/A N/A
Derivative financial liabilities
December 31, 2018 66,739 Default probability model
Credit separation 0.40%-3.50% The increase of credit separation decreases its fair value.
December 31, 2017 3,827 Default probability model
Credit separation 0.80%-3.65% The increase of credit separation decreases its fair value.
d) Valuation procedures for Level 3 fair value
Valuation of Level 3 financial instruments is executed by a specific department and external expert responsible for fair value measurement which is independent from operating department. The Bank uses data from independent source to make valuation results close to market status, confirms whether the data source is independent, reliable and consistent with other data, inspects valuation parameters on a regular basis, updates parameters of the valuation model and makes any other necessary fair value adjustments in order to ensure proper valuation results.
336
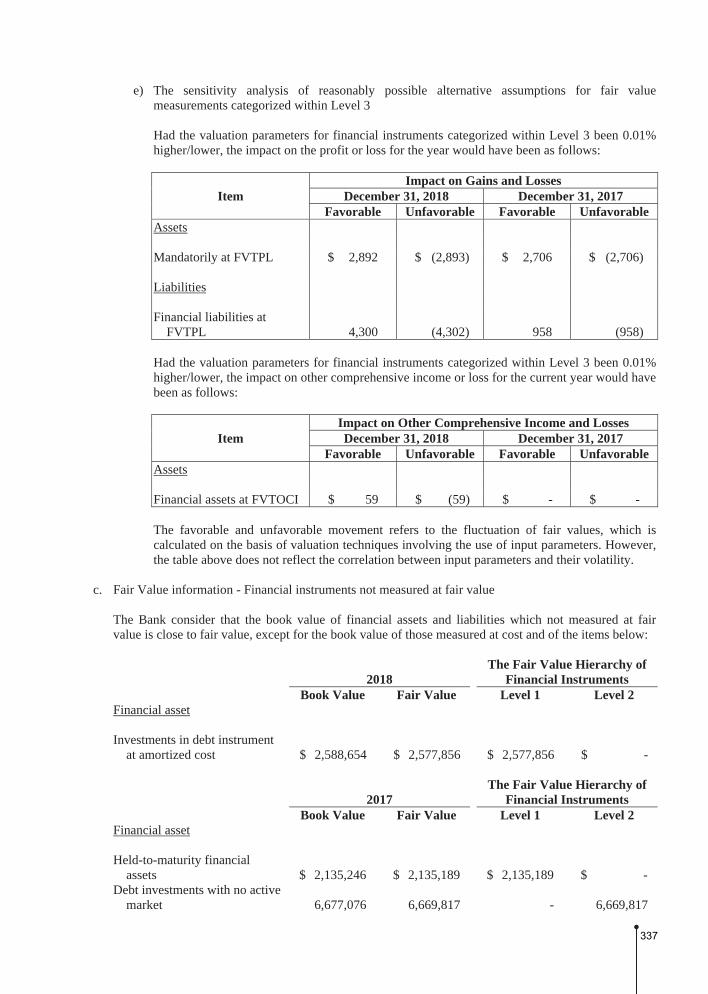
e) The sensitivity analysis of reasonably possible alternative assumptions for fair value measurements categorized within Level 3 Had the valuation parameters for financial instruments categorized within Level 3 been 0.01% higher/lower, the impact on the profit or loss for the year would have been as follows:
Item Impact on Gains and Losses
December 31, 2018 December 31, 2017 Favorable Unfavorable Favorable Unfavorable
Assets Mandatorily at FVTPL $ 2,892 $ (2,893) $ 2,706 $ (2,706) Liabilities Financial liabilities at
FVTPL 4,300 (4,302) 958 (958) Had the valuation parameters for financial instruments categorized within Level 3 been 0.01% higher/lower, the impact on other comprehensive income or loss for the current year would have been as follows:
Item Impact on Other Comprehensive Income and LossesDecember 31, 2018 December 31, 2017
Favorable Unfavorable Favorable UnfavorableAssets Financial assets at FVTOCI $ 59 $ (59) $ - $ - The favorable and unfavorable movement refers to the fluctuation of fair values, which is calculated on the basis of valuation techniques involving the use of input parameters. However, the table above does not reflect the correlation between input parameters and their volatility.
c. Fair Value information - Financial instruments not measured at fair value
The Bank consider that the book value of financial assets and liabilities which not measured at fair value is close to fair value, except for the book value of those measured at cost and of the items below:
2018 The Fair Value Hierarchy of
Financial Instruments Book Value Fair Value Level 1 Level 2 Financial asset Investments in debt instrument
at amortized cost $ 2,588,654 $ 2,577,856 $ 2,577,856 $ -
2017 The Fair Value Hierarchy of
Financial Instruments Book Value Fair Value Level 1 Level 2 Financial asset Held-to-maturity financial
assets $ 2,135,246 $ 2,135,189 $ 2,135,189 $ -Debt investments with no active
market 6,677,076 6,669,817 - 6,669,817
337
The evaluation methods and assumptions for Level 2 financial instruments above are quoted from the offering price of Bloomberg and Reuters.
44. FINANCIAL RISK MANAGEMENT
a. Overview
The Bank’s risk management policy is to form a risk management-oriented culture, and to use both qualitative and quantitative indexes from internal and external risk management regulations in developing operating strategies. The Bank has set up an independent risk control department to implement and monitor risk management policies. The Bank’s risk management policies are established to identify and measure the risks faced by the Bank, to set appropriate risk limits and controls, to monitor risks and adherence to limits, and to achieve the target profit.
b. Risk management framework
The Board of Directors, the highest decision-making body of the Bank, has overall responsibility for the establishment and oversight of the Bank’s risk management framework. Asset and Liability Management Committee and Risk Management Committee have been formed to examine and manage the Bank’s risks, to assess the execution of risk management policies and to evaluate risk tolerance. The general manager is the convener, and is responsible for appointing members of committees. Risk Management Department comprising of corporate banking and consumer banking groups which directly manage credit extension risks with regard to their respective areas, and present risk management report to Risk Management Committee and the Board of Directors, regularly. The Internal Audit Department undertakes regular reviews of risk management controls and procedures, including risk management framework, operating procedures of risk management, and provides timely suggestion and improvement.
c. Credit risk 1) Definition and scope of credit risk
Credit risk is the risk of financial loss to the Bank if a borrower, issuer or counterparty to a financial instrument fails to meet its contractual obligations due to its credit deterioration or other factors, such as a dispute between the borrower and its counterparty. Credit risk includes all risks derived from on- and off-balance sheet business, and all credit risk related to products, businesses and positions.
2) Management policies on credit risk The Bank shall identify risk factors and consider appropriate risk evaluation and control process prior to taking the existing or new business. For all credit risks identified on- and off-balance sheet, adequate credit limits are set based on the same borrower, counterparty, related party, group, or industry. The Bank shall establish review mechanism to track and assess changes in each borrower’s or issuer’s financial position; regularly assess and manage asset quality, also strengthen the management of unusual borrowers and make appropriate allowance for possible losses if applicable.
338

3) The credit risk management processes and valuation methods for credit extension are as follows:
2018 a) The credit risk has increased significantly after original recognition
The Bank assesses the change in the risk of default over the expected duration of each type of credit asset on each reporting date in order to determine whether the credit risk has increased significantly since original recognition. For this assessment, the Bank's considerations show that the credit risk has increased significantly since original recognition and can be corroborated. The main considerations include the following: Qualitative Index The debtor’s payment is overdue for 30-89 days. Quantitative Index i. Unfavorable changes in current or projected operating, financial or economic conditions that
are expected to result in significant changes in the ability of the debtor to perform its debt obligations.
ii. Significant changes in actual or expected results of the debtor’s operations. iii. The credit risk of other financial instruments of the same debtor has increased significantly.
b) The definition of default and credit impairment on financial assets
The Bank's definition of default on financial assets is the same as the judgment of credit impairment on financial assets. If one or more of the following conditions are met, the Bank determines that the financial assets have defaulted and have credit impairment: Qualitative Index The debtor’s payment is overdue for more than 90 days. Quantitative Index If there is any evidence indicates that the debtor can not pay the contract, or the debtor is in a material financial difficulties as follows: i. The debtor has become bankrupt or may file for bankruptcy or financial restructuring. ii. The debtor has conformed to a non-performed loan by authorities. iii. The debtor has conducted a negotiation of debts or self-negotiating. iv. The active market of the financial assets disappeared due to financial difficulties. The aforementioned default and credit impairment definitions apply to all financial assets held by the Bank and are consistent with the definitions used for the internal credit risk management purposes of the financial assets and are applied to the relevant impairment assessment model.
339

If the financial assets have not conformed to the definition of default and credit impairment on financial assets for 6 consecutive months, it would not be classified as a default and credit impairment on financial assets.
c) Write off policy When the Bank can not reasonably expect the recoverable from the entire or partial financial assets, the entire or partial financial assets will be written off. The index of unexpected reasonably recoverable amount includes the following: i. The recovery of debt has stopped. ii. The debtor doesn’t have enough assets or income resource to pay the debt after assessment. Financial asset which has been written-off can do the recovery of debt and institute legal proceedings continuously under related policies.
d) Measurement of expected credit loss i. Loan and receivables
The Bank considers both the 12-month and lifetime probability of default (“PD”) of the borrower with the loss given default (“LGD”), multiplying, the exposure at default (“EAD”), as well as the impact of time value, to calculate the 12-month ECLs and lifetime ECLs, respectively. The above “PD” and ”LGD” are applied to the credit business according to each group’s historical information (such as credit loss experience) from internal statistical data, and adjust historical data based on current observable and forward-looking macroeconomic information (such as GDP and unemployment rate), then calculate by applying the progressive one factor model respectively. When the Bank measured the credit loss of assets combination, the forward-looking information were taken into the PD’s consideration. Among them, the index of forward-looking adjustment in PD is predicted by the Corporate banking Sector which adopted the growth rate of real GDP in Taiwan and the Consumer banking Sector which adopted the unemployment rate in Taiwan. According to the measurement of predict loss in IFRS 9, the forward-looking adjustment in PD is requested to assess any consequences (at least 2 circumstances) and expresses with weighted-average probability. As a result, the Bank took the prediction authorities’ consensus forecasting into consideration and adopted the prediction value by at least 2 macroeconomic prediction authorities as the index of forward-looking adjustment. The Bank considered the estimate on credit loss with the forward-looking information by the above methods.
ii. The investments in debt instrument at amortized cost and at FVTOCI
The measurement of predict credit loss consider the information of PD and LGD which is announced from the external credit ratings and Moody’s to calculate. The international credit rating authority has considered the forward-looking information when assessed the credit rating which is taken consideration to measure the predict credit loss by the Bank consequently.
340

2017 a) Classification of credit assets
Credit assets are grouped into 5 different categories according to the “Regulations Governing the Procedures for Banking Institutions to Evaluate Assets and Deal with Nonperforming/Non-accrual Loans.” Normal credit assets shall be classified as “Category One”, the remaining credit assets shall be further classified based on the collateral for loans and past due status as follows: Category Two-Special Mention loans; Category Three-Substandard; Category Four-Doubtful, and Category Five-Unrecoverable. Moreover, the Bank establishes internal requirements, such as the “Principles Governing the Procedures to Evaluate Assets and Deal with Nonperforming/Non-accrual Loans,” to manage problematic credit extension and credit collection and management.
b) Credit quality
Discounts and loans and receivables The Bank sets credit quality grades according to product features, business types, operating conditions, collaterals and credit rating. Credit risk from corporate banking is categorized according to the business types, collaterals, credit rating and financial position of borrowers; credit risk from consumer banking is assessed on a case-by-case basis, except for unsecured loans and credit card products, which are assessed by internal credit rating models. Interbank facilities, derivative financial instruments and investments in debt instruments Total trading limits are determined each year by reference to financial institutions’ operating results, credit rating, rating on THE BANKER, net worth and background of shareholders, with summaries submitted to the Credit Committee, and to the Managing Directors for approval. In each quarter, view the transaction limits for each financial institution in the Risk Management Committee. Derivative financial instruments transactions entered into counterparties from banking sectors are those categorized as investment grade, and they are controlled using relevant transaction limits for each counterparty. For individual counterparty, credit exposure is controlled using the limits placed on derivative instruments by both amounts and terms in the general credit approval process. Credit risk on debt instruments is evaluated by identifying the risk using the credit rating obtained from external institutions, credit quality, geographic situations and counterparty credit risk.
4) Credit risk hedging and mitigation policies a) The terms of credit facilities are determined in the light of assessments of probability and
amounts of default and collateral and guarantees are obtained, including bank deposit receipts, securities (such as treasury securities, government bonds, bank debentures, stocks and bonds guaranteed by financial institutions) and real estate such as land and buildings. Stocks listed on TWSE and TPEx are marked to market day to day, and changes in the value of their collaterals are monitored all the time; values of land and buildings are examined every time the contract is renewed.
b) Reduce loans to non-target customers to mitigate credit risk.
341

c) Through policy mechanism, such as credit limits and credit regulation prior to the credit being committed to customers, to control the quality of credit assets. Via post-loan management, concentration analysis, midway credit and review tracking to view assets quality and changes of each case. Master and monitor risk in time. Periodic reports and feedbacks to understand credit portfolios and overall credit risks, ensure risk offsets for continued effectiveness.
d) According to the Bank’s “Principles for Acceptance and Disposal of Collaterals,” collateral of
nonperforming loans secured through compulsory enforcement or participating distribution, if the minimum auction price or liquidation price of the collateral is too low and damage the Bank’s credit right, the Bank will participate in the auction or declare to undertake, for example, the minimum auction price is too low to compensate the principal and interest of loans but the collateral must not be difficult to dispose in the future. For collaterals tendered or undertaken, the Bank should actively seek buyers, and if the collateral is real estate, the Bank should dispose of it within the period prescribed under the Banking Law.
e) Other credit enhancements
If there are guarantee, strategic alliance or collaterals provided in the terms of the loan contracts which the Bank recognized as unsecured loan, when default events occur, the Bank will demand compensation from the guarantor, strategic alliance, transfer of credits to the Bank or disposal of collaterals to decrease credit risk.
5) The maximum credit risk exposure
The carrying amount represents the Bank’s maximum exposure to credit risk of the on-balance sheet assets, without taking into account the collaterals held or other credit enhancements. The amounts of the maximum credit exposure of the irrevocable off-balance commitments and guarantees, without taking into account the collaterals held or other credit enhancements, were as follows: December 31 2018 2017 Unused portion of credit card lines $ 179,890,598 $ 171,589,511Guarantees and standby L/Cs 19,271,353 17,455,518Irrevocable loan commitments 15,866,641 12,171,019
342

The breakdown of maximum credit risk exposure of the Bank according to whether collaterals are held or other credit enhancements exist is as follows: December 31, 2018 Maximum Credit Risk Exposure
With Collaterals Other Credit
Enhancements Without
Collaterals Total Balance sheet items Discounts and loans $ 248,098,498 $ 60,682,444 $ 76,142,075 $ 384,923,017Receivables - credit card - - 14,417,111 14,417,111Receivables - acceptances - 98,272 341,087 439,359 Off-Balance sheet items Unused portion of credit card
lines - - 179,890,598 179,890,598Guarantee 5,843,474 6,147,476 6,609,086 18,600,036Letters of credit issued 11,995 220,265 439,057 671,317Irrevocable loan commitments 798,815 - 15,067,826 15,866,641 $ 254,752,782 $ 67,148,457 $ 292,906,840 $ 614,808,079 December 31, 2017 Maximum Credit Risk Exposure
With Collaterals Other Credit
Enhancements Without
Collaterals Total Balance sheet items Discounts and loans $ 234,344,356 $ 52,712,990 $ 68,883,273 $ 355,940,619Receivables - credit card - - 14,786,253 14,786,253Receivables - acceptances - 175,516 245,900 421,416 Off-Balance sheet items Unused portion of credit card
lines - - 171,589,511 171,589,511Guarantee 4,592,188 5,387,303 6,529,898 16,509,389Letters of credit issued 35,601 244,973 665,555 946,129Irrevocable loan commitments 1,795,770 - 10,375,249 12,171,019 $ 240,767,915 $ 58,520,782 $ 273,075,639 $ 572,364,336 The Bank set the procedure for the range of available to classify as collaterals and estimation of collaterals with collaterals assessed management and estimation loans of collaterals which is in order to check the nonperforming loans. When loan contracts set the security of nonperforming loans, article of collaterals and definition of credit event occurrence, the quota and the repayment period can be reduced or regard as maturity to reduce the credit risk.
343

6) Concentrations of credit risk The concentration of credit risk exists when counterparties to financial transactions are individuals or groups engaging in similar business activities and having similar economic features. The similarity would cause their ability to meet contractual obligations to be similarly affected by changes in economic or other conditions. The Bank’s concentrations of credit risk by industry, geography and type of collaterals were as follows: a) By industry
December 31, 2018 Credit Risk Profile by Industry Sector Amount % Finance and insurance $ 53,669,412 14Manufacturing 43,696,595 11Wholesale and retail trade 15,946,673 4 $ 113,312,680 29
December 31, 2017 Credit Risk Profile by Industry Sector Amount % Finance and insurance $ 52,415,634 15Manufacturing 41,373,608 12Wholesale and retail trade 11,331,381 3 $ 105,120,623 30
b) By geography
December 31 2018 2017
Region Amount % to Total Amount
% to Total
Taiwan $ 319,847,652 83 $ 299,813,491 84Asia Pacific except Taiwan 32,731,935 9 30,750,120 9Others 32,343,430 8 25,377,008 7 $ 384,923,017 100 $ 355,940,619 100
c) By type of collaterals December 31 2018 2017 Type of Collaterals Amount % Amount % Unsecured $ 136,824,519 36 $ 121,596,263 34Secured
Real estate 209,070,047 54 191,379,527 54Movable property 18,601,434 5 19,630,122 5Financial collateral 17,274,959 4 20,035,658 6Others 3,152,058 1 3,299,049 1 $ 384,923,017 100 $ 355,940,619 100
344

7) Continuing assessment of credit quality and any impairment of financial assets Some of the financial assets held by the Bank, such as cash and cash equivalents, due from the central bank and other banks, financial assets at FVTPL, securities purchased under resale agreements, bond investment, refundable deposits and operating deposits, are assessed with low credit risk due to the good credit rating of the counterparties. An analysis of credit quality of financial assets other than those listed above is shown below:
345

a)
Cre
dit q
ualit
y an
alys
is o
f dis
coun
ts a
nd lo
ans a
nd re
ceiv
able
s - D
ecem
ber 3
1, 2
017
Dec
embe
r 31
, 201
7
Nei
ther
Pas
t due
Nor
Impa
ired
Past
Due
But
N
ot Im
pair
ed
(B)
Impa
ired
(C)
Tot
al
(A)+
(B)+
(C)
Allo
wan
ce fo
r Po
ssib
le L
osse
s (D
)
Net
Am
ount
(A
)+(B
)+(C
)-(D
) E
xcel
lent
G
ood
Mod
erat
e Sp
ecia
l Men
tion
Subt
otal
(A)
With
Obj
ectiv
e E
vide
nce
of
Indi
vidu
al
Impa
irm
ent
With
out
Obj
ectiv
e E
vide
nce
of
Indi
vidu
al
Impa
irm
ent
Dis
coun
ts a
nd lo
ans
$ 2
02,1
27,0
29 $
91
,546
,163
$
53,6
57,1
11 $
1,
464,
776
$ 3
48,7
95,0
79
$
3,60
4,98
1 $
3,
540,
559
$ 3
55,9
40,6
19 $
1,
005,
118
$
3,87
8,73
9 $
351
,056
,762
R
ecei
vabl
es
C
redi
t car
d
5,55
3,26
3
2,52
5,40
9
4,67
6,78
3
14,3
47
12,7
69,8
02
57
4,60
4
1,44
1,84
7
14,7
86,2
53
469,
259
2,
209
14
,314
,785
O
ther
s
640,
792
68
6,97
2
3,35
6,22
3
-
4,98
3,98
7
2,57
2
665,
798
5,
652,
357
57
4,26
4
68,0
84
5,
017,
219
346

b) An analysis of credit quality of discounts and loans neither past due nor impaired by business types - December 31, 2017
Neither Past Due Nor Impaired
Excellent Good Moderate Special Mention Total Corporate banking
Secured $ 24,577,665 $ 19,672,117 $ 4,307,119 $ 30,498 $ 48,587,399 Unsecured 9,855,194 39,597,169 45,050,962 1,107,894 95,611,219
Consumer banking Housing mortgage 156,815,282 9,900,793 617,144 - 167,333,219 Credit loans 6,506,427 7,654,052 2,574,079 326,384 17,060,942 Others 4,372,461 14,722,032 1,107,807 - 20,202,300
Total $ 202,127,029 $ 91,546,163 $ 53,657,111 $ 1,464,776 $ 348,795,079 c) Loans and receivables past due but not impaired - December 31, 2017
Financial assets past due 90 days or less are not considered impaired unless there is objective evidence that an impairment loss has been incurred. Financial assets might become past due but not impaired by reasons of borrowers’ late processing or other administrative delays. The aging analysis of loans and receivables past due but not impaired was as follows:
Past Due Items December 31, 2017
Up to 1 Month Over 1 Month to 3 Months Total
Discounts and loans Corporate banking $ 80,944 $ 154,465 $ 235,409 Consumer banking
Housing mortgage 2,116,878 283,789 2,400,667 Credit loans 485,657 114,219 599,876 Others 344,203 24,826 369,029
Total 3,027,682 577,299 3,604,981 Receivables
Credit card 505,595 69,009 574,604 Others - 2,572 2,572
347
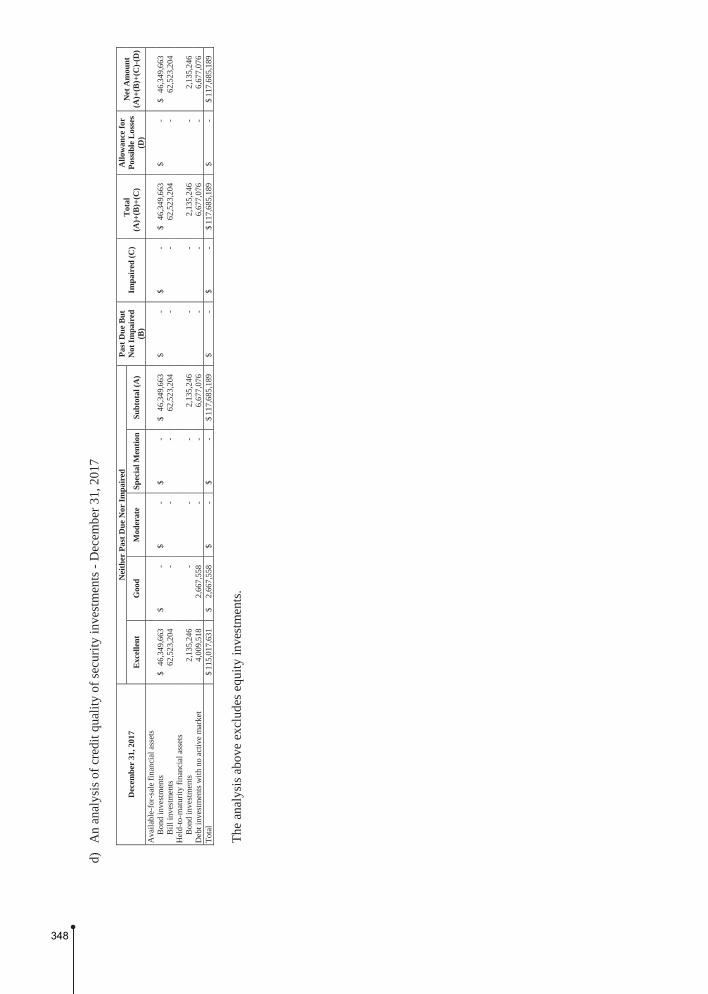
d)
An
anal
ysis
of c
redi
t qua
lity
of se
curit
y in
vest
men
ts -
Dec
embe
r 31,
201
7
Dec
embe
r 31
, 201
7 N
eith
er P
ast D
ue N
or Im
pair
ed
Past
Due
But
N
ot Im
pair
ed
(B)
Impa
ired
(C)
Tot
al
(A)+
(B)+
(C)
Allo
wan
ce fo
r Po
ssib
le L
osse
s (D
)
Net
Am
ount
(A
)+(B
)+(C
)-(D
) E
xcel
lent
G
ood
Mod
erat
e Sp
ecia
l Men
tion
Subt
otal
(A)
Ava
ilabl
e-fo
r-sa
le fi
nanc
ial a
sset
s
B
ond
inve
stm
ents
$ 46
,349
,663
$
-
$ -
$
-
$ 46
,349
,663
$ -
$
-
$ 46
,349
,663
$
-
$ 46
,349
,663
B
ill in
vest
men
ts
62,5
23,2
04
-
-
-
62,5
23,2
04
-
-
62,5
23,2
04
-
62,5
23,2
04
Hel
d-to
-mat
urity
fina
ncia
l ass
ets
Bon
d in
vest
men
ts
2,13
5,24
6
-
-
-
2,13
5,24
6
-
-
2,
135,
246
-
2,
135,
246
Deb
t inv
estm
ents
with
no
activ
e m
arke
t
4,
009,
518
2,66
7,55
8
-
-
6,
677,
076
-
-
6,67
7,07
6
-
6,67
7,07
6 To
tal
$
115,
017,
631
$
2,66
7,55
8
$ -
$
-
$ 11
7,68
5,18
9
$ -
$
-
$ 11
7,68
5,18
9
$ -
$
117,
685,
189
The
anal
ysis
abo
ve e
xclu
des e
quity
inve
stm
ents
.
348

d. Liquidity risk 1) Sources and definition of liquidity risk
Liquidity risk is the risk that the Bank is unable to liquidate assets or obtain loans to meet its obligations when they fall due as a result of customer deposits being early withdrawn, deteriorating access to and terms of interbank facilities, deteriorating delinquency by borrowers, or financial instruments not easily liquidated. Such outflows would deplete available cash resources for client lending, trading activities and investments. In extreme circumstances, lack of liquidity could result in reductions in the balance sheet and sales of assets, or potentially an inability to fulfill lending commitments. The risk that the Bank will be unable to do so is inherent in all banking operations and can be affected by a range of institution-specific and market-wide events including, but not limited to, credit events, merger and acquisition activities, systemic shocks and natural disasters, etc.
2) Risk management policies on liquidity risk
The Bank’s liquidity management processes, which are managed by an independent department, include: a) Day-to-day funding, managed by monitoring future cash flows to ensure that requirements can
be met; b) Maintaining a portfolio of highly marketable assets that can easily be liquidated as protection
against any unforeseen interruption to cash flow; c) Monitoring the liquidity ratios against internal and regulatory requirements; and d) Managing the concentration and profile of debt maturities.
Monitoring and reporting take the form of cash flow measurement and projections respectively for the next ten days, one month, two months, etc., to, one year and over one year. The starting point for those projections is an analysis of the contractual maturity of the financial liabilities and the expected collection date of the financial assets. Related information is submitted regularly to the Bank’s Asset and Liability Management Committee and the Board of Directors.
3) Financial assets held for liquidity risk management purposes
To support payment obligation and contingent funding in a stressed market environment, the Bank holds high-quality and highly-liquid interest-earning assets comprising cash and cash equivalent, due from the central bank and other banks, securities purchased under resale agreements and financial assets at FVTPL for which there is an active and liquid market and maintain legal ratio related to liquidity.
349

4) Maturity analysis of non-derivative financial liabilities The table below presents the cash flows payable by the Bank under non-derivative financial liabilities by remaining contractual maturities at the date of the balance sheet.
December 31, 2018 Due in 30 Days Due Between 31 Days and
90 Days
Due Between 91 Days and
180 Days
Due Between 181 Days and
One Year
Due After One Year Total
Due to the central bank and other banks $ 8,751,791 $ 5,532,147 $ 1,382,985 $ 59,800 $ - $ 15,726,723 Securities sold under repurchase agreement 14,704,830 - - - - 14,704,830 Payables 3,972,687 1,254,123 672,467 619,621 668,832 7,187,730 Deposits and remittances 197,090,896 92,644,699 68,393,781 136,525,003 13,993,510 508,647,889 Bank debentures 1,900 - 3,000,000 - 15,000,000 18,001,900 Principal received on structured products 65,452 16,965 71,214 - 12,325,539 12,479,170 Other financial liabilities - - - - 170,780 170,780 Total $ 224,587,556 $ 99,447,934 $ 73,520,447 $ 137,204,424 $ 42,158,661 $ 576,919,022
December 31, 2017 Due in 30 Days
Due Between 31 Days and
90 Days
Due Between 91 Days and
180 Days
Due Between 181 Days and
One Year
Due After One Year Total
Due to the central bank and other banks $ 3,005,470 $ 3,731,384 $ 200,000 $ 23,920 $ - $ 6,960,774 Settlement coverage bonds payable of short sale 50,241 - - - - 50,241 Securities sold under repurchase agreement 12,943,304 - - - - 12,943,304 Payables 3,485,320 1,270,370 604,547 450,368 610,121 6,420,726 Deposits and remittances 193,514,469 85,691,816 64,791,402 105,119,158 23,504,269 472,621,114 Bank debentures 1,900 1,617,762 - 3,500,000 15,100,000 20,219,662 Principal received on structured products 277,530 70,990 193,172 41,586 5,899,235 6,482,513 Other financial liabilities - - - - 174,704 174,704 Total $ 213,278,234 $ 92,382,322 $ 65,789,121 $ 109,135,032 $ 45,288,329 $ 525,873,038
Note: The amounts disclosed in the tables are the contractual undiscounted cash flows, some of
which may not reconcile to the corresponding items in the balance sheet. In the maturity analysis of “deposits and remittance” disclosed in the above table, it is assumed that demand deposits are expected to be drawn down in the earliest period.
5) Maturity analysis of derivative financial liabilities
a) Derivative instruments settled on a net basis are include foreign exchange derivatives (foreign exchange options, non-deliverable forwards) and interest rate derivatives (interest rate swap options, interest rate swaps and other interest rate contracts settled on net cash flow). Maturity analysis of derivative financial liabilities that will be settled on a net basis is as follows:
December 31, 2018 Due in 30 Days
Due Between 31 Days and
90 Days
Due Between 91 Days and
180 Days
Due Between 181 Days and
One Year
Due After One Year Total
Derivative financial liabilities at FVTPL Foreign exchange derivatives $ 382 $ 558 $ 199 $ - $ - $ 1,139Interest rate derivatives 3,675 6,361 8,378 5,375 552,531 576,320
Total $ 4,057 $ 6,919 $ 8,577 $ 5,375 $ 552,531 $ 577,459
December 31, 2017 Due in 30 Days
Due Between 31 Days and
90 Days
Due Between 91 Days and
180 Days
Due Between 181 Days and
One Year
Due After One Year Total
Derivative financial liabilities at FVTPL Foreign exchange derivatives $ 4,098 $ 2,077 $ 425 $ 615 $ - $ 7,215Interest rate derivatives 1,894 7,571 312,944 29,936 405,449 757,794
Total $ 5,992 $ 9,648 $ 313,369 $ 30,551 $ 405,449 $ 765,009
Note: The amounts disclosed in the table are the contractual undiscounted cash flows, some of
which may not reconcile to the corresponding items in the balance sheet.
350

b) Derivative instruments settled on a gross basis are include foreign exchange derivatives (foreign exchange swaps, foreign exchange options), interest rate derivatives (cross currency swaps) and credit derivates (credit default swap). Maturity analysis of derivative financial liabilities that will be settled on a gross basis is as follows:
December 31, 2018 Due in 30 Days Due Between 31 Days and
90 Days
Due Between 91 Days and
180 Days
Due Between 181 Days and
One Year
Due After One Year Total
Derivative financial liabilities at FVTPL Foreign exchange derivatives
Cash outflow $ 66,817,020 $ 66,620,982 $ 43,980,954 $ 14,101,278 $ 1,363,279 $ 192,883,513 Cash inflow 66,388,975 66,181,803 43,707,316 14,043,361 1,386,102 191,707,557
Interest rate derivatives Cash outflow 921,990 - - - 614,660 1,536,650 Cash inflow 903,800 - - - 603,750 1,507,550
Credit derivatives Cash outflow - - - - - - Cash inflow 3,299 20,218 28,563 45,507 292,691 390,278
Subtotal of cash outflow 67,739,010 66,620,982 43,980,954 14,101,278 1,977,939 194,420,163 Subtotal of cash inflow 67,296,074 66,202,021 43,735,879 14,088,868 2,282,543 193,605,385 Net cash flow $ (442,936 ) $ (418,961 ) $ (245,075 ) $ (12,410 ) $ 304,604 $ (814,778 )
December 31, 2017 Due in 30 Days
Due Between 31 Days and
90 Days
Due Between 91 Days and
180 Days
Due Between 181 Days and
One Year
Due After One Year Total
Derivative financial liabilities at FVTPL Foreign exchange derivatives
Cash outflow $ 64,250,569 $ 74,585,209 $ 37,070,197 $ 20,639,148 $ 304,920 $ 196,850,043 Cash inflow 63,978,148 74,429,371 37,137,723 20,870,950 298,480 196,714,672
Interest rate derivatives Cash outflow - - - 1,498,750 - 1,498,750 Cash inflow - - - 1,492,400 - 1,492,400
Credit derivatives Cash outflow - - - - - - Cash inflow 2,232 9,058 11,665 23,331 144,496 190,782
Subtotal of cash outflow 64,250,569 74,585,209 37,070,197 22,137,898 304,920 198,348,793 Subtotal of cash inflow 63,980,380 74,438,429 37,149,388 22,386,681 442,976 198,397,854 Net cash flow $ (270,189 ) $ (146,780 ) $ 79,191 $ 248,783 $ 138,056 $ 49,061
Note: The amounts disclosed in the table are the contractual undiscounted cash flows, some of
which may not reconcile to the corresponding items in the balance sheet.
6) Maturity analysis of off-balance sheet items Maturity analysis of the off-balance sheet items that are requested to pay or realize the guarantee on the basis of their earliest possible contractual maturity is as follows:
December 31, 2018 Due in 30 Days Due Between 31 Days and
90 Days
Due Between 91 Days and
180 Days
Due Between 181 Days and One Year
Due After One Year Total
Developed and irrevocable loan commitments $ 15,866,641 $ - $ - $ - $ - $ 15,866,641 Irrevocable credit card commitments 179,890,598 - - - - 179,890,598 Issued but unused letters of credit 671,317 - - - - 671,317 Other guarantees 13,012,636 5,117,400 20,000 - 450,000 18,600,036 Total $ 209,441,192 $ 5,117,400 $ 20,000 $ - $ 450,000 $ 215,028,592
December 31, 2017 Due in 30 Days
Due Between 31 Days and
90 Days
Due Between 91 Days and
180 Days
Due Between 181 Days and One Year
Due After One Year Total
Developed and irrevocable loan commitments $ 12,171,019 $ - $ - $ - $ - $ 12,171,019 Irrevocable credit card commitments 171,589,511 - - - - 171,589,511 Issued but unused letters of credit 946,129 - - - - 946,129 Other guarantees 9,977,989 5,751,100 102,000 200,000 478,300 16,509,389 Total $ 194,684,648 $ 5,751,100 $ 102,000 $ 200,000 $ 478,300 $ 201,216,048
e. Market risk
1) Definition and scope of market risk Market risk is the risk that unfavorable changes in market prices, such as interest rates, foreign exchange rates, equity prices and commodity prices will affect the Bank’s income or its holdings of on- and off-balance sheet positions. The Bank’s market risk mainly comes from equity investment securities, interest rates and foreign exchange rates. Equity investment securities risk positions include stocks listed on TWSE and TPEx and convertible (exchangeable) bonds; interest rate risk positions include bonds and interest rate derivative instruments, such as fixed and floating interest rate swap; foreign exchange rate risk positions include foreign currencies and related derivative instruments, such as spot exchange, forward exchange, foreign currency swap and option.
351

2) Management policies of market risk
The Bank develops appropriate management process to identify, measure and monitor market risk, and to effectively manage and control credit limits, valuation of profits and losses, sensitivity analysis and stress tests of each financial instrument position. Besides, the Bank takes appropriate management strategy while facing market risk in its daily operating activities and management processes. The Bank separates its exposure to market risk in banking book and trading book, which are managed, monitored and disclosed by the Risk Management Department. A summary report, including suggestion, is submitted regularly to the Risk Management Committee and the Board of Directors.
3) Market risk management process a) Recognition and measurement
The Group’s operation and risk management sections both identify market risk factors of exposure positions, which are used to measure market risks. Market risk factors include interest rates, foreign exchange rates and market price of equity securities, and exposures, gains and losses and sensitivity (PVO1, Delta, Beta) etc. Measurement of investment portfolio is affected by interest rate risk, foreign exchange risk and price of equity securities.
b) Monitoring and reporting The Group’s risk management department regularly reviews market risk management objective, positions and control of gains and losses, sensitivity analysis and pressure test and reports to the board of directors. Therefore, the board of directors could well understand market risk control. The Group has established explicit notification process, the limit and stop-loss regulation for various transactions. Stop-loss order must be taken when the limit is reached, otherwise the trading department’s reasons and plans must be approved by the management, and the department should report to relevant committee regularly.
4) Management process of interest risk
Interest rate risk is the risk of loss or changes in the fair value resulting from interest rate or credit spread fluctuations. It includes interest rates or credit spread related to securities and derivative instruments. The Bank separates the interest rate risk positions between trading book and banking book. Financial instruments and commodity positions held for trading purpose or to hedge against trading book positions are carried in trading book. Positions held for trading purpose are those held with the intention of profiting from actual or forecast spread. Positions not belonging to trading book are carried in banking book. Management of interest rate risk in trading book a) Management process
To limit the loss within acceptable range, the Bank imposes trading limits and stop loss limits on trading room, traders and commodity; it also imposes monthly maximum loss limit on trading positions.
352
b) Valuation methods Securities are marked-to-market, and the risk of interest rate related derivative instruments are measured using DV01 and Vega. Both stop loss limits are controlled on a daily basis.
Management of interest rate risk in banking book Interest rate risk management of banking book is to improve interest risk management, capital efficiency and business operations. a) Strategies
To improve its capacity to adapt to changes, the Bank measures, manages and hedges changes in its profits and losses and economic values of balance sheet items arising from interest rate fluctuations.
b) Management process
Prior to undertaking interest rates related business, the Bank identifies re-pricing and yield curve risks, and measures the possible impact of changes in interest rate on profits and losses. The Bank analyzes and monitors position limits and various risk management objectives in respect of interest rates on a quarterly basis, and the results are submitted regularly to the Asset and Liability Management Committee and the Board of Directors. If the risk management objectives are found to be in excess of designated limits during the monitoring process, the Bank will report to the Asset and Liability Management Committee and propose remedial action to be taken.
c) Valuation methods Interest rate risk measures the re-pricing risk arising from different maturity or re-pricing dates of assets and liabilities carried in the banking book. To stabilize long-term profitability taking into account business growth, the Bank sets up various monitoring indexes, such as the ratio of interest rate sensitivity gap over total assets, for key holding periods. Those indexes are reported to and reviewed by management periodically.
5) Management of foreign exchange risk a) Definition of foreign exchange risk
Foreign exchange risk is the risk of loss or changes in fair value arising from open positions in currency due to exchange rate fluctuations. Foreign exchange transactions include spot exchange, forward exchange, non-deliverable forward and foreign currency option between New Taiwan dollars and a foreign currency or between two foreign currencies.
b) Foreign exchange risk management policies, process and valuation methods To manage foreign exchange risk and limit the loss within acceptable range, the Bank imposes trading limits and stop loss limits on trading room, traders and commodity; it also imposes monthly maximum loss limit on trading positions. Spot exchange, forward exchange, non-deliverable forward and foreign currency option are controlled collectively using Delta; foreign currency option is controlled using Vega. The stop loss limits are controlled on a daily basis.
353

6) Management of equity securities market risk a) Definition of equity market risk
Equity market risk is the risk arising from open positions in equity securities as a result of fluctuations in the market prices of individual securities.
b) Management processes of equity market risk
The Bank sets gross limits on overall positions, by industries, and by groups. For stock listed on TWSE and TPEx and beneficiary certificates, the Bank sets the limit of investment in each stock and stop loss/gain limits on overall and particular positions, which are monitored daily. A stop loss/gain order would be executed once a given stop price has been reached; otherwise, traders should report to the manager of its department, including reasons for not executing stop loss/gain order.
c) Measurement
The Bank manages market risk on the basis of closing prices of equity securities.
7) Valuation techniques of market risk a) Stress tests
Stress tests are performed by the Risk Management Department at least once a year to assess the impact of risk factors that have become extremely volatile on asset portfolios and risk tolerance, and to ensure that the Bank will be able to handle potential losses incurred during extreme, but plausible, events. The Bank applies market risk factors sensitivity analysis to analyze the impact on asset that could arise under extreme scenarios: i. Interest rate: Evaluate impacts on the values of interest-rate-based securities if yield curves
move in parallel manner. ii. Foreign exchange: Evaluate impacts on changes in foreign exchange rates. iii. Equity securities: Evaluate impacts on volatility of changes in stock prices and its related
derivatives. iv. Commodity: Evaluate impacts on volatility of changes in commodity prices and its related
derivatives. The Bank will submit the results of stress tests to the Board of Directors and Risk Management Committee as a reference of the Bank’s ability to counter adverse economic conditions.
b) Sensitivity analysis
i. Interest rate sensitivity Interest rate factor sensitivity (“DV01” or “PVBP”) measured at the balance sheet date is the impact on the discounted future cash flows of bonds and interest-rate-based derivative instruments for 1 basis points (“bps”) parallel shift in all yield curves or credit spread.
354

Assuming all other variables remain constant, where the interest rate increases/decreases by 1 bps, there would be a decrease of $10,472 thousand and an increase of $10,462 thousand in income before income tax for the year ended December 31, 2018. There would be a decrease of $1,811 thousand and an increase of $1,810 thousand in income before income tax for the year ended December 31, 2017. There would be a decrease/increase of $18,572 thousand and $12,268 thousand in other comprehensive income for the years ended December 31, 2018 and 2017, respectively.
ii. Foreign exchange sensitivity Foreign exchange rate factor sensitivity (“FX Delta”) measured at the balance sheet date is the impact on the values of foreign exchange positions for a 1% change in foreign exchange rates. Where the foreign exchange increases/decreases by 1%, assuming all other variables remain constant, there would be an increase/decrease of $169,021 thousand and $374,288 thousand in income before income tax for the year ended December 31, 2018 and 2017, respectively.
iii. Equity securities market risk Equity securities market factor sensitivity measured at the balance sheet date is the impact on the values of open positions in equity securities for a 1% change in stock market prices. Where the securities prices increases/decreases by 1%, assuming all other variables remain constant, there would be an increase/decrease of $6,085 thousand and $60,783 thousand in income before income tax for the year ended December 31, 2018 and 2017 respectively. There would be an increase/decrease of $12,658 thousand and $7,587 thousand in other comprehensive income for the years ended December 31, 2018 and 2017, respectively.
8) Concentration of foreign exchange risk Information on concentration of foreign currency exposures at the balance sheet date is shown in Note 42.
f. Transfer of financial assets In the daily transactions of the Bank, most of the transferred financial assets not eligible for derecognition in full are notes and bonds under repurchase agreement. The cash flows of those financial assets have been transferred to outsiders and the liabilities of repurchasing the transferred financial assets in an agreed amount have been recognized. The Bank is not eligible to conduct, sell, or pledge the transferred financial assets during the effective period. However, the Bank is still exposed to interest rate risks and credit risks. As a result, the transferred financial assets are not derecognized. The following tables show the transferred financial assets not eligible for derecognition in full and related amounts.
Types of Financial Assets
Book Value of Transferred
Financial Assets
Book Value of Related
Financial Liabilities
Fair Value of Transferred
Financial Assets
Fair Value of Related
Financial Liabilities
Net Position of Fair Value
FVTOCI - transactions under repurchase agreements
December 31, 2018 $ 15,447,755 $ 14,665,794 $ 15,447,755 $ 14,665,794 $ 781,961Available-for-sale financial assets -
transactions under repurchase agreements December 31, 2017 $ 13,528,971 $ 12,921,364 $ 13,528,971 $ 12,921,364 $ 607,607
355

g. Disclosures required by the Regulations Governing the Preparation of Financial Reports by Public Banks 1) Asset quality of loans
Nonperforming loans and nonperforming receivables of the Bank
Item
Business
December 31, 2018
Nonperforming Loans (Note a) Loans
Ratio of Nonperforming Loans (Note b)
Allowance for Possible Losses
Coverage Ratio
(Note c) Corporate
Banking Secured 399,735 55,072,485 0.73% 771,445 192.99%Unsecured 26,210 109,101,455 0.02% 1,307,531 4,988.67%
Consumer Banking
Residential mortgage (Note d) 175,415 123,690,577 0.14% 1,950,925 1,112.18%Cash card - - - - - Small-scale credit loan (Note e) 229,975 22,122,691 1.04% 390,942 169.99%
Others (Note f) Secured 78,062 69,335,436 0.11% 744,497 953.73%Unsecured 2,941 5,600,373 0.05% 69,559 2,365.15%
Total 912,338 384,923,017 0.24% 5,234,899 573.79%Item
Business
Nonperforming Receivables
Accounts Receivable
Ratio of Nonperforming
Receivables
Allowance for Possible Losses
Coverage Ratio
Credit card 42,987 14,417,111 0.30% 432,188 1,005.39%Accounts receivable factored without
recourse (Note g) - 2,769,097 - 31,690 -
Item
Business
December 31, 2017
Nonperforming Loans (Note a) Loans
Ratio of Nonperforming Loans (Note b)
Allowance for Possible Losses
Coverage Ratio
(Note c) Corporate
Banking Secured 323,017 49,671,241 0.65% 647,700 200.52%Unsecured 145,293 96,610,855 0.15% 1,284,894 884.35%
Consumer Banking
Residential mortgage (Note d) 209,669 118,290,563 0.18% 1,826,450 871.11%Cash card - - - - - Small-scale credit loan (Note e) 207,115 20,109,172 1.03% 363,383 175.45%
Others (Note f) Secured 132,177 66,382,552 0.20% 710,877 537.82%Unsecured 2,634 4,876,236 0.05% 50,553 1,919.24%
Total 1,019,905 355,940,619 0.29% 4,883,857 478.85%Item
Business
Nonperforming Receivables
Accounts Receivable
Ratio of Nonperforming
Receivables
Allowance for Possible Losses
Coverage Ratio
Credit card 46,132 14,786,253 0.31% 471,468 1,022.00%Accounts receivable factored without
recourse (Note g) - 4,646,743 - 58,061 -
Note a: Nonperforming credit cards receivables represent the amounts of nonperforming
receivables reported to the authorities and disclosed to the public, as required by the Banking Bureau’s letter dated July 6, 2005 (Ref. No. 0944000378).
Note b: Ratio of nonperforming loans: Nonperforming loans ÷ Outstanding loan balance.
Ratio of nonperforming credit cards receivables: Nonperforming credit cards receivables ÷ Outstanding credit cards receivables balance.
Note c: Coverage ratio of allowance for possible losses for loans: Allowance for possible losses
for loans ÷ Nonperforming loans. Coverage ratio of allowance for possible losses for credit cards receivables: Allowance for possible losses for credit cards receivables ÷ Nonperforming credit cards receivables.
356

Note d: Residential mortgage is a loan given to the borrower who provides a house, to be purchased (or already owned) by the borrower or the spouse or the minor children of the borrower, as a mortgage to the Bank and will use the loan for house purchase or refurbishment.
Note e: Small-scale credit loans refer to the loans under the Banking Bureau’s regulation, dated
December 19, 2005 (Ref. No. 09440010950), but excluding small-scale unsecured loans obtained through credit cards and cash cards.
Note f: Other loans of consumer banking refer to secured or unsecured loans, excluding
residential mortgage, cash card, small-scale credit loans and credit card. Note g: As required by the Banking Bureau’s letter dated July 19, 2005 (Ref. No. 0945000494),
factoring without recourse is disclosed as nonperforming receivables in three months upon the factors’ or insurance companies’ rejection of claims.
Nonperforming loans and nonperforming receivables excluded from the information stated above
Item Business
December 31, 2018 December 31, 2017
Nonperforming Loans Excluded
Nonperforming Receivables Excluded
Nonperforming Loans Excluded
Nonperforming Receivables Excluded
Loans not classified as NPL upon debt restructuring and performed as agreed
(Note a) 64,037 184,939 88,969 250,530 Loans upon performance of a
debt discharge program and rehabilitation program (Note b) 791,658 1,005,612 721,064 1,076,306
Total 855,695 1,190,551 810,033 1,326,836 Note a: Supplementary disclosure related to the loans which need not be classified as NPL upon
debt restructuring and performed as agreed, as stipulated in the Banking Bureau’s letter dated April 25, 2006 (Ref. No. 09510001270).
Note b: About the Bank disclosures information and enumerates credit for case of pre-negotiation,
pre-mediation, debt settlement proceedings and liquidation under Statute for Consumer Debt Clearance, as stipulated in the Banking Bureau’s letter dated September 15, 2008 (Ref. No. 09700318940) and dates September 20, 2016 (Ref. No. 10500134790).
357

2) Concentration of credit extensions
Ranking (Note a)
December 31, 2018
Group Entity (Note b) Industry and Code (Note a)
Total Balances of Credit
Extensions (Note c)
Ratio of Credit
Extensions to Net Worth
(%) 1 A Group - 6700 - real estate development $ 9,501,000 21% 2 B Group - 6499 - non-categorized and other financial
services 3,831,176 9%
3 C Group - 6496 - private financing industry 3,725,413 8% 4 D Group - 4841 - retail of motor vehicles 3,027,281 7% 5 E Group - 6700 - real estate development 2,971,350 7% 6 F Group - 4210 - road engineering 2,820,240 6% 7 G Group - 5260 - air transportation assistance 2,815,985 6% 8 H Group - 2411 - smelting and refining of iron and
steel 2,469,000 6%
9 I Group - 2630 - bare Printed Circuit Boards Manufacturing
2,225,583 5%
10 J Group - 2859 - other household appliances manufacturing
2,161,075 5%
Ranking (Note a)
December 31, 2017
Group Entity (Note b) Industry and Code (Note a)
Total Balances of Credit
Extensions (Note c)
Ratio of Credit
Extensions to Net Worth
(%) 1 B Group - 6499 - non-categorized and other financial
services $ 4,194,556 10%
2 J Group - 2859 - other household appliances manufacturing
3,614,918 8%
3 C Group - 6496 - private financing industry 3,119,667 7% 4 K Group - 3010 - manufacture of motor vehicles 2,743,460 6% 5 L Group - 6499 - non-categorized and other financial
services 2,655,873 6%
6 M Group - 0850 - manufacture of dairy products 2,566,960 6% 7 I Group - 2630 - printed circuit board manufacturing 2,359,822 6% 8 F Group - 4210 - ocean freight transportation
forwarding services 2,333,686 5%
9 H Group - 2411 - smelting and refining of iron and steel
2,332,835 5%
10 N Group - 6499 - non-categorized and other financial services
2,279,666 5%
358

Note a: The rankings above represent the top 10 corporate entities except for government or state-owned enterprises, based on the total balance of credit extension granted by the Bank. The amount of credit extensions should be disclosed in aggregate for each group entity, the code and industry of which are also required. The industry of the group entities is designated as the industry of the individual group entity with the greatest risk exposure. The lines of industry should conform to the industry sub-categorization of the Standard Industrial Classification System of the Republic of China published by the Directorate-General of Budget, Accounting and Statistics under the Executive Yuan.
Note b: “Group Entity” is defined in Article 6 of “Supplementary Provisions to the Taiwan Stock
Exchange Corporation Rules for Review of Securities Listings.” Note c: Credit extension balance includes various loans (import and export negotiations, discounts,
overdrafts, unsecured and secured short-term loans, margin loans receivable, unsecured and secured medium-term loans, unsecured and secured long-term loans; and nonaccrual loans), bills purchased, factored accounts receivable without recourse, acceptances and guarantees.
3) Interest rate sensitivity
Table 1: For New Taiwan dollar items
Interest Rate Sensitivity Analysis December 31, 2018
Items 1 to 90 Days 91 to 180 Days 181 Days to One Year
Over One Year Total
Interest rate-sensitive assets $ 290,024,783 $ 146,052,263 $ 5,650,758 $ 30,665,306 $ 472,393,110Interest rate-sensitive liabilities 152,122,187 152,884,130 102,738,671 18,929,935 426,674,923Interest rate sensitivity gap 137,902,596 (6,831,867 ) (97,087,913 ) 11,735,371 45,718,187Net worth 44,744,740Ratio of interest rate-sensitive assets to liabilities 110.71%Ratio of interest rate-sensitivity gap to net worth 102.18%
Interest Rate Sensitivity Analysis
December 31, 2017
Items 1 to 90 Days 91 to 180 Days 181 Days to One Year
Over One Year Total
Interest rate-sensitive assets $ 268,141,068 $ 143,810,222 $ 6,514,486 $ 24,444,616 $ 442,910,392Interest rate-sensitive liabilities 139,781,032 157,548,328 82,244,155 19,628,693 399,202,208Interest rate sensitivity gap 128,360,036 (13,738,106 ) (75,729,669 ) 4,815,923 43,708,184Net worth 42,786,672Ratio of interest rate-sensitive assets to liabilities 110.95%Ratio of interest rate-sensitivity gap to net worth 102.15% Note a: The New Taiwan dollar amounts held by the Bank. Note b: Interest rate-sensitive assets and liabilities refer to interest-earning assets and
interest-bearing liabilities that were affected by interest rate changes. Note c: Interest rate sensitivity gap = Interest rate-sensitive assets - Interest rate-sensitive
liabilities. Note d: Ratio of interest rate-sensitive assets to liabilities = Interest rate-sensitive assets ÷ Interest
rate-sensitive liabilities.
359

Table 2: For U.S. dollar items
Interest Rate Sensitivity Analysis December 31, 2018
(In Thousands of U.S. Dollars)
Items 1 to 90 Days 91 to 180 Days 181 Days to One Year
Over One Year Total
Interest rate-sensitive assets $ 2,920,039 $ 202,692 $ 35,945 $ 99,853 $ 3,258,529Interest rate-sensitive liabilities 2,483,940 1,112,830 159,579 - 3,756,349Interest rate sensitivity gap 436,099 (910,138 ) (123,634 ) 99,853 (497,820 )Net worth 1,455,918Ratio of interest rate-sensitive assets to liabilities 86.75%Ratio of interest rate-sensitivity gap to net worth (34.19%)
Interest Rate Sensitivity Analysis December 31, 2017
(In Thousands of U.S. Dollars)
Items 1 to 90 Days 91 to 180 Days 181 Days to One Year
Over One Year Total
Interest rate-sensitive assets $ 2,188,090 $ 289,348 $ 6,968 $ 480 $ 2,484,886Interest rate-sensitive liabilities 1,996,952 1,022,244 132,994 - 3,152,190Interest rate sensitivity gap 191,138 (732,896 ) (126,026 ) 480 (667,304 )Net worth 1,433,485Ratio of interest rate-sensitive assets to liabilities 78.83%Ratio of interest rate-sensitivity gap to net worth (46.55%) Note a: The total U.S. dollar amounts held by the Bank, excluding contingent assets and liabilities. Note b: Interest rate-sensitive assets and liabilities refer to interest-earning assets and
interest-bearing liabilities that were affected by interest rate changes. Note c: Interest rate sensitivity gap = Interest rate-sensitive assets - Interest rate-sensitive
liabilities. Note d: Ratio of interest rate-sensitive assets to liabilities = Interest rate-sensitive assets ÷ Interest
rate-sensitive liabilities. 4) Profitability
Items For the Year Ended December 31, 2018
For the Year Ended December 31, 2017
Return on total assets Before tax 0.67% 0.58% After tax 0.59% 0.50%
Return on equity Before tax 9.25% 7.84% After tax 8.05% 6.82%
Net income ratio 32.22% 28.04% Note a: Return on total assets = Income before (after) income tax ÷ Average total assets. Note b: Return on equity = Income before (after) income tax ÷ Average equity. Note c: Net income ratio = Income after income tax ÷ Total net profit.
360
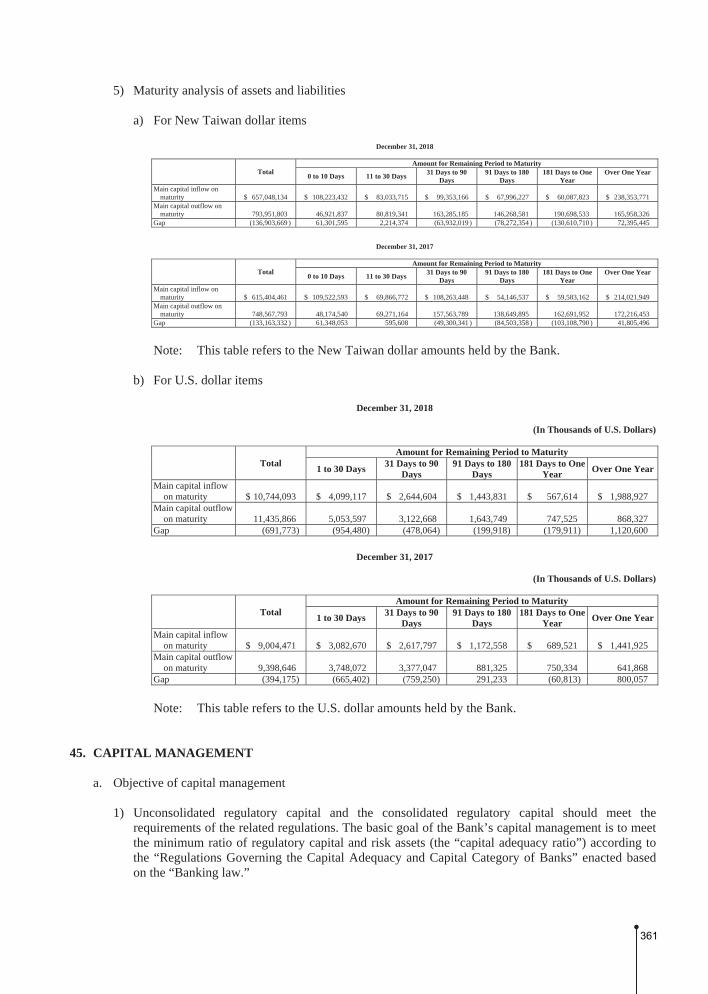
5) Maturity analysis of assets and liabilities
a) For New Taiwan dollar items
December 31, 2018
Total Amount for Remaining Period to Maturity
0 to 10 Days 11 to 30 Days 31 Days to 90 Days
91 Days to 180 Days
181 Days to One Year
Over One Year
Main capital inflow on maturity $ 657,048,134 $ 108,223,432 $ 83,033,715 $ 99,353,166 $ 67,996,227 $ 60,087,823 $ 238,353,771
Main capital outflow on maturity 793,951,803 46,921,837 80,819,341 163,285,185 146,268,581 190,698,533 165,958,326
Gap (136,903,669 ) 61,301,595 2,214,374 (63,932,019 ) (78,272,354 ) (130,610,710 ) 72,395,445
December 31, 2017
Total Amount for Remaining Period to Maturity
0 to 10 Days 11 to 30 Days 31 Days to 90 Days
91 Days to 180 Days
181 Days to One Year
Over One Year
Main capital inflow on maturity $ 615,404,461 $ 109,522,593 $ 69,866,772 $ 108,263,448 $ 54,146,537 $ 59,583,162 $ 214,021,949
Main capital outflow on maturity 748,567,793 48,174,540 69,271,164 157,563,789 138,649,895 162,691,952 172,216,453
Gap (133,163,332 ) 61,348,053 595,608 (49,300,341 ) (84,503,358 ) (103,108,790 ) 41,805,496
Note: This table refers to the New Taiwan dollar amounts held by the Bank.
b) For U.S. dollar items
December 31, 2018
(In Thousands of U.S. Dollars)
Total Amount for Remaining Period to Maturity
1 to 30 Days 31 Days to 90 Days
91 Days to 180 Days
181 Days to One Year Over One Year
Main capital inflow on maturity $ 10,744,093 $ 4,099,117 $ 2,644,604 $ 1,443,831 $ 567,614 $ 1,988,927
Main capital outflow on maturity 11,435,866 5,053,597 3,122,668 1,643,749 747,525 868,327
Gap (691,773 ) (954,480 ) (478,064 ) (199,918 ) (179,911 ) 1,120,600
December 31, 2017
(In Thousands of U.S. Dollars)
Total Amount for Remaining Period to Maturity
1 to 30 Days 31 Days to 90 Days
91 Days to 180 Days
181 Days to One Year Over One Year
Main capital inflow on maturity $ 9,004,471 $ 3,082,670 $ 2,617,797 $ 1,172,558 $ 689,521 $ 1,441,925
Main capital outflow on maturity 9,398,646 3,748,072 3,377,047 881,325 750,334 641,868
Gap (394,175 ) (665,402 ) (759,250 ) 291,233 (60,813 ) 800,057 Note: This table refers to the U.S. dollar amounts held by the Bank.
45. CAPITAL MANAGEMENT
a. Objective of capital management
1) Unconsolidated regulatory capital and the consolidated regulatory capital should meet the requirements of the related regulations. The basic goal of the Bank’s capital management is to meet the minimum ratio of regulatory capital and risk assets (the “capital adequacy ratio”) according to the “Regulations Governing the Capital Adequacy and Capital Category of Banks” enacted based on the “Banking law.”
361

2) In order to maintain an adequate level of capital to bear various risks, the Bank makes capital planning based on the operating plans and budget, the development strategies, dividend policy and stress tests and forecasts of capital adequacy which are approved by the board of directors. The objective is to optimize assets allocation and strengthen capital structure.
b. Procedure of capital management
1) The calculation of the Bank’s capital adequacy ratio is based on the “Regulations Governing the
Capital Adequacy and Capital Category of Banks” enacted by the Financial Supervisory Commission and the related information is reported to the competent authority on a regular basis.
2) In order to monitor capital adequacy ratio, the execution and changes in the parameters of the
capital planning are reviewed quarterly by the Bank’s Assets and Liabilities Management Committee. The committee assesses whether the Bank’s capital is able to respond to various risks and whether the objective of capital management is met.
The calculations of regulatory capital, risk-weighted assets and capital adequacy ratio were as follows:
December 31, 2018
Unconsolidated Consolidated
Regulatory capital
Common equity $ 41,848,384 $ 42,076,829Additional Tier capital 2,193,441 2,448,097Tier II capital 9,014,910 9,544,444Total common capital 53,056,735 54,069,370
Risk-weighted assets
Credit risk Standardized approach 367,484,931 369,490,534Internal rating-based approach - -Asset securitization 215,318 215,318
Operational risk
Basic indicator approach 19,200,700 19,686,600Standardized approach/alternative
standardized approach - -
Advanced measurement approach - -
Market risk Standardized approach 11,098,400 11,098,400Internal models approach - -
Total risk-weighted assets 397,999,349 400,490,852Capital adequacy ratio 13.33% 13.50%Ratio of common equity to risk-weighted assets 10.51% 10.51%Ratio of Tier I capital to risk-weighted assets 11.07% 11.12%Leverage ratio 6.14% 6.19%
362

December 31, 2017
Unconsolidated Consolidated
Regulatory capital
Common equity $ 39,236,233 $ 39,698,325Additional Tier capital - -Tier II capital 11,680,665 12,185,406Total common capital 50,916,898 51,883,731
Risk-weighted assets
Credit risk Standardized approach 320,791,287 322,187,276Internal rating-based approach - -Asset securitization - -
Operational risk
Basic indicator approach 19,112,088 19,646,350Standardized approach/alternative
standardized approach - -
Advanced measurement approach - -
Market risk Standardized approach 14,948,088 14,948,088Internal models approach - -
Total risk-weighted assets 354,851,463 356,781,714Capital adequacy ratio 14.35% 14.54%Ratio of common equity to risk-weighted assets 11.06% 11.13%Ratio of Tier I capital to risk-weighted assets 11.06% 11.13%Leverage ratio 6.06% 6.12% Note a: Regulatory capital, risk-weighted assets and exposure measurement are calculated under the
“Regulations Governing the Capital Adequacy and capital category of Banks” and the “The Methods for Calculating the Bank’s regulatory Capital and Risk-weighted Assets ” amended by the FSC on November 16, 2017.
Note b: An annual report should include both the current year’s and prior year’s capital adequacy ratio,
but a semiannual report should include the capital adequacy ratio of the most recent year. Note c: Formulas used were as follows:
1) Regulatory capital = Common equity + Additional Tier I capital + Tier II capital. 2) Total risk-weighted assets = Risk-weighted assets for credit risk + (Capital requirements for
operational risk and market risk) × 12.5. 3) Capital adequacy ratio = Regulatory capital/Total risk-weighted assets. 4) Ratio of Common equity to risk-weighted assets = Common equity/Total risk-weighted assets. 5) Ratio of Tier I capital to risk-weighted assets = (Common equity + Additional Tier I
capital)/Total risk-weighted assets. 6) Leverage ratio = Net Tier I capital/Exposure measurement.
46. SEGMENT INFORMATION According to the Article 23 of “Regulations Governing the Preparation of Financial Reports by Public Banks”, the Bank does not prepare the segment information of IFRS 8.
363

47. ADDITIONAL DISCLOSURES
a. Information about significant transactions: 1) Marketable securities acquired and disposed of at cost or prices at least NT$300 million or 10% of
the paid-in capital: Nil 2) Acquisition of individual real estate at cost of at least NT$300 million or 10% of the paid-in capital:
Nil 3) Disposal of individual real estate at prices of at least NT$300 million or 10% of the paid-in capital:
Table 1 (attached) 4) Service charge discounts on transactions with related parties in aggregated amount of at least NT$5
million: Nil 5) Receivables from related parties amounting to at least NT$300 million or 10% of the paid-in
capital: Nil 6) Sale of nonperforming loans: Nil 7) The type and related information of any securitization product that has been approved in accordance
with the Financial Asset Securitization Act or the Real Estate Securitization Act: Nil 8) Intercompany relationships and significant intercompany transactions: Nil 9) Other significant transactions which may have effects on decision making of financial statement
users: Nil
b. Information of subsidiaries’ financings provided, endorsement/guarantee provided, marketable securities held, marketable securities acquired and disposed of at cost or prices at least NT$300 million or 10% of the paid-in capital and derivative transactions: Table 2 and Table 3 (attached)
c. Related information of investees on which the Bank exercises significant influence: Table 4 (attached)
d. Information about branches and investments in mainland China: Table 5 (attached)
364

TA
BL
E 1
FAR
EA
STE
RN
INT
ER
NA
TIO
NA
L B
AN
K L
TD
.
DIS
POSA
L O
F IN
DIV
IDU
AL
RE
AL
EST
AT
E A
T P
RIC
ES
OF
AT
LE
AST
NT
$300
MIL
LIO
N O
R 2
0% O
F T
HE
PA
ID-I
N C
API
TA
L
FOR
TH
E Y
EA
R E
ND
ED
DE
CE
MB
ER
31,
201
8 (I
n T
hous
ands
of N
ew T
aiw
an D
olla
rs)
Com
pany
Nam
e T
ype
of A
sset
T
rans
actio
nD
ate
Acq
uisi
tion
Dat
eB
ook
Val
ue
Tra
nsac
tion
Am
ount
Rec
eipt
Sta
tus
Dis
posi
tion
of
Ben
efits
Cou
nter
-par
tyN
atur
e of
R
elat
ions
hip
Purp
ose
Ref
eren
ce o
f the
Pr
ice
Oth
erA
ppoi
ntm
ents
F
ar E
aste
rn I
nter
nati
onal
B
ank
Ltd
. H
sinc
hu J
ingg
uo b
uild
ing
and
land
20
18/9
/27
2010
/4/3
$
196,
255
$
385,
166
R
ecei
pt in
ful
l
$
174,
755
(Not
e)
A c
ompa
ny
Nil
A
ctiv
ated
ass
ets
Val
uati
on r
epor
tN
/A
Not
e:
Has
ded
ucte
d tr
ansa
ctio
n co
sts
of $
14,1
56 th
ousa
nd.
365

TA
BL
E 2
FAR
EA
STE
RN
INT
ER
NA
TIO
NA
L B
AN
K L
TD
.
SUB
SID
IAR
IES’
FIN
AN
CIN
G P
RO
VID
ED
TO
OT
HE
RS
FOR
TH
E Y
EA
R E
ND
ED
DE
CE
MB
ER
31,
201
8 (I
n T
hous
ands
of N
ew T
aiw
an D
olla
rs, I
n T
hous
and
Shar
es)
No.
(Not
e 1)
L
ende
r B
orro
wer
Fi
nanc
ial S
tate
men
t A
ccou
ntR
elat
edPa
rtie
s
Hig
hest
Bal
ance
for
the
Peri
od
End
ing
Bal
ance
Act
ual
Bor
row
ing
Am
ount
In
tere
st R
ate
Nat
ure
of
Fina
ncin
g(N
ote
2)
Bus
ines
sT
rans
actio
nA
mou
nt
Rea
sons
for
Shor
t-te
rmFi
nanc
ing
Allo
wan
ce fo
r Im
pair
men
tL
oss
Col
late
ral
Fina
ncin
g L
imit
for
Eac
h B
orro
wer
(N
ote
3)
Agg
rega
teFi
nanc
ing
Lim
it (N
ote
3)
Item
V
alue
1 F
EIB
Fin
anci
al L
easi
ng C
o., L
td.
A c
ompa
ny
Ent
rust
ed lo
an r
ecei
vabl
es
No
$
13
4,19
0
$
134,
190
$
99
,748
6%
-10%
a
$
4,
026
-
$
997
Rea
l est
ate
$
30
1,45
5
$
306,
040
$
30
6,04
0
B
com
pany
E
ntru
sted
loan
rec
eiva
bles
N
o
26
,838
26
,838
26
,838
6%
-10%
a
805
-
26
8 R
eal e
stat
e
51
,257
30
6,04
0
30
6,04
0
C
com
pany
E
ntru
sted
loan
rec
eiva
bles
N
o
26
,838
26
,838
26
,838
6%
-10%
a
805
-
26
8 S
tock
37
9,52
6
30
6,04
0
30
6,04
0
D
com
pany
E
ntru
sted
loan
rec
eiva
bles
N
o
22
,365
22
,365
22
,365
6%
-10%
a
926
-
22
4 R
eal e
stat
e
33
,748
30
6,04
0
30
6,04
0
Not
e 1:
N
o. c
olum
n is
cod
ed a
s fo
llow
s:
a.
The
Iss
uer
is c
oded
“0”
. b.
T
he in
vest
ees
are
code
d co
nsec
utiv
ely
begi
nnin
g fr
om “
1” in
the
orde
r pr
esen
ted
in th
e ta
ble
abov
e.
Not
e 2:
T
he n
atur
e of
fin
anci
ng is
des
crib
ed a
s fo
llow
s:
a.
Bus
ines
s tr
ansa
ctio
n is
cod
ed “
1”.
b.
Sho
rt-t
erm
fin
anci
ng is
cod
ed “
2”.
Not
e 3:
T
he li
mit
s on
fin
anci
ng a
re a
s fo
llow
s:
a.
Fin
anci
ng li
mit
for
eac
h bo
rrow
er
1)
In th
e ca
se o
f le
ndin
g fu
nds
to c
ompa
nies
or
firm
s w
ho h
ave
a bu
sine
ss r
elat
ions
hip
wit
h th
e le
nder
, the
tota
l len
ding
am
ount
to a
n in
divi
dual
bor
row
er s
hall
not
exc
eed
two
tim
es o
f th
e ne
t val
ue o
f th
e le
nder
as
show
n in
the
late
st f
inan
cial
rep
ort a
udit
ed o
r re
view
ed b
y a
CP
A.
2)
In th
e ca
se o
f le
ndin
g fu
nds
to th
e co
mpa
nies
or
firm
s in
nee
d of
sho
rt-t
erm
fin
anci
ng, t
he to
tal l
endi
ng a
mou
nt to
an
indi
vidu
al b
orro
wer
sha
ll n
ot e
xcee
d 40
% o
f th
e ne
t val
ue o
f th
e le
nder
as
show
n in
the
late
st f
inan
cial
rep
ort a
udit
ed o
r re
view
ed b
y a
CPA
.
b.
Agg
rega
te f
inan
cing
lim
it
1)
In th
e ca
se o
f le
ndin
g fu
nds
to c
ompa
nies
or
firm
s w
ho h
ave
a bu
sine
ss r
elat
ions
hip
wit
h th
e le
nder
, the
tota
l acc
umul
atio
n le
ndin
g am
ount
to a
n in
divi
dual
bor
row
er s
hall
not
exc
eed
two
tim
es o
f th
e ne
t val
ue o
f th
e le
nder
as
show
n in
the
late
st f
inan
cial
rep
ort a
udit
ed o
r re
view
ed b
y a
CP
A.
2)
In th
e ca
se o
f le
ndin
g fu
nds
to th
e co
mpa
nies
or
firm
s in
nee
d of
sho
rt-t
erm
fin
anci
ng, t
he to
tal a
ccum
ulat
ion
lend
ing
amou
nt to
an
indi
vidu
al b
orro
wer
sha
ll n
ot e
xcee
d 40
% o
f th
e ne
t val
ue o
f th
e le
nder
as
show
n in
the
late
st f
inan
cial
rep
ort a
udit
ed o
r re
view
ed b
y a
CP
A.
366

TA
BL
E 3
FAR
EA
STE
RN
INT
ER
NA
TIO
NA
L B
AN
K L
TD
.
INFO
RM
AT
ION
OF
SUB
SID
IAR
IES’
GU
AR
AN
TE
E P
RO
VID
ED
AT
CO
ST O
R P
RIC
ES
AT
LE
AST
NT
$300
MIL
LIO
N O
R 1
0% O
F T
HE
PA
ID-I
N C
API
TA
L A
ND
DE
RIV
AT
IVE
TR
AN
SAC
TIO
NS
FOR
TH
E Y
EA
R E
ND
ED
DE
CE
MB
ER
31,
201
8
(In
Tho
usan
ds o
f New
Tai
wan
Dol
lars
, In
Tho
usan
d Sh
ares
)
No.
(Not
e 1)
C
ompa
ny P
rovi
ding
E
ndor
sem
ents
/Gua
rant
ees
Rec
eivi
ng P
arty
L
imits
on
End
orse
men
ts/
Gua
rant
ees
Am
ount
Pr
ovid
ed to
E
ach
Ent
ity
(Not
e 3)
Max
imum
Bal
ance
for
the
Peri
odE
ndin
g B
alan
ceD
raw
dow
n A
mou
nts
Am
ount
of
End
orse
men
ts/
Gua
rant
ees
Col
late
raliz
edby
Pro
pert
y
Rat
io o
f A
ccum
ulat
edE
ndor
sem
ents
/G
uara
ntee
s to
Net
Wor
th o
f the
M
ost C
urre
nt
Fina
ncia
lSt
atem
ent (
%)
Max
imum
End
orse
men
ts/
Gua
rant
ees
Am
ount
A
llow
able
(N
ote
3)
Gua
rant
eePr
ovid
ed b
y Pa
rent
C
ompa
ny
Gua
rant
eePr
ovid
ed b
y A
Sub
sidi
ary
Gua
rant
eePr
ovid
ed to
Subs
idia
ries
in M
ainl
and
Chi
na
Not
eN
ame
Nat
ure
of
Rel
atio
nshi
p(N
ote
2)
1
Far
Eas
tern
Ass
et M
anag
emen
t Co.
, Ltd
. F
EIB
Fin
anci
al L
easi
ng C
o., L
td.
b
$ 3
,073
,300
$
71,5
68
$
71
,568
$
-
$
- 10
.46
$
6,8
39,2
31
N
N
Y
Not
e 1:
N
o. c
olum
n is
cod
ed a
s fo
llow
s:
a.
The
Iss
uer
is c
oded
“0”
. b.
T
he in
vest
ees
are
code
d co
nsec
utiv
ely
begi
nnin
g fr
om “
1” in
the
orde
r pr
esen
ted
in th
e ta
ble
abov
e.
Not
e 2:
N
o. c
olum
n is
cod
ed a
s fo
llow
s:
a.
A c
ompa
ny w
ith
whi
ch it
doe
s bu
sine
ss.
b.
A c
ompa
ny in
whi
ch th
e pu
blic
com
pany
dir
ectl
y an
d in
dire
ctly
hol
ds m
ore
than
50
perc
ent o
f th
e vo
ting
sha
res.
c.
A
com
pany
that
dir
ectl
y an
d in
dire
ctly
hol
ds m
ore
than
50
perc
ent o
f th
e vo
ting
sha
res
in th
e pu
blic
com
pany
. d.
C
ompa
nies
hol
d, d
irec
tly
or in
dire
ctly
, 90%
or
mor
e of
the
voti
ng s
hare
s fo
r ea
ch o
ther
. e.
W
here
a c
ompa
ny f
ulfi
lls
its
cont
ract
ual o
blig
atio
ns b
y pr
ovid
ing
mut
ual e
ndor
sem
ents
/gua
rant
ees
for
anot
her
com
pany
in th
e sa
me
indu
stry
or
for
join
t bui
lder
s fo
r pu
rpos
es o
f un
dert
akin
g a
cons
truc
tion
pro
ject
. f.
W
here
all
cap
ital
con
trib
utin
g sh
areh
olde
rs m
ake
endo
rsem
ents
/gua
rant
ees
for
thei
r jo
intl
y in
vest
ed c
ompa
ny in
pro
port
ion
to th
eir
shar
ehol
ding
per
cent
ages
. g.
W
here
com
pani
es in
the
sam
e in
dust
ry p
rovi
de a
mon
g th
emse
lves
join
t and
sev
eral
sec
urit
y fo
r a
perf
orm
ance
gua
rant
ee o
f a
sale
s co
ntra
ct f
or p
re-c
onst
ruct
ion
hom
es p
ursu
ant t
o th
e C
onsu
mer
Pro
tect
ion
Act
for
eac
h ot
her.
Not
e 3:
A
ccor
ding
to th
e F
EA
MC
’s “
Reg
ulat
ions
of
End
orse
men
ts/G
uara
ntee
s”, t
he li
mit
of a
mou
nt o
f it
s en
dors
emen
ts/g
uara
ntee
s fo
r an
y si
ngle
sub
sidi
arie
s is
10
tim
es o
f th
e to
tal a
mou
nt in
vest
ed in
this
sub
sidi
arie
s,
and
the
amou
nt o
f en
dors
emen
ts/g
uara
ntee
s m
ay n
ot e
xcee
d 10
% o
f th
e ne
t wor
th o
f th
e co
mpa
ny.
367

TA
BL
E 4
FAR
EA
STE
RN
INT
ER
NA
TIO
NA
L B
AN
K L
TD
.
RE
LA
TE
D IN
FOR
MA
TIO
N O
F IN
VE
STE
ES
FOR
TH
E Y
EA
R E
ND
ED
DE
CE
MB
ER
31,
201
8
(In
Tho
usan
ds o
f New
Tai
wan
Dol
lars
)
Inve
stee
Com
pany
L
ocat
ion
Mai
n B
usin
ess a
nd P
rodu
ct
Perc
enta
geof
Ow
ners
hip
(%)
Car
ryin
g A
mou
nt
Inve
stm
ent
Inco
me
(Los
s)R
ecog
nize
d
The
Pro
port
iona
te S
hare
of t
he B
ank,
Its S
ubsi
diar
ies
and
The
ir A
ffili
ates
in In
vest
ees
Not
ePr
esen
t Sh
ares
(In
Tho
usan
ds)
Pro
Form
a Sh
ares
Tot
al
Shar
es (I
n T
hous
ands
)
Perc
enta
geof
Ow
ners
hip
(%)
H
eld
by th
e B
ank
F
inan
cial
bus
ines
s
D
euts
che
Far
Eas
tern
Ass
et M
anag
emen
t Co.
, Ltd
. 7
F, N
o. 2
07 D
un H
wa
Sou
th R
oad,
Sec
. 2, T
aipe
i, T
aiw
an
Sec
urit
ies
inve
stm
ent t
rust
fun
ds
40.0
0 $
10
8,84
5 $
(1
8,59
5)
12
,000
-
12,0
0040
.00
D
ah C
hung
Bil
ls F
inan
ce C
orp.
4F
, 4F
-1, 4
F-2
, 4F
-3, N
p. 8
8 D
un H
wa
Nor
th R
oad,
Tai
pei,
Tai
wan
U
nder
wri
ting
, dea
ling
and
bro
keri
ng o
f sh
ort-
term
bil
ls
22.0
6
1,66
7,50
5
111,
062
99
,440
-
99,4
4022
.07
F
ar E
aste
rn A
sset
Man
agem
ent C
o., L
td.
R
oom
B, 1
7F, N
o. 2
07, D
un H
wa
Sou
th R
oad,
Sec
. 2, T
aipe
i, T
aiw
anP
urch
ase,
eva
luat
ion,
auc
tion
and
man
agem
ent o
f cr
edit
or’s
ri
ghts
to f
inan
cial
inst
itut
ions
10
0.00
683,
922
24
,926
68,4
00
-
68
,400
100.
00
Far
Eas
tern
Int
erna
tion
al S
ecur
itie
s C
o., L
td.
51F
, No.
7, X
inyi
Roa
d, S
ec. 5
, Tai
pei,
Tai
wan
Fo
reig
n se
curi
ties
bro
ker,
wea
lth
man
agem
ent a
nd o
ffsh
ore
fund
con
sult
ing
100.
00
33
4,70
5
43,1
96
20
,000
-
20,0
0010
0.00
Tai
pei F
orei
gn E
xcha
nge
Age
ncy
Co.
, Ltd
. 8F
., N
o. 4
00, B
ade
Roa
d, S
ec. 2
, Tai
pei,
Tai
wan
F
orei
gn e
xcha
nge,
cro
ss-c
urre
ncy
swap
s, e
tc.
0.
40
3,
802
-
80
-
800.
40
Sun
shin
e A
sset
Man
agem
ent C
o., L
td.
15F
., N
o. 2
18, D
un H
wa
Sou
th R
oad,
Sec
. 2, T
aipe
i, T
aiw
an
Man
agem
ent o
f cr
edit
or’s
rig
hts
and
rend
erin
g of
co
mm
erci
al d
etec
tive
ser
vice
s 3.
46
2,
616
-
20
7
-
207
3.46
Fin
anci
al I
nfor
mat
ion
Ser
vice
Co.
, Ltd
. N
o. 8
1, K
angn
ing
Roa
d, S
ec. 3
, Tai
pei,
Tai
wan
D
ata
proc
essi
ng s
ervi
ce a
nd e
lect
roni
c in
form
atio
n su
pply
1.
14
29
9,67
8
-
5,93
8
-
5,93
81.
14
Yua
n H
sin
Dig
ital
Pay
men
t Co.
, Ltd
. R
oom
A, 5
F., N
o. 1
, Yua
ndon
g R
oad,
Ban
qiao
Dis
t., N
ew T
aipe
i C
ity,
Tai
wan
Is
suin
g el
ectr
onic
tick
ets
and
sign
ing
cont
ract
ed in
stit
utio
ns4.
99
24
,809
-
5,
094
-
5,
094
4.99
Non
fina
ncia
l bus
ines
s
A
n F
eng
Ent
erpr
ise
Co.
, Ltd
. 3F
., N
o. 1
39, J
heng
jhou
Roa
d, T
aipe
i, T
aiw
an
AT
M m
aint
enan
ce, r
epla
cem
ent a
nd r
epai
r 10
.00
4,
425
-
30
0
-
300
10.0
0
H
eld
by F
ar E
aste
rn A
sset
Man
agem
ent C
o., L
td.
F
inan
cial
bus
ines
s
F
EIB
Fin
anci
al L
easi
ng C
o., L
td.
Roo
m 2
806,
Tow
er 1
, Gra
nd G
atew
ay 6
6, N
o.1
Hon
g Q
iao
Roa
d,
Xuh
ui D
istr
ict,
Sha
ngha
i, C
hina
L
easi
ng o
pera
tion
10
0.00
306,
040
12
,598
N/A
-
N/A
100.
00
368

TA
BL
E 5
FAR
EA
STE
RN
INT
ER
NA
TIO
NA
L B
AN
K L
TD
.
INV
EST
ME
NT
IN M
AIN
LA
ND
CH
INA
FO
R T
HE
YE
AR
EN
DE
D D
EC
EM
BE
R 3
1, 2
018
(In
Tho
usan
ds o
f New
Tai
wan
Dol
lars
, Unl
ess S
tate
d O
ther
wis
e)
Inve
stee
Com
pany
N
ame
Mai
n B
usin
ess
and
Prod
uct
Tot
al P
aid-
in
Cap
ital
(Not
e 4)
Inve
stm
ent
Typ
e(N
ote
1)
Acc
umul
ated
O
utflo
w o
f In
vest
men
t as
of
Dec
embe
r 31
, 20
17
Inve
stm
ent F
low
(Not
e 4)
A
ccum
ulat
ed
Out
flow
of
Inve
stm
ent
as o
f D
ecem
ber
31,
2018
(Not
e 4)
Net
Inco
me
(Los
s) o
f In
vest
ee(N
ote
5)
% O
wne
rshi
p of
Dir
ect o
r In
dire
ctIn
vest
men
t
Inve
stm
ent
Gai
n (L
oss)
(N
otes
2 a
nd 5
)
Car
ryin
g V
alue
as
of
Dec
embe
r 31
, 20
18
(Not
e 2)
Acc
umul
ated
In
war
dR
emitt
ance
of
Ear
ning
s as o
f D
ecem
ber
31,
2018
Not
eO
utflo
w
Inflo
w
F
EIB
Fin
anci
al
Lea
sing
Co.
, Ltd
. L
easi
ng o
pera
tion
$
30
5,11
0 (
US
$ 10
,000
thou
sand
)
a $
30
5,11
0 (
US
$ 10
,000
thou
sand
)
$
- $
-
$
305,
110
(U
S$
10,0
00
thou
sand
)
$
12,5
98 (
CN
Y
2,82
5
thou
sand
)
100%
$
12
,598
(
CN
Y
2,82
5
thou
sand
)
$
306,
040
$
-
Acc
umul
ated
Inve
stm
ent i
n M
ainl
and
Chi
na a
s of D
ecem
ber
31, 2
018
(Not
e 4)
In
vest
men
t Am
ount
Aut
hori
zed
by
Inve
stm
ent C
omm
issi
on, M
OE
A (N
ote
4)
Lim
it on
Inve
stm
ent A
utho
rize
d by
In
vest
men
t Com
mis
sion
MO
EA
(N
ote
3)
$3
05,1
10
(US
$10,
000
thou
sand
) $3
05,1
10
(US
$10,
000
thou
sand
) $4
10,3
54
Not
e 1:
R
oute
s of
inve
stm
ent i
n M
ainl
and
Chi
na a
re li
sted
bel
ow:
a.
Dir
ect i
nves
tmen
t. b.
In
vest
men
t via
thir
d pl
ace
com
pany
(st
ate
thir
d pl
ace
inve
stm
ent c
ompa
ny).
c.
O
ther
s.
Not
e 2:
C
alcu
lati
on b
ased
on
inve
stee
com
pany
’s f
inan
cial
sta
tem
ents
aud
ited
by
a lo
cal C
PA
and
cov
erin
g th
e sa
me
repo
rtin
g pe
riod
as
that
of
Far
Eas
tern
Int
erna
tion
al B
ank.
Not
e 3:
U
nder
the
“R
egul
atio
ns G
over
ning
the
App
rova
l of
Inv
estm
ent
or T
echn
ical
Coo
pera
tion
in
Mai
nlan
d C
hina
” an
noun
ced
by I
nves
tmen
t C
omm
issi
on,
MO
EA
, up
per
lim
it i
s ca
lcul
ated
by
appl
ican
t co
mpa
ny -
Far
Eas
tern
Ass
et
Man
agem
ent C
o., L
td.
Not
e 4:
C
alcu
late
d us
ing
the
exch
ange
rat
e at
rem
itta
nce
date
.
Not
e 5:
C
alcu
late
d us
ing
the
aver
age
exch
ange
rat
e fo
r th
e ye
ar e
nded
201
8.
369