Do developing Countries Benefit from Foreign Direct Investments? an Analysis of Some Arab and Asian...
43
EERI Economics and Econometrics Research Institute EERI Research Paper Series No 07/2012 ISSN: 2031-4892 Copyright © 2012 by Weshah Razzak and Elmostafa Bentour Do Developing Countries Benefit from Foreign Direct Investments? Weshah Razzak and Elmostafa Bentour EERI Economics and Econometrics Research Institute Avenue de Beaulieu 1160 Brussels Belgium Tel: +322 298 8491 Fax: +322 298 8490 www.eeri.eu
-
Upload
independent -
Category
Documents
-
view
4 -
download
0
Transcript of Do developing Countries Benefit from Foreign Direct Investments? an Analysis of Some Arab and Asian...

EERIEconomics and Econometrics Research Institute
EERI Research Paper Series No 07/2012
ISSN: 2031-4892
Copyright © 2012 by Weshah Razzak and Elmostafa Bentour
Do Developing Countries Benefit from Foreign Direct Investments?
Weshah Razzak and Elmostafa Bentour
EERIEconomics and Econometrics Research Institute Avenue de Beaulieu 1160 Brussels Belgium
Tel: +322 298 8491 Fax: +322 298 8490 www.eeri.eu

Do Developing Countries Benefit from Foreign Direct Investments?
W. A. Razzak and E. M. Bentour
Arab Planning Institute
April, 2012
Abstract
In addition to the wide believed positive effects on growth, employment and wages,
FDIs are often perceived as sources of funds for development. Developing countries,
especially low income and emerging economies, welcome FDIs because of their
favorable budgetary implications. All that resulted in increasing global FDIs. We
discuss some specification and estimation problems that might affect the estimation of
the rate of returns on FDI, and provide new figures for a number of FDI-receiving
Arab countries. We compare the results to those of some Asian countries, and discuss
the policy implications. There is evidence that Arab countries have, relatively,
benefited from their efforts to open their economies, to reform their institutions and to
attract FDIs.
JEL Classifications: C13, C14, C21, C23, C26, O24
Keywords: Rate of return on FDI, estimation and specification problems, panel
data.

1. Introduction
The connection between trade, FDI and growth was made in Bhagwati (1978), who
argued that the effects of FDI on economic growth are hypothesized to be stronger the
more outward-oriented the country is. FDI affects growth by increasing the stock of
capital and, probably, by spillover from foreign firms to local firms. It is
hypothesized that FDI makes transfer of technology easier, increases employment,
improves knowledge (whether human capital or R&D, or both, as a result of
cooperation and competition) between domestic and foreign firms, modernizes
management practices, and could enhance designs of existing products, i.e.,
development. Jones and Romer (2010) argue that there has been a positive trend in
world trade and FDI, and that the two variables are correlated. The trade, FDI, and
economic growth nexus has been tested extensively in the literature and most
economists today seem comfortable with it even though the empirical evidence is
mixed.i Interestingly, however, according to the theory of internalization, FDI only
exists because of the absences of free trade, Coase (1937).ii
Further, the availability of FDI might be crucial for development. Middle Eastern and
North African countries, for example, have been pursuing outward trade policies since
the 1980s and encouraging inward FDI in general. Developing countries view FDI as
a cost-effective source of funds for development plans. Various World Investment
Reports (WIRs) seem to suggest continuous increases in FDI for developing
countries. The WIR (2010) points out that, “Developing and transition economies
attracted half of global FDI inflows, and invested one quarter of global FDI
outflows.” For example, the 2008 WIR (p.42, figure II.4) reported the rates of return
on global FDI by trans-national companies (TNCs) for the period 1995–2007. These
figures measure the profitability of foreign investors. The average returns are double
digits, with returns on TNCs’ FDI in developing countries exceeding 10 percent.
The main objective of this paper is to examine whether some developing countries,
some are Arab and others are Asians, have benefited from FDI. We accomplish this
by measuring the rate of returns on inward FDI in a number of Arab countries, which
have been pursuing outward oriented policies and institutional reforms to attract FDIs.

2
These countries are Algeria, Egypt, Jordan, Morocco, and Tunisia, which have data
for the period from 1980 to 2009. We compare the results to four Asian countries:
China, South Korea, Malaysia, and Thailand.
Just like foreign investors calculate the expected rate of returns on their investments,
policymakers at the receiving end of FDI should be interested in the rate of returns of
inward FDIs. . The policymaker should also be interested in the factors that increase
the average returns on FDI in order to design policies to achieve that.
Essentially, measuring the rate of returns on FDI requires the estimation of the
elasticity of output with respect to FDI. The estimation, however, is significantly
affected by a number of specification and estimation issues, which we discuss in
detail in this paper.
We rely on the economic theory of production. The concept of the production
function is firmly grounded in economic theory. Theory is needed to serve as a guide
on the external validity of the econometric estimate of the elasticity of output with
respect to FDI, Acemoglu (2010). Carkovic and Levine (2002) identified some of
problems in the FDI-growth literature, which are related to our problem, but we
discuss and attempt to remedy more problems. This approach is subject to
specification and estimation problems. Specification problems include the choice of
the production function’s functional form (e.g., Cobb-Douglas, Constant Elasticity of
Substitution (CES), Trans-log, etc.). The econometrician does not know the true data-
generating-process (DGP). Specification errors occur if the true DGP is a CES
production function, and the econometrician fits a Cobb-Douglas. Other specification
and estimation problems can include nonlinearity, FDI flow versus stock, the order of
integration and the specification of trend, omitted variable problems, consistency,
endogeneity, serial correlation, small sample bias, and error-in-measurement
problems.
Given the uncertainty about the estimated elasticity and returns arising for the
problems above, we generate a rather thicker output, i.e., a number of estimates,
instead of one estimate for the elasticity and the rate of returns, and then compute an
average rate of returns, which has a smaller variance and is thus more reliable than a
single estimate.iii

3
Since we do not know what the true model is, we address the problems above by
estimating different types of production functions and regression specifications, and
use different estimators to produce a number of estimates, for a panel of five Arab
countries ( ,,1 Ni �� 5�N ) over the period from 1980 to 2009 ( 30�T ). Then, we
compare our estimates of the Arab countries to those we obtain from four Asian
countries, China, South Korea, Malaysia, and Thailand, over the same time period.
The answer to our question, whether the Arab countries have benefited from FDI over
the period from 1980 to 2009, is yes. We found that real GDP is fairly sensitive to
small changes in FDI in the Arab countries, more so than the Asian countries, i.e., the
size of the estimated elasticity is larger. However, the rate of returns in the Asian
countries, especially in China and Korea, are higher than those of the Arab countries
because average productivity levels are higher in China and Korea. China and Korea
have relatively more and higher quality human capital than the Arab countries. The
results might suggest that FDI would have a low average rate of return unless
investments are made in human capital, i.e., skills, to produce skill-intensive goods
and services, and increase productivity. These results are consistent with the findings
in the growth–FDI literature.
Although comparisons with the rate of returns on TNCs investments in the developing
country based on our calculations of the rate of returns on inward FDI in the Arab and
Asian countries is not straightforward, it is well documented that U.S. FDI abroad
earn more than foreign firms investing in the U.S.iv
We also found significant complementarities between FDI and human capital; when
taken into account, higher returns in some countries resulted, and are expected to spur
more FDI inflows in the future. We found significant nonlinear effects of FDI and the
product of FDI and human capital on the level of GDP per capita.
Next, we layout the methodologies and discuss the specification and estimation issues
pertinent to the calculation of the rate of return on FDI. The data are described in
section 3. In section 4 we report and analyze the empirical evidence. Section 5
concludes.

4
2. Methodology
The estimation of the elasticity of output with respect to FDI stock,� , i.e., the
percentage change in GDP / percentage change in FDI stock, and our analysis are
theory-based. We use the production function to describe the relationship between
FDI and real GDP. We begin with the Cobb-Douglas production function, which is,
despite some criticisms, very well-grounded in economic theory, easy to estimate, and
has a good empirical record (Miller 2008).v
The Cobb-Douglas Production function is:
��� eLAKY � (1)
Subscripts aside at this stage, Y is real output, A is a constant exogenous technical
progress, K is the stock of physical capital, L is labor input, and� is the error term,
which has classical properties. To account for FDI in the production function we
assume that the effective stock of capital consists of ( dK ), which denotes the domestic
stock of capital, and ( fK ), which is the foreign stock of capital, i.e., FDI stock.vi
Equation (1) becomes:
���� eLKKAY fd )()(� (2)
Dividing both sides by labor L (lowercase), and then taking log yields:
���� ����� Lkkay fd lnlnlnln (3)
Where 1��� ���� measures the deviation from constant returns to scale.
Estimating equation (3) would yield an estimate of the long-run elasticity or the share
of FDI, ff K
Yky
�
�
%%
lnln
�̂ =YK
KY f
f
. , therefore the theory suggests that the real
rate of return on FDI stock is ff K
YKY �̂�
, which hinges on the value of �̂ .

5
To interpret the measure for example, let the estimated elasticity � be 0.5, GDP is 6
dollars and FDI is 1 dollar. The rate of return is 0.5(6/1)=3 dollars. Thus, a 100
percent increase in FDI from 1 to 2 dollars increases GDP from 6 to 9 dollars
reflecting the estimate of � which is 0.50.
Below we list a number of the other challenges and problems.
First, an omitted variable problem might be present. Essentially, we will never be
able to tell which and how many variables are omitted, which is why we rely on
economic theory of the production function. The omitted variable problem results in
biased and inconsistent Least Squares parameter estimates. A modified theory of
production, however, considers the stock of human capital an additional explanatory
variable that is actually missing from the original production function in equation (1).
There is literature on technology diffusion where human capital is required. The
theory is found in Nelson and Phelps (1966), Grossman and Helpman (1991, ch.11),
and Barro and Sala-i-Martin (1995, ch.8). Borensztein et al. (1998) and Benhabib and
Spiegel (1994) are widely cited examples of supporting empirical evidence. Thus, we
consider having a measure of the stock of human capital as an additional regressor.
Human capital can either be an additional exogenous factor of production, see
Mankiw et al. (1992), or a factor influencing technical progress, A , in the production
function. Also, we report a regression that includes the product of human capital and
FDI stock to capture complementarities.vii
Second, errors-in-measurement lead to biased and inconsistent parameter estimates in
Least Squares. We, however, focus on the long-run and not the short-run dynamics
because we are interested in an estimate of � in equation (3), and errors-in-
measurement are less of a problem in the long run unless the errors are systematic and
cumulate to I(1). We will show that the errors are actually stationary.
Third, endogeneity is also present as a problem (single equation bias). Instrumental
Variable methods are usually prescribed as a remedy to this problem. We use the
Generalized Method of Moment (GMM) estimator, which is a Generalized IV
estimator. Finding the appropriate instruments is always challenging. Weak
instruments often cause additional problems. We will test for the presence of

6
endogeneity, discuss the choice of relevant instruments, which are correlated with the
regressors especially the FDI, capital and human capital, and not correlated with the
residuals.
Fourth, we have a small sample problem. The time series are short. Each country has
30 annual observations only, which makes the estimation of a country-by-country
times series model inappropriate. To remedy this problem we estimate a panel, where
T=30 and N= 1 to 5. The panel will also allow for a slope change and a fixed effect.
Fifth, it has been argued, see Stengos and Kottaridi (2010), that FDI and human
capital have nonlinear effects on growth. We use a semi-parametric estimator to
estimate quantile regressions, which will account for changes in the slope parameters
over the distribution.
3. The data
We use annual data from 1980 to 2009 for five Arab countries, namely Algeria,
Egypt, Jordan, Morocco, and Tunisia. We chose these countries because the
UNCTAD data are available, and because these countries, more than others, have
been pursuing outward oriented policies, reforming investment laws, patent laws, etc.
and restructuring their economies and institutions to attract FDIs . Those countries
are also non-oil producers, except for Algeria. We are interested in non-oil producers
because it is difficult to interpret the rate of returns on FDI when output is large in
size due entirely to oil production or high oil prices, and not to increasing
productivity. For comparison we also use data from the same period from four Asian
countries (China, South Korea, Malaysia, and Thailand) on the same basis.
Table 1 reports the percentage share of FDI in GDP. Share of FDI in GDP is
significantly larger in the Arab countries than the Asian countries. The Asian
countries’ production is largely driven by technical progress, domestic capital, labor,
and most importantly by skilled human capital.
Table 2 describes the data. All the data are in real terms. The stock of capital is
constructed from gross capital formation using the Perpetual Inventory Method with a
depreciation rate fixed at 6 percent, and a proxy for the initial stock 0K equals to 2

7
times real GDP. Real GDP data are taken from World Development Indicators. The
FDI stock is published by the UNCTAD. We use population of working age (15-64)
to measure labor.
The stock of human capital is computed as in Barro and Lee (1993 and 2010) and it
measures average years of schooling. Although there are other methods to measure
the stock of human capital, we do not have sufficient data for the countries in our
sample to use them.viii The available enrolment time series have missing values in the
Arab countries, therefore we interpolate the data whenever that was required.
Enrolments have trends as do the stocks of capital in the Arab countries. We use the
Barro and Lee formula to compute the time series for the stock of human capital for
each of the Arab countries, and enabled the constant term in the equation to vary
across the countries. The equation is reported in Table 2. For the Asian countries,
however, the formula above does not fit the data so we take the human capital
reported in 5-year intervals as in Barro and Lee, and we interpolated the data using a
geometric mean approach. Our estimates of human capital are plotted in figure 1.
Tables 3 and 4 report the allocation of FDI in different sectors. There are qualitative
differences in FDI between the Arab and Asian countries. These differences stem
from differences in the degree of industrialization. The Asian countries in our sample
have manufacturing-related FDIs whereas the Arab countries have more oil- and gas-
related FDIs, and some services. For Algeria, unspecified secondary includes
manufacturing, electricity, gas, and water. About one-third to two-thirds of total FDI
flows go into these sectors and we speculate that most of it is in the gas sector because
Algeria is a major gas producer. Telecommunications received a very large FDI in
2005. In Egypt most of the FDI flows goes into petroleum and other services, which
is mostly telecommunications. In Morocco, FDI is concentrated in manufacturing,
real estate, tourism, and services. Tunisia’s FDI is in the small oil and gas sector,
manufacturing, and services. It is surprising that tourism did not receive a significant
amount of FDI in Tunisia. UNCTAD does not report similar data for Jordan. A
national website, www.jordaninvestment.com, reports that in 2004-2005, 75 percent
of FDI inflows goes into the service sector, where financial services make up about 50
percent of these inflows. Less than 20 percent of the FDI goes to mining and
quarrying, and only 6 percent to manufacturing. We should also emphasize that state-

8
owned enterprises, which were privatized during the restructuring were recorded as
FDI flows. For the Asian countries, table 4 shows that the bulk of the FDI is in
manufacturing, with some significant FDI in services in South Korea.
4. Empirical evidence
We believe that the Cobb-Douglas production function is an appropriate functional
form for our purpose. We begin by estimating the following Cobb-Douglas log-linear
specifications using a panel for the Arab countries, 51��i over the period 1980 to
2009.ix Later, we will examine a CES production function for robustness.
We fit three specifications of the log linear Cobb-Douglas function:
,lnlnlnln 1ititfitditit Lkkay ���� ����� (4)
We keep labor in the regression so that� captures the deviations from constant returns
to scale 1��� ���� (remember that� is the share of labor in equation 1).
And the other specification includes human capital ( H ), which is labeled h in per
cap capita form, as an additional regressor:
,lnlnlnlnln 2 itititfitditit Lhkkay ����� ������ (5)
where � also captures the deviations from constant returns to scale
1���� ����� .
And, to account for complementarities, we have itf hk )( , the per-unit of labor product
of FDI stock and human capital, as an additional regressor:
,ln)ln(lnln 3itititfditit Lhkkay ���� ����� (6)
where 1��� ���� measures the deviation from constant returns to scale.
Understanding trend in time series is difficult. Phillips (2003) and White and Granger
(2011), among others for examples, argue and explain why it is. Typically,
practitioners test for unit root in the individual time series, and recently in the panel as

9
well. A conclusion that has been reached by many macroeconomists, e.g., Stock
(1991), Rudebusch (1993), and Christiano and Eichenbaum (1990), is that it is rather
difficult to settle the issue of unit root especially in the case of the GDP data. Further,
there are a large number of tests, where most suffer from short sample bias and lack
of power against stationary alternatives. We use a number of tests with a variety of
specifications. Razzak (2007) provides a testing strategy, where all available tests to
the practitioner should be used with all possible specifications until a consensus
emerges.x The results of all the tests indicate that the data have unit roots, which is
not surprising. The inability of the test statistic to reject the null hypothesis often is a
sign of weakness of the test.
The second step in trend identification issue is to test the null hypothesis that there is
no co-integration among the variables, which is a necessary second step of testing.xi
Following the same strategy we easily rejected the null hypothesis of no co-
integration in the Arab countries panel and in the Asian panel.xii Rejecting the null
hypothesis is encouraging because the power of the test is not a relevant issue when it
rejects the null. Given these results, we will proceed with estimating the log-level
production function because under the assumption of co-integrated I(1) variables the
estimated coefficients are super-consistent and inference is possible.
We are set to estimate the above three specifications in levels. We begin with the
EGLS estimator, which is the appropriate method to estimating panel data when the
regressors are co-linear and the explanatory variables are assumed to be strictly
exogenous. Our regressors are in log-levels and they are trending together. There is
evidence of co-linearity. However, EGLS is just a benchmark estimator, and cannot
be used in the presence of endogeneity, nonlinearity and other specification and
estimation issues.
We suspect that endogeneity is present. We test for endogeneity of the stock of
capital, ditk , the stock of FDI, fitk and the stock of human capital, ith . We use the
Hausman (1978) endogeneity test.xiii The hypothesis that all three regressors are
exogenous is strongly rejected; hence, the GMM estimator will be used to estimate the
production function.xiv

10
For instruments in GMM we use, constant term, two lags of FDI stock, the
contemporaneous log of the European Union’s real GDP which is strictly exogenous
to the Arab countries, and a number of dummy variables taking the value of one when
the programs begin and zero elsewhere. These are (1) IMF macro stability program;
(2) joining the World Trade Organization; and (3) free-trade agreement year with the
European Union. These variables are relevant and highly correlated with FDI flows
and FDI stocks. For capital and human capital we use a number of shares of age
groups in total populations, such as the share of people age 20-24, 25-29… 60-64.
Cook (2002) explains that these instruments are highly correlated with capital and
human capital because the life-cycle theory shows that both increase with age, peak at
mid age, then decline. The same is true and clearly present in the data for
employment, hours-worked and wages. We test for weak instruments. Lagged
regressors used as instruments lead to a weak instruments’ problem, which typically
leads to a downward bias in the estimated share of capital and to, generally, biased
results. We only have two lags of working age population as instruments. Our F-test
does not show any such problem.
Table 5 reports the results for the EGLS and GMM estimators.xv In addition, we
report results for the quantile regressions. We use a fixed effect model, where all
coefficients are fixed across countries, except the FDI stock elasticity it� ; the White’s
method to estimate the variance-covariance matrix; and report a number of diagnostic
statistics.
The EGLS and GMM estimates are reported in the first and second columns of each
of the two panels in table 5, but the focus is on GMM. The coefficient � (the share
of capital) is kept fixed across countries to conserve on the number of degrees-of-
freedom.xvi The estimates of � are sizable, which is typical in the Arab data.xvii
The average GMM estimates of it� across the three different regression specification
are: 0.08, 0.38, 0.32, 0.19, and 0.31 percent in Algeria, Egypt, Jordan, Morocco, and
Tunisia, respectively. The highest elasticity is in Egypt, Jordan, and Tunisia. Algeria
has the lowest. The average elasticity across the Arab countries is approximately 0.25
percent.xviii It says that a 1 percent increase in the stock of FDI stock increases the
level of real GDP by about a quarter of a one percent.

11
The quantile regressions are reported in the remaining columns of each of the panels
of table 5. There is a significant nonlinear effect on GDP per capita level. The
estimated elasticity is relatively larger in magnitude in the upper quantile for all
countries. Taking Algeria for example, the average estimated elasticity in the upper
quantile across all three regression specifications is 0.34 percent. This is significantly
larger in magnitude than the 0.08 percent reported in GMM.
In EGLS and GMM � is <0, except for the second specification, which is positive.xix
The p values of the J statistics for GMM indicate that we cannot reject the over-
identifying restrictions. The residuals pass the normality test. The main findings in
table 5 are that both FDI and human capital have significant non-linear effects on
output. The complementarities between FDI and human capital are evident in the
regressions.
Now we are in position to compute the rate of returns. We use our estimates of � to
calculate the rate of return on FDI for each country. For each country, we use the
GMM estimated value of � , and the average of output / FDI stock over the whole
sample, and also report the overall average value of the returns. Results are in table 6.
This table has three panels. Each panel represents a regression specification. Algeria
has a high rate of return because output is high due to oil and gas production. Egypt
has the second highest return 1.63, which is more meaningful than Algeria’s figure
because Egypt is not an oil-producing country and its gas production is small.
Morocco and Jordan come next, and Tunisia has the smallest return, 0.64. All these
numbers are measured in constant dollars. The estimated average rate of returns on
FDI for all five Arab countries is approximately 1.30. These numbers mean that a one
dollar increase in FDI stock increases the average output of all five Arab countries by
1.30 dollars, reflecting average elasticity of 0.25 percent.
For example, a 100 percent increase in the average FDI stock in all five Arab
countries (from 25 billion dollars to 50 billions) increases average GDP of the five
Arab countries from 120 billion to 150 billion dollars, reflecting the elasticity, which
is 0.25 percent. A similar interpretation applies to each individual country.
All in all, our estimates of the rate of returns on inward FDI are significantly smaller
than those reported by the World Investments Report (WIR) for the rates of returns to

12
TNCs on their FDI in the developing countries. This says that foreign firms receive
and profit more in terms of returns on their FDI than the FDI-receiving countries. For
example we also found (not reported) that Kuwait, a major oil-producing country
which invests abroad more than its domestic investments, has an average rate of
returns on its outward FDI equal to approximately 10 percent. The consequences of
these return differentials are not well understood and ought to be researched in the
future. Bosworth et al. (2007) and Hung and Mascaro (2004) show and explain the
high rate of returns on American FDIs abroad.
Table 7 reports the rate of returns using the estimated elasticity for quantile
regressions, which we reported in table 5 above. It is clear that the rate of returns on
FDI increases with the quantiles, the higher the quantile the higher the rate of returns.
FDI, just like human capital, has a significant nonlinear effect on output.
Now we compare our estimates of the rate of returns on FDI in the Arab countries to
those of the Asian countries. We estimate the same specifications of the Cobb-
Douglas production function in 4, 5 and 6 above using GMM only, and report the
parameter estimates in table 8.xx We report the corresponding rates of returns in table
9.
The average share of capital is 0.66, which is larger than that in the Arab counterpart,
which is about 0.50. And the production function is either a decreasing returns to
scale or more probably a constant return to scales because the P values are relatively
large.
The average estimated elasticities of FDI with respect to output are: 0.21, 0.10, 0.34,
and 0.15 percents for China, Korea, Malaysia, and Thailand, respectively. The
average across all four Asian countries is 0.20 percent. Thus, the elasticity is smaller
in magnitude than the Arab estimate. This is because these Asian countries have
massive domestic investments. We compute the rate of returns on FDI. China and
South Korea have relatively larger returns. These two countries in particular have
benefited significantly from human capital – FDI complementarities. In constant
dollars, the average rates of returns on FDI across the three different specifications of
the Cobb-Douglas production function are: 6.5 in China, 3.9 in Korea, 1.3 in
Malaysia, and 1.6 in Thailand. China and South Korea produce relatively more

13
skilled-intensive goods than the Arab countries. On average, a dollar increase in FDI
across all four Asian increases GDP by 3.3 dollars. This is at least twice as much as
the returns for the Arab countries in our sample, but still indicates that returns of
foreign firms are much higher.
For Asia and over the sample, a 100 percent increase in the average FDI stock in all
four countries, China, Korea, Malaysia and Thailand from 50 billion dollars to 100
billion dollars increases average GDP for the Asian countries by 80 billion dollars
from 400 billions to 480 billions, reflecting an average elasticity of 0.20.
Figure 2 plots the average GMM estimate of � across different specifications, by
country. Figure 3 plots the corresponding average rate of returns to FDI by country.
Our results point to significant differences in the responsiveness of the Arab and the
Asian economies to changes in FDI, where China and Korea are clearly reaping
relatively more benefits from FDI than the other countries. There could be a number
of reasons for this observation. One interesting difference between the Arab and the
Asian countries is that there are significant differences in the levels of human capital
and the quality of human capital. These differences suggest differences in the
complementarities between human capital and FDI. Countries with high skill levels
might attract foreign FDI. Our results might be consistent with the skill-biased
technical change literature. Figure 4 plots the levels of human capital, measured by
average years of schooling, which are clearly higher in the Asia countries than the
Arab countries. Figure 5 plots a measure of the quality of human capital—a measure
of cognitive skills is a country score of standardized tests in mathematics and science
published by Trends in Math and Science Study, TIMMS. The plot measures the Arab
country’s score relative to Korea’s.xxi The Arab countries have a significantly lower
quality of human capital, i.e., lower cognitive skills.
Finally, we check the robustness and the sensitivity of the results to a different
specification of the production function, namely the Constant Elasticity of
Substitution (CES), and to some measurement issues. This functional form, on the
other hand, does not require the assumptions of perfect competition and profit
maximization. Kmenta (1967) shows that estimating these flexible forms is not really
difficult (at least for two factor inputs) except that they require a large number of

14
observations because there are more parameters to estimate than in the Cobb-
Douglas.xxii
The CES production function could be written in different ways depending on the
number of inputs. In our case, we have up to four inputs: physical capital, FDI
capital, Labor, and human capital. General n -input CES function, Blackorby and
Russel (1989) is given by:
� ��
���
��� n
i ii xY 1 (7)
With ��
�n
i i1,1�
Where n is the number of inputs and the sx' [[the ‘s does not have to be italics]] are
the inputs. In our case, however, we can only be concerned with two inputs, physical
capital and FDI capital, which might be substitutable. Estimation of the CES
production function requires a large sample, which we do not have. We nested a CES
in the Cobb-Douglas function:
����� �� LKKAY fd
/)])(1()([( �� (8)
Normalizing by labor and following Kmenta (1976) log-linear approximation of the
CES:
LKKKKAY fdfd ln)ln)(ln1(2
)1(lnlogln 2 ��������� ����� (9)
We estimate three specifications of the function for all countries, but to conserve on
the degrees-of-freedom we do not allow the coefficients to vary across countries. The
value of 1�� . We estimate the panel over the same sample. Lowercase denotes per
capita measures.
itit
fitditfitditit
Lkkkkay
1
221
ln)ln(ln)1(ln)1(lnln
�������
�
����� (10)
ititit
fitditfitditit
hLkkkkay
2
221
lnln)ln(ln)1(ln)1(lnln
��������
��
����� (11)

15
itit
itfitdititfitditit
Lhkkhkkay
3
221
ln)).(ln(ln)1().(ln)1(lnln
�������
��
����(12)
We estimate the above equations for the named Arab and Asian countries and report
the results in table 10. The main results are consistent with the previous findings.
First, the estimated value of � , which is closer to zero rather than one, implies that
the CES function approaches a Cobb-Douglas. Hence, the elasticity of substitution
between the stock of foreign direct investment and domestic capital stock approaches
unity. The average GMM estimate of the elasticity of FDI across the three different
specifications is about 0.36, for the Asian countries is 0.26. Both the elasticity
estimates and the rates of returns are slightly larger in magnitude than those of the
Cobb-Douglas function.
We also estimated all the equations in this paper using real GDP in PPP-adjusted
dollars instead of constant dollars. We also examined different measures of capital
stock and FDI stock data using the Perpetual Inventory Method. Regarding PPP, the
results are qualitatively similar to what we reported. However, there seems sensitivity
to how the FDI stock is measured, which is typical.
5. Conclusions
For many developing countries, foreign direct investment (FDI) is a method to
finance development; they welcome FDIs because of their favorable budgetary
implications. It is often perceived as a source of funds for development. But most
importantly, there is some evidence in the literature that FDI could enhance the
overall economics, employment, and wage growth rates. To attract FDI, Egypt,
Jordan, Morocco, and Tunisia in particular have been revising their commercial,
trade, patent and other relevant laws, and pursuing micro- and macroeconomic
policies friendly to FDI. Consequently, they have attracted more FDI in recent
decades. European agencies, which evaluate the business climate, rate some of these
countries as good places for investment.
This paper estimates the rate of returns on inward FDI in the Arab countries, Algeria,
Egypt, Jordan, Morocco and Tunisia, and compares the results to China, South Korea,
Malaysia, and Thailand. Estimates of the rate of returns on FDI comprise important
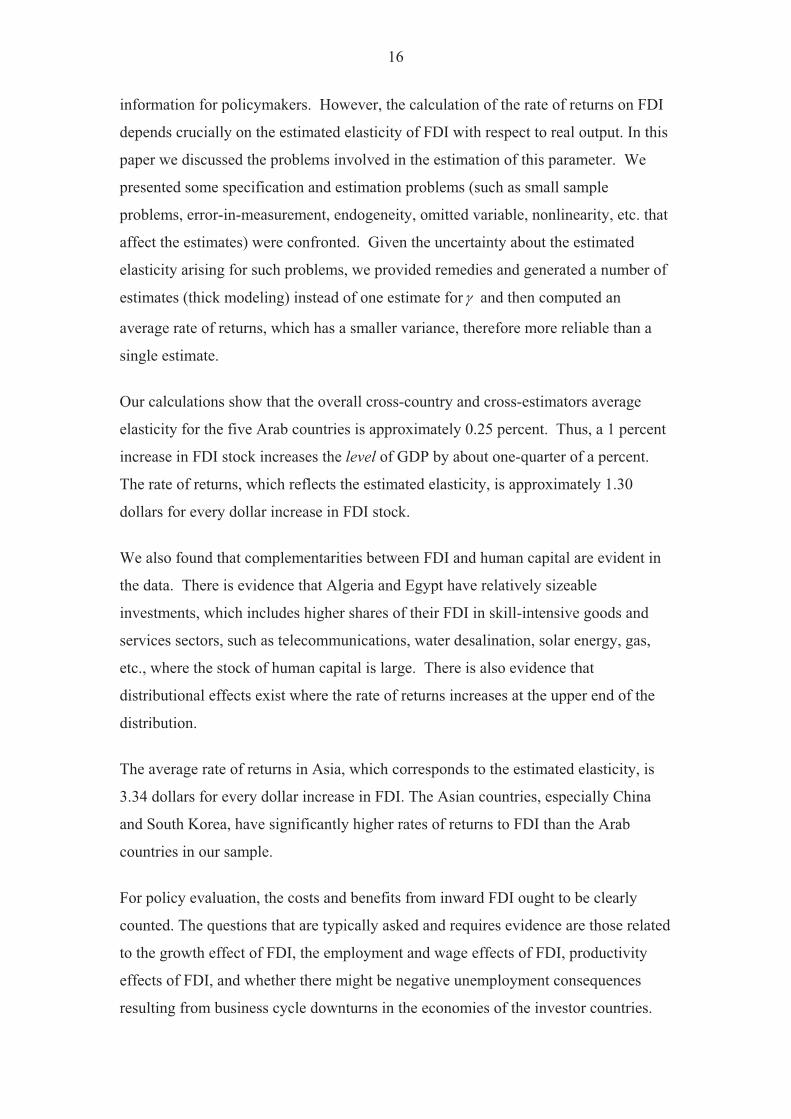
16
information for policymakers. However, the calculation of the rate of returns on FDI
depends crucially on the estimated elasticity of FDI with respect to real output. In this
paper we discussed the problems involved in the estimation of this parameter. We
presented some specification and estimation problems (such as small sample
problems, error-in-measurement, endogeneity, omitted variable, nonlinearity, etc. that
affect the estimates) were confronted. Given the uncertainty about the estimated
elasticity arising for such problems, we provided remedies and generated a number of
estimates (thick modeling) instead of one estimate for� and then computed an
average rate of returns, which has a smaller variance, therefore more reliable than a
single estimate.
Our calculations show that the overall cross-country and cross-estimators average
elasticity for the five Arab countries is approximately 0.25 percent. Thus, a 1 percent
increase in FDI stock increases the level of GDP by about one-quarter of a percent.
The rate of returns, which reflects the estimated elasticity, is approximately 1.30
dollars for every dollar increase in FDI stock.
We also found that complementarities between FDI and human capital are evident in
the data. There is evidence that Algeria and Egypt have relatively sizeable
investments, which includes higher shares of their FDI in skill-intensive goods and
services sectors, such as telecommunications, water desalination, solar energy, gas,
etc., where the stock of human capital is large. There is also evidence that
distributional effects exist where the rate of returns increases at the upper end of the
distribution.
The average rate of returns in Asia, which corresponds to the estimated elasticity, is
3.34 dollars for every dollar increase in FDI. The Asian countries, especially China
and South Korea, have significantly higher rates of returns to FDI than the Arab
countries in our sample.
For policy evaluation, the costs and benefits from inward FDI ought to be clearly
counted. The questions that are typically asked and requires evidence are those related
to the growth effect of FDI, the employment and wage effects of FDI, productivity
effects of FDI, and whether there might be negative unemployment consequences
resulting from business cycle downturns in the economies of the investor countries.

17
Our findings ought to be useful for policymakers. They suggest that governments,
which are interested in increasing inward FDIs, should aim for policies to increase not
only the stock of human capital, but also its quality. This would, in turn, give foreign
investors incentives to invest in the production of skill-intensive goods, which
increases the returns to the economy.

18
References
Acemoglu, D., 2010, Theory, General Equilibrium, and Political Economy in
Development Economics, Journal of Economic Perspectives, Volume 24, Number
3, 17-32.
Aitken, B. and A. Harrison, 1999, Do Domestic Firms Benefit from Foreign Direct
Investment? Evidence from Venezuela, American Economic Review 89 (3), 605 –
518.
Alfaro, L. and A. Charlton, 2007, Intra-Industry Foreign Direct Investment, NBER
WP 13447, Cambridge, MA.
Alkawaz, A., (2006), Non-Performing Industries in the Arab World, Arab Planning
institute, Kuwait.
Arellano, M. and S. Bond, 1991, Some Tests of Specification for Panel Data: Monte
Carlo Evidence and an Application to Employment Equations, The Review of
Economic Studies 58 (2), 277-297.
Arellano, M. and O. Bover, 1995, Another Look at Instrumental Variable
Estimation of Error-Components Models, Journal of Econometrics 68, 29-52.
Balasubramanyam, V. N., M. Salisu, and D. Sapsford, 1996, Foreign Direct
Investment and Growth in EP and IS Countries, the Economic Journal 106, 92-105.
Baltagi (ed.) Non Stationary Panels, Panel Cointegration and Dynamic Panels,
Amsterdam: Advances in Econometrics, Vol. 15: JAI Press, 161.178.
Barro, R. J. and Sala-i-Martin, X., 1995, Economic Growth, New York: McGraw-
Hill.
Barro, R. J. and J.-W. Lee, 1993, International Comparisons of Educational
Attainment,” Journal of Monetary Economics, 32(3), 363-94.
Barro, R. and Jong-Wha Lee, 2010, A New Data Set of Educational Attainment in the World, 1950–2010, NBER Working Paper No. 15902.

19
Basu, S. and J. G. Fernald, (1997), Returns to Scale in U.S. Production: Estimates
and Implications, Journal of Political Economy, Vol. 105, No.2, 249-283.
Benhabib R., and M. Spiegel, 1994, The Roles of Human Capital in Economic
Development: Evidence from Aggregate Cross-Country Data, Journal of Monetary
Economics 34, 143-173.
Bhagwati, J. N., 1978, Anatomy and Consequences of Exchange Control Regimes,
NBER.
Blackorby, C. and R. R. Russell, 1989, Will the Real Elasticity of Substitution
Please Stand Up? (A Comparison of the Allan / Uzawa and Morishima Elasticities),
American Economic Review, Vol. 79, Issue 4, 882-88.
Blundell, R. and S. Bond, 1998, Initial Conditions and Moment Restrictions in
Dynamic Panel Data Models, Journal of Econometrics 87, 115-143.
Blundell, R. and S. Bond, 1999, GMM Estimation with Persistent Panel Data: An Application to Production Functions; The Institute of Fiscal Studies Working Paper No. 99/4.
Borensztein, E., J De Gregorio and J-W Lee, 1998, How Does Foreign Direct
Investment Affect Economic Growth? Journal of International Economics 45, 115-
135.
Bosworth, B., A. M. Collins, and G. C-Reich, 2007, Returns on FDI: Does the U.S.
Really Do Batter? NBER Working Paper No. 13313, Cambridge, MA.
Breitung, J., 2000, The Local Power of Some Unit Root Tests for Panel Data, in B.
Buckley, P. J., and M. Gasson, 1976, The Future of the Multinational Enterprise.
London.
Carlovic, M. and R. Levine, 2002, Does Foreign Direct Investment Accelerate
Growth? In Moran, T. H., E. M. Graham, E. M. and M. Blomstrom (eds.,) Does
Foreign Direct Investment Promote Development? Institute for International
Economics, Washington, D.C.

20
Christiano, L. and M Eichenbaum, 1990, Unit Roots in Real GNP: Do We Know,
and Do We Care?, Carnegie-Rochester Conference Series on Public Policy, Vol. 32,
7-62.
Coase, R. H., 1937, The Nature of the Firm, Economica, Vol.4, 1937.
Dickey, D. A., and W. Fuller, 1979, Distributions of Estimators For Autoregressive
Time Series with a Unit Root, Journal of American Statistical Association, 74, 427-
431.
Elliott G., 1999, Efficient Tests for Unit Root When the Initial Observation is
Drawn from its Unconditional Distribution, International Economic Review 140:3,
767-783.
Granger, C. W. J. and J. Yongil, 2004, Thick Modeling, Economic Modeling 21, Issue 2, 323-343.
Grossman, G. and E. Helpman, 1991, Innovation and Growth in the Global
Economy, Cambridge, MA: MIT Press, 119.
Hadri, K., 2000, Testing for Stationarity in Heterogenous Panel Data, Econometric
Journal 3, 148-161.
Haddad, M. and A. Harrison, 1993, Are There Positive Spillovers from Foreign
Direct Investment? Evidence from Panel Data for Morocco, Journal of Development
Economics 42, 51-74.
Hausman, 1978, Specification Tests in Econometrics, Econometrica 46, 1251-1271.
Hung, J. H., and A. Mascaro, 2004, Return on Cross-Border Investment: Why Does
the U.S. Investment Abroad Do Better?, CBO Technical Paper, 17.
Hymer, S. H., 1976, The International Operations of National Firms: A Study of
Direct Foreign Investment, MIT Monographs in Economics 14, Cambridge MA.
Im, K. S., H. M. Pesaran, and Y. Shin, 2003, Testing for Unit Roots in
Heterogenous Panels, Journal of Econometrics, 115, 53-74.

21
Jallab, M. S., N. B. P. Gbakou, and R. Sandretto, 2008, Foreign Direct Investments,
Macroeconomic Instability and Economic Growth in Arab Countries, WP 08-17,
Centerr de la Recherche Scientifique, CNRS, France.
Jones C. and P. Romer, 2010, The New Kaldor Facts: Ideas, Institutions,
Population, and Human Capital, American Economic Journal: Macroeconomics
2010, 2:1, 224-245.
Jorgenson, D. and B. M. Fraumeni, 1992, Investment in Education and U.S.
Economic Growth,” Scandinavian Journal of Economics, 94, 51-70.
Kao, C., 1999, Spurious Regression and Residual-Based Tests for Cointegration in
Panel Data, Journal of Econometrics, 90, 1-44.
Kawai, H., 1994, International Comparative Analysis of Economic Growth: Trade
Liberalization and Productivity, Developing Economies 32, 372-397.
Kmenta, J., 1967, On Estimation of the CES Production Function, International
Economic Review, Vol.8, 180-189.
Kottaridi, C. and T. Stengos, 2010, Foreign Direct Investment, Human Capital and
Non-Linearities in Economic Growth, Journal of Macroeconomics, 32, 858-871.
Levin, A., C. F. Lin and C. S. Chu, 2002, Unit Root Tests in Panel Data:
Asymptotic and Finite Sample Properties, Journal of Econometrics 108, 1-24.
Maddala, G. S. and S. Wu, 1999, A Comparative Study of Unit Root Tests with
Panel Data and a New Simple Test, Oxford Bulletin of Economics and Statistics,
61, 631-52.
Mankiw, N G, D Romer and D N Weil, A Contribution to the Empirics of
Economic Growth, The Quarterly Journal of Economics, Vol.17:2, (1992), 407-437.
Mansfield, E. and A. Romeo, 1980, Technology Transfer to Overseas Subsidiaries
by U.S.-Based Firms, Quarterly Journal of Economics 95 (4), 737-750.

22
Mairesse, J. and B. H. Hall, 1996, Estimating the Production Function of Research
and Development in French and US Manufacturing Firms: An Exploration of
Simultaneity Issues with GMM Methods, in Wagner, K. and B. Van Ark (eds.,),
International Productivity Differences and Their Explanations, Elsevier Science,
285-315.
McGrattan, E. R. and E. C. Prescott, 2008, Technology Capital and the U.S. Current
Account, NBER Working Paper No. 13983.
Miller, E., 2008, An assessment of CES and Cobb-Douglas Production Functions,
Congressional Budget Office, WP 05.
Nelson, R. and E. Phelps, 1966, Investments in Humans, Technology Diffusion, and
Economic Growth,” American Economic Review, 56(2), 69-75.
Pedroni, P., 2004, Panel Cointegration: Asymptotic and finite Sample Properties of
pooled time series tests with an Application to the PPP Hypothesis, Econometric
Theory 20: 597-625.
Pedroni, P., (1999), Critical Values for Cointegration Tests in Heterogeneous Panel
with Multiple Regressors, Oxford Bulletin of Economics and Statistics, 61, 653-
670.
Phillips, P C B, March 2003, Laws and Limits of Econometrics,” Economic
Journal, Vol. 113, No. 486, c26-c52.
Phillips, C. B. and P. Perron, 1988, Testing in Unit Root in Time Series Regression,
Biometrika 75, 335-346.
Razzak, W. A., 2010, An Empirical Glimpse on MSEs in Four Arab Countries,
Journal of Economics and Econometric, Vol. 53 (1), 59-89.
Razzak, W. A., 2009, Self Selection versus Learning-by-Exporting: Four Arab
Countries, Applied Business and Economics, Volume 9 (3), 97-130.

23
Razzak, W. A., 2007, A Perspective on Unit Root and Cointegration in Applied
Macroeconomics, The International Journal of Applied Econometrics and
Quantitative Studies, Issue 1, 77-102.
Rudebusch, G, 1993, The Uncertain Unit Root in Real GNP, American Economic
Review, Vol. 83 (March 1993), 264-72.
Rugman, A. M., 1980, Multinationals in Canada: Theory, Performance and
Economic Impact, Boston.
Rugman, A. M., 1975, Motives For Foreign Investment: The Market Imperfections
and Risk Diversification Hypotheses, Journal of World Trade law, Vol. 9, 567-573.
Said, S. E., and D. A. Dickey, 1984, Testing for Unit Root in Autoregressive
Moving Average Models of Unknown Order, Biometrika 71, 599-607.
Sarno, L. and M. Taylor,1998, Real Exchange Rates Under the Current Float:
Unequivocal Evidence of Mean Reversion, Economics Letters 60, 131-137.
Stock, J, 1991, Confidence Intervals for the Largest Autoregressive Root in U.S.
Macroeconomic Time Series,” Journal of Monetary Economics, Vol. 28, 435-59.
Taylor, M. and L. Sarno,1998, The Behaviour of Real Exchange Rates During the
Post-Bretton Woods Period, Journal of International economics 46, 281-312.
Varum, C. A., V. C. Rocha, G. Alves, and L. Piscitello, 2011, The Enhancing
Effect f Human Capital on the FDI and Economic Growth Nexus, Working Paper,
University of Aveiro, Portugal, Presented at the First Workshop on the Economics
and Econometrics of Education in Lisbon, January 2011.
White, H. and W. J. Granger, 2011, Consideration of Trends in Time Series,
Journal of Time Series Econometrics: Vol. 3 : Issue.1.
World Investment Report, 2010, UNCTAD.
World Investment Report, 2008, UNCTAD.

24
Table 1: FDI flows as % of GDP
1980 2008 2009 Algeria 0.8 1.6 2.0 Egypt 2.3 5.7 3.6 Jordan 0.8 13.3 10.4 Morocco 0.4 2.9 1.5 Tunisia 2.8 7.0 4.3 China 0.02 2.45 1.91 Korea, Republic of 0.03 0.90 0.90 Malaysia 3.67 3.24 0.75 Thailand 0.58 3.10 1.89 Source : UNCTAD database
Table 2: Definition of data variables 1980 – 2009 Annual Data
n GDP, Y
Gross Domestic Product at constant prices 2000. Source: World Development Indicators database, WDIs, (World Bank).
FDI stock, fK
Foreign Direct Investment data stocks. Source: UNCTAD database. It is deflated by the gross capital formation price from the WDIs database.
Domestic Capital, dK Total capital stock constructed using gross fixed capital formation and the perpetual inventory method with a depreciation rate of 6% and the initial capital equal 2 times real GDP of 1979. Domestic capital stock is the total minus FDI stock.
Human capital , H
The Barro-Lee formula for the developing countries, including the Arab countries in our sample is given by � �TeSePetConsH it 092.8665.2439.0tan ���� , where Pe is primary, Se is secondary andTe is tertiary shares of gross enrolments. The constant term is allowed to vary across countries.
Working age population L
Working age population 15-64 years, a proxy for labor. Source: WDIs database.

25
Table 3: Shares of inward FDI flows by main sectors in percent (Arabic sample)
Algeria 2005 2006 2007 2008 Agriculture and hunting 0.8 0.0 0.0 0.0 Unspecified secondary 28.9 67.4 66.0 50.3 Unspecified tertiary 0.8 18.9 16.8 1.8 Transport, storage and communications 66.5 2.4 2.2 0.2 Hotels and restaurants 0.0 10.0 0.4 0.0 Construction 3.0 1.3 14.6 47.8 Total FDI 100.0 100.0 100.0 100.0
Egypt 2006 2007 2008 2009 Agriculture and hunting 0.2 0.7 0.6 2.4 Petroleum 37.5 45.5 75.3 68.8 Unspecified secondary 8.1 8.6 6.6 4.1 Finance 17.7 12.3 3.4 7.9 Other Services 36.5 33.0 14.0 16.7 Total FDI 100.0 100.0 100.0 100.0Source for Algeria and Egypt: UNCTAD and International Trade Center: www.investmentmap.org
Morocco 2006 2007 2008 2009 2010 Agriculture and fishing 0.1 0.1 0.2 0.1 0.2 Energy and mining 0.4 7.4 5.6 0.6 1.0 Manufacturing industries 34.4 8.7 6.4 10.8 10.3 Real estate 15.8 20.0 32.7 22.0 22.9 Tourism 30.0 32.7 20.3 11.4 10.2 Other Services 18.9 30.7 34.7 55.0 55.1 Unspecified 0.4 0.3 0.1 0.2 0.3 Total FDI 100.0 100.0 100.0 100.0 100.0 Source: Office des changes du Maroc; www.oc.gov.ma
Tunisia 2006 2007 2008 2009 2010 Agriculture 0.3 0.4 0.6 0.7 0.1 Energy 21.4 65.6 56.9 54.1 60.8 Manufacturing industries 7.9 23.5 18.9 33.9 26.5 Tourism and real estate 0.4 3.5 5.8 3.8 4.4 Services and others 70.0 7.1 17.8 7.5 8.2 Total FDI 100.0 100.0 100.0 100.0 100.0 Source: www.investintunisia.com

26
Table 4: Shares of inward FDI flows by main sectors in percent (Asian sample)
China 2005 2006 2007 2008 2009 Agriculture, hunting, forestry, fishing, mining and quarrying 1.5 1.5 1.9 1.9 2.1
Manufacturing industries 58.6 57.7 54.7 54.0 51.9 Business activities 13.1 18.7 31.4 30.2 29.8 Other services 26.8 22.1 12.0 13.9 16.1 Total FDI 100.0 100.0 100.0 100.0 100.0 Source: http://www.investmentmap.org/TimeSeries_Industry_fdi.aspx?prg=1
Malaysia 2005 2006 2007 2008 2009 Agriculture and hunting 2.5 -1.7 24.0 0.8 -4.4 Mining and quarrying 26.7 13.3 14.8 -8.9 84.7 Manufacturing 44.8 20.5 37.4 52.1 -44.8 Finance 13.4 54.3 24.2 53.2 80.9 Other services 12.6 13.5 -0.4 2.9 -16.3 Total FDI 100.0 100.0 100.0 100.0 100.0 Source: http://www.investmentmap.org/TimeSeries_Industry_fdi.aspx?prg=1
Republic of Korea 2008 2009 2010 Services 71.6 66.1 48.4 Machinery and equipment 21.8 26.2 40.1 Manufacturing 3.9 6.2 10.7 Others 2.7 1.4 0.9 Total FDI 100.0 100.0 100.0 Source: http://www.investmentmap.org/TimeSeries_Industry_fdi.aspx?prg=1
Thailand 2006 2007 2008 Agriculture and hunting, Mining and quarrying 1.9 8.2 0.1 Machinery and equipment 13.4 12.2 15.1 Other manufacturing 25.4 24.0 63.6 Business activities 22.9 14.9 13.8 Other services and unspecified services 36.4 40.7 7.4 Total FDI 100.0 100.0 100.0 Source: http://www.investmentmap.org/TimeSeries_Industry_fdi.aspx?prg=1

27
Tabl
e 5:
Cob
b-D
ougl
as P
rodu
ctio
n Fu
nctio
n Es
timat
ed E
last
icity
For
Ara
b C
ount
ries
Sp
ecifi
catio
n 1
Spec
ifica
tion
2 Sp
ecifi
catio
n 3
it
itfit
dit
itL
kk
ay
1ln
lnln
ln�
��
��
��
��
iii
itit
itfit
dit
itL
hk
ka
y2
lnln
lnln
ln�
��
��
��
��
��
iii
itit
itf
dit
itL
hk
ka
y3
ln)
ln(
lnln
��
��
��
��
�iii
EG
LS
GM
Mi
Qua
ntile
ii
EGLS
G
MM
i Q
uant
ileii
EGLS
G
MM
i Q
uant
ileii
0.25
0.
50
0.75
0.
25
0.50
0.
75
0.25
0.
50
0.75
�
0.66
7 (0
.000
0)
0.78
6 (0
.000
0)
0.54
0 (0
.000
1)
0.78
5 (0
.000
0)
0.62
2 (0
.000
0)
0.28
2 (0
.000
3)
0.34
7 (0
.000
0)
0.55
2 (0
.000
0)
0.63
7 (0
.000
0)
0.29
9 (0
.066
8)
0.39
6 (0
.000
9)
0.77
2 (0
.000
0)
0.57
2 (0
.000
0)
0.75
6 (0
.000
0)
0.36
0 (0
.000
2)
eria
Alg
�
0.12
6 (0
.000
0)
0.14
5 (0
.000
0)
0.10
7 (0
.025
6)
0.20
1 (0
.000
1)
0.29
1 (0
.000
2)
-0.0
92
(0.0
217)
-0
.016
(0
.287
4)
0.07
6 (0
.044
7)
0.13
2 (0
.007
4)
0.35
8 (0
.000
0)
0.07
0 (0
.000
4)
0.11
1 (0
.000
0)
0.09
7 (0
.010
3)
0.16
4 (0
.000
0)
0.37
2 (0
.000
0)
Egyp
t�
0.
389
(0.0
000)
0.
419
(0.0
000)
0.
084
(0.0
746)
0.
235
(0.0
000)
0.
274
(0.0
003)
0.
313
(0.0
000)
0.
378
(0.0
000)
0.
072
(0.1
087)
0.
155
(0.0
013)
0.
285
(0.0
000)
0.
360
(0.0
000)
0.
371
(0.0
000)
0.
087
(0.0
387)
0.
193
(0.0
000)
0.
1318
(0
.000
0)
Jord
an�
0.
339
(0.0
000)
0.
371
(0.0
000)
0.
128
(0.0
000)
0.
201
(0.0
000)
0.
230
(0.0
000)
0.
200
(0.0
000)
0.
253
(0.0
000)
0.
040
(0.4
758)
0.
084
(0.0
672)
0.
174
(0.0
000)
0.
264
(0.0
000)
0.
337
(0.0
000)
0.
099
(0.0
000)
0.
148
(0.0
000)
0.
228
(0.0
000)
Mor
occo
�
0.18
9 (0
.000
0)
0.16
4 (0
.000
0)
0.15
1 (0
.000
1)
0.27
7 (0
.000
0)
0.31
2 (0
.000
1)
0.18
6 (0
.000
0)
0.21
0 (0
.000
0)
0.13
6 (0
.000
1)
0.20
0 (0
.000
0)
0.32
8 (0
.000
0)
0.22
5 (0
.000
0)
0.16
0 (0
.000
0)
0.14
2 (0
.000
1)
0.23
2 (0
.000
0)
0.35
5 (0
.000
0)
Tuni
sia
�
0.47
2 (0
.000
0)
0.51
0 (0
.000
0)
0.12
2 (0
.000
0)
0.19
7 (0
.000
0)
0.22
8 (0
.000
0)
0.08
0 (0
.131
1)
0.17
5 (0
.000
3)
0.07
8 (0
.006
1)
0.11
5 (0
.001
3)
0.21
4 (0
.000
0)
0.30
0 (0
.000
0)
0.24
7 (0
.000
0)
0.10
8 (0
.000
0)
0.15
9 (0
.000
0)
0.25
3 (0
.000
0)
�--
--
--
--
--
0.
534
(0.0
000)
0.
536
(0.0
000)
0.
282
(0.0
778)
0.
292
(0.0
030)
0.
294
(0.0
001)
--
--
--
--
--
�
-0.1
03
(0.0
187)
-0
.054
(0
.000
0)
0.15
0 (0
.202
6)
0.00
0 (0
.994
3)
-0.0
46
(0.4
312)
0.
262
(0
.000
0)
0.18
2 (0
.000
0)
0.23
7 (0
.008
4)
0.16
0 (0
.026
5)
0.13
6 (0
.031
8)
-0.2
25
(0.0
000)
-0
.130
(0
.000
0)
0.07
9 (0
.500
9)
-0.0
61
(0.3
692)
-0
.237
(0
.000
0)
�iv
0.
0668
0.
0647
0.
1324
0.
0961
0.
1199
0.
0705
0.
0630
0.
1330
0.
0980
0.
1339
0.
0569
0.
0557
0.
1288
0.
0957
0.
1387
J
--
25.0
68
(0.1
988)
--
--
--
--
23
.916
(0
.199
4)
--
--
--
--
25.8
44
(0.1
346)
--
--
--
Jarq
ue-
Ber
a 3.
830
(0.1
473)
0.
413
(0.8
133)
--
--
--
0.
457
(0.7
954)
1.04
1 (0
.594
2)
--
--
--
1.61
8 (0
.445
2)1.
055
(0.5
899)
--
--
--
Wal
dv --
--
0.
0000
0.
0000
--
--
0.
0000
W
e do
not
repo
rt th
e co
nsta
nt te
rms,
and
P va
lues
are
in p
aren
thes
es.
T is
198
0 -2
009,
N is
5..
iPan
el G
MM
regr
essi
on fi
xed
effe
ct w
ith c
ross
-sec
tion
wei
ghts
for G
LS w
eigh
t, w
hite
cro
ss se
ctio
n fo
r GM
M w
eigh
ting
mat
rix, a
nd w
hite
cro
ss se
ctio
n fo
r coe
ffic
ient
s sta
ndar
d er
rors
and
cov
aria
nce
mat
rix (w
ith
corr
ecte
d de
gree
of f
reed
om).
The
inst
rum
ents
are
con
stan
t ter
m, l
og G
DP
for t
he E
urop
ean
Uni
on, d
umm
y va
riabl
es fo
r the
IMF
mac
ro st
abili
ty p
rogr
am, e
qual
s 1 w
hen
join
ing
the
prog
ram
and
zer
o ou
tsid
e, fo
r WTO
,

28
Con
tinue
d –
tabl
e 5
join
ing
year
= 1,
free
trad
e ag
reem
ent y
ear w
ith E
urop
ean
Uni
on=1
sinc
e th
e ag
reem
ent s
tarts
and
zer
o be
fore
, log
sha
re o
f age
gro
up in
tota
l pop
ulat
ion
(eg.
, peo
ple
age
20-2
4, 2
5-29
,…, 6
0-64
), tw
o la
gs o
f log
FD
I st
ocks
for t
he fi
rst a
nd se
cond
spec
ifica
tion,
and
two
lags
of l
og in
tera
ctio
n te
rm fo
r the
third
spec
ifica
tion.
. ii I
n th
e qu
intil
e re
gres
sion
s, w
e us
ed th
e H
uber
San
dwic
h fo
r coe
ffic
ient
stan
dard
err
ors a
nd c
ovar
ianc
e, K
erne
l (E
pane
chni
kov)
usi
ng re
sidu
als a
nd H
all-S
heat
her,
band
wid
th=0
.186
66.
ii1
�
��
��
��
mea
sure
s the
dis
tanc
e fr
om c
onst
ant r
etur
ns to
scal
e. T
he c
oeff
icie
nt�
is th
e sh
are
of la
bor i
n th
e C
obb-
Dou
glas
pro
duct
ion
func
tion.
For
the
seco
nd sp
ecifi
catio
n,
1
��
��
��
��
�.
iii�
is th
e St
anda
rd e
rror
of t
he re
gres
sion
.
ivP
valu
es. v
The
p-v
alue
s for
Wal
d te
st o
f hyp
othe
sis t
hat
75.050.0
25.0�
��
��
cal
led
slop
e eq
ualit
y te
st in
E-v
iew
s.
Jis
the
test
stat
istic
for o
ver-
iden
tifyi
ng re
stric
tions
.
Jarq
ue-B
era
is th
e no
rmal
ity te
st fo
r the
resi
dual
s.

29
Tabl
e 6:
The
Rat
e of
Ret
urns
on
Inw
ard
FDI m
easu
red
in A
rab
Cou
ntrie
s
Spec
ifica
tion
1i Sp
ecifi
catio
n 2i
Spec
ifica
tion
3ii
Ave
rage
C
ount
ry
ti
itfit
dit
itL
kk
ay
1ln
lnln
ln�
��
��
��
��
itit
itfit
dit
itL
hk
ka
y2
lnln
lnln
ln�
��
��
��
��
��
it
itit
fitdi
tit
Lh
kk
ay
3ln
).
(ln
lnln
��
��
��
��
�
Alg
eria
3.
07
0.00
2.
47
1.85
Egyp
t 1.
96
1.10
1.
83
1.63
Jord
an
1.08
0.
56
1.24
0.
96
Mor
occo
1.
28
1.64
1.
29
1.41
Tuni
sia
0.88
0.
30
0.76
0.
64
Ave
rage
1.
65
0.72
1.
52
1.30
i T
he ra
te o
f ret
urns
on
FDI i
s �� ��
�� ��
fKY
aver
age
*�
ii Th
e ra
te o
f ret
urns
on
FDI i
s� ��
� �� � ��
� ��� �� ��
�� ��
HYHY
aver
age
KYav
erag
ef
**
��

30
Tabl
e 7:
Est
imat
ed R
etur
ns fo
r qui
ntile
regr
essi
ons
Firs
t Spe
cific
atio
n
Seco
nd S
peci
ficat
ion
Third
Spe
cific
atio
n
Q
uint
iles
ti
itfit
dit
itL
kk
ay
1ln
lnln
ln�
��
��
��
��
itit
itfit
dit
itL
hk
ka
y2
lnln
lnln
ln�
��
��
��
��
��
it
itit
fitdi
tit
Lh
kk
ay
3ln
).
(ln
lnln
��
��
��
��
�
El
astic
ity
Ret
urn
i El
astic
ity
Ret
urn
i El
astic
ity
Ret
urn
ii
Alg
eria
Q
1=0.
25
0.11
0.
68
0.08
0.
48
0.10
0.
61
Q2=
0.50
0.
20
2.24
0.
13
1.48
0.
16
1.83
Q
3=0.
75
0.29
5.
32
0.36
6.
54
0.37
6.
79
Egyp
t Q
1=0.
25
0.08
0.
11
0.07
0.
09
0.09
0.
11
Q2=
0.50
0.
24
0.57
0.
16
0.38
0.
19
0.47
Q
3=0.
75
0.27
1.
04
0.29
1.
09
0.32
1.
21
Jord
an
Q1=
0.25
0.
13
0.09
0.
04
0.03
0.
10
0.07
Q
2=0.
50
0.20
0.
35
0.08
0.
15
0.15
0.
26
Q3=
0.75
0.
23
0.62
0.
17
0.47
0.
23
0.61
Mor
occo
Q
1=0.
25
0.15
0.
18
0.14
0.
17
0.14
0.
17
Q2=
0.50
0.
28
0.71
0.
20
0.51
0.
23
0.59
Q
3=0.
75
0.31
1.
39
0.33
1.
47
0.35
1.
58
Tuni
sia
Q1=
0.25
0.
12
0.08
0.
08
0.05
0.
11
0.07
Q
2=0.
50
0.20
0.
18
0.11
0.
10
0.16
0.
15
Q3=
0.75
0.
23
0.31
0.
21
0.29
0.
25
0.34
i The
rate
of r
etur
ns o
n FD
I is
�� ���� ��
fKY
aver
age
*�
ii Th
e ra
te o
f ret
urns
on
FDI i
s� ��
� �� � ��
� ��� �� ��
�� ��
HYHY
aver
age
KYav
erag
ef
**
��

31
Tabl
e 8:
Cob
b-D
ougl
as P
rodu
ctio
n Fu
nctio
n Es
timat
ed E
last
icity
For
Asi
an C
ount
ries
Sp
ecifi
catio
n 1
Spec
ifica
tion
2 Sp
ecifi
catio
n 3
t
iit
fitdi
tit
Lk
ka
y1
lnln
lnln
��
��
��
��
�i
itit
itfit
dit
itL
hk
ka
y2
lnln
lnln
ln�
��
��
��
��
��
i it
itit
fdi
tit
Lh
kk
ay
3ln
)ln
(ln
ln�
��
��
��
��
i
�
0.66
5 (0
.000
0)
0.66
9 (0
.000
0)
0.66
7 (0
.000
0)
Chi
na�
0.
233
(0.0
000)
0.
207
(0.0
000)
0.
195
(0.0
000)
Kor
ea�
0.
112
(0.0
000)
0.
090
(0.0
001)
0.
102
(0.0
000)
Mal
aysi
a�
0.
378
(0.0
000)
0.
340
(0.0
000)
0.
313
(0.0
000)
Thai
land
�
0.16
7 (0
.000
0)
0.14
0 (0
.000
0)
0.14
7 (0
.000
0)
�
--
0.20
3 (0
.331
4)
--
�ii
-0.4
56
(0.0
121)
-0
.289
(0
.264
4)
-0.4
51
(0.0
118)
�
iii
0.07
87
0.07
28
0.07
28
J
13.7
61
(0.3
160)
15
.323
(0
.287
6)
12.3
80
(0.3
357)
Ja
rque
-B
era
2.26
9 (0
.321
5)
2.05
5 (0
.357
8)
2.65
3 (0
.265
2)
Con
stan
t ter
ms a
re n
ot r
epor
ted.
T
is 1
980
– 20
09, a
nd N
is 4
..
i Pan
el G
MM
regr
essi
ons,
fixed
eff
ect,
cros
s-se
ctio
n G
LS w
eigh
t, w
hite
dia
gona
l ins
trum
ent
for w
eigh
ting
mat
rix, a
nd w
hite
dia
gona
l for
coe
ffic
ient
s sta
ndar
d er
rors
and
cov
aria
nce
mat
rix (w
ith c
orre
cted
deg
ree
of
free
dom
). T
he in
stru
men
ts a
re c
onst
ant t
erm
, dum
my
varia
ble
WTO
join
ing
year
= 1
and
zero
ther
eafte
r, lo
g of
(im
port
plus
exp
ort)
as ra
tio to
GD
P, t
hree
lags
of
ity, t
hree
lags
of l
og
fitk, t
hree
lags
of i
nter
actio
n
term
, lin
ear t
rend
. ii
1
��
��
��
�m
easu
res t
he d
ista
nce
from
con
stan
t ret
urns
to sc
ale.
The
coe
ffic
ient�
is th
e sh
are
of la
bor i
n th
e C
obb-
Dou
glas
pro
duct
ion
func
tion.
For
the
seco
nd sp
ecifi
catio
n,
1
��
��
��
��
�.
iii�
is th
e St
anda
rd e
rror
of t
he re
gres
sion
.

32
Con
tinue
d –
tabl
e 8
Jis
the
test
stat
istic
for o
ver-
iden
tifyi
ng re
stric
tions
. Ja
rque
-Ber
a is
the
norm
ality
test
for t
he re
sidu
als.

33
Tabl
e 9:
The
Rat
e of
Ret
urns
on
Inw
ard
FDI m
easu
red
in A
sian
Cou
ntrie
s �
Spec
ifica
tion
1i Sp
ecifi
catio
n 2 i
Spec
ifica
tion
3ii
Ave
rage�
Cou
ntry�
ti
itfit
dit
itL
kk
ay
1ln
lnln
ln�
��
��
��
��
itit
itfit
dit
itL
hk
ka
y2
lnln
lnln
ln�
��
��
��
��
��
iit
itit
fdi
tit
Lh
kk
ay
3ln
)ln
(ln
ln�
��
��
��
��
�
Chi
na
7.17
6.
39
6.04
6.
53
Kor
ea
4.37
3.
49
3.97
3.
94
Mal
aysi
a 1.
42
1.28
1.
20
1.30
Thai
land
1.
74
1.46
1.
57
1.59
Ave
rage
s 3.
68
3.15
3.
20
3.34
i T
he ra
te o
f ret
urns
on
FDI i
s �� ��
�� ��
fKY
aver
age
*�
ii Th
e ra
te o
f ret
urns
on
FDI i
s� ��
� �� � ��
� ��� �� ��
�� ��
HYHY
aver
age
KYav
erag
ef
**
��

34
Table 10: CES Estimated Elasticity
Arab Countries Asian Countries
First Specification
ititfitditfitditit Lkkkkay 1
221 ln)ln(ln)1(ln)1(lnln ������� ������
EGLS GMM GMM
Coefficient P-value Coefficient P-value Coefficient P-value � 0.558 0.000 0.582 0.000 0.692 0.000 � -0.302 0.000 -0.338 0.103 -0.326 0.000 � -0.081 0.151 0.091 0.000 -0.457 0.000 � 1.432 1.510 1.483
Second Specification
itititfitditfitditit hLkkkkay 2
221 lnln)ln(ln)1(ln)1(lnln �������� �������
EGLS GMM GMM
Coefficient P-value Coefficient P-value Coefficient P-value
� 0.556 0.000 0.580 0.000 0.694 0.000 � -0.316 0.000 -0.330 0.000 -0.324 0.000 � -0.011 0.847 0.079 0.165 -0.461 0.000 � 0.556 0.000 0.580 0.000 0.694 0.000 � 1.461 1.493 1.480
Third Specification
itititfitdititfitditit Lhkkhkkay 3
221 ln)).(ln(ln)1().(ln)1(lnln ������� ������
EGLS GMM GMM
Coefficient P-value Coefficient P-value Coefficient P-value
� 0.715 0.000 0.740 0.000 0.843 0.000 � -0.323 0.000 -0.325 0.000 -0.393 0.000 � -0.212 0.000 -0.104 0.109 -0.547 0.000 � 1.478 1.481 1.649
T is 1980 – 2009, and N is 5.

35
Figure 1 Log Average Years of Schooling
1.0
1.2
1.4
1.6
1.8
2.0
2.2
1980
1981
1982
1983
1984
1985
1986
1987
1988
1989
1990
1991
1992
1993
1994
1995
1996
1997
1998
1999
2000
2001
2002
2003
2004
2005
2006
2007
2008
2009
Algeria
0.8
1.0
1.2
1.4
1.6
1.8
2.0
1980
1981
1982
1983
1984
1985
1986
1987
1988
1989
1990
1991
1992
1993
1994
1995
1996
1997
1998
1999
2000
2001
2002
2003
2004
2005
2006
2007
2008
2009
Egypt
1.4
1.6
1.8
2.0
2.2
2.4
1980
1981
1982
1983
1984
1985
1986
1987
1988
1989
1990
1991
1992
1993
1994
1995
1996
1997
1998
1999
2000
2001
2002
2003
2004
2005
2006
2007
2008
2009
Jordan
0.4
0.6
0.8
1.0
1.2
1.4
1.6
1980
1981
1982
1983
1984
1985
1986
1987
1988
1989
1990
1991
1992
1993
1994
1995
1996
1997
1998
1999
2000
2001
2002
2003
2004
2005
2006
2007
2008
2009
Morocco
1.0
1.2
1.4
1.6
1.8
2.0
2.2
1980
1981
1982
1983
1984
1985
1986
1987
1988
1989
1990
1991
1992
1993
1994
1995
1996
1997
1998
1999
2000
2001
2002
2003
2004
2005
2006
2007
2008
2009
Human Capital Using Barro-Lee Data Extrapolated by Five Years IntervalsHuman Capital Using Barro-Lee Equation for Developping Countries
Tunisia

36
1.5
1.6
1.7
1.8
1.9
2.0
2.1
1980
1981
1982
1983
1984
1985
1986
1987
1988
1989
1990
1991
1992
1993
1994
1995
1996
1997
1998
1999
2000
2001
2002
2003
2004
2005
2006
2007
2008
2009
China
1.2
1.4
1.6
1.8
2.0
2.2
1980
1981
1982
1983
1984
1985
1986
1987
1988
1989
1990
1991
1992
1993
1994
1995
1996
1997
1998
1999
2000
2001
2002
2003
2004
2005
2006
2007
2008
2009
Thailand
2.1
2.2
2.3
2.4
2.5
1980
1981
1982
1983
1984
1985
1986
1987
1988
1989
1990
1991
1992
1993
1994
1995
1996
1997
1998
1999
2000
2001
2002
2003
2004
2005
2006
2007
2008
2009
Korea
1.7
1.8
1.9
2.0
2.1
2.2
2.3
2.4
1980
1981
1982
1983
1984
1985
1986
1987
1988
1989
1990
1991
1992
1993
1994
1995
1996
1997
1998
1999
2000
2001
2002
2003
2004
2005
2006
2007
2008
2009
Human Capital Using Barro-Lee Data Extrapolated by Five Years IntervalsHuman Capital Using Barro-Lee Equation for Developping Countries
Malaysia

37
0.000.050.100.150.200.250.300.350.40
Algeria
Egypt�
Jordan�
Morocco�
Tunisia
China
Korea
Malaysia
Thailand
Arab�Average
Asia�Average
Figure 2: Average Estimated Elasticity of FDI for the Three Specifications by GMM
0
1
2
3
4
5
6
7
US
Con
stan
t Dol
lar,
2000
Algeria
Egypt�
Jordan�
Morocco�
Tunisia
China
Korea
Malaysia
Thailand
Arab�Average
Asia�Average
Figure 3: Average Rates of Returns

38
0
2
4
6
8
10
12Av
erage�Ye
ars�o
f�Schoo
ling
Algeria
Egypt
Jordan
Morocco
Tunisia
ChinaKorea
Malaysia
Thailan
d
Figure�4:�Human�Capital
Average
Median
0
10
20
30
40
50
60
70
80
Algeria Egypt Jordan Morocco Tunisia
Figure�5:�Quality�of�Human�Capital�Relative�to�Korea's�Korea=100)

39
i For example see Balasubramanyam et al. (1996) and Kawai (1994) on trade-FDI-growth, Carkovic and Levine (2002) found the effect of FDI on growth is not robust in the presence of openness of trade. Levine (2002) had an interaction term of per capita income and FDI and reports no growth effect. Alfaro et al. (2007) argue that FDI has significant growth effect in countries with relatively more developed financial markets. See also Aitken and Harrison (1999), Haddad and Harrison (1993), and Mansfield and Romeo (1980). The main problem in this literature apparently is an estimation problem pointed out by Carkovic and Levine (2002) and that is not taking into account simultaneity bias, country-specific effects, and the use of lagged dependent variables in growth regression. Razzak (2009) provides micro-level evidence for trade-growth relationship in the Arab countries. ii The theory of FDI is part of the theory of internalization developed by Coase (1937). It is thoroughly discussed in Hymer (1976), Buckly and Gasson (1976), Dunning (1977), and Rugman (1975). FDI by multinational companies cannot be explained by neoclassical trade theory. Market friction and imperfections inhibit private international investments. The theory of internalization explains that the motivations and reasons for foreign production and sales by multinational companies (FDI) are associated with these market imperfections. Free trade does not give rise to such companies. For example, when a country imposes tariffs on imports, profit-maximizing foreign exporters are better off if they establish production and sales in that country to avoid the tariffs. The same is true in the case of knowledge, which is transferred within the internal market between the multinational company and its subsidiary because of the absence of such market and competitive prices. Rugman (1980) provides a number of examples. Internalization theory seems to suggest that FDI and free trade cannot be positively associated, but rather the opposite is true, which contradicts the story told in Jones and Romer (2010). iii The concept of thick-modeling was first introduced by Clive Granger (2004). iv In a related literature, Bosworth et al. (2007) and Hung and Mascaro (2005) test and explain the issue of high return on U.S. FDI abroad. They found that American firms operating outside the U.S. appear to earn a persistently higher return than that earned by foreign firms in the U.S. McGrattan and Prescott (2008) also study the differential returns on investments of foreign subsidiaries of the U.S. multinational companies and U.S. subsidiaries of foreign multinationals. They argued that measurement errors might explain some of the reported variations, mostly unmeasured intangible capitals. v The production function would have an extra term te � , where � is the rate of disembodied technical change. If the data have unit roots this linear time trend would be a misspecification issue. If, however, we find the data to be trended but the trend is not stochastic we would have to have this linear trend term back in the specification. It is, however, extremely difficult to discern one from the other.
vi FDI inflows are uneven in the five Arab countries. In some years these flows were near zero, which makes fK very small, thus fKY / becomes a very large and nonsensical number. The stock of FDI, instead, do not exhibit this problem. Thus we will use the stock of FDI instead.
vii It would be important to include a measure of the quality of human capital too. Measurement of quality is tricky. There are some data, but the time series are short. Future research must take this variable into account. viii The Jorgenson and Fraumeni (1992) method constructs a stock of human capital, which is based on lifetime earnings. ix Jallab et al. (2008) is the only paper we are aware of on the issue of FDI and growth in the Arab countries using a proper estimation technique.
x We use a variety of common test statistics such as the Dickey-Fuller (1979), the ADF test, Said and Dickey (1984), Phillips and Perron (1988), and Elliot (1999). We also use different specifications (with and without

40
trend), and test the lag structure using various testing criteria. We also tested the panel of the five countries for a unit root using a variety of common tests such as Levin et al. (2002), Breitung (2000), Im et al. (2003), Hadri (2000), Sarno and Taylor (1998) and Taylor and Sarno (1998).
xi We use panel cointegration tests, the Johansen-Fisher test found in Maddala and Wu (1999), Kao (1999) residual test, and Pedroni (1999, 2004) residual test. The latter includes a number of tests, which allow for heterogeneous slope coefficients to vary across the panel (the panel v-test, panel � test, panel Phillips-Perron test, panel ADF test, group � test, group Phillips-Perron test and group ADF test). The null hypothesis is that the residuals are I(1) – no cointegration – and the alternative hypothesis is that the residuals are I(0). For the first 4 tests, the assumption is that under the alternative hypothesis, the residuals have a common AR coefficient. In the remaining 3 tests, the assumption is that the residuals under the alternative hypothesis have an individual AR coefficients. Kao (1999) test is similar to Pedroni’s test in principle, i.e., a residual-based test, but there are cross-section specific intercepts and homogenous coefficients in the first-stage regressors. The null hypothesis is that the residuals are I(1). The Maddal and Wu (1999) Johansen test is similar to Johansen’s time series tests, i.e., a maximum eigenvalue test.
xii Only the Pedroni (2004) test(s) for the Asian panel has high the P-values. xiii We regress each of the three explanatory variables on a constant and the set of instruments, retrieve the residuals and then estimate the equations with the residuals as additional regressors. We test the hypothesis that the set of the coefficients of the residuals are zero using both F and Chi-squared. xiv The GMM estimator minimizes � ����� ��
��
N
ii
N
ii WggZWZS
11)()())(())(()( ������� with respect to the
coefficients matrix � for a chosen pxp weighting matrix W , where
)),(()( ��� itii XfY � ; � ������
N
ii
N
ii Zgg
11)()()( ���� and Z is a xpTi matrix of instruments.
xv We do not use dynamic GMM (Arellano and Bond (1991), Arellano and Bover (1995) and Blundell and Bond (1998)) because we are (1) interested in the long run point elasticity to compute the rate of returns, and (2) because we have a short panel, i.e., N is small. xvi We also allowed the share of human capital � to vary across countries, but we do not report the results to save space. The results are available upon request. We found that the coefficient estimate to be insignificant for Algeria. We also found the coefficient estimate to be negative for Jordan and Morocco. A number of papers on growth-FDI seem to report negative coefficients for FDI or human capital in similar specifications (see for example, Kottaridi and Stengos (2010) and Varum et al.(2011) And Borensztein and J-W Lee (1998)). Finally we found the coefficient to be positive, sizable, and significant for Egypt and Tunisia.
xvii Independent calculations of the ratios of gross operating surplus to GDP from National Income Accounts also
reveal similarly high values. These estimates are between 0.35 and 0.78 depending on the specification.
xviii We re-estimated the regressions (GMM) and fixed the coefficient � for all Arab countries. The estimated elasticity is an average across all Arab countries is 0.22 percent. xix This coefficient measures the distance from a constant returns to scale. There are different interpretations to this negative value. One is that the production function exhibits a decreasing return-to-scale. This suggests that the Arab markets are small, thus doubling output is costly and requires more than doubling inputs. It could also mean that output in the Arab markets is consistently priced below marginal cost. Basu and Fernald (1997) suggest that this interpretation and decreasing returns to scale sounds illogical for a profit maximizing firm. However, there is evidence that the majority of firms in the Arab countries are small in size with negative value added, hence non-profitable firms, Alkawaz (2006). Of course a positive value means that the function exhibits an increasing returns to scale. xx Quantile regressions failed to produce any sensible results for Asia., which may indicate that distributional nonlinearity is insignificant.

41
xxi A measure of cognitive skills as a proxy for the quality of human capital is found in Trends in International Math and Science (TIMMS), which is an international students assessment survey, reports country scores for students in 4th and 8th grades in more than 80 countries, every four years. In the first survey in 1995 the scores for Algeria, Egypt, Jordan, Morocco and Tunisia were 394.15, 420.40, 439, 372.36, and 439 respectively. In the last published survey in 2007 these scores declined in all countries except Jordan, 381.75, 399.5, 454.5, 319, and 377 respectively. While in Korea’s score increased from 568 in 1995 to 575 in 2007. Both Thailand and Malaysia’s scores declined from 505.5 and 462 in 1995 to 472.5 and 456 in 2007 respectively.
xxii Razzak (2010) estimated a CES production function using cross sectional data of thousands of observations
for firms in Egypt, Lebanon, Morocco and Turkey.