dna barcoding of two forensically important fleshfly species ...

RESEARCH PAPER
DNA barcoding unveils a high rate of mislabeling in a commercialfreshwater catfish from Brazil
DANIEL C. CARVALHO1,2, DANILO A. P. NETO1, BRUNO S. A. F. BRASIL1, &
DENISE A. A. OLIVEIRA1
1Departamento de Zootecnia, Escola de Veterinaria, Universidade Federal de Minas Gerais, Belo Horizonte, Minas Gerais,
Brazil, and 2Molecular Ecology Laboratory, Flinders University, Adelaide, SA, Australia
(Received 24 November 2010; revised 27 January 2011; accepted 28 March 2011)
AbstractBackground and Aims. Molecular markers have contributed to species authentication by flagging mislabeling and themisidentification of commercial landings. Such tools are of great value since the market substitution of fish of lower value forhighly commercialized species is expected to become more pronounced due to a shortage of natural stocks.Materials and Methods. Here we report on the molecular identification 4results from processed fish products (i.e. fillets) andwhole fishes sold in Brazilian markets under the common name surubim (Pseudoplatystoma spp.).Results. DNA barcoding revealed the incorrect labeling of around 80% of all samples analyzed, with mislabeling being morepronounced within fillets rather than whole fish.Conclusion. To our knowledge, this is the first report correlating the rate of fraud with processed fish products. Theestablishment of an official list of acceptable common names for freshwater fish and seafood is urgently needed in Brazil forfurther trade regulations to take place.
Keywords: DNA barcoding, catfish, Pseudoplatystoma, cytochrome oxidase c subunit I, Sao Francisco River, mislabeling
Introduction
The effects of species substitution include economicfraud, health hazards, and the illegal trade of protectedspecies. Therefore, the detection of species substi-tution has become an important topic within the foodindustry, and there is a growing need for rapid,reliable, and reproducible tests to verify speciesin commercial fish and other animal products(Rasmussen andMorrissey 2008). In addition, speciesidentification is useful in ensuring honest tradingexchanges for correct consumer information.Toward this end, regulatory organizations such asthe European Union have established labeling laws forfish and aquaculture products, in which labels shouldbring traceability information (i.e. identification,origin of fish, and production method; Moretti et al.2003; Martinez et al. 2005).
The substitution of a less valuable fish species andproducts (i.e. fillets and eggs) for a more valuable onerepresents a common commercial fraud (DeSalle andBirstein 1996; Civera 2003; Marko et al. 2004). It isknown that fluctuations in the supply and demand ofdifferent fish species together with increases ininternational trade and fish consumption are import-ant factors in intentional product mislabeling(Rasmussen and Morrissey 2008). However, the wayfishes are processed for commercialization has not yetbeen correlated with the rate of fraud.
Moreover, it has become clear that mostpopulations of fish are declining dramatically, andaquaculture efforts are not expected to compensate(Pauly et al. 2002). In this scenario, trade in animalspecies has contributed greatly to overall biodiversitycrisis (Manel et al. 2002). For example, 77% of the
ISSN 1940-1736 print/ISSN 1940-1744 online q 2011 Informa UK, Ltd.
DOI: 10.3109/19401736.2011.588219
Correspondence: D. C. de Carvalho,Molecular Ecology Laboratory, School of Biology Sciences, Flinders University, Bedford Park, Adelaide,SA 5001, Australia. Tel: ! 55 31 34092206. Fax: 61 882013015. E-mail: [email protected]; [email protected]
Mitochondrial DNA, October 2011; 22(S1): 97–105
Mito
chon
dria
l DN
A D
ownl
oade
d fro
m in
form
ahea
lthca
re.c
om b
y D
r. Se
rgio
s-O
resti
s Kol
okot
roni
s on
10/1
4/11
For p
erso
nal u
se o
nly.

fish sold in the USA as the highly threatened redsnapper (Lutjanus campechanus) are in fact anotherspecies (Marko et al. 2004). Reliable and rapidmolecular identification methods could help both toprotect citizens from fraud and to protect endangeredspecies from overexploitation and illegal trafficking(DeSalle and Birstein 1996; Teletchea et al. 2005).
To avoid mislabeling and commercial fraud, the USFood andDrugAdministration has compiled an onlineRegulatory Fish Encyclopedia (http://www.fda.gov)listing acceptable market names, isoelectric focusingprotein electrophoresis patterns, and DNA barcodingdata (Yancy et al. 2008). These molecular data are alsocorrelated with high-resolution images of whole fishand filleted fish species, plus geographic, taxonomic,and nomenclature information for imported anddomestical species. All this information is on hand toassist government officials and purchasers in thecorrect identification and detection of species substi-tution and economic fraud. Another similar initiativeis the European FishTrace Consortium (http://www.fishtrace.org), comprising 53 members from severalinstitutions (Sevilla et al. 2007). Besides its richbiodiversity, no such initiative is yet currently ongoingin Brazil. Therefore, to implement laws againstpoaching and the trade of overexploited species andenforcing labeling regulations to prevent productsubstitution, there is a need for sensitive and reliableanalyticalmethods that can be applied to determine thespecies of a fish, even when no detectable externalfeatures are present (Baker et al. 2000;Kyle andWilson2007). Not to mention the detrimental effects thatfish adulteration can have on the commercial market,it can also put consumers at risk of purchasingpotentially harmful and mislabeled products (Cohenet al. 2009; Lowenstein et al. 2010). The effectivenessof fish conservation and management programs canalso be improved which aid in the protection ofaquatic habitats and endangered species (Teletcheaet al. 2005).
Molecular tools are advantageous for fish andfish products identification for three main reasons:large number of fish species from distinct live historystages (eggs, fry, and adults) can be examined; inaddition, processed fish products lacking the mor-phological characteristics, such as frozen fillets andprecooked fish, are also accessible (typically, thesecannot be identified using the traditional identificationprocedure); and there are insufficient specialists inalpha taxonomy for fish identification, especially in theNeotropics.
Several protocols have been described for speciesidentification of fish products, based on differenttechnologies such as high-performance liquid chro-matography, isoelectric focusing, and polyacrylamidegel electrophoresis (Martinez et al. 2005; Rasmussenand Morrissey 2008). Among these, DNA-basedmethodologies are one of the most promising
approaches since they can be applied to all thedifferent life stages of fish species and fish products(Rasmussen and Morrissey 2008; Smith et al. 2008;Vinas and Tudela 2009).
The mitochondrial DNA (mtDNA) cytochrome coxidase subunit I gene (COI) has provided numerousexamples as a reliable and universal tool for theidentification of species such as the flatfish (Terol et al.2002; Espineira et al. 2008), tuna (Terol et al. 2002;Lowenstein et al. 2010), anchovy (Jerome et al. 2008),sharks (Barbuto et al. 2010), and also wildlifeforensics investigations (Dawnay et al. 2007; Nelsonet al. 2007). Its application in molecular taxonomy hasbeen criticized due to introgressive hybridization,mitochondrial pseudogenes in the nucleus, and theretention of ancestral polymorphisms (e.g. Rubinoff2006; Rubinoff et al. 2006). However, speciesassignment failure rates do not typically exceed5–10% (Hebert and Gregory 2005; Ward et al.2005; Hubert et al. 2008; Valdez-Moreno et al. 2009).Therefore, a global effort to assemble a standardizedreference DNA sequence library (using the COIregion) for all fishes has been proposed. This initiativeled to the establishment of international researchcollaboration, named the Fish Barcode of LifeCampaign (FISH-BOL; Ward et al. 2009). Thebarcode data for thousands of freshwater fishes havebeen uploaded to the Barcode of Life Data Systemsdatabase (BOLD), including freshwater species fromthe Neotropics (data available on BOLD; Carvalhoet al. 2011), allowing their application for the analysisof commercial fraud cases in Brazil.
This work was conducted to identify which specieshave been sold in Brazil labeled as surubim or pintadousing DNA barcode data. These vernacular names areapplied to Pseudoplatystoma corruscans and Pseudopla-tystoma reticulatum (former Pseudoplatystoma fasciatum;Froese and Pauly 2011); however, Brazil does not havean official list of commercial and Latin names for thesefishes. P. corruscans is considered the most valuablecommercial and recreational freshwater fish in the SaoFrancisco River (fourth biggest river in Brazil);however, surubim harvest has shown clear indicationsof collapse, since harvesting of P. corruscans hasdeclined from 10.3 to 0.8 kg captured fish per dayfrom 1987 to 1999 (Godinho et al. 2007). Moreover,the genus Pseudoplatystoma consists of at least eightspecies, five of which were recently described(Buitrago-Suarez and Burr 2007). P. reticulatum andP. corruscans are sympatric in the Parana basin(southern Brazil), whereas only the latter has beendescribed in the Sao Francisco basin. A recentmolecular phylogeny of the genus Pseudoplatystomadid not find any correlation between morphologicaland molecular data (Control Region) in two species(P. reticulatum and Pseudoplatystoma punctifer; Torricoet al. 2009). For all other species, including
D. C. Carvalho et al.98
Mito
chon
dria
l DN
A D
ownl
oade
d fro
m in
form
ahea
lthca
re.c
om b
y D
r. Se
rgio
s-O
resti
s Kol
okot
roni
s on
10/1
4/11
For p
erso
nal u
se o
nly.

P. corruscans (surubim), the molecular data supportedthe morphological classification.
From this work, we reported a fish market DNAbarcode survey of processed (i.e. fillets) and wholefishes sold in Brazil under the common name surubim.We tested the hypothesis that substitutions would bemore frequent among fillets than within whole fishbecause of the difficulty of visual identification. Ourresults showed a strong correlation between themethods in which fishes are commercialized (i.e.fillets or whole fish) and fraud, since the highestnumber of substitutions was detected within fillets.
Materials and methods
Samples labeled as surubim were purchased at ninesupermarkets in the city of Belo Horizonte (MinasGerais state, Brazil) in 2009–2010. Samples consistedof two types: whole fish (n " 30) and fillets (n " 33).Upon collection, tissues were stored in ethanol 95%and details of brand, price, and pictures of theproduct were taken for documentation purposes.DNA was isolated by homogenization and digestionwith proteinase K at 378C overnight, followed bystandard phenol/chloroform purification (Sambrooket al. 1989). A fragment of 658 bp ofCOIwas amplifiedusing the primers FishF1 and FishR1 (Ward et al.2005). The 25ml PCR mixes included 19.5mlultrapure water, 2.5ml of 10 £ PCR buffer, 2.5mMMgCl2, 0.35ml each primer (10mM), 2.5ml dNTP(1mM), 0.25ml PHT Taq polymerase (5U/ml), and1.0ml DNA template (50–100ng/ml). Thermal cyclingconditions consisted of an initial denaturation step at948C for 2min, 35 cycles at 948C for 30 s, 548C for 30 s,and 728C for 1min, with a final extension at 728C for10min. PCR products (1–2ml) were visualized on anagarose gel and selected for direct sequencing.Sequences were determined bi-directionally using theBigDye Terminator v3.1 Cycle Sequencing Kit(Applied Biosystems, Inc., Foster City, California,USA), following the manufacturer’s protocol on anABI PRISM 310 Genetic Analyzer.
Data analysis
COI sequences recovered from samples labeled assurubim were identified by searching the GenBankdatabase using the BLASTN algorithm (http://blast.ncbi.nlm.nih.gov) and by BOLD (http://www.boldsystems.org) identification engine to searchDNA barcode records within BOLD (RatnasinghamandHebert 2007). The best-scoring matches obtainedfrom both databases for each sample were registered.Genetic divergence was calculated using Kimura’stwo-parameter (K2P) nucleotide substitution model(Kimura 1980). A neighbor-joining tree (Saitou andNei 1987) of K2P distances was generated in MEGA3 (Kumar et al. 2004) to provide a graphic
representation of divergence among analyzedsamples. Node support was assessed with 10,000bootstrap replicates (Felsenstein 1985).
Brazil does not have a list of acceptable commonnames; therefore, the FishBase (http://www.fishbase.org) nomenclature was used to identify the scientificnames that may correspond to the commercial namesurubim (P. corruscans and P. reticulatum), especiallysince BOLD and GenBank rely on FishBase as ataxonomic authority for valid fish species names(Froese and Pauly 2011). It is interesting to note thathybrids obtained by crossing a female P. reticulatumand amaleP. corruscans (Carvalho et al. 2008; Bignottoet al. 2009) are of the most common freshwatercatfishes commercialized in Brazil. A standard DNAbarcode sequence for P. corruscans (Carvalho et al.2011; BOLD record number BSB400-10 andGenBank accession number HM405206) wasincluded as a reference in the alignment dataset.
Results
Genetic identification of samples commercialized assurubim using the GenBank and BOLD search engines
All amplified sequences that exceeded 600 nucleo-tides in length with no insertions, deletions, or stopcodons were observed, thus reducing the possibility ofmtDNA copies in the nucleus. The sequencesobtained from the samples were deposited onGenBank (accession numbers HQ689323–HQ689385) and compared against the BOLD andGenBank databases. Successful matches varied from89 to 100% pairwise sequence identity (Table I). Onlythree samples could not be identified in the BOLDSpecies Reference database. Nonetheless, the BOLDFull database returned hits with a percentage ofidentity as high as GenBank, with the advantage ofbeing a more reliable source of taxonomic identifi-cation. Our results showed that only one P. corruscanshaplotype (sample BS1) was detected among the 63commercial samples analyzed (Table I). Most of thesamples had 100% similarity with the catfish speciesPseudoplatystoma tigrinum and P. reticulatum. However,high-identity matches were also obtained withmarine species Genidens barbus (100% match) andCynoscion virescens (89–100%match), clearly showinga case of mislabeling (Table I). Lower identity scoreswere also returned, and samples were provisionallyidentified; for example, Netuma thalassina (sample 24,Table I) with a 90% match (BOLD database) andCynoscion jamaicensis (sample 66) with an 89% matchin BOLD. The latter species (sample 66) also had aGenBank top match with the spotfin croaker Roncadorstearnsii (87%), a species from the eastern Pacificocean (Table I).
Barcode unveils market fraud in the catfish P. corruscans 99
Mito
chon
dria
l DN
A D
ownl
oade
d fro
m in
form
ahea
lthca
re.c
om b
y D
r. Se
rgio
s-O
resti
s Kol
okot
roni
s on
10/1
4/11
For p
erso
nal u
se o
nly.

Tab
leI.
Iden
tificationofco
mmercial
surubim
samplesusingtheGen
Ban
kan
dBOLD
search
engines.
Sam
ple
number
Gen
ban
kaccession
number
Typ
eBOLD
fulldatab
ase
BOLD
reference
datab
ase
Gen
ban
kM
islabeled
*
23
HQ689374
Fillet
Brachyplatystom
aplatynem
um
(91.45)
Nosequen
ceBrachyplatystom
afilamentosum
(92)
Yes
24
HQ689375
Fillet
Netumacf.thalassina(90.69)
Nosequen
ceSiluriform
essp.BOLD:A
AC3439(90)
Yes
37
HQ689376
Fillet
Genidensbarbus(99.75)
Genidensbarbus(99.75)
Siluriform
essp.BOLD:A
AF4992(99)
Yes
38
HQ689377
Fillet
Genidensbarbus(100)
Genidensbarbus(100)
Siluriform
essp.BOLD:A
AF4992(100)
Yes
39
HQ689378
Fillet
Genidensbarbus(100)
Genidensbarbus(100)
Siluriform
essp.BOLD:A
AF4992(100)
Yes
40
HQ689379
Fillet
Genidensbarbus(99.75)
Genidensbarbus(99.75)
Siluriform
essp.BOLD:A
AF4992(99)
Yes
41
HQ689380
Fillet
Genidensbarbus(100)
Genidensbarbus(100)
Siluriform
essp.BOLD:A
AF4992(100)
Yes
42
HQ689381
Fillet
Genidensbarbus(100)
Genidensbarbus(100)
Siluriform
essp.BOLD:A
AF4992(100)
Yes
43
HQ689382
Fillet
Pseudoplatystom
afasciatum
(100)
Pseudoplatystom
afasciatum
(100)
Siluriform
essp.BOLD:A
AA2588(99)
No
44
HQ689383
Fillet
Genidensbarbus(99.75)
Genidensbarbus(99.75)
Siluriform
essp.BOLD:A
AF4992(99)
Yes
45
HQ689384
Fillet
Genidensbarbus(99.75)
Genidensbarbus(99.75)
Siluriform
essp.BOLD:A
AF4992(99)
Yes
46
HQ689385
Fillet
Pseudoplatystom
atigrinum
(100)
Pseudoplatystom
atigrinum
(100)
Brachyplatystom
afilamentosum
(100)
Yes
48
HQ689353
Fillet
Pseudoplatystom
afasciatum
(100)
Pseudoplatystom
afasciatum
(100)
Siluriform
essp.BOLD:A
AA2588(100)
No
49
HQ689354
Fillet
Pseudoplatystom
afasciatum
(100)
Pseudoplatystom
afasciatum
(100)
Siluriform
essp.BOLD:A
AA2588(99)
No
50
HQ689355
Fillet
Pseudoplatystom
afasciatum
(100)
Pseudoplatystom
afasciatum
(100)
Siluriform
essp.BOLD:A
AA2588(100)
No
51
HQ689356
Fillet
Pseudoplatystom
afasciatum
(100)
Pseudoplatystom
afasciatum
(100)
Pseudoplatystom
afasciatum
(98)
No
52
HQ689357
Fillet
Pseudoplatystom
afasciatum
(100)
Pseudoplatystom
afasciatum
(100)
Pseudoplatystom
afasciatum
(100)
No
53
HQ689358
Fillet
Pseudoplatystom
afasciatum
(100)
Pseudoplatystom
afasciatum
(100)
Pseudoplatystom
afasciatum
(100)
No
54
HQ689359
Fillet
Pseudoplatystom
afasciatum
(100)
Pseudoplatystom
afasciatum
(100)
Pseudoplatystom
afasciatum
(100)
No
55
HQ689360
Fillet
Pseudoplatystom
afasciatum
(100)
Pseudoplatystom
afasciatum
(100)
Pseudoplatystom
afasciatum
(100)
No
56
HQ689361
Fillet
Pseudoplatystom
afasciatum
(100)
Pseudoplatystom
afasciatum
(100)
Pseudoplatystom
afasciatum
(100)
No
57
HQ689362
Fillet
Pseudoplatystom
afasciatum
(100)
Pseudoplatystom
afasciatum
(100)
Pseudoplatystom
afasciatum
(99)
No
58
HQ689363
Fillet
Pseudoplatystom
afasciatum
(100)
Pseudoplatystom
afasciatum
(100)
Pseudoplatystom
afasciatum
(100)
No
59
HQ689364
Fillet
Pseudoplatystom
afasciatum
(100)
Pseudoplatystom
afasciatum
(100)
Pseudoplatystom
afasciatum
(98)
No
66
HQ689365
Fillet
Cyn
oscion
jamaicensis(89.73)
Nosequen
ceRoncadorstearnsii(87)
Yes
67
HQ689366
Fillet
Cyn
oscion
virescens(99.58)
Cyn
oscion
virescens(99.58)
Perciform
essp.BOLD:A
AJ3285(99)
Yes
68
HQ689367
Fillet
Cyn
oscion
virescens(99.16)
Cyn
oscion
virescens(99.16)
Perciform
essp.BOLD:A
AJ3285(100)
Yes
69
HQ689368
Fillet
Cyn
oscion
virescens(99.58)
Cyn
oscion
virescens(99.58)
Perciform
essp.BOLD:A
AJ3285(99)
Yes
70
HQ689369
Fillet
Cyn
oscion
virescens(99.58)
Cyn
oscion
virescens(99.58)
Perciform
essp.BOLD:A
AJ3285(99)
Yes
71
HQ689370
Fillet
Cyn
oscion
virescens(99.58)
Cyn
oscion
virescens(99.58)
Perciform
essp.BOLD:A
AJ3285(99)
Yes
72
HQ689371
Fillet
Cyn
oscion
virescens(99.16)
Cyn
oscion
virescens(99.16)
Perciform
essp.BOLD:A
AJ3285(100)
Yes
73
HQ689372
Fillet
Cyn
oscion
virescens(99.16)
Cyn
oscion
virescens(99.16)
Perciform
essp.BOLD:A
AJ3285(100)
Yes
74
HQ689373
Fillet
Cyn
oscion
virescens(99.16)
Cyn
oscion
virescens(99.16)
Perciform
essp.BOLD:A
AJ3285(100)
Yes
14
HQ689347
Whole
Pseudoplatystom
atigrinum
(100)
Pseudoplatystom
atigrinum
(100)
Brachyplatystom
afilamentosum
(99)
Yes
16
HQ689348
Whole
Pseudoplatystom
atigrinum
(99.41)
Pseudoplatystom
atigrinum
(99.41)
Brachyplatystom
afilamentosum
(99)
Yes
17
HQ689349
Whole
Pseudoplatystom
atigrinum
(98.82)
Pseudoplatystom
atigrinum
(98.82)
Brachyplatystom
afilamentosum
(98)
Yes
18
HQ689350
Whole
Pseudoplatystom
atigrinum
(100)
Pseudoplatystom
atigrinum
(100)
Brachyplatystom
afilamentosum
(100)
Yes
20
HQ689351
Whole
Pseudoplatystom
atigrinum
(100)
Pseudoplatystom
atigrinum
(100)
Brachyplatystom
afilamentosum
(99)
Yes
21
HQ689352
Whole
Pseudoplatystom
atigrinum
(100)
Pseudoplatystom
atigrinum
(100)
Brachyplatystom
afilamentosum
(100)
Yes
78
HQ689323
Whole
Pseudoplatystom
atigrinum
(99.62)
Pseudoplatystom
atigrinum
(99.62)
Brachyplatystom
afilamentosum
(99)
Yes
79
HQ689336
Whole
Pseudoplatystom
atigrinum
(100)
Pseudoplatystom
atigrinum
(100)
Brachyplatystom
afilamentosum
(100)
Yes
80
HQ689337
Whole
Pseudoplatystom
atigrinum
(100)
Pseudoplatystom
atigrinum
(100)
Brachyplatystom
afilamentosum
(100)
Yes
81
HQ689338
Whole
Pseudoplatystom
atigrinum
(100)
Pseudoplatystom
atigrinum
(100)
Brachyplatystom
afilamentosum
(100)
Yes
82
HQ689339
Whole
Pseudoplatystom
atigrinum
(100)
Pseudoplatystom
atigrinum
(100)
Brachyplatystom
afilamentosum
(100)
Yes
83
HQ689340
Whole
Pseudoplatystom
atigrinum
(100)
Pseudoplatystom
atigrinum
(100)
Brachyplatystom
afilamentosum
(100)
Yes
84
HQ689341
Whole
Pseudoplatystom
atigrinum
(100)
Pseudoplatystom
atigrinum
(100)
Brachyplatystom
afilamentosum
(100)
Yes
85
HQ689342
Whole
Pseudoplatystom
atigrinum
(100)
Pseudoplatystom
atigrinum
(100)
Brachyplatystom
afilamentosum
(100)
Yes
86
HQ689343
Whole
Pseudoplatystom
atigrinum
(100)
Pseudoplatystom
atigrinum
(100)
Brachyplatystom
afilamentosum
(100)
Yes
D. C. Carvalho et al.100
Mito
chon
dria
l DN
A D
ownl
oade
d fro
m in
form
ahea
lthca
re.c
om b
y D
r. Se
rgio
s-O
resti
s Kol
okot
roni
s on
10/1
4/11
For p
erso
nal u
se o
nly.
DNA barcode analysis of whole and filleted fishescommercialized as surubim
The careful inspection of the results presented inTable I revealed a higher rate of substitution withinspecies from genera other than Pseudoplatystomaamong fishes sold as fillets rather than whole fish.To better evaluate this difference, a neighbor-joiningtree using the K2P evolutionary model was built foreach group (fillets and whole fishes) separately(Figure 1a,c). The overall K2P distance for thewhole fish group (Figure 1a) was 1.1%, and thedivergence of commercial samples from the standardbarcode sequence of P. corruscans varied from 0 to8.4%. The overall K2P distance for the filleted fishgroup (Figure 1c) was higher (15.5%), and thedivergence of commercial samples from the standardbarcode sequence of P. corruscans varied widely from5.9 to 24.8%. Within whole fish only two clades weredetected (99% bootstrap support value), one repre-senting the Amazonian species Pseudoplatystomatigrinus and the other representing P. corruscans clade,with only one sample grouping together with ourstandard barcode sequence for P. corruscans (Table Iand Figure 1a). When considering fillets, at least sevendistinct clades with moderate to high-bootstrap value(99–68%) were recovered, characterizing at leastseven different species (Figure 1), with not even onehaplotype belonging to P. corruscans (Table I andFigure 1c). The pie charts (Figure 1b,d) show moreexplicit graphical representations of the percentage ofsamples identified as P. corruscanswithin the whole fishand fillet categories. When considering the whole fishgroup (Figure 1b), one sample was identified asbelonging to P. corruscans, whereas the remaining 97%of this group was identified as P. tigrinum (100%similarity with this Amazonian species). In contrast,only 42% of the filleted samples (Figure 1d) belongedto Pseudoplatystoma sp., whereas 58% of them hadhigher similarity with other genera (i.e. Brachyplatys-toma, Netuma, and Genidens).
Discussion
The application of COI sequences in forensics hasalready been investigated for reproducibility, hetero-plasmy, mixed DNA samples, chemical treatments,environmental conditions, and other factors showingconsistent results in which a great range of referencedata exist (Dawnay et al. 2007). Several examples havealready highlighted the potential of such moleculartools to flag the mislabeling of fish and seafoodproducts (e.g. DeSalle and Birstein 1996; Marko et al.2004; Kyle and Wilson 2007; Jerome et al. 2008;Rasmussen and Morrissey 2008; Wong and Hanner2008; Yancy et al. 2008; Barbuto et al. 2010; Filonziet al. 2010; Lowenstein et al. 2010), identifying tunasushi samples analyzed for mercury contaminationT
able
I–continued
Sam
ple
number
Gen
ban
kaccession
number
Typ
eBOLD
fulldatab
ase
BOLD
reference
datab
ase
Gen
ban
kM
islabeled
*
87
HQ689344
Whole
Pseudoplatystom
atigrinum
(99.62)
Pseudoplatystom
atigrinum
(99.62)
Brachyplatystom
afilamentosum
(99%)
Yes
88
HQ689345
Whole
Pseudoplatystom
atigrinum
(100)
Pseudoplatystom
atigrinum
(100)
Brachyplatystom
afilamentosum
(100)
Yes
89
HQ689346
Whole
Pseudoplatystom
atigrinum
(100)
Pseudoplatystom
atigrinum
(100)
Brachyplatystom
afilamentosum
(100)
Yes
90
HQ689324
Whole
Pseudoplatystom
atigrinum
(100)
Pseudoplatystom
atigrinum
(100)
Brachyplatystom
afilamentosum
(100)
Yes
91
HQ689325
Whole
Pseudoplatystom
atigrinum
(100)
Pseudoplatystom
atigrinum
(100)
Brachyplatystom
afilamentosum
(100)
Yes
92
HQ689326
Whole
Pseudoplatystom
atigrinum
(100)
Pseudoplatystom
atigrinum
(100)
Brachyplatystom
afilamentosum
(100)
Yes
93
HQ689327
Whole
Pseudoplatystom
atigrinum
(100)
Pseudoplatystom
atigrinum
(100)
Brachyplatystom
afilamentosum
(100)
Yes
94
HQ689328
Whole
Pseudoplatystom
atigrinum
(100)
Pseudoplatystom
atigrinum
(100)
Brachyplatystom
afilamentosum
(100)
Yes
95
HQ689329
Whole
Pseudoplatystom
atigrinum
(100)
Pseudoplatystom
atigrinum
(100)
Brachyplatystom
afilamentosum
(100)
Yes
96
HQ689330
Whole
Pseudoplatystom
atigrinum
(100)
Pseudoplatystom
atigrinum
(100)
Brachyplatystom
afilamentosum
(100)
Yes
97
HQ689331
Whole
Pseudoplatystom
atigrinum
(100)
Pseudoplatystom
atigrinum
(100)
Brachyplatystom
afilamentosum
(100)
Yes
98
HQ689332
Whole
Pseudoplatystom
atigrinum
(100)
Pseudoplatystom
atigrinum
(100)
Brachyplatystom
afilamentosum
(100)
Yes
99
HQ689333
Whole
Pseudoplatystom
atigrinum
(100)
Pseudoplatystom
atigrinum
(100)
Brachyplatystom
afilamentosum
(100)
Yes
100
HQ689334
Whole
Pseudoplatystom
atigrinum
(100)
Pseudoplatystom
atigrinum
(100)
Brachyplatystom
afilamentosum
(100)
Yes
BS1
HQ689335
Whole
Pseudoplatystom
acorruscans(100)
Pseudoplatystom
acorruscans(100)
Siluriform
essp.BOLD:A
AD0242(100)
No
Note:Sixty-threeco
mmercialsampleslabeled
assurubimwereobtained
from
themarketsin
BeloHorizonte
(Brazil).RecoveredCOIsequen
ceswereco
mpared
withBOLD
Fullan
dReferen
cedatab
ases,
aswellas
withGen
Ban
kforiden
tification(iden
tity
percentage
score
inparen
theses).Gen
Ban
kaccessionnumbersforeach
sample
areprovided
;*Accep
table
speciesfollow
FishBasenomen
clature.
Barcode unveils market fraud in the catfish P. corruscans 101
Mito
chon
dria
l DN
A D
ownl
oade
d fro
m in
form
ahea
lthca
re.c
om b
y D
r. Se
rgio
s-O
resti
s Kol
okot
roni
s on
10/1
4/11
For p
erso
nal u
se o
nly.
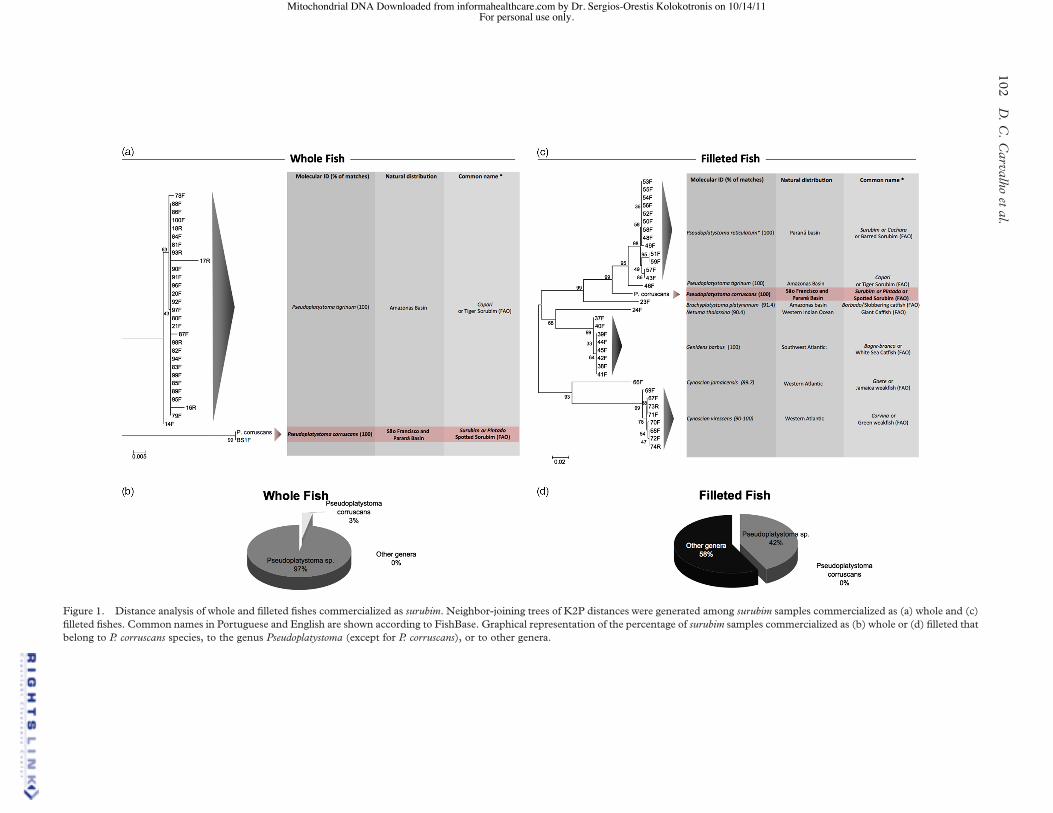
Figure 1. Distance analysis of whole and filleted fishes commercialized as surubim. Neighbor-joining trees of K2P distances were generated among surubim samples commercialized as (a) whole and (c)
filleted fishes. Common names in Portuguese and English are shown according to FishBase. Graphical representation of the percentage of surubim samples commercialized as (b) whole or (d) filleted thatbelong to P. corruscans species, to the genus Pseudoplatystoma (except for P. corruscans), or to other genera.
D.C.Carvalho
etal.
102
Mitochondrial DNA Downloaded from informahealthcare.com by Dr. Sergios-Orestis Kolokotronis on 10/14/11For personal use only.

(Lowenstein et al. 2010) plus the identification ofsmoked fish products (Smith et al. 2008). In Brazil,Ardura et al. (2010) utilizing two mtDNA genesshowed that at least seven distinct species have beensold under the common name “Acara”, making thereal estimation of exploitation rates impossible.
In this study, we identified commercial sampleslabeled as surubim through the comparisons of COImtDNA sequences using the BLASTengine to searchGenBank. In addition, the BOLD identificationengine was employed to search barcode records withinBOLD, as well as using standard P. corruscans barcodesequences (Carvalho et al. 2011), Strikingly, analysisof surubim fillets revealed a 58% rate of substitutionby fishes from the species that do not belong to thePseudoplatystoma genus. These include marine species(G. barbus and C. virescens) that were identified with agreat overall match (99–100%) as being the preferredsubstitutive species (Table I). Other recoveredhaplotypes showed poorer matches and were onlytentatively assigned to the species level (N. thalassinaand Brachyplatystoma platynemum; Table I). Withinwhole fish, only P. tigrinum was detected. Nonetheless,if we consider the identification via FishBase, whichlists only P. reticulatum and P. corruscans as valid namesfor surubim, selling P. tigrinum as surubim would alsoqualify as mislabeling.
The high rate of substitution of this freshwater speciescould be due to the fact that the vernacular namesurubim is well known within the Brazilian market.Therefore, by using this label traders might be able tosell their product for a better price. This becomes clearas we compare the market prices of the fishes sold assurubim identified in this study (Table II). For instance,species labeled bagres, a Brazilian vernacular name for aless known catfish group, are sold at a 70% lower pricethan fishes under the surubim label. Therefore, we havestrong evidence that intentional mislabeling of cheaperfish products is a more frequent phenomenon mainlywithin processed fish (Figure 1).
One limitation of DNA barcode analysis is the factthat, by using a mitochondrial gene, only thematrilineal lineage is examined. This limits theinterpretation of results when hybridization withinspecies is common, as is the case for the genusPseudoplatystoma. Hybrids between P. corruscansmalesand P. reticulatum females have been reported(Bignotto et al. 2009), figuring as the most commonhybrid catfish produced on Brazilian aquaculture
farms in Brazil (Carvalho et al. 2008). Therefore, wewere expecting a higher representation of P. reticulatumhaplotypes among the commercial samples analyzedin this study. Surprisingly, most haplotypes recoveredbelong to Amazonian species. Whether these speciesrepresent a new type of hybrids is a subject of futureresearch. Further analysis using nuclear markers isrecommended for the identification of different typesof commercial hybrids. That said, recovered haplo-types from distinct genera (even from marine species,e.g. Genidens and Cynoscion) are unlikely to be dueto hybridization, reinforcing our hypothesis of inten-tional mislabeling of lower value species as surubim.
Conclusions
In this study, we have clearly shown the occurrence ofsubstitutions of the freshwater catfish surubim by otherspecies of lower commercial value, including marinespecies. If we consider FishBase, only the species P.corruscans and P. reticulatum have the common namesurubim valid. Therefore, close to 80% of the fish soldin the surveyed markets, Brazilian markets of BeloHorizonte city are mislabeled. This figure is higherthan those reported for North American seafood(25%; Wong and Hanner 2008) and Italian fishproducts (32%; Filonzi et al. 2010). The high rates ofsubstitution of P. corruscans by other species could alsobe an indication that its wild stocks have not beencoupled with market growth. In fact, overexploitationof P. corruscans might explain, in part, why it hasbeen substituted by morphologically similar specieswhen commercialized as whole fish, and in somecases (e.g. fillets) substituted by quite dissimilarspecies (Figure 1). The establishment of conservationstrategies and the normalization of vernacular namesfor native commercially important Brazilian fishes,together with the molecular inspection of fishproducts, have the potential to form an importanttool for the preservation of the Brazilian fish fauna andprotect consumers from mislabeled products.
We strongly recommend the establishment of a validlist of commercial and Latin names for the fishescommercialized in Brazil. Such a reference list wouldmake possible for State Fish and Game Departmentsto be able to regulate and detect fraud, substitution,and the commercialization of threatened species. Inaddition, customs services will have the ability toregulate and inspect imported/exported items, for thepurpose of taxation and to protect the consumer frommisguidance. Such a list is currently in use togetherwith Barcoding analysis to detect market substitutionin North American seafood (Wong andHanner 2008).
Acknowledgments
The authors are grateful to Jose Vanderval MeloJunior and Arno Soares Seerig for helping with the
Table II. Common names and price per kilogram of commercia-lized fish mislabeled as surubim.
Common name Type Price/kg (US$)
Surubim or Pintado Whole 11.56
Surubim or Pintado Fillets 14.59
Bagre Fillets 8.16Corvina Fillets 5.63
Barcode unveils market fraud in the catfish P. corruscans 103
Mito
chon
dria
l DN
A D
ownl
oade
d fro
m in
form
ahea
lthca
re.c
om b
y D
r. Se
rgio
s-O
resti
s Kol
okot
roni
s on
10/1
4/11
For p
erso
nal u
se o
nly.

collection of fish to all personnel of the Laboratory ofAnimal Genetics at UFMG Veterinary College fortheir assistance and to Shannon Loughnan and SvenBecker for their comments on the manuscript. Thisstudy was supported by CNPq/FAPEMIG (INCT573899/2008-8) and Instituto Estadual de Florestas.D.C.C. is also grateful to CNPq for the PDJfellowship (150420/2009-9) and CAPES postdoctoralfellowship (#4095-09-0).
Declaration of interest: The authors report noconflicts of interest. The authors alone are responsiblefor the content and writing of the paper.
References
Ardura A, Linde AR, Moreira JC, Garcia-Vazquez E. 2010. DNAbarcoding for conservation and management of amazonian
commercial fish. Biol Conserv 143:1438–1443.
Baker CS, Lento GM, Cipriano F, Palumbi SR. 2000. Predicteddecline of protected whales based on molecular genetic
monitoring of Japanese and korean markets. Proc R Soc Lond
B Biol Sci 267:1191–1199.
Barbuto M, Galimberti A, Ferri E, Labra M, Malandra R, Galli P,Casiraghi M. 2010. DNA barcoding reveals fraudulent
substitutions in shark seafood products: The italian case of
“Palombo” (Mustelus spp.). Food Res Int 43:376–381.
Bignotto TS, Prioli AJ, Prioli SMAP, Maniglia TC, Boni TA, LucioLC, Gomes RA, Oliveira VN, Prioli AV, Julio HF, Jr, Prioli LM.
2009. Genetic divergence between Pseudoplatystoma corruscansand Pseudoplatystoma reticulatum (Siluriformes: Pimelodidae) in
the parana river basin. Braz J Biol 69:681–689.Buitrago-Suarez UA, Burr BM. 2007. Taxonomy of the catfish
genus PseudoplatystomaBleeker (Siluriformes: Pimelodidae) with
recognition of eight species. Zootaxa 1512:1–38.Carvalho DC, Seerig AS, Melo DC, Sousa AB, Pimenta D, Oliveira
DAA. 2008. Identificacao molecular de peixes: O caso do
surubim (Pseudoplatystoma spp.). Rev Bras Reprod Anim 32:
215–219.Carvalho DC, Oliveira DAA, Pompeu PS, Leal CG, Oliveira C,
Hanner R. 2011. Deep barcode divergence in brazilian
freshwater fishes—the case of the Sao Francisco river basin.
Mitochondrial DNA 22(Suppl 1). Epub.Civera T. 2003. Species identification and safety of fish products.
Vet Res Commun 27:481–489.
Cohen NJ, Deeds JR, Wong ES, Hanner RH, Yancy HF, White KD,Thompson TM, Wahl M, Pham TD, Guichard FM, Huh I,
Austin C, Dizikes G, Gerber SI. 2009. Public health response to
puffer fish (tetrodotoxin) poisoning from mislabeled product.
J Food Prot 72:810–817.DawnayN, Ogden R,McEwing R, CarvalhoGR, Thorpe RS. 2007.
Validation of the barcoding gene COI for use in forensic genetic
species identification. Forensic Sci Int 173:1–6.
DeSalle R, Birstein VJ. 1996. PCR identification of black caviar.Nature 381:197–198.
Espineira M, Gonzalez-Lavin N, Vieites JM, Santaclara FJ. 2008.
Development of a method for the genetic identification of flatfishspecies on the basis of mitochondrial DNA sequences. J Agric
Food Chem 56:8954–8961.
Felsenstein J. 1985. Confidence-limits on phylogenies—an
approach using the bootstrap. Evolution 39:783–791.Filonzi L, Chiesa S, Vaghi M, Nonnis Marzano F. 2010. Molecular
barcoding reveals mislabelling of commercial fish products in
Italy. Food Res Int 43:1383–1388.
Froese R, Pauly D, Editors. 2011. FishBase. World Wide Webelectronic publication. www.fishbase.org, version (02/2011).
Godinho AL, Kynard B, Godinho HP. 2007. Migration and
spawning of female surubim (Pseudoplatystoma corruscans,
Pimelodidae) in the Sao Francisco river, Brazil. Environ Biol
Fish 80:421–433.
Hebert PDN, Gregory TR. 2005. The promise of DNA barcoding
for taxonomy. Syst Biol 54:852–859.
Hubert N, Hanner R, Holm E,MandrakNE, Taylor E, BurridgeM,
Watkinson D, Dumont P, Curry A, Bentzen P, Zhang J, April J,
Bernatchez L. 2008. Identifying canadian freshwater fishes
through DNA barcodes. PLoS ONE 3:e2490.
Jerome M, Martinsohn JT, Ortega D, Carreau P, Verrez-Bagnis V,
Mouchel O. 2008. Toward fish and seafood traceability:
Anchovy species determination in fish products by molecular
markers and support through a public domain database. J Agric
Food Chem 56:3460–3469.
KimuraM. 1980. A simple method for estimating evolutionary rates
of base substitutions through comparative studies of nucleotide
sequences. J Mol Evol 16:111–120.
Kumar S, Tamura K, Nei M. 2004. MEGA3: Integrated software
for molecular evolutionary genetics analysis and sequence
alignment. Brief Bioinform 5:150–163.
Kyle CJ, Wilson CC. 2007. Mitochondrial DNA identification of
game and harvested freshwater fish species. Forensic Sci Int 166:
68–76.
Lowenstein JH, Burger J, Jeitner CW, Amato G, Kolokotronis SO,
Gochfeld M. 2010. DNA barcodes reveal species-specific
mercury levels in tuna sushi that pose a health risk to consumers.
Biol Lett 6:692–695.
Manel S, Berthier P, Luikart G. 2002. Detecting wildlife poaching:
Identifying the origin of individuals with bayesian assignment
tests and multilocus genotypes. Conserv Biol 16:650–659.
Marko PB, Lee SC, Rice AM, Gramling JM, Fitzhenry TM,
McAlister JS, Harper GR, Moran AL. 2004. Fisheries:
Mislabelling of a depleted reef fish. Nature 430:309–310.
Martinez I, James D, Loreal H. 2005. Application of modern
analytical techniques to ensure seafood safety and authenticity.
FAO Fisheries Technical Paper. Rome: Food and Agriculture
Organization of United Nations.
Moretti VM, Turchini GM, Bellagama F, Caprino F. 2003.
Traceability issues in fishery and aquaculture products. Vet Res
Commun 27:497–505.
Nelson LA, Wallman JF, Dowton M. 2007. Using COI barcodes to
identify forensically and medically important blowflies. Med Vet
Entomol 21:44–52.
Pauly D, Christensen V, Guenette S, Pitcher TJ, Sumaila UR,
Walters CJ, Watson R, Zeller D. 2002. Towards sustainability in
world fisheries. Nature 418:689–695.
Rasmussen RS, Morrissey MT. 2008. DNA-based methods for the
identification of commercial fish and seafood species. Compr
Rev Food Sci F 7:280–295.
Ratnasingham S, Hebert PDN. 2007. BOLD: The barcode of life
data system (www.Barcodinglife.Org). Mol Ecol Notes 7:
355–364.
Rubinoff D. 2006. Utility of mitochondrial DNA barcodes in species
conservation. Conserv Biol 20:1026–1033.
Rubinoff D, Cameron S, Will K. 2006. A genomic perspective on
the shortcomings of mitochondrial DNA for “barcoding”
identification. J Hered 97:581–594.
Saitou N, Nei M. 1987. The neighbor-joining method: A new
method for reconstructing phylogenetic trees. Mol Biol Evol 4:
406–425.
Sambrook J, Fritsch EF, Maniatis T. 1989. Molecular Cloning:
A Laboratory Manual. Cold Springs Harbor, NY, Cold Springs
Harbor Laboratory Press. 1659p.
Sevilla RG,Diez A, NorenM,Mouchel O, JeromeM, Verrez-Bagnis
V, Van Pelt H, Favre-Krey L, Krey G, Consortium TF, Bautista
JM. 2007. Primers and polymerase chain reaction conditions for
DNA barcoding teleost fish based on the mitochondrial
D. C. Carvalho et al.104
Mito
chon
dria
l DN
A D
ownl
oade
d fro
m in
form
ahea
lthca
re.c
om b
y D
r. Se
rgio
s-O
resti
s Kol
okot
roni
s on
10/1
4/11
For p
erso
nal u
se o
nly.

cytochrome b and nuclear rhodopsin genes. Mol Ecol Notes 7:
730–734.
Smith PJ, Mcveagh SM, Steinke D. 2008. DNA barcoding for the
identification of smoked fish products. J Fish Biol 72:464–471.Teletchea F, Maudet C, Hanni C. 2005. Food and forensic
molecular identification: Update and challenges. Trends
Biotechnol 23:359–366.
Terol J, Mascarell R, Fernandez-Pedrosa V, Perez-Alonso M. 2002.Statistical validation of the identification of tuna species:
Bootstrap analysis of mitochondrial DNA sequences. J Agric
Food Chem 50:963–969.
Torrico JP, Hubert N, Desmarais E, Duponchelle F, Rodriguez JN,Montoya-Burgos J, Montoya-Burgos J, Garcia Davila C,
Carvajal-Vallejos FM, Grajales AA, Bonhomme F, Renno JF.
2009. Molecular phylogeny of the genus pseudoplatystoma(Bleeker, 1862): Biogeographic and evolutionary implications.
Mol Phylogenet Evol 51:588–594.
Valdez-Moreno M, Ivanova NV, Elias-Gutierrez M, Contreras-
Balderas S, Hebert PDN. 2009. Probing diversity in freshwater
fishes from mexico and guatemala with DNA barcodes. J Fish
Biol 74:377–402.
Vinas J, Tudela S. 2009. A validated methodology for genetic
identification of tuna species (genus Thunnus). PLoS ONE 4:
e7606.
Ward RD, Zemlak TS, Innes BH, Last PR, Hebert PDN. 2005.
DNA barcoding Australia’s fish species. Philos Trans R Soc B
360:1847–1857.
Ward RD, Hanner R, Hebert PDN. 2009. The campaign to DNA
barcode all fishes, FISH-BOL. J Fish Biol 74:329–356.
Wong EHK, Hanner RH. 2008. DNA barcoding detects market
substitution in north american seafood. Food Res Int 41:
828–837.
Yancy HF, Zemlak TS, Mason JA, Washington JD, Tenge BJ,
Nguyen NL, Barnett JD, Savary WE, Hill WE, Moore MM, Fry
FS, Randolph SC, Rogers PL, Hebert PD. 2008. Potential use of
DNA barcodes in regulatory science: Applications of the
regulatory fish encyclopedia. J Food Prot 71:210–217.
Barcode unveils market fraud in the catfish P. corruscans 105
Mito
chon
dria
l DN
A D
ownl
oade
d fro
m in
form
ahea
lthca
re.c
om b
y D
r. Se
rgio
s-O
resti
s Kol
okot
roni
s on
10/1
4/11
For p
erso
nal u
se o
nly.
Copyright © 2022 FDOKUMEN