Intestinal adherence associated with type IV pili of enterohemorrhagic Escherichia coli O157:H7
Upload
independentCategory
view
0download
0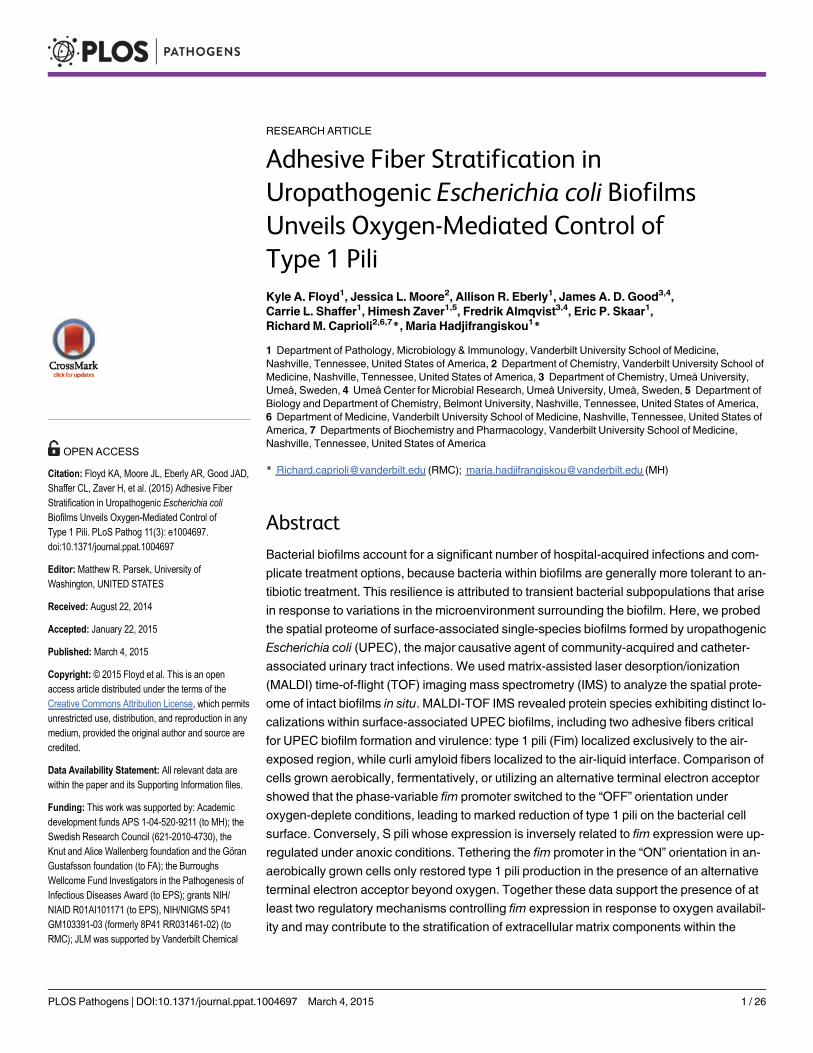
RESEARCH ARTICLE
Adhesive Fiber Stratification inUropathogenic Escherichia coli BiofilmsUnveils Oxygen-Mediated Control ofType 1 PiliKyle A. Floyd1, Jessica L. Moore2, Allison R. Eberly1, James A. D. Good3,4,Carrie L. Shaffer1, Himesh Zaver1,5, Fredrik Almqvist3,4, Eric P. Skaar1,Richard M. Caprioli2,6,7*, Maria Hadjifrangiskou1*
1 Department of Pathology, Microbiology & Immunology, Vanderbilt University School of Medicine,Nashville, Tennessee, United States of America, 2 Department of Chemistry, Vanderbilt University School ofMedicine, Nashville, Tennessee, United States of America, 3 Department of Chemistry, Umeå University,Umeå, Sweden, 4 Umeå Center for Microbial Research, Umeå University, Umeå, Sweden, 5 Department ofBiology and Department of Chemistry, Belmont University, Nashville, Tennessee, United States of America,6 Department of Medicine, Vanderbilt University School of Medicine, Nashville, Tennessee, United States ofAmerica, 7 Departments of Biochemistry and Pharmacology, Vanderbilt University School of Medicine,Nashville, Tennessee, United States of America
* [email protected] (RMC); [email protected] (MH)
AbstractBacterial biofilms account for a significant number of hospital-acquired infections and com-
plicate treatment options, because bacteria within biofilms are generally more tolerant to an-
tibiotic treatment. This resilience is attributed to transient bacterial subpopulations that arise
in response to variations in the microenvironment surrounding the biofilm. Here, we probed
the spatial proteome of surface-associated single-species biofilms formed by uropathogenic
Escherichia coli (UPEC), the major causative agent of community-acquired and catheter-
associated urinary tract infections. We used matrix-assisted laser desorption/ionization
(MALDI) time-of-flight (TOF) imaging mass spectrometry (IMS) to analyze the spatial prote-
ome of intact biofilms in situ. MALDI-TOF IMS revealed protein species exhibiting distinct lo-
calizations within surface-associated UPEC biofilms, including two adhesive fibers critical
for UPEC biofilm formation and virulence: type 1 pili (Fim) localized exclusively to the air-
exposed region, while curli amyloid fibers localized to the air-liquid interface. Comparison of
cells grown aerobically, fermentatively, or utilizing an alternative terminal electron acceptor
showed that the phase-variable fim promoter switched to the “OFF” orientation under
oxygen-deplete conditions, leading to marked reduction of type 1 pili on the bacterial cell
surface. Conversely, S pili whose expression is inversely related to fim expression were up-
regulated under anoxic conditions. Tethering the fim promoter in the “ON” orientation in an-
aerobically grown cells only restored type 1 pili production in the presence of an alternative
terminal electron acceptor beyond oxygen. Together these data support the presence of at
least two regulatory mechanisms controlling fim expression in response to oxygen availabil-
ity and may contribute to the stratification of extracellular matrix components within the
PLOS Pathogens | DOI:10.1371/journal.ppat.1004697 March 4, 2015 1 / 26
OPEN ACCESS
Citation: Floyd KA, Moore JL, Eberly AR, Good JAD,Shaffer CL, Zaver H, et al. (2015) Adhesive FiberStratification in Uropathogenic Escherichia coliBiofilms Unveils Oxygen-Mediated Control ofType 1 Pili. PLoS Pathog 11(3): e1004697.doi:10.1371/journal.ppat.1004697
Editor: Matthew R. Parsek, University ofWashington, UNITED STATES
Received: August 22, 2014
Accepted: January 22, 2015
Published: March 4, 2015
Copyright: © 2015 Floyd et al. This is an openaccess article distributed under the terms of theCreative Commons Attribution License, which permitsunrestricted use, distribution, and reproduction in anymedium, provided the original author and source arecredited.
Data Availability Statement: All relevant data arewithin the paper and its Supporting Information files.
Funding: This work was supported by: Academicdevelopment funds APS 1-04-520-9211 (to MH); theSwedish Research Council (621-2010-4730), theKnut and Alice Wallenberg foundation and the GöranGustafsson foundation (to FA); the BurroughsWellcome Fund Investigators in the Pathogenesis ofInfectious Diseases Award (to EPS); grants NIH/NIAID R01AI101171 (to EPS), NIH/NIGMS 5P41GM103391-03 (formerly 8P41 RR031461-02) (toRMC); JLM was supported by Vanderbilt Chemical

biofilm. MALDI IMS facilitated the discovery of these mechanisms, and we have demon-
strated that this technology can be used to interrogate subpopulations within
bacterial biofilms.
Author Summary
Bacteria are commonly found in multicellular communities known as biofilms. Biofilmscan form on a variety of surfaces, both outside and within living things, and can have detri-mental effects on human health. The characteristics of bacteria occupying different areaswithin biofilms are not well understood, and such knowledge is critical for understandinghow biofilms form and for developing strategies to treat biofilm-related infections. Here,we adapted a technique to sample how proteins cluster within bacterial biofilms as ameans to identify the location of bacteria with differential protein expression within thecommunity. We observed that with uropathogenic E. coli, which is the major cause of uri-nary tract and catheter-associated urinary tract infections, bacteria close to the air-exposedregion of the biofilm expressed different adhesive fibers compared to those at the liquid in-terface. We went on to show that lack of oxygen shuts down the production of fibersknown to be critical for adherence to host bladder cells and to catheter material. This dis-covery was enabled by a new application of an existing technology that allowed us to gaininsights into the spatial regulation of proteins within bacterial biofilms and to elucidatepathways that could be targeted to inhibit bacterial adherence.
IntroductionIn nature, bacteria predominantly exist in a biofilm state [1] forming mutualistic or parasiticassociations with other living organisms [2,3]. Within vertebrate hosts, the resident microbiotaare essentially multi-species biofilms that play a key role in preventing colonization by patho-gens [4]. Conversely, pathogenic bacteria exploit biofilm formation to colonize prostheses,catheters, as well as extracellular and intracellular host niches resulting in potentially life-threatening infections that are often difficult to treat [5]. Both single and multi-species biofilmsare heterogeneous in nature, comprised of bacterial subpopulations with distinct tasks, such asexpression of matrix components or a specific metabolic activity [6–9]. This “division of labor”within the community contributes to recalcitrance of the biofilm to antibiotic treatment. Bio-film subpopulations can be transient in nature, and arise in response to alterations in nutrientand oxygen availability of the surrounding microenvironment that in turn leads to localchanges in bacterial gene expression [6–9]. However, little is known about the expression anddistribution of individual protein species within a single multicellular community that resultsfrom this differential gene expression and how such differences may shape the characteristicsand the fate of the biofilm.
Traditional techniques used to visualize protein distribution within intact biofilms rely onmicroscopy-based methods that require the use of either fluorescently labeled proteins or theapplication of antibodies specific to a protein of interest [10,11]. These techniques are limitedto previously identified protein targets and can typically only accommodate one or two speciesin a single analysis. Conversely, more global genomic and proteomic-based analyses necessitatethe destruction of biofilm architecture, leading to complete loss of spatial information.
IMS Provides Insights to Pilus Regulation
PLOS Pathogens | DOI:10.1371/journal.ppat.1004697 March 4, 2015 2 / 26
Biology interface training program (T32 GM065086).CLS was supported by the Vanderbilt Infection,Pathogenesis, and Epidemiology Research TrainingProgram (5 T32 A1007474-19) and the VanderbiltUniversity Program in Microbial Pathogenesis Mini-Sabbatical award. SEM and TEM were performed atthe VUMC Cell Imaging Shared Resource (supportedby NIH grants CA68485, DK20593, DK58404,HD15052, DK59637 and EY08126). The funders hadno role in study design, data collection and analysis,decision to publish, or preparation of the manuscript.
Competing Interests: The authors have declaredthat no competing interests exist.

Matrix-assisted laser desorption/ionization time-of-flight imaging mass spectrometry(MALDI-TOF IMS) is a surface-sampling technology that can determine spatial informationand relative abundance of analytes directly from biological samples [12]. Samples are treatedwith a matrix that absorbs ultraviolet light from a laser source to ionize analytes of interest.The generated ions are accelerated along a time-of-flight (TOF) mass analyzer for separationand detection [13]. Using this technique, spectra are collected in a defined array across thesample, and each peak intensity in the spectra is then extrapolated to generate an ion intensitymap, allowing for a two-dimensional representation of analyte distribution within the imagedarray (Fig. 1 and [14]). This label-free technology does not require prior knowledge of samplecomposition or analyte distribution and provides an unbiased approach for the simultaneouslocalization analysis for multiple analytes within a single biological sample.
Here, we used MALDI-TOF IMS to examine the in situ distribution and localization of lowmolecular weight proteins within biofilms formed by uropathogenic Escherichia coli (UPEC).UPEC, one of the extra-intestinal E. coli pathotypes and the primary cause of urinary tract in-fections, can form extracellular biofilms on host cells and urinary catheters, as well as intracel-lular biofilm-like communities within host bladder epithelial cells [15–19]. These UPECvirulence mechanisms dictate multiple disease outcomes [20], including urosepsis that canhave life-threatening complications [21]. MALDI IMS detected distinct protein localizationpatterns within the surface-associated UPEC biofilms imaged in these studies. Subsequent,conventional proteomic approaches led to the identification of several of the distinctly localizedion species. Among the proteins identified were CsgA and FimA, which comprise the primarystructural subunits of curli and type 1 pili fibers respectively. Type 1 pili, encoded by the fimgene cluster, are chaperone-usher pathway (CUP) pili [22] that facilitate adherence to manno-sylated moieties and are the primary determinant that enables a) UPEC attachment to the blad-der urothelium, and b) inter-bacterial interactions in both extracellular and intracellularbiofilms [15,23].
MALDI IMS revealed that, while curli subunit signatures are found at the air-liquid inter-face of the biofilm, which is consistent with their primary role in extracellular matrix infra-structure, type 1 pili subunit signatures predominantly localize to the air-exposed regions ofthe biofilm. Subsequent studies investigating the effects of anaerobiosis on expression of type 1pili in UPEC led to the discovery of two regulatory mechanisms controlling expression of type1 pili in response to the presence of oxygen. Together, these data demonstrate howMALDIIMS can be used to dissect the spatial proteome of an intact bacterial biofilm, and highlighthow the information obtained can provide new insight into protein regulation relating tobiofilm infrastructure.
Results
Development of biofilm culture methods for MALDI-TOF IMSIn order to assess the utility of MALDI-TOF IMS for evaluating protein localization withinbacterial biofilms, we adapted a simple surface-associated biofilm setup that enabled the sam-pling of single-species biofilms formed by uropathogenic Escherichia coli (UPEC) [24]. We op-timized growth conditions to promote biofilm formation onto indium tin oxide (ITO) coatedglass slides, given that our MALDI IMS must be performed directly from an electrically con-ductive surface for high voltage analyses [25]. Slides were placed vertically into culture mediaseeded with bacteria, such that only half of the slide was submerged within the media. Thissetup created an environmental gradient of oxygen and nutrients that induced biofilm forma-tion at the air-liquid interface (Fig. 1A). We hypothesized that MALDI IMS would enable de-tection of distinct bacterial subpopulations resulting from the induced gradient (Fig. 1A).
IMS Provides Insights to Pilus Regulation
PLOS Pathogens | DOI:10.1371/journal.ppat.1004697 March 4, 2015 3 / 26
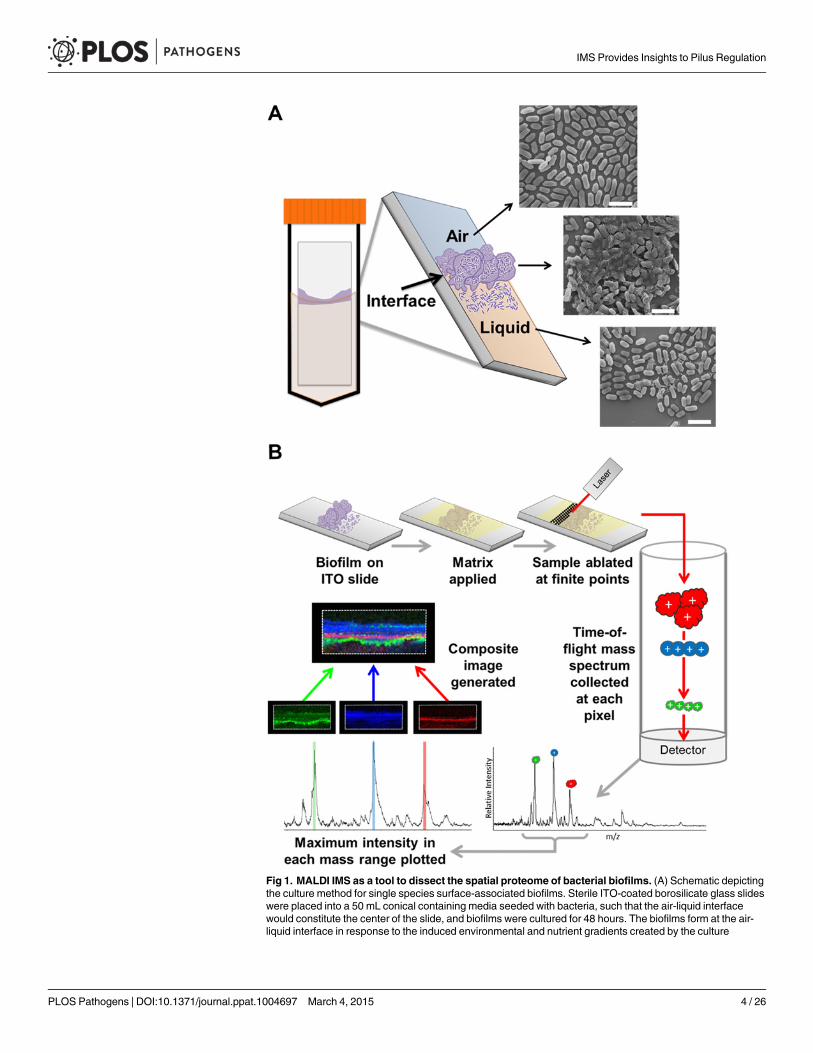
Fig 1. MALDI IMS as a tool to dissect the spatial proteome of bacterial biofilms. (A) Schematic depictingthe culture method for single species surface-associated biofilms. Sterile ITO-coated borosilicate glass slideswere placed into a 50 mL conical containing media seeded with bacteria, such that the air-liquid interfacewould constitute the center of the slide, and biofilms were cultured for 48 hours. The biofilms form at the air-liquid interface in response to the induced environmental and nutrient gradients created by the culture
IMS Provides Insights to Pilus Regulation
PLOS Pathogens | DOI:10.1371/journal.ppat.1004697 March 4, 2015 4 / 26

MALDI-TOF IMS requires the application of a UV-absorbing matrix for analyte ionization[25] (Fig. 1B). Typical sample preparation methods begin with solvent washes to decrease ionsuppression from lipids and salts within the sample in order to enhance protein ionization[25]. Here, we selected a sequential washing procedure of 70%, 90%, and 95% ethanol for30 seconds each. Following washes, we evaluated biofilm integrity using three different tech-niques: crystal violet staining, scanning electron microscopy (SEM), and optical profilometry(S1 Fig). SEM analysis of the air-exposed, the air-liquid interface, and liquid-exposed regionsof the biofilm indicated that the tertiary structure, along with cell shape and surface features,were preserved post-washing (S1 Fig). Crystal violet staining [26] and subsequent quantitationshowed that the preparative ethanol washes did not significantly reduce biofilm levels (S1 Fig).Finally, optical profilometry [27] was used to assess the biofilm depth on the surfaces analyzedby MALDI IMS (S1 Fig). Combined, these approaches indicated that the sample preparationmethods for MALDI IMS did not significantly perturb biofilm integrity.
MALDI IMS reveals distinct protein localizations within surface-associated UPEC biofilmsA schematic for the MALDI-TOF IMS analysis of UPEC biofilms is shown in Fig. 1B. TheMALDI methods and matrix selected for these studies were optimized for lower molecularweight protein species; therefore, all analyses were carried out over an ion range of mass-to-charge ratio (m/z) 2,000–25,000. Within this range, we observed 60 UPEC protein ion speciesthat were detected reproducibly in at least 5 biological replicates (S1 Dataset). The relativeabundance and localization patterns for representative ion species are shown in Fig. 2. Eachpanel depicts a heat-map intensity plot for a unique ion species within the biofilm, where red/white indicates the highest levels of relative abundance, and black/blue the lowest levels(Fig. 2). All observed ion species displayed one of the following localization/distribution pat-terns: diffuse distribution throughout the biofilm, localization specific to the air-exposed orliquid-exposed region, or localization to the air-liquid interface (Fig. 2). Overlay analysis of ionimages demonstrated that we could differentiate localization patterns for different proteinspecies within the same region of the biofilm (Fig. 2, ion overlay ofm/z’s 5,596-red and13,036-yellow).
Type 1 pili-producing and curli-producing bacteria occupy distinctregions of the UPEC biofilmFollowing MALDI IMS spatial analysis, enzymatic digestion of biofilm lysates and tandemmass spectrometry were used to identify select ion species observed (Table 1). These analysesidentified the histone-like global transcriptional regulators HU-α (UniProt KB Q1R5W6,m/z9,535) and HU-β (UniProt KB Q1RF95,m/z 9,226), which co-localized throughout the biofilmand were most abundant in the air-exposed region (Fig. 3A and S2 Fig). The acid stress-response chaperone protein, HdeB (UniProt KB Q1R595,m/z 9,064), and the uncharacterizedprotein YahO (UniProt KB Q1RFK1,m/z 7,718) were also identified (Table 1). HdeB localizedto the air-liquid interface and was most abundant towards the liquid-exposed surface, while
conditions, as indicated in the schematic of the resulting surface-associated biofilm and depicted byrepresentative SEMmicrographs of each region. Micrographs were obtained from a 48-hour ethanol-washedUPEC surface associated biofilm. Scale bar = 2.5 μm. (B) Description of the MALDI-TOF IMS pipeline asapplied to the analysis of bacterial biofilms. Surface-associated biofilms were given an organic solvent washto decrease lipids and salts from within the sample that interfere with protein ionization. The biofilm was thenoverlaid with an UV-absorbing matrix, and analyzed by MALDI IMS.
doi:10.1371/journal.ppat.1004697.g001
IMS Provides Insights to Pilus Regulation
PLOS Pathogens | DOI:10.1371/journal.ppat.1004697 March 4, 2015 5 / 26

Fig 2. MALDI IMS reveals distinct protein localizations within UPEC biofilms. Representative ion images depicting distinct protein localization patternsobserved in UPEC biofilms after 48 hours of growth. Images shown are from the same IMS analysis. Protein localizations for UPECwere validated in 16biological replicates. The depicted mass-to-charge (m/z) ratio of each selected ion was determined after internal calibration of the total ion current-normalizedaverage spectrum using mMass software [32]. Internal calibration used the theoretical mass, minus the signal peptide for proteins identified in the LC-MS/MSanalyses to obtain the best mass accuracy for the data (as previously described [72]). Images are depicted ± 5 Da for eachm/z species and data arepresented as a heat map intensity of relative abundance from 10 (blue)– 100% (Red/White). Overlay images are presented using the same criteria, withsingle color distribution instead of a heat map from 10–100% intensity. Scale bar = 2 mm.
doi:10.1371/journal.ppat.1004697.g002
IMS Provides Insights to Pilus Regulation
PLOS Pathogens | DOI:10.1371/journal.ppat.1004697 March 4, 2015 6 / 26

YahO localized throughout the biofilm (Fig. 3A and S2 Fig). Finally, two of the IMS signalsidentified by proteomics corresponded to major subunits of two UPEC adhesive organelles:The major curli subunit CsgA (UniProt KB Q1RDB7,m/z 13,036), an essential determinantfor UPEC biofilm formation under the culture conditions used for these studies [7,28], and; themajor subunit of type 1 pili, FimA (UniProt KB Q1R2K0,m/z 16,269).
Based on the MALDI IMS results, CsgA signatures were predominantly found at the air-liquid interface of the biofilm (Fig. 3A-B and S2 Fig), consistent with the role of curli as the
Table 1. Identified proteins observed by IMS within 48-hour UPEC biofilms.
Protein Name UniProtKBAccession Number
Theoretical AverageMass (Da)
Predicted SignalPeptide (Da)*
Theoretical Mass MinusSignal Peptide (Da)
Observed AverageMass (Da)#
Adhesion
Type 1 pili majorsubunit, FimA
Q1R2K0 18,553 aa1–23 / 2,302 Da 16,269 16,269
Major curli subunit,CsgA
Q1RDB7 14,992 aa1–20 / 1,974 Da 13,036 13,036
DNA-binding / Transcriptional Regulation
DNA-binding proteinHu-α
Q1R5W6 9,534 n/a 9,534 9,535
DNA-binding proteinHu-β
Q1RF95 9,226 n/a 9,226 9,226
General Stress Response
Acid stress-responseprotein, HdeB
Q1R595 12,522 aa1–33 / 3,475 Da 9,065 9,064
Uncharacterized
YahO Q1RFK1 9,929 aa1–21 / 2,240 Da 7,707 7,718
*Predicted signal peptides obtained using the SignalP Server.#Observed average mass obtained from IMS analysis of one representative 48 hour UPEC biofilm. Internal calibration was performed with mMass
Software using the theoretical mass minus the signal peptide for proteins identified by tandem mass spectrometry analyses to obtain the best mass
accuracy from the data.
doi:10.1371/journal.ppat.1004697.t001
Fig 3. IMS analysis reveals stratification of identified UPEC proteins and distinct localization of FimA and CsgAwithin the biofilm. (A) Graphicalrepresentation of the localization of each protein identified in Table 1, along with the unidentified ionm/z 8,396. The localization of the major curli subunit,CsgA, was used to demarcate the air-liquid interface. Localization of ions were measured as the distance (mm) from the middle of CsgA localization to themiddle of the localization of each individual ion using Fiji Image J software [73]. Localizations were plotted using GraphPad Prism version 6. (B) IMS ionimages of FimA and CsgA localization. Images are depicted ± 5 Da for each ion, and data are presented as a heat map intensity of relative abundance from10 (blue)– 100% (Red/White). FimA (green) and CsgA (red) ion overlay image presented using the same criteria, with single color distribution instead of aheat map from 10–100% intensity. Scale bar = 2 mm.
doi:10.1371/journal.ppat.1004697.g003
IMS Provides Insights to Pilus Regulation
PLOS Pathogens | DOI:10.1371/journal.ppat.1004697 March 4, 2015 7 / 26
primary extracellular matrix (ECM) component under the biofilm conditions tested. Converse-ly, FimA localized uniquely to the air-exposed region of the biofilm (Fig. 3A-B, and S2 Fig).Under the biofilm growth conditions used for these studies, type 1 pili have been shown toplay an accessory role to biofilm infrastructure, and loss of type 1 pili impairs integrity butdoes not abolish biofilm formation [7]. Thus, we took advantage of a fim deletion mutant(UTI89ΔfimA-H) to validate the identification of them/z 16,269 ion as FimA. MALDI IMSanalysis of UTI89ΔfimA-H biofilms showed a loss of the ion atm/z 16,269 (S3 Fig), confirmingthe ionm/z 16,269 as FimA. Similarly, the ionsm/z 9,535 andm/z 7,718 were validated asHupA and YahO respectively, through MALDI analysis of UTI89 mutants lacking the respec-tive gene (UTI89ΔhupA and UTI89ΔyahO) (S3 Fig).
Given that curli are essential for UPEC biofilm formation under the conditions tested, weutilized a more traditional immuno-fluorescence approach with an antibody against CsgA tovisualize curli-expressing bacteria within the biofilm and validate CsgA localization to the air-liquid interface. Combining immunohistochemistry with super-resolution structured illumina-tion microscopy (SIM), we observed that the majority of curli-producing bacteria localized tothe air-liquid interface of the biofilm, with only sparse populations found at the air- and liquid-exposed regions (Fig. 4, S1 Video). These data confirmed the IMS observations of CsgA locali-zation to the air-liquid interface of the biofilm. As an orthologous approach, we took advantageof small peptidomimetic molecules that interfere with curli biogenesis in UPEC [29]. We hy-pothesized that treatment of pre-formed biofilm with one such compound, FN075 [29], shouldblock curli fiber subunit incorporation leading to an abundance of CsgA monomers within thebiofilm that could be detected by IMS. To test this hypothesis we cultured UPEC biofilms for24 hours, at which time we added FN075 or DMSO (vehicle control) at previously reportedconcentrations [29]. Biofilms were allowed to grow in the presence of compound/vehicle for24 hours prior to quantitation by crystal violet staining and imaging by MALDI IMS (S4 Fig).Consistent with previous observations [30], DMSO treatment increased biofilm levels andCsgA expression compared to untreated controls (S4 Fig). Though these experiments were car-ried out under atmospheric conditions, DMSO can serve as an alternative terminal electron ac-ceptor for E. coli [31]. This ability of DMSO may be contributing to the observed increase inbiomass, though additional studies are needed to dissect the basis of biofilm increase in
Fig 4. Bacteria expressing curli amyloid fibers localize primarily to the air-liquid interface of a 48-hour surface-associated biofilm.Representativeimmuno-fluorescence images obtained with super-resolution SIM microscopy from the (A) air-exposed region, (B) air-liquid interface, and (C) liquid-exposedregion of the biofilm. Immuno-fluorescence was performed with DAPI staining for nucleic acid (Blue) and Alexa Fluor-555 conjugated secondary antibodydetection of α-CsgA antibody (Red). Images shown are from a single biological replicate and are representative of two biological replicates total. A videodepicting three-dimensional reconstruction of the biofilm at the air-liquid interface is provided in the supplemental material (S1 Video). Scale bar, 10 μm.
doi:10.1371/journal.ppat.1004697.g004
IMS Provides Insights to Pilus Regulation
PLOS Pathogens | DOI:10.1371/journal.ppat.1004697 March 4, 2015 8 / 26

response to DMSO treatment. Colorimetric quantitation of biofilm levels also revealed a signif-icant reduction in biomass with FN075-treatment of biofilms (p = 0.0089), compared to theDMSO-treated controls (S4 Fig). Consistent with the difference in biofilm levels, averageMALDI IMS spectra normalized to the total ion current (TIC) indicated a higher level of over-all signal within the DMSO-treated samples (S4 Fig). To account for the differences in biofilmlevels between non-treated 48 hour biofilms, DMSO-treated, and the FN075-treated samples,mMass [32] software was used to normalize the overall intensity of the average spectra of eachsample to the most abundant ion in the analysis (m/z ~7,280). These normalization parametersrevealed an apparent increase in detection of the ion species corresponding to CsgA (m/z13,036) within the FN075-treated sample, despite the reduction in overall biofilm levels(S4 Fig). IMS ion images for CsgA also appeared to show an increase in detectable CsgA mono-mers within the liquid-exposed region of the biofilm (S4 Fig). This is consistent with our hy-pothesis that FN075 treatment of a pre-formed biofilm would lead to an increase inmonomeric CsgA, which would be more readily ionized and thus detected. Having validatedthe identity and localization of CsgA and FimA, we next sought to understand the basis of thespatial segregation of type 1 pili within UPEC biofilms.
The presence of oxygen induces the expression of type 1 pili in UPECThe observation that type 1 pili-producing bacteria make up the top-most layer of the biofilmled us to the hypothesis that oxygen tension, at least in part, regulates the expression of type 1pili. The fim gene cluster is under the control of a phase-variable promoter region (fimS), theorientation of which in UTI89 is directed by the action of site-specific recombinases FimB,FimE, and FimX (Fig. 5A) belonging to the lambda integrase family [33]. At least two otherglobal transcriptional regulators, Lrp and IHF, have been proposed to bend the fimS DNA inorder to bring the invertible repeats in close proximity to each other and allow for recombina-tion [33,34]. We used a previously developed PCR-based “phase assay” [35] that can distin-guish between the transcription-competent ON (fimON) and transcription-incompetent OFF(fimOFF) orientations of the fim promoter (Fig. 5A), along with immunoblot analysis andtransmission electron microscopy to evaluate whether oxygen is requisite for fim expression.
UTI89 was grown statically in either the presence or absence of oxygen in two differentgrowth media (YESCA and Luria Bertani (LB)) and in two different temperature conditions(room temperature and 37°C) to evaluate the possibility that Fim localization to the air-exposed region was due to a nutritional or a temperature cue (S1 Table). Static growth at 37°Cin LB media under atmospheric conditions enhances expression of UPEC type 1 pili [36–38];these conditions were used as a positive control. UTI89ΔfimA-H was used as a negative control.Given the static nature of all culture methods, cultures grown in the presence of oxygen weretermed “semi-aerobic”.
When starting these experiments from UPEC cultures that were primarily fimOFF, we ob-served that sub-culturing statically in the presence of oxygen induced expression of type 1 pili(Fig. 5B—“semi-aerobic”, S5 Fig, S6 Fig). However, regardless of growth medium or tempera-ture, the fim promoter remained in the fimOFF orientation when bacteria were cultured in theabsence of oxygen (fermentative conditions) (Fig. 5B and S5 Fig). When oxygen is not present,E. coli can utilize alternative terminal electron acceptors, such as nitrate, DMSO, TMAO, or fu-marate [31]. Given that nitrate is the preferred alternative electron acceptor for E. coli, we as-sayed how anaerobic growth in the presence of nitrate (in the form of 40 mM sodium nitrate,NaNO3) would impact expression of type 1 pili. We observed that static cultures started fim-OFF remained largely fimOFF during anaerobic growth in the presence of NaNO3 similar towhat was observed with cultures grown fermentatively (Fig. 5B). When populations grown
IMS Provides Insights to Pilus Regulation
PLOS Pathogens | DOI:10.1371/journal.ppat.1004697 March 4, 2015 9 / 26
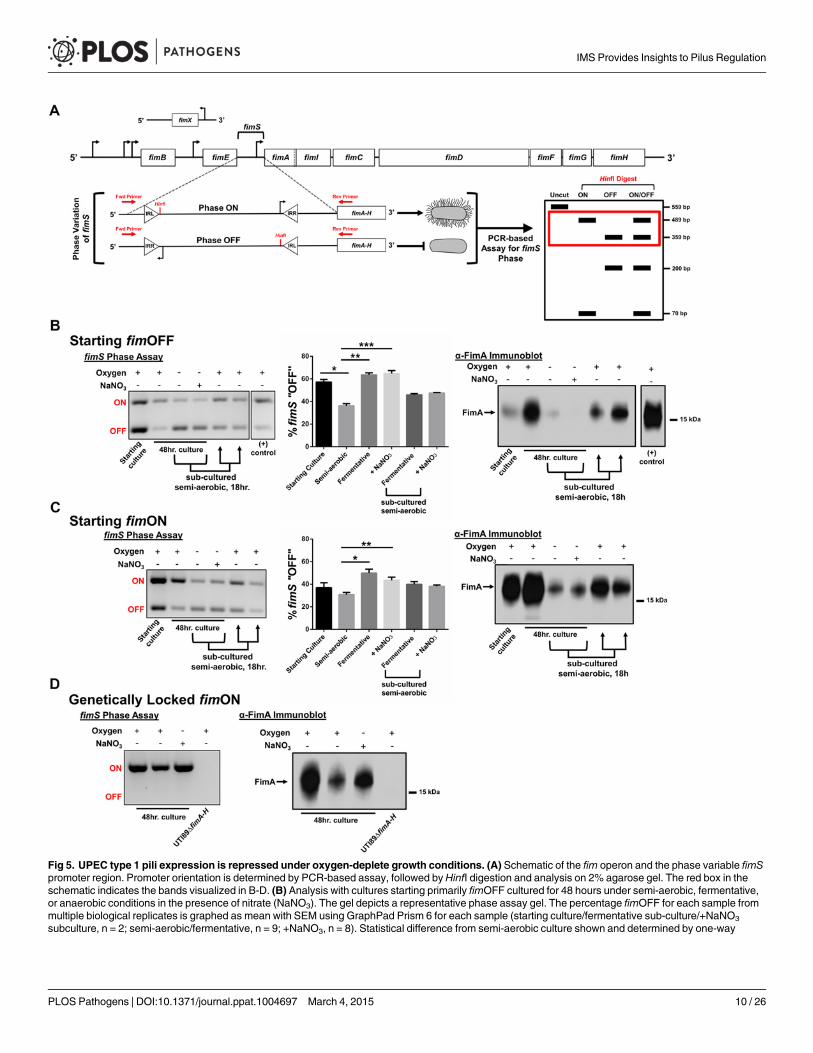
Fig 5. UPEC type 1 pili expression is repressed under oxygen-deplete growth conditions. (A) Schematic of the fim operon and the phase variable fimSpromoter region. Promoter orientation is determined by PCR-based assay, followed by HinfI digestion and analysis on 2% agarose gel. The red box in theschematic indicates the bands visualized in B-D. (B) Analysis with cultures starting primarily fimOFF cultured for 48 hours under semi-aerobic, fermentative,or anaerobic conditions in the presence of nitrate (NaNO3). The gel depicts a representative phase assay gel. The percentage fimOFF for each sample frommultiple biological replicates is graphed as mean with SEM using GraphPad Prism 6 for each sample (starting culture/fermentative sub-culture/+NaNO3
subculture, n = 2; semi-aerobic/fermentative, n = 9; +NaNO3, n = 8). Statistical difference from semi-aerobic culture shown and determined by one-way
IMS Provides Insights to Pilus Regulation
PLOS Pathogens | DOI:10.1371/journal.ppat.1004697 March 4, 2015 10 / 26
fermentatively or anaerobically with nitrate were sub-cultured into semi-aerobic conditions for18 hours, the phase-variable promoter returned predominantly to the fimON orientation, lead-ing to increased FimA protein levels (Fig. 5B). These results suggested that the phase-switchfrom fimOFF to fimON is affected by the bacterial respiration state, favoringaerobic respiration.
Cell populations starting fimON show an active switch to the fimOFForientation under oxygen-deplete conditionsPrevious studies indicated that multiple static sub-cultures under aerobic conditions enhanceexpression of type 1 pili by enriching for UPEC populations in which the fim promoter isfimON [36,37]. We thus repeated our experiments starting from cultures that were pre-enriched for fimON populations to test whether this would influence piliation in the absence ofoxygen. Phase assays, FimA western blot analyses, and transmission electron microscopy(TEM) revealed that under fermentative conditions, the promoter actively inverted to the fim-OFF orientation (Fig. 5C), leading to significantly fewer pili on the cell surface (Fig. 5C andS7 Fig). These data suggest that under fermentative conditions the phase-switch is preferablyin the fimOFF orientation. Interestingly, growth of fimON cells in the presence of nitrate par-tially preserved the fimON state and production of type 1 pili on the surface (Fig. 5C andS7 Fig). The partial preservation observed under anaerobic growth in the presence of nitratefor populations starting fimON suggests that anaerobic respiration does not impact the fimONto fimOFF phase-switch. Together, these data suggest a regulatory mechanism that activelysenses and responds to environmental oxygen levels, and/or bacterial respiration state, to con-trol the expression of type 1 pili in UPEC by altering fimS promoter orientation.
Type 1 pili expression is suppressed under oxygen-deplete conditionsfor cell populations genetically locked fimONIn previous studies we created a UPEC strain (UTI89_LON) in which the fim promoter ele-ment is genetically locked into the transcription-competent fimON orientation [38]. We postu-lated that if oxygen/respiration state only impacts the phase-state of the fim promoter, thenUTI89_LON would be piliated when cultured in the absence of oxygen. When cultured underfermentative conditions, UTI89_LON exhibited a marked reduction in type 1 pili production,similar to wild-type (WT) UTI89, despite the “locked on” position of the promoter (Fig. 5Dand S7 Fig). The phase state of the fim promoter in UTI89_LON was verified by phase assays(Fig. 5D) to exclude the possibility of mutations affecting the phase state under the conditionstested. These data point towards an additional regulatory mechanism that influences produc-tion of type 1 pili in a manner that is independent of the fim promoter switch.
Interestingly, anaerobic growth in the presence of nitrate induced fim gene expression inUTI89_LON (Fig. 5D), similar to the fimON population shown in Fig. 5C (Fig. 5C-D andS7 Fig). Taken together, these observations suggest that the absence of oxygen impacts thephase state of the fim promoter element, and demonstrate that if the promoter is found in the
ANOVA with Bonferroni’s multiple comparisons test using GraphPad (*p = 0.0019, ** and ***p =<0.0001). Statistically significant differences were alsonoted (but not indicated on the graph) between fermentative/fermentative sub-cultured [p = 0.0123], fermentative/+NaNO3 sub-cultured [p = 0.0316],+NaNO3/fermentative sub-cultured [p = 0.0072], and +NaNO3/+NaNO3 sub-cultured [p = 0.0185]. Corresponding anti-FimA immunoblots from the samesamples used for each phase assay are shown. (C) Analyses as shown in B, for cultures starting predominantly fimON. Phase assay quantitation taken frombiological replicates of starting culture/fermentative sub-culture/+NaNO3 subculture, n = 2; semi-aerobic/fermentative/+NaNO3, n = 6. Statistical analysisperformed as in B (*p = 0.0004, **p = 0.0344). Immunoblot is representative of five biological replicates. (D) Representative phase assay gel (n = 8) and anti-FimA immunoblot (n = 8) of cultures using UTI89_LON strain. Coomassie stained gels to verify equal loading and Ponceau S stained membranes to showequal transfer are provided in S6 Fig for the samples shown here.
doi:10.1371/journal.ppat.1004697.g005
IMS Provides Insights to Pilus Regulation
PLOS Pathogens | DOI:10.1371/journal.ppat.1004697 March 4, 2015 11 / 26

fimON orientation, the presence of an alternative electron acceptor is sufficient toinduce transcription.
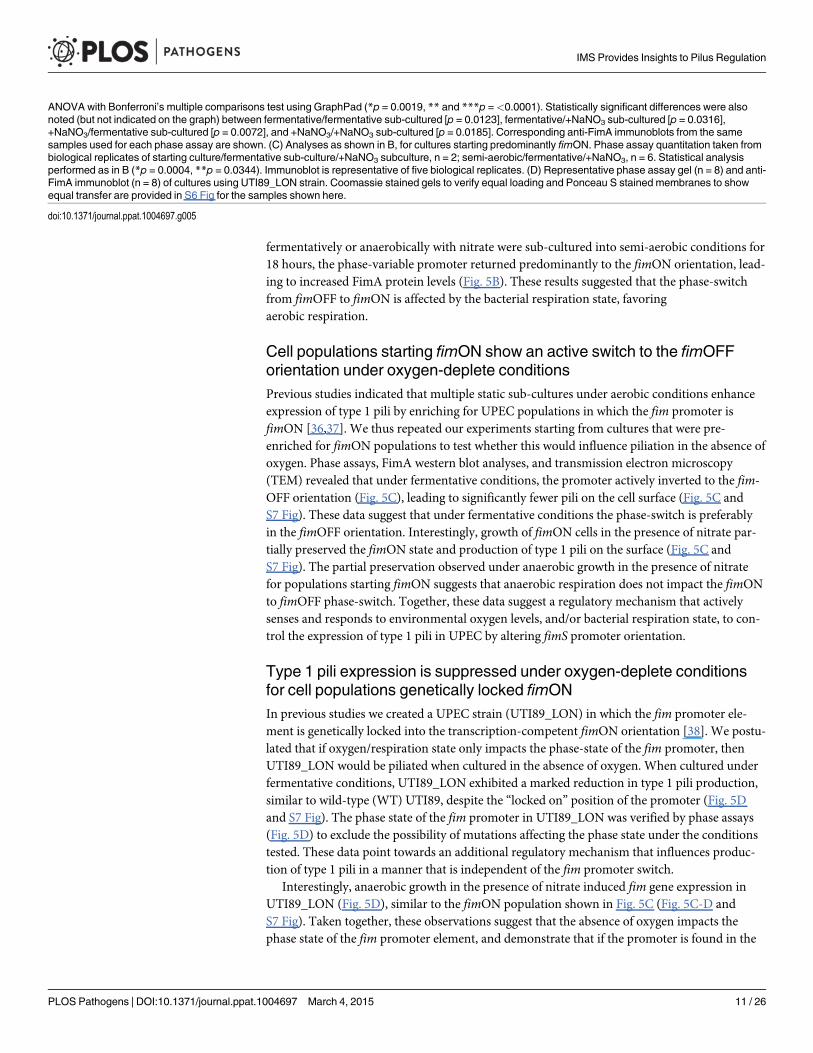
S pili are expressed during fermentative growth conditionsPrevious studies indicated that reduction in the expression of type 1 pili induces the expressionof S pili under type 1 pili-inducing conditions [39–41]. We therefore evaluated the presence ofS pili on the surface of the cell. Type 1 pili are characterized by their ability to bind mannosy-lated moieties [42]. An assay to evaluate the extent of type 1 pili in a UPEC population involvesthe agglutination of guinea pig red blood cells in the presence and absence of mannose. In bac-teria that solely express type 1 pili, hemagglutination can be abolished by the addition of man-nose to the agglutination reaction [42]. S pili bind sialic acid residues; therefore desialylation ofred blood cells using neuraminidase prior to the agglutination assay abrogates S pili-dependenthemagglutination [43,44]. We combined these two approaches to establish the identity of thepili produced by UTI89 under anaerobic growth with cultures started from populations pri-marily fimON. As expected, when WT UTI89 was grown statically in the presence of oxygen,hemagglutination (HA) was abolished in the presence of mannose and was unaffected by neur-aminidase treatment (Fig. 6A), suggesting high numbers of type 1 pili. However, WT UTI89grown under fermentative conditions exhibited lower HA titers that were inhibited by bothmannose and by neuraminidase treatment (Fig. 6B), indicating that the observed agglutinationwas mediated by both type 1 and S pili. Given the inverse relationship between these two chap-erone usher pathway (CUP) pili systems, the observable increase in S pili-mediated agglutina-tion under fermentative growth conditions is an orthologous approach to demonstrate thedown-regulation of type 1 pili in response to the lack of oxygen.
WT UTI89 grown anaerobically in the presence of nitrate exhibited overall lower HA titerscompared to semi-aerobic and fermentative conditions (Fig. 6C). However, this agglutinationwas inhibited by mannose and was not significantly impaired by neuraminidase treatment,confirming the de-repression of type 1 pili expression by addition of nitrate and the subsequentdown-regulation of S pili. UTI89_LON exhibited an HA profile that was similar to WT UTI89,suggesting that when the fim promoter is genetically locked in the fimON orientation, it exertsa negative effect thereby repressing S pili expression (Fig. 6). UTI89ΔfimA-H yielded low HAtiters under the three growth conditions tested and agglutination was not inhibited by mannosebut was abolished when treated with neuraminidase, verifying that pili observed by TEM withthe UTI89ΔfimA-Hmutant are S pili (Fig. 6 and S7 Fig). These data demonstrate that the in-verse relationship previously reported for type 1 and S pili [41] is maintained during growth inthe absence of oxygen and that depletion of oxygen does not repress expression of all CUPpili systems.
DiscussionThis work shows MALDI IMS to be a strong analytical technology to study the spatial prote-ome of intact bacterial biofilms. Using a surface-associated biofilm setup that allowed for theformation of a biomass spanning two environmental niches (liquid versus air), we show thatthis imaging technology can be applied towards the interrogation of biofilm heterogeneitywithout a priori knowledge of protein targets of interest. Various mass spectrometric tech-niques have previously been applied for the study of microbial systems [45]. Laser desorptionpost-ionization mass spectrometry has been applied to analyze peptides involved in sporula-tion and bacterial competence [46], and secondary ion mass spectrometry (SIMS) was success-fully used to analyze peptides involved in bacterial swarming [47]. MALDI IMS has been usedsuccessfully for the analysis of small molecules and metabolites within bacterial communities
IMS Provides Insights to Pilus Regulation
PLOS Pathogens | DOI:10.1371/journal.ppat.1004697 March 4, 2015 12 / 26
Fig 6. Suppression of type 1 pili under oxygen-deplete conditions enhances expression of S pili.Hemagglutination assay measuring type 1 (mannose-dependent) and S pili (sialic acid dependent) mediatedagglutination under (A) semi-aerobic, (B) fermentative, and (C) anaerobic + NaNO3 growth conditions fromcultures started from a population primarily fimON. Data presented as mean with SEM, obtained from twotechnical replicates of two biological replicates. Statistical analysis performed as a two-way ANOVA withBonferroni’s multiple comparisons test using GraphPad (#p =<0.05, ***p =<0.01, *p =<0.001,*p =<0.0001).
doi:10.1371/journal.ppat.1004697.g006
IMS Provides Insights to Pilus Regulation
PLOS Pathogens | DOI:10.1371/journal.ppat.1004697 March 4, 2015 13 / 26

[48–51]. To date, only one other study has utilized MALDI IMS for the direct analysis of pro-tein species within a bacterial community [52]. M.T. et al. used MALDI IMS for the analysis ofpeptides and proteins found at the site of interaction between E. coli and Enterococcus faecalisbiofilms co-cultured on an agar surface, as well as within each individual biofilm [52]. Otherthan this initial study, little has been done to define the stratification of proteins within intactbiofilms by IMS. Therefore, the application of MALDI IMS for the analysis of the intact spatialproteome of a single-species bacterial community represents an emerging approach that hasthe potential to offer new insights into the role and regulation of protein stratificationwithin biofilms.
One caveat to MALDI-TOF IMS analyses of intact protein localization is that the species ob-served are typically limited to those most abundant within the sample or those that crystallizeand ionize best with the MALDI matrix selected [25,53,54]. This limitation can restrict the sen-sitivity and dynamic range of the analytes observed by IMS. In turn, large molecular weightproteins or large polymeric protein complexes vital to biofilm formation, which are harder toionize by MALDI and detect by time-of-flight mass analysis could be intrinsically excludedfrom the data. This caveat is exemplified by our curli fiber studies, where FN075 treatment in-creased the amount of detectable CsgA. Thus, orthologous approaches are still critical for vali-dating MALDI IMS findings.
The profile of protein species observed can be expanded by varying the UV-absorbing ma-trix used for the analysis and by extending the overallm/z ion range analyzed (i.e. from 2,000–25,000m/z to 2,000–40,000m/z, and so on) [55]. The sensitivity of MALDI IMS can be refinedfurther by increasing the spatial resolution at which the biofilm is imaged from the current res-olution of 150 μm to as low as 20μm in order to better define stratification of subpopulations.We are currently developing both methods to enhance the number and type of protein speciesthat can be localized within a single biofilm. While our approach clearly did not capture theglobal biofilm proteome, it simultaneously detected the spatial localization of up to 60 proteinspecies within a single analysis; this represents a significant advancement compared to moretraditional antibody- or fluorescent tag-based approaches that have been largely limited in thenumber of protein species visualized per analysis. In addition, the localization of proteins suchas FimA and CsgA, which have been shown to play a crucial role in UPEC biofilm formationand pathogenesis but cannot be epitope-tagged due to their incorporation in macromolecularstructures, also highlights the strength of this application.
MALDI IMS analyses revealed that type 1 pili-producing bacteria stratify above curli fiber-producing bacteria within the UPEC glass slide surface-associated biofilms interrogated in ourstudies (Fig. 3B). Similar UPEC biofilms have been previously shown to consist of an extracel-lular matrix comprised of curli and cellulose [7,28], with type 1 pili playing an accessory role inbiofilm tensile strength [7]. The study by Hung et al., revealed that the bacteria on the air-exposed layer of a floating pellicle biofilm (formed during growth in the same media used inour studies), are morphologically distinct from those at the liquid interface [7]. In the samestudy, they also reported that disruption of fim-mediated adhesion did not ablate biofilm for-mation, but rather impaired biofilm integrity through the formation of large holes on the air-exposed side of the biomass [7]. Here, MALDI IMS demonstrated that type 1 pili are producedby the bacteria forming the topmost, air-exposed layer of the biofilm. In our studies, we ob-served that a pellicle biofilm typically surrounded the UPEC slides cultured for IMS analysiswithin 72–96 hours of starting the culture. If the slide-associated biofilm analyzed by MALDIIMS, is representative of a cross-section of the growing pellicle biomass biofilm, stratificationof type 1 pili observed in surface-associated biofilms by IMS could help to explain the loss intensile strength upon disruption of fim-mediated adhesion observed by Hung et al. However, itis important to note that the type of surface to which the bacteria adhere and the nutrient or
IMS Provides Insights to Pilus Regulation
PLOS Pathogens | DOI:10.1371/journal.ppat.1004697 March 4, 2015 14 / 26

surrounding environmental conditions can alter the genetic expression profiles within the bio-film community. Therefore, we recognize that the conclusions drawn here are representative ofbiofilms formed on a glass surface in a laboratory setting and may bear differences from cross-sections obtained from floating pellicles.
Bacterial biofilms constitute a serious problem in the healthcare setting. The unique hetero-geneous architecture of the biofilm, combined with the composition of a self-secreted extracel-lular matrix, greatly hampers the penetrance and efficacy of bactericidal drugs and limitstreatment options in the case of biofilm-related infection [21]. It is thus imperative to identifynew strategies to combat or re-program how bacteria form these multicellular structures. Nu-merous studies identified the presence of bacterial subpopulations within bacterial biofilmsand identified that these subpopulations execute unique “tasks” [56,57]. For example, in the be-nign B. subtilis biofilms, specific subpopulations produce extracellular matrix while others un-dergo sporulation [57,58]. Further studies indicated that B. subtilis biofilms are coated with ahydrophobin that renders the biofilm colony impervious to penetration [58]. In E. coli andother pathogens, metabolically inactive “persister” cells within the biofilm re-seed the infectionupon cessation of antibiotic treatment [8,56,59]. Identifying the spatial proteome of biofilmsmay uncover markers for distinct subpopulations, thereby aiding in the development of newstrategies for thwarting biofilm formation.
Our analyses so far revealed that induction of type 1 pili expression likely occurs on the top-most layer of the imaged biofilm due to the increased oxygen levels in this region. Previousstudies reported that UPEC strains rely on the TCA cycle during infection [39,60] and thatTCA cycle perturbations lead to a repression of fim gene expression and abrogation of intracel-lular bacterial community formation [39]. The studies described here show that there are atleast two regulatory mechanisms that control expression of type 1 pili in the absence of oxygen;one that exerts its regulatory effect by influencing the fim promoter switch and another thatacts independently of the fim promoter switch. Both of these mechanisms are engaged underfermentative growth, strongly suggesting that loss of the ability to use the electron transportprocesses imposes an energetic cost to the bacteria and necessitates the down-regulation of en-ergetically expensive structures.
In probing the basis of these mechanisms, we have found that under fermentative condi-tions, there is no significant change in steady-state mRNA transcripts of the two main fimrecombinases FimB and FimE (S8 Fig). We have also ruled out the involvement of the Anaero-bic Respiration Control (Arc) two-component system (S8 Fig). It is likely that the effects on thephase-state of the fim promoter result from effects on the function of FimB and/or FimE aspreviously described [61]. Muller et al. elegantly demonstrated that CRP impacts fim gene ex-pression by interfering with FimB function and repressing the expression of Lrp [61]. Otherstudies indicated that mutants deleted for the global regulator FNR had increased levels of Lrpunder anaerobic growth conditions, suggestive of FNR down-regulating lrp expression in theabsence of oxygen [62,63]. In the UPEC strain CFT073, Barbieri et al. have demonstrated thatdeletion of FNR suppresses expression of the FimB recombinase under atmospheric conditions[63]. We are currently investigating the involvement of FNR on modulating fim promoterswitching in UPEC strain UTI89.
Use of alternative electron acceptors affords E. coli the ability to continue the electron trans-port processes under a variety of growth conditions, extending the range of environmental con-ditions they can withstand. Here we show that while incorporation of an alternative terminalelectron acceptor (nitrate) partially preserved piliation in cells that had the promoter fimON, itwas unable to restore production of type 1 pili in cells with the promoter in the fimOFF orien-tation. We have attributed this effect to the ability of nitrate to serve as an alternative terminalelectron acceptor. However, it is important to note that nitrate itself, as well as byproducts of
IMS Provides Insights to Pilus Regulation
PLOS Pathogens | DOI:10.1371/journal.ppat.1004697 March 4, 2015 15 / 26

nitrate respiration, specifically nitric oxide (NO), can also serve as a signaling molecule withinthe biofilm community [64–66]. NO has also been shown to have anti-biofilm abilities, sug-gesting possible role within biofilm signaling and maintenance [67]. We are currently in theprocess of confirming our results and examining the impact of the other preferred alternativeterminal electron acceptors of E. coli (DMSO, TMAO, and fumarate), on type 1 pili expressionunder oxygen-deplete conditions.
Overall, the results of our nitrate studies are in agreement with our previous studies, inwhich a non-functional TCA cycle threw the fim switch in the fimOFF orientation [39]. Patho-genic extra-intestinal E. coli strains, such as UPEC, typically thrive in the gastrointestinal tractof humans and other warm-blooded animals where oxygen is limited. As UPEC exit the gutand ascend the urethra to eventually colonize the urinary tract, they undergo multiple metabol-ic transitions between aerobic and anaerobic growth states. Each of these transitions isaccompanied by fluctuations in oxygen tension from strictly anaerobic to highly oxygenated, tosemi-aerobic. The bacterial cells respond to these fluctuations by modulating central metabolicpathways for carbon and energy flow, which in turn impact expression of a battery of targetsincluding virulence factors. Together with previous reports [39,60], the studies described herecorroborate a direct link between respiration state and the expression of adhesive fibers thathas multiple regulatory checkpoints, possibly to account for the diverse fluctuations in oxygentension encountered by UPEC. Our study also suggests that oxygen gradients determine fiberstratification within the biofilm, which may contribute to overall integrity.
Collectively, our studies used MALDI IMS to begin to define the spatial stratification of dis-tinct bacterial subpopulations within UPEC biofilms based on differential protein expressionprofiles. Extrapolating from observations made by MALDI IMS, we discovered that type 1 pili-producing bacteria constitute the uppermost layer of UPEC biofilms under the conditions test-ed, and we identified two new UPEC regulatory mechanisms that control the expression oftype 1 pili in response to oxygen and/or bacterial respiration state. These findings highlighthow MALDI IMS can drive the identification and characterization of biofilm subpopulations,leading to a greater understanding of their role and regulation within the biofilm.
Materials and Methods
Bacterial strainsFor these studies we used the UPEC cystitis isolate UTI89 [24]. Previously constructed UTI89mutants used in this study are UTI89ΔfimA-H (gift from Dr. Scott Hultgren); UTI89_LON[38]; and UTI89ΔarcA (gift from Dr. Matthew Chapman). UTI89ΔhupA and UTI89ΔyahOwere created using the previously established λ Red recombinase methods [68] and the follow-ing primers (Integrated DNA Technologies): hupA_Fwd (5’–TTACTTAACTGCGTCTTT-CAGTGCCTTGCCAGAAACAAATGCCGGTACGTGTGTAGGCTGGAGCTGCTT–3’) /hupA_Rev (5’-ATGAACAAGACTCAACTGATTGATGTAATTGCAGAGAAAGCA-GAACTGTCCATATGAATATCCTCCTTAG-3’); yahO_Fwd (5’-ATGAAAATAATCTC-TAAAATGTTAGTCGGTGCGTTAGCGTTTGCCGTTACGTGTAGGCTGGAGCTGCTTC-3’) / yahO_Rev (5’-TTACTTCTTCTTATAAATATTTGCCGTGCCGTGAATCTTATTGT-CAGTTTCATATGAATATCCTCCTTAG-3’).
Biofilm growth conditionsAll strains were grown overnight in Lysogeny broth (LB) (Fisher), pH 7.4, at 37°C with shaking,unless otherwise specified. Overnight cultures were then sub-cultured in 1.2x Yeast-Extract/Casamino Acids (YESCA) broth [43]. Bacterial suspensions were then dispensed in 50 mL con-ical tubes containing ITO-coated glass slides (Delta Technologies) and cultured for 48 hours at
IMS Provides Insights to Pilus Regulation
PLOS Pathogens | DOI:10.1371/journal.ppat.1004697 March 4, 2015 16 / 26

room temperature. After culture, slides were removed, rinsed with water to remove non-adherent bacteria and stored at -80°C until analysis.
Biofilm quantitationBiofilms were quantified as previously described [43]. Crystal violet stained biofilms were re-moved from ITO slides using 35% acetic acid and transferred to 96-well plates for absorbancereadings. Absorbance at 570 nm was determined using a BioRad Model 680 microplate reader(BioRad). Data are presented as the average absorbance from at least three independent experi-ments. Statistical analysis was performed using a two-tailed unpaired Student’s t-test (Graph-Pad Prism 6).
MicroscopyScanning electron microscopy (SEM). Bacterial biofilms grown as described for MALDI IMSwere treated for SEM as previously described [69]. Samples were dried at the critical point,mounted onto aluminum sample stubs and sputter coated with gold-palladium. A small stripof silver paint was applied to the sample edge, and biofilms were imaged with an FEI Quanta250 Field-emission gun scanning electron microscope (FEI). At least two biological replicateswere imaged for each sample preparation and representative images were collected.
Transmission electron microscopy (TEM). TEM analyses were performed as outlined pre-viously [40]. Briefly, 100 μL of normalized bacterial cultures (OD600 = 1.0) from each conditionwere centrifuged at 4,000 rpm for 10 minutes and resuspended in 50 μL of TEM fixative (2.5%glutaraldehyde in 100mM sodium cacodylate (Electron Microscopy Sciences)) for 1 hour atroom temperature. Samples were then deposited onto glow-discharged formvar-/carbon-coated copper grids (Electron Microscopy Sciences) for 60 seconds and stained with 1% uranylacetate for 90 seconds. Samples were then analyzed on a Phillips/FEI T-12 Transmission Elec-tron Microscope (FEI).
Immuno-fluorescence by Super-resolution Structured Illumination Microscopy (SIM).The α-CsgA antibody was provided by Dr. Matthew Chapman at the University of Michigan.UPEC biofilms were grown for 48 hours as previously described. Biofilms were fixed in 4%paraformaldehyde in phosphate-buffered saline (PBS) for 30 minutes at room temperature andblocked in 5% BSA overnight at 4°C. Biofilms were immuno-stained with α-CsgA (1:1000) for1 hour at room temperature, followed by 3 washes in PBS and secondary detection with AlexaFluor-555 goat anti-rabbit (1:1000) (Life Technologies) for 1 hour at room temperature. Sam-ples were washed 3 times in PBS and mounted under a 1.5 size coverslip (Fisher Scientific)using ProLong Gold antifade reagent containing DAPI for DNA counterstain (Life Technolo-gies). Cells were imaged using a GE/Applied Precision DeltaVision OMX in SIMmode with1.516 immersion oil at 63X magnification. Post-data acquisition processing was performedusing SoftWorx for OMX. Images were processed for contrast enhancement and cropping inPhotoshop. With the exception of x-y sections (z stacks), images are shown as maximum inten-sity projections through the entire imaged area (ranging from 3–6 μm in z, 40 μm in x-y). Vid-eos depicting three-dimensional reconstruction of biofilms were generated using the VolumeViewer in Progressive mode in SoftWorx for OMX.
Optical profilometrySurface analysis was performed on crystal violet stained biofilms using a Zeta-20 True Color3D Optical Profilometer (Zeta Instruments) at 20x magnification. Fifty microns werez-stacked to create the profiles at 0.2 microns/step. Images were reconstructed using a10% optical overlap in stitching. Optical images of crystal violet stained biofilms were
IMS Provides Insights to Pilus Regulation
PLOS Pathogens | DOI:10.1371/journal.ppat.1004697 March 4, 2015 17 / 26
obtained using a Leica SCN400 Digital Slide Scanner (Leica Microsystems) at 20x magnifica-tion in manual bright field mode.
Matrix-Assisted Laser Desorption/Ionization (MALDI)—Time-of-flight(TOF) Imaging Mass Spectrometry (IMS)Biofilms grown on ITO-coated glass slides were washed to remove interfering salts and lipidsin sequential 30-second washes of 70, 90, and 95% HPLC-grade ethanol (Fisher Scientific). Ma-trix comprising 15 mg/mL 2,5-dihydroxybenzoic acid (DHB) (Fisher Scientific) and 5 mg/mLα-Cyano-4-hydroxycinnamic acid (CHCA) (Sigma-Aldrich) was applied using a TM-Sprayer(HTX Imaging), and samples were vapor rehydrated with 10% acetic acid. Samples were ana-lyzed using a Bruker Autoflex Speed mass spectrometer (Bruker Daltonics) in linear positiveion mode. Each pixel contains an average of 200 spectra. Images were collected at 150 micron(μm) lateral resolution. Data were analyzed using FlexImaging 3.0 Build 42 (Bruker Daltonics).Datasets were normalized to total ion current unless otherwise indicated. Ion intensity mapswere extracted for each range of interest and were plotted using the maximum intensity withinthe range. (Detailed MALDI-TOF IMS methods are found in S1 Methods).
Protein fractionation and identificationTo identify 48-hour UPEC biofilmm/z ion species observed by IMS, multiple slide-associatedbiofilms were lysed and pooled together. Lysates were sonicated, centrifuged, and supernatantsdried by vacuum centrifugation (Thermo Scientific). Samples were resuspended and fractionat-ed using C8 (Grace Vydac) or C18 (Phenomenex) reversed-phase high performance liquidchromatography (HPLC) (Waters). Fractions were analyzed form/z ions corresponding tothose observed in the IMS analyses, subjected to in-solution tryptic digestion, and submitted tothe Vanderbilt University Mass Spectrometry Research Center Proteomics Core for LC-MS/MS identification (Detailed methods in S1 Methods). For validation of FimA protein identifica-tion, 48-hour biofilms of the UTI89ΔfimA-H were cultured as described above and analyzed byMALDI IMS. For validation of HupA and YahO protein identifications, 48-hour static liquidcultures (in 1.2x YESCA) of UTI89ΔhupA and UTI89ΔyahO were grown. After 48 hours, an al-iquot of liquid culture was removed and pelleted. Pellets were then lysed with a volume of 35%acetic acid, and centrifuged to pellet debris. Lysates were then analyzed by MALDI-TOF MS(Bruker Daltonics) using the same matrix and parameters for IMS analyses.
FN075 experimentsFN075 was prepared and characterized as described previously [29,70]. UPEC biofilms werecultured as described above for 24 hours. After 24 hours the preformed biofilm was treatedwith either 125 μM FN075 dissolved in 100% dimethyl sulfoxide (DMSO), an equivalent vol-ume of 100% DMSO (vehicle control), or an equivalent volume of fresh YESCA media (nega-tive control) and allowed to develop for another 24 hours. Slides were then removed andprocessed as described above. Biofilms were quantified and analyzed by MALDI IMS asdescribed above.
Growth conditions for analysis of oxygen-dependent fim expression inUPECWTUTI89 and mutant strains were cultured under media and growth conditions listed in Sup-plemental Table 1 (S1 Table). Cultures starting fimOFF were begun from overnight shakingcultures, and cultures starting fimON were begun from overnight statically grown cultures,
IMS Provides Insights to Pilus Regulation
PLOS Pathogens | DOI:10.1371/journal.ppat.1004697 March 4, 2015 18 / 26

both in LB media at 37°C. Oxygen-deplete cultures were grown in an anaerobic chamber main-tained at 0% oxygen with between 2–3% hydrogen. Alternative terminal electron acceptor sam-ples were treated with 40mM sodium nitrate (NaNO3) (Sigma-Aldrich). All cultures weregrown for 48 hours to mimic biofilm growth conditions used in IMS analyses. After 48 hours,cultures were normalized to an OD600 of 1.0 with sterile PBS for phase assay andimmunoblot analysis.
fim phase assaysPhase assays were performed as previously described [35] using 100 ng of genomic DNA, or analiquot of normalized cells (OD600 1.0) and with the following modifications: Primers Phase_L(5’-GAGAAGAAGCTTGATTTAACTAATTG-3’), and Phase_R (5’-AGAGCCGCTGTA-GAACTCAGG-3’) were used and the PCR was performed using the following parameters:95°C—5min, 30 cycles (95°C—45sec, 50°C—20sec, 72°C—45sec), 72°C—5min. To determinethe proportion of the population fimON vs. fimOFF, mean pixel intensity of the bands at 489bp (fimON) and 359 bp (fimOFF) was determined within each sample using Adobe PhotoshopCS6 (Adobe Systems). Background taken from a blank area of the gel at a position equivalentto each band, was subtracted. The mean intensity of the fimON and fimOFF band for eachsample was then summed, and the percentage ON vs. OFF was then determined for each sam-ple. The percentage of each sample fimOFF was then plotted with GraphPad Prism 6 (Graph-Pad Software Inc.), and statistical analysis was performed using a one-way ANOVA withBonferroni’s multiple comparisons test.
Immunoblot analysisImmunoblots probing for FimA were performed as previously described [43]. Briefly, cultureswere normalized to an OD600 = 1.0 and 1 ml of normalized cultures was pelleted by centrifuga-tion. Normalized cell pellets were suspended 1x Laemmli sample buffer (BioRad) containing5% 2-mercaptoetahnol (Sigma-Aldrich). Samples were acidified with 1M hydrochloric acid(HCl), heated at 100°C for 10 minutes, and then neutralized with 1N sodium hydroxide(NaOH). Samples were then resolved on a 16% SDS-PAGE gel. Following SDS-PAGE, proteinswere transferred to nitrocellulose using the Trans-Blot Turbo Transfer System (BioRad),(7 minute transfer at 1.3A and 25V). Transfer efficiency was verified with Ponceau S (Sigma-Aldrich). Stains corresponding to blots shown in Fig. 5 are included in S6 Fig. Following trans-fer, membranes were blocked with 5% non-fat milk in 1x TBST overnight at 4°C. Afterblocking, membranes were washed 2x with 1x TBST and incubated with primary anti-FimAantibody [1:5,000] [43] for 1 hour at room temperature, washed 2x with 1x TBST, and incubat-ed with HRP-conjugated goat—anti-rabbit secondary antibody (Promega) for 30 minutes atroom temperature. Following secondary antibody application membranes were washed 3xwith 1x TBST, treated with SuperSignal West Pico Chemiluminescent Substrate (Thermo Sci-entific), and bands visualized on x-ray film (MidSci). Immunoblots probing for CsgA were per-formed in a similar fashion with the exception that cell pellets were first solubilized in 100%formic acid, which was then evaporated prior to re-constitution in 1x SDS sample buffer, aspreviously described [29]. The anti-CsgA antibody was used at a 1:10,000 dilution.
Hemagglutination assaysHemagglutination assays were performed as described previously [43]. Guinea pig erythrocyteswere obtained from the Colorado Serum Company. Erythrocyte de-sialylation was performedusing Clostridium perfringens neuraminidase (New England BioLabs) for 2 hours at 37°C withgentle agitation.
IMS Provides Insights to Pilus Regulation
PLOS Pathogens | DOI:10.1371/journal.ppat.1004697 March 4, 2015 19 / 26
fimB and fimE qPCR analysisRNA extraction, reverse transcription, and real-time quantitative PCR were performed as pre-viously described [71]. qPCR analysis was performed with three concentrations of cDNA(50 ng, 25 ng, 12.5 ng) each in triplicate for each sample, and internal DNA gyrase (gyrB) levelswere used for normalization. The following primers (Integrated DNA Technologies) were usedfor amplification; fimB_Fwd (5’—GCATGCTGAGAGCGAGTCGGTA—3’), fimB_Rev(5’—GGCGGTATACCAGACAGTATGACG—3’), fimE_Fwd (5’—ATGAGCGT-GAAGCCGTGGAACG—3’), fimE_Rev (5’—TATCTGCACCACGCTCAGCCAG—3’),gyrB_L (5’—GATGCGCGTGAAGGCCTGAATG—3’), gyrB_R (5’—CACGGGCACGGG-CAGCATC—3’). The following probes (Applied Biosystems) were used for quantitation; fimB(5’– 6FAM-TCATCCGCACATGTTAC-MGBNFQ—3’); fimE (5’—NED-CGGACCGACGC-TATAT-MGBNFQ—3’); gyrB (5’—VIC-ACGAACTGCTGGCGGA-MGBNFQ—3’).
Supporting InformationS1 Fig. IMS sample preparation methods do not alter UPEC biofilm architecture. (A) Rep-resentative SEMmicrographs of unwashed and ethanol-washed UPEC biofilms. Representativemicrographs from at least two biological replicates are shown. Magnification shown, 10,000x;scale bar = 5 μm. (B) Biofilm quantitation by crystal violet staining. Graph depicts quantifiedbiofilm of ethanol-washed and unwashed biofilms measured at 48 hours post-seeding. Data arepresented as the mean with the standard deviation. EtOH, ethanol; �Statistical analysis was per-formed using two-tailed unpaired Student’s t-test (n = 9, p = 0.7864) (C) Optical profilometryshowing areas of highest bacterial density on the conductive slide.(TIF)
S2 Fig. IMS ion overlay images reveals stratification of identified proteins within the UPECbiofilm. Representative IMS images depicting the localization and relative abundance of iden-tified UPEC protein species relative to each other in the biofilm. Overlays are presented as asingle color intensity map with representative intensity scale shown in white. The top-row heatmap intensity (10–100%) indicates the relative abundance and localization of each protein spe-cies in the biofilm.(TIF)
S3 Fig. Mass spectrometry analysis of gene deletion mutants validates IMS ion identifica-tions for FimA, HupA, and YahOUp. (A) IMS analysis of UTI89ΔfimA-H reveals loss of ionatm/z 16,269, corresponding to FimA. A representative single spectrum for the UTI89ΔfimA-Hmutant (red) is shown, compared to an average spectrum taken from two biologicalreplicates of wild-type (WT) UTI89 (black) after 48 hours of growth. (B–C) MALDI mass spec-trometry analysis of lysed UTI89ΔhupA (B) and UTI89ΔyahO (C) bacteria pellets. (B) Tradi-tional proteomics had identified the ion atm/z 9,535 as the transcriptional regulator, HupA(Table 1). Analysis of the UTI89ΔhupAmutant (green) indicates a loss of this ion peak. (C)Traditional proteomics had identified the ion atm/z 7,718 as the uncharacterized protein fac-tor, YahO (Table 1). Analysis of the UTI89ΔyahOmutant (blue) indicates a loss of this ionpeak. All spectra were imported to the mMass software, baseline subtracted, smoothed, andnormalized to the most abundant ion in the spectra.(TIF)
S4 Fig. MALDI IMS detects biofilm responses to external stimuli. (A) Structure of the com-pound FN075 and biofilm quantitation for DMSO- and FN075-treated biofilms using crystalviolet staining. Data presented as mean with the standard deviation (n = 2 for each condition).
IMS Provides Insights to Pilus Regulation
PLOS Pathogens | DOI:10.1371/journal.ppat.1004697 March 4, 2015 20 / 26
Statistical analysis was performed using a two-tailed unpaired Student’s t-test (�p = 0.0037,��p = 0.0089, ���p = 0.0325). (B) Immunoblot for CsgA protein levels between 48-hour cul-tures, and cultures treated with equivalent volumes of either YESCA media, DMSO (vehiclecontrol), or 125 μm FN075 in DMSO after 24-hours and cultured for another 24-hours. Blotshown is representative of two technical replicates of two biological replicates. (C) Average rawand normalized MALDI IMS spectra from non-treated 48-hour (Green), DMSO-treated(Black), and FN075-treated (Red) biofilm IMS analyses. The average spectra are a result of twobiological replicates for each condition after normalization to the total ion current using FlexI-maging software. Average spectra were then imported to the mMass Software, background-subtracted and smoothed, and normalized to the most intense ion in the spectra atm/z 7,280.(D) IMS localization and abundance of CsgA within vehicle- or FN075-treated biofilms revealsan increase in distribution throughout the liquid-exposed region of the biofilm. Images shownfor each condition are representative of two biological replicates and were processed as de-scribed in Fig. 2. Scale bar = 5 mm.(TIF)
S5 Fig. UPEC type 1 pili expression is repressed under oxygen-deplete growth conditionsregardless of growth medium and temperature. (A) Phase assay and FimA immunoblot anal-ysis of WT UTI89 cultured in 1.2x YESCA media at room temperature under semi-aerobic andfermentative growth conditions. Phase assay quantitation, n = 3. Statistical analysis performedby two-tailed unpaired Student’s t-Test in GraphPad Prism 6, with determined p-valuesshown. Immunoblot representative of n = 4 analyses. (B) Phase assay and FimA immunoblotanalysis of WT UTI89 cultured in 1.2x YESCA media at 37°C under semi-aerobic and fermen-tative growth conditions. Phase assay quantitation, n = 1. Immunoblot representative of n = 2analyses. (C) Phase assay and FimA immunoblot analysis of WT UTI89 cultured in LB media(pH 7.4) at room temperature under semi-aerobic and fermentative growth conditions. Phaseassay quantitation, n = 1. Immunoblot representative of n = 2 analyses. Statistical analysis ofphase quantitation not performed for (B) and (C) due to insufficient number of biological rep-licates. All data presented as outlined in Fig. 2. All cultures for the analyses in A-C were startedfrom primary overnight cultures grown at 37°C with shaking conditions therefore each popula-tion began primarily phase fimOFF.(TIF)
S6 Fig. Equal loading and transfer verification of FimA immunoblots. (A) Coomassiestained gels post-transfer for the immunoblots presented in Fig. 5. (B) Ponceau S staining ofmembranes post-transfer for immunoblots shown in Fig. 5. Together these data show equalloading and protein levels of gels pre-transfer and equal transfer to the membranes usedfor immunoblotting.(TIF)
S7 Fig. TEM analysis reveals the extent of surface piliation in UPEC under semi-aerobic,fermentative, and anaerobic/nitrate growth conditions. Representative TEMmicrographsfor each strain under the three tested growth conditions. Cultures were initiated from staticovernight stocks and cultured statically for 48 hours in LB media (pH 7.4) at 37°C under the re-spective growth condition. Scale bar = 500 nm.(TIF)
S8 Fig. Oxygen-dependent regulation does not affect FimB and FimE recombinase levelsand is independent of the ArcAB two-component system. (A) qPCR analysis of fimB andfimE steady-state mRNA transcript levels from semi-aerobic and fermentative cultures startedfromWT UTI89 populations primarily fimOFF (shaking), WT UTI89 populations primarily
IMS Provides Insights to Pilus Regulation
PLOS Pathogens | DOI:10.1371/journal.ppat.1004697 March 4, 2015 21 / 26

fimON (static), or genetically locked fimON (UTI89_LON, started from shaking). RNA wasextracted from bacterial pellets obtained from cultures presented in Fig. 5. Data is graphed asthe mean ± SEM from two independent biological replicates, with three technical replicates ofthree different cDNA concentrations used for each biological replicate (9 technical reads perbio replicate). All data are normalized to the internal DNA gyrase (gyrB) values calculatedwithin each sample and presented as the fold-change fromWT UTI89 cultures started fromprimarily fimOFF populations grown under semi-aerobic conditions. Statistical analysis wasperformed via two-way ANOVA with Bonferroni’s multiple comparisons test. No statisticaldifferences were noted. (B) Phase assay and FimA immunoblot with UTI89ΔarcA indicatesthis oxygen-dependent regulation of fim expression is not governed by the ArcAB two-component system. Data shown was obtained from cultures starting from populations primari-ly fimOFF (shaking) and grown in 1.2x YESCA media at room temperature. Phase assayquantitation, n = 3. Statistical analysis performed by two-tailed unpaired Student’s t-Testin GraphPad Prism 6, with determined p-values shown. Immunoblot representative ofn = 5 analyses.(TIF)
S1 Video. Immuno-fluorescence by Super-resolution Structured Illumination Microscopy(SIM) of CsgA localization at the biofilm air-liquid interface. Video depicts a representativethree-dimensional reconstruction of the biofilm at the air-liquid interface with DAPI stainingfor nucleic acids (Blue) and Alexa Fluor-555 conjugated secondary antibody detection ofα-CsgA antibody (Red). Video was generated using the Volume Viewer in Progressive mode inSoftWorx for OMX. Image is representative of two biological replicates analyzed.(MOV)
S1 Table. Growth media and conditions used for analysis of type 1 pili expression in UPEC.Listed are the growth media, temperatures, and oxygen growth conditions under which we ex-amined the expression of type 1 pili from the UPEC strain UTI89. All cultures were grown stat-ically for 48 hours prior to analysis for pili expression. NaNO3, sodium nitrate.(DOCX)
S1 Dataset. Reproducible ion species observed by MALDI-TOF IMS. Ions presented wereobserved in at least 5 biological replicates, and their relative localization within the biofilm isdescribed. The depicted mass-to-charge (m/z) ratio of each selected ion was determined afterinternal calibration of the total ion current-normalized average spectrum using mMass soft-ware. Internal calibration used the theoretical mass minus the signal peptide for proteinsidentified in the LC-MS/MS analyses to obtain the best mass accuracy for the data (asdescribed for Fig. 2).(XLSX)
S1 Methods. Technical specifications and more in-depth methods for, MALDI-TOF IMSanalyses of 48-hour UPEC biofilms and for proteomic methods for the identification of ionspecies observed by MALDI-TOF IMS.(DOCX)
AcknowledgmentsThe authors would like to thank Dr. Matthew Chapman for critical review of the manuscriptand for supplying the UTI89ΔarcAmutant strain and α-CsgA antibody. We would also like tothank Dr. Scott Hultgren for providing UTI89ΔfimA-H (SJH852). SEM and TEM analyseswere performed through the use of the VUMC Cell Imaging Shared Resource.
IMS Provides Insights to Pilus Regulation
PLOS Pathogens | DOI:10.1371/journal.ppat.1004697 March 4, 2015 22 / 26
Author ContributionsConceived and designed the experiments: KAF JLM RMCMH. Performed the experiments:KAF JLM JADG HZ ARE CLS. Analyzed the data: KAF JLM CLS ARE RMCMH. Contributedreagents/materials/analysis tools: FA RMCMH EPS. Wrote the paper: KAF JLMMH. Editedthe manuscript: JADG CLS HZ EPS FA RMC.
References1. Hall-Stoodley L, Costerton JW, Stoodley P (2004) Bacterial biofilms: from the natural environment to in-
fectious diseases. Nat Rev Microbiol 2: 95–108. PMID: 15040259
2. Danhorn T, Fuqua C (2007) Biofilm formation by plant-associated bacteria. Annu Rev Microbiol 61:401–422. PMID: 17506679
3. Visick KL, Ruby EG (2006) Vibrio fischeri and its host: it takes two to tango. Curr Opin Microbiol 9:632–638. PMID: 17049299
4. Macfarlane S, Bahrami B, Macfarlane GT (2011) Chapter 4—Mucosal Biofilm Communities in theHuman Intestinal Tract. In: Allen I. Laskin SS, Geoffrey MG, editors. Advances in Applied Microbiology:Academic Press. pp. 111–143. doi: 10.1016/B978-0-12-387046-9.00005-0 PMID: 21807247
5. Kostakioti M, Hadjifrangiskou M, Hultgren SJ (2013) Bacterial biofilms: development, dispersal, andtherapeutic strategies in the dawn of the postantibiotic era. Cold Spring Harb Perspect Med 3:a010306. doi: 10.1101/cshperspect.a010306 PMID: 23545571
6. Parsek MR, Tolker-Nielsen T (2008) Pattern formation in Pseudomonas aeruginosa biofilms. Curr OpinMicrobiol 11: 560–566. doi: 10.1016/j.mib.2008.09.015 PMID: 18935979
7. Hung C, Zhou Y, Pinkner JS, Dodson KW, Crowley JR, et al. (2013) Escherichia coli Biofilms Have anOrganized and Complex Extracellular Matrix Structure. MBio 4.
8. Lewis K (2005) Persister cells and the riddle of biofilm survival. Biochemistry (Mosc) 70: 267–274.PMID: 15807669
9. DePasWH, Hufnagel DA, Lee JS, Blanco LP, Bernstein HC, et al. (2013) Iron induces bimodal popula-tion development by Escherichia coli. Proc Natl Acad Sci U S A 110: 2629–2634. doi: 10.1073/pnas.1218703110 PMID: 23359678
10. Berk V, Fong JC, Dempsey GT, Develioglu ON, Zhuang X, et al. (2012) Molecular architecture and as-sembly principles of Vibrio cholerae biofilms. Science 337: 236–239. doi: 10.1126/science.1222981PMID: 22798614
11. Strathmann M,Wingender J, Flemming HC (2002) Application of fluorescently labelled lectins for the vi-sualization and biochemical characterization of polysaccharides in biofilms of Pseudomonas aerugi-nosa. J Microbiol Methods 50: 237–248. PMID: 12031574
12. Caprioli RM, Farmer TB, Gile J (1997) Molecular imaging of biological samples: localization of peptidesand proteins using MALDI-TOF MS. Anal Chem 69: 4751–4760. PMID: 9406525
13. Pol J, Strohalm M, Havlicek V, Volny M (2010) Molecular mass spectrometry imaging in biomedical andlife science research. Histochem Cell Biol 134: 423–443. doi: 10.1007/s00418-010-0753-3 PMID:20981554
14. Cornett DS, Reyzer ML, Chaurand P, Caprioli RM (2007) MALDI imaging mass spectrometry: molecu-lar snapshots of biochemical systems. Nature Methods 4: 828–833. PMID: 17901873
15. Martinez JJ, Mulvey MA, Schilling JD, Pinkner JS, Hultgren SJ (2000) Type 1 pilus-mediated bacterialinvasion of bladder epithelial cells. Embo J 19: 2803–2812. PMID: 10856226
16. Anderson GG, Palermo JJ, Schilling JD, Roth R, Heuser J, et al. (2003) Intracellular bacterial biofilm-like pods in urinary tract infections. Science 301: 105–107. PMID: 12843396
17. Justice SS, Hung C, Theriot JA, Fletcher DA, Anderson GG, et al. (2004) Differentiation and develop-mental pathways of uropathogenic Escherichia coli in urinary tract pathogenesis. Proc Natl Acad SciU S A 101: 1333–1338. PMID: 14739341
18. Rosen DA, Hooton TM, StammWE, Humphrey PA, Hultgren SJ (2007) Detection of intracellular bacte-rial communities in human urinary tract infection. PLoS Med 4: e329. PMID: 18092884
19. Garofalo CK, Hooton TM, Martin SM, StammWE, Palermo JJ, et al. (2007) Escherichia coli from urineof female patients with urinary tract infections is competent for intracellular bacterial community forma-tion. Infect Immun 75: 52–60. PMID: 17074856
20. Hannan TJ, Totsika M, Mansfield KJ, Moore KH, Schembri MA, et al. (2012) Host-pathogen check-points and population bottlenecks in persistent and intracellular uropathogenic Escherichia coli bladderinfection. FEMSMicrobiol Rev 36: 616–648. doi: 10.1111/j.1574-6976.2012.00339.x PMID: 22404313
IMS Provides Insights to Pilus Regulation
PLOS Pathogens | DOI:10.1371/journal.ppat.1004697 March 4, 2015 23 / 26
21. Foxman B (2010) The epidemiology of urinary tract infection. Nat Rev Urol 7: 653–660. doi: 10.1038/nrurol.2010.190 PMID: 21139641
22. Waksman G, Hultgren SJ (2009) Structural biology of the chaperone-usher pathway of pilus biogene-sis. Nat Rev Microbiol 7: 765–774. doi: 10.1038/nrmicro2220 PMID: 19820722
23. Mulvey MA, Lopez-Boado YS, Wilson CL, Roth R, ParksWC, et al. (1998) Induction and evasion ofhost defenses by type 1-piliated uropathogenic Escherichia coli. Science 282: 1494–1497. PMID:9822381
24. Mulvey MA, Schilling JD, Hultgren SJ (2001) Establishment of a persistent Escherichia coli reservoirduring the acute phase of a bladder infection. Infect Immun 69: 4572–4579. PMID: 11402001
25. Seeley EH, Oppenheimer SR, Mi D, Chaurand P, Caprioli RM (2008) Enhancement of protein sensitivi-ty for MALDI imaging mass spectrometry after chemical treatment of tissue sections. J Am Soc MassSpectrom 19: 1069–1077. doi: 10.1016/j.jasms.2008.03.016 PMID: 18472274
26. O’Toole GA, Pratt LA, Watnick PI, Newman DK, Weaver VB, et al. (1999) Genetic approaches to studyof biofilms. Methods Enzymol 310: 91–109. PMID: 10547784
27. Morris ML, Baird LM, Panigrahi A, Gross MC, Deacon RM, et al. (2013) Surfactant sculpting of biologi-cally inspired hierarchical surfaces. Soft Matter 9: 9857–9866.
28. McCrate OA, Zhou X, Reichhardt C, Cegelski L (2013) Sum of the Parts: Composition and Architectureof the Bacterial Extracellular Matrix. J Mol Biol.
29. Cegelski L, Pinkner JS, Hammer ND, Cusumano CK, Hung CS, et al. (2009) Small-molecule inhibitorstarget Escherichia coli amyloid biogenesis and biofilm formation. Nat Chem Biol 5: 913–919. doi:10.1038/nchembio.242 PMID: 19915538
30. Lim JY, May JM, Cegelski L (2012) Dimethyl sulfoxide and ethanol elicit increased amyloid biogenesisand amyloid-integrated biofilm formation in Escherichia coli. Appl Environ Microbiol 78: 3369–3378.doi: 10.1128/AEM.07743-11 PMID: 22389366
31. Unden G, Bongaerts J (1997) Alternative respiratory pathways of Escherichia coli: energetics and tran-scriptional regulation in response to electron acceptors. Biochim Biophys Acta 1320: 217–234. PMID:9230919
32. StrohalmM, HassmanM, Košata B, Kodíček M (2008) mMass data miner: an open source alternativefor mass spectrometric data analysis. Rapid Communications in Mass Spectrometry 22: 905–908. doi:10.1002/rcm.3444 PMID: 18293430
33. SchwanWR (2011) Regulation of genes in uropathogenic Escherichia coli. World J Clin Infect Dis 1:17–25. PMID: 23638406
34. Corcoran CP, Dorman CJ (2009) DNA relaxation-dependent phase biasing of the fim genetic switch inEscherichia coli depends on the interplay of H-NS, IHF and LRP. Mol Microbiol 74: 1071–1082. doi:10.1111/j.1365-2958.2009.06919.x PMID: 19889099
35. Struve C, Krogfelt KA (1999) In vivo detection of Escherichia coli type 1 fimbrial expression and phasevariation during experimental urinary tract infection. Microbiology 145 (Pt 10): 2683–2690. PMID:10537190
36. Chen SL, Hung CS, Pinkner JS, Walker JN, Cusumano CK, et al. (2009) Positive selection identifies anin vivo role for FimH during urinary tract infection in addition to mannose binding. Proc Natl Acad SciU S A 106: 22439–22444. doi: 10.1073/pnas.0902179106 PMID: 20018753
37. Pinkner JS, Remaut H, Buelens F, Miller E, Aberg V, et al. (2006) Rationally designed small compoundsinhibit pilus biogenesis in uropathogenic bacteria. Proc Natl Acad Sci U S A 103: 17897–17902. PMID:17098869
38. Kostakioti M, Hadjifrangiskou M, Cusumano CK, Hannan TJ, Janetka JW, et al. (2012) Distinguishingthe contribution of type 1 pili from that of other QseB-misregulated factors when QseC is absent duringurinary tract infection. Infect Immun 80: 2826–2834. doi: 10.1128/IAI.00283-12 PMID: 22665375
39. Hadjifrangiskou M, Kostakioti M, Chen SL, Henderson JP, Greene SE, et al. (2011) A central metaboliccircuit controlled by QseC in pathogenic Escherichia coli. Mol Microbiol 80: 1516–1529. doi: 10.1111/j.1365-2958.2011.07660.x PMID: 21542868
40. Kostakioti M, Hadjifrangiskou M, Pinkner JS, Hultgren SJ (2009) QseC-mediated dephosphorylation ofQseB is required for expression of genes associated with virulence in uropathogenic Escherichia coli.Mol Microbiol 73: 1020–1031. doi: 10.1111/j.1365-2958.2009.06826.x PMID: 19703104
41. Greene SE, Pinkner JS, Chorell E, Dodson KW, Shaffer CL, et al. (2014) Pilicide ec240 disrupts viru-lence circuits in uropathogenic Escherichia coli. MBio 5: e02038. doi: 10.1128/mBio.02038-14 PMID:25352623
42. Hultgren SJ, SchwanWR, Schaeffer AJ, Duncan JL (1986) Regulation of production of type 1 piliamong urinary tract isolates of Escherichia coli. Infect Immun 54: 613–620. PMID: 2877947
IMS Provides Insights to Pilus Regulation
PLOS Pathogens | DOI:10.1371/journal.ppat.1004697 March 4, 2015 24 / 26

43. Hadjifrangiskou M, Gu AP, Pinkner JS, Kostakioti M, Zhang EW, et al. (2012) Transposonmutagenesisidentifies uropathogenic Escherichia coli biofilm factors. J Bacteriol 194: 6195–6205. doi: 10.1128/JB.01012-12 PMID: 22984258
44. Korhonen TK, Vaisanen-Rhen V, Rhen M, Pere A, Parkkinen J, et al. (1984) Escherichia coli fimbriaerecognizing sialyl galactosides. J Bacteriol 159: 762–766. PMID: 6146600
45. Watrous JD, Dorrestein PC (2011) Imaging mass spectrometry in microbiology. Nat Rev Microbiol 9:683–694. doi: 10.1038/nrmicro2634 PMID: 21822293
46. Edirisinghe PD, Moore JF, Skinner-Nemec KA, Lindberg C, Giometti CS, et al. (2007) Detection of insitu derivatized peptides in microbial biofilms by laser desorption 7.87 eV postionizatonmass spectrom-etry. Anal Chem 79: 508–514. PMID: 17222014
47. Debois D, Hamze K, Guerineau V, Le Caer JP, Holland IB, et al. (2008) In situ localisation and quantifi-cation of surfactins in a Bacillus subtilis swarming community by imaging mass spectrometry. Proteo-mics 8: 3682–3691. doi: 10.1002/pmic.200701025 PMID: 18709634
48. Watrous JD, Phelan VV, Hsu CC, MoreeWJ, Duggan BM, et al. (2013) Microbial metabolic exchangein 3D. ISME J 7: 770–780. doi: 10.1038/ismej.2012.155 PMID: 23283018
49. Traxler MF, Watrous JD, Alexandrov T, Dorrestein PC, Kolter R (2013) Interspecies interactions stimu-late diversification of the Streptomyces coelicolor secreted metabolome. MBio 4.
50. Yang JY, Phelan VV, Simkovsky R, Watrous JD, Trial RM, et al. (2012) Primer on agar-based microbialimaging mass spectrometry. J Bacteriol 194: 6023–6028. doi: 10.1128/JB.00823-12 PMID: 22821974
51. Nguyen DD, Wu CH, MoreeWJ, Lamsa A, MedemaMH, et al. (2013) MS/MS networking guided analy-sis of molecule and gene cluster families. Proc Natl Acad Sci U S A 110: E2611–2620. doi: 10.1073/pnas.1303471110 PMID: 23798442
52. M TM, Aydin B, Carlson RP, Hanley L (2012) Identification and imaging of peptides and proteins on En-terococcus faecalis biofilms by matrix assisted laser desorption ionization mass spectrometry. Analyst137: 5018–5025. doi: 10.1039/c2an35922g PMID: 22962657
53. Norris JL, Caprioli RM (2013) Imaging mass spectrometry: a new tool for pathology in a molecular age.Proteomics Clin Appl 7: 733–738. doi: 10.1002/prca.201300055 PMID: 24178781
54. Seeley EH, Caprioli RM (2008) Molecular imaging of proteins in tissues by mass spectrometry. ProcNatl Acad Sci U S A 105: 18126–18131. doi: 10.1073/pnas.0801374105 PMID: 18776051
55. Schwartz SA, Reyzer ML, Caprioli RM (2003) Direct tissue analysis using matrix-assisted laserdesorption/ionization mass spectrometry: practical aspects of sample preparation. J Mass Spectrom38: 699–708. PMID: 12898649
56. Lewis K (2007) Persister cells, dormancy and infectious disease. Nat Rev Microbiol 5: 48–56. PMID:17143318
57. Lopez D, Vlamakis H, Kolter R (2010) Biofilms. Cold Spring Harb Perspect Biol 2: a000398. doi:10.1101/cshperspect.a000398 PMID: 20519345
58. Hobley L, Ostrowski A, Rao FV, Bromley KM, Porter M, et al. (2013) BslA is a self-assembling bacterialhydrophobin that coats the Bacillus subtilis biofilm. Proc Natl Acad Sci U S A 110: 13600–13605. doi:10.1073/pnas.1306390110 PMID: 23904481
59. Lewis K (2008) Multidrug tolerance of biofilms and persister cells. Curr Top Microbiol Immunol 322:107–131. PMID: 18453274
60. Alteri CJ, Smith SN, Mobley HL (2009) Fitness of Escherichia coli during urinary tract infection requiresgluconeogenesis and the TCA cycle. PLoS Pathog 5: e1000448. doi: 10.1371/journal.ppat.1000448PMID: 19478872
61. Muller CM, Aberg A, Straseviciene J, Emody L, Uhlin BE, et al. (2009) Type 1 fimbriae, a colonizationfactor of uropathogenic Escherichia coli, are controlled by the metabolic sensor CRP-cAMP. PLoSPathog 5: e1000303. doi: 10.1371/journal.ppat.1000303 PMID: 19229313
62. Salmon K, Hung SP, Mekjian K, Baldi P, Hatfield GW, et al. (2003) Global gene expression profiling inEscherichia coli K12. The effects of oxygen availability and FNR. J Biol Chem 278: 29837–29855.PMID: 12754220
63. Barbieri NL, Nicholson B, Hussein A, Cai W, Wannemuehler YM, et al. (2014) FNR Regulates Expres-sion of Important Virulence Factors Contributing to Pathogenicity of Uropathogenic Escherichia coli. In-fection and Immunity 82: 5086–5098. doi: 10.1128/IAI.02315-14 PMID: 25245807
64. Gusarov I, Nudler E (2012) S-Nitrosylation Signaling in Escherichia coli. pe26–pe26 p. doi: 10.1126/scisignal.2003181 PMID: 22692422
65. Seth D, Hausladen A, Wang Y- J, Stamler JS (2012) Endogenous Protein S-Nitrosylation in E. coli:Regulation by OxyR. Science 336: 470–473. doi: 10.1126/science.1215643 PMID: 22539721
IMS Provides Insights to Pilus Regulation
PLOS Pathogens | DOI:10.1371/journal.ppat.1004697 March 4, 2015 25 / 26

66. Lee AI, Delgado A, Gunsalus RP (1999) Signal-dependent phosphorylation of the membrane-boundNarX two-component sensor-transmitter protein of Escherichia coli: nitrate elicits a superior anion li-gand response compared to nitrite. J Bacteriol 181: 5309–5316. PMID: 10464202
67. Regev-Shoshani G, Ko M, Miller C, Av-Gay Y (2010) Slow Release of Nitric Oxide from Charged Cathe-ters and Its Effect on Biofilm Formation by Escherichia coli. Antimicrobial Agents and Chemotherapy54: 273–279. doi: 10.1128/AAC.00511-09 PMID: 19884372
68. Murphy KC, Campellone KG (2003) Lambda Red-mediated recombinogenic engineering of enterohe-morrhagic and enteropathogenic E. coli. BMCMol Biol 4: 11. PMID: 14672541
69. Gaddy JATA, Actis LA. (2009) The Acinetobacter baumannii 19606 OmpA protein plays a role in biofilmformation on abiotic surfaces and in the interaction of this pathogen with eukaryotic cells. Infection andimmunity 77: 3150–3160. doi: 10.1128/IAI.00096-09 PMID: 19470746
70. Aberg V, Norman F, Chorell E, Westermark A, Olofsson A, et al. (2005) Microwave-assisted decarbox-ylation of bicyclic 2-pyridone scaffolds and identification of Abeta-peptide aggregation inhibitors. OrgBiomol Chem 3: 2817–2823. PMID: 16032359
71. Guckes KR, Kostakioti M, Breland EJ, Gu AP, Shaffer CL, et al. (2013) Strong cross-system interac-tions drive the activation of the QseB response regulator in the absence of its cognate sensor. ProcNatl Acad Sci U S A 110: 16592–16597. doi: 10.1073/pnas.1315320110 PMID: 24062463
72. Anderson DM, Mills D, Spraggins J, Lambert WS, Calkins DJ, et al. (2013) High-resolution matrix-assisted laser desorption ionization-imaging mass spectrometry of lipids in rodent optic nerve tissue.Mol Vis 19: 581–592. PMID: 23559852
73. Schneider CA, RasbandWS, Eliceiri KW (2012) NIH Image to ImageJ: 25 years of image analysis. NatMethods 9: 671–675. PMID: 22930834
IMS Provides Insights to Pilus Regulation
PLOS Pathogens | DOI:10.1371/journal.ppat.1004697 March 4, 2015 26 / 26
Copyright © 2022 FDOKUMEN