
DMS 2006 - DISIT Lab
314
PROCEEDINGS DMS 2006 The 12 th International Conference on Distributed Multimedia Systems Sponsored by Knowledge Systems Institute Graduate School, USA Technical Program August 30 – September 1, 2006 Grand Canyon, Arizona, USA Organized by Knowledge Systems Institute Graduate School, USA
-
Upload
khangminh22 -
Category
Documents
-
view
0 -
download
0
Transcript of DMS 2006 - DISIT Lab

PROCEEDINGS
DMS 2006
The 12th International Conference on Distributed Multimedia Systems
Sponsored by
Knowledge Systems Institute Graduate School, USA
Technical Program
August 30 – September 1, 2006
Grand Canyon, Arizona, USA
Organized by
Knowledge Systems Institute Graduate School, USA

Copyright © 2006 by Knowledge Systems Institute Graduate School All rights reserved. No part of this publication may be reproduced, stored in a retrieval system, or transmitted, in any form or by any means, electronic, mechanical, photocopying, recording, or otherwise, without the prior written consent of the publisher. ISBN 1-891706-19-5 (paper) Additional Copies can be ordered from: Knowledge Systems Institute Graduate School 3420 Main Street Skokie, IL 60076, USA Tel:+1-847-679-3135 Fax:+1-847-679-3166 Email:[email protected] http://www.ksi.edu Proceedings preparation, editing and printing are sponsored by Knowledge Systems Institute Graduate School, USA and co-sponsored by University of Salerno, Italy. Printed by Knowledge Systems Institute Graduate School.

DMS’2006 Foreword The Program Committee of the Twelfth International Conference on Distributed Multimedia Systems (DMS’2006) welcomes you to the Grand Canyon, USA. This conference and its two associated workshops (International Workshop on Visual Languages and Computing, International Workshop on Distance Education Technology) bring together experts in multimedia systems, visual languages, and distance education technology to discuss their research results, with special emphasis on the cross-pollination of ideas across these multiple disciplines. By the deadline of March 31, 2006, the main conference and its two associated workshops received 84 submissions from 22 countries. All papers were thoroughly reviewed by at least 3 members of the Program Committee. Based on the review results, 44 papers were accepted as regular papers, an acceptance rate of 52%, while 21 papers were accepted as short papers, an acceptance rate of 25%. We thank all the authors for their contributions. We have a very interesting collection of activities in the technical program, including two keynote presentations, one panel discussion, two workshops, 14 technical sessions, and a multimedia arts competition with 16 participants from 5 countries. These activities comprise a wide range of topics, including:
Content-Based Multimedia Retrieval Data Visualization Distance Education management Distance Learning Tools and Experiences Educational Technologies Human-GIS Interaction Intelligent Resources for E-Learning Large Real-Time Multimedia Systems Media Streaming Multimedia Authorization and Security Multimedia Coding Multimedia Representation and Indexing Theoretical Aspects of Visual Languages Visual Languages and Techniques for Human-Computer Interaction Visual Modeling Languages Wireless Networking
We are very grateful to the two keynote speakers, Catherine Plaisant and Erland Jungert, to our publicity chair, Jing Dong, and to the workshop organizers, Heng-Shuen Chen, Gennaro Costagliola, Paolo Maresca, Monical Sebillo, Genny Tortora, Goran Trajkovski, and Giuliana Vitiello. We especially thank the members of the Program Committee for their hard work during the review process. Finally, we offer our thanks to Shi-Kuo Chang for his guidance and leadership throughout the organization of this conference. Rex Lee and the staff at KSI was especially helpful to us during the paper submission and review process, and we would like to thank them for their dedication. William I. Grosky, University of Michigan-Dearborn Chabane Djeraba, University of Sciences and Technologies of Lille, France Mohan Kankanhalli, National University of Singapore, Singapore

The 12th International Conference on Distributed Multimedia Systems
(DMS'2006)
August 30 – September 1, 2006 Grand Canyon, Arizona, USA
Organizers & Committees
Conference Chair
Shi-Kuo Chang, University of Pittsburgh, USA
Program Chair
Williams Grosky, University of Michigan, USA
Program Co-Chairs
Mohan Kankanhalli, National University of Singapore, Singapore Chabane Djeraba, University of Sciences and Technologies of Lille, France
Publicity Chair
Jing Dong, University of Texas at Dallas, USA
Program Committee
Imran Ahmad, University of Windsor, Canada Mohamed Ally, Athabasca University, Canada

Frederic Andres, National Institute of Informatics, Japan Arvind Bansal, Kent State University, USA Nadia Berthouze, University of Aizu, Japan
Kai H. Chang, Auburn University, USA Han-Chieh Chao, National Dong Hwa University, Taiwan
Ing-Ray Chen, Virginia Tech (VPI&SU), USA Shu-Ching Chen, Florida International University, USA
Yonghee Choi, Seoul National Univ., Korea Zied Choukair, ENST Bretagne, France
David H. C. Du, Univ. of Minnesota, USA Jean-Luc Dugelay, Institut EURECOM, France
Larbi Esmahi, National Research Council of Canada, Canada Farshad Fotouhi, Wayne State University, USA
Moncef Gabbouj, Tampere University of Technology, Finland Forouzan Golshani, Wright State University, USA Masahito Hirakawa, Shimane University, Japan
Joemon Jose, University of Glasgow Hyoung Joong Kim, Kangwon National University, Korea
James Kwok, Hong Kong University of Science and Technology, Hong Kong Michael Lew, Leiden University, Netherlands
Fuhua Lin, Athabasca University, Canada Jonathan Liu, University of Florida, USA
Chien-Tsai Liu, Taipei Medical College, Taiwan Paolo Maresca, Univ. of Napoli, Italy
Nikolay Mirenkov, The University of Aizu, Japan Rokia Missaoui, University of Quebec, Canada
Vincent Oria, New Jersey Institute of Technology, USA Ming Ouhyoung, National Taiwan University, Taiwan Sethuraman Panchanathan, Arizona State Univ., USA
Syed M. Rahman, Minnesota State University, USA K. R. Ramakrishnan, Indian Institute of Science, India Shinichi Satoh, National Institute of Informatics, Japan
Nicu Sebe, University of Amsterdam, Netherlands) Ishwar Sethi, Oakland University, USA
Yoshitaka Shibata, Prefectural University, Japan Timothy K. Shih, Tamkang University, Taiwan
Peter Stanchev, Kettering University, USA Steven L. Tanimoto, Univ. of Washington, USA
Genny Tortora, University of Salerno, Italy Joseph E. Urban, Arizona State Univ., USA
Petko Valtchev, University of Montreal, Canada Svetha Vennkatesh, Curtin University, Australia Son T. Vuong, Univ. of British Columbia, Canada

Ellen Walker, Hiram College, USA Rentaro Yoshioka, University of Aizu, Japan
Kang Zhang, The University of Texas at Dallas, USA
Proceedings Cover Design
Gabriel Smith, Knowledge Systems Institute Graduate School, USA
Conference Secretariat
Judy Pan, Chair, Knowledge Systems Institute Graduate School, USA Tony Gong, Knowledge Systems Institute Graduate School, USA
C. C. Huang, Knowledge Systems Institute Graduate School, USA Rex Lee, Knowledge Systems Institute Graduate School, USA Daniel Li, Knowledge Systems Institute Graduate School, USA

International Workshop on Visual Languages and Computing
(VLC'2006)
August 30 – September 1, 2006 Grand Canyon, Arizona, USA
Organizers & Committees
Conference Chair
Genny Tortora, University of Salerno, Italy
Program Chair
Gennaro Costagliola, University of Salerno, Italy
Program Co-Chairs
Monica Sebillo, University of Salerno, Italy Giuliana Vitiello, University of Salerno, Italy
Program Committee
Alfonso F. Cardenas, University of California, USA Shi-Kuo Chang , University of Pittsburgh, USA
Maria Francesca Costabile, University of Bari, Italy

Philip Cox, Dalhousie University, Canada Jing Dong, The University of Texas at Dallas, USA
Filomena Ferruci, University of Salerno, Italy George W. Furnas, University of Michigan, USA
Angela Guercio, Kent State University, USA John Hosking, University of Auckland, New Zealand
Chris Hundhausen, Washington State University, USA Erland Jungert, Swedish Defence Research Establishment, Sweden Hideki Koike, University of Electro-Communications, Tokyo, Japan
Zenon Kulpa, Institute of Fundamental Technological Research, Poland Robert Laurini, University of Lyon, France
Stefano Levialdi, University of Rome - La Sapienza, Italy Kim Marriott, Monash University, Australia
Piero Mussio, University of Milan, Italy Marc Najork, Microsoft, USA
Joseph J. Pfeiffer, New Mexico State University, USA Steven P. Reiss, Brown University, USA
Trevor Smedley, Dalhousie University, Canada David Stotts, University of North Carolina, USA Kang Zhang, University of Texas at Dallas, USA
Scientific Secretariat
Luca Paolino, University of Salerno, Italy Vittorio Fuccella, University of Salerno, Italy

International Workshop on Distance Education Technologies
(DET'2006)
August 30 – September 1, 2006 Grand Canyon, Arizona, USA
Organizers & Committees
Program Chair
Paolo Maresca, Università Federico II, Napoli, Italy
Program Co-Chairs
Heng-Shuen Chen, National Taiwan University, Taiwan Goran Trajkovski, Towson University, MD, U.S.A
Program Committee
Georgi Stojanov, American University of Paris, France Gabriele Meiselwitz, Towson University, MD, U.S.A Rita Francese, Università degli Studi di Salerno, Italy Paolo Maresca, Università Federico II, Napoli, Italy
Giuseppe Scanniello, Università degli Studi di Salerno, Italy Luigi Colazzo, University of Trento, Italy
Tim Arndt, Cleveland State University, Ohio, USA Pedro Isaias, Universidade Aberta (Portuguese Open University), Portugal

Mahbubur R Syed, Minnesota State University, Mankato, USA Ching-Yang Chou, National Kaohsiung Normal University, Taiwan
Kao-Shing Hwang, National Chung Cheng University, Taiwan Jer-Junn Luh, National Taiwan University,Taiwan
Por-Hsun Cheng, National Taiwan University Hospital, Taiwan Alfio Andronico, Università degli Studi di Siena, Italy
Yuan-Sun Chu, National Chung Cheng University, Taiwan Kwei-Liang Ho, Arts University, Taiwan
Ging-Ying Lin, National Academy for Educational Research, Taiwan Ling-Ling Yang, Taipei Medical University, Taiwan Goran Trajkovski, Towson University, MD, U.S.A Giovanni Vincenti, Towson University, MD, U.S.A

Foreword iii
Conference Organization iv
DMS 2006 Multimedia Arts Competition xvii
Keynote
Reaching our UsersDr. Catherine Plaisant 1
Using Multi-media to support Command and Control in Crisis Management SystemsDr. Erland Jungert 2
DMS I-A: Coding
H.264 Fast Encoder with Adaptive Interpolation Based on Motion Detection AlgorithmGianluca Bailo, Massimo Bariani, Marco Raggio, Riccardo Stagnaro (S) 3
Speed and Area Optimized Implementation of H.264 8 X 8 DCT Transform and QuantizerMythri Alle, J Biswas, S. K. Nandy 7
A New Approach to Watermark MPEG-2 VideosFranco Frattolillo 12
DMS I-B: Wireless Networking
Design and Implementation issues for the MobFishHojjat Sheikhattar,Vahid Rahiman, Ghassem Jaberipur, Neda Noroozi 17
An Evaluation of Two Policies for Placement of Continuous Media in Multi-hop Wireless NetworksShahram Ghandeharizadeh, Tooraj Helmi, Taehee Jung, Shyam Kapadia, Shahin Shayandeh 23
Table of Contents

DMS II: Representation and Indexing
A Meta-Index to Integrate Specific Indexes: Application to MultimediaIlaria Bartolini, Paolo Ciaccia, Lei Chen, and Vincent Oria 29
Multiple Spatial Objects Insertion In R-TreesJeang-Kuo Chen, Jen-Wei Huang (S) 36
DMS III: Authorization and Security
Multimedia Streaming Over IP with QoS and Access ControlMassimiliano Giordano, Giuseppe Polese, and Genoveffa Tortora 40
SVD-Based Tamper Proofing Of Multi-Attribute Motion DataParag Agarwal, Ketaki Adi, Balakrishnan Prabhakaran 46
Uncertainty: An extra layer of security for Unauthorized traffic based Web ServicesParag Agarwal, Balakrishnan Prabhakaran, Bhavani Thuraisingham 53
DMS IV: Large Real-Time Systems
A Framework for Pre-Rendered Virtual Worlds Navigation Through Motion Tracking Based InterfaceAndrea F. Abate, Michele Nappi, Stefano Ricciardi, Maurizio Tucci 59
Multimedia Conference System Supporting Group Awareness and Remote ManagementNoritaka Osawa, and Kikuo Asai 65
Log-Analysis based Characterization of Multimedia Documents for Effective Delivery of Distributed Multimedia PresentationsMaria Luisa Sapino, K. Selcuk Candan, Paola Bertolotti (S) 73
A Teleconference System by High Definition Omni-directional Video Transmission over IP NetworkYuya Maita, Yosuke Sato, Koji Hashimoto and Yoshitaka Shibata 77
Robust and Redundant Disaster Information System over Japan Gigabit NetworkHiroyuki Echigo, Hiroaki Yuze , Tsuyoshi Hoshikawa, Kazuo Takahata, Nobuhiro Sawano, Yoshitaka Shibata 83

DMS V: Content-based Retrieval
Semantic Categorization of Images for the Intuitive Image RetrievalYing Dai, and Dawei Cai (S) 88
Component Based Face Recognition Against Occlusions: Gabor Wavelets vs. GFDAndrea F. Abate, Michele Nappi, Daniel Riccio, Maria De Marsico 92
The DocSearch: Distributed Storage and Retrieval of Document ImagesBrian F. Kaplan, Christian K. Shin (S) 98
DMS VI: Media Streaming
Frame Dropping Control by Video Content Characteristics under The Limited BandwidthHuey-Min Sun, LihChyun Shu 102
Virtual Theater Network: Enabling Large-Scale Peer-to-Peer Streaming ServiceMasaru Okuda, Taieb Znati 108
Packet and Frame Rate Control Methods for Continuous Media over Heterogeneous Environment by Wired and Wireless NetworksNoriki, Uchida, Xuanrui Xiong, Kazuo Takahata, Yoshitaka Shibata 116
VLC Workshop
VLC I: Theoretical Aspects of Visual Languages
A Recognition Framework based on LR Parsing for Hand-drawn DiagramGennaro Costagliola, Vincenzo Deufemia, Michele Risi 123
Enhancing the Expressiveness of Spider Diagram SystemsGem Stapleton and John Howse 129
Designing Non-Ambiguous and Viable Visual Interactive SystemsMaria Francesca Costabile, Daniela Fogli, Piero Mussio, Loredana Parasiliti, Antonio Piccinno (S) 137

VLC II: Visual Languages and Techniques for Human-Computer Interaction
VIEW-GIS - An Environment Supporting Web GIS DevelopersLuca Paolino, Monica Sebillo, Genny Tortora, Giuliana Vitiello 141
Collaborating through Computers: the Software Shaping Workshop ApproachMaria Francesca Costabile, Daniela Fogli, Rosa Lanzilotti, Piero Mussio, Antonio Piccinno 147
Visualization and Exploration of Landscape Architecture Project InformationFranck Favetta and Robert Laurini (S) 153
A Visual Approach to Develop 3D Interactive EnvironmentsRosanna Cassino, Maurizio Tucci (S) 157
VLC III-A: Visual Modelling Languages
Formal Issues in Languages Based on Closed CurvesAndrew Fish and Gem Stapleton 161
Semantic Visualization for Business Process ModelsHans-Georg Fill, Dimitris Karagiannis (S) 168
VLC III-B: Data Visualization
Visualization and Clustering of Author Social NetworksStefani Chan, Raymond K. Pon, Alfonso F. Cardenas 174
GeOlaPivot Table: a Visualization Paradigm for SOLAP SolutionsSandro Bimonte, Sergio Di Martino, Filomena Ferrucci, Anne Tchounikine 181
VLC IV: Human-GIS Interaction
A scenario driven decision support systemKarin Silvervarg, Erland Jungert 187
A visualization tool for spatio-temporal data mining

M. Bertolotto, S. Di Martino, F. Ferrucci, T. Kechadi 193
Representing Topological Relationships by Using 3D Objects: an Empirical SurveyVincenzo Del Fatto, Luca Paolino, Fabio Pittarello 199
Visual Access to City’s WebsitesRobert Laurini (S) 205
DET Workshop
DET I: Educational Technologies
Reactive and adaptive approaches in Learning Management SystemsA. Carbonaro, L. Colazzo, A. Molinari 211
Evaluating an E-learning ProcessFadini, P. Maresca, P. Prinetto, G. Santiano 217
Integrated Management of Courses in a Distance Learning EnvironmentGiovanni Adorni, Mauro Coccoli, and Gianni Vercelli 222
The Digital Instructional design abilities cultivation of Teachers- A case study of the Health and Physical Education DomainGing-Ying Lin, Huey-Jong Tzeng (S) 228
DET II: Distance Education Management
A virtual tutor for a multimedial distance learning courseV. Rossano, T. Roselli, E. Faggiano, M.V. Pragnell 233
The ECDL Certification of ICT Usage Skills in the Italian UniversitiesMaria Carla Calzarossa, Paolo Ciancarini, Paolo Maresca, Luisa Mich, Nello Scarabottolo 238
e-Learning of Traditional Medicine Course for Elementary and Middle School in TaiwanLing-Ling Yang (S) 244

DET III: Tools and Experiences
The Design and Implementation of the Chronobot/Virtual Classroom (CVC) SystemS. K. Chang, Xin Li, Ricardo Villamarin, Dan Lyker, Chris Bryant 247
Evolution of IMA as a Tool for Accommodated LearningCatherine Beaton, Daniel Bogaard, Jeff Sonstein 253
E-World: A Platform for Managing and Tracing Adaptive E-learning ProcessesGennaro Costagliola, Andrea De Lucia, Filomena Ferrucci, Giuseppe Scanniello 258
Establishing a National Health e-Learning Portal in TaiwanHeng-Shuen Chen, Ling-Ling Yang, Jer-Junn Luh, Ging-Ying Lin 264
DET IV: Intelligent Resources for E-Learning
A Multiagent Architecture for a Learning Object RepositoryPierpaolo Di Bitonto, Teresa Roselli, Veronica Rossano 269
Integration of distributed Learning Objects by Wrapper-Mediator architectureAngelo Chianese, Paolo Maresca, Vincenzo Moscato, Antonio Penta and Antonio Picariello 275
Using Information Technologies to help doctors to provide high-quality consumer health informationWeily Jen, Heng-Shuen Chen, Chien-Yeh Hsu, WeiYi Fan 281
Preschool Music Teacher e-Learning Platform - 'Musical Magic Teacher' as the exampleYu-Huei Su, Xiu-Ling Gao, Heng-Shun Chen 285
Reviewers' Index 290
Authors' Index 293
Note: (S) means short paper.

DMS'2006 Conference
Competition in Multimedia Arts
First Prize Winner
Drawer of Memory, Po-Chou Chi, Taiwan
Second Prize Winner
Surprise, Min-Yuan Cheng, Taiwan
Third Prize Winner
Clock, Li-Jung Tseng, Taiwan
Fourth Prize Winners
Being and Space, Ruben Coen Cagli, Italy
Health Care, Yuhun Li, Taiwan
Jungle, Valentin Partenie, Romania
Fly Catcher, Wan-Ju Chen, Taiwan
Honorable Mentions
Swim and Slim, Mei-Miao Lu, USA
Groucho and Chaplin, Parag Agarwal, USA
Cherry Tree, Chen-Cheang Huang, USA


Keynote I: Reaching Our Users Dr. Catherine Plaisant
As our field matures, the tools and ideas described in our research publications are reaching users. How can we make sure we develop powerful visual tools that can deal with user diversity (age, language, disabilities, etc.) but also with the variety of technology used and the gaps in user's knowledge? Another
challenge is to adequately study the impact of our technologies. We will review many examples, and discuss evaluation methods and the emergence of Multi-dimensional In-depth Long-term Case studies (MILCs) to study the creative activities that users engage in.
About Dr. Catherine Plaisant Dr. Catherine Plaisant is Associate Research Scientist at the Human-Computer Interaction Laboratory of the University of Maryland Institute for Advanced Computer Studies. She earned a Doctorat d'Ingenieur degree in France in 1982. In 1987 she joined the Human-Computer Interaction Laboratory. Her research contributions range from focused user interaction techniques (e.g. Excentric Labeling) to innovative visualizations (such as LifeLines for
personal records or SpaceTree for hierarchical data exploration) and interactive search interface techniques such as Query Previews. She has written over 90 refereed technical publications and recently co-authored with Ben Shneiderman the 4th Edition of "Designing the User Interface".
Catherine Plaisant http://www.cs.umd.edu/hcil/members/cplaisant/
1

Keynote II: Using Multi-Media to support Command and Control in Crisis Management Systems
Dr. Erland Jungert
Societies have always been challenged by different kinds of crises, disasters and difficult times. During such challenging events society must be able to deal with the situations that often require major efforts. It is thus important to be aware of which resources that are needed to handle these crises. As a consequence, tools that can support command and control functionality in various types of crisis management systems are needed. These tools should support both proactive and operative crisis management, that is, they are needed to support the prevention of those situations that may occur as well as operative handling of ongoing crises. They must also be able to handle the uncertain situations related to crises where the conditions hastily can change. Consequently, crucial qualities needed in the crisis management systems will include situational and crisis awareness. Furthermore, to achieve reliable command and control functionality, supporting net centric crisis management means for collection, analysis, handling, visualization as well as exchange of large amounts data between different users are necessary. These data are generally of spatial/temporal type and originate in most cases from multiple sensor data sources. For these reasons techniques for handling multi-media data in various ways are required when developing command and control functionalities in crisis management systems. Other corner-stones, besides the above mentioned, that touches upon multi-media aspects in connection to crisis management architectures, are command and control models,
service related structures, distributed ontologies and models of information flow.
Proactive aspects of crisis management are quite often dealing with physical protection of facilities that eventually can be subject to different types of threats. Historically, such systems can be seen as simple alarm systems i.e. the threat becomes a reality and the alarm is activated. Most of the time, when the alarm goes off the effects of the possible actions that can be carried out are limited since nothing or very little can be done to prevent the consequences of the activated threats. For these reasons, the surroundings of the facilities must be subject to intelligent over long periods of time to achieve knowledge about possible activities that may be set into effect by antagonistic individuals or groups of individuals. Multi-media systems can here play an important role to achieve a higher degree of security. For instance, by supporting the detection of anomalous behavior.
In this presentation aspects of multi-media will be discussed in connection to techniques that can be used to give the society higher levels of security both before and during crises. Other techniques and methods that may influence the design of multi-media systems for support of crisis management systems will be discussed as well. Among these are information fusion, interoperability and means for situation awareness.
About Dr. Erland Jungert
Erland Jungert has a Ph. D. in Computer Science from the University of Linköping, Sweden, 1980. Currently he is Director of Compute Science Research at FOI, Linköping, Sweden since 1987 and since 1998 he is also part time professor in Geoinformatics at the Department of Computer and Information Science, at Linköping University. He has also been visiting Associate Professor at the department of Electrical Engineering, at the Illinois Institute of Technology, Chicago, Ill. in1985-1986. Dr Jungert is co-author of one book on spatial
reasoning and the co-editor of two other books on Visual Languages and on Intelligent Database Systems. Furthermore, he is also associate editor of the journal of Visual Languages and Computing. His interests are concerned with methods for spatial reasoning, query languages especially for sensor data sources. Lately, he has developed an interest for command and control systems for crisis management also including techniques and methods for prevention of crises and antagonistic threat activities.
2

H.264 Fast Encoder with Adaptive Interpolation Based on Motion Detection Algorithm
Gianluca Bailo, Massimo Bariani, Marco Raggio, Riccardo Stagnaro
Department of Biophysical and Electronic Engineering University of Genova Via Opera Pia 11 A,
16146 Genova, ITALY
AbstractH.264/MPEG-4 AVC is the latest video-coding standard jointly developed by VCEG (Video Coding Experts Group of ITU-T and MPEG (Moving Picture Experts Group) of ISO/IEC. It uses state of the art video signals algorithms providing enhanced efficiency, compared with previous standards, for a wide range of applications. In order to reduce the bitrate of the video signal in H.264, the ISO and ITU coding standards use a ¼ pel displacement resolution. H.264 saves 50% bit-rate maintaining the same quality if compared with existing video coder standards, but such a result demands additional computational complexity. In this paper, we propose an algorithm for the reduction of the interpolation computational time. The goal is to adapt the H.264 ¼ pel interpolation to the complexity of the video stream to encode, on the basis of our motion detection algorithm. The proposed solution allows to decrease the overall encoder complexity both in low and high complex sequences. This paper illustrates the integration of the H.264 encoder with our motion detection algorithm for the development of an adaptive interpolation. The obtained results are compared with the jm86 standard interpolation using different quantization values.
1. Introduction The video coding standard H.264 [1] introduces many new features in all the aspects of the video encoding process. The compression efficiency has been highly improved maintaining the same video quality. Anyway, the complexity of the encoder has been increased of more than one order of magnitude (while the decoder is increased by a factor of 2) [3], if compared with previous standards such as H.263 [2]. The high compression rate together with the good quality obtained by the H.264 standard make it suitable for a large variety of applications. The H.264 encoding application area requires high power efficiency in order to work on
embedded systems and mobile terminals. This requirement implies the need to reduce the complexity of the H.264 video encoder.
Figure 1: Integer samples (shaded box with upper-case letters) and fractional samples (un-shaded box with lower-case letters) for ¼ pixel Interpolation.
The most time-consuming modules of the encoder are the motion estimation (ME) and the ¼ pel interpolation. The complexity of the ME is due to the great number of SAD operations; while the major part of interpolation calculations are due to the use of a 6-tap Wiener interpolation filter (with coefficients similar to the proposal of Werner [9]) and the averaging samples at full and half sample position. The interpolation process is depicted in figure 1 and it can be divided into two steps. First, the horizontal or vertical Wiener filter is applied to calculate the half-pel positions, then, a bilinear filtering is applied to both the already calculated half-pel positions and the existing full-pel samples in order to compute residual quarter-pel positions. This sequence of calculation is very heavy, and it represents the 18% of entire compression process. In the
3

following, we will introduce the Local Dynamic Interpolation (LDI) approach tending to minimize calculation, based on our Motion Detection (MD) algorithm. The main idea is to utilize the complete ¼ pixel bilinear interpolation just in those areas where the MD module indicates the presence of motion. Otherwise, only the first part of the full interpolation (the Wiener filtering), together with a very simple ¼ interpolation, will be used. The reference JVT software version is jm86 and comparative tests are performed with standard fast motion estimation built in. The quality/compression ratio results very close to the standard full interpolation. Section 2 shows how our MD works. Section 3 shows how MD interacts with the H.264 interpolation module. LDI algorithm results are also compared with standard one, as shows in Section 4.
2. Motion detection algorithm The new approach to MD algorithm can be subdivided into the following steps:
Binary image difference evaluation Blob coloring with minimum object size threshold of entire difference image, with single pixel precision. Merging overlapped blobs
Image difference is performed calculating the difference between two subsequent frames (unlike the work presented in [7] this approach avoid background estimation). The input of MD is the luminance image and the output is a set of information about motion area, like position and size.
2.1. Binary image difference evaluation The inputs of this block are the current image and the background; the output is a binary image with motion pixels. The image difference D(n) is calculated by the difference between the current image I(n) and previously stored image I(n-1). Then a threshold value (detection value) is applied to D(n) in order to obtain Dth(n), the binary image that represents motion pixels into the image. The formula for frame n is: D(n) = I(n) – I(n-1)Dth(n)=0 if D(n) < detection value. Dth(n)=1 if D(n) >= detection value.
2.2. Blob coloring with minimum blob size threshold Blob coloring is a computer vision technique to obtain region growing and region separation for images.
The input of this block is the difference image and the output is a set of moving object. We use this technique on the entire difference image, instead of using a subsampled 8x8 difference image as in [7], to separate motion regions and growing it. Blob coloring can be performed with the algorithm described in [5]. The regions coordinates are the output of this step. After the blob coloring, the resulting object set is filtered through a threshold that permits to delete the smallest moving regions, in order to avoid the errors due to image noise.
2.3. Merging overlapped blobs At this point, there are a lot of blobs that may be overlapped. If we would obtain region growing, there is the need to check for overlapped regions and then fuse them together into a single region. The algorithm analyzes region coordinates for finding overlapping in the following way: if there are two or more overlapped regions, a new region having size growing to max dimension of overlapped blobs is created; otherwise the regions are maintained as original sets. This operation reduces object count and permit moving region separation. The input is a set of moving objects and the output is a reduced set of the same objects having enlarged size.
3. Local Dynamic InterpolationThe proposed algorithm is based on the idea that exhaustive interpolation is useful only when a video sequence contains large motions and not in low motion conditions, that is the usual situation for real video-surveillance sequences. The H.264 interpolation can be applied just when the motion detection algorithm identifies motion and, specifically, in the region where the motion is detected. In particular, the 6-tap Wiener filtering is always calculated, whereas the residual quarter-pel position, obtained by applying the bilinear filtering to half-pel and full-pel positions, is only computed in the motion regions (blobs) identified by the MD module. The motion detection evaluates where and when to apply the bilinear-filtering; otherwise a very simple interpolation is carried out (figure 2 shows LDI in the encoder scheme). The information obtained by the MD algorithm, is utilized to define a Motion Image (MI). This is an approximation of the MD output result because we need as little as possible
4

Wiener
Motion Detection
Bilinear
Smart
+
-
DCT Quantization Entropy Coding Encoded
Stream
Inverse Quantization
IDCT
+
Loop Filter
Local Dynamic Interpolation
Decoded Picture Buffer
Motion Estimation
Motion Compensation
IntraPrediction
+
Current Picture
Intra/Inter
Figure 2: the MD module controls the output of Wiener filter for choosing between smart or bilinear filtering, (input is the original size image, output is the ¼ pel interpolated image)
complexity in the motion detection algorithm. This virtual image is the interface between motion detection and H.264 interpolation.
0 0 0 0 0 0 0 0 0 0 0 0 0 0 0 0 0 0 0 0 0 0 0 0 0 0 0 0 0 0 0 0 0 0 0 0 0 1 0 0 1 0 0 0 0 0 0 0 0 0 0 0 0 0 0 0 0 0 0 1 1 1 1 0 0 0 0 0 0 0 0 0 0 0 0 0 0 0 0 0 0 0 0 0 0 0 0 0 0 0 0 0 0 0 0 0 0 0 0
Figure 3: MD interface; the motion image scanned for searching motion areas.
During the video coding, the MI (Figure 3) is scanned in order to decide the area where bilinear interpolation is applied. Alternatively, a smart interpolation will be applied. The smart interpolation uses the pixels evaluated by Wiener filtering, replicating them to the near blank positions without other calculation.
4. Results The proposed algorithm has been validated on the reference JVT software version jm86 [6] implementing the H.264 video encoder, which include a fast ME (we used this option). The reported tests have been performed using standard sequences in QCIF format. Hall,Salesman, Silent, Highway, and News have been utilized in order to test the proposed algorithm with both simple and complex sequences (Highway). In the following tests,
we encoded 200 frames of every test sequence at 30fps. The selected block configurations are 16x16, 16x8, and 8x16; the CAVLC entropy coder is used for all the tests; Hadamard transform is not used. The RD optimization option in the reference encoder is turned off for all the experiments. The reported tests show the algorithm performance for different quantization values (Q inter) selected from 8 to 28. The results show that our approach can simplify the encoder complexity, maintaining high compression rate and good video quality. The proposed algorithm is strongly influenced by the detection valuethreshold: using a very high value not all of the motions can be detected; otherwise, a very low value can cause the detection of background noise as relevant motion. In the following tests we have set the detection value to 15; thisvalue is based on previous studies reported in [7] on the Search Window Estimation (SWE). For every sequence, two tests are performed in order to compare the following implementations: the jm86 Standard Fast with original interpolation algorithm (STDI), and the jm86 Standard Fast with LDI algorithm (LDI). Tests are performed on standard pc class workstation Pentium 4 3.0 Ghz equipped with 1024 MB main memory. Table 1 shows the differences between the standard algorithm and the proposed approach for a given quantization value. The video quality is compared using the PSNR. The compression and the interpolation timeentries represent the percentage increase (positive) or decrease (negative) of the LDI approach. The reported interpolation time is the computational time of the interpolation module (summed with the MD module time in case of LDI test).
5

The proposed algorithm (LDI) obtains a consistent reduction in interpolation time for all the sequences: LDI is about 3 times faster than the reference software STDI. Noticeable fact is that there is little loss of bitrate/compression values. In particular graph 1 and graph 2 focus on the behavior of the Hall sequence (video surveillance – low complexity case). The difference in bitrate and interpolation time between STDI and LDI is shown for several quantization values (8-28). Graph 1 shows the decrement in compression efficiency of the LDI, anyway the differences ranges from 0.5% to 2%, increasing with inter quantization (QP). The speed-up is the same in all the selected quantization range (see graph 2).
Q Inter 20 Psnry (dB) Compression (%)
InterpolationTime (%)
Hall -0.01 -0.740 -76.4Salesman -0.03 -4.900 -72.8
Silent -0.05 -5.217 -70.6Highway -0.09 -4.272 -74.0
News -0.05 -5.174 -77.3
Table 1 – Comparative test for quantization value of 20
Graph 1 – Differential percentage bit rate for hall sequence
Graph 2 – Differential percentage rate for hall sequence
5. Conclusion This paper presents an adaptive interpolation module for the video coding standard H.264. The proposed solution allows decreasing the overall encoder complexity both in low and high complex sequences, having small side effects either in image quality or in compression efficiency.The integration of our Motion Detection module in the H.264 encoder is described and tested using the JVT reference software jm86 [6]. The reduction of the interpolation computational time has been measured using standard QCIF sequences. The main idea of the Local Dynamic Interpolation (LDI) algorithm is to reduce the interpolation complexity using a partial bilinear interpolation in motion areas, and a simple interpolation in background areas. Future developments will focus on a further reduction of the H.264 overall complexity by using the MD to drive the LDI together with the SWE. Since both the algorithms use the same MD module’s output, the system efficiency will be even improved.
References[1] ISO/IEC 14496-10, ITU-T Rec.H.264, Joint Video Specification, Oct. 2002. [2] ITU-T Recommendation H.263, “Video coding for low bitrate communication”, Feb. 1998 [3] S. Saponara, C. Blanch, K. Denolf, and J. Bormans, “The JVT Advanced Video Coding Standard: Complexity and Performance Analysis on a Tool-By-Tool Basis”, Packet Video 2003, Nantes, France, April 2003 [4] Y.L. Lai, Y.Y. Tseng, C.W. Lin, Z. Zhou, and M.T. Sun, "H.264 Encoder Speed-Up via Joint Algorithm/Code-Level Optimization," VCIP 2005, Visual Communications and Image Processing, Beijing, China, July 12-15, 2005. [5] D. H. Ballard and C. Brown, Computer Vision, New Jersey, Prentice Hall, pp 149 - 157, 1982 [6] JVT version jm86, Bs.hhi.de/~suehring/tml/download/ [7] G. Bailo, M. Bariani, I. Barbieri, M. Raggio, “Dynamic Motion Estimation Search Window Size Calculation In H.264 Standard Video Coder”, The Tenth International Conference on Distributed Multimedia Systems – DMS04, San Francisco, USA, Sept. 8-10, 2004 [8] Gianluca Bailo, Massimo Bariani, Ivano Barbieri, Marco Raggio. “Search window estimation Algorithm for Fast and Efficient H.264 Video Coding With Variable Size Block Configuration” - EUSIPCO2005 (Eurasip) Antalya, Turkey, Sept. 4-8, 2005. [9] O. Werner, “Drift analysis and drift reduction for multiresolution hybrid video coding”, Signal Processing: Image Commun., vol. 8, no. 5, July 1996.
6

Speed and Area Optimized Implementation of H.264 8 8 DCT Transform andQuantizer
Mythri Alle, J Biswas, S. K. NandyCAD Lab, Indian Institute of Science, Bangalore
mythri@cadl, jayanta@cadl, nandy@serc .iisc.ernet.in
Abstract
H.264 is a video codec standard which delivers high res-olution video even at low bit rates. To provide high through-put at low bit rates hardware implementations are essential.
In this paper, we propose hardware implementations forspeed and area optimized DCT and quantizer modules. Totarget above criteria we propose two architectures. Firstarchitecture is speed optimized which gives a high through-put and can meet requirements of 4096 2304 frame at30 frames/sec. Second architecture is area optimized andoccupies 2009 LUTs in Altera’s stratix-II and can meet therequirements of 1080HD at 30 frames/sec.
1. Introduction
H.264 is an advanced digital video codec standard thatcan deliver high resolution video even at low bit rates.Video is used in a wide range of applications in vari-ous fields. Applications like satellite imaging and medicalimaging require high resolution video. With the advent ofdigital video, Digital Multimedia Broadcasting, and HDTVhigh resolution media presentation is a requirement that cannot be compromised. In applications like video conferenc-ing it is required to encode video and transfer it over thenetwork in real time. It requires high throughput and highcompression ratios to provide consumer with better qual-ity. H.264 is an advanced video codec standard that sat-isfy these requirements. Hardware realization of H.264 caneasily meet the high performance requirements set by thestandard.
H.264 FRExt (Fidelity Range Extension) has madeamendments to increase quality and compression of thevideo. One of the proposed changes is to use a 8 8 trans-form instead of the 4 4 transform used in the earlier stan-dards to achieve low bit rates. 8 8 transform coefficientmatrix is more complex than 4 4 coefficient matrix.
In this paper, we propose a hardware implementation for
DCT and quantizer block. Various approaches for 4 4transform can be found in [1], [2], [3], and [6]. The au-thors in [1] and [6] give an implementation of Direct 2Dtransform in two cycles with 100MHz and 35MHz clockrespectively. The work reported in [2] implements a fullyparallel transform which produces one 4 4 transform inone cycle. Chen et. al. [3] proposes a 1-D DCT trans-form, that is performed twice and an interconnect switch toconnect outputs from first stage to the inputs of the secondstage. The authors in [4] use the three stage approach sug-gested in the standard to implement 8 8 transform. It usesa three stage pipeline for performing 1-D DCT. In this pa-per we propose a 2D-Direct approach for DCT which is anextension of the 4 4 transform proposed in [1].
The remaining sections are organized as follows. Sec-tion II, describes the high throughput architecture in detail.Section III gives a description of the area optimized archi-tecture. In section IV, we report results and evaluate theperformance. Paper is concluded in section V.
2. High throughput architecture
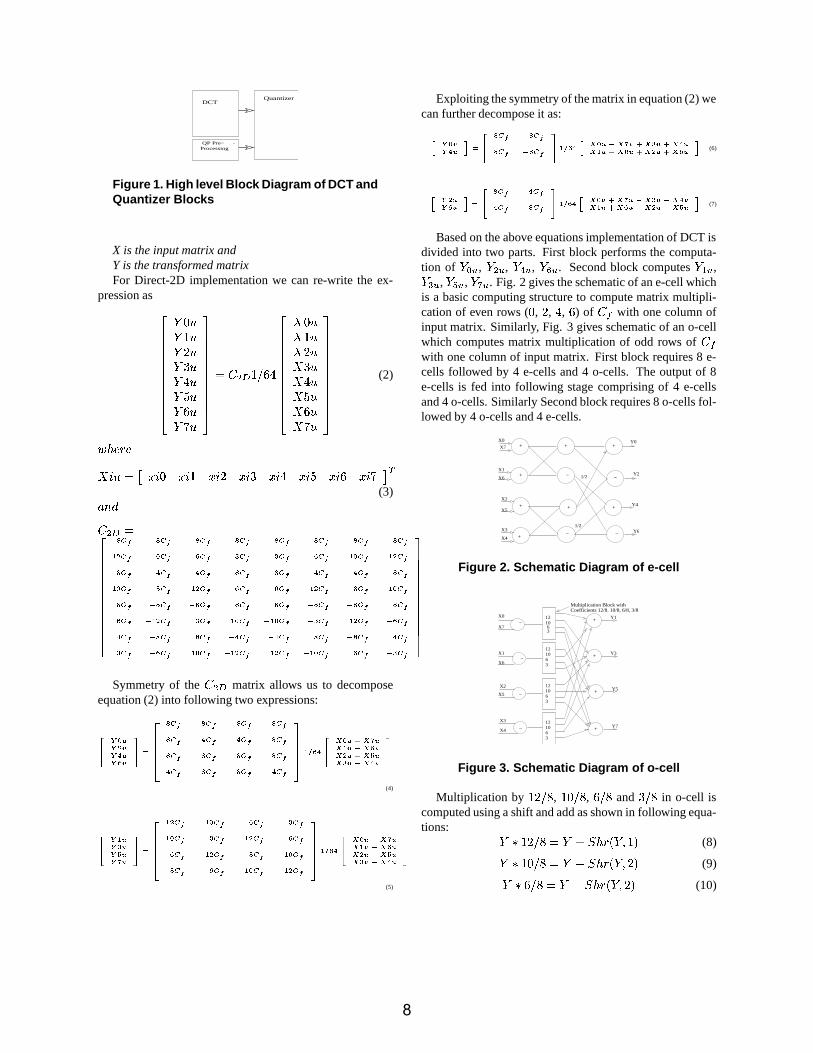
The proposed architecture is an extension of the ap-proach in [1] in which 4 4 transform is performedin two cycles. We extend it to perform an 8 8 trans-form in one clock cycle. Proposed architecture runs with aclock of 97MHz. The throughput obtained is 1264 16VGAframes/second. High level block diagram of the architectureis shown in Fig. 1 and the corresponding DCT and quantizerare detailed in later sections.
2.1. DCT Block
The 2D DCT expression of 8 8 transform is given inequation (1). Matrix is defined by H.264 FRExt standard[5].
(1)
where
7
DCT
−QP Pre−Processing
Quantizer
Figure 1. High level Block Diagram of DCT andQuantizer Blocks
X is the input matrix andY is the transformed matrixFor Direct-2D implementation we can re-write the ex-
pression as
(2)
(3)
Symmetry of the matrix allows us to decomposeequation (2) into following two expressions:
(4)
(5)
Exploiting the symmetry of the matrix in equation (2) wecan further decompose it as:
(6)
(7)
Based on the above equations implementation of DCT isdivided into two parts. First block performs the computa-tion of , , , . Second block computes ,
, , . Fig. 2 gives the schematic of an e-cell whichis a basic computing structure to compute matrix multipli-cation of even rows ( , , , ) of with one column ofinput matrix. Similarly, Fig. 3 gives schematic of an o-cellwhich computes matrix multiplication of odd rows ofwith one column of input matrix. First block requires 8 e-cells followed by 4 e-cells and 4 o-cells. The output of 8e-cells is fed into following stage comprising of 4 e-cellsand 4 o-cells. Similarly Second block requires 8 o-cells fol-lowed by 4 o-cells and 4 e-cells.
+
+
+
+
−
+
1/2
1/2
+
+
−
+
−
−
X7
X1
X6
X2
X5
X3
X4
Y0
Y2
Y4
Y6
X0
Figure 2. Schematic Diagram of e-cell
−
−
−
−
121063
121063
121063
X0
X1
X2
X3
X4
X5
X7
X6
+
+
+
+
Y1
Y3
Y5
Y7
121063
Multiplication Block withCoefficients 12/8. 10/8, 6/8, 3/8
Figure 3. Schematic Diagram of o-cell
Multiplication by , , and in o-cell iscomputed using a shift and add as shown in following equa-tions:
(8)
(9)
(10)
8

(11)
where Shr(Y, n) is right shift Y by n
2.2. Quantizer Block
Quantization in H.264 is given by the following equa-tion:
(12)
where MF, f, and qbits are calculated from Quantizationparameter as described in standard
Quantizer block uses two stage pipeline. Pre-processingis done to calculate the six possible values of MF, f, andqbits which depend on quantization parameter. We usea simple combinational logic instead of memory look up.Memory lookup increases critical path delay in quantizerblock, reducing clock frequencies. It does not add muchoverhead on resources used. On Altera Stratix-II we realizethis using 38 Logic Elements(LEs). This is overlapped withthe DCT process, so that critical path in quantizer blockcan be reduced by making the MF available by the timequantization starts. The actual quantization is done in twostages to achieve higher clock frequencies. First stage mul-tiplies the transformed coefficient with the multiplicationfactor and second stage performs an add and a shift. Thereare two minor variations in the implementation of the firststage. One variation uses a single stage multiplier and otheruses a two stage multiplier. Two stage multiplier increasesthe resources required but improves clock frequency. In ourimplementation on Altera’s stratix-II architecture DSP ele-ments are used to perform multiplication.
3. Area optimized Architecture
Area optimized architectures generally perform a rowtransform followed by column transform and use memoryto store the intermediate values. The throughput is limitedby memory latency, which will not meet the throughput re-quirements of high end applications. To meet the perfor-mance we propose a direct 2D transform without need forintermediate memory.
3.1. DCT Block
Equation (1) can be divided into row and column trans-forms given by the following expressions:
(13)
(14)
Using normal matrix multiplication and are:
(15)
(16)
Substituting in the equation (16) and expanding thesummation yields:
(17)
Looking at the above equation it is clear that it is enoughto compute to to compute to . The pro-posed approach takes advantage of this dependency. Thehigh level DCT architecture is shown in Fig. 4. First stage
1(11 bit)8(8 bit)8(11 bit) 8(11 bit) 1(14 bit)
TCD
1−D
8X11bit 8X11bit64X8bit
1−DDCT
BUFFER
UB
FFERR
EFFUB
Figure 4. High Level Block Diagram of AreaOptimized Architecture
MF
MF
MF
+/−
+/−
+/−
+/−
+
+
MF
+
Fourth StageThird StageSecond StageFirst Stage
Figure 5. 1D Transform of Area Optimized Ar-chitecture
generates elements column wise and second stage performsrow wise transform. In the proposed architecture it requiresone clock cycle at a frequency of 167MHz to compute oneelement. It takes eight cycles to generate to . Sec-ond stage can start the computation after an initial latencyof eight cycles. Once the pipeline is full computation of
to is overlapped with computation ofto . There are two buffers between the two stages. Firststage writes into the first buffer and second stage reads fromthe second buffer. Data from one buffer is moved into theother buffer every eight cycles. This architecture requires64 cycles to perform one 8 8 transform.
Fig. 5 gives a schematic of 1D DCT component . It isa four stage pipeline. Each stage performs a simple add
9

operation which allows us to generate at a frequency of167MHz. The first stage of the pipeline adds or subtractsthe data depending on the row being processed. The sec-ond stage carries out the multiplication with the appropriatecoefficient. As described in the previous section, multipli-cation is performed by one shift and one add operation. Insubsequent stages they are added together to produce the re-sult. Necessary controls are generated by control logic. Thesame architecture can be used even if the matrix changes.
3.2. Quantizer Block
High level architecture of Quantizer block is same as de-scribed in previous section. The most compute intensivepart in the quantization is multiplying with the multiplica-tion factor. Fully Pipelined multiplier is used to achievehigh clock frequencies. It generates 16 partial products inthe first stage and then adds them in the subsequent stages.When implementing on the FPGA we can also use the DSPor 18 18 multipliers present on most of the FPGA’s. Us-ing them will decrease the clock frequency as the multipli-ers are slow.
4. Results
The proposed architectures are synthesized usingQuartus-II 5.0 from Altera and Xilinx 7.1 from Xilinx.The target technology is Stratix II (EP1S30F780C5) FPGAfor Quartus and Virtex-4 (Xc4Vlx25) for Xilinx synthesis.In the following sections we present the methodology andcomparison of our results.
4.1. Methodology
Throughput is calculated assuming a 4:2:0 format. Inthis format one macroblock contains four 8 8 luma blocksand two 8 8 chroma blocks. In the high throughput archi-tecture each 8 8 transform takes one clock cycle, so ittakes 6 clock cycles per macroblock. Area optimized archi-tecture takes 64 clock cycles for a 8 8 transform, hence ittakes 384 cycles per macroblock.
The area reported includes the necessary buffering atthe input and output for both architectures. Area of highthroughput architecture includes 64 pixel buffer both at in-put and output. For Area optimized architecture area re-ported includes 64 pixel buffer at the input.
4.2. High Throughput architecture
On Quartus-II 5.0 we obtain a critical path of 13.2 nsfor the parallel 2D-Direct architecture and a single stagepipeline in quantizer block. Multiplier is implemented bya DSP block present on Stratix II. This forms the critical
path, that determines clock frequencies. This architecture isshown as PA I in the results. To achieve higher clock fre-quencies option of using a two-stage multiplier is explored.This architecture is referred as PA II. First stage of multi-plication multiplies with first eight bits of the multiplier andsecond stage with the next eight bits. The critical path inthis two stage pipeline is 10.3 ns. The number of resourcesused is 33% more than the previous approach. Since thethroughput of PA I is sufficient to meet very high through-put requirements PA II is not of practical importance. PA Ishould run above 6MHz to meet the requirements of a 4096
2304 frame at 30 frames/sec.
4.3. Area Optimized architecture
In area optimized approach it is feasible to add morepipeline stages as the overhead of one stage of pipeline islimited to one register in contrast to 64 registers in case ofspeed optimized architecture. To achieve high clock fre-quencies both DCT and quantizer blocks are aggressivelypipelined. Instead of pipelined multiplier in the quantizerblock, a DSP block on the FPGA can be used if lower fre-quencies are sufficient. With a DSP block for multiplica-tion we get a critical path of 7.8 ns with 1397 LEs in stratixII (EP1S30F780C5). The throughput obtained for this ar-chitecture is sufficient to meet throughput requirement of1080HD frame at 30 frames/second. This architecture canbe scaled by replicating all the blocks to meet throughputfor higher frame sizes. The two 1-D DCT stages and thetwo buffers between them in Fig. 4 can be replicated onemore time to get twice the current throughput. The area re-quired will be less than double as control logic and inputbuffer do not change.
4.4. Comparison
[4] obtains a critical path of 14.598 ns on Virtex II(XC2v4000) and uses 29018 LUTs. We can not directlycompare with those results as the target platforms are differ-ent. They did not mention about multiplier blocks presenton Virtex II, but are possibly using them to realize their de-sign.
The results of synthesis on Quartus are summarized in ta-ble 1. The results of synthesis on Xilinx are summarized intable 2. Parallel architecture PA I uses a single stage multi-plier and Parallel architecture PA II uses two stage pipeline.Throughput is shown in terms of 16VGA frames/second.We could not fit parallel PA II on Virtex-II using Xilinx.The values shown are approximate values given by Xilinx.We achieve a improvement of 44% in terms of LUTs and32% in the frequency in comparison with [4].
10

METHOD LEs DSPs Clock ThroughputPeriod Frames/sec
PA I 19015 96 13.2 986PA II 28708 96 10.3 1264Area Optimized 2009 0 6.0 33.9
Table 1. Summary of results on Stratix II
METHOD LUTs DSPs Clock ThroughputPeriod Frames/sec
PA I 16200 48 9.9 1315PA II 14998 112 7.3 -Area 2040 0 6.0 33.9Optimized[4] on 29018 Not 14.598 891
Virtex-II Specified
Table 2. Summary of results on Virtex-4
5. Conclusion
In this paper we presented two architectures for an effi-cient implementation of DCT and Quantizer in H.264. PA Iarchitecture is targeted for very high throughput and runs ata clock frequency of 97MHz and transforms one 8 8 ma-trix in one clock cycle. Throughput given by this architec-ture meets the throughput required by the current day highend applications using a 4096 2304 frame. The Area op-timized architecture for optimum area transforms one 8-bitpixel in one clock cycle with a frequency of 167MHz. Thethroughput of the second architecture meets throughput re-quirement of applications with 33 16VGA frames/secondwith area requirement of 2009 LEs on Altera’s Stratix II.A gain of 44% in area and 32% in throughput is achievedwhen compared to [4].
The area optimized architecture is suitable for consumerelectronic devices, since the throughput of this architectureis sufficient to provide a real time video at 30 frames/secfor a frame as large as 16VGA using less area. Since thethroughput provided is high it can provide wide screen, highcolor movies which give superior user experience. Higherthroughput is an overkill for consumer electronics as theresolution required is not very high. First architecture catersfor the requirements of very high resolutions where area isnot a concern.
References
[1] Han-Yuan Cheng et.al., “High Throughput 2-D Trans-form Architectures for H.264 Advanced video coders”,In APCCS, December, 2004.
[2] Roman Kordasiewicz, Shahram Shirani, “HardwareImplementation of the Optimized Transform AndQuantization Blocks of H.264”, Electrical and Com-puter Engineering, Vol 2 Canadian conference on 2-5May, 2004.
[3] Kuan-Hung Chen et.al., “A High-Performance LowPower Direct 2-D Transform Coding IP Design ForMPEG-4 AVC/H.264 With a Switching Power Suppres-sion Technique”, In APCCS, December, 2004.
[4] Ihad Amer, Wael Badawy and Graham Jullien, “A HighPerformance Hardware Implementation of the H.264Simplified 8 8 Transformation And Quantiza-tion”, In ATIPS, 2005.
[5] S.Gordon, D.Marpe, and T.Wiegand “Simplified Use of8 8 Transform- Proposal”, Joint Video Team(JVT) ofISP/IEC MPEG and ITU-T VCEG, doc JVT-K028, Mu-nich, March, 2004.
[6] Kuang-Hung Chen et.al. “An Efficient Spurious PowerSuppression Technique and its Applications on MPEG4AVC/ H.264 Transform Coding Design”, VLSI Design,Automation And Test, 2005.
[7] Joint Video Team(JVT) of ISP/IEC MPEG and ITU-TVCEG, doc JVT-G050.
11

A New Approach to Watermark MPEG-2 Videos
Franco Frattolillo
Research Centre on Software Technology
Department of Engineering,University of Sannio
Benevento, Italy
Abstract
Even though many recent watermarking procedures
achieve a high level of security and robustness by adopt-
ing “readable” insertion schemes based on “blind” and
not publicly available decoders as well as letting the em-
bedded watermarks depend on the host contents, the “non-
blind” watermarking schemes are usually considered more
robust then the blind ones. However, differently from the
blind ones, the nonblind schemes need the original contents
to run the watermark detection or extraction algorithms,
and this is considered a relevant drawback particularly for
the procedures that aim at being adopted in a web context.
This paper presents a nonblind watermarking procedure
for MPEG-2 videos. The procedure exploits XML docu-
ments in order to avoid the problem reported above. To this
end, it can achieve the usual security and robustness levels
characterizing the nonblind watermarking schemes without
requiring the original unprotected, large size videos to be
exchanged on the Internet whenever watermark extractions
have to be carried out.
1. Introduction
The rise of the Internet and the advances in multimedia
techniques have prompted increasing interest in the prob-
lem of protecting copyrighted multimedia contents, such
as images, audio files, and videos. Although early research
concentrated on many different multimedia technologies
[1], the copyright protection of digital contents distributed
on the Internet is currently more and more based on digital
watermarking [2, 3]. To this end, most of the recent wa-
termarking procedures proposed in literature tend to adopt
“blind” insertion schemes, which can achieve high levels
of security and robustness [3]. However, the “nonblind”
watermarking schemes are typically considered more ro-
bust then the blind ones [4, 5], even though they, differently
from the blind ones, need the original, unprotected contents
to run watermark detection or extraction algorithms. This is
considered a relevant drawback particularly for the proce-
dures that aim at being adopted in a web context, because
such procedures cannot be exploited within “watermark-
ing protocols” that resort to trusted third parties (TTPs) to
run sophisticated “identification and arbitration” protocols
[5, 6, 7]. In fact, such watermarking protocols state that wa-
termark extractions have not to be carried out by the copy-
right owners, but have to be performed by distinct TTPs in
order to correctly take into account both the buyers’ and
the owners’ rights. As a consequence, such protocols force
copyright owners to send their unprotected, large size orig-
inal contents to TTPs whenever watermarks have to be ex-
tracted from pirated copies found in the market according
to nonblind watermarking procedures. However, the ex-
change of unprotected original contents with web entities
distinct from the copyright owners can give rise to some
documented and relevant protection problems [5, 7], which
can make the whole protection process legally invalid.
This paper presents a watermarking procedure for
MPEG-2 compressed videos based on the use of XML
documents. The procedure follows the web oriented ap-
proach presented in [8] to embed a distinct code identify-
ing the buyer into each copy of the videos distributed by
web content providers. Moreover, in order to increase its
level of security and robustness against the most common
attacks known in literature, the proposed procedure allows
for repeatedly embedding watermark into some selected
I-frames of a video in the DCT domain at different fre-
quencies and by exploiting both block classification tech-
niques and perceptual analysis. The embedded watermark
can be then extracted from a video according to the infor-
mation contained in a protected XML document associated
to the video. Thus, the usual security and robustness levels
characterizing the nonblind watermarking schemes can be
achieved without requiring the original unprotected, large
size videos to be exchanged on the Internet whenever wa-
termark extractions have to be carried out. In addition, the
XML technology makes it also easier to automate the doc-
ument access in a web context, since it is well supported
by the Java world, and document parsers, such as SAX and
DOM parsers, are freely available.
The paper is organized as follows. Section 2 presents the
proposed watermarking procedure, whereas Section 3 de-
12

scribes the use of XML documents associated to the videos
to be protected. Section 4 describes the watermark extrac-
tion procedure. Section 5 reports on some experimental
results. Section 6 reports conclusion remarks.
2. The Watermarking Procedure
The watermarking procedure makes it possible to insert
into an MPEG-2 video a binary code able to unambigu-
ously identify a user. The code, which is represented by a
sequence of bits µ ∈{0,1} and whose length is denoted as
nµ , can be repeatedly embedded into each of some selected
I-frames of the video, denoted as ε1, ε2 . . . εr, in the DCT
domain at different frequencies, denoted as γ1, γ2 . . . γ f . In
particular, each frequency γ identifies a coefficient in each
8×8 DCT block, and so it can range from 1 to 82 =64 [9].
Furthermore, in order to increase the security and robust-
ness of the procedure, the watermark insertion is assumed
to be carried out at low, middle and high frequencies cho-
sen on the basis of the video to be watermarked.
More precisely, the proposed procedure assumes that
only some coefficients belonging to the luminance DCT
blocks of the selected I-frames can be chosen to be mod-
ified by a value representing a watermark information. In
fact, such a choice depends on the “perceptual capacity”
of the coefficients, which is preliminarily estimated by ex-
ploiting both block classification techniques and perceptual
analysis. In particular, the block classification techniques
[9, 10] are applied to indicate the best DCT coefficients
of the selected I-frames that can be altered without reduc-
ing the visual quality. They classify each luminance DCT
block with respect to its energy distribution. The result of
this procedure is a first selection of DCT coefficients whose
modification has a minimal or no impact to the perceptual
quality of the selected I-frames.
The perceptual analysis is then applied to calculate the
“just noticeable difference” ( jnd) values for the DCT coef-
ficients [11, 12, 13]. Such values are the thresholds beyond
which any changes to the respective coefficient will most
likely be visible. Therefore, let X εbm
(γ) denote the DCT co-
efficient at the frequency γ in the block bm of the I-frame ε ,
and let JNDεbm
(γ) denote the jnd value calculated for the
X εbm
(γ) coefficient. JNDεbm
(γ) can be expressed as:
JNDεbm
(γ) = max{
Cεbm
(γ),∣
∣
∣Cε
bm(γ)
∣
∣
∣Eε
bm(γ)g
}
(1)
where Cεbm
(γ) represents the perceptual threshold of the
contrast masking and can be expressed as:
Cεbm
(γ) = max
{
tεbm
(γ),∣
∣
∣X ε
bm(γ)
∣
∣
∣
h
tεbm
(γ)1−h
}
(2)
Eεbm
(γ) is the entropy value calculated over the eight neigh-
bors of the coefficient X εbm
(γ) [11, 12], and can be approxi-
mated by the following expression:
Eεbm
(γ) = X εbm
(γ)−uεbm
(γ)q(γ) (3)
In (1) g is assumed equal to 0.5, whereas in (2) h is assumed
equal to 0.7 and tεbm
(γ) is equal to t(γ)(X εbm
(1)/X(1)).X ε
bm(1) is the DC coefficient of the block bm of the I-frame
ε , whereas X(1) is a DC coefficient corresponding to the
mean luminance of the display. In fact, t(γ) can be ap-
proximated by the value q(γ)/2, where q(γ) represents the
coefficient of the quantization matrix corresponding to the
frequency γ [12]. Finally, in (3) uεbm
(γ) can be assumed
equal to round(X εbm
(γ)/q(γ)).The insertion procedure at the frequency γ of a selected
I-frame assumes that each bit of the sequence µ is inserted
into the I-frame by altering a pair of DCT coefficients asso-
ciated to the frequency γ and chosen among the ones pre-
viously selected by applying the block classification tech-
niques and perceptual analysis. In particular, the “choice
rule” states that two DCT coefficients of a selected I-frame
are allowed to belong to a same pair only if they have a
“similar” value.
Furthermore, to insert the bits of µ into an I-frame ε ,
the “encoding function” K has to be defined. K defines
an encoding rule by which the bits 0 and 1 are translated to
the symbols of the alphabet composed by {ր,ց}, respec-
tively called the up symbol and the down symbol. Thus,
a sequence µ ∈{0,1} is translated to a corresponding se-
quence σ ∈ {ր,ց} depending on the function K . For
example, the sequence {01101 . . .} is translated to the se-
quence {րցցրց . . .}, if K associates the up symbol
to 0 and the down symbol to 1.
Let µ be a user sequence, and let σ be the sequence ob-
tained by applying a K function. Let γi, ∀i = 1 . . . f , be
the insertion frequencies, and let εp, ∀p = 1 . . . r, be the
selected I-frames of the video. Let Wεp
bm(γi) denote the wa-
termarked DCT coefficient at the frequency γi in the block
bm of the I-frame εp. A symbol of σ is inserted into a pair
of DCT coefficients belonging to the blocks bm and bn, at
the frequency γi of the I-frame εp, by the following expres-
sions:{
Wεp
bm(γi) = X
εp
bm(γi)− JND
εp
bm(γi)
Wεp
bn(γi) = X
εp
bn(γi)+ JND
εp
bn(γi)
to insert ր
{
Wεp
bm(γi) = X
εp
bm(γi)+ JND
εp
bm(γi)
Wεp
bn(γi) = X
εp
bn(γi)− JND
εp
bn(γi)
to insert ց
∀i = 1 . . . f and ∀p = 1 . . .r
In fact, as specified above, since the choice rule requires
that Xεp
bm(γi)≈ X
εp
bn(γi), ∀i=1 . . . f and ∀p=1 . . .r, the inser-
tion process ends up maximizing the difference existing be-
tween the coefficients of the pair according to the direction
specified by the insertion symbol and by an amount that
13

cannot compromise the final visual quality of the video.
Consequently, the insertion process should be carried out
according to the following rules:
• The I-frames to watermark should qualify significant
scenes of the video, and more than three consecutive
I-frames should belong to each selected scene.
• The insertion frequencies should be evenly distrib-
uted among the low, middle and high frequencies, and
should be chosen so that attacks characterized by a fil-
tering behavior on the video frames would end up re-
ducing the final video quality. This can be achieved by
selecting the frequencies characterized by high spec-
trum values, which, if filtered, can impair the video.
• At each insertion frequency and for each selected
I-frame, the pairs of the selected DCT coefficients
should belong to spatial regions that cannot be
cropped without impairing the video.
Once the symbols of the sequence σ have been inserted
into the selected I-frames at the chosen frequencies, in or-
der to increase the security and robustness of the proposed
procedure against “collusion” attacks [4], the modifications
made to the DCT coefficients of the I-frames have to be hid-
den. Therefore, let γ1, γ2 . . . γ f be the insertion frequencies
chosen for the video, and let Σεp(γi) denote the sequences
of the pairs of DCT entries (bεpm (γi),b
εpn (γi)) that have been
involved in the watermarking process for a given frequency
γi, ∀i = 1 . . . f and for a given I-frame εp, ∀p = 1 . . . r. It
is worth noting that both the set of the frequencies γi and
the sets Σεp(γi) are always the same for all the copies of
a given video to be protected. Consequently, the DCT co-
efficients modified at the different insertion frequencies in
the selected I-frames remain the same for all the copies of
the video. Therefore, in order to prevent malicious users
from individuating the DCT coefficients modified by the
insertion process, the procedure adds the jnd values modu-
lated by a binary pseudo-noise sequence ρ ∈{−1,1} to all
the unmodified DCT coefficients of the selected I-frames
of the watermarked video:
Xεp
bk(γi) = X
εp
bk(γi)+ αkρkJND
εp
bk(γi),
(∀p = 1 . . .r) and
((i 6= 1 . . . f ) or (i = 1 . . . f and bk /∈ Σεp(γi)))
where 0<αk <0.5 is a randomly varied amplitude factor.
3. The XML Documents
The adopted watermarking scheme makes it necessary
to save the insertion information used to protect the copies
of a video in order to enable the watermark extraction. To
this end, the proposed procedure assumes that such infor-
mation is stored in XML documents. Therefore, the XML
document associated to all the watermarked copies of a
video has to include:
1. the insertion frequencies γ1, γ2 . . . γ f ;
2. the selected I-frames ε1, ε2 . . . εr, also specified in
terms of significant scenes which they refer to;
3. the sets Σεp(γi), ∀i = 1 . . . f and ∀p = 1 . . .r;
4. the definition of the encoding function K .
However, further information can be saved in the XML
document associated to a video. In fact, such information
can be exploited to synthetically describe or characterize
the video as well as individuate possible geometric mod-
ifications performed on it. In particular, information can
be stored in both textual and quantitative form. The tex-
tual information can individuate and describe the scenes
which the I-frames belong to, and some evident and sig-
nificant “feature points” and boundary segments of the se-
lected I-frames. The quantitative information can provide
the original dimensions of the video, the coordinates of the
feature points and selected boundaries, some Fourier de-
scriptors and statistical moments of K-point digital bound-
aries, as well as the eigenvectors and eigenvalues of some
well-defined regions of the selected I-frames. Thus, inverse
geometric transformations can be performed on an attacked
video to restore it before the watermark extraction [2, 9].
4. The Watermark Extraction
To extract the watermark from a video, it is necessary
to examine the pairs of coefficients specified by the DCT
entries (bεpm (γi),b
εpn (γi)) belonging to the set Σεp(γi), with
i = 1 . . . f and p = 1 . . .r, that is, for each insertion fre-
quency γi and for each selected I-frame εp.
Therefore, let Wεp
bm(γi) and W
εp
bn(γi) be the two coeffi-
cients of a pair belonging to Σεp(γi). To extract the water-
mark symbol they host, the following expressions have to
be evaluated:
{
Wεp
bm(γi)−W
εp
bn(γi) > 0 =⇒ ց is extracted
Wεp
bm(γi)−W
εp
bn(γi) < 0 =⇒ ր is extracted
(4)
Then, the extracted symbol is translated to a bit depending
on the K function.
After having completed the watermark extraction
process, f · r user sequences ˆµi,p result in being re-built,
one for each different insertion frequency γi and I-frame
εp. Therefore, let µ( j) denote the j-th bit in the user se-
quence µ . µ( j) can be derived from the sequences ˆµi,p by
14

Original Watermarked
Figure 1. A classic NAS video.
the following expression:
µ( j)≡ 1 ⇐⇒∑
fi=1 ∑r
p=1 ˆµi,p( j)
f · r> 0.5, ∀ j = 1 . . .nµ (5)
Furthermore, it is worth noting that the conducted tests
have evidenced that the expressions reported in (4) can be
also improved in order to make the watermark extraction
more robust against “collusion” attacks [4]. Therefore, the
expressions in (4) can be thus modified [8]:
{
Wbm(γi)−Wbn
(γi)> th =⇒ ց is extracted
Wbm(γi)−Wbn
(γi)<−th =⇒ ր is extracted(6)
where th is a threshold calculated as
th=ω(JNDbm(γi)+ JNDbn
(γi)), 0.45<ω <0.55
and ω is a factor depending on the characteristics of the
video.
5. Experimental Results
The robustness and security achieved by the proposed
procedure have been assessed by conducting tests on many
Attack fff rrr bbbeeerrr (%)
Add Noise 3 9 3.46
Add Noise 6 12 3.23
Add Noise 9 15 3.01
Sharpening 3 9 2.95
Sharpening 6 12 2.65
Sharpening 9 15 2.27
Median 3 9 3.75
Median 6 12 3.19
Median 9 15 2.81
Rotating 45.2◦ 3 9 6.67
Rotating 45.2◦ 6 12 6.21
Rotating 45.2◦ 9 15 5.96
Table 1. The results of some simple attacks.
videos available on the web. However, for the sake of
brevity, only the results obtained on a classic NASA video
(see Figure 1) have been reported. In particular, the res-
olution of the video is 160×120 pixels and its duration is
about 6 seconds. The user sequence µ is assumed 48 bit
long.
The bit error rate (ber) under a different number of the
insertion frequencies f and of the watermarked I-frames r
has been measured for each conducted test. In particular,
the ber is expressed in percentage and is calculated as
ber =∑
fi=1 ∑r
p=1 beri,p
f · r
where beri,p is the number of bit errors reported in the wa-
termark extraction carried out at the frequency γi from the
I-frame εp.
Table 1 shows the results obtained under some “simple”
or “detection-disabling” attacks [14]. In fact, the “simple”
attacks attempt to impair the embedded watermark by ma-
nipulations of the whole watermarked video, such as filter-
ing or compression manipulations or addition of noise. On
the contrary, the “detection-disabling” attacks attempt to
break the correlation and to make the recovery of the wa-
termark impossible or infeasible, mostly by geometric dis-
tortion like rotation. Moreover, Table 2 reports the results
obtained under some “linear” and “non linear” collusion at-
tacks, whose definitions are reported in [4]. In particular,
k denotes the number of the colluding videos, whereas the
anticollusion codes used in the tests have been generated
according to what reported in [15].
The results summarized in the tables show that the pro-
posed procedure can achieve a good performance against
attacks that are considered able to prove a high level of ro-
bustness and security [16]. In particular, the ber values are
rather low, and the user sequence µ can be re-built from
15

Attack fff rrr kkk bbbeeerrr (%)
Linear attacks
Averaging 3 9 5 7.76
Averaging 6 12 10 7.44
Averaging 9 15 15 7.28
Nonlinear attacks
Minimum 3 9 5 5.49
Minimum 6 12 10 5.23
Minimum 9 15 15 5.07
Median 3 9 5 3.71
Median 6 12 10 3.46
Median 9 15 15 3.12
Maximum 3 9 5 4.93
Maximum 6 12 10 4.54
Maximum 9 15 15 4.19
Table 2. The results of some collusion attacks.
the sequences extracted for each test by applying the ex-
pressions in (5). In fact, the redundancy assured by the
insertion process enables the procedure to behave as other
well known, robust and secure watermarking procedures
[17, 18]. This also because the procedure allows for choos-
ing the insertion frequencies as well as the regions of the
selected I-frames where to embed watermark information.
Moreover, in the conducted tests, the values of f and r are
small, but they can be also increased in order to improve
the security and robustness of the procedure without com-
promising the final visual quality of the video.
6. Conclusions
This paper has presented a nonblind procedure to water-
mark MPEG-2 videos. The procedure has been purposely
designed to be adopted in a web context. Therefore, it di-
rectly acts on compressed videos and adopts a redundant
watermark insertion process that enables the procedure to
achieve a good performance against the most common and
dangerous attacks. Furthermore, the procedure exploits
protected XML documents to store information needed to
the watermark extraction. Thus, it can behave as nonblind
watermarking schemes without requiring the original un-
protected, large size videos to be exchanged on the Internet
whenever watermark extractions have to be carried out.
References
[1] N. Memon and P. Wong, “Protecting digital media content,”
Communication of the ACM, vol. 41, no. 7, pp. 34–43, 1998.
[2] I. Cox, J. Bloom, and M. Miller, Digital Watermarking:
Principles & Practice, Morgan Kaufman, 2001.
[3] M. Barni and F. Bartolini, “Data hiding for fighting piracy,”
IEEE Signal Proces. Mag., vol. 21, no. 2, pp. 28–39, 2004.
[4] M. Wu, W. Trappe, et al., “Collusion-resistant fingerprinting
for multimedia,” IEEE Signal Processing Magazine, vol. 21,
no. 2, pp. 15–27, 2004.
[5] C. L. Lei, P. L. Yu, et al., “An efficient and anonymous
buyer-seller watermarking protocol,” IEEE Trans. on Image
Proces., vol. 13, no. 12, pp. 1618–1626, 2004.
[6] N. Memon and P. W. Wong, “A buyer-seller watermarking
protocol,” IEEE Trans. on Image Processing, vol. 10, no. 4,
pp. 643–649, 2001.
[7] F. Frattolillo and S. D’Onofrio, “A web oriented and in-
teractive buyer-seller watermarking protocol,” in Electronic
Imaging 2006, Security, Steganography, and Watermarking
of Multimedia Contents, P. W. Wong and E. J. Delp, Eds., S.
Jose, CA, USA, Jan. 2006, vol. 6072 of SPIE Proceedings,
pp. 718–726.
[8] F. Frattolillo and S. D’Onofrio, “Exploiting XML docu-
ments to watermark JPEG images,” in Procs of the IEEE
Int’l Workshop on Imaging Systems and Techniques, Minori,
Italy, 2006.
[9] Y. Wang, J. Ostermann, and Y. Zhang, Video Processing and
Communications, Prentice Hall, 2002.
[10] T.-Y. Chung, M.-S. Hong, et al., “Digital watermarking for
copyright protection of MPEG-2 compressed video,” IEEE
Trans. on Consumer Electr., vol. 44, no. 3, pp. 895–901,
1998.
[11] S. W. Kim and S. Suthaharan, “An entropy masking model
for multimedia content watermarking,” in Procs of the
37th Hawaii Int’l Conference on System Sciences. 2004, p.
70182.2, IEEE Computer Society.
[12] A. B. Watson, “DCT quantization matrices visually op-
timized for individual images,” in Human Vision, Visual
Processing and Digital Display IV, J. P. Allebach and B. E.
Rogowitz, Eds., S. Jose, CA, USA, Feb. 1993, vol. 1913 of
SPIE Procs, pp. 202–216.
[13] R. B. Wolfgang et al., “Perceptual watermarks for digital
images and video,” Procs of the IEEE, vol. 87, no. 7, pp.
1108–1126, 1999.
[14] F. Hartung, J. K. Su, and B. Girod, “Spread spectrum water-
marking: Malicious attacks and counterattacks,” in Security
and Watermarking of Multimedia Contents, E. J. Delp and
P. W. Wong, Eds., 1999, vol. 3657 of Proceedings of SPIE,
pp. 147–158.
[15] D. Boneh and J. Shaw, “Collusion-secure fingerprinting for
digital data,” IEEE Trans. on Infor. Theory, vol. 44, no. 9,
pp. 1897–1905, 1998.
[16] F. A. P. Petitcolas, “Watermarking schemes evaluation,”
IEEE Signal Processing, vol. 17, no. 5, pp. 58–64, 2000.
[17] B. Chen and G. Wornell, “Quantization index modulation:
a class of provably good methods for digital watermarking
and information embedding,” IEEE Trans. on Infor. Theory,
vol. 47, no. 4, pp. 1423–1443, 2001.
[18] H. S. Malvar and D. A. F. Florencio, “Improved spread spec-
trum: A new modulation technique for robust watermark-
ing,” IEEE Trans. on Signal Processing, vol. 51, no. 4, pp.
898–905, 2003.
16

Design and Implementation Issues for MobFish
Hojjat Sheikhattar1, Vahid Rahiman2, Ghassem Jaberipur1, Neda Noroozi2
1 Department of Electrical and Computer Engineering 2 Department of Computer Engineering Shahid Beheshty University Sharif University of Technology
Tehran, Iran Tehran Iran
Abstract New advances in mobile-computer technology, together
with the advent of wireless networking, introduce new requirements, capabilities and concerns to the computer science and industry. In this paper, we discuss the special requirements of file sharing in mobile environments. Then our proposed architecture for mobile file sharing (MobFish) is presented. Finally, we present an implementation of the proposed architecture based on its special design tactics.
Keywords: Mobile File Sharing, Mobile Computing, File Sharing Architecture, Ubiquitous Computing,
1. Introduction
New advances in mobile-computer technology together with the advent of wireless networking has lead to ever increasing number of smart mobile elements over the planet. This new trend has introduced new requirements, capabilities and concerns to the computer science and industry. The whole issue is recognized as a new paradigm, namely the mobile computing [2, 4, 5, 7, and 18].
The main aspect of mobile computing is the need of users to compute ubiquitously, anywhere and anytime [6, 22]. Transferring and sharing electronic files in a mobile environment is an important requirement of ubiquitous computing. In this paper, we aim at proposing an architecture for file sharing systems that operates on mobile environments. Since the mobility may be logical or physical [15], in the design of a mobile file sharing system, one is to consider the mobility of software agents [12] and their shared data (recognized as logical mobility) as well as the physical mobility of hosts.
Due to the constraints imposed by the nature of mobility, mobile computers such as laptops, third generation mobile phones, personal digital assistants and the like lack some of the capabilities to static hosts [9]. Moreover, the wireless networks are more error prone due to the use of electromagnetic waves as their transmission medium. Therefore there is a widely accepted understanding that mobile computing has its own special characteristics. For example [18 and 19] have enumerated four constraints for mobile computing:
� “Mobile elements are resource-poor relative to static elements.”
� “Mobility is inherently hazardous”
� “Mobile connectivity is highly variable in performance and reliability.”
� “Mobile elements rely on a finite energy source.”Considering the above constraints, our proposed
architecture is based on a set of simple but effective principles, some design tactics and abstractions. Our case study here is a mobile hospital information system (mobile HIS) exemplifying a mobile environment with characteristics of both physical and logical mobility. Physicians and nurses as the principal and very active agents of a hospital environment, with frequent displacements, can make best use of mobile hosts to connect to the hospital information system ubiquitously. Besides, mobile software agents exist in the system and migrate between the hosts to gather information and help in decision making.
The rest of this paper is organized as follows: Section 2 explains four basic principles of MobFish architecture that have been extracted from mobile environment characteristics. These principles shape the proposed architecture for mobile file sharing system. Section 3 describes design issues of the mobile file sharing system; this section includes applied tactics and the general structure of the system. Section 4 illustrates one of the implementations of MobFish and shows some results of the implemented system.
2. Principles
Our architecture is based on a set of principles to satisfy the additional requirements of the mobile file sharing system. These principles are core of our design phase and have designated as a supplement to notion of typical file sharing systems.
1. Support for heterogeneous networks and adaptive behavior
Since nomadic users need pervasive information access, mobile platforms are supposed to connect to the network ubiquitously. As a result, the mobile file sharing systems should support several access technologies including wireless LAN, short range radio and packet radio and ought to work in heterogeneous environments. It means, in contrast to classic file sharing systems, mobile file sharing systems should operate on different types of networks. For example in mobile HIS, two hosts may be able to establish several connections through the global wireless network (i.e. UMTS) or the hospital wireless LAN or a transient ad-hoc network. In this case, the file sharing system should
17

select the appropriate network automatically or with the help of users.
On the other hand, as a result of hand-over of mobile users between diverse networks as well as alteration in connectivity of the networks - and in general due to dynamic change of the computational context - designers have the tendency to use adaptive[1,8,17,19] systems for mobile environments. Adaptation is based on the rule that when the situation changes, then the behavior of the system adjusts in line with predefined or instant policies of the user. Network-adaptation, application specific adaptation and adaptation in content transmission are some examples of adaptation strategies have been researched [14]. Assume that a nomadic user move to a low bandwidth and costly network when he is downloading a large file, in this case the system should not continue file transfer unwisely. It should make a decision through predefined policies or ask the user to decide.
Consequently, the first principle is focused on supporting heterogeneity in file transmission plus methods for adaptation of the system with the environment changes.
2. Decrease the number of unnecessary and inefficient file transfers
In fixed networks it is usual to download a file from a host incorrectly just because of name similarity or other mistakes. These unnecessary file transmissions are not desirable in mobile environments while the cost of data transfer in mobile networks is much more than fixed ones.
In addition to unnecessary file transmissions, inefficient file transfers may appear. Inefficient file transfers may happen due to lack of information about the shared files and the sharers. As an example, the file may be downloaded from a host with poor connectivity while the file has been shared by its original source with a better connection. Furthermore, it is likely to start file transmission from a host which is going to leave the network in minutes.
Both incorrect and inefficient file transmissions occur owing to lack of information. Indeed, in fixed networks as the speed is high and the cost of communication is low, descriptive information about shared files are limited. However, in mobile environments due to dynamic behavior of the mobile nodes as well as high cost and low speed of the network, this information is important.
Therefore, the second design principle is providing services in the system to hold sufficient metadata attached to the shared files. This information is required to decrease the number of incorrect and inefficient file transmissions.
3. Avoid unsolicited waits In wireless networks, absence of the wanted host is
common. So, when a file placed on an absent host is requested, the requester goes to waiting state. Usually in typical file sharing systems, the requester will not be informed on the return of sharer. So, in general the requester uses the polling method to become aware of the return of the sharer. Sometimes, this leads to a long delay
before file transmission. Since, the requester itself may not be within reach when the sharer returns to the network. Another obstacle is that the sharer will not be informed about file requests sent to it in its absence time. This cause unnecessary waits too.
As the third principle, to avoid mentioned unwanted waits, the file sharing system should support a scheme to inform waited hosts when the wanted host returned to the network. It should maintain asynchronous file requests too.
4. Use simple and consistent naming system In a mobile environment, with both logical and physical
mobility, everything is dynamic. Mobile hosts are moving between networks and mobile agents are moving between hosts. Users are also mobile and may even change their host to have ubiquitous information access. Naming elements in such an environment is an interesting research topic.
The fourth principle is focused on the fact that using an appropriate naming strategy for mobile file sharing system can increase its performance and effectiveness. For this purpose, we designed and employed a consistent naming system in which shared files have persistent access names with low degree of complexity.
3. Design Issues
MobFish architecture is based on a number of tactics [3] to satisfy the requirements and quality attributes of the system. These tactics are a collection of related works that are managed with a predefined policy based on the principles mentioned in section 2.
3.1 Tactics
1. Layered Design Like most of distributed systems, MobFish exploits a
layered system. It has three major layers and each layer is almost separate from the others. The lowest layer is relay layer which is responsible for data communication; the median layer is coordination layer which provides the abstraction of a shared space and helps the hosts to convey file sharing control records; the highest layer is file sharing managerial layer which determines the arrangement and meaning of file sharing control records. In figure 2 the structure is represented. In this scheme, the heterogeneity is supported, as communication method in relay layer is absolutely independent from upper layers.
2. XML structures as descriptive metadata As described in section 2, maintaining descriptive
metadata will reduce the number of inefficient and incorrect file transfers. Consequently, we used two internal xml structures; one for publishing a shared file metadata (FXMD) and the other for describing status of a sharer host (HXMD). The former will be extended by the latter to compose the shared file effective metadata (EXMD).
When a file sharer receives a request, it generates effective metadata and passes it to the requester. Figure 1
18

represents an instance of a shared file effective metadata. The brief description of the file, the original source of the file (or the file fixed hosts), the exact size, the possibility of segmentation are some of the information that may be placed in FXMD.
Estimated time the host stays in the network, estimated time the mobile agent remains on the host, the supported file transfer methods, the quality of shared connections are some information passes with the HXMD.
3. Application aware adaptation Adaptation stands for dynamic balance between two
paradigms, autonomy of mobile hosts and interdependence of them. In MobFish, both mobile file sharers and requesters can adapt their behavior with the environment changes. This adaptation is based on the concept of application-awareness. The range of adaptation strategies is delimited by two extremes and application-aware adaptation [11, 16] is a spectrum of possibilities between these two extremes. At one extreme, adaptation is entirely the responsibility of individual applications. At the other extreme, application-transparent adaptation places entire responsibility for adaptation on the system [17]. In mobile file sharing system, a customizable adaptation handler is defined in managerial layer to work based on application-aware adaptation strategy.
4. Using listeners, status info and ASYN requests An effective approach to avoid unsolicited waits is
taking advantage of asynchronous communication. In our design, this approach is applied in three ways. Putting status info of the hosts in the shared space
Before attempt to file transfer, the requester checks for the presence of the sharer host. Putting status info of the hosts in the shared space could reduce the cost of communication as well as waiting times. Status info of a host is updated when it decides to leave the network. Moreover, on revisiting the network, it updates its status info in the shared space and changes the status to present.
Setting listeners for the hosts when they are absent When a sharer host is absent, requesters can set listeners
for it in the shared space and ask the system to notify them when the sharer host revisits the network. Using this technique, the requesters will be informed about sharer return immediately and they will be able to apply for the shared file at once. Using ASYN file requests if a file sharer is absent
When a sharer host is absent the requester can put an ASYN request for a file in the shared space and ask the sharer to send him the file. The ASYN request may suggest asynchronous or synchronous file transfer methods for sending the file. That is, if the requester predicts an unstable state, it asks for asynchronous transmission and in contrast, stable state prediction may cause a synchronous file transmission.
In mentioned techniques, the concept of shared space is an essential part of the communications. This concept is realized by the coordination layer as stated before. The coordination layer divides the shared space into two parts, a public area which is common between all hosts and a private area which holds a message inbox for each host. Listeners and ASYN file requests are put in the private area and status info records are located at public area.
5. Two-level naming system In a mobile file sharing system hosts migrate between
networks and agents. Also, their associated files migrate between hosts. Moreover, users change their hosts and their related data according to required computing context.
In such environments with high degree of mobility, the traditional naming systems are not well suited [21]. So addressing the files and locating them with a non-complex structure that runs on mobile hosts efficiently is an important challenge. Our solution uses a two level naming system, in which access names as permanent and human-friendly names are mapped to address names as temporal and location dependent names. The idea is simple. The sole names that are not changing in this environment are sharer identifiers. File sharers are either mobile users or mobile software agents. Both classes have permanent and human-friendly identifiers. So access names consist of sharer identifiers as the first segment and file names as the second segment. For example in a mobile hospital information system if the user “Nurse103” is going to share the file “BloodPressureA29” the shared file access name will be “/Nurse103/BloodPressureA29”. It emulates a big shared space, wherein each user has a separate directory and there are some automatic mount points to user directories. This scheme leads permanent names that do not change by migration of software agents and users. It means, even if Nurse103 migrate from a host to another, the access name of the file wont change.
On the contrary, address names consist of three segments, network name, host network address and file address. Network name indicates the last network visited by the mobile host. Host network address is the address of
<EXMD> <FXMD>
<filename> P028CH </filename> <source> HIS File Server 2 </source> <description> History of cardiograph
outputs for patient 028. From 2005/06/15 to 2005/11/09 </description>
<size> 15 KB </size> <dividable> no </dividable>
</FXMD> <HXMD>
<connections> <C><N> TCI </N><Q> average </Q> <C><N> LHIS </N><Q>excellent </Q> <C><N> A12 </N><Q> not good </Q>
</connections> <EDD> 14:20 </EDD>
<EAD> N </EAD> </HXMD>
</EXMD>
Figure 1. Sample Effective Metadata
19

the host in the last visited network addressing system. The file address is the file address in the host addressing system. This method supports migration of users between hosts, mobile hosts between networks and also data between hosts without any change to access names. Like the shared space, the naming system can be implemented by distributed or centralized approaches.
The advantage of mentioned naming system is acquiring name transparency with a direct single-level mapping instead of using complex multi-level mappings which do not fit into the constraints of mobility.
3.2 Structure
The first level decomposition [3] of mobile file sharing system based on the mentioned principles and tactics is shown in figure 2.
Figure 2 simply shows the involved elements of the system and their conceptual representation in a file transfer scenario. The deployment model of the components will be explained in next section.
Below is a brief description of the components of the managerial layer.
Context Monitor: Context monitor is responsible for monitoring the
changes of computing context including quality of network, remaining battery power, hosts physical location and etc. It provides adaptation data for the share and download manager component.
Share and Download Manager:
Share and download manager is in charge of the main procedures of the file sharing system including procedures of sharing and downloading files, handling XML metadata structures, listeners, status info records, and ASYN requests. This component has a significant role in adaptive behavior of the system.
Naming System: Naming System manages the two-level naming scheme.
It uses the public area of the coordination layer to store the names. When a user changes his host, or a software agent
migrate from one host to another, the naming system of the new host updates the address of the shared files in the public area. When a mobile host enters to a new network or changes its network address the update is done by naming system of the mobile host itself.
4. Implementation
The presented architecture for mobile file sharing is high level and it can be realized by several methods. We have worked on particular implementations for different environments. In this paper, SmartFish as a client-server realization of MobFish for small file sharing networks is presented to show the correctness and effectiveness of the proposed architecture. In SmartFish, clients are held on mobile hosts and they are responsible for the mobile part procedures of file sharing. In this scheme, a central server is placed to store meta-data information and manage the public shared space. SmartFish is suitable for the environments with availability of a fixed server. On the other hand in agent oriented implementation of the architecture (LimeFiSh[20]) the existence of a fixed server is not assumed and everything is done on mobile hosts.
In SmartFish, the client side is implemented on Windows CE platform, while server is implemented using J2EE. Figure 3 shows the general structure of the system. The implemented system uses Multimedia Messaging Service as the communication interface between the mobile clients and the server for transferring meta-data, requests and etc. The server has a link to the MMS center and works as an MMS value added service provider. As the size of meta-data information transferred between a client and server hardly exceeds 10 Kbytes per transaction, our experience showed that MMS is the best choice for the client-server communication in SmartFish. The assumption that all mobile clients have MMS is not much restricting the users of the system (due to its popularity), its range is very wide (scope of a mobile network operator), and it is over WAP which is a bearer independent transport protocol (i.e. CSD, CDMA, USSD, SMS and many other bearers can carry WAP messages).
The following steps show a common scenario of the file transfer in the SmartFish client-server model:
• When a sharer start to share a file, the client on its host collects information of the shared file (i.e. name, size, user comments, etc.) from both system and user. This information, along with the host’s recent specific information (i.e. location, context information, communication interface updates, etc.) is packed as an EXMD file. This file is sent to the server using MMS.
• The server receives this information and updates its meta-data information base.
• When a requester requests for a file, the client on its host generates a query including related keywords and file size interval. It sends the request to the server.
Context Monitor
Public Area
Short Range Radio WLAN Packet Radio
Private Area #m
Naming System
Share and Download Manager
Managerial Layer
Coordination Layer
Relay Layer
Figure 2. First Level Decomposition of the System
Private Area #n
Naming System
Share and Download Manager
Context Monitor
Sharer Requester
20

Figure 3. The general structure of SmartFish
• When the server receives the query, it searches the information base for the appropriate files and then makes a ranked list of the sharers. Besides file name, type, and size similarity, the aptness of the sharer’s connection interfaces impacts the ranking. The result will be sent to the requester client in XML format.
• Based on its location and available connection interfaces, the requester selects the appropriate sharer and starts the actual transfer of its shared file. The automatic selection of the best sharer is synchronized with adaptation rules of the system.
Figure 4 shows two snapshots of the SmartFish client application running.
Figure 4. Two snapshots of the SmartFish Mobile Applications
In order to show how well this system satisfies the requirements of mobile environment, we have captured some characteristics of our implemented system. Although, these parameters can not be regarded as a very complete benchmark of the system, we believe the measured parameters reflect the essential requirements of an appropriate mobile file sharing system. Some of the results are discussed below.
Figure 5 shows the average response time of the server across different query sizes. It shows that the server fulfill mobile client’s requests quite well. Usage of a scalable platform and simplicity of the whole system keeps the server efficient while used by a lot of clients.
0
100
200
300
400
500
600
700
800
900
1 5 10 >10
Query Size (KB)
Aver
age
Resp
onse
Tim
e(m
s)
Figure 5. Average Response Time of the server across different file sizes
Figure 6 shows the percentage of the transfers which were successful in first try across different file sizes. As the size of the file grows, the use of communication interfaces is more restricted (i.e. MMS and Bluetooth are normally out of place for transferring more than 50K files).
0.3
0.4
0.5
0.6
0.7
0.8
0.9
1
10 20 50 100 >100
File Size (KB)
Succ
essf
ulTr
ansf
ers
/Tot
alTr
ansf
ers
Figure 6. Successful file transfers (in first try) across different file sizes
21

5. Conclusion and Future Work
It can be seen from this paper that using new models for file sharing in mobile environments, can improve usability, performance and effectiveness of file sharing systems with mobility support. In our recent work on mobile file sharing systems, we employed an architectural style and several design techniques to fulfill the requirements and quality attributes of the mobile file sharing system. Adaptation as a key solution for mobility problems, asynchronous communication and supplementary information as two ways for reducing unnecessary waits, and innovative naming system to simplify addressing the mobile units are some design techniques exploited in our model.
In our ongoing research we plan to investigate further on adaptation and design more clever applications. To address this issue, we have divided our domain into two areas, the first denotes to pure mobile networks in which there are not auxiliary fixed hosts and everything is mobile, and the second denotes to common mobile networks that benefits from supporting fixed hosts.
The next studies can focus on specific models and implementations for each area as well as working on flexible systems to cover both areas with the ability of switching between them.
References
[1] A. Al-bar, I. Wakeman, A Survey of Adaptive Applications in Mobile Computing. Proc. 21st
International Conference on Distributed Computing Systems Workshops, pp. 0246, Apr. 2001.
[2] D. Barbara. Mobile computing and databases - a survey. IEEE Transaction on Knowledge Data Engineering, pp. 108-117, Jan. 1999.
[3] L. Bass, P. Clements, R. Kazman. Software Architecture in Practice. Second Edition, Addison Wisely, 2003, cited on pages 100, 160.
[4] Y. Chen, C. Petrie. Ubiquitous Mobile Computing. IEEE Internet Computing, pp. 16-17, Mar/Apr. 2003.
[5] I. Chlamtac, J. Redi. Mobile Computing: Challenges and Potential. Encyclopedia of Computer Science, 4th Edition, International Thomson Publishing, 1998.
[6] T. Drashansky, S. Weerawarana, A. Joshi, R. A. Weerasinghe, E. Houstis. Software architecture of ubiquitous scientific computing environments for mobile platforms. ACM Journal on Mobile Networks and Applications, 1(4), 1996.
[7] T Imielinski, B. R. Badrinath. Mobile wireless computing: Challenges in data management.Communications of the ACM 37(10), pp. 18-28, Oct. 1994.
[8] R. Katz. Adaptation and mobility in wireless information systems, IEEE Personal Communications, pp. 6-17, 1994.
[9] C. Mascolo, L. Capra, S. gachariadis, W. Emmerich. XMIDDLE: A DataSharing Middleware for Mobile Computing. Wireless Personal Communications, pp. 77-103, 2002.
[10] A. Murphy, G Picco, and G. Romjan. Lime: A coordination middleware supporting mobility of hosts and agents. Technical Report WUCSE-03-21, Washington University, Department of Computer Science, St. Louis, MO (USA), 2003.
[11] B. D. Noble, M. Price, and M. Satyanarayanan. Aprogramming interface for application-aware adaptation in mobile computing. Computing Systems, 8(4), 1995. Also as technical report CMU-CS-95-119, School of Computer Science, Carnegie Mellon University.
[12] V. Pham, A. Karmouch. Mobile Software Agent: An Overview. IEEE Communication Magazine, p.26-37, July 1998.
[13] G. Picco, A. Murphy, and G. Roman, LIME: Linda meets mobility, in International Conference on Software Engineering, pp. 368--377, 1999.
[14] C. Policroniades, R. Chakravorty, P. Vidales. AData Repository for Fine-Grained Adaptation in Heterogeneous Environments. Proc. Third ACM international workshop on Data engineering for wireless and mobile access, ACM Press, New York, pp. 51-55, Sept. 2003.
[15] I. Satoh, Physical Mobility and Logical Mobility in Ubiquitous Computing Environments, Proc. Conference on Mobile Agents (MA'02), LNCS, Vol. 2535, pp.186-202, Springer, 2002.
[16] M. Satyanarayanan, B. Noble, P. Kumar, M. Price. Application-Aware Adaptation for Mobile Computing. School of Computer Science, Carnegie Mellon University.
[17] M. Satyanarayanan, Fundamental Challenges in Mobile Computing. Proc. 15th annual ACM symposium on Principles of distributed computing, ACM Press, New York, pp. 1-7, 1996.
[18] M. Satyanarayanan. Mobile Computing. URL: www.computer.org/computer, pp. 81-82, 1993.
[19] M. Satyanarayanan. Mobile Information Access. IEEE Personal Communications, February 1996.
[20] H. Sheikhattar, A. Haghighat, N. Noroozi. Mobility in File Sharing. Proc. 11th International Conference on Distributed Multimedia Systems, Banff, pp 155-160, September 2005
[21] A. Tanenbaum, M. Van Steen. Distributed Systems, Principles and Paradigms. Prentice Hall, 2002, cited on page 210.
[22] M. Weiser. The Computer for the Twenty-First Century. Scientific American, pp. 94-104, Sept. 1991.
22

An Evaluation of Two Policies for Placement of Continuous Media in Multi-hopWireless Networks
ShahramGhandeharizadeh,ToorajHelmi, TaeheeJung,ShyamKapadia,ShahinShayandehComputerScienceDepartment
Universityof SouthernCaliforniaLosAngeles,California90089
Abstract
Thispaperfocuseson a greedydataplacementstrategyfor a meshnetworkof peer-to-peerdevicesthatcollaborateto streamcontinuousmedia,audio and video clips. Thegreedyplacementstrategy, termedSimple, strivesto maxi-mizethe numberof referencesservedby the local storageof a peer. Weanalyzetwopoliciesto realizethisplacement:Frequency-basedand Byte-hit. Thefirst sortsclips basedontheir accessfrequency, assigningthefrequentlyaccessedclips to each node. Byte-hitcomputesthe frequencyof ac-cessto each byteof a clip, sortsclips basedon this value,and assignsthosewith the highestbyte-hit value to eachnode. Both havethe samecomplexity and almost identi-cal implementations.A simulationstudyshowsByte-hit issuperiorto Frequency-basedfor two reasons.First, it max-imizesthenumberof peers that cansimultaneouslydisplaytheir referencedclips. Second,it is more robust to errorin accessfrequencies.In all our experiments,Byte-hitper-formsalmostidenticalto theoptimalplacementstrategy.
1 Introduction
Advancesin communicationandprocessinghave madead-hocnetworks of wirelessdevices a reality. A device,termeda peer, is typically configuredwith a fast proces-sor, a massstoragedevice, either one or several typesofwirelessnetworking cards[20, 11]. Peersstrive to providetheir userswith ubiquitousaccessto their dataeverywhereandarebuilding componentsof complex systemssuchasMemex [4] andMyLifeBits [12].
In this study, we focuson devicesconfiguredwith wire-lessnetworkingcardsthatoffer bandwidthsin theorderof afew Megabitspersecond(Mbps)with alimited radiorange,a few hundredfeet. Examplesinclude 802.11a,b, and gnetworking cards[3, 2]. Devicescommunicatewith eachotherwhenthey arein theradiorangeof oneanother. Some
devicesmight be in the radio rangeof a WiMax (802.16a)basestationor an accesspoint, providing the ad-hocnet-work with accessto thewired infrastructure.
In multi-hopwirelessnetworks,two peersmaycommu-nicatethrougha numberof intermediatepeersthat collab-orateto relay information. An interestingsubclassof net-works,termedmeshnetworks,is moreconstrainedby band-width andstoragelimitationsandlessconstrainedby nodemobility and power consumption. An examplemight beCanada’s SuperNet[6] which deliverseducationalmaterialto remoteareasin Alberta. It consistsof wirelesspeersthatcomplementthe wired infrastructure.Anotherapplicationmightbeanofficesetting[20] or ahomeentertainmentsys-tem [14] wheremultiple peerscollaborateto provide on-demandaccessto content.With thelatter, a householdmaystoreits personalvideo library on a peerfor retrieval ev-erywhere,e.g.,whenvisiting a friend’s home.A peermayencryptits contentto either protectit from un-authorizedaccess,i.e., authentication,or implementa businessmodelfor generatingrevenues.Thesemeshnetworksraisea hostof privacy andsecurityissues[5] whichconstituteanactiveareaof researchby severalcommunitiesandbeyondthefo-cusof this paper.
A challengeof thesead-hocnetworks is how to displaycontinuousmedia,audioandvideoclips. Continuousmediaconsistsof a sequenceof quanta,eitheraudio samplesorvideoframes,thatconvey meaningwhenpresentedatapre-specifiedrate[13, 19]. Oncethe displayis initiated, if thedatais deliveredbelow this ratethenthedisplaymaysufferfrom frequentdisruptionsanddelaystermedhiccups.
A peermay storeclips in its local storagein anticipa-tion of futurereferenceseitherby its useror a neighboringpeer. Many studiesfrom mid 1990sdescribetechniquesfora hiccup-freedisplayof a clip thatresidesin thelocal stor-ageof a peer, [17, 13] to namea few. Onemayuseoneofthesetechniqueswhena userreferencesa clip residentonlocal storageof a peer. Otherwise,this peer(denoted
���)
mustlocateapeerthatcontainsthereferencedclip (denoted���). Next, it mustadmititself into thesystemby reserving
23

oneor morepathsfrom���
to� �
in orderto streamtheref-erencedclip at a pre-specifiedbandwidth. This processistermedadmissioncontrol. It involvescollaborationof otherpeersservingas intermediateapplication-basedroutersbyrequiring themto reserve their network bandwidthon be-half of this stream.By reservingbandwidthalonga path,���
overlapsits displaywith deliveryof datafrom� �
, min-imizing thelatency observedby auser.
A peermay setasidea fraction of its availablestorageto storeaudioandvideo clips. Without lossof generalityandin orderto simplify discussion,the termstoragerefersto this fraction. TheSimpledataplacementstrategy strivesto maximizenumberof referencesmadeby a peerto clipsresidentin its storage.It realizesthisobjectiveby assigningasmany clips aspossibleto a peer. This assignmentis triv-ial whenthestoragecapacityof eachpeeris largerthantherepositorysizebecauseonemayassigntheentirerepositoryto eachpeer. Otherwise,the greedyalgorithmmustdeter-mine the identity of clips that shouldbe assignedto eachpeer. Wepresenttwo policiesto addressthis researchtopic,termedFrequency-basedandByte-hit. Both assumeanes-timateof frequency of accessto clips is available.We com-parethesetwo policiesby quantifyingthenumberof peersthatmaydisplaytheirreferencedclipssimultaneously. Thisis alsotermedsystemthroughput.
Obtained results provide the following key insights.First, when the estimatedfrequency of accessto clips isprecise,Byte-hitenablesa largernumberof requeststo findtheir referencedtitles locally, maximizingthethroughputofthe system. Second,when the estimatedfrequency of ac-cessis notprecise,Byte-hit is morerobustandcontinuestoprovide a higherthroughput.Third, Byte-hit hasthe samecomplexity asthe Frequency-basedtechniqueswith an al-mostidenticalimplementation.Theseprovideaconvincingcasefor asystemdesignerto employ theByte-hit policy.
Therestof this paperis organizedasfollows. Section2providesa survey of the relevant literature. In Section3,wepresentthedetailsof Simpleandits alternativepolicies.Section4 presentsa comparisonof the alternative policiesusinga simulationstudy. Brief conclusionsandfuture re-searchdirectionsarepresentedin Section5.
2 Related Work
Placementof data in ad-hocnetworks is an emergingareaof research.We categorizeprior studiesinto thosethatshareor donotsharestorage.Whenstorageis shared,ade-signstrivesto enhanceaglobalperformancemetricthatim-pactsall peers.Whenstorageis not shared,a designstrivesto enhancea metric local to eachpeer. Simple doesnotsharestorageandits outlinedpoliciesstrive to enhancethenumberof userrequestssatisfiedusingthelocalstorageof apeer. All prior studiesassumestorageis a sharedresource.
Parameter Definition����� ��� ���Bandwidthrequiredto displaya clip��� �����Bandwidthof a link�Numberof clips, ������� �� �Frequency of accessto clip ��Numberof peers�! #" �Sizeof clip �� �%$Sizeof thedatabase,
� �%$'&)( �+*-, � #" ��!.Storagecapacityof a peer�#/Totalstoragecapacityof peers,
�#/ & �10 � .
Table 1. Parameter s and their definitions
Below, wesummarizethesestudies.Studies that assumestorageof a peer is sharedin-
clude [21, 7, 1]. The global performancemetric of eachstudy includes: averagesearchsize for a clip [7], euclid-iandistancebetweenaclientanda server [21], andnumberof simultaneousdisplays[1]. With [7, 1], the numberofreplicasfor a clip is proportionalto the squareroot of itsfrequency of access.With [21], this numberis proportionalto
�3254 676789:7;=< �?> <+@�A where B < is the frequency of accessto clip C .Simpledoesnot computethenumberof replicasfor a clip.A comparisonof Simplewith [21, 7, 1] is a futureresearchtopic,see[16].
We focus on Simple in order to (1) identify which ofits policies is superior, and(2) usethe superiorpolicy forcomparisonwith thosetechniquesthatsharestorage.A keycontributionof thispaperis to show superiorityof Byte-hit.See[16] for a preliminary comparisonof Byte-hit with astoragesharingtechnique.
3 Simple Data Placement
We assumean ad-hocnetwork of D peersanda base-station. The base-stationprovidesaccessto the wired in-frastructureand remoteservers. It might be in the radiorangeof a few peers.
Whena useremploysa peerto referencea clip, thepeerchecksto seeif theclip is availablein its local storage.Inthis case,it initiates the display of the clip from its localstorage.Otherwise,it triesto admit itself to streamtheclipfrom eitherapeercontainingthereferencedclip or thebasestation.
Simpleassignsclips to peerswith theobjective to max-imize thenumberof simultaneousdisplayswhile minimiz-ing theincurredstartuplatency. Startuplatency is definedasthedelayincurredfrom whenapeerreferencesaclip to theonsetof its display. An effective heuristicis to maximizethenumberof requestsservicedusingthelocal storageof apeer, minimizing thedemandfor thenetwork bandwidth.
With a homogeneousrepositoryconsistingof equi-sized
24

Clip id EFG < HI< HJ<7K ELF%G <M M3N OQPSR OQP OUTV M OQP+M OQP+MW VIO OQPXV OQP OQM
Table 2. Byte-hit may not always yield the Op-timal solution.
clips,theplacementof datais similar to thefractionalknap-sackproblem[8]. Whenthe objective is to maximizethefrequency of accessto the local datastoredon eachpeer,definedas Y <[Z]\ HJ< , the optimal solutionis to assignthe Emostpopularclips to eachpeer. See[15] for a proof.
A repositoryconsistingof a mix of mediatypesis morerealistic. In this case,the size of clips will be different,changingtheplacementof datawith Simpleinto a0-1knap-sackproblem. This problemhasbeenwell studiedin theliterature.A dynamicprogramto realizethemaximumhitratiois outlinedin [8]. Thissolutionis apseudo-polynomialalgorithmwith ^�_]`bacEdfe complexity. Note that thegran-ularity of ELd is in bytes. Whenthe storagecapacityof anodeis in theorderof hundredsof Gigabytes,this optimalalgorithmmayincura longexecutiontime.
Thereexistssuitableheuristicsto approximatethe opti-malsolution.An effectiveheuristicis to (1) sortclipsbasedon their H < K E F%G < value,(2) assignthe first E clips to eachnodewhere Y <+Z7\ E FG <hg E d . Theprocessis repeateduntilstorageof a peer, E d , is exhaustedi.e. E dji Y <[Z7\ E F%G <lkELFG m for all npo�Ehq . This is the Byte-hit policy. Anotherheuristic,termedFrequency-based, is to repeatthe aboveprocedureusing H < insteadof H < K E F%G < .
Section4 shows Byte-hit approximatesan optimal as-signment.However, Byte-hit maynot alwaysyield theop-timal assignmentas illustratedby the following example.AssumeE dsr MtN
andarepositoryof 3 clips. Table2 showsthesizeof eachclip andits frequency of access.TheByte-hit policy assignsclip 2 to eachpeer, observinga 10% hitratio. TheOptimalassignmentwould assignclip
Mto each
peer, increasingthis hit ratio to 70%.While thereadermayobservetheFrequency-basedpolicy would producetheop-timal solution, it is importantto notethat onemay devisecounterexamplesto show that Frequency-basedalsodoesnotalwaysproduceanoptimalassignment.
4 A Comparison
In this section,we comparethe Frequency-basedandByte-hitpolicies.Westartwith adescriptionof oursimula-tion environment.Next, weshow Byte-hitprovidesahigherthroughputwhenthe assumedfrequency of accessto clipsis precise.Finally, we show Byte-hit is morerobust when
the frequency of accessto clips is erroneous.Due to lackof space,we refer the interestedreaderto [15] for ananal-ysisof scenarioswith two differentdemographics,showingFrequency-basedobserveshigherimprovements.However,Byte-hit continuesto outperformFrequency-based.
Simulation Set-up: Weconsideraheterogeneousrepos-itory consisting of two media types: audio and videoclipswith displaybandwidthrequirement( ufv < >]� ;�w�x ) of
WyOyOKbpsand
NMbps.Therewere3 differentclip sizesfor each
mediatype. With video,we have clips with a displaytimeofV
hours, z O minutes,andWyO
minutes.The sizeof theseclipsare
VGigabytes(GB),
MGB, and
OQPXTGB, respectively.
With audio,theclip displaytimesareN
minutes,V
minutes,and
Mminute. Resultingclip sizesare { Megabytes(MB),N#PXT
MB, andVQP VUT
MB.With a databaseof ` clips (say ` =100), the clips are
numberedsequentiallyfrom 1 to 100. Oddnumberedclipsarevideoandevennumberedclipsareaudio.Thus,thepat-tern of clip sizesis
VGB, { MB,
MGB,
N#PXTMB,
O#P TGB
andV|PXVyT
MB. This patternrepeatsitself until all 100clipsthat constitutethe repositoryare constructed. This num-beringis importantbecausedistribution of requestsacrossclips is generatedusinga Zipfian distribution with a meanof 0.27. This distribution is shown to resemblethe saleofmovie ticketsin theUnitedStates[10].
We analyzedtwo different network topologies: StringandGrid. With String, eachpeer(exceptthe two peersattheendof thetopology)is in theradiorangeof two neigh-boringpeers.This might representa communityof houseslined up in front of a lake. With Grid, a peeris in theradiorangeof thosepeerswith aManhattandistanceof one.Thismeanseachpeer, exceptfor thoseontheborderof theGrid,is in the radio rangeof
Notherpeers.This is morerepre-
sentative of a metropolitanneighborhoodin a city suchasLos Angeles. The link bandwidthbetweentwo peersis
NMbps, uf} <+~y� =4 Mbps. With all topologies,we assumethepresenceof a basestation. It is locatedat oneendof theStringtopologyandonecornerof theGrid topology.
In eachiterationof a simulationrun,peersarepickedina round-robinmannerto referencea clip for display. Thereferencedclip is selectedaspertheZipfian distribution. Ifthereferencedclip residesin local storageof thepeerthenthenumberof simultaneousdisplaysis incrementedby one.Otherwise,it invokesa centralizedadmissioncontrolcom-ponentthatemploystheFord-Fulkersonalgorithm[9]. Thiscomponenttriesto reserveoneor morepathsfrom thetargetpeerto thebasestationwith bandwidthequivalentto thatre-quiredfor continuousdisplayof theclip ( u�v < >]� ;�w�x ). If sucha path exists then the requestis admittedinto the systemand the numberof simultaneousdisplaysis increasedbyone. Otherwise,the requestis rejected. Sincethe requestis eitheradmittedor rejectedinstantaneously, the tolerablestartuplatency in this caseis
O. This would bedifferentin
25

� ��� � � ����� ���t� ���t� � � �� ����� � � � �c��� ��� � �t� � � � ������p� �����y� �I� � ��� �y� � �t� �y� � ��� �y� � � � �y� ���t� �y� �t� ���� ���c� �I� � �y� �y� � �t� �y� � ��� �y� � � � �y� ���t� �y� �t� �� � ���� ���I� �I� � � � �y� ��� � �y� � � � �y� ���t� �y� � �I� �y� � �t�� �U� �� Table 3. Y HJ< for the diff erent policies for aconstant ` K�¡ ratio of 4, E dsr V z Gigab ytes.
a real system.An iterationendsonceall ¡ peershave in-voked this procedure.Note that the maximumnumberofsimultaneousdisplaysfor aniterationis ¡ .
A key metricis theaveragenumberof simultaneousdis-plays.It is anaverageof 100,000iterations.Anothermetricis thehit ratioobservedby eachpeer. It is anaverageacross100,000requestsover ¡ peers.We alsostudyhow robustthismetricis to errorsin theclip accessfrequencies.
Weobservedidenticaltrendsfor boththeStringandGridtopologies.This is becausethebasestationis locatedatoneendof thetopology. Hence,for theremainderof this paper,we focuson theGrid topology. A futureresearchdirectionwould beto identify alternative placementsof thebasesta-tion(s) andquantify the effectsof u } <+~y� and u v < >]� ;�w�x onthenumberof simultaneousdisplays.
4.1 Number of Simultaneous displays
Figure1 shows theresultsobservedwith a scale-upex-periment.It is termedscale-upbecausethenumberof clips( ` ) is a function of the numberof peers( ¡ ), ` r N ¡ .Thus,whenweincreasethenumberof peers( ¡ ) from 25to50, thenumberof clips ( ` ) increasesfrom
MtOUOtoVyOyO
. Thestoragecapacityof eachpeeris fixed at
V z GB ( ELd r V zGB). We assumethe bandwidthbetweenthe peersis fixedatN
Mbps.In Figure1, thedashedline showsthedesirednumberof
simultaneousdisplays.Its valuesaredictatedby thenumberof peersshown on thex-axis. This is the theoreticalupperboundon systemthroughput.
Figure1 showsthefollowing two observationsasafunc-tion of ` and ¡ . First,all strategiesdivergefrom thetheo-reticalupperbound.Second,Byte-hit andOptimalprovidethesamethroughput,outperformingFrequency-basedby awidermargin. We explaineachin turn.
As weincrease and ¡ , asmallerfractionof repositoryfits on eachpeerbecausethestoragecapacityof eachpeeris fixed at 26 GB, E d =26 GB. This causesa larger frac-tion of requeststo streamclips from thebasestation.Withthe bandwidthof a connectionbetweentwo peersfixed at4 Mbps ( u ;�<�~y� r N
Mbps), the admissioncontrol admits
0 100 200 300 400 500 600 700 800 900 1000 1100 12000
20406080
100120140160180200220240260280300320340
Number of clips (C)144 324196100
Theoreticaluperbound
Optimal
Frequency−based
Byte−hit
810 25 49
Number of simultaneous displays
Number of peers (N)
Figure 1. Throughput as a function of ` , ¡ .
fewer requests. This causesall policies to diverge by awider margin from thetheoreticalupperbound.
To explainthesecondobservation,weshow thetotal fre-quency of accessto theclipsassignedto eachpeerwith Op-timal, Byte-hit andFrequency-basedin Table3. Eachcol-umnof thistablecorrespondsto adifferent ¡ and ` values,i.e.,ticksonthex-axisof Figure1. Thetotal frequency witheachstrategy dropsasa functionof ` . This is becausethestoragecapacityof eachpeeris fixedandthe frequency ofaccessto eachclip decreaseswith higher ` values.
Table 3 shows identical accessfrequencieswith Byte-hit andOptimalwhich is higherthanthatwith Frequency-based.This is becauseByte-hitandOptimalassignadiffer-entcollectionof clips to eachpeerfor eachvalueof ` and¡ . With Frequency-based,the samecollectionof clips isassignedto eachpeerfor valueof ¡ greaterthan49. With¡ r VyT
, asubsetof theseclips is assignedto eachpeer.To elaborateon these,observe that the frequency of ac-
cessto eachclip changesasa functionof ` . This changesthevalueof ¢ 9\I£p¤ 9 , causingByte-hit to assignadifferentcol-lection of clips to eachpeer. With Frequency-based,thesortedorderof clips using their accessfrequency remainsunchangedas a function of ` . Recall the patternof clipsizesis: 2 GB, 9 MB, 1 GB, 4.5MB, 0.5GB, and2.25MB.Total sizeof eachpatternis EL¥ =3515.75MB. Frequency-basedassigns7 of thesepatternsto a peer. This leaves1389.75MB of free storage.Thus, the first video clip oftheeighthpattern(clip 43) cannotbeassignedbecauseit is2 GB in size. Frequency-basedis ableto assignonly clips44,45,46,and47of theeighthpattern.Thisleaves374MBof freespace.Only audioclips canbeassignedto this free
26

0 50 100 150 200 250 300 350 4000
10
20
30
40
50
60
70
80
90
100
Shift ID (g)
Average number of simultaneous displays
Frequency−based
OptimalByte−hit
Figure 2. Error in access frequenc y.
space.When ¡ r VyTand ` r M�OyO
, a total of 79 clips areassignedto eachpeer, assigningall theaudioclipsandleav-ing 200.75MB of freespace.When ¡ r N { and ` r M {yz ,thereareadditionalaudioclips becausetherepositorysizeis larger, allowing Frequency-basedto exhaustall freestor-ageof eachpeer. In this case,it assigns117 clips to eachpeer. The identity of last assignedclip is 192. With val-uesof ¡ higherthan49, thevalueof ` exceeds192. Thismeansthesamecollectionof clipsareassignedto eachpeerbecausetheir sortedorderdoesnot changeasa functionof` .
Robustness to Frequency of Access: We analyzedthesensitivity of the alternative policiesby placingdatausinga Zipfian distribution of access.Next, theworkloadgener-atorwasmodifiedto generateaclip requestusingashifted-Zipfian distribution. The latter is generatedby shifting theoriginalZipfiandistributionwith parameter¦ . Thevalueof¦ rangesfrom 1 to ` . This meansthe frequency of accessfor clip C is assignedto clip _ C�§¨¦|eh©'ªJ«�` . When ¦ r M
,theworkloadgeneratorissuesrequestsrelative to theorig-inal distribution ( ¦ =0) in the following manner:Clip 2 isreferencedasfrequentlyasClip 1, Clip 3 is referencedasfrequentlyasClip 2, so on until Clip 400 is referencedasfrequentlyas Clip 399, and Clip 1 is referencedwith thesameaccessfrequency asClip 400. For a givenshift value¦ , we conducted100,000iterationsof eachexperimentus-ing a Grid topology of 100 peers. Note that the originalplacementof clips remainsunchangedin eachiteration.
Figure2 shows theaveragenumberof simultaneousdis-playssupportedby a grid topologyconsistingof
MtOUOpeers.
As we increasethe value of ¦ , both techniquessupportfewer simultaneousdisplaysbecausethey must referencethe remotebasestationmorefrequently. Obtainedresultsshow Byte-hit is morerobustthanFrequency-based.This is
becauseByte-hitassigns232clips to eachpeer. Frequency-basedassignsonly 117clips to eachpeer. Many of the232clips arethesmalleraudioclips with a high byte-hitvalue.Whenthefrequency of accessto theseclipsincreases,Byte-hit servicestheserequestsusingthelocal storageof a peer.
Systemthroughputdropsin a stepmannerasa functionof ¦ . Below, weelaborateon this trendwith theFrequency-basedpolicy. Theexplanationfor Byte-hit is similar. WithFrequency-based,seeFigure2.b,theaveragenumberof si-multaneousdisplaysdropssharplyas ¦ approaches42. Thisdroplevelsoff when ¦ is 43. Thereis anothersharpdropas¦ approaches192. The explanationfor this is as follows.Recall from Section4.1 that Frequency-basedassignsthefirst 42 clips to eachpeer. As ¦ approaches42, the fre-quency of accessto theseclipsdecreases,reducingthenum-berof requeststhatfind their referencedclips locally. Theyaredirectedto the basestationand the admissioncontrolrejectsmany dueto the limited bandwidthbetweenpeers.Thisexplainsthefirst sharpdropasshift ID approaches42.
Whenwe increase¦ (shift ID) from 42 to 100,thedropbecomesgradual.This is dueto assignmentof audioclipsto local storageof the peers.Recall from Section4.1 thattheid of thelastassignedclip is 192.As ¦ approaches192,throughputdegradesfasterasfewer referencesareservicedusing local storageof a peer. The lowestpoint is when ¦is 193.Beyondthis point, thethroughputincreasesbecausethe numberof referencesto the first 42 clips startsto in-creaseonceagain.
Similar trendsare observed with Byte-hit whereit as-signs232 clips to eachpeer. The trendis not asdramaticbecauseit assignsmany smallaudioclips to eachpeerandtheid of thelastassignedclip is 400.
5 Conclusions and Future Research
The primary contribution of this paperis to show thesuperiorityof Byte-hit policy when peersof a meshnet-work do not sharestorageand store clips with the ob-jective to maximizelocal hit ratio. When comparedwiththe Frequency-basedpolicy, Byte-hit provides a higherthroughputandis morerobustto theerrorin accessfrequen-cies.Thismeansit is difficult, if not impossible,to designapolicy thatwould outperformByte-hit significantly.
A decentralizedimplementationof SimpleusingByte-hit might beasfollows. Periodically, eithera remoteserveror oneof thepeerspublishes¬ clips. Eachclip hasanantic-ipatedfrequency of accessfor differentdemographics.Thismeta-datais broadcastedto all peers.A peerusesthedemo-graphicsof its householdto lookupthefrequency of accessfor eachof the clips occupying its availablestorage. Itcomputesthe Byte-hit value of theseclips and the newlypublished¬ clips. Both listsarecombinedandsortedbasedontheirByte-hit ratio. Next, it assignsclips from this list to
27

its availablestorage.We comparethis assignmentwith theexisting clips to producetwo lists. List onecontainsthoseclips to be evicted. List two contains ® clips out of ¬ tobestoredin thelocal storage.Next, it storestheidentity ofthese® new clipsin amessageandtransmitsthismessagetothepublishingpeer. Thepublishingpeermayemploy eitherunicastor multicastto disseminatethosenew clips selectedfor storageby oneor morepeers.
A futureresearchdirectionis to exploreotherplacementstrategiesthatutilize storageof a peerasa sharedresourceandcomputethenumberof replicasfor eachclip [21, 7, 1].Somepreliminary resultsare reportedin [16]. One mayconsidermoresophisticatedvariationswherea clip is par-titioned into fragmentsand different peersstoredifferentfragments.Thefirst few fragmentsof a clip might berepli-catedmoreaggressively becausethey areneededmoreur-gently [18]. Whendisplayinga clip, a peerwill displayitsfirst few fragmentsfrom its local storagewhile streamingits remainingfragmentsfrom theneighboringpeers.
6 Acknowledgments
This researchwasmadepossibleby an unrestrictedcashgiftfrom Microsoft research,a fellowshipaward from theAnnenbergCenterfor Communication,andNSFresearchgrantIIS-0307908.
References
[1] A. Aazami, S. Ghandeharizadeh,and T. Helmi. An Opti-malContinuousMediaReplicationStrategy for Ad-hocNet-worksof WirelessDevices.In TenthInternationalWorkshoponMultimediaInformationSystems(MIS), August2004.
[2] A. Adya, P. Bahl, J. Padhye,A. Wolman,andL. Zhou. AMulti-Radio UnificationProtocolfor IEEE 802.11WirelessNetworks. In BROADNETS’04: Proceedingsof the FirstIEEE International Conference on BroadbandNetworks,pages344–354,Washington,DC, USA, 2004.
[3] S. Bararia,S. Ghandeharizadeh,and S. Kapadia. Evalua-tion of 802.11afor StreamingDatain Ad-hocNetworks. InASWNBoston,MA, 2004.
[4] V. Bush. As We May Think. The Atlantic Monthly,176(1):101–108,July 1945.
[5] W. Cheng,L. Golubchik,andD. Kay. TotalRecall:Are Pri-vacy ChangesInevitable? a positionpaper. In Proceedingsof theFirst ACM Workshopon ContinuousArchival andRe-trieval of PersonalExperiences, Oct.2004.
[6] S. M. Cherry. Across the great divide. SpectrumIEEE,41(1):36–39,January2004.
[7] E. CohenandS.Shenker. ReplicationStrategiesin Unstruc-tured Peer-to-PeerNetworks. In Proceedingsof the ACMSIGCOMM, August2002.
[8] T. Cormen,C.Leiserson,andR.Rivest,editors.Introductionto Algorithms, chapter17.2. MIT Press,1989.
[9] T. Cormen,C. Leiserson,R. Rivest, andC. Stein, editors.Introductionto Algorithms, chapter26.2.MIT Press,2001.
[10] A. Dan,D. Dias,R. Mukherjee,D. Sitaram,andR. Tewari.Buffering and Cachingin Large-ScaleVideo Servers. InProc.of COMPCON, 1995.
[11] R. Draves,J. Padhye,andB. Zill. Comparisonof RoutingMetrics for StaticMulti-Hop WirelessNetworks. In ACMSIGCOMM, August2004.
[12] J.Gemmell,B. Gordon,R.Lueder, S.Drucker, andC.Wong.MyLifeBits: Fullfilling the Memex Vision. In ACM Multi-media, December2002.
[13] J. Gemmell,H. M. Vin, D. D. Kandlur, P. V. Rangan,andL. A. Rowe. MultimediaStorageServers:A Tutorial. IEEEComputer, 28(5):40–49,1995.
[14] S. Ghandeharizadeh.H2O Clouds: Issues,ChallengesandSolutions.In Fourth IEEEPacific-RimConferenceonMulti-media, December2003.
[15] S. Ghandeharizadeh,T. Helmi, T. Jung, S. Kapadia,andS. Shayandeh.An Evaluationof Two Policiesfor Contin-uousMediain Multi-hop WirelessNetworks. TechnicalRe-port 2006-03,USCDatabaseLab,2006.
[16] S.Ghandeharizadeh,T. Helmi, andS. Shayandeh.To Shareor Not To ShareStoragein Mesh Networks: A SystemThroughputPerspective. In Submittedfor publication, 2006.
[17] S.Ghandeharizadeh,S.Kim, andC. Shahabi.On Configur-ing a SingleDisk ContinuousMediaServer. In Proceedingsof theACM SIGMETRICS/Performance, May 1995.
[18] S.Ghandeharizadeh,B. Krishnamachari,andS.Song.Place-ment of ContinuousMedia in WirelessPeer-to-PeerNet-works. IEEE TransactionsonMultimedia, April 2004.
[19] S. GhandeharizadehandR. Muntz. DesignandImplemen-tationof ScalableContinuousMediaServers.Parallel Com-puting, 24(1):91–122,May 1998.
[20] K. Jain,J. Padhye,V. Padmanabhan,andL. Qui. ImpactofInterferenceon Multi-hop WirelessNetwork Performance.In ACM Mobicom, Sept2003.
[21] S. Jin andL. Wang. ContenandServiceReplicationStrate-giesin Multi-hop WirelessMeshNetworks. In Proceedingsof theIEEE/ACM MSWiM, October2005.
28

A Meta-Index to Integrate Specific Indexes:Application to Multimedia∗
Ilaria Bartolini†, Paolo CiacciaDEIS - University of Bologna, Italy{ibartolini, pciaccia}@deis.unibo.it
Lei Chen ‡
Hong Kong University of Science and Technology, [email protected]
Vincent OriaNew Jersey Institute of Technology, USA
Abstract
Although applications such as news, e-learning, e-commerce require multimedia data of different types to co-exist, data for each media type are often managed sepa-rately because technically they do not have much in com-mon. The common approach for providing the user withan integrated multimedia database is to build an applica-tion layer that presents a unified interface and deals withthe right mono-medium sub-system depending on the userrequest. The problem is that this approach does not fully in-tegrate the underlying systems. Another solution is to pushthe integration into the query processor. This second ap-proach necessitates to have access to the query processorwhich is not always possible especially if the multimediasystem is using a commercial DBMS underneath. In thispaper, we propose a meta-index that hosts different specificindexes and integrates the sub-query results to be returnedto the user.
1. Introduction
Database Management Systems (DBMS) offer somefunctionalities (transaction management, declarative querylanguages, recovery, etc.) that are necessary for novel ap-plications (e.g., multimedia and bio-informatics). Althoughcurrent DBMSs offer solutions to store and manage thecomplex data that the novel applications manipulate, theycannot be used effectively for such applications. Eventhough more suitable indexes exist for the speci c appli-cation, current DBMSs do not allow speci c indexes to be
∗This work is partially supported by the WISDOM MIUR Project†Part of the work was performed when the author was visiting NJIT‡Work performed when the author was af liated with NJIT
“plugged-in”. The reason is that indexes are to be used bythe query processor as access methods and a new index can-not be used if the query processor is not aware of its exis-tence. Most of the time, the query processor is not accessi-ble to the users. This also means that a new index will notbe recognized and used by the query processor.
For classical data, the B+-tree has been widely acceptedas the index structure and offered by Relational DBMSs.Such a standard does not exist for multidimensional data asmultidimensional indexes are very specialized [9]. For ex-ample, range queries work better with an index of the R-treefamily [10], whereas similarity search applications performbetter with an index structure such as the SS-tree [15], theSR-tree [11] or the M-tree [6]. Further, different multidi-mensional indexes can be used for the same application.The endless increasing number of multidimensional indexstructures leave a lot of choices but pushes the choice of theindex to the application designer.
In this paper we propose a meta-index that allows (1)a database system to integrate any user-de ned index and(2) an application developer to pick the appropriate indexesfor his/her applications. We de ne the operators needed atthe meta-index level to perform the integration of partial re-sults based on partial orders. Then we show how the meta-index can be used together with a uni ed semantic index tocreate a full multimedia database system. The rest of thepaper is organized as follows: Section 2 depicts the meta-index, Section 3 presents the semantic model for media ob-ject annotation, Section 4 presents the experimental resultsand Section 5 concludes.
2. The Meta-Index
We propose the meta-index as an interface between thequery processor and the indexes (see Figure 1). The idea isto have the meta-index implemented in a database system
29

in order to facilitate the integration of new indexes into thesystem. The meta-index is viewed by the query processor asa single index that is responsible of certain types of queries.As such, the meta-index has to be in charge of some of the
Meta-Index
Query Processor
DB1
IND1
DB2 DB3
IND2 IND3
Meta-Index
Query Processor
DB1
IND1
DB2 DB3
IND2 IND3IND3
Figure 1. Query Processor, Meta-Index andIndexes
tasks typically devoted to the query processor: Decomposequeries it receives into sub-queries to be sent to individualindexes; integrate the sub-query results received from indi-vidual indexes.
For the meta-index, an index refers to a piece of softwarethat provides sorted access and/or random access to somedata as result of a query. In that sense, for the meta-index anindex can range from a regular index to a speci c databasesystem.
2.1. Query Decomposition
The meta-index input is a well-formed query in disjunc-tive normal form, Q = Q1 ∨ . . .∨Qn, where Qi is a mono-answer space query. We say that a query Qi = Q1
i ∧. . .∧Qki
is a mono-answer space query if each sub-query Qji is a
mono-index query (i.e., results are obtained from a singleindex) that expresses parts of the conditions of a query (Qi)in conjunctive normal form. By well-formed we refer to theclassical correctness rules for queries: A query has a singlefree variable (a query returns one type of objects as results)and all the variables are range-restricted. For example, thequery “ nd images similar in color and texture to a givenimage” is a mono-answer space query and each sub-query(on color and texture, respectively) is a mono-index queryassuming that the features are indexed separately. The in-tegration producing the nal result is performed within asingle answer space. The term answer space comes fromof a graphical interpretation of sub-result integration whereeach sub-query result is represented by an axis in a vectorspace.
When the meta-index receives a query Q from thequery processor, the idea is to decompose this query into{Q1, . . . , Qn} so that each sub-query Qi could be answeredthrough one answer space. That means that each of the cor-responding sub-queries Qk
i uses one or more predicates de- ned on the same objects. Hence the decomposition con-
sists in: Grouping sub-queries with conditions that involvepredicates on the same index; decomposing sub-querieswith complex conditions that involve predicates on differentindexes into smaller sub-queries with conditions on singleindexes.
2.2. The Meta-Index as an Interface
Normally, any index can be added to the meta-index bythe application developer. When an index is plugged intothe meta-index, the application developer should also spec-ify the types of queries the index should be in charge of.Basically, the query processor needs to be noti ed on thetype of queries that should be passed to the meta-index andthe meta-index should know the type of queries to be passedto each index.
Since the queries are in disjunctive normal form, themeta-index needs to know the type of atomic formulas tobe sent to individual indexes. Indexes are used as accessmethods to select a subset of a set (table in the relationalworld) that satisfy a certain condition de ned on at leastone of the features of the objects. The conditions are de- ned using some predicates (i.e. =, <,> in relational).These conditions are used to de ne atomic formulas: Forexample, t.A = constant, t.A = s.B, t.A < s.B areatomic formulas on attributes A and B of tuples t ∈ R ands ∈ S. If there is an index INDi de ned on the attributeA of R that works for the predicates <,>,=, then atomicformulas of the form t.A < constant, t.A > constantand t.A = contant should be sent to INDi for t ∈ R.So when parsing a query, the meta-index should look fort ∈ R and at least one of the following atomic formulas:t.A < constant, t.A > constant and t.A = constant inorder to determine if part of the query should be sent to theindex INDi.
When the meta-index gets the lists of atomic formulasthat each index is in charge of, it compiles a complete listof atomic formulas that it can handle and noti es the queryprocessor. The meta-index is between the query processorand the indexes. It is responsible for decomposing queriesreceived into mono-index sub-queries, integrating the sub-query results received and sending the result back to thequery processor.
2.3. Operators for Sub-Query Result Inte-gration
For the meta index we de ne three operators: The joinwith order, the difference with order and the union withorder as extensions respectively of the join, the differenceand the union relational operators. These operators are de- ned in terms of partial orders because we have to be ableto reason about the queries and their results at the meta-
30

index level without knowing the metric used to de ne them.As in relational databases, the conjunctive connectives aremapped to joins with order, a negation is a difference withorder and a disjunctive connective is a union with order.
2.3.1 Join with Order
The result of a query posed against an index is a collec-tion R of objects (e.g., “list images taken by Ilaria”) or aranked list (e.g., “list images similar to the query image”).Although ranked lists are usually based on a metric, for thesake of generality we represent a ranked list as a collectionR of objects with a partial order ≺, i.e., [R,≺], since totalorders are particular cases of partial orders. Note that [R,≺]actually is a graph, where nodes are elements of R and anarc (x, y), with x, y ∈ R, means that “x is better than y”.
Complex queries can involve the integration of the re-sults of two ranked lists from different indexes. For ex-ample, “images similar to a query image on texture and oncolor”, assuming that colors and textures are indexed sepa-rately. The cases where the integration is about unorderedcollections is similar to the relational case. The novelty isintroduced by the orders and here we will focus on these.
Definition 2.1 (Join with Order) Given two collections Rand S of objects of the same type, the condition of the par-tial order join is that the objects in both sets be identicaland the join with order between two collections R and S,R ��≺ S, is defined as follows:
Case 1: R and S are sets: R ��≺ S = R �� S = R ∩ S(recall that the join condition is that the objects are identi-cal).
Case 2: One of the collections (let us say R with thepartial order ≺r) is a ranked list: R ��≺ S = [R,≺r] ∩S = [R ∩ S,≺], where for x ∈ R − S and y ∈ R, ≺=≺r
−{(x, y), (y, x)}.Case 3: Both R and S are ranked lists ([R,≺r], [S,≺s]):
R ��≺ S = [R,≺r] ��≺ [S,≺s] = [R ∪ S,≺], where ≺defines a global partial order among the objects in R and S(see discussion).
We will discuss only Cases 2 and 3 as Case 1 is identicalto the join in the relational model. An example of query ofCase 2 is Q: “list images taken by Ilaria that look like theimage i”. Given a collection S of images taken by Ilariaand a ranked list [R,≺r] of images similar to image i, theaim is to select the objects of R that also belong to S andde ne a new partial order on the qualifying objects. Thisis derived from ≺ by simply removing from it all the pairs(x, y) where x is not part of the result, x ∈ R − S (i.e., allimages not taken by Ilaria).
Given at least 2 sub-query results with partial orders, theidea in Case 3 is to compute a set with only one partial order.Each sub-query deals with one index and the nal result is
computed starting from sub-query partial results. The ques-tion is which order to use for the nal result. We discuss thesolutions in Section 2.4.
The model of queries we consider includes the standardone, where the user is interested in obtaining the top-k re-sults, the major difference being, of course, the criterionaccording to which objects are ranked. To this end, we relyon the well-de ned semantics of the Best [14] and Winnow[5] operators, recently proposed in the context of relationalDBs. The Best operator, Best(R), returns all the objects oin R such that there is no object in R better than o accordingto ≺. Ranking can be easily obtained by recursively apply-ing the Best operator to the remaining objects (i.e., thosenot in R − Best(R), and so on). This leads to a layeredview of the search space where all the objects in one layerare “indifferent”.
2.3.2 Difference with Order
This is equivalent to integrating the results of sub-querieswith negation.
Definition 2.2 (Difference with Order) Given two collec-tions R and S of objects of the same type, the differencewith order between two collections R and S, R −≺ S, isdefined as follows:
Case 1: R and S are sets: R −≺ S = R − S.Case 2 (a): R is a set and S is a ranked list [S,≺s]:
R −≺ [S,≺s] = R − S.Case 2 (b): R is a ranked list [R,≺r] and S is a set:
[R,≺r]−S = [R−S,≺] where for x ∈ R∩S and y ∈ R,≺=≺r −{(x, y), (y, x)}.
Case 3: Both R and S are ranked lists ([R,≺r], [S,≺s]).Since the difference of two partial orders is not a partialorder anymore (the transitivity property of partial orderscannot be guaranteed), this case is not considered.
Let us consider the following two queries to illustrate thede nition: Q1: “list images taken by Ilaria that do not looklike the image i” and Q2: “list images that look like theimage i that are not taken by Ilaria”. Again let us assumethat S is the collection of images taken by Ilaria and [R,≺r]the ranked list of images that are similar to the image i.Query Q1 corresponds to Case 2 (a), where the result shouldbe a set of image taken by Ilaria, that is, S−R, thus ignoringthe partial order associated to R. This makes sense if Rcontains a top-k-like answer where not all the objects in thedatabase are in the result, otherwise the result of the querywill always be empty. Query Q2 corresponds to Case 2 (b),where the result should consist of images of R that do notbelong to S, with a new partial order that involves only theobjects that are in R but not in S. This is obtained from ≺by removing from it all the pairs (x, y) where x ∈ R ∩ S(i.e., images taken by Ilaria).
31

2.3.3 Union with Order
Definition 2.3 (Union with Order) Given two collectionsR and S of objects of the same type, the union with orderbetween two collections R and S R ∪≺ S is defined as fol-lows:
Case 1: R and S are sets: R ∪≺ S = R ∪ S.Case 2: R is a set and S is a ranked list [S,≺s]: R ∪≺
[S,≺s] = [R ∪ S,≺s].Case 3: Both R and S are ranked lists ([R,≺r] and
[S,≺s]). Again, taking the union of two partial orders donot yield a partial order. For this reason the union is notperformed, but the two ranked lists are returned separatelyas alternate solutions. Note that this makes sense even whensub-results have different types (e.g., text and image).
Let us brie y comment on Case 2. Since, by de nition,a partial order does not require that all the elements are or-dered, when we take the union of a set R and a ranked list[S,≺s], we can simply add the objects in R − S withouthaving to change the order of the objects in S.
2.4. Operator Implementation
The implementation of the difference with order is nottoo much different from a set difference with sorted andrandom access. We will then focus on the join with order.
Given a query divided in independent sub-queries, thegoal is to provide the user with the set of top results min-imizing the number of objects to be accessed for it. Morein details, the top-k retrieval paradigm is applied, by split-ting the initial complex query into a set of m simpler sub-queries. Each sub-query deals with only some of the querypredicates and the nal result is computed starting from sub-query partial results. A relevant example of top-k queriesare “middleware” queries [7, 8, 3, 2], where the best k ob-jects are retrieved given the (partial) descriptions providedfor such objects by m distinct data sources. In this scenario,a rst assumption is that each data source is able to return aranked list of results. More precisely, each returned objectcomes with an ID that identi es the object in the data sourceplus a score that numerically quanti es in which measurethe object matches the query on that data source (namedpartial score). By means of the getNext() method it ispossible to execute a sorted access obtaining the best nextobject together with its partial score.
With regard to the aggregation rule of partial scores,one possibility is to use a scoring function, such as the(weighted) average, the maximum and the minimum, thataggregates the m partial scores into a global similarityscore. In this case, objects are linearly ordered and only thehighest scored ones returned to the user. A more generalsolution, that contains the scoring function-based approachas special case, consists in adopting qualitative preferences
(e.g., Skyline [1] and Region-prioritized Skyline [14]) ableto de ne arbitrary partial orders on the objects. Moreover,with qualitative preferences a more e xible comparison cri-teria able to take into account all the partial scores is pos-sible. The only requirement of this aggregation modalityis thus to de ne a binary preference relation able to assertwhen an object is “better” than another one.
Although each of the above integration solutions couldbe applied to implement our operators, in this work weadopted the iMPO [2] algorithm. The aim of this paper,in fact, is to nd a minimum common denominator to theinvolved indexes, with or without ranking, and to proposean algebra to integrate their results, independently from thespeci c integration choice; the only requirement being thatit just t our framework.
iMPO is based on a partial order approach which meansthat the meta-index can integrate the results of the indexeswithout having to know the metrics they are using. In par-ticular, for the computation of the top-k results we rely onthe BestTop [2] operator that combines the semantics of theBest and top-k operators. BestTop recursively applies Bestto the objects by computing the rst l layers containing thetop-k results.
3. The Meta-Index for Multimedia
Although users want to be able to manipulate in the sameapplication any type of medium and multimedia data (e.g.,images, audio, documents and video), data of different me-dia types are totally different: They have different represen-tation schemes, different features, different possible queriesand they need different tools to render the data. The MPEG-7 standard [4] gives an exhaustive description of the featuresfor each media type. But different media objects can sharethe same semantics and a semantic index common to all themedia type can help integrate the different media types andbuild a full multimedia application. Figure 2 depicts thefunctional architecture of the meta-index for a multimediaapplication in which the semantic index plays a central role.Although the semantic index is put at the same level as the
META-INDEX
DB1
IND1
DB2 DB3
IND2 IND3SIND
META-INDEX
DB1
IND1IND1
DB2 DB3
IND2 IND3IND3SIND
Figure 2. Semantic Integration of MultimediaData with the Meta-Index
other indexes, it references object in the other indexes.
32

To that end, we propose a simple multimedia type sys-tem that follows the common multimedia system organiza-tion where each media type is handled by a specialized sub-system. As also shown in Figure 3, the type system shouldbe rooted with multimedia as the root type. The rooted typesystem is important as it allows the semantic index to referto only one type of objects (e.g., multimedia). The multi-media type de nes two types of features, synthetic metadata(low-level features extracted from raw multimedia data) andsemantic information (salient objects). In Figure 2, SINDis the semantic index shared by all the media types, IND1can be an index on image visual features, IND2 can be anindex on video, and IND3 an index on text. The genericmedia type with synthetic and semantic information is theminimum required as the integration is based on the com-mon semantics. The goal is not to discuss how to obtain thesemantic information but how to use this information in ameta-index to glue data from different media types.
3.1. Media Content Description Model
The description of media objects mainly obeys two struc-tures. The rst one is the media class hierarchy and the sec-ond one is the media object aggregation hierarchy:
Media Class Hierarchy: The media class structure hi-erarchy is based on the “IS-A” relationship and de nes theproperties for each class. We distinguish the media class hi-erarchy used to group related media objects and the mediacontent hierarchy that de nes the descriptors for each me-dia class. Note that the two hierarchies can be combined sothat every media object comes with its content descriptors.
Media Object Aggregation Hierarchy: Every mediaobject has an inherent structure. For example, the commonhierarchy admitted for a video is: A video is composed ofscenes, scenes are composed of shots, shots are composedof key frames (images). On the other hand, the structure ofan XML document is given by a DTD or a XML schema.
The media class hierarchy de nes the necessary descrip-tors for each media object depending of its class. It is ap-plication dependent so has to be provided when the applica-tion is being developed. We capture the user-de ned mediaclass hierarchy by attaching it to the right super-class in ourpre-de ned rooted type system as shown in Figure 3. The
Image Class Hierarchy
Multimedia
Image
Video
Audio
Document
Video Class Hierarchy
Audio Class Hierarchy
Document Class
Figure 3. The Multimedia Type System
media object aggregation hierarchy de nes different granu-
larity levels for each media object. These granularity levelsare important in the content description of the media object.The media class hierarchy and the media object aggregationhierarchy form the media object metadata scheme and canbe de ned using an object-relational model or MPEG-7.
3.2. Media Object Tree
Given a media object metadata scheme and a media ob-ject, we can construct the media object tree that re ects thecomposition of the media object and records the descrip-tors. Figure 4, for example, gives a media tree of a videocomposed of 2 scenes, 5 shots, and 7 key frames.
v1
sc1 sc2
Video
Scenes
sh3 sh4sh1 sh2 sh5Shots
kf1KeyFrames kf2 kf3 kf4 kf5 kf7kf6
v1
sc1 sc2
Video
Scenes
sh3 sh4sh1 sh2 sh5Shots
kf1KeyFrames kf2 kf3 kf4 kf5 kf7kf6
Figure 4. The Media Tree of a Video
The media object trees are media objects together withdescriptors. They can be stored as MPEG-7 documents andqueried using an XML query language like XQL [16]. Thequery processing will be more effective with an index. Weused the MBM indexing method [12] that extends the BUS[13] method to index the media object trees. Each elementof the media object is assigned a Unique element IDenti er(UID) using a left-to-right, top-to-bottom traversal that canbe used to calculate the parent UID. The BUS also intro-duced the concept of the General element Identi er (GID)by extending the UID concept to include (1) DocumentNumber, (2) the UID of the element, (3) the level of theelement in the tree and (4) the element type number. Thecentral concept of the BUS method that the MBM methodinherited is that indexing information (the GID, term fre-quency, etc.) are maintained only for the leaf nodes of themedia tree (e.g. keyframe for a video). We extended theGID to include the media type number (1:image, 2:video,3:audio, and 4:document) stored using 2 bits. The mediatype information helps select the GID of a given media typeas all the media types share the same semantic index.
4. Experiments
In the experimental section we design several scenariosto show how the meta-index interacts with the query proces-sor and quantify, by means of a set of preliminary results,the improvement obtained by using the meta-index in term
33

of both effectiveness and ef cienc y. All programs are writ-ten in Java programming language (J2SE, v. 1.5) and ex-periments are run on a Sun-Blade-1000 workstation underSolaris 2.8 with 1GB of memory. Results are obtained on asimple database which extracts video clips and key framesfrom two movies1. In details, the dataset contains 20 videoclips, 230 key frames (images) extracted from the videoclips, and 23 salient objects (for semantic queries). Fromeach image, we extracted a 32-bins color histogram repre-sented in the HSV color space and a 60-bin texture vectorusing Gabor lters. To compare both color and texturefeature vectors we used the Euclidean distance.
The most typical queries that we want to test are mono-type (Q1) and mixed-type media (Q2) queries de ned asfollowing:
Q1: {i: Image | i ∈ Images, ∃A ∈ Objects, ∃B ∈Objects, i contains A ∧ i contains B ∧ i.color similarquery.color ∧ i.texture similar query.texture ∧ A besidesB};
Q2: {i: MM | i ∈ Images ∨ i ∈ KFs ∃ A ∈ Objects,∃ B ∈ Objects, i contains A∧ i contains B ∧ i.color simi-lar query.color ∧ i.texture similar query.texture ∧ A besidesB}.
In these formulas, contains, similar and besides are pred-icates, MM is a root type for multimedia, Images is a set ofimages, KFs is a set of key frames in videos and Objects isa set of salient objects. Finally, query is the example queryimage.
To deal with this type of queries, we implemented thejoin with order operator (see Section 2.3.1). In particu-lar, we applied join with order (Case 3), for the integra-tion of low-level features results, whereas for the integra-tion with salient objects-based results we adopted join withorder (Case 2). We indexed both feature vectors for colorand texture using an index structure for high-dimensionalnearest neighbor queries (i.e., the M-tree [6]), whereas forsalient objects we adopted MBM [12].
All results we present are averaged over a sample of 50randomly-chosen query images containig two salient ob-jects.
We test the ef cac y of meta-index using mono-type (Q1)and mixed-type media (Q2) queries. To measure the effec-tiveness of our solution we consider the classical precisionmetric, i.e., the percentage of relevant images found by aquery (in our experiments we set k = 20), averaged overthe query workload.
For each query Q1 the meta-index rst decomposesthe query into mono-type sub-queries and makes a searchamong registered indexes. Then, each mono-type sub-queryis sent to the corresponding registered indexes, i.e., the colorindex, the texture index, and the salient object index. Re-sults returned from low level image feature indexes (e.g.,
1“Gladiator”, 2000 and “Life is Beautiful”, 2000.
color and texture) are integrated by the meta-index usingiMPO algorithm [2] (this correspond to Case 3). The set ofimages returned by salient-object index are combined withcolor-texture integrated results by taking their intersection(Case 2). As for queries Q2, the meta-index preforms simi-lar steps. This depends on the fact that a query Q2 is com-posed by several queries Q1. Further, in this case, in addi-tion to images, video clips where images are extracted fromare also returned.
We compared precision results obtained when the meta-index was switched on with those obtained without meta-index. We start by showing a visual example (depicted inFigure 5), where the top 3 results for the same query (theimage on the left most column) are depicted when using asingle index on color (a), a single index on texture (b), andthe meta-index (c).
(a) color index results
(b) texture index results
(c) meta-index results
Figure 5. Visual Results using Color Index (a),Texture Index (b) and Meta-Index (c)
By Figure 5, we can nd out that with the meta-index,we can achieve more effective results: Images in (c) aremuch closer to the query in terms of both low level fea-tures and semantics than those obtained only using singleindexes. The reason being that the meta-index gets the bestfrom low-level features results (i.e., color and texture) andsemantic results (i.e., salient objects).
The trend in visual example is generalized by Figure 6(a), where averaged precision values for the query work-load are reported. In particular, we use the term No-Meta-Index to refer to the average precision obtained using sin-gle indexes, whereas with Meta-Index results obtained bythe meta-index. As we can observe from the graph, Meta-Index outperforms No-Meta-Index for all value of k witha nal average improvement of 19.44% (for k = 15) and15% (for k = 20), respectively.
We report the ef cienc y test of using meta-index in an-swering queries. As for the measure, we consider the run-ning time needed to answer a query based on low-level fea-tures (i.e., color and texture) and salient objects with re-
34

0
0.2
0.4
0.6
0.8
1
1.2
0 5 10 15 20
K
P
Meta-Index
No-Meta-Index
(a)
0
20
40
60
80
100
120
140
160
0 5 10 15 20
K
tota
l ti
me
(se
c)
Meta-Index
Query-Processor
(b)
Figure 6. Precision for Meta-Index and No-Meta-Index vs Number of Retrieved Imagesk (a) and Running Time Comparison UsingMeta-Index and Query Processor (b)
spect to the number of retrieved object k (in our experi-ments we vary k between 1 and 20), averaged over the ran-domly picked up queries. For this experiment, we onlyuse mono-type queries (Q1). As shown in the previoussection, queries Q1 are the bases for mixed-type mediaqueries Q2. In particular, we assume that not all queryfeatures have supporting indexes (i.e., indexes for texturesdo not exist). Under this assumption, given a query Q1,the query processor decomposes it into a set of mono-typesub-queries and keeps the sub-queries whose speci ed fea-tures do not have supporting indexes (the query processorcan not nd the registered index in the interface to matchthe sub-query) and sends sub-queries with supporting in-dexes to the meta-index. Results returned from the indexesand the query processor are then integrated by the queryprocessor. Performance is compared between queries us-ing the meta-index and the query processor only. For thequeries answered by the meta-index, the execution time canbe saved by integrating the results returned by the indexes rst, once the results from the query processor are returned,the nal results can be intergraded. For the queries that areanswered by the query processor directly, the results canonly be integrated when all results are returned.
Figure 6 (b) shows average running time results. In par-ticular, we observe how Meta-Index, by using indexes onsalient objects (MBM) and low level features (M-tree), isable to achieve better performance than Query-Processorwith a nal overage improvement of 94.47%. This dependson the correct selection of indexes and the early integrationof ranked lists alloweb by the meta-index.
5. Conclusions
In this paper we have proposed a meta-index to integratespeci c indexes in a multimedia DBMS. We have de nedthree operators for performing integration of ranked lists,namely, join with order, difference with order and union
with order. These operators are de ned in terms of partialorders, which allows an integration of sub-results withoutknowing the speci c metrics used by the underlying indexesto order them. The experimental results con rm the ef cac yand ef cienc y of the meta-index in answering top-k queries.
References
[1] S. Borzsonyi, D. Kossmann, and K. Stocker. The skyline operator.In Proc. of the 17th International Conference on Data Engineering(ICDE’01), 2001.
[2] I. Bartolini, P.Ciaccia, V. Oria, and M. T. Ozsu. Flexible integrationof multimedia sub-queries with qualitative preferences. MultimediaTools and Applications, 2006. To appear.
[3] N. Bruno, L. Gravano, and A. Marian. Evaluating top-k queries overweb-accessible databases. In Proc. of the 18th International Confer-ence on Data Engineering (ICDE’02), 2002.
[4] S.-F. Chang, T. Sikora, and A. Puri. Overview of the MPEG-7 stan-dard. IEEE Transactions on Circuit and Systems for Video Technol-ogy, 11(6), 2001.
[5] J. Chomicki. Querying with intrinsic preferences. In Proc. of the6th International Conference on Extending Database Technology(EDBT02), 2002.
[6] P. Ciaccia, M. Patella, and P. Zezula. M-tree: An ef cient accessmethod for similarity search in metric spaces. In Proc. of the 23rd In-ternational Conference on Very Large Data Bases (VLDB’97), 1997.
[7] R .Fagin. Combining fuzzy information from multiple systems. InProc. of the 15th ACM SIGACT-SIGMOD-SIGART Symposium onPrinciples of Database Systems, 1996.
[8] R. Fagin, A. Lotem, and M. Naor. Optimal aggregation algorithmsfor middleware. In Proc. of the 20th ACM SIGACT-SIGMOD-SIGART Symposium on Principles of Database Systems, 2001.
[9] V. Gaede and O. Gunther. Multidimensional access methods. ACMComputing Surveys, 30(2), 1998.
[10] A. Guttman. R-trees: A dynamic index structure for spatial search-ing. In Proc. of the ACM International Conference on Managementof Data, 1984.
[11] N. Katayama and S. Satoh. The SR-tree: An index structure for highdimensional nearest neighbor queries. In Proc. of ACM SIGMODInternational Conference on Management of Data, 1997.
[12] V. Oria, A. Shah, and S. Sowell. Indexing XML documents: Improv-ing the BUS method. In Proc. of 7th Intl Workshop on MultimediaInformation Systems (MIS’01), 2001.
[13] D. Shin, H. Jang, and H. Jin. BUS: An effective indexing and re-trieval scheme in structured documents. In Proc. of the InternationalConference on Digital Library (DL’98), 1998.
[14] R. Torlone and P. Ciaccia. Finding the best when it’s a matter ofpreference. In Proc of Workshop on Recommendation and Personal-ization in eCommerce (AH’02), 2002.
[15] D. A. White and R. Jain. Similarity indexing with the SS-tree. InProc. of the 12th International Conference on Data Engineering(ICDE’96), 1996.
[16] R. K. Wong. The extended XQL for querying and updating largeXML databases. In Proc. of the 2001 ACM Symposium on DocumentEngineering, 2001.
35

MULTIPLE SPATIAL OBJECTS INSERTION IN R-TREES
Jeang-Kuo Chen*, Jen-Wei Huang Department of Information Management, Choayang University of Technology
[email protected], [email protected]
ABSTRACT
Spatial databases have been more and more important in many applications such as Geographical Information System (GIS), Computer Aided Design (CAD), etc. The R-tree supports a dynamic index structure for efficiently retrieving objects. In the past, several papers discussed the access of individual object in R-tree, but rare mention how to access several objects simultaneously. In this paper, we propose a new operation, call spatial-insert, for R-tree. The function of this spatial-insert is to combine one group of objects into another group of objects while the two groups of objects have a special relationship and they belong to two different databases. That is, more than one spatial objects in one database are inserted into another database at once, and the corresponding R-tree of the inserted database is reconstructed due to the insertion of spatial objects. When many single-object insertions are replaced by a single multiple-objects insertion, many unnecessary node-splits or MBR-adjustments can be omitted to save a lot of time. When a node overflows due to the insertion of many objects, our method is once to generate enough nodes to contain all the objects inserted into the node. Each node does at most one node-split and/or MBR-adjustment if overflow and/or MBR-adjustment occur. The proposed spatial-insert operation can significantly reduce the number of node-splits and MBR-adjustments to improve the performance of database. Keywords: Spatial-join, R-tree, Access method.
1. INTRODUCTION
Spatial databases have been more and more important in many applications such as Geographical Information System (GIS), Computer Aided Design (CAD), etc. Many dynamic indexes of spatial objects have been proposed for speeding up the object search. In general, multi-dimensional data can be classified into two types: zero-size objects and non-zero-size objects. The K-D-B tree [[11], proposed by Robinson, and the G-tree [8], proposed by Kumar, are indexing structures for zero-size objects. The Grid files [[9], proposed by Nievergelt et al., and the Filter tree [[14], proposed by Sevcik and koudas, are indexing structures for non-zero-size objects. A detailed survey on spatial objects access methods can be found in ”Multidimensional access methods” [3] where is the R-tree family the most popular one [1,2,4,5,6,7,12,13] In the past, the R-tree was used to improve the access speed [2,4], to reduce dead space [13,14], and to improve
storage utilization [1,7]. No paper mentioned how to access several objects simultaneously. In general, the R-tree inserts an object at a time. However, we may need to insert several objects from a database B into another database A. If each insertion includes only one object, we should need much time to finish the job. The database performance will be influenced obviously because the corresponding R-tree of database A also needs to be reconstructed again and again. Suppose that there is a relationship, such as overlap, between the objects of databases A and B. Sometimes, some objects in database B must be inserted into database A because of the overlap relationship. For example, database A stores the data of community while database B stores the data of park. If a part has to be combined to a community which overlaps the park, then some objects in database B must be taken out to insert into database A. The traditional operation is to take out park objects from database B and then to inserts into database A one bye one. It should take much time to execute the operation of taking out and inserting object repeatedly. Especially, node-split or MBR-adjustment may happen again and again in the R-tree for database A. To speed up the job, we propose a new operation, called spatial-insert, for R-tree. The proposed operation can efficiently find and insert the related objects from database B into database A at a time. The corresponding R-tree of the database A is reconstructed due to the insertion of spatial objects. Each node in the R-tree will have only one node-split or MBR-adjustment if overflow or MBR-adjustment occurs.
2. Previous Work 2.1. R-tree
An R-tree is a height-balanced tree similar to a B-tree with index records in the leaf nodes containing pointers to data objects. It does adapt for the efficient access of spatial data. The B-tree stores one-dimensional data of character or number, while the R-tree keeps two (or more) -dimensional data of spatial objects. There is no order relationship between R-tree nodes. Each node is composed of several entries. Each entry includes a minimal bound rectangle (MBR) and a pointer. The format of an entry in a leaf node is (I obj-id). The I is the MBR and obj-id is a pointer to address the spatial object in database. The format of an entry in a non-leaf node is (I child-pointer). The I covers all rectangles in the lower node’s entries and child-pointer is the address of a lower node in the R-tree. We assume M be the maximum number of entries in one node and m be a parameter specifying the minimum number of entries in a
36

node. An R-tree satisfies the following properties. The root has at least two children unless it is also a leaf node. Each non-root node has between m and M children. All leaves appear on the same level.
2.2. Spatial Join
Spatial join operation was proposed in the past as many kinds of the method such as spatial-merge join [10]. Brinkhoff et.al. [2] proposed five methods to perform spatial join for R-tree. It used the depth-first search to traverse all the nodes. Each node must be checked to determine whether it overlaps with other nodes. Thus, only local optimization is performed. Later, Hung [5, 6] proposed the method of Breadth-First R-tree Join (BFRJ) with the feature of global optimization which is the optimization of memory, buffer management and the order of overlap data among non-leaf nodes. BFRJ adopts breadth-first search to traverse nodes from the top of two R-trees level by level to achieve global optimization. The technique of search pruning is used to reduce the number of node-pair checking. BFRJ uses several tables, called intermediate join indexes (IJI), to save pairs of overlapping nodes. Each entry in an IJI includes two fields to record two overlapping nodes belonging to different R-trees.
3. Spatial-Insert Operation
In this section, we purpose of spatial-insert operation to describe how to process some objects in one R-tree can be inserted into another R-tree at the same time. Assume that there are two groups of compatible spatial objects associated with two R-trees, R and S, as shown in Figure 1 and Figure 2, respectively. Figure 3 shows the overlap condition of the two groups of spatial objects. Spatial-insert operation is composed of two phase. The first phase is using the spatial-join concept to find the objects and the relevant leaf nodes in two R-trees. The second phase is using multi-object-insert concept to take out the objects, found in first phase, from S and to insert into the relevant leaf nodes in R.
3.1. The first phase of spatial-insert
We must first find the overlapping objects that belong to R or S. With the concept of spatial-join [6], we can finish the above requirement without IJI tables. Instead, we use a queue, called Spatial Join Queue (SJQ), and a data structure, called Overlap Pair of Nodes (OPN), to save the overlap pair-nodes. SJQ is used to save OPN structure. The OPN structure is composed of four fields. The fields parentR and parentS denote a pair of overlap parent nodes that belong to two R-tree, respectively. The field childR and childS represent a pair of overlap child nodes or objects that belong to parentR and parentS, respectively. Our spatial-join concept is starting from the roots of the two R-trees, with top-down direction to check pair of nodes at each level whether they are overlap or not. If two nodes have an overlap, they are stored as an OPN record to SJQ. A table, called PATH, is used to record each
ancestor node (in each level) of each object (in R) which overlaps objects in S. These ancestor nodes can be referenced when node-split and/or MBR-adjustment propagate upward. Each row, called branch, in PATH is composed of two fields. The filed nodeP denotes a certain node of R which overlaps a certain node N in S. The field nodeC denotes a certain child node or object of N. The process of fetching an OPN record, examining overlap nodes, producing new OPN records, and storing OPN records to SJQ is repeated until all related nodes of two R-trees are checked. Figure 4 shows the results of SJQ and PATH after the first phase.
3.2. The second phase of spatial-insert
After node-pair checking of two R-trees, the SJQ would store the OPN records which had overlapped nodes and objects. However, some of these OPN records are invalid because of the following two cases. First, the same object may overlap the objects in different leaf nodes at the same time. The same object may be repeatedly inserted into different leaf nodes. Second, the same object may overlap different objects in the same leaf node at the same time. The same object may be repeatedly inserted into the same leaf node. Therefore, these invalid OPN records in SJQ must be erased.
3.2.1. Deletion of invalid OPN records in SJQ
To erase the invalid OPN records in case 1, only one of the different leaf nodes must be reserved. The reserved leaf node is the one that contains an object which has the largest overlap area with the combined object. Resolve ties by choosing the one with fewer entries. The remaining OPN records in case 1 must be deleted after the reserved leaf node is determined. For example, object s9 overlaps object r11 in leaf node R4 and object r17 in leaf node R6, respectively, as shown in Figure 4. We must decide that s9 should be inserted into R4 or R6. Since the overlap area of objects r17 and s9 is larger than that of objects r11 and s9, as shows in Figure 3. In SJQ, the 11th OPN record is retained while the 1st OPN record is deleted. To erase the invalid OPN records in case 2, all the records, except one, must be deleted if these records have the same values of parentR and childS. For example, the 2-4 OPN records in Figure 4 indicate that object s4 will be inserted into leaf node R7 three times. Thus, only one OPN record is kept, others must be deleted. The same way is also applied to records 5-7, records 8 and 12. The final result of SJQ is show in Figure 5.
3.2.2. Preparing enough leaf nodes to contain objects
It is possible to insert a lot of objects into one leaf node for the spatial-insert operation. The leaf node may split many times if many objects are inserted one by one. The more number of node-split, the less the performance of R-tree. To erase redundant node-splits, we prepare enough extra leaf nodes to contain the inserted objects at the same time. The number of prepared leaf nodes can be
37

computed as follows. Suppose the maximum number of entries of a leaf node N in R-tree R is MR, the possession of entries is MRC, and the number of objects to be inserted into N is MSC. There are two conditions can be considered. First, if SCRCR MMM , all the MSC can be inserted into N directly. No extra leaf node is needed. Second, if
SCRCR MMM , one or more extra leaf node is needed. Otherwise, more than two extra leaf nodes are regained. The number of enough leaf nodes is X= RSCRC MMM )( . According to the node-split technique [4], the MRC+MSC objects must be divided into X groups to distribute to the X leaf nodes, respectively. These X leaf nodes later should be inserted into the parent node P of N upward. If P also overflows, the same idea is applied to P until P or one of P’s ancestor does not overflow.
3.2.3. Multi-objects-insertion
The multi-objects insertion is described as follows. First step, we take out several OPN records with the same parentR value Ri from SJQ. The objects identified by the childS values of these OPN records are inserted into the leaf node identified by Ri. Similar processes of inserting several objects into a leaf node each time are repeated until SJQ is empty. Second step, if the leaf node overflows, then several extra leaf nodes are allocated to store these inserted objects. These extra leaf nodes later are also inserted into the parent node of the original leaf node. Besides, a branch record for each extra leaf node is added to PATH. Third step, the MBR of the original leaf node must be adjusted in its parent node and the adjustment must be propagated upward. If the insertion of extra leaf nodes makes the parent node of the original leaf node overflow, the node-split action also needs to propagate upward. If node-split propagation makes the root split, create a new node as the root. Figure 6 shows the final R-tree R after the insertion of the objects in R-tree S.
4. Conclusions
In the tradition, the data access operations of R-tree include search, insert, delete, and update, aim at a single object. In real applications, the user may need to process large number of objects together. It is necessary to develop special operate to process several objects at the same time. Therefore, we propose the spatial-insert operation to combine two groups of objects together. The spatial-insert has some characteristics. The OPN structure can be extended dynamically to keep information for user’s demand such as adding a field to record the overlap area value of two objects. Traditional object insertion may lead to many times of node-splits and MBR-adjustments that decreases the database performance. We solve the problem by generating enough extra leaf nodes
to contain all inserted objects once. The overflowing node has only one node-split and/or MBR-adjustment.
REFERENCE [1] N. Beckmann, H.P., Kriegel, R. Schneider, B. Seeger, “The R*-tree: An Efficient and Robust Access Method for Points and Rectangles”, Proc. ACM SIGMOD Int. Conf. on Management of Data, Atlantic City, NJ, pp.322-331, 1990. [2] T. Brinkhoff, H.P., Kriegel and B. Seeger, “Efficient processing of spatial joins using R-trees”, in: Proc. ACM SIGMOD Int. Conf. on Management of Data, pp.237-246, 1993. [3] V. Gaede and O. Gunther, “Multidimensional access methods”, ACM Computing Surveys, pp.170–231, 1997. [4] A. Guttman, “R-trees: a dynamic index structure for spatial searching”, in: Proceedings of the ACM SIGMOD, pp.47-57, 1984. [5] Y.W. Hung, N. Jing, and E.A. Rundesteiner, “Spatial Joins Using R-trees Breadth-First Traversal with Global Optimizations”, in: Proc. 23rd Int. Conf. on VLDB,pp.396-405, 1997. [6] Y.W. Hung, N. Jing and E.A. Rundesteiner, “BFRJglobal optimization of spatial joins using R-trees”, Dept. of Computer Science, Worcester Polytechnic Institute, Tech. Report WPI-CS-TR-97-5, January, 1997. [7] P.W. Huang, P.L. Lin, H.Y. Lin, “Optimizing storage utilization in R-tree dynamic index structure for spatial databases”, Journal of Systems and Software of Elsevier Science, 55(3), pp.291-299, 2001. [8] A. Kumar, “G-tree: A new data structure for organizing multidimensional data”, IEEE Trans. Knowl. Data Eng. 6(2), pp.341–347, 1994 [9] J. Nievergelt, H. Hinterberger and K.C. Sevcik, “The grid file: An adaptable, symmetric multikey file structure”, ACM Trans. Database Syst. 9(1), pp.38–71, 1984. [10] J.M. Patel, and D.J. DeWitt, “Partition Based Spatial-Merge Join”, in: Proc. ACM SIGMOD Int. Conf. on Management of Data, pp.259-270, 1996. [11] J.T. Robinson, “The K-D-B-tree: A search structure for large multidimensional dynamic indexes”, In Proceedings of the ACM SIGMOD International Conference on Management of Data, pp.10–18, 1981. [12] N. Roussopoulos, D. Leifker, “Direct spatial search on pictorial databases using packed R-trees”, In: Proceedings of the ACM SIGMOD, pp.17-31, 1985. [13] T.Sellis, N. Roussopoulos, C. Faloutsos, “The R+-Tree: A Dynamic Index for Multi-Dimensional Objects”, Proc. 13th Int. Conf. on Very Large Databases, Brighton, England, pp.507-518, 1987. [14] K. Sevcik and D N. Koudas, “Filter trees for managing spatial data over a range of size granularities”, In Proceedings of the 22th International Conference on Very Large Data Bases (Bombay), pp.16–27, 1996.
38

R1 R4
r11 R5 r13
r14
r12
R2 R7 r19r18
r20
R3 r9
r10r8
R6
r15
r16r17
R1 R4
r11 R5 r13
r14
r12
R2 R7 r19r18
r20
R3 r9
r10r8
R6
r15
r16r17
Figure 1(a) The spatial objects indexed by R-tree R.
s4
s5
s6
s7
s8
s9
s10
s11
s12
S1
S2
S3 s4
s5
s6
s7
s8
s9s9
s10
s11
s12
S1
S2
S3
Figure 2(a) The spatial objects indexed by R-tree S.
R1 R2
R3 R4 R7R6R5
r8 r9 r10 r11 r12 r13 r14 r15 r16 r18 r19 r20r17
R1 R2
R3 R4 R7R6R5
r8 r9 r10 r11 r12 r13 r14 r15 r16 r18 r19 r20r17
Figure 1(b) The structure of R-tree R.
S3S2S1
s5s4 s8s7s6 s12s11s10s9
S3S2S1
s5s4 s8s7s6 s12s11s10s9
Figure 2 (b) The structure of R-tree S.
R1 R4
r11 R5 r13
r14
r12
R2 R7 r19r18
r20
R3 r9
r10r8
R6
r15
r16r17
s4
s5
s6
s7
s8
s9
s10
s11
s12
S1
S2
S3
R1 R4
r11 R5 r13
r14
r12
R2 R7 r19r18
r20
R3 r9
r10r8
R6
r15
r16r17
s4
s5
s6
s7
s8
s9
s10
s11
s12
S1
S2
S3
Figure 3 The overlap condition of the two groups of spatial objects.
Level 1
R2Null
R1Null
nodeCnodeP
R2Null
R1Null
nodeCnodeP
PATHSJQ
Null
Null
Null
parentS
Null
Null
Null
parentR
S3R2
S1R2
S3R1
childSchildR
Null
Null
Null
parentS
Null
Null
Null
parentR
S3R2
S1R2
S3R1
childSchildR
Level 2
R1Null
R2Null
R4R1
R7R2
nodeCnodeP
R2 R6
R1Null
R2Null
R4R1
R7R2
nodeCnodeP
R2 R6
PATHSJQ
S3
S3
S3
S3
S1
S1
S3
parentS
R2
R2
R2
R2
R2
R2
R1
parentR childSchildR
s12R6
s11R6
s10R6
s9R6
s5R7
s4R7
s9R4
S3
S3
S3
S3
S1
S1
S3
parentS
R2
R2
R2
R2
R2
R2
R1
parentR childSchildR
s12R6
s11R6
s10R6
s9R6
s5R7
s4R7
s9R4
Level 3 PATHSJQ
r17R6
r16R6
r15R6
r20R7
r18R7
r12R4
r19R7
R1Null
R2Null
R4R1
R7R2
nodeCnodeP
R2 R6
r17R6
r16R6
r15R6
r20R7
r18R7
r12R4
r19R7
R1Null
R2Null
R4R1
R7R2
nodeCnodeP
R2 R6
S3
S3
S3
S3
S3
S1
S1
S1
S1
S1
S1
S3
parentS
R6
R6
R6
R6
R6
R7
R7
R7
R7
R7
R7
R4
parentR childSchildR
s10r17
s9r17
s12r16
s11r16
s10r15
s5r20
s5r19
s5r18
s4r20
s4r19
s4r18
s9r11
S3
S3
S3
S3
S3
S1
S1
S1
S1
S1
S1
S3
parentS
R6
R6
R6
R6
R6
R7
R7
R7
R7
R7
R7
R4
parentR childSchildR
s10r17
s9r17
s12r16
s11r16
s10r15
s5r20
s5r19
s5r18
s4r20
s4r19
s4r18
s9r11
Figure 4 The contents of SJQ and PATH at each level.
S3S3S3S3S1S1parentS
R6R6R6R6R7R7parentR childSchildR
s9r17s12r16s11r16s10r15s5r18s4r18
S3S3S3S3S1S1parentS
R6R6R6R6R7R7parentR childSchildR
s9r17s12r16s11r16s10r15s5r18s4r18
Figure 5 The SJQ contents after deleting 5 OPN
records.
R1 R4
r11 R5 r13
r14
r12
R7 r19r18
r20
R3 r9
r10r8
R2
r15
r16r17
s9
s10
s11
s12
R6``
R6R6`R2
r15
r16r17
s9
s10
s11
s12
R6``
R6R6`
s4
s5
R7`
R2`
R1 R2
R6
r18 s5 r20r18 s5 r20r16 r11 s12r16 r11 s12s9 r17s9 r17
R6`R6``
s10 r15s10 r15 s4 r19s4 r19
R2`
R7R7` R7R7`
Figure 6 The final result of objects insertion.
39

Multimedia Streaming Over IP with QoS and Access Control
Massimiliano Giordano, Giuseppe Polese and Genoveffa Tortora
Dipartimento di Matematica e Informatica - Universita di SalernoVia Ponte Don Melillo - 84084 Fisciano (SA) - Italy
{mgiordano,gpolese, tortora}@unisa.it
Abstract
The paper describes a system to manage the distributionof multimedia content over IP with the support of QoS andfine grained access control. It relies on visual languagesto simplify the specification of complex access control andQoS policies in distributed multimedia streaming services.QoS is based on the RSVP protocol, whereas access con-trol is provided based on the RBAC model. In particular,the system translates the visually specified policies into theXACML format, which also embeds the QoS parametersthat will be successively used in RSVP negotiations.
1. Introduction
The growing availability of broad band internet connec-tions has made it possible to provide many new challeng-ing services. Among these, multimedia streaming serviceshave been among the most appealing ones. They have raisedmany important problems and critical issues, such as com-pression, content based retrieval, real time transmission, etc.Moreover, as commercial organization have started exploit-ing the internet for distributing multimedia contents, newconcerns have been raised regarding security issues.
Traditional access control mechanisms lack in abstrac-tion, and do not provide fine grained access control. Thedefinition of fine grained privileges in multimedia applica-tions and their assignment to the end user is an extremelyappealing feature. In this paper we present the PRACSY(Path Reservation Access Control System) system support-ing access control in distributed multimedia streaming ap-plications. It is based on the RBAC model[4], and the RSVPprotocol[2]. PRACSY provides a visual front-end allowinga service administrator to use a metaphor oriented graphicallanguage to easily specify the policies through which a usercan enjoy the multimedia contents over the network, pos-sibly based on the level of service that s/he has previouslybought. Policies can specify a combination of constraints atdifferent granularity levels such as time, quality of service,
number of uses, quality of media, and many other character-istics ruling the fruition of accessible multimedia resources.The system automatically translates the visually specifiedpolicies into the XACML format[8], an XML based lan-guage to represent access policies. Other than the visuallyspecified access constraints, the generated XACML file alsoembeds the transmission channel requirements necessary toguarantee the specified QoS. Such requirements will be for-warded to an RSVP daemon to enforce the bandwidth reser-vation on the underlying network infrastructure[10].
From the user perspective, PRACSY provides a web-based client application to enforce the fruition of multi-media streaming services according to the specified poli-cies. This module is written in JSP based on the Strutsframework[3]. The latter implements the Model View Con-troller (MVC) design pattern [5], which enables the gener-ation of web applications separating the control logic fromthe business and the presentation logic. In particular, we in-tegrated our access control logic in Struts at control level,implementing a Policy Enforcement Point (PEP). This PEPintercepts user access requests, and interacts with a PolicyDecision Point (PDP) through web-services in order to de-termine whether the user has rights to access a given re-source (video/audio content), and under which conditions(Bandwith, time constraints, billing, etc).
The paper is organized as follows. Section 2 presentsrelated work, Section 3 briefly overviews the technologiesunderlying PRACSY, and Section 4 shows the system archi-tecture, detailing its components and user interfaces. Con-clusions and Future perspectives are analyzed in Section 5.
2. Related Works
RBAC-XACML specifies a profile for the use of theXACML language to meet the requirements of the RBACmodel[1, 4, 8]. This specification begins with an expla-nation of the building blocks from which the RBAC solu-tion is constructed. A full example illustrates these buildingblocks. The specification then discusses how these buildingblocks may be used to implement the various elements of
40

the RBAC model. Finally, the normative section of the spec-ification describes compliant uses of the building blocks inimplementing an RBAC solution.
A PCIM-based framework for storing and enforcingRBAC policies in distributed heterogeneous systems is pre-sented in[9]. PCIM (Policy Core Information Model) is aninformation model proposed by IETF. It defines a vendorindependent model for storing network policies that con-trol how to share network resources. PCIM is a genericcore model. Application-specific areas must be addressedby extending the policy classes and associations proposedby PCIM. In order to represent network access policiesbased on the RBAC model authors propose a PCIM ex-tension, called RBPIM (Role-Based Policy InformationModel), and an RBPIM implementation framework basedon the PDP/PEP (Policy Decision Point/Policy Enforce-ment Point).
An XML-based framework for distributing and enforc-ing RSVP access control policies for RSVP-aware appli-cation servers is proposed in[10]. Policies are representedby extending XACML. Because RSVP is a specific appli-cation domain, it is not directly supported by the XACMLstandard. The authors present an XACML extension re-quired for representing and transporting the RSVP accesscontrol policy information. In the latter work the XACML-based framework is proposed as an alternative to the formerIETF PCIM-based approach, also providing a comparisonbetween the two approaches.
A policy management system and a policy enforcementpoint integrated into the Globus Toolkit middleware is de-scribed in [7]. The system enables the specification andmodification of resource policies by administrative partiesthrough a graphical user interface, and the secure associa-tion and transport of these policies to the policy decisioncomponents.
3. Underlying Technologies
As said above, PRACSY has been built by implement-ing new visual languages upon several standard technolo-gies and frameworks, such as XACML, RSVP, MVC, andStruts. In what follows we briefly revise them in order toprovide a clear description of our architecture.
3.1. The RSVP Protocol
The Resource Reservation Protocol (RSVP) is anetwork-control protocol enabling Internet applications toachieve different quality of service (QoS) for their dataflows. Some applications require reliable delivery of data,but do not impose any stringent requirements for the time-liness of delivery. Conversely, time constraints are crucial
for many modern distributed multimedia applications, in-cluding videoconferencing and IP telephony: Data deliverymust be timely but not necessarily reliable. Thus, RSVPwas intended to provide IP networks with the capability tosupport the divergent performance requirements of differentapplication types.
In RSVP, a data flow is a sequence of datagrams that havethe same source, destination (regardless of whether that des-tination is one or more physical machines), and quality ofservice. QoS requirements are communicated through anetwork via a flow specification, which is a data structureused by internetwork hosts to request special services fromthe internetwork. A flow specification describes the level ofservice required for that data flow.
RSVP is designed to manage flows of data rather thanto make decisions for each individual datagram (Figure 1).Data flows consist of discrete sessions between specificsource and destination machines. A session is more specif-ically defined as a flow of datagrams to a particular desti-nation together with the transport layer protocol to be used.Thus, sessions are identified by the following data: destina-tion address, protocol ID, and destination port.
Sending host
RSVPTunnel
RSVP Receivers
Figure 1. In RSVP, Host Information Is Deliv-ered to Receivers over Data Flows
To initiate an RSVP session, a potential sender startssending RSVP path messages to the IP destination address.The receiver application receives a path message and startssending appropriate reservation-request messages specify-ing the desired flow descriptors using RSVP. After the reser-vation request message returns back to the sender, this startssending data packets.
Under RSVP, resources are reserved for simple datastreams (that is, unidirectional data flows). Each sender islogically distinct from a receiver, but any application canact as a sender and a receiver. Receivers are responsible forrequesting resource reservations. Figure 2 illustrates thisgeneral operational environment.
During the resource reservation setup, two local deci-sion modules evaluate an RSVP request: the ”policy con-trol module” and the ”admission control module”. The
41

Classifier Packetscheduler Classifier Packet
scheduler
Application RSVPdaemon
RoutingProtocoldaemon
RSVPdaemon
Lower-layer protocols
Upper-layer protocols
Host
RSVP
Router
RSVP
Data Data
Figure 2. The RSVP Operational EnvironmentReserves Resources for Unidirectional DataFlows
admission control module determines whether the node(host or router) has sufficient resources available for sat-isfying the QoS request. The policy control module de-termines whether the user has administrative permissionfor obtaining the reservation. The parameters for policyand admission control are not defined and controlled bythe RSVP. The protocol merely transports the parametersto the appropriate module for interpretation. According tothe RFC2205[2], the sender application must specify thetype of service that is more appropriate for its requirementsof transmission by passing the related information to theRSVP daemon in the host machine. After being invoked,the RSVP daemon inquires the local decision modules, ver-ifying resources and authorizations necessary to initiate theexchange of RSVP messages with the nearest network ele-ment in the path to the receiver.
In Pracsy we have implemented a new mechanism forconfiguring access control policies (”authorization con-trol”) and QoS reservation for RSVP-aware applicationservers. It uses a visual specification approach for XACML,i.e., the policy control is implemented only by the applica-tion server. However, in this proposal we also supply theinformation for defining the Tspec and Rspec parameterstransported in the PATH and RESV messages. Therefore,the XACML policy also provides the information used for”admission control” by the network elements along the pathbetween the transmitter and the receiver.
3.2. XACML
XACML is an XML-based language, or schema, con-ceived to create access policies, automate their usein the management of access control for generic de-vices, and support interoperability among different sys-tems and frameworks[8]. It was designed to replace exist-ing, application-specific, proprietary access-control mecha-nisms. Previously, every application vendor had to create itsown customized method for specifying access control, andthese typically could not talk to one another.
XACML specification describes both a request/responselanguage for expressing queries about whether a particularaccess should be allowed, describing the answers to thosequeries, and an access control policy language (which al-lows developers to specify who can do what and when).
In a typical XACML based scenario, in order to under-take some action on a particular resource a user submits aquery to the entity protecting the resource, named PolicyEnforcement Point (PEP). Using the XACML request lan-guage, the PEP prepares a request based on user attributessuch as action, resource, and other relevant information.The request is sent to a Policy Decision Point (PDP), whichexamines the request, and retrieves policies written in theXACML policy language that are applicable to this request.The PDP also determines if the access can be granted ac-cording to the request. That answer is returned to the PEP,which allows or denies user access. It is worth noting thatthe answer returned to the PEP is expressed in the XACMLresponse language.
3.3. Apache Struts framework
Apache Struts is an open-source framework for develop-ing J2EE web applications[3]. It uses and extends the JavaServlet API to encourage developers to adopt an MVC ar-chitecture.
This framework enables the design and implementationof large web applications to be handled by different groupsof people. In other words, page designers, component de-velopers, and other developers can handle their own part ofa project, all in tandem and in a decoupled manner. It fea-tures I18N (internationalization), a powerful custom tag li-brary, tiled displays, and form validation. It also supportsdifferent presentation layers, including JSP, XML/XSLT,JavaServer Faces (JSF), and Velocity, as well as a severalmodel layers, including JavaBeans, and EJB.
3.4. MVC Architecture
Model-view-controller (MVC) is a software architecturethat separates the application’s data model, the user inter-face, and the control logic into three distinct componentsso that modifications to one component can be made withminimal impact to the others.
In other words, constructing an application using anMVC architecture involves defining three classes of mod-ules:
Model: The domain-specific representation of the informa-tion on which the application operates. The modelis another name for the domain layer. Domain logicadds meaning to raw data (e.g. calculating if todayis the user’s birthday, or the totals, taxes and shippingcharges for shopping cart items).
42

View: Renders the model into a form suitable for interac-tion, typically a user interface element. MVC is of-ten seen in web applications, where the view is theHTML page, and the code gathering dynamic data forthe page.
Controller: Responds to events, typically user actions, andinvokes changes on the model and perhaps the view.
Although MVC comes in different flavors, control flowgenerally works as follows:
1. The user interacts with the user interface in some way(e.g., user presses a button).
2. A controller handles the input event from the user in-terface, often via a registered handler or callback;
3. The controller accesses the model, possibly updatingit in a way appropriate to the user’s action (e.g., con-troller updates user’s shopping cart).
4. A view uses the model to generate an appropriate userinterface (e.g., view produces a screen listing the shop-ping cart contents). The view gets its own data fromthe model. The model should have no direct knowl-edge of the view.
5. The user interface waits for further user interactions,which begin a new cycle.
ModelView
Controller
Figure 3. Relationship between Model, View,and Controller.
In figure 3, relationship between Model, View, and Con-troller is shown. Notice that the solid lines indicate a directassociation, whereas the dashed line indicates an indirectassociation (i.e. Observer pattern).
4. System Architecture
The system architecture is shown in Figure 4. It is com-posed of the following four autonomous components in-teroperating through the HTTP protocol and through web-services:
2
1
3
4
5 1
StreamingServer
ClientVideo StreamingWeb Application Policy
Editor (Admin Console)
PMS
PDP PolicyRepository
1
Figure 4. Overall architecture of PRACSY.
• The Streaming Server, a standard streaming server de-ploying Multimedia content.
• The Policy Management Server, a java server offeringauthorization control services, policy evaluation, andpolicies management services.
• The Visual Policy Editor, a tool enabling the user todraw policies in a visual way; policy created will betranslated in XACML format, and deployed throughthe policy management server.
• The Video Streaming WEB application, a web basedapplication, written in JSP and Struts, to give the userthe ability to stream media content.
4.1. Policy Management Server
The Policy management server consists of a PDP anda PEP. Once policies have been generated by the VPE, theyneed to be managed. To this aim an XACML scenario basedon a Policy Enforcement Point (PEP) and a Policy DecisionPoint (PDP) has been developed. PEP aims at protecting theresources from unauthorised subjects. To achieve access toa particular resource a subject has to submit a query to thePEP before undertaking any action.
The PEP software module uses the XACML language toprepare a request based on user attributes such as action, re-source, and other relevant information. This request is thensent to the PDP, which examines it and retrieves XACMLbased policies that apply to this request. Once the PDP hasdetermined whether the access can be granted, a responseis returned to the PEP, which allows or denies user access.The communication between PEP and PDP is carried outtrough the exchange of XACML messages.
Figure 5 shows the UML Deployment Diagram describ-ing the distributed software architecture used to manageXACML access polices. The Application Module nodecontains only the Generic Functionality, which represents
43

a generic software component that invokes the PEP com-ponent to access a particular software resource. In the pro-posed architecture the PEP component plays the role of agatekeeper that decides whether or not a user can access asoftware resource with the support of the PDP.
Manager PC
Application Machine
PEP
Policy Machine
Generic Functionality PDP
Policy Repository
Web Server
Web Server
User PC
Web browser
ftp Server
Web browser Visual Policy Editor
SOAP/http
Figure 5. Network Distributed Architecture.
Currently, the PEP is implemented as a servlet, whereasthe PDP as a Web Service. Thus, the communication be-tween these two software components is enabled throughthe SOAP protocol over HTTP.
4.2. Visual Policy Specification and XACML trans-lation
The visual policy editor implements the suite of visuallanguages defined in[6]. It allows the policy manger to gen-erate XACML access and control policies starting from thepolicy visual specification. The first proposed visual lan-guage is the Role Diagram (RD), which allows us definethe roles and their hierarchic relations. Then, the Permis-sion Diagram (PD) allows us to define access permissionsfor a resource and to associate them to a role.
Guest Standard user
Time Limited User
Gold User
Figure 6. Role Diagram.
The visual sentence showed in figure 6 and 7, are trans-lated in XACML code like in figure 8.
Gold User
Figure 7. Permission Diagram.
<?xml version="1.0" encoding="UTF-8"?><Policy PolicyId="PPS:Gold:role" RuleCombiningAlgId="urn:oasis:names:tc:xacml:1.0:rule- combining-algorithm:permit-overrides"> <Description>The user is enabled to streaming </Description> <Rule RuleId="AccessIfInGroup" Effect="Permit"> <Target> <Subjects> <AnySubject/> </Subjects> <Resources><Resource> <ResourceMatch MatchId="urn:oasis:names:tc:xacml:1.0:function:string-equal"> <AttributeValue DataType="http://www.w3.org/2001/XMLSchema#string"> streaming </AttributeValue> <ResourceAttributeDesignator DataType="http://www.w3.org/2001/XMLSchema#string" AttributeId="urn:oasis:names:tc:xacml:1.0:resource:resource-id"/> </ResourceMatch></Resource></Resources> <Actions><Action> <ActionMatch MatchId="urn:oasis:names:tc:xacml:1.0:function:string-equal"> <AttributeValue DataType = http://www.w3.org/2001/XMLSchema#string > streaming </AttributeValue> <ActionAttributeDesignator DataType="http://www.w3.org/2001/XMLSchema#string" AttributeId="urn:oasis:names:tc:xacml:1.0:action:action-id"/> </ActionMatch> </Action></Actions></Target></Rule> </Policy>
Policy Description
Subject
Resource
Action
Figure 8. Permission Policy in XACML.
4.3. Video Streaming WEB Application
The client interacts with a video streaming web appli-cation written in JSP and Struts. The Access control logicis embedded in the control layer of the struts framework,and it consists in a pure invocation of the web services eval-uating the user request on the PMS. Then, the applicationtranslates the user-interaction in an XACML request, andtransmits it to the PMS. In what follows, we show somescreen-shots of the PRACSY system: Figure 9 show the lo-gin page, Figure 10 show the search page, and Figure 11 thestreaming page.
Figure 9. Login Page.
44

Figure 10. Search Page.
Figure 11. Streaming Page.
5. Conclusion and Future Work
We have presented the PRACSY system enhancing mul-timedia streaming services over IP. The system exploitsvisual language technologies to reduce the complexity ofspecifying fine grained access control policies on multime-dia contents. Policies are successively implemented intothe XACML language, which would be difficult to directlymanage without our visual front end. Thus, PRACSY canbe used by a broader class of users. The target XACMLspecification also addresses QoS parameters, which will beused to start an RSVP based negotiation to perform thebandwidth reservation on the underlying network infras-tructure.
The ideas underlying the PRACSY system can be used toextend the RSPVP protocol in order to directly support pol-icy based access control mechanisms. In fact, the fruitionof multimedia services over IP is often characterized by thelevel of services that the user has bought.
We have used the PRACSY system experimentally in thecontext of video on demand applications using thin clientssuch as mobile phones and palm computers. In the futurewe plan to perform further experiments in the context oflarge distributed multimedia databases and services. More-over, we plan to perform thorough usability experiments,
and to verify the possibility to plug PRACSY as a compo-nent of multimedia DBMSs.
References
[1] A. Anderson, ”XACML Profile for Role Based AccessControl (RBAC)”, Sun Microsystems, 2004.
[2] R. Braden, L. Zhang, S . Berson, S. Herzog, and S. Jamin, ”Resource reservation protocol (RSVP) ver-sion 1 functional specification”, Internet RFC 2205,Sept. 1997.
[3] C. Cavaness, ”Programming Jakarta Struts (Paper-back)”, O’Reilly, Nov. 2002.
[4] D. Ferraiolo, R. Sandhu, S. Gavrila, D.R. Kuhn,and R. Chandramouli, ”Proposed NIST Standard forRole-Based Access Control”, ACM Transaction onInformation and System Security, Vol. 4, No. 3, 2001,Pages 224-274.
[5] E. Gamma, R. Helm, R. Johnson, and J. Vlissides,”Design Patterns: Elements of Reusable Object-Oriented Software”, Addison-Wesley ProfessionalComputing Series, 1995.
[6] M. Giordano, G. Polese, G. Scanniello, and G. Tor-tora, ”Visual Modelling Of Role-Based Security Poli-cies In Distributed Multimedia Applications”, In Pro-ceedings of IEEE Sixth International Symposium onMultimedia Software Engineering (MSE’04), Miami,FL, USA, December 13-15, 2004, Pages 138-141.
[7] D. Kafura, S. Shah, ”An XACML-based Policy Man-agement and Authorization Service for Globus Re-sources”, in Proceedings of the Fourth InternationalWorkshop on Grid Computing, 2003, pp. 208-210.
[8] OASIS, ”eXtensible Access Control Markup Lan-guage (XACML)” ,Version 1.0. OASIS, Feb. 2003.
[9] Ricardo Nabhen, Edgard Jamhour, Carlos Maziero,”A Policy-Based Framework for RBAC”, LectureNotes in Computer Science, Volume 2867, Jan 2003,Pages 181 - 193.
[10] Emir Toktar, Edgard Jamhour, Carlos Maziero,”RSVP Policy Control using XACML”, policy, p.87, Fifth IEEE International Workshop on Policiesfor Distributed Systems and Networks (POLICY’04),2004.
45

SVD-BASED TAMPER PROOFING OF MULTI-ATTRIBUTE MOTION DATA
Parag Agarwal Ketaki Adi B. Prabhakaran
Department of Computer Science,
The University of Texas at Dallas, TX 75083
Email {parag.agarwal, ketaki.adi} @ student.utdallas.edu , [email protected]
ABSTRACT
Repositories of motion captured (MoCap) data can be reused for human motion analysis in physical medicine, biomechanics and animation related entertainment industry. MoCap data expressed as a matrix Mm x n can be subject to tampering from shuffling of its elements or change in element values due to motion editing operations. Tampering of archived motion data intentionally or due to machine/human errors, may result in loss of research, money and effort. The paper proposes singular value decomposition (SVD) based methodology for tamper proofing motion data. This tamper proofing methodology extracts reference patterns in the form of right and left singular vectors of motion data matrix M. These patterns are used to verify and trace the pattern of tampering. The use of first Eigen vectors for tamper detection reduces storage and computation complexities to O (m + n) and makes the solution scalable.
1. INTRODUCTION
The advent of Motion Capture systems such as Vicon [16] has brought in applications like • Physical Medicine and Rehabilitation: Analyzing
different body segments/joints for different motions aid in better diagnosis of the problem(s) that a patient might be facing.
• Biomechanics and Physiology: Researchers investigating the interplay of bone and muscle in leg movement benefit from the 3D map of human body motions.
• Reusability in Animation: Motion captured data is reusable and it can help build entertainment related animations, by using software such as Motion Builder [8].
• Quantifying the effects: of certain diseases such as the effect of spasticity on knee movements. These applications can benefit from having a large repository of 3D human motions. Motion data archived in a repository can be subject to tampering due to malicious actions or human/machine related faults. The tampering of motion data may result in loss, in terms of valuable information, money, and time spent for recording. Moreover, incorrect information can be misleading from the application's perspective. MoCap data is multi-attribute, and can be described as Mm x n matrix (see Figure 1 and Figure 2) (for the comma separated value (.csv) format of Vicon IQ [16]), with columns representing rotational and positional data of skeleton joints, and rows representing the changing values over time. The varying lengths of frames make the data bulky. Adversaries can use motion editing techniques [16] such as motion cropping, mapping and concatenation to tamper data. These techniques alter the trajectory of joints by changing values or shuffling rows, columns, row elements, and column elements. There could be combination of these attacks or it could be a random attack. The tampering methodology should be capable of verifying and tracing the pattern of such kind of attacks.
Figure 1. Motion Data representation
46

Figure 2. Motion Data Representation I matrix format with
positional information Tampering can be avoided by using tamper proofing mechanism, such as fragile watermarking. Fragile watermarking [2-13] can be achieved by embedding a watermark inside a target data. Tampering is recognized whenever during an extraction process, a sub-part of the embedded watermark is found corrupt. The sub-part points to the spatial location of corruption and serves as an evidence for tampering. Watermarking techniques alter the original data, resulting in distortion, which eventually can alter the meaning of the data. Recent research in watermarking motion data [14, and 15] uses private watermarking schemes for copyright protection. These schemes are private and are storage inefficient (not scalable), since the original data has to be stored for tamper verification. Therefore, in order to achieve tamper proofing, we need to design a novel scheme that can detect errors, without distorting the original data, and must be storage efficient. 1.1 Proposed Approach The paper proposes singular value decomposition (SVD) based tamper proofing scheme. The scheme is not a watermarking methodology, as it does not incorporate information hiding. The idea is to extract the reference patterns using SVD, and use them for tamper proofing. The reference patterns are recognized as right and left Eigen vectors of the SVD of a motion data matrix M. During the detection process, we take the SVD of the target matrix M′ and compare its left and right Eigen vectors with that of M. The proposed method is shown to verify and trace the pattern of attacks, such as row tampering, column tampering, row-column tampering, and random attack. The reference patterns are Eigen vectors with non-zero Eigen values. This helps in reducing the size of information required to be stored for verification, and as a result makes the solution scalable. The use of Eigen vectors and thresholds help us determine the exact position in M that has been tampered. Experimental results aptly demonstrate the effectiveness of our approach. The rest of the paper is organized as follows: Section 2 discusses the attack patterns and methods developed using SVD to verify and trace these patterns. In addition, we suggest ways to optimize the methodology and advantages over watermarking are mentioned. Section 3 gives experimental proof of the attacks and helps visualize
the advantage of the proposed technique. The paper ends with Sections 4 describing the future work and conclusion. Table 1, gives a list of notations used in the paper.
RT Row tampering RS Row shuffling
RES Row element shuffling CT Column tampering CS Column shuffling
CES Column element shuffling RCT Row column tampering
Table 1. Table of Notations
2. TAMPER PROOFING METHODOLOGY
The tamper proofing methodology is applied on MoCap data (.csv format) acquired from Vicon IQ [16] (120 frames/sec). As discussed earlier, this data can be expressed as a matrix Mm x n (m > n), where columns represent the joints of the human skeleton. The joints are represented as rotational and translational information, with varying values per frame (row). The attacks on a matrix M can be categorized as follows: • Row tampering (RT) attacks: This attack is restricted
to row tampering only, such that column elements of M stay invariant. Mathematically, if A is modified to using
row tampering then Amxn ≠ Bmxn such that U a (k, i) =
b (k, i), for all i (1 ≤ i ≤ n), and U a (j, k) ≠ b
(j, k), for j (1 ≤ j ≤ m). This attack can be realized either by column element shuffling (CES) or row shuffling (RS). CES exchanges the row elements, and does not alter the column element set. RS does not alter column elements, but shuffles the rows. These attacks are further categorized as combinations of {CES}, {RS}, {CES, RS}.
m
k 1=
Um
k 1=
n
k 1=Un
k 1=
• Column tampering (CT) attacks: This attack is restricted to column tampering only, such that rows elements of M stay invariant. Mathematically, if A is modified to B using column tampering then Amxn ≠ Bmxn
such that U a (i, k) = U b (i, k), for all i (1 ≤ i ≤ m),
and a (k, j) ≠ b (k, j), for j (1 ≤ j ≤ n). This
attack can be realized either by row element shuffling (RES) or column shuffling CS. RES exchanges the column elements, and does not alter the row element set. CS does not alter row elements, but shuffles the columns. These attacks are further categorized as combinations of {CS}, {RES}, {RES, CS}.
n
k 1=
n
k 1=
Um
k 1=Um
k 1=
• Combined row-column tampering (RCT) attacks: This attacks results in tampering of row and column element set, such that element set of A and B are the
47

same. The tampering can be due to combinations of row and column tampering attacks.
• Random Attacks: This kind of attacks result by adding random noise signals to motion data. This attack is different from the above attacks, since the element set of A and B is not similar. In other words it is a combination of row and column tampering, such that element set of A ≠ element set of B.
The above attack patterns will result in joint motions following different patterns from their original. Since human body motion is described by motion information of joints, it will change as a consequence of the above attacks. The paper develops a singular value decomposition (SVD) based tamper proofing technique to handle such attacks. 2.1 Background on SVD As proved in [1], any real m × n matrix M has a SVD (M) = U.S.VT, where U = [u1, u2 … um] є Rm×m and V = [v1, v2 . . . vn] є Rn×n are two orthogonal matrices, and S is a diagonal matrix with diagonal entries being the singular values of M: s1 ≥ s2 ≥ . . . ≥ s min (m, n) ≥ 0, where s1 is significantly larger than other Eigen values. Column vectors ui and vi are the ith left and right singular vectors of M respectively. The left singular vectors have length equal to the number of time frames, that vary with each individual motion data file. The right singular vector has a constant length depending on the number of joints considered. The singular values of matrix M are unique, and the singular vectors corresponding to distinct singular values are uniquely determined up to the sign, or a singular vector can have opposite signs.
Figure 3. Geometric structure of a matrix exposed by its SVD
SVD exposes the geometric structure of a matrix M. It has orthogonal bases. It transforms the matrix from one vector space to another. The components of SVD quantify the resulting change between the underlying geometry of these spaces. Along the direction of the first right singular vector, the row vectors in M have the largest variation, and along the second right singular vector direction, the point variation is the second largest, and so on. The singular values reflect the variations along the corresponding right singular vectors. Figure 1 illustrates a 10 x 2 matrix (2D (x, y)) with first and second right singular vectors V1 and V2 (orthogonal vectors). The 10 points in the matrix have different variations along
different directions; hence have the largest variation along V1. We observe that elements of the matrix M can be expressed using a set of linear combination of elements of the matrices U, V and S. The SVD (M) = U.S.VT = U. (S.VT) = {M (i, j)} where 1 ≤ i ≤ m, 1 ≤ j ≤ n, m > n. M (i, j) can be expressed as follows: M (i, j) = [U(i, 1) U(i, 2) ... U(i, m)] [S1.V(j, 1) S2.V(j, 2) ... Sn.V (j, n) 0 0 … 0] T
The tamper proofing mechanism consists of extraction phase and detection phase. During the extraction phase reference pattern are extracted from matrix M. The second phase is the detection phase, where attacks are detected. We take SVD (M) = U.S.VT, and for non-zero Eigen values S store the corresponding left and right Eigen vectors U and V. Here V and U are the reference patterns that will be used to identify and trace the attack pattern. 2.2 SVD Based Detection Once the attack has been identified it traces the pattern used for the attack. The tamper detection process can be realized as follows: Step1: SVD (M′) = U′.S′.V′TStep2: DiffU = U′ – U, DiffV = V′ – V Step3: if DiffU and DiffV are zero matrices No tampering; Else If (DiffV is zero matrix only) RS attack or CES attack or {RS, CES} attack; Else If (DiffU is zero matrix only) CS or RES or {CS, RES}; Else Random attack or RCT; In the above checking process we consider vector till k, since first k Eigen values are non-zero. The remaining (n- k) Eigen values are zero and their contribution to M is insignificant. The process of tamper detection is done by taking considering the difference (DiffU and DiffV) between Eigen vector matrix of M and M′. The above steps can be understood as verification of attack and tracing the attack pattern. The following subsection discusses the reasons behind the verification and tracing of attacks: 2.2.1 Verification and tracing of Row Tampering (RT) attacks The following theorem, an extension of the theorem mentioned in [1], helps us prove that row tampering is related to change in left Eigen vector only.
Theorem 1: Given matrix Amxn ≠ Bmxn such that a (k, i)
= U b (k, i), for all i (1 ≤ i ≤ n), and U a (j, k) ≠ U b
Um
k 1=m
k 1=
n
k 1=
n
k 1=
48

(j, k), for j (1 ≤ j ≤ m), then SVD (A) = U1.S.VT and SVD (B) = U2.S.VT. Proof: Given SVD (A) = U.S.VT, the right singular vector V can be determined from AT.A = V.S2.VT. Let C = AT.A, where
c (i, j) = a (k, i).a (k, j) => the condition U a (k, i) =
b (k, i), for all i (1 ≤ i ≤ n), and a (j, k) ≠ b (j,
k), for j (1 ≤ j ≤ m) makes no difference to C. As a result, V and S are same for A and B. However since A ≠ B => SVD (A) = U
∑=
m
k 1
m
k 1=
Um
k 1=Un
k 1=Un
k 1=
1.S.VT and SVD (B) = U2.S.VT As a consequence of the above result, we can assume that whenever there is a row tampering attack, there is a change in left Eigen vector of matrix M. The following theorem helps us realize that it is possible to trace the rows of M where the tampering has occurred. Theorem 4: If B is derived from A, by column tampering a
set of columns {c Theorem 2: If B is derived from A, by row tampering a set of rows {ri: 1 ≤ i ≤ m}, then rows of left Eigen vectors of A and B are different by the same set {ri: 1 ≤ i ≤ m}. Proof: For a given matrix A, with SVD (A) = U.S.VT, U can be determined from A.V = U. S. It can be easily be shown
that u (i, j) = sj-1 ∑
=
n
k 1(a (i, k). u (k, j)). By Theorem 1, we
know that V1 = V2 and S1 = S2. If rows of A {ri: 1 ≤ i ≤ m} are tampered => Set of rows {ri: 1 ≤ i ≤ m} will be different for the left vectors of A and B. So, by theorem 2 we can say that the non-zero rows of DiffU = |U – U′| will indicate the set of rows {ri: 1 ≤ i ≤ m} that were tampered. Since rows of U change in the same pattern as modified M, it is possible to trace the presence of RS. DiffU will point out the rows that have been shuffled. The shuffle pattern can be identified by sorting the left Eigen vectors, and observing the mapping between the rows of the sorted vectors. In case of a CES, DiffU will point out the rows, but not the exact shuffled column elements. Hence, it is not possible to trace a CES or {CES, RS} as opposed to RS. 2.2.3 Verification and tracing of Row-Column
Tampering (RCT) attacks 2.2.2 Verification and tracing of Column Tampering (CT) attacks The following theorem helps us prove that column tampering is related to change in right Eigen vector only.
Theorem 3: Given matrix Amxn ≠ Bmxn such that U a (i, k)
= U b (i, k), for all i (1 ≤ i ≤ m), and U a (k, j) ≠ U b
(k, j), for j (1 ≤ j ≤ n), then SVD (A) = U.S.V
n
k 1=n
k 1=
m
k 1=
m
k 1=
1T and SVD (B)
= U.S.V2T.
Proof: Given SVD (A) = U.S.VT, the right singular vector U can be determined from A.AT = U.S2.UT. Let C = A.AT,
where c (i, j) = ∑ a (i, k).a (j, k) => the condition U a
(i, k) = U b (i, k), for all i (1 ≤ i ≤ m), and U a (k, j) ≠
b(k, j), for j (1 ≤ j ≤ n) makes no difference to C. As a
result, U and S are same for A and B. However since A ≠ B => SVD (A) = U.S.V
=
n
k 1
n
k 1=n
k 1=
m
k 1=
Um
k 1=
1T and SVD (B) = U.S.V2
T. As a consequence, we can assume that whenever there is a column tampering attack, there is a change in right Eigen vector of matrix M. The following theorem helps us realize that it is possible to trace the columns of M where the tampering has occurred.
i: 1 ≤ i ≤ n}, then rows of right Eigen vectors of A and B are different by the same set {ci: 1 ≤ i ≤ n}. Proof: For a given matrix A, with SVD (A) = U.S.VT, V can be determined from UT. A = S.VT. It can easily be shown that
v (i, j) = si-1 ∑
=
n
k 1(u (k, j). a (k, i)). By Theorem 3, we know
that U1 = U2 and S1 = S2. If a set of columns of A {ci: 1 ≤ i ≤ n} are tampered => similar set of rows {ci: 1 ≤ i ≤ m} will be different for the right Eigen vectors of A and B. So, by theorem 4, we can say that the non-zero rows of DiffV = |V – V′ | will indicate the set of rows {ci: 1 ≤ i ≤ m} that were tampered. Since rows of V change in the same pattern as modified M, it is possible to trace the presence of CS. DiffV will point out the rows that have been shuffled. The shuffle pattern can be identified by sorting the right Eigen vectors, and observing the mapping between the rows of the sorted vectors. In case of a RES, DiffV will point out the rows, but not the exact shuffled row elements. Hence, it is not possible to trace a RES or {RES, CS} as compared to CS.
As seen from Theorem 1 and 3, left and right Eigen vectors help us realize the presence of attacks. Therefore, we can intuitively say that a combination of row and column tamper attacks will affect the right and left Eigen vectors of A. As a result we get non-zero DiffU and DiffV and can verify the presence of a row-column attack. Row and column tampering can occur in any order and any number of times. Say, we have row tampering (RT) order <rt1, rt2… rtn> and column tampering (CT) order <ct1, ct2 … ctn>. Row column tampering occurs such that order of rti and cti is not compromised. For such cases, theorem 5 helps
49

us prove that it is possible to determine final outcome of <rt1, rt2… rtn> and <ct1, ct2 … ctn>. Theorem 5: Given row tampering (RT) and column tampering (CT) pattern, the order of application of tampering to a matrix is independent of the resultant matrix. Proof: Given matrix A where SVD (A) = U1S1V1
T. By theorem 1 RT on A results in B where SVD (B) = U2S1V1
T. By theorem 3, CT on A results in matrix D where SVD (D) = U1S1V2
T. We have two orders of attack <RT, CT> and <CT, RT>. Case <RT, CT>: By theorem 1, RT on matrix A will result in B, such that SVD (A) = U1S1V1
T, SVD (B) = U2S1V1T.
Since the row information is invariant, then by theorem 3 CT on matrix B will result in matrix C, such that SVD (C) = U2S1V2
T
Case <CT, RT>: By theorem 3, CT on matrix A will result in B, such that SVD (A) = U1S1V1
T, SVD (B) = U1S1V2T.
Since the column information is invariant, then by theorem 1 RT on matrix B will result in matrix C, such that SVD (C) = U2S1V2
T. Since both the cases give the same result, we can say that the order of application of tampering to a matrix is independent of the resultant matrix. As observed above, the order of application of RT and CT are independent of each other, the net resultant left and Eigen vectors of the final matrix are same as those corresponding to row tampering order <rt1, rt2… rtn> and column tampering order <ct1, ct2 … ctn> applied to M. If RT and CT corresponded to row and column shuffling only, then it is possible to predict the shuffling pattern. In other cases we restricted to finding the columns and rows where attacks took place. In such cases we assume that the attack to be a random attack and can trace the pattern of attack as shown in subsection 2.2.4. 2.2.4 Verification and tracing of Random Attack Values of M (i, j) are changed randomly. By equation 1, any change in the jth column elements of M is reflected in the jth row of V, and any change in the ith row of M is reflected in the ith row of U. As a result, we have both DiffU and DiffV non-zero. Therefore, the indication that DiffU (i, k) and DiffV (j, p) change is non-zero, points that M (i, j) has changed due to random attack. The elements changed in M will give us the random attack used to tamper motion data. 2.3 Optimizations The number of non-zero Eigen values determines the number of computations involved in tamper detection and information required for tamper detection. This will be significant while considering the case for scalability. The following discussion describes the optimizations that can be considered to aid scalability and reduce computations. It can be observed from equation 1, the contribution of left Uk and right Vk vectors to the matix M is determined by
their corresponding Eigen value sk. As observed in section 2.1 the Eigen values can be ordered as s1 ≥ s2 ≥ . . . ≥ s min (m,
n) ≥ 0, where s1 is significantly larger than other values. This implies the contribution of V1 and U1 is significant as compared to other vectors. Therefore any change (M′ – M) will be reflected in DiffU1 and DiffV1. If we keep only the first left and right Eigen vectors, we can save computations and storage as follows: • Computation Reduction: Initially we had n left and
right Eigen vectors for comparison. We have m elements in left vector and n elements in right vector. As a result, we have O (n (m + n)) comparisons. By restricting it to first vectors, we now have O (m + n) comparisons. Therefore we save computations are O ((n -1) (m + n)).
• Storage Reduction: When we are storing U and V for n Eigen vectors, then storage required is O (n (m + n)). However, once we use first Eigen vectors storage is reduced to O (m + n). The reduction is identified as O ((n – 1) (m + n)).
2.4 Advantages
The advantages of the scheme are described as follows: 2.4.1. Computational and Storage Advantages over Private Watermarking Private fragile watermarking schemes use the original matrix M to extract the watermark. This will require the O (m.n) original data to be stored in the databases and during computations analysis of O (mn) elements in (M – M′). The proposed methodology used O (m) first left Eigen vector and O (n) first right Eigen vector. As a result it used only O (m + n) space and requires analysis of O (m + n) elements. Therefore, we save space and computations by O (m.n – m – n). Since m > n (see section 2.1), for motion data we can have large reduction in space. 2.4.2 Better Accuracy over Existing Error Detection Methods Error detection is a well studied topic with techniques [10] such as cyclic redundancy check (CRC), parity bit checking, and checksums. Schemes such as CRC and checksum are storage efficient and faster than our proposed scheme, as they do not require O (m + n) space. However, they are not capable of locating the errors in the matrix. Therefore, the proposed scheme is more efficient in terms of accuracy of error detection.
3. EXPERIMENTS AND DISCUSSION All the experiments are carried out on angular motion data (Euler angles). This data was obtained in a .csv format created by Vicon IQ [16] MoCap system (Motion Capture facility at University of Texas at Dallas). The data consists of joint information of a skeleton, expressed in terms of rotational (Euler angles) and translational (co-ordinates)
50

data. The motion clip used in these experiments can be expressed as 225 x 57 matrix, where frames = 225 and 19 skeleton joint rotational data (3 Euler angles) values. 3.1. Analysis of Attack Patterns Attack patterns can be detected in automatically by our technique, and this detection can be visualized in this subsection. In Figure 4, CS and RES attack can be perceived on a joint. It shows the original trajectories for a joint, and also the attacked data for the same. It can be seen that one of the angles is shuffled with some other column, resulting in totally different data. This causes the joint to behave abnormally. The spikes in the figure depict the row element shuffling attacks, which can be seen in case of all the three angles. Figure 6 shows the effect on first right singular vector due to CS and RES attacks. The circled parts are the change in values due to row element shuffle (RES) attack. The other changing values are due to a column shuffle attack. The left singular vectors remain unchanged in these 2 cases as seen in Figure 8.
Figure 5 shows one Euler angle over the entire time duration before and after a RS and CES attack. The spikes (circled values) represent the CES attack. Figure7 shows the first left singular vectors before and after the attack (circled spikes represent CES values). The first right singular vectors do not change during a RS and CES attack, as observed in Figure 9. Random attack affects left and right Eigen vectors. These effects can be visualized Figure 10 and Figure 11. Figure 10 corresponds to the comparison of first right Eigen vectors. Figure 11 shows first left Eigen vectors of original and attacked data. The dissimilarity between the Eigen vectors serve as evidence for tamper detection.
4. CONCLUSION The paper proposed singular value decomposition (SVD) based technique to detect tampering of archived motion data. It has been shown that this method is capable of verifying and tracing the attack patterns on motion data matrix Mm x n. The proposed scheme supports addition of copyright based watermarks. The information and computation required for tamper detection for a (m x n) matrix is reduced from O (m.n) to O (m + n), making the solution scalable.
ACKNOWLEDGEMENTS The work is supported in part by US Army Research Office grant 48645-MA and National Science Foundation under Grant No. 0237954 for the project CAREER: Animation Databases.
REFERENCES [1] Chuanjun Li, B. Prabhakaran and S.Q. Zheng, Similarity Measure for Multi-Attribute Data, Proceedings of the 30th IEEE
International Conference on Acoustics, Speech, and Signal Processing (ICASSP), Philadelphia, PA USA, pp. II-1149 – II-1152, March 2005 [2] Chung-Ping Wu, C.-C. Jay Kuo, Fragile Speech Watermarking for Content Integrity Verification (2002), citeseer.ist.psu.edu/wu02fragile.html [3] C.S. Collberg, and C. Thomborson, "Watermarking, Tamper-Proofing, and Obfuscation—Tools for Software Protection," IEEE Trans. Software Eng., Aug. 2002, pp. 735-746. [4] C.Kailasanathan, R.Safavi Naini, and P.Ogunbona, "Fragile Watermark on Critical Points", International Workshop on Digital Watermarking Seoul, Korea, (Springer-Verlag), November 21-23, 2002. [5] D. Kundur and D. Hatzinakos, "Digital watermarking for telltale tamper proofing and authentication", Proceedings of the IEEE, vol. 87, no. 7, pp. 1167--1180, July 1999 [6] F. Cayre, O. Devillers, F. Schmitt and H. Maître, Watermarking 3D Triangle Meshes for Authentication and Integrity, INRIA Research Report RR-5223, Jun. 2004 [7] H. Golub and C.F.V.Loan. Matrix Computations. The Johns Hopkins University Press, Baltimore, Maryland, 1996 [8] H.T. Wu and Y.M. Cheung, A Fragile Watermarking Approach to 3D Meshes Authentication, Proceedings of the 7th Workshop on Multimedia & Security (ACM'05), pp. 117-123, 2005. [9] Ingemar Cox, Matthew Miller, Jeffrey Bloom, Mathew Miller, Digital Watermarking: Principles & Practice (The Morgan Kaufmann Series in Multimedia and Information Systems) [10] E.T. Lin and E.J. Delp, “A review of fragile image watermarks”, in Proc. of ACM Multimedia & Security Workshop, Orlando, 1999, pp. 25—29 [11] J. Fridrich, M. Goljan, and A. C. Baldoza, "New fragile authentication watermark for images," in Proc. IEEE Int. Conf. Image Processing, Vancouver, BC, Canada, Sept. 10--13, 2000. [12] Larry L. Peterson, Bruce S. Davie, Computer Networks: A Systems Approach, 3rd Edition (The Morgan Kaufmann Series in Networking) [13] M. M. Yeung and B.-L. Yeo, "Fragile watermarking of three dimensional objects," Proc. 1998 Int'l Conf. Image Processing, ICIP98, volume 2, pp. 442--446. IEEE Computer Society, 1998. [14] Shuntaro Yamazaki, “Watermarking Motion Data”, In Proc. Pacific Rim Workshop on Digital Steganography (STEG04), pp.177-185, Nov 2004 [15] Tae-hoon Kim, Jehee Lee, Sung yong Shin, Robust Motion Watermarking based on Multiresolution Analysis, Computer Graphics Forum, Vol. 19 No. 3, pp. 189-198, 2000 (Proc. EUROGRAPHICS '2000). [16] Vicon, www.vicon.com
51

52

Uncertainty: An extra layer of security For Unauthorized traffic based Web Services
Parag Agarwal B. Prabhakaran Bhavani Thuraisingham
Department of Computer Science, The University of Texas at Dallas
MS EC 31, PO Box 830688, Richardson, TX 75083
Email{pxa016500,praba,[email protected]}
ABSTRACT
Distributed web services are under constant threat of being attacked from nodes, internal or external to the system. Internal attacks may result from hijacking of trusted web servers, resulting in loss/corruption of information, and Denial of Service (DoS) to clients. External attacks can occur from hijacking of trusted clients or malicious nodes leading to DoS to clients. The paper focuses on building an attack resistant framework for web services based on unauthorized traffic. Unauthorized traffic is a consequence of query driven session less HTTP-request/response message based web service applications, such as google.com. Dictionary.com etc. Unauthorized traffic based web service applications are supposed to have low response time. Unfortunately current mechanisms show lack of support for this traffic, since they add extra delay due to processing at intermediate nodes. The paper proposes a framework that optimizes the use of secure overlay services for unauthorized traffic. We add an extra layer of security around the web servers, which introduces uncertainty in the adversary’s actions and is achieved by introducing dummy servers to the existing system, which appear as real servers to the clients or adversaries. The dummy servers act as traps if an adversary attacks assuming them to be real servers. Secure strategies have been proposed to implement the dummy servers. These strategies reduce the risk of hijacking and DoS attacks, minimize the changes to external infrastructure, can be easily integrated with existing security systems, do not promote ISP collaboration, and helps in scaling the system.
1. INTRODUCTION
Web services are under constant threat of being abused by attacks such as the following: • Denial of service attack: These attacks can be
launched by sending flash crowds to web servers. Such flash crowds can be generated by concatenating
distributed hosts across the network; hence the name distributed denial of service (DDoS) attack. DDoS attack can be launched in an unsophisticated way by running "rootkits" and worms [6] on these malicious nodes. The source of the flash crowds can be internal trusted nodes or external trusted/distrusted nodes. The trusted nodes are made to act malicious by hijacking them.
• Information corruption: Nodes internal to the system can be hijacked. Once hijacked, these nodes can disrupt the information at the system, and also send malicious information to the client side.
The malicious nodes are either internal or external to the system, hence the name internal and external attacks. In order to subvert such attacks we need to design framework that protects different kinds of web services. We identify web services on the basis of traffic generated by web applications as follows: • Unauthorized traffic: This can be generated from
query driven web services such as search engines (google.com), online dictionary (dictionary.com, word.com), map service (mapquest.com) etc. The interaction between client and server are HTTP-request and HTTP-response messages and do not require authentication mechanism prior to any information exchange. Such kind of traffic has low response times since the user expects quick responses.
• Authorized traffic: This can be generated from web-applications such as email service (gmail.com), e-commerce website (amazon.com) etc. These applications involve authentication mechanisms prior to information exchange. Such kind of traffic can have delay tolerance since authorization mechanisms involve identification processing. Recent work on resistance against DDoS [1, 2, 3, 4, 5, 6, 7,
8, and 10] has focused on filtering traffic at the intermediate nodes. The filtering criteria can be traffic from unauthorized/illegitimate clients or absence of expected information in the message sent by the clients. Techniques such as [4] filter illegitimate traffic at the routers whenever
53

the client identifies an attack being done using such a traffic. Similar techniques [5, 6, 7, and 10] have been developed to identify illegitimate traffic as weapons for launching DDoS attacks. Unauthorized traffic is based on short lived HTTP sessions that use TCP connections that tear down after each use. Subjecting the unauthorized traffic to such mechanisms would increase the response time, which is not a valid feature for such kind of applications. However, we observe that such solutions are more suited for authorized traffic based web applications since they are delay tolerant at the cost of security. Frameworks that are based on Secure Overlay Services (SOS) [1, 2, 3, and 6] are suited for prevention against internal and external attacks. However, it is not suited for unauthorized and authorized traffic, as a result of the following problems: - Lack of traffic Support: SOS-based techniques do not
provide support for unauthorized traffic and filter such traffic assuming it to be a weapon to launch DoS attack. Therefore, we cannot rely on methods that support authorized traffic and use unauthorized traffic as a means to filter out an attack.
- Hop Delay: We could depend on techniques such as Secure Overlay Services (SOS) [1] to protect web services that support unauthorized traffic based applications. However, SOS has a potential problem for query driven application that requires fast responses. SOS adds hop-delays that will result in increase in response time.
- Points of failure: A node belonging to SOS can serve different web services. When such a node comes under attack, it malfunctions and affects all such systems. We need to remove such dependencies and points of failure, in order to secure the web services.
The above rationale motivates the design of secure framework for web services (supporting unauthorized traffic based applications) and is derived from an optimized SOS architecture. This paper contributes by proposing such a framework with the following design scope: • Risk Reduction: Reduce the risk involved in hijacking
and DoS or DDoS attacks by increasing the probability of failure of the adversary, which will act as the de-motivating factor for the adversary.
• Minimal Change to existing Infrastructure: The change in the system should least impact the external system such as the internet and transport protocols, and the routers. This also includes end-host, inter-ISP and intra-ISP cooperation.
• Co-existence with existing security features: The new layer of security should not impact the existing security features.
• Support Scalability of the existing system: The addition of the security feature should have minimal impact the scalability of the system
• Fast Query responses: The response time of the system should not be affected by the addition of security features.
• No external cooperation: The framework should result in increase in traffic due to cooperation between end-host/ISP, inter-ISP, and intra-ISP cooperation [4].
• Ease of customization: The framework requires minimal effort in customizing it for existing web service architectures [12], such as cluster-based, virtual clusters and locally distributed servers.
The proposed design introduces a set of dummy nodes/servers that are mapped to the real nodes/servers. The clients communicate either directly with the real servers or indirectly via the dummy servers. However, the clients assume direct communication with the real server. The mapping between the real and dummy servers is a secret and introduces uncertainty in launching internal or external attacks. We have shown the probability of failure of the adversary increases as the number of dummy servers is made equal to the number of real servers. Our design introduces (<) 1-hop delays which is an improvement over SOS design. Moreover it does not have points of failure since we do not use an infrastructure such as SOS.
2. DESIGN RATIONALE AND ASSUMPTIONS
The following assumptions are considered for our design: • Servers within the system can communicate with each
other over secure reliable high bandwidth links using their synchronization protocols.
• Any system node is capable of identifying a DoS attack and raises an alarm.
• During a node crash, the system will bring up another identical node with same IP address.
SOS hides the true identities of servers by introducing hidden paths to the target nodes. These paths are like levels in security. In case a web service uses a SOS, the target nodes are the web servers. Therefore, the web servers are hidden behind the SOS. We introduce an extra layer of nodes, similar to SOS, before the web servers. This layer is defined by dummy servers that are not used by the system for processing requests. We assume that the adversary views the dummy servers as real servers and will try to attack them. Therefore the dummy servers will act as traps and as a result the probability of its failure of the adversary will increase. Figure 1 illustrates the interaction between client and N servers. We introduce K dummy servers to form the extra layer of security. N- K servers communicate directly and considered exposed and vulnerable to attack. Meanwhile K servers communicate indirectly with the real servers via the dummy servers. We need the following features to implement the extra security layer:
54

• Transparency: The client nodes should visualize the dummy servers as real servers. In order to achieve such transparency we need mechanisms wherein the dummy servers should be able to process the client requests.
• Secrecy: In order to break down the system the adversary should be in a state to distinguish between dummy and real servers. In order to counter such an act, we need to maintain the identities of real and dummy servers a secret.
Figure 1 Client-Server Interaction
3. STRATEGIES TO SUPPORT THE DESIGN
The following section tries to explain strategies that can be used to maintain transparency and secrecy. 3.1 Transparency-based Strategy Each dummy server is mapped to a real server. Clients communicate with the real server via the dummy nodes. In this case, the HTTP requests are received at the dummy nodes and forwarded to the real nodes. Similarly the HTTP response is received from the real server and forwarded to the client. HTTP uses TCP at the transport layer and hence would require two separate TCP sessions, referred in figure 2 as TCP1 and TCP2. Whenever the clients send out requests represented by TCP1-Req, the dummy server establishes a TCP connection with real server represented by TCP2-req. The real server responds with TCP2-reply and this is conveyed to client as TCP1-reply. It should be observed here that the TCP1 and TCP2 are different, and TCP2 represents TCP1 to the real server.
Figure 2 TCP traffic handling
The connection is made transparent since TCP2 is hidden from the client and it always assumes interaction with the real server. It is can be observed from Figure 2 that the HTTP requests and response over TCP1 and TCP2 stay invariant and are referred as TCP1-Req/TCP21-Req and
TCP1-Reply/TCP2-Reply respectively. The client always visualizes interaction with the real server. We assume that, whenever a dummy server is under attack, all the current connections can be redirected to a back-up dummy server. 3.2 Secrecy-based Strategy We add a set of dummy servers say K (≤ N, number of real servers). Each dummy server is mapped to a real server. The number K and the mapping is kept secret and can vary with time. Therefore the adversary will be unable to distinguish between the real and dummy servers. The IP address of the real and dummy servers is made public and is used by the clients for communication. Since the mapping secret we say that it is an extra secret layer. The secret in this layer results in uncertainty in the adversary’s decision to attack the system. In this approach we only have one-to-one mapping between the real server and the dummy server; in case there is a compromise of the dummy server, the identity of at most one server is revealed, leaving rest of the system safe. .
Figure 3 (a) Insecure System
Figure 3 (b) Secret Extra Layer for Figure 3 (a) Figure 3(b) represents a secrecy-based strategy for Figure 3(a). In this case we introduce two dummy servers with mapping (D1, R1) and (D2, R2). The client’s perspective remains the same since the number of servers does not change. The following sections try to answer questions related to the use of secrecy-based strategy.
4. ATTACKS AND COUNTER MEASURES
55

The following subsections explain the attacks and their counter measures. 4.1 Internal Attack Adversaries can capture servers and use the information stored at the server to attack other servers. Compromised servers can collude to attack and obtain the identity of other servers. As a result, compromise of servers can lead to attacks that compromise the remaining servers. In order to make the system robust, we make the real servers incapable of discriminating between real and dummy servers. This can be achieved by following the secret-based strategy mentioned in section 3.2. The clients in this case are the servers themselves. Every real server is given a set S of IP address of servers they can communicate to, for synchronization purpose. The set S contains a combination of IP addresses of real servers or dummy servers. A real server by itself is unable to discriminate between the IP addresses of real and dummy servers. It assumes communication with all the real servers. In case the IP address of the dummy server is being used, communication with the real servers happens via the dummy server. During an attack, an adversary may compromise the real server. However since the real server is incapable of discriminating between the real and dummy servers, it will give no clue to the adversary. 4.2 External Attack Adversaries can capture trusted clients and launch attacks on web servers that trust these clients. The following sub-sections explain as to how the security strategy can help prevent these attacks. 4.2.1 Delay Pattern Attack The adversary may try to pin point a dummy server by observing the 1-hop delay added due to the routing process. In order to handle this situation we can add random delays to responses to the requests that do not come from the dummy servers. So that the adversary will not get an exact knowledge about the real servers, thus defeating the adversary’s purpose. 4.2.2 All node Attack A consequence of the combination of secret and transparency strategies is a layer of uncertainty that protects the real servers. However, some of the real servers are always exposed to the Internet. In order to overcome the uncertainty, an adversary may attack all the servers. We assume that the dummy servers are capable of recognizing such an attack and will raise an alarm to overcome such an attack. As a result, we will be able to protect the exposed real servers.
As long as the adversary is unable to distinguish between the true and dummy servers, the element of uncertainty always confuses the adversary. Therefore, the adversary is incapable of launching attacks [6] such as probing, adaptive flooding, and request attack. Prevention against external and internal attacks helps reduce the risk of DDoS by unauthorized traffic. The reduction in risk is evident in section 6.
5. CUSTOMIZATION FOR WEB SERVICES A web service can be organized a locally distributed set of servers [12], which can be defined as cluster-based, virtual web-cluster and geographically distributed. The following schemes customize our solution to distributed web servers: • Cluster-based: In such a scheme, we have a web-
switch that acts as the router to the incoming and out-going requests/responses. The IP address of the web-switch is the publicly known to the clients. An attack can be launched on such a system by overtaking the web-switch. Since the web-switch has full knowledge of the IP address of all the servers, it will come under attack. Such an attack can be dissuaded by making the web-switch unable to distinguish between the real and dummy servers. It can be easily observed that the dependence on a single web-switch makes the system vulnerable to central point of failure. We can overcome this problem by assuming the web-switch is the target address for SOS. As a result, the clients observe the IP address of these SOS as the contact point to the web service. It has been shown in [1] that SOS offers significant guarantee against failures due to denial of service attack. Therefore in our improved design we observe the use of SOS in combination with our technique.
• Virtual web-cluster: In such a scheme, the web servers have the same IP address. We can customize this design to our solution by adding dummy servers with the same IP address. A significant advantage of such an approach can be triangular routing where the connection requests route from dummy to real servers. However the response and further communication takes place with the real server.
• Locally Distributed servers: In such a distribution, the IP address of the web servers is publicly known. We customize this scheme to our idea by adding the IP addresses to the pool of publicly known IP addresses. The IP addresses of the real servers that pair with the dummy servers are hidden. So the publicly known IP addresses consist of IP addresses of the dummy and real servers. It should be observed here that our original scheme does not hide the IP addresses of the real servers.
It can be observed that in the above customizations, that we do not change the existing web server systems. This is evident from the fact that the IP address remains invariant. It is the mapping between real and dummy servers that will determine the difference. However, this is not influenced by
56

web service architecture. Thus we induce minimal changes and add ease in customization to the existing system. The following system analyses hop delay and risk of the proposed design.
6. ANALYSIS
This section is aimed at analyzing the framework in terms of reduction in risk and average hop delay. 6.1 Analysis of Risk The probability of failure of the adversary indicates the effectiveness in security of our system. The following analysis calculates such a probability, where for a system of N servers with K dummy servers, the adversary attacks J servers without being able to distinguish between the real and dummy servers. Probability of failure of the adversary is (K C J/ N C J).
N=5 K= 1 K=2 K=3 K=4 K=5 J =1 0.2000 0.4000 0.6000 0.8000 1.0000 J =2 0 0.1000 0.3000 0.6000 1.0000 J=3 0 0 0.1000 0.4000 1.0000 J=4 0 0 0 0.2000 1.0000 J=5 0 0 0 0 1.0000 Table 1 Probability of failure for (N=5, varying J (1 to 5),
K (1 to 5)) Table 1 illustrates different values of probability of failure, given N = 5 for different values of K (1 to 5) and J (1 to 5). We can observe from table 1 that in order to have probability of failure (> .5) we need higher number of dummy servers in the system. For K = 5, we can guarantee 100% failure of the adversary. It can be observed that in order to attack the system, uncertainty will prevail for probability of failure (> .5). If the number of dummy servers being operated is made a secret, the probability of failure is a secret. Thus, uncertainty will prevail by maintaining such secret and will dissuade adversary. Therefore, when designing the web services framework we need not require the condition N = K. Therefore, we can claim that the SOS based extra layer of security can be optimized.
N =4 K= 1 K=2 K=3 K=4
J =1 0.2500 0.5000 0.7500 1.0000
J =2 0 0.1667 0.5000 1.0000
J=3 0 0 0.2500 1.0000
J=4 0 0 0 1.0000
Table 2 Probability of failure for (N=4, varying J (1 to 4),
K (1 to 4))
Table 2 illustrates risk analysis for Figure 3(b), with different values of probability of failure given, N = 4, K (1 to 4) and J (1 to 4). We can observe that the probability of
failure for figure 3 is represented in column K =2. As observed in table 1, table 2 also shows us that for larger values of J, we need higher number of dummy servers to keep the probability of failure (> 0.5). 6.2 Analysis of average hop delay The average hop delay [11] (for K dummy servers, N real serves, Average Traffic) can be calculated as follows:
Average Hop Delay = ∑∑
=
=N
J
K
i
fficAverageTra
fficAverageTra
1
1 (1)
= fficAverageTraNfficAverageTraK
** (2)
= NK
(3)
It can be observed from equation 3, that the average hop-delay is (K/N < 1) for (K < N), and hence is an improvement over SOS where average hop-delay is > 1. For figure 3(b), K = 2, N = 4 and the average hop delay is (2/4 = 0.5 < 1).
7. DISCUSSION This section discusses our design in terms of advantages; the disadvantages with their counter measure, and compare our design to SOS. 7.1 Advantages The advantages are listed as follows: • Handling DDoS attack: Our design is capable of
handling DDoS attack as it dissuades the adversary from launching internal and external attacks (see section 4).
• Reduction in risk: As we increase the dummy servers in the system, the likelihood of an adversary attacking a dummy server increases (see section 6). The idea of secret strategy will act as a dissuading factor to the adversary. Thus we might be able to avoid external and internal attacks.
• Co-existence with existing security strategy: Our idea can work in conjunction with SOS by registering the IP addresses of the dummy and real servers to the SOS. In such a case, our system introduces uncertainty in attack to a compromised SOS node.
• No change in external system: We do not make any major changes to the external protocols such as UDP, TCP or routers. Hence our design has minimal impact on the Internet infrastructure.
• No External cooperation: The design does not assume any end-host, inter-ISP and intra-ISP cooperation. Thus making the system free of signal exchange.
• Reduced Response time: In SOS where hop delay is a problem. However, the introduction of only a single layer adds a 1-hop delay. Since some of the servers are
57

directly exposed the 1-hop delay is not present. As a result, the response time will be reduced as compared to SOS technique. It can also be observed since no prior authentication is requires, we reduce the response time.
• Ease of customization: It has been shown in section 5 that our framework does not require any major changes in existing web service architectures.
7.2 Disadvantages and Counter-measures Scalability at increased cost: As the number of requests of the clients increase, the load at the dummy servers will increase. This can be handled by increasing the computation power and memory capacity at the dummy servers. Since companies are willing to invest and the requisite hardware is getting cheaper, scalability is possible.
7.3 Comparison with Secure Overlay Services Secure Overlay Services (SOS) hides the true identities of servers by introducing hidden paths to target servers. These paths are like levels in security. An attack on a node at a given level can be handled by removing the node from the SOS, and rerouting the traffic through another SOS node. In case a web service uses a SOS, the target nodes are the web servers. Therefore, the web servers are hidden behind the SOS. It has been shown in section 5 that the probability of failure of an adversary for SOS is 100%. However, by re-using the SOS ideas of hiding some of the servers in our own system, we introduce uncertainty in the adversary’s desire to attack a web service (see section 5). We can compare SOS with our technique in terms of the following: • Traffic Support: Our technique provides this support,
and can also work in conjunction with techniques such as SOS to provide support against DDoS attacks.
• Hop Delay: Removing the extra layers and leaving certain servers directly exposed can reduce the overall delay. This evident from subsection 6.2 where it has been shown that the average hop delay (< 1).
• Points of Failure: The extra layer of dummy servers are system dependent, the points of failure are removed. A failure of a dummy server will not affect another web-application.
8. CONCLUSION
In this paper, we develop a secure framework for web service applications that generate traffic which does not require authentication as a pre-condition for communication. The design of the framework is derived by optimizing Secure Overlay Services (SOS). However, it does not suffer from the fundamental drawbacks of the SOS such as hop-delay, and lack of unauthorized traffic support. The paper proves that the framework avoids DDoS and information corruption attacks from nodes (external/internal) that are either acting malicious or have been compromised. The framework can be easily integrated with existing
frameworks such as SOS, scalable at increased cost, does not require any change in external (internet protocols), requires no ISP collaboration and can be easily customized for existing web service architectures.
ACKNOWLEDGEMENTS The work is supported in part by US Army Research Office grant 48645-MA and National Science Foundation under Grant No. 0237954 for the project CAREER: Animation Databases.
REFERENCES
[1] A. Keromytis, V. Misra, and D. Rubenstein, "SOS: Secure Overlay Services," in Proceedings of ACM, SIGCOMM'02, (Pittsburgh, PA), August 2002
[2] Angelos Stavrou Angelos, MOVE: An End-to-End Solution to Network Denial of Service. citeseer.ist.psu.edu/718186.html [3] Angelos Stavrou Debra L. Cook, WebSOS: An Overlay-based System for Protecting (2005) , Web Servers From Denial of Service Attacks. citeseer.ist.psu.edu/720742.html
[4] A. Yaar, A. Perrig, and D. Song. SIFF: A Stateless Internet Flow Filter to Mitigate DDoS Flooding Attacks. In Proceedings of the IEEE Security and Privacy Symposium [5] Drew Dean, Matt Franklin, and Adam Stubblefield, "An algebraic approach to ip traceback," in Network and Distributed System Security Symposium, NDSS '01, February 2001 [6] D. G. Andersen. Mayday: Distributed filtering for Internet services. In USITS, Seattle, WA, 2003. http://citeseer.ist.psu.edu/andersen03mayday.html
[7] J. Mirkovic, G. Prier and P. Reiher, "Attacking DDoS at the Source", in 10 ' IEEE International Conference on Network Protocols, Paris, France, November 2002.
[8] Jelena Mirkovic, Peter Reiher, A taxonomy of DDoS attack and DDoS defense mechanisms, ACM SIGCOMM Computer Communication Review, v.34 n.2, April 2004 [9] M. T. Goodrich, Efficient Packet Marking for Large-Scale IP Traceback, in: Proceedings of the 9th ACM Conference on Computer and Communications Security (CCS), 2002, [10] P. Ferguson and D. Senie, "Network Ingress Filtering: Defeating Denial of Service Attacks Which Employ IP Source Address Spoofing" IETF, RFC 2267, Janurary 1998. [11] Robert S. Cahn, "Wide Area Network Design", Morgan Kaufmann, 1998 [12] Valeria Cardellini, Emiliano Casalicchio, Michele Colajanni, and Philip S. Yu. The state of the art in locally distributed web-server systems. ACM Computing Surveys, 34(2):263-311, June 2002
58

A Framework for Pre-Rendered Virtual Worlds Navigation Through Motion Tracking Based Interface
Andrea F. Abate, Michele Nappi, Stefano Ricciardi, Maurizio Tucci
Università degli Studi di Salerno, Dipartimento di Matematica e Informatica 84084 Fisciano (Salerno), Italy
{abate, mnappi, sricciardi, mtucci}@unisa.it
ABSTRACT - Virtual reality (VR) is today mostly used for applications ranging from entertainment to interactive simulation and scientific visualization, but it can also play an important role to implement new paradigms for cultural heritage fruition and dissemination. In this paper we present a framework aimed to navigate and to interact with 3D photo-realistic virtual worlds populated by believable characters through an advanced interface exploiting wireless 6 DOF (degrees of freedom) head and hand motion tracking. The proposed approach does not rely on real-time rendering but is based on high resolution stereoscopic pre-rendered content instead. In this scheme, to navigate through the environment and to interact with its object and characters basically means to visit a graph. This methodology, though limiting in term of action freedom could be effectively used for VR applications in fields such as Edutainment and Cultural Heritage. We show the proposed framework applied to the virtual reconstruction of the Colosseum during gladiator fighting in imperial Rome.
1. INTRODUCTIONTridimensional computer graphics represents a challenging research area of information technology, whose commercial and industrial applications are continuously growing. Technical achievements in modeling, rendering and animation, have been vastly exploited in fields like design/prototyping, cinema digital effects, scientific and architectural visualization, videogames and Virtual Reality (VR). Thanks to the revolution operated by Graphical User Interface (GUI) based operative systems, the above mentioned applications were empowered by (and partly responsible for) continuous innovation in both hardware (graphics boards, local/high speed buses, vector processing capable CPUs, multi-pipelined GPUs, etc.) and software (3D engines, VRML, OpenGL and DirectX graphics libraries, etc.). Indeed, vast diffusion of graphics based applications has been one of the main reasons (at least from
a technical point of view) for research and development of many architectural enhancements which characterize most computers today, as shown by the most used PC or workstation benchmarks which are usually based on 3D intensive tasks like polygonal based rendering. Even if this scenario suggests that today any user could expect photo-realistic 3D VR applications on PC or even just on dedicated hardware, this is not exactly true, at least not yet.
Surely most advanced videogame engines coupled with the latest CPU and GPU technology can produce stunning graphics, but if polygonal detail and image resolution exceed a certain amount, like in large screen visualization for example, the illusion vanishes. Even highly expensive dedicated hardware, such as multi-GPUs based solutions suited for real-time flight or astronomical simulation could not address highly detailed complex characters and environments rendered at cinema-quality by the most sophisticated shading, lighting and animation techniques.
So, though certainly the next generations of specialized hardware will bring even more processing power to VR applications, at this moment a trade-off in terms of visual quality and/or scene complexity is still necessary. This study presents a VR framework offering virtually unlimited visual quality at the cost of a constrained interactivity, and results best suited for edutainment and cultural heritage applications like virtual museums, for example. It is based on a pre-rendered approach which relies on scalable, not dedicated hardware technology and on motion tracking technology to provide a more friendly and intuitive way to navigate and to interact. We applied this framework to the virtual reconstruction of the Colosseum in Rome as it is supposed to be near the first century a.C.. Different kind of fighting gladiators, including highly detailed weapons and armors, have been digitally replicated too (see Fig 1.).
This paper is organized as follows. In section 2 main approaches to VR are presented. In section 3 the proposed framework is presented in detail and applied to the case study. In section 4 the proposed methodology and its implementation is compared to other approaches. The paper concludes in section 5.
59

Figure 1. Thracian gladiator helmet. A sample of one among many highly detailed 3D models built for the case study presented. Itfeatures aging shaders and dynamically simulated feathers which would be hard to compute and realistically render in real time.
2. MAIN APPROACHES TO VRVirtual Reality paradigm is to provide user a visually believable experience in a virtual environment, interacting within it with objects and characters. In a classic geometry based approach to VR, the interaction requirement asks for a high frame rate real time rendering, while the visual realism requirement asks for high image resolution, fine geometry detail and sophisticated rendering algorithms.
Other typical VR options include stereoscopic and/or multi-screen visualization, which are even more demanding in terms of processing load. Though technology is rapidly changing the horizon with fast paced announcements of new and more powerful vector processing units or multi-pipelined architectures for parallel vertex and pixel processing, to achieve at the same time a high level of interaction and cinematographic visual quality is still not possible. The result is that, except for the entertainment domain (videogames), real-time based VR often does not live up to its promise of realism. With a completely different approach, Apple Computer Inc. released in the ‘90s the Quick Time Virtual Reality (QTVR) Application Program Interface as an extension of its QuickTime video compression technology [2]. In this Image Based Rendering (IBR) method, tri-dimensional visualization of an environment, is obtained projecting a panoramic view of it onto a cylinder (or a sphere or even a cube). This environmental map can be produced through image processing of actual wide angle photos stitched together or even by properly rendered synthetic images. Limited navigation option such as constrained camera rotations and movie branching are supported, so it is possible to build a
virtual world and within some extents to explore it, but the main limitation is that the scene has to be static, meaning that moving objects or characters are not allowed unless they are rendered into the scene in real time from conventional geometry based models. Other more sophisticated IBR approaches have been developed since then to model and render environments and particularly architectural scenes [3], even combining geometry based and image based approaches [4]. They proved to be very suited to real-time navigation in visually rich static worlds. IBR techniques have been also proposed to improve realism of complex object (statues, monuments, even characters) when they do not need to be seen closely [7], or just to reduce the geometry processing load in real-time engines. While these methods can effectively contribute to enrich real-time navigation in virtual environment, they can not yet address effectively animated environments with complex characters. The aim of the “pre-rendered” approach to VR is to realize a virtual experience through a vast collection of pre-rendered video clips accessed on-the-fly according to user interaction. This idea is not new, indeed in the past, different technologies were proposed for interactive video content fruition when real-time rendering was simply not an option. The Interactive Video Disk (IVD), presented in the first half of ‘80s was the first optical support to allow the storage of a big amount of visual data either as still images or broadcast quality video.
The IVD capability to randomly access a particular frame or video clip within a fraction of a second, was responsible for its usage as interactive video platform in a few entertainment applications as well as for training and educational purposes implementing a simple interaction on
60

digitized footage [6]. Since one of the most stable IT trends in the last decade has been price reduction of mass storage coupled with a huge increment in both memory space and performances, we have now the opportunity to revisit the IVD concept of video interaction overcoming many of its original limits. Indeed, is now possible to record and play hours of uncompressed high definition video content, even stereoscopic, accessing any point of a given clip randomly without any noticeable lag, simply through a head and/or hand motion. So, for applications in which visual realism is critical, while complete freedom of action is not a strict requirement, pre-rendering could represent an interesting alternative to real-time VR. This is the idea behind the system described in the following section.
3. PROPOSED FRAMEWORKThe main aim of the proposed framework is to allow the interactive fruition of rich virtual worlds making content creators free to exploit even the most realistic (and computing expensive) techniques for modeling, animation and rendering, without any constraints in terms of scene or character complexity. On the other hand, since a pre-rendering based approach limits interactivity, we want to reduce this disadvantage through effective system design and an intuitive interface, using smart techniques derived from videogame development. The whole system is exposed in the following subsections 3.1 to 3.4.
Figure 2. Schematic view of the proposed architecture.
3.1 Graph Based Navigation The foundation of our proposal is the development of a pre-rendered virtual world in which user can navigate following pre-built paths and performing available actions through a context sensitive motion tracking based interface.
In Fig. 2 a schematic view of system’s architecture is shown. The entire virtual world, is a collection of video clips stored on a high performance server, including every scene, eventually viewed from any allowed angle, and every path from one scene to another. In other terms such a virtual world can be visualized as a graph whose nodes represents scenes and whose oriented arches represent available paths which lead user from scene to scene. Any node or arch is uniquely identified with a tag pointing to the start frame of the corresponding clip. There can be various types of scene-nodes and various type of path-arches as shown in Fig. 3. Solid circled nodes, represent scenes in which user’s point of view is fixed, dash circled nodes represent scenes in which the camera can rotate along one axis, while in scene corresponding to dot circled nodes the camera can rotate along two axis. Every arch coming out from a scene-node equals to an action available to user at that precise point of the virtual experience.
Mono-directional arches only allow to move from source node to destination node according to the direction of the arrow, bi-directional arches represent a single clip that can be played in both direction, whereas two parallel mono-directional arches represent that a path is reversible, but only through two different clips. The heart of this system is the navigation engine, implementing a real time video editing application which, based on the virtual world design and on user’s input plays the correct video clip for a given context. Thanks to the underlying hardware technology (detailed in the following subsection), clips previously rendered to be jointed at specific time position are seamlessly played. In this way the navigation and interaction results in a pseudo real-time experience. For instance, since the hardware architecture is able to play a video sequence in both direction, user can smoothly change his viewpoint (on a given axis) simply playing a circular seamless pre-rendered animation if that option is available for that particular scene-node.
3.2 Hardware Architecture The hardware equipments necessary for this architecture to work effectively, are tightly related to the requested image resolution and to the number of clips present in the World-Graph (including all layers if any). Typical system configuration (for an output resolution up to 2K+ pixels) requires a RAID-0 server equipped with an array of SATA or Ultra SCSI hard-disks, each one featuring high RPMs and 8-16 MBytes buffer for more efficient read and write operations. As RAID-0 operative modality implements a parallel access to all mounted drives this results in a single virtual disk whose capacity and transfer rate are the sum of the correspondent values of all physical drives. A total of 2-3 TBytes of storage space is not unusual allowing to play
Motion Tracking Navigation Engine
Pre-rendered Content
RAID-0 Storage
Graphic Sub-SystemStereo Projection
61

up to hours of high resolution uncompressed content with a sustained transfer rate of up to 300+ Mbytes/sec.. The navigation software run on the video server as it has a very low computing load since images are stored uncompressed, therefore it does not need special hardware or powerful processors. However, as high speed data exchange between storage sub-system and video frame-buffers is crucial for this architecture, 2 GBytes of RAM (used as content buffer) and a fast system bus (PCI-Express) are required.
The graphic subsystem is based on a workstation class graphic board which is not used for polygon processing but for its high pixel fill-rate, driving simultaneously two monitors or projectors in passive stereo, or just one in active stereo through a quad buffered output.
Figure 3. Sample graph fragment of a pre-rendered world. Solid nodes, represent scenes in which user’s point of view is fixed, dashed nodes represent scenes in which the camera can rotate along one axis, while in scene corresponding to dotted nodes the camera can rotate along two axis.
3.3 Motion Tracking Based Interface User interaction is accomplished through a motion tracking system, which detect the hand and/or head position in 3D space, plus their rotation on three axis for up to 6 degrees of freedom. In our experiments we used the IS 900 ultrasonic based motion tracking hardware from Intersense corp. (see Fig. 5), able to precisely acquire and process motion data coming from each of two wireless devices the user can wear: an head tracker and a joypad. The keypad features programmable multi button interface and an analog joystick which can be used to trigger specific actions. In our implementation we developed an iconic context dependent graphical interface showing either actions or camera options available at a given stage of navigation.
These icons appear as an overlay drawn in real time over the video content (see Fig 5a), and allow the user to visualize not only which option is available (to change the viewpoint, to move forward or backward, to choose a new path, etc.) but even how to select it. In fact the user can select the desired action simply moving the head toward the corresponding icon and confirming the selection via the wireless keypad (a color based button-icon correspondence and an animated confirmation simplify this task).
Figure 4. A frame from case study showing a realistically rendered crowd of spectators inside Colosseum.
3.4 The Framework at Work The proposed system has been used for the virtual reconstruction of the Colosseum in Rome. Thanks to the information provided by archaeologists, we realized a richly detailed digital replica of architecture, gladiators, armors and weapons. Gladiators’ faces where reconstructed starting from craniometrical data, according to recently developed methodology [1]. We exploited some of the most advanced CG techniques like sub surface scattering for skin rendering, particle based hair, virtual garment design and simulation. About 40,000 animated villains have been positioned on Colosseum’s seats (see Fig. 4), while real fighting actions has been recorded during various motion-capture sessions involving specifically trained actors. As we did not need real-time performance, we were free to use even the most demanding lighting algorithms like radiosity. The project has been optimised and rendered for active stereoscopic visualization.
4. DISCUSSIONIt is reasonable to imagine that in the next few years real-time CGI will deliver virtual experiences at near cinema quality with almost comparable content richness. If we look at the most recent videogame titles, we could conclude it is just beginning to happen. So it could seems a step back to propose a non real-time VR system in a time in which there is a lot research work about real time solutions. But in the end VR is just the art of producing a believable illusion, no matter on what approach it is based on, so it is meaningful to consider other available alternatives. It is reasonable to think that if real time CGI does not match the expectations, at least for some applications the interactivity alone could not be enough to capture user’s interest. But, on the other side, it is true that interactivity is what make VR experience potentially more involving than others, like cinema for instance. So, until technology will not be ready to offer the best of both worlds, a trade off has to be accepted, and it could also be on user’s freedom of interaction.
62

Table 1. A brief comparison of main approaches to VR
Approaches to VR Main
Features Real-Time QTVR/
IBR Proposed
Visual Quality
limited by hardware
high in static scenes
virtually unlimited
Interactivity virtually unlimited
almost none
limited by scene
design / storage space
Allowed Viewpoints
virtually unlimited
limited by source images
limited by scene
design / storage space
Animated Objects or Characters
any, but performances are affected
nono
limitation
Large/Multi Screen
Visualization
yes, but cost and
performances are affected
yes yes
Stereoscopic Visualization
yes, but performances are affected
yes yes
Dedicated Hardware
Cost
directly related to
resolution / performances
none
low, does not affect content quality
Dedicated Hardware
Obsolescence
fast, due to rapidly
changingtechnology
Nodedicatedhardware required
Slow
Content Longevity
Directly Related to HW/SW
high high
Probably, the term “freedom of interaction” itself is misleading even if it is referred to a genuine real-time simulation, because even in videogames each action the user can perform (to open a door, to run, to shot, etc.) in a given moment has been carefully planned from level designers, and usually can happen only under precise circumstances. What real-time VR really leave up to user’s will (tough there are some exceptions) is the freedom to move inside the environment looking everywhere he likes at almost any angle and zooming in and out. To this regard QTVR and IBR could produce photo-realistic visualization with a minimum hardware required, but they lack other form of interaction (i.e. to open a door is a very challenging task) and they are not suited for character animation. They could be used in a hybrid approach together to a real time system to partially overcome their limits while reducing the
geometry necessary for the backgrounds. In Table 1 there is a resume of some of the characteristics featured in the three approaches to VR presented in section 2. As the comparison shows, real-time VR provides without doubt the highest level of interaction, but visual quality is directly related to rapidly changing specialized hardware, and cost can be prohibitive for large screen productions.
Moreover the obsolescence of required hardware and software is much faster resulting in a correspondent obsolescence of the content developed. With the proposed pre-rendered approach instead, content development is decoupled from hardware characteristics (except for image resolution and clips duration) and can even be integrated later simply adding new clips (new nodes and arches to the world graph). Indeed, new powerful video synthesis techniques like graph cuts [5] could be exploited to seamlessly blend new and previous video clips, or to generate new navigation paths, as the cost of dedicated hardware is really low and is going to further reduce itself.
As for a real-time VR application the level of optimization required in every aspect of high quality content development is much greater then for pre-rendering, even the cost of the development can be higher.
On the other side, the production of hours of pre-rendered content implies the use of render-farms or cluster of hundreds of pc, a number that is almost doubled in case of stereoscopic visualization. To this regard new IBR techniques have been recently proposed to reduce considerably the extra time needed for ultra high resolution stereo rendering [8], making this option more attractive than ever. In the end, pre-rendered VR can be effectively exploited in many contexts like virtual museums, or virtual reconstruction of historical characters, which not necessarily need the advanced interaction and fast feedback of pure entertainment simulations, but could greatly benefit from unparalleled visual realism.
5. CONCLUDING REMARKSWe presented a framework for pre-rendered VR, in which to navigate through the environment and to interact with its object and characters basically means to visit a graph. In this sense, nodes represent pre-rendered video clip of a scene in the virtual world, while oriented arches represent available paths, which seamlessly lead (through the appropriate animation) from one scene to another. This approach is aimed to maximize visual quality, allowing any kind of high end modelling, animation, rendering and visualization techniques to be used for content production.
Adaptivity to user’s age or interests is another advantage offered by the proposed architecture, as the whole graph can be layered to satisfy different preferences.
The intrinsic limit of this approach, related to the pre-defined number of actions or viewpoints available in a given moment of the virtual experience, can be considered a well tolerable constraint in many applicative contexts and can be mitigated, adding new clips as, today, storage cost and space is not a bottleneck anymore.
63

Figure 5a-5b. (a) The framework at work in the VR laboratory of DMI. The ceiling of this facility is equipped with ultrasonic based motion tracking emitter/receivers from Intersense Corp.. The retro-projection system support active stereoscopy. Navigation icons are displayed in the upper side of the screen. (b) The user wearing IR-controlled LCD Shutter Glasses, 6DOF head motion tracker (wired to a pocket wireless transmitter), and 6DOF hand motion tracker plus wireless joypad.
The proposed framework produced interesting results on the case study, proving this approach to be really suited for (but not limited to) applications like virtual museums and historical reconstructions. Therefore, even if we believe real-time rendering is the future of VR, there are still many interesting things we can do with pre-rendering meanwhile.
6. REFERENCES[1] A.F. Abate. M. Nappi, S. Ricciardi, G. Sabatino “3D
Face Reconstruction from Skull Aimed to Archaeological Applications. The Site of Murecine: a Case Study”, Proceeding of VAST2004: The 5th International Symposium on Virtual Reality, Archaeology and Cultural Heritage, ACM/Eurographics, Brussels, Dicember, 2004, pp. 185-191.
[2] S. E. Chen, QuickTime VR - An Image-Based Approach to Virtual Environment Navigation, Computer Graphics, Proceedings of SIGGRAPH 95, 1995, pp. 29-38.
[3] P. Debevec, G. Borshukov, and Y. Yu. Efficient View-Dependent Image-Based Rendering with Projective Texture-Mapping. 9th Eurographics Workshop on Rendering, Vienna, 1998.
[4] P. Debevec, C. J. Taylor, and J. Malik., Modeling and Rendering Architecture from Photographs: A Hybrid Geometry- and Image-Based Approach. In SIGGRAPH 96 Conference Proceedings, 1996.
[5] Vivek Kwatra Arno Sch¨odl Irfan Essa Greg Turk Aaron Bobick, Graphcut Textures: Image and Video Synthesis Using Graph Cuts, ACM Proceedings of SIGGRAPH' 2003.
[6] Lippman, A. Movie Maps: An Application of the Optical Videodisc to Computer Graphics. Computer Graphics(Proc. SIGGRAPH’80), pp. 32-43.
[7] G. Papaioannou, A. Gaitatzes, D. Christopoulos, Enhancing Virtual Walkthroughs of Archaeological Sites, Proc. of ACM/Eurographics VAST 2003, Brighton, UK, 2003.
[8] H. S. Sawhney, Yanlin Guo, K. Hanna, R. Kumar, Sean Adkins, Samuel Zhou, Hybrid Stereo Camera: An IBR Approach for Synthesis of Very High Resolution Stereoscopic Image Sequences, Proceedings of SIGGRAPH'2001.
64

Abstract— We developed a multimedia conferencing system
using IPv6/IPv4 multicasting for real-time distance education that enables video, audio, and pointing information to be shared. It supports multiple telepointers that provide group awareness information and makes it easy to share interests and attention. In addition to pointing with the telepointers, it allows users to add graphical annotations onto video and share these with one another. It also supports attention sharing using video processing techniques.
The system includes a sender application, a receiver application, a multipoint viewer, a recording/replaying/relaying tool and a voting application, along with the remote control tools for these. A modular design enables the system to adapt flexibly to various configurations with different numbers of displays and different resolutions at multiple sites. Moreover, the remote control applications help the chairperson or conference organizer to simultaneously change the settings of a group of applications distributed at multiple sites.
Index Terms— Awareness, collaborative work, remote management, flexible configuration, multimedia communication
I. INTRODUCTION The National Institute of Multimedia Education (NIME) operates a multipoint videoconferencing system, for education and research using satellite communications, called the Satellite Collaboration System (SCS) [11], which is based on H.261. SCS has one hub station at NIME and 150 VSAT stations at universities and research institutes across Japan. We are working to develop the next-generation IP-based system for large-scale distance education.
Conventional videoconferencing standards using IPs, such as H.323 [5], are widely used, and commercial videoconferencing products based on H.323 are widely available. Microsoft NetMeeting [12], GnomeMeeting [13], and other video conferencing software systems can also be used on personal computers. These systems can be used in
SCS; however, they are inadequate and inefficient to enable large-scale distance education. In the following, we will explain why conventional systems are inadequate and inefficient for large-scale distance education, especially through satellite communications.
Conventional videoconferencing systems do not provide group-awareness information to participants. Group- awareness information allows participants to understand the situations and intentions of others. There are various methods of providing such information. We think that pointing and attention sharing are important in distance education. Pointing involves the use of telepointers, and attention sharing involves the use of either telepointers or video processing. Conventional videoconferencing systems only support one telepointer or none at all. The telepointer can be shared among multiple users but it is usually only controlled by one user at a time. For someone else to control the telepointer, the current user has to transfer control. In collaborative environments, transferring control is time-consuming and slows down communications. Therefore, multiple telepointers should be supported.
Systems compliant with H.323 or SIP [10] are designed for point-to-point connections. These systems can thus use neither the broadcast capabilities of satellite communications nor the multicast-capability of IPv6/IPv4 networks. They are not efficient for large-scale distance education.
Moreover, as large numbers of people can join remote lectures in distance education, differences in the settings of the system between participants can often be a problem. Instructing participants individually about the settings using video and audio is tedious and time-consuming. Remote control functions are necessary to smooth the preparation and management of remote lectures. Although general-purpose remote control software tools are available, they cannot handle multiple sites simultaneously. Remote operation functions for groups are needed in a multipoint conferencing system.
Conventional videoconferencing systems restrict display and window configurations and cannot adapt to differences in environments well. They usually support only one display. Some conventional systems are based on ITU
Multimedia Conference System Supporting Group Awareness and Remote Management
Noritaka Osawa and Kikuo Asai National Institute of Multimedia Education
2-12 Wakaba, Mihama, Chiba Japan
{osawa,asai}@nime.ac.jp
65

recommendation H.239 [6], which defines dual video stream functions, such as People+Context, and data collaboration. They support one main display and another display, but the use of dual video stream functions requires two displays at all sites. Some sites with only one display cannot participate in a conference using dual videos in the same manner. Some sites, on the other hand, have more than two displays. Multiple displays cannot be fully utilized by conventional systems even when multiple sites send and receive videos simultaneously. A conventional video conferencing system usually uses a multipoint control unit (MCU), which composes one video stream from multiple video streams and sends the composed video to receivers. The resolutions for multiple videos on the composed video with this method are inferior to the resolutions of the original videos. We think that all displays should be effectively used when multiple displays are available and multiple videos are received even if display resolutions may be different at different sites. Conventional videoconferencing systems usually display a video as a full screen or in a window. They do not allow the users to view multiple videos as multiple windows on one display. In other words, they lack flexibility in their display configuration.
Because conventional systems are inadequate and inefficient for large-scale distance education, we developed a multimedia conferencing system that supports multiple telepointers and other attention-sharing techniques, based on a videoconferencing tool called FocusShare [9]. The tool enables video, audio, and telepointers to be shared using IPv4/IPv6 multicasting and supports some attention-sharing techniques using video processing techniques. We enhanced its functionality and added new tools for distance education. The combinations of the tools and the functions efficiently support flexible display configurations.
Alkit Confero [2] is a multimedia collaboration software tool that supports synchronous audio, video, and text communication. It also supports both point-to-point and multipoint communication. Multipoint communication uses either IP multicasting or an RTP reflector and mixer. Although Confero has many functions, it does not support multiple shared telepointers, pointer labels, focus-sharing views using video processing, simultaneous display of multipoint videos, or remote control functions, which are all supported by our system. As previously explained, ITU recommendation H.239 defines dual video stream functions but our system’s capabilities exceed this recommendation.
II. TOOLS IN SYSTEM Our system provides users with real-time
collaboration-support functions in multimedia conferencing systems. It allows them to simultaneously send multiple videos, audios, and group awareness information from one site. For example, multi-angle videos can be transmitted.
One PC can simultaneously receive multi-angle videos and different PCs can receive videos captured from different angles. Whereas conventional video conferencing software systems such as NetMeeting cannot receive multi-angle videos simultaneously on one PC without the help of video mixing at the MCU because only one instance of the software can be executed on one PC.
We developed our system based on a modular design. It is not a huge unified tool but a tool suite consisting of several small tools. It is comprised of a sender, a receiver with pointer sharing, a multipoint viewer, a recording/replaying/relaying tool, a voting tool that counts pointers for simple surveys or questionnaires, a remote controller application for the sender, a remote controller application for the receiver, and a remote controller application for the multipoint viewer.
Resolution, compression methods, and transmission rates can flexibly be selected in our system. For example, high-definition video and high-fidelity audio can be transmitted. Previously developed basic features are described in detail in [9].
III. GROUP AWARENESS SUPPORT Our system supports various techniques that provide group-awareness information.
A. Telepointers A telepointer is a cursor, such as an arrow, used to indicate where a participant is pointing. It is useful to explicitly and clearly indicate interesting points or areas in question. Telepointer movements can also be used as gestures to communicate with other users. In other words, telepointers are important for sharing information through embodiment, gestures, and coordination in collaborative environments [4]. People involved in synchronous distance education and collaborative work use telepointers to promote group awareness and attention sharing [1].
Our system allows all users to have their own telepointers. They can share multiple-pointer information with other receivers in the same session. The receiver tool can transmit mouse pointer information in a multicast session. The telepointers appear in the video windows on the local receiver and other remote receivers while transmission is in progress.
Most conventional video conferencing systems do not allow users to manipulate a telepointer on a live video although some allow them to only have a telepointer for data sharing applications such as a shared whiteboard based on T.120 [7]. Moreover, most conventional systems do not allow individual users to manipulate their own telepointers simultaneously. Whereas only one telepointer can be utilized by switching users in conventional systems, our system enables the use of shared multiple telepointers on a video. This capability allows us to explicitly show points on
66

a live video being captured with a camera. For example, we can discuss a scene using telepointers on a live video being captured through a microscope in a biology lecture, but this cannot be done with conventional systems.
1) Telepointers with different appearances and labels
All telepointers can have different shapes and colors in our system. In addition to fixed or statically shaped pointers, our system offers dynamically shaped pointers to illustrate points more clearly and attract the attention of participants. A dynamically shaped pointer is similar to the projected image of a laser pointer.
Furthermore, brief labels can be specified for all pointers. As will be described, different shapes, colors, and labels can be assigned to each mouse button state. These differences make it easy to distinguish multiple pointers clearly. A label can be entered by selecting it from the history list of items that have been entered, or by typing it directly in a text field. There is a screenshot with multiple telepointers in Fig. 1.
2) Hand-raising action
Our system supports the action of hand-raising. Pressing one of the mouse buttons will cause a shape representing a hand to appear in the video windows on the receivers. This is done by assigning a different mouse button state to a pointer with a different shape, color, and label. There is a screenshot of the hand-raising action in Fig. 2.
This capability is simple yet effective for attracting attention. Conventional systems do not have this simple but effective capability. Moreover, appropriate labels assigned to buttons can clearly indicate the intentions of users.
3) Telepointer traces
Trace images of pointers can also be used. They can improve the understanding of pointing gestures [4]. When this setting is turned on, trace images of the telepointer appear in the video window on the receivers, as can be seen in Fig. 3. The transparency of the telepointer traces decreases as time passes.
B. Graphical annotation Our receiver tool also allows lines to be drawn on videos. The lines are shared with all receivers in the same session. This function can be used for simple graphical annotation, as we can see from Fig. 4. Multiple users can draw on videos simultaneously.
When the left mouse button is clicked and dragged while this setting is turned on, trails of the telepointer appear in the video window on the receivers. Clicking the right mouse button can erase the lines. Users can only erase their own drawings but not erase others’ drawings.
IV. FOCUS-SHARING DISPLAY TECHNIQUES USING VIDEO
PROCESSING In addition to telepointers, our system supports various focus-sharing display techniques using video processing. Some of these were implemented in the previous version [9], but they have been improved based on user comments. For example, zoomed regions are now enclosed in a line frame to better highlight them. Moreover, partial zooming and a mosaic display capability have been incorporated into the system. A. Partial Zooming A region of interest (ROI) in a video is extracted on the basis of the location of the mouse pointer of the sender and displayed on the receiver. There is an example of partial zooming in Fig. 5. The region enclosed by the red rectangular frame in Fig. 5(a) of a sender is transmitted to receivers, and the receivers acquire the image in Fig. 5(b).
B. Linear zooming Linear zooming is a kind of Focus+Context visualization technique [3]. An ROI of a video is extracted. The ROI is controlled by using the location of the mouse pointer and is overlaid on the video. There is an example of linear zooming in Fig. 6. The ROI is enlarged, but an overview can also be seen. However, some of the ROI’s surroundings are hidden by the ROI and cannot be seen.
Fig. 1 Multiple telepointers
Fig. 2 Hand-raising action with labels
Fig. 3 Telepointer traces
Fig. 4 Graphical annotation
67

(a) Sender (b) Receiver
Fig. 5 Partial zooming
C. Non-linear zooming Non-linear zooming is also a kind of Focus+Context visualization technique. An extracted part of a video is displayed at the original resolution in a smaller window. The surroundings of the extracted video are non-linearly reduced and displayed. This type of zooming displays not only the zoomed region but also its surroundings. The non-distorted portion of the video moves depending on the location of the mouse pointer of the sender. There is an example of non-linear zooming in Fig. 7. This display does not hide any regions although there is some distortion.
D. Videos composed of different qualities This technique provides users with a high-quality ROI and low-quality surroundings. The sender transmits both an overview low-resolution video and a focused high-resolution region of the overview video with this technique. The focused region is extracted on the basis of the location of the pointer. The receiver composes a combined view from these using the pointer location information.
If a codec capable of specifying an ROI and encoding a video appropriately is available, we can use it. However, such codecs are not readily available. Therefore, the sender must encode videos with different qualities and transmit them to the receiver, which can compose one video with a high-quality ROI from two videos. Moreover, different frame rates can be assigned to different regions in our system.
The position of the high-resolution portion of the video varies depending on the mouse pointer location of the sender. This function is used to achieve a Focus+Context display and decrease the necessary bandwidth. Fig. 8 has an example of videos composed of different qualities.
E. Video with mosaiced area Part of a video can be concealed with a mosaiced area as shown in Fig. 9. The mosaiced area can be controlled by the location of the mouse pointer of the sender.
This function can be used to hide answers in quizzes. Conventional systems allow a window to be hidden but do not support partially hidden windows whose positions can be controlled by mouse movement.
V. SUBJECTIVE EVALUATION OF FOCUS-SHARING TECHNIQUES
We conducted an experiment to evaluate the focus-sharing techniques implemented in the system. In this evaluation, we focused on the focus-sharing of a sender and a receiver.
Fifteen subjects took part in the experiment. They read the system’s user manual and then used it both as a lecturer at a sender site and as a student at a receiver site, and answered a questionnaire about the techniques. The subjects rated each item on a scale of 1 (strongly disagree) to 5 (strongly agree). In other words, the questionnaire was presented in the form of a five-point Likert scale. The subjects also made free comments about the system.
A. Focus-sharing display techniques using video processing We first asked the subjects to evaluate focus-sharing display techniques using video processing. The questions are listed in Table 1. Figures 10 and 11 show respective average ratings of subjective evaluations as a lecturer at a sender site and as a student at a receiver site.
The answers to Questions A, B, and C reveal the subjects preferred the focus-sharing techniques used in the system over ordinary video without focus-sharing techniques (without ROI) when they wanted to indicate a region of interest. The scores for Question F indicate that linear zooming was the most preferred technique at the receiver side. The scores also disclose that non-linear zooming was not preferred as much as other zooming techniques and ordinary video without ROI.
Fig. 6 Linear zooming
Fig. 7 Non-linear zooming
Fig. 8 Videos composed of
different qualities
Fig. 9 Video with mosaiced
area
68

Non-linear zooming is considered to be a smart and effective technique for distortion in information visualization, but, in this experimental evaluation, it was not preferred for video communication of actual scenes. One reason is that actual scenes have natural dimensions and any distortion of these is perceived as unnatural. The data for information visualization, on the other hand, does not have natural dimensions and distortion does not affect user preferences.
The technique that received the best score for all questions varied. This indicates that various focus-sharing techniques are necessary to satisfy the various demands users have. The developed system supports various focus-sharing techniques and satisfies user demands more fully than conventional video conferencing systems, which support only one focus-sharing technique or none at all.
Table 1 Questions with respect to focus-sharing display techniques using video processing
Items Questions A Can it indicate ROI quickly? B Can it indicate ROI precisely? C Can it indicate ROI intelligibly? D Can it indicate surroundings for ROI? E Can it show overview? F Is it good from general viewpoint? G Does it result in less fatigue? H Are you satisfied with it? I Do you want to use it? J Is it interesting?
1.01.52.02.53.03.54.04.55.0
A B C D E F G H I JQuestions
Sco
res
Without ROI Partial zoomingLinear zooming Non-linear zoomingVideo with mosaiced area Videos composed of different qualities
Fig. 10 Average ratings for subjective evaluation as lecturer at sender side
1.01.52.02.53.03.54.04.55.0
A B C D E F G H I JQuestions
Sco
res
Without ROI Partial zoomingLinear zooming Non-linear zoomingVideo with mosaiced area Videos composed of different qualities
Fig. 11 Average ratings for subjective evaluation as student at receiver side
B. Telepointers and graphical annotations The subjects evaluated telepointers and graphical annotations as a means to indicate a point of interest (POI). They comparatively evaluated video conferences without telepointers or graphical annotation, with telepointers, and with both telepointers and graphical annotations.
Table 2 lists questions with respect to telepointers and graphical annotations. Fig. 12 shows the average ratings for telepointers and graphical annotations with standard deviation error bars. The results indicate that telepointers were useful for showing a POI, and graphical annotations also contributed to enhance the subjective evaluation.
Table 2 Questions with respect to telepointers and graphical annotations
Items Questions K Can it indicate POI quickly? L Can it indicate POI precisely? M Can it indicate POI intelligibly? N Is it good from general viewpoint? O Are you satisfied with it? P Do you want to use it? Q Is it Interesting?
1.01.52.02.53.03.54.04.55.05.5
K L M N O P QQuestions
Sco
res
No telepointers Telepointers Telepointers and graphical annotations
Fig. 12 Average ratings for telepointers and graphical annotations
C. Overall comparison of conventional video conferencing systems and ours The subjects also comparatively evaluated conventional video conferencing systems and ours. Table 3 lists the questions for overall comparison and Fig. 13 plots the average ratings for answers with standard deviation error bars.
The results demonstrated that our system was evaluated more positively than those for conventional video conferencing. The differences between them with respect to usability, i.e., Question S, were not large. This means that our system has more functionalities than the conventional systems but it is as easy to use as they are.
69
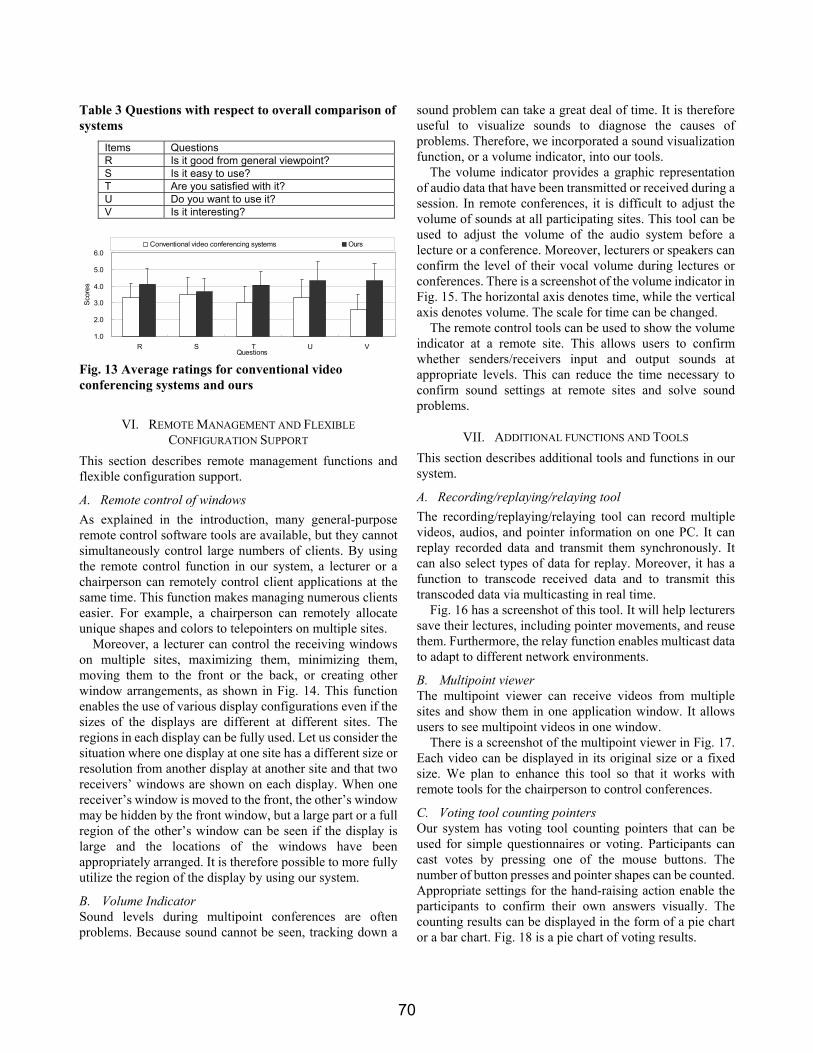
Table 3 Questions with respect to overall comparison of systems
Items Questions R Is it good from general viewpoint? S Is it easy to use? T Are you satisfied with it? U Do you want to use it? V Is it interesting?
1.0
2.0
3.0
4.0
5.0
6.0
R S T U VQuestions
Sco
res
Conventional video conferencing systems Ours
Fig. 13 Average ratings for conventional video conferencing systems and ours
VI. REMOTE MANAGEMENT AND FLEXIBLE CONFIGURATION SUPPORT
This section describes remote management functions and flexible configuration support.
A. Remote control of windows As explained in the introduction, many general-purpose remote control software tools are available, but they cannot simultaneously control large numbers of clients. By using the remote control function in our system, a lecturer or a chairperson can remotely control client applications at the same time. This function makes managing numerous clients easier. For example, a chairperson can remotely allocate unique shapes and colors to telepointers on multiple sites.
Moreover, a lecturer can control the receiving windows on multiple sites, maximizing them, minimizing them, moving them to the front or the back, or creating other window arrangements, as shown in Fig. 14. This function enables the use of various display configurations even if the sizes of the displays are different at different sites. The regions in each display can be fully used. Let us consider the situation where one display at one site has a different size or resolution from another display at another site and that two receivers’ windows are shown on each display. When one receiver’s window is moved to the front, the other’s window may be hidden by the front window, but a large part or a full region of the other’s window can be seen if the display is large and the locations of the windows have been appropriately arranged. It is therefore possible to more fully utilize the region of the display by using our system.
B. Volume Indicator Sound levels during multipoint conferences are often problems. Because sound cannot be seen, tracking down a
sound problem can take a great deal of time. It is therefore useful to visualize sounds to diagnose the causes of problems. Therefore, we incorporated a sound visualization function, or a volume indicator, into our tools.
The volume indicator provides a graphic representation of audio data that have been transmitted or received during a session. In remote conferences, it is difficult to adjust the volume of sounds at all participating sites. This tool can be used to adjust the volume of the audio system before a lecture or a conference. Moreover, lecturers or speakers can confirm the level of their vocal volume during lectures or conferences. There is a screenshot of the volume indicator in Fig. 15. The horizontal axis denotes time, while the vertical axis denotes volume. The scale for time can be changed.
The remote control tools can be used to show the volume indicator at a remote site. This allows users to confirm whether senders/receivers input and output sounds at appropriate levels. This can reduce the time necessary to confirm sound settings at remote sites and solve sound problems.
VII. ADDITIONAL FUNCTIONS AND TOOLS This section describes additional tools and functions in our system.
A. Recording/replaying/relaying tool The recording/replaying/relaying tool can record multiple videos, audios, and pointer information on one PC. It can replay recorded data and transmit them synchronously. It can also select types of data for replay. Moreover, it has a function to transcode received data and to transmit this transcoded data via multicasting in real time.
Fig. 16 has a screenshot of this tool. It will help lecturers save their lectures, including pointer movements, and reuse them. Furthermore, the relay function enables multicast data to adapt to different network environments.
B. Multipoint viewer The multipoint viewer can receive videos from multiple sites and show them in one application window. It allows users to see multipoint videos in one window.
There is a screenshot of the multipoint viewer in Fig. 17. Each video can be displayed in its original size or a fixed size. We plan to enhance this tool so that it works with remote tools for the chairperson to control conferences.
C. Voting tool counting pointers Our system has voting tool counting pointers that can be used for simple questionnaires or voting. Participants can cast votes by pressing one of the mouse buttons. The number of button presses and pointer shapes can be counted. Appropriate settings for the hand-raising action enable the participants to confirm their own answers visually. The counting results can be displayed in the form of a pie chart or a bar chart. Fig. 18 is a pie chart of voting results.
70

(a) Remote controller application
menu
(b) Window control menu in remote
controller application
Fig. 14 Remote controller application for receiver
Fig. 15 Volume indicator
Fig. 16 Recording/replaying/
relaying tool
Fig. 17 Multipoint viewer
Fig. 18 Pie chart display of voting
tool
D. Screen image transmission Our system enables a user to capture screen images at high resolution and transmit them to others. Dynamic images of the screen can be transmitted. Using an appropriate codec, or a lossless codec, the received images will be the same as the sent images. The frame rate for the captured images can be specified.
This function can be used to transmit screen images showing presentation graphics, such as those in Microsoft PowerPoint, Apple Keynote, or Lotus Freelance. Fig. 19 has a screenshot of a PC running Windows XP. Its screen has a window displaying the captured screen of a Macintosh running Safari browsers.
Fig. 19 Received PC screen
E. Sender/receiver status monitor The tools in our system can monitor and display the status of transmissions. Fig. 20 is a screenshot of a receiver monitor. Monitoring functions are useful for determining the status of networks and diagnosing network problems.
Fig. 20 Receiver status monitor
F. Captions Our system enables users to easily add captions to pointers and videos. In this subsection, we will describe how captions are added to videos.
When multiple videos are used, captions are useful for distinguishing one video from another. A caption of up to 30 double-byte characters can be specified for each video. The specified caption is then transmitted from the sender to the receiver, where it appears overlaid in the video window on the receiver. It is usually displayed at the bottom-center of the window. There is an example of a video caption on a receiver in Fig. 21.
Because a video caption hides part of the video, our system allows users to turn captions on and off. Furthermore, history functions, which will be described later, allow users to easily revert to previous captions.
Fig. 21 Video with caption
71

G. Insertion of video and audio clips The sender tool allows users to insert video and audio clips into transmissions. This function can be used to insert instructional videos, background music (BGM), and other clips.
When a video clip is inserted, the specified clip is input instead of the default video source, which is usually a camera or a screen capture module. After the video clip is viewed, the sender returns to a previously selected video source. Video clips in MPEG and AVI formats can be inserted in the current version of the sender tool.
When an audio clip is selected, sound is transmitted. Users can mix the audio clip with the captured audio feed or play the clip by itself. Repeating a replay of the clip is possible. Mixing a repeating audio clip with a captured audio feed can be useful for combining audio feeds with BGM. WAV and MP3 formats are supported in the current version.
H. History All the tools have history functions to simplify software operations. Recent operations are saved in the tool history, which is listed in menus. Users can choose menu items to perform previous operations again. This can reduce the need to repeat operations. For example, if a user wants to switch between video captions, they can easily be switched using an operation history item.
I. Internationalization The tools have a language configuration file allowing user interfaces to be displayed in various languages. The file can customize the way menus are displayed in the selected language. Moreover, the tool provides built-in support for Japanese and English. There is an example of Japanese language settings in Fig. 1, while there is an English language example in Fig. 2.
VIII. EXPERIENCE We used the system in several experiments. One
experiment was conducted between international institutes using satellite communications [8]. Four institutes took part in the experimental multipoint conference: the Institut Teknologi Bandung in Indonesia (ITB), the University of the South Pacific at Suva in Fiji (USP), Chiang Mai University in Thailand, and the National Institute of Multimedia Education in Japan (NIME).
The tools were also used for distance education between an indoor room and an outdoor farm using three-dimensional videos. The tools were useful in giving an experimental lecture using three-dimensional videos. Our experiments demonstrated the effectiveness of our system for point-to-point and multipoint conferencing.
IX. CONCLUSION We developed a multimedia conferencing system
enabling real-time collaboration between multiple sites. It supports group awareness and graphical annotations to permit efficient remote collaboration. The evaluation revealed that the focus-sharing techniques employed in the system are useful in various situations. The system includes various useful tools and remote management functions for distance education and remote collaborative work. Moreover, it can adapt to various configurations flexibly. Our system can assist in advancing synchronous distance education and collaborative learning.
We plan to incorporate new tools to allow remote collaboration that will enhance our system’s functions. We also intend to evaluate all of its features more extensively.
X. ACKNOWLEDGEMENTS This research was partially supported by a Grant-in-Aid
for Scientific Research (17300281) in Japan. We would like to thank Mr. Norio Takase for working with us in developing the FocusShare tool.
Some versions of FocusShare can be downloaded at Open.NIME (http://open.nime.ac.jp/) or http://www.nime.ac.jp/~osawa/focusShare/index-e.html.
XI. REFERENCES [1] J. Adams, B. S. Rogers, S. C. Hayne, G. Mark, J. Nash, and L. J.
Leifer, “The effect of a telepointer on student performance and preference,” Comps. & Educ., Vol. 44, No. 1, pp. 35–51, Jan. 2005.
[2] Alkit communications, Alkit Confero, <http://w2.alkit.se/confero/>. [3] S. K. Card, J. Mackinlay, and B. Shneiderman, Readings in
Information Visualization - Using Vision to Think, Morgan Kaufmann, 1999.
[4] C. Gutwin and R. Penner, “Improving interpretation of remote gestures with telepointer traces,” Proc. of 2002 ACM Conf. on Comp. supported cooperative work, pp. 49–57, 2002.
[5] ITU-T, Recommendation H.323, Packet-based multimedia communications systems, Series H: Audiovisual and multimedia systems, infrastructure of audiovisual services – Systems and terminal equipment for audiovisual services.
[6] ITU-T, Recommendation H.239, Role management and additional media channels for H.300-series terminals, Jul. 2003.
[7] ITU-T, Recommendation T.120, Data protocols for multimedia conferencing, Jul., 1996.
[8] N. Osawa, T. Shibuya, K. Yuki, K, Kondo, U. Sastrokusumo, T. Komolmis, and H. Kuroiwa, 8th IASTED Int. Conf. on Comp. and Adv. Tech. in Educ. (CATE 2005), pp. 41–46, Aug. 2005.
[9] N. Osawa, "Multipoint Remote Focus Sharing Tool: FocusShare," 8th IASTED Int. Conf. on Internet & Multimedia Sys. & Apps. (IMSA 2004), pp. 379–384, Aug. 2004.
[10] J. Rosenberg, H. Schulzrinne, G. Camarillo, A. Johnston, J. Peterson, R. Sparks, M. Handley, and E. Schooler, SIP: Session Initiation Protocol, RFC 3261, Internet Soc., Jun. 2002.
[11] K. Tanaka and K. Kondo, Configuration of Inter-University Satellite Network (Space Collaboration System), Trans. IEICE D-I, Vol. J82-D-I, No. 4, pp. 581–588, Apr. 1999 (in Japanese).
[12] Microsoft, NetMeeting, http://www.microsoft.com/windows/netmeeting/
[13] GnomeMeeting, http://www.gnomemeeting.org/
72

Log-Analysis based Characterization of Multimedia Documents for EffectiveDelivery of Distributed Multimedia Presentations
Maria Luisa Sapino
Universita di [email protected]
K. Selcuk Candan
Arizona State [email protected]
Paola Bertolotti
Universita di [email protected]
Abstract
In a distributed environment, media files have to bedownloaded, coordinated, and presented to the clients, ac-cording to the specifications given by the authors of multi-media documents. We present a server-side logO middle-ware which learns the structure of a multimedia presen-tation only by accessing traces of presentations, and con-structs an automaton which captures the dynamic aspects ofthe evolution of the document, relevant for the optimizationof the presentation delivery, prefetching, and scheduling.
1. Introduction
Multimedia documents are collections of media objects,synchronized through temporal and spatial constraints. Ina distributed environment, where media servers and clientsare dispersed, objects have to be requested, received, coor-dinated, and presented to the clients. Content servers arelargely ignorant of the high-level presentation semantics,but can only observe media les that are requested by anddelivered to the client for presentation through lower-levelnetwork protocols. These include control protocols, such asRealtime Streaming Protocol (RTSP) and Realtime ControlProtocol (RTCP), and transport-level protocols, such as Re-altime Transport Protocol (RTP). In particular RTSP [20],an application-level client-server protocol, allows timingand control of multimedia streams. After receiving infor-mation about the available media (such as addresses, ports,formats) through a DESCRIBE request and after setting upa session through a SETUP message, the client can requestmedia (or parts of the media) through PLAY requests. Themedia are then streamed to the client using RTP.
A high-level understanding of the synchronization se-mantics, on the other hand, can be essential for effectivedelivery of presentations [19, 24, 22, 9, 6]: improving thedelivery of presentations through intelligent scheduling ofdata accesses to the secondary storage, prefetching andbuffering of the media objects, or even adapting/replacingpresentation fragments can be possible only if advanceknowledge about the presentation speci cations is avail-able. Since this information is not available below the pre-
sentation level in the hierarchy, traditional work in this areaeither (a) assumed that intelligent scheduling is being doneat the client level [6] or (b) relied on less-informed access-clustering or popularity-based prefetching (such as [16])techniques to help improve content delivery.
In this paper, we note that both of these approaches havetheir shortcomings. The rst approach is naturally more in-formed than the second one; however, it is limited to onlyclient-side optimizations. Furthermore, such analysis canbe extremely dif cult in the presence of documents spec-i ed according to different reference models. Most im-portantly, even when presentation constraints are available,when there are alternative presentation plans available to theusers, such user preferences can not be directly estimatedusing the client-side presentation semantics.
We, on the other hand, highlight that there is a third alter-native which brings together the best of the approaches: (a)a high-level understanding of presentation synchronizationcharacteristics, (b) capturing user preferences in terms ofpopularity of alternative presentation pathways, and (c) in-dependence from speci c high-level synchronization mod-els, enabling analysis even if presentations are de ned withdifferent languages. In particular, we propose to learn pre-sentation structure and the user preferences directly from itsexecution traces, observable as RTSP protocol requests.Contributions. We propose a server-side middleware,logO, for log-analysis based characterization of multime-dia documents with the ultimate goal of improving the de-livery of distributed multimedia presentations (Section 2).Note that, unlike traditional log-analysis approaches usedin various application domains, such as web-page delivery,where the goal is to learn the correlation between object re-quests, the logO middleware also has to learn the temporalsynchronization characteristics underlying the multimediapresentations. For this purpose logO relies on RTSP re-quest logs which contain information about the status of themedia objects and the time instants in which changes takeplace. Then, by using the trace available in the logs, logOconstructs an automaton capturing the dynamic evolution ofa document, relevant for effective delivery (Section 3).
73

AutomatonModel
ClientClient ClientClient
logO Request Loggerand Analyzer
Network (HTTP and RTSP)
ClientClient ClientClient
logO Prefetch & Scheduler
AutomatonModel
Network (TCP and RTP)
(a) Request event logging (b) Model-based informed deliveryFigure 1. Overview of the logO middleware: (a) the request logger and analyzer listens to the RTSP requests that servers arereceiving and integrates these requests into a state automaton and collects appropriate statistics, (b) this automaton and the associatedstatistics are then used for giving intelligent prefetching and scheduling decisions for effective delivery of presentations
A particular challenge logO faces is that different execu-tions of the same presentation can vary in their evolutiontraces. Thus, logO rst approximates traces by collaps-ing to the same time instant events possibly occurring atvery close, but distinct, times. To identify quite similar, butslightly different executions of the same presentation, logOrelies on appropriate temporal similarity metrics. When-ever possible, logO merges the paths that are the same up toa certain state and introduces non-linear alternatives when-ever different evolutions are identi ed.
2. Overview of the logO Middleware
logO is a server-side middleware. In order to learn thepresentation structure, it listens to the RTSP requests thatservers are receiving and integrates these requests into anintegrated state automaton (Figure 1(a)). As it constructsthe automaton, logO collects appropriate statistics regardingclients’ preferred access patterns over this structure, to en-able effective prefetching and scheduling decisions for im-proved delivery of presentations (Figure 1(b)).
Presentations can contain static (such as images and text)or streaming objects, which need to be presented smoothlyto the user. The objects can be fetched using different trans-port protocols: static objects can be requested using HTTPand delivered using TCP. Since HTTP requests are not refer-enced against a timeline, streaming objects (or objects thatneed to be synchronized against a timeline), on the otherhand, are generally requested using RTSP and delivered us-ing RTP. A sample RTSP request is presented below:PLAY rtsp://aria.asu.edu/audioobj RTSP/1.0
CSeq: 715Session: 12567Range: npt=10-25;time=20060324T164800Z
Here, CSeq is a counter incremented for each distinct re-quest, Session is the session ID for this request, and Rangestates that the server will play seconds 10 through 25 of themedia. The Time entry speci es when the server should startthe playback (in this case at 16:48 on 03/24/2006). There-
fore, by listening to the requests, logO can observe the tim-ing characteristics of the multimedia presentations.
The logO middleware needs to accommodate for thefacts that (a) some media objects in the presentation maybe requested by the client through other sources that are notbeing logged by logO and (b) request traces can vary dueto user interactions or dynamicity of the system states. The rst issue is naturally handled by logO in that the automa-ton created using available logs will re ect the portion of themedia presentation that need to be delivered from relevantservers. The second issue, on the other hand, requires anautomata merging mechanism which can handle variationsin request traces (Section 3.2).3. Learning Presentation Structures
Without getting into the details of the HTTP and RTSPrequest formats, let us consider a simpli ed log format,where each entry is a record of the form 〈t,m, ev〉. Here,t is a (middleware) time instant, m is a media object, andev ∈ {st, end} is an event1 that has occurred, possiblychanging the state of the media m. As an example, con-sider the following event trace:
Example 3.1 (Event Trace)15:11:03:863 intro st 15:29:07:019 descr end15:11:03:891 logos st 15:29:07:052 image1 st15:14:05:129 intro end 15:29:07:059 image2 st15:14:05:133 logos end 15:35:07:021 image2 end15:14:05:150 artist st 15:35:07:128 image1 end15:19:06:997 artist end 15:35:07:400 concl st15:19:07:016 descr st 15:40:08:638 concl end
• The record hh:mm:ss:ms m st means that mediam has started at time instant hh:mm:ss:ms.
• The record hh:mm:ss:ms m end means that pre-sentation of the media m has ended at time instanthh:mm:ss:ms.
Events are simultaneous if they occur at the same time in-stant. Unfortunately, the sequential nature of the request
1For simplicity of discussion, in this paper, we ignore complex events,such as the distinction in RTSP between termination vs. pause.
74

processor can associate distinct request time instants toevents, even when they need to occur at the same time in-stant according to the synchronization speci cations. Thus,the event traces are generally interpreted at a lower gran-ularity (a system parameter) than the millisecond levellog entries. logO treats as simultaneous all events whoserecorded times are within the granularity threshold.
In the above trace example, the time instants refer tothe middleware’s internal clock. Naturally, to extract a uni-form, normalized representation of the presentation dynam-ics, logO associate times 0 to the starting instant of any pre-sentation, and shifts all the time instants accordingly.3.1. Trace Finite State Automata
To represent the information obtained from the trace,logO introduces the notion of state of the presentation atany point in time. A presentation’s state represents the setof media that are active (i.e., being delivered) at a given timeinstant. Thus, state changes occur when at least one activemedia ends or one new media starts; i.e., they occur as aconsequence of at least one media event in the trace.
Given an event trace for a presentation P , the states andstate transitions form a trace automaton. To associate eventsto their media we use the functional notation: ev(m) repre-sents the fact that the event ev occurs on the media m.
Definition 3.1 (Trace Automaton) Let logP be the nor-malized log file tracing the events of a multimedia pre-sentation. Its associated trace automaton is the 5–tupleAUT (logP ) = 〈S, s0, Sf , T R, next〉. In the automa-ton (i) S is the set of possible states of the presentation- each state is a pair 〈id,AM〉, where id is a globallyunique identifier and AM is a set of active media; (ii) s0
is the initial state, s0 = 〈id0, ∅〉; (iii) The set of final statesis the singleton Sf = {sf = 〈idf , ∅〉}; (iv) T R is thethe set of symbols that label possible transitions. T R ={〈ev(m), inst〉 | the record 〈inst,m, ev〉 ∈ logP }2. (v)next : S × T R → S is the transition function. Given astate s = 〈id,AM〉, a set of events ev, and a time instantinst, s′ = next(s, 〈{ev}, inst〉) = 〈id′,AM \ {m ∈MI | end(m) ∈ {ev}} ∪ {m ∈ MI | st(m) ∈ {ev}}〉;
Intuitively, the new state s′ reflects the items which haveterminated or have been stopped at time instant inst (andare deleted from the set of active media, accordingly) andthe items which are starting at the same time (and thus, areinserted in the set of active media).
The states of the trace automaton are implicitly associatedwith a timeline: each state is entered at a speci c timeinstant associated with the events that cause the transitionfrom the previous state to it and is exited when the next setof events (if more than one, simultaneously) occurs.
2We denote simultaneous events with a unique compact transition〈{e0(m0),. . ., en(mn)},inst〉, where {e0(m0),. . ., en(mn)} is the setof all the simultaneous events occurring at the same time instant inst.
Example 3.2 The automaton for the trace in Exam-ple 3.1 has the following media sets and durations:AM0 = ∅ AM1 = {intro, logos} d1= 182AM2 = {artist} d2 = 31 AM3 = {descr} d3 = 600AM4 = {img1, img2} d4 = 360 AM5 = {concl} d5= 300AM6 = ∅In a sense, the trace automaton describes the evolution ofthe delivery as consequence of events in the trace.
Theorem 3.1 The automaton associated to a single (nor-malized) trace logP recognizes exactly one word,
〈e0(m0), inst0〉 . . . 〈en(mn), instn〉,which is a compact representation of the event trace logP .Compactness comes from associating to a single transition,the multiple events at the same normalized time instant.
3.2. Merging Trace Automata
The trace automaton de ned above is a chain of stateswhich re ects the information extracted from the trace ofa single presentation. Thus it recognizes a single word,which is exactly the sequence of records appearing in thegiven trace. Effective prediction for multimedia delivery,on the other hand, requires knowledge from multiple ex-ecution instances. Therefore, for proper modeling of theoverall structure of a multimedia document and for cap-turing the popularity of alternative execution plans, weneed to be able to merge related trace automata. In gen-eral, logO relies on two alternative schemes for merging.History-independent merging: In this scheme, each state inthe original automata is considered independently of its his-tory. Thus, to implement history independent merging, anequivalence relation (≡log), which compares the active me-dia content of two given states, si and sj , is suf cient for de-ciding which states are compatible for being merged. Themerge algorithm produces a new automaton in which themedia items in the states are (representatives of) the equiv-alence classes de ned by the ≡log relation. The label ofthe edge connecting any two states si and sj includes (i)the event that induced the state change from a state equiv-alent to si to a state equivalent to sj in any of the mergedautomata, (ii) the duration associated to the source state,and (iii) the number of transitions, in the automata beingmerged, to which (i) and (ii) apply. The resulting automatonmay contain cycles. Note that the transition label includesthe counting of the number of logged instances where a par-ticular transition occurred in the traces. The count labels onthe transitions provide information regarding the likelihoodof each transition. In a sense, the resulting trace automatonis a timed Markov chain, where the transitions from stateshave not only expected trigger times, but also associatedprobabilities. Therefore, given the current state, the nextstate transition is identi ed probabilistically (as in Markovchains) and the corresponding state transition is performedat the time associated with the chosen state transition.
75

History-dependent merging: In this scheme, two states areconsidered identical only if their active media content aswell as their histories (i.e., past states in the chains) arematching. The equivalence relation, ≡log , compares notonly the active media content of the given states, si andsj but also requires their histories, histi and histj , to beconsidered identical for merging purposes. In particular, tocompare two histories, logO uses an edit-distance function.Possible temporal similarity functions have been describedin [25]. Unlike history independent merging, the resultingtrie-like merged automaton will not contain any cycles andthe same set of active media can be represented as differentstates, if the set is reached through differing event histories.4. Use of Merged Automaton for Prefetching
Supposing that the playout of the interactive multime-dia presentation has reached a state s in this probabilisticautomaton; to determine which objects may be needed inthe future, logO must look ahead in the automaton and esti-mate what the probabilities of possible execution paths areand which objects are contained in these paths (and when).Reachability and state likelihood analysis for caching andprefetching is commonly done for Markov chains [12]. Intrace-automata used in logO, however, one has to considernot only the state transition probabilities, but also (a) thetemporal aspects of the transitions as well as (b) the fact thatmultiple states can contain the same object. Thus, logO can-not rely on traditional Markov chain analysis techniques.
Once a trace-automaton is identi ed, logO uses the prob-abilistic prefetching framework we introduced in [7]. Inparticular, it computes j-bounded object appearance proba-bility, where if we “look ahead” j state transitions in the au-tomaton then the probability that an object o will be neededin those j levels is the sum of the probabilities of all pathscontaining object o. Based on this, path prefetching andobject prefetching strategies are developed: in the formercase, the middleware fetches as many objects along the mostprobable paths in the trace trie as will t into the prefetchbuffer. In the later, logO prefetches those objects that willmost probably be required (within the limitations imposedby the size of the prefetch buffer). The experiment resultsshowed that object-based prefetching (though is more ex-pensive to compute) can provide better hit ratios.5. Related Work
Temporal models include instant-based [11, 5] andinterval-based [2, 13] models. Timed Petri nets are usedto describe interval-based compositions [14, 8]. Automatabased approaches to temporal modelling are presented in[4, 3]. [10, 19, 24, 22, 9, 6, 15] show that knowledge aboutthe temporal characteristics of presentations can lead to sig-ni cantly better request and delivery schedules. Yet, sincethey assume direct knowledge of the presentation charac-teristics, these schemes are not directly applicable in logO.
Also most schemes for prefetching and buffering of au-dio/video streams [17] rely on the assumption that clientswill follow a linear sequence. Existing analysis-basedschemes (for web pages, documents, or database objects)consider object reference and access patterns [16, 1, 12, 18].But, they do not capture the underlying temporal structures.6. Conclusions
We presented a server-side middleware, logO, for log-analysis based characterization of multimedia documents.logO constructs a probabilistic automaton, capturing the dy-namic evolution of the presentation for effective delivery.References
[1] J.-H. Ahn and H.-J. Kim. SEOF: An Adaptable Object Prefetch Pol-icy for Objectoriented Database Systems. ICDE 1997.
[2] J.F. Allen. Maintaining Knowledge about Temporal Intervals,CACM, vol. 26, no. 11, pp. 832-843, November 1983.
[3] P. Bertolotti, O. Gaggi, M.L. Sapino Dynamic Context Adaptationin Multimedia Documents, ACM SAC06
[4] P. Bertolotti and O. Gaggi. A Study on Multimedia Documents Be-haviour: a Notion of Equivalence, accepted to MTAP.
[5] K.S. Candan, et al. A Framework for Supporting Multimedia Docu-ment Authoring and Presentation, ACM Multimedia 1996.
[6] K.S.Candan et al.Retrieval Schedules Based on Resource Availabil-ity and Flexible Presentation Specifications. Multimedia Sys. 1998.
[7] K.S. Candan, E. Lemar, V.S. Subrahmanian.View Management inMultimedia Databases. VLDB Journal 9(2): 131-153, 2000.
[8] S.M.Chung and A.L.Pereira Time Petri Net Representation of SMILIEEE Multimedia, pp.64-72, 2005.
[9] M.L. Escobar-Molano et al. Retrieval Scheduling for MultimediaPresentations, MIS01.
[10] J.W.Ham. A Pre-Scheduling Mechanism for Multimedia Presenta-tion Synchronization. ICMCS’97.
[11] M.Y. Kim and J. Song. Multimedia Documents with Elastic Time,ACM Multimedia Conference ’95, 1995.
[12] A.Kraiss and H.Weikum.Integrated Document Caching andPrefetching in Storage Hierarchies Based on Markov-Chain Pre-dictions. VLDB Journal 1998.
[13] L. Li et al. Multimedia Teleorchestra With IndependentSources:Part 1-2, ACM Multimedia Systems, 1(4), 1994.
[14] T.D.C. Little and A. Ghafoor. Synchronization and Storage Modelsfor Multimedia Objects, IEEE JSAC, 8(3), April 1990.
[15] C.Lohr and J.Courtiat. From the Specification to the Scheduling ofTime-Dependent Systems. LNCS vol. 2469. 2002.
[16] A. Nanopoulos et al. Exploiting Web Log Mining for Web CacheEnhancement. LNCS vol. 2356. 2002.
[17] R.Ng and J.Yang. An Analysis of Buffer Sharing and PrefetchingTechniques for Multimedia Systems, Multimedia Systems, 1996.
[18] R.H.Patterson et al. Informed Prefetching and Caching. ACM Sym-posium on Operating Systems Principles, 1995.
[19] B. Prabhakaran and S.V. Raghavan. Synchronization Models forMultimedia Presentation With User Participation, ACM Multime-dia Systems, vol.2, no. 2, August 1994, pp. 53-62.
[20] RTSP, http://www.rtsp.org/[21] SMIL, http://www.w3.org/TR/REC-smil/[22] Y. Song et al. NetMedia: Synchronized Streaming of Multimedia
Presentations in Distributed Environments, ICMCS’99.[23] M. Vazirgiannis and S. Boll. Events in Interactive Multimedia Ap-
plications: Modelling and Implementation Design, ICME 1997.[24] S. Wirag, Scheduling of Adaptive Multimedia Documents,
ICMCS’99, pp. 307-311, June 1999.[25] Prakash Yamuna and K.S. Candan. Similarity-based Retrieval of
Temporal Documents in Digital Libraries, accepted to MTAP.
76

A Teleconference System by High Definition Omni-directional Video Transmission over IP Network
Yuya Maita, Yosuke Sato, Koji Hashimoto and Yoshitaka Shibata Faculty of Software and Information Science, Iwate Prefectural University, Japan
[email protected], [email protected], [email protected], [email protected]
AbstractIn this paper, a flexible middleware system for
omni-directional video transmission for various teleconferencing applications is introduced. The omni-directional image has more advantages in that it provides a wider view than a single directional camera and able to flexible realize TV conferencing even between remotely separated small rooms. In this paper, we describe system architecture and functions of the middleware for high-definition omni-directional image control and effective video transmission system using DV and HDV (1080i format)[4]. The MidField system which we have developed so far is used for video stream transmission over IPv4/IPv6 networks. The prototype system of a TV conference is constructed to evaluate our suggested high-definition omni-directional middleware. Through the functional and performance evaluation of the prototyped system, we could verify the usefulness of our proposed system.
1. Introduction Recently high-power personal computers have been
commonly used for TV conference system with high quality audio and video. Since those TV conference systems usually use one directional video camera with limited angle, it is very difficult to realize the TV conference with many participants particularly in a small room and to capture wide range of the inside area in real time. In this paper, in order to overcome those problems, we introduce a new teleconferencing system and middleware system by omni-directional camera which can capture a view of 360 degree angle in real time. In the middleware system, the MidField system [1] which we have developed so far is used for video stream transmission over IP network. Then the quality of the panorama and expanded video images can be controlled and guaranteed by considering the computer and network resources. A prototype system of bi-directional TV conference with omni-directional camera is constructed to evaluate its function and performance. As result, we could verify the usefulness of our proposed system.
Both DV[5] and HDV omni-directional video transmission systems were introduced and evaluated.
In the followings, a system configuration of
bi-directional TV conference system based on the omni-directional image is precisely described in section 2. A middleware system and its system architecture of suggested TV conference are explained in section 3. The Midfield system [1] which realizes a basic function of video stream transmission over IP network is explained in section 4. The video stream control method and QoS control method for TV conference system are precisely explained in section 5. The implementation and prototype system is introduced in section 6. The section 7 discusses conclusion of our suggest system and our future research.
2. System Configuration The system configuration of our TV conference
system as shown in Fig.1 is consisted of client and server PCs. The server using a HDV or DV camera with a omni-directional lens, so called PAL lens, as shown in Fig. 2 captures 360 degree ring-shaped image and audio sound. Those image and audio are taken into the server PC through IEEE 1394 interface.
Fig. 1 System Configuration
Server PCClient PC
IPV4/V6 Network
Client PC Client PC
PAL Lens HDV camera
77

Fig. 2 Omni-Directional Camera
In typical, at the server, the captured ringed image and audio are transmitted over IPv4 or IPV6 based network as RTP video streams to the client. At the client PC, the ringed image is converted to the equivalent panorama image, expanded and displayed on the screen together with audio sound. Then any specific area selected by client user is calibrated and output.
When the network bandwidth is limited and not enough to transmit the HDV or DV video stream or the client PC power is not enough to process the ringed image, the ringed image is compressed using various image coding methods and sent to the client to reduce the required bandwidth.
In order to realize bi-directional TV conference, a set of client and server are simultaneously used at each location. Since omni-directional video provides 360 degree image, the user can view wide range of captured image and freely select any specific part he wants to watch and can expand the desired part of the panorama image by mouse operations. The user’s viewpoint can freely control in both vertical and horizontal directions and zooming as if he could control the angle of an ordinal one-directional camera.
The captured ringed image is encoded and decoded to the DV, MPEG-2/4, or M-JPEG, H. 264 compressed video formats on either the server or client depending on the CPU loads and network resource condition and transmitted using MidField which is a middleware system to transmit various formatted video streams over IP network and will be precisely explained its functionality in the following section.
3. System Architecture The system architecture of the proposed
omni-directional TV conference system consists of five layers including Application layer, Omni-directional development layer including Panorama, Expanded and Calibrated Image sub-layers, Synchronization layer, Session layer and Midfield layer as shown in Fig. 3.
Fig. 3 System Architecture
In the application layer, sampling the ringed video image and audio sound and displaying those on the monitor and speaker for TV conference are performed. In the omni-directional development layer, image development from the ringed image to the panorama, expanded and calibrated images are processed. In the synchronization layer, audio and the panorama, expanded and calibrated image are synchronized. In the session layer, a TV conference session by those images and audio is managed. In the Midfield layer, those videos and audio are transmitted as a stream in real time over IP network.
4. MidField System As shown in Fig. 4, the MidField system is
located between the application and the transport layer. The system is constructed by 3 layers and 4 vertical planes and offers multimedia communication functions to the application layer. Stream Plane is constructed by synchronization, data transform and media flow control layer, and performs multimedia stream processing. Session Plane performs management of communication sessions. System Plane monitors network traffic and CPU rate in the local host, and performs admission tests for QoS requirements from system user. Event Process Plane processes various events that are created in the system.
Fig. 4 MidField System
In the Session Plane of MidField System, information of both participants and media streams is handled. It should be considered that some new functions for handling this information are required by various session types. Therefore if both these information and the handling functions can transfer to intermediate node that performs to transcode, the system will have flexibility for updating new management functions for new session types. In addition, if there are no suitable functions to
Server side Client side
MidFieldSession Manage
Synchronization Process
Panorama Image
Expanded Image
Calibrated Image
Application
Display Omni-directional
Camera
Media Stream
Control MessageSession Query
MidFieldSession Manage
Synchronization Process
Panorama Image
Expanded Image
CalibratedImage
Application
Stream Plane
Flow Control Layer
System Plane
EventProcessPlane
Data Transform Layer
Session Plane
Synchronization Layer
Application Layer
Transport Layer
MidFieldSystem
78

process media in local computer system, the system should have some functions to get required media processing functions from the other systems. The system is able to construct intercommunication environment on computer networks dynamically according to the environment of users and QoS requirements from users. Fig. 5 shows an abstract of MidField Session. A MidField Session consists of at least one multicast session and offers peer-to-peer communication to system users. In Fig. 5, three system users (MF1, MF2 and MF3) join to a MidField Session. At this point, both MF1 and MF2 have enough communication environments to transmit DV stream. On the other hand, MF3 can't transmit DV stream because the environment doesn't have enough bandwidth and computing power to handle DV stream. Therefore MF3 requests to use MPEG4 stream to join the MidField Session. In such case, MidField System locates required transcoding functions into suitable node on computer networks to communicate with each other. In this example, both MF4 and MF5 transcode from DV stream into MPEG4. By using transcoding functions, MF3 can join to the MidField Session.
Fig. 5 MidField Session
5. Video Process and Control of Streaming 5.1 Omni-directional Video
There are several kinds of omni-directional cameras [2]. In our research, we apply a combination of commercially available video camera and omni-directional lens, so called PAL lens as previously shown in Fig. 2. Using the omni-directional camera, the ring-shaped image with the 360 degree angle can be taken into the server PC through IEEE1394 interface. The captured ringed image includes 720X480 pixels as a resolution and 30 fps as a frame rate from -20 to 40 degree of a vertical view angle using a DV camera. The resolution using a HDV camera is 1440x1080 pixels. This ringed image is processed by the middleware in the server to the panorama image to be easily understood by user. Since the panorama image by PAL lens can not be zoomed by optical way, the any specific part of the
panorama image is expanded by digital zooming method. However, digital zooming makes the image coarse as the enlargement rate increases. Therefore, the enlargement rate is limited within 3 to 5 times.
The image calibration for the expanded image from the selected area is carried out to remove the image distortion by PAL lens and to reconstruct the corrected image as if it were taken from the conventional one-directional camera.
5.2 Variation of omni-directional image The image taken through the PAL lens is called
ringed circle image. Three kinds of images shown below from this ringed circle image are generated, as shown in Fig.6.
Panorama image which is converted form the ringed circle image taken through the PAL lens of 360 degree. Expanded image which is clipped and expanded at arbitrary position from the panorama image. Calibrated image which is removed distortion of omni-directional image from the expanded as taken from the regular one-directional camera.
Fig. 6 Variation of omni-directional images
5.3 Omni-directional image development process The development process from the ringed image to
a panorama image is carried out in the following procedure as shown in Fig. 7. 1) Making a coordinate conversion table 2) Calibration of ringed image 3) Image development of panorama, expanded and
MF1
MF3
(e.g. MPEG4 : 384Kbps)(e.g. DV : 28.8Mbps)
from MF2 from MF1
MF2
from MF3from MF3
MF1 5
MidField System
MidField Session
from MF1from MF2
Video Stream
Transcoder
MF5MF4
Multicast Session(DV, MPEG4)
Multicast Session(MPEG4)
fromMF2
fromMF1
fromMF3
(via MF4)(via MF4)
(via MF5)(via MF5)
Ringed circle image
Panorama image
Expanded image Calibrated image
79

calibrated images 4) Image interpolation
Fig. 7 Omni-directional Image Processing
At the 1st step, since the image development of the ringed image is realized based on polar coordinate conversion, the computation time of image processing, particularly for addressing of memory location for a panorama image is very large. For this reason, the coordinate conversion table form polar axis to x-y axis is produced based on the size of ringed circle image and visual angle of lens in advance to reduce the computation time for image conversion.
At the 2nd step, since the ringed image is captured and processed in the DirectShow filter in MS Window operating system, its shape is not completely circle but oval. This is because the aspect ratios of the circle ringed image acquired from the camera differ from the image after filtering. A true circle is made by carrying out expansion processing of the ringed circle image so as to be adjusted to the original aspect ratio. After adjustment of the ringed circle image. its image resolution becomes 720x540 pixels for DV format and 1920x1080 pixels for HDV format.
At the 3rd step, by referring the coordinate conversion table, the panorama, expanded and calibrated images for the specified area can be extracted from the ringed circle image.
At the 4th step, the extracted image is interpolated to be smoothly displayed on the monitor. The surrounding 4 neighbor pixels of any points are interpolated by linear filtering or 2 dimensional spatial FFT or sub-band filtering methods [3]. By repeating from the 1st step through the 4th step, the original raw ringed image can be changed to desired images.
5.4 Stream Control
In our system, there are two streaming control methods between client and sever, including client based type and server based type.
In the client based type, which is normally used, as shown in Fig.8, the ringed images captured form DV/HDV camera on the server side are multicasted to the client side by DV/HDV video stream using Midfield. On the client side, the multicasted ringed DV/HDV format image is received at client and processed to the panorama image, the expanded image and calibrated image for the selected area depending on the user’s selection.
Fig. 8 Client Based Type
Using this client based type system, the ringed image is freely processed on the client and any area in the panorama image can be expanded on each client. Also since there is no use of image compression, higher quality image can be displayed. On the other hand, since DV/HDV format image have to be processed on the client side, more powerful CPU is required for client PC. Also, since DV and HDV format stream requires 29 Mbps and 26 Mbps per one stream respectively, larger network bandwidth is required.
Fig. 9 Server Based Type
In the server based type, on the other hand, as shown in Fig. 9, the ringed image captured form DV/HDV camera on the server side is first converted to the equivalent panorama image, expanded and calibrated for the specific area selected by some client and transcoded to various video formats including MPEG-2/4 M-JPEG, H.264 by Midfield, and then multicasted to the client.
The client receives the multicaseted stream and decodes to display on the monitor. Using this server based type, an image conversion from the ringed image to panorama image can be skipped on the client. Therefore, the relatively low powered PC can be used to obtain sufficient quality image on the client side. The
Coordinate Lookup Table of Circle Image
1.Reference the Coordinate
2. Get a Coordinate of Circle Image
Pre-
Pr
oces
sor
Tran
sfor
mPr
oces
s
Selected and Expanded/Calibrated Image
DVHDV
HDV camera
Server PC Client PC
DV over RTP (29 Mbps)HDV over RTP (26 Mbps)
Ringed Video Stream
DVHDV
HDV camera
Server PC Client PC
MPEG4 over RTP (1.4 Mbps)PCM over RTP (1.5 Mbps)
Developed Omni-directional Video Stream
80

network bandwidth required is also saved to about 1.4 Mbps when the MPEG-4 format is used. However, since all of image conversions and format generation are executed on the server, the CPU load on the server increases. The control of the viewpoint to all of the clients is also limited.
By combing those two methods, the more flexible and proper omni-directional video stream transmission according to the user’s environment can be attained.
5.5 QoS Control In addition to those stream control methods, QoS
control based on the client and server CPU load and network traffic is introduced in this system. By introducing QoS control, more proper and precise quality of video and audio can be provided depending on the user’s environment.
When the CPU load on the client and/or server increases, the frame rate of the video stream degreases. When the number of the high quality video streams such as HDV streams increases, the packet loss may increases. Since the load condition such as CPU occupation rate or CPU load average on the client and server can be observed, the image size and frame rate of the omni-directional image can be controlled.
On the other hand, the required network bandwidth varies depending on the size of the image and its video formats and compression rate. Therefore, by controlling the size and frame rate of the transmitted video stream according to the dynamically available network bandwidth, the omni-directional video image can be adjusted to user’s environment.
6. Prototyped System and Evaluation In order to evaluate the usefulness and effects of
our suggested omni-directional video transmission system, a prototyped TV conference system was constructed on the local area network as shown in Fig. 10.
Fig. 10 Prototype System
The prototyped TV conference system consists of client and server PCs with HDV camera attached and connected over 1 Gbps Fast Ethernet. This HDV camera (SONY HDR-CH1) can switch to the DV mode or HDV mode. As the specification of both server and client PCs, Hyper-Threading Pentium 4 processor with 3.4GHz clock including 1.5GBytes as main memory is used. The HDV camera with PAL lens was connected to server by
IEEE 1394. The middleware system of omni-directional video transmission was developed using C++ (Microsoft Visual C++ .NET 2003) language and DirectX 9.0b (DirectShow) for video and audio processing and their managements. Although the prototype provides bi-directional TV conference facility, the only one-directional audio and video streams transmission were carried out to evaluate its performance.
As the video format of omni-directional image, 1) the ringed image with DV/HDV format video images were multicasted to the client PC and converted to panorama images, expanded image and calibrated image, or 2) the ringed images were converted to panorama image, expanded image and calibrated images at the server. Then those three different images were encoded to MPEG-4 images, then multicasted to the client. On the client PC, those encoded images were decoded and displayed on the PC monitor. The control data for the view point from the clients were also transmitted to the server. The selected area based on the client viewpoint was extracted by First Come First Service base. As performance evaluation, the audio stream with 1.5 Mbps transmission rate and 16 bits sampled by 48KHz and the DV (720 x 480 pixels) with 29 Mbps as the ringed images were transmitted from the server PC to the client PC. On the client PC, the ringed circle image was converted to the panorama image (800 x 200pixels), the expanded images (320 x 240) and the calibrated image (320 x 240). In this prototype, we could attain 30 fps for the panorama image, 30 fps for the expanded image and 30 fps for the calibrated images. Processing time per one frame is 24ms for the panorama image, 17 ms for the expanded image and 19 ms for the calibrated images. CPU utilization is each to 47%, 36% and 39%. Those frame rates are enough to smoothly communicate each other between the client and server. See table 1.
The HDV (1440 x 1080 pixels) formats with about 26 Mbps as the ringed circle images were transmitted from the server PC to the client PC. On the client PC, the ringed image was converted to the panorama image (1130 x 360 pixels), the expanded images (640 x 480 pixels) and the calibrated image (640 x 480 pixels). In this prototype, we could attain 13 fps for the panorama image, 15 fps for the expanded image and 14 fps for the calibrated images. Processing time per one frame is 56 ms for the panorama image, 45 ms for the expanded image and 52 ms for the calibrated images. CPU utilization is each to 50%, 51% and 51%. Although the frame rate was stable, time delay of a several hundred milli-second was produced. This is due to MPEG-2 encoding in HDV format. Since video frame rate is fluctuated at the max rate, frame rate reduction into a half is made to be stable, as soon Table 2.
Network100Mbps
Delivery the movie server to client
Server IP Address 172.16.126.133
ClientIP Address 172.16.126.134
IP Multicast Address 224.100.100.200
Omnidirectional Camera(DV)
IEEE1394
81

Tab.1 The performance of the Omni-directional video at the time of using a DV format
Frame rate Process time CPU utilizationPanorama image 13 fps 56 ms 50 %
Expanded Image 15 fps 45 ms 51 %
Calibrated image 14 fps 52 ms 51 %
Tab.2 The performance of the Omni-directional video at the time of using a HDV format
On the other hand, when DV is used, there is almost no end-to-end delay, and both video and audio can be fully stable as a TV conference system. However, when more than two panorama and calibrated images are processed simultaneously, the client CPU load increases. In this case by reducing frame rate from the server PC, the CPU load degreases, and eventually audio noise could be eliminated.
When HDV is used, clearer omni-directional images can be seen compared with the case of DV. Also the resolution of panorama, expanded and calibrated images by HDV can be increased into twice. On the other hand, the time delay of those images gives influence to real time communication of bi-directional TV conference.
7. Conclusion In this paper, a middleware for High Definition
Omni-directional Video Transmission over IP Network was introduced and its system architecture and functions are precisely described. The video stream transmission of the ringed image over high-speed network based on the Midfield which was previously developed for DV/HDV video and audio was provided. The TV conference system as a prototyped system was constructed to evaluate the performance. As a result, our system could provide the reasonable response time which is almost equivalent to the one by the conventional one directional TV conference system although the resolution was not satisfied.
Currently we are optimizing the HDV video processing to improve performance and implementing QoS control function according to the CPU load on both client and server and network traffic.
References [1] Koji Hashimoto, Yoshitaka Shibata, “Design of a
Middleware System for Flexible Intercommunication Environment, “ IEEE Proc. on Advanced Information Networking and Applications, pp. 59-64, March 2003.
[2] Yasushi Yagi and Naokazu Yokoya, “Omni-directional Vision: Sensors,” Journal of Information Processing Society of Japan,” Vol. 42, No. SIG13, pp.1-18, 2001.
[3] Yukio Kubota, “Digital Video Dokuhon,” Ohme Co. 1995.
[4] Canon Co., Ltd., Sharp Co., Ltd., Sony Co., Ltd., Japan Victor Co., Ltd., “http://web.canon.jp/pressrelease/2003/hdv.html”(inJapanese), 2003
[5] Yuya Miata, Koji Hashimoto and Yoshitaka Shibata, “A New TV Conference system with Flexible Middleware for Omni-directional Camera”, 8th International Workshop on Network-Based Information System(NBiS’05) pp.84-88 22 Aug. 2005.
Frame rate Process time CPU utilizationPanorama image 30 fps 24 ms 47 %
Expanded Image 30 fps 17 ms 36 %
Calibrated image 30 fps 19 ms 39 %
82

Robust and Redundant Disaster Information System over Japan Gigabit Network
Hiroyuki Echigo†, Hiroaki Yuze‡, Tsuyoshi Hoshikawa††, Kazuo Takahata‡‡, Nobuhiro SAWANO‡‡‡, Yoshitaka Shibata†††
† Graduate School of Software and Information Science, Iwate Prefectural University ‡ School of Administration & Informatics, University of Shizuoka
††Faculty of Human Relations, Otsuma Women’s University ‡‡ Faculty of Human and Social Studies, Saitama Institute of Technology
†††Faculty of Software and Information Science, Iwate Prefectural University ‡‡‡Seiryo Women's Junior College, Japan
AbstractIn this paper, a robust and large scale resident-
oriented safety information system on the occurrence of the various disasters constructed over a nationwide high-speed network is introduced. The resident evacuated can registered his/her safety information in the local safety information servers in the evacuation area whether he/she can safely evaluated or not using mobile PCs or terminals at the evacuation area or mobile terminals on the way of evacuation. All of the local information servers are connected each other by wireless network and the safety information can be sent an upper-layer database in the district area and finally integrated into a district safety information in that region. In our system some of the damaged local servers due to the disaster can be detected and recovered manually by the upper-layer database server. On the other hand, the upper-layer database servers are backed up by mirror servers located to mutually different locations with long distance to isolate the influence to the same disaster when the some of them were destroyed or disordered. Thus, by introducing two levels of redundancy and backup functions, more large scale and robust safety information database system can be realized.
1. Introduction Since Japan island is mainly formed by mountain
volcano along the entire country, a number of large scale sizes of earth quick, mountain explosion, seismic sea wave, frequently happened in addition to ordinal disasters, such as typhoon, rain flooding and snow-slide since our history has started. In order to save our life from those disasters, more reliable and robust information network for disaster prevention purpose than the conventional information network.
As for the safety confirmation with the residents in the stricken area, it is very important to quickly process the frequent inquiries from the people outside of the disaster area whether the objective residents could safely evacuated or injured. Furthermore, in order to quickly process foods and life supplies, and acceptance of volunteers, information and communication network system in the evacuation places are also important. As the conventional communication means, fixed telephones, mobile phones, and as the information broadcasting, radios and TVs are usually used. However, those telephones are disadvantage that they are seriously influenced by traffic congestion and often destroyed by the disaster and cannot work as communication means. The radio and TV can
only transmit the information just only one direction. Therefore, more reliable communication network is required just after the disaster happened.
As advent of Internet and high-seed LAN technologies, various information and communication networks have been used as disaster information transmission means without any restriction for individuals in bi-directional ways. Moreover, most of the people using mobile terminal such as VoIP and PDAs can interactively communicate each other even though the public communication lines are congested and out of order. Under the such background, we have started “Disaster Prevention Information Network Project in Mt. Iwate which is located the center of Iwate Prefecture and anticipated to erupt near future. So far we developed the following systems including
1) Bi-directional Video Communication System[1] 2) Resource Management System[2] 3) Resident Safety Information System[3] In this paper, we describe the construction of a large-scale
disaster information infrastructure which facilitates remote mirroring of safety information database as backup function between the distributed database servers to improve fault tolerance and robustness for the total safety information system.
2 System Configuration In the previous research, we have developed communication network environment which combined by both wired and wireless LANs and anticipated to erupt near future as shown in Fig. 1.
Figure.1 System Configuration
The evacuation places in each cities distributed are interconnected by those wired and wireless LANs and lead to the central disaster center. Each evacuation places and central
83

disaster center include safety information database servers and disaster information Web servers including disaster information as well as ordinal life information. The advantages of using wireless LAN are to be able to achieve relatively high-speed and cost-effective network with 54Mbps and to realize robust and reliable physical connection even though the disaster happened [3]. In addition, even though the disaster provided serious damage to the information network, recovery of the network form the damage can be relatively quickly and simply attained by compensating the damage line by temporal wireless LAN which is installed on the relied vehicle[4][5]. In addition, by combining mobile network by mobile terminals and wireless LAN by personal data access (PDAs), more flexible and effective safety information system is also possible [1][2].
3 System Architecture It is predicted that not only traffic congestion on the
information network by many inquiries for safety information with evacuated residents but also failure and disorder of information servers and networks derive the fatal whole system failure just after disaster outbreak. Therefore, in order to minimize the influence to the whole system functions by system failure or disorder, distributed disaster information system is more suitable than central system.
In general, the evacuation places such as community centers or schools perform a very important role for residents to register his/her safety information to confirm the disaster information or evacuation life information. Therefore, in our system, the safety information database server and web server with the disaster are distributed to the pre -assigned evacuation places. Thus, the safety information with residents is first collected on the safety information database servers on every evacuation place and then sent to the central disaster information center to be totally integrated into totally unified safety information.
Figure 2 indicates system architecture to realize the functions described above. The system consists of 4 components including
1. clients 2. local safety information servers at each evacuation
place 3. integration server at the central disaster information
center 4. backup servers in remote place On the other hand, in actual case of disaster occupations, the
residents evacuates to the assigned evacuation place, such as community centers or schools. Therefore, it is more suitable to
prepare the safety information server collect the safety information with evacuated residents on each evacuated place.
3.1 Local server at evacuation place The local server is organized by registration module,
presentation module, database. The registration module receives a query with safety information from the client and retrieves from database and returns the retrieved results to the client through the network. The registration module newly registers the safety information from the client. The presentation module provides menu so that client can select registration, retrieving, presentation of detail information by HTML format The database based on the RDB stores and manages the safety information to attain the high-speed database retrieving The database manages the safety information with the evacuated residents including evacuation place, current health condition, sexual, location data by GPS.
3.2 Integration server at the central disaster information center
The integration server also includes the same function modules as the local server. In addition, the integration server performs gateway function to the other local servers by showing evacuation places by inquiring to the status management module on all of local server and showing a list of status of the local servers.
The status management module checks whether the local servers have failures or not and whether the daemon process in the Web servers at the each evacuation places. When those servers are out of order, this integrated server performs backup functions. In addition, the integrated server also integrated all the safety information by issuing inquiry to the local server. When the central server has failure, the remote backup server performs backup function by mirroring those information through high-speed network.
3.3 Backup server at remote place The backup server is always standing by to respond to the
failure on the central server by mirroring all of safety information. The backup server consists and performs the same modules and functions as integration server at the central disaster center. When the central server incidentally occurred into a failure, the backup server immediately substitutes as soon as the central server failed. Since the multiple backup
Figure 2 System Architecture
84

servers are allocated at the remote place far from the disaster area, the probability that both the central server and back up servers failed at the same can reduce as small as possible.
3.4 Network Environment As network environment, in order to realize more reliable
and robust large scale disaster information system, interconnection of both wired and wireless network is introduced. The Internet services are directly taken from the wireless network while the communication between the clients and local servers can be attained on wireless network based on IP protocol. The data communication between the client and server applications such as safety information is implemented using HTTP protocol to directly develop the web based service. Furthermore, the integrated servers on each central disaster centers are connected to the reliable high-speed network such as Japan Gigabit Network which is a national wide area testbed network across the Japan island. Thus, by combining the national wide ultra high-speed network, conventional wired network and wireless network, the any residents can access to the disaster information system using mobile terminals, such as mobile note PCs, PDA, mobile phone as well as desktop PC through Internet environment.
4 Dynamic Reconstruction in a Fault
Figure.3 Protocol Stack
In order to realize more robust and reliable disaster information system from the large scale serious damage, the present safety information system is extended by introducing a middleware to deal with dynamic reconstruction of the whole systems distributed over communication network. The middleware is allocated between the application and transport layer as shown in Fig. 3. The middleware system consists of Status Monitor Plane, Load Balancing Plane and Data Source Manager Plane.
4.1 Status Monitor Plane This Status Monitor performs monitoring function whether
server is on normally working or not in case of disaster and the network lines and nodes between server and client and servers are normally working or not. The failed servers and lines and nodes are reduced from the system and the only normal server and network lines and nodes can be reconstructed to perform the minimum function just after transitional disaster period until complete recovery from failure. In previous work, SNMP protocol was used [3]. However, in order to simply implement the detection function in our system, Ping and Heartbeat
commands are used to detect the failure points and then the failure server is replicated from the mirroring server.
4.2 Load-Balancing Plane At the time of large-scale disaster outbreak, it is estimated
that the inquiries from the outside of the stricken rush and a lot of disaster information is also registered to the server. However, the system has to endure the processing loads by the update and the reference of the registered information increase.
The backup function by Status Monitor and Data-Source Manager can bring increase of the number of referred databases. As result, the load-balancing in the whole database system can be realized.
By preparing multiple preliminary servers in two more locations and synchronizing data on those servers on the high speed network in the back end, thus inquiries from clients inside and outside can be distributed to those servers. Thus, this redundant database server allocation over high speed network can not only reduce the traffic and processing loads but also improve robustness of whole system. In our system, by dividing the whole referred area into the many sub-areas and statically assigning the server to the specific sub-area, all of the traffic and processing loads for inquiries can be decentralized into the each servers.
The load-balancing is also applied for data mirroring for backup servers. In order to increase the robustness for whole system, the number of backup servers to be mirrored for an original server should be larger as many as possible, but the traffic load by data mirroring increase, eventually leads to network congestion. Therefore, by load-balancing algorithm, the optimal number of backup servers to be mirror is determined.
4.3 Data Source Manager The Data Source Manager performs backup function from
the original server to backup server. The central disaster information server initiates the polling the disaster information to all of the local servers to integrate those information and replicate in the neighborhood local server. As the other function of the Data Source Manager, when the backup server received the notification from the original server which cannot be reached, the Data Source manager initiates the process from stand by state to active state.
The system behavior is precisely explained in Fig. 4 through Fig. 6. The movement of the system is concretely shown based on in the case of when breaking down being assumed.
4. 4 Fault in regional domain network In normal, a local server is set up at a evacuation place and
accumulates disaster and safety information with the residents at the evacuated place in the regional domain network,. The disaster information central server controls the distribution of the reference to each local server in evacuation place at time as shown in Figure 5.
When the local server of each evacuation place broke down, and the central Web sand database servers at the disaster center can perform backup function instead so that the user outside the stricken area can retrieve the safety information and refer equally through the Web server and the application server as shown in Figure. 6. When the automatic forwarding module in the central server detected that the local server of each evacuation broke down, the URL to access to the central database server at the disaster information center offered.
For automatically transmit the URL, the judgment module transmits a TCP packet to the 80th port offering Web service. If packet transmission is responded to 80 th port, the judgment module decides that local Web server is normally working and returns the URL. If not responded, the judgment module decides that the Web server is not working, and returns the URL of the central Web server at the disaster information center.
85

Figure.4 Usually Data Flow
Figure.5 Data Flow when Local Server Broken
Figure.6 Data Flow when Central Server Down
In this way, by confirming whether Web and database servers can provide or not before accessing in the local servers, the client user can take the disaster information system without manually switching the page.
When a central server broke down, the Status Monitor can detect this failure and one of the remote backup servers at distant place starts data unification work instead and mediates the reference from the outside as shown in Figure. 7.
4.5 Fault in a root server distributed in each place In order to improve the redundancy of the central servers at
the disaster center which integrates all of the safety information and disaster information, the backup servers are allocated the remote place through the reliable and high-speed network such as JGN2. Moreover, by parallel using both JGN2 and ordinal Internet, the total redundancy of the system could be much more improved. As an example as shown in Fig. 7, the five backup servers are set to the remote place which are apart from one another because the probability that all of those five servers broke down by disaster at the same is quite low.
At the disaster information center, the Web server and database server are physically separately. However, when database server broke down, the Web server detects the failure by Status Monitor and redirects the inquiry to the other server,
such as the remote backup database server or other local database server in the regional domain network as shown in Figure.8. When the Web server broke down, the database server grasps the failure by Status Monitor, and substitutes the functions of the Web server and navigates to other server in the regional domain network as shown in Figure.9. Thus, as long as at least one server normally alive, the disaster information system can normally keep offering information service.
As result, even though n-1 server in the whole system of out total n server broke down by disaster, this system can provide disaster information service without any dead period as shown in Fig. 10..
Figure.7 Distributed Root Server
Figure.8 Case of Central DB Server Down
Figure.9 Case of Central Web Server Down
Figure.10 Migration when other place’s server down
86

5 Prototype System
The prototype system is constructed as shown in Fig. 11 to confirm the effectiveness of the suggested system in our research and its function and performance are evaluated. This system used the Web server and the database server and set around the Mt. Iwate at the center of Iwate prefecture. In this disaster information system, we used Apache1.3.27 for a Web server and used Oracle 8 for a database server (RDBMS). We used CGI (ActivePerl 5.6.1) for information extraction from a database. The central server of disasters information center used Windows 2000 Server as operating system. Moreover, an outside refuge through the Internet was assumed, and the server was set up also in the Miyako city office Taro branch located in the Sanriku coast. For the server here, Linux (Kernel 2.4.27) is used and PostgreSQL 7.4.6 was adopted for the database server. We use CGI (Perl) for an application server part treating a safety information demand as well as the Residents Safety Information System. I used Linux (Kernel 2.4.27) for large-scale distributed servers to unify and used MySQL for a database server. The server is set up at NICT Honjo Multi-Media Open Laboratory in Saitama prefecture. Currently its performance is evaluating. The network diagram about Japan Gigabit Network II (JGN II) as the high-speed backbone network in our system is shown Figure 12. In addition, several backup servers are planed to install at University of Shizuoka and NICT IT Open Laboratories in Kitakyushu and Hokuriku to test the experiment on "Wide area Disaster Information sharing system (WIDIS System)” which is collaborative research testbed by universities and public research institutes.
Figure.11 Prototype System over JGN II
6 Conclusions
In this paper, we introduced a large scale distributed resident-oriented safety information system constructed over Japan Gigabit Network II. The safety information with residents is registered to the local database in the evacuated area and integrated into a central database server at the disaster information center in the district area. Those local databases are mutually covered when the some of the databases are destroyed or disordered. On the other hand, the central database servers are located to mutually different locations with long distance to isolate the influence to the same disaster. The backup servers are also mirrored to support when the some of the central database servers are out of order. Thus, by introducing two levels of redundancy and backup functions, more large scale and robust safety information database system can be realized. In this paper, we designed and implemented a prototype system by our introduced method over Japan Gigabit Network to evaluate whether our suggested method is useful or not.
Through the functional and performance evaluation, we could verified our suggested resident information system is effective and useful
As future plans, more flexible and simple human interface for children, old age by introducing mobile terminal with GPS function combining with electric map will be developed. Currently we are implementing this human interface. Using this mobile terminal, the user’s location information can be easily and simply registered without any operations. Secondly, it is operation by a single domain. Now, two or more servers are used by another domain specifying it. Being examining it now, when the server with IP allocated in the domain in main interface is down, the other server should use that IP dynamically.
References
[1]Yoshitaka Shibata, Daisuke Nakamura, Noriya Uchida, Kazuo Takahata, “Residents Oriented Disaster Information Network”, IEEE Proc on SAINT’2003, pp. 317-322, January 2003
[2]Daigo Sakamoto, Koji Hashimoto, Kazuo Takahata,Yoshitaka Shibata et al. ,”Performance Evaluation of Evacuation information Network System based on Wireless Wide Area Network", DPS, 100-12, (in Japanese) November 2000
[3]Daisuke Nakamura, Noriki Uchida, Hideaki Asahi, Kazuo Takahata, Koji Hashimoto, Yoshitaka Shibata "Wide Area Disaster Information Network and Its Resource Management System",AINA'03, March 2003
[4]Noriki Uchida, Hideaki Asahi, Yoshitaka Shibata, "Disaster Information System and Its Wireless Recovery Protocol" , IEEE Proc on SAINT'04, pp317-322, January 2004
[5]Hideaki Asahi, Kazuo Takahata, Yoshitaka Shibata ,"Recovery Protocol for Dynamic Network Reconstruction on Disaster Information System", IEEE Proc on AINA'04, pp.87-90, March 2004
87

Semantic Categorization of Images for the Intuitive Image Retrieval
Ying Dai, and Dawei Cai Iwate Pref. University [email protected]
Abstract In this paper, with the objective to retrieving digital collections more intuitively and flexible, we propose a system architecture of image retrieval to realize the human like image retrieval by the multi-type queries, such as query-by-category, query-by-sample, query-by-words, and the dynamic adjustment of threshold for individual’s similarity criteria. For this, the semantic categories are defined based on the human perceptual similarity experiment described in [3], and a method of perception-based feature representation of image and its automatic semantic categorization is proposed. Furthermore, the decision rules for the semantic categorization based on the probability density estimates are described. The experiment results show the effectiveness of the proposed method.
1. IntroductionRecently, the amount of digital media that has been
generated and stored, and which continues to do so at an exponential rate, has already become unfathomable. Under this background, the expectation of retrieving images intuitively and flexible is becoming urgent. In order to avoid the expense and limitations of text annotations on images, there is considerable interest in efficient database access by perceptual and other automatically extractable attributes. However, most current retrieval systems only rely on low-level image features such as color and texture whereas users rather think in terms of concepts. Often relevance feedback is the only attempt to close the semantic gap between user and system.
Recently, there were some researches which were explored to reduce the semantic gap between user and retrieval system by additional techniques to deal with the different levels of abstraction employed by the user and the system. In [3], how human observers judging image similarity was analyzed to get a conclusion that the human observers are very systematic to judge image similarity, following semantic, color, and structural characteristics. Following this conclusion, in [4], the extraction of color features, and the interpretation of these features to five image similarity criteria were proposed. However, it was shown that color could not be used as a single measure to capture the semantic meaning of images. In [6], a concept called “vocabulary-supported image retrieval” was proposed, which allowed the system to translate the user query into an internal query. However, the user query as “Find images with 10-30% of sky” seemed not to be a natural way to present the semantic regarding the images. In [8], a semantic-friendly query language for searching diverse collections of images was proposed. However,
same as [6], the query language such as « nature<10 && contrast>800 » seems not to be easy to utilize for modeling the categories. In [5], a scheme of image retrieval system which followed the human perceptual similarity criteria described in [3] was proposed. However, the semantic categorization of images was made manually.
In this paper, we propose a system architecture of image retrieval to realize the human like image retrieval by the multi-type queries, such as query-by-category, query-by-sample, query-by-words, and the dynamic adjustment of threshold for individual’s similarity criteria. For this, the semantic categories are defined based on the human perceptual similarity experiment described in [3], and a method of perception-based feature representation of image and its automatic semantic categorization is proposed. Furthermore, the decision rules for the semantic categorization based on the probability density estimates are described. The experiment results show the effectiveness of the proposed method.
2. Multi-type query-based image retrieval
Category thumbnail interface
Category-based retrieval module
Query by categoryCategory DB
Impression word interface
Query by objective word Objective word-
based retrieval module
Feature set DBPerception word interface
Query by subjective word
Sample interface
Query by sample Sample-based retrieval module
Feedback interface
Feedback by satisfaction Parameter
adjusting module
Subjective word-based retrieval module
Retrieval results interface
Image DB
Parameter database
Fig. 1 System architecture
A system of flexible digital collection retrieval by multi-type queries which have the human like performance and behavior is proposed in Fig. 1. The human like query is realized by the flexible combination of the multiple query types that comprise of the query-by-category, query-by-sample, query-by-perception words, or query-by-impression words. The retrieval procedure follows the human judging process regarding image similarity [3], which is the judgment of semantic, color, and structural characteristics regarding images.
The queries of category, words, sample, or the combination of those are inputted by the interface. Let
88

kq be the notation of the input data string. k is a index denoting the kth re-query regarding the original query.
}"","int{"0 redingpaq means that the original query is that retrieving collections of painting with red.
}"","","int{"1 softredingpaq means that the first re-query is that retrieving collections of painting with the imagery of red and soft.
The retrieve server determines which retrieval module are executed according to the input data string from interface. For }"","int{"0 redingpaq , the category-based retrieval module and the objective word-based retrieval module are executed. For
}"","","int{"1 softredingpaq , the subjective word-based retrieval module is executed to retrieve images from those extracted according to }"","int{"0 redingpaq .
For the category index DB, the categories are determined by user and images in a category are assigned automatically at advance.
The approaches for the objective word-based retrieval module, the subjective-based retrieval module, the sample-based retrieval module, and the parameter adjusting module have presented in [8]. In this paper, we mainly describe the extraction of perception-based features of images and the semantic categorization for the category-based retrieval module.
3. Extraction of perception-based features For the color images, we use the SGLD matrices of H, S,
V components to extract features due to the perceptual uniformity of HSV color space. Here, H,S,V components are scaled into 16 levels. The SGLD matrix is defined in [1]. That is
)],|,([),(, dnmfdSGLD (1) Let ]]16,1[),,)(,([1 mmmd , which is the matrix
from SGLD that the information of two pixels with the same separation having gray levels m both occurring is extracted, and let ]],16,1[,),,)(,([2 nmnmnmd , which is the matrix that the information of two pixels with the different separation having gray levels m and n both occurring is extracted.
We select the following metrics of 1
and 2 as our perceptual features.
a) Vector space ]},1[:{: IihhH i , where ih indicates the gray level of hue, and i denotes the rank of element ( ih , ih )regarding the magnitude in the set 1 . I denotes the dimensions of h, which imply the number of dominant hues that the human concerns in acquiring overall impressions on images. 21h means that the hue component with the value of 2 is in the rank 1 regarding the co-occurrence rates of hue components. Vector H reveals the dominant color distributions of image.
b) Vector space }10],,1[:{: iyiyy pIippP , where
yip indicates the position in vertical direction of the balance of center regarding the hue component, and i denotes the same described in a). The values of yip are in the range of (0.0, 1.0).
3.01yp means that the balance of center in vertical of the hue component which is in rank 1 is 0.3.
c) Vector space }10],,1[:{: ii dIiddD , where
id indicates the distribution density of hue component, and i
denotes the same described in a). The values of id are in the range of (0.0, 1.0). 3.01d means the density of hue component in rank 1 is 0.3
d) Vector space T:)}135,90,45,0(,1],15,1[:),({ oooo
k dkdtt ,where )}135,90,45,0(,1],5,1[:),({ oooo
k dkdt are the parameters of energy, entropy, correlation, inverse, and inertia of 2 regarding H components, respectively,
]}10,6[:),({ kdtk are those regarding S components,
and ]}15,11[:),({ kdtkare those regarding V
components. The vector TDPH y ,,, compose the feature space which is
used to categorize the images, and retrieve the images in a category.
4. Semantic categorization of images As we know, based on the perceptual image similarity
experiments in [3], the images can superimpose onto the space composed of two axes, nature vs. man-made axis and human vs. non-human axis according to the semantics. On the basis of this statement, the images can be classified by the two concepts, nature and human. By the concept of nature vs. man-made, the images are divided into such classes: landscape, sunset, tree & wild flower, interior, patterns of fabrics & woods & papers & others, building, and so on. Such classes are defined as the categories of nature theme, denoted by iNC , with the index i. Moreover, for these categories, a category may be strongly associated with some other categories. For example, the landscape is strongly associated with the tree & wide flower, and sunset ; interior is done with the patterns of fabrics & woods & papers & others. Such associated categories are called intra-association categories of the category, indicated by imNC .Where, i denotes the current category, and m does the associated categories. However, by the concept of human vs. non-human, the images are divided into such classes: no-face, small images of humans in various settings, and portrait. Such classes are defined as the categories of human theme, denoted by jHC , with the index j. Similar as the categories of nature theme, the intra-association categories of the category of human theme are denoted by jnHC .Images in the classes of nature theme and the classes of
89

human theme are overlapped on portion. The overlapped images form a new group ijIC called inter-group, with the index ij, which has the both concepts of nature and human. As a summary, the semantic categories of images are generalized in Fig. 2.
Fig.2 Semantic categories of images
4.1. Categorization of nature theme Firstly, the feature space ),,(1 DPHF y
is used to classify images to the categories of nature theme based on the Bayes’ class decision criterion. Assuming there are m categories
]),1[( miNCi , a feature vector 11 Ff is assigned to kNCif
kjallforNCPNCfpNCPNCfp jjkk )()/()()/( 11 (2)
where, )/( 1 kNCfp is the class-conditional probability density function that 1f is belongs to kNC , and )( kNCP is the prior probability of a image belonging to the class kNC .
Because the vector space DPH y ,, are independent each
other, and iyii dph ,, are also independent each other (iindicates the index of feature vector), assuming
)()( jk NCPNCP , the criterion (2) can be written in the form
kjallforNCdpNCppCNhp
NCdpNCppNChp
j
I
iij
I
iyij
I
ii
I
ikik
I
iyi
I
iki
)/()/()/(
)/()/()/(
111
111 (3)
Where, I denotes the dimensions of the vectors. Then, in order to assign a feature vector 1f , which
represents a image, to its corresponding category based on (3), the following problem is to model the probability density functions )/(),/(),/( kkyk NCdpNCppNChp for all k, ],1[ mk .
Here, we prepare the following 6 categories in advance. These categories are patterns as fabrics & woods &papers & others ( 1NC ),landscape( 2NC ), arranged flowers( 3NC ),tree & wild flower ( 4NC ), sunset( 5NC ), and building( 6NC ). Of course, the categories can be re-defined, or the new categories can be added, if necessary. Except sunset and building, each category collected 200 images from the particular volume of the Sozaijiten Image Book 1, published in Japan, as the training data set to model the
corresponding probability density functions. The category of sunset collected 15 images from the Four Seasons & Nature. The building collected 200 images from web.
Furthermore, let the probability that
1.1)90,1()45,1(&1.1
)0,1()45,1(
5
5
5
5o
o
o
o
tt
tt when a image belongs to the
building be denoted by bP , and the probability of it when a image belongs to the other categories be denoted by nbP . In order to identify the category of building with other categories,
nb
b
PP is used as the weight of decision criterion.
As the whole, the procedure of the semantic classification of images is as the following. The values of Iin (3) is equal to 2.
'1f
I indicates the image with the feature
vector )}90,1(),45,1(),0,1(,,,,,,{ 555212121
'1
oooyy tttddpphhf .
Let
}{
),/()/()/()/( '1
2
1
2
1
2
1
categoriesdefinedk
NCfpNCdpNCppNChp ki
kiki
yii
ki,
a)
)/()/(
),/()/(
1.1)90,1()45,1(&1.1
)0,1()45,1(
6'
16'
1
6'
16'
1
5
5
5
5
NCfpPPNCfpelse
NCfpPPNCfpthen
tt
ttif
b
nb
nb
b
o
o
o
o
(4)
b) 1
)/(
)/(max'
1
'1
TNCfp
NCfpif
jj
kk , then assign
'1f
I to kNC , (5)
else assign '
1fI to kNC and jNC .
4.2. Categorization of human theme The images are divided into three categories by the
concept of human vs. non-human. The three categories are portrait 1HC , small face 2HC , and non-face group 3HC .The images in the portrait category are what the occupied rate of human face in the image is larger than a threshold. The images without humans belong to the non-face group. The rest belong to the small face group.
By analyzing the components of skin color from the 100 collected images with the human, we got a result that the color components of human face almost range in a certain region of HSV color space. We define this color region as
fR .
For the fR , the value of H components h is equal to 1, and the value of S components s is equal to 6 or 7. In formula,
)7|6(&1: sshR f (6) However, we also observed that if a image has the color
components in fR , besides the face, there is a possibility that the image has the other objects which color
90

components are also in fR . So, we know that the portrait and small face group are all questionable face groups if we assign a image to the one of the three categories based on the fR space. The rate of false alarm regarding these groups will be discussed in the next section. Here, we give a procedure of assigning a image to the one of the three categories. ),( jiI H
m , ),( jiI Sm , ),( jiI V
m indicates the intensities of pixel (I, j) of a image with a ID m regarding the HSV color space, respectively. a) Extracting the pixels which belong to fR ;
0),(
,)7),(|6),((&1),(
jiIthenjiallforjiIjiIjiIif
Hm
Sm
Sm
Hm (7)
b) Noise cleaning ; c) Calculating the )]0,2|1,1([)0,2(, 00 fSGLD of the
above processed H components;d) Assigning the image to the one of three. "' 2,2 TT are thresholds.
2
1"
3'
,2)0,2/1,1(
,2)0,2/1,1(
HCtoIassignelseHCtoIassignthenTfif
HCtoIassignthenTfif
m
mo
mo
(8)
5. Experimental results and analysis In this section, we discuss the performance of the
categorization integrating the nature theme with the human theme. Such categories are denoted by mnIC . 11IC indicates the images belonging to 1NC and 1HC , that is, the images having humans with the background of patterns.
The test data set has 300 images selected from the personal album randomly, being appointed to belong to the one of six categories of nature theme, and the one of three categories of human theme. Then, these images were re-assigned by the decision procedure (4), (5) and (8). The overlapped portions organized the integrated categories. Table 2 shows the results of the precision and recall of the integrated categories when T1=1 and T1=3. N denotes no images assigning to the current category.
Table 2 Precision and recall of integrated category
Precision Recall Category T1=1 T1=3 T1=1 T1=3
11IC 1.0 0.56 0.83 0.87 21IC N N N N 31IC 0.3 0.26 0.3 0.62
41IC 1.0 0.83 0.9 0.9 51IC N N N N 61IC 1.0 1.0 1.0 1.0
12IC 0.71 0.69 0.43 0.48 22IC 0.75 0.67 0.88 0.92 32IC 0.33 0.6 0.31 0.8
42IC 0.45 0.41 0.82 0.86 52IC N N N N 62IC 0.58 0.5 0.54 0.59 13IC 0.5 0.67 0.33 0.66
23IC 0.89 0.78 0.73 0.81 33IC 0.33 0.35 0.36 0.63 43IC 0.47 0.43 0.75 0.81 53IC 0.14 0.14 0.25 0.31 63IC 0.92 0.87 0.4 0.47
average 0.63 0.58 0.61 0.72
From table 2, the overall average precisions of the integrated categories, when T1=1 and T1=3, are 0.63 and 0.58, respectively. The overall average recalls of the integrated categories, when T1=1 and T1=3, are 0.61 and 0.71, respectively. The experiment results showed the effectiveness that assigning the images to the categories of nature theme and human theme respectively, then taking the overlapped portions as the integrated categories with the both concepts.
Furthermore, we can also see that with the increasing of T1, the recall of integrated categories rises greatly and the precision drops slightly, which are accordance with the results of those regarding the nature theme. It illustrates that by adjusting T1, the dynamic association of the user’s requirements with the integrated categories can gain while optimizing goals such as maximum recall, maximum precision or the tradeoff between them.
However, we also noticed that the most part of integrated categories have the high precision or recall, but the performance of the some categories is not so good. Especially, the category
53IC (sunset without human) has the low precision and recall. The reason is that the dominant color of sunset is often in the space in skin color that results in determining the sunset as the human face easily. Conducting the association of category sunset with the category human maybe a solution of improving the overall precision and recall.
6. References [1] R. M. Haralick, Textural features for image classification,
IEEE Trans. SMC SMC-3(6); 610-621 (1973). [2] S. Kobayashi, Color System; Koudan Publication, Japan
(1999). [3] B. E. Rogowitz, et al. Perceptual image similarity experiments,
Human vision and electronic imaging III, Proc. Of the SPIE, 3299, USA (1998)
[4] A. Mojsilovic, et al. Extraction of perceptually important colors and similarity measurement for image matching, retrieval, and analysis, IEEE Trans. on image processing, Vol. 11, No. 11, Nov. (2002)
[5] Y. Dai, et al. Imagery-based digital collection retrieval on Web using compact perception features, Proc. of IEEE WI 2005, pp. 572-576, France(2005)
[6] J. Vogel, et al. Performance prediction for vocabulary-supported image retrieval, Proc. of IEEE ICIP 2001 (2001)
[7] Y. Dai, et al. Face-texture model based on SGLD and its application in face detection in a color scene, Pattern Recognition, Vol. 29, No. 6, pp.1007-1017, (1996)
[8] A. Mojsilovic, et al. “Semantic-friendly indexing and querying of images based on the extraction of the objective semantic cues”, International Journal of Computer Vision, Vol. 56, No. 1-2, pp. 79-107 (2004).
91

Component Based Face Recognition Against Occlusions: Gabor Wavelets vs. GFD
Andrea F. Abate, Michele Nappi, Daniel Riccio Dipartimento di Matematica e Informatica
Università di Salerno
Abstract— The need to assure the safety of places, people and information is particularly compelling nowadays. A reliable and widely accepted solution is the use of biometric systems and of face recognition in particular, thanks to its high degree of acceptance and ease of use. Most techniques presented in literature work on the whole face and often omit to consider the occlusion problem. This work proposes two classifiers, suitably adjusted to be Component Based and robust to occlusions. The experiments that we carried out show how these approaches perform well even in presence of partial occlusions.
I. INTRODUCTIONThe more and more chasing technological progress and
the induced globalization effects are deeply transforming human culture and habits. At the same time they both provide effective solutions to old problems and introduce new ones. On one hand they reduce cost and time required to connect places that were formerly difficult to reach and make it easier to retrieve and share information through a wide number of new services. On the other hand, they increase vulnerability of people and information, so that they are a further cause of the present pressing need for safety. For example, traditional badges, cards and passwords are now much easier to stole or forge, so that they cannot guarantee such safety anymore. One of the present research trends aims at exploiting biometric features tightly binding a person identity with his/her physical and behavioural characteristics. Among the most reliable biometrics nowadays we can certainly count iris and fingerprints. Nevertheless, their low degree of acceptance and their inapplicability in case of non consentient subjects are fostering the development of alternative biometrics such as the face or the ear. Though face does not reach the same recognition performances compared with fingerprints, it is more widely accepted and can be applied even in case of non consentient or unaware subjects. Many face recognition algorithms are available in literature [11]. Each of them aims at overcoming some limit which is intrinsic to the nature of the method (e.g. lighting, posture, expression …). However, definitely few of them deal with the recognition problem in presence of partial occlusions, as the scarce number of available references demonstrates. Moreover, most proposed methods tackle the problem considering the whole face.
Actually few of them break the face down into components before feature extraction, for instance the one in the work by Heisele et al. [1]. In this paper we propose the study of two methodologies, the first one exploiting the Generic Fourier Descriptor (GFD) and the second one based on Gaborwavelets. GFD was originally presented by Zhang [9],[10]for the classification of binary images representing trademarks and was never applied in the biometric field. Gabor wavelets have already been used for face recognition (i.e. [5]) but not combined with a component based approach. We adjusted both approaches for elaboration on face components, and further studied them in case of partial occlusions. Experimental results highlight how the two methods differ as for efficiency and effectiveness, and allow a comparison with other face recognition techniques found in literature which address occlusion [7]. The rest of the paper is organized as follows: Section I offers a description of GFD and Gabor Wavelets methods, while system architecture is described in Section II. The Section with experimental results follows, where system performances are evaluated; finally, a Section with conclusions closes the paper.
II. GFD AND GABOR WAVELETS
A. The GFD The Fourier Transform (FT) is largely used in image processing; because it often makes some limitations to be overcome by working in the frequency domain (e.g.: noise, shifts). In particular, we adopted a FT based descriptor defined by Zhang in [9],[10] for classifying binary trademarks, but we readapted it to our purposes. Given an image I in the Cartesian space xOy, we convert it in a polar space O , by relating I(x,y) with I( , ), defining
22cc yyxx and cc xxyya /2tan ,
where cc yxO , is the centre of the Cartesian space. The polar Fourier Descriptor is defined on this polar space as follows:
r
Ti
Rrj
ii erfPF )]2(2[),(),( (1)
where Rr0 and Tii /2 , ;Ti0 R0 and
T0 . The and represent the number of selected
abate, mnappi, driccio @unisa.it
Maria De Marsico Dipartimento di Informatica
Università degli Studi di Roma "La Sapienza" [email protected]
92

radial and angular frequencies. The FD descriptor is made rotation invariant by retaining only the magnitude of the coefficients, while robustness with respect to the scaling is achieved by dividing the first coefficient by the area containing the image and all the remaining coefficients by the first one, as follows:
0,0,
,,0,01,0
,0,0
FDnmFD
FDFD
areaFD
V (2)
The most important factor affecting the result is the way to locate the point . Indeed, imposing some restrictions places this method on a par with all the approaches requiring a pre-alignment of the face. We solve this problem by choosing as the Mass Centre of the face component:
cc yxO ,
cc yxO ,
1
0
1 N
xc x
Nx ,
1
0
1 M
yc y
My (3)
Only a small number of GFD characteristics are required for an effective shape description. It was experimentally demonstrated that 36 coefficients, obtained from 4 radial and 9 angular frequencies, are sufficient to describe the shape. The selected coefficients form a feature vector which is used to index the shape itself. Given two shapes represented by their feature vectors obtained through the GFD, it is possible to measure their similarity using city block distance.
B. Gabor Wavelets Gabor wavelets are widely used in image analysis as they present particular computational features, such as spatial localization, selectivity of orientation and spatial frequency. Moreover, they are particularly suited for image decomposition and representation when the aim is to derive local and discriminating features. Gabor wavelets, also known as kernels or filters, are defined as follows, as in [1][4]:
22
2
2
,,
2
,2
22,
)( eeek
z zik
zk
(4)
where e define orientation and scale of the filters,
is an image point, ),( yxz . is the norm operator, and
vector is defined as follows: ,kiekk , (5)
where e fkk /max 8/ . is the spacing
factor between kernels in the frequency domain and
represents the highest frequency
f
maxk
[4]. Gabor kernels show some self-similarities because they are produced by a filter, the mother wavelet, using scaling and rotation operations which are performed through the vector. Each kernel is the product of a Gaussian envelope and a complex plane, while the first term in square brackets in (4) determines the oscillatory part of the kernel and the second term compensates for the main component value. In most cases one uses Gabor wavelets with five different scale values,
,k
4,...,0 , and eight orientations, 7,...,0 [3].
An image representation through Gabor wavelets is obtained by performing a convolution between the image itself and a family of Gabor kernels, as previously defined. Given an image grey level distribution the output of the convolution of image I and of a Gabor kernel is defined as follows:
yxI ,
)()( ,, zzIO (6)
where yxz , and is the convolution operator. Convolution is a computationally very expensive operation, however. In fact, given two matrices A and B of dimensions respectively nn and , A B has complexity kk
22knO . For this reason, convolution theorem is applied for performances optimization, so that we can derive convolution output using the Fast Fourier Transform (FFT). If
FilteredImage = OriginalImage Filter applying the theorem we will have
(FilteredImage) = (OriginalImage) · (Filter)and consequently
FilteredImage = -1( (OriginalImage) · (Filter))where and respectively indicate Fourier transform and its inverse. Applying the convolution theorem complexity drops to
1
nnO log .From (6) we then obtain
zzIzO ,, (7)
and consequently
zzIzO ,1
, (8)
From now on we will indicate with the magnitude of the convolution output. As such outputs are formed by different local scale and orientation features, they will be linked together to obtain a feature vector
zO ,
. As a result, the feature vector will be formed by both the real and the imaginary part of Gabor transform. Before linking, a downsampling of each of a factor zO , is performed to reduce the dimensionality of the original vector. Given the
93

downsampled output , the feature vector is defined as follows:
)(,O
tttt
OOO 7,41,00,0 ... (9)
where t is the transposition operator. The vector so obtained will then include all the zO , outputs as discriminant information.
The downsampled vector is still too large to be managed; for this reason we apply the DCT transform to each
in (9) to further reduce their dimension. As DCT concentrates most information in the first elements of the output vector, compression is achieved taking only the first nelements of it to form a new vector of reduced dimension. We will indicate such vectors as . It has been experimentally proved that the best results are obtained with n=10. After this further step, all the obtained must be linked together to form the final feature vector
)(O
)(nC
)(nC
7,4)(
1,0)(
0,0)( ... nnn CCC (10)
The final dimension will be of 400 elements as we take the first 10 elements of the 40 downsampled elements .The whole process is summarized in
)(OFigure 1.
Figure 1 Feature vector extraction.
III. THE SYSTEM ARCHITECTURE
The system is formed by two modules: The feature extraction module and the enrolment/testing module. The core idea for the feature extraction phase is to locate and extract from the face image the main characteristics such as eyes, nose and mouth; for each of them a feature vector is computed and stored in the database As for the enrolment/testing phase, only the non-occluded face characteristics will be extracted from the image; a vector
is computed from each of them. Then, in order to search for the most similar face, we compute distances among such vectors and the ones extracted from the corresponding characteristics of each image in the database. The output image will be the one achieving the lower distance. The schema in Figure 2 describes how the proposed algorithm works.
Figure 2 Algorithm schema.
We have four functional blocks:
Pre-processing module: takes the face image as input and normalizes it. In particular, a new 256 x 256 image is created, which only contains the face without hair, ears and chin. This is because the method focuses on locating and extracting eyes, nose and mouth so that it is better to remove any possibly disturbing element. Face location within the image is performed using a tool provided by the OpenSource OpenCV library [12].Filter: the normalized image is filtered so that only face characteristics are highlighted, while uniform zones are removed. Moreover, a binarization is performed through a tresholding operation, in order to facilitate the localization phase. The 3 x 3 kernel of the exploited filter has values obtained from the function:
22)12(2),( yxyxf nn (10)
with n=3, graphically shown in Figure 3 (a), while Figure 3(b) shows the results of filtering on a test image.
However, it has been proved that a constant value in the central pixel of the filter is not suited for colour differences in subjects’ skin. As a matter of fact, for those who show a dark complexion, the filter leaves too much information that worsens the performances in characteristics localization. On the contrary, information is reduced too much for subjects
94

with fair complexion, so that it is impossible at times to locate some face parts. To overcome these problems, the value for the central pixel is adaptable and is computed according to the average colour of image pixels. It has been experimentally observed that the subjects’ average colour ranges approximately from 90 and 180. Moreover the optimal values for the central pixel range from a minimum of 5.2 for dark complexion subjects to a maximum of 6.3 for fair complexion ones. For this reason, for each subject having pixel average m , the corresponding value for the central pixel of the kernel will be:
90201.03.6 mp (11)
As previously described, binarization through a tresholding operation is performed after filtering.
Figure 3 Filtering of the normalized image.
Location module: determines the position within the binarized image of eyes, nose and mouth. In order to perform such operation, the image is divided in four search areas, one for each characteristic. Figure 4 (a) shows where each of them is searched for. Localization occurs through a scanning of the interest zone within the binarized image, analyzing each white pixel inside it. Starting from the upper left corner of the search zone, for each white pixel of the binarized image, the central position of the reference component (eye, nose or mouth) is superimposed on the original image. Then the absolute value of the difference is computed pixel by pixel between the region in the original image and the one in the reference image so aligned. The area corresponding to the lower error will be the one containing the searched characteristic. The zone will be 64 x 32 pixels for eyes, 70 x 40 for nose and 100 x 40 for mouth. Figure 4 (b) shows an example of eye location.
The location module will return the position within the original image of the pixel indicating the centre of the characteristic. Due to the high variation of the mouth, more
reference images have been used to have a more precise location.
(a) (b)
Figure 4 Location of face characteristics
Characterization module: given the extracted characteristics, two corresponding vectors are created that will be stored in the database during the training phase and exploited for comparisons in the recognition phase. Vectors are computed using GFD and Gabor wavelets.
(a)
As shown in Figure 2, during the enrolment phase the subject’s face is extracted from the obtained image, and then it is filtered and divided in its four component regions. For each such region the corresponding facial characteristic is located. During the characterization phase, the two vectors associated to each extracted characteristic are computed and then written in the database. As described above, such vectors are computed respectively through GFD and Gabor wavelets.
(b)
During the testing phase, characteristics to be used for the search are selected and extracted, while the characterization operation computes the two feature vectors. Euclidean distances between feature vectors (eyes, nose or mouth) and the corresponding vectors stored in the database are computed.
IV. EXPERIMENTAL RESULTS
System performances have been measured using the Cumulative Match Score (CMS), which represents the methodology most widely diffused in literature. Let’s define rank n as the set of the first n images that are returned by the system; the searched image must be present in such set in order for the recognition to be considered as correct. CMS computes the rate of images in a test set that fall within rank n.
100Images Training ofNumber Total
resultsn first theamong recognized ImagesTest ofNumber CMS(11)
In order to test system efficiency we performed 3 kinds of test. Test 1and 3 are performed on AR Faces database [6],using the same protocol which has been exploited by the
95

author (Martinez) to obtain the experimental results for his method [7]. Test 2 is performed on FERET database. It is to notice that FERET does not contain images of partially occluded faces. For this reason test sets have been suitably modified by superimposing the image of a pair of sunglasses on eyes and the image of a scarf on mouth. Tests on FERET were performed to stress the system. First of all the database contains a higher number of images, 400 compared to the 50 images of Martinez; moreover, such images show even variations in expression, posture, brightness and contrast, that in addition to glasses and scarf superimposition make the recognition process very difficult.
Considering the results of Test 1 in Figure 5, some interesting issues are highlighted. In general, the results obtained using Gabor wavelets are slightly better than the ones obtained using GFD, but we can notice how in many cases they are almost equivalent or, as it happens in Figure 6GFD even overcomes wavelets.
Figure 5 AR Faces database, 50 subjects with neutral expression, 50 training images and 50 probe images.
This can be considered a good result if we think that only 36 coefficients per characteristic are used compared to the 400 ones of Gabor. The automatic location of characteristics improves system performances. This is due to the fact that the characterization appears to be more accurate when determining a more precise position for eyes, nose and mouth; it is to notice that the performances of the recognition of faces with sunglasses are lower than those achieved for faces with a scarf, as eyes have a higher discriminating power than mouth. As regards Test 2 in Figure 6, it is plain that, for sunglasses, performances are lower than tests performed on Martinez database. However, the obtained results can be considered as good if we consider the high number of images, used both
for training and test, and the characteristics of FERET database discussed above.
Figure 6 FERET database, 200 subjects, 400 training images and 200 probe images.
A. Comparison with the state of the art In the last years a large number of biometric systems have been developed for face recognition. However, only few of them take into consideration the problem of occlusions. One of the most recent and effective methods is the one proposed by Martinez [7]. Its results have been used as a point of reference to evaluate our system performances. In order to perform such comparison, we used the same protocol, as discussed above for Test 1 and 2, exploiting a gallery with 50 images, one for each of 50 subjects chosen at random with neutral expression and two probe sets of 50 images each portraying as many subjects divided in categories with sunglasses and with scarf. Figure 7 shows the compared results. As we can see from Figure 7, for a value of n greater than 5 and for eye occlusion, both proposed methodologies exceed the results obtained by Martinez. This can be considered a good result for our research and opens up positive prospects of further improvements for future work.
96

Figure 7 Comparison with the method of Martinez.
V. CONCLUSIONS AND REMARKS
In this work we proposed two new kinds of approach to the problem of face recognition in presence of partial occlusions. Both methods are based on extracting from the face image of characteristics such as eyes, nose and mouth using a location procedure. The first technique exploits the Generic Fourier Descriptor to represent such characteristics. It has been applied till now only as a shape descriptor for binary images and has never been introduced in the field of face recognition. The second technique is based on the use of Gabor wavelets applied locally on face parts extracted through location, differently from previous works where they were globally used on a face image. The two proposed approaches have provided satisfying results in the recognition of partially occluded faces. From the tests that were performed it comes out that the GFD has good performances even for face recognition even if they do not reach those achieved through Gabor wavelets, in all cases. An important aspect to notice is that the GFD used a much reduced number of coefficients to describe each face characteristic. As a matter of fact the best results are obtained with only 36 coefficients while 400 are needed for Gabor. In particular, in the case of occluding eyes with sunglasses, both methods perform better than the method proposed by Martinez [7].As for future work, we could design a more efficient procedure for the location of face characteristics, based for example on fractals, and a technique to automatically establish the position of occlusions on the image. Moreover, more methods could be introduced to reduce the dimensionality of feature vectors, such as the Principal
Component Analysis, able to concentrate information in a lower number of coefficients.
REFERENCES
[1] G. Donato, M. S. Bartlett, J. C. Hager, P. Ekman, T. J. Sejnowski, “Classifyng facial actions”, IEEE Trans. Pattern Anal. Machine Intell., vol. 21, pp. 974-989, 1999.
[2] Bernd Heisele, Purdy Ho, Tomaso Poggio, Face Recognition with Support Vector Machines: Global versus Component-based Approach(ICCV), pages 688–694, 2001.
[3] J. Jones, L. Palmer, “An evaluation of the two-dimensional Gabor filter model of simple receptive fields in cat striate cortex”, J. Neurophysiol, pp. 1233-1258, 1987.
[4] M. Lades, J. C. Vorbruggen, J. Buhmann, J. Lange, C. van der Malsburg, R. P. Wurtz, W. Konen, “Distorsion invariant object recognition in the dynamic link architecture “, IEEE Trans. Comput., vol. 42, pp. 300-311, 1993.
[5] Liu C., ”Gabor-Based Kernel PCA with Fractional Power Polynomial Models for Face Recognition” , in IEEE Transaction on Pattern Analisys and Machine Intelligence, Vol. 26, No. 5, pp. 572–581, May 2004
[6] A. M. Martìnez, AR face database, CVC Tech. Report , no. 24, 1998. [7] A. M. Martinez, “Recognizing imprecisely localized, partially
occluded, and expression variant faces from a single sample per class”, Pattern Analysis and Machine Intelligence, IEEE Transactions on ,vol. 24, June 2002, pp. 748 – 763.
[8] P. J. Phillips, H. Moon, S. Rizvi, P. Rauss, “The FERET evaluation methodology for face recognition algorithms”, IEEE Trans. On PAMI, 2000, vol.22, no. 10, October.
[9] D. Zhang, G. Lu, “Generic Fourier Descriptor for Shape-based Image Retrivial”, ICME 2002, vol. 1, 425– 428.
[10] D. S. Zhang and G. Lu “Shape Based Image Retrieval Using Generic Fourier Descriptors”. International Journal of Signal Processing: Image Communication, July 2002.
[11] W. Zhao, R. Cellappa, P. J. Phillips and A. Rosenfeld, Face Recognition: A Literature Survey, ACM Computing Surveys, Vol. 35, No. 4, December 2003, pp. 399–458.
[12] OpenCV. http://sourceforge.net/projects/opencvlibrary. 28 March 2006
97

The DocSearch: Distributed Storage and Retrieval of Document Images
Brian F. Kaplan, Christian K. Shin State University of New York at Geneseo, New York, USA
E-mail: [email protected]
Abstract Ubiquitous computers have dramatically increased the volume of paper documents being printed. We often find ourselves burdened by piles of loosely organized papers eating up precious time and space. Large companies and government agencies retain enormous paper archives as records. Advances in technology, as well as economic and environmental advantages have brought about a shift from paper archives to digital document image repositories. Such repositories replace what would be warehouses full of paper documents and make them all fully searchable and highly available to any connected computing devices. Numerous document image analysis techniques are used to automatically build up metadata to be used as index values on which the documents can be retrieved. Thus a document can quickly be retrieved based on those metadata, or visual or content similarity to another document simply by being placed in the repository. We have developed the DocSearch system, which is a web-based distributed document image retrieval system. It allows both simple and sophisticated queries and returns the matching documents as a list of thumbnail images in descending order of relevance. By clicking a thumbnail, the user can view the full sized image as well as the thumbnails for the rest of the pages in that particular article. 1. Introduction
The information age has brought about drastic changes in the ways people use and store information. Ubiquitous computers have dramatically increased the volume of paper documents being printed. We often find ourselves burdened by piles of loosely organized papers taking up time and space. Large companies and government agencies retain enormous paper archives as records. Advances in technology, as well as economic and environmental advancements have brought about a shift from paper archives to digital document image repositories. Such repositories intend to replace warehouses full of paper documents and make them searchable and available to any connected computing devices. Numerous document image analysis techniques
are used to automatically generate metadata to be used as index values on which the documents can be retrieved. Thus documents in the repository can quickly be retrieved based on those metadata, or visual or content similarity [5]. The goal is to put enormous amounts of information at people’s fingertips while still allowing them to find what they want the same way they might flip through a pile of papers without the Herculean effort. In this paper, we discuss issues related to document image retrieval. We also describe the architecture, infrastructure, and technologies used to create our Internet-based distributed document image retrieval system - DocSearch.
1.1. Documents
One of the most fundamental uses of computers today is creating, manipulating, storing and transmitting documents. Even the most novice computer users see the documents they create on a computer as manipulable, searchable entities. This type of availability is something people have become accustomed to with documents endogenous to the computer, but the problem of efficient and accurate retrieval becomes significantly harder when dealing with digitized or scanned document images. Because these images are just an array of pixels, essentially a photograph of its paper counterpart, much work must be done by the system to recover the content and meaning of the document so it can be retrieved both accurately and efficiently. Often the textual content of the document cannot be accurately recovered due to poor image quality or the lack of domain specific knowledge. It is desirable that the system be capable of indexing on partially converted documents and make use of the copious structural information that can be extracted without domain knowledge. 1.2. Document Databases
Building, maintaining, and querying a database of documents is more complex than building, maintaining, and querying a traditional database. Queries on traditional databases are formulated based on the set fields, their relations, and calculations based on those fields [1]. The index information for these fields is extracted directly
98

from the generally well-structured data. For example, one could query a traditional database for, “how many people bought a ford truck in 2005”, and would receive the response as a quantitative answer. For documents, the lack of knowledge on document structure makes it difficult to derive the index information. The attributes such as author, title, or publisher are easily indexed. Returning an appropriate answer to that query in a document database is difficult unless the database is highly domain dependent and the relevant data can be extracted or if the index only relies objective structured identifiers. Answering a question not only requires the computer to understand the query, but also to understand the documents in the database, a daunting task when considering the ambiguity of natural language. An unambiguous query language like SQL used for traditional database query is much simpler to interpret than the natural language that would be used to pose questions in a document database. A more realistic goal for document retrieval is to return a subset of its documents that are likely to contain that information in some sort of relevance ranking order. The user can then simply extract the answer they are looking for from the results. 1.3. Document Image Databases
One can see that while providing the exact answer to any question posed in natural language may not be a practical goal, there are still many benefits to building and maintaining a document database. More often than not, printed documents are digitized with a scanner and those images are to be indexed into the database. This is a popular way to archive information because of its recent economic feasibility and the fact that a digital image provides a precise representation of its paper counterpart without the real world storage costs and requirements. The problem, however, is that an electronic representation of the document text is not always available. Documents endogenous to the computer contain all of the information and text representing the content of the document, but with document images all we have to work with are a set of pixels with which to extract that information from the image. Unfortunately this information extraction is not always accurate or possible. Poor document image quality resulting from imperfect scanning can be problematic for extracting information from the image for indexing. Optical character recognition (OCR) is used to recover the actual text from the scanned image for indexing into the document image database, but the quality of the character recognition depends directly on the quality of the image. In document images that are not completely text, it is also difficult to decompose graphic and picture segments of the document into indexable units. Clearly this means that some sort of human supervision or manual entry must take place to have good clean data for the database. In certain
domains, however, a simple document id may suffice for retrieval and this can be generated without human intervention. In other instances we are forced to make use of the wealth of information contained outside of the recognized text of the document.
2. The DocSearch
DocSearch is a web-based distributed document image retrieval system. We use the extracted data for indexing, but present the clean image to the user following the same approach as the SMART [4]. 2.1. Design Choices
There are two common approaches to web application development, generally referred to as Model 1 and Model 2. In the Java world, Model 1 requests are handled completely by JSPs. Everything from page layout to database access code is intertwined within the JSP. For this reason, Model 1 designs suffer from maintainability issues. Model 2 adds a servlet to the Model 1 architecture, which acts as a controller that receives requests from clients and dispatches the request to a separate business layer for processing. After processing, the servlet redirects the request to a JSP page whose sole responsibility is to generate the view for the client. Model 2 creates a clear distinction between form and function clearing all business logic out of the JSP page. This separation makes Model 2 the preferred architecture for serious web application development. DocSearch is a Model 2 web application built atop the Jakarta Struts framework making heavy use of standards compliance and best practice design. It is built using J2SE 1.5 and makes use of the Java Advanced Imaging libraries. We chose to use the Struts Framework because it facilitates maintainable, scalable, cross platform Model 2 designs. 2.2. Indexing and Searching with Lucene
For our indexing and searching needs, we chose a high performance open source Java API called Lucene [7]. On the surface you are either indexing documents or searching for documents. Lucene only deals with documents, not files, so everything that needs to be indexed must be converted to a document. Documents are little more than a set of one of more fields (name/value pairs), analogous to a row in a relational database (fields are like columns). Lucene takes care of many of the underlying details of indexing and searching such as optimization of the index, sorting, encoding of term positions, frequency counting, optimizing queries, merging sub results, placement on disk, et cetera.
99

2.3. Text Normalization
Lucene allows analyzers to be defined that are essentially preprocessors for text input during indexing and searching. Analyzers are generally used for normalizing text in an attempt to improve the quality of search results. This can include removal of common words deemed useless for queries, removal of common inflexional endings from words, converting all text to lowercase, or even defining relationships between similar words such that a query for documents containing “water” in the title might also consider documents containing “H2O.” Our analyzer performs a number of these processing steps on our textual input. The first step is to convert everything to lowercase to eliminate case sensitivity. After that, the input is run through a stop list consisting of common words that have a negligible effect of the content of the document. These are often words like “by”, “and”, “is”, et cetera. They have no effect on the content of the document, so removing them will save time, space, and improve the accuracy of our searches. Finally, the analyzer attempts to stem English words to their roots by removing common morphological and inflexional endings using the Porter stemming algorithm. This allows us to query based on word roots so the user does not need to match the inflexions of the words in the text exactly.
2.4. Query Features and Scoring
A flexible query system is necessary for searching a large document image database. Our system supports both simple and complex queries using both a query language and an advanced search feature. The query language is capable of handling single terms, phrases, searches within a particular document field, single and multiple character wildcards, fuzzy searches based on Levenshtein distance, proximity searches, range searches, term boosting, Boolean operators including required and prohibited, and term grouping. Forming complex queries can be a difficult task for those who are unfamiliar with the syntax of the query language. For this reason, an advanced search is provided which clearly defines and separates the search options for the user. It allows users to easily search both functional and logical components of the document. Logical components are chosen from a dropdown menu, while functional components are chosen from either dropdown menus or radio button sets. The user simply fills in the sub-queries they would like to use, and the system combines them into a complex query. Results are returned in descending order of relevance. The relevance is calculated based on a variety of factors including, but not limited to, the number of documents in the index, the
frequency of the term within the document, the size of the field in which the term was found, the number of other documents containing that term, the edit distance (for fuzzy queries), et cetera.
2.5. System Implementation
The DocSearch is implemented in Java, using Jakarta Struts, JSP, Jakarta Lucene, and other related technologies [7][8]. The system is built with extensibility and standards compliance in mind making use of the model-view-controller (MVC) design pattern. We have outlined the architecture, infrastructure, and technologies used to create this Internet-based document image retrieval system as well as potential for ongoing research on intuitive web-based retrieval. In our system, we used the ground truth data put together by the University of Washington as the extracted data. We used the 624 English journal articles in the UWII set as our data [6]. All of that data is extracted and placed in an index for subsequent retrieval through the web interface. It allows both simple and sophisticated queries and returns the matching documents as a list of thumbnail images in descending order of relevance. By clicking a thumbnail, the user can view the full sized image as well as the thumbnails for the rest of the pages in that particular article.
Figure 1: Advanced Query Interface of the DocSearch.
3. Evaluation
Our system makes a number of improvements over existing systems, but draws from many existing systems. For example, we draw our indexing and display concept from Cornell’s S.M.A.R.T. system [4] and draw our thumbnail and term highlighting from the DocBrowse
100

interface [3]. Our query language is very flexible and allows for everything from simple keyword searches to multidimensional complex queries based on both functional and logical components. Our main improvement is a search expansion feature that uses a thesaurus to modify queries with synonyms. This can be very useful when a complex query does not return a sufficient number of results because the user is not using the same words in their queries as those used in the documents. This can be considered a “concept” query in which the system attempts to query a concept rather than a specific set of words. As shown in Figure 1, we also added a number of useful advanced sub-queries that can be combined including, “With all the words”, “With the exact phrase”, “With at least one of the words”, and “Without the words.” We include a range search, typically used for searching numerical fields, but can also be used lexicographically for arbitrary string fields. We also allow the user to define what it means to search “With the exact phrase.” It can be a perfect match, a match in which the order of words can be swapped, or it can allow words to be completely reordered, essentially allowing a proximity search. Users can develop complex queries with little if any knowledge of the query language. Our system, through stemming, search expansion with synonyms, fuzzy search, and proximity search, allow users to easily find documents pertaining to what they want, without forcing them to define it precisely. 4. Conclusion and Future Work
The notion of a fully autonomous system capable of reading heterogeneous sets of images and accurately indexing them for retrieval is one that may be more of a hope than a reality. Despite decades of research in computer vision, nobody has been able to successfully bridge the semantic gap and replicate the human ability to visualize and classify. Document image retrieval systems have, however, been implemented and successfully replaced large paper archives. The systems often use the inaccurate, yet adequate, information from document image analysis to build the index for retrieval but return the error free image of the document as the result of a query. Such a system does not allow users to manipulate documents but can be practical replacement for paper archives. In this paper we described our implementation of such a system and the improvements it makes over existing systems. It has a richer query language and features such as search expansion, fuzzy search, term boosting, proximity search, facilitate searching by concept. It allows for searching based on both logical and functional components. Document image retrieval systems
represent a paradigm shift in the way people will manage, share, and use documents. They allow us to make warehouses full of images searchable and instantaneously available to any computing device. These retrieval systems complement content only “keyword-based” retrieval systems commonly used by web search engines by providing richer ways to query a large heterogeneous document image repository the way a human would, through both visual characteristics and content similarity. Its economic, environmental, educational potential make research in this area a worthwhile endeavor.
Our system has been built with extensibility in mind so that features can be integrated into it easily in the future. One of our goals is to further allow the user to “query by concept” meaning they can query the corpus of data without being forced to precisely define what it is they want. One such feature that would facilitate this is to allow users to define queries based on a document example. This concept of query by example has become popular recently and been used in a number of ways for scene image databases. The problem with such a feature is that it is difficult to define what “similar” means in any particular domain. One user’s notion of similarity may be completely different from another’s. Nevertheless, we would like to implement the content and structure based similarity measure for query by example as described in [2].
5. References [1] D. Doermann. The Indexing and Retrieval of
Document Images: A Survey. LAMP-TR 0013, pages 3-18, 1998.
[2] D. Doermann, C. Shin, A. Rosenfeld, et al., The Development of a General Framework for Intelligent Document Image Retrieval, In J.J. Hul;, & S.L. Taylor, editors, Document Analysis Systems II – Series In Machine Perception and Artificial Intelligence, Volume 29, pages 433-460, World Scientific, 1998.
[3] M.Y. Jaisimha, A. Bruce, T. Nguyen. DocBrowse: A System for Textual and Graphical Querying on Degraded Document Image Data. Mathsoft.
[4] G. Salton, The SMART Retrieval System. Prentice-Hall, Englewood Cliffs, NJ, 1971.
[5] S. Santini and R. Jain. Similarity matching. IEEE Transactions on Pattern Analysis and Machine Intelligence, 21:871–883, 1999.
[6] http://documents.cfar.umd.edu/resources/database/UWII.html.
[7] http://lucene.apache.org/java/docs/. [8] http://struts.apache.org/.
101

Frame Dropping Control by Video ContentCharacteristics under The Limited Bandwidth
Huey-Min Sun
Dept. of Information Management,Chang Jung Christian University,Tainan County, Taiwan 711, ROC
Email: [email protected]
LihChyun Shu
Dept. of Accounting,National Cheng Kung University,Tainan City, Taiwan 701, ROCEmail: [email protected]
Abstract— Due to the limited bandwidth and the unpredictablenetwork, the MPEG-4 video coding stream with Fine GranularityScalability (FGS) can be flexibly dropped by very fine granularityto adapt to the available network bandwidth. However, this is atrade-off problem between to drop the partial frames to reduceframe rate and to drop the partial packets of frames to keepframe rate. We propose the weighted assignment scheme inorder to dynamically control frame dropping by our schedulingalgorithm when the bandwidth is not sufficient. Our proposedscheme not only can integrate with our optimal schedulingalgorithm to maximize total important packets by the availablebandwidth but can also control frame dropping by video contentcharacteristics. In our experimental results, we analyze the framerate preference for video content characteristics under the limitedbandwidth. Based on the prior information for each test sequence,our frame dropping control scheme can be better than other fixedframe rate.
I. INTRODUCTION
Decoding and re-encoding a stream at a different frame ratein real-time is not easy, particularly for MPEG and H.263schemes which employ motion estimation techniques. Motionestimation is an extremely time-consuming process, particu-larly if a full motion search algorithm is employed. Whenthe bandwidth is not sufficient, the sender cannot arbitrarilydrop frames in the compressed domain because decoding ofsubsequent frames at the receiver depends on them. If thesender is to re-encode the video stream at a different framerate, it would have to recompute the motion vectors.
One solution is the adaptation approaches which offer sub-optimal solutions to the problem of selecting the applicationsettings that better fulfill the users expectations. These schemesencode and store the sequence at different frame rates (say 30,24, 21, 18 fps and so on) to adapt the bandwidth requirement.This will take up a lot of space on the server. The secondsolution is the dropping approaches which sacrifice the unim-portant data to save the bandwidth resource. The method storesonly the largest frame rate (say 30 fps) to save a lot of spaceon the server, but it increases the complexity of scheduling todrop some frames under the insufficient bandwidth network.
In MPEG-4 Fine Granularity Scalability (FGS) framework,the basic video packets for the base layer are not alloweddata dropping because the data may be needed during the
decoding for the enhancement layer. The FGS framework withboth the temporal and the SNR scalabilities requires threeencoders: one for the base-layer and two for the enhancementlayer. The base layer can ensure the basic acceptable QoSrequirements of the user, while the enhancement layer canrefine the result. Therefore, the important data to user mustbe satisfied the acceptable requirement. The FGS with hybridtemporal-SNR scalability has been added to the MPEG-4video coding standard[1] in order to increase the flexibility ofvideo streaming. The temporal scalability can be cut anywherebefore transmission. The received part of the stream can besuccessfully decoded thus improving upon the basic videoquality. The SNR scalability[2] can code a video sequenceinto two layers at the same frame rate and the same spatialresolution, but with different quantization accuracy. A higheraccuracy discrete cosine transform (DCT) coefficient is ob-tained by adding the base layer reconstructed DCT coefficientand the enhancement layer DCT residue. The DCT coefficientswith a higher accuracy are given to the inverse DCT unitto produce reconstructed image domain residues that are tobe added to the motion-compensated block from the previousframe. When the amount of the data for the previous frame isconsiderably less than the predicted frame, the decoding willfail.
Our proposed method employs the dropping approach whichdiscards the packets of the lower weight by a greedy schedul-ing algorithm. We survey some real-time scheduling research,most of them consider the measurement of miss ratio thatcomputes the number of missing deadline tasks over thenumber of all tasks. The imprecise computation model inthis field is similar to MPEG-4 FGS framework. The FASTalgorithm proposed by Shih and Liu [3], [4] in the modelhas been proved with the optimization for the measurementof miss ratio. In our previous study [5], we found that thescheduling based on the earliest deadline first (EDF) policydoes not work during the decoding in MPEG-4 FGS becauseit does not consider whether the dropping data will affect thedecoding. Unfortunately, the FAST algorithm is based on theEDF. This results in the decoding failure. On the other hand,their algorithm does not consider the problem of adjusting the
102

frame rate when the bandwidth is not sufficient for transmittingall the packets. Our scheduling algorithm will dynamicallycontrol frame dropping by our weighted assignment schemefor the MPEG-4 FGS framework.
The paper is organized as follows. Section 2 presents therelated work. Section 3 states our system model and problems.We make use of the unit time tasks scheduling algorithmto solve the problem for maximizing total weights includingthe packets of the base layer in Section 4. Results of theexperiment are shown in Section 5. The conclusions are drawnin Section 6.
II. RELATED WORKS
A network with limited bandwidth may not be able todeliver all the multimedia requests and fulfill all the QoSrequirements. The dropping policy adopted by most researchdrops some data packets in order to satisfy the schedula-bility requirements. The dropping mechanism saves up thebandwidth utilization to satisfy the requests with the real-time constraints [6], [7], [8]. These researchers discover thatdiscarding the frames of incurring peak rate can save thebandwidth.
Furini and Towsley[6] propose several frame droppingmechanisms to reduce bandwidth consumption subject to aQoS constraint. The proposed algorithms are evaluated bythe JPEG and MPEG videos under the proposed bandwidthallocation mechanism.
Zhang et al.[7] propose an efficient selective frame discardalgorithm for stored video delivery across resource constrainednetworks. They attempt to minimize the discarded frames tomeet the constraints in JPEG videos.
Besides, reducing the frame rate can also save the bandwidthutilization. Pejhan et al.[9] propose a dynamic frame ratecontrol mechanism. The scheme is to encode and store thesequence at different frame rates. It stores only the motionvectors for the lower frame rates, but this will take up a lot ofspace on the server. This way all motion estimation is doneoff-line. When re-encoding, motion vectors can be read fromthe motion files instead of being computed. The advantageof the scheme is that the motion files are much smallerthan the corresponding compressed streams. The dynamicframe rate control, used in conjunction with dynamic bit-ratecontrol, allows clients to solve the rate mismatch between thebandwidth available to them and the bit-rate of the pre-encodedbitstream.
Song and Chun[10] present a virtual frame rate controlalgorithm and a bit allocation algorithm at frame level forefficient MPEG-2 video encoding. The proposed frame ratecontrol scheme is composed of three steps. At the first stage,the scan format of an input video sequence is convertedinto progressive scan format before video encoding. At thesecond stage, an average motion activity of the frames withina previous temporal window of a pre-defined size is examined,and a proper frame rate of a current temporal window isadaptively determined based on the computed average motionactivity. At the final stage, the frames located at particular
positions in a current temporal window are virtually skippedaccording to the determined frame rate. The scheme can skipthe selected frames by deliberately fixing the coding types ofall the macroblocks in those frames to skipped macroblocks.
Chan et al.[11] propose a structured Rate-Quantization baserate-control framework for low-delay video coding which con-tains three processing stages: the control of encoding frame-rate, bit-allocation for frame-level and the decision of quan-tization parameters for macroblock-level. At the first stage,the proposed framework decides the encoding frame-rate pergroup of pictures (GOPS) for better motion continuity. Atthe second stage, target-bit per frame is effectively estimatedwith the frame texture and buffer fullness. At the final stage,based on an adaptive Rate-Quantization model modified bythe Kalman filter for each cluster of macroblocks, a suitablequantization parameter of each macroblock can be confirmed.
Song et al.[12] propose a new H.263+ rate control schemewhich supports the variable bit rate (VBR) channel throughthe frame rate adjustment. In particular, a fast realizationof encoding frame rate control based on motion informationwithin a sliding window is developed to efficiently determinethe tradeoff between spatial and temporal qualities.
Yang and Hemami[13] propose a frame rate-control schemewith a MINMAX distortion criterion in the framework of arate-distortion (RD) optimized motion compensated embeddedwavelet coder. The MINMAX criterion aims to minimizethe maximum distortion in a group of pictures (GOP) fora given bit rate. The proposed frame level bit allocationscheme combined with RD optimized within frame allocationallows precise rate control up to the exact bit. A simplifyingfast algorithm is developed using an initial prediction ofthe operating distortion and adaptive adjustment during GOPcoding.
Lee and Kim[14] propose an adaptive video frame ratecontrol method for the network of time-varying rate channelwith explicit rate feedback. It consists of a prediction moduleof future channel rate and an adaptive frame discarding andskipping module. They derive an encoder buffer constraintwhich guarantees an end-to-end delay bound of video frames.Recursive Least-Squares(RLS) method is used as a tool topredict the low frequency component of channel rate. Theadaptive frame discarding method prevents delay violation offrames due to the channel rate prediction error. Also, the frameskipping method adapt the encoder output rate to the channelrate while keeping the constant level of video quality.
III. SYSTEM MODEL
A. System Model
Our system model based on MPEG-4 FGS framework is asFig. 1. The hybrid temporal-SNR scalability with an all FGSstructure supports both the temporal and the SNR scalabili-ties through a single enhancement layer[1]. Each multimediastreaming is made up of encoded frames such as Intra frame (Iframe), Bidirectional frame (B frame) and Predicted frame (Pframe). At the encoding time, the frame is coded using DCTfor compressing the base layer and the enhancement layer.
103

The encoded data for the enhancement layer form a numberof bitplanes. Every bitplane consists of 16× 16 macroblocks,and each macroblock includes four 8×8 luminance blocks andtwo chroma blocks. In this stage, the frame rate is set to 30fps. The sampling rate of the base layer is 3, i.e., one frame perthree frames is encoded. The sampling rate of the enhancementlayer is 1. The Group of Pictures (GoP) structure is setIBBPBBPBBPBB. The sampling rate of the enhancementfor the SNR scalability must depend on the base layer, sincethe frames I and P are with SNR scalability enhancement.The frame B is with temporal scalability enhancement.
Fig. 1. The system model based on MPEG-4 FGS framework
At the transmission time, the compressed bitstream inMPEG-4 is divided the frames into some video packets withthe same bit size in order to overcome the effect of atransmission error occurred in group of blocks. These packetsare classified into three parts illustrated by Fig. 2. A packetof the base layer is regarded as a mandatory task, and apacket of the enhancement layer for both the the temporaland the SNR scalabilities is regarded as an optional task.In the model, performing a trade-off between the SNR andthe temporal enhancement has to depend on an adaptivescheduling algorithm. We propose the weighted assignmentscheme which employs the characteristics for the sequencecontent such as the motion and the texture. Fig. 2 illustratesthe assignment example for keeping the original frame rate.The scheme can provide the priority of the packets for thescheduling algorithm to drop partial packets of the lowerpriority when the bandwidth is not sufficient.
At the decoding time, the packets of the base layer mustbe completely received. The packets of the enhancement layerfor the temporal scalability can smooth the consecutive frames,while the packets for the SNR scalability can refine the imagequality.
B. The problem of frame dropping control
We observe the relationship between the average bits forthe motion characteristic in group of pictures and the framerate. The higher motion characteristic the sequence suits withthe larger frame rate. Fig. 3 illustrates the relationship. Wealso observe the relationship between the average bits for the
Fig. 2. The weighted assignment principle
texture characteristic in group of pictures and the bit rate. Thehigher texture characteristic the sequence suits with the largerbit rate. Fig. 4 illustrates the relationship. We aim at adjustingthe adaptive frame rate according to our weighted assignmentscheme when the motion and the texture characteristics havebeen known in advance. In our system model, the frame ratefor each sequence is initially set to 30 fps. When the bandwidthis not sufficient, we drop the unimportant packets by ourscheduling algorithm to adapt to the available bandwidth. Weassign the weights to the packets for the video sequencesof the different content characteristics by the mean opin-ion scores(MOS) of the subjective measurement in advance.The scheduling problem consider not only maximizing totalweight, i.e, maximizing the number of important packets,but also controlling frame dropping under the constraint ofsatisfying the schedulability of the base layer.
Fig. 3. The relationship between the motion characteristic and the frame rate
Fig. 4. The relationship between the texture characteristic and the bit rate
104

IV. SCHEDULING ALGORITHM
A. The weighted assignment scheme
According to the prior information of the characteristicsfor the sequences, we can assign the weight to packets soas to control the frame dropping during the transmission. Forexample, we assign the weight to the packets of the framesshown in Fig. 5 when the sequence prefers 20 fps duringsome consecutive frames. The smaller number represents thehigher priority. To illustrate the scheme, we consider 12 framesas a GOP and denote 6 frames as a half of GOP, calledthe HGOP. Then, 30 frames are divided into 5 HGOPs. Ouroriginal frame rate is set to 30 fps, so the number of thedecoded frames is usually 20 fps if drops 2 frames per HGOP.When the bandwidth is not sufficient for transmitting most ofdata, the packets of the lower priority are always dropped.Therefore, the scheme can control the frame rate according todrop frames. Based on the weighted assignment scheme, theframe rate can be controlled by 30, 25, 20, 15, and 10 fps ifdrops 0, 1, 2, 3, and 4 frames per HGOP, respectively.
Fig. 5. The weighted assignment scheme for the preference of 20 fps
B. Satisfying the schedulability of the base layer
To solve the packets schedule problem, we employ a knownscheduling algorithm, called the unit time tasks scheduling.The problem of scheduling unit time tasks with deadlines andweights has the following inputs: a set T = T1, T2, . . . , Tn
of n unit-time tasks; A set of n integer deadlines such thateach di satisfies 1 ≤ di ≤ n ; And a set of n nonnegativeweights w1, w2, . . . , wn such that wi is offered for task Ti
only if it is finished before the time di. This well-definedproblem can find a schedule for T that maximizes the totalweight and meets deadlines. This has been proved using thegreedy algorithm of running time O(n2) to find the optimalschedule [15]. Table I shows an example of the unit time tasksscheduling. We use the unit time tasks scheduling algorithmto get the optimal schedule. Therefore, we can select tasks1, 2, 3, 4 and 6 according to the algorithm, and then rejecttask 5. This optimal schedule has a total weight of 275.
Table I. An example for the unit time tasks schedulingtask i 1 2 3 4 5 6
di 4 2 4 3 1 5wi 80 70 60 50 40 15
However, our problem is both to maximize the total weightand to satisfy the schedulability of the base layer. We definethe problem as follows.
Problem 1. Follow the above definitions, we consider thatthe set of tasks is classified into the mandatory set of tasks andthe optional set of tasks. This problem is to find a scheduleincluding all the mandatory tasks for T that maximizes thetotal weight and meets deadlines.
We make use of the unit time tasks scheduling algorithmto solve Problem 1 by the theorems which have been provedin our previous study[5]. Therefore, the set of the optimalsolution, S, found by the algorithm including the given set Mif there exists at least a solution including the given set M andthe weights of all the elements in M is added by a constant y.This problem is proved in Theorem 1. We define a new set T ′
based on the set T . The weights set T ′ is similar to the weightsset T except that the weights of all the elements in a givenset M , M ⊆ T , are added by a constant y where y is definedas
∑
t∈T
W (t) . The weight of tasks in M can be expressed as
W ′(t) = W (t) + y, if t ∈ M , and W ′(t) = W (t), otherwise.Secondly, Problem 1 for the set T is equivalent to Problem
1 for the set T ′ in Theorem 2. This means OPT ′ = OPT +y ∗ |M | where OPT ′ and OPT are an optimal solution forProblem 1 in the set T ′ and T , respectively.
Finally, Problem 1 for the set T ′ is equal to Problem 1 inTheorem 3. Therefore, according to Theorem 2 and 3 underthe condition that there exists at least a solution including thegiven set M , this optimal solution of Problem 1 in the set T isequal to subtract a constant value, y ∗ |M |, from the solutionof Problem 1 in the set T ′.
Theorem 1: A set of the optimal schedule solution, S,found by the algorithm for the set T ′ exist that the given setM is belong to S if there exists at least a solution includingthe given set M in the set T .
Theorem 2: Problem 1 for set T is equivalent to Problem1 for set T ′, where W ′(t) = W (t) + y if t ∈ M otherwiseW ′(t) = W (t).
Theorem 3: The unit time scheduling problem for the setT ′ is equal to Problem 1 for the set T ′.
Theorem 4: The unit time scheduling problem for the setT ′ is equivalent to Problem 1 for the set T .
V. EXPERIMENT RESULTS
In our experiments, we use the Microsoft MPEG-4 softwareencoder/decoder with FGS functionality[16]. We encode thevideos using 30 frames per second with the CIF(352×288 pix-els) format. Every sequence has 300 frames, then the encodedstream of a frame is divided into hundreds of tasks(packets).The data size of each task is set to 64 bytes. The videos areprocessed in the Y UV format(Y is the luminance component,U and V are color components of a frame). The test sequenceafter encoding and scheduling under the limited bandwidth ismade up of the truncated encoded file. We compute the PSNRof luminance for each test sequence. The sequences employedin our evaluation are well-known MPEG-4 test sequences.
105

The sequences adopted for the analysis contain variousdegrees with both the motion and the texture characteristics.In the ”Akiyo” sequence, the motion characteristic is staticbackground and talking head, and the texture characteristicis easy. In the ”Foreman” sequence, the motion characteristiccontains high motion in the first part of the sequence andlow motion in the second part, and the texture characteristiccontains also easy in the first part and detailed in the secondpart. In the ”Stefan” sequence, the motion characteristic isvery high and the texture characteristic is relatively detailed.In the ”Mobile” sequence, the motion characteristic is slowand constant movement, and the texture characteristic is verydetailed.
We compute the average bits of all frames for the motioncharacteristic shown in Fig 6 and the average bits of Intraframes for the texture characteristic shown in Fig 7, respec-tively. In our encoded data, the ratios of the base layer forthe ”Akiyo”, the ”Foreman”, the ”Stefan”, and the ”Mobile”sequences are 0.03, 0.03, 0.07, and 0.04, respectively. Accord-ing to the information, our weighted assignment scheme canrecognize the video content characteristics. In our previousstudy[17], we evaluated the perceived quality by the doublestimulus continuous quality scale (DSCQS) method[18]to getthe preference frame rate for each test sequence. The mea-surement is based on the mean opinion scores(MOS) of therespondents. Fig. 8 illustrates that the sequences ”Akiyo” and”Mobile” prefer 10 fps and the sequences ”Foreman” and”Stefan” prefer 30 fps under the insufficient bandwidth.
0
1000
2000
3000
4000
5000
6000
Motion characteristic
Th
eav
era
ge
bit
so
ffr
am
es_
Akiyo
Foreman
Stefan
Mobile
Fig. 6. The average bits of all frames for motion characteristic
0
20000
40000
60000
80000
100000
120000
140000
Texture characteristic
Th
eav
era
ge
bit
so
fIn
tra-f
ram
es
_
Akiyo
Foreman
Stefan
Mobile
Fig. 7. The average bits of Intra frames for texture characteristic
We use the earliest deadline first (EDF) algorithm and theFAST algorithms as base lines to evaluate the performance
Fig. 8. The average mean opinion scores(MOS) by varying the frame ratefor each sequence
of transmitted packets. We implement the FAST algorithmby [3], [4] and our scheduling algorithm to analyze the lostpackets of the base layer. These algorithms can maximize thetotal number of packets. However, the EDF algorithm cannotdeal with the problem for satisfying the schedulability of allthe mandatory tasks. The FAST algorithm has been provedthe optimal scheduling for CPU in the imprecise computationmodel, but it may fail to decode in MPEG-4 FGS by ourprevious study[5]. Our optimal scheduling algorithm, namedOPT , has the optimal packets scheduling and guaranteesuccessfully decoding in MPEG-4 FGS. Table II, III, IV, andV show the lost ratios and the lost packets of the base layerby various available bandwidth for each sequence.
Table II. The lost packets of the base layer for the ”Akiyo”sequence
bandwidth(bps) 0.9M 1.0M 1.1M 1.2M 1.3Mlost ratio 0.75 0.72 0.70 0.67 0.64
EDF 0 0 0 0 0FAST/OPT 0 0 0 0 0
Table III. The lost packets of the base layer for the”Foreman” sequence
bandwidth(bps) 1.2M 1.4M 1.6M 1.8M 2.0Mlost ratio 0.83 0.80 0.78 0.75 0.72
EDF 161 79 16 0 0FAST/OPT 0 0 0 0 0
Table IV. The lost packets of the base layer for the ”Stefan”sequence
bandwidth(bps) 2.4M 2.6M 2.8M 3.0M 3.2Mlost ratio 0.76 0.74 0.72 0.69 0.67
EDF 328 111 53 0 0FAST/OPT 0 0 0 0 0
Table V. The lost packets of the base layer for the ”Mobile”sequence
bandwidth(bps) 3.8M 4.0M 4.2M 4.4M 4.6Mlost ratio 0.72 0.71 0.70 0.68 0.67
EDF 218 3 0 0 0FAST/OPT 0 0 0 0 0
To understand the effects of image quality for varying theframe rate, we show the relationship for each sequence in
106

30
33
36
39
42
45
48
10 15 20 25 30
Frame rate (fps)
PS
NR
(dB
) Akiyo
Foreman
Stefan
Mobile
Fig. 9. The average PSNR by varying the frame rate for each sequence
Fig. 9. The figure illustrates that reducing the frame ratecan increase the image quality when the bandwidth is notsufficient. However, the smoothing quality of consecutiveframes cannot be measured by the PSNR.
We adopt the subjective video quality assessment to measureour performance. Table VI illustrates that the perceived qualitybased on the subjective measurement for our scheme can bebetter than other fixed frame rates when the bandwidth is notsufficient. This is because our scheme can control the framedropping to adapt the preferred frame rate of video content.
Table VI. The analysis of effectiveness for our schemesequences Akiyo Foreman Stefan Mobile
MOS for our scheme 67.5 49.5 43.2 52.3MOS for fixed 15 fps 65.2 42.7 35.6 49.9MOS for fixed 20 fps 60.6 43.2 38.5 46.8MOS for fixed 25 fps 60.6 46.6 40.5 45.2
VI. CONCLUSION
We have proposed the weighted assignment scheme tocontrol frame dropping for MPEG-4 FGS framework when thebandwidth is not sufficient. Our scheduling algorithm not onlycan guarantee the schedulability of the base layer in MPEG-4FGS framework but can also maximize total important packetswhen the available bandwidth is sufficient for all the packetsof the base layer.
Our experimental result shows that our scheme can controlthe frame dropping to correspond to the preference for eachtest sequence. The mean opinion scores for our frame droppingscheduling algorithm can be better than other scheduling forthe fixed frame rate.
Our weighted assignment scheme and the scheduling algo-rithm can drop the partial frames or keep all the frames as faras possible to adapt to various video content characteristics.The frame dropping scheduling mechanism contributes toMPEG-4 FGS framework under the limited bandwidth.
ACKNOWLEDGEMENT
This work was supported by the National Science Councilof the R.O.C under Contract NSC 94-2213-E-309-008.
REFERENCES
[1] Radha, H.M., Schaar, V.D.M., and Chen, Yingwei. (2001) The MPEG-4 fine-grained scalable video coding method for multimedia streamingover IP. IEEE Trans. on Multimedia, Vol. 3, No.1, Page(s):53-68.
[2] Li, Weiping.(2001) Overview of fine granularity scalability in MPEG-4video standard, IEEE Transactions on Circuits and Systems for VideoTechnology, 2001, vol 11, issue 3, Page(s): 301-317.
[3] Liu, J.W.-S., Lin, K.-J., Shih,W.-K., Yu, A.C.-S., Chung, C., Yao,J., and Zhao, W., (1991) Fast Algorithms for Scheduling ImpreciseComputations, Computer, Volume:24, No. 5, May 1991, Page(s).58-68.
[4] Shih, W.-K., Liu, J.W.S., and Chung, J.-Y. (1989) Fast algorithms forscheduling imprecise computations ,Real Time Systems Symposium,1989,Page(s): 12 -19.
[5] Huey-Min Sun, Lychun Shu, and Chia-Mei Chen; (2005) OptimizingVideo Stream Scheduling Based on MPEG-4 FGS Framework, The 18thIPPR conference on computer vision, graphics, and image processing,2005, 21-23 Aug., Taiwan, Page(s):1475-1482.
[6] Furini, M. and Towsley, D.F. (2001) Real-time traffic transmissions overthe Internet. IEEE Transactions on Multimedia, Volume: 3 Issue: 1, p.33- 40.
[7] Zhi-Li Zhang, Nelakuditi, S., Aggarwal, R., and Tsang, R.P.(1999)Efficient selective frame discard algorithms for stored video deliveryacross resource constrained networks. Proceedings of INFOCOM ’99,Volume: 2, p.472 -479.
[8] Tsou,Fu-Ming., Chiou, Hong-Bin., Tsai, and Zsehong. (2000) A novelATM traffic scheduler for real-time multimedia data transport withimproved packet level QOS. Proceedings of ICME 2000, Volume: 2, p.1047 -1050.
[9] Sassan Pejhan, Ti-hao Chiang, Ya-Qin Zhang. (1999) Dynamic FrameRate Control for Video Streams, Oct 30 - Nov 5, 1999, Orlando, Florida,ACM Multimedia, Electronic Proceedings
[10] Byung Cheol Song; Kang Wook Chun;(2003) A virtual frame rate con-trol algorithm for efficient MPEG-2 video encoding, IEEE Transactionson Consumer Electronics, Volume 49, Issue 2, May 2003 Page(s):460 -465.
[11] Din-Yuan Chan; Chun-Yuan Chang; Shou-Jen Lin; Chung-WeiLin;(2004) A rate-control scheme using fast frame-rate controlling andadaptive rate-quantization modeling for H.263, 2004 IEEE InternationalSymposium on Consumer Electronics, Sept. 1-3, 2004, Page(s):390 -395.
[12] Hwangiun Song; Jongwon Kim; Jay Kuo, C.-C.; (1999) Real-timeH.263+ frame rate control for low bit rate VBR video, Proceedingsof the 1999 IEEE International Symposium on Circuits and Systems,ISCAS ’99. Volume 4, 30 May-2 June 1999 Page(s):307 - 310.
[13] Yan Yang; Hemami, S.S.; (1999) MINMAX frame rate control using arate-distortion optimized wavelet coder, International Conference onIm-age Processing, 1999. ICIP 99. Volume 3, 24-28 Oct. 1999, Page(s):551- 555.
[14] Myeong-Jin Lee; Jae-Kyoon Kim; (2000) Video frame rate controlfor non-guaranteed network services with explicit rate feedback, IEEETelecommunications Conference, 2000. GLOBECOM ’00. Volume 1,27 Nov.-1 Dec. 2000 Page(s):293 - 297.
[15] Thomas H. Cormen, Charles E. Leiserson, and Ronald L. Rivest,(1993) Introduction to Algorithms, The MIT Press, McGraw-Hill BookCompany, 1993.
[16] Microsoft.(2004)ISO/IEC 14496 MPEG-4 Video Reference Software,Version: Microsoft-FDAM1-2.5-040207.
[17] Huey-Min Sun, Yung-Chuan Lin.(2005) The Effect of Video Qualityfor Different Contents, Frame Rates and Bit Rates, National ComputerSymposium 2005, Tainan, Taiwan, Dec. 15-16, 2005.
[18] M. Pinson and S. Wolf. (2003) Comparing Subjective Video QualityTesting Methodologies, SPIE Video Communications and Image Pro-cessing Conference, Lugano, Switzerland, July, 2003.
107

Virtual Theater Network: Enabling Large-Scale Peer-to-Peer Streaming Service
Masaru OkudaTelecommunications Systems Management
Murray State UniversityMurray, KY 42071
Taieb ZnatiDepartment of Computer Science
University of PittsburghPittsburgh, PA 15260
Abstract
This research paper addresses three technical challengesassociated with the design of a large-scale, peer-to-peer,high-volume, streaming video distribution network: 1) con-tributions from peers with limited transmit bandwidth ca-pacity, 2) advertisement and discovery of time-boundedvideo frame availability, and 3) design of P2P communitystructure that enables above functionalities.
To address above issues, we propose a video distribu-tion model based on a hybrid architecture between client-server and peer-to-peer computing. In this model, a videois divided into a series of small segments. It employs ascheduling scheme through which users with excess band-width and buffer space may retrieve video segments frommultiple sources at or below the nominal streaming rate.The model also employs an advertisement and discoveryscheme through which users can share their complete se-quence of time-varying video segment availability informa-tion in one advertisement and one query.
The simulation study shows that the proposed modelgreatly alleviates the bandwidth requirement of the videodistribution server, especially when the number of partici-pating users grows large. As much as 90% of load reductionwas observed in some experiments when compared to a tra-ditional client-server based video distribution model.
1 Introduction
With the advent of recent Internet technological ad-vances, multimedia streaming service is gaining increasingimportance. Video streaming applications, such as on-lineDVD rentals, have a potential to enrich our lives and createnew business opportunities.
As high performance end-user systems are becomingwidely available and the number of subscribers to broad-band Internet access is rapidly raising, a new computingparadigm known as Peer-to-Peer (P2P) has emerged. P2Penables direct exchange of contents among a group of endusers without a need for a centralized management struc-ture. In P2P, each user plays a dual role: a client role anda server role. Once a user nishes downloading a content
through a client function, it takes on a server role to dis-tribute the received content and services a small numberof requests from other users while the resource is avail-able. P2P offers a framework in which a large-scale, dis-tributed, and self-organizing content distribution networkcan be constructed.
Although P2P has a potential to overcome the scalabil-ity problem associated with a traditional client-server basedcontent distribution network, it introduces new set of chal-lenges. First, a limited uplink capacity of a typical broad-band access technology may only allow a transmission ofa video stream at a fraction of the nominal streaming rate.Only a small percentage of the participating users may beable to become contributing sources when a bandwidth in-tensive content is being distributed. Second, streaming al-lows playback of video frames as they arrive. It also allowsdiscarding of video frames once they are played back. Thus,the contents of user buffer is constantly changing during thelife time of the video presentation. As such, the design ofan advertisement and discovery scheme must capture thedynamic nature of video frame availability of participatingusers. Third, in order to support above functionalities, anef cient and robust design of a P2P community structure isrequired.
To address these issues, we propose a new stream-ing video distribution network, called Virtual Theater Net-work and its accompanying video reception and discoveryschemes. In this model, a video stream is divided into asequence of segments. Users with excess receive band-width and buffer space are allow to prefetch future videosegments at rates below the nominal streaming rate. Theaccompanying schedule algorithm determines the order, thetiming, and the rate of each video segment download to en-sure an orderly and timely segment reception for a smoothplayback. The model also employs an advertisement anddiscovery scheme through which users can describe/capturetheir life-time of changing segment availability states in oneadvertisement/query. This is made possible by incorporat-ing the parameters of scheduling algorithm in the advertise-ment and discovery scheme.
The remainder of this document is organized as follows.Section 2 surveys the related work. Section 3 presents thearchitecture and the components of Virtual Theater Net-work. Section 4 describes Sliding Batch, the video stream
108

reception scheme used in Virtual Theater Network. Sec-tion 5 describes Virtual Chaining, the scheme for the adver-tisement and discovery of video segments among the users.Section 6 presents the analysis of a simulation study. Sec-tion 7 concludes the document.
2 Related Work
A number of attempts have been made to enable the de-ployment of P2P based streaming service over the Internet.Under the single-source distribution approach, a request-ing peer receives the entire video stream from one of thepeers in the network. Peers organize themselves to formchains [1], loops [2], or trees [3, 4] to provide video dis-tribution paths that alleviate the load on the video server.Many of the schemes under this approach focus on the sup-port of live-media applications, such as news tickers andreal-time stock updates, which distribute low-bandwidthcontents to many users. When stored-video streaming ap-plication support is intended, limited transmit bandwidthavailability of typical broadband access technology is notconsidered and falls short in the support of high-bandwidthvideo distributions.
Under the multiple-source distribution approach, a re-questing peer receives multiple video streams from mul-tiple peers. The combinations or the concatenations ofall streams allow the reconstruction of the entire video.Schemes such as [5, 6] split the video in multiple layers andeach layer of decodable video stream is transmitted fromdifferent sources. While this approach avoids the total lossof service, it induces a large amount of overhead to supportthe functionality. Other schemes, such as [7, 8, 9], dividethe video in time-axis and a sequence of segmented videois transmitted from different sources. Our scheme belongsto this category. The major difference between our schemeand others lies in the assumption of video segment avail-ability at the distribution sources. Our scheme is based onan assumption that the availability of downloaded segmentsare time-bounded, as it is often the case in video stream-ing applications where received video frames are discardedafter their playback. Other schemes assume, implicitly orexplicitly, a long-term availability of downloaded contentsat users’ storage system. Our solution addresses the chal-lenges associated with the advertisement and discovery oftime-bounded content availability of P2P network and withthe contributions from peers who are unable to send videostream at the nominal playback rate.
3 Architecture Design
This section presents the architectural overview of Vir-tual Theater Network, identi es its components, and de-scribes their functionalities.
Virtual Theater Network is a network model designedto support a large-scale, on-demand, peer-to-peer, stored-video streaming service over the Internet. It is based ona hybrid architecture between a traditional client-servermodel and an emerging peer-to-peer computing paradigm.
Content Providers
Content Distributors
Communities ofContent Consumers
CP2CP1
VT Room 1
VT Room 2VT Room 4
VT Room 3
VT Room 5
VirtualTheater 1
VirtualTheater 2
VirtualTheater 3
:Content A
:Content B
VT Distributor 1 VT Distributor 2 VT Distributor 3
Figure 1. Virtual Theater Network
Central to this model is a set of Virtual Theaters. A VirtualTheater provides a means to mass distribute video streamsto users in a certain geographical area, similar in function tothat of movie theaters and video rental shops. Within eachVirtual Theater, there exists a content distributor, known asVT Distributor, which receives video feeds from contentproviders (e.g. Dysney, MGM, Paramount). A VT Distrib-utor organizes one or more VT Rooms to service local videodistribution needs. A VT Room is a group of peers who forma P2P community to receive and distribute a video stream ata speci c playback rate and in a speci c encoding format.A cyber-cinema created by a VT Distributor and a set of VTRooms constitute a Virtual Theater.
Fig. 1 illustrates the Virtual Theater Network model. Inthis example, two content providers, CP1 and CP2, supplyvideo feeds to a set of VT Distributors. CP1 provides avideo feed to VT Distributors 1, 2, and 3. CP2 provides avideo feed to VT Distributors 1 and 2. VT Distributors 1and 2 manage two instances of VT Rooms (i.e. VT Rooms1, 2, and 3, 4 respectively) while VT Distributor 3 only man-age one VT Room (i.e. VT Room 5). Small circles withineach VT Room represent peers. With the support from therespective VT Distributor, users of each VT Room work to-gether to sustain the distribution of a streaming video.
The keystone of our proposed streaming service archi-tecture is a dynamic and distributed storage space availableat the members of a VT Room. To take advantage of thisarchitecture, a video stream is divided into blocks of seg-ments and dispersed at the caches of user systems at variouslocations in a VT Room. Users playback the video by locat-ing and retrieving the segments in their playback sequence.As video segments are being downloaded, the user makesthem available for others to access. Initially, when a VTRoom is rst organized, users receive streaming feeds fromthe VT Distributor. Once a suf cient number of cached andreplicated video segments become available within the com-munity, the distribution of streaming content becomes self-
109

sustainable. Only those occasions where the needed videosegments are unavailable within a VT Room, will the userrequest the missing segments from the VT Distributor.
4 Video Segment Reception Management
This section describes Sliding Batch, a video segmentreception scheme used in a VT Room. It allows users ofa VT Room to retrieve a video stream as a sequence ofsmall video segments from multiple distribution sources.The scheduling algorithm de ned in Sliding Batch deter-mines when and at what rate each video segment should beretrieved to assure an orderly and timely video playback.The algorithm is de ned in terms of segments, epochs, andbatches. The following subsections provide their de nitionsand describe how they relate to the management of the avail-able receive bandwidth and buffer space to determine thescheduling of segment receptions.
4.1 Segments
A video stream is a continuous o w of a sequence ofcompressed video frames transmitted over a network so thatthe recipient may playback the video frames as they arrive.In Sliding Batch, a block of a sequence of video framesmakes up a Segment, Si. In turn, a sequence of segmentsconstructs a video, V . Si is a logical unit in V , similar to achapter in a DVD, and may vary in size and length. It is alsoa unit of video frames being exchanged among the users ofa VT Room. Si is characterized by its sequence position, i,in V , a set of frames that belongs to Si, its starting playbacktime, α(Si), and a batch it belongs to, β(ej).
V = {Si, i = 1, 2, · · · , N}
Si =
{
{fk, k = 1, 2, · · · , ni, ni ≤ F} if i = 1{fk, k = ni−1 + 1, ni−1 + 2, · · · , ni,
ni ≤ F} if 2 ≤ i ≤ N
Si ∩ Sj = ∅
α(Si) =
{
t0 if i = 1α(Si−1) + δ(Si−1) if 2 ≤ i ≤ N
Si ∈ β(ej)
where N is the total number of segments in V , t0 is thetime the user joined the VT Room and began playing backthe rst segment, S1, and δ(Si) is the playback duration ofSi.
Let |V | and |Si| be the size of V and Si respectively. Letδ(V ) be the total duration of video playback time. Then,η, the nominal streaming rate of video is given by η =
|V | / δ(V ), where |V | =∑N
i=1 |Si|. Accordingly, the play-back duration of Si, δ(Si), is de ned as δ(Si) = |Si| / η.
The detail of β(ej) is given later.
4.2 Epochs
In Sliding Batch, a life-time of a video streaming is di-vided into a sequence of time intervals, known as epochs.An epoch, ei, is characterized by its starting epoch time,α(ei), its duration, δ(ei), and its associated batch, β(ei).An ei is closely related to the playback property of Si asshown below:
α(ei) = α(Si)
α(ei+1) = α(ei) + δ(ei)
δ(ei) =δ(ei)
η= δ(Si)
Each epoch is associated with a batch, β(ei), and thedetails of their relationship are given next.
4.3 Batches
A batch, β(ei), is a set of segments whose download-ing is initiated at the same time. There are N batches in avideo as there are N epochs. Each batch consists of a setof segments that are unique to each batch, except for thosebatches that are of empty set. β(ei) is characterized by thefollowing attributes: an associated epoch, ei, a set of asso-ciated video segments, and a set of streaming sessions thatare initiated at epoch ei with rate rj each.
V = {β(ei), i = 1, 2, · · · , N}
β(ei) =
⎧
⎪
⎪
⎪
⎨
⎪
⎪
⎪
⎩
{Sj , j = 1, 2, · · · , ni,ni ≤ N} if i = 1
{Sj , j = ni−1 + 1, ni−1 + 2, · · · , ni,ni ≤ N} if 2 ≤ i ≤ N and ni−1 < N
∅ otherwise
β(ei) ∩ β(ej) = ∅
Segments that belong to the same batch all start down-loading at the same time at the beginning of the associatedepoch.
A(Sj) = α(ei), ∀Sj ∈ β(ei)
where A(Sj) is the starting download time of Sj .The ending download time of segment j, Ω(Sj), differs
from segment to segment and it is the ending playback timeof segment j.
Ω(Sj) = A(Sj) +‖Sj‖
rj
= α(ej) + δ(ej)
where ‖Sj‖ is the size of Sj in number of bits and rj is therate of Sj download. rj is given by
rj =‖Sj‖
Ω(Sj) − A(Sj), Sj ∈ β(ei)
110

Figure 2. Relationship among segments,epochs, and batches
Fig. 2 illustrates the relationship among segments,epochs and batches in a simpli ed video reception scenario.In this example, a video is divided into N = 4 segments ofequal length. Batch β(e1) consists of segments S1 and S2.Segment downloading for β(e1) was initiated at time α(e1)for both S1 and S2 at rates r1 and r2 respectively. Batchβ(e2) consists of segments S3 and S4. Segment download-ing for β(e2) was initiated at time α(e2) at rates r3 and r4
respectively. No segment is associated with β(e3) or β(e4).
4.4 Batch Sizes
One of the important parameters of Sliding Batch is thenumber of segments that belong to a batch, or the size of abatch, |β(ei)|.
|β(ei)| = min(N(ei), |βR(ei)|, |βB(ei)|)
where N(ei) is the number of remaining segments yet tobe downloaded at time α(ei), |βR(ei)| is the rate-limitedbatch size at time α(ei), and |βB(ei)| is the buffer-limitedbatch size at time α(ei). The number of remaining seg-ments, N(ei), is de ned as:
N(ei) =
{
N if i = 1
N −∑i−1
k=1 |β(ek)| if 2 ≤ i ≤ N
The rate-limited batch size, |βR(ei)|, refers to the sizeof a batch being computed based solely on the available re-ceive bandwidth, RA, and is determined by the maximumnumber of concurrent segment downloading sessions thatcan be sustained given the available receive bandwidth attime α(ei).
|βR(ei)| =
⎧
⎪
⎪
⎪
⎪
⎪
⎪
⎪
⎨
⎪
⎪
⎪
⎪
⎪
⎪
⎪
⎩
mi, if i = 1
∃max(mi)|∑mi
k=1 rk ≤ RA(ei),
mi ≤ N
mi − mi−1, if 2 ≤ i ≤ N
∃max(mi)|∑mi
k=mi−1+1 rk ≤ RA(ei),
mi ≤ N
Similarly, the buffer-limited batch size, |βB(ei)|, is com-puted based solely on available buffer size, BA, at timeα(ei), as if there were in nite amount of receive bandwidthavailable. |βB(ei)| is determined by the maximum numberof concurrent segment downloading sessions that can be ac-commodated given BA at α(ei).
|βB(ei)| =
⎧
⎪
⎪
⎪
⎪
⎪
⎪
⎪
⎨
⎪
⎪
⎪
⎪
⎪
⎪
⎪
⎩
mi, if i = 1
∃max(mi)|∑mi
k=1 ‖Sk‖ ≤ BA(ei),
mi ≤ N
mi − mi−1, if 2 ≤ i ≤ N
∃max(mi)|∑mi
k=mi−1+1 ‖Sk‖ ≤ BA(ei),
mi ≤ N
where ‖Sk‖ is the size of batch in number of bits.
4.5 Receive Bandwidth Management
The receive bandwidth available at the beginning of the rst epoch, RA(e1), is de ned as the total receive band-width, RT , that can be set aside for the support of thestreaming service. The available receive bandwidth for thebeginning of the subsequent epoch is determined by howmuch bandwidth has been consumed in the previous epoch,RU (ei−1), and how much bandwidth has just been addeddue to the release of a segment reception session, ri−1.
RA(ei) =
{
RT if i = 1RT − RU (ei−1) + ri−1 if 2 ≤ i ≤ N
The used received bandwidth, RU (ei), during epoch ei
is given by
RU (ei) =
⎧
⎪
⎪
⎪
⎪
⎪
⎪
⎪
⎨
⎪
⎪
⎪
⎪
⎪
⎪
⎪
⎩
∑mi
k=1 rk, if i = 1
∃max(mi)|∑mi
k=1 rk ≤ RA(ei),
mi ≤ N
RT − RA(ei) +∑mi
k=mi−1+1 rk, if 2 ≤ i ≤ N
∃max(mi)|∑mi
k=mi−1+1 rk ≤ RA(ei),
mi ≤ N
4.6 Buffer Management
The total buffer space, BT , consists of two buffer ar-eas: the download buffer area, BD, and the post-playback
111

buffer area, BH . BD is used as a temporal storage spaceto buffer segments that are being downloaded. The size ofdownloading buffer, |BD|, determines the maximum num-ber of segments that can be downloaded at the same time(i.e. max. buffer-limited batch size). Based on |BD|, theavailable buffer space, BA(ei), and the used buffer space,BU (ei), are computed by applying a similar logic and algo-rithm de ned in the receive bandwidth management.
Let ‖BD‖ be the size of downloading buffer area in num-ber of bits. The available buffer space, BA(ei), at timeα(ei) is given by
BA(ei) =
{
‖BD‖ if i = 1‖BD‖ − BU (ei−1) + ‖Si−1‖ if 2 ≤ i ≤ N
The used buffer space, BU (ei), during epoch ei is givenby
BU (ei) =
⎧
⎪
⎪
⎪
⎪
⎪
⎪
⎪
⎪
⎪
⎨
⎪
⎪
⎪
⎪
⎪
⎪
⎪
⎪
⎪
⎩
∑mi
k=1 ‖Sk‖, if i = 1
∃max(mi)|∑mi
k=1 ‖Sk‖ ≤ BA(ei),
mi ≤ N
‖BD‖ − BA(ei) +∑mi
k=mi−1+1 ‖Sk‖,
if 2 ≤ i ≤ N
∃max(mi)|∑mi
k=mi−1+1 ‖Sk‖ ≤ BA(ei),
mi ≤ N
The post-playback buffer area, BH , is used to retain seg-ments that have nished playing back. The size of post-playback buffer, |BH |, determines the duration of time thesegments will be held in a user system after their playback.
Fig. 3 illustrates an example of how a user may receivesegments in a series of batches. In this example, a streamedvideo consists of 24 equal-size segments and segments arereceived in a total of 15 batches. The total receive band-width, RT , of the user is twice as the nominal streamingrate of the video segment. The total download buffer space,BD, can accommodate a maximum of 10 simultaneous seg-ment downloads. Notice that the rst two batches are band-width limited, the next eight batches, β(e3) through β(e15),are buffer limited, and the nal nine batch sizes are deter-mined by the remaining number of segments, N(ei), yet tobe received.
4.7 User Profile and VT Room Profile
The parameters used in Sliding Batch for the computa-tion of batch sizes are grouped into two types of pro les.
VT Room profile describes the attributes of a video dis-tributed in a VT Room. They include parameters such as thesize of a streaming video, |V |, its playback duration, δ(V ),the total number of segments, N , and the size of each seg-ment in number of bits {‖Si‖, i = 1, 2, · · · , N}. VT Roompro le is given to all users in each VT Room at their jointime by the VT Distributor.
User profile describes the attributes of an individual user,primarily its resource availability, and consists of the fol-
Figure 3. Sample segment receptions: band-width and buffer limited case
lowing parameters: the time a user joined a VT Room, t0,the total receive bandwidth set aside for the streaming ser-vice, RT , the downloading buffer size, |BD|, which deter-mines the maximum number of concurrent segment down-loads, and the size of post-playback buffer space, |BH |,which determines how long a segment will remain in bufferafter its playback. Users in a VT Room advertise their userpro le through the advertisement and discovery scheme de-scribed in the next section.
Sliding Batch signi cantly simpli es the advertisementof segment reception states of users. It enable users to ex-press their complete segment reception order, timing, andrates from the rst epoch to the last by advertising their userpro le in one advertisement at the time of their VT Roomjoin. Accordingly, one query is suf cient to know the en-tire video segment downloads and playback sequences ofanother user. In the following section, the details of howthe user pro le is shared among the users of a VT Room aregiven.
5 Segment Advertisement and Discovery
This section describes the video segment advertisementand discovery scheme used in a VT Room. Virtual Chain-ing allows users of a VT Room to cooperatively maintain acollection of user pro les, known as a state table, to sharethe segment reception state information of users. Througha selection process, users identify a set of prospective dis-tribution sources from the state table. Virtual Chaining alsode nes a mechanism through which users communicate thechanges in their transmit bandwidth availability. The details
112

Figure 4. Entry fields of a state table
of state table maintenance and distribution source identi -cation procedures are described next.
5.1 State Table Sharing
A state table is a collection of user pro les maintainedcooperatively among the members of a VT Room. It de-scribes each user’s segment reception state and the transmitbandwidth availability. An entry in the state table consistsof the following elds: IP address of the user advertising itsstate, parameters of the user pro le (t0, RT , |BB |, |BH |),available transmit bandwidth (TA), and the time of its entry.This is depicted in Fig. 4.
The state table is shared among the users of a VT Roomin the following manner. VT Distributor maintains the tail-end portion of the state table, which contains user pro lesof the last M users who joined the VT Room. VT Distribu-tor receives a user pro le from each newly joining user anddrops the oldest entry from the state table when its size be-comes greater then M . A newly arrived user Ui receivesthe tail-end portion of the state table from the VT Distribu-tor and examines the table to identify users who are capableof distributing needed segments. If the quali ed distributionsource is not found, Ui requests Ui−M , the oldest entry inthe state table, to send its state table so that Ui may receivethe user pro les of Ui−M through Ui−2M . This process isrepeated until a quali ed distribution source is located. Ifno quali ed user is found after iterating through the chainof state tables, Ui requests VT Distributor to transmit theneeded segment.
5.2 Distribution Source Identification
The selection of a distribution source from the state tableis a two-step process. First, Ui identi es a set of prospectivedistribution sources. This is executed once at the time of VTRoom join. Second, Ui identi es a qualified distributionsource among the candidates. This process is executed foreach segment download at the beginning of each epoch.
To be considered for a prospective distribution source,an entry in the state table must satisfy the following tworequirements: playback distance requirement and segmentavailability requirement. The playback distance require-ment states that Ui can receive a video segment from an-other user, Uj , only if Ui begins playing back the rst videosegment after Uj and before it is being dropped from Uj’spost-playback buffer. The segment availability requirementstates that Ui can receive a segment from Uj only if Uj be-gan downloading the segment before Ui does.
To be quali ed for and selected as an actual distribu-tion source, the transmit bandwidth availability requirementmust be satis ed. It states that Ui can receive Sk from Uj
only if Uj has the suf cient transmit bandwidth to supporta segment distribution session at rate rk, as required by Ui.When multiple users qualify, the user who departs rst fromthe VT Room will be selected. This is done to minimize theloss of unused resources in a VT Room.
In order for Ui to be able to identify a quali ed distribu-tion source, the time-varying transmit bandwidth availabil-ity of prospective distribution sources must be known. Toachieve this, Ui subscribes to a transmit bandwidth changenoti cation service at each prospective distribution sourceusing a publish-subscribe method. Each time a changein transmit bandwidth occurs at a prospective distributionsource, a noti cation message is sent to the subscribersthrough a point-to-multipoint link.
Due to its simple operation, Virtual Chaining is relativelyeasy to implement, deploy, and study its behavior. A dis-tributed and redundant state table available at participatingusers offers resiliency such that a loss of a few users do notbreak the segment advertisement, discovery, or distributionoperation. Virtual Chaining is fair, in terms of the carriedworkload among the users, that no single user is expectedto perform more work than others. Virtual Chaining is alsoscalable in that the workload placed upon each user remainsa constant regardless of the size of the membership in theP2P community.
6 Simulation Design and Analysis
This section describes the design and analysis of exper-iments performed on Virtual Theater Network. A softwaremodel was created to simulate the behavior of a VT Room.The focus of the experiments was to study how well the pro-posed video distribution schemes would alleviate the loadon the VT Distributor under different operating environ-ment. Speci cally , the peak transmit bandwidth usage of aVT Distributor is measured under different user inter-arrivaltimes, nominal streaming rates, video segment sizes, anduser receive bandwidth availability. The description of themodel, the design of the experiments, and the analysis ofsimulation results are given below.
6.1 The Model Description
The simulated VT Room consists of a VT Distributorand a series of user processes that arrive to the VT Room.VT Distributor supplies the parameters de ned in VT Roompro le to the newly joining users, such as the total videoplayback time (120 minutes)1, the nominal streaming rate(1.0 Mbps), and the total number of segments (24) in thevideo. For simplicity, the video is divided into the equallength of segments and equal duration of playback time (5minutes).
The user processes simulate the behavior of peers joiningthe VT Room, discovering other users, identifying possibledistribution sources, receiving video segments, distributingvideo segments as requests arrive, and departing from the
1The value in the parenthesis denotes the default value used in the ex-periments
113

0
0.1
0.2
0.3
0.4
0 10 20 30 40 50 60
Pea
k Tr
ansm
it B
andw
idth
Dem
and
on V
TD (N
orm
aliz
ed)
User Inter-Arrival Time (seconds)
ChainingSliding Batch
Restrained Sliding Batch
(a) Effects of user arrival pattern
0
0.1
0.2
0.3
0.4
0.5
0.6
0.7
0.8
0.9
1
0.4 0.6 0.8 1 1.2 1.4 1.6 1.8 2
Pea
k Tr
ansm
it B
andw
idth
Dem
and
on V
TD (N
orm
aliz
ed)
Nominal Streaming Rate (Mbps)
ChainingSliding Batch
Restrained Sliding Batch
(b) Effects of streaming rate
0
0.1
0.2
0.3
0.4
0.5
0.6
0.7
1 2 3 4
Pea
k Tr
ansm
it B
andw
idth
Dem
and
on V
TD (N
orm
aliz
ed)
User Receive Bandwidth Availability (Mbps)
ChainingSliding Batch
Restrained Sliding Batch
(c) Effects of user bandwidth availability
0.1
0.2
0.3
0.4
13515 3060
Pea
k Tr
ansm
it B
andw
idth
Dem
and
on V
TD (N
orm
aliz
ed)
Segment Size (min)
Time a segment is held in buffer after playback
5 min15 min30 min
(d) Effects of segment size
Figure 5. Measurement results on peak transmit bandwidth demand at VT Distributor
VT Room. The inter-arrival time of user processes is ex-ponentially distributed (mean 10 seconds). To re ect theasymmetrical nature of the transmit and receive bandwidthcapacity of typical broadband access technologies, as wellas the diversity in the amount of transmit bandwidth avail-ability, each user is equipped with a xed receive bandwidth(2.0 Mbps) and varying transmit bandwidth (30% to 100%of the receive bandwidth; uniformly distributed). Each userexecutes Virtual Chaining to identify possible distributionsources and implements Sliding Batch to receive video seg-ments. All experiments simulate the bandwidth-limited net-work environment where suf cient amount of downloadingbuffer exists at each user (|BH | ≥ N ). The default post-playback buffer size allows a segment to remain in buffer fora nate period of time (15 minutes) after its playback. Theexperiments are designed so that all users receive neededsegments successfully and complete the viewing of the en-tire video.
6.2 Experimental Design and Analysis
Four sets of experiments are conducted, each measur-ing the effectiveness of proposed schemes in mitigating thebandwidth demand on the VT Distributor. They focus on
the following areas: 1) the effects of user arrival patterns,2) the effects of nominal streaming rates, and 3) the effectsof user receive bandwidth availability, and 4) the effects ofvideo segment sizes.
For each set of experiments, the measurements are takenon the peak transmit bandwidth usage of VT Distributorusing the following schemes: a traditional client-servervideo distribution scheme, Sliding Batch, Restrained Slid-ing Batch, and Chaining [1]. A traditional client-servervideo distribution refers to a scheme where all users receivevideo feeds from a central server. The measurements takenfrom this scheme are used as the base-line and the measure-ments from other schemes are normalized to the base-linevalues when graphed. Restrained Sliding Batch is a variantof Sliding Batch and it limits the use of receive bandwidth ator below their initial available transmit bandwidth. In otherwords, a user is allowed to prefetch segments if the totalsegment downloading rate does not exceed the initial avail-able transmit bandwidth. It tames the greedy nature of theSliding Batch and further reduces the bandwidth demandon the VT Distributor. The simulation results from Chain-ing are used as a reference point. Chaining is a peer-to-peerbased streaming video distribution scheme. A major differ-ence between Chaining and Sliding Batch is that Chaining
114

distributes video stream in its entirety from one user to an-other at the nominal playback rate while Sliding Batch dis-tributes video stream in multiple segments at or below thenominal playback rate.
The rst set of experiments studies the effects of userinter-arrival times on the load at VT Distributor. The meaninter-arrival times of user processes are varied from 5.0 to60.0 seconds while other parameters were kept constant.The simulation results are shown in Fig. 5(a). RestrainedSliding Batch offers as much as 90% of bandwidth reduc-tion at the VT Distributor. Sliding Batch and Chainingachieved roughly 80% and 70% of bandwidth reductionsrespectively at their peaks. A common and assuraning trendobserved among the three schemes was that the greater therate of user arrivals, the greater the bandwidth reductions atVT Distributor. This is most appearent in Restrained Slid-ing Batch and is a sign of scalability.
The second set of experiments studies the effects of play-back rates on the load at VT Distributor. The nominal play-back rate of a video stream was varied from 0.5 to 2.0 Mbps.Under Chaining, the load on the video server increased lin-early as the playback rate increased. Sliding Batch and Re-strained Sliding Batch both have a milder incline when theplayback rates are below the mean available transmit band-width of users. Chaining performed the best among thethree schemes when the playback rate is very low. SlidingBatch and Restrained Sliding Batch both achieved a greaterload reduction in all other regions of playback rates. This isdepicted in Fig. 5(b).
The third set of experiments focuses on the effects ofthe amount of available receive bandwidth at users. As ex-pected, a sharp increase in the bandwidth demand at VTDistributor is observed on Sliding Batch when users havea large amount of excess receive bandwidth. This is dueto the greedy nature of Sliding Batch that it will prefetch aseries of segments until all available receive bandwidth isconsumed. In contrast, both Chaining and Restrained Slid-ing Batch maintain a constant level of transmit bandwidthdemand at VT Distributor regardless of how much receivebandwidth is available at each user. Fig. 5(c) shows that Re-strained Sliding Batch requires roughly one-third of band-width at VT Distributor than Chaining.
The nal set of experiments evaluates the impact of seg-ment sizes to the load on VT Distributor. It also tries tobuild a relationship between the segment sizes (i.e. seg-ment playback duration) and the post-playback buffer size(i.e. duration of time a segment is held in post-playbackbuffer). Segment playback duration is varied from 1 minuteto 60 minute and each experiment is conducted with thepost-playback buffer size of 5 minutes, 15 minutes, and 30minutes. Fig. 5(d) shows that, generally speaking, lowerbandwidth demand is placed on VT Distributor when seg-ments are held in buffer for a longer duration of time aftertheir playback. When the segment size is larger than thepost-playback buffer size, the same amount of load is placedon the VT Distributor regardless of how long the segmentsare kept in post-playback buffer. A decrease in the band-width demand at VT Distributor is observed once the seg-ment size becomes smaller than the post-playback buffer
size. With 15-minute and 30-minute post-playback bufferexperiments, a substantial amount of bandwidth decrease isobserved for segment sizes down to 5 minutes; however,very little load change is observed beyond that point.
The above four sets of experiments have con rmed thatpeer-to-peer based streaming service can alleviate load onthe video server in signi cant amount. They also gave anassurance that splitting a video stream into multiple seg-ments and distributing them concurrently at rates below thenominal playback rate allow further reductions in the trans-mit bandwidth demand on the video server. Additional loadreduction was achieved by taming the greedy nature of Slid-ing Batch by restraining the amount of segment prefetching.
7 Conclusion
We proposed Virtual Theater Network, a new videostreaming distribution network model based on a hy-brid architecture between client-server and P2P computingparadigms. In this model, streaming contents are dividedinto small pieces of segments and placed at the caches ofparticipating users. Through Virtual Chaining and Slid-ing Batch, as well as its variant Restrained Sliding Batch,users advertise, discover, and distribute available segmentsin their caches among the users of the VT Room. A simula-tion study indicated a sign of scalability and a dramatic re-duction in the transmit bandwidth requirement on the videoserver. Future work will focus on the support of QoS amongthe peers to provide a level of assurance in video segmentreceptions.
References
[1] S. Sheu and K. A. Hua, “Chaining: A generalized batchingtechnique for video-on-demand systems,” in Proceedings ofIEEE ICMCS, 1997.
[2] E. Kusmierek, Y. Dong, and D. Du, “Loopback: ExploitingCollaborative Caches for Large-Scale Streaming,” in Pro-ceedings of ACM/SPIE MMCN, 2005.
[3] S. Banerjee, B. Bhattacharjee, and C. Kommareddy, “Scal-able application layer multicast,” in Proceedings of ACMSigcomm, 2002.
[4] D. Tran, K. Hua, and T. Do, “ZIGZAG: An ef cient peer-to-peer scheme for media streaming,” in Proceedings of IEEEINFOCOM, 2003.
[5] V. N. Padmanabhan, H. J. Wang, P. A. Chou, and K. Sri-panidkulchai, “Distributing Streaming Media Content UsingCooperative Networking,” in Proceedings of ACM NOSS-DAV, 2002.
[6] R. Rejaie and A. Ortega, “PALS: Peer-to-Peer Adaptive Lay-ered Streaming,” in Proceedings of ACM NOSSDAV, 2003.
[7] M. Hefeeda, B. K. Bhargava, and D. K. Y. Yau, “A hybridarchitecture for cost-effective on-demand media streaming,”Computer Networks, vol. 44, no. 3, 2004.
[8] Y. Shan and S. Kalyanaraman, “Hybrid video download-ing/streaming over peer-to-peer networks,” in Proceedingsof IEEE ICME, 2003.
[9] M. Hefeeda, A. Habib, B. Botev, D. Xu, and B. Bhargava,“PROMISE: Peer-to-Peer Media Streaming Using Collect-Cast,” in Proceedings of ACM Multimedia, 2003.
115

Packet and Frame Rate Control Methods for Continuous Media over Heterogeneous Environment by Wired and Wireless Networks
†Noriki, Uchida, †Xuanrui Xiong , ‡‡ Kazuo Takahata, †Yoshitaka Shibata Faculty of Software and Information Science, Iwate Prefectural University, Japan ‡‡ Faculty of Human and Social Studies, Saitama Institute of Technology, Japan
Abstract In this paper, packet loss rate and frame rate control
function for multimedia communication systems under heterogeneous environment by the wired and the wireless networks is proposed. In our suggested system, as channel coding, FEC (Forward Error Correction) method with Reed-Solomon coding is introduced to reduce the packet error rate on the wireless network. On the other hand, a frame rate control function is introduced on the source host receive host and the BS (Base Station). When it becomes larger for the rate of packet loss or delay, frame rate is changed, a frame can be chosen and be transmitted. Thereby, It can maintain the throughput of End-to-End while the packet error rate is reduced to the accepted value.
Keywords: QOS control, multimedia communication, FEC, Frame rate control, wireless network.
1. Introduction In recent years, various multimedia services like
multimedia conference system, streaming video, and VoD services have been realized by the development of the high speed and broadband of networks. Not only the present wired networks, such as Cupper-based LANs, optical fiber networks, or CATV-based networks but also wireless and mobile networks, have been used to heterogeneous network environments where the bidirectional multimedia communication is realized beyond the limits of time and space. Then, the usage of the heterogeneous network by the wired and wireless networks makes us to expect the realization of new applications like the advanced traffic system[1], the disaster prevention system, and the adhoc network system. However, the wireless network has essential problems as follows: 1) network bandwidth is not sufficient.2) packet delay is large.3) the bit error, namely packet error is high, compared with wired networks. Those problems cause difficulties for seamless communication through the wired and wireless networks. As example, current popular wireless network such as IEEE 802.11b with 2.4GHz and 11Mbps provides the packet loss by the bit error over wireless and causes service quality degradation when the communication distance is larger than a
couple of Km or obstacles are existed between communicating stations. On the realtime bidirectional communication by the audio/video, the delay and jitter on packet arrival at the receiver make the realtime communication very difficult, eventually conducts the service quality degradation. To avoid these problems, it is necessary to introduce end-to-end QoS (Quality of Services) guarantee mechanism into the heterogeneous network environment. Moreover, if the reliable protocol like TCP is applied, the delay time due to retransmission for the lost packets would be increased, eventually the realtime communication would become difficult.
In order to solve those problems, we introduce, a new dynamic QoS control method based on the combination of channel coding and transcoding. As channel coding, FEC (Forward Error Correction) with Reed-Solomon coding [2,3,4] is used while various transcoding methods are used.
First, our suggested system can dynamically control the FEC redundancy to enable bidirectional realtime video communication and to reduce the packet error rate under the heterogeneous environment where the wired and wireless networks are interconnected. The packet error rate is periodically observed at the receiver side and feed backed to the sender side when the error rate varied. The number of redundant packets for error correction in the unit time is determined by observing packet error rate and the desired packet error rate. The FEC with Reed-Solomon coding is applied to both data packets and redundant packets at the sender side and the calculated packets are sent to the receiver side. The receiver side recalculates whether the packet error happened or not. If packet error happened, then error correction process is executed. Thus, the length of FEC redundancy is dynamically controlled to maintain the actual packet error rate at a constant on the end-to-end communication.
Next, transcoding method[5,6] as source coding is introduced to provide stable end-to-end multimedia service quality between the wired and wireless networks[1,7].
Transcoding can control the required network throughput even the FEC method generates additional
116

redundant packet transmission and increases the required communication bandwidth. The transcoding is executed by the system functions by frame rate at the sender side and Receiver side and BS. Here, the controls of frame rate are dynamically fitted by the corresponding to change the network bandwidth and the user resources.
The reminder of this paper is organized as follows. The next section provides system configuration of interconnected wire and wireless networks. Section 3 introduces our suggested system architecture for QOS control of realtime multimedia communication system. The functional modules are shown in Section 4 . Section 5 explains the error recovery method by FEC and it dynamic control. Section 6 introduces the frame rate control system. Section 7 introduces prototyped network system and experiment. Finally section 8 presents the conclusions.
2. System Configuration The multimedia communication services network
currently assumed in this paper is organized by integration of wireless network such as IEEE 802.11b (2.4GHz, 11Mbps) and the wired network based on an optical fiber, as shown in Fig. 1. This interconnected network is constructed by fixed hosts (FH) like desktop typed personal computers, and mobile hosts (MH) like notebook typed personal computers.
FH and MH have video cameras and video capturing functions to facilitate realtime TV conference system or net meetings. The wired and wireless networks are interconnected by base stations (BS) which performs as gateway functions. Therefore, FH and MH can communicate with each other in both directions by end-to-end manner.
Frame rate control
FECFrame rate controlFrame rate control
FEC / Frame Rate control
Frame Rate control
unicast /multicast
Media Data Stream
Media Data Control Stream
FH
FH
MH
MH
MH
BS
BS
Wireless
Wireless
Wired
Fig1. The Heterogeneous Network by the Wired and Wireless Networks
However, since the interconnected network is consisted of the wired network which is based on sufficient resource environment and the wireless
network which is not, especially because of the higher packet error rate due to the bit error rate on wireless environment, the end-to-end audio/video communication services cause service quality degradation. Therefore, when real time bidirectional communication by the audio/video is implemented using the interconnected network, the quality deterioration over audio/video streams due to the delay and jitter on packet arrivals at the receiver make the realtime communication very difficult. In order to solve these problems, it is necessary to introduce novel functions to guarantee end-to-end QoS in audio/video communication system through the wired and the wireless networks, as introduced in the next section.
3. System Architecture In this paper, the system architecture of MidField
System [8] is introduced. Fig.2. shows the system architecture to realize constructing dynamic intercommunication environment.
Transport Layer
Stream Plane
Session Plane
System Plane
EventProcessPlaneSynchronization Layer
Data Transform Layer
Flow Control Layer
Application Layer
MidFieldSystem
Transport LayerTransport Layer
Stream Plane
Session Plane
System Plane
EventProcessPlaneSynchronization Layer
Data Transform Layer
Flow Control Layer
Application Layer
MidFieldSystem
Fig2. System Architecture
This system architecture is between the application and the transport layer. The system is constructed by 3 layers and 4 vertical planes and offers multimedia communication functions to the application layer. Steam Plane is constructed by synchronization, data transform and media flow control layer, and performs multimedia stream processing. Session Plane performs management of communication sessions. System Plane monitors network traffic and CPU rate in the local host, and performs admission tests for QoS requirements from system user. Event Process Plane processes various events that are created in the system.
4. Functional Modules The functional modules are realized in the MidField
system. It is shown in Fig.3. The transcoding is executed by the system functions by frame rate at the sender side and Receiver side and BS. The FECCM
117

MidFieldSystem
Synchronization Layer
Data TransformLayer
Flow Control Layer
Session Plane/Event Process
Plane
SystemPlane
SystemPlane
Session Plane/Event Process
Plane
Session Plane/Event Process
Plane
SystemPlane
Stream Plane
Sender Application BS Receiver Application
Stream Plane
Stream Plane
FrameRate
ControlModule
FEC Control Module
Frame Rate
Manag-ement
Module
FEC Manag-ement
Module
StreamManag-ement
ControlModule
StreamManag-ement
ControlModule
StreamManag-ement
ControlModule
Frame Rate
Manag-ement
Module
Frame Rate
Manag-ement
Module
FrameRate
ControlModule
FrameRate
ControlModule
FEC Control Module
FEC Control Module
FECManag-ement
Module
FEC Manage-
mentModule
Media data streamMedia data control stream Media data control stream
Media data stream
Fig3. Functional Modules
(FEC Control Module) and FECMM (FEC Management Module) function module are included in flow control layer. The FRCM (Frame Rate Control Module) and FRMM (Frame Rate Management Module) function module are included between synchronization layer and data transform layer. The FECMM measures and determines a packet loss . The FECCM performs processing packet that determined packet loss at FECMM. The FRMM measures and determines frame rate value. The FRCM performs processing frame rate that determined a frame rate value at FRCM. The SMCM (Stream Management Control Module) function is stream transmission processing.
5. Error Recovery by FEC In the environment where a certain amount of packet
error is allowed like this research, FEC is considered to be the very effective method when focusing on the importance of a time-critical characteristic. Compared with ARQ (the Automatic Repeat reQuest) which is a method to repeat transmitting the error or lost packets, FEC which carries the additional redundant data by the error correction code has the smaller calculation time during the recovery than the packet delay time by ARQ. Reed-Solomon (RS) coding as the FEC code was introduced to the media flow control layer in our system architecture as indicated in Fig 4.
When the number of the RS coding packets is set as nand the data packets set as k in a unit time, RS coding has the capability to correct n-k error packets when the position of the bit error in a packet is known. When many packet errors occur more than n-k pieces among n packets, the error probability after RS coding and recovering processes can expressed as,
inn
kni
iin eeCE )1(
1
(1)
Here, e presents the rate of the packet error between
n
Media Packet
FEC Packet
k
n-k
FEC Packet addition
FEC Packet
Media Packet Media Packet
FEC Packet
Lost Packet
Send Packet Packet Receive Restore
The number of packets is adjusted.
Fig 4. Reed Solomon Codingthe transmitted and receipt hosts. Since k is known
value, E is determined by the value of n. If E is calculated for various cases of n in advance, target error rate can be calculated. Thus the error recovery power of RS coding is determined by n. Therefore, the packet error rate can be kept within the admissible value below by measuring e periodically, then calculating the E using formula (1) for the measured eand various n, and by feeding back the value of nwhich is equivalent to the admissible error rate E.
Even though the unexpected packet error may randomly cause beyond the predefined packet error rate, those packet error rate is periodically measured at the receiver side and suitable length n of RS coding packets can be calculated and dynamically feed back to the sender side. Therefore, the dynamic redundancy control for to maintain the packet error rate at constant can be attained.
118

6. Frame Rate control The increase of the number of the transmitted packet
per unit time between the data transform layers in both hosts by FEC redundancy when the burst error in bit transmission occurred can be kept constant by the same way during video communication service. The assumed end-to-end communication was realized by the introduction of transcoding. As typical network environment, wireless side doesn’t have sufficient resources like the available bandwidth although the wired side does. Here, in order to realize the seamless end-to-end communication, Frame rate control were introduced for our transcoding between wired and wireless side.
The video frame rate is controlled according to the user’s requirement and resource conditions. In case of Motion JPEG, any frames are simply sub-sampled to adjust to the desired rate. In the case of MPEG video which is consisted of a number of group of pictures (GOP). Furthermore, one GOP is consisted of I, B, P-pictures for inter-frame prediction and has mutual relation to each video frame. It is obvious the priority of I-picture is the highest and the priority of P-picture is higher than the B-picture, because I-picture is required to predict the P- and B-pictures and P-picture is required to predict B-pictures. Therefore, when sub- sampling of the MPEG frames is required, some of B-pictures are sub-sampling first, then P-picture and finally I-picture depending on the host and network load conditions. Besides, the transform of video coding was adopted among one coding to another such as Motion JPEG, MPEG-1, 2 4, H-261, -323 or Quicktime, etc.
7. Prototype and Experiment
Fig5. Experimental Prototype
Table1. Experimental Parameters
1200bytePacket Size
20 Packet/FramePacket number/Frame
6fpsFrame Rate
3byte(Full Color)Color Depth
320x240Frame Size
MPEG4Video Format Coding
1200bytePacket Size
20 Packet/FramePacket number/Frame
6fpsFrame Rate
3byte(Full Color)Color Depth
320x240Frame Size
MPEG4Video Format Coding
In order to evaluate the suggested method, an
experimental prototype system was constructed as shown in Fig.5. where the sender host with video camera and receiver host are connected to middle host through the Ethernet. This middle host performs as a packet loss generator like a noisy wireless network. The transmitted video packets from sender are randomly lost on the middle host. Then the lost packets are arrived at the receiver side and decoded by FEC process. The packet loss rate was calculated on the receiver side and feedback to the sender side. The number of the redundant packets was controlled to maintain the target packet loss rate was 0.005. The Table 2 shows the number of the redundant packets for the observed actual packet loss rate.
Table2. The number of redundant packets
620.20 - 0.30
340.15 - 0.20
220.12 - 0.15
160.08 - 0.12
100.05 - 0.08
80.03 - 0.05
60.02 - 0.03
40.01 - 0.02
20.00 - 0.01
The number of redundant packets
Packet loss rate
620.20 - 0.30
340.15 - 0.20
220.12 - 0.15
160.08 - 0.12
100.05 - 0.08
80.03 - 0.05
60.02 - 0.03
40.01 - 0.02
20.00 - 0.01
The number of redundant packets
Packet loss rate
In the experiment, the packet loss rate was changed for every 30 sec, namely 0 % for the first 30 sec, 2 % between 30-60 sec and again 0 % between 60-90 sec. and observed after FEC processing. As result, by controlling the number of the redundant packet due to feedback of the largest packet loss rate among the contiguous 10 times observation, the packet loss rate could be maintained to 0 % although more than 0 % for the first several seconds as shown in Fig. 6. The number of the redundant packets controlled based on the feedback information with packet loss from the receiver is shown in Fig. 7.
Packet loss control by FEC
0
0.5
1
1.5
2
2.5
3
3.5
1 7 13 19 25 31 37 43 49 55 61 67 73 79 85
Lapse Time (sec)
pack
et lo
ss ra
te %
packet loss rate betweennetworks
packet loss rate aferFEC processing by thepacket loss feedbackinformation
packet loss rate aferFEC processing by thelargest value of 10 timespacket loss feedbackinformation
119

Fig6. Packet Loss Control by FEC The number of redundant packets
0
1
2
3
4
5
6
7
8
9
1 7 13 19 25 31 37 43 49 55 61 67 73 79 85
Lapse Time (sec)
The
num
ber o
f red
unda
ntpa
cket
by
FEC
pro
cess
ing
the number ofredundant packets bypacket loss feedbackinformation
the number ofredundant packets bythe largest value of 10times packet lossfeedback information
Fig7. The No. of Redundant Packets
Next fame rate control was carried out to reduce the increase of the required bandwidth due to the redundant packets. By sub-sampling the original fame rate at sender, the frame rate was reduced and maintained at constant as shown in Fig. 8. The original required bandwidth was about 1.2 Mbps and increased without frame rate control. By introducing the frame rate control as shown in Fig. 9, the required bandwidth could be maintained to the original value with 1.2 Mbps.
Required bandwidth for video stream
0
200
400
600
800
1000
1200
1400
1600
1800
1 7 13 19 25 31 37 43 49 55 61 67 73 79 85
Lapse time(sec)
The
band
wid
th to
be
used
(kbp
s)
frame rate 6fps, no redundant packetframe rate 6fps, redundant packet additionframe rate adjustment, redundant packet addition
Fig8. Required Bandwidth for Video Stream
Frame rate control
0
1
2
3
4
5
6
7
1 7 13 19 25 31 37 43 49 55 61 67 73 79 85
Lapse time (sec)
Fram
e ra
te (f
ps)
Fig9. Frame Rate Control
8. Conclusion and Future works In this paper, packet loss rate and frame rate control
function for multimedia communication systems under heterogeneous environment by the wired and the wireless networks was proposed. In our suggested system, as channel coding, FEC (Forward Error
Correction) method with Reed-Solomon coding was introduced to reduce the packet error rate on the wireless network. On the other hand, a frame rate control function was introduced to maintain the required bandwidth. The experimental prototype system was constructed and carried out to evaluate our suggested method. Though this experiment, we could verify the usefulness and the effects of our suggested methods. In a future work, the optimization of FEC process and
experiment of multi-user and bi-directional video transmission over wired and wireless network environment will be carried out.
References [1] K.Takahata, N.Uchida, Y.shibata, ”QoS Control forReal Time Video Stream over Hybrid Network by Wired and Wireless LANs, ” Proceedings of the 17 th international Conference on Advanced Information Networking and Applications (AINA’03) [2] R.Igarashi, K.Takahata, N.Uchida, Y.Shibata,“ Packet Loss Rate Control for Continuous Media over Heterogeneous Network,”18th International Conference on Advanced Information Networking and Applications. Vol 2, pp. 58-61 (2004) [3] T.Kondo, K.Nishimura, R.Aibara,“ Implementation and Evaluation of the Robust High-Quality Video Transfer System on the Broadband Internet,” International Symposium on Applications and the Internet. pp135-141 (2004) [4] N.Yamanouchi,“Internet Multimedia Transmission Using Multiple FEC Recovery Classes”Information Processing Society of Japan Vol.42, No.2, pp.206-212 (2001) [5] K. Ueda , H.Ohsaki, S. Himojo, H. Miyahara, “ Design and Implementation of Real-Time Digital Video Streaming System over IPv6 Network using Feedback Control”, Proceedings of the 2003 Symposium on Applications and the Internet SAINT(2003) [6] H.Gharavi,K.Ban,J.Cambiotis,“RTCP-Based Frame- Synch-ronized Feedback Control for IP-Video Communications over Multipath Fading Channels”, IEEE Proc. on ICC (2004) [7] M. Charikar, J. Naor, and B. Schieber, “Resource Optimization in QoS Multicast Routing of Real-Time Multimedia”, RANSACTIONS ON NETWORKING, VOL. 12, NO. 2, APRIL (2004) IEEE/ACM [8]K.Hashimoto, Y.hibata, “A Middleware System for Flexible Intercommunications”, Proc. of The 10th International Conference on Distributed Multimedia Systems (DMS2004), Sep., 2004.
120

Proceedings
International Workshop on Visual Languages Computing
(VLC 2006)
Co-Editors
Dr. Gennaro Costagliola, University of Salerno, Italy Dr. Giuliana Vitiello, University of Salerno, Italy Dr. Monica Sebillo, University of Salerno, Italy


A Recognition Framework based on LR Parsing for Hand-drawn Diagram
Gennaro Costagliola, Vincenzo Deufemia, Michele Risi Dipartimento di Matematica e Informatica
Università di Salerno 84084 Fisciano(SA), Italy
{gcostagliola, deufemia, mrisi}@unisa.it
Abstract
Sketching provides a natural way to express ideas
during the early phases of design. The existing sketching systems provide good user interfaces but have only limited recognition capability for the graphical input. In this paper we present a framework for the recognition of hand-drawn diagrams that exploits LR parsing techniques to perform a context-based resolution of ambiguities in sketch drawing. The recognizer is automatically generated from a grammar specification, which allows diagram symbols to be defined hierarchically, and to specify the syntax of the language by composing the defined symbols. 1. Introduction
In recent years, there has been an increasing interest in the creation of computer software that works exclusively from freehand drawings, especially for the disciplines of engineering, software design, and architecture [4],[5],[6],[10],[11],[12],[17],[18],[21]. Underlying a sketch-based user interface several processes can be activated. These include the processing of pen strokes, recognition of symbols, stroke beautification [14], reasoning about shapes, and high-level interpretation.
The construction of sketch recognizers for new domain-specific languages is a non trivial and time-consuming task. Indeed, the recognition details of the new language are hand coded into the system and/or a considerable amount of training data are required to customize the system [2],[3].
The difficulties in the recognition process are increased by the lack of precision and the presence of ambiguities in messy hand-drawn sketches. Indeed, semantically different objects might be graphically represented by identical or apparently similar symbols. Sketch recognition systems should also not place
constraints on how the users can draw a symbol [15]. They should be able to draw without having to worry about where to start a stroke, how many strokes to use, in what order to draw the strokes, etc. As a consequence, sketch understanding should include an ink parsing task that establishes which strokes are part of which shapes by grouping and segmenting the user’s strokes into clusters of intended symbols [16].
In this paper we present a framework for the on-line recognition of hand-drawn diagrams [22]. The approach is based on the grammar formalism of Sketch Grammars for modeling diagrammatic sketch notations and for the automatic generation of the corresponding recognizers [9]. In particular, the formalism allows designers to hierarchically describe both the symbols’ shapes and the syntax of diagrammatic notations and to obtain efficient recognizers whose parsing technique is based on LR parsing techniques [1]. These recognizers form the high layer of the sketch recognition system for a diagrammatic notation, while the low layer consists of a domain-independent primitive shape recognizer. Once integrated into a sketch editor, the proposed recognition system incrementally and unobtrusively interprets the sketches as they are created.
The proposed framework does not constrain users to a specific drawing style since the symbols of the diagrams can be drawn with a varying number of strokes and without a particular direction or order. Moreover, the approach exploits contextual information provided by grammars during the recognition of sketched ink. For example, when a recognized symbol is unique to a context then the recognizer uses this symbol to determine the context and thereby resolve pending recognition ambiguities.
The paper is organized as follows. In Section 2 we describe the grammar formalism for describing sketch languages. The recognition framework is presented in Section 3. Finally, the conclusion and further research are discussed in Section 4.
123

2. A grammar formalism for modeling sketch languages
In this section we describe Sketch Grammars (SkGs, for short) [9], a formalism used in the proposed recognition framework for modeling both the shape of the domain symbols and the abstract syntax of the sketch languages. SkGs are an extension of eXtended Positional Grammars (XPGs) [6], a formalism that overcomes the inefficiency of the visual languages syntactic analysis through efficient parsing algorithms based on suitable extensions of the well-known LR techniques [1].
The idea underlying the proposed formalism is to use the grammar productions for clustering the pen strokes of the input sketches into shapes of the domain language, and consequently for selecting the most appropriate interpretations for the input strokes provided by the primitive shape recognizer. The productions have also associated actions that allow designers to specify the display of the recognized shapes, to specify editing gestures [20], to define routines for verifying properties on the sketches.
The SkG formalism conceives the primitive1 and domain symbol shapes as formed by a graphical representation and a type. The latter has associated a set of attributes, which are used to relate a shape to others, and their values depend on the “position” of the shape in the sentence.
An SkG G can be seen as a particular type of context-free string attributed grammar (N, T∪POS, S, P) where: - N is a finite non-empty set of non-terminal shape types; - T is a finite non-empty set of terminal shape types,
with N∩T = ∅; - POS is a finite set of binary spatial and temporal
relation identifiers, with POS∩N = ∅ and POS∩T = ∅;
- S∈ N denotes the starting non-terminal shape type; - P is a finite non-empty set of productions of the following format: A Γ → x1(p1) R1 x2(p2) R2… xm-1(pm-1) Rm-1 xm(pm), Act
where − A is a non-terminal shape type, − Γ is a set of triples {(Tj, Condj, Δj)}j=1…t, t≥0, used to
dynamically insert new terminal shapes Tj in the input during the parsing process, enhancing the expressive power of the formalism [6].
− each xi is a terminal or nonterminal shape type,
1 The primitive shapes are patterns that must be recognized directly, such as line segments and elliptical arcs.
− each pi is an optional value between 0 and 100 indicating the importance of the shape xi in the modeled symbol, and
− each Rj is a sequence (⟨RELj1h1(t1),...,RELjn
hn(tn)⟩) with 1≤k≤n. Each RELji
hi(ti) relates attributes of xj+1 with attributes of xj-hi, with 0≤hi<j, by means of a threshold ti. Notice that we denote REL1
0(0) simply as REL1. Each RELji
hi(ti) may also be a temporal relation, in this case ti represent the time value that relates the two shape types.
− Act specifies the actions that have to be executed when the production is reduced during the parsing process. These may include a set of rules used to synthesize the values of the attributes of A from those of x1, x2,…, xm, a set of display instructions used to display properties of the sketches (such as their attributes) after the strokes are recognized, semantic routines, etc. The actions are enclosed into the brackets { }. Thus, SkGs specifies a sentence by combining
symbols with spatial and temporal relations. The idea of associating importance values to the shapes of the productions comes from noting that the symbols of a particular domain have different structural complexity. As an example, use case diagrams include actor symbols, which are obtained through the composition of several strokes, and communication symbols, which are simple lines. Thus, importance values can be associated to the complex domain symbols in order to allow the generated recognizers to associate to the partially recognized symbols a value that, as we will show in the following section, aids the recognition of messy or incomplete symbols. Indeed, the shapes that allow us to distinguish a symbol from the others with a high degree of certainty will have associated a high importance value.
The following production specifies the Arrow symbol.
Arrow → LINE1(60) <joint2_1(t1), rotate(45,t2)> LINE2(20) <joint2_1
1(t3), rotate1(-45,t4)> LINE3(20), { Arrow.attach(1) = LINE1.attach(1); Arrow.attach(2) = LINE1.attach(2) ∪LINE2.attach(1) ∪ LINE3.attach(1); Arrow.attach(1).Show(“red”); Arrow.attach(2).Show(“red”);}
LINE1
LINE2
LINE3
45°
1 2
2
2
1
1
(a) (b)
Figure 1. The Arrow symbol (a) and the layout of a sketched arrow after the recognition (b).
124

The Arrow symbol is composed by three lines, as shown in Fig. 1(a) (the attributes are represented with bullets). The attribute 2 of LINE1 is jointed to the attributes 1 of LINE2 and LINE3, and the latter are rotated with respect to the former of 45 and -45 degrees, respectively. The values t1,…,t4 specify the error margin in the satisfaction of the relations. The attributes 1 and 2 of Arrow are calculated from the values of the attributes of the three lines. Moreover, the Show method invoked on such attributes visualizes the start and end points of the arrow in red color when a sketched arrow is recognized by using the previous production, as shown in Fig. 1(b). Finally, the importance values indicate that the shaft of the Arrow symbol has a greater weight with respect to the other segments for discriminating an incomplete arrow symbol.
Temporal relations are particularly useful for defining multi-stroke editing gestures such as deleting, moving, copying, because they constrain users to draw the sequence of strokes forming such gestures within a fixed time. As an example, the following production defines an editing gesture formed by a circle with a line inside it, which logically groups the set of strokes inside the circle. Notice that the line must be drawn within t4 milliseconds after the circle has been drawn.
Group → CIRCLE <contain(t1), joint1_1(t2), joint1_2(t3), before(t4)>
LINE, { SET selection = CIRCLE.contain; selection.group = true; }
SkG grammars are used to define both the symbol grammars, which specify the shapes of the language as geometric compositions of primitive shape, and the language grammars, which specify the sentences of the language as composition of the shapes defined by symbol grammars through spatial relations. For example, the following symbol grammar production specifies an Actor symbol of a use case diagram.
Actor → Ellipse (45) <joint1_1(t1)>
Line1(25) < near(t2), near1(t3)> Line2(12) < joint2_1(t4), near1(t5), near2(t6)> Line3(3) <joint2_1
2(t7), rotate2(135,t8)> Line4(12)<joint2_1
3(t9), rotate3(135,t8)> Line5(3), { Actor.attach(1) = Ellipse.attach(1) ∪ Line1.attach(1); }
The non-terminals Ellipse and Line cluster the single stroke arcs that form an ellipse and the parallel single stroke lines, respectively.
The following language grammar production defines a sub-sentence of a use case diagram as the non-terminal Sub formed by an Actor connected through a Line to a UseCase non-terminal.
Sub → Actor <joint1_1(t1)> Line <joint2_1(t2)> UseCase, {Sub.attach(1) = Actor.attach(1) ∪ UseCase.attach(1); }
3. The recognition framework
The recognition approach proposed in this paper exploits the context provided by grammars during the recognition of sketched ink. For example, when a recognized symbol is unique to a context then the recognizer uses this symbol to determine the context and thereby resolve pending recognition ambiguities. Moreover, the recognition process focuses on the shape of the strokes as opposed to other features, such as drawing speed and size. In this way, the system will not place single stroke requirements on the users, allowing users to draw the shapes as they would naturally.
As shown in Fig. 2, the process of definition of a sketch recognition system starts by specifying a grammar for each symbol of the domain language. As an example, for state transition diagrams the designer must specify a grammar for each one of the following symbols: state, initial state, final state, initial and final state, and transition. Next, a grammar is specified that models the abstract syntax of the language, i.e., the possible relations between the symbols. For each one of these grammar specifications the Parser Generator constructs the corresponding recognizer.
The recognition process consists in three phases. First the strokes are interpreted as primitive objects, such as lines, arcs, ellipses, etc., by using a domain independent recognizer. Then, symbol recognizers cluster the primitive objects in order to identify possible domain symbols. Finally, the language recognizer analyzes these candidate symbols produced by the symbol recognizers, prunes some of the symbol interpretations according to the recognition context, interacts with symbol recognizers to force the recognition of incomplete symbols, and selects the more suitable interpretation.
In the following we describe the three recognizers that constitute the three layers of the sketch recognition system shown in Fig. 2. The recognizer at the lower layer is activated each time a new stroke is entered into the edited diagram and the result of the recognition process is provided on demand to the sketch editor by the recognizer at the higher level.
3.1. The primitive shape recognizer
As shown in Fig. 2, the first task of the sketch recognition process is the classification of the pixels composing the strokes into primitive geometric
125

Compile-Time
Parser Generator
Language Grammar
Symbol Grammar 1
Run-Time
Symbol Grammar 2
Symbol Grammar n
Language Recognizer
Symbol Recognizer 1
Domain-independent Primitive Shape Recognizer
Symbol Recognizer 2
Symbol Recognizer n
•••
• • •
Figure 2. The process of generation of the sketch recognition system.
objects. This task is performed by the primitive shape recognizer whose architecture is shown in Fig. 3.
In order to support the recognition of multi-stroke symbols the stroke to be classified should be suitably split into single-stroke segments by exploiting stroke information such as curvature, speed and direction. This is accomplished by the segmentation algorithm of the SATIN toolkit [13]. Such segments are classified by using Quill [19], a domain-independent gesture recognition system, which has been properly trained on the primitive shapes used for the classification. Finally, a post-process is applied to the identified segments in order to eliminate possible redundancies. In particular, primitive shapes satisfying particular conditions are merged into single strokes. As an example, two connected line segments with nearly the same angle (two connected arcs with nearly the same center and radius, resp.) are represented with only one line (arc, resp.) stroke. Thus, for each input stroke the primitive shape recognizer outputs a sequence of substrokes with associated a classification of their most similar primitive shapes.
stroke segments segment classification
substroke classification Post-processQuill SATIN
Figure 3. The architecture of the primitive shape recognizer.
3.2. The symbol recognizer
Symbol recognizers try to cluster into symbols of the domain language the classified segments produced by the primitive recognizer. The parsing technique underlying such recognizers is an extension of the approaches proposed in [7] and [8]. In particular, the parsers scan the input in an incremental and non-
sequential way, driven by the spatial relations specified in the grammar productions.
The input to the incremental parser is formed by the new shapes produced by the primitive shape recognizer and stored in a dictionary, a parse tree and a graph stack built on the strokes analyzed so far. The parser restructures the parse tree, which represents the recognized strokes, on the base of the new strokes and updates the graph stack. Each node of the tree might have associated a value representing the importance rate of the strokes associated to the leaves of its subtree. In particular, such value is computed during the reduction of the applied productions by using the importance values associated to the symbols of the grammar. The output of the symbol recognizer is obtained by analyzing the parse tree and the graph stack. In particular, the interpretation is composed by the triple: name of the symbol, sequence of the strokes analyzed by the parser, which corresponds to the leaves of the parse tree, and eventually the importance rate obtained by the sum of the importance values associated to the grammar symbols in the graph stack.
Fig. 4 shows the recognition process of an actor symbol. In particular, from the bottom to the top it shows the incremental editing of the symbol, the primitive shapes (more similar to the last edited stroke) identified by the primitive shape recognizer, and how the symbol recognizer incrementally constructs the parse tree. Note that the third edited stroke is segmented in two substrokes. 3.3. The language recognizer
The language recognizer analyzes the interpretations produced by the symbol recognizers and applies its knowledge of the domain context to select the best interpretation, to force the recognition
126

of incomplete or inaccurate symbols, and to prune the execution of unnecessary active symbol recognizers, thus improving the efficiency of the overall recognition approach.
Each time the user draws a new stroke the output of the primitive recognizer is given in input to all active symbol recognizers. The ones that are not able to compound the new interpreted strokes with those previously parsed reject the new strokes and wait for the next ones. The other recognizers give their new interpretations as input to the language recognizer. In any case new symbol recognizers are launched on the new strokes since they can be part of a new symbol. The language recognizer includes a non-deterministic parser [8], generated from the language grammar, which analyses the symbol interpretations produced by symbol recognizers and eventually uses the importance rates associated to them for selecting the most suitable. In some cases the language recognizer is also able to prune active symbol recognizers. In particular, when a symbol interpretation S reaches a predefined high importance rate it discards the active recognizers whose analyzed strokes are also in S. Moreover, when two different symbol interpretations are such that the strokes of one are a subset of the other the symbol recognizer analyzing the strokes of the first interpretation is pruned.
ARC ARC
Ellipse Line Line Line Line Line
Actor
LINE LINE LINE LINE LINE
25 12 3 12 3 45
parse tree
primitive shapes
new strokes
symbol construction
Figure 4. Incremental recognition of an actor
ig. 5 shows the incremental editing and
rec
gle stroke the
symbol.
Fognition of a use case diagram portion. At each
editing step the figure shows the symbol interpretations provided by the active symbol recognizers and highlights the choices made by the language recognizer. In particular, the selected interpretations are indicated with a check-mark, whereas those pruned with a cross-mark. The user starts by sketching the head of the actor symbol with a
single stroke, as shown in Fig. 5(a). The symbol recognizers able to parse such stroke are the actor recognizer with an importance rate of 45 and the use case recognizer. Obviously, the candidate symbol to be selected by the language recognizer is the use case interpretation since it is a complete symbol.
Successively, the user draws with a sin body and a leg of the actor symbol as shown in Fig.
5(b). In this case, the new stroke is segmented into two line segments and only the actor recognizer is able to compound the lines to the previously recognized strokes with an importance rate of 82. Moreover, other recognizers are lunched on the new strokes. In particular, those that recognize symbols containing a line segment are active on the two new strokes.
Actor Use case Actor Use case
Include
Extend
45 82
Commun.
Generalize
55
55 55
(a) (b)
Actor Use case97
Include
Extend
Commun.
Generalize
75
75 70
Actor Use case
100
Include 75
Extend 75
Generalize 70
(c) (d)
Actor
Actor
Use case
45
100
ActorActor
70100
Use case
Include Commun. 55
GeneralizeExtend 55 55
(e) (f)
Figure 5. The incremental recognition of a use
this case, the language recognizer selects the
co
case diagram.
Inmplete interpretations provided by the use case and
communication recognizers. When the user draws the arms of the actor (see Fig. 5(c)) the interpretation of the active actor recognizer reaches an importance rate of 97 that is enough for the language recognizer to disambiguate the actor symbol from the others. Moreover, it prunes the communication recognizer since it interprets a stroke that is included into the include interpretation. In Fig. 5(d) the actor symbol is completely drawn and the language recognizer discards the remaining active recognizers. After the sketching of a use case symbol with three strokes (see Fig. 5(e)), which is interpreted by use case and actor recognizers, the user draws a communication symbol connecting them as shown in Fig. 5(f).
127

4. Conclusions and future works
We have presented a framework for the recognition of hand-drawn diagrams based on LR parsing techniques. Symbol and language recognizers are automatically generated from grammar specifications modeling the symbol shapes and the abstract syntax of diagrammatic notations [9]. The obtained recognition system consists of three hierarchically arranged layers that include context-based disambiguation and ink parsing. In particular, the user’ strokes are first segmented and interpreted as primitive shapes, then clustered into symbols of the domain by using the grammar-based symbol recognizers, and finally the best sentence interpretation is selected by exploiting the domain context of the recognizer of the diagrammatic notation.
In the future we intend to perform user studies in order to understand the limitations of the proposed parsing strategy. Moreover, we plan to integrate error correction techniques for improving the recognition effectiveness and symbol prompting strategies for assisting users during the drawing process [8].
5. References [1] A.V. Aho, R. Sethi, and J.D. Ullman. Compilers
Principles, Techniques, and Tools, 1987, Addison-Wesley.
[2] A. Ajay, V. Van, and D.K. Takayuki. “Recognizing Multistroke Geometric Shapes: An Experimental Evaluation”, in Proc. of UIST’93, 1993, pp. 121-128.
[3] C. Alvarado, “A Natural Sketching Environment: Bringing the Computer into Early Stages of Mechanical Design”, Master thesis, Massachusetts Institute of Technology, 2000.
[4] A. Caetano, N. Goulart, M. Fonseca, and J. Jorge. “JavaSketchIT: Issues in Sketching the Look of User Interfaces”, AAAI Spring Symposium on Sketch Understanding, 2002, pp. 9-14.
[5] P. R. Cohen, M. Johnston, D. R. McGee, S. L. Oviatt, J. Pittman, I. Smith, L. Chen, and J. Clowi, “Quickset: Multimodal Interaction for Distributed Applications”, in Proceedings of the fifth ACM International Conference on Mutimedia, Seattle, WA, 1997, pp. 31-40.
[6] G. Costagliola, V. Deufemia, and G. Polese, “A Framework for Modeling and Implementing Visual Notations with Applications to Software Engineering”, ACM Trans. on Soft. Eng. and Meth., 13(4), pp. 431-487.
[7] G. Costagliola, V. Deufemia, G. Polese, M. Risi, “A Parsing Technique for Sketch Recognition Systems”, in Proceedings of IEEE Symposium VL/HCC’04, Rome, Italy, September 26-29, 2004, pp. 19-26.
[8] G. Costagliola, V. Deufemia, G. Polese, M. Risi, “Building Syntax-Aware Editors for Visual Languages”. Journal of Visual Lang. and Comp., 16, 6 (Dec. 2005), pp. 508-540.
[9] G. Costagliola, V. Deufemia, and M. Risi, “Sketch Grammars: A Formalism for Describing and Recognizing Diagrammatic Sketch Languages”, in Proc. of International Conference on Document Analysis and Recognition (ICDAR’05), Seoul, Korea, 2005, pp. 1226-1230.
[10] C. Damm, K. Hansen, and M. Thomsen, “Tool Support for Cooperative Object-oriented Design: Gesture based Modeling on an Electronic Whiteboard”, in CHI 2000, April 2000, CHI Letters 2(1), pp. 518-525.
[11] M.D. Gross, “The Electronic Cocktail Napkin – A Computational Environment for Working with Design Diagrams”, Design Studies 17(1), 1996, pp. 53-69.
[12] T. Hammond and R. Davis, “Tahuti: a Geometrical Sketch Recognition System for UML Class Diagrams”, AAAI Spring Symposium on Sketch Understanding, 2002, pp. 59-68.
[13] J.I. Hong, and J.A. Landay, “SATIN: A Toolkit for Informal Ink-based Applications”, in Proc. of UIST’00, ACM Press, pp. 63-72.
[14] T. Igarashi, S. Matsuoka, S. Kawachiya, and H. Tanaka, “Interactive Beautification: A Technique for Rapid Geometric Design”, in Proceedings of ACM symposium on User Interface Software and Technology (UIST’97), 1997, pp. 105-114.
[15] D. L. Jenkins and R. R. Martin, “Applying Constraints to Enforce Users’ Intentions in Free-hand 2-D Sketches”, Intelligent Systems Engineering 1(1), 1992, pp. 31-49.
[16] L.B. Kara, and T.F. Stahovich, “Hierarchical Parsing and Recognition of Hand-sketched Diagrams”, in Proc. of UIST’04, ACM Press, 2004, pp. 13–22.
[17] J. Landay, “Interactive Sketching for the Early Stages of User Interface Design”, Ph.D. dissertation, Report #CMU-CS-96-201, Computer Science Department, Carnegie Mellon University, Pittsburgh, PA, 1996.
[18] E. Lank, J.S. Thorley, and S. J-S. Chen, “An interactive system for recognizing hand drawn UML diagrams”, in Proceedings for CASCON 2000, pp. 1-15.
[19] A.C. Long, “Quill: A Gesture Design Tool for Pen-based User Interfaces”, Tech. report. Eecs department. Computer Science Division. Berkeley. 2001.
[20] D. Rubine, “Specifying Gestures by Example”, Computer Graphics, 25(4), 1991, pp. 329-337.
[21] T.F. Stahovich, R. Davis, and H. Shrobe. “Generating Multiple New Designs from a Sketch”, Artificial Intelligence, 104(1-2), 1998, pp. 211-264.
[22] L. Wenyin, W. Qian, R. Xiao, and X. Jin, “Smart Sketchpad - An On-line Graphics Recognition System”, in Sixth International Conference on Document Analysis and Recognition (ICDAR ’01), 2001, pp. 1050-1054.
128

Enhancing the Expressiveness of Spider Diagram Systems
Gem Stapleton and John HowseVisual Modelling GroupUniversity of Brighton
Brighton, UKwww.cmis.brighton.ac.uk/research/vmg
{g.e.stapleton,john.howse}@brighton.ac.uk
Abstract
Many visual languages based on Euler diagrams haveemerged for expressing relationships between sets. The ex-pressive power of these languages varies, but the major-ity are monadic and some include equality. Spider dia-grams are one such language, being equivalent in expres-sive power to monadic first order logic with equality. Spi-ders are used to represent the existence of elements or spe-cific individuals and distinct spiders represent distinct el-ements. Logical connectives are used to join diagrams,increasing the expressiveness of the language. Spider di-agrams that do not incorporate logical connectives arecalled unitary diagrams. In this paper we explore gener-alizations of the spider diagram system. We consider theeffects of these generalizations on the expressiveness of uni-tary spider diagrams and on conciseness.
1 Introduction
Recent times have seen various formal diagrammaticlogics and reasoning systems emerging [6, 13, 17, 25, 26,31, 33]. Many of these logics are based on the popular andintuitive Euler diagrams augmented with shading. The dia-grams in figure 1 are all based on Euler diagrams.
F i s h B i r d s
d 1
F i s h B i r d s
d 2
f r e d f r e dr o b i n
F i s h B i r d s
d 3
Figure 1. Various extended Euler diagrams.
The diagramd1 expresses that there are no birds (by theuse of shading) and that nothing is both a fish and a bird
(since the two circles have disjoint interiors). The diagramd2 is an Euler/Venn diagram [31] and expresses that noth-ing is both a fish and a bird (by the use of shading) and thereis something calledfred that is either a fish or a bird, butnot both. Furthermore,robin is a bird but not a fish. Notethat fred and robin could represent the same individual.Euler/Venn diagrams use shading to express the emptinessof a set andconstant sequencesto make statements aboutspecific individuals. Finally,d3 is a spider diagram [16]and expresses that something is either a fish or a bird butnot both and there is at least one but at most two elementsin the setBirds − Fish (by the use ofexistential spidersand shading). So, by contrast to Euler/Venn, spider dia-grams use shading to place upper bounds on set cardinalityand spiders place lower bounds on set cardinality. Whilstthe spiders ind3 represent the existence of elements, spi-der diagrams useconstant spidersto make statements aboutspecific individuals.
Others have introduced diagrammatic logics based onVenn diagrams which form, essentially, a fragment of theEuler diagram language. Peirce used⊗-sequences to as-sert non-emptiness and, instead of shading,o-sequences toassert emptiness [23]. The diagramd1 in figure 2 is a Venn-Peirce diagram and expresses thatFish − Birds = ∅ orBirds − Fish 6= ∅. This example illustrates a key differ-ence between the use of shading and the use ofo-sequencesbecause the statement made is disjunctive. The diagramd2
is a Venn-II diagram [25] and uses an⊗-sequence to expressthatFish 6= ∅ and shading to expressBirds − Fish = ∅.Venn-II does not incorporateo-sequences.
The expressiveness of various diagrammatic logics hasbeen established. The Venn-II system has been shown to beequivalent in expressive power to monadic first order logic(without equality) [25]. In monadic first order logic, all ofthe predicate symbols are unary and they correspond to con-tour labels. So, for example, Venn-II cannot express thata property holds for a unique individual. Spider diagramsproperly increase expressiveness over Venn-II. In [30] it is
129

F i s h B i r d s
d 1
F i s h B i r d s
d 2
Figure 2. Venn-Peirce and Venn-II diagrams.
shown that the language of spider diagrams (without con-stant spiders) is equivalent in expressive power to monadicfirst order logic with equality and, hence, can express that aproperty holds for a unique individual. Furthermore, it hasbeen shown that the inclusion of constant spiders does notincrease the expressiveness of spider diagrams [28].
Spider diagrams have been used for specifying safetycritical systems [3], visualizing clusters which contain con-cepts from multiple ontologies [14] and for allowing filesto be viewed in multiple directories [4] as well as havingmany other applications. Furthermore, they form the basisof constraint diagrams, introduced by Kent [18], which aredesigned for object oriented specification [15, 20]. Kent’saim, when he introduced constraint diagrams, was to pro-vide a user friendly, formal notation that is well suited tothose who like to use diagrams for modelling but shy awayfrom the textual languages that are currently on offer forformal specification. The hope is that, by providing suffi-ciently expressive formal diagrammatic notations, the useof formal methods will be encouraged leading to improvedsoftware design and, as a result, more reliable software willbe built.
In order for Kent’s vision to be realized, the syntax andsemantics of constraint diagrams must be formalized (donein [6]). Furthermore, to enable software engineers to reasonabout their models, it is essential that sound and, where pos-sible, complete sets of reasoning rules are specified. Twosound and complete systems have been developed for frag-ments of the langauge [26, 27] and sound rules have beendefined for the full notation [5]. It is desirable to developautomated theorem provers for the constraint diagram lan-guage, thus providing practical support for software engi-neers to reason about their models. For example, it maybe necessary to prove that two specifications are equivalentor that the post-condition of one operation implies the pre-condition of another.
The diagrams we have seen so far are all instances ofunitary diagrams. Unitary diagrams can be joined usinglogical connectives such as∧ and∨. Many diagrammaticsystems have incorporated logical connectives, for exam-ple [5, 16, 25, 26], most of which are sound and com-plete. Unitary diagrams represent information more con-cisely than compound diagrams. The ability to expressstatements concisely could enhance the usability of a lan-
guage as well as be important for theoretical reasons (dis-cussed in section 2). An interesting question arises: is theunitary spider diagram system as expressive as the full sys-tem? The answer is, perhaps unfortunately, no. There arenumerous examples of simple statements, as well as com-plex statements, that cannot be made by any unitary spiderdiagram that can be made by a compound diagram.
In this paper, we explore deficiencies in the expressivepower of unitary spider diagrams. We generalize the syntaxof spider diagrams, increasing the expressiveness of the uni-tary system, overcoming some of these deficiencies. Thesegeneralizations give rise to a more flexible system becausethere are more ways of expressing a given piece of informa-tion. As a consequence, it may be that there is a more nat-ural mapping from a statement a user wishes to make to adiagram expressing that statement. We give our motivationfor increasing the expressiveness of unitary spider diagramsin section 2. In section 3 we give a brief overview of thesyntax and semantics of existing spider diagram systems.In sections 4 to 6 we present our generalizations. We giveexpressiveness results for the non-generalized and general-ized unitary fragments in section 7, where expressivenesslimitations of the generalized system are discussed and fur-ther generalizations are proposed.
2 Motivational Discussion
There are theoretical reasons for increasing the expres-siveness of the unitary system. Firstly, there is interestin automatically generating proofs in spider diagram sys-tems [11, 22]. Approaches have been developed that pro-duce shortest proofs [8, 9]. These approaches use a heuris-tic function to guide the theorem prover towards good rea-soning steps, reducing the amount of backtracking requiredand, hence, smaller search trees are produced. The heuris-tic function gives a numerical score that provides a lowerbound on the length of a shortest proof from the premisediagram to the conclusion diagram.
Defining an accurate heuristic function for the compoundsystem is challenging, partly due to the tree structure of thediagrams. Even if an accurate heuristic function can be de-fined, the size of the search tree can still explode due to anabundance of highly applicable reasoning rules causing thenodes of the search trees to have large out-degrees. Oneproblematic rule is idempotency which can be applied toany diagram: fromd1 we can deduced1 ∨ d1, for exam-ple. Given the potentially large number of sub-diagramsin a compound diagram, it is easy to see that the idempo-tency rule can, sometimes, be applied in many ways. Thishigh applicability makes it hard for the size of the searchtree to be controlled. Furthermore, some other highly appli-cable rules are non-deterministic, such as the informationweakening rule ‘fromd1 we can deduced1 ∨ d2’ and the
130

A rx y
x y
Figure 3. A constraint diagram.
information preserving absorption rule ‘fromd1 we can de-duced1 ∧ (d1 ∨d2)’ (in both casesd2 is any diagram). Thisnon-determinism makes implementing theorem provers thatoperate with a complete set of rules for the compound sys-tem a challenging task. By contrast, the rules that exist forunitary diagrams are all deterministic.
The effectiveness of the heuristic function can be ana-lyzed by comparing the sizes of the search trees generatedby the theorem prover to those generated by conducting abreadth first search. Analysis has shown that restricting thetheorem prover to the unitary fragment (without the gener-alizations presented in this paper) results in a much largerpercentage reduction in the size of the search tree whencompared with the compound case [8, 9]. We conjecturethat similar results can be observed when comparing themore expressive unitary system suggested in this paper withthe compound system; if this is the case then increasingthe expressiveness of the unitary system will result in moretheorems being provable in a reasonable amount of time.Given the inherent difficulty of developing efficient auto-mated theorem provers, any generalizations that may resultin more effective theorem proving techniques being devel-oped should be thoroughly investigated.
We note that some people may prefer to use spider di-agrams that do not include our generalizations. However,it is simple to translate proofs involving generalized spiderdiagrams into proofs that involve (non-generalized) spiderdiagrams. Thus, if we can develop more efficient theoremproving techniques for the generalized system then we canpass on these efficiency savings to the non-generalized sys-tem.
Secondly, we wish to be able to automate the drawingof diagrams (this is essential if we are to present automat-ically generated proofs to users in a diagrammatic form).Considerable research has been conducted into the genera-tion of Euler diagrams [1, 2, 7, 19, 24, 32] and spider dia-grams [21]. It can be time consuming to automatically drawvisually pleasing Euler diagrams; see [10] for related work.It is preferable to automatically draw unitary diagrams in-stead of compound diagrams.
Finally, the constraint diagram language [6] extends thespider diagram language. The diagram in figure 3 is a con-straint diagram and expresses
∀x ∈ A∃y ∈ U −A(r(x, y) ∧ ∀z (r(x, z) ⇒ y = z)
).
In the constraint diagram language it can be difficult, maybeimpossible, to make some first order statements involv-ing disjunction inside the scope of a universal quantifier;see [29] for a discussion of this issue. It may well be thatif the generalizations we propose are incorporated into theconstraint diagram language then the expressiveness of thewhole system is increased, not just that of the unitary frag-ment. Indeed, the task of finding efficient theorem prov-ing algorithms for constraint diagrams is daunting becausethese diagrams are highly expressive. The better we under-stand how to control the search for proofs in spider diagramsystems, the more tractable this task becomes for constraintdiagrams. The work presented in this paper is an essentialbasis for the thorough exploration of theorem proving tech-niques for spider diagram systems, which will allow us tofind highly efficient theorem proving algorithms.
3 Informal Syntax and Semantics
Various systems of spider diagrams have been devel-oped, for example [16, 28], and in this section we give aninformal overview of their syntax and semantics.
A B
C
s
Figure 4. A unitary spider diagram.
A contour is a simple closed plane curve. Each contouris labelled. Aboundary rectangle properly contains allcontours. The boundary rectangle is not a contour and isnot labelled. Abasic region is a maximal, bounded set ofpoints in the plane enclosed by a contour or the boundaryrectangle. Aregion is defined recursively as follows: anybasic region is a region; ifr1 andr2 are regions then theunion, intersection and difference ofr1 andr2 are regionsprovided these are non-empty. Azone is a region havingno other region contained within it. A region isshadedif each of its component zones is shaded. The diagram infigure 4 contains three contours, labelledA, B andC. Thereis one zone insideA and two zones insideB. In total thereare five zones (including the zone which is outside all threecontours) of which two are shaded.
A spider is a tree with nodes (calledfeet) placed inzones. The connecting edges (calledlegs) are straight lines.The feet of a spider are either all square (aconstant spider)or all round (anexistential spider). Each constant spider islabelled. A spidertouchesa zone if one of its feet is placedin that zone. A spider can touch a zone at most once. In
131

figure 4 there are three spiders. The constant spider labelleds has a two zone habitat and, therefore, touches two zones.
A unitary spider diagram is a single boundary rectan-gle together with a finite collection of contours, shading andspiders. No two contours (constant spiders) in the same uni-tary diagram can have the same contour label (constant spi-der label). Unitary spider diagrams can be joined togetherusing the logical connectives∧ and∨ to form compounddiagrams.
We now describe, informally, the semantics of spider di-agrams, see [28, 30] for formal semantics. Contours repre-sent sets. In our discussion, we will identify contour labelswith the sets they represent. The diagram in figure 4 as-serts thatA andB are disjoint, for example, because thecontours labelledA andB do not overlap. Zones and re-gions in a unitary diagramd also represent sets. The zoneinsideB but outsideA andC in figure 4 represents the setB ∩ (
U − (A ∪ C))
whereU is the universal set. A re-gion represents the union of the sets represented by its con-stituent zones.
Spiders denote elements in the sets represented by theirhabitats and the spider type affects the precise meaning.Constant spiders denote specific individuals. As with con-tour labels, in our informal discussion we will identifyconstant spider labels with the individuals that they rep-resent. The diagram in figure 4 expresses thats ∈ A ors ∈ B − C. Existential spiders denote the existence of el-ements. The two existential spiders in figure 4 denote theexistence of two distinct elements, one in the setC, theother inC ∪ (
U − (A ∪ B ∪ C)). Since distinct spiders
in a unitary diagram denote distinct elements it follows thatspiders allow us to place lower bounds on set cardinality.
Shading allows us to place upper bounds on set cardi-nality. In the set represented by a shaded region, all of theelements are denoted by spiders. For example, the shadedzone insideC in figure 4 represents a set with at most twoelements because it is touched by two existential spiders.
If D = D1∨D2 (D = D1∧D2) is a compound diagramthen the semantics ofD are the disjunction (conjunction) ofthe semantics ofD1 andD2. Unlike unitary diagrams, notall compound diagrams are satisfiable.
Spider diagrams are equivalent in expressive power tomonadic first order logic with equality [28, 30]. The unitaryfragment is less expressive than the full system. Suppose astatement,S, is made by compound diagramD. If thereis no unitary diagram semantically equivalent toD then wesay thatS cannot be expressedby a unitary diagram.
4 Generalizing Constant Spider Labelling
An example of a statement that cannot be expressed byany unitary diagram iss is in A or t is outsideA wheres andt are specific individuals. This can be expressed by
the compound diagram formed by taking the disjunction ofd1 andd2 in figure 5. If, instead of labelling each constant
A
d 1
sA
d 2
tA
d 3
s t
d 4
s s
Figure 5. Labelling constant spider feet.
spider, we label each constant spider foot (the labels on dis-tinct feet may be the same or different and each label maybe used on multiple spiders), then the unitary diagramd3 infigure 5 expressess is in A or t is outsideA, because spiderlegs represent disjunction, and is more concise thand1∨d2.
An interesting point is that, with these generalizations,contradictions can be made by unitary diagrams. For ex-ample,d4 in figure 5 asserts thats 6= s and is, therefore,unsatisfiable. The semantics of unitary diagrams contain-ing these generalized constant spiders are more subtle whenmany constant spiders are present. Since distinct spiders de-note distinct objects, the diagramd1 in figure 6 asserts thatthere are two distinct individuals, one is eithers in A or toutsideA and the other isu. Note thatd1 does not implythat s 6= u, s 6= t nor t 6= u. Without these generaliza-tions, any unitary diagram that makes an explicit statementabouts, t andu would assert thats, t andu are pairwisedistinct. The diagramsd1 and non-generalizedd2 ∨ d3 aresemantically equivalent butd1 is more concise.
A
d 1
s tu u u
A
d 2
sA
d 3
ut
Figure 6. Interacting spiders.
A
d 1
s tA
d 2
usA
d 3
ut
d 4
s tt u
A
Figure 7. Multiple label use.
Suppose that we wish to assert that there are two distinctindividuals, one is eithers in A or t outsideA and the otheris eithert in A or u outsideA. Without our generalizations,this can only be expressed (implicitly) by a compound dia-gram, such asd1 ∨ d2 ∨ d3 in figure 7. There is not a directmapping from the statement to the diagram sinced1∨d2∨d3
explicitly expresses
132
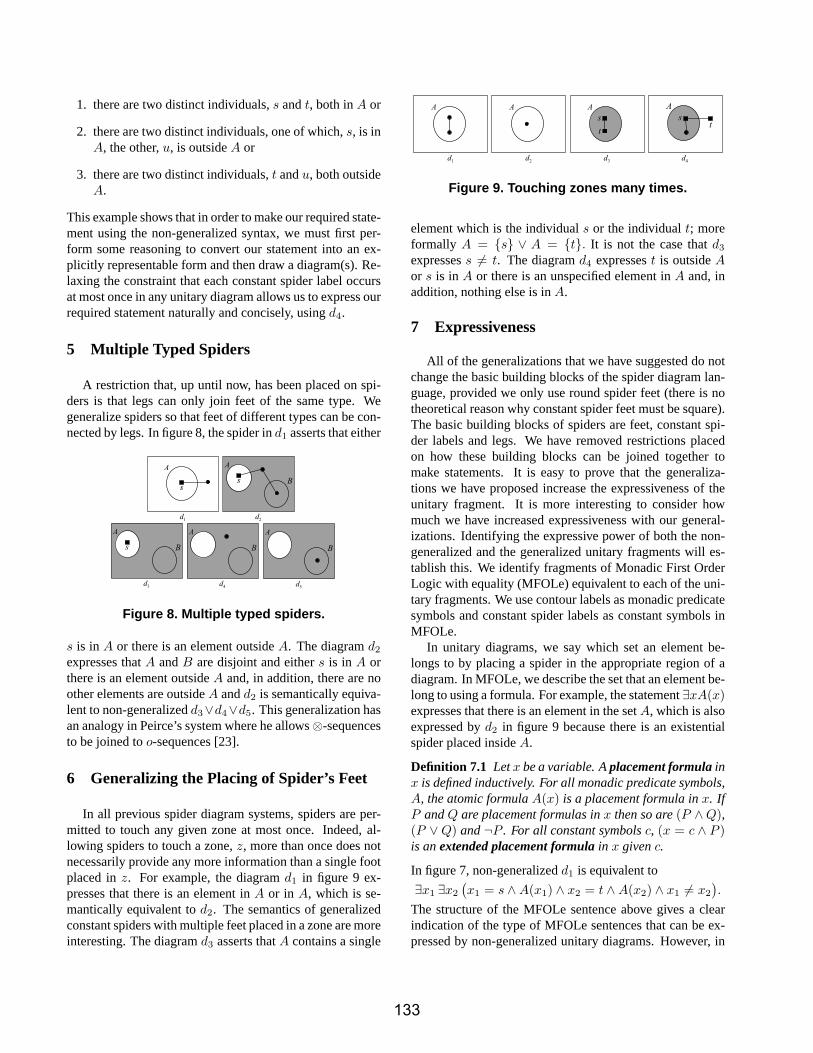
1. there are two distinct individuals,s andt, both inA or
2. there are two distinct individuals, one of which,s, is inA, the other,u, is outsideA or
3. there are two distinct individuals,t andu, both outsideA.
This example shows that in order to make our required state-ment using the non-generalized syntax, we must first per-form some reasoning to convert our statement into an ex-plicitly representable form and then draw a diagram(s). Re-laxing the constraint that each constant spider label occursat most once in any unitary diagram allows us to express ourrequired statement naturally and concisely, usingd4.
5 Multiple Typed Spiders
A restriction that, up until now, has been placed on spi-ders is that legs can only join feet of the same type. Wegeneralize spiders so that feet of different types can be con-nected by legs. In figure 8, the spider ind1 asserts that either
A
d 1
sA
d 2
Bs
A
d 3
BsA
d 4
BA
d 5
B
Figure 8. Multiple typed spiders.
s is in A or there is an element outsideA. The diagramd2
expresses thatA andB are disjoint and eithers is in A orthere is an element outsideA and, in addition, there are noother elements are outsideA andd2 is semantically equiva-lent to non-generalizedd3∨d4∨d5. This generalization hasan analogy in Peirce’s system where he allows⊗-sequencesto be joined too-sequences [23].
6 Generalizing the Placing of Spider’s Feet
In all previous spider diagram systems, spiders are per-mitted to touch any given zone at most once. Indeed, al-lowing spiders to touch a zone,z, more than once does notnecessarily provide any more information than a single footplaced inz. For example, the diagramd1 in figure 9 ex-presses that there is an element inA or in A, which is se-mantically equivalent tod2. The semantics of generalizedconstant spiders with multiple feet placed in a zone are moreinteresting. The diagramd3 asserts thatA contains a single
A
d 1
A
d 2
A
d 3 d 4
sA
st t
Figure 9. Touching zones many times.
element which is the individuals or the individualt; moreformally A = {s} ∨ A = {t}. It is not the case thatd3
expressess 6= t. The diagramd4 expressest is outsideAor s is in A or there is an unspecified element inA and, inaddition, nothing else is inA.
7 Expressiveness
All of the generalizations that we have suggested do notchange the basic building blocks of the spider diagram lan-guage, provided we only use round spider feet (there is notheoretical reason why constant spider feet must be square).The basic building blocks of spiders are feet, constant spi-der labels and legs. We have removed restrictions placedon how these building blocks can be joined together tomake statements. It is easy to prove that the generaliza-tions we have proposed increase the expressiveness of theunitary fragment. It is more interesting to consider howmuch we have increased expressiveness with our general-izations. Identifying the expressive power of both the non-generalized and the generalized unitary fragments will es-tablish this. We identify fragments of Monadic First OrderLogic with equality (MFOLe) equivalent to each of the uni-tary fragments. We use contour labels as monadic predicatesymbols and constant spider labels as constant symbols inMFOLe.
In unitary diagrams, we say which set an element be-longs to by placing a spider in the appropriate region of adiagram. In MFOLe, we describe the set that an element be-long to using a formula. For example, the statement∃xA(x)expresses that there is an element in the setA, which is alsoexpressed byd2 in figure 9 because there is an existentialspider placed insideA.
Definition 7.1 Letx be a variable. Aplacement formulainx is defined inductively. For all monadic predicate symbols,A, the atomic formulaA(x) is a placement formula inx. IfP andQ are placement formulas inx then so are(P ∧Q),(P ∨Q) and¬P . For all constant symbolsc, (x = c ∧ P )is anextended placement formulain x givenc.
In figure 7, non-generalizedd1 is equivalent to∃x1 ∃x2
(x1 = s ∧A(x1) ∧ x2 = t ∧A(x2) ∧ x1 6= x2
).
The structure of the MFOLe sentence above gives a clearindication of the type of MFOLe sentences that can be ex-pressed by non-generalized unitary diagrams. However, in
133

the particular example above,d1 does not have any shadedzones. Shading brings with it implicit universal quantifica-tion and any fragment of MFOLe that corresponds to thenon-generalized unitary system must include the syntax re-quired to place upper bounds on set cardinality. For exam-ple, in figure 8, non-generalizedd4 is equivalent to
∃x1
(¬A(x1) ∧ ¬B(x1)∧∀x2
((A(x2) ∧ ¬B(x2)) ∨ x2 = x1
)).
The shading ind4 corresponds to the universally quantifiedsub-formula in the equivalent MFOLe sentence above. Ingeneral, any element is either in a set represented by a non-shaded zone or is represented by a spider.
Definition 7.2 Let V be a finite set of variables and letxbe a variable not inV . LetP be a placement formula inx.A bounding formula in x givenV is a formula of the form
∀x(P ∨
∨
y∈V
x = y)
where an empty disjunction is taken as⊥.
We are now in a position to define MFOLe sentencesthat are expressible by our non-generalized unitary systemusing placement formulas and bounding formulas as our ba-sis. We recall that non-generalized unitary diagrams are allsatisfiable butexpressible sentences, defined below, can beunsatisfiable. However, all satisfiable expressible sentencesare equivalent to some non-generalized unitary diagram.
Definition 7.3 An expressible sentenceis defined as fol-lows.
1. The true symbol>, is an expressible sentence.
2. Any bounding formula with no free variables (that is,the disjunction overV is empty) is an expressible sen-tence.
3. Any sentence of the form
∃x1...∃xn
( ∧
1≤i≤n
Pi ∧∧
1≤i≤n−1
xi 6= xi+1 ∧Q
)
is an expressible sentence provided
(a) eachPi is either a placement formula inxi oran extended placement formula inxi given someconstantc,
(b) for eachPi and Pj if Pi and Pj are extendedplacement formulas given constantsci andcj re-spectively thenci = cj impliesPi = Pj and
(c) Q is either> or a bounding formula givenV ={x1, ..., xn} in some variable,x, not inV .
For example, the MFOLe sentence below is expressible, be-ing equivalent to non-generalizedd1 in figure 10:
∃x1∃x2
(x1 = s ∧A(x1) ∧B(x2) ∧ x1 6= x2∧
∀x3(¬B(x3) ∨ x3 = x1 ∨ x3 = x2)).
Theorem 7.1 The non-generalized unitary fragment isequivalent in expressive power to the class of satisfiable ex-pressible sentences.
A
d 1
Bs
A
d 2
Bs s
d 3
A
d 4
As
Figure 10. Expressing sentences.
Our attention now turns to the generalized case. All sen-tences that are expressible by non-generalized unitary dia-grams are obviously expressible by generalized unitary di-agrams. The generalizations we have proposed allow moredisjunctive statements to be made by unitary diagrams. Forexample, in figure 10, generalizedd2 is equivalent to thegeneralized expressible sentence
∃x1
(((x1 = s ∧A(x1)) ∨ (B(x1) ∧ ¬A(x1))
)∧∀x2
(¬B(x2) ∨ x2 = x1
)).
Definition 7.4 A generalized expressible sentenceis de-fined as follows.
1. Any expressible sentence is a generalized expressiblesentence.
2. Any sentence of the form
∃x1...∃xn
( ∧
1≤i≤n
Ri ∧∧
1≤i≤n−1
xi 6= xi+1 ∧Q
)
is a generalized expressible sentence provided
(a) Ri is any finite disjunction of placement formulasin xi or extended placement formulas inxi givensome constantc,
(b) Q is either> or a bounding formula givenV ={x1, ..., xn} in some variable,x, not inV .
Theorem 7.2 The generalized unitary fragment is equiva-lent in expressive power to the class of generalized express-ible sentences.
Theorem 7.3 The generalized unitary fragment is more ex-pressive than the non-generalized unitary fragment.
134

Theorems 7.1 and 7.2 show how our generalizationshave increased the expressiveness of the unitary system.Furthermore, they show the type of statements that eachunitary system is capable of expressing, thus highlight-ing expressive limitations. For example, no generalizedunitary diagram can express either of the two statements∀x¬A(x) ∨ ∀x¬B(x) and∀x¬A(x) ∨ ∃x1∃x2 x1 6= x2.Peirce’so-sequences can be imported into spider diagramsto make the first statement but there is no obvious general-ization that allows us to make the latter.
A further limitation is that no generalized unitary dia-gram can express arbitrary finite lower and upper boundson any given setwithout also specifying further informa-tion, exemplified by the example0 ≤ |A| ≤ 2. Schrodingerspiders, introduced in [12], have round unfilled feet and ex-press that an element might be present. Including such spi-ders in the language allows us to express0 ≤ |A| ≤ 2,shown byd3 in figure 10. We can also introduce a new typeof spider, called aSchrodinger constant spider, in order toexpress that an individual might be in a particular set, seed4
in figure 10 which expressesA ⊆ {s}. Schrodinger spiderfeet, of either type, can also be joined to other spiders fol-lowing all of the generalizations presented in the previoussections.
8 Conclusions and Open Problems
In this paper we have explored generalizations of spi-der diagrams that increase the expressiveness of the unitaryfragment. By allowing constant spiders’ feet to be labelled,for example, we have provided a natural way of makingsome simple statements using unitary diagrams. Indeed, allof the extensions we have proposed enhance the spider di-agram system by making it more flexible and notationallyefficient. We believe that our generalizations will make iteasier for people to make certain statements. This is sug-gested by the fact that some statements can be explicitlymade by generalized unitary diagrams which can only beimplicitly made by the non-generalized (compound) sys-tem. However, the increased complexity of the general-ized notation may mean that some people find certain gen-eralized unitary diagrams harder to interpret than semanti-cally equivalent non-generalized compound diagrams. It isstraightforward to convert generalized diagrams into non-generalized diagrams. With appropriate tool support, sucha conversion can be easily automated. It will be interestingto establish whether generalized spider diagrams are moreeffective, in terms of promoting human task efficiency, thannon-generalized spider diagrams.
A particular challenge faced when attempting to in-crease the expressiveness of the unitary fragment further ishow best to express disjunctive information that involvesshading. Incorporating Peirce’so-sequences, as discussed
above, will yield some increase in expressiveness but willnot entirely solve the problem. Shading brings with it (im-plicit) universal quantification. To maximize expressivenesswe need to interpret shading and spiders (which have exis-tential import) in arbitrary orders which can make defin-ing semantics difficult. It is likely that a dependence anal-ysis would be required, as in the constraint diagram lan-guage [6]. We conjecture that such an extension of the uni-tary fragment will be as expressive as the full system.
The development of reasoning rules is necessary beforewe can investigate the effect of our generalizations on theability of our theorem prover to find proofs. It will be inter-esting, and difficult, to provide a complete classification ofthe proof tasks where our generalizations are beneficial interms of time taken to find a proof.
A rx
x
s t
st
Figure 11. A generalized constraint diagram.
The constraint diagram language can be extended by in-corporating our generalizations. The generalized constraintdiagram in figure 11 expresses the same as the first orderlogic sentence
∀x ∈ A(r(x, s)∨r(x, t))∧∀y(r(x, y) ⇒ (y = s∨y = t)
).
The reading treeabove the diagram informs us that we areto read the asterisk (a universal spider) before the constantspider. It is not obvious whetheranynon-generalized con-straint diagram can make such a statement. Whilst the exactexpressive of constraint diagrams is unknown, we believethat our generalizations will lead to an increase in expres-siveness of the compound constraint diagram system as wellas the unitary fragment.
AcknowledgementsGem Stapleton is supported a by Lev-erhulme Trust Early Career Fellowship. Thanks to JohnTaylor for his comments on earlier drafts of this paper.
References
[1] S. Chow and F. Ruskey. Drawing area-proportional Vennand Euler diagrams. InProceedings of Graph Drawing2003, Perugia, Italy, volume 2912 ofLNCS, pages 466–477.Springer-Verlag, September 2003.
[2] S. Chow and F. Ruskey. Towards a general solution to draw-ing area-proportional Euler diagrams. InProceedings of Eu-ler Diagrams, volume 134 ofENTCS, pages 3–18, 2005.
135

[3] R. Clark. Failure mode modular de-composition using spi-der diagrams. InProceedings of Euler Diagrams 2004, vol-ume 134 ofElectronic Notes in Theoretical Computer Sci-ence, pages 19–31, 2005.
[4] R. DeChiara, U. Erra, and V. Scarano. VennFS: A Venndiagram file manager. InProceedings of Information Visu-alisation, pages 120–126. IEEE Computer Society, 2003.
[5] A. Fish and J. Flower. Investigating reasoning with con-straint diagrams. InVisual Language and Formal Methods2004, volume 127 ofENTCS, pages 53–69, Rome, Italy,2005. Elsevier.
[6] A. Fish, J. Flower, and J. Howse. The semantics of aug-mented constraint diagrams.Journal of Visual Languagesand Computing, 16:541–573, 2005.
[7] J. Flower and J. Howse. Generating Euler diagrams. InProceedings of 2nd International Conference on the Theoryand Application of Diagrams, pages 61–75, Georgia, USA,April 2002. Springer-Verlag.
[8] J. Flower, J. Masthoff, and G. Stapleton. Generating proofswith spider diagrams using heuristics. InProceedings ofDistributed Multimedia Systems, International Workshop onVisual Languages and Computing, pages 279–285. Knowl-edge Systems Institute, 2004.
[9] J. Flower, J. Masthoff, and G. Stapleton. Generating read-able proofs: A heuristic approach to theorem proving withspider diagrams. InProceedings of 3rd International Con-ference on the Theory and Application of Diagrams, vol-ume 2980 ofLNAI, pages 166–181, Cambridge, UK, 2004.Springer.
[10] J. Flower, P. Rodgers, and P. Mutton. Layout metrics for Eu-ler diagrams. In7th International Conference on Informa-tion Visualisation, pages 272–280. IEEE Computer SocietyPress, 2003.
[11] J. Flower and G. Stapleton. Automated theorem prov-ing with spider diagrams. InProceedings of Computing:The Australasian Theory Symposium, volume 91 ofENTCS,pages 116–132, Dunedin, New Zealand, January 2004. Sci-ence Direct.
[12] J. Gil, J. Howse, and S. Kent. Formalising spider dia-grams. InProceedings of IEEE Symposium on Visual Lan-guages (VL99), Tokyo, pages 130–137. IEEE Computer So-ciety Press, September 1999.
[13] E. Hammer.Logic and Visual Information. CSLI Publica-tions, 1995.
[14] P. Hayes, T. Eskridge, R. Saavedra, T. Reichherzer,M. Mehrotra, and D. Bobrovnikoff. Collaborative knowl-edge capture in ontologies. InProceedings of the 3rd Inter-national Conference on Knowledge Capture, pages 99–106,2005.
[15] J. Howse and S. Schuman. Precise visual modelling.Journalof Software and Systems Modeling, 4:310–325, 2005.
[16] J. Howse, G. Stapleton, and J. Taylor. Spider diagrams.LMS Journal of Computation and Mathematics, 8:145–194,2005.
[17] M. Jamnik.Mathematical Reasoning with Diagrams. CSLI,2001.
[18] S. Kent. Constraint diagrams: Visualizing invariants inobject oriented modelling. InProceedings of OOPSLA97,pages 327–341. ACM Press, October 1997.
[19] H. Kestler, A. Muller, H. Liu, D. Kane, B. Zeeberg, andJ. Weinstein. Euler diagrams for visualizing annotated geneexpression data. InProceedings of Euler Diagrams 2005,Paris, September 2005.
[20] S.-K. Kim and D. Carrington. Visualization of formal spec-ifications. In6th Aisa Pacific Software Engineering Confer-ence, pages 102–109, Los Alamitos, CA, USA, 1999. IEEEComputer Society Press.
[21] P. Mutton, P. Rodgers, and J. Flower. Drawing graphs inEuler diagrams. InProceedings of 3rd International Con-ference on the Theory and Application of Diagrams, vol-ume 2980 ofLNAI, pages 66–81, Cambridge, UK, March.Springer.
[22] O. Patrascoiu, S. Thompson, and P. Rodgers. Tableaux fordiagrammatic reasoning. InProceedings of the Eleventh In-ternational Conference on Distributed Multimedia Systems,International Workshop on Visual Languages and Comput-ing, pages 279–286. Knowledge Systems Institute, Septem-ber 2005.
[23] C. Peirce.Collected Papers, volume 4. Harvard UniversityPress, 1933.
[24] P. Rodgers, P. Mutton, and J. Flower. Dynamic Euler di-agram drawing. InVisual Languages and Human CentricComputing, Rome, Italy, pages 147–156. IEEE ComputerSociety Press, September 2004.
[25] S.-J. Shin. The Logical Status of Diagrams. CambridgeUniversity Press, 1994.
[26] G. Stapleton, J. Howse, and J. Taylor. A constraint diagramreasoning system. InProceedings of International Confer-ence on Visual Languages and Computing, pages 263–270.Knowledge Systems Insitute, 2003.
[27] G. Stapleton, J. Howse, and J. Taylor. A decidable constraintdiagram reasoning system.Journal of Logic and Computa-tion, 15(6):975–1008, December 2005.
[28] G. Stapleton, J. Howse, J. Taylor, and S. Thompson. The ex-pressiveness of spider diagrams augmented with constants.In Visual Languages and Human Centric Computing, Rome,Italy, pages 91–98. IEEE Computer Society Press, Septem-ber 2004.
[29] G. Stapleton, S. Thompson, A. Fish, J. Howse, and J. Taylor.A new language for the visualisation of logic and reasoning.In 11th International Conference on Distributed MultimediaSystems, International Workshop on Visual Languages andComputing. Knowledge Systems Institute, September 2005.
[30] G. Stapleton, S. Thompson, J. Howse, and J. Taylor. Theexpressiveness of spider diagrams.Journal of Logic andComputation, 14(6):857–880, December 2004.
[31] N. Swoboda and G. Allwein. Using DAG transformations toverify Euler/Venn homogeneous and Euler/Venn FOL het-erogeneous rules of interence. InProceedings of GT-VMT,ENTCS. Elsevier Science, 2002.
[32] A. Verroust and M.-L. Viaud. Ensuring the drawability ofEuler diagrams for up to eight sets. InProceedings of 3rd In-ternational Conference on the Theory and Application of Di-agrams, volume 2980 ofLNAI, pages 128–141, Cambridge,UK, 2004. Springer.
[33] D. Winterstein, A. Bundy, and C. Gurr. Dr Doodle: A di-agrammatic theorem prover. InProceedings of The Inter-national Joint Conference on Automated Reasoning, LNCS.Springer-Verlag, 2004.
136

Designing Non-Ambiguous and Viable Visual Interactive Systems
Maria Francesca Costabile1, Daniela Fogli2, Piero Mussio3, Loredana Parasiliti3, Antonio Piccinno1
1 Dipartimento di Informatica, Università di Bari, Bari, Italy
2 Dipartimento di Elettronica per l’Automazione, Università di Brescia, Brescia, Italy 3Dipartimento di Informatica e Comunicazione, Università di Milano, Milano, Italy
{costabile, piccinno}@di.uniba.it, [email protected], [email protected], [email protected]
Abstract This paper analyzes some characteristics of Visual
Interactive Systems to guarantee non ambiguous and safe interaction to end users. To this aim, a formal model of Visual Interactive Systems is provided, based on the concept of virtual entity that is here refined and linked to the program that generates a virtual entity. We also discuss virtual entities that satisfy some given properties and study the relationships between such virtual entities and their generating programs. Such relationships are useful to establish when a Visual Interactive System proves to be non ambiguous, visible and viable with the aim to adequately support end users during the interaction. 1. Introduction
In the last twenty years the importance of end users and of their activities has been recognized in the development of computer systems. Cypher defines end users as persons who use computer applications as part of daily life or daily work, but who are not interested in computers per se [6]. Schön highlights that they are professionals performing their activities as competent practitioners, in that “they exhibit a kind of knowing in practice, most of which is tacit” and they “reveal a capacity for reflection on their intuitive knowing in the midst of action and sometimes use this capacity to cope with the unique, uncertain, and conflicted situations of practice” [7]. In this perspective, our work aims at developing Visual Interactive Systems (VIS) that adequately support end users. Formally, a VIS can be specified by an Interaction Visual Language (IVL) enriched by a description of the admissible user activities. An IVL is a set of visual sentences, each visual sentence being a formal system associating an image on the screen, its computational meaning (described in a suitable form for the user) and the relations between the image and its meaning [4].
We clarify in this paper that each visual sentence represents a state of the VIS, being the VIS modeled as a finite state machine. The interaction process is described
by specifying the IVL and the actions which determine the transitions from one VIS state to another VIS state.
To this aim, the concept of virtual entity, is used to model both the whole VIS and its components [4][5]. In fact, in the computer age, workplaces are augmented by the use of computer-based systems that integrate and often substitute the real tools, documents, and sometimes also the real entities, on which end users were used to operate. The new tools, documents and entities become virtual entities (ves), in that they only exist as the result of the interpretation of a program P by a computer. Virtual entities are dynamic systems, able to capture the user inputs, compute the reaction to them and materialize their own state - the results of the computation – in a form perceivable by the user. To this aim, the program P must generate the images on the screen, capture the user activities, and manage their interpretation as well as the materialization (as new images on the screen) of the reactions to the user activities.
In this paper, we refine the notion of virtual entity and describe how to specify its dynamics by linking it to the design of the program P. Modeling a VIS through the notion of ve is useful to support designers to develop VISs that satisfy some formal requirements, thus allowing end users a non ambiguous and safe interaction. To this end, we restate in the global ve framework the following three necessary conditions, previously discussed in [4]: - R1 (non-ambiguity request): for each screen pixel
there is, at any state of the interaction, one and only one computational construct in the system, which is referred to when a user activity involves that pixel;
- R2 (structure visibility request): any computational construct in the system should be able to react to some user activities, and its reaction should be materialized by a set of pixels sufficient to make it recognizable;
- R3 (system viability request): no user activity should be allowed that would result in a non-meaningful situation or a system crash.
Some constraints are derived on ve and program behavior and structure for the satisfaction of the above conditions.
137

2. Modeling visual interaction in a syndetic frame
According to Barnard et al. [2], HCI is modeled as a syndetic process, i.e., a system composed by binding sub-systems of different nature, namely a cognitive sub-system (the user) and a computing sub-system (the machine). The word “syndetic” comes from the Greek term syndesis that means to bind together. To properly model the HCI process, the problems arising on the machine side, i.e., capturing and interpreting the human activities, must also be taken into account. Several models are proposed to reach this goal, including the one proposed in [1]. The model at the basis of our approach [3][4] considers HCI as a cyclic process, in which the user and the interactive system communicate by materializing and interpreting a sequence of messages at successive points in time. In WIMP interaction, these messages are the whole images represented on the screen display, formed by texts, pictures, icons, etc. They are seen as the pictorial part of visual sentence and are subject to two interpretations: one performed by the user, depending on his/her role in the task, as well as on his/her culture, experience, and skills, and the second internal to the system, associating the image with a computational meaning, as determined by the program P implemented in the system. Such program synthesizes how the designers understand the activities to be performed. Users are able to understand the meaning of the messages by recognizing some subsets of pixels on the screen as functional or perceptual units, called characteristic structures (css). Examples of css are letters in an alphabet, symbols or icons. Users associate to each cs a meaning which also depends on their tacit knowledge: the association of a cs with a meaning is called characteristic pattern (cp). Users recognize complex css formed by more simple ones (words formed by letters, plant maps formed by icons etc.) and attribute them a meaning stemming from the meaning of the components css. The interactive system itself is interpreted as a meaningful entity, a complex cp.
From the machine point of view, a cs is a set of pixels generated and managed by a computational process that is the result of the computer interpretation of the program P. (Note that words in bold denote entities perceived and interpreted by the human user, while those in arial denote processes and events perceived, computed and materialized by the computer). The computer execution of P creates and maintains active an entity, that we call virtual entity (ve). A virtual entity is a virtual dynamic open system. It is virtual in that it exists only as the result of the execution of the program P by a computer; dynamic in that its behaviour evolves in time; open in that its evolution depends on its interaction with the environment. During an interaction, the user operates on some input
device to manifest his/her requirements or commands to the ve. The ve captures input events generated by user activities and reacts to them generating output events toward users. Output events are characteristic structures materialized on the output devices of a computer to become perceptible by the users. The user perceives the cs generated in reaction to his previous operation, decides what to do next, and performs a new operation. The program P generating a ve is a system of programs, some of which - called In (Input) programs - acquire the input events generated by the user activity, some - called Ap (Application) programs - compute the reactions to these events, and some - called Out (Output) programs - output the results of this computation. Hence P = <In, Ap, Out>.
In order to formally specify how these programs operate we adopt the following notations. Let OP be the set of operations a user can perform on the images on the screen using the available input devices (e.g., mouse, keyboard) and CS be the set of characteristic structures visible on the screen. A user activity is then a pair <op, cs>∈A = OP×CS. In other words, it is defined as the operation a user can performs on a given characteristic structure in CS. Additionally, let Actions be the name of the actions managed by the application programs Ap and U be the set of the admissible states of Ap. The programs In, Ap and Out can be therefore described as functions defined as follows. The input programs In: A → Actions take as input a user activity <op,cs>∈A and give as result the name of an action a = In(op,cs) that will be executed by the application programs as reaction to the user activity. The application programs Ap: U×Actions → U execute an action whose name belongs to Actions and change their current state u∈U into a new state u’= Ap(u, a) belonging to the set U of admissible states of Ap. Finally, the output programs Out: U → CS associate every computational state u∈U of the application programs with a suitable physical manifestation cs∈CS.
3. Relating virtual entities and programs
Virtual entities are specified so that their behavior maps in the users’ view of the tasks to be accomplished, in order to capture their needs and satisfy them. On the other hand, the specification of programs maps in the software engineers’ view of the tasks to be performed by the users. The two specifications are built on two common subsets: the set of all characteristic structures used in the interaction and the set of activities performed by the user.
More formally, given a program P = <In, Ap, Out> as defined in the previous section, a ve generated by P is defined as a virtual dynamic open system by a 5-tuple ve = <S, O, f, η, s0> on a finite set of inputs, namely a set of user activities, A = OP×CSve, where CSve is the set of possible characteristic structures the ve may manifest and
138

1. S is the set of admissible ve states, each state specified as a characteristic pattern cp=<cs, d, <int, mat>> where cs∈CSve is the set of pixels managed by the In and Out programs, d∈D is a suitable description of the state u∈U of the programs Ap, int (interpretation) is a function, mapping cs onto d and mat (materialization) a function mapping d onto cs;
2. O=CSve is a finite set of outputs; 3. f: A × S → S is the next state function; 4. η: A × S → O is the output function; 5. s0 = cp0 is the initial state of the ve.
Given a user activity performed on a cs of a ve, that is a=<op,cs>, and a characteristic pattern cp = <cs, d, <int,mat>>, where d is the description of the state u of Ap, the next state function operates as follows: f(a, cp) = cp’ = <cs’, d’, <int, mat>>, where d’ is the description of the state u’ of Ap and cs’∈CS s.t. Out(u’) = cs’, and Ap(u, In(op,cs)) = u’. Note that, given a program P, a characteristic structure cs on the screen is the physical manifestation of a state u of Ap, that is Out(u) = cs, if and only if mat(d) = cs, where d is the description of the state u. In other words, the physical manifestation of a state of the application programs Ap is the materialization of the description of the given state of the ve generated by P, and vice versa. Moreover, if the application programs Ap change their state from u to u’ through the execution of an action a caused by a user activity <op,cs> - that is, u’ = Ap (u, In(op,cs)) -, then the description d of u provides the interpretation of the characteristic structure cs materializing the correspondent ve on the screen, that is int(cs) = d.
The whole Visual Interactive System can be seen as a special virtual entity, called veVIS, that is a composed virtual entity, whose css are whole images on the screen at each step of the HCI process. veVIS is generated and maintained active by a program PVIS=<InVIS,ApVIS,OutVIS> whose computational states uVIS are materialized at each instant as an image i on the screen belonging to 2i, and thus constituted by a finite set of css. Each computational state uVIS belongs to UVIS being constituted by a finite set of states ui. Two functions int and mat, define the relations of elements in 2i with elements in DVIS which are the descriptions of states in UVIS. Each state of veVIS is summarized by a visual sentence (vs), i.e. a triple vs=<i, dVIS, <int, mat>>. The set of admissible states of a visual interactive system is a set of vss which constitutes a Visual Language [4].
As a dynamic open system, a Visual Interactive System could also be defined as a 5-tuple veVIS = <S, O, F, Γ, s0> on A = OP×CSVIS, where CSVIS= 2i is the set of images i on the screen that the veVIS may manifest and 1. S is the set of admissible veVIS states, i.e. S = {vs | vs
= <i, dVIS, <int, mat>>, i∈2i, dVIS∈DVIS, where DVIS is
the set of the descriptions of admissible states of the programs Ap calculating the reactions of veVIS to the user activities, int(i) = dVIS, mat(dVIS) = i};
2. O = CSVIS; 3. F: A × S → S is the next state function; 4. Γ: A × S → CSVIS is the output function; 5. s0 = vs0 is the initial state of the veVIS.
The next state function and the output function can be specified by means of transformations. In each state of the interaction a finite number of user activities can be performed. As a consequence of a user activity, a visual sentence vs1 is transformed into a visual sentence vs2. The interaction process is specified as a sequence of such transformations. In a transformation, vs1 and vs2 share a common part, while the variable part of vs1 is transformed into the variable part of vs2 through the application of a transformation rule. We define a transformation rule as a pair tr = <a, r>, where a is the user activity and r is a rewriting rule. A rewriting rule is a triple <ant, cond, cons> where ant and cons are states (cps) of a ve and cond is a condition on ant. More precisely, let a be an activity performed at time t, then ant is the cp of a ve at time t and cons is the cp of the considered ve at time t+1. The relationships between a and r in a transformation rule is given by the fact that a = <op,cs> where cs belongs to ant. An Interaction Visual Language (IVL) can thus be specified by the pair <vs0,TR>, where TR is the set of the transformation rules. 4. Some notable sets of virtual entities and related programs
In this section we describe virtual entities and programs satisfying some interesting properties and we show the relationships between them. We start by refining the properties of fullness and faithfulness that were introduced in [3]. In that work, fullness was defined as a property ensuring that the computer is able to associate all computational constructs with some structure visible to the user. On the other hand, faithfulness ensures that everything visible on the screen is associated with a known computational construct. In this paper we extend these properties to virtual entities and we introduce two properties for programs, i.e. transitivity and visibility.
Properties of virtual entities characterize the way in which the user perceives the states of the ve and can act on them, i.e. characterize the interaction aspects of the ve.
They can be expressed as follows. Definition 1: A ve is full iff ∀d∈D ∃cs∈CS s.t.
mat(d) = cs and int(cs) = d, that is ∃cp∈S s.t. cp = <cs, d, <int, mat>>.
Definition 2: A ve is faithful iff ∀cs∈CS ∃d∈D int(cs) = d and mat(d) = cs, that is, ∃cp∈S s.t. cp = <cs, d, <int, mat>>.
139

The properties of a program P characterize the interactive computation performed executing P. A program P is transitive if every state of Ap is materialized as a characteristic structure and from every state of Ap it is possible to reach at least a new state through a computation executed by Ap, which is the controlled reaction to a user activity. Program visibility states that each user activity is captured and interpreted by P that determines a state transition and a physical manifestation correspondent to the reached state of P. In other words, P correctly visualizes the reactions to all the user activities. The transitivity and visibility properties for programs are defined in the following way.
Definition 3: P is transitive iff ∀u∈U, ∃cs s.t. Out(u) = cs and ∃op∈Op, and ∃u’∈U such that Ap(u, In(op,cs)) = u’.
Definition 4: P is visible iff ∀cs∈CS and ∀op∈Op, ∃cs’∈CS, and ∃u, u’∈U such that Ap(u, In(op,cs)) = u’ and Out(u’) = cs’.
The relationships existing between fullness and faithfulness of virtual entities and transitivity and visibility of programs can be formalized by means of the following theorems, whose proofs are trivial and not reported here for sake of brevity. Fullness of a virtual entity implies that its generating program must be transitive. By contrast faithfulness property of a ve requires for its generating program the satisfaction of the visibility property.
Theorem 1: ve full ⇒ P transitive. Theorem 2: ve faithful ⇒ P visible.
Vice versa is not true, only if a program is both transitive and visible the ve fullness and faithfulness are satisfied.
Theorem 3: P transitive and P visible ⇒ ve full. Theorem 4: P transitive and P visible ⇒ ve faithful. Proving the relationships between properties of virtual
entities and properties of programs is a necessary step to guarantee: 1) that each active program generates a ve having a cs visible on the screen; and 2) that each operation performed on each pixel of a cs on the screen is captured by the programs managing and generating the corresponding ve. 5. Non ambiguous, visible and viable VISs
This section discusses some of the characteristics that a
VIS must enjoy to adequately support its human users. First, a VIS must not disorient its users. This means that for each user activity there exists one and only one system reaction, and for each system reaction there exists one and only one physical manifestation to be perceived by the user. Another important point is to drive users to not steer the HCI process into an absorbing or crash state. To meet these requirements, a first step is to provide some constraints on veVIS behavior in order to satisfy the three conditions R1, R2 and R3 illustrated in the Introduction.
Proposition 1: veVIS full ⇒ R1 is satisfied. Being veVIS a particular case of composed ve, we can
assert that, from Theorem 1, if it is full then the program generating it is transitive and, as a consequence R1 (nonambiguity request) is satisfied.
Proposition 2: veVIS faithful ⇒ R2 satisfied. From Theorem 2, if veVIS is faithful, then the program
generating it is visible and, as a consequence R2 (structure visibility request) is satisfied.
Proposition 3: R3 satisfied ⇒ veVIS faithful. This proposition defines a necessary but not sufficient
condition for R3 to be satisfied. In fact, system viability request (R3) means that no user activity should be allowed resulting in a non-meaningful situation or a system crash. Hence, this implies that ∀op∈Op on each cs∈2i, the system is able to capture and manage it. In other words, this means that veVIS must be at least faithful. Such conditions, however, are not sufficient, because other external causes may determine non meaningful situations or system crash, such as for example hardware malfunctioning, interference with other software systems, instability of the operating system, and so on. 6. Conclusions
The paper studies some properties of VISs, such as non ambiguity, visibility, viability, which drives the implementation of programs generating VISs that adequately support the interaction process, while avoiding user disorientation and impeding users to steer the HCI process into non meaningful situations or system crash.
7. References [1] Abowd, G. D., Beale, R., Users, systems and interfaces: a
unifying framework for interaction. HCI'91: People and Computers VI, Cambridge University Press, 1991, 73-87.
[2] Barnard, P., May, J., Duke, D., Duce, D. Systems, Interactions, and Macrotheory. ACM TOCHI, 7(2), 222-262, 2000.
[3] Bottoni, P., Costabile, M.F., Levialdi, S., Mussio, P. Defining Visual Languages for Interactive Computing, IEEE Trans. on SMC, Vol. 27(6), 1997.
[4] Bottoni, P., Costabile, M.F., Mussio, P. Specification and Dialogue Control of Visual Interaction through Visual Rewriting Systems, ACM TOPLAS, 21-6 1077-1136, 1999.
[5] Costabile, M. F., Fogli, D., Fresta, G, Mussio, P., Piccinno, A., Building Environments for End-User Development and Tailoring, Proc. 2003 IEEE HCC’ 03, Auckland, New Zealand, October 2003, 31-38.
[6] Cypher, A., Watch What I Do: Programming by Demonstration. The MIT Press, Cambridge, 1993.
[7] Schön, D., The Reflective Practitioner – How Professionals Think in Action, Basic Books, 1983.
140

VIEW-GIS − An Environment Supporting Web GIS Developers
Luca Paolino, Monica Sebillo, Genny Tortora, Giuliana Vitiello Dipartimento di Matematica e Informatica
Università di Salerno, Via Ponte don Melillo 84084 Fisciano (SA) - Italy
{lpaolino,msebillo, tortora, gvitiello}@unisa.it
ABSTRACT In the last years, the increasing popularity of the Internet has greatly affected the activity of GIS researchers and laboratories, leading to the development of Web sites for the dissemination and the manipulation of spatial knowledge in specific domains. However, most of the available software development kits do not adequately support professionals like botanists, archaeologists and vets, who use GIS for spatial data management, analysis, and visualization but have no experience with web development techniques. As a solution to this issue, we propose a visual programming tool, named VIEW-GIS (VIsual Environment for Web GIS generation), which supports unskilled users in the construction of customized Web GIS applications, following a Rapid Application Development approach. Based on their requirements, users may choose the functionality of the expected Web GIS application and customize its interface by visually manipulating graphical objects.
Keywords Geographical Information Systems, Web User Interfaces, GUI Customization.
1. INTRODUCTION In the last years, the development of web sites involving spatial maps has been a diffuse activity of research and commercial laboratories. As a matter of fact, several laboratories have acquired and processed a huge number of spatial data and they have published the obtained results in order to provide some innovative GIS services [3, 4, 6]. However, professionals like botanists, archeologists, and meteorologists, who use geographical information systems for spatial data management, analysis, and visualization but are not computer science experts, traditionally rely on specialized companies for the development and the maintenance of their GIS web sites. For a long period, software applications supporting the development of GIS web sites have been very hard to use by non-experts users, who represent most of data producers. Recently, efforts along this direction have led companies and research laboratories to develop assisting tools that in most cases are simple wizards which produce Web GIS interfaces according to predefined layouts and specific widgets. They provide no ability to customize, locate and adapt interfaces to personal demands. Accordingly, the development of complex sites still forces
to manipulate lines of code, which can be done only by computer science experts. In this context, the development of advanced, customizable visual interfaces for GIS construction and manipulation is still a challenging issue. The basic idea for this research work is to follow a Rapid Application Development (RAD) approach to support development of customized Web GIS applications, both client and server side, within a highly flexible graphical environment. The environment, named VIEW-GIS (VIsual Environment for Web GIS generation), allows developers to choose the functionalities that the GIS should provide, and design the positioning of the corresponding controls inside the interface layout. Each of the chosen functionalities is indeed associated with a set of graphical objects, carrying a set of default properties, which can be modified for customization purposes. Thus, common GIS functions (e.g., zooming and panning) and common working areas (like the map viewer and the legend manager), can be added to the interface possibly personalizing their behavior or their graphical aspect. Their correct positioning inside the web interface is also ensured by the environment thanks to an automatic procedure for acquiring absolute coordinates. The remainder of this paper is organized as follows. Section 2 describes the VIEW-GIS environment by illustrating the widgets, which can be used when constructing Web GIS interface, and classifying them in agreement with the kind of GIS interaction they support. Also the algorithm useful to translate the visual positioning of objects to the corresponding web code is described. In Section 3, we report on the experience of a group of botanists who used VIEW-GIS for developing a Web GIS satisfying their specific requirements and we describe the client-server architecture which underlies a generated Web GIS and explain how a query is solved based on such architecture. Finally, Section 4 describes some related work and provides final remarks on the present research.
2. THE VIEW-GIS ENVIRONMENT Starting from a deep analysis of what is expected by users, who are experts in spatial data management and/or of GIS application domains, we have identified a set of objects which typically appear in a GIS interface/application, classified in terms of their behavior and appearance.
141

Exploiting such classification, in VIEW-GIS each object has been associated with a widget, which embeds its properties and resembles the expected behavior with its graphical appearance. The widgets are made available in the environment and organized in a visual interface in a way consistent with the most common RAD tools (e.g., JBuilder, and Dreamweaver), so as to exploit users’ familiarity with such tools. This approach also supports the learnability principle [1, 5], ensuring certain features in the interactive environment which allow novice users to understand how to use it initially and how to attain a maximum level of performance afterwards. In Subsection 2.1 we describe the working areas composing the VIEW-GIS environment, whereas the widget classification and behavior are illustrated in Subsection 2.2.
2.1 The Interface One of the most important aspects concerning Web GIS is certainly the design of the corresponding graphical user interfaces (GUI), by means of which, users may interact with the system in order to formulate complex operations on geographical data. Users’ support to GIS development has been indeed the main focus of the present research. VIEW-GIS benefits from the use of common, advanced, up-to-date visual paradigms (i.e., WYSIWYG and direct manipulation), and visual objects (e.g., icons, dialog forms, pop-up menus, etc.). This ensures high-level graphical access to the underlying geographical database and provides efficient communication facilities for querying and analysis.
Basically, in order to exploit the familiarity that users may have with other RAD systems, we have organized the VIEW-GIS interface following the approach used in the popular JBuilder application, as shown in Figure 1. The interface of VIEW-GIS contains a tabbed pane from which widgets corresponding to common GUI and GIS functionalities may be selected and arranged on the central Composition_Panel, which will contain the generated Web GIS interface. When one of the tabs is selected, the widget bar associated to the corresponding category of functions is displayed, from which the developer may choose the widgets he/she wishes in the GIS interface being constructed. In particular, in Figure 1, the mapping tab has been selected hence displaying the widget bar which provides all the widgets, that can be used to provide a Web GIS with common mapping functions. We call those widgets geographical widgets, to distinguish their specific role in human-GIS interaction. On the right-hand side of the environment a Property_Panel can be used to customize the widget which is currently focused. This task will be described in detail in Section 3. The Property_Panel may also be activated by selecting the corresponding item from the left-hand side frame. Such frame lists all the widgets so far positioned inside the Composition_Panel, and provides an overview of the Web GIS project constructed so far.
Mapping Widget Bar Build Button
Composition Panel Property Panel
Figure 1. VIEW-GIS – an overview of the visual environment.
142

2.2 Geographical Widgets Besides traditional widgets, such as buttons, check boxes, combo boxes, etc., VIEW-GIS provides domain specific controls which correspond to common functionalities of GIS and Web GIS applications. These can be selected from the widget bar associated to the Mapping tab. Table 1 depicts the minimal set of geographical widgets, whose representation and behavior are standard, and characterize every GIS interface.
Table 1. Widget description Default Symbol Name Description
Static
North Arrow
It indicates the North direction on the map.
Dynamic
Map Legend
It lists layers currently present in the map, which may be shown or hidden. Moreover, it gives visualization details for each layer.
Layer It adds a new layer within the Map, MapLegend and MapKey.
Zoom In This operation performs an enlargement of a map portion either starting from a point or selecting an area of interest. It also reduces the scale.
Zoom Out
This operation increases the visible area, hence making the ratio scale grows.
Pan This operation allows users to move the map focus.
Full Extend
The Full Extend operation makes the whole map visible.
Measure It computes the Euclidean distance between two selected points on the map.
Info It provides the descriptive component of a geographical data.
Find It highlights all the features on the map which satisfy a given condition.
Visualization
Map It defines the area where vector and raster data are visualized.
Map Key It visualizes a small representation of the whole map where the current map focus is highlighted.
Scale It graphically indicates the ratio between the map and the real world part indicated by the map.
Depending on their behavior inside the generated Web GIS, we have classified them according to three different categories, namely static, dynamic and visualization. Static widgets are widgets which are not subject to user’s interaction. An example of static widget is the North
Arrow, which can be positioned on the GIS interface during its construction, but is statically used to indicate the north orientation of the map and no action can be performed on it. On the contrary, dynamic widgets may respond to user’s interaction, by changing their aspect and/or the internal state of the system. A particular subset of dynamic widgets correspond to Measure and Find which need to obtain some information by the user at runtime. Dynamic widgets may also influence the behavior of visualization widgets, which are indeed widgets that change their appearance because of user’s indirect interaction. Map is an example of visualization widget, which represents the area where vector and raster data are visualized, and where users see results of their operations. The map portion visualized in Map, may change depending on the action performed on some dynamic widget, e.g., the Zoom In button, which is pressed to query the GIS server. By taking into account the widget subdivision, let us now show how widgets may be configured by setting up their parameters. One of the first customization users can perform deals with the icon associated with a widget, namely the first widget representation the user sees when he/she accesses VIEW-GIS. Generally, only Static and Dynamic widgets have an initial representation which can be easily set up by changing the source image file. Each Dynamic and Static widget may be related to a label which describes it. Then, besides the text, some parameters should be provided in order to indicate the font used and the alignment with respect to the widget. Another parameter which may be set up for Static and Dynamic widgets is the tooltip, namely a text string explaining the widget behavior and appearing when the user moves the mouse over the widget and keeps it still for a short time slice. Dynamic widgets may be further enhanced by customizing the icons describing events which are usually caused by the mouse. Because of that, we have decided to allow users to decide the visual representation the widget should have in response to each kind of mouse action. A familiar example comes from the desktop metaphor, where a double click on a folder causes the folder icon to change into an open folder icon. Seven kinds of mouse actions exist, that is Click, Double Click, Mouse Up, Mouse Down, Mouse Over, Mouse Out, Mouse Move. Other parameters that the Web GIS developer may set are Layer parameters, which indicate settings concerning with layer representations, such as the rendering colors, the layer name, etc. As for the visualization widgets, namely map, mapkey, and scale, parameters mainly concern with the size and the location. The size and position are parameters which can be set up also for Dynamic and Static widgets. We use the JBuilder approach where elements can
143

be resized and relocated either by a mouse down action or by setting textual attributes on the size attributes. Another important feature which distinguishes VIEW-GIS from other Web RAD tools refers to its capability to easily calculate the absolute position of widgets inside the interface. Basically, usual applications based on the HTML language can only determine a sequential positioning of graphical objects, unless users locate widgets by using tables which allow to divide the web page in cells where widgets can be positioned. However, common RAD tools are not able to manage this kind of information and charge the user with the task to find out which table is the best for inserting their widgets. This means that users need to know in advance the widget dimensions in order to calculate the right number of rows and columns, and the size of cells. The approach followed with VIEW-GIS is different. It recalls the layout management technique on which JBuilder is based, which also allows a null layout to arrange widgets on the interface with no constraints. Similarly, in VIEW-GIS users are only supposed to position widgets inside the Composition_Panel, while their absolute positioning (i.e., the right table) is automatically determined by the underlying algorithm. In the following, an example shows how the algorithm works. Let us suppose to spatially arrange five widgets (1,2,3,4,5) within a web page as shown in Figure 2.
Figure 2. A spatial arrangement of five objects and their
projections
The upper-left corner of the rectangle containing the widget is located at (xi,yi), and wi and hi are its width and height, respectively, for each i from 1 to 5. By projecting the bottom-left and the bottom-right corners of a widget i along the x and y axes, the algorithm computes the total number of rows and columns, as well as its width and height. The projection values are stored in two different sorted arrays. This phase of the algorithm requires twice the application of a sorting procedure, which both in the best and in the worst case yields a O(n log n) complexity, where n is the number of widgets. Figure 2 shows the projections resulting from the first phase of the algorithm. Once the initial table is calculated, if a widget occupies two or more cells, such cells are joined. The operation of aggregating the rows and columns crossing some widget is
performed in O(n), provided that a constant time is needed for each widget. Consequently, the overall running time for the positioning algorithm is O(n log n).
3. THE CREATION OF A WEB GIS INTERFACE
The development of VIEW-GIS was first conceived as a way to satisfy the requirements of a group professionals, expert users coming from the botany domain. Such users frequently need to promote knowledge and publish maps concerning the spatial data they acquire during their survey activity, with the goal of monitoring the status of our environment and the human effects on it. The group of botanists we interacted with, explained that, both to manage spatial data and to visualize their analysis results, they typically use basic GIS tools, which provide them only with equipment for browsing a map, querying the underlying data description and looking for specific patterns. On the contrary, they reported that when advanced applications and Web GIS services were required, they were forced to rely on specialized companies for the development of tools able to visualize data and perform querying on the Web. Moreover, the development of every new application required a strong interaction between users and developers to determine the expected functionalities, with increasing costs in terms of time and efforts. VIEW-GIS has represented an effective solution to botanists’ issue. By using this visual programming tool, a Web GIS has been built, which provides a set of mapping tools as well as functionality for querying the underlying database via Web, through a customized interface, totally developed by its users, namely the botanists themselves. In the following, we describe the basic steps performed to build the Web GIS interface and show the customization tasks performed on some of its widgets. The first phase of development consisted in the selection and arrangement of the widgets that were expected to provide the required functionalities. As an example, in order to perform the map selection task, the botanist-developers pressed the map button on the widget toolbar and used the mouse to drag the area where the map should be visualized. During the dragging phase a dashed rectangle is depicted in order to highlight the area where the widget will be located. A similar task was performed to properly place all the widgets on the Composition_Panel. Subsequently, based on specific requirements, for some widgets the botanists needed to provide a customized behaviour, and a customized appearance. The customization task can be performed by simply recalling and modifying property values of the involved widgets. Let us focus on two specific customizations that botanists performed. The former was applied to the zoom-in button,
144

which was expected to be associated with a predefined zoom factor. The latter was referred to the construction of a find supervised areas button, which was meant to enable users to highlight the areas where specimens of protected plants were detected. In order to perform the first customization task, the default icon was replaced by a new one, by simply setting up the value of the icon property located on the right of the interface. Figure 3 shows some details of the Property_Panel associated to the Zoom In button, as it appears in VIEW-GIS. As shown in the figure, the appearance is not the only aspect that users can adapt to their requirements. In the example, the behavior of the Zoom In widget was also customized by modifying the default values of the two properties named Type and Zoom Factor. The Type property indicates the zoom type, which determines if the zooming area has to be identified by a rectangular selection on the map or by a point selection. In the rectangular selection, the user defines the zooming map area by dragging a dashed rectangle on the map, while in the point selection, the focused point becomes the map center and the map is enlarged by the Zoom Factor property.
Figure 3. A portion of the Property_Panel, in VIEW-GIS
As for the find supervised areas button, it was provided by customizing the default properties of the find button. In particular, the image associated with the icon, its name and the new tooltip to supervised areas were added to the corresponding properties, and the query property value was set to the SQL query which implements the requested functionality. The Build button of VIEW-GIS was finally used to generate the code of the target Web GIS starting from the described property setting. As specified, the find supervised areas changes its visual representation upon a click down action and returns to the first representation upon a click up. Moreover, the tooltip text is set to “Find Supervised Areas.” Figure 4 shows the resulting application. The Web GIS client interface consists of a map of the Campania region located in the centre, a map legend with the Cities layer, and a set of customized widgets, grouped according to the class of functions they belong to.
Figure 4. The Botany Web GIS developed with VIEW-GIS.
Once the design of the Web GIS interface and the customization of its functionalities are completed, the Build button invokes the code generation and the expected Web GIS application is created. The Web GIS users may also formulate queries to the underlying database by visually interacting with the corresponding functionalities that developers properly included in the interface through the widgets of the Selection tab.
Figure 5. The areas selected by the query
Figure 5 shows the result of a query looking for the areas containing samples which belong to a given species. The area visualized in response to the query is red-coloured inside the Map area. The query has been solved on the basis of the architecture shown in Figure 6, where data transitions between client and server modules are depicted. VIEW-GIS has been developed using the JAVA programming language, whose platform independency allows us to easily distribute the application across multiple operating systems with no need to implement different versions. Similarly, the resulting Web GIS application is based on a client/server architecture and on a set of both standard and open technologies, PHP, Postgres/Postgis, Mapserver and SQL, which guarantee the interoperability among server modules and the client browser.
145

Figure 6. The architecture of the Web GIS generated When a query is formulated on the client side, the JAVAScript client part composes the XML/SQL request and sends it to the server side where data satisfying the query are selected and sent back to the client side in the form of HTML, JAVAScript and image data. In particular, on the VIEW-GIS server side, the component capturing the request decompiles the query and creates the HTML and JAVAScript codes which represent the response wrapper to the user. Finally, it sends instructions to Mapserver to build the images corresponding to the query solution, which will be embedded into the code generated by VIEW-GIS. If the request also includes a SQL statement, a further step is needed before the Mapserver is called. In particular, the VIEW-GIS server creates a SQL view corresponding to the SQL code on the Postgres and then modifies the map file in order to provide some rendering information. At that point, Mapserver is called and returns the image.
4. RELATED WORK AND CONCLUSION In the field of information systems, many factors have highly influenced the development of GIS as means to easily access, process and disseminate geographical information and spatial knowledge. The increasing popularity of the Internet, the strong progress of Information Technology (IT) and the merge of geographical information science and technology have determined a growing interest in investing in the area of Web GIS. In order to understand the main innovative features in this work, the state of the art in Web GIS development has been examined. The traditional approach to Web GIS application development has been to implement ad hoc software solutions using both programming languages and Application Programming Interfaces (APIs) that manage spatial data. Available APIs have been widely used to build platform-independent customized applications. They allow to design several kinds of applications, such as simple viewers and tools to query both spatial and alphanumeric data. More recently, major GIS software companies have developed specialized software for web application development. As a matter of fact, ArcIMS by ESRI [8], MapGuide by AUTODESK [7], and WebMap by INTERGRAPH [9], can be used to build web applications which allow users to query and manipulate spatial
information through browsers, such as Internet Explorer and Firefox. In [2], Lbath presents a case tool, named AIGLE, which is dedicated to the automatic generation of geographical software application. It is based on a specific formalism, named OMEGA, which is able to specify all the aspects of design by considering four general views: an organization view, a static view, a dynamic view and a function view. In this work we have experimented a new way for developing Web GIS interfaces. As a matter of fact, VIEW-GIS has been conceived with the aim of enabling unskilled (yet domain expert) users to build personalized Web GIS applications on their own. This also yields the desirable benefit of reducing usability design costs. A user who wishes to build his/her own Web GIS, learns quickly the steps he/she is supposed to perform in order to accomplish the generation task. He/she performs a sequence of intuitive manipulation tasks applying the widgets he/she is interested in, and then specifying parameters needed to satisfy the personal requirements in the target Web GIS application. Besides the most diffuse GIS widgets, customization is also possible for the GUI layout, thanks to the algorithm adopted in order to overcome the problem of web absolute positioning.
5. REFERENCES [1] Dix, A., Finlay, J., Abowd, G.D., Beale, R., Human-
Computer interaction, 3rd edition., Pearson Education Limited, 2004.
[2] Lbath, A, Pinet, F., The Development and Customization of GIS-Based Applications and Web-Based GIS Applications with the CASE Tool AIGLE. In: 8th ACMGIS 2000, Washinghton D.C, USA, November 2000.
[3] Longley PA, Goodchild MF, Maguire DJ, Rhind DW. Geographical Information System Principles – Second Edition 2001. Wiley.
[4] Longley PA, Goodchild MF, Maguire DJ, Rhind DW. Geographical Information Systems and Science 2001. Wiley.
[5] Nielsen J., Designing Web Usability: the Practice of Simplicity, New Riders Publ., Indianapolis, IN, 2000
[6] Peng ZR, Tsou MH. Internet GIS – Distributed GIServices for the Internet and wireless networks, 2003 Wiley.
[7] AUTODESK, MapGuide,usa.autodesk.com/adsk/servlet
[8] ESRI. ArcIms www.esri.com/software/arcgis/arcims/index.html
[9] INTERGRAPH. WebMap, imgs.intergraph.com
146

Collaborating through Computers: the Software Shaping Workshop Approach
Maria Francesca Costabile1, Daniela Fogli2, Rosa Lanzilotti1, Piero Mussio3, Antonio Piccinno1
1Dipartimento di Informatica, Università di Bari, Bari, Italy 2Dipartimento di Elettronica per l’Automazione, Università di Brescia, Brescia, Italy 3Dipartimento di Informatica e Comunicazione, Università di Milano, Milano, Italy
{costabile, piccinno, lanzilotti}@di.uniba.it, [email protected], [email protected]
Abstract Current work practices require end users to cooperate
not only on their daily work, but also on the customization and tailoring of the software environments they use to better fit with their needs. To this end, software environments must provide visual computing and visual programming techniques in order to support two kinds of cooperative activities: 1) the cooperative design activity performed by the design team to generate software environments for end users and 2) the cooperative work activity performed by end users in their daily work. This paper describes a methodology for the development of such software environments.
Keywords: system design, end-user development, CSCW, customization, tailoring.
1. Introduction
The research in Computer Supported Cooperative Work (CSCW) is currently considering tailoring in cooperative contexts as a cooperative activity itself [2][20]. This is in accordance with Wilson’s definition: “CSCW [is] a generic term which combines the understanding of the way people work in groups with the enabling technologies of computer networking, and associated hardware, software services, and techniques” [21]. The term groupware is often used as synonymous with CSCW, although, paraphrasing the definition provided in [8], it refers to computer-based systems that support groups of people engaged in a common task (or goal) and that provide access to some environments through a tailored interface. Groupware can be classified according to time, using the distinction between synchronous (same time) and asynchronous (different times), and to location, using the distinction between face-to-face (same place) and distributed (different places).
We are currently involved in projects in the medical domain [6][7], in which specialists in different
disciplines, distributed in different places, need to cooperate to reach a diagnosis for various diseases. Consultations and diagnoses are obtained by the use of groupware systems.
Our approach to system development starts from the observation of activities of such kind of expert users during their daily work. The research we have developed in this field and the experience gained has brought us to develop software environments that support users in performing activities in their specific domains, but also allow them to tailor these environments for better adapting to their needs, and even to create or modify software artefacts. The latter are defined activities of End-user Development (EUD) [9]. EUD means the active participation of end users in the software development process. In this perspective, tasks that are traditionally performed by professional software developers are transferred to the users, who need to be specifically supported in performing these tasks [19].
We have developed a methodology to design interactive software systems supporting EUD activities [6]. The software system is composed of various environments, each one specific for a community of users, called virtual workshops. They are organized in analogy with the artisan workshops (i.e. blacksmith and joiner workshops), since the artisans have in their working environment all and only the tools necessary to carry out their activities. Such virtual workshops are called Software Shaping Workshops (or SSWs for short) to emphasize that they are virtual workshops allowing users to “shape” software artifacts. SSWs are designed by exploiting the approach based on the theory of visual sentences developed by some of the authors [3][4]. Indeed, SSWs propose interaction visual languages based on the notations end users have traditionally developed in their work practice and provide interaction tools that resemble those used in real environments.
In this paper, we show that SSWs support two kinds of cooperative activities: 1) the cooperative design activity to develop workshops to be used by end users for their daily work; and 2) the cooperative work activity
147
performed by end users in their work tasks. In order to explain the two different kinds of cooperation, we discuss a project currently under development in the medical domain. The paper first presents the SSW methodology. Then customization and tailoring in SSWs through examples in the medical domain are illustrated. The last section discusses some related works and concludes the paper.
2. The Software Shaping Workshop Methodology
The following principles are at the basis of our methodology to design interactive software systems: i) the language in which the interaction with systems is expressed must be based on notations traditionally adopted in the domain; ii) systems must present all and only the tools necessary to perform the user work, without overwhelming users with unnecessary tools and information; iii) systems must be designed for co-evolution of users and systems [1].
In the SSW methodology, end users play two main roles in the lifecycle of the interactive software system: 1) on one side they perform their daily work tasks by carrying out visual computing activities; 2) on the other side they participate in the development of software environments as stakeholders of the domain.
In the first role, as users performing work activities, end users can tailor the workshop to their current needs and context. Professional people, such as mechanical engineers, geologists, physicians, often work in a team to reach a common goal. The team might be composed by members of different sub-communities, each sub-community with different expertise. Our approach to the design of a software system in a certain domain considers the system as composed of various environments, each one for a specific sub-community of users. Following the analogy of the artisans’ workshops, end users using a Software Shaping Workshop find available all and only the tools required to develop their activities. A first type of SSWs, allowing end users to perform their daily tasks, are called application workshops.
In the second role, as members of the design team, end users participate directly in the development of the workshops for their daily work. In fact, even if they are non-professional software developers, they are required to create or modify application workshops. To this end, a second type of workshops are made available to them, called system workshops, which permit the customization of each application workshop to the end-user community needs and requirements. The concept of system workshop is more general. Actually, system workshops allow the members of any community involved in design and validation of the system (e.g., software engineers,
Human-Computer Interaction (HCI) experts, and representatives of users) to participate in these activities.
Each member of the design team can examine, evaluate and modify an application workshop using tools shaped to his/her culture and to their visual notations. In this way, this approach leads to a workshop network that tries to overcome the difference in language among the experts of the different disciplines (software engineering, HCI, application domain) who cooperate in developing computer systems customized to the needs of the user communities without requiring all the stakeholders to become skilled in all the involved domains of knowledge.
In general, a network is organized in levels. In each level, one or more workshops can be used, which are connected by communication paths. Three levels always exist: a) the top level (the meta-design level), where software engineers use a system workshop to prepare the tools to be used and to participate in the design, implementation, and validation activities; b) the design level, where software engineers, HCI experts, and end-user representatives cooperate to the design, implementation, and validation activities; for example a user as a design member belonging to the community X participate in the design using a system workshop customized to the needs, culture and skills of the community X; c) the use level, where practitioners of the different communities cooperate to achieve a task; similarly, practitioners belonging to the community X participate in the task achievement using the application workshop customized to their needs, culture, and skills.
At each level, experts in a domain are allowed to communicate with experts in a different domain through communication paths. An expert using his/her application or system workshop can send data or programs to a different expert. These data and programs are interpreted and materialized by the workshop customized to the second expert. As we have shown in [6], currently the main tool for this kind of communication is electronic annotation, which plays a crucial role for two-way exchange of ideas among humans pursuing a common goal [12].
3. Supporting cooperation through SSWs
SSWs support cooperation both on software design and on task accomplishment. The first kind of cooperation is useful for creating application workshops and customizing them to the user community. We thus mean by customization the activity performed by the design team which generates application workshops for a specific community of users by exploiting users’ notations, dialects, principles, and standard rules. Customization is thus an activity of cooperative design, since it involves different stakeholders using their own
148

system workshops in the generation and modification of application workshops. Moreover, it is also an EUD activity because representatives of end users, as stakeholders of the application domain, are required to participate in system design and development.
The collaboration on task accomplishment can be obtained by tailoring application workshops. In our approach, tailoring is the activity performed by end users to adapt an application workshop to their current activity and context of work. The idea is to permit tailoring of systems, which are already specific and suitable to the needs of a community of users, because they have been designed through a cooperative activity performed by all stakeholders. More specifically, two types of tailoring can be devised: tailoring for individual work, concerning the activities that the end user can perform to adapt her/his environment during her/his own work; tailoring for cooperative work, including those activities that the end user performs to tailor the tools needed to permit the communication between end users. Such tools are necessary to send the information to another end user to whom collaboration is requested, such as for example, in medical cases, the exchange of consultations to reach a common diagnosis about the patient disease. We are interested here in this second type of tailoring: examples are provided in the case study discussed in the next section.
4. Customization and tailoring in the medical domain
In this section we describe a project in the medical domain, to which we are currently applying the SSW methodology.
The improvement of the quality of the medical diagnosis is the main goal of each physician. Thanks to the evolution of research and technology in the medical domain, each specialist may have the aid of medical examinations of different types, i.e. laboratory examinations, X-rays, MRI (Magnetic Resonance Imaging), etc. A team of physicians with different specialization should analyze the medical examinations giving their own contribution according to their “expertise”. However, the increasing number of medical specializations as well as the increasing number of patients do not permit the team of specialists to meet as frequently as needed to analyze the clinical cases especially if they do not work in the same building or moreover they work in different towns or states. The information technology has today the potential of overcoming this difficulty by providing software environments that allow a synchronous and/or asynchronous collaboration “at a distance”. In fact, tools for supporting the physicians in their daily work already
exist, e.g. telemedicine, videoconference, etc. Thus, the specialists do not need to meet at the same place for analyzing the clinical cases on which they collaborate. However, physicians complain that these tools are very expensive and need large system resources, and that they are often difficult to learn and to use.
Our proposal of SSWs aims at providing the physicians with software tools that are first of all easy to use and adequate to the physicians’ current tasks and that resemble their real tools. This will determine an increase in productivity and performance, with the achievement of competitive advantage for the organization they work in.
We are currently applying the SSW approach in a project we are involved, which is in collaboration with the physicians of the neurology department of the “Giovanni XXIII” Paediatrical Hospital of Bari. In this project, different communities of physicians are involved, namely neurologists and neuro-radiologists, in the analysis of clinical cases and in the generation of the diagnosis. The first step of our project was a field study with contextual interviews to identify how the physicians collaborate in the analysis of clinical cases and the environmental and organization factors influencing their work, as well as the categories of end users involved and their main tasks, their specialized medical dialects, their common languages [7].
We now describe the case in which a neurologist asks for a consultation to a neuro-radiologist to analyze cases by studying MRIs in order to make a better diagnosis for their children patients. Currently, consultations occur during a real meeting. Due to the busy schedule of the physicians, these consultations cannot be frequent, therefore when they meet they have to analyze several clinical cases. During the meeting, the cases are discussed one at a time and always with the same procedure. The neurologist chooses a case, gives the MRI plats to the neuro-radiologist and begins to tell the most relevant data about the clinical history of the patient. The neuro-radiologist puts 3 or 4 MRI plats on the diaphanoscope and begins to study them. During the study of the MRI, the neurologist and neuro-radiologist exchange information in order to clarify possible doubts and converge to an agreed opinion. At the end, the diagnosis on which the specialists agreed is written on the patient record and the next clinical case is considered. If the physicians cannot physically meet, the consultations occur through services of instant messaging or e-mail. Obviously, in this case, some problems arise, such as the limited capacity of the e-mail, the problem of connection and so on.
4.1 Customization of application workshops We adopted the SSW methodology to build
application workshops customized to the physicians’
149

notation, language, culture, and background, that physicians themselves can further tailor according to their needs. These workshops allow the specialists to cooperate in virtual asynchronous meetings. The specialists may use their own application workshops to perform their daily work tasks: for example, a specialist may analyze the available Electroencephalogram (EEG) or MRI, perform annotations and/or computations on them, select parts of them, define diagnoses and/or consultation requests.
Considering the observations collected during the field study, each workshop is equipped with a certain set of tools necessary to carry out the work task and is customized to the specific user community. For example, both application workshops devoted to neurologists and neuro-radiologists have an overview area on the top of the screen, which may be used to browse MRI plats or EEG portions. The overview area is the electronic counterpart of the diaphanoscope used by the physicians in a real meeting. Since neuro-radiologists are only interested in MRI, in their application workshop, they find only the MRI overview area (see Figure 1) together with tools to process the MRI and to formulate the diagnosis. On the other hand, neurologists study primarily a great number of EEGs but in some cases, they analyze MRI plats. Thus, in their application workshop there are two overview areas, which are resizable (see Figure 2). In this way, the neurologists can reduce (or even close completely) the area containing the MRI plats, in order to expand the EEG overview area according to their needs.
Figure 1. The application workshop prototype devoted to the neuro-radiologist.
Each workshop is the result of a cooperative design performed by a team including representatives of end users (e.g. senior physicians), HCI experts and software engineers. To this end, representatives of end users interact with a system workshop to create the application workshops by visual composition of widgets prepared by software engineers and HCI experts. Details of such a visual composition are provided in [5] describing the
application of the SSWs methodology in a mechanical engineering domain.
Figure 2. The application workshop prototype devoted to the neurologist.
Figure 3 shows a screenshot of such system workshop: the user has partially composed the application workshop devoted to neuro-radiologists by selecting from the repositories on the right side of the screen, the canvas on which the application workshop is composed, the overview area, the working area, the archive area, the Exit button and the “images” archive. Actually, the user is creating a program by visual interaction with the system workshop. Being not expert in computer science, s/he is not required to write any textual code.
Figure 3: A representative of end users is interacting with a system workshop.
4.2 Tailoring for cooperative work As already mentioned before, tailoring for cooperative
work refers to tailoring activities needed to communicate efficiently and effectively with colleagues. To this aim, end users shape software artefacts to be used to make information available to another specialist to whom a consultation is requested. In the following, we describe how a neurologist may tailor the system in order to communicate with a neuro-radiologist and requests
150

her/him a consultation. As the field study revealed, in their daily work, neurologists and neuro-radiologists request and provide consultations by indicating to their colleagues parts of EEG and/or MRI which may be of interest to formulate the diagnosis. This kind of activity is supported by the application workshops previously described. For example, the neurologist may find in a specific window, called work bench, a tool for highlighting a limited part of the selected portion of EEGs (see Figure 4). The tool can be selected by clicking the ninth button from left in the bench toolbar. The system reacts to this user action by presenting a red vertical bar that the user may position on the point of the EEG s/he would like to highlight. In Figure 4, the neurologist has positioned two bars on the EEG in order to identify a specific part of it concerning a certain period of time.
Figure 4: The work bench for EEG analysis.
A selected area can also be annotated and the annotation may be exploited to support the collaboration between specialists that want to reach a common diagnosis. For example, if the neurologist needs to consult a neuro-radiologist, s/he may create a request by clicking the eighth button in the bench toolbar (whose icon is “a”), thus opening a special type of annotation window, called consulting window. This window permits to articulate the annotation into two parts: the question to be asked to the colleague; and the description which summarizes information associated to the question. A third part can be tailored according to the addressee of the consultation request: if s/he is a physician who needs more details about the clinical case, the sender may activate the detailed description and fill it, otherwise he can hide it. Figure 5 shows a consulting window, in which all the three parts are activated. In other words, the physician who wants to ask for a consultation is allowed to prepare a tailored annotation specific to the physician s/he is consulting. In a similar way, a physician can make a different type of annotation in order to add a comment that can be stored and possibly viewed by her/his colleague. It is worth noting that both types of annotation never damages the original image.
Figure 5. An example of consulting window.
Back to the example of a consulting request of the neurologist for the neuro-radiologist, the neurologist can save the annotation that can be successively viewed by his colleagues. When the neuro-radiologist starts working with her/his application workshop and finds the request of the neurologist, s/he reads all the information and answers by filling the proper fields in the consulting window (see Figure 6).
Figure 6. An example of consulting window for the neuro-radiologist answer.
5. Discussion and Conclusion
In this paper, we presented an approach to the design of interactive systems that support end-user development and cooperative work, and described its feasibility in a medical domain, by considering the work practice in the case of neurological diagnoses. Understanding current work practice is necessary in the design of new technologies. The challenge is to dissolve the barriers existing between designer knowledge and user knowledge and to search for adequate methods to guarantee the
151

inclusion of practitioners and work practice knowledge in the design process. In [15], Karasti explores the integration of work practice and system design. Research with similar interests in work practice has been carried out within the field of CSCW [13][14][17][18].
Our approach foresees two kinds of cooperative work. One concerns system design and is performed by the design team, including software engineers, HCI experts and representatives of end users. For HCI experts and end-user representatives, design actually consists in customization activities performed by direct manipulation techniques. The other concerns the cooperative work performed by end users to achieve their goals in the system domain and to possibly tailor their software environment. Customization and tailoring are thus characterized in terms of the kind of cooperative work performed and of the goals that have to be pursued. In this sense, our definitions are different from those ones provided in [16].
The SSW methodology has some similarities with the work presented in [10][11], especially because it adopts a meta-design perspective, but it also emphasizes the need of providing personalized environments to all stakeholders, in terms of language, notation, layout, interaction features.
The approach has been applied to other domains, e.g., the mechanical engineering [5]; user-based evaluation in that domain has provided useful indications. The users feel that this novel way to design cooperative systems increases both their productivity and their performance.
6. Acknowledgements
The authors wish to thank the physicians of the Hospital “Giovanni XXIII” in Bari for their collaboration. The contribution of G. Fresta to the implementation of the prototypes is acknowledged.
7. References
[1] Bourguin, G., Derycke, A., Tarby, J.C. (2001) Beyond the Interface: Co-evolution inside Interactive Systems - A Pro-posal Founded on Activity Theory, Proc. IHM-HCI 2001.
[2] Bødker, S. (2000) Coordinating Technical Support Platforms, CACM, November 2000, 215-222.
[3] Bottoni, P., Chang, S. K., Costabile, M.F., Levialdi, S., Mussio, P. (2002) Modelling Visual Interactive Systems Through Dynamic Visual Languages, IEEE TSMC, 32(6), 654-669.
[4] Bottoni, P., Costabile, M.F., Mussio, P. (1999) Specification and Dialogue Control of Visual Interaction through Visual Rewriting Systems, ACM TOPLAS, 21(6), 1077-1136.
[5] Costabile, M.F., Fogli, D., Fresta, G., Mussio, P., Piccinno, A. (2004) Software Environments for End-User Development and Tailoring, Psychnology, 2(1), 99-122.
[6] Costabile, M.F., Fogli, D., Mussio, P., Piccinno, A. (2006) End user Development: the Software Shaping Workshop Approach”, in Lieberman, H., Paternò, F., Wulf, V. (Eds), End User Development, Springer, Dordrecht, The Netherlands, 183-205.
[7] Costabile, M.F., Fogli, D., Lanzilotti, R., Mussio, P., Piccinno, A. (2006) “End user Development Supporting Work Practice”, Journal of Organizational and End User Computing, in print.
[8] Ellis, C., Gibbs, S., Rein, G. (1991) Groupware: Some Issues and Experiences, CACM, 34, January 1991, 38-58.
[9] EUD-Net Thematic Network, Network of Excellence on End user Development. (2003) http://giove.cnuce.cnr.it/eud-net.htm.
[10] Fischer, G., Grudin, J., McCall, R., Ostwald, J., Redmiles, D., Reeves, B., Shipman, F. (2001) Seeding, Evolutionary Growth and Reseeding: The Incremental Development of Collaborative Design Environments, Coordination Theory and Collaboration Technology, Lawrence Erlbaum Associates, Mahwah, NJ, 447-472.
[11] Fischer, G., Giaccardi, E., Ye, Y., Sutcliffe, A.G., Mehandjiev, N. (2004) Meta-Design: a Manifesto For End user Development, CACM, 47(9), September 2004, 33-37.
[12] Fogli, D., Fresta, G., Marcante, A., Mussio, P. (2004) Two-way exchange of knowledge through visual annotation, Proc. DMS 2004, San Francisco, USA, Sept. 2004, 286-291.
[13] Goodwin C., Goodwin, M.H. (1997) Seeing as a situated activity: Formulating planes. In: Engeström Y & Middleton D (eds) Cognition and Communication at Work.Cambridge University Press, Cambridge, 61-95.
[14] Hughes, J.A., Randall, D., Shapiro, D. (1992) Faltering from ethnography to design. Proc. Conference on Computer-Supported Cooperative Work (CSCW'92), ACM Press, Toronto, 115-122.
[15] Karasti, H. (2001) Increasing Sensitivity Towards Everyday Work Practice in System Design, PhD thesis, University of Oulu, Oulu.
[16] Mørch, A. (1997) Three Levels of End user Tailoring: Customization, Integration, and Extension. In M. Kyng, L. Mathiassen (eds.), Computers and Design in Context. The MIT Press, Cambridge, 51-76.
[17] Suchman, L., Blomberg, J., Orr, J., Trigg, R. (1999). Reconstructing technologies as social practice. American Behavioral Scientist, 43(3), 392-408.
[18] Suchman, L., Trigg, R.H. (1991) Understanding practice: Video as a medium for reflection and design. In: Greenbaum J & Kyng M (eds) Design at Work: Cooperative Design of Computer Systems. Lawrence Erlbaum, Hillsdale, 65-89.
[19] Sutcliffe, A., Mehandjiev, M. (Guest Editors) (2004) End user Development, CACM, 47(9), September 2004, 31-32.
[20] Trigg, R., Bødker, S. (1994) From Implementation to Design: Tailoring and the Emergence of Systematization in CSCW, Proc. CSCW’94, ACM-Press New York, 45-55.
[21] Wilson, P. A. (1991) Computer Supported Cooperative Work: An Introduction, Kluwer Academic Publishers.
152

Visualization and Exploration of Landscape Architecture Project Information
Franck FAVETTA+, Robert LAURINI*
Research Center for Images and Intelligent Information Systems*, INSA-Lyon F-69622 Villeurbanne
National School of Higher Studies in Landscape Architecture and Nature+, cs2902 F-41029 Blois [email protected], [email protected]
Abstract Landscape Architecture project requires specific geographic and multimedia data management. To meet the landscape architect's needs, especially in the project analysis phase, we propose a geographic file exploration approach that improves visualization and exploration of landscape data. We have developed a prototype that incorporates our proposal. We are also realizing tests with potential users and first results are encouraging. Key-Words: data visualization and exploration, interactive and visual interfaces, metaphors, multimedia, GIS, Landscape Architecture, soundscapes 1. Introduction This paper presents a work that has been carried out thanks to the collaboration of the Laboratoire d'InfoRmatique en Images et Systèmes d'information (LIRIS, Research Center for Images and Intelligent Information Systems) of INSA of Lyon and the Ecole Nationale Supérieure de la Nature et du Paysage (ENSNP, National School of Higher Studies in Landscape Architecture and Nature). Landscape Architecture projects mainly handle multimedia and Geographic Information Systems (GIS) [1] data. After many discussions with landscape architects and students, we have noticed issues in the field of Landscape Architecture project management that led us to suggest solutions in this area. Especially, we truly believe that landscape data visualization and exploration can be highly improved with a novel approach that is introduced in this article.
The remainder of this paper firstly describes what a landscape project consists of and presents Landscape Architecture project requirements. The fourth section deals with background research. The fifth section presents our solution. The sixth section introduces the prototype we have developed and the tests we are realizing. The last section concludes and presents perspectives.
2. Landscape Architecture Project Landscape Architecture projects can be summarized through five stages: site analysis, solution proposal and design, proposal communication, realization, and maintenance. This domain meets numerous requirements and offers huge research perspectives. The analysis phase is a decisive stage and this paper mainly focuses on it.
During the analysis phase, in order to formulate a diagnosis, the landscape architect first collects and measures a sufficient amount of information on site, such as natural information (e.g., vegetation, geology, hydrology), infrastructure information (e.g., buildings, architecture, roads, networks), and social and economic information (e.g., population, economic and geo-political factors and actors, resources, site history). To do so, the landscape architect collects information from all available sources such as the general public, local governments, cadaster, population census, the media, libraries, and the Internet. He also performs measures himself on site, especially pictures, videos, notes, sketches, and distance measures. After this diagnosis stage, issues are identified. 3. Landscape Project Requirements Many different types of requirements concern Landscape Architecture project. This article mainly focuses on analysis phase and visualization needs.
The landscape architect needs to view the existing site and also to preview the result of his proposals. He needs a sufficient, not perfect, realism and needs to consider a certain sensitive aspect.
The architect essentially handles geographic information (maps, 3D maps) and multimedia information such as images, videos, texts, and 3D objects. The data are massively geographically structured: the collected documents are geographically linked, e.g., pictures are taken at precisely defined points of view and they are oriented in specific directions, videos and sounds are
153

recorded at precisely defined locations, notes and images can relate to particular objects in the landscape, several maps can concern several neighboring places. The maps are stored as GIS data or as images, and handled through GIS interfaces or image software editors. Multimedia files are stored in the computer's file system, distributed in folders, and edited through related software editors.
Information storage, access, and file exploration are not well adapted to the landscape information structure. When exploring some document folder such as a picture gallery or other multimedia file set in the file system hierarchy, the architect must remember where each picture has been taken on the site, where each video has been recorded, where each sketch has been drawn, where each textual note has been written, etc. The architect must realize this geographic location correspondence himself. This effort constitutes a major difficulty that increases again when the architect manages several projects at the same time. Landscape project information strongly calls for solutions to be visualized, explored, structured and managed in an efficient way. Besides, as visiting time on the site is usually short, the architect usually takes a maximum amount of information for later analysis away from the site. The amount of information is then generally huge, unordered, and sometimes unnecessary. It strongly needs to be filtered and smartly structured. The architect needs an effective and global data visualization to perform this task.
Moreover, information is usually visual, but also presents an important audio dimension (landscape map of sounds often called soundscape, voice recordings) and temporal dimension (moving viewers in a car or on a train, walkers, animated or moving landscapes).
Finally, interfaces must be user-friendly and fast. The architect needs to quickly acquire a sufficient representation of the existing site and to quickly preview different project proposals.
4. Background Existing systems present notable features for our field of interest [1]. 3-Dimensions landscape visualization systems [2] offer the advantage of exploring existing sites and previewing proposal results. Many 3D extensions of GIS exist [3] as well as non-GIS-based systems. Online solutions also exist such as Geo-VRML (http://www. geovrml.org). Augmented Reality is also interesting by adding virtual objects to the real world [4]. 3D presents advantages such as good communication abilities to show proposal result but 3D obliges architects to model the existing site and the project result in three dimensions. This commonly takes a long time, and architects find it quicker to touch up pictures. 3D offers realism, but realism requires expert skills and time to be achieved.
Landscape architects also dislike 3D landscape images for their numerical insensitive aspect.
Metaphors present efficient abilities to visualize information and to handle interfaces in an intuitive and user-friendly way. Two metaphors are particularly interesting in this way. They also offer useful concepts to structure Landscape Architecture project information. Hypermaps [5] propose a navigation metaphor by geographically placing links on a map to other documents. The user can navigate from maps to maps. Argumaps [6] geographically locate information by placing metaphorical pins on maps and attaching information to them.
Three other systems from the industry also present interesting features. In the MappyVisiocity system (http://www.mappyvisiocity.com), the user can explore a street by passing from a front door image to another following a street map. With widely used 360-degree panorama technologies such as Apple's QuickTimeVR (http://www.apple.com/quicktime/technologies/qtvr), the user can virtually visit a place by turning and zooming on a 360-degree picture around a point. Datria (http://www. datria.com/demo.php) proposes an interesting vocal system for staff management. The system records voice reports of geographically moving employees thanks to a Global Positioning System and a wireless phone.
To increase interface user-friendliness, it is useful to keep in mind Direct Manipulation [7] advices. It recommends to always keep the focus on objects of interest and to directly act on this objects instead of using intermediate commands. 5. Proposal In this section, we propose a solution that takes advantage of existing systems and extends some of them with new features. 5.1. Geographic File Exploration We propose to extend usual file explorers with a new geographic feature. In our geographic file explorer, landscape project documents are positioned on a map at geographic locations. This approach well suits landscape project structure and offers an efficient way to quickly memorize and retrieve location of a large set of documents. This concept can be integrated into GIS interfaces and into file explorers of operating systems. We first concentrate our efforts on extending file explorers.
In our system, on any image document of a landscape project, the user can place icons (Figure 1). Each icon constitutes a link to any other document in the project. The user chooses the linked document in the file system. The documents can be of many different types: multimedia and other types. By viewing an icon,
154

Figure 1. Geographic file explorer – (a) Map section. As the cursor moves over the section, the linked image document can be previewed above (b) Document-linked area. Icons:
Video trajectory Oriented sketch
Oriented picture Sound
Text Spreadsheet / Graph
Slideshow Pdf document Image gallery Folder
the architect can understand the linked document type (text, video, another image). He can also personalize icons, e.g., map, picture and sketch icons can all represent an image document. To really integrate multimedia documents, icons represent images, texts and also videos and sounds such as landscape sound recordings and voice recordings. Other useful icons are also available for slideshow, spreadsheet, graph, image gallery, folder contents, and PDF file links. Icons give a way to navigate from an image document to another. This navigation is similar in usual file explorers when opening a subfolder. In our system, "subfolders" are other linked maps. Classical file system subfolders can also be linked on a map. By this way, the user can navigate between the conventional file system and our geographic structure. Moreover, like with usual file explorers, the user can edit documents through external editors.
To achieve this geographic exploration, our system adds geographic meta-data to each linked document, especially its location on the map. As we find location information insufficient, the system also adds other geographic meta-data, provided by the user: the user can indicate the orientations of the pictures he took on the real site and the trajectories of the videos he recorded. Arrows represent these orientations and trajectories. The user can
Figure 2. Virtual walker preview
indicate map sections that are linked to other images. He can also define interactive areas instead of icons.
To improve visualization abilities, our system reacts when the mouse cursor passes over the icons by directly previewing documents: images are viewed, videos are played, texts are shown, and sounds are played. 5.2. The Virtual Walker Metaphor We found useful to extend our geographic file exploration by visualizing the interaction of the mouse cursor with every document on the site in the same time like if our mouse cursor becomes a virtual walker (vw, Figure 2). In the vw mode, the mouse cursor is an arrow representing the vw's orientation. The mouse's movement simulates the vw's movement. The vw is especially useful with map images. When approaching icons on the map, the system reacts with the related documents according to certain conditions. With image and video documents, previews are displayed. To simulate the vw's view, the size of the document preview depends on the distance between the icon and the vw. The shorter the distance, the larger the preview size is. Moreover, as the vw mode's goal is to simulate real movement, only oriented pictures and videos are previewed and they are displayed only if the vw's direction approximately matches their orientations.
In order to simulate the soundscape (sound landscape), the vw also hears every sound around it when approaching related sound icons. The closer the sound icon, the louder the sound is. Several surrounding sounds are mixed. This feature adds a real sound map dimension to usual visual maps. 5.3. The Virtual Walker 3D Mode Our system also offers a vw 3D mode (Figure 3). The vw 3D mode offers the advantage of requiring no 3D modeling time by the user, unlike usual 3D systems that need a long time to model the ground and all the 3D objects on it. The vw 3D scene is automatically and instantaneously generated, providing a fast 3D preview. In the vw 3D mode, the map image becomes a flat ground
155
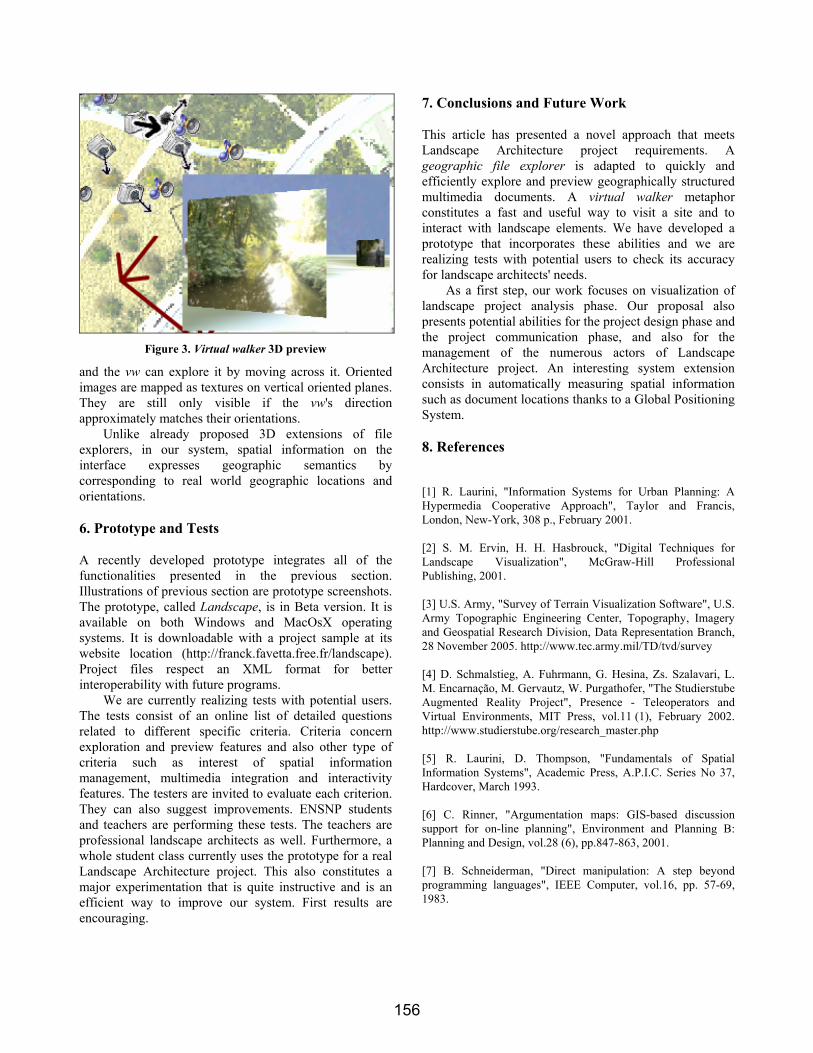
Figure 3. Virtual walker 3D preview
and the vw can explore it by moving across it. Oriented images are mapped as textures on vertical oriented planes. They are still only visible if the vw's direction approximately matches their orientations.
Unlike already proposed 3D extensions of file explorers, in our system, spatial information on the interface expresses geographic semantics by corresponding to real world geographic locations and orientations. 6. Prototype and Tests A recently developed prototype integrates all of the functionalities presented in the previous section. Illustrations of previous section are prototype screenshots. The prototype, called Landscape, is in Beta version. It is available on both Windows and MacOsX operating systems. It is downloadable with a project sample at its website location (http://franck.favetta.free.fr/landscape). Project files respect an XML format for better interoperability with future programs.
We are currently realizing tests with potential users. The tests consist of an online list of detailed questions related to different specific criteria. Criteria concern exploration and preview features and also other type of criteria such as interest of spatial information management, multimedia integration and interactivity features. The testers are invited to evaluate each criterion. They can also suggest improvements. ENSNP students and teachers are performing these tests. The teachers are professional landscape architects as well. Furthermore, a whole student class currently uses the prototype for a real Landscape Architecture project. This also constitutes a major experimentation that is quite instructive and is an efficient way to improve our system. First results are encouraging.
7. Conclusions and Future Work This article has presented a novel approach that meets Landscape Architecture project requirements. A geographic file explorer is adapted to quickly and efficiently explore and preview geographically structured multimedia documents. A virtual walker metaphor constitutes a fast and useful way to visit a site and to interact with landscape elements. We have developed a prototype that incorporates these abilities and we are realizing tests with potential users to check its accuracy for landscape architects' needs.
As a first step, our work focuses on visualization of landscape project analysis phase. Our proposal also presents potential abilities for the project design phase and the project communication phase, and also for the management of the numerous actors of Landscape Architecture project. An interesting system extension consists in automatically measuring spatial information such as document locations thanks to a Global Positioning System. 8. References [1] R. Laurini, "Information Systems for Urban Planning: A Hypermedia Cooperative Approach", Taylor and Francis, London, New-York, 308 p., February 2001. [2] S. M. Ervin, H. H. Hasbrouck, "Digital Techniques for Landscape Visualization", McGraw-Hill Professional Publishing, 2001. [3] U.S. Army, "Survey of Terrain Visualization Software", U.S. Army Topographic Engineering Center, Topography, Imagery and Geospatial Research Division, Data Representation Branch, 28 November 2005. http://www.tec.army.mil/TD/tvd/survey [4] D. Schmalstieg, A. Fuhrmann, G. Hesina, Zs. Szalavari, L. M. Encarnação, M. Gervautz, W. Purgathofer, "The Studierstube Augmented Reality Project", Presence - Teleoperators and Virtual Environments, MIT Press, vol.11 (1), February 2002. http://www.studierstube.org/research_master.php [5] R. Laurini, D. Thompson, "Fundamentals of Spatial Information Systems", Academic Press, A.P.I.C. Series No 37, Hardcover, March 1993. [6] C. Rinner, "Argumentation maps: GIS-based discussion support for on-line planning", Environment and Planning B: Planning and Design, vol.28 (6), pp.847-863, 2001. [7] B. Schneiderman, "Direct manipulation: A step beyond programming languages", IEEE Computer, vol.16, pp. 57-69, 1983.
156

A Visual Approach to Develop 3D Interactive Environments
Rosanna Cassino, Maurizio Tucci Dipartimento di Matematica e Informatica,
Università di Salerno (Italy) {rcassino, mtucci }@unisa.it
Abstract
The development of software systems effective and simple to use is a complex and elaborated work which requires a proper analysis and a careful design. A key aspect for the success of an application is a good design of its user interface. 3D environments provide designers with a more powerful space to allocate interface components on multiple levels. In this way, the interface becomes more captivating, showing realistic sceneries to the user [3]. In this paper, we present a tool for the rapid implementation of 3D interactive visual interfaces. The proposed methodology supports the designer by a two level approach. The first phase is related to the application design in terms of a graph-based description, then the implementation phase is defined in terms of a component assembly mechanism.
1. Introduction
The rapid evolution of interactive hardware devices and software applications have brought developers to invest more and more financial and time resources in the realization of software engineering products to support the design of applications and interfaces. Nevertheless, often the end users has to interact with the resulting environments uselessly complex. A proper analysis and a careful design of the user interface should guarantee simplicity, completeness, intuitiveness and usefulness. 3D environments offer a variety of solutions for interactive application designers to allocate interface components in a powerful space, where multiple levels of visualization can be presented. However, user interaction through a three-dimensional space causes frequently navigation problems, such as disorientation and difficulties in wayfinding [4]. Some guidelines for environment design and electronic navigation aids have been proposed to solve these problems [6]. Experiments have shown that the effectiveness of a navigation aid depends on the specific environment and on the specific task to use [2]. The world scenery offers several tools to support the development of interactive
graphic three-dimensional applications: often complex and integrated toolkit to design visual environments are related to specific domains or require knowledge of programming language and substantial coding efforts to perform any particular functionality, such as the implementation of interactive mechanisms. In this paper, we present a design methodology that allows software developers to easily define the graphical and layout features of a 3D interactive visual application together with its behaviour in a guided and totally visual manner. The approach is conceived to perform correctness and completeness controls during the two main phases of the development process. As a matter of fact, the proposed methodology integrates the advantages of graph-based design with a visual construction of software applications using a component assembly mechanism. In particular, starting from a top-level design of the visual environment, a usable form-based interface of the tool allows detailing the graphic aspects of each scene. A similar visual technique allows a designer to manage the interaction mechanisms, so that all the features related to an event (i.e., the source object, the action performed on it, and its effect on the application itself) can be easily specified. The paper is organized as follows. In section 2, we examine three tools to develop 3D environments. Section 3 summarize the visual methodology to develop 2D interactive visual application and describes the aspects of the customization to develop 3D environments. Section 4 presents some concluding remarks and further work.
2. Related work
Several graphical toolkits to develop 3D environments are available. Each of them integrates different functionalities and features that can be more or less preferable. Art of Illusion [11], for example, allows to the designers to define the static graphical aspect of a 3D environment, but does not allow to implement any possible interaction between objects and a user or any connections between different scenes or external files. In the Blender tool [12] a user interface shows the
157

whole 3D environment under development in form of a grid in which to insert, modify, move or resize objects. The logic of management of the events involves the manual implementation of scripts in Python code. Wings 3D [13] allows to insert several solid geometric figures in a three-dimensional space. The 3D rendering of a global scene is effective, but the tool needs external OpenGL graphical libraries to perform it. However, if these environments allow to realize 3D software interface easily and quickly, in any cases, their use involves the knowledge of a programming language and many hours of work and experience to obtain a considerable level of efficiency of the developed systems [5].
3. The proposed visual development approach
In this paper, we propose a methodology to design and implement interactive visual environments, simple to use, flexible and that requires a limited amount of foregoing knowledge and learning time. TAGIVE (Tool for the Aided Generation of Interactive Visual Environments) is the prototype system that implements the proposed approach related to the two-dimensional interactive visual applications [1]. TAGIVE-3D is its customization to develop 3D environments. The approach is based on the definition of an interactive visual application in terms of a set of scenes and a set of external components, related to each other on the basis of the kind of interactions performed. A scene is made up of elementary components representing interface widgets and arranged on the scene according to a certain layout. Each elementary component appearing in a scene is said to be dynamic, if some event is associated with it or static otherwise. External components are instead any file that can be invoked by some dynamic component of a scene (e.g., image files, text files, video clips, etc…). The proposed approach exploits such a model in order to allow a two-level approach in the construction of an application. The former level is focused on the individuation of the main elements of the system and of the interactions between scenes or between scene-to-external components. For each scene, the latter level details its graphical properties and allows to implement actions and events related to the dynamic components. Then, the methodology integrates the advantages of a graph-based design with the benefits coming from a visual construction of applications using a component assembly mechanism. The integration supports the development of interactive visual environments by directly relating the design phase to the implementation phase. In fact, a graph-based design approach is used to build the “application map”, in terms of a top-level transition diagram representing all the possible interaction paths. Indeed, oriented and
connected graphs are a very good means to design and examine the number of scenes or external files and the interaction paths of an interface. The navigation technique is useful to manage maps with a limited number of the nodes, clustering technique is suitable to model more complex application [14]. The idea is that the application map guides the following phase of the development. The resulting environment is saved in terms of a markup language so to provide the additional benefits of a portable and version resilient system. In a virtual environment, there are objects arranged in a 2 or 3-dimensional space. The objects appearing in a scene are solid figures, like parallelepipeds, spheres, pyramids, cylinders. In a 3D application, the interaction modality and the related events are more articulated than 2D ones, as several transformations on objects can be performed. The transformations are translation, rotation and resize and involve the manipulation of an object in a virtual space [7]. A 3D object can be moved along the x, y or z-axis and along the x and z-axes together. The shift is performed increasing the coordinates of the different points that define the element. The rotations have a centre of rotation corresponding to the coordinate of the same object or to a system of global coordinates, around which the rotation happens. That transformation can be performed around the x, y, z or x and z-axis. By the resizing transformation, it is possible to expand or decrease three-dimensional objects simply multiplying the coordinates of a point for resizing factor. When the factor is positive the size object is augmented, otherwise, a negative factor approaches the points to the origin and the figure is reduced. In the following, we describe the adopted strategies to realize 3D interactive applications. The first environment TAGIVE [1] is improved by means of the Java3D package classes so to allow the implementation of the features of the 3D environments. Figure 1 presents the structure of the TAGIVE-3D. TAGIVE-3D inherits from TAGIVE the Map Editor module by which to perform the general design of the application. It represents the top level of the development process. In this subsystem, a Work Area contains the graph that represents the application map (see figure 2). The nodes identify the components expected in the environment (i.e., 3D frames, .bmp, .txtand web or multimedia files). The edges represent the possible interactions paths that the end-user can to perform in the virtual environment. They are labelled by the possible actions by which to run an event (i.e., mouse single left click, mouse double left click, mouse right click, left mouse pressed and dragged, right mouse pressed and dragged, left mouse pressed and ALT key).
158

Figure 1. Schema of the implemented tool1.
A guide helps the designer to understand the meaning of the different actions. The Application Map is the output released by this phase.
Figure 2. The Application Map.
The Scene Editor is the module at lower development level. The original version was modified to allow the visual implementation of a 3D scene in terms of the three two-dimensional views (side, top and frontal) of the environment perspective. That approach allows to arrange objects in the space in easy manner supporting a global view of the environment in the preview frame. As a matter of fact, in the proposed methodology, we have exploited two-dimensional sections of the objects, so to preserve the information related to the dimensions, the volumes and the forms of the introduced components, without modifying the properties of an object also if the point of view of the user changes. The designer can manage the feature of each 3D component inserted in the virtual space by the Property Handler module of the Scene Editor (see figure 3). For each object, it is possible to define colour, name, and location in terms of the x, y, z 1 The shape indicates a tool module. The shape indicates a
graphical visualization unit of an interactive visual application. The arrow denotes the interconnection between tool modules whereas the arrow denotes the production of an output.
coordinates, and dimension in terms of height, width and depth and the designer can specify the rotation around each cartesian axis.
Figure 3. 3D component properties.
To guarantee correctness in the development process we propose a top-down technique so to check the insertion of actions in any scene. In fact, the designer establishes the scheduled actions and the related target events in each scene, already at the map level. At the lower level (the phase of the scene development), only such actions will be visible and will be associated to the particular elements of the scene (the dynamiccomponents) so to detail the related event [1]. Loop transitions in the map define actions related to events that involve modifications of the properties of objects in the scene and also they identify possible transformations that the end user can to perform on a 3D component. According to the conventions generally adopted in the three-dimensional interactive environments, and included in the Java 3D package, our system implements the visual definition of the following actions: “left mouse pressed and dragged” to perform the rotation of an abject; “right mouse pressed and dragged” to perform the horizontal or vertical translation; “left mouse pressed and ALT key (or central mouse button pressed) and dragged” to shift an object along the axis of the depth. Selecting simple toggle button, the designer visually establishes if the end user can to perform a rotation of an object around the x, z or x and z cartesian axis by the related action.
Figure 4. X-Z Translation Handler.
159

Figure 4 shows the Event Handler to implement the horizontal or vertical translation event, resulting from the dragging of the component in the virtual environment. The event is related to the right mouse pressed and dragged action. In the frame the designer defines if the end user can move an object along the x, z or x and z cartesian axis, and also he/she fixes the range of the translation (if the end user exceeds the permitted range, the object returns in the initial position on the scene). Similarly, the designer can implement the translation event along y cartesian axis. Actions not expected at the design level, cannot be implemented arbitrarily at the implementation level of the application. The approach guarantees correctness, completeness and usability checks and it prevents possible errors from the early design phase. Measures related to the quantity and the type of possible actions, or related to the number of possible transformations of 3D objects, could be checked before they are implemented. Similarly, nodes not connected in the graph denotes the presence of scenes or files expected but not achievable in the visual environment. Again, edges representing interactions, which have not been specified at the lower level, will have highlighted in the map. That controls allow to manage in advance metrics related to the efficiency of the systems in terms of the correctness and completeness of the achievement of a task that the user can to perform. After the 3D environment is implemented, during the running phase, the Java Virtual Machine processes the graphical information according to the defined operations [8]. Then, the 3D implemented environment is executable and the end user can to interact with it. The resulting environment can be saved in .t3d format (TAGIVE-3D own) or exported in VRML format [9]. The Virtual Reality Modelling Language is the standard adopted to save 3D applications to guarantee the portability and the reuse of the virtual components.
4. Conclusion and further work
In this paper, we have presented a methodology to visually develop 3D environments in terms of graphical, layout characteristics, and the related interaction mechanisms. A designer can exploit the system functionalities without any detailed knowledge or former ability. Graphic aspects management and interaction mechanisms development are simple and does not require learning of any particular programming language. The approach, implemented in the TAGIVE-3D tool, guides the designer in the modelling and implementation process so to prevent incorrectness and incompleteness errors already from the initial design phase. The system is implemented in Java, adopting the Java 3D package, so that all the rendering
algorithms and the 3D environment implementation make the tool simple to extend according to new specific requirements. Further evolution of this work will consider the introduction of new 3D objects in the component palette in addition to the actual spheres and parallelepipeds. The possibility of adding a particular texture to one or all the faces of 3D elements, the visual managing of the brightness and of the shape of the objects are other functionalities to improve. Actually, we have implemented the possibility to save a global interactive application in .t3D format (a native java format). Moreover, the VRML markup language used to export the target application ensures portability and reuse of components. In this perspective, another aspect of the presented research is the improvement of the characteristics of the X3D language and the implementation of functionalities to save developed 3D environments in this format [10].
5. References
[1]. R. Cassino, G. Tortora, M.Tucci, and G. Vitiello, “A Methodology for Computer Supported Development of Interactive Visual Applications”, WSEAS Transactions On Information Science And Applications Journal, July 2006.
[2]. L. Chittaro, I. Ierotti, “A Visual Tool for Tracing Users’ Behavior in Virtual Environments” - AVI 2004 - Proceedings of the working conference on Advanced Visual interfaces, Gallipoli, Italy, Pages: 40 – 47.
[3]. L. Chittaro and R. Ranon, “New Directions for the Design of Virtual Reality Interfaces to E-Commerce Sites” - Proceedings of AVI 2002: 5th International Conference on Advanced Visual Interfaces, ACM Press, New York, May 2002, pp. 308-315.
[4]. Darken, R.P., & Peterson, B. 2001. “Spatial Orientation, Wayfinding, and Representation” - In Stanney, K. (Ed.), Handbook of Virtual Environments, Lawrence Erlbaum Associates, New Jersey.
[5]. B. Schneidermann - “Designing the User Interface” 4rd
Edition – Prentice Hall, 2003. [6]. Vinson, N.G. 1999. “Design Guidelines for Landmarks
to Support Navigation in Virtual Environments.” Proc. CHI’99, ACM Press, 278-284.
[7]. http://education.mondadori.it/libri/Download/Capitoli/ 88-8331-278-3_Cap02.pdf
[8]. http://java.sun.com/products/java-media/3D/collateral [9]. http://www.w3.org/MarkUp/VRML [10].http://www.web3d.org/x3d/overview.html [11].http://www.artofillusion.org [12].http://www.blender3d.com [13].http://www.wings3d.com [14].http://cesare.dsi.uniroma1.it/~av/DispGrandiGrafi.htm
160

Formal Issues in Languages Based on Closed Curves
Andrew Fish and Gem StapletonVisual Modelling GroupUniversity of Brighton
Brighton, UKwww.cmis.brighton.ac.uk/research/vmg
{andrew.fish,g.e.stapleton}@brighton.ac.uk
Abstract
Three important questions arise when using visual lan-guages: for any given piece of information can we draw adiagram representing that information, can we reliably in-terpret the diagrams and can we reason diagrammaticallyabout that information? The desirable answer to all threequestions is yes, but these desires are often conflicting; forexample, well-formedness conditions can be enforced to as-sist diagram interpretation but this can result in drawabil-ity problems. In this paper, we focus on visual languagesbased on closed curves, which are used in numerous com-puting applications. Many such languages effectively usespatial properties such as containment and disjointness.We consider the consequences of enforcing various well-formedness conditions, such as simplicity and connected-ness of minimal regions, in relation to the above questions.We suggest refinements of the conditions in order to find abalance between the conflicting desires.
1 Introduction
We will use the term Euler diagram in a very generalsense, to mean any finite collection of closed curves whichexpress information about intersection, containment or dis-jointness. Often, well-formedness conditions are imposedon Euler diagrams. These conditions are usually chosen inorder to alleviate mental difficulties in the user’s interpreta-tion of the diagrams but they may also be due to applicationdomain requirements. An example of one such condition,which is often enforced, is that the closed curves must besimple. We aim is to raise awareness of consequences thatemerge as a result of well-formedness conditions.
Euler diagrams have numerous applications, includingthe visualization of statistical data [6], displaying the resultsof database queries [34] and representing non-hierarchicalcomputer file systems [8]. They have been used in a visual
semantic web editing environment [24, 35] and for view-ing clusters which contain concepts from multiple ontolo-gies [16]. Closed curves are a basis for many of the UMLnotations, including class diagrams and statecharts [9].Another major application area is that of logical reason-ing [5, 11, 15, 19, 20, 21, 26, 28, 30, 31, 33]. For example,the constraint diagram logic [21] is based on Euler diagramsand is used for formal object oriented specification [18, 22].
A BC
Figure 1. An Euler diagram.
Any Euler diagram can be described by listing the setintersections that are present in the diagram. For example,the diagram in figure 1 can be described by:A ∩ B ∩ C,A ∩ B ∩ C, B ∩ A ∩ C, A ∩ B ∩ C and A ∩ B ∩ C(whereA is the complement ofA etc). Each of the itemsin this list corresponds to a region in the diagram; for exam-pleA∩B ∩C corresponds to the region which is inside thecurveA, but outside the curvesB andC. A natural questionarises: given an Euler diagram description, does there existan Euler diagram with that description? In other words, isthe Euler diagram descriptiondrawable? The answer de-pends on the well-formedness conditions enforced. Clas-sifying which descriptions are drawable under each set ofwell-formedness conditions is important: it will allow us toinform users as to which conditions permit their informationto be visualized. In this paper, we specify well-formdnessconditions that allow all descriptions to be drawn.
When visualizing information, we may want to performsome logical reasoning or transform a diagram if informa-tion is updated. Ideally, transformation rules (of which rea-soning rules are a special case) will modify diagrams insuch a way that users can easily identify the change, pre-
161

serving their mental map as much as possible. Whethertransformation rules can be applied in such a way is, again,affected by the well-formedness conditions enforced.
The accuracy of diagram interpretation is also inter-twined with the well-formedness conditions. We demon-strate that not enforcing any well-formedness conditionsrenders some diagrams ambiguous unless care is takenwhen defining semantics.
2 Describing Euler Diagrams
We describe Euler diagrams in terms of the labels asso-ciated to their curves. Given a finite collection of labels,L = {L1, L2, ..., Ln}, let W be a subset ofPL − {∅}.The pair(W,L) is anEuler diagram description. The el-ements ofW describe the minimal regions; aminimal re-gion (called azonein [11]) is a maximal set of points in theplane that are interior to some set of curves and exterior tothe remaining curves. An element ofW is the set of labelsof the curves that contain the corresponding minimal region.For example,(W = {{A}, {B}, {A,B}, {A,B, C}}, L ={A,B, C}) describes the Euler diagram in figure 1. Theminimal region which is insideA but outsideB andC cor-responds to the set{A} in W . If W = PL − {∅} then(W,L) describes a Venn diagram. All Venn diagram de-scriptions are drawable with simple closed curves and con-nected minimal regions [25].
3 Simple Closed Curves
The closed curves in Euler diagrams are often requiredto be simple [4, 6, 15, 19, 32, 34] but not always [2, 5, 9,28, 30, 33]. Formally, acurve is a continuous function,f , defined on the interval[0, 1]. If f(0) = f(1) thenf isclosed. If, for all x, y ∈ [0, 1], f(x) = f(y) impliesx = yor |x − y| = 1 thenf is simple [3]; that is, simple closedcurves do not self-intersect.
3.1 Consequences of Enforcing Simplicity
The Jordan Curve Theorem states that any simple closedcurve with codomainR2 splitsR2 into precisely two pieces,one bounded and the other unbounded [1]. Given the imageof a simple closed curve, we can easily identify the curve’sinterior because the interior is the bounded piece. The iden-tification of the interior of closed curves (simple or other-wise) is crucial in order to be able to interpret Euler dia-grams. When formalizing the semantics of Euler diagrams,it is usually stated that the interior of each curve representsthe set denoted by that curve’s label. Many definitions givenin the literature rely on the notion of interior [15, 19, 30, 33];an example is given below.
Definition 3.1 The set of all points interior to a closedcurve is abasic region. A region is defined using opera-tions union, intersection, difference and complement on ba-sic regions.
For example, in figure 1, the basic region interior toA con-sists of the three minimal regions insideA. We can safelyuse definitions that rely on the interiors of simple closedcurves because there is a well-defined (and intuitive) notionof what constitutes the interior.
Unfortunately, enforcing simplicity has the consequencethat not every Euler diagram description is drawable [23,34]. This has implications when defining transformationrules. An example of such a rule allows the removal of aminimal region; this is used when reasoning (see [19, 33],for example) and is also useful when information being vi-sualized is updated. There is no guarantee that such a regioncan be nicely removed from a diagram (under a continu-ous transformation of the plane), maintaining the simplicityof curves. A naive technique to remove a minimal region,which does not work in general, is to shrink the region to apoint, thus ensuring that the resulting diagram looks similarto the original diagram. For example, in figure 2, the shadedminimal region can be nicely removed fromd1 to gived2.
d 1
A B
Cd 2
A B
Cd 3
A B
Figure 2. Shrinking minimal regions.
The ability to shrink a region to a point depends uponthe local geometry; for example a star like region, unlike anon-simply connected region, can be contracted to a point.In figure 2, d3 contains a non-simply connected minimalregion – interior toA but exterior toB – which cannotbe shrunk to a point. Even if it is possible to shrink agiven minimal region to a point, this may yield a diagram,d, that contains non-simple curves. In some cases, it isnot even possible to draw a diagram using only simpleclosed curves that has same description asd. For example,Venn-(9) is drawable with simple closed curves, butremoving all minimal regions except for those described by∅, {A,B,C}, {D, E, F}, {G, H, I}, {A,D, G}, {B, E, H},{C, F, I} leaves a diagram whose description is not draw-able when simplicity is enforced [23, 34].
The undrawability of some collections of set intersec-tions can have profound effects on logical reasoning sys-tems. Reasoning rules are examples of transformation ruleswhich specify, syntactically, when a diagram,d2, can beobtained from another diagram,d1. A reasoning rule is
162

valid if the semantics ofd2 can be deduced from the se-mantics ofd1. Such rules are usually defined in terms of apre-condition and a post-condition (sometimes implicitly),as in [19, 31, 33]. The expectation of such a contract isthat if the pre-condition holds for a well-formed diagramd1 then there exists a well-formed diagramd2 that satisfiesthe post-condition. Therefore, the pre-condition should bemade strong enough, or the post-condition weak enough, sothat this is indeed the case.
However, being able to specify a strong enough pre-condition can be difficult. This is because it is currently un-known which diagram descriptions are drawable under sim-plicity: to specify a strong enough pre-condition we needto know that applying the transformation rule will producea well-formed diagram in return. Furthermore, specifying aweak enough post-condition so that a well-formedd2 existscan result in the rule not being valid, meaning that the logicis unsound.
A proof is a sequence of diagrams〈d1, d2, ..., dn〉 suchthat, for all1 ≤ i < n eachdi+1 is obtained fromdi by ap-plying a reasoning rule [13]. Some reasoning systems allowa set of premise diagrams (as opposed to a single premisediagram), as in [30, 33], and the definition of a proof canbe adapted. Ideally, reasoning systems will becomplete:for any diagramsd1 anddn, if the semantics ofdn can beinferred from the semantics ofd1 then there is a proof ofdn
from d1. Suppose that the semantics ofd2 can be inferredfrom those ofd1 and we wish to write a proof fromd1 tod2. It is possible that the undrawability of some diagramdescriptions can prevent there from being a proof fromd1
to d2 (if any ‘proof’ of d2 from d1 has to pass through anon-wellformed diagram), thus making the system incom-plete. Even if the system is complete, it may be the casethat some ‘proofs’ would naturally pass through diagramsthat fail the well-formedness conditions and so some natu-ral ‘proofs’ are unobtainable.
Many completeness proof strategies are constructive,giving a sequences of reasoning rule applications that trans-form the premise diagram into the conclusion diagram, suchas those in [15, 19, 30, 31, 33]. A potential source oferror in this type of completeness proof arises if the pre-conditions are not strong enough; in this case rules are notalways applicable even when the pre-condition is satisfiedbut such completeness proofs sometimes ignore this issue.It is possible to overcome the undrawability issue and itsconsequences by not enforcing simplicity.
3.2 Consequences of Not Enforcing Simplicity
Theorem 3.1 shows, as a benefit of not enforcing sim-plicity, that all descriptions are drawable. This removes thepotential problem of reasoning systems being incompletebecause of the non-applicability of reasoning rules.
Theorem 3.1 Let (W,L = {L1, ..., Ln}) be an Euler di-agram description. Then there exists an Euler diagram,d,with description(W,L).
Proof To constructd proceed as follows. For eachSi ∈ W ,draw one simple closed curveCi labelled bySi, such that if|W | > 1 then
1. there exists a unique point,p, in the image of all of theCi’s and
2. no other point is in the image of two (or more) distinctCi’s and
3. the interiors of theCi’s are pairwise disjoint.For eachLj ∈ L such that there is noSi ∈ W satisfyingLj ∈ Si, draw a line in the plane,Ci, labelled by{Lj},so thatCi does not intersect any curve already drawn. Thediagramd consists of|L| closed curvesKj (with labelLj)where the image ofKj is the union of the images of theCi’sfor which Lj ∈ Si. The resulting diagram has description(W,L) by construction, since each required minimal regionappears in exactly one of the curvesCi and the only otherminimal region present is outside all theK ′
js.
AC
A
B CB
{ A }
{ B , C }
{ C } { A , B , C }{ D } D D
Figure 3. Diagram construction.
An example of this construction process can be seenin figure 3. Starting with the description(W ={{A}, {C}, {B,C}, {A,B, C}}, L = {A, B,C, D}), wedraw four curves labelled appropriately (theCi’s, shown inthe lefthand diagram). To construct the required Euler di-agramd (the middle diagram) we use the images of thesefour curves. For example, the image of the curve ind la-belledA is obtained by taking the union of the images of thesimple curves labelled{A} and{A,B,C}. The rightmostdiagram, where the curve labelledA is a figure of eight, alsohas description(W,L) but better exploits the containmentproperties of Euler diagrams.
From the construction process given in the proof of the-orem 3.1 we can extract a refined set of well-formednessconditions and maintain the drawability of every Euler di-agram description: the closed curves either self-intersect atmost once or are lines and, in addition, each minimal re-gion is connected. Furthermore, we can weaken these well-formedness conditions and still maintain drawability: theclosed curves either self-intersect a finite number of timesor are lines.
Our focus now turns to the interpretation of diagramswhen simplicity is not enforced. Formally, the interior of
163

a closed curve is defined by usingwinding numbers[3].Knowing the image of a closed curve is not sufficient in-formation to determine its interior. In practice we are onlygiven the images so a method to identify interior points isrequired (discussed later in this section).
Various reasoning systems based on Euler diagramsuse additional syntax to represent elements or individu-als [5, 11, 19, 30, 33]. For example, the Euler/Venn systemusesconstant sequencesto represent individuals [33]. TheEuler/Venn diagramd1 in figure 4 is ambiguous: is Jean asoftware engineer? It may well be the case that many peo-ple would say Jean is a software engineer because Jean isseemingly placed inside Software Engineers. Furthermore,it might appear that there are two curves, one of which islabelled by Jean; we are not necessarily able to correctlyidentify the syntactic components of diagrams in the non-simple case, causing further semantic ambiguity.
S o f t w a r e E n g i n e e r s
J e a n
d 1
L e c t u r e r s
J o b S e e k e r s
d 2 d 3
Figure 4. Ambiguous diagrams.
Ambiguity also arises when using self-intersectingclosed curves in Euler diagrams (even without any extrasyntax). The Euler diagramd2 in figure 4 is ambiguousfor a similar reason: are all job seekers also lecturers or arenone of them lecturers? In this case, even though the curvelabelled Job Seekers is placed in a bounded component ofR2 minus the image of the curve labelled Lecturers, there isnot an intuitive notion that the Job Seekers curve is ‘inside’the Lecturers curve: the shaded part ofd3 indicates a likely‘interior’ of the Lecturers curve.
We conclude that additional information is essential forthe unambiguous interpretation ofd2 (andd1). One mayidentify the interior and exterior points given only the im-ages using some canonical method. Such a method needs tobe clearly stated because there are various choices that giverise to different interiors; we now give two such methods.
Method 1 If we only allow curves,C, to have a finite num-ber of self intersections then we can define the interior of theimage ofC as follows. Pick a point,p, in the unbounded re-gion and letx be a point not equal top and not in the imageof C. Letγ be a path fromp to x that does not pass throughany point whereC self-intersects andγ only intersectsCtransversely and a finite number of times. Ifγ intersectsC an odd number of times thenx is interior to the imageof C (this is well-defined because the parity of the numberof crossings is the same for any such pathγ). Using this
method, no job seekers also happen to be lecturers, agree-ing with our intuitive interpretation ofd2, but, ford1, Jeanis not identified as a software engineer.
Method 2 A point, x, is interior to the image ofC if x is ina bounded face ofR2 minus the image ofC. This methodagrees with the intuitive interpretation ofd1 that Jean is asoftware engineer, but gives the non-intuitive interpretationof d2 identifying all job seekers as lecturers.
Our two methods give different notions of the interiors ofthe image of closed curves. Together with our examples infigure 4, this highlights the importance of specifying such amethod when not enforcing simplicity. No method for iden-tifying interior points from the images has been stated in thepublications on Euler diagram reasoning where simplicity isnot enforced.
As well as affecting semantic problems, not enforcingsimplicity affects the way we can define reasoning systems.In figure 5, the basic region interior toA in d1 is the set ofshaded points. This shading frequently is used to assert thatA represents the empty set. Ind2, A has no interior and,therefore, also represents the empty set.
A
d 1 d 2
A
d 3
A
d 4
Figure 5. Reasoning with Euler diagrams.
A reasoning rule in the Euler/Venn system (which is sim-ilar to a rule in [19] for spider diagrams) states that anyshaded minimal, but not basic, region can be removed froma diagram [33]. So, theremoving shaded regionsrule can-not be applied to the diagramd1 in figure 5 to gived2 be-cause the only shaded region ind1 is also a basic region.The pre-condition ensures that after an application of therule there is at least one minimal region inside each curvebecause of the ‘not basic’ constraint. Since the diagramsd1
andd2 are semantically equivalent, if the reasoning systemis to be complete then we must be able to write a proof ofd2 from d1. There is a sequence of rule applications to de-duced2 from d1: eraseA from d1, giving d3; introduceAto d3 giving d4; unify d1 andd4 to gived2 (see [33] for de-tails of these rules). In this instance, completeness may nothave been affected by the overly strong pre-condition, but acomplex sequence of rule applications is required in orderto make a seemingly trivial deduction.
164

A reason for not allowing the removal of basic regionsin [19] where simplicity is enforced is to avoid applicationsof rules yielding non-wellformed diagrams liked2. Whenallowing non-simple closed curves, as in [33], we can relaxthe pre-condition of the removing shaded regions rule toallow the removal of basic regions.
When applying reasoning or, more generally, transfor-mation rules it is a great advantage, from a usability per-spective, if the rules can be applied in such a way that auser’s mental map is minimally disrupted. The followingtheorem tells us that, when no well-formedness conditionsare enforced, a minimal region can be removed under a con-tinuous transformation of the plane, helping to preserve auser’s mental map.
Theorem 3.2 Let d be an Euler diagram. Any minimal re-gion,m, can be removed fromd by shrinkingm.
4 Connected Minimal Regions
One well-formedness condition, nearly always enforced,is that minimal regions must be connected components ofthe plane. If we enforce connectedness then we cannotnecessarily delete any curve, which is a typical reasoningrule [15, 19, 30, 33], and maintain well-formedness. Forexample, in figure 6, the deletion of any curve will result indisconnected minimal regions.
A B
CD
E
Figure 6. Venn-5.
Enforcing connectedness comes with a price: to get com-plete reasoning systems, such as Venn-II [30], we must re-draw the diagram where necessary after deleting a curve;for example, deleting a curve from Venn-(5) gives Venn-(4)which is drawable, but we may have to completely redrawthe diagram rather than simply deleting the curve. Thisplaces a larger burden on the user in terms of understand-ing (due to mental map difficulties when presented with aredrawing) or in terms of effort (when the user is forced toredraw). In fact, there are few choices of curve that can bedeleted from Venn-(n) whilst maintaining well-formedness.
Theorem 4.1 Let d be a Venn diagram that has connectedminimal regions. There are at most three choices of curvethat can be deleted fromd without leaving disconnectedminimal regions [29].
5 Inductive Definitions
Some definitions of Euler diagrams are inductive [5, 28,30, 33] and we can think of this as placing another well-formedness condition on Euler diagrams.
Definition 5.1 An Euler diagram isinductive if it can beconstructed as follows. A rectangle is an inductive Eulerdiagram. Ifd1 is an inductive Euler diagram andd2 resultsby drawing a closed curve,C, completely within the rect-angle ofd1 so that all of the minimal regions ofd1 are splitby C into at most two new minimal regions thend2 is aninductive Euler diagram.
The diagrams in figure 7 are ‘inductive diagrams’. Forexample,d3 in figure 7 is obtained fromd2 by addingB.The curveB splits the minimal region insideA into twominimal regions, one of which is disconnected: the minimalregion interior toA but exterior toB in d3 consists of twocomponents of the plane minus the images of the curves.In definition 5.1, it is stated that the new curve splits eachexisting minimal region into at most two new minimal re-gions. We observe that this condition is redundant: a curvecan only split minimal regions into at most two regions. Webelieve there is confusion between the notion of minimalregions in the usual combinatorial sense (a minimal regionis interior to some set of closed curves and exterior to theremaining curves) and in a topological sense (a connectedcomponent of the plane minus the images of the curves). Itis likely that the intention of the definition writer is to en-force the connectedness of minimal regions; if this is thecased3 should not be an inductive diagram.
d 1 d 2
A
d 3
AB
Figure 7. Inductive Euler diagrams.
The diagram in figure 6 does not comply with the induc-tive definition when connectedness is enforced since delet-ing any curve leaves disconnected minimal regions. Givenany diagram, it is not immediately obvious whether it sat-isfies the inductive definition. This is likely to affect theusability of the notation because testing to see if a diagramis inductive can be time consuming and some visually pleas-ing images (such as that in figure 6) are not inductive.
Perhaps the motivation for inductive definitions of Eu-ler diagrams came from inductive Venn diagram definitionswhere there is no drawability problem (all Venn diagramdescriptions are drawable under the inductive definition).However, it is not even clear whether it is possible to delete
165

an arbitrary curve from an inductive Euler diagram and pro-duce an inductive diagram in return (even if you redraw).
6 Precise Language and Abstraction
Concrete (drawn) level formalisms are difficult to workwith, causing a tendency to use imprecise or informal lan-guage. This can easily lead to ambiguities or oversightssuch as relying on being able to identify the interiors ofnon-simple closed curves given only their images. By con-trast, the use of precise language necessitates a thoroughunderstanding of the problem domain and permits a properanalysis of any consequences arising. The act of formaliza-tion often brings to light issues that are not apparent whenworking informally.
In order to understand the consequences of enforc-ing well-formedness conditions in their entirety, specialistknowledge of the application domain and some knowledgeof geometry and topology is required. For example, a lo-gician is likely to be focused on identifying a complete setof reasoning rules and, in order to achieve this goal, maychoose not to enforce simplicity whilst being unaware ofthe topological consequences.
An alternative to the difficult approach of formalizingat the concrete level is to use an abstract syntax [10, 17](like an Euler diagram description). Defining transforma-tion rules at an abstract level facilitates a greater level ofrigour and precision, which is essential in order to be certainthat the reasoning systems are sound and that the rules canbe applied correctly in the sense that our expectation of thepre/post contract is met. Using an abstract level is advan-tageous in that it separates the problems of reasoning fromdrawability: the rules can be defined independently of anyconcrete level well-formedness conditions. The reasoningsystems in [19, 31] are defined using an abstract syntax butmany are defined at the concrete level, as in [5, 15, 30, 33].
A major problem with defining reasoning rules (or anytransformation rules) at the concrete level is that specifyingthe pre-condition completely will require a classification ofdrawable diagrams under the chosen well-formedness con-ditions. When transformation rules are defined at the con-crete level, sometimes we must redraw a diagram after theapplication of a rule in which case one may as well haveused an abstract syntax so working at the abstract level ingeneral is sensible.
Of course, the concrete diagrams must be generated fromthe abstract syntax and this may not always be possible un-der a specified set of well-formedness conditions. However,reasoning at the abstract level allows us to be certain thatproofs exist and, because of theorem 3.2, we know that allproofs can be visualized when no conditions are enforced.Furthermore, it is computationally less expensive to applyrules at the abstract level. This computational efficiency is
essential when automating the search for proofs; even insome simple cases many thousands of diagrams are pro-duced that are not part of the proof [13], so they do notneed to be drawn. There is ongoing work in the drawingcommunity attempting to address the issue of being ableto generate diagrams under various well-formedness condi-tions [7, 6, 12, 14, 34] and also attempting to make diagramslook similar [27].
7 Conclusion
This paper provides a discussion of various issues thatarise in the many visual languages based on closed curves,of which there are numerous examples in computing [8, 9,16, 21, 22, 24, 35]. We have investigated the consequencesof enforcing various well-formedness conditions that ap-pear in the literature, especially in the areas of drawabil-ity, semantic interpretation and reasoning. Not enforcingthe simplicity condition causes problems interpreting Eulerdiagrams. Completely removing this condition is not sen-sible: it allows any closed curves ranging from space fill-ing curves [1] to straight lines or even points to be used.This not only causes difficulties in the formalization of, forexample, semantics but may lead to confusion, especiallywhen lines represent disjunction as in [5, 11, 19, 30, 33]and dots represent elements as in [11, 19]. If the simplic-ity condition is not enforced or refined then it is necessaryto specify a method for determining the interior of curvesgiven just the images.
We suggest that refinements of the conditions are used(such as refining simplicity to allow only a finite numberof self-intersections) in order to provide a balance betweenconflicting desires. From a reasoning perspective, permit-ting a finite number of self-intersections allows rules to beapplied to more diagrams by enabling the relaxation of thepre-conditions. This may enhance usability in certain cir-cumstances; for example, a minimal region can be removedusing a natural process so that the resulting diagram lookssimilar to the original diagram.
We have provided a construction process which gener-ates a diagram from any Euler diagram description. Thiswill enable the visualization of proofs in logical reasoningsystems which are defined at an abstract level; the use of anabstract level separates the issues of drawability from thoseof reasoning. Further work on the generation of diagramsunder various sets of well-formedness conditions is under-way, and will enable the visualization of proofs containingdiagrams which satisfy conditions specified by a user.
There are other standard well-formedness conditions andin future work we plan to conduct an analysis of them. Thismay lead to further refinements of the conditions as well asprovide a better understanding of their effects. We expectthat issues similar to those raised in this paper will occur
166

in other visual languages even if different well-formednessconditions are imposed.
Acknowledgement Author Stapleton is supported by aLeverhulme Trust Early Career Fellowship. Thanks to JohnTaylor for his comments on an earlier draft of this paper.
References
[1] M. Armstrong. Basic Topology. Springer-Verlag, 1979.[2] J. Barwise and E. Hammer. Diagrams and the concept of
logical system. In G. Allwein and J. Barwise, editors,Logi-cal Reasoning with Diagrams. OUP, 1996.
[3] D. Blackett.Elementary Topology. Academic Press, 1983.[4] B. Bultena and F. Ruskey. Venn diagrams with few vertices.
Electronic Journal of Combinatorics, 5:1–21, 1998.[5] L. Choudhury and M. K. Chakraborty. On extending Venn
diagrams by augmenting names of individuals. InProceed-ings of Diagrams 2004, Cambridge, UK, volume 2980 ofLNAI, pages 142–146. Springer-Verlag, March 2004.
[6] S. Chow and F. Ruskey. Drawing area-proportional Vennand Euler diagrams. InProceedings of Graph Drawing2003, Perugia, Italy, volume 2912 ofLNCS, pages 466–477.Springer-Verlag, September 2003.
[7] S. Chow and F. Ruskey. Towards a general solution to draw-ing area-proportional Euler diagrams. InProceedings of Eu-ler Diagrams, volume 134 ofENTCS, pages 3–18, 2005.
[8] R. DeChiara, U. Erra, and V. Scarano. VennFS: A Venndiagram file manager. InProceedings of Information Visu-alisation, pages 120–126. IEEE Computer Society, 2003.
[9] H. Dunn-Davies and R. Cunningham. Propostional state-charts for agent interaction protocols. InProceedings of Eu-ler Diagrams 2004, Brighton, UK, volume 134 ofENTCS,pages 55–75, 2005.
[10] A. Fish and J. Flower. Abstractions of Euler diagrams. InProceedings of Euler Diagrams 2004, Brighton, UK, vol-ume 134 ofENTCS, pages 77–101, 2005.
[11] A. Fish, J. Flower, and J. Howse. The semantics of aug-mented constraint diagrams.Journal of Visual Languagesand Computing, 16:541–573, 2005.
[12] J. Flower and J. Howse. Generating Euler diagrams. InPro-ceedings of Diagrams 2002, pages 61–75, Georgia, USA,April 2002. Springer-Verlag.
[13] J. Flower, J. Masthoff, and G. Stapleton. Generating read-able proofs: A heuristic approach to theorem proving withspider diagrams. InProceedings of Diagrams 2004, vol-ume 2980 ofLNAI, pages 166–181, Cambridge, UK, 2004.Springer.
[14] J. Flower, P. Rodgers, and P. Mutton. Layout metrics forEuler diagrams. In7th International Conference on Infor-mation Visualisation, pages 272–280. IEEE, 2003.
[15] E. Hammer.Logic and Visual Information. CSLI Publica-tions, 1995.
[16] P. Hayes, T. Eskridge, R. Saavedra, T. Reichherzer,M. Mehrotra, and D. Bobrovnikoff. Collaborative knowl-edge capture in ontologies. InProc. of the 3rd InternationalConference on Knowledge Capture, pages 99–106, 2005.
[17] J. Howse, F. Molina, S.-J. Shin, and J. Taylor. Type-syntaxand token-syntax in diagrammatic systems. InProceedings2nd International Conference on Formal Ontology in Infor-mation Systems, USA, pages 174–185. ACM Press, 2001.
[18] J. Howse and S. Schuman. Precise visual modelling.J. ofSoftware and Systems Modeling, 4:310–325, 2005.
[19] J. Howse, G. Stapleton, and J. Taylor. Spider diagrams.LMSJ. of Computation and Mathematics, 8:145–194, 2005.
[20] C. John. Reasoning with projected contours. InProceedingsof Diagrams 2004, volume 2980 ofLNAI, pages 147–150,Cambridge, UK, 2004. Springer.
[21] S. Kent. Constraint diagrams: Visualizing invariants inobject oriented modelling. InProceedings of OOPSLA97,pages 327–341. ACM Press, October 1997.
[22] S.-K. Kim and D. Carrington. Visualization of formal spec-ifications. In6th Aisa Pacific Software Engineering Confer-ence, pages 102–109, Los Alamitos, CA, USA, IEEE, 1999.
[23] O. Lemon and I. Pratt. Spatial logic and the complexity ofdiagrammatic reasoning.Machine GRAPHICS and VISION,6(1):89–108, 1997.
[24] J. Lovdahl. Towards a Visual Editing Environment for theLanguages of the Semantic Web. PhD thesis, Linkoping Uni-versity, 2002.
[25] T. More. On the construction of Venn diagrams.Journal ofSymbolic Logic, 23:303–304, 1959.
[26] C. Peirce.Collected Papers, volume 4. Harvard UniversityPress, 1933.
[27] P. Rodgers, P. Mutton, and J. Flower. Dynamic Euler di-agram drawing. InVisual Languages and Human CentricComputing, Rome, Italy, pages 147–156. IEEE ComputerSociety Press, September 2004.
[28] H. Sawamura and K. Kiyozuka. JVenn: A visual reason-ing system with diagrams and sentences. InProceedings ofDiagrams 2000, volume 1889 ofLNAI, pages 271–285, Ed-inburgh, UK, 2000. Springer-Verlag.
[29] P. Scotto di Luzio. Patching up a logic of Venn diagrams.In Proceedings 6th CSLI Workshop on Logic, Language andComputation. CSLI Publications, 2000.
[30] S.-J. Shin. The Logical Status of Diagrams. CambridgeUniversity Press, 1994.
[31] G. Stapleton, J. Howse, and J. Taylor. A decidable constraintdiagram reasoning system.Journal of Logic and Computa-tion, 15(6):975–1008, December 2005.
[32] N. Swoboda and G. Allwein. Using DAG transformations toverify Euler/Venn homogeneous and Euler/Venn FOL het-erogeneous rules of inference.J. on Software and SystemModeling, 3(2):136–149, 2004.
[33] N. Swoboda and G. Allwein. Heterogeneous reasoning withEuler/Venn diagrams containing named constants and FOL.In Proceedings of Euler Diagrams 2004, volume 134 ofENTCS. Elsevier Science, 2005.
[34] A. Verroust and M.-L. Viaud. Ensuring the drawability ofEuler diagrams for up to eight sets. InProceedings of Di-agrams 2004, volume 2980 ofLNAI, pages 128–141, Cam-bridge, UK, 2004. Springer.
[35] Y. Zhao and J. Lovdahl. A reuse based method of develop-ing the ontology for e-procurement. InProceedings of theNordic Confernce on Web Services, pages 101–112, 2003.
167

Semantic Visualization for Business Process Models
Hans-Georg Fill Dimitris Karagiannis
Institute of Knowledge and Business EngineeringUniversity of Vienna, Austria
E-mail: {hgf|dk}@dke.univie.ac.at
Abstract
Based on an analysis of the requirements for visualiza-tions of business process models and the foundations of theconcept of Semantic Visualization it is shown how differentOntological Visualization Patterns can be specified and se-mantically linked to business process conceptualizations toachieve the vision of semantically described visualizationservices.
1. Introduction
When regarding the environment in which business de-cision makers have to accomplish their tasks today it be-comes immediately obvious that the notion of a knowledgeand information society is not only a common catch wordbut clearly highlights the challenges that have to be facedwhen aiming for the success and therefore the sustainabilityof an enterprise.
To enable decision makers to master the huge amountsof knowledge and information that circulate on all levelsof modern businesses several disciplines have developedmethods and procedures which encompass technical as wellas organizational approaches. The use of visual representa-tions is a common way that is applied to facilitate the com-prehension of complex processes and interrelated data inmany of these approaches.
The field of Enterprise Modeling is an area that providesmethods of resolution for the representation, management,and analysis of the strategic goals, activities and organiza-tional relationships as well as the technological basis of abusiness. The visual representation of business processesshall be selected in the following to serve as an exem-plary application field. However, the statements made hereare applicable to a wide range of enterprise modeling ap-proaches that make use of visual representations (e.g. inperformance management [12], workflow management orintegrated process and IT architecture management [10]).
The goal of the approach presented in this paper is to
introduce an innovative view on visualizations that is exem-plarily applied to Business Process Models. The approachis seen as an evolutionary step that is fully compatible toexisting ways of specifying visualizations but takes into ac-count new paradigms such as service orientation and auto-mated information processing. It is envisaged that the wayof dealing with visual representations is thereby leveragedto the level of open, standardized and therefore interchange-able components, i.e. in the sense of technology indepen-dent, semantic visualization services.
2. Related work
The foundations for this work lie in the field of visuallanguage theory (c.f. [11, 9, 1]), which can be viewed asa starting point of analysis for every type of visual repre-sentation, and information visualization [8]. The idea oftracing back visual representations to their very core ele-ments has a long philosophical and geometric tradition (cf.the axioms in Euclid’s Elements) and has recently regainedattention by attempts of defining ontologies for visualiza-tions [3], which, however, seem to be to generally formu-lated to lead to actual implementations but are rather tax-onomies for clarifying terms in the area of visualization.Related approaches for business process methodologies areseen in Event Driven Process Chains [7] or recent efforts fora worldwide standardization of business process modelingsuch as BPMN [2].
3. Semantic Visualization
As stated in the introduction the concept of Semantic Vi-sualization is positioned as a unification and extension ofprevious approaches for defining visualizations. In analogyto the well known semantic web stack visualizations in thisapproach are specified in a hierarchical order based on prim-itive entities that can be combined to generate complex dy-namic representations (see figure 1). These representationscan then be enriched with a distinct semantic specification
168

of their state and behaviour which permits not only an auto-mated assembly of visual representations based on domainconceptualizations but also for the realization of technicalvisualization formats that can be exchanged between dif-ferent parties (similar to current XML based document for-mats).
Figure 1. Semantic Visualization Stack
In detail the Semantic Visualization stack contains on itsbottom layer the core elements of any visualisation: Pointsas the smallest visual entity and Graphical Primitives thatare composed of a number of points. On the next layer re-side Graphical Representations in the form of vector graph-ics that are composed of graphical primitives. To allow fora dynamic change of the graphical representations the Vi-sual objects layer adds variables and control structures tothe graphical representations. Thereby a representation canbe changed according to a variably assigned value. On theOntological Visualizations Patterns layer one or more vi-sual objects are combined and positioned according to a lay-out procedure. The internal variables of the visual objectsare either directly exposed as variables of the pattern or viaa transformation function. The Ontological VisualizationPattern therefore also has to contain control structures andvariables, but in contrast to the visual objects the variablesas well as the pattern itself are enriched with a semanticspecification. On the basis of this semantic specificationthat describes the nature and properties of a visualization amapping to an ontology can be established that is the basisfor possible visual inferencing mechanisms on the higherlayers such as Logic, Proof and Trust. By the linkage to anontology a visual language can be specified: Syntax and se-mantics of the visual language are defined by the ontology,the appropriate graphical representation by the OntologicalVisualization Pattern.
To show the approach in details these concepts and thelinking to a semantic description can be formally expressedas follows: A Point P has coordinate values in �2 (1), and avariable V in � (2). Points can then either be specified in thestandard way by values or by variables (3) by which vari-ations of the graphical representation are realized. Primi-tives PRIM can either be described by standard points (4) orin visual objects by a combination of variable or standardpoints VO (5). The variables within the point primitivesare used to influence the graphical representation, the ad-
ditional variables are required for the normalization of thepoint variables to allow for a mapping to ontology values1.This abstract specification can then be instantiated (6).
A simplified ontology O consisting of classes C, objectproperties OP, datatype properties DP and values V (8-13)2
can also be instantiated and then linked in the simplest caseto the visual object as shown in (14,15), thereby establishinga semantic relationship with a class of the ontology and avariable of the Ontological Visualization Pattern.
P = (x, y |x, y ∈ � ) (1)V = (z |z ∈ � ) (2)
PV O = (α, β |α, β ∈ � ∨ V ) (3)PRIM = {P1, P2, . . . , Pn} (4)
VO = {E1, E2, . . . , En
∣
∣E ∈ P ∨ PV O ∨ V }(5)VO1 :: VO (6)VO1 = {P1, P
V O2 , V1} (7)
O = {C, OP, DP, VAL} (8)C = {C1, C2} (9)
OP = {OP1} (10)DP = {DP1} (11)
OP1 = {C1, C2} (12)DP1 = {C2, VAL1} (13)
C2 ↔ VO1 (14)VAL1 ↔ V1 (15)
To fully realize the vision of Semantic Visualization,which is seen in the availability of semantically describedvisualization services that can on demand and automati-cally create dynamic visualizations that are appropriate fora specific use case the mapping between Ontological Visu-alization Patterns and a domain conceptualization such asan ontology or a meta-model has to be further specified.For this purpose four dimensions have been identified thatcharacterize this mapping: The Functional Implementation,the level of Standardization, the type of Deployment, andthe Time Reference (see figure 2). The Functional Imple-mentation describes whether the mapping takes place fullyautomatically (e.g. through intelligent agents that receive arequest for a visualization and deliver the result), semi au-tomatically (e.g. by offering visualization alternatives thatcan be chosen by the user) or manually (e.g. when the vi-sualizations for the mapping are manually selected basedon the subjective assessment of a user). The Standardiza-tion dimension determines to which amount the mapping
1A simple example that shows this normalization requirement wouldbe the graphical height of a bar in a barchart that has to be normalized toe.g. a range from 0-100 to be able to represent percentage values.
2This would correspond to a simplified conception of an ontology asexistent in the Web Ontology Language OWL.
169

is performed by using standardized technology for the de-scription of the conceptualization of the Ontological Visual-ization Patterns, the description of the domain conceptual-ization and the mapping itself. Again, for fully realizing Se-mantic Visualization standardized technologies are requiredto enable the direct cooperation of all three parts. The twotypes for the Deployment reflect whether the visualizationcan be dynamically altered after the deployment (wherebye.g. the change of an attribute status in the domain concep-tualization can influence the visualization after the mappinghas been defined) or whether the mapping is static and can-not be changed. The Time Reference dimension expresseswhether the visualization is assembled on demand (i.e. di-rectly upon the request of a user) or is pre-configured andthen accessed at a later point in time.
Figure 2. Dimensions of the Mapping
4. Requirements of Business Process Modeling
To practically illustrate the approach of Semantic Visu-alization the field of Business Process Modeling has beenselected as a field of application that is not only very wellresearched but is certainly (as stated in the introduction) ofmajor interest for meeting future business challenges.
The modeling of business processes is a complex taskthat does not only require sound knowledge of the field ofbusiness that shall be depicted but also of the used modelingmethod and its application procedure. From the viewpointof visualization we have identified three main influence fac-tors that determine the requirements for the visual represen-tation of business processes: First, the Modeling Methodas the basic definition which elements may occur in a busi-ness process model, how they are syntactically arranged andwhat semantics is assigned to them as well as the used no-tation (e.g. graph based) [6]. Second, the aspects of HumanComputer Interaction, i.e. how the interaction of a user andthe representation of the business process model takes placeand thirdly which Technology is available and suitable forimplementing the visualization.
To narrow down the large number of possible approachesfor modeling methods in business process management webuild in this paper upon the concepts of Business Graphs [5]as an elementary and intuitive approach for representingbusiness processes and their organizational embedding.
A Business Graph is a formal representation of a clearlystructured and comprehensible design of a business processincluding all important elements [5]. These elements arestructured in two components: a business process modeland a working environment model. The business processmodel contains activities, i.e. atomic units of a process (e.g.the working units which cannot or should not be dividedany more), subprocesses, i.e. the combination of activitiesin order to achieve reusability and a higher level of abstrac-tion which are both necessary for distinctely structuring theprocess, and a control flow which is characterized by vari-ables and predicates that determine the logical subsequenceof the activities and allow for the description of parallelisms(or synchronizations), decisions, sequences and loops. Asthe focus of this paper is visualization the control flow islimited to three elements (start, end, and decision). Theworking environment model consists of actors (persons),that represent the performers of activities, groups which areused to describe organizational structures such as positions,functions, roles, responsibilities and units of organizations,and resources which are defined as all means that are neces-sary for the realization of activities such as documents, dataor services. Between the business process and the workingenvironment model mappings can be established such as re-sponsibilities, i.e. the definition who is carrying out an ac-tivity or requirements, i.e. the regulations which resourcesare required to perform an activity.
Formally Business Graphs can be described as follows:Let Γ = {βj , ω, ρij} be a Business Graph with
• a number of i business processes βi = {θi, κij}in which θi signifies process element i, i ∈{1, 2, 3, . . . , n} and κij stands for a control connec-tor ij, i ∈ {1, 2, 3, . . . , n}, j ∈ {1, 2, 3, . . . , n} be-tween process elements. Process elements are definedas θi = {Ai, βj , σ, η, δk} where Ai signifies activityi, i ∈ {1, 2, 3, . . . , n}, βj signifies subprocess j, j ∈{1, 2, 3, . . . ,m}, σ signifies start, η signifies end, andδk signifies decision where k ∈ {1, 2, 3, . . . , l}.
• a working environment ω = {Pi, Gj , Rk, πij}, withi ∈ {1, 2, 3, . . . , n}, j ∈ {1, 2, 3, . . . ,m}, k ∈{1, 2, 3, . . . , o} and where Pi signifies a person i, i ∈{1, 2, 3, . . . , n}, Gj signifies a grouping j, j ∈{1, 2, 3, . . . ,m}, Rk signifies a resource k, k ∈{1, 2, 3, . . . , o} and πij the relations between the el-ements of Pi, Gj and Rk with i ∈ {1, 2, 3, . . . , n},j ∈ {1, 2, 3, . . . ,m}
• and the relations ρij between the elements of βi and ω.
Business Graphs are a syntactical conceptualization ofthe domain of business process models. For a concrete us-age the semantics of the entities of a Business Graph has tobe specified e.g. by mapping them to an ontology as shown
170

Figure 3. Semantic Visualization Framework for Business Process Models
in figure 3 and distinct rules for the arrangement of the el-ements in the business process models have to be defined.For the purposes of illustrating the relation to the visualiza-tion of the models we have instantiated the formal conceptsto a meta-model (figure 3) that defines the cardinalities be-tween the entities and can also provide a basic definitionof syntax and operational semantics via a meta-meta modelfrom which it is instantiated and that defines the core ele-ments of the underlying directed graphs (as e.g. describedin [4]).
For the discussion of the impacts of human computer in-teraction (HCI) we refer to the definition of HCI as ”a disci-pline concerned with the design, evaluation and implemen-tation of interactive computing systems for human use andwith the study of major phenomena surrounding them.” (byACM SIGCHI3) and focus on three aspects that are derivedfrom the accomodations to human diversity as described byShneiderman [13]. These are: Semiotic aspects, Pragmaticaspects, and Physiological aspects.
By Semiotic aspects we take into account human cul-tural factors that determine either the meaning of as well asthe interaction with visual representations. This is particu-larly relevant in today’s international business environmentwhere the exchange of information concerns many differ-ent countries and cultures. Culture in this context refersnot only to national culture (e.g. as expressed by differentorientations in parsing text and visual representations) butalso to group cultural factors (e.g. by different professional
3See the website of ACM SIGCHI Curricula for Human-Computer In-teraction at http://sigchi.org/cdg/cdg2.html.
views on the functioning of an enterprise where technicalexperts prefer clear ’engineering’-like representations theyare used to (as the UML notation) vs. managerial decisionmakers who require visual representations that can be usedfor special argumentation purposes e.g. to shareholders whoare not familiar with technical visualizations). For examplesof different visualizations of business processes see figure 4that shows in (A) a standard business process model basedon the Business Graph concepts in the ADONIS BPMS no-tation, in (B) a UML activity diagram and in (C) a visuallyenhanced version of (A) that additionally encodes activitycosts by color gradients.
This directly leads to the Pragmatic aspects of busi-ness process visualizations. Here the requirements con-cern the purpose of the visual representation which mightrange from knowledge codification and transfer to profes-sional analysis (cf. the methods of information visualiza-tion) and public communication purposes and strongly de-pends on the role of the recipient (e.g. technicians, externalstakeholders or customers).
By the Physiological aspects it has to be considered howinteraction possibilites can be met so that a wide range ofusers can access the visualization in the intended way -which may for example be achieved by reverting to com-mon interaction metaphors as used by standard softwarethat also brings the advantage of defining extensions for dis-abled people.
The third requirement concerns the technological factorsthat need to be considered when deploying visualizations ofbusiness process models in an enterprise. An important fac-
171

Figure 4. Different visualizations of business processes
tor is the Organizational Embedding, i.e. which technolo-gies and systems are already in use in an enterprise, whichsecurity and economic constraints have to be obeyed andwhether additional hardware or software components arerequired for a successful installation. Furthermore aspectsof Mobility may play a role, i.e. whether the visual repre-sentations need to be web-accessible, stand-alone or avail-able on mobile devices. A more strategic aspect of tech-nology which is not to be underestimated is the Relationto current paradigms, i.e. whether the chosen technology ishighly innovative for an orientation towards the future andwith the chance of benefitting from first mover advantagesor whether an experienced and highly reliable technology ischosen.
5. Application to Business Process Models
With these foundations it is now possible to apply theconcept of Semantic Visualization to the area of businessprocess modeling: At first appropriate Ontological Visual-ization Patterns have to be created that contain the requiredfunctionality based on the requirements of the modelingmethod and the HCI and technological aspects (e.g. forrepresenting arrows with bendpoints for control connectors,representations that can show a cost value by a color gra-dient for analysis purposes, black and white representationsfor simple PDA displays etc.).
In detail for the needs of business process modeling suchpatterns have to correspond to the exact semantic require-ments of the modeling method. In the case of BusinessGraphs this implies that there exist patterns that semanti-cally match to the concepts in the graph as shown in fig-ures 3 and 6, which can be achieved by reference to a com-mon ontology that either specifies the semantics of the On-tological Visualization Pattern as well as the semantics ofthe concepts in the meta-model, and that there are patterns
that can represent the operational semantic requirementsas demanded by the control connector classes of directedgraphs.
Figure 5. Ontological Visualization Patternusing a color-coding visual object for activ-ities
Furthermore the patterns have to be in line with the re-quirements from HCI and satisfy the semiotic, pragmaticand physiological aspects. The advantage of Semantic Vi-sualization is clearly visible in this respect as it allows forthe definition of multiple Ontological Visualization Patternsthat can fulfill different requirements and can (if the techno-logical foundation does not restrict it) be chosen on demandbased on individual user preferences (for an example of analternative pattern that is used for an analysis case see fig-ure 5).
As the vision of Semantic Visualization is the automaticinteraction with Semantic Visualization services the aimwould be to use standardized formats for the description ofthe Semantic Visualization Stack. However, with the cur-rently available standards only parts of the requirements forSemantic Visualization can be met: For the specificationof visual objects SVG can be partly used for the creationof templates, although it has to be extended with customnamepaces to take into account the need for externally ac-
172

Figure 6. Mapping of an Ontological Visualisation Pattern to a Meta-Model with implicit semantics
cessible variables and control structures.Currently a prototype for a visual object editor is avail-
able in Java. It has similar functionality as any graphic edi-tor for vector graphics with the additional possibility of inte-grating variables and control structures. Visual objects cantherefore be easily designed and exported as Java Swingcomponents which allows for an easy integration in otherapplications as well as for achieving a first realisation ofvisualization web services by using them in a web applica-tion.
6. Conclusion
In this paper it has been outlined how the paradigms ofservice orientation and semantic service description can beapplied to the area of visualization. To fully realize the vi-sion of the proposed idea of Semantic Visualization in anal-ogy to the Semantic Web internationally aligned open stan-dards would be required. A student project using SVG andweb service technologies is currently being conducted toevaluate the practicability of adapting common standards tothe needs of Semantic Visualization.
References
[1] P. Bottoni and A. Grau. A Suite of Metamodels as a Basisfor a Classification of Visual Languages. In IEEE Sympo-sium on Visual Languages and Human Centric Computing(VLHCC04), page 8p., Rome, Italy, 2004. IEEE.
[2] Business Process Management Initiative (BPMI).Business Process Modeling Notation - Speci-fication Version 1.0. Technical report, 2004.http://www.bpmn.org/Documents/BPMN\%20V1-0\%20May\%203\%202004.pdf.
[3] D. J. Duke, K. W. Brodlie, and D. A. Duce. Building an On-tology of Visualization. In IEEE Visualization 2004, Austin,Texas, 2004. IEEE.
[4] H.-G. Fill. UML Statechart Diagrams on the ADONISMetamodeling Platform. In International Workshop on
Graph-Based Tools (GraBaTs 2004), pages 27–36, Rome,Italy, 2004. Electronic Notes in Theoretical Computer Sci-ence.
[5] D. Karagiannis, S. Junginger, and R. Strobl. Introductionto Business Process Management Systems Concepts. InB. Scholz-Reiter and E. Stickel, editors, Business ProcessModelling, pages 81–106. Springer, Berlin et al., 1996.
[6] D. Karagiannis and H. Kuhn. Metamodelling Platforms. InK. Bauknecht, A. Min Tjoa, and G. Quirchmayer, editors,Third International Conference EC-Web 2002 Dexa 2002,LNCS2455, page 182, Aix-en-Provence, France, 2002.Springer Verlag.
[7] G. Keller, M. Nuttgens, and A.-W. Scheer. Seman-tische Prozemodellierung auf der Grundlage Ereignis-gesteuerter Prozeketten (EPK). Veroffentlichungendes Instituts fr Wirtschaftsinformatik (IWi), Uni-versitat des Saarlandes, Heft 89:29p., 1992.http://www.iwi.uni-sb.de/nuettgens/Veroef/Artikel/heft089/heft089.pdf.
[8] J. D. Mackinlay. Automating the Design of Graphical Pre-sentations of Relational Information. ACM Transactions onGraphics, 5(2):110–141, 1986.
[9] K. Marriott and B. Meyer, editors. Visual language theory.Springer, New York, 1998.
[10] C. Moser and F. Bayer. IT Architecture Management: AFramework for IT Services. In J. Desel and U. Frank, edi-tors, Proceedings of the Workshop on Enterprise Modellingand Information Systems Architectures. Lecture Notes in In-formatics - German Computer Science Society (GI), Kla-genfurt, Austria, 2005.
[11] N. H. Narayanan and R. Hubscher. Visual Language The-ory: Towards a Human-Computer Interaction Perspective.In K. Marriott and B. Meyer, editors, Visual language the-ory. Springer, New York, 1998.
[12] F. Ronaghi. A Modeling Method for Integrated PerformanceManagement. In 16th International Workshop on Databaseand Expert Systems Applications (DEXA’05), pages 972–976, 2005.
[13] B. Shneiderman. Designing the user interface - strategiesfor effective human-computer interaction. Addison-Wesley,Reading, MA, USA, 2nd edition edition, 1993.
173

Visualization and Clustering of Author Social Networks
Stefani ChanSandia National Laboratories
Albaquerque, New Mexico
Raymond K. PonUCLA Computer Science
DepartmentLos Angeles, California
Alfonso F. CardenasUCLA Computer Science
DepartmentLos Angeles, California
ABSTRACTWe visualize author information in a social network to al-leviate the burden of researchers in their literature search.A user interface has been implemented allowing users tosubmit an author name for which they wish to begin thequery process to article databases. Co-author, referencedauthor, and article keyword information are extracted fromthe search results. Directed edges connect with edge weightsare computed based on the level of collaboration. We hy-pothesize that the author information in the social networkstructure is partitioned into cluster groups based on twocriterias: (1) authors that tend to work in similar areas ofresearch are grouped together, (2) authors that tend to worktogether frequently are grouped together. Used in combina-tion, the visualized social network is separated into clustersof authors with topic labels summarizing the general area ofstudy for those groups.
1. INTRODUCTIONA difficult task in any research project is to accumulatethe related articles in a particular area of research, whichin most cases are done with keyword searches into journaldatabase, such as Citeseer. We apply social networks to thearea of medical journal articles without loss of generality,to improve the effectiveness of such searches. Researchersthat often find themselves scouring references of relevantpapers manually can use social networks to facilitate theirresearch efforts. Even search engines which offer users theability to follow links to other authors that cite a certainpaper require tedious navigation through different resultsand memorization of the relationships discovered. Insteadof manually exploring each reference individually, we presenta system to visualize author information and relationshipssimultaneously. Thus, with the social network visualization,researchers can easily identify the authors involved in par-ticular research topics and find numerous papers relevant toa particular topic.
1.1 Related WorksBeing a popular area of interest, social networks have pre-viously been investigated in the realm of author networksin other applications. While each application begins withsimilar foundations, the actual functionality and featuresavailable differ greatly. Three applications in particular, Re-ferralWeb, Netsight, and PubSearch, are discussed.
ReferralWeb [1] generates a social network of authors forrecommending and finding experts in a particular field. Theoriginal motivation for creating such a system came fromthe tediousness of having to manually search referral chains.Instead of bothering authors with inquiries regarding theirhighly regarded referrals, ReferralWeb uses data availableon the World Wide Web to determine experts automati-cally. Using the co-occurrence of author names in web doc-uments, direct relationships between authors within closeproximity on the pages is formed. ReferralWeb uses linkson personal home pages, coauthors and references from pa-pers, and messages sent between people in news archives toextract relationships and generate the social network [2].
ReferralWeb’s proposes experts in areas as well as familiar-izes users with the social network in which the user belongs.Thus, the main purpose of this system is quite different fromwhat our system hopes to accomplish. Our system focusesmore on forming clusters of subcommunities for all authorsrather than finding particular experts. Additionally, oursystem is able to generate labels for entire clusters. Despitethese different focuses, both systems obtain author relation-ships through the web and support incremental extensionsto the graph.
Netsight visualizes and analyzes large-scale author data ob-tained from CiteSeer [3]. With large relational datasets, thegraphs become so large that it is often necessary to performfiltering techniques. Netsight offers three types of filtering:KNeighborhood filtering, degree filtering, and vertex set fil-tering. With the KNeighborhood Filter option, vertices thatare within a user specified k steps away from the selectedvertices remain while the rest are filtered out of the displayedgraph. With the Degree Filter option, those vertices withdegree outside of the user defined boundaries are filtered out.Finally, with the Vertex Set Filter, the user selected verticesare not included in the final graph. Netsight additionallyoffers statistical analysis features such as Page Rank andS-T Betweenness. While Netsight focuses more on visualiz-ing and analyzing large datasets, utilizing Page Rank andfiltering algorithms, our system revolves around clusteringalgorithms instead.
The most closely related system is PubSearch [4]. Researchweb sites, such as CiteSeer, are queried to obtain relevantscientific publications. Reference author information is ex-tracted from the “Bibliography” or “References” section ofretrieved articles. After storing the obtained information inthe database, the PubSearch system applies two types ofclustering techniques to generate the experts in the fields:document clustering and author clustering. The document
174

clustering step clusters documents based on keywords whereasthe author clustering step clusters authors based on co-citation analysis. By combining the two clustering tech-niques together, a visualization is obtained, where both au-thors and their fields are represented as nodes. The distanceseparating the author node and the research label indicatethe rank for that author in the particular area. Like the Pub-Search system, our implementation also uses a variation ofthe multi-clustering technique to obtain clusters based on co-citation, co-authorship, and research area topics. However,our system places added emphasis on generating and usingthe social network idea when clustering. In PubSearch’s vi-sualizations, there are no edges that link authors together.Thus, unlike our system, relationships and collaborationsbetween authors are not the main focus of PubSearch’s im-plementation.
Each of the three applications discussed have many promis-ing features that our system has taken into account. Usingthese preexisting systems as a foundation, we are able toimplement an application to accomplish our goals.
1.2 IntuitionThis study revolves around co-authorship and co-citation ofmedical journal articles. By starting with a seed author,various search engines are used to obtain the articles writ-ten by the specified author. The coauthor and referenceinformation is extracted from the documents and visualizedin a social network. By progressively expanding the net-work to include more coauthors of coauthors and referencesof references, an author social network is formed illustrat-ing the relationships and extent of collaboration among au-thors. Given vast amounts of author data, we would like todetermine the clusters of meaningful author nodes groups.The authors are grouped together using the cosine distancemeasure [5]. The generated clusters are therefore formedbased on common areas of study. Along with clusteringbased on author keywords, our system also attempts to takeadvantage of the nature of social networks and cluster bythe actual authors. With the author relationships alreadyorganized in the form of vertices and edges in the graph, asecond clustering method makes use of the physical closenessof the author nodes. The reasoning behind this algorithmis that frequently, authors that publish works together andreference each other repeatedly form natural groups or clus-ters since they generally perform related research [6]. So, byusing the Euclidean distance measure to determine the prox-imity of author nodes, cluster collections are discovered fromthe graph. The final method explored is a multi-clusteringtechnique that merges the cluster results from the keywordand author clustering algorithms together.
2. SYSTEM ARCHITECTUREThe following sections expand on the system architecture.Figure 1 illustrates the general overview of the architectureemployed for this author social network. The architecturemainly consists of three portions: the web portion is neededto collect the author and works information, the databaseportion is needed to store the results from the search, andthe social network analysis portion is needed to analyze,cluster, and visualize all the information. Details pertainingto the web crawler and social network analysis are discussed.
2.1 Web Crawler
Figure 1: System architecture.
The first step in generating the author social network is toobtain the author, coauthor, and reference author informa-tion from the web. Since the system focuses on extractingcitation information, it is necessary to select a search en-gine which has a references section readily available for eachwork found. Additionally, a medical search engine is re-quired because our system focuses on medical journals andworks in particular. Given these constraints, the Journal ofthe American Medical Informatics Association (JAMIA) [7]is the search engine chosen for this task.
JAMIA provides users the ability to query the database ofworks based on author name, work title, abstract, and text.In our system, the user provides an author name to begin thesearching process. From this query term, a list of the spec-ified author’s articles is returned. Using a custom HTMLwrapper developed with the HTMLParser package providedby [8] to extract the HTML content from the result pages,we extract coauthor and reference information for an article.
3. COLLABORATIVE WEIGHTCOMPUTATION
The following section discusses the formulas used to com-pute author relationship weights between searched authorsand coauthors as well as searched authors and referenced au-thors. Since different information is available in both cases,different techniques are needed for weight calculation. Oncethe formulas are chosen, the weights can be used in the vi-sualization layout to determine the node positions as well asthe edge thickness.
3.1 NotationThe author social network is a directed graph G = (V, E)with nodes V and edges E where |V | = n denotes the num-ber of nodes and |E| = m denotes the number of edges. In asocial network, vertices represent the entities, or more specif-ically the authors. The edges represent the relationships be-tween entities, or in this case co-authorship and co-citationcollaboration. A network consisting of n authors, is visu-alized as a graph composed of n nodes V = a1, a2, · · · , an.A directed edge between two author nodes, ai and aj , in-dicates either a co-authorship or co-reference relationshipbetween the two authors. An edge between authors is writ-ten as ai → aj , and as is expected, the existence of an edgeai → aj does not imply aj → ai. The in-degree of a vertexis the number of edges which point to this node while theout-degree of a vertex is the number of edges which flowoutwards from this node. The degree measure is simply thenumber of edges incident to this particular vertex. Figure 2
175

Figure 2: Social network notation.
provides an example of a simple social network.
3.2 Coauthor WeightsTo connect two authors together, a similarity measure needsto be chosen to quantify the strength of the relationship.The simplest approach is to compute Jaccard’s coefficient [9]which calculates tie strength based on the number of resultsobtained from a search engine, such as Google [10]. A vari-ation of this approach is taken in our author social network.To begin with, instead of using the Google search engine andestablishing friend links, the JAMIA search engine is used toestablish coauthor and co-citation relationships. Addition-ally, our social network is inherently directed in nature. Wemodify Jaccard’s coefficient to the following where ai and aj
represent the authors whose weight is being calculated forthe edge ai → aj .
weight(ai → aj) =|ai ∩ aj ||ai|
(1)
As mentioned earlier, when the user proposes an author tobe queried or extends the graph to search more authors, thereturned results are stored in the author database. Perform-ing this calculation for each author pair, therefore, simplyamounts to counting the number of entries in the databasetables. Jaccard’s coefficient is consequently used as the edgeweight between searched authors and coauthors as well asbetween two searched authors.
3.3 Reference Author WeightsThe edge weights between searched authors and referencedauthors are calculated in a different manner and do not useJaccard’s coefficient. Since referenced authors have not beensearched in JAMIA yet, the system has no way of knowinghow many works they have actually written. Thus, we de-veloped a different approach to determine the relationshipstrength of searched author ai and referenced author ar withedge ai → ar. In essence, the weight is calculated as the sumof the ratio of the number of times ai references ar over thetotal number of referenced authors for all works written byai. This translates into the following equation, where aR
represents all the referenced authors and w represents all ofauthor ai’s works:
weight(ai → ar) =Xw
|ar||aR|
where ar, aR ∈ w (2)
When the referenced author becomes a searched author, theweight calculation connecting to this node defaults back toJaccard’s coefficient. Also, all weight values range from[0, 1).
3.4 Weighted LayoutGiven the tie strength formulas, we will use these weightsin the visualized graph. The key component in the so-
cial network visualization is the Layout. The Layout spec-ifies the vertex locations so they appear at certain partsof the visualized graph. Our implementation uses a vari-ation of the Fruchterman-Rheingold algorithm [11], whichdistributes vertices in the graph so that connected nodesremain close together yet maintain a level of separation atthe same time. Using an analogy from physics, vertices areequated to atomic charged particles exerting repulsive forcesbetween nodes. Edges, on the other hand, are equated tosprings causing attractive forces that instigate the move-ment of the edges’ connected vertices [12]. To start, thevertices’ initial configuration begins randomly on the graph.The attractive forces on each vertex are computed next, fol-lowed by the repulsive forces. The process concludes with acooling stage which limits the displacement to some maxi-mum value. As time progresses, this maximum temperaturecools so that the adjustment becomes finer as the layoutimproves. After repeated iterations on all the nodes of thegraph, a final resultant force is determined and each nodeis moved accordingly. The FRLayout provided by JUNGalready accounts for these attractive, repulsive, and tem-perature cooling components [13].
However, to incorporate the relationship weight between au-thors, the FRLayout has been extended to the WeightedFR-Layout. To account for the additional weight information,we created a new function to calculate the force constant forthe edge ai → aj :
FC(ai, aj) = (1− w(ai → aj)) ∗ 100 (3)
When calculating the attractive force FA between verticesai and aj , the force constant is used in the JUNG imple-mentation as follows, where ε is defined as 0.000001, is thex-coordinate position in the graph for vertex ai, ay
i is they-coordinate position in the graph for vertex ai, and analo-gously for aj .
FA(ai, aj) =
“max(ε,
q(ax
i − axj )2 + (ay
i − ayj )2
”2
F 2C
(4)
Thus, the higher the weight between vertices is, the smallerthe force constant becomes. The smaller force constantcauses the attractive force to be stronger, and the verticesbecome closer in the visualized graph. For completeness,the equation to compute the repulsive force FR between anytwo vertices ai and aj remains unchanged from the origi-nal specification. The FC used is the original force constantbased on the window height and width:
FR(ai, aj) =F 2
C
max(ε,q
(axi − ax
j )2 + (ayi − ay
j )2(5)
4. KEYWORD EXTRACTIONBefore clustering, the authors must be associated with a setof keywords describing their general area of research. Be-cause of the nature of JAMIA, keywords are not providedin the document metadata and must be generated explic-itly. The general approach taken for all searched authors isto preprocess the authors’ work titles and abstracts to pro-duce a list of keywords. The occurrence of these keywordsare then counted and stored in the database. A summary
176

Figure 3: Keyword processing algorithm for searched au-thor.
Figure 4: Keyword processing algorithm for references.
of the algorithm steps that we developed for the keywordprocessing is listed in Figure 3.
All work titles and abstracts written by each searched au-thor are tokenized and stemmed, discarding stop words areignored. The initial list of stop words were obtained from[14]. We use the PorterStemmer developed by Porter [15]for stemming. Next, the words extracted from the title areused as the keywords and as the words are encountered inthe abstract, the occurrence count is incremented. Afterprocessing each document, the keywords obtained are sortedby their occurrence counts and the top 20 keywords are se-lected and stored in the database.
Once the keywords are extracted for the searched authors,the occurrences of the terms in the referenced authors canbe computed. Since the abstract information is not availablein the case of referenced authors, only the titles are used.All of the searched author’s references are analyzed basedon the searched author’s keywords. Thus, for each keywordfrom the searched author, the referenced author’s titles arepreprocessed and as the words are encountered in the refer-ences’ titles, the count is incremented. A summary of thisalgorithm is given in Figure 4.
Since coauthors collaborate with searched authors on thesame work, the keywords obtained for the searched authoris also used for the coauthors. After performing these com-putations, the database is populated with document vectorsfor all authors. These values and counts can be used in theclustering algorithms described in the next section.
5. CLUSTERINGOur system incorporates two types of clustering, keywordclustering and author clustering, to identify the relation-ships and groupings of authors in a graphical manner. Aftereach clustering method is performed on the data individ-ually, the results from both techniques must somehow becombined. Using a multi-clustering technique, clusters canbe formed that group the authors working in related fieldsand labels can be generated for these groups. We developedthe keyword and author clustering algorithms and adaptedthe multi-clustering technique from [4].
5.1 Keyword Clustering
Previously, we described the process by which keywords areextracted from an author’s works. These keyword countscan now be used as part of the keyword clustering process.The algorithm begins by assigning each node a cluster stateof UNCLASSIFIED. Then, each searched author is exam-ined to determine which authors should be clustered to-gether. Each searched author is assigned an integer clusterstate number based on its unique identifier authorId fromthe database. The list of keywords and the counts associ-ated with this searched author are obtained, and the same isdone for each of the searched author’s references. To judgethe closeness of the authors, a variation of term frequency ×inverse document frequency (TF-IDF) is utilized. TF-IDFis modified to accommodate authors instead of documentsand can be referred to as term frequency × inverse authorfrequency (TF-IAF). In our adapted version, a list of refer-ence authors that are cited by the target author is generatedfor each searched author. TF-IAF can be used to match thekeywords of the reference author against the keywords ofthe target searched author. The new equation becomes thefollowing, where the term frequency measures the numberof times the keyword appears for each author, n is the num-ber of authors, and author frequency (AF ) is the number ofauthors that use the keyword:
tf − iaf(kwi) = |kwi ∈ aj | ∗ log
„n
AF (kwi)
«(6)
Similar modifications to TF-IDF were also explored in [5].
The results of term weighting computation for the searchedand reference authors are stored in separate vectors so thatthey can be compared. Because of the nature of social net-works, the n(n1) comparisons that are usually required canactually be reduced. From the social network, it is alreadyknown which authors are collaborating, so it would not makesense to compare authors that have no direct relationship atall. Thus, only searched authors and its connected authorsneed to be evaluated. Our system utilizes a popular similar-ity measure [5], the cosine distance metric, to determine theextent of the relationship between the author and the au-thor’s references. The cosine distance between two vectors,X and Y , of length i can be determined using this equation:
cos(X, Y ) =
Pi Xi ∗ YipP
i X2i ∗
Pi Y 2
i
(7)
If the cosine distance for that particular reference authoris better than any set before, then the cluster state can bechanged to the current author’s identifier. This cosine dis-tance calculation and comparison between searched authorsand references continues until all the searched authors havebeen evaluated. By the end of the algorithm, clusters havebeen generated based on common keywords. A summary ofthis procedure is given in Figure 5.
5.2 Author ClusteringIn social networks, clusters can also be formed based on thepatterns of the relationships. From a relational standpoint,a strong direct relationship between individuals increasesthe likelihood that these individuals should be clustered to-gether [16]. In the case of authors, the more they writepapers together and the more they reference one another,the more cohesive they become, forming a definable group
177

Figure 5: Keyword clustering algorithm.
of collaborators. Our system takes advantage of this prop-erty of social networks to help in generating clusters basedon author relationships.
In a previous section, the strength of the authors’ relation-ship ties are taken into account when visualizing the socialnetwork. In other words, author nodes that have a largerweight, indicating a close relationship, are visually drawncloser together whereas author nodes with a smaller weightare drawn farther apart because the relationship is not asstrong. The clustering procedure begins first by setting thecluster states of all nodes to UNCLASSIFIED. Then, eachsearched author is examined to determine which authorsshould be clustered together based on location. As in thekeyword clustering algorithm, each searched author is as-signed an integer cluster state number based on its uniqueidentifier authorId from the database. Subsequently, each ofthe searched author’s directly connected authors are evalu-ated. Since the actual x and y coordinates of the authornodes are used to determine cluster membership, the Eu-clidean distance metric is used. The Euclidean distance be-tween two authors, ai and aj , can be computed with thefollowing formula:
dist(ai, aj) =q
(axi − ax
j )2 + (ayi − ay
j )2 (8)
The smallest Euclidean distance between a searched au-thor and a particular reference author indicates that on thegraph, the two nodes are closer together than any other pair.This closeness implies that the relationship between them isstronger than anyone else’s. Therefore, when processing thesearched authors, if a smaller distance is found, the clusterstate can be changed to that author’s identifier. This dis-tance calculation and comparison between searched authorsand references continues until all the searched authors havebeen evaluated. By the end of the algorithm, all authors areassigned to a cluster based on the proximity to a searchedauthor.
5.3 Combined ClusteringUp to this point, two separate algorithms have been usedto generate clusters. The next logical step would be to de-velop yet another algorithm to combine the cluster infor-mation from both the keyword clustering and the authorclustering algorithms together. We have adapted a multi-clustering technique from [4] which analyzes generated clus-ter data from multiple clustering methods and merges themtogether through a vectorization, distance evaluation, andvector clustering process.
123
Figure 6: Node legend after clustering.
6. OBSERVATIONAL RESULTSWe present our observational results with an example au-thor social network and manually check the validity of thekeyword labels generated. The system utilizes JUNG forvisualizations.
We ran several observational runs with different authors todetermine the qualitative effectiveness of the system. In oneof the example runs, we searched for author “Frances M.Weaver” and find the works he has published in JAMIA.To generate more clusters, we expand the graph to searchWeaver’s coauthors and references. The initial graph gener-ated from these searches is illustrated in Figure 7(a). Afterselecting the cluster option, the graph changes into whatis depicted in Figure 7(b). The leftmost cluster is asso-ciated with the keywords “quality, primary, care, feedback,improve.” The middle set of authors is associated with “vac-cinations, data, veterans, cord, disorders.” And the right-most cluster is associated with “data, surveillance, associa-tion, control, infection.” The node legend summarizing thisdata is given in Figure 6.
To verify the accuracy of the labels, we look at Weaver’s ar-eas of research. He is assigned to the center cluster group as-sociated with spinal cord disorders and vaccinations. Whenwe submit “Frances M. Weaver” into Google, the profes-sor’s biography page lists his research interests as “chronicdiseases (i.e., Spinal Cord Injury, Parkinson’s Disease), longterm care, program evaluation, surgical risks and outcomes”[17]. Therefore, from the work submitted into JAMIA byWeaver and his associates, the system was able to deter-mine that one of his general areas of study is in spinal corddisorder research. Inspecting even further, a page for the“Spinal Cord Injury Quality Enhancement Research Ini-tiative (SCI QUERI)” [18] research coordinating center isdiscovered which among the participants, include Weaver,Evans, LaVela, Wallace, Goldstein, Legro, and Smith, whoare all clustered together in our system’s social network. Weevaluate other cluster groups in a similar manner.
Under manual inspection, the clusters and labels generatedby the system are able to describe the authors’ research in-terests in most of the cases. The clustering and keyword gen-eration system, however, is not perfect and possible futurework is described in the next section to improve keywordextraction part of the system.
7. FUTURE WORKSince this work was a first attempt at developing a social net-work capable of producing author clusters based on common
178

(a) Before clustering.
1 3
2
(b) After clustering.
Figure 7: Frances M. Weaver’s social network.
179

topics, future work should still be done on the system. Possi-bilities include using different search engines, improving thekeyword extraction process, implementing more clusteringmethods, and handling author ambiguity issues.
Enhancements can also be made to the keyword extractionprocess. In particular, along with stop word removal andword stemming, future implementation may also incorpo-rate knowledge sources provided by the National Library ofMedicine’s Unified Medical Language System (UMLS) [19].UMLS provides a metathesaurus to link common medicalterms and synonymous words together. Additionally, theSPECIALIST lexicon converts words with inflected formsinto the common root word. This lexicon can be used inplace of the PorterStemmer.
Other clustering methods are currently being evaluated fortheir effectiveness and correctness.
Problems of entity resolution can occur due to the methodin which we collect authorship information. Future workshould be done to account for ambiguities in the authordata. In addition to the author name, work title, and workabstract, the web mining process can also extract institutionlocations and email addresses for the authors.
In our experiments, we manually verified several examples.To manually verify all possible test cases would be too time-consuming and not very rigorous. A more comprehensiveand rigourous validation methodology for verifying the ac-curacy of the clusters and their associated keywords is cur-rently being evaluated.
8. CONCLUSIONWe have implemented a system to translate author, coau-thor, and citation data obtained from the web and generatea visual representation of a social network. We have also de-veloped and implemented clustering methods to group au-thors together based on mutual research interests. Afterevaluating example runs, it is found that authors tend to begrouped together correctly because the co-citation and jointpublications imply an extent of collaboration between theauthors in the same clusters. In some occasions, two clus-ters may have somewhat similar keyword labels that couldpossibly be merged into one. In terms of the cluster labels,there is more variability in terms of the accuracy. There arecases when the labels match very well with all the authors inthe group; the label results returned from the system matchclosely with the results returned from manually using Googleto determine the research interests for every single author inthe cluster. However, there are also cases when the keywordlabel only describes a portion of the group. In these casesthe topic description covers the majority, but not all, of theauthors in the group.
9. REFERENCES
[1] H. Kautz, B Selman, and M. Shah. Referral web: com-bining social networks and collaborative filtering. Com-mun. ACM, 40(3):63–65, 1997.
[2] D. W. McDonald. Recommending collaboration withsocial networks: a comparative evaluation. In Proceed-ings of the SIGCHI conference on Human factors incomputing systems, pages 593–600. ACM Press, Ft.Lauderdale, Florida, USA, 2003.
[3] S. Lawrence, K. Bollacker, and L. Giles. Citeseer. http://citeseer.ist.psu.edu/, 2005.
[4] Q. T. Tho, S. C. Hui, and A. C. M. Fong. A web miningapproach for finding expertise in research areas. In Cy-berworlds, 2003. Proceedings. 2003 International Con-ference on, pages 310–317, 2003.
[5] Y. He, S. C. Hui, and A. C. M. Fong. Citation-based re-trieval for scholarly publications. IEEE Intelligent Sys-tems, 18(2):58–65, 2003.
[6] D. V. Kalashnikov and S. Mehrotra. Learning im-portance of relationships for reference disambiguation.RESCUE, December 8, 2004.
[7] Journal of the American Medical Informatics Associa-tion. Jamia. http://www.jamia.org/, 2005.
[8] D. Oswald, S. Raha, J. Kerievsky, and K. Kaila. Html-parser. http://htmlparser.sourceforge.net/, 2005.
[9] Y. Matsuo, K. Hasida, H. Tomobe, and M. Ishizuka.Mining social network of conference participants fromthe web. In Web Intelligence, 2003. WI 2003. Proceed-ings. IEEE/WIC International Conference on, pages190–193, 2003.
[10] P. Mika. Social networks and the semantic web. In Pro-ceedings of the Web Intelligence, IEEE/WIC/ACM In-ternational Conference on (WI’04) - Volume 00, pages285–291. IEEE Computer Society, 2004.
[11] T. M. J. Fruchterman and E. M. Reingold. Graph draw-ing by force-directed placement. Softw. Pract. Exper.,21(11):1129–1164, 1991.
[12] P. Mutton. Inferring and visualizing social networks oninternet relay chat. In Information Visualisation, 2004.IV 2004. Proceedings. Eighth International Conferenceon, pages 35–43, 2004.
[13] J. O’Madadhain, D. Fisher, T. Nelson, J. Krefeldt,S. White, and Y. B. Boey. Jung: Java universal net-work/graph framework. http://jung.sourceforge.
net/, 2005.
[14] THOMAS. Inquery stop word list for thomas. http:
//thomas.loc.gov/home/stopwords.html, 1998.
[15] M. Porter. The porter stemming algorithm. http://
www.tartarus.org/∼martin/PorterStemmer/, 2000.
[16] M. H. Zack. Researching organizational systems usingsocial network analysis. In System Sciences, 2000. Pro-ceedings of the 33rd Annual Hawaii International Con-ference on, page 7 pp. vol.2, 2000.
[17] F. M. Weaver. Frances m. weaver, ph.d. http://www.northwestern.edu/ihs/people/f weaver.html, 2005.
[18] F. M. Weaver. Spinal cord injury quality enhancementresearch initiative research coordinating center, sciqueri. http://www.sci-queri.research.med.va.gov/mchspr.htm, 2004.
[19] National Library of Medicine. Unified medical languagesystem (umls). http://www.nlm.nih.gov/research/
umls/, 2005.
180

GeOlaPivot Table: a Visualization Paradigm for SOLAP Solutions
Sandro Bimontea,Sergio Di Martinob, Filomena Ferruccib, Anne Tchounikineaa Laboratoire d'InfoRmatique en Images et Systèmes d'information UMR CNRS 5205
INSA, 7 avenue Capelle 69621 Villeurbanne Cedex, France {sandro.bimonte | anne.tchounikine}@insa-lyon.fr
b Dipartimento di Matematica e Informatica Università di Salerno, Via Ponte don Melillo 84084 Fisciano (SA), Italy
{sdimartino | fferrucci}@unisa.it
Abstract
Pivot tables are the de-facto standard paradigm for the visualization of data in the context of multidimensional OLAP analysis. However it is recognized that they are not suited, in their original definition, to support spatio-temporal data analysis. In this paper, we propose the GeOlaPivot Table, an extension of the pivot tables specifically conceived to assist decision makers in analyzing spatial information of data warehouses. Moreover, we present a mock-up of user interface exploiting this new paradigm, by an example of application to a multidimensional dataset.
1 Introduction
Organizations are collecting always increasing amount of data, which usually contain lots of hidden but precious knowledge. To support the decision makers in discovering these concealed information, OLAP (OnLine Analytical Processing) tools provide the ability to interactively explore these multidimensional data by presenting detailed and aggregated data. Results are usually shown through some OLAP Visual Analysis tools, aimed at supporting analytical reasoning. Indeed, data are displayed using the best practices of information visualization, without requiring the decision maker to master a query language or understand the underlying structure of the database [17]. The right presentation makes it easy to organize and understand the information. Data visualization facilitates the extraction of insight from the complexity of the phenomena and processes being analyzed, as well as it offers a better understanding of the structure and relationships contained within the dataset.
However, some research is still needed on OLAP Visual Analysis tools, specially when the multidimensional analysis subject is spatio-temporal
information. This is a fundamental issue, since it has been estimated that about 80% of the data stored in corporate databases integrates spatial information [5].
Previous researches on integration of spatial information into multidimensional models leaded to the definition of the Spatial OLAP (SOLAP) concept [2]. SOLAP solutions usually lie on coupling OLAP functionalities used to provide multidimensionality and Geographic Information Systems functionalities used to store and visualize the spatial information [14]. The numerous on going works [11], [3], [4], [9] confirm the importance and the innovating character of SOLAP. Indeed, SOLAP can not be reduced to a simple coupling architecture, but implies a real re-thinking of OLAP concepts. Among others, how to visualize and explore the spatio-temporal multidimensional dataset is an emergent and critical open issue [2]. Indeed, without a visual interface for viewing and manipulating the geometrical component of the spatial data, the analysis turns out to be incomplete [13]. On the other hand, it is widely recognized that existing Geographical Information Systems are not adequate for decision-support applications when used alone, but alternative solutions must be used [3]. As a result, there is a strong need for new visual tools, enabling to exploit the full potential of the spatial and temporal dimensions and measures of data warehouses.
Based on the examination of visual analysis capabilities and limitations of current SOLAP solutions, we propose in this paper a new visualization paradigm for SOLAP tools, named GeOLAP Pivot Table especially suited to deal with spatio-temporal measures. In particular, the interface exploits the concept of Pivot Table adding to it a 3D dimension by using the Space-Time Cube [7] 3D representation.
The remainder of the paper is structured as follows. Section 2 describes the main OLAP concepts. In Section 3, after introducing the visualization requirements for a SOLAP client tool, we describe the
181

GeOlaPivot Table visualization metaphor, which permits to conduct an effective spatio-temporal multidimensional analysis. Then, in section 4 it is proposed a mock-up of user interface we designed, together with a case study scenario and a comparison with alternative SOLAP visualization solutions. Some final remarks and future work conclude the paper.
2 OLAP key concepts
A data warehouse is a collection of data suited to support management’s decisions [8]. These data are usually modelled conforming to a multidimensional model, which make possible navigation and analysis,by introducing the concepts of dimensions (analysis axes) and facts. Dimensions can be organized following hierarchies’ schemas, which allow us to modify the detail level of analysis, while facts are described by measures which represent the analysis subject. The OLAP approach provides the ability to interactively explore these multidimensional data to encourage knowledge discovery, supporting in the meantime the iterative nature of the analysis process, allowing the decision makers to navigate across the different dimensions at different levels of detail. With OLAP tools, the analyst visually interacts with the data, focusing on the results of the analysis rather than on the procedure required to perform it. This analysis process is conducted by “navigating” into the multidimensional cube through some OLAP operators (Roll up, Drill down, Slice, Rotate etc…).
In order to effectively support OLAP analysis of multidimensional databases, a visual presentation of data is required. The most adopted data presentation paradigm is the Pivot Table. A Pivot Table is a 2D spreadsheet with associated subtotals and totals that supports viewing more complex data by nesting several dimensions on the x- or y-axis and displaying data on multiple pages. Pivot tables generally interactively support the selecting of data subsets and the changing of the displayed level of detail. The success of the pivot tables is due to their capabilities of incorporating multidimensional concepts into their structure, generating a set of small multiple displays, which permit to compare easily data, and visually encapsulate the structure of the analysis process. Graphical representation of data coupled with pivot table permits to OLAP client tools to query and analyze in an interactive, effective and useful way multidimensional data. As a result, OLAP operators are translated into interaction with pivot table and/or graphical displays.
Among the many commercial [12] and free OLAP [19] solutions some tools (such as POLARIS [17]) have extended the pivot table concept with graphic
representations and visual variables (shape, size, etc…). Following this approach, cells of the pivot table are graphic canvas which collapse using visual variables measures associated to different members of a same hierarchy level into a unique visual description. The main advantage of this approach is to effectively support the user in data comparison.
3 The GeOlaPivot Table
With the development of spatial data warehouses, a fully exploitation of spatial data into decisional process has become inevitable. Thus, SOLAP applications adds new analysis capabilities to OLAP ones.
SOLAP is defined as “a visual platform built especially to support rapid and easy spatio-temporal analysis and exploration of data following a multidimensional approach comprised of aggregation levels available in cartographic displays as well as in tabular and diagram displays” [2]. The SOLAP paradigm reformulates the concepts of measure [4] [16] [13] and dimension [3], allowing spatial information to be integrated in multidimensional models as axis and/or subject of analysis.
It is obvious that if the spatial dimension is treated as any other descriptive dimension, without consideration for the cartographic component of the data, OLAP tools will present serious limitations in support of spatio-temporal analysis. Indeed, in the context of information exploration, maps and graphics are active instruments in the end user's thinking process [10]. Thus, the introduction of geographical data as measure in OLAP implies a reformulation of classical visualization paradigms, to support a multidimensional analysis using maps, tabular and graphical data representation in a concerted and synchronized way. Moreover, it worth pointing out that common Geographic Information System (GIS) techniques, such as Overlay or MultiMaps, are not appropriate. This because the Overlay, even if reveals spatial relations, hides the precious information that a measure could belong to different layers (a spatial measure could be associated to different combination of level members), while MultiMaps is conceived to emphasize thematic relations rather than spatial ones. Consequently, there is a strong needing for a visual technique suited to compare spatial measures, according to different members of the same hierarchy level, and to effectively understand spatial/thematic relations between measures. Moreover, spatial measures can be associated to a spatial context that permits to localize them in the space. In other terms a spatial dimension can be present in a SOLAP application with spatial measures. Finally, thematic attributes of geographical
182

data are necessary for an effective decision-making process. For example, what characterize a particular area can help decision-maker to understand the causes of a particular localization of a phenomenon.
To address the above issues, we propose the metaphor of GeOlaPivot Table, intended as a 3-Dimensional extension of the OLAP Pivot Table. The main idea is to exploit the 3rd dimension to provide insight on how a spatial phenomenon evolved in function of another factor (such as time, or products), by overlapping data onto a map. To this aim, we have combined the concept of Space-Time Cube [7] [6] and Pivot Table giving rise to the notion of GeOlaPivotTable. Indeed, cells of the Pivot Table related to spatial data are cubes, representing into a single, visual description measures associated to different members of a same hierarchy level, like previously described OLAP tools. A cube can be rotated to obtain the best point of view, avoiding screen and information cluttering. So, user can freely rotate the cube on 3 axes, to analyze the dataset. The base of the cube is associated to a spatial dimension (if it exists) and its 3rd dimension to another alphanumeric dimension. Spatial measures associated to the same fact are depicted by the same color. All the data that do not match the query parameters, set by the user, are removed from the visualization cube.
As a result, the main characteristics a SOLAP client tool based on GeOlaPivot Table are:
1. Visualization of spatial geometric dimension and spatial measure at same time.
2. Adoption of a visualisation technique to compare
spatial and thematic relations between measures associated to different members of a same hierarchy level.
3. Explicit visualization of spatial relations between measures and dimensions members.
4. Visual encapsulation of the structure of multidimensional application.
5. Visual representation of OLAP operators 6. Display of thematic attributes of measures.
4 A Visualization Tool based on the GeOlaPivot Table metaphor
To clarify the main aspects of the GeOlaPivot Table, we have developed a mock-up of the User Interface (UI) of the visualization tool meant to support the proposed metaphor (see figure 1). This UI is aimed at providing an interactive environment which graphically encapsulates the structure of the multidimensional application and translates interactions with the visual interface into operators. In this environment the knowledge engineer can query the Spatial Data Warehouse by defining the analysis dimensions and the level of detail to use, to get insight on spatial relationships occurring among data. In particular, a direct manipulation of both attributes and depicted values is allowed.
To this aim, the interface proposes some widgets to carefully select the information to deal with, which will be rendered in 3D using the GeOlaPivot Tablemetaphor.
The UI is composed of three main panels:
Figure 1. The UI exploiting the GeOlaPivot Table
183

• Data Panel: This is a vertical panel, located to the left of the window, which allows to select the data to be analyzed. , to query and filter data, to get the specific information that the user wants to view. In detail, it embeds two Tree-View controls, providing a hierarchical representation of Dimension and Measures attributes contained in the dataset, respectively. Among the dimensional attributes, the ones representing spatial information are depicted by a corresponding icon.
• Attribute Panel: This panel allows the user to identify the attributes to be used as base and height of the cube, respectively. To this aim, he/she can drag & drop an attribute from the Data Panel to some specific areas of this panel.
• View Panel: This is the GeOlaPivot Table, used to show in 3D, at an arbitrary zoom level, the spatial data. The user simply drags attribute names from the Data Panel into a cell, and the resulting report is updated on-the-fly. Upon completion of the analysis, the analyst can quickly drill into the report. It allows for 5 Degree of Freedom, achieved through combination of mouse clicks and gestures.
This user interface could be very flexible, being able to deal with a large variety of spatio-temporal phenomena.
4.1 A scenario of use
In order to illustrate the fundamental characteristics of the GeOlaPivot Table, we describe a possible scenario of use considering as an example the supervision of infectious (as for example AIDS, tetanus, etc…) diseases in Italy. The multidimensional application presents as dimension: • Location: (Region, Nation) Spatial geometric
dimension, i.e. Lombardia, Italy. • Time: (Year, 3 Years), i.e. 1991, 1990-1992 • Infectious Disease: (Disease, Class) A classification
of diseases according to the International Classification of Disease, i.e. AIDS
• Incidence: (Rate) Rate of incidence of deaths by population per 100000 inhabitants, i.e. 2,5-3,0
Districts are measures. A district is characterized by some attributes, as the Name, the Geometry, the Number of Hospitals and the Areaclass. The latter one is a social-economic classification of the district, such as “cities and services”. Aggregation functions are spatial union for geometry, sum for the number of hospitals and a ratio function for the areaclass. An example of the fact table is presented in Table 1. Data reported in this example, as well as complete data and
statistics about mortality, is taken from documents available on the web site of the Italian Health Institution “Istituto Superiore di Sanità” (www.iss.it). Disease Time Incidenc
e Location District
AIDS 2001 >6.0 Lombardia Piacenza AIDS 2002 >6.0 Lombardia Brescia,
Piacenza AIDS 2003 >6.0 Lombardia Lecco,
Piacenza AIDS 2002 >6.0 Emilia-
Romagna Ravenna
… … … … …
Table 1. Fact table of the Infectious Diseases Spatial Data Warehouse
Let us suppose that years taken in consideration for this example are only 2001, 2002 and 2003. If user wants to know what districts have an incidence rate superior to 6.0 for AIDS the UI configuration shown in figure 4 permits to answer to this question. We notice the AIDS value in the SLICE component and Regionand Year in the Cube Base Dimension and Cube Height Dimension components respectively. The GeOlaPivot Table permits to see that for the region “Lombardia”, three districts are present and in particular the district Piacenza is always present from 2001 to 2003. Moreover these districts are all neighboring. Changing year does not imply changing of geographical area. Examining all other regions of Italy using the GeOlaPivot Table curiously we notice that only Emilia Romagna have a district (Ravenna) with this incidence rate. Consequently user could wish to analyze this problem from a less detailed geographical point of view. He/she can apply the Roll-up operator on the Location dimension, by clicking on the ‘-‘ operator at the right of Italy in the GeOlaPivot Table. By drag the level 3 Years from the Multidimensional Data Panel into the Cube Height component he/she applies the Roll-up operator to the Time dimension too. Finally he/she clicks on level Rate and he/she drags the “>6.0” member into the Slice component applying the Slice OLAP operator to data. So, now the GeOlaPivot Tablewill contain only one cell showing the cube represented in figure 2. It shows that the highest incidence rate for AIDS from 2001 to 2003 regards at most north Italy districts. What characterize this area? Answers could be found in thematic attributes. Showing thematic attributes for the new aggregated measure it can benoticed that the areaclass for this area is classified as “cities and services”.
184

Figure 2. Aggregation of Districts in GeOlaPivot Table
5 Related Work
Several SOLAP visualization tools have been developed until now. All of these have at least one common feature: spatial dimension is the main visual instrument to explore, interact and analyze multidimensional data. In other terms, supported SOLAP applications provide one spatial cartographic dimension, and many classical dimensions and alphanumeric measures. User interacts with the map to show measures with graphical display or visual variables on the map. The following brief summary of the analysis capabilities of the main SOLAP tools will better describe this feature.
In [14] authors describe a SOLAP client tool (figure 3a) which supports a tabular data representation, 7 different types of diagrams and maps, composed by visual variables and maps superimposed with graphical diagrams. These techniques are applied to spatial dimension. Spatial data represents inputs of multidimensional analysis and the result of this analysis is an alphanumeric data spatially related to it. Moreover, some particular SOLAP operators (spatial drill down or thematic roll up) have been realized. Synchronization of maps and tabular representation of data permits to links spatial and OLAP features. User works on tabular data clicking on maps and vice versa. Another effort to support multidimensional spatial-numerical decision process is SOVAT (figure 3b) [15]. This tool permits to navigate into multidimensional databases, and to analyze spatio-temporal data using graphical displays, maps, and tabular representation. In contrast with the previous tool, in SOVAT cartographic representation of spatial dimension is predetermined in the user interface, limiting the kind of different visual possible representations, but linking more strongly the spatial dimension to the tabular representation.
Figure 3. Different SOLAP tools
In [20] is presented CommonGIS, a powerful tool for interactive visual geo-analytics, extended to process hierarchical multidimensional data from OLAP warehouses (figure 3c). This approach is very different from the previous ones, since it is GIS-compliant. Thus, no tabular representation of data is provided for the multidimensional navigation, which is permitted by means of some parametric geovisualization techniques. Finally, the prototype named GéOlap [18] (figure 3d) handles spatial dimensions and allow OLAP navigation into synchronized tabular, cartographic and diagram representations. In conclusion, in all these tools the classical OLAP features (pivot table, graphical displays, visual variables) are used to visualize alphanumeric data as dimensions and/or measures, whereas some other different and dedicated geovisualization techniques (a wider panorama of geovisualization tools and visualization-based techniques for exploratory analysis of spatio-temporal data is provided in [1]) are used for spatial dimensions. The adoption of a real implementation of the GeOlaPivot Table in a tool for Spatial OLAP could be an improvement of these solutions because it permits to coherently merge, in a single visual environment, the key concepts of pivot tables and Space-Time Cube. This allows us to represent and effectively analyze spatial measures defined as geographical objects [4] according to spatial and alphanumeric dimensions.
6 Conclusions and Future Work
The growing amount of spatial data in data warehouses leads to the formulation of Spatial OLAP (SOLAP) concept. In this work, we have introduced the metaphor of GeOlaPivot Table, which coherently merges, in a single visual environment, the key concepts of pivot tables and Space-Time Cube.
a b
c d
185

Moreover we have presented a mock-up of User Interface exploiting the GeOlaPivot Table, showing how it could be applied to a case study concerning the supervision of infectious diseases in Italy. This approach represents a first effort in adapting advanced geovisualization techniques to SOLAP ones, in order to create a specific visual paradigm for Spatial OLAP able to effectively support and fully exploit spatial multidimensional analysis process. Currently we are working on the implementation of a Server SOLAP to couple with a future real implementation of the GeOlaPivot Table. This will permit us to apply the proposed SOLAP visualization paradigm to a real spatial data warehouse and so to conduct usability tests. Our future work will also concerned with the extension of GeOlaPivot Table with adequate graphic semiology rules to visualize thematic attributes of spatial dimensions and measures and the introduction of chorems in order to visualize spatial trends.
7 References [1] N. Andrienko and G. Andrienko, Exploratory
Analysis of Spatial and Temporal Data A Systematic Approach, Springer-Verlag, 2005.
[2] Y. Bédard, Spatial OLAP, 2ème Forum annuel sur la R-D, Géomatique VI: Un monde accessible, Montréal, 1997, Conférencier invité.
[3] Y. Bédard, T. Merrett and J. Han, Fundaments of Spatial Data Warehousing for Geographic Knowledge Discovery, Geographic Data Mining and Knowledge Discovery, Taylor & Francis, London, 2001, 53-73.
[4] S. Bimonte, A. Tchounikine, M. Miquel, Towards a Spatial Multidimensional Model, In Proc. of the 8th International Workshop on Data Warehousing and OLAP, ACM Press, New York, USA, 2005, 39-46.
[5] C. Franklin, An Introduction to Geographic Information Systems: Linking Maps to databases, Database, 1992, 13-21.
[6] P. Gatalsky, N. Andrienko, and G. Andrienko. Interactive Analysis of Event Data Using Space-Time, In Proc. of International Conference on Information Visualisation (IV’04), London, July, 14-16, 2004, 145-152.
[7] T. Hägerstrand, What about people in regional science? Papers, Regional Science Association, 24, 1970, 7-21.
[8] W. H. Inmon, Building the data warehouse, Edition John Wiley and sons, 1992.
[9] Z. Kouba, K. Matoušek, and P. Mikšovský, On Data Warehouse and GIS integration, In Proc. of the 11th Int. Conf. and Workshop on Database and Expert Systems
Applications, LNCS, 1873, Springer-Verlag, London, UK, 2000.
[10] A. M. MacEachren, An evolving cognitive-semiotic approach to geographic visualization and knowledge construction, Information Design Journal, 10:1, 2001, 26-36.
[11] E. Malinowski, and E. Zimányi, Representing spatiality in a conceptual multidimensional model, In Proc. of the 12th annual ACM International workshop on Geographic information systems, ACM Press, New York, USA, 2004, 12-22.
[12] http://www.survey.com/olap/
[13] S. Rivest, Y. Bédard and P. Marchand, Toward Better Support for Spatial Decision Making: Defining the Characteristics of Spatial On-Line Analytical Processing (SOLAP), Geomatica, 55:4, 2001, 539-555.
[14] S. Rivest, Y. Bédard, M. J. Proulx, M. Nadeau, F. Hubert and J. Pastor, SOLAP: Merging Business Intelligence with Geospatial Technology for Interactive Spatio-Temporal Exploration and Analysis of Data, Journal of International Society for Photogrammetry and Remote Sensing (ISPRS) Advances in spatio-temporal analysis and representation, 60:1, 2005, 17-33.
[15] M. Scotch and B. Parmanto, SOVAT: Spatial OLAP Visualization and Analysis Tool, In Proc. of the 38th Annual Hawaii International Conference on System Sciences, Waikoloa, 2005.
[16] N. Stefanovic, J. Han and K. Koperski, Object-Based Selective Materialization for Efficient Implementation of Spatial Data Cubes, IEEE TKDE, 12:6, 2000, 938-958.
[17] C. Stolte, D. Tang and P. Hanrahan, Polaris: A System for Query, Analysis and Visualization of Multi-dimensional Relational Databases, IEEE Transactions on Visualization and Computer Graphics, 8:1, 2002.
[18] A. Tchounikine, M. Miquel, R. Laurini, T. Ahmed, S. Bimonte and V. Baillot, Panorama de travaux autour de l’intégration de données spatio-temporelles dans les hypercubes, Revue des Nouvelles Technologies de l'Information, Editions Cepaduès, numéro spécial, 2005.
[19] C. Thomsen and B. Torben, A Survey of Open Source Tools for Business Intelligence, In Proc. of 7th International Conference on Data Warehousing and Knowledge Discovery, 2005, 74-84.
[20] A. Voss, V. Hernandez, H. Voss and S. Scheider, Interactive Visual Exploration of Multidimensional Data: Requirements for CommonGIS with OLAP, In Proc. of 15th International Workshop on Database and Expert Systems Applications, 2004, 883-88.
186

Abstract - Query languages for multi-sensor data sources aregenerally dealing with spatial-temporal data that in manyapplications are of geographical type. Such applications arequite often concerned with dynamic activities where the col-lected sensor data are streaming in from multiple sensors.When applied to dynamic processes where the main purposeis to create a basis for decision making it generally becomesdifficult to demonstrate the feasibility of the system and tohandled the extra tools that may be required. To overcomethis problem the query language QL has been attached to asimulation framework that can be set up to form the basis fordemonstration of the query language and eventually also itsusage in decision making processes. In this work the querylanguage will be discussed together with some other servicesuseful as complements to the query language. The system willbe illustrated and discussed by means of a scenario that hasbeen run in the simulation environment.
1. IntroductionQuery languages dealing with dynamic processes in geo-graphical environments are hard to evaluate in realistic sit-uations. This is especially complicated as the input data generally come from various sensors that cannot produce exact data. This is due to limitations that are inherit in all sensors. Sensors can be seen as specialized tools that never includes complete information with respect to the observed objects, e.g. a video can be used to determine the colour of an object whereas an IR-camera cannot. Thus to get a com-plete description of an object, in which a user can have con-fidence not just a single sensor but a number of sensors are required. Due to the uncertainty in the multi-sensor data the result must be subject to sensor data fusion [11]. The main reason for this is that it must be determined up to some rea-sonable level of certainty that the target object is the same that was observed by all the sensors, which is a classical problem in sensor data fusion. QL [18], [19] has capabil-ities for handling multiple sensor types and a method for data fusion [14]. As sensor data systems cannot be seen as user friendly if they require sensor and sensor data user competence it is of utmost importance for their usage to make them sensor data independent. This concept, that is discussed subsequently can be seen as an important aspect of QL that must be of concern to most systems that uses sensor data as input. Clearly, this is further motivated by the fact that an end-user, that is not a sensor expert, have better
things to do then to care about which sensor(s) that should be used by the system. Another aspect related to the problem of sensor technique concerns the fact that few sensors can be successfully used under all weather and light conditions. Thus sensor data independence is motivated to let the users concentrate on their main activities and let the sensors be dealt with by the system. Sensor data are generally collected to determine what is going on during specific dynamic processes.These process are quite often of complex nature and cannot be carried out without spending much time and system resources unless they can be simulated in some way. To illustrate how a number of decision support tools (services), of which the query languages is the most powerful and general, can be used to monitor such dynamic processes, a simulation framework has been used. This particular simulation frame-work is called MOSART [20] and it is a central part of this system; it includes a scenario engine that keeps track of a large number of events while monitoring a large number of moving objects, i.e. basically vehicles. The input data to the simulation framework come from a set of sensor models that, for each sensor type, correspond to a piece of software that simulates the real sensor and generates data corre-sponding to the ongoing situation at hand in the simulation framework. As a consequence, scenarios with a number of ongoing events can be run while applying the various deci-sion support tools over time. The information used for deci-sion making thus comes from the sensor models observing the area of the scenario. Thus it becomes possible to deter-mine the various events as they occur and in parallel to this it also becomes possible to build up and maintain an opera-tional picture of the scenario. This gives the users of the system an understanding (awareness) of what is going on and on the basis of the operational picture they can make their decisions in order to solve the problems implied in the scenario. A fairly related approach is presented by Louvi-eris et al [15] that describes a method based on case based reasoning that uses input from a scenario and where the user interaction is carried out by a query language.Many attempts have been made to visual interfaces, e.g. for SQL, but only a few have touched the issues of spatial and/or temporal queries and few cases are concerned with data from sensors. An attempt to handle temporal data is given by Dionisio et al. with the tool MQuery [9], but this approach is very simple and does not, for instance, handle
A scenario driven decision support system
Karin Silvervarg, Erland JungertSwedish Defence Research Agency
[email protected], [email protected]
187

Allens [2] time intervals. Chittaro et al [8] have devel-oped a system for handling those time intervals, but it is not a complete query language. Abdelmoty et al [1] have made a representation of visual queries in spatial data-bases with a filter-based approach. Bonhomme et al [3] have proposed a visual representation for spatial/tempo-ral queries based on a query-by-example approach. Chang [6] has made an approach to use c-gestures for making spatial/temporal queries in what he calls a sen-tient map. These rapproaches have all partly influenced our approach to a visual query language for spatial and temporal queries.In this paper the problem of the work including its con-text is discussed in section 2. The query language is briefly presented in section 3 while section 4 discusses the simulation framework including the sensor models as well as the planning and association services available in the system. Section 5 describes the scenario used in the demonstration. Finally, section 6 discusses the outcome of the scenario and section 7 presents the conclusions.
2. The problem and its contextThe main problem in this work has been concerned with how to query multiple sensor data sources observing dynamic environments in a way that makes it possible for end-users to determine events of dynamic processes and eventually get a situation understanding that can be used for relevant decision making. To achieve this goal many complex subtasks must be solved. Among these are the design of a user interface. Of concern is not only, which input information to be given to the users but also how it should be given. The question also arises how the information returned by the system should be presented. These problems are all of particular importance when considering that the queries are applied in order to deter-mine events in a complex dynamic process. It is also of importance to remember that most data are of spatial/temporal type. Thus, an aspect that a user must consider when applying a query concerns what will be asked for. The general answer to this question is of various types of objects extracted from the sensor data. The objects may, for instance, correspond to vehicles but it is not suffi-cient to just return the object types since the user may also be interested in different spatial and temporal rela-tionships, status and attribute values. Of concern is also the fact that since the input data is generated by sensors various types of data uncertainties must be considered. As the activities of the observed objects correspond to events in dynamic processes means for demonstration of these aspects must be available. The approach taken to demonstrate the dynamic aspects of the query language
has been to attach it to a simulation framework with a built-in scenario generator and where the sensors are simulated by sensor models.
3. The query language QLThe query language discussed in this work is called QL [7]. QL deals generally with data from multiple sensor data sources with capabilities for sensor data fusion. A further aspect of importance is sensor data independencemeaning that an end-user should be able to apply queries without being aware of which sensors involved in the process of answering the queries. Furthermore, the vari-ous sensors may be of different types and generates het-erogeneous sensor data images. For this reason, a large number of algorithms for sensor data analysis [13] must be available to the system. It is thus necessary that selec-tion of sensors and sensor data algorithms must be car-ried out autonomously. This is controlled by an ontological knowledge based system [14]. Repetitive queries without interference from the users are also pos-sible. In this way, queries arbitrarily be repeated and as the light and weather conditions change the selections of sensor types may change. E.g., at daylight a video cam-era can be selected but as the day shifts to night the video needs to be replaced; perhaps by an IR-camera.The query language allows classification of objects but it also allows cuing, i.e. detection of possible candidates as a first step towards classification. Sensors used for cuing can, for example, be a ground senor network or a syn-thetic aperture radar (SAR), while sensors for object classification can be IR-cameras, laser radar and CCD-cameras. Observe that in this context classification means determination of the object class not strictly determination of the identity of a specific object. A dis-tinction between these two classes of sensors is that the former generally covers a much larger areas than the lat-ter. Thus, the former can be used to quickly search through the AOI for object candidates much faster than the sensors used for classification. That is, the detection sensors can be used to scale down the search areas for the classification sensors in which case the classification step can be carried out much faster. Thus the classifica-tion sensors have a low coverage and a high resolution opposite to the detection sensors.The basic functionality of the query language can be described as follows. A query is inserted by a user and the input is fed in to the query processor, which in a dia-logue with the ontological knowledge module generates a set of sub-queries; one for each of the selected sensors. The subqueries are then refined and executed by the query processor. Once the sub-queries have been exe-cuted instances of their result are inserted in a database. The execution of the sub-queries goes on until the set is
188

empty, i.e. when there is no further sensor data available to process. In a final step data fusion is, if applicable, carried out using the results of the sub-queries as input and then the process terminates. Sensor data fusion [14] is another, quite unique, property of QL that does not occur in traditional query systems. The motivation for sensor data fusion is to allow informa-tion from multiple sensors to eventually support identifi-cation of the requested objects, but also to complement the information since different sensors can register differ-ent object properties.
4. The simulation frameworkIn this section the simulation framework MOSART, the sensor models and the decision support tools that have been integrated with the framework be discussed.
4.1 MOSARTThe primary objective of MOSART [20] is to simplify integration of research results to allow increasingly larger simulations and demonstrations. MOSART has a modular environment providing basic simulation func-tionality and enabling efficient integration of own and commercial software. It contains four main parts:• software for integration,• basic features for simulation,• integrated results from other research projects,• a gateway to reality.These main parts make it easier for research projects to evaluate the results in a larger context by setting up more advanced simulations and demonstrators. This is accom-plished by integration of research results, basic features and other research results integrated in the framework.
4.2 Sensor modelsCARABASCARABAS [12] is an airborne synthetic aperture radar (SAR) [5]. Compared to traditional radars CARABAS uses a much longer wavelength. The wavelength is typi-cally 3 - 15 meter, unlike common microwave SARs that uses wavelengths in the size of centimeters. Objects that are much smaller than the wavelength does not signifi-cantly affect the result of the radar. The effect is that CARABAS can see through vegetation, i.e.tree trunks and branches in a forest does not prevent the radar from seeing what is on the ground. CARABAS flies typically at a distance of 12 km and at an altitude of 6 km.
IR-sensor and processingFor this scenario we have used a simulated IR (infrared) sensor that has been developed for use in simulations concerning network centric warfare [16]. The sensor model is developed for simulated helicopter or UAV attachment. It is fast, but still gives realistic results.
The images produced by the IR-sensor are processed by an algorithm that uses particle filtering and has the possi-bility to track moving vehicles seen by the sensor.
Ground sensor netA sensor network for ground surveillance can be used for detection, tracking and classification of vehicles. It is made up by arrays of acoustic and seismic sensors, i.e. microphones and geophones. Signal processing can be carried out by each of the sensor nodes. All sensors know their position and orientation and can communi-cate with other nodes, associate and fuse object data [4].
4.3 Tools for decision supportSB-planSB-plan is a tool for supporting and improving the work of planning for a decision maker. Nowadays a lot of the planning is made by the help of pen and paper. Thus the main idea of SB-plan is to support the decision maker transferring this work to the computer. One possible use of SB-plan is sensor management. In this case SB-plan can aid the decision maker in calcula-tion of an optimal path for a UAV, where the UAV needs to visit certain places along a certain route. The optimal locations of ground sensor networks can also be calcu-lated, e.g. to monitor movements in an area while con-sidering the known information about other parties, their positions and assumed goals.
Association analysisA tool for association analysis of observations of vehi-cles [17] is also available. Association is the process of deciding which observations that concern the same vehi-cle. This is motivated for various reasons. General asso-ciations, if possible, returns fewer tracks, and is thus a less complex situation to analyze and understand. One important question to determine is the number of vehi-cles that occur. Without association analysis they may seem a lot more than they really are. With association analysis it is possible to make guesses about which route a certain vehicle has taken.
5. The scenario descriptionIn the country Crisendo there are two ethnical groups A-people and B-people. A-people is a minority and live in small enclaves. One of these enclaves contains the mountain Great Wredski Peak. This mountain was the place of a big battle between the ethnic groups in 1455. The battle finished on the 12th of November and A-peo-ple was defeated. A small group of B-people annually celebrates this victory by marching to a place just south of the peak. During the last few years the celebrations have been rather small and only a small group of nation-
189

alists have participated. Because of increasing tension between the ethnical groups the enclave is now under the protection of the UN. This year there has been rumours that the nationalists has been able to get the sympathy from a larger group of peo-ple. Thus, there may be a problem to protect the enclave. The scenario begins at midnight November 12, 2005, the year of the 550 years anniversary of the battle
5.1 Purpose and goalThe purpose of this scenario is to show how information about the process can be gathered and presented to a decision maker to assist him in his decision process. The goal is to have as correct information as possible to make possible to the decision maker to take correct decisions about which measures to take during the scenario.
5.2 Resources available to the UN troopsThe UN troops have half a platoon deployed at an obser-vation post at a point near the route to the peak. The UN company is stationed a few km south of the mountain. The company has a UAV (Unmanned Aerial Vehicle) which carries an IR-sensor and has the possibility to carry and deploy six small ground sensor networks. In total the UN company has 10 ground sensor networks available.These networks are all unattended, i.e. of, so called, unattended ground sensornetwork type (UGS).
Figure 1. The initial setup on the morning of the 12 November 2005.
Two permanent ground sensor networks has been deployed at the probable routes to the peak. The road leading north from the peak is covered by a minefield, thus preventing vehicles and people from entering the area by that route. If needed an air plane carrying a CARABAS system can be requested. The general start situation can be seen in figure 1.
5.3 ToolsThe scenario is simulated in the simulation environment MOSART. It uses several sensor models to produce real-istic data. Three different tools for aiding the decision process has been used, i.e. the query language QL for information search, the association service that uses object information found by QL as input and SB-plan d to decide where to deploy the sensor nets.
6. Course of eventsThe scenario begins at midnight on November 12, 2005. The UN troops have received rumors about a demonstra-tion larger than usual this day, but the rumors are uncon-firmed. With the support from QL they monitor incoming data in search for vehicles in the area. For this a fairly simple query is applied:
AOI: A rather large area covering the vicinity of the peak, but none of the nearby towns.IOI: From midnight and continuously forward.Object: Vehicles
Figure 2. The result from QL at 2:37
Figure 3. The estimated location of the vehicles that arrived at 2:30.
190

At half past two in the morning three vehicles pass the southern most stationary ground sensor net from east to west. As the observation post has not detected any vehi-cles on the big soar going south the conclusion is that the vehicles have stopped between the sensor nets and the big road, see figure 3. The vehicles has been classified by the net as one large vehicle i.e. a truck or a bus, and two small vehicles, probably passenger cars.At dawn, 6.12, the observation post reports that a road-block has been setup during the night north-east of the observation post. It consists of one truck and three cars. The conclusion is that the people in the vehicles, south-east of the observation post, which arrived during the night also have set up some kind of roadblock. Together these two roadblocks, see figure 4, are probably meant to keep the UN troops locked in to stop them from patrol-ing the area. Since the UN troops have flying reconnais-sance support this will be used instead of forcing a confrontation. The CARABAS is requested to fly across the area to collect further information about the situa-tion.
Figure 4. The known situation at 6.12.
When the CARABAS data are delivered they are found to include too much data of which some probably are false due to uncertenties but with the help from QL the vehicles on roads can be determined. The query to QLwas (see also figure 5):
AOI: The are covered by CARABAS, but excluding the nearby towns.IOI: The time for the CARABAS detections.Object: Vehicles on road.
Since CARABAS only gives detections and no detailed information about the observations it is time to use a fur-ther sensor, that is the UAV with the IR-camera. Its mis-sion will be to take a look at all the observations. Since there are obvious activities in the area the UAV will also be used to drop some additional sensor nets. To find out the best positions for the nets SB-plan is used. SB-plan contains information about the roads in the area. The commander also adds information about the most proba-ble sources for “enemy traffic” which in this case is the nearby towns and the most probable goal that is the peak. This tool finds which places, usually crossings,
that will cover the most possible traffic. Then SB-plan is used to find a route between the places for the new nets and the observations from the CARABAS system.
Figure 5. The vehicles on roads found by CARABAS (left), and theconditional part of the on the road query (right).
Around 8:30 detections from the new nets start to arrive into the system. This time larger vehicles like trucks or buses have detected. The result determined by QL can be seen to the left in figure 66. It is not easy to know from the information given by QL how many trucks or buses there are in the area. QL gives all detections from all possible sources. In this case the sources were the sensor nets and the IR on the UAV. To facilitate the inter-pretation of the detected vehicles data are fed into the association analysis tool. This tool then tries to deter-mine which of the observations that probably correspond to the same vehicle. The tool then approximates the routes taken by the vehicles. Then the tool animates the course of events to make it easy for a human to under-stand. The verified detections to the left and the approxi-mations to the right in figure 66.
Figure 6. The vehicles that was detected between 8:30 and 8:45. To theleft the presentation in QL, to the right the presentation in the tool forsituation analysis.
Between 10 and 10:30 additional vehicles are detected and visualized and associated with the association tool. By now a lot of probable demonstrators have arrived and in addition some vehicles that can be assumed to contain armed persons. This is the end of the simulation since now the UN troops have gathered enough information to take their decisions. The situation as presented with the
191

combined information from the tools can be seen to the left in figure 7. The ground truth given by the simulation engine is presented to the right in figure 7. Both cases are schematical but the tools have determined the correct number of vehicles in all cases except for one bus that was missed by the sensor nets since it managed to chose a route that was not covered. The situation presented by the tools is consequently very close to the “real” situa-tion in the simulation.
Figure 7. The end of the scenario, as given by the system (left) and theground truth from the simulation engine (right)
7. ConclusionsThe system described in this work can basically be seen as a system that supports decision making in dynamic processes that take place in geographic environments and where the used data sources correspond to multiple sensors of various types. The system contains a set of services (tools) of which the query language is the domi-nant and most powerful. However, the system cannot only be used for test and demonstration purposes but for system development purposes in a recursive way where the purpose should be to develop and apply new services during controlled forms. As demonstrated the query lan-guage can systematically be used over long periods in time and consequently it can also be subject to future research for development of extended facilities in query languages such as e.g. how to apply queries about vari-ous types of time dependent object behavior.References[1] Abdelmoty, A., El-Geresy, B., Qualitative Tools to Support
Visual Querying in Large Spatial Databases, Proc. works. of Vis. Lang. and Comp., Miami, FA, Sept. 24-26, -03.
[2] Allen, J. F., Maintaining knowledge about temporal inter-vals, Communications of the ACM, vol. 26, no. 11.
[3] Bonhomme, C., Aufaure, M.-A. and Trépied, C., Metaphors for Visual Querying of Spatio-Temporal Databases, Lec-ture Notes in Computer Science Vol.1929, 2000, p 140-53
[4] Brännström, M., Lennartsson, R.K., Lauberts, A., Habbers-tad, H., Jungert, E. and Holmberg, M. Distributed Data Fusion in a Ground Sensor Network, Proc. of The 7th Int.l Conf. on Information Fusion, Stockholm, 2004.
[5] Carrara, W. H., Majewski, R. M., Goodman, R.S., Spotlight Synthetic Aperture Radar: Signal Processing Algorithms,Artech House, 1995, ISBN 0890067287
[6] Chang, S.-K., The sentient map, Journal of Visual Languag-es and Computing, Vol 11, No. 4, Aug. 2000, pp 455-474.
[7] Chang, S.-K., Costagliola, G., Jungert, E. and Orciuoli, F., Querying Distributed Multimedia Databases and Data Sources for Sensor Data Fusion, IEEE Trans. on Multi-media, Vol. 6, No. 5, October 2004, pp 687-702..
[8] Chittaro, L. and Combi, C., Visualizing queries on databas-es of temporal histories: new metaphors and their evalua-tion, Data & Knowledge Eng., v 44, n 2, Feb. 2003, p 239.
[9] Dionisio, J.D.N. and Cardenas, A.F., MQuery: a visual que-ry language for multimedia, timeline and simulation data,J.of Vis. Lang. and Comp., v 7, n 4, Dec. 1996, p 377-401
[10] Egenhofer, M., Deriving the combination of binary topo-logical relations, J.of Visual languages and Computing, Vol 5, pp 133-49.
[11] Handbook of Multisensor Data Fusion, D. L. Hall & J. Lli-nas (Eds.), CRC Press, New York, 2001.
[12] Hellsten, H., Ulander, L. M. H., Gustavsson, A., Larsson, B., Development of VHF CARABAS-II SAR, Proc. Radar Sensor Technology SPIE vol. 2747, 1996, s. 48-60
[13] Horney, T., Ahlberg, J., Jungert, E., Folkesson, M., Silver-varg, K., Lantz, F., Franssson, J., Grönwall, C., Klasén, L., Ulvklo, M., An Information Sustem for target recognition,SPIE defense and security, Orlando, FA, Apr 12-16, 2004.
[14] Horney, T., Jungert, E., Folkesson, M., An Ontology Con-trolled Data Fusion Process for Query Language, Pro-ceedings of the International Conference on Information Fusion 2003 (Fusion’03), Cairns, Australia, July 8-11.
[15] Louvieris, P., Mashanovich, N., Henderson, S., White, G., Petrou, M., OíKeefe, R., Smart Decision Support System Using Parsimonious Information Fusion, Proc. of the Int. Conf. on Information Fusion, Philadelphia, PA, 2005.
[16] Nyberg, S., IR-sensormodell för markspaning med flyg-ande farkost, FOI-R--1224--SE, 2003.
[17] Salmond, D. J. and Gordon, N. J., Group Tracking with Limited Sensor Resolution and Finite Field of View, SPIE, Vol 4048, Sig. and Data Proc.of Small Targets, Apr 2000.
[18] Silvervarg, K., Jungert, E., Uncertain topological rela-tions for mobile point objects in terrain, Proc. of 11th Int. Conf. on Distr. Mult. Systems, Banff, Canada, Sept. 5-7, 2005, pp 40-45.
[19] Silvervarg, K., Jungert, E.,A Visual Query Language for Uncertain Spatial and Temporal data, Proc. of the Conf. on Visual Information systems (VISUAL’05), Amsterdam, The Netherlands, July 2005.
[20] Tyskeng, M., MOSART - Instructions for use, FOI-R--1098-SE, dec 2003.
192

A visualization tool for spatio-temporal data mining M. Bertolottoa, S. Di Martino b, F. Ferrucci b T. Kechadi a
a University College Dublin, Dublin, Ireland {michela.bertolotto, tahar.kechadi}@ucd.ie
b Università degli Studi di Salerno – DMI, Fisciano (SA), Italy {sdimartino, fferrucci}@unisa.it
Abstract Spatio-temporal datasets are often very large and
difficult to analyze and display. Since they are fundamental for decision support in many application contexts, recently a lot of interest has arisen towards data-mining techniques to filter out relevant subsets of very large data repositories as well as visualization tools to effectively display the results. In this paper we propose a tool supporting visualization of spatio-temporal datasets, which exploits Google Earth to render in 3D the resulting knowledge and associated data overlapped onto a satellite image and an arbitrary number of cartographical layers. This tool is particularly useful to highlight spatial relationships among the considered datasets and their spatial context, in terms of geographical layers, such as cities, roads, etc., as well as to show how the phenomenon evolves during the time.
1 Introduction During the last decade, our ability to collect and
store data has far outpaced our ability to process, analyze and exploit it. Many organizations have begun to routinely capture huge volumes of historical data describing their operations, products and customers. As a result, the coverage and volume of digital geographic datasets are extensive and steadily growing (it is estimated that about 80% of the data stored in corporate databases integrates spatial information [6]), leading to huge amounts of geo-referenced information, that need to be analyzed and processed.
This data is often critical for decision support, but its value depends on the ability to extract useful information for studying and understanding the phenomena governing the data source. Consequently, the need for efficient and effective analysis techniques on spatio-temporal datasets has recently emerged as a research priority [3]. Data mining is a good approach that can contribute enormously to providing viable solutions for this problem [5]. It is a user-centric, interactive process, where data mining experts and domain experts work closely together to gain insight
on a given problem. In particular, spatio-temporal Data Mining is an emerging research area [12], encompassing a set of exploratory, computational and statistical approaches for analyzing very large spatial and spatio-temporal datasets. Presently, several open issues can be identified in this research field ranging from the definition of suitable mining techniques able to deal with spatial information to the development of effective methods to analyze the produced results.
In particular, Visualization Techniques are a widely recognized powerful approach for data analysis and mining [9], since they take advantage of human abilities to perceive visual patterns and to interpret them [11], [5], [1]. The basic idea is to complement the computer processing capabilities with the great human pattern-recognition ability, to provide new insights on the considered phenomena [6]. However it is widely recognized that spatial visualization features provided by existing geographical applications are not adequate for decision-support systems when used alone, but alternative solutions have to be defined [3]. Indeed, these novel solutions should not only include a static graphical view of the results produced by the mining algorithms, but also the possibility to dynamically obtain different spatial and temporal views as well as to interact in several ways with them. This could allow the discovery of details and patterns that might otherwise remain hidden. As a result, nowadays the most critical research challenges include how to visualize the spatio-temporal multidimensional dataset [2], and how to define effective visual interfaces for viewing and manipulating the geometrical components of the spatial data [16].
To address these issues, we have developed a system suited to interactively visualize in 3D the outcome of the mining process. It exploits Google Earth [7] to render the mining outcomes, overlapped onto a satellite image enhanced by an arbitrary number of informative layers. This tools is targeted to domain expert users, and it is particularly useful to highlight spatial relationships among the considered datasets and their spatial context, in terms of geographical layers, such as cities, roads, mountain chains, seashores etc.,
193

as well as to show how the phenomenon evolves during the time.
This newly created tool has been tested against a large real-world dataset (Hurricane Isabel, which struck the US east coast in September 2003, see [13]), trying to solve the critical issue of uncovering characteristics and behavior of a destructive natural phenomenon. The Hurricane Isabel dataset is freely available and describes the main characteristics, sampled each hour along the two days of greatest intensity of the storm. The resulting dataset is huge, containing more than 25 millions real-valued points in each timestep, resulting in 62.5 GBytes of data, and thus representing a significant case study.
The remainder of the paper is structured as follows. Section 2 introduces the main aspects of visual data mining, and then presents the developed tool, both in terms of User Interface and in technical aspects. Section 3 is dedicated to the case study selected and to a discussion of experimental results. Finally in Section 4 we present some conclusions and ideas for future work.
2 The Proposed System The Data Mining process usually consists of three
phases, or steps: 1) pre-processing or data preparation, 2) modeling and validation and, 3) post-processing or deployment. The third step can take the greatest benefits from data visualization, since its basic objective is to represent as much hidden information as possible. In this case, efficient visualization algorithms and tools should also be provided to assist the user in decision-making and data interpretations.
Visual Data Mining refers to methods, approaches and tools for the exploration of large datasets by allowing users to directly interact with visual representations of data and dynamically modify parameters to see how they affect the visualized data. This is usually achieved by means of techniques from information visualization, visual perception, visual metaphors, diagrammatic reasoning, and 3D computer graphics [5], without requiring the decision makers to have knowledge on technicalities.
Visual Data Mining techniques have proven to be very valuable in exploratory data analysis and they also have a high potential for mining large databases [11], since they shift the load from the user's cognitive system to the perceptual system [4]. As a result, visual data mining is a crucial area in explorative data mining, aimed at enhancing the effectiveness of the overall mining process, by supporting analytical reasoning.
We have developed a visualization tool, suited to render the outcome of mining on large spatio-temporal datasets, describing the behavior of some natural phenomena, which have been monitored and recorded at several time instants. The system is mainly intended to deal with datasets characterized by thematic properties, expressed through some values of attributes that change over the time [1].
Since the output of a mining process requires instruments for the interpretation, in our system we envision feeding the results of the mining process to several alternative visualization tools, possibly providing complementary interacting functionality. In this paper we focus on a tool that to render the outcome of the mining process in a 3D virtual environment, allowing the user to freely change his/her viewing perspective. The goal of this application is to enhance the overall knowledge discovery process, allowing decision makers and knowledge engineers to better understand and discuss the logic behind the models, by supporting analytical reasoning.
This tool is focused on highlighting the spatial relationships between the considered data and the real-world geographical entities involved in the phenomenon, allowing users to validate the spatio-temporal mining process, and the discovered patterns.
From a data visualization point of view, the two tools follow in many respects the same approach. Geographical data are arranged in many different layers – one for each theme (variable). Rules are intended substantially as sets of items, each identifying a range of values for a specific variable; hence displaying an item means painting an isocloud of points (a 3D scatter-plot) with the same value. Moreover, both tools allow for some degree of customization in the presentation of data (for instance in the colors used to represent a specific attribute).
2.1 The Google Earth-based tool This tool is meant for domain-expert users. Indeed,
it is aimed at providing an interactive environment, where these users can get insight on relationships between the mining outcomes and nearby geographical entities. To this aim, the tool propose some widgets to carefully select the information to deal with, which will be rendered in 3D over a map and other layers provided by Google Earth.
Google Earth (shortly GE) is a virtual globe, currently freely available for personal use. For commercial and professional use, many purchasing options are available, ranging from basic licenses to enterprise services. Google Earth combines satellite
194

raster imagery, with vector maps and layers, in a single and integrated tool, which allows users to interactively fly in 3D from outer space to street level views. A very wide set of geographical features (streets, borders, rivers airports, etc.), as well as commercial points of interest (restaurants, bars, lodging, shopping malls, fuel stations, etc.), can be overlaid onto the map. A key characteristic of this tool is the fact that the geographical data are not stored on client computers, as they are streamed, upon request, from Google's huge server infrastructure, ensuring fast connections and almost 100% up time. Moreover, this guarantees that data are always up-to-date. The application uses data from NASA databases to render 3D terrain models, thus providing also Digital Elevation Model features.
We have exploited the 3D capabilities provided by Google Earth, together with the updated geographical information layers available on the web, to combine dataset themes and variables with real world infrastructures and geographic features. This application turns out to be very flexible, being able to deal with a large variety of spatio-temporal phenomena, ranging from worldwide (e.g.: weather, pollution, epidemic diffusions, etc…) to local ones (e.g.: local health, traffic, economics, etc…). The tool we developed embeds GE and presents the same ease of use, resulting very suitable for domain-expert users.
For data presentation, we exploit the “focusing” visualization technique [1], where the user can freely move his/her perspective view in a 3D environment, to analyze the dataset. Indeed, data are shown in a 3D animated perspective canvas that can be rotated, zoomed and moved. A left panel allows the decision maker to query the dataset, in order to define the specific (set of) themes/rules to render, and to customize the way the information is depicted. A bottom panel provides a widget to see how the phenomenon evolved over the time.
Each considered variable is rendered as an isocloudwith a different color. The application works accordingly to the principle that all the data that do not match these query parameters, set by the user, are removed from the visualization canvas. This filtering is immediately applied, thus providing direct manipulation features.
Moreover, each rendered point can be made an hyper link, in order to answer query of the form “When + Where What”, which is a typical analysis task in exploratory spatio-temporal data-mining [14].
The resulting User Interface, shown in Figure 1, is composed of three main panels:
View Panel: This is the GE application, used to show in 3D, at an arbitrary zoom level, the data. It allows for 6 Degree of Freedom, achieved through
Figure 1: Schema of the User Interface
195

combination of mouse clicks and movements, or through a lower panel. Data Panel: This is a vertical panel, located to the left of the window, which allows to query and filter data, to get the specific information that the user wants to view. Through a Tabbed control, the user can choose to deal with the attributes of the whole dataset (the first tab), or with the association rules inferred by the mining engine (the second tab). a. In the former case, the system lists all themes
contained in the dataset (see Figure 1), and for each of them, the user can indicate if it should be rendered, and selects both the specific value to render as an isocloud, both the color to be used to depict the data. For instance, in Figure 1 the isocloud of hurricane’s points having “Pressure” equals to “3” has been rendered in the “Cyan” color. Moreover, to overcome some visualization problems (basically occlusions) that might arise when dealing with 3D representations, the system allows to render only a “slice” of the dataset, based on the altitude. Yet, the user can select to view all the points satisfying a criterion, or clip the representation to the set of points falling into a specific range of altitude.
b. In the latter case, the system lists the set of discovered association rules. As soon as the user selects one of them, the interface presents the antecedent and the consequent variables for the considered rule, in two different visual controls. Again, the user specifies which of them should be rendered as isoclouds, together with the respective colors to be used to depict the data. For instance, in Figure 2, the association rule “Cloud = 0, Precipitation= 0, Pressure=3 QVapor=4, Temperature=2” is being displayed. Then, the Cloud and QVapor variables are selected to be rendered, respectively, in “Cyan” and “Light Green” colors.
Dimensional Panel: This panel allows the user to move in four dimensions, namely the 3D permitted by GE (by exploiting six degree of freedom), and the time dimension, through a sliding bar. To this aim, the horizontal panel, located at the bottom of the window, realizes a unique control panel/set of commands to follow out the data painted on screen.
Figure 2: Visualization of dataset themes (Top) and rules (Bottom). Notice the different widgets provided in the left panel.
2.1.1 Technical Aspects The development of an environment exploiting
Google Earth technologies to render mining outcomes posed two main challenges: 1. How to arrange the information of the dataset
and/or the rules in a way that it could be displayed by Google Earth, and
2. How to improve the Google Earth user interface, to provide the tools to carry out the exploratory spatio-temporal data mining and visualization.
To address the first issue, we exploited the ad-hoc language provided by GE, named Keyhole Markup Language (or KML) [10], which is an XML grammar and file format suited to model one or more spatial features to be displayed in GE. For instance, through this language, a user can assign icons and labels to a location on the planet surface, specify camera positions to define views, and so on. KML supports some basic geometrical shapes, which appearance can be manipulated by defining coordinates (Longitude, Latitude, and Altitude), or extrusions, as well as they can be grouped together into collections, to create and manage complex 3D objects consisting of numerous shapes. These files are then processed by the Google Earth client in a way similar to how HTML files are processed by web browsers. Consequently, GE can be viewed as a browser of KML files. A lot of documentation and tutorials on KML are available over the web. By exploiting this language, the user community is defining a wide set of other points of interest, which can be seamlessly accessed and
196

integrated over the web. In our application, we designed and implemented some routines for an on-the-fly generation of KML files, basing on user input specified in the Data Panel. Each generated KML file contains the coordinates of each considered point of the data (or item) set. Knowing the bounding box of the whole dataset, these coordinates are calculated basing on the position of the specific point in the dataset. The generation of a file containing more than 100,000 points is almost instantaneous on a notebook based on a Pentium M 2.0 Ghz, with 768 Mb of RAM.
In relation to the second issue, there are two main ways to programmatically interact with GE. The former requires the definition of ad-hoc KML files, specifying the starting point of view. This approach is straightforward, but does not provide an effective management of the user interactions. The alternative solution is to use the set of API provided by GE. Indeed, once such an application is installed, a new COM component is available in the Windows system, namely the KEYHOLELib. Once this is imported in a programming environment as a reference library, a new namespace is available, which exports two main classes, i.e. the KHInterfaceClass and the KHViewInfoClass. They grant respectively a full control on the User Interface and the active point of view in GE. In particular, an instance of the KHInterfaceClass permits to start-up the application, to load a KML file, to enable/disable other active layers, to resize the window, and to take screenshots. Moreover to get/set the current point of view, an instance of the KHViewInfoClass allows to set its coordinates, azimuth, tilt and zoom.
To embed the GE windows within our C# application, we wrapped in .NET the FindWindow and SetParent Win32 systems calls, available in the User32.dll, suited to get the handle of an arbitrary window, and to control it, respectively.
3 A Case Study: Hurricane Isabel We have tested our system on a large spatio-
temporal dataset. This section detail the data format and the experimental results obtained.
3.1 The Dataset Hurricane Isabel was the only Category 5 hurricane
of the 2003 Atlantic hurricane season (see [13]). Official reports state that an official damage estimate of 3.37 billion of US Dollars.
All the key data about this phenomenon were logged for two days by the National Center for Atmospheric Research in the United States. The
corresponding dataset was produced by the Weather Research and Forecast (WRF) model, courtesy of NCAR, and the U.S. National Science Foundation (NSF), and is freely available. All variables are real-valued and were observed along 48 time steps (once every hour for 2 days), in a space having 500 x 500 x 100 = 25x106 total points. Each variable, in each time step, is stored in a different file, resulting in 624 files of about 100MB each. Therefore, the Hurricane Isabel Dataset is a proper instance of a massive geographical spatio-temporal dataset, and is widely adopted for data visualization studies, such as the ones made for the IEEE 2004 Visualization Contest [8].
3.2 Visual Results for Exploratory Analysis and Decision Support
In this section we show an example of result gained by applying an adapted Apriori algorithm to the Hurricane Isabel datasets and by viewing them with the visualization tool previously described. We analyzed many results and are reporting here a subset of them, which are most meaningful. In our analysis we tried to discover specific patterns/characteristics that were either well known about hurricane data (such as the existence of an area in the centre of the dataset, called the eye of the hurricane) or that were not known but might have significance for an expert study.
Figure 3: Effects of the dry land on the Cloud Water
For instance, meteorological phenomena are usually highly influenced by the morphology of the area where they occur. Since the hurricane Isabel struck a coastal area, lacking of significant mountain chains, it did not encountered strong barriers limiting its proceeding. It is however really interesting to analyze the effect of the landfall, onto the themes of the dataset. We used
197

our visualization tool to gain insight into these relationships. By analyzing the results, we found that Cloud Water and Water Vapour were the parameters most affected by the seashore. This is clearly visible in Figure 3, where the clearer points represent the locations of the dataset where the Cloud Water has a low level. Darker points basically represent the eye of the hurricane. From this figure it is possible to notice how the altitude with a low level of Cloud Water suddenly drops, as soon as the phenomenon impacts the dry land.
4 Conclusions and Future Work In this paper we have described a tool we developed
for viewing and interacting with the results of the mining process on spatio-temporal datasets, meant for the domain experts.
This tool exploits Google Earth to render in 3D these data, overlapped onto a satellite-image map and an arbitrary number of cartographical layers which can be seamlessly downloaded and integrated. It allows to highlight spatial relationships among the considered datasets and their geographical context.
One of the advantages offered by this tools is the fact that data are displayed using the best practice of information visualization [15], while users can interact in a visual (and thus more natural) fashion, without having to master a query language or understand the underlying structure of the dataset. The right presentation makes it easy to organize and understand the information. As a result, this data visualization facilitates the extraction of insight from the phenomena being analyzed, while offering a better understanding of the structure and relationships within the dataset.
Our system has been tested on a large, real-world spatio-temporal dataset, related to Hurricane Isabel, and has produced interesting results.
We are currently planning to perform additional testing with other large datasets and to improve the types of customization on the rendered data as well as the functionality of the system with the aim to provide a more complete analysis and a higher level of interactivity with the data.
Acknowledgments The authors gratefully acknowledge Dott. Paolo
Compieta for his implementation of the data-mining engine.
References [1] Andrienko N., Andrienko G., and Gatalsky P.,
Exploratory Spatio-Temporal Visualization: an Analytical Review Journal of Visual Languages and Computing, special issue on Visual Data Mining. December 2003, v.14 (6), pp. 503-541.
[2] Bédard, Y. Spatial OLAP. 2ème Forum annuel sur la R-D, Géomatique VI: Un monde accessible, 13-14 novembre 1997, Montréal, CA.
[3] Bédard, Y., Merrett, T., and Han, J. Fundaments of Spatial Data Warehousing for Geographic Knowledge Discovery. Geographic Data Mining and Knowledge Discovery. Taylor & Francis, London, 2001, 53-73.
[4] Buono P., Costabile M. F., Lisi F. A., Supporting Data Analysis Through Visualizations, Proc. Workshop on Visual Data Mining, Freiburg, Germany, 4 September 2001, pp. 67-78.
[5] Costabile M.F., Malerba D. (Editors), Special Issue on Visual Data Mining, Journal of Visual Languages and Computing, Vol. 14, December 2003, 499-501
[6] Fayyad U.M., Grinstein G.G., Introduction, in: Information Visualization in Data Mining and Knowledge Discovery, Morgan Kaufmann, Los Altos, CA, 2001, pp. 1–17.
[7] Google Earth, available at http://earth.google.com/ [8] IEEE Computer Soc., “IEEE Visualization 2004
Contest”, http://vis.computer.org/vis2004contest/, 2004. [9] Johnston W.L., Model visualization, in: Information
Visualization in Data Mining and Knowledge Discovery, Morgan Kaufmann, Los Altos, CA, 2001, pp. 223–227.
[10]KML Specifications, available at http://earth.google.com/kml/kml_intro.html
[11]Kopanakis I., Theodoulidis B. Visual data mining modeling techniques for the visualization of mining outcomes. Journal of Visual Languages and Computing. 14(6): 543-589 (2003)
[12]Koperski K., J. Adhikary, J. Han, “Spatial Data Mining: Progress and challenges”, Proceedings of the ACM SIGMOD Workshop on Research Issues on Data Miining and Knowledge Discovery. Montreal, Canada: 55-70, 1996.
[13]National Hurricane Center, “Tropical Cyclone Report: Hurricane Isabel”, http://www.tpc.ncep.noaa.gov/2003isabel.shtml, 2003.
[14]Peuquet D.J., It’s about time: a conceptual framework for the representation of temporal dynamics in geographic information systems, Annals of the Association of American Geographers 84 (3) (1994) 441–461.
[15]Rivest S., Bédard Y., Marchand P., “Toward better support for Spatial Decision Making: defining the characteristics of Spatial On-Line Analytical Processing (SOLAP)”, Geomatica vol.55, No.4, 2001, pp.539-555.
[16]Shneiderman B., Inventing discovery tools: combining information visualization with data mining, Information Visualization Volume 1, Issue 1 (March 2002), Pages: 5 - 12 ISSN:1473-8716
198

REPRESENTING TOPOLOGICAL RELATIONSHIPS BY USING 3D OBJECTS: AN EMPIRICAL SURVEY
Vincenzo Del Fatto1, Luca Paolino1, Fabio Pittarello2 1 Dipartimento di Matematica e Informatica, Università di Salerno
84084, Fisciano (SA), Italy {vdelfatt, lpaolino}@unisa.it
2 Dipartimento di Informatica, Università Ca’ Foscari di Venezia 30172, Mestre (VE), Italy
Abstract
In this paper we present a survey conducted in order to understand how simple 3D objects, named geometa-phors, can be composed for building a model that permits to represent topological relationships in a 3D space. The research was conducted on twenty participants who were familiar with geographical information systems (GIS) and the notion of topological relationship.
The subjects participating to the survey were asked to put in relation textual labels related to topological rela-tionships with visual compositions of geometaphors pairs. The result is an interpretation model of the visual compositions that represents an important component for the building of visual query environments compliant with the users’ mental model, contributing therefore to aug-ment significantly the usability of such systems.
Keywords. 3D Environments, GIS, Human Factors,
Topological Relationship, Visual Language
1. Introduction Query by Example [10] (QBE) is a method of query crea-tion that allows the user to search for documents; the search is triggered by an example chosen by the user in the form of a selected text string, a document name or a list of documents. Because the QBE backend formulates the actual query, such method, while still enabling power-ful searches, it is easier to learn than formal query lan-guages, such as the standard Structured Query Language (SQL). Such methodology has been successively extended to the composition of queries through visual representations; such approach is particularly interesting for GIS, where the spatial properties of the objects are relevant. In the last decade many efforts have been directed to this aim. As stated by [7], “visual languages are today being widely used as a means for reproducing the user’s mental model of the data-manipulated content”. A great deal of
work has already been carried out for designing such lan-guages for traditional and object-oriented databases: iconic, diagrammatic, graph-based and multi-modal ap-proaches are available in literature. In the spatial domain some of these approaches have been coupled with sketch based interfaces [1, 3]. Most of the work done takes advantage of 2D visual iconic queries. A difficulty arises from the fact that 2D icons are effective only for the retrieval of objects inhab-iting a 2D space; such icons don’t not allow an exact definition of spatial relationships where the third dimen-sion is a relevant feature. That is the reason why in this work we take into consid-eration 3D icons. Such introduction has been necessarily coupled with the definition of a 3D environment where such objects can be manipulated. In fact, as demonstrated by research in experimental and cognitive psychology, the mental processes of human beings simulate physical world processes. Computer-generated line drawings rep-resenting 3D objects are regarded by human beings as 3D structures and not as image features; as a consequence, humans imagine that spatial transformations, such as rota-tions or shifting, happen in the 3D space. Although spatial relationships have been largely studied and many visual languages have been presented there have been only a few attempts to examine, from a user centered perspective, the relations between such visual representations and the use of spatial predicates in natural language. Three interesting works have been presented by Mark and Egenhofer [2, 4, 5], although the focus of such studies is on 2D space relationships. Later, Zlatanova [9] provides a formal categorization of topological relation-ships between multidimensional simple objects in 0, 1, 2 and 3D spaces, but her work, while interesting for the association of topological relationships to real world ob-ject combinations, doesn’t take into account the user per-spective.
199

In this paper we attempt to fill the gap by exploring the relations between the visual compositions of simple 3D objects and the topological relationships expressed in terms of natural language; such work is done in order to provide a solid basis for the definition of a 3D visual lan-guage for GIS exploring.
The model for binding visual representations to topo-logical relationships is derived from a research we have performed on a group of potential users.
Basically, we asked to the subjects to provide a resem-blance value between images representing pairs of ge-ometaphors composed in a 3D abstract environment and textual labels expressing topological relationships. The answers were used for building a model compliant with the users’ perspective. The remainder of this paper is organized as follows: Sec-tion 2 presents the concept of 3D geometaphor; Section 3 describes the topological model survey; the results ob-tained by the interviews, coupled with a set of rules tak-ing into account several parameters, are used to build an interpretation model to query spatial data; Section 4 draws the final conclusions.
2. The 3D Geometaphor
Following the traditional approach of visual query lan-guages, queries are expressed in terms of spatial composition of visual elements, representing objects, op-erators and functions. This section illustrates the associa-tion of visual counterparts to the geographical objects, which represents is an important design choice for the definition of a visual environment for selecting and ma-nipulating such objects. The visual representations are composite visual elements named 3D geometaphors. They derive from previous re-search work [7] and have been extended in order to take into account the role of the third dimension. The ge-ometaphors can be moved in the 3D space in order to build visual compositions.
Figure 1. A representation of the Geometaphor components
Geometaphors are characterized by iconic and property components, as shown in Figure 1. The first component is characterized by the physical de-scription of the object, a textured 3D cube, with an asso-ciated meaning. The presence of textures is an important feature in order to stimulate the visual and textual cogni-tive styles of the end users. In such a way, users under-stand the meaning at once and are immediately able to use them. The property part is divided into type, representing the object type used to store the data (e.g., a REGION for parking areas or a LINE for roads), and source, indicating where data should be retrieved. The source field can con-tain a table, a view name, an SQL query or a function. Different geographical objects, such as points, lines and regions, can be represented by the geometaphor.
Table 1. The components of the geometaphor Parking Area
Physical description
Meaning Parking Area Type Region Source SELECT * FROM ParkingArea
WHERE city = “Rome” Table 1 illustrates the components of the geometaphor Parking Area. The 3D image represents the physical part, Parking Area the meaning, Region the object type and SELECT * FROM ParkingArea WHERE city = “Rome” the source. The example represents a theme correspond-ing to all the Parking Area instances contained in the Parking Area layer and associated to the city Rome.
3. The Topological Model Survey
The visual elements described in the previous section have been used in an empirical study where the geometa-phors’ pairs have been composed obtaining different spa-tial configurations. Subjects partecipating to the survey were asked to put in relation such spatial compositions with textual labels related to the topological relationships defined by the OpenGIS standard [6]. The aim of the survey was to find out a satisfactory matching between visual compositions and topological relationships in order to define an interpretative model as precise as possible. Such work represents an important prerequisite for improving the quality of the interaction in visual query systems where visual compositions represent geometric objects and their relations.
200

3.1 The Subjects
We selected twenty participants among the students and the researchers of the University of Salerno. The subjects were males and females between the ages of 20 and 50; all the participants were usual users of PCs and were fa-miliar with GIS technology and the notion of topological relationship. The test was conducted in a quiet classroom after courses. A lap-top computer was used for displaying the visual compositions, which were built using a custom application implemented for the survey. In order to record the interaction on the screen and the subjects’ talking aloud we used the Camtasia Studio™ software by Techsmith ™. The survey team was present at the test and included a test assistant and an observer/note-taker. We wrote a script that the test assistant read to each partici-pant in order to provide a common background.
3.2 The Task
Basically, we asked to such subjects to provide a resem-blance value between pairs of geometaphors composed in a 3D abstract environment and textual labels expressing topological relationships. Figure 2 represents the pairs of geometaphors and the visual compositions taken into ac-count; each composition corresponds to a different valid Egenhofer’s 9-intersection matrix [6].
Op1
Op2
Op3
Op4
Op5
Op6
Figure 2. Visual compositions generated by the Egenhofer’s 9-intersection matrix
As discussed in [8], the representation of 3D objects on a 2D plane benefits from the implementation of a number of pictorial cues (e.g., perspective, shadow, etc.) that di-minish the ambiguity of the recognition by the user. Accordingly to that research, we used a number of cues for easying the task of recognizing the spatial relations between the geometaphors pairs. The cues used included color, semitransparency and motion (i.e. the ability for the user to change point of view in order to address occlusion issues). It is important to point out that the order the geometa-phors were selected and put into the scene was meaning-ful for the answer and that the test participants were en-abled to distinguish the first selection from the latter. For the sake of the reader in Figure 2 the first selection is identified by the red color and labeled as R while the lat-ter selection is identified by the blue color and labeled as B. The topological relationships are defined according the OpenGIS standard [6] that represents one of the most widely used specifications and includes: Equals, Disjoint, Touches, Within, Overlaps, Contains, Crosses and Inter-sects. The scale for the resemblance parameter was set from 0 to 10, where 0 was associated to the value it does not corre-spond to the relationship and 10 was associated to the value it fully corresponds to the relationship.
The survey results are described in the following sub-section. Each visual composition is associated to a pie chart (see Figures 3-8) displaying the resemblance per-centages resulting from the answers. Percentages are cal-culated by summing, for each relationship, the resem-blance values submitted by all the subjects; the sum is then normalized, assigning 100% to the overall sum of all the resemblance values assigned by the subjects for all the labels.
3.3 The Survey Results
Concerning the Op1 visual composition (Figure 3), three relationships, namely Overlaps, Crosses and Intersects, were considered the most meaningful by having respec-tively a resemblance value of 18%, 25% and 30%.
Equals9%
Overlaps18%
Crosses25%
Intersects30%
Contains6%
Within3%
Disjoint0% Touches
9%
Figure 3. Subjects’ interpretation of the visual composition Op1
RB
B
B
R R
R
B
B R
201

The result implies that the subjects’ mental model does not univocally associate the Op1 operation with a specific relationship. An additional filter is needed in order to select a single interpretation from the resulting set. For obtaining such result we introduce three rules that reduce the most part of the ambiguity:
− Rule 1: the order the geographical objects have been
selected is relevant (e.g., for the Op4 composition only one of the following relations is true: A Con-tains B or B Contains A).
− Rule 2: the Intersects relationship has a lower priority in relation to the other relationships; Intersects is a relaxed relationship that can be defined also as Not Disjoint; in other words it can be associated to all those situations where all the other relationships de-fined above (with the exception of Disjoint) exist; in this work, when ambiguity situations exist, the higher priority relationship is applied.
− Rule 3: some topological relations make sense only for specific categories of objects (e.g., the Point-Point geometry pair accepts only the Disjoint, Equals, Intersects and Overlaps relations).
Applying such rules to the Op1 visual composition we
obtain a reduction of the ambiguity deriving from the subjects’ answers.
In the case of the Point-Point (P-P) and Region-Region (R-R) geometry pairs then only the Overlaps and Inter-sects relationships belong both the Egenhofer’s set and to the resemblance set (Overlaps, Crosses and Intersects). The Overlaps relationship has a priority greater than In-tersects; therefore, applying Rule 2, the Overlaps rela-tionship is selected.
In the case of the Line-Region (L-R), Point-Region (P-R) and Point-Line (P-L) pairs, only Crosses and Inter-sects belong both to the Egenhofer’s set and to the resem-blance set. According to Rule 2, the Crosses relationship is representative of Op1 for such geometry pairs.
A more difficult case happens when the geometaphors represent two lines (L-L). In such situation both Crosses and Overlaps are admissible; the users, interacting with a system implementing our algorithm, will need to select the proper relationship at run-time, according to the spe-cific situation.
As for the remaining geometry pairs, according to Rule 3, the Intersects relationship is the only choice that may be applied. All the results related to Op1 are summarized in Table 2.
Figure 4 shows the resemblance result obtained for the Op2 operation. The most significant percentage is repre-sented by the Disjoint relationship (88%); a much smaller value (12%) is associated to the textual label identifying the Equals relationship.
Disjoint88%
Touches0%
Equals12%
Within0%
Overlaps0%
Crosses0%
Intersects0%
Contains0%
Figure 4. Subjects’ interpretation of the visual composition Op2
Therefore the Op2 operation has been associated to the
Disjoint relationship for any pair built with the geometry types Point, Line and Region.
Equals10%
Disjoint0%
Touches41%
Overlaps9%
Crosses12%
Intersects22%
Contains3%
Within3%
Figure 5. Subjects’ interpretation of the visual composition Op3
The results for the Op3 visual composition are summa-
rized in Figure 5. Two relationships are particularly im-portant: Touches, which gains the 41% of the sample, and Intersects which is represented by the 22% of the sample. According to Rule 2, we have associated the Touches relationship to any pair of geometries, with the exception of the Point-Point (P-P) pair; given that Touches is not defined for such category of objects (i.e. points), accord-ing to Rule 3 we have decided to apply the Intersects rela-tionship.
Within14%
Overlaps7%
Crosses6%Intersects
22%
Contains36%
Equals6%
Disjoint0%Touches
9%
Figure 6. Subjects’ interpretation of the visual composition Op4
As for the Op4 visual composition (Figure 6), the most
important relationship is Contains, but significant results were obtained also for Intersects and Within. According to Rule 2, we have associated the Contains relationship for any pair of geometries that permits this relationship
202

(i.e. all pairs where the first geometry has a greater di-mension than the second one: (R-R), (R-L), (R-P), (L-L) and (L-P)). In the other cases we have applied the Inter-sects relationship that represents the second subjects’ choice. According to Rule 1, the Within relationship has not been considered; such relation seems to be related to a wrong interpretation by the subjects of the geometaphors’ selection order.
Equals20%
Disjoint0%
Touches9%
Within19%
Overlaps12%
Crosses4%
Intersects16%
Contains20%
Figure 7. Subjects’ interpretation of the visual composition Op5
Figure 7 shows the results for the Op5 operation: the
Equals, Within and Contains relationships result as ad-missible hypotheses for the interpretation (i.e. their re-semblance value varies from 19% to 20%). The interpre-tative model discriminates the proper relation on the basis of the geometry dimension (Rule 3). In particular: • if both the geometries have the same dimension
(e.g., Point-Point) the model returns an Equals re-lationship;
• if the dimension of the first geometry is strictly bigger than the second one the model returns a Contains relationship;
• if the dimension of the first geometry is strictly than the second one the model returns a Within re-lationship.
Disjoint0%
Touches8%
Within35%
Overlaps8%
Intersects18%
Contains23%
Crosses4%
Equals4%
Figure 8. Subjects’ interpretation of the visual composition Op6
The last visual composition considered is Op6 (Figure
8). Such visual composition is very similar to Op4; the only difference is related to the selection order of the op-erands. The consequence is that the results obtained rep-resent a mirror of those one obtained for Op6. In fact, we
note a significant predominance of the Within relation-ship, followed by Contains and Intersects.
According to Rule 2, the Within relationship is applied when the first geometry has an equal or smaller dimen-sion than the second one. There is an exception to this rule when both the geometries belong to the type Points; in such situation Intersects is applied. Besides, Intersects is applied when the first geometry has a greater dimen-sion than the second one.
According to Rule 1, the Contains relationship has not been considered because it seems related to a wrong in-terpretation by the subjects of the geometaphors’ selec-tion order.
In conclusion, Table 2 summarizes the bindings among the different geometry pairs, visual compositions and la-bels describing spatial relationships.
Table 2. Summarization of the bindings resulting from the survey
3.4 Using Different Shapes for Representing Geometry Types
Some participants told us that further information about geometries (e.g., using different shapes for each geometry type) would have been useful in order to get more precise bindings between visual compositions and topological relationships. Because of that, we organized a new test where geometries were represented by three different shapes, as shown in Figure 9.
Figure 9. An alternative approach for representing different geometries
Op1 Op2 Op3 Op4 Op5 Op6
R/R Overlaps Disjoint Touches Contains Equals Within
R/L Intersects Disjoint Touches Contains Contains Intersects
R/P Intersects Disjoint Touches Contains Contains Intersects
L/R Crosses Disjoint Touches Intersects Within Within
L/L Overlaps/Crosses
Disjoint Touches Contains Equals Within
L/P Intersects Disjoint Touches Contains Contains Intersects
P/R Crosses Disjoint Touches Intersects Within Within
P/L Crosses Disjoint Touches Intersects Within Within
P/P Overlaps Disjoint Intersects Intersects Equals Intersects
Region Line Point
203

Op 4.1
Op 4.2
Op 4.3
Figure 10. Comparison of the subjects’ intepretation for the visual com-positions Op4, Op4.1, Op4.2 and Op4.3
Results derived from the new test don’t highlight sig-
nificant improvements. In fact, the resulting resemblance diagrams are similar to the previous ones deriving from the unified representation. In some cases, the new results have shown a wider dispersion of data. Figure 10 shows three different visual compositions (Op 4.1, Op 4.2 and Op 4.3) depicting a shape (the blue object) representing either a Region, a Line or a Point; such geometry is dis-posed within another geometry (the red object) represent-ing a Region. The different representations were shown in parallel to the subjects, asking them to associate the visual compositions to the textual labels. The results show that the choice of increasing the number of representations augments the confusion of the subjects. In all the situa-tions, compared with Op4 (see Figure 10), there is a higher number of labels that have been associated to sig-nificant values, but with a lower variance among them. We may infer from such results that a unified representa-tion doesn’t vary significantly the subjects’ interpretation of a certain visual composition and in some cases may lead to better results in terms of convergence towards a unique association between representation and labels.
4. Conclusion
Concluding, this work has considered from a user cen-tered perspective the association between visual represen-tations and a complete set of topological relationships compliant with the OpenGIS standard. The results ob-tained represent a significant contribution for the imple-mentation of visual query systems taking into account as a primary requisite the users’ mental model, in order to augment the overall usability of the systems themselves.
5. References [1] M. Egenhofer, Query Processing in Spatial Query by
Sketch, Journal of Visual Languages and Computing, 8(4) (1997) 403-424.
[2] M. Egenhofer, J. Herring, Metrical Details for Natu-ral-Language Spatial Relations, ACM Transactions on Information System, 16(4) (1998) 295-321.
[3] Y.C. Lee, F.L. Chin, An Iconic Query Language for Topological Relationships in GIS, International Jour-nal of GIS, 9(1) (1995) 25-46.
[4] D.M. Mark, M. Egenhofer, An Evaluation of the 9-Intersection for Region-Line Relations. In Proc. of GIS/LIS '92, pp. 513-521, San Jose, CA, 1992.
[5] D.M. Mark, M. Egenhofer, Calibrating The Mean-ings Of Spatial Predicates From Natural Language: Line-Region Relations. In Proc. of the 6th Interna-tional Symposium on Spatial Data Handling, pp. 538-553, Edinburgh, 1994.
[6] OpenGIS, Simple Features Specification for SQL. Revision 1.1, 1999, Open GIS Consortium Inc. http://www.opengis.org/techno/specs/99-049.pdf.
[7] M. Sebillo, G. Tortora, G. Vitiello: The Metaphor GIS Query Language, Journal of Visual Languages and Computing, 11(4) (2000) 439-454.
[8] L.R. Wanger, J.A. Ferwerda, D.P. Greenberg, Per-ceiving spatial relationships in computer-generated images, IEEE Computer Graphics and Applications, 12(3) (1992) 44-58.
[9] S. Zlatanova, On 3D Topological Relationships. In Proc. of the 11th International Workshop on Data-base and Expert System Applications - DEXA 2000, pp. 913-919, Greenwich, 2000.
[10] M.M. Zloof, Query-by-Example: A Database Lan-guage, IBM Systems Journal, 16(4) (1977) 324-343.
6
0
9
14
7 6
22
36
13
11
22
1214
16
21
0
5
10
15
20
25
30
35
40
Equals Disjoint Touches Within Overlaps Crosses Intersects Contains
%
op4 op4.2
6
0
9
14
7 6
22
36
1 2
8
20
10
1917
23
0
5
10
15
20
25
30
35
40
Equals Disjoint Touches Within Overlaps Crosses Intersects Contains
%
op4 op4.1
6
0
9
14
7 6
22
36
8
3
1311
1311
16
25
0
5
10
15
20
25
30
35
40
Equals Disjoint Touches Within Overlaps Crosses Intersects Contains
%
op4 op4.3
204

Abstract. At the inception of the Internet, the websites were
only textual. Now, with the graphic possibilities, more and more websites integrate visual aspects, essentially to access and to visualize information. The goal of this paper is to examine the use of visual techniques in city’s websites. More particularly, we will examine the metaphor of virtual cities, hypermaps and geography-based accesses, news magazines, etc. In the conclusion, we try to examine the trends in this domain.
Key-words: Visual Access, Websites, Cities, Metaphors
I. INTRODUCTION
Nowadays, practically all cities have a website. The objective of this paper is not to make a detailed study about their contents, but to examine their organization from a visual point of view. By visual, we mean to examine the quality of graphics, the metaphors used and their efficiency. First, let us give the following definitions:
• a home-page is the first page of a website (the URL), • a sitemap is the entry structure to access all pages lying
into a website, • whereas a portal allows the accessing to pages, which
are considered as the more important for the administrators (highlights).
Usually, the portal is located into the home-page. However, in multiple language websites, or in user profiles-oriented sites, the home-page often acts as a profile selector so giving access to different sub-websites.
Concerning the use of metaphors for website design (Van Duyne et al. (2003)), let us first of all mention that the two words portal and sitemap evoke metaphors: portal meaning the entrance gate and sitemap the cartography of the website. We can summarize the situation as follows:
Tab 1. Portals and sitemaps
All Internet examples were taken in January 2006. In this paper we will examine the various types of visual
accesses in city websites, and more precisely the geography-based accesses. But before, we will very rapidly study text-only websites.
II. MAIN METAPHORS FOR CITIES
The first aspect to mention is that some sites use neither metaphor nor visual tools: their presentation is only made with words. In this category, we can distinguish text-only portals and textual portals with some pictorial decorations.
Manuscript received May 2006. Pr. R. Laurini is presently distinguished professor at INSA-Lyon, France; phone: +33 4 72 43 81 72; fax: 33 4 72 43 87 13; e-mail: [email protected]; website: http://liris.insa-lyon.fr/robert.laurini.
A. Text-only portals, or with light pictorial decorations
Text-only portals presently are very rare, although there were the majority in the 90'ies. Take for instance the site of the city of South Milwaukee, WI (See http://www.ci.south-milwaukee.wi.us/). Several years ago, the portal was practical text-only, with a unique icon for the letterbox. Few years after, the style is quite similar, and only a picture of the city entry sign was added, emphasizing the idea of a portal. See Figures 1 for an example.
Anyhow, even it those portals were common in the past, they were very functional, and were a sort of preliminary step to reach present portals.
Fig. 1. Example of a text-only website and its evolution http://www.ci.south-milwaukee.wi.us/.
Another aspect is the diversity of users. In order to target more precisely information to deliver, some cities have organized their websites by user profiles. An example is taken from the city of Richmond, Virginia (Figure 2a), offering different information according to the following text-only six profiles, businessmen, newcomer, resident, senior, visitor and young people in a text-only list. The Italian city of Salerno offers a dozen of profiles (http://www .comune.salerno.it); for instance profiles are added such as handicapped, immigrant, sportive and student.
B. Visual menu
Verbal menus are more and more replaced by visual menus. Figure 2b gives the example of a homepage including several icons for Edinburgh, Scotland as it was in 2002. Now the portal is replaced by a new one, but we can still see the same icons, illustrating a sort of historical continuity.
Fig. 2. Various kinds of portals. (a) A profile-oriented portal from the city of Richmond, Virginia, http://www.ci.richmond.va.us (b) An extract of the Edinburgh visual portal in 2002, http://www.edinburgh.gov.uk.
C. Virtual city
In another direction, there exist portals based on a sort of virtual city. An example is coming from Trenton, New
Visual Access to City’s Websites Robert Laurini
205

Jersey as illustrated in Figure 3a. The more famous example is the homepage of Bologna, Italy (See Figure 3b as it was several years ago). As pictograms such as trains or theatres are meaningful, the interpretation of some buildings can be misleading. To correct this drawback, some words are added such as "ristorante", "shop" or "lex" (it is interesting to notice that in order to be understood by anyone, some "international words were selected", one of them is in Italian (ristorante), a second in English (shop) and the last in Latin (lex)). However, we were intrigued by the spherical building located in the middle: it is the entry point for religious information; indeed a church pictogram should lead to Christian information, not valid for other religions: so the search for a very generic icon promotes the creation of pictograms the meaning of which is not clear. To conclude this paragraph, let us say that this approach is very interesting from a visual point of view, but presents some difficulties of interpretation.
Fig. 3. Examples of virtual cities. (a) Trenton, New Jersey http://www.ci.trenton.nj.us/. (b) Bologna http://www.comune.bologna.it as it was in 2002.
Fig. 4. Example of hypermap-based city portals. (a) Antwerp, Belgium http://www.antwerpen.be/MIDA/. (b) Oxford, UK http://www.oxfordcity.co.uk/maps/ox.html.
But this metaphor is not only used for cities, it can be used for any kind of organization. In the fourth section, we will examine some other examples of the metaphor.
D. Hypermaps and geographic-based access
A very interesting way of organizing geographic infor-mation is to use hypermaps (Laurini-Milleret-Raffort, 1990), also called clickable maps. Figure 4a is a good example from the city of Antwerpen, Belgium. Another example is given Figure 4b for a gridded map of Oxford,UK.
In Venice, Italy, an original entry system is provided through aerial photos (Figure 5a), whereas some accesses to symbolized shopping streets (Figure 5b) are also possible through French Yellow Pages. See also Figure 6 in Paris, France, giving another interesting access based on the approximate location of very important streets, with the Seine river as a reference map.
Fig. 5. Some portals based on geographic locations. (a) Portal of Venice, Italy based on aerial photos http://www.comune.venezia.it. (b) Excerpt of “shopping streets” from the Visiocity systems http://www.mappyvisiocity.com/ for the French Yellow Pages.
Fig. 6. Another interesting example to access to Paris information from streets http://www.umsl.edu/~moosproj/carte.html.
E. News magazines
Some cities organize their website as a news magazine: the home-page is looking as a cover giving a nice picture of the city (Figure 7). It is overall interesting that there is now a sort of convergence between the presentation of those two media, namely news magazine cover and website portal, applying same corporate design and graphic semiology.
Fig. 7. Examples of home-pages looking like news magazine covers in January 2006. (a) Lynchburg, VA, http://www.ci.lynchburg.va.us. (b) Miami, FL http://www.ci.miami.fl.us
F. Visual portals for visual portals
In some places, there exist portals of portals. By this expression, we mean that, instead of giving a textual list, or a set of icons, an interesting idea is directly to include a thumbnail of the portal the user desires to go.
Fig. 8. Examples of portals for portals made of thumbnails. (a) Nice, France http://www.nice.fr/mairie_nice_1489.html. (b) Piemonte Region, Italy http://www.regione.piemonte.it/sez_tem/cult_spett/cult_spett.htm.
206

See two examples in Figure 8, the first from the French city of Nice, the second of Region Piemonte in Italy.
III. CARTOGRAPHY FOR CITIZENS
Internet mapping for the residents is something common. Numerous cities allow the city-dwellers some mapping capabilities: indeed some kind of GIS is provided. In this section, we will examine only two aspects, risk mapping and planning consultation.
A. Risk mapping
For instance, let us examine two examples. In the Italian city of Genoa (Figure 9a), the inhabitants must first give the zone, and then, they will get detailed information: in other words location → type of risks. Whereas in Charlotte (Figure 10b), NC, this is the contrary, the inhabitants must give first the type of risk, and then they will get a map, i.e. Type of risk → location.
Fig. 9. Examples of cartography through Internet. (a) Genoa, Italy http://cartogis.provincia.genova.it/cartogis/ppc/rischincbos.htm. (b) Charlotte, NC, USA, http://maps.co.mecklenburg.nc.us/website/floodzone/map.aspx.
B. Planning consultation
Another interesting aspect is the participation of citizens for urban planning. Regarding land use plans or develop-ment plans, in all countries, there is some phase of public participation. In other words, the planning officers, together with elected politicians ask the city-dwellers their opinions regarding the future of their city. For that, usually some planning maps are proposed through Internet. But the main problem is how to organize the participation? Several trials (Craig et al. (2002) were made under the name of PPGIS (Public Participation GIS). One of the important aspects is to allow people giving their opinion about the projects. For that a solution could be using argumaps. Proposed by Rinner 1999, those argument maps are made to help the users to position arguments on a map. Figure 10 gives examples, for instance by using markers such as pins, flags or smileys. Typically three types of markers are interested to position pro-opinions, against-opinions and official arguments. Imagine that the city’s officers want to construct a new bridge over a river; official arguments will explain the necessity of building such a bridge; the citizens agreeing this project can give or explain a positive opinion (pro-opinion), whereas the opponents can detail a negative opinion (against-opinion). At the end of the consultation, hotspots can be easily detected, and an easy synthesis can be made, based on location.
Fig. 10. Cartography of arguments, examples of graphic semiology (pins, flags, smileys) and an application in a Danish city http://www. detaktiveaalborgkort.dk. The argumaps based on pins and flags are issued from Rinner 1999, the third based on smileys is from Laurini (2001).
Fig. 11. Virtual cities. (a) A virtual land development map as a transition between a map, a graph layout and a virtual city http://www.ijrr.org/images/sitemap.gif. (b) The Rigatoni band using the city metaphor to present its activities (as in 2002) http://www.rigatoni.ch/
IV. VIRTUAL CITY AS A METAPHOR FOR WEBSITE DESIGN
In another direction, the metaphor of a virtual city can also be used to structure websites not only for cities, but also for other organizations (Dieberger A., et al. (1998)). Let us show two examples. In the first one (Figure 11a), a scientific journal uses this metaphor to present its sitemap, whereas in the second (Figure 11b) a Swiss band named Rigatoni uses again this metaphor for its portal. Figure 12 illustrates another interesting case of a virtual city (http://www.tipus.uniroma3.it/Master/lezioni/AID/VirT.jpg). Here the virtual city acts as a fake reference map to access services.
Fig. 12. A city map acting as a virtual town to organize services. http://www.tipus.uniroma3.it/Master/lezioni/AID/VirT.jpg
207

A. Map metaphor (tendermaps)
The map metaphor was created in 1654 by Madame de Scudéry with her tendermap (carte du tendre) in which she published an allegorical map of love and desire. Figure 13 depicts two examples of website using this metaphor. The first one (Figure 13a) presents a small map with some “cities” corresponding to entry points into a website for a dancing company. The second (Figure 13b) reuses an existing map, in which some “locations” are superimposed. Let us call the first one as a real tendermap, and the second a fake tendermap.
Fig. 13. Some tendermaps, that is maps in which locations depict accesses to information or services. (a) A dancing company http:// www.silkroaddance.com/. (b) A fake tendermap, reusing a real existing map http://www.netcentriccommunity.com/iAppliance/WebMap.jpg.
B. Metro-line metaphor
Another interesting metaphor is the metro-line metaphor which was created by Sandvad et al. (2001). Starting from the maps for metro-lines, they use this metaphor for representing several paths for visiting websites. Indeed, in some cases, instead of proposing the access to isolated pages, it looks more important to propose structured routes to access information: the metro-line map metaphor can be a good metaphor in the context where pages are organized along paths: the site administrators propose several walk-through tours in lieu of sitemap. Figure 14 gives two examples of sitemaps designed with this metaphor.
Fig. 14. Sitemaps designed with the metro line metaphor. (a) http://www. multimap.com /images/ps/misc/sitemap.gif, (b) http://www.germinus.com /mapa.htm.
V. CONCLUSIONS
Designing visual access to website has become a research domain per se in which some metaphors seem to structure the websites. In this paper, the structuring and the visual accessing to local authorities’ websites have unveiled several tendencies.
Geography-based metaphors are also a source of inspiration for designing portals and sitemaps. The tendermaps are one of them, but the big difficulty is to update them regularly, i.e. adding or removing automatically some elements into the map, still keeping high aesthetic quality levels.
The Bologna-type virtual city experience of a totally visual access has shown the difficulty of understanding some
icons. Now, it appears that a mixture of icons and letters seem to be a nice compromise. The use of photos instead of icons appears also as an interesting research direction. Apparently, the dominant metaphor in cities seems to be the news magazine metaphor. It is also interesting to see that now, in some news magazines the website metaphor is also in use: in other words those metaphors influence each other, and some cross-fertilization will certainly appear.
The metro-line map metaphor is interesting essentially when different paths can be defining into the website. The selection of “lines” and “stops” is still difficult, and a methodology must be defined based on decision rules: for instance in user-oriented portals with the metro-line metaphor, each line can correspond to a user type. Back in cities, a line can be defined for residents, a line for businessmen, a line for home-seekers, a line for handicapped people, and so on.
In local authorities, some other visual accesses can be defined. Examples in informative cartography for instance for risks, are good illustrations. For interactive cartography, visual techniques such as Rinner’s argumaps are an interesting way for structuring public participation in urban planning.
To conclude this paper, let me say in the nearby future, some innovation will still continue to appear in designing visual access to websites, essentially because of the necessity to attract more people. Local authorities seem an interesting domain to study, not only because they are numerous, but also each of them tries to emphasize its own characteristics and culture: differently said, each of them shows or tries to show its own personality.
REFERENCES
[1] Dieberger A., Frank A.U., (1998). "A city metaphor for supporting navigation in complex information spaces". Published in Journal of Visual Languages and Computing, 1998 (9), pp. 597-622.
[2] Craig, W. J., T. M. Harris and D. Weiner, eds. 2002. "Community participation and Geographic Information Systems". London: Taylor and Francis.
[3] Laurini R, Milleret-Raffort F. (1990) "Principles of Geomatic Hypermaps". Proceedings of the 4th International Symposium on Spatial Data Handling. Zurich, 23-27 Juillet 90, Edited by K. Brassel, pp. 642-651.
[4] Laurini R. (2001) "Information Systems for Urban Planning: A Hypermedia Co-operative Approach". Taylor and Francis, 308 p. February 2001. Website: http://lisi.insa-lyon.fr/~laurini/isup.
[5] Rinner C. (1999) "Argumaps for Spatial Planning". In Proceedings of the First Int'l Workshop on TeleGeoProcessing, edited by R. Laurini, Lyon, May 6-7, 1999, pp. 95-102.
[6] Sandvad E. S., Grønbæk K., Sloth L., Lindskov Knudsen J. (2001) "A metro map metaphor for guided tours on the Web: the Webvise guided tour system". In Proc. of the 10th international conference on World Wide Web, Hong Kong, Hong Kong, pp. 326 – 333.
[7] Van Duyne DK, Landay JA, Hong JI (2003) "The Design of Sites". Addison Wesley. 761 p.
Dr. Robert Laurini is distinguished professor at the National Institute of Applied Sciences of Lyon, France (INSA-Lyon). In 76-77 he was research associate at the University of Cambridge, UK, and in 86-87 visiting professor at the University of Maryland, College Park, USA. He has written more than 150 papers dealing with geographic (GIS) and multimedia information systems. His most famous is “Fundamental of Spatial Information Systems”, written with D. Thompson, Academic Press, 1992. Presently, he chairs the steering committee of the ACM GIS symposium. He is also associate editor of the “Journal for Visual Languages and Computing”. For more details, see http://liris.insa-lyon.fr/robert.laurini.
208

Proceedings
International Workshop on Distant Education Technology
(DET 2006)
Co-Editors
Dr. Paolo Maresca, University of Naples, Italy Dr. Goran Trajkovski, Towson University, USA
Dr. Heng-Shuen Chen, National Taiwan University, Taiwan


Reactive and adaptive approaches in Learning Management SystemsA. Carbonaro*, L. Colazzo+, A. Molinari+
*Department of Computer Science, University of Bologna, Mura Anteo Zamboni 7, I-40127Bologna, Italy, [email protected]
+Department of Computer and Management Sciences, University of Trento, Via Inama 5,38100 Trento, Italy,
[email protected], [email protected]
Abstract
This work derives from a series of considerations shared by the authors of this paper,which have risen about two different experiences at the University of Bologna and at theUniversity of Trento. What pools the two experiences is the convergence of opinionsregarding the development of e-learning in real-world academic settings. In particular,cooperative tools may result in more specialized learning environments responding to theeffective user needs.
1. Introduction
In this paper we are going to describe cooperationaspects inherent to two different systems:a) a Web-based Learning Management System
based on the idea of learning community;b) a multi-agent Web-based hybrid recommender
system based on a collaborative bookmarkmanagement system approach using semanticcapabilities.
The shared hypothesis is considering academiclearning processes such as systemic and cooperativeprocesses so that, our systems represent two differentways to provide cooperative learning. In the first case,cooperation is achieved by using both an architecturalapproach and communication reactive tools. In thesecond case, cooperation is realized through adaptiveapproaches. Both reactive and adaptive approaches canbe useful and complementary in real-world learningenvironments.In our opinion, the quality of an academic institution isstrongly related to the quality of its educationalprocesses which are based, in their turn, on thecomplex relationship between professionalcompetencies of researchers/teachers and used teachingmethods. In good and evil, the actual processesoccurring in an academic institution are based on thequality of this relationship. Studying in a high-qualityeducational institution means learning from anintellectual environment where knowledge transfer(education) and creation (research) are interwoven,perceptible and “internalizable” by students. Inmarketing terminology, this could be considered as the“brand” of an academic institution.It is easy to observe how the systemic intrinsic natureof these processes requires its own governance. Thecore of these rules is the direct relation betweenresearchers/teachers and their students. Such aninterpersonal relation enforces the vocation foruniversities to be places intrinsically opened todiscussion and circulation of ideas and opinions.
Indeed, freedom in research and teaching activities aretwo ethical pillars of these institutions. E-learningapplications in academic environments introduce intothe system a set of changes that could undermine thisrelation.The creation of e-learning systems, or specializedcomponents of these systems, we are going to presentin the following pages have the same architecturalstructuring, though they are coming from differentexperiences.This common-background architecture is based on anumber of general assumptions.1) User-centered design. The systems are built with
and around users’ requirements, applying agile andevolutionary prototyping software techniques. Thesoftware developing cycle and its architecturalimplications are derived from the needs of theactors involved in the process. We spent manyhours and many resources in going around teachers’rooms and students’ classes, in order to look atpeople needs and real system usage. Such a system,therefore, was not a software architect’sconception; it has been substantially driven byusers’ suggestions.
2) Teaching methods vary depending on thedisciplinary domain of the courses and on thespecific user’s preferences. In our opinion, asoftware system should not overwhelm the waypeople act by simplifying a complex relationshiplike the training process.
3) The usage of a LMS should not be mandatory. In areal situation, there are people not attracted by e-learning technologies, and they will therefore avoidusing the system. These subjects could not belabeled as “bad teachers”.
4) Every constraint on the nature/type of learningobjects inside the system is needlessly restrictiveand counter-productive. This does not mean thatlearning objects which are built using standards(like SCORM) are not usable in the system, but wecannot imagine that this is a necessary condition.
211

Imposing such a condition means to move usersaway.
5) There must be no filters between a teacher andhis/her students. A teacher should not need for an“intermediary” in order to interact with his/herstudents through ICTs.
6) Modern Web-based learning environments must beable to dynamically respond to the different andpersonal students’ learning styles, goals, knowledgebackgrounds and abilities, in order to facilitate astudent-based approach to the provided educationalmaterial. In getting to this task, tools forpersonalized distribution of educational resourceshave emerged as an important technology to adaptand personalize e-learning system on the basis ofthe effective user needs and modifiable userbehaviour and interests [1].
The remain part of the paper describes in more detailour two experiences. In particular, we will introducethe making-of an e-learning platform based on the“virtual communities” metaphor and the necessity toextend our approach by providing adaptive services inacademic frameworks. Some final considerations willconclude the paper.
2. E_learning in academic frameworks
The rapidly increasing expansion of e-learning systemshas brought, in some cases, towards undervaluation ofsystem effects on learning processes.The problem derives from the fact that, in order toexperiment innovative solutions, researchers/teachersknowledge transformation into some electronicartefacts (Learning objects) must be provided.Consequence of such a requirement, should be, forsome authors, the redefinition of the relation withstudents, through an intermediation made by someprofessional role (multimedia developer, learningobjects designer, content producer, tutor, etc.).Though some situations exist where it is necessary torely on professionals in order to innovate theeducational process, it is quite easy to claim that thismodel, whenever it is spplied on an entire academicinstitution, is:
• A losing process: the transfer of knowledge fromthe teacher to the professional could have manydisadvantages, last but not least the material isproduced by a person that is expert withtechnologies and (perhaps) educational processes,but it is not necessarily expert about the specifictopic he is helping producing the learning objects,and therefore a loss of quality is almostinevitable.
• Economically unsustainable and/or humanlyunfeasible: it is not possible taking advantages byprofessional multimedia developers that aresimply typists, in order to achieve quality in thelearning objects. Producing electronic learningobjects at a high quality level, imlies that weshould have an expert for every teacher, availablealso when topics and courses change, or we
should have a “super-expert” able to transform inlearning objects (where students learn), topicscoming from different fields or teachers. There isno enough time and money to pay such a hugenumber of experts that help all the teachers in aUniversity, and it is not possible to find people soprepared to be able to help teachers in domainsthat range from fuzzy logic to labour psychology,from telecommunication to economic geography.It is impossible to find an expert in the field ofthe teacher able to comprehend and transmit thetopic like the teacher him/herself.
• Demotivating: every teacher is able to teach withher own method, and will probably haveproblems in recognizing him/herself aboutsomething produced by others.
Based on this assumption, the software should behavelike an amplifier of the communication space betweenteachers, students, tutors, and assistants. It will happenfor sure that some colleagues will use the system underits capabilities, but this is largely better than nothing.The intermediation of professionals should be, in ouropinion, limited to technical consultancy and theproduction of learning objects should be a processstrongly coordinated and managed by the teacher.Whenever it’s applied, this process is mostly perceivedlike a way of transferring a boring activity from theteacher to a typist.In our opinion, some LMSs demonstrate limitationsand contradictions, assigning fixed roles to subjectsparticipating to educational processes. These roles arenormally included in a vision of the training processthat we could define as a “transfer model”: the teacher(and to a lesser extend, the tutor) owns the knowledgewhich is transferred to students via a sequence oflectures. The student learns from references or bookswhile guided by the teacher’s lecture.This model, once reified in the software, represents acrystallization of the original model, only apparentlymore participatory (students have to do some actions inthe virtual), but it substantially enforces the power ofone side (teachers, in fact, can use the software withhigher privileges than students). Consequently, manynon-traditional learning and teaching approaches (likeProblem based learning, Learning by doing,Collaborative learning, Learning by projects, etc. ), areobstructed by the software itself, instead of beingfacilitated. Moreover, if we consider technical courses,where more practical skills must be acquired anddemonstrated, students have very often to develop aproject. It could be an individual work, but it is morefrequently a joint effort among students of a group. Itwould be more productive letting students worktogether also by using collaborative tools that allowthem to interact among themselves and with teachers /tutors, but this kind of freedom (with all theadministrative problems behind the scenes) is veryoften extraneous to a typical e-learning system.The academic teaching has peculiar features: we don’taim to the mere transfer of notions, but to changingprocess that motivates the students critical point ofview. Moreover the academic system life is organised
212

so that a consistent part of the work is done in acollective way.Then, the metaphor of virtual communities becomes anatural way to extend what is often meant to be a realcommunity to the electronic communication universe.Providing cooperative virtual spaces (VirtualCommunities) as a tool improving teaching/learningprocesses through communication improvement amongactors of didactical processes, falls on workorganisation, in particular:a) most of electronic communication is written and it
takes a longer period than traditional lectures-model activities
b) teacher-to-students relation cardinality is 1-to-non the lectures model, while it is about n2 withincooperative ones, where n is the numbers ofparticipants. Once again such models have anhigher cost.
a) and b) points could be trade off by introducingautomatic procedures like software agents so as Theycan make more efficacious and effectivecommunication processes. In other words, it’s suitablethat a software system, potentially capable of beingadapted to users needs and, can be used in case of e-learning applications applied within a universitycontext.There is a wide literature about the possibility toprovide the software systems with adaptivemechanisms which allow the systems themselves topersonalize their behavior, according to the users needs[7]. An initial classification of these systems is madeby the distinction between properly said user-adaptivesystems (the adaptive mechanisms are completelyautomatic) and user-adaptable systems (the adaptivemechanisms are derived by user choices) [16]. In thisfirst kind, the system must have a data structure forevery user who interacts with the system and in thisstructure the history of the interaction must becondensed in a shape (behavioral model) useful to thesystem to implement its strategies. This data structuresare known in literature as User Models (UM) [10]. AUM is a data structure which gathers information onsystem-user interactions. Typically, the UMs areobtained on the basis of the knowledge about: interestsand aims of the user [11], competences about the use orthe contents of the system, history of the interaction ofthe user with the system. In [16] is reported a list ofabout sixteen classes of data sources about the user,generally exploited in UMs building. The unprocesseddatum itself can not be immediately used in theadaptive processes of a system. The interpretation osuch data is necessary in order to change them in aninput source for the adaptation processes of the system.It is to say that the variability is abstracted throughformal processes of generalizations known asstereotypes [15]. Formally a stereotype is a structure ofgeneralization which describes different characteristicsof an hypothetic user. Any characteristic is associatedto a trigger. The unprocessed data of a user, abstractedthrough this interpretation, builds the UM of the userfor the system.
The literature indicates three basic steps to prepare thedevelopment of an adaptive system: the first refers tothe methodology used to obtain the UM; the secondstep, consequently to the chosen methodology, is aboutthe type of data which have to be classified and stored[5]. Finally, the third step regards the personalizedpresentation for the information, which is depending onthe goal of the system. The personalization occurs withdifferent paths in texts, images, lexicon and in the UserInterface as a whole. It can also occur by followingrules of ubiquitary adaptivity for the presentation ondifferent platforms and hardware systems.
On the next section we are going to describe themaking-of an e-learning platform based on the “VirtualCommunities” metaphor. In such a system manyseveral services, provided to the users in order tosupport teaching/learning processes are exclusivelyreactive.
Through the experience with such a system as well aswith a previous one, based, in its turn, on the “Course”metaphor, we have been convinced about the necessityto extend our approach by providing adaptive services(as it will be detailed in Section 4).
3. Online Community as a metaphor of learningspace
In the history of the sociological thought, the label"community" has been used in several ways, in order topoint out a variety of social phenomenons.Nevertheless, right in the difficulty found for thedefinition of the concept of "community", we find thefirst aspect that unifies the “real” and the “virtual"concepts . Usually, in the sociological literature, theconcept of community is considered in as opposed tothe concept of society, and the separation line of thetwo social structures is marked by the degrees offreedom of the individuals. In fact, in a community it ispossible to observe a greater quantity of ties (both inintensity and extension) than in a society. In return,individuals get cohesion, safety and solidarity. Virtualcommunities [4,8,9,12,13,14,17] are something else incomparison with the concept of community as it’smeant in the classics. Their use in a formativeenvironment is further different. For example, theabsence of anonymity, a typical aspect of thesecommunication spaces, produces substantial effects onthe dynamics of virtual relations. These aspects will notbe further discussed, but it’s important for us to stressthat the software was built in order to virtualize realprocesses that happen in real communities.As we already anticipated, traditional LMSs centredtheir architecture on the “course”, conceived as avirtual meeting space between teacher and student. Sodoing, these systems isolate the moment notions aredelivered in the environment, including technologicalsettings where the contents are delivered. In order toeliminate this problem, we can proceed in two ways.First, we can imagine a LMS as a component of thewhole information system of the academic institution.Second, we can adopt a more general metaphor than
213

“course”, which is able to supply communication toolsto the various collective discussion ways thatcharacterize the academic world. This unifyingmetaphor is represented by the virtual community, thatcould be subsequently specialized in learningcommunities, i.e., courses.In Fig. 1 we quickly sketch the central part of theschema adopted for the realization of “OnlineCommunities”. Actually, the system is based on morethan 300 classes, but all the main concepts aremanaged around People, Role, Community, Right,Duty and Permissions classes [6].
Figure 1. Core classes of “Online Communities”
Online Communities is exited from theexperimentation phase in September 2005, after a longtest phase (February - August 2005). Now it is used inextensive way at the Faculty of Economics and in theother six faculties of the University of Trento. InFigure 2 we show online accesses during the last year(an average of about 960 unique accesses per day).
Accessi * Mese
0
5000
10000
15000
20000
25000
30000
feb-05 mar-05 apr-05 mag-05 giu-05 lug-05 ago-05 set-05 ott-05 nov-05 dic-05 gen-06 feb-06 mar-06
Mesi
N°
Acc
essi
Figure 2. Online Communities accesses (from 2005-02-15 to 2006-03-23)
Table 1 shows the Online Communities we are using,while Table 2 reports roles of Online Communitymembers.
Community N°Faculties 7Other organizations 8Departments 1Laurea Degrees 71Students 3
Work groups 51Reserach groups 18Courses 395Total 554
Table 1. Online communities
Role N°
Students 3920
Teachers 173
Tutors 18
Phd students 38Guest 71Staff 17Total 4237
Table 2. Online community members
4. The InLinx (Intelligent Links) system
The research on e-learning and Web-based educationalsystems traditionally combines research interests andefforts from various fields, in order to tailor thegrowing amount of information, to the needs, goals,and tasks of the specific individual users. SemanticWeb technologies may achieve improved adaptationand flexibility for users and new methods and types ofcourseware compliant with the Semantic Web vision.From another point of view, multi-agent systemsworking cooperatively over space and time are animportant paradigm for building complex educationalsystems, dealing with open and dynamic environments.In this paragraph we describe both the collaborationand personalization aspects of InLinx, a multi-agentWeb-based hybrid recommender system based on acollaborative bookmark management system approachusing semantic capabilities. InLinx combines contentanalysis and the development of virtual clusters ofusers and of information sources that provides facilitiesto use the huge amount of digital informationaccording to the student’s personal requirements andinterests. InLinx intends to gather different agent-basedmodules helping the user to classify domain specificinformation found in the Web and saved as bookmarks,to recommend these documents to other users withsimilar interests and to periodically notify newdocuments potentially interesting. The resources areprocessed to extract concepts (not just words) from thedocuments. Then, the classification, recommendationand sharing phases take advantage of the word sensesto classify, retrieve and suggest documents with highsemantic relevance with respect to the student andresource models [3].Thanks to its bookmark sharing and recommendationfacility, InLinx contributes to human collaborativeworks: it supports group collaboration among peopleinvolved in a work process, independently from timeand space distance, and learns from positive andnegative experience in group practice.
214

In its first version, InLinx has been designed as a toolto be used within a group of people sharing commoninterests or working domain. In origin, it was thoughtfor a researcher group: researchers increasingly choosethe Web as primary source where finding resourcesinherenting their research context. Typically,researchers need to be updated about publications ofnew papers in their field of interest (see InLinx paperrecommendation tool) and they also need to share themost interesting resources with other individuals of thegroup who are interested in the same domain (seeInLinx recommendation tool).But InLinx can find application in any other context inwhich the group collaboration is a requisite, like aWeb-based learning system [2]. Currently, we areworking in order to improve the flexibility of InLinxadopting solutions for user modeling capable ofcapturing not only structural but also semanticsinformation so that the system could be suitable for anopen environment composed by heterogeneous userswith miscellaneous interests.On the system facet, InLinx responds to the request ofwidely accessible information services, available bothto developers and users, and to the ubiquitouscomputing and communication challenge. In fact,traditional browser bookmarks lack of immediateportability and visibility from different user locations.InLinx allows to access to personal bookmark’srepository from anywhere in every moment, withoutany software installation. You only need an Internetaccess point, being a PC as well a mobile device. So,access to your personal and shared data becomesindependently of the platform on which the system isexecuting.Moreover, InLinx deals with the issue of heterogeneityby combining a content-based and a collaborativeapproach. If by one hand a content-based approachallows to define and maintain an accurate user profile,on the other hand it has the limitation of dealing onlywith textual resources. Differently, in a collaborativeapproach, resources are recommended based on therating of other users of the system with similarinterests. As there is no analysis of the item content,collaborative filtering systems can deal with any kindof item, not only with textual content, and users canreceive items with dissimilar content respect of thoseseen in the past.
5. Conclusion
This paper describes how academic institutions needintegrated systems and technologies to guarantee thedevelopment of proficient e-learning in real-worldacademic settings. We argue a series of considerationsderived from different experiences in two differentframeworks and present their common characteristics.In particular:
• cooperative information systems,• advanced technological tools that allow to
manage educational institutions’ policies,• personalized services,
may result in a more specialized learning environmentresponding to the effective user needs and modifiableuser behaviour and interests.
References
1. A. Carbonaro and R. Ferrini (2005) Consideringsemantic abilities to improve a Web-BasedDistance Learning System, ACM InternationalWorkshop on Combining Intelligent and AdaptiveHypermedia Methods/Techniques in Web-basedEducation Systems.
2. A. Carbonaro, (2005) Defining personalizedlearning views of relevant learning objects in acollaborative bookmark management system,Web-Based Intelligent e-Learning Systems:Technologies and Applications Idea Group Inc.
3. A. Carbonaro, (2005) Personalized Views OfRelevant Information Using A CollaborativeBookmark Management System, MultimediaCommunications Technical Committee, IEEECommunications Society, Vol. 2, No. 1
4. Beamish A., (1995) Communities on-line, PhDthesis, http://loohooloo.mit.edu/anneb/cn-thesis/index.html
5. Brusilowsky P. (1996) Adaptive Hypermedia: anAttempt to Analyze and Generalize. InBrusilowsky P., Kommers & Streitz N., (Eds.),Multimedia, Hypermedia and Virtual Reality,Berlin:Springer-Verlag, pp 288-304.
6. Colazzo L., Molinari A. (2004) The Managementof Chrono - Referenced Events in VirtualCommunities, in proc ED-MEDIA 2004-WorldConference on Educational Multimedia,Hypermedia and Telecommunications, Vol. 2004,Issue. 1, 2004, pp. 117-124
7. Foster, C. (2000) The Personalization Chain. InJupiter Communications, Site Operations, Vol. 3,2000. [Foster 2000]
8. Jones S. G., (1995), Cybersociety, Sage, London.9. Jones S. G., (1997), Virtual Culture, Sage,
London.10. Kobsa A., (1990) User Modeling in Dialog
Systems: Potentials and Hazards. In AI & Society4(3), 214-240. [Kobsa, 1990]
11. Kules B.(2000) User Modeling for Adaptive andAdaptable Spftware Systems. Disponibile sulWeb all’indirizzohttp://www.otal.umd.edu/UUGuide/wmk/, ultimoaccesso 02 Giugno 2004. [Kulls 2000]
12. Lévy P., (1995), Qu’est-ce que le virtuel?, LaDécouverte, Paris, 1995 (trad. It. Il virtuale,Raffaello Cortina, Milano, 1997).
13. Lévy P., La Découverte, Paris, (1994) (trad. It.L'intelligenza collettiva. Per un’antropologia delcyberspazio, Feltrinelli, Milano, 1996).
14. Rheingold H.(1993), The Virtual Community.15. Rich E. (1979) User modeling via stereotypes.
Cognitive Science, 1979, 3: 329-354. [Rich 1979]16. Teltzrow M., Kobsa A. (2004) Impacts of user
privacy preferences on personalized systems. In:C.-M. Karat, J. Blom and J. Karat, eds: Designing
215

Personalized User Experiences for eCommerce.Dordrecht, Netherlands: Kluwer AcademicPublishers[Teltzrow & Kobsa, 2004]
17. Turkle S.(1995), Life on Screen. Identity in theAge of Internet, New York, Simon & Shuster,
216

Evaluating an E-learning Process
Fadini(+) P.Maresca(+) P.Prinetto(*) G.Santiano(*)
(+)Dip. di Informatica e Sistemistica
Un. di Napoli “Federico II” - Naples, ItalyE-mail {fadini, paomares, sanghez}@unina.it
(*)Dip. di Automatica e InformaticaPolitecnico di Torino - Turin, Italy
E-mail {paolo.prinetto, giorgio.santiano}@polito.it
Abstract
Today it is very important to adapt the formativemethod of the distance learning to the varioussituations of courses distribution and to yourvirtual class, so the e-learning platforms shouldhave “easy–customizable” formative methods.Unfortunately nowadays many e-learningplatforms don’t have modifiable formativemethods. The results is you have to use thatprocess modifying your formative methodapproach.So, in order to choice an e-learning platform youmust have tools can help you to evaluate theformative method and understand if it iscompatible with your approaches, and also toevaluate its flexibility. This paper defines amethodology and it describes a tool useful tocompare e-learning platform from the point ofview of the quantization of a formative method.This methodology is originally named GQM for e-learning platform and it is already adopted by thelabs of the University “Federico II” in Naples andthe “Politecnico di Torino”.
1. Introduction
The tools that make you able to create the e-learning process should concur the personalizationof the learning process for each virtual class.Building these processes involves often not onlythe choice of the materials to distribute (lessons,homework, test, etc) but the role and theparticipation of the actors involved (students,lurker tutors, secretarial, formation managers,etc), and the technological instruments useful toreach your objectives (computer network, PCclients and servers, platform).For ages e-learning world believed that to define aformative method was sufficient to choose an e-learning platform, even with a good-lookinginterface and user-friendly for the students.
This has been demonstrated it is not onlymisleading but definitely wrong from thedidactical point of view.The most important thing is define a formativemethod for a virtual class, and be able to change itwhen necessary.Many platforms nowadays are single-process andyou must adapt yourself to it.Absolutely this is not our target, in fact often youmust adapt dynamically the formative method forthe specific virtual courses.In this environment you must use platform with avery customizable, and possibly reusableformative method, in fact if you find a goodprocess you must be able to reuse it in anotherinstance of the virtual course or in another course.The main problem right now is to evaluate theformative method of an e-learning platform.In this paper therefore we will face with theproblem to select a methodology and a tool usefulto evaluate and to compare the quality and thecustomizability of different formative methods ofdifferent platforms.The methodology is already proposed in [1,2 ] andit apply the well-known GQM paradigm proposedby Vic Basili [3,4] to the e-learning platforms.In the paper is structured as follows: in nextsection we will present the methodology, insection 3 is showed as is build a GQM instance togather the information about the formativemethod. In section 4 the tool and the data analisisare proposed, and finally in the last section westate the conclusions and the on-going projects
2. The GQM paradigm
The Goal/Question/Metric (GQM) Paradigm is amechanism that provides a framework fordeveloping a metrics program [5,6,7]. It wasdeveloped at the University of Maryland as amechanism for formalizing the tasks ofcharacterization, planning, construction, analysis,learning and feedback. The GQM paradigm wasdeveloped for all types of studies, particularly
217

studies concerned with improvement issues. Theparadigm does not provide specific goals butrather a framework for stating goals and refiningthem into questions to provide a specification forthe data needed to help achieve the goals.The GQM paradigm consists of three steps:
1. Generate a set of goals2. Derive a set of questions3. Develop a set of metrics
1 - Generate a set of goals based upon the needsof the evaluators - Determine what it is you wantto evaluate.2 - Derive a set of questions - The purpose of thequestions is to quantify the goals as completely aspossible.3 - Develop a set of metrics and distributions thatprovide the information needed to answer thequestions
3. The GQM for the formative process
In [8] we proposed the GQM methodology toevaluate some e-learning platforms. In [2,9] wedefined methodology to compare open source e-learning platforms. The methodology is veryflexible and it can be applied simply in order toget the point of strength and the points ofweakness of a platform.With the “clusters of goals” (macro-goals) [2] you
can select a characteristic of a platform and
compare it with the same characteristic of anotherplatform.One of these characteristics is the learningprocess, even if it is the most difficult to quantize.To get this you have to select in the GQM for e-learning platforms the goals and the cluster aboutthe formative method. In fact the GQM is a tree
in which the roots are the goals (or the clusters),and obviously if you select the clusters about theformative method you get a GQM about theformative method. This GQM can be improvedincluding others goals about this argument takenfrom others clusters.
Using these criteria we considered only goals andclusters we developed in the GQM Plan [8]
4. Measuring the formative process usingGQM: GQM_PF_Tool
In this section will be described the tool we
Figure 1 – The GQM Tree
Figure 2 – The GQM Tool
218

developed to perform our platform comparison.Others tool was developed in the past [10] but noone had as target measuring and assess formativeprocesses. Our tool is developed in PHP, so it isworks in a client/server environment and it isreachable from internet with any web-browser.It uses a MySQL DataBase, in wich are stored thedata gathered during the evaluations and all theGQM structure (Cluster, Goals, QFs,…)When you decide to create a new project or tomodify an existing project the system permit toweight one or more cluster or to weight one ormore single goals.Weight a cluster, or a goal means give it's a value,a number (from 0 to 10). This number will bemultiplied for the score got by that cluster, or thatgoal during the evaluationIn fact it is important to consider not all thechapters (cluster) of our evaluation have the sameweight for the platform users, for example theSCORM capability can be vital if you will usecourses made with this standard, but if you willuse legacy courses this cluster will have lessimportance in the global score got by theplatform.After the process of weight the object useful forthe evaluation you can perform the real evalution:the questions, organized in Goals and qualityfocuses [1] are proposed to the evaluator, that canchoose the right metric from a list.Having done the clusters evaluation you can viewthe results directly on the screen in a printablestructure, in which are presented the clusters, thegoals, the quality focuses and the questions withall the metrics associated with its weight; in factevery metric (possible answer) has a weight that ispart of the score got in that goal or cluster.In figure 3 you can see an example of the resultsof an evaluation.
Obviously it is possible to view all the GQM orjust some selected cluster.It is also possible to export the results in MSExcel format: in the spread text are proposed allthe scores got in all the clusters and goals and alsoall the answers given previously with the weightassociated to the chosen metric.In figure 4 it is proposed an example of dataanalysis got with our tool.
5. Comparing open source e-learningplatforms
In this section a platform comparison, from theformative method point of view, will beperformed.The platform under test for this evaluation arethree well-known open source e-learningproducts: Dokeos, Moodle and A-Tutor.To analyze these products, from the formativemethod point of view, we answered questionsabout the kind of importable materials into theplatform, about the organization lessons andcourses, overall from the point of view of theirinteraction, the about the capability to createlearning paths linking courses and lessons.From this point of view we considered importantthe capability to have more than one instance ofthe same course.Then we considered some auxiliary didacticalinstruments useful for the learning of the students,by the others: communication instrumentsbetween students and tutors, the grading and auto-grading tools, and the shared boards, wiki, etc.The first platform under test was A-Tutor, an opensource e-learning platform distributed with GPLlicence, developed by the University of Toronto,Canada.From the content management point of view, theplatform is quite poor event if it supports theSCORM standard.
0
5
10
15
201
2
3
4
5
6
7
8
Figure 1 – The GQM Tree
Figure 3 – The results
219

Learnign Path Course, lessonsand didatt ical units
ContentM anagement Tools
SCORM Communicat ionTools
Others Didact ictools
Test and surveys
A-Tutor
Moodle
Dokeos
In fact the concept of formative method was notdeveloped. Therefore in this platform doesn’texist the learning path concept; the lessons canonly be organized in a course without anycapability to modify the sequence the lessons,neither the concept of pre-requirement wasdeveloped. Therefore in this platform the conceptof instance is the same of the concept of course,so you can’t modify it.Then, about the auxiliary didactical tools, neitherin this topic the platform is very interesting, infact there are only the forums, a system of internalmessaging and a chat. Others tools for thecooperative work are not present.Lastly it is possible to create test, even if these arenot mandatory for the following of the course(there isn’t the learning path concept), thereforethis tool it is not very customizableThe second platform analyzed was Moodle, one ofthe most popular e-learning platform in the opensource world.About the content management and the featuresthe potentiality are big, even if the standards usedare often owned and not very used in the e-learning context. It is important to consider thatthis platform give you the capability of importmany multimedia content in a lesson.It is also possible to create a learning path and tomodify it dynamically in function of the student.As said previously the lesson creator tool is verypowerful and customizable from the graphic
layout point of view.Unfortunately also in this product doesn’t existthe separation between course and its instance.Even if the capability of creating dynamiclearning path replace this lack.About the didactical tool this platform is surelythe most complete; in fact it has a lot ofcommunication tools and it supply all the tool forthe cooperative work, such as the sharing ofresource, the shared boards, the diaries and thewiki tool, etc.Finally a consideration about the tests creator tool,that is fully embedded into the learning paths andit is compliant with many tools of this type.The last open source platform analyzed wasDokeos.This product has a great SCORM support thatreplace some lacks in the course management, infact even if it is possible to import a lot of types ofmedia contents and even if exists the concept oflearning path this is just sequential and it can’t bemodified dynamically. Instead it is veryinteresting the tools used to reuse the lessons.The communication tools are not so numerous butare useful and powerful, as the cooperative worktools.There is a tool to create the tests quite incisiveeven if it is less powerful than the Moodle’s one.At the end of this section a graph, got with ourGQM tool, is presented. In this graph aresummarized the concepts expressed previously.
Figure 6 – The platfroms’ results
220

It is evident the best platform from the formativemethod point of view is Moodle, followed byDokeos.
6. Conclusions
In this paper a comparision of several open sourceplatform fro the process formation point of vie hasbeen done.As you can see in the previous picture, Moodle isa very good platform from the formative methodpoint of view, but the SCORM capabilities waspoor.A-Tutor doesn’t give you the capability of createlearning path, and, not negligible feature: itdoesn’t supply auxiliary didactical tools.Dokeos, instead, even if in some macro goalsseems be less powerful than Moodle, it gets agood total score in the learning processesmanagement.This feature, added to the good management ofSCORM content, makes of it the best choice for e-learning in open source environment.In the futures we plan to consider also theECLIPSE tools and its plug-ins dedicated todidactical objectives, to complete the overview onopen-source products.
7. References
[1] B. Fadini, P. Maresca, P. Prinetto, C.Sanghez, G. Santiano, “GQM plan for e-learning platform” CINI Internal Report,2006.
[2] B. Fadini, P. Maresca, P. Prinetto, C.Santiano, C. Sanghez, "A GQM Based E-Learning Platform Evaluation",Conference: DMS2005, invited session onE-Learning, pp.77-82. Banff , Canada,September 3-5, 2005.
[5] B. Fadini, P. Maresca, P. Prinetto, C.Santiano Validation criteria for a GQMplan applied to e-learning platformsevaluation, to be published, si-el journal,Italy
[3] Victor R. Basili “Software modelling andmeasurement: The Goal/Question/Metricparadigm. Technical Report CS-TR-2956,Departement of Computer Science ofMaryland September 1992.
[4] Victor R. Basili, Models and Metrics forSoftware Management and Engineering,IEEE Computer Society Press, IEEECatalog No. EHO-167-7, (343 pp), 1980.
[5] Yasuhiro Mashiko and Victor R. Basili,Using the GQM Paradigm to InvestigateInfluential Factors for Software ProcessImprovement, The Journal of Systems andSoftware, Volume 36, Number 1, pp 17-32,January 1997.
[6] Victor R. Basili, Quantitative Evaluation ofSoftware Methodology (invited paper),National Communications Forum '86Chicago, IL, September 29, 1986.
[7] Victor R. Basili, Applying theGoal/Question/Metric Paradigm in theExperience Factory, 10th Annual CSR(Centre for Software Reliability)Workshop, Application of SoftwareMetrics and Quality Assurance in Industry,Amsterdam, Holand, 29th September - 1stOctober, 1993.
[8] B. Fadini, P. Maresca, P. Prinetto, C.Sanghez, G. Santiano, “Comparison of e-learning platforms using GQM” CINIInternal Report, 2006.
[9] B. Fadini, P. Maresca, S. Russo, “Unapproccio alla valutazione di piattaformeper l’e-learning basate su standard diqualità ISO”, in E-Learning metodi,strumenti ed esperienze a confronto,Didamatica 2002 - Informatica per laDidattica – a cura di A. Andronico, A.Chianese, B. Fadini, pp. 107-132, Napoli,14-15 Febbraio 2002, Liguori Editore (inItalian)
[10] A. Fuggetta, L. Lavazza, S. Morasca, S.Cinti, G. Oldano e E. Orazi “ApplyingGQM in an industrial software factory”.ACM Transactions on SoftwareEngineering and Methodology, Ottobre1998.
221

Integrated Management of Courses in a Distance Learning Environment
Giovanni Adorni, Mauro Coccoli, and Gianni Vercelli E-Learning & Knowledge Management Laboratory
DIST, University of Genoa, Viale Francesco Causa 13, 16145 Genoa, Italy e-mail: {adorni, mauro.coccoli, gianni.vercelli}@unige.it
Abstract: In this paper we present a set of tools to be used together with a Learning Management System (LMS) for the integrated management of adaptive educational paths. For the sake of the modularity and reusability of components, both the LMS and the tools are stand-alone applications; on the other hand they are designed and developed such that they provide users and programmers with integration capabilities and a high degree of mutual interoperability. The proposed tools cover the life-cycle of the learning process; starting from the definition of the contents and their organic structure, passing through the authoring of the teaching materials and the packaging in standard learning objects as well as the definition of metadata for easy information retrieval and categorization over the web, until the delivery of courses to the students and their final assessment. The whole activity and life-cycle are profitably supported by the EifFE-L environment, an open source platform aimed to promoting distance learning techniques by providing easy to use web interfaces and friendly tools to an audience as wider as possible. Keywords: distance learning, user profiling, learning management system, conceptual maps, authoring tools
1. Introduction In the framework of distance learning, the areas in which effort is requested to the teachers have substantially changed during the last few years, moving the focus of attention on the design and implementation of specific learning paths and related teaching materials as well as in the evaluation and assessment. Learning outcome is evaluated against the ability acquired by students at the end of a course as well as against the satisfaction of students. The degree of satisfaction for students can depend on many factors: the good result achieved as well as the perceived quality of the teaching or the amount of time requested for completion of a course. The possibility of making available targeted courses for students tends to minimize time-wasting activity while maximizing the results in terms of notions acquired and level of knowledge at the end of the course.
Driven by these considerations, a set of tools for the integrated management of courses is presented. Such tools cover the whole life-cycle of the production and management of distance teaching activity (design of educational paths, delivery of courses, management of virtual classrooms, evaluation, and assessment). In this respect, in the last years, within the framework of a targeted action (the CampusOne Project, funded by CRUI – Conference of Rectors of Italian Universities [1]) much work has been done for encouraging the use of technology and for introducing innovative aspects in the learning/teaching process. One key action of the above project has led to the realization of the EifFE-L (Environment for Freedom in E-Learning) e-learning platform, an open source, full-featured e-learning framework based on the concepts outlined [2]. The EifFE-L platform is mainly composed by a Learning Management System (LMS) together with a set of side tools aimed to improve the productivity in the learning process. The proposed tools are the following: Subject Matter Sequencing (SMS), SCO wizard, Virtual Class Register (VCR), and Test Maker. All together they go forming what we are going to call the EifFE-L system. SMS is a Subject Matter Sequencing tool with an easy to use web inter-face and with a database architecture underlying. SCOWizard is a graphical tool for the packaging of pedagogical resources into standardized Learning Objects [3]. VCR is an XML-based “Class Register” for monitoring and evaluating all of the participants to a virtual class. Test Maker is an XML-based tool for the generation of questionnaires (both tests and quizzes, running on server-side) for students’ self-assessment and teachers’ monitoring and evaluation. The orchestrated use of the proposed tools enables authors to define teaching materials and educational contents in terms of a planned and well structured information flow. The use of these teaching materials in the proposed framework enables teachers to cover a complete learning process for their students. The whole system provides users with the technological means for the integrated management of the learning process and of the educational path which can be defined in terms of a work flow.
222

The paper is organized as follows. A methodology for the design and definition of educational path is presented in Section 1. In sections 2 and 3 considerations follow about adaptive educational path tailored to users’ needs. The components of the system are described in section 4 and some conclusions are reported in the last section.
2. Definition of the Educational Path Thinking of the concepts to be expressed, looking forward to the objective to be achieved, an educational path (i.e. learning path) has to be designed. The information flow within the process of definition of such a path is as follows: 1. Authors define and depict a set of learning modules in terms of their contents and requested effort. Authors also outline a general structure of the course. 2. Authors assign to each part of the course the relevant resources and teaching materials. 3. Authors make the course available over the Internet. Since now on, authors will also be teachers. 4. Teachers collect all of the information related to the activity carried on during the course. 5. Teachers check the effectiveness of their courses by evaluating the learning outcome of the students. These five steps can be recursively repeated and they fully define the information flow of a complete educational path. Also, from a functional point of view, these five steps can be matched with actions to be taken with the specific tools offered by the EifFE-L system. During step 1, authors define and depict a set of learning modules in terms of their contents and requested effort. Authors also outline a general structure of the course by means of the SMS tool. Outcome of the SMS is a record containing a summary (table of contents and index) of the considered learning module whose structure can be linear, hierarchical, or tree-shaped. In this record dependencies too are clearly expressed in terms of prerequisites, requested skills, and acquired skills as well as requirements and achievements. It can be easily represented through a graph with nodes and arcs. From a programmers’ point of view, it is just an XML file. During step 2 authors associate to each node of the graph (the SMS record) the relevant teaching materials. It can be easily done by authors themselves just browsing their knowledge base systems then choosing a suited Learning Object as well as by creating new ones by means of the SCOwizard. The Learning Objects (LOs) created by SCOwizard are guaranteed to be XHTML 1.0 strict and SCORM 1.2 compliant [4]. It is a good practice that, while creating LOs, authors pay attention to the correct definition of the metadata as well as of the prerequisites, requested skills, learning outcomes, and acquired skills at the end of the module. During step 3 teachers can easily make their teaching materials available over the Internet by means of the
EifFE-L e-learning platform. The outcome of the SMS is the index of the course to be published for the remote virtual class, and the SCOwizard LOs are the teaching materials stored in the database. Moreover users (students) can profitably exploit community functionality offered by the platform according to the use of a constructivist approach [5]. During step 4 teachers can easily collect all the information related to the activity carried out during the course. Such information is collected into an XML file containing a rich log of the system. Data are made available to the users through the LMS and they can be re-organized by means of the VCR so that users can collect information, perform statistical analysis and performance evaluations, and many other activities. During step 5 teachers can easily check the effectiveness of their courses by evaluating the learning outcome of the students. This can be done by means of the Test Maker tool. Pages with “Questions and Answers” sessions can be created and tests are proposed to the students. Assessment and self-assessment results are transmitted both to the LMS and to VCR. Such data can even be exploited in order to create personalized learning paths with the aim of optimizing the information flow individually for each student so that results are maximized as well as completion time can be minimized.
3. Adaptive Learning Paths User-modeling techniques allow defining models of users (based on preferences, interests, conceptual understanding, etc) and exploit such models to build systems that tailor their behavior to individuals and groups. Information is collected on the basis of the usage of the LMS by users who can easily be profiled and categorized. Within the EifFE-L framework each user is associated a user-profile. First of all personal data are collected (from external LDAP directory systems too if any available) so that users are duly registered into the LMS. According to one’s preferences, each user can customize her/his own user interface and is asked to add personal information (e.g., passport photo, hobbies, other activities, title). The LMS administrator can add further information on the role of the user in the system: five different roles are possible namely administrator, faculty administrator, teacher, student, visiting student. The LMS collects data on the users as they attend courses (completed or not completed, assessment results) so that the user profile is dynamically evolving depending on the activity carried on within the LMS. Each user is mapped into a user space according to the definition of suited filters for having a view on some characteristics rather then other ones. According to different points of view, the user profiles can be focused on different performance indicators. For example, the description of the attitude (i.e., skills) in using the user interface and the tools (e.g., the users download files or they read documents while on-
223

line? how many clicks of the mouse?) or the definition of the level of domain specific knowledge to be used for the creation of the learning path of the students (Custom Learning Path). The definition of the domain specific knowledge can be done by means of tests or check list created with Test Maker. In this work the focus is on the definition of an individual educational path (Custom learning Path) for each user. This can be done by varying (enrichment with additional information or shortening by skipping known concepts) the sequence of Learning Objects in any individual teaching program. Sequencing is possible with the ADL-SCORM 2004 model [4]. According to the SCORM sequencing and navigation technology, the proposed system can be thought as follows:
Activity tree Learning activities Sequencing rules Navigation Navigation data model
Moreover, in the proposed approach further functionality is proposed that is the capability of adapting the sequence to the user according to a personalized model of the student and of one’s a priori knowledge and skills on the subject matter. Given the general structure of a course, a variety of algorithms and techniques can be used for optimization purposes. One objective can be the minimization of the completion time and effort as well as the maximization of the results. Once the course materials and its structure are defined, the (standard) learning path can be customized for each student depending on personal ability and depending on the results achieved while attending the course, thus creating a custom learning path. A dynamic data structure is created for each student and it is updated according to the results registered within the LMS and through the evaluation and self-evaluation tools and reporting system (see figure 1).
Figure 1 - Customizing learning path to user’s profile
Generally speaking one can define a concept in terms of knowledge that is, a set of information related to it. Given a domain of knowledge K, acquiring more and more concepts (i.e., learning) we increase such domain of knowledge transforming it in a new domain K’. Knowledge can be thought as a set of information; concepts can be defined as functions mapping one domain of knowledge in a wider domain of knowledge. We can therefore define a set of concepts as:
Ci: Ki → K’ with K’⊂ K. Ki is the requirement (Prerequisite) for the user to understand what is expressed into concepts Ci he is going to learn; K’ is the new domain of the knowledge the user is in after attending that specific part of a course; K’ ∩ K represents the learning outcome. The process of definition of a standard learning path can be described in the following steps (see figure 3):
o Collect ideas together o Arrange ideas in concepts o Join concepts in learning paths
Figure 2 - Defining learning paths starting from concepts Ideas, information, references, images, … are collected and clustered to define a concept Ci. For each concept prerequisites have to be investigated as well as learning outcome, so that learning paths can be matched with individual students’ ability. Once identified feasible educational paths, they can be aggregated in more complex learning units given by the combination of concepts and their organization in learning trees. On the root of a learning tree we have the general prerequisite for the underlying subject matter, the a priori knowledge needed and sufficient to start profitably a learning path tailored on a learning tree. In its general form a learning tree is an oriented graph where arrows entering a node represent prerequisites and exiting ones represent learning outcome; concepts without entering arrows represent concepts whose prerequisites
Concept A
Concept B
Concept N
Concept A
Concept B
Concept N
IDEASIDEAS
Collect IDEAStogether
Arrange IDEASin CONCEPTS
Join CONCEPTSin learning paths
Concept BConcept C
Concept MConcept B
Concept C
Concept M
Check users’ KNOWLEDGEagainst course PREREQUISITES
Define a CUSTOMLEARNING PATH
Make suited pruningon learning trees
B
C
A
N
M
B
C
A
N
M
B
C
N M
224

are the a priory knowledge necessary for that subject matter.
4. Components of the System The system enabling teachers to the integrated management of the activities as described above is composed by a Learning Management System and by a set of specific tools. The proposed tools are the following: Subject Matter Sequencing (SMS), SCO wizard, Virtual Class Register (VCR), and Test Maker. A short description follows for each component of the system.
4.1 LMS The University of Genoa, within the CampusOne Project has activated in 2001 a three-years action finalized to the introduction of e-learning facilities ad-hoc for the athenaeum genuense. At the end of the project, in 2004, one of the results consisted in the realization of a full featured SCORM compliant e-learning management system (LMS) with an XHTML 1.0 Strict WCAG Priority 3 compliant interface – called EiFFE-L - entirely integrated with UniGE Information System. Despite the large number of e-learning commercial products available, the University of Genoa decided to realize a novel – open source - LMS/LCMS, inspired to the best solutions and innovative frameworks (e.g., OKI [6]), in order to ensure that the University has total control and ownership of the implemented source code. This choice was made to prevent possible modifications and updates of the licence giving policies of a possible commercial product. EiFFE-L has been published as open source in SourceForge repository [2], under GNU-GPL License. The main characteristics of such platform are: portability, accessibility, open source, multi-language front-end, and conformance to e-learning standards.
4.2 Subject Matter Sequencing The Subject Matter Sequencing (SMS) tool allows users to create a course starting from independent modules or single topics so that depicting standard learning path can be made easier. Arranging lessons together in a specific sequence gives raise to a specific course. The SMS offers such capabilities:
Definition of a concept Ci in terms of “assets”, atomic components who cannot be partitioned (sub-divided). Definition of a graph of concept dependencies by means of definition of logical relationships among pairs of concept Ci and Cj. For different kind of relationships are possible:
Ci > Cj Ci is a prerequisite of Cj; Ci < Cj Cj is a prerequisite of Ci; Ci ≡ Cj Ci and Cj are in some way correlated
but they have a relationship of indifference;
Ci ∅ Cj Ci and Cj are concepts completely disjointed;
from a pedagogical point of view, in case of ≡ and ∅ relationships there is no difference in composing a learning path where Ci before Cj or vice versa. The difference between the two relationships is that during the generation of a learning path, in a sequence of concepts, in order to guarantee the constraints imposed by the defined relationships, the distance ∆ between two concepts Ci and Cj (i.e., the number of concepts Ck between Ci and Cj) should be greater than zero; in the case of “indifference” relationships the system minimizes ∆. Generation of an optimal learning path following the constraints imposed by the logical relationships among concepts (see below). Partitioning of the learning path in sub learning path according to the user inputs. Possibility of editing of the generated learning path to change the order of concepts in case of possible alternatives. Creation of an XML file output of the sequence.
If we think to a lecture, or a whole course (i.e., set of lectures) in terms of a sequence of ordered concepts, in our model that is the index of topics of a Learning Object (SingleSCO) or a sequence of Learning Objects (MultipleSCO, SingleCourse). Such sequence will be generated starting from the graph of the concepts dependencies. At the very top of this graph one can find the didactic objectives (the concepts that represent the objectives). At the bottom of the graph one can find basic skills required, also called Primary Notion. All the notions that need some prerequisites are called Secondary Notion. The graph must be analyzed starting from the primary notions and back-stepping towards the secondary notions up to the top where objectives are listed to represent learning outcomes. The graph itself is a graphic representation of the definition of a hierarchy of objectives. Nodes and arcs match with concepts and relationships among concepts. By navigating the graph described above, one can find a series of elements priors one to each other and identify a specific path in it. This has been done on the basis of the Davies Matrix [7]. According to this theoretical approach the sequence outcome of the Subject Matter Sequence tool is free of redundancies; concepts in the graph appear once hence it is considered just once in the learning path. On the other hand, redundancies can be sometimes useful, from a student point of view, for refreshing basic notions acquired a long time ago. For this reason and many others the tool is not fully automatic, and allows human intervention to make modifications to the structure of the
225

learning path, leaving some degree of freedom to the user (the author of the course) who can enrich the results of the mere algorithm with one’s personal experience in teaching. On the other hand the teacher is forced to respect a rigid, formal structure while designing the courses.
4.3 SCO Wizard The SCOWizard tool has been designed for the implementation of Learning Objects ADL-SCORM compliant, based on specific XHTML templates defined for EifFE-L. The main objective has been to create a simple off-line tool that supplied the possibility to realize SCOs (Shareable Content Objects) through the insertion of contents, without having to use HTML editors nor having to work into the templates code, nor having to study the SCORM rules in order to package standardized learning objects. The philosophy underlying SCOWizard has been to tailor the packaging procedure around the typical EifFE-L authors, realizing ad-hoc sequenced forms for each selected SCO template. The pages generated are XHTML 1.0 strict. The SCOWizard has been designed taking into account the structure of learning material for a typical university lesson, defining a template asset with all the relevant components. The sequence of concepts generated with SMS can be used as input for the SCOWizard. The result of this analysis has been the realization of an XHTML base for learning objects - and several different CSS templates - with the following structure:
• Header and footer, where information about the author and the contents are defined, also in terms of metadata about the structure of the lesson (module), used in case of SCORM standardized learning object as “organization” of the resources that compose the lesson, i.e. IMS manifest structure [8].
• The number of sections (units) that compose the lesson (the number is dynamically modifiable during the authoring phase). If SCOWizard inherits a sequence of concepts from SMS, such sequence is the index and structure of the sections composing a lesson.
• The contents of each unit subdivided in paragraphs, which can be realized in several ways (typed paragraphs): only text, text with comments and notes, text with image (left/center/right), etc.
The aim of such learning object organization is that assets should satisfy accessibility and usability, being conformant to SCO packaging rules. At the end of contents’ authoring phase, SCOWizard let the author choose a CSS layout among the list of templates available, creating a valid SCORM manifest (imsmanifest.xml) and packaging all the assets into a zipped container.
The indexing phase (metadata related to IEEE P.1484 LOM standard) is given by a separate tool, Metamaker, integrated with SCOWizard, which is under development at a beta stage. SCOWizard has been realized as a Java application, with a SWING based GUI; the current release is 1.0, and the current work is devoted to reduce the rigidity of the learning object structure by having in input a “lesson semantic description” in RDF format, as well as to reduce the complexity of authoring phase without transforming the wizard into a WYSIWYG editor.
4.4 Virtual Class Registry VCR is an XML-based “Class Register” for monitoring and evaluating the participants to a virtual class, finalized to the electronic accounting of the qualitative and quantitative appraisal of the participation of the students enrolled into an EiFFE-L course. VCR is an open-source tool, integrated within the platform, which uses the users data (statistics, tracked assignments, evaluated posts on forums, etc. in a flat XML structured file) generated within the teacher’s functionalities. Once generated the XML file can be transferred on a local computer, where the VCR is installed. The VCR import XML data into an internal database, allowing the teacher to complete data and to add his own appraisals. The new data and grades are introduced "visually" (using different colors and icons, e.g. red color to characterize data to be filled), using a series of panels and forms resembling a traditional paper-based class register, with a cover that encloses six different pages. The cover and the successive pages are accessible through the home page of the tool. In synthesis the main functionalities of the pages are the following.
Cover: the cover of virtual class register contains a summary of the course; Definition of concepts in terms of “assets”, atomic components who cannot be partitioned (sub-divided); Participation: the page of the class register devoted to the evaluation of participation/attendance of each enrolled student; Activity: the page of the class register which collects all the information useful to assign one total estimated grade on the activities carried out from each student; Test: the page of the class register which collects all the information useful to assign one grade on the tests carried out during the course; Exercises: the page of the class register which collects all the information useful to assign one grades to each exercise carried out during the course; Individual Projects: the page of the class register, which collects all the information useful to assign an appraisal on the individual assignments;
226
Workgroup: the page of the class register, which collects all the information useful to assign one global evaluation to the tasks collaboratively done within a group of students.
4.5 Test Maker TestMaker is an open source tool specifically designed for the EifFE-L platform, for creating tests. TestMaker offers advanced editing capabilities for creating tests that will be published within the EifFE-L framework in order to evaluate and check skills, capabilities, and knowledge of the students at different times during the learning path:
before starting a course (prerequisites), after the completion of a course (acquired skills), at the end of a course for self-evaluation (self-improvement),
at the end of a course for the final evaluation and score (final results).
Test authors can create three different types of test: A) Evaluation test with free answers: questions are listed and answers have to be given by writing free text inside a text area. Answers are forwarded to the author of the course according to the EifFE-L database definition. Final evaluation can not be automated; it is up to the teacher reading, evaluating, and scoring given answers as well as communicate the final results to the students by using collaborative tools provided with the EifFE-L platform; B) Evaluation test with pre-defined answers: questions are listed and answers are requested and collected. The system can calculate a score of the test according to a pre-defined score table. The teacher receives both the test and the relevant result; C) Self-evaluation test: questions are listed and answers are requested. The system suddenly replies with a right or wrong message so that students can improve their knowledge. Tests are not forwarded to the teachers who are only informed about the making of the self-evaluation test. Moreover each test can also be timed. Questions and answers can be proposed by following different models:
o Multiple choices: only one is the right one! (can be with radio buttons, drop-down list, numerical evaluation);
o Multiple answers: one or more can be the right ones! With check boxes;
o True/false: only one is true! With two radio buttons; o Free answer – students have to write their own
answers, maybe correct or not! o Missing words: students have to complete text or
sentences without any suggestions. Authors of tests are also required to give explanation on the reason why answers are right or wrong so that
students are also told and they can learn from their mistakes too.
5. Conclusions This work discussed some of the result of a project, CampusOne, funded by CRUI - Conference of the Rectors of Italian Universities whose goal has been to create an e-learning open source portal which would respond to the most recent an binding provisions of law concerning the delivery of on-line education and to activate a process of cultural growth for both teachers and students concerning the use of ICT for didactic purposes. In particular, some specific aspects of the EifFE-L (Environment for Freedom in E-Learning) e-learning platform and related tools have been illustrated, aimed to improve the productivity in the learning process. The discussed system enables teachers to the integrated management of courses in a distance learning environment, making available tools to support the authoring, teaching, and evaluation activity.
References [1] http://www.campusone.unige.it, web site of the CampusOne project of the C.R.U.I. - Conference of the Rectors of the Italian Universities, developed at the University of Genoa. [2] http://www.eiffe-l.org, web site of EifFE-L, open source platform. Also available on the sourceforge repository at the URL http://sf.net/projects/eiffe-l. [3] http://ltsc.ieee.org/wg12/20020612-Final-Lom-Draft.html, IEEE Learning Technology Standardization Committee – Learning Object Metadata Working Group WG12, IEEE Standard for Learning Object Metadata, 1484.12.1 – Final Draft, 2002. [4] http://www.adlnet.org, web site of ADL, Advanced Distributed Learning Initiative. [5] K.J. Gergen, Social construction and the educational process, in L.P. Steffe and J. Gale (eds.), Constructivism in education, Lawrence Erlbaum Associates, Hillsdale N.J., pp.17-40, 1995. [6] J. Merriman, R. Robson, ‘The Open Knowledge Initiative’, Proceedings of World Conference on Educational Multimedia, Hypermedia and Telecommunications 2003, 92-94. Norfolk, VA: AACE, 2003. [7] J. Steltzer, E. Kingsley, Axiomatics as a paradigm for structuring subject matter, Instructional Science, 1975 [8] http://www.imsglobal.org, web site of the IMS Content Packaging Information Model, Version 1.1.2 Final Specification, 2001.
227

Abstract The grade 1-9 Curriculum focuses oninstructional innovations. Teachers need to have instructionaldesign abilities. An instructional system and supportingframeworks is needed to help teachers. The researchersparticipated in the setting process of the Health Learningwebsite and nDomain Instructional DeIn the first phase, an instructional design workshop was heldfor the seed-school teachers from eight schools. The teachersfollowed the design model to develop, discuss and reviseinstructional designs. Then they went back to their ownschools to teach a one-hour class and record the whole teachingprocess. According to the field notes, the feedbacks from theirstudents and teachers, -evaluation sheet of
ofevised their teaching
plans and teaching design. In the process the researchersdesigned a comprehensive questionnaire and retrospectivelystudied how to digital instructional designabilities and how to renew the teaching results with the Model.This study also expects to see that, with than Internet platformfor posting and sharing instructional design process and results,teachers can benefit in discussing, observing and teaching.
Keywords: Digital instructional design, Digital instructionalmaterial, Health and Physical Education
I. PREFACEThe grade 1-9 Curriculum has modified the curriculumstandards to be more flexible. Thus teachers must modify thetextbooks or create their own teaching materials. Since thebeginning of this education reform, to meet the change, manytraining workshops have been held by the government orlocal assistance groups to establish Health and PhysicalEducation Domain Instructional Design Model to helpteachers acquire the abilities of creating teaching materialsand teaching activities. his research, completed in 2004, isto use this model in four phases to train and help teachergroups in the seed-schools in Health Learning website toreach the following three purposes. First, it is to upgrade the
instructional design to improve theopportunities for
discussions ability to ben.Third, it uses the internet platform for teachers to learn fromothers.There are two groups -this research: one is from the schools invited by HealthLearning website; the other is from the informationseed-schools, junior high or elementary schools, under theMinistry of Education MOE , willing to develop the contentin the Health Learning website when they apply to beseed-schools. Teachers from these form their teacher groups
- n this research.
II. TEACHERS UNDER EDUCATIONAL REFORMA. With the changes of textbooks, teachers should have theability to do instructional designs
School-based curriculum is the core concept of the grade1-9 Curriculum. It develops teaching courses mainly by
asesources as its basis, to adopt
measures according to specific circumstances, schools, orstudents. It emphasizes on giving the students suitable, livingand instant learning (Chang, 2003). To reach the goal,besides selecting adequate textbooks, some ways are taken,such as transforming textbook content or activities to meetlocal features, re-organizing the lessons of textbooks
-all course plan, or re-editing theneeds (Chang,
2003).Besides methods mentioned above, we focus more on-construct the teaching materials.
T s constantlyadvocated (Ou, 1999). A scholar mentioned that to developcourses and improve teaching quality, a teacher should havethe attitude of learning and adjusting by doing in thedeveloping courses. Using action researches to improvecourse development and teaching will benefit both a
which teachers learn and adjust by doing to solve course andteaching problems will be one of the core strategies inrunning the grade 1-9 Curriculum.(Chang, 2003).According to tschool can create its own teaching materials to lessen itsdependence on textbooks (Chen,2002).But some scholars
instructionaldesigns. So in using textbooks, teachers should have theability to re-create, re-edit, or re-transform the teachingmaterials Chin,1999.2003 .Based on the above ideas, in the grade 1-9 Curriculum,Health domain and Physical Education domain werecombined as one(Lin & Chua, 2003). With many years ofexperiences in researching and developing experimentalteaching materials in the domain of Ethics and Health, theresearchers developed materials used in several experimentalschools, modified and then sent to National Institute forCompilation and Translation to be examined.To help teachers acquire the ability of instructional design,we held several meetings with experienced school principals,directors, and excellent teachers to draft a flow chart ofinstructional design which was later used by many differentusers and many workshops held by the Ministry of Education.They came up with many productive instructional designsand ideas for further modifications. Later, to meet the needsof local workshops, we discussed and exchanged views with
The Digital Instructional Design Abilities Cultivation of Teachers- A CaseStudy of the Health and Physical Education Domain
2Huey-Jong TzengFusing Elementary School, Jhonghe City, TaipeiCounty, Taiwan, Republic of China e-mail:
1Ging-Ying Lin,National Academy for Educational Research,
Taiwan, Repubic of China e-mail:[email protected]
228

Fig.1: Health and Physical Education Domain Instructional Design Model
teachers in all over the island, such as Taipei City, TaipeiCounty, etc to find ideas for modifications. We laterdevelopedInstructional DesignModel (Fig.1.), a systematic (Lin, 2001)and its four assistant instructional design charts. The userscan do an instructional design smoothly by following theguide of the systematic chart and the assistant charts.The instructional designAfter that, the theme has to be decided. After drawing theinstructional design structure chart, with the content forinstructional design in mind, a teacher may write down therelated sub-guidelines of the basic guidelines, thesupplementary explanations(including related domains andmajor issues), and the corresponding teaching objectives. He
or
she may first write down the teaching objectives and look forsuitable sub-guidelines. Then, the required class hours andthe key teaching points are decided. With the key teachingpoints, following the instructional design chart, a teacher maydesign each period which should be interesting, living andsuitable for the students. Time control and substituteactivities should also be considered. Notes andself-examination points are listed out as well. Finally, the
how do you know the students have learned whatThat is, what are the means you
finishes the paper work process which will be carried out intrial teaching and further modifications if necessary. Theteachers, in the process of personal participation, willgradually finish the instructional design according to theneeds of his won students, build the ability to design andestablish the confidence.(Lin & Tzen, 2001)
B. The learning of digital teaching materials for teachersIn recent years, the Ministry of Education has graduallypromotes digital instructional materials and internet uses (Lin,2004) and has established a website (http://content1.edu.tw),an area for sharing teaching resources and experiences. Thelearning websites for six categories were also finished,
including Life Learning website, Nature Learning website,Science Learning website, Health Learning website, Historyand Culture Learning website, and Arts Learning website(MOE, 2004). These platforms can provide teachers accessto sharing their instructional designs, exchangingexperiences or search for materials. We are now working onthe Health Learning website (http://health.edu.tw) toempower th instructional design.Therefore, learning how to transform teaching materials intodigital, how to use them, and how to share the resources byusing digital platforms will be crucial for modern teachers.
III. THE MEASURES TO DEVELOP TEACHERS DIGITALINSTRUCTIONAL DESIGN
ability to do instructional designs. The time of was fromJanuary to December, 2004. The targeted participants werethe eight seed-school teacher groups of Health Learningwebsite set up by the MOE.Four phases in the research: the first phase is to build up
the know-how basis for teachers. The second phase is to havetrial teachings in the classroom according to instructionaldesigns and record the process. The third phase is to gothrough evaluationSelf-evaluation sheet of instructionevaluation sheet of instructioninstructional designs and teaching and fill in Feedbackquestionnaires. The final phase is to finish the instructionaldesigns and make them digital to be shared.Methods of the research: analyze documents and papers;target group meetings and group discussions; group hands-onpractice; trial teaching recorded; virtual teaching evaluationand questionnaire feedbacks etc. They are described asfollows:A. Analyze documents and papersRelated documents were reviewed to form the theory basisof this research. The systematicEducation Domain Instructional Design Model and its fourassistant instructional design charts were utilized. So are theT -evaluation sheet of instruction
valuation sheet of instruction.B. Target group meetings and group discussions:The teachers joining the research were from theseed-school teacher groups. In workshops of the first andthird phases, target group meetings and discussions were heldto share experiences to enhance their expertise.C. Group hands-on practiceTo put the theory into practice, traditional lectures(one-way) were not taken. Besides making good use of groupcooperative learning method, participants were put into
s.Thus, their design ability can be advanced in hands-onpractices and instant feedbacks can be received.D. Record trial teachingThe seed-school teacher groups combining
they may document them for future discussions and use themfor instructional design evaluations in the third phase.E. Virtual teaching evaluationsThe seed-schools are in different locations. So the trial
229

teachings are recorded and will be watched by other teachersto have virtual teaching evaluations.F. Questionnaire feedbacks
Instructional Designn out and
filled in. Five items in the questionnaires which are related tothis research and there are five degrees for each item.(5-excellent, 4-good, 3-fair, 2-not well, 1-to be improved)There are also some open questions for comments. Thequestionnaires were collected to find out if the targetedobjectives are met and understand major problems therein tobe noticed in future researches. All the thirty-threequestionnaires were retrieved. The explanations for codes inthis research are described as following :Table 1 code descriptionCategory School Serial numbers Member Partition Date
Target groupdiscussions &feedbacks: AInternal groupdiscussions &feedbacks: Bquestionnaires*: Cpostedinstructionaldesigns: D
Juniorhigh: J
Primary: P
The serialnumbers forjunior high andprimary schoolsin each area arearrangedaccording to thewriting strokesof the firstChinesecharacter in theirschoolname(from leastto most) andlisted withnumbers fromsmall to big.
Specialist:S
Seniorteachers:T1,T2,T3
Teachers inteachergroups:M1,M2,M3,M4
Adash,--,is usedforpartition
Westerndates,monthand daybeing 2numbers
*questionnaires were done without signature and were assigned withnumbers starting 01,02,03,---,32,33.
IV. RESULTS AND DISCUSSIONSThis research has four phases. The results are as follows:A. First phase: build up the know-how basis. Eightseed-school teacher groups attended the workshop.
1. Every teacher in each teacher group finishes aninstructional design. There were totally eightinstructional designs from each group. The contentcovers topics like growth, man and food, mental health,safe living (including Chinese herbs), and public health.
2. Course specialists and senior teachers joined thediscussions. Different teacher groups exchanged views,gave suggestions for modifications, refreshedreminders, or helped figure out some hidden problemsto help each teacher group finish their design. After
instructionaldesigns, course specialists and senior teachersresponded with comments and feedbacks.
3. Course specialists refreshed reminders timely, forexample, the importance of time control in their design.
4. During small group discussion, course specialists joinedthem and offered their suggestions. This worked outbest for instructional design.
5. While working on the designs, teachers should noticeteaching evaluation.
6. After each group went through the process of thinking,designing, discussing, modifying, presenting andmodifying, course specialists again gave theminstructions and suggestions. Then the instructionaldesign was finalized and prepared for trial teaching.
7. Digitalizing the content of instructional designs by usingbasic computer skills like WORD or PowerPoint. 8.Making instructional designs digital also made thingseffective for presentation, interactions among teachers,
suggestions from teachers duringpresentation and small group discussions. Each processcould be completed within very short time.
From the above, the seed-school teacher groups, afterfollowing Health and Physical Education InstructionalDesign Model and its assistant charts in doing hands-oninstructional design practices, they finished their basicinstructional design. After they received instructions orsuggestions, they could modify them immediately, showingthe obvious benefit of making instructional designs digital.B. The second phase: do trial teachings according toinstructional designs and record the process. This had
With one-period instructional design completed, teachersreturned to school to have trial teachings to be recorded.After that, discussion meetings were immediately held,where the involved teachers talked about what they hadlearned, the differences between instructional design and trialteaching, points to improved etc. Other teachers also gavesuggestions and encouragement. Finally course specialistscommented.1. Before trial, teachers prepared it with assistance.2. Right after trial teaching, discussion meetings were held.Involved teachers talked about what they had learned.
3. To find out how well the students learned, pre-test wasgiven before teaching and post-test after teaching.
4. Among teacher group members, in trial teaching teacheror instructional design designers, both thought thatrechecking design flow chart and process andexchanging opinions constantly would positively helpnarrow down the differences.
5. Instructional designs should be modified after trial.6. Recorded trial teaching provides virtual classroomenvironment for evaluation basis in the third phase.
7. Completed digital instructional designs increasedconvenience after being modified according to theproblems occurred in trial teaching.
Teacher group members, after sharing what they learnedand the differences between design and operationalcurriculum can check and improve them. Besides, throughcommunications, discussions, and instructional design abilitywas enhanced. Recoding technology, applied to teaching,provides A-V information and may help teaching. Recently itis used for evaluating teaching and teaching quality(Chang,1999). Thus, recording offers a virtual classroomenvironcamera technology has become digital as welmuch easier to present the pictures through PC and edit them.The recording CDs of this research will be an importantsource for teaching discussions in the next phase.
C. The third phase : instructional design evaluations,feedbacks, and modifications
The teacher groups joined workshops again to fill outevaluations and questionnaires. Teaching recordings wereused providing virtual settings. Everyone watched therecording and started the evaluation. After it, they used the
230

Self-evaluation sheet of instruction the
modifications to improve their designs. Finallyquestionnaires were finished to show their evaluation.Following is the description of evaluation and thequestionnaires:1. Instructional Design valuation:
Recordings provide virtual classroom setting to rechecktheir own instructional design out thedifferences between instructional design and trial teachingso they could make adjustments. The advantages of the trialteaching would be pointed out and given feedbacks.Teaching objectives should be clear and meet the relatedteaching guidelines and the amendments. The content ofinstructional designs should match the objectives.Activities should be integrated, interesting. Studentevaluation measures should be multiple. Media equipmentshould be used if necessary. Besides, course specialistsshould instruct the teachers how to useSelf-evaluation sheet of instruction thepeer evaluation sheet of instruction. Finally, according tothe above results, they checked their own designs andteaching recordings for further adjustments.The results indicate that digital teaching recordings
offer virtual classroom environment for checking teachingand evaluating, a good designability. Fromwatching recordings and discussions, teacherslearned to link and combine instructional designevaluations, learning guidelines, the ten basic learningskills,evaluation and attention to making teaching interesting.2. The feedbacks in the questionnaires for instructionaldesign workshopsA. results in quantity:Teachers checked five-degree questionnaires. (5 to 1)
It showed that thefour of the five items, i.e. course arrangement, learning
performance, and workshop quality,all reached 97% satisfaction rate. The teaching processreached 84.8%. Obviously the workshops were helpful toimprove their ability for instructional design.B. quality description:From the questionnaires, the teachers participated were
considerably advanced in instructional design. In thisworkshop, the teachers learned the know-how knowledgeof instructional design step by step through interactionswith professors, senior teachers, and colleagues.
helpful for the teachers to join the workshop and improvetheir ability for doing designs. Digital instructional designflow chart helped beginners and experienced ones torecheck their work. Digital teaching activities offeredopportunities for discussions, sharing, modifications, andcan be handed down for teachers in the future.
D. The fourth phase: completion of instructional designsand making them digital for sharing
Every group posts completed instructional design unto theHealth Learning website and share these digital contents andinteractive on a learning management system platform.A complete instructional design model will help teachers
improve their ability in designing. Digital technology tomake instructional designs digital not only benefits oneself inkeeping files, but has the advantages of portability.
V. SUMMARY AND SUGGESTIONSA. Summary
1. The systematic instructional design flow chart of theHealth and Physical Education Domain InstructionalDesign Model can help teacher groups finish theirinstructional designs and definitely enhance their ability indesigns. Digitalizing each process digital can effectivelyassist teachers finish their instructional designs.
2. Confidence of teachers of doing instructional designs isstrengthened. Teachersneeds into self-made teachingmaterials closelymeeting thespecific needs of each school-based curriculum.
3. Recording teaching process can offer teachers effectiveBy watching the recordings, the
content for evaluation can be proposed and teachers canlearn how to evaluate an instructional design as well.
4. Teachers not only learned to design, but realized theimportance of interaction with senior teachers and coursespecialists.
5. Digital files or content have advantages of portability,duplication, maintenance, and easy editing. Digitalpresenting and sharing in developing courses technologyand materials can be crucial in demonstrating.
Suggestions:1. A school developing school-based curriculum can makegood use of this model to shorten the required time.
2. During the research, the teachers involved also brought upproblems of utilizing digital technology. Problems likethese can possibly be solved by assigning technology workto professionals in this field. Teachers can focus ondesigning drafts based on their teaching expertise andpassing the digital part of the work to digital professionals.Thus they can work in a team.
VI. REFERENCES:[1] B. C. Chen, structure of Grade 1-9 Curriculum: clarifying its content,
, Handbook of training workshop for junior high and elementary schoolprincipals and superintendents, Ministry of Education, Taipei , 2002 , pp. 1-14.
of lesson plan in Social Studies in elementary, Tien Wei Publishing Co ,Taipei ,1991.
[3] P. C. Chin, Handbookof Grade 1-9 Curriculum workshop, Ministryof Education, Taipei, 2003, pp. 136-141.
ching materials and methods: the essentials, methods,Wu Nan Publishing Co , Taipei, 1999.Curriculum development and
design, by Allan C. Ornstein,Francis P. Hunkins, translated by Feng,Der-long, HighEducation, Taipei, 2004.[5] S. J. Ch concepts of curriculum, handbook of Grade1-9 Curriculum
-49.study of finding effective measures to
creativity for lesson plan design: A case study based on thes-on workshop of lesson plan design in Health and Physical
Education -9 CurriculumCreativeTeaching Conference. 41-51. Education Department, National Kaoshiung Normal
Kaoshiung), 2001.process flow in major themes of Grade
1-9 Curriculum, first published in the workshop documents. 18 4 Workshopfor Taiwan elementary teachers held by Ministry of Education, Ministry of Education,Taipei, 2001, pp. 14-29.
Curriculum and Teaching in Healthand PhysicalEducation documented in the handbook of the workshop for junior highand elementary schools in Health and Physical Education Domain of Grade 1-9Curriculum, Ministry of Education, Taipei, 2003, pp. 26-32.[9] R. C. Lin, c teaching resources and creative teaching:a reviewof related foreign websites to build domestic platforms of teachinghttp://www.phy.ntnu.edu.tw/nstsc/pdf/book6/27.pdf, 2004.
231

-9 Curriculum according to concepts ofcurriculu Research Information. 7(1), National Taiwan
-32
232

A virtual tutor for a multimedial distance learning course
V. Rossano, T. Roselli, E. Faggiano, M.V. Pragnell* Department of Computer Science – University of Bari – Via Orabona, 4 –70126 Bari - ITALY
{ rossano, roselli, faggiano }@di.uniba.it*Faculty of Medicine – University of Bari – P.za G. Cesare, 1 - 70123 Bari - ITALY
Abstract
The use of new technologies is leading to great changes not only in the organization of educational programs but also in the skills required of learners. They have to take on a more active role in distance learning environments, becoming actors-producers of their own learning path. However, to be successful in this new role they need support. The present study describes a multimedial course offering support by a virtual tutor, created with the aid of Artificial Intelligence techniques.
1. Introduction
In our dynamic, fast-moving society, information has become a strategic resource that has a strong impact on the efficiency of social and economic, as well as cultural systems.
Telecommunications and especially the Internet are being increasingly adopted to create distance learning courses, that provide added value in the learning process. They ensure easy access by users to vast stores of data, greatly facilitating lifelong learning.
Because the World Wide Web is a highly flexible tool, it enables use of a variety of representation forms and different organizations of the teaching material, and allows open, unlimited interaction with the external, public environment. Users can access vast data stores, navigating freely as the mood takes them and so enriching their perception of the world.
This turns users into active movers in their learning process and so facilitates not only the acquisition of specific concepts but also the development of more general skills, such as data collecting and selection, the ability to make critical, personal interpretations, decision-making and gauging of the results, and learning to identify and modify interpretation models on the basis of stimuli deriving from the external environment.
All the same, it is not easy to become actor-directors of one’s own learning process. It is essential to be conscious of what one has already learnt and what one still needs to learn in order to attain a given target. Not all users of distance learning environments are able to do this on their own, autonomously directing the process and making the most suitable choices. For this reason, the e-learning research community has paid particular attention to personalizing the content of distance learning processes. This involves deciding what important rules need to be set to allow the system to automatically define the best path for each individual user.
Another research area that is often interwoven with the previous one is that of creating virtual tutors in distance learning environments, that can emulate the behavior of the teacher in a traditional learning situation. On the basis of analysis of the data on the user-machine interactions, the virtual tutor must intervene and advise the user about the next action s/he should take, suggest material for further study, provide feedback about exercises already done, and so on.
The present work describes an interactive distance learning course equipped with a virtual agent that supports the learner throughout the learning process.
Before going on to describe the application in detail, some consideration of previous examples of virtual agents is made, focusing particularly on those adopted to date in distance learning situations.
2. From chatterbots to virtual agents
Although they are mostly unaware of it, users navigating the Internet make daily use of information software that guides the data search within the Web, in the form of search engines. Although these are very simple virtual agents, they are essential as filters of the huge quantity of data available, in order to show only
233

those conforming most closely to the user’s search criteria.
A more sophisticated virtual agent is the chatterbot, a software that can simulate man-machine dialog. The input is generally in the form of questions or sentences of all types, to which the software responds on the basis of its own vocabulary or reasoning process. The illusion of dialoguing with another human being is sustained thanks to the results of research in the field of Artificial Intelligence, that has always concentrated on how to simulate human cognitive skills. The earliest chatterbot, Elisa, (created in the ’60s by Joseph Weizenbaum of the Massachusetts Institute of Technology) was intended to resemble a Rogerian psychologist. [5]. In recent years, thanks to developments in artificial intelligence techniques, more and more chatterbots have been developed and these are becoming more and more “human”. A competition for these has been set up, awarded the Loebner Prize that is the first formal instantiation of a Turing Test sponsored by New York philanthropist Hugh Loebner. [4]. The latest winner was A.L.I.C.E. (Artificial Linguistic Internet Computer Entity) [1], developed by Richard Wallace, which was ranked the "most human computer" by the panel of judges.
Apart from chatterbots, other virtual agents integrated in software environments guide the user in the use of the software itself. The most sophisticated ones act as true personal assistants rather than just as tools, because they learn about the user on the basis of the interaction and can anticipate his/her needs according to previous experience.
For example, NOMI and INTERWERK-Agent are virtual characters that allow the user to navigate a site, and present the available products (e-Commerce).
With MM-Mail, an experimental service that was presented by Telecom Italia Lab at the SMAU 2002, the user is given the chance to send personalized and multimedial e-mails because the service incorporates a program that can transform text messages into actions by a virtual character. The text is read by a vocal synthesis system and the associated phonetic information is transformed into facial animation parameters by an animation motor.
This experience has also been applied to the field of distance learning. In fact, Artificial Intelligence can provide a very valuable contribution to distance learning: the use of agents to create online tutors supporting the learning process by giving advice and providing appropriate feedback is now very common.
3. The role of the human tutor
In distance learning situations, the user and the tutor will become more familiar as the learning process develops and they get to know each other better. In a traditional situation, the teacher is seen as the knowledge repository, whereas in a distance learning situation the teacher figure is replaced by the tutor figure, that has more of an advisory capacity, working to support and facilitate learners working more autonomously, especially in cooperative learning situations [6]
It is clear that in an online course the tutor has a fundamental role of supporting the teaching material and technological device, as well as fostering communication among the participants in the learning process.
The tutor’s role is therefore particularly demanding in terms of time. This is the reason why, when setting up an online course, the decision to insert a virtual tutor does not only derive from the need to ensure software usability but also has the advantage of making a tutor figure permanently available to the students. To date, experiences with such a figure have ranged from a tutor that merely guides the navigation of the courseware, to more sophisticated tutors that can simulate a real teacher and provide explanations and appropriate feedback.
The complex nature of the tutor figure in distance learning contexts can be appreciated by distinguishing the different roles, as has been done in the classification below [2, 3]:
The tutor as counsellor: has the task of ensuring that communication among the learners is both simple and productive. The tutor as coordinator: must provide indications to stimulate, maintain and revive discussions about how best to carry out and coordinate the various work phases. The tutor as trainer: must support the participants during training exercises. It is essential for the tutor to be continually available to students and to adopt an encouraging attitude to those needing further explanations. The tutor as facilitator: provides clear indications on how to carry out the activities. Il tutor as moderator: encourages all discussions proceeding along “parallel tracks” without ever converging, by pointing out the conceptual nodes of the subject, suggesting methods for approaching the problem or taking a position in discussions that are going nowhere.
234

The tutor as organizer: is especially useful in cases of large groups of participants, where the collaborative activities require strong organizational cohesion and therefore someone who will take care of the collection, summary and review of the work done.
It is evident from the above classification that the tutor figure is particularly oriented toward the support of communication in collaborative and cooperative learning situations. But the classification is especially useful during design of a virtual tutor agent, and this was the starting point of the current work.
4. The virtual tutor
One of the major challenges in the e-learning field is the creation of a virtual tutor that can fully satisfy all the above roles. An analysis of the products currently available on the market has shown that in most of them only some of the characteristics listed above are addressed by the virtual tutor. For example: 1. Language courses on CD-Rom edited by Garzanti
Linguistica. In these applications the tutor acts as a guide to the cd rom, offers support in interactive dictation and marks exercises, pointing out the mistakes made.
2. “Orienta tu” introduces the figure of the virtual Tutor, that assists the user to analyze and compare the various offers. “Thanks to the Tutor, the user no longer feels like a midget among giants”.
3. On the site www.edufamily.it the tutor provides feedback on the exercises done by the users; assesses events and emits pre-recorded sounds varying according to whether the feedback is positive or negative.
4. On the site: www.smau.it/tecnorama/italiano/flash.html a tutor is provided that guides discovery of the new technologies adopted in the field of distance learning. Its functions are somewhat limited because it only presents the sections and lessons present in the site.
The functions of the above virtual agents are summarized and compared with those of the human tutor in the following scheme:
Table 1. The tutor role in the examples analyzed
1 2 3 4
Counsellor
Coordinator
Trainer X X
Moderator
Facilitator X X X X
Organizer
Without claiming to be useful as a generalization, Table 1 summarizes the results of the study conducted during the phases of analysis of our application. All the applications we studied feature tutors, that generally have the role of facilitator, guiding user navigation, but only rarely intervene during practical work on exercises. The aim of our work was to create a virtual tutor that could support the student during both navigation of the teaching materials and execution of the tests, advising on further study or revision of the topics when necessary. In the following section, the application specifics and the rules used for the tutor are analyzed.
5. The E-Fl@ash course
The “E-fl@sh” project is a multimedial course, available online, that aims to introduce users to the applicative package Macromedia Flash® 5. It is addressed to all users approaching the world of animation for the first time, allowing them to acquire the knowledge needed to start creating animation.
The application integrates an animated agent that can personalize the training path by tailoring presentation to the interaction occurring with the student. For this purpose, the agent keeps trace of the learner’s interaction with the teaching content, and intervenes if specific events occur. The tutor figure is indiscreet, in the sense that it only intervenes to suggest actions if such specific events occur.
Figure 1. System screen shot
5.1. Users involved and their roles
The potential users of E-Fl@sh belong to two macrocategories: teacher and learner.
235

The teacher’s task is to insert teaching contents in the course, in the form of tests and texts. A series of reports is also available, allowing trace to be kept of the learners’ progress, and there is a messaging service available for communicating with the learners.
The learner can: access the course content from any internet point and use the material both on-line and off-line; search for a specific content using an internal search engine; check his/her learning progress with the on-line assessment tests.
The application also provides a virtual tutor that keeps trace of all his/her interactions with the learning content and, on the basis of events, advises the learner about what the next step should be.
Details on the virtual tutor are provided in the next section.
6. The virtual tutor in E-Fl@sh
As considered above, in any learning situation, be it on-line or traditional, the learner needs some support during the learning process. This need is clearly greater in distance learning environments, in which the student plays an active role in the process but is not always able to identify and undertake the right action at the right time, to achieve his/her learning goals.
In the design of E-Fl@sh, therefore, a “tutor” was incorporated to carry out tasks, defined in the light of the roles a human tutor will adopt in a traditional learning situation.
The techniques used to create the tutor in E-fl@sh are based on the problem solving methods used in the Artificial Intelligence field to create expert systems. The idea is to collect the knowledge of teaching strategies possessed by an ideal teacher and apply it at the crucial moments during man-machine interaction. This can be done thanks to the declarative form of knowledge representation used rather than the traditional procedural representation: i.e. to the description of the goal rather than how to achieve it.
In such a system, the teacher’s description of all the teaching aims is an essential element, together with all the possible ways of attaining them. It is therefore necessary on the one hand to list the rules that will allow the system to react in a given manner when a given event occurs, and on the other, to install a means of interpreting these rules and recognizing what kind of situation has occurred and therefore what rule to apply.
We stress the fact that the teacher’s knowledge of the domain has deliberately been kept separate from the teaching strategies. This permits a wide generalization of problem solving aspects, because by
simply modifying the rules describing the knowledge, the tutor can modify the mode of interaction with the learners and adopt different teaching and tutorial strategies.
In the application E-Fl@sh, therefore, all possible intervention by the teacher has been translated into rules for the tutorial component.
Reading of a rule in natural language is of the type: “IF the condition occurs then, perform action”
where this representation of the knowledge makes it possible to define: the conditions, as the state in which the student or system could be and the action, being the intervention to be made if the condition has occurred.
The rules defined are completely context-independent, but are closely dependent on the teaching structure: the content in E-fl@sh is organized so that each assessment test is linked to a given topic, a map and a set of exercises. For this reason, the rules are defined on the basis of the results obtained in the test, the number of pages on the topic visited and whether or not the map has been viewed. The conditions therefore have the following format:
Table 2. The format of rule conditions Assessment test score (ScoreTest) AND How many pages on the topic have been visited (VisitedPage)
AND
Has the Map been viewed? (Map) AND
Some of the rules used by the tutor are shown below:
Table 3. Some tutor rules ScoreTest VisitedPage Map Action
Low Low NO More in-depth study of the topic advised
Low None NOViewing the topic
before doing the test is advised
Low more than once Low NO
Shows the map and inhibits access to the test until the theory
pages have been studied
Low more than once High
Shows the map and in-depth study pages on
the topic
High None NOPoses another test to confirm mastering of
the topic
None High NOShows the map and suggests doing an
assessment test
236

None M YES Shows the assessment test
7. Conclusions and future work
It has now been amply demonstrated and proven that distance learning supported by technology gives learners an active role in their learning process. Not only does this help them to master specific contents but it also fosters the development of self-regulation skills. It is also true, however, that not all learners are equally able to manage their learning process efficaciously. That is why a tutor figure is needed to supply suitable support and stimulation.
This work presents a first prototype of a virtual tutor embedded in a multimedial distance learning course. The idea of the tutor stemmed from shared reflection on our experience with Artificial Intelligence, virtual agents and distance learning systems.
We are currently designing experiments to be carried out to assess the efficacy both of the course content and above all of the embedded virtual tutor and relative tutorial rules.
[1] The Artificial Intelligence Foundation website http://alice.pandorabots.com/[2] M. E Cigognini. E-Learning: metodi, modelli e ambienti per l'apprendimento a distanza nella Società dell'Informazione. Available at http://tesielearning.tecnoteca.it/ [3] La Noce F., E-learning: la nuova frontiera della formazione,F. Angeli 2001 [4] The Loebner Prize in Artificial Intelligence "The First Turing Test" http://www.loebner.net/Prizef/loebner-prize.html [5] Joseph Weizenbaum, ELIZA--A Computer Program For the Study of Natural Language Communication Between Man and Machine, Communications of the ACM Volume 9, Number 1 (January 1966): 36-35. [6] Williams, V., & Peters, K., 1997. Faculty Incentives for the preparations of We-based Instruction. Web-based Instruction, ed. B.H. Khan. Englewood Cliffs, NJ: Educational Technology Publications.
237

The ECDL Certification of ICT Usage Skills in the Italian Universities
Maria Carla Calzarossa Dip. Informatica e Sistemistica
Università di Pavia, [email protected]
Paolo Ciancarini Dip. Scienze dell’Informazione
Università di Bologna, [email protected]
Paolo Maresca Dip. Informatica e Sistemistica
Università di Napoli Federico II, Italy [email protected]
Luisa Mich Dip. Informatica e Studi Aziendali
Università di Trento, Italy [email protected]
Nello Scarabottolo Dip. Tecnologie dell’Informazione
Università di Milano, [email protected]
Abstract
We present the results of a monitoring exercise whose objectives were to analyze the experiences of the Italian Universities in the framework of the ECDL programme and to assess the impact of the ECDL certification in the Universities. Our investigation focused on the ECDL projects carried out by 50 Universities in the year 2004. The analysis has shown that the ECDL certification was used by the majority of the Universities to assess the basic computer skills of their students. On the contrary, the organizational and teaching profiles of the Universities varied as a function of their size.
1. Introduction
The Italian Government, following the EU Lisbon summit held in the year 2000 [1], started a program to increase among the citizens the ability of using information technologies. Special attention was devoted to the University students: the Italian Ministry of Education, Universities and Research made a specific choice, inserting in all University curricula credits devoted to acquire some specific knowledge of ICT technologies.
The development of basic ICT abilities in our Higher Education system is hindered by the high heterogeneity of practices and policies following from different educational priorities, professional goals and funding sources. Establishing a practical benchmark capable of defining a good nation-wide educational ICT profile is quite difficult. A practice that has worked well in one context, may not work at all in a different one. The wide diversity of educational systems employed in Italian Universities prevented the transfer of practices from one
environment to another. The Ministry then decided to endorse the standard of
the European Computer Driving License (ECDL). This programme addresses the problem of establishing a benchmark of basic ICT skills, i.e., skills that everyone should possess [10].
The ECDL programme was initially introduced in Finland and then promoted at European level [3] by CEPIS (Council of European Professional Informatics Societies http://www.cepis.org). Currently, the governing body of the programme is the European Computer Driving Licence Foundation (ECDL-F http://www.ecdl.com). AICA, the Italian member of CEPIS, is the certification authority that manages the programme in our country.
The main features of the ECDL programme can be summarized as follows:
internationality: 137 countries world-wide have adopted the programme; the certification exam, based on the so-called QTB (Question and Test Base), is available in 32 languages; integration between academia and industry: the programme is supported by the national professional societies that integrate professional and academic competences; technological neutrality: the programme defines ICT skills independently of hardware and software vendors; in particular, it is possible to obtain the certificate using only open source non proprietary technologies.
The ECDL certificate proves that its recipient possesses some basic skills in using a computer, such as editing a document with a word processor, preparing a table using a spreadsheet, querying a database, browsing the Web. The ECDL syllabus consists of seven modules:
1. Basic concepts of information technology
238

2. Using the computer and managing files 3. Word processing 4. Spreadsheets 5. Database6. Presentation 7. Information and communication.
The certification is released to whomever correctly performs a set of activities randomly extracted from the QTB, which is not public. The exam is fully automatic. There are two types of certificate: a START license (obtained after passing the exams of four out of seven ECDL modules) and a FULL license (obtained after passing the exams of all seven ECDL modules). Exams take place in Test Centers. In Italy, these Centers are specifically accredited for this purpose by AICA. The ECDL programme is ten years old, and millions of people have already received an ECDL certificate all over the world. Some papers study its impact in Higher Education. In [5] the impact of the ECDL programme in Irish Universities is evaluated. The diffusion of the ECDL programme in the Italian Universities in the year 2003 is presented in [2]. In [4], the ECDL programme is used as a reference standard to define basic skills of nurses and nursing staff. The results of a project for forming University staff for ECDL via e-learning technologies are analyzed in [8]. In [9], authors describe how the programme can be adapted to special situations, like for instance those dealing with students with physical handicaps.
In this paper we present the results of a monitoring exercise aimed at analyzing the experiences of the Italian Universities in the framework of the ECDL programme in the year 2004. Our analysis focused on both the organizational and teaching aspects addressed by the Universities in the implementation of their ECDL projects. The results reported in this paper refer to 50 Universities that had ECDL projects active in the year 2004. As a similar investigation was carried out for the year 2003, in what follows, we also present a few comparisons between the outcomes of the two analyses.
The paper is organized as follows. Section 2 presents some quantitative results related to the performance of the ECDL programme. Section 3 focuses on the organization adopted by the Universities to teach the ECDL syllabus. The position of the Universities with respect to the credits awarded to the students is discussed in Section 4. The organizational and teaching profiles that characterize the Universities are presented in Section 5. Finally, a few conclusions are drawn in Section 6.
2. ECDL performance
As already pointed out, the results of our investigation refer to the ECDL activities performed by the Italian Universities in the year 2004. A first interesting result of our investigation concerns the level of diffusion of the ECDL programme in the Italian
Universities. It is worth to underline that in the year 2004, it was active in the 92.6% of the Universities, that is, 50, that participated to our monitoring exercise.
Another important aspect of our investigation deals the number of students involved in the ECDL programme. For the year 2004, this number was equal to 50,755, and among these students, 25,263, that is, about 50%, were females. The number of students involved in the ECDL programme in the year 2003 was much higher, namely, equal to 101,635.
It is worth to underline that the reduction of this number is linked to both the decrease of number of students enrolled in the Universities and to increased diffusion of the ECDL programme in high schools.
A fundamental outcome of ECDL programme is represented by the number of exams, related to the single ECDL module, performed by the students. In the year 2004, the total number of exams performed by the students was equal to 144,649. The number of exams passed by the students was equal to 120,266, with a success rate equal to 83.14%. By comparing these results with the results of the year 2003, we notice an 18% increase of the success rate, that is, the students did much better in the year 2004.
The investigation has then examined the number of ECDL START and ECDL FULL certifications awarded to the students during the year 2004. The analysis has shown that 11,842 students received the ECDL START certification, whereas 8,612 students received the ECDL FULL certification. This means that about 40.3% of the students involved in the ECDL programme received a certification. In particular, 23.3% of the students received the ECDL START certification and 17% received the FULL certification.
Table 1 summarizes the performance of the ECDL programme in terms of number of exams and number of certifications awarded to the students in the years 2004 and 2003. The table also shows the relative difference between the two years.
As can be seen, in the year 2004, both the number of exams performed by the students and the number of
Table 1 – Performance of the students in the years 2004 and 2003.
Year2004
Year2003
Number of exams performed 144,649 124,159 +14%
Number of exams passed 120,266 98,849 +18%
Number of ECDL START certifications 11,842 10,759 +9%
Number of ECDL FULL certifications 8,612 8,029 +7%
239

0
2
4
6
8
10
12
14
16
num
ber o
f Uni
vers
ities
1-4 5-8 9-12 13-20 >20
Basic Concepts Managing Files Word Processing Spreadsheets
Database Presentation Communication
Figure 1 – Distribution of the number of hours taught by the Universities for each ECDL module.
exams passed increased by 14% and 18%, respectively. Moreover, even though the number of students involved in the ECDL programme in the year 2004 was much lower, the number of ECDL certifications awarded to the students was higher. This means that the ECDL programme had a much better performance in the year 2004.
3. Teaching organization
An important aspect of the ECDL programme deals with the organization chosen by the Universities to teach the ECDL syllabus. ECDL teaching can rely on different methods, namely, classroom teaching (with the co-presence of teacher and students), self-learning, and blended learning (that combines classroom and self-learning methods). Each University can typically adopt more than one method since teaching activities are typically customized to the background of the students and to the requirements of the individual curricula.
Our analysis has shown that 32 Universities, that is, 64% of the Universities that participated to our monitoring exercise, adopted some form of blended learning, whereas classroom teaching and self-learning have been chosen by 26 and 28 Universities, respectively.
By looking at the combinations of the various teaching methods, it is interesting to notice that the teaching activities of 26 Universities, that is, 52%, relied on more than one teaching method and among these Universities, 14 adopted all the three methods. The analysis has also shown that the majority of the Universities that chose only one teaching method, namely, 11 out of 20 Universities, relied on blended learning.
The organization of teaching activities was further analyzed by focusing on the number of hours taught for
each ECDL module. On the average, the Universities organized courses whose duration ranged between 6.5 hours, corresponding to the “Using the Computer and Managing Files” module, and 9.3 hours, corresponding to the “Database” module.
To get better insights in the teaching organization chosen by the Universities, we analyzed the number of hours taught for each ECDL module. Figure 1 plots the corresponding distribution. Note that the distribution refers to the Universities that offered courses for the individual ECDL modules. Indeed, the teaching activities of a few Universities did not cover all seven ECDL modules mainly because these Universities focused on the ECDL START certification, that requires only four out of the seven ECDL modules. The figure shows that the choices operated by the Universities were rather uniform. In the majority of the Universities, the classroom teaching activities dedicated to each ECDL module did not exceed 8 hours, whereas the duration of very few courses exceeded 12 hours. Negligible was the number of Universities that offered courses whose duration exceeded 20 hours.
Another interesting result deals with the presence of tutors to support the teaching activities. The analysis has shown that 44% of the Universities employed tutors to help students with the laboratory experiences carried out during classroom teaching. Moreover, 50% of the Universities employed tutors as an aid for students during the whole ECDL learning process. This is particularly important because of the increasing presence of self-learning either used in isolation or in combination with classroom teaching.
Self-learning experiences have been investigated by analyzing the types of learning resources used to support these activities. On-line and off-line multimedia and printed material were typically used in combination. Even though there were a few Universities that
240

developed their own learning resources, the majority of the Universities relied on material available on the market, with a preference towards off-line material.
4. Credits
In our investigation, we also focused on the importance granted to the ECDL certification inside the curricula of University students. For this purpose, we evaluated the number of credits associated to the ECDL certification by the Universities involved in our monitoring exercise.
As a consequence of the Bologna pan European agreement dated 1999 – aimed at improving and standardizing Higher Education for people all over Europe – the Italian University system introduced the credit (usually referred with the acronym CFU, deriving from the Italian definition of Credito Formativo Universitario) as the measurement unit to quantify the learning effort required for students to graduate. Following the recommendations of the ECTS (European Credit Transfer System) a full time Italian University student is expected to “earn” 60 CFUs per year, where each CFU corresponds on the average to 25 hours of global student effort (i.e., lectures, exercising, laboratories, and individual study).
Due to the autonomy of each University in defining the CFU distribution of its own curricula, no common specification of the number of CFUs corresponding to the ECDL certification has been given. As a result, the Italian Universities made very different choices, as shown by Figure 2, which presents the minimum and maximum number of CFUs associated with the ECDL certification. As can be seen, the number of CFUsawarded to the ECDL certification ranged from 0 to 10. This clearly shows the lack of any reference agreement among the Universities.
Actually, if we look at each single University, we definitely find a more regular behavior: as represented in Figure 3, most Universities adopt very limited ranges of CFUs (i.e., difference between the maximum and the
minimum number of CFUs associated with the ECDL certification) for their own curricula.
However, to better comply with the aim of improving the student mobility across Universities, some reference values would be very beneficial. For this purpose, it is possible to notice that the distributions shown in Figure 2 are characterized by mean values equal to 2.89 and 5.31, respectively, and that the modes of these distributions are equal to 3 and 6. This range of values seems then a reasonable reference for the ECDL certification.
Different considerations deserve the Universities that assigned zero CFU to the ECDL certification: for these Universities, the ECDL certification was clearly considered as a pre-requisite for the corresponding academic programme. In perspective, this choice seems the most appropriate: the level of competence certified by the ECDL programme is actually very basic, and increasingly owned by high school students before entering the University.
5. Organizational and teaching profiles
A multivariate statistical analysis, based on both Correspondence Analysis (CA) and Principal Component Analysis (PCA) [6] [7], allowed the identification of some profiles characterizing the management of the ECDL programme in the Italian Universities. To this end we used also a supplementary variable, namely, the size of the Universities: large, medium or small size, “superlicei”, polytechnic, and private. Both CA and PCA highlighted two main profiles characterized by a centralized versus a decentralized management model, where the first one is characterized by centralized decision-making processes and organization of ECDL activities. These profiles emerged, albeit at a different level, with respect to the three dimensions investigated, that is, the organizational, regulatory, and teaching issues. Similar profiles were found also in the previous investigation referring to the year 2003. In particular, a more decentralized
Figure 2 – Distribution of the minimum and maximum number of CFUs associated to the ECDL certification.
241

Figure 3 – Distribution of the CFUs range.
management structure was prevalent in large Universities, frequently spread over several campuses, with several entities organizing courses and exams, namely, Faculties, Degree Courses, external organizations; on the contrary, small and private Universities usually preferred a centralized approach, with a single teaching and Test Center serving all Faculties.
Focusing on the results for the organizational dimension (Figure 4), the first observation regards two contrasting areas that are separated by the vertical axis. On the right we find Universities with a centralized organization of the ECDL activities and on the left the Universities with mostly decentralized activities. More specifically, the Universities that activated courses at a centralized level nearly always organized in the same way both exams (93% of Universities) and training (86%). On the other hand, the rules regarding the ECDL
certification were often defined at a decentralized level.In terms of financing of the teaching and testing activities, it is common across the board to make use of the funds provided by the CampusOne funding scheme but it also emerged that large and polytechnic Universities more frequently recur to direct forms of payment. “CampusOne” was a project (http://www.campusone.it) of the Conference of Rectors of Italian Universities (CRUI) that was launched in the year 2002 to promote the ECDL programme in the Italian Universities and has strongly contributed to the diffusion and the acceptance of the culture of the ICT certifications even beyond ECDL.
As regard to the regulatory dimension, it is worth noting that wherever the certification was obligatory, the ECDL START was required. Rules regarding the ECDL certification were often defined at a decentralized level. Moreover, the number of credits was higher in the Universities where the certification was obligatory.
6. Conclusions
Our monitoring exercise has shown that the majority of the Italian Universities adopted in the year 2004 the ECDL certification to assess the basic computer skills of their students. Moreover, the prevalence of the ECDL START certifications is a demonstration that the Universities considered this type of certification as a “reasonable” first-level approach towards the ICT education.
The teaching organization was characterized by a large variety of choices for what concerns the organization of the courses to teach the ECDL syllabus and the number of hours dedicated to each ECDL
University FacultyCourse
University
Faculty
Course
University
Faculty Course
Direct payment
Tasse
University Funds
CampusOneOther Entities
University
Faculty
Course
External
Self-learning
Also external
Internal
Widened
Stopped
Continue
Reduced
Medium-sizedBig-sized
Small-sized
Politecnici
Private
Superliceo
Activation levelTeaching organization levelRegulation levelExams organization levelFinancing sourcesExams locationIntention to continue the projectType of University
Decentralized organizational profile
Centralized organizational profile
Figure 4 – Correspondence Analysis for characters related to the organization of the ECDL programme.
242

module. It is interesting to notice the presence in many Universities of tutors to support students during the overall ECDL learning process.
The analysis of the organizational and teaching profiles has shown that the choices operated by the Universities were typically influenced by their size.
Acknowledgements
The authors are particularly grateful to the representatives of AICA, CINI and Fondazione CRUI who made this analysis possible. Moreover, authors wish to thank the representatives of the Italian Universities who participated in the monitoring exercise and Pietro Marzani of the University of Trento for his useful insights on the correspondence analysis.
References
[1] Bulletin EU 3-2000, “Preparing the transition to a competitive, dynamic and knowledge-based economy”. Available at: http://europa.eu.int/abc/doc/off/bull/en/200003/i1006.htm[2] M. Calzarossa, P. Ciancarini, P. Maresca, L. Mich, and N. Scarabottolo, “The ECDL Programme in Italian Universities”, Computers & Education, Elsevier, 2006 (to appear).
[3] D. Carpenter, D. Dolan, D. Leahy, and M. Sherwood-Smith, “ECDL/ICDL: A Global Computer Literacy Initiative”, Proceedings of IFIP ICEUT, 2000. [4] I.J. Cole, and A. Kelsey, “Computer and Information Literacy in Post-Qualifying Education”, Nurse Education in Practice, 4(3), Elsevier, 2004, pp.190-199. [5] H. Fallon, “The Use of the European Computer Driving Licence (ECDL) as an IT Training Package in Irish Universities”, SCONUL Newsletter (25), 2002. [6] M.J. Greenacre, Theory and Applications of Correspondence Analysis, Academic Press, 1984. [7] M.J. Greenacre, Correspondence Analysis in Practice,Academic Press, 1993. [8] F. Lockwood, “The European Computer Driving Licence within MMU: The Perceptions and Performance of Participants in the Training Programme”, Learning & Teaching in Action,3(1), Manchester Metropolitan University, 2004. [9] K. Miesenberger, M. Morandell, A. Petz, and D. Leahy, “ECDL-PD: International Co-operation to Keep the Syllabus and MQTB Open for Everybody”, Lecture Notes in Computer Science, 3118, Springer, 2004, pp. 164-170. [10] M. Sherwood-Smith, “The European Computer Driving License (ECDL): A Standard of Basic Competence for Personal Computer Users”, Information Technology Standards and Standardization: A Global Perspective, Idea Group Publishing, 2000, pp. 240-256.
243

e-Learning of Traditional Medicine Course for Elementary and Middle
School in Taiwan
Yang Ling-Ling
School of Pharmacy, College of Pharmacy, Taipei Medical University, Taipei, Taiwan.
e-mail:[email protected]
Abstract Herbal medicines are very popular taken in
dietary and tonic food by eastern country people. Since 5,000
years ago, eastern traditional medicine has been practical
used in China for disease prevent and treatment. Most of the
theory is acuminated from the experience and some of the
enthnomedicine. Recently, the natural therapy is very
commonly used by clinical doctors in the world. And the
biotechnological research papers were published in LAN cent
and many Medicinal Journals. The education and research
are more important than the western medicine. For the
western medicine has a systematic teaching course in medical
school. Therefore, how to remind the people which should be
comprehended according to traditional Chinese Medicine and
avoid confusing and easy understanding courses were
necessary -learning course is a
convenient, high speed spreading teaching to the whole world.
In this study, we have created a new teaching platform of
traditional medicine that can help people easily to learn
traditional medicine in entire life. The references of
traditional medicine were collected and edited into digital
lesson plans, such as VCR, games, or flashed cartoons. The
diversification of digital lesson plans can help people learning
the traditional medicine easily. Moreover, the e-learning
teaching method can let a lot of people to obtain the
information by networks, and learn how correctly used the
herbal medicine in daily foods. In this course, the contents of
the e-learning were suitable for the elementary schools to
undergraduate schools, and everyone who is interesting in
traditional medicine. In summary, the digital lesson plans of
traditional medicine offered a good method to teach and learn
traditional medicine.
Keywords: e-Learning ; Traditional Medicine Course
I. INTRODUCTION
Maintaining the health of oneself is all base, training
and teaching learner s correct and useful health knowledge
is very important. Chinese Medicine Prescription has been
used in clinical for thousand years. And traditional medical
science is countless intelligence that is worth application
for maintaining human health. But Chinese medicine
education curriculum isn t one part of the elementary
school or high school courses in Taiwan. Therefore, how to
remind the people which should be comprehended
according to traditional Chinese Medicine and avoid
confusing and easy understanding courses were necessary
Digital learning is very important gateway in 21st
century that is a convenient, economy effective, high speed
spreading teaching to the whole world. In this study, we
have created a new teaching platform and interactive
multimedia of traditional medicine content that is created
for use on-line has to bring added value to the learner and
support teachers in helping students to understand easily
concepts of traditional medicine.
II. THE FRAMEWORK OF CHINESE MEDICINE LEARNING
CLASSROOM
The on-line courses designed for general people to
learn health knowledge. The Chinese medicine section
provides links to interesting on-line courses, learning about
herbs materials and other e-learning solutions for Chinese
244

medicine education as well as for general interest. The nine
course sections the use of multimedia and learning
interactions in e-learning and blended learning to improve
health skills and knowledge.
This interactive multimedia was created, including (1)
Special training area for learning of Chinese traditional
medicine Concepts. For example, Ying and Yang theory,
Five elements (wood, fire, earth, metal, water) theory, Four
property of food or drug (warm, cold, hot, cool and neutral)
theory, Six excessive or untimeliness atmospheric
influences as exogenous pathogenic factor (wind, fire,
summer heat, dryness, dampness, cold), Eight therapeutic
methods (diaphoresis, emesis, purgation, mediation,
invigoration, heat reduction, tonification, and resolution)
and livelihood with four seasons and environment
change.(2)Top shop of Chinese herb (knowledge of
Chinese medicine herb).(3)Live in city (Chinese medicine
herbs applied in live).(4)Keep in good health in hall
(Traditional Chinese medicine).(5)Formosa tribal unit (folk
medical herbs).(6)Super-cool game (teaching game). (7)
Film city of time (Teaching activities videos or photos). (8)
Network island. (9)Update news unit that we can update
the knowledge about health and Chinese medicine, (Fig 1,2)
that is very base and important for learning about Chinese
medicine .
III. TYPES OF MULTIMEDIA
It is wonderful experience to discover and acquire
knowledge by oneself. The pedagogical model of explore
learn type was be adopted. And for enhance student's
learning motivation and interest by adopting the activity of
the game type.
The students were exposed to interesting computer
learning environment that embodied the lesson of Chinese
medicine guidelines set. By searching on-line, the students
were able to find and learn about Chinese traditional
medicine and take care himself.
Here are four key models for Project-Based learning,
PBL: (1) Teaching video or photo model, (2) Flash
context model for learning
the knowledge about Chinese medicine and (4) interactive
game model for examine or review have learned
knowledge of Chinese medicine.
IV. SUMMARY
Today it is true that the media, new and traditional, are
being transformed to the digitalisation phenomenon. This
has happened with the radio, television, cinema, press, etc.
Because of the development of information science and
technology, becoming a effective tool which can be used
with conveniently of information on the network. How
make the correct of network resource and how offer
high-quality Chinese medicine multimedia resource to
have message or function of efficiency even more network,
it is this research expects to probe into.
The e-learning teaching method can let a lot of people to
obtain the information by networks, and learn how
correctly used the herbal medicine in daily foods. In fact
many teachers need to acquire urgently health knowledge
and teaching media of resources available and how to
retrieve them and embed them successfully in their
classroom practice. And since new Chinese medicine
courses were established and executed, the Chinese
medicine education curriculum is becoming interesting and
economy effective, can applied by teacher to improve
learning or support student learning Chinese
medicine course by oneself just in time and on demand. It
is important to edit successfully media for e-learning; you
need to make it short (not longer 2 minutes) is required and
content link will be convenient.
In conclusion, we would like to develop funny,
impressive, engaging, and easy learning digital multimedia
and courseware of Chinese medicine knowledge. This
multimedia were created using 2D and 3D technology,
complex animations, stunning graphics and charts, text,
video for learners or visitors will understand and state the
concepts of Chinese medicine by e-learning method, apply
Chinese traditional medicine knowledge in maintaining
actual healthy life daily that acquire from experiencing
studying and web learning and learn it continuously.
245

In addition, successful programs or multimedia for
Chinese medicine learning to enhance digital integration
and professional intensification, closer co-operation
between the educator, artist, computer designer, and
Chinese medicine expert is urgently needed. We now can
do it, and we should.
Fig. 1 The framework of Chinese medicine learning classroom
( )
( )
( )
( )
( )
( )
95
Fig. 2 The pattern of Chinese medicine learning classroom
246

The Design and Implementation of the Chronobot/Virtual Classroom (CVC) System
S. K. Chang, Xin Li, Ricardo Villamarin, Dan Lyker, Chris Bryant Department of Computer Science
University of Pittsburgh, USA {chang, flying, rvillsal}@cs.pitt.edu, [email protected], [email protected]
Abstract
In this paper, we describe our approach to the design and implementation of the Chronobot/Virtual Classroom (CVC) system, which is a novel time/knowledge exchange platform. The system is based upon a flexible, component based architecture. The messages used by the distributed components are formulated in XML, and every component can be tested separately. The communication server is built on the basis of the Java Messaging Service (JMS) engine. Message archiving techniques are described to support unlimited message retrieving. Verified in practice, the system can provide an operational, robust platform for time/knowledge exchange in e-Learning and distance education.
1. Introduction
Chronobot/Virtual Classroom (CVC) [3] is a novel time knowledge exchange platform where any pair of users can exchange their time and knowledge. The chronobot is a time management tool for storing and borrowing time. Using Chronobot, one can borrow time from someone and return time to the same person or to someone else. The virtual classroom is a versatile communication tool that combines the functions of a web browser, chat room, white board, and multimedia display. The CVC system is an integration of the chronobot and virtual classroom that allows users to freely switch between these two applications and obtain maximum benefits from both.
(a)
(b) Figure 1. Application of the CVC system:
(a) Communication in Virtual Classroom; (b) Time and knowledge exchange in Chronobot
For example, as illustrated in figure 1, George, Bill, and Suzie are all students who are doing a group project together in a graphics design course in which they use the CVC system to collaborate with each other. The whole project is divided into several tasks, each of which is mainly assigned to one person. George meets a problem in his task and cannot solve it by himself. So he interacts with Bill and Suzie in the virtual classroom, and eventually they help him out. However, in order to keep workload even among teammates, George has to put in efforts either in the past or in the future to help Bill and Suzie. The chronobot serves as a platform for them to do such time and knowledge exchanges which could have significant value for many applications. Many more
247

interesting scenarios can be found in [3].
In this paper, we describe our approach to the design and implementation of the CVC system. Aiming at a large-size, reliable, and scalable communication system, we have designed a flexible, client/server based system architecture. The functionality of servers and clients are broken down and encapsulated into components. The messages exchanged among components are formulated in a platform-independent format (XML), and every component can be separately tested using a customized testing tool, (the remote control). The most important server – the communication server – is designed and implemented based on an open source Java Messaging Service (JMS) engine, ActiveMQ [1]. Additionally, a message archiving mechanism allows users to retrieve messages within any time range.
The rest of this paper is organized as follows: the overall architecture of the CVC system is described in Section 2. In Section 3, we discuss message formulation and testing of the distributed components in the system. The communication servers and client tools are described in detail in Section 4 and 5, respectively. Message archiving is discussed in Section 6, followed by a brief conclusion in Section 7.
2. System Architecture
Figure 2 System Diagram
The CVC system is illustrated in Figure 2. Basically, the system follows the client/server architecture. The clients (e.g., chronobot, teacher, and student clients) provide user interfaces interacting with different kinds of users. The time/knowledge exchange and related
functions are implemented by services from the different servers (e.g., name server, KEM/TM (Knowledge Exchange Management/ Time Management) server, communication server, and storage server). Following is a brief description of these servers and clients:
Chronobot Client: a tool for chronobot users to exchange time and knowledge. Student Client: a tool for students to attend the classes in the virtual classroom. Teacher Client: a tool for teachers to attend classes in the virtual classroom. Besides the basic communication functions found in the student client, it is equipped with some administrative functions (e.g., permission manipulation and student grades management). Name Server: a server providing naming services for all clients and dynamically managing the working load of the communication servers and KEM/TM servers. Communication Server: a server providing communication services for virtual classroom clients (i.e., teacher and student clients). The messages for learning activities in the virtual classroom are all relayed by the communication server and are recorded as learning sessions, or simply sessions.KEM/TM Server: a server managing time and knowledge exchange for chronobot clients. The transactions on time/knowledge are all performed in the KEM/TM server, which are recorded as time/knowledge exchange transactions, or simply transactions. For more detail about the KEM/TM server, please refer to [2, 6]. Storage Server: a server storing the time/knowledge exchange transactions from KEM/TM servers, and the learning sessions from communication servers.
In the entire system, there is only a single instance of the name server, which is required to be known by all clients and other servers. Multiple instances of the communication and KEM/TM servers can work at the same time. When these servers start up, they will register their profiles (address, capabilities, current work load, etc.) with the name server. The name server
248

will dynamically assign tokens to the teacher, student and chronobot clients after the proper authentication. In order to balance the workloads among the servers, periodically the name server polls messages to the communication and KEM/TM servers to fetch their status.
3. Message Formulation and Component Testing
(a) (b) Figure 3 Messages for Authentication Component in Name Server (a) Incoming message; (b) Outgoing
message
The servers and clients in the CVC system are designed based on components, which are encapsulated software elements with specific functionalities [4]. For example, the name server is designed and implemented by three components, i.e., an authentication component, a profile retrieving component, and a workload balancing component. Every component has an interface designed to achieve maximum flexibility and reliability and may be configured by incoming and outgoing messages in XML. These XML messages are partially described in [5]. For example, the authentication component in the name server may be configured with the incoming and outgoing messages shown in Figure 3.
Figure 4 Testing a Component Using Remote Control
One of the most important advantages of component-based design is that the components can be
tested separately without implementation of the whole system. For this purpose, a customized testing tool named remote control was designed and implemented. Shown in Figure 4, the remote control can simulate any incoming messages via a programming language-independent interface (i.e., Socket). At the same time, it can receive any outgoing message transmitted by the component.
Figure 5 Remote Control (with Testing Results on Authentication Component)
Using the remote control, the functions of components can be easily verified before they are integrated into the real system. For example, Figure 5 shows the remote control with the testing results on the authentication component of the name server. A tester can send the authentication component messages containing different pairs of user names and passwords. From the server responses received by the remote control, it is very easy to check whether the component works as expected.
4. Communication Server
The communication server is one of the most important servers in the CVC system. It supports the message transmission (either broadcast or peer-to-peer) for the whole system. The communication medium used is HTTP based using an open source Java Messaging Service (JMS) engine called ActiveMQ [1]. Using HTTP protocol makes the communication stateless, and the ActiveMQ messaging allows for a persistent messaging protocol.
249

Figure 6 System Diagram of Communication Server
Figure 6 shows the system diagram of the communication server. Each student/teacher tool (i.e., client) writes to the same upload queue. The communication server reads all messages from this queue and reacts accordingly, writing all messages to the student/teacher tools to individual queues A java servlet is used to create an HTTP interface to a queue. This needs to be in place to take HTTP posts and HTTP gets from all ActiveMQ servers and clients. For more information about ActiveMQ refer to [1].
5. Client Tools
There are three client tools used in the CVC system: 1) the student client, 2) the teacher client, and 3) the chronobot client. Each is described in detail in the following sections:
5.1 Student Client
Figure 7 Student Client The student client is designed for students in the
virtual classroom and is illustrated in Figure 7. The students (represented by emotive icons) can join a virtual classroom and exchange information in the form of text messages, web pages, sketches, and audio/video clips. The emotive icons express the feelings of a user during a learning session.
5.2 Teacher Client
Figure 8 Teacher Client
The teacher client is designed for teachers in the virtual classroom and is illustrated in Figure 8. In addition to all the functions as available in the student client, the teacher client also includes certain administrative functions, including permission manipulation and student grade management.
5.3 Chronobot Client
(a) (b) Figure 9. An example of chronobot, (a): bidding room for time knowledge exchange; (b): transaction records.
250

The chronobot client (illustrated in Figure 9) is designed for users in the chronobot system. Basically, the chronobot client is a tool to exchange time and knowledge though bidding processes. Users can start new bids in different bidding rooms (figure 9(a)). A simple example of such bidding is “I need someone to help me on a 2-D layout design for 5 hours”. Users can respond to these requests by placing their own bids. For example, a user can respond with “I can contribute 2 hours on it”. The details about these transactions are saved into each user’s record (figure 7(b)).
6. Message Archiving
The time/knowledge exchange transactions and learning sessions accumulated in the CVC system are the most valuable assets for further knowledge acquisition (e.g., user profiling and ontology construction). Following is a brief description of the techniques used to store and retrieve transactions and sessions.
6. 1 Message Storage
This is conceptually a very simple operation:
1. The server pulls messages from the main queue regularly;
2. The server stores the messages in a special table with the following basic (high-level) structure (Figure 10).
Figure 10 Message Structure
The timestamp field stores the date and time where the message was received by the server, not the client’s clock’s time since it can happen that the clocks are not synchronized. This serves to maintain consistency.
6. 2 Message Retrieval
The sequence of operations to retrieve messages from the storage is described below:
1. The user authenticates as usual, and after that, s/he selects the course s/he wants to retrieve messages from;
2. The user asks the system to show the retrieve message history dialog (Note that at this time, this option is only available after the user has enrolled a course);
Figure 11 Message Retrieving Dialog
3. The user selects a range of dates, user IDs (of the course participants), and whether s/he wants to retrieve private messages only;
4. The client pushes a special message in the main queue that indicates that the server must perform a message retrieval;
5. Once the server receives the retrieval message, it queries the database using the criteria specified by the user;
6. All the messages found (if any) are posted in the specific queue of the user who requested the history;
7. If no message was found, a special “not found” message is posted in the client’s queue;
8. Once the client retrieves the search result from the user’s queue, it either shows the messages in the message panel, or, in the case that no message was found, the user is notified accordingly;
7. Conclusions
In this paper, we described our design and implementation of the CVC system, which is a novel time/knowledge exchange platform. A flexible, client/server based system architecture was described in which the clients and servers are all designed based on components that can be tested separately using our customized testing tool (remote control). The communication server is designed and implemented
251

using ActiveMQ. The client tools for the users of the virtual classroom and the chronobot were described as well, as were the techniques to store and retrieve time/knowledge exchange transactions and learning sessions. Verified in practice, the system can provide an operational, robust platform for time/knowledge exchange in e-Learning and distance education.
8. Acknowledgements
This research is supported in part by the Industry Technology Research Institute (ITRI) and the Institute for Information Industry (III) of Taiwan. We would like to thank Christopher Santamaria for the design and implementation of virtual classroom Java clients, and too many others to name here for testing our CVC system.
References:
[1] Active MQ, http://www.activemq.org/, accessed on March 4, 2006. [2] S. K. Chang, Anupama Kapoor, Ganesh Santhanakrishnan and Chirag Vaidya. The Design and prototyping of the chronobot system for time and knowledge exchange. The International Journal of Distance Education Technologies (JDET), 3(3), April, 2005. [3] S. K. Chang. A Chronobot for Time and Knowledge Exchange. In Proceeding of the 17th International Conference on Software Engineering and Knowledge Engineering (SEKE), pp. 3–10, Taipei, Taiwan, Jul. 2005 [4] G. T. Heineman and W. T. Councill. Component Based Software Engineering: Putting the Pieces Together. Addison Wesley, 2001. [5] Minxin Shen. The Service Interaction Protocol for the Chronobot/Virtual Classroom (CVC) System. In Proceeding of the 17th International Conference on Software Engineering and Knowledge Engineering (SEKE), pp. 16–18, Taipei, Taiwan, Jul. 2005 [6] E. Y. Shih and W. H Yeh. The Implementation of Chronobot Engine. In Proceeding of the 17th International Conference on Software Engineering and Knowledge Engineering (SEKE), pp. 12–15, Taipei, Taiwan, Jul. 2005
252

Evolution of IMA as a Tool for Accommodated Learning Catherine Beaton, Daniel Bogaard, Jeff Sonstein
Rochester Institute of Technology [email protected] , [email protected] , [email protected]
ABSTRACT IMA is a tool that has been developed to assist learners in customizing their learning experiences. It functions in most browsers, and is currently developed to run in a local environment. Students have several options in terms of creating a personalized accessible learning environment over the Internet. IMA serves as a tool for asynchronous, accommodated learning to a diverse global student body. Feedback from testers of IMA has been incorporated into the application, so that IMA can evolve. The goal is to design and create a robust, standards-compliant, open source and cross-platform software system. By using developing and developed international standards rather than proprietary systems, users are free from operational limitations and long-term maintenance costs of proprietary systems. Open-source software will maximize the chances of developing robust and bug-free systems, because many programmers will scrutinize the code. Software that runs on all platforms ensures that the maximum number of end-users will be able to take advantage of IMA. KEY WORDS Education for Students with Special Requirements, Distance Education tools, methodologies 1. Introduction The educational bandwagon has, over the course of time, carried many passengers. For many educators, ‘hot’ phrases like ‘active learning,’ ‘peer instruction,’ “collaborative learning’ and ‘web-based learning” have changed over time, as the focus shifted from students to process. While process is important, the student’s learning should always be central. In zealousness to discover the ideal methodology, educators can lose sight of the people for whom they are working: a diverse population of learners with different needs and goals.
One of the barriers to finding a process that meets the needs of the students is that administrators get too immersed in process and evaluation. Samuel Mitchell, in The Unfinished System of Education, [1] refers to a creation myth wherein the dominant power (administration) constrains itself so tightly that it does not permit the development of new agents (individual students.) The education process should develop to meet the needs of the many, which outweigh the needs of the few, due to fiscal limitations. Surely, in the age of technology, educators can bypass that quandary. This paper examines the evolution of a model of delivery which can be customized by the student, allowing access to information as the students would like to receive it, while still allowing for the critical personal interactions which can be lacking in some distance education models. 2. IMA’s Inception IMA began as a reaction to inaccessible web content. Frustrations as an end-user of an inaccessible (information not accessible for Deaf/hard of hearing students) pre-recorded video presentation related to an Information Technology Blended course offering. “Blended” courses are those that have an in-person and an on-line component. When thinking of Distance Education, accessibility components are not always fully considered. Working with deaf students and teaching both distance and "blended" courses at RIT has been useful for faculty. As a result of these experiences, we have been conducting ad hoc experiments with blending some emerging hardware and software technologies to better serve our students, deaf and hearing alike. RIT faculty researchers have begun developing some open source software resources aimed at educators, and in particular distance education practitioners. [2] With the advcnt of the Internet, Distance Education removes the physical barrier of distance, but can implement other barriers for students in terms of interact- ability. But this ‘distance education’ concept pre-dates the Internet. Frances Cairncross, author of The Death of Distance, points out that distance education has occurred via radio and television networks for decades; long before
253

the birth of the Internet. [3] As the expense of higher education escalates in America, educational institutes look to expand their student base and decrease costs. Distance Internet-based education has been viewed as one solution. The concept of distance education is a fine one; allowing students to access education, “Anywhere, any time, for any one.” True distance education should permit students to receive materials that can be modified to suit individual learning needs (accommodations) and styles. Ideally, educators must interact with the students, learn their respective backgrounds, examine how students receive and process information. Then an appropriate methodology can be implemented. Given the diversity in the virtual classroom, this is no easy task. Educative models have changed as the population changes; from Traditionalists to Baby-Boomers, Generation to the Millennial generation. Diversity encompasses age, gender, culture, as well as physical and cognitive limitations of learners. Any of these can potentially become a barrier to receiving and processing information. Interactive Media Assistant’s (IMA) evolution focuses on the barriers for students with disabilities, and allows ALL students to create an interface that supports the reception of the materials being presented, in a fashion that is pleasing to each individual. Upon development of IMA, it became clear that all students, for a variety of reasons, might prefer a system like IMA, which allows customization of content. With the shrinking of the global community, more cultures are virtually meeting in the online educational classroom, and students are learning beyond the scope of the curriculum, which is how it should be. Sheila Tobias talks about ‘stalking the second tier;’ [4], which includes a variety of students who have ‘different learning styles, different expectations, different degrees of discipline, different “kinds of minds” from students….’ [5] How can one methodology accommodate all of these challenges? The customization of the IMA interface allows students to re-take some control over their respective learning processes. True Access for All! What are the true barriers to academic success? Throwing technology at a problem does not magically make the problem go away. Hembrooke and Gay discovered that utilization of technology in the classroom without clear guidelines for appropriate usage resulted in detrimental memory of lecture content. [6]
Distance Education certainly has potential to address issues related to accessibility in the physical classroom. But the use of uncaptioned content, and the lack of empowerment of students makes it more challenging to view Distance Education as a solution to accessibility woes. A Distance Education model is needed to support both asynchronous and customizable, accessible learning. With pod-casting increasing in popularity, and the ability to stream videos, the technology is enabling some students while clearly disabling others. The Americans with Disabilities Act was implemented to ensure access for people with disabilities. While Distance Education may be textually based, many models of delivery still require phone chats, videotape viewing or other auditory components. Learning tools need to be proactive and be accommodative to the learner’s needs. Barriers to Learning Captioning videos means that Deaf or hard of hearing students can now follow the dialogue, but for English as a Second Language students, captioning provides additional feedback which assists in both the learning and comprehension of the language. Within the classroom, virtual or physical, accommodations which permit customization of a learning experience can empower students to not only access the materials, but also to feel connected to the materials. Providing guidelines on usage of technology can enhance the learning experience. Challenges in the classroom can include issues related to physical accessibility. Students with visual disabilities may be limited in visually rich environments. Students with auditory disabilities may be limited in auditory-rich environments, and students with learning disabilities may be challenged in both of the above environments, with respect to the attention spans required to view or hear information. Another barrier not frequently considered is the issue of community. Some cultural groups feel uncomfortable leaving their home base to go and study at a school that does not have the same supports and ‘comfort’ of the home community. While some might argue that the ‘real world’ demands this personal growth, others would contend that it is perfectly acceptable to obtain an education and remain immersed in the culture or community in which one was raised. That is the foundation for mentoring and community development. Asynchronous learning should be a priority for true Distance Education. While social interaction IS a huge part of the educational process, this interaction is certainly possible and meaningful as off-line discussions.
254

Accommodative learning would allow students in different time zones to view materials at their leisure, and interact with classmates via email, bulletin boards, wikis, weblogs or other modes that are not time-critical. The Technology How, then, does technology assist with these very different challenges? Empower the learner to make the experience reflect his or her needs. Distance models provide a vehicle to unite various audiences while lowering administrative costs. Distance models are not going away; if anything, the educational growth in this area has been staggering. [7] For a successful distance experience, students must be able to interact with each other, with the faculty member, AND with the materials. There are a multitude of educational tools available which provide the former, such as BlackBoard, Breeze or Desire2Learn. There are, however, not many tools that allow students to directly interact with the materials, permitting customization for learning preferences. Interactive Media Assistant (IMA) is a tool developed at the Rochester Institute of Technology, an institute that houses the National Technical Institute for the Deaf. RIT’s student population of 15,200 includes a deaf/hard of hearing population of 1200 students. NTID is the world’s first and largest technological college for Deaf and hard of hearing students. The tool allows customization of various windows that deliver educational content. At this time, IMA is built to work in most of the major browsers (FireFox, Mozilla, Camino, Safari, Netscape, SeaMonkey, and Internet Explorer) to be delivered and run in a local environment. Each individual window generated by the application contains a video, scrolling text, or a space for students to create their own notes. All of these windows have the ability to be moved to where the user wants, resized to whatever size is necessary, or minimized if the content is unwanted or unnecessary.
Figure 1: IMA with all tools visible
Figure 1 demonstrates IMA in full functionality. Students can pause, stop and restart the materials via IMA, receive feedback related to the length of the presentation, take their own notes within the tool, and choose how to receive their educational materials. This ability to customize and pause materials would also be beneficial to students with learning or cognitive disabilities. Selecting the preferred visual windows (professor, whiteboard/PowerPoint, captioning, Interpreter or Notes) can focus the attention on the preferred modes of communication. Captioning can be laid on top of the content window, or can be placed beside the content window. Upon obtaining user feedback, a new interface was developed. This brought significant changes in how closed captioning was displayed with IMA.
255

Figure 2: IMA with CC button and Group Chat Figure 2 represents the removal of the captioning window, to allow for a group chat feature. A closed caption (cc) button has been placed in the Professor window, where it is more in keeping with a real-world familiarity for end users. The captioning can be turned on or off, depending on user preference. The captions overlay at the top of the video.
Figure 3: IMA with Interpreter Window
Figure 3 demonstrates the application as it would appear for students who are Deaf and use a sign language interpreter to receive information. The benefit of IMA becomes apparent: Deaf students can quickly glance between the interpreter and the professor, while also having the PowerPoint slides located closely. The eye movement distance is much smaller. Students can pause and rewind, changing their visual focus at any time. The windows can be paused, rewound, fast-forwarded and played at the convenience of the user. For students who are Deaf or hard of hearing, or for English as a Second Language learner, this means that materials can be viewed and reviewed, with the student being able to take notes independently. Students may arrange to meet online and view materials together, utilizing the group chat feature to learn collaboratively. The ability to pause and customize materials may also be beneficial to students with learning or cognitive disabilities. Selecting the preferred windows will cause the students to focus attention on a mode of communication that provides the most information. The challenges facing developers are related to the combination and synchronization of the delivery of course content. The current project combines three video feeds: a professor speaking, a Sign Language Interpreter, and the related course power points or white board materials. This is combined with personal notes and a group chat, happening simultaneously, remaining synchronized. The IMA solution is interesting technically because it works within an ordinary Web browser using HTML, CSS, Ajax and JavaScript. Web browsers and supportive software technologies have matured sufficiently and the promise of earlier attempts to make synchronized multimedia happen for distance education can be realized in a much more robust, standards-compliant, open source and cross-platform fashion than had been previously possible. It is the opinion of these IT department researchers that open source solutions make much more sense for educators and students than proprietary systems.
256

3. Conclusion Interactive Media Assistant allows for customization of a variety of classroom content. The tool will enable students to customize the information they receive, and to maintain a learning pace with which they are comfortable. The students can replay the materials, and alter the focus on second or third viewing of the content, if they so choose. The barriers to learning, as they relate to diverse students, can be reduced significantly by allowing students to interact with their materials when, where and how they choose, within one window. IMA provides a mechanism to accommodate these preferences. Beginning implementation of this tool has been for local use. Future research will continue with IMA to transfer the distance model to an in-class system so that students can customize their real-time learning experience. The flexibility of IMA allows students to customize their learning experience. The utilization of a web browser means that students are not compelled to purchase or use proprietary software. The dangers of transferring to an in-class experience have been considered. Providing students with a laptop or desktop computer and expecting them to only use IMA is not a realistic scenario. Students are frequently seduced by the lure of the internet. There are, however, ways to limit the ability of the students to use other applications while in the classroom. While faculty like to place responsibility on the students, Arthur Sterngold feels that students ARE accountable but not solely to blame. [9] Faculty need to provide a clear framework of how technology should be used in the classroom. Some institutes feel that internet usage should be restricted for freshmen, with seniors having unfettered access; the implication being that with maturity comes wisdom. Other institutes empower individual faculty members to dictate what happens within the classroom. Usage of a tool such as IMA would necessitate access to the internet. Therefore, guidelines would need to be given to the students on how to use the IMA, and faculty expectations of usage, in a live situation. For distance materials, the issue would not be relevant. Further development of IMA will ensue, after additional user testing and implementation via the delivery of a complete Information Technology class. This class will be recorded and then offered as a blended or distance class. As the technology advances, testing will be done with IMA as a live tool.
References 1 Samuel Mitchell, The Unfinished System of Education (Teaching, Schools and Society) 2 http://streamer.rit.edu/~jeffs/research/deafintegration/ 3 Frances Cairncross, The Death of Distance (London, U.K.: The Orion Publishing Group, ltd, 1997). 4 Sheila Tobias, They’re Not Dumb, They’re Different: Stalking the Second Tier (Tuscon, AZ: 1994). 5Sheila Tobias, They’re Not Dumb, They’re Different: Stalking the Second Tier (Tuscon, AZ: 1994). 14 6 Helene Hembrooke and Geri Gay, Journal of Computing in Higher Education fall 2003, Vol 15 (1) 7Dale Carnevale, “Rule change may spark online boom for colleges.” Feb 2006 8http://chronicle.com/weekly/v52/i22/22a00101.htm 9 Sterngold, A., “Confronting Plagiarism: How Conventional Teaching Invites Cyber-Cheating.”, Change , May/June 2004, 16-21.
257

E-World: A Platform for Managing and Tracing Adaptive E-learning Processes
Gennaro Costagliola, Andrea De Lucia, Filomena Ferrucci, and Giuseppe Scanniello Dipartimento di Matematica e Informatica, University of Salerno,
Via Ponte Don Melillo, 84084 Fisciano (SA), ITALY E-mail: {gcostagliola, adelucia, fferrucci, gscanniello}@unisa.it
Abstract In this paper we propose E-World an e-learning
platform, which is able to manage and trace adaptive didactic contents designed and created by a visual language based tool, named ASCLO-S (Adaptive Self consistent Learning Object SET) editor. We also propose a case study aimed at assessing the usability of the presented e-learning platform and students’ performances on two teaching approaches. The usability was assessed through a questionnaire, while students’ performances were analyzed using the information traced by E-World. Finally, we analyze and discuss the achieved results to identify dependences among usability, learning performances and students’ welfare. 1. Introduction
The e-learning evolution proposes a good number of tools assisting instructional designer during the analysis, design, and delivery of instruction and on the other side provides powerful tools supporting students during the knowledge acquisition process. Nowadays, the traceability of learning process is becoming more and more appealing for both teachers and students. In particular, teachers use the achieved information to compare the expected target audience with the students who really attend the course. Moreover, information on learning performances and the explicitness of teaching materials can also be analyzed to assess the agreement with the teacher expectations. From the student point of view, traceability information is used to assess the acquired knowledge and plan the efforts in the knowledge augmentation process. In order to trace the learning processes several kinds of e-learning platforms have been proposed in the market, see e.g. [16][19]. Initially, different kinds of communication infrastructures between e-learning content objects and
e-learning platforms were defined and used. On the other hand, in the last few years standards providing standardized data structures and communication protocols have been proposed. In particular, the ADL (Advanced Distributed Learning) [1] consortium produced the SCORM (Sharable Content Object Reference Model)[2] consequently the collaboration among government, industry and academia to enable interoperability, accessibility, and reusability of Web based didactic contents.
In this paper we present an e-learning platform, named E-World, which extends the software architecture proposed in [10] to trace and manage adaptive knowledge contents designed and created by a visual authoring tool, named ASCLO-S (Adaptive Self consistent Learning Object SET) editor [11]. We also propose a case study consisting of two experiments on two different teaching approaches, namely blended and pure. These experiments aimed at assessing students’ performances and the E-World platform usability. The students’ performances were assessed using information traced by the platform, while the E-World usability has been assessed by a questionnaire. We used the achieved results also to evaluate the dependences among usability problems, learning performances, and students’ welfare.
The remainder of the paper is organized as follows: Section 2 describes the E-World platform and its architecture, while the case study is discussed in Section 3. Related work and final remarks conclude the paper.
2. E-World Platform
The ADL (Advanced Distributed Learning) [1]
consortium produced the SCORM (Sharable Content Object Reference Model) [2] a de facto reference model, which was born consequently the collaboration among government, industry and academia. In
258

particular, SCORM works with standards bodies to integrate their specifications into a cohesive, usable, holistic model.
To fill the gap between the early standardization stages and the widespread adoption the ADL [1] initiative proposes content examples, a conformance test suite, and a sample Run-Time Environment (RTE) [2]. Concerning the Run-Time Environment (RTE), the ADL proposes a realization of the API (Application Programmer's Interface) enabling the communication between didactic contents and e-learning platforms to implement the traceability, and the content sequencing and navigation. This implementation is based on a typical client/server Web architecture. The server component implements the RTE by J2EE technology, while the client component needs a Web browser supporting ECMA script and Java applets to enable the communication between didactic contents and an e-learning platform.
An alternative communication schema between didactic contents and the RTE as well as a software architecture based on Web Services [12] and on a Middleware [9] software component have been proposed in [10]. In this paper, we adopt the communication schema and extend the platform proposed by the authors to enable the traceability of adaptive didactic contents, and synchronous and asynchronous collaborative environments. The contents and the collaborative environments are designed and created by two visual authoring tools named ASCLO-S (Adaptive Self consistent Learning Object SET) editor [11] and SYCLE (SYnchronous Collaborative Learning Environment) editor [14], respectively. Figure 1 shows the relationship between the run-time components and the hardware nodes of the extended e-learning platform, named E-World. For space reasons and for the scant relevance, the component diagram in Figure 1 does not contain the software components implementing the user profiling and identification.
The software components of the Middleware Machine node allow the e-learning platform to properly communicate with the software components deployed on the other nodes. E-World can be extended with a new feature implementing a software component and invoking it by an entry in the Middleware Machine node. The software component implementing the new feature is successively deployed either in the Service Machine node or in a different hardware node.
Client Device
Browser HTML
Middleware Machine
Front End
Content Sequencer
Content Deliverer TracerCollaborative
Environment Manager
RTE Machine
APIAPI SCORM
DataModel
SOAP/HTTP
Services Machine
SynchronousCollaborative
Manager
HTTP
HTTPHTTP
Deliverer
IMS Validator
Sequencer
Linear ContentSequencer
Adaptive ContentSequencer
Learning Object Repository
Figure 1. E-World architecture The Middleware Machine node is composed of five
software components. The Front End aims at presenting the appropriate features and contents to the students and teacher using the components on the Middleware Machine node. In particular, the Front End uses the Content Sequencer to show the suitable knowledge content to the students, while to trace the learning process the Tracer component is proposed. Differently, the Content Deliverer component allows the instructional designer to deploy single e-learning activities or whole courses. Finally, the Collaborative Environment Manager component is used to manage the cooperation among students and teachers.
The RTE Machine node contains the software components to manage and deploy linear and adaptive didactic contents as well as to trace learning processes. The Sequencer component is used by the Content Sequencer component to manage learning processes. Currently, E-World is able to manage linear content sequencing, as proposed in the standard SCORM, and adaptive content sequencing as suggested in [11]. It is worth noting that because of the flexible architecture, this platform can be easily extended to manage different adaptive models. The API software encapsulates a Run Time Environment (RTE) compliant with the SCORM standard and provides an interface to enable the traceability of didactic contents. The interface is the same as described by the ADL in the RTE book [2]. These APIs are used to establish a handshake between didactic contents and the RTE of the e-learning platform. The API software component is also used to store information on the student interaction with the presented didactic contents into the E-World database.
The deployment of a process based on synchronous and asynchronous activities [14] first requires the validation of its e-learning activities and then the updating of the system database. It is worth mentioning that the platform also enables the deployment of single
259

e-learning activities. Concerning the e-learning activities two different validations are performed. In particular, didactic contents, adaptive learning processes, and tests are validated differently from the synchronous collaborative activities. In order to deploy linear and adaptive didactic contents in E-World their SCORM IMS Manifest have to be validated using a suitable parser. Differently, a QTI [17] parser is required to validate the manifest of a test.
The Synchronous Collaborative Manager component on the Service Machine Node provides means to handle and use synchronous and asynchronous collaborative environments. Collaborative environments can also be used and managed separately from E-World. The database for the learners’ profiling is not considered when this component is integrated in the proposed platform.
E-World has been implemented using J2EE technologies. In particular, Apache [4] and Tomcat [5] were used as Web Server and Web container, respectively. Instead, the main technologies used to dynamically deliver contents are Java Server Pages (JSP) and servlet. Finally, to integrate the component to trace learning processes we used a Web Service implemented using AXIS SOAP Engine [3].
3. Case Study
In this section we report a cases study on the E-
World platform. The case study is composed of two experiments, which were carried out by undergraduate final year students of the University of Salerno attending the Web Technologies course of the Bachelor program in Computer Science. Once the students enjoyed the adaptive didactic contents we asked to state their satisfaction and welfare by using a questionnaire. We used the results of the usability studies and the information concerning the traceability of the adaptive learning processes to evaluate dependences among usability problems, learning performances, and students’ welfare.
3.1 Adaptive Didactic Contents
We used ASCLO-S editor to define adaptive
contents for two relevant topics of the selected course: XML (eXtended Mark-up Language) and XSLT (eXtensible Stylesheet Language Transformations). The former has been used for the first experiment (blended), while for the second experiment (pure) the latter topic was chosen. We refer to the students that participated to the blended teaching experiment as blended group, while pure group is used for the
students that participated to the pure teaching experiment. The blended group was composed of nine students that first attended a classroom lesson and after an online lesson on the same knowledge contents. The pure group was composed of six students that enjoyed only the online lesson on XSLT. The students of both the experiments had a homogenous know-how.
The experiments were carried out in a laboratory of the University of Salerno in two sessions. The experiment on XML was carried out first. The experiments started at 3 pm and were conducted in a many-to-many session. The experiment supervisors were four for both the experiment sessions. The students of the blended group did not participate to the other experiment.
The experiments were divided in four steps and were carried out without invoking any kind of tutor support and time limit. First an introductory course of ten minutes was presented to provide information about the experiment rather than to illustrate the E-World usage. After that we asked to explore the platform to familiarize with it. The third steps consisted of performing four tasks: creating an account to use E-World, selecting the course, enjoying the course, and accomplishing the test to assess the acquired knowledge. Finally, both the students’ group filled in a questionnaire (Table 1) aimed at assessing the usability of both the platform and the didactic contents.
To avoid frustration and disappointment during the knowledge content fruition, the students were not informed of the traceability of the learning process. For privacy reasons, the students were informed after the accomplishment of the experiment.
The students freely used the platform after the introductory course. They did not manifest any kind of problem and became familiar with E-World in a very short time. After that the students performed all the assigned tasks of the third experiment step. Only for space reasons the traced information as well as the test scores are not reported.
3.2 Usability and Welfare
The usability tests were carried out without
invoking any kind of support and time limit. Moreover, it was kindly required the testing participants to annotate any type of problem they found during the use of the platform. As a result, the students were motivated to carry out the experiment and to discover usability problems. To assess the perceived usability of the E-World platform from the students’ point of view we asked the students of the experiments to fill in a questionnaire. This questionnaire aimed at assessing
260

the usability of both the proposed platform and the enjoyed didactic contents.
The usability reports for both the usability experiments were achieved analyzing both objective and subjective findings. Objective findings include the subjects’ response times for the relevant aspects of the usability testing, as well as the data gathered through the testing by the supervisors. Findings from the questionnaires constitute the subjective findings. The questionnaire was divided in the following categories: Student Background (A), General Reaction (B), Page Structure (C), Terminology (D), Platform Learning (E), Platform Capability (F), Multimedia Object Management (G), and Student Satisfaction (H).
A category was composed of three questions to assess the homogeneity of the statistic sample. The general reaction of the students in terms of satisfaction degree has been evaluated by the questions belonging to the B category. The questions of the C category aimed at assessing layout and structure of the pages, as well as their contents. The satisfaction degree of the students about the terminology that the platform used was evaluated by the D category. The E and F categories aimed at investigating the satisfaction degree of the system learning simplicity and its performances, respectively. Finally, the satisfaction degree on the used multimedia objects and the enjoyed knowledge contents was evaluated by the questions of the G and H categories, respectively. The questions composing the usability questionnaire, except those of the A category, are shown in Table 1.
The answer for each question ranges between 1 and 9. For example, the value 1 for the question 2.1 represents the worst judgment (horrible) that the tester can express on the platform user interface, while the best judgment (wonderful) is expressed by the value 9.
The students of the blended group expressed a good general judgment on the platform. The students’ suggestions revealed that on one side the platform did not produce any kind of disorientation or problem and on the other side that students considered this platform not rousing. The second group of students, namely pure group, had a different reaction. In particular, the questionnaire answers revealed that the students were divided in two groups. 50% of the students expressed a sufficient satisfaction degree, while a mediocre judgment was expressed by the other students. As expected, students who first attended a traditional classroom lesson reached a greater satisfaction degree than the students enjoying only digital contents.
Better results were achieved by the answers of the questions of the C category. Indeed, the students of both the groups expressed a satisfaction degree on the page graphical layout in terms of characters, images
colours, and navigation. Despite the positive reaction of the students, some of them suggested improving both the page platform navigability and the fruition of the knowledge contents by a larger central frame.
The analysis of the D category revealed that on the average the satisfaction degree of both the group of students is sufficient. In particular, three groups of students having the same size and belonging to the pure group expressed a general judgment between mediocre and fairly good. On the other hand, 20%, 50%, and 30% of the students of the blended group expressed a mediocre, sufficient, and fairly good judgment, respectively. Once again the platform was more appreciate from students who first attended a traditional classroom lesson.
Id Question
B Cross one of the numbers that better reflect your judgment of the E-World Platform. (General Reaction)
B.1 From horrible to wonderful B.2 From frustrating to satisfying B.3 From difficult to easy B.4 From boring to exciting B.5 From incomprehensible to understandable C Judgment of the E-World pages (Page Structure)
C.1 Reading the characters in the pages is (from simple to difficult) C.2 The characters appear (from fuzzy to clean cut) C.3 The chosen fonts are (from incomprehensible to understandable) C.4 The character colours are (from appropriate to inappropriate) C.5 The character size is (from appropriate to inappropriate)
C.6 The contrast between the text and the background lets you distinguish the page content (from not well to well)
C.7 During the navigation the page structure supports you (from never to always)
C.8 The amount of the information that can be visualized in a page is (from inappropriate to appropriate)
C.9 The way the page contents are arranged is (from illogical to logical) C.10 The sequence of the pages is (from unclear to clear) C.11 The page navigation is (from unpredictable to predictable) C.12 Coming back to the previous page is (from difficult to simple) C.13 Coming back to the home page is possible (from never to always) C.14 The orientation while you navigate is (from difficult to simple) C.15 The graphical layout of the pages is coherent (from never to always)
D Used terminology and provided information (Terminology)
D.1 The use of nomenclatures and terminologies of the platform is (from inconsistent to consistent)
D.2 The nomenclatures and the terminologies are difficult to understand (from often to never)
D.3 The terminologies is appropriated with the performed actions (from often to never) D.4 Technical terminologies is used (from often to never) D.5 Links, names, and titles of the pages are (from confusing to appropriate) D.6 E-World advised you during the contents fruition (from never to always) D.7 The action accomplishment leads to predictable result (from never to always) D.8 The page contents are introduced by the page title (from never to always) E Judgment on the learning of E-World (Platform Learning)
E.1 Learn to use E-World is (from difficult to simple) E.2 How long does it take to master the platform? (from much to little) E.3 Finding the sensible maps is (from difficult to simple) E.4 Remembering the names and using the platform commands is (from difficult to simple)E.5 The steps to accomplish an operation are (from much to little) F Performance and simplicity of the E-World platform (Platform Capability)
F.1 The platform is (from slow to fast) F.2 The pages are downloaded (fro slowly to quickly) F.3 Your expertise level conditioned the E-World usage (from yes to no) G The quality of the multimedia objects (Multimedia Object Management)
G.1 The image quality is (from bad to good) G.2 The images are (from fuzzy to clean cut) H Satisfaction degree of the presented knowledge objects (Student Satisfaction)
H.1 The presented knowledge contents integrate the classroom lesson (from no to yes) H.2 The knowledge contents are clear and well organized (from no to yes) H.3 Unclear knowledge contents could be enjoyed more than once (from never to always)
Table 1. Questions of the usability questionnaire Concerning the E category, 40% and 60% of the
students of the blended group found the platform fairly
261

good and good to learn, respectively. Similarly, 83% of the students generally expressed a fairly good judgement, while the remaining students expressed a mediocre judgment. They expressed a worse satisfaction degree for the number of steps to accomplish an operation. Concerning the F category the students of both the groups expressed almost the same positive judgment.
Unlike the students of the blended group, the students of the pure group expressed a scant satisfaction about the multimedia objects. They found the images fuzzy and of a poor quality. However, both the groups provided a sufficient judgment, in general.
The assessment of the subjective findings was concluded analysing the answers provided for the questions of the H category. A mediocre judgment on the average was expressed from the pure group, while the blended group expressed a more positive judgment.
The evaluation of the objective findings was concluded by analyzing the information gathered by the experiment supervisors and E-World platform. The achieved information was used to identify further problems on platform usability and delivered knowledge contents. For instance, on the self-assessment test presented at the end of the lesson, a meaningful usability problem was revealed. The traceability information showed that most of the recruited students confused the meaning of two buttons, namely next and submit. The next button should be intended for skipping the question, while to answer to a question the latter button had to be used.
3.3 Discussion
The experiments provided relevant information in
order to comprehend the students’ satisfaction degree and their performances, as well as the usability effect of both the didactic contents and e-learning platform on the students’ welfare.
As expected, concerning the time to enjoy didactic contents the students of the pure group spent more time than the blended group. In particular, the mean time spent was about half an hour for the blended group and more than one hour for the pure group. This gap was due to the fact that the pure testers had to spend more time to enjoy the presented didactic contents, not having ever studied them before. We also observed that on the same experiment the mean times spent by the students to consume didactic contents of the same size were very different. As a result, the time spent to carry out e-learning processes and traced by the platform is not generally adequate to estimate the students’ difficulties. Hence, further considerations on didactic contents should be performed in order to
better understand the difficulties that students could encounter during the knowledge augmentation process.
The usability study and the information traced by the platform also revealed that students’ welfare is also influenced from the perceived usability of both e-learning platform and didactic contents. This assertion is confirmed first by the subjective findings and then by objective findings. The subjective findings revealed that the satisfaction degree does not exclusively depend on the knowledge complexity, but is also influenced by the knowledge that the students had before taking a course up. The students’ knowledge was assessed by a multiple choice test, whose score was traced by the e-learning platform. We observed that on the average the students of the pure group from one side achieved the best results and from the other side carried out the test in less time. Best learning performances were probably due to the awareness of their formative lack.
Concerning the results of the proposed case study we observed that the traced information should be analyzed considering the learning context, the used teaching paradigm, and the usability of both the platform and didactic contents. Hence, instructional designers should consider all these aspects whether the reengineering of a learning process is required to improve student’s performance and welfare.
4. Conclusions
In the literature there are many different proposals
[6][15][18] based on Web Services [13] to integrate e-learning software components. Xiaofei et al. [15] propose a functional architecture based on Web Services for building standard-driven distributed and interoperable learning systems. The functional architecture defines components that make up an e-learning system and the objects that must be moved among these components. A proposal for a Middleware component was suggested by Apostolopoulos and Kefala [6] with the aim to bridge the lack of a consistent management scheme in the integration of e-learning services. They implemented the e-learning components as agents, which are maintained in a local Management Information Base, and can communicate with the agent manager through the SNMP protocol. Chang et al. [13] suggested the use of SOAP to implement API Adapter and transport parameter part in LMS. The LMS Web Services are implemented in .Net, while to enjoy knowledge contents the client needs specific software components. The components include a SOAP engine to allow the communication between LMS and client machine.
262

Concerning the identification of usability attributes, Ardito et al. [7] capture the peculiar features of e-learning platforms and knowledge contents reporting a preliminary study on a group of users. The student interaction with an e-learning framework in a real teaching context was observed. Differently, in [8] the author proposed a preliminary set of guidelines and criteria to be exploited for designing usable e-learning applications. In particular, they adapted the SUE (Systematic Usability Evaluation) inspection, which was originally developed for hypermedia evaluation.
In this paper we extend the e-learning platform presented in [10] to enable the management of adaptive e-learning process. A case study was also carried out and presented in order to assess the usability of the presented platform as well as the performance and satisfaction of students enjoying adaptive didactic contents both in pure and blended teaching scenarios. Dependences between usability problems, and students’ satisfaction degree and performances were evaluated and discussed.
Future work will be devoted to further assess the proposed e-learning platform on several education contexts. We also plane to replicate the study on a larger and heterogeneous statistical sample. Finally, we are going to perform empirical studies to estimate the effort to create and to enjoy adaptive contents.
References [1] Advanced Distributed Learning (ADL) Initiative.
http://www.adlnet.org, 2006. [2] Advanced Distributed Learning (ADL). “Sharable
Content Object Reference Model (SCORM)”. http://www.adlnet.gov/scorm/index.cfm, 2006.
[3] Apache “Axis Project”. http://ws.apache.org/axis/, 2004.
[4] Apache. “HTTP Server Project”. http://httpd.apache.org/, 2004.
[5] Apache “Jakarta Tomcat Project”. http://jakarta.apache.org/tomcat/, 2004.
[6] T. K. Apostolopoulos, and A. Kefala. “An E-learning Service Management Architecture”. In Proc. of the 3rd IEEE International Conference on Advanced Learning Technologies. Athens, Greece, 2003, pp.: 140-144.
[7] C. Ardito, M. De Marsico, R. Lanzilotti, S. Levialdi, T. Roselli, V. Rossano, and M. Tersigli. “Usability of E-Learning Tools”. In Proc. of the working conference on Advanced Visual Interfaces. Gallipoli, Italy, 2004, pp.: 80-84.
[8] C. Ardito, M. F. Costabile, M. De Marsico, R. Lanzilotti, S. Levialdi, P. Plantamura, T. Roselli, V. Rossano, and M. Tersigli. “Towards Guidelines for
Usability of e-Learning Applications”. In Proc. of User Interfaces for All. Vienna, Austria, 2004, pp.: 185-202.
[9] P. A. Bernstein, and E Newcomer. “Middleware: a model for distributed system services”. In Communications of the ACM, Volume 39, Issue 2, 1996, pp. 86-98.
[10] G. Casella, G. Costagliola, F. Ferrucci, G.Polese, G. Scanniello. “A SCORM Thin Client Architecture for e-learning Systems based on Web Services”. To appear in International Journal of Distance Education end Technologies.
[11] G. Casella, G. Costagliola, F. Ferrucci, G. Polese, G. Scanniello. “A Visual System for Designing and Realizing Adaptive Distance Courses”. In Proc. of 1st International Conference Technology Enhanced Learning, November 20-21, 2003, Milan, Italy.
[12] E. Cerami. “Web Services Essentials”, O’Reilly & Associates, 2002.
[13] W. Chang, C. Hsieh, H. Hsu, N. H. Lin, L. H. Lin, and T. K.. Shih. “Using SOAP and .NET Web Service to Build SCORM RTE and LMS”. In Proc. of the 17th International Conference on Advanced Information Networking and Applications. Tamsui, Taiwan, 2003, pp. 408-413.
[14] G. Costagliola, F. Ferrucci, G. Polese, and G. Scanniello. “An Approach for the Creation of Collaborative Environments”. In Proc. of 2nd IEEE International Conference on Information Technology: Research and Education. London, United Kingdom, 2004, pp.:184-188.
[15] N. D. Georganas, A. El Saddik, and L. Xiaofei. “An Implementable Architecture of an E-Learning System”. In Proc. of IEEE Canadian Conference on Electrical and Computer Engineering, Ottawa, Canada. Vol.2, 2003, pp. 717-720.
[16] IBM. “Lotus Learning Management System”. http://www.lotus.com/lotus/offering6.nsf/wdocs/homepage, 2005
[17] C. Smythe, E. Shepherd, L. Brewer, and S. Lay. “IMS Question & Test Interoperability Overview. Ver 1.2.”. In Tech. report of IMS Global Learning Consortium, http://www.imsglobal.org/question/qtiv1p2/imsqti_oviewv1p2.html, 2002.
[18] G. Vossen, and P. Westerkamp. “E-Learning as a Web Service”. In Proc. of the 7th IEEE International Database Engineering and Applications Symposium, Hong Kong, SAR, 2003, pp. 242- 247.
[19] WebCT. “E-learning platform for educational institutions”. http://www.webct.com/, 2005.
263

Establishing a National Health e-Learning Portal in Taiwan
Heng-Shuen ChenDepartment of Family Medicine andDepartment of Medical Informatics,National Taiwan Universityi, Taiwan
Jer-Junn LuhDepartment of Physical Therapy
National Taiwan University, Taipei, Taiwan
Ling-Ling YangDepartment of Pharmacognosy,
College of Pharmacy,Taipei Medical University, Taipei, Taiwan
Ging-Ying LinPreparatory Office,
National Education Research Institute,Taoyuan, Taiwan
ABSTRACT- Taiwan introduced a new Grade 1-9 IntegratedCurriculum (G1-9 IC) in 2001. New curriculum standardsprovide only guidelines of major contents in 7 learning areasand focus on reminding teachers the basic abilities studentsshould have and not providing standardized and detailtextbooks. The national Health e-Learning Network (HeN) isone of six education networks funded by the Ministry ofEducation (MOE) to support G1-9 IC. After one year planning,the construction of the website (http://health.edu.tw) launchedin 2003. The development team recruited more than 100experts. About 40 elementary and secondary partner schoolsall over the country are collaborated to promote the websiteand digital learning contents. According to the three stagesprinciple of preventive medicine and seven major contents ofhealth and physical education learning area of G1-9 IC..Through the implementation of information and networktechnology, many multimedia e-learning units(MeU) weredeveloped. School teachers, students and parents can accessthese contents freely and share their experience interactivelyon the user community platform linked on the website. In thefuture, HEN will further coordinate the resources from publicand private sectors to establish a health e-learning portal andprovide life long health education. The familyphysician-based community integrated delivery system inconjunction with health information management and referralsystem will be integrated to provide a comprehensive andcontinuous holistic health care to reach the goal of health forall.
Keywords: health education, e-learning, integrated curriculum,elementary education, secondary education
INTRODUCTION
In Taiwan, the implementation of the 9-yearcompulsory general education system started in 1957.Since 1993 the Curriculum standards for primary andjunior high schools have undergone the first revision.Coming with the 21st century to meet the nationaldevelopment needs and public expectations thegovernment started to engage in educational reform inorder to foster national competitiveness and the overallquality of citizens lives. The development of a newcurriculum was divided into three stages including the
integration of Grade 1-9 Curriculum, guidelines of sevenlearning areas, and reviewing process.
The development adopts the following fourprinciples: (1) to involve all aspects of daily life that
development; (2) to encourage the development ofindivito foster democratic literacy and respect for differentcultures; (4) to develop scientific understanding andcompetences, in order to meet the demands of modernlife.
The goals of curriculum are to achieve the followingabilities:
1. To enhance self-understanding and exploreindividual potential;
2. To develop creativity and the ability to appreciate
3. To promote abilities related to career planningand lifelong learning;
4. To cultivate knowledge and skills related toexpression, communication, and sharing.
5. To learn to respect others, care for the community,and facilitate team work;
6. To further cultural learning and internationalunderstanding;
7. To strengthen knowledge and skills related toplanning, organizing, and their implementation;
8. To acquire the ability to utilize technology andinformation;
9. To encourage the attitude of active learning andstudying; and
10. To develop abilities related to independentthinking and problem solving.
New Grade 1~9 Integrated Curriculum has beenintroduced in 2001[1] to replace the narrowed and oldercourses. There are seven major learning areasincluding Language Arts, Health and Physical Education,Social Studies, Arts and Humanities, Mathematics,Science and Technology, and Integrative Activities.Because the outline syllabus and the learning abilityindicators of new curriculum are very general in nature,preparation and selection of teaching materials will
264

become more diversified and open. The curriculumstandard focus on reminding teachers the basic abilitiesstudents should have and not providing standards anddetails for textbooks. The trend that a teacher has toprepare his/her own teaching materials, by searchingfrom available educational resources, become aninevitable task on campus. This will add enormousworkload to classroom teachers especially in HealthEducation class which correct and specializedknowledge is critical. For most of the teachers ofhealth education did not receive adequate training ofhealth science in teachers colleges or normal universities.In teachers colleges to cultivate elementary schoolteachers there is no department of health education.For junior high schools only half of health educationteachers graduated from department of education innormal universities.
Through the rapid development of the Internet, theacquisition of medical and health information are noweasily accessed via multiple media in Taiwan[2].However for the general public, the retrieval of correctand unbiased health information has become a majorissue for health education and self-health management.Same difficulty exists for teachers of health educationbecause of lack accredited resources in common medicalknowledge and health information.
The national Health e-Learning Network (HeN) isone of six education networks funded by the Ministry of
Education (MOE) to support G1-9 IC. It is part of- he
Challenge 2008- The Six-year National DevelopmentPlan started from 2002.
The purposes of establishing a national Healthe-learning Network (HeN) are: (1) to provide correctcommon medical and health science knowledge toimprove health status for school pupils and the generalpublic; (2) to develop an e-learning resources networkfor Health and Physical Education learning area ofGrade 1-9 Integrated Curriculum; and (3) to establish alife-long health education portal for the general public.
SUBJECTS AND METHODS
The target users of HeN are teachers, elementary andjunior high school students and their parents in Taiwan.The planning and construction project for HEN wasfunded by the Ministry of Education (MOE) along withother five national education networks and a commonplatform project in the national development Plan [3].In this project, the participating experts were organizedto three major missions: the content team, the systemplatform team and the knowledge management team(Figure 1).
Figure 1. Organization chart National Health e-Learning Network(HeN)
PrincipleInvestigator
Health PromotionDivision
Health CareDivision
Sports/RecreationDivision
Content Team
Systemplatform
Team
Knowledgemanagement
Team
BodyMindFoodSafety lifeCommunity
Health promotionSpec. protectionEarly DiagnosisDisability limit.RehabilitationPalliative med.
FitnessMotor skillRecreationSport Inj.
Learning by doing
User Community
Chinese med.Chinese herbNatural foodTraditional herb
Evaluation of system structure, function, administration, database management
Metadata, searching engine, user interface, peer review standards of learning object
Co-InvestigatorHealth & Medicine
Pavilion
Co-InvestigatorTraditional medicine
Pavilion
265

The collaboration is a two-dimension model tointegrate domain knowledge part and technical part.Two co-investigators who are the experts of healtheducation and traditional medicine respectively takecharge in health & medicine pavilion and traditionalmedicine pavilion. The principle investigatorcoordinates the content expert, technology expert, andlearning by doing promotion activities. The contentstructure was complied with the three-stage principle ofpreventive medicine incorporated with the naturalcourse of disease (Table 1) and the seven major contentsof health and physical education learning area. Thethree stage-principle of preventive medicine includesprimary prevention focusing on health promotion andspecific protection, secondary prevention emphasizingon early diagnosis and prompt treatment, and tertiaryprevention targeting on limitation of disability andrehabilitation.
The three stages are closely related to theprogression of natural disease process. The first stageis related to susceptible period with risk factor althoughsubject is still in a disease free status. The risk factorscan be reduced by health promotion life style such asbalanced diet, exercise or vaccination. The secondstage is related to an occult or latent disease status whichrequires periodic health examination or screening forearly diagnosis. The third stage is related an obviousdisease condition with definite diagnosis whichemphasizes the prevention of complication and restoringthe residual function. The major contents of Healthand Physical Education focus on the learning of mentaland physical development and health management,sports and motor skills, healthful environments, fitnessand lifestyle choices. Each major contents is divided intothree learning stages (grade 1-3, grade 4-6, and grade7-9) according to the structure of knowledge concernedas well as the continuity principles of the psychologicaldevelopment of learning. Competence Indicators are setfor each learning stage.
The system platform team surveyed existing
e-learning system to evaluate the system structure,function of account administration and databasemanagement. The knowledge management teamfocused on the design of metadata, functions ofsearching engines, user interface, peer reviewmechanisms, and international standards of teachingmaterial which tightly correlated with another commonplatform project for six e-learning networks.
RESULTS
A. System Structure of HeNThe architecture of the system is shown in figure 2.
It is a 3-tier wed-based system. All the programs wereimplemented in object-oriented idea so that all thecomponents in the system can be reused for othersystems. The open-sources and platform-independentconcepts were also considered in the designing of thesystem.
HeN consists of a web server and several applicationservers including content database server, conferenceserver, and videostream server, etc.... More applicationservers can be added upon the request of user needs.Open source operating system and database softwarewere used for web servers, content database andknowledge management platform. The web server hasthree versions of general, children and English. Thechildren version is specially designed for elementaryschool students.
Fig 3. HeN: general(left) and children(right) versions
Teachers
Parents,Gen. Public
Internet
Web server
SwitchFirewall
HeNInternet
Students
System Op
Conference Server
Content Server
Videostream Server
Fig2. System structure of HeN
Table 1. Three-stage principle & natural course of disease
266

A low bandwidth multipoint videoconference systemMultivideo was implemented for communication amongteachers and also for the development team. Duringthe videoconference the network bandwidth can be aslow as 64Kbps for each site, and the conference has thecapacity connecting to maximum 17 points including apoint with electronic whiteboard sharing and conferencechair function.(Fig 4a, 4b) For videostream server,Window Media server was installed to provide video viabrowser interface.
Fig 4a. Conference server: electronic whiteboard sharing
Fig 4b Conference server: multipoint videoconference
B. Functions of HeN
Fig 5. Function Map of HeN
Figure 3 shows the function map of HeN. There areseveral components designed in HeN. The firstcomponent is the data library that stores the fullstructure of medical knowledge contents as searchablematerials. Knowledge contents were arranged in a treestructure, which were divided into 19 subgroups underHealth & Medicine Pavilion and Traditional MedicinePavilion. Health & Medicine Pavilion has threedivisions: health promotion, health care, sports andrecreation. Viewing from the top of the 6 nationale-learning networks (Life education, Health education,Nature and Ecology, History and Culture education, Artsand Humanities education, and Science education), HeNfinally has 15 level-3 knowledge base items aftertraditional medicine domains also integrated into level 4and level 5 items, In total it is about 125 level-4 itemsand 400 level-5 sub-items. Some of the domains alsostarted to develop level 6 items.
The second component is a teaching resource blockwith many sharable digital multimedia teachingmaterials that are represented by subject related to healtheducation of G1-9 IC under specific divisions of Health& Medicine pavilions on HeN. The seven majorcontents one by one project to the 5 subgroups of Healthpromotion and 2 subgroups of Sports/Recreationdivision in Health and Medicine pavilion. Theseteaching materials are called multimedia e-learning unit(MeU) can be used as computer assisted instructiontools of related major contents linked to variablecompetence indicators. For example in elementaryschool the young new students always have trouble inusing toilet in school. For toilet training aninteractive flash game was developed. Through thecollaboration among elementary education expert,school teacher, instruction designer and multimediaprogrammer, a vivid interactive game called Poo Warwas developed and became the most popular MeU onHeN. Fig 6 illustrates the instruction design ofsequential guidance and feedback in the playing process.
Fig 6a male or female Fig 6b.positive feedback
Fig 6c. Foot position Fig.6d. Poo target
267

These flash movies or interactive games aredownloadable or play online. School teachers, studentsand parents can access these contents freely and sharetheir experience interactively on the user communityplatform linked on the website. The traditionalmedicine pavilion provides abundant knowledge andmultimedia e-learning contents which are very unique inthe world and well-recognized in global Chinesecommunity (Fig 7a, 7b). Part of them are assigned tolink to seven major contents as possible and integratedwith learning by doing activities.
Fig 7. Webpage of Traditional Medicine Pavilion
.The third component is the area of learning bydoing called Life Experience Camp. Activities of realor virtual experience are provided to teachers andstudents, some activities may involve school nurses andparents. From 2006, in addition to original 15 partnerschools, HeN collaborated with 25 newly assignedelementary or junior high schools, one in each county orcity all over the country. As many as 60 learning bydoing or HeN promotion activities were scheduledduring the previous year. These activities include teachertraining in instruction design, lecture and hands-onpractice on multimedia e-learning units to promote HeN,international exchange and promotion, exposition andpress conference.
The other components of HeN provide open placefor news, hot topics, forum or interactive discussion andprovides answer for frequently asked questions (FAQs).
DISCUSSIONFrom information technology point of view, HeN is
based on the ideas of consumer health informatics(CHI)[4,5] and e-learning to provide a self-directed,problem-based, cooperative and collaborative learningenvironment[6]. For school teachers, HeN actually is
more important for them to serve as a health educationteaching materials repository. Teachers can search anycontents on the web with keywords, by category or bycompetence indicators. This would save the teachers alot of time in surfing unreliable health information andmedical knowledge on the Internet. The contentstructures of the system were contributed by more than ahundred experts including medical doctors, nurses,nutritionists, professors and school teachers. Theintegration of major contents of learning area withpreventive medicine and natural history of disease alsoprovide a comprehensive knowledge base of healthwhich can be applied to people of any age.
During the last three year construction period, thepeople in the six e-learning networks and commonplatform projects have many chances to work together.They have shared their experience on the constructionprocesses among different e-learning projects. In themean time, we have reached a consensus for thespecification of the system platform, single sign-on,metadata, and common functions of the user interface.In the next few years, MOE will keep funding the HENdevelopment project with about $NT 10 millions peryear. The system platform will be further improvingby using a Multimedia Knowledge base managementsystem, integrated with visual user interface, learningpathway and FAQ with natural language searchingability.
In the future, HEN will further coordinate theresources from public and private sectors to establish ahealth e-learning portal and provide life long healtheducation. The family physician-based communityintegrated delivery system in conjunction with healthinformation management and referral system will beintegrated to provide a comprehensive and continuousholistic health care to reach the goal of health for all.
REFERENCE
1. Ministry of Education(2004) Grade 1-9 Curriculum Guidelines.Retrieved March 1, 2006 from World WideWeb:.http://140.111.1.22/english/en04/930227Grade%201-9%20Curriculum%20Guidelines.doc
2. Silberg W.M., Lundberg G.D., Musaccio R.A. (1997).Assessing, Controlling and assuring the quality of medicalinformation on the Internet. Journal of American MedicalAssociation, 277: 1244-45.
3. Chen HS, Chan JC et al. Planning a National Health EducationNetwork in Taiwan. IMIA WG1 2003 conference Portland,USA 2003
4. Jau-Shin WU. Consumer Health Websites in Taiwan. JFMA 99:663 (2000)
5. Cline R.J.W., Haynes K.M. (2001). Consumer healthinformation seeking on the Internet: the state of the art. HealthEducation Research, 16(6): 671-92.
6. Ronteltap, C.F.M., Eurelings, A.M.C. (2002). Activity andInteraction of Students in an Electronic Learning Environmentfor Problem-Based Learning. Distance Education, 23(1): 11-21.
268

A MULTIAGENT ARCHITECTURE FOR A LEARNING OBJECT REPOSITORY
Pierpaolo Di Bitonto, Teresa Roselli, Veronica Rossano
Department of Computer Science – University of Bari Via Orabona 4, 70125 Bari
{dibitonto, roselli, rossano}@di.uniba.it
Up to now, the e-learning community has concentrated a lot of effort on the task of defining standards that can guarantee the interoperability and reusability (from the informatics standpoint) of didactic resources, but has tended rather to neglect their reusability (from the pedagogical standpoint) and the personalization of learning paths. It seems evident that in the field of content structuring it is the quality, as well as the quantity, of the pedagogical information accompanying the content that is most lacking. But how is it possible to divorce these from the educational context where the resource is used? Such an approach would be detrimental not only to the quality of the reuse but above all to the possibility of personalizing the learning path. Generally, when we consider an e-learning process, we tend to think that it differs from a traditional lesson in a number of different ways. Starting by drawing up specifics for describing learning/teaching scenarios, we propose an architectural model for a learning object repository with the aim of setting up a community of good practices in which teachers can not only find teaching materials but also the collection of all the experiences of other teachers who have used them.
Introduction
There is now widespread recognition that search engines are one of the most important technological, cultural and economic phenomena of our present age. In fact, together with web browsers and electronic mail, they have been defined as one of the most successful applications of the use of the Internet. Besides, from the cultural point of view it is interesting to observe that the verb to google has become common parlance for making a web search [14]. This can explain the growing interest in defining ever more refined and specialized search engines that can allow the user to find exactly what
resource s/he was looking for. This is the background to the new web generation, the Semantic Web, where it will be possible to publish not only documents but also information and data in a suitable format for making automatic queries, interpretations and, in general, data processing [2]. This new web will enable specification not only of the desired information content but also of the context where the content should best be inserted to serve the user’s interests. These tools have already become widespread in the educational world at all levels. In Italy, the recent reform introduced by the Ministry of Public Education has given priority to rational, homogeneous programs for instruction in the use of PCs and the Internet in the school system. Thus, the Internet has not only become a study subject but is now above all a tool for producing teaching materials and for widening knowledge in all fields. In this scenario, the problem is the great quantity of material available and the time taken to select material, that rises in direct proportion; the problem has now become severe as regards teaching materials. So, the main aim of the international community is to create a worldwide web of teaching objects (better described as learning objects) and to provide suitable tools allowing them to be shared and retrieved. A first solution was that of defining and adopting a system of metadata that describe the content of the teaching resource in more or less detail. These descriptors are aimed both at speeding up search operations and at making them more effective, by supplying results better matched to the purposes of the search. However, the use of several systems of metadata has not fostered, and indeed has hampered, the interoperability and reusability of teaching resources. For this reason, international standards were defined, such as SCORM, LOM, Dublin Core, and most teaching resources now refer to these.It soon became apparent, therefore, that the metadata specifics needed to be refined to make
269

them better able to respond to specific learning/teaching needs. This is one of the main problems emphasized by operators in the e-learning sector, denominated pedagogical neutrality [5]. So in recent years the research community has focused on integrating pedagogical information in descriptions of teaching resources.The main initiatives include: the National Science Digital Library [9], that uses the DC and three of the selected elements from the LOM, the Open Archives Initiative [10], which recommends the DC but also supports the LOM, and finally, the Gateway to Educational Materials [6], that uses the DC and other elements to describe pedagogical elements. However, most works concentrate on defining domain models by using ontologies that can achieve more accurate selection and searches of materials [3, 13], or improve the description of the metadata by providing a more accurate definition of the relations among the various concepts [1, 12]. In describing a teaching resource one of the biggest problems is that of describing the learning scenario where it can be used.
One of the most complete initiatives in this context is the IMS Learning Design [7], that aims to provide a detailed description of a learning scenario by means of a special language denominated Educational Modelling Language (EML) [4]. The specifics can describe a wide range of pedagogical models or learning approaches, including work groups, and collaborative learning. The ultimate aim is not so much to define new learning models as to describe how the actors in a given scenario interact among themselves, using the teaching resources (in terms of both teaching materials and support services), and how the whole procedure can be coordinated and channelled to create a learning path. Although these specifics are complete, they are addressed to instructional designers and/or developers of e-learning materials that have informatics skills rather than to teachers. Hence the need to define specifics describing learning/teaching scenarios to be included besides the traditional metadata describing teaching resources, that do not require advanced informatics skills. This work starts with a proposal of specifics describing learning/teaching scenarios denominated EXM (EXperiences Metadata), and then goes on to define an architectural model of a repository in which teaching experiences, metadata on teaching resources and the resources themselves can be collected. This may serve as a springboard for building an integrated software
system that can make the complex process of metadata production transparent to the final user, who will thus reap its advantages.
EXM specifications The idea of describing the teaching/learning scenario aims at allowing easier use and reuse of didactic resources. This is a fundamental aspect in distance education. The description of such scenarios allows teachers to share their experiences in using didactic resources. The ultimate goal, therefore, is to create a community of best practices in which teachers can find didactic material to use in their own didactic activities, as well as reports of their colleagues’ experiences with prior use of them.
Figure 1. EXM Specifications structure
The EXM specifications have been defined on the basis of the IMS LD specification and thanks to the collaboration of some teachers. As Figure 1 shows, the specifications consist of eight categories, each describing a particular aspect of the teaching/learning process:
1. General information: describing didactic resources details to which the experience is related.
2. Learning goals: describing, in terms of knowledge and skills, the goals that the didactic resources should achieve.
3. Prerequisites: describing, in terms of knowledge and skills, the prerequisites required in order to use the resource which the scenario refers to.
4. Learning path: describing the previous and next resources related to the resource including in the scenario.
5. Didactic material: describing the type of didactic material used in the experiences, other possible contexts in which it could be (effectively) used. This category also makes it possible to describe if the didactic resource was built by the
270

teacher or inherited from other colleagues.
6. Didactic activity: describing details of the activity in terms of students involved, tasks assigned, teacher’s roles, pedagogical strategy used, and so on.
7. Support activity: describing the role the teacher or tutor has in supporting students in their learning activities.
8. Learning assessment: describing the learning outcome in terms of quality of the learning goals attained by the student.
These specifications were the springboard from which a model of a teachers’ experiences repository was defined, which can collect both learning objects and their descriptions but also sets of best practices furthering the use of these resources.
Multiagent architecture for a learning objects repository On the basis of the problems illustrated above, it seemed wise to revise the current model of a repository, defining an architecture better suited to current lines of development. Starting from insertion of learning objects, it can be seen that the complex metadata language, as well as the need for usable work tools that should provide invisible technology (as advocated by Norman) [8], poses the risk of making the tool impractical, despite its theoretical utility. In addition, considerable experience is required to obtain a good quality of metadata, in which all the metadata present (especially subjective data) are congruous. Thus, the aim is to obtain high quality, precise metadata with the minimal possible user effort. This need can be attained with an expert system (or experience-based agent), which can draw up the metadata at expert level after dialoguing with the user (e.g. by multiple choice targeted questions). On the basis of these descriptions, the agent itself can classify the resources in given categories. The advantage of organizing resources in categories is that it will simplify searches in the repository. The user can browse through the taxonomy of available resources until s/he reaches the desired resource. This is not the only reason why a taxonomic organization of the resources is essential in the search process. Bearing in mind the unavoidable complexity of such a search, the concept of invisible technology gives rise to the need for a knowledge-based agent that can support the user in her/his searches. The agent [11] should be able to understand, according to the user profile and stipulated
specifics, what (or which) categories of learning objects are best suited to the user’s needs. In these bases, a functional architectural model for a Learning Object Repository (LOR) can be defined, having the following macro-components: - Experience-based agent supporting insertion
and cataloguing of learning objects; - User modelling component (with user models
DB);- Knowledge-based search agent; - DB of learning objects. Even if it is not explicitly included among the components, the interface has a fundamental importance and must guarantee user access to all the functions made available by the repository.
Figure 2. Agent-based architecture of the repository
Each macro-component must interface with the outside world via the Web Service and exhibit all public methods so that they can be adopted by remote call both by the repository and by any other web application wishing to use the available services. This delineates a clear distinction between the interface level and the domain level. Communication between the web service and the other applications is achieved with messages in XML (SOAP) format. Each service can be described by formal specifics, together with all information necessary to invoke it, such as localization, message or protocol format to be used. The Web Service description is in XML format, also known as WSDL (Web Services Description Language).
a. Agent for learning objects insertion and cataloguing
Owing to the complexity of the metadata languages Dublin Core, LOM, EXM, it is not possible for a user to insert complete, precise metadata. Therefore, an experience-based agent (expert system) must support the user’s navigation in the repository, and the insertion of descriptions of learning objects in order to guarantee the semantic correctness of the
271

metadata, an essential condition to censure correct cataloguing of the resources. To achieve a precise description of a knowledge-based agent, the nature of the environment where it must operate needs to be analyzed in depth, as well as the performance measure considered, and the sensors and activators the agent relies upon. The environment consists of the set of teachers (of every school order and level) who insert learning material in the repository, and can be considered partially observable because a user is unlikely to be able to insert all the metadata needed to make a full (or better exhaustive) description of the resource; stochastic because at all times the agent’s state is not determined purely by the current state and action carried out, but is strongly dependent on the user-interface interaction; sequential because it is not reasonable to consider all the user actions made to insert the metadata on a resource as separate actions since they all aim to achieve the same object; semidynamic because it must be assumed that the environment will not change while the user is reflecting, whereas the assessment of the agent’s performance will decline over a period of time; discrete becauseeach user search is considered on its own, single-agent because it does not collaborate nor compete with other agents to achieve the goal. The performance measure serves to enhance the quality of the metadata and their organization as a taxonomy of categories. The sensors are the functions that acquire the user interface data, the activators are the functions that write the XML metadata and classify the resource in the DB. To achieve the goals the agent needs to possess some particular knowledge. In particular, as regards the metadata support function, this knowledge can be represented (in the typical question-driven expert systems way) by a decision tree with which the agent can ask the user a series of questions and then insert the metadata on the basis of her/his answers. Metadata inserted in the form of clauses can be transformed into XML files or used by diagnostic rules to classify the resource in pre-established categories. The diagnostic rules stem from a comparative analysis of the various elements making up the metadata language. For example, if the field teaching subject contains the value Informatics, the level field will take on the value University, etc (as shown in Figure 4) so it can be concluded that the resource belongs to a given category inferred by its properties. These categories have precise properties and are organized as a taxonomy. This is not known to the agent inserting and cataloguing the learning
objects but will be important for the search agent described below.
Figure 4. Classification of the resources tree
b. User modelling component The user modelling component has the task of collecting all the information about the user gained during interaction with the system and processing it. This information can be collected in an explicit or implicit fashion according to the user’s level of involvement. Explicit methods for collecting information by direct involvement of the user make the user information collection process easier, and avoid the need to rely on automatic learning techniques. However, direct involvement of the user may yield wrong or only partially correct information, often due to poor collaboration of the user. This problem can be solved by using an experience-based agent, with a question-driven interface, that can ask targeted questions and decide how reliable the data inserted by the user are on the basis of the her/his answers.As regards implicit methods for collecting information, they are primarily useful because they are user-visible. They collect information by observing how the user interacts with the system, so incorrect information is highly unlikely to be acquired. In any case, the best result is obtained by combining the two methods. Once the user information has been collected it must be processed to elicit a series of user categories, again organized as a taxonomy. When designing a repository model, it is not necessary to make any further examination of the user modelling technique, but it is important to
272

have such a mechanism to provide a further filter mechanism of the resources found. c. A knowledge-based search agent A complete, precise description of learning resources requires the specification of equally complete, precise search criteria. In this case, too, it is necessary to hide much of the complexity of the search from the user. For this reason, a search agent should be able to infer which resource categories are best suited to the user’s requirements on the basis of the specifics and user model. The user’s requests may vary from specific requests for a precise learning resource to very generic requests. In the first case the agent has the task of providing a list of objects with the desired characteristics, while in the second it will have to compare different objects and providing the best suited on the basis of the user profile. The environment the search agent will operate in is the set of teachers and pupils (of all schools and types) searching for teaching materials of all types and can be considered partially observablebecause a user is unlikely to be able to insert all the research parameters serving to identify a given resource; deterministic because the state of the agent in any given moment is entirely governed by the current state and the actions taken; episodic because the agent’s experience can be divided into atomic episodes; semidynamic because the assessment of the agent’s performance will decline over a period of time; discrete because each user search is considered on its own, single-agent because it does not collaborate nor compete with other agents to achieve the goal. The sensors are the functions that acquire the interface, user model and learning objects DB data, while the activators are the functions that communicate the results of the search to the interface. The knowledge the agent needs to carry out its task has to do with the organization of the learning objects in the repository, the typology of the user making the search, and the user’s specific request.The knowledge of the learning objects organization in the repository is based on a taxonomy of categories that subdivides topics into sub-topics, and further classifications according to the planned use of the object (to be incorporated in a new learning object, used for a classroom lesson, etc) and the pedagogical aspects. Together with this high level representation each object is described in detail by its metadata. The knowledge of the user is also organized as a taxonomy of categories distinguishing between teacher categories and learner categories. In addition, for each user the
agent can refer to a series of detailed data on her/his personal profile. The agent has a series of production rules and can infer what category the resources best suited to the user’s request belong to on the basis of the representation of all the above knowledge and the user’s request. For example, if a teacher is looking for teaching material about inductive logical programming, and states that s/he wishes to use it with learners having no prior knowledge of this subject, then the system must individuate teaching materials summarizing the essential concepts underlying logical programming. Next, the system must select the material about true inductive logical programming. Thanks to EXM, a knowledge of the propaedeutic order of different topics can easily be included in the search agent’s production rules. The use of rules that can combine the knowledge of the learning objects and of the user representations can yield good results even if the request made is extremely imprecise.
Conclusions and future developments Web-searches for efficacious learning resources pose one of the main challenges being addressed by experts in the e-learning sector in recent years. The biggest problem is the lack of pedagogical information associated with such resources, which would serve to foster reuse in different contexts. A study of the state of the art has highlighted a number of ongoing projects developing in different directions, ranging from adding elements to the standards for metadata, defining new specifics for describing learning/teaching processes, up to defining ontological models for describing teaching resources. All these proposals have scientific merit and are theoretically efficacious but they have contributed to make the activity of describing a teaching resource a highly complex task. Moreover, a solution to the problems of reusability and web-searches for resources does not lie only in the definition of specifics for describing them but also requires specialized research engines to be defined. For these reasons, the current work proposes a multiagent architectural model for a learning object repository which can on the one hand facilitate the process of describing resources and on the other, provide an intelligent research engine able to retrieve the most suitable teaching resource for the user’s declared aims. Moreover, the model aims to provide a framework that could be adopted by all designers and developers of LOR, fostering not only searches for, and reusability of, teaching resources but also and above all,
273

interoperability among the LOR themselves, so creating a single worldwide network and a dedicated teaching resources web.
References[1] N. Bennacer, Y. Bourda, B. Doan, Formalizing for querying LOs using OWL. In Proceedings of 4th IEEE International Conference on Advanced Learning Technologies(ICALT 2004), Joensuu, Finland, 30 August - 1 September 2004, 321-325.
[2] T. Berners-Lee, J. Hendler, O. Lassila. The Semantic Web - A new form of Web content that is meaningful to computers will unleash a revolution of new possibilities. The Scientific American, May 2001. (Online) http://www.scientificamerican.com/article.cfm?articleID=00048144-10D2-1C70-84A9809EC588EF21&catID=2
[3] Bouzeghoub, B. Defude, S. Ammour, J.F. Duitama, C. Lecocq, A RDF description model for manipulating LOs. In Proceedings of 4th IEEE International Conference on Advanced Learning Technologies (ICALT 2004), Joensuu, Finland, 30 August - 1 September 2004, 81-85.
[4] Educational Modelling Language. Available at http://learningnetworks.org/eml-ou-nl.htm
[5] N. Friesen, Learning Objects and Standards: pedagogical neutrality and engagement. In Proceedings of 4th IEEE International Conference on Advanced Learning Technologies(ICALT 2004), Joensuu, Finland, 30 August - 1 September 2004, 1070-1071.
[6] Gateway to Educational Materials www.geminfo.org
[7] IMS Global Leaning Consortium, IMS Learning Design. Available at http://www.imsglobal.org/learningdesign/index.cfm/
[8] Norman, D. A., The Invisible Computer. MIT Press, Cambridge, 1998.
[9] National Science Digital Library www.nsdl.org
[10] Open Archives Iniziative www.openarchives.org
[11] Russell, S., Norvig, P., Artificial Intelligence. A modern Approach. Prentice-Hall, Englewood, New Jersey, 2002.
[12] S. Sánchez, M.A. Sicilia, On the semantics of aggregation and generalisation in LO contracts. In Proceedings of 4th IEEE International Conference on Advanced Learning Technologies
(ICALT 2004), Joensuu, Finland, 30 August - 1 September 2004, 425-429
[13] B. Sridharan, A. Tretiakov, Kinshuk, Application of ontology to knowledge management in web based learning. In Proceedings of 4th IEEE International Conference on Advanced Learning Technologies(ICALT 2004), Joensuu, Finland, 30 August - 1 September 2004, 663-665
[14] Wikipedia, l’enciclopedia gratuita. (Online) http://en.wikipedia.org/wiki/Google_(verb)
274

Integration of distributed Learning Objects by Wrapper-Mediator architecture
Angelo Chianese, Paolo Maresca, Vincenzo Moscato, Antonio Penta and Antonio Picariello
Dipartimento di Informatica e SistemisticaUniversita “Federico II”, Napoli, Italy
{angchian,paomares,vmoscato,a.penta,picus}@unina.it
Abstract
The main problem addressed here is the definition of astrategy to improve the sharing and reusability of learningobjects in an efficient manner inside an e-Learning commu-nity, reducing the cost of creating courses and other learn-ing objects. In particular, in this paper we present a sys-tem, for integrating multimedia heterogeneous LO reposito-ries and retrieving distributed data. Such system uses theLOM data model and a wrapper-mediator architecture toperform this task, so providing a simple mechanism for en-abling the integration while maintaining the independenceof the repositories. Our system also supports a semanticsearch on managed objects that makes more effective theretrieval process.
1 Introduction
With the advent of new technologies and World WideWeb, enormous quantities of informative material are nowa-days available on-line, and, thanks to the convergence ofservices offered by ICT companies, the future will be moreand more characterized by the ability to provide and dis-tribute multimedia information.
In such a context the integrated management of multi-media information such as images, graphics, video, audio,and text, is at the moment of great interest in a lot of applica-tion fields like Information Retrieval, Office Automation, E-learning, Virtual Museums, Newspaper and Magazines pro-duction, Video and Cinema Editing, Medical Applications,Geographical Information Systems Management, Biomet-ric Security Application, and so on.
Unfortunately such produced media are not available ina unique content container, but in heterogeneous and dis-tributed repositories as World Wide Web, professional andpersonal databases of different kinds (Relational Database,Object Database, XML Database, etc..), digital libraries andarchives. The major challenges in this non-trivial task aredue to structural, syntactic and semantic heterogeneity of
distributed multimedia data repositories that make complexthe data management processes.
To solve such problems it is necessary to define a datamodel that is capable of representing in unique logical viewthe multimedia data, so it can be used by applications, in-side an architecture able to support in an efficient mannerthe management of such data. For what concerns the datamodel, it’s natural to model multimedia data by means ofobjects using the object oriented paradigm, in order to cap-ture both the different variety of real data and the differentrelated functionalities. For what concerns the architecture, awell known strategy for supporting distributed data integra-tion is the adoption of the “wrappers/mediator” middlewarejoint to database technologies.
Modern e-Learning applications make more and morean extensive use of multimedia data to enhance and speedup the learning process. In the current assumption, one ormore multimedia contents are assembled together to gener-ate learning resources that are seen as a kind of LearningObject (LO). A Learning Object represents small capsulesof knowledge in a suitable form for didactic presentationand assimilation by learners. The LO “metadata” standard-ization is expected to introduce a large degree of interop-erability and re-use, promoting the wide-spread investmentin, and adoption of, this technology. Each learning object,by being highly atomic and complete in capturing a con-cept or “learning chunk”, provides the opportunity for theconfiguration of a large number of course variations. Theresulting fine-grained course customization is expected tolead to “just-in time”, “just-enough”, “just-for-you”, train-ing and performance support courseware.
The IEEE Learning Technology Standards Committee(IEEE-LTSC P1484) has undertaken the initiative of draft-ing a set of standards among which they define a data modelfor Learning Object Metadata (LOM) useful for e-learningcontents authoring and description [7].
The main problem addressed here is the definition of astrategy to improve the sharing and reusability of LOs in anefficient manner, reducing the cost of creating courses andother learning objects.
275

In particular, in this paper we present a system, for inte-grating multimedia heterogeneous LO repositories and re-trieving distributed data. Such system uses the LOM datamodel and a wrapper-mediator architecture to perform thistask, so providing a simple mechanism for enabling the in-tegration while maintaining the independence of the reposi-tories. Our system also supports a semantic search on man-aged objects that makes more effective the retrieval process.
The paper is organized as follows. In Section 2 the mainsystems for learning object integration are described. Insection 3, we outline the data model for LOs managementand a functional overview of system architecture, based onWrapper/Mediator schema. In section 4, we describe theretrieval process for LOs based on a semantic search, whilein section 5 some experimental results are discussed. Con-cluding remarks are given in Section 6.
2 Related Works
In the literature, several multimedia integration systemshave been proposed. In the following we report a short de-scription of the main general purposes systems.
MediaLand [13] is a database system aiming to pro-vide a “true” support for multimedia data management. Theobjective of MediaLand is to provide an integrated frame-work for users with different levels of experiences to man-age and search multimedia repositories easily, effectively,efficiently and intelligently. For satisfying these objectives,each multimedia data is represented as a particular “object”(described by apposite metadata) and the correlation amongdifferent objects is obtained by means of “links, in order toconstruct “multimedia object graphs”. In this way, the au-thors give a unique conceptual structure for describing themultimedia data, successively clustered in domains called“media class. The system presents a 4-tier architecture andsupports a multi-paradigm query approach to retrieval aims.
InfoSleuth [3] is an agents system that proposes asemantic approach to provide heterogeneous data integra-tion. In particular, the data integration is obtained extract-ing a common view of the semantic content from multime-dia repositories. This approach gives an independence ofrequests from information structures, resolving the hetero-geneity of data by means of an apposite ontology. InfoS-leuth also uses a specific language, KQL (Knowledge Queryand Manipulation Language), for communication amongagents.
Garlic [10] is a more complete and complex systemthat, similarly to some of previous projects, uses an object-oriented approach to represent in an uniform way the datafrom different content servers. But, differently from theother approaches, Garlic provides an efficient query pro-cessing and data access layers, for efficiently managing userqueries. The data model is based on Odmg-93 and defines
an apposite language for the data definition.Impact [11] is an agents-based system capable of inte-
grating heterogeneous information . Impact Architecture isbased on two entities: “Agents” - software modules createdfrom users or other agents and having high level functions -and “Impact Servers” - representing the services infrastruc-ture crated by agents. A Multi-Agents Paradigm allows tointegrate heterogeneous information using different agentswith particular functions and services. A “yellow pages”mechanism is used to manage the services discovery.
At the same time, in e-Learning domain, different sys-tems for LOs sharing and integration based on the P2P ar-chitecture have been developed. In the following the mainproposals are shortly described.
LOMSTER [12] is a project that address sharing of LOson a P2P base by using LOM fields both for indexing andsearching data and XML as representation and query lan-guage.
EDUTELLA [9] is a project that address sharing andreusability of LOs on a P2P base by combining RDF andXML binding of LOM to support query, replication map-ping, mediation and clustering services.
ROSA-P2P [4] is a P2P distributed system which pro-vide a physical environment to carry out the integration ofLOs. The environment includes functionalities for aggrega-tion, grouping definition, election, communication, balanc-ing and redistribution of peers.
Eventually, for what concerns the problem of retrievalof multimedia data, in [2] a system based on a multimediaontology (represented by the TAO XML language) conceptis proposed to solve heterogeneity of semantic content ofthe managed objects.
3 Overview of system functionalities
3.1 Data model
We describe a learning object and support the reuse andsearch of such an object. According to the LOM standardmetadata consists of nine sections.
General: this category groups the general informationthat describes this learning object as a whole, e.g. title, key-words and description.
Life Cycle: this category describes the history andthe current state of a learning object and those entities thathave affected this learning object during its evolution.
Meta-Metadata: this category describes this meta-data record itself and how the metadata instance can beidentified, who created this metadata instance, how, when,and with what references.
Technical: this category describes the technical re-quirements and characteristics of a learning object.
276

Educational: this category describes the key educa-tional or pedagogic characteristics of a learning object.
Rights: this category describes the intellectual prop-erty rights and conditions of use for a learning object.
Relation: this category defines the relationship be-tween this learning object and other learning objects.
Annotation: this category provides comments on theeducational use of this learning object, and information onwhen and by whom the comments were created.
Classification: this category describes where thislearning object falls within a particular classification sys-tem.
3.2 Mediator/Wrapper Architecture
The proposed architecture is based on the classicMediator-Wrapper schema, also used in [5], and tries to sat-isfy the main requirements of a multimedia database man-agement system. In this kind of approach, the wrapper ex-plores and examines the several LO repositories and sendthe mediator an appropriate LOM XML description of therelated information. From the other side, the mediator re-ceives and organizes these information in order to create asingle view on all repositories in order to satisfy the userqueries processing. The system architecture has tree func-tional layers: a client layer to submit queries, a mediatorlayer to manage data, a wrapper layer to extract data.
The Mediator middleware (whose logical architecture isshown in figure 1) has the following functionalities:
• classify and manage the LO XML description sent bywrapper;
• manage the user query;
• manage the communication with wrapper systems.
In the classification task, a STORAGE module takesthe repositories XML description of LOs from the wrap-pers and stores it in a special and dedicated databasecalled METADATA DB based on a XML Native DBMS.A SEMANTIC MANAGER, based on a MULTIMEDIAKNOWLEDGE BASE, is also used after the storage stage inorder to associate the repository data with a semantic con-cept, organized in leearning semantic domains, to be storedin the METADATA DB. To these aims, the module usesthe information contained in some standard LOM metadata(e.g., title, keywords, description) of multimedia objects.
During the query processing task the user queries aresubmitted by means of a USER INTERFACE; such soft-ware component is also used to show related query re-sults. The user queries are then processed by means ofa QUERY ANALYZER, whose results and related infor-mation are stored in a system database, called QUERY
Figure 1. Mediator Architecture
DB. The queries are then “taken and compiled” by meansof a QUERY ENGINE, using information stored in theMETADATA DB, which sends the appropriate wrappers thegiven query. The partial and global query results are thenstored in an another system database called RESULT DB.The results are managed by a RESULT HANDLER and bya TOP-K SELECTION module, which analyzes the resultsand chooses, by means of appropriate strategies, the best Kresults and reports them to an OBJECT RECOVERY mod-ule. In the choosing of best results also object semanticinformation (user keywords) are considered by means of aSEMANTIC REFINING module that uses a SEMANTICNETWORK to discover hidden associations between ob-jects having a similar semantic meaning. The SEMANTICNETWORK is dynamically generated by means of a generalknowledge base (in our case Wordnet [8]) and used for com-puting the semantic similarity metric described in section 4.
The communication with wrappers is carried out by anapposite component called WRAPPER INTERFACE, thatsend mediator requests and picks up the “meta-information”and the related query results according to a XML-based pro-tocol.
The Wrapper middleware (which logical architecture isshown in figure 2), entirely developed using JAVA and XMLtechnologies, has the following functionalities:
277

• it has to classify and manage the multimedia LO de-fined by the repository administrators;
• it has to manage the mediator queries;
• it has to manage the communication with the mediatorsystem.
Figure 2. Wraper Architecture
In the classification task, creation of the LO XMLdescription is the LOM EXTRACTOR responsibility. Allthe information about the metadata, defined on the cre-ated LO, and used for the query resolution, are storedin a system database called WRAPPER DB. A WRAPPERADMINISTRATOR INTERFACE is used to describe therepositories (i.e. if they are Relational Database, ObjectDatabase, Web Page, XML Database, etc...) and the loca-tion of data. For example, in the case of relational database,the administrator must indicate the tables and the stored orexternal procedure which must be exported for the class def-inition. This interface is also called every time there aresome errors in the wrapper automatic tasks.
The query processing task is carried out by means of aQUERY EXECUTOR, activated when the wrapper receives amediator query request. It analyzes the WRAPPER DB, tak-ing information about the LO and runs the query, in the op-timal manner, on the repository. The communication withmediator system is performed by means of a MEDIATOR
INTERFACE module, that is composed of two fundamen-tal sub-parts: the Communicator and the Analyzer.The Communicator has the task of managing the physicalcommunication with the Mediator. From the other side, theAnalyzer has the task of interpreting the mediator requests.
Eventually, for what concerns supported multimediaqueries, referring to the LOM description, the followingqueries can be expressed:
• metadata exact-matching queries;
• semantic keywords-based queries.
The first class of queries can be solved by the classicalSQL (XPATH) approach, while for the second ones the useof techniques for multimedia data management is required.
4 Semantic Retrieval of LOs
In this section we describe an innovative metric whichuse semantic information, based on textual annotations, toperform a more accurate retrieval process on LO reposito-ries.
Such metric allows to determine a grade of relatednessbetween user search-keywords and the LOM object descrip-tion by using a semantic net generated in an automatic waythanks to WordNet.
The construction of this net is exploited dynamicallyconsidering the information and the structure of WordNet(i.e., in WordNet the terms are organized through their lin-guistic properties: each term can have different meaningor sense, “polisemy”, depending on the topic area, and,each sense is then organized in “synsets” constituted bysynonyms). To this aim, the system supplies an interfacethat helps the user in choosing the “right sense” of a termthrough the description retrieved from the WordNet struc-ture (gloss).
Once chosen the sense and the appropriate synset, it ispossible to build a first core of the semantic net being con-sidered all the terms contained in the synset; successively,by exploiting the other WordNet linguistic properties re-lated to the type of a given term (e.g., names, adjectives,verbs, adverbs), the semantic net can be extended obtaininga strongly connected net, in which the relation between thedifferent terms are labeled using some normalized weightsthat take in account the strength of the relation. For measur-ing the correlation between terms in the LO metadata anduser data the following metric is used:
Sti,tj = e−αl eβd − e−βd
eβd + eβd(1)
where α ≥ 0 and β > 0 are two scaling parameters whosevalues have been defined by an experimental setup and i andj are the indexes of the considered terms.
278

The above equation is expressed by combining the nor-malized distance between two terms l = minj
∑hj
i=11σj
,where j spans over all the paths between the two consideredterms, hj is the number of hops in the j-th path and σj is theweight assigned to the type of relations in the j-th path, and,the depth of its subsumer d from the root of WordNet hi-erarchy (d is computed using WordNet and considering theIS-A hyponymy-hyperonymy hierarchy only).
Eventually the final relatedness measure is obtained bycombining Sti,tj
quantity with the weight of a given term ticalculated as calculated as wti
= 1poly(i) , being poly(i) is
the polisemy grade of ti.More details about the semantic net construction and the
used metric are reported in [1]. Such approach is usefulto solve a semantic heterogeneity in the description of theLO since the user can specify, in its query, keywords notdirectly present in the metadata but related to them by lin-guistic relations.
5 Experimental results
From one side, we suppose the presence of two LOrepositories containing 50 learning resources related to theComputer Science learning domain. In particular the firstrepository is a MySql Relational Database running on aLinux Slackware operating system. The second repositoryis a Tamino XML Database running on a Windows XP op-erating system. The wrapper functionalities are providedwith the USER INTERFACE.
It is possible to:
• register a new wrapper and configure the wrapper forrepository communication;
• describe the multimedia learning objects;
• set communication parameters with mediator.
By the LOM EXTRACTOR the wrapper administratorcan export from his repository the LOM metadata for thevarious managed LOs. The LOM tree structure is after con-verted in a XML format which is sent to mediator with therelated data, necessary to associate to the object a semanticmeaning. Eventually the description of the object is storedin the WRAPPER DB.
The query processing to/from mediator is managed bythe QUERY EXECUTOR: such module uses the informationin WRAPPER DB in order to translate mediator requests inthe local DBMS SQL o XPATH format. Eventually thequery results and the related scores are sent to the media-tor.
From the other side, the mediator functionalities are pro-vided with two different graphical interfaces. By means ofthe USER INTERFACE, it is possible to:
• submit a query;
• view the query results;
• set some communication parameters in order to opti-mize the transmission flow towards the user.
While, by means of the ADMINISTRATORINTERFACE, it is possible to administrate and con-figure the system.
The main task of mediator is to store the LOM descrip-tions originated by the two wrappers. If the classificationhas a success, the mediator inserts a new object in theMETADATA DB. The SEMANTIC MANAGER tries to as-sociate a semantic concept to the wrapper objects and thesemantic associations with the other objects by using thedescribed SEMANTIC NETWORK.
The query processing is carried out in three phases:
• by means of USER INTERFACE all data (Top-K di-mension, query weights), necessary to the query exe-cution, are picked up and stored in the QUERY DB;
• the query, stored in the QUERY DB, is compiled by theQUERY ENGINE and sent to wrappers;
• the query results are picked up form Wrapper and, bymeans of the TOP-K SELECTION [6], the best onesare shown to the user. During the download, as speci-fied in the user settings, the object resolution is adaptedto the user device type.
We have tested our semantic metric by performing 5queries and calculating recall on the result test. In particularwe have used search keywords not present in any managedLOs metadata, but related to Computer Science learning do-main. The table 1 summarizes the obtained results.
Table 1. Experimental ResultsQuery Search keyword TopK Recall
1 Random Access Memory 50 98%2 Cache Memory 50 92%3 Operating System 50 95%4 File System 50 89%
6 Conclusions
A learning object sharing and integration system hasbeen presented. It allows a single unified database viewfrom more LO repositories. The proposed data model isthe IEEE LOM, while the system architecture is based onthe Mediator/Wrapper schema in order to have a fine de-scription and organization of data. The user query is pro-cessed by ad hoc module and sent to appropriate wrappers.
279

The query results are calculated taking into account their se-mantic meaning and using a dynamic multimedia semanticnetwork. The reported preliminary results show the effi-ciency and effectiveness of the proposed architecture per-formances.
References
[1] M. Albanese, A. Picariello, and A. M. Rinaldi,“ Se-mantic Search Engine for WEB Information Retrieval:an Approach Based on Dynamic Semantic Networks”,Proc. of Semantic Web Workshop, ACM SIGIR 2004,Sheffield, UK, 2004.
[2] M. Albanese, Paolo Maresca, A. Picariello, and A.M. Rinaldi, “Towards a Multimedia Ontology System:an Approach Using TAO XML”, Proc. of DistributedMultimedia Systems Conference (DSM 2005), pp. 52-57, Banff, Canada, September 2005.
[3] R.J. Bayardo Jr. et Al., “InfoSleuth: Agent-Based Se-mantic Integration of Information in Open and Dy-namic Environment”, Proc. of ACM SIGMOD Int.Conf on Management of data, Vol. 26, Issue 2, 1997.
[4] G. A. D. D. Brito, “ROSA - P2P: a Peer-to-Peer Sys-tem for Learning Objects Integration on the Web”,ACM SIGMOD Record, 2005.
[5] M.J. Carey, L. M. Haas, and P. M. Schwarz, “TowardsHeterogeneous Multimedia Informations System: theGarlic Approach”, Technical Report RJ 9911, IBMAlmaden Research Center, 1994.
[6] R. Fagin, “Fuzzy Queries in Multimedia DatabaseSystems”, Proc. of the 17th ACM SIGACT-SIGMOD-SIGART symposium on Principles of database sys-tems, 1998.
[7] IEEE Learning Technology Standard Committee,“IEEE LOM Working Draft 6.1”.
[8] Miller A. G., “WordNet: A lexical database for en-glish”, Communications of the ACM, pp 3941, 1995.
[9] W. Nejdl and B. Wolf, “EDUTELLA: A P2P Net-working Infrastructure Based on RDF”, Proceedingsof WWW 2002, Honululu (Hawaii, USA), 2002.
[10] M. T. Roth et Al. , “The Garlic Project”, Proceedingsof ACM SIGMOD international conference on Man-agement of data, Volume 25, Issue 2, 1996.
[11] V. S. Subrahmanian et Al. , “IMPACT”, Journal of In-telligent Information Systems, Volume 14, Issue 2-3,2000.
[12] S. Ternier, E. Duval and P. Vadepitte, “LOMster: Peer-to-Perr Learning Object Metadata”, Proceedings ofEdMedia-2002, pp. 1942-1943, Denver (Co., USA),2002.
[13] J. Wen, Q. Li, W. Ma, and H. Zhang “A Multi-paradigm Querying Approach for a Generic Multime-dia Database Management System”, ACM SIGMOD,Volume 32 , Issue 1, pp. 26-34, March 2003.
280

Using Information Technologies to Help Doctors to Provide High-Quality Consumer Health Information
Weily Jen, Department of Family Medicine, Cardinal Tien Hospital, Hsin-Tien City,
Taipei Hsian, Taiwan, [email protected]
Heng-Shuen Chen, Department of Family Medicine and Department of Medical Informatics,
National Taiwan University, Taiwan, [email protected] Hsu, Graduate Institute of Medical Informatics, Taipei Medical University, Taiwan,
[email protected], WeiYi, Graduate Institute of Medical Informatics, Taipei Medical University, Taiwan,
Abstract
Laypeople have a lot of health related questions, although they can search on the Internet, they don't know what consumer health information (CHI) they can trust. There are many mechanisms to help laypeople to select the reliable CHI, including ethical codes, guidelines, web awards, accreditation logos, and portal sites. But the number of questions is much more than good answers provided by healthcare professionals, especially doctors. To help doctors to provide high-quality consumer health information easily and efficiently, this study will use various Information Technologies and free online services, including mailing list (for mutual discussion and newsletter publication), article template of good CHI, webmail (for anti-spam), URL redirecting (for easy memorization and click statistics), creative commons, wiki (for tagging and quick organization), online form survey (for collecting questions), FAX2email and online audio recording (to speed doctors' productivity). Under the cooperation of doctors and use of various Information Technologies, we believe this study will attract a lot of doctors and readers, and generate certain amount of good CHI content in three months. Keywords: consumer health information, doctor, mailing list, FAQ, wiki, audio message, fax2email.
INTRODUCTION
Knowledge is power. Education in advance is more important than compensation after bad things really happen. Therefore, getting reliable, accurate, and up-to-date health information is the most important way to prevent disease and promote health. Since the emergence of the internet, more and more people check and search health information, but laypeople can't judge the reliability and quality of health information. To help laypeople to select the reliable health information, several organizations and institutes
established ethical codes and guidelines of good health websites, web awards, accreditation logos, and health portal sites. Though with the help of search engines and portal sites, many laypeople still can't find reliable answers on the internet, and the questions extremely outnumber the good answers provided by healthcare professionals, especially doctors. The challenge is, many Taiwan doctors type Chinese much slowlier than English, and many of them are unfamiliar with the requirement of high-quality CHI.
Purpose The purpose of this study is to use various information technologies to help doctors to provide high-quality consumer health information easily and efficiently.
Literature Review According to the 2002 "Outpatient health service quality telephone survey" of Taiwan Health Reform Foundation, more than 90% of the responders thought doctors' explanation about patient condition, cause of disease, treatment and health education are important, but 42% of their doctors didn't offer health education information (like diet control, exercise, notice, prevention, etc) during the visit, and 57.1% of the responders' visit time was less than 5 minutes. It's obvious that many Taiwanese doctors neglect the importance of patient health education [1]. In the Information Age, more and more Taiwan families and people can access the Internet and search information. According to the 2005 "Household Online in Taiwan Survey", 76% of households in Taiwan owned computers, 67% of households in Taiwan had Internet access and 88% of these online households used broadband, 58% of the population in Taiwan had used the Internet by the end of 2005 [2, 3].
281

Figure 1. Taiwan Household online in 2005
According to 2005 "Taiwan Internet Users Survey", 41.4% of Taiwan Internet users browse news websites, 11.6% of them browse health websites (excluding portal sites); 73.5% of Taiwan Internet users subscribe electronic newsletters, 21.3% of them subscribe health newsletters [4]. It seems that websites (including blogs, BBS, newsgroups, wikis) and electronic newsletters are good tools to broadcast consumer health information. Laypeople can't judge the reality and quality of health information, so some organizations and institutes establish the checklist and ethical standards of good health and medical websites, like QUICK (QUality Information ChecKlist) [5], HONcode [6] and eHealth Code of Ethics [7]. Some organizations and institutes award good health and medical websites periodically, like World Wide Web Health Awards [8] and Good Health Information Website Portal Site in Taiwan [9]. Some government institutes set up health portal sites for consumers, like Healthfinder [10], Medlineplus [11], and HealthInsite [12].
Figure 2. Eight ways of checking information on web sites
Figure 3. Good Health Information Website Portal in Taiwan
In Taiwan, many people ask health questions in related boards and channels in newsgroup [13, 14], and Yahoo! Knowledge [15, 16]. But almost everyone posts his/her questions and answers anonymously andviolation of copyrights is common, and voting from laypeople can't assure the quality of health information.
METHODS
Accuracy is much more important than speed. To assure the quality of health information, this study will use free Internet services of Google Groups and 3 Taiwan portal sites to set up two kinds of mailing lists, one for invited doctors to post their consumer health information (CHI) articles and peer review; the other for readers to freely subscribe, browse and search newsletters [17, 18, 19].
Figure 4. Google Groups
The format and required fields of CHI articles will follow the HONcode and criteria of several health website awards, including title of article, title / full name / contact of authors (doctors), date of creation and last update, reference, etc. If the authors have concern about spam emails bombing, this study will use email alias, anti-spam, filter and forwarding funcitons of free webmail service (Gmail) to hide and protect authors' email [20].
282

To increase the cooperation and traffic of authors' websites, this study will use free URL redirecting service (notlong.com) to calculate the click rates of each author's articles [21].
Figure 5. notlong.com
To accelerate the process of agreement and peer review, if no objection and modification opinion posted in doctors' mailing list, then proposals or articles will be accepted or published. To maximize the number of potential audience, this study will encourage authors to use Creative Commons (CC, attribution, non-commercial, no derivative works) instead of Copyrights, then readers can forward and post our newsletter everywhere, and webmasters can post our newsletter on their websites, newsletters, wikis and blogs [22].
Figure 6. Creative commons
To organize and tag the articles, this study will use free standalone Tiddlywiki (a single html file) to set up a website, and readers can search texts and tags, and subscribe our RSS feed instead of subscribing our newsletter [23].
This study will collect and categorize good health questions from newsgroup and Yahoo! Knowledge, and post them for doctors' writing reference of FAQ (frequently asked question). To assure the completeness of health questions, this study will use free online form survey service for laypeople to write down their question. Besides browsing and exporting database online, each new response will be sent to our email account [24].
Figure 7. JotForm
If authors feel difficult in typing Chinese, this study will teach them how to use free FAX2email and online audio recording services, then forward their submitted contents to our mailing lists [24, 25]. Besides articles, doctors can also recommend good health websites, articles and activities, or comment on recent health news.
Expected results Under the cooperation of doctors and use of various Information Technologies, we believe this study will attract a lot of doctors and readers, and generate certain amount of good CHI content in three months.
References 1. Taiwan Health Reform Foundation. (2002/05). Outpatient health service quality telephone survey. Retrieved [2006/04/28] from [http://www.thrf.org.tw/Page_Show.asp?Page_ID=194] 2. Focus on Internet News & Data. (2005/12/16). Household Online in Taiwan Survey. Retrieved [2006/04/28] from [http://www.find.org.tw/eng/news.asp?pos=0&subjectid=4&msgid=202] 3. Focus on Internet News & Data. (2006/2/27). General Internet users in 2005. Retrieved [2006/04/28] from [http://www.find.org.tw/eng/news.asp?pos=1&subjectid=8&msgid=220] 4. Yam Digital Technology. (2006/01) 2005 Taiwan Internet Users Survey. Retrieved [2006/04/28] from [http://survey.yam.com/survey2005/chart/index.php] 5. NHS Health Development Agency & Center For Health Information Quality. (n.d.) QUICK (the QUality Information ChecKlist). Retrieved [2006/04/28] from [http://www.quick.org.uk/menu.htm]
283

6. Health On the Net Foundation. (1997/04). HON code of Conduct for medical and health web sites. Retrieved [2006/04/28] from [http://www.hon.ch/HONcode/Conduct.html] 7. Internet Healthcare Coalition. (2006) eHealth Code of Ethics. Retrieved [2006/04/28] from [http://www.ihealthcoalition.org/ethics/ehcode.html] 8. Health Information Resource Center (HIRC). (n.d.). World Wide Web Health Awards. Retrieved [2006/04/28] from [http://www.healthawards.com/wwwha/] 9. Department of Health, Taiwan. (n.d.) Good Health Information Website Portal Site. Retrieved [2006/04/28] from [http://awards.doh.gov.tw/] 10. U.S. Department of Health & Human Services. (n.d.). Healthfinder. Retrieved [2006/04/28] from [http://www.healthfinder.gov/] 11. U.S. National Library of Medicine & National Institutes of Health. (2006/06/02) MedlinePlus. Retrieved [2006/04/28] from [http://medlineplus.gov/] 12. Australian Government Department of Health and Ageing. (2006/06/05). HealthInsite. Retrieved [2006/04/28] from [http://www.healthinsite.gov.au/] 13. Google.com. (2006) Google Newsgroups. Retrieved [2006/04/28] from [http://groups.google.com/] 14. Google Groups. (n.d.). Usenet: tw.bbs.sci.medicine. Retrieved [2006/04/28] from [http://groups.google.com/group/tw.bbs.sci.medicine] 15. Yahoo.com (n.d.). Yahoo! Knowledge +. Retrieved [2006/04/28] from [http://tw.knowledge.yahoo.com/] 16. Yahoo.com (n.d.). Health channel of Yahoo! Knowledge +. Retrieved [2006/04/28] from [http://tw.knowledge.yahoo.com/dir/index?sid=396540297]
17. Google Groups. (n.d.). eHealthtw newsletter. Retrieved [2006/04/28] from [http://groups.google.com.tw/group/eHealthtw] 18. PCHome online. (n.d.). eHealthtw newsletter. Retrieved [2006/04/28] from [http://mychannel.pchome.com.tw/channels/e/h/ehealthtw] 19. Hong Kong Yahoo! Groups. (n.d.). eHealthtw newsletter. Retrieved [2006/04/28] from [http://hk.groups.yahoo.com/group/ehealthtw/] 20. Google.com. (n.d.). Gmail. Retrieved [2006/04/28] from [http://www.gmail.com] 21. notlong. (n.d.). Free Short URL Redirection: Make a long URL notlong. Retrieved [2006/04/28] from [http://notlong.com/] 22. Creative Commons. (n.d.). commons deed: Attribution-NonCommercial-NoDerivs 2.5. Retrieved [2006/04/28] from [http://creativecommons.org/licenses/by-nc-nd/2.5/deed.en] 23. Jeremy Ruston. (2006/04/20). TiddlyWiki: a reusable non-linear personal web notebook. Retrieved [2006/04/28] from [http://www.tiddlywiki.com/] 24. Aytekin Tank. (n.d.). JotForm. Retrieved [2006/04/28] from [http://www.jotform.com/] 25. Callstar.com.tw. (n.d.). FAX2EMAIL. Retrieved [2006/04/28] from [http://www.callstar.com.tw/] 26. Odeo.com. (n.d.). Retrieved [2006/04/28] from [http://odeo.com]
284

Preschool Music Teacher e-Learning Platform-
Yu-Huei Su, Hsiu-Ling KaoInstitute of Music Education,
National Hsinchu University of EducationHsinchu, Taiwan
Heng-Shuen Chen*Department of Family Medicine andDepartment of Medical Informatics,
National Taiwan University, Taipei, TaiwanCorresponding author: [email protected]
Abstract The essence of music education is sound, so thedescriptions in textbooks are not sufficient enough to providecomplete comprehension for learning. As the result, informationtechnology, integrated with texts, musical sounds, music scores,animations, visual images and other multimedia information,together create reusable musical educational digital contents can
efficiency of education. In the Musical Magic Teacher e-learningsystem, the linkage of Internet technology and the establishmentof online music e-learning platform encourage preschool teacher
-directed learning. An onlinecanvass is created and made available to fellow trainees to sharefeedbacks and the experience of cooperative learning. In this
l MusicTeacher e-information technology incorporated into musical education. Theonline learning system will be adopted and exercised in preschoolmusic teacher orientation and as the on-the-job trainingmaterials in Taiwan HESS Educational Organization. Thesystem offers a multidimensional music learning environmentthat is free from the restraints of time and space. The e-learning
professional music education and multimedia application abilitywhich can further promote the development of preschool musiceducation industry.
Keywords: music education, preschool, teacher cultivationpre-job training, e-learning
I. INTRODUCTION
The essence of music education is sound, so textdescriptions in textbooks are not sufficient enough to providecomplete comprehension for learning. As the result,information technology, integrated with texts, musical sounds,music scores, animations, visual images and other multimediainformation, together create reusable musical educational
and enhance the efficiency of education. The linkage ofInternet technology and the establishment of online digitalmusic learning platform not only assist in the systematicstructure of music education, but they also encourage preschool
-directed learning. Anonline canvass is also created and made available to fellowtrainees to share feedbacks and the experience of cooperativelearning. The assignment feedbacks after learning allow
instructor to perform analysis and evaluation of the educationprogram and use them as the accordance for futureimprovement.
Taiwan Government has been vigorously promoting theimplementation of Internet environment in recent years. TheExecutive Yuan announced the 10 new major construction
important one of them related to innovative knowledgeindustry. This project, jointly promoted by the Executive YuanScience and Technology Advisory Group, Ministry of InternalAffairs and Ministry of Economic Affairs, planned to deployInternet and wireless services of living and learningapplications to make Taiwan a mobile habitation (Ministry ofEconomic Affairs, 2004). Given the establishment of Internetenvironment in Taiwan is already mature enough for the e-learning education programs to reform, the multimedia onlinedigital learning of music becomes especially advantageousfrom the objective point of view. It allows the traditional musicteaching method to reform into a multidimensional andinteractive communication between trainee vs. instructor,trainee vs. education material and trainee vs. fellow trainees.
-
technology incorporated into musical education. The onlinelearning system will be adopted and exercised in preschoolmusic teacher orientation and as the on-the-job trainingmaterials in Taiwan HESS Educational Organization. Thesystem offers a multidimensional music learning environmentthat is free from the restraints of time and space. Via theefficient management of this open education platform,
concretely fulfilled, and therefore creates a multidimensionalmusic learning environment.
II. PURPOSE AND METHODOLOGY
A. PurposeIn this study, there are three major objectives. First is to
-map out preschool music teacher training program intocategories of program objectives, teaching demonstrations,group discussion, apresentation. At the same time, preschool music e-textbook,
285

adopted by HESS Educational Organization, is digitalized andthe contents are recorded and used for responding teachingdemonstrations to act as core reference in group discussion andteaching training. In additional, face to face courses are offeredto educate group trainees the multimedia application of musicand also to assist them in the development of personal music
be recorded and shared to fellow trainees on the platform toenhance their professional music education and multimediaapplication ability before on-boarding the job. The e-learningplatform is na The majorgoal of this study is to cultivate preschool music teachers withcapability of multimedia application and informationtechnology.
B. MethodsThe fundamental elements to develop a music education e-
Learning platform consist of multidisciplinary team, instructiondesign theory, digitizing tool of teaching materials, and e-Learning management system.
Multidisciplinary Development Team
The teamwork involved in this study including principleinvestigator (project manager), domain experts (musiceducation expert and information science expert), e-learningplatform administrator (education technologist), educationdesigners (instructor and assistant instructor), inspector (musiceducation and administrative supervisor), and online assistant(information technician).
Implementation framework system : eZLMS system
The basic framework of ezLMS system:
1.Core of knowledge: Files (overviews, documents,discussions, essences), Curricula (announcements, schooltimetables, learning maps, study assignments, examinations,questionnaires, class managements), Web Hard Disks.
2.Personal homepage: my core of knowledge (we cansurvey the subscribed documents, the latest documents, anddiscussions, etc.), reading record, personal setting, subscribingsetting
3.Core of questionnaire: System questionnaire, curricularquestionnaire.
4.System Administration: Statistic statements (file
records), identity managements (identity managements, groupmanagements, deleted accounts, and ceased accounts), systemmanagements (general setting, setting the SMTM e-mail,verification processes, trust setting, system update, backupsetting, retrieval data setting).
ADDIE Instruction Design
The development of this e-learning platform applied thegeneric ADDIE model for e-learning instruction design inReference Manual on e-Learning Program Development
Procedures (Ministry of Education, 2004). The ADDIEmodule is the process of: Analysis Design Development
Implementation Evaluation. Such standardized moduleacts as the foundation of digital education materialdevelopment Preschool Music Teacher e-LearningPlatform. Please see Figure 1 for illustration.
1. Analysis Stage
Demand Analysis: With the focus on the music teachers inthe Philharmonic Children Music Consulting Company(Elementary School of the Hess Educational Organization), this
pon this learning system for
of the instructional contents.
Learner Analysis: The music teachers in the PhilharmonicChildren Music Consulting Company (elementary school of theHess Educational Organization) are the expected users of thissystem. With the repeated interviews with the music teachers,this research comprehends the demands and characteristics ofthe music teachers.
Content Analysis: The instructional content of this learning
Children Music Consulting Company (elementary school of theHess Educational Organization). The e-based instructioncontent concentrates on the curricula of the
music appreciation, music games, instrumental ensembles,music compositions, and so on.
2. Design Stage
Design of Website Function: In accordance with thesituated-learning principle and the mathematics instructionalcontent of the first and second Grade in elementary schools, wecan divide this learning website into several functional domains:
, , theteractions and discussions, the
, .
Design of Curricular Contents: The curricula of thislearning website are presented by digital images which livelycontains the music knowledge. By coordinating with thecurricular ucurricular contents in this learning website presents the notionsof the teaching plan by employing concrete stories, rhythms,instruments, games and plays of percussion.
Design of Instructional Strategies: According to the systemfunctions, the instructional strategies of this learning systemcan be divided into four sections: the fistories, which mainly focus on the problem orientations andthe tutorial-guided strategies. The instruction is performed viathe learning thinking guided from the stories and the utilization
.is the strategy of situated-instruction. By following the storycontents, using role-playing, and matching the rhythm, learnerswould be situated in the plots of the stories, so as to reach thelearning effects.which the instructional strategy emphasizes on learninginstruments. Through the presentation of the digital images,learners can accurately understand how to perform instruments.
286

situated-instruction. Learners can develop creativity andimaginations under the playing process.
Designs of Interface: The way of the interface design in thislearning system mainly adopts the data-input and mouse-clickon the options.on the achievement displays as well as viewing and learning
is necessary to understand how to
images to the administration platform.
3. Development Stage
System Development: Based on the decided contents ofof this
whole learning system is carried out in the system developmentstage. The step of this development system can be divided intoWeb-Page Design, multimedia authoring, art designing, andsystem integration.
Some curricular forms are sound e-books. Most of them
As most curricular units are presented by images and sounds(for example, music stories, rhythm, percussion playing, andmusical play), drawing the script of teaching material based onthe learning objectives, instructional strategies, integratedinstructional content, teaching materials of each curricular unit
homepages, massages, materials, and programming logic) thefunction of the script design is to provide the samecommunicating media for instruction designers anddevelopment groups. The curricula would be able to be startedoff after finishing the script designs.
4. Implement Stage
The notions and skill possessed by learners would be ableto influence instructional quality in e-based curricula. For thereason, it is essential to implement a set of integratededucational training to educators. The contents of the traininginclude:
To make the e-instructors understand what the roles theyact and their importance.
To let the e-instructors be able to design the related-learning strategies for specific curricula and process assistingworks.
To let instructors understand each function of the learningplatform, experience the instructional environment of the e-learning system, and further design an appropriate instructionalguiding procedure.
In order to ensure the qualification of curricula implement,instructors are required to possess the knowledge and skill of e-learning system.
By incorporating the specific demand of curricula,instructors can provide the basis of continued resource forplatform manager, development team and related-informationpersonnel.
5. Evaluation phase
The implemented evaluation in this research is confined tothe formative evaluation for the purpose of promoting thissystem and evaluating its learning effect. In order to ensure thevalidity of the learning contents and ascertain the direction ofleaning development, we irregularly invited education-technology professionals and content professionals toimplement formative evaluation under the designing andestablishing processes in this learning system.
After completing and before formally implementing thissystem, we invited four related-domain professionals (aprofessional music instructor, a professional music educator,and two education-technology professionals) to implement thisevaluation. The contents of the evaluation embrace: the
y,and sketch designing on this website. Also, this system wastried out and evaluated by platform learners (music teachers).The process of the implementation includes the purposes anddirections of use, trials and observations, evaluations anddiscussions. Besides purposes, the chief evaluation in this
learning wills after they initially using this system.
III. RESULTS
This platform adopts the PowerCam & ezLMS Learning &Knowledge Management System, researched and developed byFormosa Soft Corporation, to help develop 18 educationalmodules (Figure 1) that convey five categories (Figure 2:Mommy Bird): music story, musical rhythm, instrumentalensemble, and musical games. This platform plans to complete18 educational demonstrations (Figure 3), provide canvas forgroup feedbacks (Figure 4) and offer digital learningenvironment for assignment submission and presentation oftraining results (Figure 5)
Figure 1: Musical Magic Teacher e-learning platform
287

Figure 2: Course Structure of 18 Preschool Music Education Modules
Figure 3: Five Categories of Teaching Skills
Figure 4: On Line Teaching Demonstration
Figure 5:On Line Group Discussion
Figure 6: Achievement Presentation of Trainees
.
IV. DISCUSSIONS
Application of e-Learning platform can provide an effectivepre-job orientation free from the restraints of time and space. Itis also very useful for on-the-job training. Repeated viewing ofteaching demonstration and active participation in groupdiscussion with fellow teachers on the e-learning platformenable an environment to cultivate young teachers.
In this study, multimedia digitizing tool PowerCam is usedto convert PowerPoint presentation into digital streaming videosynchronized with lecture or demonstration slides. During anordinary PowerPoint presentation without any changes of the
high quality web-voice and video, mouse cursor movement and animations ofslides. All of the actions are done with a single record buttonclick. After the completion of the recording, the digitalcontents could be packed and uploaded to the e-learning
288

shed publicly orprivately according the setting of access privileges. Theprocess simplicity of making the e-learning content alsoenhances the ability of music teacher using multimediaapplication.
professional music education and multimedia applicationability via e-learning and therefore further promote thedevelopment of the preschool music education industry.
REFERENCES[1] Kao Hsiu-ling (2001). Music Magic Book. Taipei, Philharmonic
Children.[2] Lohr, L. (1998). Using ADDIE to design a Web-based training interface.
In. S. McNeil, J.D. Price, S.Boger-Mehall, B. Robin, & J. Willis (Eds.),
Society for Information Technology and Teacher Education Proceedingsof SITE 98, Charlottesville, VA: Association for the Advancement ofComputing in Education, Vol. 1, p. 440-443.
[3] Lohr, L. (2000). Designing the instructional interface. Computers inHuman Behavior. 16( 2), 161-182.
[4] Ministry of Economic Affairs (2004). 2006 Annual Mobile TaiwanApplication Plan. Taipei: Ministry of Economic Affairs
[5] Ministry of Education (2000). Challenge 2008 E Century TalentCultivation Plan. Taipei: Ministry of Education.
[6] Ministry of Education (2004). Referential Manual of Digital LearningProgram Development Procedures. Taipei: Ministry of Education.
[7] Taiwanese Digital Learning Technology and Knowledge ManagementSystem http://ezlms.cs.nthu.edu.tw/download/xms3.exe
[8] Zhan Jia Ou & Shally (2005). Moodle Online Learning Platform. Taipei:Wen Kuo Information.
289

Reviewers’ Index
A Akshai Aggarwal
Imran Ahmad Mohammed S Alam
Mohamed Ally Frederic Andres Alfio Andronico Carmelo Ardito
Tim Arndt
B Arvind Bansal
Nadia Berthouze Sandro Bimonte
Boubakeur Boufama Nik Bourbakis
C Paul Cairns
Eduardo Calvillo-Gámez Alfonso F. Cardenas
Kai H. Chang Shi-Kuo Chang Han-Chieh Chao
Kasturi Chatterjee Heng-Shuen Chen
Ing-Ray Chen Shu-Ching Chen Por-Hsun Cheng
Bill Cheung Yonghee Choi
Ching-Yang Chou Zied Choukair Yuan-Sun Chu Luigi Colazzo
Maria Francesca Costabile Phil Cox
D Chabane Djeraba
Jing Dong David H. C. Du
Jean-Luc Dugelay Tim Dwyer
E Larbi Esmahi
F Filomena Ferrucci Farshad Fotouhi
Rita Francese Vittorio Fuccella
George W. Furnas
G Moncef Gabbouj
Forouzan Golshani Williams Grosky Angela Guercio
H Masahito Hirakawa
Raghuram Hiremagalur Kwei-Liang Ho John Hosking
Chris Hunhausen Kao-Shing Hwang
I Pedro Isaias
290

J Joemon Jose
Erland Jungert
K Kanav Kahol
Mohan Kankanhalli Hyoung Joong Kim
Hideki Koike Jun Kong
Zenon Kulpa James Kwok
L Robert Laurini
Stefano Levialdi Michael Lew
Wei Li Fuhua Lin
Ging-Ying Lin Chien-Tsai Liu Jonathan Liu
Xin Liu Yang Liu
Jer-Junn Luh
M Paolo Maresca Kim Marriot
Sergio di Martino Brahim Medjahed
Gabriele Meiselwitz Nikolay Mirenkov
Rokia Missaoui Piero Mussio
N Mark Najork
O Vincent Oria
Ming Ouhyoung
P Sethuraman Panchanathan
Luca Paolino Joseph J. Pfeiffer Antonio Piccinno
Simon Prince
R Aravindan Raghuveer
Syed M. Rahman K. R. Ramakrishnan
Steven P. Reiss Michele Risi
S Khalid Saleem Shinichi Satoh
Giuseppe Scanniello Nicu Sebe
Ishwar Sethi Yoshitaka Shibata Timothy K. Shih Karin Silvervarg Trevor Smedley Peter Stanchev
Georgi Stojanov David Stotts
Mahbubur R Syed
T Steven L. Tanimoto
Genny Tortora Goran Trajkovski
291

U Joseph E. Urban
V Athina Vakali Petko Valtchev
SvethaVennkatesh Giovanni Vincenti
Son T. Vuong
W Ellen Walker
Y Ling-Ling Yang
Rentaro Yoshioka
Z Kang Zhang
Na Zhao
292

Authors’ Index
A Andrea F. Abate, 59, 92
Ketaki Adi, 46 Giovanni Adorni, 222 Parag Agarwal, 46, 53
Mythri Alle, 7 Kikuo Asai, 65
B
Gianluca Bailo, 3 Massimo Bariani, 3 Ilaria Bartolini, 29
Catherine Beaton, 253 Paola Bertolotti, 73 M. Bertolotto, 193
Sandro Bimonte, 181 J Biswas, 7
Pierpaolo Di Bitonto, 269 Daniel Bogaard, 253
Chris Bryant, 247
C Dawei Cai, 88
Maria Carla Calzarossa, 238 K. Selcuk Candan, 73
A. Carbonaro, 211 Alfonso F. Cardenas, 174
Rosanna Cassino, 157 Stefani Chan, 174 S. K. Chang, 247
Lei Chen, 29 Jeang-Kuo Chen, 36
Heng-Shun Chen, 264, 281, 285 Angelo Chianese, 275
Paolo Ciaccia, 29 Paolo Ciancarini, 238 Mauro Coccoli, 222
L. Colazzo, 211
Maria Francesca Costabile, 137, 147 Gennaro Costagliola, 123, 258
D Ying Dai, 88
Vincenzo Deufemia, 123
E Hiroyuki Echigo, 83
F Fadini, 217
E. Faggiano, 233 WeiYi Fan, 281
Vincenzo Del Fatto, 199 Franck Favetta, 153
Filomena Ferrucci, 181, 193, 258 Hans-Georg Fill, 168
Andrew Fish, 161 Daniela Fogli, 137, 147 Franco Frattolillo, 12
G Shahram Ghandeharizadeh, 23
Massimiliano Giordano, 40
H Koji Hashimoto, 77 Tooraj Helmi, 23
Tsuyoshi Hoshikawa, 83 John Howse, 129
Chien-Yeh Hsu, 281 Jen-Wei Huang, 36
293

J Ghassem Jaberipur, 17
Weily Jen, 281 Taehee Jung, 23
Erland Jungert, 2, 187
K Hsiu-Ling Kao, 285 Shyam Kapadia, 23 Brian F. Kaplan, 98
Dimitris Karagiannis, 168 T. Kechadi, 193
L Rosa Lanzilotti, 147
Robert Laurini, 153, 205 Xin Li, 247
Ging-Ying Lin, 228, 264 Andrea De Lucia, 258
Jer-Junn Luh, 264 Dan Lyker, 247
M Yuya Maita, 77
Paolo Maresca, 217, 238, 275 Maria De Marsico, 92
Sergio Di Martino, 181, 193 Luisa Mich, 238 A. Molinari, 211
Vincenzo Moscato, 275 Piero Mussio, 137, 147
N S. K. Nandy, 7
Michele Nappi, 59, 92 Noriki, 116
Neda Noroozi, 17
O Masaru Okuda, 108
Vincent Oria, 29 Noritaka Osawa, 65
P Luca Paolino, 141, 199 Loredana Parasiliti, 137
Antonio Penta, 275 Antonio Picariello, 275
Antonio Piccinno, 137, 147 Fabio Pittarello, 199 Catherine Plaisant, 1 Giuseppe Polese, 40
Raymond K. Pon, 174 Balakrishnan Prabhakaran, 46, 53
M.V. Pragnell, 233 P. Prinetto, 217
R Marco Raggio, 3
Vahid Rahiman, 17 Stefano Ricciardi, 59
Daniel Riccio, 92 Michele Risi, 123
Teresa Roselli, 233, 269 Veronica Rossano, 233, 269
S G. Santiano, 217
Maria Luisa Sapino, 73 Yosuke Sato, 77
Nobuhiro Sawano, 83 Giuseppe Scanniello, 258 Nello Scarabottolo, 238
Monica Sebillo, 141 Shahin Shayandeh, 23 Hojjat Sheikhattar, 17
Yoshitaka Shibata, 77, 83, 116 Christian K. Shin, 98 LihChyun Shu, 102
Karin Silvervarg, 187 Jeff Sonstein, 253
Riccardo Stagnaro, 3 Gem Stapleton, 129, 161
Yu-Huei Su, 285 Huey-Min Sun, 102
294

T Kazuo Takahata, 83, 116 Anne Tchounikine, 181
Bhavani Thuraisingham, 53 Genoveffa Tortora, 40 Genny Tortora, 141
Maurizio Tucci, 59, 157 Huey-Jong Tzeng, 228
U Uchida, 116
V Gianni Vercelli, 222
Ricardo Villamarin, 247
Giuliana Vitiello, 141
X Xuanrui Xiong, 116
Y Ling-Ling Yang, 244, 264
Hiroaki Yuze, 83
Z Taieb Znati, 108
295

DMS 2007 Call For Papers
The Thirteenth International Conference on Distributed Multimedia Systems
Hotel Sofitel, San Francisco Bay, USA September 6 - September 8, 2007
Organized by Knowledge Systems Institute Graduate School
SCOPE The DMS conference is an international conference series, which covers a wide spectrum of technique discussions, demonstrations, and student program/paper contests in the fields of distributed multimedia computing. Started in 1994, the series of conference has been held at Hawaii, Hong Kong, Vancouver, Taipei, Aizu-Wakamatsu, Japan, San Francisco, Miami and Canada. This time, the conference will be held at the Hotel Sofitel, Red Wood City, San Francisco Bay, USA. TOPICS DMS'2007 focuses on techniques, systems, applications, and theories in the fields of distributed multimedia computing. The conference organizers seek contributions of high quality papers, panels or tutorials, addressing various aspects of distributed multimedia systems and applications, for presentation at the conference and publication in the proceedings. Topics of interest include, but are not limited to: audio and video compression MPEG, Quicktime, Windows API standards image, video, audio content analysis and indexing/retrieval image, video and audio watermark 3D audio and video computer graphics and animation modeling and analysis of distributed multimedia systems OS support for distributed multimedia systems distributed multimedia databases and computing distributed object management multi-paradigmatic information retrieval multimedia human-computer interaction multimedia communications and network architectures mobile networks and mobile computing multimedia stream synchronization and QoS control/scheduling multimedia software engineering multimedia processors and ASIC multimedia technologies for people with disability intelligent multimedia computing intelligent multimodal interaction multi agents, mobile agents and their applications communication encryption security of distributed computer systems sensor networks for multimedia computing Web servers and services XML applications Java, VRML and multimedia languages visual and multidimensional languages for multimedia applications multimedia digital libraries and mail systems multimedia applications for CSCW multimedia authoring tools and intelligent tutoring cultural heritage multimedia applications tele-conferencing, tele-medicine and tele-lecture virtual reality, distributed virtual environment, and their applications virtual school, virtual university, and virtual learning community distance learning methodology, tools and systems e-commerce, e-education and e-entertainment The use of prototypes and demonstration video for presentations is encouraged. WORKSHOPS AND SPECIAL SESSIONS This year, DMS'2007 will be held in conjunction with workshops, conferences and special sections. Papers submitted to workshops or special sessions are invited by the program committee chairs of the workshops/sections. This joint organization aims to collect research results from different perspectives. The following workshops and conferences are being planned: International Workshop on Visual Languages and Computing International Workshop on Mobile Systems, E-Commerce and Agent Technology International Workshop on Distance Education Technology
Please contact the conference program co-chairs if you are interested in organizing a workshop or a special session. A one-page proposal with the following items is required: Title of the workshop/special session Name of the program committee chair(s) A list of program committee members E-mail address of the corresponding program committee chair A brief description of the theme Each special session should include at least 5 invited (or accepted) papers. Each workshop should include at least 2 special sessions (10 papers). Paper review process of the workshop/special session will be arranged by the individual program committee chair. It is the responsibility of the individual chairs to ensure the quality of papers in the workshop/special sessions. The schedule of workshops/special sessions will be the same as the main conference (See Important Dates below). Each individual program committee chair can set up the Web site of the workshop/special session. However papers will be printed in the same volume as the main conference. SPECIAL ISSUE OF JOURNALS The DMS conference is closely coordinated with the International Journal of Software Engineering and Knowledge Engineering, the Journal of Visual Languages and Computing and the International Journal of Distance Education Technologies. Usually the best ranked papers from the conference, after rigorous reviews, extensive revisions and further enhancements, will appear in one or more special issues of the above journals. Papers suggested for the special issue(s) will be reviewed by external reviewers following the standard procedure of review stipulated by the respective journal. CONFERENCE SITE (HOTEL INFORMATION) The DMS2007 Conference will be held at the Hotel Sofitel, Red Wood City, and San Francisco Bay, USA. The hotel has made available for these limited dates (9/5/2007 - 9/9/2007) to DMS2007 attendees a discount rate of $86 US dollars for single/double, not including sales tax. INFORMATION FOR AUTHORS Papers must be written in English. An electronic version (Postscript, PDF, or MS Word format) of the full paper should be submitted using the following URL: http://conf.ksi.edu/dms07/submit/SubmitPaper.php. Please use Internet Explorer as the browser. Manuscript must include a 200-word abstract and no more than 6 pages of IEEE double column text (include figures and references). INFORMATION FOR REVIEWERS Papers submitted to DMS'07 will be reviewed electronically. The users (webmaster, program chair, reviewers...) can login using the following URL: http://conf.ksi.edu/dms07/review/pass.php. If you have any questions or run into problems, please send e-mail to: [email protected]. DMS'2007 Conference Secretariat Knowledge Systems Institute Graduate School 3420 Main Street Skokie, IL 60076 USA Tel: 847-679-3135 Fax: 847-679-3166 E-mail: [email protected] If you cannot submit electronically, please send four copies of the complete manuscript to the above postal address. IMPORTANT DATES March 1, 2007 Paper submission due May 1, 2007 Notification of acceptance June 1, 2007 Final manuscript due June 1, 2007 Early conference registration due