A global database of sea surface dimethylsulfide (DMS ...
46
GLOBAL BIOGEOCHEMICAL CYCLES, VOL. 13, NO 2, PAGES 399-444, JUNE 1999 A global database of seasurfacedimethylsulfide (DMS) measurements and a procedure to predict sea surface DMS as a function of latitude, longitude, and month A. J.Kettle, • M. O. Andreae, • D. Amouroux, •'2 T. W. Andreae, • T. S. Bates, 3 H. Berresheim, 4 H. B ingemer, • R.Boniforti, 6 M. A. J.Curran, 7 G.R.DiTullio, 8 G. Helas, • G. B. Jones, 9 M.D. Keller, •ø R. P. Kiene, • C. Leck, •2 M. Levasseur, • G.Malin, TM M. Maspero, •5 P.Matrai, •ø A. R.McTaggart, •6 N. Mihalopoulos, •7 B.C.Nguyen, •8 A. Novo, •9 J.P.Putaud, 2ø S.Rapsomanikis, • G.Roberts, • G. Schebeske, • S. Sharma, 2• R. Sim6, 22 R. Staubes, 5S. Turner, TM and G. Uher •'23 Abstract. A database of 15,617 point measurements of dimethylsulfide (DMS) in surface waters alongwith lesser amounts of datafor aqueous andparticulate dirhethylsulfoniopropionate concentration, chlorophyll concentration, seasurface salinityandtemperature, and wind speed hasbeenassembled. The database wasprocessed to create a series of climatological annual and monthly 1øxl ølatitude-longitude squares of data. Theresults were compared to published fields of geophysical andbiological parameters. No significant correlation wasfoundbetween DMS and these parameters, and no simplealgorithm couldbe foundto create monthlyfields of sea surface DMS concentration based on these parameters. Instead, an annual map of seasurface DMS wasproduced using an algorithm similarto that employed by Conkright et al. [1994]. In this approach, a first-guess field of DMS sea surface concentration measurements is created and thena correction to this field is generated based on actual measurements. Monthly seasurface gridsof DMS were obtained using a similarscheme, but the sparsity of DMS measurements made the method difficult to implement. A scheme was used which projected actual data into months of the year whereno datawere otherwise present. 1. Introduction That dimethylsulfide produced by planktoncould change the radiation budget of the Earth was first proposed by Charlson et al. [1987]. According to this hypothesis (known by its acronym, CLAW, after the authors of the publication), dimethylsulfoniopropionate (DMSP) in phytoplankton cells is *'r, eleased into the water column where it is transformed into MaxPlanck Institute for Chemistry, ltogeochemistry Department, Mainz, Germany. Laboratorie de Chimie Analytique Bio-Inorganique et Environnement, Universit6 de Pau et des Pays de I'Adour,France, NOAA/Pacific Marine Environmental Laboratory, Seattle, Washington. DWD/MOHp, Hohenpeissenberg, Germany. Johann Wolfgang Goethe University, Frankfurt am Main, Germany. ENEACentro Ricerthe Ambiente Marino, La Spezia, Italy. Antarctic CRCand Australian Antarctic Division, University of Taanania, Hobart, Tasmania, Australia. University of Charleston, Grice Marine Laboratory, Charleston, South Carolina. James Cook University of NorthQueensland, Townsville, Queensland, Australia. Copyright 1999by theAmerican Geophysical Union. Paper number 1999GB900004. 0886-6236/99/1999GB900004512.00 dimethylsulfide (DMS). DMS diffuses through the sea surface to the atmosphere whereit is oxidizedto SO2and methane sulfonic acid (MSA). SO2 can be oxidized to H2SO4, which can then formsulfate particles, thatmay alterthe radiation budget of the Earth through modification of cloudoptical properties. This could cooldownthe temperature of the upper ocean and might change the metabolism and speciation of plankton [Lawrence, 1993], whichin turn couldmodifythe emission of DMS to the •øBigelow Laboratory of Ocean Sciences, McKown Point, West Boothbay Harbor, Maine. '•Department of Marine Sciences, University of South Alabama, Mobile, Alabama. UDepartment of Meteorology, Stockholm University, Stockholm, Sweden. •3Institut Mauriee-Lamontagne, Minist•re des P•ehes et desOe6ans, Mont-Joli, Qu6bec, Canada. •4University of East Anglia, Norwich, England. •CISE SpA, Milano, Italy •6Australia Antarctic Division, Kingston, Tasmania, Australia. •7Universityof Crete, Iraklion, Crete, Greece. •SCentre des Faibles Radioactivit6s, Laboratoire mixte CNRS-CEA, Avenuede la Terrasse, Gif-Sur-YvettteCedex,France. •gENEL-CRAM, Milano, Italy. •øJoint Research Centre, Ispra, Italy. UAtmospheric Environment Service, Downsview, Ontario, Canada. 22Institue de Cieneies del March, Barcelona, Catalonia, Spain. 2•Universiity of Newcastle upon Tyne, Ridley Building,Newscastle upon Tyne, England. 399
-
Upload
khangminh22 -
Category
Documents
-
view
1 -
download
0
Transcript of A global database of sea surface dimethylsulfide (DMS ...

GLOBAL BIOGEOCHEMICAL CYCLES, VOL. 13, NO 2, PAGES 399-444, JUNE 1999
A global database of sea surface dimethylsulfide (DMS) measurements and a procedure to predict sea surface DMS as a function of latitude, longitude, and month
A. J. Kettle, • M. O. Andreae, • D. Amouroux, •'2 T. W. Andreae, • T. S. Bates, 3 H. Berresheim, 4 H. B ingemer, • R. Boniforti, 6 M. A. J. Curran, 7 G. R. DiTullio, 8 G. Helas, • G. B. Jones, 9 M.D. Keller, •ø R. P. Kiene, • C. Leck, •2 M. Levasseur, • G. Malin, TM M. Maspero, •5 P. Matrai, •ø A. R. McTaggart, •6 N. Mihalopoulos, •7 B.C. Nguyen, •8 A. Novo, •9 J.P. Putaud, 2ø S. Rapsomanikis, • G. Roberts, • G. Schebeske, • S. Sharma, 2• R. Sim6, 22 R. Staubes, 5 S. Turner, TM and G. Uher •'23
Abstract. A database of 15,617 point measurements of dimethylsulfide (DMS) in surface waters along with lesser amounts of data for aqueous and particulate dirhethylsulfoniopropionate concentration, chlorophyll concentration, sea surface salinity and temperature, and wind speed has been assembled. The database was processed to create a series of climatological annual and monthly 1øxl ø latitude-longitude squares of data. The results were compared to published fields of geophysical and biological parameters. No significant correlation was found between DMS and these parameters, and no simple algorithm could be found to create monthly fields of sea surface DMS concentration based on these parameters. Instead, an annual map of sea surface DMS was produced using an algorithm similar to that employed by Conkright et al. [1994]. In this approach, a first-guess field of DMS sea surface concentration measurements is created and then a correction to this field is generated based on actual measurements. Monthly sea surface grids of DMS were obtained using a similar scheme, but the sparsity of DMS measurements made the method difficult to implement. A scheme was used which projected actual data into months of the year where no data were otherwise present.
1. Introduction
That dimethylsulfide produced by plankton could change the radiation budget of the Earth was first proposed by Charlson et al. [1987]. According to this hypothesis (known by its acronym, CLAW, after the authors of the publication), dimethylsulfoniopropionate (DMSP) in phytoplankton cells is *'r, eleased into the water column where it is transformed into
Max Planck Institute for Chemistry, ltogeochemistry Department, Mainz, Germany. Laboratorie de Chimie Analytique Bio-Inorganique et Environnement, Universit6 de Pau et des Pays de I'Adour, France, NOAA/Pacific Marine Environmental Laboratory, Seattle, Washington. DWD/MOHp, Hohenpeissenberg, Germany. Johann Wolfgang Goethe University, Frankfurt am Main, Germany. ENEA Centro Ricerthe Ambiente Marino, La Spezia, Italy. Antarctic CRC and Australian Antarctic Division, University of Taanania, Hobart, Tasmania, Australia. University of Charleston, Grice Marine Laboratory, Charleston, South Carolina.
James Cook University of North Queensland, Townsville, Queensland, Australia.
Copyright 1999 by the American Geophysical Union.
Paper number 1999GB900004. 0886-6236/99/1999GB900004512.00
dimethylsulfide (DMS). DMS diffuses through the sea surface to the atmosphere where it is oxidized to SO2 and methane sulfonic acid (MSA). SO2 can be oxidized to H2SO4, which can then form sulfate particles, that may alter the radiation budget of the Earth through modification of cloud optical properties. This could cool down the temperature of the upper ocean and might change the metabolism and speciation of plankton [Lawrence, 1993], which in turn could modify the emission of DMS to the
•øBigelow Laboratory of Ocean Sciences, McKown Point, West Boothbay Harbor, Maine.
'•Department of Marine Sciences, University of South Alabama, Mobile, Alabama.
UDepartment of Meteorology, Stockholm University, Stockholm, Sweden. •3Institut Mauriee-Lamontagne, Minist•re des P•ehes et des Oe6ans, Mont-Joli, Qu6bec, Canada.
•4University of East Anglia, Norwich, England. •CISE SpA, Milano, Italy •6Australia Antarctic Division, Kingston, Tasmania, Australia. •7Universityof Crete, Iraklion, Crete, Greece. •SCentre des Faibles Radioactivit6s, Laboratoire mixte CNRS-CEA, Avenue de la Terrasse, Gif-Sur-Yvettte Cedex, France.
•gENEL-CRAM, Milano, Italy. •øJoint Research Centre, Ispra, Italy. UAtmospheric Environment Service, Downsview, Ontario, Canada. 22Institue de Cieneies del March, Barcelona, Catalonia, Spain. 2•Universiity of Newcastle upon Tyne, Ridley Building, Newscastle
upon Tyne, England.
399

400 KETTLE ET AL.: SEA SURFACE DIMETHYLSULFIDE MEASUREMENTS
atmosphere. This feedback cycle was hypothesized to modify global climate, and if the overall sign of the feedback is negative, it would act to counter greenhouse warming. In addition to the study of Charlson et al. [1987], other investigators have also considered the linkages between DMS and climate [Shaw, 1983; Schwartz, 1988; Foley et al., 1991; Lawrence, 1993; Shaw et al., 1996]. However, the processes that govern each step in the hypothesis remain poorly understood and are the subject of continuing investigations [Andreae and Crutzen, 1997].
Because the rate of aerosol production.•from marine DMS can be influenced by climatic feedbacks [Andreae and Crutzen, 1997], there has been extensive work on the processes that control the production of DMS and its precursors, its emission and oxidation in the atmosphere, and the parameterization of the effect of the resultant sulfate particles on the radiation budget. The parameterization of the DMSP production and release processes within a plankton community is of particular interest, and the ultimate goal is to understand this process well enough to predict both the generation and destruction of DMS in the upper ocean as a function of latitude, longitude, and time.
The first measurements of DMS were made by Lovelock et al. [1972], followed by Nguyen et al. [1978], Andreae and Raemdonck [1983], Cline and Bates [1983], Bingemer [1984], Turner and Liss [1985], Berresheim [1987], Leck et al. [1990], and many other research groups in more recent times. It is known that DMS is a hydrolysis product of dimethylsulfoniopropionate (DMSP), a compound produced by phytoplankton possibly for cellular osmotic regulation [Kirst et al., 1991] or cryoprotection [Karsten et al., 1992]. There have been many studies which found correlations between DMS and chlorophyll a (chl a) concentration [Andreae and Barnard, 1984; Turner et al., 1988, 1989; Malin et al., 1993, 1994; Uchida et al., 1992; McTaggart and Burton, 1993; Liss et al., 1994] or phytoplankton cell concentration [Biirgermeister et al., 1990; Barnard et al., 1984; Holligan et al., 1987; Gibson et al., 1988, 1990]. Other studies have observed correlations between DMSP and chlorophyll a concentration [Malin et al., 1993, 1994; Curran et al., 1998]. These relationships were thought to hold much promise for being able to deduce the DMS flux from satellite or airborne remote determinations of chlorophyll concentration [Thompson et al., 1990; Matrai et al., 1993; Gabric et al., 1995, 1996].
On the other hand, there have also been studies where no correlation was found with either phytoplankton cell number [Leck et al., 1990] or chlorophyll concentration [Andreae and Barnard, 1984; Holligan et al., 1987; Watanabe et al., 1995a] on larger regional scales. This has several possible explanations. First, populations of phytoplankton are not homogeneous in the ocean, and second, different species of phytoplankton contain different amounts of DMSP [Keller et al., 1989] and different concentrations and types of chlorophyll [Sathyendranath et al., 1987]. Groene [1995] states that in most cases wherein there was a high correlation between DMS and chlorophyll concentration, one species of phytoplankton dominated the bloom. As well, even though DMS is produced by phytoplankton, it is released to the water column by phytoplankton and zooplankton excretion, by phytoplankton senescence [Nguyen et al., 1990; Kwint et al., 1995], by zooplankton grazing [Dacey and Wakeham, 1986; Belviso et al., 1990; Cantin et al., 1996], and possibly by viral infection [Malin et al., 1992; Bratbak et al., 1995]. In addition, DMS is subject
to a number of removal mechanisms including bacterial and photochemical degradation [Kiene and Bates, 1990], surface outgassing, and downward mixing that vary according to time, place, and meteorological conditions [Andreae and Crutzen, 1997]. One can therefore not necessarily expect a simple correlation between DMS and phytoplankton cell number or chlorophyll concentration.
Bates et al. [1987a, 1988] proposed that latitudinally averaged concentrations of DMS flux should correlate with average light intensities or latitude. The idea that DMS sea surface concentration may be associated with light has some support in the fact that the phytoplankton, which produces DMS, grows over a period of days as the result of carbon assimilation through photosynthesis. This was investigated in laboratory experiments [Karsten et al., 1991; Vetter and Sharp, 1993; Crocker et al., 1995; Matrai et al., 1995]. Other researchers have proposed a correlation between DMS concentrations and primary production or the time rate of change of phytoplankton concentration [Andreae and Raemdonck, 1983; Andreae and Barnard, 1984; Andreae, 1986; McTaggart and Burton, 1993]. Although Matrai et al. [1993] do not find a relationship between DMS and primary productivity, the proposed correlation could still hold some promise for global modeling given recent attempts to deduce in situ primary production from satellite measurements [Platt et al., 1995; Longhurst et al., 1995; Sathyendranath et al., 1995], subject to the limitations identified by Balch et al. [1992].
There have also been attempts to find correlations between DMS and other in situ measurements. The relation with salinity was recognized relatively early in DMS investigations [Reed, 1983; Froelich et al., 1985; Vairavamurthy et al., 1985; Iverson et al., 1989] and formed the basis of the hypothesis that DMSP is used by phytoplankton as an osmoregulator. This correlation showed promise for global modelers because of the existence of globally gridded fields of salinity already in existence [Levitus et al., 1994]. However, other field studies have not found strong correlations between DMS and salinity [Leck and Rodhe, 1991], and even if a strong correlation were found, the salinity of the open ocean is homogeneous enough that a DMS sea surface concentration parameterization would not be useful. McTaggart and Burton [1993] reported a negative correlation between DMS and in situ temperatures on the coast of the Antarctica in the austral summer, and this has formed the basis of a hypothesis that DMSP may function as a cryoprotector within phytoplankton cells. However, Leck et al. [1990] reported a positive correlation between DMS and annual in situ temperature for a coastal site in the Baltic Sea, and it therefore seems unlikely that DMS sea surface concentrations can be determined from the global temperature field. Andreae [1986] hypothesized that a relationship between DMSP and dissolved nitrate could occur under conditions of nitrate limitation when DMSP is used as a
substitute for the nitrogen-containing compounds glycine betaine and proline in cell functions. This hypothesis was supported by the results of Leck et al. [1990] and Curran et al. [1998] (who reported a negative correlation between dissolved nitrate and DMSP in a field study) and also by the laboratory results of Keller and Bellows [1996]. The correlations between DMS and nutrients have generally not been high enough to allow existing gridded nutrient fields to act as a basis to create a series of DMS maps.
There have been some process models developed recently which show more promise than the simple models based on

KETrLE ET AL.: SEA SURFACE DIMETHYLSULFIDE MEASUREMENTS 401
correlations. Murray et al. [1992] developed the first of these by incorporating mechanisms of DMS and DMSP production and destruction into a simple ecosystem model incorporating dissolved inorganic nitrogen, phytoplankton, bacteria, zooflagellates, large protozoa, and macrozooplankton. One interesting result of this mathematical model is that DMS concentration should increase a few days after a phytoplankton bloom so that there should be an (imperfect) correlation between DMS and phytoplankton concentration (the exact results depend on the values of the constants chosen in this nonlinear model). This result was actually observed in field and laboratory studies [Nguyen et al., 1988; Matrai and Keller, 1993]. Gabric et al. [1993a, b] give a further elaboration of this same model without applying it to a particular geophysical data set, and Gabric et al. [1995] apply it to the Southern Ocean south of Australia, incorporating as much as possible of meteorological forcing to drive the biological model. This application of the ecosystem model predicted periodic spikes in the chlorophyll and DMS concentrations with a period of about 30 days. This behavior has not been reported in extended measurements of ecosystems made up to this point [Leck et al., 1990; Dacey et al., 1996].
Recently, van der Berg et al. [1996] successfully coupled a DMS production model with an ecosys, tem model driven by physical forcing mechanisms. The coupled model was used to simulate the annual evolution of DMS sea surface concentration
and flux in the North Sea and gave insight into the chemical and biological processes which govern DMS concentration in this water body. Specifically, the enzyme DMSP lyase was identified as an important factor in the conversion of DMSP to DMS than bacteria. As well, the modeling study highlighted the importance of Phaeocystis populations as reservoirs of DMSP and the fact that these populations are mainly not grazed by zooplankton. Thus, at least for the North Sea, bacteria and zooplankton seem to play a subordinate role in governing the DMS concentration in the water column.
Given the complex situation described in the previous paragraphs, the task of making maps of DMS concentration seems difficult, but there is a precedent for mapping other biogeochemically relevant species in the ocean [Conkright et al., 1994; Nevison et al., 1995]. To make any map based on geophysical data, one needs point measurements and a scheme to extrapolate the measurements to a gridded field, in this case, the globe. Thus, the first step in the creation of any map is the assembly of a data base of existing measurements. For example, Levitus and Boyer [1994a] used a database of 279,239 measurements of sea surface oxygen concentration to create a seasonal climatological map at løxlø latitude-longitude resolution, The basis of their map is a latitudinal average of concentrations taken in an ocean basin and the subsequent calculation of the discrepancy between this background average value and the actual point measurement using a distance- weighted average scheme. Conkright et al. [1994] used the same scheme to create global annual average maps of nitrate, phosphate, and silicate concentration with a database of 61,817, 171,064, and 80,235 surface measurements, respectively.
In contrast to these studies, previous mapping attempts for sea surface DMS have been relatively simple and hindered by the sparsity of data. For example, Erickson et al. [1990] used the assumption of Bates et al. [1987a] that DMS ocean fluxes vary with surface irradiance intensity to calculate the global field of sea surface DMS concentrations. This was a first attempt to
model DMS concentrations on a global scale, and it made the interesting prediction that the highest surface concentrations would occur at the highest latitudes. This was subsequently substantiated in numerous measurement expeditions both to the Arctic and Antarctic regions (see Table 1 and Figure 1). On the other hand, this model could not account for the observed strong longitudinal gradients in DMS concentration [Andreae et al., 1994]. Spiro et al. [1992] used the work of Bates et al. [1987a] to parameterize the oceanic contribution to DMS flux in creating a series of 1øxl ø monthly maps of sulfur emissions. Galloway et al. [1992] pooled much of the data for the North Atlantic Ocean and prescribed a scheme for the monthly variation of DMS sea surface concentration for coastal and deep ocean sites.
Liss et al. [1993] and Turner et al. [1996a] created a series of nine monthly maps of sea surface DMS distribution in the North Sea. The interpolation method used is not mentioned, but the network of measurements is quite dense. Tarrasdn et al. [1995] combined the approach of Galloway et al. [1992] and Liss et al. [1993] to develop a scheme where the North Atlantic Ocean was divided into three oceanographically similar areas (deep water and coastal sites and the North Sea as its own region) with monthly climatology to model the annual DMS flux and its contribution to sulfate aerosol levels over Europe. Turner et al. [1995] developed a similar scheme of monthly climatology for the Southern Ocean. They thus prescribed how DMS sea surface concentration should vary over an annual cycle over a large region of the ocean. This seems to be a poor substitute for a fully predictive model that can simulate plankton population dynamics and have applicability to the global ocean. However, it is otherwise difficult to map global sea surface DMS concentrations because there are not many more than 15,000 measurements in existence, and there is limited knowledge of how DMS concentrations vary in the global ocean.
The aim of this paper is to present the results of the largest global database of sea surface measurements of DMS assembled up to now. The database will be summarized, and a climatology of the results will be presented and compared with climatological summaries of other biogeochemical, oceanographic, and meteorological parameters. Finally, a procedure will be proposed to predict the monthly sea surface concentrations of DMS. Because of the temporal and spatial variability of DMS concentrations, the procedure attempts to generate monthly maps of DMS based on the biogeochemical scheme proposed by Longhurst et al. [ 1995].
We intend to derive emission estimates based on the
concentration fields presented here and to include our results into the set of maps of chemical emissions both from oceans and land surfaces produced as part of the Global Emissions Inventory Activity-International Global Atmospheric Chemistry (GEIA- IGAC) project. These have been reported by Graedel et al. [1993] and Graedel [1994], and the latest information about the gridded data sets available through the GEIA project is available from the Internet at
h ttp ://b lueskies. sprl. umich. edu/geia/index. h tml.
2. Methods
The center of the project is a database of 15,617 DMS measurements which were contributed by scientists or digitized from publications (Plate 1 and Table 1). This project was originally proposed at the NATO Advanced Research Workshop

402 KE'I'TLE ET AL.: SEA SURFACE DIMETHYLSULFIDE MEASUREMENTS
KETFLE ET AL.: SEA SURFACE DIMETHYLSULFIDE MEASUREMENTS 403

404 KETTLE ET AL.: SEA SURFACE DIMETHYLSULFIDE MEASUREMENTS
o ,.qo o,, c4 • ? ,go o

KETTLE ET AL.: SEA SURFACE DIMETHYLSULFIDE MEASUREMENTS 405

406 KETTLE ET AL.' SEA SURFACE DIMETHYLSULFIDE MEASUREMENTS
• 0 0 • o • o • 8 o • o • o _ • .... • •
• •• • < <• o o • • o

KET'FLE ET AL.: SEA SURFACE DIMETHYLSULFIDE MEASUREMENTS 407
on Biogeochemical Ocean-Atmosphere Transfers (BOAT) held in Bermuda 1992. It was suggested that the database be constructed from data contributions by individual scientists and that the completed database be made available to the scientific community. In addition to sea surface DMS concentration measurements, further information was requested about measurements of aqueous DMSP, particulate DMSP, chlorophyll a concentration, wind speed, sea surface temperature, sea surface salinity, primary productivity, and total water depth. Information was also requested about the time of sampling, the latitude and longitude of the sample, the depth at which the water samples were taken, and whether or not the seawater samples were filtered before analysis. The contributions by scientists make up more than 90% of the current DMS data set. The rest of the data was obtained through a combination of digitizing information directly from publications and contacting the research ship operators for information about ship cruise tracks and meteorological parameters. A summary of all the contributed and digitized data sets is given in Table 1.
In addition to the data contributed as part of the database, an attempt was made to draw together as much biogeochemical and geophysical climatological data as possible to assist in the interpretation of the data. The monthly climatological information about sea surface temperature, salinity, oxygen, and nutrients came from the World Ocean Atlas (WOA) of Levitus and Boyer [1994a], Levitus et al. [1994], Levitus and Boyer [1994b], and Conkright et al. [1994], respectively. All of this information has been published at 1øxl ø latitude-longitude resolution. Information about climatological wind speeds was obtained from the global wind stress climatology based on European Centre for Medium Range Weather Forecasts (ECMWF) analysis performed by Trenberth et al. [1989]. This information is provided at 2.5øx2.5 ø latitude-longitude resolution and is interpolated to 1øxl ø latitude-longitude resolution for use in this work. The climatology for the daily average insolation for a given month was calculated from the daily average insolation provided by Bishop and Rossow [1991] from July 1, 1983 to June 30, 1991. This data set was also provided at 2.5øx2.5 ø latitude- longitude resolution and interpolated to 1øxl ø latitude-longitude resolution for use in this work. The mixed layer depth was obtained from the Samuels and Cox' Geophysical Fluid Dynamics Laboratory (GFDL) Global Oceanographic Data Set Atlas obtained from National Center for Atmospheric Research (NCAR). The climatological, interpolated Coastal Zone Coastal Scanner (CZCS) chlorophyll concentrations were obtained as an unpublished data set from Carmen M. Benkovitz, Richard Wagener, and Gail Elefanio in the Department of Applied Science at Brookhaven National Laboratory. The ocean depth data was obtained from the NGDC ETOPO5 Global Ocean Depth and Land Elevation [National Geophysical Data Center (NGDC), 1988]. The data set is provided at 5-min latitude-longitude resolution, and the water depths at the points of the DMS sea surface measurements are calculated using a distance-weighted averaging scheme. The climatology for the sea ice cover in the northern and southern hemispheres was calculated from the time series data set compiled by Bill Chapman, Department of Atmospheric Sciences, University of Illinois and obtained from the Internet in 1996. These data were given in polar coordinates and was interpolated or averaged to the 1øxl ø latitude-longitude grid used in this study.
All processing of data was performed with PWAVE and

408 KETI'LE ET AL.: SEA SURFACE DIMETHYLSULFIDE MEASUREMENTS
z z z o ul • (D ©
o o o o o o
e pnll.t.D" I
KETTLE ET AL.' SEA SURFACE DIMETHYLSULFIDE MEASUREMENTS 409
o
o
z•
z
oPnt!to9

410 KETI'LE ET AL.: SEA SURFACE DIMETHYLSULFIDE MEASUREMENTS
:3
o.• iZ
o

KETTLE ET AL.' SEA SURFACE DIMETHYLSULFIDE MEASUREMENTS 411
z z z o • • •
o o o o o o

412 KETFLE ET AL.' SEA SURFACE DIMETHYLSULFIDE MEASUREMENTS
•_9 IOUaU
I
ß
i,i
i,i
'"" '""" " : • .'C" 2.. ,," d" . ..:- , - •I. - ' .. -- . ,m
P ..,,... ,. ,.%• .- .,• . -..,
..: '1 o •._... •'r"- ._ '=. ! o ' -L---.."-i•
- .. I,! '"" ,. ...... .. -- "-"' ' ' .... ": ...... •'"-' 0 Z Z Z 0 {.t3 {.t3 1,1300 0 0 0 0 0 0
epnH•r•9

KETYLE ET AL.: SEA SURFACE DIMETHYLSULFIDE MEASUREMENTS 413
Table 2. Upper and Lower Threshold Limits Used to Eliminate Measurements of DMS, Aqueous DMSP, Particulate DMSP, Chlorophyll a, Temperature, Salinity, and Wind Speed From the Raw Database
Measurement Lower Limit Upper Limit DMS, nM 0.0 500 Aqueous DMSP, nM 0.0 5000 Particulate DMSP, nM 0.0 5000 Chlorophyll a, gg t.-i 0.0 200 Temperature, øC -5.0 35 Salinity, ppt 0.0 50 Wind speed, m s -l 0.0 50
FORTRAN software. Several analyses were performed. For the simple statistical analysis, the raw contributed data was subjected to a rigorous filtering process to remove points that contained known errors or were inconsistent with other measurements. For
example, Curran et al. [1998] reported that in a number of studies wherein water samples were treated with HgC12, the resultant DMS concentrations were higher than whose measured in situ, owing to the conversion of DMSP to DMS. This throws some doubt on the absolute concentrations reported by Deprez et al. [1986], Gibson et al. [1990], McTaggart and Burton [1992], and Crocker et al. [1995], and data contributions 39 and 54 (from Table 1, 58 points) were discarded in this investigation for that reason. In addition, data set 44 (21 points) was not used because its values were feared to be anomalously high. This set is not really significant except for the fact that most of the Australian data occurs in a sector of the Southern Ocean which does not
have a high data density. Similarly, the data of Lovelock [Lovelock et al., 1972; Liss et al., 1997] (data set 1, 20 points) could not be used because the values were about an order of
magnitude too low in comparison t6 later measurements in the Atlantic Ocean. This discrepancy was also reported by Nguyen et al. [ 1978].
Two analyses were performed that led to the creation of sea surface maps of [DMS]: one using the scheme of Conkright et al. [1994] to create a single map of annual sea surface [DMS] and a second depending on a scheme of biogeochemical provinces to create a set of monthly maps of sea surface [DMS]. The data cleaning procedure used for each analysis was the same. Points from the database were flagged for elimination if they fell outside certain broad threshold limits (given in Table 2). Although it was difficult to establish an absolute criterion for the chemical
parameters (DMS and DMSP), variables such as temperature and salinity are physically constrained within certain limits, and data outside these limits were flagged and discarded. After this, a statistical checking procedure was implemented whereby the data in the database were divided up into monthly 5øx5 ø squares. For each square, a mean and the standard deviation was calculated. Then, each point in the square was compared with the mean, and if it fell outside of 4.5 standard deviations of the mean, it was discarded. (This standard deviation threshold was chosen in the data selection process after systematic trials for values between 3 and 5 standard deviations revealed a discontinuity in the number of discarded points at the 4.5 standard deviation factor.) The mean and the standard deviation were then recalculated, and the
selection process was repeated. The iteration was repeated until
no further points failed the standard deviation test. In most cases this was satisfied by one or two runs, although in one case seven iterations were made before no more points were discarded. At any time, if there were fewer than four points in the square, then the iteration/elimination procedure was stopped, and the remaining points were retained. At the end, this left a database cleaned of outlying points, leaving 14,980 good data points from the starting number of 15,617.
An annual climatology was next created by dividing these data points into a global grid of 1øxl ø squares. The DMS pixel value was taken to be the average of all the individual measurements within the 1 ø square. If there was only one measurement within the 1 ø square, the pixel value was taken as the value of the single measurement. Altogether there were 3317 annual climatological pixels formed from the database. These climatological [DMS] data were compared by regression analysis to literature fields of nitrate, silicate, phosphate, oxygen, and bathymetry (where only a single annual gridded field was available) and also to climatological quantities of aqueous and particulate DMSP, chlorophyll concentration, wind speed, salinity, and temperature (all calculated from contributions to the database using the same cleaning procedure as for [DMS]).
To form a first-guess global field of sea surface [DMS], the climatological pixels were divided into the series of 57 oceanic biogeochemical provinces formulated by Longhurst et al. [1995] to calculate global primary production..The average [DMS] of each province was calculated, and in those few instances where no data pixels were found in a given climatological province, the average [DMS] from an adjacent province was taken. Then, an unweighted 11-point filter was used to smooth the discontinuities at the borders between provinces to create a first-guess field. A correction to the first guess-field was formulated by first subtracting the first-guess field from the average DMS value in the series of ocean data squares, and then applying the same distance-weighted interpolation scheme used by Conkright et al. [1994] to create annual nutrient maps. The correction field was added to the first-guess field, and the sum was smoothed by a five-point median filter used by Conkright et al. [1994], followed by an 11-point unweighted smoothing filter (the Shuman [1957] smoothing filter created artificially steep gradients with this data set). This scheme constitutes the first step in the method of successive corrections described by Daley [1991]. The DMS objective analysis procedure was stopped after the first iteration following the approach of Conkright et al. [1994].
Formulation of the series of monthly global maps of climatological [DMS] was difficult because there were not enough data points to calculate climatological pixel values. The 4331 1 o ocean data squares calculated for the annual [DMS] field were much fewer than the 9170 used by Conkright et al. [1994] to formulate an annual nitrate field. Nevertheless, the same data-cleaning procedure used for the annual sea surface concentration field was used here. In the end, the ocean data
squares were divided by month instead of being kept on the single annual pattern. The procedure was repeated for all the quantities in the database: DMS, aqueous DMSP, particulate DMSP, chlorophyll concentration, wind speed, and sea surface temperature and salinity. These climatological quantities were then compared to published values of monthly sea surface temperature, sea surface salinity, gfidded climatological CZCS

414 KETTLE ET AL.: SEA SURFACE DIMETHYLSULFIDE MEASUREMENTS
chlorophyll concentration, actual surface irradiance, theoretical clear sky irradiance (i.e., calculated irradiance in the absence of clouds), and surface wind speeds.
The first-guess fields were formulated in the same manner as in the creation of the annual climatological map. The monthly average pixels (ocean data squares) were distributed among the series of 57 biogeochemical provinces formulated by Longhurst et al. [1995] and average monthly [DMS] quantities were calculated for each province. The problem of data sparsity was worse in this monthly case than in the annual case because the data density was diluted 12-fold. The temporal distribution of data in some provinces was sufficient to construct an annual pattern of DMS concentrations by connecting the existing points with a spline construction. In many cases, the temporal distribution of data was not sufficient to construct a clear annual
cycle, and in these cases the annual trends of [DMS] were taken from other provinces which had a better data set and were considered to be biogeographically similar. Sometimes the fitted spline construction was scaled to minimize the sum of the square of the differences with the data. The exact nature of the
substitutions which were made is summarized in Table 3.
In this way a series of monthly grids of DMS concentration were created. Following the procedure used for the annual map, the discontinuities between the boundaries of the biogeochemical provinces were smoothed by the application of an 1' 1-point filter. This became the first-guess DMS concentration field. An attempt was made to assimilate the ocean data squares into this first-guess concentration field to create a more realistic map. This created a good result in areas where there was high data density and good temporal coverage, e.g., the northeast 'Atlantic Ocean. However, for the most part, there were not enough ocean data squares in each monthly map to have a significant effect.
An analysis scheme was developed which attempted a temporal interpolation in those biogeochemical provinces where there was a higher data density. In this procedure, the monthly time series of data in individual ocean data squares was isolated. These pixels were then used to interpolate to those monthly pixels where there was no data. The template used for the interpolation was the same as that used for the larger biogeochemical province, scaled for the individual ocean data square according to the values of the data within the pixel. Because of the nature of this assumption, the procedure was only conducted for those biogeochemical provinces where there was sufficient data to determine a template of annual variation. This was defined from Table'3 to include only those biogeochemical provinces where the shape substitute in column 2 and the province in column 1 match. For those other areas which did not have enough data to define an annual template, the actual data from the database was incorporated, but no attempt at interpolation was made. Next, the interpolation and smoothing scheme used in the annual map abox•e was used to create a series of 12 monthly maps of sea surface DMS concentration.
The question of establishing a confidence interval on the stated value of DMS concentration is not easy to answer. Ideally, one would assess both the accuracy and precision associated with both the annual and monthly climatological DMS maps. Estimating the precision of DMS values for a given pixel would involve assessing the standard deviation of the point DMS measurements in that pixel. This would require many more point measurements of DMS than are actually available. In the
absence of a larger database of DMS measurements, the precision of the maps was estimated by finding the standard deviation of all the point measurements found within the radius of 555 km of an analyzed ocean pixel. This was performed for both the annual and monthly climatological data sets.
Estimating the accuracy of the entire mapping algorithm used to generate the interpolated DMS maps was also difficult because there is no a priori knowledge of the true monthly DMS concentration field which one could use to assess the
effectiveness of the procedure. There is no precedent for using this particular mapping method, and consequently no estimates of the kind of uncertainty involved. To estimate the uncertainty in the mapping algorithm for the annual climatological grid, the entire procedure was repeated for fields for which maps have already been created based on a large database of measurements: nitrate, silicate, phosphate, and oxygen from the World Ocean Atlas and the annually averaged CZCS chlorophyll field. Data were extracted from these fields at the same location as the 1øxl ø
ocean data squares for DMS, and this was then used to calculate annual average values for each biogeochemical province. These fields were smoothed, and data were assimilated in the same manner as for DMS. Then the absolute value of the difference
was found between the new annual map created with the sparse data set and the published map. This calculated difference field was divided by the standard deviation of the published field to make it comparable with other data sets. Then, the average of the five dimensionless difference fields was calculated. This
represents a average error field in reproducing published annual maps using the mapping algorithm of this paper. This error field was next scaled by the standard deviation of the annual DMS field. If DMS is distributed in the same manner as the other
published annual quantities (which is not unreasonable for chlorophyll and the nutrients), then this would be a reasonable uncertainty associated with the annual DMS map. For the monthly DMS maps, a similar procedure was applied except that the single set of monthly fields of CZCS chlorophyll concentration was employed instead.
3. Results
The location of the sea surface DMS concentration
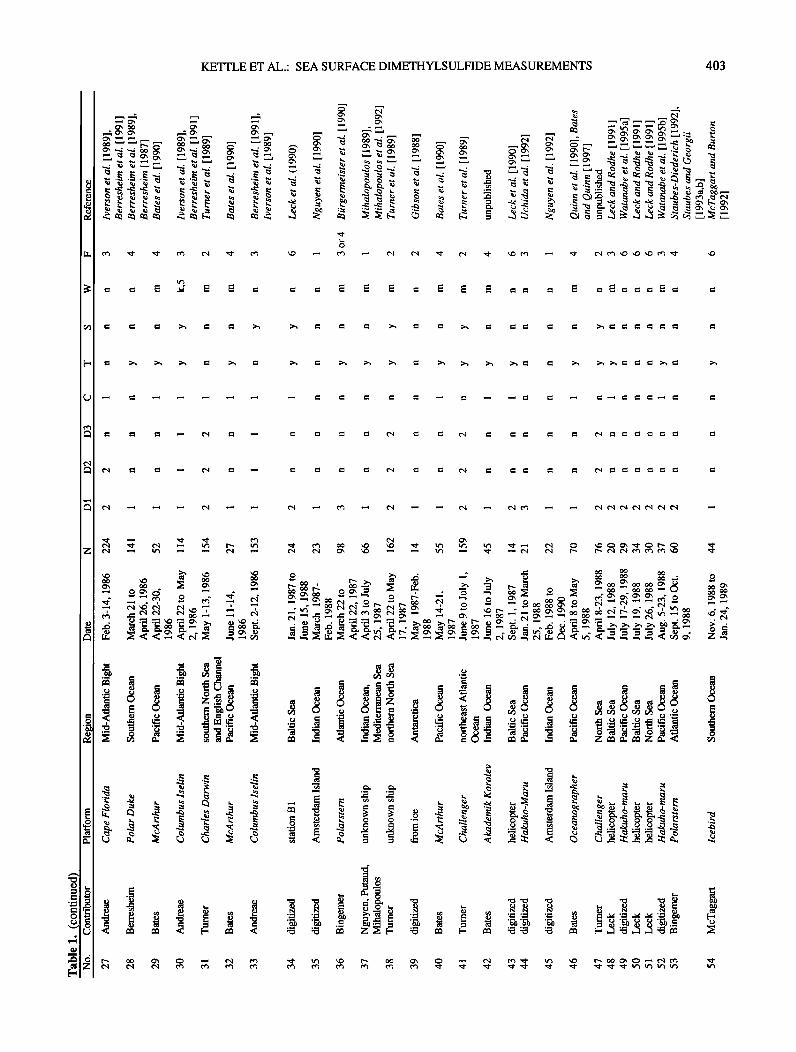
information is presented in Figure l a. Figures lb, l c, and l d present the location of sea surface concentrations of aqueous DMSP, particulate DMSP, and chlorophyll a, respectively. The data contributions are number coded to correspond with the information • in Table 1. Figure 1 a illustrates that the distribution of DMS measurements is global with the highest coverage in the North Atlantic, North Pacific, and Southern Oceans, and the lowest coverage in the Indian and southwest Pacific Oceans. Altogether, there are 15,617 DMS measurements plotted on this map.
These points were cleaned according to the procedures given in the methods section and then binned into 3317 1øxl ø ocean
data squares. The map of these pixels is shown in Plate 1. All annual variation of DMS concentration is lost in this map, but it is still interesting because it shows that DMS concentrations over much of the oceans are low. The highest concentrations are in some coastal upwelling areas (North Africa, Peru, Angola, and the equatorial Pacific Ocean), and in the high-latitude regions of both hemispheres. We find no large areas of uniformly high

KETTLE ET AL.: SEA SURFACE DIMETHYLSULFIDE MEASUREMENTS 415
Table 3: Scheme of Substitutions for the Monthly Province
First-Guess Field of DMS Concentration
Shape Phase Shift Scaling Number of Substitute Months
Boreal Polar (BPLR) Atlantic Arctic (ARCT) Atlantic Subarctic (SARC) North Atlantic Drift (NADR) Gulf Stream (GFST) North Atlantic Subtropical Gyral- West (NAST-W) North Atlantic Tropical Gyral (NATR) Western Tropical Atlantic (WTRA) Eastern Tropical Atlantic (ETRA) South Atlantic Gyral (SATL) North-East Atlantic Shelves (NECS) Canary Coastal (CNRY) Guinea Current Coastal (GUIN) Guianas Coastal (GUIA) North-West Atlantic Shelves (NWCS) Mediterranean Sea- Black Sea (MEDI) Caribbean (CARB) North Atlantic Subtropical Gyral - East (NAST-E) Chesapeake Bay (CHSB) Brazil Current Coastal (BRAZ) South-West Atlantic Shelves (FKLD) Benguela Current Coastal (BENG) Indian Monsoon Gyres (MONS) Indian South Subtropical Gyre (ISSG) East Africa Coastal (EAFR) Red Sea, Persian Gulf (REDS) North-West Arabian Upwelling (ARAB) East India Coastal (INDE) West India Coastal (INDW) Australia-Indonesia Coastal (AUSW) North Pacific Epicontinental (BERS) Pacific Subarctic Gyres - East (PSAG-E) Pacific Subarctic Gyres - West (PSAG-W) Kuroshio Current (KURO) North Pacific Polar Front (NPPF) North Pacific Subtropical Gyre - East (NPST-E) North Pacific Subtropical Gyre - West (NPST-W) Offshore California Current (OCAL) Tasman Sea (TASM) South Pacific Subtropical Gyre (SPSG) North Pacific Tropical Gyre (NPTG) North Pacific Equatorial Countercurrent (PNEC) Pacific Equatorial Divergence (PEQD) West Pacific Warm Pool (WARM) Archipelagic Deep Basins (ARCH) Alaska Downwelling Coastal (ALSK) California Upwelling Coastal (CCAL) Central American Coastal (CAMR) Chile-Peru Current Coastal (CHIL) China Sea Coastal (CHIN) Sunda-Arafura Shelves (SUND) East Australian Coastal (AUSE) New Zealand Coastal (NEWZ) South Subtropical Convergence (SSTC) Subantarctic (SANT) Antarctic (ANTA) Austral Polar (APLR)
BPLR n n 6
ARCT n n 5
NADR n n 4
NADR n n 7
NAST-W n y 6 NAST-W n n 11
NATR n n 8
ETRA n y 7 ETRA n n 6
SSTC n y 8 NECS n y 12 CNRY n n 5 ETRA n n 2
ETRA n y 2 NWCS n n 11
MEDI n n 8 CARB n n 11 NAST-E n n 8
NWCS n y 2 SATL n y 4 SSTC n y 4 SATL n y 3 MONS n n 3 SSTC n n 2
SATL n n 1
ARAB n y l ARAB n n 4
ARAB n n 0
ARAB n n 0
SATL n n 1
NECS n y 4 NAST-W n y 4 NADR n n 0
KURO n n 5
NPPF n y 4 NPST-E n n 5
NPST-E n n 2
OCAL n y 6 TASM n y 4 SSTC n n 7
NPTG n y 10 PNEC n n 7
PEQD n n 9 PNEC n n 4
note I n n 3
NECS n y 2 CCAL n n 7
CCAL n n 1
PEQD n y 2 CHIN n n 9
note 1 n n 2
TASM n n 2
SSTC n n 0
SSTC n y 12 ANTA n y 8 ANTA n y 8 APLR n y 8
Phase shift refers to a six month phase shift in those cases where a pattern from the southern hemisphere was used to characterize the annual cycle of DMS concentration in the northern hemisphere. Scaling refers to the adjustment of the spline construction so as to minimize the sum of the squares of the differences between the spline curve and the actual data. Note 1: the shape of the annual DMS cycle in these provinces was constructed by combining data from PNEC and PEQD without subsequent scaling.
416 KETYLE ET AL.: SEA SURFACE DIMETHYLSULFIDE MEASUREMENTS
1 [ , I • • , • 1
0 0 0 tO)
I
I ......... I ......... [
I
t__
1
[ ...... i ......... i ......... t ......... i , , ,! ....
0 0 0 0
0
0 "-"
b") El_
o•
o
' o o
' i • i i • i i • i I i I i , , i i • i
0
o
1 i ......... i ......... i ......... I , ! .....
0 0 0 0 0 0 0 0
'' 0 0
h
i
i • i i
0 0 0 t.• 0 t.•
I
I , , , , i
o o Lt') 0
J
!
, , [
•J
, , I
lj --j
i , i I
--1
i i i l L--•
o
m n
o
o&
o
o
•E
o&
._

KETTLE ET AL.: SEA SURFACE DIMETHYLSULFIDE MEASUREMENTS 417
Table 4. Annual Statistical Quantities for the Parameters in the Database and for Analogous Parameters Taken From the World Ocean Atlas
Quantity Mean Median Standard Geometric Geometric Minimum Maximum N Deviation Mean Standard
Deviation
Database DMS, nM 5.52 2.22 20.55 2.35 2.74 0.04 315.69 3382 Database aqueous DMSP, nM 16.91 9.76 22.17 8.97 3.38 0.13 198.50 578 Database particulate DMSP, nM 43.61 22.39 53.66 23.65 3.11 1.04 325.32 662 Database chlorophyll, lagL q 1.092 0.427 2.235 0.414 4.010 0.016 29.136 1286 Database wind speed, ms q 7.94 7.49 3.81 7.011 1.698 0.09 29.00 2367 Database salinity, ppt 34.18 34.48 3.34 33.82 1.20 3.34 37.60 1391 Database temperature, øC 17.30 19.75 10.29 N/A N/A -4.44 32.15 2883 WOA nitrate, laM 5.078 1.757 7.000 2.062 4.073 0.0002 28.864 3282 WOA silicate, laM 0.538 0.373 0.481 0.368 2.425 0.004 1.867 3282 WOA phosphorus, laM 9.198 3.909 14.292 4.971 2.594 0.634 70.350 3282 WOA oxygen, rnL/L 5.798 5.383 1.234 5.676 1.224 4.004 9.278 3282 ETOPO5 Depth, m 3381 3960 1729 2205 4 0.625 5970 3175
ETOPO5 refers to depth information taken from the National Geophysical Data Center [1988].
DMS concentrations, but there are patches of high DMS scattered throughout the oceans.
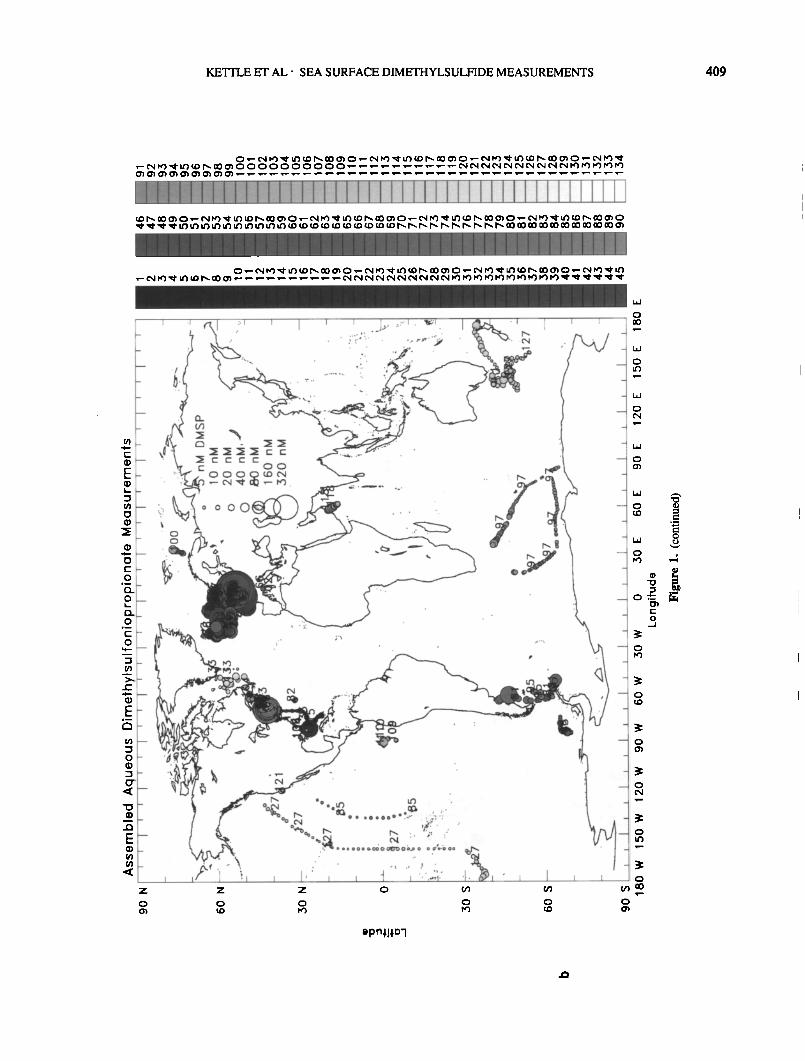
The statistical properties of the annual ocean data squares are presented in Table 4 for the parameters that were contributed to the database and for other published climatological parameters in the DMS ocean data squares. The histogram distributions of
these parameters are shown in Figure 2. Both Figure 1 and Table 4 show that DMS varies over a wide range of values. The distribution of DMS data is not Gaussian but is best fitted by a lognormal distribution. Chlorophyll a concentration is skewed to even smaller concentrations.
Efforts to find a correlation between the annual
Table 5. Correlation Matrix Between Database (DB) Parameters and Other Published Quantities Collected as Part of This Study. Parameter DB DMS WOA WOA WOA WOA
nitrate silicate phosphat oxygen e
DB DMS, nM 1.000 - - - (3317)
WOA nitrate, laM 0.2263 '1.000 - - (3201) (3201) [99.99+]
WOA silicate, laM 0.2158 0.9379 1.000 - (3207) (3201) (3207) [99.99+] [99.99+]
WOA phosphate, laM 0.3893 0.8148 0.7772 1.000 (3207) (3201) (3207) (3207) [99.99+] [99.99+] [99.99+]
WOA oxygen, mill 0.1962 0.6803 0.7158 0.6044 (3207) (3201) (3207) (3207) [99.99+] [99.99+] [99.99+] [99.99+]
ETOPO5 Depth, m -0.2117 -0.1116 -0.1119 -0.1488 (3209) (3152) (3158) (3158) [99.99+] [99.99+] [99.99+] [99.99+]
DB aq DMSP, nM 0.4380 -0913 -0.1596 -0.1726 (573) (539) (540) (540) [99.99+] [96.61] [99.98] [99.99]
DB part DMSP, nM 0.4917 -0.0227 -0.0955 -0.0646 (659) (624) (625) (625) [99.99+] [42.65] [98.32] [89.34]
DB chl, lag L '• 0.1939 0.0697 0.0568 0.0626 (1287) (1210) (1211) (1211) [99.99+] [98.46] [95.17] [97.11]
DB wind speed, m s -• 0.0279 0.1145 0.1080 -0.0097 (2378) (2318) (2323) (2323) [82.78] [99.99+] [99.99+] [35.65]
DB salinity, ppt -0.0073 -0.1876 -0.2395 -0.1882 (1375) (1320) (1324) (1324) [21.42] [99.99+] [99.99+] [99.99+]
DB SST, øC -0.1727 -0.6918 -0.7012 -0.5957 (2900) (2831) (2837) (2837)
Depth DB aq DB part DB chl a DB wind DB DMSP DMSP speed salinity
DB SST
1.000 -
(3207)
-0.3748 1.000 -
(3158) (3209) [99.99+] 0.0912 -0.3935 1.000
(540) (534) (573) [96.61] [99.99+] 0.1312 -0.2307 0.6159
(625) (621) (525) [99.90] [99.99+] [99.99+] 0.2077 -0.2922 0.1619
(1211) (1217) (489)
1.000
(659)
[99.99+] [99.99+] [99.97] 0.1005 0.0124 0.0003
(2323) (2326) (410) [99.99+] [44.70] [99.99+] [98.35] -0.4720 0.3318 0.1118 0.1123
(1324) (1323) (406) (490) [99.99+] [99.99+] [97.61] [98.72] -0.9480 0.3148 -0.0515 -0.1091
(2837) (2832) (434) (513)
0.3826
(588) [99.99+] -0.1095
(478)
1.000
(1287)
0.0052 1.000
(843) (2378) [12.01] -0.1345 0.0833
(811) (1101) [99.99] [99.44] -0.1801 -0.2126
(997) (2295)
1.000
(1375)
0.1743 1.000
(1343) (2900) [99.99+] [99.99+] [99.99+] [99.99+] [99.99+1 [99.99+] [71.70] [98.68] [99.99+1 [99.99+1 [99.99+1
The numbers in parenthesis are the number of annual ocean data squares shared by each pair of quantities. The numbers in square brackets are the significance levels determined from Student's t test.

418 KETTLE ET AL.: SEA SURFACE DIMETHYLSULFIDE MEASUREMENTS

KETTLE ET AL.: SEA SURFACE DIMETHYLSULFIDE MEASUREMENTS 419
30 N. N:PST(E) :':•CAL
30 s ?iil
..... •:':':::::::::::: ..•,•,::,•;::•::•:•::•:ii'!•'•::'•'•'•'::'•;::•::' •:::•::• •: :/:: ::•:•:: •:;::::::':;':::::":::::'::::'•'::•':'•::::' '•":::::: •::•::;•::::::: :::•:::•: ;•!'•:! •!•::'::' ::?:::::::':: '•'•'•:'"':':':" '•:'":'::: '•'•'• •::':' :•:' •: •'::;'•:•:•:•:•:::•'•:•'•':'• '•'• '•':'""::' '"'•'•' :•;•:•:•::::::•:•:•:•;•::•i•i•:•.•::•:::•:::•:::•::•::;•:•:•::•i:: ..... ß ..•.•.........i:i? ::•: !::;i•:•:...:..:.ii::::ii• .............. •--- -- .. -- ..... --•,.. •'?------..---,,,.• .... .• .,,. •...•.•--.,.,... ::::::::::::::::::::::::::::::::::::::::::::::::::::::
9O S
180 W 150 W 120 W 90 W 60 W 50 W 0 ,30 E 60 E 90 E 120 E 150 E 180 E
Longifude
Figure 4. Unsmoothed first-guess field of annual DMS sea surface concentration (nM). The first-guess field is based on average sea surface DMS concentrations in the 57 global biogeochemical provinces proposes by Longhurst et al. [1995].
1.5
1.0
0.5
0.0
climatological DMS concentrations in the database and published climatological nutrient values were not successful. Figure 3 shows contour diagrams of the scatter of points between DMS and the other climatological quantities in the database. Table 5 shows the correlation matrix between all the different pairs of data sets together with the number of pixels and the percent significance of the calculated regression coefficient against a zero-correlation null hypothesis. All the regression coefficients are small (but with very high significance levels) and do not indicate a quantitative relationship between DMS and other parameters that could be used as a predictor for DMS concentration in the world ocean. With respect to DMS concentration, the highest correlation was found with climatological particulate DMSP concentration, but the correlation coefficient was still only 0.49. The highest correlation between the annual DMS climatology and a published parameter was 0.39 for phosphate from the World Ocean Atlas.
This was not high enough to serve as the basis of a first-guess field for the sea surface distribution of DMS. Even if a
correlation had been found between the annual climatological quantities, DMS is suspected to have a pronounced seasonal cycle at high latitudes, and this information cannot be conveyed in an annual average field of DMS concentration.
When the ocean data squares of annual climatological data were sorted by the biogeochemical province according to Longhurst et al. [1995], the correlations between the annual parameters improved somewhat. The relationship between DMS and the annual nutrient fields given in the World Ocean Atlas was characterized by generally low correlation coefficients. More biogeochemical provinces tended to have the highest correlation between DMS and silicate rather than between DMS
and the other nutrients or dissolved oxygen. However, this heightened covariance with silicate was found in only 10 of the 40 biogeochemical provinces where there were more than 10

420 KETI'LE ET AL.: SEA SURFACE DIMETHYLSULFIDE MEASUREMENTS
,_'1 IOUaU
z
epnl.!;n9

KEITLE ET AL.: SEA SURFACE DIMETHYLSULFIDE MEASUREMENTS 421
0.80 ,,,
0.76
0.72
0.68
,.: 0.64
! :--i 0.60
i•: i 0.56 { 0.52
..
•::.:::::-• •.•:::•: t•:•:•.:•..•:• • •::•! :::{•: .... ß .:.:•x<•.:•a •:---•; •::f:: •. ..e3•::;•?P • • - ß : k•::•--:1•. k1•-i•:. "-•*- . ..... •. • .... ß. • •-. :i•i•::•i :::• i: .•.x.-• . --.-• , .... ß •]:.•:.• ..•:•{•':.• ............... m:-::•: ; .... -'•:•:i s::::: :•::.::•-. :*j :•:•:•. :s•k::. , j::?. .::•: ................. .s'::•...&.<- : . :.•:.:.:.-'•.: •-1'•:: •i$'t,::t• :}.k :a.:.•::..,::•:• .... ' .•:::• ::;•'•::• *•- •::-":t•";::•.;{ "-•'::g:<•?•,'•e::::•' •:- • •-• .• .'• .-2•k.• r:•.• . .: ::i•e* ..... •}•...:' .5:.• •{'1', ,':':' ..:,Y<•::;.A. '•1•7:•*• ........ :"':•½•-.-•c.,:• ..... •:•.7, "':•A< •': ::• .':..•:•2,.•'•::5•:>-':::• •:-* .;:.:•
•.:• ::•:, .•:•:e....,-:.....::g • ::,:.:..• ....... •..:,% •.z ...i .... E•?• ..•... :::.•.• ..... • .... .,:::• ..•:::...t,•;•,....• ;1.•:e .... •..•.•: ,., ....... :.-;:.2•..::::..:•..-...•:•:.•:•i:E,i:E•:i,:.•.e .... -. .-.- ::: •:•' •-'*•-•:•;'*•'a:•-::,•:: '• •::• ':::•:""•.:•-; "' ,:•1•: ............ •:m,:k• •'• :•- :•-, ,--'"•.g:'. --•. •::',:.,4•,,• ..... :::•:•4D•<• .......... •j•:f.• ,,•'• ............ - ............. -- •::- ""'.....-..'. ß ?'•:•;e .•' :• '.:•,::::.•:•:;:• ........ :•'•2'.•'• "•: •g• ß -'•4 •. •.• z•...:;:• ........ •½'•.:..•;,j•::,• ":'th;.•.tf:• .... '.•.,•.:•.,:•::,•:• ................. f•--
?• ....... , .................... .:.......•.. ,•:: -. ,• • :•%.:...... • "
90 S
180 W 150 W 120 W 90 W 60 W 50 W 0 50 E 60 E 90 E 120 E 150 E 180 E
Longitude
'" 0,24 ß
0,20
0, t6
-0.12
0.08
" 0.04
0.00
Figure 5. (a) Estimated inaccuracy in the annual sea surface DMS concentration field based on the efibctiveness of th• stated mapping procedure to reproduce five annual data fields (nitrate, phosphate, silicate, oxygen, and CZCS chlorophyll concentration) from selected subsets of the data. (b) Estimated precision of the gridded annual DMS concentration field based on a calculation of the standard deviation of all DMS data lying within a radius of 555 km from the center of an analyzed pixel.
ocean data pixels, and it would be difficult to make conclusions from this about the most important species of phytoplankton producing DMS. The relationship was not strong enough to use as the basis of a first-guess field in the Conkright et al. [1994] scheme, and a simpler scheme was used wherein the representative annual sea surface concentration of DMS was taken as the simple average of all the ocean data squares present within the biogeochemical province.
The unsmoothed first-guess field for the annual DMS sea surface concentration is given in Figure 4. It shows generally low concentrations of sea surface DMS over most of the oceans at mid and low latitudes. Certain coastal areas have elevated DMS
concentrations, especially if they are in upwelling regions such as the Benguela or the Peru upwelling zones. The equatorial Pacific shows a slightly heightened DMS concentration, but this is modest compared to what is indicated for the extreme high latitudes. The polar oceans (North Pacific, North Atlantic, and Southern) show very high values of DMS concentration in the annual map (this does not necessarily correspond to high DMS
flux values because the ocean might be ice covered in these regions at certain times). This is probably due to some seasonal sampling bias in these areas; expeditions to these regions were made during the summer months in almost all cases. The data in the annual map are biased toward summer values and do not indicate an annual mean. Possibly, the high DMS concentrations in these regions occur at the same time as phytoplankton blooms, which have been observed in CZCS satellite images.
The smoothed first-guess field for sea surface DMS concentration is given in Plate 2. It was created by applying an ll-point unweighted filter to Figure 5 to remove the discontinuities at the borders between provinces. This smoothed first-guess field was used as the basis of the procedure of successive iterations used by Conkright et al. [1994] to assimilate actual data measurements into the actual map. The result is shown in Plate 3, which shows realistic fields of sea surface
DMS concentration in most of the oceans in the tropical and temperate regions. The Atlantic Ocean has the best coverage, and in this map, heightened DMS concentrations in the Benguela

422 KETTLE ET AL.: SEA SURFACE DIMETHYLSULFIDE MEASUREMENTS
90 N' ß .................................
::!i•i .. ................................. ...:;•::• ..... ____;=-•.•,._ ß ....... ...•.•:?•:.•:•,•,..........•._,•...•.,;•?......•.:•:.:,,,,,,.•:.:?, .,,::..: .-'?:•:.: ................. :.:. ;•:'; :::::::::::::::::::::::::::::::::::::::: .................. • .... - •d;;& ..... :-'g•½•;;:; ................... ' ,' • -. ::7:;
"::%. •:-.'•:d•:; ::;::•: ..;.;:g:• •; ;•½:;:• .•*'•::•.•.;.::::;';S:' •:•'•c•:•½½w:;;½;;•;:St4- "• •' .:..'t '-•... ½" I i • ," .:', .........
. .'"' .•;.• ......• . . ;;:. :: ....... -, .. ....... :;:;{:•....: .:. ::::::::::::::::::::: :•..:•:•';•, .• * . , . ,.•: •;• *
':/i•;.; ...... :•1.,:• :::.*' ". ' "*•*:'**;:;}..•* 'h ,..•"• - ' '.. ':t•; *' -':'::.•,"i.:::::'"'.,:";•,:.'•'•'.. ,::*;::.:::'.':.'. •;•:,•, '.. .. : ........ •***:.•: . •'..• :'.,' ...D'/
,•,::::;•. :::.•:•-:•;•::.:...":. :::•:•::,•:•: •½::.:.:::,:::•,:/•,;•::,,::: ::i i:...:•:. .:c• '•,:: •..•.: .. ..:::.:: ...... :,:•.;.s•:• ,::. / .. ß, .•:::• •:;.:. ß., .
.,•j• ,.:.• .... •.•:•..:• ..::•, ......... •4.[.** ...:.::: .....:•,:. :....: ...... •..... ..... ½:::•::. :...: •. •,.**• :;.•:.
: .: ........ :• .: .:... :. :. •.:•;•,:-.• .... . •.... •
,
90 S
180 W 150 W 120 W 90 W 60 W 50 W 0 ;30 E 60 E 90 E
I.. ong[tude 120 E 150 E 180 E
Figure 5. (continued)
5.0
4.7
4.5
4.2
4.0
•;.??:.•,,=•:.ii•: i 3.7
71 3'5 g...-....?:,....• 3.2
;•;• 3.0 • 2.7
2.5 .
• 2.2 2.0
:• '• 1.5 :•?• ::•:.': 1.2
..
:'"•: "1.0 ..:•:
:' 0.7 :•:
.:•:.•
0.5
0.2
0.0
and North African upwelling zones are supported by the high density of data in these regions. The concentration in oligotrophic waters in the middle of the Atlantic Ocean is mostly low but it does show some structure. The map also shows high DMS concentrations at high latitudes in both hemispheres. Interestingly, the hot spots of DMS concentration in this map (off the southeast coast of Newfoundland, south of Iceland, off the
coast of Norway, and on the Falkland Shelf) correspond to areas of coccolithophorid blooms identified by Brown and Yoder [1994]. There is not much data coverage in the western Pacific and Indian Oceans, and the predicted DMS concentration is that of the first-guess field, but this still appears reasonable when compared to the Atlantic Ocean.
The estimated uncertainty associated with the method to produce this map is presented as the color field in Figure 5a. Generally, the lowest uncertainty in DMS concentration occurs in those areas where there is high data coverage near actual cruise tracks. The low estimated uncertainty in the western Pacific and in the Indian Oceans (where there is not much data) is a credit for the strength of the mapping algorithm to obtain true estimates of m;tnent and chlorophyll concentrations in areas of sparse data coverage. The northern North Atlantic Ocean is noted also as an area of low uncertainty, a notably good result considering sparsity
of data and the annual and spatial variability of the nutrient and chlorophyll concentrations of this area. It would have been expected that the nutrient and chlorophyll dynamics of the northern North Atlantic Ocean would behave similarly to the Southern Ocean, which exhibits high uncertainty over large regions.
The amount of variability in point measurements is shown in Figure 5b. The lowest annual variability is observed at low latitudes in mid-ocean areas, and higher variabilities are seen in coasta4 areas and higher latitudes. This is to a large extent the result of seasonal variations at mid and high latitudes. The highest calculated variability is found near the coast of Antarctica.
Latitude profiles of the data and the results of various analysis schemes are shown in Figure 6. It confirms the results already seen from the maps. Annual mean DMS concentrations are approximately 2.5 nM at low and mid latitudes but increase sharply at high latitudes (most probably during the summer months, but seasonality is not resolved in this plot). The bars for standard deviation indicate a much smaller variability at low and mid latitudes than at higher latitudes. In almost all cases the interpolation predictions fall within the range of the actual data. The most significant deviations are at high latitudes. It therefore

KETFLE ET AL.: SEA SURFACE DIMETHYLSULFIDE MEASUREMENTS 423
,.-I IOU•U
z
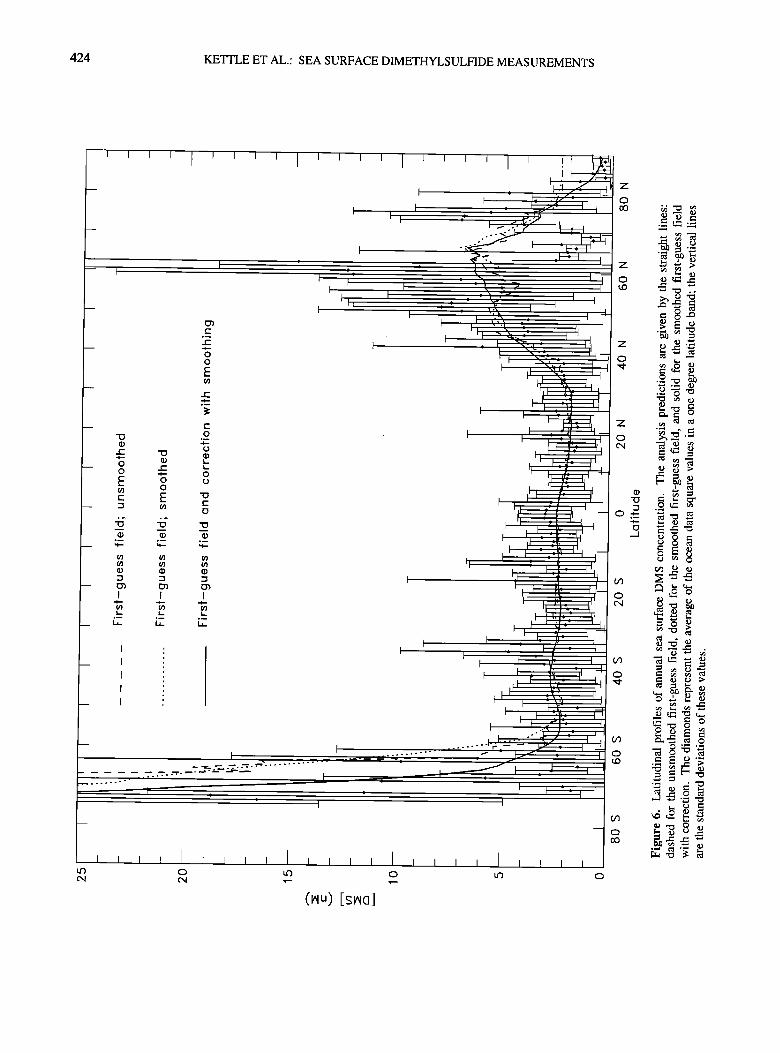
424 KETTLE ET AL.' SEA SURFACE DIMETHYLSULFIDE MEASUREMENTS
z
o .•-
z
o o,I
o •
o
o
u') o u') o u') o o,I cxi .,- .•_
(wu) [swa]

KETTLE ET AL.' SEA SURFACE DIMETHYLSULFIDE MEASUREMENTS 425
Table 6. Statistics for monthly climatological quantities derived from the database and for published monthly parameters. Quantity Mean Median Standard Geometric Geometric Minimum Maximum
Deviation Mean Standard
Deviation
Database DMS, nM 5.34 2.17 20.21 2.23 2.91 0.003 400.00 4283 Database aqueous DMSP, nM 18.14 9.69 32.44 8.81 3.43 0.03 400.67 849 Database particulate DMSP, nM 40.83 20.52 52.94 21.52 3.17 1.04 409.49 979 Database chlorophyll concentration, 1.219 0.454 2.686 0.438 4.104 0.012 38.953 1463 [tg L-I Database wind speed, rn s -• 7.93 7.45 3.88 6.956 1.726 0.09 29.00 2719 Database salinity, ppt 34.05 34.48 3.70 33.60 1.23 2.00 37.60 1530 Database temperature, øC 17.53 19.75 10.11 N/A N/A -4.44 32.15 3438 WOA temperature, øC 16.98 18.45 9.77 N/A N/A -2.21 31.68 4283 WOA salinity, ppt 34.52 34.83 2.50 34.33 1.14 5.11 40.57 4283 WOA mixed layer depth, rn 38.0 29.0 44.5 24.8 2.7 0.3 778.2 4026 CZCS chlorophyll concentration, 0.753 0.202 1.313 0.280 3.947 0.04 18.70 4283 ggL -• Bishop and Rossow [1991] actual 218.2 233.2 66.1 202.5 1.6 1.1 366.5 4283 irradiance, W m -2 Bishop and Rossow [1991] clear 293.8 313.0 68.7 280.4 1.5 1.3 424.1 4283 sky irradiance, W m -2 Trenberth wind speed, rn s -• 7.19 7.08 2.06 6.90 1.34 2.93 14.36 4283
500
400
300
2OO
100
2 4 6 8 0
DB IDMS] (nM)
lOO
o lO 20 30 40 50
DB DMSP aq (nM)
4O
2O
o 3o DB DMSP p (nM)
1200 liiiii ' 1000
800
600
400
200 ' o 1 2 3 4
Chlorophyll (/•g L-')
500
400
300
200
100
0 ,
0 2O
Wind Speed (ms-')
8OO
600
400
2OO
2O 30 40
Salindy (ppt)
25O
2OO
150
IO0
5O
0
0 2O
Temperc•ture (øC)
600
400
200
L
500
400
300
2OO
100
0 0 "'
0 50 100 15"•=•===•200 0 Depth (m)
100 200 300 400
Irradionce (W m -2)
Figure 7. Histograms of the monthly ocean data square values of quantities: (a) DMS, (b) aqueous DMSP, (c) particulate (p) DMSP, (d) database chlorophyll plotted as a solid line with CZCS chlorophyll displayed in gray shading, (e) database wind speed plotted as a solid line with Trenbeth et al. [1989] displayed in gray shading, (f) database salinity plotted as a solid line with WOA salinity displayed in gray shading, (g) database temperature plotted as a solid line with WOA temperature displayed in gray shading, (h) WOA mixed layer depth, and (i) Bishop and Rossow [1991] actual irradiance plotted as a solid line with theoretical clear sky irradiance displayed in gray shading.

426 KETTLE ET AL.' SEA SURFACE DIMETHYLSULFIDE MEASUREMENTS

KE'I'TLE ET AL.: SEA SURFACE DIMETHYLSULFIDE MEASUREMENTS 427
+ + + + + + + + + + +
+ + + + + +

428 KETI'LE ET AL.: SEA SURFACE DIMETHYLSULFIDE MEASUREMENTS
(./9 L• z L <tl
$ (./9
(lAlU) uo!•oJluoouoo SIAICl

KETI'LE ET AL.' SEA SURFACE DIMETHYLSULFIDE MEASUREMENTS 429
O o N,- Ld
< < n-- _z n o •
o t.o o 0,4 ,-- •-
o •
o •
(I/XlU) uo!•.o•.uaouoo SRO
430 KETTLE ET AL.' SEA SURFACE DIMETHYLSULFIDE MEASUREMENTS
10.0 ........................................
. . _ 9.,5 ARCT '"•"' '•' '•:"""" "' '•'"
.....:::..:..:.....:::.:::....:.. .... f'•, ...... ' ..... ' ...... ".:.:f':• :•:::::"'"' 9.0 ...................... ,.,,:., ,,.,.' ".-...' ........ . ....
..... ...•.• . ..• . . • • ,
7.0
.;: 6.0
ß
4.5
4.0
•.5
,3.0
2.5
2.0
-v m:::. ::-:::-::..::. • '"•'" :::::::::::::::::::::::::::::::::::::::::::::::::: '"::': ..
30 E 60 E 90 E 120 E 150 E 180 E
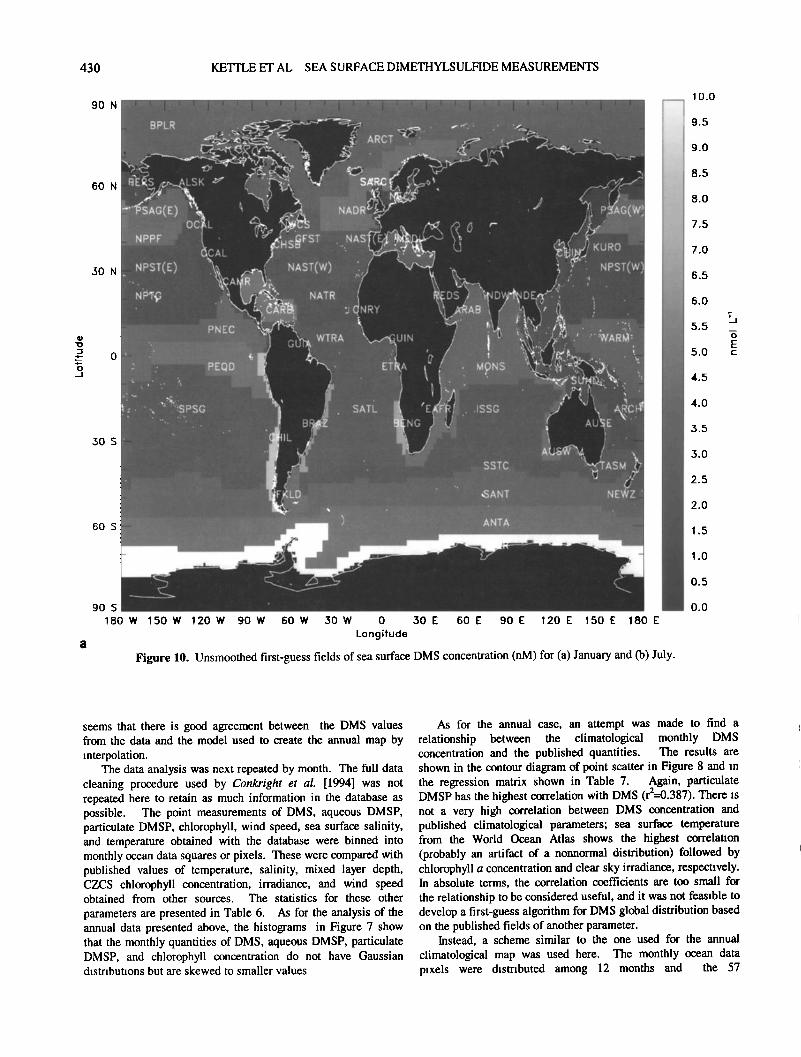
Figure 10. Unsmoothed first-guess fields of sea surface DMS concentration (nM) for (a) January and (b) July.
1,0
0,5
0.0
T _J
seems that there is good agreement between the DMS values from the data and the model used to create the annual map by interpolation.
The data analysis was next repeated by month. The full data cleaning procedure used by Conkright et al. [1994] was not repeated here to retain as much information in the database as possible. The point measurements of DMS, aqueous DMSP, particulate DMSP, chlorophyll, wind speed, sea surface salinity, and temperature obtained with the database were binned into monthly ocean data squares or pixels. These were compared with published values of temperature, salinity, mixed layer depth, CZCS chlorophyll concentration, irradiance, and wind speed obtained from other sources. The statistics for these other
parameters are presented in Table 6. As for the analysis of the annual data presented above, the histograms in Figure 7 show that the monthly quantities of DMS, aqueous DMSP, particulate DMSP, and chlorophyll concentration do not have Gaussian distributions but are skewed to smaller values.
As for the annual case, an attempt was made to find a relationship between the climatological monthly DMS concentration and the published quantities. The results are shown in the contour diagram of point scatter in Figure 8 and in the regression matrix shown in Table 7. Again, particulate DMSP has the highest correlation with DMS (r2=0.387). There is not a very high correlation between DMS concentration and published climatological parameters; sea surface temperature from the World Ocean Atlas shows the highest correlation (probably an artifact of a nonnormal distribution) followed by chlorophyll a concentration and clear sky irradiance, respectively. In absolute terms, the correlation coefficients are too small for the relationship to be considered useful, and it was not feasible to develop a first-guess algorithm for DMS global distribution based on the published fields of another parameter.
Instead, a scheme similar to the one used for the annual climatological map was used here. The monthly ocean data pixels were distributed among 12 months and the 57

KETTLE ET AL.: SEA SURFACE DIMETHYLSULFIDE MEASUREMENTS 431
9O S
180 W 150 W 120 W
10.0
9.5
9.0
8.5
................ 8.0 ..
7.5
7.0
6.5
90 W 60 W ,30 W 0 .30 E 60 E 90 E :Longitude
120 E 150 E 180 E
4.0
3,÷5
: 3.0 2.5
::•:.•:i
.:..
:.
.;:
0.5 =
Figure 10. (continued)
biogeochemical provinces defined by Longhurst et al. [1995]. For each biogeochemical province, a DMS time series was calculated by fitting the monthly average of 1 ø data squares data with a spline. For provinces where the temporal distribution of data was not sufficient, the time series pattern from another province, usually scaled to the existing data, was used. The result for each of the biogeochemical provinces is shown in Figure 9. The DMS concentration for most provinces is low for most of the year. In the northern hemisphere at mid and high latitudes, there is an increase in DMS concentration about March or April. DMS peaks in May or June and decreases suddenly. Some provinces show a secondary, smaller maximum later in the summer, in agreement with the modeled and measured results presented by M. Corn et al (unpublished manuscript, 1996). For the southern hemisphere, the annual cycle of DMS concentration is shifted by six months from what it is in the northern hemisphere. Biogeochemical provinces which lie in the tropics do not show much seasonality in this time series.
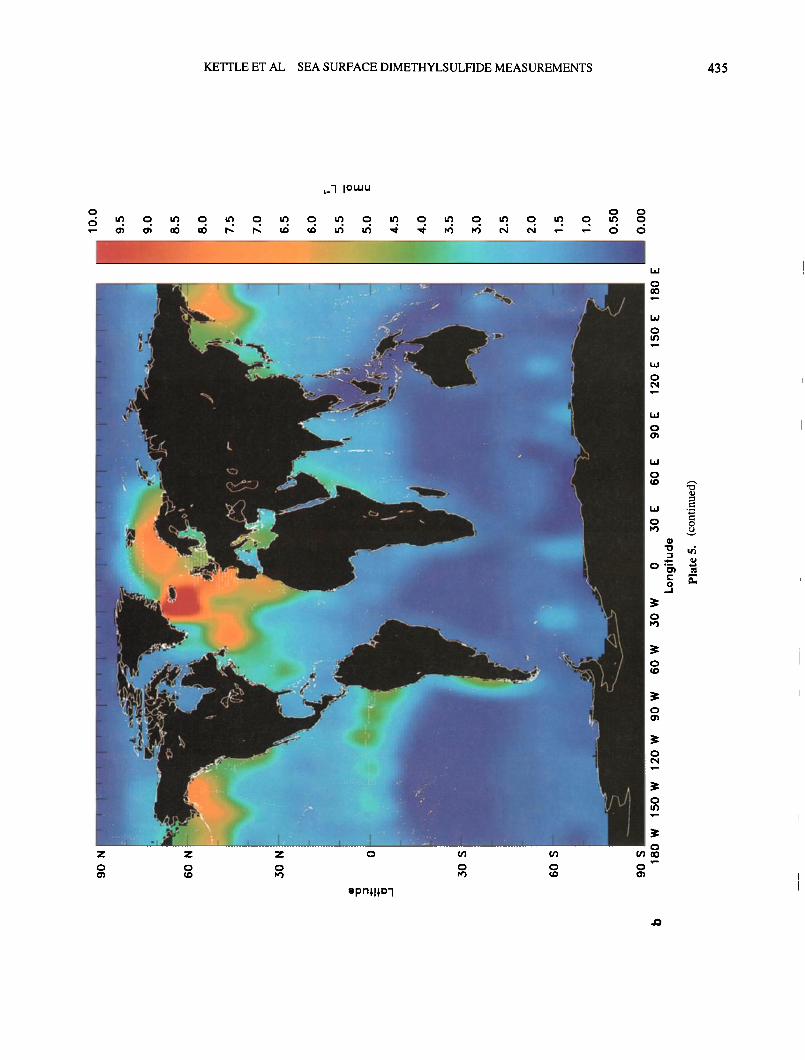
A series of first-guess global fields of DMS concentration were created after a realistic time series pattern of DMS had been assigned to each of the biogeochemical provinces. These unsmoothed fields are shown in Figures 10a and 10b for January and July. The most interesting features seen in these maps is that the high latitude areas have very high DMS concentrations in summer, flipping from the Southern Ocean in January to the North Pacific, North Atlantic and Arctic Ocean in July. The summer concentration of DMS in these high latitude areas is generally much greater than what is found in other regions. Plates 4a and 4b show the same January and July plots after the application of an unweighted 11-point smoothing filter to remove the discontinuities between biogeochemical provinces. Plates 5a and 5b show the same January and July plots after the assimilation of the ocean data squares for the relevant months using the Conkright et al. [1994] analysis. The fields look realistic, and salient features conform to what is known about the global DMS distribution. The structure in these heavily

432 KETYLE ET AL.: SEA SURFACE DIMETHYLSULFIDE MEASUREMENTS
,_9 IO•U
z
epnH•.o9
-e
u
i

KETI'LE ET AL.: SEA SURFACE DIMETHYLSULFIDE MEASUREMENTS 433
,_"1 !omu
o
• • 0 • 0 • 0 •) 0 • 0 • 0 • 0 • 0 • 0 • 0
J
L
z
i,i
i,i

434 KE'I'TLE ET AL.: SEA SURFACE DIMETHYLSULFIDE MEASUREMENTS
,_9 10u•u
o o
z
o o
o
o
o
ß
KETTLE ET AL.: SEA SURFACE DIMETHYLSULFIDE MEASUREMENTS 435
(::) (:3 (::)
c:; • q m o • q m o • o • o m o • o '9. q m. q
z z z
epn•,l•,D9
I. mJ
c:)
(:3
O

436 KETTLE ET AL.: SEA SURFACE DIMETHYLSULFIDE MEASUREMENTS
15
10
15
10
15
10
•, anuary -- February -- March - April
,
' i •. : :
May - June . -• July -- August
__
ß
* •' I •"•'• "• __ _ . r . , . , .... , .... , ', : . • •* • • • • • • • I •*', • i I ', ', • I '. ' ,• • .... • .... • , , September -- October -- November -- cember
,
.....
-50 0 50 -50 0 50 -50 0 50 -50 0 50
Figure 11. Latitude profiles of DMS sea surface concentration for all months. The lines represent the latitudinal average of the unsmoothed first-guess field, smoothed first-guess field, and the smoothed first-guess field with correction; the key is given in Figure 6. The diamonds represent the average of all ocean data squares in a given one degree latitude band. Where more than one ocean data square is present at the same latitude, the standard deviation is given by vertical lines.
smoothed maps must be viewed skeptically because the data assimilation scheme was based mostly on modeled and extrapolated data and should therefore be corroborated with more measurements. Still, the scheme illustrates the kind of fields
which could be generated with a larger database of observations. Figure 11 represents a latitudinal summary of the binned
ocean data squares and of the concentration estimates from the mapping procedure. The diagrams shows a large range of DMS data variability along a latitude band. Interestingly, the different steps in the mapping procedure (involving smoothing, data assimilation, etc.) do not make much impact according to these latitudinal plots. The seasonality of the DMS concentration is more apparent in this series of diagrams with high values at extremely high latitudes near the winter and summer solstice.
The estimated inaccuracy of the monthly DMS maps is presented in Figures 12a and 12b for January and July. For both months the uncertainties tend to be generally higher than in the
annual case because the sparsity of measurements used as input for the mapping algorithm. For both the January and July images, the lowest estimated errors are seen in the mid-ocean areas at low latitudes. This is mostly due to the fact that these are areas where there is not much seasonal or spatial variability, so that the interpolation procedure of the mapping method is not seriously tested. This is not true of high latitude regions where there is both a large seasonal cycle and a large degree of spatial variability, coupled with a low data density. The mapping procedure expectedly performs worse in these regions. There are also zones of moderate estimated inaccuracy in the South Pacific Ocean and the southern Indian Ocean arising from the very low data densities in these regions. The variability in all the data collected in January and July is shown is shown in Figures 13a and 13b. The sparsity of data limits estimation of variability to the immediate regions around the individual cruise tracks, which makes these maps somewhat

KETI'LE ET AL.: SEA SURFACE DIMETHYLSULFIDE MEASUREMENTS 437
60 N
30 N
50 S
60 S
90 S
180 W 150 W 120 W 90 W 60 W 50 W 0 50 E 60 E 90 E 120 E 150 E 180 E
Longitude
5.0
4.7
4.5
4.2
...... 4.0
'•:'*•''::•"•:3.7 *•'•'•3.5
':••:3.0 2,7
2,5
2.2
ii•:•i 0.75
•i: 0,50 ....
:iii.: .:...
0.25
.... 0.00
Figure 12. Estimated inaccuracy in the DMS concentration fields for (a) January and (b) July based on a repetition of the mapping procedure for the monthly CZCS chlorophyll concentration fields.
patchy compared to the annual map where all the data is considered on a single image. The trends in the scatter for the monthly maps of July and January are similar to what is observed in the annual map. Mid-ocean regions at low latitudes generally have low data variability compared to high latitude regions. Coastal regions have more variability in the data than mid-ocean
4. Conclusion
In connection with this project we have compiled a database of over 15,000 global DMS measurements. From this database, it was possible to create a model which generates a series of monthly maps of sea surface DMS concentration at løxl ø latitude-longitude resolution using mainly a simple data apportioning scheme between 57 biogeochemical provinces proposed by Longhurst et al. [1995]. Other researchers have
found spatial and temporal trends in DMS sea surface concentration, but these have always been on regional scales. The present study is the first to present an overview of existing DMS sea surface data on a global scale.
Some interesting trends become apparent. For instance, there is a distinct annual cycle in DMS sea surface concentration at high and midlatitudes in both the northern and southern hemispheres. The character of the cycle in the northern hemisphere is such that DMS concentration increases during the spring-summer months. The exact timing of the onset of high DMS concentrations may correspond with the spring phytoplankton blooms, and it is interesting that regions of high DMS concentrations in the database correspond roughly to the coccolithophorid bloom areas given by Brown and Yoder [1994]. Some provinces show a second, smaller peak later in the summer. The magnitude of the first peak seems to depend very much on the biogeochemical province and is highest in the highest latitude

438 KEq'TLE ET AL.: SEA SURFACE DIMETHYLSULFIDE MEASUREMENTS
::i::i•::-- :•. :i . .:::•i:. ß ß :•'. ':•: .•,' •'-- - :" • ...•,•:•:•,,':':'::•:::::::":•:.•'.•i::::" ,•:• •:.-i"-•,;•! :,•:i •,:,: ...... : ..• '"•?:::.:•?.. ..... :i;•:•:•::::::•:,::::•:::•?:' .... :. [ •. • ?•':':'":•'• ..... '•'•':::• ..t ..... •,• , '-• ..•:.•:•:::•:.:.•::•":•'/'• ..-•..•• ......... •:•:•;'• : .... '• "•""• '•"••' •... • ' 4.5 ß -•:. • • •... • - :• .... -:- ::•:. • • ,•:,.•:•:..:....:::•,.::.:..:E :•::::: ....? :• --• •.. •
'•:•: x•, : '"::'::;•" .......... •::';-:•'::;• ..... ':':.'•%•.:•-'"/•?;•'."•':::• ....... ';:'•:• ::•'•• 4.2 ß :•.•::...:::•z•:::•::'•. :... •"============================ '• ......... /::•:: •-"::• ........ ::::::::::::::::::::::::::: ::': (•:• •:•!•i'•'"::•::•:• , :•.:.....::•.:. , •: •'. ß ::?::•:.•::::• ::::•:::•::•i:..•::' ...•.....•.-'-•.•:•:- ::•::• :.•.• :•:.:::•::;•::.' :::%•:• •:•:•' •:..::•::.•t• •. ....•.•:: • ..... ß :. , :.•::-•.
•:' ..... •?:• ,• ...... ' ......... ' .............. •:::• C .•:-.-.•'-•?/•:':. •.7 • :•t.:..., '•: '. -'.'•:i•:. g • • .•:•:-'•.:•::•..•.:..•,. :: •:::•: •:. • '• ...... " •:'• ........ t:• , ;':• ========================= .... - _ • •:•.•:::•:•::::•::•:...--::•:•
•. : ...... ..•::::::• •:::•: '•. ". ',:•.?:'•.:•.i:'•,•... ' • ':•:.;• •'. • •: ' . •' ' ' ":•': , •/:;:•L::•::•:::•:'•' '
•'..•.,, •::::::• ............... . ....
, '. ..•...":. • :•.•.. :' •"•::-'L•:'• ...... ""::, '• ,
............ ß ::-:...•:. ,. . • -.....
..... -. :.:::::::?• .•, ......... ===================================== ...... :....•.. ?:.' :• -.• ......... .....::-::z .:• ..... • ..-:.::•t• •::::: ..... '.•. ?.•:::•.•" ...:.?'.• ........ 1.0
............................................................................................................ . ..................... . .... .::.:. :::.....:::...::::::•:.::•::•:•:•:•:::•:: ........................ ß ............ . .................... •:.•:: •:•.:•:.• .............. •:•.•..:::.`:::..•:::•./??•:•::.`•?•::.::::•::•:::•:•:::•:.•:`•:
60 $ 0,75
.... • • •-' 0.50
0,25
90 S 0.00 180 W 150 W 120 W 90 W 60 W 30 W 0 30 E 60 E 90 E 120 E 150 E 180 E
Longifude
Figure 12. (continued)
provinces. The annual cycle of DMS concentration for biogeochemical provinces in the southern hemisphere is similar but is shifted by six months. This means that areas of the highest sea surface DMS concentrations on Earth flip from the northern to the southern hemisphere every 6 months. Tropical regions do not show much of an annual cycle in DMS concentration. There is a somewhat higher DMS concentration in the Peru, Benguela, and North African upwelling areas, but the concentrations found in these areas is still lower than that found in the highest latitudes during the summer months.
There are strong indications that the annual cycle of DMS concentration in surface seawater is correlated with the blooming cycle of DMSP-producing phytoplankton species. However, no significant correlation was found between DMS and in situ chlorophyll concentration or any of the published values of CZCS chlorophyll concentration, monthly climatological irradiance, or the nutrient fields. The process models of Gabric
et al. [1993a, b] and M. Corn, S. Belviso, D. Ruiz-Pino, and U. Christaki (unpublished manuscript, 1996) hold promise for understanding the mechanism of formation and destruction of DMS in the water column over short time periods and space scales. The work of van der Berg et al. [1996] represents an important step in the incorporation of a simple trophic interaction scheme into an integrated ecosystem model as a means of explaining the mechanisms of DMS formation and destruction. This model was effective in simulating the annual evolution of DMS sea surface concentration in the North Sea. The next step would be the development of an annual ecosystem model to explain the annual DMS cycle over an entire ocean basin, such as the North Atlantic Ocean. However, progress in such a study is limited by the relative sparsity of data in the open ocean which could be used to validate this kind of model over an annual cycle.
The most significant impact of the present study is probably in the field of atmospheric chemistry, where the global DMS

KE'ITLE ET AL.: SEA SURFACE DIMETHYLSULFIDE MEASUREMENTS 439
90 N I •
' ß
60 N
30 N
30 S
60 S
y
90 $
180 W 150 W 120 W 90 W 60 W 30 W 0 30 E 60 E 90 E 120 E 150 E t80 E
Longitude
Figure 13. Estimated precision of the DMS concentration fields for (a) January and (b) July. The fields are calculated as the standard deviation of measured DMS data values (collected during January and July) lying within a radius of 555 km from the center of an analyzed pixel.
5.0
4.7
4.5
4.2
4.0
3.7
3.5
3.2
3.0
t.7
t.5
1.2
1.0
0.7
0.5
0.2
0.0
J
concentration maps provide a boundary condition for the flux of DMS into the atmosphere. DMS in the atmosphere is oxidized to methane sulfonic acid and sulfate particles on time scales of a few hours to a few days. Sulfate particles act as nucleation centers for aerosols that can change the reflectance characteristics of the clouds over and downwind of the phytoplankton population which produced the DMS, causing a cooling of sea surface temperatures. The production of global monthly maps of DMS concenffation as part of the present study provides a tool which can be used to predict the flux of DMS to the atmosphere and the subsequent production of sulfate aerosols.
Acknowledgments. Much of the data in this paper was obtained from third parties who generously contributed their time and resources. We thank Ray Barlow of the Plymouth Marine Laboratory for chlorophyll a data
submitted with the DMS data collected during the 1995 cruise of the Valdivia in the North Atlantic (data set 124). E. Fogelquist (G6teburg University and Chalmers University of Technology) contributed Weddell Sea data to this project. It has not been included in this surface [DMS] database because all samples were from deeper than 20 m. Steve Gegg at Woods Hole Oceanographic Institution provided the cruise track and meteorological information for the R/V Oceanus in data set 90. W. Glenn Harrison at the Bedford Institute of Oceanography provided the cruise track information for the 1992 cruise of the CSS Hudson to the North African
upwelling area; this greatly facilitated the digitization process for data set 92. G. Krause of the Alfred-Wegener Institute for Polar and Marine Research prov:.ded meteorological information for the Polarstern cruises and this was particularly useful for data set 57. Rob Lowry and Leslie Rickards at the British Oceanographic Data Centre provided DMS data and cruise track information for British research vessels. Dave McWilliams and AI Hickey (Antarctic Support Associates) and AI Sutherland (Division of Polar Programs, National Science Foundation) provided the cruise report

440 KETYLE ET AL.: SEA SURFACE DIMETHYLSULFIDE MEASUREMENTS
9O N
60 N
30 N
30 S
60 S
' i I'• I , , I , , I ,, I , , I , , I
' ,
• ,
..
, .• J ..... .
.•..
....
• : , ..
.... •:::• .
t
..... • .......
90 S
180 W 150 W 120 W
I I J J J
90 W 60 W 30 W 0 30 IE 60 E
Long;rude
./
90 E 120 E 150 E 180 E
Figure 13. (continued)
5.0
4.7
4.5
:,
• .•.7
• ::::il 2.7
ii 2,5 i 2.2 t?ii! 2.0 ß
.....
•.::
0.7
0.5
0.2
0.0
7
associated with data set 83. Shubha Sathyendranath provided a digital file of the scheme of global biogeochemical provinces presented by Longhurst et al. [1995]. After a long search, the cruise track of the RRS Shackleton for dataset 1 was eventually extracted from the COADS archive [Woodruff et al., 1987] with the assistance of Steve Worley of NCAR. A portion of the personal support for A.J.K. came from an NSERC Postgraduate Scholarship from the Canadian government. This study was supported by the Max Planck Society.
References
Andreae, M. O., Dimethylsulfide in the water column and the sediment pore waters of the Peru upwelling area, Limnol. Oceanogr., 30, 1208-1218, 1985.
Andreae, M. O., The ocean as a source of atmospheric sulfur compounds, in The Role of Air-Sea Exchange in Geochemical Cycling, edited by P. Buat-M6nard, pp. 331-362, D. Reidel, Norwell, Mass., 1986.
Andreae, M. O., and W. R. Barnard, The marine chemistry of dimethylsulfide, Mar. Chem., 14, 267-279, 1984.
Andreae, M. O., and P. J. Crutzen, Atmospheric aerosols: biogeochemical sources and role in atmospheric chemistry, Science, 276, 1052-1058, 1997.
Andreae, M. O., and H. Raemdonck, Dimethyl sulfide in the surface ocean and the marine atmosphere: A global view, Science, 221, 744-747, 1983.
Andreae, M. O., W. R. Barnard, and J. M. Ammons, The biological production of dimethylsulfide in the ocean and its role in the global atmospheric sulfur budget, Ecol. Bull., 35, 167-177, 1983.
Andreae, M. O., R. J. Ferek, F. Bermond, K. P. Byrd, R. T. Engstrom, S. Hardin, P. D. Houmere, F. Lemarrec, H. Raemdonck, and R. B. Chatfield, Dimethylsulfide in the marine atmosphere, J. Geophys. Res., 90, 12,891-12,900, 1985.
Andreae, T. W., M. O. Andreae, and G. Schebeske, Biogenic sulfur emissions and aerosols over the tropical South Atlantic, 1, Dimethylsulfide in seawater and in the atmospheric boundary layer, J. Geophys. Res., 99, 22,819-22,829, 1994.
Balch, W., R. Evans, J. Brown, G. Feldman, C. McClain, and W. Esaias, The remote sensing of ocean primary productivity: Use of new data compilation to test satellite algorithms, J. Geophys. Res., 97, 2279- 2293, 1992.
Barnard, W. R., M. O. Andreae, W. E. Watkins, H. Bingemer, and H.-W. Georgii, The flux of dimethylsulfide from the oceans to the atmosphere, J. Geophys. Res., 87, 8787-8793, 1982.
Barnard, W. R., M. O. Andreae, and R. L. Iverson, Dimethylsulfide and Phaeocystis poucheti in the southeastern Bering Sea, Cont. Shelf Res., 3, 103-113, 1984.

KETTLE ET AL.: SEA SURFACE DIMETHYLSULFIDE MEASUREMENTS 441
Bates, T. S., Evidence for the Climatic Role of Marine Biogenic Sulfur, Ph.D. thesis, Univ. of Washington, Seattle, 1988.
Bates, T., and J. D. Cline, The role of the ocean in the regional sulfur cycle, J. Geophys. Res., 90, 9168-9172, 1985.
Bates, T. S., and P. K. Quinn, Dimethylsulfide (DMS) in the equatorial Pacific Ocean (1982 to 1996): Evidence of a climate feedback, Geophys. Res. Lett., 24, 861-864, 1997.
Bates, T. S., R. J. Chaffson, and R. H. Gammon, Evidence for the climatic role of marine biogenic sulfur, Nature, 329, 319-321, 1987a.
Bates, T. S., J. D. Cline, R. H. Gammon, and S. R. Kelly-Hansen, Regional and seasonal variations in the flux of oceanic dimethylsulfide to the atmosphere, J. Geophys. Res., 92, 2930-2938, 1987b.
Bates, T.S., J. E. Johnson, P. K. Quinn, P. D. Goldan, W•C. Kuster, D.C. Covert, and C. J. Hahn, The biochemical sulfur cycle in the marine boundary layer over the Northeast Pacific Ocean, J. Atmos. Chem., 10, 59-81, 1990.
Bates, T. S., Calhoun, Julie A., Quinn, P. K., Variations in the methanesulfonate to sulfate molar ratio in submicrometer marine aerosol
particles over the South Pacific Ocean, J. Geophys. Res., 97, 9859- 9865, 1992.
Bates, T. S., K. C. Kelly, and J. E. Johnson, Concentrations and fluxes of dissolved biogenic gases (DMS, CH4, GO, CO2) in the Equatorial Pacific during the SAGA 3 experiment, J. Geophys. Res., 98, 16,969- 16,977, 1993.
Bates, T. S., R. P. Kiene, G. V. Wolfe, P. A. Matrai, F. P. Chavez, K. R. Buck, B. W. B lomquist, and R. L. Cuhel, The cycling of sulfur in surface seawater of the northeast Pacific, J. Geophys. Res., 99, 7835- 7843, 1994.
Bates, T. S., B. J. Huebert, J. L. Gras, F. B. Griffiths, and P. A. Durkee, The International Global Atmospheric Chemistry (IGAC) Project's First Aerosol Characterization Experiment (ACE-I) - Overview, J. Geophys. Res., 103, 16,297-16,318, 1998a.
Bates, T. S., V. N. Kapustin, P. K. Quinn, D. S. Covert, D. J. Coffman, C. Mari, P. A. Durkee, W. DeBruyn, and E. Saltzman, Processes controlling the distribution of aerosol particles in the lower marine boundary layer during the First Aerosol Characterization Experiment (ACE-I), J. Geophys. Res., 103, 16,369-16,383, 1998b.
Belviso, S., S.-K. Kim, F. Rassoulzadegan, B. Krajka, B.C. Nguyen, N. Mihalopoulos, P. Buat- M6hard, Production of dimethylsulfonium propionate (DMSP) and dimethylsulfide (DMS) by a microbial food web, Limnol. Oceanogr., 35, 1810-1821, 1990.
Belviso, S., P. Buat-M6nard, J.-P. Putaud, B. C. Nguyen, H. Claustre, and J. Neveux, Size distribution of dimethylsulfoniopropionate (DMSP) in areas of the tropical northeastern Atlantic Ocean and the Mediterranean Sea, Mar. Chem., 44, 55-71, 1993.
Berresheim, H., Biogenic sulfur emissions from the Subantarctic and Antarctic Oceans, J. Geophys. Res., 92, 13,245-13,262, 1987.
Berresheim, H., M. O. Andreae, G. P. Ayers, and R. W. Gillett. Distribution of biogenic sulfur compounds in the remote southern hemisphere, in Biogenic Sulfur in the Environment, edited by Eric S. Saltzman and William J. Cooper, pp. 352-366, Am. Chem. Soc., Washington, D.C., 1989.
Berresheim, H., M. O. Andreae, R. L. Iverson, and S. M. Li, Seasonal variations of dimethylsulfide emissions and atmospheric sulfur and nitrogen species over the western north Atlantic Ocean, Tellus, Ser. B, 43, 353-372, 1991.
Berresheim, H., J. W. Huey, R. P. Thorn, F. L. Eisele, D. J. Tanner, and A. Jefferson, Measurements of dimethylsulfide, dimethylsulfoxide, dimethylsulfone, and aerosol ions at Palmer Station, Antarctica, J. Geophys. Res., 103, 1629-1637, 1998.
Bingemet, H., Dimethylsulfid in Ozean und mariner Atmosph'are - Experimentelle Untersuchung einer nattirlichen Schwefelquelle for die Atmosph'are, Ph.D. thesis, Univ. Frankfurt/Main, Frankfurt, Germany, 1984.
Bingemet, H., H. W. Georgii, S. Btirgermeister, and G. Ockelmann, Die Bedeutung biogener Schwefelemissionen fur den troposph'arischen Schwefelkreislauf, in Atmospharische Spurenstoffe, edited by Ruprecht Jaenicke, pp. 145-159, Dtsch. Forsch., Weinheim. Germany, 1987.
Bishop, J. K. B., and W. B. Rossow, Spatial and temporal variability of global surface solar irradiance, J. Geophys. Res., 96, 16,839-16,858, 1991.
Blomquist, B. W., A. R. Bandy, and D.C. Thornton, Sulfur gas
measurements in the eastern North Atlantic Ocean during the Atlantic Stratocumulus Transition Experiment/Marine Aerosol and Gas Exchange, J. Geophvs. Res., 101, 4377-4392, 1996.
Boniforti, B., P. Emaldi, R. Ferraroli, M. Maspero, R. Nair, and A. Novo, Preliminary data on DMS concentration in seawater samples collected from the La Spezia Gulf (Ligurian Sea), in Dimethylsulfide: Oceans, Atmosphere, and Climate, edited by G. Restelli and G. Angeletti, pp. 163-172. Kluwer, Dordrecht, Germany, 1993.
Bratbak, G., M. Levasseur, S. Michaud, G. Cantin, E. Fem6.ndez, B. R. Heimdal, and M. Heldal, Vital activity in relation to Emiliania huxleyi blooms: A mechanism of DMSP release? Mar. Ecol. Prog. Ser., 128, 133-142, 1995.
Brown, C. W., and J. A. Yoder, Coccolithophorid blooms in the global ocean, J. Geophys. Res., 99, 7467-7482, 1994.
Bfirgermeistcr, S., R. L. Zimmermann, H.-W. Georgii, H. G. Bingemer, G. O. Kirst, M. Janssen, and W. Ernst, On the biogenic origin of dimethylsulfide: Relation between chlorophyll, ATP, organismic DMSP, phytoplankton species, and DMS distribution in Atlantic surface water and atmosphere, J. Geophys. Res., 95, 20,607-20,615, 1990.
Cantin, G., M. Levasseur, M. Gosselin, and S. Michaud, Role of zooplankton in the mesoscale distribution of surface dimethylsulfide concentrations in the Gulf of St. Lawrence, Canada, Mar. Ecol. Prog. Set., 141,103-117, 1996.
Charlson, R. J., J. E. Lovelock, M. O. Andreae, and S. G. Warren, Oceanic phytoplankton, atmospheric sulphur, cloud albedo and climate, Nature, 326, 655-661, 1987.
Cline, J. D., and T. S. Bates, Dimethyl sulfide in the equatorial Pacific Ocean: A natural source of sulfur to the atmosphere. Geophys. Res. Lett., 10, 949-952, 1983.
Conkright, M., S. Levitus, and T. P. Boyer, NOAA Atlas NESDIS 1, World Ocean Atlas 1994, vol. 1: Nutrients, technical report, Nat. Environ. Satellite, Data, and Inf. Serv., Nat. Oceanic and Atmos. Admin., U.S. Dep. of Comm., Washington, D.C., March 1994.
Crocker, K. M., M. E. Ondrusek, R.L. Petty, and R. C. Smith, Dimethylsulphide, algal pigments and light in an Antarctic Phaeocystis sp. bloom, Mar. Biol. Berlin, 124, 335-340, 1995.
Curran, M. A. J., G. B. Jones, and H. Burton, The spatial distribution of DMS and DMSP in the Australasian sector of the Southern Ocean, J.
Geophys. Res., 103, 16,677-16,689, 1998. Dacey, J. W. H., and S. G. Wakeham, Oceanic dimethylsulfide: Production
during zooplankton grazing on phytoplankton, Science, 233, 1314- 1316, 1986.
Daley, Roger, Atmospheric Data Analysis, Cambridge Univ. Press, New York, 1993.
Deprez, P. P., P. D. Franzmann, and H. R. Burton, Determination of reduced sulfur gases in Antarctic lakes and seawater by gas chromatography after solid adsorbent preconcentration, J. Chromatogr., 362, 9-21, 1986.
DiTullio, G. R., and W. O. Smith Jr., Dimethyl sulfide concentrations near the Antarctic Peninsula: November, 1992, Antarct. J. U.S., 130-132, 1993.
DiTullio, G. R., and W. O. Smith Jr., Relationship between dimethylsulfide and phytoplankton pigment concentration in the Ross Sea, Antarctica, Deep Sea Res., 42, 873-892, 1995.
Erickson, D., III, Ocean to atmosphere carbon monoxide flux: Global inventory and climate implications, Global Biogeochem. Cycles, 3, 305-314, 1989.
Erickson, D. J., III, S. J. Ghan, and J. E. Penner, Global ocean-to-atmosphere dimethyl sulfide flux, J. Geophys. Res., 95, 7543-7552, 1990.
Foley, J. A., K. E. Taylor, and S. J. Ghan, Planktonic dimethylsulfide and cloud albedo: an estimate of the feedback response, Clim. Change, 18, 1-15, 1991.
Froelich, P. N., L. W. Kaul, J. T. Byrd, M. O. Andreae, and K. K. Roe, Arsenic, barium, germanium, tin, dimethylsulfide, and nutrient biochemistry in Charlotte Harbor, Florida, a phosphorus-enriched estuary, Estuarine Coastal Shelf Sci., 20, 239-264, 1985.
Gabric, A., N. Murray, L. Stone, and M. Kohl, Modelling the production of dimethylsulfide during a phytoplankton bloom, J. Geophys. Res., 98, 22,805-22,816, 1993a.
Gabric, A., C. N. Murray, L. Stone, and M. Kohl, A model of dimethylsulphide production during a phytoplankton bloom, in Dimethylsulphide: Oceans, Atmosphere, and Climate, edited by G.

442 KETTLE ET AL.: SEA SURFACE DIMETHYLSULFIDE MEASUREMENTS
Restelli and G. Angeletti, pp. 63-81, Kluwer, Dordrecht, Germany, 1993b.
Gabtic, A. J., G. P. Ayers, and G. C. Sander, Independent marine and atmospheric model estimates of the sea-air flux of dimethylsuifide in the Southern Ocean, Geophys. Res. Lett., 22, 3521-3524, 1995.
Gabtic, A. J., G. Ayers, C. N. Murray, and J. Parslow, Use of remote sensing and mathematical modelling to predict the flux of dimethylsulphide to the atmosphere in the Southern Ocean, Adv. Space Res., 18, (7)117- (7) 128, 1996.
Galloway, J. N., et al., Sulfur and nitrogen levels in the North Atlantic Ocean's atmosphere: A synthesis of field and modeling results, Global Biogeochem. Cycles, 6, 77-100, 1992.
Gibson, J. A. E., R. C. Garrick, H. R. Burton, and A. R. McTaggart, Dimethylsulfide concentrations in the ocean close to the Antarctic continent, Geomicrobial. J., 6, 179-184, 1988.
Gibson, J. A. E., R. C. Garrick, H. R. Burton, and A. R. McTaggart, Dimethylsulfide and the alga Phaeocystis pouchetii in Antarctic coastal waters, Mar. Biol. Berlin, 104, 339-346, 1990.
Graedel, T. E., et al., A compilation of inventories of emissions to the atmosphere, Global Biogeochem. Cycles, 7, 1-26, 1993.
Graedel, T. E., Global emissions inventories to aid atmospheric modelers, Eos Trans., 75, 585, 591, 1994.
Groene, T., Biogenic production and consumption of dimethylsulfide (DMS) and dimethylsulfoniopropionate (DMSP) in the marine epipelagic zone: A review, J. Mar. Syst., 6, 191-209, 1995.
Hatton, A.D., G. Malin, S. M. Turner, and P.S. Liss, DMSO: A significant compound in the biogeochemical cycle of DMS, in Biological and Environmental Chemistry of DMSP and Related Sulphonium Compounds, edited by Ronald P. Kiene, P. T. 'Visscher, M.D. Keller, and G. O. Kirst, pp. 405-412, Plenum, New York, 1996.
Hatton, A.D., S. M. Turner, G. Malin, and P.S. Liss, Dimethylsulphoxide and other biogenic sulphur compounds in the Galapagos Plume, Deep Sea Res., Part II, 45, 1043-1053, 1998.
Hatton, A.D., G. Malin, and P.S. Liss, Distribution of biogenic sulphur compounds during and just after the Southwest Monsoon in the Arabian Sea, Deep Sea Res., Part II, 46, 1999.
Holligan, P.M., S. M. Turner, and P.S. Liss, Measurements of dimethyl sulphide in frontal regions, Cont. ShelfRes., 7, 213-224, 1987.
Holligan, P.M., et al., A biogeochemical study of the coccolithophore, emiliania huxleyi, in the North Atlantic, Global Biogeochem. Cycles, 7, 879-900, 1993.
Hu, M., X. Tang, J. Li, and Z. Yu, Flux of dimethylsulfide in the Jiaozhou Bay, China, J. of Environ. Sci. (China), 9, 80-85, 1997.
Iverson, R. L., F. L. Nearhoof, and M. O. Andreae, Production of dimethylsulfonium propionate and dimethylsulfide by phytoplankton in estuarine and coastal waters, Limnol. Oceanogr., 34, 53-67, 1989.
Karsten, U., C. Wiencke, and G. O. Kirst, Growth pattern of [5- dimethylsulphoniopropionate (DMSP) content of green macroalgae at different light irradiances, Mar. Biol. Berlin, 108, 151-155, 1991.
Karsten, U., C. Wiencke, and G. O. Kirst, Dimethylsulphiopropionate (DMSP) accumulation in green macroalgae from polar to temperate regions: Interactive effects of light versus salinity and light versus temperature, Polar Biol., 12,603-607, 1992.
Keller, M.D., W. K. Bellows, and R. L. Guillard, Dimethylsulfide production in marine phytoplankton, in Biogenic Su.li'i•r in the Environment, edited by E.S. Saltzman and W. J. Cooper, pp. 167-182, Amer. Chem. Soc., Washington, D.C., 1989.
Keller, M.D., and W. K. Bellows, Physiological aspects of the production of DMSP by marine phytoplankton, in Biological and Environmental Chemistry of DMSP and Related Sulfonium Compounds, edited by R. P. Kiene, P. T. Visscher, M.D. Keller, and G. O. Kirst, pp. 131-142, Plenum, New York, 1996.
Kieber, D. J., J. Jiao, R. P. Kiene, and T. S. Bates, Impact of dimethylsulfide photochemistry on methyl sulfur cycling in the equatorial Pacific Ocean, J. Geophys. Res., 101, 3715-3722, 1996.
Kiene, R. P., Turnover of dissolved DMSP in the estuarine and shelf waters of the northern Gulf of Mexico, in Biological and Environmental Chemistry of DMSP and Related Sulfonium Compounds, edited by R. P. Kiene, P. T. Visscher, M.D. Keller, and G. O. Kirst, pp. 337-349, Plenum, New York, 1996.
Kiene, R. P., and T. S. Bates, Biological removal of dimethyl sulphide from sea water, Nature, 345, 702-705, 1990.
Kirst, G. O., C. Thiel, H. Wolff, J. Nothnagel, M. Wanzek, and R. Ulmke, Dimethylsulfoniopropionate (DMSP) in ice-algae and its possible biological role, Mar. Chem, 35, 381-388, 1991.
Kirst, G. O., M. Wanzek, R. Haase, S. Rapsomanikis, S. de Mora, G. Schebeske, and M. O. Andreae, Ecophysiology of ice algae (Antarctica): Dimethylsulfoniopropionate content and release of dimethylsulfide during ice melt, in Dimethylsulphide: Oceans, Atmosphere, and Climate, edited by G. Restelli and G. Angeletti. pp. 23-36, Kluwer, Dordrecht, Germany, 1993.
Kwint, R. L. J., and K. J. M. Kramer, Dimethylsulfide production by plankton communities, Mar. Ecol. Prog. Ser., 121,227-237, 1995.
Kwint, R. L. J., and K. J. M. Kramer, Annual cycle of the production and fate of DMS and DMSP in the marine coastal system, Mar. Ecol. Prog. Ser., 134, 217-224, 1996.
Lawrence, M. G., An empirical analysis of the strength of the phytoplankton- dimethylsulfide-cloud-climate feedback cycle, J. Geophys. Res., 98, 20,663-20,673, 1993.
Leck, C., and C. Petsson, The central Arctic Ocean as a source of dimethyl sulfide seasonal variability in relation to biological activity. Tellus Ser. B, 48, 156-177, 1996.
Leck, C., and H. Rodhe, Emissions of marine biogenic sulfur to the atmosphere of northern Europe, J. Atmos. Chem., 12, 63-86, 1991.
Leck, C., U. Larsson, L. E. B•gander, S. Johansson, and S. Hajdu, Dimethyl sulfide in the Baltic Sea: Annual variability in relation to biological activity, J. Geophys. Res., 95, 3353-3363, 1990.
Ledyard, K. M. and J. W. H. Dacey, Kinetics of DMSP-lyase activity in coastal seawater, in Biological and Environmental Chemistry of DMSP and Related Sulfonium Compounds, edited by R. P. Kiene, P. T. Visscher, M.D. Keller, and G. O. Kirst. pp. 325-335, Plenum, New York, 1996.
Lee, P. A., and S. J. de Mora, DMSP, DMS, and DMSO concentrations and temporal trends in marine surface waters at Leigh, New Zealand, in Biological and Environmental Chemistry o.[ DMSP and Related Su.lfonium Compounds, edited by R. P. Kiene, P. T. Visscher, M.D. Keller, and G. O. Kirst, pp. 391-404, Plenum, New York, 1996.
Levitus, S., and T. P. Boyer, NOAA Atlas NESDIS 2, World Ocean Atlas 1994, vol. 2: Oxygen, Nat. Environ. Satellite, Data, and Inf. Serv., Nat. Oceanic and Atmos. Admin., U.S. Dep. of Comm., Washington, D.C., March 1994a.
Levitus, S., and T. P. Boyer, NOAA Atlas NESDIS 4, Worm Ocean Atlas 1994, vol. 4: Temperature. Nat. Environ. Satellite, Data, and Inf. Serv., Nat. Oceanic and Atmos. Admin., U.S. Dep. of Comm., Washington, D. C., March 1994b.
Levitus, S., R. Burgett, and T. P. Boyer, NOAA Atlas NESDIS 3, World Ocean Atlas 1994, vol. 3: Salinity, Nat. Environ. Satellite, Data, and Inf. Serv., Nat. Oceanic and Atmos. Admin., U.S. Dep. of Comm., Washington, D.C., March 1994.
Liss, P.S., and L. Merlivat, Air-sea exchange rates: Introduction and synthesis, in The Role of Air-Sea Exchange in Geochemical Cycling, edited by P. Buat-Menard, pp. 113-127, D. Reidel, Norwell, Mass., 1986.
Liss, P.S., A. J. Watson, M. I. Liddicoat, G. Malin, P. D. Nightingale, S. M. T•urner, and R. C. Upstill-Goddard, Trace gases and air-sea exchanges, Philos. Trans. R. Soc. London Ser. A., 343, 534-541, 1993.
Liss, P.S., G. Malin, S. M. Turner, and P.M. Holligan, Dimethyl sulphide and Phaeocystis: A review, J. Mar. Syst., 5, 41-53, 1994.
Liss, P.S., A.D. Hatton, Go Malin, P. Nightingale, and S. M. Turner, Marine sulphur emissions, Philos. Trans R. Soc. Ix•ndon Ser B, 352, 159-169, 1997.
Longhurst, A., S. Sathyendranath, T. Platt, and C. Caverhill, An estimate of global primary production in the ocean from satellite radiometer data, J. Plankton Res., 17, 1245-1271, 1995.
Lovelock, J. E., R. J. Maggs, and R. A. Rasmussen, Atmospheric dimethyl sulfide and the natural sulphur cycle, Nature, 237, 452-453, 1972.
Malin, G., S. Turner, and P. Liss, Sulfur: The plankton/climate connection, J. Phycol., 28, 590-597, 1992.
Malin, G., S. Turner, P. Liss, P. Holligan, and D. Harbour, Dimethylsulphide and dimethylsulphoniopropionate in the northeast Atlantic during the summer coccolithophore bloom, Deep Sea Res, 40, 1487-1508, 1993.
Malin, G., P.S. Liss, and S. M. Turner, Dimethyl sulfide: Production and atmospheric consequences, in The Haptophyte Algae, edited by J. C. Green and B. S.C. Leadbeater, pp. 303-320, Clarendon, Oxford, 1994.
KETI'LE ET AL.: SEA SURFACE DIMETHYLSULFIDE MEASUREMENTS 443
Matrai, P. A., and M.D. Keller. Dimethylsulfide in a large-scale coccolithophore bloom in the Gulf of Maine, Cont. Shelf Res., 13, 831- 843, 1993.
Matrai, P. A., and M. D. Keller. Total organic sulfur and dimethylsulfoniopropionate (DMSP) in marine phytoplankton: Intracellular variations. Mar. Biol. Berlin, 119, 61-68, 1994.
Matrai, P. A., and M. Vernet, Dynamics of the vernal bloom in the marginal ice-zone of the Barents Sea. DMS and DMSP budgets, J. Geophys. Res., 102, 22,965-22,971, 1997.
Matrai, P. A., W. M. Balch, D. J. Cooper, and E. S. Saltzman, Ocean color and mesoscale variability, J. Geophys. Res., 98, 23,469-23,476, 1993.
Matrai, P. A., M. Vernet, R. Hood, A. Jennings, S. Samundsdottir, and E. Brody, Light dependent production of DMS and carbon incorporation by polar strains of Phaeocystis spp., Mar. Biol Berlin, 124, 157-167, 1995.
Matrai, P. A., D. J. Cooper, and E. S. Saltzman, Frontal enhancement of dimethylsulfide concentrations across a Gulf Stream meander, J. Mar. Syst., 7, 1-8, 1996.
McTaggart, A. R., and H. Burton, Dimethyl sulfide concentrations in the surface waters of the Australasian Antarctic and Subantarctic Oceans
during an austral summer, J. Geophys. Res., 97, 14,407-14,412, 1992. McTaggart, A. and H. Burton, Aspects of the biogeochemistry of
dimethylsulfide (DMS) and dimethylsulfoniopropionate (DMSP) at an Antarctic coastal site, in Dimethylsulfide.' Oceans, Atmosphere, and Climate, edited by G. Restelli and G. Angeletti, pp. 43-52, Kluwer, Dordrecht, Germany, 1993.
Mihalopoulos, N., Contribution a l'6tude du cycle biog6ochimique de l'oxysulfure de carbone dans l'atmosphi•re, Ph.D. thesis, Univ. de Paris VII, Paris, 1989.
Mihalopoulos, N., B. C. Nguyen, and S. Belviso, The oceanic source of carbonyl sulfide (COS), Atmos. Environ., Part A, 26, 1383-1394, 1992.
Murray, N., A. J. Gabric, L. Stone, G. Realini, and M. Kohl, The production and cycling of dimethylsulfide in marine surface waters - A simulation approach, Fresenius Environ. Bull., I, 274-279, 1992.
National Geophysical Data Center (NGDC), ETOP05: Digital Relie. f of the Surface of the Earth, NGDC Data Announcement 88-MGG-02, Nat. Geophys. Data Cent., Boulder, Colo., 1988.
Nevison, C. D., R. Fo Weiss, and D. J. Erickson III, Global oceanic emissions of nitrous oxide, J. Geophys. Res., 100, 15,809-15,820, 1995.
Nguyen, B. C., A. Gaudry, B. Bonsang, and G. Lambert, Reevaluation of the role of dimethyl sulfide in the sulfur budget, Nature, 275, 637-639, 1978.
Nguyen, B.C., S. Belviso, N. Mihalopoulos, J. Gostan, and P. Nival, Dimethyl sulfide production during natural phytoplanktonic blooms, Mar. Chem.,24, 133-141, 1988.
Nguyen, B. C., N. Mihalopoulos, and S. Belviso, Seasonal variation of atmospheric dimethylsulfide at Amsterdam Island in the southern Indian Ocean, J. Atmos. Chem., I I, 123-141, .1990.
Nguyen, B.C., N. Mihalopoulos, J.P. Putaud, A. Gaudry, L. Gallet, W. C. Keene, and J. N. Galloway, Covariations in oceanic dimethyl sulfide, its oxidation products and rain acidity at Amsterdam Island in the southern Indian Ocean, J. Atmos. Chem., 15, 39-53, 1992.
Pfannkuche, O., J. C. Duinker, G. Graf, R. Henrich, H. Thiel, and B. Zeitzschel, Meteor-Berichte, Nr. 93-4, Nordatlantik 92, Reise Nr. 21, 16 M'firz- 31 August, 1992, Inst. far Meereskunde der Univ. Hamburg, Hamburg, Germany, 1993.
Platt, T., S. Sathyendranath, and A. Longhurst, Remote sensing of primary production in the ocean: Promis6 and fulfillment, Philos. Trans. R. Soc. London, Ser. B, 348, 191-202, 1995.
Press, W. H., S. A. Teukolsky, W. T. Vetterling, and B. P. Flannery, Numerical Recipes in C; The Art of Scientific Computing, Cambridge University Press, New York, 1992.
Putaud, J.-P., and B. C. Nguyen, Assessment of dimethylsulfide sea-air exchange rate, J. Geophys. Res., 101, 4403-4411, 1996.
Putaud, J.P., S. Belviso, B. C. Nguyen, and N. Mihalopoulos, Dimethylsulfide, aerosols, condensation nuclei over the tropical northeastern Atlantic Ocean, J. Geophys. Res., 98, 14,863-14,871, 1993a.
Putaud, J.P., B.C. Nguyen, S. Belviso, and N. Mihalopoulos, Are dimethylsulfide and condensation nuclei connected over the tropical northeastern Atlantic Ocean? in Dimethylsulphide: Oceans,
Atmosphere, and Climate, edited by G. Restelli and G. Angeletti, pp. 303-310, Kluwer, Dordrecht, Germany, 1993b.
Quinn, P. K.; T. S. Bates, J. E. Johnson, D. S. Covert, and R. J. Charlson, Interactions between the sulfur and reduced nitrogen cycles over the central Pacific Ocean, J. Geophys. Res., 95, 16,405-16,416, 1990.
Reed, R. H. Measurements and osmotic significance of [5- dimethylsulfoniopropionate in marine macroalgae, Mar. Biol. Lett., 4, 173-181, 1983.
Sathyendranath, S., L. Lazzara, and L. Prieur, Variations in the spectral values of specific absorption of phytoplankton, Limnol. Oceanogr., 32, 403-415, 1987.
Sathyendranath, S., A. Longhurst, C. M. Caverhill, and T. Platt, Regionally and seasonally differentiated primary production in the North Atlantic, Deep Sea Res., Part I, 42, 1773-1802, 1995.
Schwartz, S. E., Are global climate albedo and climate controlled by marine phytoplankton? Nature, 336, 441-445, 1988.
Shaw, G. E., Bio-controlled thermostatis involving the sulfur cycle, Clim. Change, 5,297-303, 1983.
Shaw, G. E., R. L. Benner, W. Cantrell and D. Veazey, The regulation of climate: A sulfate particle feedback loop involving deep convection - An editorial essay, Clim. Change, 39, 23-33, 1998.
Shuman, F. G., Numerical methods in weather prediction, II, Smoothing and filtering• Mon. Weather Rev., 85, 357-361, 1957.
Siegel, D. A. and A. F. Michaels, Quantification of non-algal light attenuation in the Sargasso Sea: Implications for biogeochemistry and remote sensing, Deep Sea Res., Part H, 44, 321-345, 1996.
Sim6, R., J. O. Grimalt, C. Pedr6s-Ali6, and J. Albaig6s, Occurrence and transformation of dissolved dimethyl sulfur species in stratified seawater (western Mediterranean Sea), Mar. Ecol. Prog. Ser., 127, 291-299, 1995.
Sim6, R., J. O. Grimalt, and J. Albaig6s, Dissolved dimethylsulphide, dimethylsulphoniopropionate and dimethylsulphoxide in western Mediterranean waters, Deep Sea Res., Part H, 44, 929-950, 1997.
Spiro, P. A., D. J. Jacob, and J. A. Logan, Global inventory of sulfur emissions with a 1øxl ø resolution, J. Geophys. Res., 97, 6023-6036, 1992.
Staubes, R., and H.-W. Georgii, Biogenic sulfur compounds in seawater and the atmosphere in the Antarctic region, Tellus, Ser. B, 45, 127-137, 1993a.
Staubes, R., and H.-W. Georgii, Measurements of atmospheric and seawater DMS concentrations in the Atlantic, the Arctic, and the Antarctic region, in Dimethylsulfide: Oceans, Atmosphere, and Climate, edited by G. Restelli and G. Angeletti, pp. 95-102, Kluwer, Dordrecht, Germany, 1993b.
Staubes-Diederich, R., Verteilung yon Dimethylsulfid, Carbonylsulfid und Schwefelkohlenstoff in Ozean und Mariner Atmosph•ire, Ph.D. thesis, Johann Wolfgang Goethe-Universit•it, Frankfurt am Main, Germany, 1992.
Suess, E., F S Sonne, Fahrtbericht SO 97, Kodiak-Vent, Kodiak-Dutch Harbour-Tokyo-Singapur, 27.7.-19.9.1994, GEOMAR Report, Tech. Rep. 29, Res. Cent. for Mar. Geosci., Christian Albrechts Univ., Kiel, Germany, 1994.
Tanzer, D., and K. G. Heumann, Gas chromatographic trace-level determination of volatile-organic sulfides and selenides and of methyl iodide in Atlantic surface water, lnt. J. Environ. Anal. Chem., 48, 17- 31, 1992.
Tarras6n, L., S. Turner, and I. Floisand, Estimation of seasonal dimethyl sulphide fluxes over the North Atlantic Ocean and their contribution to European pollution levels, J. Geophys. Res., I00, 11,623-11,639, 1995.
Thompson, A.M., W. E. Esaias, and R. L. Iverson, Two approaches to determining the sea-to-air flux of dimethyl sulfide: Satellite ocean color and a photochemical model with atmospheric measurements, J. Geophys. Res., 95, 20,551-20,558, 1990.
Trenberth, K. E., J. G. Olson, and W. G. Large, A global ocean wind stress climatology based on ECMWF analysis, Tech. Note NCAR/TN- 338+STR, Natl. Cent. for Atmos. Res., Boulder, Colo., Aug. 1989.
Turner, S. M., and P.S. Liss, Measurements of various sulfur gases in a coastal marine environment, J. Atmos. Chem., 2,223-232, 1985.
Turner, S. M., G. Malin, P.S. Liss, D. S. Harbour, and P.M. Holligan, The seasonal variation of dimethylsulfide and dimethylsulfoniopropionate

444 KETTLE ET AL.: SEA SURFACE DIMETHYLSULFIDE MEASUREMENTS
concentrations in nearshore waters, Limnol. Oceanogr., 33, 364-375, 1988.
Turner, S. M., G. Malin, and P.S. Liss, Dimethyl sulfide and (dimethylsulfonio) propionate in European coastal and shelf waters, in Biogenic Sulfitr in the Environment, edited by E. S. Saltzman and W. J. Cooper, pp. 183-200, Am. Chem. Soc., Washington, D.C., 1989.
Turner, S. M., P. D. Nightingale, W. Broadgate, and P.S. Liss, The distribution of dimethyl sulphide and dimethylsulphoniopropionate in Antarctic waters and sea ice, Deep Sea Res., Part II, 42, 1059-1080, 1995.
Turner, S. M., G. Malin, P. D. Nightingale, and P.S. Liss, Seasonal variation of dimethyl sulphide in the North Sea and an assessment of fluxes to the atmosphere, Mar. Chem., 54, 245-262, 1996a.
Turner, S. M., P. D. Nightingale, L. J. Spokes, M. I. Liddicoat, and P.S. Liss, Increased dimethyl sulphide concentrations in sea water from in situ iron enrichment, Nature, 383, 513-517, 1996b.
Uchida, A., T. Ooguri, and Y. Ishida, The distribution of dimethylsulphide in the waters off Japan and in the subtropical and tropical Pacific Ocean, Nippon Suisan Gakkaishi, 58, 261-265, 1992.
Uher, G., G. Schebeske, S. Rapsomanikis, and M. O. Andreae, Measurements of dimethyl sulfide in surface waters of the northeast Atlantic Ocean, Ann. Geophys., 13, suppl. 1I, Part II, C394, Hamburg, Germany, 1995.
Uher, G., G. Schebeske, S. Rapsomanikis, and M. O. Andreaeo The distribution of dissolved dimethylsulfide at the European continental margin, Ann. Geophys., 14, suppl. H, C590, Den Haag, Netherlands, 1996.
Uher, G., G. Schebeske, S. Rapsomanikis, and M. O. Andreae, The distribution of dissolved dimethylsulfide at the European continental margin, OMEX I final report, Subproject Carbon Cycling and Biogases, Brussels, European Union Marine Science and Technology (MAST) program, 1997.
Uzuka, N., S. Watanabe, and S. Tsunogai, Dimethylsulfide in coastal zone of the East China Sea, J. Oceanogr., 52, 313-321, 1996.
Vairavamurthy, A., M. O. Andreae, and R. L. Iverson, Biosynthesis of dimethylsulfide and dimethylpropiothetin by Hytnenomonas carterae in relation to sulfur source and salinity variations, Limnol. Oceanogr., 30, 59-70, 1985.
van den Berg, A. J., S. M. Turner, F. C. van Duyl, and P. Ruardij, Model structure and analysis of dimethylsulfide (DMS) production in the southern North Sea, considering phytoplankton dimethylsulphoniopropionate- (DMS1 •) lyase and eutrophication effects, Mar. Ecol. Prog. Ser., 145, 233-244, 1996.
Vetter, Y.-A., and J. H. Sharp, Influence of light intensity on dimethylsulfide production by a marine diatom, Limnol. Oceanogr., 38, 419-425, 1993.
Watanabe, S., H. Yamamoto, and S. Tsunogai, Dimethyl sulfide widely varying in surface water of the eastern North Pacific, Mar. Chem., 51, 253-259, 1995a.
Watanabe, S., H. Yamamoto, and S. Tsunogai, Relation between the concentrations of DMS in surface seawater and air in the temperate North Pacific region, J. Atmos. Chem., 22, 271-283, 1995b.
Woodruff, S. D., R. J. Slutz, R. L. Jenne, and P. M. Steurer, A comprehensive ocean-atmosphere data set, Bull. Am. Meteorol. Soc., 68, 1239-1250, 1987.
Yang, G.-P., Z. Zhang, L. Liu, X. Liu, Study on the analysis and distribution of dimethyl sulfide in the East China Sea, Chin. J. Oceanol. Limnol., 14, 141-147, 1996.
Yang, G.-P., X.-T. Liu, L. Liu, Z.-B. Zhang, Biogeochemistry of dimethylsulfide in the South China Sea, J. Mar. Res., 57, 189-211, 1999.
Yvon, S. A., E. S. Saltzman, D. J. Cooper, T. S. Bates, and A.M. Thompson, Atmospheric sulfur cycling in the tropical Pacific marine boundary layer
(12øS,135øW): A comparison of field data and model results, 1, Dimethylsulfide, J. Geophys. Res., 10!, 6899-6909, 1996.
D. Amouroux, Laboratoire de Chimie Analytique Bio-Inorganique et Environnement, Centre National de la Recherche Scientifique, Universit6 de Pau et des Pays de L' Adour, H61ioparc Pau Pyr6n6es, 2 Avenue Piere Angot, 64053 Pau, Cedex 9, France. ([email protected])
M. O. Andreae, T. W. Andreae, G. Helas, A. J. Kettle, S. Rapsomanikis, G. Roberts, and G. Schebeske, Max Planck Institute for Chemistry, Biogeochemistry Department, P.O. Box 3060, 55020 Mainz, Germany. (,moa @ mpch-mainz.mpg. de, twa @ mpch-mainz. mpg.de, gth @ mpch- mainz.mpg.de, [email protected], [email protected], schebi @mpch-mainz.mpg.de)
T. S. Bates, NOAA/Pacific Marine Laboratory, 7600 Sand Point Way N. E., Seattle, WA, 98115. ([email protected])
H. Berresheim, DWD/MOHp, Albin-Schwaiger-Weg 10, 82383 Hohenpeisenberg, Germany. ([email protected])
H. Bingemer and R. Staubes, Johann Wolfgang Goethe University, Georg Voigt Strasse 14, D-60325 Frankfurt am Main, Germany. (Bingemer@meteor. uni- frankfurt.de)
R. Boniforti, ENEA Centro Ricerche Ambiente Marino, P.O. Box 316, 19100 La Spezia, Italy.
M. A. J. Curran, Antarctic CRC and Australian Antarctic Division, University of Tasmania, G. P.O. Box 252-80, Hobart, Tasmania 7001, Australia. (mark.curran @utas.edu.au)
G. R. DiTullio, University of Charleston, Grice marine Laboratory, 205 Fort Johnson, Charleston, SC 29412. (ditullioj @cofc.edu)
G. B. Jones, James Cook University of North Quensland, Townsville, Queensland 4811, Australia. ([email protected])
M.D. Keller and P. Matrai, Bigelow laboratory for Ocean Sciences, McKown Point, West Boothbay Harbor, ME 04575. ([email protected], PMatrai @bigelow.org)
R. P. Kiene, Department of Marine Sciences, University of Alabama, LSCB 25, Mobile, AL 36688. ([email protected])
C. Leck, Department of Meteorology, Stockholm University, S-106 91 Stockholm, Sweden. ([email protected])
M. Levasseur, Institut Maurice-Lamontagne, Minist•re des P•ches et des Oc6ans, Mont-Joli, Qu6bec, Canada G5H 3Z4. (LevasseurM@dfo- mpo.gc.ca)
G. Malin and S. Turner, University of East Anglia, Norwich NR4 7T J, England, U.K. ([email protected], [email protected])
M. Maspero and N. Novo, ENEL SRI, Via Reggio Emilia, 39, 20090 Segrate, Milan, Italy.
A. Ro McTaggart, Australia Antarctic Division, Channel Highway, Kingston 7150, Tasmania, Australia.
N. Mihalopoulos, University of Crete, P.O. Box 1470, 71409 lraklion, Crete, Greece. ([email protected])
B. C. Nguyen, Laboratoire des Sciences du Climat et de l'Environnement, DSM/LSCE Unifi Mixte de Recherche CEA-CNRS Bbt 709 - Orme des Merisiers, CEN Saclay 91191 Gif-sur-Yvette Cedex, France. ([email protected]. fr)
J.P. Putaud, Joint Research Centre, TP 460, 97 93, I-21020 Ispra (Va), Italy. (jean.putaud @jrc.it)
S. Sharma, Atmospheric Environment Service, 4905 Dufferin Street, Downsview, Ontario, Canada M3H 5T4. (Sangeeta. [email protected])
R. Sim6, Institut de Ciencies del Mar, Pg. Joan de Borbo s/n, 08039 Barcelona, Catalonia, Spain. ([email protected])
G. Uher, University of Newcastle upon Tyne, Ridley Building, Newcastle upon Tyne NE1 7RU, England, U.K. (Guenther. [email protected])
(Received May22, 1998; revised December 10, 1998; accepted January 22, 1999)