DLDS ANALYTICS : February Report 2018 - NICDC Logistics ...
38
Report Components DLDS ANALYTICS : February Report 2018 Logistics Redefined
-
Upload
khangminh22 -
Category
Documents
-
view
1 -
download
0
Transcript of DLDS ANALYTICS : February Report 2018 - NICDC Logistics ...

Report Components
DLDS ANALYTICS : February Report 2018
Logistics Redefined
EXECUTIVE SUMMARY
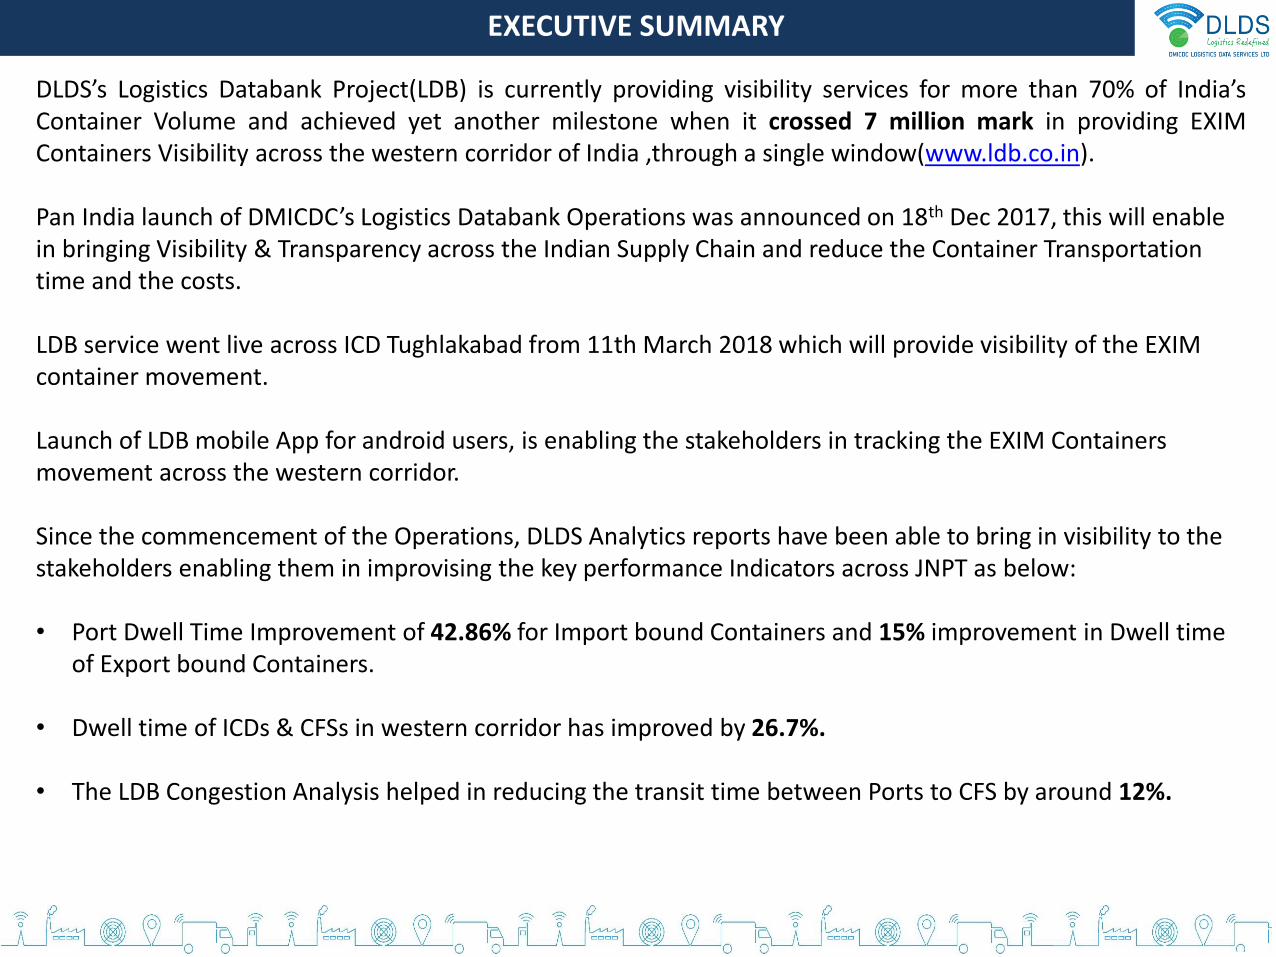
DLDS’s Logistics Databank Project(LDB) is currently providing visibility services for more than 70% of India’sContainer Volume and achieved yet another milestone when it crossed 7 million mark in providing EXIMContainers Visibility across the western corridor of India ,through a single window(www.ldb.co.in).
Pan India launch of DMICDC’s Logistics Databank Operations was announced on 18th Dec 2017, this will enable in bringing Visibility & Transparency across the Indian Supply Chain and reduce the Container Transportation time and the costs.
LDB service went live across ICD Tughlakabad from 11th March 2018 which will provide visibility of the EXIM container movement.
Launch of LDB mobile App for android users, is enabling the stakeholders in tracking the EXIM Containers movement across the western corridor.
Since the commencement of the Operations, DLDS Analytics reports have been able to bring in visibility to the stakeholders enabling them in improvising the key performance Indicators across JNPT as below:
• Port Dwell Time Improvement of 42.86% for Import bound Containers and 15% improvement in Dwell time of Export bound Containers.
• Dwell time of ICDs & CFSs in western corridor has improved by 26.7%.
• The LDB Congestion Analysis helped in reducing the transit time between Ports to CFS by around 12%.
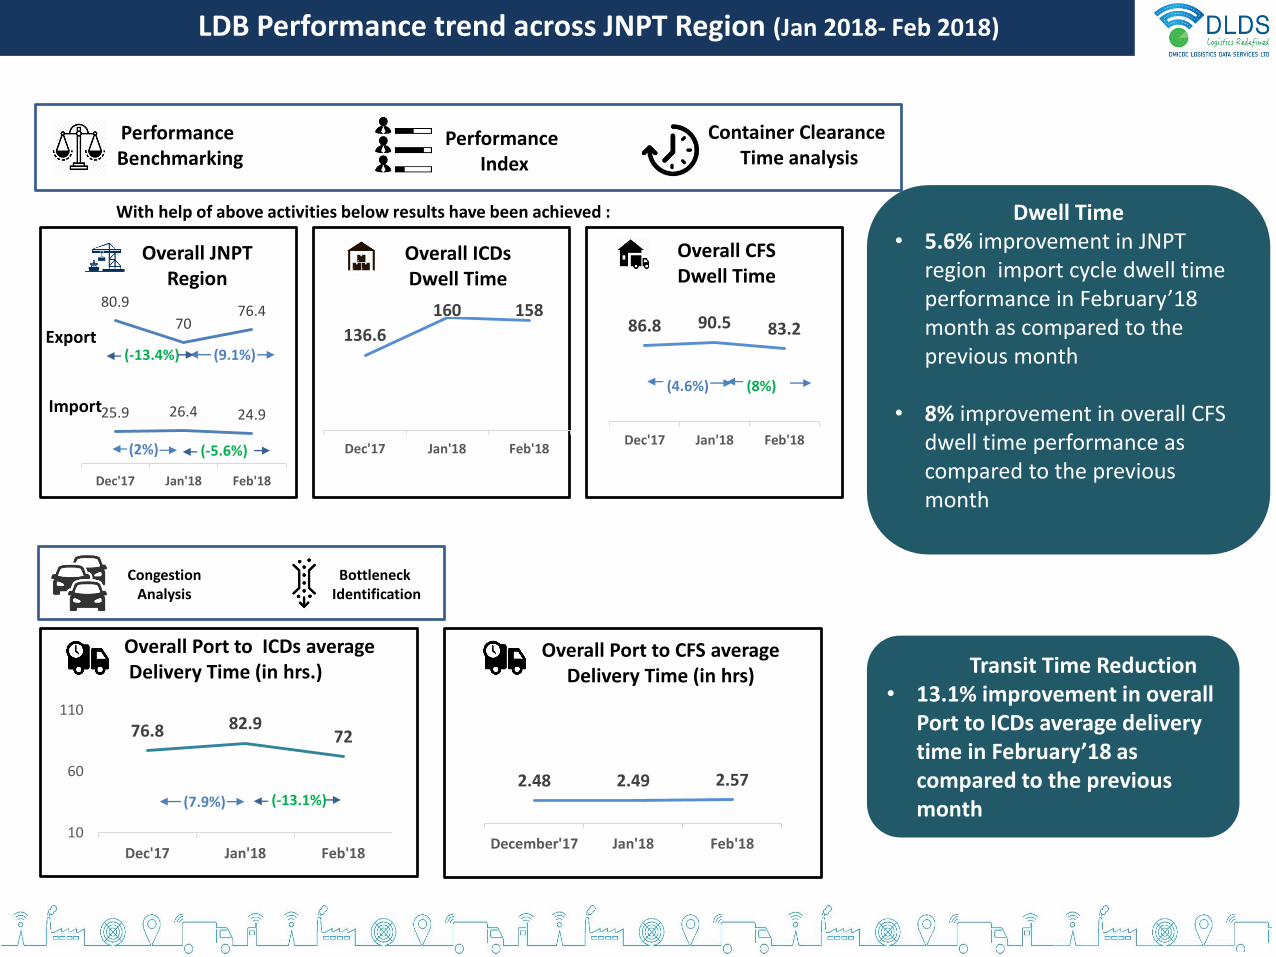
LDB Performance trend across JNPT Region (Jan 2018- Feb 2018)
Overall JNPT Region
Overall ICDs Dwell Time
Overall CFS Dwell Time
Performance Benchmarking
Performance Index
Container Clearance Time analysis
With help of above activities below results have been achieved :
Import
Export
Congestion Analysis
Bottleneck Identification
Overall Port to ICDs averageDelivery Time (in hrs.)
Overall Port to CFS average Delivery Time (in hrs)
25.9 26.4 24.9
80.9
7076.4
Dec'17 Jan'18 Feb'18
136.6
160 158
Dec'17 Jan'18 Feb'18
86.8 90.5 83.2
Dec'17 Jan'18 Feb'18
2.48 2.49 2.57
December'17 Jan'18 Feb'18
76.8 82.972
10
60
110
Dec'17 Jan'18 Feb'18
Transit Time Reduction• 13.1% improvement in overall
Port to ICDs average delivery time in February’18 as compared to the previous month
(9.1%)(-13.4%)
(4.6%)
(2%)
(8%)
(-5.6%)
(-13.1%)(7.9%)
Dwell Time• 5.6% improvement in JNPT
region import cycle dwell time performance in February’18 month as compared to the previous month
• 8% improvement in overall CFS dwell time performance as compared to the previous month
•
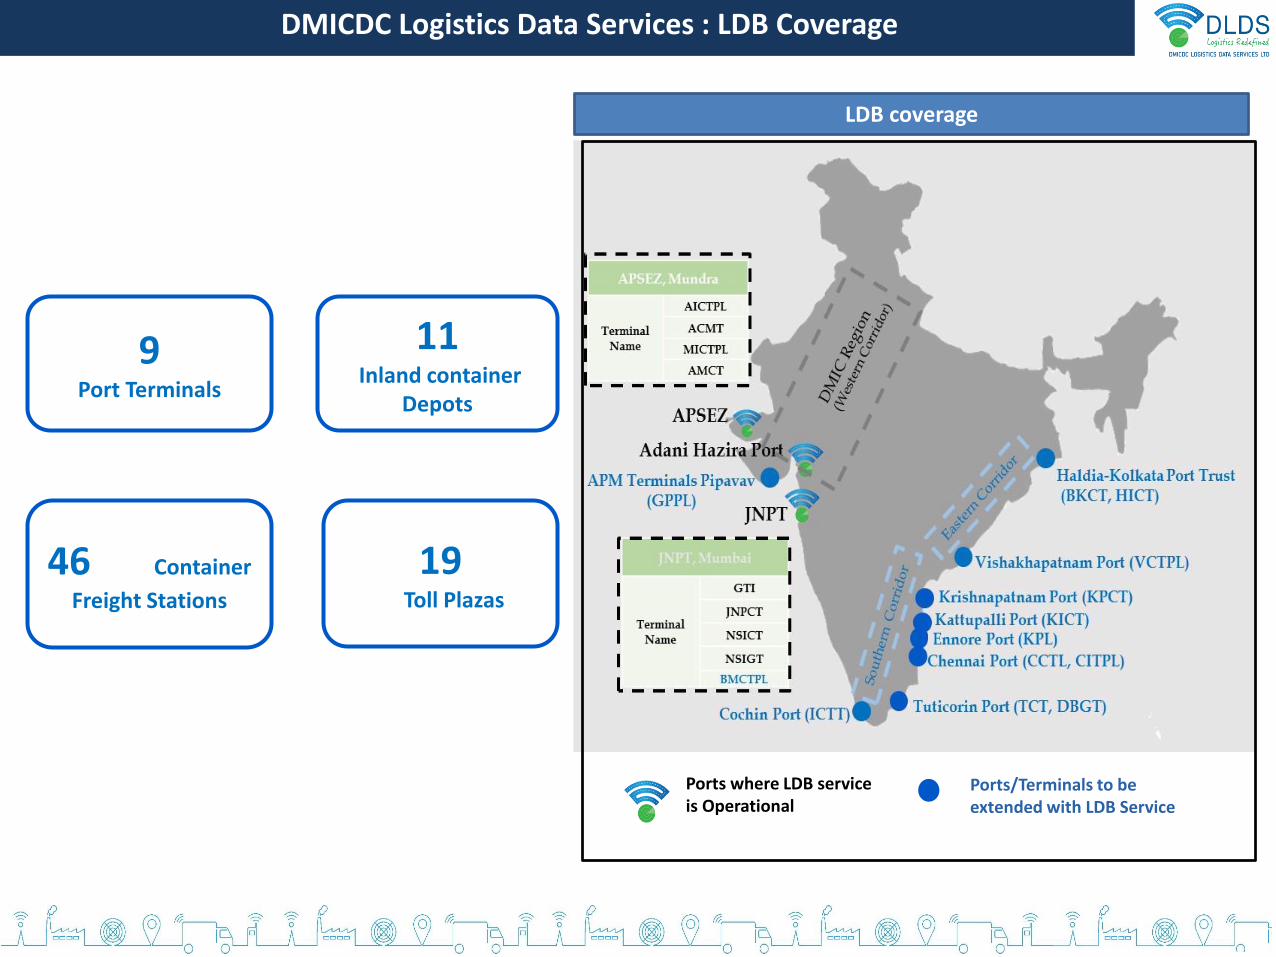
DMICDC Logistics Data Services : LDB Coverage
Ports where LDB service is Operational
Ports/Terminals to be extended with LDB Service
LDB coverage
9 Port Terminals
46 Container
Freight Stations
11 Inland container
Depots
19 Toll Plazas
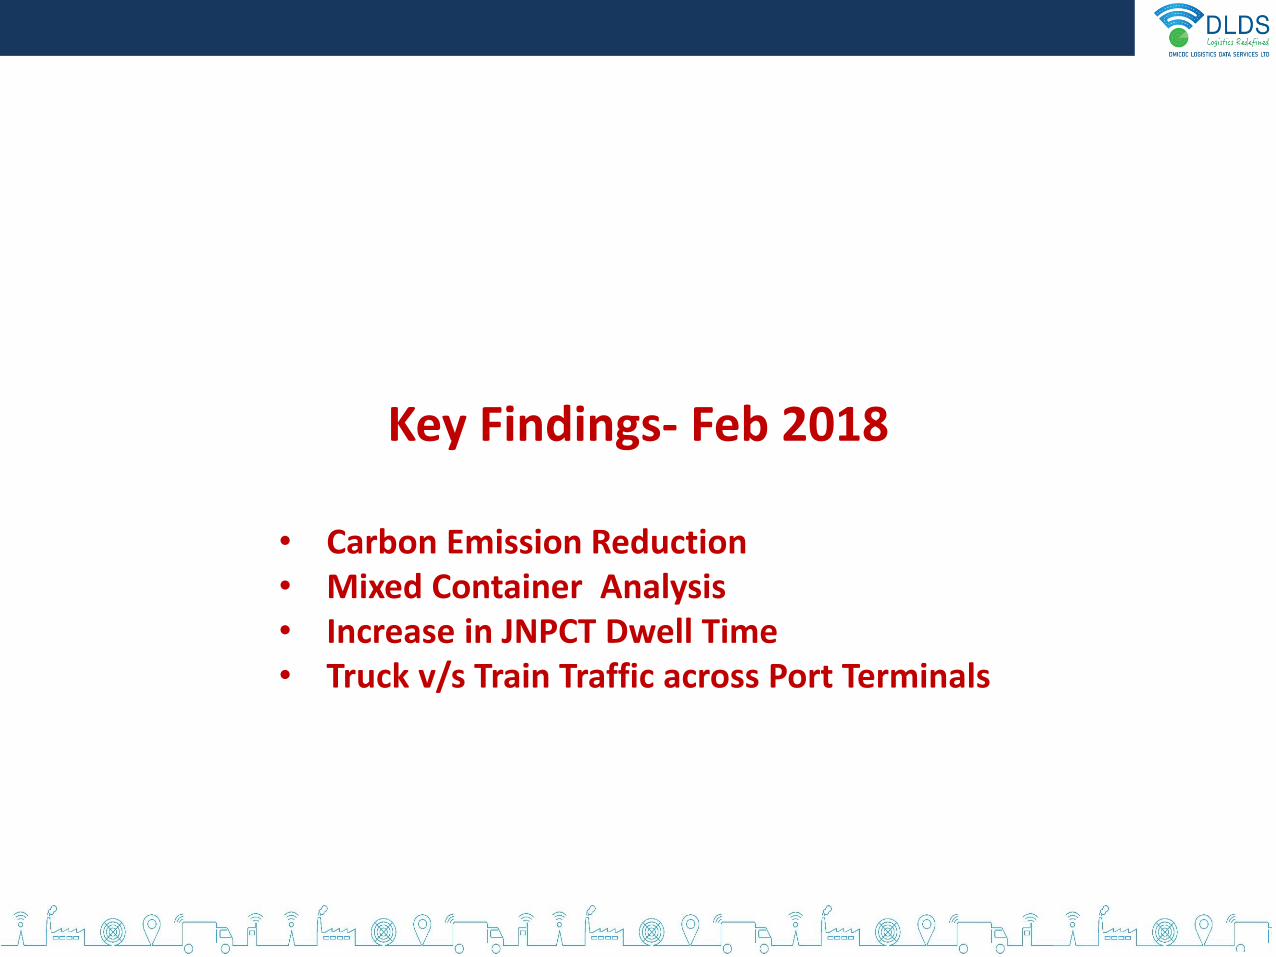
Key Findings- Feb 2018
• Carbon Emission Reduction• Mixed Container Analysis• Increase in JNPCT Dwell Time• Truck v/s Train Traffic across Port Terminals

Carbon Emission reduction

Average Transit Time (in hrs)
3.845.7
Port to CFS CFS to Port
Transit Time (Feb’17)
Congestion analysis has helped in reducing the transit time between JNPT port and surrounding CFS, this has enabled in reducing the carbon emission index.
Carbon Emission reduction around JNPT Port region
Pre-Scenario
178.17264.48
Port to CFS CFS to Port
CO2 emission (Feb’17)
CO2 emission per litre per truck (in kg CO2/ltr)
Decrease in Transit between JNPT port
and surrounding CFS has caused
reduction in carbon emission by trucks
Post-Scenario
2.44
Port to CFS CFS to Port
Transit Time (Dec’17)
111.36185.6
Port to CFS CFS to Port
CO2 emission (Dec’17)
CO2 emission per litre per truck (in kg CO2/ltr)
Results in
Results in
38% reduction in
CO2 emission
(Port to CFS)
30% reduction in
CO2 emission
(CFS to Port)
30% Reduction38%
Reduction
Average Transit Time (in hrs)
Average Transit Time (in hrs)
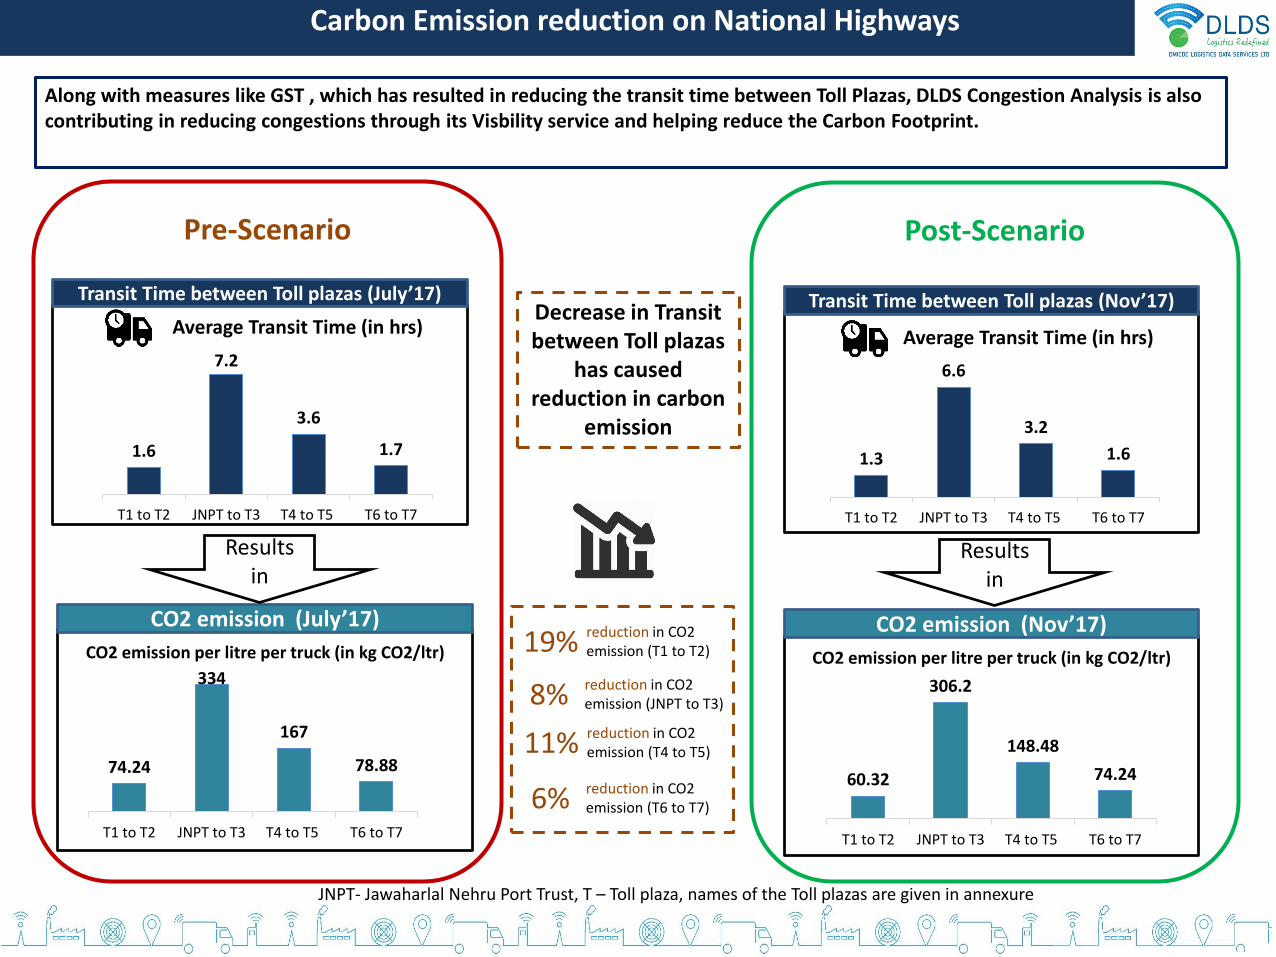
Transit Time between Toll plazas (July’17)
Carbon Emission reduction on National Highways
Pre-Scenario
CO2 emission (July’17)
CO2 emission per litre per truck (in kg CO2/ltr)
Decrease in Transit between Toll plazas
has caused reduction in carbon
emission
Post-Scenario
Transit Time between Toll plazas (Nov’17)
CO2 emission (Nov’17)
CO2 emission per litre per truck (in kg CO2/ltr)
Results in
Results in
19%
Average Transit Time (in hrs)
1.3
6.6
3.2
1.6
T1 to T2 JNPT to T3 T4 to T5 T6 to T7
1.6
7.2
3.6
1.7
T1 to T2 JNPT to T3 T4 to T5 T6 to T7
74.24
334
167
78.88
T1 to T2 JNPT to T3 T4 to T5 T6 to T7
60.32
306.2
148.48
74.24
T1 to T2 JNPT to T3 T4 to T5 T6 to T7
JNPT- Jawaharlal Nehru Port Trust, T – Toll plaza, names of the Toll plazas are given in annexure
reduction in CO2 emission (T1 to T2)
8% reduction in CO2 emission (JNPT to T3)
11% reduction in CO2 emission (T4 to T5)
6% reduction in CO2 emission (T6 to T7)
Along with measures like GST , which has resulted in reducing the transit time between Toll Plazas, DLDS Congestion Analysis is also contributing in reducing congestions through its Visbility service and helping reduce the Carbon Footprint.

JNPT Mixed Container Movement Analysis

39.00%
23%
14.00%
JNPCT
GTI
Nava Sheva
Mix container across JNPT terminal out of overall train bound containers (in%)
Below mentioned are the train bound mixed containers (in % volume) handled by the respective terminals in import and export cycle :
JNPT MIX CONTAINERS ANALYSIS (1/2)
JNPCT GTI Nava Sheva
Below figure depicts the percentage of containers of other terminals landed on respective terminals
GTI
Nava Sheva
JNPCT
Nava Sheva
JNPCT
GTI
57%
43%
22%
78%
47%
53%
Analysis has been performed on January’18 month data
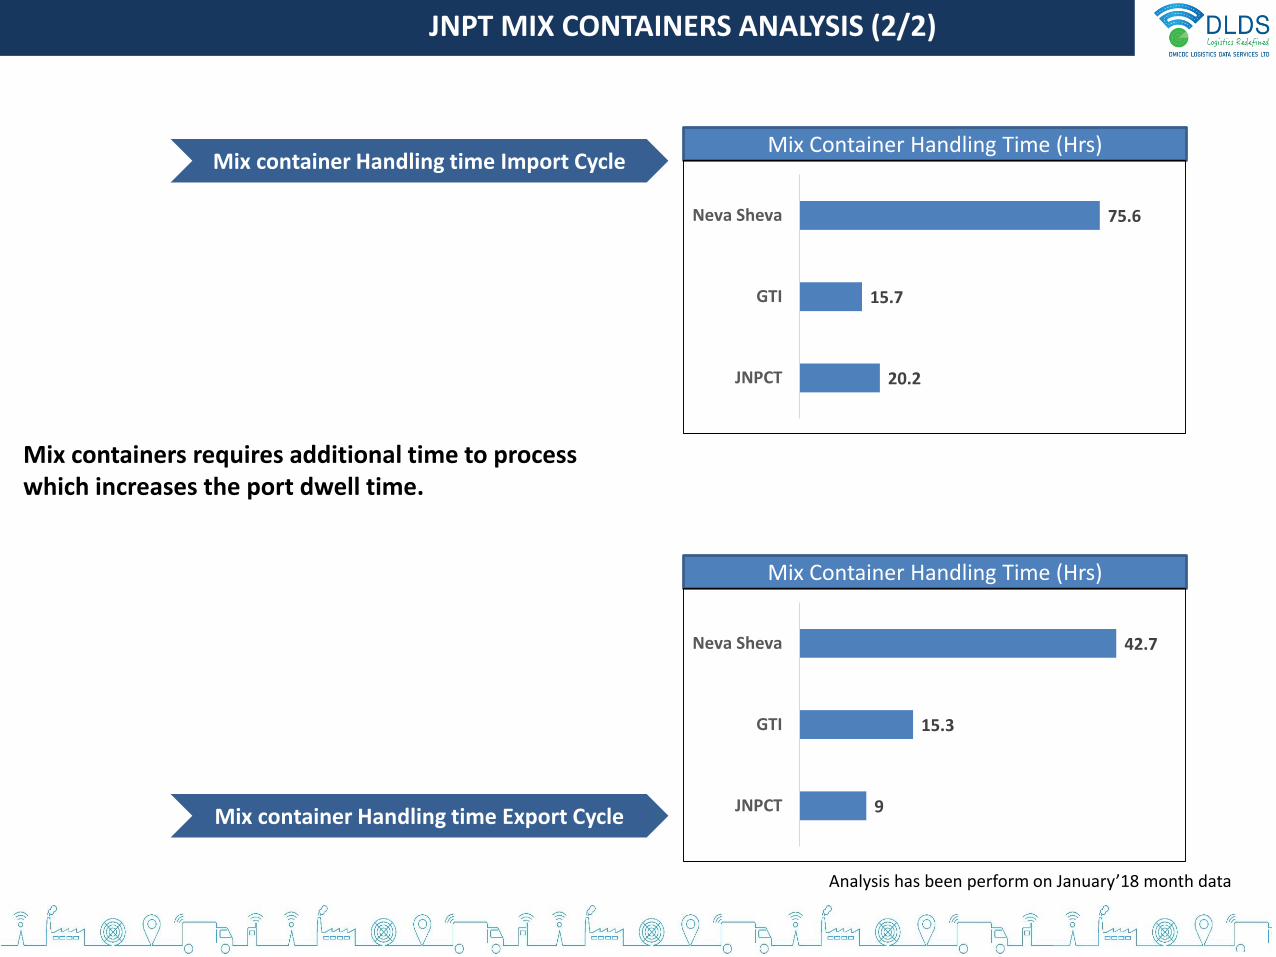
Mix Container Handling Time (Hrs) Mix container Handling time Import Cycle
Mix container Handling time Export Cycle
20.2
15.7
75.6
JNPCT
GTI
Neva Sheva
Mix Container Handling Time (Hrs)
9
15.3
42.7
JNPCT
GTI
Neva Sheva
Mix containers requires additional time to process which increases the port dwell time.
JNPT MIX CONTAINERS ANALYSIS (2/2)
Analysis has been perform on January’18 month data
Increase in JNPCT Dwell Time
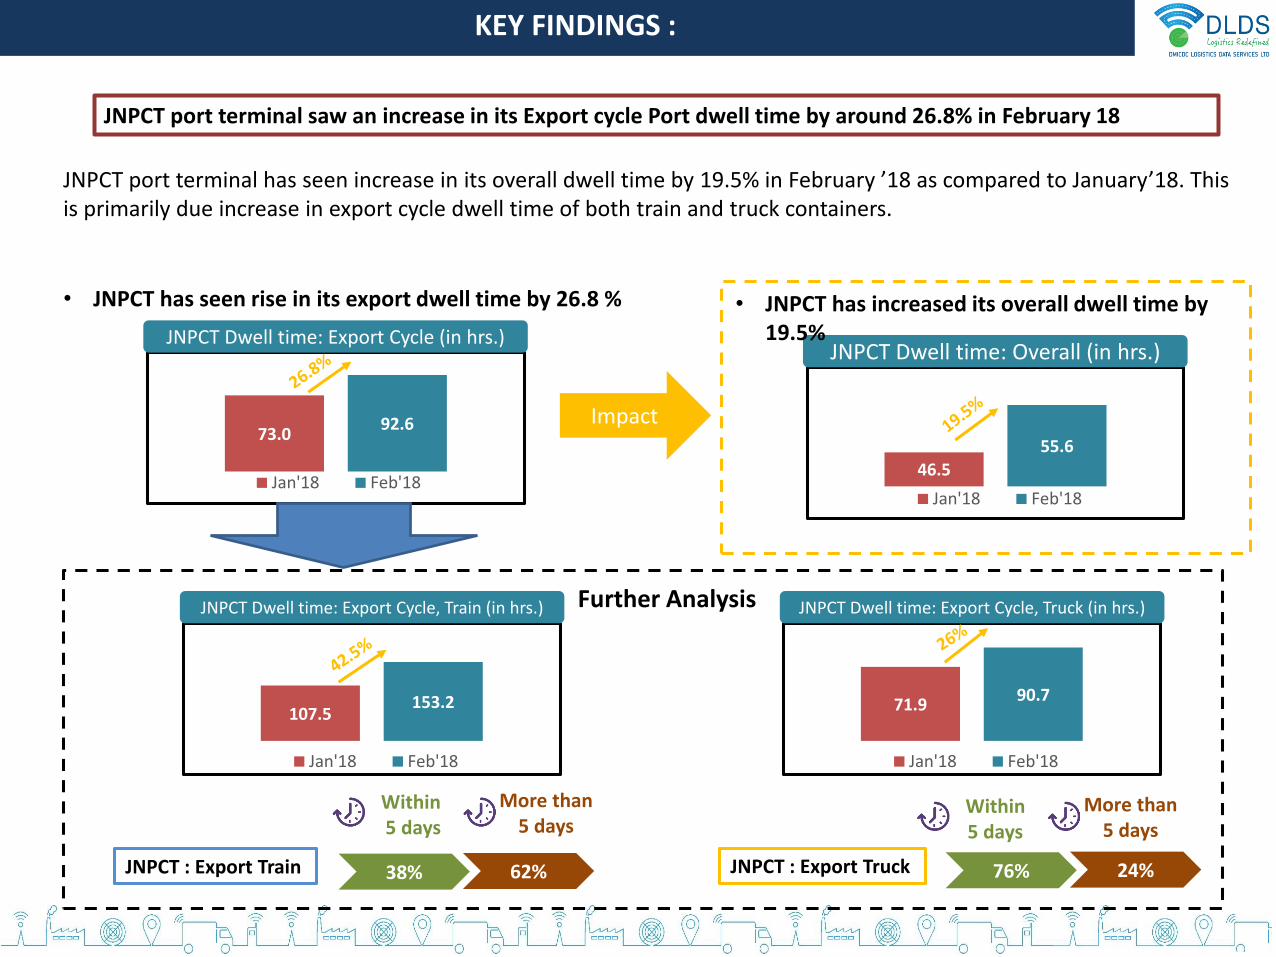
JNPCT port terminal saw an increase in its Export cycle Port dwell time by around 26.8% in February 18
KEY FINDINGS :
JNPCT port terminal has seen increase in its overall dwell time by 19.5% in February ’18 as compared to January’18. This is primarily due increase in export cycle dwell time of both train and truck containers.
46.5
55.6
Jan'18 Feb'18
JNPCT Dwell time: Overall (in hrs.)
More than5 days
Within5 days
JNPCT : Export Train JNPCT : Export Truck 38% 62% 76% 24%
• JNPCT has increased its overall dwell time by 19.5%
73.092.6
Jan'18 Feb'18
JNPCT Dwell time: Export Cycle (in hrs.)
• JNPCT has seen rise in its export dwell time by 26.8 %
Impact
107.5153.2
Jan'18 Feb'18
JNPCT Dwell time: Export Cycle, Train (in hrs.)
71.990.7
Jan'18 Feb'18
JNPCT Dwell time: Export Cycle, Truck (in hrs.)
More than5 days
Within5 days
Further Analysis
Truck v/s Train traffic handled
ImportCycle
MonthJNPT (Volume in %) APSEZ MUNDRA (Volume in %)
Truck Train Truck Train
Sept'17 83 17 78 22
Oct'17 81 19 77 23
Nov'17 82 18 82 18
Dec'17 81 19 77 23
Jan'18 86 14 80 20
Feb'18 87 13 80 20
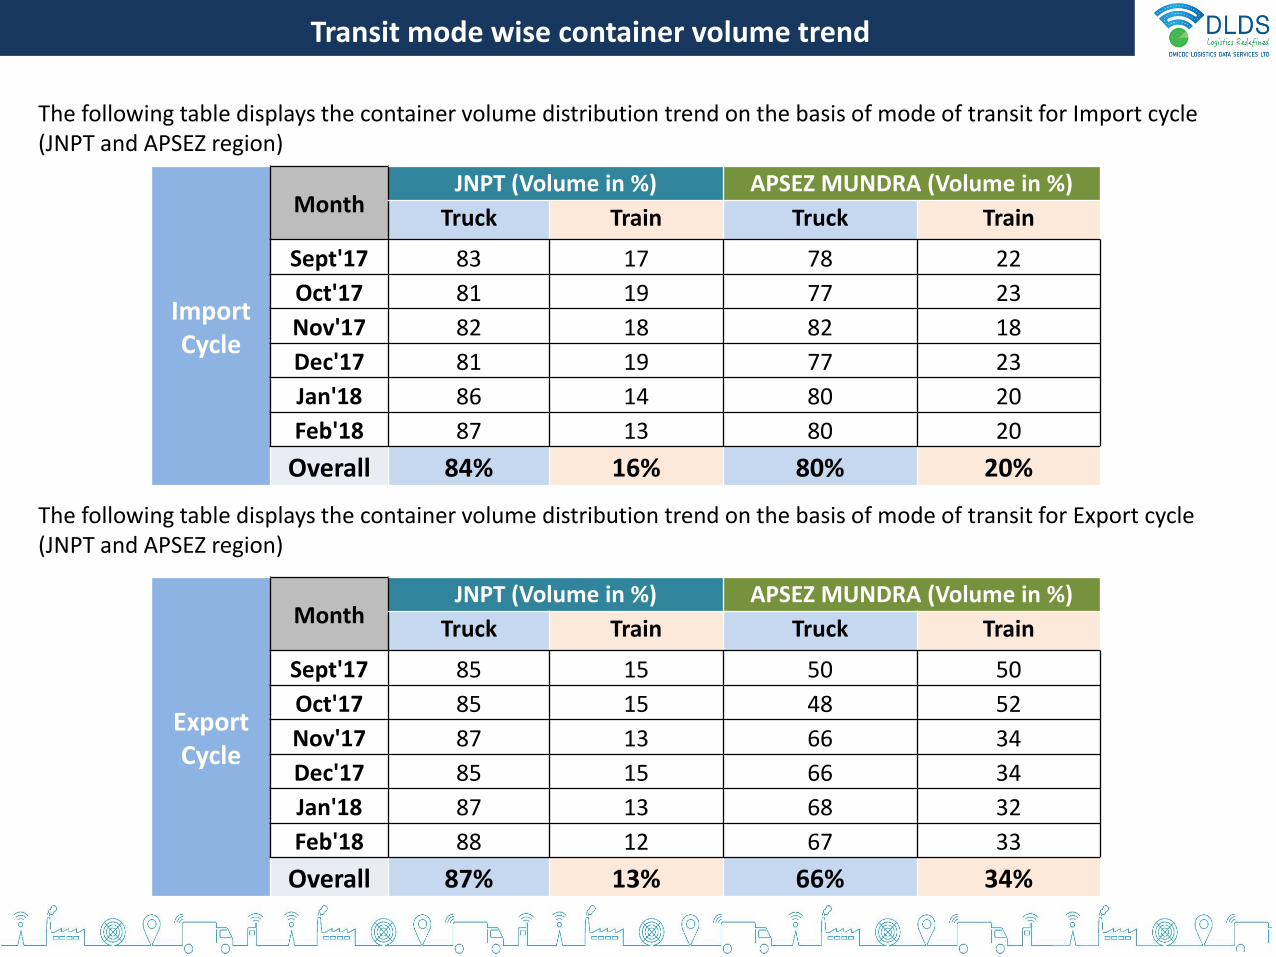
Overall 84% 16% 80% 20%
Transit mode wise container volume trend
The following table displays the container volume distribution trend on the basis of mode of transit for Import cycle (JNPT and APSEZ region)
The following table displays the container volume distribution trend on the basis of mode of transit for Export cycle (JNPT and APSEZ region)
ExportCycle
MonthJNPT (Volume in %) APSEZ MUNDRA (Volume in %)
Truck Train Truck Train
Sept'17 85 15 50 50
Oct'17 85 15 48 52
Nov'17 87 13 66 34
Dec'17 85 15 66 34
Jan'18 87 13 68 32
Feb'18 88 12 67 33
Overall 87% 13% 66% 34%

Performance Benchmarking
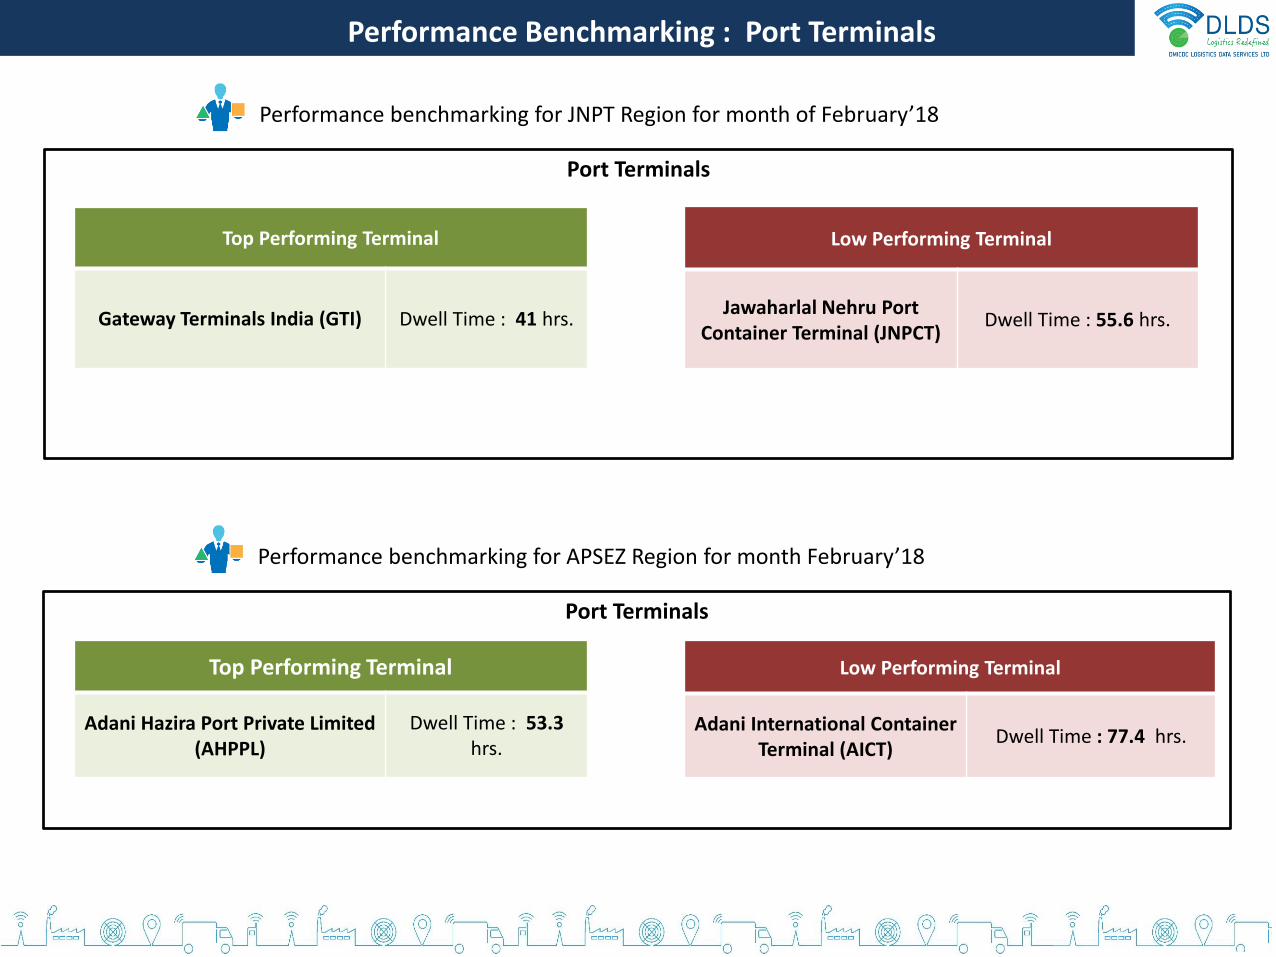
Top Performing Terminal
Gateway Terminals India (GTI) Dwell Time : 41 hrs.
Low Performing Terminal
Jawaharlal Nehru Port Container Terminal (JNPCT)
Dwell Time : 55.6 hrs.
Port Terminals
Performance Benchmarking : Port Terminals
Performance benchmarking for JNPT Region for month of February’18
Top Performing Terminal
Adani Hazira Port Private Limited (AHPPL)
Dwell Time : 53.3 hrs.
Low Performing Terminal
Adani International Container Terminal (AICT)
Dwell Time : 77.4 hrs.
Port Terminals
Performance benchmarking for APSEZ Region for month February’18
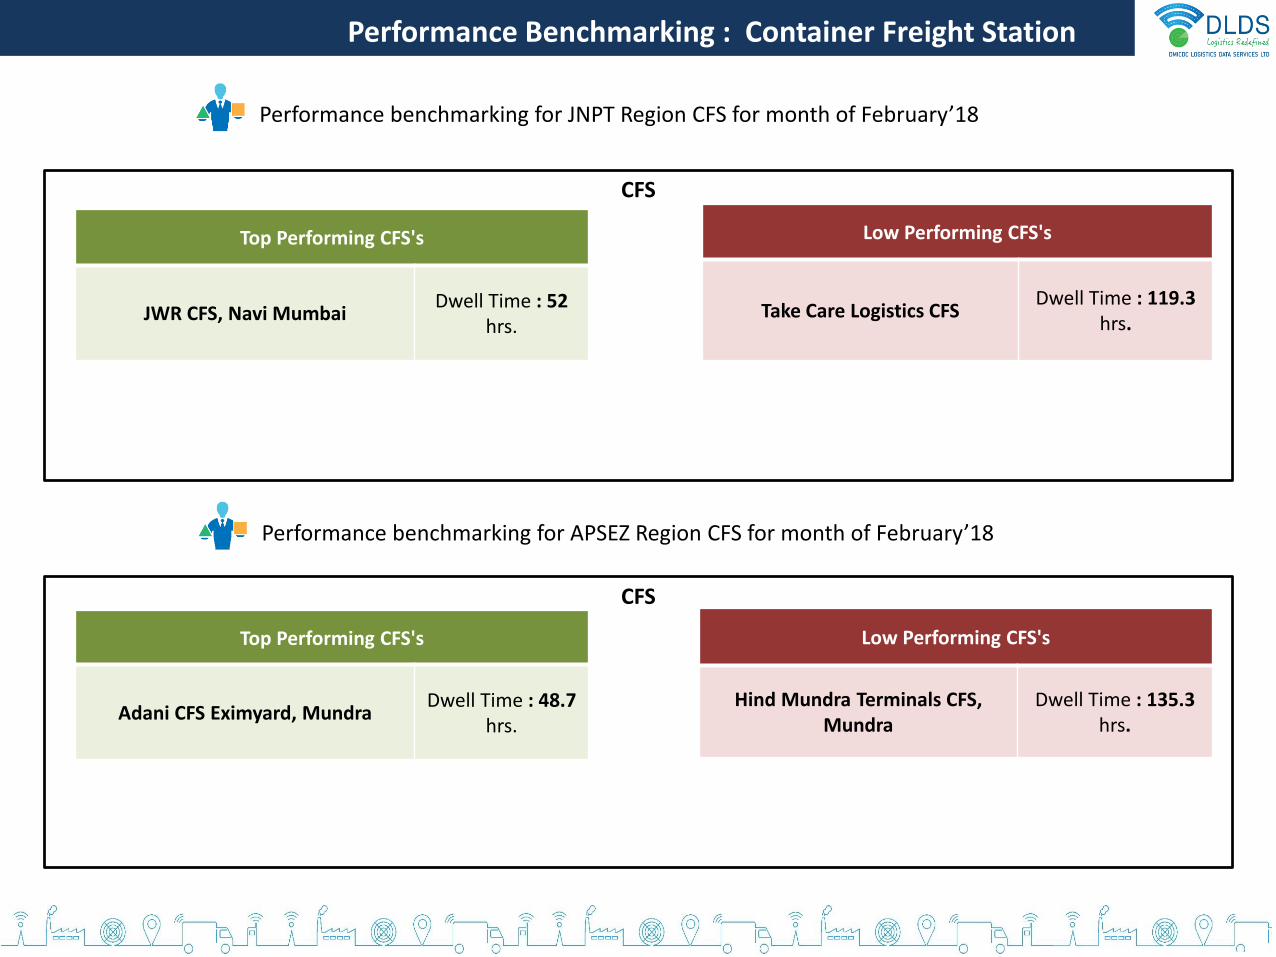
CFS
Top Performing CFS's
JWR CFS, Navi MumbaiDwell Time : 52
hrs.
Low Performing CFS's
Take Care Logistics CFSDwell Time : 119.3
hrs.
Performance Benchmarking : Container Freight Station
Performance benchmarking for JNPT Region CFS for month of February’18
CFS
Top Performing CFS's
Adani CFS Eximyard, MundraDwell Time : 48.7
hrs.
Low Performing CFS's
Hind Mundra Terminals CFS, Mundra
Dwell Time : 135.3hrs.
Performance benchmarking for APSEZ Region CFS for month of February’18
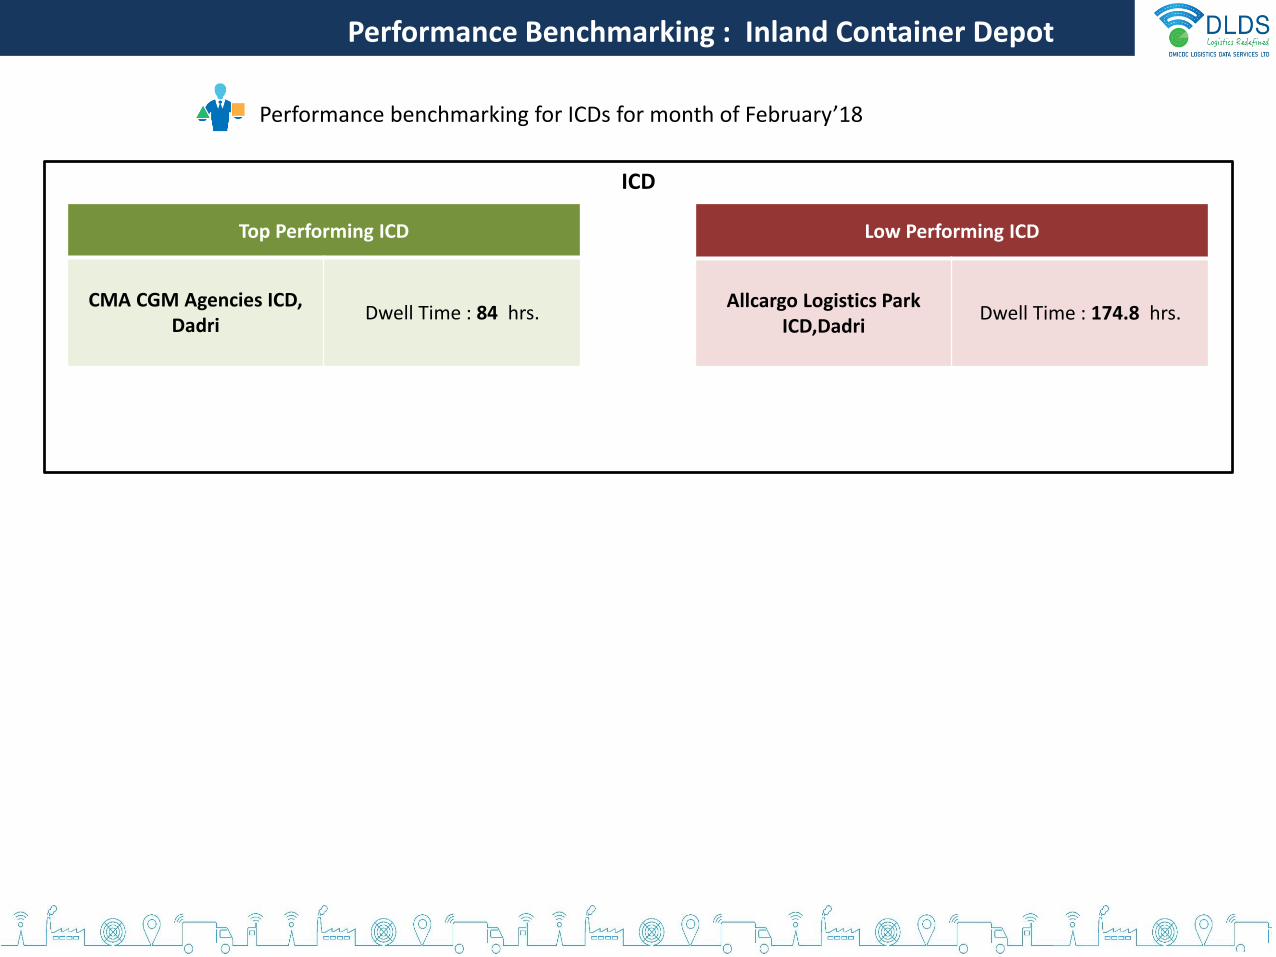
Performance Benchmarking : Inland Container Depot
Performance benchmarking for ICDs for month of February’18
Top Performing ICD
CMA CGM Agencies ICD, Dadri
Dwell Time : 84 hrs.
Low Performing ICD
Allcargo Logistics Park ICD,Dadri
Dwell Time : 174.8 hrs.
ICD
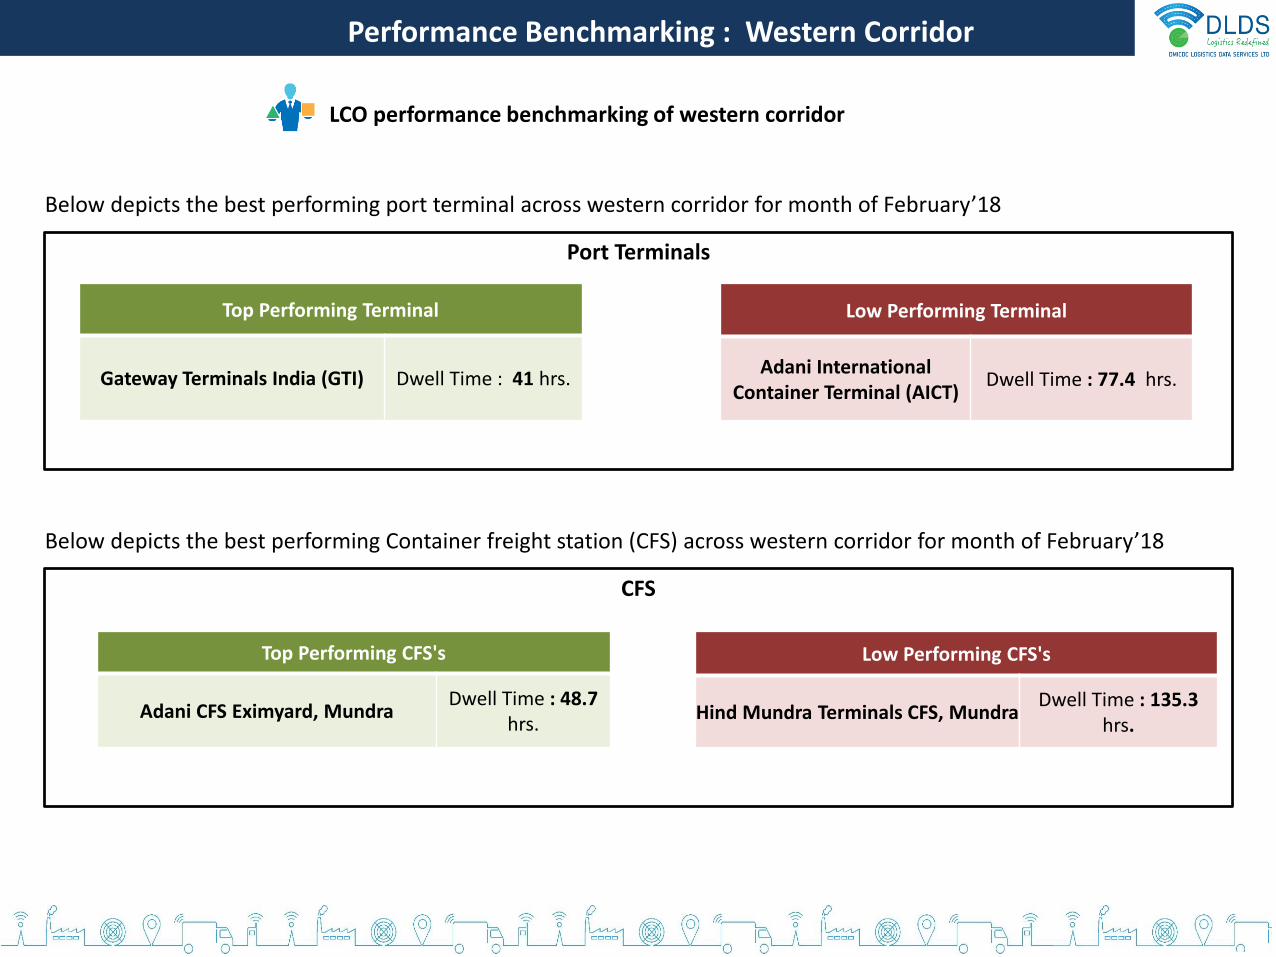
Performance Benchmarking : Western Corridor
LCO performance benchmarking of western corridor
Top Performing Terminal
Gateway Terminals India (GTI) Dwell Time : 41 hrs.
Port Terminals
Low Performing Terminal
Adani International Container Terminal (AICT)
Dwell Time : 77.4 hrs.
CFS
Top Performing CFS's
Adani CFS Eximyard, MundraDwell Time : 48.7
hrs.
Low Performing CFS's
Hind Mundra Terminals CFS, MundraDwell Time : 135.3
hrs.
Below depicts the best performing port terminal across western corridor for month of February’18
Below depicts the best performing Container freight station (CFS) across western corridor for month of February’18
JNPCT
NSICT
GTI
NSIGT
AHPPL
AMCT
AICT
ACMTPL
MICT
Quadrant : IQuadrant : II
Quadrant : III Quadrant : IV
Port Terminal Performance Index : February’18
Dwell TimeC
on
tain
er
Vo
lum
e
Highlow
low
Hig
h
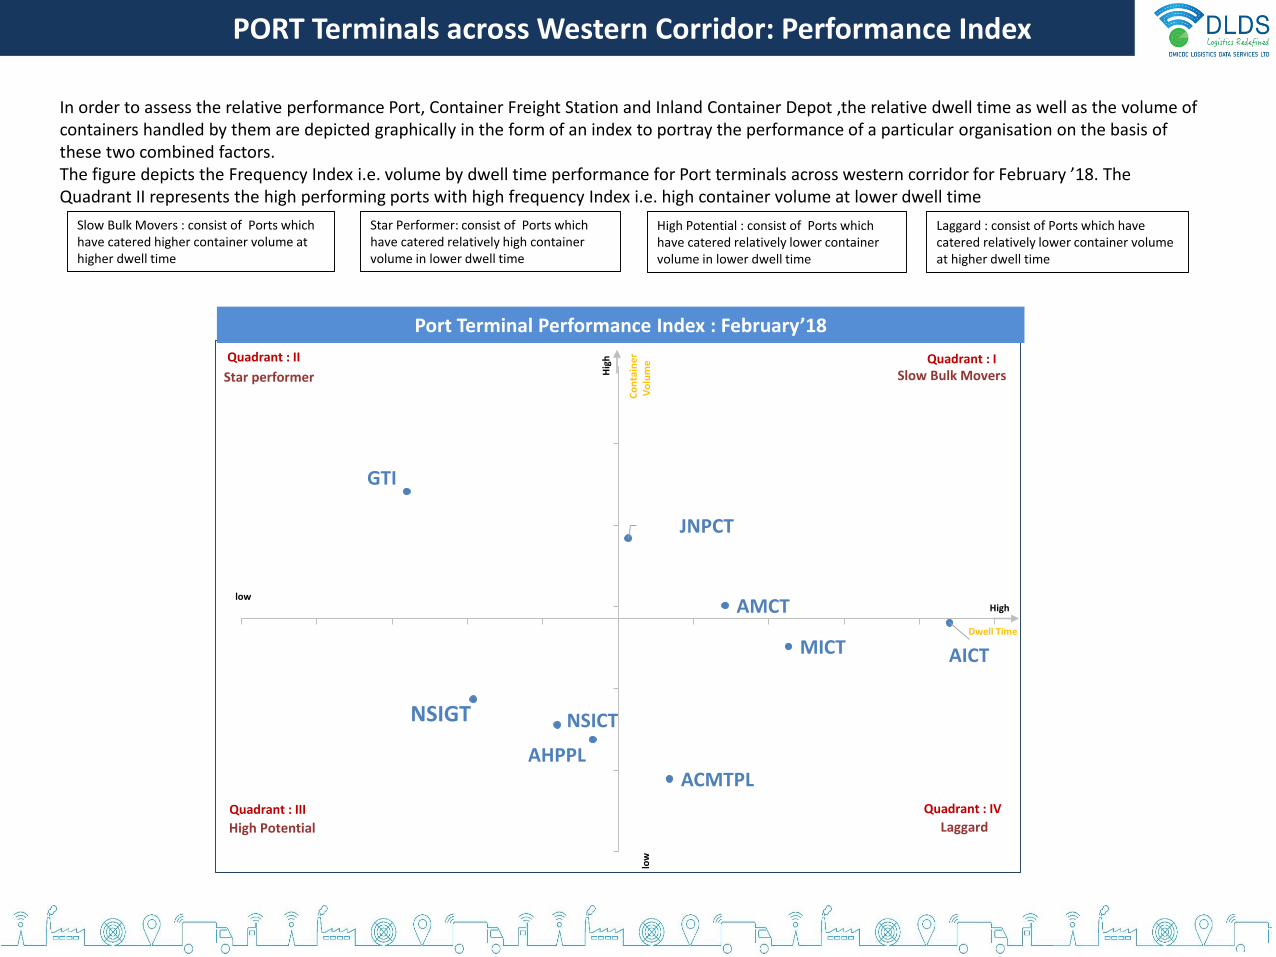
PORT Terminals across Western Corridor: Performance Index
In order to assess the relative performance Port, Container Freight Station and Inland Container Depot ,the relative dwell time as well as the volume of containers handled by them are depicted graphically in the form of an index to portray the performance of a particular organisation on the basis of these two combined factors.The figure depicts the Frequency Index i.e. volume by dwell time performance for Port terminals across western corridor for February ’18. The Quadrant II represents the high performing ports with high frequency Index i.e. high container volume at lower dwell time
Slow Bulk Movers : consist of Ports which have catered higher container volume at higher dwell time
Star Performer: consist of Ports which have catered relatively high container volume in lower dwell time
High Potential : consist of Ports which have catered relatively lower container volume in lower dwell time
Laggard : consist of Ports which have catered relatively lower container volume at higher dwell time
Star performer
Laggard
Slow Bulk Movers
High Potential
Speedy Multimode CFS, JNPT
Balmer & Lawrie CFS, Navi Mumbai
Gateway Distriparks CFS, Navi Mumbai
APM (Maersk India) CFS, …
Continental Warehousing CFS, Navi Mumbai
Seabird CFS, Navi Mumbai
JWC Logistics Park CFS
Ameya Logistics CFS, Navi Mumbai
Ashte Logistics CFS, Panvel
Navkar Corporation Yard 1 CFS, Panvel
Apollo …
Ocean Gate CFS, Panvel
Indev Logistics CFS, Panvel
Transindia Logistics Park, Navi Mumbai
CWC Dronagiri CFS, Navi Mumbai
All Cargo Logistics CFS, …
Navkar Corporation Yard 2 CFS, Panvel
JWR CFS
Punjab Conware CFS, Navi Mumbai
Dronagiri Rail Terminal CFS, Navi Mumbai
Maharashtra State Corp CFS
Navkar Corporation Yard 3 …
International Cargo Terminals (ULA) CFS, Navi Mumbai
Maersk Annex (APM)CFS, Navi Mumbai
TG Terminals CFS
SBW Logistics CFS, Navi Mumbai
International Cargo Terminal CFS
Take Care Logistics CFS
Quadrant : IQuadrant : II
Quadrant : IIIQuadrant : IV
JNPT region CFS Performance Index for February‘18
Dwell Time
Co
nta
ine
rV
olu
me
Highlow
low
Hig
h
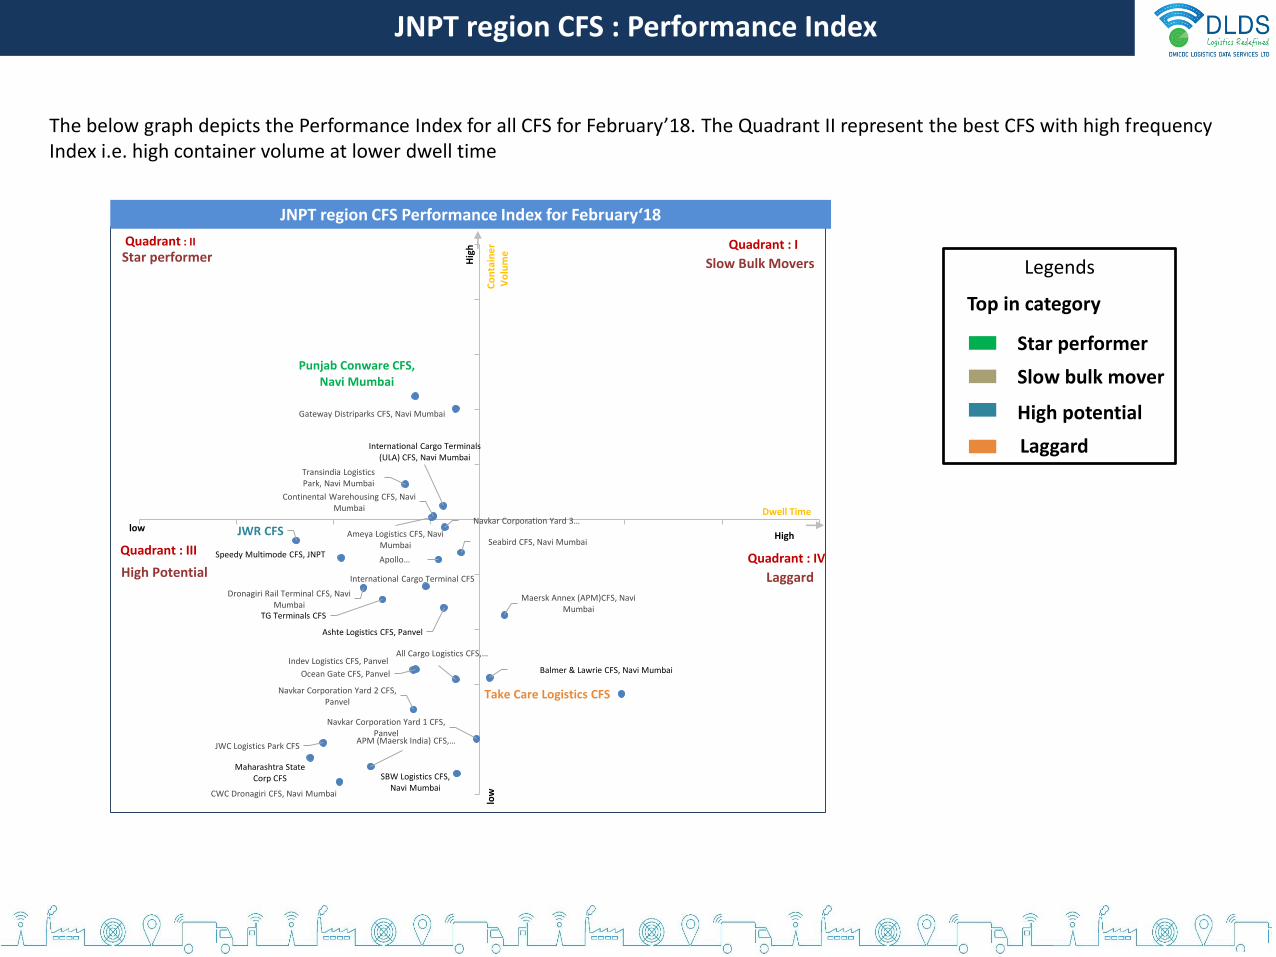
The below graph depicts the Performance Index for all CFS for February’18. The Quadrant II represent the best CFS with high frequency Index i.e. high container volume at lower dwell time
JNPT region CFS : Performance Index
Star performer
Laggard
Slow Bulk Movers
High Potential
Top in category
Star performer
Slow bulk mover
High potential
Laggard
Legends
MICT CFS, Mundra
Mundhra CFS, Mundra
Ashutosh CFS, Mundra
Saurashtra CFS, Mundra
Transworld CFS, Mundra
Honey Comb CFS, MundraSeabird CFS, Mundra
TG Terminals CFS, Mundra
Hind Mundra Terminals CFS, Mundra
Adani CFS Eximyard, …
Adani CFS, Hazira
Seabird CFS, Hazira
AllCargo CFS, Mundra
Hind Terminal CFS, Hazira
Quadrant : IQuadrant : II
Quadrant : III
Quadrant : IV
Gujrat CFS Performance Index for February‘18
Dwell TimeC
on
tain
er
Vo
lum
eHighlow
low
Hig
h
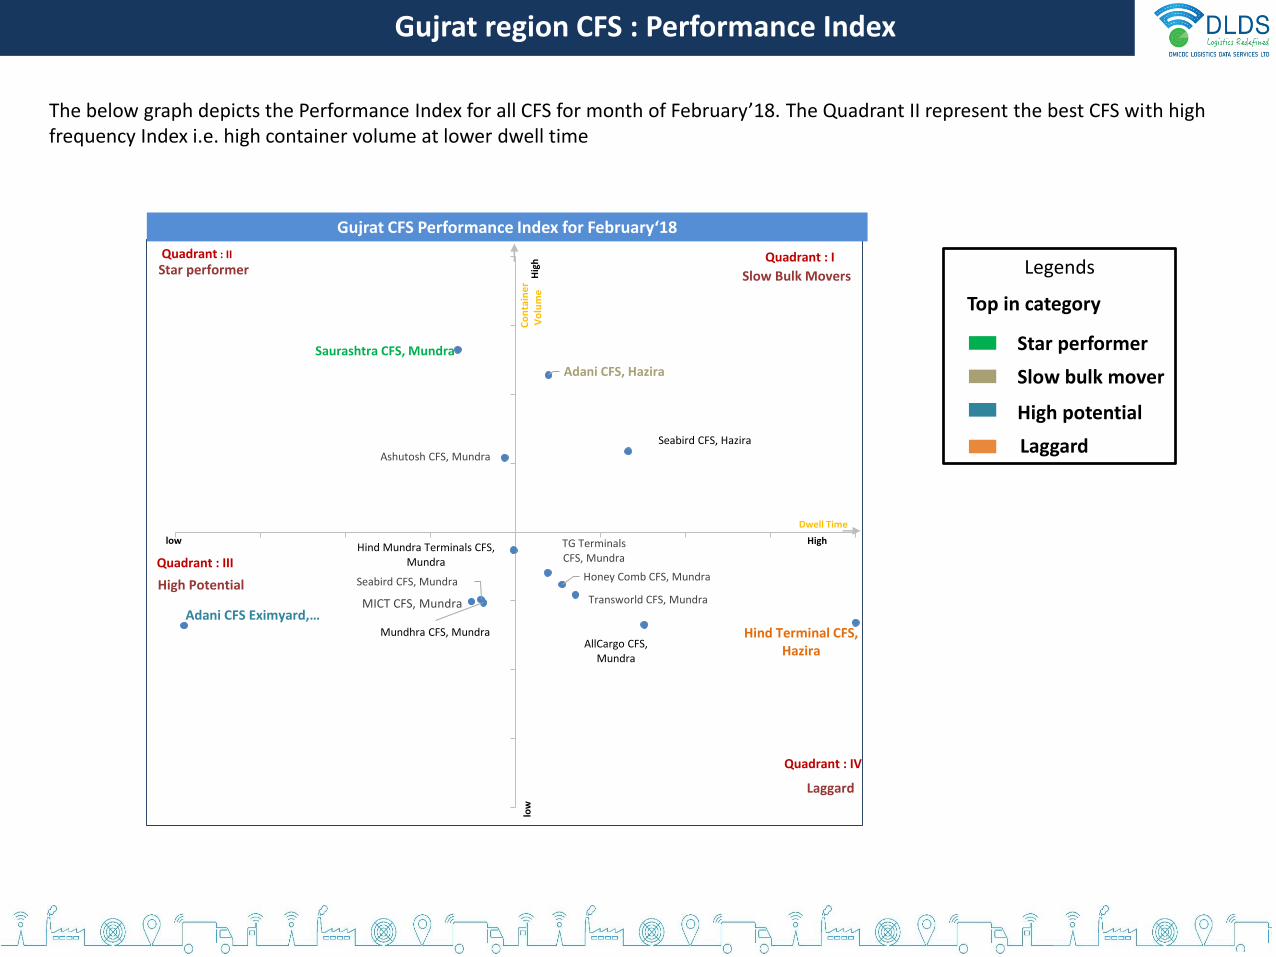
The below graph depicts the Performance Index for all CFS for month of February’18. The Quadrant II represent the best CFS with high frequency Index i.e. high container volume at lower dwell time
Gujrat region CFS : Performance Index
Star performer
Laggard
Slow Bulk Movers
High Potential
Top in category
Star performer
Slow bulk mover
High potential
Laggard
Legends
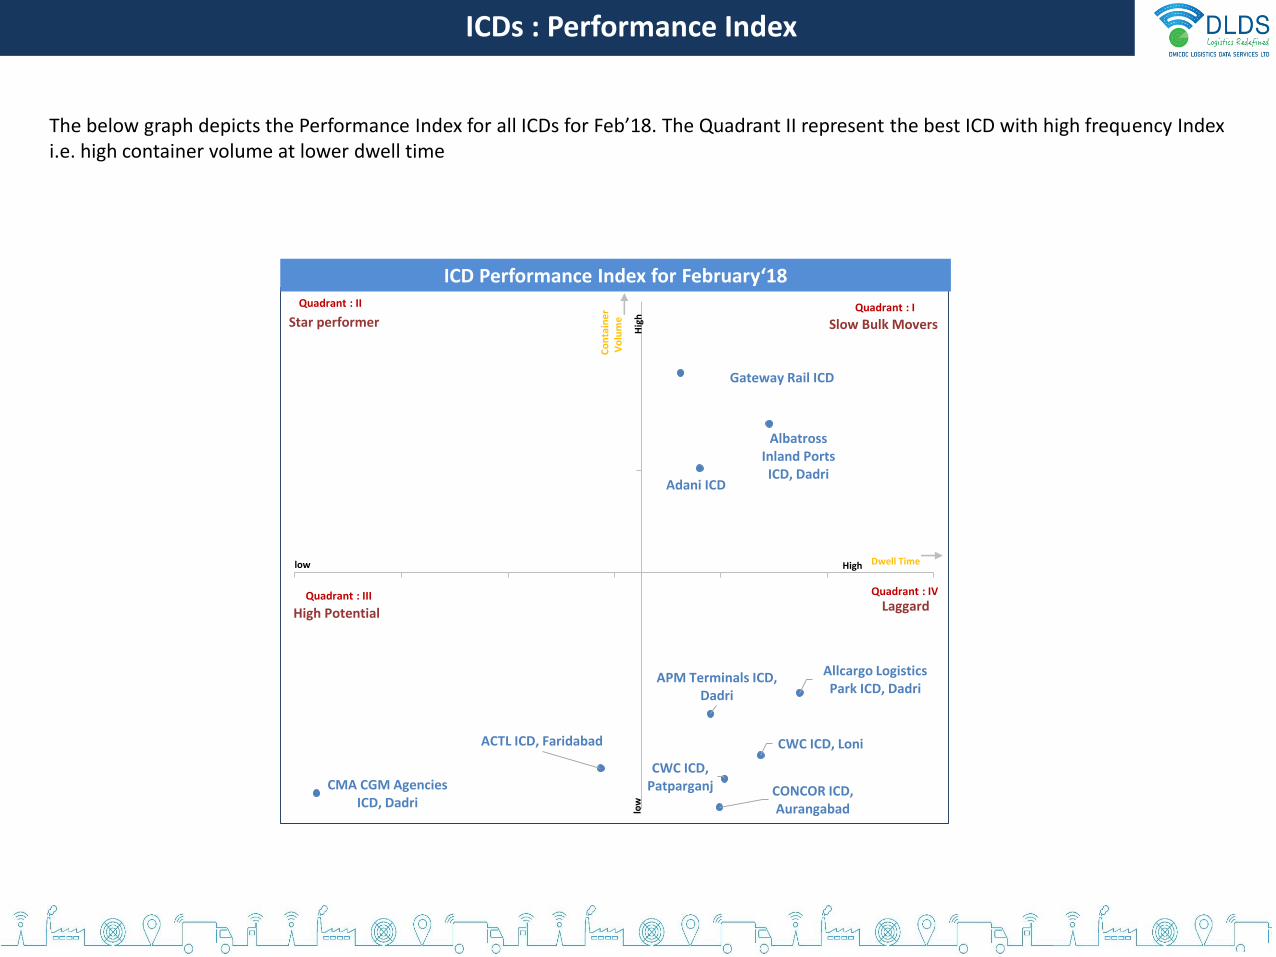
The below graph depicts the Performance Index for all ICDs for Feb’18. The Quadrant II represent the best ICD with high frequency Index i.e. high container volume at lower dwell time
Allcargo Logistics Park ICD, Dadri
Albatross Inland Ports ICD, Dadri
ACTL ICD, Faridabad
CWC ICD, Patparganj
CWC ICD, Loni
CONCOR ICD, Aurangabad
Adani ICD
Gateway Rail ICD
CMA CGM Agencies ICD, Dadri
APM Terminals ICD, Dadri
Quadrant : IQuadrant : II
Quadrant : III Quadrant : IV
ICD Performance Index for February‘18
Dwell Time
Co
nta
ine
rV
olu
me
Highlow
low
Hig
h
ICDs : Performance Index
Star performer
Laggard
Slow Bulk Movers
High Potential

PERFORMANCE TREND METRICS
JNPT PORT DWELL TIME TREND
46.5 45.857.8
49.055.641.0
50.9 45.4
JNPCT GTI NSICT NSIGT
Jan'18 Feb'18
JNPT Region Dwell time: Overall (in hrs.)
24.2 24.234.0 31.7
22.5 24.028.8 29.0
JNPCT GTI NSICT NSIGT
Jan'18 Feb'18
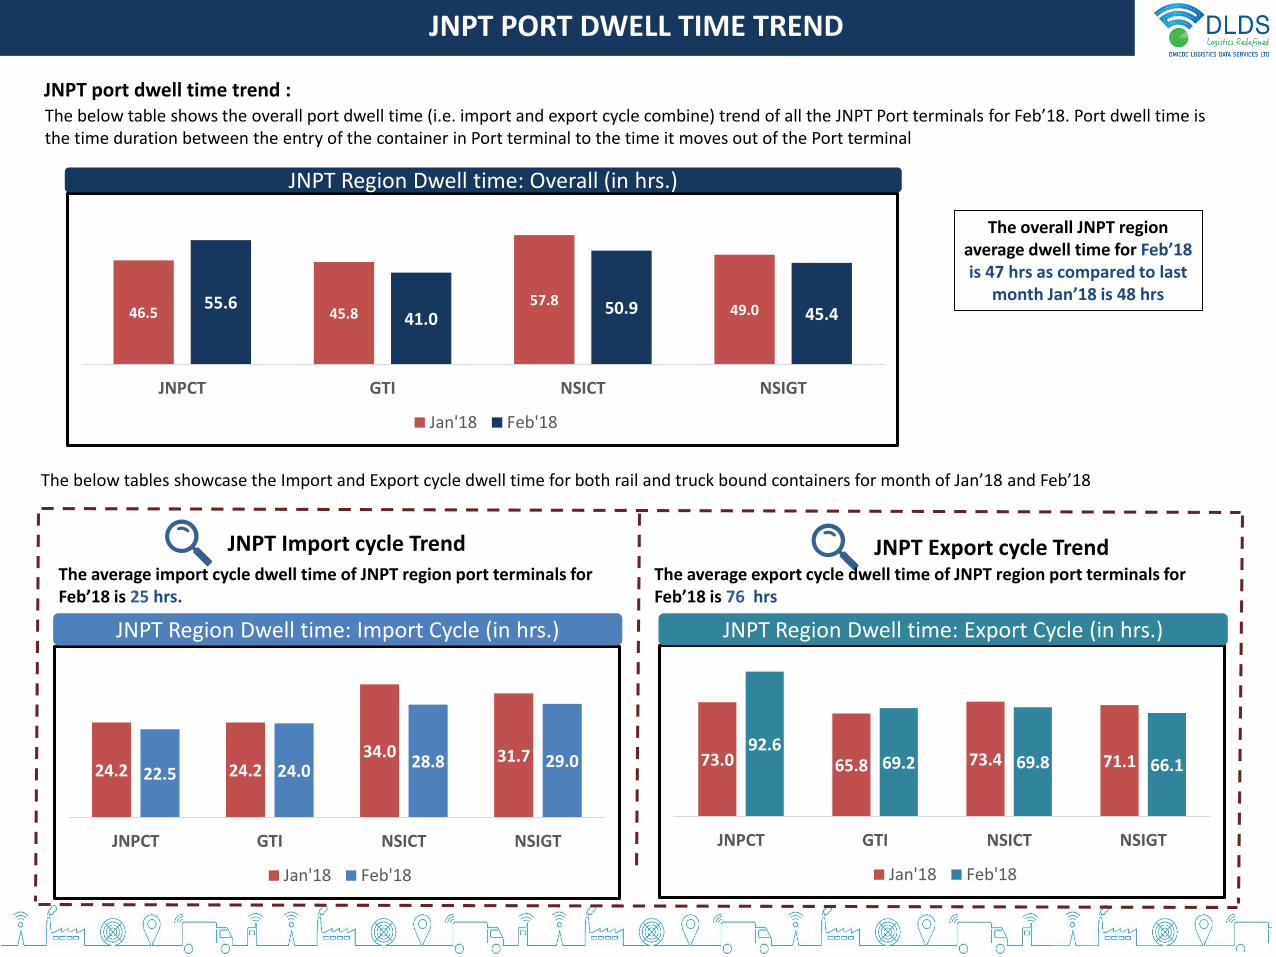
The average import cycle dwell time of JNPT region port terminals for Feb’18 is 25 hrs.
JNPT Region Dwell time: Import Cycle (in hrs.)
73.0 65.8 73.4 71.192.6
69.2 69.8 66.1
JNPCT GTI NSICT NSIGT
Jan'18 Feb'18
JNPT Region Dwell time: Export Cycle (in hrs.)
JNPT Import cycle Trend JNPT Export cycle Trend
JNPT port dwell time trend :The below table shows the overall port dwell time (i.e. import and export cycle combine) trend of all the JNPT Port terminals for Feb’18. Port dwell time is the time duration between the entry of the container in Port terminal to the time it moves out of the Port terminal
The below tables showcase the Import and Export cycle dwell time for both rail and truck bound containers for month of Jan’18 and Feb’18
The average export cycle dwell time of JNPT region port terminals for Feb’18 is 76 hrs
The overall JNPT region average dwell time for Feb’18 is 47 hrs as compared to last
month Jan’18 is 48 hrs
Gujarat PORT DWELL TIME TREND
Gujarat Region Import cycle Trend Gujarat Region Export cycle Trend
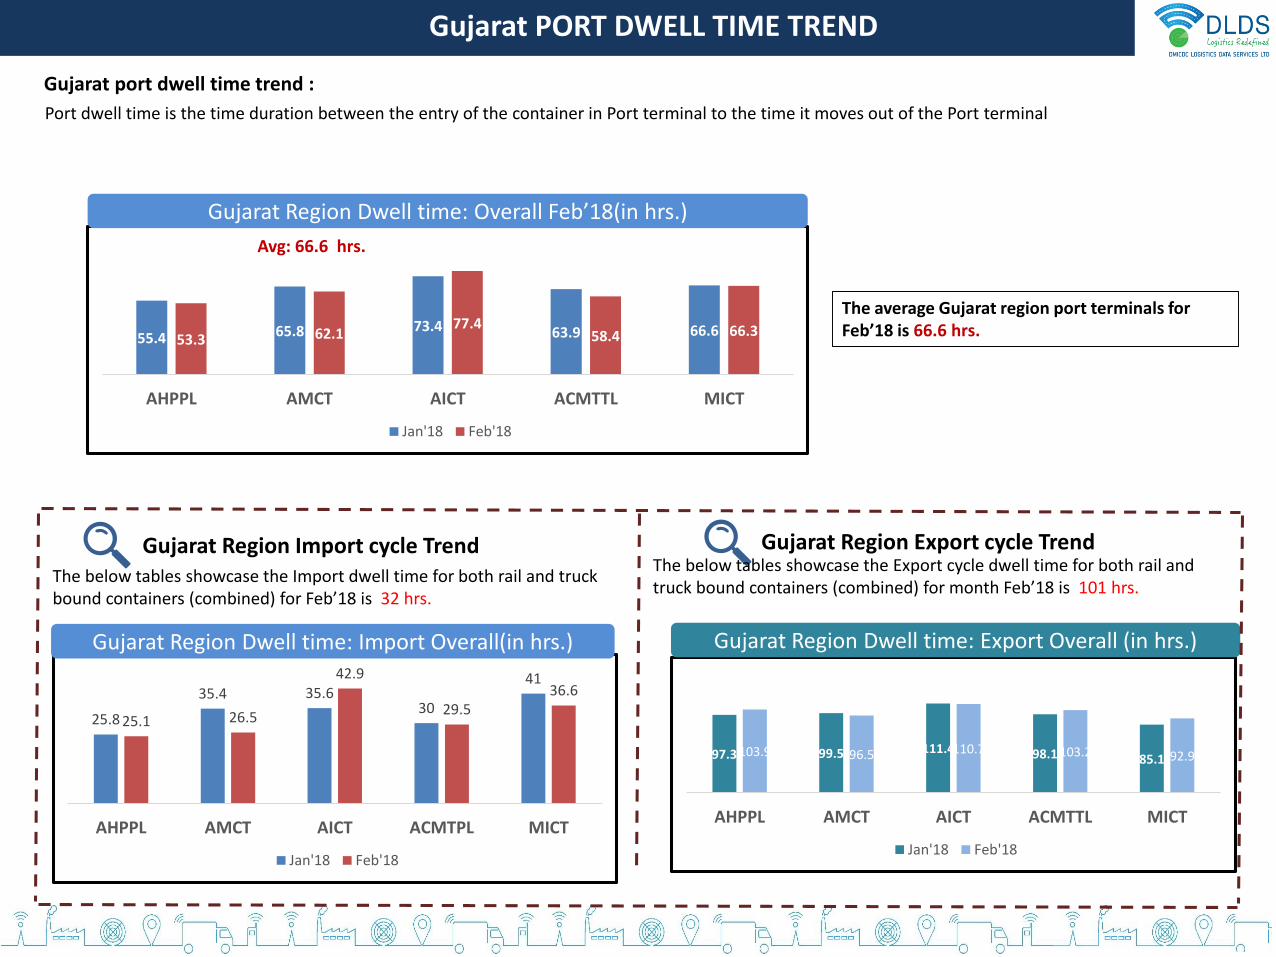
Gujarat port dwell time trend :
Port dwell time is the time duration between the entry of the container in Port terminal to the time it moves out of the Port terminal
55.4 65.8 73.4 63.9 66.653.3 62.1
77.458.4 66.3
AHPPL AMCT AICT ACMTTL MICT
Jan'18 Feb'18
Gujarat Region Dwell time: Overall Feb’18(in hrs.)
97.3 99.5 111.4 98.1 85.1103.9 96.5 110.7 103.2 92.9
AHPPL AMCT AICT ACMTTL MICT
Jan'18 Feb'18
Gujarat Region Dwell time: Export Overall (in hrs.)
Avg: 66.6 hrs.
25.8
35.4 35.630
41
25.1 26.5
42.9
29.536.6
AHPPL AMCT AICT ACMTPL MICT
Jan'18 Feb'18
Gujarat Region Dwell time: Import Overall(in hrs.)
The average Gujarat region port terminals for Feb’18 is 66.6 hrs.
The below tables showcase the Export cycle dwell time for both rail and truck bound containers (combined) for month Feb’18 is 101 hrs.
The below tables showcase the Import dwell time for both rail and truck bound containers (combined) for Feb’18 is 32 hrs.

TRANSIT TIME METRICS
JNPT REGION : CONGESTION ANALYSIS Jan’18
Cluster 2
Cluster 5
Cluster 7
Cluster 4
Cluster 6
Cluster 3
Cluster 1
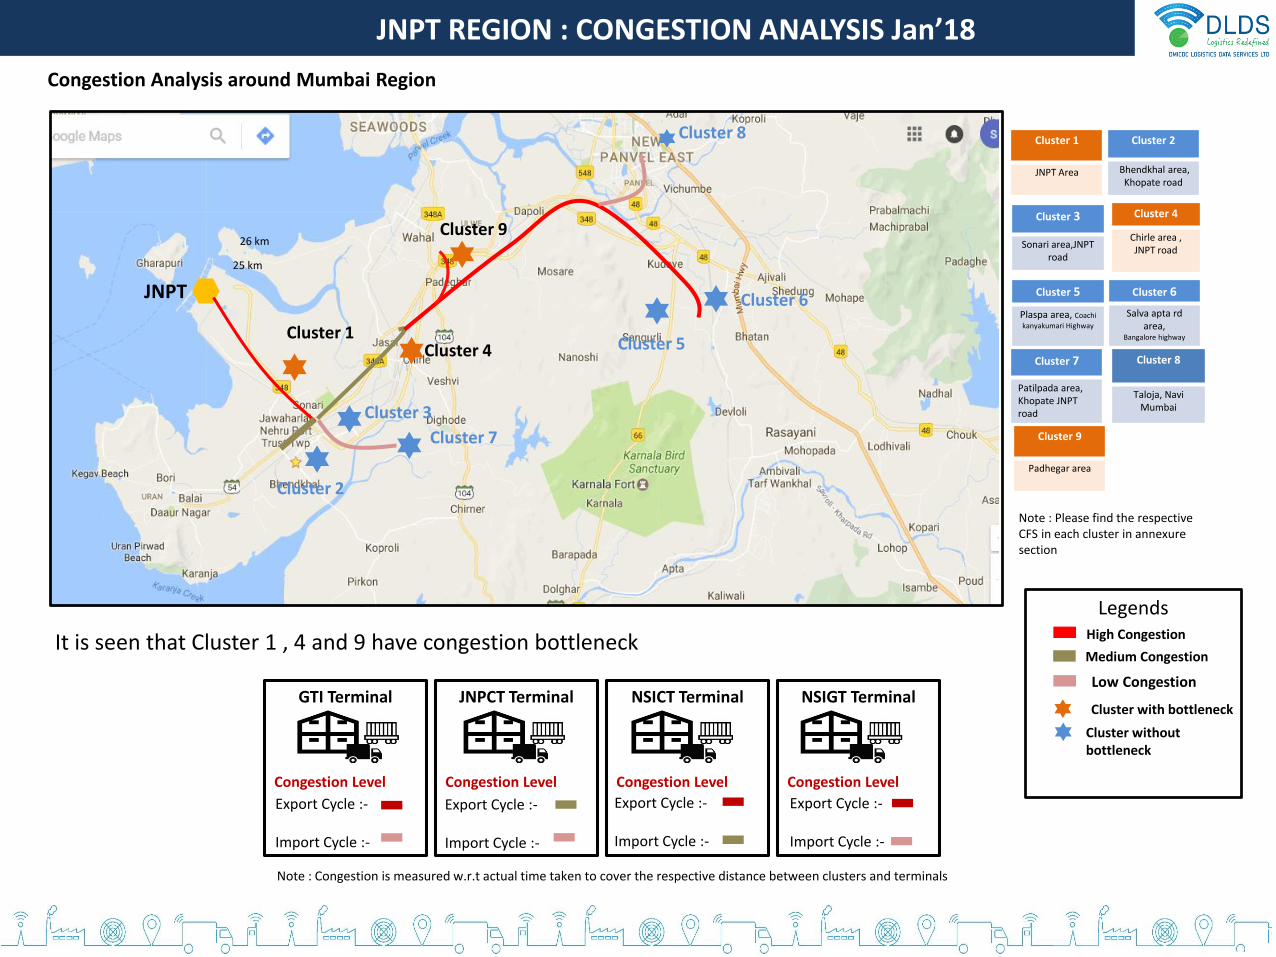
Congestion Analysis around Mumbai Region
JNPT
25 km
26 km
High Congestion
Cluster without bottleneck
Cluster with bottleneck
Medium Congestion
Cluster 8
GTI Terminal
Congestion Level
JNPCT Terminal
Congestion Level
NSICT Terminal
Congestion Level
NSIGT Terminal
Congestion Level
Export Cycle :-
Import Cycle :-
Export Cycle :-
Import Cycle :-
Export Cycle :-
Import Cycle :-
Export Cycle :-
Import Cycle :-
Note : Congestion is measured w.r.t actual time taken to cover the respective distance between clusters and terminals
Cluster 1
JNPT Area
Cluster 2
Bhendkhal area, Khopate road
Cluster 3
Sonari area,JNPT road
Cluster 5
Plaspa area, Coachi
kanyakumari Highway
Cluster 6
Salva apta rd area,
Bangalore highway
Cluster 7
Patilpada area, Khopate JNPT road
Note : Please find the respective CFS in each cluster in annexure section
Cluster 8
Taloja, Navi Mumbai
Low Congestion
Legends
It is seen that Cluster 1 , 4 and 9 have congestion bottleneck
Cluster 9
Cluster 9
Padhegar area
Cluster 4
Chirle area , JNPT road
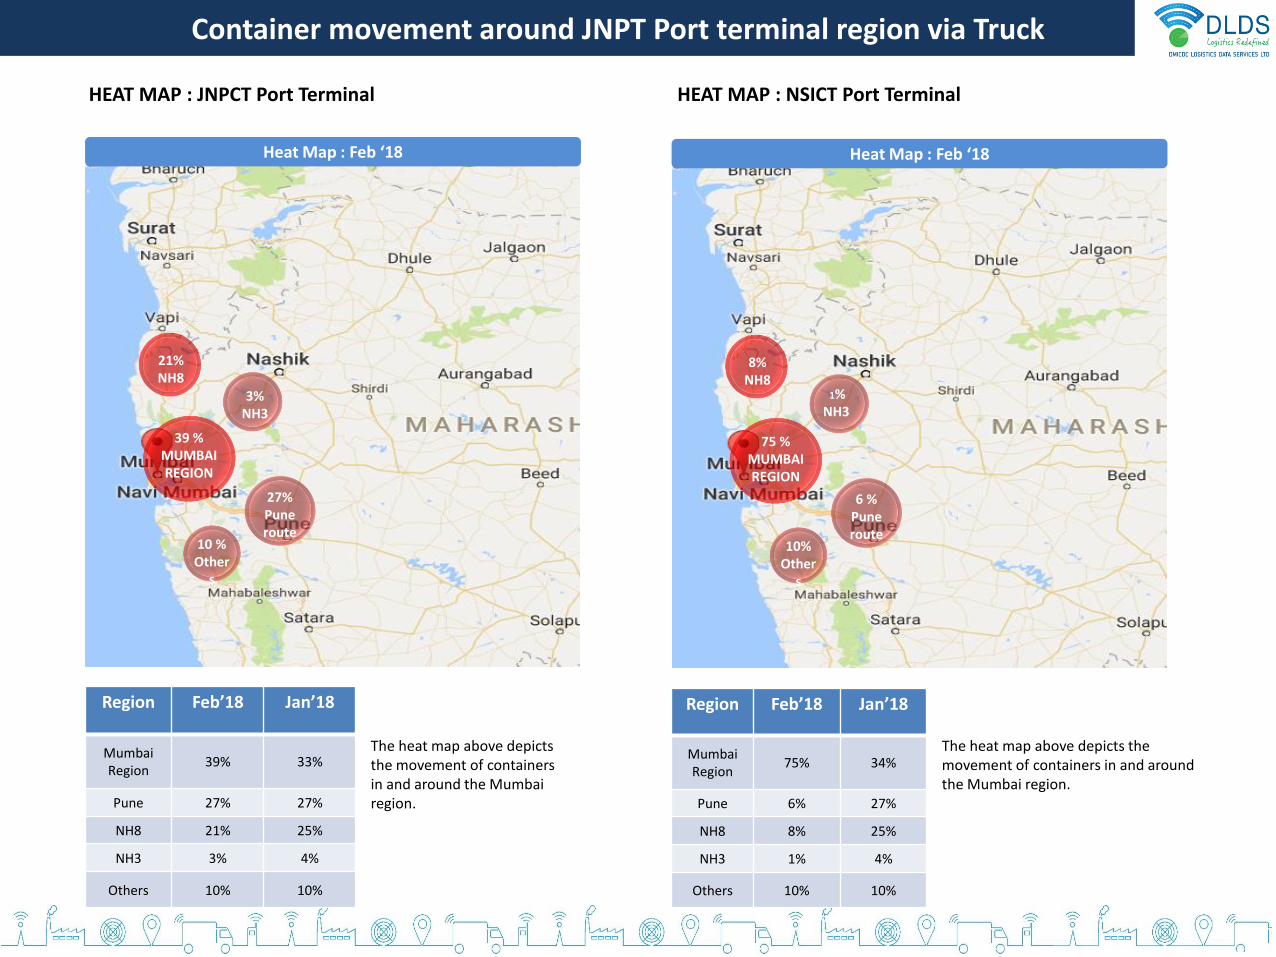
Container movement around JNPT Port terminal region via Truck
39 %MUMBAI REGION
Heat Map : Feb ‘18
The heat map above depicts the movement of containers in and around the Mumbai region.
27%Pune route
10 %Other
s
Region Feb’18 Jan’18
MumbaiRegion
39% 33%
Pune 27% 27%
NH8 21% 25%
NH3 3% 4%
Others 10% 10%
HEAT MAP : JNPCT Port Terminal
21%NH8
75 %MUMBAI REGION
Heat Map : Feb ‘18
The heat map above depicts the movement of containers in and around the Mumbai region.
1%NH3
6 %Pune route
10%Other
s
Region Feb’18 Jan’18
MumbaiRegion
75% 34%
Pune 6% 27%
NH8 8% 25%
NH3 1% 4%
Others 10% 10%
8%NH8
HEAT MAP : NSICT Port Terminal
3%NH3
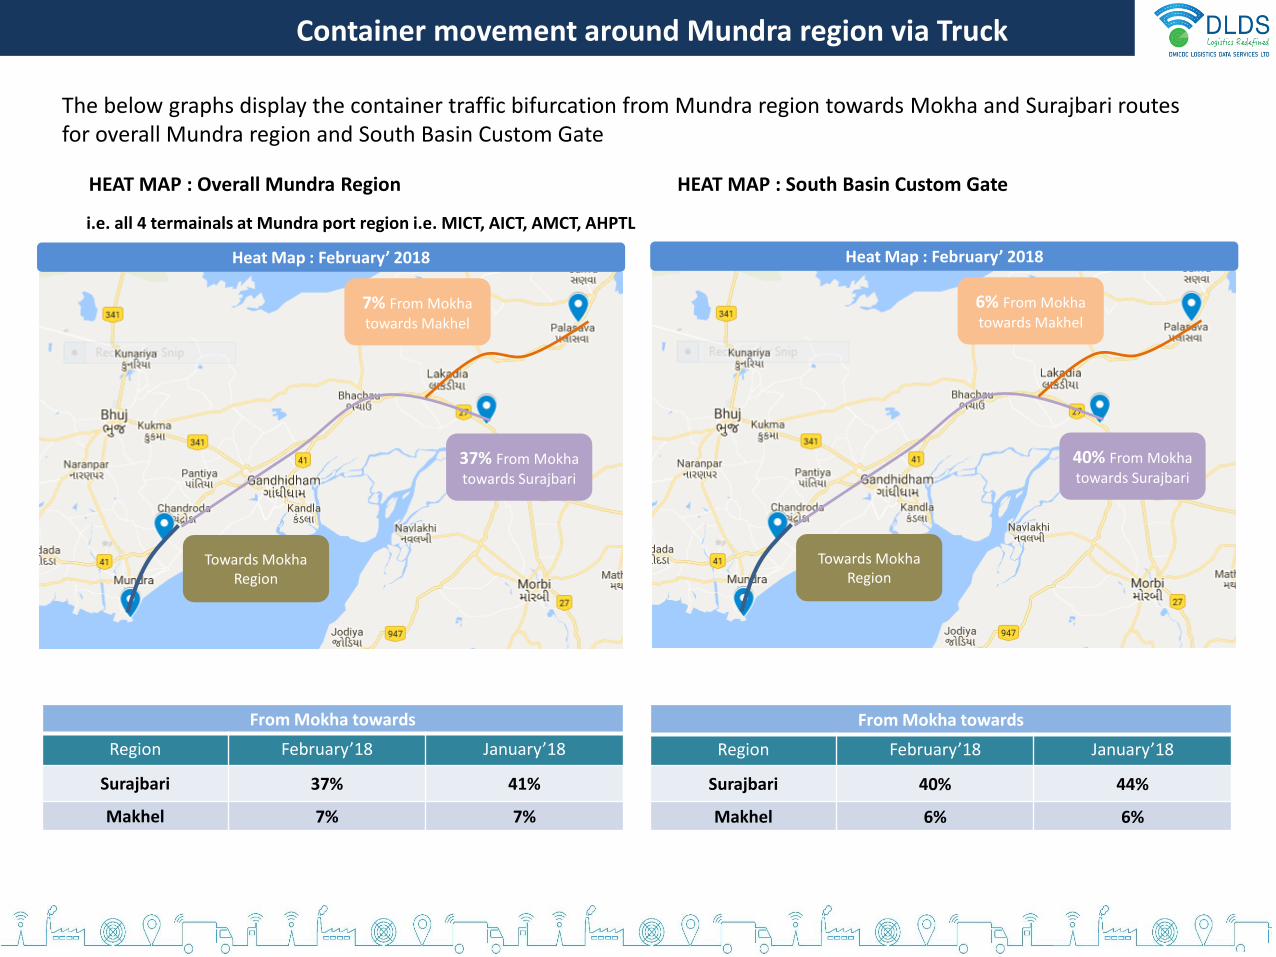
Container movement around Mundra region via Truck
Heat Map : February’ 2018
HEAT MAP : Overall Mundra Region HEAT MAP : South Basin Custom Gate
i.e. all 4 termainals at Mundra port region i.e. MICT, AICT, AMCT, AHPTL
Towards MokhaRegion
37% From Mokhatowards Surajbari
7% From Mokhatowards Makhel
Heat Map : February’ 2018
Towards MokhaRegion
40% From Mokhatowards Surajbari
6% From Mokhatowards Makhel
From Mokha towards
Region February’18 January’18
Surajbari 37% 41%
Makhel 7% 7%
From Mokha towards
Region February’18 January’18
Surajbari 40% 44%
Makhel 6% 6%
The below graphs display the container traffic bifurcation from Mundra region towards Mokha and Surajbari routes for overall Mundra region and South Basin Custom Gate

Container movement around Mundra region via Truck
HEAT MAP : MPT Custom Gate HEAT MAP : APSEZ Region
Note: LDB system has been installed at Mundra region toll plaza from November’17 onwards
i.e. only Adani port termainals at Mundra port region i.e. AICT, AMCT, AHPTL
Heat Map : February’ 2018
Towards MokhaRegion
33% From Mokhatowards Surajbari
8% From Mokhatowards Makhel
Heat Map : February’ 2018
Towards MokhaRegion
31% From Mokhatowards Surajbari
61% From Mokhatowards Makhel
From Mokha towards
Region February’18 January’18
Surajbari 33% 36%
Makhel 8% 7%
From Mokha towards
Region February’18 January’18
Surajbari 31% 31%
Makhel 61% 60%
The below graphs display the container traffic bifurcation from Mundra region towards Mokha and Surajbari routes for overall MPT Custom gate and APSEZ Region

Container Movement around JNPT region via TrainThe map shows the volume wise container movement through different railway routes in export and import cycle for
Feb’18
27.6%
5.3%
58.5%
IMPORT CYCLE
21.3%
11.9%
52.3%
EXPORT CYCLE
Nagpur Route
Vadodara Route
Panvel Route
Panvel Route
Nagpur Route
Vadodara Route
Container movement around JNPT Port terminal region via Train
Bhopal Route
Bhopal Route
8.6%14.5%

Mundra Port
Ratlam Jn. Route
Vadodara Jn. Route
Jodhpur Jn. Route
Palanpur
Jn. Route
24.3 %
18.1 %
39.3 %
18.3 %
EXPORT CYCLE
Container Movement around APSEZ region via Train : EXPORT CYCLEThe map shows the volume wise container movement through different railway routes in export cycle for the month
of February’18
Container movement around APSEZ Port terminal region via Train
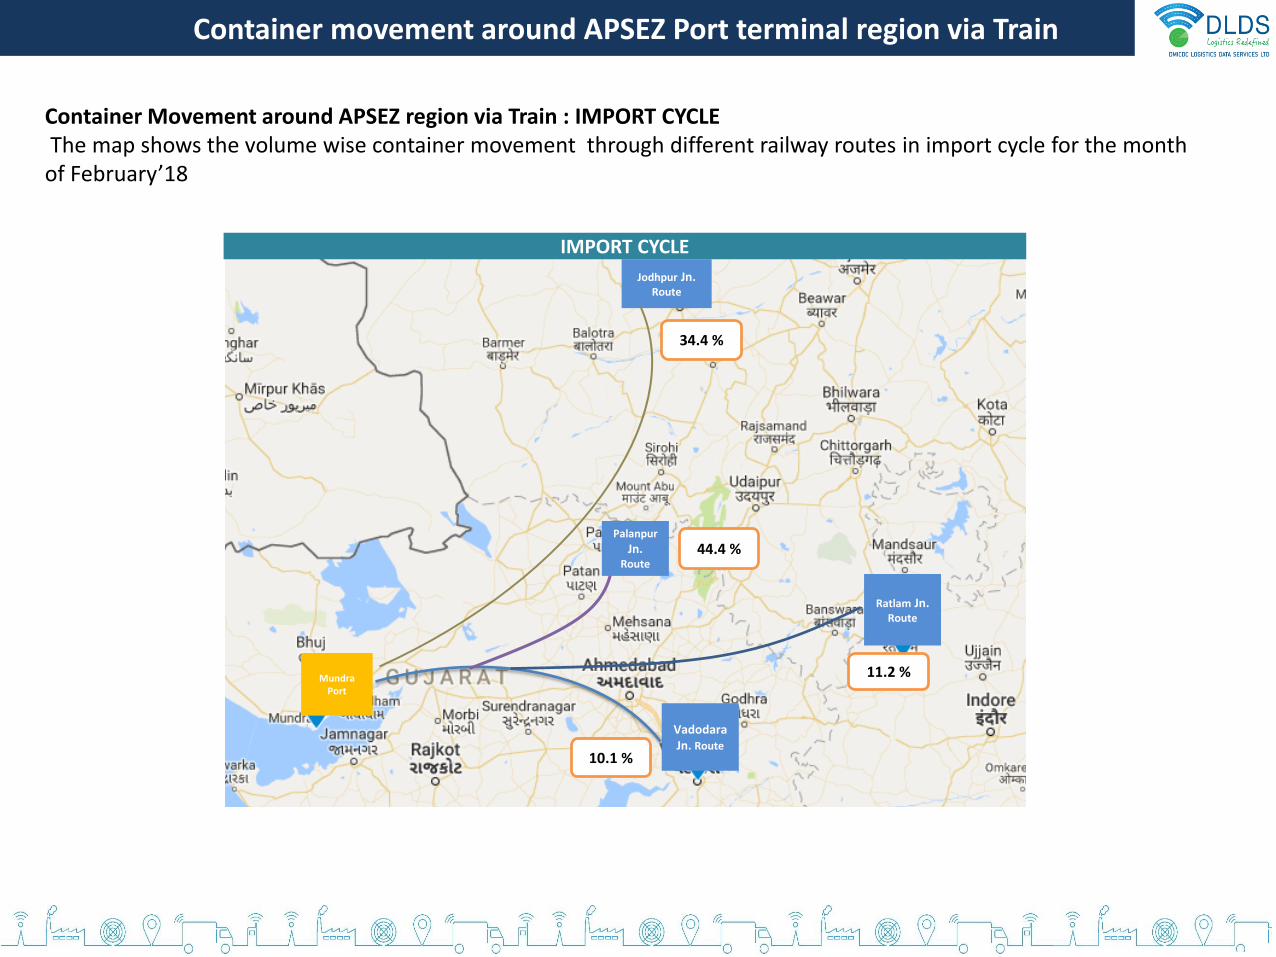
Mundra Port
Ratlam Jn. Route
Vadodara Jn. Route
Jodhpur Jn. Route
Palanpur
Jn. Route
34.4 %
11.2 %
44.4 %
10.1 %
IMPORT CYCLE
Container Movement around APSEZ region via Train : IMPORT CYCLEThe map shows the volume wise container movement through different railway routes in import cycle for the month
of February’18
Container movement around APSEZ Port terminal region via Train
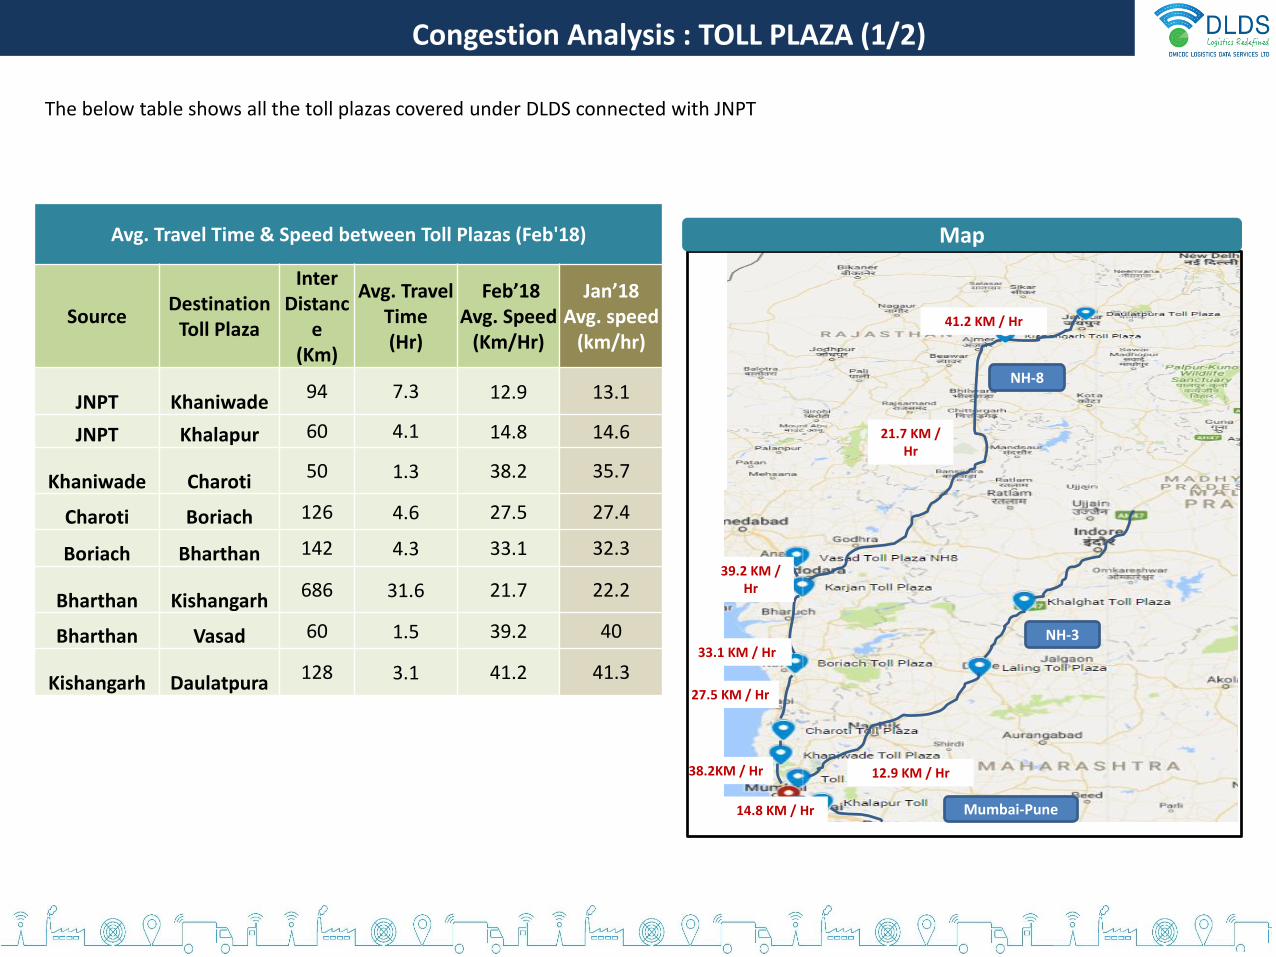
The below table shows all the toll plazas covered under DLDS connected with JNPT
Congestion Analysis : TOLL PLAZA (1/2)
Avg. Travel Time & Speed between Toll Plazas (Feb'18)
Source Destination
Toll Plaza
Inter Distanc
e(Km)
Avg. Travel Time (Hr)
Feb’18Avg. Speed
(Km/Hr)
Jan’18 Avg. speed
(km/hr)
JNPT Khaniwade94 7.3 12.9 13.1
JNPT Khalapur 60 4.1 14.8 14.6
Khaniwade Charoti50 1.3 38.2 35.7
Charoti Boriach 126 4.6 27.5 27.4
Boriach Bharthan 142 4.3 33.1 32.3
Bharthan Kishangarh686 31.6 21.7 22.2
Bharthan Vasad 60 1.5 39.2 40
Kishangarh Daulatpura128 3.1 41.2 41.3
Mumbai-Pune
NH-3
NH-8
14.8 KM / Hr
12.9 KM / Hr38.2KM / Hr
27.5 KM / Hr
33.1 KM / Hr
21.7 KM / Hr
39.2 KM / Hr
Map
41.2 KM / Hr
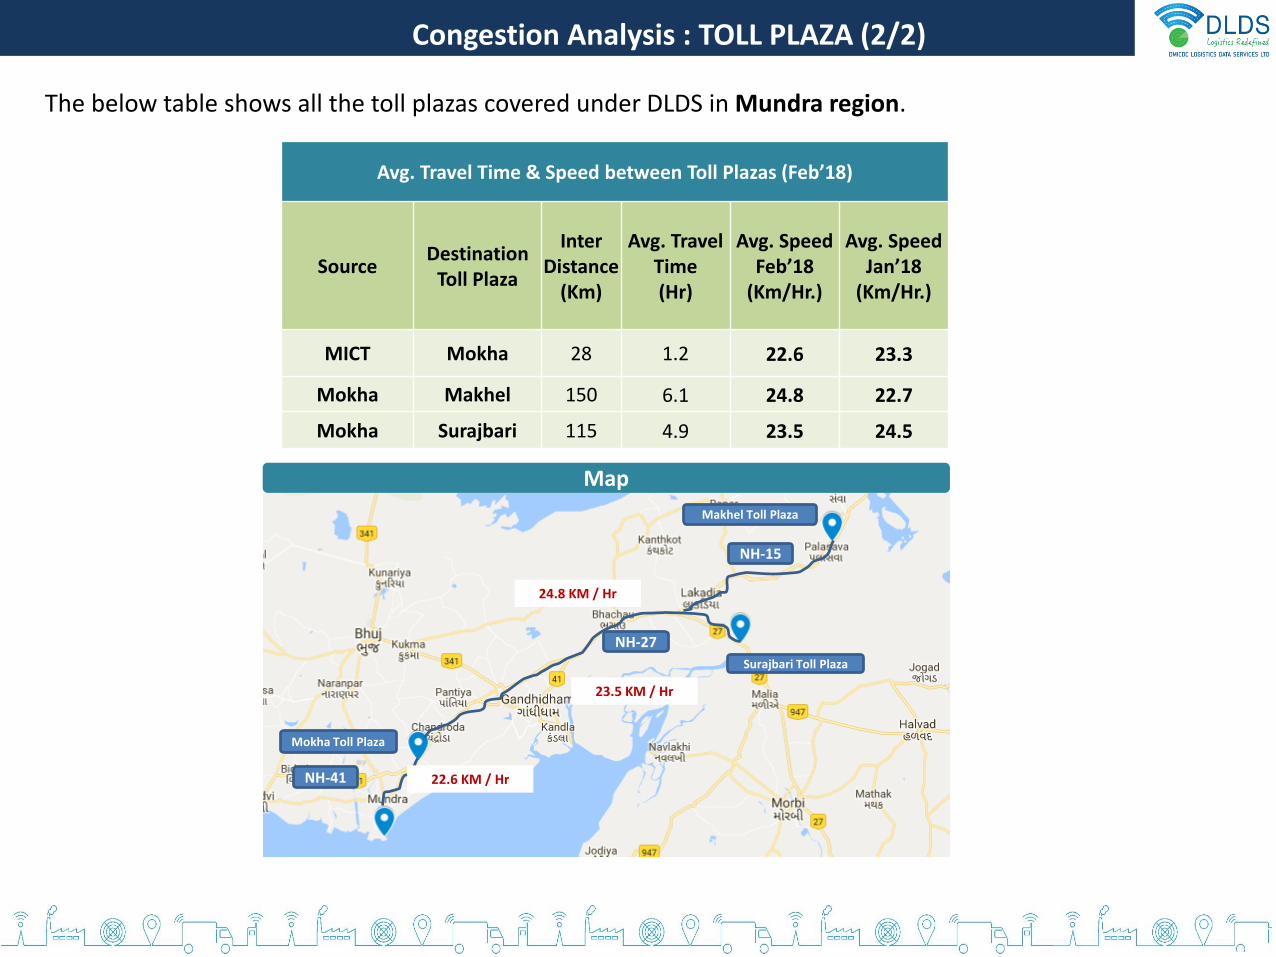
The below table shows all the toll plazas covered under DLDS in Mundra region.
Congestion Analysis : TOLL PLAZA (2/2)
Avg. Travel Time & Speed between Toll Plazas (Feb’18)
Source Destination
Toll Plaza
Inter Distance
(Km)
Avg. Travel Time (Hr)
Avg. SpeedFeb’18
(Km/Hr.)
Avg. SpeedJan’18
(Km/Hr.)
MICT Mokha 28 1.2 22.6 23.3
Mokha Makhel 150 6.1 24.8 22.7
Mokha Surajbari 115 4.9 23.5 24.5
Map
Mokha Toll Plaza
NH-41
Surajbari Toll Plaza
NH-27
Makhel Toll Plaza
NH-15
22.6 KM / Hr
24.8 KM / Hr
23.5 KM / Hr
Thank You !!