Diversification and the rate of molecular evolution: no evidence of a link in mammals
12
RESEARCH ARTICLE Open Access Diversification and the rate of molecular evolution: no evidence of a link in mammals Xavier Goldie * , Robert Lanfear and Lindell Bromham Abstract Background: Recent research has indicated a positive association between rates of molecular evolution and diversification in a number of taxa. However debate continues concerning the universality and cause of this relationship. Here, we present the first systematic investigation of this relationship within the mammals. We use phylogenetically independent sister-pair comparisons to test for a relationship between substitution rates and clade size at a number of taxonomic levels. Total, non-synonymous and synonymous substitution rates were estimated from mitochondrial and nuclear DNA sequences. Results: We found no evidence for an association between clade size and substitution rates in mammals, for either the nuclear or the mitochondrial sequences. We found significant associations between body size and substitution rates, as previously reported. Conclusions: Our results present a contrast to previous research, which has reported significant positive associations between substitution rates and diversification for birds, angiosperms and reptiles. There are three possible reasons for the differences between the observed results in mammals versus other clades. First, there may be no link between substitution rates and diversification in mammals. Second, this link may exist, but may be much weaker in mammals than in other clades. Third, the link between substitution rates and diversification may exist in mammals, but may be confounded by other variables. Background Diversification is the net outcome of speciation and extinction. Clade size, the current species richness of a lineage, is a measure of net diversification because it is the result of the addition of species through speciation and the removal by extinction. A number of recent stu- dies have shown positive relationships between rates of molecular evolution and net diversification. A positive relationship between substitution rates and species rich- ness has been reported in angiosperms [1,2], carnivorous plants [3], and birds and reptiles [4,5]. Additionally, a relationship between the molecular path lengths of lineages and the number of nodes through which those lineages pass in molecular phylogenies has been inter- preted as evidence of a connection between net diversifi- cation and rates of molecular evolution in a large range of taxa [6-8]. There are a number of possible causes of a relation- ship between rates of molecular evolution and net diver- sification. It has been suggested that elevated substitution rates in diverging populations are the result of changes to the selective and demographic landscape that accompany speciation [6,7]. Changed selective regimes at speciation could lead to elevated substitution rates at a number of loci as species adapt to new niches [9,10]. Strong reinforcing selection at hybrid contact zones, in particular, can lead to elevated substitution rates in genes associated with reproductive isolation [11-15]. Neutral loci linked to positively selected genes may also experience increased substitution rates at spe- ciation events [16-18]. However, the majority of studies that report a link between net diversification and substitution rates focus on genes that are not obviously associated with traits under strong positive selection during speciation events. Rather, they tend to be based on “house-keeping” genes, such as metabolic genes (e.g. CYTB, COIII, ND2, ALDOB) and genes associated with transcription and * Correspondence: [email protected] Centre for Macroevolution and Macroecology, Division of Evolution, Ecology and Genetics, Research School of Biology, The Australian National University, Canberra, A.C.T. 0200, Australia Goldie et al. BMC Evolutionary Biology 2011, 11:286 http://www.biomedcentral.com/1471-2148/11/286 © 2011 Goldie et al; licensee BioMed Central Ltd. This is an Open Access article distributed under the terms of the Creative Commons Attribution License (http://creativecommons.org/licenses/by/2.0), which permits unrestricted use, distribution, and reproduction in any medium, provided the original work is properly cited.
Transcript of Diversification and the rate of molecular evolution: no evidence of a link in mammals
RESEARCH ARTICLE Open Access
Diversification and the rate of molecularevolution: no evidence of a link in mammalsXavier Goldie*, Robert Lanfear and Lindell Bromham
Abstract
Background: Recent research has indicated a positive association between rates of molecular evolution anddiversification in a number of taxa. However debate continues concerning the universality and cause of thisrelationship. Here, we present the first systematic investigation of this relationship within the mammals. We usephylogenetically independent sister-pair comparisons to test for a relationship between substitution rates and cladesize at a number of taxonomic levels. Total, non-synonymous and synonymous substitution rates were estimatedfrom mitochondrial and nuclear DNA sequences.
Results: We found no evidence for an association between clade size and substitution rates in mammals, for eitherthe nuclear or the mitochondrial sequences. We found significant associations between body size and substitutionrates, as previously reported.
Conclusions: Our results present a contrast to previous research, which has reported significant positiveassociations between substitution rates and diversification for birds, angiosperms and reptiles. There are threepossible reasons for the differences between the observed results in mammals versus other clades. First, there maybe no link between substitution rates and diversification in mammals. Second, this link may exist, but may bemuch weaker in mammals than in other clades. Third, the link between substitution rates and diversification mayexist in mammals, but may be confounded by other variables.
BackgroundDiversification is the net outcome of speciation andextinction. Clade size, the current species richness of alineage, is a measure of net diversification because it isthe result of the addition of species through speciationand the removal by extinction. A number of recent stu-dies have shown positive relationships between rates ofmolecular evolution and net diversification. A positiverelationship between substitution rates and species rich-ness has been reported in angiosperms [1,2], carnivorousplants [3], and birds and reptiles [4,5]. Additionally, arelationship between the molecular path lengths oflineages and the number of nodes through which thoselineages pass in molecular phylogenies has been inter-preted as evidence of a connection between net diversifi-cation and rates of molecular evolution in a large rangeof taxa [6-8].
There are a number of possible causes of a relation-ship between rates of molecular evolution and net diver-sification. It has been suggested that elevatedsubstitution rates in diverging populations are the resultof changes to the selective and demographic landscapethat accompany speciation [6,7]. Changed selectiveregimes at speciation could lead to elevated substitutionrates at a number of loci as species adapt to new niches[9,10]. Strong reinforcing selection at hybrid contactzones, in particular, can lead to elevated substitutionrates in genes associated with reproductive isolation[11-15]. Neutral loci linked to positively selected genesmay also experience increased substitution rates at spe-ciation events [16-18].However, the majority of studies that report a link
between net diversification and substitution rates focuson genes that are not obviously associated with traitsunder strong positive selection during speciation events.Rather, they tend to be based on “house-keeping” genes,such as metabolic genes (e.g. CYTB, COIII, ND2,ALDOB) and genes associated with transcription and
* Correspondence: [email protected] for Macroevolution and Macroecology, Division of Evolution, Ecologyand Genetics, Research School of Biology, The Australian National University,Canberra, A.C.T. 0200, Australia
Goldie et al. BMC Evolutionary Biology 2011, 11:286http://www.biomedcentral.com/1471-2148/11/286
© 2011 Goldie et al; licensee BioMed Central Ltd. This is an Open Access article distributed under the terms of the Creative CommonsAttribution License (http://creativecommons.org/licenses/by/2.0), which permits unrestricted use, distribution, and reproduction inany medium, provided the original work is properly cited.
translation (e.g. 16S rRNA, EEF2, MYC) [4,5]. Theobservation that substitution rates at these loci are posi-tively correlated to species richness suggests that gen-ome-wide substitution rates are associated with netdiversification.It has been suggested that the process of speciation
may cause increases in genome-wide substitution rates[7]. For instance, if small, fragmented and geneticallyisolated founder populations characterise most specia-tion events, slightly deleterious mutations may be fixedat an elevated rate due to reductions in the effectivepopulation size (Ne) [19].It is also possible the link between net diversification
and rates of molecular evolution could be caused by dif-ferences in mutation rates between lineages. Forinstance, higher mutation rates, and subsequently ele-vated substitution rates, may lead to a more rapid acqui-sition of hybrid incompatibilities in divergingpopulations [20-22]. Given that hybrid incompatibilitiesaccrue faster than linearly with the number of substitu-tions between diverging populations [23], even small dif-ferences in the underlying mutation rate could lead torelatively large differences in the number of incompat-ibilities between taxa, potentially resulting in more rapidreproductive isolation. In addition, elevated mutationrates may lead to higher levels of standing variation[24,25] available for divergent selection to act on duringspeciation, leading to the more rapid acquisition of localadaptations [11]. Elevated mutation rates could poten-tially influence net diversification by lowering extinctionrates, for example by generating standing variation onwhich selection for adaptation to environmental changecan act [26].Finally, there may be no direct causal link between
rates of molecular evolution and net diversification.Instead, the association between may be caused indir-ectly by co-variation between molecular evolutionaryrates, diversification and other traits and processes.Shorter generation time, higher fecundity and shorterlife-spans have all been linked to substitution rates inmammals [24,27-29]. If these processes independentlyinfluence the process of diversification, this may lead toa non-causal association between substitution rates andnet diversification. For instance, it has been suggestedthat larger bodied mammals have a higher extinctionrisk due to the effect of reduced reproductive rates andlow population densities [30,31]. Consequently, if extinc-tion rates determine clade size, larger bodied animalsmay characterise smaller clades. This could lead to anindirect positive association between clade size and sub-stitution rates.Methodological artifacts could also cause an associa-
tion between rates of molecular evolution and diversifi-cation. For example, it has been suggested that the node
density effect, where molecular branch-lengths whichpass through more nodes tend to be longer, could beresponsible for the association between rates of molecu-lar evolution and diversification in some studies [32].However an association between rates and diversifica-tion has also been noted in studies that controlled forthe node density effect [5].Mammals provide an ideal opportunity to investigate
the generality and potential direction of causality of therelationship between net diversification and rates ofmolecular evolution. A considerable amount of researchhas been conducted investigating the relationshipbetween substitution rate variation and life history inmammals [27,28,33,34]. In particular, body size, genera-tion time and longevity have been shown to be asso-ciated with substitution rates [27,28,34]. The availabilityof a large amount of life history data for mammals per-mits their inclusion in this study as a potentially con-founding factor [35]. Additionally, phylogeneticrelationships are well studied in mammals [36-42],allowing independent sister-clades to be chosen withsome confidence.In this study, we use phylogenetically independent
comparisons of sister clades to test for an associationbetween substitution rate and clade size in mammals.Using protein-coding genes from both nuclear andmitochondrial genomes, we test for a relationshipbetween clade size and total substitution rates (T),synonymous substitution rates (dS), non-synonymoussubstitution rates (dN), and the ratio of dN to dS (ω).These measures provide a way in which to examine
the different processes that may cause rates of molecularevolution to co-vary with clade size. Synonymous muta-tions do not change the encoded amino acid sequences,and while not necessarily neutral [43,44], are expectedto have sufficiently small selection co-efficients [25,43],for differences in dS between species to closely reflectunderlying differences in mutation rates [45]. Non-synonymous mutations, by contrast, change the encodedamino acid sequences. These changes are more likely tobe affected by the interaction between selection andeffective population size (Ne), that is, slightly deleteriousnon-synonymous substitutions are expected to be fixedin populations of smaller Ne at a greater rate than in lar-ger populations [45]. As a result, dN is expected to beinfluenced by Ne, selection and mutation rates. Conse-quently, higher values of ω may reflect reduced Ne orincreased positive selection.If positive selection or reductions in Ne at speciation
events were responsible for the link between net diversi-fication and substitution rates, then we would expect toobserve a positive relationship between ω and clade size.This is because both positive selection and reductions inNe should increase the fixation rate of non-synonymous
Goldie et al. BMC Evolutionary Biology 2011, 11:286http://www.biomedcentral.com/1471-2148/11/286
Page 2 of 12
mutations, but are unlikely to greatly influence the rateof fixation of synonymous mutations. By contrast, ifhigher net diversification was an outcome of elevatedmutation rates causing more rapid reproductive isolationand divergence, then we would expect to observe posi-tive relationships between all measures of substitutionrate and clade size, but not necessarily a relationshipbetween ω and clade size [5].
MethodsSister-PairsWe used phylogenetically independent [46] sister-pairsof clades to investigate the relationship between substi-tution rates and clade size, using both nuclear and mito-chondrial sequences. Each of the two clades in a sister-pair has had, by definition, the same amount of timesince their most recent common ancestor to accumulateboth species and genetic change. Thus, any difference inspecies numbers between the sister-pair reflects a differ-ence in net diversification since their last commonancestor. Similarly, difference in the average substitutionrate since their most recent common ancestor should bereflected as a difference in molecular branch lengthbetween a sister-pair [1]. Each sister-pair is independentof other such pairs, and therefore fulfills the require-ment of independence for subsequent statistical analyses[46,47].We used published phylogenies to select our phylo-
genetically independent sister-pairs and their nearestavailable out-groups. We excluded any potential sister-pairs for which a reciprocally monophyletic relationshipbetween the two clades was not well supported in theliterature. References in support of each sister-pair inour analyses are included in Additional File 1.
Mitochondrial Sister-Pairs and Sequence DataFor our mitochondrial analyses we investigated the rela-tionship between clade size and substitution rates using28 sister-pairs of clades, corresponding approximately tofamily level contrasts. Our mitochondrial dataset alsoprovided the additional opportunity to perform analyseson deeper (n = 9 pairs) and shallower (n = 27) sister-pairs of clades, to test whether the relationship betweenclade size and substitution rate differed with the taxo-nomic level of the clades [48]. Details of these sister-pairs are included in Additional File 1.For mitochondrial analyses, we used all protein coding
genes from the heavy strand of whole mitochondrialgenomes available from GenBank (ND1, ND2, ND3,ND4, ND4L, ND5, COI, COII, COIII, ATP6, ATP8 andCYTB). We removed regions of coding overlap sharedby mitochondrial genes (ATP8-ATP6, ATP6-COIII,ND4L-ND4).
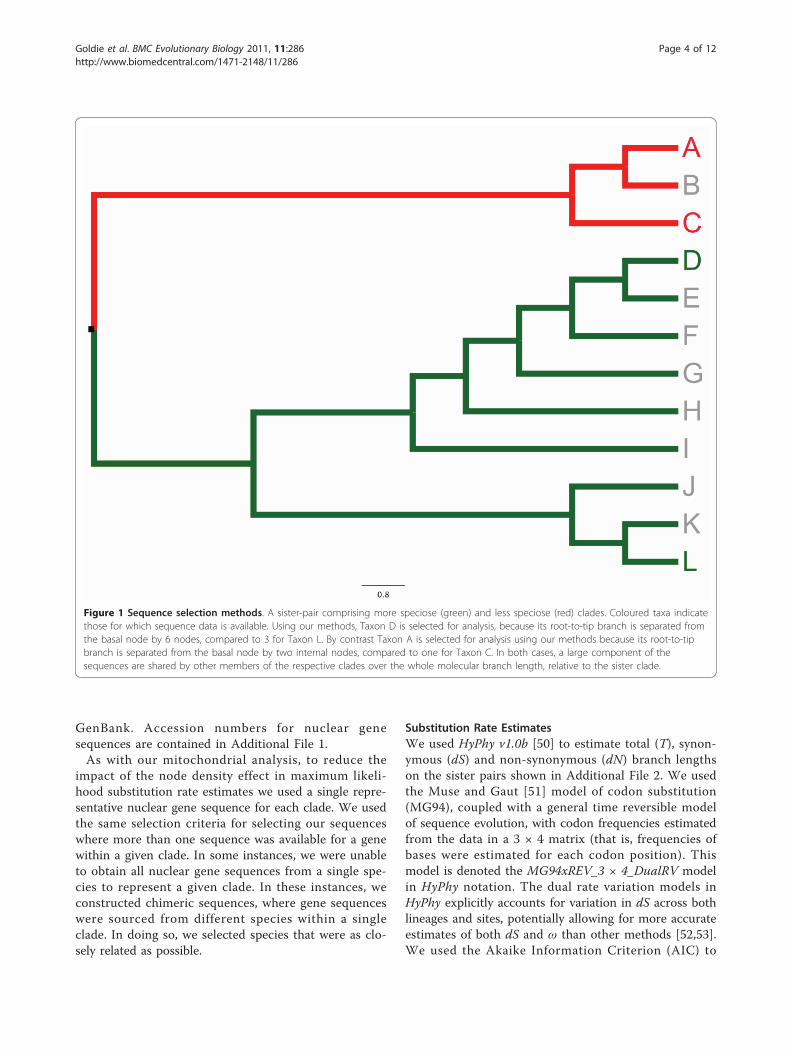
To avoid the node density effect in maximum likeli-hood substitution rate estimates [32,49], we used a sin-gle mitochondrial genome sequence to represent eachclade. A single sequence can be used to estimate repre-sentative substitution rates for a clade because a numberof the substitutions from that sequence will occur oninternal (shared) branches (Figure 1). Although somepotential data are excluded using this method, it reducesthe likelihood that substitution rate estimates are biasedby the node density effect [5].Where more than one mitochondrial genome
sequence was available on GenBank for a given clade,we selected the sequences based on the number ofinternal nodes in the published molecular phylogeniesused to select the sister clades. In the more specioseclade, we chose the sequence with the greatest numberof internal nodes. In the less speciose clade, we selectedthe sequence with the fewest number of internal nodes(shown in Figure 1). We did this in order to maximizethe potential difference in number of cladogeneticevents, and thus to increase the power to detect any dif-ference in branch length due to lineages undergoing cla-dogenesis [6,8], without reconstructing those nodes inthe estimation of rates, which may lead to node densityeffect [32].
Nuclear Sister-Pairs and Sequence DataFor our nuclear data, we investigated the relationshipbetween substitution rate and clade size using 31 sister-pairs of clades, corresponding to approximately family-level contrasts. We also tested for relationships betweenclade size and substitution rate within specific groups ofmammals, as it has been shown that patterns of substi-tution rate variation and patterns of diversification candiffer between these groups [27,28]. Consequently, wetested for a relationship between clade size and substitu-tion rate independently for the Eutheria (n = 22 pairs)and the Metatheria (n = 7). Details of these sister-pairsare included in Additional File 1.For our nuclear analyses, we used nuclear genes
obtained from GenBank. There was a substantialtrade-off between taxonomic and genetic coverage fornuclear gene sequences. In order to optimise both ofthese (and thus optimise power in subsequent regres-sion analyses), different sets of nuclear genes were cho-sen for different groups. Our whole mammaliananalysis (n = 31) included BRCA1, RAG1 and VWF(2850 bp); our eutherian analysis (n = 22) includedADORA3, ATP7A, BDNF, BRCA1, RAG1, RAG2 andVWF (4302 bp); and our metatherian analysis (n = 7)included APOB, BRCA1, IRBP, RAG1 and VWF (4255bp). These genes were the most widely samplednuclear protein coding sequences available on
Goldie et al. BMC Evolutionary Biology 2011, 11:286http://www.biomedcentral.com/1471-2148/11/286
Page 3 of 12
GenBank. Accession numbers for nuclear genesequences are contained in Additional File 1.As with our mitochondrial analysis, to reduce the
impact of the node density effect in maximum likeli-hood substitution rate estimates we used a single repre-sentative nuclear gene sequence for each clade. We usedthe same selection criteria for selecting our sequenceswhere more than one sequence was available for a genewithin a given clade. In some instances, we were unableto obtain all nuclear gene sequences from a single spe-cies to represent a given clade. In these instances, weconstructed chimeric sequences, where gene sequenceswere sourced from different species within a singleclade. In doing so, we selected species that were as clo-sely related as possible.
Substitution Rate EstimatesWe used HyPhy v1.0b [50] to estimate total (T), synon-ymous (dS) and non-synonymous (dN) branch lengthson the sister pairs shown in Additional File 2. We usedthe Muse and Gaut [51] model of codon substitution(MG94), coupled with a general time reversible modelof sequence evolution, with codon frequencies estimatedfrom the data in a 3 × 4 matrix (that is, frequencies ofbases were estimated for each codon position). Thismodel is denoted the MG94xREV_3 × 4_DualRV modelin HyPhy notation. The dual rate variation models inHyPhy explicitly accounts for variation in dS across bothlineages and sites, potentially allowing for more accurateestimates of both dS and ω than other methods [52,53].We used the Akaike Information Criterion (AIC) to
Figure 1 Sequence selection methods. A sister-pair comprising more speciose (green) and less speciose (red) clades. Coloured taxa indicatethose for which sequence data is available. Using our methods, Taxon D is selected for analysis, because its root-to-tip branch is separated fromthe basal node by 6 nodes, compared to 3 for Taxon L. By contrast Taxon A is selected for analysis using our methods because its root-to-tipbranch is separated from the basal node by two internal nodes, compared to one for Taxon C. In both cases, a large component of thesequences are shared by other members of the respective clades over the whole molecular branch length, relative to the sister clade.
Goldie et al. BMC Evolutionary Biology 2011, 11:286http://www.biomedcentral.com/1471-2148/11/286
Page 4 of 12
determine whether our datasets should be partitioned[54]. For the nuclear sequences, the best AIC score wasobtained with separate MG94xREV_3 × 4_DualRVcodon substitution models, equilibrium frequencies, andrate parameters estimated for each gene. For the mito-chondrial sequences, the best AIC score was obtainedwith a single MG94xREV_3 × 4_DualRV codon substi-tution model estimated for all genes combined. Esti-mates of T, dN and dS, were calculated for each branchof the phylogeny; the latter two were used to calculateω. However, only the substitution rate and ω estimatesfor terminal branches were retained for use in subse-quent analyses [55].
Clade SizeWe used extant clade size as a measure of net diversifica-tion for our analyses. Previous research investigating theserelationships have used varied metrics to represent diversi-fication, including extant clade size [1,5], node number[6,8] and diversification rate [4]. Differences in extant cladesize between sister clades - which are by definition thesame age - are measures of differences in the net diversifi-cation rates of those clades. We calculated extant speciesnumbers for each clade in each sister-pair from Wilsonand Reeder’s Mammal Species of the World [56], ensuringalso that species numbers reflected any changes to taxon-omy within more recent systematics literature. Speciesnumbers for each clade are given in Additional File 1.
Body sizeSubstitution rates in mammals are known to be influ-enced by a number of life history variables, includinggeneration time [29], fecundity [27], and longevity [57].These life history variables, which are correlated withbody size [58,59], have also been suggested as candidatevariables influencing net diversification in mammals[60-63]. It is possible that an association between substi-tution rates and clade size may be the result of both netdiversification and substitution rates co-varying indepen-dently with these life-history variables. We tested forthese indirect associations between clade size and sub-stitution rate by including body size in our analyses.We calculated body mass contrasts for each sister pair
used in our analyses. We obtained body mass values formost species in each clade from the panTHERIA data-base [35]. For eight species for which a value was notavailable in panTHERIA, we sourced body mass esti-mates from the literature. Where more than one esti-mate for a species was available in the primaryliterature, we took the arithmetic mean for all availableestimates for the species, weighted by the sample sizesof the estimates, and excluding extreme minimal andmaximal values. These data, together with references,are available in Additional File 3.
We used the maximum likelihood estimator (MLE) ofWelch and Waxman [55] to calculate body mass con-trasts for each sister pair. The MLE uses suitably trans-formed (in this case, log transformed [64]) body sizevalues with the phylogeny of the sub-tree defined by themost recent common ancestor of the two clades to cal-culate time-averaged differences in body mass betweenclades. We used a number of source phylogenies forthese estimates [39,41,61,65,66]. This maximum likeli-hood estimation method has advantages over simpleaverages of body sizes (tip measurements) across aclade, in that it is less prone to the effect of extremevalues; provides robust estimates where data may bemissing (i.e. unmeasured tips); and takes into accountthe evolution of the trait over a clade’s evolutionaryhistory.
Statistical TestsTesting for Substitution Rate VariationWe tested whether our alignments contained significantvariation in substitution rates between terminal lineages.We compared the likelihoods of two models: an equal-rate model, where terminal branches within a pair areconstrained to have equal substitution rates, but substi-tution rates are allowed to vary between pairs; and afree-rate model, where a separate substitution rate isestimated for each terminal branch. We calculated thelikelihood of each of these models using the phylogeniesshown in Additional File 2. We used Akaike informationcriterion scores (AIC) to compare the likelihoods of thetwo models [54]. We took a difference in AIC (ΔAIC)scores of 10 units as our threshold for significance,where ΔAIC < 10 failed to reject the null hypothesis ofno difference in substitution rates. Details of this analy-sis are included in Additional File 4.Linear regressionsWe tested for associations between differences in cladesize, body size and substitution rates, using linearregressions forced through the origin [47,67]. Differ-ences in the variables for each sister pair were calculatedas ln(VA)-ln(VB), where ln(Vi) represents the log-trans-formed variable for Clade i. Log transformation of thevariables was necessary to meet the assumptions ofparametric regressions. Diagnostic tests recommendedby Freckleton [68] indicated that these transformationswere appropriate.More distantly diverged sister-pairs are associated with
more evolutionary change, and thus tend to generatecontrasts of larger magnitude; this can lead to unequalvariance between data points [47,67], which violates theassumptions of parametric statistical tests. To accountfor this, we standardised differences in all variables byweighting each contrast by a measure of the pair’sgenetic divergence. We determined that the square root
Goldie et al. BMC Evolutionary Biology 2011, 11:286http://www.biomedcentral.com/1471-2148/11/286
Page 5 of 12
of the sum of the pair’s total substitution branch lengthvalues was suitable as a measure of standardisation: (TA +TB)
0.5. We used the diagnostic methods recommended byGarland [67] to confirm that these standardisations wereappropriate for the data to meet assumptions of linearregression. Contrasts were excluded from the analysiswhere diagnostic tests indicated that the differences insubstitution rates could not be reliably estimated from themolecular branch lengths, either because the contrastswere too shallow, or their substitution rates too slow[27,55], or their substitution rates saturated (i.e. > 1 substi-tutions per site for T; > 1 substitutions per codon for dNand dS). Details of which data points were removed foreach analysis are indicated in Additional File 1.To verify that our results were not dependent on the
transformations or standardisations used, all statisticswere also performed on non-transformed and non-stan-dardised data, and the results did not differ. All statisticsand diagnostic tests were performed in R [69].Correction for multiple testsOur analysis resulted in a number of tests of three hypoth-eses: dN, dS, T and ω are associated with clade size; dN, dS,T and ω are associated with body size; and clade size isassociated with body size. Weighted Z tests were used toaddress the issue of multiple testing [70]. A weighted Z testcombines tests of the same hypothesis to assess the supportfor that hypothesis across different datasets. To combinetests of the same hypothesis performed on different data-sets, the P values from the individual regressions are firstconverted to one-tailed P values. In this instance, we con-verted P values from regressions (two-tailed) to one-tailedvalues by assuming that substitution rate would be posi-tively associated with clade size (as observed by [1,4-6,70])and negatively associated with body mass (as observed by[27]). Values were then converted to individual Z-scores.We then calculated an overall weighted Z-score, weightingeach individual Z-score by the degrees of freedom in eachtest,[70]. Weighted Z-scores were then used to calculateoverall P values for the combined test for each hypothesis.In combining our tests of hypotheses of clade size
against measures of rates of molecular evolution, T, dN,dS and ω were treated separately, given that we weretesting for the effect of each independently on clade sizein our analyses. For example, we combined the P valuesfor tests of dN against clade size, from both nuclear andmitochondrial datasets. For tests of body size againstmeasures of rates of molecular evolution, dN, dS and Tand were also treated separately. Details of the Z-testsare included in Additional File 5.
ResultsEvidence of Substitution Rate VariationA free-rate model, where a separate substitution ratewas estimated for each branch, had significantly better
fit to the data for 4 of our 6 alignments, over an equal-rate mode where terminal branches within a pair hadequal substitution rates. Free-rate models for dN, dSand T all had a significantly better fit to the data forthese alignments; only results for T are shown. For twoof our alignments (mitochondrial shallow, nuclearmetatherian), an equal-rate model had significantly bet-ter fit to the data over a free-rate model. Equal-ratemodels for dN, dS and T were all significantly preferredfor these alignments; only results for T are shown.Details of this analysis are included in Additional File 4.
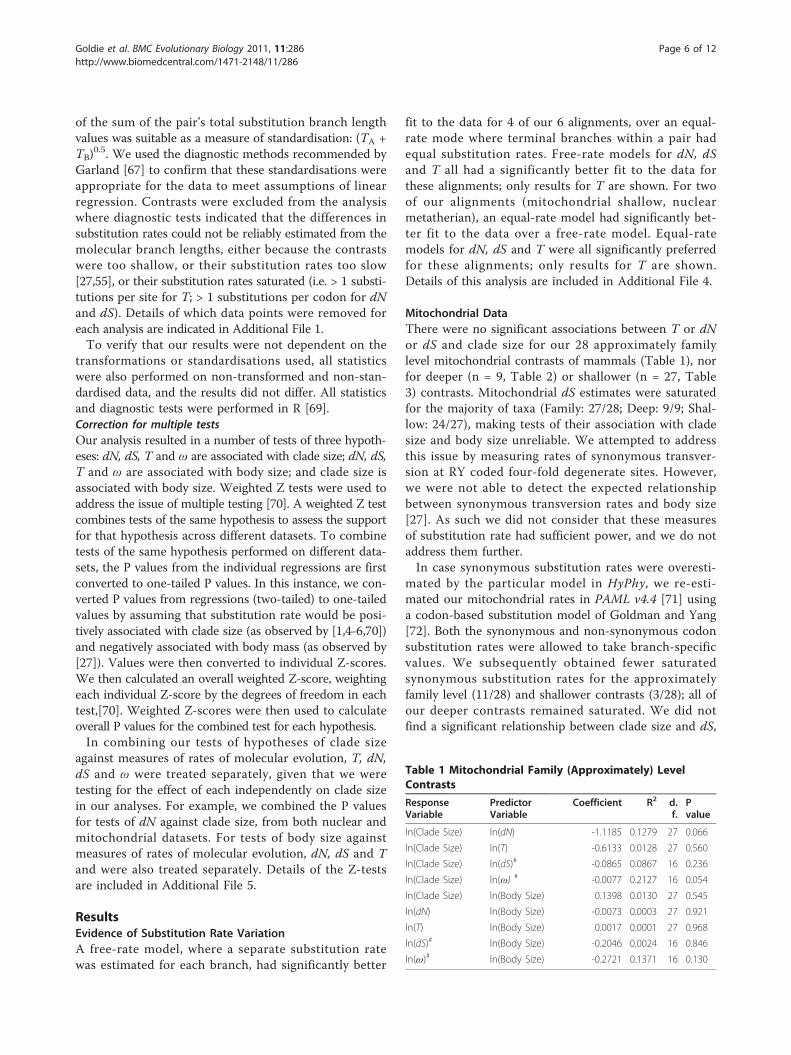
Mitochondrial DataThere were no significant associations between T or dNor dS and clade size for our 28 approximately familylevel mitochondrial contrasts of mammals (Table 1), norfor deeper (n = 9, Table 2) or shallower (n = 27, Table3) contrasts. Mitochondrial dS estimates were saturatedfor the majority of taxa (Family: 27/28; Deep: 9/9; Shal-low: 24/27), making tests of their association with cladesize and body size unreliable. We attempted to addressthis issue by measuring rates of synonymous transver-sion at RY coded four-fold degenerate sites. However,we were not able to detect the expected relationshipbetween synonymous transversion rates and body size[27]. As such we did not consider that these measuresof substitution rate had sufficient power, and we do notaddress them further.In case synonymous substitution rates were overesti-
mated by the particular model in HyPhy, we re-esti-mated our mitochondrial rates in PAML v4.4 [71] usinga codon-based substitution model of Goldman and Yang[72]. Both the synonymous and non-synonymous codonsubstitution rates were allowed to take branch-specificvalues. We subsequently obtained fewer saturatedsynonymous substitution rates for the approximatelyfamily level (11/28) and shallower contrasts (3/28); all ofour deeper contrasts remained saturated. We did notfind a significant relationship between clade size and dS,
Table 1 Mitochondrial Family (Approximately) LevelContrasts
ResponseVariable
PredictorVariable
Coefficient R2 d.f.
Pvalue
ln(Clade Size) ln(dN) -1.1185 0.1279 27 0.066
ln(Clade Size) ln(T) -0.6133 0.0128 27 0.560
ln(Clade Size) ln(dS)# -0.0865 0.0867 16 0.236
ln(Clade Size) ln(ω) # -0.0077 0.2127 16 0.054
ln(Clade Size) ln(Body Size) 0.1398 0.0130 27 0.545
ln(dN) ln(Body Size) -0.0073 0.0003 27 0.921
ln(T) ln(Body Size) 0.0017 0.0001 27 0.968
ln(dS)# ln(Body Size) -0.2046 0.0024 16 0.846
ln(ω)# ln(Body Size) -0.2721 0.1371 16 0.130
Goldie et al. BMC Evolutionary Biology 2011, 11:286http://www.biomedcentral.com/1471-2148/11/286
Page 6 of 12
or ω for these re-estimated data (Tables 1, 2 and 3).However, we also did not detect the expected positiverelationship between dS and body size [27], indicatingour data most likely did not have sufficient power.Therefore, as a post hoc analysis, we used mitochon-
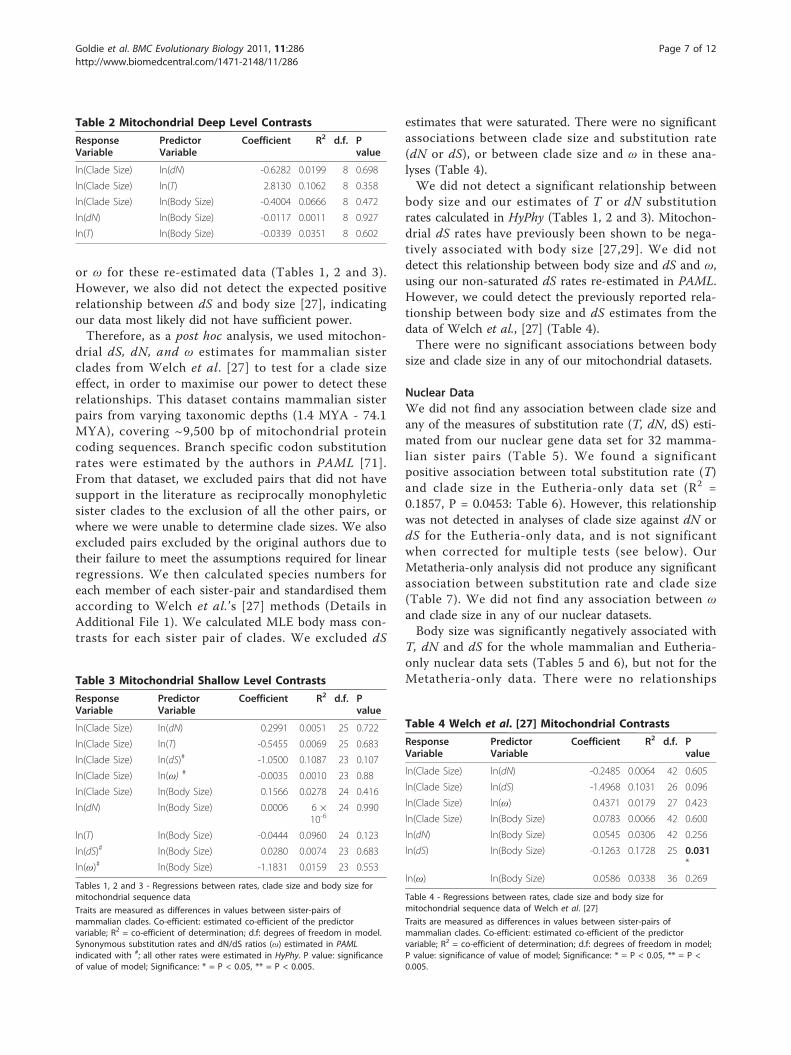
drial dS, dN, and ω estimates for mammalian sisterclades from Welch et al. [27] to test for a clade sizeeffect, in order to maximise our power to detect theserelationships. This dataset contains mammalian sisterpairs from varying taxonomic depths (1.4 MYA - 74.1MYA), covering ~9,500 bp of mitochondrial proteincoding sequences. Branch specific codon substitutionrates were estimated by the authors in PAML [71].From that dataset, we excluded pairs that did not havesupport in the literature as reciprocally monophyleticsister clades to the exclusion of all the other pairs, orwhere we were unable to determine clade sizes. We alsoexcluded pairs excluded by the original authors due totheir failure to meet the assumptions required for linearregressions. We then calculated species numbers foreach member of each sister-pair and standardised themaccording to Welch et al.’s [27] methods (Details inAdditional File 1). We calculated MLE body mass con-trasts for each sister pair of clades. We excluded dS
estimates that were saturated. There were no significantassociations between clade size and substitution rate(dN or dS), or between clade size and ω in these ana-lyses (Table 4).We did not detect a significant relationship between
body size and our estimates of T or dN substitutionrates calculated in HyPhy (Tables 1, 2 and 3). Mitochon-drial dS rates have previously been shown to be nega-tively associated with body size [27,29]. We did notdetect this relationship between body size and dS and ω,using our non-saturated dS rates re-estimated in PAML.However, we could detect the previously reported rela-tionship between body size and dS estimates from thedata of Welch et al., [27] (Table 4).There were no significant associations between body
size and clade size in any of our mitochondrial datasets.
Nuclear DataWe did not find any association between clade size andany of the measures of substitution rate (T, dN, dS) esti-mated from our nuclear gene data set for 32 mamma-lian sister pairs (Table 5). We found a significantpositive association between total substitution rate (T)and clade size in the Eutheria-only data set (R2 =0.1857, P = 0.0453: Table 6). However, this relationshipwas not detected in analyses of clade size against dN ordS for the Eutheria-only data, and is not significantwhen corrected for multiple tests (see below). OurMetatheria-only analysis did not produce any significantassociation between substitution rate and clade size(Table 7). We did not find any association between ωand clade size in any of our nuclear datasets.Body size was significantly negatively associated with
T, dN and dS for the whole mammalian and Eutheria-only nuclear data sets (Tables 5 and 6), but not for theMetatheria-only data. There were no relationships
Table 2 Mitochondrial Deep Level Contrasts
ResponseVariable
PredictorVariable
Coefficient R2 d.f. Pvalue
ln(Clade Size) ln(dN) -0.6282 0.0199 8 0.698
ln(Clade Size) ln(T) 2.8130 0.1062 8 0.358
ln(Clade Size) ln(Body Size) -0.4004 0.0666 8 0.472
ln(dN) ln(Body Size) -0.0117 0.0011 8 0.927
ln(T) ln(Body Size) -0.0339 0.0351 8 0.602
Table 3 Mitochondrial Shallow Level Contrasts
ResponseVariable
PredictorVariable
Coefficient R2 d.f. Pvalue
ln(Clade Size) ln(dN) 0.2991 0.0051 25 0.722
ln(Clade Size) ln(T) -0.5455 0.0069 25 0.683
ln(Clade Size) ln(dS)# -1.0500 0.1087 23 0.107
ln(Clade Size) ln(ω) # -0.0035 0.0010 23 0.88
ln(Clade Size) ln(Body Size) 0.1566 0.0278 24 0.416
ln(dN) ln(Body Size) 0.0006 6 ×10⁻⁶
24 0.990
ln(T) ln(Body Size) -0.0444 0.0960 24 0.123
ln(dS)# ln(Body Size) 0.0280 0.0074 23 0.683
ln(ω)# ln(Body Size) -1.1831 0.0159 23 0.553
Tables 1, 2 and 3 - Regressions between rates, clade size and body size formitochondrial sequence data
Traits are measured as differences in values between sister-pairs ofmammalian clades. Co-efficient: estimated co-efficient of the predictorvariable; R2 = co-efficient of determination; d.f: degrees of freedom in model.Synonymous substitution rates and dN/dS ratios (ω) estimated in PAMLindicated with #; all other rates were estimated in HyPhy. P value: significanceof value of model; Significance: * = P < 0.05, ** = P < 0.005.
Table 4 Welch et al. [27] Mitochondrial Contrasts
ResponseVariable
PredictorVariable
Coefficient R2 d.f. Pvalue
ln(Clade Size) ln(dN) -0.2485 0.0064 42 0.605
ln(Clade Size) ln(dS) -1.4968 0.1031 26 0.096
ln(Clade Size) ln(ω) 0.4371 0.0179 27 0.423
ln(Clade Size) ln(Body Size) 0.0783 0.0066 42 0.600
ln(dN) ln(Body Size) 0.0545 0.0306 42 0.256
ln(dS) ln(Body Size) -0.1263 0.1728 25 0.031*
ln(ω) ln(Body Size) 0.0586 0.0338 36 0.269
Table 4 - Regressions between rates, clade size and body size formitochondrial sequence data of Welch et al. [27]
Traits are measured as differences in values between sister-pairs ofmammalian clades. Co-efficient: estimated co-efficient of the predictorvariable; R2 = co-efficient of determination; d.f: degrees of freedom in model;P value: significance of value of model; Significance: * = P < 0.05, ** = P <0.005.
Goldie et al. BMC Evolutionary Biology 2011, 11:286http://www.biomedcentral.com/1471-2148/11/286
Page 7 of 12
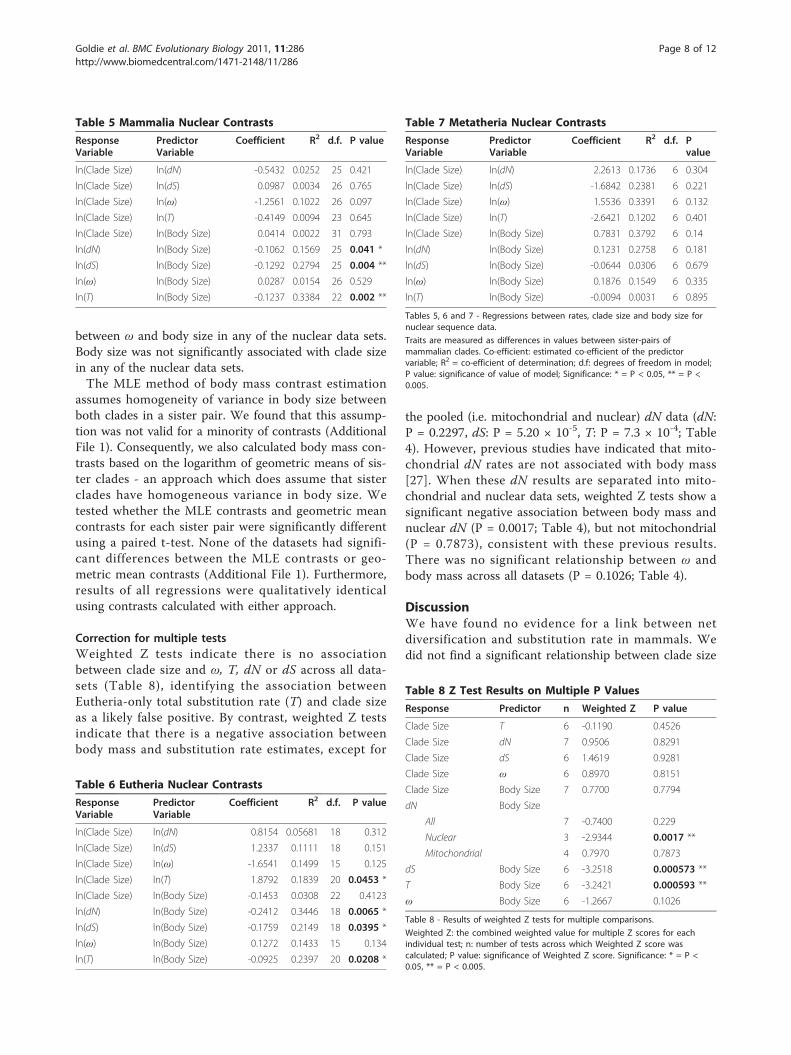
between ω and body size in any of the nuclear data sets.Body size was not significantly associated with clade sizein any of the nuclear data sets.The MLE method of body mass contrast estimation
assumes homogeneity of variance in body size betweenboth clades in a sister pair. We found that this assump-tion was not valid for a minority of contrasts (AdditionalFile 1). Consequently, we also calculated body mass con-trasts based on the logarithm of geometric means of sis-ter clades - an approach which does assume that sisterclades have homogeneous variance in body size. Wetested whether the MLE contrasts and geometric meancontrasts for each sister pair were significantly differentusing a paired t-test. None of the datasets had signifi-cant differences between the MLE contrasts or geo-metric mean contrasts (Additional File 1). Furthermore,results of all regressions were qualitatively identicalusing contrasts calculated with either approach.
Correction for multiple testsWeighted Z tests indicate there is no associationbetween clade size and ω, T, dN or dS across all data-sets (Table 8), identifying the association betweenEutheria-only total substitution rate (T) and clade sizeas a likely false positive. By contrast, weighted Z testsindicate that there is a negative association betweenbody mass and substitution rate estimates, except for
the pooled (i.e. mitochondrial and nuclear) dN data (dN:P = 0.2297, dS: P = 5.20 × 10⁻⁵, T: P = 7.3 × 10⁻⁴; Table4). However, previous studies have indicated that mito-chondrial dN rates are not associated with body mass[27]. When these dN results are separated into mito-chondrial and nuclear data sets, weighted Z tests show asignificant negative association between body mass andnuclear dN (P = 0.0017; Table 4), but not mitochondrial(P = 0.7873), consistent with these previous results.There was no significant relationship between ω andbody mass across all datasets (P = 0.1026; Table 4).
DiscussionWe have found no evidence for a link between netdiversification and substitution rate in mammals. Wedid not find a significant relationship between clade size
Table 5 Mammalia Nuclear Contrasts
ResponseVariable
PredictorVariable
Coefficient R2 d.f. P value
ln(Clade Size) ln(dN) -0.5432 0.0252 25 0.421
ln(Clade Size) ln(dS) 0.0987 0.0034 26 0.765
ln(Clade Size) ln(ω) -1.2561 0.1022 26 0.097
ln(Clade Size) ln(T) -0.4149 0.0094 23 0.645
ln(Clade Size) ln(Body Size) 0.0414 0.0022 31 0.793
ln(dN) ln(Body Size) -0.1062 0.1569 25 0.041 *
ln(dS) ln(Body Size) -0.1292 0.2794 25 0.004 **
ln(ω) ln(Body Size) 0.0287 0.0154 26 0.529
ln(T) ln(Body Size) -0.1237 0.3384 22 0.002 **
Table 6 Eutheria Nuclear Contrasts
ResponseVariable
PredictorVariable
Coefficient R2 d.f. P value
ln(Clade Size) ln(dN) 0.8154 0.05681 18 0.312
ln(Clade Size) ln(dS) 1.2337 0.1111 18 0.151
ln(Clade Size) ln(ω) -1.6541 0.1499 15 0.125
ln(Clade Size) ln(T) 1.8792 0.1839 20 0.0453 *
ln(Clade Size) ln(Body Size) -0.1453 0.0308 22 0.4123
ln(dN) ln(Body Size) -0.2412 0.3446 18 0.0065 *
ln(dS) ln(Body Size) -0.1759 0.2149 18 0.0395 *
ln(ω) ln(Body Size) 0.1272 0.1433 15 0.134
ln(T) ln(Body Size) -0.0925 0.2397 20 0.0208 *
Table 7 Metatheria Nuclear Contrasts
ResponseVariable
PredictorVariable
Coefficient R2 d.f. Pvalue
ln(Clade Size) ln(dN) 2.2613 0.1736 6 0.304
ln(Clade Size) ln(dS) -1.6842 0.2381 6 0.221
ln(Clade Size) ln(ω) 1.5536 0.3391 6 0.132
ln(Clade Size) ln(T) -2.6421 0.1202 6 0.401
ln(Clade Size) ln(Body Size) 0.7831 0.3792 6 0.14
ln(dN) ln(Body Size) 0.1231 0.2758 6 0.181
ln(dS) ln(Body Size) -0.0644 0.0306 6 0.679
ln(ω) ln(Body Size) 0.1876 0.1549 6 0.335
ln(T) ln(Body Size) -0.0094 0.0031 6 0.895
Tables 5, 6 and 7 - Regressions between rates, clade size and body size fornuclear sequence data.
Traits are measured as differences in values between sister-pairs ofmammalian clades. Co-efficient: estimated co-efficient of the predictorvariable; R2 = co-efficient of determination; d.f: degrees of freedom in model;P value: significance of value of model; Significance: * = P < 0.05, ** = P <0.005.
Table 8 Z Test Results on Multiple P Values
Response Predictor n Weighted Z P value
Clade Size T 6 -0.1190 0.4526
Clade Size dN 7 0.9506 0.8291
Clade Size dS 6 1.4619 0.9281
Clade Size ω 6 0.8970 0.8151
Clade Size Body Size 7 0.7700 0.7794
dN Body Size
All 7 -0.7400 0.229
Nuclear 3 -2.9344 0.0017 **
Mitochondrial 4 0.7970 0.7873
dS Body Size 6 -3.2518 0.000573 **
T Body Size 6 -3.2421 0.000593 **
ω Body Size 6 -1.2667 0.1026
Table 8 - Results of weighted Z tests for multiple comparisons.
Weighted Z: the combined weighted value for multiple Z scores for eachindividual test; n: number of tests across which Weighted Z score wascalculated; P value: significance of Weighted Z score. Significance: * = P <0.05, ** = P < 0.005.
Goldie et al. BMC Evolutionary Biology 2011, 11:286http://www.biomedcentral.com/1471-2148/11/286
Page 8 of 12
and total substitution rate (T), non-synonymous substi-tution rates (dN), or synonymous substitution rates (dS)for any of our mitochondrial or nuclear datasets. Theseresults are in contrast to results of similar studies onother taxa, which have shown a positive relationshipbetween rates of molecular evolution and clade size inangiosperms [1], birds [4,5], and reptiles [4], and a posi-tive relationship between molecular branch lengths andthe number of nodes through which those branchespass in a large range of taxa [6,8].There are a number of explanations for our failure to
detect a relationship between substitution rates andclade size in mammals: (1) the relationship exists butour analyses do not have the power to detect it; (2) therelationship exists, but is confounded by other processesin mammals; and (3) the relationship between clade sizeand substitution rates is not universal and does not existin mammals.We cannot rule out a lack of power producing the
results we report here, but we do not consider this themost likely explanation for our results. We were able todetect a significant relationship between body size andsubstitution rates in both our nuclear data and the mito-chondrial data from Welch et al [27], indicating that thedata used here have the power to detect associationsbetween substitution rate and life history variables.Given the previously reported strength of the associationbetween clade size and substitution rates in othergroups (angiosperms, 89 comparisons, ~5 kbp [1]; rep-tiles, 16 comparisons ~10 kbp DNA [4]; and birds, 12comparisons and ~10 kbp for mtDNA [4], 32 compari-sons and ~17 kbp for nuclear DNA [5]), the lack of asignificant relationship between substitution rate andclade size in our data (42 comparisons and ~10 kbp formtDNA, 31 comparisons and ~3 kbp for nuclear DNA)suggests that this relationship is either weak or absentin mammals.It is possible that there is an association between sub-
stitution rates and clade size in mammals, but that thisrelationship is masked by interactions with other vari-ables. For instance, it has been suggested that abun-dance (measured as group size or population density) ispositively linked to diversification rate in mammals [62].If abundance is also correlated to effective populationsize, then more abundant mammal species could havereduced rates of non-synonymous substitution, sinceslightly deleterious mutations have lower fixation prob-abilities in larger populations [45,73]. So it is possiblethat more abundant mammal species have both highernet diversification and lower substitution rate, and thatthese relationships could confound our ability to observea positive link between net diversification and the sub-stitution rate. However, if the link between diversifica-tion and molecular evolution is confounded by effective
population size, we might expect to detect an associa-tion between ω and clade size, which we have not seenin this study.Perhaps a more likely explanation for the lack of an
association between substitution rates and clade size inmammals is that the relationship does not exist for thisgroup. Previous explanations of the association betweenrates of molecular evolution and clade size have focusedon three possible causes: (i) speciation causes increasesin substitution rates; (ii) mutation rates drive diversifica-tion; and (iii) both diversification and substitution rateare linked to another factor.Some previous studies have explained a positive asso-
ciation between net diversification and substitution rateas the result of the demographic and selective processescharacterising speciation [7]. Specifically, more frequentspeciation events could be expected to lead to reduc-tions of the long term Ne in more rapidly speciatingclades [6,8]. Reductions in long term Ne would beexpected to increase the fixation rate of nearly neutralmutations (i.e. those with selection co-efficientsapproaching 1/Ne) [73], and thus increase the non-synonymous substitution rate. If this is the cause of thepreviously noted link between diversification and ratesof molecular evolution then it is possible that the con-nection between speciation events and substitution rateis for some reason not as strong in mammals. For exam-ple, it is possible that frequent population size fluctua-tions in mammals overwhelm any signal of populationsize reduction associated with speciation events.A recent study indicated that the correlation between
substitution rate and clade size in birds might be drivenby the effect of mutation rates on the process of diversi-fication [5]. Hybrid fitness in birds has been shown tobe inversely proportional to genetic distances betweenparents [74-77], possibly supporting a significant role forthe accumulation of Dobzhansky-Muller incompatibil-ities in speciation in birds [20,21]. If this is the case,then the rate of formation of species through post-zygo-tic hybrid incompatibility might be influenced by themutation rate [22,23]. It has been suggested that hybridincompatibilities in mammals develop at a much fasterrate than in birds [78], possibly due to higher rates ofregulatory evolution [78,79]. If reproductive isolation inmammals is determined to a greater degree by adaptivedivergence at regulatory and developmental loci (such asthose loci associated with placentation, genomicimprinting or mediating viviparity driven conflicts[80-82]), then the molecular change accompanying spe-ciation may be predominantly in a few key loci, ratherthan due to the accumulation of genome-wideincompatibilities.It is also possible that the positive association between
rates of molecular evolution and clade size observed in
Goldie et al. BMC Evolutionary Biology 2011, 11:286http://www.biomedcentral.com/1471-2148/11/286
Page 9 of 12
some taxa is not due to a direct effect of speciation onmolecular evolution, or vice versa, but the result ofanother variable driving both processes independently ofeach other, leading to an indirect correlation betweenthe two.Many life-history correlates of substitution rate in
mammals have been identified [27,29,57], however, fewof these life history traits have been shown to consis-tently scale with mammalian clade size. The life-historytraits that scale with substitution rates in mammals(generation time, fecundity, and longevity) also correlatetightly with body size [57-59]. Because of this, body sizeis significantly negatively associated with substitutionrates, as demonstrated both here and in other studies[24,27,29,53,59]. If extinction rates increase with bodysize, it could reduce the clade size of larger-bodied taxapotentially leading to an indirect positive relationshipbetween substitution rates and clade size. However, aconsistent relationship between body size and clade sizein mammals has not been established - we find no evi-dence for such a relationship in this study, and theresults of other studies are equivocal and inconsistentacross different clades of mammals [60,62,63,83]. Takentogether these results suggest that it is unlikely in mam-mals that body size, or life history traits that correlatewith size, drives both substitution rates and diversifica-tion (via extinction or speciation) rates, as may be thecase in other taxa [5,83].
ConclusionsContrary to patterns observed in other taxa, we have notdetected a relationship between clade size in mammalsand substitution rate, measured from total, synonymousand non-synonymous substitution rates in both nuclearor mitochondrial genes. Given that our study is likely tohave comparable power to other similar studies, theseresults suggest that any association between net diversi-fication and substitution rate is either absent or veryweak in mammals.
Additional material
Additional file 1: Nuclear and Mitochondrial Data. Excel spreadsheetcontaining substitution rate estimates, estimates of body size differencesbetween sister-pairs, estimates of species number (clade size), AccessionNumbers and references.
Additional file 2: Phylogenies. PDF document containing phylogeniesused for all analyses described in the main text.
Additional file 3: Body Mass Data. PDF document containing bodymass data and references additional to those sourced from thepanTHERIA life history database [35].
Additional file 4: Rate Variation Test outputs. PDF documentcontaining outputs of tests of rate variation in all datasets used,comparing a free-rate versus fixed rate models across trees.
Additional file 5: Weighted Z Test calculations. Excel spreadsheetcontaining values and calculations for Weighted Z test of multiplecomparisons.
AcknowledgementsThanks to Marcel Cardillo for providing the mammalian super-tree andassistance with running the MLE analysis. Thank you to Simon Ho, Dorothee-Marie Huchon-Pupko and Geeta Eick for providing additional phylogenetictrees. Thank you to Matt Phillips for assistance with statistical analyses.Thanks to John Welch for providing assistance with running the MLEanalysis. We appreciate the thorough work of two anonymous reviewers fortheir assistance in greatly improving this article.
Authors’ contributionsXG, RL and LB designed the analyses; XG performed the analyses; XG, RLand LB wrote the manuscript. All authors have read and approved the finalmanuscript.
Received: 15 June 2011 Accepted: 4 October 2011Published: 4 October 2011
References1. Barraclough TG, Savolainen V: Evolutionary rates and species diversity in
flowering plants. Evolution 2001, 55:677-683.2. Lancaster LT: Molecular evolutionary rates predict both extinction and
speciation in temperate angiosperm lineages. BMC Evolutionary Biology2010, 10:162.
3. Jobson RW, Albert VA: Molecular Rates Parallel Diversification Contrastsbetween Carnivorous Plant Sister Lineages. Cladistics 2002, 18:127-136.
4. Eo SH, DeWoody JA: Evolutionary rates of mitochondrial genomescorrespond to diversification rates and to contemporary species richnessin birds and reptiles. Proceedings of the Royal Society of London B: BiologicalSciences 2010, 277:3587-3592.
5. Lanfear R, Ho SYW, Love D, Bromham L: Mutation rate is linked todiversification in birds. Proceedings of the National Academy of Sciences2010, 107:20423-20428.
6. Pagel M, Venditti C, Meade A: Large punctuational contribution ofspeciation to evolutionary divergence at the molecular level. Science2006, 314:119-121.
7. Venditti C, Pagel M: Speciation as an active force in promoting geneticevolution. Trends in Ecology & Evolution 2010, 25:14-20.
8. Webster A, Payne R, Pagel M: Molecular phylogenies link rates ofevolution and speciation. Science 2003, 301:478.
9. Losos JB, Warheit KI, Schoener TW: Adaptive differentiation followingexperimental island colonization in Anolis lizards. Nature 1997, 387:70-73.
10. Seehausen O, Terai Y, Magalhaes IS, Carleton KL, Mrosso HDJ, Miyagi R, vander Sluijs I, Schneider MV, Maan ME, Tachida H, et al: Speciation throughsensory drive in cichlid fish. Nature 2008, 455:620-627.
11. Nosil P, Funk DJ, Ortiz-Barrientos D: Divergent selection andheterogeneous genomic divergence. Molecular Ecology 2009, 18:375-402.
12. Ogden R, Thorpe R: Molecular evidence for ecological speciation intropical habitats. Proceedings of the National Academy of Sciences 2002,99:13612-13615.
13. Orr H, Masly J, Presgraves D: Speciation genes. Current Opinion in Genetics& Development 2004, 14:675-679.
14. Orr M, Smith T: Ecology and speciation. Trends in Ecology & Evolution 1998,13:502-506.
15. Rundle H, Nosil P: Ecological speciation. Ecology letters 2005, 8:336-352.16. Barton NH: Genetic hitchhiking. Philosophical Transactions of the Royal
Society B: Biological Sciences 2000, 355:1553-1562.17. Kim Y, Gulisija D: Signatures of recent directional selection under
different models of population expansion during colonization of newselective environments. Genetics 2010, 184:571-585.
18. Stephan W, Song YS, Langley CH: The hitchhiking effect on linkagedisequilibrium between linked neutral loci. Genetics 2006, 172:2647-2663.
19. Ohta T: Slightly deleterious mutant substitutions in evolution. Nature1973, 246:96-98.
Goldie et al. BMC Evolutionary Biology 2011, 11:286http://www.biomedcentral.com/1471-2148/11/286
Page 10 of 12
20. Dobzhansky T: Studies on hybrid sterility. II. Localization of sterilityfactors in Drosophila pseudoobscura hybrids. Genetics 1936, 21:113-135.
21. Muller HJ: Isolating mechanisms, evolution, and temperature. InTemperature, Evolution, Development. Volume 6. Edited by: Dobzhansky T.Jaques Cattell Press; 1942:71-125.
22. Orr HA, Turelli M: The evolution of post-zygotic isolation: accumulatingDobzhansky-Muller incompatibilities. Evolution 2001, 55:1085-1094.
23. Orr H: The population genetics of speciation: the evolution of hybridincompatibilities. Genetics 1995, 139:1805-1813.
24. Nabholz B, Mauffrey J, Bazin E, Galtier N, Glemin S: Determination ofmitochondrial genetic diversity in mammals. Genetics 2008, 178:351-361.
25. Popadin K, Polishchuk LV, Mamirova L, Knorre D, Gunbin K: Accumulationof slightly deleterious mutations in mitochondrial protein-coding genesof large versus small mammals. Proceedings of the National Academy ofSciences 2007, 104:13390-13395.
26. Frankham R: Genetics and extinction. Biological Conservation 2005,126:131-140.
27. Welch J, Bininda-Emonds O, Bromham L: Correlates of substitution ratevariation in mammalian protein-coding sequences. BMC EvolutionaryBiology 2008, 8:53.
28. Bininda-Emonds O: Fast Genes and Slow Clades: Comparative Rates ofMolecular Evolution in Mammals. Evolutionary Bioinformatics 2007, 59-85.
29. Bromham L, Rambaut A, Harvey PH: Determinants of rate variation inmammalian DNA sequence evolution. Journal of Molecular Evolution 1996,43:610-621.
30. Cardillo M, Bromham L: Body size and risk of extinction in Australianmammals. Conservation Biology 2001, 15:1435-1500.
31. Cardillo M, Mace GM, Jones KE, Bielby J, Bininda-Edmonds ORP, Sechrest W,Orme CDL, Purvis A: Multiple causes of high extinction risk in largemammal species. Science 2005, 309:1239-1241.
32. Hugall A, Lee M: The likelihood node density effect and consequencesfor evolutionary studies of molecular rates. Evolution 2007, 61:2293-2307.
33. Goetting-Minesky M, Makova K: Mammalian male mutation bias: impactsof generation time and regional variation in substitution rates. Journal ofMolecular Evolution 2006, 63:537-544.
34. Nabholz B, Glémin S, Galtier N: The erratic mitochondrial clock: variationsof mutation rate, not population size, affect mtDNA diversity acrossbirds and mammals. BMC Evolutionary Biology 2009, 9:54.
35. Jones K, Bielby J, Cardillo M, Fritz S, O’Dell J, Orme C, Safi K, Sechrest W,Boakes E, Carbone C: PanTHERIA: a species-level database of life history,ecology, and geography of extant and recently extinct mammals.Ecology 2009, 90:2648-2648.
36. Agnarsson I, Kuntner M, May-Collado LJ: Dogs, cats, and kin: a molecularspecies-level phylogeny of Carnivora. Molecular Phylogenetics andEvolution 2010, 54:726-745.
37. Agnarsson I, May-Collado L: The phylogeny of Cetartiodactyla: Theimportance of dense taxon sampling, missing data, and the remarkablepromise of cytochrome b to provide reliable species-level phylogenies.Molecular Phylogenetics and Evolution 2008, 48:964-985.
38. Beck RMD: A dated phylogeny of marsupials using a molecularsupermatrix and multiple fossil constraints. Journal of Mammalogy 2008,89:175-189.
39. Bininda-Emonds O, Cardillo M, Jones K, MacPhee R, Beck R, Grenyer R,Price S, Vos R, Gittleman J, Purvis A: The delayed rise of present-daymammals. Nature 2007, 446:507-512.
40. Campbell V, Lapointe F-J: An application of supertree methods tomammalian mitogenomic sequences. Evolutionary Bioinformatics 2010,6:57-71.
41. Fabre P-H, Rodrigues A, Douzery EJP: Patterns of macroevolution amongPrimates inferred from a supermatrix of mitochondrial and nuclear DNA.Molecular Phylogenetics and Evolution 2009, 53:808-825.
42. Meredith R, Westerman M, Springer M: A phylogeny of Diprotodontia(Marsupialia) based on sequences for five nuclear genes. MolecularPhylogenetics and Evolution 2009, 51:554-571.
43. Chamary J-V, Parmley JL, Hurst LD: Hearing silence: non-neutral evolutionat synonymous sites in mammals. Nature Reviews Genetics 2006, 7:98-108.
44. Parmley JL, Hurst LD: How do synonymous mutations affect fitness?BioEssays 2007, 29:515-519.
45. Ohta T, Gillespie J: Development of neutral and nearly neutral theories.Theoretical Population Biology 1996, 49:128-142.
46. Harvey PH, Pagel MD: The Comparative Method in Evolutionary Biology.Oxford: Oxford University Press; 19911.
47. Felsenstein J: Phylogenies and the comparative method. The AmericanNaturalist 1985, 125:1-15.
48. Rabosky DL: Ecological limits and diversification rate: alternativeparadigms to explain the variation in species richness among cladesand regions. Ecology Letters 2009, 12:735-743.
49. Sanderson MJ: Estimating rates of speciation and evolution: a bias dueto homoplasy. Cladistics 1990, 6:387-391.
50. Kosakovsky-Pond S, Frost S, Muse S: HyPhy: hypothesis testing usingphylogenies. Bioinformatics 2005, 21:676-679.
51. Muse S, Gaut B: A likelihood approach for comparing synonymous andnonsynonymous nucleotide substitution rates, with application to thechloroplast genome. Molecular Biology and Evolution 1994, 11:715-724.
52. Kosakovsky-Pond S, Frost S: Not so different after all: a comparison ofmethods for detecting amino acid sites under selection. MolecularBiology and Evolution 2005, 22:1208-1222.
53. Lanfear R, Welch J, Bromham L: Watching the clock: studying variation inrates of molecular evolution between species. Trends in Ecology &Evolution 2010, 25:495-503.
54. Akaike H: A new look at the statistical model identification. IEEETransactions on Automatic Control 1974, 19:716-723.
55. Welch JJ, Waxman D: Calculating independent contrasts for thecomparative study of substitution rates. Journal of Theoretical Biology2008, 251:667-678.
56. Wilson DE, Reeder DM: Mammal Species of the World. A Taxonomic andGeographic Reference. Baltimore, MD: John Hopkins University Press; 2005.
57. Nabholz B, Glemin S, Galtier N: Strong variations of mitochondrialmutation rate across mammals–the longevity hypothesis. MolecularBiology and Evolution 2008, 25:120-130.
58. Western D: Size, life history and ecology in mammals. African Journal ofEcology 1979, 17:185-204.
59. Martin A, Palumbi S: Body size, metabolic rate, generation time, and themolecular clock. Proceedings of the National Academy of Sciences 1993,90:4087-4091.
60. Cardillo M, Huxtable J, Bromham L: Geographic range size, life history andrates of diversification in Australian mammals. Journal of EvolutionaryBiology 2003, 16:282-288.
61. Chatterjee H, Ho S, Barnes I, Groves C: Estimating the phylogeny anddivergence times of primates using a supermatrix approach. BMCEvolutionary Biology 2009, 9:259.
62. Isaac NJB, Jones K, Gittleman J, Purvis A: Correlates of species richness inmammals: body size, life history, and ecology. The American Naturalist2005, 165:600-607.
63. Liow L, Fortelius M, Bingham E, Lintulaakso K, Mannila H, Flynn L,Stenseth N: Higher origination and extinction rates in larger mammals.Proceedings of the National Academy of Sciences 2008, 105:6097-6102.
64. Cooper N, Purvis A: Body Size Evolution in Mammals: Complexity inTempo and Mode. The American Naturalist 2010, 175:727-738.
65. Blanga-Kanfi S, Miranda H, Penn O, Pupko T, DeBry R, Huchon D: Rodentphylogeny revised: analysis of six nuclear genes from all major rodentclades. BMC Evolutionary Biology 2009, 9:71.
66. Teeling E, Springer M, Madsen O, Bates P, O’Brien S, Murphy W: Amolecular phylogeny for bats illuminates biogeography and the fossilrecord. Science 2005, 307:580-584.
67. Garland T, Harvey P, Ives A: Procedures for the analysis of comparativedata using phylogenetically independent contrasts. Systematic Biology1992, 41:18-32.
68. Freckleton R: Phylogenetic tests of ecological and evolutionaryhypotheses: checking for phylogenetic independence. Functional Ecology2000, 14:129-134.
69. R Development Core Team: R: A Language and Environment forStatistical Computing. Vienna, Austria: R Foundation for StatisticalComputing;, 2.11.1 2010.
70. Whitlock M: Combining probability from independent tests: theweighted Z-method is superior to Fisher’s approach. Journal ofEvolutionary Biology 2005, 18:1368-1373.
71. Yang Z: PAML 4: a program package for phylogenetic analysis bymaximum likelihood. Molecular Biology and Evolution 2007, 24:1586-1591.
Goldie et al. BMC Evolutionary Biology 2011, 11:286http://www.biomedcentral.com/1471-2148/11/286
Page 11 of 12

72. Goldman N, Yang Z: A codon-based model of nucleotide substitution forprotein-coding DNA sequences. Molecular Biology and Evolution 1994,11:725-736.
73. Woolfit M: Effective population size and the rate and pattern ofnucleotide subsitutions. Biology Letters 2009, 5:417-420.
74. Lijtmaer DA, Mahler B, Tubaro PL: Hybridization and postzygotic isolationpatterns in pigeons and doves. Evolution 2003, 57:1411-1418.
75. Price TD: Speciation in Birds. Greenwood Village, CO: Roberts andCompany; 2008.
76. Price TD, Bouvier M: The evolution of F1 postzygotic incompatibilities inbirds. Evolution 2002, 56:2083-2089.
77. Tubaro PL, Lijtmaer DA: Hybridization patterns and the evolution ofreproductive isolation in ducks. Biological Journal of the Linnean Society2002, 77:193-200.
78. Fitzpatrick BM: Rates of evolution of hybrid inviability in birds andmammals. Evolution 2004, 58:1865-1870.
79. Wilson AC, Maxson LR, Sarich VM: Two types of molecular evolution:evidence from studies of interspecific hybridisation. Proceedings of theNational Academy of Sciences 1974, 71:2843-2847.
80. Elliot MG, Crespi BJ: Placental invasiveness mediates the evolution ofhybrid inviability in mammals. The American Naturalist 2006, 168:114-120.
81. Vrana PB: Genomic imprinting as a mechanism of reproductive isolationin mammals. Journal of Mammalogy 2007, 88:5-23.
82. Zeh JA, Zeh DW: Viviparity-driven conflict: more to speciation thanmeets the fly. Annals of the New York Academy of Sciences 2008,1133:126-148.
83. Gittleman J, Purvis A: Body size and species-richness in carnivores andprimates. Proceedings of the Royal Society of London B: Biological Sciences1998, 265:113-119.
doi:10.1186/1471-2148-11-286Cite this article as: Goldie et al.: Diversification and the rate ofmolecular evolution: no evidence of a link in mammals. BMCEvolutionary Biology 2011 11:286.
Submit your next manuscript to BioMed Centraland take full advantage of:
• Convenient online submission
• Thorough peer review
• No space constraints or color figure charges
• Immediate publication on acceptance
• Inclusion in PubMed, CAS, Scopus and Google Scholar
• Research which is freely available for redistribution
Submit your manuscript at www.biomedcentral.com/submit
Goldie et al. BMC Evolutionary Biology 2011, 11:286http://www.biomedcentral.com/1471-2148/11/286
Page 12 of 12