Diurea Cross-Linked Poly(oxyethylene)/Siloxane Ormolytes for Lithium Batteries
40
J. Electrochemical Society 1 S. C. Nunes et al. Di-urea cross-linked poly(oxyethylene)/siloxane ormolytes for lithium batteries S. C. Nunes, V. de Zea Bermudez * Departamento de Química and CQ-VR Universidade de Trás-os-Montes e Alto Douro, 5000-911 Vila Real, Portugal D. Ostrovskii Department of Experimental Physics, Chalmers University of Technology 41296 Göteborg, Sweden M. M. Silva, S. Barros, M. J. Smith Departamento de Química, Universidade do Minho, Gualtar, 4710-057 Braga, Portugal L. D. Carlos Departamento de Física and CICECO, Universidade de Aveiro, 3810-193 Aveiro, Portugal J. Rocha Departamento de Química and CICECO, Universidade de Aveiro, 3810-193 Aveiro, Portugal E. Morales Instituto de Ciencia y Tecnología de Polímeros (CSIC) Calle Juan de la Cierva 3, 28006 Madrid, Spain Poly(oxyethylene) (POE)/siloxane hybrids (di-ureasils) doped with a wide concentration range of lithium triflate (LiCF 3 SO 3 ) were investigated. The host matrix of these materials (d- U(2000)) is a sol-gel derived siliceous framework to which POE chains with about 40.5 repeat units are bonded through urea linkages. Xerogels with ∞ ≥ n ≥ 5 (n is the molar ratio OCH 2 CH 2 /Li + ) were obtained as amorphous monoliths thermally stable up to at least 340 ºC. * E-mail: [email protected]
Transcript of Diurea Cross-Linked Poly(oxyethylene)/Siloxane Ormolytes for Lithium Batteries

J. Electrochemical Society 1 S. C. Nunes et al.
Di-urea cross-linked poly(oxyethylene)/siloxane ormolytes
for lithium batteries
S. C. Nunes, V. de Zea Bermudez*
Departamento de Química and CQ-VR
Universidade de Trás-os-Montes e Alto Douro, 5000-911 Vila Real, Portugal
D. Ostrovskii
Department of Experimental Physics, Chalmers University of Technology
41296 Göteborg, Sweden
M. M. Silva, S. Barros, M. J. Smith
Departamento de Química, Universidade do Minho, Gualtar, 4710-057 Braga, Portugal
L. D. Carlos
Departamento de Física and CICECO, Universidade de Aveiro, 3810-193 Aveiro, Portugal
J. Rocha
Departamento de Química and CICECO, Universidade de Aveiro, 3810-193 Aveiro, Portugal
E. Morales
Instituto de Ciencia y Tecnología de Polímeros (CSIC)
Calle Juan de la Cierva 3, 28006 Madrid, Spain
Poly(oxyethylene) (POE)/siloxane hybrids (di-ureasils) doped with a wide concentration
range of lithium triflate (LiCF3SO3) were investigated. The host matrix of these materials (d-
U(2000)) is a sol-gel derived siliceous framework to which POE chains with about 40.5
repeat units are bonded through urea linkages. Xerogels with ! " n " 5 (n is the molar ratio
OCH2CH2/Li+) were obtained as amorphous monoliths thermally stable up to at least 340 ºC.
* E-mail: [email protected]

J. Electrochemical Society 2 S. C. Nunes et al.
A crystalline POE/LiCF3SO3 complex was detected spectroscopically in samples with n # 10.
Below 90 ºC the ormolyte with n = 20 exhibits the highest conductivity (5.8x10⁻⁶ $-1cm-1 at
26 ºC). The redox stability domain of this material spans 4.1 V. Although FT-IR data suggest
that the Li+ ions are complexed by the POE ether oxygen atoms at n # 10, this threshold
composition is probably located at slightly lower salt content. “Free” triflate ions and weakly
coordinated anions, present in all the samples examined, must be the main charge carriers of
the d-U(2000)20LiCF3SO3 xerogel. Ion pairs (Li+CF3SO3-) or negatively charged triplets
([Li(CF3SO3)2]-) are formed at n # 40. At n # 5 positively charged triplets [Li2(CF3SO3)]+ also
appear. Divalent positively charged multiplets [Li3(CF3SO3)]2+ occur at n = 1.
Introduction
A long-standing objective of research within the domain of solid-state electrochemistry
has been the synthesis of polymer electrolytes1,2 that combine the physical properties of
conventional thermoplastics with the high ionic conductivity required in applications such as
high energy density batteries.3
Polymer electrolytes are prepared through the dissolution of an ionic salt in an adequate
polymer. The host polymer is typically a polyether, such as POE, a macromolecule that
displays a remarkable solvating ability towards cations. The Li+-based polymer systems have
yielded the highest conductivities reported to date and thus have been the most widely
investigated.4
The practical application of POE-based electrolytes in solid state electrochemical devices
has been somewhat delayed, however, by their poor processability and marked tendency to
crystallise. In 1983, Berthier et al.5 provided conclusive evidence that in semi-crystalline
polymer electrolyte systems the ionic conductivity is confined to amorphous regions. This
suggested that high ionic conductivity should be correlated with polymer matrices that had

J. Electrochemical Society 3 S. C. Nunes et al.
low glass transition temperatures (Tg). This view prevailed in the polymer electrolyte research
community until Gadjourova et al.6 demonstrated very recently that ionic conductivity in the
crystalline domains of the matrix can be significantly higher than in the corresponding
amorphous phases. As the low levels of conductivity exhibited by the complexes described by
Gadjourova et al.6 do not permit to foresee their immediate application as practical
electrolytes, a considerable amount of the research currently carried out is still focused on the
development of amorphous systems.
Organically modified silicate electrolytes (ormolytes) represent a valuable alternative to
conventional polymer electrolytes. The ormolyte concept relies on the production of sol-gel7
derived organic/inorganic host frameworks8 that are able to accommodate the ionic species:
while the organic component includes the solvating POE segments, the inorganic component
is a siloxane network. In these materials crystallinity is either significantly reduced or
completely suppressed and extremely high contents of salt may be incorporated without any
undesirable consequences. In addition, samples of these materials may be readily processed
into thin films or monoliths and a marked improvement in the mechanical resistance and
chemical/thermal stability results. The organic/inorganic hybrid strategy has been successfully
employed in the last few years to prepare several Li+-doped ormolytes. 9-16
The present work is focused on the investigation of the structure, morphology, thermal
properties and electrochemical behaviour of a series of POE/siloxane ormolytes containing a
wide range of LiCF3SO3 concentration. The host structure of the materials analysed belongs
to the class of di-ureasils,17-19 a family of hybrids in which the organic and inorganic
components are bonded through urea groups. The di-ureasil matrix employed, which
possesses approximately 40.5 oxyethylene repeat units per polymer segment, was chosen
because of the encouraging conductivities displayed by electrolytes based on this host matrix
doped with Eu3+ ions.20,21 In an attempt to understand the ionic conductivity mechanism, we
J. Electrochemical Society 4 S. C. Nunes et al.
have used vibrational spectroscopy to examine the cation/polymer and cation/anion
interactions.
Experimental
Starting Materials - Lithium trifluoromethanesulfonate (LiCF3SO3, Aldrich) and %,&-
diaminepoly(oxyethylene-co-oxypropylene (commercially designated by Jeffamine ED-
2001®, Fluka, average molecular weight 2001 g/mol) were dried under vacuum at 25 ºC for
several days prior to being used. 3-isocyanatepropyltrietoxisilane (ICPTES, Fluka) was used
as received. Ethanol (CH3CH2OH, Merck) and tetrahydrofuran (THF, Merck) were stored
over molecular sieves. High purity distilled water was used in all experiments.
Synthesis of the di-ureasils - The preliminary stage of the preparation of Li+-doped di-
ureasils involved the formation of a covalent bond between the terminal NH2 groups of
Jeffamine-2001® and the -N=C=O group of ICPTES in THF to yield the urea cross-linked
organic-inorganic hybrid precursor designated as di-ureapropyltriethoxysilane (d-
UPTES(2000)). The grafting process was infrared monitored. During the formation of the
urea groups the intensity of the strong and sharp band characteristic of the stretching vibration
of the -N=C=O group of ICPTES, typically located at 2273 cm-1, was progressively reduced,
until it disappeared upon completion of the reaction. In parallel, a series of new bands,
associated with the vibrations of the urea group, appeared in the 1760-1530 cm-1 spectral
region. The d-UPTES(2000) compound was produced as a transparent oil. Its structure,
represented in Scheme 1, was confirmed by 1H NMR (CDCl3, 400.13 MHz) and 13C NMR
(CDCl3, 100.62 MHz) (Table 1).
In the second stage of the synthetic procedure, a mixture of CH3CH2OH and water was
added to the d-UPTES(2000) solution, followed by the incorporation of LiCF3SO3. Samples
with n = !, 200, 100, 80, 60, 40, 20, 10, 7, 5 and 1 were prepared according to the procedure
described elsewhere20,21. Details of the synthesis of the d-U(2000)nLiCF3SO3 xerogels are

J. Electrochemical Society 5 S. C. Nunes et al.
indicated in Table 2. The samples with n > 1 were obtained as transparent, flexible monoliths
with a yellowish hue. The d-U(2000)1LiCF3SO3 material was produced as a white solid.
In agreement with the terminology used in previous papers20,21, the hybrid matrix of the
materials obtained was designated as d-U(2000), where d indicates di, U denotes the urea
group and 2000 corresponds to the average molecular weight of the starting organic precursor.
The di-ureasils doped with LiCF3SO3 will be described by the d-U(2000)nLiCF3SO3 notation,
where n (salt composition) represents the number of ether oxygen atoms per Li+ cation. For
instance, the xerogel material d-U(2000)80LiCF3SO3 is the di-ureasil incorporating an amount
of LiCF3SO3 such that the OPOE / Li+ ratio is equal to 80.
Experimental Techniques. - The 1H and 13C NMR spectra were recorded in CDCl3 on a
Brüker ARX400 NMR spectrometer (400.13 MHz and 100.62 MHz, respectively) at CACTI-
Universidad de Vigo (Spain). Chemical shifts, ' , are quoted in ppm from tetramethylsilane
(TMS).
29Si magic-angle spinning (MAS) and 13C cross-polarization (CP) MAS NMR spectra
were recorded on a Brüker Avance 400 (9.4 T) spectrometer at 79.49 and 100.62 MHz,
respectively. 29Si MAS NMR spectra were recorded with 2 µs (equivalent to 30 º) rf pulses, a
recycle delay of 60 s and at a 5.0 kHz spinning rate. 13C CP/MAS NMR spectra were
recorded with 4 µs 1H 90º pulse, 2 ms contact time, a recycle delay of 4 s and at a spinning
rate of 4.5 kHz (the spinning rate of the 13C CP/MAS NMR spectrum for the undoped sample
is 8.kHz). Chemical shifts are quoted in ppm from TMS.
The X-ray diffraction (XRD) measurements were performed at room temperature (RT)
with a Rigaku Geigerflex D/max-c diffractometer system using monochromated CuK%
radiation (( = 1.54 Å) over the 2) range of between 4 and 80º at a resolution of 0.05º. The
xerogel samples, analyzed as films, were not submitted to any thermal pre-treatment.

J. Electrochemical Society 6 S. C. Nunes et al.
A DSC131 Setaram Differential Scanning Calorimeter was used to determine the thermal
characteristics of the ormolytes. Disk sections with masses of approximately 30 mg were
removed from the di-ureasil film, placed in 40 µl aluminium cans and stored in a dessicator
over phosphorous pentoxide (P2O5) for one week at RT under vacuum. In the case of the di-
ureasils with n = 5 and 1 it was necessary to grind the samples first to form a fine powder in
order to remove all the water. After this drying treatment the cans were hermetically sealed
and the thermograms were recorded. Each sample was heated from 25 to 300 ºC at 10 ºC min-
1. It was subsequently quenched from RT to -100 ºC and then heated up to 80 ºC at 15 ºC min-
1. The purge gas used in both experiments was high purity nitrogen supplied at a constant 35
cm3 min-1 flow rate. Samples for thermogravimetric studies were transferred to open platinum
crucibles and analysed using a Rheometric Scientific TG 1000 thermobalance at a heating rate
of 10º min-1 using dried nitrogen as purging gas (20 ml/min). Prior to measurement, the
xerogels were vacuum-dried at 80 ºC for about 48 h and kept in an argon-filled glove box.
For bulk conductivity measurements, an ormolyte disk was placed between two 10 mm
diameter ion-blocking gold electrodes (Goodfellow, > 99.9%). The
electrode/ormolyte/electrode assembly was secured in a suitable constant volume support.
The cell support was installed in a Buchi TO51 tube oven and a type K thermocouple placed
close to the electrolyte disk measured the sample temperature. Bulk conductivities of the
samples were obtained during heating cycles using the complex plane impedance technique
(Schlumberger Solartron 1250 frequency response analyser and 1286 electrochemical
interface) over a temperature range of between 25 and 100 ºC and at approximately 7 ºC
intervals. Prior to recording the thermograms, the di-ureasil ormolytes were vacuum-dried at
80 ºC for about 48h and kept in an argon-filled glove box.
The electrochemical stability of the solid polymer electrolytes was examined by means of
cyclic voltammetry using Radiometer/Copenhagen Voltalab 32 potentiostat/galvanostat
equipment. A stainless steel working electrode was used with lithium foil counter and

J. Electrochemical Society 7 S. C. Nunes et al.
reference electrodes. Swagelok type test cells (6 mm diameter) were assembled and sealed in
an argon-filled glove box. Prior to characterization, the ormolyte sample was dried under
vacuum at 60 ºC for about 24 hours. Experiments were run at RT at a sweep rate of 10 mV/s.
FT-IR spectra were acquired at RT using a Bruker 22 (Vektor) spectrometer placed inside
a glove-box with a dry argon atmosphere. The spectra were collected over the 4000-400 cm-1
range by averaging 150 scans at a spectral resolution of 2 cm-1. Solid samples (2 mg) were
finely ground, mixed with approximately 175 mg of dried potassium bromide (Merck,
spectroscopic grade) and pressed into pellets. Prior to recording the spectra, the pellets were
first vacuum dried at 80-90 ºC for about 60 h, in order to reduce the levels of adsorbed water
and solvent, and then transferred into a glove-box.
The FT-Raman spectra were recorded at RT with a Bruker IFS-66 spectrometer equipped
with a FRA-106 Raman module and a near-infrared YAG laser with wavelength 1064 nm.
The spectra were collected over the 3200-300 cm-1 range at a resolution of 2 cm-1. The
accumulation time for each spectrum was 4 hours.
To evaluate complex band envelopes and to identify underlying spectral components, the
iterative least-squares curve-fitting procedure in the PeakFit22 software was used extensively
throughout this study. The best fit of the experimental data was obtained by varying the
frequency, bandwidth and intensity of the bands. Taking into account the morphology of
materials under investigation we decided to employ Gaussian band shapes. It is well known
that the disordering of a system, which causes statistical distribution of the oscillators, may
explain why the experimentally observed band shapes are very often changed from the natural
Lorentzian shape toward the Gaussian form. As a consequence, typical band profiles observed
in solid disordered materials (e.g., polymers, glasses and non-ideal crystals) are rather
Gaussian. Although it is in general accepted that in such cases the peaks are best fitted with a
Voigt shape (a mixture of Lorentzian and Gaussian contributions), the use of this function is

J. Electrochemical Society 8 S. C. Nunes et al.
not straightforward and may lead to ambiguous results due to the possibility of different
Gaussian-Lorentzian proportions.
Results and Discussion
Structure, morphology and thermal properties of the d-U(2000)nLiCF3SO3 ormolytes -
Figs. 1(a) and 1(b) show the 13C CP/MAS and 29Si MAS NMR spectra of representative
samples of the d-U(2000)nLiCF3SO3 di-ureasil family, respectively. The position ' and
assignment11,23-31 of the resonance peaks are given in Table 1.
Fig. 1(a) demonstrates that the 13C CP/MAS NMR spectra of the di-ureasils with n = !,
80, 10 and 7 are dominated by a prominent peak centered around 70 ppm, associated with the
resonance of the oxyethylene CH2 carbon atoms (Table 1). Because of the high concentration
of these moieties in d-U(2000), the signals associated with the carbon atoms of all the other
functional groups present in this hybrid matrix are relatively weak. As the salt concentration
increases, there is a broadening of the signal at ca. 70 ppm, its full width at half maximum
being 29 and 39 Hz at n = 80 and 10, respectively (Fig. 1(a)). As it will be demonstrated
below, in the d-U(2000)80LiCF3 sample the Li+ ions do not interact with the ether oxygen
atoms.
Comparison of the 13C CP/MAS NMR spectra of the d-U(2000)nLiCF3SO3 xerogels with
that of the d-UPTES(2000) precursor compound confirms that no modifications of the Si-
bonded propyl chains, urea groups or oxyethylene/oxypropylene moieties occurred during the
second stage of the synthetic procedure of the di-ureasil composites (Table 1). There are,
however, indications (see carbon atoms C4 and C5 in Table 1) that non-reacted OCH2CH3
groups remain in the non-doped and doped materials, a result that clearly suggests that the
hydrolysis reaction did not continue to completion.
In the 29Si MAS NMR spectra of the di-ureasils with n = 80, 20 and 10 three signals are
detected at approximately -50.7, -57.6 and -66.1 ppm (Fig. 1(b)). Based on the conventional

J. Electrochemical Society 9 S. C. Nunes et al.
Tm silicon notation (m = 1, 2 and 3, where m is the number of silicon-bridging oxygen
atoms**), these peaks are attributed to T1, T2 and T3 units, respectively (Table 1). The relative
proportions determined for these different silicon environments (Table 1) show that in this set
of samples the main site present is T3, usually associated with CH2-Si(OSi)3 moieties, a result
that supports the suggestion that the condensation process favoured branched structures rather
than linear segments. The polycondensation rates c (where c = 1/3 (%T1 + 2%T2 + 3%T3 ))
calculated for the Li+-doped di-ureasils examined by 29Si MAS NMR demonstrate that the
highest polycondensation degree was reached in the case of the most dilute sample (Table 1).
The value exhibited by d-U(2000)10LiCF3SO3 is similar to that displayed by the non-doped
framework.32 The empirical formula derived from the 29Si MAS NMR data for each of the
samples analyzed (Table 1) corroborate the conclusion drawn from the 13C CP/MAS NMR
spectra that in the final materials a minor number of ethoxy (and very likely hydroxyl) groups
persist bonded to the silicon atoms.
The diffractograms of the d-U(2000)nLiCF3SO3 di-ureasil xerogels reproduced in Fig. 2
indicate that the samples with 200 " n > 1 are totally amorphous. This result proves that the
addition of the guest lithium salt to d-U(2000) inhibits the formation of crystalline phases of
free LiCF3SO3, POE/salt complexes or pure POE. The existence of crystalline POE chains in
the non-doped hybrid is responsible for the sharp and intense Bragg peaks discerned at about
19.15 and 23.25º in the XRD pattern of d-U(2000) (Fig. 2).33 The broad band, Gaussian in
shape, located at approximately 21.61º in the XRD patterns of the di-ureasils with 200 " n " 5
is ascribed to the coherent diffraction of the siliceous domains.33 The structural unit distance,
calculated using the Bragg law, is approximately 4.22 Å. The weak broad hump distinguished
at ca. 40º in the diffractogram of d-U(2000)5LiCF3SO3 might be associated with the second-
order of the peak centered near 21.61º (Fig. 2). These findings confirm that the use of the
** The classical notation Tn has been changed to Tm, to avoid any confusion with the notation n used throughout the text to designate salt composition.

J. Electrochemical Society 10 S. C. Nunes et al.
siloxane-modified POE structure instead of linear POE is clearly beneficial. In fact, the phase
diagram of the POEnLiCF3SO3 system exhibits various crystalline domains in this
concentration range at RT.34-36
In the case of the salt-rich material d-U(2000)1LiCF3SO3, a series of peaks centered at
about 10.52, 12.46, 17.92, 19.80, 20.76, 21.38, 24.76, 25.76, 26.72, 28.08, 28.74 and 33.90 º
are detected (Fig. 2). The absence of the reflections characteristic of the salt bear witness to
the inexistence of free LiCF3SO3 in this ormolyte. As the position of these peaks coincides
exactly with the location of the diffraction peaks of the crystalline complex with
stoichiometry 3:135,37 that is formed between high molecular weight POE and LiCF3SO3,38 we
may presume that this complex also appears in the d-U(2000) medium at n = 1.
The DSC curves of the d-U(2000)nLiCF3SO3 xerogels in the 20-300 ºC range are
represented in Fig. 3(a). The thermogram of d-U(2000) exhibits a melting peak centered at 40
ºC (Fig. 3(a)), ascribed to the fusion of crystallites of POE, thus confirming the semi-
crystalline character of this material suggested by XRD data. The inspection of the DSC
curves of the LiCF3SO3-doped di-ureasils with n " 5 allows us to deduce that the
incorporation of increasing amounts of the guest lithium salt into the host organic/inorganic
matrix produces entirely amorphous xerogels in this range of salt content (Fig. 3(a)). Upon
further addition of LiCF3SO3 to d-U(2000) (n = 1) a single endothermic, broad and very
intense event is produced (Fig. 3(a)). This peak, centered at about 154 ºC (onset at
approximately 123 ºC), is attributed to the fusion of the POE-based complex with n = 3
identified by means of XRD. This melting temperature is considerably lower than that
reported for the POE3LiCF3SO3 electrolyte (172 ºC),36 an expected result since the POE
chains included in d-U(2000) are significantly shorter than those of the high molecular weight
POE employed by Vallée et al.36. The pair of endotherms characteristic of the free salt
centered near 62 and 141 ºC, assigned to the loss of hydration water molecules, are not

J. Electrochemical Society 11 S. C. Nunes et al.
detected in the DSC trace of the most concentrated samples (Fig. 3(a)). We note that
LiCF3SO3 melts at ca. 430 ºC.36
When dealing with sol-gel derived materials broad endotherms, usually centered around
100 ºC, are often observed in the thermograms. No such features, normally ascribed to the
evaporation of occluded solvents (water, ethanol or THF), are discerned in any of the
thermograms depicted in Fig. 3(a)). Samples submitted to DSC measurements were
previously stored in a dessicator over P2O5 for one week at RT under vacuum (see
Experimental section). It is useful to mention at this stage that the d-U(2000) matrix is only
slightly hygroscopic. This implies that in the Li+-doped samples the presence of water must
be exclusively associated with the guest lithium salt, owing to the markedly hygroscopic
nature of the Li+ species. Nevertheless, the almost complete removal of water from the salt-
containing materials could be readily accomplished by drying under vacuum at RT, in the
presence of a dessicant, as confirmed by the low intensity of the characteristic broad OH
stretching envelope in the high-frequency region of the FT-IR spectra (not shown).
The variation of the Tg of the d-U(2000)nLiCF3SO3 di-ureasils with composition is
reproduced in Fig. 3(b). The determination of the Tg is fundamental in the context of polymer
electrolytes. In these systems, the cation/polymer interaction is accompanied by the formation
of transient ionic cross-links that partially restrict the local motion of the adjacent solvating
segments.3 This effect typically leads to the upshift of the Tg of the host polymer. In the plot
of Fig. 3(b) we observe that the Tgs of samples with n > 20 are essentially the same as that of
d-U(2000) (-54 ºC). In contrast, in xerogels with n # 20 the Tg of the POE segments suffers a
significant increase with salt addition (Fig. 3(b)), an indication that Li+/polymer bonding takes
place in these materials. The marked increase of Tg at high salt concentration is noteworthy
(37 ºC at n = 1). These results induce us to envisage two possible scenarios for the Li+ ion
coordination in the dilute xerogels with n > 20: (1) the POE chains of d-U(2000) are not
involved in the complexation of the alkali metal cations; (2) in this range of salt composition

J. Electrochemical Society 12 S. C. Nunes et al.
the number of Li+/POE interactions is too low to influence the Tg of the sample. We will
return to the discussion of this fundamental aspect in the section devoted to the spectroscopic
analysis of the cation/polymer interactions.
The TGA curves of selected Li+-based di-ureasils shown in Fig. 3(c) lend support to the
observation that the presence of the guest lithium salt appears to stabilise the hybrid host
structure in a non-oxidising atmosphere. In all the samples analysed a unique mass loss is
detected in the curves (Fig. 3(c)). While in the xerogels with n = !, 80 and 40 thermal
decomposition starts near 305, 338 and 347 ºC, respectively, the compounds with 20 " n " 7
are thermally stable up to approximately 384 ºC (Fig. 3(c)). The degradation of d-
U(2000)5LiCF3SO3 is initiated at about 370 ºC (Fig. 3(c)).
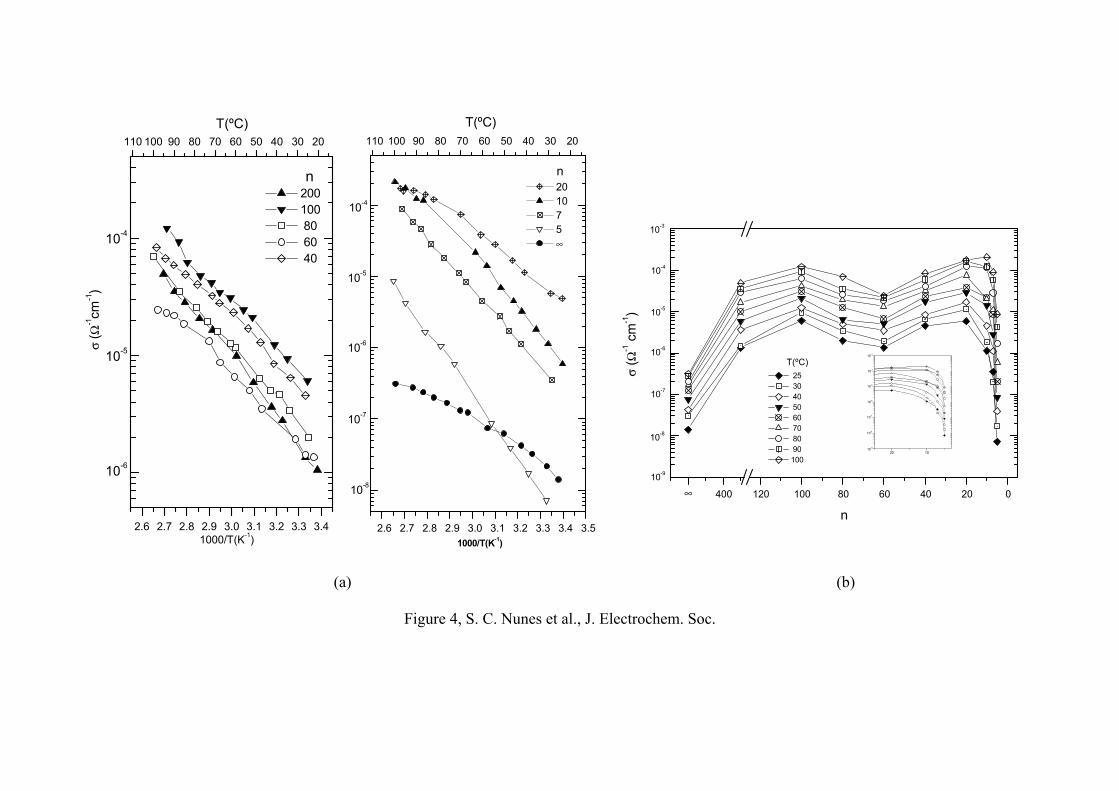
Electrochemical behaviour of the d-U(2000)nLiCF3SO3 electrolytes - The analysis of the
Arrhenius conductivity plots of the d-U(2000)nLiCF3SO3 ormolytes with ! > n " 5 depicted
in Fig. 4(a) leads us to the conclusion that some of these materials exhibit moderate ionic
conductivity over the range of temperatures considered. At temperatures lower than 90 ºC, d-
U(2000)20LiCF3SO3 is the most conducting sample of the whole series of di-ureasils
investigated (e.g., approximately 5.8x10⁻⁶ $-1cm-1 at 26 ºC).
The conductivity isotherms included in Fig. 4(b) show the presence of two conductivity
maxima: one appears at n = 20 (see inset of Fig.4(b)) and the second, considerably less
pronounced, is apparent at n = 100. At temperatures greater than 90 ºC, the high concentration
maximum shifts to n = 10. These findings are in perfect agreement with the results of
Robitaille and Fauteux34 who reported the presence of two conductivity maxima at n = 100
and 18 in the POEnLiCF3SO3 system at temperatures greater than 60 ºC. The latter
temperature corresponds to the melting temperature of the eutectic located around n = 100 in
the phase diagram.34

J. Electrochemical Society 13 S. C. Nunes et al.
The low conductivity observed in the xerogel with n = 5 (Fig. 4(a)) over the whole range
of temperatures is associated with the formation of the crystalline POE3LiCF3SO3 complex. It
is worth referring in this context that below 55 ºC d-U(2000) is more conducting than d-
U(2000)5LiCF3SO3 (Fig. 4(a)). The moderate conductivity exhibited by this essentially
amorphous, non-doped hybrid structure between 25 and 100 ºC (approximately 1x10⁻⁸ to
2x10⁻⁷ $-1cm-1, respectively (Fig. 4(a)) was correlated with proton hopping between
neighbouring urea groups.18
According to the 29Si MAS NMR data, a minor proportion of non-reacted, low molecular
weight precursor molecules remain in the final xerogels. However, as their concentration is
very low, these species are not expected to influence the conductivity of the ormolyte
samples.
It is of interest to compare the values of ionic conductivity observed for the
d-U(2000)nLiCF3SO3 composites with those of the POEnLiCF3SO3 family. Due to the high
proportion of crystalline material, the POE-based electrolytes are typically poor conductors at
ambient temperature. The Arrhenius plots of Fig. 4(a) prove that the sol-gel strategy permits
this problem to be resolved. At 30 ºC the most conducting POEnLiCF3SO3 samples exhibit
conductivity values around 10-7 $-1cm-1,34 whereas at the same temperature the conductivity
of the di-ureasil compounds with 100 " n " 7 varies from 10-6 to 10-5 $-1cm-1 (Fig. 4(a)). As
expected, at higher temperatures the electrolytes produced using POE as host polymer are
better ionic conductors than the analogues derived from the d-U(2000) host hybrid
framework. While the POE100LiCF3SO3 and POE20LiCF3SO3 electrolytes exhibit
conductivities around 10-3 $-1cm-1 at 111 ºC,34 the most conducting ormolyte sample (n = 10)
displays a conductivity of about 2.1x10⁻⁴ $-1cm-1 at 103 ºC (Fig. 4(a)).
Early studies confirmed that the use of LiCF3SO3 in POE-based polymer electrolytes for
secondary batteries is not viable.39 In contrast, the triflate ion may be safely employed in

J. Electrochemical Society 14 S. C. Nunes et al.
primary batteries, as the insoluble layer of LiF formed protects the lithium metal electrode.39
In the voltammogram of POE4.5LiCF3SO3 the cathodic peaks at -2.8 and -1.7 V vs. Ag/Ag3SI
(+1.05 and +2.15 V vs. Li/Li+, respectively), characteristic of lithium deposition and triflate
reduction, respectively, and the anodic oxidation of the anion at +2.4 V vs. Ag/Ag3SI (+6.25
V vs. Li/Li+) allow us to affirm that the redox stability domain of this electrolyte spans 4.1
V.39
The results of the cyclic voltammetry performed at RT on the amorphous d-
U(2000)20LiCF3SO3 composite, a conductivity maximum of this di-ureasil system, are
reproduced in Fig. 5. The ormolyte stability is demonstrated by the negligibly small currents
observed at extreme potentials (e.g., 9.1 µA/cm2 at 5 V vs. Li/Li+) (Fig. 5).
Cation/polymer and cation/anion interactions - In polymer electrolytes several types of
charge carriers may participate in the conduction process: (a) “free” or weakly coordinated
ions with relatively high mobility; (b) cations interacting strongly with the host polymer and
thus with low mobility; (c) charged aggregates with moderate to low mobility. Papke et al.40
established that in POE-based electrolytes containing monovalent ions an increase in the
number of uncharged ion pairs is accompanied by a decrease in the ionic conductivity.
Infrared and Raman spectroscopies are powerful tools in the elucidation of the ionic
conductivity/ionic association relationship in polymer electrolyte systems. This sort of
spectroscopic analysis usually involves the examination of diagnostic bands of the host
polymer and of the anion. In the present work we chose to incorporate the Li+ ions as a triflate
salt, since the CF3SO3- ion probe has vibration modes that are easily identified in the infrared
and Raman spectra and whose attribution is well documented.
To examine the coordination of the Li+ ions to the POE chains we decided to inspect the
skeleton CO stretching (*CO) mode of the spectra of the di-ureasil ormolytes, as this mode is
very sensitive to alterations of the backbone conformation arising from the cation/ether
oxygen atom interaction.

J. Electrochemical Society 15 S. C. Nunes et al.
The RT FT-IR spectra of selected d-U(2000)nLiCF3SO3 compounds in the *CO region
(1200-1060 cm-1) are presented in Fig. 6(a). The curve-fitting results of the spectra of
representative samples in this range of wavenumbers are shown in Figs. 6(b) and 6(c).
In the *CO region the complexation of the Li+ ions by the oxygen atoms of the POE
chains induces a distinct shift of the prominent *CO band to 1095-1089 cm-1 .41,42 The FT-IR
spectrum of d-U(2000) displays in this spectral region an intense broad band around 1111 cm-
1 and a shoulder at about 1148 cm-1 (Fig. 6(b)), ascribed to the *CO vibration mode and to the
coupled vibration of the *CO and rCH2 modes, respectively.43,44 The intensity and frequency
of both features persists essentially unchanged within the 200 " n " 20 salt composition range
(Fig. 6(b)). As these spectral events are characteristic of non-coordinated, disordered
oxyethylene moieties,43,44 we may deduce, not only that in the di-ureasil samples with n " 20
the ether oxygen atoms of the polymer segments do not in principle bond to the monovalent
alkali metal cations, but also that these POE chains remain amorphous over the same
concentration interval. The latter conclusion is consistent with the XRD and DSC data. The
further incorporation of guest triflate salt into d-U(2000) (n = 10) gives rise to the appearance
of new components in the broad *CO band (Fig. 6(c)): although the polymer features located
at 1148 and 1111 cm-1 subsist, three new events appear at 1162, 1137 and 1090 cm-1 and two
new shoulders emerge around 1175 and 1080 cm-1. In the salt-rich sample with n = 5 the *CO
envelope suffers major modifications (Fig. 6(c)): the band profile becomes better resolved,
with strong bands located at 1162, 1111 and 1090 cm-1. The 1175 and 1162 cm-1 bands -
attributed to the asymmetric stretching vibration of the CF3 group - and the 1137, 1090 and
1080 cm-1 features coincide exactly with those produced by the POE3LiCF3SO3 crystalline
complex,45 thus providing evidence of the occurrence of this compound in the d-
U(2000)10LiCF3SO3 and U(2000)5LiCF3SO3 materials. Nevertheless, the presence of the 1111
cm-1 band in the spectra of both composites gives support to the explanation that non-
J. Electrochemical Society 16 S. C. Nunes et al.
coordinated and amorphous POE chains coexist with the crystalline compound at n = 10 and
5. Curiously, the POE/LiCF3SO3 complex is only detected at n = 1 by XRD (Fig. 2) and DSC
(Fig. 3(a)).
Although the first spectroscopic signs of Li+/POE bonding are evident in the *CO region
at n = 10, the salt concentration at which the alkali metal cations start to effectively interact
with the ether oxygen atoms of the polymer chains may be lower. In fact, in the case of the
more dilute di-ureasil samples (n > 10) it is very likely that the broad and strong *CO
envelope centred at 1111 cm-1 (Fig. 6(a)) is masking the characteristic band of Li+-
coordinated amorphous POE chains. Interestingly, the changes detected in the CH2 rocking
region of the same set of samples indicate that the complexation of the alkali metal cations by
the ether oxygen atoms of POE is initiated at n = 20,46 thus as a slightly higher value of n
(lower salt concentration) than that indicated by analysis of the *CO region.
Neither the results of thermal analysis, nor spectroscopic data, allow us to determine with
certainty the composition that corresponds to the beginning of PEO chain participation in the
cation coordination in the d-U(2000)nLiCF3SO3 composites. Given that there are two different
types of sites in the host matrix where complexation may occur (the ether oxygen atoms of the
POE chains and the carbonyl oxygen atoms of the urea linkages), it seems plausible that at
low salt concentrations the site with lower energy is occupied preferentially. Under these
conditions the POE chains of d-U(2000) may not be involved in the coordination of alkali
metal cations until a certain critical electrolyte composition is reached. According to the
results of the analysis of the “amide I“ region of the same set of di-ureasil materials,46 the Li+
ions bond to the urea carbonyl oxygen atoms in all the samples studied here.
The triflate oxygen atoms are the third type of coordinating site available for the Li+ ions
in the d-U(2000)nLiCF3SO3 xerogels. Let us now assess the nature and extent of ion pairing
and ion aggregation in the lithium-doped di-ureasils as a function of LiCF3SO3 concentration.
J. Electrochemical Society 17 S. C. Nunes et al.
We will examine for this purpose two diagnostic vibration modes of the triflate ion which are
very sensitive to coordination effects: the symmetric stretching vibration of the SO3 group
(*sSO3) and the symmetric deformation of the CF3 group ('sCF3).
*sSO3 region: The *sSO3 mode of a “free” triflate ion gives rise to a feature located at 1032
cm-1.47 Upon coordination to the Li+ ion, the *sSO3 band - associated with a non-degenerate
mode of the CF3SO3- ion - is shifted to higher wavenumbers.42, 45,48-58
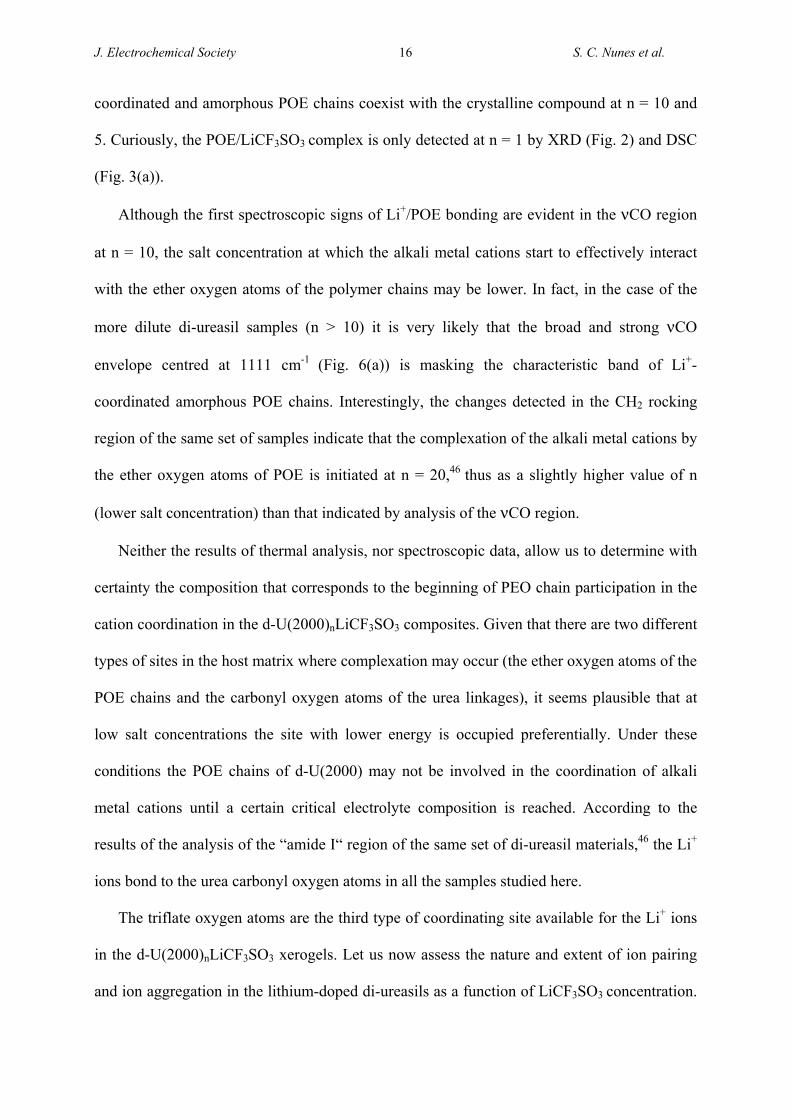
The FT-Raman spectra of selected di-ureasils in the *sSO3 region and the results of the
curve-fitting performed in the *sSO3 envelope are represented in Figs. 7(a) and 7(b),
respectively.
The *sSO3 band of the FT-Raman spectra of the xerogels with n " 7 was decomposed into
four components: a sharp band at 1032 cm-1, two weak shoulders positioned around 1039 and
1025 cm-1 and a very weak, ill-defined peak centered around 1045 cm-1 (Fig. 7(b)). In this
range of salt composition the 1032 cm-1 feature is considerably stronger than the shoulders,
although the introduction of increasing amounts of lithium salt leads to a moderate increase of
the intensity of the 1045 and 1039 cm-1 features (Fig. 7(b)). A marked reduction of the
intensity of the 1025 cm-1 shoulder occurs in parallel (Fig. 7(b)). In the FT-Raman spectrum
of the rich-salt sample with n = 5 several changes are worth noting: although the 1032 cm-1
event subsists as the strongest band of this spectral region, the 1025 cm-1 is no longer seen,
the components at 1045 and 1039 cm-1 become significantly more intense and a new shoulder
located at about 1052 cm-1 is discerned (Fig. 7(b)). The FT-Raman profile of the *sSO3 band
of the most concentrated hybrid studied (n = 1) was best fitted with five peaks centered at
1063, 1052, 1045, 1039 and 1032 cm-1 (Fig. 7(b)). The strongest component is the one
situated at 1052 cm-1, followed by those at 1045, 1039 and 1032 cm-1 (Fig. 7(b)).
The presence of the 1032 cm-1 band in the FT- Raman spectra of all the doped di-ureasil
xerogels inspected unequivocally confirms the occurrence of “free” anions over the whole

J. Electrochemical Society 18 S. C. Nunes et al.
range of salt concentration. We cannot, however, discard the contribution to the 1032 cm-1
band of the so-called “cross-link separated ion pairs”, as observed in analogue materials.59-61
This would explain the regular increase of this feature as LiCF3SO3 concentration is
progressively increased and specially its remarkable intensity at n = 1. The shoulders found at
1039 and 1025 cm-1 are associated with weakly coordinated triflate ions located in two
different sites: (1) CF3SO3- species weakly bonded to Li+ ions, which simultaneously interact
with the carbonyl oxygen atoms of the urea groups; (2) CF3SO3- ions hydrogen-bonded to the
urea N-H groups.59 The feature situated near 1045 cm-1 in samples with n # 40 is attributed to
the formation of monodentate Li+CF3SO3- ions pairs or negatively charged triplets
[Li(CF3SO3)2]-.49,51,53 The component seen near 1052 cm-1 in the spectra of the di-ureasils
with n = 5 and 1 is ascribed to the existence of a bidentate bridging aggregate (aggregate I)49
(the positively charged triplet [Li2(CF3SO3)]+)49,51,53. This result correlates well with the
detection of the POE3LiCF3SO3 crystalline complex37,57,58 at n = 5 and 1. In fact in this
compound the triflate ion vibrates essentially as the [Li2(CF3SO3)]+ entity because two oxygen
atoms of the CF3SO3- ion bridge, in a monodentate arrangement, two Li+ ions that lie adjacent
to each other within the polymer helix.37,57,58 At last, the event that emerges at 1063 cm-1 in
the *aSO3 region of the most concentrated di-ureasil prepared is associated with the presence
of a tridentate bridging aggregate (aggregate II)49, the divalent positively charged multiplet
[Li3(CF3SO3)]2+. The absence of a band at 1077 cm-1 in the *aSO3 envelope of any of the
samples analyzed excludes the occurrence of pure crystalline salt54 and therefore confirms the
XRD and DSC results. The anionic configurations detected in the FT-Raman SO3 symmetric
stretching region are in perfect agreement with those deduced from the FT-IR spectra.46
'sCF3 region: Several authors consider that the 'sCF3 mode is a much more reliable way of
identifying CF3SO3- ions in different coordinating environments than the *sSO3 mode.
J. Electrochemical Society 19 S. C. Nunes et al.
37,42,45,49,57,58 The 'sCF3 vibration is located near 754 cm-1 when the ion is “free”.50 Shifts to
higher wavenumbers result upon interaction of this anion with the Li+ ion.37,42,45,49,57,58
The FT-Raman spectra of selected Li+-doped di-ureasils in the 'sCF3 region and the results
of the tentative curve-fitting carried out in the 'sCF3 envelope are represented in Figs. 8(a)
and 8(b), respectively.
While the 'sCF3 band of the material with n = 40 was resolved into a pair of components
situated at about 754 and 757 cm-1, at higher salt concentration (20 " n " 5) the band contour
was best fitted with an additional peak at 762 cm-1 that grows with salt addition (Fig. 8(b)).
We note in this range of compositions the marked decrease of the intensity of the 754 cm-1
component (Fig. 8(b)). The 'sCF3 band of the salt-rich di-ureasil with n = 1 was decomposed
into a prominent band at 766 cm-1 and a minor component at 762 cm-1 (Fig. 8(b)).
Based on the attribution of Huang et al.,49 the 754, 757, 762 and 766 cm-1 components
discerned in the FT-Raman spectra of the d-U(2000)nLiCF3SO3 composites are associated
with the following entities, respectively: “free” triflate ions, Li+CF3SO3- ion pairs (or
[Li(CF3SO3)2]- triplets), aggregate I ([Li2(CF3SO3)]+) and aggregate II ([Li3(CF3SO3)]2+). As
mentioned above, these species are manifested in the *sSO3 region as bands situated at 1032,
1045, 1052 and 1063 cm-1, respectively.49
Comparison of the curve-fitting data obtained for the *sSO3 (Fig. 7(b)) and 'sCF3 (Fig.
8(b)) regions leads us to the conclusion that there is not a direct correspondence between the
number of resolved components. For instance, in the case of the sample with n = 1, the 'sCF3
band results essentially from the presence of aggregates II (Fig. 8(b)), unlike the
corresponding *sSO3 envelope that demonstrates the occurrence of four different coordinating
environments for the triflate ion (Fig. 7(b)). This evidence may be correlated with the fact that
the CF3 end of the triflate ion in the di-ureasils is apparently significantly less perturbed by
ion association than the SO3 end. This is not unexpected, considering that, as the negative

J. Electrochemical Society 20 S. C. Nunes et al.
charge of the triflate ion is delocalized on the SO3 end, the latter group should in principle
bond preferentially to the cation.
The main conclusion that stems from the spectroscopic study performed here is that the
charge carriers of the d-U(2000)nLiCF3SO3 di-ureasil system with the highest ionic
conductivity (i.e., the sample with n = 20) must be very likely “free” anions or weakly
coordinated species.
Conclusions
In this paper studies of the structural, morphology and electrochemical properties of a
series of hybrid materials (di-ureasils) based on a host matrix composed of short POE chains
covalently bonded to a siloxane backbone through urea groups and incorporating LiCF3SO3
are reported. Samples with ! " n > 1 are amorphous. A crystalline POE/LiCF3SO3 complex
was detected by FT-IR in the materials with n # 10. The conductivity maximum of this
POE/siloxane system is found at n = 20 (5.8x10⁻⁶ $-1cm-1 at RT). The electrochemical
stability domain of this material spans 4.1 V. Although the carbonyl oxygen atoms of the urea
groups of the di-ureasils interact with the alkali metal cations in the whole range of salt
concentration examined,46 we found spectroscopic evidences that coordination of the Li+ ions
to the ether oxygen atoms of the POE chains is restricted to samples with n ! 10. However it
is likely that the latter value is situated at slightly lower salt concentration. In all the samples
investigated “free” triflate ions and weakly coordinated anionic species were detected. In the
di-ureasils with n # 40 ions pairs (Li+CF3SO3-) or negatively charged triplets ([Li(CF3SO3)2]-)
are formed. At n # 5 positively charged triplets ([Li2(CF3SO3)]+) also appear. Divalent
positively charged multiplets [Li3(CF3SO3)]2+ are formed only at n = 1. The charge carriers of
the d-U(2000)20LiCF3SO3 conductivity maximum appear to be “free” anions or weakly
coordinated species.

J. Electrochemical Society 21 S. C. Nunes et al.
The encouraging results obtained with the d-U(2000)nLiCF3SO3 nanocomposites, in
particular the improved mechanical properties and the moderate ionic conductivity, induce us
to state that further research on Li+-doped d-U(2000)-based di-ureasils is fully justified. The
incorporation of a more suitable third generation lithium salt instead of LiCF3SO3 will
certainly permit us to obtain materials with higher ionic conductivity values.
This work was supported by Fundação para a Ciência e Tecnologia
(POCTI/P/CTM/33653/00, SFRH/BD/13559/03 and POCTI/P/CTM/46780/03). S. C. Nunes
acknowledges Fundação para a Ciência e Tecnologia for a grant. D. Ostrovskii thanks
National Research Council (Sweden) for financial support. The authors thank A. P. Passos de
Almeida for her help in the DSC measurements.

J. Electrochemical Society 22 S. C. Nunes et al.
References
1. P. V. Wright, Br. Polymer, 7, 319 (1975)
2. M. Armand, M. T. Duclot and J. M. Chabagno, in Proceedings of the Second
International Meeting on Solid State Electrolytes, St. Andrews, Scotland (1978), Extended
Abstract 6.5
3. F. M. Gray, Polymer Electrolytes, RSC Materials Monographs, The Royal Society of
Chemistry, London (1997)
4. J.-M. Tarascon and M. Armand, Nature, 414, 359 (2001)
5. C. Berthier, W. Gorecki, M. Minier, M. B. Armand, J. M. Chabagno and P. Rigaud,
Solid State Ionics, 11, 91 (1983)
6. Z. Gadjourova, Y. G. Andreev, D. P. Tunstall and P. G. Bruce, Nature, 412, 520 (2001)
7. C. J. Brinker and G. W. Scherer, Sol-gel Science: The Physics and Chemistry of Sol-Gel
Processing, Academic Press, San Diego, CA (1990)
8. Functional Hybrid Materials, P. Gomez-Romero and C. Sanchez, Editors, Wiley
Interscience, New York, (2003)
9. D. Ravaine, A. Seminel, Y. Charbouillot and M. Vincens, J. Non-Cryst. Solids, 82, 210
(1986)
10. M. Popall, M. Andrei, J. Kappel, J. Kron, K. Olma and B. Olsowski, Electrochim.
Acta, 43 (10-11), 1155 (1998)
11. P. Judeinstein, J. Titman, M. Stamm and H. Schmidt, Chem. Mater., 6, 127 (1994)
12. K. Dahmouche, M. Atik, N. C. Mello, T. J. Bonagamba, H. Panepucci, M. A. Aegerter
and P. Judeinstein, J. Sol-Gel Sci. Technol., 8, 711 (1997)
13. V. de Zea Bermudez, L. Alcácer, J. L. Acosta and E. Morales, Solid State Ionics, 116,
197 (1999)
14. C. Wang, Y. Wei, G. R. Ferment, W. Li and T. Li, Mater. Lett., 39, 206 (1999)
15. J. R. MacCallum and S. Seth, Eur. Polym. J., 36, 2337 (2000)

J. Electrochemical Society 23 S. C. Nunes et al.
16. K. Nishio and T. Tsuchiya, Sol. Energy Mater. Sol. Cells, 68, 295 (2001)
17. M. Armand, C. Poinsignon, J.-Y. Sanchez and V. de Zea Bermudez, U.S. Patent 5,
283, 310, 1993
18. V. de Zea Bermudez, C. Poinsignon and M. B. Armand, J. Mater. Chem., 7(9), 1677
(1997)
19. V. de Zea Bermudez, D. Baril, J.-Y. Sanchez, M. Armand and C. Poinsignon, A.
Hugot-Le Goff, C.- G. Granqvist and C. M. Lampert, Editors, Proc. SPIE, 1992, Vol. 1728,
pág. 180
20. M. M Silva, V. de Zea Bermudez, L. D. Carlos, A. P. Passos de Almeida and M. J.
Smith, J. Mater. Chem., 9, 1735 (1999)
21. M. M. Silva, V. de Zea Bermudez, L. D. Carlos and M. J. Smith, Electrochim. Acta,
45, 1467 (2000)
22. PeakFit is a product of Jandel Corporation, 2591 Rerner Boulevard, San Rafael,
CA 94901, U.S.A.
23. F. Ribot, A. Lafuma, C. Eychenne-Baron and C. Sanchez, Adv. Mater., 14, 1496
(2002)
24. D. Cohn, A. Sosnik and A. Levy, Biomater., 24, 3707 (2003)
25. M. C. Gonçalves, V. de Zea Bermudez, R. A. Sá Ferreira, L. D. Carlos, D. Ostrovskii
and J. Rocha, Chem. Mater., in press
26. S. R. Davis, A. R. Brough and A. Atkinson, J. Non-Cryst. Solids, 315, 197 (2003)
27. A.-C. Franville, D. Zambon, R. Mahiou and Y. Troin, Chem. Mater., 12, 428 (2000)
28. T. C. Chang, G. P. Wang, H. C. Tsai, Y. S. Hong and Y. S. Chiu, Polym. Degrad.
Stab. 74, 229 (2001)
29. E. El Nahhal, M. M. Chehimi, C. Cordier and G. Dodin, J. Non-Cryst. Solids, 275,
142 (2000)

J. Electrochemical Society 24 S. C. Nunes et al.
30. S. Hvidt, E. B. Jørgersen, W. Brown and K. Schillén, J. Phys. Chem., 98, 12320
(1994)
31. E. A. Williams, C. L. Sabourin, P. E. Donahue, J. L. Spivack and N. A. Marotta,
General Electric Research & Development Center, Technical Information Series
(98CRD171), Dec. 1998
32. L. D. Carlos, R. A. Sá Ferreira, I. Orion, V. de Zea Bermudez and J. Rocha, J. Lumin.
87-89, 702 (2000)
33. L. D. Carlos, V. de Zea Bermudez, R. A. Sá Ferreira, L. Marques and M. Assunção,
Chem. Mater., 11(3), 581 (1999)
34. C. D. Robitaille and D. Fauteux, J. Electrochem. Soc., 133(2), 315 (1986)
35. S. M. Zahurak, M. L. Kaplan, E. A. Rietman, D. W. Murphy and R. J. Cava,
Macromolecules, 21, 654, (1988)
36. A. Vallée, S. Besner and J. Prud’homme, Electrochim. Acta, 37(9), 1579, (1992)
37. C. P. Rhodes and R. Frech, Macromolecules, 34, 2660 (2001)
38. P. G. Bruce, S. A. Campbell, P. Lightfoot and M. A. Mehta, Solid State Ionics, 78,
191 (1995)
39. P. Rigaud, Ph.D. Thesis, University of Grenoble, France, 1980
40. B. L. Papke, R. Dupon, M. A. Ratner and D. F. Shriver, Solid State Ionics, 5, 685
(1981)
41. B. L. Papke and M. A. Ratner, D. F. Shriver, J. Electrochem. Soc., 129(7), 1434
(1982)
42. A. Bernson, J. Lindgren, W. Huang and R. Frech, Polym., 36(23), 4471 (1995)
43. K. Machida and T. Miyazawa, Spectrochim. Acta, 20, 1865 (1964)
44. H. Matsuura and T. Miyazawa, J. Polym. Sci., 7(A-2), 1735 (1969)
45. M. A. K. L. Dissanayake and R. Frech, Macromolecules, 28(15), 5312 (1995)

J. Electrochemical Society 25 S. C. Nunes et al.
46. S. C. Nunes, V. de Zea Bermudez, D. Ostrovskii and L. D. Carlos, J. Mol. Struct., in
press
47. Å. Wendsjö, J. Lindgren, J. O. Thomas and G. C. Farrington, Solid State Ionics, 53-
56, 1077 (1992)
48. A. Bernson and J. Lindgren, Solid State Ionics, 60, 37 (1993)
49. W. Huang, R. Frech and R. A. Wheeler, J. Phys. Chem., 98, 100 (1994)
50. D. H. Johnston and D. F. Shriver, Inorg. Chem. 32, 1045 (1993)
51. J. R. Stevens and P. Jacobsson, Can. J. Chem., 69, 1980 (1991)
52. L. M. Torell, P. Jacobsson and G. Petersen, Polym. Adv. Tech., 4, 152 (1992)
53. P. Jacobsson I. Albisson, B.-E. Mellander and J. R. Stevens, Polym., 33(13), 2778
(1992)
54. G. Petersen, L. M. Torell, S. Panero, B. Scrosati, C. J. Silva and M. J. Smith, Solid
State Ionics, 60, 55 (1993)
55. G. Petersen, A. Brodin, L. M. Torell and M. J. Smith, Solid State Ionics, 72, 165
(1994)
56. A. Brodin, B. Mattsson, K. Nilsson, L. M. Torrel and J. Hamara, Solid State Ionics,
85, 111 (1996)
57. R. Frech, S. Chintapalli, P. G. Bruce and C. A. Vincent, Chem. Comm., 157 (1997)
58. R. Frech, S. Chintapalli, P. G. Bruce and C. A. Vincent, Macromolecules, 32, 808
(1999)
59. V. de Zea Bermudez, D. Ostrovskii, S. Lavoryk, M. C. Gonçalves and L. D. Carlos,
Phys. Chem. Chem. Phys., 6(3), 649 (2004)
60. M. C. Gonçalves, V. de Zea Bermudez, D. Ostrovskii and L. D. Carlos, Electrochim.
Acta, 48, 1977 (2003)
61. M. C. Gonçalves, V. de Zea Bermudez, D. Ostrovskii and L. D. Carlos, Solid State
Ionics, 166(1-2), 103 (2004)

J. Electrochemical Society 26 S. C. Nunes et al.
List of figure captions
Figure 1 - 13C CP/MAS (a) and 29Si MAS (b) NMR spectra of selected d-U(2000)nLiCF3SO3
di-ureasils
Figure 2 - XRD patterns of selected d-U(2000)nLiCF3SO3 di-ureasils
Figure 3 - Thermal behaviour of selected d-U(2000)nLiCF3SO3 di-ureasils: (a) DSC
thermograms; (b) Glass transition temperature versus composition (Note: the line drawn is
just a guide for the eyes); (c) TGA curves.
Figure 4 - Arrhenius conductivity plot (a) and isotherms of the ionic conductivity versus
composition (b) of the d-U(2000)nLiCF3SO3 di-ureasils
Figure 5 - RT cyclic voltamogram of the d-U(2000)20LiCF3SO3 di-ureasil (5th cycle, sweep
rate = 10 mV s-1) obtained with a stainless steel working electrode and lithium counter and
reference electrodes.
Figure 6 - RT FT-IR spectra (a) and curve-fitting results ((b) and (c)) of selected d-
U(2000)nLiCF3SO3 di-ureasils in the "*CO region. The wavenumbers indicated in (a) and (c)
regard the values observed in the spectrum of the most concentrated sample.

J. Electrochemical Society 27 S. C. Nunes et al.
Figure 7 - RT FT-Raman spectra (a) and curve-fitting results (b) of selected d-
U(2000)nLiCF3SO3 di-ureasils in the *sSO3 region. In order to examine exclusively the
contribution of the *sSO3 mode, the FT-Raman spectrum of the pure polymer had to be first
subtracted from those of the hybrids with n " 10.
Figure 8 - RT FT-Raman spectra (a) and curve-fitting results (b) of selected d-
U(2000)nLiCF3SO3 di-ureasils in the 'sCF3 region.

J. Electrochemical Society 28 S. C. Nunes et al.
Tables
Table 1 - NMR data (in ppm) of the d-UPTES(2000) precursor and of selected d-
U(2000)nLiCF3SO3 di-ureasils
Table 2 - Relevant details of the synthetic procedure of the d-U(2000)nLiCF3SO3 di-ureasils

J. Electrochemical Society 29 S. C. Nunes et al.
Scheme
Scheme 1 - Structure of the d-UPTES(2000) di-ureasil precursor

(a) (b) Figure 1, S. C. Nunes et al., J. Electrochem. Soc.
200 180 160 140 120 100 80 60 40 20 0
!
n
7
10
80
" (ppm)
n=80
n=10
180 170 160 150 140
n=7
0 -20 -40 -60 -80 -100 -120" (ppm)
10
n
80
20
T3
T2
T1

Figure 2, S. C. Nunes et al., J. Electrochem. Soc.
5 10 15 20 25 30 35 40 45 50 55 60 65 70 75 80
!
200
60
20
7
5
1
0
n
2" (º)
Inte
nsity
(a.u
.)

(a) (c)
Figure 3, S. C. Nunes et al., J. Electrochem. Soc.
0 50 100 150 200 250 300
!
endo
T (ºC)
5
1
10
4080
20
200
exo
400
Hea
t flu
x (m
W g
-1)
n
0
0 100 200 300 400 5000
20
40
60
80
100
n ! 80 40 20 10 7 5
wei
ght (
%)
T (ºC)
800 400 100 80 60 40 20 0
-55
-50
-45
-40
-35
-30
-25
-20
-15
(b)
200
T g (ºC
)
n!
(a) (b)
Figure 4, S. C. Nunes et al., J. Electrochem. Soc.
20 10
10-9
10-8
10-7
10-6
10-5
10-4
10-3
800 400 120 100 80 60 40 20 0!
T(ºC)
10-3
10-4
10-5
10-7
10-8
10-6
10-9
25 30 40 50 60 70 80 90 100
" (#
-1 c
m-1)
n2.6 2.7 2.8 2.9 3.0 3.1 3.2 3.3 3.4 3.5
20 10 7 5 !
1000/T(K-1)
110 100 90 80 70 60 50 40 30 20
n
10-4
10-5
10-6
10-7
10-8
T(ºC)
2.6 2.7 2.8 2.9 3.0 3.1 3.2 3.3 3.4
200 100 80 60 40
" (#
-1cm
-1)
1000/T(K-1)
110 100 90 80 70 60 50 40 30 20
n
10-4
10-5
10-6
T(ºC)

Figure 5, S. C. Nunes et al., J. Electrochem. Soc.
-1 0 1 2 3 4 5-100
-50
0
50
100
i (
µA/c
m2 )
E (V vs. Li/Li+)

(a
)
Figu
re 6
, S. C
. Nun
es e
t al.,
J. E
lect
roch
em. S
oc.
1200
1180
1160
1140
1120
1100
1080
1060
!20 40 200
10
1162
1090
1137
1111
5n 1
Absorbance (a.u.)
wav
enum
bers
(cm
-1)
10
4010
6010
8011
0011
2011
4011
6011
8012
0012
20
wav
enum
bers
(cm
-1)
105
1175
1162
1090
1111
n
(c)
1080
1148
1137
1120
1160
1080
10
4012
00
!
wav
enum
bers
(cm
-1)
(b)
1148
1111
n 20

(a) (b)
Figure 7, S. C. Nunes et al., J. Electrochem. Soc.
1080 1070 1060 1050 1040 1030 1020 1010 1000
1042
1032
1049
n
1
5
7
40200
20
Raman shift (cm-1)
In
tens
ity (a
.u)
1030
1
7
5
40
20
Raman shift (cm-1)
10401050 102010601070
1025
1045
1052
103210
39
n
Inte
nsity
(a.u
)
1063

(a) (b)
Figure 8, S. C. Nunes et al., J. Electrochem. Soc.
775 770 765 760 755 750 745 740
In
tens
ity (a
.u)
Raman shift / cm-1
n
1
5
7
40
60
80
200
20
756
757
759
766
750755760 740745765770775
40
7
5
1
20
In
tens
ity (a
.u)
754
n
Raman shift / cm-1
757
766
762

Scheme 1, S. C. Nunes et al, J. Electrochem. Soc.
CH3CH2OCH3CH2O
CH3CH2O
OCH2CH3
OCH2CH3OCH2CH3
a ab bc cd de e
21 2 133
44 55
Si-CH2-CH2-CH2-N C N-CHCH2-(OCHCH2)a'(OCH2CH2)40.5(OCH2CH)c' -N C N-CH2-CH2-CH2-Si
CH3CH3 CH3
OO
HHHH8
6 6
8
9 9
7 77 7 7 7
f ff
h h g g g g h h
iii i8
a'+c' = 2.5

Tabl
e 1,
S. C
. Nun
es e
t al.,
J. E
lect
roch
em. S
oc.
1 H
NM
R
Attr
ibut
ion11
,23-
31
13C
NM
R
13C
CP/
MA
S N
MR
A
ttrib
utio
n11,2
3-31
d-U
PTES
(200
0)
d-
UPT
ES(2
000)
d-
U(2
000)
nLiC
F 3SO
3
!
80
10
7
3.
92-3
.82
m
1
2H
Hd
1
58.1
9 1
60
- -
-
C9
3.
79-3
.51
m
"16
2H
Hg
77.3
2-74
.88
75
75
- -
C
7
3.
49-3
.29
m
"11
H
Hh
73
.12-
70.1
1 72
-70
70
70
70
C
6
3.
20-3
.04
m
4H
Hc
58
.30-
58.1
4 61
61
61
-
C
4
2.
38
s,b
4H
Hi
42.
72
47-4
1 -
- -
C
3
1.
56-1
.51
m
4H
Hb
23
.75-
23.5
3 25
-22
- -
-
C2
1.
18-1
.15
m
1
8H
He
18
.32-
18.2
1 18
18
18
-
C
5
1.
12-1
.02
m
1
8H
Hf
17
.04-
16.7
8 17
-
- -
C
8
0.
60-0
.55
m
4H
Ha
7
.60-
7.50
15
-10
- -
-
C1
29
Si M
AS
NM
R
n
T 1 (C
H2-
Si(O
Si)(
OR
) 2)
T2 (C
H2-
Si(O
Si) 2
(OR
))
T 3 (C
H2-
Si(O
Si) 3
) c
(%)
Em
piric
al fo
rmul
a
po
pula
tion
(%)
popu
latio
n (%
) po
pula
tion
(%)
80
-
50.0
1.1
-58
.3
4
3.0
-66.
6
5
5.9
85
R’ 0
.5Si
(OR
) 0.4
5(O
) 1.3
20
-5
3.0
1.4
-
58.1
3
7.2
-66.
0
6
1.4
87
R’ 0
.5Si
(OR
) 0.4(O
) 1.3
10
-49.
2
23.
3
-
56.5
29.
1
-6
5.6
47.
6 75
R
’ 0.5Si
(OR
) 0.7
6(O
) 1.1
Not
e: R
'=-(C
H2)
3-N
H-C
(=O
)-NH
-(CH
(CH
3)C
H2-
(OC
H(C
H3)
CH
2)a'-
(OC
H2C
H2)
40.5
-(OC
H(C
H3)
CH
2)b'-
NH
-C(=
O)-N
H-(C
H2)
3-
R =
H o
u C
H2C
H3;
m –
mul
tiple
t, s –
sing
let a
nd b
- br
oad

Table 2, S. C. Nunes et al., J. Electrochem. Soc.
n = O/Li+ m(LiCF3SO3) Si/Li+ Si/Li+
(mol / mol) (g) (mol / mol) (g / g)
! - - -
200 0.0395 9.8765 15.6603
100 0.0790 4.9383 7.8301
80 0.0987 3.9506 6.2641
60 0.1316 2.9630 4.6981
40 0.1974 1.9753 3.1321
20 0.3949 0.9876 1.5660
10 0.7898 0.4938 0.7830
5 1.5796 0.2469 0.3915
1 7.8980 0.0494 0.0783


![High capacity Li[Ni0.8Co0.1Mn0.1]O2 synthesized by sol–gel and co-precipitation methods as cathode materials for lithium-ion batteries](https://static.fdokumen.com/doc/165x107/6336e10720d9c9602f0b0e64/high-capacity-lini08co01mn01o2-synthesized-by-solgel-and-co-precipitation.jpg)