
A Search for the Optimum Lithium Rich Layered Metal Oxide Cathode Material for Li-Ion Batteries
10
A1236 Journal of The Electrochemical Society, 162 (7) A1236-A1245 (2015) A Search for the Optimum Lithium Rich Layered Metal Oxide Cathode Material for Li-Ion Batteries Mehmet Nurullah Ates, ∗ Sanjeev Mukerjee, ∗∗ and K. M. Abraham ∗∗, z Center for Renewable Energy Technology, Department of Chemistry and Chemical Biology, Northeastern University, Boston, Massachusetts 02115, USA We report the results of a comprehensive study of the relationship between electrochemical performance in Li cells and chemical composition of a series of Li rich layered metal oxides of the general formula xLi 2 MnO 3 · (1-x)LiMn 0.33 Ni 0.33 Co 0.33 O 2 in which x = 0,1, 0.2, 0,3, 0.5 or 0.7, synthesized using the same method. In order to identify the cathode material having the optimum Li cell performance we first varied the ratio between Li 2 MnO 3 and LiMO 2 segments of the composite oxides while maintaining the same metal ratio residing within their LiMO 2 portions. The materials with the overall composition 0.5Li 2 MnO 3 · 0.5LiMO 2 containing 0.5 mole of Li 2 MnO 3 per mole of the composite metal oxide were found to be the optimum in terms of electrochemical performance. The electrochemical properties of these materials were further tuned by changing the relative amounts of Mn, Ni and Co in the LiMO 2 segment to produce xLi 2 MnO 3 · (1-x)LiMn 0.50 Ni 0.35 Co 0.15 O 2 with enhanced capacities and rate capabilities. The rate capability of the lithium rich compound in which x = 0.3 was further increased by preparing electrodes with about 2 weight-percent multiwall carbon nanotube in the electrode. Lithium cells prepared with such electrodes were cycled at the 4C rate with little fade in capacity for over one hundred cycles. © The Author(s) 2015. Published by ECS. This is an open access article distributed under the terms of the Creative Commons Attribution 4.0 License (CC BY, http://creativecommons.org/licenses/by/4.0/), which permits unrestricted reuse of the work in any medium, provided the original work is properly cited. [DOI: 10.1149/2.0481507jes] All rights reserved. Manuscript submitted February 25, 2015; revised manuscript received March 19, 2015. Published April 9, 2015. The energy densities of Li-ion batteries are limited by the capacities of cathode materials. The highest energy density commercially avail- able Li-ion batteries utilize graphite anodes with a capacity of about 370 mAh/gram, and LiNi 0.8 Co 0.15 Al 0.05 O 2 (NCA) cathodes exhibiting approximately190 mAh/gram capacity. The latter corresponds to the reversible charge/discharge cycling of 0.7 Li per transition metal, the highest capacity achievable in these and related layered metal dioxide (LiMO 2 ) congeners of LiCoO 2 . The reversible cycling of one Li per transition metal is not possible in these positive electrode materials because they cannot be charged to a voltage necessary to fully extract all the Li in LiMO 2 , in which M = Ni and Co, due to the instability of the fully delithiated metal dioxides NiO 2 and CoO 2 containing Ni and Co in the 4 + oxidation state. The Li rich transition metal dioxides of the general formula xLi 2 MnO 3 · (1-x)LiMn a Ni b Co c O 2 are promising class of cathode ma- terials capable of delivering discharge capacities >250 mAh/gram or the transfer of nearly one Li per transition metal. They exhibit such high capacities once the materials are charged initially to a voltage be- tween 4.6 and 4.9 V versus Li/Li + . 1–4 Their high capacity stem from the activation of Li 2 MnO 3 in the first charge beginning at approxi- mately 4.5 V in a Li cell. This process encompasses a very complex mechanism triggering transition metal (TM) migration into vacant Li and/or TM sites leading to voltage hysteresis in the following cy- cles. Although the origin of the voltage fade is still under debate, 5–8 data we obtained with 0.3Li 2 MnO 3 .0.7LiNi 0.5 Co 0.5 O 2 in which Mn was absent in the LiMO 2 segment 9 indicated unambiguously that the latter Mn was responsible for the voltage fade. This layered com- posite metal oxide showed little voltage fade with cycling at 50 ◦ C at which electrodes containing Mn in both segments of the layered composite metal oxide showed significant voltage fade. All of the studies previous to our work were done with materials containing Mn in both segments of the layered composite so that the results from those investigations were not unambiguous. Stable voltage responses and good capacity retentions of cathode materials are crucial to obtain high energy and power densities and the long cycle life needed for Li-ion batteries suitable for portable consumer products and electric vehicle propulsion. A great deal of recent studies has been aimed at mitigating or arresting the voltage fade and power loss of these ma- terials with repeated charge/discharge cycling. One way to suppress the voltage fade is through alkali metal cation (Na + ,K + ) doping 10–12 ∗ Electrochemical Society Student Member. ∗∗ Electrochemical Society Fellow. z E-mail: [email protected] in which the cation plays a pillaring role within the structure with the result of arresting the transition metal migration and voltage fade with cycling. In addition, coating the cathode material was found to be effective in reducing the voltage decay 13,14 by suppressing oxygen vacancies created during the first cycle, and mitigating side reactions at high potentials. Also, it has been shown 9,15 that the amount of Mn in these classes of material have a direct impact on the layered to spinel structural conversion accompanying the cycling-related voltage de- cay. However, none of these structural and surface modifications have been able to fully overcome the performance deficiencies of these cathode materials including the large irreversible capacity loss (ICL) in the first cycle, 16 voltage hysteresis and structural transformation that accompany charge/discharge cycling, 6 and the inability to main- tain stable capacity over hundreds of cycles 17 at either low or high rates. Although a number of studies 5,18–24 have attempted to unravel the root causes of these issues they utilized materials containing different types of transition metals and/or ratios of transition metals prepared via different synthesis methods without the ability to provide a sys- tematic understanding of the relationship between cathode materials structure and electrochemistry in Li-ion cells. The conclusions of each work, therefore, might not necessarily be relevant to each other and could mislead the battery community. In an effort to systematically elucidate the structure-electrochemistry relationships in these high capacity cathode materials, we have prepared a series of materials of the general formula xLi 2 MnO 3 · (1-x)LiMn a Ni b Co c O 2 using the same synthesis method, and performed a detailed study of the relationship among their material composition, structure and electrochemical per- formance as cathodes in Li-ion batteries. We synthesized a series of Li rich layered metal oxide cathode ma- terials using the co-precipitation technique. In these materials Li and transition metal oxide contents were varied systematically in order to assess how the relative amounts of Li, Mn, Co and Ni in the mixed metal oxides affect their capacity and rechargeability, and influence capacity fade and voltage slippage as a function of charge/discharge cycling of Li cells at various rates. We eliminated property differ- ences due to synthesis by preparing all of the materials via the same method. In addition, the ratio of Li 2 MnO 3 to LiMO 2 in the composite oxide structure was varied to correlate electrochemical performance with oxide structure. To enhance the rate capability of Li rich com- pounds, we studied the effect on Li cell electrochemistry of addition of multi-walled carbon nanotube (MWCT) to the cathode electrode com- position. We employed a multitude of experimental methods includ- ing X-ray diffraction (XRD) to identify structural phase information, ) unless CC License in place (see abstract). ecsdl.org/site/terms_use address. Redistribution subject to ECS terms of use (see 73.167.223.240 Downloaded on 2015-04-12 to IP
-
Upload
independent -
Category
Documents
-
view
2 -
download
0
Transcript of A Search for the Optimum Lithium Rich Layered Metal Oxide Cathode Material for Li-Ion Batteries
A1236 Journal of The Electrochemical Society, 162 (7) A1236-A1245 (2015)
A Search for the Optimum Lithium Rich Layered Metal OxideCathode Material for Li-Ion BatteriesMehmet Nurullah Ates,∗ Sanjeev Mukerjee,∗∗ and K. M. Abraham∗∗,z
Center for Renewable Energy Technology, Department of Chemistry and Chemical Biology, Northeastern University,Boston, Massachusetts 02115, USA
We report the results of a comprehensive study of the relationship between electrochemical performance in Li cells and chemicalcomposition of a series of Li rich layered metal oxides of the general formula xLi2MnO3 · (1-x)LiMn0.33Ni0.33Co0.33O2 in which x= 0,1, 0.2, 0,3, 0.5 or 0.7, synthesized using the same method. In order to identify the cathode material having the optimum Li cellperformance we first varied the ratio between Li2MnO3 and LiMO2 segments of the composite oxides while maintaining the samemetal ratio residing within their LiMO2 portions. The materials with the overall composition 0.5Li2MnO3 · 0.5LiMO2 containing 0.5mole of Li2MnO3 per mole of the composite metal oxide were found to be the optimum in terms of electrochemical performance. Theelectrochemical properties of these materials were further tuned by changing the relative amounts of Mn, Ni and Co in the LiMO2segment to produce xLi2MnO3 · (1-x)LiMn0.50Ni0.35Co0.15O2 with enhanced capacities and rate capabilities. The rate capability ofthe lithium rich compound in which x = 0.3 was further increased by preparing electrodes with about 2 weight-percent multiwallcarbon nanotube in the electrode. Lithium cells prepared with such electrodes were cycled at the 4C rate with little fade in capacityfor over one hundred cycles.© The Author(s) 2015. Published by ECS. This is an open access article distributed under the terms of the Creative CommonsAttribution 4.0 License (CC BY, http://creativecommons.org/licenses/by/4.0/), which permits unrestricted reuse of the work in anymedium, provided the original work is properly cited. [DOI: 10.1149/2.0481507jes] All rights reserved.
Manuscript submitted February 25, 2015; revised manuscript received March 19, 2015. Published April 9, 2015.
The energy densities of Li-ion batteries are limited by the capacitiesof cathode materials. The highest energy density commercially avail-able Li-ion batteries utilize graphite anodes with a capacity of about370 mAh/gram, and LiNi0.8Co0.15Al0.05O2 (NCA) cathodes exhibitingapproximately190 mAh/gram capacity. The latter corresponds to thereversible charge/discharge cycling of 0.7 Li per transition metal, thehighest capacity achievable in these and related layered metal dioxide(LiMO2) congeners of LiCoO2. The reversible cycling of one Li pertransition metal is not possible in these positive electrode materialsbecause they cannot be charged to a voltage necessary to fully extractall the Li in LiMO2, in which M = Ni and Co, due to the instabilityof the fully delithiated metal dioxides NiO2 and CoO2 containing Niand Co in the 4+ oxidation state.
The Li rich transition metal dioxides of the general formulaxLi2MnO3 · (1-x)LiMnaNibCocO2 are promising class of cathode ma-terials capable of delivering discharge capacities >250 mAh/gram orthe transfer of nearly one Li per transition metal. They exhibit suchhigh capacities once the materials are charged initially to a voltage be-tween 4.6 and 4.9 V versus Li/Li+.1–4 Their high capacity stem fromthe activation of Li2MnO3 in the first charge beginning at approxi-mately 4.5 V in a Li cell. This process encompasses a very complexmechanism triggering transition metal (TM) migration into vacant Liand/or TM sites leading to voltage hysteresis in the following cy-cles. Although the origin of the voltage fade is still under debate,5–8
data we obtained with 0.3Li2MnO3.0.7LiNi0.5Co0.5O2 in which Mnwas absent in the LiMO2 segment9 indicated unambiguously that thelatter Mn was responsible for the voltage fade. This layered com-posite metal oxide showed little voltage fade with cycling at 50◦Cat which electrodes containing Mn in both segments of the layeredcomposite metal oxide showed significant voltage fade. All of thestudies previous to our work were done with materials containing Mnin both segments of the layered composite so that the results fromthose investigations were not unambiguous. Stable voltage responsesand good capacity retentions of cathode materials are crucial to obtainhigh energy and power densities and the long cycle life needed forLi-ion batteries suitable for portable consumer products and electricvehicle propulsion. A great deal of recent studies has been aimed atmitigating or arresting the voltage fade and power loss of these ma-terials with repeated charge/discharge cycling. One way to suppressthe voltage fade is through alkali metal cation (Na+, K+) doping10–12
∗Electrochemical Society Student Member.∗∗Electrochemical Society Fellow.
zE-mail: [email protected]
in which the cation plays a pillaring role within the structure withthe result of arresting the transition metal migration and voltage fadewith cycling. In addition, coating the cathode material was found tobe effective in reducing the voltage decay13,14 by suppressing oxygenvacancies created during the first cycle, and mitigating side reactionsat high potentials. Also, it has been shown9,15 that the amount of Mn inthese classes of material have a direct impact on the layered to spinelstructural conversion accompanying the cycling-related voltage de-cay. However, none of these structural and surface modifications havebeen able to fully overcome the performance deficiencies of thesecathode materials including the large irreversible capacity loss (ICL)in the first cycle,16 voltage hysteresis and structural transformationthat accompany charge/discharge cycling,6 and the inability to main-tain stable capacity over hundreds of cycles17 at either low or highrates.
Although a number of studies5,18–24 have attempted to unravel theroot causes of these issues they utilized materials containing differenttypes of transition metals and/or ratios of transition metals preparedvia different synthesis methods without the ability to provide a sys-tematic understanding of the relationship between cathode materialsstructure and electrochemistry in Li-ion cells. The conclusions of eachwork, therefore, might not necessarily be relevant to each other andcould mislead the battery community. In an effort to systematicallyelucidate the structure-electrochemistry relationships in these highcapacity cathode materials, we have prepared a series of materials ofthe general formula xLi2MnO3 · (1-x)LiMnaNibCocO2 using the samesynthesis method, and performed a detailed study of the relationshipamong their material composition, structure and electrochemical per-formance as cathodes in Li-ion batteries.
We synthesized a series of Li rich layered metal oxide cathode ma-terials using the co-precipitation technique. In these materials Li andtransition metal oxide contents were varied systematically in order toassess how the relative amounts of Li, Mn, Co and Ni in the mixedmetal oxides affect their capacity and rechargeability, and influencecapacity fade and voltage slippage as a function of charge/dischargecycling of Li cells at various rates. We eliminated property differ-ences due to synthesis by preparing all of the materials via the samemethod. In addition, the ratio of Li2MnO3 to LiMO2 in the compositeoxide structure was varied to correlate electrochemical performancewith oxide structure. To enhance the rate capability of Li rich com-pounds, we studied the effect on Li cell electrochemistry of addition ofmulti-walled carbon nanotube (MWCT) to the cathode electrode com-position. We employed a multitude of experimental methods includ-ing X-ray diffraction (XRD) to identify structural phase information,
) unless CC License in place (see abstract). ecsdl.org/site/terms_use address. Redistribution subject to ECS terms of use (see 73.167.223.240Downloaded on 2015-04-12 to IP
Journal of The Electrochemical Society, 162 (7) A1236-A1245 (2015) A1237
Field-emission scanning electron microscopy (FESEM) to observesurface features of the synthesized cathode materials, and X-ray ab-sorption spectroscopy (XAS) to study local geometry and valence statevariations of transition metals in each material. The electrochemicalproperties of each material were discerned from cyclic voltammetry(CV) and galvanostatic cycling data in Li cells.
Experimental
Preparations of materials.— A series of Li rich layered metaloxide cathode materials of the general formula xLi2MnO3 · (1-x) LiMnaNibCocO2 were synthesized using the conventional co-precipitation method followed by a high temperature treatment.1,10,15
Briefly, appropriate amounts of nitrate salts of the transition met-als (Mn, Ni and Co) were dissolved in deionized water. The dissolvedmetal nitrates were then slowly dropped into a mildly alkaline solutionof LiOH.H2O through a burette. The time for adding the metal nitratesinto the alkaline solution was set to be around 1 h. The pH of the so-lution was maintained around 12 by monitoring with a SypmHonymodel SP70P pH meter. When co-precipitation was completed, themixed metal hydroxide precipitate was washed with copious deion-ized water three times in order to remove any residues of alkali metalnitrates. After drying the mixed metal hydroxide precipitate in a vac-uum oven, it was thoroughly mixed with an appropriate amount ofLiOH.H2O and calcined first at 480◦C for 3 h, then grounded, pel-letized and calcined again at 900◦C for another 3 h under air toobtain the Li rich layered metal oxide powders. In order to obtaina Ni4+ reference material for XAS experiments we also synthesizedLiNi0.85Co0.15O2 which produced Ni4+ when it was charged to 5.1 V.Details of this synthesis can be found in our previous publication10
and elsewhere.25
Materials characterizations.— The crystalline phase of each Lirich cathode powder was characterized by Rigaku Ultima IV X-raydiffractometer using CuKα radiation. The scan range was set between10–80 2θ degrees for each measurement. The crystal structures of allas-synthesized powders were processed with the aid of PDXL soft-ware, provided by Rigaku Corporation. Unit cell visualization wasdrawn with VESTA software. The surface feature of each powder wasinvestigated with a Hitachi S-4800 Field Emission Scanning ElectronMicroscopy (FESEM). To unravel local geometry and valence statesof each transition metal in the composite metal oxide cathode, weran X-ray absorption spectra at beam line X-3A and X18-A of theNational Synchrotron Light Source (NSLS-I) located at BrookhavenNational Laboratory. XAS experiments were performed in ex-situmode using electrodes extracted from coin-cells. The electrodes weresealed with Kapton tape and stored in glass vials followed by pack-ing in moisture impermeable aluminized bags in Ar filled glove boxbefore transporting to NSLS-I. Each raw scan was calibrated, nor-malized and aligned with respect to reference foils through Artemissoftware.26
Electrochemical tests.— Galvanostatic cycling tests were per-formed at room temperature using coin cells. The cells were cycledbetween 2 and 4.9 V unless otherwise stated. For the purpose of cyclelife and rate capability assessments, an Arbin BTZ2000 model cy-cler was employed. The cathode for a coin cell was prepared in foursteps: i-) 10 wt% polyvinylidene fluoride (PVDF) was dissolved inan NMP-containing vial mounted in a sonicator bath, ii-) 80 wt% ofcathode active material and 10 wt% of Super P carbon were intimatelymixed and dropped into the NMP mixture, iii-) the resulting ink wascoated on Al foil substrate via doctor-blade to control the thicknessof the electrodes, and finally iv-) the electrodes were vacuum driedunder 120◦C overnight. The electrolyte employed in this work wasobtained by dissolving 1 M LiPF6 in a 1:1.2 EC/DMC mixture. TheC rates were calculated using the same theoretical capacity of 280mAh/g based on 1 Li per MO2 for all of the Li rich metal oxide cath-ode materials studied. For more details on the electrochemical testconditions, readers are referred to our previous publication.10 Cyclic
voltammograms of the Li cells were recorded at room temperature inthe range of 2–4.9 V at a 50 μV/s scan rate using VoltaLab PGZ402model potentiostat.
Results and Discussion
Our investigations to unravel the composition, structure and elec-trochemistry relationships in Li rich layered metal oxides proceededalong three avenues. First we synthesized a series of materialsof the formula xLi2MnO3 · (1-x)LiMn0.33Ni0.33Co0.33O2 (0.1≤x≤0.7)and studied their structure and electrochemistry in detail. We fur-ther explored the 0.5Li2MnO3 · 0.5LiMnaNibCocO2 composition bypreparing two materials in which the amounts of Mn, Ni and Coin the LiMO2 segment were varied since this composite with 0.5mole of Li2MnO3 was found to be the optimum material in termsof electrochemical performance. Finally, our efforts were directedtoward the enhancement of rate capabilities of the Li rich layeredmetal oxide cathode material by MWCT addition to the electrodecomposition.
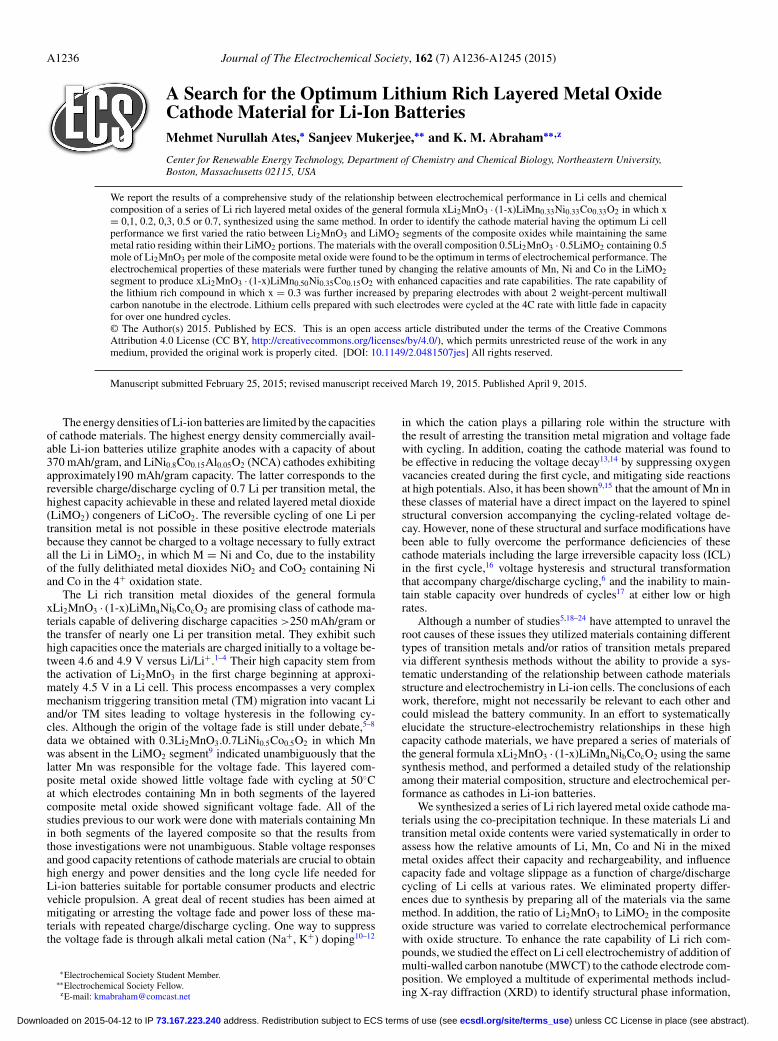
The effect of the ratio of Li2MnO3 to LiMO2 on structure and elec-trochemistry of xLi2MnO3 · (1-x)LiMn0.33Ni0.33Co0.33O2.— The vari-ous metal oxides we prepared and characterized and their first chargeand the subsequent discharge capacities measured are presented inTable I. The XRD patterns allow a visual inspection of the effect ofLi2MnO3 on the crystal structure of each material. Figure 1a displaysthe XRD patterns for five xLi2MnO3 · (1-x)LiMn0.33Ni0.33Co0.33O2
(0.1≤x≤0.7) cathodes, all synthesized through the co-precipitationmethod. All of the materials presented in the Figure 1a possess thesame 1:1:1 ratio of Mn:Ni:Co in the LiMO2 segment with only theLi2MnO3 to LiMO2 ratio varying from one material to the other.This allows us to understand how Li2MnO3 contribute to the firstcharge capacity, the reversible capacities following the first charge,the change in the charge/discharge voltage profiles from the first to thesubsequent cycles, and the decay in the discharge voltage accompa-nying repeated charge/discharge cycling. Figure 1a shows that as theamount of Li2MnO3 increases, the corresponding superlattice featureappearing between about 20 and 26 2θ degrees, highlighted in therectangle, also becomes more visible. A plot of the ratio of I(020),which solely belongs to Li2MnO3, to I(003)LiMO2 and/or I(001)Li2MnO3
versus the actual weight percentage of Li2MnO3 in the series ofxLi2MnO3 · (1-x)LiMn0.33Ni0.33Co0.33O2 (0.1≤x≤0.5) cathodes, dis-played in Figure 1b, approximately intersects through the origin man-ifesting excellent correlation between the weight ratio of Li2MnO3
and its respective feature in the XRD pattern.15 Surface morphologiesof the Li rich powders were investigated and a representative FESEMimage corresponding to 0.2Li2MnO3 · 0.8LiMn0.33Ni0.33Co0.33O2 isshown as the inset of Figure 1a. The nano particles comprising thematerial are agglomerated to form larger 200–400 nm grains. No sig-nificant difference was detected in the morphologies of the differentcathode materials. The higher Mn resulted in materials with a browncolor while higher Co causes the final materials to acquire a blackcolor.
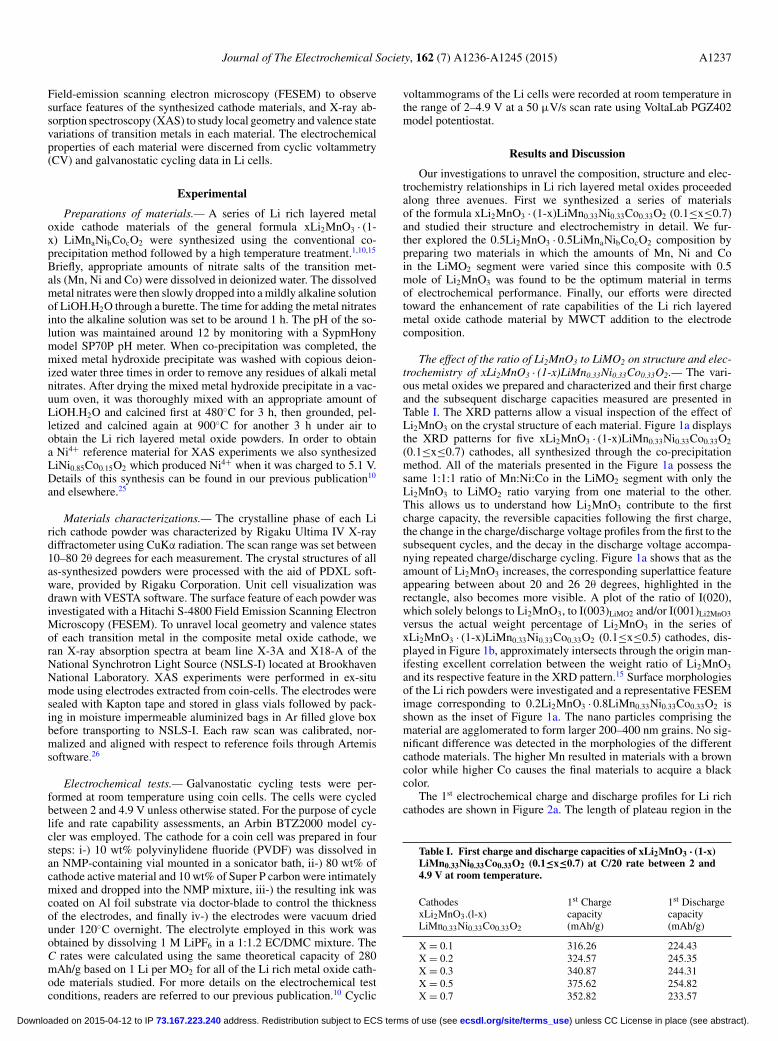
The 1st electrochemical charge and discharge profiles for Li richcathodes are shown in Figure 2a. The length of plateau region in the
Table I. First charge and discharge capacities of xLi2MnO3 · (1-x)LiMn0.33Ni0.33Co0.33O2 (0.1≤x≤0.7) at C/20 rate between 2 and4.9 V at room temperature.
CathodesxLi2MnO3.(l-x)LiMn0.33Ni0.33Co0.33O2
1st Chargecapacity(mAh/g)
1st Dischargecapacity(mAh/g)
X = 0.1 316.26 224.43X = 0.2 324.57 245.35X = 0.3 340.87 244.31X = 0.5 375.62 254.82X = 0.7 352.82 233.57
) unless CC License in place (see abstract). ecsdl.org/site/terms_use address. Redistribution subject to ECS terms of use (see 73.167.223.240Downloaded on 2015-04-12 to IP
A1238 Journal of The Electrochemical Society, 162 (7) A1236-A1245 (2015)
Figure 1. a-) XRD patterns for xLi2MnO3 · (1-x)LiMn0.33Ni0.33Co0.33O2 where x ranges from 0.1 to 0.7. FESEM image shows particle sizes approximately 250nm. b-) a plot of the weight percentage of xLi2MnO3 · (1-x)LiMn0.33Ni0.33Co0.33O2 as a function of the ratio of first peak intensities of Li2MnO3(020) to LiMO2(003) planes.
first charge was found to correlate with the amount of Li2MnO3 since0.7Li2MnO3 · 0.3LiMn0.33Ni0.33Co0.33O2 with the greatest amount ofLi2MnO3 has the longest 4.6 V plateau region in the first charge.The sloping first discharge voltage of the same material, however,has the highest hysteresis in addition to inferior discharge capacitycompared to the other materials presented in Figure 2a. One caninfer from these results that a very high Li2MnO3 results in lowdischarge voltage slopes and low specific discharge capacities. Thematerials with x = 0.2, 0.3 and 0.5 are particularly appealing basedon their high capacities obtained in the first cycle. Nevertheless, interms of capacity retentions during further cycling and rate capabil-ities, 0.5Li2MnO3 · 0.5LiMn0.33Ni0.33Co0.33O2 (x = 0.5) was foundto be the optimum composite oxide among the various Li rich ma-terials shown in Figure 2a. The graph depicting the rate capabili-ties of the x = 0.2, 0.3 and 0.5 compounds are shown in Figure2b. Previous studies had demonstrated that Li2MnO3 alone possessextremely low rate capability and cycling ability.27 Therefore, it iscrucial to create enough MnO2 as a reservoir for Li+ that cannot behosted by LiMO2 after de-intercalation. We showed here that the com-posite, having 50% of Li2MnO3 and 50% of LiMO2 (i.e. x = 0.5),
host approximately 1 Li per metal redox reaction leading to optimumcapacity.
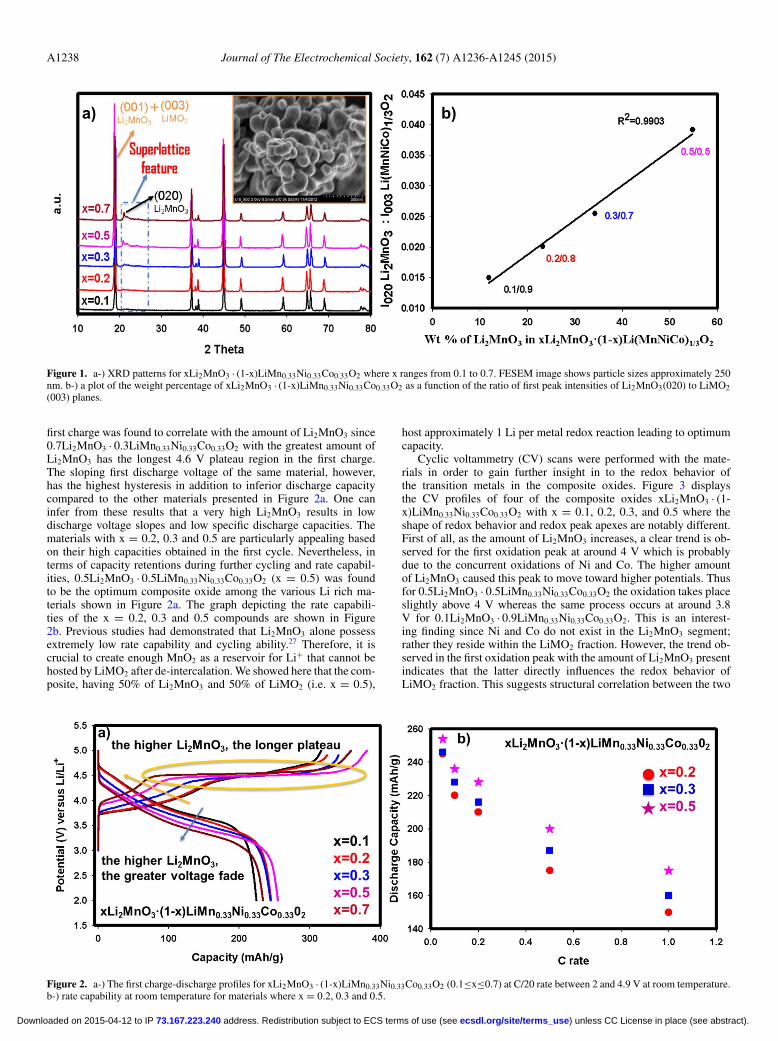
Cyclic voltammetry (CV) scans were performed with the mate-rials in order to gain further insight in to the redox behavior ofthe transition metals in the composite oxides. Figure 3 displaysthe CV profiles of four of the composite oxides xLi2MnO3 · (1-x)LiMn0.33Ni0.33Co0.33O2 with x = 0.1, 0.2, 0.3, and 0.5 where theshape of redox behavior and redox peak apexes are notably different.First of all, as the amount of Li2MnO3 increases, a clear trend is ob-served for the first oxidation peak at around 4 V which is probablydue to the concurrent oxidations of Ni and Co. The higher amountof Li2MnO3 caused this peak to move toward higher potentials. Thusfor 0.5Li2MnO3 · 0.5LiMn0.33Ni0.33Co0.33O2 the oxidation takes placeslightly above 4 V whereas the same process occurs at around 3.8V for 0.1Li2MnO3 · 0.9LiMn0.33Ni0.33Co0.33O2. This is an interest-ing finding since Ni and Co do not exist in the Li2MnO3 segment;rather they reside within the LiMO2 fraction. However, the trend ob-served in the first oxidation peak with the amount of Li2MnO3 presentindicates that the latter directly influences the redox behavior ofLiMO2 fraction. This suggests structural correlation between the two
Figure 2. a-) The first charge-discharge profiles for xLi2MnO3 · (1-x)LiMn0.33Ni0.33Co0.33O2 (0.1≤x≤0.7) at C/20 rate between 2 and 4.9 V at room temperature.b-) rate capability at room temperature for materials where x = 0.2, 0.3 and 0.5.
) unless CC License in place (see abstract). ecsdl.org/site/terms_use address. Redistribution subject to ECS terms of use (see 73.167.223.240Downloaded on 2015-04-12 to IP
Journal of The Electrochemical Society, 162 (7) A1236-A1245 (2015) A1239
Figure 3. The first cyclic voltammograms run at 50 μV/s for xLi2MnO3 · (1-x)LiMn0.33Ni0.33Co0.33O2 (0.1≤x≤0.5) scanned between 2 and 4.9 V at roomtemperature.
segments in the composite oxide at the atomic level. In other words,the original Li2MnO3 affects the redox nature of LiMO2. During thefirst discharge, while materials having x = 0.1 and 0.2 compositionshave sharp peak features,15 cathodes comprised of higher amount ofLi2MnO3 yielded broader peaks suggesting that structural rearrange-ments involving metal migration occurs in x = 0.3 and 0.5 com-positions at higher degrees of Li extraction. The former advocateshomogeneous reaction kinetics while the latter suggest more likelyheterogeneous reaction mechanism. A lower amount of Li2MnO3 ap-pears to trigger electrochemical reaction primarily in single-phaseLiMO2 while a higher amount of Li2MnO3 stimulates involvementof a two-phase phenomenon where Li2MnO3 and LiMO2 are jointlycontributing to the redox capacities of the composite cathode.
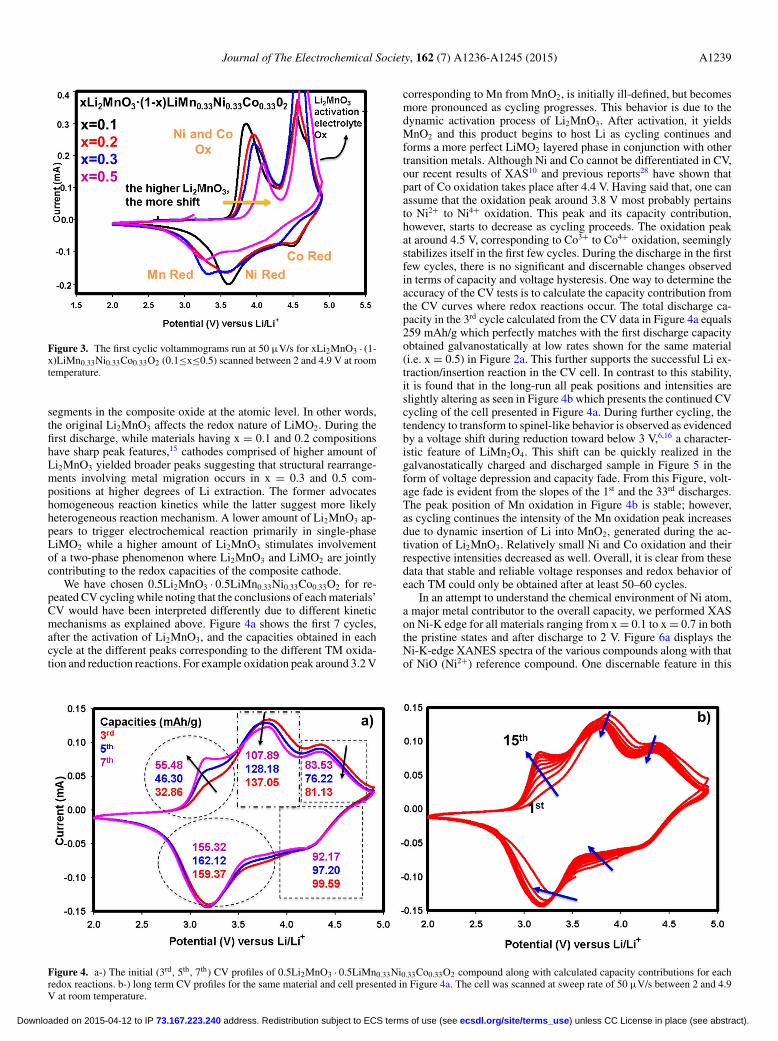
We have chosen 0.5Li2MnO3 · 0.5LiMn0.33Ni0.33Co0.33O2 for re-peated CV cycling while noting that the conclusions of each materials’CV would have been interpreted differently due to different kineticmechanisms as explained above. Figure 4a shows the first 7 cycles,after the activation of Li2MnO3, and the capacities obtained in eachcycle at the different peaks corresponding to the different TM oxida-tion and reduction reactions. For example oxidation peak around 3.2 V
corresponding to Mn from MnO2, is initially ill-defined, but becomesmore pronounced as cycling progresses. This behavior is due to thedynamic activation process of Li2MnO3. After activation, it yieldsMnO2 and this product begins to host Li as cycling continues andforms a more perfect LiMO2 layered phase in conjunction with othertransition metals. Although Ni and Co cannot be differentiated in CV,our recent results of XAS10 and previous reports28 have shown thatpart of Co oxidation takes place after 4.4 V. Having said that, one canassume that the oxidation peak around 3.8 V most probably pertainsto Ni2+ to Ni4+ oxidation. This peak and its capacity contribution,however, starts to decrease as cycling proceeds. The oxidation peakat around 4.5 V, corresponding to Co3+ to Co4+ oxidation, seeminglystabilizes itself in the first few cycles. During the discharge in the firstfew cycles, there is no significant and discernable changes observedin terms of capacity and voltage hysteresis. One way to determine theaccuracy of the CV tests is to calculate the capacity contribution fromthe CV curves where redox reactions occur. The total discharge ca-pacity in the 3rd cycle calculated from the CV data in Figure 4a equals259 mAh/g which perfectly matches with the first discharge capacityobtained galvanostatically at low rates shown for the same material(i.e. x = 0.5) in Figure 2a. This further supports the successful Li ex-traction/insertion reaction in the CV cell. In contrast to this stability,it is found that in the long-run all peak positions and intensities areslightly altering as seen in Figure 4b which presents the continued CVcycling of the cell presented in Figure 4a. During further cycling, thetendency to transform to spinel-like behavior is observed as evidencedby a voltage shift during reduction toward below 3 V,6,16 a character-istic feature of LiMn2O4. This shift can be quickly realized in thegalvanostatically charged and discharged sample in Figure 5 in theform of voltage depression and capacity fade. From this Figure, volt-age fade is evident from the slopes of the 1st and the 33rd discharges.The peak position of Mn oxidation in Figure 4b is stable; however,as cycling continues the intensity of the Mn oxidation peak increasesdue to dynamic insertion of Li into MnO2, generated during the ac-tivation of Li2MnO3. Relatively small Ni and Co oxidation and theirrespective intensities decreased as well. Overall, it is clear from thesedata that stable and reliable voltage responses and redox behavior ofeach TM could only be obtained after at least 50–60 cycles.
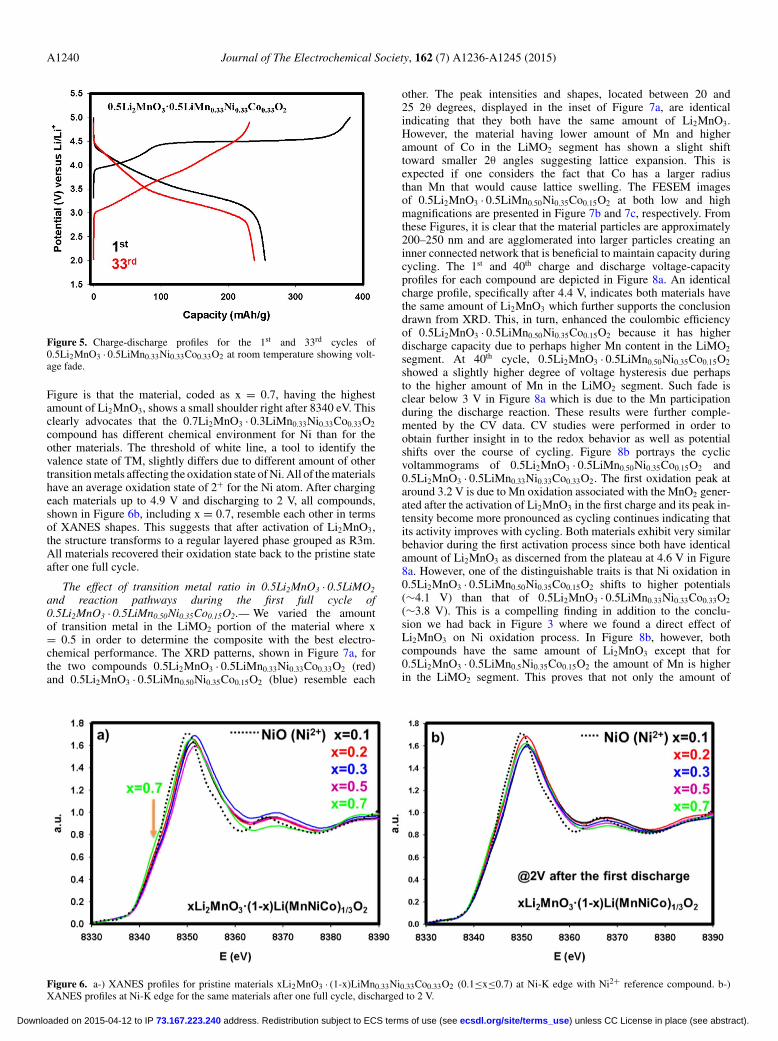
In an attempt to understand the chemical environment of Ni atom,a major metal contributor to the overall capacity, we performed XASon Ni-K edge for all materials ranging from x = 0.1 to x = 0.7 in boththe pristine states and after discharge to 2 V. Figure 6a displays theNi-K-edge XANES spectra of the various compounds along with thatof NiO (Ni2+) reference compound. One discernable feature in this
Figure 4. a-) The initial (3rd, 5th, 7th) CV profiles of 0.5Li2MnO3 · 0.5LiMn0.33Ni0.33Co0.33O2 compound along with calculated capacity contributions for eachredox reactions. b-) long term CV profiles for the same material and cell presented in Figure 4a. The cell was scanned at sweep rate of 50 μV/s between 2 and 4.9V at room temperature.
) unless CC License in place (see abstract). ecsdl.org/site/terms_use address. Redistribution subject to ECS terms of use (see 73.167.223.240Downloaded on 2015-04-12 to IP
A1240 Journal of The Electrochemical Society, 162 (7) A1236-A1245 (2015)
Figure 5. Charge-discharge profiles for the 1st and 33rd cycles of0.5Li2MnO3 · 0.5LiMn0.33Ni0.33Co0.33O2 at room temperature showing volt-age fade.
Figure is that the material, coded as x = 0.7, having the highestamount of Li2MnO3, shows a small shoulder right after 8340 eV. Thisclearly advocates that the 0.7Li2MnO3 · 0.3LiMn0.33Ni0.33Co0.33O2
compound has different chemical environment for Ni than for theother materials. The threshold of white line, a tool to identify thevalence state of TM, slightly differs due to different amount of othertransition metals affecting the oxidation state of Ni. All of the materialshave an average oxidation state of 2+ for the Ni atom. After chargingeach materials up to 4.9 V and discharging to 2 V, all compounds,shown in Figure 6b, including x = 0.7, resemble each other in termsof XANES shapes. This suggests that after activation of Li2MnO3,the structure transforms to a regular layered phase grouped as R3m.All materials recovered their oxidation state back to the pristine stateafter one full cycle.
The effect of transition metal ratio in 0.5Li2MnO3 · 0.5LiMO2
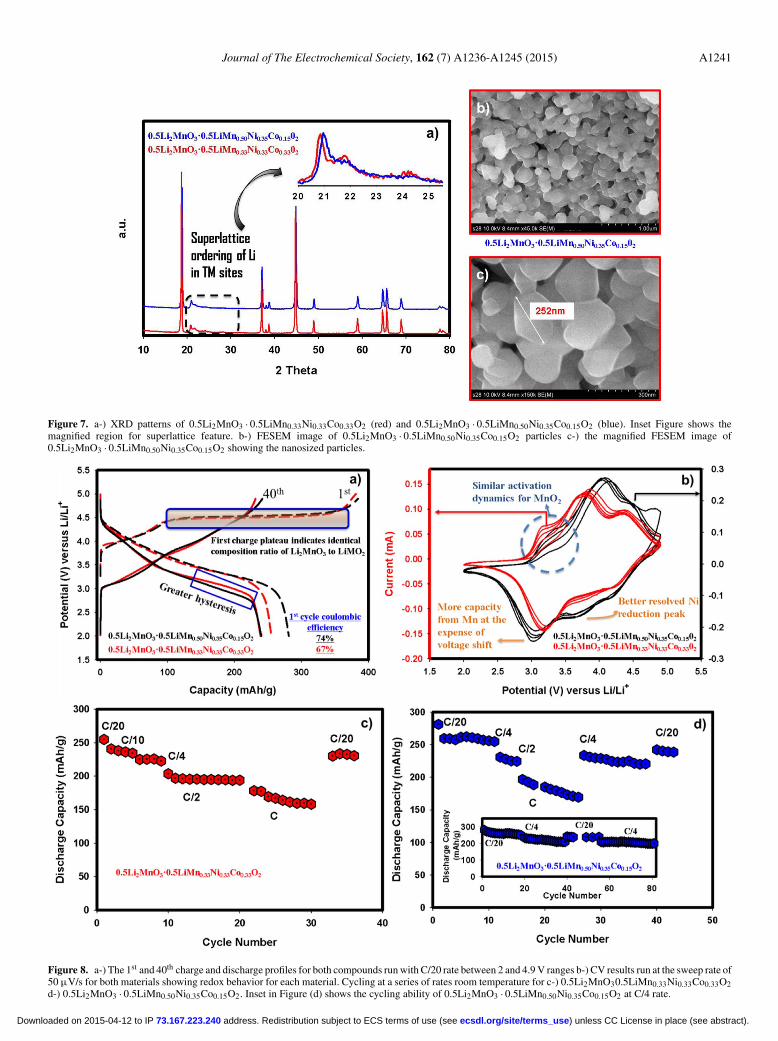
and reaction pathways during the first full cycle of0.5Li2MnO3 · 0.5LiMn0.50Ni0.35Co0.15O2.— We varied the amountof transition metal in the LiMO2 portion of the material where x= 0.5 in order to determine the composite with the best electro-chemical performance. The XRD patterns, shown in Figure 7a, forthe two compounds 0.5Li2MnO3 · 0.5LiMn0.33Ni0.33Co0.33O2 (red)and 0.5Li2MnO3 · 0.5LiMn0.50Ni0.35Co0.15O2 (blue) resemble each
other. The peak intensities and shapes, located between 20 and25 2θ degrees, displayed in the inset of Figure 7a, are identicalindicating that they both have the same amount of Li2MnO3.However, the material having lower amount of Mn and higheramount of Co in the LiMO2 segment has shown a slight shifttoward smaller 2θ angles suggesting lattice expansion. This isexpected if one considers the fact that Co has a larger radiusthan Mn that would cause lattice swelling. The FESEM imagesof 0.5Li2MnO3 · 0.5LiMn0.50Ni0.35Co0.15O2 at both low and highmagnifications are presented in Figure 7b and 7c, respectively. Fromthese Figures, it is clear that the material particles are approximately200–250 nm and are agglomerated into larger particles creating aninner connected network that is beneficial to maintain capacity duringcycling. The 1st and 40th charge and discharge voltage-capacityprofiles for each compound are depicted in Figure 8a. An identicalcharge profile, specifically after 4.4 V, indicates both materials havethe same amount of Li2MnO3 which further supports the conclusiondrawn from XRD. This, in turn, enhanced the coulombic efficiencyof 0.5Li2MnO3 · 0.5LiMn0.50Ni0.35Co0.15O2 because it has higherdischarge capacity due to perhaps higher Mn content in the LiMO2
segment. At 40th cycle, 0.5Li2MnO3 · 0.5LiMn0.50Ni0.35Co0.15O2
showed a slightly higher degree of voltage hysteresis due perhapsto the higher amount of Mn in the LiMO2 segment. Such fade isclear below 3 V in Figure 8a which is due to the Mn participationduring the discharge reaction. These results were further comple-mented by the CV data. CV studies were performed in order toobtain further insight in to the redox behavior as well as potentialshifts over the course of cycling. Figure 8b portrays the cyclicvoltammograms of 0.5Li2MnO3 · 0.5LiMn0.50Ni0.35Co0.15O2 and0.5Li2MnO3 · 0.5LiMn0.33Ni0.33Co0.33O2. The first oxidation peak ataround 3.2 V is due to Mn oxidation associated with the MnO2 gener-ated after the activation of Li2MnO3 in the first charge and its peak in-tensity become more pronounced as cycling continues indicating thatits activity improves with cycling. Both materials exhibit very similarbehavior during the first activation process since both have identicalamount of Li2MnO3 as discerned from the plateau at 4.6 V in Figure8a. However, one of the distinguishable traits is that Ni oxidation in0.5Li2MnO3 · 0.5LiMn0.50Ni0.35Co0.15O2 shifts to higher potentials(∼4.1 V) than that of 0.5Li2MnO3 · 0.5LiMn0.33Ni0.33Co0.33O2
(∼3.8 V). This is a compelling finding in addition to the conclu-sion we had back in Figure 3 where we found a direct effect ofLi2MnO3 on Ni oxidation process. In Figure 8b, however, bothcompounds have the same amount of Li2MnO3 except that for0.5Li2MnO3 · 0.5LiMn0.5Ni0.35Co0.15O2 the amount of Mn is higherin the LiMO2 segment. This proves that not only the amount of
Figure 6. a-) XANES profiles for pristine materials xLi2MnO3 · (1-x)LiMn0.33Ni0.33Co0.33O2 (0.1≤x≤0.7) at Ni-K edge with Ni2+ reference compound. b-)XANES profiles at Ni-K edge for the same materials after one full cycle, discharged to 2 V.
) unless CC License in place (see abstract). ecsdl.org/site/terms_use address. Redistribution subject to ECS terms of use (see 73.167.223.240Downloaded on 2015-04-12 to IP
Journal of The Electrochemical Society, 162 (7) A1236-A1245 (2015) A1241
Figure 7. a-) XRD patterns of 0.5Li2MnO3 · 0.5LiMn0.33Ni0.33Co0.33O2 (red) and 0.5Li2MnO3 · 0.5LiMn0.50Ni0.35Co0.15O2 (blue). Inset Figure shows themagnified region for superlattice feature. b-) FESEM image of 0.5Li2MnO3 · 0.5LiMn0.50Ni0.35Co0.15O2 particles c-) the magnified FESEM image of0.5Li2MnO3 · 0.5LiMn0.50Ni0.35Co0.15O2 showing the nanosized particles.
Figure 8. a-) The 1st and 40th charge and discharge profiles for both compounds run with C/20 rate between 2 and 4.9 V ranges b-) CV results run at the sweep rate of50 μV/s for both materials showing redox behavior for each material. Cycling at a series of rates room temperature for c-) 0.5Li2MnO30.5LiMn0.33Ni0.33Co0.33O2d-) 0.5Li2MnO3 · 0.5LiMn0.50Ni0.35Co0.15O2. Inset in Figure (d) shows the cycling ability of 0.5Li2MnO3 · 0.5LiMn0.50Ni0.35Co0.15O2 at C/4 rate.
) unless CC License in place (see abstract). ecsdl.org/site/terms_use address. Redistribution subject to ECS terms of use (see 73.167.223.240Downloaded on 2015-04-12 to IP
A1242 Journal of The Electrochemical Society, 162 (7) A1236-A1245 (2015)
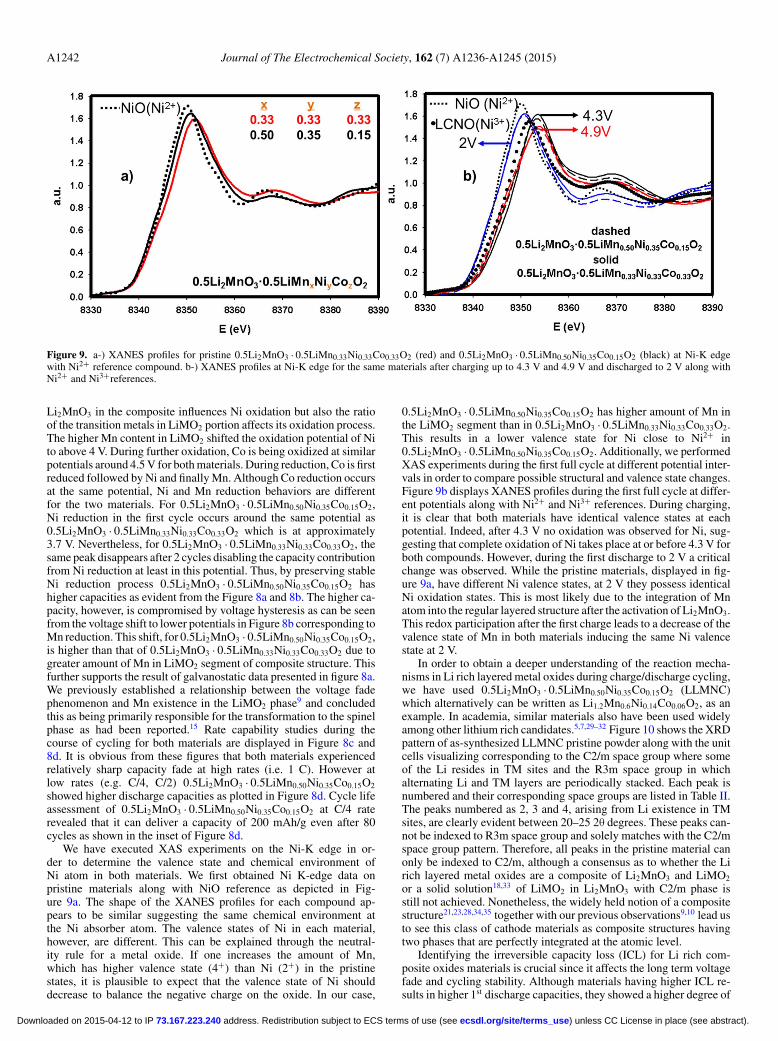
Figure 9. a-) XANES profiles for pristine 0.5Li2MnO3 · 0.5LiMn0.33Ni0.33Co0.33O2 (red) and 0.5Li2MnO3 · 0.5LiMn0.50Ni0.35Co0.15O2 (black) at Ni-K edgewith Ni2+ reference compound. b-) XANES profiles at Ni-K edge for the same materials after charging up to 4.3 V and 4.9 V and discharged to 2 V along withNi2+ and Ni3+references.
Li2MnO3 in the composite influences Ni oxidation but also the ratioof the transition metals in LiMO2 portion affects its oxidation process.The higher Mn content in LiMO2 shifted the oxidation potential of Nito above 4 V. During further oxidation, Co is being oxidized at similarpotentials around 4.5 V for both materials. During reduction, Co is firstreduced followed by Ni and finally Mn. Although Co reduction occursat the same potential, Ni and Mn reduction behaviors are differentfor the two materials. For 0.5Li2MnO3 · 0.5LiMn0.50Ni0.35Co0.15O2,Ni reduction in the first cycle occurs around the same potential as0.5Li2MnO3 · 0.5LiMn0.33Ni0.33Co0.33O2 which is at approximately3.7 V. Nevertheless, for 0.5Li2MnO3 · 0.5LiMn0.33Ni0.33Co0.33O2, thesame peak disappears after 2 cycles disabling the capacity contributionfrom Ni reduction at least in this potential. Thus, by preserving stableNi reduction process 0.5Li2MnO3 · 0.5LiMn0.50Ni0.35Co0.15O2 hashigher capacities as evident from the Figure 8a and 8b. The higher ca-pacity, however, is compromised by voltage hysteresis as can be seenfrom the voltage shift to lower potentials in Figure 8b corresponding toMn reduction. This shift, for 0.5Li2MnO3 · 0.5LiMn0.50Ni0.35Co0.15O2,is higher than that of 0.5Li2MnO3 · 0.5LiMn0.33Ni0.33Co0.33O2 due togreater amount of Mn in LiMO2 segment of composite structure. Thisfurther supports the result of galvanostatic data presented in figure 8a.We previously established a relationship between the voltage fadephenomenon and Mn existence in the LiMO2 phase9 and concludedthis as being primarily responsible for the transformation to the spinelphase as had been reported.15 Rate capability studies during thecourse of cycling for both materials are displayed in Figure 8c and8d. It is obvious from these figures that both materials experiencedrelatively sharp capacity fade at high rates (i.e. 1 C). However atlow rates (e.g. C/4, C/2) 0.5Li2MnO3 · 0.5LiMn0.50Ni0.35Co0.15O2
showed higher discharge capacities as plotted in Figure 8d. Cycle lifeassessment of 0.5Li2MnO3 · 0.5LiMn0.50Ni0.35Co0.15O2 at C/4 raterevealed that it can deliver a capacity of 200 mAh/g even after 80cycles as shown in the inset of Figure 8d.
We have executed XAS experiments on the Ni-K edge in or-der to determine the valence state and chemical environment ofNi atom in both materials. We first obtained Ni K-edge data onpristine materials along with NiO reference as depicted in Fig-ure 9a. The shape of the XANES profiles for each compound ap-pears to be similar suggesting the same chemical environment atthe Ni absorber atom. The valence states of Ni in each material,however, are different. This can be explained through the neutral-ity rule for a metal oxide. If one increases the amount of Mn,which has higher valence state (4+) than Ni (2+) in the pristinestates, it is plausible to expect that the valence state of Ni shoulddecrease to balance the negative charge on the oxide. In our case,
0.5Li2MnO3 · 0.5LiMn0.50Ni0.35Co0.15O2 has higher amount of Mn inthe LiMO2 segment than in 0.5Li2MnO3 · 0.5LiMn0.33Ni0.33Co0.33O2.This results in a lower valence state for Ni close to Ni2+ in0.5Li2MnO3 · 0.5LiMn0.50Ni0.35Co0.15O2. Additionally, we performedXAS experiments during the first full cycle at different potential inter-vals in order to compare possible structural and valence state changes.Figure 9b displays XANES profiles during the first full cycle at differ-ent potentials along with Ni2+ and Ni3+ references. During charging,it is clear that both materials have identical valence states at eachpotential. Indeed, after 4.3 V no oxidation was observed for Ni, sug-gesting that complete oxidation of Ni takes place at or before 4.3 V forboth compounds. However, during the first discharge to 2 V a criticalchange was observed. While the pristine materials, displayed in fig-ure 9a, have different Ni valence states, at 2 V they possess identicalNi oxidation states. This is most likely due to the integration of Mnatom into the regular layered structure after the activation of Li2MnO3.This redox participation after the first charge leads to a decrease of thevalence state of Mn in both materials inducing the same Ni valencestate at 2 V.
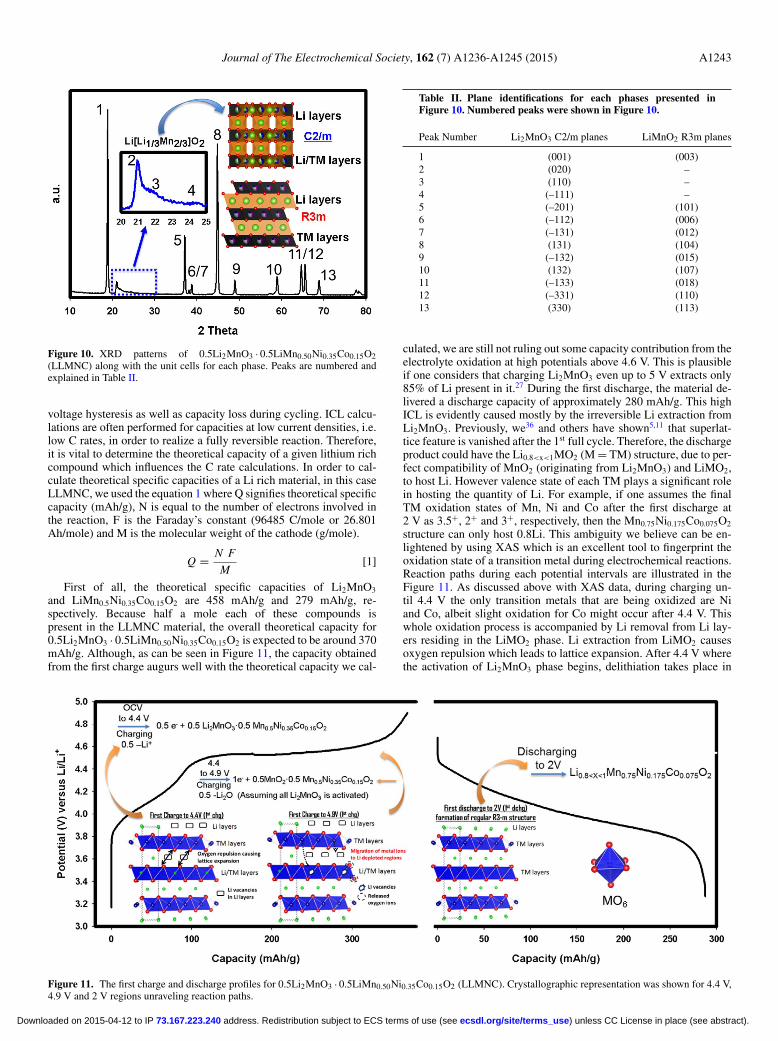
In order to obtain a deeper understanding of the reaction mecha-nisms in Li rich layered metal oxides during charge/discharge cycling,we have used 0.5Li2MnO3 · 0.5LiMn0.50Ni0.35Co0.15O2 (LLMNC)which alternatively can be written as Li1.2Mn0.6Ni0.14Co0.06O2, as anexample. In academia, similar materials also have been used widelyamong other lithium rich candidates.5,7,29–32 Figure 10 shows the XRDpattern of as-synthesized LLMNC pristine powder along with the unitcells visualizing corresponding to the C2/m space group where someof the Li resides in TM sites and the R3m space group in whichalternating Li and TM layers are periodically stacked. Each peak isnumbered and their corresponding space groups are listed in Table II.The peaks numbered as 2, 3 and 4, arising from Li existence in TMsites, are clearly evident between 20–25 2θ degrees. These peaks can-not be indexed to R3m space group and solely matches with the C2/mspace group pattern. Therefore, all peaks in the pristine material canonly be indexed to C2/m, although a consensus as to whether the Lirich layered metal oxides are a composite of Li2MnO3 and LiMO2
or a solid solution18,33 of LiMO2 in Li2MnO3 with C2/m phase isstill not achieved. Nonetheless, the widely held notion of a compositestructure21,23,28,34,35 together with our previous observations9,10 lead usto see this class of cathode materials as composite structures havingtwo phases that are perfectly integrated at the atomic level.
Identifying the irreversible capacity loss (ICL) for Li rich com-posite oxides materials is crucial since it affects the long term voltagefade and cycling stability. Although materials having higher ICL re-sults in higher 1st discharge capacities, they showed a higher degree of
) unless CC License in place (see abstract). ecsdl.org/site/terms_use address. Redistribution subject to ECS terms of use (see 73.167.223.240Downloaded on 2015-04-12 to IP
Journal of The Electrochemical Society, 162 (7) A1236-A1245 (2015) A1243
Figure 10. XRD patterns of 0.5Li2MnO3 · 0.5LiMn0.50Ni0.35Co0.15O2(LLMNC) along with the unit cells for each phase. Peaks are numbered andexplained in Table II.
voltage hysteresis as well as capacity loss during cycling. ICL calcu-lations are often performed for capacities at low current densities, i.e.low C rates, in order to realize a fully reversible reaction. Therefore,it is vital to determine the theoretical capacity of a given lithium richcompound which influences the C rate calculations. In order to cal-culate theoretical specific capacities of a Li rich material, in this caseLLMNC, we used the equation 1 where Q signifies theoretical specificcapacity (mAh/g), N is equal to the number of electrons involved inthe reaction, F is the Faraday’s constant (96485 C/mole or 26.801Ah/mole) and M is the molecular weight of the cathode (g/mole).
Q = N F
M[1]
First of all, the theoretical specific capacities of Li2MnO3
and LiMn0.5Ni0.35Co0.15O2 are 458 mAh/g and 279 mAh/g, re-spectively. Because half a mole each of these compounds ispresent in the LLMNC material, the overall theoretical capacity for0.5Li2MnO3 · 0.5LiMn0.50Ni0.35Co0.15O2 is expected to be around 370mAh/g. Although, as can be seen in Figure 11, the capacity obtainedfrom the first charge augurs well with the theoretical capacity we cal-
Table II. Plane identifications for each phases presented inFigure 10. Numbered peaks were shown in Figure 10.
Peak Number Li2MnO3 C2/m planes LiMnO2 R3m planes
1 (001) (003)2 (020) –3 (110) –4 (–111) –5 (–201) (101)6 (–112) (006)7 (–131) (012)8 (131) (104)9 (–132) (015)10 (132) (107)11 (–133) (018)12 (–331) (110)13 (330) (113)
culated, we are still not ruling out some capacity contribution from theelectrolyte oxidation at high potentials above 4.6 V. This is plausibleif one considers that charging Li2MnO3 even up to 5 V extracts only85% of Li present in it.27 During the first discharge, the material de-livered a discharge capacity of approximately 280 mAh/g. This highICL is evidently caused mostly by the irreversible Li extraction fromLi2MnO3. Previously, we36 and others have shown5,11 that superlat-tice feature is vanished after the 1st full cycle. Therefore, the dischargeproduct could have the Li0.8<x<1MO2 (M = TM) structure, due to per-fect compatibility of MnO2 (originating from Li2MnO3) and LiMO2,to host Li. However valence state of each TM plays a significant rolein hosting the quantity of Li. For example, if one assumes the finalTM oxidation states of Mn, Ni and Co after the first discharge at2 V as 3.5+, 2+ and 3+, respectively, then the Mn0.75Ni0.175Co0.075O2
structure can only host 0.8Li. This ambiguity we believe can be en-lightened by using XAS which is an excellent tool to fingerprint theoxidation state of a transition metal during electrochemical reactions.Reaction paths during each potential intervals are illustrated in theFigure 11. As discussed above with XAS data, during charging un-til 4.4 V the only transition metals that are being oxidized are Niand Co, albeit slight oxidation for Co might occur after 4.4 V. Thiswhole oxidation process is accompanied by Li removal from Li lay-ers residing in the LiMO2 phase. Li extraction from LiMO2 causesoxygen repulsion which leads to lattice expansion. After 4.4 V wherethe activation of Li2MnO3 phase begins, delithiation takes place in
Figure 11. The first charge and discharge profiles for 0.5Li2MnO3 · 0.5LiMn0.50Ni0.35Co0.15O2 (LLMNC). Crystallographic representation was shown for 4.4 V,4.9 V and 2 V regions unraveling reaction paths.
) unless CC License in place (see abstract). ecsdl.org/site/terms_use address. Redistribution subject to ECS terms of use (see 73.167.223.240Downloaded on 2015-04-12 to IP
A1244 Journal of The Electrochemical Society, 162 (7) A1236-A1245 (2015)
Capacity (mAh/g)
0 10 20 30 40 50 60 70
Po
ten
tial
(V
) ve
rsu
s L
i/Li+
1.5
2.0
2.5
3.0
3.5
4.0
4.5
5.0
5.5
30th35th40th45th50th
Capacity (mAh/g)
0 20 40 60 80 100 120
Po
ten
tial
(V
) ve
rsu
s L
i/Li+
1.5
2.0
2.5
3.0
3.5
4.0
4.5
5.0
5.530th35th40th45th50th
0.3Li2MnO
3·0.7LiMn
0.33Ni
0.33Co
0.330
2 MWCT-0.3Li2MnO
3·0.7LiMn
0.33Ni
0.33Co
0.330
2
@4C rate and RT @4C rate and RT
c) d)
Cyling Number0 20 40 60 80 100
Dis
char
ge
Cap
acit
y (m
Ah
/g)
0
50
100
150
200
250 C/20
C
2C
4C
Cycle Number0 20 40 60 80
Dis
char
ge
Cap
acit
y (m
Ah
/g)
0
50
100
150
200
250C/20
C/10
C/5
C
2C
4C
C/20
0.3Li2MnO
3·0.7LiMn
0.33Ni
0.33Co
0.330
2 MWCT0.3Li2MnO
3·0.7LiMn
0.33Ni
0.33Co
0.330
2
a) b)
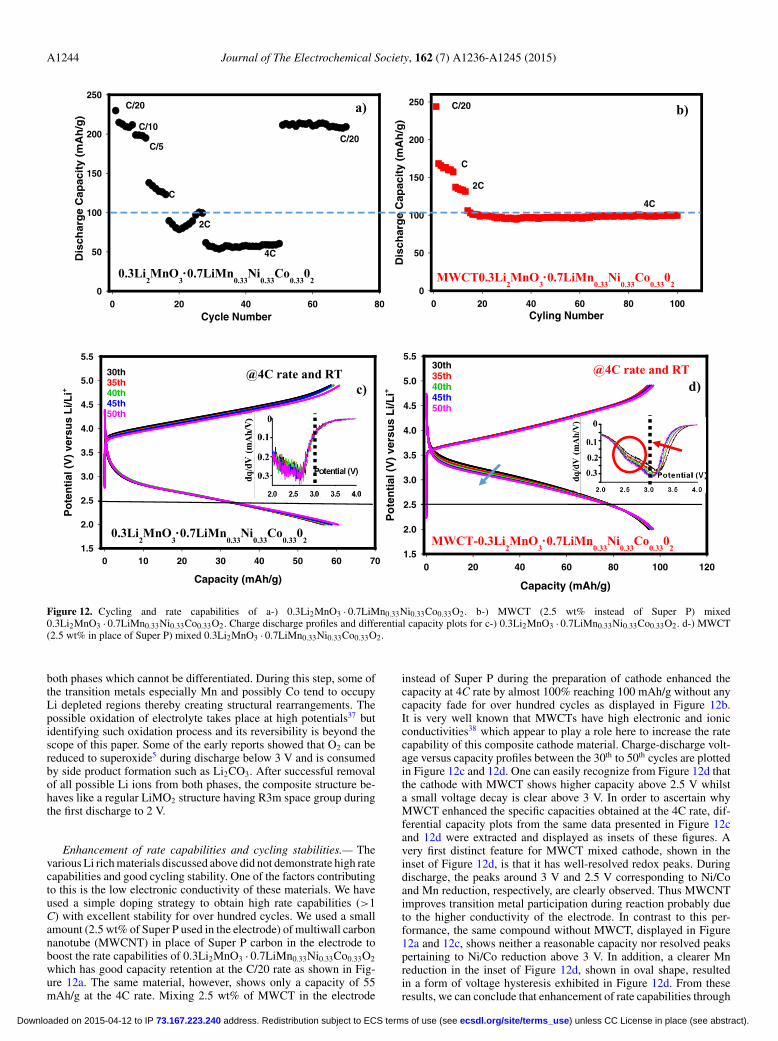
Figure 12. Cycling and rate capabilities of a-) 0.3Li2MnO3 · 0.7LiMn0.33Ni0.33Co0.33O2. b-) MWCT (2.5 wt% instead of Super P) mixed0.3Li2MnO3 · 0.7LiMn0.33Ni0.33Co0.33O2. Charge discharge profiles and differential capacity plots for c-) 0.3Li2MnO3 · 0.7LiMn0.33Ni0.33Co0.33O2. d-) MWCT(2.5 wt% in place of Super P) mixed 0.3Li2MnO3 · 0.7LiMn0.33Ni0.33Co0.33O2.
both phases which cannot be differentiated. During this step, some ofthe transition metals especially Mn and possibly Co tend to occupyLi depleted regions thereby creating structural rearrangements. Thepossible oxidation of electrolyte takes place at high potentials37 butidentifying such oxidation process and its reversibility is beyond thescope of this paper. Some of the early reports showed that O2 can bereduced to superoxide5 during discharge below 3 V and is consumedby side product formation such as Li2CO3. After successful removalof all possible Li ions from both phases, the composite structure be-haves like a regular LiMO2 structure having R3m space group duringthe first discharge to 2 V.
Enhancement of rate capabilities and cycling stabilities.— Thevarious Li rich materials discussed above did not demonstrate high ratecapabilities and good cycling stability. One of the factors contributingto this is the low electronic conductivity of these materials. We haveused a simple doping strategy to obtain high rate capabilities (>1C) with excellent stability for over hundred cycles. We used a smallamount (2.5 wt% of Super P used in the electrode) of multiwall carbonnanotube (MWCNT) in place of Super P carbon in the electrode toboost the rate capabilities of 0.3Li2MnO3 · 0.7LiMn0.33Ni0.33Co0.33O2
which has good capacity retention at the C/20 rate as shown in Fig-ure 12a. The same material, however, shows only a capacity of 55mAh/g at the 4C rate. Mixing 2.5 wt% of MWCT in the electrode
instead of Super P during the preparation of cathode enhanced thecapacity at 4C rate by almost 100% reaching 100 mAh/g without anycapacity fade for over hundred cycles as displayed in Figure 12b.It is very well known that MWCTs have high electronic and ionicconductivities38 which appear to play a role here to increase the ratecapability of this composite cathode material. Charge-discharge volt-age versus capacity profiles between the 30th to 50th cycles are plottedin Figure 12c and 12d. One can easily recognize from Figure 12d thatthe cathode with MWCT shows higher capacity above 2.5 V whilsta small voltage decay is clear above 3 V. In order to ascertain whyMWCT enhanced the specific capacities obtained at the 4C rate, dif-ferential capacity plots from the same data presented in Figure 12cand 12d were extracted and displayed as insets of these figures. Avery first distinct feature for MWCT mixed cathode, shown in theinset of Figure 12d, is that it has well-resolved redox peaks. Duringdischarge, the peaks around 3 V and 2.5 V corresponding to Ni/Coand Mn reduction, respectively, are clearly observed. Thus MWCNTimproves transition metal participation during reaction probably dueto the higher conductivity of the electrode. In contrast to this per-formance, the same compound without MWCT, displayed in Figure12a and 12c, shows neither a reasonable capacity nor resolved peakspertaining to Ni/Co reduction above 3 V. In addition, a clearer Mnreduction in the inset of Figure 12d, shown in oval shape, resultedin a form of voltage hysteresis exhibited in Figure 12d. From theseresults, we can conclude that enhancement of rate capabilities through
) unless CC License in place (see abstract). ecsdl.org/site/terms_use address. Redistribution subject to ECS terms of use (see 73.167.223.240Downloaded on 2015-04-12 to IP
Journal of The Electrochemical Society, 162 (7) A1236-A1245 (2015) A1245
MWCT does not have any ramifications on voltage fade phenomenonrather it triggers Mn reduction which causes voltage swelling.
Conclusions
We carried out a comprehensive investigation of Li rich layeredmetal oxide cathode materials for Li-ion batteries with all of them syn-thesized under identical conditions combined with detailed structuraland electrochemical characterization. This has resulted in the selectionof an optimum cathode material of this class for Li-ion batteries. Wehave found that the highest Li2MnO3-containing composite cathode inthe series xLi2MnO3 · (1-x)LiMn0.33Ni0.33Co0.33O2 in which x = 0.1,0.2, 0.3, 0.5 or 0.7 demonstrated greater voltage fade with cycling.Ultimately this causes low energy and power densities when thesematerials are used in Li-ion cells. Lower amounts of Li2MnO3 incor-porated into Li-rich composite oxides delivered low capacities despitetheir low voltage hysteresis. Among the various materials studied thegeneral composition 0.5Li2MnO3 · 0.5LiMO2 was found to be the op-timum in terms of both specific capacity and overall energy output. Inthis composite oxide, the amount of Mn located in the LiMO2 portionplayed a crucial role in improving its specific capacity. Thus we syn-thesized and characterized 0.5Li2MnO3 · 0.5LiMn0.50Ni0.35Co0.15O2
as the best material in terms of electrochemical performance in Licells. The addition of a small amount of MWCT to the electrodewas found to be effective in increasing the rate capability and cy-cling stability of these cathode materials due to the higher electronicconductivity of the electrode.
Acknowledgments
We are grateful to Erich Farqhuar and Syed Khalid for the as-sistance with XAS experiments at the hatches of X3 A and X18 Aat Brookhaven National Lab. This publication was made possibleby the Center for Synchrotron Biosciences grant, P30-EB-009998,from the National Institute of Biomedical Imaging and Bioengineer-ing (NIBIB). We thank Qingying Jia for the logistic and experimentalsupport during XAS experiments at the Light source.
References
1. Z. Lu, D. D. MacNeil, and J. R. Dahn, Electrochemical and Solid-State Letters, 4,A191 (2001).
2. Z. Lu and J. R. Dahn, Journal of The Electrochemical Society, 149, A815 (2002).3. J.-S. Kim, C. S. Johnson, J. T. Vaughey, M. M. Thackeray, S. A. Hackney, W. Yoon,
and C. P. Grey, Chemistry of Materials, 16, 1996 (2004).4. M. M. Thackeray, S. H. Kang, C. S. Johnson, J. T. Vaughey, and S. A. Hackney,
Electrochemistry Communications, 8, 1531 (2006).5. N. Yabuuchi, K. Yoshii, S.-T. Myung, I. Nakai, and S. Komaba, Journal of the
American Chemical Society, 133, 4404 (2011).6. J. R. Croy, D. Kim, M. Balasubramanian, K. Gallagher, S.-H. Kang, and
M. M. Thackeray, Journal of The Electrochemical Society, 159, A781 (2012).7. D. Mohanty, S. Kalnaus, R. A. Meisner, K. J. Rhodes, J. Li, E. A. Payzant,
D. L. Wood Iii, and C. Daniel, Journal of Power Sources, 229, 239 (2013).8. J. R. Croy, K. G. Gallagher, M. Balasubramanian, Z. Chen, Y. Ren, D. Kim,
S.-H. Kang, D. W. Dees, and M. M. Thackeray, The Journal of Physical ChemistryC, 117, 6525 (2013).
9. M. N. Ates, S. Mukerjee, and K. M. Abraham, Journal of The Electrochemical Soci-ety, 161, A355 (2014).
10. M. N. Ates, Q. Jia, A. Shah, A. Busnaina, S. Mukerjee, and K. M. Abraham, Journalof The Electrochemical Society, 161, A290 (2014).
11. W. He, D. Yuan, J. Qian, X. Ai, H. Yang, and Y. Cao, Journal of Materials ChemistryA, 1, 11397 (2013).
12. Q. Li, G. Li, C. Fu, D. Luo, J. Fan, and L. Li, ACS Applied Materials & Interfaces,6, 10330 (2014).
13. J. M. Zheng, J. Li, Z. R. Zhang, X. J. Guo, and Y. Yang, Solid State Ionics, 179, 1794(2008).
14. J. M. Zheng, Z. R. Zhang, X. B. Wu, Z. X. Dong, Z. Zhu, and Y. Yang, Journal ofThe Electrochemical Society, 155, A775 (2008).
15. C. S. Johnson, N. Li, C. Lefief, J. T. Vaughey, and M. M. Thackeray, Chemistry ofMaterials, 20, 6095 (2008).
16. M. M. Thackeray, C. S. Johnson, J. T. Vaughey, N. Li, and S. A. Hackney, Journalof Materials Chemistry, 15, 2257 (2005).
17. F. Amalraj, D. Kovacheva, M. Talianker, L. Zeiri, J. Grinblat, N. Leifer, G. Goobes,B. Markovsky, and D. Aurbach, Journal of The Electrochemical Society, 157, A1121(2010).
18. K. A. Jarvis, Z. Deng, L. F. Allard, A. Manthiram, and P. J. Ferreira, Chemistry ofMaterials, 23, 3614 (2011).
19. J. R. Croy, M. Balasubramanian, D. Kim, S.-H. Kang, and M. M. Thackeray, Chem-istry of Materials, 23, 5415 (2011).
20. A. Ito, K. Shoda, Y. Sato, M. Hatano, H. Horie, and Y. Ohsawa, Journal of PowerSources, 196, 4785 (2011).
21. M. Gu, I. Belharouak, J. Zheng, H. Wu, J. Xiao, A. Genc, K. Amine, S. Thevuthasan,D. R. Baer, J.-G. Zhang, N. D. Browning, J. Liu, and C. Wang, ACS Nano, 7, 760(2012).
22. D. Mohanty, A. S. Sefat, S. Kalnaus, J. Li, R. A. Meisner, E. A. Payzant,D. P. Abraham, D. L. Wood, and C. Daniel, Journal of Materials Chemistry A, 1,6249 (2013).
23. M. Gu, A. Genc, I. Belharouak, D. Wang, K. Amine, S. Thevuthasan, D. R. Baer,J.-G. Zhang, N. D. Browning, J. Liu, and C. Wang, Chemistry of Materials, 25, 2319(2013).
24. S. K. Martha, J. Nanda, Y. Kim, R. R. Unocic, S. Pannala, and N. J. Dudney, Journalof Materials Chemistry A, 1, 5587 (2013).
25. X. J. Zhu, H. H. Chen, H. Zhan, D. L. Yang, and Y. H. Zhou, J Mater Sci, 40, 2995(2005).
26. B. Ravel and M. Newville, Journal of Synchrotron Radiation, 12, 537 (2005).27. J. K. Rana, Investigation of structural changes in cathode materials for rechargeable
Li-ion batteries by X-ray Absorption Spectroscopy, in Engineering Sciences, p. 168,Technische Universitat Berlin, Berlin (2013).
28. X. Yu, Y. Lyu, L. Gu, H. Wu, S.-M. Bak, Y. Zhou, K. Amine, S. N. Ehrlich, H. Li,K.-W. Nam, and X.-Q. Yang, Advanced Energy Materials, 4, n/a (2014).
29. W. Liu, G. Fang, B. Xia, H. Sun, S. Kaneko, and D. Li, RSC Advances, 3, 15630(2013).
30. S. K. Martha, J. Nanda, G. M. Veith, and N. J. Dudney, Journal of Power Sources,199, 220 (2012).
31. H. Yu, H. Kim, Y. Wang, P. He, D. Asakura, Y. Nakamura, and H. Zhou, PhysicalChemistry Chemical Physics, 14, 6584 (2012).
32. F. Amalraj, M. Talianker, B. Markovsky, D. Sharon, L. Burlaka, G. Shafir, E. Zinigrad,O. Haik, D. Aurbach, J. Lampert, M. Schulz-Dobrick, and A. Garsuch, Journal ofThe Electrochemical Society, 160, A324 (2013).
33. C.-H. Shen, Q. Wang, F. Fu, L. Huang, Z. Lin, S.-Y. Shen, H. Su, X.-M. Zheng,B.-B. Xu, J.-T. Li, and S.-G. Sun, ACS Applied Materials & Interfaces, 6, 5516(2014).
34. D. Mohanty, S. Kalnaus, R. A. Meisner, A. S. Safat, J. Li, E. A. Payzant, K. Rhodes,I. I. I. D. L. Wood, and C. Daniel, RSC Advances, 3, 7479 (2013).
35. H. L. Bohang Song, Zongwen Liu, Pengfei Xiao, Man On Lai, and Li Lu, ScientificReports, 3, 1 (2013).
36. M. N. Ates, S. Mukerjee, and K. M. Abraham, RSC Advances, 5, 27375 (2015).37. H. Koga, L. Croguennec, M. Menetrier, K. Douhil, S. Belin, L. Bourgeois, E. Suard,
F. Weill, and C. Delmas, Journal of The Electrochemical Society, 160, A786(2013).
38. A. Shah, M. N. Ates, S. Kotz, J. Seo, K. M. Abraham, S. Somu, and A. Busnaina,Journal of The Electrochemical Society, 161, A989 (2014).
) unless CC License in place (see abstract). ecsdl.org/site/terms_use address. Redistribution subject to ECS terms of use (see 73.167.223.240Downloaded on 2015-04-12 to IP