Electrospinning Carbon nanofibers Polyacrylonitrile Polypyrrole Lithium-ion batteries
Upload
khangminh22Category
view
3download
0
Thèse de Doctorat
Mention : Chimie
Spécialité : Chimie des Solides et Sciences des Matériaux
présentée à l'Ecole Doctorale en Sciences Technologie et Santé (ED 585)
de l’Université de Picardie Jules Verne
par
Ronan LE RUYET
pour obtenir le grade de Docteur de l’Université de Picardie Jules Verne
Identification of new Mg2+ solid ionic conductors through
the exploration of the Mg(BH4)2-Mg(NH2)2 phases diagram
Soutenue le 28 janvier 2020 après avis des rapporteurs, devant le jury d’examen :
M. Maximilian FICHTNER, Professeur, Helmholtz Institute Ulm Rapporteur
M. Arndt REMHOF, Directeur de Recherche, EMPA Rapporteur
Mme Montse CASAS-CABANAS, Directrice de Recherche, CIC energigune Examinateur
M. Christian MASQUELIER, Professeur, UPJV Examinateur
M. Romain BERTHELOT, Chargé de Recherche CNRS, ICGM Examinateur
M. Raphaël JANOT, Chargé de Recherche CNRS, LRCS Directeur de thèse
M. Benoît FLEUTOT, Maître de Conférences, UPJV Co-directeur de thèse


A ma famille,
A Laura


Acknowledgements
First, I would like to express my gratitude to my supervisors Raphaël Janot, Benoît Fleutot
(LRCS, Amiens) and Romain Berthelot (ICGM, Montpellier) for giving me the opportunity to do this
PhD thesis and for their guidance. Thanks to the RS2E for the funding of this work through the
Labex project STORE-EX.
Then, I would like to thank the members of my PhD committee Maximilian Fichtner
(Helmholtz Institute Ulm), Arndt Remhof (EMPA, Zurich), Montse Casas-Cabanas (CIC energigune,
Vitoria-Gasteiz) and Christian Masquelier (LRCS, Amiens) for accepting to be part of this
committee and for their interest in my work.
I am grateful to all the persons that have made this work possible: Elodie Salager and Pierre
Florian (CEMHTI, Orléans) for the NMR spectroscopy measurements and their analysis, Matthieu
Courty (LRCS, Amiens) for all the thermal analysis measurements and Jean-Noël Chotard (LRCS,
Amiens) for teaching me how to analyze XRD patterns. I would like to thank also Yaroslav Filinchuk
(Université catholique de Louvain) for his help on crystal structure resolution.
Of course, these three years would not have been the same without the people from the
LRCS with whom I had nice discussions and even built friendships. Special thanks to Damien for all
the time spent with me on fixing our glovebox (a.k.a. Big Mama). Thanks to the ASSB team: Lord
Kudu, Theo, Cédric, Xavier and Mathieu with who I have learned a lot and spent some good time.
Thanks to the MESC family: Aman, Viki, Garima, Yinhue, Alexis, Ana, Abbos, Scotty, Fan. I do not
forget the others with who I have also spent great moments in Amiens: Marianita, Z, Tu, Nour,
Carlito, Josesito, Kiril, Gaspard, Caro, Vito, Roberto, Teo, Arina, Sorina, Alexis, François, Tristan,
Chabert, Clément, Marlène, Jenny, Adolpho, Dudley, Bagheera, …
Finally, I would like to thank my family and especially Laura for supporting me all along this
work.


[1]
Table of contents
General introduction ................................................................................. 7
References .................................................................................................... 11
Chapter I - State-of-the-art: Rechargeable Mg batteries and Mg2+ inorganic
solid electrolytes ..................................................................................... 13
I-1. Batteries: short reminder of their principle and main characteristics ....... 15
I-2. Rechargeable Mg batteries ..................................................................... 17
I-2a. From Li-ion to post Li-ion batteries ............................................................... 17
I-2b. Magnesium metal anode ............................................................................. 18
I-2c. Prototypes of rechargeable Mg batteries ...................................................... 19
I-2d. Limitations of rechargeable Mg batteries ..................................................... 24
I-3. Interest for solid electrolytes .................................................................. 26
I-4. Mg2+ inorganic solid electrolytes ............................................................. 27
I-4a. Phosphates ................................................................................................. 27
I-4b. Sulphides..................................................................................................... 30
I-4c. Complex hydrides ......................................................................................... 31
I-5. Aims of the PhD thesis ............................................................................ 42
References .................................................................................................... 44
Chapter II – The known parts of the Mg(BH4)2-Mg(NH2)2 binary phases
diagram: Mg(BH4)2, Mg(NH2)2 and Mg(BH4)(NH2) ..................................... 49
II-1. Introduction........................................................................................... 51
II-2. Magnesium borohydride: Mg(BH4)2 ........................................................ 51
II-2a. Polymorphs of Mg(BH4)2 ............................................................................. 51
II-2b. Commercially available Mg(BH4)2 powders .................................................. 53

Table of contents
[2]
II-3. Magnesium amide: Mg(NH2)2 ................................................................. 56
II-4. Study of Mg(BH4)(NH2) ........................................................................... 62
II-4a. Synthesis .................................................................................................... 62
II-4b. MAS-NMR spectroscopy.............................................................................. 69
II-4c. Infrared spectroscopy .................................................................................. 72
II-4d. Thermal stability ........................................................................................ 74
II-4e. Ionic conductivity ........................................................................................ 76
II-5. Conclusion .............................................................................................. 82
References .................................................................................................... 84
Chapter III – The exploration of the unknown parts of the Mg(BH4)2-
Mg(NH2)2 binary phases diagram ............................................................. 87
III-1. Introduction .......................................................................................... 89
III-2. First exploratory syntheses with different Mg(BH4)2:Mg(NH2)2 ratios ..... 90
III-3. The α phase: Mg(BH4)2x(NH2)2(1-x) (x = 0.17, 0.20 and 0.25) ...................... 94
III-3a. Structural analysis of the α-phase .............................................................. 94
III-3b. Ionic conductivity of the α-phase.............................................................. 100
III-3c. Thermal analysis and α to β phase transition ............................................ 102
III-4. The β phase: Mg(BH4)2x(NH2)2(1-x) (x = 0.25 and 0.33) ............................ 106
III-4a. Crystal structure of the β-phase ............................................................... 106
III-4b. Ionic conductivity of the β-phase .............................................................. 107
III-4c. Thermal analysis of the β-phase ............................................................... 108
III-5. The γ-phase: Mg(BH4)2x(NH2)2(1-x) (x = 0.67, 0.71 and 0.75) .................... 109
III-5a. Structural analysis of the γ-phase ............................................................ 109
III-5b. Ionic conductivity of the γ-phase .............................................................. 115
III-5c. Thermal stability of the γ-phase ............................................................... 118
III.6. Comparative study of the Mg(BH4)2-Mg(NH2)2 binary phases diagram .. 121

Table of contents
[3]
III-7. Conclusions ......................................................................................... 123
References .................................................................................................. 125
Chapter IV – Characterization of ionic conductors as solid electrolytes:
towards all-solid-state Mg batteries ...................................................... 127
IV-1. Introduction ....................................................................................... 129
IV-2. Chemical stability ............................................................................... 130
IV-2a. Selection of electrode materials ............................................................... 130
IV-2b. Chemical stabilities of Mg(BH4)(NH2) and γ-Mg3(BH4)4(NH2)2 ..................... 133
IV-3. Electrochemical stability ..................................................................... 136
III-3a. Anode/electrolyte compatibility............................................................... 136
III-3a. Electrochemical stability window ............................................................. 140
IV-4. Conclusions ........................................................................................ 143
References .................................................................................................. 144
General conclusion ................................................................................ 147
References .................................................................................................. 151
Annex I – Experimental methods .......................................................... 153
AI.1 – Note on the air sensitivity of the materials ........................................ 155
AI.2 – Synthesis methods ............................................................................ 156
AI.2a – Ball-milling ............................................................................................ 156
AI.2b – Annealing under controlled atmosphere ................................................. 157
AI.3 – Structural analysis ............................................................................. 158
AI.3a – Powder X-ray diffraction ........................................................................ 158
AI.3b – Solid state MAS NMR spectroscopy ........................................................ 160
AI.3c – Infrared spectroscopy ............................................................................. 161

Table of contents
[4]
AI.4 – Thermal analysis ................................................................................ 162
AI.4a – Differential scanning calorimetry ........................................................... 162
AI.4b – Thermal gravimetric analysis ................................................................. 163
AI.5. Electrochemical analysis ...................................................................... 164
AI.5a – Electrochemical Impedance spectroscopy ............................................... 164
AI.5b – Polarization ........................................................................................... 167
AI.5c – Cyclic voltammetry ................................................................................. 169
References .................................................................................................. 171
Annex II – Extra data .............................................................................. 173
AII.1 – Neutron diffraction of the α-phase for x = 0.25 ................................. 175
AII.2 – Structural analysis of the β-phase for x = 0.25 ................................... 176
Résumé étendu de la thèse (french summary) ....................................... 179

Table of contents
[5]

Table of contents
[6]

[7]
General introduction
In a world consuming more and more electricity (cf. Figure 1a),1 rechargeable batteries are
playing a key role.2 They are used in many applications such as: electrical vehicles (EVs), mobile
electronics and stationary energy storage. Rechargeable batteries have been mainly used until
now for portable electronics but a growing demand is coming from other applications such as
electrical vehicles (cf. Figure 1b).3 EVs are expected to replace the majority of the vehicles using
internal combustion engines in the coming years. The production of stationary batteries could also
start to grow in the context of renewable energies. Indeed, renewable energies are intermittent
and need to be stored to ensure a continuous electricity supply.
Figure 1. a) World electricity consumptions per year for the different regions of the world. b) Li-ion batteries sales per year for different applications.1,3

General introduction
[8]
Nowadays, the most common rechargeable batteries are based on Li-ion technology. This
leadership is mainly due to their energy density that is the highest of all existing technologies (up
to 200 Wh.kg-1, cf. Figure 2).4 Their large impact on the society has been rewarded with the Nobel
Prize of Chemistry 2019 to John B. Goodenough, Stanley Whittingham and Akira Yoshino for the
development of rechargeable Li-ion batteries. This technology is so versatile that its massive
utilization starts to create problem of sustainability. Elements such as Co, which is used in the
cathode material of most of the commercial Li-ion batteries, are rare and present in only few
regions of the world. For these reasons, their price and availability are unstable.5 Solutions are
studied to substitute these elements by more abundant ones or to replace them totally by using
post Li-ion technologies such as Li-S batteries. Beyond Li-based batteries, other technologies are
studied. For instance, systems based on Na or K ions, two elements which are much more
abundant than lithium, are developed. Then, systems based on multivalent Mg2+, Ca2+, Zn2+ or Al3+
ions are studied to try to increase the energy density of the batteries.6 Among these multivalent
ions, Mg2+ has been the one attracting the more interest during the last two decades.
Figure 2. Comparison of different battery technologies in terms of volumetric and gravimetric energy densities.4
Rechargeable Mg batteries have been studied since the early 90’s but it is only in 2000 that
a functional cell has been assembled by Aurbach et al.. Nevertheless, this first cell could not deliver

General Introduction
[9]
large energy amounts. Thus, important efforts have been put by the scientific community to
design better cells but none of them can deliver high capacity and/or high voltage for many cycles.
The main problems lay in finding cathode materials allowing fast insertion of Mg ions and
electrolytes with good ionic conductivities and wide electrochemical stability windows. To
improve rechargeable Mg batteries, our approach was to study the possibility of using solid-state
electrolytes. Indeed, they could offer benefits such as better chemical and electrochemical
stabilities and better safety. The candidates as solid electrolyte materials were selected among
the existing inorganic solid Mg2+ ionic conductors (i.e. no mixed electronic/ionic conductors such
as electrode materials). Few materials are reported as Mg2+ is a strongly polarizing cation and,
thus, it has a sluggish mobility in solids. Most of the inorganic solid state Mg2+ ionic conductors
are listed in Chapter I. Three families can be found: the phosphates, the sulphides and the complex
hydrides. The phosphates, based on Mg-Zr-PO4, have high ionic conductivities but only at high
temperatures, typically ~10-3 S.cm-1 at 800°C. Then, the sulphides, based on MgS-P2S5 glasses or
glass/ceramics, have too low ionic conductivities (~10-7 S.cm-1 at 200°C) to be interesting as solid
electrolytes. Finally, the complex hydrides, based on Mg(BH4)2, have the best ionic conductivities
at low temperatures (~10-5-10-6 S.cm-1 below 150°C). Furthermore, they are the only ones that
have been characterized regarding possible applications in Mg batteries (e.g. Mg
deposition/stripping, electrochemical stability, etc.). It was decided to start our study with
Mg(BH4)(NH2) that was previously reported as a promising Mg2+ solid ionic conductor.7
Mg(BH4)(NH2) was described for the first time by Noritake et al. in 2013.8,9 They synthesized it
from the reaction of Mg(BH4)2 with Mg(NH2)2. Unfortunately, the synthesis parameters were not
reported (ball-milling speed, annealing time or temperature, etc.).
The first part of this thesis is dedicated to the determination of the appropriate synthesis
parameters needed to obtain Mg(BH4)(NH2) (cf. Chapter II). After several attempts with different
synthesis parameters, crystalline Mg(BH4)(NH2) could be obtained. It appeared however by 11B
MAS-NMR spectroscopy that none of our samples was completely pure as they all contain an
additional phase. Interestingly, this additional phase had an important effect on the ionic
conductivity values.
The next part of the thesis was the exploration of the Mg(BH4)2-Mg(NH2)2 binary phases
diagram (cf. Chapter III). A series of syntheses with different stoichiometries has been performed:
it revealed the existence of three other crystalline phases. Two rich in amide that we labeled α
and β-phase, and one rich in borohydride labeled the γ-phase. These phases were studied for the
first time as no other reported work describes these compounds. Their crystal structures and ionic

General introduction
[10]
conductivities were especially studied. It appeared that the ionic conductivity follows a trend as a
function of the composition and that new compounds with a high Mg2+ mobility can be obtained.
Once it was demonstrated that good inorganic solid Mg2+ ionic conductors could be obtained,
these materials had to be further characterized to assess their potential use as solid electrolytes.
The final part of this PhD thesis is dedicated to the characterization of the chemical and
electrochemical stability of the newly discovered Mg2+ ionic conductors (cf. Chapter IV). The
chemical stability was characterized by annealing a mixture of our solid electrolytes with electrode
materials that can be used in rechargeable Mg batteries (e.g. Mg metal as the anode electrode
and the Chevrel phase Mo6S8 as the cathode). Then, the electrochemical stability was
characterized by polarization and cyclic voltammetry experiments.

General Introduction
[11]
References
1. World power consumption, electricity consumption. Available at:
https://yearbook.enerdata.net/electricity/electricity-domestic-consumption-data.html.
(Accessed: 21st November 2019)
2. Battery 2030. Manifesto European scientific leadership. (2019).
3. European Commission. Li-ion batteries for mobility and stationary storage applications
Scenarios for costs and market growth. (2018).
4. Tarascon, J.-M. & Armand, M. Issues and challenges facing rechargeable lithium batteries.
Nature 414, 359–367 (2001).
5. European Commission. List of Critical Raw Materials for the EU. (2017).
6. Larcher, D. & Tarascon, J.-M. Towards greener and more sustainable batteries for electrical
energy storage. Nat. Chem. 7, 19–29 (2015).
7. Higashi, S., Miwa, K., Aoki, M. & Takechi, K. A novel inorganic solid state ion conductor for
rechargeable Mg batteries. Chem. Commun. 50, 1320–1322 (2014).
8. Noritake, T. et al. Synthesis and crystal structure analysis of complex hydride
Mg(BH4)(NH2). Int. J. Hydrogen Energy 38, 6730–6735 (2013).
9. Noritake, T. et al. Dehydrogenation properties and crystal structure analysis of
Mg(BH4)(NH2). J. Alloys Compd. 580, S85–S89 (2013).
10. Borgschulte, A. et al. Surface and bulk reactions in borohydrides and amides. Energy
Environ. Sci. 5, 6823–6832 (2012).

General introduction
[12]

[13]
Chapter I - State-of-the-art: Rechargeable Mg
batteries and Mg2+ inorganic solid electrolytes
Table of contents
I-1. Batteries: short reminder of their principle and main characteristics ....... 15
I-2. Rechargeable Mg batteries ..................................................................... 17
I-2a. From Li-ion to post Li-ion batteries ............................................................... 17
I-2b. Magnesium metal anode ............................................................................. 18
I-2c. Prototypes of rechargeable Mg batteries ...................................................... 19
I-2d. Limitations of rechargeable Mg batteries ..................................................... 24
I-3. Interest for solid electrolytes .................................................................. 26
I-4. Mg2+ inorganic solid electrolytes ............................................................. 27
I-4a. Phosphates ................................................................................................. 27
I-4b. Sulphides..................................................................................................... 30
I-4c. Complex hydrides ......................................................................................... 31
I-5. Aims of the PhD thesis ............................................................................ 42
References .................................................................................................... 44

Chapter I - State-of-the-art: Rechargeable Mg batteries and Mg2+ inorganic solid electrolytes
[14]

Chapter I
[15]
I-1. Batteries: short reminder of their principle and main characteristics
A battery is the assembly of one or several cells used to store electrical energy under
chemical one through electrochemical reactions. Each cell is made of two electrodes separated by
an electrolyte (cf. Figure I. 1). Batteries can be separated into two categories: the primary cells and
the secondary cells. The primary cells are not rechargeable and secondary cells can be recharged.
If a cell is charged, connecting the two electrodes will allow the electrical current to pass from one
electrode to the other and the battery will discharge. Once a cell is discharged, it can be charged
by applying a reverse current.
Figure I. 1. Scheme of the principle of a battery upon discharge (a) and charge (b).
Redox reactions are occurring simultaneously at both electrodes: at the anode and at the
cathode. In electrochemistry, the oxidation happens at the anode (negative electrode) while the
reduction happens at the cathode (positive electrode). In batteries, it is commonly admitted to
call “anode” the electrode with the lower redox potential and “cathode” the one with the higher
redox potential. The cells are characterized by their working potential Vcell and their capacity Qcell.
The working potential Vcell is the difference between the potential of each electrode. The capacity
Q is the quantity of charges that can be released or stored by the electrodes and it can be
calculated by the Faraday’s law:
𝑄 = 𝑛. 𝑛𝑒 . 𝐹 Equation I. 1
with n: the number of exchange species (mol)
ne-: the number of electrons exchanged
F: the Faraday’s constant (96500 C.mol-1, and 1 C = 1 A.s)

Chapter I - State-of-the-art: Rechargeable Mg batteries and Mg2+ inorganic solid electrolytes
[16]
Equation I.1 gives the capacity Q in Coulomb but the unit commonly used for batteries is the Ah.
The specific and volumetric capacity can be calculated modifying Equation I. 1. The specific
capacity is:
𝑄𝑠𝑝𝑒 =
1
𝑀. 𝑛𝑒− . 𝐹
Equation I. 2
with M: the molar mass of the electrode
The volumetric capacity is obtained in a similar way with the equation II.3:
𝑄𝑣𝑜𝑙 =𝜌
𝑀. 𝑛𝑒− . 𝐹 Equation I. 3
with ρ: the density of the electrode
In a full cell, the capacity is limited by the electrode having the lowest capacity. To avoid
dead weight of electrode materials, the battery must be balanced to have the same capacity at
both cathode and anode. The specific and volumetric capacities are expressed as:
𝑄𝑠𝑝𝑒 𝑐𝑒𝑙𝑙
= 𝑄𝑠𝑝𝑒 𝑐𝑎𝑡ℎ𝑜𝑑𝑒 . 𝑄𝑠𝑝𝑒 𝑎𝑛𝑜𝑑𝑒
𝑄𝑠𝑝𝑒 𝑐𝑎𝑡ℎ𝑜𝑑𝑒 + 𝑄𝑠𝑝𝑒 𝑎𝑛𝑜𝑑𝑒
and
𝑄𝑣𝑜𝑙 𝑐𝑒𝑙𝑙
= 𝑄𝑣𝑜𝑙 𝑐𝑎𝑡ℎ𝑜𝑑𝑒 . 𝑄𝑣𝑜𝑙 𝑎𝑛𝑜𝑑𝑒
𝑄𝑣𝑜𝑙 𝑐𝑎𝑡ℎ𝑜𝑑𝑒 + 𝑄𝑣𝑜𝑙 𝑎𝑛𝑜𝑑𝑒
Equation I. 4 and
Equation I. 5
From Vcell and Qcell it is possible to determine the energy Ecell (usually in Wh) that can be
delivered by the cell:
𝐸𝑐𝑒𝑙𝑙 = 𝑉𝑐𝑒𝑙𝑙 . 𝑄𝑐𝑒𝑙𝑙 Equation I. 6
The power Pcell (in W) of the cell is calculated by dividing the energy by the time:
𝑃𝑐𝑒𝑙𝑙 =
𝐸𝑐𝑒𝑙𝑙
𝑡
Equation I. 7
with t: the time of charge/discharge
To ensure the charge balance of the redox reactions, it is necessary to have an electrolyte
between the two electrodes. The electrolyte is an ionic conductive medium that allows ions to
pass from an electrode to the other; whereas it is an electronic insulator avoiding short-circuits
between the electrodes. It is characterized by different intrinsic properties:

Chapter I
[17]
- the transference number,
- the viscosity,
- the ionic conductivity,
- the electrochemical stability window.
For solid electrolytes, the important parameters are the ionic conductivity and the
electrochemical stability window. The transference number in inorganic solid electrolytes is
usually 1 as only one ion is the charge carrier, the counter anions/cations are fixed in the structure
and the electronic conductivity must be close to zero.
I-2. Rechargeable Mg batteries
I-2a. From Li-ion to post Li-ion batteries
Nowadays, the most commonly used rechargeable batteries are Li-ion batteries (LIBs). They
have many advantages in terms of energy density, lifetime and can be used at different scales:
portable electronics, vehicles and stationary energy storage systems. Nevertheless, the massive
production of LIBs needed to meet the ever-growing demand in electricity has arisen new
problematics such as the shortage of raw materials because of their low relative abundance and
geopolitical issues. For instance, there is a mismatch between some of the most abundant element
on earth which are the constituents of the biomass (H, O, S, P, Na, K, Ca, Mg, Mn, Fe, Ti) and main
constituents of LIBs (for example, Li, Co, Ni, Cu, F). In 2017, the European Commission has
classified Li and Co as critical raw materials for the European Union (EU) because of risks of supply
shortage.1 To anticipate this situation, researchers are looking for post Li-ion technologies based
on more abundant elements like Na, K, Mg, Ca, Zn or Al. Among these new technologies Na-ion
batteries (NIBs) are the most advanced one, achieving high voltage (>3 V) and good capacity
retention. 2
Mg batteries are another option to replace LIBs. On the contrary to NIBs for which the
knowledge transfer from LIBs helped their development, the rechargeable Mg batteries need
specific electrolytes and electrode materials. The particular chemistry of Mg open the way for new
advantages but also new challenges that will be described in the following subsections.3

Chapter I - State-of-the-art: Rechargeable Mg batteries and Mg2+ inorganic solid electrolytes
[18]
I-2b. Magnesium metal anode
The intrinsic properties of magnesium present many advantages that make it an excellent
candidate as anode material for batteries. First of all, it has a highly negative standard potential
of -2.356 V vs. NHE close to the one of lithium (-3.040 V vs NHE, cf. Figure I. 2b). The second
interesting feature of magnesium as anode material is its divalency as a cation. Its redox reaction
involves two electrons and its theoretical gravimetric capacity is 2205 mAh.g-1. This value is lower
than the one of lithium (3829 mAh.g-1) but taking into account the higher density of magnesium
(1.74 g.cm-3), its volumetric capacity overpasses the one of lithium (3833 mAh.cm-3 vs. 2046
mAh.cm-3, cf. Figure I. 2c).
Figure I. 2. Illustration of some intrinsic advantages of Magnesium. a) Magnesium is a solid metal in ambient conditions. b) Standard redox potentials and c) gravimetric and volumetric capacities
of different anode materials: Li, Na and Mg.

Chapter I
[19]
Magnesium has also interesting technical properties. It is solid at room temperature
(Tmelting = 650°C). It can be manipulated in ambient atmosphere. It has a large abundance in the
Earth crust of 21,100 ppm (vs. 10 ppm for Lithium)4 but it is considered as a critical raw materials
by the European Comission as Li and Co because of geopolitical issues. Actually, 94 % of Mg
consumed in the EU comes from China. In terms of electrochemistry, its deposition has been
considered for many years to be dendrites free.5–7 In fact, many studies have proved that the
electrodeposition of magnesium leads to the formation of smooth films (cf. Figure I. 3a).8
Nevertheless, this consideration has been questioned and a recent paper from Davidson et al.
warns on the possibility of dendrites formation on magnesium electrodes9. They show that
magnesium, as any other electrodeposited metals, can form dendrites under certain conditions.
They concluded that local inhomogeneities can result in an electrochemical reaction rate that
overpasses self-diffusion rate and thus leads to the formation of dendrites (cf. Figure I. 3b). So the
dendrite free characteristic of Mg electrodeposition has to be considered with caution because it
depends on the studied system.
Figure I. 3. a) Smooth electrodeposited Mg film using an electrolyte made of 0.25 M of EtMgCl-2Me2AlCl (Et = ethyl and Me = methyl) in THF (THF = tetrahydrofuran) applying 1.0 mA cm−2 in a
cell made of a polished Pt working electrode and a Mg foil counter electrode.8 b) Magnesium dendrites formed in a cell using 0.5 M of MeMgCl in THF and operating at a constant current of
0.921 mA.cm-2 in a Mg-Mg symmetrical cell.9
I-2c. Prototypes of rechargeable Mg batteries
Here, we describe how the rechargeable Mg batteries have evolved during the past 30 years
and give a non-exhaustive list of examples of rechargeable prototypes. Thomas D. Gregory et al.
were the first to consider the feasibility of rechargeable Mg batteries in 1990.10 Trying different
intercalation materials as cathode and different electrolytes, they assembled the first
rechargeable Mg battery. Their cell was made of Mg for the anode and Co3O4 for the cathode with

Chapter I - State-of-the-art: Rechargeable Mg batteries and Mg2+ inorganic solid electrolytes
[20]
an electrolyte made of 0.25 M of Mg[B(Bu2Ph2)]2 (Bu = butyl and Ph = phenyl) in THF/DME (DME
= dimethoxyethane) solvent (cf. Figure I. 4). It was a preliminary study on materials that could be
used for rechargeable Mg batteries. Only few cycles were performed and the electrolyte might
have decomposed because of the high potential of cobalt oxide (2.28 V vs. Mg2+/Mg).
Figure I. 4. a) Cycling behavior of a cell Mg/0.25M Mg[B(Bu2Ph2)]2,THF/DME/Co304.10
Ten years later, in 2000, Aurbach et al. published a study on the first prototype of
rechargeable Mg battery able to handle hundreds of cycles.11 There were two breakthroughs in
their study. First, the development of a new family of liquid electrolytes based on Mg organo-halo-
aluminate salts such as Mg(AlCl3R)2 and Mg(AlCl2RR’)2, where R and R’ are alkyl groups, in THF or
polyethers of the glyme family. These electrolytes have a good ionic conductivity (~10-3 S.cm-1 at
room temperature) and allow a deposition/stripping of magnesium with a coulombic efficiency
close to 100%. The other advantage of these electrolytes is their electrochemical stability that
reaches 2.5 V vs Mg2+/Mg using a Pt working electrode. The second breakthrough is the use of the
Chevrel phase Mo6S8 as cathode material. Indeed, usual cathode materials for Mg batteries suffer
from slow kinetics and/or too high working potentials compared to the electrolyte
electrochemical stability. This Mo6S8 cathode allows Mg to be reversibly intercalated
electrochemically, at relatively fast kinetics and at moderate potential (~1.2 V vs. Mg2+/Mg). Thus
they assembled a cell made of Mg/0.25 M Mg(AlCl2BuEt)2 in THF/Mo6S8 that could perform
hundreds of cycles with a high coulombic efficiency at both cathode and anode sides (cf. Figure I.
5). Still, this battery cannot compete with any type of Li-ion battery in terms of energy density
because its working potential is too low and the maximum theoretical capacity of Mo6S8 is only
122 mAh.g-1. However, with its theoretical energy density (~60 Wh.kg-1, considering that only 50
% of the mass is active), it could be a substitute to Ni-Cd and lead-acid batteries
(about 40 Wh.kg-1).12

Chapter I
[21]
Figure I. 5. a) Typical electrochemical behavior and the basic structure of the MgxMo6S8 cathodes, 0 < x < 2, corresponding to a maximal charge capacity of 122 mAh.g−1. b) Performance of
rechargeable Mg–MgxMo6S8 coin-cell batteries during cycling at constant currents (0.2-0.3 mA.cm-2). The electrolyte was 0.25 M Mg(AlCl2BuEt)2 in THF. The specific capacity of the
active mass is plotted against cycle number for three cells, at different optimization levels, together with voltage profiles of representative charge–discharge cycles.11
It has been demonstrated that other MXn electrodes (M = transition metal and X = S, Se)
can allow reversible Mg intercalation.13 Among them, TiS2 has been reported as an interesting
insertion electrode for rechargeable magnesium batteries. Sun et al. showed that at 60°C and at
C/10 it was possible to obtain a stable capacity of 115 mAh.g-1 (cf. Figure I. 6).14 This capacity is
lower than the one obtained for the first discharge (250 mAh.g-1). The authors explain this capacity

Chapter I - State-of-the-art: Rechargeable Mg batteries and Mg2+ inorganic solid electrolytes
[22]
drop as a consequence of Mg2+ entrapment in the crystalline structure owing to complex ordering
and kinetic effects that were not studied in that paper. Furthermore, the working potential is quite
low (~1 V vs. Mg2+/Mg), so TiS2 as cathode material is limited in terms of energy density. Still, it is
an interesting material to study the Mg diffusion in solid phases. This can provide guidance in the
search for new Mg positive electrode materials. It can also be considered as a standard
intercalation material for evaluating new electrolytes.
Figure I. 6. a) Discharge and charge profile of TiS2 vs. Mg at 60°C and b) its capacity and coulombic efficiency upon cycling.14
There is a need to find high capacity cathode materials for magnesium batteries to achieve
high energy densities. A promising cathode for rechargeable Mg batteries is sulphur. Using S as
the cathode allows to reach very high capacities and to develop batteries with high energy density.
With a theoretical voltage of 1.77 V vs Mg2+/Mg, Mg-S batteries would surpass the volumetric

Chapter I
[23]
energy of Li-S batteries, 3221 Wh.L-1 and 2856 Wh.L-1 respectivley.15 Zhao-Karger et al. did a
comprehensive study of Mg-S batteries. They used an electrolyte based on Mg-HMDS (HMDS =
N(SiMe3)2- = hexamethyldisilazide) and have obtained a high capacity of 800 mAh.gS
-1 during the
first discharge.16 They could also demonstrated that the reaction pathway of Mg with S is similar
to the one of Li-S batteries forming different MgSx species (8 > x > 1, cf. Figure I. 7). More works
have been done to improve Mg-S batteries but, as Li-S batteries, suffer from fast capacity fading
due to side reactions as the dissolution of polysulphides in the electrolyte.17 CuS has also been
reported as high capacity cathode (560 mAh.g−1 in theory). This conversion electrode suffers
however from poor cyclability because of important volume changes during the magnesiation and
demagnesiation. Kravchyk et al. reported the possibility to maintain a good capacity during cycling
by downsizing the CuS particles to 20 nm. Hence, they obtained a stable capacity of approximately
300 mAh.g-1 at a working potential of about 1.2 V vs Mg2+/Mg with a rate of 1C for more than 100
cycles.18
Figure I. 7. a) The discharge profile of a Mg-S cell. b) Cycling performance of S/CMK400PEG(mesoporous carbon impregnated with S) cathode in different electrolytes:
diglyme/PP14TFSI (denoted as DEGIL in blue), in tetraglyme/PP14TFSI (denoted as TEGIL in green), in tetraglyme (denoted as TEG in red) using CMC or PVDF as binder.16
To reach high energy densities, the working potential of cathode materials for Mg batteries
has to be increased. In this way, an interesting material as cathode is V2O5 because of its large
interstitial vacancies able to accommodate Mg cations and its working potential of about 2.4 V vs
Mg2+/Mg. However, the electrolytes stable at this potential are scarce and generally very
corrosive, thus, leading to corrosion issues with the steal of the cells and aluminum of the current
collectors. To study V2O5, Gershinsky et al. used an electrolyte made of 0.1 M of MgTFSI2 in
acetonitrile but Mg metal cannot be used with this electrolyte as a passivation layer would be

Chapter I - State-of-the-art: Rechargeable Mg batteries and Mg2+ inorganic solid electrolytes
[24]
formed at its surface. To solve this problem, they used activated carbon as the negative electrode
on which Mg ions are reversibly adsorbed and desorbed. They could cycle a thin film of V2O5 and
get a relatively stable capacity of 150 mAh g−1 with a good coulombic efficiency (cf. Figure I. 8b).19
Fu et al. used a similar approach to cycle V2O5 nano-tubes, but instead of activated carbon as the
negative electrode, they used MgxMo6S8. They did in-situ measurements on their V2O5 electrode
and observed the reversible magnesiation/demagnesiation. Nevertheless, their electrode had a
poor cyclability with an important capacity fading.20
Figure I. 8. a) Discharge and charge profile of V2O5 thin film b) its capacity and coulombic
efficiency upon cycling.19
These studies show that electrodes enabling reversible magnesiation/demagnesiation exist.
They also show that for some materials the downsizing is important to promote the magnesium
diffusion. Nevertheless, there are few systems with high voltage, high capacity and high cycling
capability. The next section describes the main limitation of these systems focusing on the
problems of the electrolytes.
I-2d. Limitations of rechargeable Mg batteries
In the paper of Gregory et al. of 1990 cited previously, it was said: “Over the past 25 years,
a considerable amount of attention has been paid to the use of alkali metals, particularly Li, in

Chapter I
[25]
non-aqueous secondary batteries, but comparatively little work has been done with the alkaline
earth metals”.10 At that time, the first commercial rechargeable Li-ion battery was arriving on the
market. In the case of rechargeable Mg batteries, after more than 25 years of work on this topic,
no commercial device exists. There are two main reasons explaining why the scientific community
is still struggling to find a viable system for rechargeable Mg batteries. The first one is the difficulty
to find electrodes enabling reversible magnesiation/demagnesiation with good performances.
This is due to the sluggish diffusion of Mg2+ into solids: the double charge of the cation increases
the electrostatic interaction with the surrounding ions. The other reason is the difficulty to find a
good electrolyte for Mg-based systems.13
Contrarily to Li-ion batteries, there is no standard liquid electrolyte working for Mg batteries
yet. For instance, the electrolytes using carbonate-based solvents, which are the best for LIBs,
cannot be used with the Mg metal anode. The carbonates are reduced at the surface of the Mg
metal forming the well-known solid electrolyte interface (SEI). This interface is, in the Mg case,
very detrimental because it blocks the Mg ions migration.6
To replace carbonate-based electrolytes, liquid electrolytes compatible with Mg metal were
needed. Grignard reagents-based electrolytes are stable versus Mg metal and allow a very good
Mg deposition/stripping. They are known since the beginning of 20th century as electrolyte for Mg
electrodeposition. It is only in the 90’s that they started to be used as electrolytes for Mg
batteries.21 The best ones have a good oxidative stability: typically 3.7 V vs Mg2+/Mg using a Pt
working electrode for (Mg2(μCl)3·6THF)(B(C6F5)3Ph).22 Nevertheless, they are very air sensitive and
strongly corrosive because of the presence of chlorine. Indeed, they cannot be used at potentials
higher than 2.2 V vs. Mg2+/Mg if the cell contains stainless steel as a consequence of corrosion.
Then, non-corrosive electrolytes are needed to work at high potential. Mohtadi et al.
developed borohydride-based electrolytes. They used Mg(BH4)2 as a salt in THF or DME. This
electrolytes suffer from high overpotential during Mg deposition/stripping and have a low
electrochemical stability (1.7 V vs. Mg2+/Mg).23 Later, Tutusaus et al. used MgCB11H12 in
tetraglyme. This halide-free electrolyte is compatible with Mg metal and allows deposition and
stripping with an excellent coulombic efficiency (> 99%). It has also a high electrochemical stability
(~3.8 V vs. Mg2+/Mg using a stainless steel working electrode). Nevertheless, these salts have a
low solubility so the conduction properties of these liquid electrolytes are still limited.24 More
recent studies from Zhao-Karger et al. show the good properties of Cl-free electrolytes using
Mg(B(hfip)4)2 (hfip = hexafluoroisopropyloxy) dissolved in DME.25,26 These electrolytes have high
ionic conductivities (~10-3 mS.cm-1). They also have a large electrochemical stability window of 3.5

Chapter I - State-of-the-art: Rechargeable Mg batteries and Mg2+ inorganic solid electrolytes
[26]
V vs. Mg2+/Mg (using a Pt working electrode). They are used in Mg-S batteries for which the
dissolution of polysulphides in the electrolyte remains problematic.
Consequently, there is a real need of new electrolytes for rechargeable Mg batteries. These
new electrolytes should:
- be compatible with Mg anode and cathode materials,
- be non-corrosive,
- have good transport properties,
- have a large electrochemical stability window.
Beside the liquid electrolytes, some groups have been working on gels, polymers, ionic
liquid electrolytes or MOF-based electrolytes (MOF = metal-organic framework)27 but these works
are out of this thesis scope. Our approach was to look for inorganic solid electrolytes and to know
if they can fulfill the criteria described above.
I-3. Interest for solid electrolytes
To improve existing rechargeable magnesium batteries, it would be interesting to use a solid electrolyte. Two main possibilities exist to use solid electrolytes in batteries:
- as bulk electrolyte in an all-solid-state battery (cf. Figure I. 9a and b) - as coating for the electrode materials (cf. figure 9b and c) The all-solid-state battery is an old concept developed at the beginning of the 20th century
with the work of Tubandt and Lorentz on α-AgI as solid-state electrolyte. The interest for solid
electrolytes grew in the 60’s with the discovery of the superionic conduction of Na+ in -Al2O3.
This solid electrolyte enabled the development of efficient Na-S batteries working between 270°C
and 350°C. Nowadays, a new hype is growing around all-solid-state batteries as many private and
academic groups are focused on the discovery of functional solid electrolytes at room
temperature. This interest comes from the advantages that all-solid-state batteries could offer.
They are expected to be safer as no liquid electrolyte is used, avoiding problems of thermal
decomposition that can lead to the release of toxic and flammable gases. Then, without liquid
electrolyte, an increase of the range of workable temperatures is expected. The assembly of an
all-solid-state battery could also be simpler than the one of a battery using a liquid electrolyte.
Instead of assembling several cells, an all-solid-state battery could be made simply by successive
stacks of all-solid-state cells as the one on Figure I. 9a or b.28
We have to bear in mind that solid electrolytes can be used as bulk electrolytes but also as
coating materials for electrodes. Actually, some solid electrolytes have a poor ionic conductivity
but have really good electrochemical and chemical stabilities. These stable materials can be used

Chapter I
[27]
as interface between the electrodes and the electrolyte. Of course, their thickness has to be
minimized (typically few nanometers) to ensure a good ionic diffusion. The coating of electrodes
with solid electrolytes can be done with a solution of dissolved solid electrolyte in which the
electrode is dipped before subsequent evaporation of the solvent and recrystallisation of the solid
electrolyte.29,30 More sophisticated techniques can also be used as physical vapor deposition.31
The following section reviews the main families of inorganic solid state Mg2+ conductors known at
the time of this PhD thesis.
Figure I. 9. Illustration of Mg batteries with different uses of solid electrolytes. a) Bulk solid electrolyte. b) Solid electrolyte used as protective layer between the electrode active materials
and another solid electrolyte. c) Solid electrolyte used as protective layer between the electrode active materials and a liquid electrolyte.
I-4. Mg2+ inorganic solid electrolytes
I-4a. Phosphates
The first solid Mg2+ inorganic electrolytes were reported in 1987. That year, the team of
Kaname Ito from the Nagoya Technological Institute was the first one to propose the use of solid
electrolytes in Mg batteries.32 As explained in their work, the research in monovalent solid ionic
conductors was progressing fast but in the meantime almost nothing was done on multivalent ion

Chapter I - State-of-the-art: Rechargeable Mg batteries and Mg2+ inorganic solid electrolytes
[28]
conductors. They foresaw that the discovery of Mg2+ solid electrolytes would “not only be
academically interesting but also be highly expected to compose higher energy density
electrochemical devices using such materials”. They studied different NASICON-like
(NASICON = Na super ionic conductor) Mg2+ conductors in the system Mg-Zr-PO4. A standard
ceramic synthesis route at high temperature (1200°C) was used to synthesize materials with
different Mg:Zr:PO4 molar ratio. Then, they made pellets from the as-obtained materials by
sintering at 1200°C for 24h. It is known that oxides are hard to compact and in their study, the
pellets have an important porosity, even after sintering (about 20-30%). The pellets are used to
measure the ionic conductivity by AC (alternative current) impedance spectroscopy. The ionic
conductivity of these materials follows an Arrhenius law (cf. Figure I. 10a). The best ionic
conductor was MgZr4(PO4)6 with a conductivity of 6.1x10⁻³ S.cm-1 at 800°C and an activation
energy Ea of 84.18 kJ.mol-1 (0.88 eV). They described its crystallographic structure as the same as
the NASICON material NaZr2(PO4)3. Later, Nomura et al. demonstrated that the structure is
actually monoclinic of the β-Fe2(SO4)3-type with cell parameters a = 8.863 Å, b = 8.888 Å, c = 12.408
Å, β = 90.64 Å, Z = 4 and d = 3.265 g.cm-3.33 Magnesium ions randomly occupy 50% of the
tetrahedral interstitial sites within the structure creating vacancies. These vacancies enable Mg2+
conduction. Ikeda et al. performed the polarization of MgZr4(PO4)6 between two platinum
electrodes at 800°C and could electro-deposit Mg through a solid for the first time. To prove this,
they performed Electron Probe Microanalysis (EPMA) along the electrolyte and revealed that Mg
metal was deposited on the cathodic part which also confirmed the mobility of Mg2+ in the
material (cf. Figure I. 10b). A more recent study was published by Adamu et al. In their work,
MgZr4(PO4)6 was synthesized via a sol-gel method.34 They could obtain pellets with better
compactness after sintering at 1300°C for 24 h (99 % of the theoretical density). This improvement
of compactness leads to a slight increase of the conductivity value reaching 7.23x10⁻³ S.cm-1 at
725°C. They determined an activation energy of 0.84 eV which is in agreement with the value
previously reported by Ikeda et al. (0.88 eV).
In the late 90’s, another Japanese team from the Osaka University continued the work
started by Ikeda et al. and tried to improve the ionic conductivity of MgZr4(PO4)6. First, Imanaka
et al. added excess of Zr2O(PO4)2.35,36 They obtained composite materials made of Mg1+xZr4P6O1+x +
x Zr2O(PO4)2. They found an optimum composition in terms of ionic conductivity for x = 0.4
reaching 6.92x10⁻³ S.cm-1 at 800°C and Ea = 135.8 kJ.mol-1 (1.41 eV). This value is the same than
the one obtained by Ikeda et al. for pure MgZr4(PO4)6 but it is one order of magnitude higher than
the one they obtained in the same study for MgZr4(PO4)6 (cf. Figure I. 10a). They explained this
result by the improvement of the compactness due to the presence of Zr2O(PO4)2. It increased

Chapter I
[29]
from 93.1 % of the theoretical compactness for x = 0 to 99.3 % for x = 0.4. Nevertheless, the
presence of a too large excess of Zr2O(PO4)2 would be detrimental for the ionic conductivity as this
material is an insulator. The Zr2O(PO4)2 presence also explains the increase in term of activation
energy as compared to pure MgZr4(PO4)6. As Ikeda et al., they demonstrated the deposition of Mg
metal by EPMA after polarization of their composite material. Imanaka et al. worked also on the
substitution of Zr by Nb in MgZr4(PO4)6.37 They could synthesize a Mg1-2x(Zr1-xNbx)4(PO4)6 solid
solution and observed the shrinkage of the cell as the radius of Nb5+ (0.78 Å) is smaller than the
radius of Zr4+ (0.86 Å). The optimum composition in terms of conductivity was for x = 0.15 with a
conductivity of 3.7x10⁻³ S.cm-1 at 750°C and Ea ~ 80 kJ.mol-1 (0.83 eV). Whithout any information
about the compactness, it remains difficult to know if the slight improvement of conductivity
compared to MgZr4(PO4)6 is due to a lower porosity or to the formation of Mg vacancies. Later,
they synthesized composite materials Mg0.7+x(Zr0.85Nb0.15)4(PO4)6+x + xZr2O(PO4)2 and got a
maximum conductivity of 9.53x10⁻³ S.cm-1 at 800°C for x = 0.4.38 To better understand the Mg2+
conduction process in the materials described above, Kawamura et al. performed 31P solid state
NMR spectroscopy. They proved that, in these materials, the hopping of Mg2+ from one site to
another was related to a large deformation of the coordinating PO4 tetrahedra. Thus, they could
link the Ea determined from the relaxation time measured by 31P NMR spectroscopy to the Ea
determined by impedance spectroscopy and confirmed the fast motion of Mg2+.39 So, MgZr4(PO4)6-
based materials allow to reach high ionic conductivities (~10-3 S.cm-1) but only at high
temperatures (~800°C). The only application reported for these solid electrolytes is as Mg2+
conductor in Cl2 gas sensors.40 The very high operating temperatures make the application of these
materials in solid-state batteries difficult.
It has been demonstrated recently by Su et al. that magnesium phosphates, MgxPyOz thin
films (~100 nm) can be deposited by ALD.41 These films are glasses and can have different
networks depending on the deposition parameters. Such films have really low ionic conductivities,
1.6x10⁻⁷ S.cm-1 at 500°C and an activation energy of 1.37 eV. The ionic conductivity should be
improved for use in batteries. The authors proposed that further work on the nitridation of the
films could be done to increase the ionic conductivity, equivalently to what has already be done
with LiPON solid electrolytes.42 We can give the example of a patent from Panasonic describing
nitridated magnesium silicate glasses, MgxSiOyNz, thin films (< 20 µm) but their ionic
conductivities are also low, around 1x10⁻⁸ S.cm-1 at 800°C.43

Chapter I - State-of-the-art: Rechargeable Mg batteries and Mg2+ inorganic solid electrolytes
[30]
Figure I. 10. a) Thermal evolution of the ionic conductivity for Mg1.1(Zr0.85Nb0.15)4(PO4)6.4 + 0.4
Zr2O(PO4)2, Mg0.7(Zr0.85Nb0.15)4(PO4)6, Mg1.4Zr4P6O1.4 + 0.4 Zr2O(PO4)2 and MgZr4(PO4)6.38 b) EPMA elementary analysis patterns along a MgZr4(PO4)6 pellet after polarization at 800°C.32
I-4b. Sulphides
The group of Masahiro Tatsumisago from Osaka Prefecture Univeristy has a great
experience in the synthesis of sulphide-based glasses (e.g. Li2S-P2S5 and Na2S-P2S5) and their
application as solid electrolytes.44 They discovered that after annealing of these glasses, they could
obtain glass-ceramic materials. These materials are interesting solid electrolytes as the
coexistence of a crystalline and an amorphous phase results in superionic conductivity at room
temperature.45,46 In 2014, they studied new glasses based on MgS-P2S5.47 They synthesized first
the mother glass 60MgS-40P2S5. After annealing of the glass at 450°C for 1h, they could observe
some diffraction peaks indexed as Mg2P2S6 crystallizing in the space group C2/m (cf. Figure I. 11a
and b). They confirmed this result by Raman spectroscopy as only the vibration bands of the P2S64-
groups remained after annealing. Hence, they claimed that they synthesized a glass-ceramic
material. The conductivity at 200°C of the 60MgS-40P2S5 solid electrolyte jumps from 2x10⁻¹⁰
S.cm-1 for the glass to 1x10⁻⁷ S.cm-1 for the glass-ceramic (cf. Figure I. 11c). They also added MgI2
to the material with different (100-x)(60MgS-40P2S5)-xMgI2 compositions to increase the number
of charge carriers. For various compositions, new unexplained weak peaks appeared by X-ray
diffraction while the ones of Mg2P2S6 remained. The effect of MgI2 on the ionic conductivity is

Chapter I
[31]
negligible for the glass-ceramic but clearly improves the one of the glass (i.e. by two orders of
magnitude, cf. Figure I. 11c). For the glass-ceramic samples, the ionic conductivity at 200°C
increases from 1x10⁻⁷ S.cm-1 to 2x10⁻⁷ S.cm-1 for x=0 and x=20, respectively. The ionic conductivity
of these sulphides is too low and needs to be improved for solid electrolyte application.
Figure I. 11. a) XRD patterns of the (100−x)(0.6MgS-0.4P2S5)-xMgI2 samples after 1 h of
ball-milling and b) after annealing. c) Composition dependence of the conductivities at 200 °C for (100−x)(0.6MgS-0.4P2S5)-xMgI2 solid electrolytes.47
I-4c. Complex hydrides
Another class of materials has been studied as solid state electrolyte for Mg batteries: the
complex hydrides. This thesis is exclusively based on the study of complex hydrides as Mg2+ ionic
conductors. Hence, extra details will be given in this subsection to understand better why these
materials are interesting as solid electrolytes.
In 2006, the group of Shinichi Orimo at the Tohoku University in Japan revealed for the first
time the possibility to use complex hydrides as solid state ionic conductor. While studying LiBH4
as hydrogen storage material, they measured how the material behaves when it is heated up by

Chapter I - State-of-the-art: Rechargeable Mg batteries and Mg2+ inorganic solid electrolytes
[32]
microwaves.48 They observed that the behavior of LiBH4 is similar to other complex hydrides at
low temperature but drastically change around 110°C (cf. Figure I. 12a). This is due to the phase
transition that undergoes LiBH4 with a reorganization of the (BH4)- anions in the structure (cf.
Figure I. 12c). The crystal structure changes from a low temperature (LT) orthorhombic phase
(space group: Pnma) to a high temperature (HT) hexagonal phase (space group: P63mc). They
actually discovered that this structural transition affects the electrical properties of the material.
Performing dielectric constant measurements, they could determine that LiBH4 was passing from
an insulator to a conductor behavior (cf. Figure I. 12b). They predicted that the charge carrier
would be Li+ cation as B and H are strongly covalently bonded in the BH4 units. They measured the
ionic conductivity by AC impedance spectroscopy and as predicted, the conductivity exceptionally
increases with the structural transition at 110°C from ~10-7 S.cm-1 to ~10-3 S.cm-1 (cf. Figure I.
12d).49 Thus, they demonstrated the superionic conductivity of the hexagonal HT-LiBH4 phase. The
activation energies were found by the Arrhenius law to be 0.69 eV and 0.53 eV for the
orthorhombic LT and hexagonal HT LiBH4 phases, respectively. They confirmed that Li+ was the
mobile specie by 7Li solid state MAS-NMR spectroscopy. A great narrowing of the NMR peak can
be observed after the phase transition from LT- to HT-phase, indicating the increased Li+ mobility
(cf. Figure I. 12e). Then, they measured the spin-lattice relaxation time (T1) as a function of the
temperature from which they could extract an activation energy of 0.56 eV which is in agreement
with the one determined by impedance spectroscopy (0.53 eV).

Chapter I
[33]
Figure I. 12. a) Temperature and pressure changes as a function of microwave irradiation time for MBH4 M=Li, Na, or K. b) Temperature dependence of the dielectric constants εr’ and εr” of
LiBH4 at a frequency of 2.16 GHz.48 c) Crystal structures of low temperature (LT) and high temperature (HT) phases of LiBH4. d) Thermal evolution of the ionic conductivity of LiBH4. d) 7Li
solid state NMR spectra of LiBH4 at different temperatures.49
Later, the electrochemical stability of LiBH4 was determined by cyclic voltammetry done on
HT-LiBH4 at 120°C.50 A pellet was sandwiched between a lithium and a molybdenum electrode and
the potential scanned at a speed of 5 mV.s-1. Only the lithium deposition/stripping (around 0 V vs
Li+/Li) and no oxidation of the electrolyte were observed (cf. Figure I. 13a). The electrochemical
stability window of LiBH4 was estimated between 0 and 5 V vs Li+/Li which is really interesting
for all-solid-state batteries. Nowadays, we know that the characterization of solid electrolyte with

Chapter I - State-of-the-art: Rechargeable Mg batteries and Mg2+ inorganic solid electrolytes
[34]
planar counter electrodes (here molybdenum) can hinder the decomposition process.51 This
electrochemical stability window was overestimated. Recent studies have demonstrated that the
actual stability of LiBH4 is about 2.1 V vs Li+/Li.52,53 Nevertheless, in 2014, Takahashi et al.
assembled the first all-solid-state Li battery using LiBH4 as solid electrolyte and working at 120°C.31
They used Li as anode and LiCoO2 as cathode. When bare LiCoO2 was used an important interface
resistance was observed after cycling. By Raman spectroscopy, they showed that this interfacial
resistance was due to the reaction of LiBH4 with charged Li1-xCoO2. Species as Co3O4 and CoO(OH)
were formed. To prevent the reaction of the borohydride with the high potential cathode, a LiCoO2
cathode thin-film coated with Li3PO4 solid electrolyte was prepared (cf. Figure I. 13b). Li3PO4 is
used here as a protective layer. This strategy worked as no degradation of the electrode was
observed after cycling and the interfacial resistance with the electrolyte remained stable (cf.
Figure I. 13c). This first all-solid-state battery using a borohydride showed the feasibility of such
systems but also shed the light on the reactivity of these materials with high potential cathodes.
Another study made by Unemoto et al. was done on a full-cell using a low potential cathode
material, TiS2 (cf. Figure I. 13d).54 This time, no coating of the cathode was necessary to achieve
good capacity retention. They observed that a stable interface was formed between TiS2 and
LiBH4. This interface could be made of closo-borane as Li2B12H12 and appeared to be stable,
ensuring a good capacity retention after 300 cycles (cf. Figure I. 13f). Their study also
demonstrated that borohydrides can have good physical interfaces with the electrodes even by
simple cold-pressing assembly and reach very high compactness (close to 100 % of the theoretical
density, cf. Figure I. 13e). These mechanical characteristics are of major interest for the assembling
of all solid-state batteries. The low density of borohydride (< 1 g.cm-3) is also an advantage as, for
the same volume, these solid electrolytes would represent less mass than other solid electrolytes
(e.g. sulphides or oxides) so the energy density of the cell would increase.
Other all-solid-state batteries have been assembled using LiBH4 as solid electrolyte55,56 but
an important issue remained: the high conductivity of LiBH4 can only be reached at elevated
temperatures (> 120°C). Different approaches were developed to obtain good conductivity at
room temperature with LiBH4-based materials. Among these approaches, the mixture of the
lithium borohydride with lithium halides can be cited. It has been proved that a mixture with LiX (X
= Cl, Br and I) can form a solid solution where HT-LiBH4 is stabilized at lower temperatures.57 The
best mixture with LiI resulted in superionic conductivity at room temperature (cf Figure I. 14a).
The HT-LiBH4 polymorph can also be stabilized by nano-confinement into mesoporous silica
scaffolds (cf. Figure I. 14b).58

Chapter I
[35]
Figure I. 13. a) Cyclic voltammogram of HT-LiBH4 sandwiched between lithium and molybdenum electrodes at 120°C with a voltage scan rate of 5 mV.s-1.50 b) A cross-sectional SEM image of a thin-film LiCoO2 cathode coated with a thin layer of amorphous Li3PO4.31 c) Charge-discharge curves at 120°C of a cell using LiBH4 solid electrolyte and LiCoO2 cathode coated with Li3PO4. d) Photograph of a bulk-type all-solid-state cell Li/LiBH4/TiS2 and e) cross-sectional FIB-SEM
image of the TiS2+LiBH4 composite cathode.55 f) Charge-discharge curves at 120°C of a bulk-type all-solid-state cell Li/LiBH4/TiS2.
54

Chapter I - State-of-the-art: Rechargeable Mg batteries and Mg2+ inorganic solid electrolytes
[36]
Figure I. 14. a) Thermal evolution of the ionic conductivity of LiBH4-LiX composites (X = Cl, Br and
I) compared to LiBH4 and LiI. 57 b) Ionic conductivities of bulk (red) and nanoconfined LiBH4
(black).59
Another approach was to use compounds from the LiBH4-LiNH2 binary system that have
already been studied as hydrogen storage materials. LiNH2 was also known as a fast Li+ ionic
conductor since 1979.60 Its ionic conductivity is 3x10⁻⁴ S.cm-1 at 25°C but its poor electrochemical
stability (0.7 V vs Li+/Li) does not allow a practical use as solid electrolyte. Two crystalline defined
compounds have been reported in the LiBH4-LiNH2 binary phases diagram: Li2(BH4)(NH2) (space
group: R-3) and Li4(BH4)(NH2)3 (space group: I213) (cf. Figure I. 15a).61 Li2(BH4)(NH2) has an ionic
conductivity of 1×10⁻⁴ S.cm-1 at room temperature with Ea = 0.56 eV. Li4(BH4)(NH2)3 has a
conductivity of about 2×10⁻⁴ S.cm-1 at room temperature and its activation energy is two times
lower (0.26 eV).62 These materials melt at elevated temperatures which induces a decrease of the
activation energy and an increase of the ionic conductivity (cf. Figure I. 15b). Their conductivities

Chapter I
[37]
reach 6×10⁻² S.cm−1 at 105°C for Li2(BH4)(NH2) and 2×10⁻¹ S.cm−1 at 240°C for Li4(BH4)(NH2)3. Later,
it was also shown that the ionic conductivity of Li4(BH4)(NH2)3 can be enhanced by changing the
stoichiometry. With a 2:3 Li(BH4):Li(NH2) ratio, the conductivity reaches 6.4 × 10⁻³ S cm−1 at 40°C.63
Yan et al. even demonstrated that this material could be used as solid electrolyte. A cell with Li as
the negative electrode and LTO (LTO = Li4Ti5O12) as the positive was assembled and showed
excellent rate and stable cycling capability (140 mAh.g-1 for 400 cycles at 1C at 40°C).
Figure I. 15. a) Binary LiBH4-LiNH2 phases diagram.61 b) Thermal evolution of the ionic
conductivity of Li2(BH4)(NH2) and Li4(BH4)(NH2)3 compared to LiBH4 and LiNH2.62

Chapter I - State-of-the-art: Rechargeable Mg batteries and Mg2+ inorganic solid electrolytes
[38]
An analogous strategy was used to find solid-state Na+ ionic conductors. The NaBH4-NaNH2-
NaI ternary system was explored (cf. Figure I. 16a).64 On the NaBH4-NaI side, a solid solution is
formed with different (1-x)NaBH4-xNaI compositions. This solid solution has a slightly better ionic
conductivity than the raw materials. Then, on the NaNH2-NaI side, a defined compound is obtained
with the composition Na(NH2)0.5I0.5 with also an improved ionic conductivity. Finally, on the NaBH4-
NaNH2 side, the compound Na(BH4)0.5(NH2)0.5 was synthesized. This compound has the best ionic
conductivity from all the phases described previously: 2x10⁻⁶ S.cm-1 at room temperature. The
better ionic conductivity is assumed to come from its anti-perovskite structure where Na ions can
migrate through vacancies. This material is known to have two crystalline allotropes with a
structural transition at 100°C. In this study, they declared to observe only the high temperature
one. They have also characterized the electrochemical stability of Na2(BH4)0.5(NH2)0.5 by
sandwiching this compound between Na and Mo electrodes and applying a scan rate of 1 mV.s-1
(cf. Figure I. 16b). They concluded that the electrochemical stability of the material was up to 6 V
vs Na+/Na but as it was mentioned previously, this technique might highly overestimate the
electrochemical stability.
Figure I. 16. a) Thermal evolution of the ionic conductivity of different materials in the NaBH4-NaNH2-NaI system. b) Cyclic voltammogram measured at 333 K for Na(BH4)0.5(NH2)0.5 sandwiched
between sodium and molybdenum electrodes.64

Chapter I
[39]
Now, coming back to the case of Mg2+ ionic conductors, a material inspired from the
discoveries introduced previously was studied as solid electrolyte for Mg batteries. This material
is Mg(BH4)(NH2). As the above complex hydrides, it was first synthesized and studied as hydrogen
storage material.65 Its structure was solved by Noritake et al. in a tetragonal crystal system (space
group: I41) with a= 5.814(1) Å, c = 20.450(4) Å, V = 691.3(2) Å and Z = 8. The material has a low
density of 0.9966 g.cm-3.66 This low density is very interesting for a solid-state electrolyte as it
allows obtaining good ionic percolation in composite electrodes with a relatively low weight of
electrolyte, ensuring reasonable electrochemical gravimetric capacities for the composite
electrodes. In 2014, a team from the Toyota research center in Japan studied Mg(BH4)(NH2) as
solid electrolyte.67 A band gap of 4.9 eV was determined by first principle calculations so this
material is an electronic insulator. It was also calculated that the bonds between Mg and the
anions are ionic while the B-H and N-H bonds are covalent. From this first theoretical work, it
appeared that this material could be an ionic conductor. They measured an ionic conductivity of
1x10⁻⁶ S.cm-1 at 150°C by AC impedance spectroscopy and an activation energy of 1.31 eV (cf.
Figure I. 17a). This conductivity was the highest ever reported for a Mg2+ inorganic ionic conductor
at low temperatures so far. It is three orders of magnitude higher than one measured for Mg(BH4)2
(~10-9 S.cm-1 at 150°C). This improved ionic conductivity might be due to the shortest distance
between the nearest Mg atoms in Mg(BH4)(NH2) (3.59 Å) than in Mg(BH4)2 (4.32 Å), indicating that
Mg hopping diffusion may be favored in this structure. The electrochemical stability window was
also estimated up to 3 V vs Mg2+/Mg using cyclic voltammetry with a cell made of
Mg/Mg(BH4)(NH2)/Pt (cf. Figure I. 17b). This stability is interesting for a solid electrolyte
application in batteries but needs to be confirmed with proper measurements. Finally, Higashi et
al. tried for the first time to assemble an all-solid-state Mg battery using Mg(BH4)(NH2) as solid
electrolyte, a Mg anode and different sulfur-based cathodes (S, FeS and Ag2S, cf. Figure I. 17c).
Unfortunately, they were unable to cycle these cells and only observed a potential decay while
applying current. Even so, the stack was done well enough to have the expected OCV for each
cathode tried. It was the most advanced work reported so far on all-solid-state magnesium
batteries.
The last ionic conductor mentioned in this state of the art chapter is not a fully inorganic
material but rather a hybrid material combining Mg(BH4)2 with organic molecules. Indeed,
Roedern et al. discovered that it was possible to coordinate ethylene diamine molecules with
Mg(BH4)2.68 They studied two different mixtures prepared by ball-milling: Mg(en)3(BH4)2 and
Mg(en)1(BH4)2 (en = ethylene diamine).The best conductivity was obtained for Mg(en)1(BH4)2 with
6 × 10⁻⁵ Scm−1 at 70°C (cf. Figure I. 18a). It is a crystalline compound but the structure remains

Chapter I - State-of-the-art: Rechargeable Mg batteries and Mg2+ inorganic solid electrolytes
[40]
unknown yet. Infrared and Raman spectroscopy measurements unveil that the chelating cis
configuration is favored. This material as a thermal stability up to 75°C before to undergo an
endothermic phase transition then it starts to decompose above 100°C. They proved that
reversible Mg deposition/stripping was possible at 60°C by cyclic voltammetry with this material
as solid electrolyte (cf. Figure I. 18b). Despite its good ionic conductivity, it suffers from a low
electrochemical stability of 1.2 V vs Mg2+/Mg.
Figure I. 17. a) Thermal evolution of the ionic conductivity of Mg(BH4)2 and Mg(BH4)(NH2)
compared to MgZr4(PO4)6 and Mg1.4Zr4P6O24.4+0.4Zr2O(PO4)2. b) Cyclic voltammogram measured at 150°C of Mg(BH4)(NH2) sandwiched between magnesium and platinum electrodes.
c) Discharge curves at 150°C of Mg-S, Mg-FeS and Mg-Ag2S cells using Mg(BH4)(NH2) as solid electrolyte. Inset shows the photo of a cell.67

Chapter I
[41]
Figure I. 18.a) Thermal evolution of the ionic conductivity of Mg(BH4)2, Mg(en)3(BH4)2 and
Mg(en)1(BH4)2, compared with MgZr4(PO4)6, Mg1.4Zr4P6O24.4 + 0.4Zr2O(PO4)2 and Mg(BH4)(NH2). b) Cyclic voltammogram of Mg(en)1(BH4)2 sandwiched between magnesium and platinum
electrodes measured at 60°C with a scan rate of 10mV.s-1.Inset: Mg stripping charge vs. cycle number.68

Chapter I - State-of-the-art: Rechargeable Mg batteries and Mg2+ inorganic solid electrolytes
[42]
I-5. Aims of the PhD thesis
Reviewing the state-of-the-art of rechargeable Mg batteries shows that some systems are
very interesting in terms of energy density but suffer from limitations. One of the main limitations
is the difficulty to find viable liquid electrolytes. Hence, our approach is to study the possibility of
using a solid-electrolyte in Mg rechargeable batteries and to determine if it would be beneficial or
not. The second part of the state-of-the-art chapter was on inorganic solid-state Mg2+ ionic
conductors and it appears that few of them exist. This can be explained by the important
electrostatic interaction of the double positive charge of Mg2+ with its surrounding atoms making
its diffusion in solids very sluggish. Each of the three families of materials reported as solid
electrolytes has different range of ionic conductivities. The phosphates have high ionic
conductivities but only at high temperatures, typically ~10-3 S.cm-1 at 800°C. This temperature is
too high for using these materials in practical energy storage devices. Then, sulphides have too
low ionic conductivities (~10-7 S.cm-1 at 200°C) to be interesting as solid electrolytes. The third and
most recent family of materials is the one of complex hydrides. These materials have the best ionic
conductivities at low temperatures (~10-5-10-6 S.cm-1 below 150°C). Furthermore, they are the only
ones that have been really characterized regarding possible applications in Mg batteries (e.g. Mg
deposition/stripping, electrochemical stability, etc.). Figure I. 19 compares the different
magnesium solid electrolytes in terms of ionic conductivity.
To assemble a magnesium all-solid-state battery, it is paramount to have a good solid
electrolyte in terms of ionic conductivity, electrochemical stability and ease of implementation
(i.e. good electrode/electrolyte interface, chemical stability with the electrode components, etc.).
Nevertheless, to be used as a solid electrolyte in batteries, an ionic conductor must have an ionic
conductivity higher than 10-4 S.cm-1 as close as possible to room temperature. Diffusion of Mg2+ is
sluggish in solids at low temperatures so we first target materials having good ionic conductivities
below 200°C. Few Mg2+ inorganic solid electrolytes exist and none of them present an ionic
conductivity reaching our target. So the goals of this PhD thesis was:
I. the synthesis and, when possible, improvement of existing Mg2+ inorganic conductors,
II. the identification of new Mg2+ inorganic conductors,
III. the characterization of the possible use of the obtained ionic conductors as solid
electrolytes.

Chapter I
[43]
To achieve these goals, the most promising starting material was Mg(BH4)(NH2). Indeed, it
was the best Mg2+ inorganic conductor reported in the literature at the beginning of this thesis
and it was demonstrated that it allows reversible Mg deposition/stripping at 150°C. Then, we
extended the study to the Mg(BH4)2-Mg(NH2)2 binary phase diagram to identify new ionic-
conducting phases as what has been done with LiBH4 and LiNH2 for instance. Finally, we
characterized the ionic conductors as solid electrolytes using proper techniques.
Figure I. 19. Thermal evolution of the ionic conductivity of the different Mg2+ inorganic
conductors reported in the literature. The different families of reported materials are highlighted. The range of ionic conductivity targeted for a suitable solid electrolyte in a magnesium
all-solid-state battery is also displayed.

Chapter I - State-of-the-art: Rechargeable Mg batteries and Mg2+ inorganic solid electrolytes
[44]
References
1. European Commission. List of Critical Raw Materials for the EU. (2017).
2. Larcher, D. & Tarascon, J.-M. Towards greener and more sustainable batteries for electrical energy storage. Nat. Chem. 7, 19–29 (2015).
3. Fichtner, M. Chapter 1. Motivation for a magnesium battery. in Magnesium batteries: research and applications 1–16 (2019).
4. Anderson, D. L. Theory of the Earth. (Blackwell Scientific Publications, 1998).
5. Yoo, H. D. et al. Mg rechargeable batteries: an on-going challenge. Energy Environ. Sci. 6, 2265–2279 (2013).
6. Mohtadi, R. & Mizuno, F. Magnesium batteries: Current state of the art, issues and future perspectives. Beilstein J. Nanotechnol. 5, 1291–1311 (2014).
7. Muldoon, J., Bucur, C. B. & Gregory, T. Quest for nonaqueous multivalent secondary batteries: Magnesium and beyond. Chem. Rev. 114, 11683–11720 (2014).
8. Matsui, M. Study on electrochemically deposited Mg metal. J. Power Sources 196, 7048–7055 (2011).
9. Davidson, R. et al. Formation of magnesium dendrites during electrodeposition. ACS Energy Lett. 4, 375–376 (2019).
10. Gregory, T. D. Nonaqueous electrochemistry of magnesium. J. Electrochem. Soc. 137, 775-780 (1990).
11. Aurbach, D. et al. Prototype systems for rechargeable magnesium batteries. Nature 407, 724–727 (2000).
12. Aurbach, D. et al. A short review on the comparison between Li battery systems and rechargeable magnesium battery technology. J. Power Sources 97–98, 28–32 (2001).
13. Canepa, P. et al. Odyssey of multivalent cathode materials: open questions and future challenges. Chem. Rev. 117, 4287–4341 (2017).
14. Sun, X., Bonnick, P. & Nazar, L. F. Layered TiS2 positive electrode for Mg batteries. ACS Energy Lett. 1, 297–301 (2016).
15. Kong, L. et al. A review of advanced energy materials for magnesium-sulfur batteries. Energy Environ. Mater. 1, 100–112 (2018).
16. Zhao-Karger, Z. et al. Performance improvement of magnesium sulfur batteries with modified non-nucleophilic electrolytes. Adv. Energy Mater. 5, 1401155 (2015).
17. Zhao-Karger, Z. & Fichtner, M. Beyond intercalation chemistry for rechargeable Mg batteries: A short review and perspective. Front. Chem. 6, (2019).
18. Kravchyk, K. V et al. Copper sulfide nanoparticles as high-performance cathode materials for Mg-ion batteries. Sci. Rep. 9, 7988 (2019).

Chapter I
[45]
19. Gershinsky, G., Yoo, H. D., Gofer, Y. & Aurbach, D. Electrochemical and spectroscopic analysis of Mg2+ intercalation into thin film electrodes of layered oxides: V2O5 and MoO3. Langmuir 29, 10964–10972 (2013).
20. Fu, Q. et al. In operando synchrotron diffraction and in operando X-ray absorption spectroscopy investigations of orthorhombic V2O5 nanowires as cathode materials for Mg-ion batteries. J. Am. Chem. Soc. 141, 2305–2315 (2019).
21. Muldoon, J., Bucur, C. B. & Gregory, T. Fervent hype behind magnesium batteries: An open call to synthetic chemists-electrolytes and cathodes needed. Angew. Chemie Int. Ed. 56, 12064–12084 (2017).
22. Muldoon, J. et al. Electrolyte roadblocks to a magnesium rechargeable battery. Energy Environ. Sci. 5, 5941–5950 (2012).
23. Mohtadi, R., Matsui, M., Arthur, T. S. & Hwang, S. J. Magnesium borohydride: From hydrogen storage to magnesium battery. Angew. Chemie - Int. Ed. 51, 9780–9783 (2012).
24. Tutusaus, O. et al. An efficient halogen-free electrolyte for use in rechargeable magnesium batteries. Angew. Chemie Int. Ed. 54, 7900–7904 (2015).
25. Zhao-Karger, Z., Gil Bardaji, M. E., Fuhr, O. & Fichtner, M. A new class of non-corrosive, highly efficient electrolytes for rechargeable magnesium batteries. J. Mater. Chem. A 5, 10815–10820 (2017).
26. Zhao-Karger, Z. et al. Toward highly reversible magnesium–sulfur batteries with efficient and practical Mg[B(hfip)4]2 electrolyte. ACS Energy Lett. 3, 2005–2013 (2018).
27. Deivanayagam, R., Ingram, B. J. & Shahbazian-Yassar, R. Progress in development of electrolytes for magnesium batteries. Energy Storage Mater. 21, 136–153 (2019).
28. Viallet, V. & Fleutot, B. Introduction. in Inorganic massive batteries VII-XX5 (John Wiley & Sons, Inc., 2018).
29. Yubuchi, S., Uematsu, M., Deguchi, M., Hayashi, A. & Tatsumisago, M. Lithium-ion-conducting argyrodite-type Li6PS5X (X = Cl, Br, I) solid electrolytes prepared by a liquid-phase technique using ethanol as a solvent. ACS Appl. Energy Mater. 1, 3622–3629 (2018).
30. Duchêne, L. et al. A stable 3 V all-solid-state sodium-ion battery based on a closo-borate electrolyte. Energy Environ. Sci. 10, 2609–2615 (2017).
31. Takahashi, K. et al. All-solid-state lithium battery with LiBH4 solid electrolyte. J. Power Sources 226, 61–64 (2013).
32. Ikeda, S., Takahashi, M., Ishikawa, J. & Ito, K. Solid electrolytes with multivalent cation conduction. 1. Conducting species in Mg-Zr-PO4 system. Solid State Ionics 23, 125–129 (1987).
33. Nomura, K., Ikeda, S., Ito, K. & Einaga, H. Framework structure, phase transition, and transport properties in MIIZr4(PO4)6 compounds (MII = Mg, Ca, Sr, Ba, Mn, Co, Ni, Zn, Cd, and Pb). Bull. Chem. Soc. Jpn. 65, 3221–3227 (1992).

Chapter I - State-of-the-art: Rechargeable Mg batteries and Mg2+ inorganic solid electrolytes
[46]
34. Adamu, M. & Kale, G. M. Novel sol–gel synthesis of MgZr4P6O24 composite solid electrolyte and newer insight into the Mg2+-ion conducting properties using impedance spectroscopy. J. Phys. Chem. C 120, 17909–17915 (2016).
35. Imanaka, N., Okazaki, Y. & Adachi, G. Divalent magnesium ionic conduction in the magnesium phosphate based composites. Chem. Lett. 28, 939–940 (1999).
36. Imanaka, N., Okazaki, Y. & Adachi, G. Divalent magnesium ion conducting characteristics in phosphate based solid electrolyte composites. J. Mater. Chem. 10, 1431–1435 (2000).
37. Imanaka, N. Divalent magnesium ionic conduction in Mg1−2x(Zr1−xNbx)4P6O24 (x=0–0.4) solid solutions. Electrochem. Solid-State Lett. 3, 327 (1999).
38. Imanaka, N., Okazaki, Y. & Adachi, G. Optimization of divalent magnesium ion conduction in phosphate based polycrystalline solid electrolytes. Ionics (Kiel). 7, 440–446 (2001).
39. Kawamura, J. et al. High temperature 31P NMR study on Mg2+ ion conductors. Solid State Commun. 120, 295–298 (2001).
40. Imanaka, N., Okamoto, K. & Adachi, G. ya. A chlorine gas sensor based on the combination of Mg2+ cation conducting and O2- anion conducting solid electrolytes with lanthanum oxychloride as an auxiliary electrode. Electrochem. commun. 3, 49–51 (2001).
41. Su, J. et al. Atomic layer deposition of a magnesium phosphate solid electrolyte. Chem. Mater. 31, 5566–5575 (2019).
42. Kozen, A. C., Pearse, A. J., Lin, C.-F., Noked, M. & Rubloff, G. W. Atomic layer deposition of the solid electrolyte LiPON. Chem. Mater. 27, 5324–5331 (2015).
43. Fujinoki, N., Tsujita, T., Nishitani, Y. & Tomiyama, M. Solid electrolyte having magnesium ion conductivity and magnesium secondary battery using the same. (Patent, 2017).
44. Hayashi, A., Sakuda, A. & Tatsumisago, M. Development of sulfide solid electrolytes and interface formation processes for bulk-type all-solid-state Li and Na batteries. Front. Energy Res. 4, 1–13 (2016).
45. Mizuno, F., Hayashi, A., Tadanaga, K. & Tatsumisago, M. New, highly ion-conductive crystals precipitated from Li2S-P2S5 glasses. Adv. Mater. 17, 918–921 (2005).
46. Tsukasaki, H., Mori, S., Morimoto, H., Hayashi, A. & Tatsumisago, M. Direct observation of a non-crystalline state of Li2S-P2S5 solid electrolytes. Sci. Rep. 7, 1–7 (2017).
47. Yamanaka, T., Hayashi, A., Yamauchi, A. & Tatsumisago, M. Preparation of magnesium ion conducting MgS–P2S5–MgI2 glasses by a mechanochemical technique. Solid State Ionics 262, 601–603 (2014).
48. Nakamori, Y., Orimo, S. & Tsutaoka, T. Dehydriding reaction of metal hydrides and alkali borohydrides enhanced by microwave irradiation. Appl. Phys. Lett. 88, 112104 (2006).
49. Matsuo, M., Nakamori, Y., Orimo, S., Maekawa, H. & Takamura, H. Lithium superionic conduction in lithium borohydride accompanied by structural transition. Appl. Phys. Lett. 91, 224103 (2007).
50. Matsuo, M. & Orimo, S. I. Lithium fast-ionic conduction in complex hydrides: Review and prospects. Adv. Energy Mater. 1, 161–172 (2011).

Chapter I
[47]
51. Tian, Y. et al. Compatibility issues between electrodes and electrolytes in solid-state batteries. Energy Environ. Sci. 10, 1150–1166 (2017).
52. Gulino, V. et al. Phase stability and fast ion conductivity in the hexagonal LiBH4–LiBr–LiCl solid solution. Chem. Mater. 31, 5133–5144 (2019).
53. Asakura, R. et al. Electrochemical oxidative stability of hydroborate-based solid-state electrolytes. ACS Appl. Energy Mater. 2, 6924–6930 (2019).
54. Unemoto, A. et al. Stable interface formation between TiS2 and LiBH4 in bulk-type all-solid-state lithium batteries. Chem. Mater. 27, 5407–5416 (2015).
55. Unemoto, A., Matsuo, M. & Orimo, S. I. Complex hydrides for electrochemical energy storage. Adv. Funct. Mater. 24, 2267–2279 (2014).
56. Guzik, M. N., Mohtadi, R. & Sartori, S. Lightweight complex metal hydrides for Li-, Na-, and Mg-based batteries. J. Mater. Res. 34, 877–904 (2019).
57. Maekawa, H. et al. Halide-stabilized LiBH4, a room-temperature lithium fast-ion conductor. J. Am. Chem. Soc. 131, 894–895 (2009).
58. Blanchard, D. et al. Nanoconfined LiBH4 as a fast lithium ion conductor. Adv. Funct. Mater. 25, 184–192 (2015).
59. De Jongh, P. E., Blanchard, D., Matsuo, M., Udovic, T. J. & Orimo, S. Complex hydrides as room-temperature solid electrolytes for rechargeable batteries. Appl. Phys. A Mater. Sci. Process. 122, 1–6 (2016).
60. Boukamp, B. A. & Huggins, R. A. Ionic conductivity in lithium imide. Phys. Lett. A 72, 464–466 (1979).
61. Borgschulte, A. et al. Surface and bulk reactions in borohydrides and amides. Energy Environ. Sci. 5, 6823–6832 (2012).
62. Matsuo, M. et al. Complex hydrides with (BH4)− and (NH2)− anions as new lithium fast-ion conductors. J. Am. Chem. Soc. 131, 16389–16391 (2009).
63. Yan, Y. et al. A lithium amide-borohydride solid-state electrolyte with lithium-ion conductivities comparable to liquid electrolytes. Adv. Energy Mater. 1700294, 1–7 (2017).
64. Matsuo, M. et al. Sodium ionic conduction in complex hydrides with [BH4]- and [NH2]- anions. Appl. Phys. Lett. 100, 2–6 (2012).
65. Noritake, T. et al. Dehydrogenation properties and crystal structure analysis of Mg(BH4)(NH2). J. Alloys Compd. 580, S85–S89 (2013).
66. Noritake, T. et al. Synthesis and crystal structure analysis of complex hydride Mg(BH4)(NH2). Int. J. Hydrogen Energy 38, 6730–6735 (2013).
67. Higashi, S., Miwa, K., Aoki, M. & Takechi, K. A novel inorganic solid state ion conductor for rechargeable Mg batteries. Chem. Commun. 50, 1320–1322 (2014).
68. Roedern, E., Kühnel, R.-S., Remhof, A. & Battaglia, C. Magnesium ethylenediamine borohydride as solid-state electrolyte for magnesium batteries. Sci. Rep. 7, 46189 (2017).

Chapter I - State-of-the-art: Rechargeable Mg batteries and Mg2+ inorganic solid electrolytes
[48]

[49]
Chapter II – The known parts of the Mg(BH4)2-Mg(NH2)2 binary phases
diagram: Mg(BH4)2, Mg(NH2)2 and Mg(BH4)(NH2)
Table of contents
II-1. Introduction........................................................................................... 51
II-2. Magnesium borohydride: Mg(BH4)2 ........................................................ 51
II-2a. Polymorphs of Mg(BH4)2 ............................................................................. 51
II-2b. Commercially available Mg(BH4)2 powders .................................................. 53
II-3. Magnesium amide: Mg(NH2)2 ................................................................. 56
II-4. Study of Mg(BH4)(NH2) ........................................................................... 62
II-4a. Synthesis .................................................................................................... 62
II-4b. MAS-NMR spectroscopy.............................................................................. 69
II-4c. Infrared spectroscopy .................................................................................. 72
II-4d. Thermal stability ........................................................................................ 74
II-4e. Ionic conductivity ........................................................................................ 76
II-5. Conclusion ............................................................................................. 82
References .................................................................................................... 84

Chapter II – The known parts of the Mg(BH4)2-Mg(NH2)2 binary phases diagram: Mg(BH4)2, Mg(NH2)2 and
Mg(BH4)(NH2)
[50]

Chapter II
[51]
II-1. Introduction
My PhD work started with the study of Mg(BH4)(NH2) that was previously reported as a
promising Mg2+ solid ionic conductor.1 It has been described for the first time by Noritake et al. in
2013.2,3 They synthesized this compound in the scope of finding new solid state hydrogen storage
materials. Through a series of synchrotron X-ray diffraction measurements at different
temperatures, they could obtain this phase pure and solve its crystal structure. The synthesis was
done from the reaction of Mg(BH4)2 with Mg(NH2)2 (cf. Equation II. 1):
Mg(BH4)2 + Mg(NH2)2 → 2 Mg(BH4)(NH2) Equation II. 1
Magnesium borohydride has been extensively studied as hydrogen storage material
because of its high gravimetric hydrogen density (14.5 wt%) and its capability of dehydrogenation
at moderate temperatures (250-400°C).4 It can also be used as salt in liquid electrolytes for Mg
batteries,5 as described in chapter I, but its ionic conductivity as solid electrolyte is very low
(~10-12 S.cm-1 at 70°C and ~10-9 S.cm-1 at 150°C).1,6 Mg(BH4)2 is known to have several crystal
structures which will be described in the following section.
Magnesium amide is also mainly known in the literature in the field of hydrogen storage
materials, especially in the mixture Mg(NH2)2-2LiH, which can reversibly store 5.6 wt.% of
hydrogen with suitable thermodynamics according to the following reaction:7–9
Mg(NH2)2 + 2 LiH Li2Mg(NH)2 + 2 H2 Equation II. 2
This chapter will depict the precursors used for the synthesis of Mg(BH4)(NH2) i.e.
commercial Mg(BH4)2 and homemade Mg(NH2)2. Then, it will describe the optimization of the
synthesis parameters of Mg(BH4)(NH2) and how its purity influences its ionic conductivity.
II-2. Magnesium borohydride: Mg(BH4)2
II-2a. Polymorphs of Mg(BH4)2
The crystalline polymorphs of Mg(BH4)2 that are described the most in the literature are the
α-, β-, γ-, and δ-phase. Their structures and cell parameters are presented in Figure II. 1. In the
literature, the existence of other phases is also discussed (e.g. amorphous phase, β’, ε, etc.).4 The
α-Mg(BH4)2 polymorph is stable at room temperature and undergoes a phase transition at about
220°C forming the β-phase.10 After cooling, the structure of β-Mg(BH4)2 remains, it is considered

Chapter II – The known parts of the Mg(BH4)2-Mg(NH2)2 binary phases diagram: Mg(BH4)2, Mg(NH2)2 and
Mg(BH4)(NH2)
[52]
as a metastable phase at room temperature. γ-Mg(BH4)2 has an extremely porous structure and a
very low density (0.5431 g.cm-3). The pores of its structure can accommodate gas molecules such
as H2 or N2.11 It has two phase transitions: around 135-165°C to the ε-phase and around 165-215°C
to the β’-phase.12 Finally, δ-Mg(BH4)2 is obtained under high pressures (> 2.1 GPa) from γ-
Mg(BH4)2 and it is stable at room temperature.11
Figure II. 1. Crystal structures of α-, β-, γ- and δ-Mg(BH4)2 polymorphs drawn with the software VESTA.13

Chapter II
[53]
II-2b. Commercially available Mg(BH4)2 powders
The first magnesium borohydride used for the synthesis of Mg(BH4)(NH2) was the
commercial γ-Mg(BH4)2 (> 95 %, Sigma-Aldrich). X-ray diffraction (XRD) measurement and Le Bail
profile matching indicate that it is pure crystalline γ-Mg(BH4)2 (cf. Figure II. 2a) crystallizing in a
cubic unit cell with space group Ia-3d with Z = 24 and the cell parameter a = 15.843(1) Å. Note that
all the diffractograms measured with the Cobalt radiation present an important background due
to the set-up of the diffractometer and to the beryllium window of the air-tight cell used for the
measurements. As γ-Mg(BH4)2 stopped to be commercially available during this thesis, another
precursor had to be used for the synthesis of Mg(BH4)(NH2). This new precursor sold as “Mg(BH4)2”
by Sigma-Aldrich (> 95 % pure) was, as a matter of fact, a mixture of γ and α-Mg(BH4)2. The γ and
α phases are clearly detected by X-ray diffraction (cf. Figure II. 2b). Owing to a Rietveld refinement,
it was determined that about 79% of the product was γ-Mg(BH4)2 and 21 % was α-Mg(BH4)2.
Figure II. 2. XRD patterns of commercial a) γ-Mg(BH4)2 and its profile matching and b) of γ and
α-Mg(BH4)2 and its Rietveld refinement.

Chapter II – The known parts of the Mg(BH4)2-Mg(NH2)2 binary phases diagram: Mg(BH4)2, Mg(NH2)2 and
Mg(BH4)(NH2)
[54]
Additionally, 11B solid state magic angle spinning nuclear magnetic resonance (MAS NMR)
spectroscopy was performed on γ-Mg(BH4)2. It shows one peak at about -39.6 ppm (cf. Figure II.
3a) which corresponds to the chemical shift of (BH4)-.12 No peak is visible in the -10/-20 ppm region
indicating that no boranes such as (B3H8)- or (B12H12)2- are present. Nevertheless, some borates are
detected around 2 and 20 ppm, BO4 (0.2 molar %) and BO3 (2.7 molar %). For γ and α-Mg(BH4)2, it
shows as expected a peak around -40 ppm for the (BH4)- anion (cf. Figure II. 3b). The peak is made
of two contributions: one at -39.2 ppm, which can be attributed to the γ-phase, and one at -38.7
ppm, due to the α-phase.
Figure II. 3. 11B MAS NMR spectra of commercial a) γ-Mg(BH4)2 and b) γ and α-Mg(BH4)2.
a)
b)

Chapter II
[55]
Infrared spectroscopy was also used to characterize these magnesium borohydrides. Only
the characteristic vibrations bands of Mg(BH4)2 appear on the infrared spectra of both products:
the stretching bands around 2300 cm-1 and the bending bands around 1200 cm-1 (cf. Figure II. 4).
No -OH impurities are visible (no bands around 3500 cm-1).14
Figure II. 4. Infrared spectra of commercial a) γ-Mg(BH4)2 and b) γ and α-Mg(BH4)2.
The differential scanning calorimetry (DSC) measurement shows the phase transition that
undergoes γ-Mg(BH4)2 as described previously (cf. Figure II. 5a).12 At 146°C, it starts to transform
into the ε-phase and at 185°C into the β’-phase. For the product made of γ and α-Mg(BH4)2 the
result is different as the thermal phenomena linked to the two different phases are observed10,12:
γ → ε → β’ at 146°C and 185°C then α → β around 219°C (cf. Figure II. 5b). The borohydride starts
to decompose around 280°C, forming first H2 and amorphous species. Then at about 350°C, the
amorphous species react exothermically with H2 to form MgH2. Finally, the MgH2 decomposes
endothermically into Mg and H2. at about 365°C. The decomposition of Mg(BH4)2 is still unclear
and the steps given here are just one example among many described in the literature.4
b
a

Chapter II – The known parts of the Mg(BH4)2-Mg(NH2)2 binary phases diagram: Mg(BH4)2, Mg(NH2)2 and
Mg(BH4)(NH2)
[56]
Figure II. 5. DSC recorded at 5°C/min under argon flow of commercial a) γ-Mg(BH4)2 and b) γ and α-Mg(BH4)2.
II-3. Magnesium amide: Mg(NH2)2
Mg(NH2)2 is not commercially available and had to be synthesized during this thesis. This
compound has been obtained from the reaction of magnesium hydride with gaseous ammonia as
described in other studies.9,15 The synthesis process is described on Figure II. 6 and the reaction is
written in Equation II. 3:
MgH2(s) + 2 NH3(g) → Mg(NH2)2(s) + 2 H2(g)
Equation II. 3
Chapter II
[57]
Figure II. 6. Diagram summarizing the synthesis for Mg(NH2)2.
Commercial MgH2 (> 98%, Alfa Aesar), is first ball-milled to increase its reactivity. In an
argon-filled glovebox, 2 g of MgH2 is introduced in a 50 cm3 stainless steal jar with a balls to powder
weight ratio of 53:1 and then ball-milled at 600 rpm using a Retsch PM100 miller for 2 h with a 2
min break every 30 min. By X-ray diffraction, MgH2 appears well amorphized as all its reflections
are much weaker and broader after ball-milling (cf. Figure II. 7b). A color change of the powder
was noticed, before and after ball milling, from grey to brown. This is due to the partial transition
from the α-phase (s.g.: P42/mnm, crystalline phase of MgH2 at ambient conditions) to the γ-phase
(s.g.: Pca21) which is formed under high pressure (13.9 GPa).16 Here, weak reflections of γ-MgH2
appear at 30 and 36°.

Chapter II – The known parts of the Mg(BH4)2-Mg(NH2)2 binary phases diagram: Mg(BH4)2, Mg(NH2)2 and
Mg(BH4)(NH2)
[58]
Figure II. 7. XRD pattern after different steps of the Mg(NH2)2 synthesis. a) As-received commercial MgH2. b) MgH2 after ball-milling. c) Amorphous product after ball-milling of MgH2
under NH3 pressure. d) Crystalline Mg(NH2)2 after annealing under NH3 atmosphere.
Then, a jar with an inlet valve is used to perform the milling of MgH2 under NH3 pressure
(99.9%, Messer). In an argon-filled glovebox, 600 mg of milled MgH2 is placed in a 25 cm3 stainless
steel jar equipped with a gas inlet. 23 stainless steel balls of 8 mm diameter are added (balls to
powder weight ratio is 77:1). The jar is tightly closed and the following three steps are performed:
step 1: vacuum at 1x10⁻⁵ bar
step 2: filling with 4 bar of NH3
step 3: milling in a Spex miller for 1 h
After step 3, the process is repeated from step 1 twice to achieve a total of three cycles.
The repetition allows to evacuate the formed H2 and to ensure that all of the MgH2 has reacted
with NH3. Once this ball milling is finished, the product is amorphous (cf. Figure II. 7c). The last
step of the synthesis is an annealing at 290°C under 4 bar of NH3 to crystallize Mg(NH2)2 and to
make sure that the reaction is completed. After annealing, pure crystalline Mg(NH2)2 is obtained

Chapter II
[59]
(cf. Figure II. 7d). Figure II. 8 shows the diffractogram of as-synthesized Mg(NH2)2 crystallizing in
the space group I41/acd with Z = 32 and the cell parameters a=10.393(1) Å, c = 20.089(3) Å and
V = 2170.1(5)Å3 which are close to the one of the literature (a = 10.37 Å, c = 20.15 Å and
V = 2166.87 Å3).
Figure II. 8. a) XRD pattern of synthesized Mg(NH2)2 and its profile matching. b) The crystalline structure of Mg(NH2)2 drawn with VESTA.
The IR spectrum exhibits the typical vibration bands of Mg(NH2)2: sharp asymmetric and
symmetric stretching bands at respectively ~3324 and ~3270 cm-1 and bending bands at 1564 cm-
1 (cf. Figure II. 9).17,18 Note that there is no trace of impurities as –OH groups around 3500 cm-1.

Chapter II – The known parts of the Mg(BH4)2-Mg(NH2)2 binary phases diagram: Mg(BH4)2, Mg(NH2)2 and
Mg(BH4)(NH2)
[60]
Figure II. 9. Infrared spectrum of as-synthesized Mg(NH2)2.
15N solid state MAS NMR spectroscopy features one peak at 4.8 ppm (cf. Figure II. 10). This
peak is broad with a FWHM of 5.1 ppm. The existence of three distinct NH2 in the crystalline
structure might be causing this broadening. Even so, these NH2 are very similar and that is the
reason why only one peak is observed.
Figure II. 10. 15N solid state MAS NMR spectrum of as synthesized Mg(NH2)2.

Chapter II
[61]
The DSC shows that Mg(NH2)2 starts to decompose into MgNH around 350°C (cf. Figure II.
11). Here, the decomposition involves two endothermic-steps which might be due to a difference
in the crystallites size. Indeed, after annealing, the product always consists in two different parts:
a fine powder and a heap of agglomerate powder, in which the crystallites could have different
sizes. Similar multi-step decompositions have been observed in the literature and they are also
attributed to inhomogeneities in the sample.19 At higher temperatures, MgNH decomposes into
Mg3N2 (around 500°C). The complete decomposition of Mg(NH2)2 is described according to the
following reaction20:
Mg(NH2)2 → MgNH + NH3 → 1/3 Mg3N2 + 4/3 NH3 Equation II. 4
Figure II. 11. DSC of as-synthesized Mg(NH2)2 recorded at 5°C/min under Ar flow.

Chapter II – The known parts of the Mg(BH4)2-Mg(NH2)2 binary phases diagram: Mg(BH4)2, Mg(NH2)2 and
Mg(BH4)(NH2)
[62]
II-4. Study of Mg(BH4)(NH2)
II-4a. Synthesis
Noritake et al. ball-milled Mg(BH4)2 with Mg(NH2)2 and then annealed the mixture to obtain
Mg(BH4)(NH2).2,3 In their study, in-situ X-ray diffraction was performed upon heating up the
mixture. They determined that Mg(BH4)(NH2) starts to crystallize around 120°C and becomes
amorphous at about 180°C. The dehydrogenation of the material happens at 200°C.
The as-reported synthesis is hardly reproducible as only few parameters are known: a planetary
ball milling was used and the milling duration was 2 h. No indication is given about the rotation
speed or the balls to powder weight ratio. In their case, the ball-milling was strong enough to
amorphize the precursors and only weak peaks of Mg(NH2)2 remained. The annealing parameters
are also difficult to reproduce as the study was performed with a small amount of powder in a
capillary during their synchrotron XRD experiments. In the work of Higashi et al., the same
procedure as that of Noritake et al. was used, i.e. ball-milling with subsequent annealing but again,
no parameters are given.1 The third and last paper reporting the synthesis of Mg(BH4)(NH2) comes
from Yang et al..21 The formation of Mg(BH4)(NH2) was observed while heating up a mixture of
Mg(BH4)2.2NH3 and MgH2. At 100°C, pure Mg(BH4)(NH2) was detected by XRD.
Owing to this literature, we decided to synthesize Mg(BH4)(NH2) by ball-milling and
subsequent annealing as described by Noritake et al.. The main problematic of this synthesis was
to find the correct ball-milling and annealing parameters as none of them are reported in detail.
X-ray diffraction was measured for each set of parameters to determine which one were optimal
to obtain purely crystalline Mg(BH4)(NH2). The procedure of the synthesis optimization is
summarized in Figure II. 12, the different synthesis parameters tested are described in Table II. 1
and the XRD pattern of the products are presented on Figure II. 13.

Chapter II
[63]
Figure II. 12. Diagram summarizing the synthesis route for Mg(BH4)(NH2).
The first batch was made from the ball-milling of 1 g of an equimolar mixture of γ-Mg(BH4)2
and Mg(NH2)2 performed at 600 rpm for 2 h with 2 min break every 30 min and a balls to powder
weight ratio of 105:1. The ball milled powder does not show any diffraction peaks as all the
precursors are amorphized (cf. Figure II. 14). After ball-milling, the powder has been annealed at
160°C for 48 h under 1 bar of Ar(g). The as-obtained product was totally amorphous (sample 1 on
Figure II. 13) and the powder turned into a porous solid (i.e. a foam) indicating the formation of
gas during the annealing and thus a degradation. This was unexpected as Noritake et al. reported
that Mg(BH4)(NH2) is stable up to 180°C. Moreover, none of the reactants shows degradation at
160°C (cf. Figure II. 5 and Figure II. 11). Nevertheless, this unexpected degradation was correlated
to the formation of MgNH. Indeed, stretching bands attributed to the magnesium imide MgNH
were observed by infrared spectroscopy around 3180 cm-1 (cf. Figure II. 15).17

Chapter II – The known parts of the Mg(BH4)2-Mg(NH2)2 binary phases diagram: Mg(BH4)2, Mg(NH2)2 and
Mg(BH4)(NH2)
[64]
Table II. 1. Synthesis parameters investigated for the Mg(BH4)(NH2) synthesis.

Chapter II
[65]
Figure II. 13. XRD patterns smoothed and normalized of the products obtained with different ball-milling and annealing parameters as described in Table II. 1.

Chapter II – The known parts of the Mg(BH4)2-Mg(NH2)2 binary phases diagram: Mg(BH4)2, Mg(NH2)2 and
Mg(BH4)(NH2)
[66]
Figure II. 14. XRD patterns smoothed and normalized of the products after ball-milling of Mg(BH4)2 and Mg(NH2)2 at different milling speeds.
To avoid the formation of MgNH, the same annealing at 160°C for 48h under Ar was
performed on a mixture of Mg(BH4)2 and Mg(NH2)2 simply mixed in an agate mortar. The resulting
product was again amorphous (sample 2 on Figure II. 13). At this point, the annealing temperature
was questioned as a too high temperature could be the cause of the degradation of the samples.
So, the temperature was reduced to 120°C. This allowed us to obtain a product that was not
amorphous but a mixture of remaining reactants, an unknown additional phase and weak peaks
of Mg(BH4)(NH2) (sample 3 on Figure II. 13). Then, the annealing time was increased to 96h
(sample 4 on Figure II. 13). The product was still not pure but similar to sample 3. So a temperature
of 120°C seems to be high enough to obtain Mg(BH4)(NH2) but a simple mixing in an agate mortar
does not allow an intimate mixture of the two reactants and a complete reaction.
We tried to optimize the ball-milling parameters starting with softer conditions than those
used previously. The balls to powder weight ratio was decreased from 105:1 to 38:1 and the ball-
milling speed reduced to 100 rpm for 1h. In this case, the ball-milling does not degrade Mg(NH2)2

Chapter II
[67]
into MgNH as no bands corresponding to the imide appear on the infrared spectrum (cf. Figure II.
15). An annealing at 120°C has been performed for 48 h under 1 bar of Ar. It allowed the
crystallization of a product that was still impure and mainly made of the unknown additional phase
encountered before (sample 5 on Figure II. 13). A longer annealing of 96 h was performed. It leads
up to a product with more Mg(BH4)(NH2) than the additional phase and no more reactant (sample
6 on Figure II. 13). Later, the ball milling was increased to 200 rpm and the sample was annealed
in the same conditions as previously (i.e. at 120°C for 96h under 1 bar of Ar). The purity of this
sample was similar to sample 5 with Mg(BH4)(NH2) more present than the additional phase
(sample B on Figure II. 13). Another annealing was tried at 130°C for 48h after the same ball-milling
of 200 rpm. This time, the sample contained mainly the additional phase (sample A on Figure II.
13). We noticed also that this sample appears foamy after the annealing treatment. We
considered that the additional phase could be a decomposition product of the samples during
annealing under Ar. Subsequently, the annealing atmosphere was changed from 1 bar of Ar to 10
bar of H2 to avoid any gas evolution during the synthesis. With this new annealing atmosphere,
the product was not foamy anymore but it was impure and the additional phase was still present
(sample 7 on Figure II. 13). For the next syntheses, the ball-milling speed was increased to 300 and
400 rpm and an annealing at 120°C for 96 h under 10 bar of H2 was performed. With the ball-
milling at 300 rpm, the amount of crystalline additional phase was greatly reduced (sample 8 on
Figure II. 13). Finally, after the ball-milling at 400 rpm and subsequent annealing, the product
consists only in crystalline Mg(BH4)(NH2) as revealed by X-ray diffraction (sample 9 on Figure II.
13). So the ball-milling has to be strong enough for the synthesis of pure crystalline Mg(BH4)(NH2).
To know if the ball milling is strong enough, one can look at the diffraction patterns of the powders
right after ball-milling. On Figure II. 14, by increasing the ball-milling speed, the amorphisation of
the reactants is increased and it is once the borohydride Mg(BH4)2 is completely amorphous that
the purest samples are obtained after annealing.

Chapter II – The known parts of the Mg(BH4)2-Mg(NH2)2 binary phases diagram: Mg(BH4)2, Mg(NH2)2 and
Mg(BH4)(NH2)
[68]
Figure II. 15. Infrared spectra of the equimolar mixture of Mg(BH4)2 and Mg(NH2)2 before and after a high energy ball-milling and a low energy ball-milling.
An optimization was implemented to try to decrease the annealing time. The product ball-
milled at 400 rpm was annealed at 120°C under 10 bar of H2 for 24 h, 48h and 72h. For the
annealing of 24 h, the additional phase is present (sample 11 on Figure II. 13). Then, after 48h and
72h of annealing, the samples are pure Mg(BH4)(NH2) (sample 10 and C respectively on Figure II.
13). The annealing time of 72h was chosen as optimal parameter to make sure that the reaction
is completed.
Later during the PhD, γ-Mg(BH4)2 stopped to be commercialized. We started to do the
synthesis from the magnesium borohydride consisting in a mixture of the γ and α-Mg(BH4)2. We
first used the same synthesis parameters than for sample C, i.e. a ball milling at 400 rpm for 1h
with a balls to powder weight ratio of 38:1 and a subsequent annealing at 120°C for 72h under 10
bar of H2. The as-obtained product was mainly Mg(BH4)(NH2) but it was not pure (sample 12 on
Figure II. 13). A new crystalline additional phase was present. It was different from the additional
phase observed in samples A, B and C. From the previous syntheses, we know that one of the
important parameters for improving the purity of the sample was the ball-milling speed. So a
synthesis with an increased ball-milling speed (500 rpm) and the same annealing conditions was
performed. As expected, the product appears as purely crystalline Mg(BH4)(NH2) (sample D on
Figure II. 13). The diffraction pattern of this sample and its profile matching are shown on Figure
II. 16. The compound crystallizes with the space group I41 with Z = 8 and the cell parameters a =

Chapter II
[69]
5.768(5) Å, c = 20.486(2) Å, and V = 681.6(1) Å3 which is in agreement with the literature (a =
5.814(1) Å, c = 20.450(4) Å and V = 691.3(2) Å3).2
In the following sections, the samples labeled A, B, C and D will be compared due to their
different compositions, especially regarding the content of additional phase as observed by XRD
(cf. Figure II. 13). Their purity will be further analyzed by 11B solid-state MAS NMR spectroscopy.
The thermal stability of the samples will be evaluated and the influence of the additional phase
on the ionic conductivity will be investigated by electrochemical impedance spectroscopy (EIS).
Figure II. 16. a) XRD pattern of sample D and its profile matching. b) Crystal structure of Mg(BH4)(NH2) drawn with VESTA.
II-4b. MAS-NMR spectroscopy
To verify the purity of our materials and the local environment of boron in Mg(BH4)(NH2),
11B MAS-NMR analyses were performed on samples A, B, C and D (cf. Figure II. 17a). No peaks are
detected around -20 ppm which indicate that no BxHy borane groups such as (B3H8)-, (B12H12)2-,
(B10H10)2- and BH3 are present.22–24 In Figure II. 17, the four 11B NMR spectra display strong peaks

Chapter II – The known parts of the Mg(BH4)2-Mg(NH2)2 binary phases diagram: Mg(BH4)2, Mg(NH2)2 and
Mg(BH4)(NH2)
[70]
between -37 ppm and -40 ppm, which can be unambiguously attributed to (BH4)- anions.12,25
Samples A and B show actually two peaks in this chemical shift area: a first one at about -37.6 ppm
and a second one at about -39.6 ppm (cf. Figure II. 17b). We can consider that one of the NMR
peak is due to (BH4)- in Mg(BH4)(NH2) and the other one to (BH4)- in a slightly different environment
as in the additional phase detected by XRD. To assign the two peaks, the spectra were fitted with
two components and the percentage of boron atoms contributing to each environment (cf. Figure
II. 17d) was extracted and compared to the relative proportion of the two crystalline phases
observed by XRD analyses (cf. Figure II. 13). The percentage of boron atoms corresponding to the
peak at -37.6 ppm increases from sample A to sample B, so with increasing proportion of
Mg(BH4)(NH2). In the same time, the percentage of boron atoms contributing to the peak at -39.6
ppm decreases from sample A to sample B, with the decrease of the additional phase content. We
conclude therefore that the peak at -37.6 ppm is due to the (BH4)- anions in Mg(BH4)(NH2) and
that the second peak at -39.6 ppm is due to (BH4)- present in the additional phase.
In the case of sample C and D, for which only Mg(BH4)(NH2) was observed by XRD (cf. Figure
II. 13), only one peak was expected on the NMR spectrum as, in the crystal structure reported for
Mg(BH4)(NH2), the boron atoms occupy a single Wyckoff site. Two NMR peaks are however
detected in both samples. For sample C, the first peak (52 molar % of the boron in the sample) at
-37.6 ppm is similar to samples A and B and confirms the assignment to Mg(BH4)(NH2) (cf. Figure
II. 17b). The second peak (48 molar %) differs from that in the other samples: it is slightly less
shielded at -38.6 ppm. For sample D, the contribution at -37.7 ppm due to Mg(BH4)(NH2) (79 molar
%) is also present as well as the other one at -38.8 ppm (21 mol %). For sample D, Mg(BH4)(NH2)
is in larger quantity than in sample C (cf. Figure II. 17d).
Additional information as crystallinity degree can be extracted from the Full Width at Half
Maximum (FWHM) of the NMR peaks. The FWHM is in between 1.1-1.7 ppm for all peaks except
for the additional phase in sample C and D which has a value of 3.8 and 3.0 ppm respectively
(cf. Figure II. 17c). This peak broadening and the pure Gaussian shape reveal the amorphous
character of the new additional phase. The very amorphous character of this additional phase
explains its non-observation by XRD; even if it represents 48 molar % of the total boron atoms in
sample C.

Chapter II
[71]
Figure II. 17. a) 11B MAS-NMR spectra for the samples A, B, C and D. b) Chemical shifts and c) FWHM of the peaks attributed to Mg(BH4)(NH2) and the additional phase. d) Molar percentages
of boron contributing to each peak.
A 15N MAS-NMR spectrum was also recorded for sample D (cf. Figure II. 18). The peak
observed at 5.0 ppm corresponds to the (NH2)- anions and can be fitted with only one component.
a) b)
c)
d)

Chapter II – The known parts of the Mg(BH4)2-Mg(NH2)2 binary phases diagram: Mg(BH4)2, Mg(NH2)2 and
Mg(BH4)(NH2)
[72]
This is in agreement with the crystalline structure of Mg(BH4)(NH2) described in the literature
where the nitrogen atoms occupy only one Wyckoff site. It also means that if the additional phase
contains NH2 groups, they are very similar to the ones of Mg(BH4)(NH2) and are not affected by
the change of structure. Note also that the chemical shift is similar to the one measured for
Mg(NH2)2 but its FWHM is smaller (3.0 ppm instead of 5.1 ppm). Despite the similarity between
the (NH2)- anions in the two compounds, the FWHM difference can be explained by the fact that
the structure of Mg(BH4)(NH2) is described with only one NH2 and not three as that of Mg(NH2)2.
Figure II. 18. 15N solid state MAS-NMR spectrum for sample D.
II-4c. Infrared spectroscopy
The infrared spectrum shown on Figure II. 19 confirms that sample D features only BH4 and
NH2 groups signatures as described in the previous sections about Mg(BH4)2 and Mg(NH2)2.
Interestingly, the bending vibration bands of BH4 groups have changed compared to Mg(BH4)2. In
the borohydride Mg(BH4)2, there are several bending bands around 1200 cm-1 (cf. Figure II. 4). In
the as-synthesized Mg(BH4)(NH2), these bands are split into four distinct bands at 1109, 1230,
1439 and 1638 cm-1. This is explained by the deformation of the BH4 tetrahedra with two B-H
lengths shorter than the two others (cf. Table II. 2). The vibration due to NH2 has also changed
compared to the one of Mg(NH2)2. The asymmetric stretching at 3326 cm-1 has a higher amplitude
than the symmetric one at 3270 cm-1 which is the opposite of the Mg(NH2)2 amide (cf. Figure II.
9). The bending band at 1541 cm-1 has lower amplitude than in the amide. These amplitude
changes might be caused by the change in the N-H bond length (cf. Table II. 2) and the change in

Chapter II
[73]
the NH2 environment. Note that few imide has been formed during the synthesis (small absorption
bands around 3200 cm-1) and that no OH groups are present (no absorption bands around 3500
cm-1).
Figure II. 19. Infrared spectrum of sample D.
Table II. 2. B-H and N-H bond lengths in γ-Mg(BH4)2, Mg(NH2)2 and Mg(BH4)(NH2).
Bond Bond length (Å) Ref.
γ-Mg(BH4)2
B1-H1 1.14 12
B1-H2 1.14
Mg(NH2)2
N1-H1 0.92
26 N2-H2 0.87
N3-H3 0.89
N3-H4 0.94
Mg(BH4)(NH2)
B1-H1 1.17
2
B1-H2 1.17
B1-H3 1.29
B1-H4 1.22
N1-H5 1.01
N1-H6 1.06

Chapter II – The known parts of the Mg(BH4)2-Mg(NH2)2 binary phases diagram: Mg(BH4)2, Mg(NH2)2 and
Mg(BH4)(NH2)
[74]
II-4d. Thermal stability
Figure II. 20 presents the differential scanning calorimetry (DSC) curves recorded for the
samples A, B, C and D. As reported in the literature1, an endothermic phenomenon related to an
amorphization occurs between 120°C and 170°C and then the product is exothermically
decomposed above 200°C. A decrease in the onset temperature of the amorphization is observed,
decreasing from 152°C, 142°C and finally 120°C for samples A, B and C, respectively. Then, for
sample D, the onset temperature of amorphization is at 172°C with a maximum at 183°C which is
close to the one reported in the literature at 181°C.1
Figure II. 20. DSC of the samples A, B, C and D recorded at 5°C/min.

Chapter II
[75]
By thermal gravimetric analysis (TGA) coupled with DTA (Differential Thermal Analysis), no
important mass loss was observed below 190°C. Only a small release of NH3 starts at the same
temperature than the endothermic phenomenon (cf. Figure II. 21). The measurement was not
recorded at higher temperatures because the sample starts to decompose around 200°C and to
produce a lot of foam that goes outside the crucible used for the measurement and can damage
the device.
Figure II. 21. (a) TGA coupled with DTA measurement of sample D recorded at 5°C/min. (b) Gas
mass spectrometry of sample D recorded at 5°C/min showing both NH3 and H2 releases.

Chapter II – The known parts of the Mg(BH4)2-Mg(NH2)2 binary phases diagram: Mg(BH4)2, Mg(NH2)2 and
Mg(BH4)(NH2)
[76]
II-4e. Ionic conductivity
The ionic conductivities were measured by Electrochemical Impedance Spectroscopy (EIS)
on pellets made from powders of the samples A, B, C and D. Figure II. 22b exhibits the Nyquist and
the Bode plots at 100°C for sample A, B and C which were measured using 13 mm diameter pellets
with a thickness of about 0.8 mm (experimental details in Annex I). For each sample, a semi-circle
can be observed on the Nyquist plot at high frequencies (HF) with the presence of a semi-circle
weakly marked at middle frequencies (MF). At lower frequency, a more vertical straight line
(capacitive effect) characteristic of ion-blocking electrodes (Papyex foils) can be observed. This
line is not perfectly vertical due to the surface roughness. The impedance spectroscopy
measurement protocol has been improved for sample D, using a 6 mm diameter pellet with a
thickness of about 1.1 mm (experimental details in Annex I). The semicircle appears clearly at high
frequency and it is followed by a straight line due to the capacitive effect of the blocking
electrodes (cf. Figure II. 22a).
As discussed previously, XRD and 11B MAS-NMR analyses showed that each sample contains
Mg(BH4)(NH2) and an additional phase. By a simple observation of the Nyquist diagrams, it can be
noticed that the proportion of the second phenomenon at middle frequencies increases with the
quantity of the additional phase. The observation of the Bode plots at high and middle frequencies
clearly shows the presence of two phenomena (cf. Figure II. 22a). With an appropriate equivalent
circuit, the conductivity, the activation energy and the real capacitance can be extracted as a
function of temperature to attribute the physical meaning of each phenomenon. We chose the
brick layer model. Indeed, the sample preparation by ball-milling involves a good mixing of the
different precursors. As the thermal treatment is performed on pellets, and the different phases
are generated during this thermal treatment, we could consider that Mg(BH4)(NH2) is the grain
and the additional phase the grain boundaries as in a brick layer model. By taking this model into
account, the fitting of impedance signals were performed with the equivalent circuit shown on
Figure II. 22c. The equivalent circuit is composed of an initial resistor R0 for the device and current
collectors resistance, in series with a first R1//CPE1 (R1 for the bulk solid electrolyte resistance in
parallel with a constant phase element CPE1 for the non-ideal capacitance) and a second R2//CPE2
for the grain boundaries conduction (resistance and capacitance) and, finally, another constant
phase element (CPE3) for the impedance of both the top and bottom electrode-electrolyte
junctions to consider the roughness of the electrical contact. As described previously, R1 could be
associated to the conduction of Mg(BH4)(NH2) and R2 to the grain boundaries constituted by the
additional phase.

Chapter II
[77]
Figure II. 22. Nyquist plots and Bode plots at 100°C from EIS measurements of a) sample D (with a 6 mm diameter pellet) and of b) samples A, B and C (with 13 mm diameter pellets).
c) Equivalent circuit model used to fit the experimental data.

Chapter II – The known parts of the Mg(BH4)2-Mg(NH2)2 binary phases diagram: Mg(BH4)2, Mg(NH2)2 and
Mg(BH4)(NH2)
[78]
The conduction phenomena at high and middle frequencies can be separated by the
equivalent circuit described previously and described by their intrinsic characteristics: their
activation energy (Ea) and their real capacitances. These characteristics helped us to validate or
not our model. To extract the activation energy of each phenomenon, ln(σ.T) is plotted as a
function of 1/T for each sample as shown on Figure II. 23a. For the samples A, B and C, a clear
difference of behavior can be observed for the two phenomena. The Ea for the middle frequency
phenomenon remains constant around 1.3 eV whereas the one at high frequency decreases as
the sample is getting higher purity in Mg(BH4)(NH2), evolving from 1.3 eV to 1.0 eV, which confirms
our attribution of Mg(BH4)(NH2) as the grain in our model. These Ea values are similar to those
reported in the literature for the same material (1.31 eV) and other Mg2+ ionic conductors.6,27 For
sample D, the activation energy is about 1.0 eV for the high frequency phenomenon and 0.9 eV
for the middle frequency one.
To evaluate our fit, model and physical meaning, the real capacitance values of each
conduction phenomenon is extracted for the R//CPE couple. The calculated capacitances for each
phenomenon are plotted versus the temperature on Figure II. 23b. They remain constant as a
function of temperature, which is scientifically sound as the capacitance is only dependent on the
electrical permittivity of the phases and their geometrical dimensions, these parameters being
independent of the temperature. For the phenomenon at high frequency, a real capacitance of
the order of 10-10 F.cm-2 is obtained for all the samples whereas for the one at middle frequency,
the real capacitance is around 10-9 F.cm-2 for sample A, B and C but around 10-8 F.cm-2 for sample
D. Capacitance values around 10-9-10-10 F.cm-2 are typical of ionic conduction phenomena28 and,
hence, confirm our assumption that the high and middle frequencies phenomena are due to the
ionic conduction in both phases. The value of 10-8 F.cm-2 corresponds to an interface between the
electrode and the electrolyte. So, for sample D, the fitted middle frequency phenomenon is not
due to the additional phase. The additional phase is in too low quantity in this sample to form
grain boundaries detectable by EIS. For the other samples (A,B and C), the interface did not need
to be modeled even though they were measured with the same electrodes. Thus, the equivalent
circuit with two components was not appropriate for sample D. The data were fitted with a second
equivalent circuit made of only one R//CPE component (cf. Figure II. 24). This model fits very well
the data. The calculated activation energy (1.0 eV) and real capacitance (10-10 F.cm-2) are the same
than the one found for the phenomenon at high frequency while using a model with two R//CPE.
So, an equivalent circuit with one R//CPE is more appropriate to model the ionic conduction in
sample D.

Chapter II
[79]
Figure II. 23. a) ln(σ.T) = f(1/T) used to calculate the activation energies of the two ionic conduction phenomena (at high and middle frequency, HF and MF. b)Real capacitance values for
the two conduction phenomena as a function of the temperature.

Chapter II – The known parts of the Mg(BH4)2-Mg(NH2)2 binary phases diagram: Mg(BH4)2, Mg(NH2)2 and
Mg(BH4)(NH2)
[80]
Figure II. 24. EIS measurements of sample D fitted with one R//CPE. a) Nyquist plot at 100°C. b) Equivalent circuit model used to fit the experimental data. c) Real capacitance as a function of
the temperature. d) ln(σ.T) = f(1/T) used to calculate the activation energy.
Once the models were validated, the ionic conductivity for each sample was calculated. For
samples A, B and C the ionic conductivity is calculated from R1 and R2 as both were determined
to be linked to ionic conduction phenomena. The equation used is as follow:
𝜎 = 1
(𝑅1 + 𝑅2).
𝑙
𝑆
Equation II. 5
For sample D, only R1 was used in Equation II. 5. The results are plotted on Figure II. 25 as
a function of 1/T. The ionic conductivity increases gradually from sample A to D. This increase can
be correlated to the increase of the amount of Mg(BH4)(NH2) present in the samples. The more
Mg(BH4)(NH2) is present, the highest is the conductivity. Very interestingly, the ionic conductivity
reaches 1x10⁻⁵ S.cm-1 at 100°C for sample D. This conductivity is four orders of magnitude higher
than the one reported by Higashi et al.1 for the same compound (cf. black dots on Figure II. 25).
This value of ionic conductivity is one of the highest reported at this temperature, getting close to
the one obtained by Roedern et al. for Mg(en)1(BH4)2 (en = ethylene-diamine).6 These results could
be explained by the presence of the additional phase. Especially, once this phase gets amorphous

Chapter II
[81]
as shown by 11B MAS-NMR spectroscopy, it would create a glass-ceramic-like composite material
with improved ionic conduction, as previously described by Tsukasaki et al. on Li2S–P2S5 glass-
ceramics.29 In their study, nano-crystals of Li3PS4 were observed by TEM within an amorphous
matrix in Li2S–P2S5 glass-ceramics explaining the improvement in ionic conductivity compared to
the glasses. This assumption is also supported in our study by the fact that the ionic conductivity
of the pellet decreases with the increase of the proportion of crystalline additional phase.
Nevertheless, it is hard to observe this kind of glass-ceramic structure by TEM on our samples
without exposing them to air during the transfer into the microscope and without damaging them
with the electronic beam. The enhancement of the ionic conductivity can also be related to the
study of Yan et al. in which they demonstrate that adding an excess of BH4 in Li4(BH4)(NH2)3 would
create a solid solution with disorder in the structure which enables fast Li+ diffusion30. In our case,
the Mg(BH4)(NH2)-based composite material could have a similar behavior but the nature of the
additional phase needs to be clearly characterized to support this hypothesis. Another explanation
would be that the compound studied by Higashi et al. was not pure Mg(BH4)(NH2) but contained
an important amount of amorphous additional phase (> 50 molar %). Again, further information
as the synthesis parameters or 11B MAS solid sate NMR measurements on their sample would have
been very useful.
Figure II. 25. Ionic conductivity of samples A, B, C and D as a function of 1/T. The results are compared to the measurement of Higashi et al..1

Chapter II – The known parts of the Mg(BH4)2-Mg(NH2)2 binary phases diagram: Mg(BH4)2, Mg(NH2)2 and
Mg(BH4)(NH2)
[82]
II-5. Conclusion
Mg(BH4)(NH2) has been synthesized by ball-milling of Mg(BH4)2 and Mg(NH2)2 and a
subsequent annealing. The crystalline phase of Mg(BH4)2 used for the reaction is important as the
synthesis parameters needed to obtain pure crystalline Mg(BH4)(NH2) are different depending on
the precursor used. The other critical parameters are the ball milling speed and the annealing
conditions. The ball-milling speed must be not too strongly energetic in order to avoid the
decomposition of the reactants but strong enough to make an intimate mixture of the two
reactants. Besides the ball milling, the annealing has to be properly performed as well. The
annealing temperature should not be too high, otherwise the product will decompose, but the
temperature should be high enough to crystallize Mg(BH4)(NH2). We also found out that a back
pressure of H2 helps to keep the product stable during the synthesis and that the time of annealing
has to be long enough to get a complete reaction. To obtain a compound with no other crystalline
phase than Mg(BH4)(NH2) using pure γ-Mg(BH4)2 as precursor, a ball-milling at 400 rpm and a
subsequent annealing at 120°C for 72h under 10 bar of H2 were performed. Whereas with a
borohydride made of the γ and α-phases, a more energetic ball-milling at 500 rpm and the same
subsequent annealing were needed. 11B MAS-NMR spectroscopy revealed that even if by X-ray
diffraction only crystalline Mg(BH4)(NH2) appears in samples C and D, an additional amorphous
phase was still present. It was observed that this additional phase could be crystallized in samples
for which the synthesis parameters were not optimized.
The content in additional phase present in the samples strongly influences the ionic
conductivity. If the sample contains a large amount of the additional phase, its ionic conductivity
will be lower than if it contains less of it. An ionic conductivity of 1.10-5 S.cm-1 was obtained for
sample D that is made of 80 molar % of crystalline Mg(BH4)(NH2) and 20 molar % of the amorphous
additional phase. This conductivity is four orders of magnitude higher than the one previously
reported by Higashi et al.. The activation energy is also lower than the one reported, 1.0 eV vs.
1.31 eV, indicating an improved Mg2+ mobility. The ionic conductivity values become especially
high once this additional phase is amorphous forming a glass-ceramic-like composite material.
This could explain why the ionic conductivity values measured are several orders of magnitude
higher than the one reported in the literature. We can also consider that the additional phase is
actually detrimental for the ionic conductivity as we observe that the more it is present in the
sample, the lower is the ionic conductivity. However, it is necessary to know if the compound of
Higashi et al. contained the additional phase or not to be able to conclude if it has a benefic or
detrimental effect on the ionic conductivity.

Chapter II
[83]
The nature of the additional phase remained unclear but its strong influence on the
properties of the as-synthesized Mg(BH4)(NH2) is interesting. The first assumption was that this
additional phase was an Mg(BH4)2-x(NH2)x substoichiometric compound. Indeed, it is not a
decomposition product and it was encountered in large proportion in samples for which the
reaction was not fully completed. From 11B MAS-NMR spectroscopy, we observed that it had
slightly different environments for the BH4 groups as compared to Mg(BH4)(NH2). Unfortunately,
no compound of such composition has ever been reported so far. Therefore, we decided to
explore the Mg(BH4)2-Mg(NH2)2 binary phases diagram to try to identify this additional phase.

Chapter II – The known parts of the Mg(BH4)2-Mg(NH2)2 binary phases diagram: Mg(BH4)2, Mg(NH2)2 and
Mg(BH4)(NH2)
[84]
References
1. Higashi, S., Miwa, K., Aoki, M. & Takechi, K. A novel inorganic solid state ion conductor for rechargeable Mg batteries. Chem. Commun. 50, 1320–1322 (2014).
2. Noritake, T. et al. Synthesis and crystal structure analysis of complex hydride Mg(BH4)(NH2). Int. J. Hydrogen Energy 38, 6730–6735 (2013).
3. Noritake, T. et al. Dehydrogenation properties and crystal structure analysis of Mg(BH4)(NH2). J. Alloys Compd. 580, S85–S89 (2013).
4. Zavorotynska, O., El-Kharbachi, A., Deledda, S. & Hauback, B. C. Recent progress in magnesium borohydride Mg(BH4)2: Fundamentals and applications for energy storage. Int. J. Hydrogen Energy 41, 14387–14403 (2016).
5. Mohtadi, R., Matsui, M., Arthur, T. S. & Hwang, S.-J. Magnesium borohydride: From hydrogen storage to magnesium battery. Angew. Chemie Int. Ed. 51, 9780–9783 (2012).
6. Roedern, E., Kühnel, R.-S., Remhof, A. & Battaglia, C. Magnesium ethylenediamine borohydride as solid-State electrolyte for magnesium batteries. Sci. Rep. 7, 46189 (2017).
7. Nakamori, Y., Kitahara, G. & Orimo, S. Synthesis and dehydriding studies of Mg–N–H systems. J. Power Sources 138, 309–312 (2004).
8. Leng, H. Y., Ichikawa, T., Hino, S. & Hanada, N. New Metal-N-H System Composed of Mg(NH2)2 and LiH for Hydrogen Storage. 8763–8765 (2004).
9. Leng, H. Y. et al. Synthesis and decomposition reactions of metal amides in metal–N–H hydrogen storage system. J. Power Sources 156, 166–170 (2006).
10. Filinchuk, Y., Cerny, R. & Hagemann, H. Insight into Mg(BH4)2 with synchrotron X-ray diffraction: structure revision, crystal chemistry, and anomalous thermal expansion. Chem. Mater. 21, 925–933 (2009).
11. Filinchuk, Y. et al. Porous and dense magnesium borohydride frameworks: Synthesis, stability, and reversible absorption of guest species. Angew. Chemie - Int. Ed. 50, 11162–11166 (2011).
12. David, W. I. F. et al. The structure, thermal properties and phase transformations of the cubic polymorph of magnesium tetrahydroborate. Phys. Chem. Chem. Phys. 14, 11800–11807 (2012).
13. Dimitrievska, M. et al. Structure-dependent vibrational dynamics of Mg(BH4)2 polymorphs probed with neutron vibrational spectroscopy and first-principles calculations. Phys. Chem. Chem. Phys. 18, 25546–25552 (2016).
14. D’Anna, V., Spyratou, A., Sharma, M. & Hagemann, H. FT-IR spectra of inorganic borohydrides. Spectrochim. Acta Part A Mol. Biomol. Spectrosc. 128, 902–906 (2014).
15. Ma, L. et al. Enhanced Hydrogen storage properties of Li−Mg−N−H system prepared by reacting Mg(NH2)2 with Li3N. J. Phys. Chem. C 113, 9944–9949 (2009).
16. Moriwaki, T., Akahama, Y., Kawamura, H., Nakano, S. & Takemura, K. Structural phase transition of rutile-type MgH2 at high pressures. J. Phys. Soc. Japan 75, 2–7 (2006).
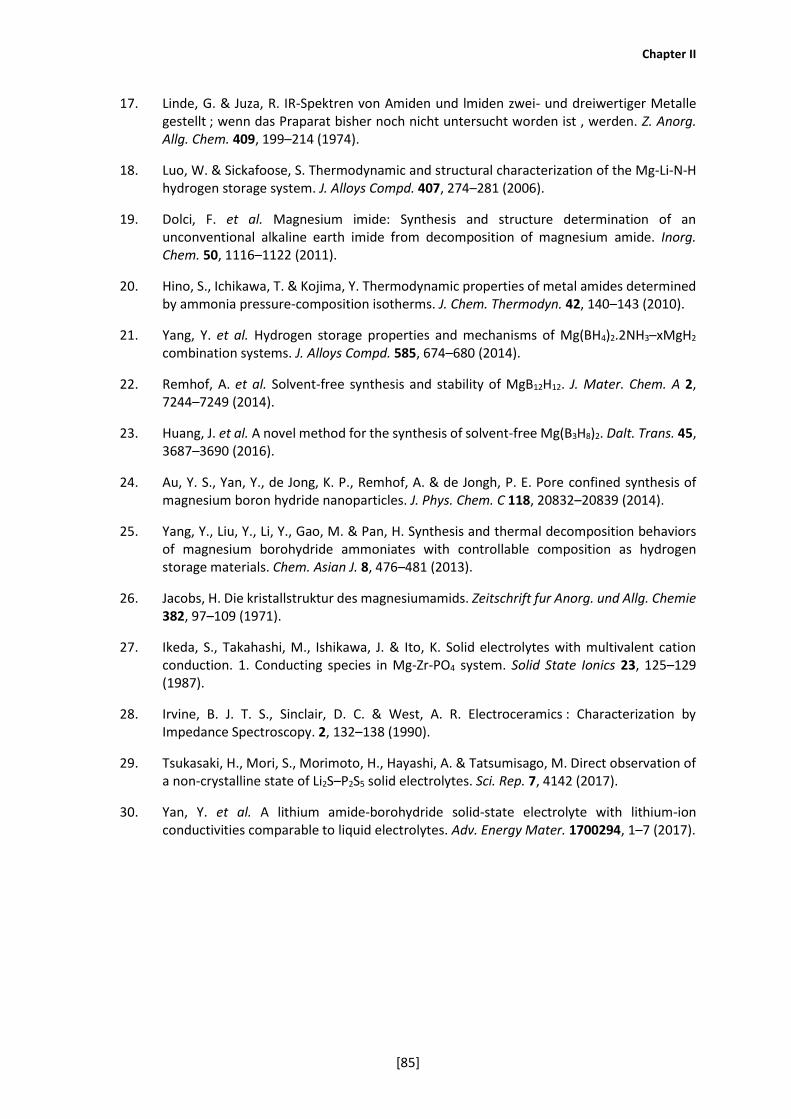
Chapter II
[85]
17. Linde, G. & Juza, R. IR-Spektren von Amiden und lmiden zwei- und dreiwertiger Metalle gestellt ; wenn das Praparat bisher noch nicht untersucht worden ist , werden. Z. Anorg. Allg. Chem. 409, 199–214 (1974).
18. Luo, W. & Sickafoose, S. Thermodynamic and structural characterization of the Mg-Li-N-H hydrogen storage system. J. Alloys Compd. 407, 274–281 (2006).
19. Dolci, F. et al. Magnesium imide: Synthesis and structure determination of an unconventional alkaline earth imide from decomposition of magnesium amide. Inorg. Chem. 50, 1116–1122 (2011).
20. Hino, S., Ichikawa, T. & Kojima, Y. Thermodynamic properties of metal amides determined by ammonia pressure-composition isotherms. J. Chem. Thermodyn. 42, 140–143 (2010).
21. Yang, Y. et al. Hydrogen storage properties and mechanisms of Mg(BH4)2.2NH3–xMgH2 combination systems. J. Alloys Compd. 585, 674–680 (2014).
22. Remhof, A. et al. Solvent-free synthesis and stability of MgB12H12. J. Mater. Chem. A 2, 7244–7249 (2014).
23. Huang, J. et al. A novel method for the synthesis of solvent-free Mg(B3H8)2. Dalt. Trans. 45, 3687–3690 (2016).
24. Au, Y. S., Yan, Y., de Jong, K. P., Remhof, A. & de Jongh, P. E. Pore confined synthesis of magnesium boron hydride nanoparticles. J. Phys. Chem. C 118, 20832–20839 (2014).
25. Yang, Y., Liu, Y., Li, Y., Gao, M. & Pan, H. Synthesis and thermal decomposition behaviors of magnesium borohydride ammoniates with controllable composition as hydrogen storage materials. Chem. Asian J. 8, 476–481 (2013).
26. Jacobs, H. Die kristallstruktur des magnesiumamids. Zeitschrift fur Anorg. und Allg. Chemie 382, 97–109 (1971).
27. Ikeda, S., Takahashi, M., Ishikawa, J. & Ito, K. Solid electrolytes with multivalent cation conduction. 1. Conducting species in Mg-Zr-PO4 system. Solid State Ionics 23, 125–129 (1987).
28. Irvine, B. J. T. S., Sinclair, D. C. & West, A. R. Electroceramics : Characterization by Impedance Spectroscopy. 2, 132–138 (1990).
29. Tsukasaki, H., Mori, S., Morimoto, H., Hayashi, A. & Tatsumisago, M. Direct observation of a non-crystalline state of Li2S–P2S5 solid electrolytes. Sci. Rep. 7, 4142 (2017).
30. Yan, Y. et al. A lithium amide-borohydride solid-state electrolyte with lithium-ion conductivities comparable to liquid electrolytes. Adv. Energy Mater. 1700294, 1–7 (2017).

Chapter II – The known parts of the Mg(BH4)2-Mg(NH2)2 binary phases diagram: Mg(BH4)2, Mg(NH2)2 and
Mg(BH4)(NH2)
[86]

[87]
Chapter III – The exploration of the unknown parts
of the Mg(BH4)2-Mg(NH2)2 binary phases diagram
Table of contents
III-1. Introduction.......................................................................................... 89
III-2. First exploratory syntheses with different Mg(BH4)2:Mg(NH2)2 ratios ..... 90
III-3. The α phase: Mg(BH4)2x(NH2)2(1-x) (x = 0.17, 0.20 and 0.25) ..................... 94
III-3a. Structural analysis of the α-phase .............................................................. 94
III-3b. Ionic conductivity of the α-phase.............................................................. 100
III-3c. Thermal analysis and phase transition α to β-phase .................................. 102
III-4. The β phase: Mg(BH4)2x(NH2)2(1-x) (x = 0.25 and 0.33) ............................ 106
III-4a. Crystal structure of the β-phase ............................................................... 106
III-4b. Ionic conductivity of the β-phase .............................................................. 107
III-4c. Thermal analysis of the β-phase ............................................................... 108
III-5. The γ-phase: Mg(BH4)2x(NH2)2(1-x) (x = 0.67, 0.71 and 0.75) .................... 109
III-5a. Structural analysis of the γ-phase ............................................................ 109
III-5b. Ionic conductivity of the γ-phase .............................................................. 115
III-5c. Thermal stability of the γ-phase ............................................................... 118
III.6. Comparative study of the Mg(BH4)2-Mg(NH2)2 binary phases diagram .. 121
III-7. Conclusions ......................................................................................... 123
References .................................................................................................. 125

Chapter III – The exploration of the unknown parts of the Mg(BH4)2-Mg(NH2)2 binary phases diagram
[88]

Chapter III
[89]
III-1. Introduction
In the previous chapter, the formation of unknown phases has been observed during the
synthesis of Mg(BH4)(NH2). It was determined that these phases were not decomposition products
but were rather obtained from non-optimized synthesis. Thus, the hypothesis of the existence of
other compounds with different Mg(BH4)2x(NH2)2(1-x) stoichiometries was made. All the known
parts of the Mg(BH4)2-Mg(NH2)2 binary phases diagram have been described in the previous
chapter, namely: Mg(BH4)2, Mg(NH2)2 and Mg(BH4)(NH2). Nevertheless, other borohydride-amide
binary systems have been studied in other works. The most studied one is the LiBH4-LiNH2 binary
phases diagram. Besides LiBH4, LiNH2 and Li2(BH4)(NH2), other crystalline compounds were
obtained such as Li4(BH4)(NH2)3 and Li3(BH4)(NH2)2.1–8 The Li+ ionic conduction properties of these
compounds are higher compared to Li2(BH4)(NH2) so it was important to know if similar phases do
exist or not in the Mg(BH4)2-Mg(NH2)2 binary phases diagram and if so, to characterize their Mg2+
ionic conduction properties.
In this chapter, the exploration of the Mg(BH4)2-Mg(NH2)2 binary phases diagram is
presented. Looking for new Mg(BH4)2x(NH2)2(1-x) compounds, a series of synthesis with different
stoichiometries has been performed. It actually confirmed the existence of new phases. Then, the
synthesis parameters were optimized to try to improve the purity of these new phases and to
characterize them more precisely.

Chapter III – The exploration of the unknown parts of the Mg(BH4)2-Mg(NH2)2 binary phases diagram
[90]
III-2. First exploratory syntheses with different Mg(BH4)2:Mg(NH2)2 ratios
The unknown phases observed during the synthesis of Mg(BH4)(NH2) were actually assumed
as never reported Mg(BH4)2x(NH2)2(1-x) compounds. The last sample for which one of these phases
appeared was sample 12 (cf. Chapter II). So the same annealing and ball-milling parameters were
used but the Mg(BH4)2:Mg(NH2)2 molar ratio was changed. As a reminder, the synthesis
parameters were a ball-milling at 400 rpm for 1h and a subsequent annealing at 120°C for 72h
under 10 bar of H2. The XRD patterns and the 11B solid state MAS-NMR spectra of the as-obtained
products are presented on Figure III. 1 and Figure III. 2, respectively. Interestingly, three new
unreported crystalline phases were obtained. Two Mg(NH2)2-rich phases that were labeled the α
and the β-phase, and one Mg(BH4)2-rich phase labeled the γ-phase.
The α-phase is the richest in Mg(NH2)2. By simple observation of the XRD pattern of the
sample obtained for the ratio 1:4 (x = 0.20), it appears that the reflections of this new phase are
similar to the ones of Mg(NH2)2 but with an important shift towards lower angles, i.e. larger
reticular distances. It is the typical behavior of a solid solution. The (BH4)- are substituting the
(NH2)- in the structure of Mg(NH2)2 and the shift towards lower angles is due to an expansion of
the cell as (BH4)- anions are larger than (NH2)- (bond distances: B-H ~1.2 Å and N-H ~0.9 Å, see
chapter II). The 11B NMR spectrum indicates that there is only one type of BH4 in this compound
with a chemical shift at -40.2 ppm. This chemical shift is specific to this new phase.
The β-phase crystallizes for ratios 1:3 (x = 0.25) and 1:2 (x = 0.33). For the ratio 1:2 (x = 0.33),
important X-ray diffraction peaks of Mg(BH4)(NH2) are also observed but by 11B NMR spectroscopy,
it was probed that only 5 % of the product is made of crystalline Mg(BH4)(NH2) (chemical shift at -
37.5 ppm, see chapter II). Another broad component can be fitted at -38.7 ppm, representing 51
% of the signal. This broad component is similar to the amorphous additional phase observed in
sample C and D (see chapter II). The remaining 44 % is attributed to the crystalline β-phase with a
shift at -39.5 ppm. For the ratio 1:3 (x = 0.25), only few crystalline Mg(NH2)2 reflections are
observed by XRD and the other diffraction peaks can be attributed to the β-phase. It is probed by
11B NMR spectroscopy that a tiny amount of Mg(BH4)(NH2) remains with a contribution at -37.3
ppm (2% of the signal). There is still a broad contribution that represents 60 % of the signal but it
is shifted to -39.2 ppm. The peak corresponding to the β-phase (-39.3 ppm) is representing 38 %
of the signal so its amount decreased even if by XRD, it seems well crystallized. This last
observation may suggest that the broad contribution could be not only due to an amorphous
phase but also to a disorder in the crystalline structure.

Chapter III
[91]
Figure III. 1. XRD patterns of the products obtained for different Mg(BH4)2-Mg(NH2)2 ratios (different x of Mg(BH4)2x(NH2)2(1-x)).

Chapter III – The exploration of the unknown parts of the Mg(BH4)2-Mg(NH2)2 binary phases diagram
[92]
The γ-phase is rich in borohydride. From XRD measurements, it is identical to the unknown
phase appearing in addition to Mg(BH4)(NH2) in sample 12 (see chapter II). It is confirmed by 11B
NMR spectroscopy as the spectrum of this sample can be fitted with a component at -37.8 ppm
which is due to Mg(BH4)(NH2) and one at -39.3 ppm which is the chemical shift observed for the
γ-phase. Note that in this sample, these two components represent respectively 27 and 21 % of
the signal and that the remaining 52 % are due to an amorphous phase with a chemical shift at -
38.4 ppm. For the ratio 2:1 (x = 0.66), some weak diffraction peaks due to Mg(BH4)(NH2) can be
observed. Then, crystalline α-Mg(BH4)2 starts also to be observed for the ratio 3:1 (x = 0.75) and
even more clearly for the ratio 4:1 (x = 0.8). It was assumed that the γ-phase was a defined
compound with a composition between the 2:1 ratio (x = 0.66) and the 3:1 ratio (x = 0.75). So a
synthesis with a 2.5:1 Mg(BH4)2-Mg(NH2)2 ratio (x = 0.71) was done and a sample with solely the
γ-phase crystallizing was obtained. Nevertheless, the diffraction pattern is evolving with the
composition as the α-phase, so the γ-phase behaves like a solid solution. By looking at the 11B NMR
spectra of the composition 2:1 (x = 0.66), 2.5:1 (x = 0.71), 3:1 (x = 0.75) and 4:1 (x = 0.80), it can
be observed that all of them exhibit mainly one BH4 environment with a chemical shift at about -
39.3 ppm which is close to the chemical shift of pure Mg(BH4)2 (-39.6 ppm, see chapter II). Another
shift around -41.4 ppm is also slightly detectable (< 7 % of the signal). It might be due to the
presence of a Mg(NH2)2-rich phase as the α-phase, as a consequence of an incomplete reaction.
So, three new crystalline phases have been identified by XRD, each of them has a
characteristic chemical shift for the (BH4)- anion as determined by 11B MAS-NMR spectroscopy.
From the NMR spectra, it has been possible to determine the range of compositions where each
new phase can be formed. In the next sections, the syntheses will be optimized in order to try to
obtain pure phases and to perform further characterizations especially for solving their crystal
structures and for measuring their ionic conduction properties.

Chapter III
[93]
Figure III. 2. a) 11B solid state MAS-NMR spectra of the products obtained for different Mg(BH4)2-Mg(NH2)2 ratios. b) Chemical shifts as a function of the Mg(BH4)2 amount present in the
compound. The area of the circles is proportional to the amount of each component.
Table III. 1. Fitted parameters of the different components of the 11B solid state MAS NMR spectra presented on Figure III. 2 for different Mg(BH4)2x(NH2)2(1-x).

Chapter III – The exploration of the unknown parts of the Mg(BH4)2-Mg(NH2)2 binary phases diagram
[94]
III-3. The α phase: Mg(BH4)2x(NH2)2(1-x) (x = 0.17, 0.20 and 0.25)
III-3a. Structural analysis of the α-phase
Here above, a solid solution where the (BH4)- replace the (NH2)- anions in the crystal
structure of Mg(NH2)2 was obtained for x = 0.20 (i.e. α-Mg(BH4)0.40(NH2)1.60). A new synthesis for
this stoichiometry was performed but this time the ball-milling speed was increased to 600 rpm
to make sure that a maximum amount of Mg(NH2)2 and Mg(BH4)2 have reacted. The XRD pattern
of the as-synthesized sample is presented in Figure III. 3. Only weak reflections of Mg(NH2)2 are
still observed so the increase of the ball-milling speed was successful in enhancing the reaction
yield. Assuming that this compound is a solid solution with the same structure as Mg(NH2)2, the
new cell parameters have to be determined. In the case of Mg(NH2)2, the (200) and (004)
reflections produce a double weak peak at 17.1° and 17.3°. This double peak is also present on
the XRD pattern of α-Mg(BH4)0.40(NH2)1.60. It is shifted to lower angles at 16.2° and 16.5°. The new
cell parameters are roughly equal to a = 10.9 Å and c = 21.5 Å. These values were used as starting
parameters to refine the XRD pattern of the α-phase. A good fitting of the Bragg positions was
obtained and after refinement, the unit cell parameters are a = 10.9945(6) Å and c = 21.624(3) Å
(cf. Figure III. 4). This confirms that the α-phase crystallizes in a tetragonal unit cell with the same
space group as Mg(NH2)2, i.e. I41/acd.9
Figure III. 3. XRD pattern of α-Mg(BH4)0.40(NH2)1.60. The inset is a zoom on the (200) and (004) reflections for the space group I41/acd.

Chapter III
[95]
To make sure that the α-phase is a solid solution, another synthesis was performed for
x = 0.17 with a ball-milling speed of 600 rpm Compared to the α-phase at x = 0.20, the one at
x = 0.17 has smaller cell parameters. Surprisingly, the ball-milling at 600 rpm seems to help the
stabilization of the α-phase for x = 0.25 instead of the β-phase that was obtained with a ball-milling
at 400 rpm (cf. Figure III. 1). The α-phase obtained for x = 0.25 has larger cell parameters; so the
cell parameters increase with x (cf. Figure III. 5). These observation confirms that the α-phase is a
solid solution crystallizing in the same structure as Mg(NH2)2, for which the (BH4)- anions are
substituting the (NH2)- leading to the expansion of the unit cell. The cell parameters are not
following a Vegard’s law as they are not changing linearly with x.
In order to determine where the (BH4)- anions were exactly located in the crystal structure,
a Rietveld refinement was performed on each compound using the structure of Mg(NH2)2. A
change in one of the N sites occupancy could mean that it is the actual location of the B. The H
atoms are not taken into account due to their very low scattering effect. Before that the
occupancies of the N sites were fitted, the structure of the different compounds could already be
well fitted with exactly the same structure as Mg(NH2)2 (cf. Figure III. 4). This result can be
explained by the fact that (NH2)- and (BH4)- anions have exactly the same number of electrons, 9
electrons each. Indeed, X-rays interact with the electronic cloud of the atoms so in our case it is
difficult to have enough contrast between these two anions using standard powder X-ray
diffraction (PXRD). After fitting, the N sites occupancies vary around their initial values but without
important variation (cf. Table III. 3a). The variations are too low to be significant considering that
only light elements are present in the structure and that an error is added because of the intensity
correction from the Be window. Nevertheless, for x =0.25, the occupancy of the site of the atom
N1 decreased more than the others. Another fit was realized exchanging the N1 atom on this site
by a B atom (cf. Table III. 3b). It resulted in occupancies values higher than the initial one (0.5)
meaning that this site is not occupied only by B atoms. This result confirmed that our PXRD data
do not allow a complete resolution of the structure. It is assumed that the BH4 randomly substitute
the NH2 in the structure.
To go further in the determination of the structure of the solid solution, neutron diffraction
was considered as B and N atoms have a large difference of neutron absorption. However, for this
kind of compound, it is really challenging to perform neutron diffraction because of the presence
of incoherently scattering H and strongly absorbing B. A test was done on the sample x = 0.25 but
no neutron diffraction peaks were observed (cf. Annex II). To avoid these negative effects, the
solution would be to enrich the sample in 2D and 11B.

Chapter III – The exploration of the unknown parts of the Mg(BH4)2-Mg(NH2)2 binary phases diagram
[96]
Figure III. 4. XRD patterns and Rietveld refinements of α-Mg(BH4)x(NH2)2-x for compositions x = 0, 0.17, 0.20 and 0.25.

Chapter III
[97]
Figure III. 5. Cell parameters of α-Mg(BH4)2x(NH2)2(1-x) as a function of x.
Table III. 2. Cell parameters of α-Mg(BH4)x(NH2)2-x for compositions x = 0, 0.17, 0.20 and 0.25 from the Rietveld refinements presented on Figure III. 4.

Chapter III – The exploration of the unknown parts of the Mg(BH4)2-Mg(NH2)2 binary phases diagram
[98]
Table III. 3. Refinement of the occupancy of the N site with a) the original atoms from the Mg(NH2)2 structure and b) replacing the atom N1 by a B atom.
Looking at the FTIR spectra of the different compounds (cf. Figure III. 6), it can be noticed
that the B-H bending bands around 1200 cm-1 are different from the BH4 of Mg(BH4)(NH2) and
those of Mg(BH4)2 (cf. Chapter II). The shape of the BH4 tetrahedra must have changed. Then, the
NH2 anions are modified by the presence of BH4 in their surroundings. The N-H bending band at
1564 cm-1 is similar to the one of Mg(NH2)2 but the intensity ratio between the asymmetric and
symmetric stretching around 3300 cm-1 has been modified. In the same way as in the case of
Mg(BH4)(NH2), their intensities have been reversed, and this can be due to a change of dipolar
moment. The dipolar moment of the NH2 molecules can be affected by the presence of BH4
molecules in their surrounding as Hδ+ of NH2 are attracted by the Hδ- of the BH4. The positions of
the bands have also changed: they are shifted to higher wavenumbers indicating a change of the
N-H bond. This change can be explained by a modification of the Mg-N bonding strength caused
by the replacement of some of these bindings by Mg-BH4 ones.

Chapter III
[99]
Figure III. 6. a) FTIR spectra of α-Mg(BH4)x(NH2)2-x for compositions x = 0, 0.17, 0.20 and 0.25. b) Zoom on the stretching vibration bands of N-H bonds.
11B solid state MAS-NMR spectroscopy was also performed on these phases (cf. Figure III.
7a). As observed with the synthesis at 400 rpm (cf. Figure III. 2), the chemical shifts of the (BH4)-
anion for the α-phase are at about -40 ppm which is slightly different than the chemical shifts of
Mg(BH4)2 and Mg(BH4)(NH2) (see chapter II). This observation can be correlated with the
difference of B-H vibrations probed by FTIR and confirms that the BH4 environment is specific to
this phase. The chemical shift slightly moves towards more negative values as x increases,
indicating that the shape of the BH4 is also slightly changing with x (cf. Figure III. 7b). The FWHM
(Full Width at Half Maximum) decreases with x (cf. Figure III. 7c). This change might be due to an
ordering of the BH4 in the structure or an increase of the rotational mobility of the (BH4)- anions
as their quantity increases in the solid solution.

Chapter III – The exploration of the unknown parts of the Mg(BH4)2-Mg(NH2)2 binary phases diagram
[100]
Figure III. 7. a) 11B MAS-NMR spectra of α-Mg(BH4)x(NH2)2-x x = 0.17, 0.20 and 0.25. b) 11B chemical shift and c) Full Width at Half Maximum (FWHM) as a function of x.
III-3b. Ionic conductivity of the α-phase
The ionic conductivity was measured by EIS (Electrochemical Impedance Spectroscopy)
using 6 mm diameter pellets of about 0.9 mm thickness (cf. Figure III. 8). In the case of Mg(NH2)2,
the Nyquist plot at 100°C displays only a straight line generated by the purely capacitive behavior
of the sample. Mg(NH2)2 does not conduct ions nor electrons. For x = 0.17, 0.20 and 0.25, a
semicircle starts to appear around 90°C and it is followed by a straight line at lower frequencies.
The semicircle is attributed to the bulk ionic conduction of the materials. The straight line is the
capacitance formed by the carbon blocking electrodes on the two sides of the solid electrolyte.
The data are fitted with one R//CPE to model the bulk ionic conduction in series with a resistance
for the electrical resistance of the cell and a CPE for the capacitance at low frequency. The
resistances below 80°C for x = 0.25 and below 90°C for x = 0.17 and 0.20 are too high to be
measured precisely so the ionic conductivity cannot be determined below these temperatures.
The values obtained at 100°C for x = 0.17, 0.20 and 0.25 are 4x10⁻⁹, 5x10⁻⁹ and 2x10⁻⁸ S.cm-1,
respectively. High activation energies of about 1.6-1.7 eV were calculated for these compounds,
revealing the relatively low Mg2+ mobility in these -phases. The ionic conductivity values are

Chapter III
[101]
quite low but it is interesting to see that adding Mg(BH4)2 into the structure of Mg(NH2)2 improves
its ionic conductivity. Even more, the ionic conductivity continuously increases with x as presented
on Figure III. 8d.
Figure III. 8. a) Nyquist plots at 100°C of α-Mg(BH4)x(NH2)2-x for x = 0.17, 0.20 and 0.25. b) Ionic conductivity as a function of 1/T. c) ln(σ.T) as a function of 1/T. d) Ionic conductivity at 100°C
as a function of x.

Chapter III – The exploration of the unknown parts of the Mg(BH4)2-Mg(NH2)2 binary phases diagram
[102]
The improvement of the ionic conductivity can be explained by the evolution of the
structure. By XRD, it was shown that the cell parameters were increasing with x. The expansion of
the unit cell can help the mobility of the Mg2+ ions forming a larger pathway through the structure
for the Mg2+ cations. The 11B NMR spectroscopy showed also that there might be an increase of
the BH4 rotational mobility with x. It could promote the Mg2+ mobility through the paddle wheel
mechanism, well described in the literature, where the rotating anions shovels the cations.10
III-3c. Thermal analysis and α to β phase transition
DSC measurements at 5 °C/min were performed on the samples obtained after ball-milling
and before the annealing of the compounds (cf. Figure III. 9). All the samples undergo an
endothermic phenomenon at low temperatures (65-80°C). This endothermic peak has a low
enthalpy; between 16 and 19 J.g-1 (~0.8-1 kJ/mol, cf. Table III. 4) and its onset temperature
gradually shifts towards lower temperature as x increases. This phenomenon might be due to the
organization of the (BH4)- anions into the Mg(NH2)2 structure to form the α-phase. After 200°C, an
exothermic phenomenon happens. This phenomenon is related to the degradation of the
products and is similar to what was observed previously with Mg(BH4)(NH2) at 200°C with the
release of gases (H2 and NH3) and the formation of a very foamy solid residue (cf. Chapter II).
Figure III. 9. DSC recorded at 5°C/min under Ar flow of α-Mg(BH4)2x(NH2)2(1-x) for x = 0.17, 0.20 and 0.25 before annealing.

Chapter III
[103]
Table III. 4. Enthalpy and temperatures of the endothermic phenomenon for different α-Mg(BH4)2x(NH2)2(1—x) compositions.
Figure III. 10. TGA coupled with DTA recorded at 1°C/min under Ar flow of α-Mg(BH4)x(NH2)2-x for
x = 0.17, 0.20 and 0.25.

Chapter III – The exploration of the unknown parts of the Mg(BH4)2-Mg(NH2)2 binary phases diagram
[104]
Table III. 5. Enthalpy and temperatures values of the endothermic phenomenon recorded by DSC for different α-Mg(BH4)2x(NH2)2(1—x) compositions.
Then, the thermal stability of the samples obtained after annealing, i.e. the -phases, was
measured by TGA coupled with DTA (cf. Figure III. 10). The endothermic phenomenon observed
before annealing has disappeared so it can be attributed to the formation of the α-phase. All the
annealed samples undergo an endothermic phenomenon at about 150°C. The enthalpy of this
phenomenon is approximately 105 J.g-1 (~5.9 kJ.mol-1, cf. Table III. 5) and there is no mass loss as
observed on the TGA curves.
To determine the nature of this endothermic phenomenon, a DSC measurement was
performed on the sample for x = 0.25 upon heating, until to 170°C, and cooling. This phenomenon
is irreversible. Then, the sample with x = 0.25 has been annealed at 170°C for 12h under 1 bar of
Ar to see what happens to the α-phase. The crystalline β-phase was formed. So, the α-phase turns
irreversibly into the β-phase at about 150°C through an endothermic structural transition caused
by the reorganization of the structure. As the β-phase remains stable at room temperature, it can
be considered that the α-phase with x = 0.25 is actually metastable. This metastability is
highlighted by the fact that only a powerful ball-milling can lead to its synthesis. As a matter of
fact, for x = 0.25, a ball-milling at 400 rpm leads to the formation of the β-phase (cf. Figure III. 1)
whereas the α-phase is obtained at 600 rpm.

Chapter III
[105]
Figure III. 11. a) DSC recorded at 1°C.min-1 under Ar flow upon heating up to 170°C and cooling of Mg(BH4)x(NH2)2-x for x = 0.25. b) XRD patterns of the sample before and after annealing at 170°C
for 12h under Ar.

Chapter III – The exploration of the unknown parts of the Mg(BH4)2-Mg(NH2)2 binary phases diagram
[106]
III-4. The β phase: Mg(BH4)2x(NH2)2(1-x) (x = 0.25 and 0.33)
III-4a. Crystal structure of the β-phase
In the previous paragraph, the β-phase was obtained for x = 0.25 by annealing of the
α-phase or by ball-milling at lower speed (400 rpm). Another synthesis was performed for x = 0.33
with a ball-milling at 600 rpm followed by an annealing at 120°C for 72h under 10 bar of H2. The
as-obtained sample is very amorphous and only weak reflections of the β-phase appear (cf. Figure
III. 12). The low crystallinity of the sample might be due to a low stability of the phase with this
stoichiometry. It is interesting to compare XRD pattern of the β-phase to the one of sample A
which was obtained for a non-optimized synthesis of Mg(BH4)(NH2) and contains mainly a
crystalline additional phase. Indeed, the reflections of the β-phase are similar to the ones of the
additional phase so it can be assumed that it is actually the same phase but with slightly different
unit cell parameters. Therefore, the β-phase seems to behave like a solid solution as the α-phase
does. No space group was found so far to explain the XRD pattern of the β-phase. It matched only
with monoclinic cells but even the indexing in such low symmetry space group was not fully
adequate (cf. Annex II)
Figure III. 12. XRD patterns of β- Mg(BH4)0.5(NH2)1.5 compared with β-Mg(BH4)0.67(NH2)1.33 and sample A.

Chapter III
[107]
III-4b. Ionic conductivity of the β-phase
The ionic conductivity of the β-phase was measured by EIS using 6 mm diameter pellets of
about 0.9 mm thickness. The results were fitted with the same model as the one used previously
for the α-phase. For the sample obtained after annealing of the α-phase, the resistances were too
high to be measured at low temperatures (cf. Figure III. 13). The value of ionic conductivity at
100°C is approximately the same as the α-phase, 2.10-8 S.cm-1. However, the activation energy
increased, reaching a high value of about 2 eV.
Figure III. 13. a) Nyquist plots at 100°C of β-Mg(BH4)0.5(NH2)1.5. b) Ionic conductivity as a function
of 1/T. c) ln(σ.T) as a function of 1/T.
The results of the EIS measurements on the sample synthesized with a ball-milling of
600 rpm for x = 0.33 are presented on Figure III. 14. In term of ionic conductivity, the as-obtained
sample has a higher conductivity than the compounds obtained for x = 0.25, σ100°C = 2.10-7 S.cm-1.
The activation energy is similar to the one of the α-phase, 1.6 eV. The conductivity in the β-phase
seems to increase with x as observed in the α-phase. Nevertheless, the two samples were not
synthesized with the same route so the comparison remains difficult and not fully conclusive.

Chapter III – The exploration of the unknown parts of the Mg(BH4)2-Mg(NH2)2 binary phases diagram
[108]
Figure III. 14. a) Nyquist plots at 100°C of β-Mg(BH4)0.67(NH2)1.33. b) Ionic conductivity as a function of 1/T. c) ln(σ.T) as a function of 1/T.
III-4c. Thermal analysis of the β-phase
Thermal analyses were performed on the sample with x = 0.33 synthesized at 600 rpm. The
DSC performed on the mixture after ball-milling and before annealing is similar to what was
obtained for the compositions x = 0.17, x= 0.20 and x =0.25 (cf. Figure III. 9 and Figure III. 15). An
endothermic phenomenon occurs at low temperature, 47°C. Its enthalpy of 14 J.g-1 (0.8 kJ.mol-1,
cf. Table III. 6) is closed to the ones described previously. The DSC curve shows an important noise
after 200°C due to the decomposition of the sample.
Then, TGA coupled with DTA was performed on the sample obtained for x = 0.33 after
annealing. It shows that no thermal phenomenon happens below 180°C but, after this
temperature, a slight mass loss is noticed which is related to the beginning of the material
decomposition.

Chapter III
[109]
Figure III. 15. a) DSC recorded at 5°C/min under Ar flow of β-Mg(BH4)0.67(NH2)1.33 before annealing. b) TGA coupled with DSC recorded at 1°C/min under Ar flow of β-Mg(BH4)0.67(NH2)1.33
after annealing.
Table III. 6. Enthalpy and temperatures of the endothermic phenomenon recorded by DSC for β-Mg(BH4)0.67(NH2)1.33 before annealing.
III-5. The γ-phase: Mg(BH4)2x(NH2)2(1-x) (x = 0.67, 0.71 and 0.75)
III-5a. Structural analysis of the γ-phase
The last part of the Mg(BH4)2-Mg(NH2)2 binary phases diagram that was explored is the one
rich in borohydride with x = 0.67, 0.71 and 0.75. To get samples as pure as possible, syntheses
were done with a ball-milling speed of 600 rpm for 1h. The same subsequent annealing as that
previously used was performed, i.e. 120°C for 72h under 10 bar of H2. The XRD patterns of the as-
synthesized samples are presented on Figure III. 16a. For x = 0.66, weak peaks of Mg(BH4)(NH2)
are observed. The γ-phase has a completely new unknown crystal structure. This structure
changes depending on the stoichiometry so it behaves like a solid solution as observed for the α-
phase. To emphasize this structural evolution, Figure III. 16b displays the double peak observed at
about 20° that obviously shifts as x is changing.

Chapter III – The exploration of the unknown parts of the Mg(BH4)2-Mg(NH2)2 binary phases diagram
[110]
Figure III. 16. a) XRD patterns of γ-Mg(BH4)2x(NH2)2(1-x) for x = 0.66, 0.71 and 0.75. b) Zoom on the most intense reflections.
The structure of the γ-phase can be indexed in a tetragonal unit cell with space group I-4
(No.: 82) (cf. Figure III. 17). The fitted unit cell parameters reveal that the increase of the amount
of (BH4)- anion leads to an expansion of the cell (cf. Figure III. 18). This expansion is similar to the
one observed in the α-phase so the γ-phase is also a solid solution in which (NH2)- anions can be
partially substituted by (BH4)- ones. It is also interesting to note that this cell has a tetragonal
symmetry as other compounds in the Mg(BH4)2:Mg(NH2)2 binary system: Mg(NH2)2 (s.g.: I41/acd),
Mg(BH4)(NH2) (s.g.: I41) and δ-Mg(BH4)2 (s.g.:I41/acd).

Chapter III
[111]
Figure III. 17. a) XRD patterns and profile matching of γ-Mg(BH4)2x(NH2)2(1-x) for x = 0.67, 0.71 and 0.75. b) Cell parameters and unit cell volume as a function of x.

Chapter III – The exploration of the unknown parts of the Mg(BH4)2-Mg(NH2)2 binary phases diagram
[112]
Figure III. 18. Cell parameters of γ-Mg(BH4)x(NH2)2-x as a function of x.
Table III. 7. Refined unit cell parameters of γ-Mg(BH4)2x(NH2)2(1-x) for x = 0.66, 0.71 and 0.75.
The crystalline structure is still under investigation in collaboration with Pr. Yaroslav
Filinchuk (University of Louvain, Belgium). A first structure has been proposed for x = 0.67, i.e.
γ-Mg3(BH4)4(NH2)2 (cf. Figure III. 19). It is a complex structure with 3 independent Mg atoms, two
sites for B atoms and one for the N atoms (cf. Table III. 8). This structure still needs to be confirmed
and optimized by DFT calculations, especially for the H atom positions. Better XRD data would be
also useful.
Chapter III
[113]
Figure III. 19. a) Rietveld refinement of γ-Mg3(BH4)4(NH2)2 and b) its structure drawn with the software VESTA.

Chapter III – The exploration of the unknown parts of the Mg(BH4)2-Mg(NH2)2 binary phases diagram
[114]
Table III. 8. Proposed structure for γ-Mg3(BH4)4(NH2)2.
The infrared (IR) spectra for each sample are presented on Figure III. 20. The N-H stretching
and bending bands have the same wavenumbers as those of Mg(BH4)(NH2) but the stretching
bands present a small shoulder at higher wavenumber. This shoulder can be due to the presence
of different N-H bonds similar to the one encountered in the α-phase. In the B-H bending region,
vibrations are observed around the same position as in Mg(BH4)(NH2) but in these compounds the
vibrations are split in two. This splitting could be explained by a distortion of the (BH4)- anions.

Chapter III
[115]
Figure III. 20. IR spectra of γ-Mg(BH4)2x(NH2)2(1-x) for x = 0.66, 0.71 and 0.75.
III-5b. Ionic conductivity of the γ-phase
The ionic conductivities of the samples containing the -phases were measured by
impedance spectroscopy using 6 mm diameter pellets of about 1.1 mm thickness (cf. Figure III.
21). The Nyquist plots show only one semicircle at high frequency that is attributed to the ionic
conduction in the materials. The semicircle is followed by a straight line that is the capacitance
formed by the carbon blocking electrodes placed on both sides of the samples. In the same way
than for the α and the β-phases, the data are fitted with one R//CPE for the bulk ionic conduction
in series with a resistance for the cell and with a CPE for the capacitance formed by the electrical
contacts on both sides of the electrolyte. The ionic conductivity values extracted from these fits
are presented as a function of the temperature on Figure III. 21b. At 100°C, the ionic conductivity
is 0.8x10⁻⁵, 2x10⁻⁵ and 4x10⁻⁵ S.cm-1 for x = 0.75, 0.71 and 0.67, respectively (cf. Figure III. 21d).
These values are the highest ever recorded for an inorganic Mg2+ solid ionic conductor at such low

Chapter III – The exploration of the unknown parts of the Mg(BH4)2-Mg(NH2)2 binary phases diagram
[116]
temperature. The ionic conductivity is increasing as x is decreasing in the γ-phase. This trend is
opposite to what was observed for the α and β-phases.
The activation energies determined from these measurements are low with values equal to
about 0.8, 0.9 and 1.0 eV for x = 0.67, 0.71 and 0.75, respectively (cf. Figure III. 21c). These
activation energies are low for an inorganic Mg2+ solid ionic conductor, indicating a high mobility
of the Mg2+ cations in the γ-phase. This mobility is increasing as x decreases which is also confirmed
by the ionic conductivity values.
Thanks to the good mobility of Mg2+ in the γ-phase, it was possible, for the sample x = 0.71,
to record 25Mg solid state MAS NMR spectra with a good signal in a short time without isotopic
enrichment in 25Mg. A good spectrum could be recorded in 5h whereas, for Mg(BH4)(NH2), an
acquisition of about 15h was necessary. This improvement of the signal allowed us to do
measurement in temperature and to try to obtain more information about the Mg2+ mobility in
this -phase (cf. Figure III. 22a). Tries were attempted to measure the spin-lattice relaxation time
T1 at different temperatures to calculate an activation energy using the Bloembergen-Purcell-
Pound formula. Indeed, from this formula, a Mg2+ motion correlation time τ can be obtained. This
correlation time should follow an Arrhenius behavior from which the activation energy can be
calculated. Unfortunately, the variation of T1 was too small and in the range of the signal-to-noise
ratio of the measurement. So, it was not possible to determine the activation energy with this
technique.
Still, with these measurements in temperature, a clear decrease of the FWHM of the peak
was observed, indicating an increase of the Mg2+ mobility with the temperature. Looking at the 1H
solid state MAS-NMR spectra recorded in the same conditions, no changes of the shape of the
peak can be observed. These two measurements prove that the mobile species in this phase are
Mg2+ cations and definitively not H.

Chapter III
[117]
Figure III. 21. a) Nyquist plots at 100°C of γ-Mg(BH4)x(NH2)2-x for x = 0.67, 0.71 and 0.75. b) Ionic conductivity as a function of 1/T. c) ln(σ.T) as a function of 1/T.
d) Ionic conductivity at 100°C as a function of x.

Chapter III – The exploration of the unknown parts of the Mg(BH4)2-Mg(NH2)2 binary phases diagram
[118]
Figure III. 22. a) 25Mg and b) 1H solid state MAS NMR spectra of γ-Mg(BH4)1.42(NH2)0.58 at different temperatures.
III-5c. Thermal stability of the γ-phase
DSC was measured on samples for x = 0.67, 0.71 and 0.75 just after the ball-milling step and
before the annealing (cf. Figure III. 23). As the α-phase, these compounds undergo an endothermic
phenomenon at low temperature, around 60°C. Here, the enthalpy is higher with values ranging
from 25 to 37 J.g-1 (1.4 to 2.0 kj.mol-1, cf. Table III. 9). The enthalpy and the onset temperature of
this phenomenon decrease with x. It could be due to a rearrangement of the crystalline structure.
At about 110°C, an exothermic phenomenon occurs with a higher enthalpy, about -160 J.g-1 (~9
kJ.mol-1). This exothermic phenomenon is related to the crystallization of the γ-phase. At 200°C,
there is another endothermic phenomenon followed by the degradation of the product. This last
phenomenon might be the melting of the products as observed for Li2(BH4)(NH2) and
Li4(BH4)(NH2)3.6

Chapter III
[119]
Figure III. 23. DSC recorded at 5°C/min under Ar flow of γ-Mg(BH4)2x(NH2)2(1—x) for x = 0.67, 0.71 and 0.75 before annealing.
Table III. 9. Temperatures and enthalpy values of the endothermic and exothermic phenomena recorded by DSC for different γ-Mg(BH4)2x(NH2)2(1-x) compositions.
TGA coupled with DTA measurements were performed on the final products, after
annealing. These measurements do not show any thermal phenomenon occurring before 190°C.
Only the sample obtained for x = 0.67 seems to start to degrade around 180°C. At 200°C, the
samples are decomposed as shown by the DSC previously recorded (cf. Figure III. 23). These results
are interesting because they mean that the γ-phases are more thermally stable than Mg(BH4)(NH2)
and could be used at higher temperatures up to 180°C.

Chapter III – The exploration of the unknown parts of the Mg(BH4)2-Mg(NH2)2 binary phases diagram
[120]
Figure III. 24. TGA coupled with DTA recorded at 1°C/min under Ar flow of γ-Mg(BH4)2x(NH2)2(1—x) for x = 0.67, 0.71 and 0.75.

Chapter III
[121]
III.6. Comparative study of the Mg(BH4)2-Mg(NH2)2 binary phases diagram
From the data presented here above and the ones obtained in the chapter II, a pseudo-
binary Mg(BH4)2-Mg(NH2)2 phases diagram is proposed between room temperature and 200°C (cf.
Figure III. 25). The new Mg(BH4)2x(NH2)2(1-x) phases found and described above are included in this
diagram. The content of the unexplored regions are assumed from our experimental observations.
On both extreme parts are the magnesium amide and borohydride, and in the center
Mg(BH4)(NH2) which decompose into an amorphous compound around 180°C. Between, Mg(NH2)2
and Mg(BH4)(NH2), two new phases have been observed: the α and the β phase. The α-phase is a
solid solution crystallizing in the Mg(NH2)2 tetragonal structure (s.g.: I41/acd) which expands as
(NH2)- anions are substituted by larger (BH4)-. It undergoes a phase transition at about 150°C and
turns into the β-phase. The β-phase was observed up to x = 0.33 but seems to be less stable as x
is getting close to 0.5. On the other side, between Mg(BH4)2 and Mg(BH4)(NH2), only one new
phase was observed: the γ-phase. This phase is also a solid solution crystallizing in a tetragonal
structure with the space group I-4. Its structure also expands as x increases.
Figure III. 25. Pseudo binary Mg(BH4)2-Mg(NH2)2 phases diagram. The full areas are the known ones and the shaded ones are assumed.

Chapter III – The exploration of the unknown parts of the Mg(BH4)2-Mg(NH2)2 binary phases diagram
[122]
Another diagram showing the values of ionic conductivity at 100°C as a function of x,
obtained for the different compounds, is shown in Figure III. 26. There are no data for Mg(BH4)2
and Mg(NH2)2 as they are very bad ionic conductor. The ionic conductivity of Mg(NH2)2 was too
low to be measured and the one of Mg(BH4)2 is reported to be about 10-9 S.cm-1 at 150°C.11 So it
is interesting to see that the phases based on a mixture of this two compound show better ionic
conductivities. For instance, the substitution of (NH2)- anions by (BH4)- in the α-phase improves
the ionic conductivity, reaching 2x10⁻⁸ S.cm-1 for x = 0.25. This increasing trend is followed by the
β-phase as well with an ionic conductivity of 2x10⁻⁷ S.cm-1 for x = 0.33. In the center, Mg(BH4)(NH2)
has a good ionic conductivity of 1x10⁻⁵ S.cm-1 and a low activation energy of 1.0 eV. Finally, the
phase rich in borohydride, the γ-phase, is the one having the highest ionic conductivity and the
lowest activation energy with 4x10⁻⁵ S.cm-1 and 0.8 eV for x = 0.67. In this phase, the ionic
conductivity decreases as x increases. Overall, even if the crystalline structure changes from one
compound to another, a trend appears in terms of ionic conductivities. Indeed, the maximum was
measured for the γ-phase at x = 0.67. From this point, the ionic conductivity gradually decreases
and it is true from one compound to the other. This trend is not random and is concomitant to the
evolution of the structures and of the different substitutions of (NH2)- anions by (BH4)-.
Figure III. 26. Ionic conductivity at 100°C and activation energy as a function of x in Mg(BH4)2x(NH2)2(1-x).

Chapter III
[123]
III-7. Conclusions
In this chapter, the discovery of three new crystalline phases in the Mg(BH4)2-Mg(NH2)2
binary phases diagram has been reported. These phases behave as solid solutions with different
Mg(BH4)2x(NH2)2(1-x) compositions.
Two phases, named the α-phase and the β-phase, have a composition rich in amide. The α-
phase crystallizes with the same structure as Mg(NH2)2 in which (BH4)- anions are substituting the
(NH2)-. This substitution leads to an expansion of the unit cell and an improvement of the ionic
conductivity at 100°C, increasing from 4x10⁻⁹ S.cm-1 for x = 0.17 to 1x10⁻⁸ S.cm-1 for x = 0.25. Upon
heating, the α-phase undergoes an irreversible endothermic structural transition, forming the β-
phase. The β-phase crystallizes in a new unknown crystal structure and might be the one
crystallizing in sample A in addition of Mg(BH4)(NH2) (cf. Chapter II). This phase transition has a
little impact on the ionic conductivity of the material, σ100°C = 2x10⁻⁸ S.cm-1, and the activation
energy of the ionic conductivity increases from 1.7 eV to 2 eV. For x = 0.33, with a ball-milling at
600 rpm, poorly crystallized β-phase was obtained with an amorphous background visible by XRD.
So, it might be less stable around this stoichiometry. The ionic conductivity at 100°C of this last
compound is improved, as it reaches 2x10⁻⁷ S.cm-1 and its activation energy is 1.6 eV.
The phase crystallizing in the borohydride-rich region was named the γ-phase. It crystallizes
in a tetragonal structure with the space group I-4. Similarly to the α-phase, adding more BH4 into
this compound increases the unit cell volume but decreases the ionic conductivity. The γ-phase
exhibits high ionic conductivity values that decrease with x, while the activation energy increases.
The best ionic conductor is γ-Mg(BH4)1.33(NH2)0.67 (which can be also written γ-Mg3(BH4)4(NH2)2)
with an ionic conductivity at 100°C of 4x10⁻⁵ S.cm-1 and an activation energy of 0.8 eV. These values
mean that it features one of the best Mg2+ mobility in an inorganic solid ionic conductor reported
so far. The good mobility of Mg2+ was confirmed by 25Mg solid state MAS-NMR spectroscopy with
a significant narrowing of the NMR peak upon heating. The γ-phase has also a good thermal
stability as no thermal event nor mass loss was detected below 190°C.
A pseudo binary phases diagram was proposed. It helps us to understand the complexity of
the Mg(BH4)2-Mg(NH2)2 system. A trend was observed for the ionic conductivity of the compounds
as a maximum is reached for γ-Mg3(BH4)4(NH2)2 and then it decreases and this trend continues
even if the crystal structure changes. Deeper structural (synchrotron) and theoretical (DFT) studies
could allow to understand this trend that might depend on the crystalline structure (Mg2+ mobility
pathways) and the different substitution of (NH2)- anions by (BH4)- (interaction of Mg2+ with its

Chapter III – The exploration of the unknown parts of the Mg(BH4)2-Mg(NH2)2 binary phases diagram
[124]
surrounding). Understanding this trend in this binary phases diagram could allow the design of
better Mg2+ ionic conductors based on other compounds.
The following chapter is dedicated to the characterization of two of the best Mg2+ ionic
conductor studied, Mg(BH4)(NH2) and γ-Mg3(BH4)4(NH2)2, as solid electrolytes for Mg batteries.

Chapter III
[125]
References
1. Pinkerton, F. E., Meisner, G. P., Meyer, M. S., Balogh, M. P. & Kundrat, M. D. Hydrogen desorption exceeding ten weight percent from the new quaternary hydride Li3BN2H8. J. Phys. Chem. B 109, 6–8 (2005).
2. Noritake, T. et al. Crystal structure analysis of novel complex hydrides formed by the combination of LiBH4 and LiNH2. Appl. Phys. A 83, 277–279 (2006).
3. Chater, P., David, W. I. F. & Anderson, P. Synthesis and structure of the new complex hydride Li2BH4NH2. Chem. Commun. 4770 (2007).
4. Chater, P. A., David, W. I. F., Johnson, S. R., Edwards, P. P. & Anderson, P. A. Synthesis and crystal structure of Li4BH4(NH2)3. Chem. Commun. 0, 2439 (2006).
5. Matsuo, M. et al. Complex hydrides with (BH4)- and (NH2)- anions as new lithium fast-ion conductors. J. Am. Chem. Soc. 131, 16389–16391 (2009).
6. Zhou, Y. et al. Enhanced electrical conductivities of complex hydrides Li2(BH4)(NH2) and Li4(BH4)(NH2)3 by melting. Mater. Trans. 52, 654–657 (2011).
7. Borgschulte, A. et al. Surface and bulk reactions in borohydrides and amides. Energy Environ. Sci. 5, 6823 (2012).
8. Yan, Y. et al. A lithium amide-borohydride solid-state electrolyte with lithium-ion conductivities comparable to liquid electrolytes. Adv. Energy Mater. 1700294, 1–7 (2017).
9. Jacobs, H. Die kristallstruktur des magnesiumamids. Zeitschrift fur Anorg. und Allg. Chemie 382, 97–109 (1971).
10. Skripov, A. V. et al. Nuclear magnetic resonance study of atomic motion in A2B12H12 (A = Na, K, Rb, Cs): Anion reorientations and Na+ mobility. J. Phys. Chem. C 117, 25961–25968 (2013).
11. Higashi, S., Miwa, K., Aoki, M. & Takechi, K. A novel inorganic solid state ion conductor for rechargeable Mg batteries. Chem. Commun. 50, 1320–1322 (2014).

Chapter III – The exploration of the unknown parts of the Mg(BH4)2-Mg(NH2)2 binary phases diagram
[126]

[127]
Chapter IV – Characterization of ionic conductors as
solid electrolytes: towards all-solid-state Mg
batteries
Table of contents
IV-1. Introduction ....................................................................................... 129
IV-2. Chemical stability ............................................................................... 130
IV-2a. Selection of electrode materials ............................................................... 130
IV-2b. Chemical stabilities of Mg(BH4)(NH2) and γ-Mg3(BH4)4(NH2)2 ..................... 133
IV-3. Electrochemical stability ..................................................................... 136
III-3a. Anode/electrolyte compatibility............................................................... 136
III-3a. Electrochemical stability window ............................................................. 140
IV-4. Conclusions ........................................................................................ 143
References .................................................................................................. 144

Chapter IV – Characterization of ionic conductors as solid electrolytes: towards all-solid-state Mg
batteries
[128]

Chapter IV
[129]
IV-1. Introduction
During this PhD thesis, new solid-state Mg2+ conductors have been discovered but before
to use them as solid electrolytes, it is crucial to know more about their chemical and
electrochemical stabilities. Indeed, a solid electrolyte needs, of course, to be electronically
insulative and to have a good ionic conductivity but other parameters are also very important. The
chemical stability is important to make sure that the electrolyte will not react with one of the
active or inactive material of the battery. Any unwanted reaction can hinder or make impossible
the cycling of the electrochemical cell. The compatibility between the solid electrolyte and the
electrodes is fundamental for a rechargeable device. A bad interface would lead to a quick fading
of the device. Finally, the electrochemical stability window (ESW) of a solid electrolyte has to be
as large as possible to avoid its reduction at low potential or its oxidation at high potential. A wide
ESW would provide a larger choice in terms of usable electrodes for rechargeable Mg batteries.
In this chapter, Mg(BH4)(NH2) and γ-Mg3(BH4)4(NH2)2 have been characterized as solid
electrolytes. It was shown in the previous chapters that they have both good ionic conductivities
(~10-5 S.cm-1 at 100°C). First, different active and inactive materials that can be used in a
rechargeable Mg battery have been selected. Then, the chemical stability of the ionic conductors
was tested by annealing mixtures of electrode materials with the solid electrolytes. The
electrochemical stability is evaluated by polarization and cyclic voltammetry measurements. The
polarization is especially used to characterize the interface between the electrolyte and the
anode. The cyclic voltammetry enables the determination of the ESW.

Chapter IV – Characterization of ionic conductors as solid electrolytes: towards all-solid-state Mg
batteries
[130]
IV-2. Chemical stability
IV-2a. Selection of electrode materials
First, it was needed to know if our solid electrolytes would react with components of a
rechargeable all-solid-state Mg battery. Two different materials have been chosen for the anode:
Mg and Bi. The Chevrel phase Mo6S8 has been selected as the cathode material and carbon C45
has been used as electronic conduction additive. Each material is described here after.
Magnesium metal anode
One of the main advantages of using a solid electrolyte should be the possibility of using a
metallic anode. In the first chapter, the different properties of magnesium metal as negative
electrode for batteries have already been described. As a reminder, its redox standard potential
is -2.375 V vs. NHE and it has a gravimetric capacity of 2205 mAh.g-1. Commercial magnesium
powder (Alfa Aesar, 99.8 % purity) was used. Magnesium metal is usually covered by a very stable
layer of MgO. So, the powder was ball-milled under argon to break this oxide surface layer and
make the Mg particles more reactive. The ball-milling was performed under Ar as followed: 2 g of
commercial Mg powder was placed in a 50 cm3 WC airtight jar and planetary ball-milled at 600
rpm for 2 h with a 2 min break every 30min and with a balls to powder weights ratio of 53:1. The
XRD pattern of the Mg powder obtained after ball milling is presented on Figure IV. 1a. The
diffractogram indicates that no crystalline impurities are present: only Mg metal is visible,
crystallizing in a hexagonal structure with the space group P63/mmc and the cell parameters
a = 3.210(1) Å and c = 5.211(2) Å.
Bismuth anode
Bismuth has been considered as a second solution for the anode in case of reactivity and/or
instability of the interface between Mg and the solid electrolytes. The Mg-Bi binary phases
diagram indicates that no solid solution exists between these two elements and that only the
intermetallic compound Mg3Bi2 can be formed. The magnesiation of Bi leads to the formation of
a biphasic mixture of Bi and Mg3Bi2 as follows: 1,2

Chapter IV
[131]
3x Mg2+ + 2 Bi +6x e- → x Mg3Bi2 + (2 - 2x) Bi Equation IV. 1
This reaction happens at ~ 0.27 V vs Mg2+/Mg and has a specific capacity of 385 mAh.g-1.
Bi powder obtained after ball-milling of Bi ingots (Prolabo, 99.999 % purity) was used. The ball-
milling parameters were the same than the ones described previously for Mg. After ball-milling,
the powder was sieved to separate large aggregates from the fine powder. Then it was stored in
an Ar filled glovebox. The powder does not show any traces of impurities as analyzed by XRD. The
only seen peaks are from Bi crystallizing in a hexagonal structure with the space group R-3m and
the cell parameters a = 4.5438(4) Å and c= 11.854(1) Å (cf. Figure IV. 1b).
Mo6S8 Chevrel phase as cathode
For the cathode, the Chevrel phase Mo6S8,3 which is commonly used for Mg intercalation,
4,5 has been selected. It has been synthesized at the ICGM in Montpellier from Cu2.5Mo6S8 by acid
leaching in a solution of HCl to remove Cu. The reaction with Mg is as follows:
x Mg2+ + Mo6S8 + 2x e- → MgxMo6S8 Equation IV. 2
The intercalation occurs in two steps: a first one at 1.2 V vs. Mg2+/Mg and a second one at
1.0 V vs Mg2+/Mg. Each step corresponds to the intercalation of Mg into two different
crystallographic sites. The maximum quantity of Mg that can be intercalated is x = 2 for a
theoretical specific capacity of 122 mAh.g-1. This maximum capacity is hard to reach as, upon
charge, the ionic conductivity decays as the concentration of Mg ions decreases, leading to the
entrapment of Mg ions. From our XRD measurement, pure crystalline Mo6S8 is obtained with the
hexagonal space group R-3 and the cell parameters a = 9.1837(8) Å, c = 10.869(1) Å and
V = 793.8(1) Å3 (cf. Figure IV. 1c).

Chapter IV – Characterization of ionic conductors as solid electrolytes: towards all-solid-state Mg
batteries
[132]
C45 carbon black
To enhance the electronic conductivity of the electrodes, it is necessary to use a carbon
additive. Carbon black C45 (Imerys) was used. It has a specific surface area of 45 m².g-1. Before
use, C45 is placed under dynamic vacuum at 750°C overnight to remove all molecules adsorbed
onto the carbon surface. It is then stored in an Ar filled glovebox. Carbon black consists in a poorly
graphitized carbon and this low crystallinity causes a broad diffraction peak around 26° as
observed on the XRD pattern on Figure IV. 1d.
Figure IV. 1. XRD patterns of the different electrode materials: a) Ball-milled Mg powder, b) Bi powder, c) Mo6S8 and d) carbon C45.

Chapter IV
[133]
IV-2b. Chemical stabilities of Mg(BH4)(NH2) and γ-Mg3(BH4)4(NH2)2
To characterize the chemical stability of our solid electrolytes, Mg(BH4)(NH2) (sample D in
Chapter II) and γ-Mg3(BH4)4(NH2)2 were mixed with the electrode materials described above in a
1:1 mass ratio. The mixtures were done in an Ar filled glovebox by hand with an agate mortar.
They were subsequently annealed under Ar for 12h at 100°C for Mg(BH4)(NH2) and 150°C for
γ-Mg3(BH4)4(NH2)2 as it was observed in Chapter III that this compound is thermally stable at least
up to 180°C. The powders are then recovered after annealing and analyzed by XRD.
For the mixture of the solid electrolytes with the anode materials: Mg and Bi (cf. Figure IV.
2 and Figure IV. 3), and with the carbon additive C45 (cf. Figure IV. 4), only the reflections of the
solid electrolytes and the electrode materials are visible. The refined cell parameters of the
Mg(BH4)(NH2) and γ-Mg3(BH4)4(NH2)2 change slightly compare to the ones obtained in the previous
chapters. Nevertheless, the volume of cell is similar to the one of the raw materials. So, no bulk
reaction has occurred. This is an interesting result, because it indicates that the solid electrolytes
do not react with the anode materials. Indeed, some liquid electrolytes are not stable at low
potential and form a passivation layer on the anode. This passivation layer is blocking the Mg2+
ions diffusion and thus makes impossible the cycling of the cell.6 With these solid electrolytes, the
interface with the anode would be chemically stable.
On the contrary, the mixture with Mo6S8 led to a clear reaction between the solid electrolyte
and the electrode material. The magnesiation of the Chevrel phase occurs forming MgxMo6S8. A
profile matching was performed on the XRD pattern of the mixture after annealing. The refined
unit cell parameters of MgxMo6S8 are a = 9.7693(4) Å and c= 10.3734(8) Å (V = 857.31 Å3) for the
mixture with Mg(BH4)(NH2) and a = 9.7549(8) Å and c= 10.362(2) Å (V = 853.8(2) Å3) for the one
with γ-Mg3(BH4)4(NH2)2. These parameters correspond to the Chevrel phase with x = 2 so it has
been completely magnesiated (the cell parameters of Mo6S8 are a = 9.1837(8) Å, c = 10.869(1) Å
and V = 793.8(1) Å3). The solid electrolytes are therefore oxidized in contact with the cathode. This
oxidation forms amorphous products that are not detected by XRD. It even leads to a complete
amorphization of the solid electrolyte for γ-Mg3(BH4)4(NH2)2. This kind of reaction was also
observed in the study of Unemoto et al. where the lithiation of TiS2 in contact with LiBH4 is
observed.7 Titanium disulfide has a working potential of about + 2.3 V vs. Li+/Li and recent studies
showed that the actual stability of LiBH4 is + 2.0 V vs. Li+/Li.8,9 So, LiBH4 can be spontaneously
oxidized by TiS2. Similarly, our results indicate that the oxidation potential of our solid electrolytes
is lower than the working potential of Mo6S8.

Chapter IV – Characterization of ionic conductors as solid electrolytes: towards all-solid-state Mg
batteries
[134]
Figure IV. 2. XRD patterns of the 1:1 mixture of Mg with a) Mg(BH4)(NH2) and b) γ-Mg3(BH4)4(NH2)2 after respective annealing at 100°C and 150°C for 12h under Ar.
Figure IV. 3. XRD patterns of the 1:1 mixture of Bi with Mg(BH4)(NH2) after annealing at 100°C for 12h under Ar.
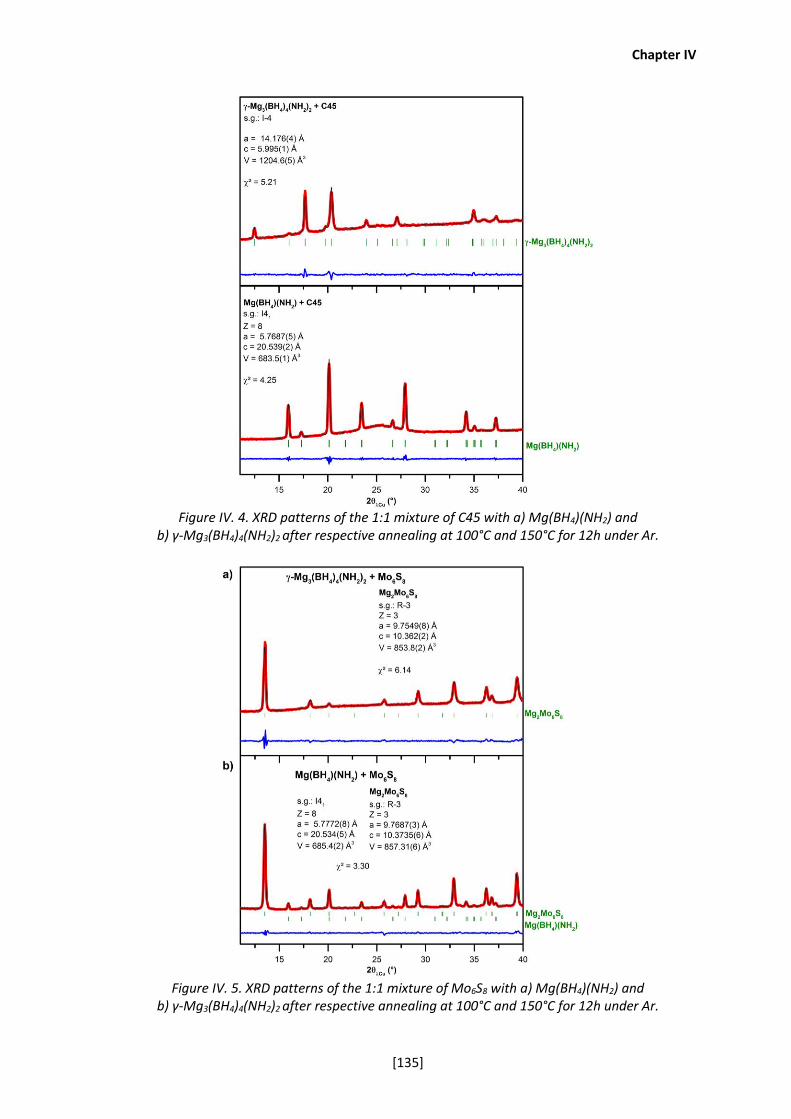
Chapter IV
[135]
Figure IV. 4. XRD patterns of the 1:1 mixture of C45 with a) Mg(BH4)(NH2) and
b) γ-Mg3(BH4)4(NH2)2 after respective annealing at 100°C and 150°C for 12h under Ar.
Figure IV. 5. XRD patterns of the 1:1 mixture of Mo6S8 with a) Mg(BH4)(NH2) and
b) γ-Mg3(BH4)4(NH2)2 after respective annealing at 100°C and 150°C for 12h under Ar.

Chapter IV – Characterization of ionic conductors as solid electrolytes: towards all-solid-state Mg
batteries
[136]
IV-3. Electrochemical stability
III-3a. Anode/electrolyte compatibility
To determine the compatibility between the electrolyte and the anode, galvanostatic
polarization measurements were performed on a symmetrical cell. The cell was simply made of a
parallel stack of two anodes (Mg or Bi) separated by the solid electrolyte. Ideally, the anodes are
pressed onto the electrolyte to form a self-standing stack and to get good electrical contacts.
Unfortunately, Mg is a relatively hard metal and it cannot be stacked onto the electrolyte. Mg has
a Brinell hardness (HB) of 260 at room temperature which is close to the HB of Al (245) for
instance.10 By comparison, alkaline elements like Na or K have HB < 1. This means that Mg is not
a soft metal and it does not easily form good contact with other materials. So, instead, our stack
was made with two magnesium discs made from cold pressed powder and a pellet of solid
electrolyte. This assembly was not optimum for good contacts but it was the only way to use Mg
powder as anode in a symmetrical cell.
The results for Mg(BH4)(NH2) are presented on Figure IV. 6. A current of ±5 µA.cm-2 was
applied for 2h and each polarization was separated by 5 min of rest. During the first cycles, the
potential evolved slowly before reaching its steady-state equilibrium with a plateau at about 0.5
V. This evolution of the potential can be due to the slow diffusion of Mg2+ in the solid electrolyte.
If the ionic conductivity of our pellet is 1x10⁻⁵ S.cm-1 at 100°C, the expected polarization potential
should be around 25 mV. The measured polarization was 20 times higher. The bad contacts
between the electrolyte and the electrodes might be the cause of this over potential, creating a
high interfacial resistance. The interfacial resistance was estimated to be about 120 kΩ
(152 kΩ.cm-2). As the cycling continued, the interfacial resistance increased and, after 60 h of
cycling, the polarization did not reach a steady-state anymore but reached a maximum before
slowly decreasing. This new evolution of the potential can be due to side reactions happening, as
inhomogeneous deposition of Mg (dendrites, foam, etc.)11 or decomposition of the solid
electrolyte. Therefore, this symmetrical cell measurement indicates that the interface between
Mg(BH4)(NH2) and Mg is electrochemically unstable for such stack.

Chapter IV
[137]
Figure IV. 6. Galvanostatic measurement at 100°C of a symmetrical cell Mg/Mg(BH4)(NH2)/Mg cycled with a current of 5 µA.cm-2 for 2h with 5 min rest between each polarization.
A different anode was then used, the magnesiated form of Bi, i.e. Mg3Bi2. With this anode,
no metal deposition/stripping process occurs anymore but a biphasic reaction instead as
described in Equation IV. 1. For polarization measurements, the same redox reaction is needed at
both electrodes to be able to reach equilibrium and to be sure that the polarization evolution is
only due to the interface evolution and not to electrochemical reactions occurring at the
electrodes. Thus, Mg3Bi2 cannot be used directly otherwise on one side would occur the biphasic
reaction described in Equation IV. 1 and, on the other side, Mg deposition:
x Mg2+ + 2x e- → x Mg Equation IV. 3

Chapter IV – Characterization of ionic conductors as solid electrolytes: towards all-solid-state Mg
batteries
[138]
An electrode was prepared by ball-milling Mg and Bi with the objective that only half of the
Bi was magnesiated. In an Ar filled glovebox, 0.177g of Mg were mixed with 1.840g of Bi. The
mixture was placed in a stainless steel jar with 12 stainless steel balls of 8 mm diameter for a balls
to powder weights ratio of 12:1. The ball-milling is performed using a Spex mill for 5h. The XRD
pattern of the as-obtained product is presented on Figure IV. 7. A Rietveld refinement confirmed
that a mixture of Mg3Bi2 + Bi was obtained with 46 mass % of Mg3Bi2 and 54 mass % of Bi. With
this mixture, only the biphasic redox reaction (cf. Equation IV.1) would occur at both electrodes.
Finally, to use this material, 10 wt% of C45 was added to ensure a good electronic conductivity as
Bi is a bad electronic conductor. The electrodes were cold pressed into discs and used in the same
configuration as with the Mg electrodes.
Even if Bi has a lower hardness than Mg (HBBi = 94.2), it is still too hard to stick to the solid
electrolyte. A low current density had to be used for the galvanostatic measurements to avoid a
too important polarization. Already, with a current density of 1 µA.cm-2, the polarization potential
was about 1 V (cf. Figure IV. 8) so the interfacial resistance was about 1.2 MΩ (1.5 MΩ.cm-2). This
huge resistance was not due to chemical reactivity as shown in the previous section. The interface
was inhomogeneous as the electrode surface was made of Bi, Mg3Bi2 and C45 and this
inhomogeneity could explain the initial bad interface. The first polarization cycles were stable and
featured the formation of an arc before to reach a steady-state. Rapidly, the polarization turned
into an unstable state and the potential increased. The complex shape of the polarization
observed after several cycles might be due to a detrimental evolution of the contact between the
electrode and the solid electrolyte because of the volumetric expansion of Bi upon cycling. The
volume increases of 73 % when Bi transforms into Mg3Bi2. Actually, important volume changes are
very problematic in all-solid-state batteries because it cannot be compensated by any change of
shape or mechanical flexibility. It can also be assumed that upon cycling some of the Bi or Mg3Bi2
particles could lose their electrical contact with the carbon. So, the change of Mg metal for Bi
anode unfortunately did not improve the compatibility of the anode with the solid electrolyte.

Chapter IV
[139]
Figure IV. 7. XRD pattern of the as-prepared Mg3Bi2 + Bi electrode material and its Rietveld refinement.
Figure IV. 8. . Galvanostatic measurement at 100°C of a symmetrical cell
Mg3Bi2 + Bi + C45/Mg(BH4)(NH2)/ Mg3Bi2 + Bi + C45 cycled with a current of 1 µA.cm-2 for 2h with 5 min rest between each polarization.

Chapter IV – Characterization of ionic conductors as solid electrolytes: towards all-solid-state Mg
batteries
[140]
III-3a. Electrochemical stability window
One of the most important parameter to know about our solid electrolytes is their
electrochemical stability window (ESW). To determine the ESW of our materials, cyclic
voltammetry was performed using a cell made of a Mg anode versus a composite positive
electrode made of the solid electrolyte mixed with 10 wt% C45. Both electrodes were separated
by the solid electrolyte. The cyclic voltammetry was performed with a slow scanning rate of
0.05 mV.s-1 at 100°C starting by the reduction process. Figure IV. 9a and b show the results for
Mg(BH4)(NH2) and γ-Mg3(BH4)4(NH2)2, respectively. For both phases, the Mg deposition/stripping
happens around 0 V vs. Mg2+/Mg. No reduction other than the Mg deposition occurred so these
solid electrolytes are stable at low potentials. This was confirmed by the chemical stability
experiments described in the previous section.
On the other side, the oxidation of the solid electrolytes was observed. It started in both
cases around 1 V vs Mg2+/Mg and had an onset potential of about 1.49 V vs Mg2+/Mg for
Mg(BH4)(NH2) and 1.48 V vs Mg2+/Mg for γ-Mg3(BH4)4(NH2)2 (cf. Figure IV. 9c and d). The
composition does not seem to have a strong influence on the ESW. In the case of Mg(BH4)(NH2),
the oxidation potential is lower than that reported by Higashi et al..12 In their work, they assumed
that Mg(BH4)(NH2) would not be oxidized before 3V vs Mg2+/Mg. This value was clearly
overestimated as they performed their cyclic voltammetry using a flat Pt electrode as counter
electrode and a fast scanning rate of 1 mV.s-1. The use of a flat counter electrode does not allow
a good contact with the solid electrolyte and can hinder the oxidation reaction as only a few
amount of the electrolyte would react and the measured current is therefore very low. The
measured current will be even lower if the scanning rate is fast (kinetic limitation). A recent study
showed that using carbon with different specific surface area changed the kinetic of oxidation
reaction and changed the observed oxidation potential.9 The most accurate measurements were
obtained for composite electrodes using high specific surface area carbon blacks. The high contact
surface area allows a good electronic percolation through the solid electrolyte and hence ensures
a precise measurement of the oxidation potential. This highlights once more the importance of
the contact surface area between the counter electrode and the solid electrolyte. In our case, the
fact that a composite counter electrode was used instead of a flat electrode explains the
discrepancy between the ESW measured for Mg(BH4)(NH2) and the results of Higashi et al.. With
an oxidation starting at about 1 V vs Mg2+/Mg, it is obvious that these solid electrolytes are
unstable versus cathode electrodes as Mo6S8 that has a working potential around 1.2 V vs

Chapter IV
[141]
Mg2+/Mg. This explains why the solid electrolytes are oxidized by Mo6S8 to form Mg2Mo6S8 and
amorphous decomposition products.
Figure IV. 9. Cyclic voltammetry measurements of cells made of Mg/solid electrolyte/solid electrolyte + C45 (90:10) recorded at 0.05 mV.s-1 at 100°C with
a) Mg(BH4)(NH2) and b) γ-Mg3(BH4)4(NH2)2. The insets are the coulombic efficiencies of the Mg deposition/stripping. c) and d) are the zoom on the first oxidation observed on a) and b)
respectively.
Another information that could be extracted from the cyclic voltammetry curve was the
coulombic efficiency of the Mg deposition/stripping that is shown on the inset of Figure IV. 9a and
b. For Mg(BH4)(NH2), during the first cycle, the coulombic efficiency is about 60%. This low value
can be due to the low conductivity of the solid electrolyte. Upon cycling, this efficiency dropped
to 20% and then stayed stable. This drop reveals that the oxidation of the electrolyte created a
passivation layer with low conductivity. Note that the coulombic efficiency for γ-Mg3(BH4)4(NH2)2

Chapter IV – Characterization of ionic conductors as solid electrolytes: towards all-solid-state Mg
batteries
[142]
was already at 20% during the first cycle. It was because the cell had already undergone a cycle
before this measurement but the current range selected was too high. So, the following cycles
had to be repeated with a lower current range to get the result shown on Figure IV. 9d. Hence,
the passivation layer formed by the oxidation of the solid electrolytes is detrimental to the
cyclability of the cell.

Chapter IV
[143]
IV-4. Conclusions
Two of our best ionic conductors found in the Mg(BH4)2-Mg(NH2)2 phases diagram have
been evaluated as possible solid electrolytes: Mg(BH4)(NH2) and γ-Mg3(BH4)4(NH2)2. Interestingly,
they do not react with the carbon additive and the anode materials: Mg and Bi. However, they
reacted with the cathode material: Mo6S8. In contact with Mo6S8, they were oxidized to form
Mg2Mo6S8 and amorphous decomposition products. The compatibility of Mg(BH4)(NH2) with the
Mg anode was also tested by a polarization measurement in a symmetrical cell using Mg
electrodes. A large interfacial resistance was observed. It could be explained by a poor contact
between the electrolyte and Mg, especially because Mg is a hard metal and sticks very poorly on
the solid electrolyte pellet. The interfacial resistance increased upon cycling indicating its
instability upon Mg deposition/stripping. The same experiment was performed with “Mg3Bi2 + Bi”
electrodes, but unfortunately the interfacial resistance was even larger than that with Mg. This
could be due to the inhomogeneity of the surface in contact with the solid electrolyte as the
electrode is made of Mg3Bi2, Bi, and C45. The interfacial resistance increased upon cycling, which
could be caused by the important volume change between Mg3Bi2 and Bi.
The electrochemical stability windows of the two solid electrolytes were measured by cyclic
voltammetry. Magnesium deposition/stripping is observed around 0 V vs. Mg2+/Mg, which
represents a nice result as it has been very rarely reported for a solid Mg2+ ionic conductor. The
oxidation of the solid electrolytes starts at about 1.0 V vs. Mg2+/Mg and had an onset potential
around 1.5 V vs. Mg2+/Mg. The oxidation potential was not affected by the composition of the
phase studied. The coulombic efficiency values of the Mg deposition/stripping decreased upon
cycling probably because the oxidation of the electrolytes leads to the formation of non-
conductive passivation layers.
So, on one hand, these materials are unstable at potentials higher than 1.0 V vs. Mg2+/Mg
and would be oxidized by cathodes such as Mo6S8. This oxidation leads to the detrimental
formation of non conducting compounds. On the other hand, they are stable chemically and
electrochemically versus the anode materials. Unfortunately, it is hard to obtain a good interface
between the anode and the solid electrolytes due to the important hardness of Mg metal. This
point is critical to develop all-solid-state Mg batteries and might be improved by using foldable
Mg thin foils or very fine powder of the anode material that could be dispersed in a composite
electrode with the solid electrolyte.

Chapter IV – Characterization of ionic conductors as solid electrolytes: towards all-solid-state Mg
batteries
[144]
References
1. Murgia, F., Stievano, L., Monconduit, L. & Berthelot, R. Insight into the electrochemical behavior of micrometric Bi and Mg3Bi2 as high performance negative electrodes for Mg batteries. J. Mater. Chem. A 3, 16478–16485 (2015).
2. Arthur, T. S., Singh, N. & Matsui, M. Electrodeposited Bi, Sb and Bi1-xSbx alloys as anodes for Mg-ion batteries. Electrochem. commun. 16, 103–106 (2012).
3. Chevrel, R., Sergent, M. & Prigent, J. Un nouveau sulfure de molybdene : Mo3S4 preparation, propriétés et structure cristalline. Mater. Res. Bull. 9, 1487–1498 (1974).
4. Levi, M. D. et al. Kinetic and thermodynamic studies of Mg2+ and Li+ ion insertion into the Mo6S8 Chevrel phase. J. Electrochem. Soc. 151, A1044 (2004).
5. Aurbach, D. et al. Prototype systems for rechargeable magnesium batteries. Nature 407, 724–727 (2000).
6. Mohtadi, R. & Mizuno, F. Magnesium batteries: Current state of the art, issues and future perspectives. Beilstein J. Nanotechnol. 5, 1291–1311 (2014).
7. Unemoto, A. et al. Stable interface formation between TiS2 and LiBH4 in bulk-type all-solid-state lithium batteries. Chem. Mater. 27, 5407–5416 (2015).
8. Gulino, V. et al. Phase stability and fast ion conductivity in the hexagonal LiBH4–LiBr–LiCl solid solution. Chem. Mater. 31, 5133–5144 (2019).
9. Asakura, R. et al. Electrochemical oxidative stability of hydroborate-based solid-state electrolytes. ACS Appl. Energy Mater. 2, 6924–6930 (2019).
10. Samsonov, G. V. Handbook of the Physicochemical Properties of the Elements. (Springer US, 1968).
11. Chen, K. et al. Dead lithium: Mass transport effects on voltage, capacity, and failure of lithium metal anodes. J. Mater. Chem. A 5, 11671–11681 (2017).
12. Higashi, S., Miwa, K., Aoki, M. & Takechi, K. A novel inorganic solid state ion conductor for rechargeable Mg batteries. Chem. Commun. 50, 1320–1322 (2014).

Chapter IV
[145]

General conclusion
[146]

General conclusion
[147]
General conclusion
The main aims of this PhD thesis were to enhance the ionic conductivity of known Mg2+
inorganic ionic conductors, to find new ones and to characterize them electrochemically in order
to know if they could be used as solid electrolytes in Mg batteries. The first studied material was
Mg(BH4)(NH2) (cf. Chapter II). It has been synthesized by ball-milling of Mg(BH4)2 and Mg(NH2)2
and a subsequent annealing. The synthesis parameters were not described in the literature so
they had to be determined. Different ball-milling speeds and annealing times, temperatures and
atmospheres were tested. The purest sample was obtained with a ball-milling at 500 rpm for 1h
and a subsequent annealing at 120°C for 72h under 10 bar of H2. The X-ray diffraction pattern of
this sample showed only Mg(BH4)(NH2), crystallizing in the space group I41 with Z = 8 and the cell
parameters a = 5.768(5) Å, c = 20.486(2) Å, and V = 681.6(1) Å3 which are in agreement with the
literature.1 During the synthesis optimization, composite samples made of Mg(BH4)(NH2) and an
unknown crystalline additional phase were obtained. 11B MAS-NMR spectroscopy experiments,
that were performed for the first time on these compounds, revealed that even in samples
presenting only crystalline Mg(BH4)(NH2) by X-ray diffraction, the additional phase was
nevertheless present as an amorphous phase. The additional phase content determined by
11B MAS-NMR spectroscopy strongly influences the ionic conductivity. The sample containing
mainly the additional phase (73 %) has an ionic conductivity of 8.10-8 S.cm-1 at 100°C with an
activation energy of 1.3 eV; while the sample containing less additional phase (20 %) has an ionic
conductivity of 1x10⁻⁵ S.cm-1 at 100°C with an activation energy of 1.0 eV. This last ionic
conductivity value is four order of magnitude higher than the one previously reported by Higashi
et al. (~10-9 S.cm-1 at 100°C and Ea = 1.31 eV).2 Two hypotheses can be made to explain this
discrepancy. In the first hypothesis, the material of Higashi et al. is considered as 100 % pure
Mg(BH4)(NH2), then the presence of the additional phase in our composite samples would
enhance the ionic conductivity, especially, once it becomes amorphous forming a glass/ceramic-
like material with enhanced Mg2+ mobility.3 For the second hypothesis, the additional phase has
actually a negative effect on Mg2+ mobility. Indeed, it was observed in our study that the lowest is
its content; the highest is the ionic conductivity. In that case, the material of Higashi et al. would
contain an important amount of amorphous additional phase, lowering its ionic conductivity. To
validate one of these two hypotheses, a precise description of the synthesis parameters used by
Higashi et al. and 11B MAS-NMR spectroscopy measurements on their sample would have been
very useful. However, in both cases, the additional phase has clearly an impact on the ionic

General conclusion
[148]
conductivity and it was important to try to obtain it pure. As it contains (BH4)- anions, as-probed
by 11B MAS-NMR spectroscopy, that it was not a decomposition product and that it was obtained
for non-optimized synthesis, the assumption was made that it was actually a never reported
Mg(BH4)2x(NH2)2(1-x) compound.
Then, to try to identify this additional phase and to find new Mg2+ ionic conductors, the
Mg(BH4)2-Mg(NH2)2 binary phases diagram has been explored (cf. Chapter III). Three new
Mg(BH4)2x(NH2)2(1-x) crystalline phases were discovered. Two phases with a composition rich in
amide were named the α-phase and the β-phase. The α-phase crystallizes with the same crystal
structure as Mg(NH2)2 in which large (BH4)- anions are substituting the (NH2)-. This substitution
leads to an expansion of the unit cell and an improvement of the ionic conductivity, increasing
from 4x10⁻⁹ S.cm-1 for x = 0.17 to 1x10⁻⁸ S.cm-1 for x = 0.25. Upon heating, the α-phase undergoes
an irreversible endothermic structural transition, forming the β-phase. The β-phase crystallizes in
a new unknown crystal structure. This phase transition has a little impact on the ionic conductivity
of the material, σ100°C = 2x10⁻⁸ S.cm-1, and the activation energy of the ionic conductivity increases
from 1.7 eV to 2 eV. For x = 0.33, with a ball-milling at 600 rpm, poorly crystallized β-phase was
obtained with an amorphous background visible by XRD. The ionic conductivity at 100°C of this
last compound is improved, as it reaches 2x10⁻⁷ S.cm-1 and its activation energy is 1.6 eV. The β-
phase might be the additional phase present in the composite materials described in Chapter II
during the Mg(BH4)(NH2) synthesis. Indeed, for the samples with the crystalline additional phase,
the X-ray diffraction patterns and ionic conductivity values are similar. This observation would
confirm the second hypothesis we have made, considering that the presence of additional phase
decreases the ionic conductivity of the composite materials.
Another phase crystallizes in the borohydride-rich region of the Mg(BH4)2-Mg(NH2)2 phases
diagram: it was named the γ-phase. It has a tetragonal structure with the I-4 space group. Similarly
to the α-phase, adding more (BH4)- anions into this compound increases the unit cell volume but,
here, it decreases the ionic conductivity. The best ionic conductor is γ-Mg(BH4)1.33(NH2)0.67 (which
can be also written γ-Mg3(BH4)4(NH2)2) with an ionic conductivity at 100°C of 4x10⁻⁵ S.cm-1 and an
activation energy of 0.8 eV. These values mean that it features one of the best Mg2+ mobility in an
inorganic solid ionic conductor reported so far. The good mobility of Mg2+ was confirmed by 25Mg
solid state MAS-NMR spectroscopy with a significant narrowing of the NMR peak upon heating.
The γ-phase has also a good thermal stability as no thermal event nor mass loss was detected
below 190°C. A pseudo-binary Mg(BH4)2-Mg(NH2)2 phases diagram was proposed. It helps us to
understand the complexity of this Mg(BH4)2-Mg(NH2)2 system. A trend was observed for the ionic

General conclusion
[149]
conductivity of the compounds as a maximum is reached for γ-Mg3(BH4)4(NH2)2. This trend
continues even if the crystal structure changes. So, good Mg2+ ionic conductors were found in this
binary phases diagram but they still needed to be characterized as solid electrolyte in order to
know if they could be used in Mg batteries.
Two of our best ionic conductors found in the Mg(BH4)2-Mg(NH2)2 phases diagram have
been evaluated as possible solid electrolytes: Mg(BH4)(NH2) and γ-Mg3(BH4)4(NH2)2
(cf. Chapter IV). Interestingly, they do not react with the carbon additive and the anode materials:
Mg and Bi. However, they reacted with the Mo6S8 cathode material. In contact with Mo6S8, they
were oxidized to form Mg2Mo6S8 and amorphous decomposition products. The compatibility of
Mg(BH4)(NH2) with the Mg anode was also tested by a polarization measurement in a symmetrical
cell using Mg electrodes. A large interfacial resistance was observed. It could be explained by a
poor contact between the electrolyte and Mg, especially because Mg is a hard metal and sticks
very poorly on the solid electrolyte pellet. The interfacial resistance increased upon cycling
indicating its instability upon Mg deposition/stripping. The same experiment was performed with
“Mg3Bi2 + Bi” electrodes, but unfortunately the interfacial resistance was even larger than that
with Mg. The interfacial resistance increased upon cycling, which could be caused by the
important volume change between Mg3Bi2 and Bi. The electrochemical stability windows of the
two solid electrolytes were measured by cyclic voltammetry. Magnesium deposition/stripping is
observed around 0 V vs. Mg2+/Mg, which represents a very positive result as it has been very rarely
reported for a solid Mg2+ ionic conductor. The oxidation of the solid electrolytes starts at about +
1.0 V vs. Mg2+/Mg and had an onset potential around + 1.5 V vs. Mg2+/Mg. The oxidation potential
was not affected by the composition of the phase studied. Unfortunately, it is hard to obtain a
good interface between the anode and the solid electrolytes due to the important hardness of Mg
metal. This point is critical to develop all-solid-state Mg batteries and might be improved by using
foldable Mg thin foils or very fine powder of the anode material that could be dispersed in a
composite electrode with the solid electrolyte.
To summarize, through the exploration of the Mg(BH4)2-Mg(NH2)2 phases diagram, we have
discovered new solid inorganic Mg2+ ionic conductors. A trend appears between the ionic
conductivity and the composition of these materials. One of them reaches one of the highest ionic
conductivity ever reported for an inorganic Mg2+ ionic conductor (4x10⁻⁵ S.cm-1 at 100°C) and has
also one of the lowest activation energy (0.8 eV). Deeper structural (synchrotron X-ray diffraction)
and theoretical studies (DFT) could help to understand this trend. It might depend on the
crystalline structure (Mg2+ mobility pathway) and the different substitution of (NH2)- anions by

General conclusion
[150]
(BH4)- (i.e. interaction of Mg2+ with its surrounding). Understanding this trend in this binary phases
diagram could allow the design of better Mg2+ ionic conductor based on other compounds. For
instance, the substitution of (NH2)- and (BH4)- by other anions such as (B12H12)2- (as demonstrated
with Na3(B12H12)(NH2))4 or (CB11H12)- could lead to the discovery of better ionic conductors. To
obtain this kind of compounds, important effort on the synthesis process would be needed as
there is no report of pure magnesium closo-borane or carborane synthesis. They are stabilized
only with solvent molecules or in carbon scaffolds.5,6 Synthesis process could be imagined to react
Mg(BH4)(NH2) with solid or liquid B10H14 for instance, similarly to what is done to get Li2B12H12 and
Na2B12H12.7 In terms of electrochemistry, it is hard to imagine using these materials directly as bulk
solid electrolytes. However, their chemical and electrochemical stability vs. the Mg anode makes
them interesting as coating materials. Indeed, it is possible to think about a system where the
electrodes are coated by a thin layer of stable electrolytes and separated by a good solid or liquid
ionic conductor. Then, of course, the contact with Mg metal will have to be optimized and our
materials will have to be chemically stable with the bulk electrolyte. If a coating is necessary at
the cathode, materials such as phosphates should be stable.8 Other compounds such as
magnesium halides are studied by Canepa’s group to form stable interfaces that are crucial for
rechargeable batteries.9
For bulk solid state electrolyte, more studies could also be done on Mg2P2S6. Indeed, this
compound has been reported only once in the work of Yamanaka et al., where it was obtained as
a side product studying MgS-P2S5-MgI2 glass-ceramics.10 A recent study showed that Zn2P2S6
features a good Zn2+ mobility with an ionic conductivity of about 10−7 S cm−1 at 60°C and more
interestingly, a very low activation energy of 351 ± 99 meV.11 So it is possible that Mg2P2S6 also
has good Mg2+ mobility because it has a very similar crystal structure as that of Zn2P2S6
(Mg2P2S6: C2/m, Z = 2, a = 6.085(1) Å, b = 10.560(2) Å, c = 6.835 (1) Å, β = 106.97(3)° and Zn2P2S6:
C2/m, Z = 2, a = 5.9717(4) Å, b = 10.3424(8) Å, c = 6.7565(5), β = 107.139(4)°). So, inorganic solid
electrolytes for Mg batteries are still worth of investigation and there are plenty of rooms to
improve their ionic conductivity/mobility and stability. The implementation of solid electrolytes in
Mg batteries would help to develop systems with high energy densities such as the Mg-S batteries
and, thus, to bring more options to the world of energy storage.

General conclusion
[151]
References
1. Noritake, T. et al. Synthesis and crystal structure analysis of complex hydride Mg(BH4)(NH2). Int. J. Hydrogen Energy 38, 6730–6735 (2013).
2. Higashi, S., Miwa, K., Aoki, M. & Takechi, K. A novel inorganic solid state ion conductor for rechargeable Mg batteries. Chem. Commun. 50, 1320–1322 (2014).
3. Le Ruyet, R. et al. Investigation of Mg(BH4)(NH2)-based composite materials with enhanced Mg2+ ionic conductivity. J. Phys. Chem. C 123, 10756–10763 (2019).
4. He, L. et al. Na3NH2B12H12 as high performance solid electrolyte for all-solid-state Na-ion batteries. J. Power Sources 396, 574–579 (2018).
5. Remhof, A. et al. Solvent-free synthesis and stability of MgB12H12. J. Mater. Chem. A 2, 7244 (2014).
6. Tutusaus, O. et al. An efficient halogen-free electrolyte for use in rechargeable magnesium batteries. Angew. Chemie Int. Ed. 54, 7900–7904 (2015).
7. He, L., Li, H., Hwang, S. & Akiba, E. Facile solvent-free synthesis of anhydrous alkali metal dodecaborate M2B12H12 (M = Li, Na, K). J. Phys. Chem. C 118, 6084–6089 (2014).
8. Su, J. et al. Atomic layer deposition of a magnesium phosphate solid electrolyte. Chem. Mater. 31, 5566–5575 (2019).
9. Chen, T., Sai Gautam, G. & Canepa, P. Ionic transport in potential coating materials for Mg batteries. Chem. Mater. 31, 8087–8099 (2019).
10. Yamanaka, T., Hayashi, A., Yamauchi, A. & Tatsumisago, M. Preparation of magnesium ion conducting MgS–P2S5–MgI2 glasses by a mechanochemical technique. Solid State Ionics 262, 601–603 (2014).
11. Martinolich, A. J. et al. Solid-state divalent ion conduction in ZnPS3. Chem. Mater. 31, 3652–3661 (2019).

General conclusion
[152]

[153]
Annex I – Experimental methods
Table of contents
AI.1 – Note on the air sensitivity of the materials ........................................ 155
AI.2 – Synthesis methods ............................................................................ 156
AI.2a – Ball-milling ............................................................................................ 156
AI.2b – Annealing under controlled atmosphere ................................................. 157
AI.3 – Structural analysis ............................................................................. 158
AI.3a – Powder X-ray diffraction ........................................................................ 158
AI.3b – Solid state MAS NMR spectroscopy ........................................................ 160
AI.3c – Infrared spectroscopy ............................................................................. 161
AI.4 – Thermal analysis ............................................................................... 162
AI.4a – Differential scanning calorimetry ........................................................... 162
AI.4b – Thermal gravimetric analysis ................................................................. 163
AI.5. Electrochemical analysis ..................................................................... 164
AI.5a – Electrochemical Impedance spectroscopy ............................................... 164
AI.5b – Polarization ........................................................................................... 167
AI.5c – Cyclic voltammetry ................................................................................. 169
References .................................................................................................. 171

Annex I – Experimental methods
[154]

Annex I
[155]
AI.1 – Note on the air sensitivity of the materials
The studied materials are extremely moisture and O2 sensitive so all the experimental
techniques have been adapted to be able to keep the materials protected. The storage and all the
handling of the different products were done in an Ar filled glovebox. All the different syntheses
and measurements were performed using airtight set-ups. In contact with H2O or O2, the hydrides,
borohydrides and the amides would form very exothermically oxides and hydroxides and release
an important quantity of gases such as H2 and NH3. This can be dangerous for instance if an
important quantity of material is exposed to H2O, especially if the material is powdery. In cases
where the materials have to be exposed to air, like for the cleaning of the ball milling jar, it is
important to neutralize them quickly after exposition to air and if possible under a fume hood. For
the neutralization, it is better to use ethanol as the production of gases will be slower than with
water and thus avoid explosions (cf. Figure AI. 1).
Figure AI. 1. Picture taken while pouring deionized water on the remaining powder in a jar used to ball-mill a mixture of Mg(BH4)2 and Mg(NH2)2. It illustrates the reactivity of these compounds
and that they can lead to explosions if not manipulate with care.

Annex I – Experimental methods
[156]
AI.2 – Synthesis methods
AI.2a – Ball-milling
Ball-milling was used to perform mechanochemical syntheses and also to reduce the grains
size of powders. Two kinds of ball-milling were used during this work: the planetary ball-milling
and the Spex ball-milling. Planetary ball milling will produce frictions while the balls rolls on the
walls of the jar and compression when the balls are projected from one side of the jar to the other.
The Spex ball milling will mainly shake the balls and the powder describing a 3D 8-shape rotation.
The planetary ball-milling was performed with a Retsch PM100 mill and a 50cm3 tungsten carbide
(WC) jar with 10 mm diameter WC balls. The ball-milling jar was sealed by a rubber o-ring encased
in its cap which is tight together with the jar with a clamping bracket. The spex ball-milling was
performed with a Spex 8000M mill. To perform the Spex ball-milling under NH3 atmosphere, a 25
cm3 stainless steel Spex jar equipped with a gas inlet was used (cf. Figure AI. 2). The atmosphere
inside the jar was changed using the same montage than described here after for the annealing
reactor. For Spex ball-milling under Ar, a jar without gas inlet was used. 8 mm diameter stainless
steel balls were used. The Spex jars were airtight thanks to a rubber o-ring encased in the jar and
tight with the cap using screws.
Figure AI. 2. Picture of the Spex jar equipped with a gas inlet.

Annex I
[157]
AI.2b – Annealing under controlled atmosphere
Annealing was needed to crystallize samples or to promote chemical reactions. A stainless
steel airtight reactor was used (cf. Figure AI. 3). The sealing of the reactor is ensured by a copper
ring that is strongly tightened between the body of the reactor and the cap. The cap was equipped
with a gas valve using graphite seals. With such reactor, the annealing can be performed at high
temperature and under several bar of gas pressure. During this thesis, three different atmosphere
of annealing had to be used: Ar, H2 and NH3. To do annealing under Ar atmosphere, the
atmosphere of the Ar filled glovebox in which the samples were loaded in the reactor was used.
Then to place the reactor under different atmospheres, a montage was assembled. It was made
of a vacuum pump and a gas inlet (H2 or NH3), both connected to a series of pipes and valves. The
montage allowed to vacuum the reactor up to 1x10⁻⁵ bar. Then, by closing the valve of the vacuum
and opening the one of the gas inlet, the reactor could be refilled without any air contamination.
Figure AI. 3. Picture of the stainless steel reactor used for our syntheses.

Annex I – Experimental methods
[158]
AI.3 – Structural analysis
AI.3a – Powder X-ray diffraction
Powder X-ray diffraction (PXRD) was performed on Bruker D8 diffractometers using Co Kα1-
Kα2 or Cu Kα1-Kα2 radiation in a θ-θ configuration. For the measurements, the LeRiCh’S cell that has
been developed in the lab was used.1 It is airtight and uses a X-ray-transparent Be window.
The Fullprof suite was used to analyze our data. Le Bail method2 (profile matching) was used
to determine the unit cell parameters. Rietveld refinement3 was used to get information on the
complete crystalline structure of the unit cell and also to quantify the amount of phases present
in some samples. For unknown structures, the software DICVOL4 was used to find the symmetry
of the unit cell and the software checkcell helped us to find the best space group based on the
extinction rule.
To perform correctly the Rietveld refinements, the measured intensity had to be corrected
from the absorption of the X-ray by the Be window. The correction was done with the Beer
Lambert law:
𝐼 = 𝐼0. exp (−µ. 𝑥) Equation AI. 1
with I: the X-ray intensity after absorption
I0: the X-ray intensity before absorption
µ: the mass absorption coefficient of Be (m-1)
x: the distance travelled by the X-ray in the Be window (m)
The mass absorption coefficient does not follow a linear behavior as a function of the
photons wavelength so it has to be calculated for each radiation (cf. Figure AI. 4). The National
Institute of Standards and Technology (NIST) provides a table corresponding to the mass
absorption coefficient of Be for different photon energies.5 It is from this table that can be
calculated the mass absorption coefficient corresponding to the photons from Co (λ = 1.78897 Å,
i.e. E = 6935 eV) and Cu (λ = 1.54060 Å, i.e. E = 8053 eV) sources:
µλCo = 29.9 m-1 and µλCu = 20.5 m-1

Annex I
[159]
Figure AI. 4. Mass absorption coefficient of Be for different values of photon energy.5
The distance x is determined by trigonometry knowing the angle of measure (θ) and the
thickness of the Be window (h):
𝑥 = 2.
ℎ
sin (𝜃)
Equation AI. 2
with h: thickness of the Be window (300 µm)
θ: detector angle (°)
Figure 3. Illustration of the path of the incident X-ray beam through the Be window during diffraction measurement.
Annex I – Experimental methods
[160]
AI.3b – Solid state MAS NMR spectroscopy
The solid state MAS NMR spectroscopy measurements were performed and analyzed at the
CEMHTI in Orléans by Elodie Salager and Pierre Florian.
11B, 15N, 25Mg and 1H solid-state MAS-NMR spectroscopy measurements were performed
using a 20 T Avance III Bruker spectrometer operating at 272.7 MHz, 86.16 MHz, 52.05 MHz and
850 MHz, respectively. All samples were handled and packed in rotors in an Ar filled glovebox.
11B solid-state MAS-NMR spectroscopy measurements were performed using a 2.5 mm
CP-MAS probe. The spectra were obtained at a magic angle spinning rate of 30 kHz under pure
nitrogen at 278 K. The one pulse 11B experiments were recorded with a RF power of 50 kHz and a
short excitation pulse (<π/18). Spinal-64 1H heteronuclear decoupling was applied at 100 kHz
during acquisition (8 ms). All spectra are referenced to a 1 mol.L-1 solution of B2O3 set at 20.5 ppm
and processed with a 3 Hz exponential broadening.
15N, 25Mg and 1H solid-state MAS-NMR spectroscopy measurements were performed using
a 4 mm CP-MAS probe.
The 15N experiments were recorded at a magic angle spinning rate of 14 kHz under pure
nitrogen at 278 K using a 1H-15N cross-polarization (CP) experiment with a contact time of 1.4 ms.
Spinal-64 1H heteronuclear decoupling was applied at 50 kHz during the acquisition period (15 ms).
The recycle delay was 1 s, for a total experiment time of approximately 15 h. All spectra are
referenced to a (NH4)(NO3) sample set at 22 ppm and processed with a 50 Hz exponential
broadening.
The 25Mg and 1H variable temperature experiments were recorded at a magic angle
spinning rate of 10 kHz under pure nitrogen for temperatures ranging from -25°C to +100°C.
The 1H spectra were recorded with a rotor-synchronized Hahn echo (π/2-tau-π-tau) using
a RF power of 110 kHz and a tau delay of 3 rotor periods. The recycle delay was 2 s, for a total
experiment time of approximately 30 s. All spectra were referenced to pure TMS set at 0 ppm.
The 25Mg signal was enhanced through a double-frequency sweep (DFS) followed by a
rotor-synchronized Hahn echo. The Hahn echo pulses were performed using a RF power of 360 W
(25 kHz for MgCl2 solution). Spinal-64 1H heteronuclear decoupling was applied at 100 kHz during
evolution (200µs) and acquisition (8 ms). The recycle delay was 1.5 s, for a total experiment time
of approximately 5 hours. All spectra are referenced to a 1 mol.L-1 solution of MgCl2 set at 0 ppm.

Annex I
[161]
Baseline correction and removal of the probe background were performed using a home-
made Matlab program. The spectra were fitted with the DMfit software.6
NMR spectroscopy was used to identify the phases present in our compounds. From
11B NMR spectroscopy, the measured chemical shift can be compared with the literature to know
what is the environment around the B atoms. The full width at half maximum (FWHM) of the peaks
gave us an information on the crystallinity of the present phases as a broad peak suggest that the
phase is disordered and might be amorphous. Then 15N NMR was performed to have more
information on the structure of our phases. Finally, 25Mg and 1H NMR were performed in
temperature to confirm that Mg2+ was the mobile specie and not H+.
AI.3c – Infrared spectroscopy
Fourrier transform infrared (FTIR) spectroscopy was performed in transmission mode. In an
argon filled glovebox, the samples were mixed with dried KBr powder and pelletized into thin
transparent 13 mm diameter pellets. KBr is used as IR-transparent matrix to support our sample.
The pellet is placed in an airtight sample holder that has two thick IR-transparent KCl windows.
The measurements were performed on Nicolet iS10 spectrometer (Thermo Scientific company)
from 4000 to 600 cm-1 with 100 spectra recorded by measurement.
The infrared spectroscopy gave us information on the B-H and N-H bonds in the different
samples. It also indicates if some impurities such as –OH groups are present in our samples. These
information are given by the vibration that are observed and by their wavenumbers.

Annex I – Experimental methods
[162]
AI.4 – Thermal analysis
The thermal analysis measurements were performed by Matthieu Courty (LRCS, Amiens).
AI.4a – Differential scanning calorimetry
The differential scanning calorimetry (DSC) measurements were carried out on a Netzsch
DSC 204 F1 heat flux differential calorimeter at a heating rate of 5°C.min-1 under a constant argon
flow of 50 mL.min-1. The samples were placed in aluminum crucibles which were sealed in a Ar
filled glovebox and their lids were pierced under argon flow prior to the measurement to allow
gas release upon heating. The onset and starting temperatures of the heat flow peaks were
determined with the software Proteus Analysis. The same software was used to measure the
enthalpy of each thermal phenomenon.
The DSC tells us if the samples will undergo exothermic or endothermic thermal
phenomena. To determine at which temperature a thermal phenomenon occurs, three values can
be defined: the starting temperature (Tonset), the temperature at the maximum of the peak (Tmax)
and the finishing temperature (Toffset). The DSC also gives the enthalpy of each phenomenon by
integration of the area under each peak.
Figure 4. Illustration of a DSC peak with its characteristic temperatures.

Annex I
[163]
AI.4b – Thermal gravimetric analysis
Thermogravimetric analyses (TGA) coupled with differential thermal analysis (DTA) and gas
mass spectrometry (MS) were performed between 25°C and 190°C under a constant flow of dry
argon (50 mL/min) using a Simultaneous Thermal Analyzer STA 449C Jupiter/ STA 449F3 from
Netzsch, and a heating/cooling rate of 1 K/min. The isothermal drift and sensitivity values are
0.6 µg/h and 0.1 µg, respectively. Alumina (or Platinum with an Al2O3 insert) crucibles were loaded
with 3-6 mg of sample powder in an Ar filled glovebox.
The MS was done on a quadrupole QMS403D Aëolos® mass spectrometer with a stainless
steel capillary heated at 230°C and a SEV detector (Channeltron). The counting time for mass
spectrometer is of 20 ms per m/z values (scanning width: m/z = 1-100) with a resting time of 1 s.
This measurement was performed under Ar atmosphere in a glovebox. The mass spectrometry
(MS) was coupled to the TGA measurements to identify any gas molecule that would be released.
At the entrance of the device, the gases are ionized and then separated by their mass-to-charge
ratio (m/z).

Annex I – Experimental methods
[164]
AI.5. Electrochemical analysis
AI.5a – Electrochemical Impedance spectroscopy
Electrochemical impedance spectroscopy (EIS) measurements were realized with a MTZ-35
frequency response analyzer (BioLogic Company) coupled with an Intermediate Temperature
System (ITS) controlling the sample temperature by Peltier effect. Pellets of our samples were
loaded in a Controlled Environment Sample Holder (CESH) in which two gold discs are the
electrodes. Papyex discs (flexible graphite previously dried under vacuum at 150°C) were placed
on both side of the pellets to improve the electrical contact between the gold electrodes and the
pellets. The combined Papyex foil and gold disk ensure an ion blocking electrode. Once the sample
is loaded, the CESH was placed in the ITS. AC impedance spectra were recorded in the frequency
range from 30 MHz to 500 mHz with an excitation signal of 50 mV amplitude and from 50°C to
100°C upon heating and cooling (1°C.min-1) with a temperature stabilization of 15 min before
impedance measurement every 10°C. The results shown are the one recorded upon cooling. At
the beginning of this thesis, the samples were cold pressed into pellets of 13 mm diameter under
a pressure of 6 tons with 100 mg of powder per pellet. A thickness of about 0.8 mm was obtained,
corresponding to a density close to 95% of the crystalline density in the case of Mg(BH4)(NH2)
(calculated from the crystallographic density: 0.9966 g.cm-3). The pellets were simply sandwiched
between two Papyex foils. Later, the pellets were prepared with a 6 mm diameter die in which
they were cold pressed directly between two Papyex foils. With this method, the Papyex foils are
stuck to the solid electrolyte. It improves a lot the contacts and thus the quality of the
measurements. It also needs less powder as only 30 mg of powder was pressed under 2 tons for
a final thickness of about 1.1 mm, so also a density close to 95% in the case of Mg(BH4)(NH2).
The following equation was used to determine the ionic conductivity of our materials from
EIS measurements:
𝜎 = 1
𝑅 .
𝑙
𝑆
Equation AI. 3
with σ: is the conductivity (S.cm-1)
R: is the resistance (Ω)
l: the thickness of the pellet (cm)
S: the cross-sectional area of the pellet (cm²)

Annex I
[165]
The value of the resistance is obtained from the Nyquist diagram that is fitted with the
proper model. For the measurement of a solid electrolyte between two blocking electrodes, a
Nyquist plot as shown on Figure AI. 5a is obtained. The semicircle at high frequency is due to the
bulk ionic conduction of the solid electrolyte. The following straight line is due to the capacitance
formed by the contact with the blocking electrodes. The diameter of the semi-circle is the
resistance R. The experimental data are fitted with an equivalent circuit model. The resistance of
the external electrical circuit is modelled by a resistance R0 in series with a R1//CPE1 which model
the ionic conductivity in the solid electrolyte and a CPE2 that models the capacitance formed by
the blocking electrodes on both sides of the solid electrolyte (cf. Figure AI. 5). Constant phase
elements (CPE) had to be used instead of ideal capacitances to model the roughness of the
contacts between the solid electrolyte and the blocking electrodes. The impedance of a real
capacitance would be expressed as:
𝑍𝐶𝑟𝑒𝑎𝑙 = 1
𝑗. 𝐶. 𝜔
Equation AI. 4
with C: the capacitance (F)
𝜔 = 2. 𝜋. 𝑓: the angular frequency (rad.s-1)
While the impedance of a CPE is expressed as:
𝑍𝐶𝑃𝐸 =
1
𝑌0. (𝑗. 𝜔)𝑛
Equation AI. 5
with Y0: a prefactor
n: a factor comprised between 0 and 1, depending on the surface roughness or a
nonuniform current distribution
Before to start fitting, the model needs to be fed with approximate values for R1 and CPE1.
If R1 is difficult to approximate from the Nyquist plot, it can be extracted from the Bode plot.
Indeed, the maximum on the Bode plot corresponds to the end of the semicircle (cf. Figure AI. 5b).
Knowing the frequency at which is the maximum on Bode plot allows to find the point
corresponding to this frequency on the Nyquist plot and thus to find R1. For the capacitance value,
the point at the top of the semi-circle has to be used. At this specific point, the cut-off frequency
is reached. This frequency is linked to the resistance R1 and the capacitance C1 by the relation:

Annex I – Experimental methods
[166]
𝑓𝑐𝑢𝑡−𝑜𝑓𝑓 =
1
2. 𝜋. 𝑅1. 𝐶1
Equation AI. 6
From Equation AI. 6, C1 can be calculated knowing R1 and fcut-off. This value of C1 can be
used as starting parameter for the CPE1, putting Y0 = C1 and n = 1.
Figure AI. 5. Typical a) Nyquist and b) Bode plots obtained for the measurement by EIS of a solid electrolyte with two blocking electrodes. c) The equivalent circuit used to simulate the data of the
Nyquist and Bode plots.
From the fitting of the data, other information than the resistance R can be extracted. The
real capacitance C linked to the ionic conduction phenomenon can be obtained. It is calculated
from the real parts of Equation AI. 4 and Equation AI. 5:
𝑅 =
1
𝐶. 𝜔
and 𝑅 =
1
𝑌0. 𝜔𝑛
Equation AI. 7 and
Equation AI. 8

Annex I
[167]
From Equation AI. 7 and Equation AI. 8 the relationship between the parameters of the
CPE (Y0 and n) and the real Capacitance (C) is obtained:
𝐶 = 𝑅1−𝑛
𝑛 . 𝑌0
1𝑛 Equation AI. 9
The value of the real capacitance will change depending on the conduction phenomenon
happening. The ionic conduction in the bulk and in the grain boundaries can be differentiated for
instance as it is described in Chapter II.
The ionic conductivity should follow an Arrhenius law. Plotting the logarithm of the ionic
conductivity values as a function of the reverse of the temperature gives us access to the
activation energy of the ionic motion in our solid electrolyte. Indeed, the ionic conductivity in a
solid electrolyte is given by the equation:
𝜎 =
𝜎0
𝑇. exp (
−𝐸𝑎
𝑘𝐵 . 𝑇)
Equation AI. 10
with σ0: a constant (K.S.cm-1)
Ea: the activation energy of the ionic conductivity (eV)
A linear fit of ln(σ.T) as a function of 1/T give us access to the activation energy Ea from
the slope which is equal to Ea/kB.
AI.5b – Polarization
Galvanostatic cycling with potential limit (GCPL) was performed using a VSP potentiostat
(Biologic company) equipped with a low current channel allowing us to work with current as low
as the nA. The current was applied with a positive and negative alternatively for 2h and each
polarization was separated by a 5 min rest. This resting time is used to remove the accumulate
charges at the interfaces. The assembly of the stacks was hardly reproducible so the current
density was set at a value for which the polarization would be at reasonable potential that is the
reason why it was changed from a cell to another. As our electrolytes have interesting ionic
conductivities only at elevated temperature, it was necessary to perform electrochemical
measurements at 100°C with a specific cell. A high temperature electrochemical cell has been
developped in our lab.7 This cell is based on the design of swagelock cells. It is made of a glass tube
that is closed on both side with swagelocks cells using teflon rings for sealing (cf. Figure AI. 6a).
The sample is placed in the middle of the glass tube where it is squeezed between two long

Annex I – Experimental methods
[168]
plungers. The pressure in the cell is maintained by a spring placed at the back of one of the plunger.
The glass part of the cell is placed in a homemade tubular oven that heats only the middle of the
cell and hence avoids the warming up of the teflon rings that could be detrimental to the sealing.
For the polarization measurements, a 10 mm diameter cold pressed pellet of a thickness of about
0.5 mm is placed between two 10 mm diameter discs of cold pressed Mg powder. In this
configuration, the open circuit voltage (OCV) should be close to 0 V vs Mg2+/Mg. Nevertheless, for
the first tries, the OCV was very unstable as shown on Figure AI. 6b and the measure was very
noisy (cf. Figure AI. 6c). It was observed that the spring used previously was actually too stiff so
when the cell was tight, the strength of the spring was large enough to push one of the swagelock
parts that slid along the glass tube. It leads to the decompression of the cell making the contacts
between the different parts of the stack very bad and that is the reason why the signal was so
noisy. To avoid this, the initial spring was replaced by a less stiff one and it results in a perfect
conservation of the mechanical pressure applied to the stack. After this change, the OCV of the
cells was much more stable and the measurement had almost no noise (cf. Figure AI. 6b and d).
Figure AI. 6. a) Design of the high temperature electrochemical cell. b) Typical open circuit voltage (OCV) before and after optimization by changing the spring of the electrochemical cell.
Polarization measurement c) before and d) after optimization.
The polarization measurements with symmetrical cells were used to determine the
compatibility between the anode and the solid electrolyte. A stable interface should result in a
stable polarization. If it is not the case, the polarization potential will increase and evolve in

Annex I
[169]
different ways depending on the phenomena occurring at the interface (dendrite or foam
formation, degradation of the solid electrolyte, lost of contacts, etc.).
AI.5c – Cyclic voltammetry
The cyclic voltammetry (CV) measurements were performed with a VSP potentiostat
(Biologic company) with a scanning rate of 0.05 mV.s-1 at 100°C using the high temperature
electrochemical cell presented in the previous subsection. The samples were prepared in an argon
filled glovebox where 20 mg of solid electrolyte were poured in a 6 mm diameter die, a first low
pressure of 0.5 ton was applied only with the plunger of the die to tamp the powder. Then, the
plunger was taken out and 10 mg of a composite electrode made of the solid electrolyte and
carbon black (90:10 wt%) mixed by hand in an agate mortar was poured on the top of the tamped
solid electrolyte in the die. A pressure of 2 tons was applied to obtain a dense pellet made on one
side of the solid electrolyte and on the other side of the composite electrode (cf. Figure AI. 7). The
fact to tamp the solid electrolyte in the die before to introduce the composite electrode ensure
that there will be no carbon of the composite electrode passing on the other side of the pellet
which would cause a short circuit. The side of the pellet made only of solid electrolyte is placed
on a disc made from cold pressed Mg powder. They are stacked in the electrochemical cell where
the pressure applied by a spring ensures the contact between them. As for polarization
measurements, the CV measurements were hard to realize so the parameters as the voltage
window or current range had to be modified depending on the cell (see chapter IV).
Cyclic voltammetry measurements were performed to measure the electrochemical
stability window of our solid electrolytes. By measuring anodic and cathodic currents, it is possible
to know at which potential our solid electrolytes are oxidized and/or reduced. If a measured
electrochemical reaction is reversible, its coulombic efficiency can be calculated from a plot where
the current is plotted as a function of time. On this plot, the area under the peak of oxidation or
reduction gives the capacity of the electrochemical reaction in Ah. The coulombic efficiency of a
reaction is the ratio between the measured areas of the reduction and oxidation during the same
cycle.

Annex I – Experimental methods
[170]
Figure AI. 7. Scheme of the assembling used to measure the electrochemical stability window by cyclic voltammetry.

Annex I
[171]
References
1. Leriche, J. B. et al. An electrochemical cell for operando study of lithium batteries using synchrotron radiation. J. Electrochem. Soc. 157, A606 (2010).
2. Le Bail, A. Whole powder pattern decomposition methods and applications: A retrospection. Powder Diffr. 20, 316–326 (2005).
3. Rietveld, H. M. A profile refinement method for nuclear and magnetic structures. J. Appl. Crystallogr. 2, 65–71 (1969).
4. Boultif, A. & Louër, D. Indexing of powder diffraction patterns for low-symmetry lattices by the successive dichotomy method. J. Appl. Crystallogr. 24, 987–993 (1991).
5. NIST: X-Ray Mass attenuation coefficients - Beryllium. Available at: https://physics.nist.gov/PhysRefData/XrayMassCoef/ElemTab/z04.html. (Accessed: 12th November 2019)
6. Massiot, D. et al. Modelling one- and two-dimensional solid-state NMR spectra. Magn. Reson. Chem. 40, 70–76 (2002).
7. Lalère, F. et al. An all-solid state NASICON sodium battery operating at 200°C. J. Power Sources 247, 975–980 (2014).

Annex I – Experimental methods
[172]

[173]
Annex II – Extra data
Table of contents
AII.1 – Neutron diffraction of the α-phase for x = 0.25 ................................. 175
AII.2 – Structure analysis of the β-phase for x = 0.25.................................... 176

Annex II – Extra data
[174]

Annex II
[175]
AII.1 – Neutron diffraction of the α-phase for x = 0.25
Neutron diffraction was used to try to differentiate the position of (BH4)- to the one of (NH2)-
anions in the structure of the α-phase obtained for x = 0.25 (cf. Chapter III). Indeed, from powder
X-ray diffraction, it is difficult to differentiate the positions of these two anions, especially because
they contain the same number of electrons (9 electrons). By neutron diffraction, B and N should
be clearly identified as they have a large difference of neutron absorption, 679.977 and 1.684 barn
respectively.
The samples were sent to the ILL (Institut Laue-Langevin) in Grenoble and the diffraction
measurements were performed by Emmanuel Suard with the beam line D2B (high resolution
neutron powder diffractometer). The wavelength was 1.594 Å with a high flux resolution. The
sample was placed in a 5.5 mm diameter vanadium tube sealed in an Ar filled glovebox.
Unfortunately, the measurement resulted in a quasi-total absorption of the neutrons and
no diffraction was obtained (cf. Figure AII. 1). This strong absorption is due to the presence of
incoherently scattering H and strongly absorbing B.
Figure AII. 1. Neutron diffraction pattern of the α-phase for x =0.25.

Annex II – Extra data
[176]
AII.2 – Structural analysis of the β-phase for x = 0.25
The β-phase obtained after annealing at 170°C of the α-phase for x = 0.25, crystallizes in an
unreported crystalline structure. The only symmetry found for the β-phase was monoclinic. On
Figure AII. 2, the XRD pattern of the β-phase for x =0.25 is fitted by profile matching using the
monoclinic space group P2/m. The obtained cell parameters are a = 21.522(2) Å, b = 11.7689(5) Å,
c = 10.428(5) Å, V = 2437.9(3) Å3 and β = 112.625(3) °. They are similar to the tetragonal unit cell
of the α-phase for x = 0.25 (s.g.: I41/acd, a = 11.0330(6) Å, c = 21.968(3) Å and V = 2674.2(4) Å3)
but for the β-phase, the volume is slightly smaller and the β angle is deformed to 112.625(3) °. So
the transition from α to β could be related to a shrinkage of the unit cell along with a monoclinic
deformation. Nevertheless, too many Bragg’s positions of this space group do not correspond to
experimental reflections. Further work is needed to find a more adequate space group and to fully
solve the crystal structure.
Figure AII. 2. XRD pattern and profile matching of the β-phase for x = 0.25.

Annex II
[177]

Résumé étendu de la thèse (french summary)
[178]

Résumé étendu de la thèse (french summary)
[179]
Résumé étendu de la thèse (french summary)
Dans un monde qui consomme de plus en plus d’électricité, les batteries rechargeables
jouent un rôle clé. Jusqu’à présent, elles étaient principalement utilisées pour l’électronique
mobile mais de nouvelles demandes commencent à émerger de la part d’autres applications,
notamment de la part des véhicules électriques. Ces derniers pourraient remplacer la majorité du
parc automobile utilisant des moteurs à combustion dans les prochaines décennies. La production
de batteries rechargeables pourrait aussi être accélérée par leur utilisation dans le domaine des
énergies renouvelables. En effet, les énergies renouvelables sont pour la plupart intermittentes
(solaire, éolien, etc.) et doivent donc être stockées pour permettre une utilisation continue de
l’électricité.
Aujourd’hui, les batteries rechargeables les plus couramment utilisées sont les batteries Li-
ion. Cette hégémonie est due à leur densité d’énergie qui est la plus élevée de toutes les
technologies existantes (jusqu’à 200 Wh.kg-1). Leur fort impact sur la société à conduit à
l’attribution du Prix Nobel de Chimie 2019 à John B. Goodenough, Stanley Whittingham et Akira
Yoshino pour le développement des batteries Li-ion. Cette technologie est tellement versatile que
sa production massive commence à créer des problèmes de développement durable. Des
éléments tels que le cobalt, qui est utilisé dans les matériaux de cathode de la plupart des batteries
Li-ion commerciales, sont rares et seulement présents dans certaines régions du monde. Pour ces
raisons, leur prix et leur disponibilité peuvent fluctuer de façon importante. Des solutions sont à
l’étude pour substituer ces éléments par des éléments plus abondants ou pour les remplacer
totalement et dans ce cas utiliser des technologies dites post-Li-ion tel que les batteries Li-S. Au-
delà des batteries basées sur le lithium, d’autres technologies sont étudiées. Comme celles basées
sur d’autres ions monovalents comme Na+ ou K+. D’autres systèmes basés sur des ions
multivalents comme Mg2+, Ca2+, Zn2+ ou Al3+ sont aussi étudiés. Parmi ces éléments, le magnésium
a été celui qui a attiré le plus l’attention durant les vingt dernières années.
Les batteries Mg rechargeables sont étudiées depuis le début des années 90 mais c’est
seulement en 2000 qu’une cellule fonctionnelle fut assemblée par Aurbach et al.. Néanmoins,
cette première cellule ne pouvait pas délivrer une importante quantité d’énergie. D’importants
efforts ont été faits par la communauté scientifique pour concevoir de meilleures cellules qui
puissent atteindre de grandes capacités ainsi que des hautes tensions pendant de nombreux
cycles. Les principaux problèmes rencontrés proviennent des difficultés à trouver des matériaux
de cathode qui permettent une insertion rapide des ions Mg2+ et des électrolytes présentant une
bonne conductivité ionique tout en possédant une large fenêtre de stabilité électrochimique. En

Résumé étendu de la thèse (french summary)
[180]
vue d’améliorer les batteries Mg rechargeables, notre approche fut d’étudier la possibilité
d’utiliser des électrolytes solides. En effet, les électrolytes solides pourraient être bénéfiques en
termes de stabilité chimique et électrochimique et en termes de sécurité. Les candidats comme
électrolytes solides ont été choisis parmi les conducteurs ioniques solides inorganiques de Mg2+
existants (sans les conducteurs mixtes tels que les matériaux d’électrode). Très peu de matériaux
sont rapportés du fait de la difficulté qu’ont les ions Mg2+ à se mouvoir dans les solides. Ces
matériaux sont listés dans le Chapitre I et ils peuvent être séparés en trois familles : les
phosphates, les sulfures et les hydrures complexes. Les phosphates, basés sur Mg-Zr-PO4, ont des
conductivités ioniques élevées mais seulement à hautes températures, typiquement ~10-3 S.cm-1
à 800°C. Ensuite, les sulfures, basés sur des verres du type MgS-P2S5, ont de trop faibles
conductivités ioniques (~10-7 S.cm-1 à 200°C) pour être intéressants en tant qu’électrolytes solides.
Finalement, les hydrures complexes, basés sur Mg(BH4)2, ont les meilleures conductivités ioniques
à basses températures (~10-5-10-6 S.cm-1 en dessous de 150°C). De plus, ce sont les seuls matériaux
qui ont été réellement caractérisés dans le but de les utiliser dans des batteries Mg (e.g. mesures
de dépôt/dissolution du Mg, fenêtre de stabilité électrochimique, etc.). Il a donc été décidé de
commencer notre étude avec Mg(BH4)(NH2) qui était rapporté comme un conducteur ionique
solide prometteur pour les ions Mg2+.
Mg(BH4)(NH2) fut décrit pour la première fois par Noritake et al. en 2013. Ils le
synthétisèrent à partir de Mg(BH4)2 et Mg(NH2)2 mais ils ne donnèrent aucun des paramètres de
synthèse (vitesse de broyage, temps et température de recuit, etc.). Il a donc fallu dans un premier
temps trouver les paramètres adéquats pour cette synthèse en testant différentes vitesse de
broyage et différents temps, atmosphères et températures de recuit (cf. Chapitre II). L’échantillon
le plus pur fut obtenu avec un broyage à 500 tr/min pendant 1 h et un recuit ultérieur à 120°C
pendant 72 h sous 10 bar de H2. Le diffractogramme de cet échantillon montre seulement
Mg(BH4)(NH2) qui cristallise dans le groupe d’espace I41/acd avec Z = 8 et les paramètres de mailles
a = 5.768(5) Å, c = 20.486(2) Å, et V = 681.6(1) Å3 qui sont en adéquation avec ceux de la littérature.
Lors de l’optimisation de la synthèse, des échantillons composites de Mg(BH4)(NH2) et d’une phase
additionnelle cristalline inconnue furent obtenues. Des mesures par spectroscopie 11B MAS-RMN
révélèrent que même dans les échantillons ne présentant que Mg(BH4)(NH2) cristallin par
diffraction des rayons X (DRX), la phase additionnelle subsistait mais elle était amorphe.
La teneur en phase additionnelle déterminée par spectroscopie RMN influence fortement
la conductivité ionique. L'échantillon contenant principalement la phase additionnelle (73%) a une
conductivité ionique de 8.10-8 S.cm-1 à 100°C avec une énergie d'activation de 1.3 eV; tandis que
Résumé étendu de la thèse (french summary)
[181]
l'échantillon contenant le moins de phase additionnelle (20%) a une conductivité ionique de 1x10-
5 S.cm-1 à 100°C avec une énergie d'activation de 1.0 eV. Cette dernière valeur de conductivité
ionique est quatre ordres de grandeur supérieure à celle rapportée par Higash et al. (~10-9 S.cm-1
à 100°C et Ea = 1,31 eV). Deux hypothèses peuvent être émises pour expliquer cette différence.
Pour la première hypothèse, le matériau de Higashi et al. est considéré comme étant
Mg(BH4)(NH2) pur à 100%. Dans ce cas, la présence de la phase additionnelle dans nos échantillons
composites améliorerait la conductivité ionique. En particulier, une fois qu’elle devient amorphe,
elle forme un matériau de type vitrocéramique augmentant la mobilité de Mg2 +. Pour la deuxième
hypothèse, la phase supplémentaire a en fait un effet négatif sur la mobilité de Mg2+. En effet, il a
été observé dans notre étude que moins elle est présente et plus la conductivité ionique est
élevée. Dans ce deuxième cas de figure, le matériau de Higashi et al. contiendrait une quantité
importante de phase additionnelle amorphe, diminuant sa conductivité ionique. Pour valider l'une
de ces deux hypothèses, une description précise des paramètres de synthèse utilisés par Higashi
et al. et des mesures de spectroscopie 11B RMN sur leur échantillon auraient été très utiles.
Cependant, dans les deux cas, la phase additionnelle a clairement un impact sur la conductivité
ionique et il était important d'essayer de l'obtenir pure. Comme elle contient des anions (BH4)-
observés par spectroscopie RMN, qu’il ne s’agit pas d’un produit de décomposition et qu’elle a
été obtenu pour des synthèse non optimisées, il a été supposé qu’il s’agissait en réalité d’un
composé du type Mg(BH4)2x(NH2)2(1-x).
Par la suite, pour tenter d'identifier cette phase additionnelle et pour identifier de nouveaux
conducteurs ioniques de Mg2+, le diagramme de phases binaire Mg(BH4)2-Mg(NH2)2 fut exploré (cf.
Chapitre III). Trois nouvelles phases cristallines de type Mg(BH4)2x(NH2)2(1-x) furent découvertes.
Deux phases avec une composition riche en amidure, appelées phase α et phase β. La phase α
cristallise avec la même structure cristalline que Mg(NH2)2, dans laquelle les anions (BH4)- se
substituent aux (NH2)-. Cette substitution conduit à une expansion de la maille cristalline et à une
amélioration de la conductivité ionique, passant de 4x10⁻⁹ S.cm-1 pour x = 0.17 à 1x10⁻⁸ S.cm-1 pour
x = 0,25. En montant en température, la phase α subit une transition structurale endothermique
irréversible formant la phase β. La phase β cristallise dans une nouvelle structure cristalline
inconnue. Cette transition de phase a un faible impact sur la conductivité ionique du matériau,
σ100°C = 2x10⁻⁸ S.cm-1, et l’énergie d’activation de la conductivité ionique augmente de 1.7 eV à 2.0
eV. Pour x = 0,33, avec un broyage à 600 tr/min, la phase β fut obtenue mal cristallisée. La
conductivité ionique à 100°C de ce dernier composé est améliorée car elle atteint 2x10⁻⁷ S.cm-1 et
son énergie d'activation est de 1.6 eV. La phase β pourrait être la phase additionnelle présente
dans les matériaux composites décrits dans le chapitre II lors de la synthèse de Mg(BH4)(NH2). En

Résumé étendu de la thèse (french summary)
[182]
effet, pour les échantillons avec la phase additionnelle cristalline, les diagrammes DRX et les
valeurs de conductivité ionique sont similaires, même si la valeur de Ea de la phase β est plus
élevée. Cette observation confirmerait la deuxième hypothèse que nous avons faite
précédemment, pour laquelle il est considéré que la présence de la phase additionnelle diminue
la conductivité ionique des matériaux composites.
Une autre phase cristallise dans la région riche en borohydrures, elle a été appelée la phase
γ. Elle a une structure tétragonale avec le groupe d’espace I-4. Comme pour la phase α, l’ajout
d’anions (BH4)- dans ce composé augmente le volume de la maille, mais diminue ici la conductivité
ionique. La phase γ présente des valeurs de conductivité ionique élevées qui diminuent avec x
tandis que l’énergie d’activation augmente. Le meilleur conducteur ionique est γ-
Mg(BH4)1.33(NH2)0.67 (qui peut également s’écrire γ-Mg3(BH4)4(NH2)2) avec une conductivité ionique
à 100°C de 4x10⁻⁵ S.cm-1 et une énergie d'activation de 0.8 eV. Ces valeurs signifient que ce
matériau présente l'une des meilleures mobilités des ions Mg2+ dans un conducteur ionique solide
inorganique jamais rapportées. La bonne mobilité des ions Mg2+ a été confirmée par spectroscopie
25Mg RMN-MAS avec un affinement significatif du pic de RMN lors du chauffage. La phase γ
présente également une bonne stabilité thermique, aucun événement thermique ni aucune perte
de masse n'ayant été détecté en dessous de 190°C. Un pseudo-diagramme de phases binaire
Mg(BH4)2-Mg(NH2)2 a été proposé. Il nous aide à comprendre la complexité de ce système. Une
tendance a également été observée pour la conductivité ionique puisqu’un maximum est atteint
pour γ-Mg3(BH4)4(NH2)2. Cette tendance se poursuit même si la structure cristalline change. De
bons conducteurs ioniques pour ions Mg2+ ont été trouvés dans ce diagramme de phases binaire,
mais ils devaient encore être caractérisés en tant qu’électrolytes solides pour savoir s'ils
pourraient être utilisés dans des batteries Mg.
Deux des meilleurs conducteurs ioniques trouvés dans le diagramme de phases
Mg(BH4)2-Mg(NH2)2 furent caractérisés comme possibles électrolytes solides: Mg(BH4)(NH2) et
γ-Mg3(BH4)4(NH2)2 (cf. chapitre IV). Premièrement, ils ne réagissent pas avec le carbone utilisé
comme additif conducteur et ils ne réagissent pas non plus avec les matériaux d'anode: Mg et Bi.
Cependant, ils réagissent avec le matériau de cathode Mo6S8. Au contact de Mo6S8, ils ont été
oxydés pour former Mg2Mo6S8 et des produits de décomposition amorphes. La compatibilité de
Mg(BH4)(NH2) avec l'anode de Mg a également été testée par une mesure de polarisation dans
une cellule symétrique utilisant des électrodes de Mg. Une grande résistance interfaciale a été
observée. Cela pourrait s'expliquer par un mauvais contact entre l'électrolyte solide et Mg,
notamment parce que Mg est un métal dur qui adhère très mal à l’électrolyte solide. La résistance

Résumé étendu de la thèse (french summary)
[183]
interfaciale augmente au fur et à mesure des cycles, indiquant son instabilité lors du
dépôt/dissolution du Mg. La même expérience a été réalisée avec des électrodes «Mg3Bi2 + Bi»,
mais malheureusement, la résistance interfaciale était encore plus grande que celle avec Mg. La
résistance interfaciale a augmenté lors du cyclage, ce qui pourrait être causé par le changement
important de volume entre Mg3Bi2 et Bi. Les fenêtres de stabilité électrochimiques des deux
électrolytes solides ont été mesurées par voltammétrie cyclique. Le dépôt/dissolution du Mg est
observé autour de 0 V vs. Mg2+/Mg, ce qui représente un résultat positif car il a été très rarement
rapporté pour un conducteur ionique solide d’ions Mg2+. L'oxydation des électrolytes solides
commence à environ 1.0 V vs. Mg2+/Mg. Le potentiel d'oxydation n’est pas affecté par la
composition de la phase étudiée.
En résumé, l’exploration du diagramme de phases Mg(BH4)2-Mg(NH2)2 nous a permis de
découvrir de nouveaux conducteurs ioniques inorganiques solides de Mg2+. Une tendance
apparaît entre la conductivité ionique et la composition de ces matériaux. L'un d'eux atteint l'une
des conductivités ioniques les plus élevées jamais rapportées pour un conducteur ionique
inorganique pour ions Mg2+ (4x10⁻⁵ S.cm-1 à 100°C) et possède également l'une des énergies
d'activation les plus basses (0.8 eV). Des études cristallographiques plus approfondies (diffraction
des rayons X par rayonnement synchrotron) et théoriques (DFT) pourraient aider à comprendre
cette tendance. Elle peut dépendre de la structure cristalline (chemin de diffusion des ions Mg2+)
et de la substitution des anions (NH2)- par (BH4)- (interaction des ions Mg2+ avec leur
environnement). La compréhension de cette tendance dans ce diagramme de phases binaires
pourrait permettre de trouver de meilleurs conducteurs ioniques de Mg2+.


Résumé
Cette thèse porte sur l’identification de nouveaux conducteurs d’ions Mg2+ inorganiques pour les utiliser en tant qu’électrolyte solide dans des batteries Mg. Le choix a été fait d’étudier les composés du diagramme de phases binaire Mg(BH4)2-Mg(NH2)2. Dans ce diagramme, seuls les composés Mg(BH4)2, Mg(NH2)2 et Mg(BH4)(NH2) étaient connus. Mg(BH4)(NH2) avait été rapporté comme un bon conducteur ionique mais ses paramètres de synthèse n’étaient pas rapportés. Dans un premier temps, il a donc fallu déterminer les paramètres de synthèse nécessaires pour l’obtention de Mg(BH4)(NH2). Après avoir tester différentes vitesses de broyage, différents temps, atmosphères et températures de recuit, Mg(BH4)(NH2) a pu être obtenu. Au cours des différentes optimisations des paramètres de synthèse, une phase additionnelle inconnue fut identifiée. Cette phase a une influence importante sur la conductivité ionique des échantillons. L’hypothèse fut faite que cette phase était en fait un composé du type Mg(BH4)2x(NH2)2(1-x). A partir des paramètres de synthèse déterminés précédemment, de nouvelles synthèses furent réalisées avec différentes stœchiométries. Trois nouvelles phases cristallines du type Mg(BH4)2x(NH2)2(1-x) purent être identifiées et une tendance fut observée entre la stœchiométrie et la conductivité ionique des phases. Un maximum est atteint pour x = 0.67 avec une conductivité de 4x10⁻⁵ S.cm-1 à 100°C, ce qui représente l’une des meilleures conductivités ioniques pour Mg2+ jamais mesurée dans un solide inorganique. Les propriétés d’électrolyte solide des meilleurs conducteurs ioniques identifiés lors de ces travaux furent caractérisées. Il apparut que ces composés ne sont pas stables à hauts potentiels. Ils commencent à s’oxyder aux alentours de + 1.0 V vs. Mg2+/Mg. Néanmoins, ils sont stables vis-à-vis de Mg et permettent son dépôt et sa dissolution électrochimique.
Mots clés : batteries magnésium, électrolyte solide, hydrures complexes, conducteurs ioniques solides, stockage de l'énergie
Abstract
This PhD thesis concerns the identification of new Mg2+ inorganic solid ionic conductors for possible use as solid electrolytes in Mg batteries. The choice was made to study the compounds from the Mg(BH4)2-Mg(NH2)2 binary phases diagram. In this phases diagram, only Mg(BH4)2, Mg(NH2)2 and Mg(BH4)(NH2) were known. Mg(BH4)(NH2) was reported previously as a good ionic conductor but its synthesis parameters were unknown. First, it was necessary to determine the synthesis parameters of Mg(BH4)(NH2). After testing different ball milling speeds, and different annealing times, atmospheres and temperatures, Mg(BH4)(NH2) could be obtained. During the optimization of the synthesis parameters, an unknown additional phase was identified. This phase has a strong influence on the ionic conductivity of the samples. The hypothesis was made that it was actually a Mg(BH4)2x(NH2)2(1-x)-type compound. From the synthesis parameters determined previously, new synthesis were performed with different stoichiometries. Three new crystalline Mg(BH4)2x(NH2)2(1-x) phases were identified and a trend was observed between the composition of the products and their ionic conductivity. A maximum is reached for x = 0.67 with an ionic conductivity of 4x10⁻⁵ S.cm-1 at 100°C, which is one of the best Mg2+ ionic conductivity ever reported in an inorganic solid. The solid electrolyte properties of the best ionic conductors identified during this work were characterized. It appeared that these compounds are not stable at high potentials. They start to get oxidized around + 1.0 V vs. Mg2+/Mg. Nevertheless, they are stable against Mg and allow its electrochemical deposition and stripping.
Keywords: magnesium batteries, solid electrolyte, complex hydrides, solid ionic conductors, energy storage
Copyright © 2022 FDOKUMEN


![Batteries In A Portable Wold [captured website] WW.pdf](https://static.fdokumen.com/doc/165x107/631bc4c07051d371800f2b67/batteries-in-a-portable-wold-captured-website-wwpdf.jpg)