
available-power prediction of lithium-ion batteries in electric ...
234
Aachener Beiträge des ISEA Alexander Farmann A comparative study of reduced-order equivalent circuit models for state-of- available-power prediction of lithium-ion batteries in electric vehicles Band 124
-
Upload
khangminh22 -
Category
Documents
-
view
3 -
download
0
Transcript of available-power prediction of lithium-ion batteries in electric ...

Aachener Beiträge des ISEA
Alexander Farmann
A comparative study of reduced-order equivalent circuit models for state-of- available-power prediction of lithium-ion batteries in electric vehicles
Band 124

A comparative study of reduced-order equivalent circuit models for
state-of-available-power prediction of lithium-ion batteries in
electric vehicles
Von der Fakultät für Elektrotechnik und Informationstechnik
der Rheinisch-Westfälischen Technischen Hochschule Aachen
zur Erlangung des akademischen Grades eines Doktors der
Ingenieurwissenschaften genehmigte Dissertation
vorgelegt von
Diplom-Ingenieur (FH)
Alexander Farmann, M. Sc. aus Teheran, Iran
Berichter:
Univ.-Prof. Dr. rer. nat. Dirk Uwe Sauer
Univ.-Prof. Dr. Ing. Olfa Kanoun
Tag der mündlichen Prüfung: 25. Januar 2019
Diese Dissertation ist auf den Internetseiten der Universitätsbibliothek online verfügbar.

ii
AACHENER BEITRÄGE DES ISEA Vol. 124
Editor:
Univ.-Prof. Dr. ir. h. c. Rik W. De Doncker
Director of the Institute for Power Electronics and
Electrical Drives (ISEA), RWTH Aachen University
Copyright ISEA and Alexander Farmann 2019
All rights reserved. No part of this publication may be reproduced, stored in a
retrieval system, or transmitted in any form or by any means, electronic,
mechanical, photocopying, recording, or otherwise, without prior permission of
the publisher.
ISSN 1437-675X
Institut für Stromrichtertechnik und Elektrische Antriebe (ISEA)
Jägerstr. 17/19 • 52066 Aachen • Germany
Tel: +49 (0)241 80-96920
Fax: +49 (0)241 80-92203

iii
Alexander Farmann
A comparative study of reduced-
order equivalent circuit models for state-of-available-power prediction of
lithium-ion batteries in electric vehicles

iv

v
Preface When I started my diploma thesis at Forschungsstelle für Energiewirtschaft in Munich
in 2010, I was slightly sceptical at first and often honestly wondered whether I had
taken the right decision to take a specific topic dealing with battery technologies. Over
time, as I kept learning and became more familiar with the topic, I realized that one will
never stop to gain new knowledge about a battery’s behavior. However, obviously this is
an open-end story as even after nine years since those days I have to admit that there
are still many of topics to be investigated and understood that I need to investigate and
understand. During my time at ISEA, I was given the opportunity of doing research on
many aspects of battery technology/behavior, and I tried to make the best of it. This
work is the result of countless hours of my life during the time when I worked at ISEA
and afterwards.
My gratitude and appreciation go especially to professor Dirk Uwe Sauer, who made this
work possible and supervised my thesis. He always encouraged me to follow my
ambitions, he believed in me to bring this work to an end and supported me in
publishing several scientific papers in renowned journals and magazines. In addition,
special thanks go to professor Kanoun for undertaking the second examiner’s role and for the interesting discussions in advance.
I thank all my colleagues and friends at ISEA for their support during the time we
worked together. Many thanks for all the animated technical and non technical
discussions which we had together. Special thanks go to Wladislaw Waag who always
contributed his experience and technical knowledge. Performing measurements would
not have been possible without the helping hand of Holger Blanke, who continously
supported me in manufacturing and adapting the test benches with his longstanding
expertise.
I would like to express my gratitude and appreciation to my colleagues, Thomas Olbrich
and Dietmar Vogt at Continental AG, who have always offered their support and
believed in me. It is a great pleasure for me to have got to know you.
I cannot thank my family enough who made everything possible for me. My parents who
helped me through school and supporting me to come to Germany for studying.
Moreover, especial thanks goes to my grandfather and my brother who always believed
in me and supported me.
Landshut, March 2019
Alexander Farmann

vi
Abstract Lithium-ion batteries (LIBs) definitely belong to the most promising commercially
available energy storage systems (ESS) for use in electric vehicles (EVs). Their higher
specific volumetric and gravimetric energy and power density, higher cycle lifetime and
lower self-discharge rate in contrast to settled ESS (e.g., lead-acid batteries, nickel-
cadmium or nickel-metal hydride) have gained the attention of many vehicle
manufacturers, suppliers and research institutions in order to explore and improve
different LIB technologies in recent years.
Battery management systems (BMS) consisting of both hardware and hardware are
responsible for reliable and safe operation of LIBs in EVs. State-of-Charge (SoC), State-
of-Health (SoH) and State-of-Available-Power (SoAP) are the major battery states that
must be determined by means of so-called monitoring algorithms. The main focus of the
present study lies on on-board SoAP prediction of LIBs in EVs. The prediction of the
maximum power that can be applied to the battery by (dis)charging it during
acceleration, regenerative braking and gradient climbing is definitely one of the most
challenging tasks of BMS. The available battery power is limited by the safe operating
area (SOA), where SOA is defined by battery temperature, current, voltage
and SoC. Accurate SoAP prediction allows the energy management system to regulate
the power flow of the vehicle more precisely and optimize battery performance and
improve its lifetime accordingly.
In this study, LIBs at different aging states using various active materials are
investigated whereby the primary focus lies on investigating the electrical behavior of
LIBs using lithium titanium oxide, Li4Ti5O12 (LTO) anodes. In addition, other LIB
technologies such as lithium nickel cobalt manganese
oxide, Li(Ni1/3Co1/3Mn1/3)O2 (NMC) and lithium iron phosphate, LiFePO4 (LFP) are
examined. Characterization tests are performed over a wide temperature range (-
20 °C⋯+40 °C) by employing electrochemical impedance spectroscopy and current pulse
tests. Furthermore, the behavior of battery impedance parameters and open-circuit
voltage over the battery lifetime with regard to temperature, SoC is investigated
comprehensively.
The closed-loop model-based approaches using reduced order equivalent circuit models
(ECM) for battery state estimation have received increasing attention in recent scientific
publications due to their simple nature and the possibility for implementation on low-
cost embedded systems. The aforementioned techniques are often reliable and can track
the changes of impedance characteristics over the battery lifetime. However, most of the

vii
methods presented in the literature are often validated under nominal conditions using
standardized load profiles and neglect major internal and external factors, among others,
extreme temperature variation or adaptability of the applied algorithm to present
operating condition and aging state of the battery. In this study, a comparative study of
a wide range of impedance-based ECMs for on-board SoAP prediction is carried out. In
total, seven dynamic ECMs including ohmic resistance, RC-elements, ZARC elements
connected in series with a voltage source are implemented. The investigated ECMs are
verified under varying conditions (different temperatures and wide SoC range) using
real vehicle data obtained in an EV prototype and current pulse tests. Furthermore, the
current dependence of the charge transfer resistance is considered by applying the
Butler-Volmer equation. The dependence of voltage estimation and SoAP prediction
accuracy for different prediction time horizons on SoC, temperature and applied current
rate is examined.

viii
Table of contents
1 Introduction and motivation ....................................................................................... 1
2 Lithium-ion batteries and their experimental characterization ................................ 5
2.1 Fundamentals of lithium-ion batteries ...................................................................... 5
2.1.1 High performance electrode materials for lithium-ion batteries ................ 8
2.2 The lithium-ion batteries investigated in this work ................................................ 14
2.2.1 Experimental setup .................................................................................... 15
2.3 Experimental techniques commonly applied for electrical characterization of
lithium-ion batteries ................................................................................................. 15
2.3.1 Electrochemical impedance spectroscopy .................................................. 15
2.3.2 Hybrid pulse power characterization ......................................................... 19
2.4 Measurement results and discussion ....................................................................... 20
2.4.1 Characterization of the impedance characteristics ................................... 20
2.4.2 Characterization of the open-circuit voltage .............................................. 36
2.5 Validation datasets ................................................................................................... 55
2.5.1 Load profiles investigated in this work for verification reasons ............... 56
2.6 Summary ................................................................................................................... 63
3 Review of monitoring algorithms and battery models presented in the literature . 66
3.1 State-of-Charge estimation ....................................................................................... 70
3.1.1 Methods based on coulomb counting technique ......................................... 70
3.1.2 Methods based on measured or estimated OCV ........................................ 71
3.1.3 Methods based on active or passive impedance spectroscopy ................... 73
3.2 State-of-Health and capacity estimation .................................................................. 73
3.2.2 Methods based on measured or estimated OCV ........................................ 79
3.2.3 Methods based on electrochemical models................................................. 89
3.2.4 Methods based on Incremental capacity analysis and differential voltage
analysis methodologies ............................................................................... 91
3.2.5 Methods based on aging prediction models ............................................... 95
3.3 State-of-Available-Power prediction ......................................................................... 97
3.3.1 Methods based on adaptive characteristic maps ..................................... 104
3.3.2 Methods based on equivalent circuit models ........................................... 106
3.4 State-of-Safety estimation ...................................................................................... 118
3.5 Lithium-ion battery models .................................................................................... 121
3.5.1 Classification of battery models ............................................................... 121
3.5.2 Requirements on battery models employed in monitoring algorithms ... 132
3.6 Summary ................................................................................................................. 132

ix
4 The equivalent circuit models investigated in this work ....................................... 134
4.1 Equivalent circuit model using an ohmic resistance (Model 1) ............................. 136
4.2 Equivalent circuit models using an ohmic resistance connected in series with a
finite number of RC-elements (Models (2-4)) ......................................................... 136
4.3 Equivalent circuit models using an ohmic resistance connected in series with a
finite number of ZARC-elements (Models (5-7)) ..................................................... 139
4.4 Summary ................................................................................................................. 142
5 Applied method for battery state estimation ......................................................... 143
5.1 Method for impedance parameters estimation ....................................................... 143
5.1.1 A selection of simulation results for impedance parameters estimation 147
5.1.2 Sensitivity analysis of impedance parameters and voltage estimation
accuracy during an extreme temperature variation .............................................. 148
5.2 Method for battery State-of-Available-Power prediction ....................................... 150
5.2.1 Basic idea of the applied technique for SoAP prediction ......................... 151
5.2.2 Results and discussion ............................................................................. 153
5.3 On-board open-circuit voltage estimation .............................................................. 168
5.4 Summary ................................................................................................................. 169
6 Summary and outlook ............................................................................................. 170
Bibliography ..................................................................................................................... 174
List of abbreviations ........................................................................................................ 195
List of symbols .................................................................................................................. 199
Appendices ....................................................................................................................... 205
Appendix A: Measured OCVs of NMC/LTO and NMC/C-based Lithium-ion batteries at
different aging states for various temperatures ..................................................... 205
Appendix B: Step-wise illustration of on-board capacity estimation of lithium-ion
batteries .................................................................................................................. 207
Appendix C: Charge and discharge curves behavior over the battery lifetime .............. 208
Appendix D: Static charge and discharge power capability of the battery ..................... 209
Appendix E: Comparison of model performances for Cell-D-new and Cell-A-aged using
the examined driving cycles .................................................................................... 210
Appendix F: Impact of prediction time horizon on SoAP prediction accuracy for different
applied current rates and State-of-Charges using the examined driving cycles ... 211
List of publications ........................................................................................................... 213
Conference and magazine contributions ................................................................ 213

x
Peer-Reviewed journal contributions ..................................................................... 213

Introduction and motivation 1
1 Introduction and motivation
Upcoming and existing regulations offered on national or international scale in order to
reduce the vehicle local emissions present new technical and economic challenges to the
automotive industry. Partial or full electrification of the vehicle powertrain is one of the
certain unfailing measures to reach particular targets in the aforementioned sector [1].
In this regard, alternative energy storage systems (ESS) as a fundamental part of the
vehicle powertrain play a key role in achieving the desired strategic objectives. According
to already adopted regulations in the European Union (EU), the fleet average local CO2
emissions of passenger cars must be limited to 95 g/km from 2021 [2]. In order to achieve
the aforementioned target, hybridization of the vehicle powertrain in mid-term, is a
preferred solution of the vehicle manufactures where the aforementioned target can be
fulfilled with a moderate cost increase. However, in long-term (i.e., very probably from
2025), there are ambitions to further limit vehicle local CO2 emissions to
75 g/km. Thereafter, full electrification of the vehicle powertrain becomes increasingly
important. Fig 1 illustrates a selection of important requirements on ESS for use in
electric vehicles (EVs) [3].
Fig. 1: A selection of requirements on energy storage systems for use in electric vehicles

Introduction and motivation 2
Lithium-ion batteries (LIBs) definitely belong to the most promising commercially
available ESS for use in automotive applications. The higher specific volumetric and
gravimetric energy and power density, lower weight, higher cycle lifetime and lower self-
discharge rate of LIBs [4] in comparison to settled ESS (e.g., lead-acid batteries, nickel-
cadmium or nickel-metal hydride) have gained the attention of many vehicle
manufacturers, suppliers and research institutions in order to explore and improve
different LIB technologies in recent years. Beside some technical and infrastructural
challenges, the main barrier for market entry of the EVs still remains their price that is
in turn highly dependent on battery price. Thereafter, EVs can only be successful in
achieving a commercial breakthrough if their price decreases significantly and end user
acceptance is high enough. Following the noticeable drop in LIB prices in recent years
and the forecast for continuing trend in coming years mainly as a result of increasing
production volume (e.g., in Ref. [5]), almost nothing stands in the way of successful EVs
market entry.
Nevertheless, there are still some drawbacks associated with LIBs which need to be
addressed. First, up to now the aging mechanisms of LIBs are not sufficiently
understood [6]. Second, on the one hand their lack of safety at high temperatures or in a
crash case and on the other hand their limited performance at very low temperatures
(e.g., especially challenging for hybrid electric vehicles (HEVs) with regard to cold
cranking capability) belong to the main concerns of the vehicle manufacturers [7].
Consequently, certain targeted improvements have to be made in terms of safety,
developing innovative electrode and electrolyte materials yielding higher lifetime, cycle
stability and more efficient power and capacity performance even at low temperatures
[8].
In large lithium-ion battery packs several hundred LIBs are connected in series and/or
in parallel to fulfill specific electrical and thermal requirements. The performance of
LIBs and their operation in EVs are controlled and diagnosed by means of so-called
battery management systems (BMS) consisting of both software and hardware. In other
words, among the main tasks of BMS are battery state estimation, protection against
battery over/under-voltage, over-current, over-temperature, under-temperature etc. The
main battery states of interests are often State-of-Charge (SoC), State-of-Health (SoH)
and State-of-Available-Power (SoAP). Since the aforementioned battery states are not
measureable on-board, the so-called monitoring algorithms must be used.

Introduction and motivation 3
Various internal and external factors such as temperature distribution inside battery
pack, change of battery impedance characteristics (i.e., mainly because of battery aging
or temperature change etc.), cell-to-cell variations either in an initial state or over the
battery lifetime resulting from different cell impedances or capacities, influence the
battery behavior with regard to energy content and/or power capability. Therefore, using
robust monitoring algorithms working precisely over the battery lifetime is necessary. In
ideal case, monitoring algorithms employed for battery state estimation must work
reliable over the battery lifetime. Furthermore, a precise estimation of battery states
should be ensured in order to satisfy end consumers with regard to e.g., power and/or
energy management strategy or safety aspects etc. During the early stage of
development phase of monitoring algorithms, an especial emphasis should be put on low
computational effort, low model parameterization effort, high model fidelity over a wide
SoC and temperature range and so far possible consideration of physical equivalence.
As will be discussed later in this work, closed-loop model-based approaches using
reduced order equivalent circuit models (ECM) for battery state estimation have received
increasing attention in recent scientific publications due mainly to their simple nature
and the possibility for implementation on low-cost embedded systems. The
aforementioned techniques are often reliable and can track the changes of impedance
characteristics over the battery lifetime. However, most of the methods presented in the
literature are often validated under nominal conditions using standardized load profiles
and neglect major internal and external factors, among others, extreme temperature
variation or adaptability of the applied algorithm to present operating condition and
aging state of the battery. One of the main objectives of this work is to investigate the
influence of the employed ECMs on voltage estimation and SoAP prediction accuracy
under varying conditions. The applied algorithm is validated using real vehicle data
obtained in an EV prototype and pulse tests performed under varying conditions. In
total, seven different impedance based ECMs are implemented and dependence of
voltage estimation and SoAP prediction accuracy on temperature, SoC and applied
current rate is examined comprehensively. Moreover, dependence of SoAP prediction
accuracy on various prediction time horizons often of interest in EVs is examined.
LIBs using various active materials are commercially available on the market for
automotive and stationary applications. The primary focus of this work lies on
investigating the electrical behavior of LIBs at different aging states using lithium
titanium oxide, Li4Ti5O12 (LTO) anodes. In addition, other LIB technologies such as
lithium nickel cobalt manganese oxide, Li(Ni1/3Co1/3Mn1/3)O2 (NMC) or lithium iron

Introduction and motivation 4
phosphate, LiFePO4 (LFP) are examined. The measurements are performed over a wide
temperature range (− °C⋯ °C). It is worth noting that the investigated ECMs and
the applied estimator can be employed independent of battery types/chemistries.
The main objectives of this work can be summarized as follows:
Discussion and analysis of various internal and external factors influencing the
impedance characteristics of the battery,
Discussion and analysis of various internal and external factors influencing the
open-circuit voltage (OCV) behavior of the battery,
A comprehensive review of available techniques for battery states/parameters
estimation (e.g., SoC, SoH and actual battery capacity, SoAP etc.) and various
classes of battery models presented in the literature,
Discussion and analysis of requirements on verification load profiles for battery
monitoring algorithms and detailed description of the ECMs investigated in this
work,
Analysis of dependence of voltage estimation and SoAP prediction accuracy of the
investigated ECMs on temperature, SoC and applied current rate.
In chapter 2, fundamentals and principal functionality of LIBs are discussed and a brief
overview of active materials commonly used in for LIBs is provided. Moreover, the
results of extensive experimental impedance and OCV measurements performed at
different aging states of the battery and over a wide temperature and SoC range are
shown and the findings are described profoundly.
A review of available techniques for on-board battery state/parameters estimation, in
particular methods for on-board SoC, actual battery capacity, SoH, State-of-Safety (SoS)
estimation and SoAP prediction is provided in chapter 3.
Chapter 4 addresses the ECMs investigated in this work and physical meaning of
impedance parameters employed in the respective ECMs is discussed comprehensively.
The applied estimator for on-board impedance parameters estimation and SoAP
prediction of the battery is described in chapter 5. In addition, the impact of battery
temperature, SoC and applied current rate on voltage estimation and SoAP prediction
accuracy is discussed. Finally, this work is concluded in chapter 6 with a summary and
discussion of the presented results.

Lithium-ion batteries and their experimental characterization 5
2 Lithium-ion batteries and their experimental characterization
In this chapter, principle functionality of LIBs and various commercially available LIB
technologies including a brief description of commonly used anode and cathode materials
are discussed profoundly. Moreover, the LIBs investigated in this work and their
technical specifications are presented in subsection 2.2. Experimental techniques
commonly used for electrical characterization of LIBs are discussed in subsection 2.3.
Subsection 2.4 presents a selection of the measurement results obtained from battery
impedance characterization tests and OCV tests performed on the investigated LIBs at
different temperatures and aging states. Moreover, in subsection 2.5, the datasets used
for validating the applied algorithm are shown and important requirements on
verification datasets for battery monitoring algorithms are discussed.
2.1 Fundamentals of lithium-ion batteries
The first primary LIB using lithium in the anode and manganese oxide in the cathode
was commercialized by the company Sanyo in 1972. After permanent improvements of
used active materials and cell structure in order to achieve for example higher voltage
level, the first commercially available secondary LIB was introduced to the market by
Sony in 1991. The particular LIB used amorphous carbon anode and lithium cobalt
dioxide, LiCoO2 (LCO) cathode [9].
Although the LIBs mainly differ in their characteristics and the used active materials
(materials used in the cathodes or the anodes), the basic functionality of the LIBs
remains always the same. A LIB consists of two electrodes that are separated by an
electronically insulating but ionically conducting separator. Using separator often made
of porous polymer membrane is necessary in order to prevent a short-circuit in a LIB.
Between both electrodes, an ion conductive electrolyte often containing lithium salts (i.e.,
LiPF6) is used where electrolyte is usually mixed with carbonates (i.e., ethylen carbonate
or dimethyl carbonate). It is worth noting that alternative electrolyte materials based on
gel, polymeric or glassy matrices are currently under development [10]. The anode of LIB
in its most conventional structure is made of graphite while the cathode is made of metal
oxides (e.g., LCO, lithium manganese oxide, LiMn2O4 (LMO) etc.). A more detailed
description of commercially available anode and cathode materials will be provided later
in following subsection. The current collector of the negative electrode often consists of
copper and that of the positive electrode consists of aluminum because of its passivation

Lithium-ion batteries and their experimental characterization 6
properties. Fig. 2 shows a typical structure of a secondary LIB using graphite anode and
metal oxide cathode.
Fig. 2: Schematic illustration of a common lithium-ion battery using graphite anode and metal oxide cathode
The chemical equation representing the intercalation and deintercalation phenomenon of
lithium-ions in electrode materials in an example of a LIB using lithium metal oxide
(LiMO2, e.g., LiCoO2) cathode and graphite anode is as follows (Eq. (1)):
yC+LiMO2↔LixCy + Li(1-x)MO2 (1)
where x ≅ 0.5 and y=6 for V= 3.7 V.
LIBs operate according to the so-called “rocking chair” principle. During battery operation (i.e., charging or discharging process), the lithium-ions (Li+) are transferred
from one electrode through the electrolyte and the separator to the other electrode and
then stored in active material. In particular, during discharge Li+ move from the anode
to the cathode while electrons flow from the anode through the external circuit to the
cathode producing electrical power. The aforementioned processes are reversed when the
LIB is charged [9]. The LIBs commercially available for automotive applications can be
classified into following three formats [11]-[12]:
Cylindrical,
Pouch,

Lithium-ion batteries and their experimental characterization 7
Prismatic.
The electrical and mechanical design of a lithium-ion battery pack including cell
selection is significantly influenced by type of respective EV (i.e., HEV or battery electric
vehicle (BEV)). Accordingly, an unsophisticated decision could have an enormous impact
on different factors such as power/energy requirements, costs, packaging or over/under-
sizing of lithium-ion battery pack.
The cells integrated into a lithium-ion battery pack should be protected against the
intrusion of liquids by adequate measures. Thereafter, the housing of a lithium-ion cell is
often based on flexible pouch foils or robust metal housings [13]. The three LIB formats
mentioned above can be found in different EVs currently released in series on the
market. Unfortunately, vehicle manufacturers worldwide have not been agreeing on a
standardized LIB format for EVs independent of vehicle and local market1 up to now.
The latter fact could have huge impact on cost minimizing in long-term since with
increasing sales numbers of a particular LIB format that is used in a wide range of EVs,
the cost of production significantly decrease.
The cylindrical LIBs with more than 3 billion production figures a year mainly for
consumer applications such as laptops are widespread and actually belong to the most
produced LIBs. Along with prismatic LIBs these both cell formats are based on robust
metal housing where at least one predetermined breaking point inside the cell or over-
pressure valve is implemented. The aforementioned over-pressure valve becomes active
at pressures about 10 to 15 bars. The main difference between the mentioned LIB
formats is their different heat dissipation characteristics whereby prismatic LIB format
is often the preferred choice because of its larger external surface2.
The next format of LIBs often used in EVs is called pouch format or so-called stacked
electrode design. The housing of the aforementioned LIBs is based on multi-layer film
composites with an aluminum core. As current collectors metallic foils (commonly copper
for negative electrode and aluminum for positive electrode) are used. The housing of
pouch cells deflects noticeably under gas evolution occurring inside the LIB and, thus no
over-pressure valve is implemented in such LIBs [13]. In addition to the above
mentioned safety devices, the LIBs are often equipped with additional safety devices
such as melting fuse, shutdown separators or positive temperature coefficient contact
disc [12], [14].
1 The German vehicle manufacturers defined DIN SPEC 91252:2011-01 (D) in 2011 in order to support the
standardization process at least in Germany. 2 It is assumed that the chemistry and the energy content of LIBs are the same.

Lithium-ion batteries and their experimental characterization 8
In Table 1, a general comparison of automotive specified LIB-formats available on the
market is given. It is worth noting that the given values and advantages and
disadvantages are a generalization and could differ between individual cell manufacture
etc.
Table 1: Lithium-ion battery cell formats commonly used in automotive applications (adopted from Refs. [12]-[13])
Cell format Dimension
Format 1
Dimension
Format 2
Dimension
Format 3 Advantages Disadvantages
Cylindrical 18650 26650 217003
Low cost and
considerable
experience
(e.g.,
production)
Cooling and
packaging
Pouch
(LxHxT
[mm3])
- 121x243xT 330x162xT
Higher
energy
density
because of
low case
weight and
well cooling
characteristi
c; cheap;
simple
production
Low
mechanical
stability; low
cost
Prismatic
(LxHxT
[mm3])
173x115x
32 (or 45)
120x85x
12.5
V1: 175x85x21
V2:
148x91x26.5V
3:
148x125x26.5
Efficient
thermal
management
; packaging;
Mechanical
stability
High
volumetric
energy density
on battery
pack level
2.1.1 High performance electrode materials for lithium-ion batteries
In the following two subsections, a brief overview of cathode and anode materials
commonly used in LIBs for automotive application is given. It is worth mentioning that
the purpose of the aforementioned subsections is not discussing individual active
material in great detail as it is out of the scope of this work. Interested readers are
referred to the review articles given below.
Advanced cathode materials are essential to meet specific requirements regarding e.g.,
voltage level and durability of LIBs. In general, it can be stated that layered transition
3 This cell format is still under development and will in all probability be used in diverse mobile applications such as EVs
or pedelecs etc.

Lithium-ion batteries and their experimental characterization 9
metal oxides based on α-NaFeO2, spinel and olivine structures are the most used cathode
materials in commercially available LIBs [15]. Among the main challenges for present
and future cathode material structures are the stabilization of crystal structure during
lithiation and delithiation and prevention of reaction with electrolyte. In addition, anodic
stability of electrolyte must be ensured since it directly influences the highest useable
potential for charging and the maximum releasable capacity from the cathode,
respectively [8]. A wide overview of available cathode materials and recent advances and
developments can be found for example in Refs. [8], [15]. A selection of the state-of-the-
art cathode materials commonly used in LIBs is listed in Table 2.
Table 2: A selection of advanced cathode materials commonly used for LIBs adopted from Refs. [8]-[11], [15]
Cathode materials
Cathode
capacity
(mAh ∙g− )
Structure
Voltage
vs.
Li|Li+
Advantages Disadvantages
LiCoO2 140-155 α-NeFeO2 3.9
High stability,
good rate
capability
Expensive;
Availability of
cobalt
LiNiO2 160-170 α-NeFeO2 3.8
Cheaper than
LiCoO2, High
current rate
capability,
higher energy
density then
LiCoO2
Expensive;
Less stable
and less
ordered than
LiCoO2,
Li(Ni1-x-y,Mnx,Coy)O2 140-180 α-NeFeO2 ≈3.8
High capacity,
operation at
high voltages
Safety
Li(Ni0.8,Co0.15,Al0.05)O2 190 α-NeFeO2 3.6
High capacity
and high power
capability,
higher
structure
stability
Safety
LiMn2O4 100-120 Spinel
structure 4.0
Lower cost and
safer than
LiCoO2, very
fast cathode
material
because of the
possibility for
multi-
directional
diffusion of
lithium-ions
Lower
capacity than
cathodes
based on
α-NeFeO2
structure,
occurrence of
phase changes
during cycling
V2O5 and
LiV3O8 ≈300
Layered
compounds 3.0
Higher capacity
than above
Low voltage
and low

Lithium-ion batteries and their experimental characterization 10
compounds energy
density,
respectively
LiMnPO4 150
Olivine
structure
4.1
Higher redox
potential and
higher energy
density,
respectively
than LiFePO4
Lower
capacity and
lower rate
capability
than LiFePO4
LiFePO4 ≈ 3.45
Safe, Excellent
rate capability
and high
capacity
Low electronic
conduction,
low voltage
LiCoPO4 <135 4.8
Higher redox
potential and
higher energy
density,
respectively
than LiFePO4
Lower
capacity and
lower rate
capability
than LiFePO4
LiNiPO4 160-170 5.2
Higher redox
potential and
higher energy
density,
respectively
than LiFePO4
Moderate
ionic and
electronic
conductivity
Sulfur 1675 - ≈2.5 Higher capacity
and low cost
High volume
expansion
during
discharging
and the
possibility of
occurrence of
parasitic
reactions
Graphite with a capacity of approx. 350 – 372 mAh∙g-1 and a flat operating voltage range
between 0.05 - 0.2 V vs. Li|Li+ is definitely the most used anode material in
commercially available LIBs [8]. The low working potential vs. lithium of graphite yields
high voltage and high energy content, respectively. Among further advantages of
graphite are its low cost and promising cycle life. However, at the same time, the main
disadvantage of graphite anode is that at high discharge current rates, graphite anode
may be polarized and, thus highly reactive dendritic lithium can be formed on surface of
the electrode. At the same time, lithium metal as anode material with a theoretical
specific capacity of approx. 3800 mAh∙g-1 and a potential of approx. 0 V vs. Li|Li+
indicate the highest anode materials capacity and full cell voltage in combination with
wide range of cathode materials [16]. However, mainly because of some safety issues
such as instability in organic solvents or formation of dendrites on lithium metal surface

Lithium-ion batteries and their experimental characterization 11
during charge/discharge processes, an internal short-circuit can occur. Therefore, the use
of lithium metal as anode material in LIBs is limited at least in mobile applications [17].
In general, anode materials can be classified in following three groups [16]:
Insertion/de-insertion materials such as carbon-based, porous carbon, carbon
nanotubes, graphene etc.,
Alloy/de-alloy materials or so-called group IV elements such as Si, Ge, SnO2 etc.,
Transition metal oxides (e.g., MnxOy, NiO), metal sulphides, metal nitrides etc.
In fact, it can be stated that carbon-based anode materials (hard or soft carbon) belong to
the most used anode materials in LIBs mainly because of their thermal stability, low
cost and availability. However, among their main disadvantages are their low coulomb
efficiency and high voltage hysteresis [16]. Moreover, the carbon-based anode materials
suffer from solid electrolyte interface (SEI) formation.
LIBs using LTO anodes as a kind of zero strain insertion material [16] in combination
with various cathode materials such as LMO, LFP or NMC definitely belong to the most
promising ESS in various aspects [18]. During full lithiation the LTO anode reaches a
theoretical capacity of 175 – 330 mAh∙g-1 [16]. Moreover, because of the two-phase
lithium insertion/extraction process in the electrode a flat voltage of approx. 1.55 V vs.
Li|Li+ appears while its spinel symmetry structure remains almost unaltered [19]-[20].
All of this means that LIBs using LTO anodes show a reduction in operating cell voltage,
electronic conductivity and theoretical capacity yielding less overall energy density but
high power density while the opposite is valid for graphite-based LIBs [16]. For HEVs
where high power and cycling performance in a wide temperature range are required,
LIBs using LTO anodes are proved with their excellent power performance.
Moreover, the LTO anode may not suffer from SEI and dendrite formation mainly
because of its high potential level [8]. Therefore, for LIBs using LTO anodes, the SEI
phenomenon is mainly referred to the cathode [21]. Among the further advantages of
LIBs using LTO anodes are their cyclability even at low temperatures, without the
occurrence of lithium plating [22] and exfoliation of active materials, and their promising
thermal stability at higher temperatures [16]. A selection of state-of-the-art carbon and
non-carbon-based anode materials commonly used in LIBs is given in Table 3.

Lithium-ion batteries and their experimental characterization 12
Table 3: A selection of advanced anode materials commonly used for LIBs adopted from Refs. [8], [16], [23]
Anode materials
Anodes
capacity
(mAh ∙ g− )
Potential
vs. Li|Li+ Advantages Disadvantages
Carbon nanotubes 1100
< . Low cost and
safety
Low columbic
efficiency, high
voltage hysteresis
and high irreversible
capacity
Hard carbon 200-600
Graphene 780/11164
SiO >1600 0.6 High capacity, good
cycling stability, low
cost and high power
capability
High volume change ≈ %, Low
columbic efficiency
and high capacity
fade
Silicon (Si) 4200 <0.5
Germanium (Ge) ≈1600 0.12
Tin oxide(SnO2) 783 0.6
Transition metal
oxides and metal
phosphides/sulfides
500 - 2000 0.8 - 1.6
High (specific)
capacity, high
energy, low cost and
low operation
potential
Low coulomb
efficiency, high
voltage hysteresis,
short cycle life and
high production costs
Titanium oxides 175 - 330 ≈1.5
Safety, good cycle
lifetime and high
power capability,
excellent low
temperature
performance
Low capacity and low
energy density
Based on the capacity values listed in
Table 3, it can be stated that Si with
approx. 4200 mAh∙g-1 indicates the highest capacity among the discussed anode
materials. The high capacity value is mainly related to formation of intermetallic
lithium-silicon compounds. At the same time, Si is the second most abundant element in
the earth’s crust and, thus, inexpensive and environmental friendly [8].
Summarized, it can be concluded that the material combination (i.e., between the anode
and the cathode materials) should be performed considering safety aspects,
possible/required operating voltage range and high power and capacity capability. In this
regard, a selection of the active materials discussed above by giving the respective
potential vs. Li/Li+ is illustrated in Fig. 3.
4 These values can be achieved when a number of graphene sheets are considered together [16].

Lithium-ion batteries and their experimental characterization 13
Fig. 3: Potential ranges of different active materials used in lithium-ion batteries adopted from Refs. [11], [13]
In order to configure a LIB that theoretically indicates the highest possible voltage,
active materials must be selected where the difference between their potentials (anode
and cathode potentials) is the highest. At the same time, capacity of the electrodes (
or ) need to be considered. The specific energy (E) of a LIB increases with increasing
capacity of electrodes and cell voltage; thereafter, the E can be determined as follows
(Eq. (2)): = + (2)
Even if the housing of LIB is not involved in the electrochemical reaction occurring in
LIB, the cell case can have an enormous impact on LIBs power and energy density,
current carrying capacity and durability. In order to fullfill the increasing power and
energy requirements on future ESS, improvement of existing and development of novel
active materials and electrolyte becomes essential. The energy density of LIBs can be
increased by either using high voltage cathode materials or high capacity anodes and
cathodes with promising cycle lifetime [13]. At the same time, developing novel
electrolyte materials such as LiFAP or fluorinated solvents that e.g., indicate more
thermal stability at high operating voltage become important. The theoretical specific
energy density of LIBs using the above discussed active materials is approx. 400 Wh∙kg-1.
When additional factors such as electrolyte, cell case, current collectors etc. are
considered, theoretical specific energy density decreases by more than 50% [13].

Lithium-ion batteries and their experimental characterization 14
Consequently, from a single LIB to a large lithium-ion battery pack by considering
additional components, a maximum theoretical specific energy density of 8 – Wh ∙kg− may be reached.
2.2 The lithium-ion batteries investigated in this work
In this work, LIBs at different aging states using various active materials are
investigated. An overview of the LIBs investigated in this work and a brief description of
their previous history is given in Table 4.
Table 4: Overview of lithium-ion batteries investigated in this work
Cell name
Cell chemistry
(cathode/
anode)
Nominal
capacity
[Ah]
Actual
capacity
[Ah]
Aging history
Cell-A-new NMC/LTO 15 16.8 New cell
Cell-A-aged NMC/LTO 15 13.7
Aged battery cell after
approximately 1500 full cycles
(100% DoD) at 35 °C
Cell-B-new NMC/LTO 20 20 New cell
Cell-C-new NMC/LTO 15 16 New cell
Cell-C-aged NMC/LTO 15 12.3
Aged battery cell after
approximately 3 months calendric
aging stored at 40 °C and at 2.5 V
Cell-D-new NMC/LTO 15 15.7 New cell
Cell-E-new NMC/LTO 15 16.6 New cell
Cell-E-aged NMC/LTO 15 12.4
Aged battery cell after
approximately 3 months calendric
aging stored at 40 °C and at 2.5 V
Cell-F-new NMC/C 40 40.3 New cell
Cell-F-aged NMC/C 40 35.9
Aged battery cell after
approximately 6 months calendric
aging stored at 60 °C
Cell-G-new NMC/C 40 42 New cell
Cell-H-new NMC/C 25 25 New cell
Cell-H-aged NMC/C 25 21.2
Aged battery cell after approx. 5
months calendric aging stored at
60 °C
Cell-I-new LFP/C 3.6 3.6 New cell

Lithium-ion batteries and their experimental characterization 15
Cell-J-new LFP/C 8.2 8 New cell
Cell-J-aged LFP/C 8 7.2 Aged battery cell after approx. 500
full cycles at 30 °C
2.2.1 Experimental setup
The experimental measurements are carried out using test bench consisting of MK53
temperature chamber manufactured by the company BINDER GmbH in Tuttlingen,
Germany with a temperature range between -40 °C and +180 °C and Digatron BTS-600
manufactured by the company Digatron Power Electronics GmbH in Aachen, Germany.
Electrochemical impedance spectroscopy (EIS) measurements are performed in a
frequency range of kz mz. Within this work, the galvanostatic EIS
measurement technique is applied using an experimental setup (Digatron EISmeter)
developed at ISEA of RWTH Aachen and manufactured by the company Digatron Power
Electronics GmbH in Aachen, Germany. In Table 5, the specification of the used test
bench is given.
Table 5: Characteristics of the measuring test bench
Characteristic Maximum measurement
inaccuracy in a full scale
Available
measurement
range
Sampling rate
Voltage
measurement ±6 mV or ±0.1% from the end value [0…6] V
100 ms Current
measurement
±200 mA or ±0.1% from the end
value [-200…+200] A
2.3 Experimental techniques commonly applied for electrical characterization of lithium-ion batteries
EIS measurement and hybrid pulse power characterization (HPPC) techniques are often
used for electrical characterization of batteries. As a main difference between both
measurement techniques, the experimental setup and employed excitation signals may
be addressed. In the following two subsections, a brief review on basic theory of EIS
measurements and HPPC tests for parameterizing the battery models is discussed.
2.3.1 Electrochemical impedance spectroscopy
EIS is often used as a promising non-invasive technique for parameter identification and
investigation of a battery’s dynamic behavior. Generally, two techniques can be used for
EIS measurement. The first technique, so-called galvanostatic EIS measurement,
applies a small ac excitation (sinusoidal) current at various frequencies and the voltage
response is measured. The second measurement technique, a so-called potentiostatic EIS

Lithium-ion batteries and their experimental characterization 16
measurement, applies a sinusoidal voltage to the LIB as an excitation signal and the
resulting current is measured. Performing EIS measurement allows deep insight into
electrochemical processes occurring inside the cell over a wide frequency range. This
yields a very simple and accurate parameter and process identification from very low
(some µHz) up to high frequencies (some kHz and even more) [24]. The complete
impedance spectrum can be obtained determining the complex impedance for each
frequency in the investigated frequency range using current and responded voltage as
follows (Eq. (3)): = (3)
Commonly, the impedance spectrum is shown in a so-called Nyquist diagram by plotting
the negative imaginary part as a function of the real part. The measured complex
impedance spectrum can be subdivided into five sections referring to various
electrochemical processes occurring in the battery (Fig. 4) [25]:
Section 1, corresponding to the inductivity of the LIB at high frequencies,
Section 2, corresponding to the ohmic resistance (R0),
Section 3, corresponding to SEI,
Section 4, corresponding to charge transfer processes,
Section 5, corresponding to diffusion, migration and remaining convection
processes.
It is worth noting that the ECM5 shown in Fig. 4 is not investigated in the later sections
of the present work and has only representative character of a possible sophisticated
battery modeling considering the above mentioned processes.
5 Constant phase element (CPE) corresponds to the generalized capacitive element forming a straight line in a complex
plane. The impedance of a CPE-element is determined as follows: C E = . where 0 < ξ < 1 and A refers to
generalized capacitance, ξ is a depression factor and is the frequency range [4].

Lithium-ion batteries and their experimental characterization 17
Fig. 4: Typical Nyquist plot of LTO/NMC lithium-ion battery measured at -20 °C and 50% State-of-Charge, frequency range: 5 kHz – 1 mHz
At very high frequencies (i.e., above approx. 1000 Hz), the impedance spectrum (section 1
in Fig. 4) is mainly dominated by the inductive behavior of the battery caused by wires
and windings. However, L is often neglected in BMS since it does not contain valuable
information about the battery’s electrochemical state for monitoring algorithms. Moreover, it is only measureable when very high currents are applied to the battery
(e.g., several hundred amperes) or when the measuring cables are long.
Section 2 in Fig. 4 is used to identify the R0 of the battery. When the impedance
spectrum crosses the real axis (i.e., m = ), the corresponding point on the real
axis refers to R0 [26]. Fig. 4 illustrates the dependence of R0 of the investigated LIBs
(Cell-A-new, Cell-A-aged, Cell-B-new and Cell-G-new) on temperature and SoC.
According to the results it can be concluded that the impact of battery temperature on R0
in contrast to the impact of the SoC is more pronounced. The latter fact is mainly
referred to high resistive behavior of electrolyte differing at various temperatures.
Moreover, it may be stated that R0 increases slightly with decreasing SoC. In Ref. [26],
the authors show that dependence of R0 on SoC for NMC/C LIBs is negligible and the R0
remains almost constant over the SoC range. For Cell-A-new, Cell-A-aged, it is obvious
that the increase of the R0 over the battery lifetime is negligible and, thus the obtained
curves almost overlap.

Lithium-ion batteries and their experimental characterization 18
Fig. 5: Dependence of ohmic resistance on State-of-Charge and temperature (relative to the values measured at 23 °C and 50% State-of-Charge)
The first small high frequent semi-circle (section 3 in Fig. 4) is attributed to SEI in the
anode or in the cathode [21]. However, it is worth mentioning that the SEI formation in
the anode for LIBs using graphite is generally more pronounced than the one in the
cathode [16].
Charge transfer processes are investigated considering the second large semi-circle of
the impedance spectrum (section 4 in Fig. 4). The time constant (τ) of the second semi-circle, which is an important indicator for the dynamic behavior of battery, is obtained
investigating the maximum frequency, when the negative imaginary part of the
impedance spectrum reaches its local minimum (section 3 and section 4 in Fig. 4) as
follows (Eq. (4)):
= / ∙ (4)

Lithium-ion batteries and their experimental characterization 19
Based on the derived charge transfer resistance (Rct) and τ, the value of the double layer capacitance (Cdl) can be determined. Due to the slower reactions and respectively higher
impedance values, both above mentioned semi-circles can be clearly distinguished at low
temperatures or when the LIB is aged. At higher temperatures and especially for a LIB
in new state, the time constants of both processes are very similar which leads to
inseparable semi-circles indicating very high charge transfer kinetics [27]. According to
the authors in Ref. [28], the SEI-related semi-circle appears clearly at low temperatures
because of the following three reasons: First, the frequency range of the impedance of the
inductive component overlaps with that for SEI. Second, the time constants of anode and
cathode are almost identical and third, the value of the SEI-resistance is negligible.
Solid state diffusion in the active material at very low frequencies (frequencies below
approx. 1.5 Hz) can be investigated by exact exploration of section 5 in Fig. 4. This part
of Nyquist plot shows a -45° slope and is often described by means of the Warburg
impedance ( ) or a ZARC-element [29]. The latter two elements will be investigated in
great detail in later sections of this work. In Ref. [4], the authors investigate the aging
behavior of NMC/C LIBs over a wide SoC range by means of EIS measurement in a
frequency range of 5 kHz f 0.2 Hz. The impedance parameters of the employed ECM
including two ZARC-elements and have been determined through a fitting procedure
of the measured spectrum. Moreover, the increase of R0 over the battery lifetime is then
used for SoH estimation where no clear interdependence between Rct, τ and battery’s actual aging state for investigated LIBs could be identified.
2.3.2 Hybrid pulse power characterization
The second experimental approach often used to examine the impedance characteristic
and available battery power is the so-called HPPC test. Within this measurement
technique, current pulses with various amplitudes for charging and discharging cases
with durations of few seconds (e.g., 10 s or 20 s) are applied to the battery. Different
parameters and processes can then be identified by investigating the corresponding part
of the battery voltage response. As long as the battery is under load, its voltage differs
from the measured C and can be written as follows (Eq. (5)):
− C = Δ +Δ E , +Δ E , +Δ , +Δ , +Δ (5)
Accordingly, the difference between the measured voltage and the C is equal to the
sum of the following overvoltages, each referring to a specific physical phenomenon:

Lithium-ion batteries and their experimental characterization 20
Ohmic overvoltage6,
SEI-related overvoltages on both electrodes,
Charge transfer overvoltages on both electrodes,
Remaining concentration-related overvoltages including diffusion, migration and
convection processes.
In the first moment directly after the beginning of the current pulse (approx. 50 ms), R0
can be determined (employing ohmic law) by observing the measured voltage drop after
discharging or voltage rise after charging. The voltage drop/rise because of R0 is mainly
caused by the resistive behavior of the battery’s electrolyte, poles and current collectors.
Kinetic processes and current dependence of internal resistance can be identified by
employing the Butler-Volmer equation (BVE). For this reason, the sum of Rct and R0,
referring to the d.c. resistance (Rdc) during the current pulse is determined as a voltage
value reached after 2 s from the beginning of the current pulse divided by the current.
Diffusion overvoltage and corresponding impedance parameters can be obtained
exploring the voltage response in a range of a few seconds (e.g., ∆t >= 5 s [30]). According
to Ref. [30], the diffusion effect becomes more pronounced during discharging than
during charging of the LIB.
2.4 Measurement results and discussion
In this subsection, the measurement procedures applied for battery impedance
characterization and OCV investigation are described. Moreover, a selection of
measurement results obtained from EIS and HPPC tests for electrical characterization
of the battery are presented. The OCV behavior of the investigated LIBs is investigated
over a wide temperature range and the obtained results and the findings are discussed
in great details.
2.4.1 Characterization of the impedance characteristics
In total, 28 characteristic measurement points (various temperatures and SoCs) have
been examined. Before each test is performed, LIBs are tempered to 23 °C for 3 h and
then charged to 100% SoC with 1C current rate (i.e., 15 A for Cell-A-new and Cell-A-aged
LIBs) and 2.75 V by applying the constant current-constant voltage (CC-CV) charging
strategy. The charging process is interrupted as soon as the applied current rate
6 Strictly speaking ohmic overvoltage (Δ ) is not an overvoltage, since it is not caused by electrochemical reactions in
the LIB. However, in this study for simplicity reasons it is included under the term battery overvoltage.

Lithium-ion batteries and their experimental characterization 21
decreases below 0.01C. For EIS measurement the following test procedure is performed
for each investigated temperature point:
1. Tempering the LIB in the temperature chamber to desired temperature for at
least 3 h.
2. Performing EIS measurements at 100% SoC.
3. Pause for 15 min.
4. Discharging to the next SoCF
7 level with 0.5C.
5. Pause for 2 h.
6. Performing EIS measurements for the given SoC.
7. Repeating steps 3 to 6 for each SoC (90%, 70%, 50%, 30%, 20%, 10%).
HPPC tests with various current rate amplitudes and pulse duration of 20 s are
performed to examine the current dependence of Rdc and Cdl. For this reason, the
following current rates are employed in sequence (±0.2C, ±0.5C, ±0.7C, ±1C, ±1.5C, ±2C,
±3C, ±5C8). To ensure the consistency of each SoC step, the amount of discharged and
charged Ah during current pulses is then equalized by charging/discharging during the
so-called equalization step. In the present work, the defined measurement procedure for
HPPC tests differs slightly with regard to the current pulse duration and the relaxation
time between each applied pulses from other specifications reported for example in Ref.
[31]. In Ref. [32], the authors only investigate the battery voltage response behavior after
discharging and neglect the charging case completely. Moreover, the authors investigate
battery polarization effects after a very long current pulse duration (i.e., 720 s) that
refers mainly to solid electrode diffusion processes.
For HPPC tests the following test procedure is applied to each battery beginning from a
fully charged state for each examined temperature:
1. Tempering the LIB in the temperature chamber to desired temperature for at least
3h.
2. HPPC test:
7 In this subsection, the SoC is related to the battery’s nominal capacity (Cnom). 8 ± C is not applied to every investigated LIB at different temperatures.

Lithium-ion batteries and their experimental characterization 22
2.1. Charging the LIB for 20 s with a predefined current rate9
2.2. Pause for 15 min in order to tempering the cell
2.3. Discharging the LIB for 20 s with a predefined current rate
3. Pause for 15 min.
4. Discharging to the next SoC level with 0.5C.
5. Pause for 2 h.
6. Performing the HPPC test as described in step 2.
7. Repeating steps 4 to 6 for each SoC level (90%, 70%, 50%, 30%, 20%, 10%).
In fact longer pause phases between two pulses as implemented in our measurement
procedure yield more accurate results from thermal balance point of view. Impedance
characteristics of ESS, in particular LIBs, depend mainly on the following factors [26]:
SoC,
Temperature,
Actual aging state of the battery.
Some works in the literature show results of extensive accelerated calendar and cycling
aging tests at various temperatures and Depth-of-Discharge (DoD) discussing the change
of impedance parameters over the battery lifetime and how this information can be used
for predicting the battery’s remaining useful lifetime (RUL) [33]. A detailed review on
available techniques for actual capacity and RUL estimation will be discussed later on in
chapter 3.
In Ref. [35], the authors show results of experimental investigations over a wide
temperature range using LIBs in a new state with lithium nickel cobalt aluminum oxide,
LiNi0.8Co0.15Al0.05O2 (NCA) cathodes and graphite anodes. High dependence of R0 on
temperature is shown while dependence on SoC is less pronounced. In addition, an
increase of the Rct with decreasing SoC is observed. Furthermore, the low temperature
power capability of LIBs using LCO cathodes and graphite anodes is investigated by
performing three electrode measurements and the simulation of the ECM in Ref. [36].
The main contribution of Rct and its increase with decreasing temperatures is noted as a
major source of cell polarization at low temperatures.
9 At 100% SoC only discharging current pulses are applied to the LIB. Otherwise by applying charging current pulses, the
predefined upper voltage limit would be hit.
Lithium-ion batteries and their experimental characterization 23
A cycle life analysis of LIBs using NMC cathodes and LTO anodes is performed in Ref.
[34]. The authors report a higher capacity fade due to active material loss in the cathode
than the degradation occurred in the anode. For degradation analysis, the incremental
capacity analysis (ICA) technique is consulted. In Ref. [27], the same results are
obtained by investigating diverse LIBs using different cathodes (e.g., LMO and LCO
cathodes) and LTO anodes. According to the authors, for the cycle-aged LIBs, the loss of
cyclable lithium and the loss of positive electrode active material are identified as the
main aging contributor. Results indicate minor loss of negative electrode active material
and negligible aging for calendar-aged LIBs.
In Ref. [21], impedance measurement results of LIBs using LCO cathodes and LTO
anodes in a new state for various temperatures and DoDs are shown. An ECM employing
passive elements (resistances, capacitances, inductance etc.) representing the cathode
and the anode is used for parameterization of the LIBs. The main focus lies on
understanding the capacity fade mechanism on both electrodes. The results indicate that
the increase of the Rct and the capacity fade of the cathode are major degradation
mechanisms.
However, most of the researches published in the literature explore the impedance
characteristic of LIBs using graphite anodes. Up to now, few works have investigated the
aging mechanism and especially the behavior of impedance characteristics of the LIBs
using LTO anodes under different conditions. In the following, LIBs using LTO anodes
(Cell-A-new, Cell-A-aged, Cell-C-new, Cell-C-aged) at different aging states are
characterized in order to determine the influence of SoC, temperature and current rate
on impedance characteristics and battery power capability, respectively. Kinetic
processes described by the BVE with regard to the current dependence of Rdc and the
behavior of BVE parameters, in particular exchange current density ( ) and symmetry
factor (), are analyzed. A full evaluation of the Butler-Volmer behavior of the
investigated LIBs is performed over a wide temperature and SoC range at different
aging states.
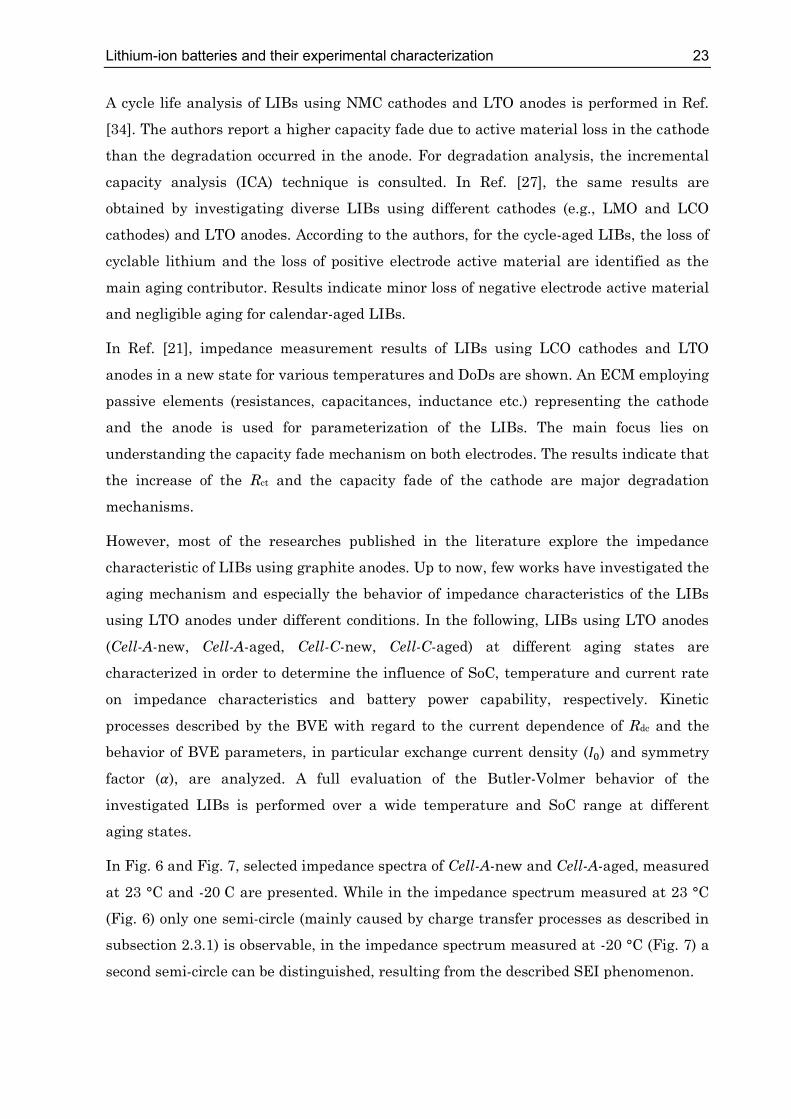
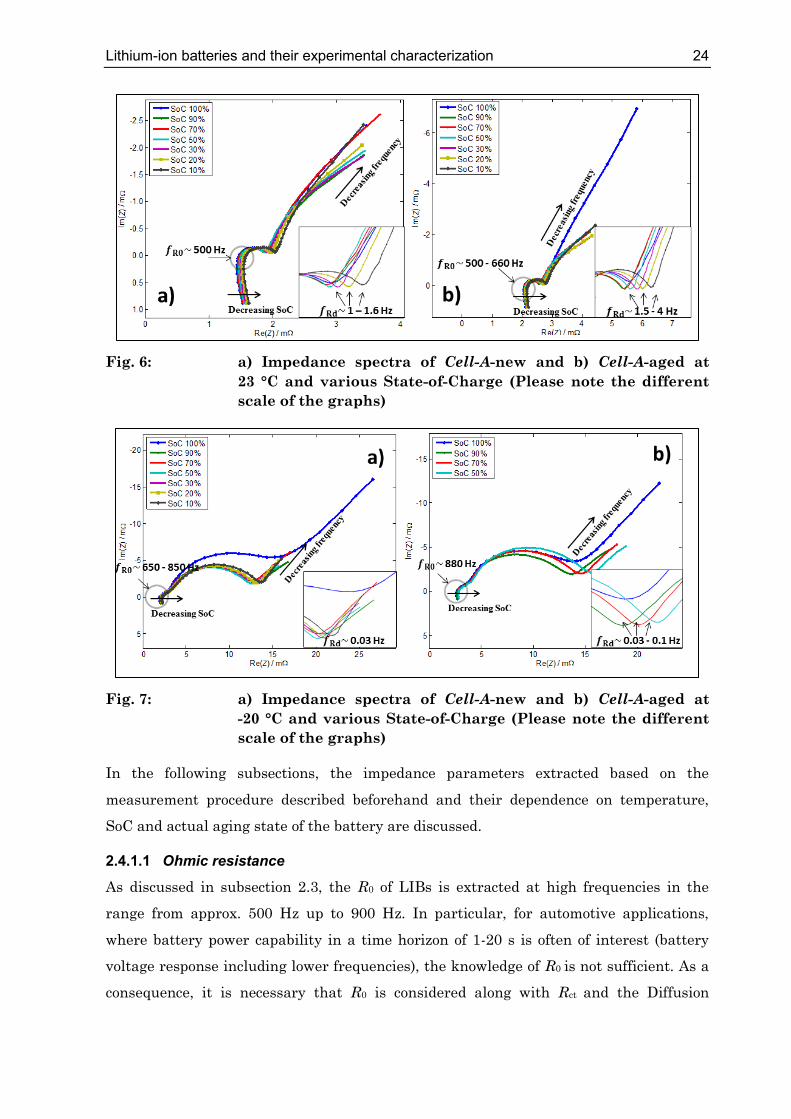
In Fig. 6 and Fig. 7, selected impedance spectra of Cell-A-new and Cell-A-aged, measured
at 23 °C and -20 C are presented. While in the impedance spectrum measured at 23 °C
(Fig. 6) only one semi-circle (mainly caused by charge transfer processes as described in
subsection 2.3.1) is observable, in the impedance spectrum measured at -20 °C (Fig. 7) a
second semi-circle can be distinguished, resulting from the described SEI phenomenon.
Lithium-ion batteries and their experimental characterization 24
Fig. 6: a) Impedance spectra of Cell-A-new and b) Cell-A-aged at 23 °C and various State-of-Charge (Please note the different scale of the graphs)
Fig. 7: a) Impedance spectra of Cell-A-new and b) Cell-A-aged at -20 °C and various State-of-Charge (Please note the different scale of the graphs)
In the following subsections, the impedance parameters extracted based on the
measurement procedure described beforehand and their dependence on temperature,
SoC and actual aging state of the battery are discussed.
Ohmic resistance 2.4.1.1
As discussed in subsection 2.3, the R0 of LIBs is extracted at high frequencies in the
range from approx. 500 Hz up to 900 Hz. In particular, for automotive applications,
where battery power capability in a time horizon of 1-20 s is often of interest (battery
voltage response including lower frequencies), the knowledge of R0 is not sufficient. As a
consequence, it is necessary that R0 is considered along with Rct and the Diffusion

Lithium-ion batteries and their experimental characterization 25
resistance (Rd). Fig. 8 presents the behavior of the R0 measured at different SoCs and
temperatures for Cell-A-new and Cell-A-aged.
Fig. 8: Ohmic resistance of Cell-A-new and Cell-A-aged determined as described in subsection 2.3.1: a) dependence on temperature b) dependence on State-of-Charge
As shown in Fig. 8, by decreasing the battery’s SoC, R0 increases slightly which is mainly
due to the change of ionic conductivity of LTO during discharging [37]. The shape of the
dependence of the R0 on the SoC remains almost unchanged over the battery lifetime.
The results obtained from slightly aged LIB cycled up to 500 cycles approve this
assumption. As expected, the impact of temperature on R0 in comparison to impact of the
SoC is more pronounced10, which is mainly due to the high contribution of electrolyte at
different temperatures [38].
Charge transfer resistance 2.4.1.2
Rct corresponds mainly to charge transfer processes of lithium-ions between the
electrolyte and the electrodes. The Rct is obtained from the impedance spectrum when R0
is subtracted from the measured Rd (Eq. (6)), while Rd corresponds to begin of transport
10 The values of the R0 for Cell-A-aged measured at -20 °C and at SoCs < 50% are missing: In combination with advanced
aging state of the battery and capacity fade, this leads to missing SoC points at lower SoC range.

Lithium-ion batteries and their experimental characterization 26
limitations in solid and liquid phases at approx. 1 Hz (see Fig. 4), which is highly
temperature dependent [26]. = − (6)
R0 or a combination of R0 with Rct and Rd is often used as an input for SoH and RUL
estimation. According to the authors in Ref. [39], Rd values (determined in a frequency
range between 0.1 Hz and 1 Hz) increase significantly over the battery lifetime. Within
the present work, the Rd values for Cell-A-new are obtained in a frequency range
between 1 Hz and 1.6 Hz and for Cell-A-aged between 1.5 Hz and 4 Hz at 23 °C. The
same tendency is also observed for other temperatures, where the respective frequency
range decreases with decreasing temperature.
Due to kinetic limitations of the processes and according to the Arrhenius law, the high
dependence of Rct on temperature is expected and actually exists as shown in
Fig. 9a. According to Ref. [40], the impact of temperature on the negative electrode
(LTO) is less pronounced compared to the positive electrode. At the same time the
dependence of Rct on SoC is surprisingly less pronounced. An increase of Rct (approx.
15%) with decreasing SoC (SoC < 50%) is detected for aged LIBs (Fig. 9b). According to
the report published in Ref. [21], the main contributor for increasing the Rct with
decreasing SoC is the cathode. However, this effect might also be referred to the change
of electronic conductivity of the LTO during discharge.
Furthermore, the slight change of Rct over the battery lifetime is approved. This fact
might be related to the absence of SEI growth in the anode. In Ref. [27], the authors
have performed cycle and calendar life tests on both full and half cells using LTO anode
material. Based on the obtained results it may be concluded that the positive electrode is
the main impedance contributor, especially for cycle-aged cells. The increase of the
impedance in the negative electrode is noticeably small so that the impedance increase
over the battery lifetime can mainly be related to the positive electrode.

Lithium-ion batteries and their experimental characterization 27
Fig. 9: Charge transfer resistance determined as described in subsection 2.3.1 for Cell-A-new and Cell-A-aged. a) dependence on temperature (linear representation) b) dependence on State-of-Charge11
The high temperature dependence of Rct can be investigated more detailed, when
resistance values are plotted logarithmically. By decreasing the temperature by 10 °C
the resistance increases by a factor in the range of 1.6 - 2.2. A so-called Arrhenius plot is
presented in Fig. 10, using the extracted values of Rct for Cell-A-new and Cell-A-aged at
100%, 50% and 10% SoC. This plot illustrates the relation between Rct and temperature
according to the Arrhenius equation (Eq. (7)):
= · −∙ (7)
where A is the proportionality constant in [Ω-1], T is the temperature in Kelvin, R is the
gas constant (=8.314 J ∙ mol ∙ K− ) and Ea refers to the activation energy [41]. Higher
activation energy means higher temperature dependence and higher required lithiation
energy than delithiation energy [42]. The activation energy of lithium-ion transfer
determined for Cell-A-new is approx. 48±0.8 kJ ∙ mol− and for Cell-A-aged
is approx. 44±0.8 kJ ∙ mol− which is almost consistent with the data reported in Ref. [43].
11 An unexpected behavior of Rct for Cell-A-aged at -20 °C and 90% SoC is detected. At 90% SoC, the value of the Cell-A-
aged decreases below that of Cell-A-new, which could not be expected from a theoretical point of view and is most likely
related to inaccurate measurement.

Lithium-ion batteries and their experimental characterization 28
Moreover, it can be stated that the activation energy remains almost constant over the
investigated SoC range.
Fig. 10: Arrhenius plot for charge transfer resistance of Cell-A-new and Cell-A-aged at various State-of-Charges
In Ref. [44], the authors have determined an activation energy of 44 - 49 kJ ∙ mol− for
LIBs using LTO anode and LCO cathode materials by employing resistance values at
1 Hz corresponding to lithium-ion transfer at electrode-electrolyte interface. In Ref. [26]
almost the same results have been achieved for LIBs using NMC cathodes and graphite
anodes. In Ref. [21], the authors show activation energy values of 58 kJ ∙ mol− for the
cathode (LCO) and 29 kJ ∙ mol− for the anode (LTO) for LIBs in a new state. In Ref. [40],
an activation energy of 41 kJ ∙ mol− for LIBs using NCA cathode and graphite anode
materials has been determined. Moreover, an activation energy of 40 kJ ∙ mol− for LIBs
using LFP cathodes is derived in Ref. [42]. By comparing the results obtained in this
work and the data reported in the literature, the derived values for activation energy
seem to be more related to the activation energy of the cathode.
Time constant and double layer capacitance 2.4.1.3
Time constant of the battery is often employed as an indicator for investigating the
dynamic behavior of the battery. The higher the τ the slower is the voltage response of
the battery. τ changes over the battery lifetime and is highly temperature dependent
[45]. As mentioned in subsection 2.3.1, within this work τ is determined by investigating
the maximum frequency of the impedance spectrum at the point where the local

Lithium-ion batteries and their experimental characterization 29
minimum of the negative imaginary axis is reached. Fig. 11 shows the dependence of τ
on temperature for Cell-A-new and Cell-A-aged at selected SoCs in linear and
logarithmical form. τ increases by a factor of approx. 2.5 with decreasing temperature by
10 K. For both LIBs τ reaches its minimum in the middle of the SoC range for almost all
investigated temperatures. Furthermore, it may be stated that τ decreases over the
battery lifetime which is actually in agreement with results presented in Ref. [26].
Fig. 11: Dependence of the time constant on temperature at various State-of-Charges for Cell-A-new and Cell-A-aged: a) linear representation and b) semi-logarithmical representation
When τ is known, Cdl can be simply derived dividing τ by Rct (see subsection 2.3.1).
Unfortunately, in the literature the dependence of τ or Cdl on SoC or temperature has
found little attention up to now, which makes a clear comparison between the results
obtained in this work with others difficult. According to the obtained results, the Cdl
increases by a factor of 1 - 1.5 with decreasing temperature by 10 K and changes slightly
over the battery lifetime, which is in agreement with the results reported in Ref. [21].
According to the authors in the latter reference, the obtained values for Cdl are mainly
dominated by the capacitance of the cathode and are obviously one order lower than the
capacitance of the LTO anode. The dependence of Cdl on SoC is less pronounced and no

Lithium-ion batteries and their experimental characterization 30
clear tendency is observed. In Ref. [46], the authors show an increase of Cdl with the
decrease of temperature and over the battery lifetime for LIBs using NMC cathodes and
graphite anodes. Moreover, the authors state that for LFP/C LIBs the Cdl decreases with
decreasing temperature and over the battery lifetime. In Ref. [37], the same tendency of
Cdl behavior with regard to temperature and actual aging state for LFP/C LIBs is shown
which is in agreement with results obtained in the present work.
According to Ref. [47], the Cdl of lead-acid batteries shows high current dependence,
whereas up to now its existence for LIBs has not been investigated extensively. The
current dependence of Cdl can be simply determined using HPPC tests as follows (Eq.
(8)): = ∆∆ (8)
where ∆ refers to the amount of charge throughput during current pulse and ∆ refers
to the voltage difference between measured battery voltage at the end of the current
pulse and the voltage before applying current pulse. Fig. 12 illustrates the current
dependence of Cdl of Cell-C-new and Cell-C-aged for different temperatures. The
measurements are performed at 50% SoC.
Fig. 12: Current dependence of the double layer capacitance determined as described in Eq. (8) for Cell-C-new and Cell-C-aged at different temperatures and 50% State-of-Charge
Based the results shown in Fig. 12, it may be stated that the current dependence of Cdl
might be neglected for the aforementioned LIBs, since the applied current rate does not
significantly influence the Cdl behavior.

Lithium-ion batteries and their experimental characterization 31
Total battery resistance 2.4.1.4
In applications where the available battery power plays a major role the knowledge of
impedance values in very low frequency ranges is important. In this work the measured
total battery resistance (R0.001Hz) at 1 mHz (lowest measured frequency) is used to
investigate the impact of SoC and temperature on R0.001Hz for Cell-A-new and Cell-A-
aged. R0.001Hz can also be interpreted as a sum of all resistances obtained from the
impedance spectrum. Fig. 13 shows the behavior of R0.001Hz over the battery lifetime at
different SoCs and temperatures. R0.001Hz does not show any significant SoC dependence
but is highly temperature dependent. The R0.001Hz increases by a factor of 2 - 2.5 with
decreasing temperature by 10 K. Presented results are in agreement with the results
shown in Ref. [48] with regard to the impact of SoC on R0.001Hz. In Ref. [49], the authors
present the same results according to the behavior of R0.001Hz (in that case, resistances at
0.2 Hz) over the battery lifetime. However, the authors demonstrate an increase of
R0.001Hz with decreasing SoC.
Fig. 13: Total resistance determined as described in subsection 2.3.1 for Cell-A-new and Cell-A-aged: a) dependence on temperature b) dependence on State-of-Charge

Lithium-ion batteries and their experimental characterization 32
Current dependence of the direct current resistance 2.4.1.5
HPPC tests with various charging and discharging current rates are performed on
Cell-C-new and Cell-C-aged to investigate the current dependence of the Rdc. The Rdc is
derived by examining the battery voltage drop after 2 s by employing ohmic law.
A nonlinear dynamic ECM (Fig. 14) including three impedance parameters and C is
sufficient to reproduce a nonlinear characteristic of the battery for applications such as
BMS, where computing power is limited. The employed ECM considers the nonlinearity
of Rct, which results in an additional parameter the so-called kI. As will be discussed in
great detail later in chapter 4, the latter parameter depends on SoC, actual aging state
and temperature of the battery where the impact of temperature is significantly higher
than SoC. Generally, in such simplified ECMs, battery electrodes are represented by
simple RC-elements. However, for BMS applications, it is not significantly relevant
whether the implemented RC-element refers to the cathode or anode, since monitoring
algorithms are not able to distinguish between this additional information. Thereafter,
the implemented RC-element represented by a parallel connection of Rct and Cdl
corresponds mainly to charge transfer processes occurring mainly on the interfacial
between electrode and electrolyte. This yields the share of the current through Cdl, the
so-called capacitive current (Ic) and faradaic current through Rct.
Fig. 14: Nonlinear first order lithium-ion battery model commonly employed in battery management systems
Based on the ECM shown in Fig. 14, the relation between the measured battery voltage
and the overvoltages caused by the current flow through the LIB can be described as
follows (Eqs. (9)-(10)): − C = Δ + Δ (9) − C = Δ (10)

Lithium-ion batteries and their experimental characterization 33
where is the measured battery voltage, C ≈ OCV is the battery open-circuit
voltage, Δ is the voltage drop/rise due to R0 and Δ corresponds to the voltage drop
related to the charge transfer processes. Since the battery voltage drop after 2 s is
assumed to be equal to the sum of Δ and Δ , the Eq. (10) can simply be derived from
Eq. (9).
The BVE is often used to describe the kinetic processes occurring at the interface
between electrode and electrolyte: If charge transfer reactions are the only limiting
processes (which means that other processes are neglected), the concentration of
reactants might be assumed to be constant. This yields the equal rate constants of
forward and backward reactions which is concluded in a factor as presented in Eq. (11)
[50]. = ∙ exp ∙ ∙∙ ∙ Δ − exp − ∙ ∙∙ ∙ Δ (11)
where factor denotes the exchange current density, which depends on the
concentration of the reactants and is therefore often employed for the characterization of
equilibrium state, n is the number of electrons involved in the reaction (n = 1 for LIBs), T
is the absolute battery temperature in Kelvin, F is the Faraday constant, R is the
universal gas constant, and is the symmetry factor of anodic and cathodic reactions in
the electrodes. The latter parameter shows how symmetrical the dependence of both
reactions on electrode’s potential is [41].
Fig. 15 depicts Rdc determined at different temperatures and 50% SoC for Cell-C-new
and Cell-C-aged by applying the HPPC technique as described in subsection 2.3.2. As
expected, Rdc increases with decreasing temperature, where its current dependence is
interpreted by BVE. However, the current dependence is negligible for Cell-C-new for
temperatures above 0 °C. Rdc increases when the LIB is aged and its current dependence
becomes more pronounced even at temperatures above 0 °C. However, a typical Butler-
Volmer behavior shown for example in Ref. [26] is not observed which could be an
indicator for the low impact of current on Rdc for the LIBs investigated in this work.

Lithium-ion batteries and their experimental characterization 34
Fig. 15: Direct current resistance for various temperatures at 50% State-of-Charge (a: Cell-C-new and b: Cell-C-aged)
The current dependence of Rdc for 0 °C at different SoCs is illustrated in Fig. 16. A strong
current dependence for all investigated SoCs can be observed. What is remarkable is the
fact that Rdc increases with decreasing discharging current at SoC of 100% but remains
almost constant at all other SoCs for discharging currents. Furthermore, it may be
pointed out that obviously the Rdc for charging case is lower than the discharging case for
the same current value. This may be advantageous for applications where the battery
has to accept a high amount of power in a short period of time, for example during
regenerative braking phases in EVs.
Fig. 16: Direct current resistance for various State-of-Charges at 0 °C (a: Cell-C-new and b: Cell-C-aged)
However, in most of the presented researches the current dependence of Rdc is neglected
and it is assumed to be linear. In order to fit the respective parameters of the BVE to the
measured values, a simple nonlinear least-square (LS) technique is employed. In Fig. 17,
based on a relation between applied current and Δ , fitting results for both parameters

Lithium-ion batteries and their experimental characterization 35
of BVE, namely symmetry factors ( , assuming + = and
are illustrated.
The following conclusions may be derived from the results shown in Fig. 17:
The high influence of battery temperature on , and is observed.
The influence of SoC in comparison to the impact of temperature is less
pronounced for both parameters.
The , referring to the anodic reaction (Li-deintercalation) of the cathode
increases by a factor of 1 - 1.3 with decreasing temperature by 10 K, which
denotes a larger anodic reaction than cathodic reaction in the cathode, especially
at low temperatures.
The symmetry factors ( and ) change slightly over the battery
lifetime. However, unfortunately, no clear tendency can be observed.
Higher battery temperature yields higher values for . increases by a factor of
1.1 - 2 with increasing temperature by 10 K. The slope of this increase decreases
over the battery lifetime.
As expected, decreases over the battery lifetime and it can be concluded that
decreases with decreasing SoC.

Lithium-ion batteries and their experimental characterization 36
Fig. 17: a, b: Dependence of and on temperature for selected SoCs for Cell-C-new and Cell-C-aged; c: dependence of on temperature for selected SoCs for Cell-C-new and Cell-C-aged – Please notice the different scale of the graphs
In addition to the above discussed results, measured charge and discharge curves of the
aforementioned NMC/LTO-based LIBs can be found in appendix C.
2.4.2 Characterization of the open-circuit voltage
In modern monitoring algorithms, accurate estimation of battery SoC and SoAP is often
coupled with the knowledge of nonlinear monotonic SoC-OCV correlation [51]. When the
battery is in an equilibrium state and all the side reactions are finished, the nonlinear
monotonic correlation between the OCV or strictly speaking, the electro motive force
(EMF12) and the battery SoC can be used. The OCV is always a function of SoC,
OCV = f(SoC). In fact, as a consequence of some external or internal issues such as
temperature or actual aging state of the battery, the SoC-OCV correlation may change
under varying conditions [52] and long relaxation time resides in a range of some hours
12 The term EMF refers to the battery voltage under open-circuit condition when the thermodynamic equilibrium potential
of the main and side reactions is reached. In this study, the OCV is employed as an equivalent to the EMF.

Lithium-ion batteries and their experimental characterization 37
is necessary until the equilibrium state is reached [53]. A detailed description of methods
applied for on-board OCV estimation will be discussed later in great detail in chapter 4.
From electrochemical point of view, the OCV of a full cell when no current flows and the
electrode potentials are in equilibrium state, can be determined as follows (Eq. (12)): OCV = − (12)
The OCV of each electrode depends on temperature and concentration of lithium-ions in
the electrode that is normalized by the SoC of the respective electrode [54]. The OCV of
LIBs depends mainly on the following factors:
Applied current rate before current interruption [53], [55]-[56],
Battery temperature [53], [55]-[57],
Previous history [55]-[56],
Cell-to-cell variations [53], [57],
Actual aging state of the battery etc. [53], [57]-[58].
Deep understanding of the impact of the above mentioned factors on relaxation behavior
of the battery is of great interest as it can make a significant contribution to improving
the SoC estimation accuracy. Prior researches on the above mentioned factors and theirs
impact on OCV of LIBs are limited in amount and scope. Up to now, most of the
researches published in the literature have explored the OCV behavior of LIBs either
under nominal condition or when the battery was in a new state. Unfortunately, the
impact of actual aging state or temperature of the battery is often neglected or assumed
to be negligible. In Refs. [59]-[60], the authors investigate the OCV behavior of LIBs in a
new state using LFP cathodes whereby special emphasis is put on investigating the OCV
hysteresis of the aforementioned LIBs; in this regard a hysteresis model for BMS
applications is presented and verified. Moreover, in Ref. [55], the OCV behavior of LIBs
using various active materials in new state is investigated comprehensively. The authors
present measurement results with respect to determined OCV gradient, OCV hysteresis
and OCV behavior of the LIBs at different temperatures. However, in the latter
reference the impact of battery aging is not considered further. In Ref. [61], the authors
propose an accurate normalized OCV modeling technique considering the impact of
aging and temperature of the battery. According to the authors, the SoC-OCV correlation
remains unchanged over the battery lifetime for various temperatures.

Lithium-ion batteries and their experimental characterization 38
The main contribution of the present subsection is to discuss the importance of precise
battery OCV characterization procedure and examine various factors influencing the
battery OCV behavior of LIBs. Moreover, special emphasis is put on understanding the
impact of temperature and aging on battery’s relaxation behavior. The qualitative discussion should give the readers an overview and possible explanation of the OCV
behavior of the investigated LIBs and potentially clarify the origin of the found
dependences. The OCV measurements are performed over a wide temperature range
(-20 °C⋯0 °C⋯+10 °C⋯+23 °C⋯+45 °C). The OCV characterization measurements are
carried out using the measuring test bench presented in Table 5. A careful selection of
experimental setup used for OCV measurements with regard to voltage measurement
accuracy and defining a standardized measurement procedure is essential before the
OCV measurements are started. Unfortunately, available test manuals (e.g., Ref. [62]),
do not provide a comprehensive and consistent test procedure to assess OCV of the
batteries. It is worth mentioning that by setting experimental setup for OCV
measurements, it is necessary to keep the temperature of the battery during
measurement procedure constant since it could influence the OCV behavior, as will be
examined later.
Within this work, the following test procedure is applied to each LIB for each
characteristic measurement point:
1. Tempering the battery cell in the temperature chamber to 23 °C for 3 h.
2. Charging the battery cell to 100% SoC by applying the CC-CV charging strategy
with 1C current rate until upper cut-off voltage is reached and the current
decreases below 0.01C.
3. Tempering the battery in the temperature chamber to desired temperature
(-20 °C⋯ +45 °C) for 8 h.
4. Discharging to the next SoC13 level (5% increment) with 0.5C followed by interim
relaxation time of ∆t=8 h.
5. Repeating step 4 for each SoC until the battery voltage reaches the lower cut-off
voltage limit. The OCV values obtained after the relaxation process build the
OCV external discharge boundary.
13 In this subsection, SoC is related to the battery’s actual capacity (Cactual) unless otherwise noticed. The Cactual is
measured at 23 °C with 1C discharge current rate immediately after performing OCV test. It is worth noting that for
SoC-OCV modeling, the battery’s actual capacity must be employed since the SoC-OCV correlation/curve
differs/changes for different capacity values employed for SoC determination.

Lithium-ion batteries and their experimental characterization 39
6. Repeating steps 4 and 5 for charging case until the battery voltage reaches the
upper cut-off voltage limit. The OCV values obtained after the relaxation process
build the OCV external charge boundary.
Open-circuit voltage behavior of lithium-ion batteries under nominal condition 2.4.2.1
The short-time previous history of a battery has an enormous impact on measured
battery OCV. Depending on whether the LIB is charged or discharged, the possible
equilibrium potentials differ at the same SoC, respectively. In particular, the OCV after
discharging is lower than the OCV after charging at the same SoC under the same
operating condition. The difference between the OCV values after charging and
discharging process is called hysteresis. Thereafter, the existence of OCV hysteresis
implies that alone the knowledge of battery OCV without considering the previous
history (i.e., charge/discharge history) is not sufficient for an accurate SoC estimation.
From electrochemical point of view, the hysteresis phenomenon is known to result from
mechanical stress, microscopic misconception in active materials and different
thermodynamic equilibrium potentials at same SoC [61]. The depletion of lithium ions in
pores can be described by the path dependent shrinking-core model [63]. Moreover, it is
known that the direction, amplitude and duration of the applied current before current
interruption influence the OCV hysteresis [61]. In addition, the lithium intercalation in
graphite anode can be assumed as a further source to OCV hysteresis [64]. The
hysteresis phenomenon has been reported for a wide range of active materials such as
LCO, LiMnO2 and LFP [55], [65]. However, olivine-based LFP cathodes are known to
exhibit the maximum hysteresis in contrast to other LIB chemistries [59], [65].
In Fig. 18, the results obtained from OCV measurements performed on NMC/LTO-based
LIBs (Cell-B-new and Cell-E-new, Cell-E-aged) are illustrated. The measurements are
performed at 23 °C. In particular, measured OCV curves, OCV hysteresis and OCV
gradients determined based on the OCV rate of variation per % SoC are examined
profoundly. According to the results, it can be stated that the OCV of the Cell-E-new
changes significantly over the battery lifetime. Moreover, it is observed that OCV
hysteresis of Cell-E-aged is lower than that of Cell-E-new over a wide SoC range (i.e.,
20% - 80%). The OCV hysteresis of Cell-E-aged becomes higher than OCV hysteresis of
Cell-E-new in a SoC range above 90% SoC. A local maximum of OCV hysteresis of
approx. 15 mV at approx. 55% SoC and a local minimum of approx. 0 mV are detected in
a SoC range of approx. 65% - 75%. In contrast to Cell-E-new, Cell-E-aged, the OCV

Lithium-ion batteries and their experimental characterization 40
hysteresis of Cell-B-new is almost negligible and becomes more pronounced with
decreasing temperature as will be discussed later in subsection 2.4.2.2.
Furthermore, the behavior of the OCV gradients for the aforementioned LIBs is
examined. In this regard, it can be stated that the OCV gradient of Cell-B-new is
significantly higher than the OCV gradients of Cell-E-new and Cell-E-aged. For
Cell-B-new, a local maximum of OCV rate of change per % SoC after discharging of
approx.10 mV/% is detected in a SoC range above 90% and a local minimum of approx.
2 mV/% is observed at 65% SoC. The local maximum of OCV rate of change per % SoC
for Cell-E-new is approx. 5 mV and for Cell-E-aged is approx. 4.5 mV whereby the local
maxima are detected in a SoC range of 50% - 60%. For the latter two LIBs, two local
minima are observed in a SoC range of approx. 25% - 35% and 75% - 85%. Hence, if the
measurement accuracy of test bench is 5 mV, then the SoC error obtained through OCV-
based estimation technique would be approx. 0.5% for Cell-B-new and 1% for Cell-E-new
and Cell-E-aged.
Fig. 18: OCV curves, OCV hysteresis and OCV variation per % SoC of Cell-E-new, Cell-E-aged, and Cell-B-new measured at 23 °C
Fig. 19 shows the results obtained from OCV measurements performed at 23 °C on
NMC/C-based LIBs (Cell-F-new, Cell-F-aged, Cell-H-new and Cell-H-aged). The OCV
Lithium-ion batteries and their experimental characterization 41
hysteresis of Cell-F-new and Cell-F-aged, reaches the local maximum of approx. 30 mV
in a SoC range of 25% - 35%. At the same time, the corresponding OCV hysteresis of the
aforementioned LIBs decreases significantly with increasing SoC. The OCV hysteresis of
Cell-F-new and Cell-F-aged remains lower than 10 mV in a SoC range above 70%.
Summarized, it can be stated that OCV hysteresis of the aforementioned LIBs increases
gradually with decreasing SoC up to approx. 40% SoC and decreases again. Almost the
same tendency can be approved for Cell-H-new and Cell-H-aged. Moreover, the OCV
hysteresis of Cell-F-new decreases over the battery lifetime for a wide SoC range (i.e.,
SoCs below 70%) while OCV hysteresis of Cell-H-new remains almost unchanged over
the battery lifetime. However, in contrast to Cell-F-new and Cell-F-aged, lower OCV
hysteresis peaks are observed for Cell-H-new and Cell-H-aged.
The corresponding OCV rate of change per % SoC of Cell-F-new and Cell-F-aged
increases up to approx. 15 mV/% at both ends of SoCs (i.e., SoC>90% and SoC<10%) and
reaches its local minimum of approx. 5 mV/% at approx. 40% SoC. For Cell-H-new and
Cell-H-aged the OCV rate of change per % SoC with some slight exceptions is lower than
Cell-F-new and Cell-F-aged. The local minimum of approx. 2.5 mV/% is detected at 40%
SoC. The OCV gradient of Cell-H-new becomes more pronounced than the OCV gradient
of Cell-H-aged in a SoC range below 25%. The shape of the OCV gradients after charging
and discharging remains almost unchanged where the local peaks of OCV gradients of
Cell-F-aged and Cell-H-aged are shifted about 5% towards high SoCs. Thereafter, it can
be concluded that local maximum of OCV gradient peak is shifted slightly as the LIB
ages. According to Ref. [66], the two peaks (plateaus) observed in the OCV curves of the
LIBs using the same chemistry are mainly referred to staging phenomena occurring in
the anodes. The staging phenomenon occurs because of transitions between two-phase
regions in the anode.

Lithium-ion batteries and their experimental characterization 42
Fig. 19: OCV curves, OCV hysteresis and OCV variation per % SoC of Cell-F-new, Cell-F-aged, Cell-H-new and Cell-H-aged measured at 23 °C
Fig. 20 shows the results obtained from OCV measurements performed at 23 °C on LFP-
based LIBs (Cell-I-new, Cell-J-new and Cell-J-aged). As expected, the measured OCV-
curves of the LFP-based LIBs are significantly smoother than the OCVs of the NMC/C-
based LIBs discussed beforehand. Based on the obtained results for Cell-J-new and
Cell-J-aged, it can be stated that their OCV curves change significantly over the battery
lifetime as the OCV curves of Cell-A-new and Cell-A-aged do. The change of the OCV
curve at high SoC range (i.e., voltage above 3.3 V) is mainly related to loss of lithium
inventory that actually cannot be used for main conversion reaction [60]. In contrast to
the aforementioned NMC/C-based LIBs, the existing plateau of the Cell-J-new at high
SoC range disappears over the battery lifetime whereas the large plateau behavior in the
middle SoC range of Cell-J-aged is shifted to high SoC range. The latter fact could be
referred to an increase of battery impedance over the battery lifetime.
The OCV hysteresis of Cell-I-new shows two local peaks; the first local maximum of OCV
hysteresis reached at 30% SoC is approx. 40 mV and the second hysteresis peak of
26 mV is detected at 65% SoC. However, for Cell-J-new and Cell-J-aged, it seems that

Lithium-ion batteries and their experimental characterization 43
the OCV hysteresis does not change remarkably over the battery lifetime; a slight
difference is observed in a SoC range above 70%. For the latter two LIBs, the OCV
hysteresis reaches its local maximum of approx. 20 mV at 20% SoC. The OCV gradient of
the investigated LIBs increases significantly at very low SoC range (i.e., below 20% SoC).
The maximum corresponding OCV rate of change per % SoC reaches approx. 15 mV/% in
the mentioned SoC range whereas for remaining SoC range (i.e., above 20% SoC) the
OCV rate change per % SoC remains below 5 mV/%.
Fig. 20: OCV curves, OCV hysteresis and OCV variation per % SoC of Cell-I-new, Cell-J-new and Cell-J-aged measured at 23 °C
In total, it can be concluded that the OCV gradient of Cell-J-new changes significantly
over the battery lifetime in a SoC range above 50% SoC. An OCV rate of change per %
SoC of approx. 3 mV/% means that when voltage measurement accuracy of test bench is
5 mV, the SoC error that is obtained through OCV estimation technique for Cell-J-new
and Cell-J-aged is approx. 1.6% which is three time higher than the expected error for
the investigated LTO-based LIBs.
The monitoring algorithms presented in the literature often neglect the OCV hysteresis
and employs the mean value of the OCV after charging and discharging instead. For
LFP-based LIBs because of the mentioned flat OCV curve over a wide SoC range, a
difference of only few millivolts in measured OCV value yields significant error in SoC
Lithium-ion batteries and their experimental characterization 44
estimation. However, for the investigated NMC/C-based LIBs (Cell-F-new, Cell-F-aged,
Cell-H-new and Cell-H-aged), a separate consideration of charge and discharge OCV
curves seems not to be necessary since its influence on SoC estimation accuracy is
negligible. According to Ref. [60], the slope of the OCV curves of the investigated LFP-
based LIBs in flat SoC range is approx. 0.1 mV/% ∆SoC and in steep SoC range is
1.5 mV/%∆SoC that is quite similar to the results achieved in this work. However, the
authors state that the examined LIBs show a maximum OCV hysteresis of 50 mV at
23 °C, which is quite higher than the results obtained in this work. Moreover, in Ref.
[67], the authors show results of OCV measurements performed on LIBs in new state
using various active materials (NMC/C, NMC/LTO, LMO/C and LFP/C). According to the
results, the maximum SoC rate of change per mV voltage is approx. 3% for the examined
LFP/C LIBs. Thereafter, when voltage measurement accuracy is 5 mV, the resulting SoC
estimation error is approx. 13%. Therefore, the voltage measurement accuracy of the test
bench should be at least 1 mV. However, to the best knowledge of the author, at the
present the measurement accuracy of commercially available battery test benches can
only reach approx. 5 mV.
Open-circuit voltage behavior of lithium-ion batteries at different temperatures 2.4.2.2
The OCV behavior of the examined LIBs under nominal condition has been discussed in
the previous subsection. The battery temperature plays a major role regarding the OCV
and the SoC estimation accuracy, respectively. Therefore, for accurate voltage based SoC
estimation, it is highly recommended that the impact of battery temperature on OCV is
considered in the applied algorithm [68].
Fig. 21 shows a selection of measured OCVs for Cell-E-new and Cell-E-aged at various
temperatures (i.e., in particular -20 °C and +45 °C), determined OCV difference at a
specific temperature to OCV of Cell-E-new at 45 °C14 as well as determined OCV
gradients after discharging. Moreover, OCVs measured after charging and discharging
for the mentioned temperatures are illustrated in Fig. 21a. According to the obtained
results, the OCVs change over the battery lifetime at different temperatures
significantly. The highest OCV change is observed in a SoC range of 30% - 70%.
Furthermore, in order to investigate the impact of battery aging on OCV at different
temperatures more detailed, the difference between the measured OCVs after
14 In order to ensure better visibility of the measured curves, only a selection of the obtained results are illustrated in
Fig. 21 and Fig. 22; thus giving the interested readers an opportunity to use the OCV values measured over the whole
temperature range (i.e., -20 °C, 0 °C, 10 °C, 23 °C and 45°C), a complete list of the OCV values can be found in tables
A.1 and A.2 in Appendix A.

Lithium-ion batteries and their experimental characterization 45
discharging for individual temperature (i.e., -20 °C and 45°C) to the respective OCVs
after discharging of the Cell-E-new at 45 °C is determined. The respective results are
shown in Fig. 21b. According to the results obtained at -20 °C, the OCVs after
discharging change significantly over the battery lifetime whereby the aforementioned
difference reaches its local minimum of approx. -40 mV in a SoC range of 50% - 60%. The
results obtained from OCV measurements after charging indicate almost the same
tendency for the investigated LIBs. However, after analyzing all measured OCVs for
examined temperatures, it may be stated that no clear tendency regarding the
dependence of battery OCV on temperature can be observed. In total, the determined
difference between the OCV values for the investigated temperatures becomes more
pronounced in the middle SoC range.
In addition, the OCV gradients of the aforementioned LIBs are investigated for different
temperatures. In this regard, Fig. 21c illustrates the determined OCV gradients of
Cell-E-new, Cell-E-aged after discharging for -20 °C and 45 °C. The determined OCV
gradients at 45 °C remain almost unchanged over the battery lifetime whereby the local
maximum of OCV rate of change per % SoC of approx. 4 mV/% is detected at approx. 50%
SoC and a local minimum of approx. 2 mV/% is observed at 80% SoC. A local maximum
of OCV rate of change per % SoC of approx. 5 mV/% at 60% SoC and local minima of
approx. 1 mV/% at 80% SoC and 30% SoC are observed for Cell-E-aged at -20 °C. The
determined local maximum seems to be shifted about 10% to higher SoC range over the
battery lifetime. In total, we conclude that OCV gradients of the mentioned LIBs are
affected by battery temperature.

Lithium-ion batteries and their experimental characterization 46
Fig. 21: Open-circuit voltage behavior of Cell-E-new and Cell-E-aged measured at 45 °C and -20 °C, a) OCV curves after charging and discharging, b) The difference between the OCVs after discharging for individual temperature to OCVs of Cell-E-new at 45 °C, c) The gradients of the OCV curves after discharging (Please note that the SoCs are related to the battery’s nominal capacity).
In addition to the above mentioned LIBs, the OCVs of Cell-F-new and Cell-F-aged are
investigated at different temperatures. Fig. 22 illustrates a selection of OCVs of the
aforementioned LIBs measured at 0 °C and 45 °C15, determined OCV difference at a
specific temperature to OCV of the Cell-F-new at 45 °C as well as determined OCV
gradients after discharging. Fig. 22a illustrates the OCVs after charging and discharging
measured at mentioned temperatures. The obtained results indicate that the OCVs of
the respective LIBs change over the battery lifetime (mainly at SoCs below 35% SoC).
For Cell-F-new and Cell-F-aged the influence of actual battery aging state on the
determined OCV difference (i.e., the difference between measured OCV at particular
temperature and OCV of Cell-F-new at 45 °C) seems to be more pronounced in a SoC
15 In order to prevent lithium plating and accelerated aging, respectively, no OCV measurements are performed on Cell-F-
new and Cell-F-aged at -20 °C.

Lithium-ion batteries and their experimental characterization 47
range of 40% - 70%. According to the results obtained at 45 °C, the absolute values of
OCVs increase over the battery lifetime while the same tendency can be approved for
other temperature points.
Fig. 22: Open-circuit voltage behavior of Cell-F-new and Cell-F-aged measured at 45 °C and 0 °C, a) OCV curves after charging and discharging, b) The difference between the OCVs after discharging for individual temperature to OCVs of Cell-F-new at 45 °C, c) The gradients of the OCV curves after discharging (Please note that the SoCs are related to the battery’s nominal capacity).
Furthermore, the behavior of OCV gradients of the aforementioned LIBs is examined for
respective temperatures. In contrast to Cell-E-new, the OCV gradients of Cell-F-new do
not change remarkably over the battery lifetime for the examined temperatures. A slight
change of the determined OCV gradient over the battery lifetime is observed in a SoC
range below 50% SoC. A local minimum of OCV rate of change per % SoC of 5 mV/% is
observed in a SoC range of 30% - 50%. At the same time, the local maximum of OCV rate
of change per % SoC of approx. 12 mV/% is detected in a SoC range above 80%. In a SoC
range below 20% SoC, the OCV gradients increase extremely. As expected, the OCV

Lithium-ion batteries and their experimental characterization 48
gradients of Cell-F-new and Cell-F-aged are significantly higher than the determined
OCV gradients of Cell-E-new and Cell-E-aged. In total, it can be concluded that the
impact of temperature on OCVs of NMC/LTO-based LIBs is higher than on OCVs of
NMC/C-based LIBs. The impact of battery temperature on OCV becomes more
pronounced over the battery lifetime mainly as a result of increasing battery impedance
and decreasing diffusion coefficient.
According to the authors in Ref. [55], in general, the OCV gradients of LIBs increase
with increasing temperature. Moreover, the authors show a parabola-shaped curve for
OCV hysteresis at different temperatures indicating the increase of OCV hysteresis with
increasing temperatures. Unfortunately, the presented results are not in agreement with
the results obtained in this work. In Ref. [60], no clear tendency for the OCV behavior of
LFP-based LIBs for different temperatures is observed which seems to be in agreement
with the results obtained in this work. In Ref. [68], the authors investigate the OCVs of
LFP-based LIBs in new state in a temperature range of 0 °C - 50 °C. As a result, a
significant difference between OCV curves for examined temperatures is observed in a
SoC range of 30% - 80%. Unfortunately, almost all latter references address the cases
where battery is new state and the impact of battery aging is neglected completely.
Factors influencing the relaxation behavior of lithium-ion batteries after 2.4.2.3
current interruption
Directly after current interruption, in the first few minutes up to some hours, the
relaxation behavior of the battery is dominated by fast diffusion, migration and charge
transfer processes occurring at the electrode/electrolyte interface or in the electrolyte.
Afterwards, over a longer time period, solid-state diffusion processes become more
pronounced. As postulated by Fick’s law, it is known that with increasing temperature all reaction and diffusion processes take place faster [69]. The diffusion processes
occurring in the solid electrode can be described by second Fick’s law.
In the present subsection, the results obtained from OCV measurements performed on
Cell-B-new, Cell-F-new and Cell-F-aged are presented with an especial emphasis on
their relaxation behavior after current interruption. Furthermore, the factors
influencing the relaxation behavior of the aforementioned LIBs after current
interruption are analyzed. In particular, the voltage response of LIBs after current
interruption and the needed relaxation time until all the side reactions are declined are
investigated comprehensively. From electrochemical point of view, charge transfer and
diffusion overvoltages occurring in the middle and at very low frequency region can be
attributed as main contributors to the relaxation process of the battery.

Lithium-ion batteries and their experimental characterization 49
The relaxation behavior of the aforementioned LIBs at different temperatures and SoCs
is illustrated in Fig. 23. Fig. 23a.1 and 23b.1 show the battery’s voltage response over the relaxation period (i.e., I = 0 A): The battery voltage at the end of the relaxation period
( ) is subtracted from the battery voltage measured directly after current
interruption (i.e., ∆ = − . As a result, it can be concluded that the voltage
response of the battery after current interruption changes over the battery lifetime for
different temperatures; this evidence is caused mainly by the fact that internal
resistance of the battery is remarkably influenced by actual aging state and temperature
of the battery. Moreover, the battery SoC affects the shape of the voltage response; this
phenomenon is more pronounced for Cell-F-new and Cell-F-aged than for Cell-B-new
which is in agreement with the results presented in Ref. [53]. However, in the latter
reference, the impact of actual aging state of the battery on battery’s relaxation behavior is neglected.
Furthermore, in Fig. 23a.2 and Fig. 23b.2 voltage relaxation curves of Cell-B-new and
Cell-F-new after charging and discharging with 0.5C at 23 °C for different SoCs are
shown. The low pronounced OCV hysteresis of Cell-B-new in contrast to Cell-F-new is
confirmed as discussed beforehand in subsection 2.4.2.1.
Fig. 23a.3 and Fig. 23b.3 depict the determined required relaxation times of Cell-B-new,
Cell-F-new and Cell-F-aged at different temperatures over the investigated SoC range.
The needed relaxation time for individual LIB is determined as follows: The battery is in
an equilibrium state as soon as the gradient of the voltage relaxation curve over time is
approx. zero (i.e., ∆V/∆t ≅ 0 where the measurement inaccuracy of the test bench is
considered). Consequently, it may be stated that a high dependence of needed relaxation
time of the aforementioned LIBs on SoC and temperature exists. The increase of
required relaxation time with decreasing SoC might be referred to increase of time
period for homogeneous distribution of lithium ions in the electrode. The latter effect
seems to be more pronounced for Cell-F-aged than for Cell-F-new.
Since the diffusion coefficient decreases over the battery lifetime and varies for different
temperatures, the needed relaxation time is influenced by actual aging state of the
battery. Fig. 23c illustrates the required relaxation time of the aforementioned LIBs at
50% SoC and different temperatures. As expected, with decreasing temperature the
required relaxation time increases significantly. Based on the obtained results, it can be
stated that the required relaxation time depends linearly on battery’s temperature. The
knowledge of the aforementioned relationship/dependency is useful for BMS developers

Lithium-ion batteries and their experimental characterization 50
in order to save costs and time effort with regard to OCV measurements during product
development phase.
Fig. 23: Impact of temperature and aging on relaxation behavior of the battery, a.1) Voltage response of Cell-B-new after charging and discharging at different temperatures and 50% SoC under open-circuit condition, a.2) Voltage response of Cell-B-new after charging and discharging at 23 °C and different SoCs under open-circuit condition, a.3) Required relaxation time of Cell-B-new after discharging at different temperatures and SoCs, b.1) Voltage response of Cell-F-new and Cell-F-aged after charging and discharging at different temperatures and 50% SoC under open-circuit condition, b.2) Voltage response of Cell-F-new after charging and discharging at 23 °C and different SoCs under open-circuit condition, b.3) Required relaxation time of Cell-F-new and Cell-F-new after discharging at different temperatures and SoCs, c) Required relaxation time of Cell-B-new, Cell-F-new and Cell-F-aged for different temperatures at 50% SoC.
In Ref. [70], the relaxation behavior of LFP-based LIBs is examined under nominal
conditions. The authors state that for the examined LIBs over relaxation period from 1
hour up to 24 hours at 45% SoC, the applied OCV-based SoC estimator could introduce

Lithium-ion batteries and their experimental characterization 51
an error of approx. 4% into SoC estimation. It is worth noting that in addition to the
above mentioned factors, the impact of applied current rate on required relaxation time
until all the side reactions are finished on relaxation behavior of LIBs is enormous and
its consideration in a full OCV characterization procedure is unavoidable. In this work,
the impact of applied current rate on OCV behavior of the battery is not further
examined as it has been investigated comprehensively by other researches in the past.
According to Ref. [53], an increase of the applied current rate yields an increase of
required relaxation time for LIBs using NMC cathodes. However, in contrast to the
results obtained in the present work, the authors state that the OCV characteristics of
the investigated LIBs do not change over the battery lifetime or strictly speaking the
impact of aging is marginal. In Refs. [59]-[60], the opposite results are achieved
regarding the impact of the applied current rate on OCV behavior for LFP-based LIBs.
The authors state that with increasing applied current rate the required relaxation time
decreases.
Simplified OCV-model considering temperature correction term and actual 2.4.2.4
aging state of the battery
As discussed in the previous subsections, for a precise SoC estimation over the battery
lifetime and under varying conditions, it is necessary that dependence of OCV on
temperature and actual aging state of the battery is considered. Therefore, the drift of
the SoC dependence of OCV on battery temperature over the investigated temperature
range can be employed for an accurate OCV modeling. In addition, it is worth
mentioning that the dependence of the battery OCV on further thermodynamic
quantities such as pressure and concentration plays also an important role in the field of
accurate OCV modeling. But the latter dependences are not considered further in this
work.
Assuming that battery OCV after charging and discharging depends (approx.) linearly
on temperature, the SoC-based temperature correction term ( [V ∙ K− ]) can be simply
determined for individual SoC after charging or discharging as follows (Eqs. (13)-(14)):
, oC = C @ °C C − C @ °C C (13)
, oC = C @ °C C − C @ °C C (14)
From electrochemical point of view, the derived kth is equal to battery entropy (S), when
the faraday constant (F) and the number of electrons per reaction (n) are included in the
Eqs. (13)-(14) [71]-[72]. The entropy differs for various active materials and affects the
reversible heat generation and the output voltage response of the LIB, thus it is of great

Lithium-ion batteries and their experimental characterization 52
interest that kth behavior is investigated comprehensively. In this regard, the
corresponding kth values of Cell-E-new, Cell-E-aged, Cell-F-new and Cell-F-aged are
determined based on Eqs. (13)-(14). The obtained results are illustrated in Fig. 24.
Fig. 24: Temperature correction term (kth) determined as described in Eqs. (13)-(14) for Cell-E-new, Cell-E-aged, Cell-F-new and Cell-F-aged
As discussed in subsection 2.4.2.2, the dependence of OCV on temperature becomes more
pronounced over the battery lifetime; this tendency can be approved according to the
determined kth values. For Cell-F-new and Cell-F-aged, a difference of
approx. 0.3 mV ∙ K− between the kth values after charging and discharging is observed in
a SoC range above approx. 40% SoC. As a result, it can be concluded that the impact of
kth over the battery lifetime for a wide SoC range is almost negligible and becomes more
pronounced in a SoC range below 40%. However, in contrast to Cell-F-new and
Cell-F-aged, the kth values (i.e., absolute values) of Cell-E-new and Cell-E-aged increase
with battery aging (especially in a SoC range of 40% - 60%) whereby the difference
between kth values after charging and discharging remains almost negligible which is in
agreement with the results presented beforehand.

Lithium-ion batteries and their experimental characterization 53
As discussed in the previous subsections, the OCVs of LIBs may change over the battery
lifetime depending on the LIB chemistry. In this regard, for Cell-E-new, Cell-E-aged,
Cell-F-new and Cell-F-aged, the coefficient of OCV change (i.e., the difference between
OCV values at two different aging states for respective temperature and SoC) over the
battery lifetime (∆SoH), the so-called kSoH, is determined as follows Eqs. (15)-(16):
, oC = C , @ °C C,ϑ − C , @ °C C,ϑ− (15)
, oC = C , @ °C C,ϑ − C , @ °C C,ϑ− (16)
Fig. 25 shows the kSoH values of Cell-E-new, Cell-E-aged, Cell-F-new and Cell-F-aged
determined as proposed in Eqs. (15)-(16). As a result, no clear tendency regarding the
dependence of the kSoH on temperature can be observed. It is worth noting that for
realizing a reliable comparison between both LIB chemistries, the determined OCV
values of Cell-F-new and Cell-F-aged below 0 °C are not considered. For Cell-E-new,
Cell-E-aged, the corresponding maximum ∆OCV rate of change per % ∆SoH is approx. 0.5 mV/% at 50% SoC. The resulting difference between the determined kSoH values after
charging and discharging for the aforementioned LIBs is negligible. For Cell-F-new and
Cell-F-aged, the corresponding minimum ∆OCV rate of change per % ∆SoH is approx. -0.8 mV/% at 60% SoC and 23 °C. However, in contrast to Cell-E-new and Cell-E-aged,
the obtained differences between the kSoH values after charging and the kSoH values after
discharging of Cell-F-new and Cell-F-aged seem to be more pronounced.

Lithium-ion batteries and their experimental characterization 54
Fig. 25: Coefficient of the OCV change over the battery lifetime (kSoH) determined as described in Eqs. (15)-(16) for Cell-E-new, Cell-E-aged, Cell-F-new and Cell-F-aged (The SoCs are related to the battery’s nominal capacity)
By employing the Eqs. (13)-(14) and considering the impact of battery aging, a simplified
equation for determining the battery OCV and SoC dependences of the OCV, can be
derived as follows (Eq. (17)): OCV oC, ϑ, o = OCV °C oC + OCV , °C oC − OCV , °C oC ∙ − o ∙ϑ − °C . oC (17)
In the Eqs. (15)-(17), the SoH must be considered in a range between 0 and 1 whereby
the zero refers to aging state of the battery at End of Life (EoL) and the one refer to
aging state of the battery at Begin of Life (BoL). In this work, the EoL criterion of
battery is defined as the decrease of battery’s capacity to 80% of its initial value.
In the present work, the OCV measurements are performed on single LIBs and, thus the
influence of cell-to-cell variations regarding the individual OCV value of the LIBs is
neglected. However, for large lithium-ion battery packs where a high amount of LIBs are
connected in series, considering an additional correction term referring to the influence
of cell-to-cell variations on OCV in Eq. (17) is highly recommended.

Lithium-ion batteries and their experimental characterization 55
2.5 Validation datasets
In order to optimize the software functionalities and decrease the required development
phase and costs of embedded software for BMS applications, the Automotive Open
System Architecture (AUTOSAR)-compliant along with model-based software
development have become more and more popular in the automotive industry in recent
years [13]. The state-of-the-art product development process for BMS and large battery
systems in automotive applications is based on V-Model [73] where further automotive
standards such as ISO 26262 [74] and Automotive SPICE process assessment and
process reference model [75] that rely on V-model, are often used. For example, ISO
26262 standards has ten different parts, whereby the requirements for product
development at system level with respect to functional safety are specified in part 4.
Fig. 26 depicts schematically the product development process (i.e., systems engineering
and software engineering) of BMS according to the mentioned V-Model.
Fig. 26: Product development process according to V-Model (adopted from Ref. [73], [75])
The product development process according to V-Model begins by analyzing the
stakeholder requirements on Sys.1 level. Thereafter, on Sys.2 and Sys.3 levels, system
requirements and system architecture are defined. According to V-Model, at each
individual development phase e.g., the developed BMS software model or the developed
BMS must be verified individually. In this regard, for verification tests in individual
development phase (module, integration and system tests) the developed models etc. are

Lithium-ion batteries and their experimental characterization 56
often verified by means of model-in-the-loop (MIL), software-in-the-loop (SIL) and
Hardware-in-the-loop (HIL) test environment [75]. The last stage of product verification
is then often performed on vehicle level.
In fact, load profiles and environmental conditions that the battery is exposed to in the
field differ in terms of characteristic, frequency etc. to that in laboratory environment.
Hence, for analyzing the performance of monitoring algorithms, the application of real
load profiles collected under real conditions over a long period of time (i.e., over days,
weeks or even more) is highly recommended. Unfortunately, the monitoring algorithms
presented in the literature are often verified under nominal conditions or by applying
simple pulse tests or standardized load profiles such as urban dynamometer driving
schedule (UDDS), dynamic stress test (DST) or federal urban driving schedule (FUDS)
etc.
Beside the above mentioned factors referring to the necessity of using real load profiles
(i.e., load profiles measured on-board during vehicle operation) for validating the
monitoring algorithms, collecting real vehicle data over a long period of time can provide
helpful information on battery’s aging behavior etc. In general, real vehicle data can be employed for developing new operation strategies of the vehicle and optimizing power
demand/capabilities and operation limits of the battery.
In this regard, among the main parameters to be collected on-board in EVs are [10], [76]:
Amount of charge and energy throughput,
Actual capacity and impedance of the battery referring to battery’s SoH both on cell and system-levels,
Temperature spread inside lithium-ion battery pack etc.
In the following subsection the load profiles used in this work for verification reasons are
presented.
2.5.1 Load profiles investigated in this work for verification reasons
Within this work, the following two different types of load profiles with various
characteristics are examined for validating the applied monitoring algorithms:
Real vehicle data under varying conditions,
HPPC (see subsection 2.3.2).
The aforementioned load profiles are applied to the investigated LIBs at different aging
states over a wide temperature and SoC range.

Lithium-ion batteries and their experimental characterization 57
Real vehicle data obtained under varying conditions 2.5.1.1
The ECM parameters depend not only on battery characteristic itself but also on the load
profile the battery is exposed to. The latter fact is a result of following two issues: First,
the ECMs commonly used for monitoring algorithms are simplified and, thus the
employed ECMs are not able to reproduce the battery behavior (both thermal and
electrical) precisely. Second, the only signals that are usually available on-board for
monitoring algorithms are current, voltage and temperature of the battery. Therefore,
the ECM parameters can be estimated accurately when there is enough fluctuation
available in applied current and voltage of the battery [46]. Adaptive filters used for
ECM parameters identification minimize the resulting error between the measured
voltage and the modeled battery voltage. Thereafter, such filters optimize the estimated
parameters only for the applied load profile available during the parameter
identification process. Consequently, the identified ECM parameters could differ for
respective load profiles.
The main objective of the datasets investigated in this work is to understand the
performance of different ECMs over a wide range of temperature, SoC and applied
current rates. As will be discussed later in chapter 5, the investigated ECMs are further
examined with regard to voltage and SoAP prediction accuracy. An especial emphasis is
put on following factors: First, the battery behavior and performance of the applied
algorithm are investigated over a wide SoC range including varying relaxation and
charging periods (see Fig. 27). Second, the impact of “extreme” temperature variation performed between individual driving cycle or during a single driving cycle over a wide
temperature range (-20 °C⋯-5 °C⋯+10 °C⋯30 °C) on battery’s and algorithms performance is investigated. Third, for long-term robustness analysis, tests using real
vehicle data including various vehicle operating conditions (e.g., highway or city,
defensive or aggressive driving styles) are considered. For this purpose, 39 real driving
cycles from ten different drivers are recorded in a time range of one week.
Fig. 27 illustrates a selection of driving cycles investigated in this work for validation of
the applied battery state estimator. The normalized energy content released or applied
to the LIB and the temperature profile of the LIB measured on its surface are shown.
The third driving cycle always refers to the case where the vehicle is driven on the
highway and approx. 40% of the total battery energy content is released. During a
driving phase on a highway, as the LIB must mainly deliver energy to vehicles
powertrain and the recuperation phases are rarely given, the increase of battery
temperature is significantly higher than e.g., the driving cycle obtained in the city

Lithium-ion batteries and their experimental characterization 58
including different stop-phases. In addition, after the last driving cycle (7th driving cycle)
a relaxation period of 24 h is inserted to the load profile where no current flows to/from
the LIB.
The negative power values refer to cases where the battery is discharged and positive
values refer to cases where the battery is charged (e.g., regenerative phases or charging
periods). The sampling rate of battery temperature is 10 s since temperature of the
battery does not change rapidly under normal/safe operating conditions as for example
current and voltage do. During vehicle parking and charging phases, battery voltage is
measured with a sampling rate of 10 s where sampling rates of current and voltage
during driving phases are decreased to 100 ms. Furthermore, in order to have
deterministic points for verifying the predicted voltage and SoAP, respectively, a current
pattern consisting of two current pulses in both charge and discharge directions with
amplitudes of 1C and 2C each for 20 s is integrated into the load profiles. It is worth
noting that normalized energy content illustrated in Fig. 27 is determined using nominal
voltage and capacity values of the examined LIBs.

Lithium-ion batteries and their experimental characterization 59
Fig. 27: Examples of synthetic real driving cycles over a wide temperature and normalized energy content range; a) Cell-A-aged, b) Cell-B-new, c) Cell-D-new, d) Cell-G-new, e) Cell-J-aged.

Lithium-ion batteries and their experimental characterization 60
In order to provide a better visibility of a single load profile, the second driving cycle of
the Cell-G-new is illustrated exemplary in Fig. 27. In particular, the measured power
profile and the determined State-of-Available-Energy (SoAE16) of the respective driving
cycle are investigated under real condition.
Fig. 28: Illustration of the measured power and the determined State-of-Available-Energy profile of the second driving cycle for Cell-G-new depicted in Fig. 27.
Relative distribution of specific parameters of the investigated load profiles 2.5.1.2
In the previous subsection a detailed description of the investigated driving cycles is
provided. As mentioned beforehand, the main objective is to investigating the battery
behavior over a wide SoC and temperature range. In this regard, the relative
distribution of the aforementioned parameters of the driving cycles is used as a basis for
analyzing and a explanation of possible deviations. Fig. 29 presents relative distribution
of temperature and SoC of the investigated driving cycles for selected LIBs discussed
above. Unfortunately, because of some measurement setup failures during performing
measurements on Cell-A-aged and Cell-D-new, the attached temperature sensors on
surface of the aforementioned LIBs were loose. Thus, the measured temperature profiles
illustrated in Fig. 27 refer mainly to temperature of the climate chamber and not the
real surface temperature of the aforementioned LIBs, which in turn makes an
illustration of their relative distribution values unreasonable.
16 The technique applied for SoAE determination will be presented in great detail in subsection 3.1.

Lithium-ion batteries and their experimental characterization 61
Fig. 29: Relative distribution of State-of-Charge and temperature of the investigated driving cycles for selected LIBs (Cell-B-new, Cell-G-new and Cell-J-aged)
As can be seen in Fig. 29, relative temperature distribution of Cell-B-new is relatively
homogenous for the examined temperature range and lies below approx. 15%. For
Cell-G-new and Cell-J-new, the temperature distribution differs slightly as the
temperature distribution in a range of above 10 °C is significantly higher than lower
temperatures. As discussed beforehand, during a single driving cycle mainly depending
on respective load profile, temperature of the battery increases by some degrees
(5 °C⋯10 °C). Consequently, the mentioned temperature increase has a high influence
on impedance characteristic of the LIB. The SoC distribution of the investigated load
profiles show only slight differences at high SoC ranges (i.e., above 95%) while for
remaining SoC range the distribution sems to be very similar. It is worth mentioning
that the battery SOC shown in Fig. 29 is related to battery’s nominal capacity.
Hybrid pulse power characterization tests 2.5.1.3
Along with the presented real vehicle data measured under varying conditions, HPPC
tests are performed at different temperatures. A detailed description of test procedure

Lithium-ion batteries and their experimental characterization 62
for HPPC tests was provided in subsection 2.3.2. In order to minimize the impact of
battery temperature on impedance parameters of the LIBs, an especial focus was put on
temperature equalization between individual charge and discharge current pulses
during a single HPPC test. Fig. 30 shows current and voltage profiles measured during
HPPC test performed at 23 °C on Cell-G-new. Moreover, the normalized energy content
determined using battery’ nominal capacity is illustrated.
Fig. 30: Hybrid pulse power test performed at 23 °C on Cell-G-new
The upper voltage limit of the LIB was set to 4.2 V and the lower voltage limit was set to
2.7 V as proposed in the datasheet. The maximum applied current is limited to ±3C.
Frequency analysis of the employed load profiled 2.5.1.4
In the previous subsections, the electrical and thermal characteristics of the investigated
load profiles and their impact on battery behavior have been discussed. In Fig. 31 the
normalized frequency spectra of current profile of the HPPC test and the second driving
cycle (see Fig. 28) both applied to Cell-G-new are illustrated. The spectra are determined
based on simple discrete-time Fourier transformation (DTFT).

Lithium-ion batteries and their experimental characterization 63
Fig. 31: Normalized frequency spectra of two different current profiles for Cell-G-new. The determination of spectra is performed using discrete-time-Fourier transformation divided by root-mean square value of the current as proposed in Ref. [290]
According to the results, it can be concluded that the current amplitude of the HPPC test
is significantly higher than the current amplitude of the investigated driving cycle;
especially in a frequency range of (0.1 ⋯ 0.01) Hz. The normalized current amplitude
reaches its local maximum of approx. 0.8 of its root-mean square (RMS) value at approx.
0.5 Hz. At the same time, the amplitudes of both load profiles become almost similar
with slight exceptions at frequencies below 0.01 Hz. In general, it can be stated that in
the frequency range where the current amplitude is high or in other words where there
is enough dynamic/fluctuation available, the ECMs used in modern monitoring
algorithms are favor to reproduce the battery behavior more accurate.
2.6 Summary
In this chapter, the results of extensive electrical characterization tests performed on
NMC/LTO LIBs at different aging states are presented and compared to those presented
in the literature. First, the impedance parameters of the battery are characterized and
the impact of battery SoC and temperature on impedance characteristics of the LIBs is
investigated comprehensively. The influence of temperature on impedance
characteristics of the LIBs is investigated in a temperature range of -20 °C ⋯ +40 °C.
According to the results, the values of R0 and Rct increase with decreasing temperature
and Cdl shows high temperature dependence while its values decrease over the battery

Lithium-ion batteries and their experimental characterization 64
lifetime. The R0 increases slightly with decreasing SoC while at the same time a low
impact of SoC on Rct, and Cdl is observed. Generally, it can be summarized that the
basic shape of the dependence of the R0 and Rct on SoC and temperature remains almost
unchanged over the battery lifetime, especially at high temperatures. Based on the BVE,
the behavior of and I0 is examined. The obtained results indicate the high impact of
SoC and temperature on I0 whereby the impact of temperature is significantly more
pronounced in contrast to the impact of SoC. It is also shown that the current
dependence of the Rdc at high temperatures is less pronounced. Hence, for simplicity
reasons depending on the application the current dependence might be neglected.
However, its consideration at lower temperatures (i.e., below 0 °C) and at advanced
aging state seems to be necessary.
Second, the results of extensive OCV characterization tests performed on LIBs using
various active materials are presented. The impact of actual aging state, temperature
and previous history on OCV behavior of the LIBs are investigated comprehensively.
Impact of aging of the battery on OCV behavior can be summarized as follows:
The required relaxation time until the equilibrium state of the battery is reached
increases over the battery lifetime,
The aging of the battery influences the OCV hysteresis where the dependence of
OCV hysteresis on actual aging state of the battery differs for individual LIB
chemistry,
The shape of battery’s voltage response after current interruption changes over the battery lifetime,
The battery aging influences the OCV gradients; the change of the OCV gradients
over the battery lifetime for NMC/LTO LIBs is more pronounced than other cell
chemistries investigated in this work.
Impact of temperature of the battery on OCV behavior can be summarized as follows:
The required relaxation time until all the side reactions are finished increases
with decreasing temperature whereby it can be assumed that a linear dependence
exists between the aforementioned parameters (i.e., required relaxation time and
temperature of the battery),
The temperature of the battery influences significantly the measured OCVs; in
case of OCV curves after discharging for NMC/C and NMC/LTO LIBs, regarding
the temperature dependence of the hysteresis no clear statement can be provided,

Lithium-ion batteries and their experimental characterization 65
The OCV curves change over the battery lifetime at different temperatures,
The OCV gradients of the NMC/C LIBs remain almost unchanged for different
temperatures while the impact of temperature on OCV gradients of NMC/LTO
LIBs seems to be more pronounced.
Moreover, the load profiles used in this work for validating the applied monitoring
algorithms are presented. In this regard, two different load profiles with different
characteristics are used. First, driving cycles obtained in an EV prototype over a time-
period of one week are applied to the LIBs over a wide temperature and SoC range
where the battery temperature varies during/between each driving cycle. Additional
factors such as relaxation and charging periods are considered in the investigated load
profiles. Second, HPPC tests are performed on LIBs at different temperatures over a
wide SoC range where current pulses with different amplitudes are applied to the LIBs
for both charge and discharge direction. The frequency spectra analysis of the
aforementioned load profiles show that the amplitude of the applied current differ
significantly in a frequency range below 0.1 Hz mainly as a result of the higher constant
current rates applied to the LIB during HPPC test in contrast to the driving cycle used
for verification reasons.

Review of monitoring algorithms and battery models presented in the literature 66
3 Review of monitoring algorithms and battery models presented in the literature
In order to fulfill specific power and energy requirements in EVs generally specified by
vehicle manufactures, LIBs are connected in series and/or in parallel (depending on
topology of the battery pack), thus forming a large lithium-ion battery pack [77]. The
EVs mainly differ in degree of electrification of their electrical distribution system that
correlates with resulting voltage level of the lithium-ion battery pack. When d.c. voltage
of the appropriate battery system is above 60 V and a.c. voltage is above 30 V [78], the
respective battery system is defined as a high voltage (HV) battery system. At the same
time, a battery system indicating voltage level below the aforementioned levels is
handled as low voltage (LV) system [79] and requires no contact protection etc. [80]. In
Table 6, the four commonly used voltage levels for lithium-ion battery pack or vehicle
electrical distribution system available in series production or currently under
development are given.
Table 6: Comparison of different voltage levels of lithium-ion battery systems commonly used in automotive industry
Voltage level
(nominal) 12 V 48 V 400 V 800 V
Vehicle type Conventional or
micro HEVs Mild HEVs
Full EV or HEV
(including
PHEV)
Full EV
The higher the voltage level of the battery system is, the lower the power loss of the
system would be, mainly as a result of lower current rates. Accordingly, total weight of
the respective system decreases and available range for fully electrical drive “could” increase. The performance of LIBs and their operation in EVs are controlled and
diagnosed by means of BMS consisting of both software and hardware. In other words,
protection against battery over/under-voltage, over-current, over-temperature, under-
temperature and cell balancing are among the main tasks of BMS. Fig. 3217 illustrates
schematically a simplified lithium-ion battery pack including the following BMS electric
and electronic components [81]:
Cell Controller Board (CCB),
BMS Master,
LV and HV interfaces,
17 It is worth noting that thermal connections and cooling system are not illustrated in Fig. 32.

Review of monitoring algorithms and battery models presented in the literature 67
Fuses, contactors etc.
Fig. 32: Schematic illustration of simplified modular-based lithium-ion battery pack including high and low voltage interfaces, lithium-ion batteries, electric and electronic components (adopted from Refs. [10], [82])
Besides the above mentioned electric/electronic specifications; from thermal point of
view, the battery system need to be tempered (cooling or heating according to
environmental specifications) actively or passively, thus keeping the LIBs in predefined
temperature range during operation (e.g., charging or driving phases).
For a safe operation of battery pack, software-based applications implemented on
electronic control unit (ECU) are needed where the extension of the realized software
applications is influenced directly by degree of system complexity [13]. As shown in
Table 6, voltage level of lithium-ion battery pack is directly correlated with the system
complexity. The system complexity of a 12 V battery systems is significantly lower than
that of 800 V battery systems given in Table 6, whereby for example for a 12 V battery
system a particular number of diagnosis functions, thermal functions etc. are not
required. A selection of software-based functions operated by BMS can be found in Fig.
33.

Review of monitoring algorithms and battery models presented in the literature 68
Fig. 33: A selection of software-based functions operated by battery management systems
The main task of the CCB is to measure a particular number of cell voltages and
temperatures (e.g., 1-12 cells) [81]. In fact, the CCB is the only physical interface
between the BMS and the battery cells. Furthermore, cell balancing is performed by
means of balancing resistances implemented on each CCB and controlled by an
algorithm implemented on the ECU in the BMS master. Depending on topology of
lithium-ion battery pack and number of LIBs which have to be monitored, one or more
CCBs are required. Each CCB communicates with the other CCBs via Controlled Area
Network (CAN) or Isolated Communications Interface (isoSPI). Measured cell voltages
and temperatures are then submitted via CAN to the BMS Master and analyzed,
respectively. On the one hand the BMS Master is responsible for evaluating the
measured battery pack’s current and voltage as well as triggering the contactors (opening, closing) during pre-charge phases or when a crash or fault is detected, and on
the other hand it performs plausibility checks and diagnoses of the battery states and
parameters. Furthermore, monitoring algorithms implemented for battery state
estimation are running on the ECU. Submitting or receiving data to/from the vehicle
EMS as well as the electronic power supply are all performed over a designed LV
interface.
The accurate estimation of battery states such as SoC, SoAP or SoH, is still a
challenging task, keeping in mind that the implemented monitoring algorithms have to
work accurately over years in the particular application. Monitoring algorithms use on-
board measured values such as battery temperature, battery voltage and current for
state estimation. However, since a direct insight into electrochemical processes inside

Review of monitoring algorithms and battery models presented in the literature 69
the LIBs in the field is not possible, estimated battery states or parameters may differ
from real values. For example, according to Ref. [83], the difference between the
measured cell temperature on the surface and in the core may be approximately 10 K.
Keeping in mind that often one single temperature sensor is used in a battery module for
monitoring the module’s temperature18 and the measurement accuracy of implemented
temperature sensors are often low, it becomes obvious how challenging the task of
reliable and accurate battery monitoring can be by considering all uncertainties and
disturbances.
The electrical and thermal performance of a lithium-ion battery pack is mainly
influenced by the following factors:
Topology of the lithium-ion battery pack [84]-[85],
Internal and external factors, such as unequal aging behavior of the LIBs over
the battery lifetime (capacity and impedance spread between each individual LIB
in the battery module/pack) [77], [86],
Inconsistency of the SoCs [76], [85],
System losses occurring in the battery pack (e.g., power rails, contactor
resistances etc.) [76]-[77],
Limitation of the use of the battery’s maximum power and energy capacity, caused by the increase of battery impedance and decrease of available battery
capacity over the battery lifetime [85],
Distribution of the temperature in the battery pack19 etc. [38], [76].
Therefore, considering the above mentioned factors is necessary during system design
phase in order to prevent oversizing the system and reducing costs, respectively, while
specified requirements are fulfilled. In the following subsections a review of available
techniques for estimating the following battery states/parameters is provided:
SoC,
SoH and actual battery capacity,
SoAP,
SoS.
18 Each battery module consists of several LIBs connected in series or parallel. 19 Temperature differences between individual LIB must be kept in a range of 3 °C - 5 °C [288].

Review of monitoring algorithms and battery models presented in the literature 70
3.1 State-of-Charge estimation
On-board estimation of battery SoC is always a part of BMS. The Battery SoC is
equivalent to the fuel gauge used in conventional vehicles. The SoC is often employed as
a basis for reliable energy/power management strategy [87]. The SoC corresponds to the
ratio of releasable battery capacity (Cr) to the actual battery capacity (oC =∙100%). An inaccurate SoC estimation might have fatal consequences for vehicle
manufacturers with regard to customer acceptance or safety failures (i.e., occurrence of
unwanted battery overcharge or over-discharge etc.). Moreover, an inaccurate SoC
estimation leads to a change of operating SoC window that in short term has high
impact on battery power capability prediction and in long term on expected battery
lifetime [65]. Battery SoC definitely belongs to the most investigated battery states and
it has often been discussed in many researches in the past. Comprehensive reviews on
available SoC estimation techniques can be found, for example, in Refs. [82], [87]-[89]. In
the following, a brief overview of available techniques for SoC estimation is provided.
3.1.1 Methods based on coulomb counting technique
The simplest and may be the most common technique for SoC estimation is the so-called
coulomb counting (CC) technique. The CC technique is based on integrating the current
over time while it is assumed that the actual battery capacity and initial SoC value are
known or determined by other supporting algorithms (Eq. (18)) [82]:
oC = oC + ∫ (18)
where SoC(t0) refers to the SoC at the initial time, is the actual battery capacity
determined by other algorithms and represents the current applied to the battery.
Among the main advantages of the CC technique are low computing power, simple
nature and the possibility of combination with other supporting techniques. However,
since the CC technique is an open-loop estimator, the SoC estimation accuracy is affected
by measurement uncertainties (e.g., current measurement), disturbances or inaccuracies
by setting the initial SoC or the battery capacity [67]. Therefore, in order to ensure long-
term stability of the CC technique and compensate the mentioned disadvantages, the CC
technique is often combined with other supporting techniques such as OCV-based
estimation techniques.
In addition to SoC, the SoAE of the battery is a further key factor/battery state for a
precise energy optimization/management of EVs. The SoAE is often employed for an
accurate remaining driving range prediction either in combination with SoC or

Review of monitoring algorithms and battery models presented in the literature 71
completely standalone [90]. Simply speaking, with the support of an accurate SoAE
estimator, the possibility is given to figuring out how long the battery would last for a
specific power demand. However, the main challenge is to ensure high SoAE estimation
accuracy during battery operation as the measurement inaccuracies and battery
nonlinearities affect significantly estimation results. The main difference between the
SoAE and the SoC is that for SoAE estimation the measured battery voltage must be
considered in addition to the measured current [91]. The SoC is not an appropriate state
for predicting the available battery energy and remaining drive range of the vehicle since
it considers the amount of charge (As) applied to the battery whereas the SoAE accounts
for the amount of available energy (Ws) and can be employed as a direct indicator for
accurate vehicle energy optimization. The SoAE can be determined as follows [91]-[93]:
oAE = oAE + ∫ = oAE + ∫ OCV C ∙ ∙ CC (19)
where oAE is the oAE of the battery at the initial time ( ), P is the applied power at
time and is the actual energy content of the battery which mainly depends on
battery temperature and applied current. Moreover, the SoAE is highly nonlinear mainly
because of the voltage considered in the equation. Consequently, it can be stated that
among the main factors influencing the SoAE of the LIBs are temperature, applied
current and battery voltage (i.e., strictly speaking the OCV) [94]. In general, the
techniques applied for SoAE estimation of LIBs can be subdivided into following two
classes:
Model-based methods using ECMs or advanced electrochemical battery models,
Neuronal network.
Unfortunately, in contrast to SoC, the topic of SoAE estimation has found little attention
in the literature up to now and few articles have performed systematic investigation on
SoAE estimation. For more detailed description of methods for on-board SoAE
estimation of LIBs, the readers are referred to Refs. [91], [94]-[97].
3.1.2 Methods based on measured or estimated OCV
As described in the previous chapter, the OCV is always a function of SoC; i.e.,
OCV = f(SoC). Thereafter, this correlation is often employed to recalibrating the CC-
based SoC estimator and setting the initial SoC value [98]. In this regard, when the
battery is in an equilibrium state and all the side reactions are finished, the SoC-OCV
correlation is used to recalibrate the CC-based SoC estimator. Fig. 34 illustrates the
OCVs of LIBs at different aging states using various active materials measured at 23 °C.

Review of monitoring algorithms and battery models presented in the literature 72
Fig. 34: Open-circuit voltages of Lithium-ion batteries at different aging states using various active materials measured at 23 °C
As discussed in chapter 2, the SoC-OCV correlation may change over the battery
lifetime; hence, the latter fact should be considered in the applied algorithm for an
accurate SoC estimation. A detailed review of references available in the literature
dealing with the topic of OCV-based SoC estimation will be discussed later on in
subsection 3.2.2.
Alternatively, SoC can be estimated in a closed-loop form using model-based techniques
based on ECMs or advanced electrochemical models [87].Within the former technique
(i.e., ECM-based methods), the battery SoC is not directly incorporated in the ECM and
it is determined over the SoC-OCV correlation based on estimated OCV from the
implemented ECM. In an example of the ECM shown in Fig. 14, the OCV can be simply
determined by subtracting the determined overvoltages from the measured battery
voltage as follows (Eq. (20)):
C = − ∆ − ∆ (20)
Unfortunately, the ECM-based methods are not able to precisely reproduce the
electrochemical processes occurring in the LIB, mainly because of their significant
simplification. In this regard, the electrochemical battery models are the promising
solution for accurate battery modeling. The electrochemical battery models are able to
capture various electrochemical processes such as diffusion, intercalation and migration
processes. Unfortunately, as a result of their complex mathematical model structure and

Review of monitoring algorithms and battery models presented in the literature 73
required high computational effort, the aforementioned models have received less
attention in the field of battery monitoring algorithms up to now.
3.1.3 Methods based on active or passive impedance spectroscopy
The methods based on active or passive impedance spectroscopy are often applied for
battery impedance parameters and battery state estimation. Thereafter, when the
dependence of the impedance parameters on SoC is known, battery SoC can be simply
determined [99]. For this purpose, it is necessary that following two factors are
considered: First, a pronounced relationship between the battery impedance parameters
such as R0 and the SoC should be given. Second, impedance characteristics of LIBs
change over the battery lifetime and, thus the applied estimator must be able to track
the aforementioned changes, otherwise the SoC estimation accuracy decreases as the
LIB ages.
A selection of techniques applied for SoC estimation is illustrated in Fig. 35.
Fig. 35: A selection of techniques commonly applied for on-board State-of-Charge estimation
3.2 State-of-Health and capacity estimation
Battery capacity with ampere hours (Ah) or ampere seconds (As) as a unit corresponds to
the amount of charge extractable from the battery until cut-off discharge voltage limit is
reached when starting from a fully charged state. One important issue is that the

Review of monitoring algorithms and battery models presented in the literature 74
capacity is not a constant parameter, and it decays over the battery lifetime due to
internal aging processes when the battery is cycled or even if it is not being used due to
calendar aging [100], [101]. In automotive applications, battery temperature, discharging
and charging current rates, the DoD during battery operation and the SoC during rest
periods are the major degradation factors [102]. In general, it can be stated that
degradation mechanisms of LIBs are either electrochemical or mechanical where often
the source of aging mechanism has its origin in battery electrodes. From an
electrochemical point of view, the capacity loss of LIBs generally occurs because of loss of
cyclable lithium due to SEI formation in electrodes and impedance increase of the LIB.
In general, aging processes occurring inside the LIBs can be mainly related to e.g.,
structural changes, mechanical changes, defoliation of active mass, current collectors
corrosion, increase of internal resistance or contact loss etc. [6], [102]-[104]. However, a
detailed discussion of aging mechanisms of LIBs is out of the scope of this work and,
thus the readers are referred to given review articles.
The SoH is a figure of metric to evaluate the actual aging state or present condition of
the battery and, thus it must be determined by BMS. In particular, the SoH refers to
battery’s capacity fade and/or power fade [105]. When the SoH has to reflect the battery
energy capability (oC), then the actual battery capacity ( ) is of interest. At the
same time, when the SoH is used to describe the power capability (o ) of the battery,
then the actual battery impedance ( ) is of interest [87]. An accurate estimation of
the SoH is of great importance for BMS since the obtained information is often employed
for identifying ongoing battery degradation and prevents a possible battery system
failure. As mentioned above, the actual battery capacity and actual battery impedance
are the main factors for SoH estimation. Thereafter, the SoH is often defined either
as a ratio between the actual battery capacity at nominal conditions (nominal
temperature and nominal discharge current) and the battery’s nominal capacity,
i.e., oC = , or
as a ratio between the actual battery impedance value at nominal conditions
(nominal temperature and nominal discharge current) and its nominal
impedance, i.e., o = .
The unit of SoH is percent where 100% refers to battery aging state at BoL and 0% to
battery aging state at EoL. Generally, as an established rule in automotive applications,
the EoL of the battery is reached when its actual capacity has decreased to 70% - 80% of

Review of monitoring algorithms and battery models presented in the literature 75
its nominal value or in applications where the available power plays more important role
such as HEVs, the EoL is often defined as being reached when the battery impedance is
doubled [10], [106]. For plug-in hybrid electric vehicle (PHEV) where both parameters
(i.e., power and energy capability) are of interest, the oC and the o of the battery
should be considered [82]. However, even if the EoL (SoH=0%) of the battery is reached,
the LIBs can still be used for a while, for example in second-life applications etc. [107].
Fig. 36 shows a selection of possible techniques for on-board SoH estimation commonly
applied for BMS applications.
Fig. 36: A selection of techniques commonly applied for on-board State-of-Health estimation (adopted from Ref. [105])
In general, methods for SoH estimation can be subdivided into experimental and model-
based techniques. The experimental-based techniques require the fundamental
knowledge of interdependences between operation and degradation of the LIB while the
model-based estimators determine the SoH thorough specific impedance parameters of
the LIB (e.g., R0 etc.) that are sensitive to aging state of the battery [105]. A clear
distinction and description of advantages and drawbacks of the aforementioned SoH

Review of monitoring algorithms and battery models presented in the literature 76
estimators can be found in Ref. [105]. For more detailed reviews with respect to available
methods for SoH estimation and aging mechanism of LIBs, the readers are referred to
Refs. [82], [87], [103], [105], [108]. In Fig. 37, possible integration of on-board SoH and
actual battery capacity estimators in the context of simplified BMS architecture is
illustrated.
Fig. 37: Integration framework of State-of-Health and actual battery capacity estimators in the context of simplified battery management system
Generally, the methods for on-board capacity estimation can be divided into the
following four categories:
Voltage-based estimation methods using the OCV-SoC correlation during an idle
or operation time,
Electrochemical model-based methods using electrolyte’s conductivity and electrode’s porosity as an indicator for SoH estimation,
Incremental capacity analysis (ICA) and differential voltage analysis (DVA)
methods, through which information about the aging mechanism can be directly
obtained,
Aging prediction methods, in which an aging model prediction is used for
estimating the capacity and the RUL.
Discussion of different battery capacity definitions 3.2.1.1
Different definitions for battery capacity are given in the literature. Unfortunately, they
are often inconsistent and unclear. In this subsection, a proposal for consistent

Review of monitoring algorithms and battery models presented in the literature 77
definitions of battery capacity is given. The following three main capacity definitions,
illustrated in Fig. 38, may be employed [98], [109]:
Nominal Capacity (Cdatasheet),
Initial capacity (Cinitial),
Actual capacity (Cactual).
Fig. 38: Comparison of different battery capacity definitions
The nominal capacity (Cdatasheet) is the capacity of a battery defined by the manufacturer
for operation under nominal conditions, including nominal temperature (e.g., 23 °C),
nominal discharge current (e.g., one hour discharge rate (1C)), and being fully
discharged from an initially fully charged state. Often, the nominal capacity is the
capacity guaranteed by the manufacturer, and the real capacity of a given battery cell
under nominal conditions is slightly higher. This leads to possible negative values of SoC
if the nominal capacity of the LIB is used as reference for SoC estimation.
The initial capacity (Cinitial) refers to the highest amount of charge that can be extracted
from the battery in a new state and starting from a fully charged state.
The actual capacity (Cactual) is the highest amount of charge that can be extracted from
the battery in its actual aging state starting from a fully charged state. When the battery
is new, its initial capacity is the same as its actual capacity. The difference between the

Review of monitoring algorithms and battery models presented in the literature 78
initial and the actual capacity of the battery over the battery lifetime refers to capacity
loss caused by aging effects.
The Cinitial and Cactual can be defined either at nominal conditions, including nominal
temperature, nominal charging and nominal current or at conditions different from
nominal. The influence of the conditions might be quite substantial. For example, a high
battery temperature generates an increase in the capacity/energy due to a decrease of
the internal resistance and an increase in the kinetics and thermodynamic aspect of the
chemical processes involved in the cell reaction [291]. In Ref. [110], the authors have
investigated the battery capacity for a wide temperature range. An enhancement of
battery capacity by 7.7% at 45 °C in comparison to 15 °C is observed in the latter
example. At the same time, the higher the current rate is, the lower the extractable
battery capacity is [111]-[112]. Empirical derivation of battery capacity based on the
peukert-equation for automotive applications by considering different temperature
ranges and current rates is shown in Refs. [113]-[114]. It is worth noting that the battery
SoC is always defined based on the battery capacity. Depending on the employed battery
capacity (nominal, initial, actual, at nominal conditions or at other conditions) the
respective SoC value will be different.
Basic idea and challenges of on-board capacity estimation 3.2.1.2
The simplest way to determine Cactual is to discharge the battery with nominal current at
nominal temperature from a fully charged state until the battery’s cut-off voltage is
reached [108], [115]. This procedure can be simply applied in the laboratory. However, in
EVs, the use of this procedure is hardly possible, and, therefore, other methods are
required. For example, capacity can be defined as a ratio between ampere hours
charged/discharged and the difference between SoCs (∆oC )20 before and after the
charge or discharge process, as shown in the following equation (Eq. (21)) [116]-[118]: ∫ d = oC − oC (21)
where denotes the actual capacity of the LIB, and is the columbic efficiency,
defined as the ratio between the discharged and charged ampere hours. However, in
most cases, the coulomb efficiency of LIBs can be assumed as ( ≈ ) due to the relatively
low rate of side reactions in comparison to other battery technologies, such as lead-acid
or nickel metal-hydride batteries [110], [119].
It is worth noting that the only useable SoC estimation technique within this method is
a voltage-based SoC estimation method and not CC-based technique discussed in
20 SoCv refers to the voltage-based estimation technique of SoC.

Review of monitoring algorithms and battery models presented in the literature 79
previous subsection. The application of a CC-based estimator would be meaningless, as it
would lead to a circularity of dependencies in the algorithms [116], [120]. Thereafter, the
Eq. (21) can be rewritten as follows (Eq. (22)):
= ∫ C − C (22)
A possible implementation of the use of Eq. (22) for on-board capacity estimation is
shown in step-by-step manner in appendix B. In step 1, all necessary variables are
initialized. In step 2, the OCV of the battery is measured at the beginning of the driving
cycle, and the respective SoC is estimated by the predefined SoC-OCV relation. In
general, it is a good compromise to estimate the OCV(t1) using this method at the
beginning since EVs and PHEVs are often used only for a few hours a day and are
parked during the remaining time, and the battery can be relaxed for a more accurate
measurement. In step 4, OCV(t2) refers to the battery voltage (OCV) during driving or
after driving (during a key-off mode). When both SoCs are estimated, ΔoC can then be
calculated for a considered time span (t1 ⋯ t2) in step 5. For this purpose, it is
recommended that the battery is sufficiently discharged and the ΔSoC is respectively
higher than a predefined value where an accurate SoC estimation (e.g., ΔSoC > 60%) is
possible [121]. At the same time, a moderate temperature change from an initial state
has to be met; otherwise, the influence of temperature on the battery capacity, as
described in previous subsection, cannot be neglected. These conditions are checked in
step 6. Finally, in step 7, the capacity of the battery is determined as defined in Eq. (22)
where the transferred charge from step 3 is divided by the estimated ∆SoC. An accurate
current and voltage measurement of the battery in the vehicle is essential. Especially for
step 3 (determination of the transferred charge), it is important that the current is
measured as precisely as possible. Otherwise, a logged current offset will be considered
in the measurement and consequently in the model, which will result in biased battery
capacity estimation.
3.2.2 Methods based on measured or estimated OCV
As discussed in subsection 3.1, one common method for estimating the battery SoC given
in Eqs. (21)-(22)) is to use the available SoC-OCV correlation. The use of SoCV in
latter equations yields in the following two possible on-board techniques for determining
the value of the OCV (or, strictly speaking, the EMF21) and the SoC both after current
interruption or when the battery is under load:
21 As described in chapter 2, the term “OCV” is used as an equivalent to EMF.

Review of monitoring algorithms and battery models presented in the literature 80
The OCV can be measured accurately after enough periods in the idle mode when
the battery is in its equilibrium state.
The OCV and, accordingly, the SoC can be estimated under load using model-
based techniques by applying one of the state identification methods.
OCV estimation techniques during an idle mode of the battery 3.2.2.1
As shown in chapter 2, less relaxation time is needed at higher temperatures than at
lower temperatures since diffusion processes and chemical reactions taking place inside
the cell are faster at higher temperatures than at lower temperatures, as first postulated
by Fick’s law [69], [122].
Ref. [119] presents an algorithm for OCV and capacity prediction after the battery is
charged by the CC-CV method. The focus lies on the consideration of overpotentials (i.e.,
ohmic overvoltage, due to charge transfer overvoltage or due to electrolyte migration and
due to solid state diffusion) during the relaxation process and its change over the battery
lifetime. In Ref. [121], an on-board fitting algorithm of the OCV relaxation model to the
measured OCV progression with a capacity estimation accuracy of 2% is developed. This
model is based on an ECM consisting of one ZARC-element and a voltage source in
series, representing the OCV. Presented model is fully adaptive and considers the
change of the battery impedance characteristics over its lifetime. Refs. [123]-[124]
present an adaptive OCV estimation method based on LS method for a second order
ECM. A linear dependency between a time constant of a diffusion element and the OCV
is detected for LIBs using LMO and LFP cathodes. For both chemistries, OCV is
accurately estimated within 20 minutes after a current interruption.
Further BMS algorithms and empirical methods for OCV prediction by observing and
fitting the OCV-curve during a relaxation process for a predefined time range are
discussed in Refs. [57], [125]-[126]. The advantage of the OCV prediction method is that
it is not necessary to wait many hours until the battery reaches a steady state, as the
relaxed voltage value can be predicted after mere minutes. Inaccuracies can occur
because of the battery’s potential behavior, such as the hysteresis effect or a flat OCV curve over a wide SoC range. Furthermore, in order to improve the estimation accuracy,
the possible change of SoC-OCV correlation over the battery lifetime need be considered
[52]. However, depending on the application, using such a method, even if there is
potential for an evident lack of accuracy, could be beneficial regarding the capacity
estimation for applications such as taxis due to their low idle time and the lack of
opportunities to wait a defined relaxation time.

Review of monitoring algorithms and battery models presented in the literature 81
The application of the OCV prediction technique is meaningful when a pronounced
dependency between OCV and SoC is available. For example, this technique can be
employed with sufficient estimation accuracy for LIBs using NMC or NCA cathodes;
mainly because of their steep OCV curves for almost the entire SoC range. The
algorithms mentioned above are summarized in Table 7 by means of their
implementation complexity.
Table 7: A selection of open-circuit voltage-based literature sources for on-board capacity estimation
Employed Methodology Relevant possible
references
Complexity of the model
implementation
Using the SoC-OCV relation directly after
the charging and discharging process [117], [120], [126] Low
Using empirical-based models for OCV
prediction [57], [127]-[128] Medium
Using adaptive filters for capacity
estimation
[119], [121],
[125],[129] High
OCV estimation techniques during an operation mode of the battery 3.2.2.2
As mentioned previously, another possible way to estimate the battery capacity is to use
the voltage obtained through an ECM. The basic principle of this method is based on the
comparison of the measured and the simulated battery voltages where the states and
parameters of the battery model are estimated. An accurate determination of OCV from
an ECM is highly dependent on the employed battery model. The more accurate the
battery model is, the more accurate the determined battery overvoltages and the battery
OCV can be. Nevertheless, consideration of all overvoltages, especially overvoltages with
higher time constants (some hours), is hardly possible with ECMs. This means that the
extracted OCV from Eq. (20) is not the same as the OCV discussed beforehand.
Considering the limited available computing power of BMS, reducing the model
parameters to a minimum by trying to depict the electrochemical processes as accurately
as possible becomes necessary. In this regard, ECMs employed in the BMS often consist
of a C , a simple linear R0 and a number of RC-elements connected in series. The
number of applied RC-elements depends highly on the application, relevant time
constants and required estimation accuracy. A higher number of RC-elements yield
higher estimation accuracy whiles at the same time the computational effort increases
[130], [131]. An example of a possible ECM for use in monitoring algorithms is shown in

Review of monitoring algorithms and battery models presented in the literature 82
Fig. 39. Each element of the ECM refers to a certain electrochemical process during
battery operation or even in a battery steady state.
Fig. 39: An example of an equivalent circuit model employed in battery management systems considering various time constants
In order to ensure high estimation accuracy over the battery lifetime and under various
operating conditions (e.g., various temperatures and SoCs), ECM parameters need to be
adapted to the actual aging state of the LIB on-board [132]. In Ref. [86], the authors
show that the estimation accuracy could decrease over the battery lifetime even if the
parameters of the ECM are adapted to the actual aging state of the battery. Algorithms
presented in many researches in the past were often validated under nominal conditions
or when the battery was in a new state.
As a common solution for ECM parameters estimation, the battery model is represented
in a discrete-time state-space form. The methods differ in the way how the states and
parameters of the model are estimated. Generally, it can be differentiated between the
following two techniques [133]:
Adaptive joint estimation technique,
Adaptive dual estimation technique.
With the joint estimation technique an adaptive filter is applied on a single vector of
unknown parameters and states for their estimation. The dual estimation technique
uses two filters in parallel. One filter is used for the state estimation and the other one
for the parameter estimation. A selection of well-known methodologies that are often
applied for the on-board estimation of the ECM parameters is listed in Fig. 40.

Review of monitoring algorithms and battery models presented in the literature 83
Fig. 40: A selection of commonly applied techniques for ECM parameters estimation
In the following subsections, the available algorithms using adaptive filters and observer
techniques for on-board capacity estimation are discussed in more detail. A comparison
of the techniques is conducted, and the complexity of the model implementation is
presented.
3.2.2.2.1 Least squares-based methods
The underlying idea of LS-based algorithms is very simple; it is mainly based on the
minimization of the sum of squared prediction errors. The LS-based filters consider
input data, model states and parameters as deterministic signals. These filters are
simple to handle for on-board estimation purposes, especially because of their simple
implementation and low computational effort in embedded systems. Therefore, the
implementation of LS-based algorithms on microcontrollers for automotive applications
is very popular. Among the main disadvantages of LS-based algorithms are their
divergence problem and the fact that they are not suitable for application on very
complex ECMs. There are different classifications of LS-based filters known for time
varying parameters estimation, such as recursive least square (RLS), recursive extended
least square (RELS), least square with forgetting factor, weighted least square (WLS),
weighted recursive least square (WRLS) etc. [134]. However, their divergence problem
and inapplicability on very complicated nonlinear battery models can be considered
disadvantages [87].

Review of monitoring algorithms and battery models presented in the literature 84
In Refs. [118], [120], [135], on-board capacity estimation algorithms using RLS for ECM
parameters identification are proposed. Developed algorithms are evaluated for both
driving and charging mode in PHEVs. Refs. [136]-[138] present WRLS-based methods for
extracting ECM parameters. From estimated impedance parameters, based on a
combined weighted filter, SoC and SoH of the battery and, correspondingly its actual
capacity are estimated. Joint estimation techniques based on RLS and an adaptive
extended Kalman filter (AEKF) for online parameter identification and SoC estimation
employing a first order ECM are applied in Ref. [139].
Moreover, in Refs. [60], [140]-[141], the authors investigate the voltage behavior of LIBs
using LFP cathodes due to capacity degradation. Changes in the OCV-curve observed,
particularly at high SoC ranges, but only the constant current part of the charge curve is
investigated. The drawback of this cell’s behavior is that the changes of the OCV curve and the consequent capacity loss can be detected when the cell is degraded enough. The
authors propose detecting the capacity loss by defining a prediction residual between the
estimated OCV from a simplified ECM (by employing the RLS-method) and the
measured one. The residual (∆OCV) values increase over the battery lifetime while OCV
behavior of the LIBs change. This is then used for capacity estimation by comparing the
actual residual value and a predefined threshold. The proposed technique is only verified
for LFP-based LIBs, and only battery aging due to cycling and its influence on OCV
characteristics are investigated whereas the impact of calendar aging processes is
neglected.
In Ref. [142] charging curves of LIBs with different chemistries are investigated for SoH
estimation. Based on the observation of a CC-regime of a charging curve, a
transformation function is derived and model parameters are identified by employing a
nonlinear LS technique. After examination of the results, an absolute difference of
approximately 2% between the estimated and measured SoH over 1800 cycles is
achieved. Because of the simplicity and promising results of the investigated algorithm,
it is definitely one of the most promising methodologies for on-board capacity estimation.
In Ref. [143], the authors investigate the on-board capacity and SoH estimation by
investigation of charging time and current for four different LIB types. Unlike the above-
presented methods, the authors investigated both charging regimes (including the CV-
regime) of the curves. The authors found a correlation between the charging time during
the CV-regime due to the intercalation process in this phase and the capacity loss of

Review of monitoring algorithms and battery models presented in the literature 85
LIBs using LFP cathodes. However, its applicability in the field needs to be investigated
in more detail.
3.2.2.2.2 Kalman filter, similar filters and observer technique estimation based
methods
Algorithms based on the KF technique are widely spread in the field of monitoring
algorithms. KF was for the first time presented in 1960 by Kalman in Ref. [144].
However, since KF can only be applied to linear systems and batteries show a highly
nonlinear behavior (e.g., current dependence of the Rct etc.), it is often used in
combination with other extended filters (e.g., LS, Extended Kalman filter (EKF), Sigma-
Point Kalman filter (SPKF) etc.). The working principle of KF-based algorithms is very
simple, whereby the simulated battery voltage is compared with the measured voltage
and based on their resulting difference (ε) which is amplified with K (the Kalman gain),
states of a state space model are updated to minimize ε. Contrary to LS-based methods
KF accepts only stochastic inputs with zero-mean Gaussian covariance.
However, there are some disadvantages of the KF-based algorithms which need to be
addressed: a) required complicated matrix calculations (i.e., Jacobian matrix), b) the
linearization of the nonlinearity of the battery characteristics and the necessity of
knowing a priori the variable of the system noises, such as mean value, relevance and
covariance matrix. An inconvenient information matrix of the system noise may yield
estimation error and parameters divergence, respectively [67], [145]-[146].
As further improved versions of the KF methodology, the EKF, AEKF, and sigma point
KF (SPKF) (including unscented KF (UKF) and central difference KF (CDKF)) can be
addressed. In the system theory, EKF is widely used for the state estimation of
nonlinear systems where at each time step a linearization process of the system by
means of a linear time-varying (LTV) system is performed. It is assumed that the noise
processes are zero mean white Gaussian stochastic processes of covariance matrices
which refer to the uncertainty of the state estimation. As a main difference to the KF
algorithm, battery nonlinearities (nonlinear state transition function and nonlinear
measurement function) are approximated by means of first-order Taylor-series
expansions at each time step [108], [133], [147]. In this context, different approaches
using EKF as joint or dual estimator for SoAP predictions are discussed in great detail in
Refs. [148]-[149].
To overcome the disadvantages of EKF, such as linearization of the nonlinear battery
model and high computational effort, more improved algorithms, such as UKF or CDKF,

Review of monitoring algorithms and battery models presented in the literature 86
which both belong both to the SPKF class, can be used for more accurate and robust
battery state estimation without the need for system linearization or calculation of the
Jacobi matrix. The latter technique approximates the probability density of the state
estimation by using characteristic points, so-called sigma points [150]. In comparison to
EKF, SPKF algorithms do not need the linearization of the equation at each sample
point by using a Taylor-series. SPKF uses an unsteady, function evaluation for
covariance matrix estimation. In the literature, there are many different algorithms
known from this class and discussed for battery state estimation. However, an extensive
exploration of the aforementioned methods is out of the scope of this work. In the
following, some relevant methods and papers will be introduced and discussed.
Ref. [151] introduces an algorithm whereby SoC and battery capacity are estimated by
utilizing an EKF. SoC is estimated by employing EKF, while a RLS filter is used for
ECM parameter estimation. Based on the resulting SoC, capacity is derived using the
difference between the SoC increment of a fresh cell and the SoC increment at present
aging state of the battery. The more accurate the estimated SoC increment for a defined
sample data is, the more accurate the battery capacity that can be estimated by the
employed technique is. The authors show estimation accuracy of less than 4% employing
New European Driving Cycle (NEDC) as a reference profile for LIBs at different aging
states.
In comparison to the described EKF technique, the AEKF improves the estimation
accuracy by an adaptive update of the noise covariance. In Ref. [152], the authors
present an algorithm based on adaptive joint filter methodology using AEKF for state
estimation of LIBs with LFP cathode materials. Furthermore, they proposed an
algorithm for on-board capacity estimation called the iterative transferred charge
method. The basic idea of this methodology is almost the same as that presented in Eq.
(22). An absolute error of 4% for battery capacity estimation over its life-time was
achieved using this methodology.
A model-based approach for on-board battery state estimation is presented in Ref. [153].
Moreover, a battery capacity and driving range prediction methodology for EVs is
presented. For this reason, EKF and ∞-Filter for SoC estimation is applied, and the
corresponding results are compared and analyzed. Based on Eq. (22), the battery
capacity and driving range are estimated. While, for an accurate performance of KF
estimation methods, the priori noise is assumed to be zero-mean Gaussian, estimation
techniques based on a sliding mode observer or ∞-Filter actually do not require this

Review of monitoring algorithms and battery models presented in the literature 87
prerequisite. Maximum estimation error is minimized while an alternative feedback gain
for considering estimation errors and measurement noises is applied. After analyzing the
results of both models, the authors found almost the same performance and convergence
speed for EKF and ∞-filter.
Almost the same methodology has been proposed in Refs. [154]-[155]. A dual EKF, which
employs two EKFs in parallel based on a simplified ECM, is implemented. The first EKF
estimates the SoC, and the second one, the so-called weight filter, is responsible for
capacity estimation. Because of the high complexity of the proposed algorithm and the
compensation for the model error, the above filters are extended by the measurement
noise model to separate the state and weight filter. The algorithm was validated with a
maximum absolute capacity estimation error of 5%.
A dual extended Kalman filter (DEKF) combined with pattern recognition based on a
Hamming network, which is normally used for binary pattern search, is presented in
Refs. [156]-[158]. Two patterns have been investigated for SoC, capacity and,
respectively, SoH estimation at different temperatures. The investigated patterns, so-
called the capacity pattern and (dis)charging voltage pattern are predefined from
laboratory measurements, while the input-patterns are compared to find the closest
using statistical analysis. Estimation results within a range of ±5% for SoC and capacity
are achieved.
In Ref. [159], the authors investigate the combination of the EKF technique and a per-
Unit system for SoC and capacity estimation by employing a simplified ECM
(considering ∆ and diffusion overvoltages). A capacity estimation error of less than 5%
is achieved. However, due to the high computational effort of the proposed algorithms,
intensive simplifications need to be carried out for their application in the field. In Refs.
[160]-[162], an algorithm based on dual sliding-mode observer for SoC and SoH
estimation is presented. This algorithm consists of two observers, where the first fast-
paced time-varying observer is responsible for battery parameter and voltage estimation
and the second slow-paced filter for SoH estimation in terms of battery capacity and
resistance. The Lyapunov equation is applied to ensure the convergence of both
observers. During each sampling time, the state and parameter observers are updated
after each other. The state observer is updated using previous estimated parameters
from the second observer. Subsequently, the parameters are updated by using the new
estimated state values.

Review of monitoring algorithms and battery models presented in the literature 88
A dual joint estimation filter is introduced in Ref. [116], whereby SPKF is used for SoC
estimation and various total least square (TLS) algorithms for the second filter are
employed and compared for capacity estimation. After analyzing different TLS-based
filters, promising results could be achieved from the weighted TLS (WTLS) method,
whereby noises on both the accumulated charge and SoC difference are considered. The
algorithms are verified only by using simulated battery data. As a further investigation,
the adaptability of the WTLS to embedded systems with real vehicle data could be
performed.
Refs. [163]-[164] present an adaptive EKF-based algorithm for SoC and SoH estimation
on lead-acid battery example. However, due to a difference between the SoC-OCV
relationship of lead-acid batteries and LIBs and their various behaviors during the
battery lifetime, the exact implementation and use of the proposed methodology for LIBs
need to be optimized and adapted. A combined SoC and SoH estimation method using a
dual Kalman Filter in combination with a support vector machine is presented in Ref.
[165]. The presented dual KF consists of a simple KF and UKF for SoC and capacity
estimation, respectively. The support vector machine (SVM) is implemented and
additionally coupled with a dual filter to predict the RUL of the battery. Refs. [150],
[166]-[167] used a CDKF filter that affords lower parameter count than UKF using a
linear parameter varied for a simplified ECM. The advantage of the presented algorithm
is the need for only one filter that is able to estimate a battery’s internal resistance and capacity for SoH determination as a parameter and SoC as a battery state. The needed
computational effort is, accordingly, greatly decreased, and promising performance could
be observed due to the robustness of the algorithm.
An alternative to the KF is a particle filter (PF). The main difference between them is
that the PF does not need an assumption of the zero mean Gaussian distribution of
model states and noises and it can generally deal with any Probability density function
(PDF) by applying the Monte Carlo method. For this reason, a limited set of samples are
employed. In Refs. [168]-[170], SoC and capacity estimation techniques based on PF
methodology are investigated for EVs and stationary applications. After long-term
simulation tests for EVs, accurate results are achieved for capacity estimation with an
estimation error of 2% or better, whereby the authors propose the applicability of their
algorithm for on-board implementation on a microcontroller. According to the authors,
the computational effort of a PF increases linearly with the amount of defined samples.
However, employing a reasonable amount of states and samples and their determining
techniques yields a well compromise for its implementation on a microcontroller.

Review of monitoring algorithms and battery models presented in the literature 89
Moreover, in Ref. [171], the authors propose a combined model employing genetic global
optimization algorithm and Levenberg-Marquardt local optimization algorithm to
estimate the impedance parameters of the ECM for SoH estimation.
The discussed algorithms and respective literature sources for on-board capacity
estimation based on ECMs are listed and compared in Table 8.
Table 8: A selection of ECM-based literature sources for on-board capacity estimation of LIBs
Possible relevant
References
Employed
Methodology
Combination with other
adaptive filters required
Complexity of the
model
implementation
[116] LS SPKF Medium
[60], [118],[135],
[140], [141], [172] RLS No Low
[154]-[155] DEKF No Medium
[152] AEKF Iterative transferred charge Medium
[150], [166]-[167] CDKF No High
[165] Dual Filter
(KF+UKF) SVM High
[168]-[170] PF No High
[93] Genetic
algorithm
No Medium
EKF (for SoC estimation)
3.2.3 Methods based on electrochemical models
The models discussed in the previous subsection are generally preferred for
implementation on low-cost microcontrollers mainly because of their simplicity and their
high robustness. However, the main drawback of such models is the less pronounced
chemical and physical meaning of parameters. This results in increasing estimation
inaccuracy over the battery lifetime, as different aging processes cannot be tracked
accurately. As an improvement with more emphasis on the physical meaning of
parameters at the expense of computational effort, electrochemical-based models can be
noted [173]. In the following, methodologies regarding on-board capacity and SoH
estimation based on these models and their principals are discussed. More detailed
explanation regarding electrochemical battery modeling and their pros and cons will be
given in 3.5.

Review of monitoring algorithms and battery models presented in the literature 90
In Refs. [174]-[176], the authors investigate electrochemical models based on pervasively
accepted single particle model (SPM) theory. The scope of their research lied in the field
of on-board SoC and SoH estimation. For this reason, an observer technique based on
partial differential equations (PDE) has been investigated. The corresponding SoH
estimator algorithm was divided into two parts: i) the capacity estimator ii) the power
fade estimator (impedance rise). Due to the challenge of on-board parameter estimation
by the PDE technique, it is therefore combined with a first order pad 22 approximator
(for the estimation of the diffusion coefficient), a backstepping PDE estimator and a LS
technique.
In Refs. [177]-[179], the authors investigate a SPM model based on a UKF methodology
for SoC estimation. LS technique is used for estimation of battery capacity and internal
resistance rise, which is consequently connected to SoH estimation. As a parameter for
the detection of the capacity loss, the porosity of the cathode (ε, the volume fraction of the intercalation particles) was considered; for power fade detection, the decrease of the
effective electrolyte conductivity (keff) has been considered. One advantage of the
presented model is the ability to distinguish between the capacity loss due to impedance
increase and due to active material loss. Unfortunately, only the LIB degradation of the
cathode material is examined, which is possibly a limiting factor for accurate capacity
estimation. A control-oriented simplified SPM for estimating SoH of the LIB and
determining battery’s impedance and solid phase diffusion time of lithium ions in the positive electrode is introduced in Ref. [180]. The coefficients of the third-order pad approximated transfer function (used for discretization of the SPM) are related to aging
relevant parameters (capacity and impedance). The linear increase of the total resistance
is related to the increase of the Rct and contact resistance, while the increase of the
diffusion time as battery ages occurs because of the SEI layer’s growth of active particles of the positive electrode, according to the authors. Furthermore, a non-monotonic
increase in the capacity factor is observed, which can hardly be used as SoH indicator.
In Ref. [181], a comparison between SPM and a semi-empirical electrical model is
performed. Parameter identification is also performed by employing a nonlinear LS
technique. Several criteria, such as root mean square error, sum of the squared error,
and voltage prediction boundaries, are investigated for comparison of both models. Both
models require the same computational time, while the SPM model delivered more
accurate results due to voltage prediction.
22 A Pad approximant corresponds to a simple function represented by a ratio of two power series. Its main difference
from Taylor series is the possibility to match the Taylor series of the function that needs to be approximated [289].

Review of monitoring algorithms and battery models presented in the literature 91
Furthermore, Ref. [93] compare a simple second-order ECM (consisting of 6 adaptive
parameters) with an extended ECM based on the SPM model (consisting of 10 adaptive
parameters), whereby the focus of their research lie in the improvement of the voltage
estimation accuracy in the low SoC range (SoC < 20%). The concentration of lithium in
the electrode particle (describing solid-phase diffusion processes) represented by the
surface SoC in the developed model is employed in order to enhance the estimation
accuracy. According to the authors, the estimation accuracy through the improved model
(extended ECM) could be improved by 50%. A selection of literature sources dealing with
electrochemical-based models for battery capacity and SoH estimation can be found in
Table 9.
Table 9: A selection of electrochemical model-based literature sources for on-board capacity estimation of LIBs
References Employed
Methodology
Combination with other
adaptive filters required
Complexity of the model
implementation
[182]
PDE observer
No
High [174]-[176] LS
[177]-[179] LS UKF Medium
[181] LS No Low
[180] Gradient-based
recursive estimator LS Medium
3.2.4 Methods based on Incremental capacity analysis and differential voltage analysis methodologies
The investigation of LIBs inner chemical reactions and aging mechanisms can be carried
out by means of differential mathematic approaches, such as ICA or DVA. Generally,
these approaches are widely applied to investigate the behavior of a battery in a
laboratory environment in order to characterize the chemical and physical processes that
take place inside the cell during its operation and to examine how each of the processes
evolves over the lifetime of the battery. Recently various concepts and techniques have
been developed in order to address the use of these methods, including on-board capacity
loss estimation for EVs.
ICA has been already investigated as a reliable offline tool to study the electrochemical
behavior of a battery in Refs. [183]-[185]. The analysis is achieved by the differentiation
of the charged or discharged battery capacity in respect to the terminal voltage. The
obtained curves V – dQ/dV transform the plateau present in the cell voltage trend
(representative of electrochemical equilibrium phases during the battery operating

Review of monitoring algorithms and battery models presented in the literature 92
conditions) into peaks, with different amplitude depending on the cell chemistry and
aging conditions. Refs. [183]-[185] have demonstrated how powerful the differential
analysis is as a non-invasive tool, which does not require the physical separation of each
electrode. The investigations have shown the feasibility of using the ICA to observe how
the characteristic peaks of the curves change in terms of amplitude and position over the
battery lifetime, with the intention of detecting the different aging mechanisms that
take place in the LIB.
This evidence makes the offline SoH estimation relatively simple compared to a post-
mortem analysis, in terms of aging mechanism identification. As will be discussed
further later on, and as can already be foreseen, one of the drawbacks and limitations of
this method lies in the fact that the cell has to be charged or discharged with a constant
current in the entire voltage region where at least one of the peaks is detectable; with
the compromise that the current rate has to be limited enough to show the voltage
plateau, which is otherwise covered from the resistance voltage drop in the case of high
load current operation.
The DVA investigates the working operation of a battery through the differentiation of
the terminal voltage trend with respect to the (dis)charged capacity, whereby the
obtained trend Q – dV/dQ represents, for each peaks, the transition between two
electrochemical equilibrium conditions during the cell operation. As for ICA, also in this
case, several studies e.g., Refs. [186]-[190] have investigated how the curves obtained
through this analysis change over the battery lifetime, in qualitative and quantitative
terms. For example, Ref. [190] applies the DVA analysis to the full and single electrode
voltage curves, and further derived a model to predict the capacity loss due to aging. The
proposed model is able to detect irreversible capacity loss and useable positive and
negative active material losses during calendar and cycle life. Furthermore, the
potentiality of the DVA can also be extended to obtain information relative battery SoC,
as the position of each peak can be addressed to the quantity of lithium charges present
in the positive and the negative electrodes, and consequently to the SoC.
The possibility of using the aforementioned methodologies in a BMS for on-board SoH
estimation has been introduced in Ref. [191]. In the latter specific case, a methodology
for using the ICA method on EVs for on-board battery capacity estimation is proposed.
Firstly, the lifetime modification of the ICA curves for 8 LFP-based LIBs cycled at the
same conditions is investigated as already demonstrated in Ref. [184]; according to the
obtained results, the change in the positions and, mainly, in the height of the ICA peaks

Review of monitoring algorithms and battery models presented in the literature 93
over the lifetime for this type of LIB chemistry is significant, thus the information
obtained from the differential analysis can be used directly for the estimation of the
battery capacity. Furthermore, the authors explain how the ICA curve can be
determined on-board taking into account that for PHEVs and EVs, it is possible to
occasionally have a charge curve with constant current, they chose to apply ICA only
during the charging process and in a defined voltage range. The assumption is that one
of the peaks must be clearly visible and detectable, i.e., a complete plateau in the voltage
curve has to be measured. Examples of applications of ICA and DVA on the charging
process for SoH estimation through SVM method can be found in Refs. [34], [192]-[194].
First, an online fitting process of a piece of the charge curve − is accomplished, and
then a numerical differentiation of the curve is carried out in order to obtain the
characteristic peak curve. The height of the peak is then compared with the offline data
to obtain a first estimation of actual capacity of the battery.
Moreover, the validation of the SoH estimation is performed for different LIBs of the
same type. Nevertheless, some critiques of the method can be found by considering the
real on-board conditions that can be encountered during the normal operation of EVs.
First of all, the authors explain that the method can be applied in each moment to a
battery voltage profile that does not necessarily have to be an OCV curve. However, as
soon as ICA is applied to a charge voltage curve obtained under high current rates, the
possibility to detect the peaks of the ICA curve corresponding to phase transformation of
the cathode becomes limited, thus it is suggested to obtain ICA curve only when the
current rate is low. This is due to the different voltage polarization that a cell can
present over a wide SOC range. Moreover, unfortunately, for online application is shown:
the necessity of testing such an approach in a battery pack, where the cell variability
plays a fundamental role, cannot be neglected.
An alternative approach using differential analysis methods for on-board capacity
estimation is proposed in Ref. [195]. The aging behavior of LFP-based LIBs is examined
by applying cyclic voltammetry (CV) analysis. According to the authors, the method
gives the same qualitative results as the ICA and DVA methodologies [196]-[197].
Thereafter, the authors discuss the difficulties of applying the ICA and DVA for on-board
battery capacity estimation due to the following requirements:
The voltage samples have to be preciously measured and collected with an
adequate frequency, especially when the current rate is limited enough in the SoC
range in which the plateau is completely visible,

Review of monitoring algorithms and battery models presented in the literature 94
The collected samples have to be filtered or smoothed in order to obtain a correct
and feasible differentiation analysis as they would otherwise be unclear and full
of useless small peaks,
Fitting and a differentiation process have to be accomplished,
At the end, a comparison between offline and online data has to be performed.
This is a complex issue, as the information, in terms of the identified aging
mechanism, has to be converted into a single cell capacity value.
Due to these conditions, the authors proposed the using PDF as a simple approach that
is comparable qualitatively and quantitatively with differential analysis. The advantage
of the PDF method is not only to be restricted to the on-board SOH estimation, whereas
the PDF method realizes the discretization of the ICA/DVA method. Such a
discretization provides two conveniences in battery SOH research: First, when
processing ICA/DVA, the derivative through probability counting of the sampled voltage
using the PDF method can directly be derived without curve fitting. Second,
discretization property of the PDF can be easily applied to on-board SOH estimation.
However, the PDF method needs some calibration work before being applied for on-board
use.
In fact, when the PDF function is applied to the battery terminal voltage curve, the
result is again a curve with peaks in the correspondence values where voltage plateaus
are detected, or simply speaking, each peak expresses the number of measurements in
which the same voltage value is detected. The on-board application of the PDF is
achieved by comparing the curve measured offline (e.g., stored in the form of a simple
lookup table) with the information gathered on-board, taking into account that:
The voltage curve in which the PDF is applied has to be obtained with a constant
current process,
The (dis)charge current has to be sufficiently limited to allow for clear detection of
the voltage plateau,
The (dis)charge process has to cover at least the voltage range in which a
complete plateau can be detected.
In Ref. [192], PDF method combined with a fuzzy logic approach is proposed. The main
advantage of the fuzzy logic method is the grant of particular level of uncertainty and
ambiguity in transforming noisy data [108]. However, the applicability of this method in

Review of monitoring algorithms and battery models presented in the literature 95
a complex system (which is a single cell or a battery pack) in everyday life conditions has
not yet been proven and needs further investigations.
In Table 10, a selection of the relevant mentioned references are shown and compared.
Table 10: Incremental capacity analysis and differential voltage analysis-based methods for capacity estimation
Employed
Methodology References
Adaption of model parameters to the actual
aging state of the
battery
Complexity of the
model
implementation
SVM [191], [193] Yes Medium
PDF [192], [195] Yes Medium
3.2.5 Methods based on aging prediction models
The aging behavior of LIBs under different operating conditions has been deeply
investigated in the past and in particular, recently. The aim is generally to understand
how the energy and power capability change over the battery lifetime by modifying the
conditions under which a defined LIB operates. The main concern of this approach is
that, normally, lifetime tests are very time consuming: in fact, considering that LIBs are
able to reach more than thousand cycles, the goal is to accomplish the tests in a
reasonable time and, at the same time, to gather enough information in terms of battery
lifetime.
Generally, the test results are finalized by obtaining a model that describes the battery
capacity loss or resistance increase during the lifetime based on operating conditions
(actual voltage, current, temperature, etc.). Aging models attempt to predict the capacity
and internal resistance in terms of SoH estimation based on actual operating conditions
and past history. Several authors have already shown numerous results following this
procedure [198]-[201].
Refs. [33], [66], [202] investigate the aging behavior of LIBs using NMC cathodes in
storage and cycling tests for different temperatures and SoCs. The obtained capacity and
resistance model predictions are validated with measured data obtained from cycling
tests, with accurate approximation for capacity loss prediction. In Ref. [199], the authors
investigate a semi-empirical cycle life of a LIB with LFP as cathode material by using a
large test matrix. Experimental results show that the capacity loss is strongly influenced
by time and temperature, while, for high current rates, the charge and discharge rate is
more relevant. Similar results were obtained from Ref. [198] for capacity loss both for
storage and cycling, while Ref. [200] proposed a prediction model based on accelerated
aging tests able to describe the internal mechanism for capacity loss. The authors in Ref.

Review of monitoring algorithms and battery models presented in the literature 96
[201] carried out accelerated aging tests on LFP-based LIBs and developed a model that
correlates the effect of combined multiple stress factors on the capacity degradation, with
the goal of predicting the lifetime of the battery under dynamic operating conditions.
The necessity of building a prediction model can be generally related, on one hand, to the
lifetime prediction of the battery when it is subjected to some defined working conditions
or, on the other hand, to the possibility of using this on-board information for capacity
estimation. Another important contribution is provided in Ref. [203]. The authors use
the data obtained from accelerated aging tests as input for a SVM, which is a powerful
machine learning algorithm, in order to obtain an identification system able to work in
an on-board environment for diagnosis and prognosis by considering temperature,
current rate and SoC. The basic idea of such algorithms is to set a vector as an input of
the proposed model and another as its target values. The goal is then defined as
updating the model parameters by observing the dependency of output and input values,
which enables the possibility of making an accurate prediction of the output vector in the
future.
In Refs. [204]-[207], a machine learning methodology based on a relevance vector
machine (RVM) and a PF from a Bayesian network framework is presented. RVM, as
proposed for example, in Ref. [203], is responsible for identification of an employed
model. The main difference between RVM and SVM is the PDF as an output of the
employed models. The PF is used for estimation of the RUL of the LIB in the form of a
PDF. The main difference of the investigated model from the model mentioned in the
previous subsection is the investigation of in series with the to Rct. LIBs using NCA
cathodes are investigated and based on the mentioned techniques, the battery’s state and parameters are estimated.
An alternative novel data driven technique-based on sample entropy (SampEn) has been
recently shown by some authors. Richman and Moorman presented a SampEn algorithm
for the first time in the field of health prognosis [208]. The authors in Ref. [209]
performed HPPC tests on different LIBs using NMC cathodes, whereby SampEn of a
responding voltage during a constant current regime is used as an input for an LS-based
estimator. Ref. [210] shows an algorithm based on a determined surface temperature of
the battery during the charging process. The authors have developed a model using
information gathered during the battery’s life-time in combination with PF algorithms
for remaining battery capacity estimation. Furthermore, Ref. [211] presented a combined

Review of monitoring algorithms and battery models presented in the literature 97
model consisting of a machine learning technique based on SVM methodology and a
SampEn as their input vector regarding network training for SoH estimation.
Moreover, in Ref. [100], the authors tested LIBs in a cycling condition using two dynamic
profiles, the so-called charge depleting and charge sustaining profiles, while varying the
temperature and the average SOC. In Ref. [212], cylindrical LIBs with five different
dynamic profiles for roughly 120 days in order to investigate the aging path dependence
due to the magnitude and frequency of the power pulses and due to the variation of the
temperature during cycling are cycled. In Ref. [213], an energy-based battery model was
developed and investigated; the model consists of calendar and cycle aging prediction
parts. Different scenarios, such as various driving cycles, charging strategies and peak-
shaving, and their aging effect on battery lifetime have been simulated. In Ref. [214], the
authors designed a system based on ECMs that model the behavior of each cell electrode;
summing up the contribution of each electrode the total cell voltage can be simulated
and reproduced. The inputs of the model are the degradation mode, i.e., the type of
mechanism involved in the aging process. In this case, it is necessary to have a system
that is able to predict which type of degradation has taken place inside the cell
depending on the actual and past operating condition.
The above mentioned algorithms and references are listed and concluded in Table 11.
Table 11: Aging model based methods for capacity estimation
A selection of
relevant references
Employed
Methodology
Combination with other
filter required
Complexity of the model
implementation
[203] SVM No Medium
[204]-[207] RVM PF Medium
[209]-[210] SampEn PF Medium
3.3 State-of-Available-Power prediction
SoAP is a further battery state that must be determined continuously by BMS in EVs.
Up to now, different approaches for SoC and SoH estimation of LIBs have been shown
and reviewed in the literature by many authors in the past. However, the topic of SoAP
prediction has not been explored enough sufficiently yet and there are still a lot of
researches required to optimize, improve and understand this challenging task. As a
general rule, the time horizon for SoAP prediction lies between 1 s and 20 s in EVs [26].
By knowing the available battery power in addition to the actual battery SoC and SoH, a

Review of monitoring algorithms and battery models presented in the literature 98
reasonable EMS strategy can be applied and specified vehicle functions, such as vehicle
acceleration, deceleration or gradient climbing can be performed without exiting battery
SOA and affecting the lifetime of the battery or causing safety damage, respectively
[215]-[217]. Fig. 41 shows schematically the interaction between various battery states
and SoAP in the context of a simplified BMS architecture.
Fig. 41: Schematic illustration of possible interaction between different battery states/parameters and State-of-Available-Power in the context of a simplified battery management system architecture
One of the state-of-the-art approaches used for static power capability determination is
the HPPC method presented by the partnership for new generation vehicles (PNGV)
battery test manual, published by the Idaho National Engineering & Environmental
Laboratory of the U.S. Department of Energy [218]. An improved method for the
determination of power capability by means of pulse tests with some modifications
regarding applied current rates, resting time etc., was presented in subsection 2.3. In
fact, accurate results may be achieved by applying this technique in laboratory
environments. But under real conditions, such as in vehicles where available peak
current or voltage for a specified time horizon need to be known, accurate power values
are not provided and the results are mostly overestimated since only the operational
design limit of battery voltage is considered [219]-[222]. Fig. 42 shows the dependence of
battery power capability on SoC for Cell-C-new and Cell-C-aged measured at 23 °C. The

Review of monitoring algorithms and battery models presented in the literature 99
available battery power is determined based on resistance values obtained as a voltage
value reached after 20 s from the beginning of the current pulse divided by the current.
Fig. 42: Power capability of Cell-C-new and Cell-C-aged at 23 °C determined as proposed in Eqs. (23)-(24); (Vcell,min=1.5 V, Vcell,max=2.75 V)
The power fade occurred over the battery lifetime directly influences the driving
performance of the vehicle in terms of acceleration or battery charging during
regenerative phases and charging periods [223]. From the relationship between battery
SoC and power capability shown in Fig. 42, it becomes obvious that the charging power
capability decreases with the increase of SoC and vice versa. The maximum available
power of a lithium-ion battery pack is derived by investigating the battery’s VOCV and
resistance as follows [106], [215], [224]:
Pdischarge= [Vcell,min∙ ( C , - Vcell,min)/Rcell,discharge]∙ , ∙ , (23)
Pcharge= [Vcell,max∙(Vcell,max - C , )/Rcell,charge]∙ , ∙ , (24)
Based on Eqs. (23)-(24), it can be concluded that the power fade over the battery lifetime
is mainly influenced by the increase of battery impedance. The current that can be
applied to the battery can simply be derived from Eqs. (23)-(24) after some mathematical
calculations from [224]. It is worth noting that the applied technique for determination
of the battery power capability is independent of the battery chemistry used. However, it
is important to ensure the constant battery temperature and to adjust the correct SoC
level during the tests.

Review of monitoring algorithms and battery models presented in the literature 100
As discussed in subsection 3.2, the EoL criterion of the battery is mainly dominated by
actual capacity and actual impedance of the battery. In fact, in terms of available battery
power prediction the latter parameter plays a major role. In Ref [106], the authors
examine the power capability of a battery pack at different aging states using three
different driving cycles obtained from an EV. The obtained results indicate that when
the available battery power fades down to 50% (i.e., the battery impedance is doubled)
the vehicle might have trouble accommodating the discharge or charge power at low and
at high SoC ranges, respectively. Furthermore, according to the results, the decrease of
available battery power leads to the increase of acceleration time, in particular at low
SoCs.
The available battery power is limited by the SOA, where the SOA is defined by battery
temperature, current, voltage and SoC [46], [87]. However, during a single applied
current over a time horizon of several seconds (∆t <= 10 s), the battery’s temperature and SoC do not change significantly. It can be therefore concluded that in practice battery
voltage and current are the major limiting factors for SoAP prediction [87], [225].
Because of safety reasons the battery must be operated in a specified voltage window
( ); this limitation influences the maximum current which can be
drawn from or fed into the battery and it is therefore often used as an indicator for the
battery’s power capability. Consequently, the maximum power which is allowed to be applied to the battery can be determined when the predefined SOA limit of battery
current or battery voltage is reached. It is worth noting that not only the voltage of the
lithium-ion battery pack but also the voltage of individual cells must be monitored.
For this reason, by the beginning of the pulse (t=t0), battery voltage and battery current
at the end of the applied pulse (t=t0+∆t) should be predicted (Fig. 4323). As by the
beginning of the pulse it is not known whether the voltage or the current or both of them
are limiting factors, one must distinguish between the following four different cases
[225], [226]:
Case A: Charging with cell or battery system voltage limitation,
Case B: Charging with battery current limitation,
Case C: Discharging with cell or battery system voltage limitation,
Case D: Discharging with battery current limitation.
23 Fig. 43 shows cases where it is assumed that constant current pulses are applied to the battery; however, depending on
the application, it is also possible that constant power pulses are applied to the battery which means that both the
battery current and voltage would change during the applied power pulse.

Review of monitoring algorithms and battery models presented in the literature 101
In Fig. 43a and 43c, the cases are illustrated where the battery voltage at the end of the
applied charge or discharge current reaches exactly the allowed upper or lower voltage
limit (see case A and case C above). In these two cases the predefined current limit is not
exceeded. At the same time in Fig. 43b and Fig. 43d, the maximum limiting charge and
discharge current is applied to the battery while the upper or lower voltage limit is not
reached (see case B and case D above). In fact, case B is the only case among all the four
listed cases where the battery is charged with the maximum limiting current while the
absolute value of the available battery power is increasing. In the remaining cases, the
absolute value of the available battery power decreases over particular charging or
discharging periods.
Fig. 43: Schematic illustration of four cases for limiting available battery power in case of battery charging or discharging with constant current: a) applying constant charge current (Icharge<Imax) while battery voltage is the limiting factor (in this case the battery could be at very high SoC range); b) applying constant charge current (Icharge=Imax) while current is the limiting factor (SoCcase,b < SoCcase,a); c) applying constant discharge current (Idischarge>Imin) while battery voltage is the limiting factor (in this case the battery could be at very low SoC range); d) applying constant discharge current (Idischarge=Imin) while current is the limiting factor (SoCcase,d > SoCcase,c)

Review of monitoring algorithms and battery models presented in the literature 102
In an example of the ECM shown in Fig. 39, the predicted battery voltage ∆ at
the end of the applied current pulse for a certain time horizon of ∆t can be derived as
follows (Eqs. (25)-(29)): ∆ = ∙ (25) ∆ ∆ = = ∙ −∆ + ∙ ( − −∆ ) ∙ (26) ∆ ∆ = = ∙ −∆ + ∙ ( − −∆ ) ∙ (27) ∆ ∆ = = ∙ −∆ + ∙ ( − −∆ ) ∙ (28) ∆ = ∆ + ∆ ∆ + ∆ ∆ + ∆ ∆ + C oC + oC . ∆. 24 (29)
In addition to the discussed impacts of battery SoC, current and voltage on available
battery power, it is essential not to neglect the influence of battery temperature. Since
applied high charge or discharge current rates or battery temperatures may influence
the aging behavior of the battery (e.g., lithium plating25 etc.) [227], the SoAP prediction
algorithm must consider these boundary conditions as well [228]. However, as discussed
in Refs. [46], [225], the accurate prediction of the available battery power becomes more
challenging at low temperatures or when the battery is aged, as the LIB reaches the
predefined SOA and power limits, respectively, readily. Fig. 44 shows the dependence of
SoAP on temperature and applied current rate in an example of a NMC/LTO LIB in a
new state. As expected, the available battery power for both charge and discharge
direction decreases with the decrease of battery temperature, as a consequence of
increasing battery resistance. At the same time, the available battery power increases
with the increase of temperature while aging processes occurring in the LIB are faster
under such operating conditions.
24 oC [V ∙ A− ∙ s− ] represents the change of the C per As of current flow. 25 Lithium plating refers to deposition of metallic lithium in form of dendrites in the anode [6]. Lithium plating occurs
directly on locations where local anode potential drops below 0 V vs. Li|Li+.

Review of monitoring algorithms and battery models presented in the literature 103
Fig. 44: Dependence of available battery power on battery current and SoC at different temperatures in an example of Cell-C-new (Vcell,min=1.5 V, Vcell,max=2.75 V) determined as proposed in Eqs. (23)-(24)
This subsection aims to give an overview of available techniques for SoAP prediction of
LIBs in EVs. Unfortunately, it seems that there is no uniform definition available in the
literature for battery power capability. The definition used in this work, namely SoAP,
differs little from the definition of State-of-Function (SoF) estimation which is often
employed. SoF is a figure of merit that describes the battery capability to perform a
certain task [229]-[230]. In the particular case of battery power capability, it may be
concluded that SoF is a kind of logical signal that only allows yes or no response to the
required battery power for a certain function, such as cranking capability etc. At the
same time, SoAP is mainly related to the amount of power which the battery can deliver
to or accept from the vehicle powertrain over a certain time horizon (∆t) [231]-[234].
Therefore, in order to prevent misinterpretation of the used parameters, in the following
only the SoAP definition whose meaning and particular definition is described above, is
used. An alternative definition is given in Refs. [102], [235], where the authors state that
SoAP is actually defined as a ratio of available battery power to the maximum nominal
battery power.
In general, the available techniques for predicting the SoAP can generally be subdivided
into the following two groups:

Review of monitoring algorithms and battery models presented in the literature 104
Methods based on (adaptive) characteristic maps (CM),
Methods based on ECMs.
3.3.1 Methods based on adaptive characteristic maps
The methods based on CM use the known static interdependences between battery
power capability and battery parameters and states. Related battery parameters and
states generally used in this context are listed as follows [31], [236]:
SoC,
Temperature,
Duration of the power pulse,
Required power,
Battery voltage.
In order to build the CM: First, the above mentioned dependences are characterized by
various battery characterization techniques, such as HPPC tests or EIS. Second, the
extracted parameters are stored as a more dimensional matrix in a non-volatile memory
in the ECU used as initial parameter sets of the battery.
As discussed in the previous section, because of aging mechanisms occurring in the LIBs,
their impedance characteristics change over the battery lifetime. This makes the use of
adaptive techniques for tracking the CMs over the battery lifetime necessary. The basic
idea of the techniques using CMs is simple: The battery power measured on-board is
compared with the predicted value (∆P = Pmeas – Ppredict) and the corresponding reference
point in the CM is adapted if a deviation between both values is detected. This process
yields more accurate future power prediction in the corresponding area of the map.
Among the main advantages of CM-based techniques for predicting the SoAP are their
simple implementation and straight forward characteristic. However, since batteries are
nonlinear devices, there are some issues which need to be considered thoroughly. First,
battery’s characteristics (e.g., dynamic behavior etc.) depend strongly on its previous history. Various electrochemical processes, such as charge transfer processes become
pronounced when dynamic load is applied to the battery. Since these effects are not
considered in the CMs, the SoAP prediction accuracy is affected significantly. Second,
the dependences of the above mentioned parameters are stored on the memory in
multidimensional form. This means that a high amount of storage capacity is needed
depending on the amount of parameters. Unfortunately, in most cases, data storage
Review of monitoring algorithms and battery models presented in the literature 105
capability and computational resources on microcontrollers are limited. Therefore, a
specific functional extension is required in order to reduce the computational effort, so
that the dependences of the parameters are approximated by empirical functions (e.g.,
polynomial functions) [226], [237]-[239].
In Ref. [236], the authors present an adaptive CM-based (ACM) technique where the
dependences between actual SoC, temperature, duration of the applied load (1 s – 10 s)
and available power of LIBs are considered. Moreover, battery voltage and current are
measured and observed over a predefined time horizon and consequently compared with
a reference power value of the CM. If any difference is detected and it is higher than a
value specified beforehand, the respective reference point of the CM is adapted
accordingly.
In Ref. [239], a method for determining the maximum available charge or discharge
battery power depending on actual battery SoC, temperature and its actual aging state
(available discharge capacity) is discussed. A 5th order polynomial function is applied in
order to build the interrelation function between power and SoC and between power and
available discharge capacity. The interrelation function between temperature and power
is built by means of a second order polynomial function.
In Refs. [237]-[238], a self-learning technique for SoAP prediction in HEVs using NiMH
and Lead-Acid batteries is introduced. The authors introduce an algorithm employing
ACM where the second order polynomial function is used to approximate the operating
point of the CM by means of simple multidimensional regression techniques, resulting in
less consumption of the memory on the microcontroller. Otherwise, according to the
authors, about 3000 measured values would have to be stored which requires a high
amount of memory capacity. In this context, the battery behavior is represented by the
coefficients of the used polynomial function. In order to track the battery’s characteristics over its lifetime, the applied regression function is continuously updated
during operation. The dependences between voltage, SoC, temperature, pulse duration
and the absolute power value are employed to build the ACM. The implemented
algorithm is able to predict the SoAP under the above conditions by considering the
allowed voltage window.
In Ref. [240], an algorithm for estimating certain parameters such as battery discharge
power, available charge capacity, over-charge or over-discharge detection of lithium-ion
battery packs in HEVs is presented. For this reason, the authors propose to use the
determined battery internal resistance as a reference for estimating the above

Review of monitoring algorithms and battery models presented in the literature 106
mentioned battery parameters. In this regard, the proposed algorithm uses the values of
internal resistance and OCV for a given SoC from CM and determines the available
battery power based on Eqs. (23)-(24). However, the non-adaptive nature of the proposed
algorithm and neglect of the influence of temperature are its main disadvantages.
Consequently, the values of the internal resistance remain constant over the battery
lifetime although an increase of battery resistance during operation is expected.
3.3.2 Methods based on equivalent circuit models
As a second technique for predicting the battery SoAP, model-based methods employing
ECMs are discussed in this subsection. These techniques differ mainly in the used ECM
and methodology for on-board parameters identification. In order to be able to predict
the available battery power accurately, it is necessary to use a dynamic battery model
which reproduces electrochemical processes occurring in the battery as accurately as
possible. However, a feasible replica of each of the processes can rarely be obtained since
up to now many processes occurring under different conditions are not identified or
understood sufficiently. In fact, because of their high complexity and the required high
computational effort, such battery models are not suitable for battery state estimation.
As described in the previous subsection the KF-based and LS-based estimators belong
definitely to the most often employed recursive estimators in various engineering
disciplines. In both cases, the system uses a linear regression model in a generic form
[241]-[242]. In the following subsection, in the literature presented methods from the
class of KF and LS for SoAP prediction presented in the literature are discussed.
Kalman filter-based methods 3.3.2.1
In Ref. [232], a SoAP prediction technique using KF for estimating the ECM parameters
(R-RC ECM) is introduced. The main differences with regard to the definitions of SoF
and SoAP are carefully addressed and alternative possibilities are provided. The applied
algorithm considers the change of C during the applied discharge current pulse
(∂ C / ∂ ∙ ∆) which consequently improves the C convergence and estimation
accuracy of the algorithm. For verification reasons, HPPC tests and UDDS load profile
are used. Eqs. (23)-(24) are employed as a basis for SoAP prediction where battery
nonlinearities are neglected and only the discharging case is considered.
In Ref. [243], the authors present an approach based on a KF filter for SoAP prediction
in an example of lead-acid battery. An ECM (R-RC) considering the nonlinearity of
charge transfer processes by means of the BVE is applied and the results are compared
with the same model neglecting the mentioned nonlinearity. After analyzing the results,

Review of monitoring algorithms and battery models presented in the literature 107
the authors state that considering the aforementioned nonlinearity improves the
estimation accuracy significantly. However, there are some points which may be
addressed here: First, the is assumed to be equal for both anodic and cathodic
reactions (i.e., = 0.5) in this work, which is actually not applicable to lead-acid
batteries and could at best be applied to LIBs [145], [244]. Second, for both models the I0
is assumed to be constant. In fact, the I0 decreases over the battery lifetime and is highly
temperature-dependent as shown in chapter 2. This means that the accuracy of the
proposed algorithm might decrease over the battery lifetime. Real vehicle data gathered
in the field are used to verify the algorithm whereas the SoAP estimator is only
validated for cases when maximum allowable discharge current is drawn. Furthermore,
in Ref. [245], the same authors investigate the Arrhenius equation and consider
temperature as model input for the determination of resistance and overvoltage in an
example of LIBs using LFP cathode. Based on the KF technique, parameters of the ECM
are identified on-board. In contrast to the previous work, the temperature dependence of
the ECM parameters is considered in the model. Obtained results indicate the necessity
of considering the nonlinearity at very low temperatures while a significant
improvement with regard to the voltage prediction accuracy could be achieved.
In Ref. [246], an approach based on R-RC ECM for predicting the battery’s SoAP is
presented. Battery current and voltage are considered as limiting factors for the applied
algorithm. As an advantage, in the employed algorithm the difference between each
individual cell VOCV is considered to identify the weakest cell in the battery pack. VOCV is
determined based on a nonlinear SoC-OCV correlation characterized in the laboratory.
Evaluating each cell’s C by its own has on the one hand the advantage that the
weakest LIB (LIB with minimum C for discharging case or LIB with maximum C
for charging case) in the battery pack can thus be simply identified, but it requires on
the other hand a higher computational effort since in large lithium-ion battery packs
often large amounts of LIBs are connected in series and each LIB have to be supervised
individually. In this regard, the authors propose using only the information from
maximum C in case of charging and minimum VOCV in case of discharging.
Unfortunately, no information has been provided with regard to the estimation
technique applied for impedance parameters; the authors mention, however, that KF-
based algorithms could be applied.
In Ref. [247], a novel algorithm for SoAP prediction is proposed where an impedance-
based ECM using the connected in series with a simple R-RC ECM is employed. An

Review of monitoring algorithms and battery models presented in the literature 108
adaptive approach based on fractional joint KF is applied for on-board impedance
parameters and SoAP estimation. Unfortunately, the RC-element representing the
charge transfer processes is neglected and thereafter it is simplified to a linear
resistance. The authors define SoC, I and V for both charge and discharge cases as
limiting factors for the SoAP prediction algorithm. For verification reasons, constant
current pulses with durations of 10 s and 60 s are inserted to the FUDS load profile and
the predicted SoAP at the end of the pulse is analyzed. As discussed beforehand, such
algorithms may work accurately and robust under the nominal condition described by
the authors but it is definitely of interest to examine the applied technique under
conditions beyond nominal.
In Ref. [148], a model-based approach using EKF for estimating impedance parameters,
voltage across the RC-element and SoAP prediction in an example of a HEV is
presented. Minimum charging current or maximum discharging current for (∆t =1 - 10 s)
is determined after performing some simple mathematical calculations from the
employed ECM (R-RC). Based on the derived limiting current values, (dis)charge
voltages of the battery pack are calculated for the desired time horizon. The proposed
algorithm is verified under nominal conditions in a MIL environment.
Furthermore, in Ref. [149], an EKF-based algorithm for on-board impedance parameters
estimation is proposed where predefined limits for ECM-parameters depending on
battery temperature and SoC are set. A simple R-RC ECM is employed where the correct
and meaningful convergence of the impedance parameters is ensured by setting the
upper and lower limits of the impedance parameters. Moreover, in Ref. [248] the authors
present a novel technique for estimating the impedance parameters of the ECM and
instantaneous SoAP prediction. The parameters of the lithium-ion battery pack used in a
HEV are extracted by means of EIS measurements for an initial state. Based on various
filters, such as high-pass, low-pass or band-pass filters and/or a combination thereof, the
measured battery’s voltage response is split up into different appropriate frequency ranges (medium to high frequency range as well as low and steady-state part). When the
impedance parameters of the ECM for the respective frequency range are identified, the
battery’s limiting current and instantaneous power can then be simply determined. The authors propose an EKF-based algorithm for estimating the parameters of the RC-
element on-board. However, since the corresponding frequencies are influenced by many
factors such as temperature and actual aging state of the battery, the impedance
parameters estimation from each frequency range might be underlined some

Review of monitoring algorithms and battery models presented in the literature 109
inaccuracies when the battery is operated under conditions other than those initially
obtained. In addition, since commercially available hardware for performing EIS-
measurement in the vehicles is still in a primitive development stage, accurate
measurements over a wide frequency range can hardly be carried out.
In contrast to the above referenced literatures where adaptive joint estimators using
EKF for SoAP prediction are proposed, in Refs. [220], [235] the authors propose a SoAP
estimation technique based on the DEKF. The DEKF method uses two EKFs (i.e., a
Kalman state and a weight filter) that run concurrently at every time step, where one
filter is responsible for state estimation (e.g., SoC or SoAP etc.) and the other one for
parameters identification (e.g., R0, τ, Rct etc.) while both of them concurrently provide
each other with derived information and ensure a more stable independent estimation
path in this way.
In Ref. [235], an R-RC ECM using the DEKF algorithm for on-board parameters
estimation is used, where battery current and voltage are considered as limiting
constraints for SoAP estimation. Each of the limiting factors (current and voltage) is
considered separately and its impact on SoAP is discussed thoroughly. For the applied
DEKF algorithm, the flowing current through the Rct is taken into the state vector, and
the remaining parameters of the ECM (R0, τ, VOCV) with a slower rate of change are
stored in the parameter vector. The proposed algorithm is examined by performing
verification experiments on the LFP-based LIBs at different aging states and
temperatures. For verification reasons the FUDS load profile is used as a reference.
Furthermore, the maximum time that the current can be applied to the battery and
voltage limits is determined based on an ECM employed. Unfortunately, during
verification tests a narrow range of applied current (-3C - +2C) is examined. According to
the authors, promising results for SoAP prediction with a relative estimation error of
less than 5% could be achieved. However, the proposed technique neglects the battery
nonlinearities and no SoAP prediction results for a particular time horizon are provided.
In fact as discussed in chapter 2, the impact of the applied current on the voltage
estimation accuracy is not negligible; therefore, higher current rates which actually often
occur in a real field must be considered. Moreover, the obtained results indicate the
decrease of voltage estimation accuracy at very low SoC range, which occurs mainly
because of high pronounced diffusion processes [46].
Furthermore, in Ref. [215] the authors propose a static SoAP prediction (using SoC-Ri
relationship) methodology based on the EKF technique (EKF is employed for SoC

Review of monitoring algorithms and battery models presented in the literature 110
estimation). An R-RC ECM with a little deviation concerning the internal resistance is
implemented. The instantaneous available battery power is derived based on Eqs. (23)-
(24). The authors combine the ohmic and charge transfer resistance in one linear
resistance connected in series with the RC-element representing diffusion overvoltage.
The combination of both resistances may help to overcome the mentioned linearization
problem of battery’s nonlinear characteristics by EKF algorithms. However, since the impedance parameters change over the battery lifetime, it is essential to ensure their
adaption to the actual aging state of the battery.
In Refs. [220], [249]-[250], battery voltage, current and SoC limits are considered as
constraints for SoAP prediction in a lithium-ion battery pack. In Ref. [220], the
possibility to employ EKF and DEKF methods for impedance parameters and SoC
estimation of LFP-based LIBs is discussed comprehensively. Moreover, in Refs. [249]-
[250] maximum discharge and minimum charge currents are determined based on
derived battery SoC and resistance values. Two algorithms are proposed for SoAP
prediction and their performances are compared, where simple ECMs employing a
simple R0 connected in series with VOCV are implemented and the available battery
power is determined based on Eqs. (23)-(24). In order to be able to predict the available
battery current for a ∆t, the change of C over the prediction time horizon is estimated
by means of the Taylor-series expansion. In the second algorithm proposed, the ECM is
implemented in a state-space form and the limiting battery current considering the
voltage and SoC limits is estimated based on the bisection search method. However, in
both cases the employed ECMs are very simple and neglect battery nonlinearities and
polarization effects. Moreover, the available battery power is determined separately for
individual LIBs in the battery pack; this fact requires high computational effort that is
actually not given on commercial microcontrollers used in the automotive industry.
In Ref. [251], an adaptive joint estimator employing a simple R-RC ECM for SoC and
SoAP estimation is presented. LIBs at different aging states using LFP cathodes are
investigated for different temperatures. The Nernst model is used to build and adapt the
nonlinear SoC-OCV correlation over the battery lifetime and make the SoC be a part of
the developing model, respectively. Battery SoC and SoAP are estimated by means of
AEKF where the UDDS load profile is used as a reference for verification reasons.
Moreover, a simple LS estimator is used to identify the ECM parameters. In addition to
the estimated SoC, the battery’s design limits, namely voltage and current, are defined as constraints in the implemented SoAP estimator. The available battery power is

Review of monitoring algorithms and battery models presented in the literature 111
determined and validated for ∆t=0 and ∆t = 30 s. Since current and voltage limits for the
respective operating condition and the battery’s aging state are calculated on-board,
safety damaging the LIBs by either over- or underestimating the available power can be
prevented. However, for verification tests, the applied current is downscaled to ±2C,
which is actually low (especially in case of HEVs) as mentioned above and might
influence the reliability analysis of the proposed algorithm.
Furthermore, in Ref. [146], the authors present an AEKF-based six-step joint estimator
for SoC and SoAP estimation (verified for ∆t = 15 s, 30 s, 60 s) in an example of PHEV.
An R-RC ECM is applied, where HPPC tests and UDDS load profiles are applied in
order to verify the robustness and real-time applicability of the proposed algorithm.
However, since the authors use the Nernst equation to build the nonlinear SoC-OCV
correlation and the limiting battery current is determined based on the actual battery’s SoC, the estimation accuracy of the model might decrease over the battery lifetime or
when the operating temperature differs extremely from the one used to parameterize the
Nernst equation.
In Ref. [216], the authors present a multi-states joint estimator employing the RLS
technique with optimal forgetting factor (RLSF) for impedance parameters estimation
and an AEKF for SoC and SoAP estimation. In addition, battery voltage, current and
SoC are considered as limiting factors for the SoAP prediction algorithm. LFP-based
LIBs at various aging states are used for verification reasons and an R-RC ECM is
employed, where the R0 is implemented separately for charge and discharge directions.
Thereafter, in total there are four impedance parameters needed to be identified on-
board. The identified parameters are transmitted to the prior state estimator in order to
update the battery’s SoC. Since the SoC-OCV correlation is built by the Nernst equation,
the C is then updated over the equation when new SoC values are available.
Thereafter, the battery’s SoAP is predicted based on the results from the SoC and parameter identification estimators. According to the authors, promising results for
SoAP prediction with a relative estimation error of less than 1% could be achieved.
Least-square-based methods 3.3.2.2
In the following, LS-based techniques for SoAP prediction are discussed
comprehensively. In Ref. [252], the authors show the results of the applied SoAP and
voltage estimator by performing verification tests on the test bench and in HEV. The
obtained results of the predicted voltage indicate an estimation accuracy of approx. 5%
where the impedance parameters of the ECM are identified by means of the RLS

Review of monitoring algorithms and battery models presented in the literature 112
algorithm, and a predictive control algorithm based on step response, the so-called
Dynamic Matrix Control (DMC), is applied for the maximum discharge current
estimation. The applied DMC algorithm belongs to the class of filters employed in the
systems theory which is able to determine a sequence of manipulated variables for
predicting the upcoming behavior of the model. The main important difference to the
previously discussed literature lies in the applied ECM, where n RC-elements are
connected in series and the time constant of each RC-element is determined offline.
However, the developed algorithm is only evaluated for the discharging case whereas the
charging case (e.g., regenerative braking etc.) is neglected.
A novel approach for SoAP prediction considering both voltage and current as limiting
factors is presented in Ref. [253]. Within this approach, a so-called moving average (MA)
noise covering the remaining battery overvoltages (e.g., diffusion processes etc.) is
connected in series with RC-element and R0 in the ECM. Furthermore, an RELS
algorithm is applied for impedance parameters identification. The main advantage of the
RELS algorithm over the common RLS algorithm is the additional implementation of a
feedback process which allows the estimate of unmeasurable noise. The proposed
algorithm is validated by UDDS load profile and HPPC tests while the algorithm’s accuracy is analyzed for various time horizons (5 s - 120 s). The achieved results indicate
a more accurate and reliable SoAP prediction by employing the proposed ECM rather
than a simple R-RC ECM, especially for cases where the SoAP is predicted for a large
prediction time horizon. As the next step, the presented approach might be investigated
in more detail under real conditions and especially over a wide temperature range since
it is only validated under nominal condition.
In Ref. [222], the authors propose an algorithm for SoAP prediction considering SoC,
current and voltage as limiting factors. A RLSF technique is applied to estimate battery
impedance parameters. The main difference of the proposed technique (RLSF) in
comparison to the common RLS filter is that if the model parameters change
continuously but slowly, the RLS technique is rarely able to capture the occurred
changes instantaneously. Therefore, an enhanced filter is required, which gives more
weight to recent data than to an older dataset as proposed in Ref. [216]. The on-board
applicability of the proposed algorithm is then verified by means of HIL tests using the
FUDS load profile as a reference. A simple R-RC ECM is employed where the VOCV is
modeled by Nernst model. Moreover, the change of the VOCV over a prediction time
horizon is determined, which leads to higher voltage prediction accuracy. According to

Review of monitoring algorithms and battery models presented in the literature 113
the authors, promising results could be achieved with the battery voltage estimated
within an accuracy range of 1%.
In Ref. [224], the authors investigate a method for SoAP prediction in an example of a
transporter, the so-called Segway. Based on Eqs. (23)-(24), the available battery power is
simply determined. The authors propose using LS or RLS-based techniques for
estimating the battery resistance and VOCV. Furthermore, based on the estimated values
for available battery power, the maximum velocity of the transporter is determined. In
this particular case it is assumed that the current is equal to the electric-motor current
and the resistance is determined as a sum of the motor winding resistance and battery
resistance.
In addition to the methods discussed above, in Refs. [225], [254] the authors present an
adaptive technique for SoAP prediction of the lithium-ion battery pack using the varied
parameters approach (presented in Ref. [145]) for impedance parameters estimation. The
current dependence of the Rct is considered in the proposed algorithm by simplifying the
BVE. The authors employ a nonlinear R-RC ECM where the differences between SoCs
and resistances of individual LIBs are considered in an implicit way. Battery voltage,
current and SoC are considered as limiting factors for SoAP prediction. In order to
identify the weakest LIB in the battery pack, C and resistance are considered as
supporting indices. In this regard, the LIB with the highest VOCV for charging case or
lowest C for discharging case as well as the LIBs with the highest resistance is
considered as the weakest. As an improvement to the used ECM shown in references
above, its extended version is presented in Ref. [46] for SoAP prediction. For this reason,
a second RC-element capturing diffusion processes is added to the basis ECM. A RLS
filter is used for estimating the parameters of the diffusion branch. The proposed
algorithm is verified under various conditions (various SoC ranges and different
temperatures) by using real vehicle data. Unfortunately, no long-term robustness
analysis of the proposed algorithm is performed.
In Refs. [30], [255], the authors apply a direct differential (DD) algorithm to estimate
battery states (SoC, SoAP and SoH) and the WRLS algorithm to identify the impedance
parameters of an R-RctRdC ECM. The Rd is derived empirically and connected in series
with Rct. According to the authors, considering the Rd in the ECM increases the SoAP
prediction accuracy for discharge cases and for prediction time horizons in a range of
∆t >= 10 s significantly. However, the Rd is not implemented as an adaptive parameter in
the proposed algorithm, and the fact that it changes over the battery lifetime and under
Review of monitoring algorithms and battery models presented in the literature 114
different operating conditions [46] may lead to the decrease of the estimation accuracy
over the battery lifetime.
In Refs. [256]-[257], the authors present an algorithm based on the WRLS technique for
estimating the impedance parameters of an ECM that considers the mass transport
effects by incorporating the . Moreover, the current dependence of the Rct is
considered, and the applicability of the Tafel-equation for determining the Rct in case of
high current rates is proven. The applied algorithm is verified under various conditions
(different temperatures and different aging states of the battery) by investigating LIBs
using NMC and LFP cathode materials. Based on the developed algorithm, battery VOCV
and SoC, respectively, are derived from an employed ECM by using the SoC-OCV
correlation. Furthermore, the actual battery SoH using the estimated battery impedance
and SoAP is determined on-board. However, for SoAP prediction the authors consider
only the battery voltage as a limiting factor and determine the maximum current rate
that the battery can deliver or accept.
Other adaptive filters and observer methods 3.3.2.3
In Ref. [258], the authors propose an SoAP estimation algorithm putting special
emphasis on investigating time horizons much larger than in the researches presented
above (i.e., ∆t >= 60 s). Asymmetric ECM parameters (R-RC-RC) for charge and
discharge directions are considered in the applied algorithm. According to the authors,
variation of the ECM parameters is necessary when SoAP prediction is performed for
larger time horizons. The asymmetric parameter values yield higher estimation accuracy
for appropriate charge and discharge directions. In this regard, two different SoAP
prediction algorithms are investigated. First, a voltage limited-based method
extrapolating battery resistances and VOCV (so-called VLERO) is investigated. Second, a
method based on a so-called multi-step model predictive iterative (MMPI) technique.
Furthermore, battery SoC, voltage and current are considered as limiting factors for
SoAP prediction. Applied algorithms are able to calculate the maximum battery current
whereas voltage and SoC design limits are used. For verification reasons, the proposed
algorithms are evaluated by means of the UDDS load profile at low temperatures (0 °C
and -20 °C). According to the obtained results, the MMPI technique shows a higher
degree of SoAP prediction accuracy. However, since the proposed algorithms are only
evaluated in a MIL environment, it is recommended to examine their performance under
real conditions as the next step.

Review of monitoring algorithms and battery models presented in the literature 115
Moreover, in Ref. [259], the authors propose a model-based approach using the
Levenberg-Marquadt methodology for SoAP estimation in an example of a lithium-ion
battery pack (ns=20, np=4). The proposed technique is then compared with the technique
based on the bisection methodology described in Ref. [249]. LIBs using NMC and LFP
cathode materials are used to perform verification tests. The applied algorithm is
evaluated by means of FUDS, DST load profiles and HPPC tests. The authors
investigate two R-RC ECMs where the first ECM neglects the VOCV hysteresis and the
second one uses a one-state hysteresis. Battery SoC, voltage and current are considered
as limiting factors for SoAP prediction. According to the authors, the bisection technique
shows some advantages over the proposed algorithm with regard to its computational
efficiency. However, the inconsistency of individual LIBs in the lithium-ion battery pack
is neglected and it is assumed that the LIBs show a similar behavior. Moreover, battery
nonlinearities are neglected.
In Ref. [219], a model-based approach for SoAP estimation in an example of a lithium-ion
battery pack (ns=16, np=1) for HEVs is discussed. In addition to the battery’s voltage design limits, SoC and current limits are calculated and considered as further limiting
factors for SoAP prediction. An R-RC ECM is employed and based on determined
impedance parameters, the SoAP is predicted. However, the proposed SoAP prediction
algorithm is verified under nominal conditions for LIBs in new state by comparing the
results from HPPC test and DST load profile. The authors do not give information about
the applied technique for on-board impedance parameters estimation. According to the
results shown in the aforementioned paper, the discussed theory with regard to the over
and under estimation of the available battery power by means of the HPPC test in the
previous subsection is approved.
In Ref. [217], contrary to the above-mentioned approaches, the authors apply the PF
technique for estimating the SoAP where battery SoC serves as an input parameter. The
main advantage of PF-based techniques in comparison to other Bayesian filters is the
possibility of approximating the PDF even if non-Gaussian measurement uncertainty is
given. A dependence of the polarization resistance on SoC and current (R=f(SoC, I)) is
used as a basis for an accurate instantaneous SoAP prediction. Thereafter, the Gaussian
shape is chosen as membership function of the employed fuzzy set. The measured
current and the voltage estimated from the employed ECM are used for the implemented
PF algorithm. In the presented approach, the battery’s SoC is firstly estimated based on
the PF method, and the SoAP is determined by evaluating the resulting PDF function of
the estimated SoC performed by means of a simple look-up table representing the

Review of monitoring algorithms and battery models presented in the literature 116
relationship between SoAP and battery SoC. However, the authors use a simplified
“fuzzy” ECM (ECM 1 is responsible for charging case, ECM 2 is responsible for discharging case) whereas the double-layer capacitance and the temperature’s influence are neglected.
In Ref. [221], the impedance parameters of the employed ECM (R-RC) and battery SoAP
are estimated based on a genetic algorithm. The presented approach is validated by
means of the FUDS load profile for LFP-based LIBs in a new state whereupon a lithium-
ion battery pack (ns=1, np=9) is used. The difference between both charge and discharge
ohmic resistances (Rdch, Rch) is considered in the employed ECM. In the first step, the
authors apply a SOC-limited method for instantaneous SoAP prediction. Afterwards, a
voltage-limited method is applied where the change of VOCV over the prediction time
horizon is considered in order to improve the SoAP prediction accuracy. The obtained
results compared with the results of the HPPC-based method discussed beforehand
indicate a higher estimation accuracy of the proposed algorithm within an accuracy
range of 2%.
Fuzzy logic and machine learning-based methods 3.3.2.4
In addition to the techniques discussed above, there are some publications dealing with
machine learning-based algorithms for SoAP prediction. The underlying idea of such
techniques is based on the ability to learn and to adjust the relationship between input
and output signals without the need of complex mathematical functions by using human
knowledge. However, the development of machine learning methods is still in a primitive
stage and the applied techniques need to be further modified and verified under real
conditions.
In Ref. [260], the authors investigate a technique based on the BP neural network
training algorithm for SoAP prediction. The BP neural network algorithm is a forward,
mono transmission multi-layers network including an input layer (containing 2 nodes),
hidden layer (containing 4 nodes) and output layer (containing 1 node) network. It allows
considering the nonlinear battery behavior without the need of high-level hardware. The
basic idea of the proposed algorithm is simple: When the output vector does not meet the
expected values, then the output error is transformed to input layer and distributed to
units of hidden layers, respectively. Thereafter, the estimation error of each layer can be
obtained. Based on the obtained estimation error, the weight of each neuron is adjusted
until the output vector reaches the correct values. The proposed technique is verified
under nominal conditions by means of offline simulations and constant discharging

Review of monitoring algorithms and battery models presented in the literature 117
power profiles. Its applicability on real-time applications needs to be investigated in
greater detail in the future.
In Ref. [261], the authors present a method using an adaptive neuro-fuzzy-inference
system (ANFIS) for on-board SoAP prediction whereby the main focus lies on the battery
voltage prognosis. The proposed approach combines the strengths of two common
techniques, the artificial neuronal networks (ANN) and fuzzy inference system (FIS), in
such a way that the battery parameters are adapted to the actual aging state. In this
regard, according to the authors, a meaningful convergence of the parameters can be
ensured. However, the authors neglect the battery current as further limiting factor for
predicting the SoAP. The obtained SIL test results indicate high algorithm feasibility
and estimation accuracy. For a predefined time horizon the battery voltage is predicted
within a relative estimation accuracy of less than 1%. The implemented algorithm acts
more as an SoF algorithm since the model output delivers an answer as to whether a
power pulse can be performed or not. Furthermore, in Ref. [262], the authors show
results employing the same algorithm as before with the difference that the battery’s SoC is also considered as an additional input parameter of the employed model. Battery
SoC is determined by means of the robust extended Kalman filter (REKF).
In Ref. [228], the authors perform a large experimental investigation considering the
impact of temperature, SoC, resistance on SoAP using HPPC method as a basis. The
measurements have been performed on LIBs using LMO cathodes over a wide
temperature range (i.e., from -20 °C up to 50 °C) whereby the increase of available
battery power with increasing temperature is approved as shown in Fig. 44. The authors
present two models, namely parametric model considering the impact of temperature on
power capability of the battery in Eq. (23) and non-parametric model using SVM
technique based on radial basis function (RBF). The latter method (i.e., SVM) is a
popular machine learning technique for data analysis and pattern recognition,
respectively. In general, the SVM method tries to find the best compromise solution
between the model complexity and the learn ability. According to the results, with
decreasing temperature and SoC the parametric model becomes more accurate than the
non-parametric model and vice versa. Unfortunately, the available battery power is only
investigated for discharge cases and the authors neglect charging cases completely.
The algorithms mentioned above and the respective literature sources for techniques
based on equivalent circuit models are listed and compared in Table 12.

Review of monitoring algorithms and battery models presented in the literature 118
Table 12: Referenced works based on equivalent circuit models for SoAP prediction
Possible References Employed ECM Applied estimation technique
Current
dependence of
the charge
transfer
resistance is
considered?
[253] R-RC-(C(z)) RELS No
[225], [254] R-R(I)C VPA Yes
[46] R-R(I)C-RC VPA, RLS Yes
[249], [250] R KF No
[232], [246] R-RC KF No
[235] R-RC DEKF No
[256]-[257] R-R(I)C- W WRLS Yes
[146], [251] R-RC AEKF No
[148]-[149], [215], [248] R-RC EKF No
[252] R-RC RLS and DMC No
[247] R-RC- W Fractional Joint KF No
[258] R-RC-RC a) VLERO, b) MMPI No
[243], [245] R-RC KF Yes
[216] R-RC RLSF and AEKF No
[219] R-RC - No
[221] R and R-RC Genetic algorithm No
[217] R PF Yes
[261]-[262] - ANFIS, ANFIS+ REKF -
[260] - BP neural network -
[228] - SVM No
[222] R-RC RLSF No
[30], [255] R-RctRdC WRLS No
[259] R-RC Levenberg-Marquadt No
3.4 State-of-Safety estimation
The safety of LIBs is of paramount importance not only for vehicle manufacturer but
also producers of consumer electronics. Unfortunately, because of several fire incidents
in various applications (e.g., aviation or automotive industry etc.) in recent years, the
attention regarding safety state of particular applications has been increased
significantly. As discussed beforehand, in order to provide the respective system with a
specific amount of power and energy, several hundreds of LIBs are connected in series
and/or parallel in a lithium-ion battery pack. Thereafter, a failure in a single LIB could
have fatal consequences throughout the battery system.

Review of monitoring algorithms and battery models presented in the literature 119
In general, safety of the battery can be defined inversely proportional to the concept of
abuse as follows (Eq. (30)) [263]: = (30)
where refers to the state of abuse and represents the SoS whereby x
addresses all state and control variables such as temperature, current, voltage, battery
deformation etc. at the time t. Consequently, it can be stated that there is a direct
correlation between SoS, SOA and other battery states such as SoAP or SoAE;
thereafter, ignoring the aforementioned control variables ( , , ) may damage the
battery. In this regard, the SoS can be defined as a function of following
parameters/battery states (Eq. (31)): , , , = , , , oC (31)
Generally, the battery safety is classified by means of hazard levels (HL) originally
defined by European Council for Automotive Research and Development (EUCAR) [264].
The HL is defined in a range of 0 up to 7 referring to the severity of the respective
hazard where the lowest level (i.e., HL = 0) indicates that no damage is detected and the
highest level (i.e., HL = 7) refers to the case where an explosion is detected. In total, it
can be stated that an ESS is defined as safe when the HL is lower than 4.
Safety measures in a lithium-ion battery pack equipped with BMS can be subdivided
into internal or external methods. In case of former case, measures such as shut down
separators or in subsection 2.1 discussed cell-built-in current interrupt switches
activated after detection of an internal gas pressure etc., are used. External methods
mainly rely on hardware for lithium-ion battery pack protection against abuse conditions
such cell bypass techniques where the weakest cell is temporarily or permanently
bypassed. In this regard, fuses or contactors are used for protecting the battery system
against short-circuiting, over-charging and over-discharging etc.
Among further battery abuse test procedures are FreedomCAR [265] and SAE J2464
[266]. In addition to the latter standards, the SAE J2929 [267] is a logical follow-up to
J2464 establishing pass/fail criteria for lithium-ion battery packs used in EVs. However,
the aforementioned test procedures are based on the idea revealing the battery to
different abuse conditions and then observe its behavior. In fact, no information
regarding the likelihood of the hazards and the risks accused by them is provided [268].
Potential hazardous external events can be classified into the following four cases:

Review of monitoring algorithms and battery models presented in the literature 120
Electrical hazard (e.g., short-circuit, over-charge etc.),
Thermal hazard (e.g., fire),
Mechanical hazard (e.g., crush, nail penetration etc.),
System hazard (e.g., contactor fails).
In general, it can be stated that hazardous failure on cell-level is mainly referred to
electrolyte leakage, internal short-circuit and occurring thermal runaway. In Table 13,
HL ranges and corresponding descriptions and required criteria are described.
Table 13: Hazard levels adopted from Ref. [265]
Level Description Criteria
0 No effect No effect; no loss of functionality
1 Reversible loss of function No defect; no leakage; no venting or fire detected; no
explosion, temporary loss of functionality
2 Irreversible damage/ defect No leakage; no venting or fire, no explosion but
irreversibly damaged
3 Minor leakage or venting
(i.e., ∆mass < 50%)
No leakage; no venting or fire, no explosion. Weight loss
< 50% of electrolyte weight. Light smoke
4 Major leakage or venting
(i.e., ∆mass % )
No fire or flame; no rupture, no explosion. Weight loss % of electrolyte weight. Heavy smoke
5 Fire or flame No rupture, no explosion (i.e., no flying part)
6 Rupture No explosion, but flying parts.
7 Explosion Explosion (disintegration of the LIB)
According to Ref. [263], based on Eq. (30), SoS is defined in a numerical range between 0
and 1 whereby with increasing the absolute value of abuse, the value of safety decreases
to zero and vice versa. The authors propose a quadratic function for general definition of including three parameters. In this regard, the EoL value of the battery (i.e., = .8 ∙ ) is considered as a boundary condition indicating whether the
battery is at acceptable value of abuse. Within the aforementioned study, the authors
examine the abuse boundaries of LFP-based LIBs considering subfunctions such as
current, voltage (over and under voltage), thermal and mechanical limits.
In Ref. [268], the authors propose the so-called Hazard Modes and Risk Mitigation
Analysis (HMRMA) methodology considering three simple principles for reducing the
hazardous risk. First, the design process should be considered at all levels (i.e., cell,
module and battery pack). Second, the control, sensing and protection devices and the

Review of monitoring algorithms and battery models presented in the literature 121
impact of each individual component on the battery pack should be included. Third, the
hazards are identified while possible risks are analyzed and quantified, respectively. In
contrast to EUCAR, the presented methodology covers also module and battery pack
level. In the aforementioned study the hazard risk ( ) is defined as a product of hazard
severity ( ) and hazard likelihood ( ) as follows (Eq. (32)): = ∙ (32)
where HS refers to values between 0 and 7 according to hazard level, HL refers to values
between 1 and 10 based on the rate of occurrence. According to Eq. (32) the of
respective application can be reduced either by decreasing or . The correlation
between the latter parameters is represented by a hyperbolic curve.
The topic of LIB safety in various applications is still a very challenging task for
application engineers and, thus there is still a need for significant efforts to be made in
various disciplines.
3.5 Lithium-ion battery models
The electrochemical processes occurring in LIBs are influenced by many internal and
external factors such as battery temperature, external applied potential, concentration
and concentration gradient of the reaction partners etc. Subsequently, developing a
battery model that is able to consider the aforementioned factors is not a simple issue.
Experimental techniques based on e.g., EIS measurement are powerful tools for
describing and understanding electrochemical reactions occurring in LIBs and, thus can
be applied for accurate battery modeling. The main challenge for an accurate battery
modeling is always to ensure a reasonable precision of model results in accordance to the
results obtained from experimental investigations. Unfortunately, most of the
parameters of the LIBs are not measureable on-board and, thus cannot be employed for
direct comparison to the corresponding variables of the employed battery model.
Thereafter, such parameters can be often determined by comparing the model results
and the experimental data [269]. In the following subsections, a brief review on different
classes of LIB models presented in the literature is given.
3.5.1 Classification of battery models
The battery models proposed in the literature mainly vary in terms of model structure,
model complexity, required computing power and reliability of the obtained results. The
more precise the electrochemical processes occurring during battery operation can be
reproduced by the employed battery model, the more accurate the obtained results can

Review of monitoring algorithms and battery models presented in the literature 122
be. However, the latter fact can be only achieved at the expense of increasing
computational effort and required simulation time. In this regard, it is of great interest
for application engineers that a battery model is employed that satisfies the needs of the
particular application.
In general, battery models can be classified into following three groups [270]:
White box models,
Grey box models,
Black box models.
The white box models refer to the battery models that are based on complex
mathematical equations describing physical and electrochemical processes occurring in a
LIB. As a basis for developing such battery models, tools based on e.g., Finite Element
Method (FEM)26, Finite Volume Method (FVM) and Finite Difference Method (FDM) etc.
are employed [271]. However, as mentioned above the more complex the employed model
is the higher the required computing power can be. Contrary to the latter class of battery
models, the grey box battery models are widespread in BMS applications mainly because
of their simple nature and low computing power. However, from accuracy point of view
such battery models are less accurate than white box models, mainly as a result of
lacking interpretation of electrochemical processes. As mentioned in in chapter 2, grey
box models are often parametrized offline by means of EIS-measurements or HPPC
tests. Such battery models are based on ECMs while their parameters are always
determined using prior empirical knowledge and experimental data. Such battery
models simulate the voltage response of the battery for different current-based or power-
based loads applied to the battery.
In contrast to the above mentioned battery model classes, the black box battery models
refer to the category of battery models that are based on machine learning techniques
such as neuronal network, fuzzy logic or evolutionary algorithms etc. [272]. In such
battery models, the battery is often observed as a black box where a detailed
representation of electrochemical processes occurring in the LIB is neglected. Among the
main advantages of such battery models are their simple structure and possibility for
fast simulation. However, in contrast to the latter two battery model classes, the low
estimation accuracy and high parameterization effort of black box battery models can be
addressed as their main disadvantages.
26 The FEM-based tools are available from zero dimensional up to more complex systems such as 3 dimensional models.

Review of monitoring algorithms and battery models presented in the literature 123
In Ref. [269], a systematic review on various battery models from empirical models to
atomistic models is given in a wide length and time scale. Within the aforementioned
study, the authors classify the battery models into four different groups; empirical
models, electrochemical models, multi-physics models and molecular/atomistic models.
Moreover, a review article addressing safety-focused modeling of LIBs is presented in
Ref. [14]. According to the authors in the latter reference, the following three scales can
be considered for an accurate battery modeling:
Material level (Microscopic length scale) where electrochemical processes such as
charge transfer, diffusion processes are modeled,
Cell level where thermodynamic, thermal and mechanical phenomena are
described,
Battery pack level where the LIBs are often undifferentiated and the integration
of LIBs in advanced applications such as EVs is addressed.
White box battery models 3.5.1.1
As discussed beforehand, the white box battery models or well-known as electrochemical
battery models are mainly based on complex mathematical equations (e.g., methods
based on PDE or differential algebraic equations (DAE)). Within such battery models,
the focus of modeling mainly lies on representing the interaction between physical and
chemical properties of the internal components such as electrodes, electrolyte and
separator. In this regard, thermodynamic, fluid mechanics and kinetic reactions are
considered in great detail for reproducing the behavior of the battery as accurate as
possible [272]. Such battery models are parameterized by means of material properties.
Consequently, during development phase the influence of material property on battery’s electrochemical behavior can be investigated upon on the results obtained from such
models [273]. However, it is worth noting that the current/voltage behavior of battery
cannot be reproduced by the aforementioned models.
In general, white box battery models can be classified into two groups, namely P2D-
based models and SPM-based models. The P2D models are based on porous electrode,
concentrated solution theory and kinetics equations [274]-[275]. In fact, because of their
high computational effort, employing P2D models in real-time applications such as BMS
is limited. Hence, the focus has turned to simplifying such models into so-called SPM
models in recent years. Within such models ionic intercalation are defined as a dominant
dynamics part [293]. Generally, the SPM models neglect specific properties of battery’s electrolyte and the transfer processes are simplified significantly (e.g., variations in

Review of monitoring algorithms and battery models presented in the literature 124
concentration of electrolyte and potential are neglected) [271]. The latter simplifications
yield inaccurate simulation results for specific operating conditions such as when high
discharge current rates are applied to the battery or when thick electrodes need to be
simulated. The main advantages of SPM models are their comparatively simple nature,
low computing power and given possibility for implementation on embedded systems for
on-board state estimation such as SoC or SoH.
3.5.1.1.1 Pseudo-two-Dimensional battery model
Because of porous structure of battery electrodes, the interfacial area between the solid
electrode and the electrolyte solution increases and negatively affects occurring
electrochemical reactions in these areas. Such complex porous structure makes an
efficient and accurate battery model development very difficult. The first porous
electrode theory for batteries using macroscopic approach was presented in 1975 by
Newman and Tiedemann in Ref. [274]. The proposed method for battery modeling has
become the basis structure for most of the P2D models. It was only years later as the
first P2D LIB model was presented in 1993 in Refs. [275]-[276]. The aforementioned
porous electrode theory and the concentrated solution theory were combined together in
an example of lithium metal/TiS2 battery with polymeric separator. The behavior of
battery electrodes is simulated using spherical particles surrounded by electrolyte.
Another P2D-based battery model was presented for LMO/C-based LIBs using organic
electrolyte in 1994 in Ref. [277].
Fig. 45 illustrates schematically the three domains (i.e., porous anode, porous separator
and porous cathode) of a P2D battery model.

Review of monitoring algorithms and battery models presented in the literature 125
Fig. 45: Schematic illustration of pseudo-two-dimensional lithium-ion battery model
The latter references employ a 1D approach that considers the (de)intercalation
processes through the surface area of spherical particles surrounded by electrolyte. The
1D approach considers only the dynamics along one axis (x-axis as illustrated in Fig. 45)
whereby the dynamics along other dimensions (y-axis and z-axis) are neglected.
However, often the latter approximation (i.e., only consideration of x-axis) is a well
compromise for LIB structures since the length scale of remaining axes are at least
thousand times (approx. 100000 µm) higher than the length scale of x-axis (approx. 100
µm) [173]. Equations for P2D lithium-ion battery models can be explained as follows
[271]:
1. The concentration of Li+ in solid state (cs) is determined based on Fick’s law.
2. The concentration of Li+ in electrolyte (ce) and in separator is determined based
on conservation of Li+.
3. The solid-state potential ( ) of electrode is determined by ohmic law.
4. The electrolyte potential ( ) and in separator is determined based on Kirchhoff’s and ohmic laws.
5. The transport/flux of Li+ through electrolyte to electrodes is described by the
BVE.

Review of monitoring algorithms and battery models presented in the literature 126
The respective governing nonlinear equations of P2D battery models are summarized in
Table 14. In total, there are 14 nonlinear partial differential algebraic equations (PDAE)
with 14 unknown parameters [173].
Table 14: Governing equations27 of pseudo-two-dimensional lithium-ion battery models adopted from Refs. [271] and [278]
Region Governing equations Brief description of the respective
equation
Electrodes
(k=(n, p);
n=negative
electrode
and p=
positive
electrode)
, , , = , ∙ ( ∙ , , , )
Conservation of Li+ species in a
spherical solid phase particle that
is described by Fick’s law.
, , = ( , ∙ , , ) +− + ∙ ,
, , refers to electrolyte
concentration and and ,
differ for each domain (anode,
cathode and separator).
, , , = ,
, refers to effective
conductivity of the electrode.
Conservation of charge in solid
phase of each electrode represents
the potential in solid phase. − , ∙ , , − , ∙ , , + , ∙ − +∙ , =
Combination of Kirchhoff’s law with ohmic law in electrolyte
phase.
, = ( , − , )∙ ( , )∙ ( , , )∙ [ ( , , )− (− , , )]
The relationship between current
density, concentration and
overvoltage based on BVE as
described in chapter 2.
, = , , − , , − ( , ); = , , − , , − ∙
The terminal voltage is
determined based on electrode
potential at the end of two solid
electrodes and contact resistance.
Separator
(k=s) , , = ( , ∙ , , ) See above
27 where represents the effective electronic conductivity in solid electrode, is the specific surface area of electrode, I
is the current density (I=I0/A), is the effective ionic diffusion coefficient, R the universal gas constant, T the absolute temperature in Kelvin, is the porosity of the region, is the reaction rate constant of electrode , F the Faraday’s constant, C is contact resistance, kis the wall flux of Li+ on particle of the electrode, eff the effective ionic conductivity
of electrolyte in region k and + is the transference number of Li+ in electrolyte.

Review of monitoring algorithms and battery models presented in the literature 127
− , ∙ , , + , ∙ − +∙ , =
See above
3.5.1.1.2 Single particle battery model
As discussed beforehand, in order to make the P2D models suitable for real-time
applications, some simplifications must be performed. In this regard, two approaches can
be considered: First, the model order is reduced whereby the fidelity of the respective
system should be preserved. Second, some model properties are neglected whereby
information loss should be accepted [173]. A SPM model of LIBs can be simply derived
from P2D models after some simplifications where each battery electrode is idealized as
single spherical solid particles in which (de)intercalation processes occur.
In Ref. [279], the authors present a model considering the diffusion and intercalation
processes inside a single electrode particle where the anode and the cathode are
implemented with the same surface area. However, because of the mentioned
simplifications, SPM models can only be used with some limitations (i.e., low current
rates and thin electrodes [269]). In Ref. [271], the authors state that SPM is a preferred
choice rather than the P2D model at very low current rates (I<=1C) . However, more
sophisticated battery models must be employed for high discharge current rates.
Fig. 46 shows schematically a SPM model for LIBs.
Fig. 46: Schematic illustration of single particle model
A comprehensive review on simplified P2D models with especial emphasis on SPM
models can be found in Ref. [271]. Moreover, in Ref. [292], the authors propose an
extended P2D-based approach considering the cell-to-cell variations on battery pack level
under constant voltage charging and discharging. In this regard, coupled P2D model
considering aging (only capacity fade), porosity variation and temperature distribution is
presented. The authors state that the influence of temperature distribution on individual

Review of monitoring algorithms and battery models presented in the literature 128
LIB performance in the battery pack in contrast to the impact of remaining parameters
is more significant and, thus using an efficient cooling strategy is necessary.
Grey box battery models 3.5.1.2
The grey box battery models abstracts away the electrochemical processes occurring in
the LIB. Such models employ simple passive elements such as resistances, capacitances,
inductances for representing the nonlinear behavior of the battery. As discussed in
chapter 2, the aforementioned passive elements depend mainly on temperature, SoC,
applied current rate and actual aging state of the battery.
The aforementioned battery models are often based on experimental data gathered in
laboratory for a specific SoC and temperature operating range and, thus the estimation
accuracy decreases when the battery is operated beyond the specified range [269]. Beside
the possibility for current or voltage simulation by employing the aforementioned battery
models, further battery parameters/states such as SoC, SoAP, SoH or heat generation
can be determined based on the determined overvoltages and the applied current.
Generally, the main criterion for differentiating between grey box battery models and
black box battery models is the higher emphasis on physical-chemical background of
grey box battery models. For control systems or for on-board battery state estimation,
grey box battery models are often the preferred choice [173]. Reviews and descriptions of
different grey box battery models may be found in Refs. [280]-[283].
A simple impedance-based ECM describing the electrode reactions in the battery was
proposed by Randle in Ref. [284]. The proposed ECM consisting of resistances (including
R0 and Rct) and a Cdl connected in series with is still very popular in in the field of
battery modeling. Fig. 47 shows the aforementioned Randles circuit representing
electrode and cell reaction.
Fig. 47: Equivalent circuit model of LIBs adopted from Ref. [284]

Review of monitoring algorithms and battery models presented in the literature 129
The Randles circuit shown in Fig. 47 considers in addition to the in chapter 2 described
electrochemical processes, the occurring diffusion processes by means of where 28
refers to the Warburg coefficient, is the angular frequency and j is the imaginary
number √− [280]. A comprehensive description of remaining impedance parameters can
be found in chapter 2. The impedance of the ECM illustrated in Fig. 47 can be simply
determined as follows: = + + +σ∙ −√ (33)
= − = ,+ +√ ,σ ∙ − (34)
where , = ∙ and ,σ = σ .
After some simple mathematical formulations, the can be written as follows: = ,+ +√ ∙ , ∙ − (35)
where k is a parameter in a range between 0.001 and 1.
Based on the boundary conditions applied to differential equations, the can be
expressed by three various cases. For the first case, the so-called semi-infinite case with
x=0 and a constant concentration ( ), the at x→∞ can be calculated as follows
(Eq. (36)): = ∙ ∙ ∙√ ∙ −√ (36)
As discussed in chapter 2, the follows a straight line with -45° angle in the complex
plane [237]. The second solution is the so-called ideal reservoir where it is assumed that
from a finite length/distance ( ) the concentration remains constant even if diffusion
current is still flowing. Consequently, the is determined as follows (Eq. (37)): = ∙ ∙ ∙√ ∙ tanh √ (37)
In addition to the latter cases, the third and the last case is the so-called non-permeable
wall at where it is assumed that diffusion is blocked from a and no diffusion
current is flowing. Thereafter, the can be determined as follows (Eq. (38)):
28 w = ∙ ∙ ∙ ∙√ where R is the ideal gas constant, T is the temperature, m is the molarity of the reacting
species, F is the Faraday constant, D is the diffusion constant and is the effective electrode surface.
Review of monitoring algorithms and battery models presented in the literature 130
= ∙ ∙ ∙√ ∙ coth √ (38)
A sophisticated ECM consisting infinite number of RC-element connected in series to a
finite length transmissive and a simple capacitance representing charge storage in
electrodes is discussed in Ref. [285]. The impedance parameters of the proposed ECM are
identified by means of EIS measurements. In Ref. [130], the authors examine the impact
of the number of RC-elements on battery voltage estimation accuracy. According to the
results, two RC-elements are enough for precise battery voltage estimation where with
the increase of used RC-elements the estimation accuracy increases but the speed of this
increase becomes slower.
A sensitivity analysis of ECM output of a simple R-RC-RC ECM based on Morris
technique is performed in Ref. [286]. The authors explicitly investigate which of the
impedance parameters can be assumed to be constant without having a considerable
impact on voltage output. The influence of temperature on impedance parameters
behavior is neglected and only the SoC dependent parameters are examined. According
to the results, if a certain number of impedance parameters, in particular C1, C2 and
are fixed at their mean values and their variation with SoC is avoided, the output
voltage is affected minimal and the obtained error of estimated voltage in contrast to the
case where the latter parameters change with SoC, increases just slightly. In total, it can
be stated that the model output is mainly sensitive to variation of and .
In Ref. [230], the performance of ten different ECMs with respect to estimation accuracy
SoC and SoAP is investigated. The impedance parameters of the employed ECMs and
the battery states are estimated by means of DEKF algorithm. For verification of the
applied algorithm and performing a sensitivity analysis, NEDC load profile is employed
in a SoC range of 5% - 90% and LIBs in new state using NMC and LFP cathodes are
investigated. According to the presented results, the ECM using two RC-elements
connected in series to R0 and VOCV provides the most accurate result. The authors use the
determined average root-mean square error (RMSE) as a merit for SoC and SoAP
estimation accuracy. Furthermore, in Ref. [229], the same authors investigate the
behavior of the impedance-based battery model using two RC-elements. A sensitivity
analysis regarding the influence of ECM parameters on resulting battery impedance is
performed where it is shown that the R0 is the most dominant impedance parameter. As
a result, the authors state that a change of approx. 50% in the value of R0 yields a
deviation of

Review of monitoring algorithms and battery models presented in the literature 131
approx. 8 mΩ in the determined battery impedance. The impedance parameters of the employed ECM are identified by means of EIS measurements based on Levenberg-
Marquardt algorithm. Unfortunately, the impact of actual battery aging state and
temperature on impedance behavior of the investigated LFP-based LIBs is neglected.
In Ref. [131], a wide overview of ECMs often applied for battery state estimation in BMS
is given. The Employed ECMs are compared considering their robustness, model
complexity and accuracy of the estimated battery voltage. Multi-swarm particle (MPSO)
algorithm is applied for on-board estimation of the ECM parameters. On the one hand,
using a complex ECM yields a higher degree of voltage estimation accuracy, but on the
other hand the parameter identification of such ECMs requires high computing power
which is rarely given on low cost embedded systems. According to the authors, the ECM
using R0 connected in series with one RC-element yields most accurate results with
regard to the above mentioned criteria for voltage estimation.
In addition to the latter references, a comparative study of five various ECMs
considering SoC estimation accuracy and dynamic model performance is performed in
Ref. [287]. For this reason, LMO-based LIBs in a new state are investigated while the
employed ECMs are evaluated by means of HPPC tests and standardized load profiles
(i.e., DST and FUDS). According to the obtained results, the R-RC-RC ECM indicates
the highest SoC estimation accuracy and best dynamic performance. In the
aforementioned study, a method based on genetic algorithm is applied for identifying the
time constant of RC-element and a REKF approach is applied for SoC estimation.
Black box battery models 3.5.1.3
The black box battery models mainly refer to class of battery models that are based on
analytical techniques [272]. As mentioned beforehand, in such models the physical
dependencies are almost neglected and the battery behavior is modeled by simple
functional dependencies or system equations. In general, the black box battery models
can be subdivided into methods based on neuronal networks and fuzzy logic.
The basic principal of neuronal network-based models is very simple whereby the
relationships are reproduced by means of so-called neurons and nodes. The neurons and
nodes are interconnected together with various weights. Unfortunately, the
parameterization of the mentioned weights requires large amount of training and real
datasets. Moreover, the fuzzy logic-based battery models are likewise based on empirical
approach working according to Boolean logic where the battery is implemented as a
network of insufficient described states. The latter fact yields only a qualitative

Review of monitoring algorithms and battery models presented in the literature 132
statement of system state. Among the main advantages of black box battery models are
their low computational effort and simple nature. However, the aforementioned battery
models are not able to reproduce the electrochemical processes and, thus they are not
employed for an advanced battery modeling.
3.5.2 Requirements on battery models employed in monitoring algorithms
As often mentioned in the previous subsections, the battery modeling technique is highly
affected by respective application. In case of real-time applications/embedded systems
where available computing power is limited, many functions (e.g., battery state
estimation, diagnosis etc.) must work robust and accurate over years and over a wide
operating range. In general, following requirements on battery models for use in BMS
applications in EVs must be considered [272]:
Required implementation effort,
Computational effort or simply speaking algorithms efficiency,
Required (offline)-parameterization effort,
Consideration of aging phenomena and inhomogeneity’s of current and temperature distribution on battery pack level,
High accuracy over a wide SoC range; especially at very low SoCs,
Physical equivalent.
3.6 Summary
In this chapter, available techniques for major battery states/parameters (i.e, SoAP, on-
board capacity, SoH, SoS etc.) estimation as well as different classes of LIB models
presented in the literature are discussed comprehensively. A substantial number of
approaches for capacity estimation use the same simple principle, i.e., the relationship
between ampere-hours charged or discharged from the battery and the difference
between the two values of the voltage-based SoC (SoCV) relative to the initial and end
point where the ampere-hour throughput is measured. In addition, the methodologies
such as ICA and DVA, electrochemical model-based techniques and aging prediction
models are addressed. The main challenge for capacity estimation of lithium-ion battery
packs is still to apply a technique that is able to detect the distribution of capacity loss
from each single LIB over the battery lifetime and to try to optimize the operation
strategy of the battery in order to increase its lifetime and reduce further costs for end
consumers.

Review of monitoring algorithms and battery models presented in the literature 133
The SoAP refers to the amount of power that the battery can deliver to or accept from
the vehicle powertrain. The available battery power is mainly limited by battery SoC,
temperature, current and voltage. At the same time, battery power capability of the
battery is influenced significantly by battery’s aging state. The techniques that have up to now been applied for predicting the SoAP can be classified into the following two
groups: The first group is based on so-called ACM; the second group, which up to now
has received most attention, is based on ECMs.
In addition to the presented techniques for estimating the aforementioned battery states,
a brief review on different classes of battery models is provided. Generally, the battery
models can be subdivided into three various classes. The first class of battery models is
the so-called white box models whereby occurring electrochemical processes such as
mass transport, diffusion, ion transport and the temperature distribution inside the LIB
are represented in great detail. Moreover, grey box battery models neglect detailed
representation of occurring electrochemical phenomena and try to reproduce the
nonlinear behavior of LIBs by simple passive elements such as resistances and
capacitances. The parameters of ECM can be identified on-board by means of adaptive
techniques or offline using EIS measurements or HPPC tests. Techniques using adaptive
filters such as KF, LS or similar observer methods are the most promising compromise
between estimation accuracy and low computational effort for battery state/parameter
estimation. The use of adaptive methods for parameter identification is necessary as
impedance parameters of the employed ECMs change over the battery lifetime. In this
regard, the grey box battery models are very popular in the field of BMS mainly because
of their simplicity and low computational effort. Black box battery models are the third
class of battery models that are based on machine learning techniques such as neural
network and fuzzy logic. The latter models neglect physical dependencies of occurring
electrochemical reactions and consider simple functional system dependencies.

The equivalent circuit models investigated in this work 134
4 The equivalent circuit models investigated in this work
As discussed in the previous chapter, the computing power of ECUs commonly used in
BMS applications is limited. Thereafter, it is not technically feasible to apply white-box
battery models for BMS applications at least at present. In this regard, grey box battery
models are very popular approaches for use in monitoring algorithms since such battery
models are simple and can precisely reproduce the battery dynamics over a wide
frequency range. In this work, a systematic overview over impedance-based ECMs often
employed for battery state estimation is given, thus a feasibility study is performed. In
total, seven different impedance-based ECMs incorporating various passive components
such as simple linear (as described in chapter 2) up to more complex components such
as ZARC-elements are investigated. It is worth noting that the nonlinearity of the charge
transfer processes is considered by applying the BVE (Eq. (11)). The investigated ECMs,
their model equations in discrete form and a brief description of each can be found in
Table 15.
Table 15: Specification of the equivalent circuit models investigated in this work
Equivalent circuit models Model equations ECM description
Model 1:
∆ = ∙
Vsim(k)=∆VR0(k)+
VOCV(k)
The employed ECM
consists of R0 and
VOCV. The ECM
consists of one
adaptive parameter.
Model 2:
∆ + = , ∙ −∆+ ,∙ − −∆∙
Vsim(k)=∆VR0(k)+
∆Vct(k)+VOCV(k)
= ∙ refers to
time constant and
∆Vct refers to
overvoltage of the RC-
element.
The ECM consists of
R0, RC-element
representing charge
transfer processes and
VOCV.
The ECM consists of
four adaptive
parameters.

The equivalent circuit models investigated in this work 135
Model 3:
∆ , + = ,∙ −∆+ , ∙− −∆∙
Vsim(k)=∆VR0(k)+
∆Vct(k)+∆Vd,1(k)+VOCV(k)
= , ∙ , refers to
time constant and ∆ , refers to
overvoltage of the
second RC-element.
The ECM consists of
R0, RC-element
representing charge
transfer processes,
RC-element
representing diffusion
processes and a VOCV.
The ECM consists of
six adaptive
parameters.
Model 4:
∆ , + = ,∙ −∆+ , ∙− −∆∙
Vsim(k)=∆VR0(k)+
∆Vct(k)+
∆Vd,1(k)+∆Vd,2(k)+
VOCV(k)
= , ∙ , refers to
time constant and ∆ , refers to
overvoltage of the
third RC-element.
The employed ECM
consists of R0, three
RC-elements
representing charge
transfer and diffusion
processes and a VOCV.
The ECM consists of
eight adaptive
parameters.
Model 5:
∆ ZA C, += ZA C, ∙ −∆+ ZA C, ∙ − −∆∙
Vsim(k)=∆VR0(k)+
∆VZARC,1(k)+VOCV(k)
= ZA C, ∙ ZA C,
refers to time
constant and ∆ ZA C,
refers to overvoltage
of the ZARC-element.
The employed ECM
consists of R0, ZARC-
element representing
charge transfer
processes and a VOCV.
The ECM consists of
five adaptive
parameters.
Model 6:
∆ ZA C, += ZA C, ∙ −∆+ ZA C, ∙ − −∆∙
Vsim(k)=∆VR0(k)+
∆VZARC,1(k)+∆VZARC,2(k)+
VOCV (k)
= ZA C, ∙ZA C, refers to time
constant and ∆ ZA C,
refers to overvoltage
of the second ZARC-
element.
The employed ECM
consists of R0, two
ZARC-elements
representing charge

The equivalent circuit models investigated in this work 136
transfer and diffusion
processes and a VOCV.
The ECM consists of
eight adaptive
parameters.
Model 7:
∆ ZA C, += ZA C, ∙ −∆+ ZA C, ∙ − −∆∙
Vsim(k)=∆VR0(k)+
∆VZARC,1(k)+∆VZARC,2(k)+
∆VZARC,3(k)+VOCV(k)
= ZA C, ∙ ZA C, refers to time
constant and ∆ ZA C,
refers to determined
overvoltage of the
third ZARC-element.
The employed ECM
consists of R0, three
ZARC-elements
representing charge
transfer and diffusion
processes and a VOCV.
The ECM consists of
eleven adaptive
parameters.
4.1 Equivalent circuit model using an ohmic resistance (Model 1)
Each of the investigated ECM consists of R0 representing resistive contribution of the
electrolyte, current collectors etc. The R0 is highly temperature dependent and increases
over the battery lifetime while its dependence on battery SoC is more or less pronounced
depending on active materials of LIBs. The C represents the voltage when the LIB is
in steady state and all side reactions are finished (for more detailed explanation
regarding internal or external factors influencing the aforementioned parameters the
readers are referred to chapter 2). The impedance of the model 1 is determined as follows
(Eq. (39)):
, = (39)
4.2 Equivalent circuit models using an ohmic resistance connected in series with a finite number of RC-elements (Models (2-4))
In order to capture the dynamics of LIBs more precisely, a finite number of RC-elements
are connected in series with R0. Each RC-element consists of a resistance and a
capacitance. The models 2-4 differ in the number of the RC-elements. The higher the
number of RC-elements is the higher the accuracy of estimated voltage can be. However,
at the same time, the execution time or required computing power increases, thus often a
compromise between these both parameters needs to be found. The first RC-element
with as time constant is always responsible for capturing charge transfer processes

The equivalent circuit models investigated in this work 137
occurring at the interface between the electrode and the electrolyte. It is worth noting
that depending on ECM parameterization and relating frequency of respective processes,
the first RC-element could also refer to SEI in the anode. However, in the present work,
the impact of SEI formation is neglected for battery modeling and it is assumed that
time constant of both processes are very similar and does not lead to an inseparable
semi-circle in the measured impedance spectrum. In this regard, the impedance of the
aforementioned models can be determined as follows (Eq. (40)):
, − = + ∑ ∙ += (40)
Charge transfer processes in batteries can be divided into the following two types:
Homogenous or heterogeneous charge transfer processes [244]. Homogenous charge
transfer corresponds to charge carrier (ion) exchange in electrolyte and second type
corresponds to charge transfer between ions in electrolyte and ions in the electrode.
Charge transfer overvoltage is determined when the difference between the amount of
lithium-ions during intercalation and deintercalation at both electrodes is not zero and
the LIB is being charged or discharged. The correlation between current density and ∆
can be described by the BVE as described beforehand in chapter 2 as follows: = ∙ exp ∙ ∙∙ ∙ Δ − exp − ∙ ∙∙ ∙ Δ (41)
When the effective internal surface ( ) is considered, the multiplication of the current
density and the is equal to the current flowing into the electrodes (i.e., = ∙ ).
Accordingly, Eq. (41) can be rewritten as follows (Eq. (42)): = ∙ exp ∙ ∙∙ ∙ Δ − exp − ∙ ∙∙ ∙ Δ (42)
The definition of each parameter given in Eq. (42) was provided in chapter 2; thus no
additional description is provided here. The current dependence of the Rct is considered
in the employed ECMs by applying the BVE. Considering the current dependence of Rct
becomes essential at very low temperatures or when the LIB is aged as discussed in
chapter 2. The latter fact yields higher battery voltage prediction accuracy. For
simplicity reasons it is assumed that the of both anodic and cathodic reactions are
equal (i.e., = = . 29) and, thus the BVE can be solved analytically (Eq.
(43)): = sinh . ∆ (43)
29 For most of the LIBs, may be assumed to be approx. 0.5. However, for other battery technologies, such as lead-acid
batteries this simplification is not applicable, whereas values between 0.25 and 0.3 seem to be feasible [244].

The equivalent circuit models investigated in this work 138
After some simple mathematical formulations the current dependence of Rct can be
derived as follows (Eq. (44)):
= , ∙ ( . ∙ +√ . ∙ +
. ∙ )
30 (44)
As described in chapter 2, the changes for different temperatures and decreases
significantly over the battery lifetime and, thus it is of great interest for application
engineers to consider this term in an adaptive manner for monitoring algorithms.
Thereafter, within this work, an additional impedance parameter, so-called is
employed. is determined as follows (Eq. 45): = . [A− ] (45)
kI describes the behavior of that is mainly aging state and temperature dependent.
Moreover, in order to avoid singularities, the factor , is employed which is equal to Rct
at IR=0 A, which is determined by L'hopital's rule. In Fig. 48, Butler-Volmer behavior of
Rct are depicted schematically using the above mentioned equations for different current
rates and kI values.
Fig. 48: Schematic illustration of the nonlinear behavior of Butler-Volmer characteristic; a: anodic and cathodic reactions, b) normalized charge transfer resistance for various kI values where it is assumed that symmetry factor is 0.5
30 In order to decrease the computational effort for considering the current dependence of the Rct it can be implemented by
a means of simple look-up table as follows: ln + √ + .

The equivalent circuit models investigated in this work 139
The dynamic behavior of LIBs is influenced by ; the higher is the slower is the voltage
response. The time constant of individual RC-element must be differentiated in a range
of some (mili)seconds up to some hours. Another important impedance parameter used
in the models 2 – 4 is the Cdl. As discussed in chapter 2, the Cdl can be determined in a.c.
or d.c. domain using EIS measurement or HPPC tests. In model 3 and model 4, the
second and third RC-elements with time constants and refer to diffusion processes
occurring at very low frequencies (i.e., approx. f 1 Hz). Summarized, the electrical
behavior of RC-elements described above can be expressed as follows (Eqs. (46)-(47)):
[ ∆∆ ,∆ , ] = [ −∆ −∆ −∆] ∙ [ ,, ] + [
∙ − −∆, ∙ − −∆
, ∙ − −∆ ] ∙
[ ] (46) = ∆ + ∆ + ∆ , + ∆ , + C (47)
4.3 Equivalent circuit models using an ohmic resistance connected in series with a finite number of ZARC-elements (Models (5-7))
Unfortunately, the RC-elements described above are not able to reproduce accurately
battery dynamics for specific operating conditions and often yield unsatisfactory results;
especially when the battery voltage needs to be predicted over a large time horizon or
when the battery is operated at very low SoCs or very low temperatures. The latter issue
will be discussed in great detail in chapter 5. Moreover, in some cases the intention of
the employed ECM could be to modeling the inhomogeneous material distribution or
modeling the porosity [171]. Therefore, the so-called ZARC-element is often a preferred
choice for an accurate battery modeling in the aforementioned operating areas and
describes depressed semi-circles more precise. If a CPE-element is used instead of the
capacitance in a simple RC element, the resulting circuit is a ZARC-element with the
following impedance: ZA C = .. + ; where R refers to the resistance, A is the
generalized capacitance; ξ is the depression factor and is the frequency range [280].
Purely capacitive behavior is expected when ξ=1. Moreover, as described in chapter 2,
ξ=0.5 yields a -45° branch whereby ξ=0 refers to purely resistive behavior of the CPE-
element. The impedance of the above mentioned models can be determined as follows
(Eq. (48)):
− = + ∑ . . += (48)
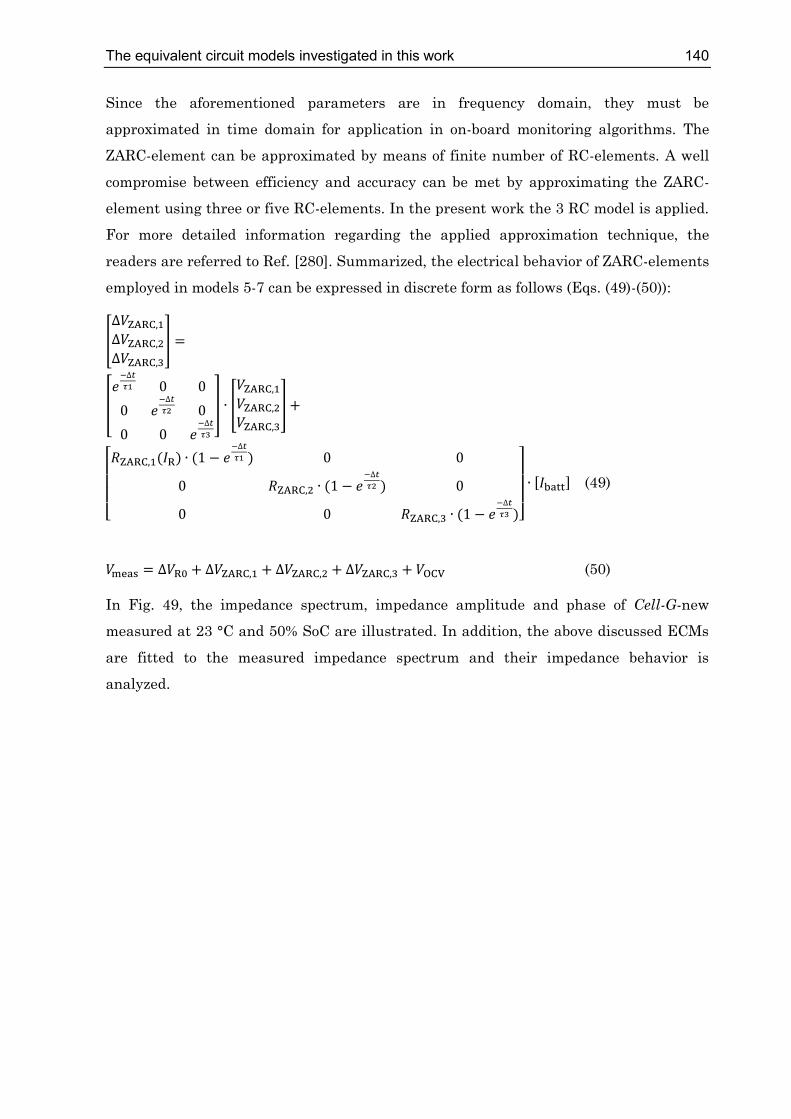
The equivalent circuit models investigated in this work 140
Since the aforementioned parameters are in frequency domain, they must be
approximated in time domain for application in on-board monitoring algorithms. The
ZARC-element can be approximated by means of finite number of RC-elements. A well
compromise between efficiency and accuracy can be met by approximating the ZARC-
element using three or five RC-elements. In the present work the 3 RC model is applied.
For more detailed information regarding the applied approximation technique, the
readers are referred to Ref. [280]. Summarized, the electrical behavior of ZARC-elements
employed in models 5-7 can be expressed in discrete form as follows (Eqs. (49)-(50)):
[∆ ZA C,∆ ZA C,∆ ZA C, ] =[ −∆ −∆ −∆
] ∙ [ ZA C,ZA C,ZA C, ] +
[ ZA C, ∙ − −∆
ZA C, ∙ − −∆ZA C, ∙ − −∆ ]
∙ [ ] (49)
= ∆ + ∆ ZA C, + ∆ ZA C, + ∆ ZA C, + C (50)
In Fig. 49, the impedance spectrum, impedance amplitude and phase of Cell-G-new
measured at 23 °C and 50% SoC are illustrated. In addition, the above discussed ECMs
are fitted to the measured impedance spectrum and their impedance behavior is
analyzed.

The equivalent circuit models investigated in this work 141
Fig. 49: Impedance spectra of the investigated ECMs compared with an impedance spectrum of Cell-G-new measured at 23 °C and 50% State-of-Charge; a) Nyquist plot, b) Bode plot.
In order to compare the resulting impedances of the ECMs, the RMSE of individual ECM
is determined as follows (Eq. (51)):
REZ = √∑ | | , −| | ,− (51)
where refers to the lowest measured frequency (i.e., approx. 1 mHz) and is the
highest measured frequency before inductive tail of the impedance spectrum starts; in
other words, refers to frequency where R0 is detected (i.e., approx. 500 Hz). The results
of the obtained RMSE values are given in Table 16. According to the obtained RMSE
values, model 7 indicates the highest accuracy with regard to the determined battery
impedance.
Table 16: Comparison of impedance behavior of the investigated ECMs based on determined root-mean square error
Model number Model 1 Model 2 Model 3 Model 4 Model 5 Model 6 Model 7
REZ [Ω] 0.325 0.098 0.0543 0.0522 0.09 0.043 0.0175

The equivalent circuit models investigated in this work 142
4.4 Summary
In this chapter, the ECMs investigated in this work are presented. Moreover, physical
meaning and electrochemical dependencies of impedance parameters are described for
the respective ECMs. In total, seven different ECMs are examined; resulting voltage
equations and electrical behavior of the ECMs are given. According to the obtained
results for impedance behavior of the examined ECMs, it can be concluded that model 7
is the most precise ECM with regard to battery impedance determination for the
examined frequency range. The accuracy of the determined complex battery impedance
using the aforementioned ECM is increased approx. by a factor 2 in comparison to
model 1. In the following chapter, the performance of the aforementioned ECMs will be
investigated with regard to accuracy of voltage estimation and SoAP prediction based on
load profiles presented in chapter 2.
Applied method for battery state estimation 143
5 Applied method for battery state estimation
As described in chapter 3, adaptive techniques often applied for on-board ECM
parameters estimation can be subdivided into following two groups: First, methods based
on adaptive joint estimation techniques. Second, methods based on adaptive dual
estimation techniques. In this work, a recursive joint estimator, the so-called enhanced
varied parameters approach (EVPA) is applied for on-board parameters identification of
the investigated ECMs. Combination of the implemented ECMs (see chapter 4) and the
EVPA applied for impedance parameters estimation yields very high voltage estimation
accuracy. The employed algorithm can further be used to estimate other battery states
such as for voltage-based SoC (SoCV) or SoH. As discussed in chapter 3, the main
limiting parameters for SoAP are voltage and current of the battery whereby it must be
ensured that the battery voltage is always in predefined voltage limits. An accurate
prediction of battery voltage for a certain current belongs always to a successful SoAP
prediction strategy. The more precise the predicted battery voltage, the higher is the
accuracy of the predicted SoAP.
This chapter first describes the basic idea of the applied algorithm and provides
examples of the obtained results regarding the estimated ECM parameters.
Furthermore, the basic idea of the algorithm applied for voltage and SoAP prediction is
discussed comprehensively. Thereupon, dependence of the voltage estimation and SoAP
prediction accuracy on following parameters is investigated as follows:
Dependence of voltage estimation and SoAP prediction accuracy on applied
current rate,
Dependence of voltage estimation and SoAP prediction accuracy on SoC,
Dependence of voltage estimation and SoAP prediction accuracy on battery
temperature.
Dependence of SoAP prediction accuracy on prediction time horizon (∆). 5.1 Method for impedance parameters estimation
As discussed beforehand, the impedance parameters and states of the battery can be
estimated on-board by means of adaptive methods. In this work, a model-based joint
estimator is applied for estimating ECM parameters and different overvoltages referring
to various electrochemical processes, respectively. The core algorithm of EVPA is based
on a straight forward recursive technique and it was presented for the first time in detail

Applied method for battery state estimation 144
in Ref. [46]. The aforementioned algorithm is able to adapt each adaptive parameter to
particular aging state and/or operating condition of the battery and works accurately
over a wide temperature range. The latter fact is a key factor for accurate voltage
estimation. Fig. 50 illustrates schematically operating principle of the employed
algorithm in context of simplified BMS architecture.
Fig. 50: Schematic illustration of operating principle of the applied algorithm for impedance parameters and voltage estimation in the context of simplified battery management system architecture
In the first step, the algorithm is initialized by ACM for given temperature and SoC. In
real application which means that when a code generation is performed and the
algorithm is implemented on microcontroller, an ACM is implemented for each adaptive
parameter which is based on a polynomial approximation (i.e., 2nd order polynomial
function). In this regard, the impedance parameters of the employed ECM can be
extracted by means of EIS measurements or HPPC tests in the laboratory.
The underlying idea of the parameter estimation algorithm is the combination of certain
values of average LIB parameters within a parameter set P for a nonlinear ECM
consisting of various impedance parameters discussed in the previous chapter (e.g., for
model 2 means that the model consists of four adaptive parameters ( , , kI, ) for
example P = = 0.8 mΩ, = 1 mΩ, = 100 F and kI = 0.01 A-1. The load profile
applied to the LIB is then divided into short evaluation periods with a duration of some
seconds each (e.g., k = 200 values at sampling frequency of 10 Hz). During each

Applied method for battery state estimation 145
evaluation period n different parameter sets (P1, P2, … Pn) are generated and then n
battery voltages at each sample step k during this period are determined using
measured battery current with these parameter sets.
It is assumed that during the evaluation period the OCV remains constant or its change
is negligible. The decision for starting and terminating of each of the evaluation periods
is made according to following criteria:
It is verified whether the current through the capacitance over a short period of
time is low (i.e., < , for ∆ ). The definition of this criterion is important,
since the battery voltage can only be determined on the basis of the previous ∆ .
At the same time, it is important to minimize the impact of the previous history of
the battery on resulting battery voltage. Moreover, high current fluctuation in
load profile allows obtaining more valuable information regarding the battery
impedance. Thereafter, it is necessary that the current fluctuation is evaluated.
When the conditions mentioned beforehand are fulfilled and the current profile
for a predefined time range is evaluated, the evaluation period can be terminated
and preferably the next evaluation directly begins.
The estimated voltages are then compared to the measured battery voltage. The
parameter set which results in the lowest quadratic voltage deviation or so-called cost
function ( C ) between the measured and the determined voltage (Eq. (52)) is selected
as the ideal parameter set and then used as a basis to generate parameter sets for the
next evaluation period.
C = ∑ , − ,= (52)
As discussed in the previous subsections, a compromise often has to be achieved between
an accurate battery modeling and a low computational effort in BMS applications. In
contrast to the core algorithm presented in Ref. [46], an improvement is performed
regarding the amount of the parameter loops need to be compared. The latter fact yields
almost the same grade of accuracy for impedance parameters estimation and faster
convergence of each adaptive parameter. Moreover, the simplification allows the
contribution of more complex nonlinear ECMs. The principle of searching method used
by the EVPA for an example of three adaptive parameters is shown schematically in Fig.
51.

Applied method for battery state estimation 146
Fig. 51: Schematic illustration of searching principle of the applied algorithm for impedance parameters estimation
The C given in Eq. (52) is determined for the initial parameter set and for parameter
sets containing each time one different value of individual parameter. Each parameter is
varied in positive and negative directions. This means that for n adaptive parameters,
only 2n calculations instead of 3n calculations as proposed in Ref. [46] need to be
performed yielding an enormous decrease of the needed computing effort and faster code
generation. For example, in case of parameter , the coefficient (∆ ) is used to calculate
two variations of this parameter value as follows: +( ∙ ∆ ) and − ∙ ∆1). The
coefficient (∆ ) is implemented as a variable, which may change during each iteration
period in order to accelerate the parameter convergence. In general, when the parameter
adaption is stable or simply speaking the correct convergence of the parameter was
successful, the value of ∆ remains constant. It is worth noting that the width of ∆ plays
a major role in order to ensure the parameter’s convergence in a correct direction. Choosing high initial values may lead to wrong results and the parameter might be
converges to the wrong direction or diverges. Therefore, it is recommended to explore
proper initial values that yield accurate results for each of parameters during offline
tests.
In Fig. 51, the blue point in the middle represents a reference parameter set where the
new parameter pairs are built as described above around this point with the width of ∆ .
Green points indicate that the value of the cost function in Eq. (53) in this direction for
these two dimensions yield lower value than value for other parameter sets illustrated

Applied method for battery state estimation 147
with red points. The third dimension which is marked with orange color shows no
improvement in the determined results and therefore no more investigation will be
performed in respective dimensions. Once all the dimensions are examined a new
parameter set is set for next evaluation period.
5.1.1 A selection of simulation results for impedance parameters estimation
Based on the method described in the previous subsection, the results obtained for model
6 are investigated using Cell-G-new as a reference. As discussed in chapter 4, the
aforementioned model consists of totally eight adaptive parameters
i.e., R0, RZARC,1, RZARC,2, AZarc,1, AZarc,2, , , kI. In Fig. 52, the adaption process of the
impedance parameters measured and simulated voltages are illustrated for the
examined load profile as shown in Fig. 27.
Fig. 52: Results of voltage simulation and adaption process of the impedance parameters of model 6 for Cell-G-new
According to the results, the adaption of the impedance parameters during temperature
change for respective SoC can be observed. For example, an increase of resistances or
decrease of capacitances with decreasing temperature can be clearly observed which is in
agreement with results presented in chapter 2. In addition to the results shown above,

Applied method for battery state estimation 148
Fig. 53 depicts measured and simulated battery voltages including determined
overvoltages (i.e., ∆ + ∆ ZA C, etc.) and C . The C is determined according to Eq.
20 by subtracting the simulated voltage from the sum of the determined overvoltages.
Fig. 53: Measured and simulated battery voltages including determined overvoltages and estimated open-circuit voltage based on model 6 for Cell-G-new
5.1.2 Sensitivity analysis of impedance parameters and voltage estimation accuracy during an extreme temperature variation
In the previous subsection, the robustness analysis of the applied algorithm is performed
and applicability of the used ECMs for BMS applications in an example of model 6 is
analyzed. According to the results, consideration of extraordinary internal or external
battery temperature change is essential for monitoring algorithms. The latter fact occurs
as a result of high impact of the battery’s temperature on battery impedance characteristic. In order to examine the impact of temperature change on the applied
algorithm regarding robustness and correct convergence of the estimated parameters, a
measurement procedure on the test bench is defined and the load profile shown in Fig.
27 (in particular the second day driving cycle) is used. The measurement was performed

Applied method for battery state estimation 149
on each investigated LIB while only the results obtained from Cell-B-new are discussed
in this subsection.
The defined measurement procedure is as follows: The LIB was fully charged at 23 °C
using CC-CV technique and then tempered in temperature chamber for more hours to -
20 °C at fully charged state. Thereafter, the test was performed while the temperature
was increased to +30 °C after 1 hour driving until the battery was almost fully
discharged and the driving cycle is ended. Fig. 54 shows exemplary the results of
adaption process of estimated impedance parameters of model 6 obtained for Cell-B-new.
Fig. 54: Sensitivity analysis of adaption process of the impedance parameters of model 6 during an extreme temperature variation (from -20 °C up to +30 °C) over a wide SoC range for Cell-B-new
For robustness analysis, the initial values of the impedance parameters shown in Fig. 54
are intentionally chosen incorrect. The results indicate the fast adaption (approx. below
10 minutes) of the parameters to correct values for given conditions. For example, correct
adaption of resistances can be seen while they are increasing with decreasing
temperatures and decreasing with increasing temperatures respectively.
Fig. 55 shows exemplary the results of sensitivity analysis with regard to battery voltage
estimation accuracy in an example of Cell-B-new.

Applied method for battery state estimation 150
Fig. 55: Sensitivity analysis and instantaneous voltage estimation during an extreme temperature variation (from -20 °C up to +30 °C) over a wide SoC range for Cell-B-new
As expected due to higher pronounced diffusion processes occurring in the battery at
very low temperatures31, the deviation between estimated and measured voltage is
higher than the calculated error when the temperature is increased. Furthermore, at
very low SoCs (i.e., SoCs 20%) the estimation accuracy decreases again due to
pronounced diffusion phenomena and rapid/extreme OCV change at very low SoCs as
discussed in chapter 2.
5.2 Method for battery State-of-Available-Power prediction
In the previous subsection, the basic idea of the applied algorithm for battery impedance
parameters estimation is presented. Moreover, the results of sensitivity analysis for
adaption process of the impedance parameters and the impact of temperature change
during a driving cycle on impedance behavior of the LIB are discussed. In the following
subsections: First, the basic idea and relating mathematical equations of the applied
technique for a precise SoAP prediction is discussed. Second, model performances (i.e.,
31 It is assumed that the impedance parameters are converged to their right values.

Applied method for battery state estimation 151
models 1 - 6) are analyzed and compared with regard to voltage estimation and SoAP
prediction accuracy.
5.2.1 Basic idea of the applied technique for SoAP prediction
As described in the previous chapter, the investigated ECMs are employed as a basis for
battery voltage estimation whereby, at the same time the battery voltage can be
predicted for a certain time horizon (∆). The battery voltage for charging and
discharging cases for models 2 - 7 are determined as follows (Eqs. (53)-(54)): ∆ = ∆ + = ∙ −∆ + ∙ ∙ ( − −∆ ) + = ∙ −∆ + ∙∙ − −∆ + C = + oC ∙ ∆ ∙ (53)
∆ = ∆ + = ∙ −∆ + ∙ ∙ ( − −∆ ) + = ∙ −∆ +∙ ∙ − −∆ + C = + oC ∙ ∆ ∙ (54)
where i refers to the number of RC-elements or ZARC-elements ( ∈ … ) employed in
the respective ECM given in Table 15. Description and method for determining
and oC have been described in chapters 3 and 4.
In addition to the latter equations, for determining the limiting charge/discharge current
( ) that yields exactly the upper or the lower battery voltage limits (i.e., or ),
the following equation must be solved (Eq. (55)): = ∆ + = ∙ −∆ + ∙ ∙ ( − −∆ ) + = ∙ −∆ + ∙ ∙ −−∆ + C = + oC ∙ ∆ ∙ (55)
where = and = refer to the case when the battery is charged and = and = refer to the case when the battery is discharged,
respectively. By employing the aforementioned equations, the available battery power
for charge and discharge cases (i.e., and ) for a predefined prediction
time horizon (∆) can be simply calculated as follows (Eqs. (56)-(57)): = ∙ ∆ (56) = ∙ ∆ (57)
As described in chapter 3, Eqs. (56)-(57) are valid for the case where constant current
pulses are applied to the battery (see Fig. 43). However, for the case when constant
power pulses are applied to the battery, the change of current over ∆ should additionally
be considered in the aforementioned equations.
Furthermore, it is worth mentioning that Eqs. (53)-(55) are ideal candidates for voltage
and current prediction of models 2 – 7. Unfortunately, these equations cannot be applied

Applied method for battery state estimation 152
to model 1 as the latter ECM consists of only one linear impedance parameter and
transient behavior of the battery is neglected completely. Therefore, available power of
the battery considering design limits; i.e., voltage, SoC and current can be predicted as
follows (Eqs. (58)-(67)) [249]-[250]: ∆ = ∆ + C + oC ∙ ∆ ∙ (58) ∆ = ∆ + C + oC ∙ ∆ ∙ (59)
, , = OCV C −+ C ∙∆ ∙ (60)
, , = OCV C −+ C ∙∆ ∙ (61)
, , C = C − C∆ (62)
, , C = C − C∆ (63)
, = max , , , , , , , C (64)
, = min , , , , , , , C (65) = ∆ ∙ , (66) = ∆ ∙ , (67)
It is worth noting that the definition of and mentioned above in Eqs.
(56)-(57) and Eqs. (66)-(67) is equal to SoAP presented in chapter 3. Please notice that
the SoAP mentioned in the following subsections is calculated based on the
aforementioned equations.
As described in chapter 3 (see Fig. 43), for the case where the battery voltage reaches its
predefined limit (i.e., or ) and the applied current is within the predefined
battery current limits (i.e., cases a and c), the prediction of SoAP is more challenging
than the remaining two cases (i.e., cases b and d). Unfortunately, the real available
SoAP is unknown and, thus the inaccuracy of the predicted SoAP cannot be derived
directly. In fact, the real maximum available battery power can only be predicted when
the exact current (Ireal,max power) that leads to ∆ = or ∆ = 32 is known or in
other words when the battery voltage hits or . However, the Ireal,max power cannot
be calculated; if so, then we have an ideal SoAP prediction.
As a basis for an accurate SoAP prediction it is necessary that battery voltage and SoAP,
respectively, are predicted precisely for a certain constant current pulse (i.e., ) over a
prediction time horizon. Hence, based on the estimated impedance parameters, battery
32 The ∆ and ∆ are determined as follows: ∆ = − and ∆ = − .

Applied method for battery state estimation 153
voltage is predicted for a specific ∆ and compared with voltage/power measured on test
bench. Thereafter, the relative SoAP prediction error is determined as follows (Eq. 68):
∆ = ,∆− ∆∆ (68)
5.2.2 Results and discussion
In this subsection, the results obtained from HPPC tests and load profiles shown in
Fig. 27 are presented. In this regard, first, dependence of calculated RMSE for estimated
battery voltage ( ) on SoC, temperature and applied current rate is examined for the
aforementioned load profiles. For this reason, a statistical analysis of the obtained
results is performed whereby is determined as follows (Eq. (69)):
= √∑ , − ,= (69)
The dependence of on SoC, temperature and applied current rate is investigated as
follows:
1. The accuracy analysis of the employed ECMs is performed based on determined
for each manifold 10% SoC range (0-10%, 10%-20%, 20%-30%,⋯,90%-100%).
It is worth mentioning that the SoCs are calculated using battery’s nominal
capacity.
2. The accuracy analysis of the employed ECMs is performed based on determined
in following temperature ranges:
a. ∆1 = -20 °C⋯-5 °C
b. ∆2 = -5 °C⋯10 °C
c. ∆3 = 10 °C⋯25 °C
d. ∆4 = 25 °C⋯40 °C
3. The accuracy analysis of the employed ECMs is performed based on determined
for following current rate ranges:
a. ∆ -4C
b. ∆ = -4C⋯-2C
c. ∆ =-2C⋯0
d. ∆

Applied method for battery state estimation 154
It is worth mentioning that because of occurring parameters convergence problem,
model 7 is not considered for further analysis in the present chapter. The main reason
for convergence problem of the estimated impedance parameters of model 7 can be
referred to high number of implemented adaptive parameters included in the respective
model. Thereafter, only the first six ECMs are investigated in the following subsections.
Dependence of voltage estimation accuracy ( ) on SoC, temperature and 5.2.2.1
applied current rate
In this subsection, the main focus lies on performance analysis of the investigated ECMs
with regard to estimation accuracy of . In Fig. 56, the results obtained from HPPC
tests performed at 23 °C on Cell-B-new, Cell-C-new, Cell-C-aged and Cell-G-new are
illustrated.

Applied method for battery state estimation 155
Fig. 56: Model performances based on HPPC tests performed at 23 °C on Cell-B-new, Cell-C-new, Cell-C-aged and Cell-G-new33
In fact, for Figs. 56-57 where the results obtained from the performed HPPC tests are
shown, charging pulses with the same amplitudes as illustrated discharging pulses are
available. However, in order to stay conform to the later results derived from driving
cycles where charging current pulses are limited, the investigated current range (i.e., x-
axis, respectively) is limited to 2C. According to the results illustrated in Fig. 56 it can be
concluded that the model 1 indicates the poorest performance in contrast to other ECMs
for the investigated LIBs. For Cell-G-new the differences between models 2-6 with
regard to current dependence of is almost negligible. The obtained differences are
simply too low for a convincing statement regarding the most accurate model for voltage
estimation. However, by investigating the SoC dependence of , the performance of
the models differ for various SoC ranges. In total, it may be stated that despite some
slight exceptions model 4 seems to be more accurate than other ECMs. In contrast to
Cell-G-new, the results obtained for Cell-B-new shows that performance of the models
are slightly different. The slight difference between the derived results for model 4 and
model 6 indicate that their performances depending on SoC and applied current rate are
almost similar. In addition to the latter two LIBs, the results obtained for Cell-C-new
and Cell-C-aged are analyzed. According to the obtained results, it may be stated that
model 4 indicates the most accurate results for both LIBs. As it can be seen, the models
accuracy decreases slightly when the battery is aged while the latter fact is more
pronounced for model 1. Moreover, it becomes obvious that estimation accuracy of the
investigated models decreases significantly with decreasing SoC.
The results discussed above have a representative character since the influence of
temperature is not considered and the HPPC tests are performed under nominal
condition. In chapter 2, the significant impact of temperature on battery’s impedance characteristics is discussed comprehensively. In this regard, in case of model 1 the
impact of battery temperature on voltage estimation accuracy is examined. It is worth
noting that selection of model 1 is not met according to any special reasons and should
just give an indication for possible behavior of other models at different temperatures.
33 It is worth mentioning that in the present chapter, the x-axis of figures referring to current dependence of and
SoAP are based on battery’s nominal capacity.

Applied method for battery state estimation 156
Fig. 57 illustrates the results obtained for the dependence of the determined on
applied current rate and SoC at various temperatures, in particular 0 °C, 23 °C and 40
°C.
Fig. 57: Comparison of model 1 performance based on HPPC test performed at different temperatures (i.e., 0 °C, 23 °C and 40 °C); a) Cell-G-new, b) Cell-C-new and c) Cell-C-aged
As expected, the performance of model 1 decreases with decreasing temperature for the
investigated LIBs. The model inaccuracy at 0 °C is approx. 5 times higher than the
model inaccuracy at 40 °C. Contrary, the SoC dependence of calculated seems to be
less pronounced at 23 °C and 40 °C. Moreover, it becomes obvious that at 0 °C voltage
estimation accuracy decreases continuously with decreasing SoC whereas this trend
cannot be approved for Cell-C-new. In the latter case estimation accuracy at 23 °C seems
to be slightly better than at 40 °C which probably has its source in measurement

Applied method for battery state estimation 157
uncertainty; however, unfortunately no clear explanation can be provided regarding this
unexpected behavior.
Up to now, the model performances for the performed HPPC tests are examined. In the
following, the performance of the investigated models for the examined driving cycles is
discussed comprehensively. Fig. 58 illustrates the results obtained from the investigated
driving cycles shown in Fig. 27 for different temperature, SoC and applied current
ranges.
Fig. 58: Model performances based on the examined driving cycles for Cell-B-new, Cell-G-new and Cell-J-aged34
As a general explanation for the obtained results for current dependence of determined
, it may be concluded that the differences between model accuracies are very similar
and almost negligible. The voltage estimation accuracy is improved by approx. 15% from
model 1 to model 4 or model 6. Depending on application of interest and its
requirements, the application engineers may weight the advantages and disadvantages
of the respective models for particular application.
34 The results obtained for Cell-D-new and Cell-A-aged can be found in appendix E.

Applied method for battery state estimation 158
Moreover, by analyzing the results obtained for SoC dependence of estimated for
Cell-G-new, two local peaks become obvious in SoC range of 30%-40% and SoC range of
60%-70%. The same behavior can also be detected in the results obtained for Cell-B-new
and Cell-J-aged whereby the obtained voltage errors are slightly lower pronounced. In
contrast to Cell-B-new and Cell-G-new, for Cell-J-aged the first peak is shifted to SoC
range of 20% - 30%. According to SoC ranges where the aforementioned peaks are
observed, these peaks may be referred to staging phenomenon occurring in the anode.
As shown in Fig. 57, temperature of the battery may affect significantly the voltage
estimation accuracy. Consequently, voltage estimation accuracy decreases with
decreasing temperature. In general, the same tendency can also be observed in Fig. 58;
however, for Cell-G-new the voltage estimation accuracy decreases significantly in a
temperature range of -5 °C ⋯ +10 °C in contrast to other temperature regions. The
reason for the mentioned observation can be found in temperature distribution of the
examined driving cycle shown in Fig. 29. Unfortunately, no clear statement can be
provided with regard to selection of the most accurate model using the obtained results
since the determined deviations for voltage estimation accuracy of the models; in
particular, model 3, model 4 and model 6 are marginal and by considering further
external uncertainty sources such as measurement errors etc. an exact answer cannot be
provided to the question which model is the most accurate one. The obtained results may
be employed for a model selection when the target system/application and the respective
operating SoC range, temperature and the applied current rates are more specified.
In the following subsections, model performances with regard to their SoAP prediction
accuracies depending on the mentioned parameters (i.e., temperature, SoC and applied
current rate) are analyzed.
Dependence of SoAP prediction accuracy on SoC, temperature and applied 5.2.2.2
current rate
In the previous subsections, model performances with regard to the determined for
different applied current rates, SoCs and temperatures are discussed. In the present
subsection, the SoAP prediction accuracy is analyzed for the investigated ECMs where
the ∆ as proposed in Eq. (68) is applied for analysis of the predicted SoAP. In the first
step, dependence of SoAP prediction accuracy on applied current rate followed by
examining its SoC and temperature dependency are investigated based on HPPC tests
performed at 23 °C and driving cycles. Moreover, in the second step, the influence of

Applied method for battery state estimation 159
defined prediction time horizon on SoAP prediction accuracy is examined using model 1
as an example. For this reason, five various prediction time horizons are investigated.
As a basis for precise scientific evaluation, the performance of the investigated ECMs is
compared using so-called boxplots. For better interpretation of the boxplots, a brief
description is provided as follows:
1. The tops and the bottoms of the boxplots refer to the 25th and 75th percentiles of
the samples whereby the distance between them (i.e., tops and bottoms of the
boxplots) refers to interquartile ranges.
2. The median of the samples are illustrated using a line in the middle of each
boxplot. Moreover, the skewness of the samples occurs when the median is not
centered.
3. The lines extending above and below each boxplot are the so-called whiskers. In
this work, the whiskers are determined as follows:
a. The whiskers correspond to ±2.7 and 99.3% coverage of the samples if
the data are normally distributed.
b. The illustrated whiskers extend to the most extreme data value identified
not to be an outliner.
c. In this work, the outliners are excluded in the figures and not shown
further. A data value is identified as an outliner if it is higher than
P2+w∙(P2-P1) or less than P1-w∙(P2-P1) where P1 and P2 refer to 25th and 75th
percentiles of the samples.
5.2.2.2.1 Dependence of SoAP prediction accuracy (∆) on applied current rate
The current range investigated for accuracy analysis of determined ∆ differs slightly to
the current range used beforehand for accuracy analysis of . The examined current
ranges are as follows:
a. ∆ -4C
b. ∆ =-4C⋯-2C
c. ∆ =-2C⋯-1C
d. ∆ =-1C⋯0
e. ∆ = ⋯1C

Applied method for battery state estimation 160
f. ∆ =1C⋯2C
g. ∆ =2C⋯4C
h. ∆ 4C
In Fig. 59, the results obtained from HPPC tests performed at 23 °C on the investigated
LIBs are shown. The illustrated boxplots address the dependence of the determined ∆
on applied current rate for a prediction time horizon of 20 s. It is worth mentioning that
the range of applied current rates (on the x-axis) for Cell-C-new and Cell-C-aged differs
to that of other LIBs. That is mainly caused by the fact that for the aforementioned two
LIBs the applied current rates were limited to ±3C. Moreover, the illustrated results
indicate much lower values for the determined ∆ (i.e., prediction accuracy is very high)
in a current rate range of ∆ . The latter fact occurs actually as a result of battery
discharge with a constant current rate of 0.5C between two various SoCs whereby no
SoAP prediction is performed in this areas (i.e., ∆ = ). Thereafter, in combination with
”correct” determined ∆ values derived based on applied current pulses in this range
(e.g., ∆ =0.5C or ∆ =0.75C etc.), resulting ∆ is low in the aforementioned ranges.
However, when the constant discharge phases are excluded, resulting model accuracies
(i.e., at least the tendency of model behavior) should be very similar to that obtained in a
current range of ∆ .
According to the results shown in Fig. 59 for HPPC tests performed at 23 °C, following
conclusions may be drawn:
1. As expected, model 1 indicates the poorest performance in contrast to other
models with regard to SoAP prediction accuracy. The model inaccuracy increases
by a factor of approx. 1.5 - 2.
2. The accuracy analysis indicates that SoAP prediction accuracy decreases
gradually with increasing (dis)charge current.
The differences between model accuracies of models 2 – 6 are very low and, thus the
derived differences between model accuracies can be neglected. Unfortunately, the
prediction accuracy is not significantly improved with increasing number of RC-elements
or by employing ZARC-elements.
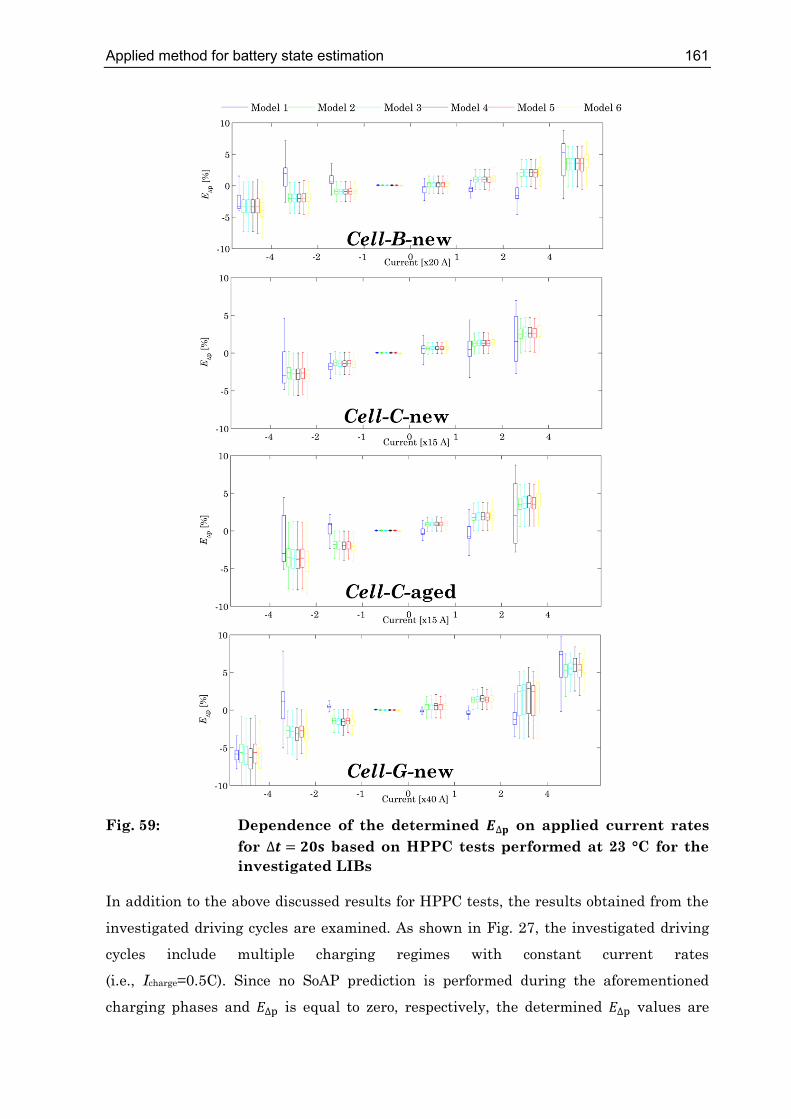
Applied method for battery state estimation 161
Fig. 59: Dependence of the determined ∆ on applied current rates
for ∆ = based on HPPC tests performed at 23 °C for the investigated LIBs
In addition to the above discussed results for HPPC tests, the results obtained from the
investigated driving cycles are examined. As shown in Fig. 27, the investigated driving
cycles include multiple charging regimes with constant current rates
(i.e., Icharge=0.5C). Since no SoAP prediction is performed during the aforementioned
charging phases and ∆ is equal to zero, respectively, the determined ∆ values are

Applied method for battery state estimation 162
very low in the respective current range (∆ ) where charging regimes and remaining
applied charging currents (e.g., recuperation phases)are included. Thus, from theoretical
point of view when the charging phases are excluded from the processing data, the
obtained ∆ values should be in the same scale as it is the case for ∆ . Moreover, it is
worth noting that ∆ values calculated in a current range of 2C - +4C a small amount of
charging current pulses of +2C.
Fig. 60 illustrates the determined ∆ values obtained based on the investigated driving
cycles for the investigated LIBs.
According to the results shown in Fig. 60, following conclusions may be drawn for
current dependence of ∆ :
1. With increasing (dis)charging current rates the SoAP prediction accuracy
decreases significantly.
2. In contrast to the results shown in Fig. 59, the prediction accuracy of model 1 is
not significantly lower than other models. But nevertheless, the SoAP prediction
accuracy of model 1 is still slightly lower than other models.
In total, it may be stated that the investigated models excluding model 1 perform almost
similar for the respective applied current range. In fact, the differences between model
inaccuracies for the investigated models are negligible and, thus no clear statement can
be provided regarding the selection of the most accurate ECM for SoAP prediction.

Applied method for battery state estimation 163
Fig. 60: Dependence of the determined ∆ on applied current rates
for ∆ = based on driving cycles for the investigated LIBs

Applied method for battery state estimation 164
5.2.2.2.2 Dependence of SoAP prediction accuracy (∆) on SoC and temperature
In contrast to previous subsection where model performances are compared with regard
to current dependence of SoAP prediction error; in this subsection SoC and temperature
dependence of determined ∆ for ∆=20 s is discussed. It is worth mentioning that in
order to provide better visibility of the obtained results, only discharge cases are
considered for ∆ calculation while charging cases are neglected. The results obtained
from charging cases are almost similar and indicate the same behavior tendency.
Fig. 61 illustrates the dependence of the determined ∆ values on SoC and measured
temperature. According to the results shown in Fig. 61, following conclusions may be
drawn for SoC dependence of calculated ∆ :
1. With decreasing SoC the SoAP prediction accuracy decreases slightly.
2. The prediction accuracy of model 1 (at least for most of the investigated SoC
ranges) indicates comparative results to other models.
3. However, for SoCs below approx. 40%, model 1 seems to perform very poor and be
very inaccurate in contrast to other ECMs. Unfortunately, the main reason for
the aforementioned significant difference for the determined ∆ values between
model 1 and other models is not clear.
According to the results shown in Fig. 61, following conclusions may be drawn for
temperature dependence of calculated ∆ :
1. With decreasing temperature the SoAP prediction accuracy decreases.
2. Model 1 indicates poorest performance and yields very inaccurate results with
regard to predicted SoAP. The inaccuracy of model 1 is approx. 3 times higher
than other ECMs.
3. The obtained results for models 2 - 4 indicate a very similar performance and
quite the same degree of accuracy.

Applied method for battery state estimation 165
Fig. 61: Performance comparison of the investigated ECMs for ∆ = based on the driving cycles for the investigated LIBs; a) Dependence of determined ∆ on State-of-Charge; b) Dependence
of determined ∆ on temperature
5.2.2.2.3 Impact of prediction time horizon on SoAP prediction accuracy (∆)
In the previous subsections, model performances with regard to the determined ∆
depending on SoC, temperature and applied current rate are analyzed. In the
aforementioned cases, determined ∆ is based on a specific prediction time horizon of ∆ = s. In general, the tendency of model performances should not differ significantly
for other prediction time horizons (∆). However, in the present subsection, the impact of

Applied method for battery state estimation 166
various prediction time horizon on SoAP prediction for a wide range of common
prediction time horizons often of interest in EVs is investigated. In particular, the
investigated prediction time horizons (∆) are as follows:
∆=0.5 s,
∆=2 s,
∆=5 s,
∆=10 s,
∆=20 s.
Fig. 62 illustrates the model performances for the investigated LIBs for various
prediction time horizons depending on applied current rate. The left column (a) shows
the results obtained from HPPC tests performed at 23 °C and the right column (b) refers
to the results obtained from driving cycles. The results illustrated in the aforementioned
figure are obtained using model 1 as an example. The investigated results obtained from
other ECMs indicate the tendency and do not show any significant deviation.
According to the results shown in Fig. 63 following conclusions may be drawn:
1. As expected, with increasing prediction time horizons, the SoAP prediction
accuracy decreases significantly.
2. Moreover, it seems that the impact of the defined prediction time horizon becomes
more pronounced for the examined driving cycles than HPPC tests.
3. In total, it can be concluded that difference between SoAP prediction accuracy for
a prediction time horizon below 5 s (i.e., ∆ 5 s) is not significant and the
prediction accuracy decreases significantly for ∆ 10 s. For selected discharge
currents; especially for HPPC tests, it may be stated that prediction inaccuracy is
doubled when ∆ is increased from 10 s up to 20 s.

Applied method for battery state estimation 167
Fig. 62: Performance comparison of model 1 for various prediction time horizons for the investigated LIBs; a) Results obtained from HPPC tests at 23 °C; b) Results obtained from driving cycles35
35 Dependence of determined ∆ on applied current rate and SoC for various prediction time horizons for Cell-J-aged can
be found in Appendix F. Moreover, dependence of SoAP prediction accuracy on SoC for different prediction time
horizons for the investigated LIBs is illustrated in Fig. F.2

Applied method for battery state estimation 168
5.3 On-board open-circuit voltage estimation
In the previous subsections, model performances with regard to voltage estimation
(determined using as a basis for analysis) and SoAP prediction accuracy
(determined using ∆ as a basis for analysis) over a wide range of SoCs, temperatures
and applied current rates are discussed. In addition to the above mentioned parameters/
battery states, the on-board OCV estimation accuracy of the investigated ECMs is
examined in the present subsection. In this regard, a single driving cycle performed on
Cell-G-new is selected and the OCV is determined as proposed in Eq. 20. It is worth
noting that a simple low-pass filter is applied to the determined OCV values for each
sampling time in order to filtering away possible fluctuation in the calculated OCVs.
Fig. 63 shows the results of measured and estimated OCVs using Cell-G-new as an
example. The load profile employed for verification reasons is performed at 23 °C.
Fig. 63: Measured and determined open-circuit voltages and relative estimation error for the investigated ECMs using a single driving cycle performed at 23 °C on Cell-G-new. Please note that the SoCs are related to battery’s nominal capacity
Table 17 gives the calculated RMSE values of the estimated OCVs over the whole SoC
range. According to the results, it can be concluded that model 4 is a preferred candidate

Applied method for battery state estimation 169
for OCV estimation under described condition while OCV estimation accuracy of model 1
is very low; in particular, the model accuracy is approx. 3 time lower than other models.
Table 17: Root-mean-square error of the determined open-circuit voltages for the investigated ECMs
Model number Model 1 Model 2 Model 3 Model 4 Model 5 Model 6 RE C [mV] 74.5 22 23.3 22.1 21.9 22.3
Furthermore, it can be stated that based on the results, OCV estimation accuracy
decreases significantly with decreasing SoC. The estimation accuracy decreases by a
factor 2 or higher for SoCs below 20%.
5.4 Summary
In this chapter, the basic idea of the applied method for battery impedance parameters
estimation is presented and a sensitivity analysis is performed with regard to model
behavior under varying conditions. Furthermore, model performances with regard to
voltage estimation and SoAP prediction accuracy are compared and analyzed. The
accuracy analysis is performed using the load profiles presented in chapter 2 while the
main focus lies on investigating the dependence of the aforementioned parameter/state
on SoC, temperature and applied current rates.

Summary and outlook 170
6 Summary and outlook
This work contributes to the topic of dynamic battery modeling and on-board lithium-ion
battery state estimation for BMS. In order to meet specified power and/or energy
requirements, hundreds of LIBs are connected in series and/or parallel, thus building a
large lithium-ion battery pack. Thereafter, to ensuring an efficient operation strategy
and an optimal system design for a wide range of applications, an accurate modeling and
understanding the battery’s nonlinear behavior both on cell and system levels becomes necessary. Accurate electrical and thermal modeling of LIBs is a very challenging task
since LIBs are nonlinear devices; especially when the employed battery model is
responsible for reproducing the behavior of the battery at very low temperature and SoC
range. The main objective of this work is to investigate the impact of the employed ECMs
on estimation/ prediction accuracy of battery states and parameters such as
instantaneous voltage, SoAP for a predefined prediction time horizon and OCV etc. In
particular, accuracy of the estimated voltage and the predicted SoAP for different
prediction time horizons is examined over a wide SoC, temperature and applied current
range. The aforementioned target is achieved starting from studying internal and
external factors influencing the impedance characteristics of LIBs under varying
conditions, and proceeding through a comprehensive literature review on relating topics
right down to implementation of the ECMs and accuracy analysis of the examined ECMs
with regard voltage estimation and SoAP prediction. The measurements performed on
the examined LIBs at different aging states and the results achieved are summarized as
follows:
First, a short introduction to principle operation of LIBs and a brief overview of different
LIB formats and commonly used anode and cathode materials is given. In addition, the
methods for investigation and interpretation of impedance characteristics/parameters
and OCV behavior of LIBs are discussed comprehensively. In this regard, dependence of
impedance characteristics of LIBs on internal and external factors is investigated where
a nonlinear first order ECM is parameterized for different SoCs and temperatures
(-20 °C ⋯ +45 °C). The measurements are performed using EIS and HPPC tests. For this
purpose, the following parameters are examined extensively: , double-layer
capacitance, charge transfer resistance, time constant, total resistance and OCV. In
total, it can be stated that the aforementioned impedance parameters are influenced
significantly by actual aging state of the LIB. In contrast to temperature the impact
battery SoC on impedance parameters seems to be much lower. Moreover, current

Summary and outlook 171
dependence of direct current resistance and double-layer capacitance is examined
comprehensively. According to the results, it can be stated that the current dependence
of double-layer capacitance of NMC/LTO-based LIBs is negligible while current
dependence of battery’s direct resistance becomes more pronounced with decreasing
temperature and over the battery lifetime. Contrary to the aforementioned impedance
parameters, it is shown that the influence of temperature on OCV is more or less
pronounced depending on the used active materials. In particular, for NMC/LTO LIBs
the impact of temperature on OCV behavior seems to be very significant whereas for
NMC/C LIBs the OCV behavior is less affected. Furthermore, it can be stated that SoC-
OCV correlation changes remarkably when the LIB ages. Based on the obtained
information from the latter facts, a simple OCV model considering temperature
correction term and aging state of the battery is proposed. Moreover, the impact of
battery temperature and SoC on required relaxation time until all side reactions are
finished and the behavior of battery voltage response after current interruption is
investigated. As expected with decreasing temperature the required relaxation time
increases significantly and it can be assumed that a linear dependence between the both
parameters exists.
Second, an extensive review of available techniques for major battery state and/or
parameters estimation/prediction such as SoAP, SoC, SoH, actual capacity and
impedance parameters presented in the literature is provided. For this purpose, approx.
300 literature sources, patents etc. are analyzed and reviewed while a special emphasis
is put on elaborating their strengths and weaknesses. In addition, the requirements on
battery monitoring algorithms and importance of considering realistic load profiles for
verifying the applied monitoring algorithms for respective application are discussed. As
pointed out, the applied monitoring algorithms should be able to consider internal and
external factors affecting battery’s electrical/thermal behavior such as extreme
temperature change and battery aging over years etc. Thereafter, the necessity of using
adaptive techniques working robust over the battery lifetime and under varying
conditions is highlighted. In addition to the presented techniques for battery state
estimation, a review on different classes of battery models presented in the literature is
given. Generally, the battery models can be subdivided into three various classes,
namely white box, grey box and black box battery models. A brief overview of relevant
literature sources is provided and the strengths and the weaknesses of individual
battery model class are addressed. The result is that grey box battery models are wide
spread in the field of on-board battery state estimation due mainly to their simple
Summary and outlook 172
nature, low computational effort and high accuracy over a wide frequency/operating
range. At the same time, white box battery models show very accurate results with
regard to precise representation of electrochemical processes occurring in the LIB during
operation and battery’s nonlinear behavior, respectively. The latter fact is a result of detailed consideration of electrochemical processes by of complex mathematical
equations. However, up to now, the aforementioned battery models have received little
attention in the field of monitoring algorithm mainly because of their complex structure
and required high computing power which is rarely given on embedded systems
implemented in BMS.
Third, a wide range of reduced order impedance-based ECMs is investigated
comprehensively with regard to electrical and impedance behavior of individual ECM. A
selection of the ECMs is performed based on the forecast/possibility of implementation
on target low cost embedded systems in BMS. Since computational power capability of
BMS in EVs is limited, the employed ECMs must be significantly simplified. In total,
seven different impedance-based ECMs from a simple ECM consisting of connected in
series with VOCV up to more complex ECMs consisting of so-called ZARC elements are
implemented and investigated. The current dependence of the is considered in the
employed ECMs by means of BVE. Moreover, physical meaning of the employed
impedance parameters and relating electrochemical processes occurring during LIB
operation are discussed carefully. From theoretical point of view, it can be stated that
with increasing number of ECM-elements (i.e., number of RC-elements or ZARC-
elements), voltage estimation or impedance determination accuracy “should” increase;
however, at the expense of higher computational effort. Based on the results achieved
from impedance analysis of the investigated ECMs, the ECM consisting of an and
three ZARC elements connected in series with a VOCV indicates the most accurate result
for a selected frequency range with an RMSE error of approx. 20 mΩ.
Fourth, the investigated ECMs are used as a basis for model-based battery
state/parameters estimation, in particular SoAP prediction and OCV estimation etc.
Based on the EVPA method, impedance parameters of the employed ECMs are
estimated on-board for various load profiles with different characteristics. Thereupon, in
the first step, the model accuracies are compared based on determined RMSE of battery
voltage for the investigated LIBs. Subsequently, the impact of the investigated ECMs on
SoAP prediction accuracy is analyzed based on the calculated relative prediction error
using the deviation between measured and predicted power. For both latter parameters,
the accuracy analysis is performed concerning the dependence of the determined voltage

Summary and outlook 173
error and SoAP on temperature, SoC and applied current range. In total, it can be stated
that the calculated model error differences between model 2 - 6 are negligible and, thus
no clear statement can be provided regarding the most sufficient and accurate ECM.
However, as expected, model 1 consisting of an connected in series with a voltage
source indicates the poorest performance in contrast to other examined ECMs. It is
pointed out that it is always recommendable to functions developer to studying the
requirements of target application carefully before development process is started. In
this regard, temperature profile/distribution, SoC operating area of target system and
current rates which the battery will be exposed to under real conditions in EVs are very
important factors for precise battery modeling and selection of most appropriate battery
model class. It is also shown that when for particular target application the
requirements on voltage estimation or SoAP prediction accuracy are not high, the
application of model 1 may be sufficient.
The methods and the obtained results discussed in this work give a general overview
over necessity of considering different approaches/requirements during product
development phase. Concerning the impact of ECM on battery states and parameters
estimation accuracy for various operating conditions, following battery
states/parameters may be of interest for further investigation in future works:
Remaining charging time prediction,
SoAE determination,
Actual capacity and SoH estimation etc.
Moreover, in addition to the ECMs investigated in this work, examining other advanced
ECMs consisting of e.g., Warburg impedance in various combinations such as a Randles
circuit discussed in chapter 3 or more advanced ECM where a Warburg impedance is
connected in series with ZARC elements etc. may be helpful.
An especial focus could lie on further development of white box battery models or in
particular SPMs with an especial emphasis on computational efficiency for use in BMS.
Thereafter, occurring electrochemical processes should be reproduced computationally
efficient and very precise so far as possible. Furthermore, the application of white box
battery models can be investigated with regard to SoAP prediction accuracy.

Bibliography 174
Bibliography
[1] Z. Chen, R. Xiong and J. Cao, “Particle swarm optimization-based optimal
power management of plug-in hybrid electric vehicles considering
uncertain driving conditions,” Energy, 2016, vol. 96, pp. 197 – 208.
[2] Press Release:”Reducing CO2 emissions from passenger cars”, [Online Available:
https://ec.europa.eu/clima/policies/transport/vehicles/cars_en”], [accessed on 15.03.2017].
[3] A. Füßel, Technische Potenzialanalyse der Elektromobilität - Stand der
Technik, Forschungsausblick und Projektion auf das Jahr 2025. Springer
Fachmedien Wiesbaden, 2017, ISBN: 978-3-658-16695-3.
[4] M. Galeotti, L. Cin , C. Giammanco, S. Cordiner and A. D. Carlo,
“Performance analysis and SOH (state of health) evaluation of lithium
polymer batteries through electrochemical impedance spectroscopy,” Energy, 2015, vol. 89, pp. 678 – 686.
[5] Press Release: [Online Available:
https://www.tesla.com/de_DE/blog/battery-cell-production-begins-
gigafactory?redirect=no], [accessed on 01.05.2017].
[6] J. Vetter, P. Nov k, M.R. Wagner, C. Veit, K.-C. Müller, J. Besenhard,
M. Winter, M. Wohlfahrt-Mehrens, C. Vogler and A. Hammouche, “Ageing
mechanisms in lithium-ion batteries,” Journal of Power Sources, 2005, vol.
147, no. 1-2, pp. 269 – 281.
[7] B. Scrosati and J. Garche, “Lithium batteries: Status, prospects and future,” Journal of Power Sources, 2010, vol. 195, no. 9, pp. 2419 – 2430.
[8] V. Etacheri, R. Marom, R. Elazari, G. Salitra and D. Aurbach, “Challenges in the development of advanced Li-ion batteries: a review,” Energy &
Environmental Science, 2011, vol. 4, pp. 3243 – 3262.
[9] J.-M. Tarascon and M. Armand, “Issues and challenges facing rechargeable
lithium batteries,” Nature, 2001, vol. 414, pp. 359 – 367.
[10] B. Scrosati, J. Garche,and W. Tillmetz, Advances in Battery Technologies
for Electric Vehicles, 1st Edition. Woodhead Publishing Series in Energy,
2015, ISBN: 978-1-78242-377-5.
[11] A. Jossen and W. Weydanz, “Moderne Akkumulatoren richtig einsetzen: 36 Tabellen,” Ubooks, 2006, ISBN: 3939359114, 9783939359111.
[12] H. Berg, “Batteries for Electric Vehicles- Materials and Electrochemistry,” Cambridge University Press, 2015, ISBN: 9781316090978.
[13] R. Korthauer, “Handbuch Lithium-Ionen-Batterien”, Springer Verlag,
2013, ISBN 978-3-642-30652-5.
[14] S. Abada, Marlair, A. Lecocq, M. Petit, V. Sauvant-Moynot and F. Huet,
“Safety focused modeling of lithium-ion batteries: A review”, Journal of
Power Sources, 2016, vol. 306, pp. 178 – 192.

Bibliography 175
[15.] J. W. Fergus, “Recent developments in cathode materials for lithium ion batteries”, Journal of Power Sources, 2010, vol. 195, no. 4, pp. 939 – 954.
[16] S. Goriparti, E. Miele, F. D. Angelis, E. D. Fabrizio, R. P. Zaccaria and
C. Capiglia, “Review on recent progress of nanostructured anode materials for Li-ion batteries”, Journal of Power Sources, 2014, vol. 257, pp. 421 –
443.
[17] P. Gao, C. Zhang and G. Wen, “Equivalent circuit model analysis on electrochemical impedance spectroscopy of lithium metal batteries”, Journal of Power Sources, 2015, vol. 294, pp. 67 – 74.
[18] I. Belharouak, G. M. K. Jr. and K. Amine, “Electrochemistry and safety of Li4Ti5O12 and graphite anodes paired with LiMn2O4 for hybrid electric
vehicle Li-ion battery applications”, Journal of Power Sources, 2011, vol.
196, no. 23, pp. 10344 – 10350.
[19] S. K. Martha, O. Haik, V. Borgel, E. Zinigrad, I. Exnar, T. Drezen, J. H.
Miners and D. Aurbach, “Li4Ti5O12/LiMn2O4 lithium-ion battery systems
for load leveling application”, Journal of The Electrochemical Society, 2011,
vol. 158, no. 7, pp. A790–A797.
[20] B. Zhao, R. Ran, M. Liu and Z. Shao, “A comprehensive review of Li4Ti5O12-
based electrodes for lithium-ion batteries: The latest advancements and
future perspectives”, Materials Science and Engineering: R: Reports, 2015,
vol. 98, pp. 1 – 71.
[21] T. Hang, D. Mukoyama, H. Nara, N. Takami, T. Momma and T. Osaka,
“Electrochemical impedance spectroscopy analysis for lithium-ion battery
using Li4Ti5O12 anode”, Journal of Power Sources, 2013, vol. 222, no. 0, pp.
442 – 447.
[22] Z. Yang, Q. Meng, Z. Guo, X. Yu, T. Guo and R. Zeng, “Highly reversible lithium storage in uniform Li4Ti5O12/carbon hybrid nanowebs as anode
material for lithium-ion batteries”, Energy, 2013, vol. 55, pp. 925 – 932.
[23] H. Tian, F. Xin, X. Wang, W. He, and W. Han, “High capacity group-IV
elements (Si, Ge, Sn) based anodes for lithium-ion batteries,” Journal of
Materiomics, 2015, vol. 1, no. 3, pp. 153 – 169.
[24] E. Barsoukov and J. R. Macdonald, “Impedance Spectroscopy”, 2005. A
John Wiley and Sons Inc., Publication, ISBN: 0-471-64749-7.
[25] Y. Firouz, J. Timmermans, N. Omar, P. V. den Bossche and J. V. Mierlo,
“Advanced lithium ion battery modeling and nonlinear analysis based on robust method in frequency domain: Nonlinear characterization and non-
parametric modeling”, 2016, Energy, vol. 106, pp. 602 – 617.
[26] W. Waag, S. Käbitz and D. U. Sauer, “Experimental investigation of the lithium-ion battery impedance characteristic at various conditions and
aging states and its influence on the application,” Applied Energy, 2013,
vol. 102, no. 0, pp. 885 – 897.
[27] P. Svens, R. Eriksson, J. Hansson, M. Behm, T. Gustafsson and
G. Lindberghwa, “Analysis of aging of commercial composite metal oxide -

Bibliography 176
Li4Ti5O12 battery cells,” Journal of Power Sources, 2014, vol. 270, no. 0, pp.
131 – 141.
[28] T. Momma, M. Matsunaga, D. Mukoyama and T. Osaka, “Ac impedance analysis of lithium ion battery under temperature control,” Journal of
Power Sources, 2012, vol. 216, no. 0, pp. 304 – 307.
[29] P. Mauracher and E. Karden, “Dynamic modelling of lead/acid batteries using impedance spectroscopy for parameter identification,” Journal of
Power Sources, 1997, vol. 67, no. 1-2, pp. 69 – 84.
[30] S. Wang, M. Verbrugge, J. S. Wang and P. Liu, “Power prediction from a battery state estimator that incorporates diffusion resistance,” Journal of
Power Sources, 2012, vol. 214, no. 0, pp. 399 – 406.
[31] Battery Test Manual For Low-Energy Energy Storage System for Power-
Assist Hybrid Electric Vehicles, U.S. Department of Energy, 2013.
[32] B. Xia, C. Chen, Y. Tian, M. Wang, W. Sun, and Z. Xu, “State of charge estimation of lithium-ion batteries based on an improved parameter
identification method,” Energy, 2015, vol. 90, Part 2, pp. 1426 – 1434.
[33] M. Ecker, J. B. Gerschler, J. Vogel, S. Käbitz, F. Hust, P. Dechent and
D. U. Sauer, “Development of a lifetime prediction model for lithium-ion
batteries based on extended accelerated aging test data,” Journal of Power
Sources, 2012, vol. 215, no. 0, pp. 248 – 257.
[34] X. Han, M. Ouyang, L. Lu and J. Li, “Cycle life of commercial lithium-ion
batteries with lithium titanium oxide anodes in electric vehicles,” Energies,
2014, vol. 7, no. 8, pp. 4895–4909.
[35] D. Andre, M. Meiler, K. Steiner, C. Wimmer, T. Soczka-Guth and D. U.
Sauer, “Characterization of high-power lithium-ion batteries by
electrochemical impedance spectroscopy. I. Experimental investigation,” Journal of Power Sources, 2011, vol. 196, no. 12, pp. 5334 – 5341.
[36] H.-M. Cho, W.-S. Choi, J.-Y. Go, S.-E. Bae, and H.-C. Shin, “A study on
time-dependent low temperature power performance of a lithium-ion
battery,” Journal of Power Sources, 2012, vol. 198, no. 0, pp. 273 – 280.
[37] Y. Yu, J. Shui, and C. Chen, “Electrostatic spray deposition of spinel Li4Ti5O12 thin films for rechargeable lithium batteries,” Solid State
Communications, 2005, vol. 135, no. 8, pp. 485 – 489.
[38] L. Saw, Y. Ye and A. Tay, “Electro-thermal analysis and integration issues
of lithium ion battery for electric vehicles,” Journal of Applied Energy,
2014, vol. 131, no. 0, pp. 97 – 107.
[39] A. Eddahech, O. Briat, E. Woirgard and J. Vinassa, “Remaining useful life prediction of lithium batteries in calendar ageing for automotive
applications,” Microelectronics Reliability, 2012, vol. 52, no. 9-10, pp. 2438
– 2442.
[40] D. P. Abraham, E. M. Reynolds, P. L. Schultz, A. N. Jansen, and D. W.
Dees, “Temperature dependence of capacity and impedance data from fresh and aged high-power lithium-ion cells,” Journal of The Electrochemical
Society, 2006, vol. 153, no. 8, pp. A1610–A1616.

Bibliography 177
[41] D. Bendt “Maintenance-Free Batteries,” Research Studies Press LTD., 2003, ISBN: 086380 2796.
[42] L. Liao, P. Zuo, Y. Ma, X. Chen, Y. An, Y. Gao and G. Yin, “Effects of temperature on charge/discharge behaviors of LiFePO4 cathode for Li-ion
batteries,” Electrochimica Acta, 2012, vol. 60, no. 0, pp. 269 – 273.
[43] B. Y. Liaw, E. Roth, R. G. Jungst, G. Nagasubramanian, H. L. Case and
D. H. Doughty, “Correlation of arrhenius behaviors in power and capacity fades with cell impedance and heat generation in cylindrical lithium-ion
cells,” Journal of Power Sources, 2003, vol. 119-121, no. 0, pp. 874 – 886.
[44] H. Kitaura, A. Hayashi, K. Tadanaga and M. Tatsumisago,
“Electrochemical analysis of Li4Ti5O12 electrode in all-solid-state lithium
secondary batteries,” Journal of The Electrochemical Society, 2009, vol.
156, no. 2, pp. A114–A119.
[45] T. R. Tanim, C. D. Rahn and C.-Y. Wang, “State of charge estimation of a lithium ion cell based on a temperature dependent and electrolyte
enhanced single particle model,” Energy, 2015, vol. 80, pp. 731 – 739.
[46] W. Waag, “Adaptive algorithms for monitoring of lithium-ion batteries in
electrical vehicles,” Ph.D. thesis, RWTH Aachen University, 2014, ISBN:
978-3-8440-2976-5.
[47] E. Karden, “Using low-frequency impedance spectroscopy for
characterization, monitoring, and modeling of industrial batteries,” Ph.D.
thesis, RWTH Aachen University, 2002, ISBN: 978-3-8265-9766-4.
[48] M. Kassem, J. Bernard, R. Revel, S. P lissier, F. Duclaud and C.
Delacourt, “Calendar aging of a graphite/LiFePO4 cell,” Journal of Power
Sources, 2012, vol. 208, no. 0, pp. 296 – 305.
[49] T. Osaka, S. Nakade, M. Rajamaki and T. Momma, “Influence of capacity fading on commercial lithium-ion battery impedance,” Journal of Power
Sources, 2003, vol. 119-121, no. 0, pp. 929 – 933.
[50] T. Erey-Gruz and M. Volmer, “The theory of hydrogen high tension,” Journal of Physical Chemistry, 1930, vol. 150, pp. 203 – 213.
[51] I. Snihir, W. Rey, E. Verbitskiy, A. Belfadhel-Ayeb, and P. H. Notten,
“Battery open-circuit voltage estimation by a method of statistical
analysis,” Journal of Power Sources, 2006, vol. 159, no. 2, pp. 1484 – 1487.
[52] V. Pop, H. J. Bergveld, P. P. L. Regtien, J. H. G. O. het Veld, D. Danilov
and P. H. L. Notten, “Battery aging and its influence on the electromotive force,” Journal of The Electrochemical Society, 2007, vol. 154, no. 8, pp.
A744–A750.
[53] C. Unterrieder, C. Zhang, M. Lunglmayr, R. Priewasser, S. Marsili and
M. Huemer, “Battery state-of-charge estimation using approximate least
squares,” Journal of Power Sources, 2015, vol. 278, no. 0, pp. 274 – 286.
[54] L. Lavigne, J. Sabatier, J. M. Francisco, F. Guillemard and A. Noury,
“Lithium-ion open circuit voltage (OCV) curve modelling and its ageing
adjustment,” Journal of Power Sources, 2016, vol. 324, pp. 694–703.

Bibliography 178
[55] J. B. Gerschler and D. U. Sauer, “Investigation of open-circuit-voltage
behaviour of lithium-ion batteries with various cathode materials under
special consideration of voltage equalisation phenomena,” in International
Battery, Hybrid and Fuel Cell Electric Vehicle Symposium EVS 24, 2009.
[56] M. Petzl and M. Danzer, “Advancements in OCV Measurement and
Analysis for Lithium-Ion Batteries,” Energy Conversion, IEEE
Transactions on, 2013, vol. 28, no. 3, pp. 675 – 681.
[57] V. Pop, H. Bergveld, D. Danilov, P. Regtien and P. Notten, “Battery Management Systems: Accurate State-of-Charge Indication for Battery-
Powered Applications”, 2008, Philips Research Book Series 9. London:
Springer Verlag, ISBN: 978-1-4020-6944-4
[58] C. R. Birkl, E. McTurk, M. R. Roberts, P. G. Bruce and D. A. Howey, “A parametric open circuit voltage model for lithium ion batteries,” Journal of
the Electrochemical Society, 2015, vol. 162, no. 12, pp. A2271–A2280.
[59] M. A. Roscher and D. U. Sauer, “Dynamic electric behavior and open-
circuit-voltage modeling of LiFePO4-based lithium ion secondary
batteries,” Journal of Power Sources, vol. 196, no. 1, 2011, pp. 331 – 336.
[60] M. A. Roscher, “Zustandserkennung von LiFePO4-Batterien für Hybrid-
und Elektrofahrzeuge”, Ph.D. thesis, RWTH Aachen University, 2010, ISBN: 978-3-8322-9738-1.
[61] B. Pattipati, B. Balasingam, G. Avvari, K. Pattipati and Y. Bar-Shalom,
“Open circuit voltage characterization of lithium-ion batteries,” Journal of
Power Sources, 2014, vol. 269, no. 0, 2014, pp. 317 – 333.
[62] Test Specification for Lithium-ion Traction Battery Packs and Systems;
Part 2: High-energy applications, Electrically propelled road vehicles. ISO
12405-2:2012 ed., 2012.
[63] V. Srinivasan and J. Newman, “Discharge model for the lithium iron-
phosphate electrode,” Journal of the Electrochemical Society, 2004, vol.
151, no. 10, pp. A1517 – A1529.
[64] P. A. Derosa and P. B. Balbuena, “A lattice-Gas Model Study of Lithium
Intercalation in Graphite,” Journal of The Electrochemical Society, vol.
146, no. 10, pp. 3630–3638, 1999.
[65] A. Barai, W. D. Widanage, J. Marco, A. McGordon, and P. Jennings, “A study of the open circuit voltage characterization technique and hysteresis
assessment of lithium-ion cells,” Journal of Power Sources, vol. 295, no. 0,
pp. 99 – 107, 2015.
[66] M. Ecker, N. Nieto, S. Käbitz, J. Schmalstieg, H. Blanke, A. Warnecke and
D. U. Sauer, “Calendar and cycle life study of Li(NiMnCo)O2-based 18650
lithium-ion batteries,” Journal of Power Sources, 2014, vol. 248, no. 0, pp.
839 – 851.
[67] R. Xiong, X. Gong, C. C. Mi and F. Sun, “A robust state-of-charge estimator
for multiple types of lithium-ion batteries using adaptive extended kalman
filter,” Journal of Power Sources, vol. 243, no. 0, pp. 805 – 816, 2013.

Bibliography 179
[68] Y. Xing, W. He, M. Pecht, and K. L. Tsui, “State of charge estimation of
lithium-ion batteries using the open-circuit voltage at various ambient
temperatures,” Journal of Applied Energy, 2014, vol. 113, no. 0, pp. 106 –
115.
[69] A. J. Bard, G. Inzelt and F. Scholz, Electrochemical Dictionary. Springer
Berlin Heidelberg, ISBN: 978-3-540-74597-6, 2008.
[70] A. Li, S. Pelissier, P. Venet and P. Gyan, “Fast characterization method for modeling battery relaxation voltage,” 2016, Batteries, vol. 2, no. 2, p. 7.
[71] S. Mendoza, M. Rothenberger, A. Hake and H. Fathy, “Optimization and experimental validation of a thermal cycle that maximizes entropy
coefficient fisher identifiability for lithium iron phosphate cells,” Journal of
Power Sources, 2016, vol. 308, pp. 18 – 28.
[72] V. V. Viswanathan, D. Choi, D. Wang, W. Xu, S. Towne, R. E. Williford, J.-
G. Zhang, J. Liu and Z. Yang, “Effect of entropy change of lithium intercalation in cathodes and anodes on li-ion battery thermal
management,” Journal of Power Sources, 2010, vol. 195, no. 11, pp. 3720 –
3729.
[73] Press Release: [Online Available: “www.v-modell-xt.de.”], [accessed on
27.03.2017].
[74] ISO 26262-1:2011; Road vehicles – Functional safety – Part 1-10.
[75] VDA QMC Working Group 13 / Automotive SIG, “Automotive SPICE
Process Assessment/ Reference Model,” 2015-07-16 (V 3.0).
[76] S. F. Schuster, M. J. Brand, P. Berg, M. Gleissenberger and A. Jossen,
“Lithium-ion cell-to-cell variation during battery electric vehicle
operation,” Journal of Power Sources, 2015, vol. 297, pp. 242 – 251.
[77] Y. Zheng, X. Han, L. Lu, J. Li and M. Ouyang, “Lithium ion battery pack power fade fault identification based on Shannon entropy in electric
vehicles,” Journal of Power Sources, 2013, vol. 223, no. 0, pp. 136 – 146.
[78] ISO 6469-3:2011 Electric road vehicles - Safety specifications -Part 3:
Protection of persons against electric hazards.
[79] M. Kuypers, “Application of 48 Volt for Mild Hybrid Vehicles and High
Power Loads,” SAE Technical Paper, 2014-01-1790.
[80] ISO 6469-1, Electrically propelled road vehicles - safety specifications - Part
1: On-board rechargeable energy storage systems (RESS). Second Edition,
2009-09-1.
[81] L. H. Saw, Y. Ye and A. A. Tay, “Integration issues of lithium-ion battery
into electric vehicles battery pack,”, 2015 Journal of Cleaner Production,
vol. 113, no.0, pp. 1032 – 1045.
[82] L. Lu, X. Han, J. Li, J. Hua and M. Ouyang, “A review on the key issues for lithium-ion battery management in electric vehicles,” Journal of Power
Sources, 2013, vol. 226, no. 0, pp. 272 – 288.
[83] R. R. Richardson, P. T. Ireland and D. A. Howey, “Battery internal temperature estimation by combined impedance and surface temperature

Bibliography 180
measurement,” Journal of Power Sources, 2014, vol. 265, no. 0, pp. 254 –
261.
[84] S. Bhattacharya and P. Bauer, “Requirements for Charging of an Electric
Vehicle System based on State of Power (SoP) and State of Energy (SoE),” in Power Electronics and Motion Control Conference (IPEMC), 2012 7th
International, vol. 1, pp. 434 – 438.
[85] J. Jiang and C. Zhang, Fundamentals and Applications of Lithium-ion
Batteries in Electric Drive Vehicles. John Wiley & Sons, Inc., 2015, ISBN:
9781118414781.
[86] Y. Zou, X. Hu, H. Ma, and S. E. Li, “Combined state of charge and state of health estimation over lithium-ion battery cell cycle lifespan for electric
vehicles,” Journal of Power Sources, 2015, vol. 273, no. 0, pp. 793 – 803.
[87] W. Waag, C. Fleischer and D. U. Sauer, “Critical review of the methods for monitoring of lithium-ion batteries in electric and hybrid vehicles,” Journal
of Power Sources, 2014, vol. 258, no. 0, pp. 321 – 339.
[88] S. Piller, M. Perrin and A. Jossen, “Methods for state-of-charge
determination and their applications,” Journal of Power Sources, 2001,
vol. 96, no. 1, pp. 113 – 120.
[89] Z. Li, J. Huang, B. Y. Liaw and J. Zhang, “On state-of-charge
determination for lithium-ion batteries,” Journal of Power Sources, 2017,
vol. 348, pp. 281 – 301.
[90] G. Liu, M. Ouyang, L. Lu, J. Li and J. Hua, “A highly accurate predictive-
adaptive method for lithium-ion battery remaining discharge energy
prediction in electric vehicle applications,” Journal of Applied Energy,
2015, vol. 149, pp. 297 – 314.
[91] Y. Wang, C. Zhang and Z. Chen, “A method for joint estimation of state-of-
charge and available energy of LiFePO4 batteries,” Journal of Applied
Energy, 2014, vol. 135, pp. 81 – 87.
[92] X. Zhang, Y. Wang, C. Liu and Z. Chen, “A novel approach of remaining discharge energy prediction for large format lithium-ion battery pack,” Journal of Power Sources, 2017, vol. 343, pp. 216 – 225.
[93] M. Ouyang, G. Liu, L. Lu, J. Li and X. Han, “Enhancing the estimation accuracy in low state-of-charge area: A novel onboard battery model
through surface state of charge determination,” Journal of Power Sources,
2014, vol. 270, no. 0, pp. 221 – 237.
[94] G. Dong, X. Zhang, C. Zhang, and Z. Chen, “A method for state of energy estimation of lithium-ion batteries based on neural network model,” Energy, 2015, vol. 90, pp. 879 – 888.
[95] W. Zhang, W. Shi, and Z. Ma, “Adaptive unscented kalman filter based
state of energy and power capability estimation approach for lithium-ion
battery,” Journal of Power Sources, 2015, vol. 289, pp. 50 – 62.
[96] G. Dong, Z. Chen, J. Wei, C. Zhang, and P. Wang, “An online model-based
method for state of energy estimation of lithium-ion batteries using dual
filters,” Journal of Power Sources, 2015, vol. 301, pp. 277 – 286.

Bibliography 181
[97] Y. Wang, C. Zhang, and Z. Chen, “An adaptive remaining energy prediction approach for lithium-ion batteries in electric vehicles,” Journal of Power
Sources, 2016, vol. 305, pp. 80 – 88.
[98] D. U. Sauer, O. Bohlen, T. Sanders, W. Waag, R. Schmidt and J. B.
Gerschler, “Batteriezustanderkennung: Mögliche Verfahrens- und
Algorithmenansätze, Grenzen der Batteriezustandserkennung,” Energiemanagement und Bordnetze 2. expert-Verlag, 2007. pp. 1 – 30.
[99] H. Blanke, O. Bohlen, S. Buller, R. W. D. Doncker, B. Fricke,
A. Hammouche, D. Linzen, M. Thele and D. U. Sauer, “Impedance measurements on lead-acid batteries for state-of-charge, state-of-health
and cranking capability prognosis in electric and hybrid electric vehicles,” Journal of Power Sources, 2005, vol. 144, no. 2, pp. 418 – 425.
[100] J. Belt, V. Utgikar and I. Bloom, “Calendar and PHEV cycle life aging of
high-energy, lithium-ion cells containing blended spinel and layered-oxide
cathodes,” Journal of Power Sources, 2011, vol. 196, no. 23, pp. 10213 –
10221.
[101] J. Schmalstieg, S. Käbitz, M. Ecker and D. U. Sauer, “From accelerated aging tests to a lifetime prediction model: Analyzing lithium-ion batteries,” EVS 27, 2013.
[102] S. Rezvanizaniani, D. Liu, Y. Chen and J. Lee, “Review and recent advances in battery health monitoring and prognostics technologies for
electric vehicle (EV) safety and mobility,” Journal of Power Sources, 2014,
vol. 256, no. 0, pp. 110 – 124.
[103] A. Barr , B. Deguilhem, S. Grolleau, M. Gerard, F. Suard and D. Riu, “A review on lithium-ion battery ageing mechanisms and estimations for
automotive applications,” Journal of Power Sources, 2013, vol. 241, no. 0,
pp. 680 – 689.
[104] M. Broussely, P. Biensan, F. Bonhomme, P. Blanchard, S. Herreyre, K.
Nechev and R. Staniewicz, “Main aging mechanisms in Li ion batteries,” Journal of Power Sources, 2005, vol. 146, no. 1-2, pp. 90–96.
[105] M. Berecibar, I. Gandiaga, I. Villarreal, N. Omar, J. V. Mierlo and P. V.
den Bossche, “Critical review of state of health estimation methods of Li-
Ion batteries for real applications,” Renewable and Sustainable Energy
Reviews, 2016, vol. 56, pp. 572 – 587.
[106] S. Saxena, C. L. Floch, J. MacDonald and S. Moura, “Quantifying EV battery end-of-life through analysis of travel needs with vehicle powertrain
models,” Journal of Power Sources, 2015, vol. 282, no. 0, pp. 265 – 276.
[107] S. F. Schuster, “Reuse of automotive lithium-ion batteries: An assessment
from the cell aging perspective,” Ph.D. thesis, Technical University of
Munich, 2016.
[108] J. Zhang and J. Lee, “A review on prognostics and health monitoring of li-ion battery,” Journal of Power Sources, 2011, vol. 196, no. 15, pp. 6007 –
6014.

Bibliography 182
[109] D. U. Sauer, G. Bopp, A. Jossen, J. Garche, M. Rothert, and M. Wollny,
“State of charge - what do we really speak about ?” INTELEC’99, Kopenhagen, 1999.
[110] G. Liu, L. Lu, J. Li and M. Ouyang, “Thermal modeling of a LiFePO4/Graphite battery and research on the influence of battery
temperature rise on EV driving range estimation,” in Vehicle Power and
Propulsion Conference (VPPC), 2013, pp. 1–5.
[111] J. Penna, C. Nascimento and L. Ramos Rodrigues, “Health monitoring and remaining useful life estimation of lithium-ion aeronautical batteries,” in Aerospace Conference, IEEE, 2012, pp. 1–12.
[112] S. Park, A. Savvides and M. Srivastava, “Battery Capacity Measurement and Analysis using Lithium Coin Cell Battery,” in Low Power Electronics and Design, International Symposium on, 2001, pp. 382–387.
[113] A. Hausmann and C. Depcik, “Expanding the peukert equation for battery capacity modeling through inclusion of a temperature dependency,” Journal of Power Sources, 2013, vol. 235, no. 0, pp.148 – 158.
[114] D. Doerffel and S. A. Sharkh, “A critical review of using the peukert equation for determining the remaining capacity of lead-acid and lithium-
ion batteries,” Journal of Power Sources, 2006, vol. 155, no. 2, pp. 395 –
400.
[115] P. Rong and M. Pedram, “An analytical model for predicting the remaining battery capacity of lithium-ion batteries,” Very Large Scale Integration
(VLSI) Systems, IEEE Transactions on, 2006, vol. 14, no. 5, pp. 441 –451.
[116] G. L. Plett, “Recursive approximate weighted total least squares estimation of battery cell total capacity,” Journal of Power Sources, 2011,
vol. 196, no. 4, pp. 2319 – 2331.
[117] M. Einhorn, F. Conte, C. Kral and J. Fleig, “A method for online capacity
estimation of lithium ion battery cells using the state of charge and the
transferred charge,” in Sustainable Energy Technologies (ICSET), IEEE
International Conference on, 2010, pp. 1 – 6.
[118] X. Tang, X. Mao, J. Lin and B. Koch, “Capacity estimation for li-ion
batteries,” American Control Conference (ACC), 2011, pp. 947 – 952.
[119] H. J. Bergveld, V. Pop, P. Hericus and P. H. L. Notten, “Method of estimating the state-of-charge and of the use time left of a rechargeable
battery, and apparatus for executing such a method,” 2008, US
2008/0150491 A1.
[120] X. Zhang, X. Tang, J. Lin, Y. Zhang, M. Salman and Y. Chin, “Method for battery capacity estimation,” 2011, US 8,084,996 B2.
[121] W. Waag and D. U. Sauer, “Adaptive estimation of the electromotive force
of the lithium-ion battery after current interruption for an accurate state-
of-charge and capacity determination,” Journal of Applied Energy, 2013,
vol. 111, no. 0, pp. 416 – 427.
[122] G. Simopoulos, G. T. Fattic and J. V. Caputo, “Method of determining the energy capacity of a battery,” 2010, US 7800,344 B2.
Bibliography 183
[123] L. Pei, R. Lu and C. Zhu, “Relaxation model of the open-circuit voltage for
State-of-Charge estimation in lithium-ion batteries,” Electrical Systems in
Transportation, IET, 2013, vol. 3, no. 4, pp. 112–117.
[124] L. Pei, T. Wang, R. Lu and C. Zhu, “Development of a voltage relaxation model for rapid open-circuit voltage prediction in lithium-ion batteries,” Journal of Power Sources, 2014, vol. 253, no. 0, pp. 412 – 418.
[125] V. Pop, H.J. Bergveld, P.H.L. Notten, J.H.G. Op. het Veld and
P.P.L. Regtien, “Accuracy analysis of the state-of-charge and remaining
run-time determination for lithium-ion batteries,” Measurement, 2009,
vol. 42, no. 8, pp. 1131 – 1138.
[126] E. Barsoukov, D.R. Poole and L. Freeman, “Circuit and method for measurement of battery capacity fade,” 2004, US 2004/0220758 A1.
[127] S. Hoenig, H. Singhand and T. Palanisamy, “Method for determining state of charge of a battery by measuring its open circuit voltage,” 2002, US
6,366,054 B1.
[128] Y. Zhang, K-K Shin, X. Tang and M. Salman, “Method and apparatus for estimating battery capacity of a battery,” 2012, US 12/0072145 A1.
[129] H.J. Bergveld, V. Pop, P. Henricus and L. Notten, “Apparatus and method
for determination of the state-of-charge of a battery when the battery is not
in equilibrium,” 2010, US 2010/0036627 A1.
[130] H. Zhang and M.-Y. Chow, “Comprehensive dynamic battery modeling for PHEV applications,” in Power and Energy Society General Meeting, IEEE,
2010, pp. 1 – 6.
[131] X. Hu, S. Li and H. Peng, “A comparative study of equivalent circuit models for Li-Ion batteries,” Journal of Power Sources, 2012, vol. 198,
no. 0, pp. 359 – 367.
[132] T. Kim, Y. Wang, H. Fang, Z. Sahinoglu, T. Wada, S. Hara and W. Qiao,
“Model-based condition monitoring for lithium-ion batteries,” Journal of
Power Sources, 2015, vol. 295, pp. 16 – 27.
[133] G. Plett, “Dual and joint EKF for simultaneous SOC and SOH estimation,” EVS 21, 2005.
[134] D. Schroeder, “Intelligente Verfahren; Identifikation und Regelung
nichtlinearer Systeme,” Springer Verlag, 2010, ISBN: 978-3-642-11397-0.
[135] X. Tang, Y. Zhang, A. C. Baughman, B. J. Koch, J. Lin and D. R. Frisch,
“Dynamic battery capacity estimation,” 2012, US 2012/0136594 A1.
[136] M. Verbrugge, D. T. Edward, D. Frisch and B. Koch, “Method and apparatus for generalized recursive least-squares process for battery state
of charge and state of health,” 2004, US 2004/0162683 A1.
[137] M. Verbrugge, D. Frisch and B. Koch, “Adaptive energy management of electric and hybrid electric vehicles,” Journal of The Electrochemical
Society, 2005, vol. 152, no. 2, pp. A333 – A342.
[138] M. Verbrugge and B. Koch, “Generalized recursive algorithm for adaptive multiparameter regression: Application to lead acid, nickel metal hydride,

Bibliography 184
and lithium-ion batteries,” Journal of The Electrochemical Society, 2006,
vol. 153, no. 1, pp. A187 – A201.
[139] H. Wu, S. Yuan and C. Yin, “Online state of charge estimation based on adaptive extended Kalman filter and linear parameter-varying model with
recursive least square technique,” submitted to Vehicular Technology,
IEEE Transactions on, 2013.
[140] M. Roscher, J. Assfalg and O. Bohlen, “Detection of utilizable capacity deterioration in battery systems,” Vehicular Technology, IEEE
Transactions on, 2011, vol. 60, no. 1, pp. 98 – 103.
[141] A. Jochen and M. Roscher, “Verfahren und Vorrichtung zum Betreiben
eines Energiespeichers”, 2012, DE 201,010,031,050.
[142] Z. Guo, X. Qiu, G. Hou, B. Y. Liaw and C. Zhang, “State of health estimation for lithium ion batteries based on charging curves,” Journal of
Power Sources, 2014, vol. 249, no. 0, pp. 457 – 462.
[143] A. Eddahech, O. Briat and J.-M. Vinassa, “Determination of lithium-ion
battery state-of-health based on constant-voltage charge phase,” Journal of
Power Sources, 2014, vol. 258, no. 0, pp. 218 – 227.
[144] R. E. Kalman, “A new approach to linear filtering and prediction problems,” Journal of Fluids Engineering, 1960, pp. 35 – 45.
[145] W. Waag, C. Fleischer and D. U. Sauer, “On-line estimation of lithium-ion
battery impedance parameters using a novel varied-parameters approach,” Journal of Power Sources, 2013, vol. 237, no. 0, pp. 260 – 269.
[146] R. Xiong, H. He, F. Sun, X. Liu and Z. Liu, “Model-based state of charge
and peak power capability joint estimation of lithium-ion battery in plug-in
hybrid electric vehicles,” Journal of Power Sources, 2013, vol. 229, no. 0,
pp. 159 – 169.
[147] G. L. Plett, “Extended kalman filtering for battery management systems of
LiPB-based HEV battery packs: Part 1. Background,” Journal of Power
Sources, 2004, vol. 134, no. 2, pp. 252 – 261.
[148] R. Anderson, Y. Zhao, X. Wang, X. G. Yang and Y. Li, “Real time battery power capability estimation,” in American Control Conference (ACC), 2012,
pp. 592 – 597.
[149] Y. Li and X. Wang, “Parameter and state limiting in model based battery control,” 2015, US 2015/0066405 A1.
[150] J. Remmlinger, M. Buchholz and K. Dietmayer, “Model-based on-board
monitoring for lithium-ion batteries,” at-Automatisierungstechnik, 2014,
vol. 64, pp. 282 – 295.
[151] B. Rosca, J. Kessels, H. Bergveld and P. van den Bosch, “On-line
parameter, state-of-charge and aging estimation of Li-ion batteries,” in Vehicle Power and Propulsion Conference (VPPC), IEEE, 2012, pp. 1122 –
1127.
[152] H. Macicior, M. Oyarbide, O. Miguel, I. Cantero, J. Canales and
A. Etxeberria, “Iterative capacity estimation of LiFePO4 cell over the
lifecycle based on SOC estimation correction,” EVS27, 2013.

Bibliography 185
[153] J. Kessels, B. Rosca, H. Bergveld and P. Van den Bosch, “On-line battery
identification for electric driving range prediction,” in Vehicle Power and
Propulsion Conference (VPPC), IEEE, 2011, pp. 1 – 6.
[154] S. Lee, J. Kim, J. Lee and B. Cho, “State-of-charge and capacity estimation
of lithium-ion battery using a new open-circuit voltage versus state-of-
charge,” Journal of Power Sources, 2008, vol. 185, no. 2, pp. 1367 – 1373.
[155] S. Lee, J. Kim, J. Lee, and B. H. Cho, “The state and parameter estimation
of an Li-Ion battery using a new OCV-SOC concept,” in Power Electronics
Specialists Conference, IEEE, 2007, pp. 2799 – 2803.
[156] J. Kim and B. Cho, “Pattern recognition for Temperature-Dependent State-
of-Charge/Capacity estimation of a Li-ion cell,” Energy Conversion, IEEE
Transactions on, 2013, vol. 28, no. 1, pp. 1 – 11.
[157] J. Kim, S. Lee and B. H. Cho, “Complementary cooperation algorithm based on DEKF combined with pattern recognition for SOC/Capacity
estimation and SOH prediction,” Power Electronics, IEEE Transactions on,
2012, vol. 27, no. 1, pp. 436 – 451.
[158] J. Kim, S. Lee and B. Cho, “SOH prediction of a Li-ion battery based on
Hamming Network using two Patterns Recognition,” 25th World Battery,
Hybrid and Fuel Cell Electric Vehicle Symposium & Exhibition, 2010.
[159] J. Kim and B. H. Cho, “State-of-charge estimation and State-of-Health
Prediction of a Li-ion Degraded Battery Based on an EKF combined with a
Per-Unit System,” Vehicular Technology, IEEE Transactions on, 2011, vol.
60, no. 9, pp. 4249 – 4260.
[160] I.-S. Kim, “A technique for estimating the state of health of lithium batteries through a dual-sliding-mode observer,” Power Electronics, IEEE
Transactions on, 2010, vol. 25, no. 4, pp. 1013 – 1022.
[161] T. Kim, W. Qiao and L. Qu, “Online SOC and SOH estimation for multicell
lithium-ion batteries based on an adaptive hybrid battery model and
sliding-mode observer,” in Energy Conversion Congress and Exposition
(ECCE), IEEE, 2013, pp. 292 – 298.
[162] I.-S. Kim, “The novel state of charge estimation method for lithium battery
using sliding mode observer,” Journal of Power Sources, 2006, vol. 163,
no. 1, pp. 584 – 590.
[163] B. Bhangu, P. Bentley, D. Stone and C. Bingham, “State-of-Charge and
State-of-Health prediction of lead-acid batteries for hybrid electric vehicles
using non-linear observers,” in Power Electronics and Applications,
European Conference on, 2005.
[164] B. Bhangu, Bentley, Stone, and Bingham, “Nonlinear observers for predicting state-of-charge and state-of-health of lead-acid batteries for
hybrid-electric vehicles,” Vehicular Technology, IEEE Transactions on,
2005, vol. 54, no. 3, pp. 783 – 794.
[165] D. Andre, C. Appel, T. Soczka-Guth, and D. U. Sauer, “Advanced mathematical methods of SOC and SOH estimation for lithium-ion
batteries,” Journal of Power Sources, 2013, vol. 224, no. 0, pp. 20 – 27.

Bibliography 186
[166] J. Remmlinger, M. Buchholz, T. Soczka-Guth and K. Dietmayer, “On-board
state-of-health monitoring of lithium-ion batteries using linear parameter-
varying models,” Journal of Power Sources, 2013, vol. 239, no. 0, pp. 689 –
695.
[167] J. Remmlinger, M. Buchholz, M. Meiler, P. Bernreuter and K. Dietmayer,
“State-of-health monitoring of lithium-ion batteries in electric vehicles by
on-board internal resistance estimation,” Journal of Power Sources, 2011,
vol. 196, no. 12, pp. 5357 – 5363.
[168] S. Schwunk, S. Straub, N. Armbruster, S. Matting and M. Vetter, “Parallel particle filter for state of charge and health estimation with a long term
test,” EVS27, 2013.
[169] S. Schwunk, N. Armbruster, S. Straub, J. Kehl, and M. Vetter, “Particle filter for state of charge and state of health estimation for lithium iron
phosphate batteries,” Journal of Power Sources, 2013, vol. 239, no. 0, pp.
705 – 710.
[170] S. Schwunk, “Partikelfilter zur Ladezustands-und Alterungsbestimmung
bei Lithium-Ionen-Batterien auf Basis von Metalloxiden und
Phosphorolivinen,” Ph.D. thesis, Fern Universitaet in Hagen, 2013. [171] U. Trältzsch, “Modellbasierte Zustandsdiagnose von Gerätebatterien,”
Ph.D. thesis, Universität der Bundeswehr München, 2005.
[172] S. J. Heo, G. B. Kang,and H.G. Kim, “Available Power and Energy Prediction Using a Simplified Circuit Model of HEV Li-ion battery,” SAE
Technical Paper,2010-01-1074, 2010.
[173] A. Seaman, T.-S. Dao and J. McPhee, “A survey of mathematics-based
equivalent-circuit and electrochemical battery models for hybrid and
electric vehicle simulation,” Journal of Power Sources, 2014, vol. 256, no. 0,
pp. 410 – 423.
[174] S. J. Moura, Chaturvedi, and Krstic, “PDE estimation techniques for advanced battery management systems part II: SOH identification,” in
American Control Conference (ACC), IEEE, 2012, pp. 566 – 571.
[175] S. J. Moura, N. Chaturvedi and M. Krstic, “PDE estimation techniques for advanced battery management systems part I: SOC estimation,” in
American Control Conference (ACC), IEEE, 2012, pp. 559 – 565.
[176] S. J. Moura, M. Krstic and N. A. Chaturvedi, “Adaptive Partial Differential
Equation Observer for Battery State-of-Charge/State-of-Health Estimation
Via an Electrochemical Model,” Journal of Dynamic Systems,
Measurement, and Control, 2013, vol. 136, no. 1, pp. 1 – 11.
[177] A. P. Schmidt, “A novel electrochemical battery model for state of charge
and state of health estimation,” Ph.D. thesis, ETH Zürich, 2010.
[178] A. P. Schmidt, M. Bitzer, . W. Imre and L. Guzzella, “Model-based
distinction and quantification of capacity loss and rate capability fade in li-
ion batteries,” Journal of Power Sources, 2010, vol. 195, no. 22, pp. 7634 –
7638.

Bibliography 187
[179] A. P. Schmidt, M. Bitzer, . W. Imre and L. Guzzella, “Experiment-driven
electrochemical modeling and systematic parameterization for a lithium-
ion battery cell,” Journal of Power Sources, 2010, vol. 195, no. 15, pp. 5071
– 5080.
[180] G. K. Prasad and C. D. Rahn, “Model based identification of aging parameters in lithium ion batteries,” Journal of Power Sources, 2013, vol.
232, no. 0, pp. 79 – 85.
[181] S. K. Rahimian, S. Rayman and R. E. White, “Comparison of single particle and equivalent circuit analog models for a lithium-ion cell,” Journal of
Power Sources, 2011, vol. 196, no. 20, pp. 8450 – 8462.
[182] N. Chaturvedi, R. Klein, J. Christensen, J. Ahmed and A. Kojic,
“Algorithms for advanced battery-management systems,” Control Systems,
IEEE, 2010, vol. 30, no. 3, pp. 49 – 68.
[183] M. Dubarry, V. Svoboda, R. Hwu and B. Y. Liaw, “Incremental Capacity Analysis and Close-to-Equilibrium OCV Measurements to Quantify
Capacity Fade in Commercial Rechargeable Lithium Batteries,” Electrochemical and Solid-State Letters, 2006, vol. 9, no. 10, pp. A454 –
A457.
[184] M. Safari and C. Delacourt, “Aging of a commercial Graphite/LiFePO4 cell,” Journal of The Electrochemical Society, 2011, vol. 158, no. 10, pp. A1123 –
A1135.
[185] M. Dubarry and B. Y. Liaw, “Identify capacity fading mechanism in a commercial LiFePO4 cell,” Journal of Power Sources, 2009, vol. 194, no. 0,
pp. 541 – 549.
[186] I. Bloom, A. N. Jansen, D. P. Abraham, J. Knuth, S. A. Jones, V. S.
Battaglia and G. L. Henriksen, “Differential voltage analyses of high-
power, lithium-ion cells: 1. Technique and application,” Journal of Power
Sources, 2005, vol. 139, no. 12, pp. 295 – 303.
[187] I. Bloom, J. Christophersen and K. Gering, “Differential voltage analyses of high-power lithium-ion cells: 2. Applications,” Journal of Power Sources,
2005, vol. 139, no. 12, pp. 304 – 313.
[188] I. Bloom, J. P. Christophersen, D. P. Abraham and K. L. Gering,
“Differential voltage analyses of high-power lithium-ion cells: 3. Another
anode phenomenon,” Journal of Power Sources, 2006, vol. 157, no. 1, pp.
537 – 542.
[189] H. M. Dahn, A. J. Smith, J. C. Burns, D. A. Stevens and J. R. Dahn, “User-
friendly differential voltage analysis freeware for the analysis of
degradation mechanisms in li-ion batteries,” Journal of The
Electrochemical Society, 2012, vol. 159, no. 9, pp. A1405 – A1409.
[190] K. Honkura, K. Takahashi and T. Horiba, “Capacity-fading prediction of
lithium-ion batteries based on discharge curves analysis,” Journal of Power
Sources, 2011, vol. 196, no. 23, pp. 10141 – 10147.
[191] C. Weng, Y. Cui, J. Sun, and H. Peng, “On-board state of health monitoring
of lithium-ion batteries using incremental capacity analysis with support

Bibliography 188
vector regression,” Journal of Power Sources, 2013, vol. 235, no. 23, pp. 36
– 44.
[192] X. Han, M. Ouyang, L. Lu, and J. Li, “A comparative study of commercial lithium ion battery cycle life in electrical vehicle: Aging mechanism
identification,” Journal of Power Sources, 2014, vol. 251, no. 0, pp. 38 – 54.
[193] S. Bourlot, P. Blanchard and S. Robert, “Investigation of aging mechanisms of high power Li-ion cells used for hybrid electric vehicles,” Journal of Power Sources, 2011, vol. 196, no. 16, pp. 6841 – 6846.
[194] A. J. Smola and B. Schoelkopf, “A tutorial on support vector regression,” Statistics and Computing, 2004, vol. 14, no. 3, pp. 199 – 222.
[195] X. Feng, J. Li, M. Ouyang, L. Lu, J. Li and X. He, “Using probability density function to evaluate the state of health of lithium-ion batteries,” Journal of Power Sources, vol. 232, 2013, no. 0, pp. 209 – 218.
[196] X.-Z. Liao, Z.-F. Ma, z Liang Wang, X.-M. Zhang, Y. Jiang and Y.-S. He, “A
Novel Synthesis Route for LiFePO4 /C Cathode Materials for Lithium-Ion
Batteries,” Electrochemical and Solid-State Letters, 2004, vol. 7, no. 12, pp.
A522 – A525.
[197] D. Zhang, B. Haran, A. Durairajan, R. White, Y. Podrazhansky and
B. Popov, “Studies on capacity fade of lithium-ion batteries,” Journal of
Power Sources, 2000, vol. 91, no. 2, pp. 122 – 129.
[198] R. Wright, C. Motloch, J. Belt, J. Christophersen, C. Ho, R. Richardson, I.
Bloom, S. Jones, V. Battaglia, G. Henriksen, T. Unkelhaeuser, D. Ingersoll,
H. Case, S. Rogers, and R. Sutula, “Calendar- and cycle-life studies of
advanced technology development program generation 1 lithium-ion
batteries,” Journal of Power Sources, 2002, vol. 110, no. 0, pp. 445 – 470.
[199] J. Wang, P. Liu, J. Hicks-Garner, E. Sherman, S. Soukiazian, M.
Verbrugge, H. Tataria, J. Musser and P. Finamore “Cycle-life model for
graphite-LiFePO4 cells,” Journal of Power Sources, 2011, vol. 196, no. 0,
pp. 3942 – 3948.
[200] R. Spotnitz, “Simulation of capacity fade in lithium-ion batteries,” Journal
of Power Sources, 2003, vol. 113, no. 0, pp. 72 – 80.
[201] Z. Li, L. Lu, M. Ouyang and Y. Xiao, “Modeling the capacity degradation of LiFePO4/graphite batteries based on stress coupling analysis,” Journal of
Power Sources, 2011, vol. 196, no. 22, pp. 9757 – 9766.
[202] J. Schmalstieg, S. Käbitz, M. Ecker and D. U. Sauer, “A holistic aging model for Li(NiMnCo)O2 based 18650 lithium-ion batteries,” Journal of
Power Sources, 2014, vol. 257, no. 0, pp. 325 – 334.
[203] A. Nuhic, T. Terzimehic, T. Soczka-Guth, M. Buchholz and K. Dietmayer,
“Health diagnosis and remaining useful life prognostics of lithium-ion
batteries using data-driven methods,” Journal of Power Sources, no. 0, pp.
1 – 9, 2012.
[204] B. Saha and K. Goebel, “Modeling Li-ion battery capacity depletion in a
particle filtering framework,” NASA, 2009.

Bibliography 189
[205] B. Saha and K. Goebel, “Uncertainty Management for Diagnostics and Prognostics of Batteries using Bayesian Techniques,” in Aerospace
Conference,IEEE, 2008, pp. 1 – 8
[206] B. Saha, K. Goebel, S. Poll, and J. Christophersen, “Prognostics methods for battery health monitoring using a bayesian framework,” Instrumentation and Measurement, IEEE Transactions on, 2009, vol. 58,
no. 2,
pp. 291 – 296.
[207] B. Saha and K. F. Goebel, “Model-based prognostics for batteries which
estimates useful life and uses a probability density function,” US 8,332,342 B1, 2012.
[208] JS. Richman and JR. Mooman, “Physiological time-series analysis using
approximate entropy and sample entropy,” The American Journal of
Physiology Heart and Circulatory Physiology, 2000, vol. 278, no. 6, pp. 2039
– 2049.
[209] X. Hu, S. E. Li, Z. Jia and B. Egardt, “Enhanced sample entropy-based
health management of li-ion battery for electrified vehicles,” Energy, 2014,
vol. 64, no. 0, pp. 953 – 960.
[210] J. Li, C. Lyu, L. Wang, L. Zhang and C. Li, “Remaining capacity estimation of li-ion batteries based on temperature sample entropy and particle filter,” Journal of Power Sources, 2014, vol. 268, no. 0, pp. 895 – 903.
[211] A. Widodo, M.-C. Shim, W. Caesarendra and B.-S. Yang, “Intelligent prognostics for battery health monitoring based on sample entropy,” Expert
Systems with Applications, 2011, vol. 38, no. 9, pp. 11763 – 11769.
[212] K. L. Gering, S. V. Sazhin, D. K. Jamison, C. J. Michelbacher, B. Y. Liaw,
M. Dubarry and M. Cugnet, “Investigation of path dependence in commercial lithium-ion cells chosen for plug-in hybrid vehicle duty cycle
protocols,” Journal of Power Sources, 2011, vol. 196, no. 7, pp. 3395 – 3403.
[213] C. Guenther, B. Schott, W. Hennings, P. Waldowski, and M. A. Danzer,
“Model-based investigation of electric vehicle battery aging by means of
vehicle-to-grid scenario simulations,” Journal of Power Sources, 2013, vol.
239, no. 0, pp. 604 – 610.
[214] M. Dubarry, C. Truchot and B.Y. Liaw “Synthesize battery degradation
modes via a diagnostic and prognostic model,” Journal of Power Sources,
2012, Vol. 219 no. 0, pp. 204 – 216.
[215] J. H. Kim, S. J. Lee, J. M. Lee and B. H. Cho, “A New Direct Current
Internal Resistance and State of Charge Relationship for the Li-ion
Battery Pulse Power Estimation,” Power Electronics, 7th International
Conference on, 2007, pp. 1 – 6.
[216] R. Xiong, F. Sun, H. He and T. D. Nguyen, “A data-driven adaptive state of
charge and power capability joint estimator of lithium-ion polymer battery
used in electric vehicles,” Energy, 2013, vol. 63, no. 0, pp. 295 - 308.
[217] C. Burgos-Mellado, M. E. Orchard, M. Kazerani, R. C rdenas and D. S ez,
“Particle-filtering-based estimation of maximum available power state in

Bibliography 190
lithium-ion batteries,” Journal of Applied Energy, 2015, vol. 161, no. 0, pp.
349 – 363.
[218] Battery Test Manual For Electric Vehicles, U.S. Department of Energy
Vehicle Technologies Program, 2015.
[219] Z. Cai-ping, Z. Cheng-ning, and S. Sharkh, “Estimation of real-time peak
power capability of a traction battery pack used in an HEV,” in Power and
Energy Engineering Conference (APPEEC), Asia-Pacific, 2010, pp. 1 – 6.
[220] G. L. Plett, “Extended Kalman filtering for battery management systems of
LiPB-based HEV battery packs: Part 3. State and parameter estimation,” Journal of Power Sources, 2004, vol. 134, no. 2, pp. 277 – 292.
[221] F. Sun, R. Xiong, H. He, W. Li and J. E. E. Aussems, “Model-based
dynamic multi-parameter method for peak power estimation of lithium-ion
batteries,” Journal of Applied Energy, 2012, vol. 96, no. 0, pp. 378 – 386.
[222] R. Xiong, H. He, F. Sun and K. Zhao, “Online Estimation of Peak Power
Capability of Li-Ion Batteries in Electric Vehicles by a Hardware-in-Loop
Approach,” energies, 2012, vol. 5, no. 0, pp. 1455 – 1469.
[223] J. Song, R. Anderson, D. Oliver and S. J. Thompson, “System and method for managing a power source in a vehicle,” 2014, US 8,698,348 B2.
[224] D. Robinson, “Power source estimation methods and apparatus,” 2010, WO2010096317 A1.
[225] W. Waag, C. Fleischer,and D. U. Sauer, “Adaptive on-line prediction of the
available power of lithium-ion batteries,” Journal of Power Sources, 2013,
vol. 242, no. 0, pp. 548 – 559.
[226] O. Bohlen and M. Roscher, “Method for determining and/or predicting the maximum power capacity of a battery,” 2014, US 8,718,988 B2.
[227] M. Berecibar, M. Garmendia, I. Gandiaga, J. Crego and I. Villarreal, “State of health estimation algorithm of LiFePO4 battery packs based on
differential voltage curves for battery management system application,” Energy, 2016, vol. 103, pp. 784 – 796.
[228] F. Zheng, J. Jiang, B. Sun, W. Zhang and M. Pecht, “Temperature
dependent power capability estimation of lithium-ion batteries for hybrid
electric vehicles,” Energy, 2016, vol. 113, no. 0, pp. 64 – 75.
[229] S. Nejad, D. T. Gladwin and D. A. Stone, “Sensitivity of lumped parameter battery models to constituent parallel-RC element parameterisation error,” in 40th Annual Conference of the IEEE Industrial Electronics Society, 2014,
pp. 5660 – 5665.
[230] S. Nejad, D. Gladwin and D. Stone, “A systematic review of lumped-
parameter equivalent circuit models for real-time estimation of lithium-ion
battery states,” Journal of Power Sources, 2016, vol. 316, pp. 183 – 196.
[231] B. Balagopal and M. Y Chow, “The state of the art approaches to estimate
the state of health (SOH) and state of function (SOF) of lithium ion
batteries,” in Industrial Informatics (INDIN), IEEE 13th International
Conference on, 2015, pp. 1302 – 1307.

Bibliography 191
[232] W. Larry, J. Phillip, J. Kollmeyer, T. M. Jahns and R. D. Lorenz,
“Implementation of Online Battery State-of-Power and State-of-Function
Estimation in Electric Vehicle Applications,” Energy Conversion Congress
and Exposition (ECCE), 2012, pp. 1819 – 1826.
[233] E. Meissner and G. Richter, “Battery monitoring and electrical energy management: Precondition for future vehicle electric power systems,” Journal of Power Sources, 2003, vol. 116, no. 12, pp. 79 – 98.
[234] G. Richter, “Method and device for determining the state of function of an
energy storage battery,” 2005, US 6,885,951 B2. [235] L. Pei, C. Zhu, T. Wang, R. Lu, and C. Chan, “Online peak power
prediction based on a parameter and state estimator for lithium-ion
batteries in electric vehicles,” Energy, 2014, vol. 66, no. 0, pp. 766 – 778.
[236] A. Boehm and J. Weber, “Adaptives Verfahren zur Bestimmung der maximal abgebaren oder aufnehmbaren Leistung einer Batterie,” 2011,WO 2011/095368 A1.
[237] O. Bohlen, “Impedance-based battery monitoring,” Ph.D. thesis, RWTH
Aachen University, 2008, ISBN: 978-3-8322-7606-5.
[238] O. Bohlen, J. B. Gerschler and D. U. Sauer, “Robust algorithms for a reliable battery diagnosis managing batteries in hybrid electric vehicles,” EVS 22, 2006.
[239] D. Kim and D. JUNG, “Method of estimating maximum output of battery
for hybrid electric vehicle,” 2009, US 7,518,375 B2.
[240] C. Vacher, “Method for calculating the parameters of the power battery of
an electric motor vehicle,” 2004, US 6,788,069 B2.
[241] B. Fridholm, T. Wik and M. Nilsson, “Robust recursive impedance estimation for automotive lithium-ion batteries,” Journal of Power Sources,
2016, vol. 304, pp. 33 – 41.
[242] M. S. Grewal and A. P. Andrews, “Kalman Filtering: Theory and practice
Using Matlab”, 2001, John Wiley & Sons, Inc., ISBN: 0-471-39254-5.
[243] L. Juang, P. Kollmeyer, T. Jahns and R. Lorenz, “Improved nonlinear
model for electrode Voltage-current relationship for more consistent online
battery system identification,” Industry Applications, IEEE Transactions
on, 2013, no. 3, pp. 1480 – 1488.
[244] J. Kowal, “Spatially-resolved impedance of nonlinear inhomogeneous
devices - using the example of lead-acid batteries -,” Ph.D. thesis, RWTH
Aachen University, 2010, ISBN: 978-3-8322-9483-0.
[245] L. Juang, P. Kollmeyer, T. Jahns, and R. Lorenz, “Improved modeling of lithium-based batteries using temperature-dependent resistance and
overpotential,” in Transportation Electrification Conference and Expo
(ITEC), IEEE, 2014, pp. 1 – 8.
[246] J. Song, R. Anderson, Y. Li, Y. Zhao and X. Yang, “Method for determining a power capability for a battery,” 2012, US2012/0179435 A1.

Bibliography 192
[247] X. Li, J. Sun, Z. Hu, R. Lu, C. Zhu, and G. Wu, “A New Method of State of
Peak Power Capability Prediction for Li-ion Battery,” Vehicle Power and
Propulsion Conference (VPPC), IEEE, 2015.
[248] T. Lee, “Frequency based battery model parameter estimation,” 2015, US
9,132,745 B1.
[249] G. Plett, “High-performance battery-pack power estimation using a
dynamic cell model,” Vehicular Technology, IEEE Transactions on, 2004,
vol. 53, no. 5, pp. 1586 – 1593.
[250] G. Plett, “Method for calculating power capability of battery packs using advanced cell model predictive techniques,” 2008, US 7,321,220 B2.
[251] F. Sun, R. Xiong and H. He, “Estimation of state-of-charge and state-of-
power capability of lithium-ion battery considering varying health
conditions,” Journal of Power Sources, 2014, vol. 259, no. 0, pp. 166 – 176.
[252] L. Wang, Y. Cheng and J. Zou, “Battery available power prediction of
hybrid electric vehicle based on improved dynamic matrix control
algorithms,” Journal of Power Sources, 2014, vol. 261, no. 0, pp. 337 – 347.
[253] T. Feng, L. Yang, X. Zhao, H. Zhang and J. Qiang, “Online identification of lithium-ion battery parameters based on an improved equivalent-circuit
model and its implementation on battery state-of-power prediction,” Journal of Power Sources, 2015, vol. 281, no. 0, pp. 192 – 203.
[254] W. Waag, C. Fleischer and D. Sauer, “Method for determining model
parameters of electrochemical energy storage of e.g. electric vehicle,
involves defining parameter record variant as new reference dataset to
describe battery model and to determine maximum power of storage,” 2014, DE201,310,000,572.
[255] S. Wang, M. Verbrugge, J. S. Wang and P. Liu, “Multi-parameter battery
state estimator based on the adaptive and direct solution of the governing
differential equations,” Journal of Power Sources, 2011, vol. 196, no. 20,
pp. 8735 – 8741.
[256] C. Fleischer, W. Waag, H.-M. Heyn and D. U. Sauer, “On-line adaptive
battery impedance parameter and state estimation considering physical
principles in reduced order equivalent circuit battery models: Part 1.
Requirements, critical review of methods and modeling,” Journal of Power
Sources, 2014, no. 0, pp.276 – 291.
[257] C. Fleischer, W. Waag, H. -M. Heyn, and D. U. Sauer,, “On-line adaptive
battery impedance parameter and state estimation considering physical
principles in reduced order equivalent circuit battery models: Part 2.
Parameter and state estimation,” Journal of Power Sources, 2014, no. 0,
pp. 457 – 482.
[258] P. Malysz, J. Ye, R. Gu, H. Yang and A. Emadi, “Battery state-of-power
peak current calculation and verification using an asymmetric parameter
equivalent circuit model,” Vehicular Technology, IEEE Transactions on,
2015, vol. 65, no. 6, pp. 4512 – 4522.

Bibliography 193
[259] X. Hu, R. Xiong and B. Egardt, “Model-based dynamic power assessment of
lithium-ion batteries considering different operating conditions,” Industrial
Informatics, IEEE Transactions on, 2014, vol. 10, no. 3, pp. 1948 - 1959.
[260] W. Haiying, H. Zhonghua, H. Yu, and L. Gechen, “Power state prediction of battery based on BP neural network,” Strategic Technology (IFOST), 7th
International Forum on, 2012.
[261] C. Fleischer, W. Waag, Z. Bai and D. U. Sauer, “On-line self-learning time
forward voltage prognosis for lithium-ion batteries using adaptive neuro-
fuzzy inference system,” Journal of Power Sources, 2013, vol. 243, no. 0, pp.
728 – 749.
[262] C. Fleischer, Z. B. Wladislaw Waag and D. U. Sauer, “Adaptive on-line
state-of-available-power prediction of lithium-ion batteries,” Journal of
Power Electronics, 2013, vol. 13, no. 4, pp. 516 – 527.
[263] E. Cabrera-Castillo, F. Niedermeier and A. Jossen, “Calculation of the state of safety (SOS) for lithium ion batteries,” Journal of Power Sources,
2016, vol. 324, pp. 509 – 520.
[264] W. Josefowitz, H. Kranz, D. Macerata, T. Soczka-Guth, H. Mettlach,
D. Porcellato, F. Orsini and J. Hansson, “Assessment and Testing of
Advanced Energy Storage Systems for Propulsion-European testing
report,” Proc. of the 21st Worldwide Battery, Hybrid and Fuel Cell Electric
Vehicle Symposium & Exhibition, EVS 21, 2005.
[265] D. H. Doughty and C. C. Crafts, “FreedomCAR Electrical Energy Storage
System Abuse Test Manual for Electric and Hybrid Electric Vehicle
Applications,” SAND 2005 – 3123.
[266] J2464_200911, “SAE, Electric and Hybrid Electric Vehicle Rechargeable
Energy Storage System (RESS) Safety and Abuse Testing,” SAE
International, 2009, pp. 1 – 33.
[267] J2929_201302,”Safety Standard for Electric and Hybrid Vehicle Propulsion
Battery Systems Utilizing Lithium-based Rechargeable Cells”, SAE
International, 2013, pp. 1 – 18.
[268] C. Ashtiani, “Analysis of battery safety and hazards’ risk mitigation,” ECS
Transactions, 2008, vol. 11, no. 19, pp. 1 – 11.
[269] V. Ramadesigan, P. W. C. Northrop, S. De, S. Santhanagopalan, R. D.
Braatz and V. R. Subramanian, “Modeling and simulation of lithium-ion
batteries from a systems engineering perspective,” Journal of The
Electrochemical Society, 2012, vol. 159, no. 3, pp. R31 – R45.
[270] J. P. SCHMIDT, “Verfahren zur Charakterisierung und Modellierung von Lithium-Ionen Zellen,” Ph.D. thesis, Karlsruher Institut für Technologie, 2013, ISBN: 1868-1603.
[271] A. Jokar, B. Rajabloo, M. D silets and M. Lacroix, “Review of simplified pseudo-two-dimensional models of lithium-ion batteries,” Journal of Power
Sources, 2016, vol. 327, pp. 44 – 55.

Bibliography 194
[272] J. B. Gerschler, “Ortsaufgelöste Modellbildung von Lithium-Ionen-
Systemen unter spezieller Berücksichtigung der Batteriealterung,” Ph.D. thesis, RWTH Aachen University, 2012, ISBN: 978-3-8440-1307-8.
[273] M. Ecker, “Lithium plating in lithium-ion batteries-an experimental and
simulation approach,” Ph.D. thesis, RWTH Aachen University, 2016,
ISBN: 978-3-8440-4525-3.
[274] J. Newman and W. Tiedemann, “Porous-electrode theory with battery
applications,” AIChE Journal, 1975, vol. 21, no. 1, pp. 25 – 41.
[275] M. Doyle, T. F. Fuller and J. Newman, “Modeling of Galvanostatic Charge
and Discharge of the Lithium/Polymer/Insertion cell,” Journal of The
Electrochemical Society, 1993, vol. 140, no. 6, pp. 1526 – 1533.
[276] M. Doyle, J. Newman, A. S. Gozdz, C. N. Schmutz and J. Tarascon,
“Comparison of Modeling Predictions with Experimental Data from Plastic
Lithium Ion Cells,” Journal of The Electrochemical Society, 1996, vol. 143,
no. 6, pp. 1890 – 1903.
[277] T. F. Fuller, M. Doyle and J. Newman, “Simulation and Optimization of
the Dual Lithium Ion Insertion Cell,” Journal of The Electrochemical
Society, vol. 141, no. 1, pp. 1 - 10, 1994.
[278] T. R. Tanim, C. D. Rahn and C.-Y. Wang, “A Temperature Dependent,
Single Particle, Lithium Ion Cell Model Including Electrolyte Diffusion,” Journal of Dynamic Systems, Measurement, and Control, 2015, vol. 137,
no.1, 011005.
[279] D. Zhang, B. N. Popov and R. E. White, “Modeling Lithium Intercalation of
a Single Spinel Particle under Potentiodynamic Control,” Journal of The
Electrochemical Society, 2000, vol. 147, no. 3, pp. 831 - 838.
[280] S. Buller, “Impedance-based simulation models for energy storage devices
in advanced automotive power systems,” Ph.D. thesis, RWTH Aachen
University, 2003, ISBN: 978-3-8322-1225-4.
[281] M. Ceraolo, “New dynamical models of lead-acid batteries,” Power Systems,
IEEE Transactions on, 2000, vol. 15, no. 4, pp. 1184 – 1190.
[282] F. M. Gonz lez-Longatt, “Circuit based battery models: A review,” IEEE
Proceedings., 2006.
[283] D. Linzen, “Impedance-based loss calculation and thermal modeling of
electrochemical energy storage devices for design considerations of
automotive power systems,” Ph.D. thesis, RWTH Aachen University, 2006,
ISBN: 978-3-8322-5706-4.
[284] J. E. B. Randles, “Kinetics of rapid electrode reactions,” Discuss. Faraday
Soc., 1947, vol. 1, pp. 11 – 19.
[285] E. Barsoukov, J. H. Kim, C. O. Yoon and H. Lee, “Universal battery parameterization to yield a non-linear equivalent circuit valid for battery
simulation at arbitrary load,” Journal of Power Sources, 1999, vol. 83, no.
12, pp. 61 – 70.
[286] S. Zhao and D. A. Howey, “Global sensitivity analysis of battery equivalent circuit model parameters,” 2016.

List of abbreviations 195
[287] H. He, R. Xiong, and J. Fan, “Evaluation of lithium-ion battery equivalent
circuit models for state of charge estimation by an experimental approach,” Energies, 2011, vol. 4, no. 4, pp. 582 – 598.
[288] M. A. Monema, K. Trad, N. Omar, O. Hegazy, B. Mantels, G. Mulder, P. V.
den Bossche and J. V. Mierlo, “Lithium-ion batteries: Evaluation study of
different charging methodologies based on aging process,” Journal of
Applied Energy, 2015, vol. 152, no. 0, pp. 143 – 155.
[289] C. Brezinski, “Pad -Type Approximation and General Orthogonal
Polynomials,” Birkhäuser Basel, 1980, vol. 50, ISBN: 978-3-0348-6559-3.
[290] S. W. Smith, “The Scientist and Engineer’s Guide to Digital Signal Processing,” California Technical Publishing, 1999, vol. 50, ISBN: 0-
9660176-6-8.
[291] J. Jaguemonta, L. Boulon and Y. Dub , “A comprehensive review of
lithium-ion batteries used in hybrid and electric vehicles at cold
temperatures,” Journal of Applied Energy, 2016, vol. 164, no. 0, pp. 99 –
114.
[292] T.R. Ashwin, A. McGordon and P. A. Jennings, “Electrochemical modelling
of Li-ion battery pack with constant voltage cycling,” Journal of Power
Sources, 2017, vol. 341, no. 0, pp. 327 – 339.
[293] A. Romero-Becerril and L. Alvarez-Icaza, “Comparison of discretization
methods applied to the single-particle model of lithium-ion batteries,” Journal of Power Sources, 2011, vol. 196, no. 0, pp. 10267 – 10279.
List of abbreviations
ACM adaptive characteristic maps
AEKF Adaptive extended Kalman filter
ANFIS Adaptive neuro-fuzzy-inference system
AUTOSAR Automotive open system architecture
BEV Battery electric vehicle
BMS Battery management system
BoL Begin of Life
BSE Battery state estimation
BVE Butler-Volmer equation
CAN Controller area network
CC-CV Constant current-constant voltage

List of abbreviations 196
CDKF Central difference Kalman filter
CPE Constant phase element
CV Cyclic volumetric
DAE Differential algebraic equation
DEKF Dual extended Kalman filter
DTFT Discrete-time Fourier transformation
DD Direct differential
DMC Dynamic matrix control
DoD Depth-of-Discharge
DST Dynamic stress test
DVA Differential voltage analysis
E Specific energy
ECU Electronic control unit
ECM Equivalent circuit model
EES Energy storage system
EoL End of life
EKF Extended Kalman filter
EMF Electro motive force
EMS Energy management system
EU European Union
EUCAR European Council for Automotive Research and Development
EV Electric vehicle
EU European Union
EVPA Enhanced varied parameters approach
FDM Finite difference method
FEM Finite element method
FIS Fuzzy inference system

List of abbreviations 197
FUDRLS Fast upper-diagonal recursive least square
FUDS Federal urban driving schedules
FVM Finite volume method
HR Hazard risk
HL Hazard likelihood
HS Hazard severity
HEV Hybrid electric vehicle
HIL Hardware-in-the-Loop
HMRMA Hazard Modes and Risk Mitigation Analysis
HL Hazard level
HV High voltage
ICA Incremental capacity analysis
isoSPI Isolated communications interface
KF Kalman filter
LIB Lithium-ion battery
LFP Positive electrode active materials with a common formula LiFePO4
LMO Positive electrode active materials with a common formula LiMn2O4
LTV linear time-varying
LS Least square
LTO Negative electrode active materials with a common formula Li4Ti5O12
LTV linear time-varying
LV Low voltage
MA Moving Average
MMPI multi-step model predictive iterative
MIL Model-in-the-Loop
NEDC New European Driving Cycle
NMC Positive electrode active materials with a common formula of Lix(NixMnyCoz)O2

List of abbreviations 198
NCA Positive electrode active materials with a common formula of Lix(NixCoyAlz)O2
OCV Open-circuit voltage
PDE Partial differential equation
PDF Probability density function
PHEV Plug-in hybrid electric vehicle
P2D pseudo-two-dimensional
RBF Radial basis function
REKF Robust extended Kalman filter
RELS Recursive extended least square
RMSE Root-mean square error
RLS Recursive least square
RLSF Recursive least square with optimal forgetting factor
RUL Remaining useful lifetime
RVM Relevance vector machine
SampEn Sample entropy
SIL Software-in-the-loop
SoA Safe operating area
SoAE State-of-Available Energy
SoH State-of-Health
SoC State-of-Charge
SoF State-of-Function
SoAP State-of-Available Power
SoS State-of-Safety
SPKF Sigma point Kalman filter
SPM Single particle model
SVM Support vector machine
TLS Total least square

List of symbols 199
UDDS Urban dynamometer driving schedule
UKF Unscented Kalman filter
V2G Vehicle to grid
WLS Weighted least squares
WRLS Weighted recursive least squares
WTLS Weighted total least square
List of symbols
Symbol Unit Meaning
Ai F∙sξ-1 Generalized capacitance – Parameter of the CPE-element where i ∈1 … 3 refers to the number of ZARC element
m2/m3 Table 4: Specific surface area of electrode
A m2 Surface area of electrode
Aeff m2 Chapter 4: Effective internal electrode surface
Ah Actual battery capacity
Ah Nominal battery capacity
Ah Initial battery capacity
Cr Ah Releasable battery capacity
cs,k mol/m3 Table 4: Solid-state concentration
ce,k mol/m3 Table 4: Electrolyte concentration
F Double-layer capacitance – Parameter of the ECM
D m2/s Diffusion coefficient
m2/s Table 4: Effective ionic diffusion coefficient
E Wh Chapter 2.1: Specific energy
Wh Chapter 3.1: Actual energy content of the battery
kJ ∙ mol− Activation energy
EMF V Electromotive force

List of symbols 200
F As∙mol-1 Table 4: Faraday constant
f Hz Frequency
Hz Maximum frequency when the imaginary part of the impedance
spectrum reaches its local minimum
- State of safety of the battery
- State of abuse of the battery
Im Ω Imaginary part of impedance
HS - Hazard severity
HL - Hazard likelihood
HR - Hazard risk
A Current
A Table 15: Current
I A/m2 Chapter 2 & 4: current density
IC A Chapter 2 & 5: Capacitive current flowing through double-layer
capacitance
IC,max A Chapter 5: Predefined value of the current on the capacitance of
the employed ECM
Icharge A Chapter 3: Applied charge current
Idischarge A Chapter 3: Applied discharge current
Imax A Chapter 3: Maximum charge current
Imin A Chapter 3: Minimum discharge current
, , A Chapter 5: Maximum charge current whereby the upper voltage
limit is considered as a constrain
, , A Chapter 5: Maximum discharge current whereby the lower voltage
limit is considered as a constraint
, , C A Chapter 5: Maximum charge current whereby the upper SoC limit
is considered as a constraint
, , C A Chapter 5: Maximum discharge current whereby the lower SoC
limit is considered as a constraint

List of symbols 201
A/m2 Table 4: Exchange current density
A Chapter 2 & 4: Exchange current density
Jk mol/s.m2 Table 4: Wall flux of Li+ on electrodes particle
j - Complex variable: j=√−
m2.5/s.mol0.5 Table 4: Reaction rate constant of electrode
V ∙ K− Temperature correction term of
the OCV model
V/% Coefficient of OCV change over the battery lifetime
kI A-1 A parameter of the employed ECMs
Lk m Table 4: Thickness of the region
ldiff m Pore length
n - Number of electrons involved in the reaction (n = 1 for LIBs)
ns - Chapter 3: Number of cells connected in series
np - Chapter 3: Number of cells connected in parallel , - Chapter 3: Number of cells connected in series , - Chapter 3: Number of modules connected in parallel
OCV V Open-circuit voltage
Pn - Chapter 5: Parameter set of the employed ECM where n refers to
the number of parameter sets
W Chapter 3: Discharge power
W Chapter 3: Charge power
Pmeas W Chapter 3: Measured battery power
Ppredict W Chapter 3: Predicted battery power Δ As Amount of charge throughput
R J ∙ mol ∙ K− Universal gas constant
Ω Actual battery impedance
C Ω Contact resistance

List of symbols 202
Ω Ohmic resistance
Rcell,discharge Ω Chapter 3: Discharge resistance of the battery
Rcell,charge Ω Chapter 3: Charge resistance of the battery
Ω Charge transfer resistance
, Ω Chapter 4 & 5: Parameter of the ECM referring to diffusion
resistance
Ω Chapter 2: Resistance corresponding to begin of transport
limitations in solid and liquid phases
Ω Direct current resistance
R0.001Hz Ω Chapter 2: Total battery resistance Re Ω Real part of impedance Z
S J ∙ K− Entropy
SoCV % Voltage-based Stage-of-Charge
T or Kelvin Temperature + - transference number of Li+ in electrolyte s Initial time
∆t s Chapter 2: Interim relaxation time
V Battery voltage
V Simulated battery voltage
V Measured battery voltage ∆ V Chapter 5: Predicted discharge voltage of the battery ∆ V Chapter 5: Predicted charge voltage of the battery
Vcell,min V Chapter 3: Minimum cell voltage
Vcell,max V Chapter 3: Maximum cell voltage
, V Table 15: Voltage on the first (double-layer) capacitance of the
employed ECM
, V Table 15: Voltage on capacitances of the employed ECMs where i ∈1 … 2

List of symbols 203
V Chapter 5: Maximum voltage of the battery
V Chapter 5: Minimum voltage of the battery
V Chapter 3: Operating voltage of the battery
V Chapter 5: Limiting battery voltage
C V Open-circuit voltage of the battery V C , V Chapter 3: Open-circuit voltage after discharging V C , V Chapter 3: Open-circuit voltage after charging
V Equilibrium potential of the positive electrode
V Equilibrium potential of the negative electrode
V ∆ V Chapter 3: Predicted voltage of the battery for a predefined time
horizon
VZA C, V Table 15: Voltage on the ZARC-element of the employed ECM
where i ∈1 … 3 refers to the number of ZARC elements
Greek , - Symmetry factor of anodic reactions used for BVE - Symmetry factor of cathodic reactions used for BVE S/m Effective electronic conductivity of electrodes solid phase Ω/√s Warburg coefficient - Porosity of the region
ε V Difference between measured and simulated voltage - Coloumb efficiency V Solid-phase potential of electrode V Electrolyte potential s Time constant oC V ∙ A− ∙ s− The change of open-circuit voltage per 1 As current flow
Δ V Ohmic overvoltage or simply speaking voltage drop due to ohmic
resistance

List of symbols 204
Δ E , V SEI-related overvoltage on the anode Δ E , V SEI-related overvoltage on the cathode Δ , V Charge transfer overvoltage on the anode Δ , V Charge transfer overvoltage on the cathode
Δ V Concentration-related overvoltages including diffusion, migration
and convection processes
Δ V Table 15: Determined overvoltage of the RC-element representing
charge transfer processes
Δ , V Table 15: Determined overvoltage of the second RC-element
representing diffusion processes
Δ , V Table 15: Determined overvoltage of the third RC-element
representing diffusion processes
∆ - Chapter 5: A coefficient used for determination of two variants of
the parameter
Δ ZA C, V Table 15: Determined overvoltage of respective ZARC-element of
the employed ECM ∆ s Predefined prediction time horizon
∆tC s Chapter 5: Time period where the current through capacitance of
the employed ECM is lower than a predefined value ∆ W Chapter 3: Difference between measured and predicted power S/m Effective ionic conductivity of electrolyte
1/s Angular frequency
ξi - Chapter 4: Depression factor used for ZARC-elements employed in
the ECMs where i ∈1 … 3 refers to the number of ZARC element
Ω Complex impedance
Ω Warburg impedance
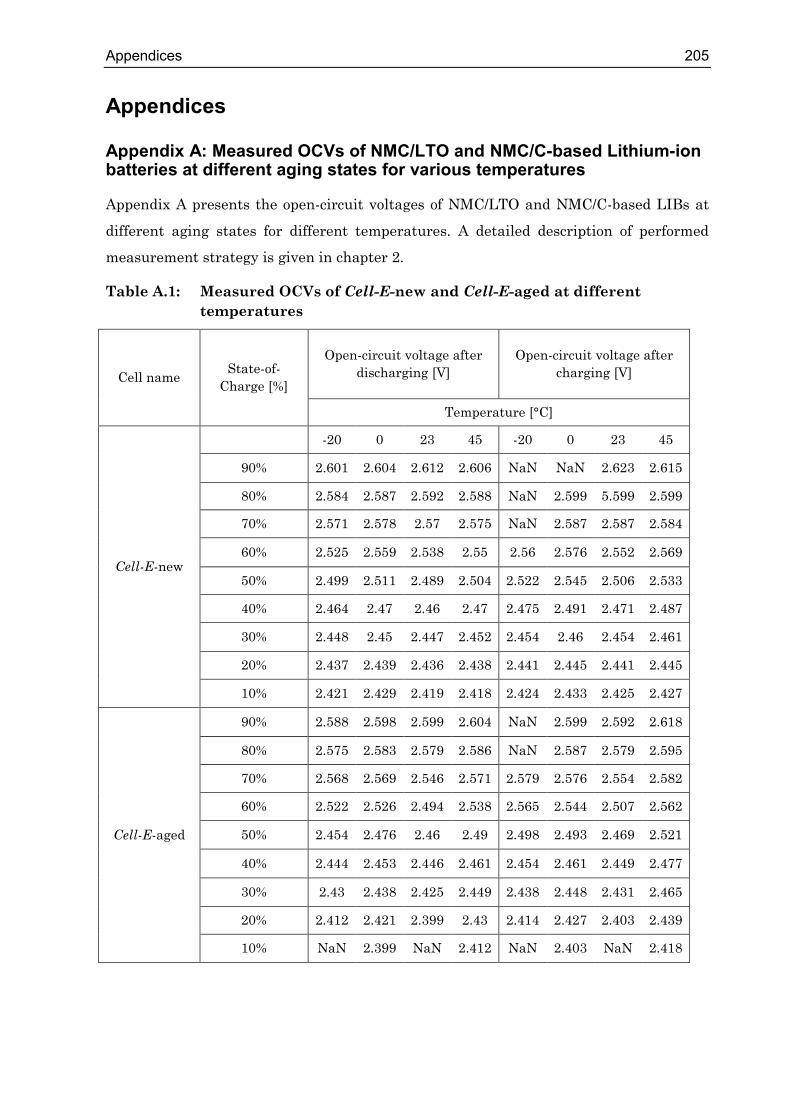
Appendices 205
Appendices
Appendix A: Measured OCVs of NMC/LTO and NMC/C-based Lithium-ion batteries at different aging states for various temperatures
Appendix A presents the open-circuit voltages of NMC/LTO and NMC/C-based LIBs at
different aging states for different temperatures. A detailed description of performed
measurement strategy is given in chapter 2.
Table A.1: Measured OCVs of Cell-E-new and Cell-E-aged at different temperatures
Cell name State-of-
Charge [%]
Open-circuit voltage after
discharging [V]
Open-circuit voltage after
charging [V]
Temperature [°C]
Cell-E-new
-20 0 23 45 -20 0 23 45
90% 2.601 2.604 2.612 2.606 NaN NaN 2.623 2.615
80% 2.584 2.587 2.592 2.588 NaN 2.599 5.599 2.599
70% 2.571 2.578 2.57 2.575 NaN 2.587 2.587 2.584
60% 2.525 2.559 2.538 2.55 2.56 2.576 2.552 2.569
50% 2.499 2.511 2.489 2.504 2.522 2.545 2.506 2.533
40% 2.464 2.47 2.46 2.47 2.475 2.491 2.471 2.487
30% 2.448 2.45 2.447 2.452 2.454 2.46 2.454 2.461
20% 2.437 2.439 2.436 2.438 2.441 2.445 2.441 2.445
10% 2.421 2.429 2.419 2.418 2.424 2.433 2.425 2.427
Cell-E-aged
90% 2.588 2.598 2.599 2.604 NaN 2.599 2.592 2.618
80% 2.575 2.583 2.579 2.586 NaN 2.587 2.579 2.595
70% 2.568 2.569 2.546 2.571 2.579 2.576 2.554 2.582
60% 2.522 2.526 2.494 2.538 2.565 2.544 2.507 2.562
50% 2.454 2.476 2.46 2.49 2.498 2.493 2.469 2.521
40% 2.444 2.453 2.446 2.461 2.454 2.461 2.449 2.477
30% 2.43 2.438 2.425 2.449 2.438 2.448 2.431 2.465
20% 2.412 2.421 2.399 2.43 2.414 2.427 2.403 2.439
10% NaN 2.399 NaN 2.412 NaN 2.403 NaN 2.418

Appendices 206
Table A.2: Measured OCVs of Cell-F-new and Cell-F-aged at different temperatures
Cell name State-of-Charge
[%]
Open-circuit voltage after
discharging [V]
Open-circuit voltage after
charging [V]
Temperature [°C]
Cell-F-New
0 10 23 45 0 10 23 45
90% 4.058 4.057 4.059 4.062 NaN 4.071 4.063 4.066
80% 3.941 3.947 3.948 3.954 3.962 3.962 3.957 3.96
70% 3.822 3.825 3.825 3.834 3.843 3.842 3.83 3.845
60% 3.734 3.736 3.73 3.747 3.753 3.753 3.75 3.758
50% 3.673 3.676 3.67 3.685 3.691 3.69 3.688 3.695
40% 3.63 3.634 3.63 3.642 3.65 3.65 3.649 3.655
30% 3.586 3.589 3.584 3.583 3.611 3.614 3.614 3.613
20% 3.528 3.533 3.53 3.53 3.55 3.556 3.556 3.554
10% 3.465 3.47 3.47 3.472 3.471 3.482 3.486 3.484
Cell-F-aged
90% 4.072 4 4.076 4.077 NaN 4.007 4.077 4.076
80% 3.955 3.887 3.965 3.966 3.959 3.898 3.967 3.966
70% 3.854 3.801 3.864 3.867 3.869 3.812 3.87 3.867
60% 3.771 3.699 3.745 3.785 3.787 3.739 3.753 3.79
50% 3.704 3.65 3.687 3.718 3.72 3.688 3.697 3.724
40% 3.656 3.596 3.633 3.662 3.672 3.646 3.655 3.675
30% 3.609 3.54 3.582 3.602 3.628 3.592 3.603 3.626
20% 3.551 3.509 3.495 3.55 3.567 3.523 3.505 3.565
10% 3.492 3.166 3.287 3.496 3.498 3.423 3.3 3.502

Appendices 207
Appendix B: Step-wise illustration of on-board capacity estimation of lithium-ion batteries
Appendix B shows schematically a widespread technique for actual capacity estimation
of LIBs in EVs. A detailed description of boundary conditions and available methods for
on-board battery capacity estimation is given in chapter 3.
Fig. B.1: Step-wise presentation of on-board capacity estimation based on the OCV-SoC correlation
START
Initialization of the variables(Ahinitial = 0)
Determination of the OCV(t1) and
SoC(t1)
Ah Counter
ΔSoC = SoC(t2)-SoC(t1)
SoC
QC
Step 2
Step 3
Step 4
Step 5
Step 7
2
1)(
t
tdttiQ
Border conditions fullfilled?(Δυ< Δυmax) && (ΔSoC > ΔSoCmin)
No
Step 6
Determination of the OCV(t2) and
SoC(t2)
Yes
END
Step 1

Appendices 208
Appendix C: Charge and discharge curves behavior over the battery lifetime
Appendix C describes the impact of current and aging state on (dis)charge curves and
actual capacity of NMC/LTO-based LIBs comprehensively discussed in chapter 2.
Fig. C.1: Discharge curves of Cell-C-new over the battery lifetime discharged from a fully charged state with 1C (≅15 A) current rate measured at 23 °C
Fig. C.2: Discharge curves of Cell-C-aged at End of Life discharged with various current rates from a fully charged state measured at 23 °C

Appendices 209
Fig. C.3: Charge curves of Cell-A-new and Cell-A-aged with various current rates measured at 23 °C
Appendix D: Static charge and discharge power capability of the battery
In appendix D, power capability of Cell-G-new determined based on Eqs. (23)-(24)
proposed in chapter 3 is given.
Fig. D.1: Power capability of Cell-G-new at 23 °C determined as proposed in Eqs. (23)-(24); the voltage boundaries are predefined as follows: Vcell,min=2.7 V and Vcell,max=4.2 V.

Appendices 210
Appendix E: Comparison of model performances for Cell-D-new and Cell-A-aged using the examined driving cycles
Appendix E addresses the results of the determined and SoAP prediction accuracy
for Cell-D-new and Cell-A-aged based on the examined driving cycles.
Fig. E.1: Model performances based on the examined driving cycles for Cell-D-new and Cell-A-aged

Appendices 211
Appendix F: Impact of prediction time horizon on SoAP prediction accuracy for different applied current rates and State-of-Charges using the examined driving cycles
The results obtained for Cell-J-aged based on the examined driving cycles concerning the
impact of prediction time horizon on SoAP prediction accuracy are shown in Fig. F.1. In
this regard, model 1 is employed for accuracy analysis of predicted SoAP depending on
applied current rate and SoC for various prediction time horizons. Moreover, the results
obtained for dependence of SoAP prediction accuracy of the investigated ECMs on SoC is
illustrated in Fig. F.2.
Fig. F.1: Performance analysis for various prediction time horizons for Cell-J-aged using model 1 as a reference

Appendices 212
Fig. F.2: Performance comparison of model 1 for the investigated LIBs for various prediction time horizons based on the investigated driving cycles

Appendices 213
List of publications
Conference and magazine contributions
A. Farmann, D. U. Sauer (2018): High-voltage Lithium-ion Batteries –
Methods for On-board State Estimation – ATZ elektronik worldwide, Vol. 13, pp 58- 63
A. Farmann, D. U. Sauer (2018): HV-Lithium-Ionen-Batterien — Monitoring-
Algorithmen für die Onboard-Zustandserkennung – ATZelektronik, Vol. 13, pp 58- 63
A. Farmann, C. Vogel, D. U. Sauer (2015): On-board impedance parameters estimation
of SLI batteries in micro-hybrid vehicles: Part I. Requirements and Modeling, Kraftwerk
Batterie
A. Farmann, C. Vogel, D. U. Sauer (2015): On-board impedance parameters estimation
of SLI batteries in micro-hybrid vehicles: Part II. Parameter Identification and cranking
capability, Kraftwerk Batterie
A. Farmann, A. Gitis, H. S. Luong, D. U. Sauer (2014): Investigation of battery
monitoring algorithms for on-line power prediction in stationary applications, Kraftwerk
Batterie
Peer-Reviewed journal contributions
A. Farmann and D. U. Sauer: Comparative study of reduced order equivalent circuit
models for on-board state-of-available-power prediction of lithium-ion batteries in
electric vehicles, Journal of Applied Energy, 2018, vol. 225, pp. 1102 - 1122.
A. Farmann and D. U. Sauer: A study on the dependency of the open-circuit voltage on
temperature and actual aging state of lithium-ion batteries, Journal of Power Sources,
2017, vol. 347, no. 0, pp. 1 - 13.
A. Farmann and D. U. Sauer: A comprehensive review of on-board State-of-Available-
Power prediction techniques for lithium-ion batteries in electric vehicles, Journal of
Power Sources, 2016, vol. 329, no. 0, pp. 123 - 137.
A. Farmann, W. Waag and D. U. Sauer: Application-specific electrical characterization of
high power batteries with lithium titanate anodes for electric vehicles, Energy, 2016, vol.
112C, no. 0, pp. 294 - 306.

Appendices 214
A. Farmann, W. Waag and D. U. Sauer: Adaptive approach for on-board impedance
parameters and voltage estimation of lithium-ion batteries in electric vehicles, Journal
of Power Sources, vol. 299, 2015 , no. 0, pp. 176 - 188.
A. Farmann, W. Waag, A. Marongiu and D. U. Sauer: Critical review of on-board
capacity estimation techniques for lithium-Ion batteries in electric and hybrid electric
vehicles, Journal of Power Sources, 2015 , vol. 281, no. 0, pp. 114 - 130.

Aachener Beiträge des ISEA
ABISEA Band 1 Eßer, A. Berührungslose, kombinierte Energie- und Informations-übertragung für bewegliche Systeme 1. Auflage 1992, 130 Seiten ISBN 3-86073-046-0 ABISEA Band 2 Vogel, U. Entwurf und Beurteilung von Verfahren zur Hochausnutzung des Rad-Schiene-Kraftschlusses durch Triebfahrzeuge 1. Auflage 1992, 130 Seiten ISBN 3-86073-060-6 ABISEA Band 3 Redehorn, Th. Stromeinprägendes Antriebssystem mit fremderregter Synchron-maschine 1. Auflage 1992, 130 Seiten ISBN 3-86073-061-4 ABISEA Band 4 Ackva, A. Spannungseinprägendes Antriebssystem mit Synchron-maschine und direkter Stromregelung 1. Auflage 1992, 135 Seiten ISBN 3-86073-062-2 ABISEA Band 5 Mertens, A. Analyse des Oberschwingungsverhaltens von taktsynchronen Delta -Modulationsverfahren zur Steuerung von Pulsstromrichtern bei hoher Taktzahl 1. Auflage 1992, 170 Seiten ISBN 3-86073-069-X ABISEA Band 6 Geuer, W. Untersuchungen über das Alterungsverhalten von Bleiakkumulatoren 1. Auflage 1993, 100 Seiten ISBN 3-86073-097-5
ABISEA Band 7 Langheim, J. Einzelradantrieb für Elektrostraßenfahrzeuge 1. Auflage 1993, 215 Seiten ISBN 3-86073-123-8 (vergriffen) ABISEA Band 8 Fetz, J. Fehlertolerante Regelung eines Asynchron-Doppelantriebes für ein Elektrospeicherfahrzeug 1. Auflage 1993, 136 Seiten ISBN 3-86073-124-6 (vergriffen) ABISEA Band 9 Schülting, L. Optimierte Auslegung induktiver Bauelemente für den Mittelfrequenzbereich 1. Auflage 1993, 136 Seiten ISBN 3-86073-174-2 (vergriffen) ABISEA Band 10 Skudelny, H.-Ch. Stromrichtertechnik 4. Auflage 1997, 259 Seiten ISBN 3-86073-189-0 ABISEA Band 11 Skudelny, Ch. Elektrische Antriebe 3. Auflage 1997, 124 Seiten ISBN 3-86073-231-5 ABISEA Band 12 Schöpe, F. Batterie-Management für Nickel-Cadmium Akkumulatoren 1. Auflage 1994, 156 Seiten ISBN 3-86073-232-3 (vergriffen) ABISEA Band 13 v. d. Weem, J. Schmalbandige aktive Filter für Schienentriebfahrzeuge am Gleichspannungs-fahrdraht 1. Auflage 1995, 125 Seiten ISBN 3-86073-233-1
ABISEA Band 14 Backhaus, K. Spannungseinprägendes Direktantriebssystem mit schnelllaufender geschalteter Reluktanzmaschine 1. Auflage 1995, 156 Seiten ISBN 3-86073-234-X (vergriffen) ABISEA Band 15 Reinold, H. Optimierung dreiphasiger Pulsdauermodulations- verfahren 1. Auflage 1996, 116 Seiten ISBN 3-86073-235-8 ABISEA Band 16 Köpken, H.-G. Regelverfahren für Parallelschwingkreis- umrichter 1. Auflage 1996, 125 Seiten ISBN 3-86073-236-6 ABISEA Band 17 Mauracher, P. Modellbildung und Verbundoptimierung bei Elektrostraßenfahrzeugen 1. Auflage 1996, 192 Seiten ISBN 3-86073-237-4 ABISEA Band 18 Protiwa, F.-F. Vergleich dreiphasiger Resonanz-Wechselrichter in Simulation und Messung 1. Auflage 1997, 178 Seiten ISBN 3-86073-238-2 ABISEA Band 19 Brockmeyer, A. Dimensionierungswerkzeug für magnetische Bau- elemente in Stromrichter-anwendungen 1. Auflage 1997, 182 Seiten ISBN 3-86073-239-0

Aachener Beiträge des ISEA
ABISEA Band 20 Apeldoorn, 0. Simulationsgestützte Bewer-tung von Steuerverfahren für netzgeführte Stromrichter mit verringerter Netzrück-wirkung 1. Auflage 1997, 132 Seiten ISBN 3-86073-680-9 ABISEA Band 21 Lohner, A. Batteriemanagement für verschlossene Blei-Batterien am Beispiel von Unter-brechungsfreien Stromversorgungen 1. Auflage 1998, 144 Seiten ISBN 3-86073-681-7 ABISEA Band 22 Reinert, J. Optimierung der Betriebs-eigenschaften von Antrieben mit geschalteter Reluktanz-maschine 1. Auflage 1998, 168 Seiten ISBN 3-86073-682-5 ABISEA Band 23 Nagel, A. Leitungsgebundene Störungen in der Leistungselektronik: Entstehung, Ausbreitung und Filterung 1. Auflage 1999, 160 Seiten ISBN 3-86073-683-3 ABISEA Band 24 Menne, M. Drehschwingungen im An-triebsstrang von Elektro-straßenfahrzeugen - Analyse und aktive Dämpfung 1. Auflage 2001, 192 Seiten ISBN 3-86073-684-1 ABISEA Band 25 von Bloh, J. Multilevel-Umrichter zum Einsatz in Mittelspannungs-Gleichspannungs-Übertragungen
1. Auflage 2001, 152 Seiten ISBN 3-86073-685-X ABISEA Band 26 Karden, E. Using low-frequency impedance spectroscopy for characterization, monitoring, and modeling of industrial batteries 1. Auflage 2002, 154 Seiten ISBN 3-8265-9766-4 ABISEA Band 27 Karipidis, C.-U. A Versatile DSP/ FPGA Structure optimized for Rapid Prototyping and Digital Real-Time Simulation of Power Electronic and Electrical Drive Systems 1. Auflage 2001, 164 Seiten ISBN 3-8265-9738-9 ABISEA Band 28 Kahlen, K. Regelungsstrategien für per-manentmagnetische Direkt-antriebe mit mehreren Freiheitsgraden 1. Auflage 2003, 158 Seiten ISBN 3-8322-1222-1 ABISEA Band 29 Inderka, R. Direkte Drehmoment-regelung Geschalteter Reluktanzantriebe 1. Auflage 2003, 190 Seiten ISBN 3-8322-1175-6 ABISEA Band 30 Schröder, S. Circuit-Simulation Models of High-Power Devices Based on Semiconductor Physics 1. Auflage 2003, 124 Seiten ISBN 3-8322-1250-7 ABISEA Band 31 Buller, S. Impedance-Based Simu-lation Models for Energy Storage Devices in Advanced Automotive Power Systems
1. Auflage 2003, 136 Seiten ISBN 3-8322-1225-6 ABISEA Band 32 Schönknecht, A. Topologien und Regelungs-strategien für das induktive Erwärmen mit hohen Frequenz-Leistungs- produkten 1. Auflage 2004, 170 Seiten ISBN 3-8322-2408-4 ABISEA Band 33 Tolle, T. Konvertertopologien für ein aufwandsarmes, zwei-stufiges Schaltnetzteil zum Laden von Batterien aus dem Netz 1. Auflage 2004, 150 Seiten ISBN 3-8322-2676-1 ABISEA Band 34 Götting, G. Dynamische Antriebs-regelung von Elektro-straßenfahrzeugen unter Berücksichtigung eines schwingungsfähigen Antriebsstrangs 1. Auflage 2004, 166 Seiten ISBN 3-8322-2804-7 ABISEA Band 35 Dieckerhoff, S. Transformatorlose Strom-richterschaltungen für Bahn- fahrzeuge am 16 2/3Hz Netz 1. Auflage 2004, 158 Seiten ISBN 3-8322-3094-7 ABISEA Band 36 Hu, J. Bewertung von DC-DC- Topologien und Optimierung eines DC-DC-Leistungs-moduls für das 42-V-Kfz-Bordnetz 1. Auflage 2004, 156 Seiten ISBN 3-8322-3201-X

Aachener Beiträge des ISEA
ABISEA Band 37 Detjen, D.-0. Characterization and Modeling of Si-Si Bonded Hydrophobie Interfaces for Novel High-Power BIMOS Devices 1. Auflage 2004, 146 Seiten ISBN 3-8322-2963-9 ABISEA Band 38 Walter, J. Simulationsbasierte Zuver-lässigkeitsanalyse in der modernen Leistungs-elektronik 1. Auflage 2004, 134 Seiten ISBN 3-8322-3481-0 ABISEA Band 39 Schwarzer, U. IGBT versus GCT in der Mittelspannungsanwendung - ein experimenteller und simulativer Vergleich 1. Auflage 2005, 184 Seiten ISBN 3-8322-4489-1 ABISEA Band 40 Bartram, M. IGBT-Umrichtersysteme für Windkraftanlagen: Analyse der Zyklenbelastung, Mo-dellbildung, Optimierung und Lebensdauervorhersage 1. Auflage 2006, 195 Seiten ISBN 3-8322-5039-5 ABISEA Band 41 Ponnaluri, S. Generalized Design, Analysis and Control of Grid side converters with integrated UPS or Islanding functionality 1. Auflage 2006, 163 Seiten ISBN 3-8322-5281-9 ABISEA Band 42 Jacobs, J. Multi-Phase Series Resonant DC-to-DC Converters 1. Auflage 2006, 185 Seiten ISBN 3-8322-5532-X
ABISEA Band 43 Linzen, D. Impedance-Based Loss Calculation and Thermal Modeling of Electrochemical Energy Storage Devices for Design Considerations of Automotive Power Systems 1. Auflage 2006, 150 Seiten ISBN 3-8322-5706-3 ABISEA Band 44 Fiedler, J. Design of Low-Noise Switched Reluctance Drives 1. Auflage 2007, 183 Seiten ISBN 978-3-8322-5864-l ABISEA Band 45 FuengwarodsakuI, N. Predictive PWM-based Direct Instantaneous Torque Control for Switched Reluctance Machines 1. Auflage 2007, 150 Seiten ISBN 978-3-8322-6210-5 ABISEA Band 46 Meyer, C. Key Components for Future Offshore DC Grids 1. Auflage 2007, 196 Seiten ISBN 978-3-8322-6571-7 ABISEA Band 47 Fujii, K. Characterization and Optimization of Soft-Switched Multi-Level Converters for STATCOMs 1. Auflage 2008, 206 Seiten ISBN 978-3-8322-6981-4 ABISEA Band 48 Carstensen, C. Eddy Currents in Windings of Switched Reluctance Machines 1. Auflage 2008, 190 Seiten ISBN 978-3-8322-7118-3 ABISEA Band 49 Bohlen, 0. Impedance-based battery monitoring 1. Auflage 2008, 200 Seiten ISBN 978-3-8322-7606-5
ABISEA Band 50 Thele, M. A contribution to the modelling of the charge acceptance of lead-acid batteries - using frequency and time domain based concepts 1. Auflage 2008, 168 Seiten ISBN 978-3-8322-7659-1 ABISEA Band 51 König, A. High Temperature DC-to-DC Converters for Downhole Applications 1. Auflage 2009, 160 Seiten ISBN 978-3-8322-8489-3 ABISEA Band 52 Dick, C. P. Multi-Resonant Converters as Photovoltaic Module-Integrated Maximum Power Point Tracker 1. Auflage 2010, 192 Seiten ISBN 978-3-8322-9199-0 ABISEA Band 53 Kowal, J. Spatially-resolved impedance of nonlinear inhomogeneous devices - using the example of lead-acid batteries - 1. Auflage 2010, 214 Seiten ISBN 978-3-8322-9483-0 ABISEA Band 54 Roscher, M. Zustandserkennung von LiFeP04-Batterien für Hybrid- und Elektrofahrzeuge 1. Auflage 2011, 194 Seiten ISBN 978-3-8322-9738-l ABISEA Band 55 Hirschmann, D. Highly Dynamic Piezoelectric Positioning 1. Auflage 2011, 156 Seiten ISBN 978-3-8322-9746-6

Aachener Beiträge des ISEA
ABISEA Band 56 Rigbers, K. Highly Efficient Inverter Architectures for Three-Phase Grid Connection of Photovoltaic Generators 1. Auflage 2011, 254 Seiten ISBN 978-3-8322-9816-9 ABISEA Band 57 Kasper, K. Analysis and Control of the Acoustic Behavior of Switched Reluctance Drives 1. Auflage 2011, 214 Seiten ISBN 978-3-8322-9869-2 ABISEA Band 58 Köllensperger, P. The Internally Commutated Thyristor - Concept, Design and Application 1. Auflage 201 J, 212 Seiten ISBN 978-3-8322-9909-5 ABISEA Band 59 Schoenen, T. Einsatz eines DC/DC-Wand-lers zur Spannungs-anpassung zwischen Antrieb und Energiespeicher in Elektro-und Hybrid-fahrzeugen 1. Auflage 2011, 138 Seiten ISBN 978-3-8440-0622-3 ABISEA Band 60 Hennen, M. Switched Reluctance Direct Drive with Integrated Distributed Inverter 1. Auflage 2012, 150 Seiten ISBN 978-3-8440-0731-2 ABISEA Band 61 van Treek, D. Position Sensorless Torque Control of Switched Reluctance Machines 1. Auflage 2012, 144 Seiten ISBN 978-3-8440-IO 14-5
ABISEA Band 62 Bragard, M. The Integrated Emitter Turn-Off Thyristor. An Innovative MOS-Gated High-Power Device 1. Auflage 2012, 172 Seiten ISBN 978-3-8440-1152-4 ABISEA Band 63 Gerschler, J. B. Ortsaufgelöste Modellbil-dung von Lithium-Ionen-Systemen unter spezieller Berücksichtigung der Batteriealterung 1. Auflage 2012, 350 Seiten ISBN 978-3-8440-1307-8 ABISEA Band 64 Neuhaus, C. Schaltstrategien für Geschaltete Reluktanz-antriebe mit kleinem Zwischenkreis 1. Auflage 2012, 144 Seiten ISBN 978-3-8440-1487-7 ABISEA Band 65 Butschen, T. Dual-ICT- A Clever Way to Unite Conduction and Switching Optimized Properties in a Single Wafer 1. Auflage 2012, 178 Seiten ISBN 978-3-8440-1771-7 ABISEA Band 66 Plum, T. Design and Realization of High-Power MOS Turn-Off Thyristors 1. Auflage 2013, 130 Seiten ISBN 978-3-8440-1884-4 ABISEA Band 67 Kiel, M. Impedanzspektroskopie an Batterien unter besonderer Berücksichtigung von Batteriesensoren für den Feldeinsatz 1. Auflage 2013, 232 Seiten ISBN 978-3-8440-1973-5
ABISEA Band 68 Brauer, H. Schnelldrehender Geschalteter Reluktanz-antrieb mit extremem Längendurchmesser-verhältnis 1. Auflage 2013, 202 Seiten ISBN 978-3-8440-2345-9 ABISEA Band 69 Thomas, S. A Medium-Voltage Multi-Level DC/DC Converter with High Voltage Transformation Ratio 1. Auflage 2014, 236 Seiten ISBN 978-3-8440-2605-4 ABISEA Band 70 Richter, S. Digitale Regelung von PWM Wechselrichtern mit niedrigen Trägerfrequenzen 1. Auflage 2014, 134 Seiten ISBN 978-3-8440-2641-2 ABISEA Band 71 Bösing, M. Acoustic Modeling of Electrical Drives - Noise and Vibration Synthesis based on Force Response Superposition 1. Auflage 2014, 208 Seiten ISBN 978-3-8440-2752-5 ABISEA Band 72 Waag, W. Adaptive algorithms for monitoring of lithium-ion batteries in electric vehicles 1. Auflage 2014, 242 Seiten ISBN 978-3-8440-2976-5 ABISEA Band 73 Sanders, T. Spatially Resolved Electrical In-Situ Measurement Techniques for Fuel Cells 1. Auflage 2014, 138 Seiten ISBN 978-3-8440-3121-8

Aachener Beiträge des ISEA
ABISEA Band 74 Baumhöfer, T. Statistische Betrachtung experimenteller Alterungs-untersuchungen an Lithium-Ionen Batterien 1. Auflage 2015, 174 Seiten ISBN 978-3-8440-3423-3 ABISEA Band 75 Andre, D. Systematic Characterization of Ageing Factors for High- Energy Lithium-Ion Cells and Approaches for Lifetime Modelling Regarding an Optimized Operating Strategy in Automotive Applications 1. Auflage 2015, 210 Seiten ISBN 978-3-8440-3587-2 ABISEA Band 76 Merei, G. Optimization of off-grid hybrid PV-wind-diesel power supplies with multi-technology battery systems taking into account battery aging 1. Auflage 2015, 194 Seiten ISBN 978-3-8440-4148-4 ABISEA Band 77 Schulte, D. Modellierung und experi-mentelle Validierung der Alterung von Blei-Säure Batterien durch inhomogene Stromverteilung und Säureschichtung 1. Auflage 2016, 168 Seiten ISBN 978-3-8440-4216-0 ABISEA Band 78 Schenk, M. Simulative Untersuchung der Wicklungsverluste in Geschalteten Reluktanz-maschinen 1. Auflage 2016, 142 Seiten ISBN 978-3-8440-4282-5
ABISEA Band 79 Wang, Y. Development of Dynamic Models with Spatial Resolution for Electro- chemical Energy Converters as Basis for Control and Management Strategies 1. Auflage 2016, 198 Seiten ISBN 978-3-8440-4303-7 ABISEA Band 80 Ecker, M. Lithium Plating in Lithium-Ion Batteries: An Experimental and Simulation Approach 1. Auflage 2016, 170 Seiten ISBN 978-3-8440-4525-3 ABISEA Band 81 Zhou, W. Modellbasierte Auslegungs-methode von Tempe-rierungssystemen für Hochvolt-Batterien in Personenkraftfahrzeugen 1. Auflage 2016, 192 Seiten ISBN 978-3-8440-4589-5 ABISEA Band 82 Lunz, B. Deutschlands Stromversor-gung im Jahr 2050 Ein szenariobasiertes Verfahren zur vergleich-enden Bewertung von Systemvarianten und Flexibilitätsoptionen 1. Auflage 2016, 196 Seiten ISBN 978-3-8440-4627-4 ABISEA Band 83 Hofmann, A. Direct Instantaneous Force Control Key to Low-Noise Switched Reluctance Traction Drives 1. Auflage 2016, 244 Seiten ISBN 978-3-8440-4715-8
ABISEA Band 84 Budde-Meiwes, H. Dynamic Charge Acceptance of Lead-Acid Batteries for Micro-Hybrid Automotive Applications 1. Auflage 2016, 168 Seiten ISBN 978-3-8440-4733-2 ABISEA Band 85 EngeI, S. P. Thyristor-Based High-Power On-Load Tap Changers Control under Harsh Load Conditions 1. Auflage 2016, 170 Seiten ISBN 978-3-8440-4986-2 ABISEA Band 86 Van Hoek, H. Design and Operation Considerations of Three-Phase Dual Active Bridge Converters for Low-Power Applications with Wide Voltage Ranges 1. Auflage 2017, 242 Seiten ISBN 978-3-8440-5011-0 ABISEA Band 87 Diekhans, T. Wireless Charging of Electric Vehicles - a Pareto-Based Comparison of Power Electronic Topologies 1. Auflage 2017, 156 Seiten ISBN 978-3-8440-5048-6 ABISEA Band 88 Lehner, S. Reliability Assessment of Lithium-Ion Battery Systems with Special Emphasis on Cell Performance Distribution 1. Auflage 2017, 202 Seiten ISBN 978-3-8440-5090-5

Aachener Beiträge des ISEA
ABISEA Band 89 Käbitz, S. Untersuchung der Alterung von Lithium-Ionen-Batterien mittels Elektroanalytik und elektrochemischer Impedanzspektroskopie 1. Auflage 2016, 258 Seiten DOI: 10.18154/RWTH-2016-12094 ABISEA Band 90 Witzenhausen, H. Elektrische Batteriespeichermodelle: Modellbildung, Parameteridentifikation und Modellreduktion 1. Auflage 2017, 286 Seiten DOI: 10.18154/RWTH-2017-03437 ABISEA Band 91 Münnix, J. Einfluss von Stromstärke und Zyklentiefe auf graphitische Anoden 1. Auflage 2017, 178 Seiten DOI: 10.18154/RWTH-2017- 01915 ABISEA Band 92 Pilatowicz, G. Failure Detection and Battery Management Systems of Lead-Acid Batteries for Micro- Hybrid Vehicles 1. Auflage 2017, 212 Seiten DOI: 10.18154/RWTH-2017-09156 ABISEA Band 93 Drillkens, J. Aging in Electrochemical Double Layer Capacitors: An Experimental and Modeling Approach 1. Aufl. 2017, 179 Seiten DOI: 10.18154/RWTH-2018-223434
ABISEA Band 94 Magnor, D. Globale Optimierung netz-gekoppelter PV-Batterie-systeme unter besonderer Berücksichtigung der Batteriealterung 1. Auflage 2017, 210 Seiten DOI: 10.18154/RWTH-2017-06592 ABISEA Band 95 Iliksu, M. Elucidation and Comparison of the Effects of Lithium Salts on Discharge Chemistry of Nonaqueous Li-O2 Batteries 1. Aufl. 2018, 160 Seiten DOI: 10.18154/RWTH-2018-223782 ABISEA Band 96 Schmalstieg, J. Physikalisch-elektrochemische Simulation von Lithium- Ionen-Batterien: Implementierung, Parametrierung und Anwendung 1. Aufl. 2017, 176 Seiten DOI: 10.18154/RWTH-2017- 04693 ABISEA Band 97 Soltau, N. High-Power Medium-Voltage DC-DC Converters: Design, Control and Demonstration 1. Aufl. 2017, 176 Seiten DOI: 10.18154/RWTH-2017-04084 ABISEA Band 98 Stieneker, M. Analysis of Medium-Voltage Direct-Current Collector Grids in Offshore Wind Parks 1. Aufl. 2017, 144 Seiten DOI: 10.18154/RWTH-2017-04667
ABISEA Band 99 Masomtob, M. A New Conceptual Design of Battery Cell with an Internal Cooling Channel 1. Aufl. 2017, 167 Seiten DOI: 10.18154/RWTH-2018-223281 ABISEA Band 100 Marongiu, A. Performance and Aging Diagnostic on Lithium Iron Phosphate Batteries for Electric Vehicles and Vehicle-to-Grid Strategies 1. Aufl. 2017, 222 Seiten DOI: 10.18154/RWTH-2017-09944 ABISEA Band 101 Gitis, A. Flaw detection in the coating process of lithium-ion battery electrodes with acoustic guided waves 1. Aufl. 2017, 132 Seiten DOI: 10.18154/RWTH-2017-099519 ABISEA Band 102 Neeb, C. Packaging Technologies for Power Electronics in Automotive Applications 1. Aufl. 2017, 132 Seiten DOI: 10.18154/RWTH-2018-224569 ABISEA Band 103 Adler, F. S. A Digital Hardware Platform for Distributed Real-Time Simulation of Power Electronic Systems 1. Aufl. 2017, 156 Seiten DOI: 10.18154/RWTH-2017-10761

Aachener Beiträge des ISEA
ABISEA Band 104 Becker, J. Flexible Dimensionierung und Optimierung hybrider Lithium-Ionenbatteriespeichersysteme mit verschiedenen Auslegungszielen 1. Aufl., 2017, 157 Seiten DOI: 10.18154/RWTH-2017-09278 ABISEA Band 105 Warnecke, A. Degradation Mechanisms in NMC Based Lithium-Ion Batteries 1. Aufl. 2017, 158 Seiten DOI: 10.18154/RWTH-2017-09646 ABISEA Band 106 Taraborrelli, S. Bidirectional Dual Active Bridge Converter using a Tap Changer for Extended Voltage Ranges 1. Aufl. 2017 ABISEA Band 107 Sarriegi, G. SiC and GaN Semiconductors – The Future Enablers of Compact and Efficient Converters for Electromobility 1. Aufl. 2017 ABISEA Band 108 Senol, M. Drivetrain Integrated Dc-Dc Converters utilizing Zero Sequence Currents 1. Aufl. 2017 ABISEA Band 109 Koijma, T. Efficiency Optimized Control of Switched Reluctance Machines 1. Aufl. 2017
ABISEA Band 110 Lewerenz, M. Dissection and Quantitative Description of Aging of Lithium-Ion Batteries Using Non-Destructive Methods Validated by Post-Mortem-Analyses 1. Aufl. 2018 ABISEA Band 111 Büngeler, J. Optimierung der Verfüg-barkeit und der Lebens-dauer von Traktionsbatterien für den Einsatz in Flurförder-fahrzeugen 1. Aufl. 2018 ABISEA Band 112 Wegmann, R. Betriebsstrategien und Potentialbewertung hybrider Batteriespeichersysteme in Elektrofahrzeugen 1. Auflage 2018 ABISEA Band 113 Nordmann, H. Batteriemanagementsysteme unter besonderer Berück-sichtigung von Fehlererken-nung und Peripherieanalyse 1. Aufl. 2018 ABISEA Band 114 Engelmann, G. Reducing Device Stress and Switching Losses Using Active Gate Drivers and Improved Switching Cell Design 1. Aufl. 2018 ABISEA Band 115 Klein-Heßling, A. Active DC-Power Filters for Switched Reluctance Drives during Single-Pulse Operation 1. Aufl. 2018
ABISEA Band 116 Burkhart, Bernhard Switched Reluctance Generator for Range Extender Applications - Design, Control and Evaluation 1. Aufl. 2018 ABISEA Band 117 Biskoping, Matthias Discrete Modeling and Control of a versatile Power Electronic Test Bench with Special Focus on Central Photovoltaic Inverter Testing 1. Aufl. 2018 ABISEA Band 118 Schubert, Michael High-Precision Torque Control of Inverter-Fed Induction Machines with Instantaneous Phase Voltage Sensing 1. Aufl. 2018 ABISEA Band 119 Van der Broeck, Christoph Methodology for Thermal Modeling, Monitoring and Control of Power Electronic Modules 1. Aufl. 2019 ABISEA Band 120 Hust, Friedrich Emanuel Physico-chemically motivated parameterization and modelling of real-time capable lithium-ion battery models – a case study on the Tesla Model S battery 1. Aufl. 2019 ABISEA Band 121 Ralev, Iliya Accurate Torque Control of Position Sensorless Switched Reluctance Drives 1. Aufl. 2019

Aachener Beiträge des ISEA
ABISEA Band 122 Sarah Paul Ayeng’o Optimization of number of PV cells connected in series for a direct-coupled PV system with lead-acid and lithium-ion batteries 1. Aufl. 2019 ABISEA Band 123 Stefan Andreas Koschik Permanenterregte Synchron-maschinen mit verteilter Einzelzahnsteuerung - Regelkonzepte und Betriebs-strategien für hochintegrierte Antriebssysteme 1. Aufl. 2019

ISSN 1437-675X
In this study, LIBs at diferent aging states using various active materials are investigated whereby the primary focus lies on investigating the electrical behavior of LIBs using LTO anodes. In addition, other LIB technologies such as NMC/C and LFP/C are examined. Characterization tests are performed over a wide temperature range by employing electrochemical impedance spectroscopy and current pulse tests. Furthermore, the behavior of battery impedance parameters and open-circuit voltage over the battery lifetime for various temperatures and SoCs is investigated. Model based approaches using reduced-order equivalent circuit models (ECM) for battery state estimation have received increasing attention in recent publications mainly due to their simple nature and the possibility for implementation on low-cost embedded systems. The aforementioned techniques are often reliable and can track the changes of impedance characteristics over the battery lifetime. In this study, a comparative study of a wide range of impedance-based ECMs for on-board SoAP prediction is carried out. In total, seven dynamic ECMs including ohmic resistance, RC-elements, ZARC elements connected in series with a voltage source are implemen-
ted. The investigated ECMs are veriied under varying conditions using real vehicle data obtained in an EV prototype and current pulse tests. Furthermore, the current dependence of the charge transfer resistance is considered. The dependence of voltage estimation and SoAP prediction accuracy for diferent prediction time horizons on SoC, temperature and applied current rate is examined.