District Census Handbook, Ahmadabad, Part X-C-II, Series-5
332
CENSUS 1971 SERIES-5 GUJARAT DISTRICT CENSUS HANDBOOK PART X-C-Il (wiCII .. Prints eI Part X--:C-I) ANALYTICAL REPORT ON CENSUS AND RELATED STATISTICS SOCIO -ECONOMIC AND CULTURAL TABLES (RURAL AREAS) AND HOUSING TABLES AHMADABAD DISTRICT c. c. oocrOR of the Indian Administrative Service Director of Census Operations Guj",fIt
-
Upload
khangminh22 -
Category
Documents
-
view
1 -
download
0
Transcript of District Census Handbook, Ahmadabad, Part X-C-II, Series-5
CENSUS 1971
SERIES-5
GUJARAT
DISTRICT CENSUS HANDBOOK
PART X-C-Il (wiCII .. Prints eI Part X--:C-I)
ANALYTICAL REPORT ON CENSUS AND
RELATED STATISTICS
SOCIO - ECONOMIC AND
CULTURAL TABLES (RURAL AREAS)
AND HOUSING TABLES
AHMADABAD DISTRICT
c. c. oocrOR of the Indian Administrative Service
Director of Census Operations Guj",fIt

CENSUS OF INDIA 1971
LIST OF PUBLICATIONS
Census of India 1971-Series-5-Gujarat is being published in the follQ.wing parts :
Part Number
I-A I-B I-C II-A
Centra.l Government Publications
SuEJject covered
General Report Detailed Analysis of the Demographic, Social, Cultural and Migration Patterns Subsidiary Tables General Population Tables ('A' Series)
II-B Economic Tables ('B' Series) II-C(i) Distribution -of Population; Mother Tongue and Religion, Scheduled Castes and
Scheduled Tribes II-C-(ii) Other Social and Cultural Tables and Fertility Tables, Tables on Household
Composition, Single Year Age, Marital Status, Educational Levels, Scheduled
III IV~A
IV~B
V VI,A VI,B VI,C VII VIlI-A VIII-B IX
X-A x-s X-C-I X-C-II
X-C-II
Castes and Scheduled Tribes, etc., Bilingualism. . Establishments Report and Tables ('E' Series) Housing Report and Housing Subsidiary Tables Housing Tables . Special Tables and Ethnographic Notes on Scheduled Castes and Scheduled Tribes Town Directory Special Survey Report on Selected Towns Survey Report on Selected Villages Special Report on Graduate and Technical Personnel Administration Report-Enumeration 1
Administration Report-Tabulation '- For official use only Census Atlas
State Government Publications
DISTRICT CENSUS HANDBOOK
Town and Village Directory Village and Townwise Primary Census Abstract Departmental Statistics and Full Count Census Tables Analytical Report on Census and Related Statistics, Socio Economic and Cultural Tables (Rural Areas), and Housing Tables (Supplement) Urban Sample Tables
II
CONTENTS
1. ANALYTICAL REPORT ON CENS'("S AND RELATED STATIS'lJ('1"
A. INTROPUCTION
(1) History of District CenBu;.; Handbook, (2) Seo1';' of District Cpn"us Hal.6 book, (3) Definit ions and Concl'ptH.
B. LOCATION AND PHYSICAL FEATURES
(1) Location,(2) PhYRiography.(lI) Soils, (4) F()le~b.(5) Mill('IU'" (6) RivpP- (7) Lak(,HandTank~ (8) C'limai('ant!
Temperature, (9) Rainfall.
C. ADMINISTRATIVE SET-UP
(1) AdministrEttive DivisionF, (2) Revenue, (3) Parli8m~nlf1I~' srI' A;;,nJ,:~ constituI'llci,'s and Elections, (4) Jlldici:H~-.
(5) Police, (6) Jail" (7) Local Self Government.
D. 'l'EHRITORIAL AND OTHER CHANGES
(I) Tllrt'it-orisl changes, (~) Growth or Decay of ITI bOil Cpntl ('S, (;: i Cl-vngpf in FU!I('tiellal Categnn- of Tov.r~.
~, ~{AJOR EVENTS
(1) Scarcity.
}<'. ECONOMIC AND OTHER ACTJVITIES DrRlNG 1HE DECADE
PAGES
i-ii
3·9
9·10
11·18
18·20
20
21-35
(1) Agric\\lture, (2) Irrigatiol , (3) Agricultuy'al PY'ooUCf' MaIl,f't;, (4) C'o-o,o'Rti( n, (5) -Wslf'hoUF"", (6) Live&to('k and .An'IDol
Husbandry, (7) Industrie~, (~) Trade and Comme]('(', \9) Elp('tJ;{';1~ (1.( r("~l. PO) TJ!llhloli pn" Communi('ation.{11, p,;c<C'f-<
(12) Joint Stock Compories, (l:{) Banking, (14) In~uronce, (15) Education. (Hi) !ikfh~f18nd ruhlie Heolth. (17) Agrllrip,n
R{'forms and Agrarilln Developmeni~.
U. DK\WGRAPHIC CHANGES D'CR]NG 'IHE IJECAIJE
(1) General, (2) Density and Decadal variation in J'opulnl;( n (:5) Spx Ratio, (4) Hou~{'holcl Rize,
(;;) Urban Population, (n) Hou~ele~ Population, (7) InQti!uti01wl Population, (1') Growth of Population,
(9) Size ofYilIagr, (10) Population b~' Age and Sex, (11) I,itpJI1cy, (12) Mo1lf'1 tongue, (13) Religion,
(14) 'WorkerS and Non-wollef'l k, (15) Schpduled Ca~teR, (J 6) Scheduler] Tribes, (17) EstabliRl mNlt~, (18) HOUsing.
H. SETTLE1iENT PATTER:', AND SOCIAL Dl'MCCRAI'HY (InclUding Tables)
(I) Rural Areas, (2) Urban Ar('a~
H. 1 Distt ihution of villa,ges with refol'ence to area in hectare"
H. ! Distribution of inhat.it"d villages b~' selectNl amenit,i('~. infra-st! uctural and land u~e data with reference to
diHtance from near('st town H_ 3 Distribution of inhabitNl villages by self'cted rloIDogl aphir rhflrllctel i"ticF and diRtal1(,(, from nNll'f'st town
Average sizp of villagf's by rliAtanco rango from nearpst town by size class
36-53
53-70
57
58-59 60-61
62 H. 5 Distribution of inhobi1rd Yillflges by sizp claRs of popn1ntioL hnvir g selectf'd servicing,institutions and drmog,nphic
H.6
H.7
characteristics
Medical and Postal fa('iiities P('J 100 Km2. of rura 1 area at taluka levAI
Distribution ofvillag('" by (lonsity per Km2. and aVorage distance'from nAaH)st town
62-63
63 64
H. 8 Distribution ofinhabitpd yjJlagps hy proportion of scherlnlpd castes and schf'duled tribe8 poi~ldat.ion and dpr'sity of
population 64-65
H. 9 Ranking ofvillag('s of different. size ClaSFf'8 b~' amf'nit~· scores 65
H. 10 Selected demographic characteristics in towns by size claRs of populatior 66 H. 11 S"Iected d,'mographic characteristics b~' dpnRity of popnlation of towr ~ 67 H.12
H.U H-14 H.15 H.I6
H.17
H. IS
H. HI
H.20
Distribution of towns by ~i7p ('lass of popUlation and functional category
Funet'onal {'atf'gor~' and j.;rowth ,'otp of towns
F~maJe workers o,R pel ceNnge oft."tal fomaie populoti(~n in t.own~'by size. cias~ of popl;l~tion PE'I' capita Receipt and Exp0nditur(' Of)O('fI~ hodi0~ in towns by 9i~e class ofpl)p'llation
Per capita Recoipt fwd Exp{'nditu' p onoeal hodip~ ir old and new townR
Per oapita Re(,pipt onil expendtnrp of IocR I podies in old lind new towns
Per capita Heceipt and Expf'nditnrE' of 10cB,1 bodif'R in towllA hy function!' I ('ategory
Educatir;nal and Medical fBcilitiPR pf'l 1,('((' populatinr in tOWllR by siz!' c1aRR of populatioll
MediC'n I fl\cilitiA" in to'" nR by fun{'tlona I c8t<'l!Or~-
If I
67 68 68
69 69 09 70 70 70

8ECTION·I
SECTION-II
SECTION-III
Kote
II TABLES
DEPARTMENTAL STATISTICS (Detailed contents are given 011 page:; iii and iv ill Pal·t II Tablo6)
CENSUS TABLES BASED ON FULL COUNT
(Detailed conteIJt~ are given 011 pafles v and iv in part II Tab)e~)
sOCIO ECONOMICS AND CULTURAl, TABLES (RURAL AREAS) AND HOUSING '!'ABLER
ExplanatOry note to Sample Census
B- Economic Tables
....
Table B-lIi PART B ()lu;;sificat.iOH of ,Yorken and Nou-worken Rccol'Jing to lJlaiu activity by educational levels ill
rural arcas ollly
Table B-rY Part A Jndustrial cl",,,ificalioll ofpeJ'sOD'; at wo, k other than at eultiY>lti o)\ at main IIctivily hy W:l[ and
l-li4
LIS·ISS
IS9·23~
191
192-19S
1\)4·1\15
divisiolls. :\lajOl' gl'OUp:-; uwl min,,!, grol')" (Hulal) ._. l\)t).198
Ap!,<,udix-D i,t I'ihut ion of \\ ortn, ill manu[uet Ul'ill!!. ProCc,sillg ;;el'viciu_[( all!ll'cpail-' by household indust.ry ami
1l0]L·holl';f'holrl indu,;t,y (Rulul) " 199-201
Table B-Yl Pa!'t B (i) OeeupHtiollUl('hl",.;ificlltioll (lfp<'r';OIlHat woJ), 1\('('01 ding to main activity othtlr than cultivatiorl
by :-;px al,d ngt' g:rolll's in rli1 rt I ill PU;-; Oldy 202 .. 2t)(
J\.N'XEXrHE·Xntionvl C'hl,,,ifit">Iti(,lt of Ocettpntiou" 2 Hh211
Table 13-V1 Pall B (ii) OC('ul'utiou,d clu"ifiellliuH uf pCl-tiOnS at -work nceunliul': to lllaiJll1ctitivity othe)' than CUltivation
i.
Tah 11' D-Y11 :'>"<'011(.111)':" ,,01 I, i, e. P(,I',,,'Jl' Ill" ;llg- maill act it iyity (I) ('Hit iy" t iuu. (ii) ag I i"nlt III c] III houn I'. (ii i) H()u8~h(Jld ill<lll~ll'Y, (iv) nOll·household indu8tJ-~' IIwl (v) llon-work<,}'>; cln"ifl"d 1,y ""X alld hy B('('ondal'Y work
212·215
(i) hlluocholll illdu"t ry (ii) rultiyati(lll (iii) IIgr ir u ]jHra I labou),,,!, (If (iv) non-houHt'hold il'dll~trY. tl'utlf', bu~ine,,~ Or ~{)l'Victl
(Rural) :118
Tabl. B-Y 111 1"'1'",,,,, cla:<sifh'tl a" non''''''1 kp),>, aecordil'.g to main ndiYity eros,·cla,;.~ified by 8eX, age grO\lpll and type or
.. ctivity (Rural) 216
C-Social and Cultural Tables
Rote
Table C-1I Agn ,tad 'Jlal'ital t:itatlls
Table CoLlI Pal,t-A.Ag<,. i'lf'J< aud Etlllca i ioll illl'lll'al ,\1','HN
D-lligration Tables
Kote
Tab}p D-T Populatiou clu"ifk(l I.,\" plac(' of birth (Rund)
AppelHlix-l :P1'I'~o](~ hO)'ll in othE'1 di,.;tl'ids of tIl(> Htnt,· alld t'IlUIn"lIlt"d ill t]li, ,li,11 i(t
ApPt'Il(lix-ll Pel''<''I, Lot n ill t,hi, ,liK\rid but cnunll'l'atcd ill ot.her di,t,ri(,t s of thp :;\\-81-"
, H-Housing Table~
217
218-219
218·219
221
222-223
224
225
22(i·22fl
:Note 231
Tahlt'-H-I Cpllsll~ R(lu'e~ amI th,' nSf'" to which tlwy are put. 232
Table-H-II Distribution of C'(,!I~lIs Roil"" h~> pll'(\"minant mnt('rial of wn II !luI ]11' dominrr,t met, I is I of loof 232
Appendix-Dish,j}mtioJl of J('"idl'nt iul ('rn"" Hou'f'f( by matrl-ia I of wall enWK claK,iiird by Instcl'ial (lr ro(.f 233
Table-H-IlI C'I'IlSU" H(Jll,,,jlOld, clo",-ifil'r] b, numb,,], of membl'l" aud by llumb,,)' I)f j'lH'JflR occnpipd 23c4
Tab]p-H.TY Hnllf-p]lolcls :~II1"ifi{'d L: ,'7,(' and tPnllJ'" Ktatus 23 ..
IV
PREFACE
The District Census Hand Book Volumes of 1971 were divided into three parts. Part A contained the town and village directories and B contained the Urban Block and viIlagewise Primary Census abstracts. These two parts were brought out within a record time of one year after the taking of the Census. Part C-I containing the departmental statistics and the full count Census tables was also published within six months of the first publications named above.
The sample tables took a little longer time, as the mechanical data processing for urban areas, which was first to be done at the national level could not be completed untill the tables for all the States were received, checked and cleared by the Registrar General. India. It was for this reason that his special permission was obtained to publish the available data as part C-I so as not to withhold from the scholars, administrators and planners what was already compiled and ready for publication.
The present combined volume C-I, C-II contains in addition to what has been already published separately as C-I, the analytical and interpretative reports on the districts based on the published data of 1971 Census and throws some highlights on the demographic changes which have occured during the decade. A number of hypotheses have been tested in their application to the data of each district. The results in some cases have been startling while in others have been just as expected. It further includes sample tables of all the rural areas of the State. The urban sample· tables are being published as an annexture to this volume separately in the near future.
The idea about including in this volume a portion about the decadal changes that had occured was first conceived by our Directorate. Similarly the work of testini the various hypotheses suggested by Dr. Roy Burman was first done in Gujarat State and sent to the Registrar General for approval. Both these points
, were examined critically by the Registrar General and cleared for inclusion in Part C-II. It is with a deep sense of satisfaction that I place them before the readers as an interesting feature. D-tOO7
The analysis of whatever data was available to us. ~s completed at the time I was about to leave the Census Organisation in March 1974. But the task was incomplete. It had to be supplemented by additional analysis of further data as and when it became available after the sample tables were compiled. The Census Organisation was also being slowly wound up at this stage, and it was posing a very serious problem in my mind as to how the work already done could be well rounded and properly supplemented after I had left and the organisation shrunk to the intercensal level. Shri P. B. Buch, Director of the Bureau of Economics and Statistics came to my rescue at this stage and promised to take over the loose threads and weave them into a strong and fine yam from the moment the wanting data became available. What is now presented in this volume in the form of analytical essays is the combined effort of the Census Organisation and the State Bureau of Economics and Statistics. Shri Buch has taken great pains, not only in interpretation of fresh data, but also in going through the interpretations done before he stepped in and made valuable suggestions for reducing the bulk of the present volume. He has read every line of what is written here and weighed every word that is printed. While I claim general responsibility for the contents of this volume, I would like to give full credit to Shri Buch for the spirit of love and dedication with which he has volunteered to take the entire load for the publication of this volume from the stage at which I had left it. I have great pleasure in placing on record here, that none could have done the work better. My grateful thanks are to him and his excellent team of workers, which included among others Sarva Shri G. R. Shaikh. Deputy Director; C. P. Vyas, Research Officer; S. M. Shelke, Research Assistant; B. R. Patel, Research Assistant and V. A. Dhagia. Tabulation Officer. These persons greatly helped in maintaining the continuity of work.
With the publication of this volume the District Hand Book Series of 1971 Census are completely out It is hoped that they would prove useful to students, administrators and planners and also the general reader for whose benefit much labour and pain has been
shared by a team of dedicated workers to all of whom I am deeply indebted.
I would be failing in my duties if I do not acknowledge here the deep debt of gratitude lowe to Shri A. Chandra Shekhar, lAS, Registrar General, India apd Dr. B. K. Roy Burman, Dy. Registrar General, India for the valuable suggestions and guidance I have received from them from time to time.
AHMADABAD,
8th April, 1975.
I am equally indebted to Shri. L. R. Dalal, l.C.S .• Chief Secretary to the Government of Gujarat for the sustained interest taken by him in all matters connected with Census. But for his support and encouragement it would not have become possible to bring out this volume even at this stage.
ii
c. C. DOCTOR, Director of Census Operations, Gujarat
now Administrator, Municipal Corporation, Ahmadabad.

SECTION I
~ Departmental Statistics

INTRODUCTORY NOTE
Departmental Statistics
An effort has been made to present in this part of the Handbook the basic data of the district in 6~ difi'erent tables prepared from the material collected from various administrative departments of the State Government and the Government of India as well as from various statutory organisations like the Gujarat Electricity Board, the Life Insurance Corporation of India; the Food Corporation of India, the Reserve Bank, Central and State Warehousing Corporations etc. A mere glance at the contents of the tables presented in this volume would show that they provide a deep insight into the infrastructure of the district which will prove useful not only to the administrator and the social, political and research worker but also to the framers of the Dist.rict and the State plans. It. has also been devised in order t.o provide interesting material to the reader who wants to know morE about the District. The tables highlight the structural changes that have undergone in various spheres of activity in the district during the period 1961-197]. An attempt has been made to present the data talukawise as far as possible in order to facilitate inter-regional comparisons within the district.
The tables on departmental statistics included in the present series of Handbooks are more or less devised on the lines of the District Census Handbooks of 1961 Census so as to make the data comparable. In addition to these, some useful data on agricultural research stations, veterinary and animal husbandry institutions, rest houses, land revenue collections, secondary school certificate examinations, forests, composition of Panchayati Raj bodies, etc., have also been included.
The tables on departmental statistics have been grouped under 18 different heads as listed below :-
I Rainfall and Temperature XI Administration II Vital Statistics XII Public Entertainment, Presses and Journals III Agriculture, including Forests XIII Transport and Communications IV Livestock XIV Local Bodies V Coopera.tion XV Warehousing VI Fisheries XVI Prices VII Factories XVII Joint Stock Companies, Insurance, Banks VIII Electricity and Cooperative Societies IX Medical and Public Health XVIII Fairs and Festivals and Ancient X Education Monuments
A brief desrrip-::ion of the contents of the tables included under each of the above groups is given ill tbe following paIagraphs :-
I-Rainfall and Temperature
This ~oup contains two tables-one on rainfall and the other on temperatures in the district.
Table No. 1.1 gives the mean maximum, mean minimum, highest and lowest temperaturfs recorded at the district head'1uarter stations-monthwise for the years 1961 to 1970. Table No. 1.2 gives the monthV\ise details of rainfall and rainy days recorded at the district headquarter stations for the Yfars 1£61 to 1970.
II-Vital Statistics
This group contains hm tables-one on birth and death rates based on mid-year population estimates and the second on the num])'3I of dut'Ghs il' the district by selected causeS.
1'able No. 2.1 gives the loirth and death rn.tes for a period of ten years 1961 to 1970-bas(d on m:d-year population es1imated by and the number of births and deaths registtred for Each district by the Directorate of Health Services, Ahmadabad. The min-year population has been estimated by projecting the 1961 pO[Julation arrived at the time of 191H Census. The figures of births and deaths have been compiled on tLe bs:s of d'strict and taluka returns received in the State Health Department. Table No. 2.2 gives the figures of deaths in the district by selected canSeS for the years 1961, 196(; and 1970.
3
III-Agriculture
This group contains nine tables which give important data pertaining to the agricultural sector of the district's. economy.
Table No. 3.1 gives the details of utilisation of land in the distrif't for the years 1961-62 and 1967-68. It sho,ws the figures for cultivated and un-cultivated land, barren, fallow and cultivable waste land etc. Table Np: 3.2 gives the figures of area and outturn of principal crops for the years 1961-62 to 1970-71, highlighting tlie cropping pattern of the district. Table No. 3.3 givts details of the' irrigation projects in the district with particulars of capacity, water spread and command areas 80S on 1st April 1971. Table No. 3.4 gives details of irrigated areaS by SourceS of irrigation for the years 1961-62 to 1967-68. Table No. 3.5 gives the details of area under irrigated crops for years 1961-62 and 1967-68. Table No. 3.6 is an interesting table which gives talukawise percentage of areas under different crops for the years 1965-66 and 1968-69 showing the relative importance of the crops viz-a-vis the total area undel such crops in the district as well as the total clOpped area of the talukas. These percentag6s have been calculated on the basis of provisional talukawise figures maintained by the State Department of Agri(;ulture. 'l'able No. 3.7 gives thu details of the location of agricultural research stations in the district as in 1969-70 with a brief description of the nature of activities carriEd out at each oentrE'. Table No. ~.8 gives the area under different tyPfS of forests in the district for the years 1961-62 1~69-70. The forests have been divided into four broad categories, namely, Reserved, Protected, Unclassified arid' Private-the first three of which are under the control of the State Forest Department. ThEBe figures are made available for the first time by the Chief Conservator of Forests. Table No. 3.9 gives the market placEs wheIe a major portion of the agricultural produce of the district is being marketed. The table contains the names of Produce Markets regulated under the Agricultural Produce Markets Act of 19:\9 giving details of main yards, subyards, year of establishment and the agricultural commodities bought and sold in those markeh. The information embodied in this table pertains to the year 1970-71.
IV -Livestock
This group contains four tables which give the details of livestock wealth, animal husbandry promotion and poultry farms located in the district. Table No. 4.1 gives the results of livestock Censuses conducted in the district by the State's Bureau of Economies and Stat,istics in the years 1961 and 1966. Table No. 4.2 gives the details of the location of animal hUSbandry, and poultry farIDS in the district 80S in 1969-70. It gives further details about the agency of management, year of establishment and a brief description of the activities being carried out in those farms. Table No. 4.3 which is very similar to the preceding tabl!:;, gives details of various animal husbandry and poultry rearing activites in the district as in 1970-7]. Table No. 4.4 gives a list of various types ~of veterinary institutions available in the district viz., veterinary hospitals, veterinary dispensaries and subdispensaries, first aid veterinary centres, cross-breeding centres, artificial insemination c('ntres and sub-centres, mobile veterinary dispensaries etc.
V-Co-operation
This group includes only one table, namely, No. n.1 which shows the number, membership and financial position of co-operativE. societies in the district for 1969-70. The table shows the number of different types of co-operative societies, both credit and non-credit, with details of membership, working capital, loans, share capital, reServe and other fnnds and deposits.
VI-Fishine
This group includes only one table, namely, No. 6.1 which gives the details of fishing centres, landing places and number of fishing boats according to size in the district as on 31st MaIt'h 1971. The tahle also give~ the information about the n'lmber of fishermen's 000pPlative societies .:md their membership in these societies.
VII-Registered Faeiories
This group Includes three ta bJes (In factory and industrial establishments and skikes and lor kouts at th(lse establishment in the district.
Table No. 7.1 gives the number and types of working factories showing averll~e emp;oym€llt therein for the years 1960, 1965 and 1970. The wOlking far-tories have hen shown under vari(ll's iml1:strial clflsses according
4
to the Standard Industrial Classification adopted by the State Factories Department. Table No. 7.2 giTes the ~tatistics relating to factory industries in the district for the years 1961 to 1967. This table is based on the results of annual survey of industries being conducted by the State Bureau of Economics and Statistics in colla.boration with the Central Statistical Organisation, New Delhi. The table has been divided into two parts of which the first part gives the actual figures of persons employed, productive capital, ex-factory value of output and net value added by manufacture for all industries covered under the annual survey in the State. The second part ~hows the district's relative share in those very items in terms of percentages of the State totals. Table No. 7.3 shows the details of industrial strikes and lockouts which took place in the district during 1970. The table gives details of the industry codes of the units affected by such strikes and 10 kouts, number of such events, un ts affi'cted and the number of maT1days lost. .
VIII-Electricity
This group includes only one table VIZ., No. S.l which gives the data on the consumption of electricity according to purposes in the district for the years 1960-61, 1965-66 and 1970-7l. The data pertains to power h011ses run by the State Electricity Board as well as those run by private licencees. The consumption has been classified into four broad classes VI~Z. domestic, commercial light and small power, industrial and other purposes.
IX-Medical and Public Health
This group contains five tables glVmg data on medical and public health facilities available in the district.
Table No. 9.1(A) gives the number of allopathic hospitals and dispensaries in the district with details of beds available and the outdoor and indoor patients treated for the years 1960, 1965 and 1970 while table No. 9.1(B) gives similar data for Ayurvedic medical institutions for the years 1961, 1966 and 1971. Table No. 9.2 gives details of public health activities in the district for the years 1966-67 to 1969-70. This table gives the number of primary health centres, rural dispensaries, maternal and child health centres and family planning centres existing in the district in those years alongwith the number of persons treated therein. Table No. 9.3 gives the data on another important activity of the State Health Department, viz., small-pox vaccination in the district for a period of ten years from 1961 to 1970. The table gives yearwise figures of primary vaccinations and revaccinations carried out by the State Health Department in those years. Table No. 9.4 gives details of E.O.G. vaccination programme in the. district. It shows the number of persons vaccinated in the talukas in which this programme was launched in 1970.
X-Education
This group includes SLX tables glvmg valuable information on pnmary, secondary, collegiate and technical education in the district.
Table No. 10.1 gives the data on schools, scholars and teachers in non-municipal areas of the district for the year 1970-7l. The data in this table have been presented talukawise and contains, besides the number of schools, students and teachers, information on villages with or without schools. Table No. 10.2 gives the statistical data about education in non-municipal areas of the district for the year 1970-71 and includes talukawise data on average attendance of pupils per school and the number of students per thousand of population per primary school and per teacher in primary school. Table No. 10.3 gives an overall picture of education in the district and gives details of institutions, pupils and teachers in four broad categories namely, primary, secondary, higher and others for the years 1961-62, 1965-66 and 1969-70. The figures for pupils and teachers have been given sexwise. Table No. 10.4 gives an inventory of colleges and technical institution existing in the district as on 31st March 1971. The table No. 10.5 gives the centrewise data on candidates appearing and passing at the Secondary School Certificate Examination for the years 1961 to 1970. Figures in this table are shown separately for the March and October examinations. Table No. 10.6 !!hows the figures of enrolment of students in Classes I to V, VI to VIII and IX to XI with percentages by sex to its corresponding estimated population within age groups 6 to 10, 11 to 14 and 14 to 17 respectively for the years 1960-61, 1965-66 and 1969-70.
XI-Administration
This group includes lIeven tablel'l glVmg Tital data on admini!!tration in the district .
. Table No. 1l.1 shows the strength of the police force in the district for the year 1970-71 by nriouil catsgones of personnel and also by permanent and temporary status. It may be noted that Central Police establishments such as Railway Police, Special Reserve Police, Polic4il Training Schools and Inspector General of Polics's
Y-1I2-3
establishments have been excluded from the perview of this table. Table No. 11.2 gives the districtwise data OIl
the proportion of area, population and cognisable offences per police for the year 1970. Table No. 11.3(A) gives the results of the trials of criminal cases for the years 1961 to 1970. The table shows the number of offences reported and the manner in which the cases were disposed off. Table No. 11.3(B) gives the number of cognisable offencell reported in the district for the yeltrs 1961 to 1970. The offences have been classified in eight broad categories according to the nature of offences. Tltble No. 11.4 gives the data on jails of the district for the year:-- 1960, 1965 and 1970. The table shows the number of prisons and their authorised accommodation along with the category of prisoners including those received and discharged during the relevant years. Table No. 11.5 giVfll'! the data on instruments registered, and the value of property transferred during the years 1960, 1965 and 1970. The table covers both n.ovable and immovltble properties and also compulsory and optional registrations. Table No. 11.6 gives the figures of collection of land revenue in the district for the years 1960-61 to 1969-70.
XII-Places of Public Entertainment, Presses and Journals
This group consists of three tables giving statistics of newspapers and journals published III the district, printing presl'Ies and cinema theatres.
Table No. 12.1 gives the figures of newspapers published in different languages in the district for the years 1960-61 and 1969. The jou.rnals have been classified im a daily, weekly, fortnightly, monthly, quarterly and others and have bee:'} differently shown for English, Gujarati, Hindi and other languages. Table No. 12.2 gives the talukawise data. on the number of printing presses which existed in the district in the years 1961 and 1968. Table No. 12.3 gives the talukawise location and number of cinemlt threatres as in 1970-71 with det&ils of monthy averages of spectators. The touring talkies have also been included in this table.
XIII~Transport and Communications
This group includes four tables on transport and communication facilities available in the district.
Table No. 13.1 gives details ofrailway mileages and the railway stations in the district for the year 1970-71. The railway mileages have been shown separately for different guages of railway line and the railway stations have been 5hown talukawise. Table No. 13.2 shows the road kilometreage by type of surface and category of road in the district for the years 1960-61, 1964-65 and 1969-70. The data have been pre,~ented for National Highways, State Highways, Major District Roads, Other District Roads and Village Roads and the surface has been classified by asphalt, cement concrete, water bound macadum and murram and other lower types. Table No. 13.3 gives the tonnage of import and export cargo handled at each port of the district for the years 1960-61, 1964-65 and 1969-70. Separate figures have been given for foreign a.nd coastal traffic and also for' sailing and steamer vessels. Table No. 13.4 gives the list of Atithi graMS (circuit houses), t ishram grahas (inspection bungalows), Aram grahs (rest houses) and Dharamshalas in the district maintained by the State P. W. D., Panchayats and Municipalities for the use of travelling officers and the public. The details of the maintaining authorities have also been shown in the table.
XIV·-Local Bodies
This group includes statistical information pertaining to the institutions of local self-government namely Municipalities, Municipal Corporations and District, Taluka, Nagar and Gram Panchayats.
Table No. 14.1 gives the number of local bodies Itnd organs of democratic decentralisation in the district for the years 1961-62 to 1970-71. The table covers Municipal Corporations, Municipalities, District Local Board,,, and District, Taluka, Nagar and Gram Panchayats. Table No. 14.2 shows the composition of Municipal Corporations and Municipalities in the district for the years 1961, 1966 and 1971. Besides the data on the total number of seats, the table gives details of reserved seats for scheduled castes, scheduled tribes and women and also of those categories returned against unreserved seats. Table No. 14.3 shows the composition of the District Panchayat as on 1st January 1971. It covers all associate, elected and ex-officio members of the District Panchayat. Similarly table No. 14.4 shows the composition of the Talnka Panchayats of the district as on 1st January, 1971 and tables No. 14.5 and 14.6 show the composition of the Nagar and Gram Panchayats respectively. Table No. 14.7 shows the details of income and expenditure of the municipalities of the district for the year 1970-71 while the subsequent table No. 14.8 gives the details of the income and expenditure of Taluka and District Panchayats for the years ]963-64, 1966-67 and 1969-70. Table No. 14.9 gives simibr dab for the Gram and Nagar Panchayats for the year 1969-70.
6
xv - Warehouses and Godowns
This group contains three tables which show details of the facilities for ~torl!,ge and vra,rehousing in the district.
Table No. 15. 1 gives the details of the loclttion and capacity of warehouses of the district owned by the State Civil Supplies Department, Central Warehousing Corporation lI,nd the Gujltut State Warehousing Corporation ason If1t January 1971. Table No. 15.2 gives details of god owns owned by co-operative soeietie" of the district and their cap.-1cities as on 1st January, 1971. The names of the societies Itnd the talukas of their location tave also been shown. Table No. 15.3 gives the loc!ttion Itnd capacity of wltrehouses of the Food Corporation of India in the district.
XVI-Prices
This group includes two tables, one on average retail prices of staple food-stuffs and the other on the consumer price index.
Table No. 16.1 shows the average retail prices of stltple food-stuffs monthwise recorded a,t the district headquarter town in 1970. The commodities included in this table !tre cereals n!tmely rice (medium), wheat, jowar and bajri and pulses namely arhar dal (tur), moong and udid. Table No. 16.2 gives the consumer price inc:.ex numbers for industrial worker at the Ahmadabad and Bhavnagar centres for the years 1961 to 1970. Besides general indices, the group indices have also been shown. Figures for the years 1961 to 1969 have been ihown for full years while those for 1970 have been shown monthwise.
XVII-Joint Stock Companies, Banks and Insurance
This group contains four table! which give vital data on various financial institutions of the district.
Table No. 17.1 gives the details of the Joint Stock Comp!tnies registered in the district for the year 1969-70. The companies have been classified into 10 industrial classes and their number, authorised capital and subscribed capital have been shown in the table. Table No. 17.2 gives the number of scheduled and non-scheduled banks in the district for the years 1960, 1965 and 1970. Table No. 17.3 gives the number and type of co-operative banks ill the district for the years 1960-61, 1965-66 and 1969-70. The table coverR all types of cooperative banks including Land Development Banks, Industrial Banks and Urban Cooperative banks. Table No. 17.4 shows the data pertaining to Life Insurance policies issued and sums insured in the district for the years 1961 to 1970. The table also gives the number of authorised agents during the relevant years.
XVIU---Fairs and Festivals and Ancient Monuments
Thifl group contains two tables, one on fairs and festivals and tlfe other on ancient mOlluments.
Table No.. 18.1 gives the detailed talukawise information about the fairs and festivals of the district, their occasion dates, estimated congregation and transport facilities available for going to such fairs and festivals. Table No. 18.2 gives a list of ancient monuments protected both by thc Statc Government as well as the Unioll Government and a brief description of each of them and the period during which they were raised.
Uniform table numbers have been adopted in the handbooks for all the districts. \Vherever a particular tab.le is not applicable to or could not be compiled for want of information in any particular district, it has been omitted. It would therefore appear in such cases that the sequence has been broken.
To facilitate further reference, the source of information for compiling the table itS well as explanatory notes about the nnits they refer to and other relevant particulars have been given at the foot of the table. The following abbreviations have been used in the tables.
(1) N. A.=Not Available (2) =NIL
7


I ANALYTICAL REPORT
ON CENSUS AND
RELATED STATISTICS

ANALYTICAL REPORT
A. INTRODUCTION
1. History of District Census Handb.ok
In 1941, the population figures were exhibited according to communities in the "Village Handbooks" published by the erstwhile Government of Bombay. In 1951, the basis of classification of the Census was changed from a social to an economic one and the figures were given in the Primary Census Abstract according to eight Livelihood Classes. The Primary Census Abstract contained the basic information in respect of every village and town. A decision to bring out the District Census Handbooks giving the Primary Census Abstract and important Census tables for every district of the State was taken for the first time in 1951. Census statistics given in the Primary Census Abstract related to the area of the village, number of houses and households, total population, houseless and institutional population, literates and agricultural and nonagricultural classes distributed under eight main Livelihood Classes. These census statistics were further supplemented by the addition of useful administrative information on the availability of amenities in \-illages and towns on items like post offices, railway stations, the distance of a bazzar from the village. primary schools, village panchayats, co-operative societies, etc. This was a unique achievement of the Indian Census. The 1951 series of District Census Handbooks, however, varied in content and size from state to state depending upon the resources offered by the State Governments. It was, therefore, decided during the Census of 1961 that the District Census Handbooks ofl 1961 Census should contain a certain minimum of statistical data, maps and other useful information to be adopted uniformly throughout the country. Thus the District Census Handbook of 1961 Census differed widely in the matter of content and coverage from that published in the 1951 Census. The District Census Handbooks of 1961 were subdivided into the following three parts:
PART I-THE DJSTRICT
(i) Introductory Essay (ii) Brief Gazetteer of Place Names
PART rI-STATISTJCS
(i) Census Tables (ii) Villagewise List of Industrial Establishments
(iii) Handicraft Tables (iv) Departmental or Official Statistics
PART HI-VILLAGE DIRECTORY
(i) Explanatory Note (ii) Village Directory (iii) Taluka Maps
3
Besides Census data, the 1961 District Census Handbooks covered villagcwise and townwise information on the availability of different types of amenities such as educational facilities, public health and medical facilities, supply of drinking water, electricity and its uses etc., shown by means of abbreviations placed against the name of each village. Thus, in the 1961 Census an attempt was made to make the District Census Handbooks more informative.
During the 1971 Census, efforts have been made to compile both census and non-census statistics in a uniform manner under an enlarged perspective. The District Census Handbook of 1971 Census has been· divided into three sub-parts with a view to making the census and non-census information available to the data users as quickly as possible. Part A of the District Census Handbook contains the Town Directory and Village Directory. Part B contains the Primarv Census Abstracts and Part C contains the Introductory Essay, Official Statistics, Census tables, etc. The details of the contents in each of the parts are described in the following paragraphs.
2. Scope of District Census Handbook 1971
The District Census Handbooks are the only publications which incorporate the data down to the village and block level of a town, which are urgently. and frequently required by the data users. They are constantly referred to for several purposes by the· administrator, planner, policymaker and academician. The delay in the publication of the District Census Handbooks would reduce the value of these very useful publications. In order to avoid delay in the publication the District Census Handbooks of 1971 are sub-divided into three parts, two of which are combined in one volume, and the third published separately. The details of the contents of each of the parts are as follows:
Part A: Town and Village Directory
Part A contains the non-census statistics of each village and town. The Town Directory portion furnishes the data for each town in the district in seven statements covering (1) the civic administration status of town and the functional category of towns and their growth of population since 1901 ; (2) physical aspects and location; (3) town finance; (4) civic and other amenitiel>; (5) medical, educational recreational and cultural facilities; (6) trade, industry, commerce and banking facilities and (7) population by religion.
The Village Directory Section· of Part A gives particulars of amenities available for each village in the matter of educational and medical institutions· power supply, drinking water facilities, post and te]e: graph facilities, communications, particulars of land use, weekly markets and places of religious, historical· and archaeological interest in the village. ' ., .
Part B : Primary Census Abstract
Part B gives for each village and for each block and ward of a town the primary census data incorporating area of the town in square kilometres, and of village in acres and gunthas, number of occupied residential houses, number of households, total population and its break up by sex, scheduled ~aste and scheduled tribe population, literate populatlOn, and working population by nine broad !ndustrial categories namely (1) cultivators, (2) agncultural ~abourers, (3) those working in livestock, forest~y, fishl~g, plantation~, etc., (4) in mining and quarrylllg; p) III man~-' facturing. processing, servicing and repalfln~, (6) III
construction, (7) in trade and c.ommerce, (8) I.n transport, storage and communicatlOns, an~ (9) III other services and the non-working populatIOn.
The non-census data of the village directory ~nd town directory were collected from the local bodies. The villagewise details regardi ng different types of amenities available in the village, land. use data and other information were collected in the VIllage directory form through the tal uka panchayat. offices. These !o.rms were filled in by the VIllage officIals and were scrutlmsed bv the Statistical Assistants at the taluka level. The District Statistical Officers supervised th~ work ~nd carried out percentage scrutiny. The detaIls regardIng the number of villages having post and. telegra~h facilities in the State, those connected wlt.h electnc power supply, those havin~ all weat~er ~nd falf weat.~~r bus facilities and those without drmkmg water facilities etc., were obtained from the concerned depart~ents by the Office of the Direct~r of Census Ope.ratlOns. The information recorded In the vIllage. dlfectory forms was cross checked with the data obtamed from concerned departments, confirmed and made up-todate.
The non-census data for each of the towns were obtained from the municipal authorities in case of municipal towns and for other towns the data were. obtained from the concerned nagar and gram Panchavats. The information received from the. ~oncerned ~llunicipalities and panchayats. was scrll:tlUlsed. a?-d cross checked with other published offiCIal statIstiCS for a few items wherever it was possible.
Part C: Departmental Statistics, Census Tables and Analytical Report
Part C incorporates the administrative statistics pertaining to the district in various fi.el~s of develo.pment. The other census tables pertammg to the d~strict and talukas ",ill also be reproduced here. ~ wnte lip indicating the changes in the scx:io-~c0l:l0mlc and demographic characteristics of the dlstnct In the last decade would also be given.
Departfflerrtal Statistics
An effort has been made to present in this part of the Handbook the basic data of the district in 68 dilferent tables based on the data collected from
4
various administrative departments of the State Government and the Government of I ndia as well as fro111 .vl:lrious statutory o~ganisations like the Gujarat ElectncJty Board, the LIte Insurance Corporation of India. the Food Corporation of India the Reserve Bank. of India, Central and State War~housing CorporatIOns etc. A mere glance at the contents of the tables presented in this volume would show that they provide a deep insight i uto the infrastructure of the district which will prove useful not only to the administrator and the social, political and research worker but also to the framers of the District and the State plans. . It has als.o been devised in order to provide IOterestlllg matenal to an intelligent and prudent reader who wants to know more about the district. The tables highlight the structural changes that have undergone in various spheres of activity in the district during the period 1961-1971. An attempt has been made to present the data talukawise as far as possible in order to facilitate inter-regional comparisons within the district.
The tables on administrative statistics included in the present series of Handbooks are more or less devised on the lines of the District Census Handbooks of 1961 <;ensus so as to make the data comparable. In additIOn. to these, ~ome useful data on agricultural research' statIOns, vetermary and animal husbandry institutions rest. houses. lan~ reyenue collections, seco'ndary school certtficate ~xamlllatlOns, forests, composition of panchayat bodIes etc. have also been included:
The tables on administrative statistics have been grouped under 18 different heads as listed below:
I Rainfall and temperature II Vital Statistics
HI Agriculture, including Forests IV Livestock
V Co-operation
VI Fisheries
vn Factories
VUJ Electricity
IX Medical and Public Health X Education
XI Administration
xn Public Entertainment; Presses and Journals
XlII Transport and Communications
XLV Local Bodies
XV Warehousing
XVI Prices
XVII Joint Stock Companies, Insurance, Banks and Co-operative Societies
XVHI Fairs and Festivals and Ancient Monuments
C~IISUS Tabl~s
For the first time ill the Census history comiderable part of the 1971 Census data has been processed on electronic computors. However, the manual ~orting could not be altogether avoided. For the purpose of providing the primary census data and the data on mother tongue, religion and scheduled caste and scheduled tribe and broad age-groups the Individual Slips \"ere processed manually during 1971 Census at the Regional Tabulation Offices as was being done at the previous censuses. The data pertaining to 20 per cent of the Urban Individual Slips was transferred on to punch cards and thence to magnetic tape and all the cross tabulation for the urban data is being generated by processing it on electronic computors. The crosstabulation of the rural data is being derived from 10 per cent sample of the Individual slips which were processed manuallv. The tabulation of the Houselist data was also p;ocessed on 20 per cent sample basis. The establishment schedules were processed on full count basis. The data relating to the housing and establishments has been processed on electronic com-putor. I
Thus the 1971 Cemus was a pioneer in the introduction of sampling procedures to a considerable extent. Careful studies were made of the 1961 schedull's as also the 1971 pre-test schedules before evolving the optimum sampling size and the procedures so as 10 yirld data within reasonabk margin of error.
\ During 1971 Census it was decided to prepare a number of tables under the following series:
A Series
B Series
C Series
o Series
E Series
F Series
G Series
H Series
General Population Tables
Economic Tables
Social and Cultural Tables
Migration Tables
Establishment Tables
Fertility Tables
Special Tables for Degree Holders and Technical Personnel
Housing Tables
As in the 1961 Census all the Census Tables of 197 i Census that give data down to the district level or below have been incorporated in the Part C of the District Census Handbook of 1971. The Census Tables of 1971 Census that can be reproduced in the District Census Handhooks Part C in so far as they rda te to the district are: .
Tables A-I to A-IV, B-1 to 8-IV Part A, 8-IV Pa rt 0, B-VI Pa rts A(i) and A(ii) , B-VI Parts B(i) and B(ii), B-VII, B-VIIJ, C-I Part A, C-III Part A, C-III Part-B, C-V, C-VJI, C-VIIJ Parts A and B and their appendices, D-I, D-I Appendix-I, Appendix-II, D-JII and D-IV for each city D-V, D-VL E-l Ie E-IV and H-I to H-IV.
(Ilk) H.1JQ-~-2
5
However, to achieve the objectives of making the data available to lhe consumers as soon as possible after it has become ready without having to wait for [he completion of other cross tabulations which may take quite some time, it waS planned to release the Census tables by splitting up into two volumes as follows:
1. Part C-I (Full Count Census Tables)
2. Part C-II (Remaining Tables)
But as the urban sample tables which were mechanic<:t.l!y processed are likely to take some time, it is felt desirable to publish Part C-H without urban sample tables so that the available material can bl:' released for the ds ta users.
The following tables based on full count were included in Part-C-I of District Census Hand book which has already been published:
A-I to A-IV with their appendices, B-1 Part-A, B-Ir. C-V, C-VJf, C-VIn Part A and its appendix, C-VIII Part B and its appendix, and E-I to E-1V.
The remaining tables without urban sample tables have been incorporated in the present volume. The tables already publiShed in Part C-I have also been included in this volume for ready reference,
3. Definitions and Concepts
During 1971 Census Operations large mass of data of a varied nature such as demographic, social and economic characteristics was collected. In order to ensure accuracy in the collection of information of such a varied nature various terms used were well defined during the 1971 Census Operations. In the ensuing paragraphs the definitions and concepts of some important terms are explained,
(i) Village
'Village' is a revenue village which is an administrative rather than a demographic unit. The definition of the term 'Village' has practically remained the same during the entire census period. In short, it is a revenue cadastrally surveyed village which has a separate entity and a distinct number assigned to it in the revenue records of the State. It may consist of a single village with a cluster of houses or a number of hamlets with separate clusters of houSes. In forest areas it may even consist of scattered houses situated on the fields within the boundaries of the village. It may be inhabited or uninhabited.
(ii) Urban Area
It is cu_stomary in every country to classify the population as rural and urban. Such a classification is helpful in assessing the differentials in the social, economic, cultural and demographic characteristics of the population. Urbanisation is the result of economic, social and migrational processes. The ic'entification
of rural and urban areas and the distribution of population by urban and rural is a great service rendered by the census for the proper understanding of the interplay of various f()fces.
'There was no uniform criterion prescribed for distinguiShing urban areas from rural in our country till the Census of 1951. The definition of town, therefore, varied from state to state and a place was treatee: as urban, if in the opinion of the State Government or the Superintendent of Census Operations it was deemed to possess urban characteristics. In view of the increasing importance of the study of urbanisation in all its aspects the need for a uniform understanding of the term by strictly defining the concept of 'town' was emphasised at the 1961 Census. For the purpose of 1961 Census 'town' was defined as a place having a municipality or a cantonment or a place with a population of 5,000 bond over, if 75 per cent of its male population pursued non-agricultural activities. These tests were applied in respect of places other than municipalities or cantonments with reference to their population during 1961 Census. There were however, certain exceptional cases where an area had a population of less than 5,000 but had definite urban characteristics. These were newly found commercial areas, large urban housing settlements or places of tourist importance where all civic amenities WCfe provided. All such caSes were examined in detail in consultation with the Collectors of the Districts and lists drawn were got approved by the Slate Government and the Registrar General, befert' they were finally accepted as such.
The list of urban areas, for the purpose of 1971 Census, was likewise finalised in consultation with the State Government. The following criteria were applied for the purpose of determining any area as urban at 1971 Census.
(1) All places where there is a Municipal Corporation, or a Municipality or a Town CommitteI' or a Notified area or a Cantonment Board have been treated as urban areas.
(2) The remaining places were recognised as enjoying urban characteristics and declared as urban areas only jf the following conditions were fulfilled:
(a) The estimated population at J 971 Census should be at least 5,000.
(b) The density of population per sq. kilometre should not be below 400.
(c) 75 per cent of the male working population should follow non-agricultural pursuits, and
(d) In the opinion of the Director of Census Operations any other place where predominant urban characteristics are noticed.
(iii) Ward
All large towns were usually divided into well established mohallas or localities or wards bearing dist~nct local names and covered by roads, streets, Janes and by-lanes. In some citil's, instead of a loca-
6
lity the electoral wards of the city or town was taken at the major unit into which the city or town is divided, so long as it was a well recognised unit with definite boundaries and was likely to be fairly permanent.
(iv) Block
Each town was divided into convenient blocks each block consisting of a group of adjoining streets or other co;npact local area with well-defined boundarjes.
The formation of blocks during the first stage of Census Operations was on the basis of the number of houses; but during the second stage of Census, blocks were formed on the basis of the popUlation.
"Enumerator'S Block" was formed on the basis of the population. In rural area, the block consisted of 750 to 1,000 persons; while, in the urban areas, it compris(~d of 600 to 750 persons. The above were the ideal limits for the blocks of rural and urban areas respectively; but in exceptional circumstances, the liI1lit of rural block was lowered down to the tune of 600, andl or raised to the tunc of 1,150. Similarly, in urban area, the limit of the block was lowered down upto 500 or raised upto 850. But, these liinits were changed only in exceptional cases. Ordinarily the rural block was within 750 to 1,000 and urban block was within 600 to 750 persons.
(v) House
A "Census House" is a building or part of a building having a separate main entrance from the road or common courtyard or staircase etc., used or recognised as a separate unit. It may be inhabited or vacant. It may be used for a residential or non-residential purpose or both.
If a building has a number of fiats or blocks which arc independent of one another having separate entrances of their own from the road or a common staircase or a common courtyard leading to a main gate, they will be considered as separate cenSus houses. If within a large enclosed area there are separate buildings, then each such building will be considered one or more s('parate cenSUS houses. If all the structures within Dll enclosed compound are together tre,~ted as one building then each structure with a separate entrance Should be treated as a separate census house.
(vi) HOlISr'hold
A household is a group of persons who commonly live together and would take their meals from a common kitchen unless the exigencies of work prevents any of them from doing so. There may be 'one-member household, two-member household or multi-member household'. For censuS purposes each one of these types is regarded as a "Household", Again, there may be a household of persons related by blood or household of unrelated persons; the latter are boarding houses, hostels, residential hotels, orphanages, rescue homes, ashrams etc. These are called "Institutional Households'".
(vii) Scheduled Castes and Scheduled Tribes
A person belonging to any of the caSte or tribe, given hereunder, is considered to be belonging to that scheduled Caste or Scheduled Tribe as the case may be. A list of such Schcduled Castes and Scheduled Tribcs recognised for the Gujarat State is furnished as unc!er:
Scheduled Castes: Throughout the Sta Lt: except JamnagaL Rajkot, Surendrc.nagar, Bhavnagar. Amn:ii, Junagadh and Kutch· districts:
1 Ager
2 Bakad or Bant
;\ Bhambi, Bhambhi,Asadaru, Asodi, Chamadia, Cltamar, Chambhar, Chamgar. Haralayya, Harali, Khalpa. Machigar. Madar. Mac1ig, Tdegu Mochi, Kamali Mochi, Mochigar, Ranigar, Rohidas, Rohit or Samgar
4 Bhangi, Mf'hrar, Olgana, Rukhi, Malkana. Ha13 1khor, Lalbegi, Ralmiki, Korar or Zadmalli
5 Chalvac1i or Channayya
6 Chenna Dasar or HoJaya Dasar
7 Dhor, Kakkayya or Kankayya
S Garo(la or Gara
9 Hallet,r
10 Halsar, Hasiar, Huiasvar or Halasvar 11 Holar or Valhar
]2 Holaya or Holer
13 Lingader
14 Mahar, Tara! or Dhegu Megu
15 Mahyavanshi, Dehd, Vankar or Maru Vankar
. 16 Mang, Matang or Minimadig
17 Mang-Garudi
18 Meghval or Menghval'
19 Mukri
20 Nadia or Hac1i
21 Pasi
22 Shenva, Chcnva, Sedl11a Of Rawat
23 Tirgar or Tirbanda
24 Turi
In the district of Dangs and Umbergaon taluka of Val sad district:
Mochi.
111 Jamnagar, Rajkot, Surendranagar, Bhavnagar, Amreli and Junagadh districts :
2
Bawa (Dedh) or Dedh~Sadhu
Bhangi or Rukhi
3 Chamadia
4 Chamar, Nalia or Rohit
5 Dangashia
7'
6 Garoda
7 Garmatang
b Hadi
9 Megln'3J
10 Senva
11 Shcmalia
12 Thori
13 Turi
14 Turi-Barot or Dedh-Barot
15 Vankar, Dhedh or Antyaj
In the district of Kutch:
Bhangi
2 Chamar
3 Garocla
4 Meghwal
5 Turi
6 Tllri-Barot
Scheduled Trihe~ : Throughout the State excep Jamnagar. Raikot. Surendranagar. BhavnaQar. Amreli Junag;Jll and Kutch di~trict~: .,.
1 Barela
2 Bavacha or Bamcha
3 Bhi!. including Bhil Garasia. Dholi Bhil, Dungri Bhil, Dungri Garasia, Mewasi Bhil, Rawal Bhil, Tadvi Bhil, Bhagalia, Bhilala, Pawra. Vasava and Vasave
4 Chodhara
5 Dhanka, including Tadvi, Tetaria and Valvi
6 Dhodia
7 Dubla, including Talavia or Halpati
8 Gamit or Gamta or Gavit, including Mavchi Padvi, Vasava, Vas ave and Valvi
9 Gond or Rajgond
10 Kathodi or Katkari, including Dhor Kathodi or Dhor Katkari and Son Kathodi or' Son Katkari
11 Kokna, Kokni, Kukna
]:2 Koli Dhor, Tokre Koli, Kolcha or Kolgha
13 Naikda or Nayaka, including Cholivala Nayaka, Kapadia Nayaka, Mota Nayaka and Nana Nayaka
14 Pardhi, including Advichincher and Phanse Pard hi
15 Patelia
16 Pomla
17 Rathwa
18 Varli
19 Vitolia, Kotwalia or Barodia
In the Dangs district:
Kunbi.
In Surat and Valsad districts: (a) in Umbergaon taluka, Koli Malhar, Koli
Mahadev or Dongar Koli (b) in the other talukas, Chaudhri.
In the Jamnagar, Rajkot, Surendranagar, Bhavnagar, Amreli and Junagadh districts:
Siddi.
(n Ness areas in the forests of AJech, Gir and Barada:
I 2 3
Bharwad Charan Rabari
In Surendranagar district: 1 Padhar
In Kutch district: 1 Bhil 2 Dhodia 3 Koli -4 Paradhi 5 Vaghri.
(viii) Literate
A person who can both read and write with understanding in any language is to be taken as literate. A person who can merely read but cannot write is not a literate.
It is not necessary that a person who is literate should have received any formal education or should have passed any minimum educational standard.
fix) Worker and Non- Worker
During 1971 Census a question was asked to every individual about his main activity i.e. how he> engagt~d himself mostly. For the purpose of this question, all persons were divided into two broad streams of main activity namely, (1) as workers and (2) as non-workers as the type of main activity that the person returned himself as engaged in mostly.
a) Worker
A 'worhr' was ddlned as a person whos(' main activity was participation in any economically productive work by his physical or mental activity. Work involved not only actual work but effective supervision and direction of work.
The reference period for this purpose was oneweek: prior to the date of enumeration in case of regular work in trade profession, service or business and on~ year prior to the date of enumeration in case of certain types of works which were not carried on throughout t.he year such as cultivation, livestock keeping, plantation work, some types of household industry ... tc.
s
Persons belonging to the category of workers were sub-divided into 9 main industrial catf.'gories namely;
I Cultivators II Agricultural Labourers III Persons engaged in Livestock, Forestry, Fishing
Hunting and Plantations, Orchards and Allied Activities
IV Mining and Quarrying V Manufacturing, Processing, Servicing and
Repairs, in (a) Household Industry and (b) Other thall household industry.
VI Construction VII Trade and Commerce VIII.Transport, Storage and Communications and IX Other Services
Definitions were prescribed to segregate the follo-wing activities from otht"f catcgoric~ of workers.
(I) (2) (3)
Cultivators Agricultural Labourers and Persons engag("d in Household
Cultivator
Industry
For purposes of the census a person is working as Cultivator if he or She is engaged in cultivation by oneself or by supervision or direction in one's capacity as the owner or lessee of land held from Government or as a tenant of land held from private persons or institutions for payment of money, kind or share.
Cultivation involves ploughing, sowing and harvesting and production of cereals and millet crops such as wheat, paddy, jowar, bajra, ragi t'tc., and pulses, raw jute and kindred fibre crop, cotton etc., and other crops such as sugar cane, groundnuts tapioca, etc., but does not include fruit growing, vegetabk growing or keeping orchards 0r groves or working on plantations like tea, coffee, rubber, cinchona and other medicinal plantations.
A person who merely owns Jand but has given out land to another perSon or persons for cultivation for money, kind or share of crop and who does not even ~upervise or direct cultivation of land, will not be treat('d as working as cultivator. Similarly, a person working in another pn~on's land for wa,geli in cash, kind or share (Agricultural labourer) will not b" treated as cultivator.
Agricultural Labourer
A person who works in another person's land for wage: in money, kind or share should be regarded as an agricultural labourer. He has no risk in the cultivation but he merely works in another person's land for wages. Th~ labourer could have no right of lease or contract on land on which he works.
Household Industry
A Household Industry is defined as an industry conducted by the head of the household himself! herself and/or mainly by the members of the household at home or within the village in rural areas and only within the premises of the house where the household lives in urban areas. The industry should not be run on the scale of a registered factory.
(b) Non-worker
Persons not engaged in any of these activities were treated as non-workers and were sub-divided into Seven broad heads namely:
(1) Household duties, (2) Students, (3) Retired persons or rentiers, (4) Dependents, (5) Beggars, () Inmat eS of a penal, mental or charitable institution or convicts of jails etc., and (7) Other non-workers.
In 1961 Census emphasis was laid on work so that all people who worked including family workers who were not in receipt of any income or working children who I,;uuld not cam enough for their maintenance had also been included as workers. An adult woman who was engaged in household duties but not doing any other productive work to augment the family's resources was not considered as a worker. If, however. in addition to her household work, she engaged herself in work such as rice pounding for sale or wages, or in domestic services for wages for others or minding cattle or selling firewood or making and selling cowdung cakes or grass etc., or any such work she was treated as a worker.
In caSe of seasonal work, if a person had some regular work of more than one hour a day throughout the greater part of the working season, he I she waS considered as a workers. In case of regular employment in any trade, profession, service, business or commerce, if a person was employed during any of the fifteen days preceding the day of visit he I she was recorded as a worker.
B. LOCATION AND PHYSICAL FEATURES
1. Location
Situated in the Central Gujarat, Ahmadabad district lies between 21 °_58' and 23°-30' north latitudes and
71°-37' and 73°-02' east longitudes. It is bounded on the north by M::!hcsana and Gandhinagar districts, on the south by Kheda district and the Gulf of Cambay, on the north-cast by Sabar Kantha district and on the west by Bhavnagar and Surendranagar districts.
2. Physiography
Except for a few rocky features in the extreme Southern portion, the district as a whole forms a level pl~in gradually rising towards the north and the east. It IS believed that in the past a portion of the district was under the sea. Even today a part of the tract between the head of the Gulf of Cambay and the Rann
(B],) H-119-3
of Kutch is subject to water logging at high tides during monsoon. The district haj) no hills of any importance although a few small hills do obtain at Vasai and Miroli in the southern section of the district, near Thaltej and Gota in Daskroi taluka in the north, and also at Chandisar in Dholka taluka and Vastrapur in City taluka.
3. Soil
The soils of the district can be broadly classified as black and medium black, goradu, kyari and rocky.
(i) Black and medium black soil.-Black and medium black soils are noticed in the Bhal. area (low lying fiat land) comprising the southern half of Dholka taluka and eastern half of Dhandhuka taluka. The depth of the black and medium black soil varies from 60 cms. to 150 ems. and the underground water is brackish.
(ii) Goradu soil .-Goradu soil varies from fertile brown to sandy I.oam and is found in Dehgam taluka, the- north of C1 t y and D2Skroi ta!ubs, 1hc en stern· parts of Sanand and Dholka talukas and the northeast portions of Viramgam taluka. The two varieties are locally known as goracu and sandy respectively. The soils are fertile and have a depth of about 3 to 5 metres, with good drainage_
(iii) Kyari soil.-It is found in the southern half of the City and Daskroi talukas, the south-east portion of Sanand taluka and Nalkantha tract cf Dholka and Yiramgam taJ~kas.. ~ormed by alluvial deposits, this IS the most fertIle sod wlth very good moisture retentive capacit;y .well suited for pad~y cultivation. Locally, thIS soIl IS known as Bhal soll of Daskroi taluka and Nalkantha Kyari land. Well-known varieties of paddy such as PankhaJi, ~amod, Jirasal, Sukhvel, Sutarsal and the coarse vanety of Basmati are grown in this soil.
(iv) Rocky soil.-It is found in the western part of Dhandhuka taluka which is known as Kaner tract. It i~ s~allow light in texture and fit for early maturing vanetleS of crops.
4. Forests
According to the information supplied by the Chief Conservator of Forests, Gujarat State, the district has a total forest area of only 21.84 km 2 out of which 9.52 km2• are classified as reserved forests, 7.52 km2 as unclassed forests and 4.80 km 2 as private forests.
5. Minerals
No major minerals are commercially worked and no commercially workable deposits of such minerals except oil and natural gas are known to exist in the district. .Among the minor minerals, however, gravc], kankar, hmestone, ordinary clay and sand and trap are commercially worked in the district.
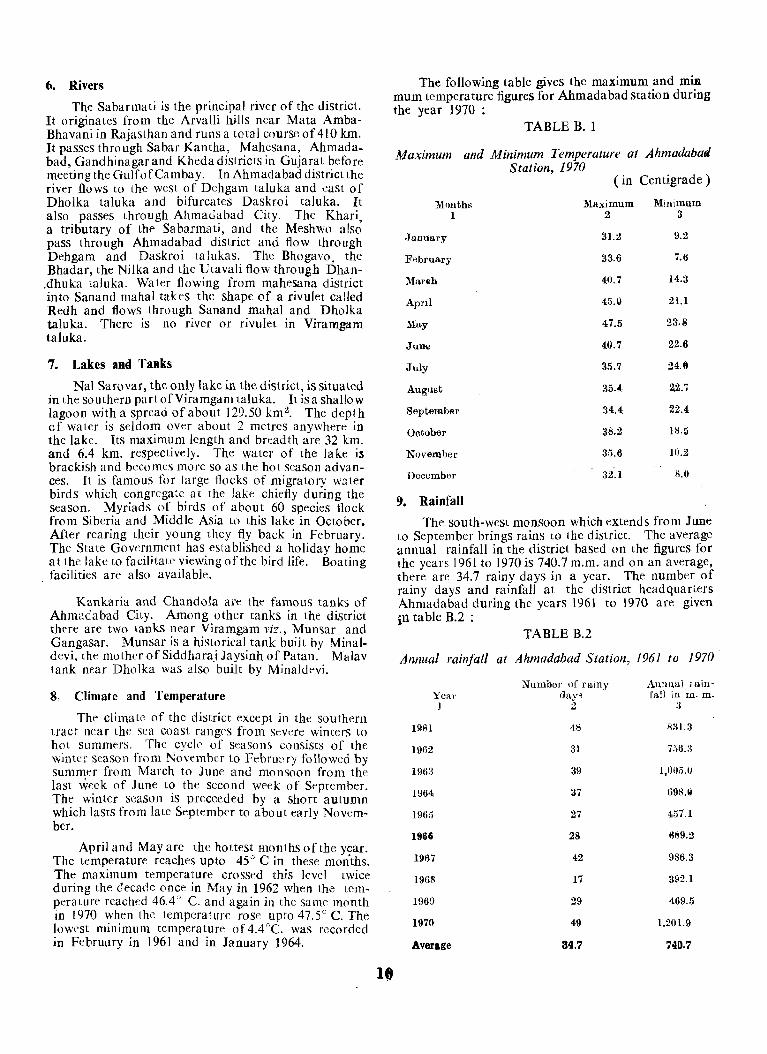
6. Rivers
The Sabarmati is the principal river of the district. It originates from the Arvalli hills near Mata AmbaBhavani in Rajasthan and runs a tOlal course of 410 km. It passes through Sabar Kantha, Mahesana, Ahmadabad, Gandhinagar and Kheda districts in Gujarat before meeting the GulfofCambay. In Ahmadabad district the river flows to the west of Dehgam taluka and cast of Dho1ka taluka and bifurcates Daskroi taluka. It also passes through Ahmadabad City. The Khari, a tributary of the Sabarmati, and the Meshwo also pass through Ahmadabad district and flow through Dehgam and Daskroi talukas. The Bhogavo, the Bhadar, the Nilka and the Utavali flow through Dhan
.dhuka taJuka. Water flowing from mahesana district into Sanand mahal tahs the shape of a rivulet called Redh and flows through Sanand mahal and Dholka taluka. There is no river or rivulet in Viramgam taluka.
7. Lakes and TaRks
Nal Sarovar, the only lake in the district, is situated in the southern part of Vir am gam taluka. It is a shallow lagoon with a spread of about 129.50 km 2• The depth of water is seldom over about 2 metres anywhere in the lake. Its maximum length and breadth are 32 km. and 6.4 km. respectively. The water of the lake is brackish and becomes more so as the hot season advances. It is famous for large flocks of migratory water birds which congregate at the lake chiefly during the Season. Myriads of birds of about 60 species flock from Siberia and Middle Asia to this lake in October. After rearing their young they fly back in February. The State Governmrnt has established a holiday home at the lake to facilitate viewing of the bird life. Boating
. facilities are also available.
Kankaria and Chandola are the famous tanks of Ahmadabad City. Among other tanks in the district there are two tanks near Viramgam viz., Munsar and Gangasar. Munsar is a historical tank built by Minaldevi. the mother of Siddharaj Jaysinh of Patan. Malav tank near Dholka was also built by Minaldevi.
8, Climate and Temperature
The climate of the district except in the southern tract near the sea coast ranges from sewre winters to hot summers. The cyclr of Seasons consists of the winte,' season from November to Febnw ry followed by summer from March to June and monsoon from the last \veek of June to the second week of Srptember. The winter season is preceeded by a short autumn which lasts from late Septembrr to about early November.
April and Mayare the hottest months of the year. The temperature reaches upto 45° C in these months. The maximum temperature crossed this level twice dming the decade once in May in 1962 when the temperature reached 46.4 0 C. and again in the same month in 1970 when the temperature rose upto 47.5° C. The lowest minimum temperature of 4.4 DC. was recorded in FebrullTY in 1961 and in January 1964.
If)
The following table gives the maximum and miD mum temperature figures for Ahmadabad station during the year 1970 :
TABLE B. 1
Maximum and Minimum Temperature at Ahmadabad Station, 1970
(in Centigrade)
Mouths Maximum Minimum 1 2 3
.January 31.2 9.2
February 33.6 7.6
Mareh 40.7 14.3
April 45.0 21.1
May 47.5 23.8
.JU)};! 40.7 22.6
J\dy 35.7 24.0
August 35.4, 22.7
September 34.4 22.4
October 38.2 1S.a
November 35.6 10.2
December :32.1 S.O
9. Rainfall
The south-west monsoon which extends from June to September brings rains to the district. The average annual rainfall in the district based on the figures for the years 1961 to 1970 is 740.7 m.m. and on an average, there are 34.7 rainy days in a year. The number of rainy days and rainfall at the district headquarters Ahmadabad during the years 1961 to 1970 are given in ta bIe B.2 :
TABLE B.2
Annual rainfall at Ahmadabad Station, 1961 to 1970
.Number of rainy Annllal rain· Year davs fall in m. m·
J 2 a
H)61 4S ~:H.:3
1962 :31 7n6.:::
196:3 39 1,OOi).0
19(H 37 69S.ii
196.~ 27 457.1
19611 28 669.2
1967 42 986.3
1968 17 392.1
196!} 29 469.5
1970 49 1.201.9
Average 34.7 740.7
C. ADMINISTRATIVE SET-UP
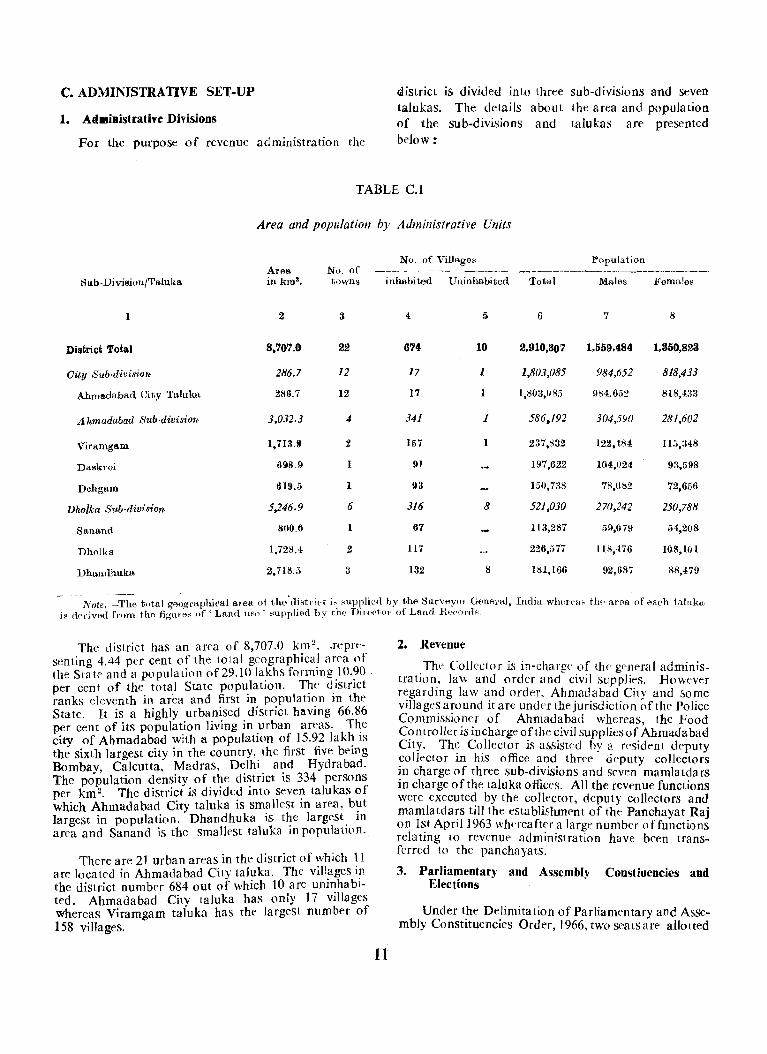
1. AdllliBistratil'e Divisions
For the purpose of revenue administration the
district is divided into three talukas. The details about of the sub-divisions and below:
sub-divisions and seven the area and population talukas are presented
TABLE C.l
Area and population by Administrative Units
No. of Villages l"opulation Area No. of --~~-.-----. -----~ ---------- .------~---
Sllb·Division/Taiuka in km". towns inhabited Uninhabited Total Males Females
1 2 3 4 I} 6 7 8
District Total 8.707.0 22 674 10 2.910.307 1.559.484 1.350,823
Oity Sub·d'ivision 286.7 12 17 1 1,803,085 984,652 818,433
Ahmadabad City Taluka 286.7 12 17 1 1,803,085 984.652 818.433
Ahmadabad Sub·division 3,032.3 4 341 1 586.192 304,590 281,602
Viramgam 1.713.8 2 157 1 237.832 122,484 11;:;.348
Da3kroi 698.9 91 197,622 104,,(J24 93,598
Dehgam 619.5 1 9iJ 150,738 78,082 72,656
Dho/ka Snb·division 5,246.9 6 316 8 521,030 270,242 250,788
Sanand SM.!) 67 U3,287 ,')9,079 54,208
Dholka 1,7211.4 2 117 226,577 118,476 1011,101
Dhalldhuka 2,718.5 3 132 8 11>1,166 92,687 88,479
Note. ~The total geographical area of the'di3triet j, supplied by the Surveyur Gellel'aJ India wherpuk th" arrn (f I t I k iR ,{"rived [rom tho figureH of' Land use' 8upplied by tlw Dirpf't.Ol of Land R"('Ol'r{" ' < , , eac- 1 ,ft n a
The district has an area of 8,707.0 km 2 •• repn:
senting 4.44 per cent of the tolal geographical area of the State and a population of29.10 lakhs forming 10.90 per cent of the total State population. The district ranks eleventh in area and first in popUlation in the State. It is a highly urbanised district having 66.86 per cent of its population living in urban areaS. The city of Ahmadabad with a population of 15.92 lakh is the sixth largest city in the country, the first five being Bombay, Calcutta. Madras, Delhi and Hydrabad. The population density of the district is 334 persons per km 2• The district is divided into seven talukas of which Ahmadabad City taluka is smallest in area, but largest in population. Dhandhuka is the largest in area and Sanand is the smallest taluka in populatipn.
There are 21 urban areas in the district (If which 11 are located in Ahmadabad City taluka. The viJlages in the district number 684 out of which 10 are uninhabited. Ahmadabad City taluka has only 17 villages whereas Viramgam taluka has the largest number of 158 villages.
II
2. Revenue
. The Collector is in-charge of the general administratllm .. la\\ and order and civil supplies, However r~gardlllg law ~nd order, Ahmadabad CiiY and some VIllages around It are under the juriSdiction of the Police Commissi0!l~r of Ahmadabad whereas, the Food C?lltrollcr IS ill charge of the civil supplies of Ahmadabad CIty. Th~ CO.IIector is assistn] hy a n'sidpnt dpputy ~olJector III hiS office and three deputy collectors ~11 charge of three sub-divisions and seven mamlatdars 111 charge of the taluka offices. All the revenue functions were executed by the collector, deputy collectors and mamlatda~s till the establishment of the Panchayat Ra.i on I~t Apnl1963 whneafter a large number offunctions relatmg to revenue administration have been transferred to the panchayats.
3. Parliamentary and Assemblv Constiuencies and Elections . '
Under t.he De_limitation of Parliamentary and Assembly ConstituenCies Order, 1966, two seats are allotted
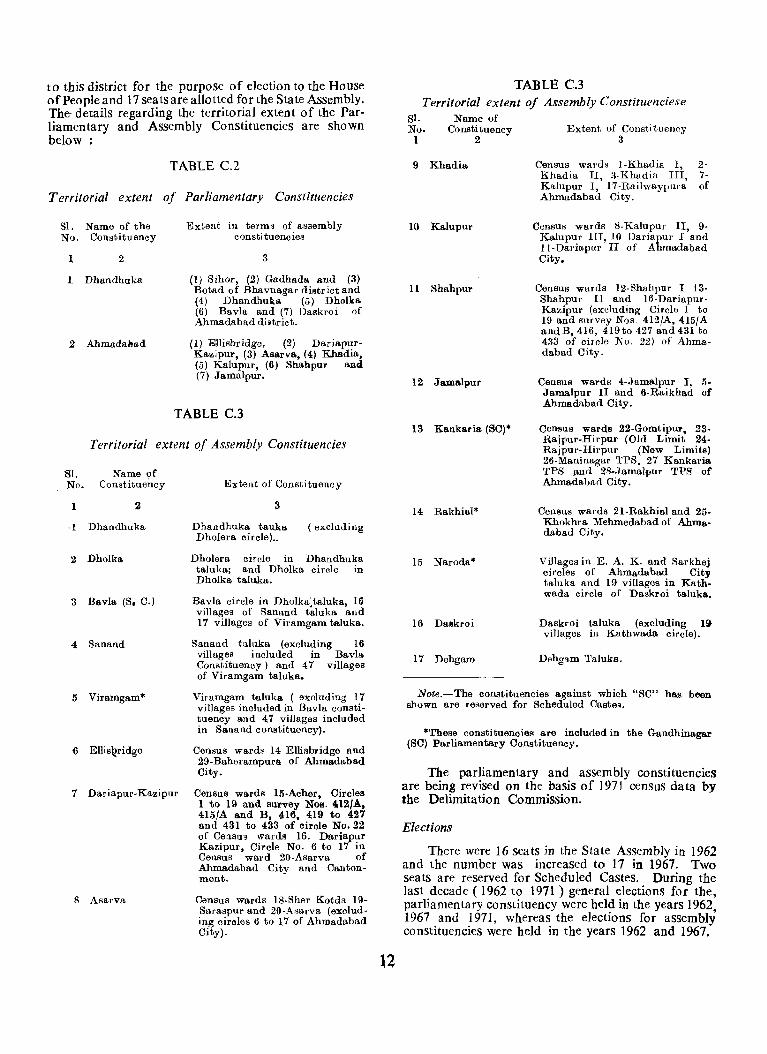
to this district for the purpose of election to the House of People and 17 seats are allotted for the State Assembly. The- details regarding the territorial extent of the Parliamentary and Assembly Constituencies are shown below:
TABLE C.2
Territorial extent of Parliamentary Constituencies
S1. Name of the No. Constituency
1 2
1 Dhandhuka
2 Ahmadabad
Extent in terms of assembly consti tuencies
3
(I) Sihor, (2) Gadhada and (3) Botad of Bhavnagar dietl'ict and (4) Dhandhuka (5) Dholka (6) Bavla and (7) Daskroi of Ahmadabad district.
(I) Ellisbridge. (2) Dariapur-Kazipur, (3) Asarva, (4) Khadia, (5) Kalupur, (6) Shahpur and. (7) Jamalpur.
TABLE C.3
Territorial extent of Assembly Constituencies
Sl. Name of No. Constituency
1 2
, I Dhanuhuka
2 Dholka
'3 Bavla (S. C.)
4 Sanand
5 Viramgam*
6 EllisQridge
1 Dariapur·Kazipur
8 Asarva
Extent of Constituency
3
Dhandhuka tauka Dholera circle) ..
( excluding
DhoIera circle in Dhandhuka taluka; and Dholka circle in Dholka taluka.
Ba:vla circle in Dholka;taluka, HI vIllages of Sanand taluka and 17 villages of Viramgam taluka.
Sanand taluka (excluding 16 villages included in Bavla Constituency) and 47 villages of Viramgam taluka.
Viramgam taluka ( excluding 17 villages included in Bavla consti· tuency and 47 villages included in Sanand constituency).
Census wards 14 Ellisbridge and 29-Baherampura of Ahmadabad City.
Census wards 15-Acher, Circles 1 to 19 and survey Nos. 412/A, 4151A and B, 416, 419 to 427 and 431 to 433 of circle No. 22 of Census wards 16. Dariapur Kazipur, Circle No.6 to 17 in Census ward 20-Asarva of Ahmadabad City and Cantonment.
Census wards 1S-Sher Kotda 19-Saraspur and 20-Asarva (exclud· ing circles 6 to 17 of Ahmadabad City).
12
TABLE C.3 Territorial extent of Assembly Constituenciese
SL Name of No. Constituency Extent of Constituency 123
9 Khadia
10 Kalupul'
11 Shahpur
12 Jamalpur
13 Kankaria (SC)*
14 Rakhial*
15 Naroda*
16 Daskroi
17 Dehgam
Census wards ~l-Khadia I, 2-Khadia II, 3-Khadia III, 7-Kalupur I, 17-Railwaypura of Ahmadabad City.
Census wards S-Kalupur II, 9-Kalupur III, 10 Dariapul' I and ll-Dariapur II of Ahmadabad City.
Census wards 12-Shahpur I 13-Shahpur II and 16-Dariapur· Kazipur (excluding Circle I to 19 and survey Nos. 412/A, 415/A andB,416,4I9to427and431to 433 of circle No. 22) of Ahmadabad City.
Census ward~ 4·,Jamalpur I, 5-Jamalpur II and 6-Raikhad of Ahmadabad City.
Census wards 22-Gomtipur, 23-Rajpur.Hil'pur (Old Limit 24-Rajpur.Hil'pul' (New Limits) 26-Maninagal' TPS. 27 Kankaria TPS JOIu(l 2S·.1amalpur TPS of Ahmadabad City.
Census wards 21-Rakhial and 25· Khokhra Mehmedabad of Ahmadabad City.
Villages in E. A. K. and Sarkhej circles of Ahmadabad City taluka and 19 villages in Kath. wada circle of Daskroi taluka.
Daskroi taluka (excluding 1~ villages in Kathwada circle).
Dehgam Taluka.
Note.-The constituencies against which "SC" has been shown are reserved for Scheduled Castes_
*These constituencies are included in the Gandhinagar (SC) Parliamentary Constituency.
The parliamentary and assembly constituencies are being revised on the basis of 1971 census data by the Delimitation Commission.
Elections
There were 16 Seats in the State Assembly in 1962 and the number was increased to 17 in 1967. Two seats are reserved for Scheduled Castes_ During the last decade ( 1962 to 1971) general elections for the, parliamentary constituency were held in the years 1962 1967 and 1971, whereas the elections for assembly constituencies were held in the years 1962 and 1967.
Parliamentary Constituency parliamentary constituency during 1962, 1967 and 1971 have been given belo'w: The details about the number of voters, valid
votes polled. candidates contesting the elections for TABLE C.4
Results of Parliamentary Elections
Name of Constitu.ency
1
1 Ahmadabad
2 Sabarmati
3 Dhanclhuka
Total
Year of election
2
1962
1967
1971
1962
1967
1971
1962
1967
1971
No. of polling booths
3
N.A.
N.A
520
N. A.
N. A.
624
N. A.
1,233
1,144
CON/INC: Indian National Congress
No. of voters in the constituency
4.
433,392
474,589
496.:,87
4.>4,460
432,903
4158,444
887,852
907,492
954,831
NJP Nutan Maha Gujarat Janata Parishad
IND : Independent
RPI/REP: Republican Party of India
NC (0) National Congress (Organisation)
SWA : Swatantra BJS: Bhartiya Jan Sangh
N. A- =Not available
No. of valid votes
polled
5
255,169
300,524
336.157
259,581
266,086
237,511
514,750
566,610
573,668
Percentage Partywise votes polled Whether of valid No of including independent elected
votes polled candidate~- --------- - candidate to total
votes
6
58.88
63.32
67.72
;;7.12
6:.·{7
:i1.81
5798
62.44
60.08
contest· ing
7
3
7
7
3
2
5
6
9
12
Name of party
8
NJP CON IND
IND INC IND RPI IND IND IND
INC NC(O)
RIP IND IND IND IND
CON SWA REP
SWA INC
SWA INC BJS IND IND
Votes waS Male/ polled Female
9 10
134,323 Male 112,731
8,115
179,844 Male 95,047 13,683 4,883 3,020 2,253 1,794
193,834 Male 137,374
2,372 364 802 703 708
128,242 Male 84,031 47,308 "
148,372 Male II 7, 714
94,127 Male 83,136 52,725
4,858 2,665
The figures of 1962 are not strictly comparable with those of1967 and 1971 as constituencies have been revised according to the Delimitation of Parliamentary and Assembly Constituencies Order of 1966. The number of polling booths which was 1,233 in 1967 decreased to 1,144 in 1971 registering a fall of 7.22 per cent. The number of voters in Dhandhuka conS- , titutency increased from 4.33 lakhs in 1967 to 4.58 lakhs in 1971. The number of voters in Ahmadabad
constituency increased from 4.75 lakhs in 1967 to 4.96 lakhs in 1971. Valid votes in Ahmadabad Constituency were 58.88 per cent of the total voters in 1962, and this proportion was to 63.32 per cent in 1967 and 67.72 per cent in ]971. In Dhandhuka constituency the valid votes were 61.47 per cent to the total voters in 1967 and this proportion declined to 51.81 in 1971. In Ahmadabad constituency, the candidate of Nutan Maha Gujarat Janata Parishad was elected
13 (Bk) B·llD-.
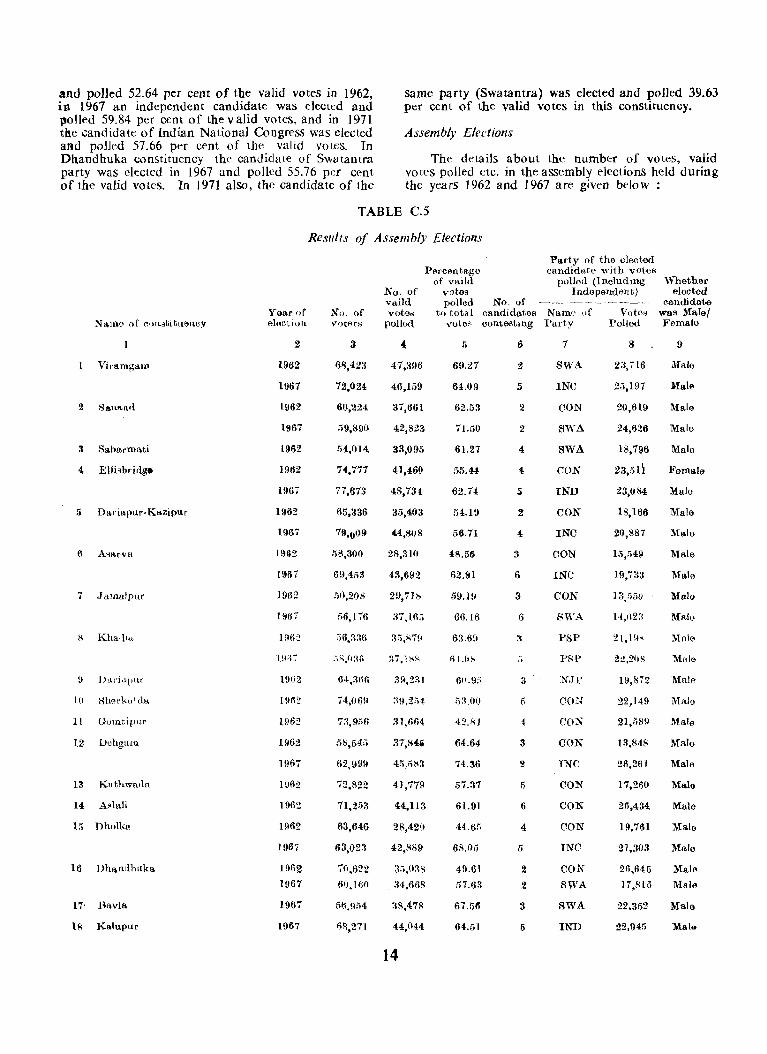
and polled 52.64 per cent of the valid votes in 1962, i:n 1967 an independent candidate was elected and llolled 59.84 per cent of the valid votes, and in 1971 th.e candidate of Indian National Congress was elected and polled 57.66 per cent of the valid votes. In Dhandhuka constituency the candidate of Swatantra party was elected in 1967 and polled 55.76 per cent of the valid votes. In ]971 also, the candidate of the
same party (Swatantra) was elected and polled 39.63 per cent of the valid votes in this conStituency.
Assembly Elections
The details about the number of votes, valid votes polled etc. in the assembly elections held during the years 1962 and 1967 are given below:
TABLE C.s
Viramgam
3 Ssbarmati
4, Ellisbrin.g.
a DSl"iapllr·Kazipur
6 A,ltrva
7 Jamalpll(
II Gumtipltr
12 V"hgam
13 Kathwarl"
14 ARlali
l.~ Dhulkfl
16 Dh"fi(lh'lka
17· Ravia
18 Kalupur
Ysar or elsctiult
2
1962
1967
1962
1967
1962
19t52
196.
1962
1967
191>2
lito 7
1962
1 !1(5,
1962
19('12
1962
1962
1967
1962
1962
1962
196',
Ul62
1967
1967
1967
Results of Assembly Elections
No. of voters
3
68,423
72,024
60,224
59,890
54,014
U,771
77,673
65,336
;'8,300
69,453
.'}O,20S
1\6,176
64,306
74,1169
73,9MI
62,999
72,822
11,253
63,646
63,023
70,622
60.160
56,!lfi4
6R,271
No. of vttild votes
pul10d
Percentage of vaild
votes polled
to total votes
41,396
46,159
37,661
42,823
33,095
41,46()
48,731
35,403
44,808
28,31(,
43,692
29,718
:;7,16.;
39,2:n
:{H.2;l4
:1l,fo64
37,S4iii
45,583
41,779
44,113
28,420
42,1189
35,038
34,668
38,478
14
69.21
64.09
62.53
71.50
61.27
55.44
62.74
54.19
56.71
<t8.56
62.91
59.W
66.16
63.69
fl4.(I:-
6i1.9;;
1,:).00
42.81
64.64
74.36
57.37
61.91
44.61\
68.0r.
49.61
r.7.63
67.511
64.51
No. of candidates contesting
I)
2
5
2
2
4
4
3
6
3
6
3
4
3
6
4
5
2
2
3
5
Party of the elected candi'dute with vote~
polled (Including Independent)
Naml' "f Votes Party Polled
1
SWA
INC
8
23,716
25,197
20,619
24,626
Whether elected
candidate was Malal Female
9
Male
Male
Male
Male
CON
SWA
SWA 18,796 Male
CON
IND
CON
INC
CON
INC
CON
8WA
PSP
PSP
N.'!'
CON
CON
CON
INC
CON
CON
CON
INC
CON
SWA
SWA
IND
23,i}l1 Female
23,0(>4
18,166
20,887
15,549
13,550
2I,I!I~
111,872
22,1411
21,589
13,848
26,261
17,260
21l,434
19,761
26,645
17,815
22,31;2
22,I}45
Male
]\fale
Male
M80le
Male
Male
'Male
Male
Male
Male
Male
Male
Mala
Male
Male
Male
Male
Mal",
Mals
Mala
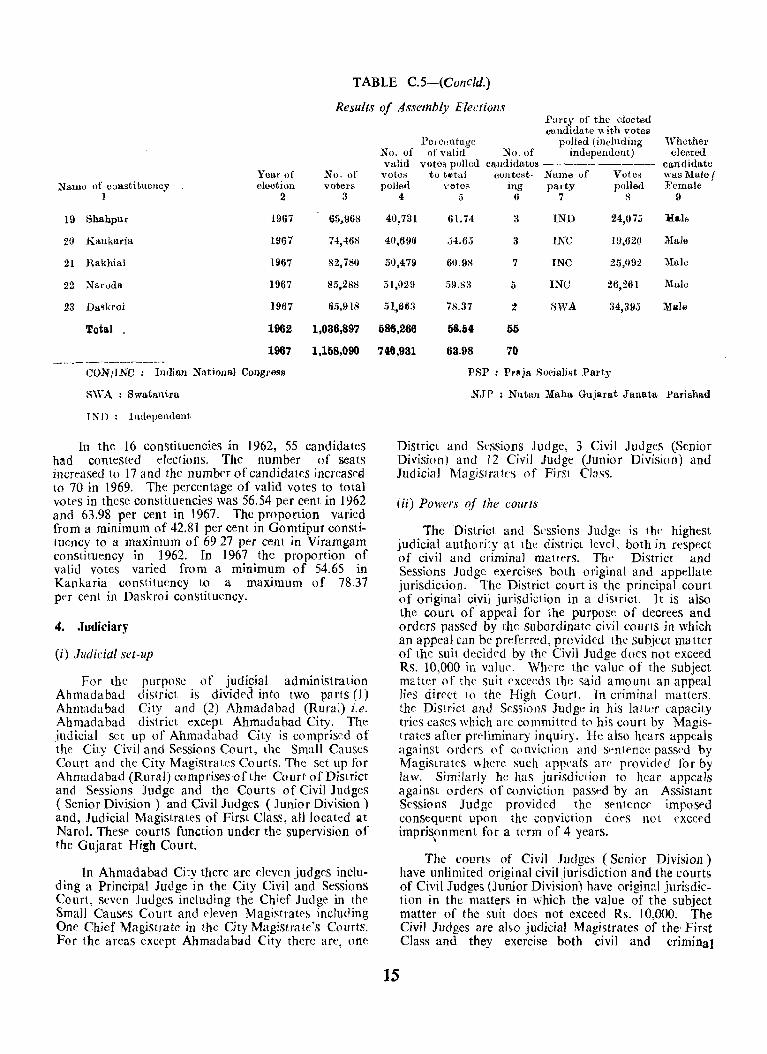
TABLE C.5-(Conctd.)
Results of Assembly Elections
Year of Name of constituency election
19
20
21
22
23
1 2
Shahpur 1967
Kankaria 1967
Rakhial 1967
Naroda 1967
Da~kroi 1967
'rotal 1962
1967
CON lINe: Indian National Cougress
S'VA : Swatantra
IND: In<lependent
No. of voters
:l
65,\168
74,46S
82,780
85,288
&.1,9 IS
1,036,897
1,158,090
In the 16 constituencies in 1962, 55 candidates had contested elections. The number of l)(;ats increased to 17 and the numbt'r of candidates increasf'C'i to 70 in 1969. The percentage of valid votes to total votes in these constituencies was 56.54 per cent in 1962 and 63.98 per cent in 1967. The proportion varied from a minimum of 42.81 per cent in Gomtipur constituency to a maximum of 69.27 per cent in Viramgam constituency in 1962. In 1967 the proportion of valid votes varied from a minimum of 54.65 in Kankaria constituency to a maximum of 78.37 per cent in Daskroi constituency.
4. Judiciary
(i) Judicial set-up
For the purpose of judipial administration Ahmadabad district is divided into two parts (I) Ahmadabad City and (2) Ahmadabad (Rural) i.e. Ahmadabad district except Ahmadabad City. The judicial set up of Ahmadahad City is comprised of the City Civil and Sessions Court, the Small Causes Court and the City Magistrates Courts. The set up for Ahmadabad (Rural) comprises of the Court of District and Sessions Judge and the Courts of Civil Judges ( Senior Division) and Civil Judges (Junior Division) and, Judicial Magistrates of First Class, all located at Narol. These courts function under the supervision of the Gujarat High Court.
In Ahmadabad City there are eleven judges including a Principal Judge in the City Civil and Sessions Court, Seven Judges including the Chief Judge in the Small Causes Court and eleven Magistrates including Onf' Chief Magistrate in the City Magistrate's Courts. For the areaS exct"pt Ahmadabad City there are, one
No. of valid
votes polled
4
40,731
4(J,696
50,479
:51,029
.'fI.,fili.!
586,266
748,931
Party of the elected candida t,e " ith votes
Percentage polled (including of valid No, uf independent)
votes polled candidates -----------to t"'ti11 contest· Name uf Vote"
votes ing party polled ;) 6 7 S
61. 74 3 IND 24,075
.54.6.5 3 INC l!),620
60.9il 7 INC 25,092
;39.8:3 5 INC 26,261
78.37 2 i'iWA 34,395
56,{i4 55
63.98 70
PSP : Praja Socialist Pal·ty
'Whether elected
candidate was Male/ Female
9
Male
Male
Male
Mall!
NJP : Nlltan Maha Guju.rat Janata Parishad
District and Sessions Judge, 3 Civil Judges (Senior Division) and 12 Civil Judge (Junior Division) and Judicial MagisJrates of First Class.
(ii) Powers of the courts
The District and Sessions Judge is th(~ highest judicial authority at the district level, both in respect of civil and criminal matterS. Tht" District and Sessions Judge ext"rcises both original and appellate juriSdiction. The District court is the principal court of original civil jurisdiction in a district. It is also the court of appeal for the purpose of decrees and orders passed by the subordinate civil courts in which an appeal can be preferred, provided the subject matter of the suit decided by the Civil Judge does not exceed Rs. 10,000 in value. Where the value of the subject matter of the suit exce(~ds the said amount an appeal lies direct (0 the High Court. In criminal matters. the District and Sessions Judge in his lattcr capacity tries cases which are committed to his court by MagistrateS after preliminary inquiry. He also hears appeals against orders of cpnviction and SI'ntencc passed by Magistrates where such appeals are provided for by law. Similarly he has jurisdiction to hear appeals against orders of conviction passf:d by an Assistant Sessions Judge provided the st"ntenc(' impost"d consequent upon the conviction dot'S not t'Xcced imprisonment for a term of 4 years.
\
15
The courts of Civil Judges (Senior Division) have unlimited original civil jurisdiction and the courts of Civil Judges (Junior Division) have original jurisdiction in the matters in which the value of the subject matter of the suit does not exceed Rs. 10,000. The Civil Judges are also judicial Magistrates of the' First Class and they exercise both civil and criminal
jurisdiction, except when they are required to exercise only the civil jurisdiction, or only the criminal jurisdiction as the case may be. They are also invested with powers of a small cause court to try suits upto the value ranging from Rs. 200 to Rs. 1,500.
The City Civil and Sessions Court, Ahmadabad, exercises unlimited original civil jurisdiction within the City of Ahmadabad and, on the criminal side it exercises the powers of Sessions Court within the City of Ahmadabad.
Similarly the courts of City Magistrates exercise within the city of Ahmadabad powers akin to those of the Courts of Presidency Magistrates in Presidency towns.
For disposal of suits involving small claims, the Court of Small Causes, invested with summary powers, has been established at Ahma.dabad. In addition to the Chief Judge, there are 6 Judges functioning in the small cause court. These judges are empowered to try suits upto the value of Rs. 2,000. They also try suits under the Rent Act. The Registrar of the Small Cause Court is also empowered to try suits upto the value of Rs. 20.
5. Police
For the purpose of police administration, the district is divided into two parts viz., (I) Ahmadabad City (2) Ahmadabad Rural. The Police Commissioner is in charge of Ahmadabad City and some villages around it while the remaining areas of the district are under the control of the District Superintendent of Police. In 1970-71 the Commissi oner of Police, Ahmadabad was assisted by 5 Deputy and Assistant Commissioners and 10 Superintendents. In addition there were 35 Inspectors, 190 Sub-Inspectors, 875 Jamadars, 243 Head Constables and 2,918 Constables for the city. There were also 13 Police Prosecutors· to assist the police administration in legal proceedings. There were 13 police stations and 55 out posts under the control of Commissioner of Police. The total strength of police including temporary force in Ahmadabad City area was 4,290 at the end of 1970. This gives an average of 0.02 km2• of area and a population of 371 per police. The average number of cognisable crimes investigated per police works out to 3.56.
The District Superintendent of Police was assisted by two Deputy Superintendents in 1970-71. In addition there were 3 Inspectors, 30 Sub-Inspectors, 9 Jamadars,207 Head Constables and 593 Constables. There were 5 police prosecutors to assist the Ahmadabad Rural police administration in legal proceedings. The Ahmadabad Rural police administration had 17 police stations and 7 out posts at the end of 1970. The total strength of Ahmadabad Rural police including temporary force was 823, giving an average of 46.18 km 2• of area and a population of 1,160 persons per police. The average number of cognisable offences investigated per police works out to 2.96.
16
The total strength of police in the district as a whole was 5,113 with 30 police stations and 62 out posts. In all 17,718 cognisable offences were investigated during 1970, giving an average of 3.47 offences per police. During the decade 1961-71 the number of cognisable offences varied from a minimum of 4,703 in 1965 to a maximum of 5,023 in 1969. The number of cognisable offences recorded during the year 1970 was 4,698 of which 59 were murders, 7 decoities, 39 robberies, 529 house breakings, 1,720 thefts. and 86 riots.
6. Jails
Sabarmati Central Jail located at Ahmadabad is the only jail in this district. It had an authorised accommodation for 1,646 male and 8 female prisoners. In 1970, 5,672 convicts were received and 5,848 convicts discharged from the jail. The daily average of convicts in the jail came to 743. The number of under trial prisoners received in the jail was 8,378 whereas the number of such prisonsers discharged from the jail was 7,522. The daily average of under trial prisoners was 405.
The authorised acccmoc'ation in the jail increased from 1,333 priso nerS (1,325 rna les and 8 females) in 1960 to 1,654 ( 1,646 males and 8 females) in }970 Similarly the number of convicts received in the jail increased from 3,280 in 1960 to 5,672 in 1970. The under trial prisoners received in numbered 3,050 in 1961 and increased to 8,378 in 1970. There was a Significant fall in the daily average of convicts from 1,357 to 743 during the decade. The fall may be partly due to the reclassification of jails, resulting in the transfer of a number of convicts to other jails in the State and partly due to release of convicts on account of special remission granted on the occasion of Mahatama Gandhi Birth Centenary in 1969. The average number of under trial prisoners has gone up from 179 in 1960 to 405 in 1970.
7. Local Self Government
(i) Present Set-up
With a view to achieving the objective of democratic decentralisatic.n at aU levels, the Guiarat Panchayats Act, 1961 has been brought into force from 1st April 1963. The Panchayati Raj envisages a three tier system consisting of gram or nagar panchayat at the village/nagar level, taluka panchayat at the taluka level and district panchayat at the district level. The district local boards forming part of the then Local Self Government system have been replaced by the district panchayats. But the municipal form of Local Self Government has been retained and at present municipalities are functioning in the towns with a popUlation above 20,000 and th(' areaS with a population ranging from 10,000 to 20,000 arc given the status of nagar panchayats whereas the areas below 10,000 popUlation have been classified as gram panchayats.
Acccrding to the provisions of the Gujarat Panchayats Act, a gram panchayat consistsofnotless than 9 and not more tban 15 members depending upon the population of the village. The nagar panchayat consists cf not less than 15 and not more than 21 members depending upon the population of the nagar. The taluka panchayat consists of ex-officio, co-opted and associate members. The district panchayat also consists of ex-officio, elected and associate members. Provision has been made to reServe sealS for women, scheduled casteS and scheduled tribes in all the tiers of panchayats.
The District Development Officer is the chief executive officer of the district panchayat. He is generally borne on the cadre cf the Indian Administrative Service and is appointed by the Government. The chief executive officer of the taluka panchayat is the Taluka Development Officer who is also appointed by the Government. Both these officers are secretaries of their respective panchayats. These panchayats function through various committees appointed for different groups of functions. At present there are four statutory committees; namely, Executive, Production, Education and Public WOiks. Two nonstatutory committees, namely Social Welfare Committee and Health Committee have been constituted by thl' district panchayats.
(ii) Functions
The functions of the three_ tiers of panchayats have been elaborately detailed in the three schedules of the Act. In addition, the functions of collecting land revenue (including cesses) and dues recoverable as arrearS of land revenue, levied or assessed by for under the Land Revenue Code and all other functions and duties of a village accountant under the Land Revenue Code have been transferred to gram/nagar panchayats. The powers exercised and functions performed by the diStrict school boards have been similarly transferred to the district panchayat. The functions relating to agriculture, animal husbandry, public health, medical relief, family planning, social welfare, cottage and small scale industries, statistics and ayurvedic institutions have been transferred on an agency basis to the district panchayats.
(iii) Staff
To enable the panchayats to carry out the numerouS activities entrusted to them, the Government has transferred and deputed a number of its employees along with their functions transferred. The staff, of the district school boards has also been transferred to the district panchayats. Government has constituted Panchayat Service Commission for the purpose of recruitment to the non~gazetted posts in the district panchayats.
(iv) Funds
The panchayats have been given necessary funds to execute all the schemes transferred to them.
(Bk) H.lI!:I---li
Provision has been made in the Act for levying taxes by different tiers of panchayats, such as tax on buildings. pilgrim tax, tax on fairs and other entertaillmentS, tax on bicycles or vehicles drawn by animals, sanitary tax, etc., and fees like levy fee on the markets, cart stands, tonga stands, supply of water from wells and tanks for purposes other than the domestic USC' and for cattle. The taluka panchayats and the district panchayats can request the Government for increase in stamp duty and can also levy surcharge on house tax. Moreover, provision has been made in the Act for grants to the panchayats for their activities.
The Act provides that the State Government will give grants to the panchayats on th(~ basis of the average of the land revenue colkcted during the preceeding three years, after deducting therefrom the expenditure on the salaries and training of the secretaries of gram panchayats and village accountants and crediting 5 per cent of the amount tc tbe State Equalisation Fund. 50 per cent of the balance will be distributed among gram panchayats and nagar panchayats, 25 per cent among taluka panchayats and 10 per cent among the district panchayats. Out of the remaining 15 per cent of the land revenue. 7! per cent will be carried to the District Equalisation Fund and 71 per cmt to the Gram Encouragement Fund.
(v) Working of the Local Bodies
In addition to the Ahmadabad Municipal Corporation there are two municipalities in the district viz., Dholka and Viramgam. At the beginning of the decade i. e. in 1961 there were, besides the Ahmadabad Municipal Corporation, six municipalities in the district n2mely, Viramgam, Sanand, Dehgam, Dholka, Dhandbuka and Ranpur. With the implementation of the Panchayat Raj in 1963-64, three municipalities namely, Sanand, Dehgam and Dhandhuka were converted into nagar panchayats while Ranpur Municipality \\as converted into village panchayat. Sardarnagar refugee colony which was declared as a separate revenue village from 30th March 1968. has been declared as Notified Area with effect from 27th April 1970. under the Gujarat Municipal Act. 1963.
17
There were 7 taluka panchayats, 6 nagar panchayats and 612 gram panchayats in the district at the end of the year 1970-71. Out of the 10tal population of 2,910,307, a popUlation of 1,195,183 was covered under the nagar and gram panchayats and 1,664,854 was covered by the municipalities and the Municipal Corporation. The Sardarnagar Notified Area and Ahmadabad Cantonment covered a population of 39,454 and 10,816 respectively.
The Ahmadabad Borough Municipality was raised to the status of a corporation with effect from 1st July 1950. It had 70 seats and covered an area of 35.91 Km2• in 1961. In 1971 the Ahmadabad Municipal Corporation had 91 members and covered an area of 92,98 km2• Out of 91 seats, 10 seats were reserved for the scheduled castes.
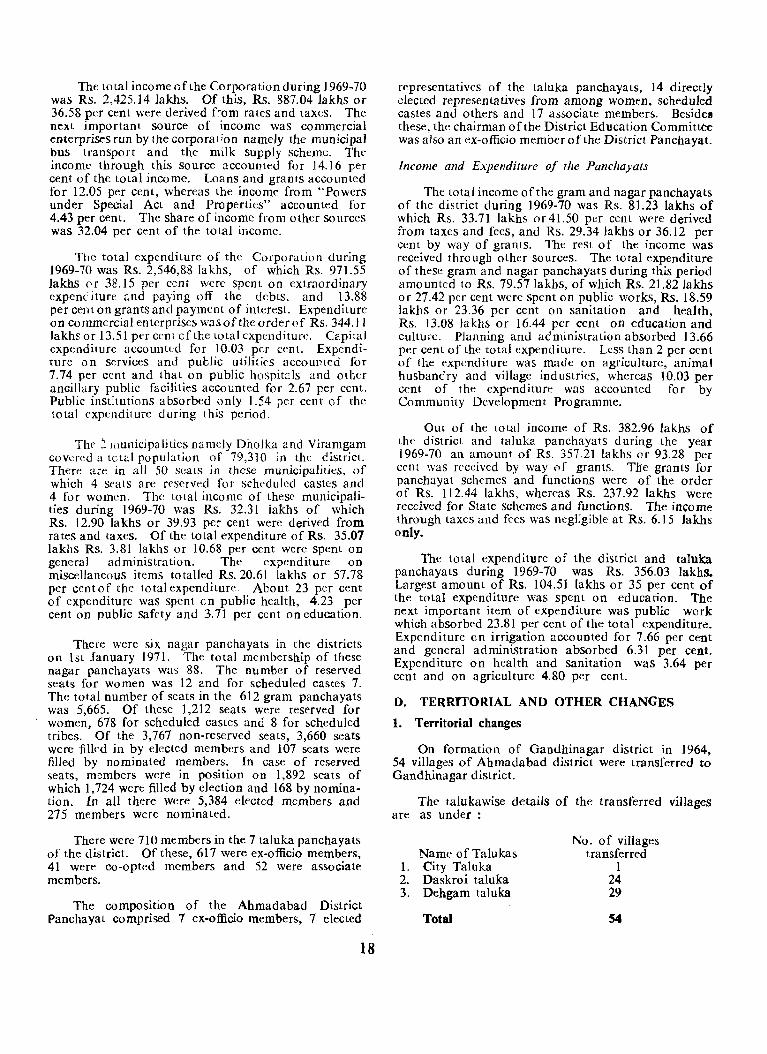
The total income of the Corporation during 1969-70 was Rs. 2,425.]4 lakhs. Of this, Rs. 887.04 lakhs or 36.58 per cent were derived from rates and taxes. The next important source of income was commercial enterprises run by the corporation namely the municipal bus transport and the milk supply scheme. The income through this source accounted for 14.16 per cent of the total income. Loans and grants accounted for 12.05 per cent, whereas the income from "Powers under Special Act and Properties" accounted for 4.43 per cent. The share of income from other sourceS was 32.04 per cent of the total income.
The total expenditure of the Corporation during 1969-70 was Rs. 2,546,88 lakhs, of which Rs. 971.55 lakhs ('f 38.15 per cent were spent on extraordinary expenc iture and paying off the debts. and 13.88 per cent on grants and payment of interest. Expenditure on commercial enterprises wasoftheorderof Rs. 344.11 lakhs or 13.51 per cent cf the lotal expenditure. Capital expenditure accounted for lO.03 per cent. Expenditure on services and public utilities accounted for 7.74 per cent and that on public hospitals and other ancillary public facilities accounted for 2.67 per cent. Public institutions absorbed only 1.54 per cent of the total expenditure during this period.
The ~ municipalities namely Dholka and Viramgam covered a tctal population of 79,310 in the cistrict. There are in all 50 seats in these municipalities, of which 4 seats are reserved for scheduled castes and 4 for women. The total income of these municipalities during 1969-70 was Rs. 32.31 lakhs of which Rs. 12.90 lakhs or 39.93 per cent were derived from rates and taxes. Of the total expenditure of Rs. 35.07 lakhs Rs. 3.81 lakhs or 10.68 per cent were spent on general administration. The expenditure on miscellaneous items totalled Rs.20.61 lakhs or 57.78 per cent 0 f the total expenditure About 23 per cent of expenditure was spent cn public health, 4.23 per cent on public safety and 3.71 per cent on education.
There were six nagar panchayats in the districts on 1st January 1971. The total membership of these nagar panchayats was 88. The number of reserved seats for women was 12 and for scheduled castes 7. The total number of seats in the 612 gram panchayats was 5,665. Of these 1,212 seats were reserved for women, 678 for scheduled castes and 8 for scheduled tribes. Of the 3,767 non-reserved seats, 3,660 seats were filled in by elected members and 107 seats were filled by nominated members. In case of reserved seats, members were in position on 1,892 seats of which 1,724 were filled by election and 168 by nomination. In all there were 5,384 elected members and 275 members were nominated.
There were 710 members in the 7 taluka panchayats of the district. Of these, 617 were ex-officio members, 41 were co-opted members and 52 were associate members.
The composition of the Ahmadabad District Panchayat comprised 7 ex-officio members, 7 elected
18
representatives of the taluka panchayats, 14 directly elected representatives from among women, scheduled castes and others and 17 associate members. Beside8 these, the chairman of the District Education Committee was also an ex-officio member of the District Panchayat.
Income' and Expenditure of the Panchayats
The total income of the gram and nagar panchayats of the district during 1969-70 was Rs. 81.23 lakhs of which Rs. 33.71 lakhs or41.50 per cent were derived from taxes and fees, and Rs. 29.34 lakbs or 36.12 per cent by way of grants. The reSt of the income was received through other SourceS. The total expenditure of these gram and nagar panchayats during this period amounted to Rs. 79.57 lakhs, of which Rs. 21.82 Jakhs or 27.42 per cent were spent on public works, Rs. 18.59 lakhs or 23.36 per cent on sanitation and health, Rs. 13.08 Jakhs or 16.44 per cent on education and culture. Planning and administration absorbed 13.66 per cent of the total expenditure. Less than 2 per cent of the expenditure was made on agriculture, animal husbandry and village industries, whereas 10.03 per cent of the expenditure was accounted for by Community Development Programme.
Out of the total income of Rs. 382.96 lakhs of the district and taluka panchayats during the year 1969-70 an amount of Rs. 357.21 lakhs or 93.28 per cent was received by way of . grants. Tbe grants for panchayat schemes and functions were of the order of Rs. 112.44 lakhs, whereas Rs. 237.92 lakhs were received for State schemes and functions. The income through taxes and fees was negligible at Rs. 6.15 lakhs only.
The total expenditure of the district and taluka panchayats during 1969-70 was Rs. 356.03 lakhs. Largest amount of Rs. 104.51 lakhs or 35 per cent of the total expenditure was spent on education. The next important item of expenditure was public work which absorbed 23.81 per cent of the total expenditure. Expenditure on irrigation accounted for 7.66 per cent and general administration abSorbed 6.31 per cent. Expenditure on health and sanitation was 3.64 per cent and on agriculture 4.80 per cent.
O. TERRITORIAL AND OTHER CHANGES
1. Territorial changes
On formation of Gandhinagar district in 1964, 54 villages of Ahmadabad district were transferred to Gandhinagar district.
The talukawise details of the transferred villages are as under :
Name of Talukas 1. City Taluka 2. Daskroi taluka 3. Dehgam taluka
Total
No. of villages transferred
1 24 29
54
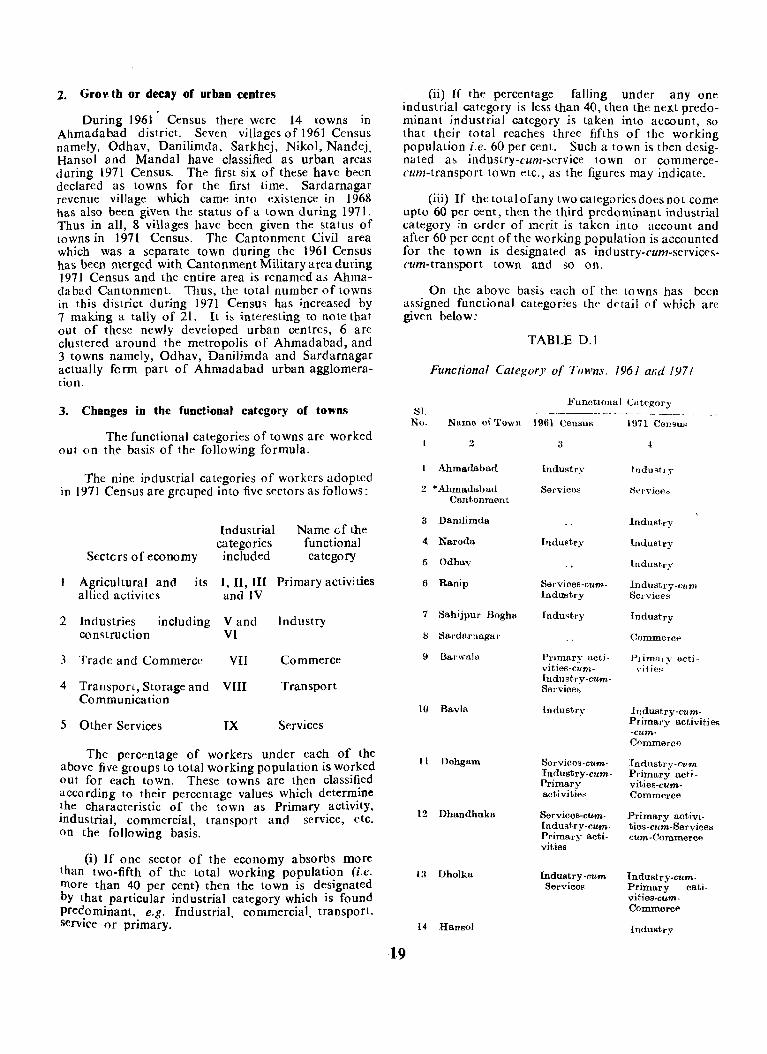
2. Grov tb or decay of urban centres
During 1961 Census there were 14 towns in Ahmadabad district. Seven villages of 1961 Census namely, Odhav, Danilimda. Sarkhej, Nikol, Nandej, Hansol and MandaI have classified as urban areas during 1911 Census. The first six of these have been declared as towns for the first time. Sardarnagar revenue village which came into existence in 1968 has also been given the status of a lown during 1911. Thus in all, 8 villages have been given the status of towns in 1911 Census. The Cantonment Civil area which was a separate town during the 1961 Census has been merged with Cantonment Military area during 1911 Census and the entire area is renamed as Ahmadabad Cantonment. Thus, the total number of towns in this district during 1911 Census has increased by 7 making a tally of 21. It is interesting to note that out of these newly developed urban centres, 6 are clustered around the metropolis of Ahmadabad, and 3 towns namely, Odhav, Danilimda and Sardarnagar actually form part of Ahmadabad urban agglomeration.
3. Changes in the functional category of towns
The functional categories of towns are worked out on the basis of the following formula.
The nine ipdustrial categories of workers adopted in 1911 Census are grcuped into five sectors as follows:
Industrial categories
Sectcrs of economy included
Agricultural and its I, II, III allied activites and IV
2 Industries including Vand construction VI
3 Trade and Commerce VII
4 Transport, Storage and VIII Communication
5 Other Services IX
Name of the functional category
Primary activities
Industry
Commerce
Transport
Services
The percentage of workers under each of the above five groups to total working population is worked out for each town. These towns are then classified according to their percentage values which determine the characteristic of the town as Primary activity, industrial, commercial, transport and service, etc. on the following basis.
(i) If one sector of the economy absorbs more than two-fifth of the total working population (i.e. more than 40 per cent) then the town is designated by that particular industrial category which is found predominant, e.g. Industrial, commercial, transport. servi(.'e or primary.
(ii) If th(' percentage falling under anyone industrial category is less than 40, then the next predominant industrial category is taken into account, so that their total reaches three fifths of the working population i.e. 60 per cent. Such a town is then designated as industrY-fum-service town or commercecum-transport town etc., as the figures may indicate.
(iii) If thctotalofanytwocalegoriesdoesnol come upto 60 per cent, then the third predominant industrial category in order of merit is taken into account and after 60 per cent of the working population is accounted for the town is designated as industry-cum-servicescum-transport town and so on.
On the above basis each of the lawns has been assigned functional categories the detail (If which are given below:
19
TABLE 0.1
Functional Category of Towns. 1961 QI;d 1971
Functional Category ::;1.
No. Name Qf'l'own 1961 Census
2 3 4
I Ahma.dabad
2 * AhmaualHLu Cantonm€tnt
3 Danilimda
4 Naroda
5 Odhav
6 Ranip
7 Sahijpul' Boghs
H Sardarnag81'
9 Barwala
10 Bavln
II Dehgam
12 Dhandhuka
Ul Dholka
l4 Hansol
Industry
Servicm~
['ldu~t·ry
Services·cum· Industry
Industry
Industry
Industry
Industry
Indu"tl'y'C·/)JTI. ServicE'::-l
lndustry
(~ommercp
Primaryacti· Plimalyacti-vities-cum- "iti~~ [ndustry·cum· Sel'vice.~
lndustry Industry·cum.
Sorvices-cumIndustry-cum· Primary act.iviti",
Serv ices· CUm·
[ndustry·cum· Primary actio vities
Industry ·cum Services
Primary activitioo -cum-Commerce
Industl'y·cumPrimary acti· viti€ts,cumCommflrce
Primary activi· ties·cum·ServiceH cum·Commerce
Industry.cum. Primary cati· vities-cum. Commerce
Industry
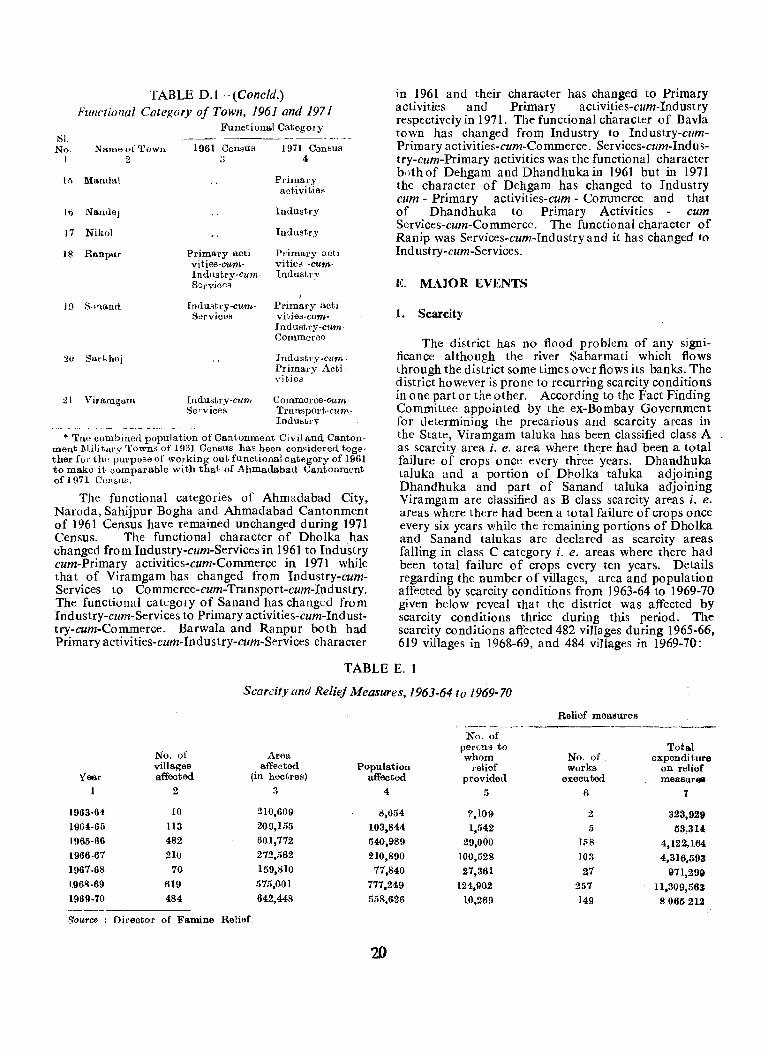
81. No.
1
In
16
17
18
TABLE D.l~-(Concld.) Punctional CateKory of Town, 1961 and 197 J
Functional CategoIy
Natne of 1.'own 2
Manda!
NandeJ
Nikol
Ranpul'
1961 Census
Primary activities-cumIndustry-cumServic~s
1971 Census 4
Primar'Y activitie~
Industry
Industry
Primary netivi tie" -cumIndustry
}
[ndustry-cum- Primary acti Services vities-cam-
Industry-cum· Commerce
2(i Sar·khej Industry-cvm· Primary Acti "itied
21 Viramgam Industry-cum Services
Commerce-cum· Transport-cumIndustry
* Thn combined population of Cantonment Civil and Cantonment Militarv Towns of HJ61 Census has been considered together fur thl' purpose of w01'king out functional category of 1961 to make it comparable with that of Ahmadabad Cantonment of 1971 CeusHS.
The functional categories of Ahmadabad City, Naroda, Sahijpur Bogha and Ahmadabad Cantonment of 1961 Census have remained unchanged during 1971 Census. The functional character of Dholka has changed from Industry-cum-Services in 1961 to Industry cum-Primary activities-cum-Commerce in 1971 while that of Viramgam has changed from Industry-cumServices to Commerce-cum-Transport-cum-Industry. The functional category of Sanand has changed from Industry-cum-Services to Primaryactivities-cum-Industtry-cum-Commerce. Barwala and Ranpur both had Primary activities-cum-In d us try-cum-Services character
in 1961 and their character has changed to Primary activities and Primary activi,ties-cum-Industry respectively in 1971. The functional character of Bavla town has changed from Industry to Industry-cumPrimaryactivities-cum-Commerce. Services-cum-Industry-cum-Primary activities was the functional character b0th of Dehgam and Dhandhuka in 1961 but in 1971 the character of Dehgam has changed to Industry cum - Primary activities-cum - Commerce and that of Dhandhuka to Primary Activities cum Services-cum-Commerce. The functional character of Ranip was Services-cum-Industryand it has changed to Industry-cum-Services.
E. MAJOR EVENTS
1. Scarcity
The district has no flood problem of any significance although the river Sabarmati which flows through the district some times over flows its banks. The district however is prone to recurring scarcity conditions in one part or the other. According to the Fact Finding Committee appointed by the ex-Bombay Government for determining the precarious and scarcity areas in the State, Viramgam taluka has been classified class A as scarcity area i. e. area where_ there har;l_ been a total failure of crops once every- three years. Dhandhuka taluka and a portion of Dholka taluka adjoining Dhandhuka and part of Sanand taluka adjoining Viramgam are classified as B class scarcity areas i. e. areas where there had been a total failure of crops once every six years while the remaining portions of Dholka and Sanand talukas are declared as scarcity areas falling in class C category i. e. areas where there had been total failure of crops every ten years. Details regarding the number of villages, area and population affected by scarcity conditions from 1963-64 to 1969-70 given below reveal that the district was affected by scarcity conditions thrice during this peri.od. The scarcity conditions affected 482 villages during 1965-66, 619 villages in 1968-69, and 484 villages in 1969-70:
TABLE E. 1
Scarcity and Relief Measures, 1963-64 to 1969-70
Relief meaSllres
No. of
No. of villages
Year affected
perons to Total Area whom No. of expenditure
affected Population relief works on relief (ill hectres) affected provided executed measure.-
2 3 4 5 6 7
1963-64 10 210,609 8,654 ?,109 2 323,929 1964·65 113 209,155 103,84;4 1,542 5 53,314 1965-66 482 601,772 540,989 29,000 1;;8 4,122,164 1966·67 210 272,562 210,890 100,528 103 4,316,593 1967-68 70 159,810 77,840 27,361 27 971,299 1968-69 619 575,001 777,249 124,902 257 11,309,563 1969·70 484 642,448 558,626 10,269 149 8065212
,Source : Director of Famine Relief.
20
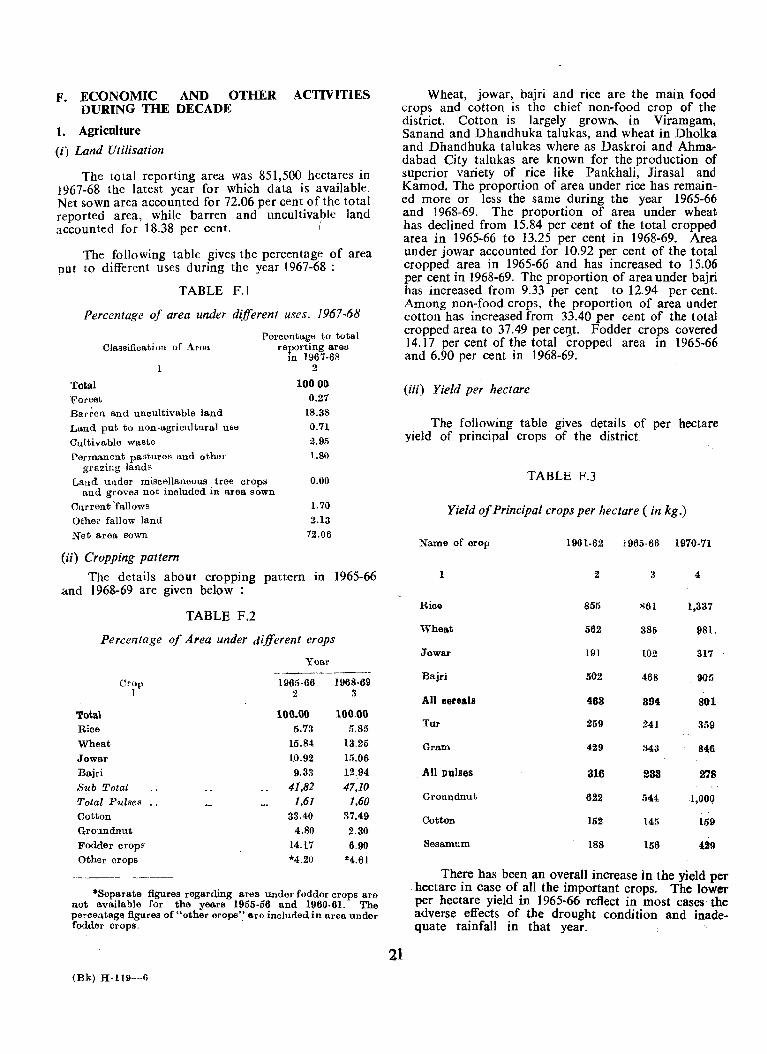
F. ECONOMIC AND OTHER ACTIVITIES DURING THE DECADE
1. Agriculture
(i) Land Utilisation
The total reporting area was 851,500 hectares in 1967-68 the latest year for which data is available. Net sown area accounted for 72.06 per cent of the total reported area, while barren and uncultivablc land accounted for 18.38 per cent. (
The following table gives the percentage of area put to different uses during the year 1967-68 :
TABLE F.l
Percentage of area under different uses, 1967-68
Total Forest
Classifica.tion of Aron
Bar~en and uncultivable land
Land put to non·agricultural use
Cultivable waste Permanont pastures and oth",.
grazing lands
Percentage to total reporting area
in 1967-6R 2
10000 0.21
18.38
0.11
2.95 L80
Land under miscellaneous tree crops and groves not included in area sown
0.00
Current 'fallows Other fallow land
Net area sown
(ii) Cropping pattern
1.70
2.13
12.06
The details about cropping pattern in 1965-66 and 1968-69 are given below :
TABLE P.2
Percentage of Area under different crops
Year
Crop 1965-66 1968-69 1 2 :I
'rotal 100.00 100.00 Rice 5.73 5.85
Wheat 15.84 13.25
Jowar 10.92 15.06
Bajri 9.33 12.94
Sub Total 41,82 47,10 Total Pulse8 .. 1,61 1,60 Cotton 33.40 31.49
Groundnut 4.80 2.30
Fodder crop~ 14.11 6.90 Other crops *4.20 *4.61
*Separate figures regarding area· under fodder crops are not available for the years 1955-56 and 1960·61. The percentage figures of "other orops" 11.1'0 included in area under fodder CrOpS.
(Bk) H-1l9--6
Wheat, jowar, bajri and rice are the main food crops and cotton is the chief non-food crop of the district. Cotton is largely. grown... in Viramgam, Sanand and Dhandhuka talukas, and wheat in Dholka and Dhandhuka talukas where as Daskroi and Ahma, dabad City talukas are known for the production of superior variety of rice like Pankhali, Jirasal and Kamod. The proportion of area under rice has remained more or less the same during the year 1965-66 and 1968-69. The proportion of area under wheat has declined from 15.84 per cent of the total cropped area in 1965-66 to 13.25 per cent in 1968-69. Area under jowar accounted for 10.92 per cent of the total cropped area in 1965-66 and has increased to 15.06 per cent in 1968-69. The proportion of area under bajri has increased from 9.33 per cent to 12.94 per cent. Among non-food crops, the proportion of area under cotton has increased from 33.40 per cent of the total cropped area to 37.49 per ceg,t. Fodder crops covered ]4.17 per cent of the total cropped area in 1965-66 and 6.90 per cent in 1968-69.
21
(iii) Yield per hectare
The following table gives details of per hectare yield of principal crops of the district.
TABLE F.3
Yield of Principal crops per hectare ( in kg.)
Name of crop 1961-62 1965-66 1970-71
1 2 3 4
Rioe 855 S61 1,337
Whea.t 562 385 1)81.
Jowar 191 102 317
Bajri 502 468 905
All cereals 463 394 801
Tur 259 241 359
Gram 429 343 846
. All pulses 316 233 278
Groundnut. 622 544 1,000
Cotton 152 145 159
Sesamum ISS 156 429
There has been an overall increase jn the yield per hectare in cas.e of.all the important crops. The lower per hectare YIeld m 1965-66 reflect in most cases the adverse effects of the drought condition and inadequate rainfall in that year.

(iv) Crop Calendar
The following table gives details of the months of sowing and harvesting of some important crops in the district.
TABLE FA
Sowing and harvesting months
SI. Name of Months of Monlhs of No. crop sowing Harvesting
2 3 4
Paddy July Oct-ober· November
~ Wheat October·November }larch
3 Hairi .Tune.July September. October
4. Jowar August.Septembe,· December·J anuary
5 Tur JWle·July January·Fcbruary
6 Gram November March
7 Cotton June·July ~·obruary. March
8 Groundnut . June.July Novembel'
(v) Agricultural Research and Extension Schemes
Various measures to raise agricultural production in the district are broadly classified under the following heads:
(1) Agricultural Research (2) Agricultural Extension Schemes.
(a) Agricultural Research
There are 5 Agricultural Research Stations in the district. The Research Station at Viramgam is a Regional Cotton Centre established in 1922 for research work on Vagad cotton and a sub-station for research on different varieties of jowar. The agricultural research station at Dhandhuka established in 1959 is a regional station for research on different varieties of dry wheat, a sub-station for research on Vagad cotton and a dry-farming research station for research on other dry crops. The Agricultural Research Station at Arnej in Dholka taluka carries out research on non-irrigated wheat and gram, whereas the Fruit Research Station at Dholka calries out research on guava. The Agricultural Trial-cum-Demonstration Farm established at Dehgam in 1965 carries out agricultural trials and demonstrations for estimating the requirement of tube-well water for different crops and also carries out research on different varieties of fruits.
(b) Agricultural Extension Schemes
The agricultural extension schemes include various programmes for the supply of improved types of inputs to increase agricultural production. There is a seed multiplication farm in each of the talukas of the district. Seed multiplication is being done in these farms and the seeds are supplied to the progressive farmers
22
for sowing on their farms. The distribution of improved seeds is looked after by the State Department of Agriculture and the scheme is executed through the Taluka Panchayats. Various other extension schemes viz., supply of chemical fertilizers, supply of improved implements, loans and subsidies to the farmers for rahats, oil engines, wells etc., are also in operation in the district. Loans for the purchase of oil engines, electric motors and rahats and also for digging of new wells are advanced by the Land Development Bank while loans for purchase of improved seeds, chemical fertilizers, insecticides and pesticides and improved implements are advanced by the primary co-operative societies in the district. The schemes of subsidies for new wells, oil engines, seeds, fertilizers, pesticides and insecticides and implements are operated through the Community Development Programme of the district and taluka panchayats. The co-operative organisations and panchayat agencies work hand in hand in implementing the extension schemes.
2. Irrigation
The area under irrigation in the district has increased from 70,600 hectares in 1964-65 to 85,100 hectares in 1967-68, showing an increase of 20.53 per cent . The proportion of irrigated area to net area sown has gone up from 11.46 per cent in 1964-65 to 13.86 per cent in 1967-68.
(i) Sources oj Irrigation
Wells are the main source of irrigation and accounted for 61.10 per cent of the net irrigated area in 1967-68. Government canals are the next major source with 30.08 per cent share in the net irrigated area in 1967-68. Among other sources, irrigation tankS accounted for 6.11 per cent of the net area under irrigation in 1967-68. The following table gives details of sourcewise irrigation in terms of percentages. :
TABLE F.5
Percentage a/irrigation by sources, 1964-65 and 1967-68
1$1. No. Source 1964·65 1967·68
1 2 3 4
Gov61'nment Canale 35.89 30.08
2 Private Canal. 1.58 0.36
:I Tanks 1412 6.11
4 Well. 48.41 61.10
[) Othor· sourceR 2.35
6 Net area irrigaterl 100.00 100.00
(ii) Crops irrigated
More than three fourth (78.78 per cent) of the total gross irrigated area in ]967-68 was under food crops. Rice which is the main irrigated crop of the district, accounted for 45.60 per cent of the total area under irrigation in 1967-68. Wheat covered 22.86 per cent and cotton 17.23 per cent of the total irrigated area. ~
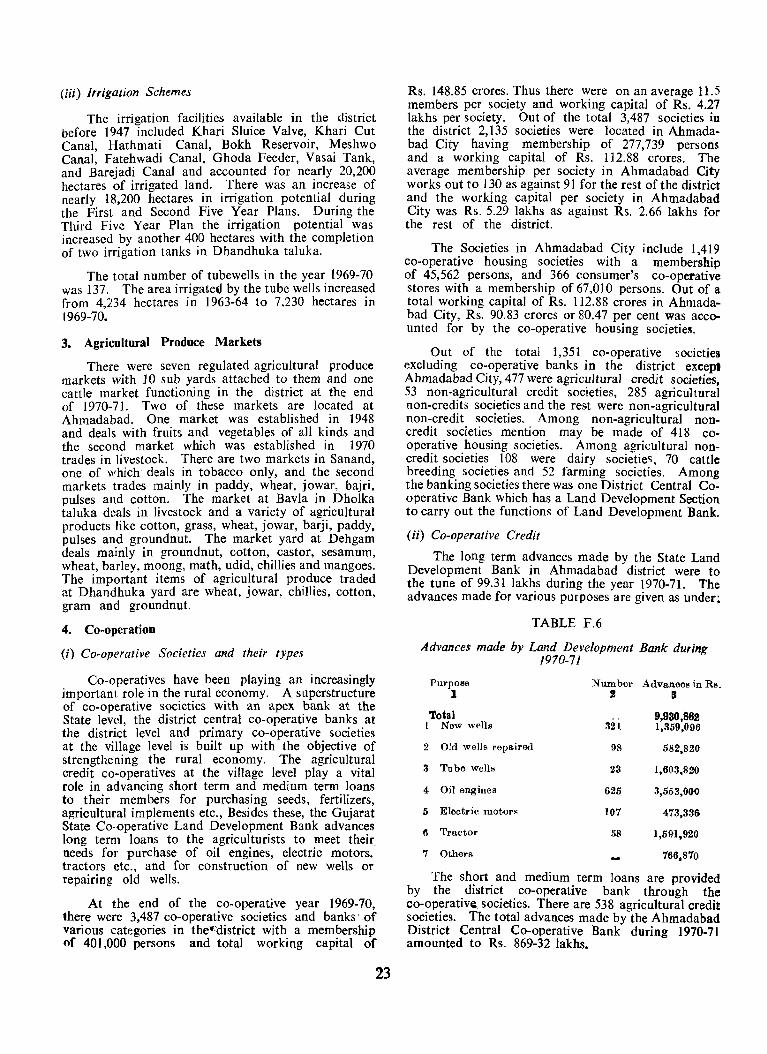
(iii) Irrigation Schemes
The irrigation facilities available in the district before 1947 included Khari Sluice Valve, Khari Cut Canal, Hathmati Canal, Bokh Reservoir, Meshwo Canal, Fatehwadi Canal, Ghoda Feeder, Vasai Tank, and Barejadi Canal and accounted for nearly 20,200 hectares of irrigated land. There was. an increase of nearly 18,200 hectares in irrigation potential during the First and Second Five Year Plans. During the Third Five Year Plan the irrigation potential was increased by another 400 hectares with the completion of two irrigation tanks in Dhandhuka taluka.
The total number of tubewells in the year 1969-70 was 137. The area irrigateu by the tube wells increased from 4,234 hectares in 1963-64 to 7,230 hectares in 1969-70.
3. Agricultural Produce Markets
There were seven regulated agricultural produce markets with 10 sub yards attached to them and one cattle market functioning in the district at the end of 1970-71. Two of these markets are located at Ahmadabad. One market was established in 1948 and deals with fruits and vegetables of all kinds and the second market which was established in 1970 trades in livestock. There are two markets in Sanand, one of which deals in tobacco only, and the second markets trades mainly in paddy, wheat, jowar, bajri, pulses and cotton. The market at Bavla in Dholka taluka deals in livestock and a variety of agricultural products like cotton, grass, wheat, jowar, barji, paddy. pulses and groundnut. The market yard at Dehgam deals mainly in groundnut, cotton, castor, sesamum, wheat, barley, moong, math, udid, chillies and mangoes. The important items of agricultural produce traded at Dhandhuka yard are wheat, jowar, chillies, cotton, gram and groundnut.
4. Co-operation
(i) Co-operative Societies and their types
Co-operatives have been playing an increasingly important role in the rural economy. A superstructure of co-operative societies with an apex bank at the State levd, the district central co-operative banks at the district level and primary co-operative societies at the village level is built up with the objective of strengthening the rural economy. The agricultural credit co-operatives at the village level play a vital role in advancing short term and medium term loans to their members for purchasing seeds, fertilizers, agricultural implements etc., Besides these, the Gujarat State Co.,operative Land Development Bank advances long term loans to the agriculturists to meet their needs for purchase of oil engines, electric motors, tractors l~tC., and for construction of new wells or repairing old wells.
At the end of the co-operative year 1969-70, there were 3,487 co-operative societies and banks' ,of various categories in thet:district with a membership of 401,000 persons and total working capital of
23
Rs. 148.85 crores. Thus there were on an average 11.5 members per society and working capital of Rs. 4.27 lakhs per society. Out of the total 3,487 societies in the district 2,135 societies were located in Ahmadabad City having membership of 217,739 persons and a working capital of Rs. 112.88 crores. The average membership per society in Ahmadabad City works out to 130 as against 91 for the rest of the district and the working capital per society in Ahmadabad City was Rs. 5.29 lakhs as against Rs. 2.66 lakhs for the rest of the district.
The Societies in Ahmadabad City include 1,419 co-operative housing societies with a membership of 45,562 persons, and 366 consumer's co-operative stores with a membership of 67,010 persons. Out of a total working capital of Rs. 112.88 crores in Ahmadabad City, Rs. 90.83 crores or 80.47 per cent was accounted for by the co-operative housing societie~.
Out of the total 1,351 co-operative societies excluding co-operative banks in the district except Ahmadabad City, 477 were agricultural credit societies, 53 non-agricultural credit societies, 285 agricultural non-credits societies and the rest were non-agricultural non-credit societies. Among non-agricultural noncredit societies mention may be made of 418 cooperative housing societies. Among agricultural noncredit societies 108 were dairy societies, 70 cattle breeding societies and 52 farming societies. Among the banking societies there was one District Central Cooperative Bank which has a Land Development Section to carry out the functions of Land Development Bank.
(ii) Co-operative Credit
The long term advances made by the State Land Development Bank in Ahmadabad district were to the tune of 99.31 lakhs during the year 1970-71. The advances made for various purposes are given as under;
TABLE F.6
Advances made by Land Development Bank during 1970-71
Purpose Number Advances in RB. I ! B
Total 9,930,882 1 New wells :'l21 1,359,096
2 Old wells repaired 98 582,820
3 Tube wells 23 1,603,820
4: Oil engines 625 3,553,000
5 Electric motorR 107 4:73,336
tI Tractor 58 1,591,920
7 Others 766,870
The short and medium term loans are provided by the district co-operative bank through the co-operativ~ societies. There are 538 agricultural credit societies. The total advances made by the Ahmadabad District Central Co-operative Bank during 1970-71 amounted to Rs. 869-32 lakhs.
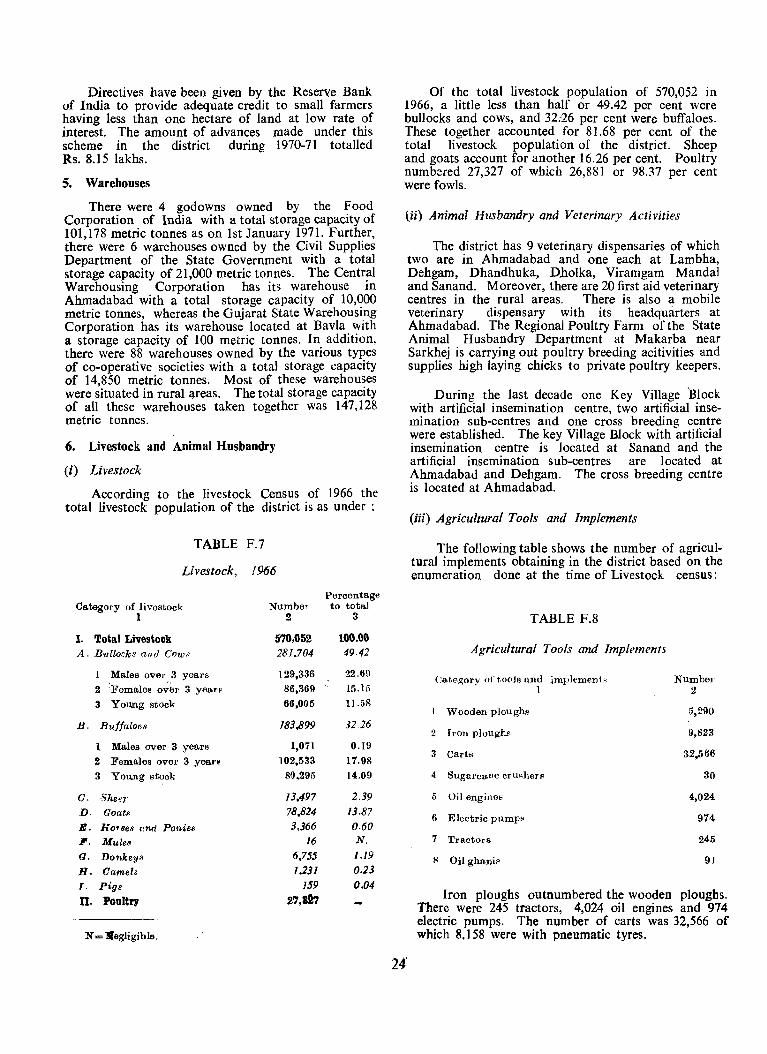
Directives have been given by the Reserve Bank of India to provide adequate credit to small farmers having less than one hectare of land at low rate of interest. The amount of advances made under this scheme in the district during 1970-71 totalled Rs. 8.15 lakhs.
5. Warehouses
There were 4 godowns owned by the Food Corporation of India with a total storage capacity of 101,178 metric tonnes as on 1st January 1971. Further, there were 6 warehouses owned by the Civil Supplies Department of the State Government with a total storage capacity of 21,000 metric tonnes. The Central Warehousing Corporation has its warehouse in Ahmadabad with a total storage capacity of 10,000 metric tonnes, whereas the Gujarat State Warehousing Corporation has its warehouse located at Bavla with a storage capacity of 100 metric tonnes. In addition, there were 88 warehouses owned by the various types of co-operative societies with a total storage capacity of 14,850 metric tonnes. Most of these warehouses were situated in rural areas. The total storage capacity of all these warehouses taken together was 147,128 metric tonnes.
6. Livestock and Animal Husbandry
(0 Livestock
According to the livestock Census of 1966 the total livestock population of the district is as under :
TABLE F.7
Livestock, 1966
Ca.tegory of livestock 1
I. 'Iotal Livestock A. Bullocks find Cows
1 Males over 3 years
2 ~Females o;er 3 yean
3 Y OU/llg stock
B. Buffaloes
1 Males over 3 years
2 Fema.les over 3 years
3 You.ng stock
G. SheeT'
D. Goats
E. H o. aea and Ponies ,. Mules
G. Donkey .•
H. Gamels ,. Pig8
U. Poultry
N = .6gligible.
Number 2
570,052 281.704
129,336
86,369
66,005
183,899
1,071
102,533
80,295
13,497 78,824 3,366
16 6,755 1.231
159
27.at7
Percentage to total
3
100.00 49.42
22.69
15.15
11.58
3226
0.19
17.98
14.09
2.39 13.87 0.60 N.
/.19 0.23 0.04
Of the total livestock popUlation of 570,052 in 1966, a little less than half or 49.42 per cent were bullocks and cows, and 32.-26 per cent were buffaloes. These together accounted for 81.68 per cent of the total livestock population of the district. Sheep and goats account for another 16.26 per cent. Poultry numbered 27,327 of which 26,881 or 98.37 per cent were fowls.
(ii) Animal Husbandry and Veterinary Activities
The district has 9 veterinary dispensaries of which two are in Ahmadabad and one each at Lambha, Dehgam, Dhandhuka, Dholka, Viramgam Mandai and Sanand. Moreover, there are 20 first aid veterinary centres in the rural areas. There is also a mobile veterinary dispensary with its headquarters at Ahmadabad. The Regional Poultry Farm of the State Animal Husbandry Department at Makarba near Sarkhej is carrying out poultry breeding acitivities and supplies high laying chicks to private poultry keepers.
24'
During the last decade one Key Village 'Block with artificial insemination centre, two artificial insemination sub-centres and one cross breeding centre were established. The key VjlJage Block with artificial insemination centre is located at Sanand and the artificial insemination sub-centres are located at Ahmadabad and Dehgam. The cross breeding centre is located at Ahmadabad.
(iii) Agricultural Tools and Implements
The following table shows the number of agricultural implements obtaining in the district based on the enumeration done at the time of Livestock census:
TABLE F.8
Agricultural Tools and Implements
Cal.egol'Y of t,00J8 and implements 1
I 'Wooden ploughR
2 [ron plough..",
3 Carts
4 Sugarcane cruRherF
5 Oil engine ..
6 Electric pumps
7 Tractors
S Oil ghanip
Number 2
5,290
9,823
32,566
30
4,024
974
24-5
9]
Iron ploughs outnumbered the wooden ploughs. There were 245 tractors, 4,024 oil engines and 974 electric pumps. The number of carts was 32,566 of which 8, J 58 were with pneumatic tyres.
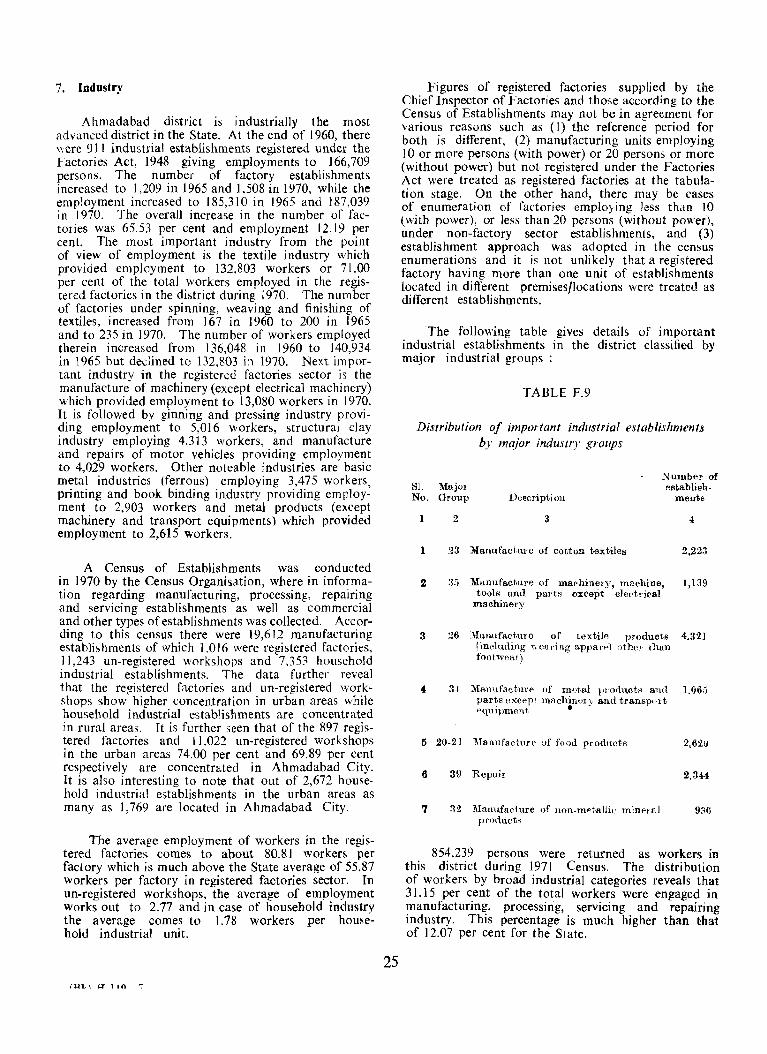
7. Industry
Ahmadabad district is industrially the most advanced district in the State. At the end of 1960, there were 911 industrial establishments registered under the Factories Act, 1948 giving employments to 166,709 persons. The number of factory establishments increas.ed to 1,209 in 1965 and 1,508 in 1970, while the employment increased to 185,310 in 1965 and 187,039 in 1970. The overall increas.e in the number of factories was 65.53 per cent and employment 12.19 per cent. The most important industry from the point of view of employment is the textile industry which provided employment to 132,803 workers or 71.00 per cent of the total workers employed in the registered factories in the district during 1970. The number of factories under spinning, weaving and finishing of tex.tiles, increased from 167 in 1960 to 200 in 1965 and to 235 in 1970. The number of workers employed therein increased from 136,048 in 1960 to 140,934 in 1965 but declined to 132,803 in 1970. Next important industry in the registered factories sector is the manufacture of machinery (except electrical machinery) which provided employment to 13,080 workers in J 970. It is followed by ginning and pressing industry providing employment to 5,016 workers, structural clay industry employing 4,313 workers, and manufacture and repairs of motor vehicles providing employment to 4,029 workers. Other noteable industries are basic metal industries (ferrous) employing 3,475 workers, printing and book binding industry providing employment to 2,903 workers and metal products (except machinery and transport equipments) which provided employment to 2,615 workers.
A Census of Establishments was conducted in 1970 by the Census Organisation, where in information regarding manufacturing, processing, repairing and servicing establishments as well as commercial and other types of establishments was collected. According to this census there were 19,612 manufacturing establishments of which 1,016 were registered factories, 11,243 un-registered workshops and 7,353 household industrial establishments. The data further reveal that the ref!istered factories and un-registered workshops show higher concentration in urban areas while household industrial establishments are concentrated in rural areas. It is further seen that of the 897 registered factories and 11,022 un-registered workshops in the urban areas 74.00 per cent and 69.89 per cent respectively are concentrated in Ahmadabad City. It is also interesting to note that out of 2,672 household indmtrial establishments in the urban areas as many as 1,769 are located in Ahmadabad City.
The average employment of workers in the registered factories comes to about 80.81 workers per factory which is much above the State average of 55.87 workers per factory in registered factories sector. In un-registered workshops, the average of employment works out to 2.77 and in case of household industrv the average comes to 1.78 workers per household industrial unit.
25
Figures of registered factories supplied by the Chief Inspector of Factories and those according to the Census of Establishments may not be in agreement for various reasons such as (1) the reference period for both is different, (2) manufacturing units employing 10 or more persons (with power) or 20 persons or more (without power) but not registered under the Factories Act were treated as registered factories at the tabulation stage. On the other hand, there may be cases of enumeration of factories employing less than 10 (with power), or less than 20 persons (without power), under non-factory sector establishments, and (3) establishment approach was adopted in the census enumerations and it is not unlikely that a registered factory having more than one unit of establishments located in different premises/locations were treated as different establishments.
The following table gives details of important industrial establishments in the district classified by major industrial groups :
TABLE F.9
Distribution of important industrial eSUlblishments by major industry groups
81. No.
1
2
3
4
5
6
7
Number of lVIajOl ~stabb8h-Group DeBcripti 011 mellt~
2 :I 4
23 Manufacture of cotton textiles 2,223
3;; Manufacture of machine's, machine, 1,139 tools and parts except ele~tJ-il:al
machiner·y
26 ){anufacture of tcxtilfl products 4.321 (in01uding "enring appar,'] other' than footweaJ)
34 :Manufacture of mow] product" G1 l<1 1.06:' parts except machinen and transp"l't "quipm.ClH •.
20-21 }\[anufact,nre of food pl'odncts 2,62(1
39 Repair 2,344
!'I 2 1Ifallufacture of Jloll·met·allic minei'll] 936 pr()(lucts
854,239 persons were returned as workers in this district during 1971 Census. The distribution of workers by broad industrial categories reveals that 31.15 per cent of the total workers were engaged in manufacturing, processing, servicing and repairing industry. This percentage is much higher than ~hat of 12.07 per cent for the State.
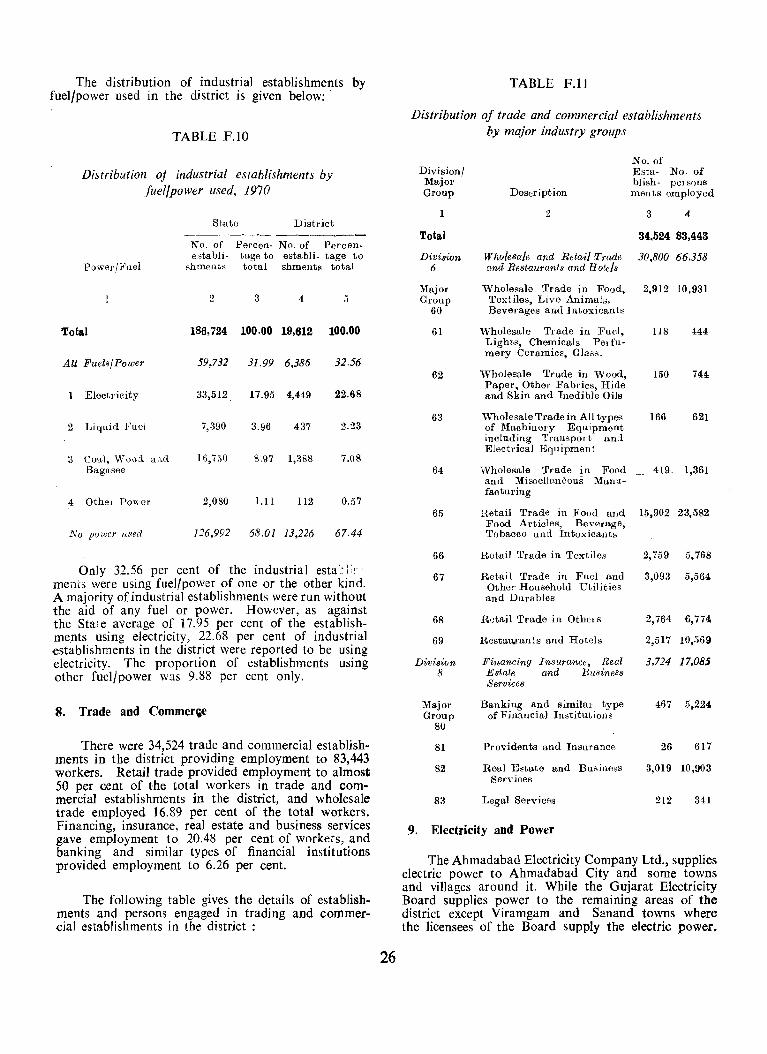
The distribution of industrial establishments by fuel/power used in the district is given below: .
TABLE F.1O
Distribution oj industrial establishments by fuef/power used, 1970
Power/Fuel
Total
All Fuels/Power
Elect!' icity
2 Liquid Fuel
3 Coal, Wooel an,(l Bagasee
4 Othel Power
No power used
State District
No. of Percen· No. of Percen· e3tabli· tage to establi. tage to
shments total shments total
2 3 4 5
186,724 100.00 19,612 100.00
59,732 31.99 6,386 32.56
33,512 17.95 4,449 22.68
7,390 3.96 437 2.23
16,750 8.97 1,388 7.08
2,080 1.11 112 0.57
)26,992 68.01 13,226 67.44
Only 32.56 per cent of the industrial esta~:k' menU, were using fuel/power of one or the other kind. A majority of industrial establishments were run without the aid of any fuel or power. However, as against the Stale average of 17.95 per cent of the establishments using electricity, 22.68 per cent of industrial establishments in the district were reported to be using electricity. The proportion of establishments using other fuel/power was 9.88 per cent only.
8. Trade and Commer~e
There were 34,524 trade and commercial establishments in the district providing employment to 83,443 workers. Retail trade provided employment to almost 50 per cent of the total workers in trade and commercial establishments in the district, and wholesale trade employed 16.89 per cent of the total workers. Financing, insurance, real estate and business services gave employment to 20.48 per cent of workers, and banking and similar types of financial institutions provided employment to 6.26 per cent.
The following table gives the details of establishments and persons engaged in trading and commerdal establishments in the district:
26
TABLE F.II
Distribution of trade and commercial establishments by major industry groups
Division! Major Group
1
Total
Description
2
No. of Esta· No. of bIi sh· per sons menta employed
3 4
34,524 83,443
Division 6
Wholesale and Retail Trade 30,800 66,358 and Restaurants and Hotels
Major Group
60
Wholesale Trade in Food, 2,912 10,931
61
62
63
Textiles, Live Animals, Beverages and Intoxicants
Wholesale Trade in Fuel, Lights, Chemicals Perfumery Ceramics, Glass.
Wholesale Trade in Wood, Paper, Other Fabrics, Hide and Skin and Inedible Oils
'Wholesale Trade in All types of Machinery Equipment including Transport and Electrical Equipment
64 Wholesale Trade in Food and Miscellaneous Manufacturing
65 Retail Trade in Food and Food Articles, Beverage, Tobacco and Intoxicants
66 Retail Trade in Textiles
67
68
69
Division 8
Major Group
80
Retail Trade in Fuel and Other Household Utilities and Durables
Retail Trade in Others
Restau.rants and Hotels
Financing Insurance, Real Estate and Busine8s Services
Banking and similar type of Financial Institutions
81 Providents and Insurance
82 Real Dstate and Business Services
83 Legal Services
9. Electricity and Power
118 444
150 744
166 621
419 1,361
15,902 23,582
2,759 5,768
3,093 5,564
2,764 6,7740
2,517 10,569
3,724 17.08$
467 5,2240
26 617
3,019 10,903
212 341
The Ahmadabad Electricity Company Ltd., supplies electric power to Ahmadabad City and some towns and villages around it. While the Gujarat Electricity Board supplies power to the remaining areas of the district except Viramgam and Sanand towns where the licensees of the Board supply the electric power.
At the beginning of the last decade i.e. in 1960-61, 774.10 million KWH of electricity were sold to public for various purposes and the sales increased by 47.95 per cent during the period 1960-61, 1970-71. During the first quinquennium sales increased by 13.86 per cent and in the second quinquennium sales incl eased by 34.09 per cent. It is interesting to note that Ahmadabad district accounted for one-third of the total consumption of electricity in the State in 1970-71.
Categorywise, 82.03 per cent of the total consumption of electric power in 1970-71 was utilised for industrial purposes and 8.91 per cent was utilised for "Other purposes". The consumption of electricity for domestic purposes and commercial use was 5.77 per cent and 3.29 per cent respectively. It should, however, be noted that the use of electricity for domestic consumption increased by more than 150 per cent, and for com~ercial light and small power by 113.90 per cent dunng the decade.
10. Transport and Commnnication
(i) Roads
In 1960-61 the total ru",J. :dle,ll ih .. ht: lli"lrld was 1,360 kms. of which 519 kms. were of asphalt surface, 63 kms. were of cement concrete, 85 kms. were of water bound macadam and 693 kms. were of other murram and lower types of surface. The road length increased by 13.68 per cent during the period of 1960-61 to 1969-70. At the end of the year 1969-70 the total road length was 1,546 kms. of which 781 kms. were of asphalt, 58 kms. of cement concrete, 97 kms. were of water bound macadam and 610 kms. were of the murram and lower types of roads.
The total road length in 1969-70 comprised 113 kms. of National Highways, 488 kms. of State Highways, 325 kms. of Major District roads, 499 kms. of Other District roads and 209 kms. of Village roads.
(ii) Railways
The total length of railways in the district as on 31st March, 1971 was 377 kms. (inclusive of railway in Gandhinagar district) of which 100 kms. were broad gauge and 277 kms. metre gauge. There were 55 railway stations. There has been no increase or decrease in the length of railway in the district during the last decade.
(iii) Post and Telegraph
In 1969, 336 villages of the district were served by post offices, and combined post and telegraph facilities were available in another 17 villages. The district has a net work of telephone exchanges. In addition to the telephone exchanges in the urban areas, 54 villages are served by telephone facilities. Ahmadabad City also enjoys the Subscriber Trunk Dialling facility to Bombay, Delhi, Poona, Rajkot, Surat and Vadodara. All the taluka head-quarters of the district are connected by telephones.
27
(iv) Airways
Ahmadabad is the only city in the district linked by air with Delhi, Bombay, Vadodara, Udaipur and Jaipur. Daily flights are operated by the Indian Airlines from Ahmadabad. The airport has been modernised to facilitate landing of jet aircrafts.
(v) State Road Transport
As a consequence of the bifurcation of the bilin· gual State of Bombay with effect from the 1st May, 1960, the Bombay State Road Transport Corporation closed its operations in Gujarat. At the same time the Saurashtra State Road Transport Corporation and the Kutch State Road Transport Corporation operating in Saurashtra and Kutch areas, respectively were dissolved and a new Corporation namely, the Gujarat State Road Transport Corporation was established on 1st May, 1960.
Ahmadabad district is served by the Ahmadabad Division of the Gujarat State Road Transport Corporation. This division comprised of Ahmadabad and Gandhinagar districts and Kadi and Kalol talukas of Mahesana district. It was started with effect from 1st March 1949. Due to inclease in passenger traffic on roads, efforts were made to provide more facilities by increasing a number of schedules and routes. The schedules operated increased from 252 on 31st March, 1961 to 345 on 31st March, 1971 showing an increase of 39.90 per cent. The number of routes operated increased from 341 to 538, indicating an increase of 57.77 per cent during the last decade. The average vehicle utilization or kilometreage operated by each vehicle per day improved from 185.3 kms. to 231.8 kms. The number of passengers increased from 212.081akhs in 1960-61 to 401.571akhs in ]970-71, an increase of 89.35 per cent. The average route distance however increased only marginally as also the average distance tra veiled by passengers. The gross revenue of this division for the period May, 1960 to March, 1961 was Rs. 122.271akhs and has gone upto Rs. 369.36 lakhs (by 202.09 per cent) in 1970-71. The earnings per vehicle kilometre was 92.99 paise for the period from May 1960 to March, 1961 and has gone up to 138.20 paise during 1970-71.
Out of 676 inhabited villages of the district, 200 villages or 29.58 per cent are connected by bus service throughout the year, and 306 villages or 45.27 of the total inhabited villages of the district are connected by this facility during fair season only. 25.15 per cent of the total inhabited villages (170 villages) are devoid of this facility.
11. Prices
(i) Retail Prices
The average retail prices of staple foodstuffs collected at Ahmadabad Centre, in 1970 reveal that the price of rice (medium) was highest during the months of February, April, June and July, and lowest in December. The price of wheat was highest in February
and March, and lowest in August. The price of jowar was highest in June and lowest in November and December, whereas the price of bajri was. highest in July and lowest in November. Among pulses the price of arhar (tur) dal was highest in December and lowest in April. In case of gram the highest price was recorded in January and February while the lowest price was recorded in November and December.
(ii) Consumer Price Index
The Consumer Price Index Numbers for Industrial Workers worked out by the Labour Bureau, Government of India, Simla for Ahmadabad and Bhavnagar centres are being used to determine the dearness allowances paid to the industrial workers in Guiarat. The average general index in 1961 was 102 for both Ahmadabad ane Bhavnagar centres whereas the corresponding index in 1970 was 175 f,l[ Ahmadabad and 185 for Bhavnagar. The index for food rt'gistt"red the highest increase (~uring lhe last lIecade from 101 in 1961 to 189 in 1970 flll· Ahmadabad centre and from 102 in 1961 to ]98 in 1970 for Bhavnagar centre. The following table gives the Consumer Price Index Numbers for Industrial Workers at Ahmadabad and Bha vnagar centres fo r the years 1961 and 1970
TABLE F.12
Consumer Price Illdex .lor indusf,.illi lI"Orkers
Ahma'labad Bhavnagat· ---~--.-- ------
Hem of Expenrlitlll'6 1961 1910 1961 1910 1 ~ 3 4 5
1 Food 101 189 102 198
2 Pan, Supal'i, tobac('o W:, 1.39 100 151 and intoxicants
3 Fuc] and lighting JOJ 1.,2 101 14.,
4 Housinl?" 100 114 100 123
.) Clothin!?". h(,dding If);) 14X 10f) lSi a:uI fo"twoal'
I} Mi3('t~llaneotls 106 172 Hl3 ISO
1 Gell",ul 102 In 102 18.;
12. Joint Stock Companies
There were 545 joint stock companies functioning in the district at the end of the financial year 1969-70. with total authorised capital of Rs. 170.17 crores and total sub~cribed capital of Rs. 63.31 crores. The authori<;ed and subscribed capital per company works out to about Rs. 31.22 lakhs and Rs. 11.62 lakhs respectively. The following t"ble gives the percentage share of ('ach class of joint stock company in the' district during 1969-70.
28
TABLE F.13
Percelltage share of different classes of joint stock companies in authorised and slibscrircd capital
/969-70
Cl!»l~I!l"atioll of joint stnck companies
I
AgriculturE' and allied act.ivities
2 :\Iining awl Quarryillg
a ProcH~~ing and :Maultfactl!l'c of foodst.uff. textilo", 10tlther an(l p rodue ts thel'eof
t J'rore;-. . ...,ing alld )iHnu~ factul'(~ of n1.Bt&:s, Chomicals awl produc1' thMc,of
~) Pl'o(;0l'-1;-.;iug an(l rna.nu· factul''''' noi. ebe-who: t' c]a;-siflll(l
{i C')ll,t. ttet.ion Hndnlili· t;flS
7 ('Olnmorco (TI'nd(l all(1 Financ(l)
Ii Tran::;port Conununica· tiuu" aud Storage
\} Community and Business Services
11) Personal and othe, service;;
Total
Percentltg<' to total ----- ----------
AuthoriRed Subscribed No. ca.pital capital
2 ., -1 .. 3.12 0.,,1 O.:l4
(S(;'90) (2l.39)
0.55 1.24 2.111 (211.01)) (1:17.26)
22.:J8 44.,,;; .J2. ~ 1 (7,;,7 ..... 60) (3,33(;.16)
2;;.14 29.:~9 24.02 ( ... 000.80) (1,.,20.90)
11).6-1 6.14 4.~H (l,')4-4.:;:;; (29f1.IO)
2.::JO 0·00 0.70 IU';;.R6, (4!).96)
::l(J. x:} 16';"z{ 1:;.OS (:!,~W :)5) 19:'J1.16)
0.3.) 0.14 0.01 (23.50) (0.16)
2.94 0.11 0.24-(28.02) (15.27)
1.6., 0.24 0.22 (41.00) (13.83)
100.00 10000 100.00 (17.017.38) (6.330.59)
Not~ Figures ill b,·ac)<el .. ' jmlieate aetna.] amount. ill R~. ]akhs.
In 1969-70, 317 or 58.16 per cent of the total l\Umber of joint stock companies were engaged in processing and manufacturing of various products. Their share in the total authorised capital was 80.06 per cent and in subscribed capital 81.31 per cent. Joint stock companies engaged in Commerce (Trade and Financf') accounted for the next largc',t percentage (30.83 per cent) of the joint stock companies in the district anc claimed a share of 16.74 per ccn! in the (otal authorised capital and 15.08 per cent in th(' total subscribed capital of the joint stock companies in the district during 1969-70.
13. Banking
There has becn a rapid incH'ase in the banking facilities in the cistrict since 1960. Thl' number of scheduled banks which was 57 in 1960, increased to 91 in 1965 and at the end of the year 1970 there were 153 scheduled banks functioning in the district.
The number of co-operative banks including their Branches has likewise increased from 27 in 1960-61 to 32 in 1965-66 and 80 in 1969-70.
14. Insurance
In 1961, 23,308 life insurancc policies of the value of Rs. 990.18 lakhs were issued in the district whereas in 1970-71; 38,992 policies of the value of Rs. 3,470.81 lakhs were issued.
15. Education
Education plays an important role in the national development programme. Primary education has been made compulsory both for boys and girls in the age group of 6 to 11 years. Efforts arc being made by the State Government to provide at least one primary school in each village of the State so that this fundamental necessity can be within the reach of every citizen. Till the formation ofPanchayat Raj, the primary education in the rural areas was looked after by the District S..;hooJ Board. Wid1 the introduction of the Panchayat Raj, the functions of primary education have been transferred to the district panchayats in the rural areas In the municipal areas this subject is under the municipalities.
The number of primary schools has increased from 1,360 in 1961-62 to 1,614 in 1969-70, showing an increase of 18.68 per cent. The number of students enrolled in these schools has gone up from 298,030 (0 398,514 i.? an incrt'ase of 33.72 per cent. The llumbt'T of primary school ((':lchers has also gone up from 6,875 to 11,214 showing an increase of 63.11 per cellt. Out of a total enrolment of 398,514 pupils in primary schools in 1969-70. 40,.99 per cent were girls.
670 or 95.04 per cent of the total villages in the di~trict have primary schools (1970-71). All the villJgcs in Ahmacabad City, Daskroi and Sanand talukas and more than 95 per cent of the villages in Dholka and Viramgam talukas, have prim<lry schools. 16 pf'r cent of the villagrs of Dhandhuka taluka :uc yet 10 be provided with primary schools. In the rural 31T3S the proportion of single teacher schools 10 total schools in the rural areas of the district was 27.03 per cent. The proportion of such schools is above the district average in Sanand, Viramgam and Dehgam La luka:,. There is only one single tC(lche-r schoo I in Ahmadabad City taluka. There is one primary scho01 P(':- ('very 9.20 km2 • of rural areas. TrJukawise, the r,qi" varies from a minimum of 3.07 in Ahmadabad Cin' laluka to a maximum of 19.70 in Dhandhuka u'luka. The proporli0n 0f pupils per 1,000 of rural population was 132.21 in 1960-61 and 128 in 1970-71. There are large variations between lalukas in this r('gar .. '. The talukas below tht' district average ( 128) arc Daskroi, Ahmadabad City, Sanand, Dh(llka anc Viramgam, Daskroi taluka taking thf' last place in litis respect. The average numhcr 0f schol;us per school which was 120.86 in 1960-61 has gone up to 167 in 1970-71. The numb(>r of pupils p('r teacher in t h(' primary schools has gone down from 42.33 in 1960-61 to 35 in 1970-71. Talukawisf' proportion varies
I U t· TT 1 1 J, ~
29
from a minimum of 27 in Daskroi taluka to a maximum of 46 in Sanand taluka.
The number of secondary schools has increased from 164 in 1961-62 to 272 in 1969·70. The number of teachers in secondary schools has increased from 3,002 to 4,485. The number of students in these schools has increased from 83,315 students to 137,867 (i. e. by 65.48 per cent).
Ahmadabad City and Dholka were centres for the Secondary School Certificate Examination till 1962. In 1963, Ellisbridge (North) and Kankaria centres were opened for March as well as October examinations and Dhandhuka and Viramgam centres were opened in 1965 for March examination. Ellisbridge (South) centre has been opened since 1969. Thus at the end of 1970 there were 7 centres for S. S. c. Examinations in the district. Of these, all except, Dhandhuka and Viramgam are centres both for March and October examinations. During 1961 out of 14,206 students who appeared at the S. s. C. Examination 6,485 per cent were declared successful. During 1970, 28,016 students appearfd and 14,011 students were declared successful. Tht' number of students appearing at the S. S. C. Examination and the proportion of successful candidates are given below in Table F. 14:
TABLE F.14
Results of the S. S. C. Examination in the district
Xo. I)f ~hHll'n.t.", p())·,.ontage Year ------ -_-_--- -_._-----_ of ~nccessful
1 Appearo(l 1'a"ol)(l ('andi(lates 2 3 <i
1961 14,2()u 6,485 4.).65
196:! Ifl,:!6 11 ,,180 44 . .16
1963 17,328 StO G7 ·W.50
1964 J9,.,;'9 ~, 741 404.69
196" 22,,;64 JO,756 4767
191)6 ~ 1,91! lo.G::~ 48.54
1967 ~:1,~)2~ I 1,7.':.' ~9.~3
1\)6& 20.4()>. 1:1.471 51.01
Hill!) 26, 71 ~ H.'!'!~ .;3.24
U17(1 23,('16 14,011 50.01
Thne werf' 32 colleges in the (~istrict as on 31st March,1961. There was an addition of 46 colleges during tl,.. last dl~cade. Thll~ at the end of March 1971 lhcrc were 78 colleges in the district. Of these, 74 collegp<; are located in Ahmadabad City and one each in Dholka, Dhandhuka, Dehgam and Viramgam. All the Co !leges except 7 colleges in Ahmadabad City arC' affiliated to the Gujarat University. Of the 7 co11-egcs a ffilia It'd to other universities, one is affiliated to the S. N. D. T. Univer,ity. one to the Gujarat Ayurved Univr>rsity and the remaining 5 to the Gejarat Vicyapith.
There were four technical institutic,ns in Ahmadabad City in 1971 of which two are Polytechnics, one of which is exclusively for girls. Among other institutions mention may be made of the Government run R. C. Technical Institute and the Industrial Training Institute.
Ahmadabad City is the most important centre of education in Gujarat State. There are four medical colleges including one ayurvedic college and one dental college. Other institutions include the engineering college, the college of pharmacy, the college of soci?.) service attached to the Gujarat Vidyapith, 9 colleges of education, 6 re&earch institutions including the Physical Research Laboratory and the Ahmababad Textile Industries Research Association and, 5 postgraduate instituti(lns. There are 11 arts colleges, 6 science colleges, 12 commerce colleges, 4 law collegesbesides 3 combined arts and science colleges., 6 combined arts and commerce colleges and 2 combined commerce and law colleges.
16. Medical and Public Health
(i) Medical Institutions
There were 4 aHopa thlc ho spnals an d 1 ') (ll~pensaries in the district in 1960. There was an addition of 8 hospitals but a decline of 4 dispensaries during the last decade. The number of beds in these institutions has increased from 780 in 1960 to 3,045 in 1970, showing an increase of290 per cent. The number of indoor and outdoor patients treated in tbe hospitals and dispensaries has also increased from 25,595 and 245,558 respectively in 1960 to 177,858 and 1,219,291 respectively in 1970.
In 1961 there was no ayurvedic hospital or dispensary but by the end of 1971 there were 3 Ayurvedic hospitals and 2 dispensaries functioning with 240 beds. The number of indoor patients treated was 16,067 in 1966 and increased to 55,041 in 1970. The number of outdoor patients has however declined from 233,332 in 1966 to 171,315 in 1971.
There were 10 primary health centres and 245 rural dispensaries in 1969-70. The number of patients treated in these institutions increased from 361,525 in 1966-67 to 458,210 in 1969-70, indicating an increase of 26.74 per cent during this period. There were 2 maternal and child health centres and 53 family planning centres.
(ii) Public Health Activities
Among various public health schemes small pox vaccination and revaccination and B. C. G. vaccination are important. During 1961, 90,lOl children were given small pox primary vaccination and 355,408 persons were revaccinated. The number of children given primary vaccination in 1971 was 105,581 while 651,020 persons were revaccinated. 4 out of 7 ta1ukas of the district were covered by B. C. G. vaccination programme in 1970 and in all 79,190 persons were vaccina ted.
30
(iii) Vital Statistics
Based (1n the registration data the birth rate inrural areas in 1961 was 25.9 per 1.000 population but declined to 23.9 in 1970. In urban areas the birth rate in 1961 was 36.9 and declined to 29,(: in 1971. In all the years, the birth rate in urban areas has remained higher than in rural areas. Also thl" birth rate for male has becn high cr than the birth rate for females in all these years both in rural as well as urban areas.
The death rate in rural ar('a~ declined from 1 1.6 in 1961 to 11.2 in 1970. A lower death ;~(e however has been recorded during 1968 when it wa~ 8.9. The erath rate in urban artdS tas declined from 14.3 in 1961 to 12.2 in 1970. The Ie \\e~t drath rate in urban .. ,reas was, however, Ob~tTVfd in 1968 at 10.9. As in lhe case of birth rate, erath rate also has been higher in urban areas thr.n in the rural areas.
(iv) Causes of deaths
Deaths due to smGli pox have significantly come down. There wnc 886 (~('aths cur to small pox in 1961 and the figurr of eeath has sharply come down to only 110 in 1970. The number of deaths due to cholera was I in 1':ioi4Ilu ':J in 1':1;'('. 'jT¥L!· Wi>:-- ,ilL m,):" :ll,purtant single cause of deaths thrc'ughout the decade. Of the 29,707 ~eaths during I 961,_H,42l (28.35 per cent), were due to fever and the number has (';ome down to 5098 in 1970. There has been considerable decline in the number of ckaths due to respiratory diseases. There were 7,080 deaths due to this di~ease in 1961 and the number has come do \\'n to 4,118 in 1970. Similarly the deaths due to dyscntryand diarrhorea have come down from 803 in 1961 to 524 in 1970. Deaths due to suicide were 11 in 1961 and 12 in 1970. The deaths d uc to wounding or accidents have also increased from 414 in 1961 to 620 in 1970.
17. Agrarian Reforms and Agrarian Developments
(i) Reforms
Originally the Ahmadabad District consisted of in addition to the Ryotwari lands and villages, the following special land tenures.
(1) Jagir (2) Talukadari (3) Matadari (4) Bhagdari and Narvadari tenure (5) Ankadia (6) Banhedhari tenure (7) Devsthan inam (8) Pargana and Kulkarni watans (9) Vatwa Vajifdari lands
(lO) Saranjam jagirs and other inams of Political nature
(II) Baroda watans.
The erstwhile Bombay State as well as Gujarat State has enacted as many as 29 tenure abolition laws abolishing all the intermediary tenures during 1949 to 1969. All the lands in the district have now become
Ryotwari lands and the holders thereof have directly become liable to pay land revenue to the Government. Direct relations between the holders of lands and Government have now been establised. The scheme of the tenure abolition laws of Gujarat provides not only for the abolition of tenures but also for the upgrading the tenant-cultivators to the status of occupants with or without payment of occupancy price according to the nature of occupancy rights enjoyed by them. Whereever the tenure abolition law does not provide for conferment of occupancy rights on any holder, the holder has an opportunity of obtaining purchase rights over the land held by him under the compulsory purchase provision of the Bombay Tenancy and Agricultural Lands Act, 1948. Thus no holder of land under any of the intermediary tenures already abolished is left without an opportunity of securing occupancy rights. The holders directly become occupants and whatever liability of occupancy price rests on them is recorded as a liability in the record of rights, where he is recorded as an occupallt. The implementation of the abolition laws is thus simple and quick so far as conferment of occupancy rights is concerned. The number of persons who have become occupants under the various tenure abolition laws and the area of land acquired by them in the district is not separately available. But as many as 10.21 lakh persons have become occupants of 103.60 lakh acres of land and as many as 507,941 intermediaries have been abolished in the whole State. Total villages covered under these laws were 12,121 and the total area covered is 143.80 lakh acre., in the State.
As regards the tenancy reforms the beginning was made as early as in 1939 when the first Tenancy Act had been enacted in the former Bombay State. Subsequently, the Act was replaced by the present comprehensive legislation in 1948. This too was subsequently amended in 1955-56, wnen the "tiller's day" provisions were incorporated in the Act. By that provision, all the tenants were deemed to have purchased the lands held by them on lease from their landlords, on the first day of April 1957. (referred to as "Tiller's Day"). The revenue machinery who had to implement the Act had only to fix the purchase price within the limit of 20 times to 200 times the assessment of the land. Under the compulsory purchase provision of the Tenancy Act, as many as 7.72 lakh tenants have acquired purchase rights over more than 24.59 lakh acres of land in the whole State. These figures relate upto 30th June 1970. Separate figures for Ahmadabad district are not available .. Under the provisions of the Tenancy Act no land owner can resume the land from his tenant except under an order of a mamlatdar. Taking of possession by the landlord directly from his tenant is therefore statutorily prohibited. However under the following circumstances a land owner can apply to the mamlatdar for resumption of his lands.
(1) A tenant can surrender his tenancy rights by surrendering his interest therein in favour of the landlord. Such surrenders have to be registered and also to be verified by the mamlatdar before permitting the 1 andlord to act upon them. Now after the compulsory
31
purchase provision, there is no scope left for securing lands by surrenders as all the tenants have become purchasers and their purchase price has also been fixed. Tenancy relations however subsist ill the case of tenants of the exempted catt'gories oflandlords. The exempted categories of the landlords are widows, minors, persons with mental and physical disability and the members of the armed forces. Their tenants have not become deemed purchasers because their landlcrds are pJaced in the exempted categories and only in case of these tenants there is a possibility of surrender. Upto 30th June 1970, 87 cases 0 f surrender ha ve been sanctioned which covered 620 acres of lar,d in Ahm<l,dabad district.
(2) A landlord can also apply for resumption of land ifhis tenant has failed to pay the rent of<:ny revenue year within the stipulated period or that the tenant ha, SUb-l:ivid(d~ sub-kt, or assigned the land in contravention of the provisions of the Act, or has failed to cultiV<l(e tht' land perS<:lnally or has done any aet which is destructive or permanently injurious to the land. Such types of cases would also be very few in number, because as stated earlier most of the tenants have now become purchser-owners of the lands. Upto 30th June 1970,88 cases of such types have been registered and the total land resumed under this category is 528 acres.
(3) At the time when the Tenancy Act was enacted in 1948 the land .owners were given an opportunity to apply for possessIOn of the lands for bonafide personal cultivation, subject to fulfilment of certain conditions. The time limit for making such an application expired on 31 st December 1956. Thereafter again by an amendment in the Act, the small land owners whose income did not exceed Rs. ] ,500/- and whos~ lea sedholding did not exceed an economic holding, were given an opportunity to apply for possession of the lands for bonafid" personal cultivation subject to certain conditions. The last date for making such application was 31st March 1962 which has expired. Total number of cases registered under this section in the district are 491. The figures of area involved in these suits arc not available.
. Special Agricultur.al Lands Tri.bunals were appointed ln each taluka for lmplementatlOn of the provisions of the tenancy legislation. The jurisdiction of the Civil Courts is barred under the provisions of the Act. There have thus been lesser delays and fewer litigations in regard to tenancy matters.
(ii) Security of tenancy
There is a provision made in the Tenancy Act for security of tenancy. Under section 29 (2) of the Act' no land owner can take direct possession of the land from the tenant. Whenever a landlord wants to take possession of the land from his tenant, he has to make an application to the Mamlatdar stating the grounds on which he is entitled to possession. The mamlatdar after helding an inquiry pass such order thereon as he deems fit. Provision is so strict that even if a tenant
relinquishes the land, . the land owner cannot take posse~sion of it, except under an order of a Mamlatdar. There cannot therefore be any dispute relating to security of tenancy. The legal provision made in section 2()
of the Act has succeeded in giving complete security of the tenure.
lfa tenant is illegally dispossessed by his landlord, he can apply for restoration of po~session, to the Mamlatdar and if the tenant's claim for restoration of possessi0n is proved to be right then the mamlatdar restoers possession to him.
There is another provision made in section 4B of the Tenancy Act which prohibits termination of tenancy by efflux of time. No tenancy of any land can therefore be terminated merely on the ground that the period fixed by agreement, or usage for its duration has expired. The scheme of the Act is such that once a person becomes a tenant of the land, his tenancy cannot be terminated at the sweet will of the landlord. It can be terminated only under the provision of the Act.
(iii) Security of shafe cropper and dispute about share and terms and conditions of cultivations by "fwre cropper
There is no share cropping system prevalent in Gujarat. Cash rent is pre~crjbed for each parcel of land. The terms and conditions of cultivation are abo prescribed. It is not a matter to be agreed upon bet ween the tenant and a land owner. ft is legally provided by a statute. Under section 8 of the Tenancy Act, maximum and minimum limits of rent has been fixed. Such rent is not to exceed five times the assessment of the land or rupees 20 per acre whichever is less and shall not be less than twice the as~essment of the land, provided that where the amount equal to twice the assessment exceeds the sum of twenty rupees, the rent shall be twice the assessment of the land. The mamlatdar in accordance with the above provision has to fix the cash amount of rent for each parcel of land within bis jurisdiction. Accordingly cash rent has been fixed for each parcel of land by mamlatdars. If any bnd owner recovers rent in excess of the rent fixed bv law he has to refund the excess amGunt together \\ it-h the compensation to the tenant as may be ~ determined by the mamlatdar. He is also liable to certain penalty prescribed by rules. As regards terms and conditions of cultivation, it is provided in the Tenancy Act that (1) The landlord is not liable to make any contribution towards the cost of cultivation. (2) The tenant is liable to pay the land revenue and certain other cesses. (3) Landlord shall not levy any cess, rate, vera, huk or tax, or service of any description or denomination whatsoever other than rent fixed bv law from his tenant, (4) Whenever from any cause the payment of land revenue is suspended or remitted. wholly or partially, the landlord has to suspend or remit, wholly or partially, as the case may be the rent of land, lawfully payable to rum by his tenant.
As observed earlier most of the tenants have become owners of the lands cultivated by them by virtue of the tiller's clay provision made in the Tenancy Act.
32
Very few tenants now remai n as tenants. It may be that by mutual understanding crop sharing system may be prevailing in some cases, but their percentage will probably be very small. There may be some cases in which the names of tenants may not have been entered in the record of rights.
(iv) Serrice tenure including commlltation of rent in service to cash
There is no service tenure existing in the Gujarat State. Gujarat State has passed as many as 29 Tenure Abolition Laws abolishing all the tenures includjng service tenUre. Most of the above laws have been passed before 1961. Since there is no service tenure existing in the whole of the Gujarat State, the question of commutation of rent in service to cash does not arise.
(I') Commutation of rent in kind to cash
In Gujarat the rent in kind is prohibited. Cash rent has been Jixed for each pal cel of land. Under section 9 of the Tenancv Act. the mamlatdar has to fix the rate of rent payable by a tenant for the lease of different classes of land in each village within his jurisdiction. Accordingly the rate of cash rent has been fixed and notified by all the mamlatdars for each class of land i 11 all the villages. There is therefore no question of commutation of rent in kind to cash.
(vi) Rent disp1!tes
As observed earlier cash rent has been notified for all villages and for all type~ of land under the provisions of the Tenancy Act. Such rent can be enhanced or reduced by the Mamlatdar or the Collector only on an application made to him by the land owner or the tenant. Reduction in rent can be made when there is deterioration of the land by flood or other cause beyond the control of the tenant and the land has been wholly or partially rendered unfit for cultivation. The enhancement in the rent has to be made when there is any improvement made in the land at the expense of the landlord and thereby there is an increase in the agricultural produce of the land. The disputes regarding quantum of rent would be rare because cash rent has been fiXed statutorily for each land and no enhancement or reduction can be made therein without the order of mamlatdar. There can be disputes regarding non-payment of rent by the tenant. If the tenant does not pay the rent, the land owner has to remedies available under the law. He can file the assistance suit under the Bombay Land Revenue Code and the Mamlatdar, if the arrears of rent is proved recovers 'the rent from the tenant as arrears of land revenue and pays it to the land owner. Alternatively the land owper can file a suit under the Tenancy Act for resumption of the land on the ground that the tenant has failed to pay the rent of the land. Tn such cases the mamlatdar "ives three months time to the tenant to pay up the
rent and if the tenant complies during that period the suit is filed. Tf he does not pay the rent during that period then after holding inquiry the legal order of possession is rassed by the mamlatdar. There may he rare cases of upward revision of rent or reduction in the quantum of rent.
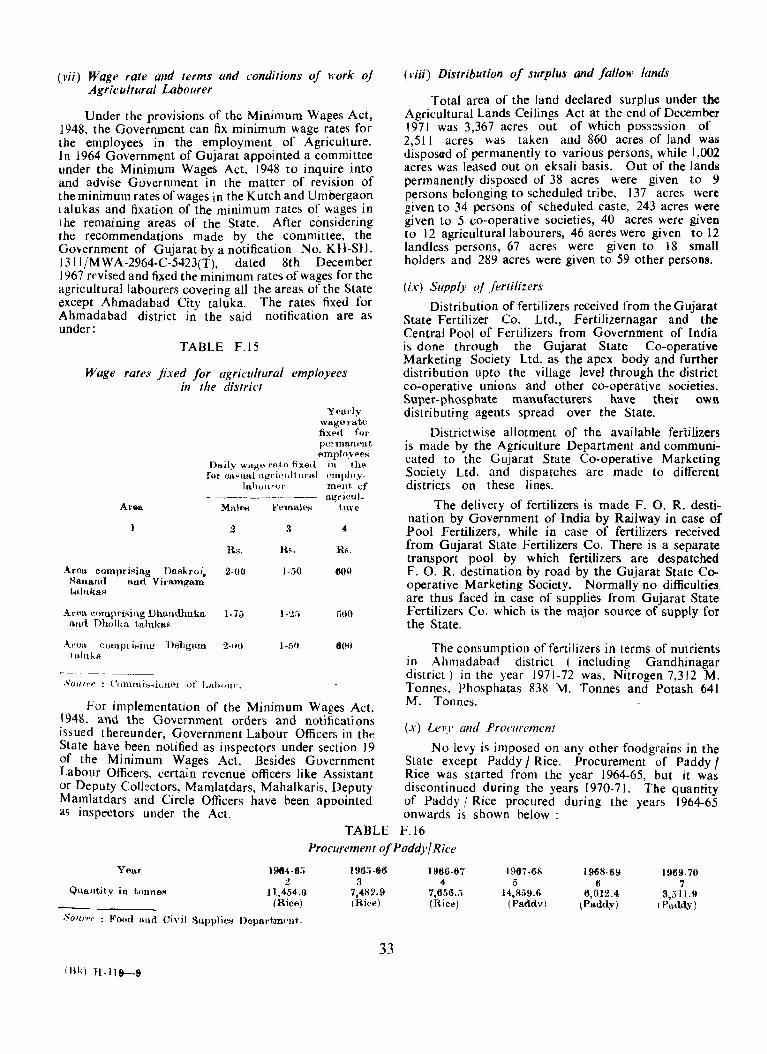
(I'ii) Wage rate and terms and conditions of work oj Agricultural Labourer
Under the provisions of the Minimum Wages Act, 1948, the Government can fix minimum wage rates for the employees in the employment of Agriculture. In 1964 Government of Gujarat appointed a committee under the Minimum Wages Act, 1948 to inquire into and advise Government in the matter of revision of the minimum rates of wages in the Kutch and Umbergaon I alukas and fixation of the minimum rates of wages in the remaining areas of the State. After considering the recommendations made by the committee, the Government of Gujarat by a notification No. KH-SH. 1311/MWA-2964-C-5423(T), dated 8th December J 967 revised and fixed the minimum rates of wages for the agricultural labourers covering all the areas of the State except Ahmadabad City taluka. The rates fixed for Ahmadabad district in the said notification are as under:
TABLE F.15
Wage rates fixed for agricultural employees in the district
A1'%
.-\.~tla comprising ])askroi, Sanalld and Vi.·amgam tnlukaR
A.t·en comprising Dhalldh.uka alld Dholka talukas
.-\.,'0" eOlnpril-ling Dehgam tahd'll
Y<'l1J'ly waglJ ... ~te fix~d foJ' per'manflllt emplo,YpeR
J)a,ily wago J'n,tA fixe.l in th" foJ' oll"ual agrieldtlll'al (,1Il1'1 .. y-
laho(LnH' mPHI. of - ---------- agricul.
'Mnlt'H l<'emal<'!-\ tine
2 3 4
Rs. Us. R8.
2-00 1·50 000
1.75 1·25 ;;(lli
2-tHI 1-51.1 6(10
For implementation of the Minimum Wages Act, 1948. and the Government orders and notifications issued thereunder, Government Labour Officers in the State have been notified as inspectors under section 19 of the Minimum Wages Act. Besides Government Labour Officers, certain revenue officers like Assistant or Deputy ColI~ctors, Mamlatdars, Mahalkaris, Deputy Ma~latdars and Circle Officers have been appointed as mspectors under the Act.
TABLE
(I'ij;) Distribution of surplus and fallow lands
Total area of the land declared surplus under the Agricultural Lands Ceilings Act at the end of December 1971 was 3,367 acres out of which possession of 2,511 acres was taken and 860 acres of land was disposad of permanently to various persons, while 1,002 acres was leased out on eksali basis. Out of the lands permanently disposed of 38 acres were given to 9 persons belonging to scheduled tribe, 137 acres were given to 34 persons of scheduled caste, 243 acres were given to 5 co-operative societies, 40 acres were given to 12 agricultural labourers, 46 acres were given to] 2 landless persons, 67 acres were given to 18 small holders and 289 acres were given to 59 other persons.
(ix) Supply oj fertilizers
Distribution of fertilizers received from the Gujarat State Fertilizer Co. Ltd., Fertilizernagar and the Central Pool of Fertilizers from Government of India is done through the Gujarat State Co-operative Marketing Society Ltd. as the apex body and further distribution upto the village level through the district co-operative unions and other co-operative societies. Super-phosphate manufacturers have their own distributing agents spread over the State.
Districtwise allotment of the available fertilizers is made by the Agriculture Department and communicated to the Gujarat State Co·operative Marketing Society Ltd. and dispatches are made to different districts on these lines.
The delivery of fertilizers is made F. O. R. destination by Government of India by Railway in case of Pool Fertilizers, while in case of fertilizers received from Gujarat State Fertilizers Co. There is a separate transport pool by which fertilizers are despatched F. O. R. destination by road by the Gujarat State Cooperative Marketing Society. Normally no difficulties, are thus faced in case of supplies from Gujarat State Fertilizers Co. which is the major source of supply for the State .
The consumption of fertilizers in terms of nutrients in Ahmadabad district (including Gandhinagar district) in the year 1971-72 was, Nitrogen 7,312 M. Tonnes, Phosphatas 838 M. Tonnes and Potash 641 M. Tonnes.
(x) Lev_)' and Procurement
No levy is imposed on any other foodgrains in the St.ate except Paddy I Rice. Procurement of Paddy / RIce was started from the year 1964-65, but it was discontinued during the years J 970-71. The quantity of Paddy / Rice procured during the years 1964-65 onwards is shown below :
F.16 Procurement of Paddy! Rice
Yea)'
Quantit.y in tonneR
1964-6:> 2
11,454.0 (RiCA)
Sow'rr : Food and Ci"il Supplies Depad~m'llt.
IRk) H-II9-9
196.,-&6 3
1,482.9 (Rice)
33
1966-61 4
1,656.i; (Rice)
1967.68 5
14,859.6 (Paddy)
1968-69 6
6,012.4 (Paddy)
1969·70 7
3,51I.9 I Paddy)

The procurement ,pri~es of Paddy / Rice are fixed after' consIdering the recommendations of the ~icultural Price Commission. The purchase prices
of different foodgrains fixed for the years 1964-65 to I 970~71 are as under :
TABLE F.I7
Purchase price of foodgraills fixed for the years. 1964-65 to 1970-71
V'.tJ'iety "f FOf)flqrains
R i,·O' I P"dtly
Kavchi, Kalla, Dhudhalli. Khadashi, La,jhital'i, f'iathi, Sutal'"ai. Vank],), Bhare.sha.l
Maujal'vfll, hhuBboi, K'Jlmndi, Pankhi, Vartldi, Rukhvel. Fn1kl), Vallkval
Kolam, Ba,;mati, PaJ'imal, K-42
Pankha1i
Other }I'oodyro i /18'
WllOat red
Wheat white ordinary
~Wheat -;nporioJ'
Bajri
I!J64·6.;
2
.5O.:W
64.10
7).S(
77.90
87. III
94.7C
1(J:l.90
;liS.OO
40.00
. 8clllrce : POOl! and Ciyil Snpplip, ])ppartm""t.
Ripe
I !)6.)·66
:3
54.a;}
68.10
76.:10
82.7:;
9Z.i.;
Wn.6n
110AO
.. 5.00
60.00
fj;'.OO
:3:-.00
40.00
:16.(1)
(xi) Stalutory fixation of price.~ of agricultural commodity
The State Government's policy is to distribute foodg:rain~ through fair .price shops on "no profit no loss" basis to the weaker and vulnerable sections of the society. excluding those paying income tax, or holding
l!JfJ6·67 1967·68
4 !)
;)6.70 4:l.(!0
72.20 ;")ii.OO
S(UII) . 02.()()
87.70 67.00
9!1.11J 76.(HI
I06.6n 82.00
117.00 91.00
,'i2.75 ' ,)~.(j0
56.75 59.00
60.71) fj3.1)O
:1".1I() 6;;.1)1)
40.0() 1l:}.OO
36.00 65.0n
(Figures in rnpees per quintal)
1908·69
6
4:1.110
.5;").00
62.O!)
07.(1)
71i.OO.
82.IH)
91.(1)
7:1.110
78.<i()
8:3.00
70.00
.. ;;. (1('.
f\.") ,00
Paddy
1909·70 1970·71
7 8
4:1.00 4:3.00
5;;.00 :;5.00
f}2.06 62.00
fl7 .(11) 67.()0
7(LOO . 76.110
82.00 82.00
91.01/ 91.00
71 tv 74 71 to 74
76.00
n t. .. 78 :;:; to 70 ')Il t~-;i(!(\ th"
~t,ntn
71 to 77 ;,::; t<> 6.; Withiu the
State 8:1 out~ide thp State
;),~ to 0;'
1/9 and above area of ceiling of land fixed under Gujarat Land Ceilings Act. 1960.
The ex-godO\~n issue prices at which the fair price shops were given; foodgrains including loc~i1ty procured rice and retail issue prices at which fair price shops sold them to consumers during the vear 1970-71 are as under: ~ .
34
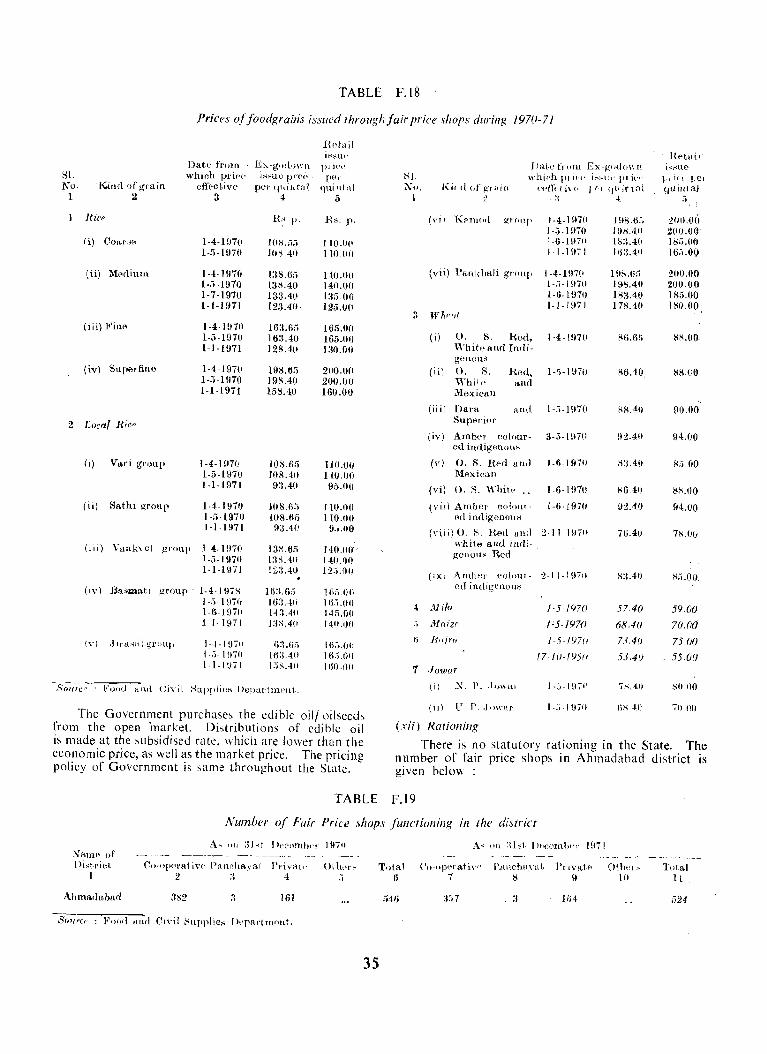
TABLE F.1S
Prices affaodgrains isslIed throllgh fair price shops during /970-71
S1. No.
I K.illd of ~rain
2
!ticp
Ii) Coal'30
(ii) Merlium
(iii) Fine
(iv) Superfine
Date frum which pl'i('"
effectivE' 3
1-4-1970 1-r.-1970
1-4-1970 l-r.-1970 1-7-1970 1-1-1971
1-4-197(1 1-5-1970 1-1-1971
1-4-1970 1-;;-1970 1-1-1911
2 Local Ric"
(i) Vari gl'Oul' J -4-197t! 1-5-1970 1-1-1971
(ii) Sathi group 1-4-1970 1-5·1970 1-1-1971
(i i i) Vankyel group I--t- 1 970 1-5-1970 1-1-1971
(iv) Baiimati group' 1-4-I!liS J -;.-1 U711 1-6-1!l,O 1-1-197 I
(y) :Jln1:-;<1l group 1-4-1 (1,1i 1-.;- 1 !!ili 1-1-1 !i71
Ex·gll,lowll l~;-:UO I)f'{'p
pel' '1',illtfll 4
lOs.;,;; 1(1~.40
13S.6.; 13H.40 I 33.4() 123.40·
16:$.65 16:UO 12S.4(1
19IU)i; 19S.40 158.,10
lOS.(ir. 108.41) 9:1.40
108.1\;; lO8.fi5 9:3.40
l:l~.6fi
1:IH.40 l:;a.40
lll:1.6;. 16:1..10 143.411 J:~S.4(1
1 r.:Ui:i 16:140 1.')S..10
SOUICt; Food and Civil SUppJiuK Uepal·tlnt"Tlt..
RBtail i~8tH'
pej(,l'
Pfll'
quintal 5
lb. p.
110.0(. 110.00
140.00 14t).OO 13;; 0(1 125.00
16;;.00 165.00 130.00
2UO.OO 200.00 160.00
IlO.OII 110.00 95.00
110.00 110.00
9.).00
140.1111-140. 1)(1 12.;.0(1
16;; on H>.i.OO 1~5.0(l
140.1)(1
lli.'.OO 16.'.()1I 1110.0(1
The Government purchase~ the edible oil/oilseed, from the open il1arket. Distributions of cdiblc oil is made at the ~llbsidised rate, which are lower than the economic price, as well as the market price. The pricing policy of Government is same throughout the State.
TABLE
HI. Ko. Kird ('[1-(''''1(
2
j )at.e fronl Ex-gfJdo\\]1 whir·h pi jet' i:--I--l-'.l' pI it,(,
('<'I1('(i\" jf'r(J"ir(ttl J :1 4
("i! 'Kpm,,,[ f!1'f'llr' 1-4-1970 1 -.;-1970 '-6-HJ70 1-1-1971
(vii) Pallldittii grollp 1-4-1\)7(' l-i)-1!170 1-ll-1970 1-1-1\)71
(i) O. S. .kod, 1-4-1970 Whikanct Indi-go l\(I ltK
(iii O. fl. .ked, 1-,i-1970 Whi:" and ;_Uexican
(iiil Dartt Superi(.T'
"uri. l-I\-HliO
(iv) Amber culour- 3-5-1970 ad indigenolls
(\') O. S. Hpd awl 1-6-1970 Mexicun
(vi) O. S. Whit.. .• 1-6- !II 70
(\'iil Arub,,!' cololll'- L-t;-J97t1 (1,1 ind'genoll~
(,-iii) O. fl. l{('d awl 2-11-1970 whit", and fJtdi-gonom, Red
(ix· Am!.", eol",,,- 2-11-1970 eel indigenollo
.j, ~IJ i/o 1-5 ·1970
:; Mrdzr: 1'5-197{1
7 Jowar
(il X. P .. JO\Hll
(i ill' J' .. T owar
(xii) Ratiuning
1 5 !97U
/7-/0-/950
1-.)-1971 1
Li-I!Ji'O
19S.ti'-. IIIS.40 IS:J.40 1I;:{.411
198.6;' 198.40 183.40 17S.40
S6.6r,
1)2.40
S641)
92.40
W.4u
57.40
68.4(1
73.40
53.40
7s.-i1)
lisA!'
1 J ,. , I·e. ({uinta)
1)
2011.00 2f10.UO· 1 85.0(:J 16[ •. 0(,)
200.00 200.00 ISo.00 180.00
8S.00-
88.{iO
90.00
94.00
SS.OO
94.00
7S.0&
S;;.OO.
59.0(1
70.00
75 (JO
55.00
SO.oo
711 00
There is no statutory rationing in the State. The number of fair price shops In Ahmadahad district is given below
F.19
Number of Fair Price c\JlOpS functiuning ill the district
Na,m" of Di,t.ri('t
1
Ahmarlabarl
A, "" :n . ..;i 1>t'('orniwJ' Ill,,,
Co-opAraj·iv(' P'tn"'la~·at Privak 2 :; 4
382 161
SOllrc(· : Food "ItO en-il Suppliei' [kpal'tJII(lllt.
P.;'lp.('hnyut Pl'l'VatH Oth,:t" Total S 9 to II
G41l . 3 524
35
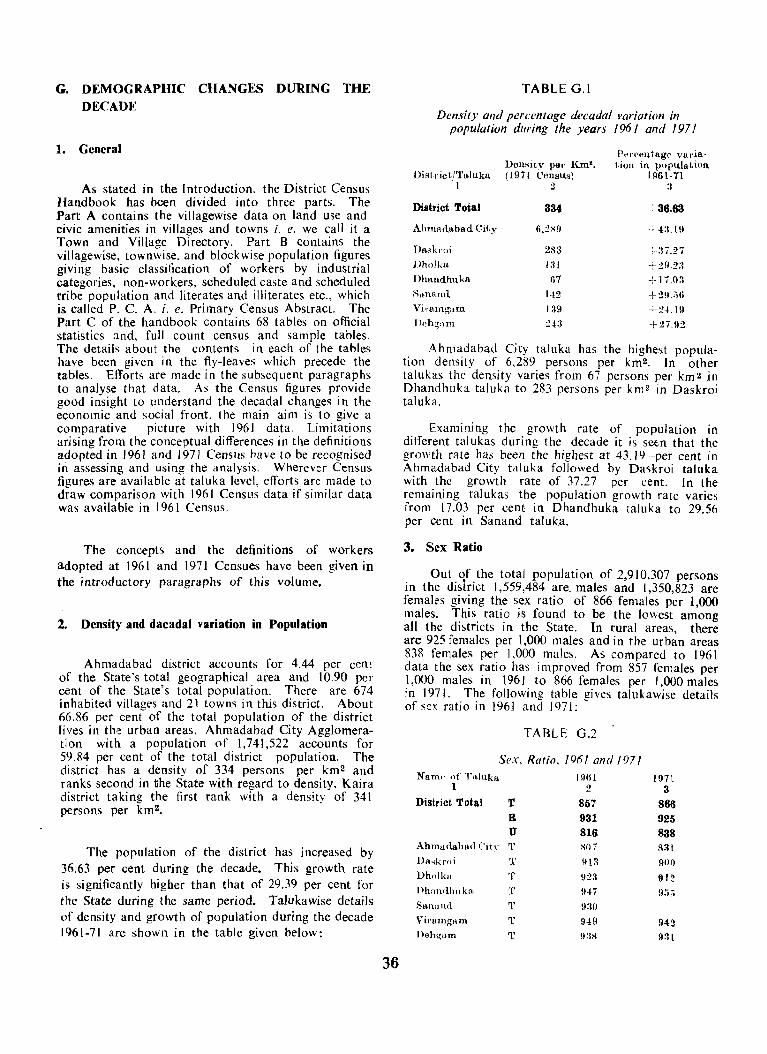
G. DEMOGRAPHIC CHANGES DURING rHE DECADE
1. General
As stated in the Introduction, the District Census Handbook has been divided into three parts. The Part A contains the villagewise data on land use and civic amenities in villages and towns i. e. we call it a Town and Village Directory. Part B contains the villagewise, townwise, and block wise population figures giving basic classification of workers by industrial categories, non-workers, scheduled caste and scheduled tribe population and literates and illiterates etc., which is called P. C. A. i. e. Primary Census Abstract. The Part C of the handbook contains 68 tables on official statistics and, full count census and sample tables. The details about the contents in each of the tables have been given in the fly-leaves which precede the tables. Efforts are made in the subsequent paragraphs to analyse that data. As the Census figures provide good insight to understand the decadal changes in the economic and social front, the main aim is to give a comparative picture with 1961 data. Limitations arising from the conceptual differences in the definitions adopted in 1961 and 1971 Census have to be recognised in assessing and using the analysis. Wherever Census figures are available at taluka level, efforts are made to draw comparison with 1961 CenslIs data if similar data was available in 1961 Census.
The concepts and the definitions of workers adopted at 1961 and 1971 Censues have been given in the introductory paragraphs of this volume.
2. Density and dacadal variation in Population
Ahmadabad district accounts for 4.44 per cen~ of the State's total geographical area and 10.90 per cent of the State's total population. There are 674 inhabited villages and 21 towns in this district. About 66.86 per cent of the total population of the district lives in the urban areas. Ahmadabad City Agglomerati e)Jl with a population of 1,741,522 accounts for 59.84 per cent of the total district population. The district has a density of 334 persons per km 2 and ranks second in the State with regard to density, Kaira district taking the first rank with a density of 341 persons per km2• •
The population of the district has increased by 36.63 per cent during the decade. This growth rate is significantly higher than that of 29.39 per cent for the State during the same period. Talukawise details of density and growth of population during the decade 1961-71 are shown in the table given below:
36
TABLE G.l
Density and percentage decadal "ariation in population during the years 1961 and 1971
Dell~itv pOl' Km2. District/'l'aluka (1971 Census)
I 2
District Total 334
Alnnaflabad Cit·v 6,:lSH
Tlaskroi 283
lJhoiku !:H
Dhandhllka 67
Sanallfl 142
Vi,.arngam I :l9
!lehgnm :l.!3
P""ecn (.ago Vii,· iii' tioll in popl\la.tiol\
1961·71 ::
! 36.63
-'.1.7.03 +2\1,;';6
-'·24.19
+27.92
Ahmadabad City taluka has the highest population density of 6.289 persons per km2• In other talukas the density varies from 67 persons per km2 in Dhandhuka taluka to 283 persons per km 2 in Daskroi taluka.
Examin.ing the growth rate of population in different talukas during the decade it is seen that the growth rate has been the higbest at 43.19 per cent in Ahmadabad City taluka followed by Daskroi taluka with the growth rate of 37.27 per cent. In the remaining talukas the population growth rate varies from [7.03 per cent in Dhandhuka taluka to 29.56 per cent in Sanand taluka.
3. Sex Ratio
Out of the total population of 2,910,307 persons in the district 1,559,484 are. males and j ,350,823 are females giving the sex ratio of 866 females per 1,000 males. This ratio is found to be the lowest among all the districts in the State. In rural areas, there are 925 females per 1,000 males and in the urban areas 838 females per 1,000 males. As compared to 1961 data the sex ratio has improved from 857 females per 1,000 males in 1961 to 866 females per 1,000 males in 1971. The following table gives talukawise details of sex ratio in 196J and 197];
TABLE G.2
Sex, Ratio, 1961 and 1971 Nam .. of Taluka
1
District Total
Ahmao.abRd Cih'
Da,kroi
Dhnlkll
llhallclhllka
Sanlllld
Vir;amgllnl
l)eh~Q.m
T R U T
T
T T T
T
T
I \IIi! 2
857 931 816 :so, 913
!)2:l
941
9:HJ
949
!l:IS
1!l71 3
866 925 838 1'131
900
912 9!)()
942
9:H
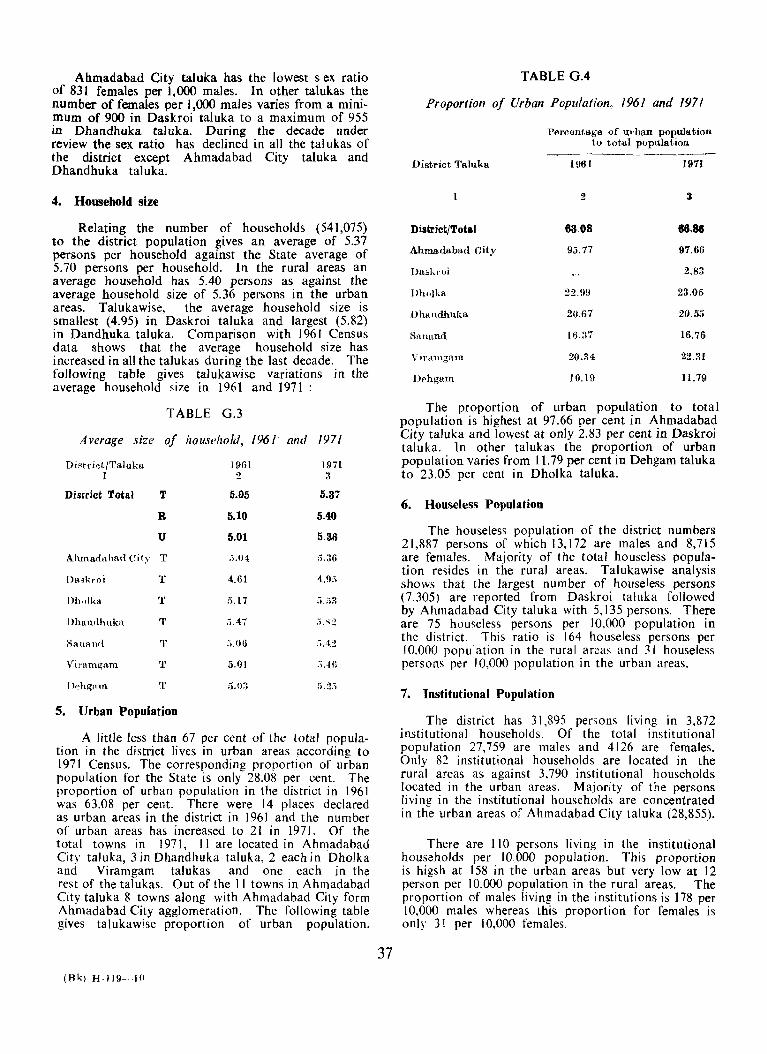
Ahmadabad City taluka has the lowest s ex ratio of 831 females per 1,000 males. In other talukas the number of females per 1,000 males varies from a mini~ mum of 900 in Daskroi taluka to a maximum of 955 in Dhandhuka taluka. During the decade under review the sex ratio has declined in all the tal ukas of the district except Ahmadabad City taluka and Dhandhuka taluka.
4. Household size
Relating the number of households (541,075) to the district population gives an average of 5.37 persons per household against the State average of 5.70 persons per household. In the rural areas an average household has 5.40 persons as against the average household size of 5.36 persons in the urban areas. Talukawise, the average household size is smallest (4.95) in Daskroi taluka and largest (5.82) in Dandhuka taluka. Comparison with 1961 Census data shows that the average household size has increased in all the talukas during the last decade. The following table gives talukawise variations in the average household size in 1961 and 1971 :
TABLE G.3
A verage size of household, 1961 and 197/
DiRt('i~t/Taluka ]961 1971 1 2 3
District Total T 5.05 5.37
R 5.10 5.40
U 5.01 5.36
Ahman.aflA.<i Cit.v T .•. 04 5.36
Da,kroi T 4.61 4.9;,
DIl,.!ka T i).17 fi.;;3
Dhall<1hllka T .i.47 ,).:"\2
I>ana 11,1 T .i.06 ; • .42
Virnmgam T 5.01 .• .46
I) .. h~nm T 5.o:} !).~.)
s. Urban Population
A little less than 67 per cent of the total population in the district lives in urban areas according to 1971 Census. The corresponding proportion of u;ban population for the State is only 28.08 per cent. The proportion of urban population in the district in 1961 was 63.08 per cent. There were 14 places declared as urban areas in the district in 1961 and the number of urban areas has increased to 21 in 197 J. Of the total towns in 1971, II are located in Ahmadabad City taluka, 3 in Dhandhuka taluka, 2 each in Dholka and Viramgam talukas and one each in the rest of the talukas. Out of the II towns in Ahmadabad City taluka 8 towns along with Ahmadabad City form Ahmadabad City agglomeration. The following table gives talukawise proportion of urban population.
(BI<) H-I 19-J('
37
TABLE G.4
Proportion of Urban Population,. 1961 and 1971
District'l'sluka
District/Total
Ahmadabad City
Dask,.oi
I HlOlka
t>aHllud
Viramgam
Percentage of ul·ban population to total population
1961 1971
2 3
6308 88.88
95.77 97.66
2.83
22.99 23.05
20.67 20.55
16.37 16.76
20.34 22.31
10.19 H.79
The proportion of urban population to total population is highest at 97.66 per cent in Ahmadabad City taluka and lowest at only 2.83 per cent in Daskroi taluka. In other talukas the proportion of urban population varies from 11.79 per cent in Dehgam taluka to 23.05 per cent in Dholka taluka.
6. Houseless Population
The houseless population of the district numbers 21,887 persons of which 13,172 are males and 8,715 are females. Majority of the total houseless population resides in the rural areas. Talukawise analysis shows that the largest number of houseless persons (7,305) are reported from Daskroi taluka followed by Ahmadabad City taluka with 5,135 persons. There are 75 houseless persons per 10,000 population in the district. This ratio is 164 houseless persons per 10.000 population in the rural areas and 31 houseless persons per 10,000 population in the urban areas.
7. Institutional Population
The district has 31,895 persons living in 3,872 institutional households. Of the total institutional population 27,759 are males and 4126 are females. Only 82 institutional households are located in the rural areas as against 3.790 institutional households located in the urban areas. Majority of the persons living in the institutional households are concentrated in the urban areas of Ahmadabad City taluka (28,855).
There are 110 persons living in the institutional households per 10 000 population. This proportion is higsh at 158 in the urban areas but very low at 12 person per 10.000 population in the rural areas. The proportion of males living in the institutions is 178 per 10,000 males whereas this proportion for females is only 31 per 10,000 females.

8. Growth of Population
The district had a population of 722,218 persons in 1901 and the population increased to 29.10 lakhs in 1971. Thus there has been almost a four-fold increase in the district population during the last 70 years In terms of percentages the population of Ahmadabad district has increased by 302.97 per cent during the la~t 70 years.as against the State level increase of 193.55 per cent during the same period. The following table gives in the population growth rates and sex ratios during different decades:
TABLE O. 5
Growth of Population
Percentage decadal inCl'A-aH8 Sex
Celll.U" Year PopulatioIl OI' decrea~e Ratio
2 3 4
1901 722,218 947
1911 7,)9,796 +5.2() 913
1921 SIl,176 +6.S0 86:l
19:H 900,605 + 10.98 889
UHI 1,249,ISI +38.70 824
19.-,1 1,6()7,16!1 f 2H.66 8H
i!)61 2,1:10,272 -i :;~ .. );. 8.)7
1!17I :!,910,:107 +:1662 Sllil
During the decade 1901-11 the population of the district increased by 5.20 percent i.t'. at a lower rate when compared to the corresponding percentage increase of 7.79 per cent for the State. During the next decade i.e. 1911-21 the population in the district increased at a faster rate (6.80 per cent) than that of the State (3.79 per cent) During 1921-31 the increase of 10.98 per cent in the population of the district was again lower than the State average of 12.92 per cent but during the subsequent decade the population of the district recorded an increase of 38.70 per cent as against the increase of only 19.25 per cent in the State as a whole. It is interesting to note that duri ng the decade 1931-41 Ahmadabad district has recorded the highest population growth rate among all the districts of the State. In all the subsequent decade:also the district has recorded higher growth rates a!'. compared to the corresponding growth rates for the State.
38
It is seen that therewere 947 females per 1,000 males in 1901 and the ratio declined to 913 in 1911 and 863 in 1921. In 1931 the sex ratio was 889 per 1,000 males but declined to 824 in 1941. The ratio thereafter has increased in all the subsequent decades.
9. Size of village
The district has 9.64 lakh persons living in 674 inhabited villages. This givl's an average of 1,431 persons per village in the district which is significantly higher than the average of 1,051 persons per village in the State. The population of an average village in ttie district was 1,152 persons in 1961 and increased to 1,431 persons in 1971. The following table gives details regarding average size of villages in different talukas in 1961 and 1971
TABLE G.6
Average size a/villages, 1961 and 1971
2 3
DistrictjTaluka Ul61 1971
District Total 1,152 1,431
Ahmadabad City 2,129 2,479
n,,~kr()i l,fi65 2,llO
Dholka 1,164 1,490
Dhandhuka. 9:10 I,O!lO
~flIUtlHl 1,1)91 1,4()7
,Til'ulngam 9,;9 1,177
D('h~arn 1, ];,0 1,4:W
Ahmadabad City taluka has the largest avcragc of 2,479 persons per viflagc followed by Daskroi taluka with an aV(Tuge of 2,110 persons pel' vill<ige, whereas the lowcst average' of ],090 persons per village is noticed in ca~e of Dhandhuka taluka. During the decade uneler r('vif'w the average size G f a village has increa~ed in all th(~ talukas of the district.
Distribution of villages by size class of population shows that about one-third or 33.23 per cent of the villages are in the population &ize of 1,000 to 1,999 and 22.85 pn cent of the villages have a population of 2,000 or more than 2,000. persons. The proportion of villages having less than 1,000 population is about 44.00 per cent of the total number of villages. The proportion of villages having population below 1,000 has declined during the decade whereas there has been an incff'ase in population in the largt' size villagf's ':
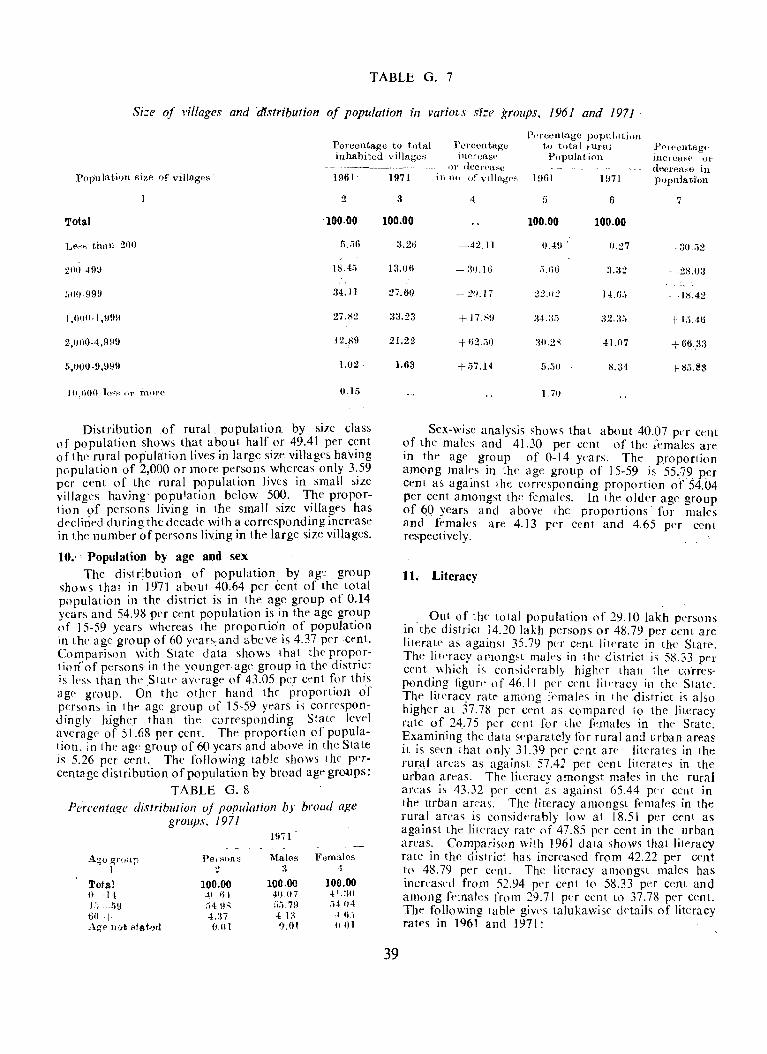
TABLE G. 7
Si:::e of l'illages and 'dfstribution of population i/1 vario~s sb' groups, 1961 and 1911
Percentage popul,ltion Perceutal!e to total Percen tage to total rural PPI ('eutage inhabite'(I villageR InereaS(~ Population lnCn!a~p 0)'
------~ .. ---- - 1)1' flecrpn~o decrea,e in population size of viJlage~ 1961
2
Total 100.00
Le,," thHll 21)0 Ii. iii;
200-499 18.4:5
500-99!J :l4.11
1,0(10-1,\199 27.H2
2,O()O·4,9\l9 )2.1'9
5,IJOlj·9,9911 1.02
10.1)01) lO':f:: or tnOre 0.15
Distribution of rural. population by size class of population shows that about half_or 4,9.41 per c~~nt of the rural population lives in large Size Villages havmg population of 2,000 or more pe~sons .whe~eas only 3 .. 59 per cent of the rural populatIOn hves III small ~lze villages having population below 50~. T~e proportion of persons living in the small size v.J)la~es has declined during the decade with a correspondmg mcrease in the number of persons living in the large size villages.
10.' . Population by age and sex The distribution of popUlation by age group
~hows that in] 971 about 40.64 per cent of the total popUlation in thr district is in the age group of 0.14 years and 54.98 per cent population is in the age gro_up of 15-59 years whereas the proportion of populatIOn in the age group of 60 years: and above is 4.37 per cent. Comparison with State data shows tha~ tIl(' pr.op<?rliori'of persons in the younger age group III the dlstn~t is less than the Statr avt'l'age of 43.05 per cent ~or thIS age group. On the other hand the p~oportlOn of persons in the age group of 15-59 years IS correspondingly higher than the correspondin~ St~le !eve) average of 51.68 pfr cent. The proportIOn .of population. in the ag(~ group of 60 years and above III the State is 5.26 per cent. The following table shows the PPfcentagc distribution of population by broad age groups;
TABLE G.8 Pe'rcentage distribution of population by broad age
groups, J 971 1!I'jl
A.ge .!ST'c,ap PerRon:::; Males Femalos 1 2 :, 4
Total 100,00 100.00 100.00 n -l{ .!( 61 41) 117 .t 1.:111 Jii -59 ,,4 !IS r." 1\l ;'404
60 + 4.:31 4 1:, 4.11,) c\ge not RIMed O.HI 0.01 HOI
1971 in no of villngps 1961 1971 pupilla cion
3 4 5 6 7
100.00 100.00 100.00
:l.2Ii --42.11 0.49' 0.27 :30 .. i2
13.(l6 - :li!.16 ii.GIl :1.:12 -28.03 l
27.60 -20_17 22.o:? 14.lj.; -18.42
3:1.23 + 17.Hll :14.:3;' :12.3;; +1;';.40
21.22 +f32_.;O :11l_2il 4I.07 + 6~.,:'3
1.63 + i)7 .14 5.50 8.34 +S5.l!3
39
1,70
Sex-wise analysis shows that about 40.07 ptT cellt of the ma)cs and 41.30 per cent of the females are in the age group of 0-14 years. The proportion among males in the age group of 15-59 is 55.79 per cent as against the corresponding proportion of 54.04 per cent amongst th(~ females. In the older age group of ~O years and above the proportions· for males and femaks are 4.13 rer cent and 4.65 per cent respectively.
11. Literacy
_ Out of the total population of 29.10 lakh persons in the district 14.20 lakh persons or 48.79 per cent are literate as against 35.79 pn cent literate in the State. The litnacy amongst males in the district is 58.33 per crnt which is consid'Tably higher than the corresponding figure' of 46.11 per cent litnacy ill the State. The literacy rat~ among kmales in the district is also higher at 37.1'8, per CI'I~t as compared to the literacy rate of 24.75 per cent for the fema)cs in the State. Examining the data separately for rural and urban areas it is seen that only 31.39 per crnt are literates in the rural areas as against 57.42 per cent literates in the urban areas. The literacy amongst males in the rural areas is 43.32 pn cent as against 65.44 per cent in the urban arc·as. The literacy amongst females in the rural arcas is considerably low at 18.51 per cent as against the literacy rate of 47.85 per cent in the urban areas. Comparison with 1961 data shows that literacy rate in the district has increased from 42.22 per C('llt
to 48.79 per ccnt. The literacy amongst males has increasnj from 52.94 per cent to 58.33 per cent and among females from 29.71 per cent to 37.78 per cent. The following table gives talukawist' ddails of literacy ratl's in 1961 and. 1971:
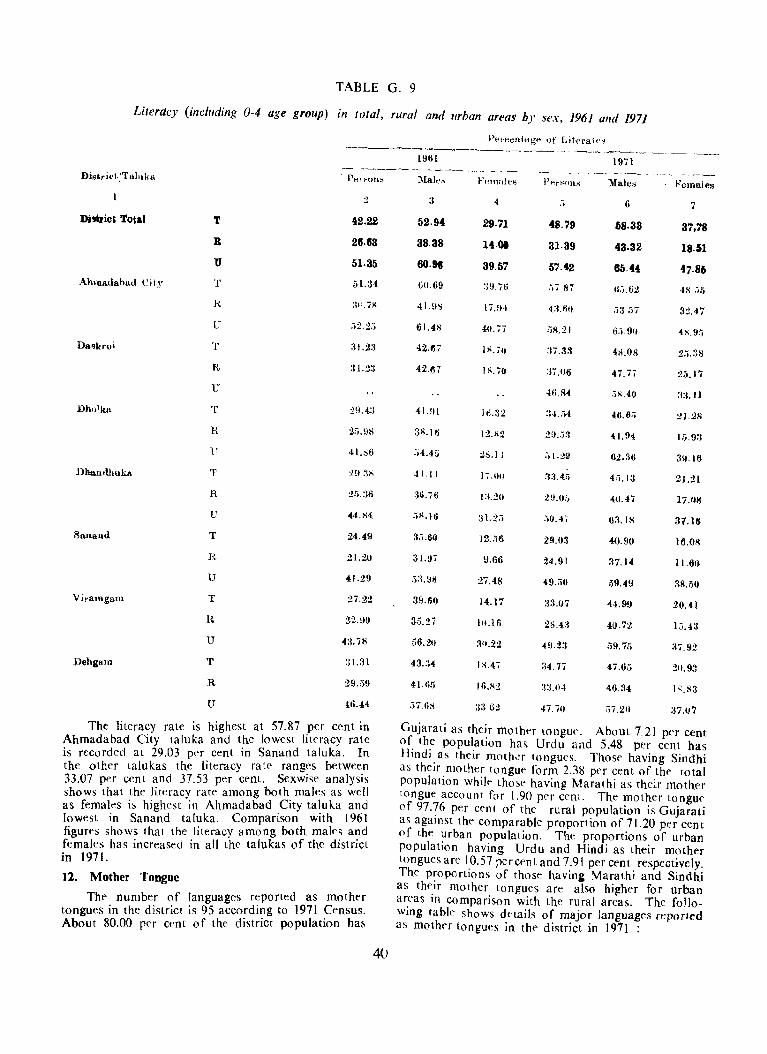
TABLE G. 9
Literacy (incil/ding 0-4 age group) in total, rural and urban areas by sex, 1961 and 1971
,loer'eentAgflo of Lit('rat(·" ---------------------- .. ---... ----- ---~.----- .. ---
19tH 1971 -~-- .......... -----.-------- ------ -__
Di~tri"t!Ta],lk" . Pell"Ou::;
2
District Total T 42,22
R 26.63
U 51·35
Ahmauahatl City T 51.:H
}{ :{':.7X
U ,;2.2 .•
Daskr"i T :11.2:1
R :ll.2:1
U
Dho11w T :lH.4:1
P. :l;;.!JS
F 41.S6
D~lldhukn T :In.:l>>
R 2[,.:l6
U 44.!·14
Sanand T 24.49
l{ 21.20
U 41.29
Viralllgalll T 27.22
n 22.9!l
U 4:!.7S
Dehgam T :!1.:11
R 29.,,;9
U 46.H
The literacy rate is highest at 57.87 'per cent in Ahmadabad City taluka and the lowest literacy rate is recorded at 29.03 per cent in Sanand taluka. In the other talukas the litemcy rate ranges between 33.07 per cent and 37.53 per cent. Sexwise analysis shows that the literacy rate among both males as well as females is highest in Ahmadabad City taJuka and lowest in Sanand taluka. Comparison with 1961 figures show,> that the literacy among both mafp~ a~d females has increased in all the talukas of the dlstnct in 1971.
12. Mother Tongue
The number of languages reported as mother tongues in the district is 95 according to 1971 Census. About 80.00 per cent of the district population has
40
----- - ----~------ -- -._-----_--_ ::\Iales FemalcH P~I'::;.on,.; Males .FemalelS
3 4 :i 6 ~ . 52·94 29·7} 48.?9 58.33 3,(,18
38.38 14·01 3U9 43.32 ls.1il
60·91 39.57 5''-42 65.44 4?85 611.69 :l!).iti .,i S7 1).;.62 4:-; :;i)
41.!)S li.Hi 4:VltI .1:1 ;;7 32.47
61.4S 4(1.77 ;,8.21 6 .•. 90 4s.9.')
42.67 I';. ill :17.:1~ 4:>.08 2:;.:18
42.67 IS. iO :17.06 47.77 2.;.17
{IUI4 :;~.40 :1:1. ) I
41.!1l ]tl.:12 :1·L'i4 46.6:; 2J.2S
:1)!.16 1:l.1l2 2!1 . .'i:1 -U.94 1iJ.9!l
.)4.45 28.11 .;1.:!9 62.:l6 39.16
41.11 17."" :1:1.4" 4!j.1:! 21.21
:16.76 I:LW 2!).0;; 411.47 17.lil!
.i1l.16 31.2 .• :;0.47 ti3.IS 37.16
35.60 12.ii6 29.03 ~.90 IS.OS
31.97 9.66 ~4 .91 37.14 11.60
.-;:1.118 27.48 49.;;0 59.49 38.50
3!).1I0 14.17 :l:J.07 44.99 20.41
3.').27 W.lfj 2~.·H 40.72 l,j.43
.56.20 3u.22 49.23 ~)9. 70 :17.92
43.:~4 IS.47 :14.77 47.65 2ft.9:!
41.(;[, 16.82 ~:l.()4 4f).:l4 1'.83
.)7.68 :1:1 &2 47.70 ;)7.20 :n.07
Gujarati as their mother tongue. About 7.21 per cent of the popUlation has Urdu and 5.48 per cent has Hindi as their motha tongues. Those having Sindhi as their mother tongue form 2.38 per cent of the total population whik those having Marathi as their mother tongue account for 1.90 pn cent. The mother tongue of 97.76 per cent of the rural population is Gujarati as against thl:' comparable proportion of 71.20 per cent of the urban popUlation. The proportions of urban popUlation having Urdu and Hindi as their mother tongues arc 10.57 percent and 7.91 per cent respectively. The proportions of those having Marathi and Sindhi as their mother tongues are also higher for urban areas in comparison with the rural areas. The following table shows details of major Janguages reported a s mother ton gues in the district in 1971 :

TABLE G.lO
Percentage distribution of persons according to mother tongue (major languages) 197]
Percentage of total population
1971 . -~ .. ---- -_.
Language Total Rural Urban
2 :~ 4
Total 100.00 100.00 100.00
Gujarati 80.0r 97.76 71.20
Urdu 7.21 0.44 10.57
Kachllhhi 0.04 O.O:? ().Of;
Hindi 5.48 (1.57 7.91
Marathi 1.90 (I.la 2.77
Sindhi 2.38 0.64 :;.24
OtherH 2.99 0.44 t.26
Distribution of persons speaking different languages in rural and urban areas shows that 40.50 per cent of those speaking Gujarati live in the rural areas as against 59.50 per cent of the Gujarati speaking population living in the urban areas. As regards other languages 97.97 per cent of the popUlation speaking Urdu, 97.70 per cent of the popUlation speaking Marathi 96.58 per cent of those speaking Hindi and 91.04 per cent of those speaking Sind hi live in the urban areas. The proportion of persons speaking Kachchhi in the urban areas is 81.43 per cent. The following table gives distribution of population speaking different languages by rural and urban areas:
TABLE G.lI
Percentage distribution of persons according to mother tongue (major languages) in rural and
urban areas, 1971
PeL'centage distribution of perSOll" according to mother tongue in
rural and urban areas
197) --- ----.--~.----- --._- -------"
Language Rural Urban
1 2 3
Total 83.14 66.86
Gujarati 40.50 59.50
Urdu 2.03 91.97
Kachchhi t8.57 81.43
Hindi 3.42 96.58
Marathi 2.30 97.10
Sindhi 8.96 91.04
OthOI'R 483 95.)7
(Bk) H 1I9 11
41
13. Religion
16 religions were returned from the district during 1971 Census. The population ofthe each of six principal religions in the district is given below:
TABLE G.12
Percentage distribution of population by different religions, 1971
Religion 1
Total
I Hinduism
2 Islam
3 ·Jainism
4 ChrIstianity
ii Sikhism
Ii Buddhi8m
I Othol' l{eligiom and PNsuationF
~ ReligiolL not stated
Pel'<.:ontage to total
populat.ion 2
100.00
81.19
11.02
3.58
0.86
() 20
0.02
0051
O.Of.
g4.19 per cent of the district popUlation follows Hindu religion and 11.02 per cent follows Islam. About 3.58 per cent are followers of lainism and about 0.86 per cent of the popUlation follows Christianity.
Distribution of populatiun by rural and urban areas shows that 37.39 per cent of the Hindus live in the rural areas 62.61 per cent live in the urban areas. About 87.92 per cent of those following Islam and 93.84 per cent of those following Jainism live in the urban areas. A large maJority of the followers of the other religions also live in the urban areas. The following table gives distribution of population by different religions in rural and urban areas;
TABLE G.l3
Percentage distribution of population by different religions in rura/and urban areas. 1971
Percentage of followel's in
Rural Urban Religion areas areal
I 2 3
Total 33.14 66.86
1 Hinduism 37.39 62.61 2 Islam 12.08 87.92 3 .Jainism 6.16 93.84 4 Christianit.y 11.03 81l.97
5 Sikhism 3.31 96.69 6 Buddhism 6.01> 93.92 7 Other Religions and PorBuationE' 0.67 99.33 s Religion not. st.at.ed 9.06 90.94

14. Workers and Non-workers
Out of the total population of 29.lO lakb persons in the district. 8.54 lakh persons or 29.35 per cent are returned as workers and the remaining 70.65 per cent are non-workers. In the rural areas 31.05 per cent of the population is returned as workers as 2.gainst 28.51 per cent workers in the urban areas. The following table gives the comparison of the 1961 and the 1971 data:
TABLE G.14
Workers and Non-workers, 1961 and 1971
~otal Rural Urban
Percentage of workers and non·workers to total population
'Yorkers Non-workers .-~--~~-----..----
1961 1971 1961 1911 2 3 4 fi
34.42 29.35 65.58 70.65 39.61 31.05 60.33 68.9/i 31.36 28.51 68.64 11.49
The concept of 'worker' adopted in 1961 Census was somewhat different from the concept adopted in the 1971 Census and hence the figures of .workers are not strictly comparable. The details of the concept adopted in 1961 and 1971 Censuses have been given in the introductory paragraphs of this volume.
The proportion of workers declined from 34.42 per cent in 1961 to 29.35 per cent in 1971. In the rural areas the proportion declined from 39.67 per cent to 31.05 per cent and in the urban areas from 31.36 per cent to 28.51 per cent.
Examining the figures separately for males and females it is seen that a little less than half or 49.45 per cent of the males arc reported as workers in 1971 as against 6.15 per cent workers among females. In the rural areas 51.90 per cent of the males and in the urban areas 48.29 per cent of the males are reported as workers. The corresponding proportions for female workers in the rural and urban areas are 8.52 and 4.91 per cent respectively. The following table compares the 1961 and 1971 Census data.
TABLE G. 15
Percentage distrihution of workers and non-workers by sex, 1961 and 1971
Worker. Non-workers
1961 1971 1961 1911 -_ --------------_._--- ---.-------~-- - -~----- - --- --~-----------
Males Female" MaleH 2 3 4
Total 52.29 13.57 49.45
Rural 53.81 24;.41 51.90
Urban 51.45 6.13 48.29
The proportion of workers among males as well as females has declined in 1971 both in the rural and the urban areas. The decline has been sharp in case of female workers viz. from l3.57 per cent to 6.15 per cent. In rural areas, the proportion of female workel'S declined from 24.47 per cent to 8.52 per cent while in the urban areas it has come down from 6.73 per cent to 4.91 per cent. The decline in the female participation rate in 1971 is in part attributable to the difference in definition of workers adopted in 1961 and 1971.
Sector oj Economy 31.63 per cent of the workers are eng'lged in the
primary sector of economy which includes cultivation, agricultural labour, live stock, forestry, fishing, hunting, plantations, orchards, mining and quarrying
actiyities. 33.42 per cent of the workers are englged in the secondary sector i.e. manufacturing, processing, servicing and repair industry and construction and the remaining 34.95 are employed in the tertiary sector which includes trade and commerce, transport, storage and communications and other services.
Examining the figures separately for males and females a large proportion of female workers (48.27 per cent) are engaged in the primary sector of economy
42
Females Males Femal<.lil Males Females 5 6 7 8 9
6.15 47.71 86.43 50.56 93.85
8.52 46.19 15.53 48.10 91.48 .
4.91 48.55 93.27 51. 71 95.09
as compared to the male workers (29.84 per cent). In the secondary sector of economy the proportion of male workers (35.16 per cent) is higher than the proportion of the female workers (17.19 per cent). The proportions of male and female workers employed in the tertiary sector of economy are 35.00 per cent and 34.54 per cent respectively. The following table compares the 1961 and 1971 census data.
TABLE G.16 Percentage distribution of workers in difjerent sectors
by sex, 1961 and 1971
Sector of Economy
1
All Sectors Primary Secondary Tertiary
( Total Areas) Percentage distribution of workers in
Primary, Secondary and Tertiary Sectors of economy, by sex
1961 1971 ---_--_----_. --------------------Per- Fe- Per- Fe-sons Males males sons Males males
2 3 <1 5 () '1
100.00 100.00 100.00 100.00 100.00 100.00 32.89 21.76 55.93 31.63 29.84 48.27 36.45 39.25 23.87 33.42 35.16 17.19 30.66 32.99 20.20 34.95 35.00 34.54
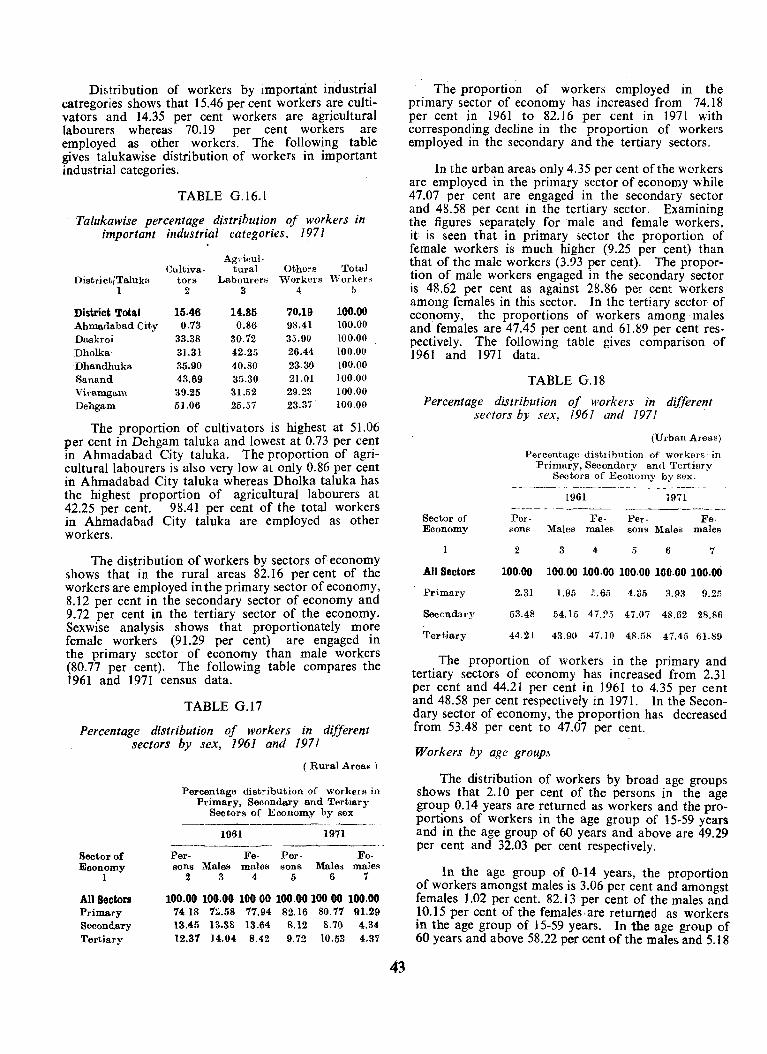
Distribution of workers by important industrial catregories shows that 15.46 per cent workers are cultivators and 14.35 per cent workers are agricultural labourers whereas 70.19 per cent workers are employed as other workers. The following table gives talukawise distribution of workers in important industrial categories.
TABLE G.16.1
Talukawise percentage distribution of workers in important industrial categories. 1971
Agl·j"ul-Total Cultiva- tural Others
DistrictiTalukll tors Labourerb Workers 'Yorker" 1 2 3 4 h
District Total 15.46 14.35 70.19 100.00 Ahmadabad Cit.y 0.73 0.86 98.41 100.00 Daskroi 33.38 30.72 35.90 100.00
Dholka 31.31 42.25 26.44 100.00
Dhandhuka 35.90 40.80 23.30 100.00
8anand 43.69 35.30 21.01 100.00 Viramgam 39.25 31.52 29.23 100.00 Dehgam 51.06 25.57 23.3'1 100.00
The proportion of cultivators is highest at 51.06 per cent in Dehgam taluka and lowest at 0.73 per cent in Ahmadabad City taluka. The proportion of agricultural labourers is also very low at only 0.86 per cent in Ahmadabad City taluka whereas Dholka taluka has the highest proportion of agricultural labourers at 42.25 per cent. 98.41 per cent of the total workers in Ahmadabad City taluka are employed as other workers.
The distribution of workers by sectors of economy shows that in the rural areas 82.16 per cent of the workers are employed in the primary sector of economy, 8.12 per cent in the secondary sector of economy and 9.72 per cent in the tertiary sector of the economy. Sexwise analysis shows that proportionately more female workers (91.29 per cent) are engaged in the primary sector of economy than male workers (80.77 per cent). The following table compares the 1961 and 1971 census data.
TABLE G.17
Percentage distribution of workers in different sectors by sex, ]961 and ]971
Sector of Economy
)
All Sectors Primary Secondary Tertiary
( Rural Areas)
Percentage distribution of workers in Primary, Secondary and Tertiary
Sectors of Economy by sex
1961 1971
Per· Fe· Per· Fe· sons Males males sons Males males
2 3 4 5 6 7
100.00 100.00 100 00 100.00100 00 100.00 7418 7~.58 77.94 82.16 80.77 91.29 13.45 13.38 13.64 8.12 8.70 4.34-12.37 ]4.04 8.42 9.72 10.53 4.37
43
The proportion of workers employed in the primary sector of economy has increased from 74.18 per cent in 1961 to 82.16 per cent in 1971 with corresponding decline in the proportion of workers employed in the secondary and the tertiary sectors.
In the urban areas only 4.35 per cent of the workers are employed in the primary sector of economy while 47.07 per cent are engaged in the secondary sector and 48.58 per cent in the tertiary sector. Examining the figures separately for male and female workers, it is seen that in primary sector the proportion of female workers is much higher (9.25 per cent) than that of the male workers (3.93 per cent). The proportion of male workers engaged in the secondary sector is 48.62 per cent as against 28.86 per cent workers among females in this sector. In the tertiary sector of economy, the proportions of workers among· males and females are 47.45 per cent and 61.89 per cent respectively. The following table gives comparison of ] 961 and 1971 data.
TABLE G.18
Percentage distribution of workers in different sectors by sex, 1961 and 1971
Sector of Economy
All Sectors
Primary
Secondary
Tertiary
(Urban Arell~)
Percentage distlibution of workers in Primary, Secondary an(l Tertiary
Sectors of Economy by sex.
Per· 80n8
2
100.00
2.31
53.48
44.21
1961 1971
Fe- Per· Fe· Males males sons Males males
3 4 5 6 7
100.00 100.00 100.00 100.00 100.00
1.95 ".65 4.35 :l.93 9.25
54.15 47.:>.5 47.07 48.62 28.86
43.90 47.10 48.58 47.45 61.89
The proportion of workers in the primary and tertiary sectors of economy has increased from 2.31 per cent and 44.21 per cent in 1961 to 4.35 per cent and 48.58 per cent respectively in 1971. In the Secondary sector of economy, the proportion has decreased from 53.48 per cent to 47.07 per cent.
Workers by age groups
. The distribution of workers by broad age groups shows that 2.10 per cent of the persons in the age group 0.14 years are returned as workers and the proportions of workers in the age group of 15-59 years and in the age group of 60 years and above are 49.29 per cent and 32.03 per cent respectively.
In the age group of 0-14 years, the proportion of workers amongst males is 3.06 per cent and amongst females 1.02 per cent. 82.13 per cent of the males and 10.15 per cent of the females· are returned as workers in the age group of 15-59 years. In the age group of 60 years and above 58.22 per cent of the males and 5.18
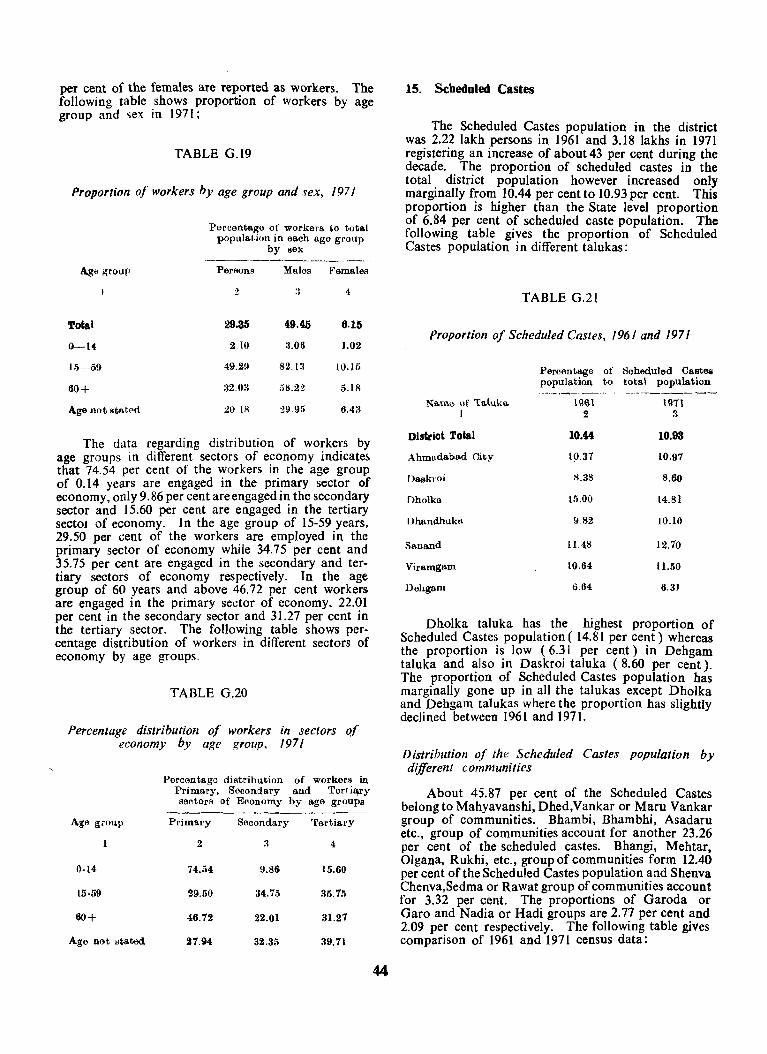
per cent of the females are reported as workers. The following table shows proportion of workers by age group and ~ex in t 971 ;
TABLE G.19
Proportion of workers by age group and sex, 1971
Ag" group
Total
0--14
15--59
60+
Age not stated
Percentage of workers to tota.l populat,ioll in each age group
by sex
PersonR Males Females
Z :1 4,
29.35 49.45 6.15
2,10 :1.06 1.02
49.29 82,13 10.15
:12.0:{ :;S.22 5.18
20 IS 29,95 6.4a
The data regarding distribution of workers by age groups in different sectors of economy indicate~ that 74.54 per cent of the workers in the age group of 0.14 years are engaged in the primary sector of economy, only 9.86 per cent are engaged in the secondary sector and 15.60 per cent are engaged in the tertiary seeto} of economy. In the age group of 15·59 years, 29.50 per cent of the workers are employed in the primary sector of economy while 34.75 per cent and 35.75 per cent are engaged in the secondary and tertiary sectors of economy respectively. In the age group of 60 years and above 46.72 per cent workers are engaged in the primary sector of economy, 22.01 per cent in the secondary sector and 31.27 per cent in the tertiary sector. The following table shows percentage distribution of workers in different sectors of economy by age groups.
TABLE G.20
Percentage distribution of workers in sectors of economy by age group, /971
Percent ago distribution of workers in Prima.ry. Secondary and Terti"ry sectors of Economy by age groups
Age g.oup Primary Secondary Tertiary
2 :l 4
0·14 74.54 9.8S 15.60
15·59 29.50 34.75 35.75
60+ 46.72 22.01 31.27
Age not sta.t,ed 27.94 32.35 39.71
44
15. Scheduled Castes
The Scheduled Castes population in the district was 2.22 lakh persons in 1961 and 3.18 lakhs in 1971 registering an increase of about 43 per cent during the decade. The proportion of scheduled castes in the total district population however increased only marginally from 10.44 per cent to 10.93 per cent. This proportion is higher than the State level proportion of 6.84 per cent of scheduled caste population. The following table gives the proportion of Scheduled Castes population in different talukas:
TABLE G.21
Proportion of Scheduled Castes, 1961 and 1971
Percentage of Soheduled Cast8il population to total population
- --.-- ._- ---~. -_-_--------Name of Te.luku. 1961 1971
J 2 3
District Total 10.44 10.93
Ahmadabad City 19.37 10.97
Daskroi 8.38 8.60
Dholka 15.00 14.81
Dhandhuka 9.82 10.10
Sanand 11.48 12.10
Viramgam 10.64 1l.50
Dehgam 6,64 6.31
Dholka taluka has the highest proportion of Scheduled Castes population ( 14.81 per cent) whereas the proportion is low (6.31 per cent) in Dehgam taluka and also in Daskroi taluka (8.60 per cent). The proportion of Scheduled Castes popUlation has marginally gone up in all the talukas except Dholka and Dehgam talukas where the proportion has slightly declined between 1961 and 1971.
Distribution of the Scheduled Castes population by different communities
About 45.87 per cent of the Scheduled Castes belong to Mahyavanshi, Dhed,Vankar or Maru Vankar group of communities. Bhambi, Bhambhi, Asadaru etc., group of communities account for another 23.26 per cent of the scheduled castes. Bhangi, Mehtar. Olgana, Rukhi, etc., group of communities form 12.40 per cent of the Scheduled Castes population and Shen'Va Chenva,Sedma or Rawat group of communities account for 3.32 per cent. The proportions of Garoda or Garo and Nadia or Hadi groups are 2.77 per cent and 2.09 per cent respectively. The following table gives comparison of 1961 and 1971 census data:
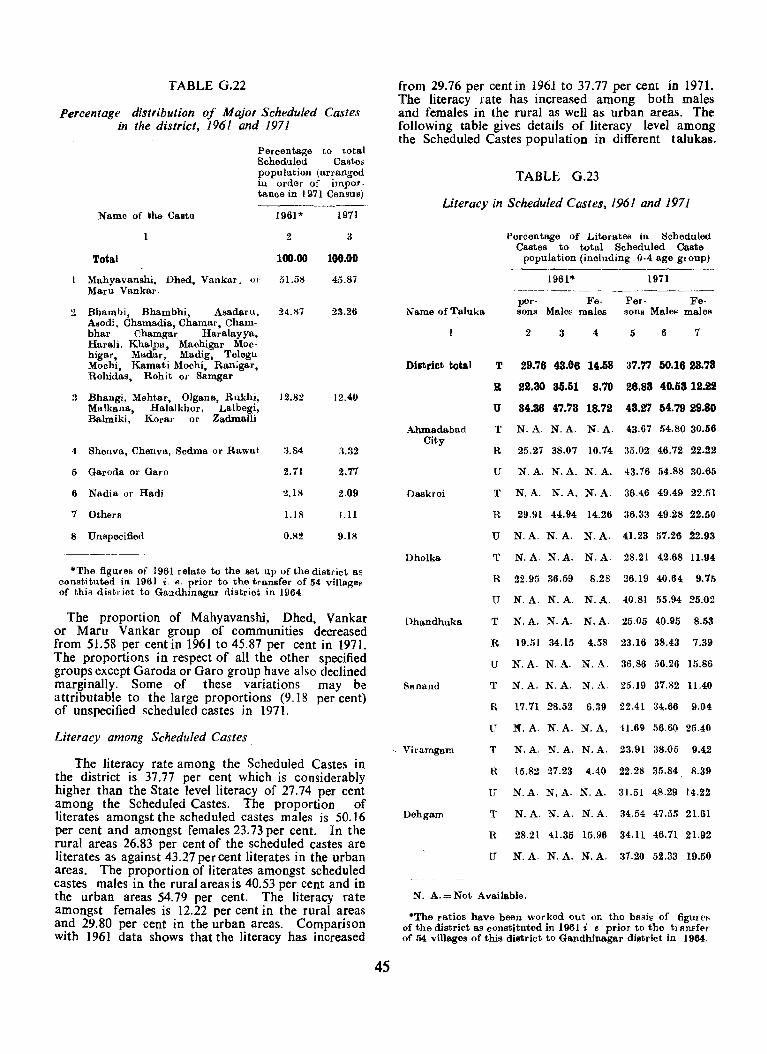
TABLE G.22
Percentage distribution of Major Scheduled Castes in the district, 1961 and 1971
Percentage to total Scheduled Castes population (arranged in order of impoTtance in 1971 Census)
Name of ,he Casto
Total
1 Mahyavanshi, DhOO, Vankar. or
Maru Vankar.
2 Bhambi, Bhambhi, Asadaru, Asodi, Chamadia, Chamar, Chambhar Chamgar Haralayya, Harali, KhaJ,pa, Maohigar Moc-higar, Madar, Madig, Telegu Mochi, Kamati Mochi, Ran;gar, Rohidas, Rohit or Samgar
:l Bhangi, Mehtar, Olgana, Rukhi, Malkana, Halalkhor, Lalbegi, Balmiki, Koral' or Zadmalli
4 Sheuva, Chen va. Sedma or Rawat.
5 Gal'oda 01' Garo
6 Nadia or Hadi
1 Others
8 Unspecified
".---~~
1961* 1971
2 3
100.00 100.00
51.58 45.87
24.S7 23.26
12.82 12.40
:;.84 :~.32
2.71 2.77
2.18 2.09
1.18 1.11
0.82 9.18
*The figures of 1961 relate to the set up of the district as constituted in 1961 i. ". prior to the transfer of 54 villages of this district to Gandhinagar district in 1964.
The proportion of Mahyavanshi, Dhed, Vankar or Maru Vankar group of communities decreased from 51.58 per cent in 1961 to 45.87 per cent in 1971. The proportions in respect of all the other specified groups except Garoda or Garo group have also declined marginally. Some of these variations may be attributable to the large proportions (9.18 per cent) of unspecified scheduled castes in 1971.
Literacy among Scheduled Castes
The literacy rate among the Scheduled Castes in the district is 37.77 per cent which is considerably higher than the State level literacy of 27.74 per cent among the Scheduled Castes. The proportion of literates amongst the scheduled castes males is 50.16 per cent and amongst females 23.73 per cent. In the rural areas 26.83 per cent of the scheduled castes are literates as against 43.27 per cent literates in the urban areas. The proportion of literates amongst scheduled castes males in the rural areas is 40.53 per cent and in the urban areas 54.79 per cent. The literacy rate amongst females is 12.22 per cent in the rural areas and 29.80 per cent in the urban areas. Comparison with ]961 data shows that the literacy has increased
45
from 29.76 per cent in 1961 to 37.77 per cent in 1971. The literacy rate has increased among both males and females in the rural as well as urban areas. The following table gives details of literacy level among the Scheduled Castes population in different talukas.
TABLE G.23
Literacy in Scheduled Castes, 1961 and 1971
Name of Taluka
District total T
R
U
_.\funadabad T City
R
U
Daskroi T
R
U
Dholka T
R
U
Dhandhuka T
R
U
Sa.nand T
R
If
, Viramgam T
R
U
Dehgam T
R
U
Percentage of Literates in Scheduled Castes to total Scheduled Caste
population (including 0·4 age giOUp)
1961* 1971
pel'- Fe-sons Males males
Per- Fe-sons Male~ males
2 3 5 6 7
29.76 43.06 14.58 37.77 5U623.78
22.30 35.51 8,70 26,88 40.58 12.22
34.36 47.73 18.72 43.27 54.7929.80
N.A. N.A. N.A. 4:3.67 54.8030.56
25.27 38.07 10.74 35.02 46.72 22.22
N.A. N.A. N.A. 43.76 54.88 30.65
N.A. N.A. N.A. 36.46 49.49 22.51
29.91 44.94 14.26 36.33 49.28 22.50
N.A. N.A. N.A. 41.23 51.26 22.93
N.A. N.A. N.A. 28.21 42.68 11.94
22.95 36.59 8.28 26.19 40.64 9.75
N.A. N.A. N.A. 40.81 55.94 25.02
N.A. N.A. N.A. 25.05 40.95 8.53
19.51 34.15 4.58 23.16 38.43 7.39
N.A. N.A. N.A. 36.86 06.26 15.86
N.A. N.A. N.A. 25.19 37.82 11.40
17.71 28.52 6.39 22.41 34.66 9.04
N.A. N.A. N.A, 41.69 56.60 25.40
N.A. N.A. N.A. 23.91 38.05 9.42
15.82 27.23 4.40 22.28 35.84 8.39
N.A. N,A. N.A. 31.51 48.29 14.22
N.A. N.A. N.A. 34.54 47.55 21.61
28.21 41.35 15.96 34.11 46.71 21.92
N.A. N.A. N.A. 37.20 52.33 19.50
N. A.=Not Available.
*The ratios have been worked out on the basis of figure~ of the district as constituted in 1961 i e prior to the tr BnFfer of 54 villages of this district to Gandhinagar district in 1964.
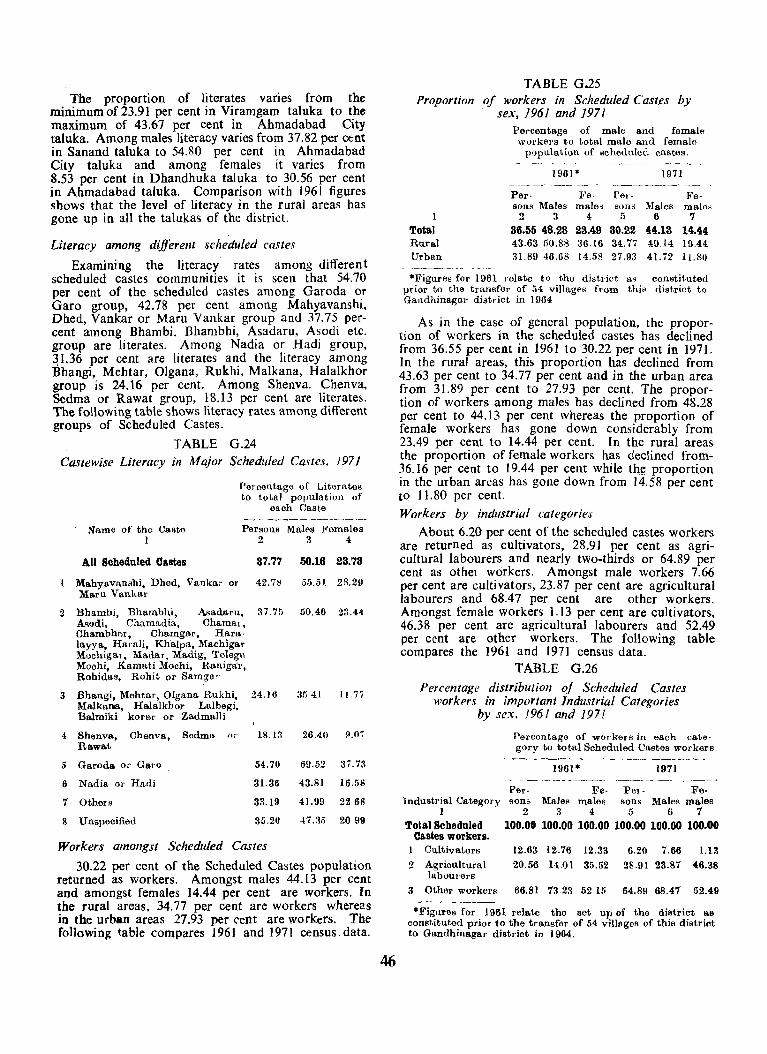
The proportion of literates varies from the minimumof23.91 per cent in Viramgam taluka to the maximum of 43.67 per cent in Ahmadabad City taluka. Among males literacy varies from 37.82 per cent in Sanand taluka to 54.80 per cent in Ahmadabad City taluka and among females it varies from 8.53 per cent in Dhandhuka taluka to 30.56 per cent in Ahmadabad taluka. Comparison with 1961 figures shows that the level of literacy in the rural areas has gone up in all the talukas of the district.
Literacy among different scheduled castes
Examining the literacy rates among different scheduled castes communities it is seen that 54.70 per cent of the scheduled castes among Garoda or Garo group, 42.78 per cent among Mahyavanshi, Dhed Vankar or Maru Vankar group and 37.75 percent ~mong BhambL Bhambhi, Asadaru, Asodi etc. group are literates. Among Nadia or Hadi group, ~1.36 per cent are literates a~d the literacy among Bhangi, Mehtar, Olgana, Rukht, Malkana, Halalkhor group is 24.16 per cent. Among Shenva, Chenva, Sedma or Rawat group, 18.13 per cent are literates. The following table shows literacy rates among different groups of Scheduled Castes.
TABLE G.24 Caste wise Literacy in Major Scheduled Castes, J97J
1
2
3
4
5
6
7
8
Percentage of Literate .. to total population of
each Caste
. Name of the Caste I
Persons Males Fomales 234
All Scheduled Ca.stes 37.77 50.16 23.73
Mahyavanshi, Dhed, Vankar or 42.7s 55.51 28.29 Maru Vankai'
Bhamhi, Bhambhi, Asadaru, 37.75 50.46 2:l.44 A<;odi, Chamadia, Chamal, Chamoh»r, Chamgar, Hara-layya, Harali, Khalpa,. Machigar Mochigar, Madar, Madlg, Telegn Moohi, Kamati Machi, Ranigal', Rohidas, Rohit or Samgar
Bhangi, Mehtar, Olgana Rukhi, Malkanoa, Halalkhor Lalbegi.
24.16 35.41 11.77
Balmiki korar or Zadmalli
Shenva, Chenva, Sedma or 18.1:! 26.40 9.07 Rawat
Garoda 01' Ga1'o 54.70 69.52 37.73
Nadia or Hadi 31.36 43.81 16.58
Others 33.19 41.99 226f!
Unspecified 35.20 {7.:15 2099
Workers amongst Scheduled Castes
30.22 per cent of the Scheduled Castes population returned as workers. Amongst males 44.13 per cent and amongst females 14.44 per cent are workers. In the rural areas, 34.77 per cent are workers where<'s in the urban areas 27.93 per cent are wo rkers. The fo])owjn~ table compares 1961 and 1971 census data.
46
TABLE G.25 Proportion of workers in Scheduled Castes by
sex, ]961 and ]971
I
Total Rural Urban
Percentage of male and female workers to total male and female
population of scheduled castes.
1961* 1971
Per· Fe- Per· Fe-sons Males . male, sons Males mala:<.
2 3 4 5 6 7 36.5648.28 23.49 30.22 44.13 14.44 43.63 50.88 36.16 34..77 4.9.14 19.44 31.89 46.68 14.58 27.93 41.72 1].80
"'Figures for 1961 relate to the district as constituted prior to the transfer of 54 villages from this district to Gandhinagar district in 1964.
As in the case of general popUlation, the proportion of workers in the scheduled castes has declined from 36.55 per cent in 1961 to 30.22 per cent in 1971. In the rural areas, this proportion has declined from 43.63 per cent to 34.77 per cent and in the urban area from 31.89 per cent to 27.93 per cent. The proportion of workers among males has declined from 48.28 per cent to 44.13 per cent whereas the proportion of female workers has gone down considerably from 23.49 per cent to 14.44 per cent. In the rural areas the proportion of female workers has declined from-36.16 per cent to 19.44 per cent while thf: proportion in the urban areas has gone down from 14.58 per cent to 11.80 per cent. Workers by industrial categories
About 6.20 per cent of the scheduled castes workers are returned as cultivators, 28.91 per cent as agricultural labourers and nearly two-thirds or 64.89 per cent as othet workers. Amongst male workers 7.66 per cent are cultivators, 23.87 per cent are agricultural labourers and 68.47 per cent are other workers. Amongst female workers 1.13 per cent are cultivators, 46.38 per cent are agricultural labourers and 52.49 per cent are other workers. The following table compares the 1961 and 1971 census data.
TABLE G.26 Percentage distribution oj Scheduled Castes
workers in important Industrial Categories by sex. 1961 and 1971
Percontage of workers in each cate· gory to total Scheduled Castes workers.
1961* 1971
Per- Fe- Pel'- Fe· Industrinl Category son" Males males sons MaIl'S males
1 2 3 4 5 6 7 Total Scheduled 100.00 100.00 100.00 100.00 100.00 100.00
Ca.stes workers. I Cultivators 12.63 12.76 12.33 6.20 7.66 1.13
2 AgriCUltural 20.56 14.01 35.52 28.91 23.81 46.38 labourers
3 Other workers 66.S1 7323 5215 64.89 68.41 52.49
*Figures for 1961 relate the set up of the district as constituted prior to the transfer of 54 villl'ges of this district to GandhinagaJ' district in 1964.
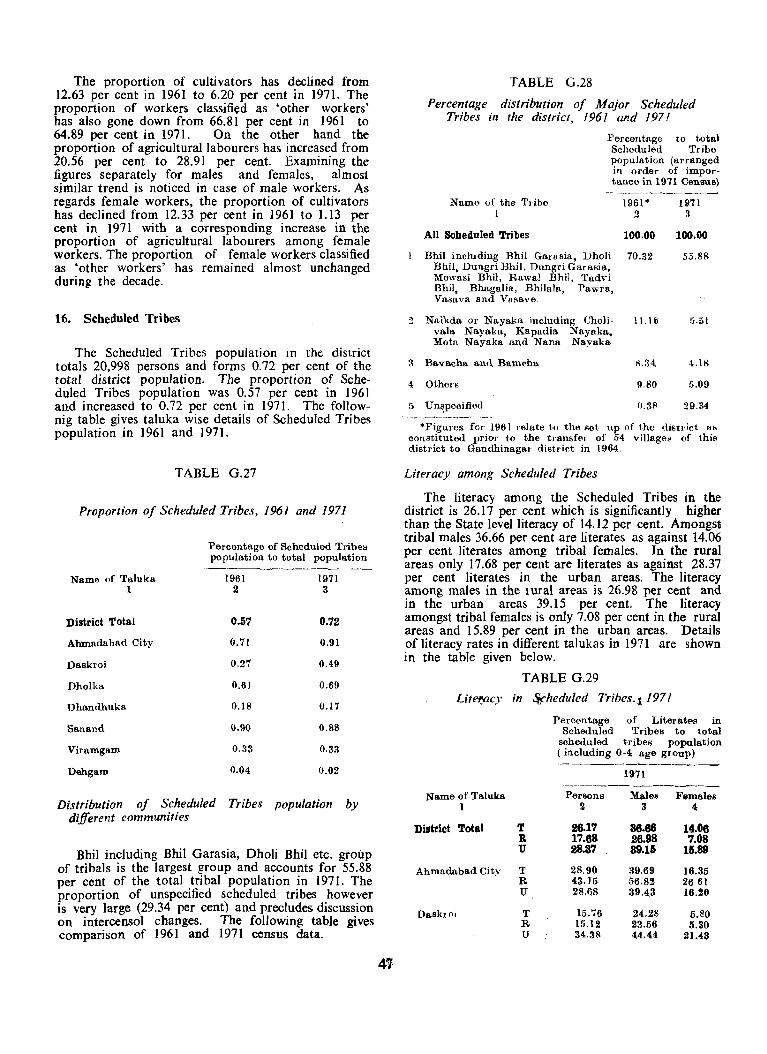
The proportion of cultivators has declined from 12.63 per cent in 1961 to 6.20 per cent in 1971. The proportion of workers classjfi~d as 'other workers' has also gone down from 66.81 per cent in 1961 to 64.89 per cent in 1971. On the other hand the proportion of agricultural labourers has increased from 20.56 per cent to 28.91 per cent. Examining the figures separately for males and females, almost similar trend is noticed in case of male workers. As regards female workers, the proportion of cultivators has declined from 12.33 per cent in 1961 to 1.13 per cent in 1971 with a corresponding increase in the proportion of agricultural labourers among female workers. The proportion of female workers classified as 'other workers' has remained almost unchanged during the decade.
16. Scheduled Tribes
The Scheduled Tribes population in the district totals 20,998 persons and forms 0.72 per cent of the total district population. The proportion of Scheduled Tribes population was 0.57 per cent in 1961 and increased to 0.72 per cent in 1971. The follownig table gives taluka wise details of Scheduled Tribes population in 1961 and 1971.
TABLE G.27
Proportion of Scheduled Tribes, 1961 and 1971
Na.me of Taluka 1
District Total
Ahmadabad City
Daskroi
Dholka
Dhandhuka
Sanand
Viramgam
Dehgam
Percentage of Scheduled Tl'ibel; population to total population
1961 1971 2 3
0.57 0.72
0.71 0.91
0.27 0.49
0.61 0.69
0.18 0.11
0.90 0.88
0.33 0.33
0.04 0.02
Distribution of Scheduled Tribes population by different communities
Bhil including Bhil Garasia, Dholi BhiI etc. group of tribals is the largest group' and accounts for 55.88 per cent of the total tribal popUlation in 1971. The proportion of unspecified scheduled tribes however is very large (29.34 per cent) and precludes discussion on intercensol changes. The following table gives comparison of 1961 and 1971 census data.
4'lf
TABLE G.28
Percentage distribution of Major Scheduled Tribes in the distriCI, 1961 and 197f
l'ercentage to total Scheduled Tribe population (arranged in order of importance in 1971 Census)
Name of the Ttibe 1961* 1971 I 2 3
All Scheduled Tribes 100·00 100,00
I Bhil including Bhil Galasia, Dholi 70.32 Bhil, Dungri Bhil, Dungri Garasia,
55.88
Mewasi Bhil, Rawa! Bhil, 1'advi Bhi!, Bhagalia, Bhilala, Pawra, Vadava and Vasave.
'" Naikda 01' Nayaka including Choli- 11.16 5.&1 vala Nayaka, Kapadia Nayaka, Mota Nayaka and Nana Nayaka.
3 Bavacha and Bamcha K.:~4 40.18
4 Others 9.80 5.09
5 Un~pecified (J.3~ 29.34 "_ '--~------.--'--
*Figul'es foJ' 1961 relate t·o the set up of' the diBt.1 iet 01>
constituted prior to t.he tram.fel· of 54 villages of this district to GandhinagaJ' district in 1964.
Literacy among Scheduled Tribes
The literacy among the Scheduled Tribes in the district is 26.17 per cent which is significantly higher than the State level literacy of 14.12 per cent. Amongst tribal males 36.66 per cent are literates as against 14.06 per cent literates among tribal females. In the rural areas only 17.68 per cent are literates as against 28.37 per cent literates in the urban areas. The literacy among males in the lUral areas is 26.98 per cent and in the urban areas 39.15 per cent. The literacy amongst tribal females is only 7.08 per cent in the rura] areas and 15.89 per cent in the urban areas. Details of literacy rates in different tal ukas in 1971 are shown in the table given below.
TABLE G.29
Litet:pcy in *heduled Tribes.! 1971
Name of Taluks 1
District Total T R U
Ahmadabad Cit~, T R U
Dsskroi T R U
Percentage of Literates in Scheduled Tribes to total
scheduled tribes population ( including 0·4 age group)
1971
Persons Males F8males 2 3 4
26.17 38.86 14.08 17.88 28.98 7.08 28.37 39.16 16.89
28.90 39.69 16.35 43.15 56.8~ 2661 28.68 39.43 16.20
15.76 24.28 5.80 15.12 23.56 5.30 34.38 44.44 21.43
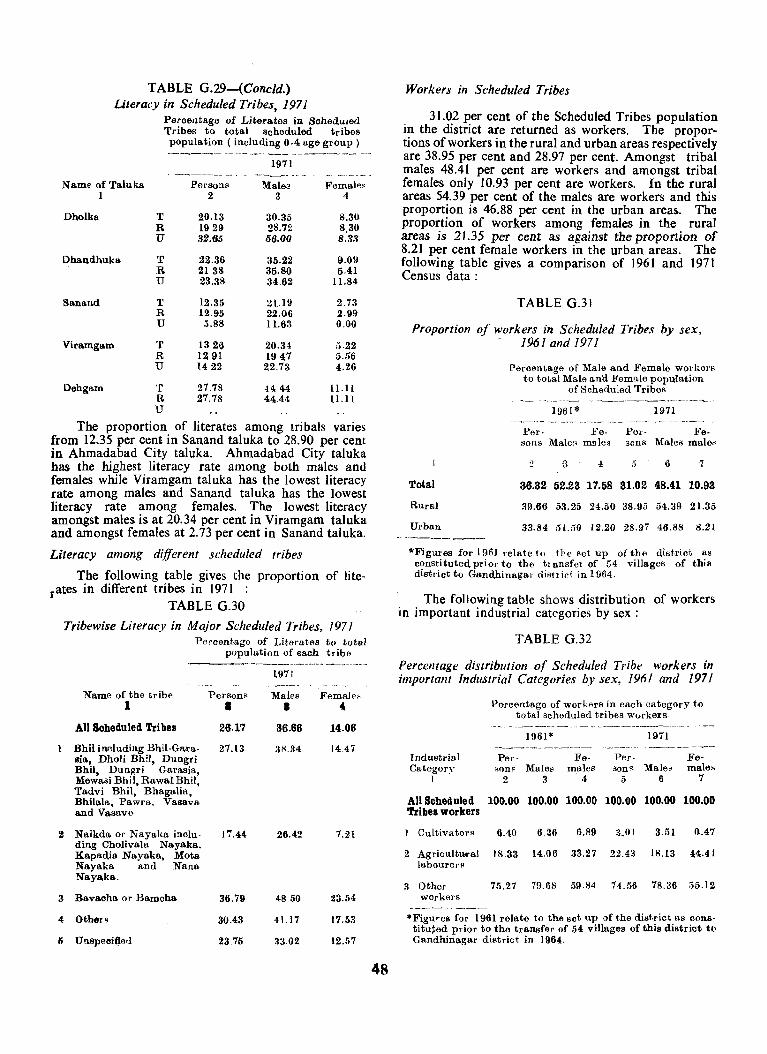
TABLE G.29-(Concld.) Literacy in Scheduled Tribes, 1971
Percentage of Literates in Scheduled Tribes to total scheduled tribes population ( includ.ing 0·4 age group) --__ -_._-- ._----- ---------- --~
1971 ------------ -_ .. - --~---- -- _---.--
Name of Taluka Persons Male" Females 1 2 3 4
Dholka T 20.13 30.35 8.30 R 1929 28.72 8.30 U 32.65 56.QO 8.33
Dhandhuka T 22.36 35.22 9.011 R 2138 35.80 5.41 U 23.38 34.62 11.84
Sanand T 12.35 2.1.19 2.73 R 12.95 22.06 2.99 U 5.88 11.63 0.00
Viramgam T 1326 20.34 5·22 R 12 91 1947 5.56 U 1422 22.73 4.26
Dehgam T 27.78 4444 ILl 1 R 27.78 44.44 U.ll U
The proportion of literates among tribals varies from 12.35 per cent in Sanand taluka to 28.90 per cent in Ahmadabad City taluka. Ahmadabad City taluka has the highest literacy rate among both males and females while Viramgam taluka has the lowest literacy rate among males and Sanand taluka has the lowest literacy rate among females. The lowest literacy amongst males is at 20.34 per cent in Viramgam taluka and amongst females at 2.73 per cent in Sanand taluka.
Literacy among different scheduled tribes
The following table gives the proportion of literates in different tribes in 1971 :
TABLE G.30
Tribewise Literacy in Major Scheduled Tribes, 1971 Pcecentago of Literates to total
population of each tribe
Na.me of the tribe 1
All Scheduled Tri bes
Person~
I
26.17
Bhil including Bhil-Gara· 27.13 sis, Dholi Bhil, Dungri Bhil, Dungri Garasia, Mewasi Bhil, Rawal Bhi!, Tadvi Bhil, Bhagalia, Bhilala, Pawl'a. Vasava and Vasav6.
2 Naikda or Nayaka inclu· 17.44 ding Cholivala Nayaka, Kapadia Nayaka, Mota Nayaka and Nana Nayaka..
3 Bavacha or Bamcha 36.79
4 Other~ 30.43
I) Un.Bpeci(i,ed 23.75
197J
Males Femalp~ . , 36.86 14.06
3S.34
26.42
4850
41.17
33.02
1447
7.21
23.54
17.53
12.57
48
Workers in Scheduled Tribes
31.02 per cent of the Scheduled Tribes population in the district are returned as workers. The proportions of workers in the rural and urban areas respectively are 38.95 per cent and 28.97 per cent. Amongst tribal males 48.41 per cent are workers and amongst tribal females only 10.93 per cent are workers. In the rural areas 54.39 per cent of the males are workers and this proportion is 46.88 per cent in the urban areas. The proportion of workers among females in the rural areas is 21.35 per cent as against the proportion of 8.21 per cent female workers in the urban areas. The following table gives a comparison of 1961 and 1971 Census data:
TABLE G.31
Proportion of workers in Scheduled Tribes by sex,
Total
Rural
Urban
- 1961 and 197J
Percentage of Mal6 and Female workers to total Male and Female population
of Scheduled Tribes
1961 * 1971 .. -.--.--~------ ----- .---~-.---------.. --~--
Per. Fe· Per- Fe-sons Males lIlllles sons Males males
" R 4: 5 6 7
36.32 52.23 17.58 31.02 48.41 10.93
39.66 53.25 24.50 38.95 54.39 21.35
33.84 51.50 12.20 28.97 46.88 8.21 ~- .... -------
*Figures for 1961 relate to n'e set up of the district as constituted. prior to the tl ansfer of 54 villages of this distl'ict to Gandhinagal' <list) iet in 1964.
The following table shows distribution of workers in important industrial categories by sex:
TABLE G.32
Percentage distribution of Scheduled Tribe workers in important Industrial Categories by sex, 1961 and 1971
Industrial Category
1
All Scheduled Tribes workers
1 Cultivator~
2 AgricultU<ral labourerR
3 Other workers
_._-- - -- -~--.-
Percentage of workers in each category t·o total scheduled tribes workers.
1961* 1971 ~---~------- -_,- _- - ..... -"-Per- Fe- Per· Fe·
HonR Males males 30ns Males maIeR 2 3 4 5 6 7
100.00 100.00 100.00 100.00 100.00 100.00
6.40 6.2.6 6.89 VII 3.51 0.47
18.33 14.06 33.27 22.43 [8.13 44.41
75.27 79.68 59.84 74.56 78.36 ;)5.12
*Figures for 1961 relate to the set up of t,he district as cons· titu~ed prior to the transfer of 54 villages of this district to GandhiIiagar district in 1964.
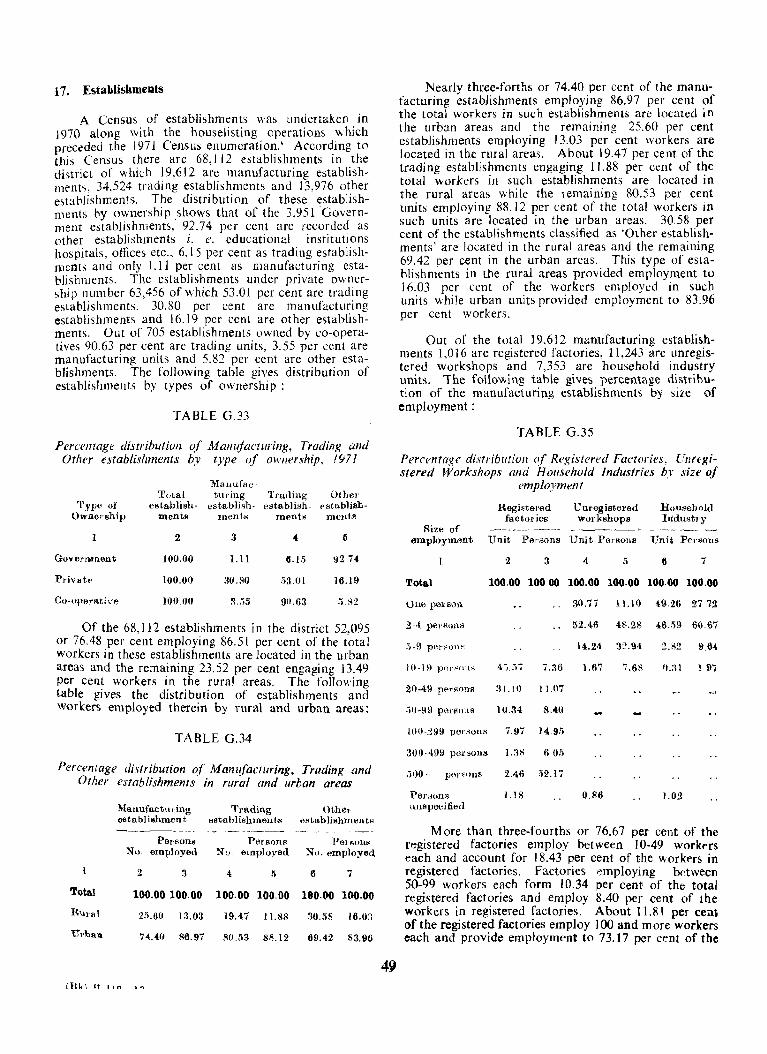
17. Establishments
A Census of establishments was undertaken in 1970 along with the houselisting operations which preceded the J 971 Census enumeration.' According to this Census there are 68,112 establishments in the district of which 19,612 are manufacturing establishment";, 34,524 trading establishments and 13,976 other estahlishments. The distri bution of these establishments by ownership shows that of the 3,951 Government establishments, 92.74 per cent are recorded as other establishments i. e. educational institutions hospitals, offices etc., 6.15 per cent as trading establishments and only 1.11 per cent as manufacturing establishments. The establishments under private ownership number 63,456 of which 53.01 per cent are trading establIshments, 30.80 per cent are manufacturing establishments and 16.19 per cent are other establish':. ments. Out of 705 establishments owned by co-operatives 90.63 per cent are trading units, 3.55 per cent are manufacturing units and 5.82 per cent are other establishments. The following table !lives distribution of establishments by types of owner~hip :
TABLE G.33
Percentage distribution of Manujacturing, Trading and Other establishments b}' type of ownership, /971
Type of Ownership
Goverllment
pJ'ivate
ell-operative
)1a.llUfHC· Total tllJ'ing Trailing Other
cstablish- cstablish- establish. I'stablish-mente 1 ntm tF; ment. mellts
2 3 .( l5
100.00 l.ll 6. ].') 9274
100.00 30.RO 53.01 16.19
100.00 ~.:;5 90,63 :; 112
Of the 68,112 establishments in the district 52095 or 76.48 per cent employing 86.51 per cent of the t~tat workers in these establishments are located in the urban areas and the remaining 23.52 per cent engaging 13.49 per cen~ workers i.n ~he :ural areas. The following table gIves the dIstrIbutIOn of establishments and workers employed therein by rural and urban areas:
TABLE G.34
Percentage distribution of Manl!facturing, Trading an(/ Other establishments in rural and urban areas
Total
Run .. 1
U,'hslt
~lanufacttlling Tra.ding Ot,her establishment est,ablishmeut.8 establi8hmellt~
Persons No. employed
2 :)
100.00 100.00
2;'.60 1:l.03
74.40 86.97
PCrson8 No employed
4 I)
100.00 100.00
19.47 11.88
80.53 88.12
Pel"llOIl" No. employed,
6 7
180.00 100.00
30.58 16.(i:1
69.42 83.96
(Rk\ n IJn 'I.'" 49
Nearly three-forths or 74.40 per cent of the manufacturing establishments employing 86.97 per cent of the total workers in such establishments are located in the urban areas and the remaining 25.60 per cent establishments employing 13.03 per cent workers are located in the rural areas. About 19.47 per cent of the trading establishments engaging 11.88 per cent of the total workers in such establishments are located in the rural areas while the remaining 80.53 per cent units employing 88.12 per cent of the total workers in such units are located in the urban areas. 30 58 per cent of the establishments classified as 'Other establishments' are located in the rural areas and the remaining 69.42 per cent in the urban areas. This type of estahlishments in the rural areas provided employment to ] 6.03 per cent of the workers employed in such units while urban units provided employment to 83.96 per cent workers.
Out of the total J 9,612 manufacturing establishments 1,016 are registered factories, 11 ,243 are unregister~d workshops ~nd 7,353 . are household industry umts. The followmg table glYes percental!c distribution of the manufacturin.g establishments by size of employment:
TABLE G.35
Percentage distributioll (~r Registered Factories, Unregistered Workshops and Household industries by size of
employment
Rize of 6l1lployment
Total
One payson
2·4 per>;!)ll;;
,'}-9 pen~()n~
In-HI P(""o·,~
20-49 per~on8
50-!lI) pm'sons
100·299 pe,.~onH
300·499 pcn;olls
.100 ~ P(~l'~()llS
Per,wns llllspecificd
Registered factories
U uregistel'ed workshops
Unit Persons Unit Per SOIlS
2 3 4 5
100.00 10000 100.00 100.00
.. 30.71 lLlO
., 52.46 48.28
14.24 3:.!.94
4.;,.,); 7.36 1.67 I.SS
:Jut) 11.07
10.34 8.40
1.97 1495
1.3S 605
2.46 52.17
1. J 8 0.86
Household lIidustJ'Y
6 7
100·00 100.00
4.9.26 2772
4.6.59 60.67
2.R2 9.64
11.:11 197
1.02
M ore than three-fourths or 76.67 per cent of the registered factories employ between 10-49 workas each and account for 18.43 per cent of the workers in registered factories. Factories ~mploying bdween 50-99 workers each form 10.34 per cent of the total registered factories and employ 8.40 per cent of the workers in regi stered factories. A bout 11.81 per cen~ of the registered factories employ 100 and more workers each and provide employment to 73.17 per cent of the
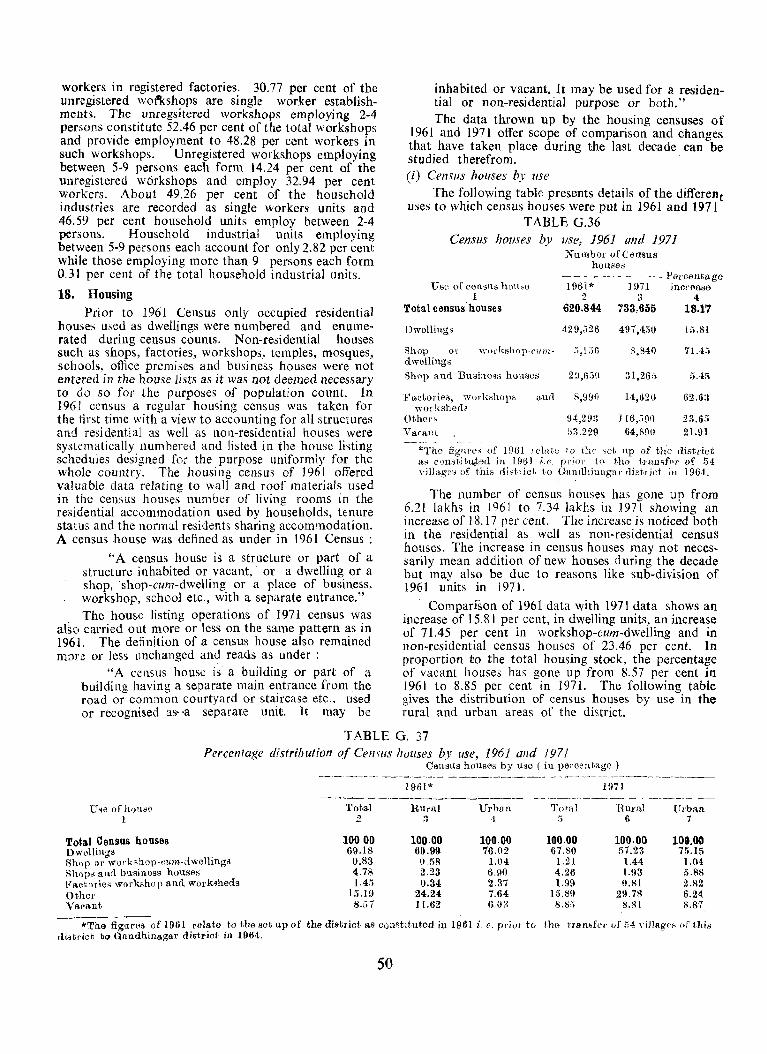
workers in registered factories. 30.77 per cent of the unregistered woflkshops are single worker establishments. The unregsitered workshops employing 2-4 persons constitute 52.46 per cent of the total workshops and provide employment to 48.28 per cent workers in such workshops. Unregistered workshops employing between 5-9 persons each form 14.24 per cent of the unregistered w6rkshops and employ 32.94 per cent workers. About 49.26 per cent of the household industries are recorded as single workers units and 46.59 per cent household units employ between 2-4 persons. Household industrial units employing between 5-9 persons each account for only 2.82 per cent while those employing more than 9 persons each form 0.31 per cent of the total household industrial units.
18. Housing Prior to 1961 Census only occupied residential
houses used as dwellings were numbered and enumerated during census counts. Non-residential houses such as shops, factories, workshops, temples, mosques, schools, office premises and business houses were not entered in the house lists as it was not deemed necessary to do so for the purposes of population count. In 1961 census a regular housing census was taken for the first time with a view to accounting for all structures and residential as well as nOll-residential houses were systematically numbered and listed in the house listing schedules designed for the purpose uniformly for the whole country. The housing census of J 961 offered valuable data relating to wall and roof materials used in the census houses number of living rooms in the residential accommodation used by households, tenure status and the normal residents sharing accommodation. A census house was defined as under in 1961 Census :
"A census house is a structure or part of a structure inhabited or vacant, or a dwelling or a shop, ·shop-cum-dwelling or a place of business, workshop, school etc., with a separate entrance." The house listing operations of 1971 census was
al~o carried out more or less on the same pattern as in 1961. The definition of a census house also remained mor~ or less unchanged and reads as under:
"A census house is a building or part of a building having a separate main entrance from the road or common courtyard or staircase etc.. used or recognised as-"a separate unit. It may be
inhabited or vacant. It may be used for a residential or non-residential purpose or both." The data thrown up by the housing censuses of
1961 and 1971 offer scope of comparison and changes that have taken place during the last decade can be studied therefrom. (i) Censlls hOllses b.v use
The following tablf: presents details of the different uses to which census houses were put in 1961 and 1971
TABLE G.36 Censlls hOllses by use, 1961 Dnd 1971
N umbel' of C'ellBus houses
Use of cenSllS house 1
Total census houses
Dwellings
Shop or ,yor kshop-cu m ~ dwellings Shop and Businoss houses
Factol'ies, wC)l'ktiho1'8 and worksheet,
Othol'" Vacanl
- - --- ---- .. _-_ Percentage 1(1)1 * 1971 incl'ottse 234
620,844 733,655 18.17
429,326 491,430 15.81
.),1.)6 S,840 71.45
29,6,-'0 31,265 5.4"
8,990 14,620 62.63
94,293 116,.}!)O 23.65 53.229 64.R90 21.91
*The fignres of 1961 relate to t}10 .~ct, up of tho dist.rict a" c')lJstit14ted in 191H i.e. pdor to th!) tJ'ansff'r of 54 Yillages of t,his rlist·rict to GalHlhillagal' district ill 1964.
The number of census houses has gone up from 6.21 lakhs in 1961 to 7.34 lakhs in ]971 showing an increase of 18.17 per cent. The increase is noticed both in the residential as well as non-residential census houses. The increase in census houses may not necessarily mean addition of new houses during the decade but may also be due to reasons like sub-division of 1961 units in 1971.
Comparison of 1961 data with 1971 data shows an increase of 15.81 per cent, in dwelling units, an increase of 71.45 per cent in workshop-cum-dwelling and in non-residential census hOllses of 23.46 per cent. In proportion to the total housing stock, the percentage of vacant houses has gone up from 8.57 per cent in 1961 to 8.85 per cent in 1971. The following table gives the distribution of census houses by use in the rural and urban areas of the district.
TABLE G. 37 Percenfage distributioll ojCellslIs llouses by llse, 1961 and 1971
Census houses by use ( ill pel'ccntage )
1961* 1971 -~----,-------------~--- --- -------,._- ~- '--'--~------ --
Use ofhotlso Tot·al RUral Urban Total Rural Urban 1 2 .,
-1 ;) 6 7 .J
Total Census houses 10000 100.00 100·00 100.00 100.00 100.00 Dwellings 69.18 6().99 76.02 67.80 57.23 75.15 Shop 01' wOl'kshop·cwn·clweHinga 0.83 058 1.04 1.21 1.44 1.04 Rhopg and. business houses 4.78 2.23 6.90 4.26 1.93 5.8S ~'act.ories workshop and worksheds 1.41) 0.34 2.37 1.99 (Un 2.82 Other 15.19 24.24 7.64 15.89 29.78 6.24 Vitcant. 8.GI 1[,62 60R 8.8" 8.8l 8.81
*Tlle figures of 1961 relate to the set up of the district as constituted in 1961 i. e. prior to the tran8fc)I' of ;;4 yjJJageH (If this di8trict to Gnndhina.gar district in 1964.
50
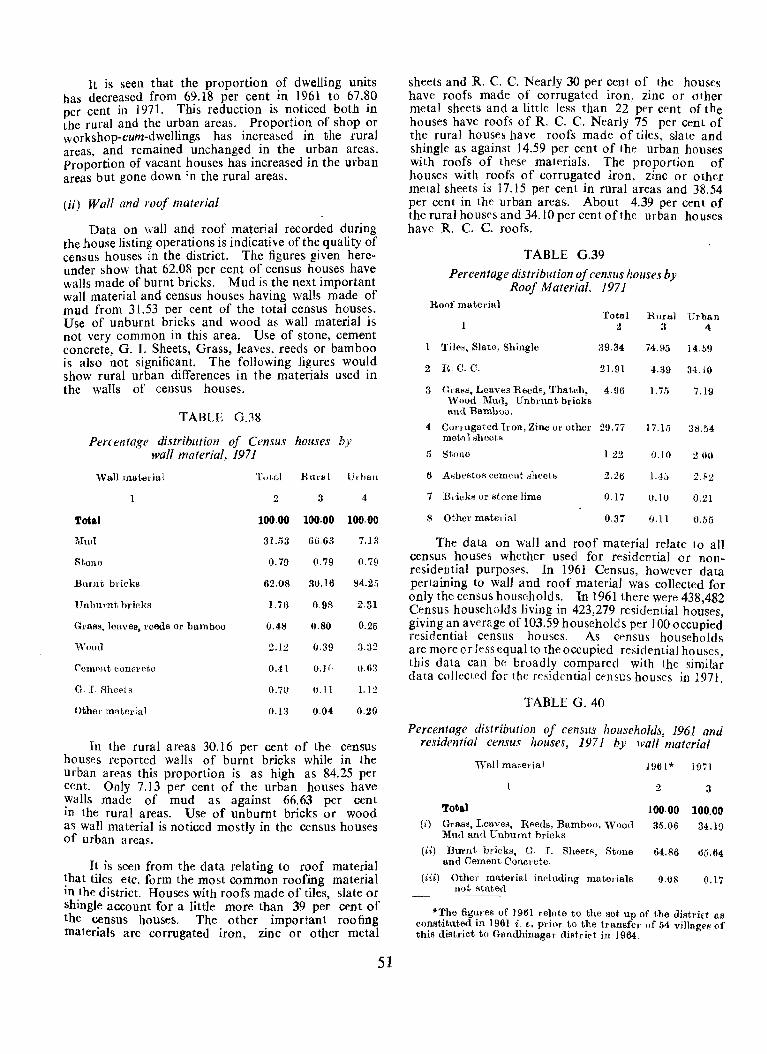
It is seen that the proportion of dwelling units has decreased from 69.18 per cent in 1961 to 67.80 per cent in 1971. This reduction is noticed both in the rural and the urban areas. Proportion of shop or workshop-cum-dwellings has increased in the rural areas, and remained unchanged in the urban areas. Proportion of vacant houses has increased in the urban areas but gone down ;n the rural areas.
(ii) Wall and roof material
Data on wall and roof material recorded during the house listing operations is indicative of the quality of census houses in the district. The figures given hereunder show that 62.08 per cent of census houses have walls made of burnt bricks. Mud is the next important wall material and census houses having walls made of mud from 31.53 per cent of the total census houses. Use of un burnt bricks and wood as wall material is not very common in this area. Use of stone, cement concrete, G. I. Sheets, Grass, leaves, reeds or bamboo is also not significant. The following figures would show rural urban differences in the materials used in the walls of census houses.
TABLE G.38
Percentage distribution of CenslIs houses by wall material, 1971
WalllUaterial Tot,al Rural Urhall
1 2 3 4
Total 10000 100·00 100.00
i';Iud 3l.li3 66.63 7.13
Rtone 0.79 0.79 0.7{J
Burnt bricks 62.08 30.16 84.25
FnbuTnt bricks 1.76 098 2.31
G1'IISS, leaves, reeds or bamboo 0.48 (1.80 0.25
'Wood 2.12 0.39 3.32
Cem"ut concl'(,te 0041 0.11 o.6~
G. I. Rhet,j ~ 0.70 0.11 1.12
Other material 0.13 0.04 0.20
In the rural areas 30.16 per cent of the census houses reported walls of burnt bricks while in the urban areas this proportion is as high as 84.25 per cent. Only 7.13 per cent of the urban houses have ~alls made of mud as against 66.63 per cent III the rural areas. Use of unburnt bricks or wood as wall material is noticed mostly in the census houses of urban areas.
It is seen from the data relating to roof material !hat tiles etc. form the most common roofing material In the district. Houses with roofs made of tiles, slate or shingle account for a little more than 39 per cent of the census houses. The other important roofing materials are corrugated iron, zinc or other metal
51
sheets and R. C. C. Nearly 30 per cent of the houses have roofs made of corrugated iron, zinc or other metal sheets and a little Jess than 22 per cent of the houses have roofs of R. C. C. Nearly 75 per cent of the rural houses have roofs made of tiles, slate and Shingle as against 14.59 per cent of the urban houses with roofs of these materials. The proportion of houses with roofs of corrugated iron, zinc or other metal sheets is 17.15 per cent in rural areas and 38.54 per cent in the urban areas. About 4.39 per cent of the rural houses and 34.10 per cent of the urban houses have R. C. C. roofs.
TABLE G.39
Percentage distribution of census houses by Roof Material, 197 J
Roof material Total Rllral
1 2 3
'l'ile~, Slate, Shingle 39.34 i4.95
2 R. C. C. 21.91 4.39
3 GI'8-Sti, Leavos Reeds, 'l'hat,ch, 4.96 1. 75 Wood Mud, Unbl'lmt bricks and Bamboo.
4 COI'l'ugated IrOll, Zinc 01' other 29.77 17.15 met,al sheej l'!
ii StOl,e 1.22 0.10
6 AHbestos Comf'ut :;h('et8 2.26 1.4[)
7 Bricks or stone lime 0.17 0.10
8 Other mateJ'ial 0.37 0.11
Ulban 4
14 &9
34.10
7.19
38.54
2.00
2.S2
0.21
0.55
The data on wall and roof material relate to all census houses whether used for residential or nonresidential purposes. In 1961 Census, however data pertaining to wall and roof material was collected for only the census households. In 1961 there were 438,482 Census households living in 423,279 residential houses giv~ng a~ average of 103.59 households per 100 occupied resldentwl census houses. As census households are more or less equal to the occupied residential houses this data can be broadly compared with the simila; data collected for the re~idential cenSllS houses in 1971.
TABLE G. 40
Percentage distribution of census households 1961 and residrntial census houses, 197 J by wall 'material
iVaII mat,erial
Total ('i) Grass, Leaves, Reeds. Bamboo, 'Vood
Mud anrl Uuburnt bricks
(i·i) Burnt bricks, G. 1. Sheets, Rtone and Cement Concrete.
(iii) Other material including matel'ialR not stated
1961 * 2
100·00
35.06
64.86
0.08
J971
3
100.00 34.19
(1).64
0.17
*~he figl~re8 of ] .961 l'e~ate to the set up of the district as constItuted In 1961 ~. e, pliOI' to the transfer of 54 viJ1ag~f! of this district to Gllndhillsga.T distrirt in 1964.

It i~ seen that in lcSpcct of wall materials the proportions in 1971 differ only marginally from the proportions in 1961. Th~ comparision of inforn:ation relating to roofll1g matenals shows a deC.'ease lfi the l'st' of grass, leaves, reeds, thatch, bamboo, unburnt bricks and mud and an increase in the use of tiles, corrugated sheets, asbcst(]s sheets, stone, bricks or R. C. C.
Comparison of the data on the rod material is presented in tb,e follo,'vjng tabi<':
TABLE G.41
Percentage distribution of census householdY, 1961 and residelltia! C enSHS hous('s. 197 J by roof materiaf
Hoof mate'rin I
<11'a:119 L~a.vos [{('oJ:.;, Thatch, l:hl,lnho() U"lJlll'ut bricks, 3',[nd
., Tile,:. RIa,,'. Rhinglf> COl'l'ngat()(\ Iron, Zinc 01' Oth"" ~he"tg, A><beclHlb Hheet., St() 11" brick" OJ' R. C. C.
.} Oth\",l' 'Inat-eria.l:, autl 111;ltoriul...; not
skIt""
1961 :2
S.6()
ill.27
0.(1'7
* 1!l71
3
:;. l!J
!l4.34
11.47
;!lThe fi..('U1·t-\~ of HH11 1 ()la.t.e t,o t.ht· sot. ttp of th(\ diBll'jvt it:
Cflltstitut.;d ill 190 I i ''- P"l()J' to the tl'an,i'(,I' of .,4 \,illng.l., of thi" di~trict to (iHll(lhin'lgal' di"t,,-ict in 196-1.
(iii) Households b1' number of r(:l)t!ls
In 1961, about 63 per c~n t of the CCl1<'US households and about 5~ pl:r cene of the population lived in single room Lcncmcn's. The' pn'porti('n of hOl'seholds has decreased to 61.52 per een' ill 1971 but jhe proportion of pepu latin n ha ~ remained me re c r ]c:;~ unchanged. Similarly the proportions of households and popula-
! , h tion living in tt'llt'ments havmg more t an one fO?m do not show any significant variations, The followmg table gives distribution of households and household memb~rs by numbt'f of rooms occupied:
TABLE GAl
Percentage distribution of households and members by l1u'illber of rooms octupicd, 1961 alld 1971
N,) IIf 1 ·,orns 1
Total One !'oorn 'Twt. rtl()lUS
''fhroc' l'()')ms
PO\Lr !'OnffiH
l!~ive rOunlB. OJ' more
Ot.}wr" ( 1l1l<,pecifi,l(i nllmbe' of room'" no l'eg:tl1a.r l'oom:4 ~t,C,)
1961* 1971
Pt~rCt"'\H- POi ('.('1\.-
ta.u·e 1.1) P0;'ceu- t,agp to Por cellt:;'tal tage to total tage to hOll~f" tol!al hou.~f:\- to-tal h()lds lllembol s holds m8TUhfl,'1-5
2 3 4 ii
100.00 100.00 10G,OO 100.00 I)::I.:W ,,7.62 6J.ii2 ;;7,94
2:;.60 :lfUHl 26.:'1 27.70
:l,g.) 6.H2 !lAG 1.30
26t ~",:l 3, IO 3,16
2.~!l :1.87 2,28 3.~()
n 16 O.lt 0,13
*The fi<Y(lCaf< of 19G 1 relate) r.t, t,lV' Kot up of the dish iot as (l 'Litit(lt.c,,'i: ill 1961 i. e prio!' to t.he trallRfer of ;;4 village" of thi. 'lL-<t 'iet to (}sndhinaga1' (listrict iTI HIM
52
The following table gives the number of persons per room in the census house by number of rooms in tenements:
TABLE G.43
Number of per SOilS per room, 1961 and /971
N:). of rOOln~
Total
One room
:?, Two i'(HHllt">
3 Th!,lJi' t·(~,)nl:-;
4 F"Ltl· ronlrl ....
5 Fi\-{~ r(i·)nl:::; (I: 11}(q C'
n Uth(" s (l:IlSp"cifi('(l 1Lulnbol' of f·()Onl~. IlO
r-('~ul~1r ,'()()ln~ At.C.
1961*
Xu. of memben. pAr room
316
., -'" ':",J,_)
1.9-1
l.0(i
19i1
No, of members pel' J'f)Onl
3.41
,j. [;,
2.KG
2,116
l.oti
1.29
*'l'ht, figIlJ-p,;:.: of ! 9Hl l'olat '.' t·o tht_\ Sl._~t· np of nIt' di:-.:t! let as (Jon"l itntna ill I (lill i. e prior t·o t,he transfm' of ii'i Ylliagecl of t·hi~ rli",t·! i{'i- to G<-lndhiru~g;1 r (lj~tl jet in j!J64
In ,ingk room t('!l"111cnt5 [here were 4.53 members pCI' room in 1961. hnd tile numbn i!lereasC'd to 5.15 peTH.JJ1S pCI' rOOI11 in 1971. In two room \<:neme11ts the numberofmcmlwrs per room was 2.73 in 1961 and jncl'e(l~ed to 2.86 in 1971. In thlee rooms tenements there were 1.94 persons per room in 1961 and increased to 2.06 in 1971. In houses baving four rooms the number of persons per room has not changed in 1971 and the ratio in case of tenrments with five or more rooms has also remained more or less lInchanged,
(iv) Tenure Status
Data on tenure status is given in the following table:
TABLE 0.44
Percciltage distributioll of hnus('hnlds by tenure status, 1()61 and 1971
To:tu'"t" St.atus
1 Total house·holds
2 Owned
3 HHllted
1 !Hll * 1!-l71
Total [~lll'al UrhHIl Tot,,1 Rural Urban
2 3 i 6 7
100.00 100.00 100.00 100.00 100.00 100.00
4::;'21, xi.ifl 2:!.17 41-;,40 8,),\14 28.24
"l. 1.) 12,30 i7.S:l ,,1.60 14,(16 71.76
*Tho fig'lre~ of 19(11 relflte to t}\{, ~ot. up of the di~t-rid, as (,Oll"titllted in UHl1 'i e. prior to the t"'anRff'J" "f ;-,4 villages of this district to Gandhinagal' diRt1 i0t in !9t).t.
In 1961 about 43.25 per cent of the households had owned tenements and this propo~tion has only marginally increas~d to 48.40 per cent III 1971. Rural urban differences m the tenure status can be cJearl~ licen in that in 1971 in rural areas 8~.94 per cent ?f the households lived in owned dwellmgs, whereas m the urban areas only 28.24 per cent jived in dwellings owned by them. Between 1961 and 1971 the proportion of households Jiving in owned teJ_1ements has declined in the rural arcas but shown an mcrcase in the urban areas.
H. SETTLEMENT PATTERN AND SOCIAL DEMOGRAPHY
Utilising the Census data thrown up in the Primary Census Abstract and the Non-Census data in the Town and Village Directory, it becomes possible to develop and test some hypothEses relating to certain population or habitation characteristics. Anumber of tables were devised by the Registrar General for the rural as well as urban areas for this purpose. Villagewise demographic data recorded in the Pri!11ary S~nsus Abstract and non-census data recorded lD the "VIllage Directory available from the Distri~t Census Hand-. book were proce&sed on computor III the Bureau of Economics and Statistics of the State Government. The table& for the rural areas are generated at the district and taluka level. The data on the urban areas WCfe orocessed manually and as far as possible townwise t'ables are prepared with a view to studying intertown variations in the district. The tables generated for the rural areas and for the urban areas are presentf'd at the ('nd of thi<; note. It is 0hserv('d from the tables for the rural areas that because the number of dlages in a taluka i~ comparatively smal.l, ~he di Sl ributions developed do not lead to su bstantlatlOn or otherwise of the various hypotheses, at the taluka le'll'l. At the ristrict level, howcvfT, the picture becomes somewhat clearer. The talukawise data are Pl"{"<;f'llted in this volume in orc1er that the data users mav find them useful for research studies for sub-regions in 'J. district. A short summ<l.ry of the findings is ITco,-;Jed hercundpr tablewise.
1, Rural Areas
Table H.l give~ the distribution of villages by size class of village area. Of tIle 684 villages in the district, area for 2 villages is not seoarately available. The distribution of remaining villages given in the tabl.': shows that maximum number of villages (216 or 31.66 per cent) arein the size class of 501-1.000 hectares. The next important size class is of 1,001-2 000 hectares wher·~in 206 or 30.20 per cent villages are recorded, As many as 93 villages have more than 2,000 hectares of area. Villages having less than 200 hectares of area are 37 or little more than 5 per cent of the total villages. The talukalvise figures given in the table also show more or less similar distributions.
Table H,2 gives the distribution of the villages by ~elected amenities, infra structure and land use data bv distance from the nearest town. It is seen that th~ lowest proportion of villages having primary school facilities is as high as 90 per cent for the villages
53
in the dIstance range of 21-5(J kms. and 93 per cent in the villages within 3 kms. from the nearest town. This proportion varies within a narrow margin in the villages in the remaining distance ranges except the two villages beyond 50 kms. frem the nearest town both of which have primary school facilities.
72 or a little over 10 per cent of the villages in the district have higher secondary schools and these villages fall in the distance ranges from 3-5 kms. to 21-50 kms. Only one out of 52 villages in the distance range of 3.5 kms. from the nearest town has this facility whereas 28 out of 210 or 13 per cent of the villages in the distance range of 21-50 kms. from the nearest town have this facility. No village within 3 kms. and also beyond 50 kms. from the nearest town has this facility. The population size of a village and location of the primary/secondary school in nearby non-urban centre are relevant considerations in such an analysis and distance from the nearest town is not the sole determinant for location of schooling facilities.
Nearly 33 per cent of the 671 inhabited villages in the district are connected with elctric power supply. About 69 per cent of the villages in the distance range of 3 kms. and 40 per cent of the villages in the next distance range i.e. 6-10 kms. are connected with electricity. It is further noticed that none of the two villages beyond the distance of 50 kms. and 18 per cent of the villages in the distance range of 21-50 kms. are connected with electricity. The distribution of villages in the remaining distance ranges does not seem to indicate any definite pattern.
The distribution of the villages according to the rail and road facilities available to the villages, indicates that with the exception of villages in the distance range of 11-15 kms. the proporti on of villages connected by pucca road declines with the increase in the distance from the nearest town. The proportion of average cultivable waste land to total average cultivated land in the villages according to the distance range from the nearest town shows that with the exception of the two villages beyond 50 kms. the proportion of cultivable waste land to total cultivable land increases with the increase in the distance from the nearest tOWI1. It is lowest at 5.40 per cent in the villages located within 3 kms. from the nearest town and highest at 14.20 per cent in the villages situ{tted in the distance range of 21-50 kms.
Table H.3 shows distribution of the villages by distance from the nearest town and selected demographic characteristics. It is seen that the average population per village is lowest in the villages situated in the distance range of 3-5 kms. at 1,220 persons per Village. The highest average population per village is 1,652 persons for the villages beyond 50 kms. The next high average population per village is 1,641 persons for villages situated within 3 kms. from the nearest town. No definite trend either increasing or decreasing is noticed in relation to distance from the nearest town.
The average num ber of households per census house given in column 5 of the table shows little difference
in the averages for villages in all the distance ranges. A study of sex ratio by dislance ranges from. th~ nearest town indicates that by and large the ratIO Increases with the increase in the distance from the nearest town. The ratio is lowest at 884 for villages located within 3 kms. from the nearest town and after fluctuating within a very narrow range of 918-920 in the next three distance ranges, increases to 928 for villages in the distance range of 16-20 kms. and 939 for villages in the subsequent range stands at 942 for the vil~ages beyond 50 kms. from the nearest town. The literacy rates given in column 7 of the .able show.that the .lit~racy rate is highest at 36.10 per cent in the villages wlthm 3 kms. from the neatest town and lowest at 24.88 per cent in the villages beyond 50 kms. from the ?earest town. The li~eracy is also low at 29.47 per cent III the vJ].'a~es in tht: distance range of 21-50 kms. In the remallltng distance ranges the literacy rate valil"S between 31.04 and 33.09 per cent.
The data on proportion of workers to total population given in column .8 of the. table shows that with the exception of villages III the distance range. of 3-5 kl_l1s. the proportion of workers shows a steadIly declining trend with the increase in the distance from the nearest town. The proportion is highest at 31.90 per cent in the villages located wi~hin 3 k1:nS. and slowly decJllles to 29.81 per cent in the v_Illages sItua~ed beyond 5~ kms. from the nearst town. rhe proportIOn for the VIllages in the distance range of 3-5 kms. is 30.84 which is slightly lower than that of the villages in the subsequent distance range. The percentage distribution or work~rs by the sectors of economy shows that the proportIOn of workers engaged in the primary sector of economy is lowest in the villages situated within 3 kms. froJ?the nearest town where it is 66.58 per cent. ThIS proportion is highest at 91.57 per cent in the v~llages beyond 50 kms. and also high at 87.64 per cent III the villages in the distance range of 21-5~ kms. In the remaining distance ranges the proportIOn of w?rkcrs shows a declining trend from 85.80 per cent ~n the distance range of 3-5 kms. to 79.63 per cent III the distance range of 16-20 kms. It can be, however, inferred that due to the urban impact !he proportio_n of workers in the secondary and tertiary sectors IS
more in the villages situated within a range of 3 kms. from the town than those further away from the towns. The proportion of female workers is lowest at 2.00 per cent in the villages beyond 50 kms. from the nearest town and also low at 7.61 per cent in the villages. in the distance range of 21-50 kms. The proportIOn varies within narrow range of 8.54 per cent to 9.42 per cent. No definite relationship is however noticed between the proportion of female workers and the distance from the nearest town.
Table H.4 gives the average size of populati,on per village by distance from the nea~est town by ~lze class of the town. It reveals that wIth the exceptIOn of villages in the distance range of 21-50 kms. from class II towns, the average population size of the villages in the periphery o~ t~e cla~s I to,,:n (Ahmadabad City) is greater than SimIlar vIllage~ sItuat~d rrom towns baving less than 100,000 populatIOn. SImIlarly
54
the average size of villages in the distance range in the periphery of class IV towns is larger than villageS similarly situated from class III and V towns except the villages at a distance of between 16-20 kms. from class III towns. It is further seen that in respect of class V towns the average popUlation size per villages increases with the increase in the distance.
Table H.5 provides data about selected servi. cing institutions and demographic characteristics by the population size of the villages. It is seen that the proportion of villages having post offices increases with the size of the villages. Only 2 out of 22 villages having less than 200 population and 9 out of 87 villages in the population range of 200 to 499 have post office facility whereas 96 per cent of villages having population between 2,000-4,999 and all the villages beyond 5,000 population have post offices.
It is seen from column .5 of the statement that average distance from the nearest town varies within a narrow margin of 20.45 kms. for the villages in the population range of 200-499 persons to 13.50 kms. for villages having a population of 5,000-9,999 persons and does not indicate any definite pattern in relation to the size of population of a village. The sex ratio by size class of village population is seen to be lowest at 884 females per thousand males in the villages in the population range of 5,000-9,999 and also low at 891 in the villages with a popUlation of less than 200 persons. The sex ratio varies within a very narrow range in the remaining population ranges and does not indicate any definite pattern in relation to the popUlation size class of villages. It is however seen that the literacy does have a ditect relationship with the population size of villages and increases with the increase in the population size class of villages.
The figures of proportion of workers by size class of village popUlation show that the proportion varies within a narrow margin in all the different population sizes. However. the proportion of workers is lower in the villages having less than 200 population than III the villages having larger population.
Table H.6 gives the number of medical and postal institutions per 100 km2 of rural areas in different talukas of the district. The number of medical insti. tutions varies from 0.97 per 100 km2 of rural areas in Dhandhuka taluka to 4.39 per 100 km2• of rural areas in Dehgam taluka. The number of post offices per 100 km2 of rural areas varies from 2.77 in Dhandhuka taluka to 10.16 in Ahmadabad City taluka.
Table H.7 gives the average distance per village from the nearest town by density of popUlation. It is seen that the average distance from the nearest town is lowest in the villages having a density of 501 or more persons per km2 and also low in the villages having less than 11 persons per km2. The average distance varies within a narrow range of 17.11 kms. to 20.50 kms and does not show any definite pattern in relation to the density range of population.
Table H. 8 shows the relationship between the density of population of villages and the proportion of Scheduled Castes and Scheduled Tribes population. As regards Scheduled Castes, it can be seen that the average density of population of villages per hectare varies within a narrow margin and no definite pattern is observed. In the case of scheduled tribes, the average density of population increases with the increase in the proportion of scheduled tribes population upto the percentage range of 26-50.
Table H.9 seeks to provide some ins-ight into the infrastructure of villages as it takes into account the combined amenities score per village by population "ize class. The details of score values assigned to each of the amenities is as under:
/ll11enities available in the villages and the scores assigned to each of them
Amenities Score for each item
E:loct"'i'1itv/Elout'l'icih' [or Ag' icul- 6 tUl'e olll~~", Univo!'Aity
., _H :lihvi;,\Y ~t l~ti(1ll, Tnlepholl.e, G.)llu:;o, Ot,h01' i:l,lnstrial :>chool, Tnlining school, Ad sch()ol
:l S""·jwlary Selwol, l{o"pital, :\Iat""!litO' ana Child \Velf(Ho Centl(', rI,>:dth Cent.,'n, T. B, Clinic" P<)):~L .and Telo~I'aph Offico
·1 ~rid'lJ.' School, )l"l",ing Homo, Tap \\-,tt,_\·,. Tnbe w\,l] / Han(l })lunp, Po~t OffiCl'
:; Primary School, DidpClllSal'Y I"f1milv Plannil1o' Centre, Veterj. 1101'.\' 'l:Io~pital r Dispfll1sal'Y et,c,
6 ';I',·ll. Tank, C,mal I Hive!' "te. P"r;ca Road Kutcha Road, Navi. ,sphlp Riv8r! Canal, Other comIn'l nication facility,
~ ..
2
While assigning the scores weightages have been 6i \!,:n to the various amenities in the villages primarily on consideration of their scarcity values. The significant contribution that a particular item can make in the infrastructure for development in the rural areas ha>; also been taken into account to some extent in giving the weightages, The table shows that large size villages have higher amenity scores than smaller size villages. The average amenity score for the villages having less than 200 population is only 4.46 and the amenity score is higher for each successive size class o,r population the score being as high as 35.60 per Village for the villages having more than 5,000 population, indicating a direct relationship between, the size of population of villages and the amenities in villages. The average amenity score per village in the district IS 12.41. It is 'however, observed that villages of Ahmadabad City taluka and Daskroi, Dholka and Sanand talukas have comparatively higher amenity ~core than the district average while the amenity score IS. lo~er by over 10 per cent as compared to the dIstrict average in the case of villages of Dhandhuka and Viramgam talukas. Villages of Dehgam taluka
55
also have slightly lower amenity score than the district average.
2. Urban Areas
Tables H ,lO to H .20 relate to urban areas of the district. As stated earlier the details are given townwise as well as according to the group by size class of towns. But the distribution of towns by size class at the district level results in a very small number of towns in the different size classes.
Out of 21 towns in the district, Ahmadabad City is in the size class of more than one lakh population 6 towns are in the population range of 20,000·49,999,7 towns have populatIOn between 10,000 and 19,999, 6 towns have popUlation between 5,000 to 9,999 and one town has popUlation below 5,000. The population growth rate by size class of towns during 1961-71 is available for size class 1 town only i. e. Ahmadabad City and no hypothesis regarding the growth rate of popUlation for the group of towns in the specified size classes can be tested. Analysing the data townwise it is however seen that the growth rate of popUlation in Sahijpur Bogha a class III town and Dehgam, Ahmadabad Cantonment and Ranip all class IV towns is much higher than that in the remaining towns. The demity;f population per hectare is ~ much higher in Ahmadab2d City than in the towns of smaller c;izc, The nllmber of females per thousand males is higher in class III and V towns than that in ciass I, IV and Vl towns. The proportion of scheduled castes population is highest in Ahmadabad City ( class I) and also high in class IV and V towns as compared to class III and VI towns. The proportion of scheduled tribes population is much higher in class III towns as compared to that in class I, IV, V and VI towns. The literacy rate is highest at 59.02 per cent in Ahmadabad City and also high at 51.41 per cent in class III towns and 51.20 per cent in class IV towns as compared to that in class V and VI towns. Table R.ll gives townwise density, sex ratio and literacy rate, It reveals that density varies greatly from town to town
whereas household size varies within a narrow margin. The sex ratio varies from 594 in Ahmadabad Cantonment to 1,003 in Ranpur town. The proportion of literates varies from a minimum of 37.80 per cent in Nikol town to a maximum of 60.40 per cent in Ahmadabad Cantonment town.
Table H.12 gives the distribution of towns by functional categories and Table H.I3 shows the changes in the functional category and the growth rate in the last two censuses. It is seen that some towns had shown a rapid increase during 1951-61 whereas population in other towns has increased at a rapid rate in 1961· 71 but no definite relationship can be established with the functional categories.
Table H.14 which gives townwise proportion of female workers, indicates that the proportion is highest at 9.39 per cent in class V towns, lowest at 2.79 per cent in class VI town and about 5 per cent in class I, III and IV towns. There are proportionately more female
workers in tertiary sector than in primary or secondary sector in class 1, III and VI towns than in class IV and V towns. It is also seen that the proportion of female workers in tertiary sector is hi~hest in Ahmadabad City and declines in each successive size class of towns. Table H.15 gives the per capita receipt and expenditure of local bodies by size class of towns. The figures reveal that with the exception of class IV towns the per capita total receipt and expenditure decreases with the decline in the size class of towns. Table H.l6 furnishes data on per capita receipt and expenditure in old and new towns. New towns are those which have come into existence for the first ti me duri ng 1951 Census or thereafter. The table reveals that the per capita receipt and expenditure in old towns is much higher as compared to the figures of receipt and expenditure in new towns. mainly due to high per capita receipt and expenditure in Ahmadabad City.
Table H.17 gives data on per capita receipt and expenditu, e separately for (I) the towns which have come into existence in the wake of industrialisation or through Government policy and (2) for ail other towns in the district. It is seen that the per capita receipt and expenditure in new towns is very low as compared to
56
the remaining towns in the district which include Ahmadabad City where the per capita receipt as well as expenditure is high. Table B.I8 gives the per capita receipt and expenditure by functional categories of the towns. It is seen that the per capita receipt and expenditure in the towns having functional category of industry is greater than in the towns having other functional categories. Table H.19 which shows the educational and medical facilities per one thousand population in the towns by size class, reveals that the number of secondary schools per 1,000 population varies within a narrow margin in all the size classes of towns. The number of primary schools per 1,000 population is, however, highest at 0.48 in the class I town and lowest at 0.22 in class I II towns. The number of beds in medical institutions per 1,000 population also does not show uny definite pattern in relation to the population size class of towns. However the number of beds in medical institutions in Ahmadabad, a class I city is highesl. Table H. 20 shows the number of beds per one thousand popUlation by functional category of towns. It is seen that the number of beds per one thousand population is greater in the towns having functional category of industry or other categories in combination with it.
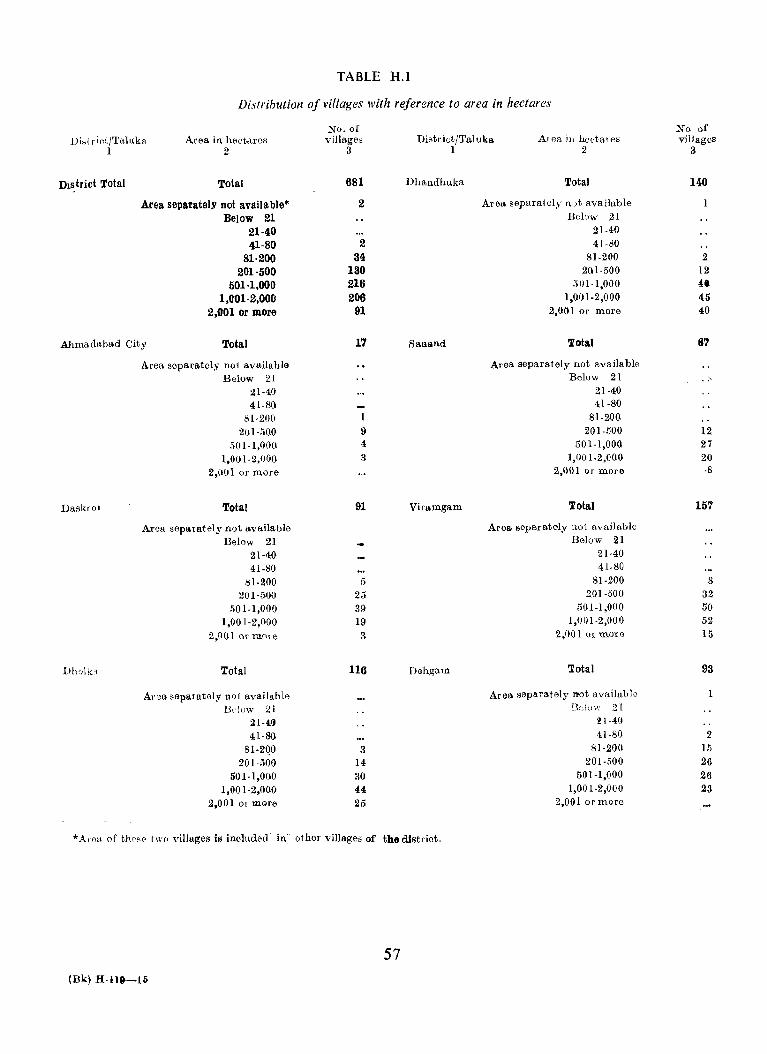
TABLE H.I
Distribution of villages with reference to area in hectares
l>iHtr iet/Tahlka I
Area in hectares 2
Dis trict Total Total
Area separately not available* Below 21
21-40 41-80
81-200 201-500
501-1,000 1,crOl-2,OOO
2,001 or more
Ahmadabad City Total
Daskro 1
Area separately not available Below 21
21-40 41-8a
81-200 201-500
50I-l,OOa 1,001-2,000
2,001 or more
Total
Area separately not available Below 21
21-40 41·80
81-200 201-500
501-1,000 1,001-2,000
2,001 or more
Total
Area separately not. available lklow 21
21-lij 41-SO
81-2QO 201-500
501-1,000 1,001·2,000
2,001 or more
No. of villages
3
681
2
2 34
130 216 206
91
17
1 9 4 3
91
5 25 39 19 3
116
3 14 30 44 25
District/Talnka I
Area ill hectal e~ 2
Dhandhuka
Sanand
Viramgam
Dehgam
Total
Area separately not. available Below 21
21-40 41-80
81-200 201-500
MH-I,OOO 1,001-2,000
2,0()1 or more
Total
Area separately not. available Below 21
21-40 41-80
81-200 201-500
GOI-I,OOO 1,001-2,000
2,00.1 Dr more
Total
Area separately not available Below 21
21·40 41-80
81-200 201-500
501-1,000 1,001-2,000
2,O() 1 or 'more
Total
Area separately not available nn"'w 21
21·40 41-80
81-200 201-500
501-1,000 1,001-2,000
2,001 or more
*A.oa of those twc> villages is included' in~ other villages of the district.
57 (Bk) H-1l9-15
No of viUages
3
140
1
2 12 4. 45 40
&7
.:-.
12 27 20 ·8
157
8 32 50 52 It}
93
2 15 26 26 23
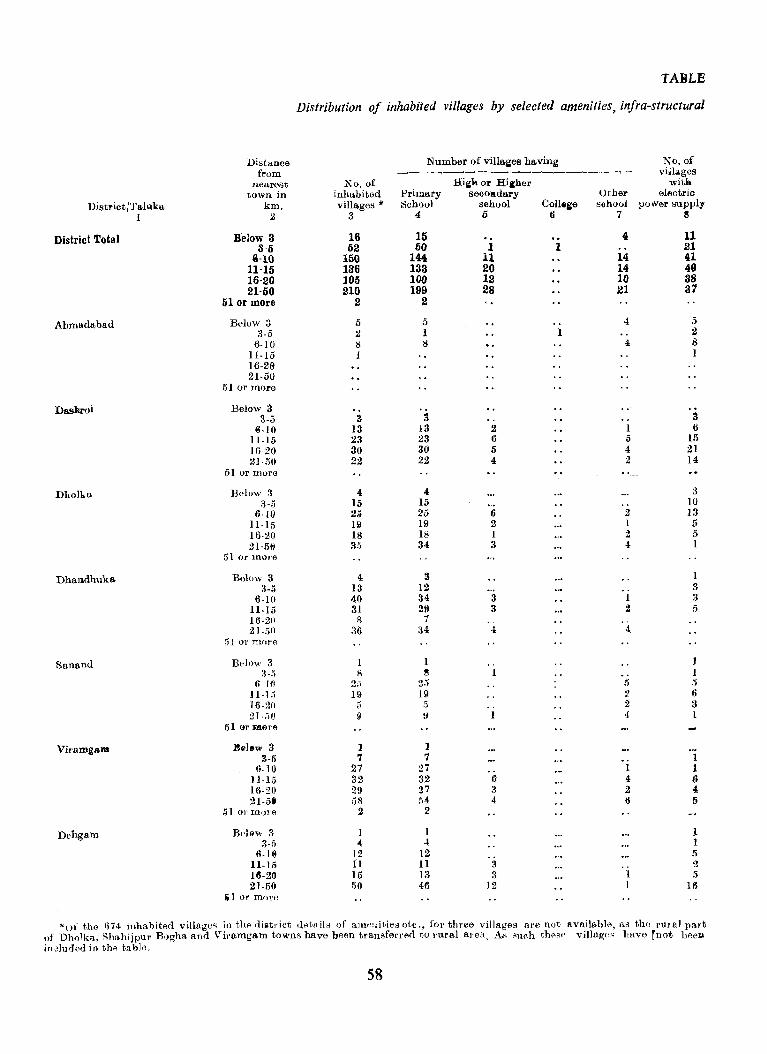
TA8LE
Distribution of inhabited villages by selected amenities, infra-structural
Distance Number of villai6s having No. of from _--- ~-------------.~~----,- vi'llages
nearest No. of Hi&» or Hi,her with town in inhabited Primary secolldary Other electrio
Districtl'l'aluka km. villages * School sehool 0011.&6 s()hool power supply
1 2 3 4 5 6 7 S
District Total Below 3 16 15 4 11 8-5 52 50 1 1 21
6-10 150 144 11 14 41 11-15 136 133 20 14 49 16-20 ]05 100 12 l{) 38 21-50 210 199 28 21 31
5101' more 2 2
Ahmadabad Below 3 5 5 4 5 3-5 2 1 1 2
6·10 8 8 4 S 11-15 1 1 16-28 21-50
51 or more
Daskroi Below 3 3-3 3 3 3
8-10 13 13 2 6 11-15 23 23 6 ;) 15 16-20 30 30 5 4 21 21·50 22 22 4 2 14
5101' more .. Dholka Below 3 4 4- 3
3-5 15 15 10 6-H! 23 25 6 .2 13
ll-l.'i 19 19 2 I 5 16·20 18 18 1 2 5 21-5@ 35 34 3 4- 1
51 or Inore
Dhandhuka Below 3 4 S 1 3-5 13 12 !{
6·10 40 34 3 I :3 II·15 31 29 3 2 5 16·20 8 1 21.;;0 36 34 4 -I.
5101' more
Sanand Below 3 1 1 1 3-.1 8 ~ 1
6·ft! 25 25 " i)
11·1 ij 19 19 2 6 16-20 ;) .~ 2 3 21 -.ill 9 l) 4 1
51 ar ll'llne
Viramgam B.,J.w 3 1 I 3-5 7 7 1
6-10 27 27 1 1 11-15 32 32 6 4- 6 16·20 29 27 3 2 4 21·5' 58 54 4 6 5
51 01' InorA 2 2
Dehgam B"]@,,, 3 1 I 1 3-5 4, 4 1
6·19 12 12 fi II·I5 11 11 3 2 1t}·20 15 13 3 1 5 21-50 50 4('1 12 I 16
iiI or mol'''
*uf t·he 1374 inhabited village~ in tllfl rli~tl'ict d"tail~ of amAl1ities etc., for three villages are not available, as t,he I'UI'a! part of Dholklt, Shahijpllr Rogha and Viramgam towns have been transftlrred to rural area. AR "1l~ h these villagp," havtl rnot been inc]ur)fld in thfl tabJA.
58
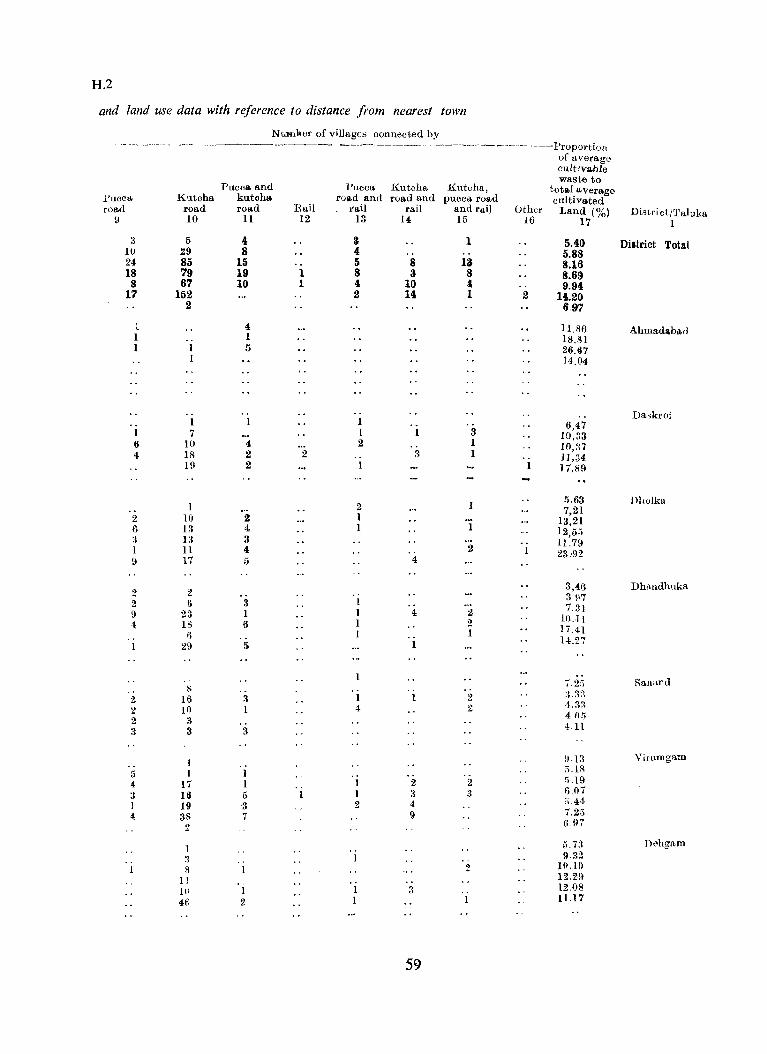
H.2
and land use data with reference to distance from nearest town
pucca road
9
3 10 24 18
8 17
1 1 ]
1 6 4
2 6 ;{
1 I)
2 2 9 -t
2 2 2 3
5 4 ., ., I 4
Num1ger of villages connected by ... ' -- - ---.. - --------~------- --------.. ---.-------- -----.-- '---Proportion
Kutcha road 10
5 29 85 79 67
152 2
]
1
1 7
10 18 19
1 10 l:{
1 :~ 11 17
2 {)
23 18 6
29
.' S
16 10
3 3
I I
17 16 19 3g
2
)
3 8
II 11) 46
of average culdvable waste to
Pucca and l'ucca Kutcha Kutuha, tota.l averagE> kutcha roa,d and road and pucca road cultivated road Rail tail rail and rail Other Land (%) District/Taluka
11 12 13 14 15 16 17 1
4 3 1 5.40 8 4 5.88
15 5 8 13 8.16 19 1 8 3 8 8.69 10 1 4 10 " 9.94
2 14 1 2 14.20
Diltrict Total
697
4 IUl6 1 I8.Sl
Ahmada.botrl
5 26.67 14.04
Da"kroi 1 6,47 1 3 10,33
4 2 1 10,:17 2 2 3 1 11,34 2 1 17,89
I 5.63 llholka
2 7,21 2 1 13,21 4 1 12,55 3 11.79 4 2 23 .. 92 5 4
3,4,6 Dhandhnka 3\17 3 1 7,31
1 1 4 2 If) .11
6 1 2 17 Al 1 1 14.27 5
7.2;-; Ran<tnd 3.~~ 3 1 1 2 4.33 1 4 " ., 4 Or,
3 ,f,Il
H.13 Vil'amgam ,).18 I ;;.19 1 2 2 607 5 1 3 3 ;).44
3 2 4 1 \} 7.25
697
5,73 Dehgam 9,32 .,
2 1(~.19 1 12.29 12.08 I 1 3
2 1 1 lLl7
59
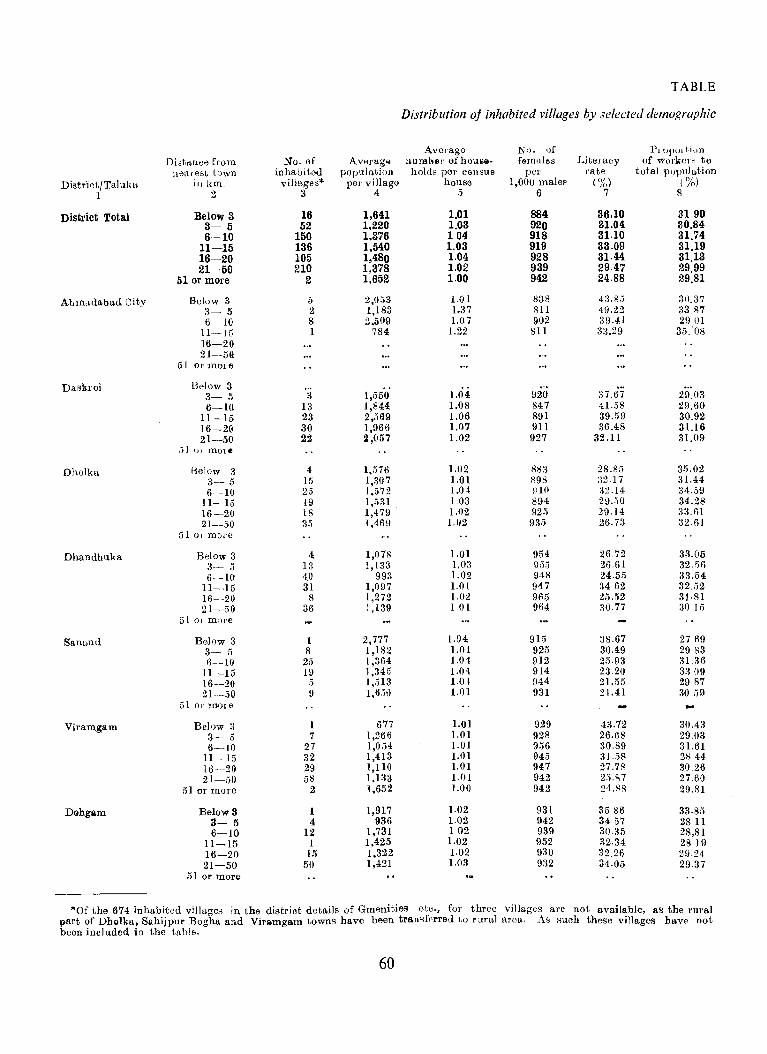
District/Taluka I
District Total
Abmadabad City
Daskroi
Dholka
Dhandhuka
Sanand
Viramgam
Dehgam
Didttluee from nearest tOwn
iukm. 2
Below 3 3- 5 6-10
11-15 16-20 21-50
51 or mOre
Below 3 3- 5 6-10
11-15 16-20 21-50
510rlllC}le
Below 3 3- 5 6-10
II-15 16-26 21-50
5] OJ mOle
Below 3 3- 5 6-10
11-15 16-20 21-50
51 Or more
Below 3 3--- 5 6-10
11-·15 16-20 21-1;0
51 01 more
Below 3 3- 5 6--10
11-15 16-20 21-50
51 01' more
Below 3 3- 5 6-10
11-15 16-20 21-50
51 or more
Below 3 3- 5 6-10
11-15 16-20 21-50
51 or more
No. of inhabited
villages* 3
16 52
150 136 105 210
2
" 2 S I
3 13 23 30 22
4 15 25 19 18 35
4 13 '10 31
8 36
1 8
25 19
i)
9
1 7
27 32 29 58
2
1 4
12 I
15 50
Averag(,l popcllation
pel' village 4:
1,641 1,220 1,376 1,540 1,480 1,378 1,652
2,0;,3 1,183 2,509
784
1,550 1,844 2,569 1,966 2,057
1,.376 1,307 1,572 1,,;31 1,479 1,469
1,078 1,133
993 1,097 1,272 J ,139
2,777 1,182 1,364 1,345 1,.')13 1,6.i\)
677 1,266 1,054 1,413 1,110 1,133 1,652
1,917 936
1,731 1,425 1,322 1,421
TABLE
Distribution oj inhabited villages by selected demographic
Average nU1Hb8r ofhou£8· holds pel' census
house .3
1.01 1.03 104 1.03 1.04 1.02 1.00
1.01 1.37 1.07
1.22
1.04 1.08 1.06 1.07 1.02
1.02 1.01 1.04 1.03 1.02 1.02
1.01 1.03 1.02 1.01 1.02 1.01
1.04 1.01 1.04 }'04 1.0 I 1.01
1.01 1.01 1.01 1.01 1.0 I l.0 1 1.00
1.02 1.02 102 1.02 1.02 L03
N". of females
per 1,000 malef
6
884 920 918 919 928 939 942
838 811 902
811
920 847 891 9Il 927
883 898 910 894 925
931)
954 955 948 947 965 964
915 925 912 914 944 931
929 928 956 945 947 942 942
931 942 939 952 930 9:32
Litemey rate
(%) 7
36,10 31.04 31.10 33.09 31.44 2947 24.88
43.83 49.22 39.41 3:3.29
37.67 41.:i8 39.59 36.48
32.Il
28.85 :{2.17 :i2.14 29.50 29.14 26.7!3
26.72 26.61 24.5.~ :14 62 25.52 30.77
38.67 30.49 25.93 23.20 21.55 21.41
43.72 26.68 :30.89 31.158 27.78 2iU17 24.RS
3586 3457 30.35 32.34 32.26 34.05
I>] o}JUJ t.ion of Work,,]·" ttl
total population (%)
8
2190 30.84 31.74 31,19 31.13 29.99 29.81
30.37 33.87 29 In
35.'08
29.03 29.60 30.92 3U6 31.09
35.02 31.44 34.59 34.28 33.61 32.6]
33.05 32.')6 33.54 32.52 31·81 30 If;
27 fl9 29 S3 31.36 3309 2987 30 .. 59
30.43 29.03 31.61 2R.44 30.26 27.60 29.81
33.85 2811 28.81 2819 29.24 29.37
*Of the 674 inhabited villages in the district details of Gmenities ete., for three villages are not available, as the rural part of Dholka, Sahijpur Bogha and Viramgam t,owns have been tran'!f,'rred to rllral area. As such these villages have not been inoluded in the table.
60
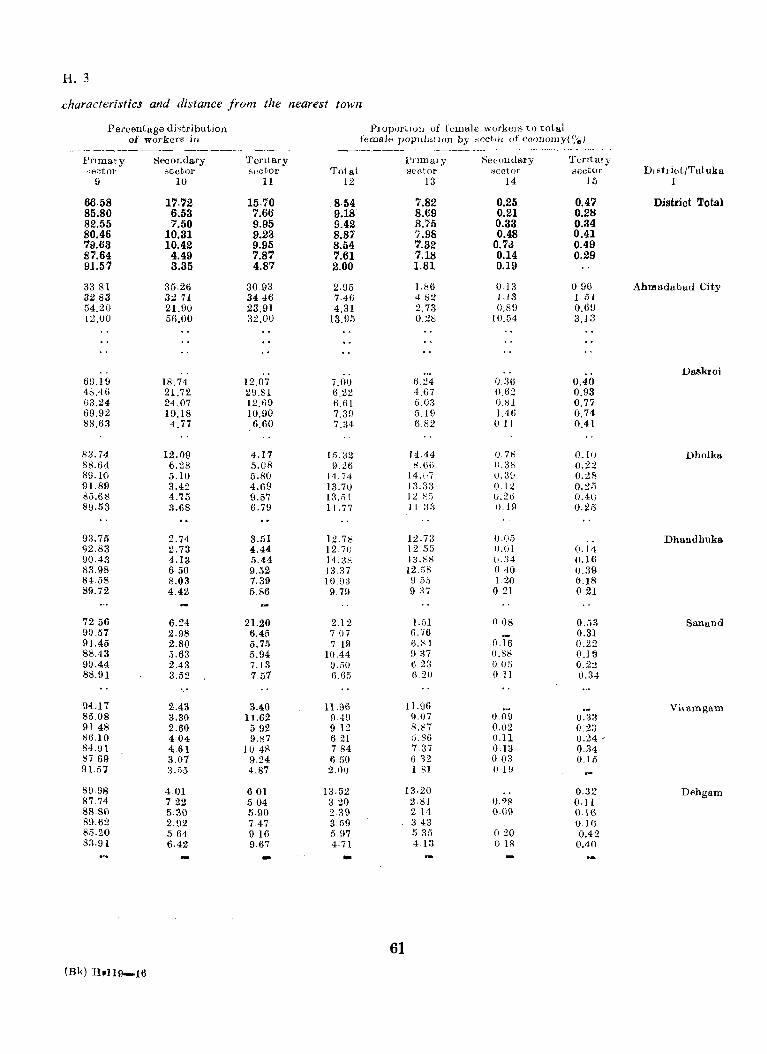
H.3
characteristics and distance from the nearest town
Pel'centage di,tribution PrOpOl'tlO1J uf female workel's to total of workers in female populatlOn by "ector of ecoIlomy{ ~;,,)
_._- -- -_------_. __ --- ~-- .. ~~--. -------- _- --.. ----.----.-~----- -- ----_--------- - ..
Primary Secondary 'rental'y Primary l:"leeulldaI'Y Terjtary ~ector Hector seotor 'rotal see-tor sector seetor
9 10 11 12 13 14 15
66·58 17.72 15.70 .8·54 7.82 0.25 0.47 85.80 6.53 7.66 9.18 8.69 0.21 0.28 82.55 7.50 9.95 9.42 8.75 0.33 0.34 80.46 10.31 9.23 8.87 7.98 0.48 0.41 'iv.53 10.42 9.95 8.54 1.32 0.73 0.49 87.64 4.49 7.87 1.61 7.18 0.14 0.29 91.57 3.35 4.87 2.00 1.81 0.19
3381 35.26 3093 2.95 U;6 o 13 096 3288 3271 8446 7·46 482 1 18 1 61 54.20 21.90 23.91 4.31 2.73 0.89 0.69 12.00 56.00 32.00 13.95 O.2S 10.54 3.13
69.19 18.74 12.07 7.00 6.24 (U6 0.40 48.46 21.72 29.81 6.22 4.67 0.62 0.93 G3.24 24.07 12.69 6.61 5.03 (J.81 0.77 69.92 19.18 10.90 7.39 6.19 l.46 0.74 88.63 4.77 6.60 7.34 6.82 011 0.4 t
83.74 12.09 4.17 15. :32 1·1.'14 078 0.10 88.64 6.28 5.08 9.26 "UW 0.31:> 0.22 89.10 6.10 6.80 14.74- 14.i'7 O.::H: 0.28 9l.89 3.42 4.69 13.70 1 :3.:'1::\ 0.12 O.2n 85.68 4.75 9.57 13.;; 1 12 ~i) 0.26 0.4() 89.53 3.68 6.79 1 J. 77 II :3:1 0.19 0.25
93.75 2.74 3.51 12.n 12.n 0.05 92.83 2.73 4.44 12.70 12.55 (J.Ol 0.14 90.43 4.13 5.44 14.:3" I:U;S (J.:34 0.16 8:3.98 650 9.52 13.37 12.1)8 040 0.39 84.58 8.03 1.39 10 \)3 9 :5.~ 120 0.18 89.72 4.42 5.86 9.79 9 :n o 21 o 21
7256 6.24 21.20 2.12 J.;)1 008 0.53 90.57 2.98 6.45 707 6.76 0.31 91.45 2.80 5.75 7 Hi 6.81 o 16 0.22 88.43 5.63 5.94 10.44 9 :n 0.88 0.19 90.44 2.43 7.13 0.i50 623 00,; 0.22 88.91 3.52 7.51 6.615 620 Oll 0.:34
94.17 2.43 3.40 11.96 11.96 85.08 3.30 11.62 9.49 !}.() j 009 0.33 91.48 2.60 592 9 12 8.87 0.02 0.2:3 8(l.10 404 9.87 6 21 1;.86 0.11 0.24 • 84.91 4.61 10 48 1.84 7.37 0.13 0.34 8769 3.07 9.24 I) 50 6 32 003 0.1.5 91.51 3.i'55 4.87 2.00 lSI 019
8998 401 601 13.52 13.20 0.32 8774 722 504 320 2.81 0.98 O.ll 8f\.80 5.30 5.90 239 2 14 0.09 0.16 8(J.62 2.92 747 359 343 0.16 8.~.:!0 564 9.16 597 535 020 0.42 83.91 6.42 9.67 4.71 4 13 018 0.40 -
61 (Bk) H~1l9-16
DJ otl"ict/Tal uka 1
District Total
Ahmadabad Oity
DalSkToi
Dholka
Dhandhuka
Sanand
Vilsmgam
Dehgam
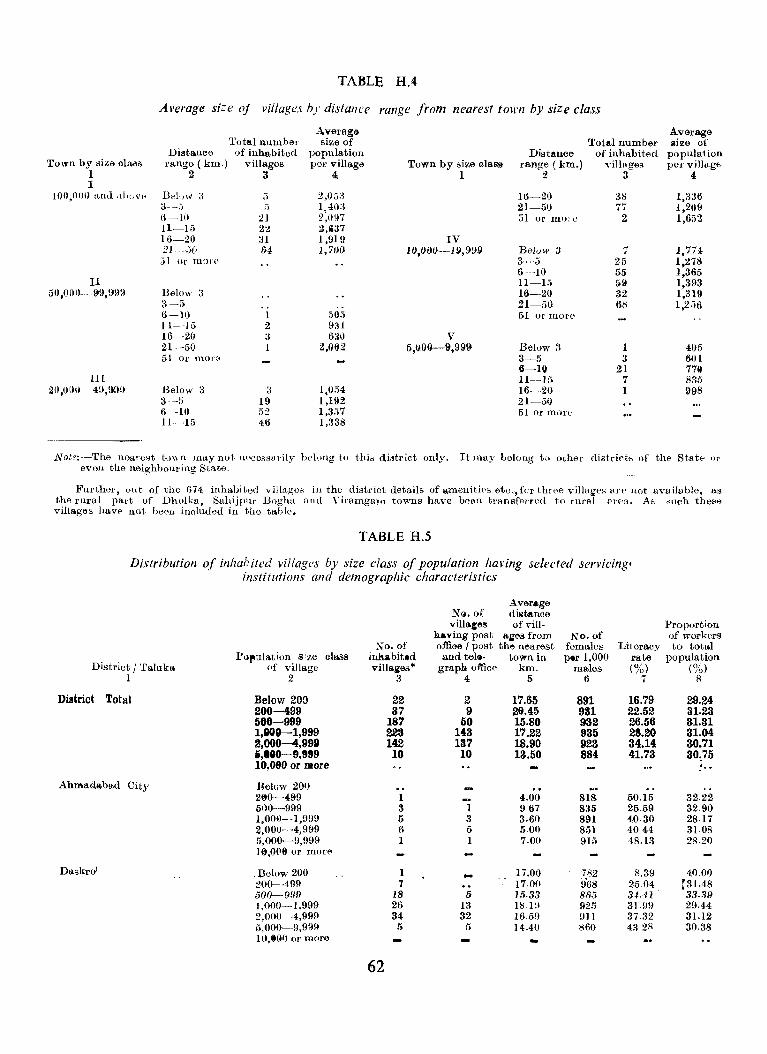
TABLE H.4
Average size of villages by distance range from nearest tOll'n by size class
Average Average Total numbel' size of Total number size of
Distance of inhabited population Distance of inhabited population TO\l'l1 by Bize class range (km.) villages per village Town by size class range (km.) villages pel villag6
1 2 3 4 1 2 3 4 I
100,O{)O and .11",Vl' Bd"w;{ ;; 2,O3:{ 16-20 38 1,336 3--f' ~) 1 40:1 21-aU 77 1,209 ti~lO 21 2:097 31 or ruLl'L- 2 1,652 11-15 22 2,i37 16·-20 31 1,919 IV 21-,}(i 64 1,700 1O,QOO-~19,999 Beluw 3 " 1,774: ,
31 Or mOlt> 3--5 25 1,278 6-10 55 1,365
II 11-15 59 1,393 50,01)()~-99,(199 Below 3 16--20 32 1,319
3-r. 21-50 68 1,256 6--10 1 505 51 or mort> 11-15 2 9;jl 16-20 3 630 V 21-50 1 2,0"2 5.QO()--9,999 Below 3 1 405 51 or nlO{,C1: 3-5 3 601
6-1Q 21 719 III 11--15 7 835
ZO,U()O --49,()99 Below 3 3 1,054 16- -20 1 998 3---5 19 1,192 21-50 6-10 52 1,357 51 or m"re 11--15 46 1,338
NQte;-The noarest to\\n lilay not llbceRsarily b810ng to thio district on.ly. It may belong to other distri"t~ of the Statt- ')revon the neighbouring Stat.e.
Fllrther, (Jut of the 674 inhabited V illagos in the district details of amen it if's etc." fcr thTf'e villages an' not ava il3 ble, as the rllral part of Dholka, Sahijpur Bogha and Yiramgam towns have been. transfNred t,o rllfal (lrE'a. As ~nch theR.., villages have not be('u included in the table.
TABLE H.5
Distribution of inhahited villages by size class of population having selected servicing. institutions and demographic characteristics
District / Taluka 1
District Total
Ahmadabad Oity
Do.tskrol
l'o~ulation g;ze class of village
2
Below 200 200-499 560-999 I,GOG--l,999 2.000-4.99g 5,180-9,889 19,OeO or Dlore
Below 201) 260-489 500-999 1,000-1,999 2,000-4,999 5,000-9,999 ]6,0(19 or mor€'
. Below 200 200-499 500--9f!9 1,000--1,999 2,000-·4,999 5,000-·9,999 10,t(1) or more
No. of inhabit.d villages*
3
22 37
187 223 142 10
I 3 5 6 1
1 7
18 26 34
5
62
[email protected] Average dil.tanco
villa.,el!l of vill-having post !tiles from No. of offioe I post the nearest female::; Literacy and teltt- town in pttr 1,000 rate
graph office km. males (%) 4 5 6 7
2 17.65 891 16.79 9 29.45 931 22.52
50 15.80 932 26.56 143 17.22 935 28.20 137 18.90 923 34.14 10 13.50 884 41.73
4.00 818 50.15 1 967 835 25.59 3 3.60 891 40·30 5 5.00 851 4044
7.00 915 48.13
17.00 782 8.39 17.00 '9'68 2504
5 15.33 865 34.41 13 1819 925 31.99 32 16.59 9Il 37.32
!) 14.40 860 432S
Proportion of workers to total
population (%)
8
29.24 31.23 31.31 31.04 30.71 30.75
32.22 32.90 28.17 31.08 28.20
40.00 r31.48 33.39 2!).44 31.12 30.38
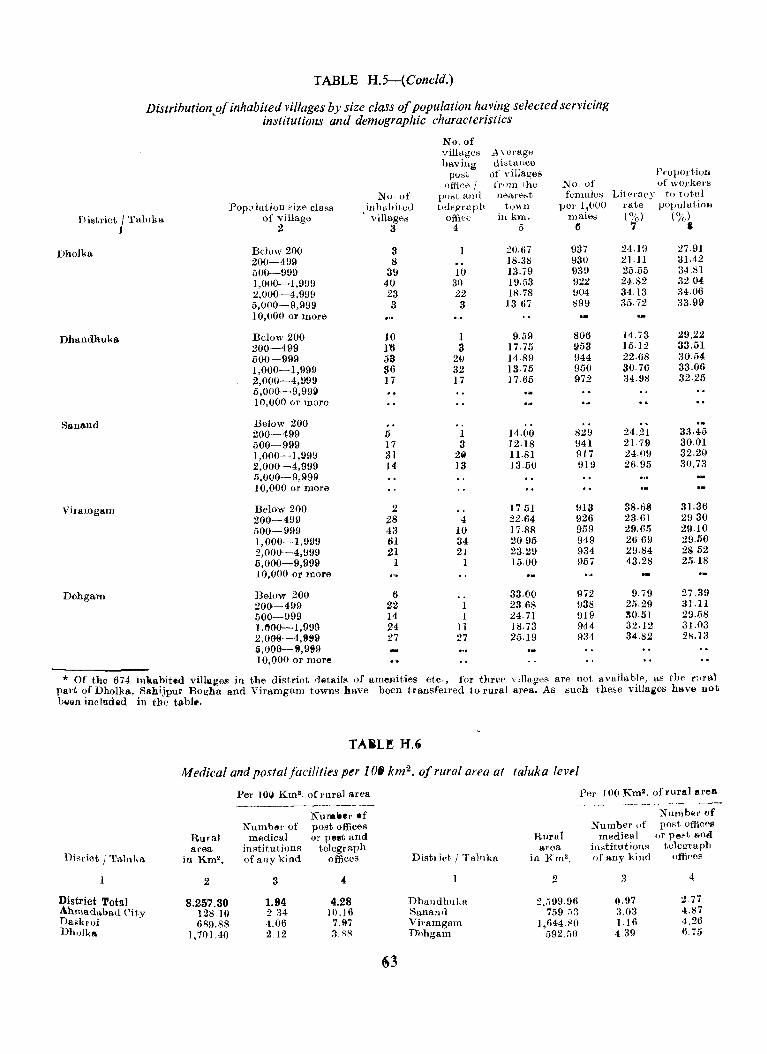
TABLE H.5-(Concld.)
Distributioll,oj inhabited villages by size class of population having selected servicing institutions and demographic characteristics
No.of villages A vcr8ge haying tli"tance
post of villages ojfico ! frum the ~o of
PrujJol·tion "fworkers
.N o. of pI"" alld nBl:tf'B:.-;t, females Lilerl1ey to tutal Pop~11aiion "ize c_lass inh"biLeJ t<elegl'uph to\\11 pel' l,tWO rate l'ojlulutiOl)
District I Talnka of village villages offif:e ill km. Inale~ (%) (%)
1 2 3 4 5 tj 7 , Dholka Below 200 3 20.67 937 24.19 27.91
200-499 I) ]8.38 930 21.11 31.42 500-999 39 10 13.79 939 25.55 34.81 1,00()"-'1,999 400 30 19.53 922 2482 3204 2,000-4.999 23 22 18.78 904 34.13 3406 5,000-9,999 3 3 1367 899 35.72 3399 10,000 or more
Dhandhuka. Below 200 10 I 9.59 806 14.73 29.22 200-499 1'6 3 17.75 953 15.12 33.51 500-999 53 2U 14.89 944 22.68 30.54 1,000-1,999 36 32 13·75 950 30.76 33.06 2,000-4,999 17 17 17.65 972 34.98 32.25 5,000-9,99~ 10,000 or Inure
Sanand Below 200 200-499 5 1 14.00 829 24.21 33·45 .')00-999 17 3 12.18 941 21.79 30.01 1,000--1,999 31 2" ll.81 917 24.09 32.20 2,000-4,999 14 13 13.50 9111 26.95 30.73 5.000-9,999 10,000 or more
ViJ-amgam Below 200 2 1751 913 38.68 31.36 200-499 28 4 22.64 926 2361 2930 500-999 43 10 17.88 959 29.65 29.10 1.000-1,999 61 34 2095 949 2669 :W.50 2,000-4,999 21 21 2329 934 29.84 2852 5,000-9,999 1 1 15.00 957 43.28 25.18 10,000 or more
Dehgam Below 200 6 33.00 972 9.79 2739 200-499 22 1 2368 938 25.29 31.11 500-999 14 1 24.71 919 ~0.51 29.58 1.~00-1,9!)9 24 lJ J8.73 944 32.12 31.03 2,0138-4,999 27 27 25.19 934 34.82 21->.13 5,1306-9,999 10,000 or more
* Of the 674 inlaabited villages in the district '-!4!ltails of amenities etc., for three villages al'e not available, as the r!'ral part of Dholka, Sahijpur Bogha and Viramgam towns haye been transferred to rural al'ea. As such these villal,\es have not been included in tIle table.
Medical and postaljacilities per 10' km 2 • of rural area at toluka level
Disrict I Talnka
1
District Total Ahmadabad City Daskroi . Dholka
Rural area
in Km".
2
8.257.30 128.10 689.88
1.701.40
Pel' 1011 Km". of ],IIral Sfea
Number of medical
institutions of any kind
3
1.94 234 4.06 2.12
Nuraleer .f post offices or pellt and
telegraph offices
.t
4.28 10.16
7.97 3.88
Distl id· ! Talllka
Dhandhuiw Sanand Viramgam J)Ahgam
63
Rural area
in Km'.
2
2.;';99.96 759 .,)3
1,644.80 ;)92.50
Per 100 Km". of rural area
Number of medie!>l
institutions of ftny kind
3
0.97 3.03 1.16 4.39
)l"tlmblill' of post Offices
or pe~t anfI telegraph
offi('cs
4
2 77 4.87 4.26 I) 75
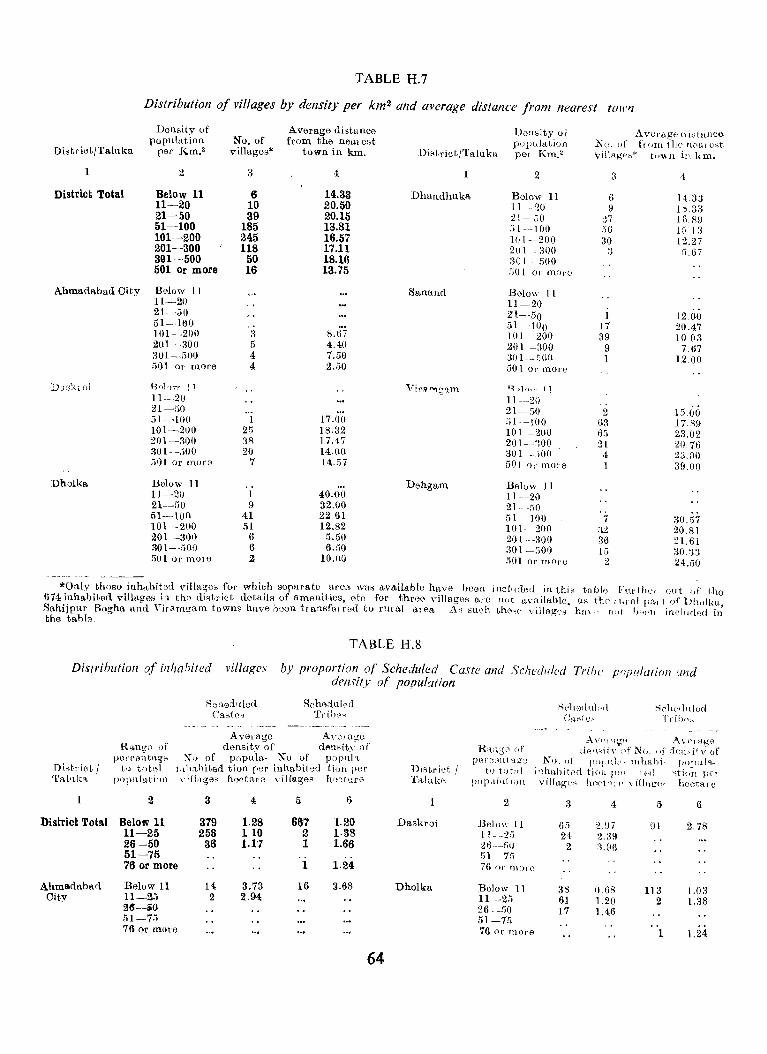
TABLE H.7
Distribution of villages by density per km2 and average distance from nearest tOll''l
Distl'i(Jt/Taltlka
Density of population
per Km." No. of villages*
Average disttmce from the neal est
town in km. Di~trictrraluka
Density of pUllltiation pel Km."
Average di~ taHce Ku. of fr(lm thl' lwalest .. villHgp,,* t,'\On ill. km.
1 2
District Total Below 11 1l~20 21~50 51~100 101~200 201~300 301 500 501 Or more
Ahmadabad City Below 11 11-20 21-50 51--HW 101-200 201---300 301-500 501 or more
l);:;,s:{"loi H.,1 r n-,.r 1] 11-20 21-50 :a-LOO 101--200 201--300 301-;iOO liOI or more
Dholka Below 11 11-20 21--50 51-100 101--200 201--300 301--iiOO 1i01 Or male
3
6 10 39
185 245 118
50 16
3 5 4 4
25 38 20
7
1 9
41 51
6 6 2
4
14.33 20.50 20.15 18.81 16.57 17.11 18.16 13.75
8.67 4.40 7.50 2.50
17.00 18.32 17.47 14.00 14.57
40.QO 32.00 22.61 12.82
5.50 6.l)(j
10.00
Dhandhuka
Sanand
Dehgam
2
Below 11 11 20 21 - :;0 ;j l--J 00 Hi 1 ---200 20 l-- :{OO :301----/i00 501 01' mOI'U
Below 11 11-20 21--50 ;')1--100 101- -200 201---aOO 301---fiOO 501 0,' more
q ~l(\·" '1 11---20 21--50 51--100 101--200 201 100 301 - ,00 501 01' mOl'E\
Below 11 ll- 20 21 50 51--100 10l- 200 201--:{OO 301--500 .~01 0[' mOr'u
3
6 9
27 ;')()
30 3
I 17 39
9 I
2 (;3 6;') 21
4 1
7 :32 36 1:)
2
4,
14 33 HL33 16.89 If; 13 12.27 1i.67
12.00 20.47 1003
7.67 1200
1500 17.89 23.02 2{) 76 2;{,()0 39.00
30.57 2(),81 21.61 3() 13 24.~0
*Ouly those inhabitml villa~os for which sopal'ate area was availuble have been inclluletl in thiH taule Fudhe, out of the 674 inhabited villages in the district details of amenities, etc for three villages a,rC not available, a~ th0 "u'Hl pal t of IJtlOlka, Sahijpnf Bogha and Viramgam towns have been transfel red to rllral area As sueh thEl,(' 'V illllgl's hm {. not he'('ll incl"d0d in the tahle.
TARLE H.8
Distribution of ill/zahited villages by proportion of Scheduled Caste and Scheduled Trih(' p·)pulatirm and density of population
DL,t!'iet / Tah.!m
1
District Tota.l
Ahmadabad City
S"ll".duled Castoo
Schedulf'd Trih(:lr.-';
R>tngl' uf pereentftgC-l
to total p"pl1[ati,,,.
Average AV0rage density of density- of
N,} of popu'!a- No. of p"p,il t-i.lh"bited tion per inhabitgd tion pHI'
vi!htges heota"0 vitlages hw;("re
2
Below 11 11-25 26--50 51-75 76 or more
Below 11 11-25 21$-iO 51-71i 76 or more
3
379 256 36
14 2
4
1.28 110 1.1'7
3.73 2.94
5 6
687 1.20 2 1.38 1 1.66
1 1·24
16 3.68
64
District / Tttltlka
Daskroi
Dholka
R'lllgc' of pel' 0(";11 t ng:._,
to tr)tal l'()plli>ttiOll
2
Below II 1'- 2!i 26-;;0 1)1 --75 76 (),- mOIU
Below II 11-25 26. -1i0 51-75 76 Or more
R('l10dlllc,,1 C,;l,Kl e~
Hchc,(liliod Trih{-l~
AV{_'lq~(.. i\VOlf1ge
de'l,it.v of No. tOr ,kllcilv of No. of pOI·ld,o. illh8hi· ["'I'ulft-
i,.hahit(l(l tiol' pHi tpd stion pel' villttg0s fweh:!' villl1[((" hectare
3 4 5 6
(If) 2.97 HI 2.78 24 2.a~
2 ~Ul(l
38 () 68 113 1.03 61 1.20 2 1.38 17 1.46
1 1.24
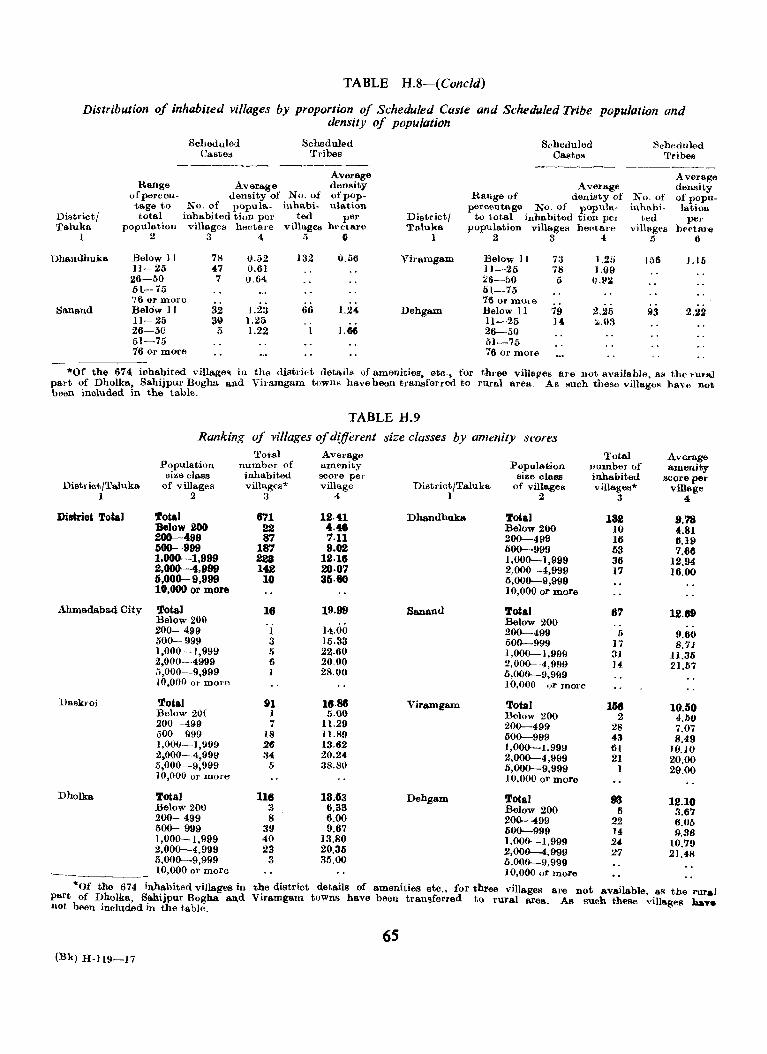
TABLE H.8-(Concld)
Distribution of inhabited villages by proportion of Scheduled Caste and Scheduled Tribe population and density oj population
District/ Taluka
1
Dhauuhuka
Sanand
Scheduled Scheduled Caste:! Tribes
Average density of No. of
No. of popula- inhabi-
Average density of pop_ ulation
Range of perc entage to total
popUlation 2
inhabited tion per ted per h"cta:re
G
Below II ]]-25 26--50 51-75 76 or mOI'e Below] 1 11- 25 26-1)0 51-75 16 or more
villages hectare v illagcs 345
78 0.52 132 47 0.61 7 0.64
32 1.2:3 66 39 1.2[>
0.56
5 1.22 1 ),116
District/ Taluka
1
Viramgam
Dehgam
Scheduled RcheduJed Castes Tribes
Average Range of denisty of
percentage No. of populato total inhabited tion pel
popUlation villages hectlne 234
Below II n 1.25 11-25 78 1.09 :.!6-i'l0 5 0,1.12 1)1-75 76 or mOle Below II 79 2.25 1I-25 14 :'.03 26--50 !i]-75 7601' more
No. of inhabi
t,ed villages
I)
]56
93
Average density of popu-latioll
per 1,t'ctllTe
6
1.15
2,22
"Of the 674 illhabited village~ in the djstl';ct details of amenities, etc., for t.hl'Cle villsj1es are not availablfl, as the ,.UI'&] part of Dholka, Sahijpul' Bogha and Viramgam townR have been transferred to rural area. As !luch these villages have not been included in the table.
DistrictfTaluka 1
District Total
Ahmadabad City
Daskr-oi
Dholka
TABLE H.9
Ranking of villages of different size classes by amenity scores
PopUlation size class
of villages 2
Total Below 200 200-499 500-999 1,000----1,999 2,000-4,999 5,000----9,999 10,000 or more
Total Below 200 200-499 500-999 1,000-1,999 2,000--4999 ;.,000--9,999 10,000 OJ' more
Total Below 20( 200 -499 i500- 999 1,000·-1,999 2,000-4,999 5,000-9,999 10,000 01' more
Total number of inhabited village .. *
3
671 22 87
187 22a 142 10
16
1 3 5 6 I
91 1 7
18 26 84
5
AVEn·age amenity score per village
4
12·41 4.41 7·11 9.02
12·18 20·07 35·80
19.99
14.00 15.33 22.60 20.00 28.00
18·86 5.00
1I,29 11.89 13.62 20.24 38.80
DistrictfTaluka I
Dhandhuka
Viramgam
Population size cla8S
of villages .2
Total Below 200 200--499 600-999 1,000-1,999 2,000-4,999 6,000-9,999 10,000 or more
Total Below 200 200--499 500--999 1,000---1,999 2,00~-4,999 5,000---9,999 10,000 or more
Total Below 200 200---499 600---999 1,000-1,999 2,000-4,999 5,000-9,999 10,000 or more
Total 116 13.63 Dehgam Total Below 200 3 6.33 Below 200 200- 499 8 6.00 200-499 500- 999 39 9.67 600-999 1,000-1,999 40 13.80 1,000--1,999 2,000---4,999 23 20.35 2,000-4,999 5.000---9,999 3 311.00 6,000--9.999 10,000 or more 10,000 or more
Total Ilumber of inhabited villages*
3
132 10 J6 53 36 17
67
5 17 31 14.
168 .2
28 43 61 21
I
93 II
22 14 24 27
Average amenity
score pel' village
4
9.78 4.81 6.19 7.66
12.94 16.00
12.89
9.60 8.71
11.35 21.57
1UO 4.DO 7.07 8.49
JO.1O 20.00 29.00
12.10 3.67 6.05 9.36
10.79 21.48
"Of the 674 inhabited villages in the district details of amenities etc., for three villages a.re not a.vailable, as the rural part of Dholka, Sahijpur Bogha and Viramgam towns have been transferred t.o rural area. As such these villages »ay. not been included in the t,able.
6S (Bk) H-I19-17
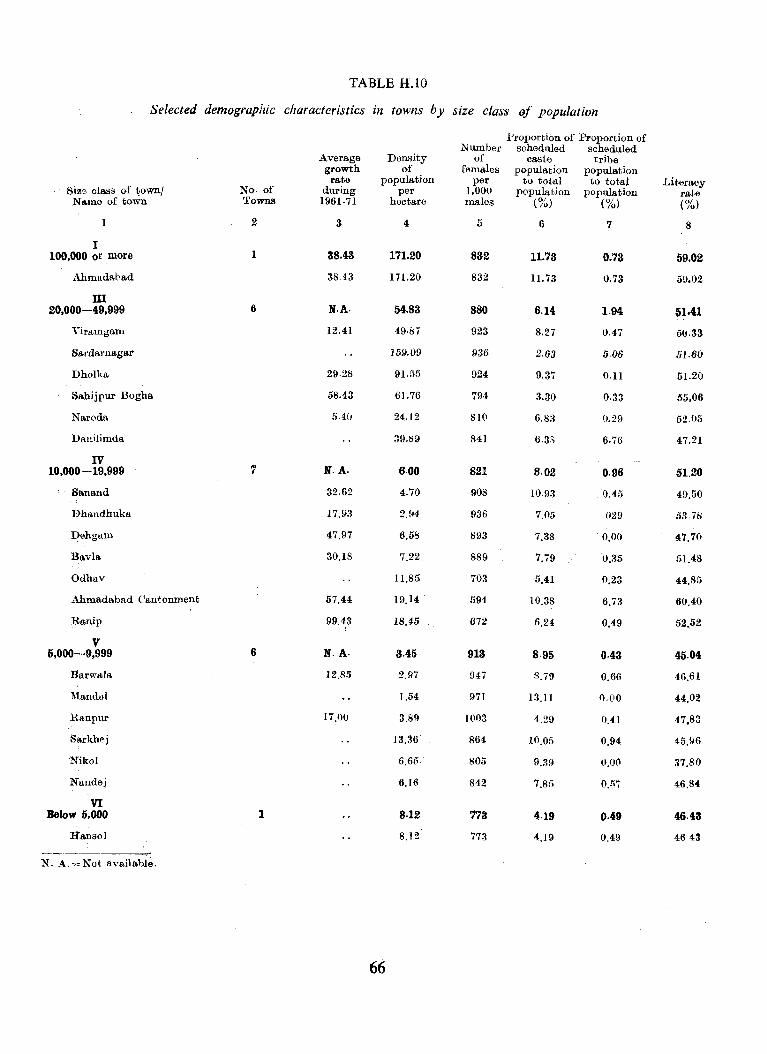
TABLE H.lO
Selected demographic characteristics in towns by size class of population
"",umber .i:'roportion of Proportion of
scheduled scheduled Average Density of caste tribe growth of females population population
rate population per to total to total Literacy Size class of town] No· of during per 1,000 population popUlation rate
NlIome of town Towns 1961-71 hectare males (%) (%) (%)
1 2 3 4 5 6 7 8
I 100,000 or more 1 38.43 171.20 832 11.73 0.73 59.02
Ahmadabad 38.43 171.20 832 11.73 0.73 5(1.02
III 20,000-49,999 6 M.A. 54.83 880 6.14 1.94 5lo41
Yiramgam 12.41 49.&7 923 8.27 0.47 50.33
Sardarnagar 159.()9 936 2.63 /j.()6 51.60
Dhollm 29.28 91.55 924 9.37 0.11 51.20
Sahijpur Bogha 5S.43 61.76 794 3.30 0.33 M.06
Naroda 5.40 24.12 810 6.83 0.29 52.05
Danilimda 39.89 841 6.38 6.76 47.21
IV 10,000 -19,999 "/ N.A. 6·00 821 8·02 0.96 51.20
Banand 32.62 4.70 908 10.93 0.45 49,50
Dhandhuka 17.93 2.94 936 7.05 ()29 53.78
Dehgam 47.97 6.58 893 7.38 0.00 47.70
Bavia 30.1S 7.22 889 7.79 0.35 51.48
Odhav II.S5 703 5.41 0.23 44.S5
Ahmadabad Cantonment 57.44 19.14 . 594 10.38 6.73 60.40
Ranip 99.43 18.45 672 6.24 0.49 52,52
V 5,000-9,999 6 M.A· 3.45 913 8·95 0·43 45.04
Bar~-ala 12.85 2.97 947 8.79 0,66 46.61
MandaI 1.54 971 13.11 0.00 H.02
Ranpur 17.00 3.89 1003 4.29 0.41 47.83
Sl:trkhej 13.36' 864 10.05 0.94 45.96
'Nikol 6.65 805 9.39 0.00 37.80
Nandej 6.16 842 7.85 0.57 46.8(
VI Below 5.000 1 8·12 773 4·19 0·49 46.43
Hansol 8.12 773 4.19 0.49 464:'1
N. A.=Not. available.
66
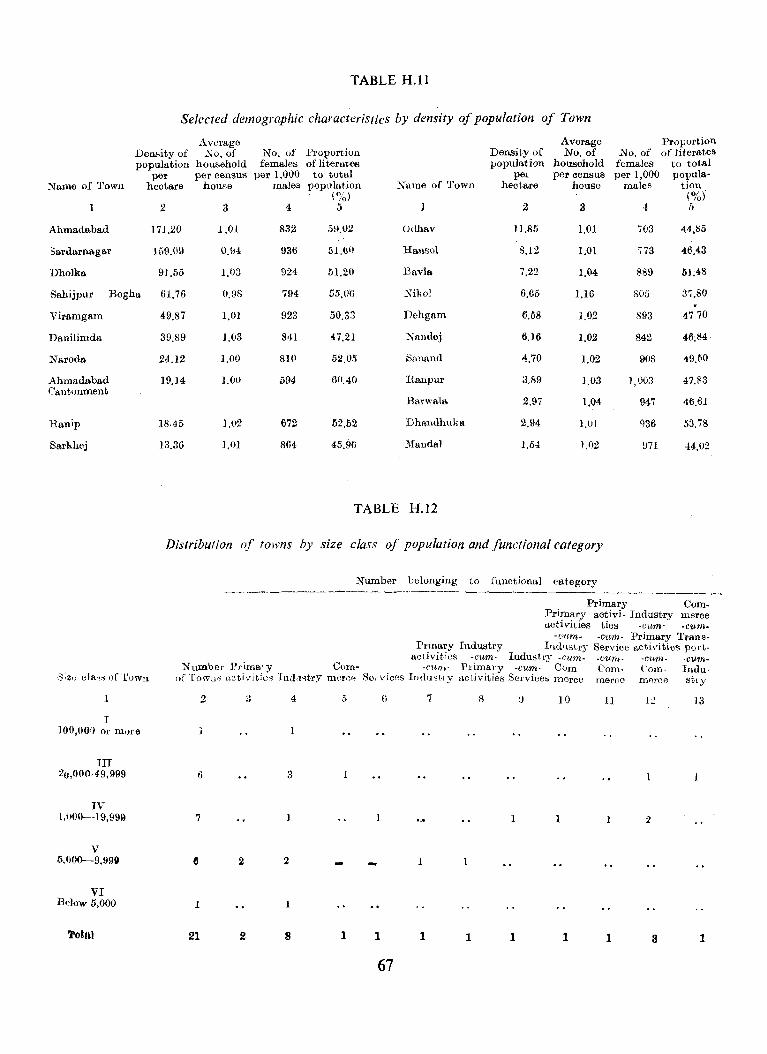
TABLE H,l1
Selected demographic characteristics by density of population of Town
Average Average Proportion Density of No, of No, of Proportion Density of No, of No. of of literates
household to total population household females of literates population females per 1,000 to total per 1,000 popula-
)iame of Town
Ahmadabad
3srdarnagar
Dholka
Sahijpur Bogha
Viramgam
Danilimda
Naroda
Ahmadabad Cantonment
Ranip
Sarkhej
1
I 100,(01) or lnore
TIl 20,000.49,999
IV 1,{}00-19,999
V 5,OOO-9,99g
VI Below 5,000
Totnt
per per censuS pe~ per census hectare house males populat.ion Name of Town hectare house males tion
(%) (Ufo> 2 3 4 5 1 2 3 4 fj
171.20 1.01 832 59.02 Odhav II.85 1.01 703 44.85
159.09 0.94 936 51.60 Hauso1 8.12 1,01 773 46.43
9J .55 1,03 924 51.20 RavIa 7,22 1.04 889 lil;48
61,76 0.98 794 55,06 Nikol 6.65 1.16 805 37,80
49,87 1.01 923 50.33 Dehgam 6.58 ].02 893 4770
39.89 1.03 841 47.21 Nandej 6.16 1.02 842 46;84
24.12 1.00 810 52.05 SllnSllll 4.70 1.02 908 49.liO
19.14 1.(1) 1)94 60.40 Rallpur 3,89 1.03 ],003 47.83
Barw!\Ja 2.97 1.04 947 46.61
18.45 1.02 672 52.52 Dhandhuka 2.94 1.01 936 53.78
13.36 1,01 864 45.96 l\1anda) 1.04 J .02 971 44.02
TABLE H.12
Distribution (~r towns by size class of population and functional category
Number belonging to functional category
Primary Com-Primary activi. Industry merae activities ties -cum- -cum-
-cum- -cum- Primary Trans-Prmary Industry Industry Service a.ctivities pOI't.-
actIvltlCS -cum- Industry -cum- -cum- -cum- "cum-Number' Prima1Y Corn- -Cllm- Pl'imal'y -cum- Com· Com- ('om- Indu-
of Towns ,<cti\-itie.~ In;llt~try merG" Sel'vices Inrluf'try activities Services nlOrce merco merco Stty
2 3 4 [) 7 8 10 11 J3
6 3
7 1 z
2 2 1
1
21 2 8 1 1 1 1 1 1 1 3 1
67
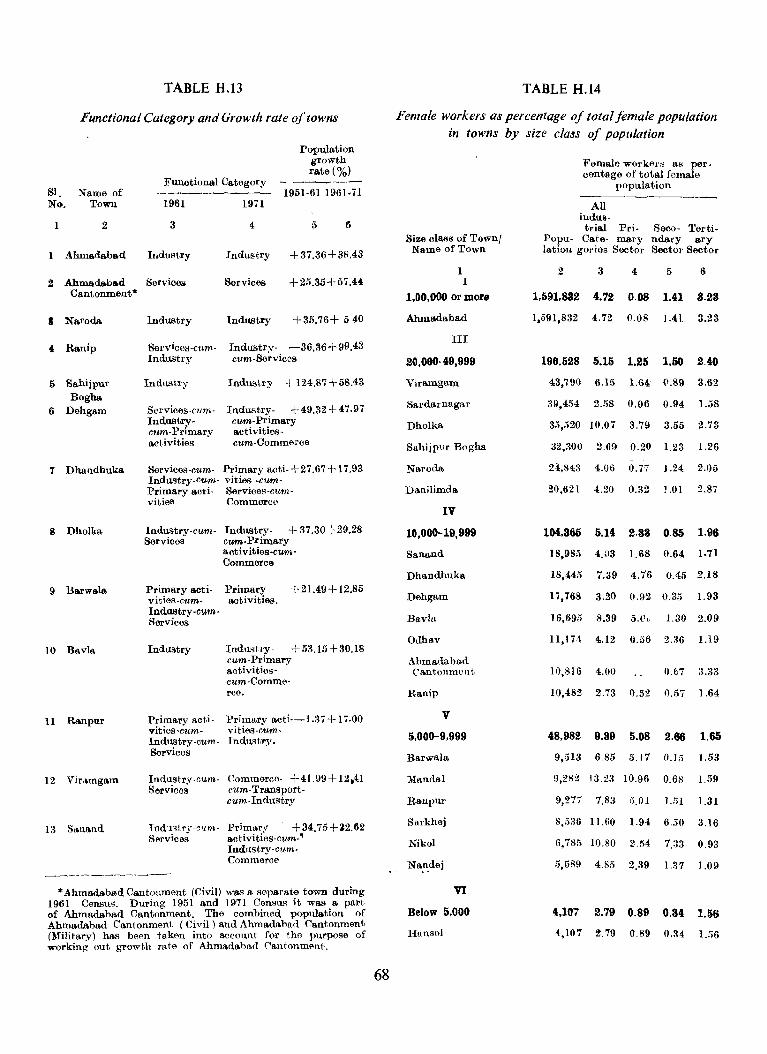
TABLE H.B
Functional Category and Growth rate of towns
St. Name of No, Town
2
I Ahmadabad
Functional Category
1961
3
Industry
1971
4
IndUf,try
PopuJation growth rate(%)
1951·61 1961·71
5 6
+37.36+38.43
2 Ahmadabad Services Services +25.35+57.44 Cantonment*
I Naroda Induatry Industry +35.76+ 540
4 Ra.uip
5 Sahijpur
Bogha 6 Dehgam
7 Dhalldhuka
8 Dholka
9 Barwala.
10 Bavla
11 RlLnpnr
12 Viramgam
13 Siionand
Services·cttm· Industry
Industry
Services·eu.1n . Induatrycum-Primary activities
Industrv- -36.36+99.43 eum.Services
Industry + 124.87 + 58.43
Industry- +49.32+ 47.97 cum-Primary activities-cum-Commerce
Services-cum- Primaryacti-+27.67+17.93 Industry-cum- vities -cum-Primary acti- Services-cum-vities Commerce
Industry-cum- Industry- + 37.30+29.28 Services cum· Primary
activities·cum· Commerce
Primary actio vities·cum· Industry·cum· Services
Industry
Primary activities-cumIndustry -cumServices
Primary activities.
+21.49+12.85
Indu'ltq- +53.15+30.18 cum· Primary activities-cum-Comme-rce.
Primary aeti--1.37 + 17.00 vities-cum-Indust,ry .
Industrv-wm- Commerce- +41.99+ 12.41 Services cum-Transport-
Ind1Htry-cnmServices
cum-Industry
Primary +34.75+:l2.62 antivities-cum-" Industry-cu.m· Commeroe
* Ahmadabad Cantonment (Oivil) was a separate town during 1961 CensU';;. During 1951 a.nd 1971 Oensus it was a part of Ahmadabad Oantonment. The combined population of AhIlUl.d.a.bad Oantonment (Oivil) and Ahmadabad Cantonment (Military) has been t.akon into aocount, for the purpose of working out growt.h rate of Ahma.dabad Cantonment ..
68
TABLE H.14
_Female workers as percentage of total female population in towns by size class of popUlation
Size elMS of Town! Name of Town
1 I
1,00,000 or more
Alunadabad
III
20.000·49,999
Viramgam
Sal'darnagar
Dholka
Sahijp\Jr Bogha
Naroda
Danilimda
IV
10,000-19.999
Sanand
Dhandhuka
Dehgam
Bavla
Odhav
Ahmadabad Ca.ntonment.
Ranip
V
5.00D-9.999
Barwala
MandaI
Raupur
Sarkhej
Nikol
VI
Below 5.000
Ransol
Female workers as per· centage of total female
popUlation
All indU8-trial Pri·
Popu- Cate- mary latioll gories Sootor
Seco- Terti· ndal'Y ary Sector Sector
23456
1,1)91,832 4.72 0.08 1.41 3.23
1,591,832 4.72 0.08 1.41 3.23
196.528 5.15 1.25
43,790 6.15 1.6<1
39,454 2.58 0.06
35,:520 10.07 3.79
32,300 2,69 0.20
1.50
{l.89
0.94
3.55
1.23
2.40
3.62
1.58
2.73
1.26
24.843 4.06 0.77 1.24 2.05
20.621 4.20 0.32 ],01 2.87
104,365 5.14 2.33 0.85 1.96
18,985 4.U3 ] .68 0.64 1.71
18,445 7.39 4.76 0.45 2.18
17,768
16,695
3.20
8.39
0.92 0.35 1.93
5.(1" 1.30 2.09
11,174 4.12 0.56 2.36 1.19
10,816 4.00 0.67 3.33
10,482 2.73 0.52 0.57 1.64
48,982 9.39 5.08 2.66 1.65
9,513 6.85 5.11 0.15 }.53
9,282 13.23 10.96 0.68 1.59
9,277 1.83 i).OI 1.51 1.31
8,536 11.60
6,785 10.80
5,589 4.85
1.94
2.54
2.39
650
1.33
U7
3.16
0.93
1.09
4,107 2.79 0.89 0.34 1.56
4,1012.79 0.89 0.~4 1.56
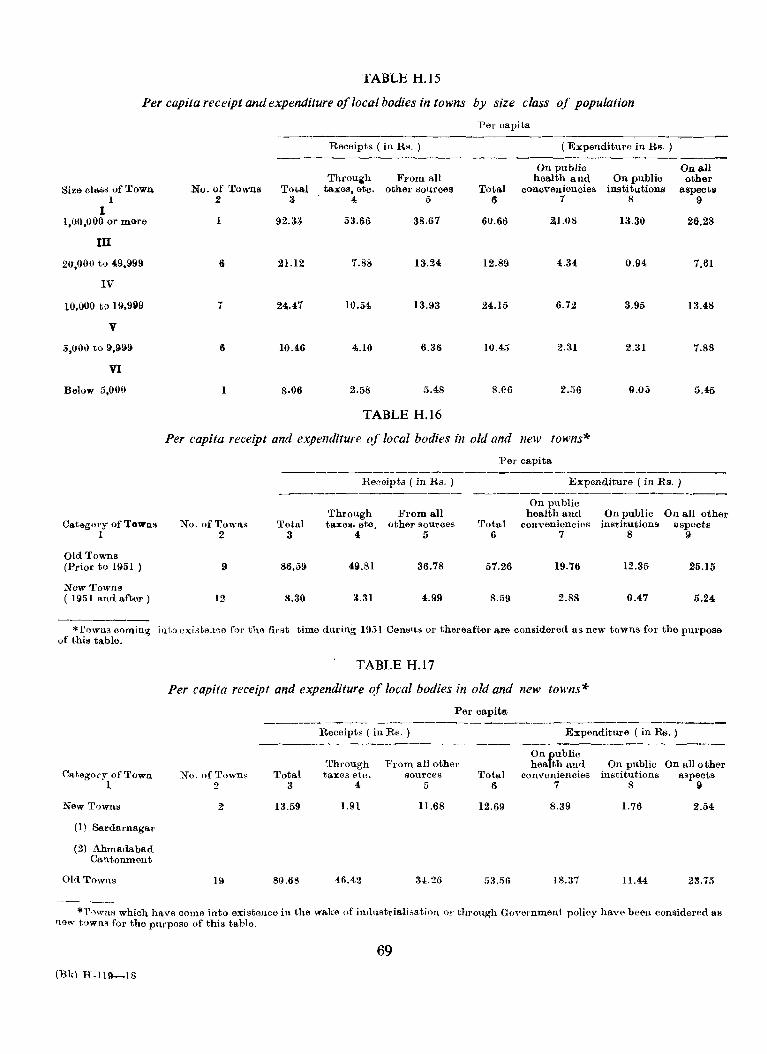
TABLE H.lS
Per capita receipt and expenditure of local bodies in towns by size class of population
Pel' capita
Receipts ( in Rs. ) ( Expenditure in Rs. ) -_--- -----------~-----_ ----On puhlic OuaIl
Throu~h From all health and On puhlic other ~ize cltl.3O of Towu. No. of Towns Total taxes, etc. other l:lources Total concveniencies institutions aspects
1 2 3 4. 5 6 7 8 9 I
1,00,000 or more 92.33 53.66 38.67 60.66 Zl.OS 13.30 26.28
nI
20,000 to 49.999 21.12 7.88 13.24 12.89 4.34 0.94 7.61
IV
10,000 to 19,9119 '7 24.47 10.54 13.93 24.15 6.72 3.95 13.48
V
5,000 to 9,999 10.46 40.10 6.36 10.45 2.31 2.31 7.88
VI
Below 5,000 1 8.06 2.58 5.48 8.06 2.56 0.05 5.45
TABLE H.16
Per capita receipt and expenditure of local bodies in old and new towns*
Per capita
Receipts ( in Rs. ) Expenditure ( in Rs. ) ~--------------- --------~-----~---------
On public Through From all health and Onpuhlic On all other
CategnI'Y of Towns No. of Towns Total taxes. etc. other sources '.rotal conveniencies institutions aspects 1 2 3 4 5 6 7 8 9
Old Towns (Prior to 1951 ) 9 86,59 49.81 36.78 51.26 19.76 12.35 25.15
New TownB ( 1951 and after) 12 8.30 3.31 4.99 8.59 2.88 0.41 5.24
*r'HVIlS coming into ex:i~ten"e flYl' the first time (lttring 19S1 Census or thereafter are considered as new towns for the purpose of this table.
Categol'Y of Town 1
New Tow'us
(l) Sardarnagar
(2) Ahmadabad Cantonment
Old. Towns
TABLE H.t7
Per capita receipt and expenditure of local bodies in old and new towns*
Per capita
Receipts ( in Rs. ) Expenditure ( in Rs. )
Through From all other On public health and On public On all other
No. of Towns Total taxes .. tc. sources Total conveniell.cies institutions aspects 2 3 4, 5 6 7 8 9
2 13.59 1.91 11.68 12.69 8.39 1.76 2.54
19 80.68 46.42 34.26 53.56 18.31 11.44 2:'1.75
*r'''VllS which have come into existence in the wake of itvlustrialisatioll Or through Government policy haye heen considered al! new tOWIlS for the purpose of this table.
69 (Bk) H-1l9-1S

TABLE H.U
Per capita receipt and expenditure of local bodies in lowns by fUllctional category
l'er capite. ------~---------~----- ---,---------------~------
Receipt ( in .Ks.
Through Taxes
Fuuet.ional Ca.te~'}ry :No. of Town.s 'l'otal etc. I 2 3 4
Primary activities 2 8.65 2·56
Industry Ii 87.16 50.58
Commerce 0.46
Services 4:3.23 8.87
Primaryactivities-cum-1ndu~try 1531 7.45
Industry-c 11111-] 'l'imary acti"i t i('S ]3.50 4_53
Indu~tJ'Y -r" m -Services 13·57 6.5\.1
Prin'Sl'Y act iviti8s-"lIm-Iuclustries-c Im,-Com-IllfTf'C 3t.ll 18.00
Prinlar.vactiyitie-';-CU!H-SPl~vic('(l, -c llli1-C(11nlneree 31·95 16.54
Indus tr y -CU 1/1-Primary activit jpR-rl/l)l-C'OTn-
lTIf'l'Ce 3 21.48 7,3\.1
Com)neref'~cunl-Tl'alls,;
port-cum-Industry 38.65 17_03
TABLE H.19
Educational and medicalfacilities per 1,000 population ill tOWI1S by size rlass oj population
:No. of schools pel' 1.000 population No. of X,). of ----~--~-- h0Cls hods High 01' in pOl'
Higher mocli",t] l,nOO Size clas~ of No. of ~ocon- insti- popn-
tOWll'4 towns (lary Primary tutions lation 1 2 3 4 :, 6
I 00,000 0.10 O.4S 3,64.; 2.211 or more.
III 20,000-49,999 6 009 0.2.2 143 o.n
IV 10,000. J 9, 999 7 0.11 0.28 74 o.n
V i),OOO-9,999 6 0.12 0.27 62 1.27
VI Below .1),006
70
Expenditure ( in Rs. ) --__.....--____...--~.---~~------------
On public From all health and On publio On all othe
other sources Total convenieucies inst.itutions aspects 5 Ii 7 i) 9
t).OU 9.U5 2.44 0.26 7.25
36.58 57.48 19.90 12.52 25.06
5.46 5.45 5.45
34.36 3909 19.10 8.17 11·82
7.S!! 11.1)7 1.84 0.83 9.90
8.97 13.48 0.99 12·49
6.98 II3.58 4.34 ].47 7.77
19.11 3683 2.56 656 27.71
15.41 29.19 11.36 150 16.33
14.09 18.31 3 •• 9 2)1 12.71
21.62 20.36 9.54 2,66 8.16
TABLE H.20
Medical facilities in towns by jll!1ctional category
(a) (b)
(e)
( (l)
2 (a) (b)
(e) (d)
3 (a) (b)
Funnt,ionnl Catt'gory 1
J?rimnry !leth- j1 if'~ Primm.'''\' act,jyitirs - CU1I1-
Indnst:J y. Prirn[lJ'Y' nctiyitic:-, - {'111i1-
Indust,]'Y-CUm-C(llllllWl(,t' Pl'imftJ'y"scti\-it,ios-tU?11-Sf'1·yices "C'U1N~Commel'('n
Sub-Total 1
TndllstTY Indu~tl'\'-(,II-m - PI iman' actidtles ..
Industrv -('um -Sc]'\'i CPS
InclI18j,],\- - cum - PJ'imRna(~ t i \. it'] C,S -Cit 'fil - COnlmC]'~' ()
Sub-Total 2
COllllJlf'J c('
OommA rce-CII111-TrRn sport. -cllm-Jndu~t,r\'
Sub-Total 3
No. of beds per
No. of 1,000 beds popll2at ion
2 ,)
10 n.:;:! 42 4-!):}
30 I.58
23 1.25
105 UIO
3,64:; 2.15 10 1.17
Nil 87 1.24
3,742 2.09
4 0.10 73 1.67
77 0.92
Nil
II TABLES
(With off Prints of Part X-C-J from
pages iii-ix and 1 to 188)

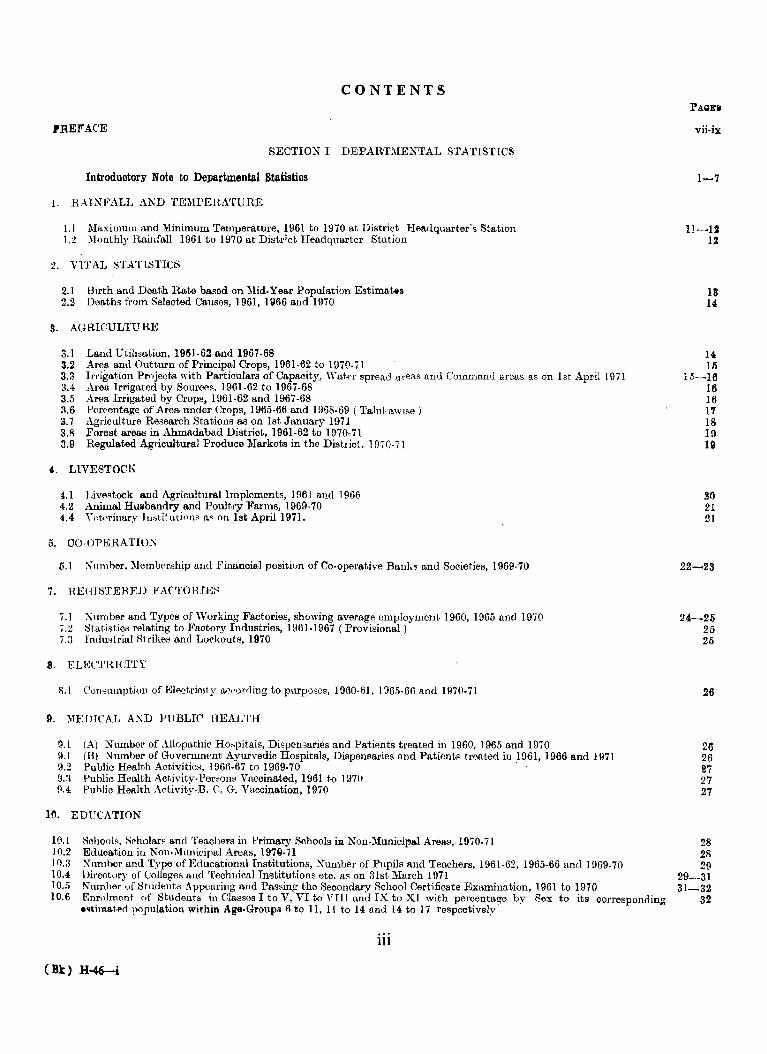
CONTENTS
.PREfACE
SECTIO~ I DEP ART:'IENTAL STATISTICS
Iutroductory Note to Departmental Statistics
1. R~-\l~FALL A~D TE~lPEl{ATURE
1.1 ;\IaXUllurn and Minimum Temperature, 1961 to 1970 at DistrIct Headquarter's Station 1.2 :\Ionthly Itainfall 1961 to 1970 at District Headquarter Station
2. VITAL t;TATISTICS
2.1 Birth and Death Rate based on :'lid-Year Population Estimates !!.2 Deaths from Selected Causes, 1961, 1966 and 1970
3. AGRICULTURE
3.1 Land Utilisation, 1961-62 and 1967-68 3.2 Area and Outturn of Principal Crops, 1961·62 to 1970·il 3.:! Irrigation Projects with Particulars of Capacity, \Yat·"r spread areas and Command areas as on 1st April 1971 3.4 Area Irrigated by Sources, 1961-62 to 1967-68 3.5 Area Irrigated by Crops, 1961-62 and 1967·68 3.6 Perc·entage of Area under Crops, 1965-66 and 1968-69 ( Talnkawise ) 3.7 Agriculture Research Stations as on 1st January 1971 3.fI ,Forest areas in Ahmadabad District, 1961-62 to 1970-71 3.9 Regulated Agricultural Produce Markets in the District, 1970· i 1
4,. LIVESTOCK
i.l Livestock and Agricultural Implements, HI61 and 1966 4.2 Animal HUilb6Ildry and Poultry Farms, 1969-70 4.4 Vdf'rinary Tu,;titutipn" a~ on 1st April 1971.
5. CO-OP.lMtATIOX
5.1 Xumber, :'lembf'rship and Financial position of Co-operative Banks and Societies, 1969-70
7. RE(JlSTERED FACTORIEf'
7.1 Xnrnber and Types of Working Factories, showing average employment 1960,1965 and 1970 7.2 Statisticti relating to Factory Industries, 1961-1967 (Provisional 1 7.3 Industrial Htrike8 and Lockouts, 1970
8. FjLFJCTRICITY
8.1 C()n~llInption of Electricity acnording to purposes, 1960·61, 1965-611 and 1970-71
9. )tEDICAL AXD PUBLIC HEALTH
~.l (Al Number of Allopathic Ho~pitals, Dispensaries and Patients treated in 1960, 1965 and 1970 9.1 (B) Number of Government Ayurvedic Hospitals, Dispensaries Imd Patient8 treated in 1961,1966 and 1971 11.2 Public Health Activities, 1966·67 to 1969-70 . 9.3 Public Health Activity-PersonR Vaccinated, 1961 to 1970 0.4 Plll:>lic Health Activity-B. C. G. Vaccination, 1970
10. EDUCATION
10.1 Schools. Scholars and Teacheps in Primary Schools iR Non-:Municil"al Areas, 1970-il 10.2 Education in Non.;\fnnicipal Areas, 197Q·71 10.3 Xumber and Type of Educational Institutions, Number of Pupils and Teachers, 1961·62, 1965·66 and 1969.70 10.4 Directory of Colleges and Technical Institutions etc. as on 31st March 1971 10.5 Number of St,udents Appearing and Passing the Secondary School Certificate Examination, 1961 to 1970 10.6 Enrolment of Studenh in Classes I to V, VI to VIII and IX to. XI with percentage by Sex to. its corresponding
.~tin'l&tf"rI population within Age.Groups 6 to 11, 11 to 14 and 14 to 17 respectively
iii
( Bt) H-46-i
PAIJEi
vii-ix
11-12 12
18 14
14 16
15-16 16 16 17 18 19 19
lW 21 21
22-23
24-25 25 25
26
26 26 27 27 27
28 28 29
29--31 31-32
32
11. ADMINISTRATION
11.1 11.2 11.3. 11.3 11.4 11.5 11.6
Strength of Police, 1970-71 Proportion of Area, Population and Cognisable Offences per Polio., 1970 (A) General results of trials of Criminal Cases, 1961 to 1970 (B) Number of Cognisable Crimes reportcd, 1961-1970 Jails 1960, 1965 and 1970 Instrumcnts Registered and Value of Property transferred, 1960, 1965 and 1970 Land Revenue realised, 1960-61 to 1969-70
12. PLACES OF PUBLIC ENTERTAIXl\1ENT, PHEl:iSES AXD JOURNALS
12.1 Newspalmrs published in different languages. 19GO-61anrl 1969. 12.2 Printing Presses, 1961 and 1968 lll.3 Cinema l'hcatl'Cls, 1970·71
13. TRANSPORT AN!) CO)ll\lUNICATlON
33 33 34-34 35 35 36
36 36 87
13.1 Railway ::ilileages ami Names of ltailwny ~tatiQns, 1970-71 37 13.2 Road Kilometreage by Type of Surfaoe and Category of Rond, 1960·61, 1965-66 and 1969-70 38 13.3 Tonnage of Imports and Exports Cargo handled at different Ports, 1960-61, 1964·66 and 1969-70 38 13.4 Circuit HUllS8 I In"pection Bungalow I Travellers Bungalows maintained by Public "':orks Department Itnd Local 39
Bodies
14. LOCAL BODIEi:'>
14.1 14.2 14.3 14.4 14.5 14.6 14.7
Number of Local Bodies and Organs of Democratic Decentralisation, 1961.62 to 1970-71 Comp03ition oL\JunicipaI Corporation and ;\Iunicipalities, 1961, 1966 and 1971 Compoe;it,ion of District Pallchayat as on 1st January 1971 Composil ion of Taluka Panchayats as on 1st, January 1971 Composition of Xagar Panchayats as on lst January If)?1 Composition of Gram Pancbayats as on 1st January 1971 (A) Income and Expendi~ure of ~Iunicipalities, 196!)-70 (B) Income unci Expenditure of?lIunicipal Corporations, 1969-70 Income and Expenditure of District Punchayat I Taluka Pauchayats, 1963·54, 1966·6; and 1061:1-70 Income and Expenditure of Gram and Nagar Panchayats, 1969· 70
14.8 14.9
15. WAREHOUSES AND GODOWXS
15.1 Nmnber. Location and Capacity of \Varehouses as on 1st Jantlltry 1971 15.2 Number, Location and Capacity of \Varehouses owned by Co-operative Societie,3 as on 1st January 1971 15.3 Numbel', Loration and Capacit~· of \Yarehous(ls of the Food Corporation of India as OIl 1st ,Tanuary In1
16. PRICES
HI.l AVClrage Hetail Prices of Staple FoodstuffB, 1970 16.2 Consumm'''' Price Index Number for Industrial ",Vorkers at Ahmadabad and Bhavnagar
17. JOINT STOCK CD:\IPA~IES, BANKS AND INSURANCE
(a) JOINT STOCK CD:\1PANIES
17.1 Joint Stock Companies, 1969·70
(b) BANKIK(l
17.2 Scheduhld anct Non-Schoduled Banks, 1960, 1965 and 1970 17.3 "Number and Type of Co· operative BankA, 1960-61,1965-66 and 1980-70
(c) INSFRA:\CI<;
17.4 Life Insurance Policies issued and Sum Insured, 1961 to 1970
18. FAIRS A~D FESTlYALS AND ANCIE~T :JIOKrl\1ENTS
1S.1 Fairs and Festivals 18.2 Ancient'i\lonumenh;
IV
39 4H 40
40-41 41 42 4.2 43 43 44
46 45-46
47
47 47-48
4.11
'"
SECTION II-CJEN8US TABLES BASED ON FULL COUNT
1:DtroductorJ :lote to Cenlua Tables
Note
TaItle A·I
Appendix I
Annexure to Appendix I
Appendix II
AppendIx III
Table A·II
AppF'ndix
Table A..III
Appendix
Table A·l\'
Appendix T
Explanatory Note-A
List A
Appendix II
Special Appendix
Table B.I Part A
Tabl.14.lI
A-GBNERAl. POPULATION TABLJIIS
Area, Housell and Population
Sta.tement showing 1961 Territorial Units constituting t,he pre~ent ~et.up of Ahmadabad Distriot
Statement showing particulars of villages involved in ohanges of territorie~ in Column. 3 and 6 of Appendix I
Number of villages with a population of 5,000 and over and towns with a population under 5,000
Houseless and Institutional Population
Variation in Population during Seventy years
District showing 1961 population according to its territorial jurisdiction in 1961, oha.nges in area and population of 1961 adjusted to jurisdiction of 1971
Villages classified by population
Villages cla.ssified by population-Summary
Towns find Urban Agglull}(1ration., ('ia,,~ified by Population in 19i1 with Variation since 1901
~ew Towns added in 1971 and Towns in 1961, Deolassified in 1971
Each Xew Town added in 1971 Showing the Xamo of villago with its Land Revenuf> Record No., Ar~a and Population a~ in 1961 nOW Constituting Town
List of pll1ce~ With a Populuti(Jll undpr 5,000 treu teu at town;; for th., Fir~t Time ill 1971
Changes in area of towns (with population) between 1961 Ilnd 1971 and reasonij for changes in area
Statement showing the constituent villages of each of the town~ at 1971 Census
B-ECONOMIC TABLES
Worker! tmd Non·work€lrs according to ma.in activity (lla;,~i6.iI<l by ~&x Itnd age-groups
Workers and Non·workeri in citiea and non-oity urban areas aocording to main aotiyity cla."ifiecl ~;y .el( and ai.·group.
v
FAG ••
67-68
69
70
70
71
71
72--73
72-78
74-76
77
77
77
78
78
T9
80-81
82-91
Not.
Ta.ble C·Y
Ta.bl. C·VII
Tabl. C·VIII
PART A
Appendix
PART B
Appendix
Note>
Table E·I
Table E·II PART A
Table E.Il PART B
Table E.Il PART C
TabJe B.Hr
Table E·l\,
Annpl[urA
C-Social and Cultural Tables
~Iot,her Tongue ( Alphabetioal order)
Religion
~cheduled Castes and Soheduled Tribes
Classification by literacy and indu8trial category of workers and non· workers ac()ording to
P-'-GE8 93
94-107
108-109
main activity among Scheduled Castes 11 o-~ 113
Scheduled Castes classified by literates Imrl illiterates 114--·125
Classificatiull by literacy and industrial category of wurkers and nun· workers according to main activit,_\' among Scheduled Tribe" 126--129
Scheduled Tribes cla~"ified by literate" and illiterates 130--- 137
E-Establishment Tables
139-140
DistributIon of Establishments by Broad Types 141
Distribution of '\ianufaciuring, Processing or Servicing Establishments other than Household Ind.ustries clMsified by Registered Factorie~, Unregistered \Vorkershops and Size of Employment 142-145
Distribution of Manufacturing, Processing or Servicing Establishments other than Household Industrie, classified by Industry. Fuel / POIl-rr or 1'JanuIlIll,;erl and ~ize of Employment Ufj~167
Distribution of Household Industry 'l~,;tl1hli"hltlellt ola~sifif)d by Industry, FlIel / Power used and Siz" of Employment 168--175
J)i~triblltioll of Trade / Commer('ial E~t.a bliHhrnents cla8sified by the Type of Bneine,.s or Trade alld i'\iz" "f Employment l i6~179
Distributioll of Establi8hmellts (other than :.'Ilanufactul'ing, I:'roce~sing Of Servicing or BURines8 and Trad, Establishments by) Size nf Employment 180-185
:National Industrial Classification, 1970 ( Divisit)n~ and Major Groups) 186-187
VI
PREFACE
The District Census Handbook Volumes for 1971 Census have been brought out in record time, Part A and B of the District Census Handbook Volumes 1971 have been already brought out within about a year of the Census count. Part A contains the Town and Village Directories and Part B contains the Primary Census Abstract. Part C which is now being Dublished contains the departmental statistics and the full count Census tables. The departmental statistics have been collected from various departments of the State and Central Governments and statutory bodies and Corporations. The Census tables which have been presented in this volume are only the. full count tables.
It was our original intention to include in Part C of the District Census Handbook all full count and sample tables. But since the sample tables which are being mechanically compiled at the national level are not likely to become available for quite some time. due to a variety of reasons. we thought. it would not be proper to withhold the publication of departmental statistics and full count tables which are already compiled. any longer than necessary.
. I. therefore made a special request to the Registrar General. India. to allow me to split up Part C into two-Col and ColI-and publish immediately in Part C-I the departmental statistics and full count tables and defer the publication of Part C-1I which will contain the sample tables and other data as originally contemplated. This request of mine had the active ,>upport of the State Director of the Bureau of Economics and Statistics, since he was withholding during the current year. the publication of the statistical Abstracts of the. Districts which were customarily published every year. In delaying the public-ation of the (data already collected, on the
ground that we were waiting for the sample tables to get ready. we Would be depriving the adnunistralive departments of the State Government of some very valuable material, at a lime when they were formulating the Fifth Five Year Plan for the State.
H-934-1
We, therefore, strongly pleaded the case before the Registrar General during his visit to Gujarat in June 1972 and he very kindly agreed to permit 'us to publish Part C-I in the present form.
District level statistical data on various socioeconomic topics have assumed very great importance at a stage when the State is forging ahead with the formulation of its fifth developmental plan. It would facilitate considerably the task of the farmers of the district and State plans, if they had with them the basic, ,statistical data which would provide a deep in~
sight into the infrastructure that obtains in each District. It would enable them to undertake technoeconomic appraisal of the resources available and the felt needs of the district. Structural chang~s that have taken place during the past decade an~, the inter-regional disparities within the district,'couid be properly gauged with the help of th~ statistica(data that is here provided.
The present volume-Part C-I of the " District Census Handbook. has been divided into two sections. Section I contains the departmental statistics w~lich are grouped under eighteen different heads and comprise of as many as sixty eight tables. The data hM been collected from the departments of the State and Central Governments and statutory Corporations. like Life Insurance Corporation of India, Food Corporation of India, Central Ware Housing Corporation and the Gujarat Electricity Board etc. The State Bureau of Economics and Statistics have. checked the data flowing· from various. sources· and hav:e. not only vouchsafed ,the authenticity and accuracy of· the data presented here, but have. also supplemented it with some very useful data which was in their posses.. sion. The compilation of the departmental statistics has been a joint endeavour of this Directorate and the State Bureau of Economics and Statistics.
Section II olf this volume contains thirty one Census tables based on full count. including appendices. AU the tables and appendices of A series General
Population Tables A-I to A-lV-according to the publication plan of 1971 Census have been included here_ They contain informatian abaut Area, Houses and Populatian, Decadal variation since 1901, villages classified by pap,ulation, towns and urban agglomeration classified by populatioit in 1971 with variation since 1901. Only two tables from B series, which contain the economic tables - B-I Part A and B-nhave been included here. They relate to' workers and non-workers according to main activity classified by sex and age groups and workers and nan-workers in cities and non-city urban areas according to main activity by sex and age gronps.
The C series tables contain social and cultural tables_ Only three tables and three Appendices aut of this series, which are on full caunt have been included here. They contian data an Mother tongue, Religion, Scheduled Castes, Scheduled Tribes etc.
The entire set of sir Establishment Tables have been included here. The ESI:lblishment Schedule was canvassed a year before the taking af the Census. The data was coded and transferred on punch cards, and later taken, On magnetic tapes which were fed to the electronic computer and the tables were generated centrally tiy t~e Data Processing Divisian of Registrar General's office.
ACKNOWLEDGEMENTS
The whole hearted help and co-aperation which I have received in compiling. this Valume from Shri P. B. Buch, Director of the Bureau of Economics and Statistics, deserves a special mention. But for his
infectious enthusiasm, this Volume would not have seeti the light of the day as early as it has done. His thdtough knowl~dge of the stage of statistical prepate~ess . of the various departments of the State Go"Vernitlent, and his intimate knowledge of the extent to ·.vhich any da ta furnished by them could be accepted unquestioningly, and the degree of scrutiny to which certain data shoud be subjeclcd, has been a source of immense help to us. Each table presented here has been carefully scanned by him and wherever the data furnished has been found to be incomplete or inconsistent in any manner, the cancerned department has been asked to re-check and confirm. His colleagues, Shri M. A Malavde, Research Officer, Demography
and Kum. Jyotsna -Shah from the Bureau, who patiently went on checking the data and compiling the tables with admirable sincerity till the end also deserve a special mentian. They stuck to' the time limit ariginally set and hanaured the cammitment made by their Director abaut handing aver of the manuscripts of the tables entrusted to' them, within limits which at the outset appeared to be a sheer impossibility. My sincere and heartfelt thanks are due to them and their illustrious leaded for the patience and perseverance .\'ith' which they have campleted thi&
assignment.
My thanks are as much due to my valued colleague, Shri S. C. Merh, Deputy Director in charge of the District Censu~ Handbaok Unit for the care and devation he has bestowed on the accurate compilation of the tables embodied in this Volume. We had come to a Working arrangement with the Bureau that while the entire responsibility far the compilation of certain tables would be taken by the Unit working ill this Directorate under Shri Merit, the remaining tables would be compiled and checked at the Bureau itself. It gives me great pJeasure to place on record that the work: done in this UIiit under the leadership of Shri Merh WaS both fast and accurate. They had also to supervise and check the entire material, prepared by them and received from the Bureau, before and after it was typed. Shri Merh was ably assisted in this wark by Sarvashri S. M. Sht:lke and D, S. Gosai both Research Assistants from the Bureau who spared no pains to ensure that the data compiled and typed was faultless in every respect. Many thanks are also due to the three Statistical Assistants, Sarvashri J. A. Brahmachari, O. U. Shaikh and U. k. Shah, who have wdrked very sincerely on the compilations entrusted to them. Similar thanks are also due to a number of Assistant Compilers and Typists, who have worked hard to make this publication pOssible.
The Census tables have been prepared in the Central Tabulation Unit, specially carved for the purpose, under Shri V. A. Dhagia, Tabulation Officer, and supervised by Shri K. F. Patel, Deputy Director of Census Operations (HQ). This unit has done its' work with the utmost sincerity and dedication. Shri Dhagia. 3S an officer of proved ability, has not only delivered the goods in time but set an example worthy of emulation by producing solid results without much ado and
vIII
complete harmony with his team, Shri B. I. Patel.
Tabulation Officer, and his team has prepared the 'A' series tables and it must be said to their credit that
they have been found nearly flawless on scrutiny by
Registrar General's office. I have to acknowledge my
very sincere thanks to both the Tabulation Officers.
who are veterans in the field and to Shri K. F. Patel.
Deputy Director of Census Operations (HQ), under whose able guidance they have worked and produced
results which speak for themselves.
In the end, I shall be failing in my duties jf I do not place on record my very sincere and heart felt
thanks to Shri A. Chandra Sekhar, Registrar General.
India and Dr. B. K. Roy Burman, Deputy Registrar
General, India for the very valuable and instructive
suggestions received from them from time to time. I am particularly grateful to them both for allowing me
to publish this Volume in slight deviation from the
publication programme envisaged earlier.
I am deeply indebted to Shri L. R. Dalal, IeS .• Cheif Secretary to the Government of Gujarat, for
AHMEDABAD
5th August, 1972.
having agreed to my proposal to bring out Part C-I of the District Census Handbook Volumes as a separate publication.
I am grateful to Shri J. J. Mistry, Deputy Secre.
tary in the General Administration Department for
always baving shown readiness to appreciate out point of view, and expedited the issue of Government
orders at a speed which can be called uniformly extraordinary. I am ever so grateful to the General Admi
nistration Department for the kind and sympathetic
attitude they have always taken to all matters emanating from the Census Organis'ltiol1.
Shri G. J. Gonsalves, Director of Government Printing and Stationery, Government of Gujarat, took
special interest to see that the agency fixed for print.
ing executed the work without any loss of time. I
am grateful to him and his Deputy Director, Shri T. A. Saifuddin for the valuable help given to us from time to time.
1X
C. C. DOCfOR. Director oj Census O~Q1II"
Griiardl.

SECTION I
Departmental Statistics
H-944 (ii)

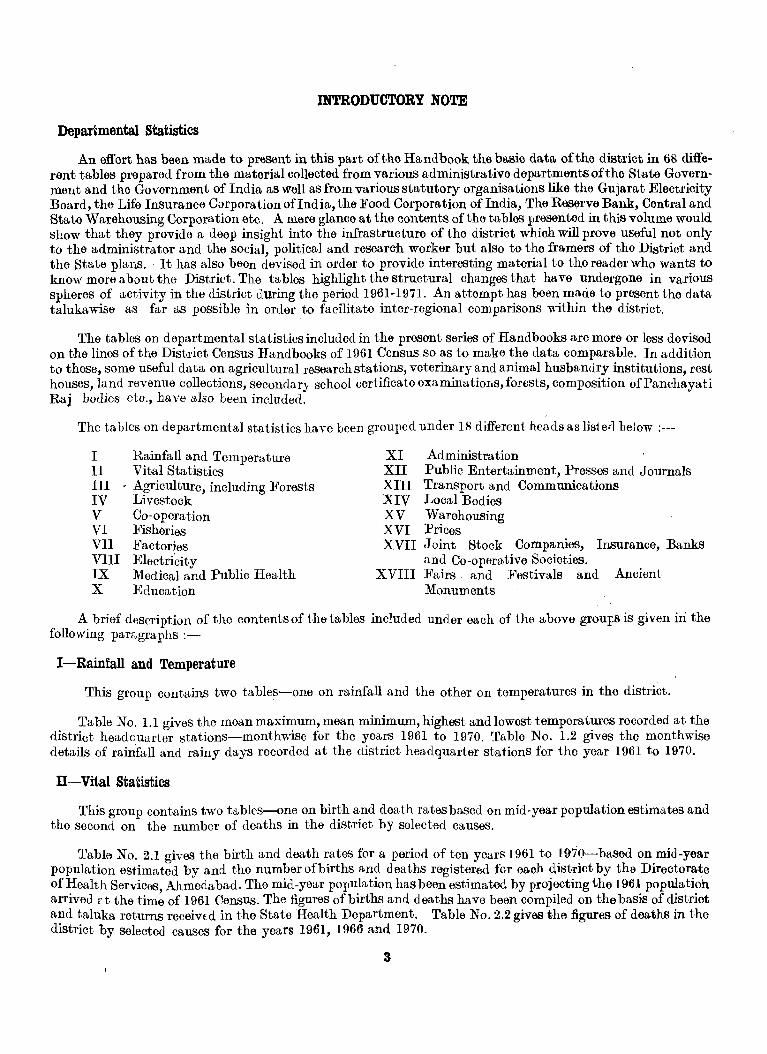
INTRODUCTORY NOTE
Departmental Statistics
An effort has been made to present in this part of the Handbook the basic data of the district in 68 different tables prepared from the material collected from various administrative departments of the State Governmellt and tho Government of India as well as fmm various statutory organisations like the Gujara t Electricity Board, the Life Insurance Corporation ofIndia, the Food Corporation of India, The Raserve Bank, Central and State Warehousing Corporation etc. A mere glance at the contents of the tables presented in this volume would show that they provide a deep insight into the infrastructure of the district whioh will prove useful not only to the administrator and the social, political and research worker but also to the framers of the District and the State plans. It has also been devised in order to provide interesting material to the reader who wants to know more about the District. The tables highlight the structural changes that have undergone in various spheres of activity in the district during the period 1961-1971. An attempt has been made to present the data talukawi5e as far as pOSSible in order to facilitate inter-regional comparisons within the district.
The tables on departmental statistics included in the present series of Handbooks are more or less devised on the lines of the District Census Handbooks of 1961 Census so as to make the data comparable. In addition to these, some useful data on agricultural research sta tions, veterinary and animal husbandry institutions, rest houses, land revenue collections, secondar} school certificate examinatiorls,forests, composition ofPanchayati Raj bodies etc., have also been included.
The tables on departmental statistics have been grouped under 18 different heads as listerl below ;---
I II III IV V VI VII VIII IX X
Rainfall and Temperature Vital Statistics
- Agriculture, including Forests Livestock Co-operation Fisheries Factories Electricity Medical and Public Health Education
XI Administration XII Public Entertainment, Presses and Journals XIII Transport and Communications XIV Local Bodies XV Warehousing XVI Prices XVII Joint Stock Companies, Insurance, Banks
and Co-operative Societies. XVIII Fairs and Festivals and Ancient
Monuments
A brief description of the contents of the tables included under each of the above grouFs is given iIi the following paragraphs :-
I-Rainfall and Temperature
This group contains two tables-one on rainfall and the other on temperatures in the district.
Table No. 1.1 gives the mean maximum, mean minimum, highest and lowest temperatures recorded at the district headquarter stations-monthwise for the years 1961 to 1970. Table No. 1.2 gives the monthwise details of rainfall and rainy days recorded at the district headquarter stationS for the year 1961 to 1970.
II-Vital Statistics
This group contains two tables-one on birth and death rates based on mid-year popUlation estimates and the second on the number of deaths in the district by solected causes.
Table No. 2.1 gives the birth and death rates for a period of ten years 1961 to 1970-based on mid-year population estimated by and the number of births and deaths registered for eaoh distriot by the Directorate of Health Servicos, Ahmedabad. The mid-year population has been estimated by projecting the 1961 population arrived rt the time of 1961 Census. The figures of births ancl deaths have been compiled on the basis of district and taluka returns receiVEd in the State Health Department. Table No. 2.2 giV-e8 the figures of deaths in the district by selected causes for the years 1961, 1966 and 1970.
3

W-Agriculture
This group conta.ms nine tables whioh give important data pertaining to the agricultural sector of the district's economy.
Table No. 3.1 gives the details of utilisation of land in tIle district for the years 1961-62 and 1967-68. It shows the figures for cultivated and un-oultivated land, barren, fallow and oultivable waste land eto. Table No.3.2 gives the figures of area and outturn of principal crops for the years 1961-62 to 1970-71, highlighting the cropping pattern of the district. Table No.3.3 gives details of the irrigation projects in the district with partioulars of capaoity, water spread and command areas as on 1st April 1971. Table No.3.4 gives details of irrigated areas by sources of irrigation for the years 1961-62 to 1967 -68. Table No.3.5 give the details of area underirrigated crops for years 1961-62and1967-68. TableNo.3.6is an interesting table whiohgives talukawise percentages of areas under different crops for the years 1965-66 and 1968-69 showing the relative importance of the crops viz-a-vis the total area under such crops in the district as well as the total cropped area of the talukas. These percentages have been calcUlated on the basis of provisional talukawise figures maintained by the State Department of Agriculture. Table No. 3.7 gives the details of the location of agricultural researoh stations in the district as in 1969-70 with a brief description of the nature of activities carried out at each centre. Table No. 3.8 gives the area under different types of forests in the district for the years 1961-62 to 1969-70. The forests have been divided into four broad categories, namely, Reserved, Protected, Unolassified and Private-the first three of which are under the control of the State Forest Department. These figures are made available for the first time by the Chief Conservator of Forests. Table No. 3.9 gives the market places where a major portion of the agricultural produce of the district is being marketed. '1'he table contains the names of Prod uce Markets regulated under the Agricultural Produce Markets Act of 1939 giving details of main yards, sub-yards, year of establisbment and the agricultural commodities bought and sold in those markets. The information embodied in this table pertains to the year 1970-71.
IV -Livestock
This group contains four tables which give the details of livestock wealth, animal husbandry promotion and poultr~ farms located in the district. Table. No.4. 1 giv~s ~he .results of livestock ~ensuses conducted in the distrIct by the State's Bureau of EconomICS and StatIstICS Il1 the years 1961 and 1966. TableNo. 4.2 gives the details of the location of animal husbandry and poultry farms in the district as in 1969-70. Itgives further details about the agency of management, year of establishment and a brief description of the activities being carried out in thoSe farms. Table No. 4.3 which is very similar to the preceding table, gives details of various animal husbandry and poultry rearing activities in the distriot as in 1970-71. Table NoAA gives a list of varioUS types of veterinary institutions a vaila ble in the district viz., veterinary hospitals, veterinary dispensaries and Sub-dispensaries, first aid veterinary centres, cross-breeding centres, artificial insemination centres and sub-cantres, mobila veterinary dispensaries etc.
V-Co·operation
This group includes only one table, namely, No.5.1 which shows the numher~ membarship and financial position of co-operative societies in the district for 1969-70. The table shows the number of differenttypesof co-operative societies, both credit and non-credit, with details of membership, working capital, loans, share capital, reserve and other funds and deposits. .
Vl-Fishing This group includes only one table, namely, No. 6.1 which gives the details of fishing centres, landing
places and number of fishing boats according to si7.e in the district as on 31st March 1971. The table also gives tbe information about the number of fishermen's co-operative societies and their memhorship in these societies.
VII-Registered Factories This group includes three tables on factory and industrial establishments and strikes and lockouts at
those establishments ,in the district.
Table No.7.1 gives the number and types of working factories showing average emploYlnent therein for the years 1960,1965 and 1970. The working factories have heen shown under Yariol1s inQustrial classe11 according
to the Standard Industrial Clr,ssificdion adopted by the State Factories Department. Table No. 7.2 gives the statistics relating tc factory industries in the district for the years 1961 to 1967. This table is based on the results of annual survey of industries being conducted by the State Bureau of Economics and Statistics in collaboration with the Central Statistical Organisation, New Delhi. The table lueS been divided into two parts of which the first part gives the actual figures of persons employed, productive capital, ex-factory value of output and net value adCled h,v manufacture for a,H industries covered under the annual survey in the State. The secoJJ.d part sho·ws the uistriet's relative share in those very items in terms of porcentp,ges of the State totals. Table No. 7.3 shows the details of industrial strikes and lockouts which to(}k place in the district dnring ] 970. The t:,tble gives netr"ils of the industry codes of the units affected by such strikes and lockouts, llumber of such events, units afi"e('ted and the number of mandays lost.
VIn-Electricity
This group includes only one table ]'i::., :::\0. 8.1 ,rLic:h gives the data on the consumlJtion of electricity according to purposes in the district for thl! years 1900-61, 1965-66 and 1970-71. The data peltains to powel houses rUI, by tho Stato Electricity Board p,S ,Yell itS those run b;y private licencees. The c::>nsumption has been classifioct into four broad classos viz., domestic, commercial light and small power, industrial and other purposes.
IX-Medical and Public Health
This group contains fivu tables giving data OIl medical and public health facilitios a yailable in the district.
Table No. 9.1 (A) gives the number_of allopathic hospitals and dispensaries in the district with details ,of beets available and the outdoor and indoor patitmts troat()d for the years 1960,1965 and 1970whilo table No. 9.1 (B) gives similar dr,ta for Ayuryedic metiical institutions for the year 1961, 1966 and 1971. Table No. 9.2 gives details of pl,blic health activities in the district for the years 1966-67 to 1969-70. This table gives the number of primary he"lth centres, rural dispensaries, maternal and child health centres and family planning centres existing in the nistrict in those years alongwith the number of persons tnated therein. Tn,ble. No. 9.3 gives the data on mwther important activity of the State Health Department, viz., small-pox vaccination in the district for a period of ten years from 1961 to 1970. The table gives year wise figures of primary vaccinations and revaccinations carried out by the State Health Department in those years. Table No. 9.4 gives oetails ofB. C. G. vacc.ination programme in'the aistrict. It s11o"s the nllmber of persoT,s vaccinated in the talukas in which this programme ,yas launched in 1970. .
X......JEducation
This group includes six tables giving vahw hIe information on primary, secondary, collegiate and technical alucation in the district.
TabJe No. 10.1 gives the data all schools, schol;1,r8 alld tei.tchers ill non-municipal ~m.",s of the district for tbe veal' 1970-71. The data in this table have heen presented talukawise and contains, besides the number of scho~ls, students and teacl1 0ls, illbrmation on villages with or without schools. Tablt No. 10.2 gives tb8 statistical data about education ir.. non-municipal artas of the disLl'ict fOl' the year 1970-71 Hnd in<..ludes talukawise dati" 011 average attendance of pupils per school and the number of students ]Jel' thousand of popUlation per primary school and per teacher in primary school. Table No. 10.3 gives an overall pictul'6 of education in the aistrict al~d giv-es deta,ils of institutions, pupils aud teachers in four broad categories namely, primary, seconclary, higher Hud others for the yeii.rs l!)(i L-U2, 1965-66 and. 1969-70. The figures for pupils and teachers haV"e been given sexwise. Table No. lOA gives an inventory of colleges aUd technical 'institutiol,s existing ill the clistrict as on 31st March 1971. Th€ table Ko. 10.5 gives the centrewise data on candidates appearing and passing at the Secondary School Certificate Examination ·for the years 1961 t,O 1970. Figures in this table are shown separately for the ~h~lCh and Octoher exa.minations. Table No. 10:6 shows the figures of enrolment of students in Classes I to V, VI to VIII and I;X to XI with percentages bv Sex to its l'vrrespondiIlg estimated popUlation within age groups 6 to .} 0, 11 to 14 and 14 to 17 respectively for the years 1'960-6], 1965-66 and 1969-70 .
. XI ---'A\tmi:DiStration This group includes seven tables giving ~'ital data Oll. administration .ill the district.
. Table No: 1].1 shows the strength of the p~lice force in the district for the year H}70-71 b)- vari61lScilt~gQ~ ries of personnel r,nd aJsd by permlment and t-emporary·sta.tus. It may oo·wte'd that (,-eutralp6'.lice 6stft'~i8bmeBts
~"M}Y~s Railway Police, Special Reserve Police, Pclice Tr,jning Schools ",uu Inspector General of Police's 1.lM1JI~1~hmer.ts have boon excluded from the ferviow of this h ble. Table No. 11.2 gives tIlt) districtwisa ~ffl:1fiol'tn the proportion of area, population a,rld cognisable offences per police for tlle .}ear 1970. Table ~~hr lJ.3 (A) gives the results of the trials of e;riminal caSeS for the YOdI'S 1961 to 1970. The table shows tlmiqy>jIlber of offelJces reported and tho manner in which the cases were disposed off. Table Nc. 11.3 (B) g~}\mriRe number of cognisable offences raportej in the district for tIle yems 1961 to 1970. The offences hava P~mllf~ssified in eight broad categories according tu the llc..ture uf 01fences. Tabb ~(). 11.4 gives the cata ~l_\Jr,~iof tpe district for the Ydars 1960, 1965 and 1970. '_L'lle tahle shows tl'e number of rrisons and their 'J1ffi~oljj;ed accommodation along with the category of Fiso113l"s inclu,[ing tiles received and discharged during the relevant years. Table No.ll.5 gives we data un instruments reglsterecl anu the value of property transferred during the years 1960, 1965 and 1970. The table coverS both mo\'able ~nd immovable properties a,nd also compulsory and optional registrations. Table No. 11.6 gives the figures of collection of land l~,eG~~u~utn the district for the years 1960-61 to 1969-70.
''XlI:..L.!PJ.aces of Public Entertainment, Presses and Journals c;;il n()1~qJ. . . .. . . ... . IUd ;/ThHl._group consIsts of three tables glVlllg statIstIcs of newspn,pel's Mlll J0Hrll.Ci.lS publIshod 111 the dIstrICt, printing presses and cinemh theatres.
Table Xo.12.1 givtJs the figmes ofllewsprvpers published. ill oiffel'(m'~ bnguages in the district for the years 196061 and 1969. The journals ha,Ye qevn classified into cbily, weekly, fortnightly, monthly, quarterly a1WI.' {)tue'til c.nd have been o.ifferently shown for English, Gujarati, Hindi ~md. other languages. Table No. 12.2 givei'! the t.alukawise data on the number of printing presses which existed ill the (liSlrict in tho years 1961 it'ilcllrHJ68'.f1 Table No. 12.3 gives the talukawise lucation [md number of cinema theatres as III 1970-71 'Vitiho~its of monthly averages of spectators. The touring ttblkies have also been included in this table. ~.\.; .()/ ... ~)lt,\.
'X!I!n-..:LIJ'ia1ispor~ and Communica'~ions '" Ii limtJa '[~l. . 1 ... 1 . I -;JI: i~-rl1~~lgr~up lllcludes four tables on tmnsport P,llC cOllunumcabon fg,ci itws r.ve.ilable m t l(l district.
:lU~.:;t~'61fv~o.1.3.1 gives details of railway mileages a:nd t~e railway sta tions ~n the ~istrictfor the .near 1970.-71. T«era~rJ:" mIleages have bean shown separately for different gauges of raIlway lllle and the raIlway statIOns ii~v~.\:61:,e~ shown talukawise. Table Nv. 13.2 shows tha road kilometreage by type of surface and category onoalf1ii 1tl'le district for the years 1960-61,1964-65 and 1969-70. The data have been presented for National Highways, State Highways, Major District Roads, Other District Roads and Village Roaus and the surface has been claSSified by asphalt, cement concroto, water bound macadum and murram and other lower types. Table No. 13.3 gives Ghe tonnage of impJrt a,nd export cargo handled. at each port of the district for the years Hl60,6i}H96~h65 and 1969-70. Separate figures nave been given for foreign and coastal traffic and also for sailing and steamer vessels. Table No. 13.4 gives the list of Atithi grahas (circuit houses), Vishram graha8 (inspe«;lti.oll b;ungalows), Aram grahas (rest houses) and Dharamshalas in the district maintained by the sj~~~~t.:Jt. 'P..,. Panchaya.t~ and Municipalities for th~ use of travelling officers and the public. The details Jr\t~e_map:l~l!>lr'Illg authormes have also been shown III the table. ! .. UJ r.Ollg _.\ ~
~~~~~! ~9dies ~);'J ) 'K~ifflJM9}l.P includes statistical information po~tainillg to the iustitutiohs of local self government namely ~~\l~~§Mt~,e$, : Municipal Corporations and DistrIct, Taluka, Nagar and Gram Panchayats .
."
; ',ij l ',.:-r1 en~ .. :i. I ;·;ii:ta,YJe~q.)~j:.1 gives the humber of 10cal bodies and org~~s of democra~ic decol1~r~lis~t~on in. th~ district ~~~ t.~~)~~r.~".l~. 6.1-62 to 1970-71. The tabla covers MUlllClpal Corpor.:-tIOI1, .MumCIpahtIes, D1Str~c~ Local· ~9ar~Iaoo .;I;>Is~rlCt, Taluka, Nagar and Gram Panchayats. Table 1'\0. 14.2 shows the compOSItIOn of WJl~i?~~r')<porporations and Municipalitie~ in the ~istrict for the years 1961, 196ti and 1971. Besides t,he~ata W. ~~.W&J.Auwber of seats, the table gIves detaIls 0: reservel seats for scheduled ~astes, scheduled trIbes a,ijli.sli~9dfl~li\lapp (~l.so ?f those categories retmned agamst ~nreserveu secAs. Tabl~ No. 14.3 shows the co~poSItIon of the DIstrIct Panchayat as on 1st January 19J1. It covers all assocIate, elected and ex:-officlo members of the District Panchayat. Similarly table Nv. 14.4 showS the composition of the Taluka Panchayats of the district 80S on 1st January 1971 and tables No. 14.5 and 14.6 show the composition of the Nagar and Gram Panchayats respectively. Table No. 14.7 shows the details of income and exp8nditure oft.he municipalities of the district for the year 1970-71 while the subse9uent table No.1 :l.8 gives the details of the income ~~~Jt~~j.~1,lr~r~f Taluka and District Panchayats for the years 1963-64, 1966"67 and 1969-.'10; Table ~~)rMta:JsiH~~ljIplar data for the Gram and Nagar PanQhayats for the year 1969-70. "
XV-Wareshouses and Godowns
This group contains three tables ,yhich show cletails of the facilities for stora,ge (o1'.(l ,yarehousing in the district.
T(1,blo .xc. 15.1 gives the details ofthe 10c(1,tion <l.lJd c<tpacity of warhouses of the distri(;t o'Yned by the ;-;~a,t(l Civil Supplies Department, Central 'Warehousing Corpore,tion and the Guja.rn,t St"te ·Wa.l'ehousing Corpora.tion as on 1st January 1971. Table No. 15.2 gives debils of godmn1s ownerl by co-opera.tiye societies of the district and their capacities as on 1st January 1971. The llameS of the soeioi:ies and the talukas of their location have also boen shown. Table No. 15.3 gives tho location ,loUll capacity of warehouses of the :Food C;orporation of India in the district.
XVI-Prices
1'11:s group includes hyo tables, one on (1,\-orage retail prices of staple food-stuffs and the other on the C,.IlISUmer price index.
Table ~o. 16.1 shows the average rotail prices of staple food-stuffs m011tlnriso recorded at the district he~lo(t quarter town in 1970. The commorlities included in this t11, hIe are cel'ca.ls namely rice (1ll1:}~liUlll), ",heRot, jowar and bajri and pulses namely arhar dal (tur), moong and u lid. Table Xo. 16.2 gives the COnSUl1.ler price index numbers for industrial workers at the Ahmedabad and Bhavnagar contre'3 for the yea,rs H)61 to 1970. Besides general indices, the group indices have also been shown. Figures for the years 1961 to 19()9 ha.ve been shown for full years while those for 1970 have been shown lllonthwiso.
XVII-Joint Stock Companies. Banks and Insurance
This group contains four tables which give vital el.ata. on various financial institutions of the district.
Table No.17.1 gives the details of the Joint Stock C;ompanies registerel in the district for the year 1969-70 The companies have been classified into 10 industrial classes and their Humber, authorised capital and subscribed capital have been shown in the table. Table No. 17.2 gives the number of schedulec1 and nonscheduled banks in the district for the years 1960, 1965 and 1970. Table ~o. 17.3 gives the number and type of co-operative banks in the district for the years 1960-61, 1965-66 and 1969-70. The tnble coversall types of co-operative banks including Land. Development Banks, Industrial Bnnks and Urban ('o-operative banks. Table No. 17.4 shows the dat:1 pertaining to Life Insurance policies issu6d and sums insured in the district for the years 1961 to 1970. The tahle also gives the number of 2outhorise~1 a.gents during the relevant years.
XVUI-Fairs and Festivals and Ancient Monuments
This group contains two tables, one on fairs a.ud festiv,l.ls and. the other on am;ient monuments.
Table No. 18.1 gives the detailed t20luka.wise inforation il.bout the fairs and fes:ivals of the district, their occasion dates, ostimated congrega.tion and transport facilities a.vailable for going to such fairs and festivals. Table No. 18.2 gives a list of anciont monuments protected both by the State Government as well as the Union Government and a brief doscription of each of them and the period during which they were raised.
Uniform table numbers have been adopted in the handbooks for ",)1 the districts. Wherever a particular table is not applicable to or could not be compiled for want of informatioll in a.ny particular district, it has been omitted. It would therefore appeEior in such uases that the sequer}ce has been broken.
To facilitate further reference, the source of information for compiling the tal;le as wdl as explanatory notes about the units they refer to and other r31evant particulars have been given at the foot of the table. The following abbreviations IJave been used in the tables.
(1)
(2) -Not Available
- ~IL
7

(Bk) H-46-3
DEPARTMENTAL STATISTICS


TABLE 1.1
MAXIMUM AND MINIMUM TEMPERATURE, 1961 To 1970 AT DISTRICT HEADQUARTERS STATION
( In Centigrade) ( In Centigrade)
Mean Mean Mean Mean 81. Month/ Max!- High- Mini- Low- 81. Monthj Maxi- High- Mini- Low-
No. year mum est mum est No. year mum est mum est
2 3 4 5 6 2 3 4 5 6
1961 1965
January 28.9 33.8 1l.8 07.4 1 January 30.0 34.5 14.7 10.5 2 February 29.4 35.1 12.2 04.4 2 February 31.7 35.7 13.6 10.5 3 March 37.5 40.7 18.9 14.3 3 March 35.4 39.4 17.7 11.5 4 April 39.4 44.5 22.7 18.4 4 April 38.7 42.3 23.0 17.0 5 May 41.6 44.8 26.6 23.4 5 May 41.4 43.6 25.2 21.0 6 June 37.9 41.5 26.3 21.0 6 June 39.8 42.1 27.3 23.9
7 July 32.1 38.0 25.5 24.3 7 July 34.1 40.4 25.4 23.3 8 August 32.2 34.7 25.2 23.4 8 August 33.2 38.3 24.6 23.2 9 September 31.2 33.1 24.4 22.3 9 September 34.3 38.6 24.0 22.2
10 October 34.3 36.3 19.8 14.0 10 October 37.1 39.6 21.4 19.4 11 November 32.4 34.0 16.9 13.8 11 November 34.5 37.2 17.3 13.5 12 December 28.4 30.9 11.9 08.2 12 December 30.6 33.0 13.4 09.1
1962 1966
1 January 27.8 31.0 09.5 04.4 1 January 30.0 33.5 13.7 09.6 2 February 31.8 35.0 14.6 11.0 2 February 33.9 38.2 15.8 12.6 3 March 35.3 38.7 18.2 12.6 3 March 35.2 39.6 17.5 10.3 4 April 39.8 43.0 23.2 19.4 4 April ·39.2 42.0 22.5 20.3 5 May 42.5 46.4 27.0 23.8 5 May 42.2 44.9 25.8 23.3 6 June 38.7 42.1 26.8 23.6 6 June 38.7 44.6 27.0 25.2
7 July 33.3 40.5 25.7 23.2 7 July 31.7 41.0 26.2 24.2 8 August 32.5 35.7 24.9 23.4 8 August 33.2 36.0 25.3 24.4 9 September 33.0 36.0 24.0 19.4 9 September 34.3 39.0 24.0 20.5
10 October 34.5 35.7 17.6 14.9 10 October 36.3 39.8 21.0 17.5 11 November 33.1 35.0 16.2 11.4 11 November 34.1 37.4 17.9 12.7 12 December 30.2 32.1 13.4 09.6 12 December 30.3 33.3 12.1 07.8
1963 1967
1 January 29.5 32.0 12.3 07.4 January 28.0 33.0 09.4 06.0 2 February 33.6 35.8 14.7 11.3 2 February 33.8 36.2 14.5 10.0 :t March 36.1 39.6 18.6 15.0 3 March 34.7 39.0 19.1 14.3 4 April 38.7 41.7 23.3 20.4 4 April 39.0 43.0 22.9 17.4 5 May 41.2 45.0 25.9 20.2 5 May 42.5 45.0 26.1 23.4 6 June 39.3 40.8 27.1 22.0 6 June 37.4. 42.0 26.6 23.0
7 July 34.1 38.0 25.8 23.5 7 July 32.7 36.6 25.5 23.5 8 August 31.6 35.0 24.8 ~3.0 8 August 31.4 33.2 24.9 23.7 9 September 32.1 37.0 23.2 20.0 9 September 33.1 38.6 24.1 22.0
10 October 35.6 38.6 21.1 18.3 10 October 36.6 39.5 20.9 16.2 11 November 32.7 36.5 18.5 15.8 II November 34.4 36.4 16.6 14.7 1 ~ December 29.5 34.0 15.1 09.0 12 December 29.1 32.6 16.3 12.4
1964 1968
1 January 26.7 31.7 09.9 04.7 I JlI.nuary 27.3 31.6 11.7 7.8 2 February 31.5 36.7 13.6 07.7 2 February 29.1 34.0 13.2 5.4 3 March 37.5 40.0 19.7 14.3 3 March 35.5 39.0 18.7 13.5 4 April 40.7 44.0 23.7 20.7 4 April 39.5 42.3 23.1 17.8 5 May 41.6 44.5 26.3 23.4 5 May 41.2 43.8 24.9 20.3 6 June 38.2 42.3 26.8 2 •. 5 6 June 40.7 43.6 27.3 25.6
i July 32.7 35.8 25.5 24.U i July 35.5 41.U 26.4 24.6 8 August 31.6 35.3 24.9 23.4 8 August 31.6 34.4 24.6 23.5 9 September 33.6 37.0 24.2 21.8 9 September 35.7 40.0 25.1 23.4
10 October 36.2 38.0 19.7 13.5 10 October 37.2 39.6 21.8 16.1 11 November 33.2 37.6 14.2 10.0 11 November 34.7 37.6 16.7 13.7 12 December 30.3 .35.0 11.7 05.4 12 December 29.9 33.9 13.1 4.4
11
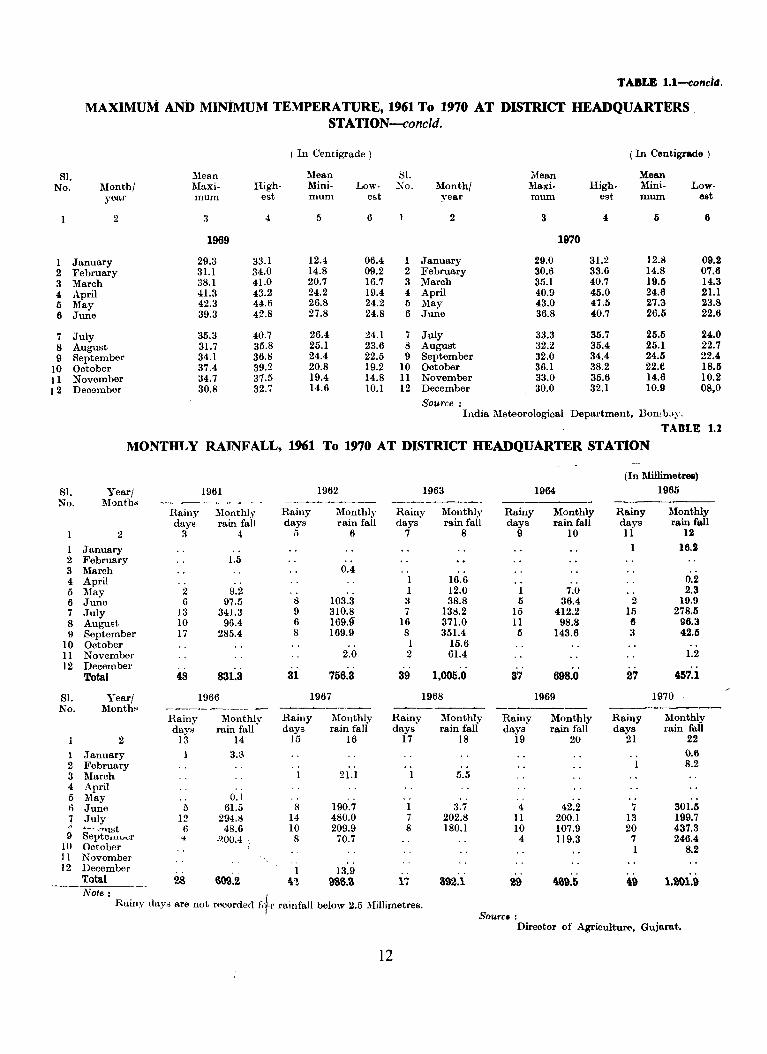
TABLE 1.1-concla.
MAXIMUM ANi> MINIMUM TEMPERATURE, 1961 To 1970 AT DISTRICT HEADQUARTil:RS. STATION-conc1d.
( In Centigrade) (In Centigrade)
81. Mean :31ean 1:;1. :,{ean Mean No. Month/ Maxi· High. Mini. Low. No. Month/ Maxi· High. :Mini. Low·
year mum est. mum est year mum est mum est
2 3 4 5 6 2 3 4 5 6
1969 1970
1 January 29.3 33.1 12.4 06.4 1 January 29.0 31.2 12.S 09.2 2 February 3Ll 34.0 14.S 09.2 2 February 30.6 33.6 14.S 07.6 3 March 38.1 41.0 20.7 16.7 3 March 35.1 40.7 19.5 14.3 4 April 41.3 43.2 24.2 19.4 4 April 40.9 45.0 24.6 21.1 5 May 42.3 44.6 26.S 24.2 l) May 43.0 47.5 27.3 23.8 6 June 39.3 42.8 27.8 24.8 6 June 36.8 40.7 26.5 22.6
7 July 35.3 40.7 26.4 24.1 7 July 33.3 35.7 25.5 24.0 8 August 31.7 35.8 25.1 23.6 8 August 32.2 35.4 25.1 22.7 9 September 34.1 36.8 24.4 22.5 9 September 32.0 34.4 24.5 22.4
10 October 37.4 39.2 20.8 19.2 10 October 36.1 3S.2 22.11 18.5 11 November 34.7 37.5 19.4 14.8 11 November 33.0 35.6 14.6 10.2 12 December 30.8 32.7 14.6 10.1 12 December 30.0 32.1 10.9 OS,O
Source; India :i\Ieteorological Department, Bomb:>y.
TABLE 1.1
MONTHLY RAINFALL, 1961 To 1970 AT DISTRICT HEADQUARTER STATION
(In Millimetrea)
SI. Year/ 1961 1962 1963 1964 1965 No. Mont.b$ ------~---- ------..----- _------- ----_.---
Rainy Monthly Rainy Monthly Rainy Monthly Rainy Monthly Rainy Monthly days rain fall days rain fall days rain fail days rain fall days rain fall
2 3 4 5 6 7 8 9 10 11 12
1 January 1 16.2 2 February 1.5 3 March 0.4 4 April 1 16.6 0.2 5 May 2 9.2 1 12.0 1 7.0 2.3 6 June 6 97.5 S 103.3 3 3S.S 5 36.4 2 19.9 7 July 13 341.3 9 310.S 7 13S.2 15 412.2 15 278.5 8 August 10 96.4 6 169.!f 16 371.0 11 98.13 6 96.3 9 September 17 285.4 8 169.9 8 351.4 5 143.6 3 42.11
10 October 1 15.6 11 November 2.0 2 61.4 1.2 12 December
Total 48 831.3 31 756.3 39 1,005.0 37 698.0 27 457.1
Sl. Year/ 1966 1967 1968 1969 1970 No. Months --------_- -------- ._----
Rainy Monthly Rainy Monthly Rainy Monthly Rainy Monthly Rainy Monthly days rain fall days rain fall days rain fall days rain fall days rain fall
2 13 14 15 16 17 18 19 20 21 22
1 January 3.l~ 0.6 2 February 8.2 3 March 21.1 5.5 4 April 5 May 0.1 I) June 5 61.5 8 190.7 I 3 ~ 4 42.2 7 301.5 .1
7 July 12 294.8 14 480.0 7 202.8 11 200.1 13 199.7 " .I..-~ '~llst 6 48.6 10 209.9 8 180.1 10 107.9 20 437.3 9 Septew"vr .. ·'.100.4 , 8 70.7 4 119.3 7 246.4
10 October 1 8.2 11 Kovember 12 December 13.9 ..
Total 28 609.2 ,~ 986.3 17 392.1 29 ~&9.5 49 1,201.9 Note:
Rainy days are not recorded fCJ. .. rainfall below 2.5 lHillimetres. Soure. :
Direct.or of Agriculture, Gujarat.
12
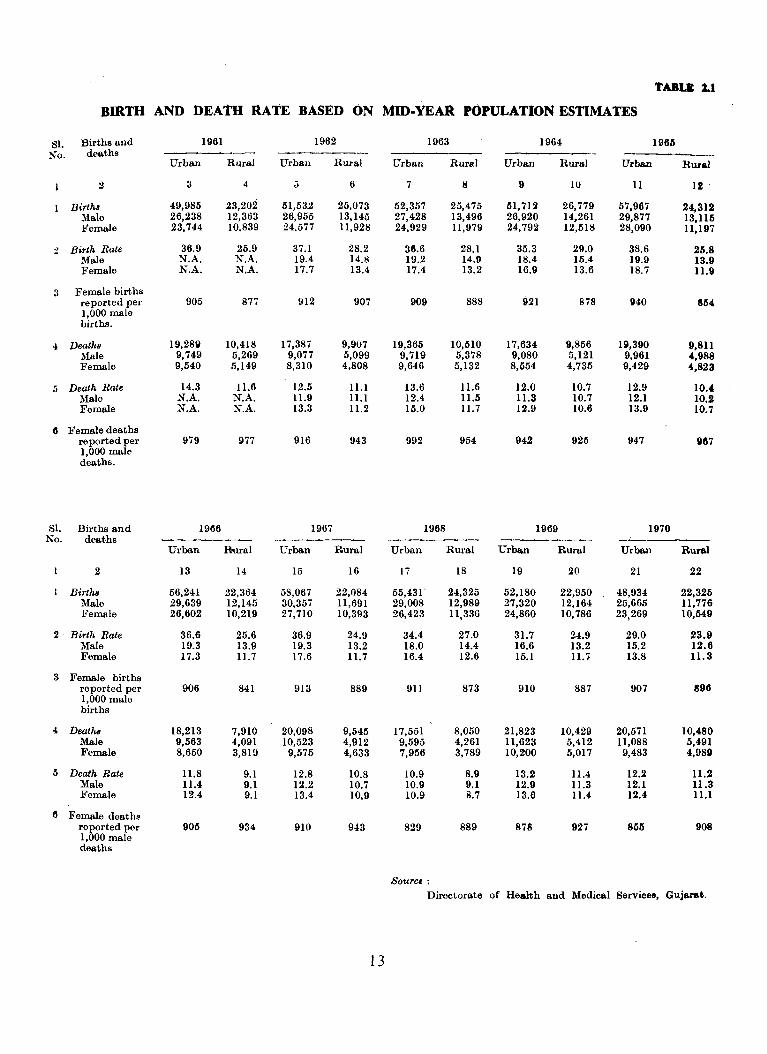
TABU 2.1
BIRTH AND nEATH RATE BASED ON MID-YEAR POPULATION ESTIMATES
S1. Births and 1961 1962 1963 1964 1966 No. deaths
Urban Rural Urban Rural Urban Rural Urban Rural Urban Rural
2 3 4 5 6 7 II 9 10 11 12
Birth8 49,985 23,202 51,532 25,073 52,357 25,475 111,712 26,779 57,967 24,312 )lale 26,238 12,363 26,955 13,145 27,428 13,496 26,920 14,261 29,877 13,115 Female 23,744 10,839 24,577 11,928 24,929 1l,979 24,792 12,518 28,090 11,197
:l Birth Rate 36.9 25.9 37.1 28.2 38.6 28.1 35.3 29.0 38.6 25.8 Male N.A. N.A. 19.4 14.8 19.2 14.9 18.4 15.4 19.9 13.9 Female N.A. N.A. 17.7 13.4 17.4 13.2 16.9 13.6 18.7 11.9
3 Female births reported per 905 877 912 907 909 888 921 878 940 854 1,000 male births.
4 Deaths 19,289 10,418 17,387 9,907 19,365 10,510 17,634 9,856 19,390 9,811 Male 9,749 5,269 9,077 5,099 9,719 5,378 9,080 5,121 9,961 4,988 Female 9,540 5,149 8,310 4,808 9,646 5,132 8,554 4,735 9,429 .,823
5 Death Rate 14.3 11.6 12.5 ILl 13.6 11.6 12.0 10.7 12.9 10.4 Male N.A. N.A. 11.9 ILl 12.4 11.5 11.3 10.7 12.1 10.2 Female N.A. X.A. 13.3 11.2 15.0 11.7 12.9 10.6 13.9 10.7
6 Female deaths reported per 979 977 916 943 992 954 942 925 947 967 1,000 male deaths.
81. Births and 19116 1967 1968 1969 1970 No. deaths -------
Urban Rural Urban Rural Urban Rural Urban Rural Urban Rural
2 13 14 15 16 17 18 19 20 21 22
1 Birth8 56,241 22,364 58,067 22,084 55,431 24,325 52,180 22,950 48,934 22,325 Male 29,639 12,145 30,357 11,691 29,008 12,989 27,320 12,164 25,665 11,776 Female 26,602 10,219 27,710 10,393 26,423 11,336 24,860 10,786 23,269 10,549
2 Birth Rate 36.6 25.6 36.9 24.9 34.4 27.0 31.7 24.9 29.0 23.9 Male 19.3 13.9 19.3 13.2 18.0 14.4 16.6 13.2 15.2 12.6 Female 17.3 11.7 17.6 11.7 16.4 12.6 15.1 11.1 13.8 11.3
3 Female births reported per 906 841 913 889 911 873 910 887 907 896 1,000 male births
4 Death8 18,213 7,910 20,098 9,545 17,551 8,050 21,823 10,429 20,571 10,480 Male 9,563 4,091 10,523 4,912 9,595 4,261 11,623 5,412 11,088 5,491 Female 8,650 3,819 9,575 4,633 7,956 3,789 10,200 5,017 9,483 4,9811
/) Death Rate 11.8 9.1 12.8 10.8 10.9 8.9 13.2 11.4 12.2 11.2 Male 11.4 9.1 12.2 10.7 10.9 9.1 12.9 11.3 12.1 11.3 Female 12.4 9.1 13.4 10.9 10.9 8.7 13.6 11.4 12.4 ILl
6 Female death!' reported per 905 934 910 943 829 889 878 927 855 908 1,000 male deaths
Source: Directorate of Health and Medical Services, Gujarat.
13
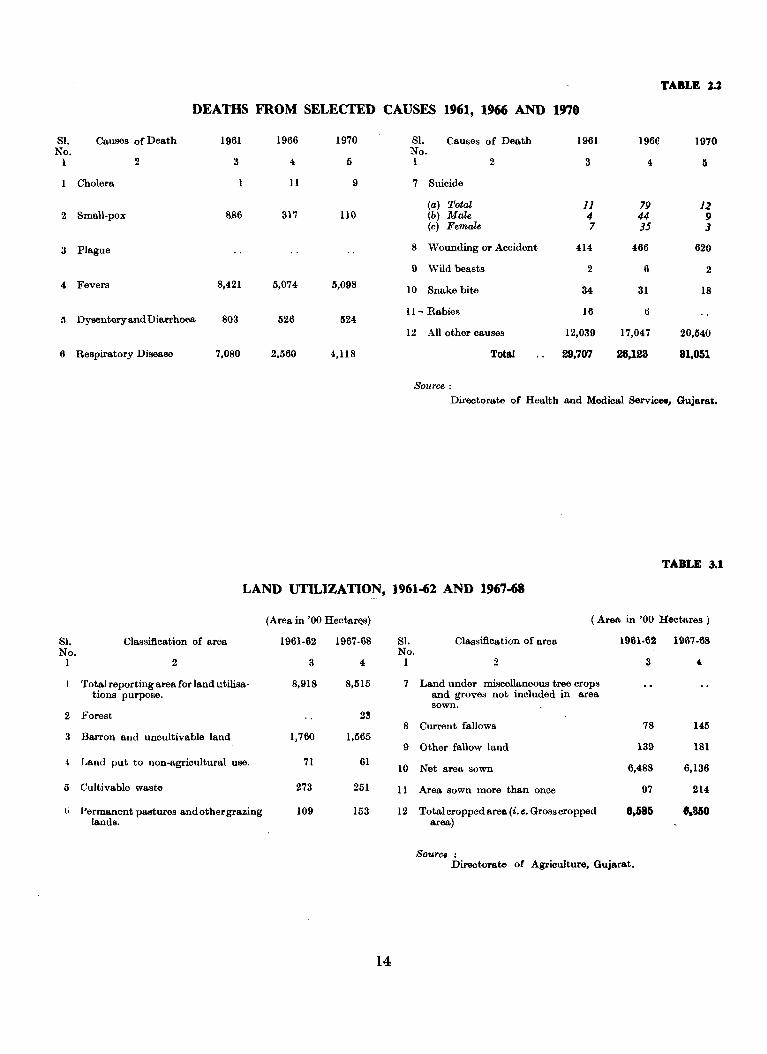
TABLE U
DEATHS FROM SELECTED CAUSES 1961, 1966 AND 1970
Sl. Causes of Death 1961 1966 1970 Sl. Causes of Death 1961 1966 1970 No. No.
1 2 3 4 fi 1 2 3 4 05
Cholera II 9 7 Suicide
(a) Total 11 79 12 2 Small-pox SS6 317 110 (b) Male 4 44 9
(c) Female 7 35 3
3 Plague S \Vounding or Accident 414 466 620
9 Wild beasts 2 6 2
4 Fevers 8,421 5,074 6,09S 10 Snake bite 34 31 18
ll- Rabies 16 6 (\ Dysentery and Diarrhoea 803 526 0524
12 All other causes 12,039 17,047 20,640
6 Respiratory Diseaso 7,OSO 2.560 4.11S Total 29,707 26,123 81,051
SI. No_
1
2
3
t
5
(j
Source: Directorate of Health and Medical Service., Gujarat.
TABLE 3.1
LAND UTILIZATION, 1961-62 AND 1967-68
(Area in '00 Hectar€ls)
Olassification of area 1961-62 1967-68
2 3 4
Total reporting area for land utilisa- 8,918 8,515 tions purpose.
Forest 23
Barron and uncultivable land 1,760 1,565
Land put to non-agricultural use. 71 61
Cultivable waste 273 251
Permanent pastures and other grazing 109 153 lands.
14
SI. No.
1
7
S
9
10
II
12
(Area in '00 Hectares )
Olassifioation of area
2
Land under miscellaneous tree crops and groves not inoluded in area sown.
Ourrent fallows
Other fallow land
Net area sown
Area sown more than once
Total oropped area (i. e. Gross cropped area)
Source:
1961·62 1967-68
3 ,
78
139
6,488
97
8.585
145
181
6,136
214
6.360
Directorate of Agriculture, Gujarat.
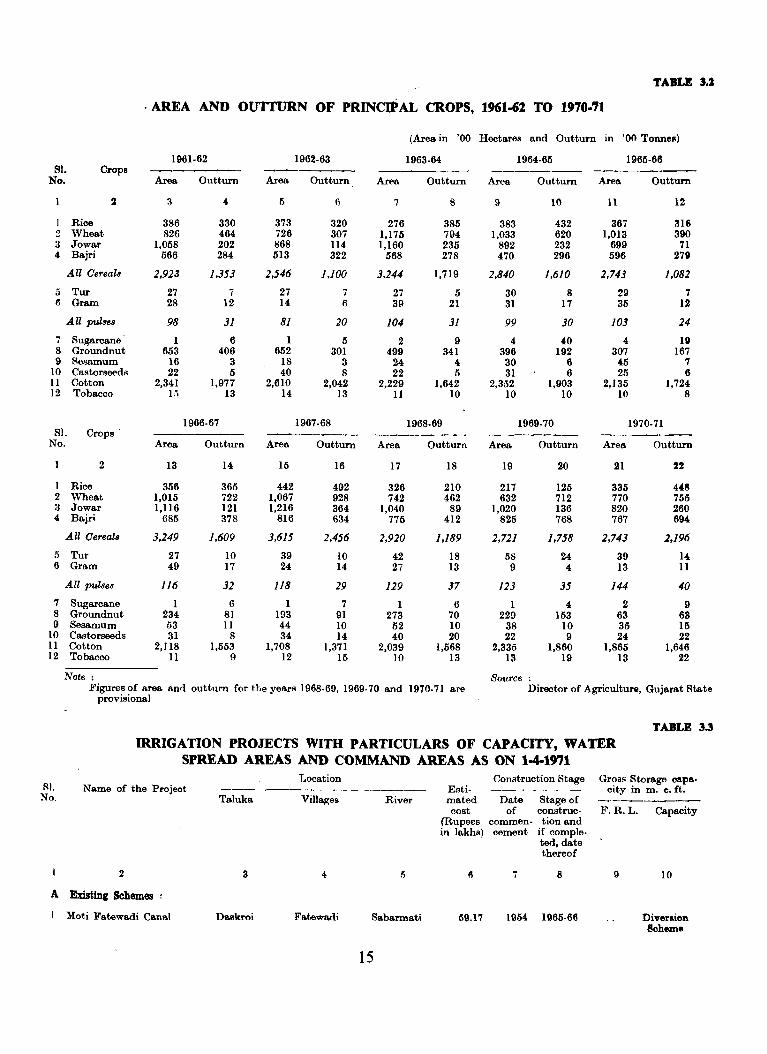
TABLE J.2
. AREA AND OUTI'URN OF PRINCnt AL CROPS, 1961-62 TO 1970.71
(Area in '00 Hectares and Outturn in '00 Tonnel)
1961·62 1962·63 1963·64 1964·65 1965·66 Sl. Crops --------
No. Area Outturn Area Outturn Area Outturn Area Outturn Area Outturn
2 ~ 4 I) 6 7 8 9 10 11 12
Rice 386 330 373 320 276 385 383 432 367 316 !l Wheat 826 464 726 307 1,175 794 1,033 620 1,013 390 3 Jowar 1,058 202 868 114 1,160 235 892 232 699 71 4 Bajri 566 284 513 322 568 278 470 296 596 279
All Oereals 1,923 1,353 1,546 1,100 3,144 1,719 2,840 1,610 2,743 1,081
5 Tur 27 7 27 7 27 5 30 8 29 7 I) Gram 28 12 14 6 39 21 31 17 35 12
All pulses 98 31 81 20 104 31 99 30 103 24
7 Sugarcane 1 6 1 5 2 9 4 40 4 19 8 Groundnut 653 406 652 301 499 341 396 192 307 167 9 Sesamum 16 3 18 3 24 4 30 6 45 7
10 Castorsel'ds 22 5 40 8 22 5 31 6 25 6 II Cotton 2,341 1,977 2,610 2,042 2,229 1,642 2,352 1,903 2,135 1,724 12 Tobacco 15 13 14 13 11 10 10 10 10 8
1966·67 1967·68 1968·69 1969·70 1970·71 Sl. Crops' ------- -------
No. Area Outturn Area Outturn Area Outturn Area Outturn Area Outturn
2 13 14 15 16 17 18 19 20 21 22
I Rice 356 365 442 492 326 210 2li 125 335 448 2 Wheat 1,015 722 1,067 928 742 462 632 712 770 755 3 Jowar 1,116 121 1,216 364 1,040 89 1,020 136 820 260 4 Bajri 685 378 816 634 775 412 825 768 767 694
All Oereals 3,149 1,609 3,615 2,456 2,910 1,189 1,711 1,758 2,743 2,196
5 Tur 27 10 39 10 42 18 58 24 39 14 6 Gram 49 17 24 14 27 13 9 4 13 11
All pulses 116 32 118 29 119 37 113 35 144 40
7 Sugarcane 1 6 1 7 1 6 1 4 2 9 8 Groundnut 234 81 193 91 273 70 229 153 63 63 9 Sesamum 53 II 44 10 52 10 38 10 35 15
10 Castorseeds 31 8 34 14 40 20 22 9 24 22 11 Cotton 2,118 1,553 1,708 1,371 2,039 1,568 2,335 1,860 1,865 1,646 12 Tobacco 11 9 12 15 10 13 13 19 13 22
Note: Source: Figures of area and outturn for the years 1968.69, 1969·70 and 1970·71 are
provisional Director of Agriculture, Gujarat State
TABLE 3.3 IRRIGATION PROJECTS WITH PARTICULARS OF CAPACITY, WATER
SPREAD AREAS AND COMMAND AREAS AS ON 1-4-1971 Location Construction Stage Gross Storage oapa·
Sl. Name of the Project -------~--------- Esti· ------ - city in m. c. ft. No. Taluka Villages River mated Date Stage of
cost of construe· 1<'. R. L. Capacity (Rupees commen· tion and in lakhs) cement if comple·
ted, date thereof
2 3 4 Ii II 7 8 9 10
A Eldstin, Schemes
Moti Fatewadi Cane.1 Da.skroi Fe.tewadi Sabarmati 59.17 1954 1965·66 Di~err.ion Scheme
15
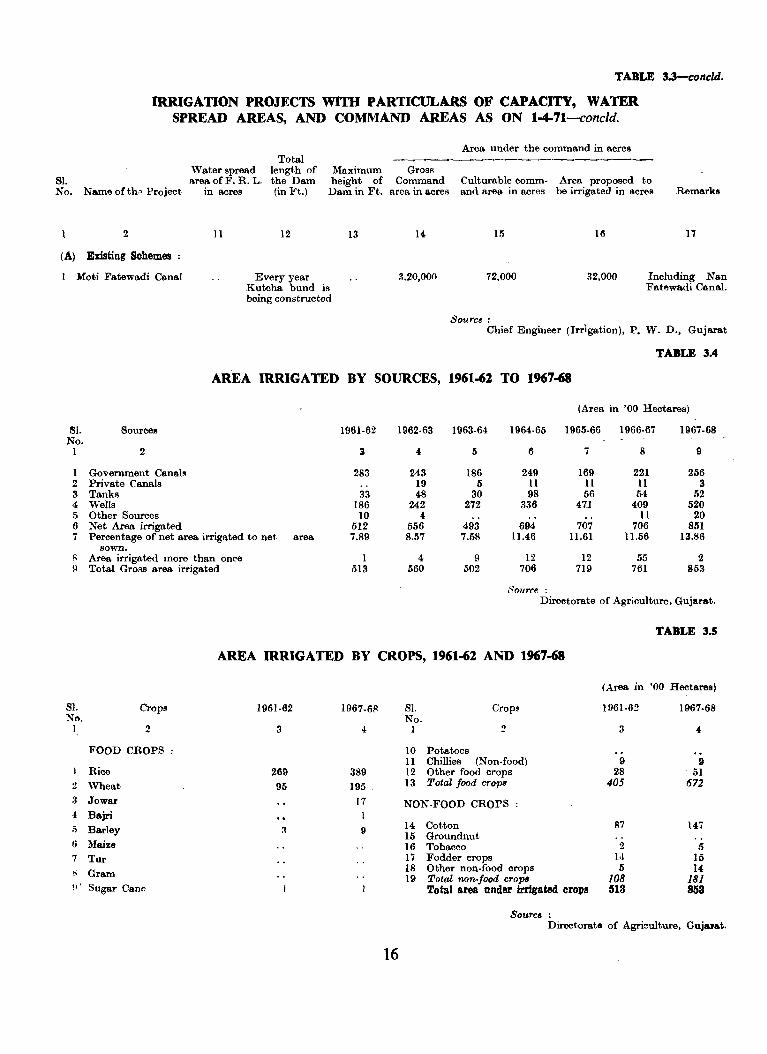
Sl. No.
(A)
TABLE 3.3-concld.
IRRIGATION PROJECTS WITH PARTICULARS OF CAPACITY, WATER SPREAD AREAS, AND COMMAND AREAS AS ON 1-4-71-concld.
Total Water spread length of area ofF. R. L. the Dam
Name oCth" Project in acres (in Ft.)
2 11 12
Existing Schemes
Maximum Gross height of Command Dam in Ft. area in acres
13 14
Area under the command in acres
Culturable comm· Area proposed to and area· in acres be irrigated in acres
Hi 16
Remarks
17
I Moti Fatewadi Canal Every year 3.20,000 72,000 32,000 Including Nan
:'II. No.
1
1 2 3 4 5 6 7
R !I
81. No.
1
2
:l
4
i)
6
7
~
H'
Kutcha bund is Fatewadi Canal. being constructed
Source: Chief Engineer (Irrigation), P. W. D., Gujarat
TABLE 3.4
AREA IRRIGATED BY SOURCES, 1961-62 TO 1967-68
(Area in '00 Hectares)
Source! 1961·62 1962·63 1963·64 1964·65 1965·66 1966·67 1967·68
2 3 4 5 6 7 8 9
Government Canal~ 283 243 186 249 169 221 256 Private Canals 19 5 11 II 11 3 Tanks 33 48 30 98 56 54 52 Wells 186 242 272 336 4'ZJ 409 520 Other Sources 10 4 11 20 Net Area irrigated 512 556 493 694 707 706 851 Percentage of net area irrigated to net area 7.89 8.57 7.58 11.46 11.61 11.56 13.86
sown. Area irrigated more than once 1 4 9 12 12 55 2 Total Gross area irrigated 513 560 502 706 719 761 853
Source: Directorate of Agriculture, Gujarat.
TABLE 3.5
AREA IRRIGATED BY CJlOPS, 1961-62 AND 1967-68
Crops
2
FOOD CROPS
Rice Wheat Jowar Bajri Barley
Maize Tur Gram Sugar Cane
1961·62
3
269
95
1967·61l
4
389 195
17
I I)
16
(Area in '00 Hectares)
S1. Crops 1961·62 1967·68 No.
1 2 3 4
10 Potatoes 11 Chillies (Non.food) 9 9 12 Other food crops 28 . 51 13 Total food crops 405 672
NON·FOOD CROPS
14 Cotton 87 147 15 Groundnut 16 Tobacco 2 5 17 Fodder crops 14 15 18 Other non·food orops 5 14 19 Total non· food crops 108 181
Total area under irrigated crops 513 853
SOUTce : Directorate of Agriculture, Gujuat.
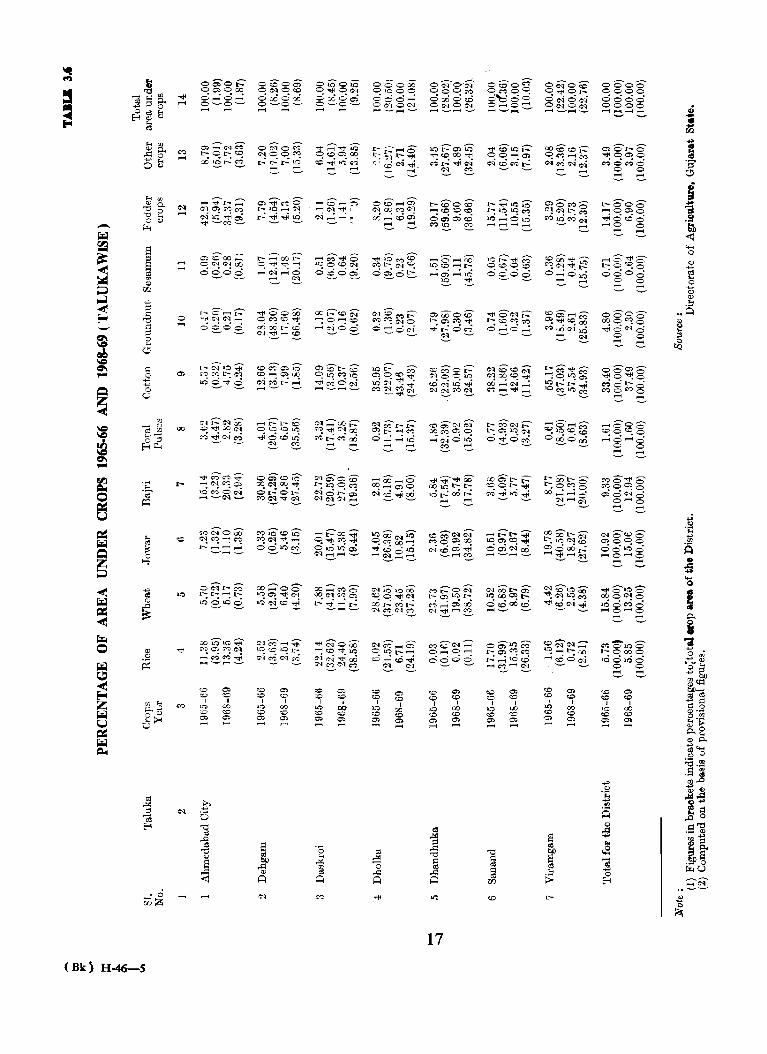
I U) Q)
en
. 0 wZ
(Bk) H-46-S
o
ao
10
00;0;:: o~ooo
0""';0""': 0-0-- .....
~ ~
Q':l ....... G'lc:t'!l r-Or-<:e oo!!i~ e
""!j'i;:;-~:;;; ......-IC"-l.t::'r"::Q':l
~~oc-:i I""""i-cq_
M~OOO C'l,"I":l~~
r--:~~~ ~~~
;r.;l'Q'LQ:;;; ~;J 0) M C'l ,....:MM~ ,.....-,.....;-
~ 0>
"" '" I I 1-0 00
'"' '" 0> 0>
o iCo 0:; 0",,0<:>:> 000000 o~o~
..... -
t-;:=;-oot:' O"1""!j1P""""1
~e.i~o ""
<:O~~LQ ~,,_..,O')oo
~~r_--.:~ -~
oi'Q'o;o 0.,;<0"" o:;iOQ 0-0-- .....
I""""'IG'I"""'\S ......-IC'l~c...
c-:i~~ ..
t:'l;;oo_t:' ~ ""di C"-l 00 c-t5r:--:~oo ..........
00000 OtOOO oco~ OO-IOCl !"""'-I""""I-
lOr_::::--~iO' .... <:>:>00"'" M~~~ e. e
...... 0 1""""1 00 tOo:.cl""""lt-,....;~~u-j
>0 :!-
~oooG" t-~.:¢~
~~OM ~ ~
17
~§'~~ ~~~~ ~ ~
1""""It:"~~ J.OO'lCC'"":l"l oo;e<i oo ,.....-......-1-
1 en
00'00' 0000 0000 0000 1""""I::j..1"""'\:=,
r-ooS 1""""100:.0 ..t<OoOO _0 ° -
~OlOO 000""0 .00"";0 I""""IOP"""'lO ..........
- ~ <'>0100 1:-0000 .00.00
° ° - -
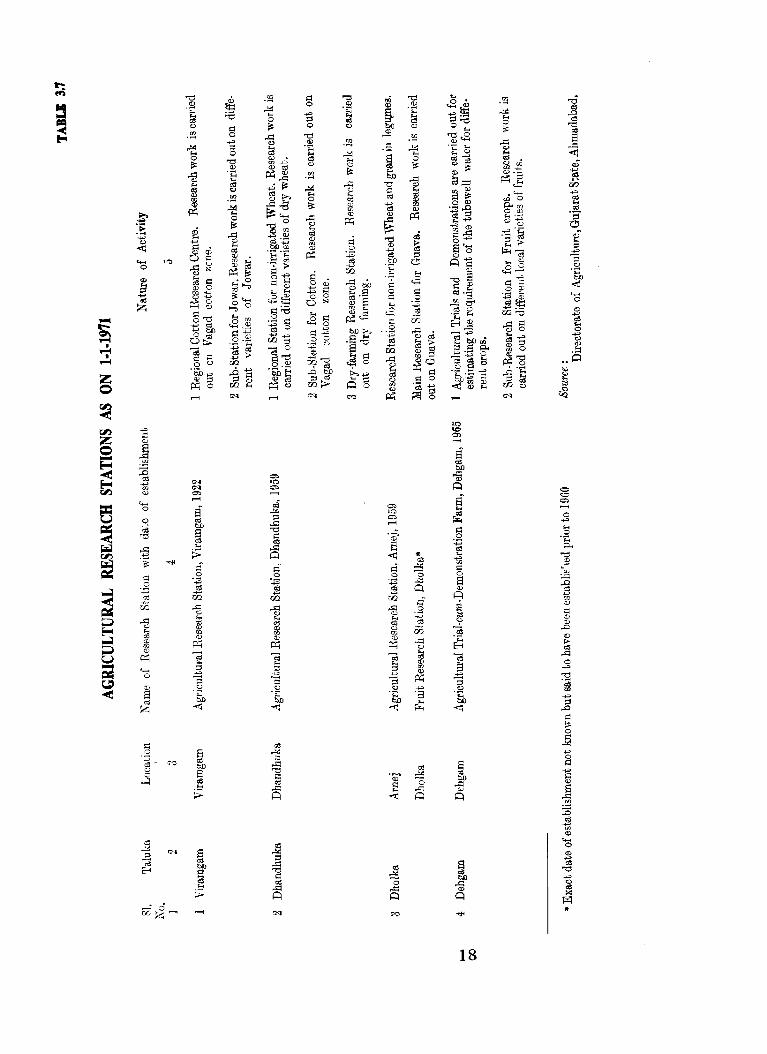
...... o
~ Z
~ c:: ] .~
::0 '" .p en (J:)
'+-< o
~ ~ i:: ~
.::: .S ~ "" w.
.~
ao 10 0>
18
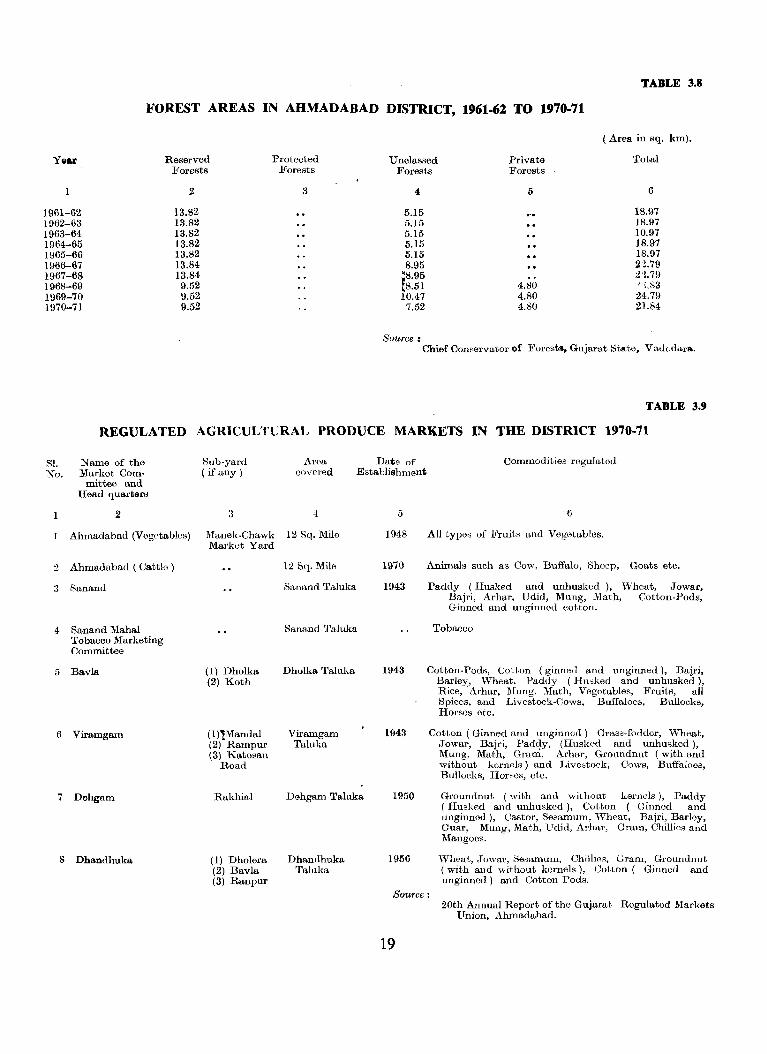
TABLE 3.8
FOREST AREAS IN AHMADABAD DISTRICT, 1961-62 TO 1970-71
( Area in sq. km).
YIIM Reserved Protected Unclassed Private Forests
Total Forests
1 2
1961-62 13.82 1962-63 13.82 1963-64 13.82 1964-65 13.82 1965-66 13.82 1966-67 13.84 1967-68 13.84 1968-69 9.52 1969-70 9.52 1970-71 9.52
Forests
3
Forests
4
5.15 5.15 5.15 5.15 5.15 8.95 i8.95 .8.51 10.47
7.52
SaUTee:
5
'1.80 4.80 4.80
6
18.97 18.97 10.97 18.97 18.97 22.79 :n.79 ~ !.83 24.79 21.84
Chief Conservator of :FOl'ostll, Gujarat St",te, Vad"c\ara.
TABLE 3.9
REGULATED AGRICULTURAl, PRODUCE MARKETS IN THE DISTRICT 1970-71
81. Name of the No. Market Com·
mittee and Head quarters
2
Ahmadabad (Vegetables)
2 Ahmadabad ( Cattle)
... . ) Sanand
4- Sanand Mahal Tobacco Marketing Committee
5 Bavla
6 Viramgam
7 Dehgam
8 Dhandhuka
Sub·yard ( if any)
3
Manek·Chawk Market Yard
(1) Dholka (2) Koth
(1)1Mandal (2) Rampur (3) Katosan
Road
Rakhial
(1) Dholera (2) Bavla (3) Ranpur
Date of Commodities regulated Area covored Establishment
4
12 Sq. Mile
12 Sq. Mile
Sanand Taluka
Sanand Taluka
Dhulka Taluka
Viramgam Taluka
Dehgam Taluka
Dhandhuka Taluka
1948 All type,; of .Fruits and Vegetables.
1970
1943
1943
1943
1950
1956
Animals such as Cow, Buffalo, Sheep, Goats etc.
Paddy (Husked and unhusked), Wheat, Jowar, Bajri, Arhar, Udid, Mung, Math, Cotton· Pods, Ginned and unginned cotton.
Tobacco
Cotton·Pods, Cotton (ginned and unginned), Dajri, Barley, Wheat, Paddy (Husked and unhusked), Rice, Arhar, Mung, Math, Vegetables, Fruits, all Spices, and Livestock·Cows, Buffaloes, Bullocks, Horses etc.
Cotton ( Girllled and ungillned) Crass· fodder, \Vheat, Jowar, Bajri, Pad4y, (Husked and unhusked), Mung, Math, Gram, A1'ha1', Groundnut (with and without kornels) and Livestock, Cows, Buffaloes, Bullocks, Horses, etc.
Groundnut (with and without kernels), Paddy (Husked and unhusked), Cotton (Ginned and unginned), Castor, Sesamum, \Vheat, Bajri, Barley, Guar, Mung, Math, Udid, Arhar, Gram, Chillies and Mangoes.
\Vheat, .Towa!', ~esamum, Chillins, Gram, Groundnut (with and without kernels), Cotton ( Ginned and unginned) and Cotton Pods.
SOUTce:
19
20th Annual Report of the Gujarat Regulated Markets Union. Ahmadabad.
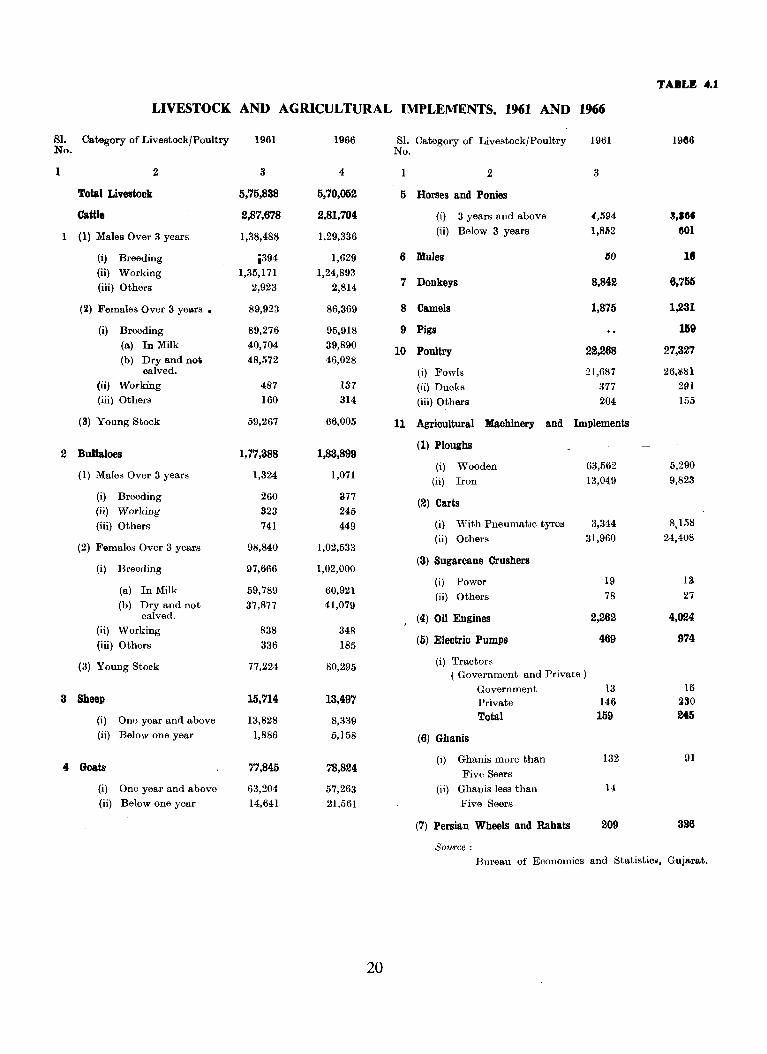
TABLE 4.1
LIVESTOCK AND AGRICULTURAL IMPLEMENTS. 1961 AND 1966
81. Category of Livestock/Poultry 1961 1966 Sl. Category of Livestock/Poultry 11161 1966 No. No.
1 2 3 4 2 3
Total Livestock 5,75,838 5,70,052 5 Horses and Ponies
Cattle 2,87,678 2,81,704 (i) 3 years and above 4,594 S,16.
1 (1) Males Over 3 years 1,38,488 1,29,336 (ii) Below 3 years 1,852 601
(i) Breeding ii394 1,629 6 Mules 60 11 (ii) Working 1,35,171 1,24,893
Donkeys 8,842 6.755 (iii) Others 2,923 2,814 7
(2) Females Over 3 years • 89,923 86,369 8 Camels 1,875 1,231
(i) Breeding 89,276 95,918 9 Pigs 169
(a) In Milk 40,704 39,890 10 Poultry 22,268 27,327
(b) Dry and noi 48,572 46,028 calved. (i) Fowls 21,687 26,281
(ii) Working 487 137 (ii) Ducks 377 291 (iii) Others 160 314 (iii) Other~ 204 155
(3) Young Stock 59,267 66,005 11 Agricultural Machinery and Implements
2 Bulfaloes 1,77,388 1,83,899 (1) Ploughs
(i) Wooden 63,562 5,290 (1) Males Over 3 years 1,324 1,071
(ii) Iron 13,049 9,823
(i) Breeding 260 377 (2) Carts
(ii) Working 323 245
(iii) Others 741 449 (i) Wit,h Pneumatic tyres 3,344 8,158
(ii) Others 31,960 24,408 (2) F@males Over 3 years 98,840 1,02,533
(i) Breeding 97,666 1,02,000 (3) Sugarcane Crushers
(i) Power 19 13 (a) In Milk 59,789 60,921
(ii) Others 78 27 (b) Dry and not 37,877 41,079
calved. (4) Oil Engines 2,262 4,024 (ii) Working 838 348
(iii) Others 336 185 (5) Electric Pumps 469 974
(3) Young Stock 77,224 80,295 (i) Tractors ( Government and Private)
Government 13 15 3 Sheep 15,714 13.497 Private 146 230
(i) One year and above 13,828 8,339 Total 159 245
(ii) Below one year 1,886 5,158 (6) Ghanis
(i) Ghanis morc than 132 91 4 Goats 77,845 78,824 Five Seers
(i) One year and above 63,204 57,263 (ii) Ghanis less than 14
(ii) Below one year 14,641 21,561 Five Seers
(7) Persiau Wheels and Rahats 209 396
Source: Bureau of Economics and Statistic2, Guj&rat.
20
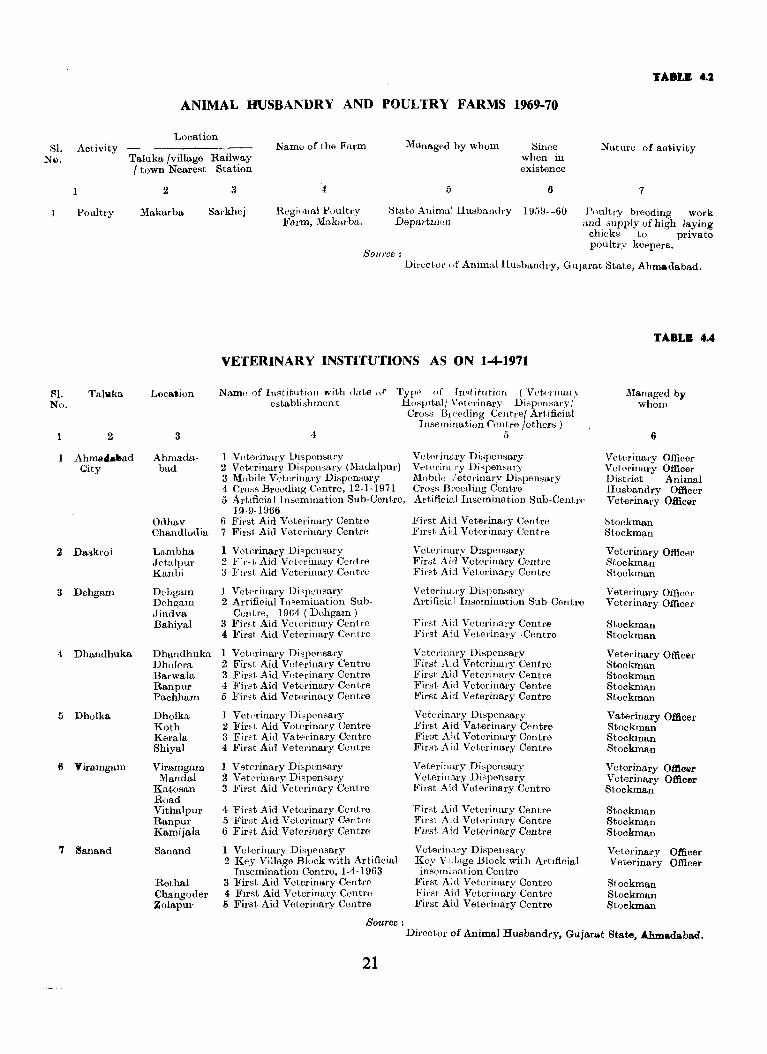
TAB". U
ANIMAL HUSBANDRY AND POULTRY FARMS 1969·70
Location Managed by whom Sl. Activity Name of the Farm Silwe Nature of aotivity
N~. Taluka {village Railway when ill
Poultry
Sl. 'l'alw.ka No.
2
Ahmall."ad City
Daskl'oi
3 Dehgam
4 Dhaudhuka
5 Dholka
S Yiramgam
7 SanaBd
I town Nearest Station existence
2 3 4 5 6 7
Makarba Sarkhej Regional Poultry lltato Animo,] Hu~barull'Y 1959--60 Poultry breeding work and supply of high laying
Location
3
Ahmada-bad
Odhav Chandludia
Lambha Jetalpur Kanbi
Dehgam Dchgam Jindva Bahiyal
Dhandhuka Dholcra Barwala Ranpur Pachham
Dholka Koth Kerala Shiyal
Viramgam MandaI
Katosan Road Vithalpur Ranpur Kamijala
Sanand
Rethal Changuder Zolapur
Farm, Malmrbn. Departmcll: chicks to private poultry keepers.
SouJ'ce: Dil'ecLol' "f Anim,t[ Husbandry, Gujarat State, Ahmadabad.
VETERINARY INSTITUTIONS AS ON 1-4·1971
Namo of Inslit,utinll with date nf establi~hmen t
Type' of Institution (VCkl'llllll,\' Hospitalj I'cl!'rinary Dispensary I
Cross HI,peeling Centrel Art,ificial Insemination Centro lother" )
4
I Votorinary Disponsary 2 Votf'rinary Di~poll"ary (J\laualpur) 3 Mobile VeterinaI'Y Di"pon~ary 4 Cross Breeding Centre, 12-1·1971 5 Artificial Insemination Sub-Centre,
19-9-1966 6 First Aid Veterinary CentI'e 7 Firsi Aid Voterinal'Y Centre
1 Veterinary Dispensary 2 FiI',l, Aid Veterinary Cent.re 3 First Aid Veterinary Cent,re
1 Vekrinary Di,'pl'llsary 2 Artificial Insemination Sub-
Cent.re, 19()4 (Dehgam ) 3 Fir,t Aid Veterinary Centre 4 First Aid Veterinary Centre
1 Vctorinary Dispensary 2 First Aid Vderinary Centre 3 First Aid Veterinary Centre 4 Firet Aid Veterinary Centre 5 First Aid Veterinary Contre
1 Vekrinary Di~pcnsary 2 Firtt Aid Vetorinarv Centre 3 First Aid Vatt'rina;y Centre 4 First Aid Veterinary Centre
1 VetOI';nary Dispensary 2 Veturinary Dispensary 3 First Aid Vetprinary Centre
4 First Aid Veterinary Centre 5 First Aid Veterinary Centre 6 First Aid Veterinary Centro
1 Veterinary Dispensary 2 Key Village Bluck with Artificial
Insemination Centre, 1-4-1963 3 First Aid Veterinary Centre 4 First Aid Vetorinary Centre 6 First Aid Veterinary Centre
Source:
5
Veterinary Dispensary Vetel'im,l'y Dispensary 1\lobil., -,1 etorillary DislJen~ary CrosH Be'eeding Centre Artifici[d Insemination Sllb-Celltl'e
First Aid Veterinal'y Centre First Ai,l Veterinary Cl'ntl'e
Veterinary Dispensary First Aid Veterinary Centre First Aid Vetorinary Centre
Veterinary Disponclary ArtificiD 1 Inseminatiun Sub-Centre
:Fit'st Aid Veterinary Centre First Aid Veterinary ,Centro
Veterinary Dispensary First A:d Veterinary Centre First Aid Veterinary Centre First Aid Veterinary Centre First Aid Veterinary Centre
Veterinary Dispensary First Aid Vaterinary Centre First Aid Veterinary Centre First Aid Veterinary Centre
Veterinary Dispensary Voterin;1.ry Dispensary First Aid Veterinary Centre
First Aid Veterinary Centre Firot Aid Veterinary Centre First Aid Veterinary Centre
Veterill,l,ry Dispensary Key Vi:lage Block with ArtIficial insemination Centre
First Aid Veterinary Centre First Aid Veterinary Centre Fir~t Aid Veterinary Centre
TABL. 4.4
Managed by whom
6
Veterinal'y Officer Vetorinary Officer District Animal Husbandry Officer Veterinary OffiClU
Stockman Stockman
Veterinary Officer Stockman Stockman
Veterinary Oificol' Veterinary Officer
Stockman Stockman
Veterinary Officer Stockman Stockman Stockman Stockman
Vaterinary Officer Stockman Stockman Stockman
Veterinary Ofticlil' Veterinary Officer Stockman
Stockman Stockman Stockman
Veterinary Officer Veterinary Officer
Stockman Stockman Stockman
Director of Animal Husbandry, Gajarat State, Ahmadabad.
21
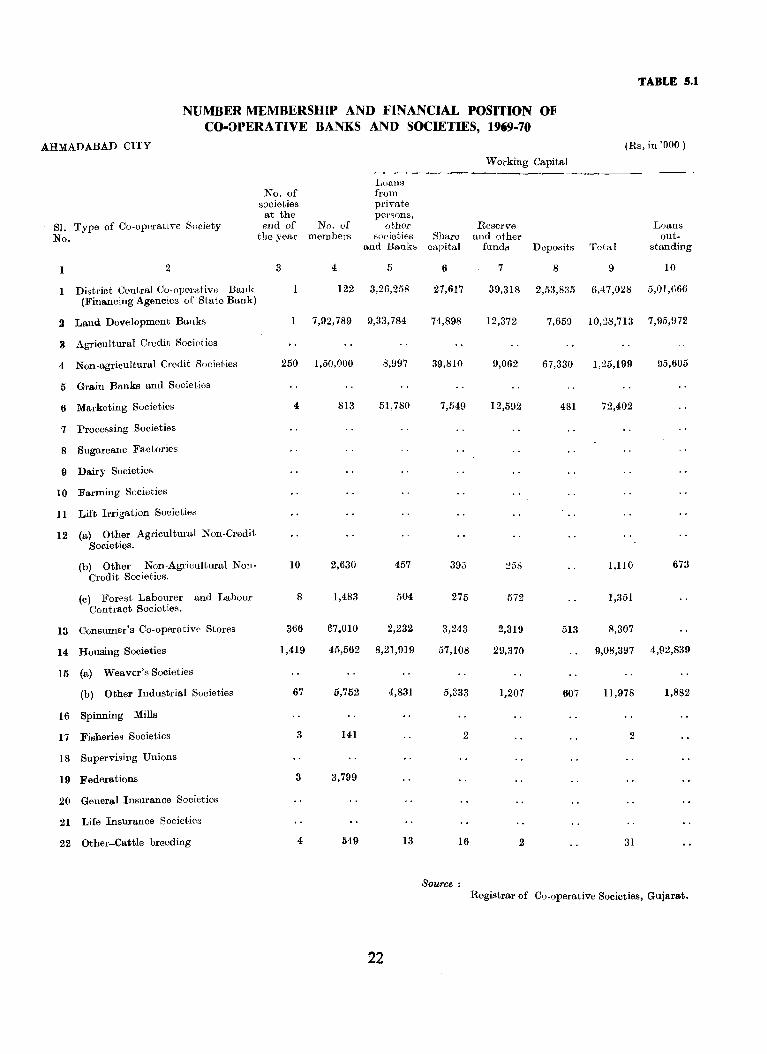
TABLE 5.1
NUMBER MEMBERSHIP AND FINANCIAL POSITION OF CO·OPERATIVE BANKS AND SOCIETIES, 1969-70
AHMADABAD CITY
Sl. Type of Cu-oporative Society No.
1 2
1 District Central Co-opemtivo Ballk (Financing Agencies of State Bank)
!! Land Development Banks
3 Agricultural Credit Societies
4 Non-agricultural Credit Sucieties
5 Grain Banks and Societies
6 Marketing Societies
7 Processing Societies
8 Sugarcane Factories
I) Dairy Societies-
10 Farming Sucieties
11 Lift Irrigation Societie~
12 (a) Other Agricultural Non-Credit Societies.
(b) Other Non-Agricultural NonCredit Societies.
(c) Forest Labourer and Labour Contract Societies.
13 Consumer's Co-operative Stores
14 Housing Societies
15 (a) Weaver's Societies
(b) Other Industrial Societies
16 Spinning Mills
17 Fisheries Societies
18 Supervising Unions
19 Federations
20 General Insurance Societies
21 Life Insurance Societies
22 Other-Cattle breeding
No. of societies at the end of
the year
3
No. of members
4
Loans from private perBons,
other societies
and Bank~
5
122 3,26,258
7,92,789 9,33,784
250 1,50,000 8,997
4
10
8
366
1,419
67
3
3
4
813 51,780
2,630 457
1,483 504
67,010 2,232
45,562 8,21,!H9
5,752 4,831
141
3,799
549 13
22
Share capital
6
27,617
74,898
39,810
7,549
393
275
3,243
57,108
5,333
2
16
Source:
Working Capital
Reserve alld other
funds
7
Deposits
8
Total
9
(Rs, in '000 )
Loans out
standing
10
39,318 2,53,835 6,47,028 5,01,666
12,372 7,659 10,:18,713 7,95,972
9,062
12,592
258
572
2,319
29,370
1,207
2
67,330
481
513
607
1,25,199 115,605
72,402
1,110 673
1,351
8,307
9,08,397 4,92,839
11,978 1,882
2
31
Registrar of Co-operative Societies, Gujarat.
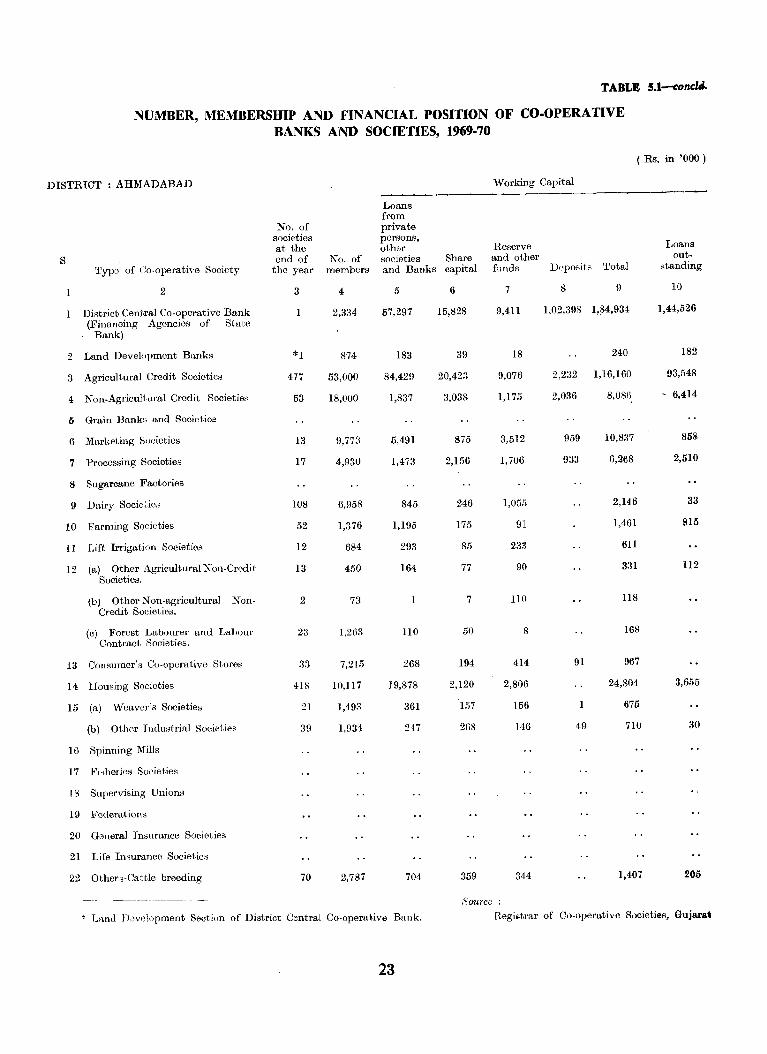
TABLE 5.1--concl"
NUMBER, MEMBERSHIP AND FINANCIAL POSITION OF CO-OPERATIVE BANKS AND SOCIETIES, 1969-70
( Rs. in '000)
DISTRICT: AHMADABAD Working Capital
Loans from
No. of private societies persons, at the other Reserve Loans
S end of No. of societies Share and other out"
Typo of Co"operative Society tho year members and Banks capital funds Deposits Total standing
2 3 4 5 6 7 8 9 10
District Cent,ral Co"operative Bank 2,334 57,297 15,828 9,411 1,02,398 1,84,934 1,44,526
(Financing Agencies of State Bank)
2 Land Development Banks *1 874 183 39 18 240 182
3 Agricultural Credit Societies 477 53,000 84,429 20,423 9,076 2,232 1,16,160 93,548
4 Non"Agricult'lral Credit Societies 53 18,000 1,837 3,038 1,175 2,036 8,080 - 6,414
5 Grain Banks and Societies
6 Marketing Societies 13 9,778 5,491 875 3,512 959 10,837 85S
7 Processing Societies 17 4,930 1,473 2,156 1,706 933 6,268 2,510
8 Sugarcane Factories
9 Dairy Societies 108 6,958 845 246 1,055 2,146 33
10 Farming Societies 52 1,376 1,195 175 91 1,461 915
II Lift Irrigation Societies 12 684 293 85 233 611
12 (a) Other Agricultural NOll·Credit 13 450 164 77 90 331 112 Societies.
(b) Other NOll "agricultural Credit Societies.
NOll" 2 73 7 llO 118
(0) Forest Laboul'er und Labour Contract Societies.
23 1,263 110 50 8 168
13 Consumer's Co"operative Stores :{3 7,215 268 194 414 91 967
14 Housing Societies 418 10,117 19,878 2,120 2,806 24,804 3,655
15 (a) Weaver's Societies 21 1,493 361 157 156 675
(b) Other Industrial Societies 39 1,934 247 268 146 49 710 30
16 Spinning Mills
17 Fi"herifls Societies
18 Supervising Unions
19 Federations
20 General In~urance Societies
21 Life InRurance Societies
22 Others-Cattle breeding 70 2,787 704 359 344 1,407 205
-.~-------- Source
• Ln,nd novelopment Section of District Oentral Co "operative Bank . Jtcgi~t,rar of Co"operative Societies, Gujar&l
23
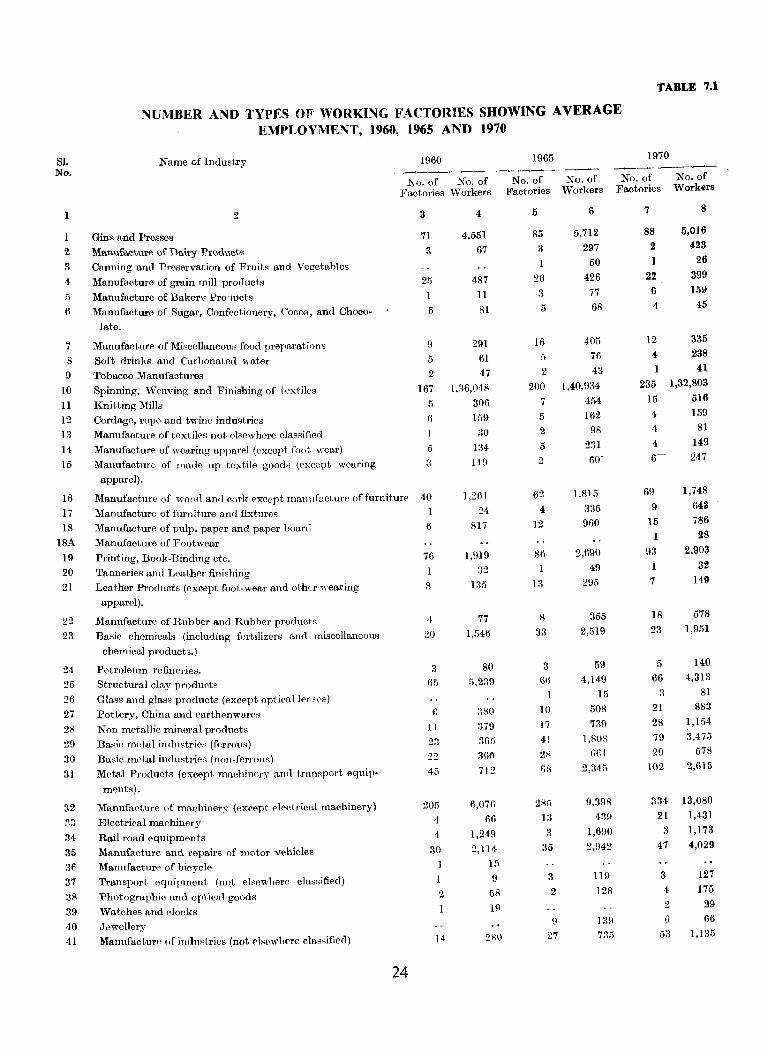
SI. No.
1
1
2-
3 4
5
6
7
8
9
10
11 12
13
14
15
16
17 18
18A
19
20 21
22
23
24
25
26
27
2il
29
30
31
32
34 35
36
37 38
39
40
41
TABLE 7.1
NUMBER AND TypES OF WORKING FACTORIES SHOWING AVERAGE EMPLOYMENT, 1960, 1965 AND 1970
Name of Industry 1960 1965 1970 ------_.___.___, ----'_------- -------~~
No. of Work@rs No. of No. of
Factories vVorkers
2
Gins and Presses
Manufacture of Dairy Products
Canning and Preservation of Fruits and Vegetahles
Manufacture of grain mill products
Manufacture of Bakerv Pro,lucts
Manufacture of Sugar, Confectionery. Cocoa, and Choco
late.
Manufacture of Miscellaneous food preparations
Soft drinks and Carbonated water
Tobacco Manufactures
Spinning, Weaving and Finishing of text.iks
Knitting Mills
3
71
3
25
1
5
9
5
2
167
5
Cordage, rope and twine industries 6
Manufacture of textiles not elRewhere classifwd
Manufacture of wearing apparel (except foot wear) 5
Manufacture of made up textile good~ (except wearing :J
apparel).
Manufacture of wood and cork excopt ma.mlfncture of furniture 40
Manufacture of furniture and fixtures 1
Manufacture of pulp, paper and paper board 6
Manufacture of Footwear
Printing, Book-Binding etc. 76
Tanneries and Leather finishing
Leather Products (except foot-wear and other wearing R
apparel).
Manufacture of Rubber and Rubber products 4
Basic chemicals (including fertilizers and miscellaneous 20
chemical products_)
Petroleum refineries. 3
Structural clay products 65
Glass and glass products (excppt optical knsf's)
pottery, China and parthenwares C
Non metallic mineral prorlucts II
Basic mAtal indnstries (fArrous) 2:1
Basic metal industries (non-ferrous) 22
Metal Product,s (except machinery anrl transport equip- 45
ments).
Manufacture of machinf'fY (e'K('''pt el('ctrical machinery) 205
Electrical machinery 4
Rail road equipments 4
Manufacture and repairs of motor vehicles 30
Manufacture of bicycle
Transport equipment (nqt elsewhere classified) 1
Photographic and optical goods 2
Watches and clocks
Jewellery
ManufacturA of industries (not f'lscwh('re claA~ifi('d) 14
24
4
4,551
67
487
11
81
291
61 47
1,:{6,048
306
lli9
ao
1,261
24
817
1,919
32
135
77 1,546
80 fi,239
3RO
379 365 :WO
712
6,07(.
66
1,249
2,114 Hi
9 58
19
280
No. of Factories
5
85
3
1 26
3
5
16
2
200
7 5
2
5
2
62 4
12
86 1
13
8
33
3 (\6
10
17
41
2R G8
2R5 13
3
35
3 2
9
27
No. of Workers
6
5,712 297
50
426
77 68
405
76
43
],40,934
454
162
98
231 - 60-
1,815
335
960
2,690
49
295
355
2,519
59 4,149
15
508
739
1,80R (\(l]
2,345
9,398
439
1,690
2,942
119
128
735
No. of Factories
7
88
2
1
22 6
4
12
4 1
235
15
8
5,016
423
26
399
151:1
45
335
238 41
1,32,803
516
4 159
4 81
4 149 6- . 247
69 1,748
9 643 15 756
1 !IS
93 2,903
1 3~
7 149
18 57S
23 1,951
5 140
66 4,313
3 81
21 883
28 1,154 79 3,475 29 578
102 2,615
334 13,080
21 1,431
3 1,173
47 4,029
3 127
4 175
2 ~9
6 66
53 1,135
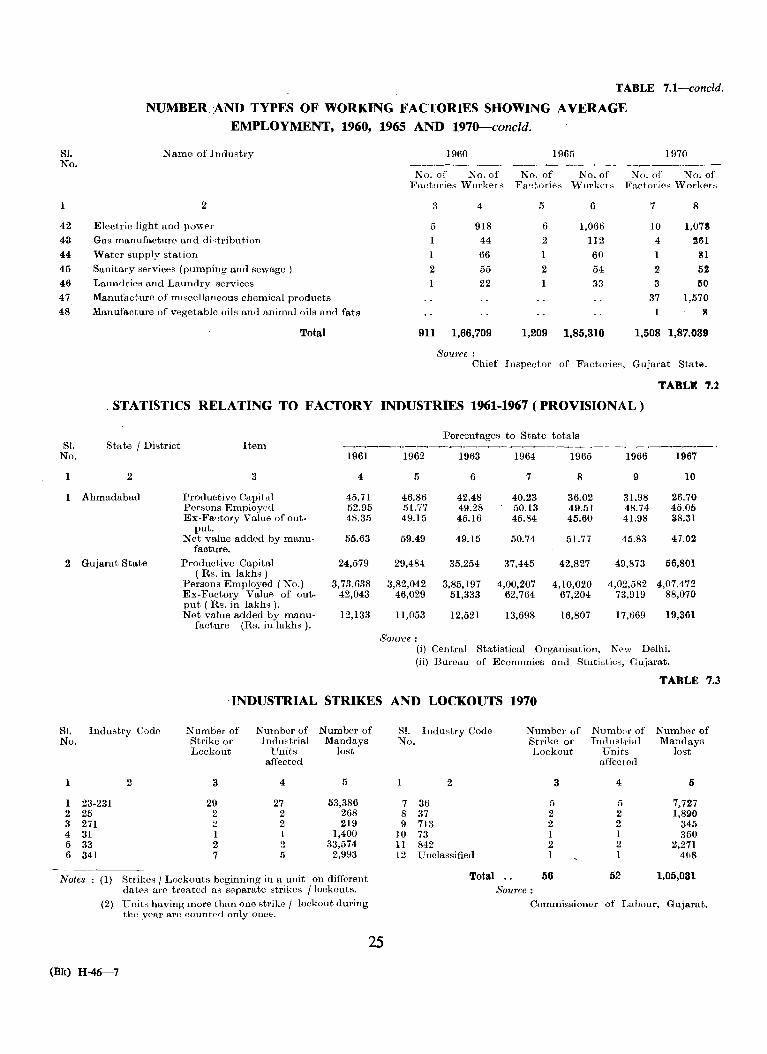
TABLE 7.1-concld.
NUMBER :AND TYPES OF WORKING FACTORIES SHOWING AVERAGE EMPLOYMENT, 1960, 1965 AND 197O-concld.
Sl. No.
Name of Induqtry
I 2
42 Electric light and power
43 Gas manufacture and distribution
44 Water supply station
45 Sanitary services (pumping and sewage)
46 Laundries and Laundry services
47 Manufacturc of miscellaneous chemical products
48 Manufacture of vegetable oils and animal oils and fats
Total
1960 1965 1970
No. of No. of No. of No. of No. of No. of Faetorie3 Workers Fa')t,ories ""York"T',,, Factm·jes WorkeI',.,
3 4 5 6 7 8
5 918 6 1,066 10 1,071 44 2 112 4 261
1 66 1 60 1 In 2 55 2 M 2 52
22 33 3 50
37 1,570 8
911 1,66,709 1,209 1,85,310 1,508 1,87,039
Source: Chief Inspector of Factories. Gujarat State.
TABLE '1.2
. STATISTICS RELATING TO FACTORY INDUSTRIES 1961-1967 (PROVISIONAL)
Percentages to State totals Sl. State / District Item
No. 1961 1962 1963 1964 1965 1966 1967
2 3 4 5 6 7 8 9 10
Ahmadabad Productive Capital 45.71 46.86 42.48 40.23 36.02 31.98 26.70 Persons Employed 52.95 51.77 49.28 50.13 49.51 48.74 45.05 Ex-Fa~tory Value of out- 48.35 49.15 45.16 45.84 45.60 41.98 38.31
put. Net value added by manu- 55.63 59.49 49.15 50.74 51.77 45.83 47.02
facture.
2 Gujarat State Productive Capital 24,579 29,484 35,254 37,445 42,827 49,873 56,801 ( Rs. in lakhs )
Persons Employed (No.) 3,73,638 3,82,042 3,85,197 4,00,207 4,10,020 4,02,582 4,07,472 Ex-Factory Value of out- 42,043 46,029 51,333 62,764 67,204 73,919 88,070 put ( Rs. in lakhs). Net value added by manu- 12,133 1l,053 12,521 13,698 16,807 17,669 19,361
facture (Rs. in lakhs ). Source:
SI. No.
I
1 2 3 4 5 6
Industry Code
2
23-231 25 271 31 33 341
. INDUSTRIAL STRIKES
Number of Strike or Lockout
:I
29 2 2 1 2 7
Number of Industrial
Units affected
4
27 2 2 1 :! 5
Number of Mandays
lost
5
53,386 268 219
1,400 33,574
2,993
Notes: (I) Strikes / Lockouts beginning in a unit on different dates arc trcated as separate strikcs / lockouts.
(2) Unit,s having more than one strike / lockout during the year are counted only once.
(Bit) H-46-7
25
(i) Central Statistical Organisation, New Delhi. (ii) Bureau of Economics and StatisticH, Cujarat.
AND LOCKOUTS 1970
Sl. Industry Code No.
2
7 36 8 37 9 713
10 73 11 842 12 Unclassified
Number of Strike or Lockout
3
5 2 2 1 2 1
Total 56 Source:
TABLE 7.3
Number of Industrial
Units affected
Number of Mandays
lost
4 5
5 7,727 2 1,890 2 345 1 350 2 2,271 1 4(J8
52 1,05,031
Commissioner of Labour, Gujarat.
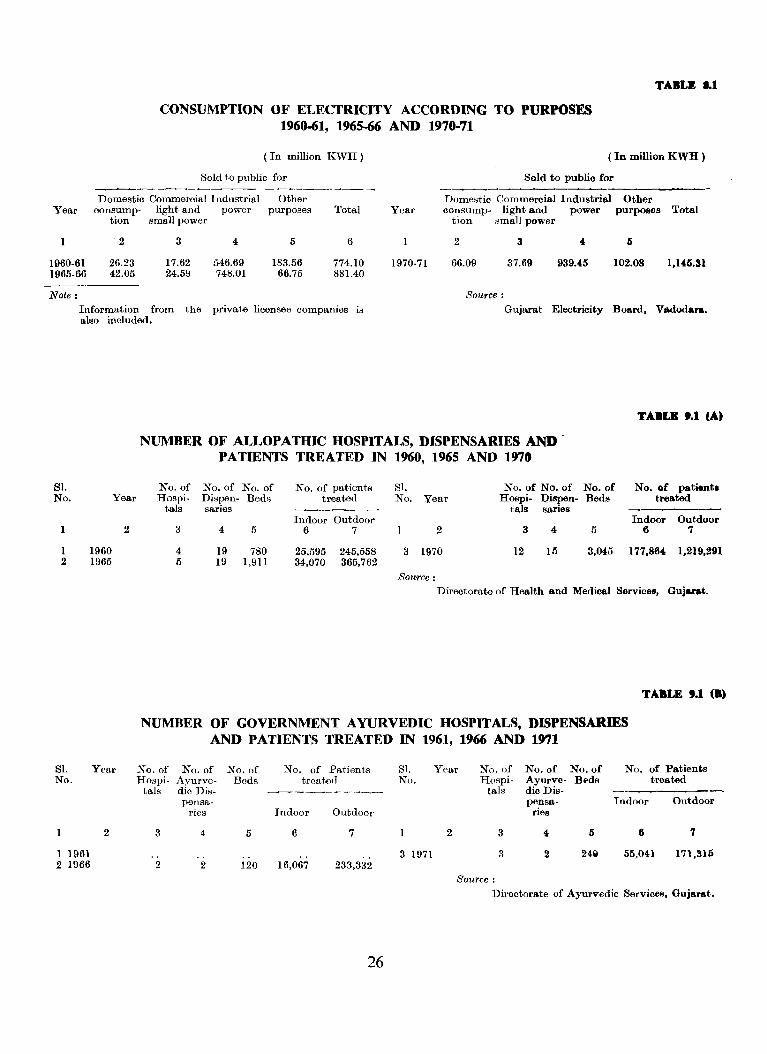
Year
1960-61 1965-66
CONSUMPTION OF ELECTRICITY ACCORDING TO PURPOSES 1960-61, 1965-66 AND 1970-71
TABL:K '.1
(In million KWH)
Sold to public for
( In million KWH )
Sold to public for
Domestic Commercial Industrial Other Domestic Commercial Industrial Other consump- light and power
tion small power
2 3 4
26.23 17.62 546.69 42.05 24.59 748.01
purposes Total
5 6
183.56 774.10 66.75 881.40
Year consump- light and power purposes Total
1970-71
tion small power
2
66_09
3
37.69
4
939.45
5
102.08 1,145.31
--------_ Note: Source:
Information from the private licensee companies is also included.
Gujarat Electricity Board, Vadodara.
Sl. No. Year
2
1 1960 2 1965
SI. Year No.
2
1 1961 2 1966
TABLB t.1 (A)
NUMBER OF ALLOPATHIC HOSPITALS, DISPENSARIES ANDPATIENTS TREATED IN 1960, 1965 AND 1970
No_ of No. of No. of No. of patients SI. No. of No. of No. of No. of patient. Hospi- Dispen- Beds treated No. Year Hospi- Diapen- Beds treated
tals saries -------- tals saries Indoor Outdoor Indoor Outdoor
3 4 5 6 7 2 3 4 5 6 7
4 19 780 25,595 245,558 3 1970 12 15 3,045 177,864 1,219,291 5 19 1,911 34,070 365,762
Source: Directorate of Health and Medical Services, Gujarat.
TABLE t.l (B)
NUMBER OF GOVERNMENT A YURVEDIC HOSPITALS, DISPENSARIES AND PATIENTS TREATED IN 1961, 1966 AND 1971
No. of No. of No. of No. of Patients Sl. Year No. of No. of No. of No. of Patients Hospi- Ayurve- Beds treated No. Hospi- Ayurve- Beds treated
tals die Dis- ---------'_-_- ta.Is die Dis-pensa- pensa- Indoor Outdoor
ries Indoor Outdoor ries
3 4 5 6 7 2 3 4- 5 6 T
3 1971 3 2 24~ 55,041 171,315 2 2 120 16,067 233,332
Source: Directorate of Ayurvedic Services, Gujarat.
26
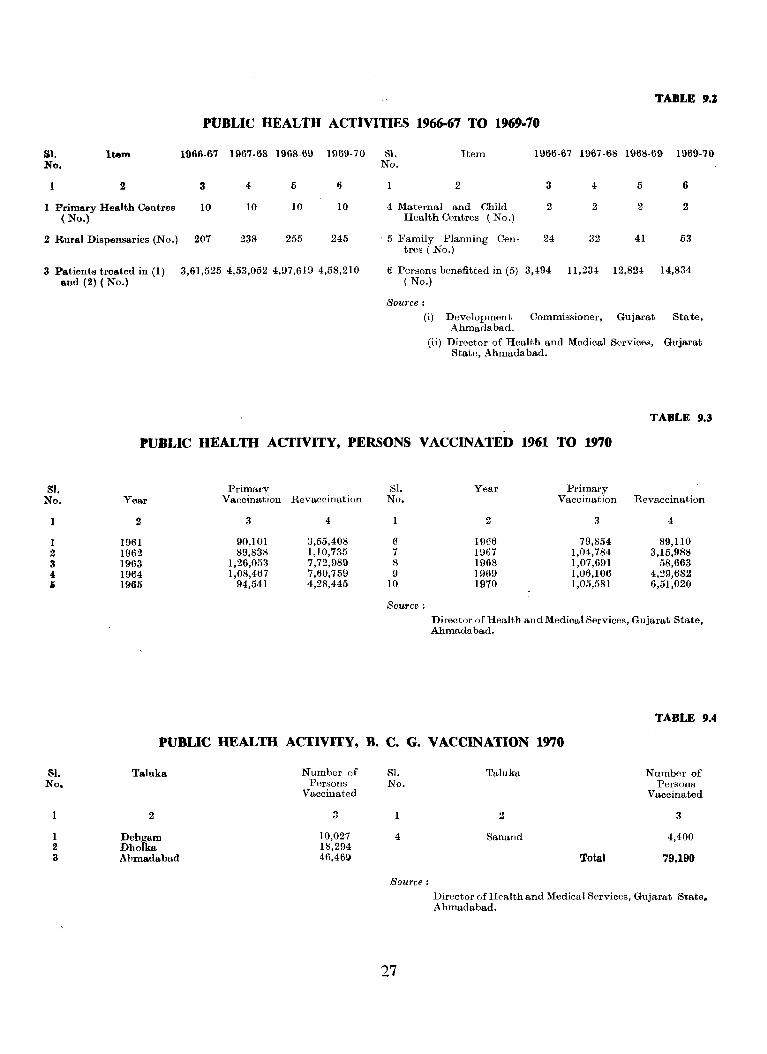
&1. No.
Item
2
1 Primary Health Centres ( No.)
2 RUTal Dispensaries (No.)
3 Patients treated in (1) and (2) (No.)
TABLE 9.l
PUBLIC HEALTH ACTIVITIES 1966-67 TO 1969-70
1966.67 1967.68 1968-69 1969-70 HI. Item 1966-67 1967-68 1968-69 1969-70 No.
3 4- 5 (j 2 3 4 5 6
10 10 10 10 4 Maternal and Child 2 2 2 2 Health Centres (No.)
207 238 255 245 ·5 Family Planning Cen- 24 32 41 53 tres (No.)
3,61,525 4,53,052 4,97,619 4,58,210 6 Persons benefitted in (5) 3,494 11,234 12,824 14,834 (No.)
Source:
(i) Development Commissioner, Gujarat State, Ahmadabad.
(ii) Director of Health and Medical Services, Gujarat State, Ahmadabad.
TABLE 9.3
PUBLIC HEALm ACTIVITY, PERSONS VACCINATED 1961 TO 1970
SI. No.
1 2 3 4 i
Sl. No.
1 2 3
Primary SI. Year Primary Year Vaccination Revaccination No. Vaccination Revaccination
2 3 4 2 3 4
1961 90,101 3,55,408 6 1966 79,854 89,110 1962 89,838 1,10,735 7 1967 1,04,784 3,15,988 1963 1,26,053 7,72,989 8 1968 1,07,691 58,663 1964 1,08,467 7,60,759 9 1969 1,06,106 4,29,682 1965 94,541 4,28,445 10 1970 1,05,581 6,51,020
Source:
Director of Health and Medical Services, Gujarat State, Ahmadabad.
TABLE 9.4
PUBLIC HEALTH ACTIVITY, B. C. G. VACCINATION 1970
Taluka
2
Dehgam Dholka Ahmadabad
Number of Persons
Vaccinated
3
10,027 18,294 46,46~
SI. No.
4-
Source:
27
Taluka
2
Sanand
Total
Nnmber of Persons
Vaccinated
3
4,400
79,190
Director of Health and Medical Services, Gujarat State. Ahmadabad.

... =
~ ~ ~ ~ 0<.0";.0
,..;
g8g~~~~ gggg~~~ ""' ""'
~r-Ir--..lOQ.:c~ ....-I O:l O:C....-l 0 l..':) ""'"' ""' ...,
.8
28
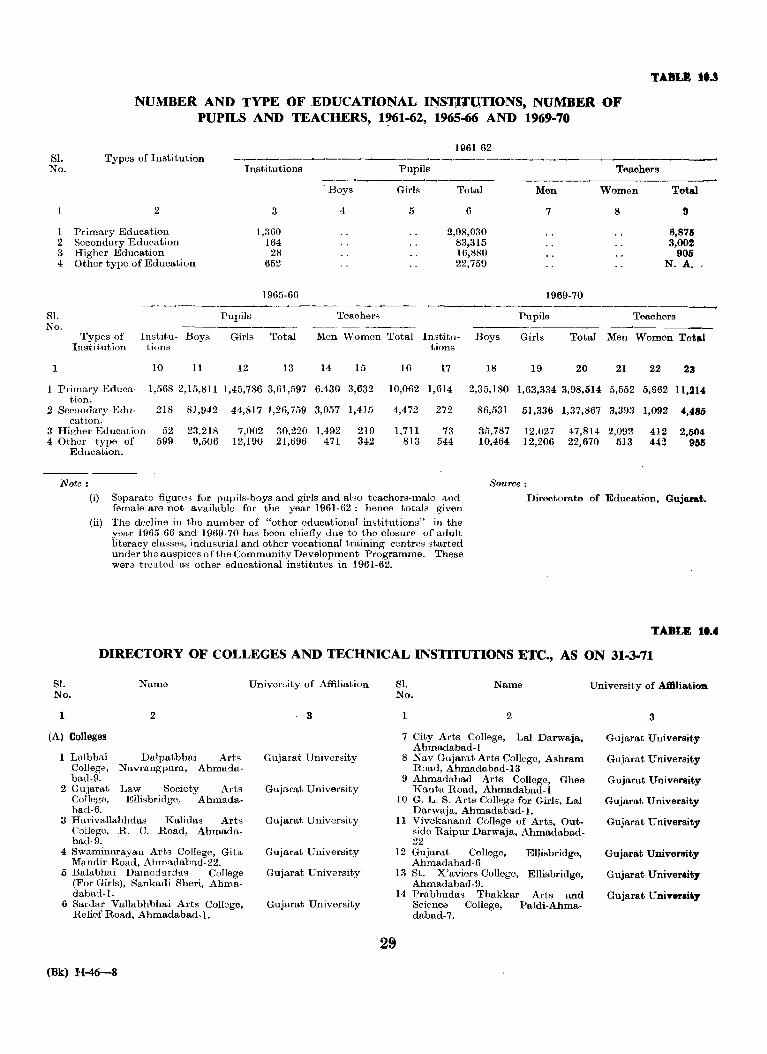
TABLA tU
NUMBER AND TYPE OF EDUCATIONAL INST"UTIONS, NUMBER OF PUPILS AND TEACHERS, 1961-62, 1965-66 AND 1969-70
SI. No.
Types of Institution Institutions
H161-62
Pupils Teachers
'Boys Girls Total Men Women Total
2 3
1 Primary Education 1,360 2 Secondary Education 164 3 Higher Education 21; 4 Other type of Education 652
1965-66
4 5 6
2,98,030 83,315 16,1;1;0 22,759
7 8
1969-70
9
6,875 3,002
905 N. A.
--~___'----______'------~------~---- ~----------~-------------
SI. Pupils Teaohers Pupils Teaohers No. ----------- ---------
Types of Institu- Boys Girls Total Men "Vomen Total Institu- Boys Girls Total Men Women Total Institution tions tions
1 10 11 12 13 14 15 16 17 18 19 20 21 22 23
1 Primary Eduea- 1,568 2,15,811 1,45,786 3,61,597 6,430 3,632 10,062 1,614 2,35,180 1,63,334 3,98,514 5,552 5,662 11,214 tion.
2 Secondary Edu- 218 81,942 44,817 1,26,759 3,057 1,415 4,472 272 86,531 51,336 1,37,867 3,393 1,092 4,485 cation.
3 Highm Education 52 23,218 7,002 30,220 1,492 219 1,711 73 35,787 12,027 47,814 2,092 412 2,504 4 Other type of 599 9,506 12,190 21,696 471 342 813 544 10,464 12,206 22,670 513 442 955
EducaLion.
Note: Source:
(i) Separate figures for pupils-boys and girls and also teachers-malo and female are not available for the year 1961-62: hence totals given
Directorate of Education, Gujarat.
(ii) The decline in the number of "other educational institutions" in the year 1965-66 and 1969-70 has been chiefly due to the closure of adult literacy classes, indusLrial and other vocational training centres started under the auspices of the Community Development Programme. These wer" tref1teli as other educational institutes in 1961·62.
TABLE 1 ....
DIRECTORY OF COLLEGES AND TECHNICAL INSTITUTIONS ETC., AS ON 31.3.71
Sl. No.
1
Name
2
(A) Colleges
1 Lalbhai Colleg.:l, bad-9.
Dalpatbhai Arts Navrangpura, Ahmada-
2 Gujarat Law Society Arts College, Ellisbridge, Ahmada· bad-6.
3 Harivallabhdas Kalidas Arts College, R. C. Road, Ahmadabad-g.
4 Swaminarayan Arts College, Gita Mandir Roali, Ahmadabad-22.
{; Balabhai Damcdardas College (For Girls), Sankadi Sheri, Ahmadabad-I.
6 Sarliar Vallabhbhai Arts College, Relief Road, Ahmadabad-I.
(Bk) H-46-8
University of Affiliation
3
Gujarat University
Gujarat University
Gujarat University
Gujarat University
Gujarat University
Gujarat University
Sl. No.
Name
2
7 City Arts College, Lal Darwaja, Ahmadabad-l
2S
8 Nav Gujarat Arts College, Ashram Road, Ahmadabad-13
9 Ahmadabad Arts College, Ghee Kanta Road, Ahmadabad-l
10 G. L. S. Arts College for Girls, Lal Darwaja, Ahmadabad-I.
11 Vivekanand College of Arts, Outside Raipur Darwaja, Ahmadabad. 22
12 Gujarat College, Ellisbridge, Ahmadabad-6
13 St. X'aviers College, Ellisbridge, Ahmadabad-9_
14 Prabhudas Thakkar Arts and Science College, Paldi-Ahma-dabad-7.
University of Aftlliatiol'l
3
Gujarat University
Gujarat University
Gujarat University
Gujarat University
Gujarat University
Gujarat University
Gujarat University
Glljarat Uni-".rait;y
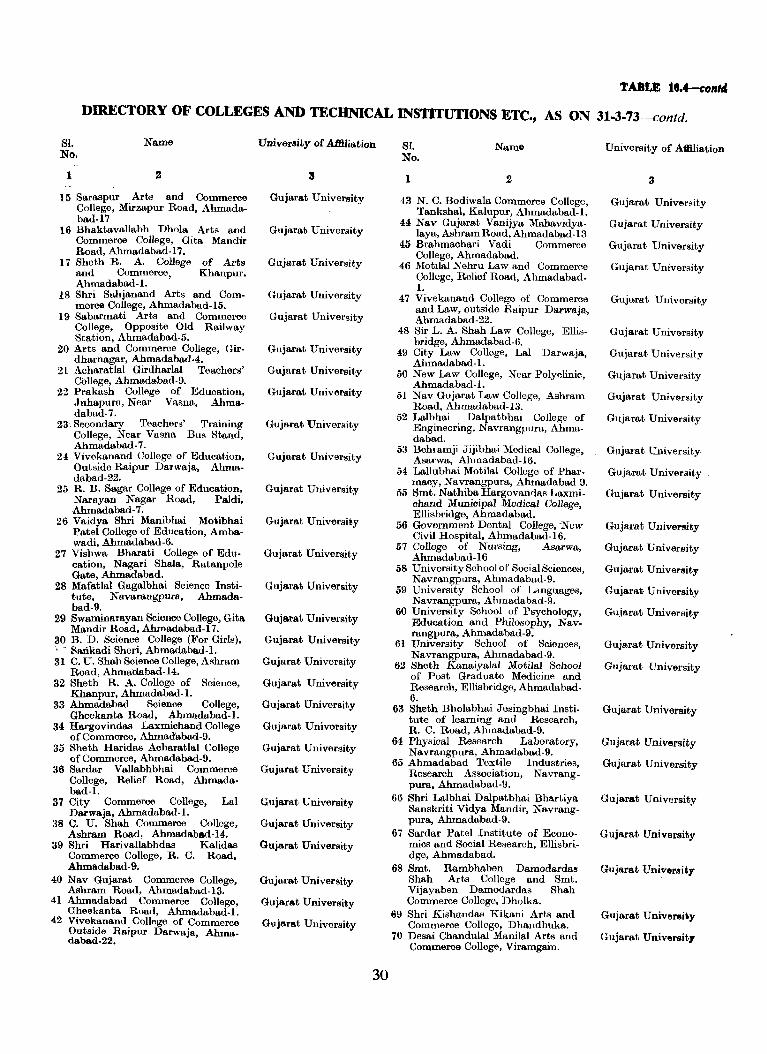
DIRECTORY OF COLLEGES AND TECHNICAL INSTITUTIONS ETC., AS ON 31~3.73-contd.
SI. No.
Name University of ABiliatioD
1 2
15 Saraspur Arts and Commerce Gujarat University College, Mirzapur Road, Ahmada-bad·17
16 Bhaktavallabh Dhola Arts and Gujarat University Commerce College, Gita Mandir Road, Ahmadabad-I7.
17 Sheth R. A. College of Arts Gujarat University and Commerce, Khanpur, Ahmadabad-I.
18 Shri Sahjanand Arts and Com- Gujarat University merce College, Ahmadabad-15.
19 Sabarmati Arts and Commerce Gujarat University College, Opposite Old Railway Station, Ahmadabad-5.
20 Arts and Commerce College, Gir- Gujarat University dharnagar, Ahmadabad-4.
21 Acharatlal Girdharlal Teachers' Gujarat University College, Ahmadabad-9.
22 Prakash College of Education, GujarBt University Juhapura, Near Vasna, Ahma· dabad-7.
23. Secondary Teachers' Training Gujarat University College, Near Vasna Bus Stand, . Ahmadabad-7.
24 Vivekanand College of Education, Gujarat University Outside Raipur Darwaja. Ahma-dabad-22.
25 R. B. Sagar College of Education, Gujarat University Narayan Nagar Road, PaJdi, Ahmadabad-7.
26 Vaidya Shri Manibhai Mo.ibhai Gujarat Universi.y Patel College of Education. Amba-wadi. Ahmadabad-6.
27 Vishwa Bharati College of Edu- Gujarat University cation, Nagari Shala, Ratanpole Gate. Ahmadabad.
28 Mafatlal Gagalbhai Science Insti- Gujarat University tute, Navarangpurs., Ahmada-bad-9.
29 Swaminarayan Science COllege. Gita Gujarat University Mandir Road, Ahmadabad-I 7.
30 B. D. Science College (For Girls), Gujarat University .. SaIikadi Sheri, Ahmadabad-I. 31 C. U. Shah Science College, Ashram Gujarat University
Road, Ahmadabad-I4. 32 Sheth R. A. College of Science, Gujarat University
Khanpur, Ahmadabad-I. 33 Ahmadabad Science College, Gujarat University
Gheekanta Road, Ahmadabad-I. 34 Hargovindas Laxmichand College Gujarat University
of Commerce, Ahmad'abad-9. 35 Sheth Haridas Acharatlal College Gujarat University
of Commerce. Ahmadabad-9. 36 Sardar Vallabhbhai Commerce Gujarat University
College. Relief Road, Ahmada-bad-l.
37 City Commerce College, Lal Gujarat University Darwaja, Ahmadabad-I.
38 C. U. Shah Commerce College, Gujarat University Ashram Road, Ahmadabad-H.
39 Shri Harivallabhdas Kalidas Gujarat University Commerce College, R. C. Road, Abmadabad-9.
40 Nav Gujarat Commerce College, Gujarat University Ashram Road, Ahmadabad-13.
41 Ahmadabad Commerce College, Gujarat University Gheekanta Road, Ahmadabad-I.
42 Vivekanand College of Commerce Gujarat University Outside Raipur Darwaja, Ahma-dabad-22.
30
SI. No.
1
Name
2
University of Aililiation
3
43 N. C. Bodiwala Commerce College, Gujarat University Tankshal, Kalupur, Ahmadabad-I.
44 Nav Gujarat Vanijya Mahavidya- Gujarat University laya, Ashram Road, Ahmadab.ad-I3
45 Brahmachari Vadi Commerce Gujarat University College, Ahmadabad.
46 Motilal Nehru Law and Commeme Gujarat University College, Relief Road, Ahmadabad-1.
47 Vivekanand College of Commerce Gujarat University and Law, outside Raipur Darwaja, Ahmadabad-22.
48 Sir L. A. Shah Law College, Ellis- Gujarat University bridge, Ahmadabad-6.
49 City Law College, Lal Darwaja, Guiarat University Ahmadabad-I.
50 New Law College, Near Polydinic, Gujarat University Ahmadabad-l.
51 Nav Gujarat Law College, Ashram Gujarat University Road, Ahmadabad-13.
52 Lalbhai Dalpatbhai College of Gujarat University Engineering, Navrangpura, Ahma-dabad.
53 Behmmji Jijibhai Medical Colleg"" G!ljarat University Asarwa, Ahmadabad-16.
54 Lallubhai Motilal College of Phar- Gujarat University maoy, Navrangpura, Ahmadabad 9.
55 Smt. Nathiba Hargovandas Laxmi. Gujarat University chand Municipal Medical College, Ellisbridge, Ahmadabad.
56 Government Dental College, 'New Gujarat University Civil Hospital, Ahmadabad-I6.
57 College of Nursing, Asarwa, Gujarat University Ahmadabad-I6
58 University School of Social Sciences, Gujarat University Navrangpura, Ahmadabad-9.
59 University School of Languages, Gujarat University Navrangpura, Ahmadabad-9.
60 University School of Psychology, Gujarat University Education and Philosophy, Nav-rangpura, Ahmadabad-9.
61 University School of Sciences, Gujarat University Navrangpura, Ahmadabad-9.
62 Sheth Kanaiyalal Motilal School Gujarat University of Post Graduate Medicine and Research, Ellisbridge, Ahmadabad-6.
63 Sheth Bholabhai Jesingbhai Insti- Gujarat University tute of learning and Research, R. C. Road, Ahmadabad-9.
64 Physical Research Laboratory, Gujarat University Navrangpura, Ahmadabad-9.
65 Ahmadabad Textile Industries, Gujarat University Research Association, Navrang-pura, Ahmadabad-9.
66 Shri Lalbhai Dalpatbhai Bhartiya Gujarat University Sanskriti Vidya Mandir, Navrang-pura, Ahmadabad-9.
67 Sardar Patel Institute of Econo- Gujarat University mics and Social Research, Ellisbri-dge, Ahmadabad.
68 Smt. Rambhaben Damodarda.!l Gujarat University Shah Arts College and Smt. Vijayaben Damodardas Shah Commerce College, Dholka.
69 Shri Kishandas Kikani Arts and Gujarat UniversilY Commerce College, Dhandhulm.
70 Desai Chandulal Manilal Arts and Gujarat University Commerce College, Viramgam.
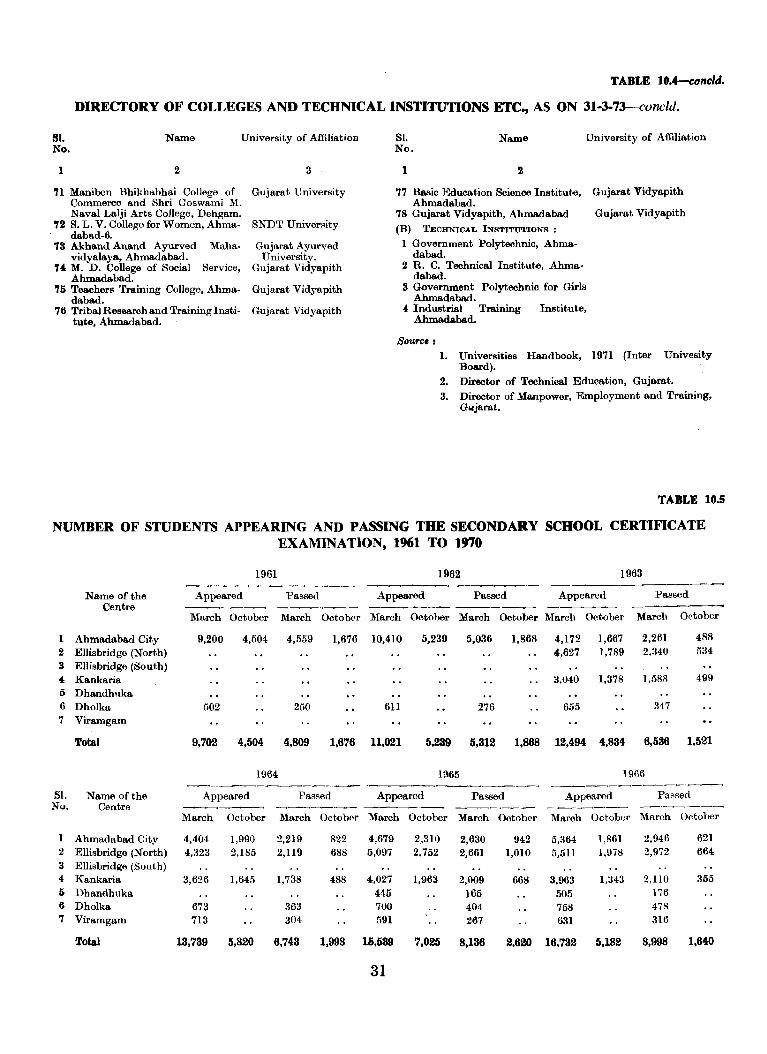
TABLE IO.4-cl)ncld.
DIRECTORY OF COLJ_.,EGES AND TECHNICAL INSTITUTIONS ETC., AS ON 31-3-73-concld.
Sl. No.
Name University of Affiliation
1 2
n Maniben Bhikhabhai College of Commerce and Shri Goswami M. Naval Lalji Arts College, Dehgam.
'1'2 S. L. V. College for Women, Ahma· dabad·6.
73 Akhand Anand Ayurved Maha· vidyalaya, Ahmadabad.
'1'4 M. D. College of Social Service, Ahmadabad.
'15 Teachers Training College, Ahma· dabad'
76 Tribal Research and Training Institute, Ahmadabad.
3
Gujarat University
SNDT U niverRity
Gujarat Ayurved University.
Gujarat Vidyapith
Gujarat Vidyapith
Gujarat Vidyapith
Sl. No.
Name University of Affiliation
1 2
77 Basic Education Science Institute, Gujarat Vidyapith Ahmadabad.
78 Gujarat Vidyapith, Ahmadabad Gujarat Vidyapith
(B) TEOHNICAL INSTITU'l'IONS :
1 Government Polytechnic, Ahmadabad.
2 R. C. Technical Institute, Ahmadabad.
3 Government Polytechnic for Girls Ahmadabad.
4, Industrial Training Institute, Ahmadabad.
Sou,.ce: 1. Universities Handbook, 1971 (Inter Univesity
Board).
2. Director of Technical Education, Gujarat.
3. Director of Manpower, Employment and Training, Glljarat.
TABLE I4I.S
NUMBER OF STUDENTS APPEARING AND PASSING THE SECONDARY SCHOOL CERTIFICATE EXAMINATION, 1961 TO 1970
1961 1962 1963 -------------_.-
Name of the Appeared Passe!i Appeared Passed Appeared Passed Centre ----~-- ------~ ------- -------- ------ ------~-
March October March October March October Ma.rch October March October March October
1 Ahmadabad City 9,200 4,504 4,559 1,676 10,410 5,239 5,036 1,868 4,172 1,667 2,261 488
2 Ellisbridge (North) 4,627 1,789 2,340 534
3 Ellisbridge (South) 4 Kankaria 3,040 1,378 1,58S 499
5 Dhandhuka 6 Dholka 502 250 611 276 655 347 7 Viramgam
Total 9,702 4,504 4,809 1,676 11,021 5,239 5,312 1,868 12,494 4,834 6,536 1,521
1964 1l'65 1966 --------------- - ---------------
Sl. Name of the Appeared Passed Appeared Passed Appeared Passed No. Centre ----~-- ------- ---_.-- ------- ------- __ ---..----... __ ..-.0 __
March October March October March October March October March October March October
Ahmadabad City 4,404 1,990 2,219 822 4,679 2,310 2,630 942 5,364 1,861 2,946 621 2 Ellisbridge (North) 4,323 2,185 2,119 688 5,097 2,752 2,661 1,010 5,511 1,978 2,972 664 3 Ellisbridge (South) 4 Kankaria 3,626 1,64fi 1,738 488 4,027 1,963 2,009 668 3,963 1,343 2,110 355 l) Dhandhuka 445 165 505 176 6 Dholka 673 363 700 404 758 478 7 Viramgam 713 304 591 267 631 316
Total 13,739 5,820 6,743 1,998 16.539 7,025 8,136 2,620 16,732 5,182 8,998 1,640
31

,
TABLE 18.S-concld.
NUMBER OF STUDENTS APPEARING AND PASSING THE SECONDARY SCHOOL CERTIFICATE EXAMINATION, 1961 TO 197O-concld.
1967 1968 -------------------- ---~-----
81. Name of the Appeared Passed Appeared Passed No. Centre --'--~-- --------- --------- ___.-__,--.-----~-
March October March October March October March October
1 Ahmadahad City 5,662 2,115 3,242 674 6,246 2,259 3,675 656 ! Ellisbridge (North) 6,056 2,489 3,340 733 7,106 2,442 4,008 850 3 Ellisbridge (South) 4 Kankaria 4,206 1,495 2,376 463 4,362 1,569 2,517 526 (, Dhandhuka 535 213 598 270 6 Dholka 791 420 930 284 564 72 7 Viramgam 573 321 612 333
Total 17,823 6,099 9,912 1,870 19,854 6,554 11,367 2,104
1969 1970 Name of the --------------------- ---------------------
81. Centre Appeared Passed Appeared Passed No. -------- ------- --------- --------
March October March October March October March October
1 Ahmadabad City 6,890 1,750 4,144 662 7,028 2,275 3,nIl 913 2 Ellisbridge (North) 3,322 625 1,910 293 2,493 811 1,395 318 3 Ellisbridge (South) 4,511 1,522 2,461 600 4,306 1,406 2,354 493 4 Kankaria 4,616 1,141 2,500 405 5,166 1,972 2,602 680 5 Dhandhuka 574 243 544 279 6 Dholka 956 212 551 75 1,026 278 543 83 7 Viramgam 674 378 711 440
Total 21,462 5,250 12,187 2.035 21,274 6,742 11,524 2,487.
Note: Source:
The centres against which - is shown were not in existence The Seconclary School Certificate Examination Board, during the relevant year. Vadodara.
Year
1960-61
1965-66
1969-70
Note:
TABLE 10.6
ENROLMENT OF STUDEN'fS IN CLASSES I TO V, VI TO VIII AND IX TO XI WITH PERCENTAGE BY SEX TO ITS CORRESPONDING ESTIMATED
POPULATION WlmlN AGE GROUPS 6 TO 11, 11 TO 14 AND 14 TO 17 RESPECTIVELY
Enrolment in Std. Percentage of the I-V age group 6-11
Enrolment in Percentage of Enrolment in Std. Percentage of Std. VI-VIII the agc group IX-XT t,he age group
11-14 14-17
-------- --------- ___ ----'_-------..---------.. -----...--~~- ------- --~-__.--
Boys Girls Total Boys Girls Total Boys Girls Total Boys Girls Total Boys Girls Total Boys Girls Total
2 3 4 5 6 7 8 9 10 11 12 13 14 15 16 17 18 19
1,56,846 1,00,544 2,57,390 94 68 82 38,417 19,336 57,753 52 32 43 20,681 9,263 29,944 31 17 25
2,00,885 1,33,069 3,33,954 117 86 103 60,257 36,564 96,821 61 44 56 36,611 20,970 57,581 44 27 36
2,11,577 1,47,118 3,5S,893 103 83 94 07,811 42,512 1,10,323 63 45 55 42,323 25,O~2 67,365 42 28 36
Source:
Qandhinagar was inclu(lecl in Ahmadabad and Mal18sana Districts during the year 1960-61 and J 965- 66.
Dir"ctorate of Education, Gujarat.
32
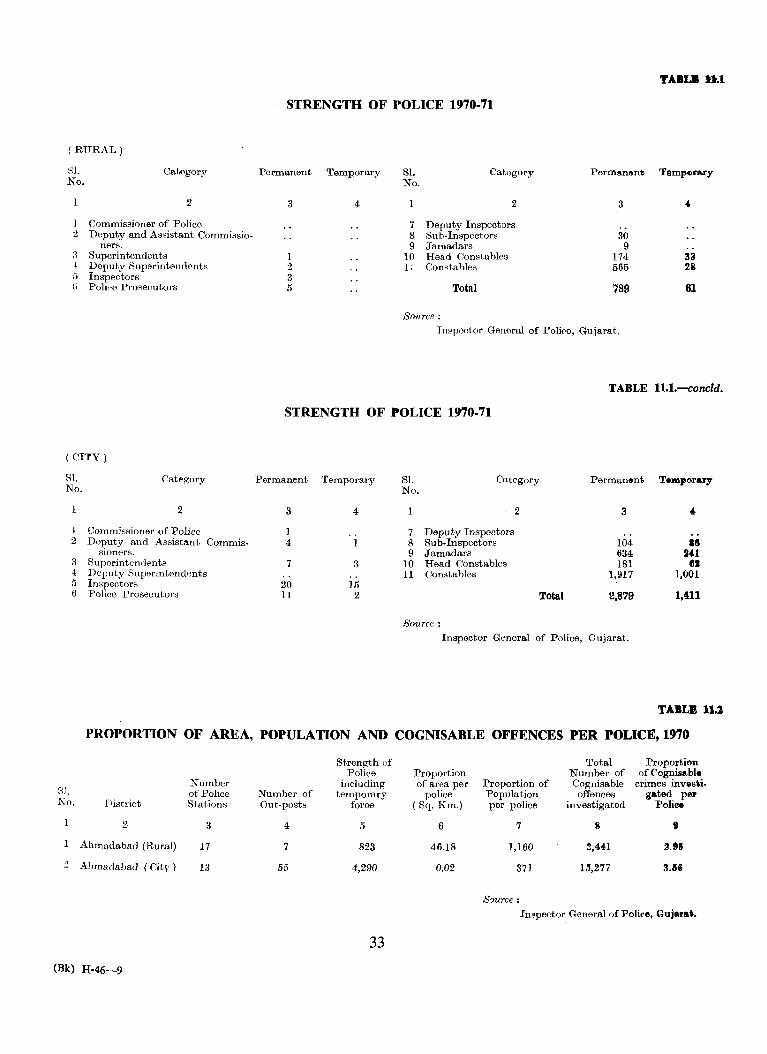
(RURAL)
Sl. No.
Category
2
Commissioner of Police 2 Deputy and Assistant Commissio-
ners. :1 Superintendents t Deputy Superintendf'nts " Inspectors (i Poli"e Prosecutors
( CITY)
Sl. Category No.
2
Commissioner of Police 2 Deputy and Assistant Commis-
SlOners. 3 Superintendents 4 Deputy Superintendents 5 Inspectors 6 Police Prosecutors
STRENGTH OF POLICE 1970-71
Permanent Temporary
3
2 3 5
4
81. No.
7 8 9
10 L
Category
2
Deputy Inspectors Rub-Inspectors Jamadars Head Constables Constables
Total
Source:
3
30 9
174 565
789
Inspector General of Police, Gujarat.
TABU 1l.1
33 28
61
TABLE 1l.1.-concld.
STRENGTH OF POLICE 1970-71
Permanent Temporary 81. No.
Category
3
1 4
7
20 11
4 1
7 Deputy Inspectors 8 Sub-Inspectors 9 Jamadars
:l 10 Head Constables 11 Constables
15
2
2 Total
Source:
Perman<9nt
3
104 634 181
1,917
2,879
Inspector General of Police, Gujarat.
Temporuy
• •• 24.1 61
1,001
1,411
TABLE J:U
PROPORTION OF AREA, POPULATION AND COGNISABLE OFFENCES PER POLICE, 1970
Strength of Total Proportion Police Proportion Number of of Cognis&ble
Number including of area per Proportion of Cognisable crimes invesii. Sl. of Police Number of temporary police Population offences gated pe:r :1\0. District Stations Out-post,s force (Sq. Km.) per police investigated Police
2 3 4 5 6 7 8 t
Ahmadabad (Rural) 17 7 823 46.18 1,160 2,441 !U5
2 Ahmadabad (CitV) 13 55 4,290 0.02 371 11l,277 3.66
S')urce:
Inspector General of Police, Gujar •••
33
(Bk) H-46-9
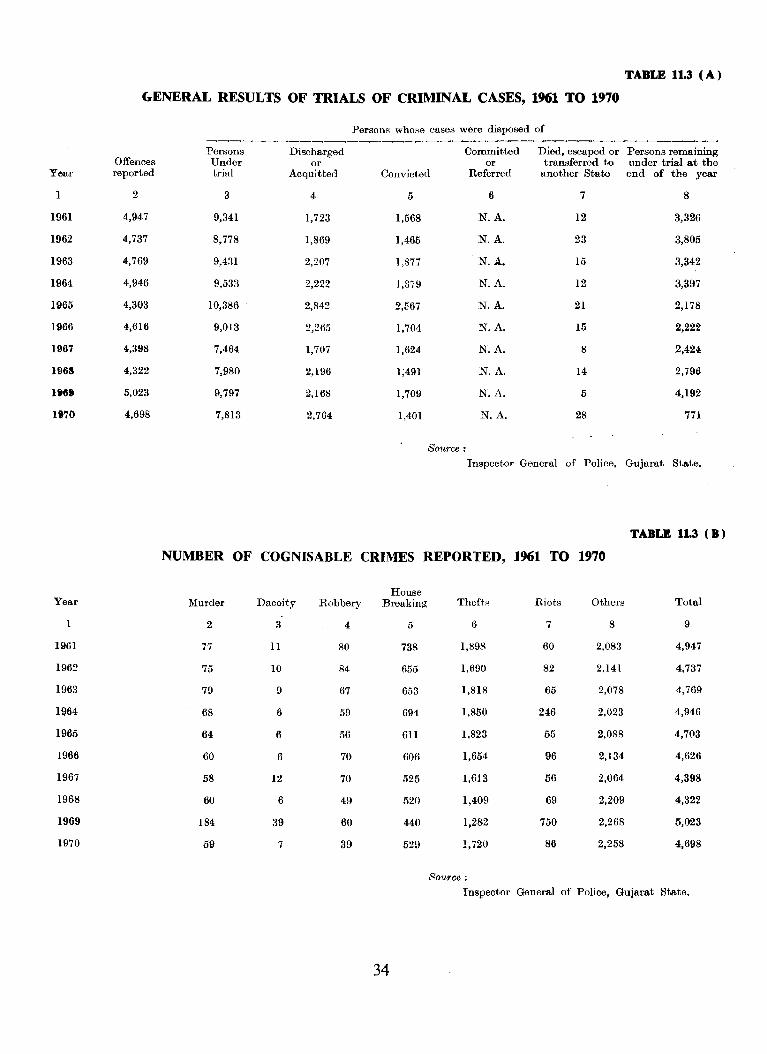
Year
1
1961
1962
1963
1964
1965
1966
1967
1965
lie. 1870
Year
1
1961
1962
1963
1964
1965
1966
1967
1968
1969
1970
TABLE 11.3 (A)
~ENERAL RESULTS OF TRIALS OF CRIMINAL CASES, 1961 TO 1970
Persons who;;e cases were disposed of -----------------__.----~
Persons Discharged Committed Died, escaped or Persons remaining Offences Under or or transferred to nnder trial at the reported trial Acquitted Convicted Referr(ld another State end of the year
2 3 4 5 6 7 8
4,947 9,341 1,723 1,568 N.A. 12 3,326
4,737 8,778 1,869 1,465 N.A. 23 3,805
4,769 9,431 2,207 1,877 N.A. 15 3,342
4,946 9,533 2,222 1,879 N.A. 12 3,397
4,303 10,386 2,842 2,567 N.A. 21 2,178
4,616 9,013 2,265 1,704 N.A, 15 2,222
4,398 7,464 1,707 1,624 N.A. 8 2,424
4,322 7,980 2,196 1;491 N.A. 14 2,796
5,023 9,797 2,168 1,709 N.A. 5 4,192
4,698 7,813 2,764 1,401 N.A. 28 771
Source:
Inspector General of Police, Gujarat State.
TABLE 11.3 (B)
NUMBER OF COGNISABLE CRIMES REPORTED, 1961 TO 1970
House Murder Dacoity Robbery Breaking Thefts Riots Others Total
2 3 4 5 6 7 8 9
77 11 80 738 1,898 60 2,083 4,947
75 10 84 655 1,690 82 2,141 4,737
79 9 67 653 1,818 65 2,078 4,769
68 6 59 694 1,850 246 2,023 4,946
64 6 56 6Il 1,823 55 2,088 4,703
60 6 70 606 1,654 96 2,134 4,626
58 12 70 525 1,613 56 2,064 4,398
60 6 49 520 1,409 69 2,209 4,322
184 39 60 440 1,282 750 2,268 5,023
59 7 39 529 1,720 86 2,258 4,698
Source;
Inspector General of Police, Gujarat State.
34
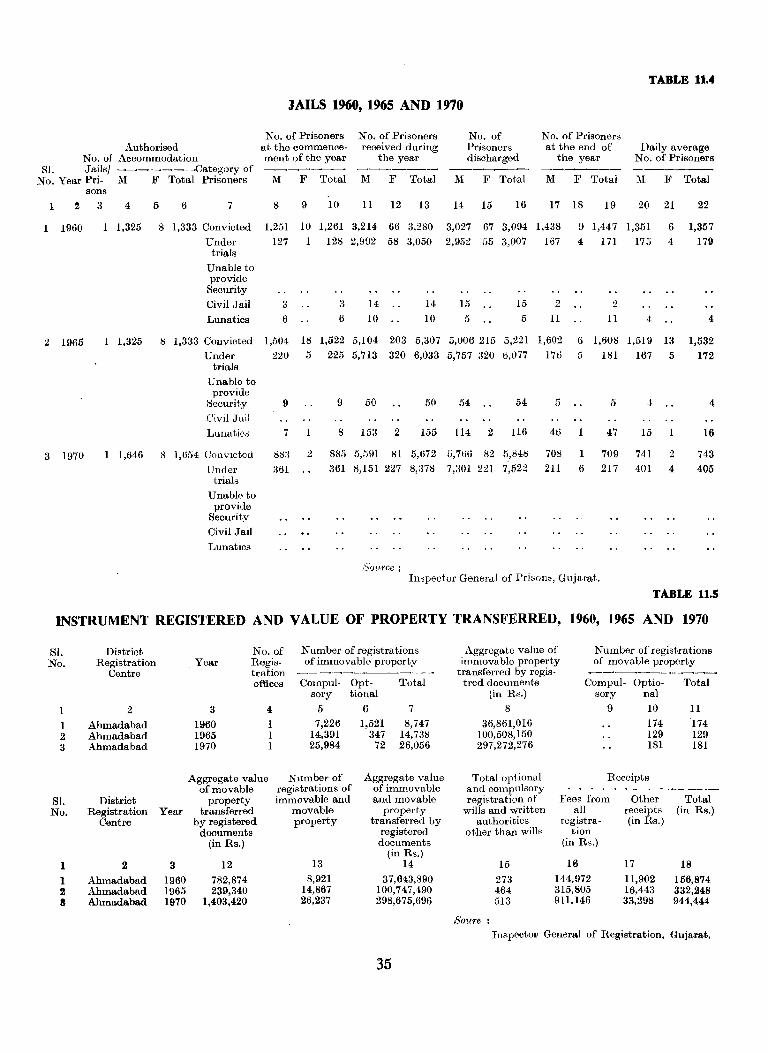
TABLE 11.4
JAILS 1960, 1965 AND 1970
Authorised No. of Accommodation
No. of Prisoners at the commence· ment of the year
No. of Prisoners received during
the year
No. of Prisoners discharged
No. of Prisoners at the end of
the year Daily average
No. of Prisoners Sl. J ailsl -~----~Category of
No. Year Pri·;\1 F Total Prisoners M F Total M F Total M F Total M F Total 1\1 F Total sons
1 4 5
1960 1 1,325
2 1965 1 1,325
3 1970 1 1,646
6 7
8 1,333 Convicted
Under trials
Unable to provide
Security
Civil Jail
Lunatics
8
1.251
127
3
6
8 1,333 Convicted 1,504
Under 220 trials
Unable to provide
8ecurity 9 Civil Jail
Lunaticci
8 1,654 COllvicted
LInder trials
Unable to provide
Security
Civil Jail
Lunatics
7
88:>
361
9 10 11 12 13 14 15 16 17 18 19 20 21
10 1,261 3,214 66 3,280
128 2,992 58 3,050
3
6
14
10
14
10
3,027 67 3,094 1,438
2,952 55 3,007 167
15
5
15
5
2
11
18 1,522 5,104 203 5,307 5,006 215 5,221 1,602
5 225 5,713 320 6,033 5,757 320 6,077 176
9 50 50 54 54 5
9 1,447 1,351
4 171 175
11 4
6
4
6 1,608 1,519 13
5 181 167 5
5 4
8 153 2 155 114 2 116 46 1 47 15
2 885 5,591 81 5,672 5,766 82 5,848 708 1 709 741
361 8,151 227 8,:378 7,301 221 7,522 211 6 217 401
Iuopector Geneml of Prison" Gujarat.
2
4
22
1,357
179
4
1,532
172
4
16
743
405
TABLE 11.5
INSTRUMENT REGISTERED AND VALUE OF PROPERTY TRANSFERRED, 1960, 1965 AND 1970
Sl. No.
1
1 2 3
Sl. No.
1 1 2 S
District Registration
Centre
2
Ahmadabad Ahmadabad Ahmadabad
District Registration
Centre
2
Ahmadabad Ahmadabad Ahmadabad
Year
3
1960 1965 1970
Year
3
1960 1965 1970
No. of Regis. tration offices
4
1 1 1
Number of registrations of immovable property
Compul. Opt. sory tional
5 6
7,226 14,391 25,984
1,521 347
72
Total
7
8,747 14,738 26,056
Number of Aggregate value Aggregate value of movable registrations of of immovable
property immovable and and movable transferred movable property
by registered property transferred by doouments registered
(in Rs.) documents (in Rs.)
12 13 14
782,874 8,921 37,643,890 239,340 14,867 100,747,490
1,403,420 26,237 298,675,696
35
Aggregate value of immovable property
transferred by regis. tred documents
Number of registrations of movable property
(in RS.)
8
36,861,016 100,508,150 297,272,276
Total optional and compulsory regiBtration of
wills and written authorities
other than wills
15
273 464 513
Satire
Compul. Optio· Bory ual
9 10
174 129 181
Receipts
Total
11
174 129 181
_4 ____ -...... __________
Fees from Other Total all receipts (in Rs.)
registra. (in Rs.) tion
(in Rs.)
Hi 17 18 144,972 11,902 156,874 315,805 16,443 332,248 911,146 33,298 944,444
InspectoJ) General of Registration, Gujarat,
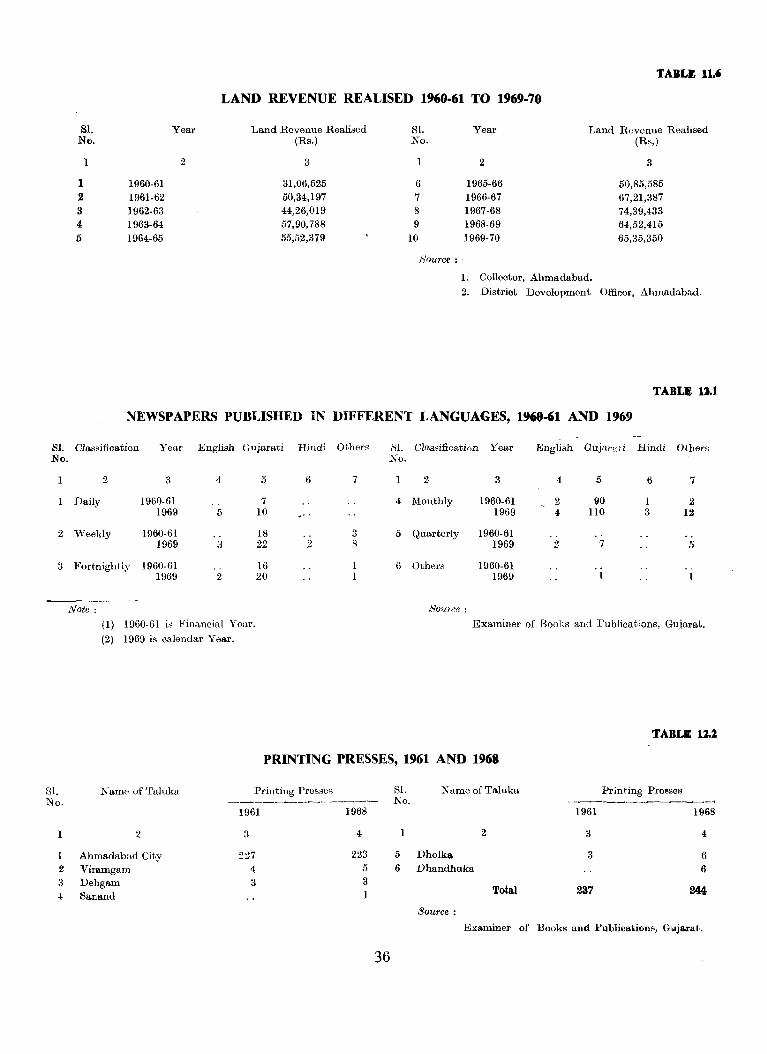
TABLE II.'
LAND REVENUE REALISED 1960-61 TO 1969-70
SI. Year Land Revenue Realised No. (Rs.)
1 2 3
1 1960-61 31,06,525 2 1961-62 50,34,197 3 1962-63 44,26,019 4 1963-64 57,90,788
5 1964-65 55,52,379
Sl. No.
6 7 8 9
10
Source:
Year
2
1965-66 1966-67 1967-68 1968-69 1969-70
Land Revenue Realised (Rs,)
3
50,85,585 67,21,387 74,39,433 64,52,415 65,35,350
1. Collector, Ahmadabad.
2. District Development Officer, Ahmadabad.
TABLa 11.1
NEWSPAPERS PUBLISHED IN DIFFERENT LANGUAGES, 1968-61 AND 1969
Sl. Classification Year English Gujarati Hindi Others 81. Classification Year English Gujarc:ti Hindi Others No. No.
1 2 3 4 5 6 7 2 3 4 5 6 7
Daily 1960-61 7 4 Monthly 1960-61 2 90 1 2 1969 5 10 " . 1969 4 110 3 12
2 Weekly 1960-61 18 3 5 Quarterly 1960-61 1969 3 22 2 8 1969 2 7 5
:1 Fortnightly 1960·61 16 6 Others 1960-61 1969 2 20 1969
Note: Source:
(1) 1960·61 is Financial Ycar. Examiner of Books and l'ublications, GU,jarat.
(2) 1969 is caiemlar Year.
TABLE 11.2
PRINTING PRESSES, 1961 AND 1968
81. No.
Name of Taluka
1 2
Ahmadabad Cit,y 2 Viramgam 3 Dehgam 4 Sanand
Printing Presses
1961
3
227 4 3
1968
4
223 5 3 1
36
Sl. No.
5 6
Nam~ of Taluka Printing Presses
1961 1968
2 3 4
Dholka 3 6 Dhandhuka 6
Total 237 244
Source:
Examiner of Books and Publications, Guju.rat.
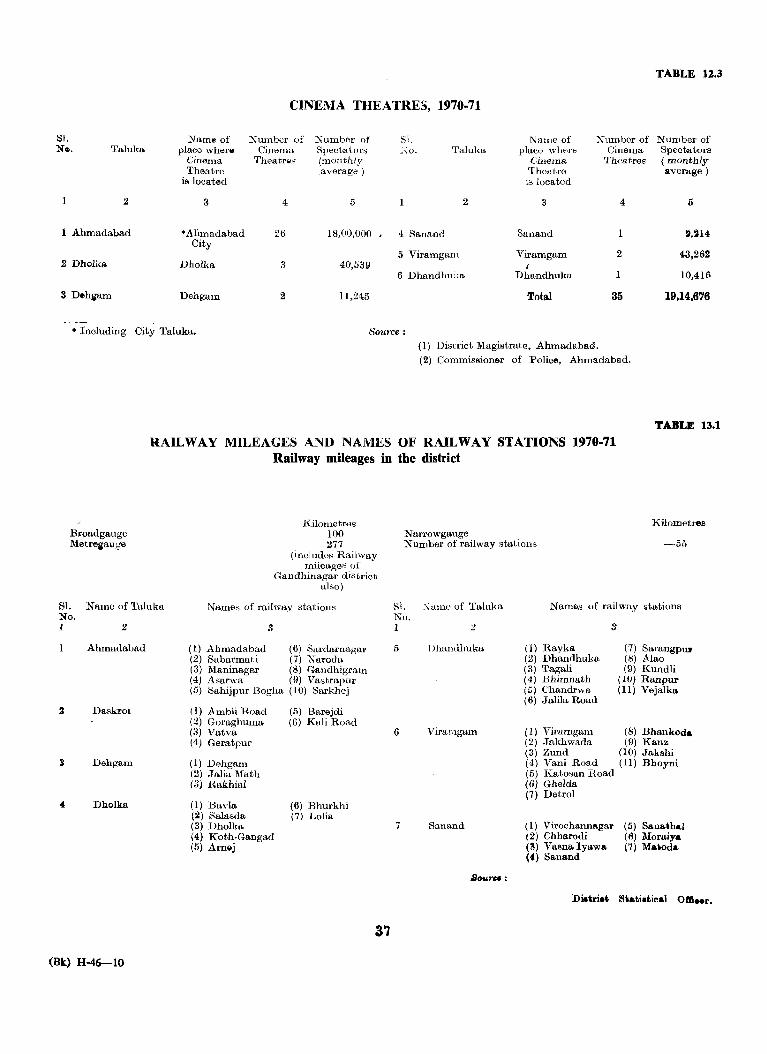
TABLE 12.3
CINEMA THEATRES, 1970-71
Sl. Nam ... of ~umbcr of ;\"umber of 151. Name of ~umber of Number of N". Taluka place wh .. r .. CineIIlu Spectator" =·,0. Taluka place wh,.,.e Cinema Spectators
Cinema Theatr .. s (monthly Cinema Theatres (monthly Theatre ,average) Theatre average)
is located is located
2 3 4 5 2 3 4 5
1 Ahmadabad "Ahmadabad 26 18,00,000 4 Sanand Sanand 1 ',214 City
2 Dholka 5 Viramgam Viramgam 2 43,262
Dholka 3 40,5311 I 6 DhandllU"a Dhandhuka 1 10,416
Dehgam 2 11,245 Total 35 19,14,676
* Including City Taluka. Source: (1) Discrict Magiijtrate. Ahmadabad.
(2) Commissioner of Police, Ahmadabad.
TABLE 13.1
RAILWAY MILEAGES AND NAMES OF RAILWAY STATIONS 1970-71 Railway mileages in the district
Broadgauge Metregauge
81. Name of Taluka No. 1 2
Ahmadabad
Daskroi
Dahgam
Dholka
(Bk) H~lO
Kilometres 100 277
(includes Railway mileages of
Gandhinagar district also)
Names of railway stations
(1) Ahmadabad (2) Sabarmati (3) Maninagar (4) Asarwa
3
(5) Sahijpur Bogha
( I) Arnbli Road (2) Goraghuma. (3) Vatva (4) Geratpur
(1) Dehgam (2) Jalia Math (3) Rakhial
(I) Bavla (!iI) Salasda (3) Dhollm (4) Koth.Gangad (5) Arnej
(6) Sardarnagar (7) Naroua (8) Gandhigram (!I) Vastrapur (10) Sarkhej
(5) Barejdi (6) Kali Road
(6) Bhurkhi (7) Lolia
37
Kilometres Narrowgauge Number of railway stations --55
Sl. r, ",me of Taluka No. 1 2
I) Dhandhuka
6 Viraragam
7 Sanand
,so"rc. :
Nam,,:; of railway stations
(I) Ravka (2) Dhandhuka (3) Tagali (4) Bhimllitth (t) Chandrwa (6) Jalila Road
3
(7) SarangpUl' (8) Mao (9) Kundli
(10) Ranpur (11) Vejalka
(1) Viramgarn (8) Bhankoda (2) .Takhwada (9) Kanz (3) Zund (10) Jakshi (4) Vani Road (U) Bhoyni (5) Katosan Road (6) Ghelda (7) Detrol
(I) Virochanlll"gar (2) Chharodi (~) Vasna Iyawa (4) Sanand
(5) Sana.h.l (6) Moraiya (7) Maloda
Diliiri., Si.ti.tieaI om .. r.
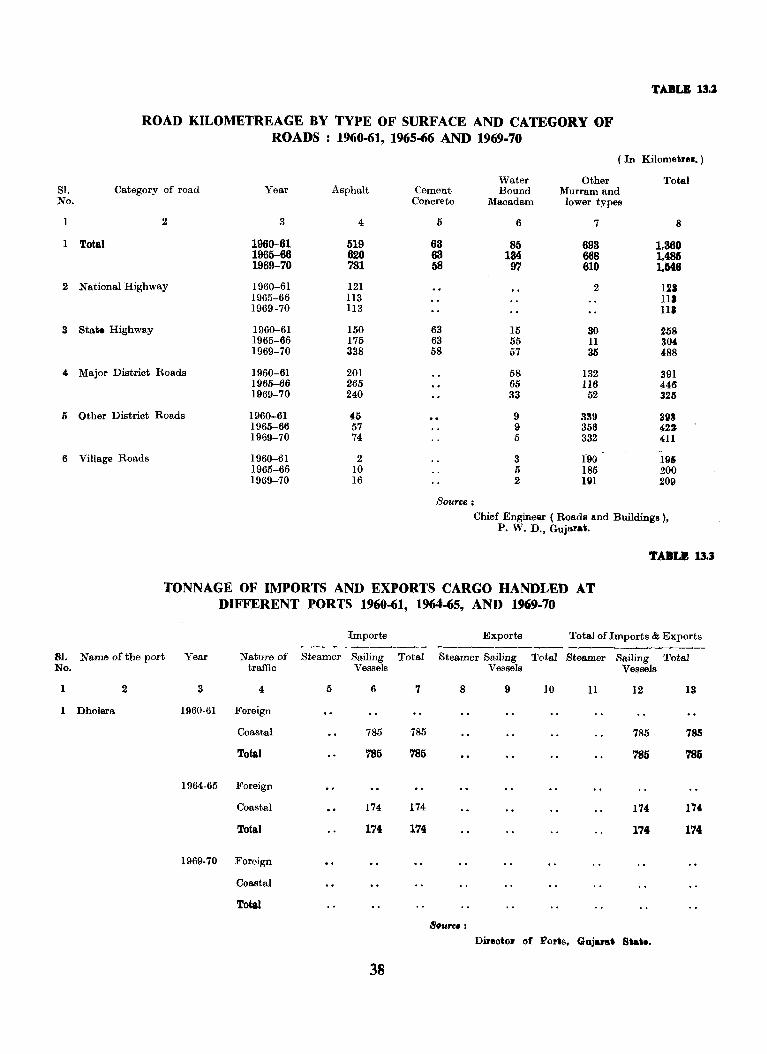
S1. No.
1
1
2
3
4
5
6
81. No.
1
1
TABLE 13.2
ROAD KILOMETREAGE BY TYPE OF SURFACE AND CATEGORY OF ROADS : 1960-61, 1965-66 AND 1969-70
(In Kilometre •• )
Water Other Total Category of road Year Asphalt Cement Bound Murram and
Concrete Macadam lower types
2 3 4 5 6 7 8
Total 1960-61 519 63 85 693 1,360 1965-66 620 63 134 668 1,486 1969-70 781 58 97 610 1,1548
National Highway 1960-61 121 2 12S 1965-66 113 111 1969-70 113 UI
State Highway 1960-61 150 63 15 30 258 1965-66 175 63 55 11 304, 1969-70 338 58 57 35 488
Major District Roads 1960-61 201 58 132 391 1965-66 265 65 116 446 1969-70 240 33 52 325
Other District Roads 1960-61 45 9 339 S93 1965-66 57 I} 356 422-1969-70 74 5 332 411
Village Roads 1960-61 2 3 f90 195 1965-66 10 5 185 200 1969-70 16 2 un 201)
Sour~e ; Chief Engineer ( RQads and Buildings ),
P. W. D., Guj~Ai.
TABU 13.3
TONNAGE OF IMPORTS AND EXPORTS CARGO HANDLED AT DIFFERENT PORTS 1969-61, 1964-65, AND 1969·70
Imports Exports Total of Imports & Exports
----------------Name of the port Year Nature of Steamer Sailing Total Steamer Sailing Total Steamer Sailing Total
traffic Vessels Vessels Vessels
2 3 4 5 6 7 8 I) 10 11 12 13
Dholera 1960-61 Foreign
Coastal 785 785 785 785
Total 785 785 785 785
1964-65 Foreign
Coastal 174 174 174 174,
Total 174 174 174 174
1969-70 Foreign
Coastal
Total
Sou,," ;
Director of Poris, Guj .... &t Siai •.
38
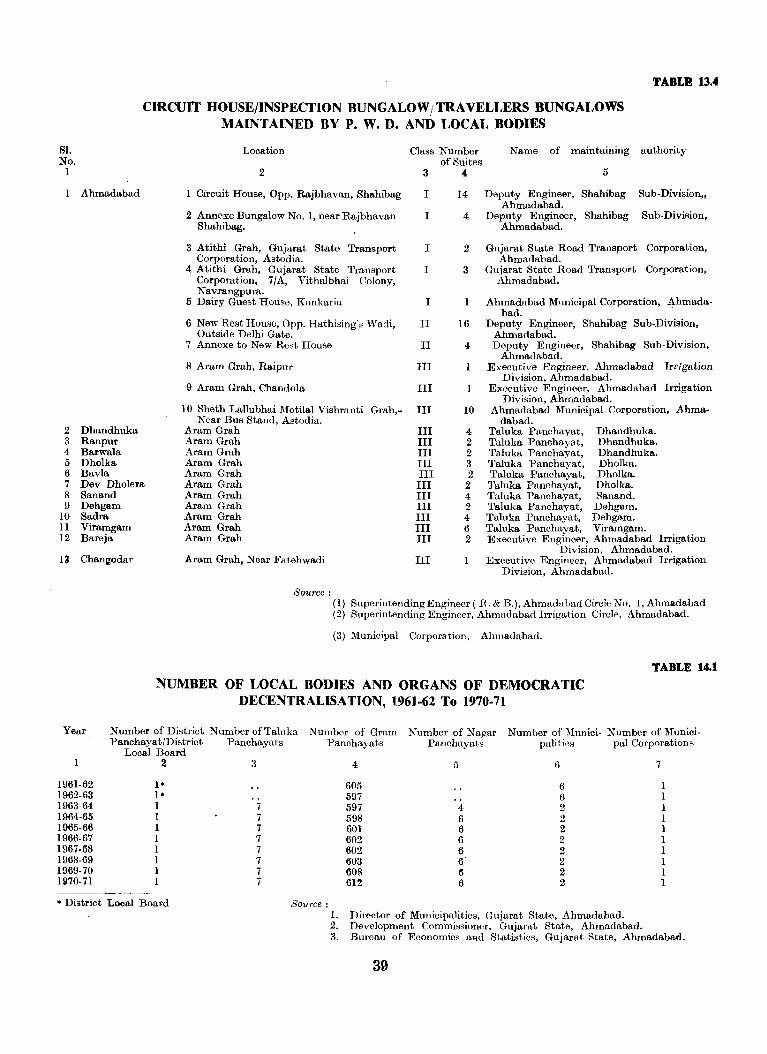
Sl. No.
1
1 Ahmadabad
2 Dhandhuka 3 Ranpur 4 Barwala 5 Dholka 6 Bavla
TABLe 13.4
CIRcun HOUSE/INSPECTION BUNGALOW I TRA VELLERS BUNGALOWS MAINTAINED BY P. W. D. AND LOCAL BODIES
Location Class Number of Suites
Name of maintaining authority
2 3 4, 5
Circuit House, Opp. Rajbhavan, Shahibag
2 Annexe Bungalow No.1, near Rajbhavan Shahibag.
I
I
3 Atithi Grah, Gujarat State Transport I Corporation, Astodia.
4 Atithi Grah, Gujarat State Transport I Corporation, 7/A, Vithalbhai Colony, Navrangpura.
5 Dairy Guest House, Kankaria I
6 New Rest House, Opp. Hathising'8 Wadi, II Outside Delhi Gate.
7 Annexe to New Rest House II
8 Aram Grah, Raipur III
9 Aram Grah, Chandola III
10 Sheth Lallubhai Motilal Vishranti Grah,- III Near Bus Stand, Astodia.
Aram Grah III Aram Grah III Aram Grah III Aram Grah III Aram Grah III
14 Deputy Engineer, Shahibag Sub.Division" Ahmadabad.
4 Deputy Engineer, Shahibag Sub-Division, Ahmadabad.
2 Gnjarat State Road Transport Corporation, Ahmadabad.
3 Gujarat State Road Transport Corporation, Ahmadabad.
Ahmadabad Municipal Corporation, Ahmadabad.
16 Deputy Engineer, Shahibag Sub-Division, Ahmadabad.
4 Deputy Engineer, Shahibag Sub-Division, Ahmadabad.
Executive Engineer, Ahmadabad Irrigation Division, Ahmadabad.
Executive Engineer, Ahmadabad Irrigation Division, Ahmadabad.
10 Ahmadabad Municipal Corporation, Ahma-dabad.
4 Taluka Panchayat, Dhandhuka. 2 Taluka Panchayat, Dhandhuka. 2 Taluka Panchayat, Dhandhuka. 3 Taluka Panchayat, Dholka.
7 Dev Dhole:ra Aram Grah III 2 Taluka Panchayat, Dholka.
2 Taluka Panchayat, Dholka. 8 Sanand 9 Dehgam
10 Sadra 11 Viramgam 12 Bareja
U Changodar
Aram Grah III Aram Grah III Aram Grah III Aram Grah III Aram Grah III
Aram Grah, Near Fatehwadi III
Source:
4 Taluka Panchayat, Sanand. 2 Taluka Panchayat, Dehgam. 4 Taluka Panchayat, Dehgam. 6 Taluka Panchayat, Viramgam. 2 Executive Engineer, Ahmadabad Irrigation
Division, Ahmadabad. Executive Engineer, Ahmadabad Irrigation
Division, Ahmadabad.
(1) Superintending Engineer ( R. & B.), Ahmadabad Circle No.1, Ahmadabad (2) Superintending Engineer, Ahmadabad Irrigation Circle, Ahmadabad.
(3) }funicipal Corporation, Ahmadabad.
NUMBER OF LOCAL BODIES AND ORGANS OF DEMOCRATIC DECENTRALISATION, 1961-62 To 1970-71
TABLE 14.1
Year Number of District PanchayatfDistrict
Local Board
Number of Taluka Panchayats
Number of Gram Panchayats
Number of Nagar Panchayats
Number of Munici- Number of Munici-palities pal CorporationR
1961-62 1962-63 1963-64 1964-65 1965-66 1966·67 1967-68 1968-69 1969-70 1970-71
2
II' I 1 1 1 1 1 1 1
* District Loeal Board
3
7 7 7 7 7 7 7 7
Source: 1. 2. 3.
4 5 6
605 6 597 6 597 4 2 598 6 2 601 6 2 602 6 2 602 6 2 603 6' 2 608 ('I 2 612 6 2
Director of Municipalities, Gnjarat State, Ahmadabad. Development Commissioner. Gujarat State, Ahmadabad.
7
1 1 1 1 1 1 1 1 1 1
Bureau of Economics aRd Statistics, Gujarat. State, Ahmadabad.
39
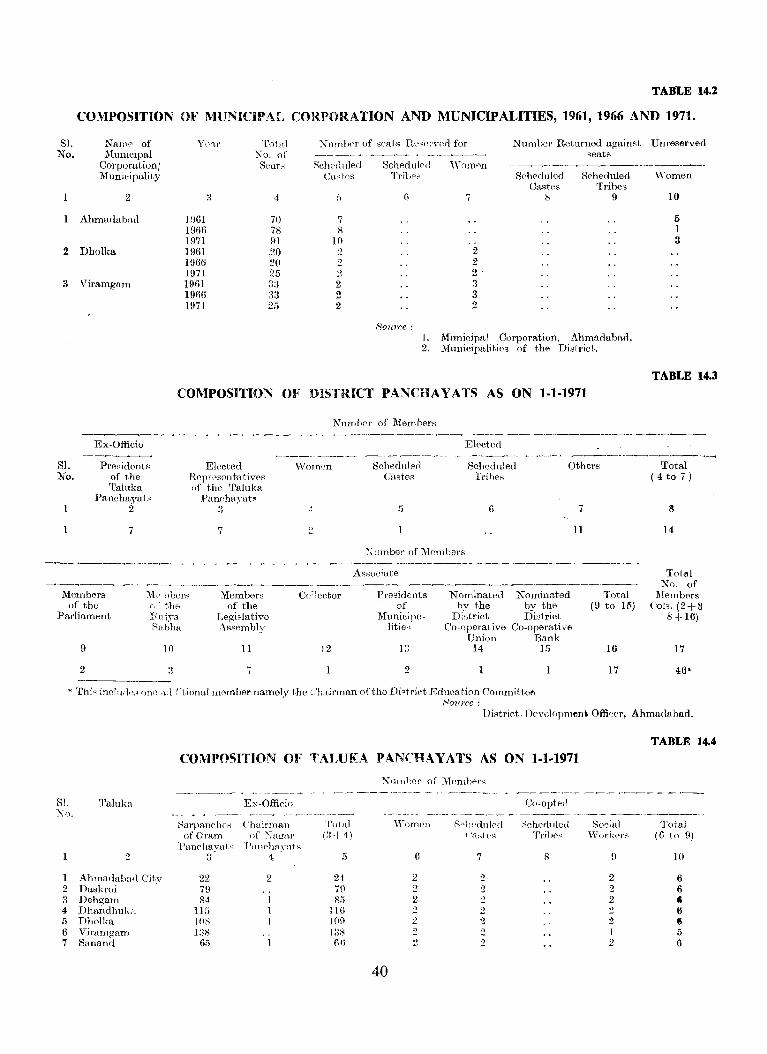
TABLE 14.2
COMPOSITION OF MUNICIPAL CORPORATION AND MUNICIPALITIES, 1961, 1966 AND 1971.
S1. No.
Naml' of :Municipal
Corporationj Municipality
To1rcl l\TO. of
Seatd
Number Roturned against Unreserved seats
2
Ahmadabad
2 Dholka
3 Viramgam
]961 1966 ]971 1961 1966 1971 1961 196fl 1971
4
70 78 9] ,20 20 25 :1:3 :~3 25
Rcht'dllled Ca~tes
7 8
10 2 2 2 2 2 2
Schedllkd Tribes
SOU1'ce:
7
2 2 2 3 3 2
Scheduled Castes
8
S~heduled Tribes
9
]. Municipal Corporation, Ahmadabad_ 2. lV[nnicipalities of the District.
COMPOSITION OF DISTRICT PANClIAYATS AS ON 1-1-1971
SL No.
Ex-Officio
Presidents of the Taluka
Panchayats 2
7
Elected Rcp,o,C'selltati VI'S
of tIlE' Talulm Pan"ba~'at'
7
Members of the
Parliament
M<, nbers (;:" the ]~ a j~-a Sabha
Members of the
Legislative Assembly
9
2
10 11
7
Number of Members
Elected
'Vom,m Scheduled Scheduled Others Castes Tribes
5 G 7
0 11
Xunbcr of Members
Cc,lector
l2
Associate
Presidents of
]\funicillHlities'
1:J
2
Nominated hy the
District Co° operative
[Inion 14
Xominated by the District
Co-operati ,'e Bank
II)
Total (9 to If')
16
17
• Thi" incr'lrh, one .),(ll'tioml1 member namely the Chairman of the District Education Committee , 80'l~r('c :
'Vomen
10
5 1 3
TABLE 14.3
Total ( 4 to 7 )
14
Total No. of
Members Cols. (2+8
-'-8+16)
17
46*
Distrir,t. DC'Yt;lopmenl OffiPer, Ahmadabad.
Sl. ?--~0.
Taluka
2
1 Ahmadnhn!l Citv 2 Daskroi ' 3 Dehgurn 4 Dhandhulm 5 Dholl<a 6 Viramgam 7 Sana-net
COMPOSITION OF TALUKA PANCHAYATS AS ON 1-1-1971
Ex-Officio Co-opted
~al'pan('hC';-; (,hnirnlan Total "'omen Pe1:{_'dul('(1 ~~ch('fll11e(1
of Gram of ~-:arr(tr 1:1 f 4) ( 'a;-;i('s Tl'jh('~
J>aneltayai" P"n('hfl~onts
:3 4 5 G 7 8
22 2 24 2 2 79 79 2 2 84 8~ L() 2 2
115 l1G 2 2 lOS 100 2 2 1:18 18R 2 2
65 (il) 2 2
40
TABLE 14.4
Soclal Total \\' ork('rs (G to 9)
9 10
2 6 2 6 2 , 2 6 2 6 1 5 2 6
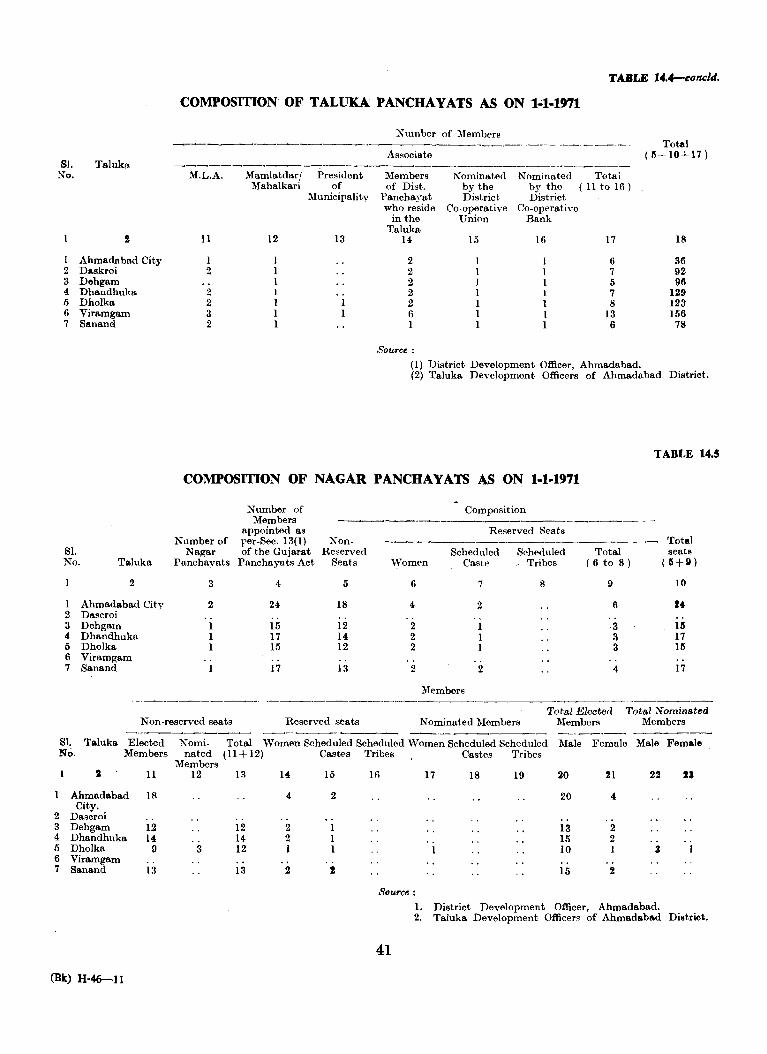
TABLE 14.4-conc/ti.
COMPOSmON OF TALUKA PANCHAYATS AS ON 1~1-1971
Number of Members -------_---------------------.---.~-.-~--.~-.--- Total
Associate (5+10+17) SJ. Taluka -----------------------_---_--_ ............... _---._--------_
No. M.L.A. Mamlatdar/ President Members Nominated Nominated Total Mahalkari of of Dist. by the by the ( 11 to 16 )
1II unici pali t v l'anchayat District District who reside Co-operative Co-operative
in the Union Bank Taluka
2 11 12 13 14 15 16 17 18
1 Ahmadabad City 1 1 2 1 1 6 36 2 Daskroi 2 1 2 1 1 7 92 3 Dehgam 1 2 1 1 5 96 4- Dhandhuka 2 1 2 1 1 7 129 Ii Dholka 2 1 2 1 1 8 123 6 Viramgam 3 1 6 1 1 13 156 7 Sanand 2 1 1 1 1 6 78
Source:
(1) District Development Officer, Ahmadabad. (2) Taluka Development Officers of Ahmadabad District.
TABLE 14.5
COMPOSmON OF NAGAR PANCHAYATS AS ON 1-1-1971
Xumber of Composition Members -----------------------~-----
appointed as Reserved Seats Number of rer-Sec. 13(1) Non- ------------------.. -------- Total
SI. Nagar of the Gujarat Reserved Scheduled Scheduled Total seats No. Taluka Panchayats Panchayats Act Seats ,"Vomen Caste - Tribes (6 to 8) ( 5+9)
2 3 4 I) 6 7 8 9 10
1 Ahmadabad City 2 24 18 4 2 6 rf 2 Dascroi 3 Dehgam 15 12 2 1 3 15 4 Dhandhuka 17 14 2 1 3 17 5 Dholka 15 12 2 1 3 15 6 Viramgam 7 Sanand 17 13 2 2 4 17
Members
Total Elected Total Nominated Non-reserved seats Reserved seats Nominated Members Members Members
Sl. Taluka Elected Nomi- Total No. Members nated (1J+12)
Members J 11 12 lil
Ahmadabad Ifl City.
2 Dascroi 3 Dehgam 12 12 4 Dhandhuka 14 14 5 Dholka 9 3 12 6 Viramgam 7 Sanand 13 13
(Bk) H-46-11
Women Scheduled Scheduled ·Women Scheduled Scheduled Male Female Male Female Castes
14 15
4 2
2 1 2 1 1 1
2 !
Tribes Castes Tribes
lfl 17 18 19 20
20 •
13 15 10
2 2 1
15 2
22
3
SDurce:
1. District Development Officer, Ahmadabad. 2. Taluka Development Officer~ of Ahmadabad District.
41
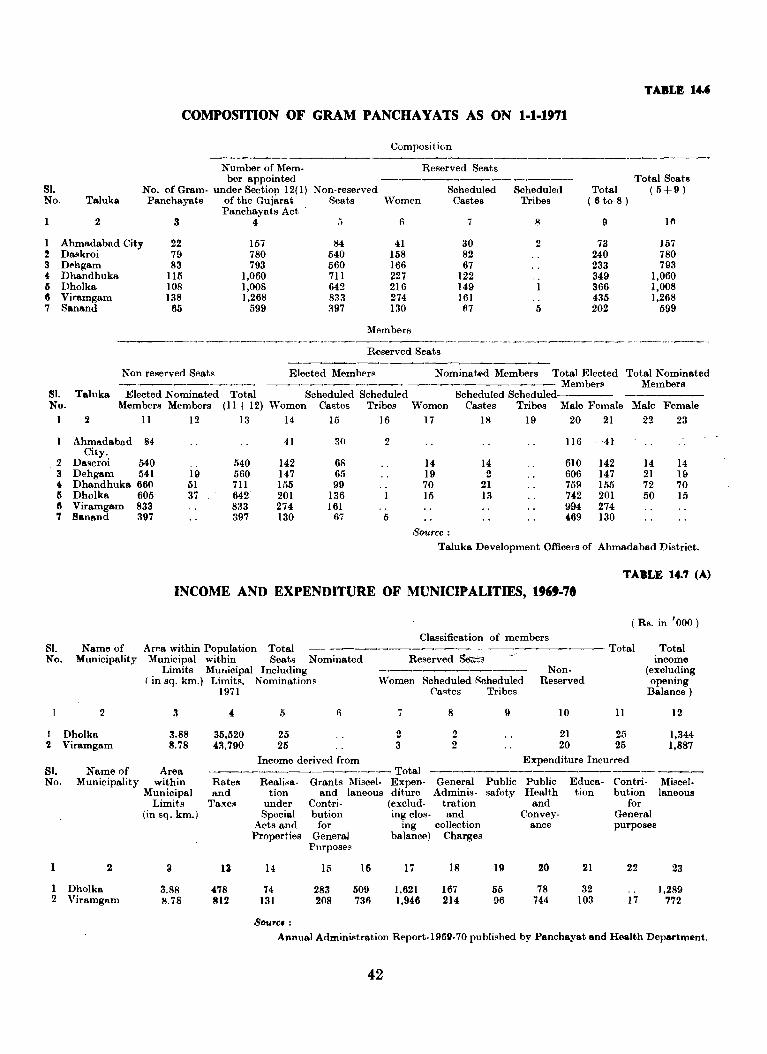
TABLE 14.'
COMPOSITION OF GRAM PANCHAYATS AS ON 1-1-1971
SI. No.
1 % 3
• II «I 7
Taluka
2
Number of Member appointed
No. of Gram- under Sectio!1 12(1) Panchayats of the Gujarat
Panchayats Act 3 4
Ahmadabad City 22 157 Daskroi 79 780 Dflhgam 83 793 Dhandhuka 115 1,060 Dholka 108 1,008 Viramgam 138 1,268 Sanllnd 65 599
Non-reserved Seats
;3
84 540 560 711 642 833 397
Composition
Reserved Seats
Scheduled 'Vomen Castes
6 7
41 30 158 82 166 67 227 122 216 149 274 161 130 117
-------------
Scheduled Tribes
2
5
Total (6 to 8)
9
73 240 233 349 366 435 202
Total Seats ( 5+9)
1~
157 780 793
1,060 1,008 1,268
599
Members -------------_--
Reserved Seats
Non reserved Seats Elected Members Nominated Members Total Elected ----.--------- ------------- Members
Total Nominattld Members
SI. No_
Taluka Elected Nominated Total Members Members (11+ 12)
Scheduled Scheduled Scheduled Scheduled-----'Women Castes Tribes Women Castes Tribes Male Female Male Female
2 11 12 13 14 15 16 17 18 19 20 21 22 23
Ahmadabad 84 41 3(1 2 116 41 City.
2 Dascroi 540 540 142 68 14 14 610 142 14 14 3 Dehgam 541 19 560 147 65 19 2 606 147 21 19 4 Dhandhuka 660 51 711 155 99 70 21 759 155 72 70 Ii Dholka 605 37 642 201 136 15 13 742 201 50 15 6 Viramgam 833 833 274 161 994 274 7 Sanand 397 397 130 67 I) 469 130
Source: Taluka Development Officers of Ahmadabad District.
TABLE 14.7 (A)
INCOME AND EXPENDITURE OF MUNICIPALITIES, 196'-70
Sl. No.
Name of Municipality
2
I Oholka 2 Viramgam
ArAa within Population Total Municipal within Seats Nominated
Limits Mm,icipal Including (in sq. km.) Limits. Nominations
:l
3.88 8.78
1971
35,520 43,790
5
25 25
Income derived from
Classification of members
Reserved S'e';;3
Women Scheduled Scheduled
i
2 3
Castes Tribes
8
2 2
9
Non· Reserved
10
21 20
( Rs. in '000)
Total
11
25 25
Total income
(excluding opening
Balance)
12
1,344 1,887
Expenditure Incurred 81. Name of Area No. Municipa.lity within
Municipal Limits
(in sq. km.)
--------------- Total --------------------Rates Realisa- Grants Miscel- Expen- General Public Public Educa- Contri- Miscel-and tion and laneous diture Adminis- safety Health tion bution laneou!
Taxes under Contri- (exclud. tration and for Special but ion ing clos· and Convey- General
Acts aurl for ing collection ance purposes Properties General balanee) Charges
Purposes
1 2 13 14 15 16 17 18 19 20 21 22 23
1 Dholka 3.88 478 74 283 509 1,621 167 55 78 32 1,289 2 YirBmgam S.7S 812 131 208 736 1.946 214 96 744 103 17 772
Sourc. : Annual Administration Report. I 96S1·70 published by PBnchayat and Health Department.
42

TABU 14.7 '(B)
INCOME AND EXPENDITURE OF MUNICIPAL CORPORATIONS, 1969·70
(1) Total number of Members (2) Population of Municipal Corporation Limit: ( 1971 ) (3) Limit of Municipal Corporation Area ( in Sq. Kms.)
91 15,85,544
92.98
81. No.
81. No.
Kame of :Municipal
Corporation
2
Ahmadabad
Name of Municipal Corporation
2
Ahmadabad
Total Income
excluding opening balance
2,42,514
Total expenditure
excluding closing'
balance
10
2,54,688
Income 1969·70
Other Sources
RealiRation Rate under Special and Act amI Interest
rI'axes Properties receipts
4 () 6
88,704 10,757 1,790
Expenditure 19(19·70
Public Hospitals
Services and Grants and other anci· anti
public liary public Public interest utilities facilities Institution, payment
11 12 13 14
19,702 6,807 3,934 35,345
80'ul'ce :
(Rs. in '000)
Grants Income ftom and Commercial Miscell&.
Loans Enterprises neous
7 8 9
29,229 34,330 77,704
Expenditure for Commer· Capital Extraordinary
cial Enter· Expentli. expenditure Miscella. prises ture and debts neoUi
15 16 17 18
34,411 25,552 97,156 31,782
.' Statistics of)Iunicipal Towns and Cities, Gujarat" published by the Bureau of Economics _d Statistics, Government of Gujarat.
TABU 14.1
INCOME AND EXPENDITURE OF DISTRICT PANCHAYAT/TALUKA
PANCHAYATS 1963.64, 1966·67 AND 1969·70
( Rs, in lacs) ( Rs. in lacs)
81. Income SI.
Expenditure -.---------"'---------~--------.-
No. Item 1963·64 ] 966·67 1969·70 No. Item 1963·64 1966·67 1969·7Q
2 3 4 5 6 7 8 ' 9
Land Revenue 1 General Administration 15.32 18.88 22.45
2 Local Rates 5.40 13.29 2 Education 45.96 84.8!! 104.51 3 Medical 2.01 3.19 3.68
3 Other Taxes and Fees 6.15 4 Health and Sanitation 2.13 6.55 12.97 4 Statutory Grants 18.80 19.03 6.85 5 Agriculture 3.61 12.33 17.03
5 Grants from Statutory Funds 6 Animal Husbandry 1.56 1.91 2.75 7 Co·operation 0 .. 32 0.26 0.32
6 Grants for Panchayat Sche· 45.98 69.03 112.44 8 Industries O.R7 0.92 0.67 mes and Functions. 9 C. D. Proiects 12.65 17.59 13.80
7 Grants for State Schemes 104.96 125.84 237.92 10 Social Welfara 2.76 5.23 8.23
and Functions. 11 Irrigation 14.88 37.20 27.28
Other Receipts 18.35 20.24 19.60 12 Public "'orks 26.05 35.84 84.77
8 13 Other ExpenditUTe 14.76 29.93 67.52 Total Revenue 193.49 247.43 382.96 14 Total Revenue Expenditure 142.88 254.69 366.03
h'QU,.ce :
Development Commissioner, Gujarat State, Ahmadabact.
43
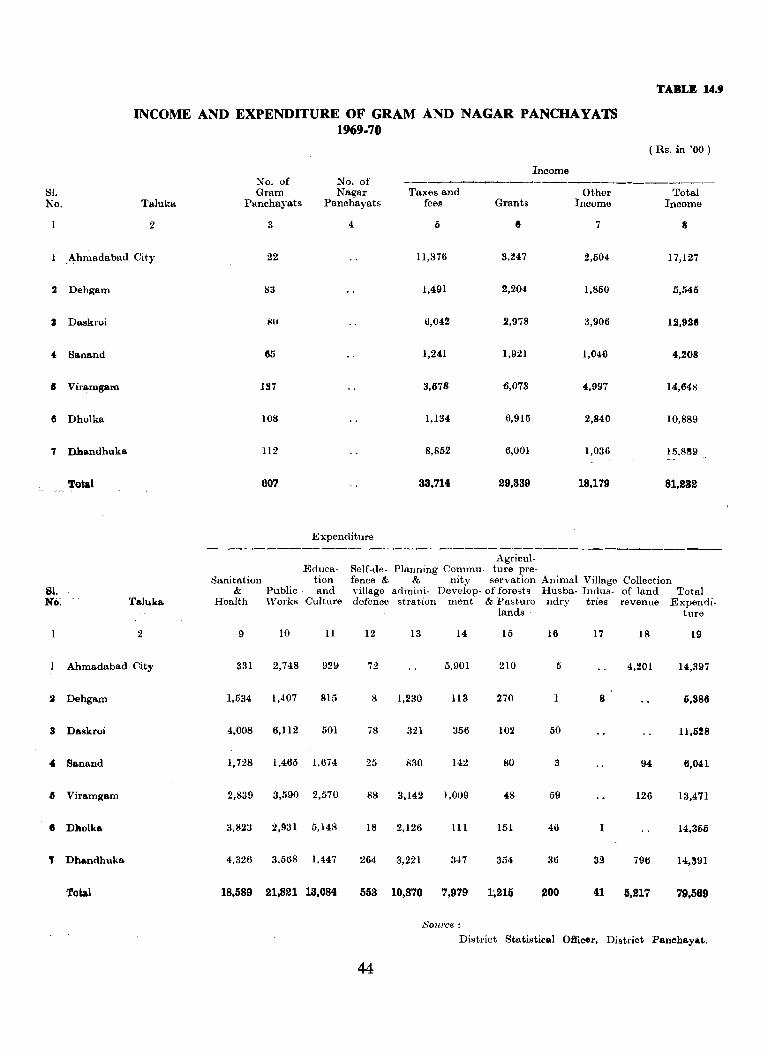
'l'ABLE 14.9
INCOME AND EXPENDITURE OF GRAM AND NAGAR PANCHAYATS 19(;9.70
(Rs. in '00)
Income No. of No. of .----------.-
SI. Gram Nagar Taxes and Other Total No. Taluka Panchayats Panchayats fees Grants Income Income
2 3 4 5 II 7 8
I Ahmadabad City 22 11,376 3,247 2,504 17,127
2 Dehgam 83 1,491 2,204 1,850 5,546
3 Daskroi ~II 6,042 2,978 3,906 12,9211
4 Sanand &5 1,241 1,921 1,046 4,208
• Viramgam 137 3,678 6,073 4,997 14,648
G Dholka 108 1,134 6,915 2,840 10,889
7 Dhandhuka 112 8,852 6,001 1,036 15,S~9
Total 607 33.714 29,339 18,179 81,232
Expenditure ---------------.. -_____.,.--.~.~-----~----------------------
Agricul-Erluca- Self-de- Planning Commu- ture pre-
Sanitation tion fence & & nity servation Animal Village Collection 81. & Public· and village admini- Develop- of forests Husba- lndus- of land Total No: Taluka Health 'Yorks Culture defence stration ment & Pasture ndry tries revenue Expendi-
lands tura
2 9 10 11 12 13 14 15 16 17 18 19
Ahmadabad City 331 2,748 929 72 5,901 210 5 4,201 14,397
2 Dehgam 1,534 1,407 815 8 1,230 113 270 1 8 6,886
3 Daskroi 4,008 6,112 501 78 321 356 102 50 11,628
4 Sanand 1,728 1,465 1,674 25 830 142 80 3 94 6,041
6 Viramgam 2,839 3,590 2,570 88 3,142 1,01)9 48 59 126 13,471
• Dholka 3,823 2,931 5,148 IS 2,126 III 151 46 14,366
., Dhandhuka 4,326 3,568 1,447 264 3,221 347 354 36 32 796 14,391
Total 18.589 21.821 13,084 553 10,870 7,979 1:,215 200 41 5,217 79,589
SQurce:
District Statistical Officer, District PanchaYllt.
44
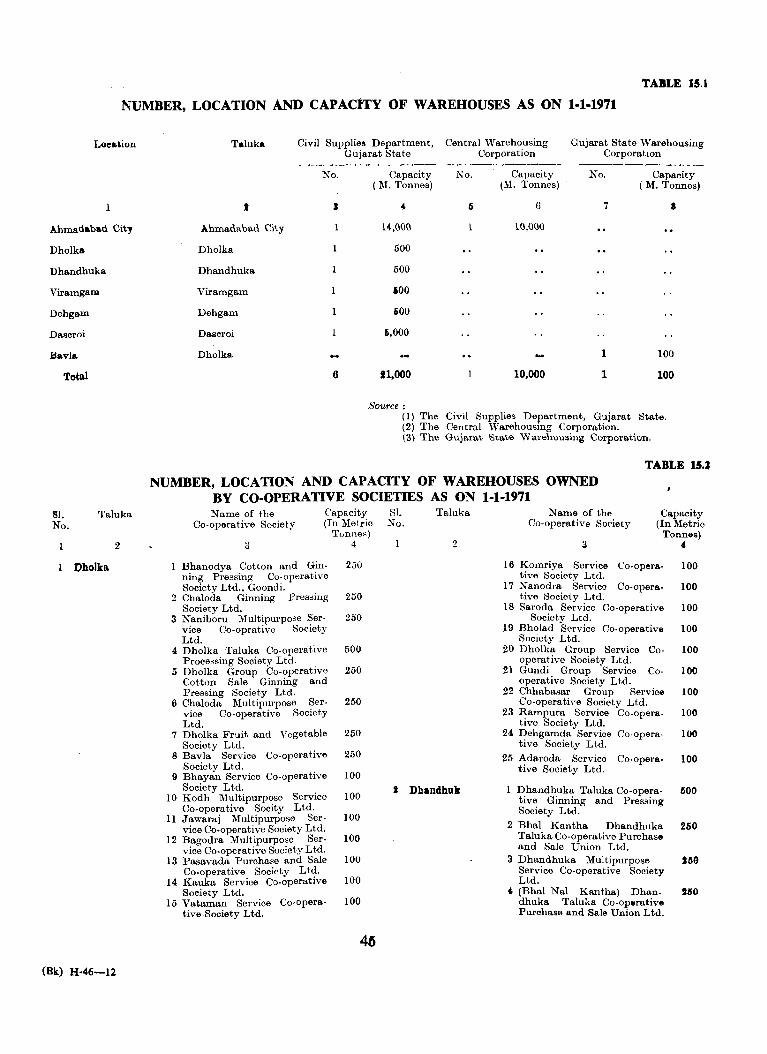
TABLE 1$,1
~-UMBER, LOCATION AND CAPACl'fY OF WAREHOUSES AS ON 1·1·1971
Loeaiion
Ahmadabad City
Dholka
Dhandhuka
Viramgam
Dehgam
Dascroi
Bavla
Total
131. No.
Taluka
2
Dholka
(Bk) H·46-12
Taluka
I
Ahmadabad City
Dholka
Dhandhuka
Viramgam
Dehgam
Dascro;
Dholka
Civil Supplies Department, Gujarat State
No. Capacity ( 1\1. Tonnes)
S 4
14,000
500
500
600
600
6,000
6 11,000
Source: (1) The (2) The (3) The
Central Warehousing Corporation
Ko. Capacity (1\1. Tonnes)
Ii 6
1 lO,OO()
10,000
Gujarat State 'Varehousing Corporation
No. Capacity (M. Tonnes)
7 •
1 100
1 100
Civil Supplies Department, Gujarat State. Central 'Warehousing Corporation. Gujarat State Warehousing Corporation.
TABLE 15.%
NUMBER, LOCATION AND CAPACITY OF WAREHOUSES OWNED BY CO·OPERATIVE SOCIETIES AS ON 1·1·1971 Name of the
Co· operative Society Capacity ElL (In :Melric No.
3 Tonne")
4
1 Bhanodya Cotton and Gin- 250 ning Pressing Co-operative Society Ltd., Goondi.
2 Chaloda Ginning rressiIlg 250 Society Ltd.
3 Naniboru Multipurpose Ser- 250 vice Co-oprative Society Ltd.
4 Dholka Taluka Co-operative 50!) Processing Society Ltd. .
5 Dholka Group Co-operative 250 Cotton Sale Ginning and Pressing Society Ltd.
6 Chaloda Multipurpose Ser· 250 vice Co-operative Society Ltd.
7 Dholka Fruit and Vegetable 250 Society Ltd.
8 Bavla Service Co-operative 250 Society Ltd.
9 Bhayan Service Co-operative 100
Taluka
2
Society Ltd. 10 Kodh Multipurpose Service 100
I Dhandhuk
Co-operative Socity Ltd. 11 .Jawaraj Multipurpose Ser- 100
vice Co-operative Society Ltd. 12 Bagodra Multipurpose Ser- 100
vice Co-operative Society Ltd. 13 Pasavada Purchase and Sale 100
Co-operative Society Ltd. 14 Kauka Service co-operative 100
Society Ltd. 15 Vataman Service Co-opera- 100
tive Society Ltd.
46
Name of the Co-operative Society
:I
Capacity (In Metric
Tonnes) 4
16 Komriya Service Co-opera- 100 tive Societv Ltd.
17 Nanodra Service Co-opera- 100 tive Society Ltd.
18 Saroda Service Co· operative 100 Society Ltd.
19 Bholad Service Co.operative 100 Society Ltd.
20 Dholka Group Service Co- 100 operative Society Ltd.
21 Gundi Group Service Co- 100 operative Society Ltd.
22 Chhabasar Group Service 100 Co.operative Society Ltd.
23 Rampura Service Co. opera- 100 tive Society Ltd.
24 Dehgamda Service Co-opera- 100 tive Society Ltd.
25 Adaroda Service Co.opera- 100 tive Society Ltd.
1 Dhandhuka Taluka Co.opera- 500 tive Ginning and Pressing Society Ltd.
2 Bhal Kantha Dhandhuka 250 Taluka Co-operative Purchase and Sale Union Ltd.
3 Dhandhuka Multipurpose 150 Service Co-operative Society Ltd.
, (Bhal Nal Kantha) Dhan- 250 dhuka Taluka Co-operative PurchasE> and Sale Union Ltd.
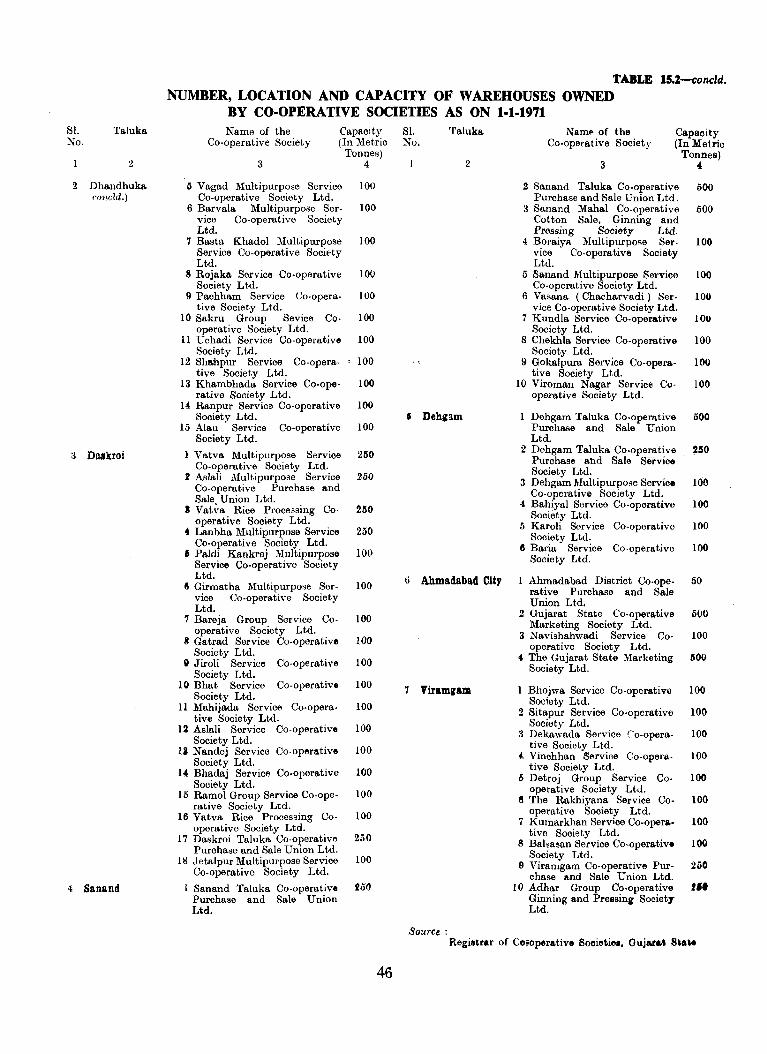
Sl. Xo.
Taluka
2
2 Dhandhuka concld.)
~ Dalkroi
4 Sanand
TABLE 15.2-concld. NUMBER, LOCATION AND CAPACITY OF WAREHOUSES OWNED
BY CO-OPERATIVE SOCIETIES AS ON 1-1-1971 Name of the
Co.operative Society Capacity Sl. Taluka Naml' of the Capacity
(In Metric Tonnes)
4
(In Metric Xo. Co· operative Society
3 Tonnes)
4
5 Vagad Multipurpose Service IOU Co-operative Society Ltd.
6 Barvala Multipurpose Ser- 100 ViCe Co-operative Society Ltd.
7 Basta Khadol Multipurpose 100 Serviee Co-operative SociE'ty Ltd.
8 Rojaka Service Co-operative 100 Society Ltd.
9 Pachham Service Co-opera- 100 tive Society Ltd.
10 Sakru Group Sevice Co· 100 operative Society Ltd.
11 Uchadi Service Co-operative 100 Society Ltd.
12 Shahpur Service Co-opera- 100 tive Society Ltd.
13 Khambhada. Service Co-ope- 100 rative Society Ltd.
a Ranpur Service Co-operative 100 Society Ltd.
15 Alau Service Co-operative 100 Society Ltd.
1 Vatva Multipurpose Service 250 Co-operative Society Ltd.
l! Aslali Multipurpose Service 250 Co-operative Purchase and Sale, Union Ltd.
• Vatva Rice Processing Co- 2150 operative Society Ltd.
• Lanbha Multipurpose Service 250 Co.operative Society Ltd.
• Paldi Kankrej Multipurpose 100 Service Co-operative Society Ltd.
II Girmatha Multipurpose Ser- 100 vice Co-operative Society Ltd.
7 Bareja Group Service Co- 100 operative Society Ltd.
8 Gatrad Service Co-operative 100 Society Ltd.
II Jiroli Service Co-operative 100 Society Ltd.
10 Bhat Service Co-operative 100 Society Ltd.
11 Mahijada Service Co-opera- 100 tive Society Ltd.
12 Aslali Service Co-operative 100 Society Ltd.
13 Nandej Service Co-operative 100 Society Ltd.
14 Bhadaj Service Co-operative 100 Society Ltd.
15 Ramol Group Service Co-ope- 100 rative Society Ltd.
16 Vatva Rice Processing Co- 100 operative Society Ltd.
17 Daskroi Taluka Co-operative 250 Purchase and Sale Union Ltd.
18 .Jetalpur Multipurpose Service 100 Co-operative Society Ltd.
I Sanand Taluka Co-operative 250 Purcha~e and Sale Union Ltd.
46
2 3
2 Sanand Taluka Co-operative 500 Purchase and Sale Union Ltd.
3 Sanand Mahal Co-operative 500 Cotton Sale, Ginning and Pressing Society Ltd.
4 BoraiYA Multipurpose Ser- 100 vice Co-operative Society Ltd.
a Sanand Multipurpose Service 100 Co-operative Society Ltd.
6 Vasana (Chacharvadi) Ser- 100 vice Co-operative Society Ltd.
7 Kundla Service Co.operative 100 Society Ltd.
8 Chekhla Service Co-operative 100 Society Ltd.
9 Gokalpura Service Co-opera· 100 tive Society Ltd.
10 Viroman Nagar Service Co- 100 operative Society Ltd.
• Dehgam Dehgam Taluka Co.operative 500 Purchase and Sale Union Ltd.
2 Dehgam Taluka Co.operative 260 Purchase . and Sale Service Society Ltd.
3 Dehgam Multipurpose Service 100 Co-operative Society Ltd.
4 Bahiyal Service Co-operative lOG Society Ltd.
5 Karoli Service Co-operative 100 Society Ltd.
6 Baria Service Co-operative 100 Society Ltd.
tI Ahmadabad City 1 Ahmadabad District Co-ope- 50 rative Purchase and Sale Union Ltd.
2 Gujarat State Co-operative 500 Marketing Society Ltd.
3 Navishahwadi Service Co- 100 operative Society Ltd.
4. The Gujarat State Marketing 1100 Society Ltd.
7 Viramgam Bhojwa Service Co-operative 100 Society Ltd.
Source:
2 Sitapur Service Co·operative 100 Society Ltd.
3 Dekawada Service (,o-opera- 100 tive Society Ltd.
#, Vinchhan Service Co-opera- 100 tive Society Ltd.
Ii Detroj Group Service Co- 100 operative Society Ltd.
e The Rakhiyana Service Co· 100 operative Society Ltd.
7 Kumarkhan Service Co·opera. 100 tive Society Ltd.
S BahMan Service Co-operative 100 Society Ltd.
9 Viramgam Co-operative Pur- 250 chase and Sale Union Ltd.
10 Adhar Group Co.operative 21. Ginning and Pressing Society Ltd.
Registrar of Cu.operative Sooietiel, Gujar .. ' Staie
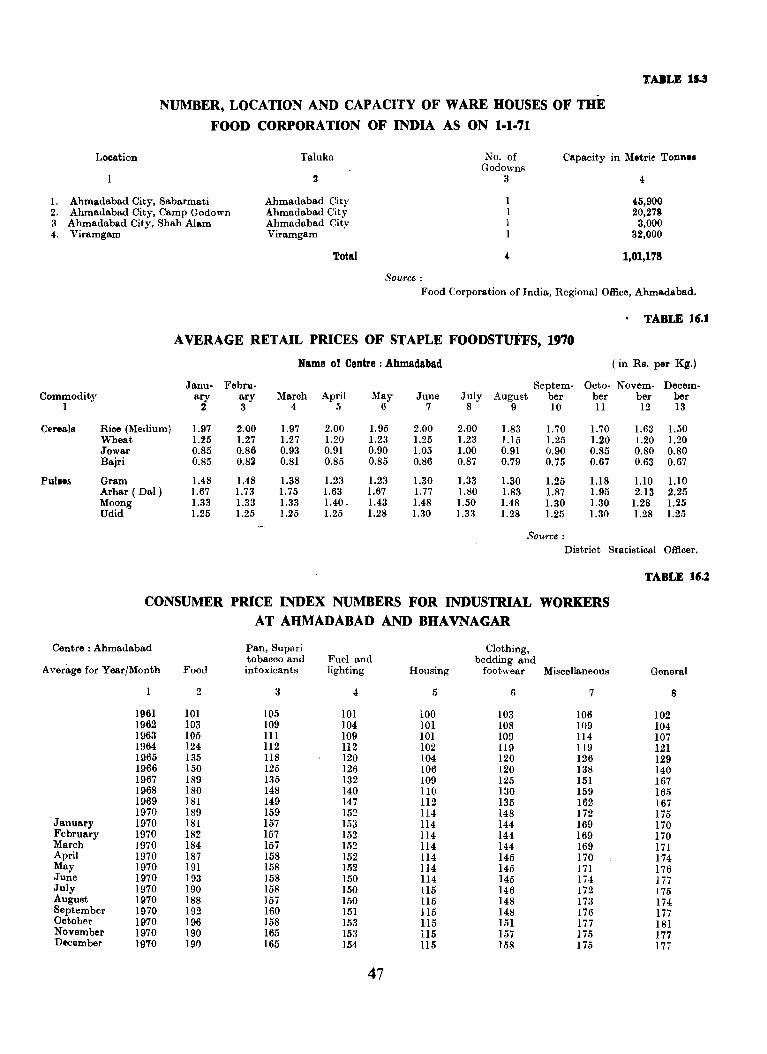
NUMBER, LOCATION AND CAPACITY OF WARE HOUSES OF mE
FOOD CORPORATION OF INDIA AS ON 1-1-71
TABLE 15.3
Location Taluka .No. of Godowns
3
Capacity in Metric Tonne •
1. Ahmadabad City, Sabarmati 2. Ahmadabad City, Camp Godown a Ahmadabad City, Shah Alam 4. Viramgam
Ahmadabad City Ahmadabad City Ahmadabad City Viramgam
Total
Source:
4
45,900 20,278 3,000
32,000
1,01,178
Food Corporation of India, Regional Office, Ahmadabad.
TABI..E 16.1
AVERAGE RETAIL PRICES OF STAPLE FOODSTUFFS, 1970
Name of Centre: Ahmadabad ( in Rs. per Kg.)
Janu· FebN- Septem· Octo· Novem· Decem· Commodity ary ary March April ::IIay June July August ber ber ber ber
I 2 3 4 5 6 7 8 9 10 II 12 13
Cereals Rice (Medium) 1.97 2.00 1.97 2.00 1.95 2.00 2.00 1.83 1.70 1.70 1.63 1.50 Wheat 1.25 1.27 1.27 l.20 1.23 l.25 1.23 !.I 5 1.25 1.20 1.20 1.20 Jowar 0.85 0.86 0.93 0.91 0.90 1.05 1.00 0.91 0.90 0.85 0.80 0.80 Bairi 0.85 0.83 0.81 0.85 0.85 0.86 0.87 0.79 0.75 0.67 0.63 0.67
Pul •• & Gram 1.48 1.48 1.38 1.23 1.23 1.30 1.33 1.30 1.25 1.18 1.10 1.10 Arhar (Dal) 1.67 1.73 l.75 1.63 1.67 1.77 1.80 l.83 1.87 1.95 2.13 2.25 Moong 1.33 1.33 1.33 lAO. 1.43 1.48 1.50 1048 1.30 1.30 1.28 1.25 Udid 1.25 1.25 1.25 1.25 1.28 1.30 1.33 1.28 1.25 1.30 1.28 1.25
Source: District Statistical Officer.
CONSUMER PRICE INDEX NUMBERS FOR INDUSTRIAL WORKERS AT AHMADABAD AND BRA VNAGAR
Centre : Ahmadabad Pan, Supari Clothing, tobacco and Fuel and bedding and
Average for Year/Month Food intoxicants lighting Housing footwear Miscellaneous
2 3 4 r; 6 7
1961 101 105 101 100 103 106 1962 103 109 104 101 108 109 1963 105 III 109 101 109 114 1964 124 112 112 102 119 119 1965 135 118 120 104 120 126 1966 150 125 126 106 120 138 1967 189 135 132 109 125 151 1968 180 148 140 1I0 130 159 1969 181 149 147 ll2 135 162 1970 189 159 152 1I4 148 172
January 1970 181 157 153 ll4 144 169 February 1970 182 157 152 114 144 169 March 1970 184 157 152 ll4 144 169 April 1970 187 158 152 ])4 145 170 May 1970 191 158 152 114 145 J 71 June 1970 193 158 150 1I4 145 Ii-! July 1970 190 158 150 115 146 172 August 11170 188 157 150 115 148 173 September 1970 192 160 151 115 148 176 October 1970 196 158 153 1I5 151 177 November 1970 190 165 153 ll5 157 175 December 1970 190 165 154 llli 158 175
47
TABLE 16.2
General
8
102 104 107 121 129 140 167 165 167 175 170 170 171 174 176 177 175 174 177 181 177 177
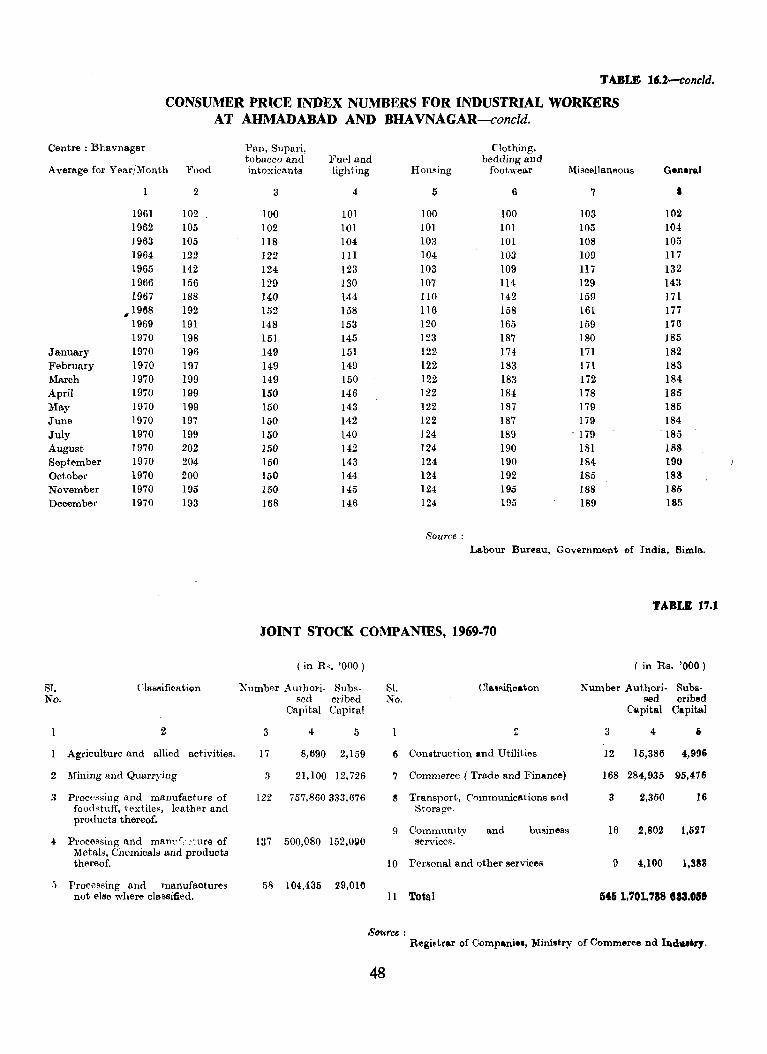
TABLE lU-conc1d.
CONSUMER PRICE INDEX NUMBERS FOR INDUSTRIAL WORKERS AT AHMADABAD AND BHAVNAGAR-conc1d.
Centre: Bhavnagar Pan, Supa!'i, Clothing, tobacco and Fuel and bedding and
Average for Year/Month Food intoxicants lighting Hou~ing footwear Miscellaneous General
2 3 4 5 6 7 I
1961 102 100 101 100 100 103 102 1962 105 102 101 101 101 105 104 1963 105 U8 104 103 101 108 105 1964 122 122 111 104 103 109 117 1965 142 124 123 103 109 117 132 1966 156 129 130 107 H4 129 143 1967 188 140 144 110 142 159 171
,,1968 192 152 158 116 158 161 177 1969 191 148 153 120 165 159 176 1970 198 151 145 123 187 180 185
January 1970 196 149 151 122 174 171 182 February 1970 197 149 149 122 183 171 183 March 1970 199 149 150 122 183 172 184 April 1970 199 150 146 122 184 178 185 May 1970 199 150 143 122 187 179 185 June 1970 197 150 142 122 187 179 184 July 1970 199 150 140 124 189 - 179 185 August 1970 202 150 142 124 190 181 188 September 1970 204 150 143 124 190 184 190 October 1970 200 150 144 124 192 185 18S November 1970 195 150 145 124 195 188 185 December 1970 193 168 146 124 195 189 185
Source: Labour Bureau, Govermnt!lnt of India, Simla.
TABLE 17.1
JOINT SrOCK COMPANms, 1969·70
( in Rs. '000) ( in Rs. '000)
81. ClassificatiQn Number Authori- Subs- Sl. Cllusifioaton Number Authori- Sublil-No. sed cribed :-'0. sed cribed
Capital Capital Capital Capital
2 3 4 5 <" 3 4 i " Agriculture and allied activities. 17 8,690 2,159 6 Construction and Utilities 12 15,386 4,996
2 Mining and Quarrying 3 21,100 ]2,726 7 Commerce (Trade lind Finance) 168 284,935 95,476
~ Processing and manufacture of 122 757,860333,676 ~ Transport, Communications and 3 2,350 16 .l
foodstuff, textiles, leather and Storage. products thereof.
!l Community and business 16 2,802 1,527 4 Processing and mam,r· cture of 137 500,080 152,0110 services.
Metals, Chemicals and products thereof. 10 Personal and other services (J 4,100 1,383
;; Processing lind manufactures 58 104,435 29,010 not else ~'here cIa·seined. II Total 5451,701.188 eaa,OIl
Source : Regi~trar of Comp .. nie., Ministry of Commeree nd ble!"'".
48
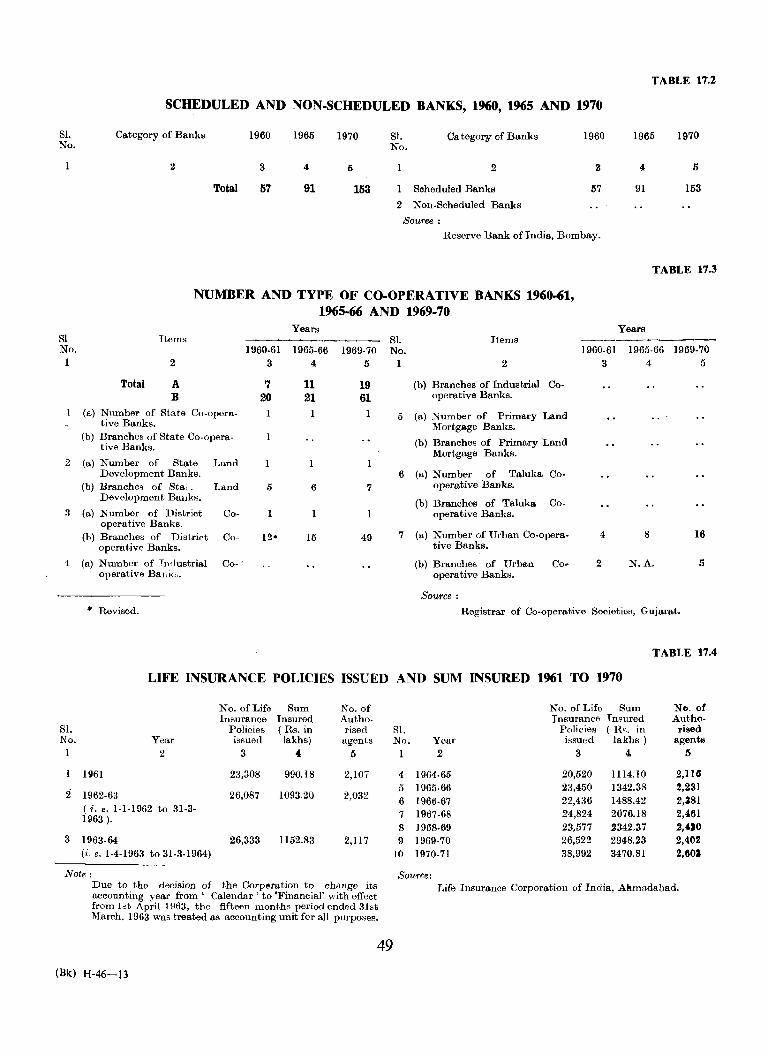
TABLE 17.2
SCHEDULED AND NON-SCHEDULED BANKS, 1960, 1965 AND 1970
S1. Category of Banks 1960 1965 1970 Sl. Category of Banks 1960 1965 1970 No. No.
2 3 4 5 2 <1 4 5
Total 57 91 153 1 Scheduled Banks 57 91 153
2 Non-Scheduled Banks
Souree: Reserve Bank of India, Bombay_
TABLE 17.3
NUMBER AND TYPE OF CO-OPERATIVE BANKS 1960-61, 1965-66 AND 1969-70
SI Items No. 1 2
Total A B
(a) Nnmber of State Co-opera-tive Banks_
(b) Branches of State Co-opera-tive Banks.
2 (a) Number of State Land Development Banks.
(b) Branches of Sta, , Land Development Ballks.
3 (a) Number of District Co-operative Banks.
(b) Branches of District Cooperative Banks.
4 (a) Number of Industrial Co- . operative Ball tee.
... Revised.
Years
1960-61 1965-66 3 4
7 11 20 21
5 6
12* 15
1969-70 5
19 61
I
7
49
SI. No_
1
5
Items
2
(b) Branches of Industrial Cooperative Banks_
(a) Number of Primary Land Mortgage Banks_
(b) Branches of Primary Land Mortgage Banks.
6 (a) Number of Taluka Cooperative Banks_
(b) Branches of Talnka Cooperative Banks.
7 (a) Number of Urban Co-operative Banks.
(b) Branches of Urban Co-operative Banks.
Source:
1960-61 3
4
2
Years
1965-66 1969-70 4 5
8 16
N.A. 5
Registrar of Co-operative Societies, Gujarat.
TABLE 17.4
LIFE INSURANCE POLlCIES ISSUED AND SUM INSURED 1961 TO 1970
No. of Life Sum No. of Insurance Insured Autho-
SI. Policies (Rs. in rised No. Year issued lakhs) agents
1 2 3 4 5
1961 23,308 990.18 2,107
:2 1962-63 26,087 109320 2,032 ( i. e. 1-1-1962 to 31-3-1963 ).
3 1963-64 26,333 1152.83 2,117 (i.e. 1-4-1963 to 31-3-1964)
Note: Due to the decision of the Corp&ration to change its accounting year from' Calendar' to 'Financial' with effect from Lot April 1963, the fifteen months period ended 31st March, 1963 was treated as accounting unit for all purposes.
49
(Bk) H-46-13
No. of Life Sum No. of Insurance Insured Autho-
81. Policies (Rq. in rised No. Year issued lakhs) agents
1 2 3 4, 5
4 1964-65 20,520 1114.10 2,116 5 1965-66 23,450 1342.38 2,231
6 1966-67 22,436 1488.42 2,381 7 1967-68 24,824 2076.18 2,461 8 ] 968-69 23,577 2342.37 2,430 9 1969-70 26,522 2948.23 2,402
10 1970-71 38,992 3470.81 2,603
Source: Life Insurance Corporation of India, Akmadabad.
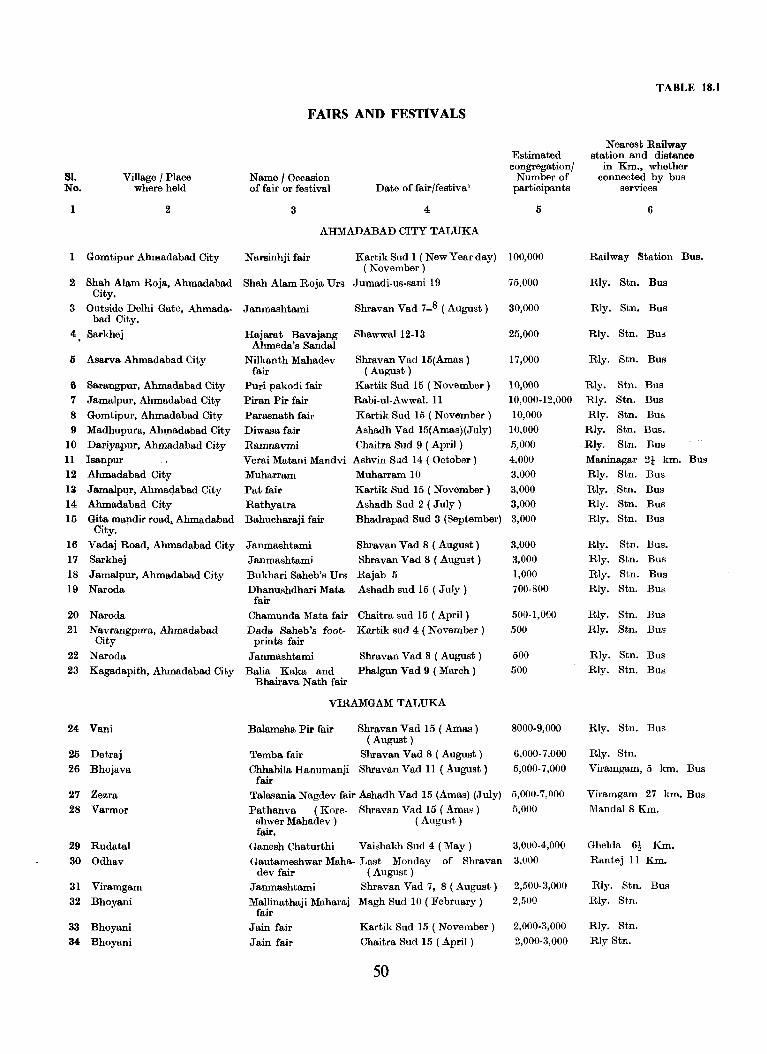
81. No.
1
Village / Place where held
2
FAIRS AND FESTIVALS
Name I Occasion of fair or festival Date of fair/festival
3 4
AHMADABAD CITY TALUKA
Estimated eongregation/
Number of participants
5
1 Gomtipur Ahmadabad City Narsinhji fair KartikSudl(NewYearday) 100,000 ( November)
2 Shah Alam Roja, Ahmadabad Shah Alam Roja Urs Jumadi·us·sani 19 City.
3 Outside Delhi Gate, Ahmada· J anmashtami bad City.
4 Sarkhej
5 Asarva Ahmadabad City
6 Sarangpur, Ahmadabad City
7 Jamalpur, Ahmadabad City
8 Gomtipur, Ahmadabad City
Hajarat Bavajang Ahmeda's Sandal
Nilkanth Mahadev fair
Puri pakodi fair
Piran Pir fair
Parasnath fair
Diwasa fair
Ramnavmi
Shravan Vad 7_8 (August)
Shawwal 12·13
Shravan Vad 15(Amas) (August)
Kartik Sud 15 (November)
Rabi·ul·Awwal. 11
Kartik Sud 15 (November)
Ashadh Vad 15(Amas)(July)
Chaitra Sud 9 ( April)
9 Madhupura, Ahmadabad City
10 Dariyapur, Ahmadabad City
11 lsanpur Verai Matani Mandvi Ashvin Sud 14 ( October) 12 Ahmadabad City
13 Jamalpur, Ahmadabad City
14 Ahmadabad City
Muharram
Pat fair
Rathyatra
Muharram 10
Kartik Sud 15 (November) Ashadh Sud 2 ( July)
75,000
30,000
25,000
17,000
10,000 10,000.12,000
10,000
10,000
5,000
4.000
3,000
3,000
3,000
15 Gita mandir road, Ahmadabad Bahucharaji fair Bhadrapad Sud 3 (September) 3,000 City.
16 Vadaj Road, Ahmadabad City Janmashtami Shravan Vad 8 (August)
Shravan Vad 8 ( August)
Rajab 5
17 Sarkhej Janmashtami
18 Jamalpur, Ahmadabad City Bukhari Saheb's Urs 19 Naroda
20 Naroda
21 Navrangpura, Ahmadabad City
Dhanushdhari Mata fair
Ashadh sud 15 (July)
Chamunda Mata fair Chaitra sud 15 ( April)
Dada Saheb's foot· Kartik sud 4 (November) prints fair
22 Naroda Janmashtami Shravan Vad 8 ( August)
Phalgun Vad 9 ( March) 23 Kagadapith, Ahmadabad City Balia Kaka and Bhail'ava Nath fair
24 Vani
25 Detraj
26 Bhojava
27 Zezra
28 Varmor
29 Rudatal
30 Odhav
31 Viramgam
32 Bhoyani
33 Bhoyani
34 Bhoyani
VIRAMGAM: TALUKA
Balamsha Pir fair Shravan Vad 15 (Amas) (August)
Temba fair Shravan Vad 8 ( August)
Chhabila Hanumanji Shravan Vad 11 (August) fair
Talasania Nagdev fair Ashadh Vad 15 (Amas) (July)
Pathanva (Kore. Shravan Vad 15 ( Amaa) shwer Mahadev ) ( August) fair.
Ganesh Chaturthi Vaishakh Sud 4 (May)
Gautameshwar Maha. Last Monday of Shravan dey fair ( August) .
Janmashtami Shravan Vad 7, 8 (August)
Mallinathaji Maharaj Magh Sud 10 ( February) fair
Jain fair
Jain fair
Kartik Sud 15 ( November)
Chaitra Sud 15 ( April)
50
3,000
3,000
1,000
700·800
500·1,000
500
500
500
8000·9,000
6,000·7,000
5,000·7,000
5,000.7,000
5,000
3,000.4,000
3,000
2,500·3,000
2,500
2,000.3,000
2,000·3,000
TABLE 18.1
Nearest Railway station and distanee
iu Km., whether connected by bus
services
6
Railway Station Bus.
Rly. Stu. Bus
Rly. Stu. Bus
Rly. Stn. Bu;,j
Rly. Stu. Bus
Rly.
Rly.
Rly.
Rly.
. Ely.
Stn. Bus
Stn. Bus
Stu. Bus
Stn. Bus.
Stn. Bus
Maninagar 21 km. Bus
Rly. Stu. Bus
Rly. Stu. Bus
Rly. Stn. Bus
Rly. Stn. Bus
Rly. Stn. Bus.
Rly. Stn. Bus
Rly. Stn. Bus
Rly. Stn. Bus
Rly. Stn. Bus
Rly. Stu. Bus
Rly. Stn. Bus
Rly. Stn. Bus
Rly. Stn. Bus
Rly. Stn.
Viramgam, 5 km. Bus
Viramgam 27 km. Bus
MandaI 8 Km.
Ghelna 6! Km.
Rautej 11 Km.
Rly. Stu. BUR
Rly. Stu.
Rly. Stn.
Rly Stn.

SI. No.
Village / Place where held
35 Hansalpur
36 Jetapur
37 Thuleta
38 Ughroj 39 Vithalapur
40 Dadhana
41 Goraiya
2
42 Aligadh ( Viramgam )
43 Dalsana
44 Bhadana
45 Dadhana
46 Dadhana 47 Endla
48 Balsasan
49 Kadvasan
50 Nana Ubhda
51 Moti Kumad
52 Jakhwada
53 Gamanpura
54 Shobhasan
55 Kanbha
56 Vatva
57 Pirana ( Giramtha )
58 Jetalpur
59 Enasan
60 Pirana ( Giramtha)
61 Ognaj
62 Chandkheda
63 Lambha
64 Aslali
65 Pardhol
66 Sadara
67 Sampa
68 Palaiya
69 Kadadara
70 Dabhoda
FAIRS AND FESTIVALS
Name/Occasion of fair or festival
3
Date of fair/festival
4
Estimated congregation/
Number of participants
5
VIRAMGAM TALUKA-concld.
Sereshwer Mahadev fair
Nagdev fair
Nagdev fair
Shakat Mata fair
Shakat Mata fair
Verai Matani: Palli
Bhavani Mata
Gebanshah Pri Urs
Navratri fair
Naga Panchami fair
Goga ( Nagdev ) fair
Habibshah Pir fair Shaktimata fair
Balsasan Mahadev fair
Janmashtami
Ajam Pir Dargah
Sakha pir fair
Nag Panchami
Nag Panchami
Shitala Mata fair
Every Monday of Shravan (August)
Shravan Sud 11 ( August)
Shravan Vad 5 ( August)
Phalgun Vad 13 (March)
Phalgun Sud 9 ( March)
Ashvin Sud 9 ( October)
1st Monday of Bhadra'pad ( September )
Shawwal-l
Ashvin Sud 2 ( October)
Shravan Vad 5 ( August)
Shravan Vad 5 (August)
Shravan Vad 11 (August)
Ashvin Sud 5 ( October)
Last Monday of Shravan ( August)
Shravan Vad 8 (August)
2,000-2,500
2,000
2,000
2,000
1,700
1,500
1,400
1,000-1,500
1,100-1,200
1,000-1,100
1,000
1,000
1,000
800-1,000
800-1,000 Bhadrapad Vad 4 (September) 500
Safar 7 300
Shravan Vad 5 (August) 270
Shravan Vad 5 (August) 250
Shravan Vad 7 ( August) 200
DASKROI TALUKA
Kanbhafair
Devi Mata fair
Pirana fair
Jal Jhilni Ekadashi
Nilkanth Mahadev fair, Mahashivratri
Pirana fair
Ramdev Pir fair
Shravan Vad 15 (Amas) (August)
10,000
Bhadrapad Sud 8 (September) 5,000
Bhadrapad Sud 8 (September) 4,000
Bhadrapad Sud 11 (September) 3,000
Magh Vad 14 (February) 1,500
Bhadrapad Sud 11 (September) 1,000-1,200
Bhadrapad Vad 11 (Septem- 1,000 ber)
Brahmani Mata no Ashvin Sud 14 ( October) 1,000 Garbo.
Brahmani Mata ni Ashvin Sud 14 ( October) Mandvi.
But Mata nu Havan Ashvin Sud 8 ( October)
Kalka Mata Pratish- Ashvin Sud 11 ( October) thotsav
DEHGAM TALUKA
1,000
1,000
400-500
Jakshani Devi fair 2nd Sunday of Bhadrapad 10,000
Kalka Mata fair
Janmashtami
Halani Mata fair Janmashtami
Hanumanji fair
( September)
Chaitra Sud 15 ( April)
Shravan Vad 8 ( August)
Shravan Vad 8 ( August)
1,000-1,500
800 600
Kartik Vad 14 ( November) 600
51
TABLE 18.1-cQntd.
Nearest Railway station and distanoe in Km., whether connected by bus
service!
6
Viramgam 3 Km. BUll
Viramgam 27 Km. Viramgam, 29 Km.
Viramgam 141 Km. Bus
Viramgam 27 Km. Bus
Jaksi, 3 Km. Bus
Jhund 21 Km.
Viramgam I! Km.
Bhankoda 61 Km. Bus.
Bhankoda 6! Km. Bus Jaksi,3 Km.
Jaksi 3 Km.
Bhankoda 8 Km. BUB
Katosan Road 3 Km.
Viramgam 26 Km.
MandaI 6! Km.
Viramgam 12t Km. Rly. Stn. Bus
Detroj 6! Km.
Bhoijni 21 Km.
Ahmadabad 16 Km. Bus
Rly. Stn. Bus
Vatva 9! Km. Bus
Barejdi 9! Km. Bus
Medra 3 Km. Bus
Vatva 9! Km. Bus
Khodiar 8 Km. Bus
Sabarmati 5 Kill. Bus
Vatva 61 Km. Bus
Vatva 8 Km. Bus
Medva 5 Km. Bus
Dabhoda 16 Km. Bus
Rly. Stn. Bus
Dehgam I! Km.
Dehgam 91 Km. Bus
Rly. Stn. Bus
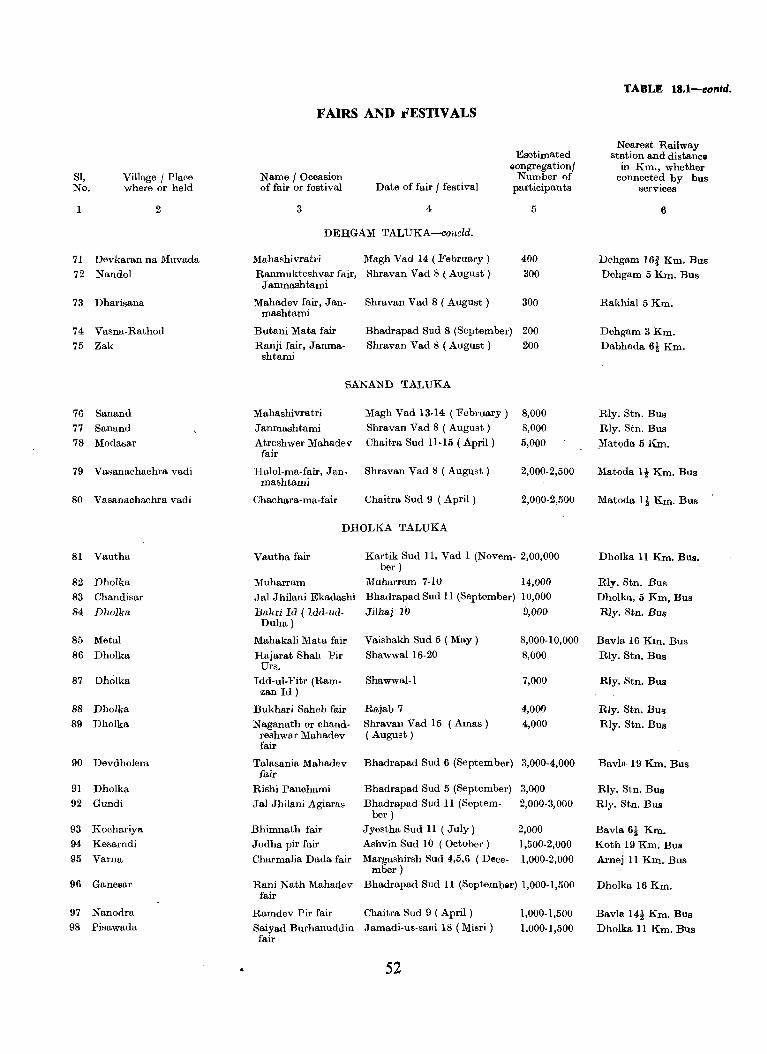
TABLE 18.1-eDlltd.
FAIRS AND ~'ESTIV ALS
Esetimated Nearest Railway
station and distance IIongregation/ in Km., whether
Sl, Village I Place Name / Occasion Number of connected by bus No. where or held of fair or festival Date of fair / festival participants services
I 2 3 4 5 6
DEHGAM TALUKA-concld.
71 Devkaran na Muvada Mahashivratri Magh Vad 14 (February) 400 Dehgarn 16i K m. Bus 72 Nandol Ranmukteshvar fair,
J anmashtami Shravan Vad 8 (August) 300 Dehgam 5 Km. Bus
73 Dharisana Mahadev fair, Jan- Shravan Vad 8 (August) 300 Rakhial 5 Km. mashtami
74 Vasna-Rathod Butani Mata fair Bhadrapad Sud 8 (September) 200 Dehgam 3 Km. 75 Zak Ranji fair, Janma-
shtami Shravan Vad 8 (August) 200 Dabhoda 6t Km.
SANAND TALUKA
76 Sanand Mahashivratri Magh Vad 13·14 (February) 8,000 Rly. Stn. Bus 77 Sanand J anmashtami Shravan Vad 8 (August) 8,000 Rly. Stn. Bus
78 Modasar Atreshwer Mahadev Chaitra Sud 11·15 (April) 5,000 _M:atoda 5 Km. fair
79 Vasanachachra vadi Halol-ma-fair, Jan. Shravan Vad 8 (August) 2,000-2,500 Matoda 1 t Krn. Bus mashtami
80 Vasanachachra vadi Chachara-ma·fair Chaitra Sud 9 (April) 2,000-2,500 Matoda 1 t Km. Bus
DHOLKA TALUKA
81 Vautha Vautha fair Kartik Sud 11, Vad 1 (Novem· 2,00,000 Dholka 11 Km. Bus. ber)
82 Dholka Muharram Muharram 7·10 14,000 Rly. Stn. Bus 83 Chandisar J al Jhilani Ekadashi Bhadrapad Sud 11 (September) 10,000 Dholka, 5 Km, Bus
84 Dholka Bakri Id ( Idd·ud. Jilhaj 10 9,000 Rly. Stu. Bus Duha)
85 Metal Mahakali Mata fair Vaishakh Sud 5 ( May) 8,000·10,000 Bavla 16 Km. Bus 86 Dholka Hajarat Shah Pir Shawwal16·20 8,000 Rly. Stu. Bus
Urs. 87 Dholka Idd·ul·Fitr (Ram· Shawwal·l 7,000 Rly. Stn. Bus
zan Id)
88 Dholka Bukhari Saheb fair Rajab 7 4,000 Rly. Stu. Bus 89 Dholka Naganath or chand· Shravan Vad 15 (Amas) 4,000 Rly. Stn. Bus
reshwar Mahadev (August) fair
90 Devdholera Talasania Mahadev Bhadrapad Sud 6 (September) 3,000·4,000 Bavla 19 Km. Bus fair
91 Dholka Rishi Panchami Bhadrapad Sud 5 (September) 3,000 Rly. Stn. Bus 92 Gundi J al Jhilani Agiaras Bhadrapad Sud 11 (Septem.
bel' ) 2,000·3,000 Rly. Stn. Bus
93 Kochariya Bhimnath fair Jyestha Sud 11 (July) 2,000 Bavla 6t Km. 94 Kesarndi J odha pir fair Ashvin Sud 10 (October) 1,500·2,000 Koth 19 Km. Bus 95 Varna Charmalia Dada fair Margashirsh Sud 4,5,6 (Dece· 1,000·2,000 Arnej 11 Km. Bus
ruber)
96 Ganeear Rani Nath Mahadev Bhadrapad Sud 11 (September) 1,000·1,500 Dholka 16 Km. fair
97 Nanodra Ramdev Pir fair Chaitra Sud 9 ( April) 1,000·1,500 Bavla 14t Km. BUB 98 Pisawada Saiyad Burhanuddin Jamadi·us·sani 18 ( Misri ) 1,000·1,500 Dholka 11 Km. Eus
fair
52

TABLE 18.1-concld.
FAIRS AND FESTIVALS
Sl. NGl.
1
99
100
101 102
103
Dholka
Dholka
Village I Place where held
2
Bhetawada
Dholka
Arnej
Name I Occasion of fair or festival
3
Lakada Kui fair Janmashtami
Najummiya Pir Urs
Mahakali Mata fair Rathyatra
Buta Bhavani Mataji
Date of fair / festival
4
5hravan Vad 8 ( August)
Rajab, 6, 8 Chaitra Sud 15 ( April) Ashadh Sud 2 ( July)
Ashvin Sud 8 ( October)
Estimated congregationl
Number of participants
5
1,000
500 500
500 400-500
Near"st Railway station and distance
in Kms. whether connected by hus
services
6
Rly. Stn. Bus
Rly. Stn. Bus
Dholka 6! Km. Bus Rly. Stn. Bus
Rly. Stn. Bus
DHANDHUKA TALUKA
104 Bhimnath Bhimnath Mahadev fair
105 Tagdi Annakoot fair
106 Salangpur Salangpur Hanuman fair
107 Dhandhuka Janmashtami
108 Dhandhuka Piran Pir fair
109 Bhadiad Pir Mohmad Bukhari fair
llO Galsana Panch Pir fair III Dhandhuka Pir Mohmadsha
Bukhari fair 112 Khadol Janmashtami
ll3 Akru Thakurdwarll fail' ll4 Ranpur Muharram 115 Ranpur Gebensha Pir Urs
Note: 1. In case of Hindu Months columan ~ shows the
corresponding months according to Gregorian calendar also. Hindu months are mentioned according to Vikram Era.
2. In the Hindu calendar followed in Gujarat, months end with Amavasya, i. e. New moon and not Purnima, i. e. full moon day.
3. Km.=Kilometrel!.
Shravan Vad 14, Bhadrapad 20,000-30,000 Rly. Stn. Bus Sud I (August-September)
Kartik Sud 9 ( November) 5,000 Rly. Stn. Bus
Bhadrapad Sud 11 (September) 4,000-5,000 Salangpur Road 8 Km. Bus
Shravan Vad 7, 8, 11 (August) 4,000-5,000 Rly. Stn. Bus Rabi-ul-Awwalll 3,000-4,000 Rly. Stn. Bus
Rajab 9-12 2,500-3,000 Dhandhuka 221 Km. Bus
Shravan Vad 11 ( August) 1,700 Dhandhuka 11 Km.
Rajah 9-14 1,000-1,500 Rly. Stn. Bus
Shravan Vad 8 ( August) 500-700 Royka I! Km. BIlB.
Shravan Vad 8 (August) 500-700 Tagdi 61 Km.
Muharram 7-11 500 Rly. Stn. BUB
Shravan Vad 9-11 (August) 500 Rly. Stn. Bus
Source :
District Census Hand Book, 1961.
TABLE 18.2
ANCIENT MONUMENTS
Sl. No.
Monuments
1 Achyut Bibi's Mosque a.nd tomb
2 Ahmed Shah's Mosque
3 Ahmedshah's Tomb 4 Baba Lului's Masjid
5 Bhadra Tower 6 Bibiji's Mosque at Rajpur 7 Brick Minars at the Railway St.ation
8 Dada Harir's well 9 Darya Khan's Tomb
10 Dastur Khan's Masjid
(Bk) H-46-14
2
~3
Name of the Townl Period of arohitecture Description Village I Place to whioh it belongs
3 4 Ahmadabad 1472 AD Mosque and tomb
1414 AD Mosque
1445 AD Tomb C.lst half of 16th Mosque
Cent. AD 1411 AD Tower
.. 1454 AD Mosque
C. 15th Cent. AD Brick Towers 1499 AD Step well
1453 AD Tomb
1463 AD Mosque
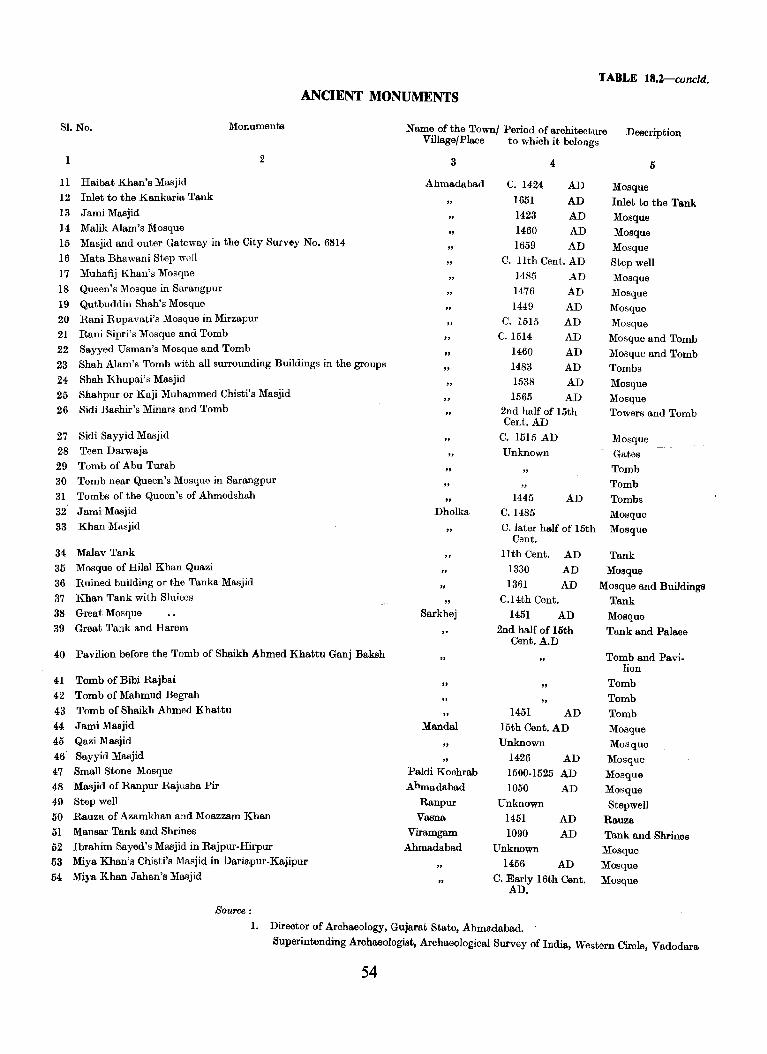
TABLE 18.2-cuncld.
ANCIENT MONUMENTS
SI. No. Monuments Name of the Town/ Period of architecture Village/Place to which it belongs
Description
I
11 Haibat Khan's Masjid 12 Inlet to the Kankaria Tank
13 Jami Masjid 14 Malik Alam's Mosque
2
15 Masjid and outer Gateway in the City Survey No. 6814
16 Mata Bhawani Step well 17 Muhafij Khan's Mosque 18 Queen's Mosque in Sarangpur
19 Qutbuddin Shah's Mosque 20 Rani Rupavati's Mosque in Mirzapur 21 Rani Sipri's Mosque and Tomb 22 Sayyed Usman's Mosque and Tomb 23 Shah Alam's Tomb with all surrounding Buildings in the groups
24 Shah Khupai's Masjid 25 Shahpur or Kaji Muhammed Chisti's Masjid
26 Sidi Bashir's Minars and Tomb
27 Sidi Sayyid Masjid 28 Teen Darwaja 29 Tomb of Abu Turab 30 Tomb near Queen's Mosque in Sarangpur 31 Tombs of the Queen's of Ahmedshah
32 Jami Masjid
33 Khan Masjid
34 Malav Tank 35 Mosque of Hilal Khan Quazi 36 Ruined building or the Tanka Masjid
37 Khan Tank with Sluices
38 Great Mosque 39 Great Tank and Harem
40 Pavilion before the Tomb of Shaikh Ahmed Khattu Ganj Baksh
41 Tomb of Bibi Rajbai 42 Tomb of Mahmud Begrah 43 Tomb of Shaikh Ahmed Khattu
44 Jami Masjid 45 Qazi Masjid 46 Sayyid Masjid 47 Small Stone Mosque 48 Masjid of Ranpur Rajusha Pir
49 Step well 50 Rauza of Azamkhan and Moazzam Khan
51 Mansar Tank and Shrines 52 Ibrahim Sayed's Masjid in Rajpur.Hirpur 53 Miya Khan's Chisti's l\Iasjid in Dariapur.Kajipur
54 Mil'a Khan Jahan's Masjid
Source:
3
Ahmadabad
"
"
" "
"
" Dholka
"
Sarkhej
,.
"
Mandai
Paldi Kochrab Ahmadabad
Ranpur Vaana
Viramgam Ahmadabad
4
C. 1424 AD 1651 AD 1423 AD 1460 AD 1659 AD
C. 11th Cent. AD 1485 AD 1476 AD 1449 AD
C. 1515 AD C.1514 AD
1460 AD 1483 AD 1538 AD 1565 AD
2nd half of 15th Cent. AD
C. 1515 AD
Unknown
1445 AD C.1485
C. later half of 15th Cent.
11th Cent. AD 1330 AD 1361 AD
C.14th Cent. 1451 AD
2nd half of 15th Cent. A.D
"
" 1451 AD 15th Cent. AD
Unknown 1426 AD 1500·1525 AD 1050 AD
Unknown 1451 AD 1090 AD
Unknown 1456 AD
C. Early 16th Cent. AD.
1. Director of Archaeology, Gujarat State, Ahmadabad. -
I)
Mosque
Inlet to the Tank Mosque Mosque Mosque Step well
Mosque Mosque
Mosque
Mosque Mosque and Tomb
Mosque and Tomb Tombs Mosque Mosque Towers and Tomb
Mosque Gates Tomb Tomb
Tombs Mosque
Mosque
Tank
Mosque
Mosque and Buildings Tank
Mosque Tank and Palace
Tomb and Pavi. lion
Tomb
Tomb Tomb
Mosque Mosque
Mosque Mosque
Mosque
Stepwell Rauza
Tank and Shrines Mosque
Mosque Mosque
Superintending Arohaeologist, Archaeological Survey of India, Western Cirole, Vadodara
54
SECTION II CENSUS TABLES
(BASED ON FULL COUNT)

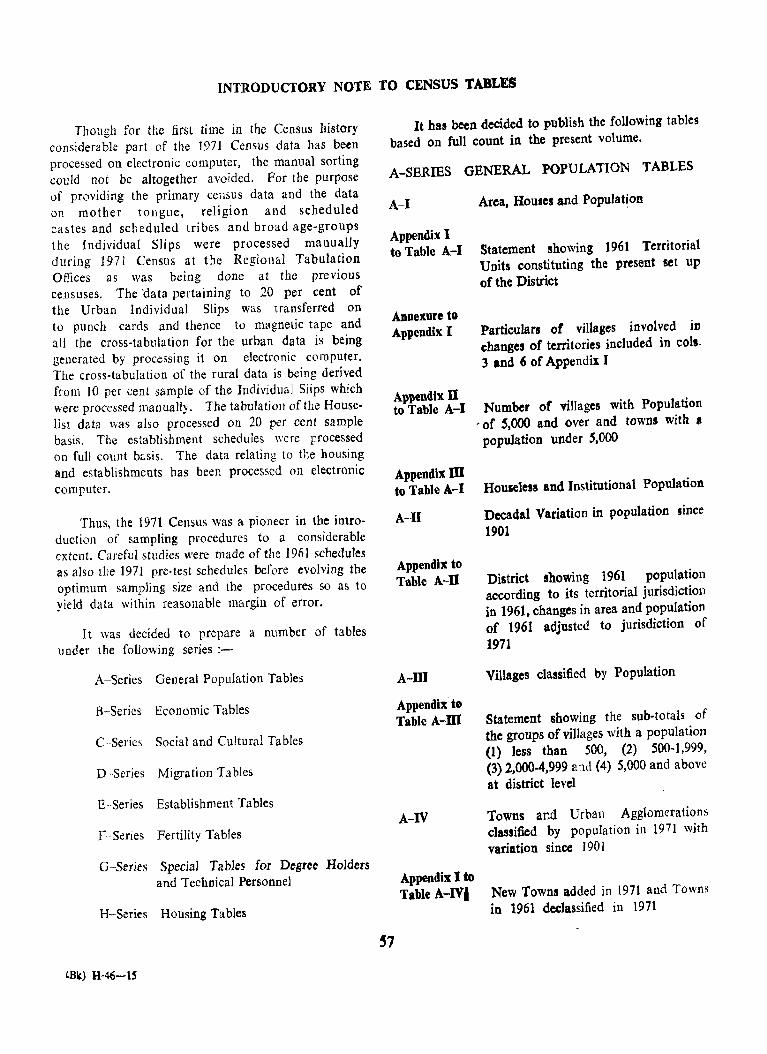
INTRODUCTORY NOTE TO CENSUS TABLES
Though for the first time in the Census history considerable part of the 1971 Census data has been processed on electronic computer, the manual sorting could not be altogether avoided. Par the purpose of providing the primary census data and the data on mother tongue. religion and scheduled castes and scheduled tribes and broad age-groups the Individual Slips were processed manually during 1971 Census at the Regional Tabulation Offices as was being done at the previous censuses. The 'data pertaining to 20 per cent of the Urban Individual Slips was transferred on to punch cards and thence to magnetic tape and all the cross-tabulation for the urban data is being generated by processing it on electronic computer. The cross-tabulation of the rural data is being derived from 10 per cent sample of the Individual Slips which were processed manually. The tabulation of the Houselist data was also processed on 20 per cent sample basis. The establishment schedules were processed on full count b"sis. The data relating to the housing and establishments has been processed on electronic computer.
Thus, the 1971 Census was a pioneer in the introduction of sampling procedures to a considerable extent. Careful studies were made of the 1961 schedules as also the 1971 pre-test schedules before evolving the optimum sampling size and the procedures so as to yield data within reasonable margin of error.
It was decided to prepare a number of tables under the following series :-
A-Series General Population Tables
B-Series Economic Tables
C-Serics Social and Cultural Tables
D~Serjes Migration Tables
E-Series Establishment Tables
F-Series Fertility Tables
G--Series Special Tables for Degree Holders and Technical Personnel
H-Series Housing Tables
LBk) H-46-1S
It has been decided to publish the following tables based on full count in the present volume.
A-SERIES GENERAL POPULATION TABLES
A-I
Appendix I to Table A-I
Annexure to Appendix I
Appendix U to Table A-I
S7
AppendixW to Table A-I
A-II
Appendix to Table A-U
A-ID
Appendix to Table A-m
A-IV
Appendix I to Table A-IVI
Area, Houses and Population
Statement showing 1961 Territorial Units constituting the present set up of the District
Particulars of villages involved in changes of territories included in coli. 3 and 6 of Appendix I
Number of villages with Population 'of 5,000 and over and towns with •
population under 5,000
Houleless and Institutional PopUlation
Decadal Variation in population since
1901
District showing 1961 population according to its territorial jurisdiction in 1961, changes in area and population of 1961 adjusted to jurisdiction of
1971
Villages classified by Population
Statement showing the sub-totals of the groups of villages with a population (1) Jess than 500, (2) 5OO~1,999, (3) 2,000-4,999 and (4) 5,000 and above at district level
Towns and Urban Agglomerations classified by population in 1971 with variation since 190 I
New Towns added in 1971 and Towns in 1961 declassified ill 1971
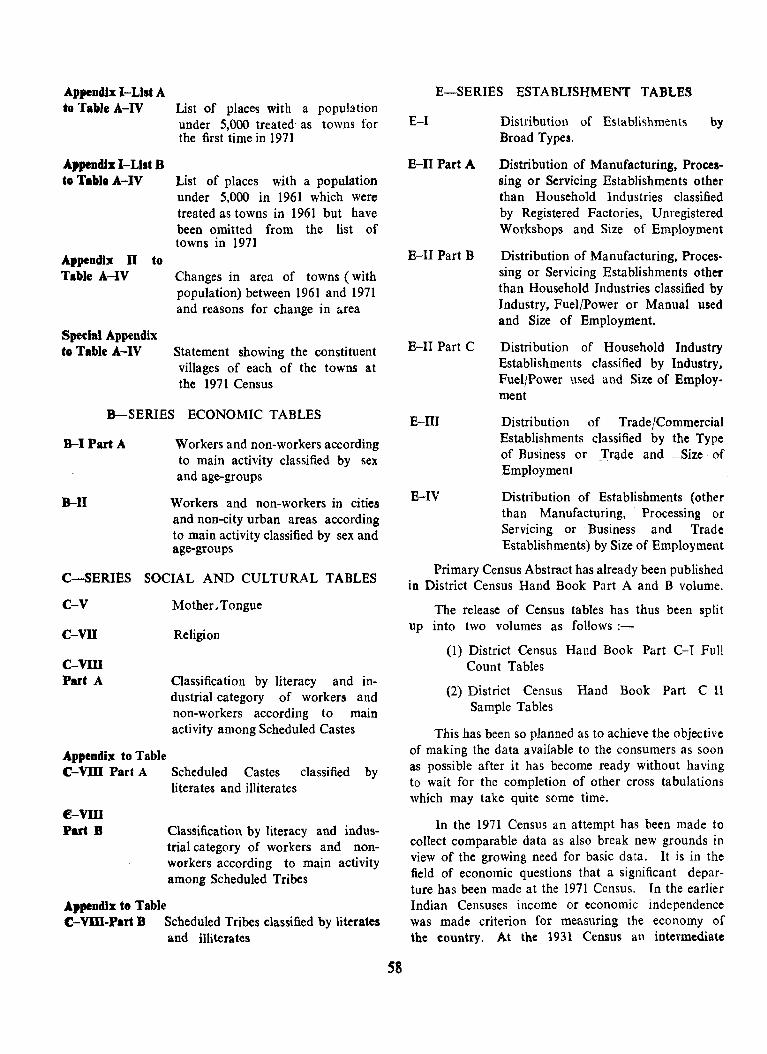
Appendix I-List A to Table A-IV
Appendix I-List B to TaJJI. A-IV
Appendix n to Table A-IV
Spedal Appendix to Table A-IV
List of places with a population under 5,000 treated as towns for the first time in 1971
List of places with a population under 5,000 in 1961 which were treated as towns in 1961 but have been omitted from the list of towns in 1971
Changes in area of towns ( with population) between 1961 and 1971 and reasons for change in ~rea
Statement showing the constituent villages of each of the towns at the 1971 Census
B-SERIES ECONOMIC TABLES
B-1 Part A
B-II
Workers and non-workers according to main activity classified by sex and age-groups
Workers and non-workers in cities and non-city urban areas according to main activity classified by sex and age-groups
C-SERIES SOCIAL AND CULTURAL TABLES
C-V
C-VII
C-VIll Part A
Appendix to Table
Mother, Tongue
Religion
Classification by literacy and industrial category of workers and non-workers according to main activity among Scheduled Castes
C-VIll Part A Scheduled Castes classified by literates and illiterates
fJ-VIll Part B
Appendix te Table
Classification by literacy and industrial category of workers and nonworkers according to main activity among Scheduled Tribes
C-vnI-Part B Scheduled Tribes classified by literates and illiterates
58
E-SERIES ESTABLISHMENT TABLES
E-I Distribution of Establishments Broad Types.
by
E-II Part A Distribution of Manufacturing, Processing or Servicing Establishments other than Household Industries classified by Registered Factories, Unregistered Workshops and Size of Employment
E-II Part B Distribution of Manufacturing, Processing or Servicing Establishments other than Household Industries classified by Industry, Fuel/Power or Manual used and Size of Employment.
E-ll Part C Distribution of Household Industry Establishments classified by Industry, Fuel/Power used and Size of Employment
E-IIJ
E-IV
Distribution of Trade/Commercial Establishments classified by the Type of Business or _Trade. and -Size·· of Employment
Distribution of Establishments (other than Manufacturing, Processing or Servicing or Business and Trade Establishments) by Size of Employment
Primary Census Abstract has already been published in District Census Hand Book Part A and B volume.
The release of Census tables has thus been split up into two volumes as follows:-
(1) District Census Hand Book Part C-I Full Count Tables
(2) District Census Hand Book Part C-lI Sample Tables
This has been so planned as to achieve the objective of making the data available to the consumers as soon as possible after it has become ready without having to wait for the completion of other cross tabulations which may take quite some time.
In the 1971 Census an attempt has been made to collect comparable data as also break new grounds in view of the growing need for basic data. It is in the field of economic questions that a significant departure has been made at the 1971 Census. In the earlier Indian Censuses income or economic independence was made criterion for measuring the economy of the country. At the 1931 Census an intermediate

category of economic semidependence was introduced and it was called 'working dependent'. In 1941 this category was known as partly dependent, and earning dependent in 1951. At the 1961 Census, stress was laid on work so that all people who work, including family workers, who are not in receipt of any income, and/or who cannot earn enough for their maintenance, could also be included as 'workers'. At the 1971 Census the main activity of a person is first ascertained according as he spends his time basically as a 'worker' producing goods and services or as a 'non-worker'. For regular work in Industry, Trade or Service the reference period is the week prior to the enumeration (a fortnight in 1961) and for seasonal work such as agriculture, etc. the last one year. The person is categorised according to the main activity returned by an individual. Where a person, who is basically a non-worker such as a student or housewife, does make some marginal contribution to work, that secondary work is recorded in a separate question of the individual slip. Experience of the 1961 Census had shown that census was not a proper agency to collect reliable data on unemployment as such. Therefore the 1971 Census does not ask a question on unemployment directly but the unemployed are expected to fall in the residuary category of non-workers and data in respect of them will be provided which has to be utilised subject to all the limitations.
It is a census tradition to present data by rural and urban areas. Village or Town is recognised ~s the basic area of habitation. In all Censuses throughout the world this dichotomy of rural and urban areas is recognised and the data are generally presented for the rural and urban areas separately. In the rural areas the smallest area of habitation viz., the village generally follows the limits of a revenue village that is recognised by the normal district administration. The revenue village need not necessarily be a single agglomeration of the habitations. But the revenue village has a definite surveyed boundary and each village is a separate administrative unit. It may have one Or more hamlets. The entire revenue village is one unit. There may be unsurveyed villages within forests etc.
It is in defining the urban areas that several problems generally arise. However, for the 1971 Census the definition adopted for an urban area generally follows that of 1961 which is as follows ;-
(a) All places with a municipality, corporation or cantonment or notified town area.
59
(b) All other places which satisfied the following criteria:
(i) a minimum population of 5,000
(ii) at least 75 per cent of the male working population was non-agricultural,
(iii) a density of population of at least 400 per sq. km. (i.e. 1,000 per sq. mile).
The Director of Census of each State is, however, given some discretion in respect of some marginal cases, in consultation with the State Government to include some places that had other distinct urban characteristics and to exclude undeserving cases.
In several areas around a core city or statutory town have come up fairly large well recognised railway colonies, university campuses, port areas, military camps, etc., and even though these are outside the statutory limits of a corporation, municipality or cantonment, they fall within the revenue boundary of the place by which the town itself is known. It may not be altogether realistic to treat such areas lying outside the statutory limits of a town as rural units and at the same time each such individual area by itself may not satisfy the minimum popUlation limit to qualify it to be treated as an independent urban unit. Such areas deserve to be reckoned alongwith the main town and the continuous spread including such urban outgrowths would deserve to be treated as an integrated urban .. rea, what is being called urban agglomeration at the 1971 Census. There are different situations in which urban agglomerations would be constituted for example;
(a) A city with continuous outgrowth (the part of outgrowth being out of the statutory limits but falling within the boundaries of the adjoining village or villages ),
(b) One town with similar outgrowth or two or more adjoining towns with their outgrowths as in (a), and
(c) A city and one or more adjoining towns with their outgrowth all of which forming a continuous spread.
The distribution of population by broad industrial categories has been made on 1961 pattern except for the fact that Category III of 1961 has been divided into two categories, viz., Category III-Workers in livestock, forestry, fishing, hunting, plantation, orchards and allied activities and Category IV-Workers in mining
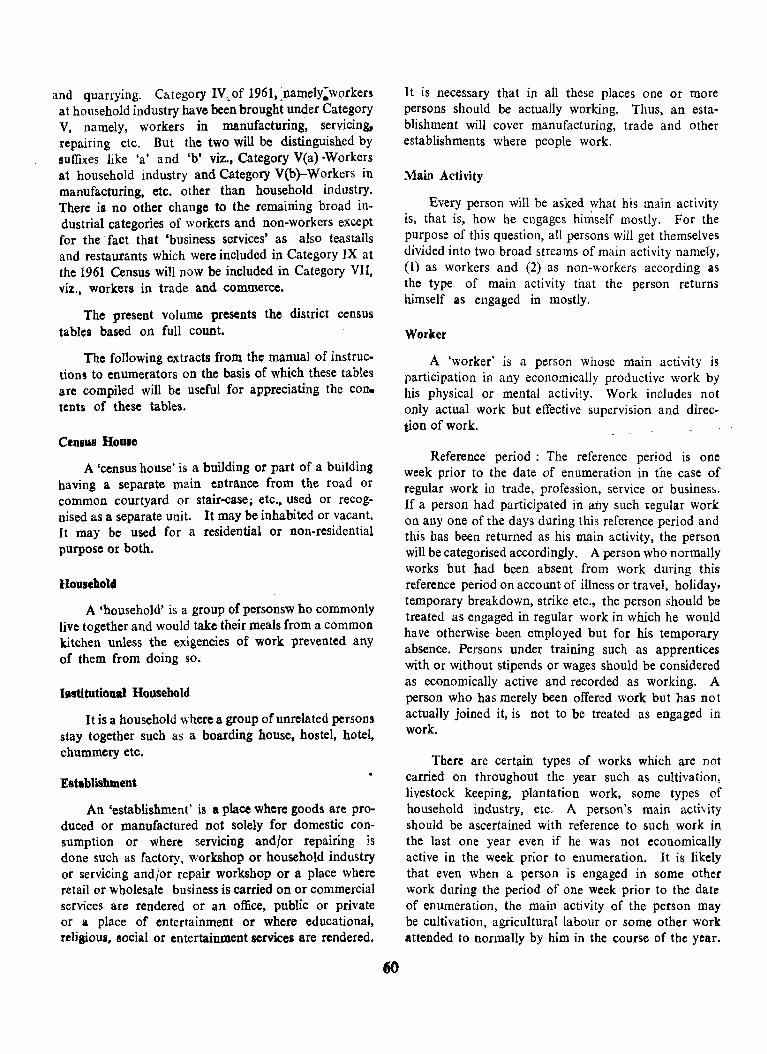
and quarrying. C~tegory IVc,of 1961,.namely:worken at household industry have been brought under Category V, namely, workers in manufacturing, servicing, repairing etc. But the two will be distinguished by suffixes like 'a' and 'b' viz., Category V(arWorkers at household industry and Category V(b)-Workers in manufacturing, etc. other than household industry. There is no other change to the remaining broad industrial categories of workers and non-workers except for the' fact that 'business services' as also teastalls and restaurants which were included in Category IX at the 1961 Census will now be included in Category VII, viz., workers in trade and commerce.
The present volume presents the district census tables based on full count.
The following extracts from the manual of instructions to enumerators on the basis of which these tables are compiled will be useful for appreciating the con. tents of these tables.
Census Hoose
A 'census house' is a building or part of a building having a separate main entrance from the road or common courtyard or stair-case; etc., used or recognised as a separate unit. It may be inhabited or vacant. It may be used for a residential or non-residential purpose or both.
llousebold
A 'household' is a group of personsw ho commonly live together and would take their meals from a common kitchen unless the exigencies of work prevented any of them from doing so.
Iastitutional Household
It is a household where a group of unrelated persons stay together such as a boarding house, hostel, hotel, chummery etc.
Establishment
An 'establishment' is a place where goods are produced or manufactured not solely for domestic consumption or where servicing and/or repairing is done such as factory, workshop or household industry or servicing andjor repair workshop or a place where retail or wholesale business is carried on or commercial services are rendered or an office, public or private or a place of entertainment or where educational, relisious, 80cial or entertainment services are rendered.
T t is necessary that in all these places one or more persons should be actually working. Thus, an establishment will cover manufacturing, trade and other establishments where people work.
Main Activity
Every person will be asked what his main activity is, that is, how he engages hiu1self mostly. For the purpose of this question, all persons will get themselves divided into two broad streams of main activity namely, (1) as workers and (2) as non-workers according as the type of main activity that the person returns himself as engaged in mostly.
Worker
A 'worker' is a person whose main activity is participation in any economically productive work by his physical or mental activity. Work includes not only actual work but effective supervision and direction of work.
Reference period: The reference period is one week prior to the date of enumeration in the case of regular work in trade, profession, service or business. If a person had participated in ally such regular work on anyone of the days during this reference period and this has been returned as his main activity, the person will be categorised accordingly. A person who normally works but had been absent from work during this reference period on account of illness or travel, holiday, temporary breakdown, strike etc., the perSOll should be treated as engaged in regular work in which he would have otherwise been employed but for his temporary absence. Persons under training such as apprentices with or without stipends or wages should be considered as economically active and recorded as working. A person who has merely been offered work but has not actually joined it, is not to be treated as engaged in work.
There are certain types of works which are not carried on throughout the year such as cultivation, livestock keeping, plantation work, some types of household industry, etc, A person's main activity should be ascertained with reference to such work in tbe last one year even if he was not economically active in the week prior to enumeration. It is likely that even when a person is engaged in some other work during the period of one week prior to the date of enumeration, the main activity of the person may be cultivation, agricultural labour or some other work attended to normally by him in the course of the year.
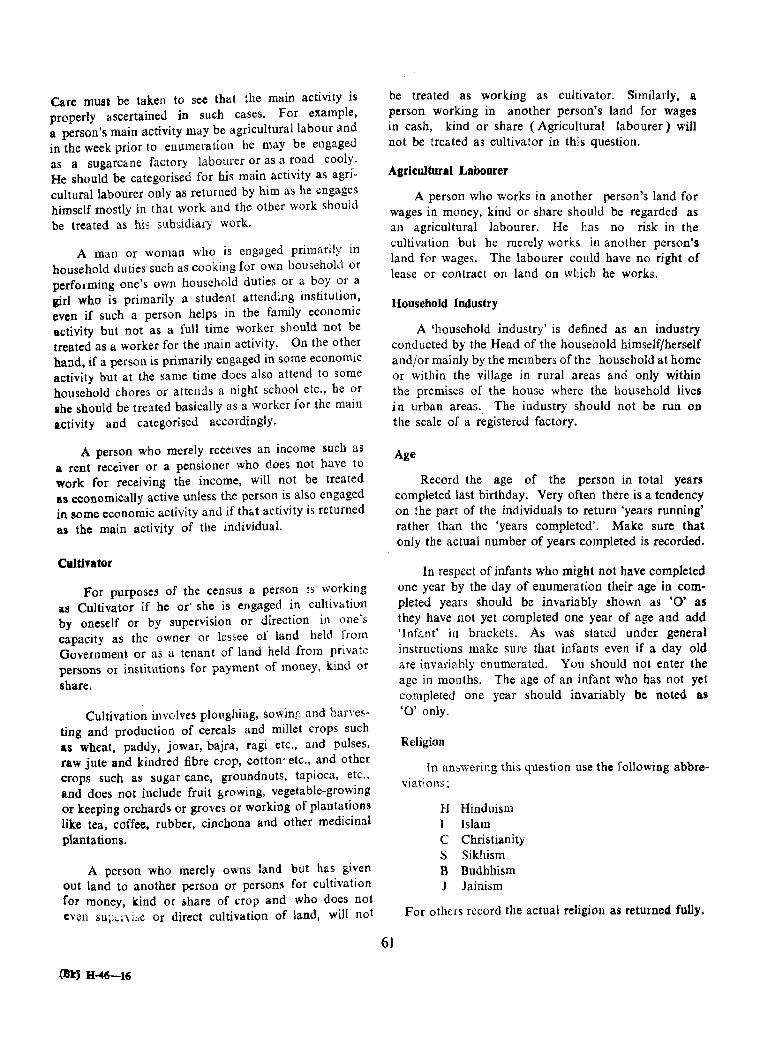
Care must be taken to see that the main activity is properly ascertained in such cases. For example, a person's main activity may be agricultural labour and in the week prior to enumeration he may be engaged as a sugarcane factory labourer or as a road cooly. He should be categorised for his main activity as agricultural labourer only as returned by him as he engages himself mostly in that work and the other work should be treated as his subsidiary work.
A man or woman who is engaged primarily in household duties such as cooking for own household or perfoJming one's own household duties or a boy or a girl who is primarily a student attending institution, even if such a person helps in the family economic activity but not as a full time worker should not be treated as a worker for the main activity. On the other hand, if a person is primarily engaged in some economic activity but at the same time does also attend to some household chores or attends a night school etc., he or ahe should be treated basically as a worker for the main activity and categorised accordingly.
A person who merely receives an income such as a rent receiver or a pensioner who does not have to work for receiving the income, will not be treated as economically active unless the person is also engaged in some economic activity and if th4t activity is returned as the main activity of the individual.
Cultintor
For purposes of the census a person is working itS Cultivator if he or' she is engaged in cultivation by oneself or by supervision or direction in one's capacity as the owner or lessee of land held from Government or as a tenant of land held from private persons or institutions for payment of money, kind or
share.
Cultivation involves plollghing, sawin,", and harve~ting and production of cereals and millet crops such as wheat, paddy, jowar, bajra, ragi etc., and pulses, raw jute and kindred fibre crop, cotton" etc., and other crops such as sugar cane, groundnuts, tapioca, etc., and does not include fruit growing, vegetable-growing or keeping orchards or groves or working of plantations like tea, coffee, rubber, cinchona and other medicinal plantations.
A person who merely owns land but has given out land to another person or persons for cultivation for money, kind or share of crop and who does not even sur~ni~e or direct cultivation of land, will not
(Btl H-46-16
be treated as working as cultivator. Similarly, a person working in another person's land for wages in cash, kind or share (Agricultural labourer) will not be treated as cultivator in this question.
Agricultural Labourer
A person who works in another person's land for wages in money, kind or share should be regarded as an agricultural labourer. He has no risk in the cultivation but he merely works in another person's land for wages. The labourer could have no right of lease or contract on land on which he works.
Household Industry
A 'household industry' is defined as an industry conducted by the Head of the household himself/herself and/or mainly by the members of the household at home or within the village in rural areas and only within the premises of the house where the household lives in urban areas. The industry should not be run on the scale of a registered factory.
61
Age
Record the age of the person in total years completed last birthday. Very often there is a tendency on the part of the individuals to return 'years running' rather than the 'years completed'. Make sure that only the actual number of years completed is recorded.
In respect of infants who might not have completed one year by the day of enumeration their age in completed years should be invariably shown as '0' as they have not yet completed one year of age and add 'Inf::..nt' ill brackets. As was stated under general instructions make sure that infants even if a day old are invariably enumerated. You should not enter the age in months. The age of an infant who has not yet completed one year should invariabJy be noted as '0' only.
Religion
In answering this question use the following abbreviations;
H Hinduism I Islam C Christianity S Sikhism B Budhhism J lainism
For others record the actual religion as returneG fully.
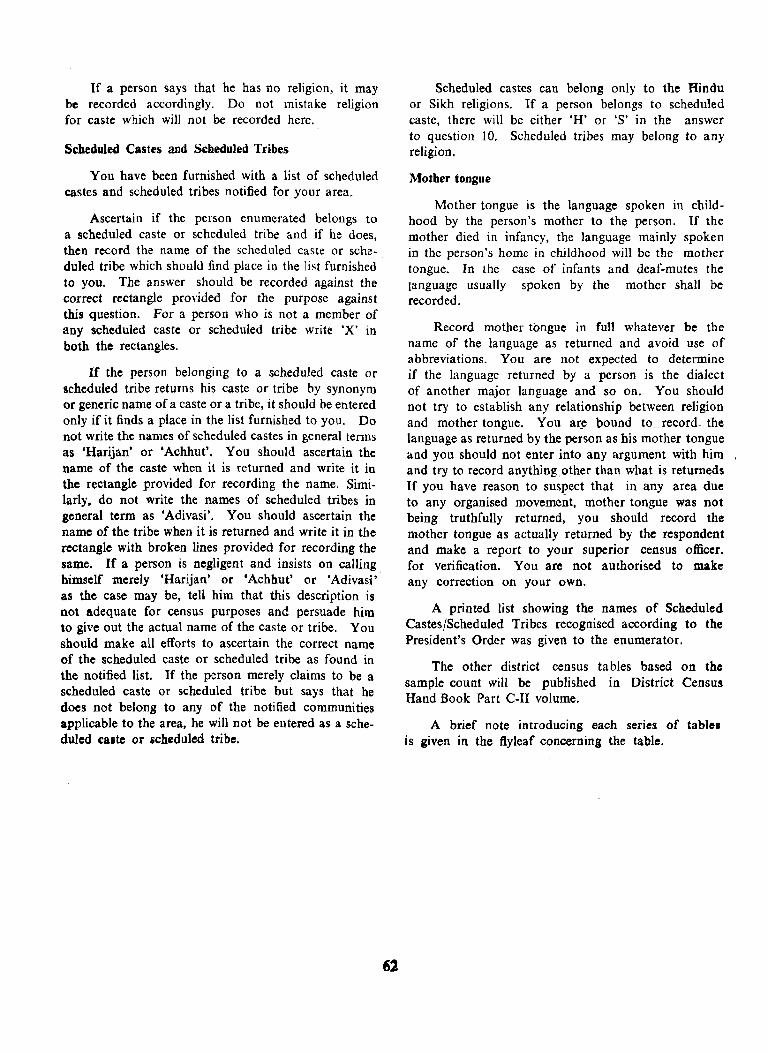
If a person says that he has no religion, it may be recorded accordingly. Do not mistake religion for caste which will not be recorded here.
Scbeduled Castes and Scheduled Tribes
You have been furnished with a list of scheduled castes and scheduled tribes notified for your area.
Ascertain if the person enumerated belongs to a scheduled caste or scheduled tribe and if he does, then record the name of the scheduled caste or scheduled tribe which should find pJace in the Jist furnished to you. The answer should be recorded against the correct rectangle provided for the purpose against this question. For a person who is not a member of any scheduled caste or scheduled tribe write 'X' in both the rectangles.
If the person belonging to a scheduled caste or scheduled tribe returns his caste or tribe by synonym or generic name of a caste or a tribe, it should be entered only if it finds a place in the list furnished to you. Do not write the names of scheduled castes in general terms as 'Harijan' or 'Achhut'. You should ascertain the name of the caste when it is returned and write it in the rectangle provided for recording the name. Similarly, do not write the names of scheduled tribes in general term as 'Adivasi'. You should ascertain the name of the tribe when it is returned and write it in the rectangle with broken lines provided for recording the same. If a person is negligent and insists on calling himself merely 'Harijan' or 'Achhut' or 'Adivasi' as the case may be, tell him that this description is not adequate for census purposes and persuade him to give out the actual name of the caste or tribe. You should make all efforts to ascertain the correct name of the scheduled caste or scheduled tribe as found in the notified list. If the person merely claims to be a scheduled caste or scheduled tribe but says that he does not belong to any of the notified communities applicable to the area, he will not be entered as a scheduled calte or scheduled tribe.
62
Scheduled castes can belong only to the Hindu or Sikh religions. If a person belongs to scheduled caste, there will be either 'R' or '5' in the answer to question 10. Scheduled tribes may belong to any religion.
Mother tongue
Mother tongue is the language spoken in childhood by the person's mother to the person. If the mother died in infancy, the language mainly spoken in the person's home in childhood will be the mother tongue. In the case of infants and deaf-mutes the language usually spoken by the mother shall be recorded.
Record mother tongue in full whatever be the name of the language as returned and avoid use of abbreviations. You are not expected to determine if the language returned by a person is the dialect of another major language and so on. You should not try to establish any relationship between religion and mother tongue. You ar_e bound to __ record- the language as returned by the person as his mother tongue and you should not enter into any argument with him , and try to record anything other than what is returneds If you have reason to suspect that in any area due to any organised movement, mother tongue was not being truthfully returned, you should record the mother tongue as actually returned by the respondent and make a report to your superior census officer. for verification. You are not authorised to make any correction on your own.
A printed list showing the names of Scheduled Castes/Scheduled Tribes recognised according to the President's Order was given to the enumerator.
The other district census tables based on the sample count will be published in District Census Hand Book Part C-1I volume.
A brief note introducing each series of table. is given in the flyleaf concerning the table.
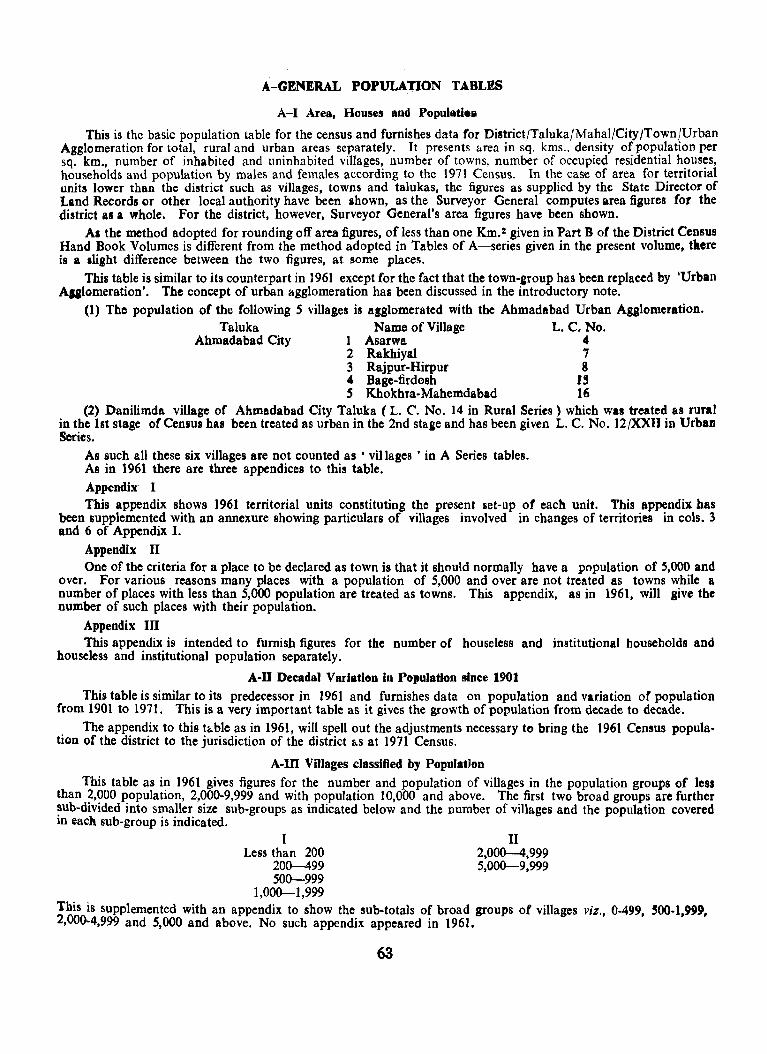
A-GENERAL POPULATION TABLES
A-I Area, Houses and Populatiea
This is the basic population table for the census and furnishes data for District/Taluka/Mahal/CitY/Town/Urban Agglomeration for total, rural and urban areas separately. It presents "rea in sq. kms .. density of population per sq. km., number of inhabited and uninhabited villages, number of towns, number of occupied residential houses, households and population by males and females according to the 1971 Census. In the case of area for territorial units lower than the district such as villages, towns and talukas, the figures as supplied by the State Director of Lind Records or other local authority have been shown, as the Surveyor General computes area figures for the district as a whole. For the district, however, Surveyor General's area figures have been shown.
AI the method adopted for rounding off area figures, of less than one Km.: given in Part B of the District Census Hand Book Volumes is different from the method adopted in Tables of A-series given in the present volume, taere is a .light difference between the two figures, at some places.
This table is similar to its counterpart in 1961 except for the fact that the town-aroup has been replaced by 'Urban Aulomeration'. The concept of urban agglomeration has been discussed in the introductory note.
(1) The population of the following 5 villages is agglomerated with the Ahmadabad Urban Agglomeration. Taluka Name of Village L. C. No.
Ahmadabad City 1 Asarwa 4 2 Rakhiyal 7 3 Rajpur-Hirpur 8 " Bage-firdosh I' S Khokhra-Mahemdabad 16
(2) Danilimda village of Ahmadabad City Taluka ( L. C. No. 14 in Rural Series) which was treated all rural in the ht stage of Census has been treated as urban in the 2nd stage and has been given L. C. No. l2/XXII in Urban Series.
As such all these six villages are not counted as ' villages ' in A Series tables. As in 1961 there arc three appendices to this table. Appendix· I This appendix shows 1961 territorial units constituting the present set-up of each unit. This appendix has
been supplemented with an annexure showing particulars of villages involved in changes of territories in cols. 3 and 6 of Appendix I.
Appendix II One of the criteria for a place to be declared as town is that it should normally have a population of 5,000 and
over. For various reasons many places with a population of 5,000 and over are not treated as towns while a number of places with less than 5,000 population are treated as towns. This appendix. as in 1961, will give the number of such places with their population.
Appendix m This appendix is intended to furnish figures for the number of houseless and institutional households and
house1ess and institutional population separately.
A-II Decadal Variation in Population since 1901
This table is similar to its predecessor in 1961 and furnishes data on population and variation of population from 1901 to 1971. This is a very important table as it gives the growth of population from decade to decade.
The appendix to this tt-ble as in 1961, will spell out the adjustments necessary to bring the 1961 Census population of the district to the jurisdiction of the district as at 1971 Census.
A-m Villages classified by Population
This table as in 1961 gives figures for the number and population of villages in the population groups of lesl than 2,000 population, 2,000-9,999 and with population 10,000 and above. The first two broad groups are further ~ub-divided into smaller size sub-groups as indicated below and the number of villages and the population covered 10 each sub-group is indicated.
I II Less than 200 2,000-4,999
200--499 5,000-9,999 500-999
1,000-1,999 This is supplemented with an appendix to show the sub-totals of broad groups of villages viz., 0-499, ~OO-l,999, 2,000-4,999 and 5,000 and above. No such appendix appeared in 1961.
63
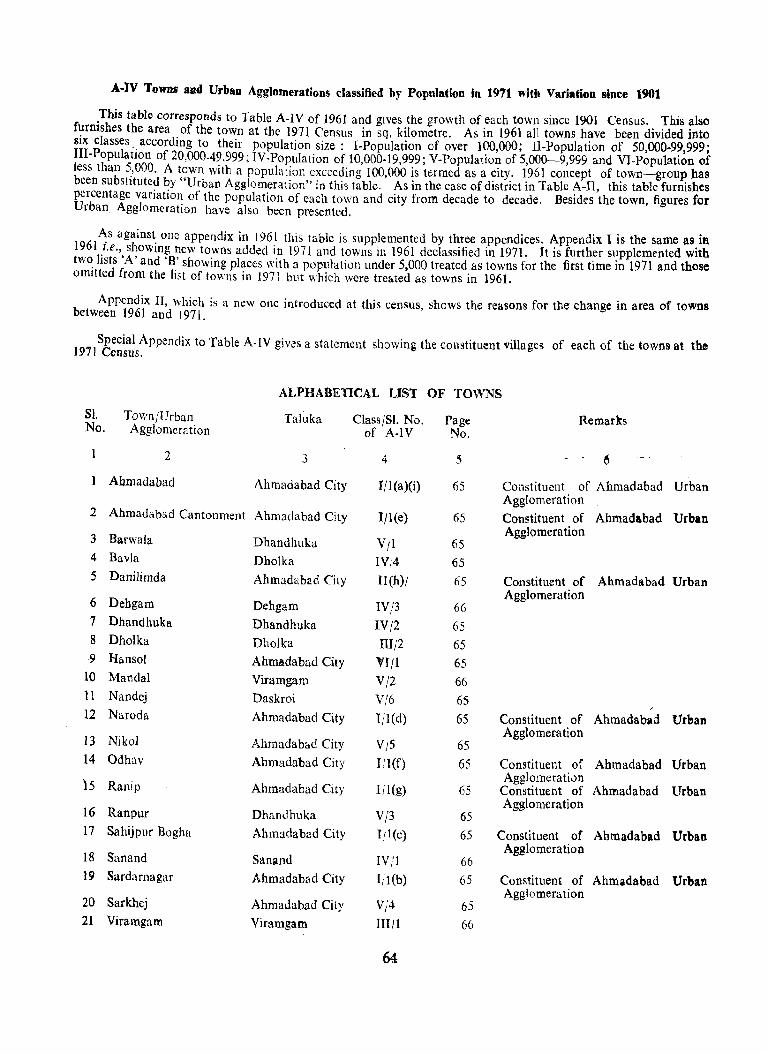
A-IV TowDs aud Urbau Agglomerations classified by Population in 1971 with Variation since 1901
.This table corresponds to Table A-IV of 1961 and gives the growth of each town since 1901 Census. This also f,!rmshes the area of the town at the 1971 Census in sq. kilometre. As in 1961 all towns have been divided into SIX classes", according to their population size: I-Population of over 100,000; II-Population of 50,000-99,999; III-PopulatIOn of 20,000-49,999; IV-Population of 10,000-19,999; V-Population of 5,000-9,999 and VI-Population of Jess than ~,OOO. A town with a population exceeding 100,000 is termed as a city. 1961 concept of town-group has been substituted by "Urban Agglomeration" in this table. As in the case of district in Table A-II, this table furnishes percentage variation of the population of each town and city from decade to decade. Besides the town, figures for Urban Agglomeration have also been presented.
~s against, one appendix in 1961 this table is supplemented by three appendices. Appendix I is the same as in 1961 I.e., showmg new towns added in 1971 and towns in 1961 declassified in 1971. It is further supplemented with tw~ lists 'N and 'B' showing places with a popUlation under 5,000 treated as towns for the first time in 1971 and those omItted from the list of towns in 1971 b~lt which were treated as towns in 1961.
Appendix II, which is a new one introduced at this census, shows the reasons for the change in area of towns between 1961 and 1971.
Special Appendix to Table A-IV gives a statement showing the constituent villages of each of the towns at the 1971 Census.
81. Town/Urban No. Agglomeration
2
Ahmadabad
2 Ahmadabiid Cantonment
3 Barwala
4 Bavla
5 Danilimda
6 Dehgam
7 Dhandhuka
8 Dholka
9 Hansol
10 MandaI
II Nandej
12 Naroda
13 Nikol
14 Odhav
15 Ranip
16 Ranpur
17 Sahijpur Bogha
18 Sanand
19 Sardarnagar
20 Sarkbej
21 Viramgam
ALPHABETICAL LIST OF TO\YNS
Taluka Class/S!. No. of A-IV
3 4
Ahmadabad City J /l (a)(i)
Ahmadabad City Ij 1 (e)
Dhandhuka VII Dholka IV/4 Ahmadabad City Il(h);
Dehgam IV/3
Dhandhuka IV/2
Dholka III/2 Ahmadabad City VIII Viramgam V/2 Daskroi V/6 Ahmadabad City Ij1(d)
Ahmadab&d City VJ5 Ahmadabad City I/1(f)
Ahmadabad City Ill(g)
Dhandhuka Vj3
Ahmadabad City TJ1(c)
Sanand IV,'I
Ahmadabad City l!l(b)
Ahmadabad City V/4
Viramgam III/I
64
Page No.
5
65
65
65 65
65
66 65 65 65 66 65
65
65
65
65
65 65
66
65
65 66
Remarks
Constituent of Ahmadabad Urban Agglomeration
Constituent of Ahmadabad Urban Agglomeration
Constituent of Ahmadabad Urban Agglomeration
Constituent of Ahmadabad Urban Agglomeration
Constituent of Ahmadabad Urban Agglomeration
Constituent of Ahmadabad Urban Agglomeration
Constituent of Ahmadabad Urban Agglomeration
Constituent of Ahmadabad Urban Agglomeration
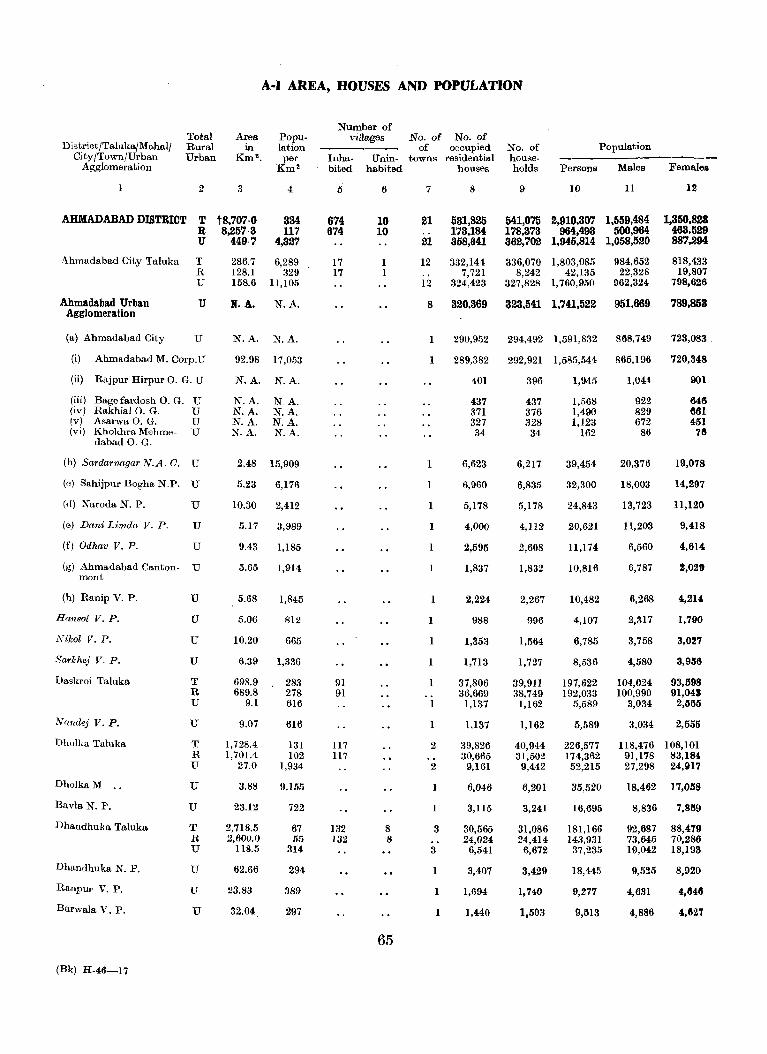
A-I AREA, HOUSES AND POPULATION
District/Taluka/Mahall City/Town/Urban
Agglomeration
Total Rural Urban
2
Area in
Km 2 •
3
Popu. lation per
Km'
4
AHMADABAD DISTRICT T t8,707·0 R 8,257·3 U 449·7
334 117
4,327
Ahmadabad City Taluka
Ahmadabad Urban Agglomeration
(a) Ahmadabad City
T R U
U
U
(i) Ahmadabad M. Corp.U
(ii) Rajpur Hirpur O. G. U
(iii) Bagefardosh O. G. U (iv) Rakhial O. G. U (v) Asarwa O. G. U (vi) Khokhra Mohme- U
dabad O. G.
(b) Sardarnagar N.A. O. U
(c) Sahijpur Bogha N.P. U
(d) Naroda N. P.
(e) Dani Limda V. P.
(f) Odhav V. P.
U
U
U
(g) Ahmadabad Canton- U ment
(h) Ranip V. P.
Hansol V. P.
Nikol V. P.
Sarkhej V. P.
Daskroi Talllka
Nandej V. P.
Dholka Taluka
DholkaM ..
Bavla N. 1".
Dhandhuka Taluka
Dhandhuka N. P.
Ranpur V. P.
Barwala V. P.
(Bk) H-46-l7
U
U
U
U
T R U
U
T R U
U
U
T R U
U
U
U
286.7 128.1 158.6
6,289 329
11,105
M.A. N.A.
N.A. N.A.
92.98 17,053
N.A.
N.A. N.A. N.A. N.A.
N.A.
NA. N.A. N.A. N.A.
2,48 15,909
5.23 6,176
10.30 2,412
5.17 3,989
9,43 1,185
5.65 1,914
1 5.68
5.06
10.20
1,845
812
665
6.39 1,336
698.9 689.8
9.1
9.07
1,728.4 1,701.4
27.0
3.88
23.12
2,718.5 2,600.0
118.5
62.66
23.83
32.04
283 278 616
616
131 102
1,934
9,155
722
67 55
314
294
389
297
Number of villages No. of No. of
Population of occupied No. of Inha. Unin. towns residential housebited habited houses holds Persons Males Females
5
674 674
17 17
91 91
117 117
132 132
6
10 10
1 1
8 8
65
7
21
21
12
12
8
531,825 173,184 358,641
332,144 7,721
324,423
9 10 11
541,075 2,910,307 1,559,484 178,373 964,493 500,964 362,702 1,945,814 1,058,520
336,070 1,803,085 8,242 42,135
327,828 1,760,950
984,652 22,328
962,324
1,350,823 463,529 887,294
818,433 19,807
798,626
8 320,369 323,541 1,741,522 951,669 789,858
1 290,952 294,492 1,591,832 868,749 723,083
1 289,382 292,921 1,585,544 865,196 720,348
1
1
1
1
1
1
1
1
1
2
2
3
3
1
401
437 371 327 34
6,623
6,960
5,178
4,000
2,595
1,837
2,224
988
1,353
1,713
37,806 36,669
1,137
1,137
39,826 30,665
9,161
6,046
3,115
30,565 24,024
6,541
3,407
1,694
1,440
396
437 376 328
34
6,217
6,835
5,178
4,ll2
2,608
1,832
2,267
996
1,564
1,727
39,911 38,749
1,162
1,162
40,944 31,502
9,442
6,201
3,241
31,086 24,414
6,672
3,429
1,740
1,503
1,945
1,568 1,490 1,123
162
39,454
32,300
24,843
20,621
11,174
10,816
10,482
4,107
6,785
8,536
197,622 192,033
5,589
5,589
226,577 174,362 52,215
35,520
16,695
181,166 143,931 37,235
18,445
9,277
9,513
1,044
922 829 672
86
20,376
18,003
13,723
11,203
6,560
6,787
6,268
2,317
3,758
4,580
104,024 100,990
3,034
3,034
901
646 ~61 451
78
19,078
14,297
11,120
9,418
4,614
~,02t
4,214
1,790
3,027
3,936
93,598 91,043
2,lJt55
2,555
118,476 108,101 91,178 83,184 27,298 24,IH7
18,462 17,058
8,836 7,839
92,687 73,645 19,042
88,479 70,286 18,193
9,525 8,920
4,681
4,886
4,848
4,627
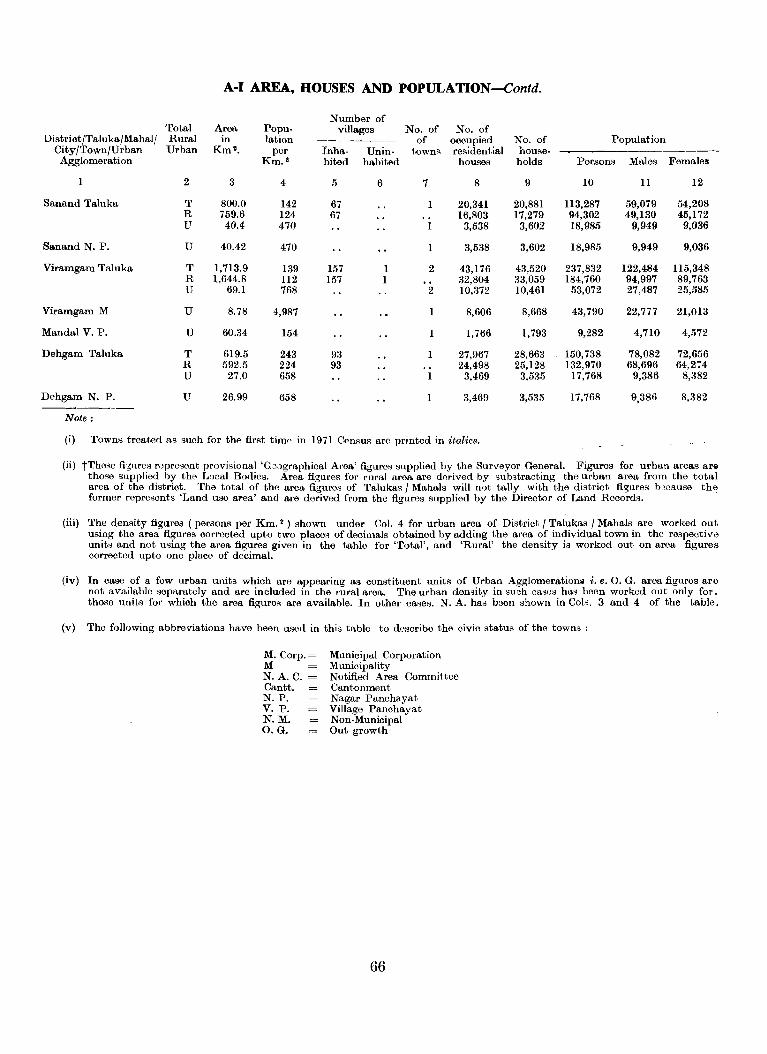
A-I AREA, HOUSES AND POPULA TION-Contd.
Number of Total Area Popu. villages No. of No. of
District/Taluka/Mahal/ Rural In lation ------- of occupied No. of Population City/Town/Urban Urban Km 2• per Inha· Unin· town~ re8idential house·
Agglomeration Km." bited habited houses holds Persons Males Females
1 2 3 4 5 6 7 8 9 10 11 12
Sanand Taluka T 800.0 142 67 20,341 20,881 113,287 59,079 54,208 R 759.6 124 67 16,803 17,279 94,302 49,130 45,172 U 40.4 470 3,538 3,602 18,985 9,949 9,036
Sanand N. P. U 40.42 470 3,538 3,602 18,985 9,949 9,036
Viramgam Taluka T 1,713.9 139 157 1 2 43,176 43,520 237,832 122,484 115,348 R 1,644.8 112 157 1 32,804 33,059 184,760 94,997 89,763 U 69.1 768 2 10,372 10,461 53,072 27,487 25,585
Viramgam M U 8.78 4,987 8,606 8,668 43,790 22,777 21,013
MandaI V. P. U 60.34 154 1,766 1,793 9,282 4,710 4,572
Dehgam Taluka T 619.5 243 93 1 27,967 28,663 150,738 78,082 72,656 R 592.5 224 93 24,498 25,128 132,970 68,696 64,274 U 27.0 658 3,469 3,535 17,768 9,386 8,382
Dehgam N. P. U 26.99 658 1 3,469 3,535 17,768 9,386 8,382 --------
Note:
(i) Towns t,reated as such for the first time in 1971 Census are printed in italics.
(ii) tThese fi~ures rapre~ent provisional 'Gaographical Area' figures supplied by the Surveyor General. Figures for urban areas aril those supplied by the Local Bodies. Area figures for rural area are derived by sub3tracting the urban area from the total area of the district. The total of the area figures of Talukas / Mahals will not tally with the district figures b)cause former represents 'Land use area' and are derived from the figures supplied by the Director of Land Records.
the
(iii) The density figures ( persons per Km. 2 ) shown under Col. 4 for urban area of District / Talukas / Mahals are worked out using the arsa figures corrected upto two places of decimals obtained by adding the area of individual town in the respective units and not using the area figures given in the table for 'Total', and 'Rural' the density is worked out on area figures corrected upto one place of decimal.
(iv) In case of a few urban units which are appearing as constituent units of Urban Agglomeration~ i. e. O. G. area figures are not available separately and are included in the rural area. The urban density in such cases has been worked out only for. those units for which the area figures are available. In other cases. N. A. has been shown in Cols. 3 and 4 of the table.
(v) The following abbreviations have been used in this table to describe the civic status of the towns:
M. Corp.= M N.A.C. Cantt. N.P. V. P. N.M. O.G.
Municipal Corporation Municipality Notified Area Committee Cantonment Nagar Panchayat Village Panchayat Non-Municipal Out growth
66
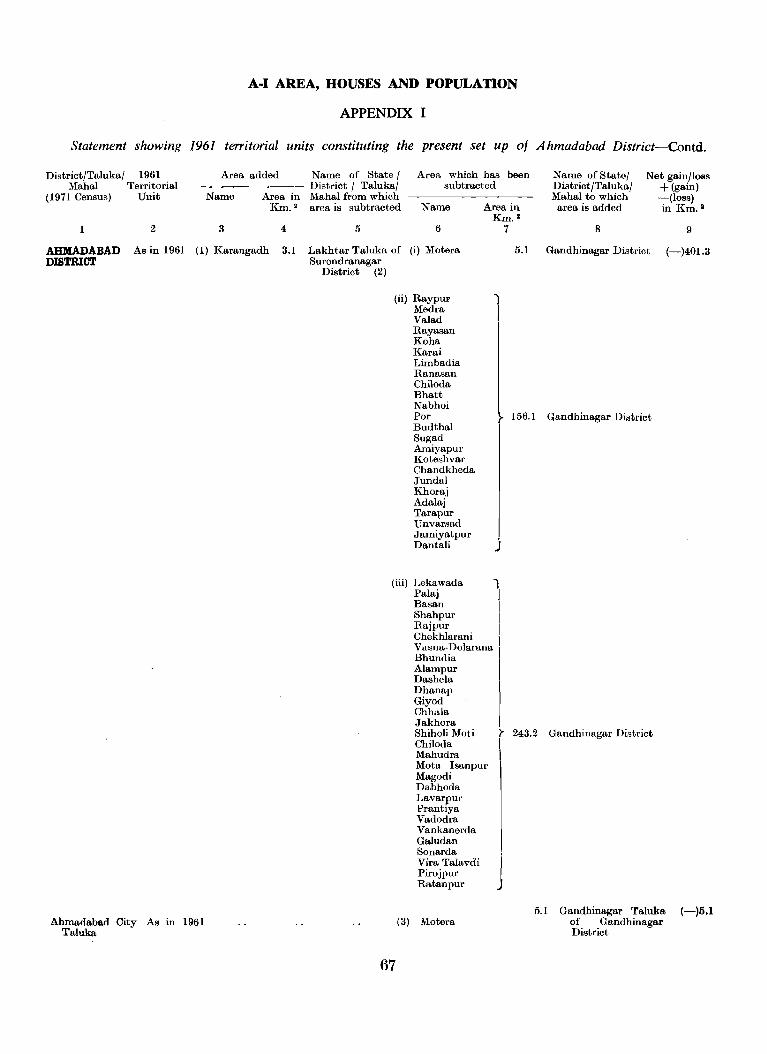
A-I AREA, HOUSES AND POPULATION
APPENDIX I
Statement showing 1961 territorial units constituting the present set up of Ahmadabad District-Contd.
District/Taluka/ 1961 Mahal Territorial
Area added Name of State / --------- District / Taluka/
Area which has been subtracted
(1971 Census) Unit Name Area in Mahal from which
2 3
AHMADABAD As in 1961 (1) Karangadh DISTRICT
Km. 2 area IS subtracted Name
4 5 6
3.1 Lakhtar Taluka of (i) Motera Surendranagar
District (2)
(ii) Raypur Medra Valad Rayasan Koha Karai Limbadia Ranasan Chiloda Bhatt Nabhoi
Area in Km."
7
5.1
1 I
Name of State/ DiRtrict/Taluka/ Mahal to which area is added
8
Net gain/loss + (gain) -(loss) in Km."
Gandhinagar District
9
(-)401.3
Por 156.1 Gandhinagar District
Ahmadabad City As in 1961 Taluka
Budthal Sugad Amiyapul' Koteshvar Chandkheda Jundal Khoraj Adalaj Tarapur Unvarsad Jamiyatpur Dantali j
(iii) Lekawada I
67
Palaj II Basan Shahpur I R " aJPur I Chekhlarani I Vasna-Dolarana I Bhundia I Alampur Dashela I Dhanap Giyod Chhala I Jakhora Shiholi Moti ~ Chiloda I Mahudra Mota Isanpur Magodi Dabhoda Lavarpur Prantiya Vadodra Vankanerda Galudan Sonarda Vira Talavdi Pirojpur Ratanpur
(3) Motera
I
J
243.2 Gandhinagar District
5.1 Gandhinagar Taluka (-)5.1 of Gandhinagar District
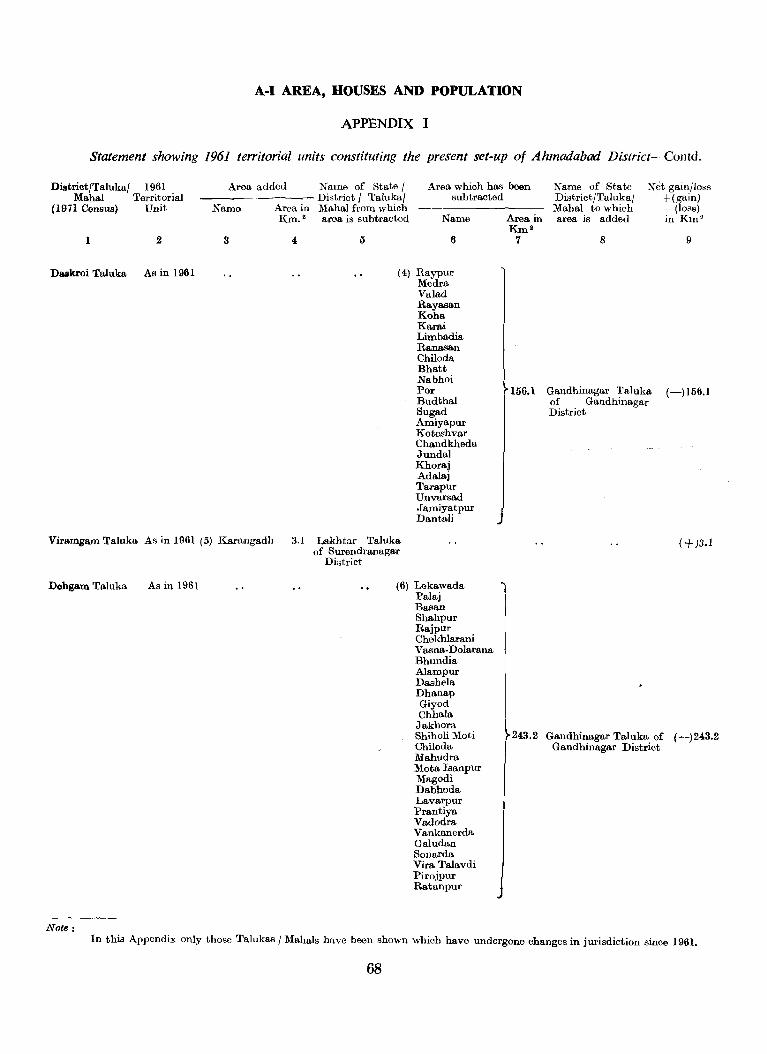
A-I AREA, HOUSES AND POPULATION
APPENDIX I
Statement showing 1961 territorial units constituting the present set-up of Ahmadabad District- COlltd.
District/Taluka/ 1961 Mahal Territorial
(1971 Census) Unit
1 2
Daskroi Taluka As in 1961
Area added
Name
3
Area in Km.!
4
Name of State / District / Taluka/ Mahal from which area is subtracted
Area whioh has been subtracted
5
Name
6
(4) Raypur Medra Valad Rayasan Koha
Area in KID!
7
Name of State DistriotJTalukaJ Mahal to which area is added
8
Net gain/loss +(gain) -(loss) in Km 2
9
Karai Limbadia Ranasan Chiloda Bhatt Nabhoi POl" Budthal Sugad Amiyapur Koteshvar Chandkheda Jundal Khoraj Adalaj Tarapur Unvarsad Jamiyatpur Dantali
~156.1 Gandhinagar Taluka (-)156.1 of Gandhinagar District
j Viramgam Taluka As in 1961 (5) Karangadh 3.1 Lakhtar Taluka (+)3.1
Dehgam Taluka As in 1961
Note:
of Surendranagar District
(6) Lekawada Palaj Basan Shahpur Rajpur Chekhlarani Vasna·Dolarana Bhundia Alampur Dashela Dhanap Giyod Chhala Jakhora Shiholi Moti Chiloda Mahudra Mota Isanpur Magodi Dabhoda Lavarpur Prantiya Vadodra Vankanerda Galudan Sonarda Vira Talavdi Pirojpur Ratanpur
~243.2 Gandhinagar Taluka of (-)243.2 I Gandhinagar Distriot
In this Appendix only those Talukas / Mahals have been shown which have undergone changes in jurisdiction since 1961.
68
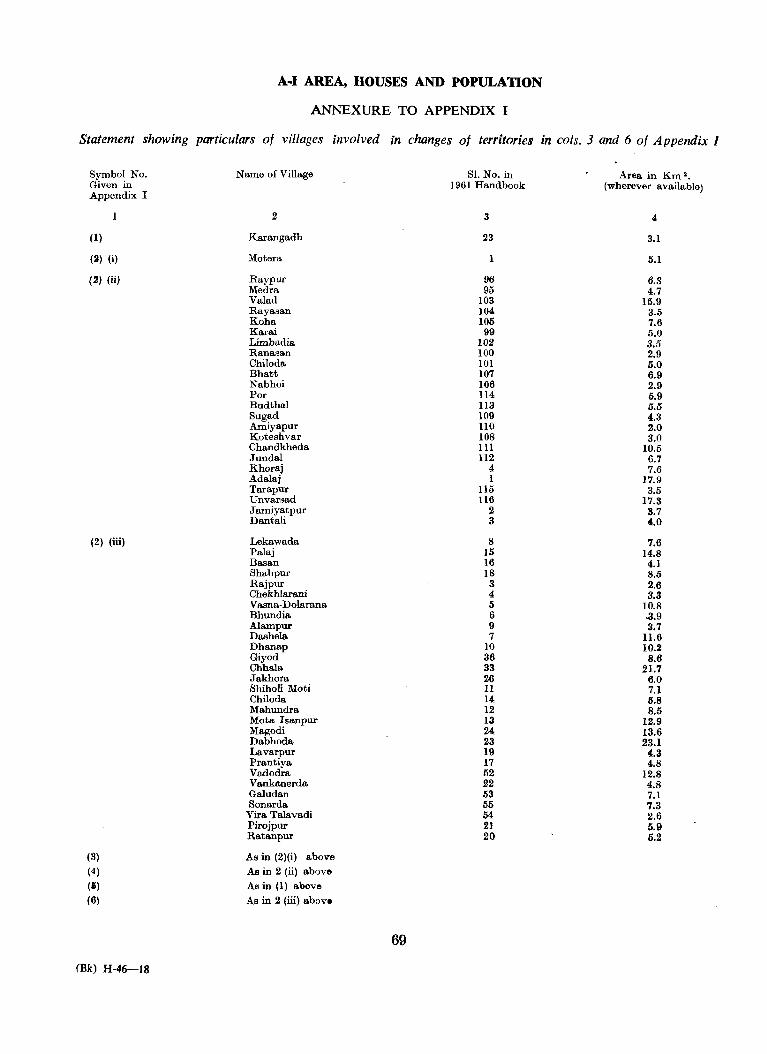
A-I AREA, HOUSES AND POPULATION
ANNEXURE TO APPENDIX I
Statement showing particulars of villages involved in changes of territories in cols. 3 and 6 of Appendix I
Symbol No. Given in Appendix I
(1)
(~) (i)
(2) (ii)
(2) (iii)
(3)
(4)
(5) (6)
(Bk) H-46-18
Name of Village
2
Karangadh
Motera
Raypur Medra Valad Rayasan Koha Karai Limbadia Ranasan Chiloda. Bhatt Nabhoi Por Budthal Sugad Amiyapur Koteshvar Chandkheda Jundal Khoraj Adalaj Tarapur Unvarsad Jamiyatpur Dantali
Lekawada Palaj Basan Shahpur Rajpur Chekhlarani Vasna-Dolarana Bhundia. Ala.mpur Dashela DhaI16p Giyod Chba.la. Ja.khora Shiholi Moti Chiloda Ma.hundra Mota Isanpur Magodi Dabhoda Lavarpur Prantiya. Vadodra Va.nkanerda Galudan Sonarda
Vira Talavadi Pirojpur Ratanpur
As in (2)(i) above As in 2 (ii) above As in (1) aoove
As in 2 (iii) above
Sl. No. in Area in Km·. 1961 Handbook (wherever available)
3 4
23 3.1
1 5.1
96 6.3 95 4.7
103 15.9 104 3.5 105 7.6 99 5.0
102 3.5 100 2.9 101 5.0 107 6.9 106 2.9 114 5.9 113 5.5 109 4.3 110 2.0 lOS 3.0 III 10.5 112 6.7
4 7.6 1 17.9
115 3.5 116 17.8
2 8.7 3 ".0
S 7.6 15 14.8 16 4.1 18 8.5 3 2.6 4 3.3 5 10.8 6 -3.9 9 3.7 7 11.6
10 10.2 36 8.6 33 21.7 26 6.0 11 7.1 14 5.8 12 S.5 13 12.9 24 13.6 23 23.1 19 4.3 17 4.S 52 12.8 22 4.S 53 7.1 55 7.3 54 2.6 21 5.9 20 5.2
69
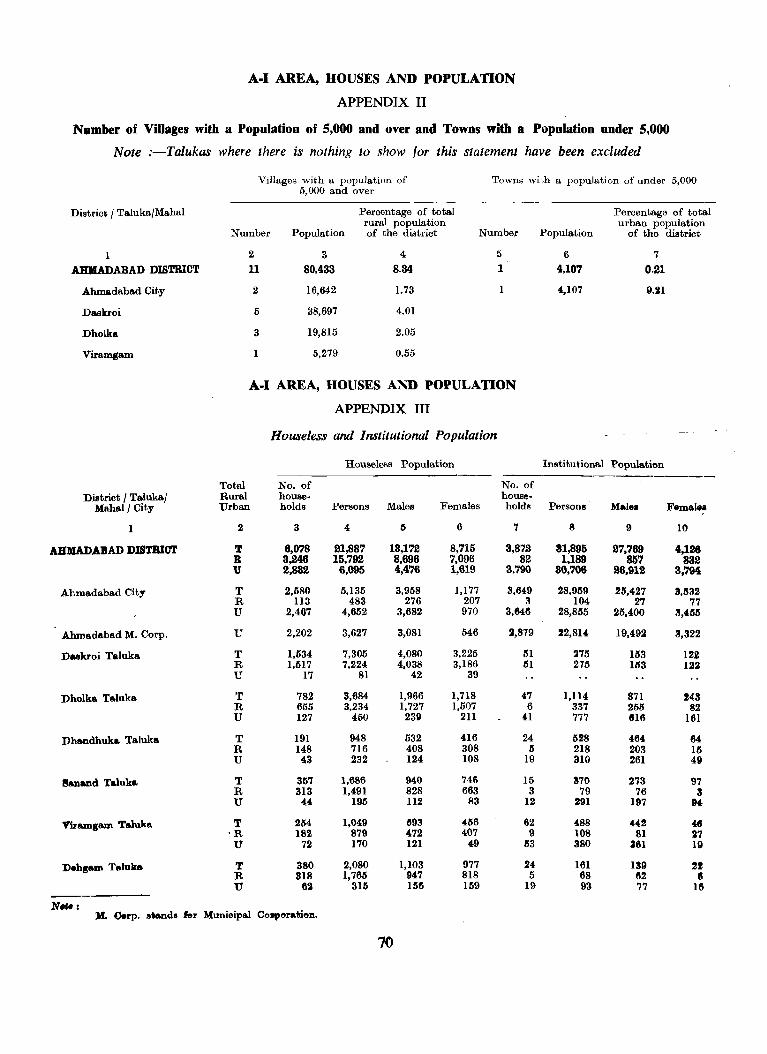
A-I AREA, HOUSES AND POPULATION
APPENDIX II
Number of Villages with a Population of 5,000 and over and Towns with a Population under 5,000
Note :-Talukas where there is nothing to show for this statement have been excluded
Villages with a population of Towns wi-,h a population of under 5,000 5,000 and over
District / Taluka/Mahal Percentage of total Percentage of total rural population urban population
Number Population of the district Number Population of the district
1 2 3 4 5 6 7
AHMADABAD DISTRICT 11 80,433 8.34 1 4,107 0.21
Ahmadabad Cit,y 2 16,642 1.73 1 4,107 Q.lH
Daskroi 5 38,697 4.01
Dholka 3 19,815 2.05
Viramgam 5,279 0.55
A-I AREA, HOUSES AND POPULATION
APPENDIX III
Houseless and Institutional Population
Houseless Population Institutional Popula.tion -------
Total No. of No. of District / Taluka/ Rural house- house-
Kahal/ City Urban holdl! Persons Males Females holds Persons Male. Female.
1 2 3 4 5 6 7 8 9 10
AHMADABAD DISTBlCT T 8,078 21,887 13,172 8,715 3,872 81,895 27,789 4,128 R 3,246 15,792 8,696 7,006 82 1,189 857 332 U 2,832 6,095 4,476 1,619 3,790 30,706 26,912 3,794
Ahmadabad City T 2.580 5,135 3,958 1,177 3,649 28,959 25,427 3,532 R 113 483 276 207 3 104 27 77 U 2,467 4,652 3,682 970 3,648 28,855 25,400 3,455
.Ahmadabad M. Corp. U 2,202 3,627 3,081 546 2,879 22,814 19,492 3,322
Daskroi Taluka T 1,534 7,305 4,080 3,225 51 275 153 122 R 1,517 7,224 4,038 3,186 51 275 Ill3 122 U 17 81 42 39
Dholka. Taluka T 782 3,684 1,966 1,718 47 1,114 871 248 R 655 3,234 1,727 ],507 6 337 255 82 U 127 450 23~ 211 41 777 616 161
Dhandhuka Taluka T 191 948 532 416 24 1128 464 64 R 148 716 408 308 5 218 203 15 U 43 232 124 108 19 310 261 49
l5anand Taluka T 357 1,686 940 746 15 870 273 97 R 313 1,491 828 663 3 79 76 8 U 44 195 112 83 12 291 197 94
Virlml,am Taluka. T 254 1,049 1193 456 62 488 442 46 oR 182 879 472 407 9 108 81 27 U 72 170 121 49 113 380 381 19
Dehs-m Taluka T 380 2,080 1,103 977 24 161 189 21 R 318 1,765 947 818 5 68 62 8 U 82 316 156 159 19 93 77 16
N.,.: M_ Cerp. etand. fer Munioipal Co..,ora~iol'l.
70
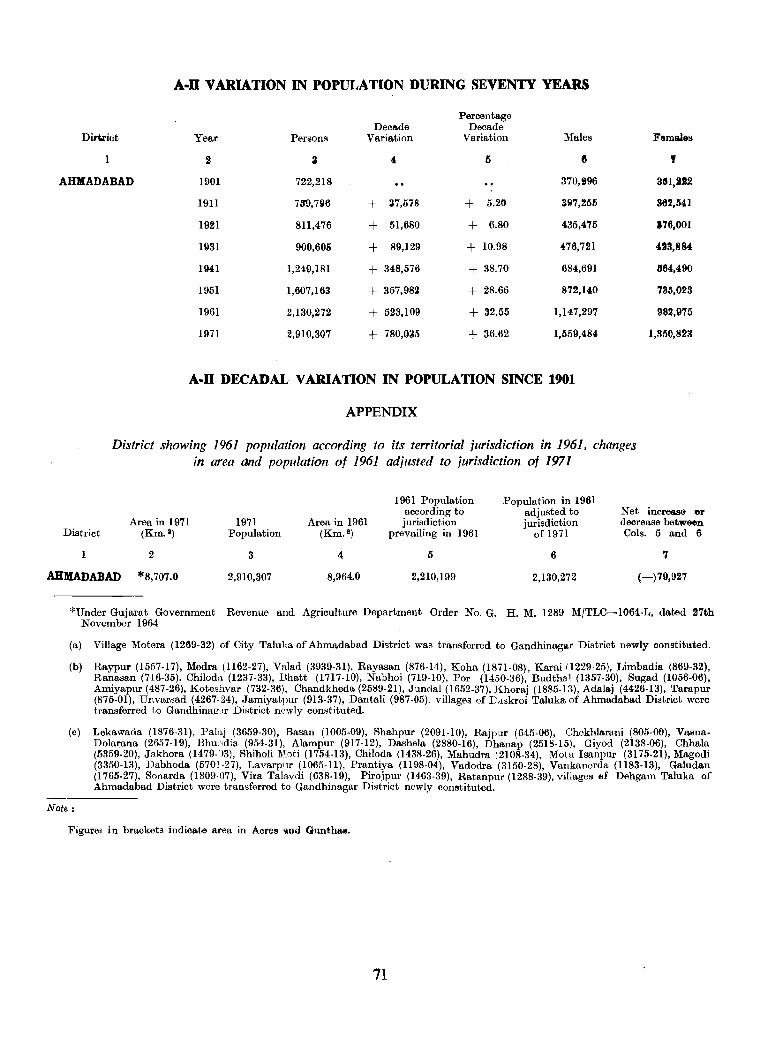
A .. ll VARIATION IN POPULATION DURING SEVENTY YEARS
Percentage Decade Decade
Dil1rict Year Persons Variation Va,riation Males
1 2 3 4 5 6
AHMADABAD 1901 722,218 370,'96
1911 71r9, 7~6 + :17,578 + 5.20 3117,256
1921 811,476 + 51,680 + 6.80 435,475
HI31 900,605 + 89,129 + 10.98 476,721
1941 1,249,181 + 348,576 + 38.70 684,691
1951 1,607,163 + 357,982 + 28.66 872,UO
1961 2,130,272 + 523,109 + 32.55 1,147,297
1971 2,910,307 + 780,0~5 + 36.62 1,559,484
A·ll DECADAL VARIATION IN POPULATION SINCE 1901
APPENDIX
District showing 1961 population according to its territorial jurisdiction in 1961, changes in area and population of 1961 adjusted to jurisdiction of 1971
1961 Population Population in 1961 according to Net
Females , 3111,JI2
362,541
1'76,001
423,884
864,490
735,023
982,975
1,850,823
increase ~r
Area in 1971 1971 Area in 1961 jurisdiction adjusted to jurisdiction decrease between
District (Km.') Population (Km. l ) prevailing in 1961 of 1971 Cols. S and 6
1 2 3 4 5 6 7
AHMADABAD *8,707.0 2,910,307 8,964.0 2,210,199 2,130,272 (-)79,927
*Under Gujarat Government Revenue and Agriculture Department Order No. G. H. M. 1289 M/TLC-I064.L, dated 27th November 1964
(a) Village Motera (1269·32) of City Taluka of Ahmadabad District was transferred to Gandhinagar District newly constitlIted.
(b) Raypur (1557.17), Medra (1162·27), Valad (3939·31), Rayasan (876-14), Koha (1871-08), Karai 11229-25), Limbadia (869-32), Ranasan (716-35), Chiloda (1237·33), Bhatt (1717-10), Nabhoi (719-10), Por (14:'50-36), Budthal (1357-30), Sugad (1056.06), Amiyapur (487·26), Koteshvar (732-36), Chandkheda (2589-21), Jundal (1652-37), Khoraj (1885-13), Adalaj (4426-13), Tarapur (875-01), Unvarsad (4267-24), Jamiyatpur (913-37), Dantali (987-05). villages of Da,skroi Taluka of Ahmadabad District were transferred to Gandhinaglr District newly constituted. '
(e) Lekawada (1876-31), Palaj (3659-30), Basan (1005.09), Shahpur (2091-10), Rajpur (645-06), Chekhlarani (805-00), Vssna· Dolarana (2657-19), Bhmldia (954-31), Alampur (917-12), Dashela (2880.16), Dhanap (2518-15), Giyod (2138-06), Chhala (5359.20), Jakhora (1479-J3), Shiholi ]\~oti (1754-13), Chiloda (1438-26), Mahudra (2108-34), Mota Isanpur (3175.21), Magodi (3350-13), Dabhoda (570J -27), Lavarpur (1065-11), Prantiya (1198-04), Vadodra (3150-28), Vankanerda (1183-13), Galudan (1765-27), Sonarda (1809-07), Vira Talavdi (638.19), Pirojpur (H63-39), Ratanpur (1288-39), villages 6£ Dehgam Taluka of Ahmadabad District were transferred to Gandhinagar District newly conetituted.
Note:
Figural in brackets indicate area in Acres ~nd Gunthall.
71
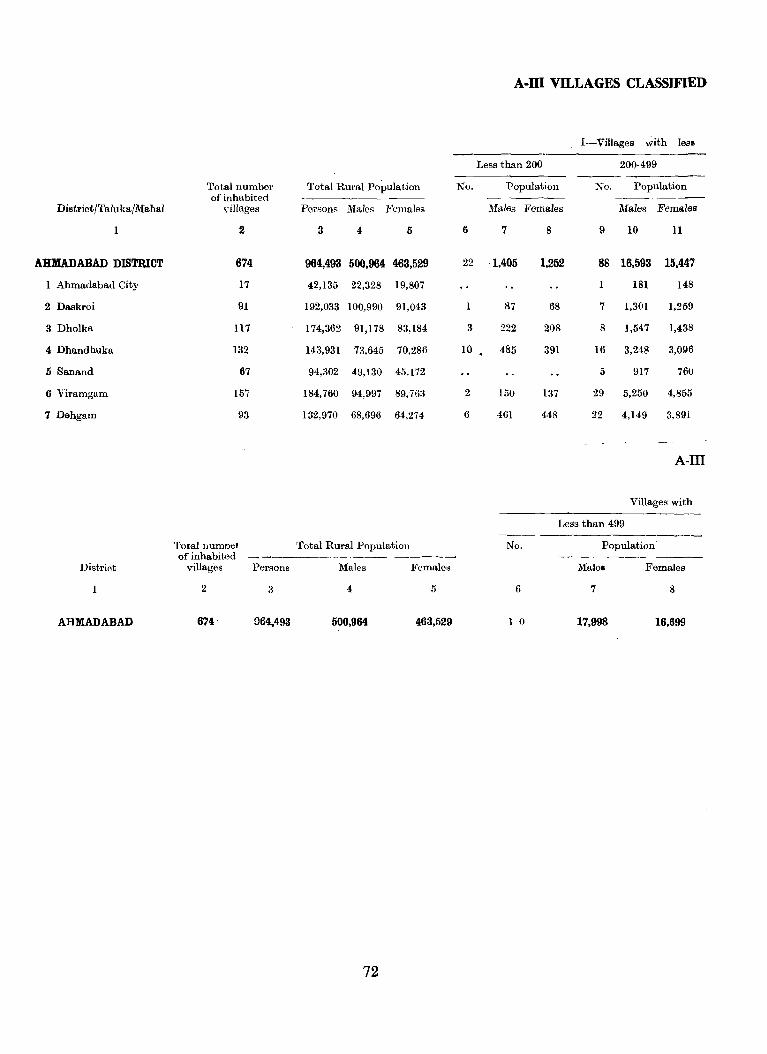
A-llI VILLAGES CLASSIFIED
I-Villages ~ith less
Less than 200 200-499 ----- -------
Total number Total Rural Population No. Population No. Population of inhabited -------
District/Taluka/Mahal villages Pe,sons Males Females Males Females Males Females
1 2 3 4 5 6 7 8 9 10 11
AHMADABAD DISTRICT 674 964,493 500,964 463,529 22 1.405 1,252 88 16,593 15,447
1 Ahmadabad City 17 42,135 22,328 19,807 1 181 148
2 Daskroi 91 192,033 100,990 91,043 1 87 68 7 1,301 1,259
3 Dholka 117 174,362 91,178 83,184 3 222 208 8 1,547 1,438
4 Dhandhuka 132 143,931 73,645 70,286 10 485 391 16 3,248 3,096
5 Sanand 67 94,302 49,130 45,172 5 917 760
6 Yiramgam 157 184,760 94,997 89,763 2 luO 137 29 5,250 4,855
7 Dehgam 93 132,970 68,696 64,274 6 461 448 22 4,149 3,891
A-III
Villages with
Less than 499
'fotal 11 urn otl 'fotal Rural Population No. Population of inhabited
District villages Persons Males Females Male. Females
2 3 4 5 6 7 8
AHMADABAD 674 1)64,493 500,964 463,529 1 ° 17,998 16,699
72
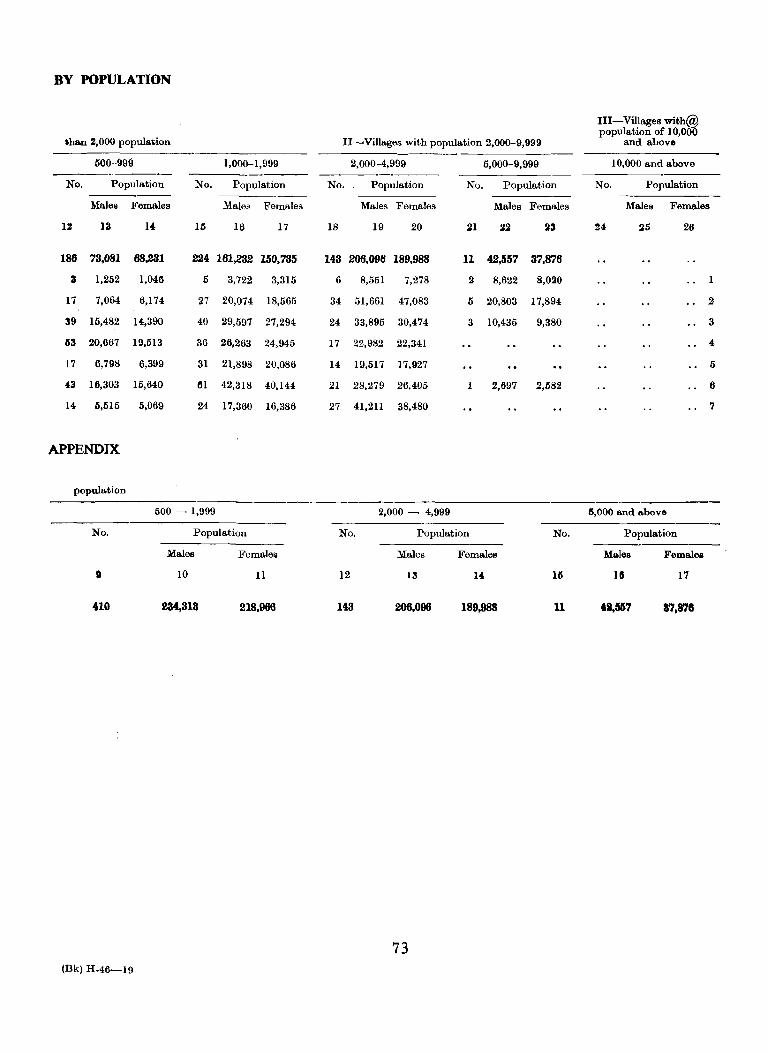
BY POPULATION
III-Villages with@ population of 10,000
.han 2,000 population II~Villages with population 2,000-9,999 and above
500·-999 1,000-1,999 2,000-4,999 5,000-9,999 10,000 and above
No. Population No. Population No. Population No. Population No. Population
Males Females Males Females Males Females Males Females Males Females
12 13 U 15 16 17 18 19 20 21 .22 .23 24 .25 26
186 73,081 68,231 224 161,232 150,735 143 206,096 189,988 11 42,557 37,876
3 1,252 1,046 5 3,722 3,315 6 8,551 7,278 .2 8,622 8,0.20 1
17 7,064 6,174 27 20,074 18,565 34 51,661 47,083 5 20,803 17,894 .2
39 15,482 a,390 40 29,597 27,294 24 33,895 30,474 3 10,435 9,380 3
63 20,667 19,513 36 26,263 24,945 17 22,982 22,341 4
17 6,798 6,399 31 21,898 20,086 14 19,517 17,927 5
43 16,303 15,640 In 42,318 40,144 21 28,279 26,405 1 2,697 2,582 6
14 6,515 5,069 24 17,360 16,386 27 41,211 38,480 7
APPENDIX
population .---_-_
500 - 1,999 2,000 - 4,999 5,000 and above
No. Population No. Population No. Population
Males Fema.le~ Males Females Males Females
II 10 11 12 13 a 16 15 17
410 234,313 218,966 143 206,096 189,988 11 41,1167 37,878
73 (Bk) H.46-19
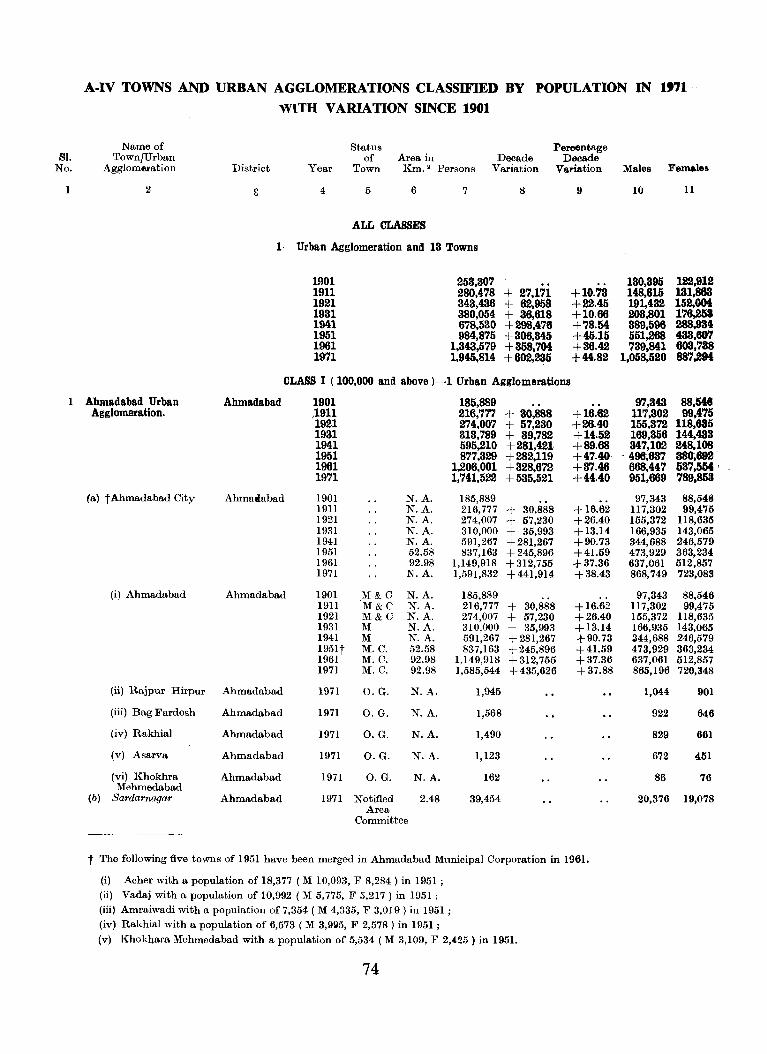
81. No.
1
A-IV TOWNS AND URBAN AGGLOMERATIONS CLASSIFIED BY POPULATION IN 197' .
WITH VARIATION SINCE 1901
Name of Status Percentage Town/Urban of Area in Decade Decade
Agglomeration District Year Town Km.· Persons Variation Variation
2 {; 4 5 6 7 8 9
ALL CLASSES
1 Urban Agglomeration and 13 Towns
1901 253,307 1911 280,478 + 27,171 +10.73 1921 343,436 + 62,958 +22.45 1931 380,054 + 36,618 +10.66 1941 678,530 +298,476 +78.54 1951 984,875 +306,345 +45.15 1961 1,343,579 +358.704 +36.42 1971 1,945,814 +602,235 +44.82
CLASS I ( 100,000 and above )-1 Urban Agglomerations
AhEnadabad Urban Ahmadabad 1901 185,889 Agglomeration. ,1911 216,777 + 30,888 +16.62
1921 274,007 + 57,230 +26.40 1931 313,789 + 39,782 +14.52 1941 595,210 +281,421 +89.68 1951 877,329 +282,119 +47.40 1961 1,206,001 +328,672 +37.46 1971 1,741,522 +535,521 +44.40
(al t Ahmadabad City Ahma.abad 1901 N.A. 185,889 1911 N.A. 216,777 + 30,888 +16.62 1921 N.A. 274,007 + 57,230 +26.40 1931 N.A. 310,000 + 35,993 +13.14 1941 N.A. 591,267 +281,267 +90.73 1951 52.58 837,163 +245,896 +41.59 1961 92.98 1,149,918 +312,755 +37.36 1971 N.A. 1,591,832 +441,914 +38.43
(i) Ahmadabad Ahmadabad 1901 M&C N.A. 185,889 1911 M&C N.A. 216,777 + 30,888 +16.62 1921 M&C N.A. 274,007 + 57,230 +26.40 1931 M N.A. 310,000 + 35,993 +13.14 1941 M N.A. 591,267 +281,267 +90.73 1951t M.C. 52.58 837,163 +245,896 +41.59 1961 M.C. 92 .. 98 1,149,918 +312,755 +37.36 1971 J\L C. 92.98 1,585,544 +435,626 +37.88
(ii) Rajpur Hirpur Ahmadabad 1971 O.G. N.A. 1,945
(iii) Bag Fardosh Ahmadabad 1971 O.G. N.A. 1,568
(iv) Rakhial Ahmadabad 1971 O.G. N.A. 1,490
(v) Asarva Ahmadabad 1971 O.G. N.A. 1,123
(vi) Khokhra Ahmadabad 1971 O.G. N.A. 162 Mehmedabad
(b) Sardarnagar Ahmadabad 1971 Notified 2.48 39,454 Area
Committee
t The following five towns of 1951 have been merged in Ahmadabad Municipal Corporation in 1961.
(i) Acher with a population of 18,377 (M 10,093, F 8,284 ) in 1951 ; (ii) Vadaj with a population of 10,992 (M 5,775, F 5,217) in 1951 ; (iii) Amraiwadi with a population of 7,354 (M 4,335, F 3,019) in 1951 ; (iv) Rakhial with a population of 6,573 (M 3,9115, F 2,578) in 1951 ; (v) Khokham Mehmedabad with a population of 5,534 (M 3,109, F 2,425) in 1951.
74
Males Females
10 11
130,395 122.912 148,615 131,863 191,432 152,004 203,801 176,253 389,596 288,934 551,268 433,607 739.841 603,738
1,058,520 887,294
97,343 88,546 117,302 99,475 155,372 118,635 169,356 144,433 347,102 248,108
- 400,637 38Ct,692 668,447 637,554 951,669 789.853
97,343 88,546 117,302 99,475 155,372 118,635 166,935 143,065 344,688 246,579 473,929 363,234 637,061 512,857 868,749 723,083
97,343 88,546 117,302 99,475 155,372 118,635 166,935 143,065 244,688 246,579 473,929 363,234 637,061 512,857 865,196 720,348
1,044 901
922 646
829 661
672 451
86 76
20,376 19,078
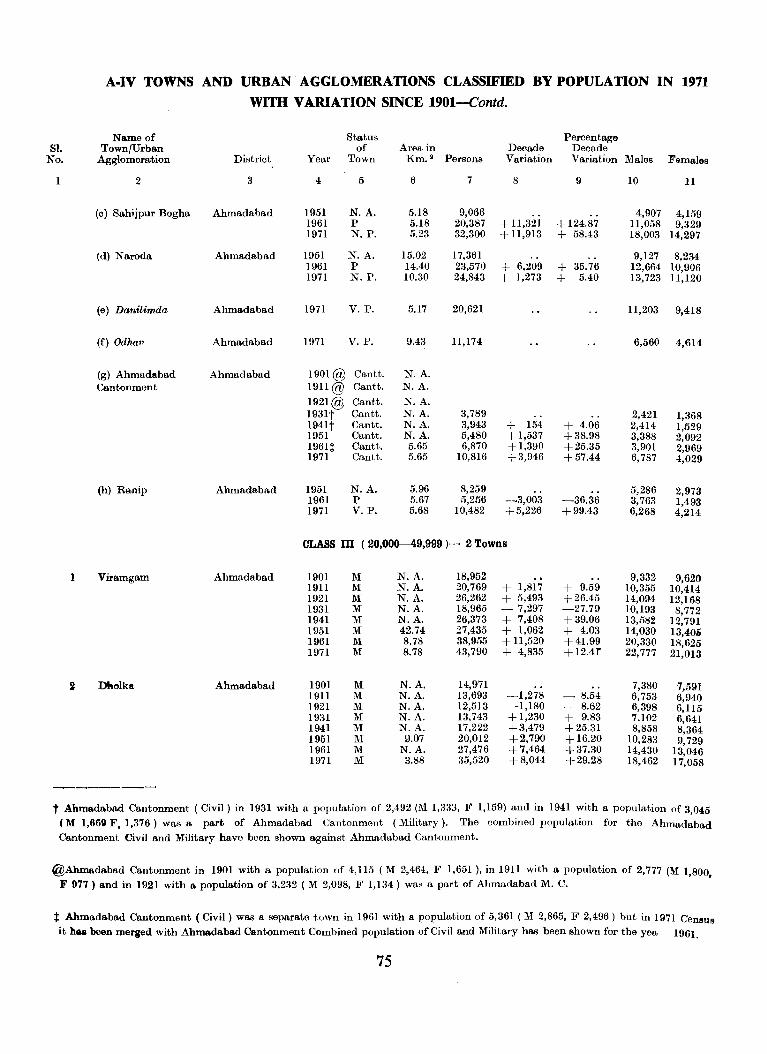
81. No.
1
1
A-IV TOWNS AND URBAN· AGGLOMERATIONS CLASSIFIED BY POPULATION IN 1971
WITH VARIATION SINCE 1901-Contd.
Name of Town/Urban
Agglomeration
2
(c) Sahijpur Bogha
(d) Naroda
(e) Danilimda
(f) Odhav
(g) Ahmadabad Cantonment
(h) Ranip
Viramgam
Dholka
District
3
Ahmadabad
Ahmadabad
Ahmadabad
Ahmadabad
Ahmadabad
Ahmadabad
Ahmadabad
Ahmadabad
Status of
Year Town
4
1951 1961 1971
1951 1961 1971
1971
1971
1901@ 1911@
1921@ 1931t 1941t 1951 1961t 1971
1951 1961 1971
5
N.A. P N.P.
N.A. P N.P.
V. P.
V.P.
Cantt. Cantt.
Cantt. Cantt. Cantt. Cantt. Cantt. Cantt.
N.A. P V.P.
Percentage Area in Decade Decade
Km. 2 Persons Variation Variation M ales Females
6
5.18 5.18 5.2:1
15.02 14.40 10.30
5.17
9.43
N.A. N.A.
N.A. N.A. N.A. N.A. 5.65 5.65
5.96 5.67 5.68
7 8 9
9,066 20,387 + 11,321 + 124.87 32,300 + 11,913 + 58.43
17,361 23,570 + 6,209 + 35.76 24,843 + 1,273 + 5.40
20,621
11,174
3,789 3,943 5,480 6,870
10,816
8,259 5,256
10,482
+ 154 + 1,537 + 1,390 +3,946
-3,003 +5,226
+ 4.06 +38.98 +25.35 +57.44
-36.36 +99.43
10 II
4,907 4,159 11,058 9,329 18,003 14,297
9,127 8,234 12,664 10,906 13,723 11,120
11,203 9,418
6,560 4,614
2,421 2,414 3,388 3,901 6,787
5,286 3,763 6,268
1,368 1,529 2,092 2,969 4,029
2,973 1,493 4,214
CLASS m (20,000-49,999)- 2 Towns
1901 1911 1921 1931 1941 1951 1961 1971
1901 1911 1921 1931 1941 1951 1961 1971
M M M M M M M M
M M M M M M M M
N.A. N.A. N.A. N.A. N.A. 42.74 8.78 8.78
N.A. N.A. N.A. N.A. N.A.
9.07 N.A.
3.88
18,952 20,769 26,262 18,965 26,373 27,435 38,955 43,790
14,97l 13,693 12,513 13,743 17,222 20,012 27,476 35,520
+ 1,817 + 5,493 - 7,297 + 7,408 + 1,062 + 11,520 + 4,835
-1,278 -1,180 + 1,230 +3,479 +2,790 +7,464 +8,044
+ 9.59 +26.45 -27.79 +39.06 + 4.03 +41.99 + 12.4r
- 8.54 - 8.62 + 9.83 +25.31 + 16.20 +37.30 +29.28
9,332 10,355 14,094 10,193 13,582 14,030 20,330 22,777
7,380 6,753 6,398 7,102 8,858
10,283 14,430 18,462
9,620 10,414 12,168
8,772 12,791 13,400 18,625 21,013
7,5!H 6,940 6,115 6,641 8,364 9,729
13,046 17,058
t Ahmadabad Cantonment ( Civil) in 1931 with a population of 2,492 (M 1,333, F 1,159) and in 1941 with a population of 3,045
(M 1,669 F, 1,376 ) was a part of Ahmadabad Cantonment (Military). The combined population for tho Ahmadabad
Cantonment Civil and Military have been shown against Ahmadabad Cantonment.
@Ahmadabad Cantonment in 1901 with a popUlation of 4,115 (M 2,464, F 1,651 ), in 1911 with a population of 2,777 (M 1,800, F 977) and in 1921 with 1\ population of 3,232 (M 2,098, F 1,134) was a part of Ahmadabad M. C.
t Ahmadabad Cantonment (Civil) was a separate town in 1961 with a population of 5,361 ( M 2,865, F 2,496) but in 1971 Ceneus
it haa been merged with Ahmadabad Cantonment Combined population of Civil and Military has been shown for the yea 1961.
75

A.IV TOWNS AND URBAN AGGLOMERATIONS CLASSIFIED BY POPULATION IN 1971 WITH VARIATION SINCE 1901--Contd.
Name of Status Percentage 81. 'fown/Urban of Area in Decade Decade
No. Agglomeration District Year Town Km.· Persons Variation Variation Males Females 1 2 3 4 5 6 7 8 9 10 11
CLASS IV ( 10,000-19,999 )-4 Towns
Salla.nd Ahmadabad 1901 N.A. N.A. 6,783 3,297 3,486 1911 N.A. N.A. 6,474 309 4.56 3,138 3,1136 1921 N.A. N.A. 6,962 + 488 + 7.54 3,590 3,372 1931 N.A. N.A. 7,319 + 357 + 5.13 3,790 3,529 1941 N.A. N.A. 8,733 + 1,414 + 19.32 4,492 4,241 1951 N.A. 40.40 10,623 + 1,890 + 21.64 5,472 5,151 1961 M 1.29 14,315 + 3,692 + 34.75 7,462 6,853 1971 N.P. 40.42 18,985 + 4,670 + 32.62 9,949 9,036
Dhandhuka Ahmadabad 1901 M N.A. 10,314 4,917 5,397 1911 M N.A. 8,040 - 2,274 - 22.05 3,803 4,237 1921 M N.A. 8,056 + 16 + 0.20 3,963 4,093 1931 M N.A. 9,076 + 1,020 + 12.66 4,466 4,610 1941 M N.A. 11,150 + 2,074 + 22.85 5,521 5,629 1951 M 46.62 12,250 + 1,100 + 9.87 6,097 6,153 1961 M 2.59 15,640 + 3,390 + 27.67 7,940 7,700 1971 N.P. 66.66 18,445 + 2,805 + 17.93 9,525 8,920
3 Dehgam Ahmadabad 1901 M N.A. 4,884 2,467 2,417 1911 M N.A. 4,636 248 - 5.08 2,370 2,266 1921 M N.A. 4,954 + 318 + 6.86 2,708 2,246 1931 M N.A. 5,861 + 907 + 18.31 3,172 2,689 1941 M N.A. 6,771 + 910 + 15.53 3,522 3,249 1951 M 26.94 8,042 + 1,271 + 18.77 4,104 . 3,9a8 1961 M 1.71 12,008 + 3,966 + <19.32 6,401 5,607 1971 N.P. 26.99 17,768 + 5,760 + 47.97 9,386 8,382
4 Bavla Ahmadabad 1951 N.A. 2.59 8,374 4,317 4,057 1961 P 23.13 12,825 + 4,451 + 53.15 6,610 6,215 1971 N.P. 23.12 16,695 + 3,870 + 30.18 8,836 7,859
CLASS V ( 5,000-9,999)-6 Towns
1 Barwala Ahmadabad 1951 N.A. 32.12 6,939 3,519 3,420 1961 P 32.04 8,430 + 1,491 + 21.49 4,289 4,141 1971 V. P. 32.04 9,513 + 1,083 + 12.85 4,886 4,627
2 MandaI Ahmadabad 1901 M N.A. 5,091 '2,405 2,686 1911 M N.A. 4,334 757 -14.87 1,987 2,347 1921 N.A. N.A. 5,350 + 1,016 + 23.44 2,656 2,694 1931 N.A. N.A. 5,373 + 23 + 0.43 2,798 2,575 1941 N.A. N.A. 5,806 + 433 + 8.06 2,936 2,870 1951 N.A. 5.96 5,832 + 26 + 0.45 2,891 2,941 1961 Declassified 1971 V.P. 60.34 9,282 4,710 4,572
Ranpur Ahmadabad 1901 M N.A. 6,423 3,254 3,169 1911 M N.A. 5,755 668 - 10.40 2,907 2,848 1921 M N,A. 5,332 423 - 7.35 2,651 2,681 1931 M N.A. 5,928 + 596 + 11.18 2,924 3,004 1941 M N.A. 7,265 + 1,337 + 22.55 3,583 3,682 1951 M 24.03 8,039 + 774 + 10.65 3,918 4,121 1961 M 0.34 7,929 110 - 1.37 3,932 3,997 1971 V.P. 23.83 9,277 + 1.348 + 17.00 4,631 4,646
4 Sarkhej Ahmadabad 1971 V.P. 6.39 8,536 4,580 3,956
5 Nikol Ahmadabad 1971 V.P. 10.20 6,785 3,758 3,027
6 Nandej Ahmadabad 1971 V.P. 9.07 5,589 3,034 ~,556
CLASS VI (Less than 5,000 )-1 Towns
Hansol Ahmadabad 1971 V.P. 5.06 4,107 2,317 1.79"
Note: (i) Towns treated as such for the first time in 1971 Census are printed in italic8.
(ii) For a few urban units which are appearing as constituent units of Urban Agglomeration i. e. Out Growth, 1971 area figures are not available separately and are included in the rural area of respective Talukas. In such cases N.A. haa been shown in col. 6.
(iii) The following abbreviations have been used in this table to denote the civic status of the town :
P/V.P. Village Panchayat O.G. Out Growth N.P. Nagar Panchayat N.A. Not Available. M Municipality M.C. -- Municipal Corporation M.&C. Municipality and Can.tonment
76
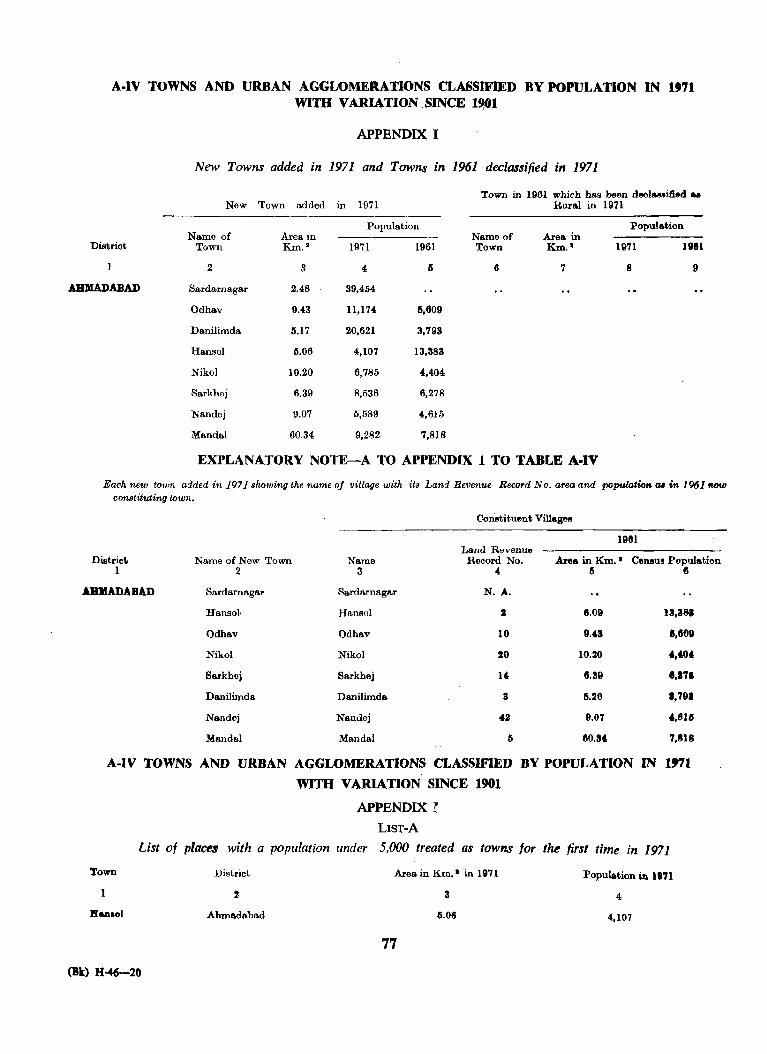
A·IV TOWNS AND URBAN AGGLOMERATIONS CLASSIFIED BY POPULATION IN 1971 wlm VARIATION . SINCE 19,()1
APPENDIX, I
New Towns added in 1971 and Towns in 1961 declassified in 1971
Town in 1961 which has been df!(lI&88i1ied .. New Town added in 1971 Rural in 1971
Population Population Name of Area in Name of Area in
Distriot Town Km.· 1971 1961 Town Km." IB7l IIJ81
1 2 8 4 {j I} 7 8 9
AHMADABAD Sardarnagar 2.48 39,454
Odha.v 9,43 B,la 6,609
Danilimda 5.17 20,621 3,793
Hansol 5.06 4,107 13,383
Nikol 10.20 6,785 4,404
Sarkhej 6.39 8,536 6,278
Nandej 9.07 6,589 4,615
Mandai 60.34 9,282 7,818
EXPLANATORY NOTE-A TO APPENDIX 1 TO TABLE A·IV
Each new town added in 1971 showing the name of village with its Land Revenue Record No. area and populatitm lU in 1961 ttOtD
constituting town.
Con~titu9nt Villages
19tH Land Revenue
District. Name of New Town Name Reoord No. Area in Km. " Cell!lUI Population 1 2 3 4 II 6
ABIIADABAD Sardarnagar Sardarnagar N. A.
Hansol Hansol 2 6.09 13,881
Odhav Odhav 10 9.43 1,80D
Nikol Nikol 20 10.20 4,404
Sarkhej Sarkhej 14 8.39 41,17.
Danilimda. Da.nilimd& 3 11.20 1,79'
Nandej Nandej 42 9.07 4,6111
Mandai MandaI 15 80.:" 7,818
A·IV TOWNS AND URBAN AGGLOMERATIONS CLASSIFIED BY POPULATION IN "'1 Wlm VARIATION SINCE 1901
APPENDIX r LIST·A
List of plac~! with a population under 5,000 treated as towns for the first ti~ in 1971
Town District Area in Km." in 1971 Population in 18n
1 3 4
Ranlol Ahmadabad 6.06 4,107
77
(Bk) H-46-20
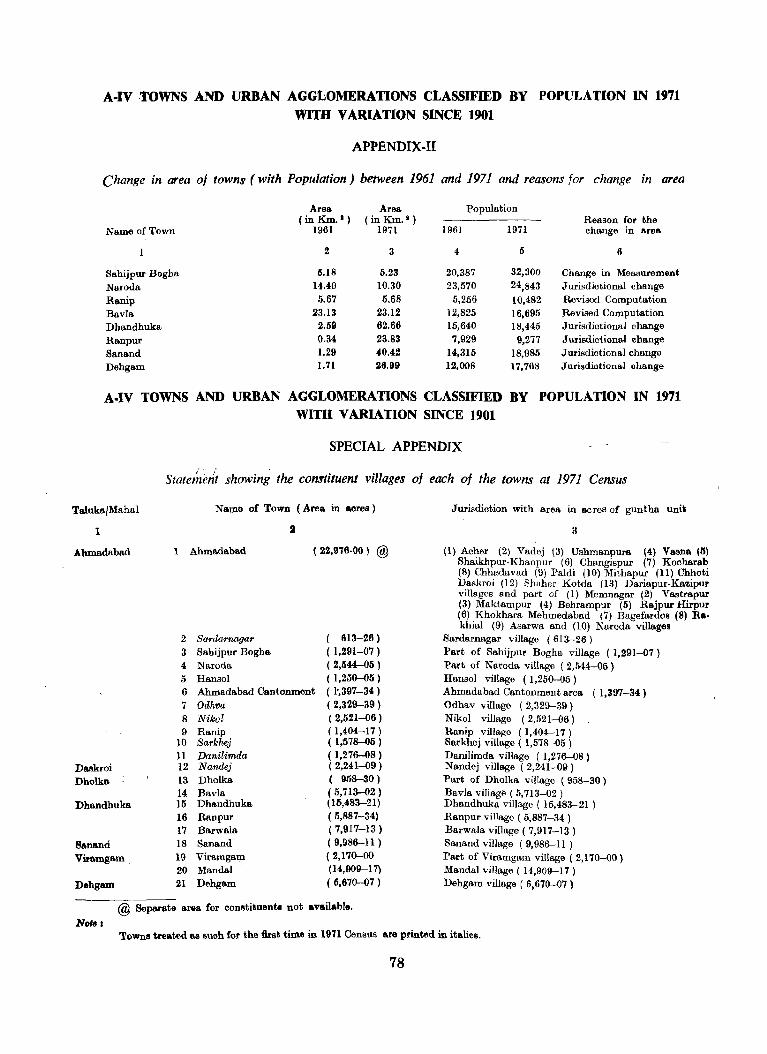
A.IV TOWNS· AND URBAN AGGUOMERATIONS CLASSIFIED BY POPULATION IN 1971 WITH VARIATION SINCE 1901
APPENDIX-II
Change in area of towns (with Population) between 1961 and 1971 and reasons for change in area
Area Area Population (inKm.I) (inKm.I) Reason for the
Name of Town 1961 1971 1961 1971 change in area
2 3 4 5 6
Sahijpur Bogha 5.l8 5.23 20,387 32,300 Change in Measurement
Naroda 14040 10.30 23,570 24,843 Jurisdictional change
Ranip 5.67 5.68 5,256 10,482 Revised Computation Bavla 23.13 23.12 12,825 16,695 Revised Computation Dhandhuka 2.59 62.66 15,640 18,445 Jurisdictional change
Ranpur 0.34 23.83 7,929 9,277 Jurisdictional change Sanand 1.29 .0.42 14,315 18,985 Jurisdictional change Dehgam 1.71 26.99 12,008 17,768 Jurisdictional ohange
A.IV TOWNS AND URBAN AGGLOMERATIONS CLASSIFIED BY POPULATION IN 1971 WIlli VARIATION SINCE 1901
Taluka.{Mahal
1
Ahmadabad
Daskroi Dholks
Dhandhuka
8anand Viramgam
Dehgam
SPECIAL APPENDIX
State~ent showing the constituent villages of each of the towns at 1971 Census
Name of Town (Area in acres)
1 Ahmadabad ( 22,976.00) @
2 Sordarnagar ( 613-26 )
3 Sahijpur Bogha ( 1,291-07) 4 Naroda ( 2,544-05) 5 Hansol ( 1,250-05 ) 6 Ahmadabad Cantonment ( 1',397-34 ) 7 Odhva ( 2,329-39) 8 Nikt'Z (2,521-06 ) 9 Ranip ( 1,404-17)
10 Sarkhej ( 1,578-05)
11 Danilimda ( 1,276-08) 12 Nandej ( 2,241-09)
13 Dholka ( 958-30)
14 Bavla ( 5,713-02) 15 Dhandhuka (15,483-21)
16 Ranpur ( 5,887-34) 17 Barwala ( 7,917-13)
18 Sanand ( 9,986-11 )
19 Viramgsm ( 2,170-00 20 MandaI (14,909-17)
21 Dehgam (6,670-07 )
Jurisdiction with area in acreS of guntha uni,
3
(1) Acher (2) Vadej (3) Ushmanpura (4) Vasna (ft) Shaikhpur-Khanpur (6) Changispur (7) Kocharab (8) Chhadavad (9) Paldi (10) Mithapur (11) Chhoti Daskroi (12) Shaher Kotda (13) Dariapur-Kazipur villages and part of (1) Memnagar (2) Vastrapur (3) Maktampur (4) Behrampur (5) Rajpur Hirpur (6) Khokhara Mehmedabad (7) BagefardoB (8) Re· khial (9) Asarwa and (10) Naroda villages
Sardarnagar village (613-26) Part of Sahijpur Bogha village (1,291-07) Part of Naroda village ( 2,544-05) Hansol village (1,250-05) Ahmadabad Cantonment areB (1,397-34) Odhav village (2,329-39) Nikol village (2,521-06) Ranip village (1,404-17) Sarkhej village ( 1,578-05 ) Danilimda village (1,276-08) Nandej village (2,241-09) Part of Dholka village (958--30) Bavla village (5,713-02) Dhandhuka village ( 15,483-21 ) Ranpur village (5,887-34 ) Barwala village ( 7,917-13 ) Sanand village (9,986-11) Part of Viramgam village (2,170-00) MandaI village (14,909-17) Dehgam village ( 6,670-07 )
@ Separate area for constituents not available.
Hole, Towns treated as suoh for the first time in 19'71 Census are printed in italics.
78
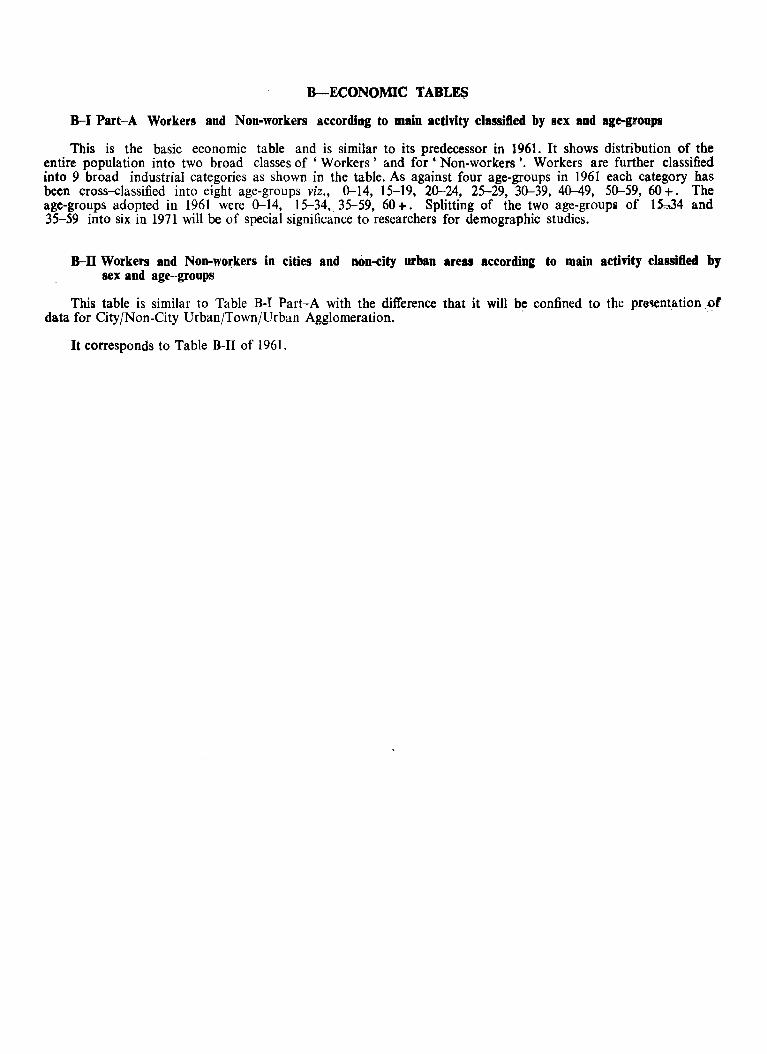
B-ECONOMIC TABLES
B-1 Part-A Workers and Non-workers according to main activity classified by Hex and age-groupl
This is the basic economic table and is similar to its predecessor in 1961. It shows distribution of the entire population into two broad classes of ' Workers' and for' Non-workers '. Workers are further classified into 9 broad industrial categories as shown in the table. As against four age-groups in 1961 each category has been cross-classified into eight age-groups viz., 0--14, 15-19, 20--24, 25-29, 30--39, 40--49, 50--59, 60 +. The age-groups adopted in 1961 were 0--14, 15-34, 35-59, 60+. Splitting of the two age-groupfi of 15:-oJ4 and 35-59 into six in 1971 will be of special significance to researchers for demographic studies.
B-II Workers and Non-woI:kers in cities and non-city urban areas accordinl: to main activity classified by sex and age-groups
This table is similar to Table B-1 Part-A with the difference that it will be confined to the pr6,entation ,of data for City/Non-City Urban/Town/Urban Agglomeration. .
It corresponds to Table B-II of 1961.
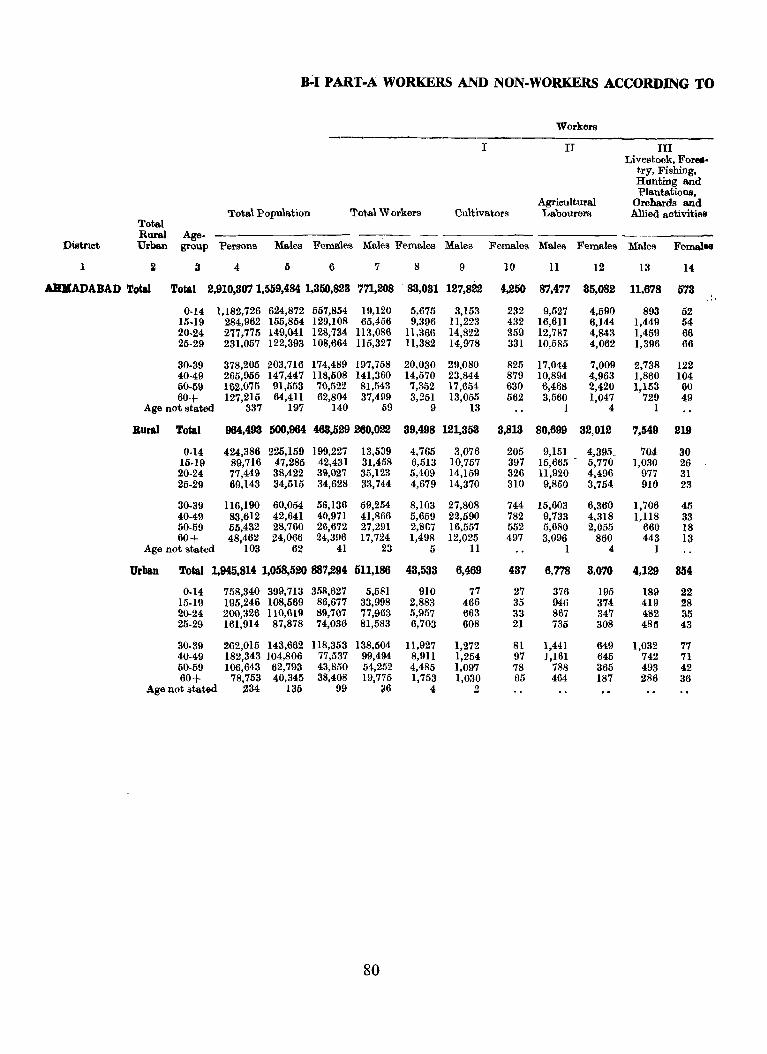
B~I PART·A WORKERS AND NON·WORKERS ACCORDING TO
Workers
I II III Livestock, FO:rel'
try, Fishing, Hunting and Plantations,
Agricultural Orchards and Total Population Total Workers Cultivators Labourers Allied activities
Total Rural Age-
District Urban group Persons Males Females Males Females Males Females Males Females Males Femal ..
1 2 3 4 5 6 7 8 9 10 11 12 13 14
AIOtADABAD Total Total 2,910,307 1,559,484 1,350,823 771,208 83,031 127,822 4,250 87,477 35,082 11,678 573 "
0·14 1,182,726 624,872 557,854 19,120 5,675 3,153 232 9,527 4,590 893 52 15·19 284,962 155,854 129,108 65,456 9,396 11,223 432 16,611 6,144 1,449 54 20·24 277,775 149,041 128,734 lI3,086 11,366 14,822 359 12,787 4,843 1,459 66 25·29 231,057 122,393 108,664 115,327 11,382 14,978 331 10,585 4,062 1,396 66
30·39 378,205 203,716 174,489 197,758 20,030 29,080 825 17,044 7,009 2,738 122 40·49 265,955 147,447 118,508 141,360 14,570 23,844 879 10,894 4,963 1,860 104 50·59 162,075 91,553 70,522 81,543 7,352 17,654 630 6,468 2,420 1,153 60 60+ 127,215 64,411 62,804 37,499 3,251 13,055 562 3,560 1,047 729 49
Age not stated 337 197 140 59 9 13 1 4 1
Bural Total 964,493 500,964 463,529 260,022 39,498 121,353 3,813 80,699 32,012 7,549 219
0·14 424,386 225,159 199,227 13,539 4,765 3,076 205 9,151 4,395. 704 30 15·19 89,716 47,285 42,431 31,458 6,513 10,757 397 15,665 - 5,770 1,030 26 20·24 77,449 38,422 39,027 35,123 5,409 14,159 326 1l,920 4,496 977 31 25·29 69,143 34,515 34,628 33,744 4,679 14,370 310 9,850 3,754 910 23
30·39 116,190 60,054 56,136 59,254 8,103 27,808 744 15,603 6,360 1,706 45 40·49 83,612 42,641 40,971 41,866 5,659 22,590 782 9,733 4,318 1,118 33 50-59 55,432 28,760 26,672 27,291 2,867 16,557 552 5,680 2,055 660 18 60+ 48,462 24,066 24,396 17,724 1,498 12,025 497 3,096 860 443 13
Age not stated 103 62 41 23 5 11 1 4 1
Urban Total 1,945,814 1,058,520 887,294 511,186 43,533 6,469 437 6,778 3,070 4,129 354
0·14 758,340 399,713 358,627 5,581 910 77 27 376 195 189 22 15·19 195,246 108,569 86,677 33,998 2,883 466 35 946 374 419 28 20-24 200,326 110,619 89,707 77,963 5,957 663 33 867 347 482 35 25·29 161,914 87,878 74,036 81,583 6,703 608 21 735 308 4811 43
30·39 262,015 143,662 118,353 138,504 11,927 1,272 81 1,441 649 1,032 77 40·49 182,343 104,806 77,537 99,494 8,911 1,254 97 ] ,161 645 742 71 50·59 106,643 62,793 43,850 54,252 4,485 1,097 78 788 365 493 42 60+ 78,753 40,345 38,408 19,775 1,753 1,030 65 464 187 286 36
Age not stated 234 136 99 36 4 2
80
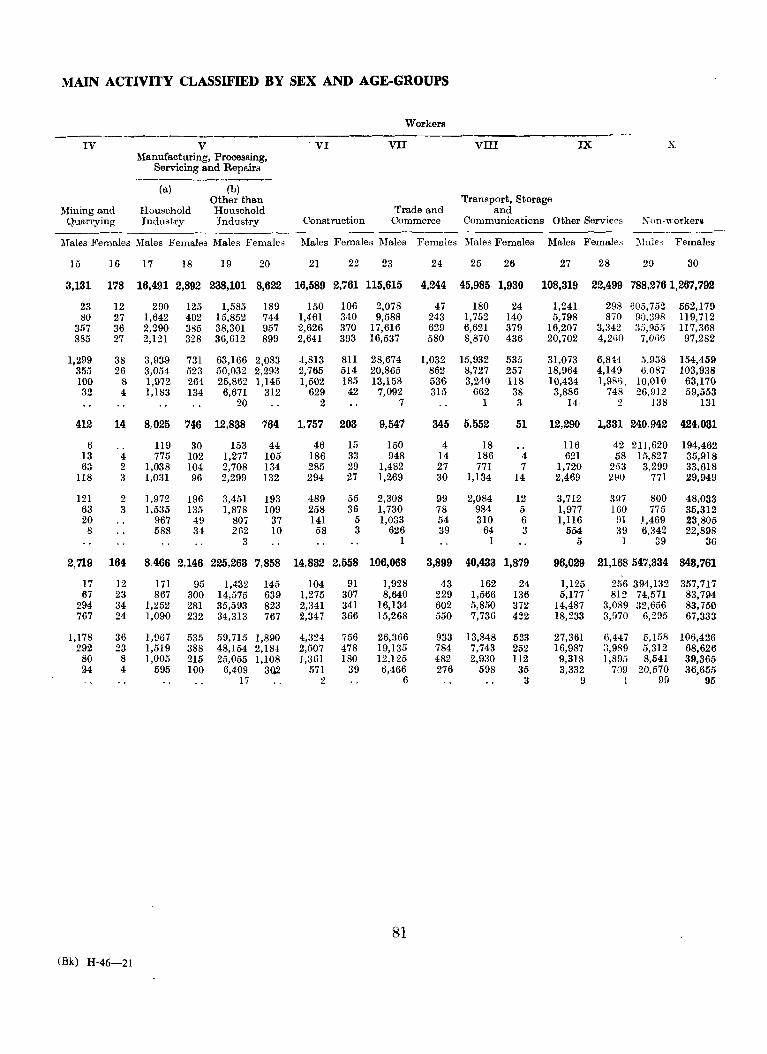
MAIN ACTIVITY CLASSIFIED BY SEX AND AGE-GROUPS
Workers _-----
IV V ' VI VII VIII IX X Manufacturing, Processing,
Servicing and Repairs
(a) (b) Other than Transport, Storage
Mining and Household Household Trade and and Quarrying Industry Industry Construction Commerce Communications Other Services Kon-workers
------ ----_--Males Females Males Females Males Femalea Males Females Males Females Males Females Males Female,; :JlaJe,; Females
15 16 17 18 19 20 21 22 23 24 25 26 27 28 29 30
3,131 178 16,491 2,892 238,101 8,622 16,589 2,761 115,615 4,244 45,985 1,930 108,319 22,499 788,2761,267,792
23 12 290 125 1,585 189 150 106 2,078 47 180 24 1,241 298 605,752 552,179 80 27 1,642 402 15,852 744 1,461 340 9,588 243 1,752 140 5,798 870 90,398 119,712
357 36 2,290 385 38,301 957 2,626 370 17,616 629 6,621 379 16,207 3,342 3;),95;3 117,368 885 27 2,121 328 36,612 899 2,641 393 16,537 580 8,870 436 20,702 4,2!10 7,066 97,282
1,299 38 3,939 731 63,166 2,083 4,813 811 28,674 1,032 15,932 535 31,073 6,814 5.958 154,459 355 26 3,054 523 50,032 2,293 2,765 514 20,865 862 8,727 257 18,964 4,149 6.087 103,938 100 8 1,972 264 25,862 1,145 1,502 185 13,158 536 3,240 118 10,434 1,986, 10,010 63,170 32 4 1,183 134 6,671 312 629 42 7,092 315 662 38 3,886 748 26,912 59,553
20 2 7 1 3 14, 2 138 131
412 14 8,025 746 12,838 764 1,757 203 9,547 345 5,552 51 12,290 1,331 240.942 424,081
6 119 30 153 44 46 15 150 4 18 116 42 211,620 194,462 13 4 775 102 1,277 105 186 33 948 14 186 4 621 58 15,827 35,918 63 2 1,038 104 2,708 134 285 29 1,482 27 771 7 1,720 253 3,299 33,618
lI8 3 1,031 96 2,299 132 294 27 1,269 30 1,134 14 2,469 290 771 29,949
121 2 1,972 196 3,451 193 489 55 2,308 99 2,084 12 3,712 397 800 48,033 63 3 1,535 135 1,878 109 258 36 1,730 78 984 5 1,977 160 775 35,312 20 967 49 807 37 141 5 1,033 54 310 6 1,116 01 ),469 23,805
8 588 34 262 10 58 3 626 39 64 3 554 39 6,342 22,898 3 1 1 5 1 39 36
2,719 164 8.466 2,146 225,263 7,858 14,832 2,558 106,068 3,899 40,433 1,879 96,029 21,168547,334 843,761
17 12 171 95 1,432 145 104 91 1,928 43 162 24 1,125 256 394,132 357,717 67 23 867 300 14,575 639 1,275 307 8,640 229 1,566 136 5,177 . 812 74,571 83,794
294 34 1,252 281 35,593 823 2,341 341 16,134 602 5,850 372 14,487 3,089 32,656 83,750 767 24 1,090 232 34,313 767 2;347 366 15,268 550 7,736 422 18,233 3,970 6,295 67,333
1,178 36 1,967 535 59,715 1,890 4,324 756 26,366 933 13,848 523 27,361 1i,447 5,158 106,426 292 23 1,519 388 48,154 2,184 2,507 478 19,135 784 7,743 252 16,987 3,989 5,312 68,626
80 8 1,005 215 25,055 1,108 1,361 180 12,125 482 2,930 112 9,318 1,805 8,541 39,365 24 4 595 100 6,409 302 571 39 6,466 276 598 35 3,332 709 20,570 36,655
17 2 6 3 9 9!J 95
81
(Bk) H-46-21
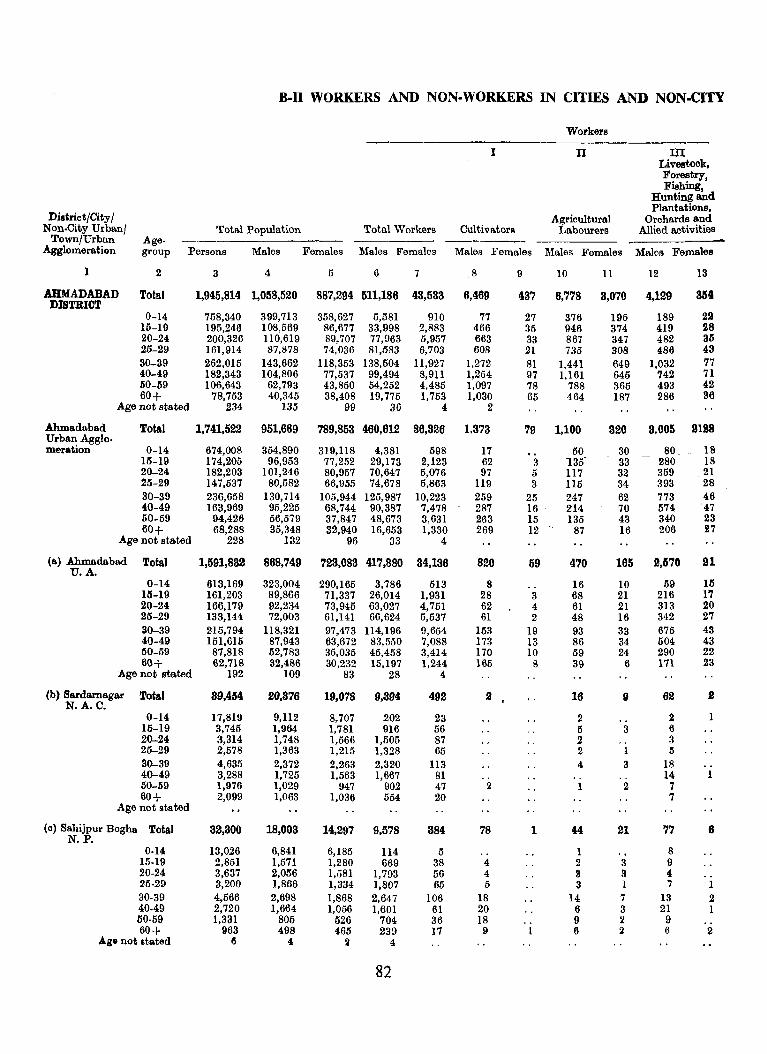
B-II WORKERS AND NON· WORKERS IN CITIES AND NON·CITY
Workers
1 11 ill Livestock, Forestry, Fishing,
Hunting and Plantations,
District/City/ Agricultural Orchards and Non.City UrbanI Total Population Total Workers Cultivators Labourers Allied activities
Town/Urban Age. Agglomeration group Persons Males Females Males Females Males Females Males Females Males Females
1 2 3 4 5 6 7 8 9 10 11 12 13
AHMADABAD Total 1,945,814 1,058,520 887,294 511,186 DISTRICT
43,533 6,469 437 6,778 3,070 4,129 854
0-14 758,340 399,713 358,627 5,1581 910 77 27 376 195 189 211 15-19 195,246 108,569 86,677 33,998 2,883 466 35 946 374 419 28 20-24 200,326 110,619 89,707 77,963 5,957 663 33 867 347 482 35 25-29 161,914 87,878 74,036 81,583 6,703 608 21 735 308 486 43 30-39 262,015 143,662 118,353 138,504 1l,927 1,272 81 1,441 649 1,032 77 40-49 182,343 104,806 77,537 99,494 8,911 1,254 97 1,161 645 742 71 50-59 106,643 62,793 43,850 54,252 4,485 1,097 78 788 365 493 42 60+ 78,753 40,345 38,408 19,775 1,753 1,030 65 464 187 286 86
Age not stated 234 135 99 36 4 2
Ahmadabad Total 1,741,522 951,669 789,853 460,612 36,326 Urban Agglo·
1,373 79 1,100 320 8,005 2198
meration 0-14 674,008 354,890 319,118 4,381 598 17 150 30 80 18 15-19 174,205 96,953 77,252 29,173 2,123 62 3 135 33 280 18 20-24 182,203 101,246 80,957 70,647 5,076 97 5 117 32 359 21 25-29 147,537 80,582 66,955 74,678 5,863 119 3 115 34 393 28 30-39 236,658 130,714 105,944 125,987 10,223 259 25 247 62 773 46 40-49 163,969 95,225 68,744 90,387 7,478 287 16 . 214 70 574 47 50-59 94,426 56,579 37,847 48,673 3,631 263 15 135 43 340 23 60+ 68,288 35,348 32,940 16,653 1,330 269 12 87 16 206 27
Age not Btated 228 132 96 33 4
(8.) Ahmadabad Total 1,591,832 U.A.
868,749 723,083 417,880 34,136 820 59 470 165 2,570 21
0-14 613,169 323,004 290,165 3,786 513 8 16 10 59 115 15-19 161,203 89,866 71,337 26,014 1,931 28 3 68 21 216 17 20-24 166,179 92,234 73,945 63,027 4,751 62 4 61 21 313 20 25-29 133,144 72,003 61,141 66,624 5,537 61 2 48 16 342 27 30-39 215,794 118,321 97,473 114,196 9,654 153 19 93 33 675 43 40-49 151,615 87,943 63,672 83,550 7,088 173 13 86 34 504 43 50-59 87,818 52,783 35,035 45,458 3,414 170 10 59 24 290 22 6()+ 62,718 32,486 30,232 15,197 1,244 165 8 39 6 171 23
Age not stated 192 109 83 28 4
(b) Sardarnagar N.A.C.
Total 39,454 20,376 19,078 9,394 492 2 16 9 62 2
0-14 17,819 9,112 8,707 202 23 2 2 1 15-19 3,745 1,964 1,781 916 56 5 3 6 20-24 3,314 1,748 1,566 1,505 87 2 .. 3 25-29 2,578 1,363 1,215 1,328 65 2 1 5 30-39 4,635 2,372 2,263 2,320 113 4 3 18 40-49 3,288 1,725 1,563 1,667 81 . . .. 14 I 50-59 1,976 1,029 947 902 47 2 1 2 7 60+ 2,099 1,063 1,036 554 20 7
Age not stated
(0) Sahijpur Bogha N.P.
Total 32,300 18,003 14,297 9,578 384 78 1 44 21 77 8
0·14 13,026 6,841 6,185 114 1) 1 " 8 15-19 2,851 1,571 1,280 669 38 4 2 3 9 20·24 3,637 2,056 1,581 1,793 56 4 3 3 4 25·29 3,200 1,866 1,334 1,807 65 5 3 1 7 30·39 4,566 2,698 1,868 2,647 106 18 14 7 13 2 40.49 2,720 1,664 1,056 1,601 61 20 6 3 21 1 liO·59 1,331 805 526 704 36 18 9 2 9 60+ 963 498 4615 239 17 9 6 :l 6 2
Age not stated 6 4 2 4
82
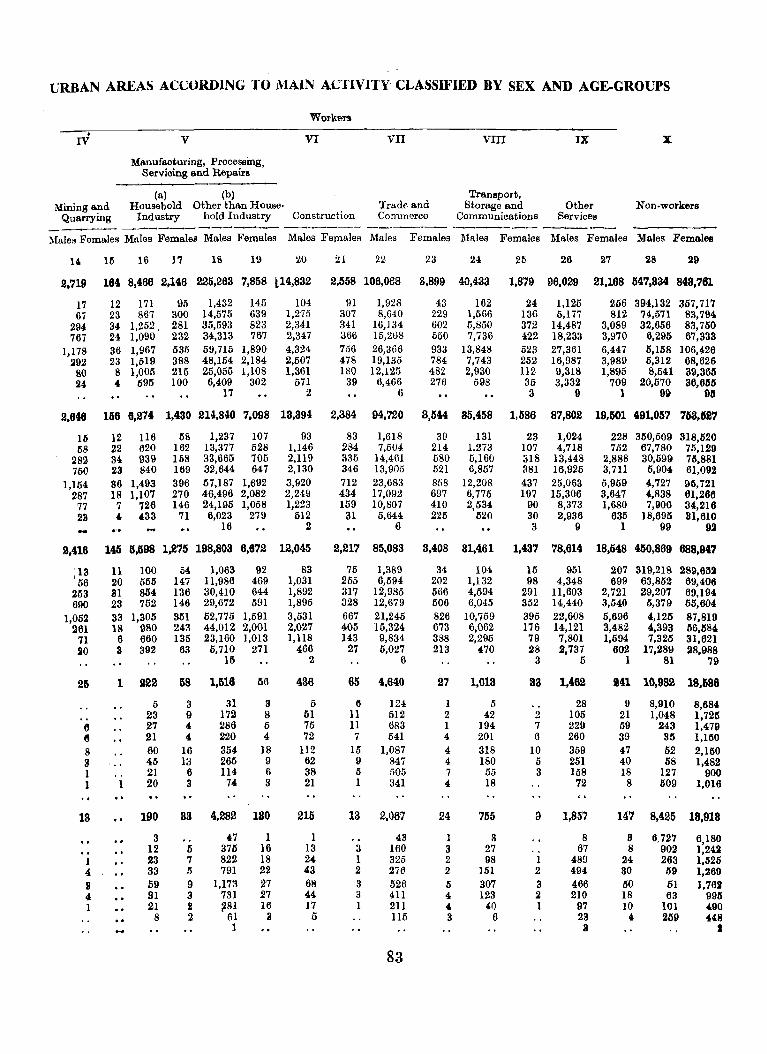
URBAN AREAS ACCORDING TO MAIN ACTIVITY CLASSIFIED BY SEX AND AGE-GROUPS
Worken . V VI VII VIII IX X IV
Manufacturing, Processing, Servicing and Repairs
(a) (b) Transport, Mining And Household Other than House- Trade and Storage and Other Non-workers
Quarrying Industry hold Industry Construction Commerce Communications Services ---- ---~----------- ----.~--- -------:\fales Females Males Females Males Females Males Females Males Females Males Females Males Females Males Females
14 15 16 17 18 19 20 21 22 23 24 25 26 27 28 29
2,719 164 8,466 2,146 225,263 7,858 t14,832 2,558 106,088 3,899 40,433 1,879 96,029 21,168 547,334 848,761
17 12 171 95 1,432 145 104 91 1,928 43 162 24 1,125 266 394,132 357,717 67 23 867 300 14,575 639 1,275 307 8,6010 229 1,566 136 5,177 812 74,571 83,794
294 34 1,252 _ 281 35,593 823 2,341 341 16,134 602 5,850 372 14,487 3,089 32,656 83,750 767 24 1,090 232 34,313 767 2,347 366 15,268 550 7,736 422 18,233 3,970 6,295 67,333
1,178 36 1,967 535 59,715 1,890 4,324 756 26,366 933 13,848 523 27,361 6,447 5,158 106,426 :192 23 1,519 388 48,154 2,184 2,507 478 19,135 784 7,743 252 16,987 3,989 5,312 68.626
80 8 1,005 215 25,055 1,108 1,361 180 12,125 482 2,930 112 9,318 1,895 8,541 39,366 24 4 695 100 6,409 302 571 39 6,466 276 598 35 3,332 709 20,570 36,6115
17 2 6 3 9 1 99 93
2,646 156 6,274 1,430 214,840 7,098 13,394 2,384 94,720 3,544 35,458 1,586 87,802 19,501 491,057 763,627
16 12 116 58 1,237 107 93 83 1,618 39 131 23 1,024 228 350,509 318,520 58 22 620 162 13,377 528 1,146 284 7,504 214 1,273 107 4,718 752 67,780 75,129
282 34 939 158 33,665 705 2,119 335 14,4131 580 5,160 318 13,448 2,888 30,599 75,881 750 23 840 169 32,644 647 2,130 346 13,905 521 6,857 381 16,925 3,711 5,904 61,092
1,154 36 1,493 396 57,187 1,692 3,920 712 23,683 858 12,208 437 25,063 5,959 4,727 96,721 287 18 1,107 270 46,496 2,082 2,249 434 17,092 697 6,775 197 15,306 3,647 4,838 61,266
77 7 726 146 24,195 1,058 1,223 159 10,807 410 2,534 90 8,373 1,680 7,906 34,216 23 4 4,33 71 6,023 279 512 31 5,644 225 520 30 2,936 635 18,695 31,610
16 .2 6 3 9 1 99 92
~,416 145 5,598 1,275 198,803 6,672 12,045 2,217 85,083 8,408 31,461 1,437 78,614 18,548 450,869 688.947
:13 11 100 54 1,063 92 83 75 1,389 34 104 15 951 207 319,218 289,6112 56 20 555 147 11,986 469 1,031 255 6,594 202 1,132 98 4,348 699 63,852 69,406
.253 81 864 136 30,410 644 1,892 317 12,985 566 4,594 291 11,603 2,721 29,207 69,194 690 23 752 146 29,672 591 1,895 328 12,679 506 6,045 352 14,440 3,546 5,379 55,604
1,052 33 1,305 351 52,775 1,591 3,531 667 21,245 826 10,759 395 22,608 5,696 4,125 87,819 261 18 980 243 44,012 2,001 2,027 405 15,324 673 6,062 176 14,121 3,482 4,393 1'l6,584
71 6 660 135 23,160 1,013 1,118 143 9,834 388 2,295 79 7,801 1,594 7,325 31,621 lIO 3 392 63 5,710 271 466 27 5,027 213 4,70 .28 2,737 602 17,289 .28,988
15 2 6 3 5 1 81 79
25 1 112~ 58 1,516 56 436 65 4,640 27 1,013 33 1,462 141 10,982 18,686
5 3 31 3 5 6 124 ] [j 28 9 8,910 8,684 23 9 172 8 51 11 512 2 42 2 105 21 1,048 1,725
6 27 4 286 5 75 II 683 I 194 7 229 59 243 1,479 6 21 4 220 4 72 7 541 4 201 6 260 39 85 1,130
8 60 16 354 18 112 15 1,087 4 318 10 359 47 52 2,150 3 46 13 265 9 62 9 847 4 180 5 251 40 118 1,482 I 21 6 114 6 38 5 505 7 55 3 158 18 127 900 1 1 20 3 74 3 21 1 341 4 18 72 8 509 1,016
13 190 83 4,282 180 215 13 2,067 24 755 9 1,857 147 8,425 18,918
3 47 I 1 43 1 3 8 8 6,727 6,180 12 6 3711 16 13 3 160 3 27 67 8 902 1,24~
1 23 7 822 18 24 1 325 2 98 1 489 24 263 1,525 4 33 5 791 22 43 2 276 2 151 2 494 ao 39 1,269
8 59 9 1,173 27 68 3 526 5 307 3 466 50 51 1,762 4 81 3 731 27 44 3 411 4 123 :I 210 18 63 9911 1 21 11 ~81 16 17 1 211 , 40 1 97 10 101 490
8 2 61 g 5 115 3 6 23 4 259 448 1 3 II
83
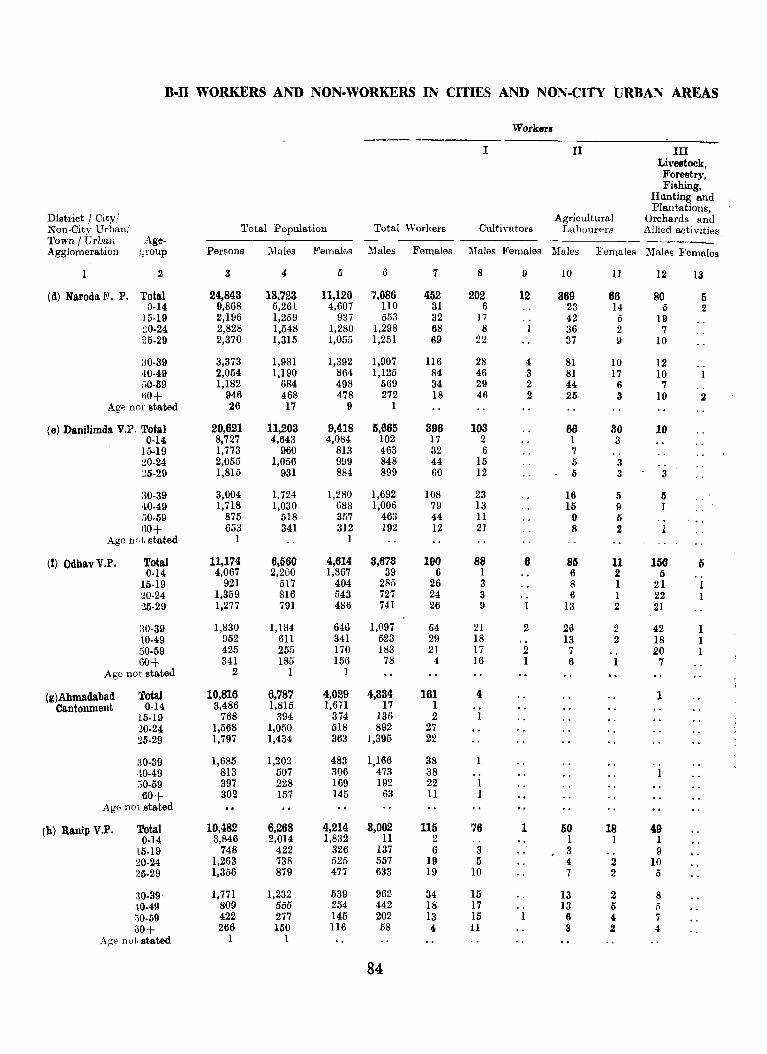
B·II WORKERS AND NONwWORKERS IN CITIES AND NON·CITY URBAN AREAS
Worker. ---- r II ITr Livelltock, Forestry, Fishing,
Hunting and Plantations,
District / Cityj Agricultural Orchards and Non-City Urban! Total Population Total Workers Cultiyators Labourers Allied activities Town tUrban Age- ---~
Agglomeration group Persons :l\Iales Females Males Females Males Females MoJos Females Males Females
2 g 4 5 6 7 8 9 10 11 12 13
(d) Naroda ~r. P. Total 24,843 13,723 11,120 7,086 452 202 12 369 86 80 5 0-14 9,868 5.261 4,607 llO 31 6 23 14 5 2
15-19 2,196 1.259 937 553 32 17 42 5 19 ::0·24 2,828 1,548 1,280 1,298 68 8 36 2 7 25·29 2,370 1,315 1,055 1,251 69 22 37 9 10
:10·39 3,373 1,981 1,392 1,907 116 28 4 81 10 12 40·49 2,054 1,190 864 1,125 84 46 3 81 17 10 ,,0·69 1,182 684 498 569 34 29 2 44 6 7 (iO+ 946 468 478 272 18 46 2 25 8 10 2
Age not stated 26 17 9 1
(e) Danilimda V.l'. Total 20,621 11,203 9,418 5,665 396 103 66 30 10 0·14 8,727 4,643 4,084 102 17 2 1 3
15·19 1,773 960 813 463 32 6 7 :W·24 2,055 1,056 999 848 44 15 5 3 ::5·29 1,815 931 884 899 60 12 5 3 --- - 3
:)0·39 3,004 1,724 1,280 1.692 108 23 16 /'i l5 ,10·49 1,718 1,030 688 1,006 79 13 15 9 I 50·59 875 518 357 463 44 11 9 5 (JO+ 653 341 312 192 12 21 8 2
Age not stated 1 1
(I) Odhav V.P. Total 11,174 6,560 4,614 8,673 190 88 6 85 11 156 5 0·14 4,067 2,200 1,867 39 6 1 6 2 5
15·19 921 517 404 285 26 3 8 1 21 ~0·24 1,359 816 543 727 24 3 6 I 22 25-29 1,277 791 486 741 26 9 13 2 21
30-39 1,830 1,184 646 1,097 54 21 2 26 2 42 1 40·49 952 611 341 523 29 18 13 2 18 1 50·59 425 255 170 183 21 17 2 7 20 1 60+ 341 185 156 78 4 16 1 6 7
Age not stated 2 1 1
(g) Ahmadabad Total 10,816 6,787 4,029 4,334 161 4 1 Cantonment 0·14 3,486 1,815 1,671 17 1
15·19 768 394 374 136 2 20-24 1,568 1,050 518 892 27 25·29 1,797 1,434 363 1,395 22
30·39 1,685 1,202 483 1,166 38 ,W·49 813 507 306 473 38 30·59 397 228 169 192 22 60+ 302 157 145 63 11
Age not stated
(h) Ranip V.P. Total 10,482 6,268 4,214 8,002 115 76 1 50 18 49 0-14 3,846 2,014 1,832 11 2 1 I 1
15·19 748 422 326 13.7 6 3 3 .. 9 20-24 1,263 738 525 557 19 5 4 2 10 25·29 1,356 879 477 633 19 10 7 2 5
:10·39 1,771 1,232 539 962 34 15 13 2 8 40·49 809 555 254 442 18 17 .. 13 5 ii :\0-59 422 277 145 202 13 15 1 6 4. 7 ()O+ 266 150 116 58 4 11 3 2 4
Age not stated 1 1
84
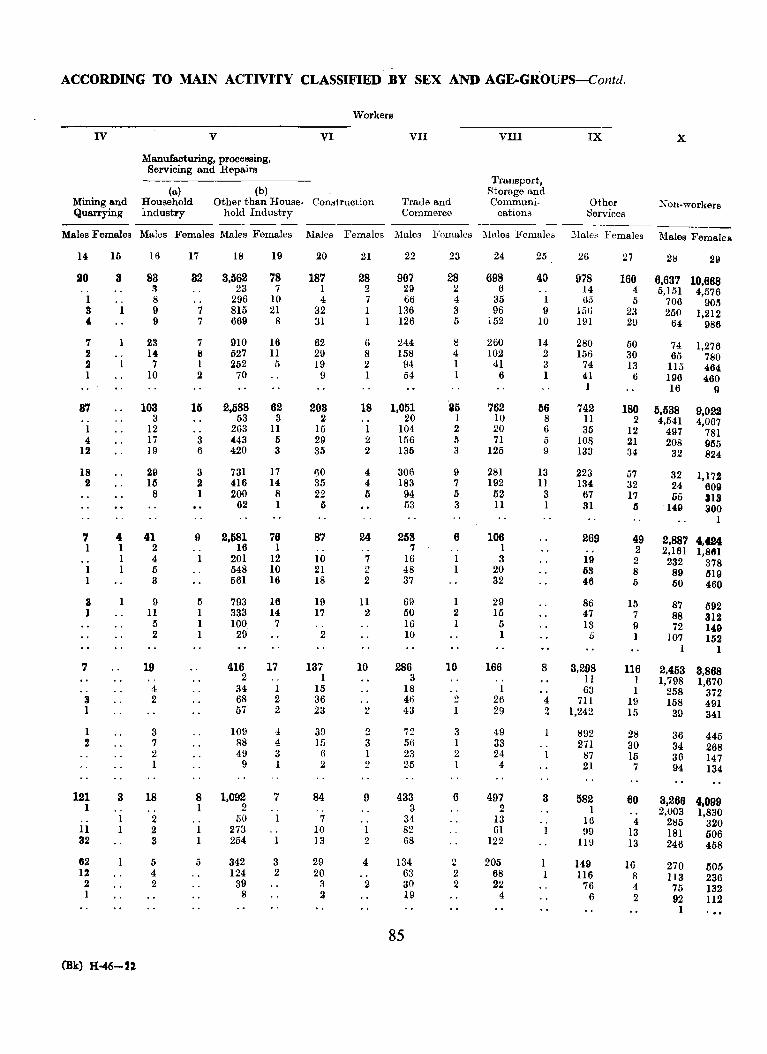
ACCORDING TO MAIN ACTIVITY CLASSIFIED BY SEX AND AGE-GROUPS-Contd.
Workers
IV V VI VII VIII IX X
Manufacturing, processing, Servicing and Repairs
(a) (b) Transport,
Storage and Mining and Household Other than House- Construction Trade and Communi- Other Kon-workers Quarrying industry hold Industry Commerce cations Services
----- ------- - -------Males Females Males Females Males Females Males Females Males Females }Iales FemalcB 3.Iales Females Males Females
14 16 16 17 18 19 20 21 22 23 24 25 26 27 28 29
:aO 3 83 32 3,562 78 187 28 907 28 698 40 978 160 6,637 10,668 !'l 23 7 I 2 29 2 6 14 4 5,151 4,576
1 8 296 10 4 7 66 4 35 I Go 5 706 905 3 9 7 815 21 32 1 136 3 96 9 156 23 250 1,212 , 9 7 669 8 31 1 126 6 162 10 191 20 64 986
7 23 7 910 16 62 6 244 8 260 14 280 liO 74 1,276 2 a s 627 II 29 8 168 4 102 2 166 30 65 780 .2 7 I 252 6 19 2 94 1 41 3 74 13 115 464 1 10 2 70 9 1 54 1 6 1 41 6 196 460
1 16 9
87 103 lIS 2.688 62 203 18 1,051 35 762 66 742 180 6.638 9.022 3 53 3 2 20 1 10 8 11 .2 4,641 4,067 1 12 263 11 16 1 104 2 20 6 36 12 497 781 4 17 3 443 6 29 2 156 5 71 [) 108 21 208 955
12 19 6 420 3 35 2 136 3 125 9 133 34 32 824
18 29 8 731 17 60 4 306 9 281 13 223 67 32 1,17.2 .2 15 .2 416 14 36 4 183 7 192 11 134 32 24 609
8 1 200 8 22 5 94 [) 52 3 67 17 55 313 62 1 6 53 3 11 1 31 5 149 300
1
'1 4 41 9 2.681 76 87 24 258 6 106 269 49 2,887 4,124 1 1 2 16 1 7 1 2 2,161 1,861
1 4 201 12 10 7 16 1 3 19 2 232 378 1 1 5 548 10 21 2 48 1 20 liS 8 89 519 1 3 561 16 18 2 37 32 46 5 liO 460
a 1 {} IS 793 16 19 11 69 1 29 86 15 87 592 1 11 1 333 14 17 2 50 2 15 47 7 88 312
5 1 100 7 16 1 6 13 {} 72 149 2 1 29 2 10 1 i5 1 107 152 1 1
7 19 416 17 137 10 286 10 166 8 3,298 116 2.453 3,868 2 1 3 11 1 1,798 1,670 4 34 1 15 18 1 63 1 258 372
3 2 68 2 36 41l ::: 26 4 711 19 168 491 1 57 2 23 2 43 29 2 1,242 15 39 341
1 3 109 '1 39 ::: 72 3 49 892 28 36 445 2 7 88 4 15 3 56 1 33 271 30 34 268 2 49 3 6 1 23 2 24 87 15 36 147 1 9 1 2 2 25 1 4 21 7 94 134
121 3 18 8 1,092 ? 84 9 433 6 49'1 3 582 60 3,266 4.099 1 1 2 3 2 1 2,003 1,830 1 2 00 7 34 13 16 4 285 320
11 1 2 1 273 10 1 82 61 99 13 181 506 32 3 1 254 13 2 68 122 119 13 246 458
«12 5 6 342 3 29 4 134 2 205 1 149 16 270 605 12 4 124 2 20 63 2 68 1 116 8 1I3 236 2 2 39 3 2 30 2 22 76 4 75 132 1 8 2 19 4 6 2 92 112 1
85
(Bk) H-46-2%
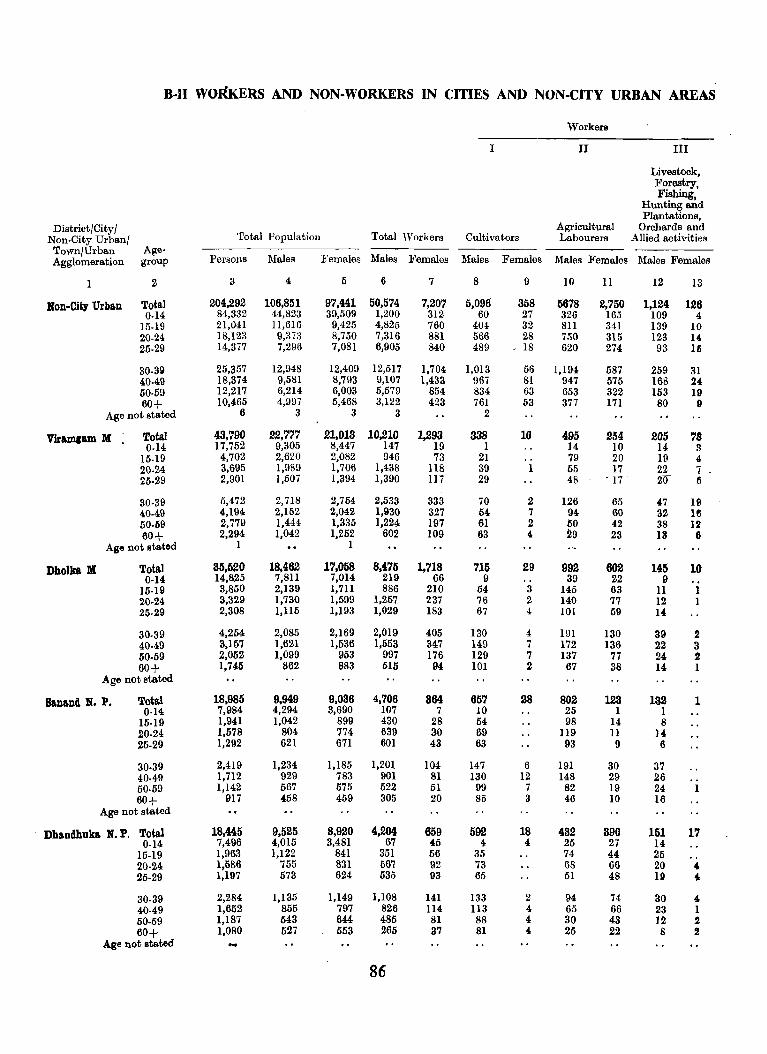
B·lI WORKERS AND NON-WORKERS IN CITIES AND NON-CITY URBAN AREAS'
Workers
I II III
Livestock, Forestry, Fishing,
Hunting and Plantations,
Distriot/City! Agricultural Orchards and Non-City Urban! Total Population Total ·Workers Cultivators Labourers Allied activities Town/Urban Age-
Persons l\Iales Females Males Females Males Females Males Females Agglomeration group Males Females
1 2 3 4 5 6 7 8 9 10 11 12 13
Non-City Urban Total 204,292 106,851 97,441 50,574 7,207 5,096 358 5678 2,750 1,124 126 0-14 84,332 44,823 39,509 1,200 312 60 27 326 165 109 4
15-19 21,041 11,616 9,425 4,825 760 404 32 811 341 139 10 20-24 18,123 9,373 8,750 7,316 881 566 28 750 315 123 14 25-29 14,377 7,296 7,081 6,905 840 489 18 620 274 93 16
30-3~ 25,357 12,948 12,409 12,517 1,704 1,013 56 1,194 587 259 31 40-49 18,374 9,581 8,793 9,107 1,433 961 81 947 575 168 24 50-59 12,217 6,214 6,003 5,579 854 834 63 653 322 153 19 60+ 10,465 4,991 5,468 3,122 423 761 53 377 171 80 9
Age not stated 6 3 3 3 2
VlraDllam M Total 48,'(90 22,7'17 21,013 10,210 1,293 338 16 495 254 205 '1'8 . 0-14 17,752 9,305 8,447 147 19 1 14 10 14 3
15-19 4,702 2,620 2,082 946 73 21 79 20 19 4,
20-24 3,695 1,989 1,706 1,438 118 39 1 55 17 22 7 25·29 2,901 1,507 1,394 1,390 117 29 48 - 17 .. 20 6
30-39 5,472 2,718 2,754 2,533 333 70 2 126 65 47 19 40-49 4,194 2,152 2,042 1,930 327 54 7 94 60 32 16 50-59 2,779 1,444 1,335 1,224 197 61 2 50 42 38 12 60+ 2,294 1,042 1.252 602 109 63 4 29 23 18 6
Age not stated 1 1
DhoJIra M Total 85,520 18,462 17,058 8,475 1,718 715 29 992 602 145 10 0·14 14,825 7.811 7.014 219 66 9 39 22 9
15-19 3,850 2,139 1,711 886 210 54 3 145 63 11 1 20·24 3,329 1,730 1,599 1.257 237 76 2 140 77 12 1 25-29 2,308 1,115 1,193 1.029 183 67 4 101 59 a
30-39 4.254 2,085 2,169 2.019 405 130 4 191 130 39 2 40-49 3,157 1,621 1,536 1,553 347 149 7 172 136 22 3 50·59 2,052 1,099 953 997 176 129 7 137 77 24 2 60+ 1,745 862 883 515 94 101 2 67 38 14 1
Age not stated
Sanand N. P. Tot",l 18,985 9,949 9,036 4,706 864 657 28 802 123 132 1 0-14 7,984 4,294 3,690 107 7 10 25 1 1
15-19 1,941 1,042 899 430 28 54 98 14 8 20-24 1,578 804 774 639 30 69 119 11 14 25-29 1,292 621 671 601 43 63 93 9 6
30·39 2,419 1.234 1,185 1,201 104 147 6 191 30 37 40-49 1,712 929 783 901 81 130 12 148 29 26 50-69 1,142 567 575 522 51 99 7 82 19 24 60+ 917 458 459 305 20 85 3 46 10 16
Age not stated
Dhandhuka N. P. Total 18,445 9,525 8,920 4,204 659 592 18 432 390 151 17 0-14 7,496 4,015 3,481 67 45 4 4 25 27 14
16·19 1,963 1,122 841 351 56 35 74 44 25 20·24 1,586 755 831 567 92 73 68 66 20 4-25·29 1,197 573 624 535 93 65 51 48 19 , 30-39 2,284 1,135 1,149 1,108 141 133 2 94 74 30 4 40-49 1,652 855 797 826 114 113 4 65 66 23 1 50·59 1,187 543 644 485 81 88 4 30 43 12 2 60+ 1.080 527 553 265 37 81 4 25 22 S 2
Age not stated
86
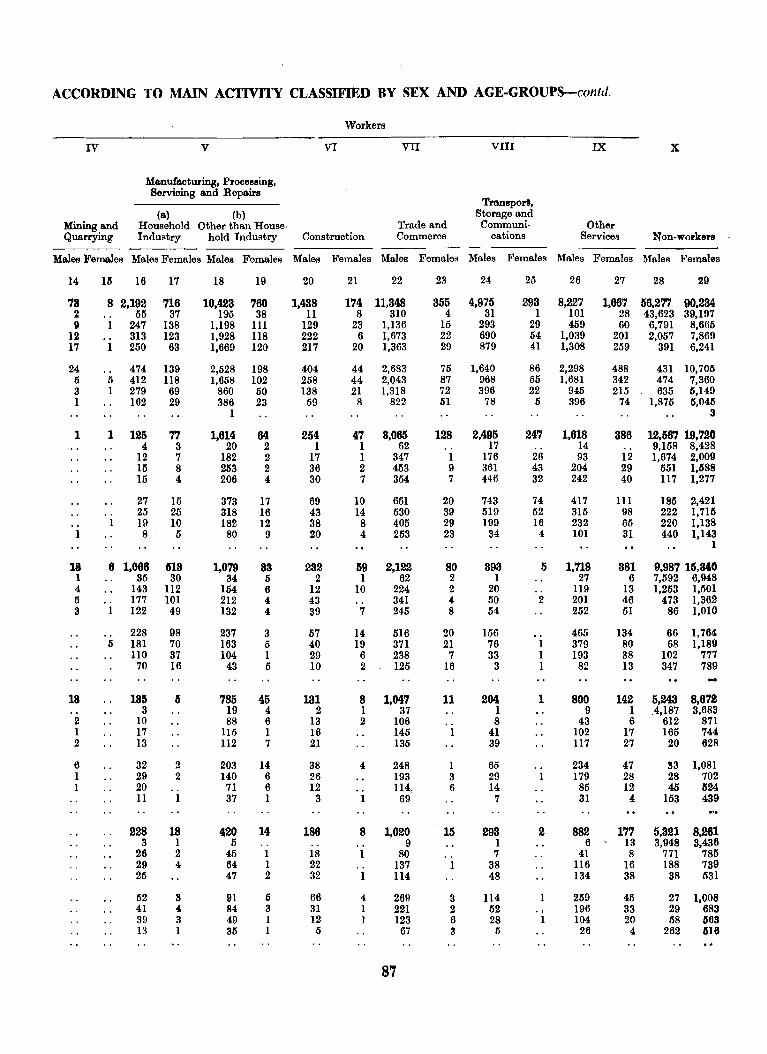
ACCORDL~G TO MAIN ACTIVITY CLASSIFIED BY SEX AND AGE·GROUPS-conld.
Workers
IV V VI VII VIII IX X
Manufacturing, Pl'ocessing, Servicing and Repairs
Transport, (a) (b) Storage and
Mining and Household Other than House. Trade and Communi- Other Quarrying Industry hold Industry Construction Commerce cations Services Non-workers
Males Females Males Females Males Females Males Females Males Females Males Females Males Females Males Females
14 15 16 17 18 19 20 21 22 23 24 25 26 27 28 29
73 8 2,192 716 10,423 760 1,438 174 11,348 355 4,975 293 8,227 1,667 56,277 90,234 2 · . 55 37 195 38 11 8 310 4 31 1 101 28 43,623 39,197 9 1 247 138 1,198 111 129 23 1,136 15 293 29 459 60 6,791 8,665
12 313 123 1,928 118 222 6 1,673 22 690 54 1,039 201 2,057 7,869 17 250 63 1,669 120 217 20 1,363 29 879 41 1,308 259 391 6,241
24 474 139 2,528 198 404 44 2,683 75 1,640 86 2,298 488 431 10,705 5 5 412 118 1,658 102 258 44 2,043 87 968 65 1,681 342 474 7,360 3 1 279 69 860 50 138 21 1,318 72 396 22 945 215 635 5,149 1 162 29 386 23 59 8 822 51 78 5 396 74 1,875 5,045
1 3
1 1 125 77 1,614 64 254 47 3,065 128 2,495 247 1,618 886 12,567 19.720 4 3 20 2 1 1 62 .. 17 14 . . 9,158 8,428
12 7 182 2 17 1 347 1 176 26 93 12 1,674 2,009 15 8 253 2 36 2 453 9 361 43 204 29 551 1,588 15 4 206 4 30 7 354 7 446 32 242 40 117 1.277
27 15 373 17 69 10 661 20 743 74 417 III 185 2,421 · . 25 25 318 16 43 14 530 39 519 52 315 98 222 1,715 I 19 10 182 12 38 8 405 29 199 16 232 65 220 1,138
8 5 80 9 20 4 253 23 34 4 101 31 440 1,143 1
18 6 1.066 513 1.079 38 232 59 2,122 80 393 5 1,718 381 9.987 15,340 1 35 30 34 5 2 1 62 2 1 27 6 7,592 6,948 4 143 112 154 6 12 10 224 2 20 .. 119 13 1,253 1,501 5 · . 177 101 212 4 43 341 4 50 2 201 46 473 1,362 3 1 122 49 132 4 39 7 245 8 54 252 51 86 1,010
228 98 237 3 57 14 516 20 156 465 134 66 1,764 6 181 70 163 5 40 19 371 21 76 1 379 80 68 1,189
110 37 104 1 29 6 238 7 33 1 193 38 102 777 70 16 43 5 10 2 125 16 3 1 82 13 347 789 -
18 135 5 785 45 131 8 1.047 11 204 1 800 142 5,243 8.672 3 19 4 2 1 37 1 9 1 ,4,187 3,683
2 10 88 6 13 2 106 8 43 6 612 871 1 17 115 1 16 145 41 102 17 165 744 2 13 112 7 21 135 39 117 27 20 628
6 32 2 203 14 38 4 248 1 65 234 47 !l3 1,081 1 29 2 140 6 26 193 3 29 1 179 28 28 702 1 20 .. 71 6 12 114" 6 14 85 12 45 524
11 1 37 1 3 1 69 7 31 4 153 439
228 18 420 14 186 8 1,020 15 293 2 882 1'7'7 5.321 8.261 3 1 5 9 1 6 , 13 3,948 3,436
26 2 45 1 18 1 80 7 41 8 771 785 29 4 64 1 22 137 38 116 16 188 739 25 47 2 32 114 48 134 38 38 531
62 11 91 {) 66 4 269 3 114 259 45 27 1,008 41 .,. 84 3 31 1 221 2 52 196 33 29 683 39 3 49 1 12 1 123 6 28 104 20 58 563 13 1 35 1 5 67 3 5 26 4 262 518
8'7

B·II WORKERS AND NON·WORKERS IN CITIES AND NON·CITY URBAN AREAS
Workers
1 II m Livestock, Forestry, Fishing,
Hunting and Plantations,
District/City Agricultural Orchards and Non-City Urbtn/ Age T()tal Population Total 'Workers Cultivators Labourers Allied activition Town/Urban group ------ ---_---- -------Agglomeration Persons l'vIales Females Males Females Males Females Males Females Males Females
2 3 4 5 6 7 8 9 10 11 12 13
Dehgam N. P. Total 17,768 9,386 8,382 4,678 268 585 26 463 60 66 1 0-14 7,258 3,R60 3,398 130 9 12 3 50 3 " 15-19 1,697 965 732 418 22 59 4 55 9 12
20-24 1,683 883 800 711 34 64 2 69 6 6 25-29 1,422 732 690 712 40 62 2 52 4 5
30-39 2,285 1,209 1,076 1,182 64 105 6 95 9 15 40-49 1,540 826 714 807 46 107 2 70 9 11 1 50-59 991 489 602 450 38 98 5 50 4 7 60+ 891 421 470 267 15 87 2 22 6 6
1\ ge not stated 1 1 I I
Bavla N. P. Total 16,695 8,836 7,859 4,401 659 385 17 502 356 75 19 0-14 7,000 3,802 3,198 139 20 1 23 11 13 1
15-19 1,676 922 754 442 64 23 44 - 36 -"6 4 20.24 1,424 741 683 607 88 38 2 43 44 11 1 25-29 1,269 648 621 624 88 37 1 61 45 5 5
30-39 2,161 1,132 1,029 1,123 165 74 2 120 86 17 4 40-49 1,441 749 692 735 126 80 7 87 78 11 2 60-59 962 468 494 442 90 62 5 71 44 7 2 60+ 762 374 388 289 18 70 53 12 5
Age not stated
Barwala V. F. Total 9,513 4,886 4,627 2,216 317 429 76 416 163 84 0-14 4,269 2,259 2,000 105 45 5 11 55 32 23
15-19 1,000 513 487 225 49 41 12 71 35 11 20-24 693 349 344 266 32 63 9 55 13 3 25-29 574 276 298 261 34 48 5 41 13 3
30-39- 1,059 509 550 497 67 100 15 64 30 19 40-49 803 422 381 403 46 71 11 52 25 13 60-59 582 2!)5 287 273 28 56 8 53 8 7 60+ 543 263 280 ]86 16 55 5 25 7 5
Age not stated
MandaI V. P Total 9,282 4,710 4,572 2,346 605 379 66 625 434 85 0-14 3,918 2,027 1,891 93 56 6 Ii 52 48 11
15-19 914 486 428 232 89 34 7 98 68 14 20-24 686 348 338 292 68 39 10 63 43 11 25-29 583 267 316 253 60 40 5 61 47 10
30-39 1,045 534 511 524 III 59 9 129 88 19 40-49 917 463 454 447 109 72 10 113 73 8 50·59 635 313 322 296 69 70 8 66 44 7 60+ 584 272 312 209 43 59 12 43 23 5
Age not stated
Ranpur V. p, Total 9,277 4,631 4,646 2,155 364 404 68 234 165 69 0-14 3,859 2,029 1,830 62 12 9 4 18 7 6
15-19 984 510 474 247 48 38 6 39 27 18 20-24 767 372 395 327 29 48 2 31 16 10 25-29 521 261 260 253 17 33 20 8 4
30-39 971 455 516 431 69 74 7 33 30 16 40-49 877 425 452 400 86 86 HI 44 43 6 60-59 625 292 333 258 60 57 15 29 15 tl 60+ 673 287 386 177 43 59 18 20 19 1
Age not stated
88
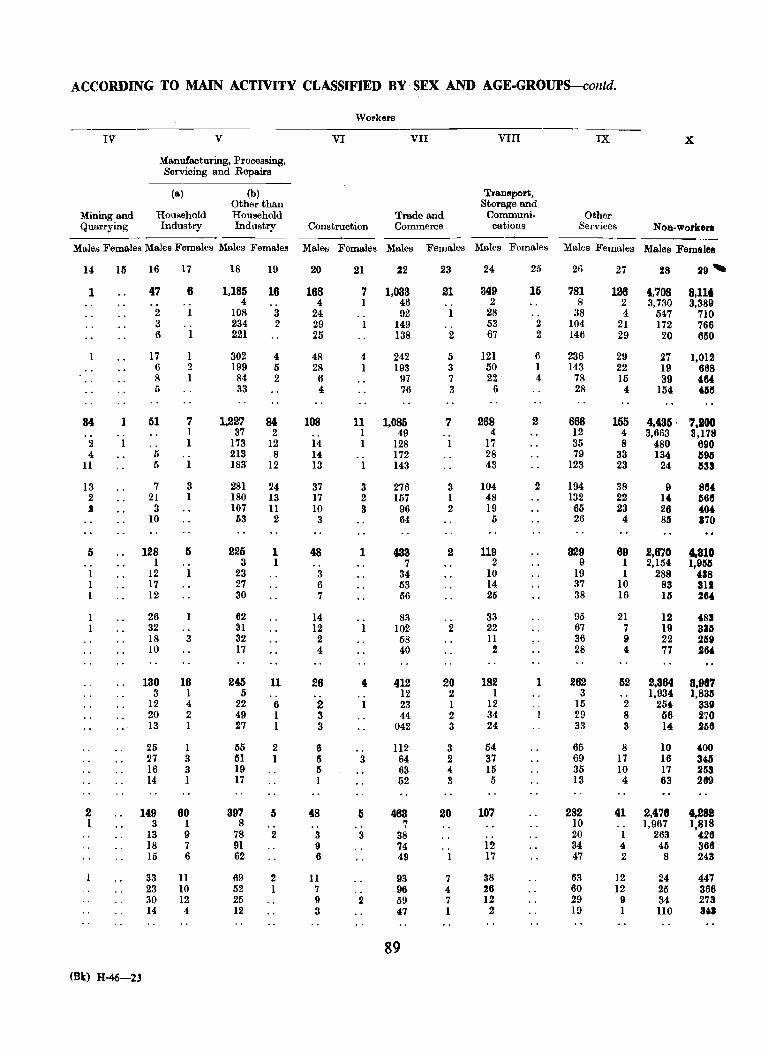
ACCORDING TO MAIN ACTIVITY CLASSIFIED BY SEX AND AGE-GROUPS-collld.
Wopkere
IV V VI VII VIII IX X
Manufacturing, Processing, Servicing and R.epairs
(a) (b) Transport, Other than Storage and
Mining and Household Household Trade and Communi. Other Quarrying Industry Industry Construction Commerce cations Services NOli-workers
Males Females MaJes Females Males Femalee Males Females Males Females Males Females Males Females Males Females
14 15 16 17 18 19 20 21 22 23 24 25 26 27 28 29"'
1 47 6 1,185 16 168 7 1,033 21 349 15 781 126 4,708 8,Ut .. 4 .. 4 1 46 · . 2 8 2 3,730 3,389
2 1 108 3 24 92 1 28 38 4 547 710 3 234 2 29 1 149 · . 53 2 104 21 172 766 6 221 25 138 2 67 2 146 29 20 6110
17 1 302 4 48 4 242 5 121 6 236 29 27 1,012 6 2 199 5 28 1 193 3 50 1 143 22 19 668 8 1 84 2 6 97 7 22 4 78 15 39 464 Ii 33 4 76 3 6 28 4 154 41111
84 1 51 7 1,227 84 108 11 1,085 7 288 2 668 155 4,435' 7,200 1 37 2 .. I 49 4 12 4 3,663 3,178
2 1 173 12 14 1 128 17 35 8 480 690 4 Ii .. 213 8 14 172 28 79 33 134 11911
11 5 1 183 12 13 143 43 123 23 24 1133
13 7 3 281 24 37 3 276 3 104 2 194 38 9 8114 2 21 1 180 13 17 2 157 1 48 132 22 14 1166 11 3 107 11 10 S 96 2 19 65 23 26 404
10 63 2 3 64 6 26 4 811 170
5 128 I) 225 1 48 1 433 2 119 329 69 2,670 1,310 1 3 1 7 2 9 1 2,154 1,91111
1 12 1 23 3 34 10 19 1 288 418 1 17 27 6 53 14 37 10 83 312 1 12 30 7 56 26 38 16 15 264
26 62 14 83 · . 33 95 21 12 48a 32 31 12 102 2 22 67 7 19 3311 18 3 32 2 58 II 36 9 22 2119 10 17 4 40 2 28 4, 77 264
130 16 245 11 26 4 412 20 182 1 262 52 2,364 8,987 3 I 5
" 12 2 I 3 1,934 1,8311 12 4 22 6 2 I 23 I 12 .. 15 2 254 339 20 2 49 I 3 44 2 34 I 29 8 56 270 13 1 27 1 3 042 3 24 33 3 14 2116
25 1 55 2 6 112 3 54 65 8 10 400 27 3 IH I 6 3 64 2 37 69 17 16 3411 16 3 19 5 63 4 15 35 10 17 2113 14 I 17 I 52 3 5 13 4 63 269
2 149 60 397 I) 48 I) 463 20 107 282 41 2,476 1,281 I 3 I 8 .. . . . . 7 10 1,967 1,818
13 9 78 2 3 3 38 20 1 263 426 18 7 91 9 74 12 34 4 45 366 15 6 62 6 49 17 47 2 8 243
33 11 69 2 11 93 7 38 63 12 24 447 23 10 52 1 7 .. 96 4 26 60 12 25 366 30 12 25 9 2 59 7 12 29 9 34 273 14 4 12 3 47 1 2 19 1 110 84.1
89
(Bk) H-46-23
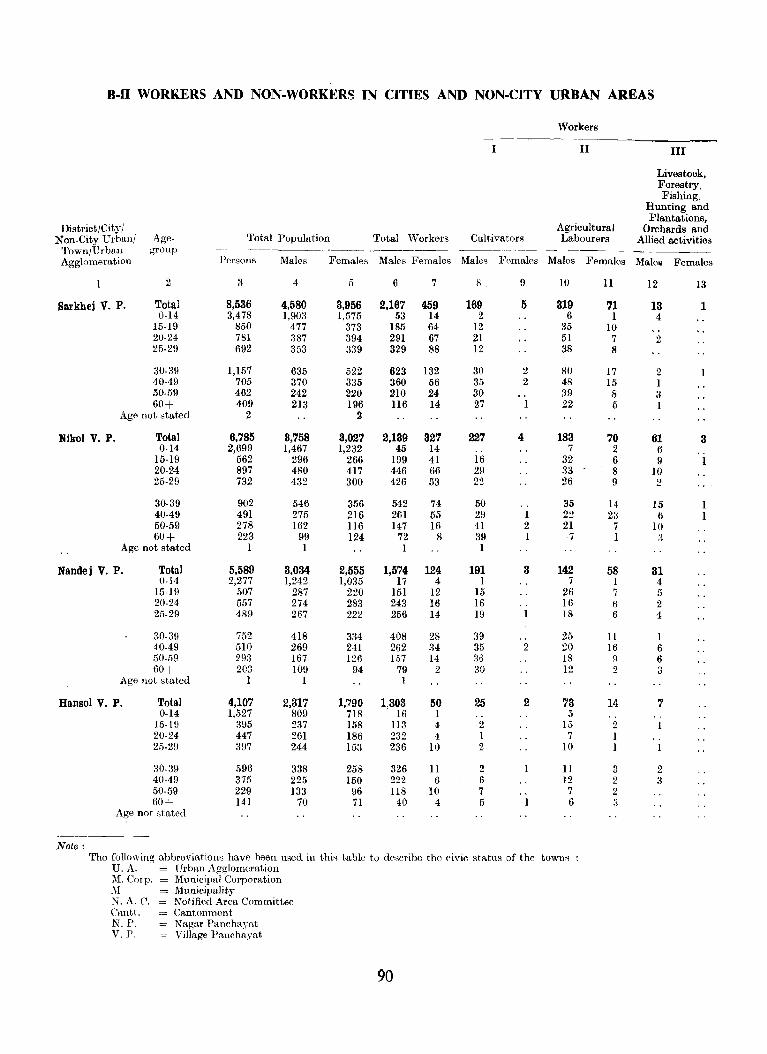
B-II WORKERS AND NON-WORKERS IN CITIES AND NON-CITY URBAN AREAS
Workers
I II III
Livestook, Forestry, Fishing,
Hunting and Plantations,
District/City / Agricultural Orchards and Non-City Urbani Age- Total Population Total ';Yorkers Cultivators Labourers Allied activities
Town/Urban group ---------------- ~-~---- -------
Agglomeration Persons Males Females Males Females Males Females Males Females Malea Females
2 3 4 5 6 7 8 9 10 11 12 13
Sarkbei V. P. Total 8,536 4,580 3,956 2,167 459 169 5 319 71 13 1 0-14 3,478 1,903 1,575 53 14 2 6 1 4
15-19 850 477 373 185 64 12 35 10 20-24 781 387 394 291 67 21 51 7 2 25-29 692 353 339 329 88 12 38 8
30-39 1,157 635 522 623 132 30 2 80 17 2 40-49 705 370 335 360 56 35 2 48 15 1 50-59 462 242 220 210 24 30 39 8 3 60+ 409 213 196 116 14 27 22 5 I
Age not stated 2 II
Mikol V. P. Total 6,785 3,758 3,027 2,139 327 227 4 183 70 61 3 0-14 2,699 1,467 1,232 45 14 7 .2 6
15-19 562 296 266 199 41 16 32 6 a 20-24 897 480 417 446 66 29 33 8 10 25-29 732 432 300 426 53 22 26 9 2
30-39 902 546 356 542 74 50 35 14 15 1 40-49 491 275 216 261 55 29 1 22 23 6 1 50-59 278 162 116 147 16 41 2 21 7 10 60+ 223 99 124 72 8 39 1 7 I 3
Age not stated 1 1 1 1
Mandei V. P. Total 5,589 3,034 2,555 1,574 124 191 3 142 58 31 0-14 2,277 1,242 1,035 17 4 1 7 1 4
15-19 507 287 220 151 12 15 26 7 5 20-24 557 274 283 243 16 16 16 6 2 25-29 489 267 222 256 14 19 18 6 4
30-39 752 418 334 408 28 39 25 II 1 40-49 510 269 241 262 34 35 2 20 16 6 50-5g 293 167 126 157 14 36 18 9 6 60+ 203 109 94 79 2 30 12 2 3
Age not stated 1 1 1
Hansol V. P. Total 4,107 2,317 1,790 1,303 50 25 2 73 14 7 0-14 1,527 809 718 16 1 5
15-HI 395 237 158 113 4 2 15 2 20-24 447 261 186 232 4 1 7 I 25-29 397 244 153 236 10 2 10 1
aO-39 596 338 258 326 II 2 11 3 2 40-49 375 225 150 222 6 6 12 2 3 50-59 229 133 96 U8 10 7 7 2 60+ 141 70 71 40 4 5 6 3
Age not stated
Note: The following ahbreviations have heen used in this table to de~erihe tho ('ivic status of the towns
U. A. = Urban Agglomeration ;VI. Corp. = Municipal Corpomtion M = Municipality N.A.C. = Notified Area Committee Calltt. = Cantonment N.P. = Nagar Panehayat V. J'. = Village Prtnchayat
90
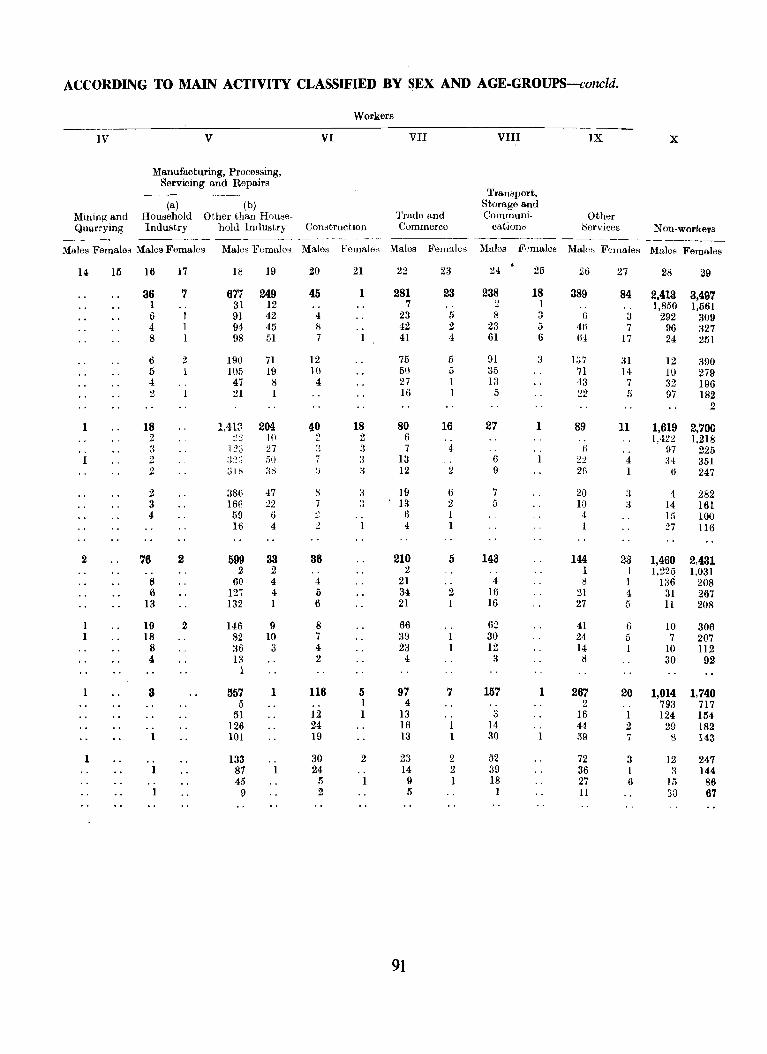
ACCORDING TO MAIN ACTIVITY CLASSIFIED BY SEX AND AGE-GROUPS-conc1d.
Workers
IV V VI VII VIII IX X
Manufacturing, Processing, Servicing and Repairs
------------------ Transport, (a) (b) Storage and
Mining and Household Other than House- Trade and Communi- Other QUIl.rrying Industry hold In(lustry Construction Commerce cation" ::;ervices Non-workers
--------- -------- ----~~-- ---------- ----- ~-- ---------Males Females Males Females Malos Fomales Males Females Males Female8 Males F0males Mal0H Females Malee Females
14 HI 16 17 18 19 20 21 22 23 24 25 26 27 28 29
36 ? 677 249 45 1 281 23 238 18 389 84 2,413 3,497 1 31 12 7 2 1 1,850 1,561 6 91 42 4 23 5 8 3 6 3 292 309 4 94 45 8 42 2 23 5 40 7 96 327 8 98 51 7 41 4 61 6 (i4 17 24 251
6 2 190 71 12 75 5 91 :J 137 31 12 390 5 1 105 19 10 50 5 35 71 14 10 279 4 47 8 4 27 1 13 43 7 32 196 2 21 1 16 1 5 22 5 97 182
2
1 18 1,413 204 40 18 80 16 27 1 89 11 1,619 2,700 2 ~:! 10 2 2 6 1,422 1,218 3 1:):3 27 :~ 3 7 4 6 .. 97 225 2 :{:~:) 50 7 3 13 6 2:! 4 :'14 351 2 3IH :>8 :J 3 12 2 9 26 I 6 247
2 :J8ti 47 8 3 19 6 7 20 3 4 282 3 16(; 22 7 3 13 2 5 10 3 14 161 4 59 6
., 6 4 15 100 16 4 2 4 I 27 116
2 76 2 599 33 36 210 5 143 144 23 1,460 2,431 2 2 2 1 1 1,225 1,031
8 60 4 4 21 4 8 1 136 208 6 127 4 5 34 2 16 21 4 31 267
13 132 1 6 21 I 16 27 5 II 208
1 19 2 146 9 8 66 62 41 6 10 306 1 18 82 10 7 39 30 24 5 7 207
8 36 3 4 23 12 14 I 10 112 4- 13 2 4 3 8 30 92
1
8 557 1 116 5 97 7 157 1 267 20 1,014 1.740 5 I 4 2 793 717
51 12 I 13 3 16 I 124 1M 126 24 16 I 14 44 2 29 182
1 101 19 13 1 30 59 7 S 143
133 30 2 23 2 52 72 3 12 247 87 24 14 2 39 36 I 3 144 45 5 9 1 18 27 6 15 86
9 2 5 1 11 30 67
91

C-SOCIAL AND .... CULTURAL TABLES
"'" ,. __ ~1I "',. L~~
C-V Mother Tongue
This table corresponds to Table C-Y of 1961. In this table mother tongues have been given in alphabetical order. The figures for the district have been presented for total/rural/urban areas, while taluka figures have been presented for total area only. The separate figures for town/Urban agglomeration have also been presented. In 1961 the table was presented for total, rural and urban areas for the district and for rural area only for talukaJmahal.
C· VII Religion
This table like its corresponding Table C-YII in 1961 has been prepared on full count for total, rural and urban population. It gives the distribution of the population by religion. The units for presentation of figures for this table in 1961 were total/rural/urban areas for the district and rural area for talukas. The units for presentation of figures for this table in 1971 are total/ rural/urban areas for the district / taluka / mahall city I town / urban agglomeration.
C· VIII Scheduled Castes and Scheduled Tribes (Part A and B) Classification by literacy and Industrial category of workers and non-workers according to main activity among Scheduled Castes/Scheduled Tribes
This table has been prepared for total, rural and urban population on full count. It gives the total population of Scheduled Castes and Scheduled Tribes and their distribution by literacy and classification of workers into different industrial categories and the total number of non-workers. This is a general table that is prepared for the Scheduled Castes and Scheduled Tribes. The table gives figures for district / taluka/ mahal/city /town/urban agglomeration. .
Appendix to Table C-YIII Part A gives individual castewise details on literacy for total/rural/urban areas for!district/talukaimahaI/city/town/urban agglomeration. Appendix to Table C-VIII Part B gives similar detai s for individual Scheduled Tribe.
(Bk) H-46-24
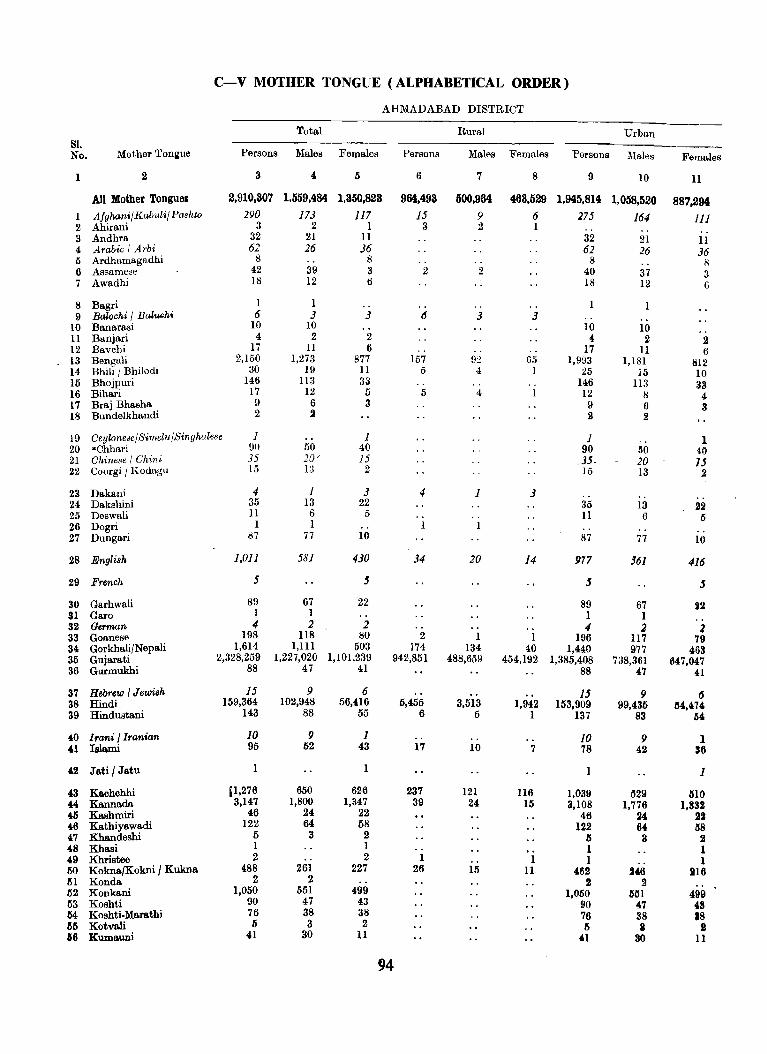
C-V MOTHER TONGUE (ALPHABETICAL ORDER)
AHMADABAD DISTRICT
Total Rural Urban Sl. No. Mother Toniue Persons Males Fema,les Persons Males Females Persons Males Females
1 2 3 4 5 6 7 8 9 10 11
All Mother Tongue. 2,910,307 l.559,484 1,350,823 964,493 500,964 463,529 1,945,814 1,058,520 887,294 1 Afghani/Kabuli/ Pashto 290 173 117 15 9 6 275 164 111 2 Ahirani 3 2 1 3 2 1 3 Andhra 32 21 11 32 21 11 4 Arabic I Arbi 62 26 36 62 26 36 5 Ardhamagadhi 8 8 8 8 6 Assamese 42 39 3 2 2 40 37 3 7 Awadhi 18 12 6 18 12 G
8 Bagri 1 1 9 BalQchi / BaluGhl 6 3 3 t5 3 3
10 Banarasi 10 10 10 10 11 Banjari 4 2 2 4 2 2 12 Bavchi 17 11 6 17 11 6 13 Bengali 2,150 1,273 877 157 92 65 1,993 1,181 812 14 Bhili / Bhilodi 30 19 11 5 4 1 25 15 10 15 Bhojpuri 146 113 33 146 113 33 16 Bihari 17 12 5 5 4 12 8 4 17 Braj Bhasha 9 6 3 9 6 3 18 Bundelkhandi 2 2 2 2
19 Ceylonese/Simelu/Singhale8e 1 1 1 , . 1 20 ·Chhari 90 50 40 90 150 40 21 Chinese I Chini 35 20' 15 _35- 20 15 22 Coorgi / Kodagu 15 I" 2 15 13 2 ,j
23 Dakani 4 1 3 4 1 3 , . 24 Dakshini 35 13 22 35 13 22 25 Deswali 11 6 5 11 6 5 26 Dogri 1 1 1 27 Dungari 87 77 10 87 77 10
28 English 1,011 581 430 34 20 14 917 561 416
29 French 5 5 j j
30 Garhwali 89 67 22 89 67 22 31 Garo 1 1 1 1 32 German 4 2 2 4 2 2 33 Goanese 198 118 80 2 1 1 196 117 79 34 Gorkhali/Nepali 1,614 1,111 503 174 134 40 1,440 977 463 35 Gujarati 2,328,259 1,227,020 1,101,239 942,851 488,659 454,192 1,385,408 738,361 647,047 36 GUl'mukhi 88 47 41 88 47 41
37 Hebrew I Jewish 15 9 6 15 9 IS 38 Hindi 159,364 102,948 56,416 5,455 3,513 1,942 153,909 99,435 34,474 39 Hindustani 143 88 55 6 5 1 137 83 64
40 Irani / Iranian 10 9 1 10 9 1 41 Islami 95 52 43 17 10 7 78 42 36
42 Jati / Jatu 1 1 1 1
43 Kachchhi p,276 650 626 237 121 116 1,039 529 510 44 Kannada 3,147 1,800 1,347 39 24 15 3,108 1,776 1,332 45 Kashmiri 46 24 22 46 24 22 46 Kathiyawadi 122 64 58 122 64 118 4.7 Khandeshi 5 3 2 is 3 2 48 Khasi 1 1 1 1 49 Khristee 2 2 1 1 1 ,. 1 50 Kokna/Kokni / Kukna 488 261 227 26 15 11. 462 246 lU6 51 Konda 2 2 2 2 62 Konkani 1,050 551 499 1,050 551 499 1)3 Koshti 90 47 43 90 47 411 64 Koshti-Marathi 76 38 38 76 38 18 55 Kotvali 5 3 2 5 II I 16 Kumauni 41 30 11 41 30 11
94
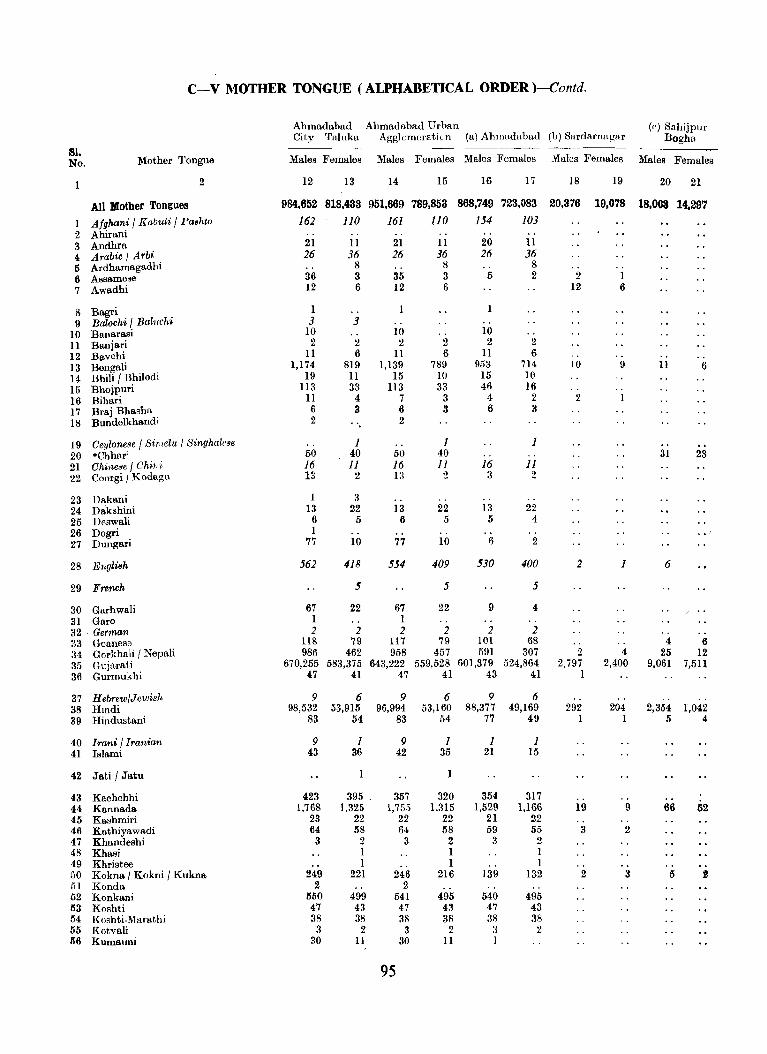
C-V MOmER TONGUE (ALPHABETICAL ORDER )-Contd.
Ahmadabad Ahmadabad Urban (e) Sahijpur City Taluka Agglomerati( n (a) Ahmadabad (b) Sardarnngar Bogha
81. ------ -----No. Mother Tongue Males Females Males Females Males Females Males Females Males Females
1 2 12 13 14 15 16 17 18 19 20 21
All Mother Tongues 984,652 818,433 951,669 789,853 868,749 723,083 20,376 19,078 18,003 14,297
1 Afghani I K abuli I Pashto 162 110 161 110 154 103 2 Ahirani 3 Andhra 21 II 21 II 20 11
4 Arabic I Arbi 26 36 26 36 26 36 5 Ardha.magadhi 8 8 8 6 Assa.mese 36 3 35 3 5 2 2 1 7 Awadhi 12 6 12 6 12 6
8 Bagri 1 1 9 Balochi I Baluchi 3 3
10 Bana.rasi 10 10 10 11 Banjari 2 2 2 2 2 2 12 Bavchi 11 6 11 6 II 6 13 Bengali 1,174 819 1,139 789 953 714 10 9 11 6 14 Bhili I Bhilodi 19 11 15 10 15 10 15 Bhojpuri ll3 3:{ 113 33 46 16 16 Bihari 11 4 7 3 4 2 2
17 Braj Bhasha 6 3 6 3 6 3 18 Bundelkha.ndi 2 2
19 Ceylonese I Si1delu I Singhalc8B 1 1 1 20 ·Chhari 50 40 50 40 31 23 21 Chinese I Chir,i 16 11 16 11 16 11 22 Coorgi I Kodagu 13 2 13 2 3 2
23 Dakani 1 3 24 Dakshini 13 22 13 22 13 22 25 Deswali 6 5 6 5 5 4 26 Dogri 1 .. 27 Dungari 77 10 77 10 6 2
28 Engluh 562 418 554 409 530 400 2 1 6
29 French 5 5 5
30 Garhwali 67 22 67 22 9 4 31 GarO 1 1 32 ' German 2 2 2 2 2 2 33 Goancse 118 79 117 79 101 68 4 6 34 Gorkhali I Nepali 986 462 958 457 591 307 2 4 25 12 35 Gujarati 670,255 583,375 643,222 559,528 601,379 524,864 2,797 2,400 9,061 7,511 36 Gurmukhi 47 41 47 41 43 41 1
37 Hebrew/Jewish 9 6 9 6 9 6 38 Hindi 98,532 53,915 96,994 53,160 88,377 49,169 292 204 2,354 1,042 39 Hindustani 83 54 83 54 77 49 1 1 5 4
40 Irani I Iranian 9 1 9 1 1 1 41 Islllmi 43 36 42 35 21 15
42 Jati I Jatu
43 Kachchhi 423 395 357 320 354 317 44 Kannada 1,768 1,325 1,755 1,315 1,529 1,166 19 9 66 52 45 Kashmiri 23 22 22 22 21 22 46 Kathiyawadi 64 58 64 58 59 55 3 2 47 Khandcshi 3 2 3 2 3 2 48 Khasi 1 1 1 49 Khristee 1 1 1 50 Kokna./ Kokni I Kukna 249 221 246 216 139 132 2 3 5 ! 51 Konda 2 2 52 Konka.ni 550 499 541 495 540 495 53 Koshti 47 43 47 43 47 43 54 Koshti·Marathi 38 38 38 38 :38 38 55 Kotvali 3 2 3 2 :3 2 56 Kumauni 30 II 30 II I
95
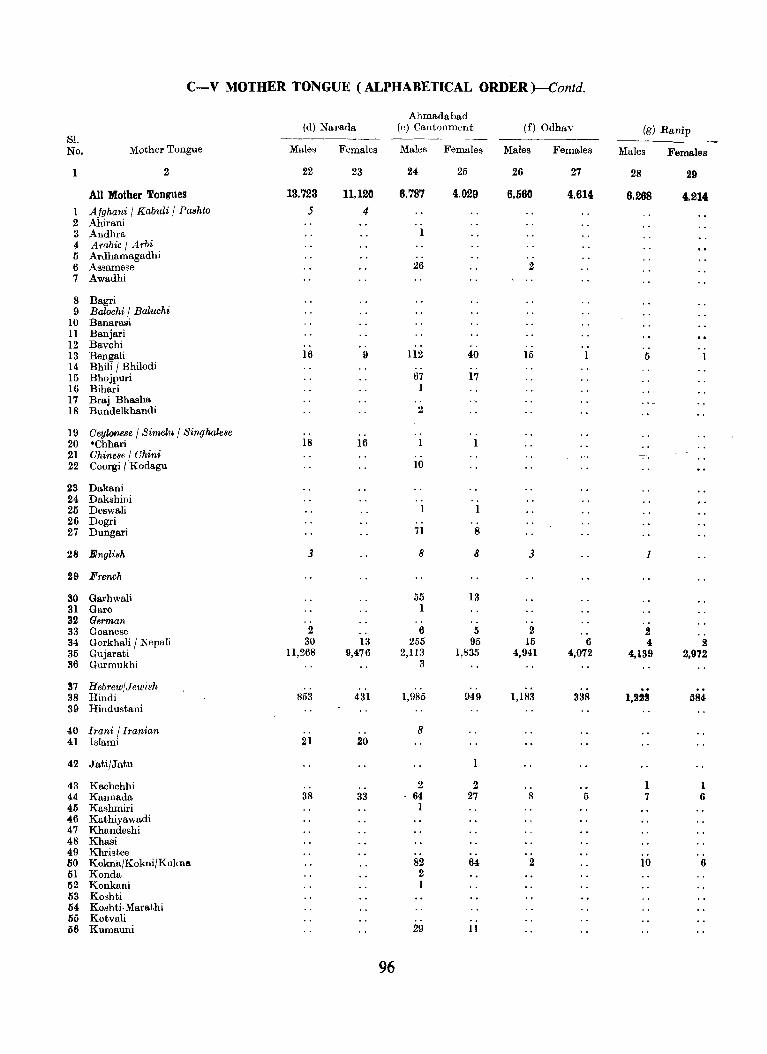
C-V MOTHER TONGUE (ALPHABETICAL ORDER }-Contd.
Ahmadabad (d) Narada (8) Cantonmont (f) Odhav (g) Eanip
81. -------- -----_--- ---------No. Mother Tongue Males Females Males Females Males Females Males Females
1 2 22 23 24 25 26 27 28 29
All Mother Tongues 13.723 11,120 6.787 4.029 6.1)60 4.614 6.268 4.214 Afghani / Kabuli / Pashio 5 4
2 Ahirani 3 Andhra 1 4 Arabic / Arbi 5 Ardhamagadhi 6 Assamese 26 2 7 Awadhi
8 Bagri 9 Balochi / Baluchi
10 Banarasi 11 Banjari 12 Bavchi 13 Bengali 16 9 ll2 40 16 5 14 Bhili / Bhilodi 15 Bhojpuri 67 17 16 Bihari I 17 Braj Bhasha 18 Bundelkhandi 2
19 Oeylonese / Simelu / Singhale8e 20 'Chhari 18 16 21 Ohinese / Ohini .. 22 Coorgi / Kodagu 10
23 Dakani 24 Dakshini 26 Deswali 1 26 Dogri 27 Dungari 71 8
28 Bnglish 3 8 8 3 1
29 French
30 Garhwali 55 13 31 Garo 1 32 German 33 Goanese 2 6 5 2 2 34 Gorkhali / Nepali 30 13 255 95 15 6 4 2 35 Gujarati 11,268 9,476 2,113 1,835 4,941 4,072 4,139 2,972 86 Gurmukhi 3
37 Hebrew/Jewish 38 Hindi 853 431 1,985 949 1,183 338 1,222 584 39 Hindustani
40 Irani /lranian 8 41 Islami 21 20
42 Jati/Jatu
43 Kachchhi 2 2 1 1 44 Kannada 38 33 64 27 8 5 7 6 45 Kashmiri 1 46 Kathiyawadi 47 Khandeshi 48 Khasi 49 Khristee 50 Kokna/Kokni/Kukna 82 64 2 10 6 51 Konda 2 52 Konkani 1 53 Koshti 54 Koshti·Marathi 55 Kotvali 56 Kumauni 29 II
96
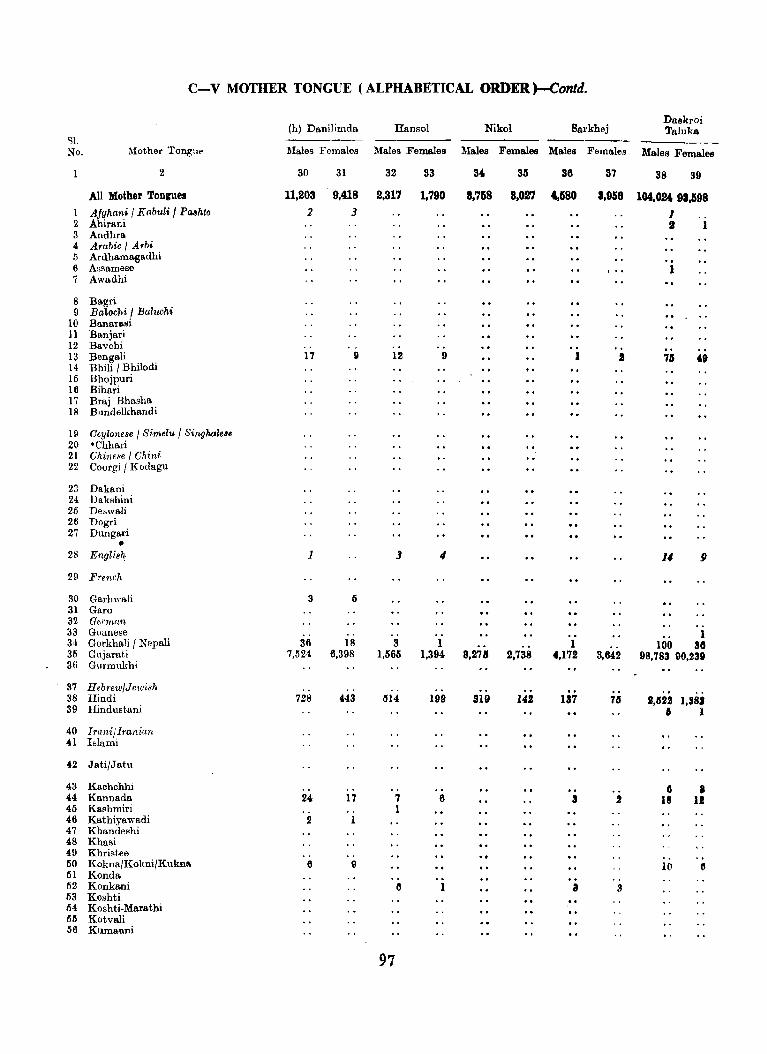
C-V MOTHER TONGUE (ALPHABETICAL ORDER )-Contd.
(h) Danilimda Ransol Nikol Daskroi
Sarkhej Taluka Sl. No. Mother Tongue Males Females Males Females Males Females Males Females Males Females
2 30 31 32 33 34 35 36 37 38 S9
All Mother Tongnes 11,203 9,418 2,311 1,190 8,158 8,021 t,580 8,958 104,024 98,598 I Afghani I Kobuli I Pcuhto 2 3 1 2 Ahirani a 1 3 Andhra. 4 Arabic I Arbi 5 Ardhamagadhi 6 Assamese \ .. 1 7 Awadhi
8 Bagri 9 Balochi I Baluchi
10 BanaTlJ,si 11 Baniari 12 Bavehi 13 Bengali 17 0 12 9 1 J 71S 49 14 Bhili I Bhilodi 15 Bhojpuri 16 Bihari 17 Braj Bhasha 18 Bundelkhandi
19 Ceylonese I Simclu I Singhale8' 20 ·ehhari 21 Chinese I Ghini 22 Coorgi I Kodagu
23 Dakani 24 Dakshini 25 Deswali 26 Dogri 27 Dungari
• 28 Engli8h J 3 4 11 9
29 French
30 Garhwali 3 5 31 Garo 32 Ge,rmrtn 33 Goanese 1 34 Gorkhali I Nepali 36 18 3 1 1 100 36 36 Gnjarati 7,524 6,398 1,565 1,394 8,271 2,738 4,172 3,642 98,783 90,230 36 Gurmukhi
37 HebrewfJewish 38 Hindi 728 443 IJl4 199 319 142 137 75 a,1I2% 1,382 39 Hindustani 6 1
40 Irani/Iranian 41 Islami
42 Jati/Jatu
43 Kachchhi 6 • 44 Kannada 24 17 7 6 II 2 18 11 45 Kashmiri 1 46 Kathiyawadi 2 1 47 Khandeshi 48 Khasi 49 Khristee 60 Kokna/I{okni/Kukna 6 9 10 6 51 Konda 52 Konkani 6 1 8 8 63 Koshti Il4 Koshti-Marathi 115 Kotvali 66 Kllmauni
97
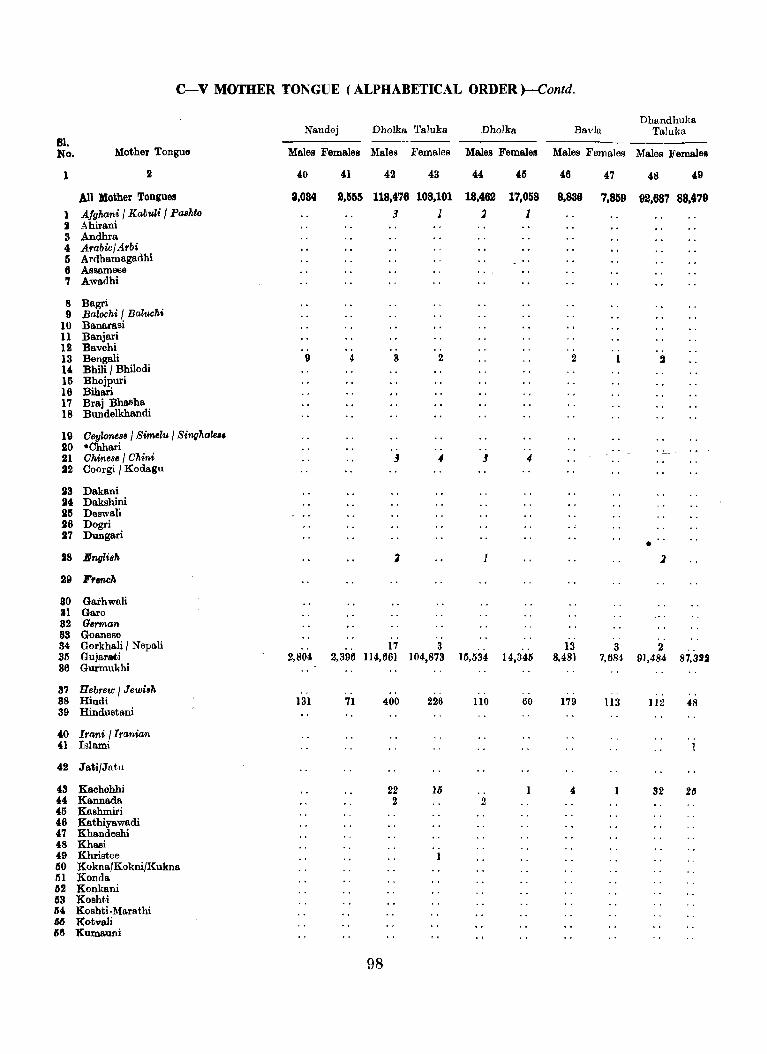
c-v MOTHER TONGUE (ALPHABETICAL ORDER )-Contd.
Dhandhuka Nandej Dholka Taluka Dholka Bavla, Taluka
Bl. No. Mother Tongue Males Females Males Females Males Females Males Females Males Females
1 2 40 41 42 43 44 45 46 47 48 49
All Mother Tongues a,034 2,1155 118,476 108,101 18,462 17,058 8,838 7,859 92,687 88,479 1 Afghani / Kabuli I Pa8hto 3 1 1 1 I Abirani 3 Andhra 4 Arabic/Arbi li Ardhamagadhi 6 Assameee 7 Awadhi
8 Bagri 9 Balochi I Balucht
10 Bana.rasi 11 Banjari 12 Bavchi 13 Bengali 9 4 S 2 2 2 14 Bhili / Bhilodi 15 Bbojpuri 16 Bihari 17 Braj Bhasha 18 Bundelkbandi
19 OeylofIC86 I Simelu / Sinl/hale" 20 • Cbhari .. 21 Ohine8e/ Ohini j 4 J 4 22 Coorgi / Kodagu
lI3 Dakani 24 Daksbini III! Deswali 26 Dogri lI7 Dungari
• 118 Engli8h :1 1 1
29 French
80 Ga.rhwali 31 Garo 82 a.man 83 Goanese 84 Gorkhali / Nepali .. 17 3 13 3 2 . . 35 Gujarati 2,804 2,396 114,661 104,873 15,534 14,345 8,481 7,684 91,484 87,aU 36 Gurmukhi
37 Hebrew / Jewish .. 38 Hindi 131 71 400 226 110 60 179 ll3 112 48 39 Hindustani
40 Irani / Iranian .. 41 Islami 1
42 Jati/Jatu
43 K80hchhi 22 15 " 32 2" 44 Kannada 2 2 45 Kashmiri 46 Kathiyawadi 47 Khandeshi 48 Khasi 49 Khristee 50 Kokna/Kokni/Kukna III Kondo, 52 Konkani 53 Koshti 54 Koshti -Marathi M Kotval! 68 Kumauni
98

c-v MOTHER TONGUE (AL}tHABETICAL ORDER )-Contd.
Sanand Dhandhuka Ranpur BarwBla Taluka Banand
----SI. Males Females Malee Females Males
No. ){other Tongue Females Males Females Males Females
2 60 51 52 53 54 55 56 57 68 G9
All Mother Tongues 9,526 8,920 4,631 4,648 4,888 4,827 59,079 54,208 9,949 9,088
1 Afghani I Kabuli / Paahlo 6 8
2 Ahirani 3 Andhra 4 Arabic I Arbi 6 Ardhamagadhi 6 Assamese 7 AwOOhi
8 Bagri 9 Balochi I Baluchi
10 Banarasi 11 Banjari 12 Bavchi 13 Bengali 14 Bhili I Bhilodi 16 Bhojpuri
" .. 16 Bibari
1 1 1
17 Braj Bhasha 18 Bundelkhandi
19 Oeylonese / Simelu I Singhalull 20 'Chhan 21 Ohinese I Onini 22 Coorgi / Kodacu
23 Dakani 24 Daksbini 25 Deswali 26 Dogri 27 Dungari
28 lCnql16h 1 1 2 1
29 P"tteh
30 Garhwali 31 Garo 32 German .. 33 Goanese 34 Gorkhali / Nepali
.. 1 .2 2 1 2
35 Gujarati 9,075 8,488 4,069 4,046 4,876 4,624 58,536 63,864 9,648 8,842
36 Gurmukhi ..
37 Hebrew I Jewi8h ..
98 Hindi 33 6 4 % 1 133 66 46 HI
39 Hindustani
40 I rani I Iranian 1 9 6 41 Islami
4i Jati/Jatu
43 Kachchhi
" Kanna.da 45 Kashmiri 46 Kathiyawadi 47 Khandeshi 48 Khasi 49 Khristee 50 Kokna/Kokni/Kukna III Konda 112 KonkaDi 53 KoBhti 64 Kosbti·Maratbi 116 Kotvali 56 Kumauni
99
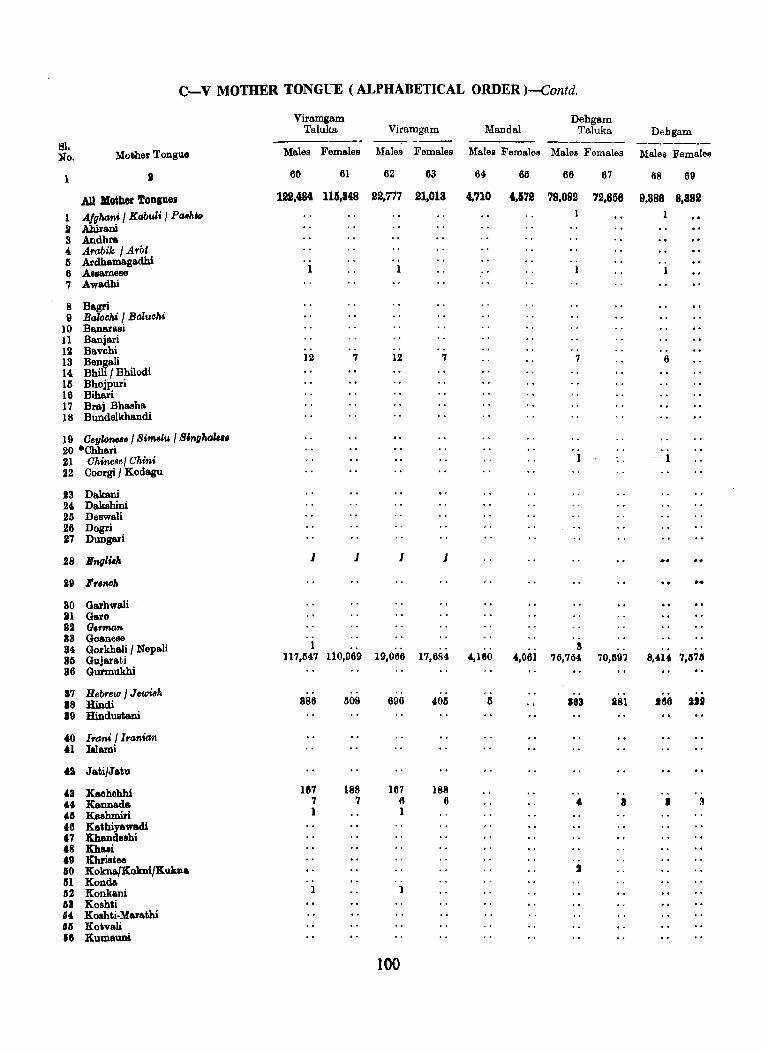
C-V MOTHER TONGUE (ALPHABETICAL ORDER )-Contd.
Viramgam Dehgam Taluka Viramgam Mandai Taluka Dehgam
81. ----.- --.. ---.-lTo. Mo,her Tongue Males Females Males Females Malei Females Males Females Males Females
I 60 61 62 63 64 65 66 67 68 69
All .000er 'loDlues 122,484 116,848 22,777 21,013 4,710 4.1172 78,082 72,856 9,888 8,882
1 Alghan'/ Kabul. I Pallhlo 1
2 Ahir&Di 3 Andhra
• Arabik / Arbl II Ardhamagadhi .. . . 6 Assamese 1 1 1
7 Awadhi
8 Bagri 9 Baloehi / Baluchi
10 Banarssi 11 Banjari 12 Bavchi
12 7 12 13 Bengali 7 7 6 14 Bhili / Bhilodi 111 Bhojpuri 16 Bihari 17 Braj Bhasha 18 Bundelkhandi
19 Oeylone,,/ Simelu / StngAalu. 20 *Chhari .. 21 Ohinese I Ohini 1 - 1
22 Coorgi / Kodagu
13 Dakani 24 Dakshini 25 Deswali 26 Dogri 27 Dungari
28 lIngliiA J J J J ... 29 '"noh -30 Garhwali 21 Garo 82 G.rman 83 Goanese .. .. 84 Gorkhali / Nepali 1 .. S .. 85 Gujarati 117,547 110,969 19,066 17,684 4,180 4,061 75,754 70,597 8,4014 7,57tJ 36 Gurmukhi
87 Hebrew / JeuMk .. 88 Hindi 886 !l08 61la 405 5 163 181 166 Illi 89 Hindustani
40 Irani /Iranian 41 Illami
'I Jati/Jatu
43 Kaohohhi 1117 188 1117 188 44 K8DIl&Iia 7 7 6 6 4 3 • 3
'" Kashmiri I 1
46 Kathiyawadi 47 Khandeshi 48 Kh8li '9 Khriltee .. 60 Kokna/Kolmi/Kulm. 1 In Konda 62 Konkani 1 1
III Koshti li4 Koshti·Ma.rathi 65 Kohali 16 Kumauni
100
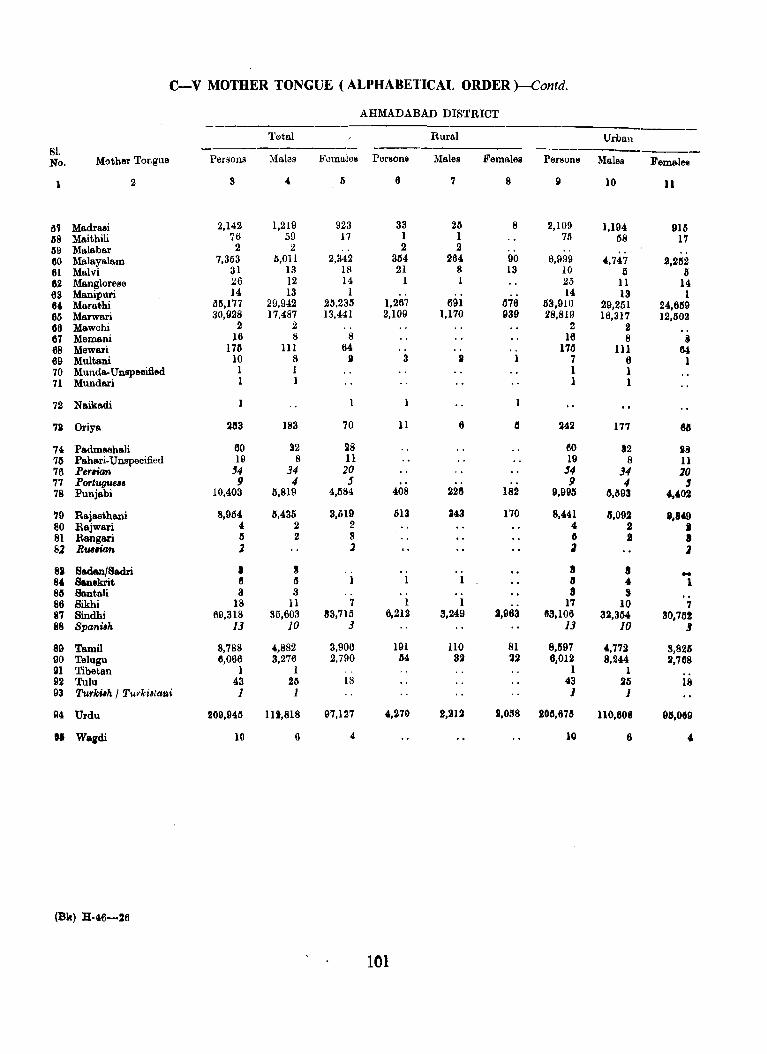
c-v MOTHER TONGUE (ALPHABETICAL ORDER )-Contd.
AHMADABAD DISTRICT
Tetal Rural Urban Sl. ---. ---___ o ___ • ___
No. Mother Tongue Persons Males Female!!! Persona :Nlalea Females Persons Males Femalea
1 2 S • 5 II 7 8 II 10 11
6'1 Madrasi 2,142 1,219 923 33 26 8 2,109 1,194 916 68 Maithili 76 59 17 I 1 75 68 17 119 Malabar 2 2 .. 2 2 . . . . 110 Malayalam 7,353 5,011 2,342 3M 2M 90 6,999 4,,747 2,262 61 Malvi 31 13 18 21 8 13 10 (I tl 82 Manglorese 26 12 14 1 1 25 11 14 63 Manipuri 14 13 1 14 13 1 64 Marabhi 55,177 29,942 25,235 1,267 691 1176 63,IHO 29,251 24,669 66 Marwari 30,928 17,487 13,441 2,109 1,170 939 28,811} 16,317 12,1102 Cl6 Mawohi 2 2 2 2 67 Memani 16 8 8 16 8 8 68 Mewari 175 111 64 176 HI 64 69 Multani 10 8 ~ 3 ~ 1 7 6 1 70 Munda. Unspecified 1 I 1 1 71 Mundari 1 1 1 1
72 N&ikadi 1
71 Oriya 233 183 70 11 6 II 242 177 611
74 Padmashali 60 32 28 eo 32 28 76 Pahari-Unspecified 19 8 11 19 8 11 76 Permn 54 34 20 54 34 10 77 Portuguue 9 4 5 9 4 , 78 Punjabi 10,403 1'1,819 4,584 408 226 182 9,995 3,1193 4,402
'19 Rajasthani 8,954 5,435 a,iB9 1113 143 170 8,441 3,092 ',"9 80 Rajwari 4. 2 2 4 2 I 81 Rangari 1I 2 8 I) J II 81 RWflan 1 1 1 1
81 Badan/Sadri I II .. 8 II -84, Sanekrit II 5 1 1 1 " 4. 1 811 Bantali 3 3 .. 8 S 86 8ikhi 18 11 7 1 1 17 10 7 87 Bindhi 69,318 35,603 33,715 6,212 3,249 2,963 113,106 32,354 30,75! 88 Spanilh 13 10 3 13 10 J
89 Tamil 8,788 .,882 3,906 191 no 81 8,1197 4,772 8,8211 90 Telugu 11,066 3,276 2,790 34 32 22 6,012 8,244 2,768 91 Tibetan 1 1 1 1 92 Tulu 43 25 18 43 25 18 93 Turkilh I T1u'ki8ta»i 1 1 1 1
A4 Urdu 209,945 112,818 97,127 ',270 1,212 11,0118 203,6711 110,608 911,069
II Waidi 10 6 4, 10 6 ,
(Bk) H-46-26
101
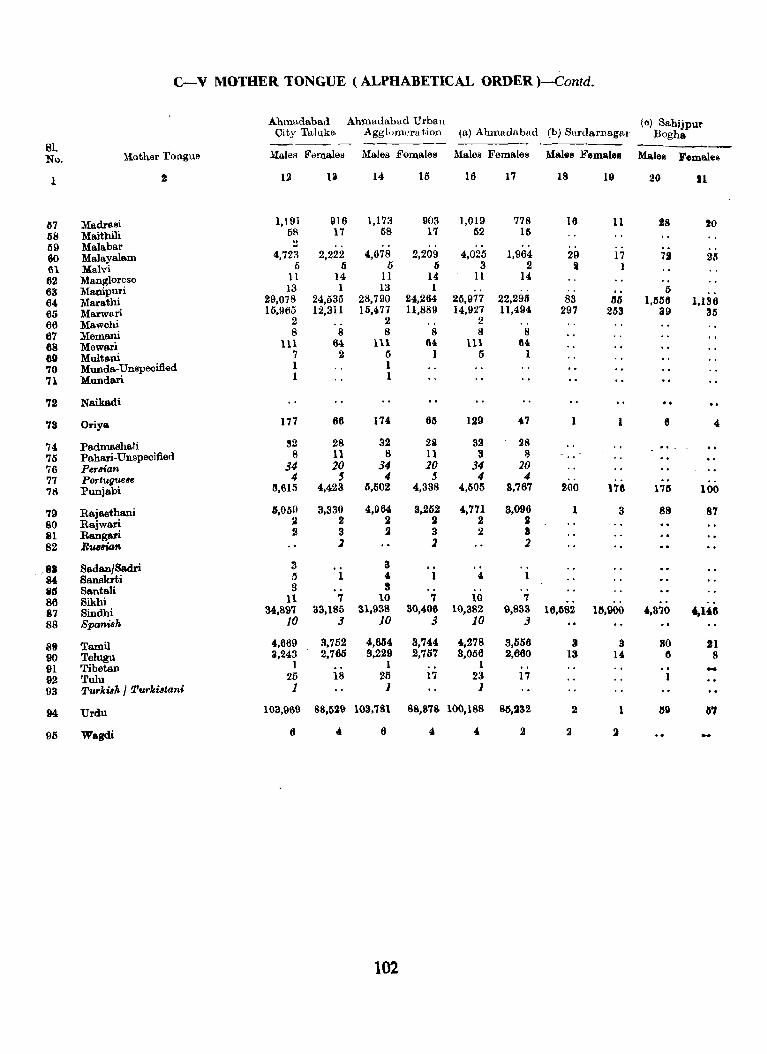
c-v MOTHER TONGUE (ALPHABETICAL ORDER )-Contd.
Ahmadabad Ahmadabad Urban (0) Sahijpur City Talllka Agglumera tion (a) Ahmadabad (b) Sardarnagar Bogha
81. -------No. Mother Tongue Males Females )Iales Females Males Females Males Females Ma.les Females
1 2 12 13 14 15 16 17 18 19 20 n
l'I7 Madrasi 1,191 916 1,173 903 1,019 778 16 11 i8 20 68 Maithili 68 17 58 17 52 liS 69 Malabar 2
60 Malayalam 4,723 2,222 4,678 2,209 4,025 1,964 29 17 71 211 61 Malvi 5 5 5 5 3 2 II 1 62 Manglorese 11 14 11 14 II 14
63 Manipuri }3 1 13 1 I)
64 Marathi 29,078 24,535 28,790 24,264 26,977 22,295 83 lI5 I,IIM 1,136 65 Marwari 15,965 12,311 15,477 11,889 14,927 11,494 291 263 39 35 66 Mawchi 2 2 2
67 Memani 8 8 8 8 8 8
68 Mewari III 64 III 64- 111 64
60 Mult&ni 7 2 (j 1 5 1
70 Munda-Unspeoifted 1 1 71 Mundari 1 1
72 Naikadi
73 Oriya 177 66 174 611 129 4.7 1 1 II 4,
74 PadmtLshali 32 28 32 29 32 28
75 Pahari-Unspecified 8 11 8 11 3 8
76 PerMan 34 20 34 10 34 20 77 Portug'Ull8fJ 4 , 4 , 4 4 78 Punjebi ll,615 4,423 5,502 4,338 4,605 3,767 200 176 17lJ 100
79 Rajasthani 6,059 3,330 4,964 3,252 4,771 3,096 1 3 88 87 SO Raiwari 2 2 2 2 2 2 Sl Rangari 2 3 2 3 2 a 82 BU8Man 2 2 2
.88 Sadan/Sadri 3 a 84 Sanskrti II .. 4
i3 Santali 3 S
86 Sikhi 11 7 10 7 10 7
87 Sindhi 34,897 33,185 . 31,938 30,406 1(),382 9,833 16,582 11S,900 4,870 '-148 88 Spanish 10 3 10 3 10 3
89 Tamil 4,669 3,752 4,654 3,744 4,278 3,556 8 3 80 21 90 Telugu 3,243 2,765 9,229 2,757 8,066 2,660 13 14 ., 8 91 Tibetan 1 1 1
92 Tulu 25 18 25 17 23 17 -93 Turkish / Turkiatani 1 1 1
94 Urdu 103,969 88,629 103,781 88,878 10O,lS8 81S,232 2 1St 37
95 Wagdi 6 .. 6 .. 4 2 2 2
102
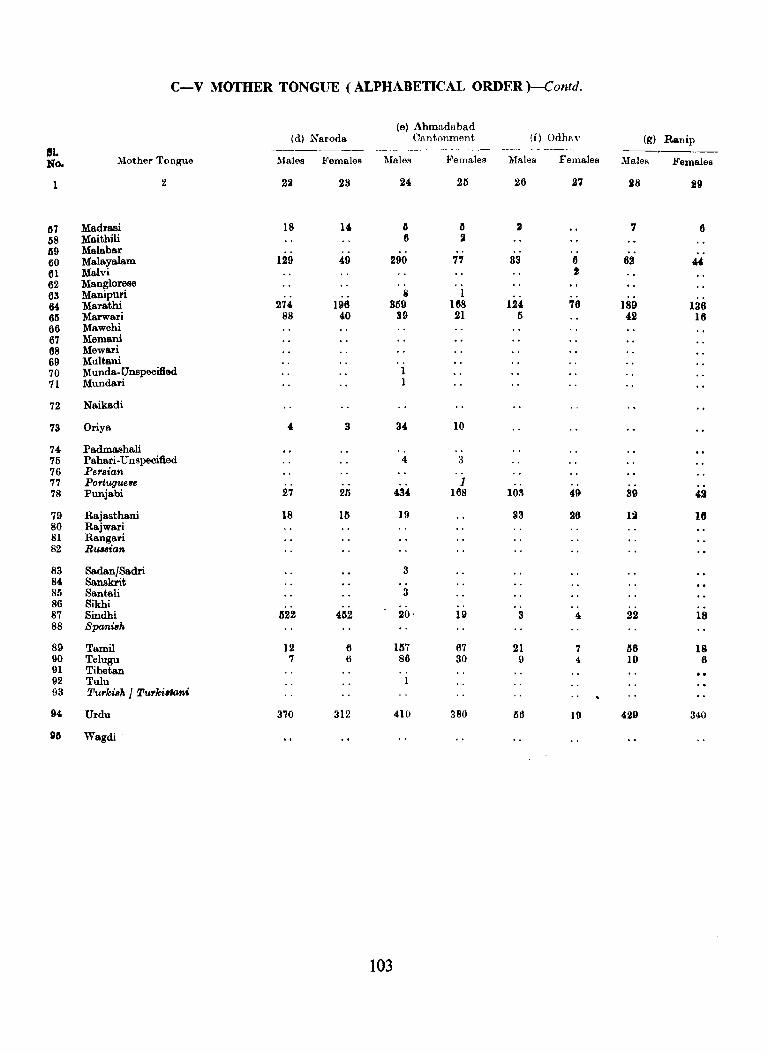
C-V MOTHER TONGUE (ALPHABETICAl, ORDER )-Contd.
(e) Ahmadabad (d) Naroda Cant.onment (f) Odhov (g) Ranip
81. -------- ----------- --------- -- ---.-_ .. _-No. Mother Tongue )Jalt's FemlLles ;\Iales Females :Males Females Males Females
1 2 2~ 28 24 26 26 27 liS 29
1S7 Madrasi 18 16 II IS 2 7 6 li8 Maithili 6 ~
59 Malabar 60 Malayalam 129 49 290 7' 83 II 62 ,4, 61 Malvi ! 62 MangioresB 63 Manipuri Ii 1 64 Msrathi 274 196 359 168 124 76 189 136 65 Msrwari 88 40 89 21 5 42 16 66 Mawchi 67 Memani 68 Mewari 69 Multani 70 Munds-Unspecified 1 71 Mundari 1
72 Nsikadi
73 Oriya 4, 3 34 10
74 Padrnashali 75 Pahari· Unspecified 4 3 76 Persian 77 Portuguese 1 78 Punjabi 27 25 434 168 103 49 39 42
79 Rajssthani 18 lIi 19 33 26 1~ 16 80 Rajwari 81 Rangari 82 llus8ian
83 Sadan/Sadri 3 84 Sanskrit 85 Santali 3 86 Sikhi 87 Sindhi 1S22 452 20· 19 3 4 22 18 88 SpaniBh
89 Tamil 12 6 1157 67 21 7 116 18 90 Telugu 7 6 86 30 9 4 19 6 91 Tibetan 92 Tulu 93 TurkiBh / Turki.kmi
94 Urdu 370 312 410 380 56 19 429 340
911 Wagdi
103
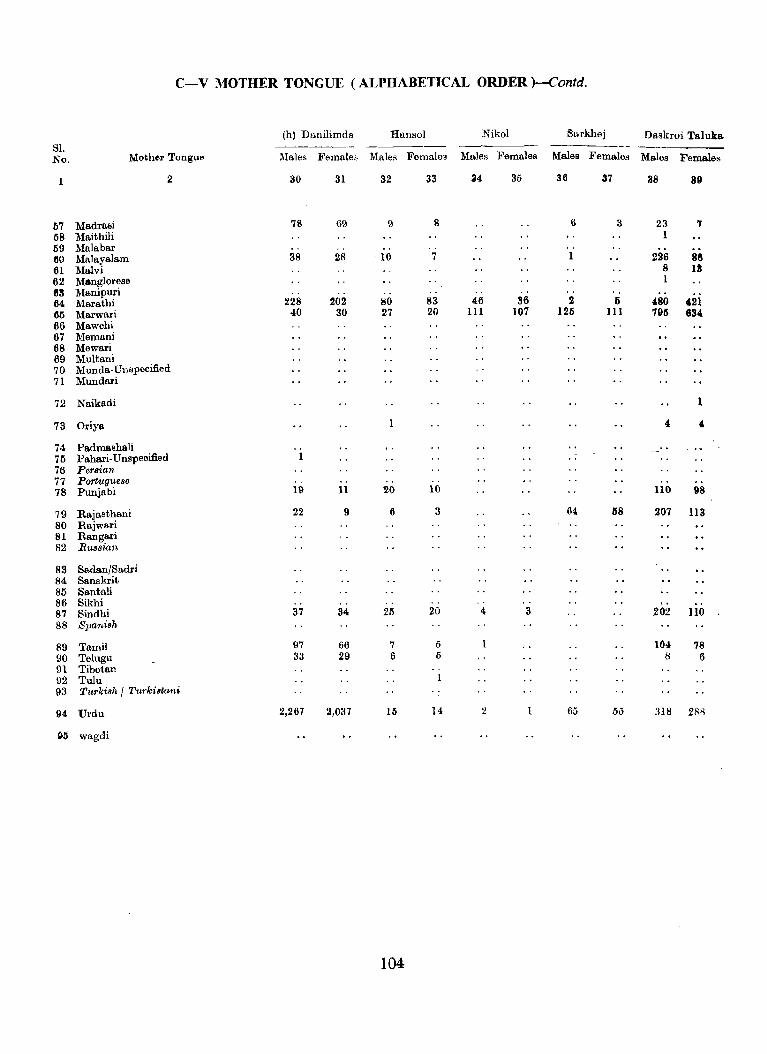
c-V ~10THER TONGUE (ALPHABETICAL ORDER )-Contd.
(h) Danilimdll Ransol Nikol Sarkhej Daskroi Taluks. 81. ---_----No. Mother Tongue Males Females Males Female3 Males Females Males Females Males Females
2 30 31 32 33 34 35 36 37 38 39
67 Madrasi 78 69 9 8 6 3 23 'I 1i8 Maithili 1 1i9 Malabar 110 Malayalam 38 28 10 7 1 2.26 86 61 Malvi 8 It 62 Manglorese 1
fl3 Manipuri 64 Marathi 228 202 80 83 46 86 2 Ii 480 4.21 115 Marwari 40 30 27 20 III 107 125 111 796 634 66 Mawchi 67 Memani 68 Mewari 69 Multani 70 Munda· Unspecified 71 Mundari
72 Ns.ikadi 1
73 Oriya 4 4-
74 Padmashali 71i Pahari· Unspecified -.. 76 Per8ian 77 Portugue8e 78 Punjabi 19 11 20 10 110 98
79 Rajasthani 22 9 6 3 64 58 207 113 80 Rajwari 81 Rangari 82 Russian
83 Sadan/Sadri 84 Sanskrit 85 Santali 86 Sikhi 87 Sindhi 37 34 25 20 4 3 202 110 88 Spanish
89 Tamil 97 66 7 5 104 78 90 Telugu 33 29 6 {) 8 6 91 Tibetan 92 Tulu 93 Turki.,h / Turkilltan,
94 Urdu 2,267 2,037 16 14 2 65 55 318 2S8
95 wagdi
104
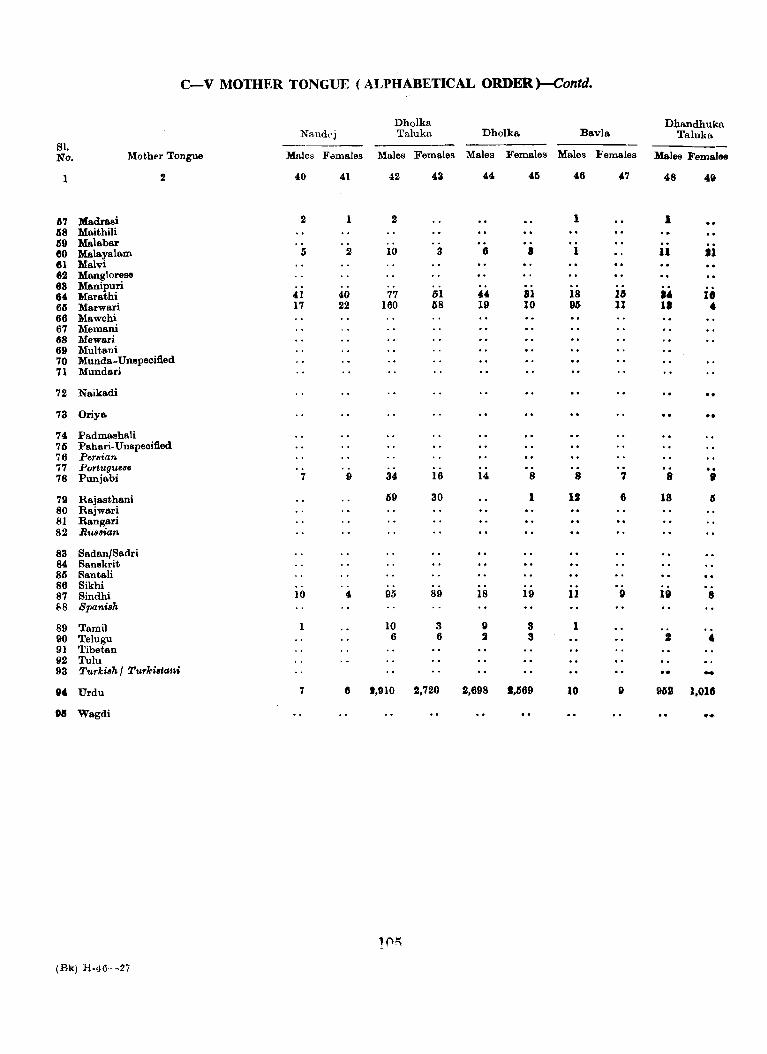
C-V MOTHER TONGUE (ALPHABETICAL ORDER)-Contd.
Dholka Dhandhuka NandPj Taluka Dholka Bavla Taluka
S1. -------No. Mother Tongue Males Females Males Females Males Females Males Females Males F'emales
1 2 40 41 42 43 44 45 46 47 48 49
67 Madrasi 2 1 2 1 1 118 Maithili 119 Malabar 80 Malayalam 15 2 10 3 6 • 1 11 II 81 Malvi 82 Manglorese 83 Manipuri 64 Marathi 41 40 77 61 44 81 18 III " Ie 65 Marwari 17 22 160 68 19 10 95 11 11 4 66 Mawchi 67 Memani 68 Mewari 69 Multani 70 Munds-Unspecified 71 Mundari
72 Naikadi
73 Oriya .. 74 Padmashali 76 Pahari· Unspecified 76 Persian 77 Portuguese 78 Punjabi 7 9 34 16 14 8 8 7 8 t
79 Rajasthani 611 30 1 12 6 18 II 80 Rajwari 81 Rangari 82 Bus8ian
83 Sadan/Sadri 84 Sanskrit 85 Santali 86 Sikhi 87 Sindhi 10 4 95 89 18 19 11 0 19 8 88 Spani8h
89 Tamil 1 10 3 Il S 1 90 Telugu 6 6 2 3 2 4 91 Tibetan 92 Tulu 93 Turkish, Turki,tant
04 Urdu 7 6 1,910 2,720 2,698 .,1169 10 " 962 1,018
tIS Wagdi ....
(Bk) H·46--27
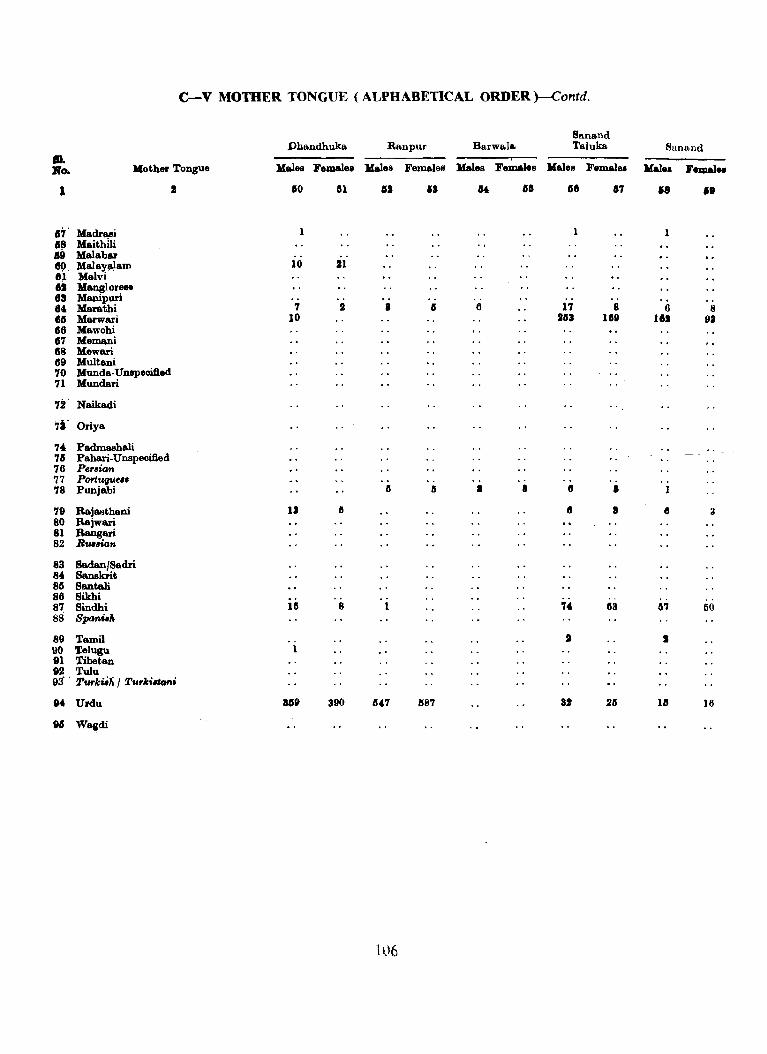
c-v MornER TONGUE (ALPHABETICAL ORDER )-Contd.
Banand Dhandhuka Ranpur Ba,rwaJa Taluka Sanand ...
JIlo. Mother Tongue Males Female. lIales Females :t.Iales Females Kales Female. Kal •• J'ema!e.
1 I 110 III CS2 IS " III Ie 67 18 '9
a'" Madrui a~ Maithili a, Malabar 89. Malayl'Jam 10 21 8,1 Malvi es Manglore •• 6S Manipuri 64 Maratbi 'I 2 • II 6 17 8 6 8 Gil Marwari 10 2113 11111 leJ 91 66 Mawobi 67 Memani 88 Mewari 89 Multani '10 Munda· Unspecified '1l Mundari
'12" Naikadi
7. Oriya
U Padmasbali 'III Pabari· Unspecified 76 Per8ian 77 PortugtIUe 78 Punjabi II II • I 6 • 'I' Rajastbani 1J II 6 I 6 :I 80 Rajwari 81 Rangari 82 Bwrian
83 Badan/Sadri 84 Sanskrit 85 Santali 86 Sikbi 87 Sindhi 111 8 1 'I' ISS 11'1 50 88 SpanN'"
89 Tamil J J 90 Telugu 1 91 Tibetan 92 Tulu 9:1" Turkiili I Turk'81on;
'4 Urdu aall 390 11,7 1587 S! 211 UI 16
'" Wagdi
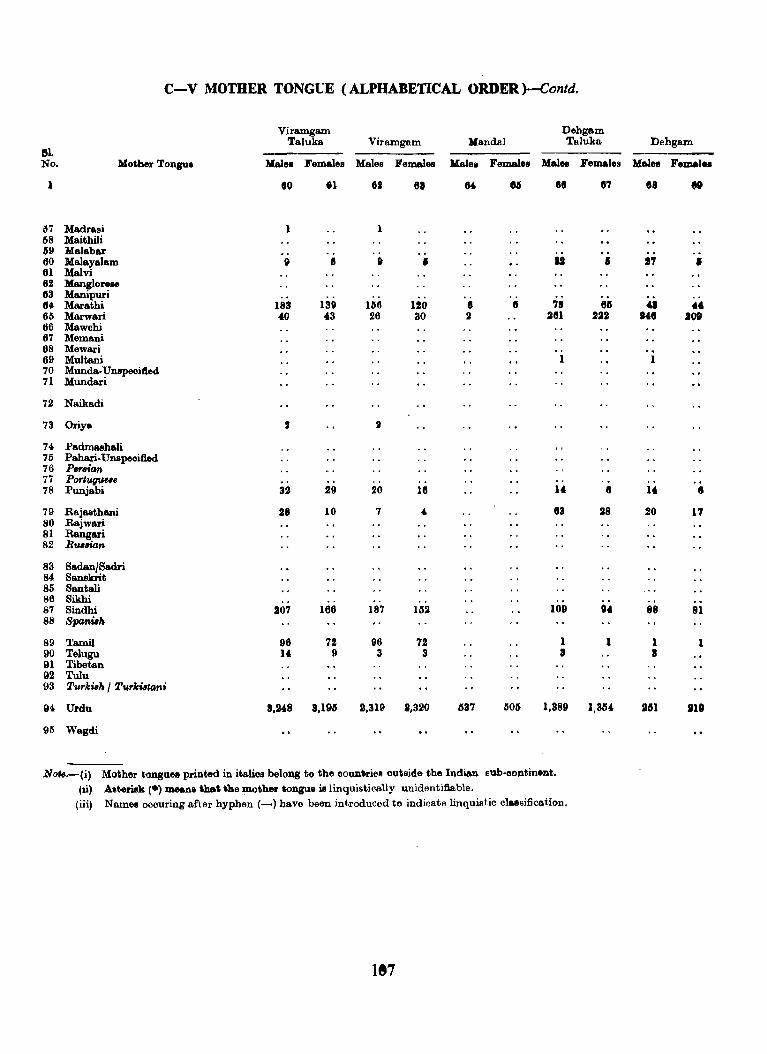
C-V MornER TONGUE (ALPHABETICAL ORDER )-Contd.
Yiramgam Dehgam Taluka Yiramgam Kandal Taluka Dehgam
SI. No. Mother Tonpe Male. Females Males Females Males Females Males Females Malee Femal ..
1 00 .1 62 6. 0. 86 80 07 68 " 37 Madrasi 1 1 68 Maithili 69 Malabar 60 Malayalam " 3 0 • U • .7 • 61 Malvi 62 Manglor ... 83 Manipuri 114 Marathi 183 139 1M 120 8 6 7. 68 41 ., 65 Marwari 40 43 26 30 2 261 222 1411 lOt 66 Mawchi 67 Memani 68 Mewari 69 Multani 1 1 70 Munda.UnspeciAed 71 Mundari
72 Naikadi
73 Oriya 2 2
74 Padmashali 75 Paharl· Unspeoified 76 Persian 77 PonuguuB 78 Punjabi 3J 29 20 18 l' fI 14 • 79 Rajasthani 28 10 7 4 83 28 20 1'7 80 Rajwari 81 Rangari 82 BWMn
83 Sadan/Sadri 84 Sanskrit 85 Santali 86 Sikhi 87 Sindhi 207 166 187 152 109 04 88 81 88 Spanwh
89 Tamil 96 72 96 72 1 1 1 1 90 Telugu U 9 3 3 3 I 91 Tibetan 92 Tulu 93 Turkuh I Turkwlant
94 Urdu .,248 3,198 2,319 8,320 lSS7 11011 1,389 1,354- 2111 Jilt
95 Wagcii
NON.-(i) Mother tongllell printed in italios belong to the oountriel! outside the Indian BUb,oolltinent.
In) ABterillk (.) IDMna that the mother tongue islinquistically unidentifiable.
(iii) Names occuring after hyphen (-) have been introduced to indicate linquistic classification.
187
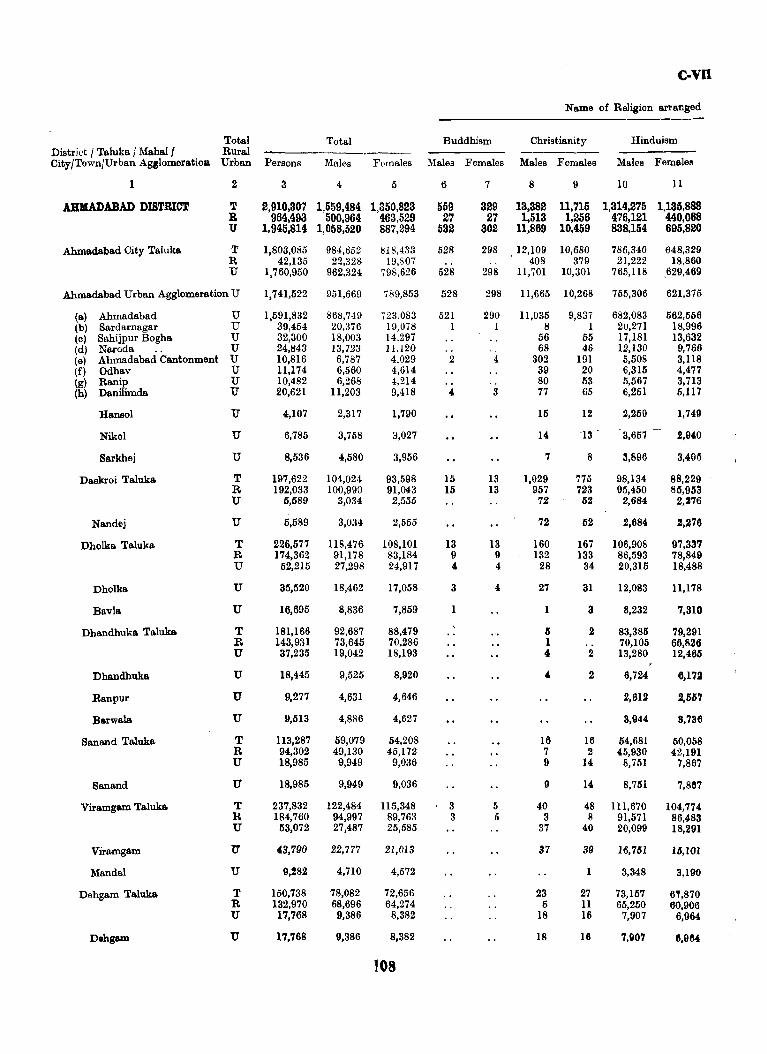
c-vn
Name of Religion arranged
Total Total Buddhism Christianity Hinduism District I Taluka / MahaI I Rural .---City/Town/Urban AgslomeratioB Urban Persons Males Females Males Females Males Females Males Females
1 2 3 4 5 6 7 8 9 10 11
AHMADABAD DISTRICT T 2,910,307 1,559,484 1,350,823 559 329 13,382 11,715 1,314,275 1,135,888 R 964,493 500,964 463,529 27 27 1,513 1,256 476,121 440,068 U 1,945,814 1,058,520 887,294 532 302 11,869 10,459 838,154 695,820
Ahmadabad City Talulta. T 1,803,085 984,652 818,433 528 298 . 12,109 10,680 786,340 648,329 R 42,135 22,328 19,807 .. · . 408 379 21,222 18,860 U 1,760,950 962,324 798,626 528 298 11,701 10,301 765,118 ,629,469
Ahmadabad Urban Agglomeration U 1,741,522 951,669 789,853 528 298 11,665 10,268 755,306 621,375
(a) Ahmadabad U 1,591,832 868,749 723,083 521 290 11,035 9,837 682,083 562,556 (b) Sardarnagar U 39,454 20,376 19,078 1 1 8 1 20,271 18,996 (e) Sahijpur Bogha. U 32,300 18,003 14.297 56 55 17,181 13,632 (d) Naroda .. U 24,843 13,723 11.120 . . · . 68 46 12,130 9,766 (e) Ahmadabad Cantonment U 10,816 6,787 4.029 2 4 302 191 5,508 3,118 (f) Odhav U 11,174 6,560 4,614 39 20 6,315 4,477 (g) Ranip U 10,482 6,268 4,214 · . 80 53 5,567 3,713 (b) DaniIimda U 20,621 11,203 9,418 4 3 77 65 6,251 6,117
Hansol U 4,107 2,317 1,790 16 12 2,259 1,749
Nikol U 6,785 3,758 3,027 14 "13 3,657 2,940
Sarkhej U 8,536 4,580 3,956 7 8 3,896 3,405
Da.akroi Taluka T 197,622 104,024 93,598 15 13 1,029 775 98,134 88,229 R 192,033 100,990 91,043 15 13 957 723 95,450 85,953 U 5,589 3,034 2,555 72 52 2,684 2,276
Nandej U 5,689 3,034 2,555 72 52 2,684 2,276
Dholka Taluka T 226,577 118,476 108,101 13 13 160 167 106,908 97,337 R 174,362 91,178 83,184 9 9 132 133 86,593 78,849 U 52,215 27,298 24,917 4 4 28 34 20,315 18,488
Dholka U 35,520 18,462 17,058 3 4 27 31 12,083 11,178
Bavla U 16,695 8,836 7,859 3 8,232 7,310
Dbandhuka Taluka T 181,166 92,687 88,479 5 2 83,385 79,291 R 143,931 73,645 70,286 1 .. 70,105 66,826 U 37,235 19,042 18,193 4 2 13,280 12,465
Dhandhuka U 18,445 9,525 8,920 4 2 6,724 6,172
Ranpur U 9,277 4,631 4,646 2,612 2,557
Barwala U 9,513 4,886 4,627 3,944 8,736
Sanand Taluka T 113,287 59,079 54,208 16 16 54,681 50,058 R 94,302 49,130 45,172 7 2 45,930 42,191 U 18,985 9,949 9,036 9 14 8,751 7,867
Sanand U 18,985 9,949 9,036 9 a 8,751 7,867
Viramgam Taluka T 237,832 122,484 115,348 3 5 40 48 111,670 104,774 R 184,760 94.997 89,763 3 5 3 8 91,671 86,483 U 63,072 27,487 25,585 37 40 20,099 18,291
Viramgam U' 43,790 22,777 21,013 37 39 16,761 16,101
MandaI U 9,282 4,710 4,572 3,348 3,190
Debgam Tllluka T 150,738 78,082 72,656 23 27 73,157 6',870 R 132,970 68,696 64,274 6 11 65,250 60,906 U 17,768 9,386 8,382 18 16 7,907 6,964
Dehgam U 17,768 9,386 8,382 18 16 7,907 6,964
108
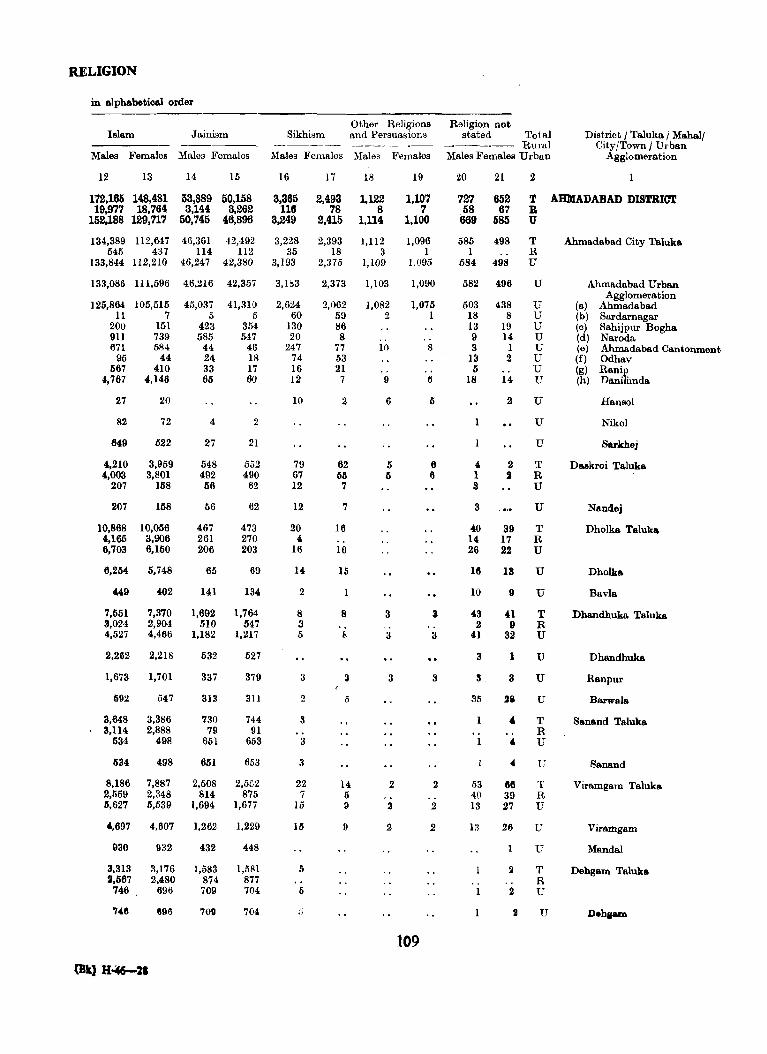
RELIGION
in alphabetical order
Islam Jainism
Males Females Males Females
12 13 14 15
172,165 148,481 53,889 50,158 19,977 18,764 3,144 3,262
152,188 129,717 50,745 46,896
134,389 112,647 46,361 42,492 545 437 114 112
133.844 112,210 46,247 42,380
133.086 111,596
125,864 11
200 911 671
95 667
4,767
27
82
649
4,210 4,003
207
207
10,868 4,165 6,703
6.254
449
7,561 3,024 4,527
105,515 7
151 739 584
44 410
4,146
20
72
522
3,959 3,801
158
158
10,056 3,906 6.150
5,748
402
7,370 2,904 4,466
2,262 2,218
1,673 1.701
592
3,648 3.114
534
634
8,186 2,559 5,627
',697
!l30
3,313 :1.567
746
'146
547
3,386 2,888
498
498
7,887 2,348 5,539
4,607
932
3,176 2,480
690
696
(Btl H~2'
46,216
45,037 5
423 585
44 24 33 65
4
27
548 492 56
06
467 261 206
65
141
42,357
41,310 5
354 547
46 18 17 60
2
21
552 490
62
62
473 270 203
69
134
1,692 1,764 510 547
1,182 1,217
532
337
313
730 79
651
651
2,508 814
1,694
1,262
432
1,583 874 709
700
527
379
311
744 91
653
653
2,562 875
1,677
1,229
448
1,581 877 704
704
Other Religions Sikhism and Persuasions
Males Females :\lale8 Females
16
3,365 1111
3,249
3,228 35
3,193
3,11}3
2,624 60
130 20
247 74 16 12
10
79 67 12
12
20 4
16
a
2
8 3 5
3
2
:I
3
3
22 7
15
15
5
5
Ii
2,493 78
2,415
2,393 18
2,375
2,373
2,062 59 86 8
77 53 21
7
2
62 65 7
7
16
16
15
8
8
3
14 5 9
9
18
1,122 8
1,114
1,112 3
1,109
1,103
1,082 2
"" 10
9
6
5 6
3 " " 3
3
2
.3
2
19
1,107 7
1,100
1,096 1
1,095
1,090
1,075 1
109
8
6
Ii
6 II
3
3
3
2
2
2
Religion not stated Total
~---.-- Rural Males Females Urban
20 21 2
District / Taluka j Mahal/ City/Town / Urban
Agglomeration
727 58
669
652 67
685
T AHMADABAD DISTRICT B U
585 498 T R U
1 584 498
582
503 18 13 9 3
13 5
18
4 1 3
3
40 14 26
16
10
43 2
41
3
3
35
53 40 13
13
-:l96
438 8
19 14
1 2
14
2
2 2
39 17 22
111
9
41 9
32
1
3
66 39 27
26
U
U U U U U U U U
U
U
U
T R U
U
T R U
U
U
T R U
U
U
U
T R U
U
T R U
U
U
II T R
2 U
II U
Ahmadabad City Taluka
Ahmadabad Urban Agglomeration
(a) Ahmadabad (b) Sardarnagar (c) Sahijpur Bogha (d) Naroda. (e) Ahmadabad Cantonment (f) Odhav (g) Ranip (h) Danilimda
Hansol
Nikol
Sarkhej
D&!lkroi Taluka
Nandej
Dholka. Taluka
Dholka
Bavla.
Dhandhuka Taluka
Dhandhuka
Ranpur
Barwala
Sanand Taluka
Sanand
Viramgam Taluka
Viramgam
MandaI
Dehgam TaInka
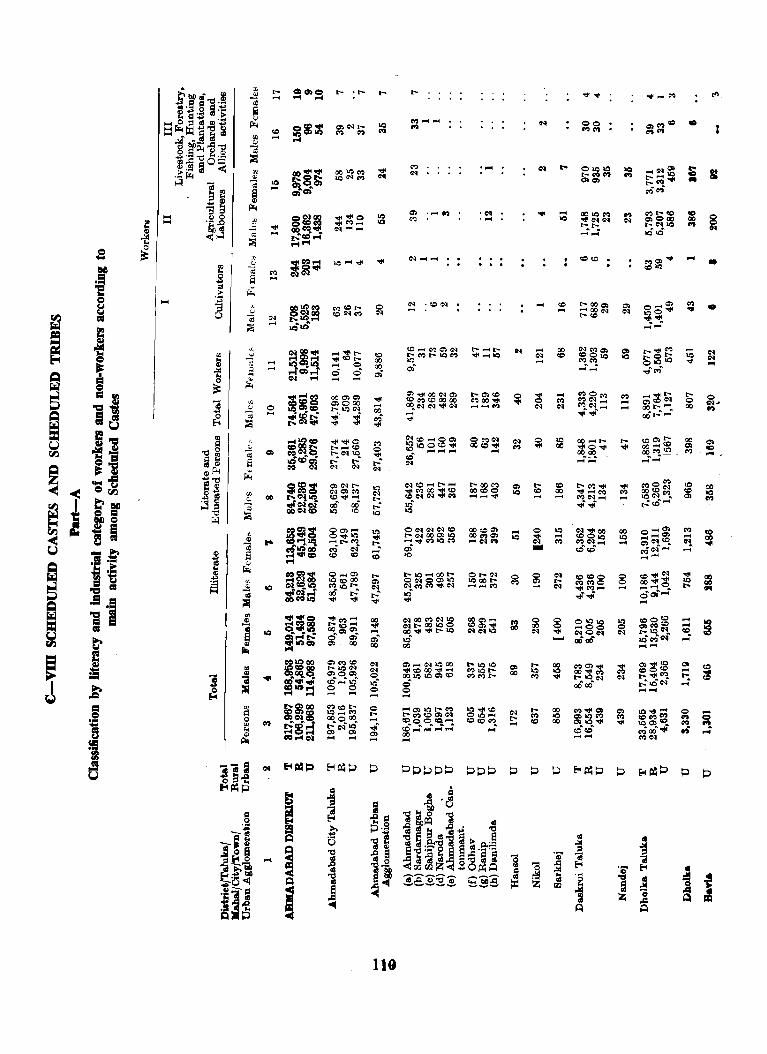
.... ....
o ....
co
...
.~ o
j 119
M ..... ~
t-COM coeoo ........ "'"
o "'"
teo ....
o :; -o 00 ~
rIO M
eo ....
00 eo
10 ao
eo 00 ....
10 .... M
g "'"
00 10
"'"
00 10 00
00 10 ....
g ....
•
to .. c co ..,
•
•
Q> C) ...
01) co Oil
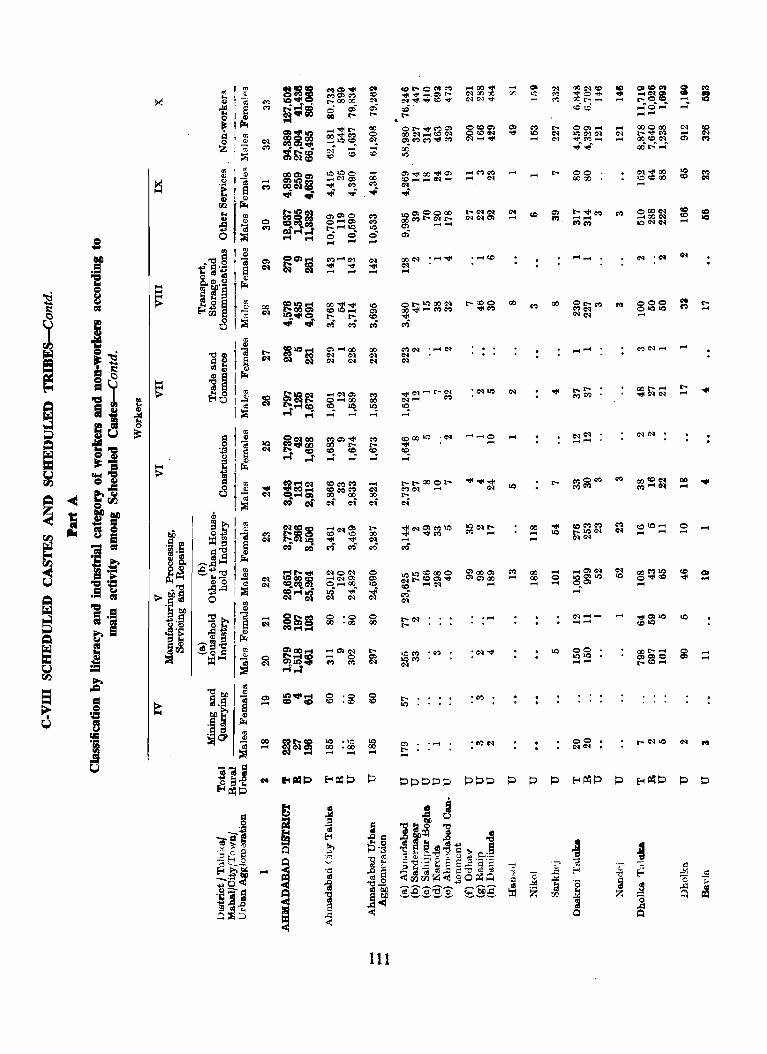
I
I I
~"'<ojI ~ 00 .,. .,. CO CO ~ 1""'4'" .... ;' 1""'4
o '0 0 00 '00 00
III
00 .... 0 ... "" ~"'!t~_~r:-.. "."",«j<<:C'oI'
,Ji .,. 0.,...,.""'" C()~-tc:oe-::t
"'''''''''..,.'''' £ It")
.,. IQ
'" ..... .,. ....
.....
:~
00
"" ....
"" IQ ....
....
00 .... ....
00 00 ....
'" l')
.... o ....
.......
........
<:<I ........ .........
00 IQIQ ........
.... <:<I ....
000 OIQIQ ....
.,. ....
00 ...
o .... ....
CIt ....
... ....
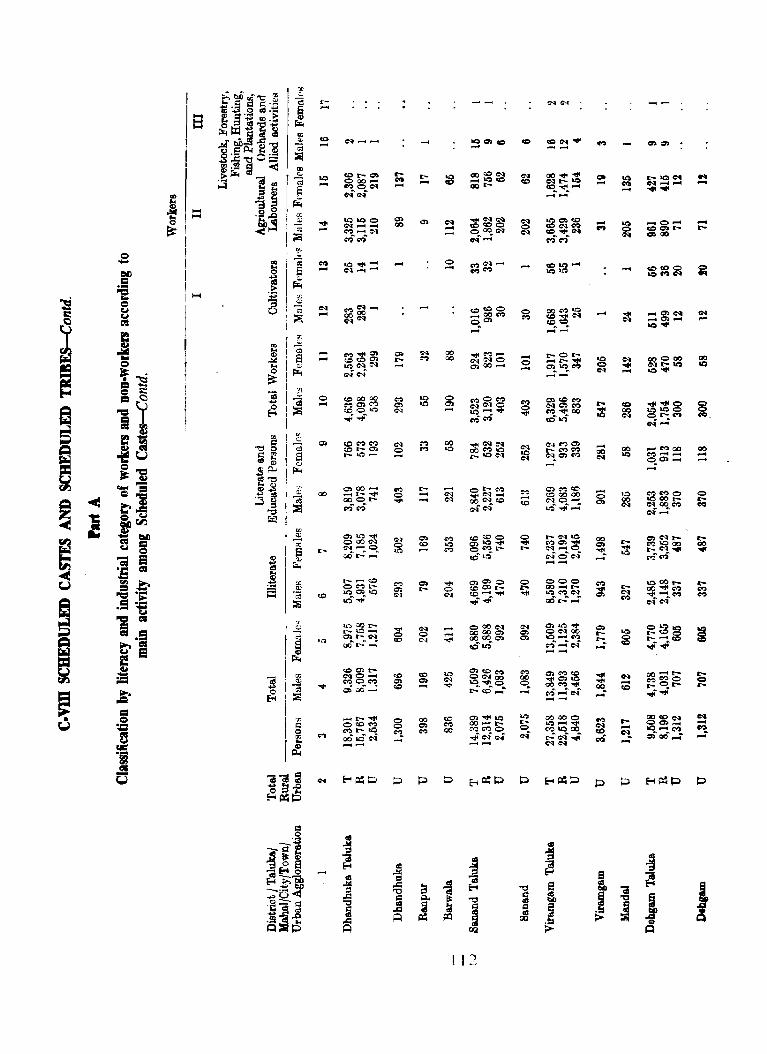
... ..
I
Is I
~ I:: ... I
~I I !
I I~ I r I
I
<0 -
"'" -.., .....
.... ....
c .....
00
-
~- .....
u-:>OOt<-l!;) ..... 0> t- <N oo .. r.-... ,--:
<00> t~O_
MO~ a; 00 .. ......:
...... <- "'" C<o"'" "",t-1O oO.o~ ...........
p
t-
M ...,
t..... ....
0> CO -
c .....
00 CO
g -CI.) 10
co "'" 00
o>"<tIlO 00"'" troMC ..i'~c:i ..........
1 l2
....
..... 00 eN
.... o 0>
~ ....
-t-
00 ---
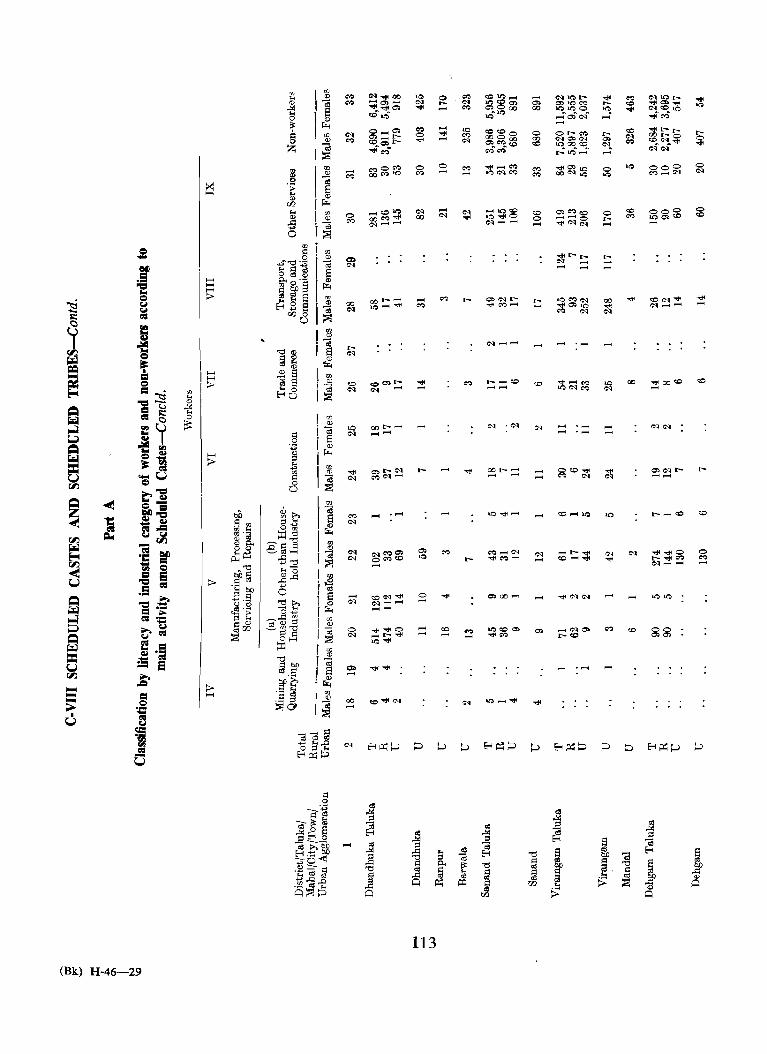
I I~ I
(Bk) H-46-29
§
1 §
Q
...... "" o
""
......
............
...... .,.,
...;<
......
o ......
113
o r--o ......
...... ""
00 .......... ...... ......
...... ~ 00
'" o ......
.... .....
.....
...... ......
1 r:n
""lOr- -.jI 0)100':1 t-101OO 1O ..... j' ~ e.l'" ,...-i, ...
......
. ......
..... .,...., ,...., .,....,
o ,_ ......
.... ...... ......
,...., ......
J
00
""10 .... ....~ .... """'1O ..... .,; .... .... ,_ OO'_o <:OC'I .... c:-1"'C"l"
-.jI .....
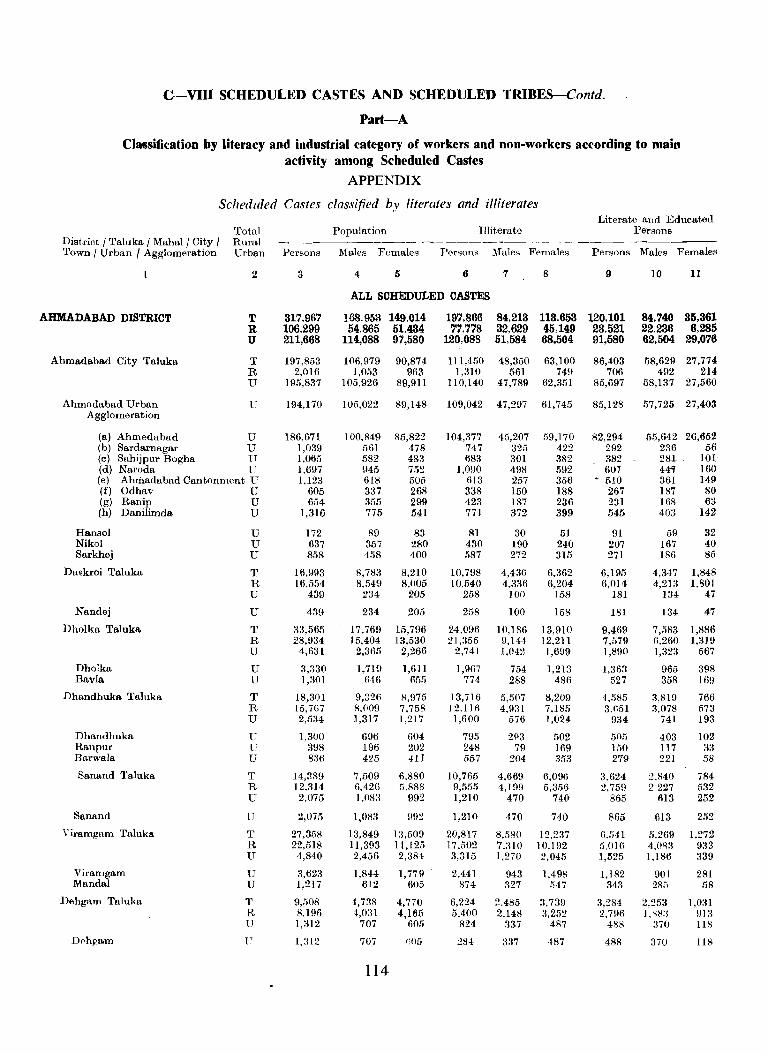
C~VIII SCHEDULED CASTES AND SCHEDULED TRIBES-Contd.
Part-A
Clafisification by literacy and indnstrial category of workers and non-workers according to main activity among Scheduled Castes
APPENDIX
Scheduled Castes classified by literates and illiterates Literate and Educated
Total Population Illiterate Persons District I Taluka I Mahal/ City I Rural ------------- -----Town I Urban I Agglomeration Urban Persons Males Females Persons Males Females Persons Males Females
1 2 3 4 5 6 7 8 9 10 11
ALL SCHEDULED CASTES
AHMADABAD DISTRICT T 317.967 168.953 149.014 197,866 84.213 113.653 120,101 84,740 35,361 R 106.299 54,865 61.434 77,778 32,629 45,l49 28,521 22,236 6,285 U 211.668 114,088 97,580 120,088 51.584 68,504 91,580 62,504 29,076
Ahmadabad City Taluka T 197,853 106,979 90,874 111,450 48,350 63,100 86,403 58,629 27,774 R 2,016 1,053 963 1,310 561 749 706 492 214 U 195,837 105,926 89,911 110,140 47,789 62,351 85,697 58,137 27,560
Ahmadabad Urban U 194,170 105,022 89,148 109,042 47,297 61,745 85,128 57,725 27,403 Agglomeration
(a) Ahmedabad U 186,671 100,849 85,822 104,377 45,207 59,170 82,294 55,642 26,652 (b) Sardarnagar U 1,039 561 478 747 325 422 292 236 56 (c) Sahijpur Bogha U 1,065 582 483 683 301 382 382 2&1- 101 (d) Naroda U 1,697 945 752 1.090 498 592 607 44i 160 (e) Ahmadabad Cantonment U 1,123 618 505 613 257 356 - 510 361 149 (f) Odhav U 605 337 268 338 150 188 267 187 80 (g) Ranip U 654 355 299 423 187 236 231 168 63 (h) Danilimda U 1,316 775 541 77] 372 399 545 403 ]42
Hansol U 172 89 83 81 30 51 . 91 59 32 Nikol U 637 357 280 430 190 240 207 167 40 Sarkhej U 858 458 400 587 272 315 271 186 85
Daskroi Taluka T 16,993 8,783 8,2]0 10,798 4,436 6,362 6,195 4,347 1,848 R 16,554 8,549 8,005 10,540 4,336 6,204 6,014 4,213 1,801 U 439 234 205 21;8 100 158 181 134 47
Nandej U 439 234 205 258 100 158 181 134 47
Dholka Taluka T 33,565 17,769 15,796 24.096 10,186 13,910 9,469 7,583 1,886 R 28,934 15,404 13,530 21,:1515 9,144 12,211 7,579 (i.260 1,3]9 U 4,631 2,365 2,266 2,741 1.042 1,699 1,890 1,323 567
Dholka U :1,a30 ],719 ],611 1,967 754 ],213 1,363 965 398 BavIa U 1,301 6i6 655 774 288 486 527 358 169
Dhandhuka Taluka T 18,301 9,:126 H,975 13,716 5,507 8,209 4,585 3,819 766 R 15,7(i7 8,009 7,758 ] 2.116 4,9:11 7,185 3,651 3,078 573 U 2,5;{4 1,317 1,217 1,600 576 1,024 934 741 193
Dhandhuka U 1,300 696 604 795 2!l3 502 505 403 102 Ranpur U 398 196 202 248 79 169 ISO 117 33 Barwala U S:W 425 411 557 204 353 279 221 58
Sanand Taluka T 14,389 7,509 6,880 10,765 4,669 6,096 3,624 2,840 784 R 12.314 6,426 5.888 9,555 4,199 5.356 2,759 2227 532 U 2,075 1,083 992 1,210 470 740 865 1113 252
Sanand U 2,075 1,083 992 1,210 470 740 865 613 252
\'iramgam Taluks T 27,358 13,849 13,509 20,817 8,580 12.237 6,541 5,269 1,272 R 22,518 11,393 11,125 17,502 7,310 10,192 5,016 4.083 933 U 4,840 2,456 2,384 3,315 1,270 2,045 1,1525 1,186 339
Viramgam U 3,623 1,844 1.779 2.441 943 1,498 1,182 901 281 MandaI U 1,217 612 605 874 327 ,";47 343 285 58
Dehgam Talllka T 9,508 4,738 4,770 6,224 2.485 3,739 3,284 2,253 1,031 R 8,196 4,031 4,165 5.400 2.148 ;{,252 2,796 I, '1H:! 913 1J 1,312 707 605 824 337 487 488 :170 118
D(·h~.am U 1,312 707 1105 284 337 487 488 370 118
114
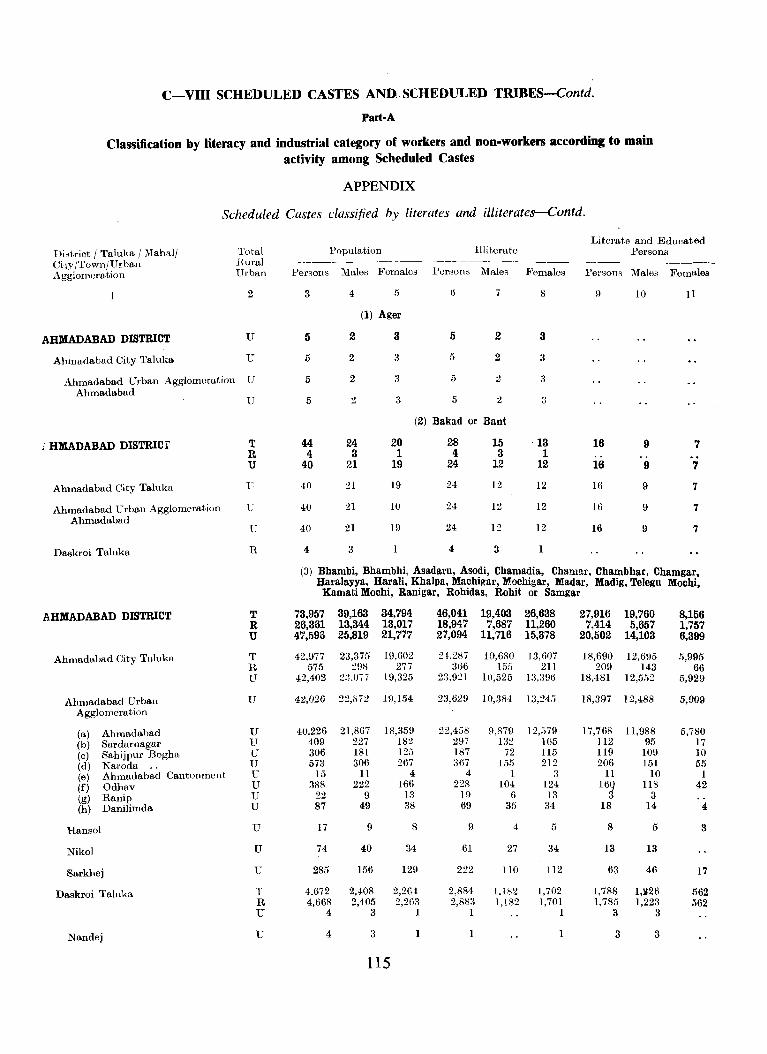
C-VIII SCHEDULED CASTES AND SCHEDULED TRIBES-Contd.
Part-A
Classification by literacy and indnstrial category of workers and non-workers according to main activity among Schednled Castes
APPENDIX
Scheduled Castes classified by literates and illiterates--Contd.
District / Talllka / Mahal/ CiW /Town/Urban Agglomeration
AHMADABAD DISTRICT
Ahmadabad City Taluka
Total Jiural Urban
2
u
U
Ahmadabad Urban Agglomeration U Ahmadabad
; HMADABAD DISTRlCr
Ahmadabad City Talllka
Ahmadabad Urban Agglomeration Ahmadabad
Daskroi Taluka
AHMADABAD DISTRICT
Ahmadabad City Taluka
Ahmadabad Urban Agglomeration
(a) Ahmadabad (b) Sardarnagar (c) Sahijpur Bogha (d) Naroda .. (e) Ahmadabad Cantonment (f) Odhav (g) Ranip (h) Danilimda
Hansol
Nikol
Sarkhej
Daskroi Taluka
Nandej
U
T It U
1)
U
U
R
T R U
T R U
U
u u U U U U U U
U
U
U
T R U
U
Population Illiterate
Persons Males Females Persons Males Females
3
5
5
5
5
44 4
40
40
40
40
4
4
2
2
2
24 3
21
21
21
21
3
5
(1) Ager
3
3
3
3
20 1
19
19
10
19
6
5
5
5
5
7
2
2
2
(2) Bakad or Bant
28 4
24
24
24
24
4
15 3
12
12
12
12
3
8
8
3
3
-, "
13 1
12
12
12
12
1
Literate and Educated Persons
Pe"sons Males Females
9
16
16
16
16
16
10
9
9
9
9
9
7
"I
7
7
7
(3) Bhambi, Bhambh.i, Asadaru, Aso~i, Chama~ia, Chamar, Chambhar, Chamgar, HaraJayya, Harah, KhaJpa, Machlgar, Mochlgar, Madar, Madig TeJegu Mochi
Kamati Mochi, Ranigar, Rohidas, Rohit or Samgar' ,
73,957 26,361 47,598
42,977 575
42,402
39,163 13,344 25,819
23,375 :!\)&
2;~,077
34,794 13,017 21,777
l!J,602 277
W,325
42,026 22,872 19,154
40,226 409 306 573
15 38R
22 87
17
74
285
4.672 4,668
4
4
21,867 227 181 306
11 222
9 49
9
40
156
2,408 2,405
3
3
18,359 182 125 267
4 166
13 38
8
34
129
2,2G4 2,2(i3
1
1
115
46,041 18,947 27,094
24,2K7 366
23,921
19,403 7,687
11,716
10,680 155
10,525
26,638 11,260 15,378
13,(;07 211
13,396
23,G2!J 10,384 13,245
22,458 297 187 367
4 228
19 69
9
61
222
2,884 2,883
1
1
9,879 132
72 155
1 104
6 35
4
27
110
1.182 1,182
12,579 165 115 212
3 124 13
34
5
34
112
1,702 1,701
I
1
27,916 7,414
20,502
18,690 209
18,481
19,760 5,657
14,103
12,695 143
12,552
18,397 12,488
17,768 1I2 119 206 II
16~
18
8
13
63
1,788 1,785
3
3
II,988 95
109 151
10 U8
3 14
5
13
46
1,1I26 1,22:{
3
3
8,156 1,757 6,399
5,995 66
5,929
5,909
5,780 17 10 55
1 42
4
3
17
562 562
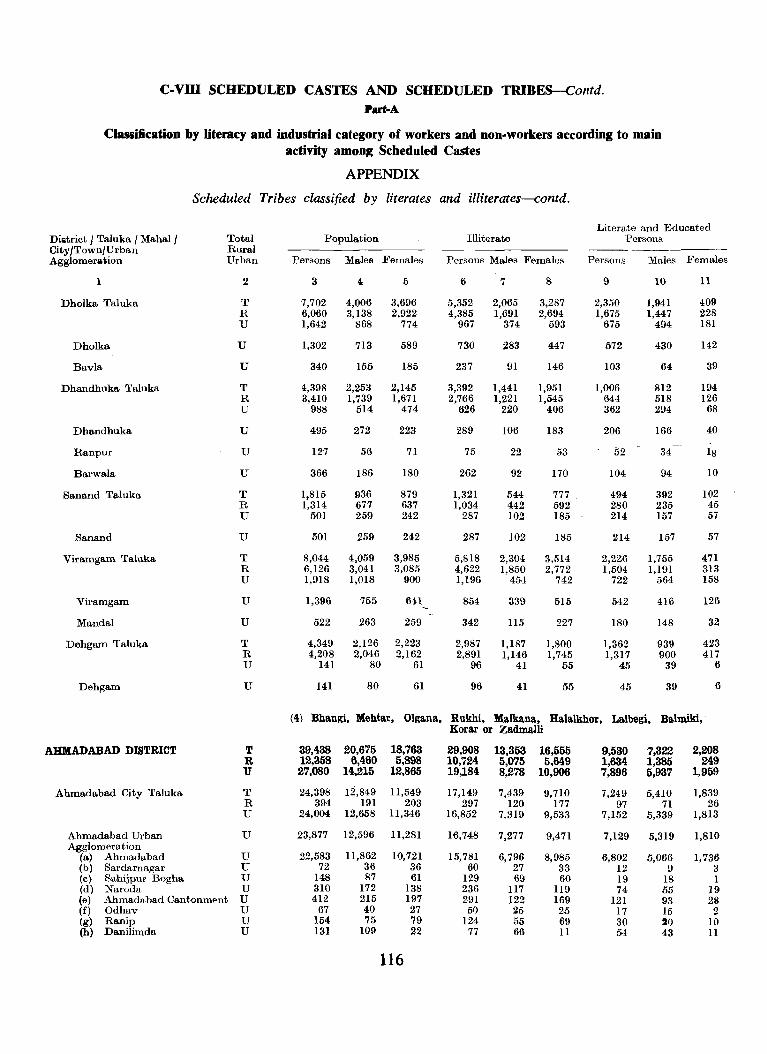
C-VIU SCHEDULED CASTES AND SCHEDULED TRIBES-Contd. Part-A
Classification by literacy and industrial category of workers and non-workers according to main activity among Scheduled Castes
APPENDIX
Scheduled Tribes classified by literates and illiterates-contd.
Literate and Educated Diatric.t J Taluka J Mahal/ Total Population Illiterate Persons City/Town/Urban Rural Agglomera.ion Urban Persons Males Females Persons Males Females Persons Males Females
1 2 3 4 5 6 7 8 9 10 11
Dholka Taluka T 7,702 4,006 3,696 5,352 2,065 3,287 2,350 1,941 409 R 6,060 3,138 2,922 4,385 1,691 2,694 1,675 1,447 228 U 1,642 868 774 967 374 593 675 494 181
Dholka U 1,302 713 589 730 2S3 447 572 430 142
Bavla U 340 155 185 237 91 146 103 64 39
Dhandhuka. Taluka T 4,398 2,253 2,145 3,392 1,441 1,951 1,006 812 194 R 3,410 1,739 1,671 2,766 1,221 1,545 644 518 126 U 988 514 474 626 220 406 362 294 68
Dhandhuka U 495 272 223 289 106 183 206 166 40
Ranpur U 127 56 71 75 22 53 52 34 18
Barwala U 366 186 180 262 92 170 104 94 10
Sanand Taluka T 1,815 936 879 1,321 544 777 494 392 102 R 1,314 677 637 1,034 442 592 280 235 45 U 501 259 242 287 102 185 214 157 57
Sanand U 501 259 242 287 102 185 214 157 57
Viramgam Taluka T 8,044 4,059 3,985 5,818 2,304 3,514 2,226 1,755 471 R 6,126 3,041 3,085 4,622 I,S50 2,772 1,504 1,191 313 U 1,91S 1,01S 900 1,196 454 742 722 564 158
Viramgam U 1,396 755 641 854 339 515 542 416 120
MandaI U 522 263 259 342 115 227 ISO 148 32
Dehgam 'l'aluka T 4,349 2,126 2,223 2,987 1,187 1,800 1,362 939 423 R 4,208 2,046 2,162 2,S91 1,146 1,745 1,317 900 417 U 141 80 61 96 41 55 45 39 6
Dehgam U 141 80 61 96 41 55 45 39 6
(4) Bha.ngi, Mehta.r, Olgana, Rukhi, Malkana, Halalkhor, Lalbegi, Bahniki, Korar or Zadmalli
AHMADABAD DISTRICT T 39,438 20,675 18,763 29,908 13,353 16,555 9,530 7,322 2,208 R 12,358 6,460 5,898 10,724 5,075 5,649 1,634 1,385 249 U 27,080 14,215 12,865 19,184 8,278 10,906 7,896 5,937 1,959
Ahmadabad City Taluka T 24,398 Ui,849 11,549 17,149 7,439 9,710 7,249 5,410 1,839 R 394 191 203 297 120 177 97 71 26 U 24,004 12,658 11,346 16,852 7,319 9,533 7,152 5,339 1,813
Ahmadabad Urban U 23,877 12,596 ll,2S1 16,748 7,277 9,471 7,129 5,319 1,810 Agglomeration
U 22,583 11,862 10,721 (a) Ahmadabad 15,781 6,796 8,985 6,802 5,066 1,736 (b) Sardarnagar U 72 36 36 60 27 33 12 9 3 (0) Sahijpur Bogha U 148 87 61 129 69 60 19 18 I (d) Naroda U 310 172 138 236 117 119 74 55 19 (e) Ahmadabad Cantonment U 412 215 197 291 122 169 121 93 28 (f) Odhav U 67 40 27 50 25 25 17 15 2 (g) Ranip U 154 75 79 124 55 69 30 20 10 (h) Danilimda U 131 109 22 77 66 11 54 43 II
116
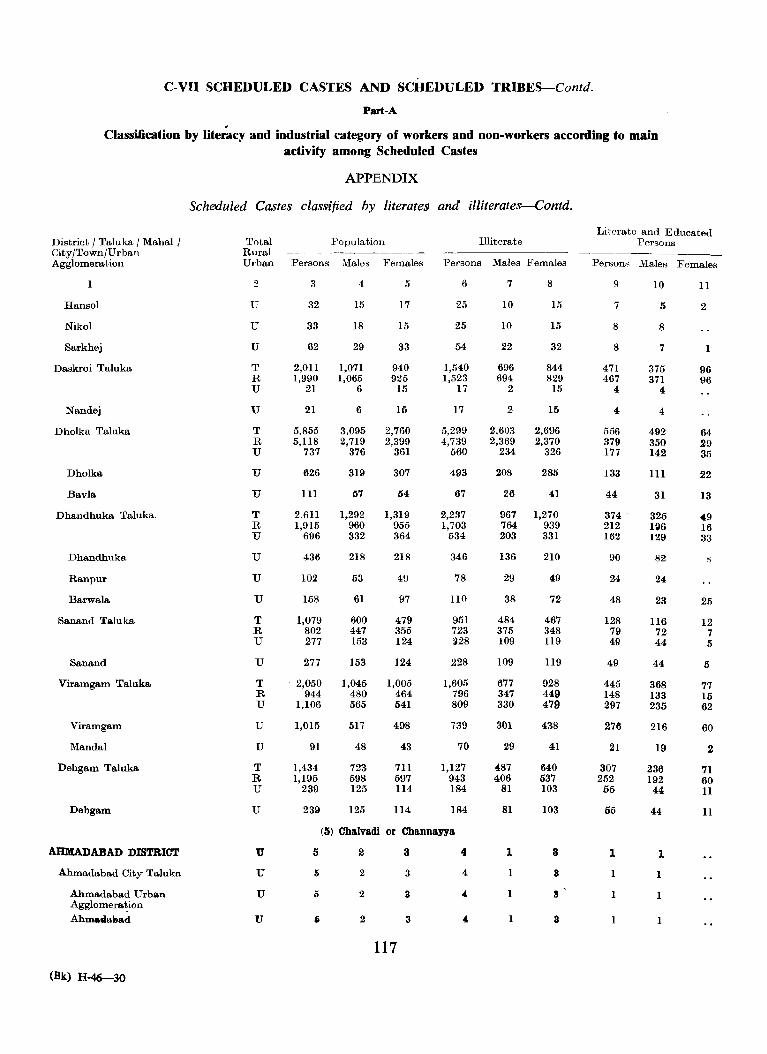
C-VII SCHEDULED CASTES AND SCHEDULED TRIBES-Contd.
Part-A
Classification by literacy and industrial category of workers and non-workers according to main activity among Scheduled Castes
APPENDIX
Scheduled Castes clas~ified by literates and illiterates-Contd.
Literate and Educated District / Taluka / Mahal / City/Town/Urban Agglomeration
1
Hansol
Nikol
Sarkhej
Daskroi Taluka
Nandej
Dholka Taluka
Dholka
Bavla
Dhandhuka Taluka.
Dhandhuka
Ranpur
Barwala
Sanand Ta.luka
Sanand
Viramgam Taluka
Viramgam
MandaI
Dehgam Taluka
Dehgam
AHMADABAD DISTRICT
Ahmadabad City Taluka
Ahmadabad Urban Agglomeration
AhmatilaDad
(Bk) H-46-30
Total Rural Urban
2
U
U
U
T R U
U
T R U
U
U
T R U
U
U
U
T R U
U
T R U
U
U
T R U
U
u u
u
lJ
Population Illiterate Persons
Persons ;VIales Females Persons Males Females Persons Males Females
3
32
33
62
2,01l 1,990
21
21
5,855 5,118
737
626
111
2,611 1,915
696
436
102
158
1,079 802 277
277
2,050 944
1,106
1,015
91
1,434 1,195
239
239
4
15
18
29
1,071 1,065
6
6
3,095 2,719
376
319
57
1,292 960 332
218
53
61
600 447 153
153
1,045 480 565
517
48
723 598 125
125
5
17
15
33
940 925 15
16
2,760 2,399
361
307
54
1,319 955 364
218
49
97
479 355 124
124
1,005 464 541
498
43
711 597 114
114
6
25
25
54
1,540 1,.523
17
17
5,299 4,739
560
493
67
2,237 1,703
534
346
78
no
951 723 ~28
228
1,605 796 809
739
70
1,127 943 184
184
(5) Chalvadi or Channayya
5 2
Ii 2
5 2
2
3
3
3
3
117
4
4
4.
7
10
10
22
696 694
2
2
2,603 2,369
234
208
26
967 764 203
136
29
38
484 375 109
109
677 347 330
301
29
487 406
81
81
1
1
8
15
15
32
844 829
15
15
2,696 2,370
326
285
41
1,270 939 331
210
49
72
467 348 119
119
928 449 479
438
41
640 537 103
103
3
8
II
3
9
7
8
8
471 467
4
4
556 379 177
133
44
374 . 212 162
90
24
48
128 79 4@
49
445 148 297
276
21
307 252
55
55
1
1
10
5
8
7
375 371
4
4
492 350 142
111
31
325 1116 129
82
24
23
116 72 44
44
368 133 235
216
19
236 192
44
44
1
1
1
1
11
2
96 96
64 29 35
22
13
4.9 16 33
25
12 7 5
5
77 15 62
60
2
71 60 11
11
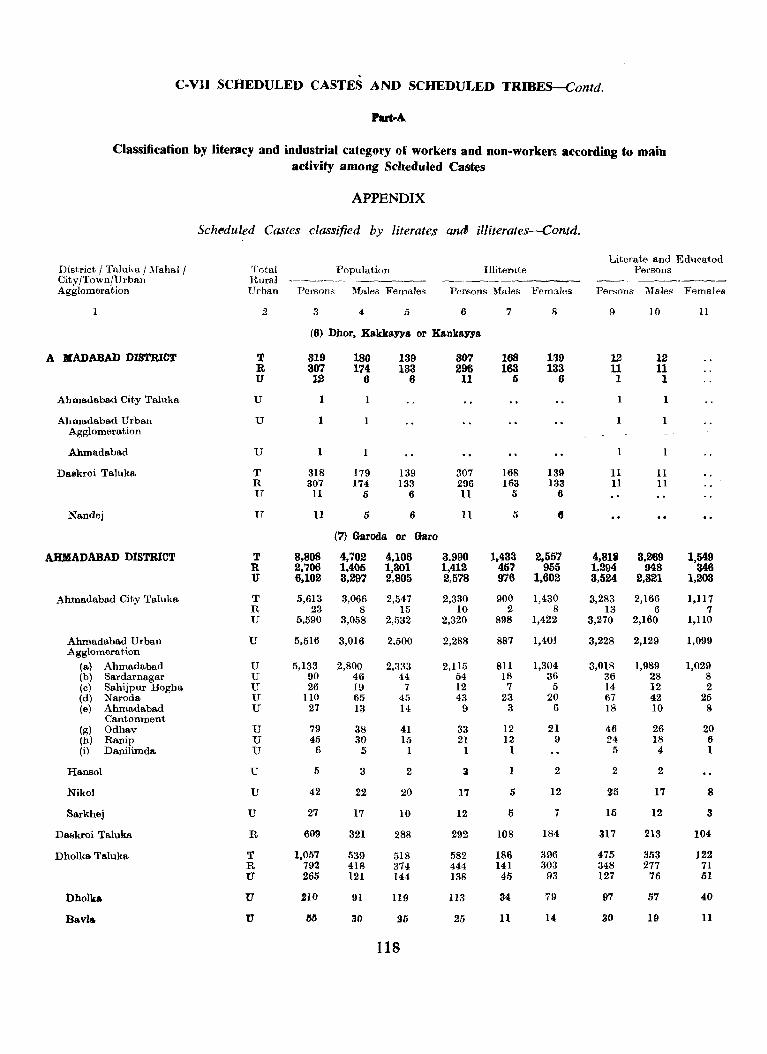
C-VU SCHEDULED CASTES AND SCHEDULED TRIBES-Contd.
PIU't-A
Classification by literacy and industrial category of workers and non-workers: according to main activity among Scheduled Castes
APPENDIX
Scheduled Castes classified by literates and illiterates-Contd.
Literate and Educated District / 'l'aluka / .'.rahal/ Total Population Illiterate Persons City/Town/Urban Hural ---------- -----Agglomeration Urban Pe""oll~ Males Females PerRons Males Fem«les Per'snlls Males Females
2 3 4 5 6 7 8 9 10 II
(6) Dhor, Kakkayya or Kankayya
A MADABAD DISTRICT T 319 180 139 307 168 1:J9 12 12 R 307 174 133 296 163 133 11 11 U 12 6 6 11 5 6 1 1
Ahmadabad City Ta1uka U 1 1 1
Ahmadabad Urban U 1 1 Agglomeration
Ahmadabad U 1
Daskroi Taluka T 318 179 139 307 168 139 11 11 R 307 174 133 296 163 133 11 11 U 11 5 6 11 /) 6
Nandej U 11 5 6 II 5 8
(1) Garoda or Garo
AHMADABAD DISTRICT T 8,808 4,702 4,106 3,990 1,433 2,557 4,818 3,269 1,549 R 2.706 1,405 1,301 1,412 457 955 1,294 948 346 U 6,102 3,297 2,805 2,578 976 1,602 3,524 2,321 1,203
Ahmadabad City Taluka, T 5,613 3,066 2,547 2,330 900 1,430 3,283 2,166 1,117 R 23 8 15 10 2 8 13 6 7 U 5,590 3,058 2,532 2,320 898 1,422 3,270 2,160 1,110
Ahmadnbad Urba,n U 5,516 3,016 2,500 2,288 887 1,401 3,228 2,129 1,099 Agglomeration
(a) Ahmndabad U 5,133 2,800 2,333 2,115 811 1,304 3,018 1,989 1,029 (b) Sa,rdarnagnr U 90 46 44 54 18 36 36 28 8 (c) Sa,hijpur Bogha U 26 19 7 12 7 5 14 12 2 (d) Naroda U 110 65 45 43 23 20 67 42 25 (e) Ahmndaba,d U 27 13 14 9 3 {) 18 10 8
Ca,ntonment (g) Odhav U 79 38 41 33 12 21 46 26 20 (h) Ranip U 45 30 15 21 12 9 24 18 6 (i\ Danilimda. U 6 " 1 1 1 5 4 1
Hansol U 5 3 2 3 1 2 2 2
Nikol U 42 22 20 17 5 12 25 17 8
Sarkbej U 27 17 10 12 5 7 15 12 3
Da.skroi Ta1uka R 609 321 288 292 108 184 317 213 104
Dholka Talukn T 1,057 539 518 582 186 396 475 353 122 R 792 418 374 444 141 303 348 277 71 U 265 121 144 138 45 93 127 76 51
Dholka U 210 91 119 113 34 79 97 57 40
Bavla U M 30 !i5 25 11 14 30 19 11
llS
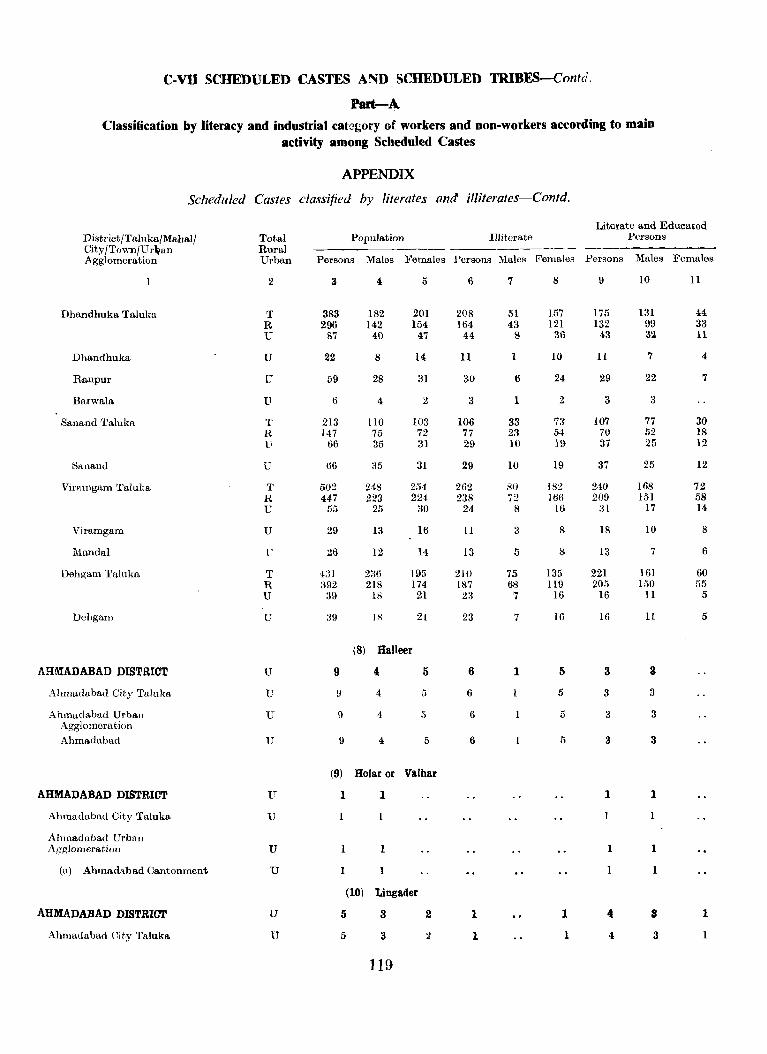
C-VlJ SCHEDULED CASTES AND SCHEDULED TRIBES-Contd.
Part-A Classification by literacy and industrial category of workers and non-workers according to main
activity among Scheduled Castes
APPENDIX
Scheduled Castes classified by literates and illiterates-Contd.
Literate and Educated District/Taluka/Mahal/ Total Population Illiterate Persons City /Town/U r\>an Rural Agglomeration Urban Persons Males Females Persons Males Females Persons Males Females
I 2 3 4 5 6 7 8 9 10 11
Dhandhuka Talukl1 T 383 182 201 208 51 157 175 131 44 R 296 142 154 164 43 121 132 99 33 U 87 40 47 44 8 36 43 3:2 11
Dhandhuka U 22 8 14 11 1 10 II 7 4
Ranpur U 59 28 31 30 6 24 29 22 7
Barwala U 6 4 2 3 1 2 3 3
Sanand 'falulm T 213 110 103 106 33 73 107 77 30 R 147 75 72 77 23 54 70 52 18 U 66 35 31 29 10 }9 37 25 12
Sauand U 66 35 31 29 10 19 37 25 12
Vinllugam Taluka T 502 248 254 262 SO 182 240 168 72 R 447 223 224 238 -'l
1- 166 209 151 58 U 55 25 30 24 8 16 31 17 14
Viramgam U 29 13 16 11 3 8 18 10 8
MandaI U 26 12 14 13 5 8 13 7 6
Dehgam Taluka T 4:0 236 195 210 75 135 221 161 60 R :~92 218 174 187 68 119 205 150 55 U :39 18 21 23 7 16 16 11 5
Dehgam U 39 IS 21 23 7 16 16 II 5
(8) Balleer
AHMADABAD DISTRICT U 9 4 5 6 1 5 3 3
Ahmadabad City Taluka U 9 4 I) 6 5 3 3
Ahmadabad Urban U 9 4 5 6 5 3 3 Agglomeration
Ahmadabad U 9 4 5 6 5 3 3
(9) Holar or Valhar
AHMADABAD DISTRICT U 1 1 1 1
Ahmadabl1d City Ta1uka U I
Ahmadabad Urban Agglomerat.ion U 1 1 1
(a) Ahmadabad Cantonment U 1 1 1 1
(10) Lingader
AHMADABAD DISTRICT U 5 3 2 1 1 4 3 1
Ahmadabad Cit,y Ta1uka U 5 3 2 1 1 4 3
119
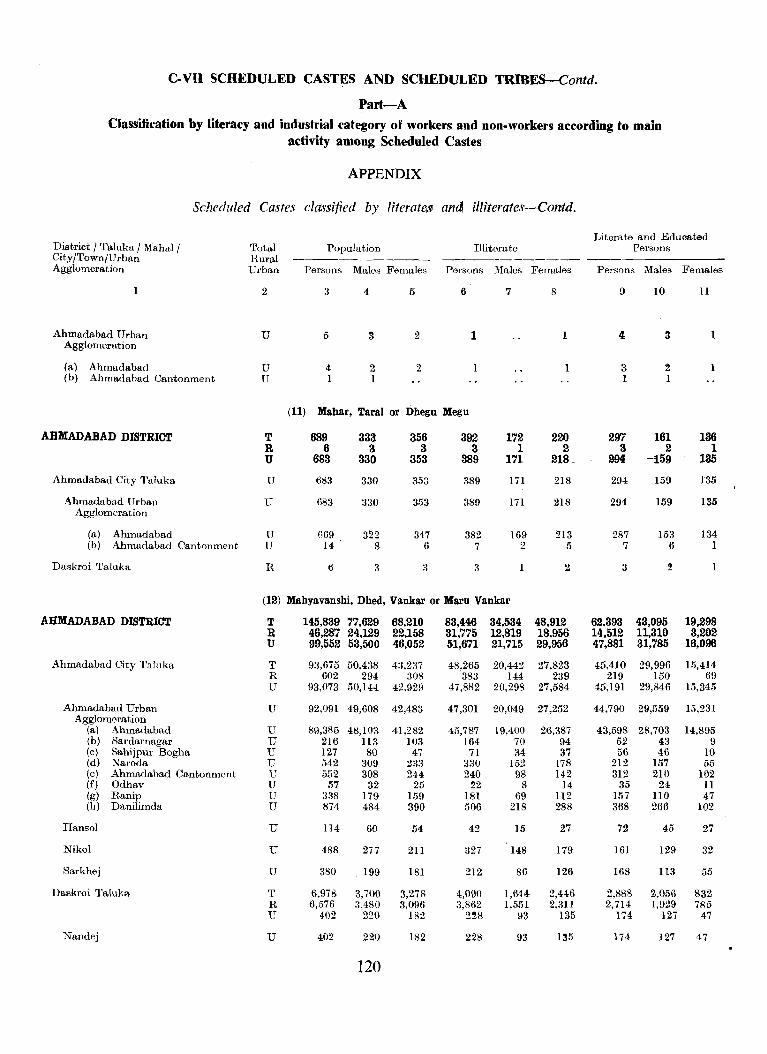
C-VII SCHEDULED CASTES AND SCHEDULED TRIBES-Contd.
Part-A
Classification by literacy and industrial category of workers and non-workers according to main activity among Scheduled Castes
APPENDIX
Scheduled Castes classified by literate~ and illiterates-Contd.
Literate and Educated District / Taluka / Mahal/ Total Population Illiterate Persons City/Town/Urban Hural ------------ _----_------Agglomeration Urban Persons Males Females Persons Males Females Persons Males Females
2 3 4 5 6 7 8 9 10 11
Ahmadabad Urban U 5 3 2 1 1 4 3 1 Agglomeration
(a) Ahmadabad U 4 2 2 1 3 2 1 (h) Ahmadabad Cantonment U 1 1 I I
(11) Mahar, Taral or Dhegu Megu
AHMADABAD DISTRICT T 689 333 356 392 172 220 297 161 136 R 6 3 3 3 1 2 3 2 1 U 683 330 353 389 171 218 _ 294 -159 135
Ahmadabad City Taluka U 683 330 353 389 171 218 294 159 135
Ahmadabad Urban U (i83 330 353 389 171 218 294 159 135 Agglomeration
(a) Ahmadabad U G69 322 347 382 169 213 287 153 134 (b) Ahmadabad Cantonment U 14 8 6 7 2 5 7 6 1
Daskroi Taluka R 6 3 3 3 1 2 3 2
(12) Mahyavanshi, Dhed, Vankar or Maru Vankar
AHMADABAD DISTRICT T 145,839 77,629 68,210 83,446 34,534 48,912 62.393 43,095 19,298 R 46,287 24,129 22,158 31,775 12,819 18,956 14,512 11,310 3,202 U 99,552 53,500 46,052 51,671 21,715 29,956 47,881 31,785 16,096
Ahmadabad City Talllka T 93,675 50,438 43,237 48,265 20,442 27,823 45,410 29,996 15,414 R 602 294 308 383 144 239 219 150 69 U 93,073 50,144 42,929 47,882 20,298 27,584 45,191 29,846 15,345
Ahmadabad Urban U 92,091 49,608 42,483 47,301 20,049 27,252 44,790 29,559 15,231 Agglomeration
(a) Ahmadabad U 89,385 48,103 41,282 45,787 19,400 26,387 43,598 28,703 14,895 (b) Sardarnagar U 216 113 103 164 70 94 52 43 9 (c) Sahijpur Bogha U 127 80 47 71 34 37 56 46 10 (d) Naroda U 542 309 233 330 152 178 212 157 55 (e) Ahmadabad Cantonment U 552 308 244 240 98 142 312 210 102 (f) Odhav U 57 32 25 22 8 14 35 24 11 (g) Ranip U 338 179 159 181 69 112 157 no 47 (h) Danilimda U 874 484 390 506 218 288 368 266 102
Ransol U 114 60 54 42 15 27 72 45 27
Nikol U 488 277 211 327 148 179 161 129 32
Sarkhej U 380 199 18] 212 86 126 168 113 55
Daskroi Taluka T 6,978 3,700 3,278 4,090 1,644 2,446 2,888 2,056 832 R 6,576 3,480 3,096 3,862 1,551 2,311 2,714 1.929 785 U 402 220 182 2~8 93 135 174 127 47
Nandej U 402 220 182 228 93 135 174 127 47
120
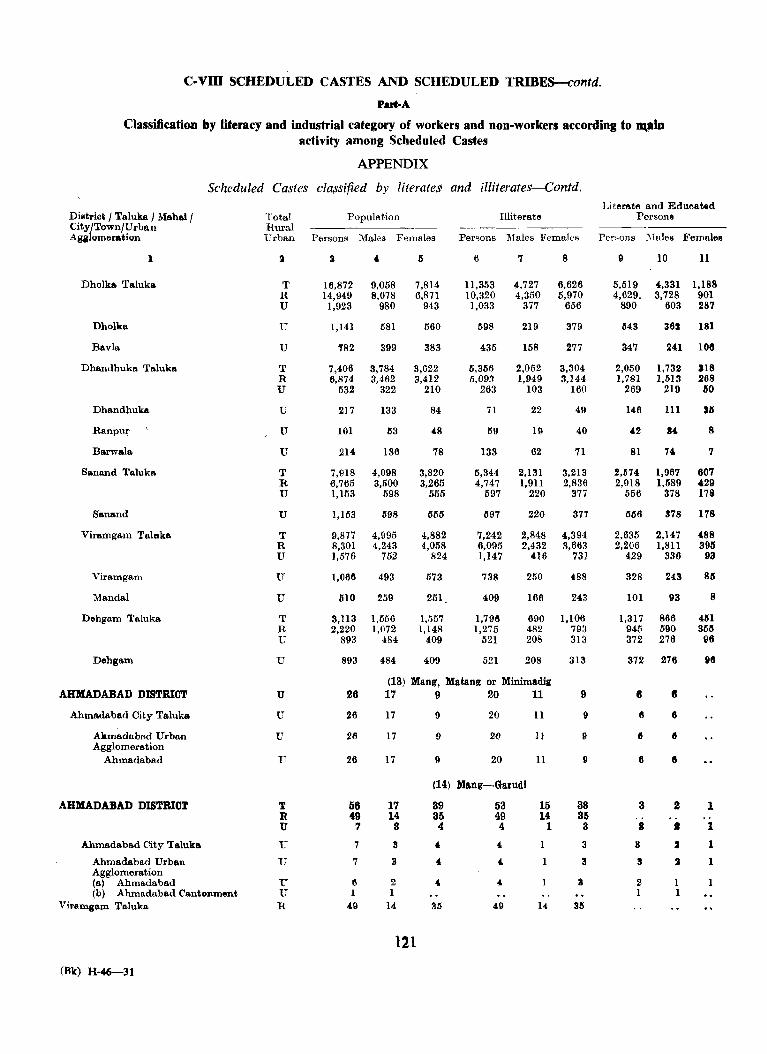
C-VIII SCHEDULED CASTES AND SCHEDULED l'RIBES-Contd.
Put-A
Classification by literacy and industrial category of workers and non-workers according to nt_in activity among Scheduled Castes
APPENDIX
Scheduled Castes classified by literates and illiterates-Contd.
District I Taluka / .1.1ahal/ City/Town/Urban Agglomeration
1
Dholka Taluka
Dholka
Bavla
Dhandhuka Taluka
Dhandhuka
Ranpnr
Barwaia
Sanand Taluka
Sanand
Viramgam Talllka
Vira,mgam
MandaI
Dehgam Talnka
Dehgam
AHMADABAD DISTRICT
Ahmadabad City Taluka
A1amadabad Urban Agglomeration
Ahmadabad
AHMADABAD DISTRICT
Ahmadabad City Taluka
Ahmadabad Urban Agglomeration (a) Ahmadabad (b) Ahmadabad Cantonment
Viramgam Taluka
(Rk) H-46-31
Literate and Edueat.d Total Population Illiterate Persons Rural ---_._-----l'rhan Persons Males Females Persons l\lales Females Peri<ons :'Ii ale" Females
T R U
U
T R U
U
U
u
T R U
u
T R U
U
u
T R U
U
u u U
T R U
U
u
u U R
3
16,872 14,949
1,923
1,141
,.82
7,406 6,874
532
217
101
214
7,918 6,765 1,153
1,153
9,877 8,301 1,576
1,0611
1110
3,113 2,220
893
893
26
26
26
26
56 49
7
7
7
(I
1
4.9
9,058 8,078
980
681
399
3,784 3,462
322
133
113
136
4,098 3,500
598
698
4,995 4,243
752
493
259
1,556 1,072
484
484
5
7,814 6,871
943
660
383
3,622 3,412
210
84
48
78
3,820 3,265
555
655
4,882 4,058
824
573
251
1,557 1,148
409
409
6
11,353 10,320 1,033
598
435
5,356 5,09:1
263
71
59
133
5,344 4,747
597
1197
7,242 6,095 1,147
738
409
1,798 1,275
521
521
7
4,727 4,350
377
219
158
2,052 1,949
103
22
19
62
2,131 1,911
220
220
2,848 2,432
416
250
166
690 482 208
208
(13) Mang, Matang or Minimadig 17 9 20 11
17
17
17
17 14 S
8
3
2 1
14
121
9 20
{) 20
9 20
(14) Mang-Garudi
39 35
4
53 49 4
4.
4.
40
11
II
11
15 14
1
1
1
14
8
6,626 5,970
656
379
277
3,304 3,144
160
49
40
71
3,213 2,836
377
377
4,394 3,663
731
488
243
1,106 79a 313
313
9
II
I)
II
38 35 3
3
3
II
9
5,519 4,629.
890
1143
347
2,050 1,781
269
146
42
81
2,574 2,018
556
1156
2,635 2,206
429
328
101
1,317 945 372
372
8
8
6
3
8
3
3
2 1
10 11
4,331 1,188 3,728 901
603 287
362
241
1,732 1,513
219
HI
34.
74.
1,967 1,589
378
378
2,147 1,811
336
243
93
866 590 276
276
6
6
2
• J
J
1 1
181
108
318 268
110
lIS
8
7
607 429 17i
178
488 395
93
811
8
41H 358 96
118
1
1
1
1
1
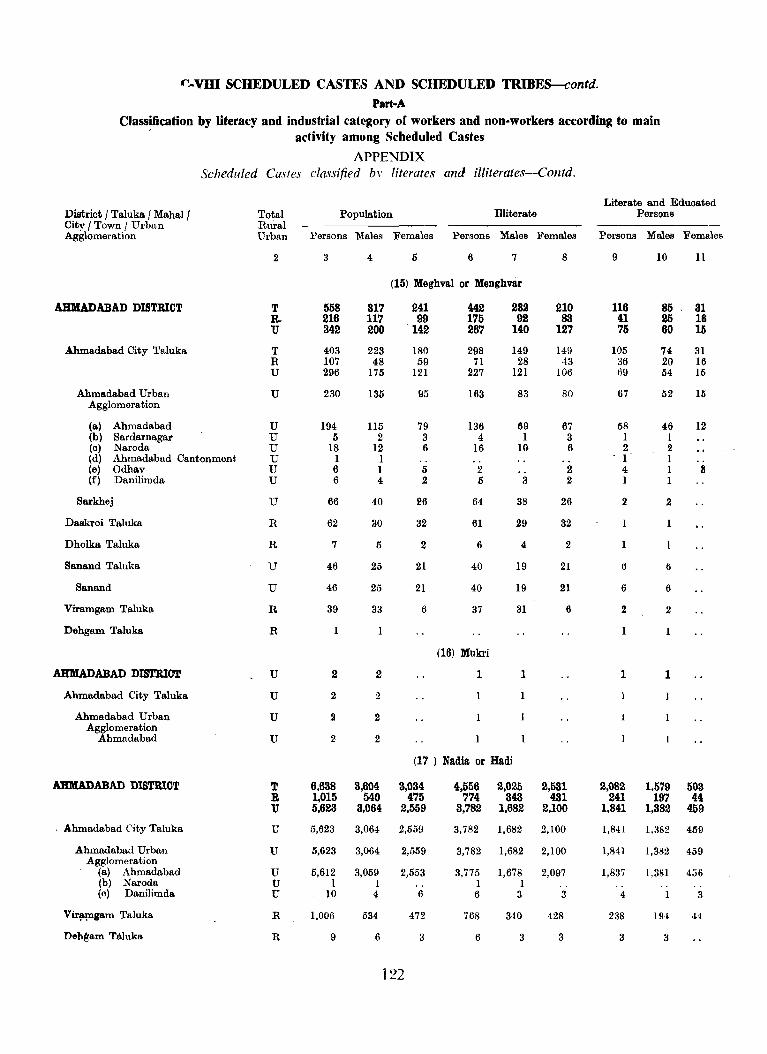
I""-vm SCHEDULED CASTES AND SCHEDULED TRIBES-contd.
Part-A Class!fication by literacy and industrial category of workers and non-workers according to main
activity among Scheduled Castes
APPENDIX Scheduled Castes classified by literates and illiterates-Contd.
Literate and Eduoated Distriot / Taluka/ Mahal/ Total Population Illiterate Persons City I Town I Urban Rural Agglomeration Urban Persons "Males Females Persons Males Females Persons Males Females
2 3 4 5 6 7 8 9 10 11
(15) Meghvai or Menghvar
AHMADABAD DISTBICT T 558 317 241 442 232 210 116 85 31 R. 216 117 99 175 92 83 41 25 16 U 342 200 142 267 140 127 75 60 16
Ahmadabad City Taluka T 403 223 180 298 149 14-9 105 74- 31 R 107 48 59 71 28 43 36 20 16 U 296 175 121 227 121 106 69 54 15
Ahmadabad Urban U 230 135 95 163 83 80 67 52 15 Agglomeration
(a) Ahmadabad U 194 115 79 136 69 67 58 46 12 (b) Sardarnagar U 5 2 3 4 1 3 1 I (0) Naroda U 18 12 6 16 10 6 2 2 (d) Ahmadabad Cantonment U 1 1 1 1 (e) Odhav U 6 1 5 2 2 4 1 B (f) Danilimda U 6 4 2 5 3 2 1 I
Sarkhej U 66 40 26 64 38 26 2 2
Daskroi Taluka R 62 30 32 61 29 32
Dholka Taluka R 7 5 2 6 4, 2 1
Sanand Taluka U 46 25 21 40 19 21 6 6
Sanand U 46 25 21 40 19 21 6 6
Viramgam Taluka R 39 33 6 37 31 6 2 2
Dehgam Taluka R
(16) Mukri
AHMADABAD DISTRICT U 2 2 1 1 1 1
Ahmadabad City Taluka U 2 2
Ahmadabad Urban U 2 2 Agglomeration
Ahmadabad U 2 2
(17 ) Nadia or Hadi
AHMADABAD DISTRICT T 6,638 3,604 3,034 4,556 2,025 2,531 2,082 1,579 503 R 1,015 540 475 774 343 431 241 197 44 U 5,623 3,064 2,559 3,782 1,682 2,100 1,841 1,382 459
. Ahmadabad City Taluka U 5,623 3,064- 2,559 3,782 1,682 2,100 1,841 1,382 459
Ahmadabad Urban U 5,623 3,064 2,559 3,782 1,682 2,100 1,841 1,382 459 Agglomeration
(a) Ahmadabad U 5,612 3,059 2,553 3,775 1,678 2,097 1,837 1,381 456 (b) Naroda U 1 1 1 1 (0) Danilimda U 10 4 6 6 3 3 4 3
Vir!,~gam Taluka R 1,006 534 472 768 340 428 238 194- -H
De}i~am Tliluka R 9 6 3 6 3 3 3 3
122
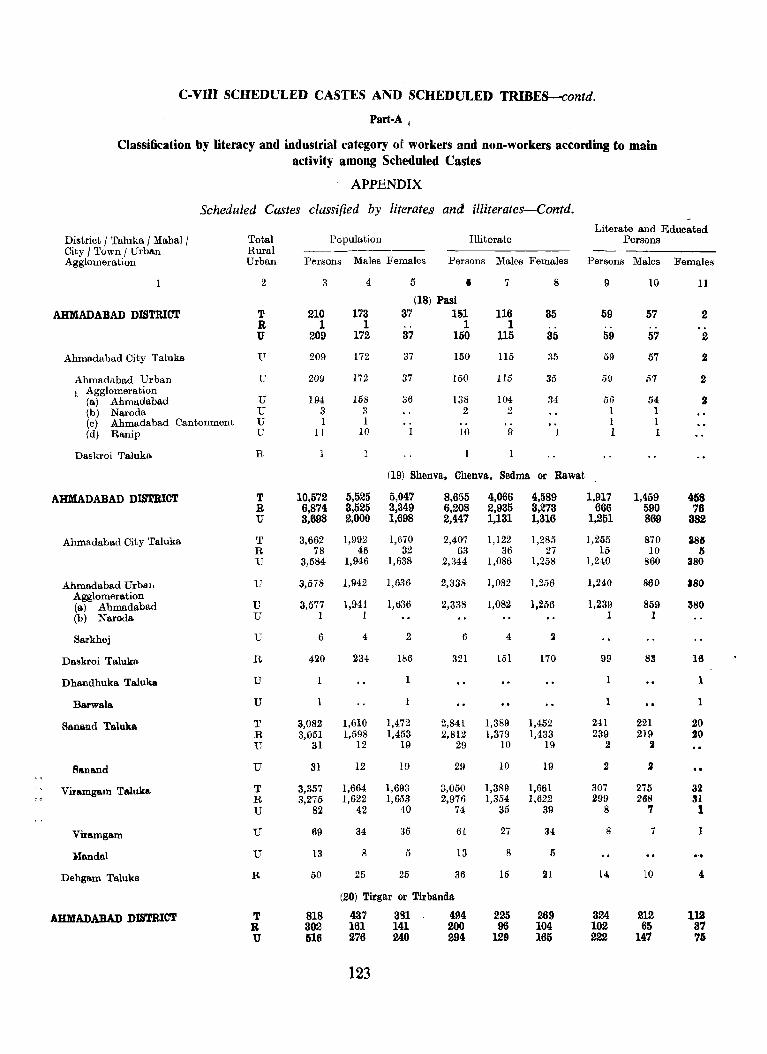
C-VIll SCHEDULED CASTES AND SCHEDULED TRIBES-contd.
Part-A,
Classification by literacy and industrial category of workers and non-workers according to main activity among Scheduled Castes
APPENDIX
Scheduled Castes classified by literates and illiterates-Contd. Literate and Educated
District / Taluka / l\Iabal/ City / Town I Urban Agglomeration
AHMADABAD DISTRIC'l'
Ahmadabad City Taluka,
Ahmadabad Urban Agglomeration (a) Ahmadabad (b) Naroda (c) Ahmadabad Cantonment (d) Ranip
Daskroi Taluka
AHMADABAD DISTRIC'l'
Ahmadabad City Taluka
Ahmadabad Urban Agglomeration (a) Ahmadabad (b) Naroda
Sarkhej
Daskroi Taluka
Dhandhuka Taluka
Barwala
Banand Taluka
Banand
Viramgam Taluka
Viramgam
Mandai
Dehgam Taluka
AHMADABAD DISTRICT
Total Rural Urban
2
T R U
U
u
u u U U
R
T R U
T R U
u
u U
u
R
U
U
T R U
U
T R U
u
U
R
T R U
Population Illiterate Persons
Persons Males Females Persons Males Females Persons Males Females
3
210 1
209
209
209
194 3 1
II
4
173 1
172
172
172
158 3 1
10
5 • (18) Pasi
37 151 .. 1 37 150
37
37
36
150
150
138 2
10
1
l16 1
ll5
115
115
104 2 .. 9
8
35
35
35
35
34
o.
1
(19) Shenva, Chenva, Sedma or Rawat
10,572 6,874 3,698
3,662 78
3,584
3,578
3,577 1
6
420
1
3,082 3,051
31
31
3,357 3,275
82
69
13
50
5,525 3,525 2,000
1,992 46
1,946
1,942
1,941 I
4
234
1,610 1,598
12
12
1,664 1,622
42
34
8
25
5,047 3,349 1,698
1,670 32
1,638
1,636
1,636
2
186
1
1,472 1,453
19
19
1,693 1,653
40
35
5
25
8,655 6,208 2,447
2,407 63
2,844
2,:J38
2,338
I)
321
2,841 2,812
29
29
3,050 2,976
74
61
13
36
(20) Tirgar or Tirbanda
818 437 381 494 302 161 141 200 516 276 240 294
123
4,066 2,935 1,131
1,122 36
1,086
1,082
1,082
4
151
1,389 1,379
10
10
1,389 1,354
35
27
8
15
225 96
129
4,589 3,273 1,316
1,285
1,258
1,256
1,256
~
170
1,452 1,433
19
19
1,661 1,622
39
34
is
21
269 104 165
9
59 .. 59
59
59
56 1 1 1
1,917 666
1,251
1,255 15
1,240
1,240
1,239 1
99
1
241 239
2
2
307 299
8
8
14
324 102 222
10
57
57
57
57
54 1 1 1
1,459 590 869
870 10
860
860
859 1
811
221 219
2
2
275 268
7
7
10
212 65
147
11
2
2
2
2
458 76
382
388 5
380
180
380
16
1
1
20 20
32 31 1
I
4
llJ 37 75
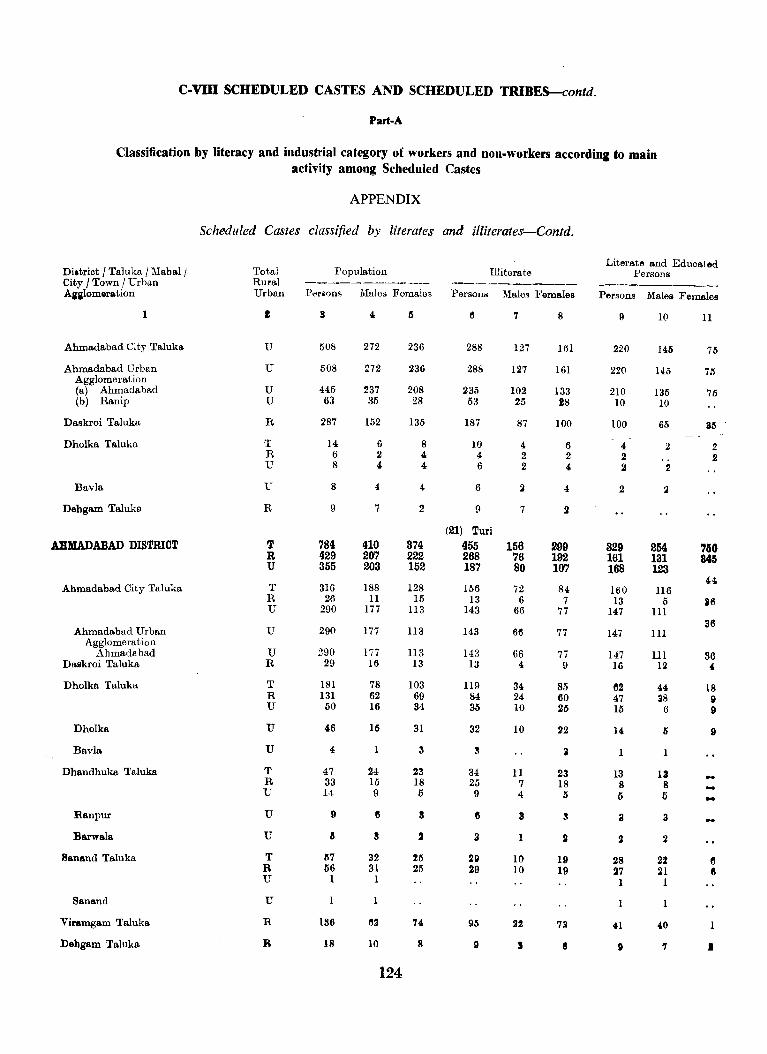
c-vm SCHEDULED CASTES AND SCHEDULED TRIBES-contd.
Part-A
Classification by literacy and industrial category of workers and non-workers according to main activity among Scheduled Castes
APPENDIX
Scheduled Castes classified by literates and illiterates-Contd.
Literate and Educated Di.trict I Taluka J :VlabalJ Total Population Illiterate Persons City I Town / Urban Rural ------------ ----------- -----------Aiglomeration Urban Periions Males Females Persons Males Females Persons Male!! Female.
1 ! 11 4. 5 6 7 8 9 10 11
Ahmadabad City Taluka U 508 272 236 288 127 161 220 146 75
Ahmadabad Urban U 508 272 236 288 127 161 220 145 7:) Agglomel'ation
445 237 208 (a) Ahmadabad U 235 102 133 210 135 76 (b) Ranip U 63 35 28 53 25 28 10 10
Daskroi Taluka R 287 152 136 187 87 100 100 65 311
Dholka Taluka T 14 6 8 10 4 6 4 2 2 R 6 2 4. 4 2 2 2 2 U 8 4 4 6 2 4 2 2
Bavla U 8 4 4 6 :J 4 2 :1
Dehgam Taluka R 9 7 2 9 7 2
(21) Turi AHMADABAD DISTRICT T 784 410 874 455 156 299 329 254 760
R 429 207 222 268 76 192 161 131 845 U 355 203 152 187 80 107 168 123
Ahmadabad City Taluka T 316 188 128 156 44
72 84 160 116 R 26 11 15 13 6 7 13 5 36 U 290 177 113 143 66 77 147 III
Ahmadabad Urban U 290 177 113 143 36
66 77 147 III Agglomerat.ion
U 290 177 WI Ahmadabad 143 66 77 147 ill 36 Daskroi Taluka R 29 16 13 13 4 9 16 12 • Dholka Taluka T 181 78 103 119 34 85 62 44 18
R 131 62 69 84 24 60 47 38 9 U 50 16 34 35 10 25 15 6 "
Dholka U 46 lIS 31 32 10 22 14 II " Bavla. U 4 I 3 II • 1 1
Dhandhuka Taluka T 47 24 23 34 11 23 13 13 R 33 Hi 18 25 7 18 8 8 U 14 9 5 9 4 II I) 5 -
Ranpur U 9 8 S 6 3 S 3 3
Bar'Wala U IS S 2 3 .2 II 2
Banand Taluka T lS7 32 211 29 10 19 28 22 6 R 56 31 25 29 10 19 27 21 II U I 1 1 1
Sa.nand U
Viramgam Taluka R 186 1'12 74 96 22 73 41 40
Debgam Taluka :R 18 10 8 9 S II D '7 I
124
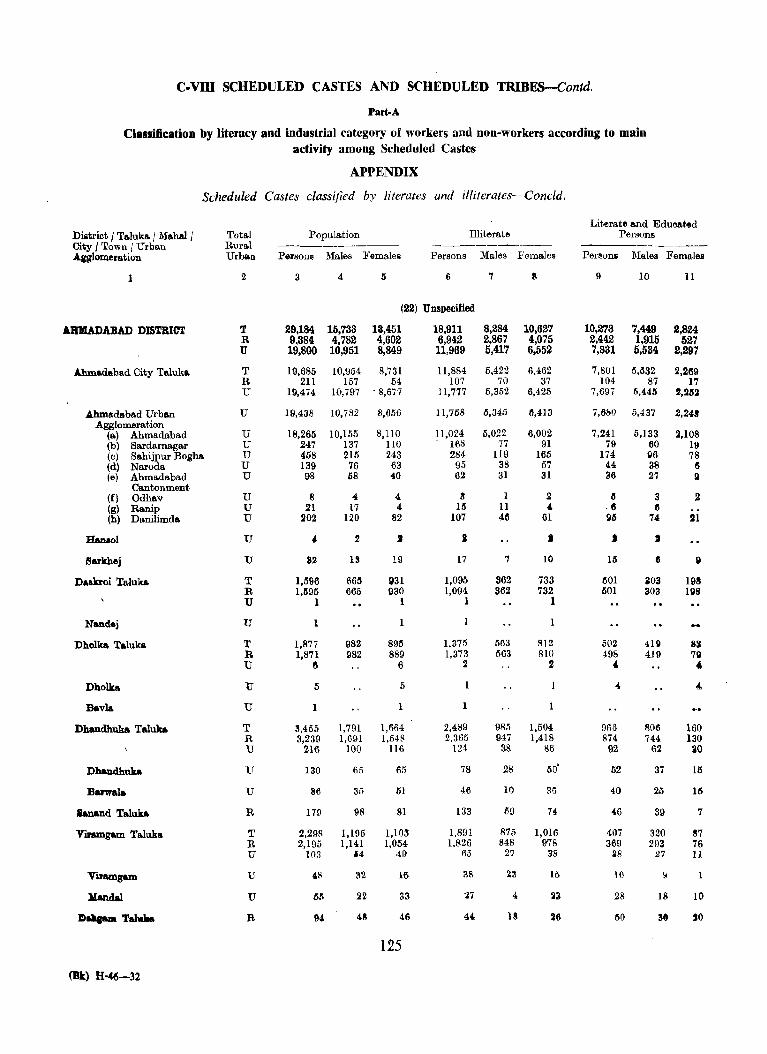
C-VIII SCHEDULED CASTES AND SCHEDULED TRIBES-Contd.
Part-A
Classification by literacy and industrial category of workers and non-workers according to main activity among Scheduled Castes
APPENDIX
Scheduled Castes classified by literates and illiterates-Concld.
Literate and Educated District I Taluka /Mahal / Tota.l Popula.tion Illiterate Persons City I Town / Urball Rural -----------A.wlQmera tion Urban Ptl~sons Ma.les Femalei Persons Males Females Persons I1Iales Females
1 2 3 4 5 6 7 S 9 10 11
(22) Unspecified
AHMADABAD DISTRICT T 29,184 15,733 13,451 18,911 8,284 10,627 10,273 7,449 2,824 R 9,384 4,782 4,602 6,942 2,867 4,075 2,442 1,915 527 U 19,800 10,951 8,849 11,969 5,417 6,552 7,831 5,534 2,297
Ahmada,bad City Taluka T 19,685 10,954 8,731 11,884 5,422 6,462 7,801 5,532 2,269 R 211 157 54 107 70 37 104 87 17 U 19,474 10,797 - 8,677 11,777 5,352 6,425 7,697 6,446 2,262
Ahma.dabad Urban U 19,438 10,782 8,656 11,758 6,345 11,413 7,680 5,437 2,241 Agglomeration
p,024 (a) Ahmadabad U 18,265 10,155 8,110 5,022 6,002 7,241 5,133 2,108 (b) Sardarnagar U 247 137 no 168 77 91 79 60 19 (e) Sahijpur Bogba U 458 215 243 284 Il9 165 174 116 78 (d) Na.roda U 139 76 63 95 38 57 44 38 6 (e) Ahmadabad U 98 58 40 62 31 31 !l6 27 II
Cantonment (f) Odhav U 8 4. " II 1 2 ~ 3 II (g) Ranip U 21 17 4, 15 II 4, -~ ~ (b) Danilimda. U 202 120 82 107 411 61 96 74 21
HaMol U 4, .2 J J I J J
Sarkhej U 82 13 19 17 7 10 15 e 9
Da.luoi Taluka. T 1,1196 6611 931 1,095 362 733 601 a03 198 R 1,1195 665 930 1,094 362 732 601 303 19S U 1 I 1 1
Nandej U 1 1
Dholka Taluka T 1,877 982 8911 1,375 563 812 502 410 83 R 1,871 g82 8B9 1,373 563 8lO 498 419 70 U fI 6 :I .2 , ,
Dholk& U 5 5 4. 4
Bavla U 1 1 1
Dhandhuka Taluka T 3,455 1,791 1,664 2,489 985 1,504 966 806 160 R 3,239 1,691 1,548 2.365 947 1,418 874 744- 130 U 216 100 116 124 38 86 92 62 30
Dhandhuka U 130 65 M 78 28 50' 52 37 15
Banrala U 86 35 ISl 46 10 35 40 25 16
lanand Taluka R 179 98 81 133 59 74 46 39 7
Vinmgam Taluka T 2,2911 1,195 1,103 1,891 875 1,016 40i 320 87 R 2,195 1,141 1,054 1.826 848 978 369 293 76 U lO2 J4 41) 65 27 38 ~8 27 11
Vuampm U ,~ 32 16 38 23 15 10 9
Kandal IT ll/) 22 33 27 4 !l3 28 18 10
»alpJa Tal ... R 94- 48 46 44- 18 26 50 30 JO
125
(Bk) H-46-32
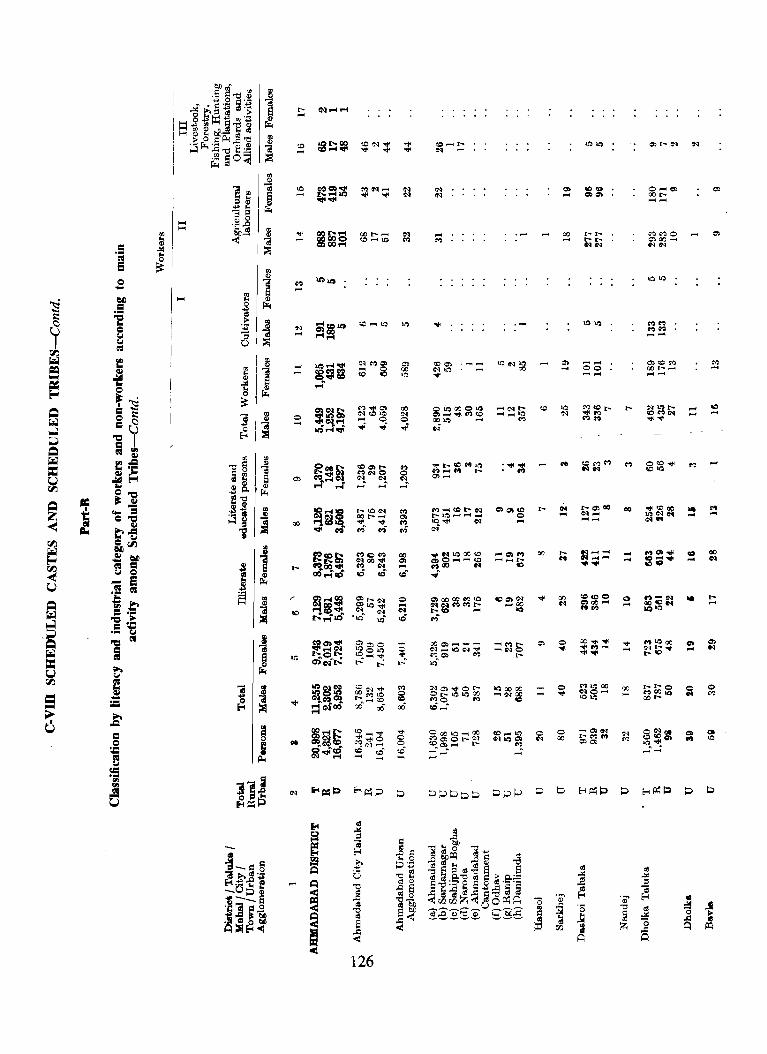
'"
J 1 8
... .....
00
126
M~(C~tN ~lQ""""''''"''....-4 "''<1' C<l "';
... '"
00 C<l
o ....
o :L)
... ... ...... ~o:-o
... ",00 0:-0 .... ........
.... ....
'" ....
..
'" ..,
M ....
'" ....
....
M ....
... ....
o M
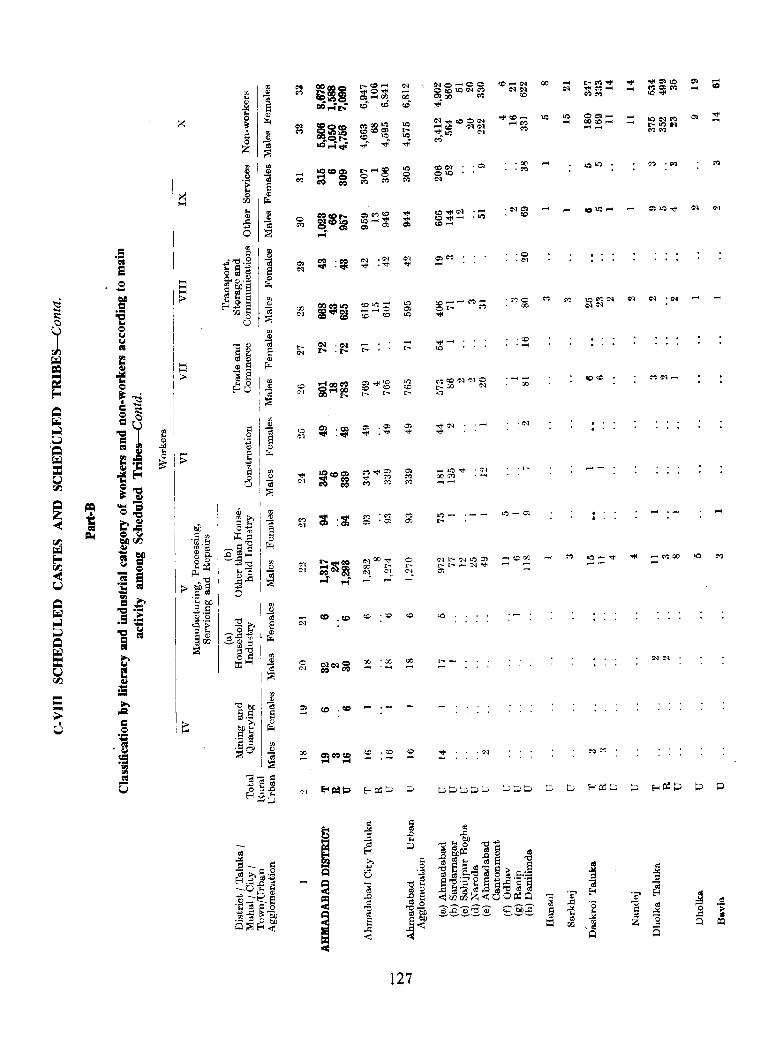
H H
>
§
1 §
Q
'" ...,
U) .CO
IN ..... 00 <D
<C • '"
127
.0>
~e.o!':'le-10 r-:f) ~l
k"
_;to "o:'tI • G'l 00 M -->e,...
·00 ·M
·0 • IN
.<c
.~ ..... 00
· IN
· L-
00 ..... IN
b
.... .....
M ....
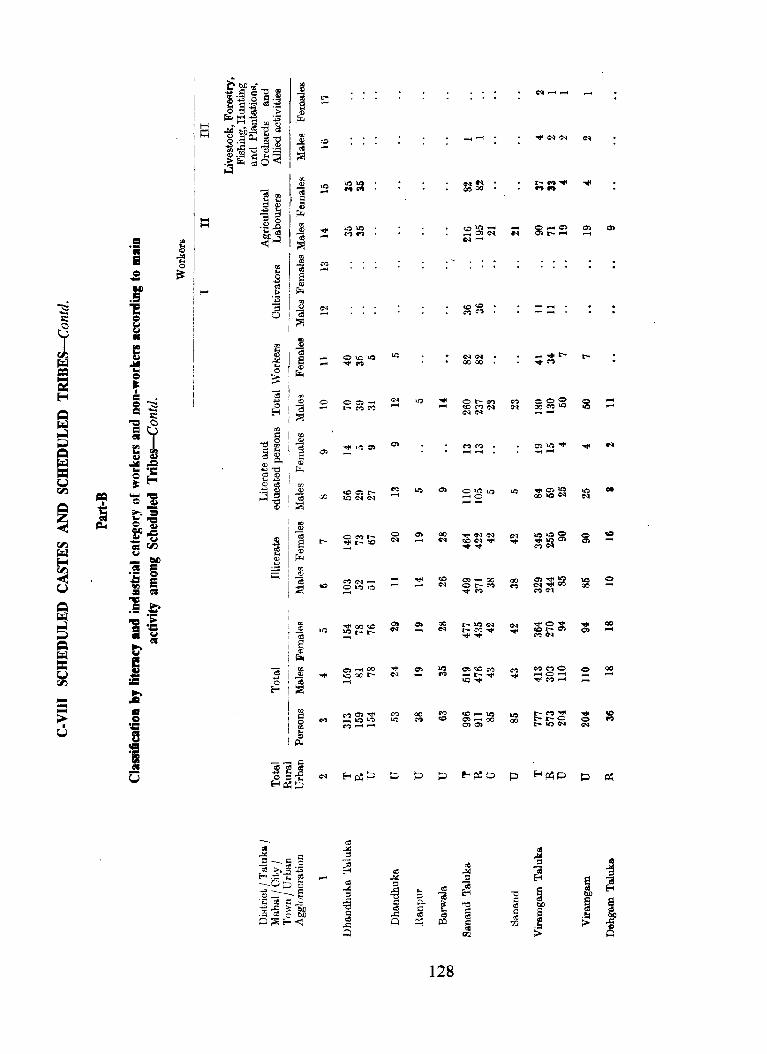
Ii I~
" ..IIi ~ :::--~o 0; ~1l ~ E--;."'t: F.o ce -o~ ~ .;.>~~S .~ 0; .: .::
.~i 518 o;:;:;~<
..... -
oe ..IIi ;:l
0; ~ oe
..IIi ::s "'" "d ~ aI
.J:;
-=i
"" -
oe ..IIi
.E "d §
.J:; 0
C> ,.....
00 ...
;; ;:0.. .: oe ~
III 0;
~ dl
;:Q
128
_-
010 l..."") _0 --
oe ..IIi ::s ~ "d ,:::
; <T.l
to 00
"d a Q
'" rn
<"1 __
~ ..;.I ::s
~ S aI tID S
~
to 00
<:> -,.....
~ tID
~ ... >
-,.....
...
<::> -QD ....
QD ,.....
1 ~ ~ !)I)
..c: CI 0
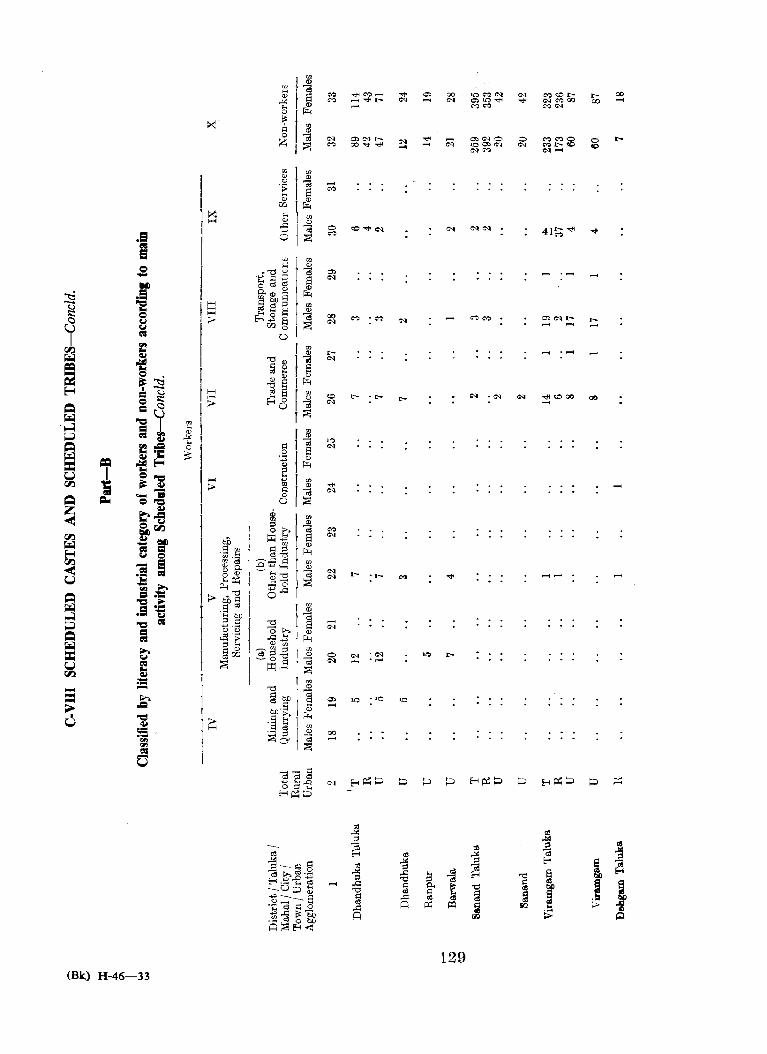
.s a s
---~
(Bk) H-46-33
129
I:- 00 00
o l:e>
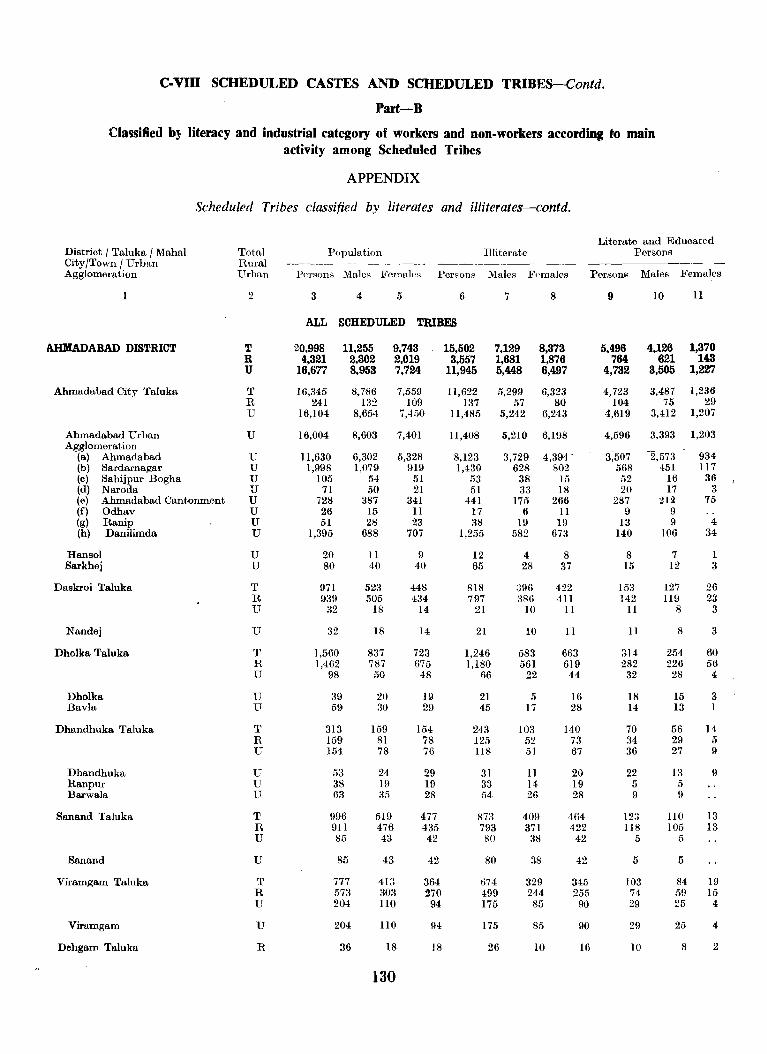
c-vm SCHEDULED CASTES AND SCHEDULED TRIBES-Contd.
Part-B
Cla9Sified b~ literacy and industrial category of workers and non-workers according to main activity among Scheduled Tribes
APPENDIX
Scheduled Tribes classified by literates and illiterates-contd.
Literate and Educated District / Taluka / Mahal Total Population Illiterate Persons City/Town / Urban Rural ------------ --~--------- -------~-- -Agglomeration Urban PATRons MaieR FemaleR Persons Males Fpmales Persons Males Females
1 2 3 4 5 6 7 8 9 10 11
ALL SCHEDULED TRIBES
AHMADABAD DISTRICT T 20,998 11,255 9,743 15,502 7,129 8,373 5,496 4,126 1,370 R 4,321 2,302 2,019 3,557 1,681 1,876 764 621 143 U 16,677 8,953 7,724 11,945 5,448 6,497 4,732 3,505 1,227
Ahmadabad City TaIuka T 16,345 8,786 7,559 1I,62Z 5,299 6,323 4,723 3,487 1,236 R 241 132 109 137 57 80 104 75 29 U 16,104 8,654 7,4iiO 11,485 5,242 6,243 4,619 3,412 1,207
Ahmadabad Urban U 16,004 8,603 7,401 11,408 5,210 6,198 4,596 3,393 1,203 Agglomeration
(a) Ahmadabad U 11,630 6,302 5,328 8,123 3,729 4,394- 3;507 2,573 934 (b) Sardarnagar U 1,998 1,079 919 1,430 628 802 568 451 117 (e) Sahijpur Bogha U 105 54 51 53 38 15 52 16 36 (d) Naroda "IT 71 50 21 51 33 18 20 17 3 (e) Ahmadabad Cantonment U 728 387 341 441 175 266 287 212 75 (f) Odhav U 26 15 11 17 6 11 9 9 (g) Ranip U 51 28 23 38 19 19 13 9 4 (h) Danilimda U 1,395 688 707 1,255 582 673 140 106 34
Hansol U 20 II 9 12 4 8 8 7 1 Sarkhej U 80 40 40 65 28 37 15 12 3
Daskroi Taluka T 971 523 448 818 :196 422 153 127 26 R 939 505 434 797 386 411 142 1I9 23 U 32 18 14 21 10 11 11 8 3
Nandej U 32 18 14 21 10 11 11 8 3
Dholka Taluka T 1,560 837 723 1,246 583 663 314 254 60 R 1,462 787 675 1,180 561 619 282 226 56 U 98 50 48 fi6 22 44 32 28 4
Dholka U 39 20 HI 21 5 16 18 15 3 Bavla IT 59 30 29 45 17 28 14 13 1
Dhandhuka Taluka T 313 159 154 243 103 140 70 56 14 R 159 81 78 125 52 73 34 29 5 U 154 78 76 118 51 67 36 27 9
Dhandhuka U 53 24 29 31 11 20 22 13 9 Ranpur U 38 HI 19 33 14 19 5 5 Barwala U 63 35 28 54 26 28 9 9
Sanand Taluka T 996 519 477 R73 409 464 12:1 1I0 13 R 911 476 435 793 371 422 lIS 105 13 U 85 4il 42 80 38 42 5 5
Sanand U 85 43 42 80 38 42 5 5
Viramgam TaIuka T 777 41il 364 674 329 345 103 84 19 R 573 303 270 499 244 255 74 50 15 U 204 1I0 94 175 85 90 29 25 4
Viramgam U 204 110 94 175 85 90 29 25 4
Dehgam Taluka R 36 18 18 26 10 lfl 10 S 2
130
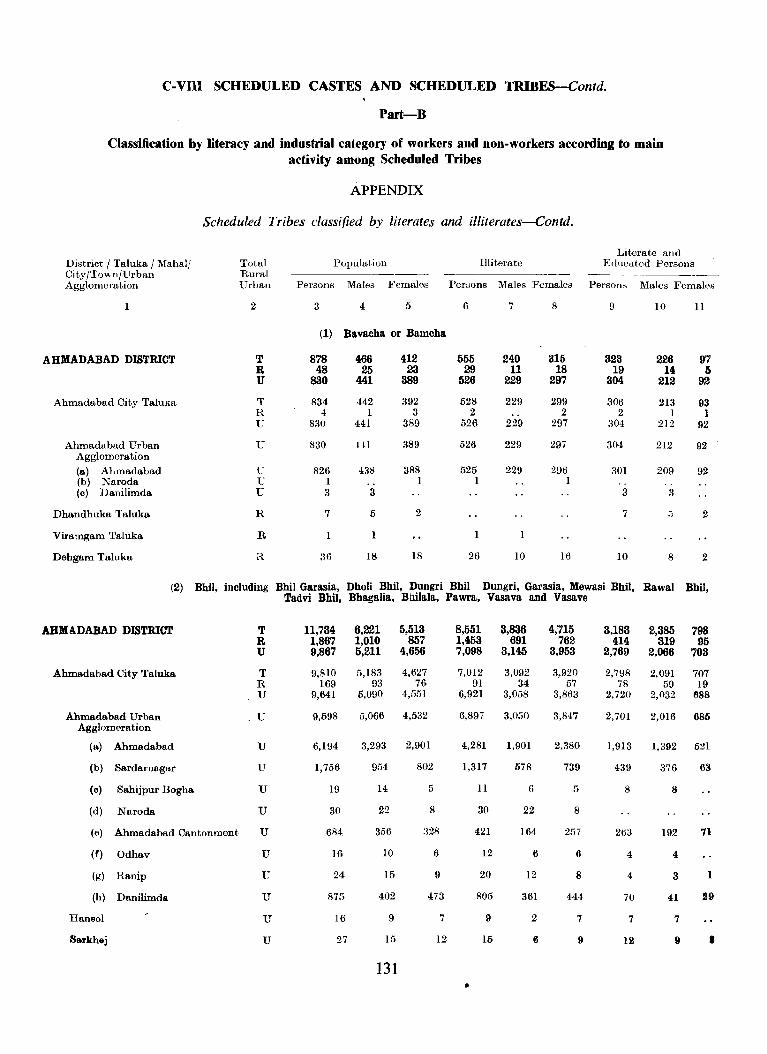
c-VIlt SCHEDULED CASTES AND SCHEDULED TRIBES-Contd.
Part-B
Classification by literacy and industrial category of workers and non-workers according to main activity among Scheduled Tribes
APPENDIX
Scheduled Tribes classified by literates and illiterates-Contd.
Literate and District / Taluka / J\Iahalj City/Town/Urban Agglomeration
Total Rural Urban
Population Illiterate Educated Persons
1
AHMADABAD DISTRICT
Ahmadabad City Taluka
Ahmadabad Urban Agglomeration
(a) Ahmadabad (b) Naroda (e) Danilimda
Dhandhuka Taluka
Viramgam Taluka
Dehgam Taluka
2
T R U
T H U
U
U U U
R
R
Persons Males Females Per,;ons Males Females Persons Males Females
3 4 5
(1) Bavacha or Bamcha
878 48
830
834 4
830
830
826 1 3
7
466 25
441
442 1
441
HI
438
3
5
1
18
412 23
389
392 3
389
389
388 1
2
18
6
555 29
526
528 2
526
526
525 1
1
26
7
240 11
229
229
229
229
229
10
315 18
297
299 2
297
297
296 1
16
9
323 19
304
306 2
304
304
301
3
7
10
10
226 14
212
213 1
212
212
209
3
8
11
97 5
92
93 1
92
92
92
2
2
(2) Bhil, including Bhil Garasia, Dholi Bhil, Dungri Bhil Dungri, Garasia, Mewasi Bhil, Rawal Bhil, Tadvi Bhil, Bhagalia, Bhilala, Pawra, Vasava and Vasave
AHMADABAD DISTRICT
Ahmadabad City Taluka
Ahmadabad Urban Agglomeration
(a) Ahmadabad
(b) Sardarnagar
(c) Sahijpur Bogha
(d) Naroda
(e) Ahmadabad Cantonment
(f) Odhav
(g) Ranip
(h) Danilimda
Hansol
SBrkhej
T R U
T R U
U
u U
U
U
U
U
U
U
U
U
11,734 1,867 9,867
9,810 169
9,641
9,598
6,194
1,756
19
30
684
16
24
875
16
27
6,221 1,010 5,211
5,183 93
5,090
5,066
3,293
954
14
22
356
10
15
402
9
15
131
5,513 857
4,656
4,627 76
4,551
4,532
2,901
802
5
8
328
6
9
473
7
12
8,551 1,453 7,098
7,012 91
6,921
6,897
4,281
1,317
II
•
30
421
12
20
805
9
15
3,836 691
3,145
3,092 34
3,058
3,050
1,901
578
6
22
164
6
12
361
2
6
4,715 762
3,953
3,920 57
3,863
3,847
2,380
739
5
8
257
6
8
444
7
II
3,183 414
2,769
2,798 78
2,720
2,701
1,913
439
8
263
4
4
70
7
12
2,385 319
2,066
2,091 59
2,032
2,016
1,392
376
8
192
4
3
41
7
9
798 95
703
707 19
688
685
521
63
71
1
ll9
•
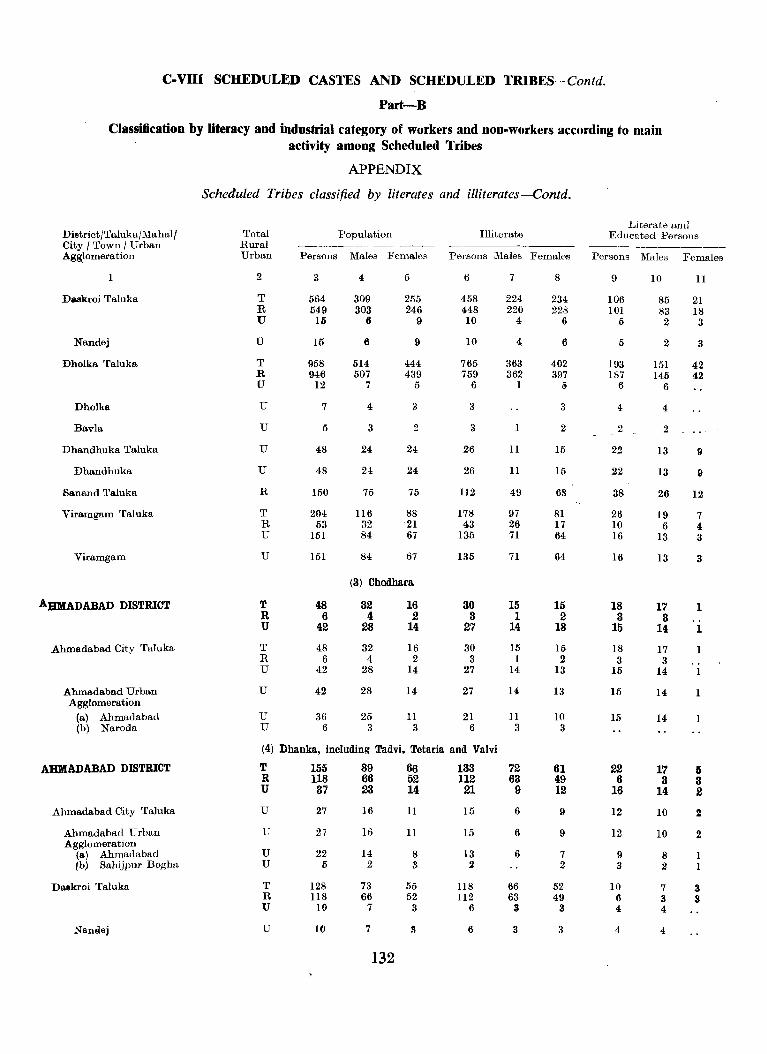
C-VIII SCHEDULED CASTES AND SCHEDULED TRIBES-Contd.
Part-B
Classification by literacy and industrial category of workers and uon-workers according to main activity among Scheduled Tribes
APPENDIX
Scheduled Tribes classified by literates and illiterates-Contd.
Literate rmd DistrictjTalukajMahal1 Total Population Illiterate Educated Persons City j Town I Urban Rural -----~-
---------~-
Agg_lomeration Urban Persons Males Females Persons Males Females Persons Males Females
2 3 4 5 6 7 8 9 10 11
Daekroi Taluka T 564 309 255 458 224 234 106 85 21 R 549 303 246 448 220 228 101 83 18 U 16 6 9 10 4 6 5 2 3
Nandej U 15 6 9 10 4 6 5 2 3
Dholka Taluka T 958 514 444 765 363 402 193 151 42 R 946 507 439 759 362 397 187 145 42 U 12 7 5 6 1 S 6 6
Dholka U 7 4 3 3 3 4 4
Bavla U 5 3 2 3 2 2 2
Dhandhuka Taluka U 48 24 24 26 11 15 22 13 9
Dhandhuka U 48 24 24 26 II 15 22 13 9
Sanand Taluka R 150 75 75 112 49 6S 38 26 12
Viramgam Taluka T 204 116 88 178 97 81 26 19 7 R 53 32 21 43 26 17 10 6 4 U 151 84 67 135 71 64 16 13 3
Viramgam U 151 84 67 135 71 64 16 13 3
(3) Chodhara
AHMADABAD DISTRICT T 48 32 16 30 15 15 18 17 1 R 6 4 2 3 1 2 3 3 U 42 28 14 27 14 18 15 14 1
Ahmadabad City Taluka T 48 32 16 30 15 15 18 17 R 6 4 2 3 1 2 3 3 U 42 28 14 27 14 13 15 14 1
Ahmadabad Urban U 42 28 14 27 14 13 15 14 Agglomeration
(a) Ahmadabad U 36 25 II 21 II 10 15 14 (b) Naroda U 6 3 3 6 3 3
(4) Dhanka, including Tadvi, Tetaria and Valvi
AHMADABAD DISTRICT T 155 89 66 133 72 61 22 17 I» R 118 66 52 112 63 49 6 3 3 U 37 23 14 21 9 12 16 14 2
Ahmadabad City Taluka U 27 16 11 15 6 9 12 10 2
Ahmadabad Urban U 27 16 11 15 6 9 12 10 2 Agglomeration
U 22 14 6 7 (fl.) Ahmadabad 8 13 9 8 1 (b) Sahijpur Bogba U /) 2 3 2 2 3 2 1
Dalkroi Taluka T 128 73 55 118 66 52 10 7 3 R 118 66 52 112 63 49 6 3 S U 10 7 3 6 3 3 4 4
Nllmlej U 10 7 S 6 3 3 4 4
132
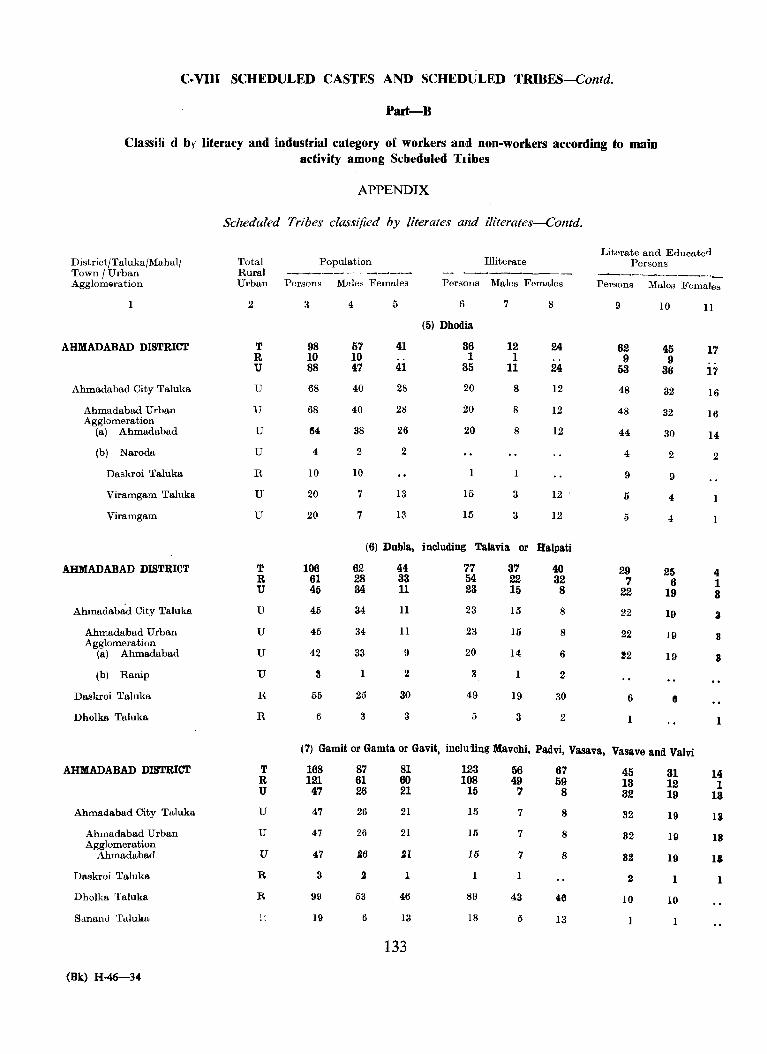
C-VIlI SCHEDULED CASTES AND . SCHEDULED TRIB£S-Contd.
Part-B
Classili d b l' literacy and industrial category of workers aud non-workers according to main activity among Scheduled Tribes
District/Taluka/Mahal/ Town /Urban Agglomeration
AHMADABAD DISTRICT
Ahmadabad City Taluka
Ahmadabad Urban Agglomeration
(a) Ahmadabad
(b) Naroda
Daskroi Taluka
Viramgam Taluka
Viramgam
AHMADABAD DISTRICT
Ahmadaba:d City Taluka
Ahmadabad Urban Agglomeration
(a) Ahmadabad
(b) Ranip
Daskroi Taluka
Dholka Taluka
AHMADABAD DISTRICT
AhmaQabad City Taluka
Ahmadabad Urban Agglomeration
Ahmadabad
Daskroi Taluka
Dholka Taluka
Sanantl Taluka
(Bk) H-46-34
APPENDIX
Scheduled Tribes classified by literates and iliterates-Contd.
Total Population Rural --_._- -- ----Urban Persons Males Females
2
T R U
U
U
U
U
R
U
U
3
98 10 88
68
68
64
4
10
20
20
4
57 10 47
40
40
38
2
10
7
7
5
41
41
28
28
26
2
13
13
Illiterate
Persons Males Females
6
(5) Dhodia
36 1
35
20
20
20
1
15
15
7
12 1
11
8
8
8
3
3
8
24
24
12
12
12
12
12
(6) Dubla, including Talavia or Halpati
T R U
U
U
U
U
R
R
106 61 45
45
45
42
1I
55
6
62 28 34
34
34
33
25
3
44 33 11
11
11
9
2
30
3
77 54 23
23
23
20
3
49
5
37 22 15
15
15
14
1
19
3
40 32 8
8
8
6
2
30
2
Literate and Educatod Persons
------------Persons Males Females
9
62 9
53
48
48
44
4
9
5
29 7
22
22
22
!2
6
1
10
45 9
36
32
32
30
2
9
4
4
25 6
19
19
HI
19
11
17
17
16
16
14
2
4 1 3
3
1I
I
1
(7) Gamit or Gamta or Gavit, inclu1ing Mavchi, Padvi, Vasava, Vasave and Valvi
T R U
U
U
U
R
R
168 121
47
47
47
47
3
99
19
87 61 26
26
26
JZ6
2
53
6
81 60 21
21
21
U
1
46
133
123 108
15
15
15
15
89
18
56 49 7
7
7
7
43
is
67 59
8
8
8
8
46
13
45 13 32
32
32
811
2
10
1
31 12 19
19
19
19
1
10
1
14 1
13
13
18
11
1

C-VIII SCHEDULED CASTES AND SCHEDULED TRIBES-Contd.
Part-B
Classification by literacy and industrial category of workers and non-workers according to main activity among Scheduled Tribes
APPENDIX
Scheduled Tribes classified by literates and illiterates-Contd.
Lit, 'rate and Educated District/Talui{a/Mahail Totall Population [iliteratc Persons
City I Town ILJl'uim l'tural -..o_......___. __________ ----.-- ------------~ ---~-------
Agglomeration Urban Persons Males Females Persons ~vIales F31.,ale8 l:'erbms Males Females
2 3 4 5 6 7 c t; 10 11 0
(8) Gond or Raibond
AHMADABAD DISTRICT U 4 1 3 3 1 2 1 1
Ahmadabad City Taiuka U 4 3 3 I 2
Ahmadabad Urban U 4 3 3 2
Agglomeration (a) Ahmadabad U 3 3 2 2
(b) Ahmadabad U 1 1 1
Cantonment (9) Kathodi or Katkari, including Dhor Kathodi or Dhor Katkari and Son Kathodi
or Son Katkari
A HMADABAD DISTRICT U 19 4 15 2 2 17 4 13
Ahmadabad City Taluka U 19 4 15 2 2 ! 7 4 18
Ahmadabad Urban U J9 4 15 2 2 17 4 18 Agglomeration
Ahmadabad U 19 4 15 2 2 17 4 18
(10) Kokna, Kokni, Kukna
AHMADABAD DISTRICT U 4 2 2 3 2 1 1 1
Ahmadabad City Taluka U 4 2 2 3 2 I
Ahmadabad Urban U 4 2 2 3 2 Agglomeration
Ahmadabad U 4 2 2 II 2 1
(11) Koli Dhor, Tone Koli. Kolcha or Kolgha
AHMADABAD DISTRICT U 55 42 13 25 16 9 30 26 4
Ahmadabad City Taluka U 55 42 13 25 16 9 30 26 4
Ahmadabad Urban U 55 42 13 25 16 9 30 26 4 Agglomeration
Ahmitdabad U 55 42 13 25 16 fl 30 26 4
(12) Naikda. or Nayaka, including Cholivala Nayaka, Kapadia Nayaka, Mota Nayaka and Nana Nayaka
AHMADABAD DIS'rRICT T 1,158 617 541 956 454 5{)2 202 163 39 R 788 428 360 649 814 £.35 139 114 25 U 370 189 181 807 140 167 63 49 14
Ahmadabad City Taluka T 317 171 146 242 117 125 75 54 21 R 60 34 26 40 22 18 20 12 8 U 257 137 120 202 05 107 55 42 13
Ahmadabad Urban U 204 112 92 152 73 79 52 39 13 Agglomeration
U 188 104 84 146 71 (11) Ahmadabad 75 42 33 II
(h) SahijpOlr Bogha U 6 3 a 5 2 3
(0) Naroda U 3 8 8 3
(ci) Ranip u 7 2 5 5 4 2 1
Sarkh.j U 53 25 28 50 12 28 3 3
134
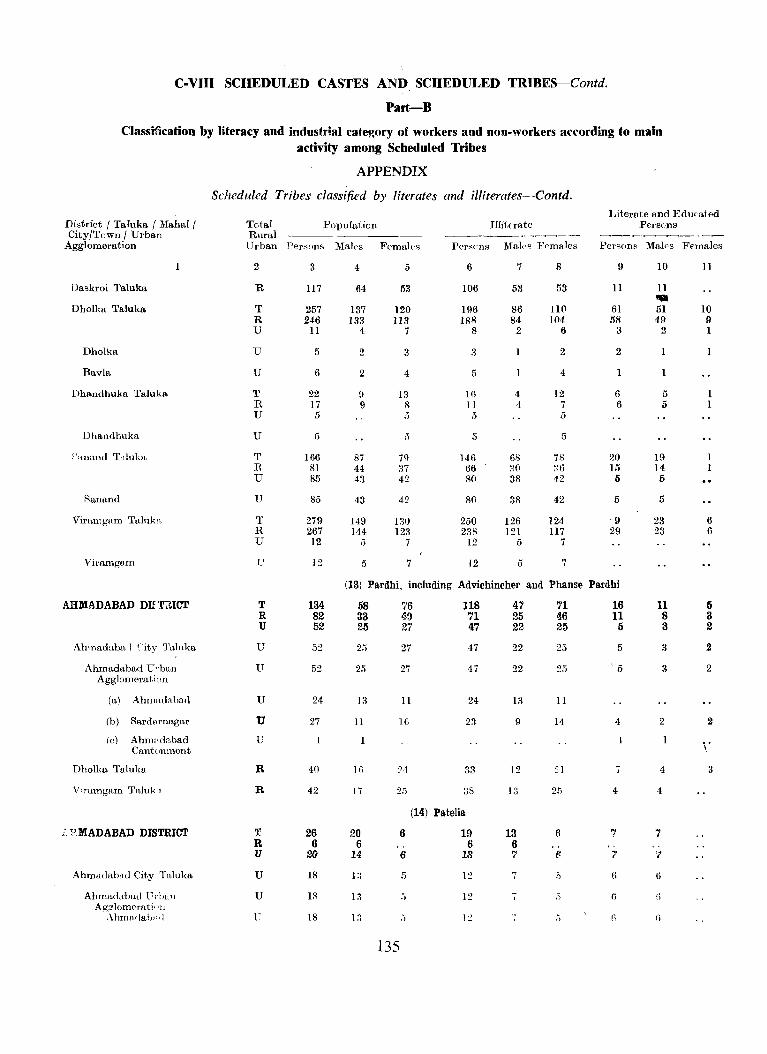
C-VIII SCHEDULED CASTES AND SCHEDULED TRIBES--Contd.
Part-B
Classification by literacy and industrial cate~ory of workers and non-workers according to main activity among Scheduled Tribes
District ( Taluka ( MahaI ( City/Town / Urban
Agglomeration
Oaskroi Taluka
Dholka Taluka
Dholka
Bavla
Dhandhuka Taluka
Dhandhuka
,',mand Tdnka
Sanand
Viramgam Tahlkrt
Vimmgam
AHMADABAD DIf1'EICT
Ahmadaba I City Talllka
Ahmadabad U"ban Agglomerati un
(a) Ahmadabad
(b) Sard~rnagar
(c) Ahm"dp,bad Cantonment
Dhollm 'l'aluka
Virumgarn Taluk.
,·,l:'.MADABAD DISTRICT
Ahm'j(lahad City Taluka
Ahmadabad Urban AC'f!lomf'rati· )11
"AhmndaiJ,,<I
APPENDIX
Scheduled Tribes classified by literates and illiterates-Contd.
Total Population Rural -
Urban Persons MalAs Femal .. s
2
R
T R U
U
U
T R U
U
'1' R. U
U
T R U
u
3
117
257 246
11
5
6
22 17 5
5
166 81 85
85
279 267 12
12
4
64
137 133
4
2
2
9 9
87 44 43
43
149 144
5
15
5
53
120 ll3
7
3
4
13 8 5
5
79 37 42
42
130 123
7
7
Illitf'rate
Persens Maks FAmales
6
106
HI6 188
8
If; II
5
5
146 66 80
80
250 238
12
12
7
53
86 84
2
4 4
68 ~(l
38
38
126 121
5
5
8
53
110 104
6
2
4
12 7 5
5
78 :113 42
42
124 117
7
7
Literate and Educated Persons
Persons MalI's Females
9
11
61 58
3
2
6 6
20 15 5
5
9 29
10
11 .... 51 49
2
5 5
19 14 5
5
23 23
II
10 9 1
1 I
6 6
(13) Pardhi, including Advichincher and Phanse Pardhi
T R U
U
U
U
U
U
R
R
T R U
U
U
u
134 82 52
52
52
24
27
40
42
26 6
20
18
18
18
58 33 25
25
25
13
Il
16
17
20 6
14
l:l
13
27
27
II
16
:>1
25
118 71 47
47
47
24
23
33
(14) Patelia
135
6
6
5
;"_;
19 6
13
12
12
1:.'
47 25 22
22
22
13
9
12
I ,~,
,)
13 6
'" 7
71 46 25
25
25
II
14
~l
25
6
(j
.~
16 11 5
5
'5
4
7
4
6
fi
11 8 3
3
3
2
4
4
7
'i'
6
(j
5 3 2
2
2
2
\.
3
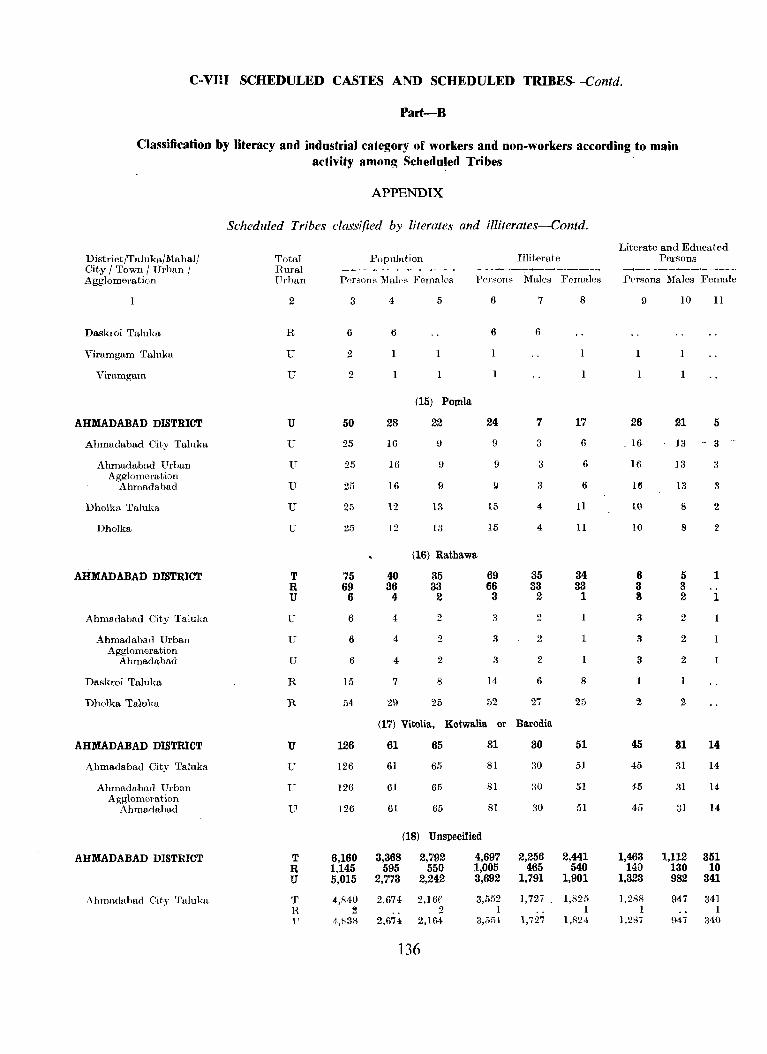
C-VIlI SCHEDULED CASTES AND SCHEDULED TRIBES-Contd.
Part-B
Classification by literacy and industrial category of workers and non-workers according to main activity among Schedn!ed Tribes
APPENDIX
Scheduled Tribes classified by literates and illiterates-Contd.
Literate and Educated District/TaIuka/Mahal! Totul Populution Illiterate Persons City / Town / Urban / HuraI ---------~_____, -- ---_....,j-_.,.-~----~ .. -------.... ----~--Agglomeration Urban Persons Males Femah's Persons Males F('males Porsons Males Female
2 3 4 5 6 7 8 9 10 11
Daskroi Taluka H 6 6 6 6
Viramgam Talu"ka U 2
Virumgam U 2
(15) Pomla
AHMADABAD DISTRICT U 50 28 22 24 7 17 26 21 5
Ahmadabad City Talnka U 25 16 9 9 3 6 16- 13 --- 3
Ahmadabad Urban U 25 16 9 9 3 6 Hi 13 3 Agglomoration
Ahmadabad U 25 16 9 9 3 6 HI 13 3
Dholka Taluka U 25 12 13 15 4 11 10 8 2
Dholka U 25 12 1::1 15 4 11 10 8 2
(16) Rathawa
AHMADABAD DISTRICT T 75 40 35 69 35 34 6 5 1 R 69 36 33 66 33 33 3 3 U 6 4 2 3 2 1 3 2 1
Ahmadabad City Talulm U 6 4 2 3 2 3 2
Ahmadabad Urban U 6 4 2 3 2 3 2 Agglomeration
Ahmadabad U 6 4 2 3 2 3 2 1
Daskroi Taluka H 15 7 8 14 6 8
Dbolka Talulm R 54 29 25 52 27 25 2 2
(17) Vitolia, Kotwalia or Barodia
AHMADABAD DISTRICT U 126 61 65 81 30 51 45 81 14
Ahmadabad City Talnka U 126 61 65 81 30 51 45 31 14
Ahmadabad Urbon U 126 61 65 81 30 51 45 31 14 Ag~lomeration
Ahmadabad U 126 61 65 81 30 51 45 31 14
(18) Unspecified
AHMADABAD DISTRICT T 6,160 3,368 2,792 4,697 2,256 2,441 1,463 1,112 351 R 1,145 595 550 1,005 465 540 140 130 10 U 5,015 2,773 2,242 3,692 1,791 1,901 1,323 982 341
Abmadabad City Talnka T 4,R40 2,674 2,16f 3,552 1,727 1,825 1,288 947 341 R ~ 2 1 1 1 1 11 4,838 2,674 2,104 3,5!11 1,727 I,S2,t 1,287 947 340
136
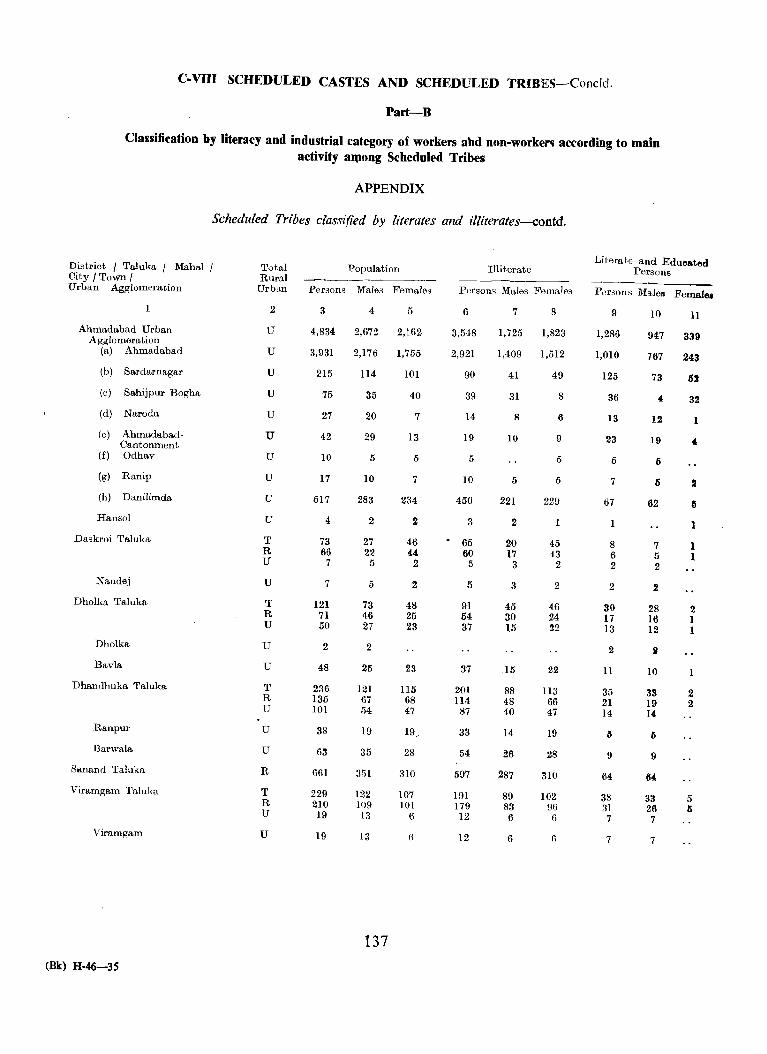
C-VIII SCHEDULED CASTES AND SCHEDULED TRIBES--Condd.
Part-B
Classification by literacy and industrial category of workers abd non-worker'i according to main activity aQlong Scheduled Tribes
ApPENDIX
Scheduled Tribes classified by literates and illiterates-contd.
Literate and Educated District I Taluka I Mahal Total Population Illiterate Persons City I Town I Rural Urban Agglomeration Urban Penons Males Females Person'l Males Females Porsons Males Female.
1 2 3 4 5 6 7 8 9 10 11 Ahmadabad Urban U 4,834 2,672 2,162 3,548 1,725 1,823 1,286 947 339 Agglomeration
(a) Ahmadabad U 3,931 2,176 1,755 2,921 1,409 1,512 1,010 767 243 (b) Sardarnagar U 215 114 101 90 41 49 125 73 tl2 (e) Sahijpur Bogha U 75 35 40 39 31 8 36 4 32 (d) Naroda U 27 20 7 14 8 6 13 12
(e) Ahmadabad- U Cantonment
42 29 13 19 10 9 23 19 • (f) Odhav U 10 5 5 5 5 II 5
(g) Ranip U 17 10 7 10 5 5 7 5 2 (h) Danilimda U 517 283 234 450 221 229 67 62 tl Hansol U 4 2 2 3 2 1 1
Daskroi Taluka T 73 27 46 . 65 20 45 8 7 1 R 66 22 44 60 17 43 6 II 1 U 7 5 2 5 3 2 2 2 Nandej U 7 5 2 5 3 2 2 2
Dholka Taluka T 121 73 48 91 45 46 30 28 2 R 71 46 25 54 30 24 17 16 1 U 50 27 23 37 15 22 13 12 1 Dholka U 2 2 2 » Bavla U 48 25 23 37 .15 22 11 10
Dhandhnka Taluka T 236 121 115 201 88 113 35 33 2 R 135 67 68 114 48 66 21 19 2 U 101 54 47 87 40 47 14 14 Ranpur U 38 19 19 33 14 19 5 5 Barwa1a U 63 35 28 54 26 28 9 9
Sltnand Taluka R 661 351 310 597 287 310 64 64 Viramgam Taluka T 229 122 107 191 89 102 38 33 5 R 210 109 101 179 83 96 31 26 Ii U 19 13 6 12 6 6 7 7
Viramgam U 19 1:1 6 12 6 r; 7 7
137
(Bk) H-46-3S

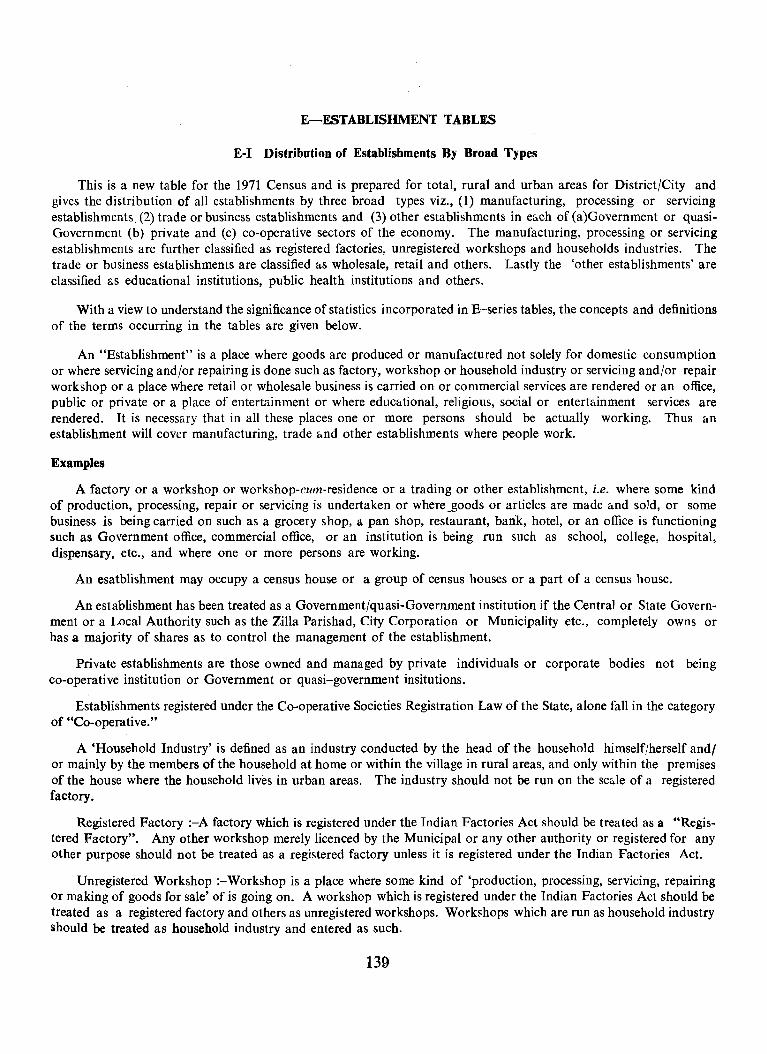
E-ESTABLISHMENT TABLES
E-I Distribution of Establishments By Broad Types
This is a new table for the 1971 Census and is prepared for total, rural and urban areas for District/City and gives the distribution of all establishments by three broad types viz., (1) manufacturing, processing or servicing establishments, (2) trade or business establishments and (3) other establishments in each of (a)Government or quasiGovernment (b) private and (c) co-operative sectors of the economy. The manufacturing, processing or servicing establishments are further classified as registered factories, unregistered workshops and households industries. The trade or business establishments are classified uS wholesale, retail and others. Lastly the 'other establishments' are classified as educational institutions, public health institutions and others.
With a view to understand the significance of statistics incorporated in E-series tables, the concepts and definitions of the terms occurring in the tables are given below.
An "Establishment" is a place where goods are produced or manufactured not solely for domestic consumption or where servicing and/or repairing is done such as factory, workshop or household industry or servicing and/or repair workshop or a place where retail or wholesale business is carried on or commercial services are rendered or an office, public or private or a place of entertainment or where educational, religious, social or entertainment services are rendered. It is necessary that in all these places one or more persons should be actually working. Thus an establishment will cover manufacturing, trade and other establishments where people work.
Examples
A factory or a workshop or workshop-cum-residenC",e or a trading or other establishment, i.e. where some kind of production, processing, repair or servicing is undertaken or where _goods or articles are made and sold, or some business is being carried on such as a grocery shop, a pan shop, restaurant, bank, hotel, or an office is functioning such as Government office, commercial office, or an institution is being run such as school, college, hospital, dispensary, etc., and where one or more persons are working.
An esatblishment may occupy a census house or a group of census houses or a part of a census house.
An establishment has been treated as a Government/quasi-Government institution if the Central or State Government or a Local Authority such as the Zilla Parishad, City Corporation or Municipality etc., completely owns or has a majority of shares as to control the management of the establishment.
Private establishments are those owned and managed by private individuals or corporate bodies not being co-operative institution or Government or quasi-government insitutions.
Establishments registered under the Co-operative Societies Registration Law of the State, alone fall in the category of "Co-operative."
A 'Household Industry' is defined as an industry conducted by the head of the household himself/herself andl or mainly by the members of the household at home or within the village in rural areas, and only within the premises of the house where the household lives in urban areas. The industry should not be run on the scale of a registered factory.
Registered Factory :-A factory which is registered under the Indian Factories Act should be treated as a "Registered Factory". Any other workshop merely licenced by the Municipal or any other authority or registered for any other purpose should not be treated as a registered factory unless it is registered under the Indian Factories Act.
Unregistered Workshop :-Workshop is a place where some kind of 'production, processing, servicing, repairing or making of goods for sale' of is going on. A workshop which is registered under the Indian Factories Act should be treated as a registered factory and others as unregistered workshops. Workshops which are run as household industry should be treated as household industry and entered as such.
139
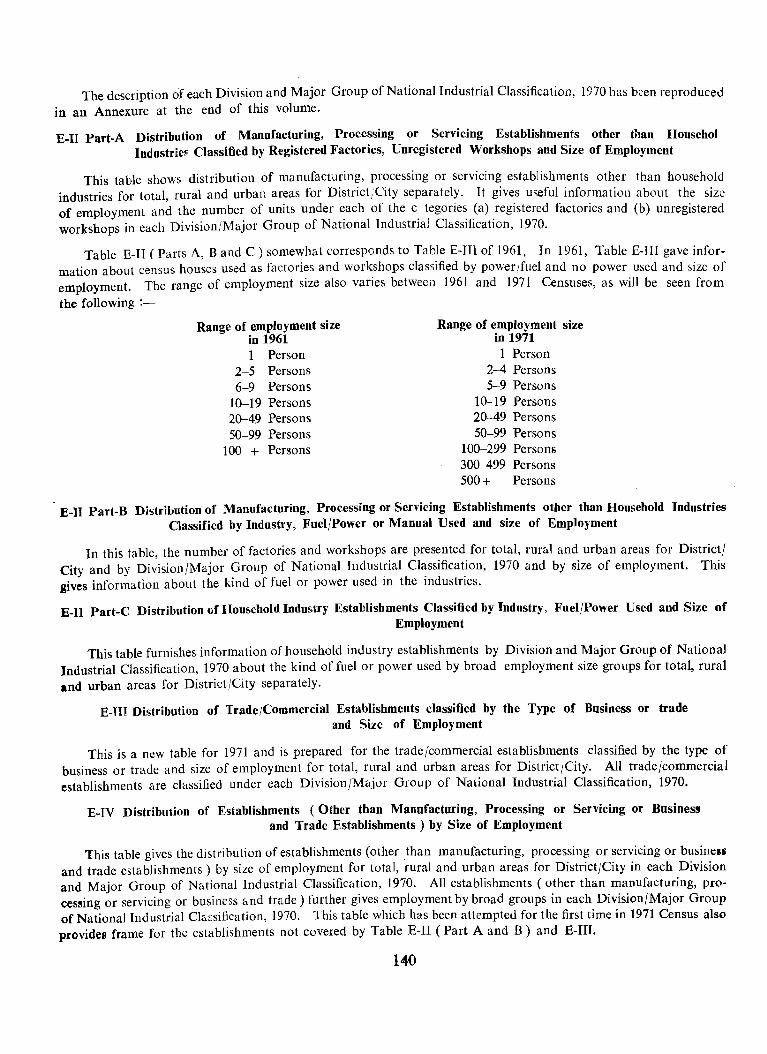
The description of each Division and Major Group of National Industrial Classification, 1970 has been reproduced in an Annexure at the end of this volume.
E-II Part-A Distribution of Manufacturing, Processing or Servicing Establishments other than Househol Industrie!1 Classified by Registered Factories, Unregistered Workshops and Size of Employment
This table shows distribution of manufacturing, processing or servicing establishments other than household industries for total, rural and urban areas for District/City separately. It gives useful information about the size of employment and the number of units under each of the c tegories (a) registered factories and (b) unregistered workshops in each Division/Major Group of National Industrial Classification, 1970.
Table E-II ( Parts A, Band C) somewhat corresponds to Tahle E-IH of 1961. In 1961, Table E-III gave information about census houses used as factories and workshops classified by power/fuel and no power used and size of employment. The range of employment size also varies between 1961 and 1971 Censuses, as will be seen from
the following :-
Range of employment size in 1961 1 Person
2-5 Persons 6-9 Persons
10-19 Persons 20--49 Persons 50-99 Persons
100 + Persons
Range of employment size in 1971 1 Person
2-4 Persons 5-9 Persons
10-19 Persons 20-49 Persons 50-99 Persons
100-299 Persons 300-499 Persons 500 + Persons
E-II Part-B Distribution of Manufacturing, Processing or Servicing Establishments other than Household Industries Classified by Industry, Fuel/Power or Manual Used and size of Employment
In this table, the number of factories and workshops are presented for total, rund and urban areas for District/ City and by Division/Major Group of National Industrial Classification, 1970 and by size of employment. This gives information about the kind of fuel or power used in the industries.
E-II Part-C Distribution of Household Industry Establishments Classified by Industry, Fuel/Power Used and Size of Employment
This table furnishes information of household industry establishments by Division and Major Group of National Industrial Classification, 1970 about the kind of fuel or power used by broad employment size groups for total, rural and urban areas for District/City separately.
E-III Distributiun of Trade/Commercial Establishments classified by the Type of Business or trade and Size of Employment
This is a new table for 1971 and is prepared for the trade/commercial establishments classified by the type of business or trade and size of employment for total, rural and urban areas for District/City. All trade/commercial establishments are classified under each Division/Major Group of National Industrial Classification, 1970.
E-IV Distribution of Establishments (Other than Manufacturing, Processing or Servicing or Business and Trade Establishments) by Size of Employment
This table gives the distribution of establishments (other than manufacturing, processing or servicing or businel' and trade establishments) by size of employment for total, fural and urban areas for District/City in each Division and Major Group of N"tional Industrial Classification, 1970. All establishments (other than manufacturing, proces~ing or servicing or business and trade) further gives employment by broad groups in each Division/Major Group of National Industrial Classification, 1970. This table which has been attempted for the first time in 1971 Census also provides frame for the establishments not covered by Table E-II (Part A and B) and E-II1.
140
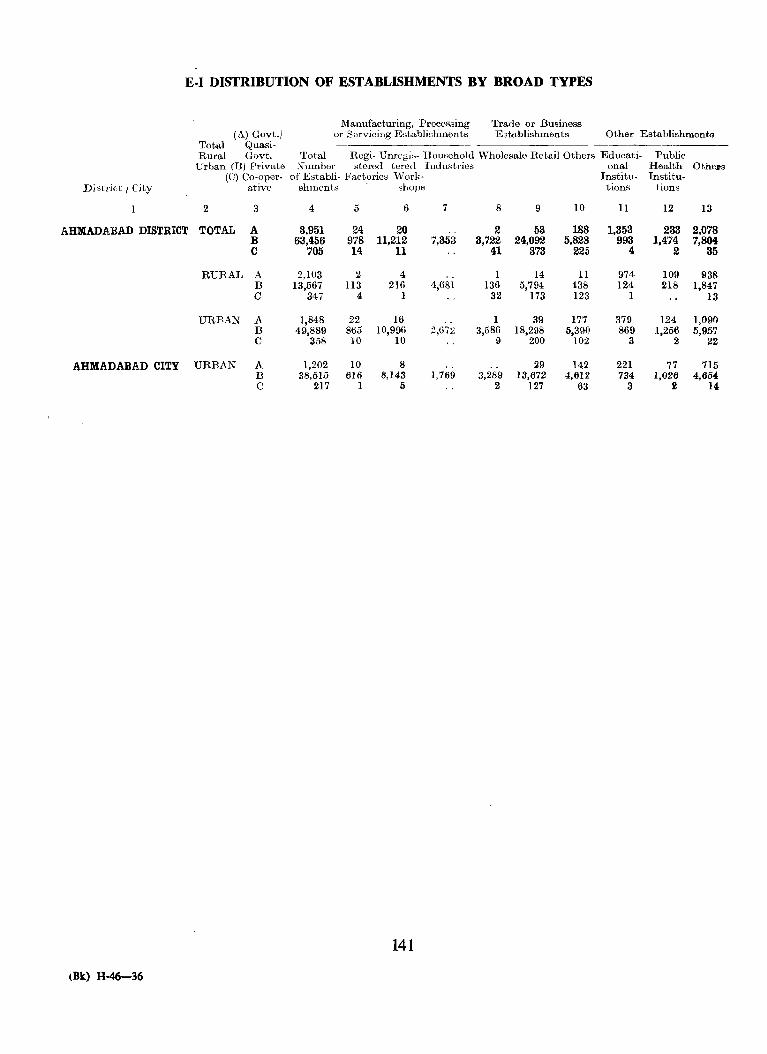
E·I DISTRIBUTION OF ESTABLISHMENTS BY BROAD TYPES
Manufacturing, Processing Trade or Business (A) Govt.; or Servicing Establishments Establishments Other Establishments
Total Quasi-Rural Govt. Total Regi- Unregi~- Household Wholesale ReLail Others Edueati- Public
Urban (Bl Private _::~umber stored tered Iudustries onal Health Otheps (C) Co-oper- of Establi- Factories Work- Institu- Institu-
Ditltrict I City ative shments "bops tions tions
1 2 3 4 5 6 7 8 9 10 11 12 13
AHMADABAD DISTRICT TOTAL A 3,951 24 20 2 53 188 1,353 233 2,078 B 63,456 978 11,212 7.353 3,722 24,092 5,828 993 1,474 7,804 C 705 14 11 41 373 225 4 2 35
RURAL A 2,103 2 4 1 14 11 974 109 938 B 13,567 113 216 4,681 136 5,794 438 124 218 1,847 C 347 4 1 32 173 123 1 13
URBAN A 1,848 22 16 1 39 177 379 124 1,090 B 49,889 865 10,996 2,07!2 3,586 18,298 5,390 869 1,256 5,957 C 358 10 10 9 200 102 3 2 22
AHMADABAD CITY URBAN A 1,202 10 8 ~9 142 221 77 715 B 38,515 6It; 8,143 1,769 3,289 13,672 4,612 734 1,026 4,654 C 217 1 5 2 127 63 3 2 14
141
(Bk) H-46-36
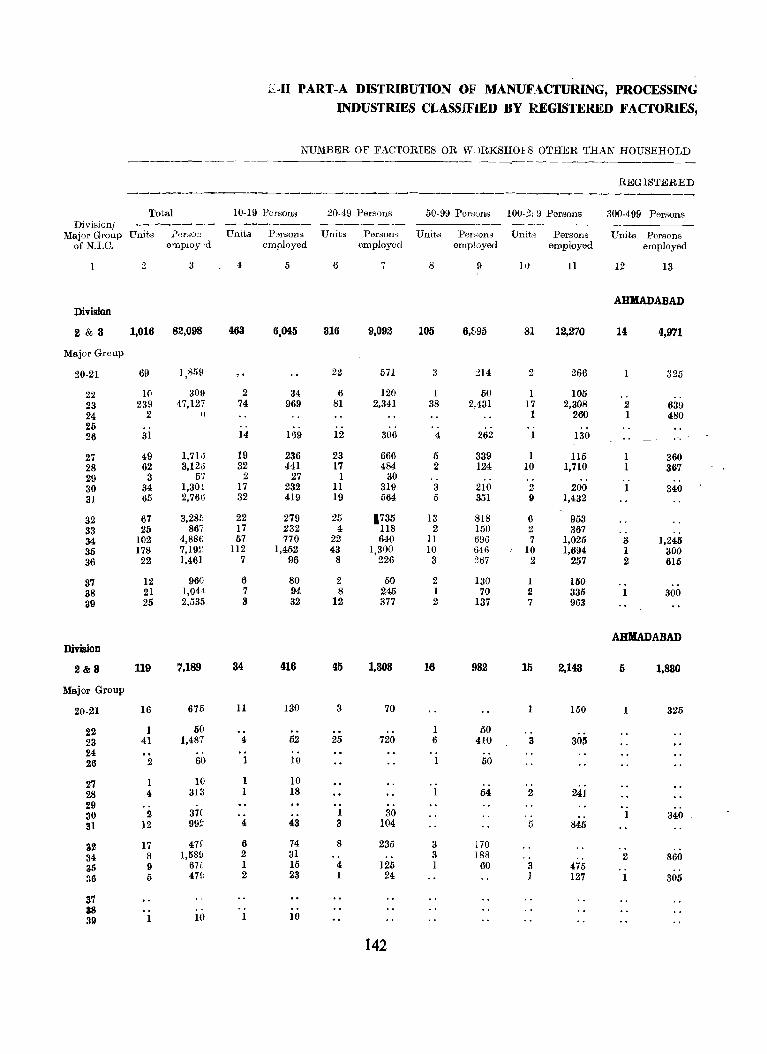
Loll PART-A DISTRIBUTION OF MANUFACTURING, PROCESSING INDUSTRIES CLASSiFIED BY REGISTERED FACTORIES,
NUMBER OF FACTORIES OR W, )RKSHOIS OTHER THAN HOUSEHOLD
REGISTERED _________________________ -...0_-________ ----.. _______________
Total 10-19 Persons 20-49 l'er~ons 50- 99 Per~()ns 100-219 Porsons 300-499 Persons Division! ---_----- ---------- ----_.---_
Major Group Units Per;~o:J Units Parsons Units PerSOll'3 Units Per,ons Un,t,) Persons Units Porsons of N.LC. employ d employed employod employed employed employed
2 3 4 I) (j 7 8 9 11) 11 12 13
AHMADABAD Division
2 & 3 1,016 82,098 463 6,045 316 9,092 105 6,895 81 12,270 14 4,971
Major Group
20-21 69 1,859 22 571 3 214 2 266 325
22 1(\ 30!! 2 34 6 120 1 50 1 105 .. .. 23 239 17,127 74 969 81 2,341 38 2,431 17 2,308 2 639 24 2 I) 1 260 I 480 25 .. .. 26 31 14 H9 12 306 4 262 130 .-. 27 49 1,71'; 19 236 23 666 5 339 1 115 1 360 28 62 3,12li 32 441 17 484 2 124 10 1,710 1 367 29 3 57 2 27 1 30 .. .. 30 34 1,301 17 232 11 319 3 210 2 200 1 340 31 65 2,76tl 32 419 19 564 5 351 9 1,432
32 67 3,285 22 279 25 1735 13 818 6 953 33 25 867 17 232 4 118 2 150 2 367 .. 34 102 4,88(; 57 770 22 640 11 696 7 1,025 3 1,245 36 178 7,192 112 1,452 43 1,300 10 616 I 10 1,694 1 300 36 22 1,461 7 96 8 226 3 267 2 257 2 616
87 12 96G 6 80 2 50 2 130 1 150 88 21 I,OH 7 94 8 245 1 70 .2 335 1 300 39 25 2,535 3 32 12 377 2 137 7 963
AHMADABAD Division
2&8 119 7,189 34 416 45 1,308 16 982 15 2,143 5 1,830
Major Group
20-21 16 675 11 130 3 70 1 150 1 325
22 1 60 1 50 23 41 1,487 4 62 25 720 6 410 3 305 24 26 2 60 1 10 50
27 1 10 1 10 .. 28 4 313 1 18 54 2 241 29
37( 1 30 30 2 340 31 12 99f 4 43 3 104 5 845
32 17 47f 6 74 8 235 3 [70 34 8 l,58e 2 31 3 188 2 860 35 9 671 1 15 4 125 1 60 3 475 .. 36 5 470 2 23 1 24 1 127 1 305
37 IS .. 39 10 1 10
142
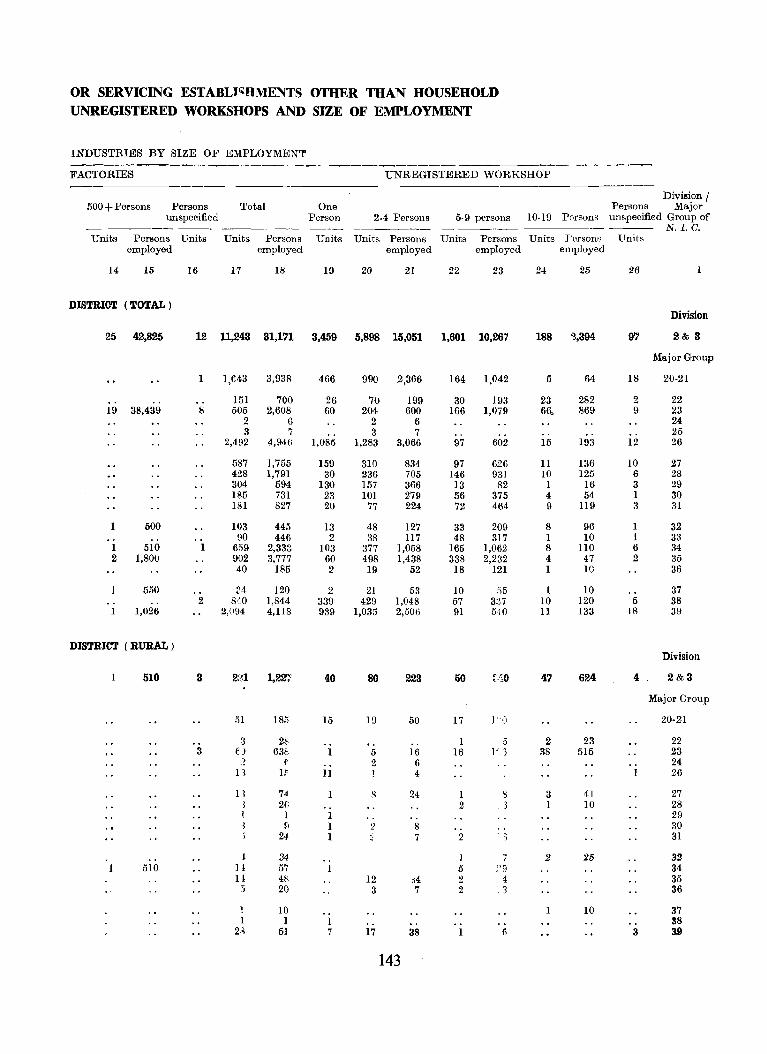
OR SERVICING ESTABLI~HMENTS OTHER THAN HOUSEHOLD UNREGISTERED WORKSHOPS AND SIZE OF EMPLOYMENT
INDUSTRIES BY SIZE OF EMPLOYMENT ------------_------- --- _------FACTORIES UNREGISTERED WORKSHOP
Division I 500 + Persons Persons Total One Persons Major
unspecified Person 2-4 Persons 5-9 persons 10-19 Persons unspecified Group of ------- N.I.C.
Units Persons Units Units Persons Units Units Persons Units Persons Units J'ersons Units employed employed employed employed employed
14 15 16 17 18 19 20 21 22 23 24 25 26
DISTRICT (TOTAL) Division
25 42,825 12 11,243 31,171 3,459 5,898 15,051 1,601 10,267 188 ".,394 97 2& 3
Major Group
1 1,643 3,938 466 990 2,366 164 1,042 5 64 18 20-21
151 700 26 70 199 30 193 23 282 2 22 19 38,439 8 505 2,608 60 204 600 166 1,079 66, 869 9 23
2 6 2 6 24 3 7 .. 3 7 25
2,492 4,94{; 1,085 1,283 3,066 97 602 15 193 12 26
587 1,755 159 310 834 97 626 11 136 10 27 428 1,791 30 236 705 146 931 10 125 6 28 304 594 130 157 366 13 82 1 16 3 29 185 731 23 101 279 56 375 4 54 1 30 lSI 827 20 77 224 72 464 9 119 3 31
1 500 103 445 13 48 127 33 209 8 96 1 32 90 446 2 38 117 48 317 1 10 1 33
1 510 659 2,333 103 377 1,058 165 1,062 8 no 6 34 2 1,800 902 3,777 60 498 1,438 338 2,232 4 47 2 35
40 185 2 19 52 18 121 1 10 36
1 550 34 120 2 21 53 10 55 1 10 37 .. 2 S(O 1,844 339 429 1,048 57 337 10 120 5 38 1 1,026 2,091 4,118 939 1,035 2,506 91 540 11 133 18 39
DISTRICT (RURAL) Division
510 3 2f!1 1,227 40 80 223 00 f~O 47 624 4 2&3
Major Group
51 L85 15 19 50 17 I "'J 20-21
3 2E .. 1 5 2 23 22 3 €) 63~ 5 16 16 l' 3 38 515 23
'.~ f 2 6 24 13 It- II ! 4 26
n 74 8 24 I " 3 41 27 2(: 2 3 1 10 28
1 29 f1 ? 8 30
24 7 2 31
! 34 1 7 2 25 32 1 510 11 57 5 ;'9 34
11 48 12 ,14 2 ' i 35 .5 20 3 7 2 3 36
10 10 37 1 1 I 38
28 51 7 17 38 6 3 39
143
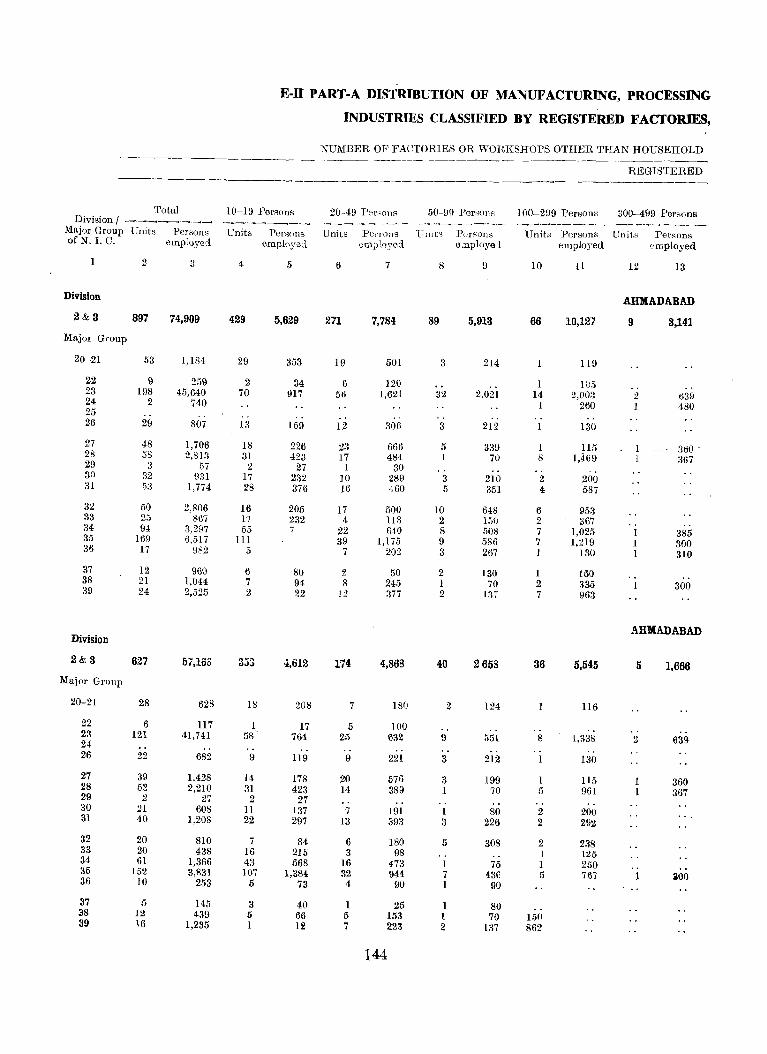
E-II PART-A DISTRIBUTION OF MANUFACTURING, PROCESSING
INDUSTRIES CLASSIFIED BY REGISTERED FACTORIES,
:\,UMBER OF FACTORIES OR WORKSHOPS OTHER THAK HOUSEHOLD -----------------------------------------_._--------
REGISTERED -------~-------- ---------_
Total 10-19 PerRonR 20-49 Per~ons 50-99 Persons 100-299 Persons 300-499 Persons Division I ------__ --------.---- ,--_------- -------_----. __ - ............. ----_---- --------_ ____,,_
Major Group Units Persons Units Persons Units Perrons Ullltfl Persons Units PersonS Units Persons of N. 1. C. employed employed em,)loyod e.nployel employed employed
2 3 4 5 6 7 8 9 10 11 12 13
DiVision AHMADABAD 2&3 897 74,909 429 5,629 271 7,784 89 5,913 66 10,127 9 3,141
Major Group
20-21 53 1,184 29 353 19 501 3 214 119
22 9 259 2 34 6 120 .. 1 105 23 198 45,640 70 917 56 1,621 32 2,021 14 2,OOa 2 639 24 2 740 I 260 1 480 25 .. ., . . . . .. 26 29 807 13 159 12 306 3 212 130
27 48 1,706 18 226 23 666 5 339 I 115 300 -28 58 2,813 31 423 17 484 1 70 8 1,469 367 29 3 57 2 27 1 30 .. 30 32 931 17 232 10 289 3 210 2 200 31 5:3 1,774 28 376 16 460 5 351 4 587
32 50 2,806 16 205 17 500 10 648 6 953 33 25 867 17 232 4 118 2 150 2 367 .. 34 91 3,297 513 , 22 6iO 8 508 7 1,025 I 385 35 169 6,,517 111 39 1,175 9 586 7 1,219 1 300 36 17 982 13 7 202 3 21\7 1 130 1 310
37 12 960 6 80 2 50 2 130 1 150 38 21 1,044 7 94 8 245 1 70 2 335 300 39 24 2,525 2 22 Ll 377 2 137 7 963
Division AHMADABAD
2&3 627 57,166 333 4,612 174 4,868 40 2658 36 5,545 5 1.666 Major Group
20-21 28 628 18 208 7 180 2 124 116
22 6 117 1_ 17 5 100 .. , . 23 121 41,741 58 764 25 632 9 551 8 1,338 2 639 24 .. .. " 26 22 682 9 119 9 221 3 212 130
27 39 1,428 14 178 20 576 3 199 1 115 360 28 52 2,210 31 423 14 389 1 70 5 961 367 29 2 27 2 27 30 21 608 11 137 7 191 1 80 2 200 31 40 1,208 22 297 13 393 3 226 2 292
32 20 810 7 84 6 180 5 308 2 238 33 20 438 16 215 3 98 I 125 34 61 1,366 43 568 16 473 1 75 1 250 , . :{fi 152 3,831 107 1,384 32 944 7 43e 5 767 1 300 36 10 253 5 73 4 90 1 90
37 5 145 3 40 1 25 1 80 38 12 439 5 66 5 153 1 70 150 39 \6 1,235 1 U1 7 223 2 137 862
144
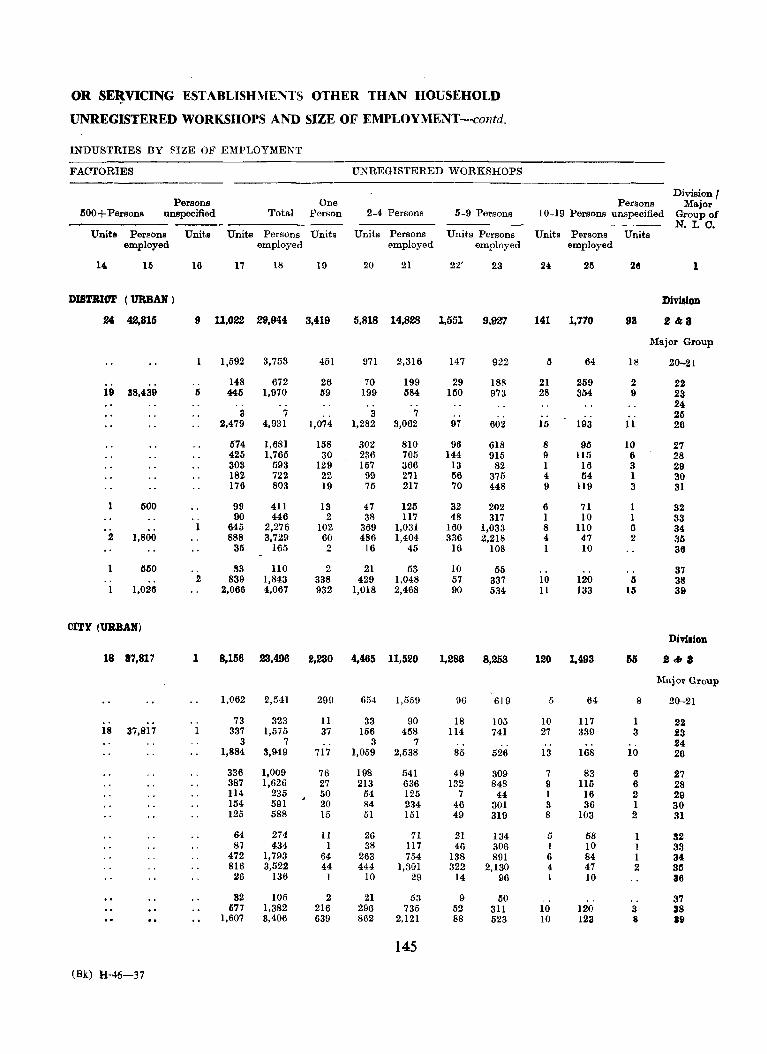
OR SE~VICING ESTABLISHMENTS OTHER THAN HOUSEHOLD
UNREGISTERED WORKSHOPS AND SIZE OF EMPLOYMENT--contd.
INDUSTRIES BY SIZE OF EMPLOYMENT
FACTORIES UNREGISTERED 'WORKSHOPS
Persons Division I
Persons One Major llOO+Persons unspecified 'rotal Person 2-4 Persons 5-9 Persons 10-19 Persons unspecified Group of
Persons N. I. C.
Units Persons Units Units Persons Units Units Units Persons Units Persons Units employed employed employed employed employed
14- 16 16 17 IS 19 20 21 22' 23 24 25 26 1
DISTRICT (URBAN) DiviaiOD
24 42,815 9 11,022 29,944 3,419 5,818 14,828 1,551 9,927 141 1,770 93 2 &3
Major Group
1,592 3,753 451 971 2,316 147 922 5 64 18 20-21
.. 148 672 26 70 199 29 ISS 21 259 2 22 19 38,439 6 446 1,970 59 199 584 150 973 28 354 9 23
.. 24 3 7 3 7 .. 25
2,479 4,931 1,074 1,282 3,062 97 602 Hi 193 11 26
iS74 1,6S1 158 302 810 96 618 8 95 10 27 425 1,765 30 236 705 144 915 9 Il5 6 28 303 593 129 157 366 13 82 1 16 3 29 182 722 22 99 271 56 375 4 54 1 30 176 803 19 75 217 70 448 9 119 3 31
1 500 99 411 13 47 125 32 202 6 71 1 32 90 446 2 38 117 48 317 1 10 1 33
645 2,276 102 369 1,031 160 1,033 8 no 6 34 2 I,SOO 888 3,729 60 486 1,404 336 2,218 4 47 2 35
35 165 2 16 45 16 108 1 10 36
550 .. S3 llO 2 21 53 10 55 37 ., 2 839 1,843 338 429 1,048 57 337 10 120 6 38 1 1,026 2,066 4,067 932 1,018 2,468 90 534 11 133 15 39
CITY (URBAN) Divi.ion
18 17,817 1 8,156 23,496 2,230 4,465 11,520 1,286 8,253 120 1,493 155 2"'8
:Major Group
1,062 2,541 299 654 1,559 96 619 5 64 8 20-21
73 323 II 33 90 18 105 10 117 1 22 18 37,817 337 1,575 37 156 458 114 741 27 339 a !3
3 7 3 7 .. 24 1,884 3,949 717 1,059 2,538 85 526 13 168 10 26
336 1,009 76 198 541 49 309 7 83 6 27 387 1,626 27 213 636 132 848 9 115 6 28 114 235 50 54 125 7 44 1 16 2 29 154 591 20 S4 234 46 301 3 36 1 30 125 588 15 51 151 49 319 S 103 2 31
64 274 11 26 71 21 134 5 58 1 32 87 434 1 38 117 46 306 1 10 1 33
472 1,793 64 263 754 138 891 6 84 1 34 816 3,522 44 444 1,301 322 2,130 4 47 2 35 26 136 1 10 29 14 96 1 10 36
82 105 2 21 53 9 60 .. 37 577 1,382 216 296 735 52 311 10 120 3 38
1,607 8,406 639 862 2,121 88 523 10 123 i 19
145
(Bk) H-46-37
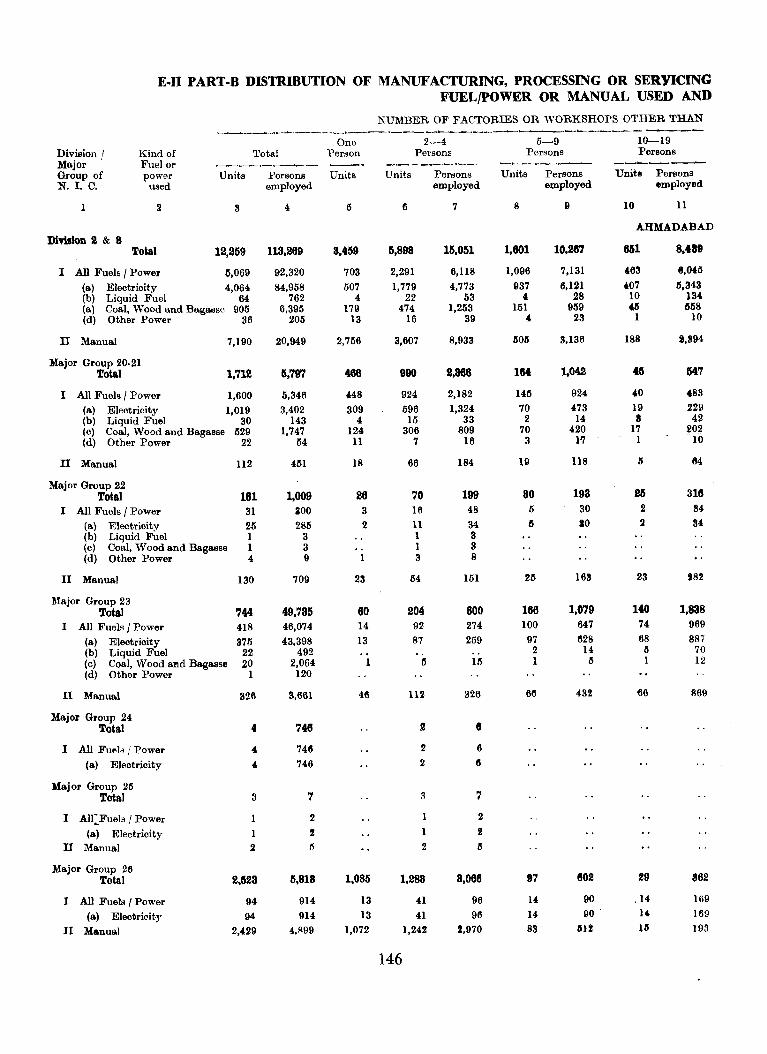
E.II PART·B DISTRIBUTION OF MANUFACTURING, PROCESSING OR SERVICING FUEL/pOWER OR MANUAL USED AND
NUMBER OF FACTORIES OR WORKSHOPS OTHER THAN .._---..__.__.__----,.,_-----------__....--~-------__.--.-------
Total Division I Major . Group of N. I. C.
Kind of Fuel or power Units Persons
used
1 2 3
Dhillon 2 & 8 Total 12,259
I All Fuels I Power 6,069
(a) Electricity 4,064 (b) Liquid Fuel 64 (a) Coal, Wood and Bagasse 9011 (d) Other Power 36
II Manual
Major Group 20·21 Total
7,190
1,712
I All Fuels I Power 1,600
(a) Electricity 1,019 (b) Liquid Fuel 30 (c) Coal, Wood and Bagasse 529 (d) Other Power 22
II Manual 112
Major Group 22 Total 181
I All Fuels I Power 31 (a) Electricity 211 (b) Liquid Fuel 1 (c) Coal, Wood and Bagasse 1 (d) Other Power 4
II Manual 130
Major Group 23 Total 744
I All Fuels I Power 418
(a) Electricity 375 (b) Liquid Fuel 22 (c) Coal, Wood and Bagasse 20 (d) Other Power 1
II Manual 326
Major Group 24 Total
I All FUI'IlR I Power
(a) Electricity
Major Group 25 Total
I All:Fue!s / Power
(a) Electricity II Manual
Major Group 26 Total
I All Fuels I Power
(a) Electricity
II Manual
4
4.
4
3
1
1 2
2,623
94
94
2,429
employed
4
113,269
92,320
84,958 762
6,395 205
20,949
G,797
5,346
3,402 143
1,747 114
451
1,009 aoo 2811
3 3 9
709
49,735 46,074
43,398 492
2,064 120
3,661
746
7411
746
7
6,818
914
914
4,899
One Person
Units
3,459
703
507 4
179 13
2,756
466
448
309 4
124 11
18
26 3 2
1
23
60 14
13
46
1,085
13
13
1,072
2-4 Persons
Units Persons
6
lI,898
2,291
1,779 22
474 16
3,607
990
924 596 15
306 7
66
70 16
11 1 1 3
64
204 92
87
IS
112
2
2
3
1
1 2
1,283
146
41
41 1,242
employed
7
15,051
6,118
4,773 53
1,253 39
8,933
8,866
2,182
1,324 33
809 16
184
199 48
34 3 3 8
lIil
600 274 259
HI
326
6
6
7
2
2
5
8,068
96 96
2,970
5-9 PersonS
Units Persons
8
1,801
1,096
937 4
151 4.
5011
let
146
70 2
70 3
19
80 5
5
25
166 100
97 2 1
66
17
14
14
83
employed
9
10,287
7,131
6,121 28
959 23
3,136
1,042
924 473 14
420 1'7
118
193 30
SO
163
1,079 647
628 14
IS
432
4102
90 90 .
til!
10-19 Persons
Units Persons employed
10 11
AHMADABAD
651
188
8,ta9
8,045
6,343 134 558
10
2,894
647
40 483 19 229 • 42
17 il02 1 _. 10
23
140 74
68 5 I
29
64
318 84 S4
282
1,838 969 887
70 12
869
862
169 169 193
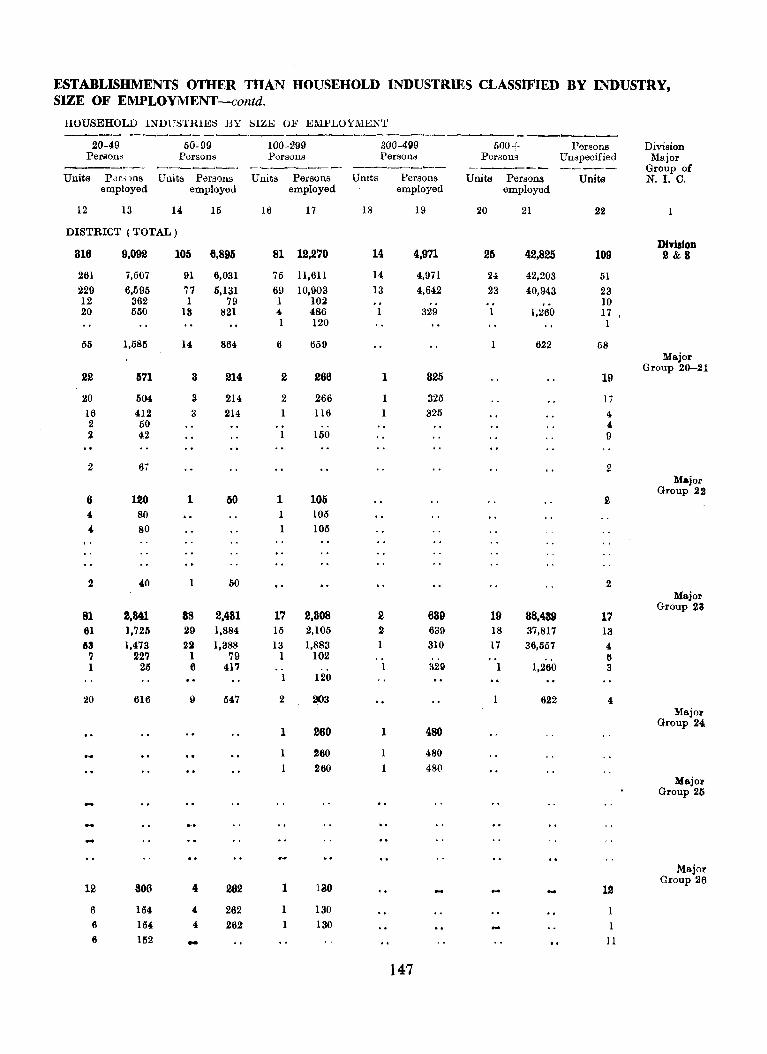
ESTABLISHMENTS OTHER THAN HOUSEHOLD INDUSTRIES CLASSIFIED BY INDUSTRY, SIZE OF EMPLOYMENT -contd.
HOUSEHOLD INDUSTRIES BY SIZB OF El\IPLOYMEKT -------_----- -----~----......__-------__.------------------20-49 60-99 100-299 300-4119 600+ Persons Division
Persons Persons P"rsons Persons Persons Unspecified Major ----_--- -------~- _--_-_---- ------~--- ------- ----- Group of Units Pdt'.; )US Units P0rsons Units Persons Units Persons Units Persons Units N. I. C.
employed employed employed employed employed
12 13 14- 15 16 17 18 19 20 21 22
DISTRICT (TOTAL) DiYialon
316 9,092 105 6,895 81 12,2'10 14 4,9'11 25 42,825 109 2&8
261 7,507 91 6,031 76 11,611 14 4,971 24 42,203 61 229 6,595 77 6,131 69 10,903 13 4,642 23 40,943 23 12 362 1 79 1 102 .. 10 20 550 18 821 4, 486 1 329 1 1,260 17
1 120 1
56 1,685 14 864 6 659 622 68 Major
22 571 3 214 2 266 1 825 19 Group 20-21
20 504 3 214 2 266 325 17
16 412 3 214 116 325 4 2 60 4 2 42 1 160 9
2 6i 2 Major
6 120 1 50 1 105 2 Group 22
4 80 1 106 4, 80 1 106
Major
12 306 4 262 1 180 12 Group 26
6 154 4 262 1 130 6 104 4, 262 130 1 6 152 - 11
147
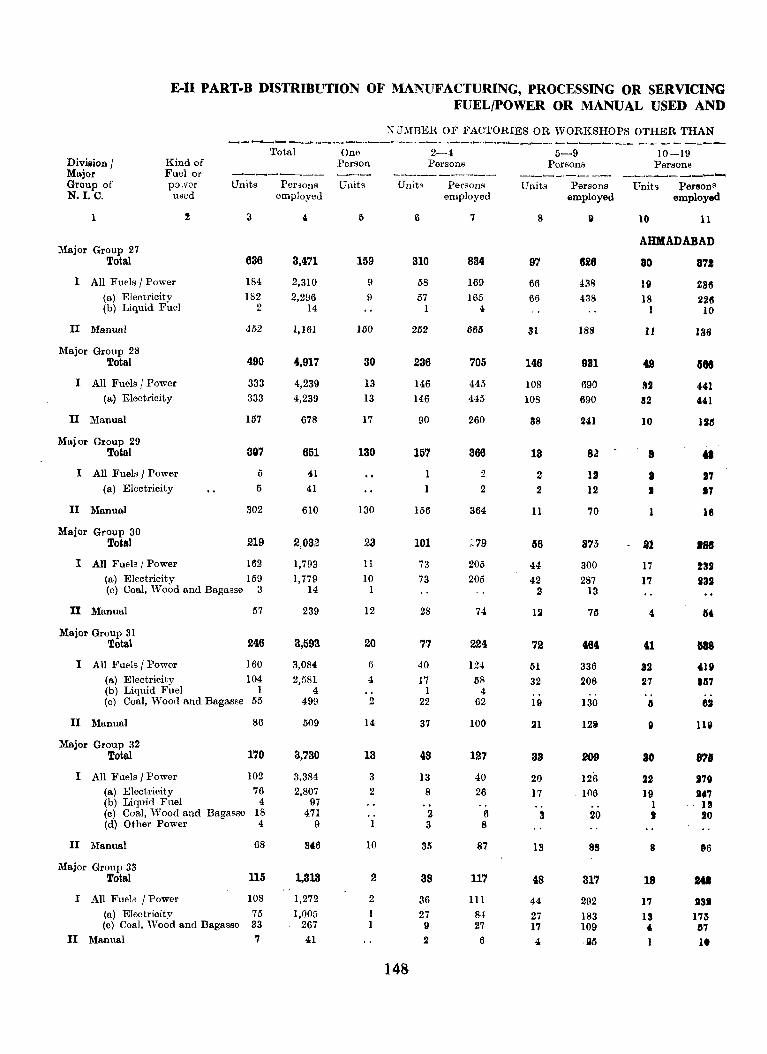
E-II PART-B DISTRIBUTION OF MANUFACTURING, PROCESSING OR SERVICING FUEL/POWER OR MANUAL USED AND
:w~mER OF FACTORIES OR WORKSHOPS OTHER THAN .._ __________ ~ ___ o___~ _____ __, __ ........... __ .......__ _____ • ...._ ____ ._. __ • ________ _
Total Division I Major Group of N.I.C.
Kind of Fuel or p:r.v2r Units Per~ons
1
Major Group 27 Total
used
I All Fuels / Power (a) Electricity (b) Liquid Fuel
II llIlmual
Major Group 28 'fotal
I All Fuels I Power (a) Electricity
II Manual
Maj or Group 29 Total
I All Fuels I Power
(a) Electricity
II Manual
Major Group 30
636
184 182
2
452
490
333
333
157
3G7
5
302
Total 219
I All Fuels i Power 162 (a) Electricity 159 (c) Coal, 'Wood and Bagasse 3
U Manual 57
Major Group 31 Total 246
I All Fuels I Power 160
(a) Electricity 104 (b) Liquid Fuel 1 (c) Coal, Wood and Bagasse 55
II Manual
Major Group 32 Total
86
170
I All Fuels I Power 102 (a) Electricity 76 (b) Liquid Fuel 4 (e) Coal, Wood and Bagasse 18 (d) Other Power 4
II Manual
Major Group 33 Total
I All Fuels I Power
68
115
108 (a) Electricity 75 (e) Coal, 'Wood and Bagasse 33
II Manual 7
employed
3,471
2,310
2,296 14
1,161
4,917
4,239
4,239
678
651
41 41
610
2,032
1,793 1,779
14
239
3,593
3,084 2,581
4 499
509
3,730
3,384
2,807 97
471 9
846
1,313
1,272
1,005 267 41
One Person
Unib
159
9
9
150
30
13 13
17
130
130
23
11
10 1
12
20
6
4
2
14
13
3
2
10
2
2
2-4 Persons
Units Persons
148
6
310
58 57
1
252
236
146 146
90
157
156
101
73
73
28
77
40
17 1
22
37
48
13 8
2 3
311
38
36 27 9
2
employed
7
834
169 165
4
665
705
445 445
260
366
2
2
364
205 205
74
224
IN
58 4
62
100
127
40
26
6 8
87
117
III 84 27 6
5-9 Persons
Units Persons
8
97
66 66
31
146
108 108
38
13
2
2
11
56
44 42
2
12
72
51
32
19
21
33
20 17
3
18
48
44 27 17
4
employed
1126
488
438
188
931
690 690
241
8~
12 12
70
875
300 287
13
73
464
336 206
130
12!t
209
126 . 106
20
88
317
292 183 109 i5
10-19 Persons
-----~----.._.. Units Persons
employed
10 11
AHMADABAD
30
19 18
1
11
4S
U 32
10
8
J I
- 81
17
17
41
32 27
II
o
30
22 19
1 J
8
18
17
13
•
87.
286 2211 10
136
•• IT IT
18
.88
231 232
ISI8
419
1117
62
1111
••• 1131 175
117
1.
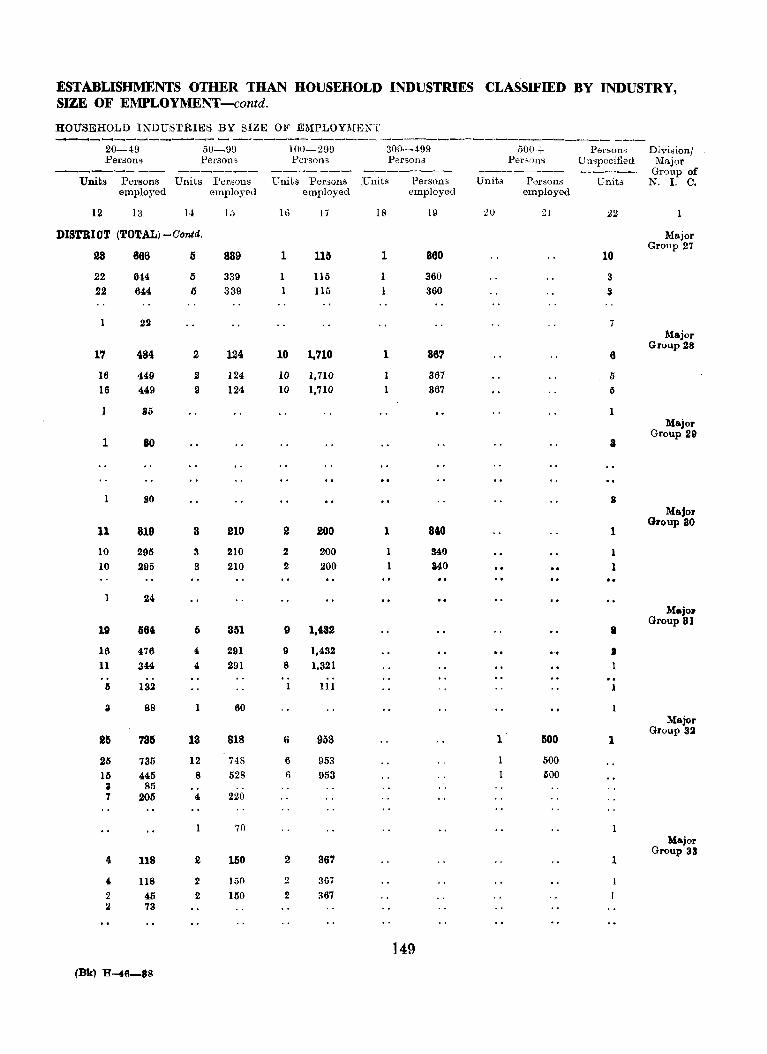
ESTABLISHMENTS OTHER THAN HOUSEHOLD INDUSTRIES CLASSIFIED BY INDUSTRY, SIZE OF EMPLOYMENT-contd.
HOUSEHOLD INDUSTRIES BY SIZE OF EMPLOYl\IE~T ----_---_----_-...._ -----.._... __ .....__--_ ------------.....__,,---------~--- ---20-49 5U-99 1OU-299 300-499 500+ Persons Division! Person~ l'erson'l Pcrson3 Persons Per.,olls Umpecified .Major ----_...__-- ------- ------- ............ _-----....____._ ---------- ------- Group of
Units Persons Units Persons Units Persons .Units Persons Units Persons Units N. I. C. employed employed employed employed employed
12 13 14 15 16 17 18 19 iO 21 22 1
DISTRICT (TOTAL)-Oonta. Major
28 666 Ii 839 1 ll5 1 880 10 Group 27
22 644 5 339 115 1 360 3 22 644 6 339 115 1 360 S
1 22 7 Major
17 484 2 124 10 1,710 1 867 6 Group 28
16 449 2 124 10 1,710 367 5 16 449 2 124 10 1,710 867 5
1 115 Major
1 80 a Group 29
80 II
11 819 3 IUO 2 200 1 840 1
Major Group 80
10 295 S 210 2 200 940 1 10 295 S 210 2 200 1 340 1
24 Majo.
Ii 351 9 l,D2 I Group 81
19 584
16 476 4 291 9 1,432 I
11 344 4. 291 8 1,321 1 .. I) 132 1 III I
3 88 60 Major
25 785 13 818 6 953 1 500 1 Group 32
25 735 12 748 6 953 500 15 445 8 528 6 953 ~oo ; 85 7 205 4 220
70 Major
4 118 2 150 2 367 1 Group 33
4. 118 2 150 2 36i 2 45 2 150 2 367 2 73
149
(Bk) H-46-lIS

E-II PART-B DISTRIBUTION OF MANUFACTURING, PROCESSING OR SERVICING
FUEL/POWER OR MANUAL USED AND
NUMBER OF ]!~AOTORIES OR WORKSHOPS OTHER THAN
One Total Person Divisionl
Major Group of N.I.C.
Kind of Fuel or power used
Units Persons Units employed
1 2 3
Major Group 34
Total 761
I All Fueb I Power 568 (a) ]!;Iectricity 399 \b) Liquid Fuel 1 (e) Coal. Wood and Bagasse 164 (d) Other Power 4
II Manual 193
Major Group 35 Total 1,080
I All Fuelo I Power 988 (a) Eledricity 942 (b) Liq'liJ Fuel 3 (0) Coal, \\~ood and Bagasse 43
II ::\Ianual 92
)lajor Group 36 Total 62
1 All Fuel;; i Power 57 (s) rJlertricity j 57
II Manual
Major Group 37 Total
I All Fuel,-; i Power (a) Electricity
II Manual
c\lajor Group 38 Total
All Fuels I Power (a) Elect,ricity (0) Coal, Wood and Bagasse (d) Other Power
II Manual
:'Ilajor Group :19 Total
I All Fuel, ! Power (a) Elect,rieity (e) Coal, 'Wood and Bagasse
II Manual
Division 2 & 8
46
32 32
14
861
83 52 30 1
778
2,119
139 130
9 1,980
Total 340
I All Fuels I Power 202 (a) Electricity 139 (b) Liquid Fuel 35 (0) Coal, Wood and Bagasse 27 (d) Other Power 1
II Manual 138
4
7,219
6,441 5,481
3 944
13
778
10,969
10,591 10,277
6 308
378
1,646
1,624 1,624
22
1,080
1,032 1,032
48
2,888
1,142 1,078
64
1,746
6,653
1,985 1,971
14 4,668
8,416
6,897 5,464
685 738
10 1,519
IS
103
75 39
36
28
60
49 46
:I
11
1 1
2
I 1
339
12 6 6
327
939
43 38
5 896
40
18 11
1 I)
22
Persons
Units Persona
6
377
268 176
1 88
3
109
498
441 424
3 14
57
19
17 17
2
21
11 11
10
429
40 17 23
389
1,035
150
71 67
4 964
80
49 38
4
31
employed
7
1,058
763 522
3 231
7
295
1,438
1,280 1,236
6 38
158
52
46 46
6
53
27 27
26
1,048
104 51 53
944
2,506
194 185
9 2,312
223
141 113
16 12
82
5-9 Persons
Units Persona
8
165
121 98
22 1
44
338
321 305
16
17
18
17 17
10
8 8
2
57
15 14
1
42
91
15 15
76
50
32 29
I 2
18
employed
9
1,082
788 641
141 6
274
2,232
2,112 1,996
116
1.20 -
121
1I6 ll6
li
44 44
11
33?
91 86
5
246
540
95 95
445
340
222 200
9 13
118
10-19 Persons
Units Persons employed
10 11
AHMADABAD
65
57 49
8
8
116
11:1 104
8
8
7 7
7
6 ft
1
17
7 7
10
14
3 :I
II
880
770 663
107
llO
1,499
1,452 1,354-
98
106
96 96
10
90
80 80
10
214
94 94
120
165
32 32
133
AHMADABAD
81
34 21
9 :I 1
47
1,040
416 258 116
32 10
624
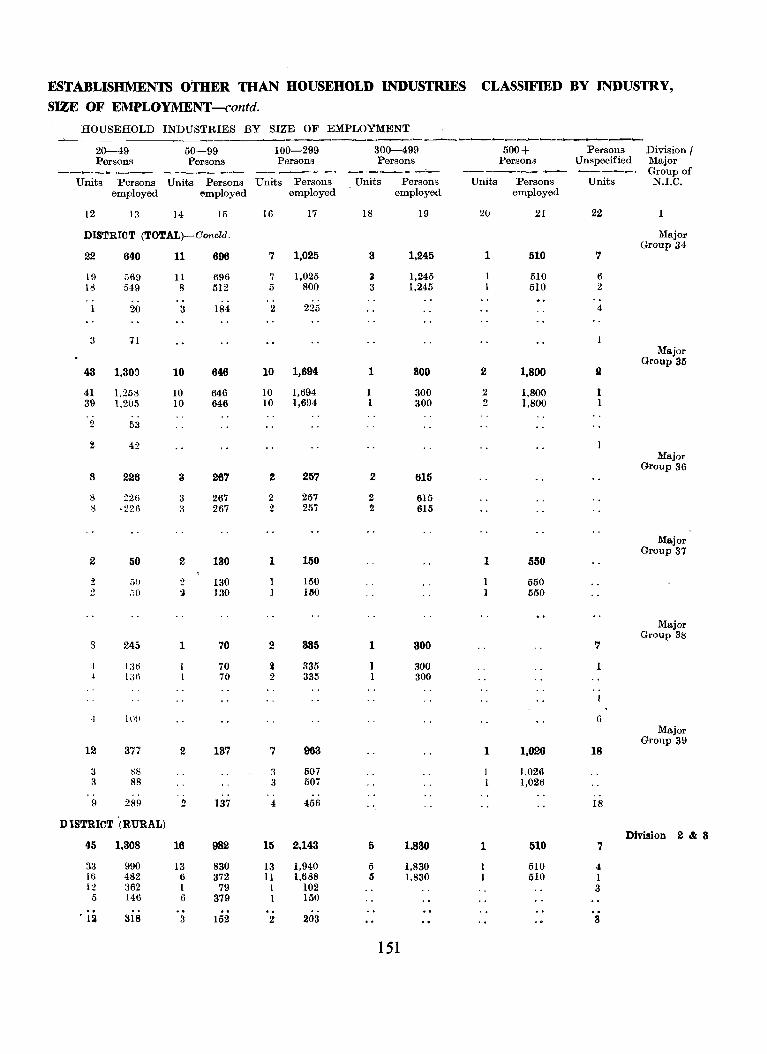
ESTABLISHMENTS OTHER THAN HOUSEHOLD INDUSTRIES CLASSIFIED BY INDUSTRY,
SIZE OF EMPLOYMENT -contd.
HOUSEHOLD INDUSTRIES BY SIZE OF EMPLOYMENT
20--49 50--99 100--299 Persons Persons Persons
Units Persons Units Persons Units Persons employed employed employed
12 13 14 15
DISTRICT (TOTAL)-Ooncld.
22
19 18
640
569 549
20
3 71
43 1.30~
41 1.258 39 1.205
2 53
~ 42
8
8 8
2
t 2
s
12
:I 3
9
226
226 .226
50
51) ,',0
245
136 1:)6
lU\1
377
Sf)
88
289
DISTRICT (RURAL)
45 1,308
:~3 16 12
5
990 482 :{62 146
318
11
11 8
3
10
10 10
3
3 3
2
2
1
2
.. 2
16
13 6 I 6
3
696
696 512
184
646
646 646
267
267 267
130
130 130
70
70 70
137
137
982
830 372
79 379
152
16 17
7 1,025
7 1,025 5 800
2 225
10 1,694
10 1,694 10 1,694
2 2
1
2
j
2
7
3 3
4
257
257 257
150
150 11!O
385
335 335
963
507 507
456
15 2,143
13 1,940 11 1,688
I 102 I 150
2 203
300--499 Persons
Units Persons
18
3
:I :I
1
I 1
2
2 2
1
1 1
5
5 5
employed
151
19
1,245
1,245 1,245
300
300 300
615
615 615
300
300 300
1.830
1,830 1,830
500 + Persons Persond Unspecified
Division I Major Group of
Units Persons Units employed
20
1
2
2 2
1
1
1
21
510
510 510
1,800
1,800 1,800
550
550 550
1,026
1,026 1,026
510
510 510
22
7
6 2
4
g
1 I
7
(j
18
18
7
4 I 3
3
N.I.C.
1
Major Group 34
Major Group 35
J.I-Iajor Group 36
Major Group 37
Major Group 38
Major Group 39
Division 2 & 3
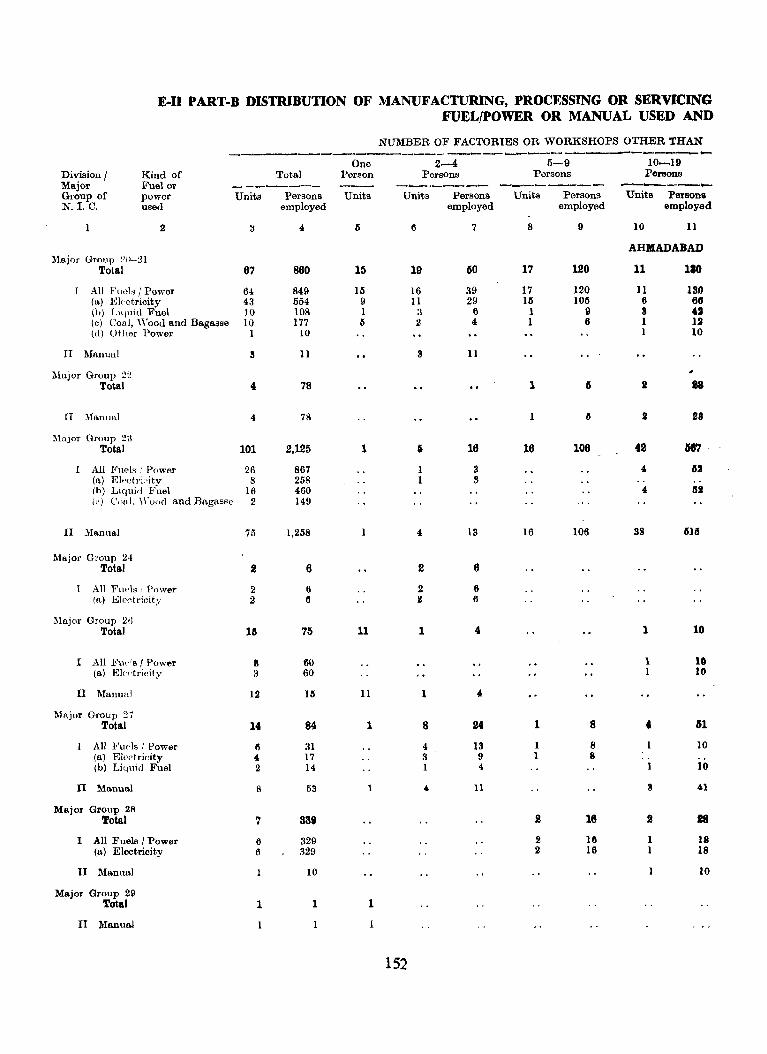
E-II PART-B DISTRIBUTION OF MANUFACTURING, PROCESSING OR SERVICING FUEL/POWER OR MANUAL USED AND
NUMBER OF FACTORIES OR WORKSHOPS OTHER THAN _----------------------------------...... One 2-4 5-9 10-19
Division / Kind of Total Person Persons Porsons Persons Major Fuel or ----_-_ ------- --------- ---------Group of power Units Persons Units Units Persons Units Persons Units Persons N. I. C. used employed employed employed employed
2 3 4 IS 6 7 8 () 10 11
AHMADABAD Majoi' Group :!11-21
Total 67 860 15 19 1)0 17 120 11 180
All Fuels I Power 64 849 lIS 16 39 17 120 11 130 (a) Ekctrioity 43 554 9 11 29 lIS 106 6 611 (b) Liquid Fuel 10 108 1 :1 6 1 9 3 42 (c) Coal, 'Vood and Bagasse 10 177 IS 2 4 1 6 1 12 (d) Other Power 1 10 1 10
II Manual 3 11 3 11
Major Group 2:l Total 4 78 1 I) 2 18
II :Manual 4 78 IS 2 28
Major Group 2:1 Total 101 2,125 1 i 16 16 106 42 _ H'7 .
I All Fu('is ' Power 26 867 1 3 4 1S2 (a) EI<'ctl'i:'ity 8 258 1 11 (h) Liquid Fuel 16 460 4 1S2 (l') Coal. \rood and Bagasse 2 149
II }Ianual 75 1,258 4 13 16 106 38 ISlIS
Major Group 24 Total 2 6 2 6
All FuPls: Power 2 6 2 6 (a) Elp('tricity 2 II I! 6
Major Group 26 Total 15 75 11 1 4 1 10
r All Fuels I Power II 60 1 I. (a) Electricity 3 60 1 10
II Manual 12 111 11 1 , Major Group 27
Total 14 84 1 8 24 1 8 « 61
All Fuds! Power II :n 4 13 1 8 10 (a) Eleetricity 4 17 3 9 1 8 (b) Liquid Fuel 2 14 I " 10
II Manual 8 53 1 4 11 3 41
Major Group 28 'fotal 7 888 2 18 2 18
1 All Fuels I Power 6 329 2 16 I 18 (a) Electrioity 6 329 2 16 1 18
II Manual 10 10
Major Group 29 Total 1 1 1
II Manual
152
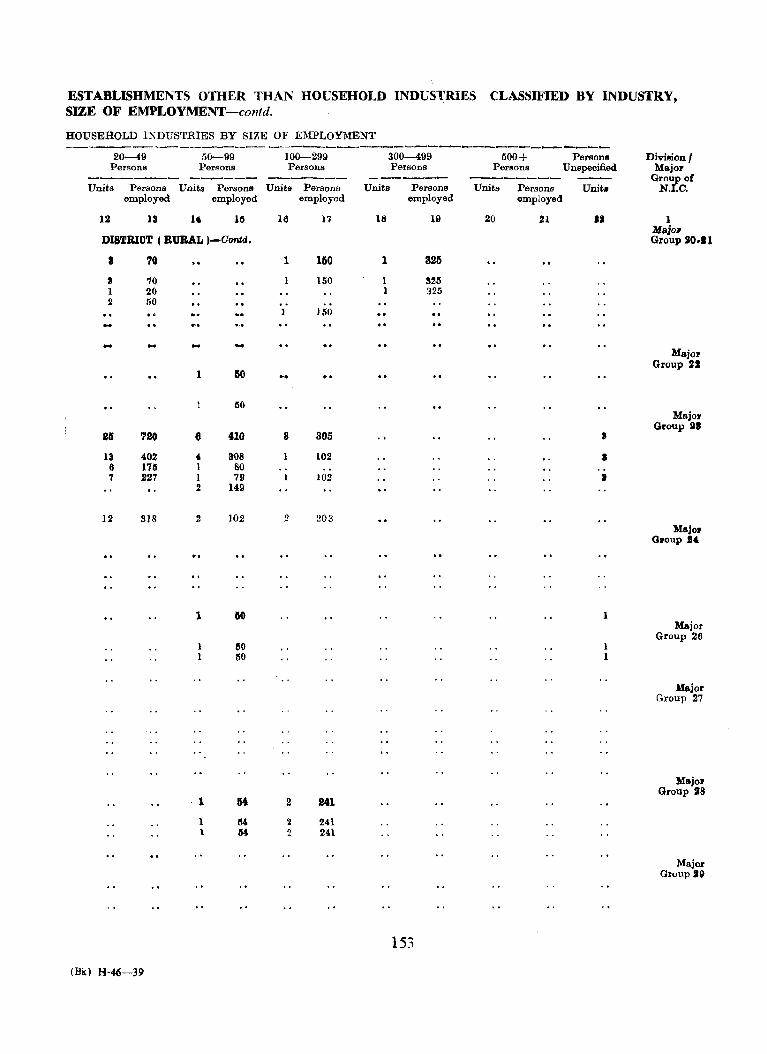
ESTABLISHMENTS OTHER THAN HOUSEHOJ_,D INDUSTRIES CLASSIFIED BY INDUSTRY, SIZE OF EMPLOYMENT -contd.
HOUSEHOLD INDUSTRIES BY SIZE OF EMPLOYJYIENT ------.__--------------------------------------
20-49 50-99 100--299 300-499 500+ Persons Divillion/ Persons Persons Persons Persons Persons Unspecified Major ------ ------ ----- -------- ------- Group of
Units Persona Units Persons Units Persons Units Persons Units Persons Units N.I.C. employed employed employed employed employed
12 13 I' 111 16 17 18 19 20 21 III 1
DISTRICT ( RURAL )-Oontd. Majo .. Group 10.11
8 70 1 150 1 325
3 70 150 1 3M 1 20 1 325 2 50
HiO
Major Group 2J
1 150
110 Major
83 720 6 410 3 305 Group J. ,
13 402 , 308 102 • 6 1711 1 80 7 227 1 79 102 »
2 149
12 318 l! 102 2 203 MaJOII
GIIOUp .&
1 60 1 Major
Group 26 1 IiO 1 1 110 1
Major Group 27
Majo:r Group 28
1 54 2 241
1 t\4 2 241 1 M 2 241
Major Group 19
153
(Bk) H-46-39

E·lI PART·B DISTRmUT!oN OF MANUFACTURING, PROCESSING OR SERVICING
FUEL/POWER OR MANUAL USED AND
Division/ Major Group of N. I. C.
Kind of Fuel or power used
1
Major Group 30 Total
I All Fuels I Powllr (a) Electricity
Major Group 31 Total
I All Fuels I Power (a) Electricity
II Manual
Major Group 311 'fotal
I All Fuels; Power (a) Electri()ity (b) Liquid Fuel
II
(c) Coal, Wood and Bagasse
II Manual
Major Group 34 Total
I All Fuels I Power (8) Electricity (c) Coal, Wood and Bagass?
II Manual
Major Group 311 Total
I All Fuels; Power (a) Electricity (b) Liquid Fuel (0) Coal. 'Wood and Bagasse
II Manual
Major Group 36 Total
I All Fuels I Power (a) Electricity
Major Group 37 Total
II Manual
Major Group 38 Total
II Manual
Major Group 39 Total
I All Fuels; Power (s) Electricity
II Mallual
1'0,,,,1
Units Persons
17
Ie 16
21
18 4, 4,
10
3
12
20 16
" 2
23
22 18 3 1
10
10 10
1
1
29
4, 4,
115
employed
879
379 379
1,016
1,013 ., 1,013
3
1113
4,86 72 97
317
27
1,646
1,637 1,568
69
9
723
721 689
II 26
II
499
499 499
10
10
1
61
One Person
Units
1
1 1
1
1 1
1
1
1
1
7
7
NUMBER OF FAOTORIES OR WORKSHOPS OTHER THAN
2-4 Persons
Units Persons
1.14
J
II i
•
1
1
8
7 II II
1
12
11 8 3
8
17
2 II
III
employed
7
8
II 8
1
• • I' '
•
I
S1
211 17 8
II
84
32 26 6
II
7
7 7
88
'" 4
34
5-9 Persons
Units Persons
8
'. "j
J
1
1
• • 1
2
I 2
2 J
1
1 1
employed
"18
"HI 16
?
7
7
29
112 22
7
14
14 14
18
1~ 13
• 6 tI
10-19 Persons
Units Persons employed
10 11
AHMADABAD
c
• •
8
6 J 1 J
II
S
2 2
1
1 1
fa
2 II
1
1
1 1
43
99
74 - 42
12 20
25
81
lSi 31
15
III 15
23
23 23
10
10
10
10 10
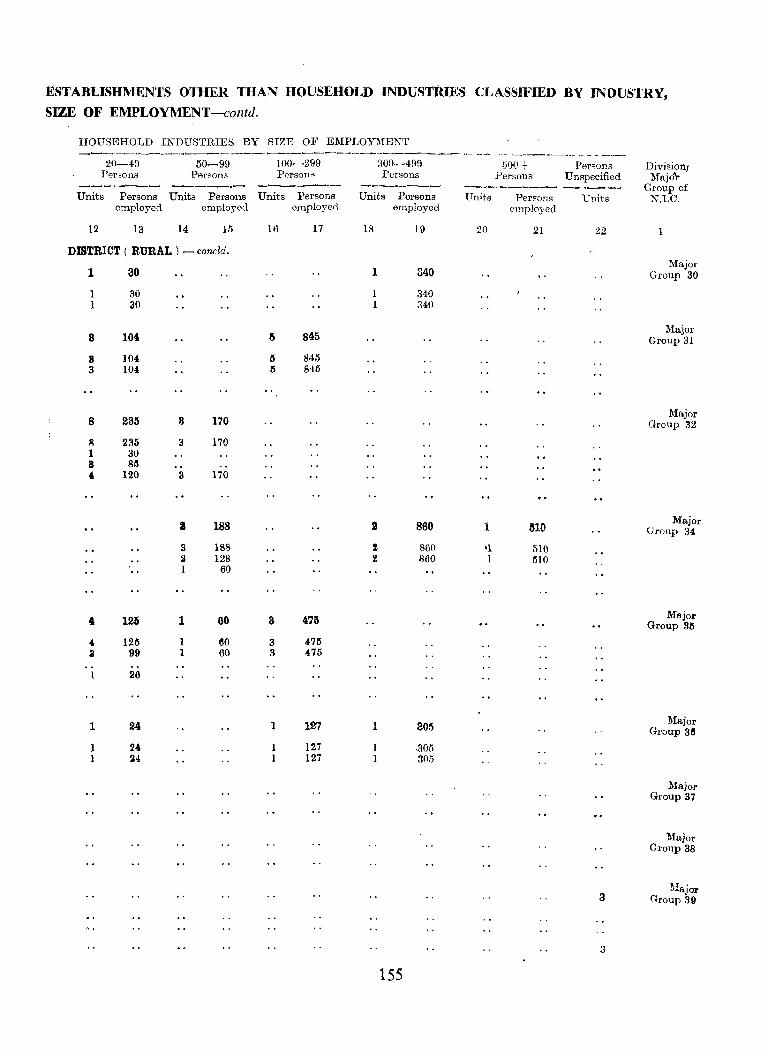
ESTABLISHMENTS OTHER THAN HOUSEHOLD INDUS-fkIES CLASSIFIED BY INDUSTRY,
SIZE OF EMPLOYMENT -contd.
HOUSEHOLD INDUSTRIES BY fUZE OF EMPLOY:\fENT --------.----~------~--~~---~.-..... ~--.-----.-.- .. - ---. - .--~--~ .. ~- - ~ - ~.+.-
20-49 50-9!J 100-299 :300-4fl9 500+ Persons Division! PerSOflf-3 Persona Person.~ Persons Persons Unspecified Majo\-------- -----.- ------- ------- -------~ ----- Group of
Units Persons Units Persons Units Persons Units Persons Units Persons Units X.I.C. employod employeu. employed employed employed
12 13 14 15 16 17 18 Hl 20 21 22 1
DISTRICT ( RURAL) - concld.
1 30 1 340 Major
Group 30
1 30 1 340 1 30 1 340
3 104 ~ 845 Major
Group 31
3 104 IS 845 3 104 5 845
8 233 3 170 Major
Group 32
8 235 3 170 1 30 3 811 4 120 3 170
a 188 2 860 1 310 Major
Group 34
3 188 ! 860 '1 510 2 128 II 860 1 1510 1 60
4 125 1 60 3 475 Major Group 35
• 125 1 60 3 475 3 99 1 60 3 475
1 26
1 24 1 127 1 305 Major Group 311
1 2' 1 127 305 1 24 1 127 30.'5
Major Group 37
Major GI'OUP 38
a Majol' Group 39
3
155
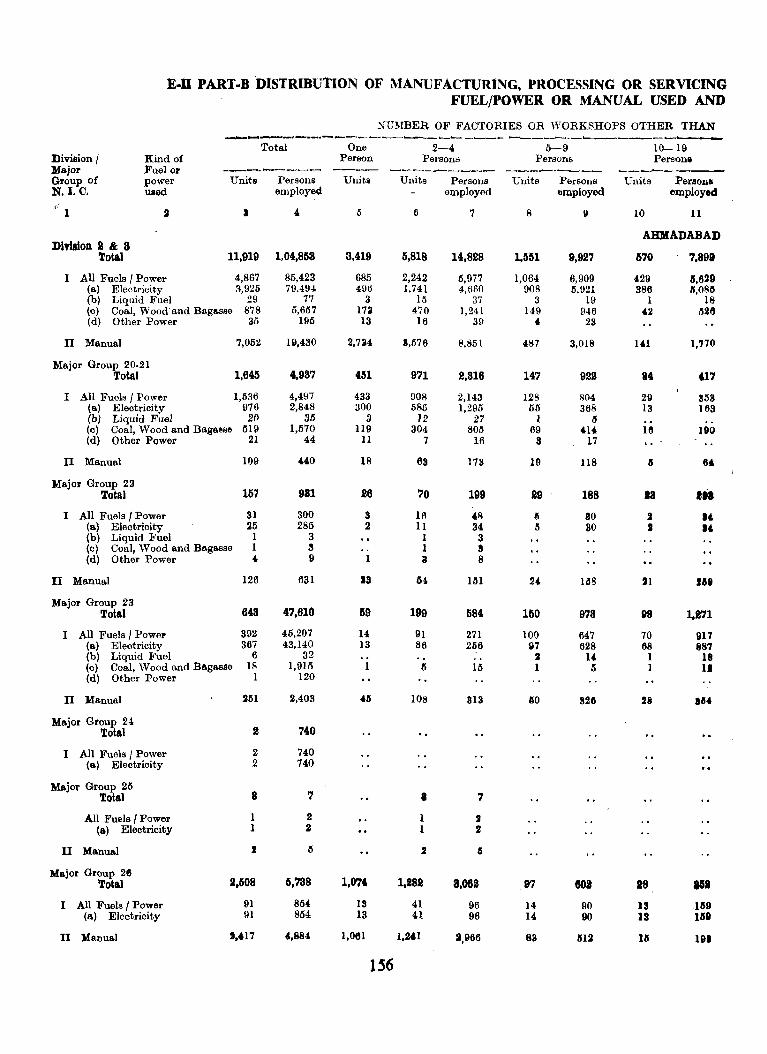
E·U PART.B'DISTRIBUTION OF MANUFACTURING, PROCESSING OR SERVICING FUEL/POWER OR MANUAL USED AND
NL':!I.IBER OF FACTORIES OR \YORKSHOPS OTHER THAN -------_.---__ ... _-------------- ----~..__~--------Total One 2-' 6-9 10-19
Divillionj Kind of Person Persons Persons Person. Major Fuel or --.---,---- --__ --------- -~--.---- ----------Group of power Units Persons Units Units Persons Units Persons Units Persona N. I. C. used employed employed employed employed
" 1 " I , I) 6 7 8 " 10 11
AHMADABAD DiY1s1oD. 2 & 8
Total 11,919 1,04,853 3,419 1S,818 14,828 1,1S51 9,92'7 6'70 7.899
I All Fuels I Power 4,867 85,423 685 2,242 5,977 1,064 6,909 .29 11,629 (a) Electricity 3,925 79,494 496 1,741 4,660 908 5,921 386 11,0811 (b) Liquid Fuel 29 77 3 15 37 3 19 1 18 (c) Coal, Wood' and Bagtl.sse 878 5,657 173 470 1,241 149 946 '2 1126 (d) Other Power 35 195 13 16 39 , 23
II Manual 7,052 19,430 2,734 8,576 8,851 4H7 3,018 141 1,'770
Major Group 20·21 1.645 Total 4,937 451 9'71 2,316 147 922 84 U7
I All Fuels I Power 1,536 4,497 433 908 2,143 128 804 211 853 (a) Electricity 976 2,848 300 585 1,295 05 368 13 163 (b) Liquid Fuel 20 3.5 3 12 27 1 fj
(c) Coal, vVood and Bagasse 519 1,570 119 304 805 69 '14 Ifl no (d) Other Power 21 44 11 7 16 8 17 .-.- -
II Manual 109 640 18 63 173 19 118 4 6.
Major Group 22 15'7 981 26 10 tn Total 199 29 188 18
I All Fuels I Power 31 300 3 16 .8 6 80 2 14. (a) Electricity 25 285 2 II 34 5 SO II " (b) Liquid Fuel 1 3 1 3 (c) Coal, Wood and Bagasse 1 3 1 8 (d) Other Power , 9 1 iI 8
II Manual 126 631 13 114 1111 24. 1118 21 168
Major Group 23 648 47,610 59 199 Total 584 150 978 98 1.2'71
I All Fuels I Power 892 45,207 14 91 271 100 647 70 917 (a) Electricity 367 43,140 13 86 266 ~7 628 68 1187 (b) Liquid Fuel 6 32 II a 1 18 (c) Coal, Wood and Bagasse 18 1,915 I II 15 1 6 1 11 (d) Other Power 1 120
II Manual 251 2,403 4.5 108 313 M 826 28 154.
Major Group 24 Total 2 740
I All Fuels I Power 2 740 (a) Electricity 2 740
Major Group 26 8 Total 7 8 7
All Fuels I Power 1 2 1 I (a) Electricity 1 :: 1 2
II Manue.l I II 2 II
Major GrQup 26 2,508 5,738 1,074 1,282 Total 8,062 97 1D2 28 ,58
I All Fuels I Power 91 854 13 41 96 14 90 13 1119 (a) Electricity 91 854 13 41 96 14 90 ]3 ]119
II Manual 2,4.17 4,884 1,Oln 1.24.1 S,966 83 512 13 191
156

ESTABLISHMENTS OTHER mA.~ HOUSEHOLD lNDUSTRlF,s CLASSIFIED BY fl'II.'DUSTRY, SIZE OF EMPLOYMENT-contd.
HOUSEHOLD INDUdl'RIEd BY 8IZE OF EMPLOYlIIEXT -- ~---,___.----------
20-49 50-~11 10v-2lJ9 300-499 500+ PensOf18 Division I Per8on~ P~l'''Ol'''' Pdl'ttUUt:I Per~oIl3 Pt1r~.ons LI ns p"oifi"d ~Iajor _----- ------ ------ ------- ------ ~---- Group of
Units P .. r8ous uniW! Persun" Unit~ P"l'tlont!, t: nits l)er~ons Units Persoll,; unit .. N. I. C. employed emplo.f"d employed emphyed employed
12 . 13 14 15 III l7 Is Hi :20 21 ;.l:.l 1
DISTRICT ( URBAN) Divisloa 24 a 271 7,784 89 6,918 66 10,127 9 8,141 24 42,815 lOS
228 6,517 78 6,201 62 9,671 9 3,141 23 41,693 47 213 6,113 71 4,759 58 9,215 8 2,812 22 40,433 22
7 111 .04. 7 4.42 3 336 329 1,260 17
1 120 1
68 1,267 11 712 • 456 1 622 M
1t 501 , 214 1 118 19 Major
Group 20.21
17 4.114. 3 21. 1 1111 17 16 392 a 21' 1 116 • 4
2 42 II
J 67 '. j
8 120 1 105 a Majol'
Group 22
4 80 1011 4 80 105
I 4.0 • H 1,621 82 2,021 14 2,003 2 689 19 88,489 14
Major Group 28
48 1.323 211 1,1176 14 2,003 J 639 18 87,817 10 47 1.298 21 1,308 13 1,883 1 310 17 36,557 4.
J 1 III , 268 1 829 1,260 3
120
8 S98 7 '"~ 622 • 1 260 1 488
Major Group 24.
I 260 480 1 260 480
Major Group 211
12 808 3 IUS 1 180 11 Major
Group 28
~ 1M 3 212 180 e 1154 !I 112 130
It UI2 11
157
(Ak} R-48-40
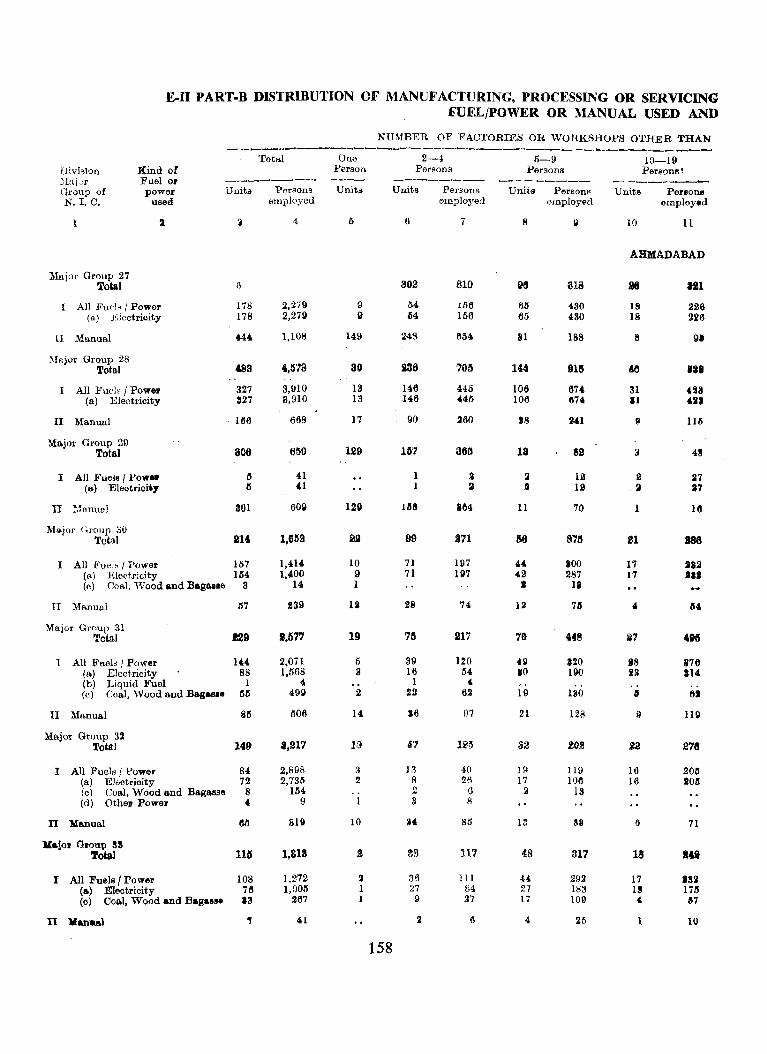
E.n PART-B DISTRIBUTION OF MANUFACTURING, PROCESSING OR SERVICING FUEL/POWER OR MANUAL USED AND
Total Division JIa.jjr Group of N.l. C.
Kind of Fuel or power
ussd Units Persons
1
Major Group 27 Total
2
I All Fu(')H I Powsr (a) l':Jectricity
1I Manual
:'Ilfljor Group 28 Total
I All Fuels I Power (a) Electricity
II Manual
Ma.jor Group 29 Total
I All }<'uele I Po.,," (a) Eleotrici.,
fl
178 178
444
&83
327 327
166
306
II ~.fnnUllj 301
Major lC;roup 30 'rotal UI
I All Fuch I Power 157 (a) EleC'tricity 154 (c) Coal. Wood and Bage. •• s 3
II Manual 57
Major Grnup 31 Total U9
1 All Fne],; I Power 1(4 (a) Electricity 88 (b) Liquid Fuel 1 (0) Coal, 'Vood and Bagas.. 55
II Manual 811
Major Group 32 Total 149
I All Fuels I Power 84 (s) Electrioity 72 (c) Coal, Wood and Bagaese 8 (d) Othe:r Powe:r ,
IT M~~l M
VAjo1' GI!Ol1P SS 'rotal 111S
I All Fuels! Power 108 (e.) Eleotricity 711 (0) Coal, Wood and Baga .. e 13
IT Van ... l 'T
employed
2,279 2,279
1,108
4,!.S18
3,910 8,910
668
650
41 41
609
1,6~!I
1,4l.ft 1,400
14
239
1,577
2,Oil 1,668
4 499
506
1,211
2,898 2,735
1M 9
1319
1,813
1,272 1,005
267
41
NUMBER OF FACTORIES OR WORKSHOPS O'£HER THAN -----------.--------- ---------------One
Person
Units
149
SO
IS 13
17
129
120
10 9 I
III
19
5 II
Ii)
3 2
10
2 1 1
2-4 Persons
Units
158
6
302
54 114
248
1136
146 .146
90
167
1 1
Ill8
99
71 71
28
76
39 16
1 22
S6
4"
13 8 2 1.l
114
36 27
9
Persons emllloyed
7
810
156 156
654
445 445
1I60
864
an
IIl7 197
74
sri
120 54
4. 611
07
40 211
(3
8
11'1
III 84 27
(I
0-9 Persons
Unit,s Persons
III
144
106 106
18
18
II !J
11
li4 42
J
12
78
49 10
19
21
82
19 17
2
13
H 27 17
4
emploYild
818
430 430
188
916
82
12 11)
7()
876
100 287
1IJ
7lJ
448
120 190
130
128
119 106
18
SII
31?
292 183 109
25
10-19 Peraonlll
UniM PeraonM employed
10 11
AHMADABAD
18 18
8
'0 31 11
S 11
1
11
17 17
118 i3
IJ
16 16
17 IS 4
HI
226 226
9.
43
1I7 27
16
888
4i5
876 114
61
119
2'i'fJ
20ll 103
71
1lJ1I 1711 87
10
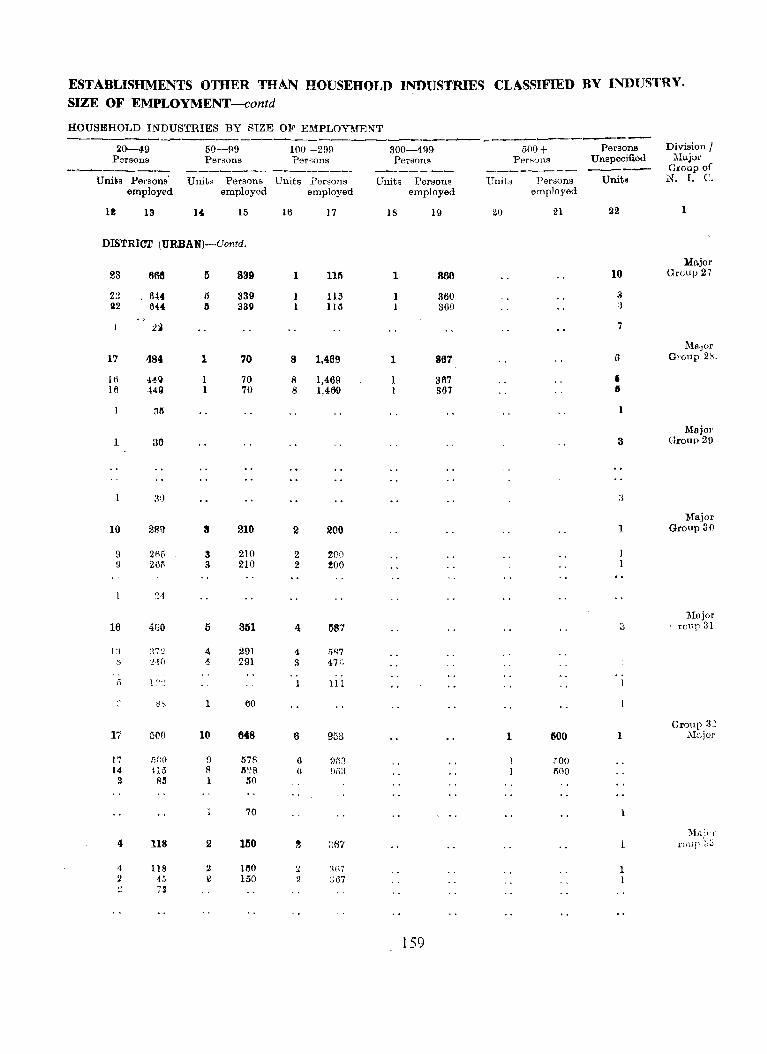
ESTABLISHMENTS OTHER THAN HOUSEHO.,D INDUSTRIES CLASSIFIED BY INDUSTRY. SIZE OF EMPLOYMENT-contd
HOUSEHOLD INDUSTRIES BY SIZE OF EMPLOYMENT -_--_-~-------_--------_--_---------- ----~--.-------
20-49 50-99 100-299 300-499 500+ Persons Division / Persons Persons Per30ns Persons Persons Unspecifiod Majo..:
--------'--_ -------~ --_----"---- ----_......._,_ ----------- ------ Group of Units Persons UnitR Persons Units Persons Units Persons Units Per.sons Units N. 1. C.
employed employed employed employed employed
11 13 H- 15 16 17 18 19 20 21 22 1
DISTRICT (URBAN)-Oontd.
Major 23 R66 5 8a9 1 115 1 880 10 Group 27
22 614 is 339 110 360 3 22 644 II Sag 116 360 :1
:2~ 7
1\18.Jor 17 484 1 70 8 1,469 1 867 6 Group 28.
III 4~9 1 70 8 1,469 367 I HI ·1411 1 70 8 1,469 367 II
311 1
Majo]' 1 30 3 Group 29
;10 :l
Major 10 289 3 210 2 200 1 Group 30
9 21\5 3 210 2 200 9 261i 3 210 2 tOO
~4
Major 16 460 5 351 4 587
-, roup 31 u
1 ;.~ :{72 <1 291 4 5'l7 ;; ',.!,t(} ,1, 291 3 47'~
;-, 1 :':' III .,
b~ 60 ,',
Group 3~ 17 5(1() 10 648 6 953 1 600 1 .:Ifnjor
17 non 9 5711 0 95:1 fOO 14 Hil R 1128 u 053 500
3 85 1 50
70
~hl.,~( I'
4 118 2 160 ~ ~;6'1 i l'UUp :);3
4 lIB 2 180 :;: :i07 1 2 45 Il 150 ~ ;;\)7 1 .} 73
159
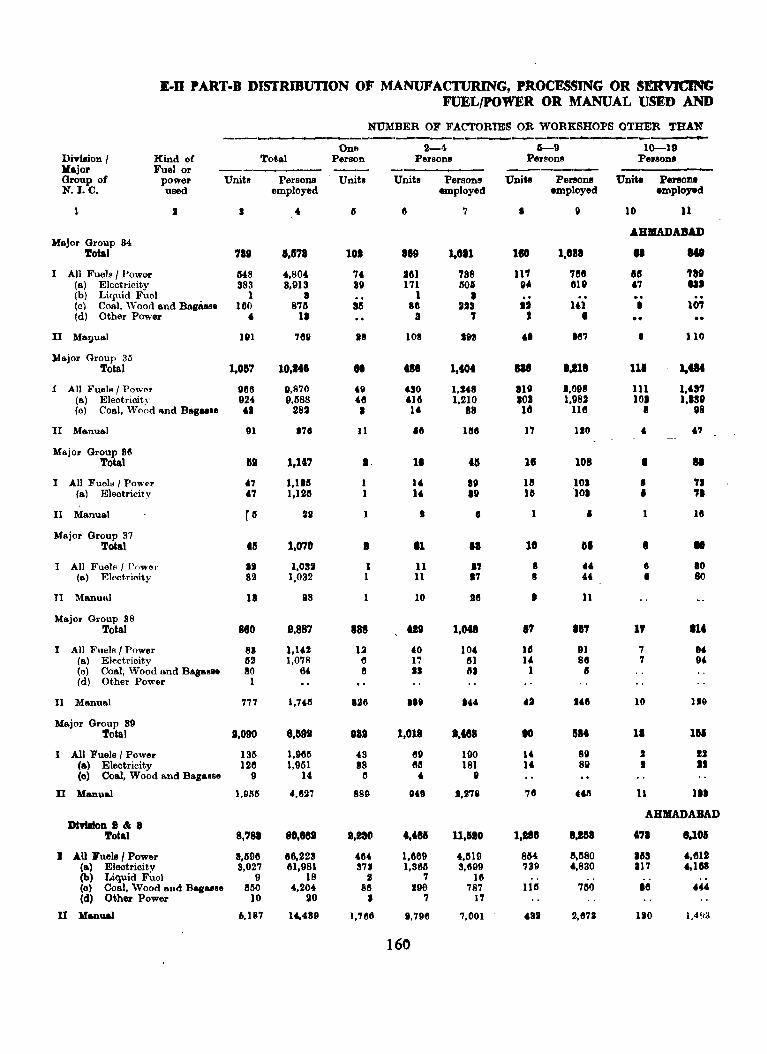
E-n PART-B DISTRIBUTION OF MANUFACTIJRING, PROCESSING OR SERVICING FUEL/POWER OR MANUAL USED AND
NUMBER OF FACTORIES OR WORKSHOPS OTHER THAN -------- -----------------------One Division I Kajor Group of N.I.C.
Kind of Fuel or
power used
Total Person
Units Persons Units
1 I I
Major Group 84 Total 7111
I All Fuels / POW0l' 348 (a) Electricity 883 (b) Liquid Fuel 1 (c) Coal. Wood and Baga!lB. 160 (d) Other Power ,
II Ma~ual lUI
Major Group 3/\ Total l,OIl?
I All Fuels/ Power 968 (a) Electricity 924 (ol Coal, Wood .. nd Bag ... e ••
II Manual 91
Major Group M Total III
I All Fuels I Power 4' (a) Eleotrioity 47
II Manual
Major Group 37 Total
I All Fuels I Powel' (a) Elootricity
II Manual
Major Group 88
til
I' 82
18
Total 880
I All Fuels I Power 83 (al Electricity 82 (0) Coal, Wood and BagaB'. 80 (d) Other Power 1
II lfanual 777
Major Group 89 Total .,090
I All Fuels/ Power 135 (a) Eleotricity 128 (0) Coal, Wood and Bage8s. 9
J1 Manual 1,9511
DlvllloD 8 &: 8 Total
) .AU I'uel. I Power (a) Electricity (b) Liquid Fuel (0) Coal, Wood and Baga.ae (d) Other Power
U Me.nual
8,?8.
8,11911 3,027
9 11110
10
6,187
employed
I,ll?
4,804 8,913
a 8711 II
7119
10,141
9,870 9,1188
282
I" l,lt?
1,1111 1,1211
211
1.070
1,031 1,032
88
e,887
1,10 1,078
M
1 ,all
8,1191
l,9M 1,951
14
4,627
80,881
116,223 111,981
18 4,204
iO
14.'89
101
74 39
lUI
18
I
1 1
1
• J 1
1
188
12 II 6
1211
la. '9 88
II
889
US" 484 37.
II 86
• 1,'1l1li
2-4 G-9 10-19 PersonJ Person!! Pel'SOM
Unite PersODe Unite Perlons UDite Perllollll
189
2111 171
1 86
3
108
al
11
.4 16
I
.1 11 11
10
tiD
'0 17 II
.Ie
1,018
69 611
4
0411
.,'85 1,669 1,3611
7 190
7
1,796
160
employed employed employed
7
1,011
738 1106
I 223
7
193
l,40t
1,14.8 1,210
88
1116
tlJ
8D III
e
.1 I' 17
1111
'" I,CS8
190 181
II
',27i
11,1110
4,1119 3,699
111 787
17
7,001
I
180
11' 1140 .. I'
J
" aIG lOS 14
1'7
18
III UI
1
10
8
" I
,7 UI .4
1
10
76
1,1811
864 739
1111
4311
l,oa8
7118 419
1&1
• 167
t.l18
1,098 1,98'
118
110
108
101 101
• IS.
" 44
11
"7 91 86
"
lilt
89 811
8,118
11,1180 4,830
760
2,671
10 11
AHMADABAD
II
1111
" • I
11. HI 101 ,
• • •
• e •
7 7
10
II
II I
11
.. '1SI1 OJ
10'1
110
1,'S7 1,IS9
118
" 81
'II ,. 16
• 10 80
lit
lllO
111
!J II
III
AHMADABAD
.7. 8,101
1118 117
III
uo
',611 4,168
444
1,493
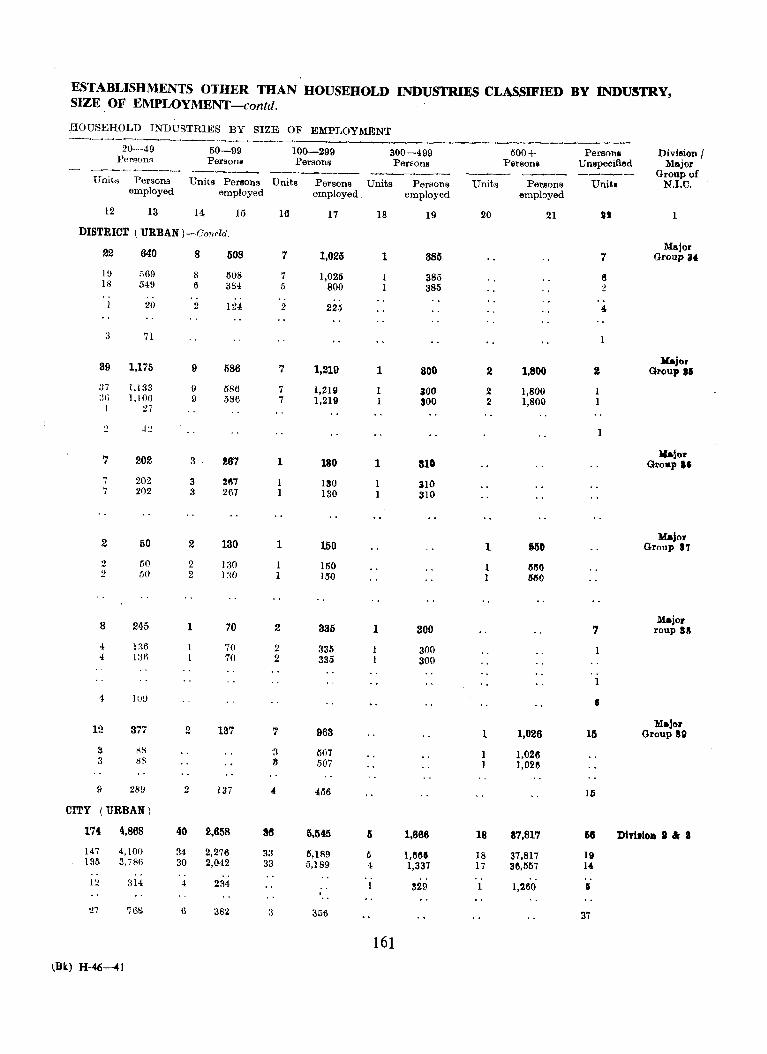
ESTABLISHMENTS OTHER THAN HOUSEHOLD INDUSTRIES CLASSIFIED BY INDUSTRY, SIZE OF EMPLOYMENT-contd.
HOUSEHOLD INDUSTRIES BY SIZE OF EMPLOYMENT -------- .------------------20-49 50-99 100-299 300-499 500+ Person. Divieion I ParBons Person. Persons Persons Persons U 118pecified Major ---~------ ------- ------ --- ---- ---- Groupof Unit" Persons Unite Persons Units Persons Units Persons Units PerBons Units N.I.C.
employed employed employed_ employed employed
12 13 14 15 16 17 18 19 20 21 IS
DISTRICT (URBAN )-Oonda.
22 640 8 508 7 1,025 1 385 7 Major
Group 84
19 i)tl9 8 508 7 1,026 385 II 18 549 6 384 5 800 385 '2 .. . . 20 2 124 2 22.5 4
:3 71
39 1,175 9 586 7 1,219 1 800 2 1,800 Kajol'
2 Group II
:J7 1,133 9 586 7 1,2111 1 300 2 1,800 1 ~H) 1.106 9 586 7 1,219 1 SOO 2 1,800 1
27
.) ·l~
7 202 :l 267 1 180 1 81. lbiol'
Gl'OllP If
7 202 3 267 1 130 1 310 7 202 3 267 1 130 1 310
Major 2 50 2 130 1 150 1 158 Group I.,
2 50 2 130 1 150 1150 2 150 2 130 I 150 51)0
8 245 1 70 2 335 1 300 '1 Major
roup 58
4 136 1 70 2 335 1 300 -1 I:Hl I 70 2 335 1 300
4 lu9 • Major 12 377 2 137 7 963 1 1,026 15 Group Sg
3 K8 3 (l07 1.0211 3 ss II 1507 1,02~
9 289 2 137 .{ 456 16
CITY (URBAN)
174 4,868 40 2,658 86 5,545 Ii 1,666 18 37,817 illS Dlvilioll lola 147 4,100 34 2,276 33 6,189 () 1,660 J8 37,817 Ii 135 3,786 30 2,042 33 5,189 4 1,337 17 36,557 l' ..
" .. .. I:! 314 4 234 .. 1 329 1 l,2~O I . 27 768 6 382 :~ 356 37
161
(Bk.) H-4(i--.U

E-ll PART-B DISTRIBUTION OF MANUFACTURING, PROCESSING OR SERVICING FUELjPOWER OR MANUAL USED AND
NUMBER 0]' FACTOlUES OR WORKSHOPS OTHER THAN ---------..----_ ... _-------- - -----~-----------One 2-4 5-9 10-19
Division I Kind of Total Person Persons Persons Persons Ma.jor Fuel or -_-......__--- ---~-- ------- -----~-Group of power Units, Persons Units Units Persons Units Persons Units Persons
N.I. C. used employed empoyed employed employed
1 2 3 4 Jj 6 7 8 \:J 10 11
AHMADABAD Major Group 20·21
Total 1,090 3,169 299 634 l,M9 96 618 23 272
I All Fuels I Power ',025 2,873 293 617 1,454 81 526 18 208 (a) Electricity 686 1,788 223 414 910 82 220 7 84 (b) Liquid Fuel 8 15 2 6 13 (c) Coal, Wood and Bagasae 829 1,067 67 196 529 49 305 11 124 (d) Other Power 2 3 1 1 .2
II Manual 65 296 6 37 105 15 94 II 64
Major Group II Total 79 440 11 33 90 18 106 11 184
I All Fuels I Power IIi 136 II , 7 i5 30 17 (a) Electricity 13 132 1 2 " 15 30 17 (c) Coal, Wood and Bagasse 1 8 1 3 (d) Other Power 1 1
II Manual M 304 9 SO 88 13 7{l, 10 11'1
)lajor Group 23 Total 438 43,816 37 J56 158 114 741 85 1,103
I All Fuels / Power 254 42,097 7 64 192 68 442 li8 764 (a) Electricity 243 40,272 7 61 182 67 4~7 (17. 752 (0) Coal, 'Wood and Bagl\98f1 1l 1,825 3 10 1 5 1 19
n Manual 204 1,219 30 92 266 46 295 27 3311
Major Group 25 Total 'a 7 8 '1
I All Fuels I Power 2 I) (a) Eleotricity 2 1I
II Manual 2 5 2 5
Major Group 26 Total 1,806 4,631 'iI7 1,059 2,538 85 526 22 287
1 All FuelH! Power 71 734 12 31 75 10 62 i) 119 (a) Electrioity 71 734 12 31 75 10 62 f) 119
,I Manual 1,835 lI,897 705 1,028 2,463 75 464 13 1118
Major Group 1.7 'rotal 375 2,437 76 19S 5401 4.9 309 21 261
I All Fuels / Power 91 1,626 .2 30 86 20 132 14 178 (a) Eleotricity In 1,626 2 30 86 20 132 14 178
II Manua! 284 811 74 168 455 20 177 7 88
»ajol' Group 2S Total 439 8,886 27 218 686 139 848 to 538
I All Fuele I Power 292 3,203 12 126 381 99 635 31 423 (a) Eleotrioity 292 3,203 12 125 381 99 635 31 423
II ).l9,nual 147 633 lii 88 255 33 lila 9 llD
162
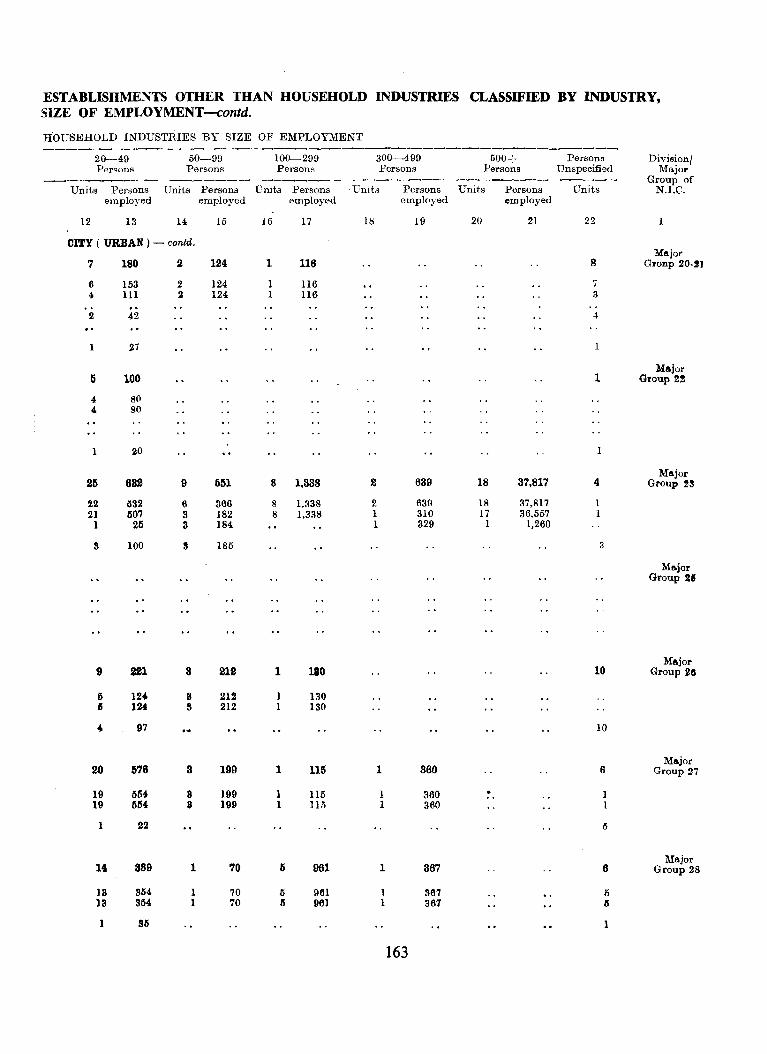
ESTABLISHMENTS OTHER THAN HOUSEHOLD INDUSTRIES CLASSIFIED BY INDUSTRY, SIZE OF EMPLOYMENT-contd.
HOUSEHOLD INDUSTRIES BY SIZE OF EMPLOYMENT ---------------------------------------------------20-49 50-99 100-299 300-499 500+ Persons Divieion/ Persons Persons Persons Persons Persons Unspecified Major
---------- ----_-_ ------- ---__ ----- -------- ----- Group of Units Pe1'80nS Units Persons Units Persons -Units .Persons Unit.s Persons Units N.I.C.
employed employed employed employed employed
12 13 14 15 16 17 18 19 20 21 22
CITY ( URBAN) - cOlUd.
'( 180 2 124 1 116 8 Major
Gronp 20-21
6 153 2 124 1 116 ~ , 4 III 2 124 1 116 3
2 42 4-
1 27
1 Major
5 100 Group 2!
4 80 4 SO
20
25 682 9 551 8 1,388 2 639 18 37,817 4 Major
Group !1I
22 lS32 6 366 8 1,338 2 639 18 37,817 1 21 507 3 182 8 1,338 1 310 17 36,557 I
1 25 3 184 1 329 1 1.260
S 100 8 185 3
Major Group 21
9 921 8 212 1 10 Major
110 Group illS
I) 12' 8 212 1 130 15 12' S 212 1 130
4, 97 10
20 578 8 199 1 115 1 360 8 Major
Group 27
19 554 8 199 1 Il5 1 360 . .. 19 5114 3 199 1 115 1 360
1 22 5
14 889 1 70 I) 961 1 367 6 Major
Group 28
18 854 1 70 5 961 367 5 18 354 I 70 I) 961 367 5
1 95 1
163
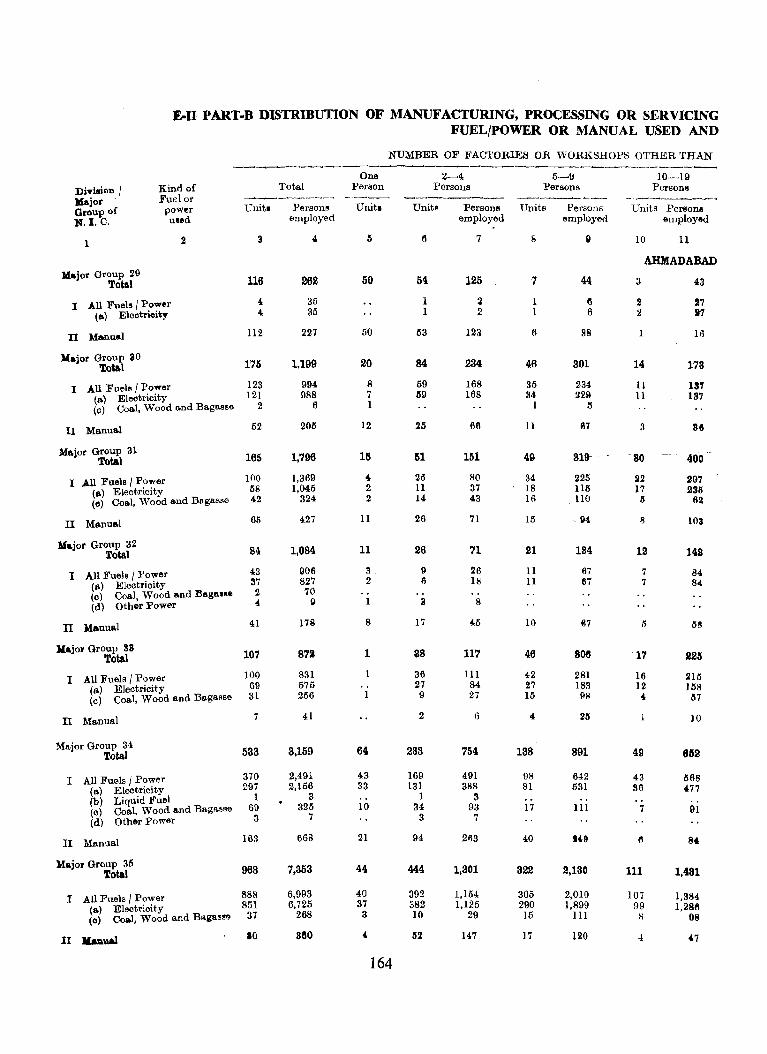
E-II PART·B DISTRIBUTION OF MANUFACTURING, PROCESSING OR SERVICING FUEL/POWER OR MANUAL USED AND
NUMBER OF FACTORIES OR WORKSHOPS OTHER THAN -------------------Di-yision I Xajor Group of H.I.C-
Kind of Fuel or power uasd
1
Major Group 29 Total
I All Fuels I Power (a) Electrioity
n Manual
Kajor Group 30 Total
2
I All Fuele I Power (a) Electricity (c) Coal, Wood and Ba.gasse
II Manual
Major Group 31 Total
I .All Fuels I Power (a) Eleotricity (0) Coal, Wood and Bagasse
II Manual
Major Group 32 Total
I All Fuels / Power (6) Electrioity (0) Coal, Wood a.nd 13aga.s •• (d) Other Power
IT Hanual
Kajor Group SlI Total
I All Fuels I Power (0.) Electrioity (0) Coal, Wood o.nd Bagasse
IT Manual
Major Group 34 Total
I All Fuels I Power (a) Electrioity (b) Liquid Fuel (0) Coal, Wood and BagMse (d) Other power
II Manual
Major Group 35 Total
I All Fuels I Power (a) Electricity (0) Coal, Wood and Baga.!I!G
II JlaQual
One Total Person
Unit. Persons (Tnit. employed
3
116
4 4
112
175
123 121
2
52
165
100 58 42
65
84
43 37 2 4
41
107
100 69 31
7
533
370 297
1 69
3
163
968
888 851 37
10
4
262
35 35
227
1,199
994 988
6
2011
1,796
1,369 1,045
324
427
1,084
906 827 70
g
178
872
831 575 256
41
8,159
2,491 2,156
3 325
7
668
7,353
6,993 6,725
268
360
50
50
20
8 7 1
12
15
4 2 2
11
11
3 2
1
8
1
1
64
43 33
10
21
44
40 37 3
4
164
2-4 Persons
Units Persone
54
63
84
59 69
25
25 11 14
26
26
II 6
<I
17
88
36 27 9
2
263
169 131
1 34
3
94
444
392 382 10
52
employed
7
125
2 2
123
234
168 168
66
151
80 37 43
71
71
26 18
8
45
117
III 84 27
6
754
491 388
3 93
7
263
1,801
1,154 1,125
29
147
5-9 Persons
Units Persons
8
7
1 1
6
46
35 34
1
11
49
34 18 16
15
21
11 11
10
46
42 27 15
4
138
98 81
17
40
322
305 290 15
17
employed
II
44
6 6
S8
801
234 !IllS
5
67
819-
225 115 llO
184
67 67
67
806
281 183 98
25
891
642 531
III
2,130
2,010 1,899
III
120
10-19 Persons
Units Persona employed
10 11
AHMADABAD
3
2 2
14
11 11
3
80
Jl2 17
5
8
12
7 7
/)
17
16 12 4
49
43 36
7
111
107 99
R
4
43
27 i7
16
178
13'7 187
400··
297 235
62
103
142
84 84
68
225
2111 158 l'I7
10
852
668 '77
91
84
1,481
1,384 1,2811
98
47
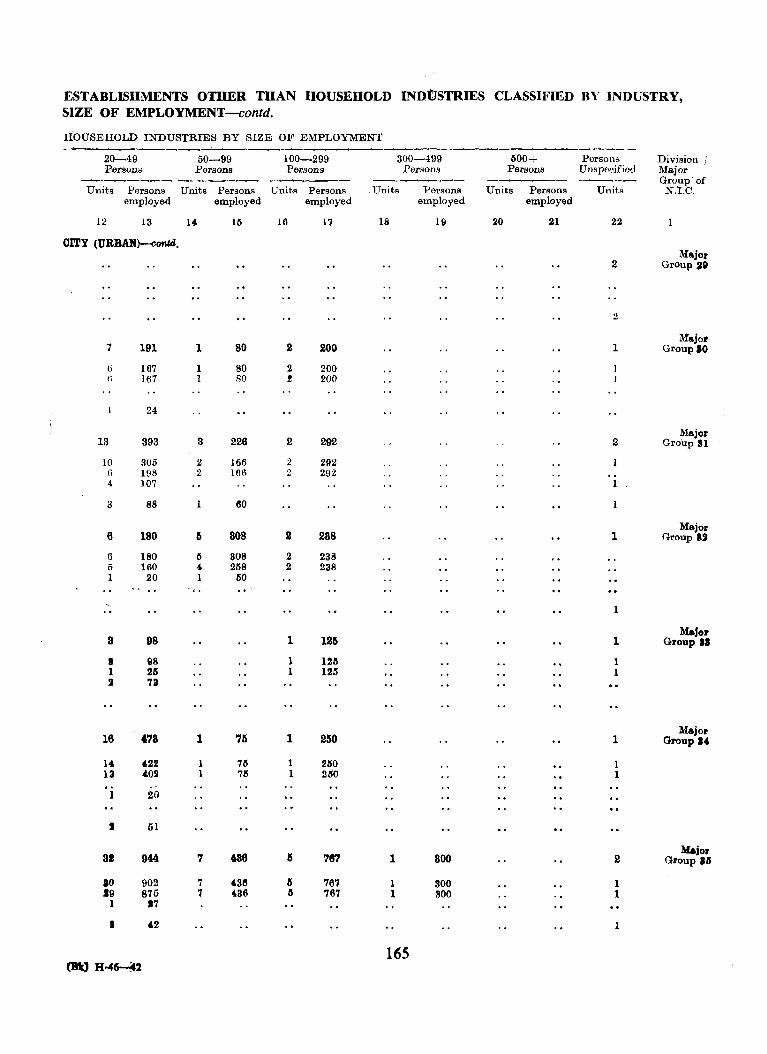
ESTABLISHMENTS OTHER THAN HOUSEHOLD INDtJSTRIES CLASSIFIED BY INDUSTRY, SIZE OF EMPLOYMENT-contd.
HOUSEHOLD INDUSTRIES BY SIZE OF EMPLOYMENT
20-49 Persons
50-99 Persons -------- -------
Units Persons Units Persons employed employed
12 13 14 15
CITY (URBAN)-contd.
7 191 1 80
6 167 1 80 I) 167 1 SO
24
13 393 3 226
10 305 2 166 I) 198 2 166 4 107
3 88 I 60
6 180 II 808
6 180 5 308 5 160 4 2118 1 20 1 110
"i.
3 98
• 98 1 25 II 73
18 .78 1 711
14 422 1 711 13 402 1 75
1 20
t 51
8t 944 7 438
10 902 7 4311 19 875 7 486
1 17
I '2
(BtJ H-4642
100-299 Persons
Units Persons employed
16 17
2 200
2 200 ! 200
2 292
2 292 2 292
2 288
2 238 2 238
1 1211
1 1211 1 1211
1 250
1 2M 1 250
II 787
IS 767 II 767
300-499 Persons
---~---Units Persons
employed
18 111
1 800
1 300 1 SOO
165
1100+ Persons Division! Persons Unspeoified Ivlajor ------- ------ Group· of
Units Persons Units N.I.C. employed
20 21 22 1
2 Major
Group .all
2
1 l\Iajor
Group 10
2 Major
Group III
1
1
1 Major
Group 12
1 Major
Group II
1 1
1 Major
Group I'
1 1
2 Major
Group 15
1 1
1
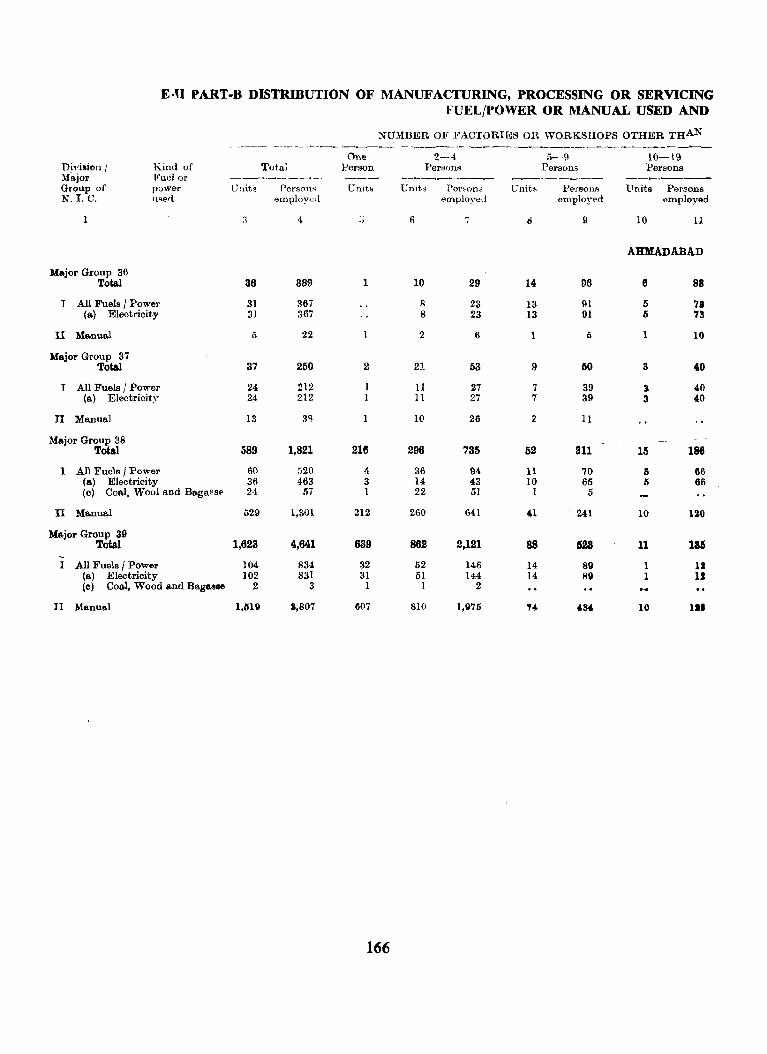
E·n PART-B DISTRIBUTION OF MANUFACTURING, PROCESSING OR SERVICING FUEL/POWER OR MANUAL USED AND
NUMBER OF FACTORIES OR WORKSHOPS OTHER THAN - ------.-~------- --~--------__.------------ ---"-_._--_--_
One 2-4 5-9 10-19 Division/ Kind of Total Person Per"OHS Persons Persons Mfljor Fuel or ------ ------ -------- -----~-----.. ------Group of power Unit.s Persons Units Units Person", Units Persolls Units Persons N. I. C. uRed employ", I employee! employed employed
1 :l 4 .j 6 7 8 Il 10 11
AHMADABAD
Major Group 36 Total 36 889 1 10 29 14 96 11 88
1 All Fuels I Powel' 31 367 S 23 13 91 5 7. (a) Electricity 31 367 8 23 13 91 5 73
II Manual 5 22 1 2 6 1 5 1 10
Major Group 37 Total 37 250 2 21 53 9 60 8 40
I All Fuels I Power 24 212 1 11 27 7 39 3 40 (a) Electricity 24 212 1 11 27 7 39 3 4,0
n Manual 13 3S 10 26 Z 11
Major Group 38 Total 589 1,821 216 296 735 52 811 15 188
I All Fuels I Power 6(1 520 4 36 94 11 70 5 66 (a) Electricity 36 463 3 14 43 10 65 5 66 (c) Coal, Wool and Baga8 s(' N 57 1 22 51 1 5
II Manual 529 1,301 212 260 641 '1 241 10 120
Major Group 39 Total 1,623 4,641 639 882 2,121 88 523 11 186
I All Fuels I Power 104 834 32 52 146 14 89 1 U (a) Electricity 102 831 31 51 144 14 89 1 IS (c) Coal, Wood Ilnd Bagasse 2 3 1 1 2
II Manual 1,1119 3,807 607 810 1,975 '4 • 34 10 II •
166
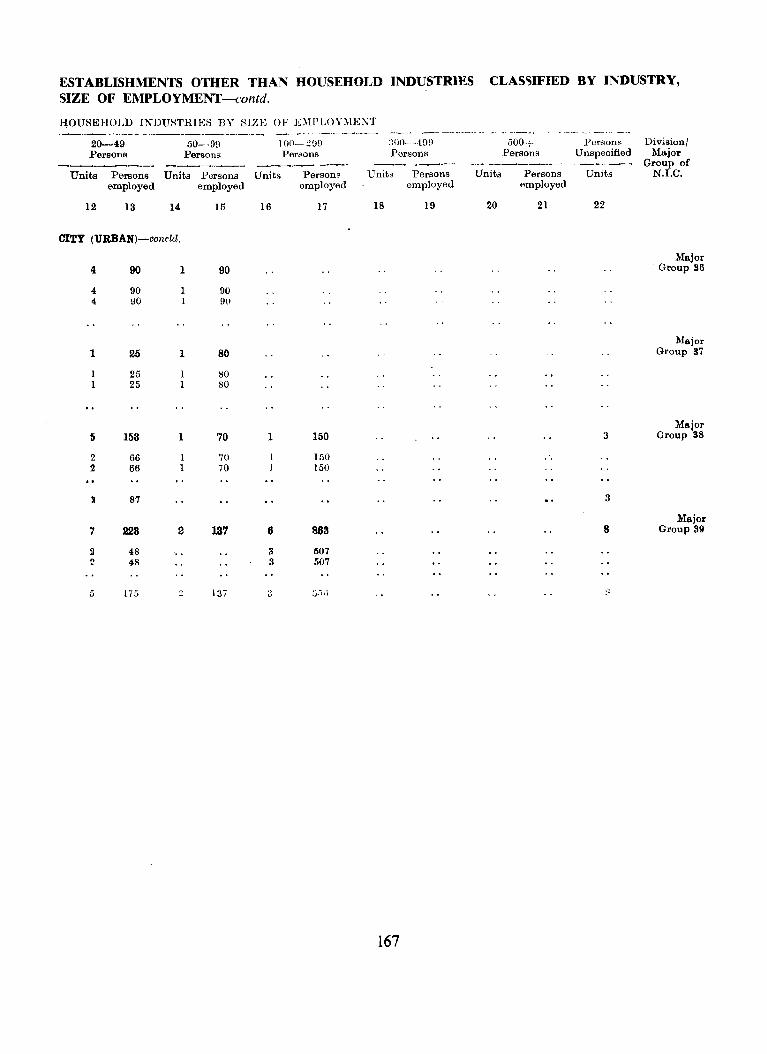
ESTABLISHMENTS OTHER THAN HOUSEHOl,D INDUSTRlES CLASSIFIED BY INDUSTRY, SIZE OF EMPLOYMENT --contd.
HOUSEHOLD IXDUSTRIES BY SrZg OF E;\U'LOY:\LE.\'l' ----~----- -- ----------.--------- _. __ ~ 4_ •• _.~_ - --__..- .-- ~-- .... --.- ___ ,_" _-0-- _ . .,
20--49 50-99 100-209 :lOn~ -199 ;)00+ Persons Division! Persons Persons Persons Persons Persons Unspecified Major
-------.- ------ ------ -------- _---- Group of Units Persons Units Persons Units Persons Units Persons Units Persons Units N.LC.
employed employed employed employed employed
12 13 14 15 16 17 18 19 20 21 22
CITY (URBAN)-concld.
Major 4 90 1 90 Group 36
4 90 90 4 90 9U
Major
1 25 1 80 Group 37
25 SO 25 80
\'; 153 1 70 1 150 3 Major
Group 38
2 66 70 150 2 66 70 150
:4 87 3
Major 7 223 2 137 6 863 8 Group 39
2 48 " 507 2 48 3 507
5 175 2 137 ., ;):;!) :' oJ
167
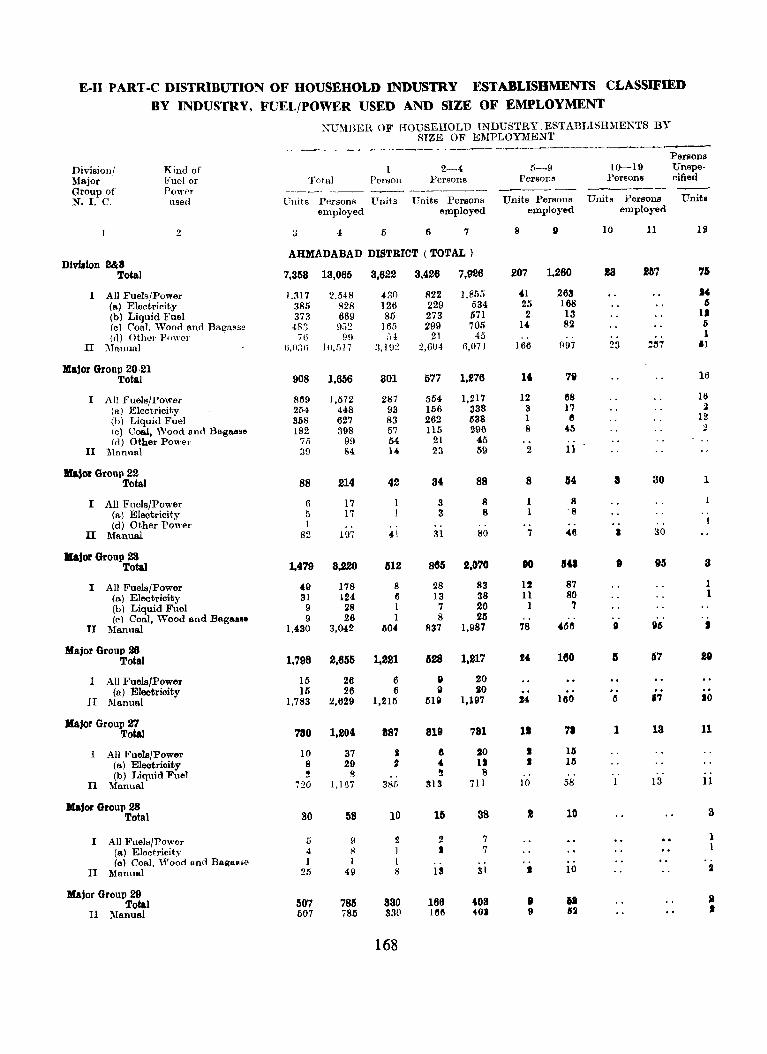
E-II PART -C DISTRIBUTION OF HOUSEHOLD INDUSTRY ESTABLISHMENTS CLASSmffiD
BY INDUSTRY, FUEL/POWER USED AND SIZE OF EMPLOYMENT
CfU;\IBEH. OF HOUSEHOLD INDUSTRY ESTABLIHHMENTS BY fUZE OF EMPLOYMENT
.~----~-~____..-.-- ~--_"'--- ~--.---- ~-_...~--.-- ...... - .-----"'--"'----Persons
Division/ Kind of 2-4 5-9 10--19 Unspe-Major Fuel or TotaJ Person Persons Persons Persons eified Group of POW!'l' --_ .. -- _--... ------ _------ -------N. 1. C. used Units Persons lInits Units Persons Units Persons Units Persons Units
employed employed employed employed
2 :I 4 5 6 7 8 0 10 11 III
AHMADABAD DISTRICT (TOTAL) Dlvilion 2&8
Total 7.358 13,065 3.622 3,426 7.926 207 1.260 18 187 76
I All Fuels/Power 1.:H7 2.548 .:10 822 1,855 4.1 263 J4. (a) Electricity 385 828 126 229 534 25 168 6 (b) Liquid Fuel 373 669 85 273 671 2 13 lJ (e) ('oal. Wood anrl Ba~asse 4S~ !l;;2 16.5 299 705 14. 8~ I)
(d) Oth",' Power 7H 99 34 21 45 1 II ::\[anual t),O:1ii 10,;;17 :l. 1 !l:! 2,(lO4 6,071 166 !l97 23 :!:!7 .1
Major Group 20-21 Total 908 1,656 301 577 1,276 14 7(1 16
I ,\ll Fuels/Power 869 1,672 287 554 1,217 12 68 16 (It) Electricity 264 448 93 156 338 3 17 ~
(b) Liquid Fuel 358 627 83 262 iS38 1 6 12
Ie) Coal, \Vood a,nd Bagass., 182 398 57 115 296 8 .6 :.l
(d) Other Power 75 99 54 21 45 II Monnal 39 84 14 23 69 2 11
Major Group 22 Total 88 214 42 34 88 8 34 3 30 1
I All Fuels/Power 6 17 3 8 1 8 (a) Electricity 5 17 3 8 1 8
(dl Other Power I n J\Ianual 82 197 4\ 31 80 7 46 I 30
"jor Group 23 Total 1,479 3,220 312 885 2,070 to 341 • 95 8
I All li'uelsfPower 49 178 8 28 83 12 87 1 (a) Electricity 31 124 6 13 38 11 80 1 (b) Liquid Fuel 9 28 1 7 20 1 7 (el Coal, Wood and Baga ••• 9 26 1 8 25
II l\fanllal 1,430 3,042 lI04 837 1,987 78 4.lIe II 116 I
Major Group 96 Total 1.798 2.655 1,221 528 1,217 14. 180 5 67 20
I All Fuels/Power 15 26 6 II 20 (a) Electricity Ili 26 6 II 20
II ;\Ianual 1,783 2,629 1,216 Mil 1,197 24 leO II 17 10
"jor Group m Total 780 1,204 887 819 781 11 ,. 1 13 11
I All Fuels/Power 10 37 II 4 to J HI (a) Electrioity 8 29 , 4. 11 I 111 (b) Liquid Fuel ! 8 !! 8
II ::\fanual 720 1,167 3s6 313 711 10 58 13 11
llajor Group 28 Total 30 58 10 15 38 18 10 a
I All }<'uels/Power 5 9 2 2 7 1 (a) Eleetricit~, 4 H 1 1 7 1 (e) Coal, ',"ood and Bagasse I 1 I
II Manual 25 49 g IS 51 J 10 2
Major Group 29 Total 507 785 830 166 103 8 II 2
II ::\Ianual (>07 786 330 1M .0' 9 62 I
168
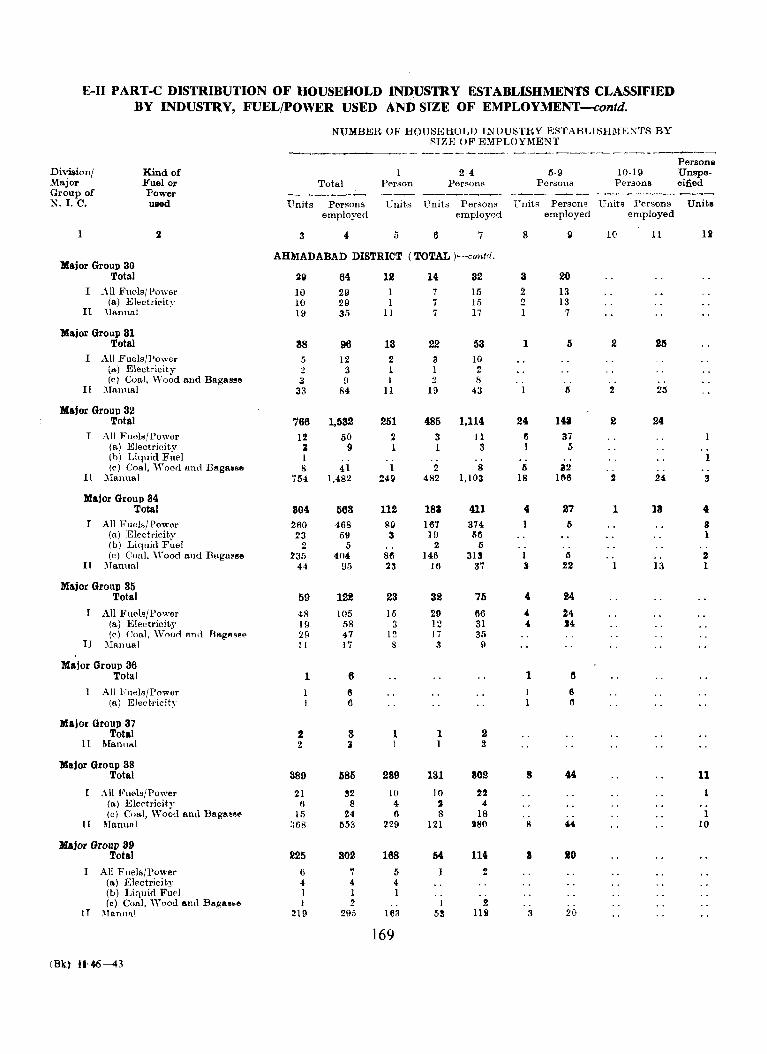
E-II PART-C DISTRIBUTION OF HOUSEHOLD INDUSTRY ESTABLISHMENTS CLASSIFIED BY INDUSTRY, FUEL/POWER USED AND SIZE OF EMPLOYMENT-contd.
Division/ ?Iajor Group of N. I. C.
Kind of Fuel or Power ulIlId
1 2
Major Group 30 Total
I All Fuels/Pm,-ar (a) Electricitv
II :l1anual .
Major Group 31 Total
I All Fuels/Power (a) Electricity (e) Coal, Wood and Bagasse
II )[annal
Major Group 32 Total
I All Fuels/Power (a) Ele~tri()ity (b) Liquid Fuel (e) Coal, \"oor! and B"gaMse
II )[anual
Major Group 34 Total
All Fuels/ POWN'
(n) Electricit.~, (b) Liquid Fuel (c) Coal. 'Yood and Bagasse
IT )fannal
Major Group 35 Total
I All Fuels/Power (a) Electricity (d ConI, "Toorl awl Baga •• e
II ~Ianual
Major Group 36 Total
T All Fuels/Power (a) Eiectri('ity
Major Group 37 Total
1 I Mafilml
Major Group 38 Total
1 All Fuels/Power (a) Electricity (e) Coal, "Yood anti BagM~"
n Mnnuol
Majol GrollP 89 Total
I All Fuels/Power (a) Eleetricity (b) Liquid FUf'l (c) Coal, \Yood and Bag .......
TT \ranllfll
NUMBEB OF HOUSEHOLD I~DUSTRY ESTABLISHl\IE:\TS BY RIZFJ OF EMPLOYMENT
Total
Units Persons employed
3
2-4 Perdon Persons
Units Units Persons employed
5 6 7
AHMADABAD DISTRICT (TOTAL )"--COtltri.
2~
10 10 19
38 5 2 a
33
766
12 3 1 8
754
804 260 23
2 235
44
59
4R 19 29 II
! 2
1
389
21 6
15 :168
225 I) .. 1 I
219
64 29 29 35
96 12
3 9
84
1,532
50 9
41 1,482
563 468 59
5 404
95
122 105
58 47 17
6
6 6
3 3
585
82 8
24 M3
302
7 4 1 2
295
12 I 1
11
13 2 1 1
11
251 2 1
112 80 3
86 23
23 ]Ii
3 l~
8
1 l
239
10 4 6
229
168 5 4 1
163
169
14 7 7 7
22
3 1
19
32 15 15 17
53 10 2 1;
43
485 1,114 3 11 1 3
2 8 482 1,103
183 411 167 19
2 146
16
32
29 12 17 3
1 1
131
10 2 8
121
54
1 5S
374 56
(,
313 37
75
tl6 31 35 !l
2 2
802
22 4
18 280
l14
2 1 III
(,-9 Porsons
l~nits Persons employed
8
a 2 2 1
1
24 6 1
" 18
I :'I
4
4 4
1
I 1
8
8
8
3
20 13 13
7
I)
141
37 :;
32 166
27 I)
5 22
24
24 14
6
6 6
so
20
10-19 Persons
Cnits Persons employed
10 11
II
2 25
2 24
2 24
1 18
13
Persona Unspecified
Units
1
3
4 8 1
2 1
11
1 10
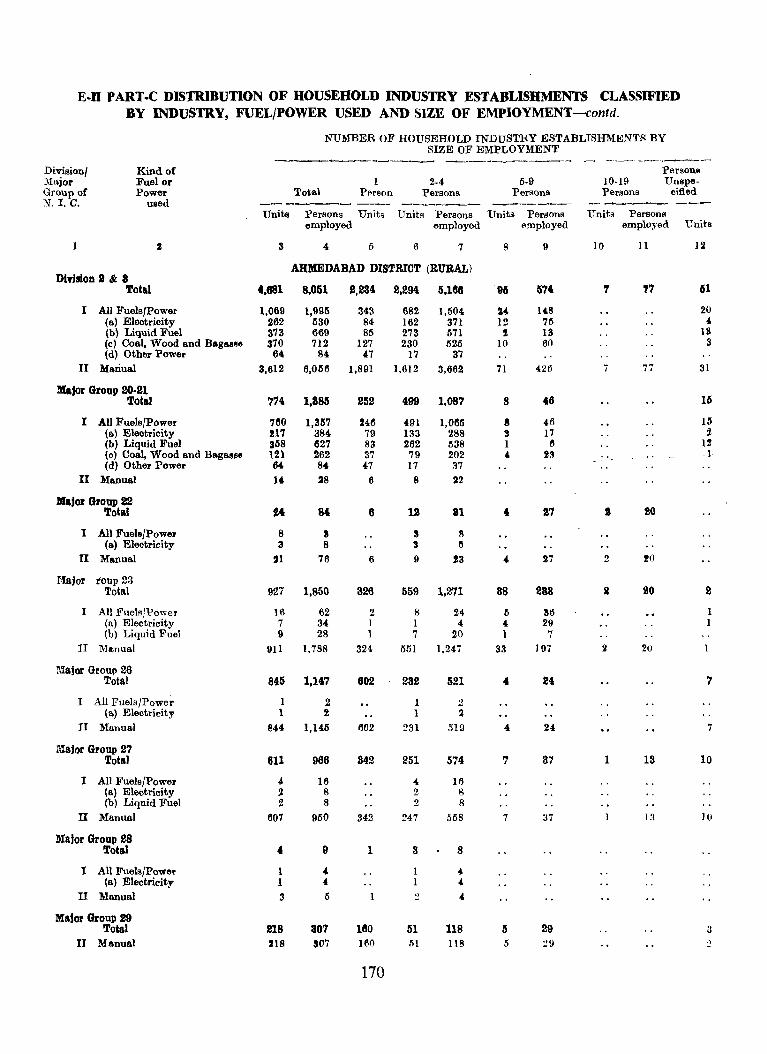
E-D PART-C DISTRIBUTION OF HOUSEHOLD INDUSTRY ESTABLISHMENTS CLASSIFIED BY INDUSTRY, FUEL/POWER USED AND SIZE OF EMPIOYMENT-contd.
NUMBER OF HOUSEHOLD INDUSTRY ESTABLIS.IDfENTF: BY SIZE OF EMPLOYMENT
~~ ------...---~-.-- -- _----- ..__---------..-Division/ Kind of Person!! l\Iajor Fuel or 1 2·4 5·9 10·19 Unspe. Group of Power Total Person Persons Persons Persons cified N. I. C. used _- -------- --- _----
Units Persons Units Units Persons Units Persons Units Persons employed employed employed employed Unit,s
2 3 4 5 6 7 8 9 10 II ]2
Division 8 & 8 AHMEDABAD DISTRICT (RURAL)
Total '.881 8.051 2,284 2.294 5,188 95 574 "I '17 61
I All Fuels/Power 1,069 1,995 343 682 1,1)04 24 148 20 (a) Electricity 262 530 84 162 371 12 7lS 4 (b) Liquid Fuel 373 669 85 273 571 2 13 IS (c) Coal, Wood and Bagallse 370 712 127 230 525 10 60 3 (d) Other Power 64 84 47 17 37
II Mariual 3,612 6,056 1,891 1,612 3,662 71 420 7 77 31
Major Group 20·21 16 Total 774 1,885 252 499 1,087 8 46
I All FuelS/Power 760 1,3117 246 491 1,0115 8 46 III (a) Electricity !l7 384 79 133 288 3 17 :I. (b) Liquid Fuel 358 627 83 262 538 1 II U (c) Coal, Wood and Bagasse 121 262 37 79 202 " 23 1 (d) Othel' Power 64 84 47 17 :J7
II Manual 14 28 6 8 22
Major Group 22 Total U 84 6 11 81 4 17 • 20
I All FuelsJPow61' s 3 3 8 (a) Electricity 3 8 3 II
II Manual '1 76 6 9 23 " 27 !? !O
Major roup 23 Total 927 1,850 326 559 1,271 88 283 I SO 2
I All Fuels/Power )6 62 2 8 24 6 36 1 (a) Electrioity 7 34 I 1 4 " 29 I (b) Liquid Fuel 9 28 1 7 20 1 7
II M.nual 911 1,788 324 551 1,247 33 J97 2 20
!lIajor Group 26 Total 845 1,147 602 232 521 4 24 7
I All Fuels/Powe~ 1 2 1 2 (a) Electricity 1 2 1 2
II Manual 844 1,145 602 231 519 4 24 7
rdajor Group 21 Total 611 966 842 251 574 7 37 1 13 10
I All Fuels/Power 4. 16 " 16 (a) Electricity 'l 8 2 8 (b) Liquid Fuel 2 8 2 8
II Manual 607 950 342 247 558 7 37 1::1 10
Major Group 28 Total .. 9 1 3 8
r All Fuels/Powe~ 1 " 1 4-(a) Electricity 1 " 1 " II Manual :1 5 n 4
Major Group 29 TotaJ 218 807 180 51 118 IS 29 3
II Manual 218 S07 160 iiI ll8 5 20 .>
170
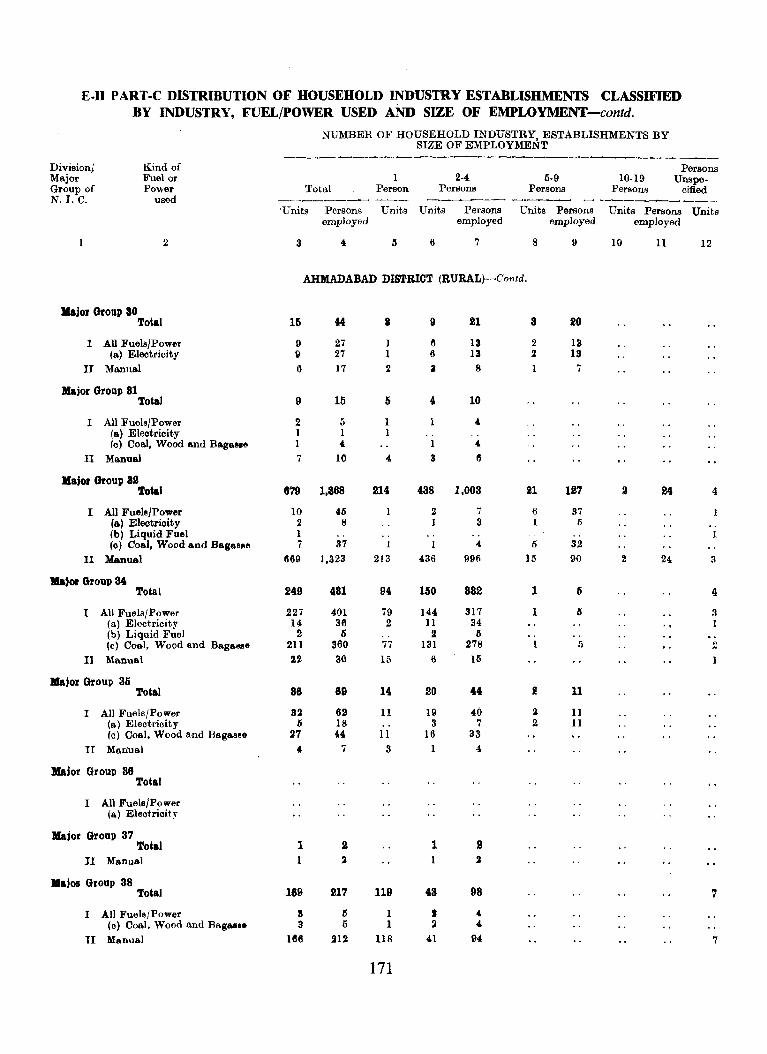
E-II PART-C DISTRIBUTION OF HOUSEHOLD INDUSTRY ESTABLISHMENTS CLASSIFIED BY INDUSTRY, FUEL/POWER USED ANn SIZE OF EMPLOYMENT-contd.
NUMBER OF HOUSEHOLD INDUSTRY, ESTABLISHMENTS BY SIZE OF EMPLOYMENT
-----Divisiont Kind of Persons Major Fuel or 2-4 5·9 10·l9 Unspe-Group of Power Total Person Persons Persons Persons cified N. I. C. used ----------- --- ------- - .. --_-
'Units Persons Unit.s Units Persons Unite Persons Units Persons Units employed employed employed employed
2 3 4 5 6 7 8 9 10 11 12
AHMADABAD DISTRICT (RURAL)-Contd.
Major Group 80 Total 16 44 8 II 21 8 20
I AU Fuels/Power 9 27 1 a 13 2 13 (a) Electricity I) 27 1 6 13 II 13
II Manual 6 17 2 a 8 1 7
Major Group 81 Total 9 16 5 4 10
I All Fuels/Power 2 5 1 , (a) Electricity 1 1 1 (c) Coal, Wood and Bagas8e 1 4 1 4.
II Manual 7 10 4 3 8
Major Group 82 Total 679 1,868 214 438 1,003 21 127 2 24 4
I All Fuels/Power 10 45 2 7 6 37 (a) Electricity 2 8 1 3 1 5 (b) Liquid Fuel 1 (0) Coal, Wood and Bagasse 7 37 1 " 5 32
II Manual 669 1,323 213 436 1196 15 90 2 24 a
Major Group 34 Total 249 431 94 150 832 1 Ii 4
I All Fuels/Power 227 401 79 144 317 1 IS 3 (a) Electricity 14 36 2 11 34 I (b) Liquid Fuel 2 5 II 5 (c) Coal, Wood and BagasslI 211 360 77 131 278 1 !) 2
IJ Manual 22 30 15 6 15 1
Major Group 35 Total 86 89 14 20 44 I 1l
I All Fuels/Power 32 62 11 19 40 2 11 (a) Electricity 6 18 3 7 2 11 Ie) Coal. Wood and Bagas~e 27 44 11 16 33
II Manual 4, 7 3 4
Major Group 36 Total
I All Fuele/Power (a) Electricity
Major Group 37 1 2 1 B Total
n Manual 1 2 II
Majos Group 38 169 217 119 48 98 Total 7
I All Fuels/Power S IS 1 I 4. (e) Coal. Wood and Bagasse 3 5 1 :I 4-
II Manual HI6 :112 118 41 94 7
171

E·n PART-C DISTRIBUTION OF HOUSEHOLD INDUSTRY ESTABLISHMENTS CLASSIFIED BY INDUSTRY, FUEL/POWER USED AND SIZE OF EMPLOYMENT -contd.
NU1LBER OF HOUSEHOLD INDUSTRY ESTABLISHME~TS BY SIZE OF EMPLOYMENT
-------_._--------Persons
Division! Kind of 1 2-4 5-9 10-1 \l . Unspe-Major Fuel or Total Person Persons Persons Persons cilied Group of Power ---- ---------, __._----.......--...- ... -----N. I. C. lBed Unit." Person,.; Units Units Persons Units Person~ Units Peroons Unih
empluyeu emplOyelt employl"o\ pmp\nyell
:l 3 4 ;; t) 7 ~ 9 In II 12
Major Group 39 AHMADABAD DISTRICT t RURAL )---~O!~cld.
Total 120 157 96 22 46 2 15 I All Fuel"JPower 1 1 1
(h) Liquid Fm,] 1 1 1 II Manual ll9 156 95 22 46 2 Hi
Division 2 & 3 AHMADABAD DISTRICT ( URBAN)
Total 2,672 5,014 1,388 1,132 2,760 112 686 16 180 24
I All Fuels/Pm,er 248 553 S7 14.0 ,,51 17 115 4 (a) Electricity 123 298 42 iii 163 13 93 1 (c) Coal, Wood and Baga~~e 113 210 38 69 180 4 22 2 (d) Ot,her PowE'r 12 15 i 4 8 .. 1
II Manual 2,424 4,461 1,301 !l92 2,4,0\) 95 571 16 180 20
Major Group 20·21 Total 134 271 49 78 189 6 33 - 1
I All Fue],S.'Power 109 215 41 63 152 4 22 (a) Electricity 37 64 14 23 liO (c) Coal, "rood and Baga~5e 61 136 20 36 94 4 22 (d) OthE1r Powf'r 11 15 ~ 4 f' ,
II Manual 26 56 8 15 37 2 11
Kajor Group 22 Total 64 180 86 22 67 4 27 1 10 1
I All Fueh:Powt'l1' 3 9 8 (II) Eleetricity 2 9 8 (d) Other Power 1 ..
II Manual 61 121 35 22 57 3 19 ]0
Major Group 23 1)52 Total 1,370 186 306 799 52 310 , 76 1
r All Fuols/Pow",r 33 116 6 20 ·'i9 7 51 (a) Electricity 24 90 /) 12 :14 i 51 (c) Coal, \Yooc] and Baga'M 9 26 1 8 ,,-
~O
II Manual 510 1,254 180 286 740 45 259 i 75
Major Group 26 953 Total 1,508 619 296 696 20 136 5 57 11
I All Fuel"IPower 14 24 6 8 18 (a) Ekctricit? 14 24 6 8 18 .,
II ManU'll (l39 1,484 613 288 678 20 136 1\ :37 13
Major Group 27 Total 119 238 45 68 157 5 36 1
I All Fuels/PuwfT {\ 21 2 2 4 2 15 (a) EIPetri"it y {I 21 2 2 4 2 15
II :'1l1nl1l\l Jl3 217 43 66 153 3 21 1
_aj or Grou'll 28 Total 26 49 9 12 30 2 10 II
I All Fue]s/Powpr 4 5 ! 3 (a) E1pctricity 3 ,~ I 1I 1 (C') C .. fI] , W'ood ann Flag!l~8~ 1 1 I ..
II :'>Isnnnl 22 44 7 II 27 2 lO ~
Major Group 29 Total 289 478 170 115 285 4 23
n Manual 289 478 170 l1jj 2Rii 4 23
172
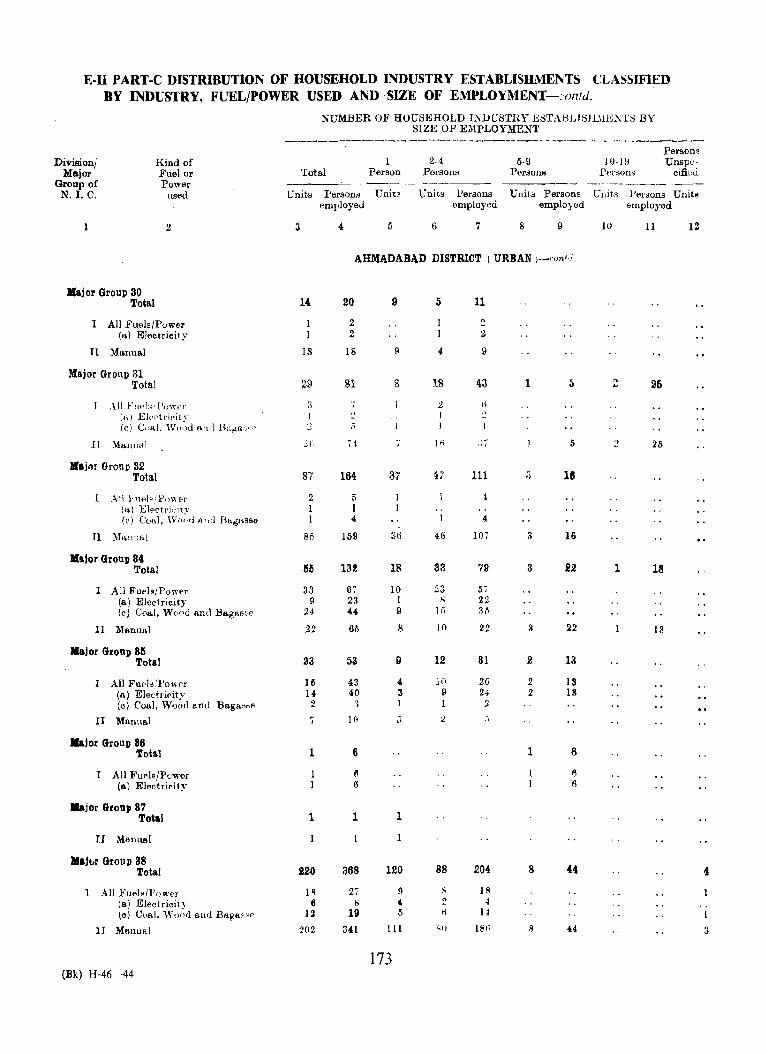
E-Il PART-C DISTRIBUTION OF HOUSEHOLD INDUSTRY ESTABLISHMENTS CLASSIFIED BY INDUSTRY, FUEL/POWER USED AND SIZE OF EMPLOYMENT -:'OI11d.
:NUMBER OJ<' HOUSEHOLD I.'IDUSTIty ESTABLlSJ-DlE.'IT" BY SIZE O.F E~lPLOYMENT
------------- ----_ ---------_----Persons
Divisionj Kind of 2-4 5·9 10-I!J Unspe-Major Fuel or Total Person Persons Persons Persons cifi8d
Group of Power ---~------- ---N. I. C. used Unit,; Persons Units Units Persons Unita Persons C"nits l'el'~ons Units
employed employed employed employed
2 3 4 5 6 7 8 9 lU 11 12
AHMADABAD DISTRICT ( URBAN )--conl'i,
lIajor Group 30 Total 14 20 9 5 11
I All FuelsjPuwer 2 2 (a.) Electricity 2 :4
II Ma.nua.1 18 18 Il 4 I)
Major Group 31 Total 29 81 8 18 43 1 5 " 26 ..
All f,u>!, ['"wer ~ J Ii .>
(H) Elp[·tl'icit~-., .,
(e) C"al. "\V""d BIt<1 n"ga ... , ,'. :! .'i
II Manual 2.11 .4 Iii .,' 5 2 25
lIajrn Group 32 Total 51 164 37 47 IIi ;j 18
1 A II Fuel" l1:'owpr 2 5 4 (a) Electrj,·it~· 1 1 (r) Coal, W<",d R.t,d Bagnss6 1 4 4
n :l-fnllual 815 159 36 46 107 3 16
lIajor Group 8( Total ISIS 132 18 33 79 3 22 1 18
I All Fuels/Power 33 67 1(1 23 67 (a) Electricity 9 23 1 ,., 22 (c) Coal, Wood and Baga8~e 24 44 9 I:; ~J'I
II Manual 22 66 8 10 22 g 22 13
Major Grollp 86 9 12 81 13 Total 23 53 2
All Fu('b/I'owpr 16 43 4 JO 26 2 13 (/\) Electrioity 14 40 3 I) 24 :2 18 (0) Coal. Wood and Baga""" 2 " 1 1 2 ~
II Manual 7 10 i-) ;l .j
Major Group 86 1 Total 1 6 6
T All FupjsjPo'l';er 1 ~ II (a) Electrjpity 1 fI 6
Major Grollp 87 1 Total 1 1
11 Manual
lIajllr Group 38 120 88 204 S 44 Total 220 368 4
1 All Fuel"tl'ower I ~ 2i 9 S IS (a) Electricity 6 b 4 ~ 4
(0) Coal, "\"00<1 alld BagacFP 12 19 1'1 fi 14 1
11 ManUI'd 202 341 111 SO 18(; 8 44 3
173 CBk) H-46 -44
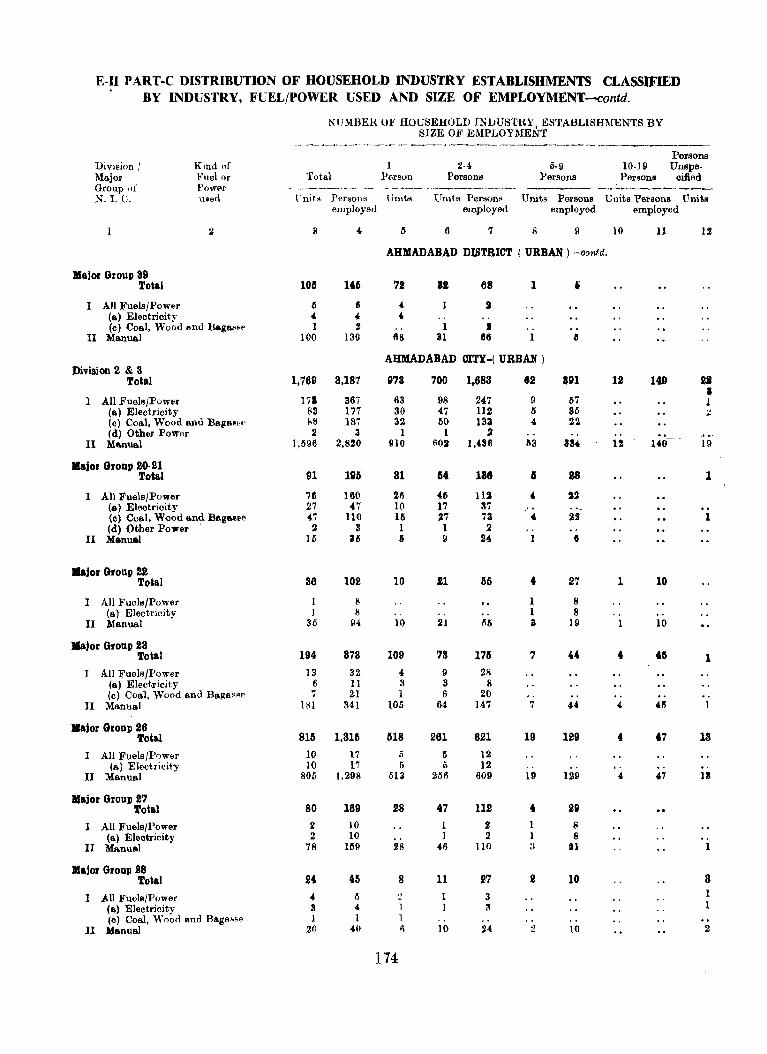
E-II PART-C DISTRIBUTION OF HOUSEHOLD INDUSTRY ESTABLISHMENTS CLASSIFIED BY INDUSTRY, FUEL/POWER USED AND SIZE OF EMPLOYMENT-contd.
NUMBER OF HOUSEHOLD INJJUSTRY, ES'rABLlSHMENTS BY SIZE OF E~IPLOYMENT
- .... ----,,~--_,--------.--.... ---, ... ~ ..... --~-- ---_",,_------_ --_ .. Persons
DivIsion; Kind of 2-4 0-9 10-19 Unepe-:Major Fuel or Total Person Persons Persons Persons cifted Group of POWE\r .------_. __ - "-- --_ - .---- --------~--- ----- --..._---~- ---... :S-. I. C. u.en. lTnit~ Persons tinite Units Persous Units Fersous Units Fersons Units
employed employed employed employed
:1 II 4 6 6 7 8 9 10 11 12
AHMADABAD DISTRICT ( URBAN) -contd.
lIalor Group 89 Total lOll 165 72 12 68 1 i
I All Fuels/Fowflr 6 6 , 2 (a) Electricity 4 , , (e) Coal, Wood end Baga~H' 1 ! 1 I
II Manual 100 139 68 31 66 1 II
AHMADABAD CITY -( URBAN ) Division 2 & 3
Total 1,769 8.187 978 700 1,683 82 '91 12 149 II
• I All ~'uels/Powel' 17' 367 63 98 247 9 67 1 (a) Electricity 83 177 30 47 112 6 86 ;I
(e) Coal, Wood and Bsga@8e (,8 187 32 50 133 4 22 (d) Other Pow{'r 2 3 1 1 .2
II Manual 1,596 2,820 Ino 602 1,436 113 aS4 12 1'0 19
IIajor Group 20-21 91 196 31 64 1M I S8 1 Total
I All Fuels/Power 76 160 26 ~6 112 , '2 (a) Electricity 2i 47 10 Ii 37 (c) Coal, Wood 6.nd lle.gailS{, (7 11Q 16 27 73 , U 1 (d) Other Poyer . 2 3 I 1 2
II Manual 16 36 6 9 2~ II
"jor Group 22 Total 36 102 10 21 65 4 27 1 10
I All Fuels/Power 1 8 1 8 (a) Electricity 1 8 1 8 ..
II Manual 36 94 10 loll 66 a 19 10
Malor Group 23 194 378 109 78 176 7 " 4 til Total 1
I All Fuels/Power 13 32 4 9 2/l (a) Elect.ricity 6 11 3 S 8 (e) Coal, Wood and Raga""f' 7 21 1 6 20
II Manual 181 341 105 64 147 7 " 4 411
Major Group 26 815 1,316 518 281 621 19 129 4 47 13 Total
I All Fuels/Power 10 17 ii Ii 12 (a) Electricity 10 17 5 5 12
II Manual 805 1,298 513 256 609 19 1:39 4 47 13
lIajor Group 27 80 169 28 47 112 4 SP Total
I All Fuels/Power 2 10 1 2 1 8 (a) Electricity :1 10 I 2 1 8
II Manual 78 169 28 46 llO 3 III 1
lIajor Group 88 24 45 8 11 27 II 10 8 Total
I All Fuols/Power 4 IS .) 3 I
(a) Electricity 3 4 1 ~ I (e) Coal, Woorlllud BagA .• ,,(' 1 1 1
II Manual 2(1 40 6 10 24 2 10 2
174

E·II PART·C DISTRIBUTION OF HOUSEHOLD INDUSTRY ESTABLISHMENTS CLASSIFIED BY INDUSTRY, FUEL/POWER USED AND SIZE OF EMPLOYMENT-:·ontd.
XUl\IBFJR OF HOUSEHOLD INDUSTRY, ESTABLISHMENTS BY SIZE OF EMPLOYMENT
-~---~.---.---- -------_--- _-'._ .... -_. ------- - .,,_---_.- *---- --_-----Division / Kind of Persons
Major Fuel of 2-4 5-9 10-19 Unspeci-Group of Power Total Person PersonR Persons Persons fled N.I_ C. used ------ ----- ----_-
Units Persons Units Unit.s Persons Fnits Persons Units Persons Units employed employed employed employed
1 2 S .. 5 6 7 8 9 10 11 12
Major Groap 29 aHMADABAD ( URBAN l--<'oncld.
. Total 117 229 54 59 152 '4 23
II Manual 117 229 154 59 152 4 :!3
Major Group 30 Toial 9 15 4 5 11
I All Fuels/Power 1 2 1 2 (a) Electricity 1 2 .. 1 2
II Manlllal 8 13 4- 4 9
.IiIajor Group 31 Total 26 75 6 17 39 1 /') 2 25
I All Fuels/Power 1 2 1 2 (a) Electricity I 2 1 :!
II Manual 26 73 ti 15 37 5 2 26
Major Group 32 Total 24 40 17 6 17 1 6
I All Fuels/Power 1 1 1 (a) Electricity 1 1 1
II Manual 18 S9 16 I) 17 6
Major Group 84 Total 41S 111 HI 25 60 8 22 1 18
I All Fuels/power 26 1i3 II 17 44 (a) Electricity 8 22 8 22 (0) Coal, Wood and Bagasse 18 31 II II 22 ..
II Manual 111 68 7 H 16 a 22 13
Major Group 85 Toial 22 49 9 11 27 2 13
I All Fuels/Power 15 39 4 9 22 ! 13 (a) Electricity 13 36 3 8 20 :I 13 (c) Coal, Woo,j and Bagasse 2 3 1 1 2
II Manual 7 10 5 2 il
Major Group 36 Total 1 6 II
I All Fuels/Power 1 tl ti (a) Electrioity 1 6 t3
Major Group 87 Total 1 1 1
II Manual
Major Group 88 Total 198 341 104 83 193 8 44 3
I All Fuels/Power 18 27 !l 8 18 (a) Electricity 6 8 4 2 4 (c) Coal, Wood and Bagasse 12 19 5 6 14 .. 1
II Manual 180 ~14 \15 75 l75 S 44 2
Major Group 39 Total 86 121 58 27 58 1 5
I All Fuels/Power 4 fi :I 2 (a) Electricity II S :1 (e) Coal, Wood and Bagasse 1 I . . .) ..
II Manual 82 116 55 26 56 1 ..
175

E-Ill DISTRIBUTION OF TRADE/COMMERCIAL ESTABLISH:\1ENTS CLASSIFIED
NlJ:\InEU OF R:STABLISHJ\IENTS --------~ ~- _._- --~-.--.----_._--------,-_._------- --_------------ -_._----
Division! Total Per81)n 2-4 Per~()nF 5-9 l'ersonH ~Iajor Group ~----- -_---_.- _" - '--.--- ... --_.---_._---",--_._- - -~-- ------- ~-----of N. 1. C. E~tablish· PPl'~OnH Establish- Establish- PerSPTlB Establish- Pprsons
ments '~mjJloy(>(1 mentR ments f'mployed mf'nb ernpl"yed
2 3 4 IS 6 7 s
AHMADABAD
!'o*al 34,524 83,443 16,185 14,579 86,699 2,892 14,608
Division 6 80,800 66,358 15;042 12,802 32,107 2,019 12.281
)IajOl' Group 60 2,912 10,931 349 1,742 4,969 657 4,038 61 118 444 16 64 170 29 ISO 62 150 744 18 1/ 218 37 248 63 166 f)21 34 92 249 28 169 64 419 1,:Hil 94 239 648 63 374
Ii;) 15 (lot :_>'lJ;S:'> 10,4'71 4,950 1I ,373 221 1,278 60 2:759 ii.7lii; 1,109 1,473 3,581 134 781 ti7 3.093 £1.;'!;4 1,!i9R 1,352 3,214 93 546 fiK ~, 7H4 6,774 932 1,450 3,R32 214 1.1180 69 2,517 10,Mi9 421 1,363 3,853 543 l(340
Division 8 3,724 17,085 1.143 1,777 4,692 878 2,276
:\fa.jnr O"()I,P 80 467 5,224 117 172 446 43 279 81 26 oJ7 4 8 22 _ 6 43 1:IZ 3,019 10,903 912 1,605 3,917 3110 1.930 83 212 341 110 92 207 4- ~u
AHMADABAD
Total 6.722 9,913 4,761 1,706 3,991 83 lS08
DlYision 6 6,522 9,056 4,690 1,603 3,746 76 4119
Major Group 60 110 283 16 79 :10.51 8 113 61 2 2 2 .. 6% 11 55 9 25 15 63 1 3 1 a 64 45 98 IS 24 60 IS
65 5,340 6,596 4,lS2 1,026 2,267 20 III 66 221 385 139 71 162 7 (4
67 153 189 11S 31 64 1 7 68 267 /'i93 76 167 48~ () 28 69 372 852 139 19/'i 474 32 208
Division 8 200 857 71 103 241S 8 ., :vrajnr Group 80 56 127 17 36 90 2 10
81 I .2 1 J 82 143 72S 54 66 1113 6 U
AHMADABAD
Total 27,802 73,530 11.424 12,878 82,708 2,809 14,0011
Division 6 24,278 57.302 10.352 11,199 28,361 1,944 11,778
~ajor Gruup 60 2,802 10.648 333 1,663 4,767 649 3,988 61 116 H2 14 64 170 29 ISO 62 139 61:19 Ii! 68 193 36 24~ tiS J65 tl18 34 91 246 lI8 16~ 64 374 l,2tl3 7ft 215 588 G2 369
H5 10,562 10,9% 6,289 3,924 9,106 1101 1,167 116 2,538 5,3:-\3 1)70 1,402 3,419 127 7:17 67 2.940 '},375 1.480 1,321 3,150 02 539 liS 2,497 li,lS! 1'56 1,283 3,343 209 1,2112 (HI :!,145 ~, 717 282 1,16~ 3.379 511 :{la4
176
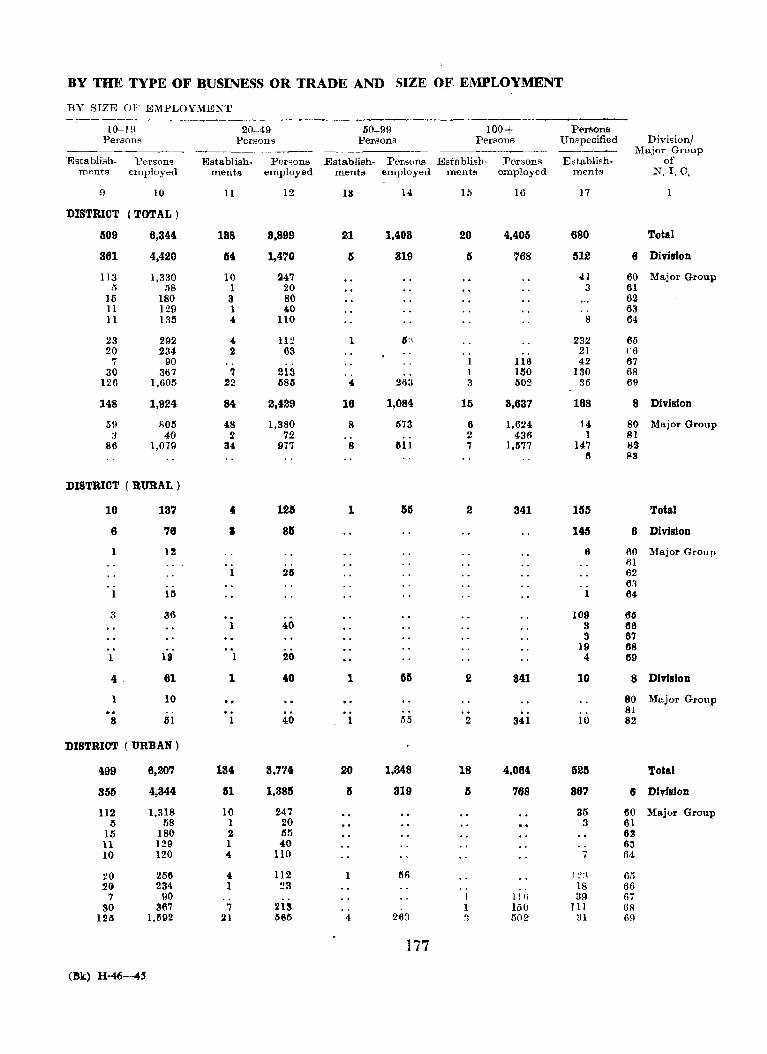
BY TIlE TYPE OF BUSINESS OR TRADE AND SIZE OF EMPLOYMENT
BY fUZE OF E1iPLOY.\1ENT --- --,~---.. --_._-_-- ._-
10-19 20-49 50-99 100+ Persons Persons Persons Persons Persons Unspecified Divisionl
--------~-~ --~-- Major Group Establish- Persons Establish· Per~oru; Establish· Persons Establish- Persons Establish. of
ments employed ments employed ments employed ments employed ments N,I.C,
9 10 II 12 13 14 15 16 17 1
DISTRICT (TOTAL)
509 6,344 188 8,899 21 1.403 20 4,405 680 Total
361 4,420 154 1,470 6 819 ts 768 512 8 Division
113 1,330 10 247 41 60 Major Group .'l 58 1 20 3 61
15 180 3 80 62 11 129 1 40 63 11 135 " 110 8 64
23 292 .. 11:1 1 ISn 232 6li 20 234 2 63 21 r6
7 90 1 116 42 67 30 367 7 213 .. 1 150 130 68
126 1,605 22 585 4. 263 :3 502 35 69
148 1.924 84 2,429 16 1,084 15 3,637 168 8 Division
59 80tS 48 1,380 8 573 6 1,624 14 80 Major Group 3 40 2 72 2 436 I 81
86 1,079 34 977 8 LHl 7 1.577 147 82 6 83
DISTRICT ( RURAL)
10 137 4 126 1 55 2 341 11S5 Total
6 76 I 81S 1~ 6 Division
1 12 6 60 Major Group 61
1 25 62 63
1 15 1 64
3 36 109 65 1 40 3 66
3 67 19 68
1 111 1 20 4 69
4 61 1 40 1 65 2 341 10 8 Division
1 10 80 Major Group ... 81 3 in 1 40 1 M 2 341 10 82
DISTRICT (URBAN)
499 6,207 134 3,774 20 1,348 18 4,064 525 Total
355 4,344 51 1.385 5 319 5 768 361 6 Division
112 1,318 10 247 35 60 Major Group 5 58 1 20 3 61
15 180 2 55 62 11 129 1 40 63 10 120 4 no ~ 64 i
20 256 4 112 1 116 J"" _., 65 2~ 234 1 23 18 66
7 110 I Ill) 39 f)7 30 367 7 213 1 150 111 68
1215 1,1592 ~l 1565 4 263 3 502 31 69
177
(Bk) H-46-45
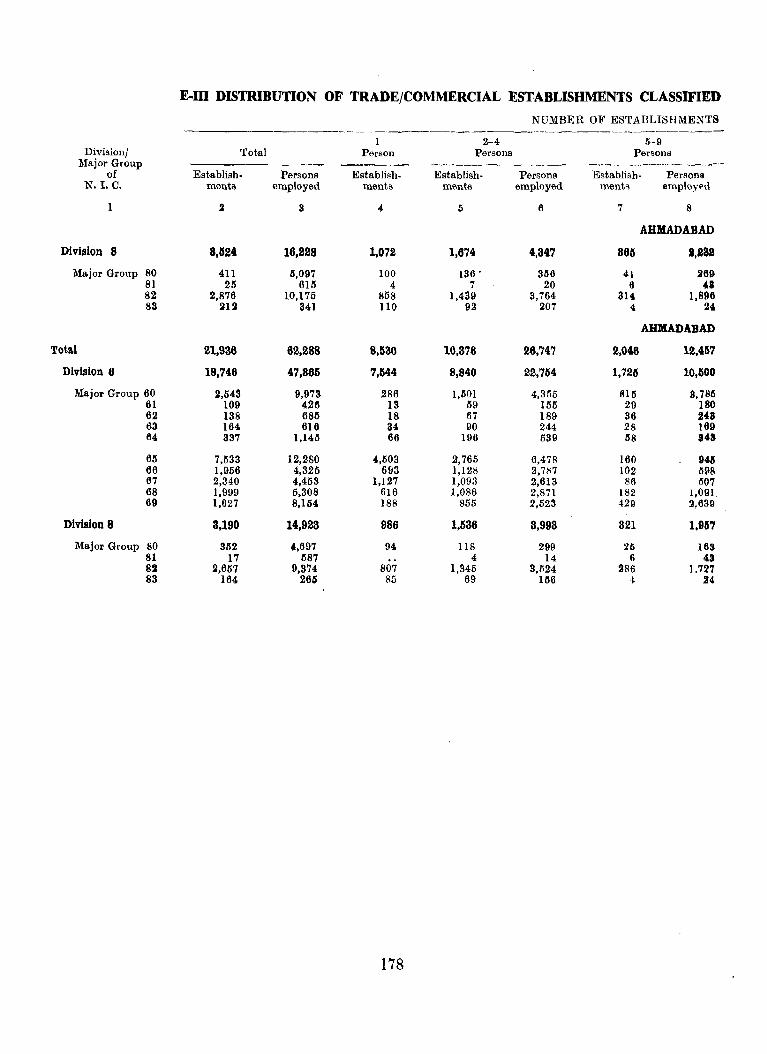
E-m DISTRIBUTION OF TRADE/COMMERCIAL ESTABLISHMENTS CLASSIFIED
NUMBER OF ESTABLISHMENTS --~-------
2-4 5-9 Division! Total Person Persons Persons
Major Group ------------- ----~--------
of Establish. Persons Establish. Establish· Persons Establish- Persona N.I.C. ments employed menta menta employed ment~ employed
1 .2 3 4 Ii 6 7 8
AHMADABAD
Division 8 8,IS24 16,228 1,072 1.674 4,847 361S 1,282
Major Group SO 411 5,097 100 136 • 3116 41 269 81 25 615 4 7 20 6 4. 82 2,876 10,175 858 1,439 3,764 314 1,896 83 212 341 110 92 207 " 24
AHMADABAD
Total 21,936 62,288 8,530 10,376 26,747 2,046 12,457
Division 6 18,746 47,865 7,1544 8,840 22,754 1,72l1 10,600
Major Group 60 2,543 9,973 286 1,501 4,355 8111 8,785 61 109 426 13 59 155 29 180 62 138 685 18 67 189 36 243 63 164 616 34 90 244 28 169 64 337 1,1411 66 196 539 58 843
65 7,533 12,280 ,,503 2,765 6,478 160 948 66 1,956 4,325 693 1,128 2,787 102 1198 67 2,340 4,453 1,127 1,093 2,613 86 1107 68 1,999 5,308 616 1,086 2,871 182 1,091 69 1,627 8,154 188 855 2,528 429 ~.639
Division 8 3,190 14,923 986 1,536 3,993 321 l,9l17
Major Group 80 352 4,697 94 118 299 25 163 81 17 587 4 14 6 43 82 2,657 9,374 807 1,345 3,524 ~86 1.727 83 164 266 85 69 156 4 24
178
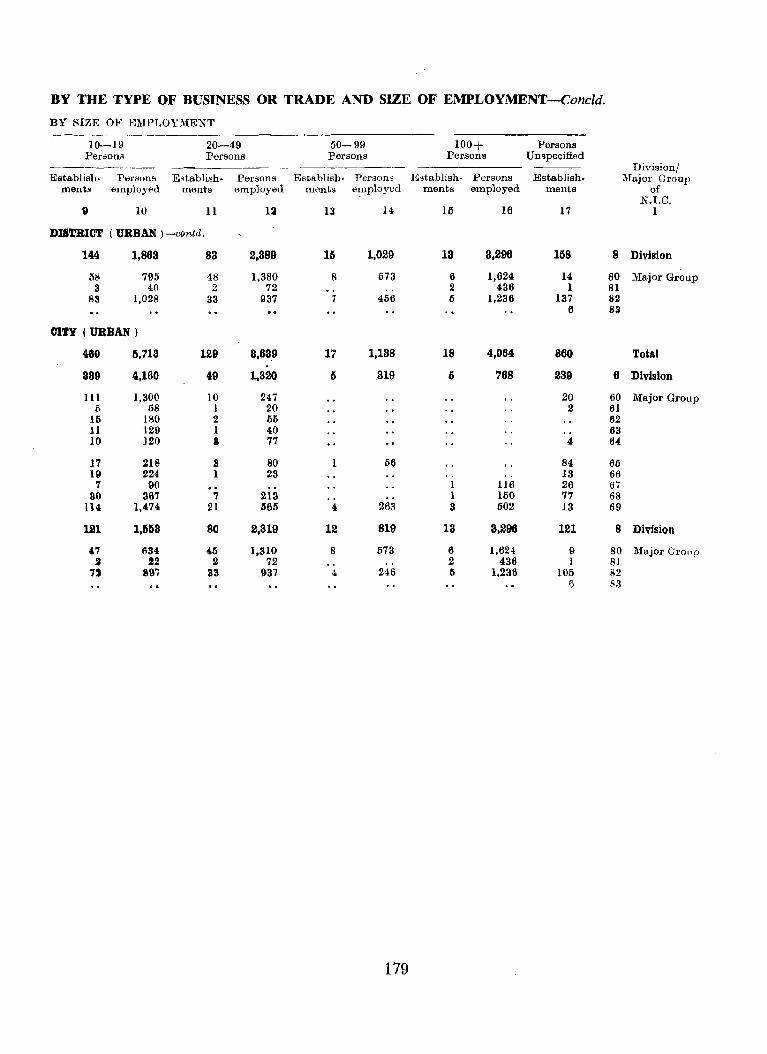
BY THE TYPE OF BUSINESS OR TRADE AND SIZE OF EMPLOYMENT -Concld.
BY SIZE OF EMPLOY}IEN'l'
10-19 20-49 50-99 100+ Persons Peraons Persons Persons Persons Unspecified
---------- --~------- Dh-isionj Establish· Persons Establish· Persons Establish· Person, E~tablish· Persons Establish· Major Group
mente employed ments employed ments employed ments employed ments of N.I.C.
D 10 11 12 13 14 IlS 16 17 I
DISTRICT (URBAN )-contd.
144 1,863 83 2,389 15 1,029 13 3,296 158 8 Division
58 795 48 1,380 8 673 6 1,624 14 80 Major Group 3 40 2 72 2 436 1 81
83 1,028 33 937 7 466 6 1,236 137 82 6 83
CITY (URBAN)
480 5,713 129 8,639 17 1,138 18 4,064 860 Total
8S9 4,160 49 1.320 5 319 I) 768 239 8 Division
111 ],300 10 247 20 60 Major Group (> 68 1 20 2 61
15 ISO 2 55 62 11 129 1 40 63 10 120 a 77 4 64
17 218 S 80 1 56 84 6fi 19 224 1 23 13 66
7 90 1 116 26 6i 30 367 7 213 1 150 77 68
114 1,474 21 665 4 263 3 502 13 69
121 1,653 80 2,319 12 819 13 3,296 121 8 Division
47 634 45 1,310 8 573 6 1,624 I) 80 Major Group 2 22 II 72 2 436 I 81
" 897 33 937 4, 246 5 1,236 105 !l2 6 113
179
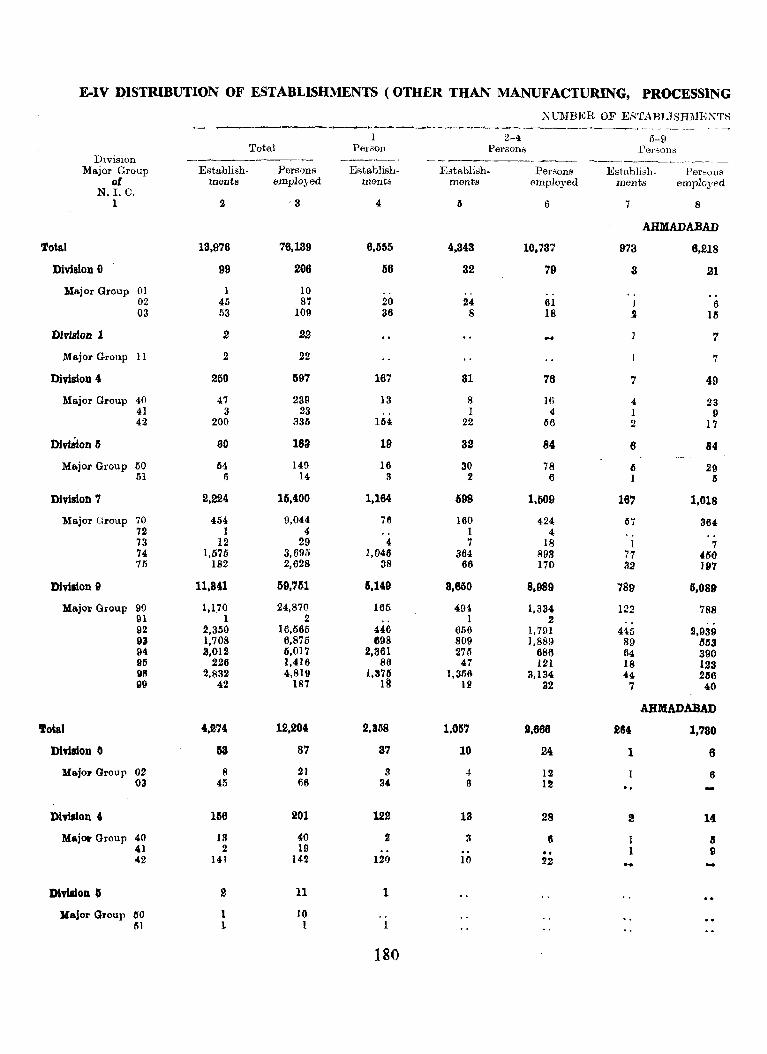
E-IV DISTRIBUTION OF ESTABLISHMENTS (OTHER THAN MANUFACTURING, PROCESSING
.N UMBER OF E8TABL1SHlUE~TS ~.---,,--,__--~--_,.~-~ __________ ..-_o--- _______ • __
2-4 5-9 Total Person Persons Persons
Division _ .... ----- ~ ---__.~------ -------~----------
Major Group Establish- Persons Er;tablish- .Establish. Persons Establish- Persons of menta employed ments mentl.! omployed mellts employed
N.1. C. 1 2 <3 4 I) 6 7 8
AHMADABAD
Total 18,976 76,189 6,555 4,843 10,737 973 6,218
Division 0 99 206 66 32 79 3 21
Major Group 01 1 10 02 45 87 20 24 61 J 6 03 53 109 36 8 18 .t lIS
Dlvisfon 1 2 22 1 7
Major Group 11 2 22 7
Division 4 250 697 167 81 76 7 49
Major Group 40 47 239 13 8 16 4 23 41 3 23 I 4 1 9 42 200 335 154 22 66 2 17
Division 3 80 163 19 32 84 6 84
Major Group 60 54 149 16 30 78 Ii 29 51 6 14 3 2 6 1 IS
Division 7 2,224 15,400 1.164 698 1,509 167 1,018
Major Group 70 454 9,044 76 160 424 57 364 72 I 4 I " 73 12 29 4. 7 18 1 7 74 1,575 3,695 1,046 364 893 77 450 75 182 2,628 38 66 170 32 197
Division 9 11.841 69,751 6,149 8,850 8.989 789 5,089
Kajol' Group 90 1.170 24.870 165 494 1.334 122 788 91 1 2 .. 1 2 92 2,350 16,1565 446 656 1,791 445 2,939 93 1,708 6,875 698 809 1,889 89 /jlS3 94 3,012 6.017 2,361 275 686 64 390 95 226 1,416 86 47 121 18 123 96 2,832 4,819 1,376 1.356 3,134 44 256 99 42 187 IS 12 32 7 40
AHMADABAD 'fotal 4,274 12,204 2.358 1.057 9,866 264 1.730
Dinllon 0 113 87 87 10 24 1 6
Majol' Group 02 8 21 8 4 12 6 03 45 66 34 6 12 -.
Division' 166 201 122 13 28 2 14
Majow Group 40 13 40 :I 3 6 1 II 41 2 19 .. 1 9 42 141 142 120 10 22 -
Divialoll 0 2 11 1
MajoX' Group tlO 1 10 51 L 1
180
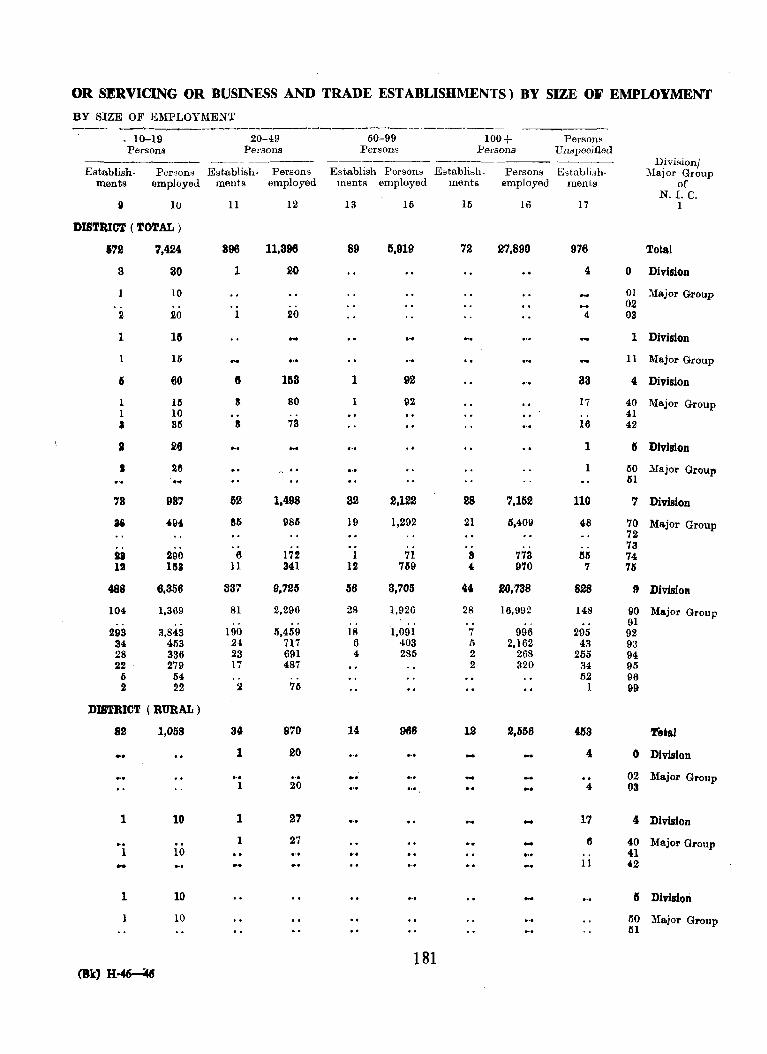
OR SERVICING OR BUSINESS AND TRADE ESTABLISHMENTS) BY SIZE 01' EMPLOYMENT
BY SIZE OF EMPLOYMENT --~~--------------------
. 10-19 20-49 60-99 100+ Persons Persons Persons Persons Persons Unspeoified
---_----- ----- Divisionj Establish· PerRons Establish- Persons Establish Person~ Establish· Persons Establish· Major Group
ments employed ments employed ments employed menta employed ments of N. 1. C.
{) 10 11 12 13 16 15 16 17 1
DISTRICT ( TOTAL)
672 1.424 396 11.396 89 6,919 72 27,890 976 Total
3 30 1 20 4 0 Division
10 01 Major Group 02
2 20 1 20 4 03
1 16 ... 1 Division
16 11 Major Group
6 60 G 153 1 92 33 4 Division
1 16 3 80 1 92 17 40 Major Group 1 10 41
• 811 8 73 16 42
I 26 ... 1 5 Division
• 2& 1 50 :Vlajor Group ... 51
73 937 52 1.498 82 2,122 28 7.152 110 7 Division
Ii 404- 86 986 19 1,292 21 5,409 48 70 Ma.jor Group 72 73 •• 290 6 172 1 71 8 773 1S5 74
11 1113 11 341 12 769 4. 970 7 75
488 6,356 337 9,125 56 3.105 44 20,138 828 IJ Division
104 1,369 81 2,296 28 1,926 28 16,992 148 90 Major Group . . .. 91
293 3,843 190 5.459 18 1,091 7 996 295 92 34 453 24 717 6 403 I) 2.162 43 9a 28 336 23 691 4 285 2 268 255 94 22 279 17 487 2 320 34 95
6 54 1i2 96 2 22 2 71S 1 99
DISTRICT (RURAL)
82 1,058 34 870 14 966 12 2,556 453 T'otal
1 20 4 0 Division
, .. - 02 Major Group 1 20
'" 4 03
1 10 1 27 17 4 Division
1 27 - 6 40 Major Group 1 10 41 - 11 42
1 10 II Division
10 IlO Ma.jor Group lSI
181 (Bk) H~
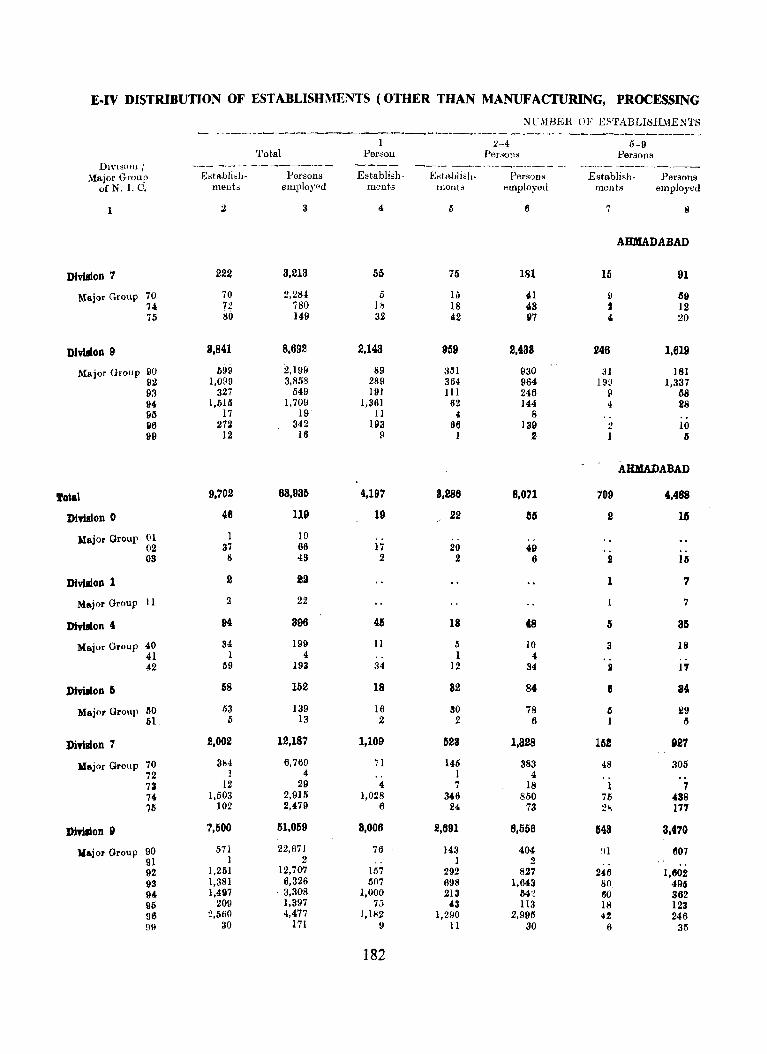
E.IV DfSTRlBUTION OF ESTABLISHMENTS (OTHER THAN MANUFACTURING, PROCESSING
:\TUIBEH OF ERTABLISHi\1ENTS ~ - -----<---
• ___ ~_~--.... _____________ o_____ .... _______ ._.__ _______
:2-4 6-9 Total Persoll Per . ..;ons Perdons
Dl\~lSlOn / ---~- ~- ------._ --_- ---- -~,----~.-- - --- .-~----~ --~- -------Major Group E8tablish- IJo1'sonH E~tablish· Est'l,blish- Persons Est.ablish- Persons
orN.I. C. mellts 8mployod ment.3 lueut. employed rnellt~ employed
1 :.I 3 4 6 6 7 s
AHMADABAD
Division 7 222 3,213 55 75 181 15 91
Major Group 70 70 2,284 ii Iii 41 (} 69 74 7t 780 jll 18 43 2 12 75 80 149 32 42 97 , 20
Division 9 8,841 8.692 2.143 959 2,433 246 1,619
Major Group gO 699 2,199 89 351 930 31 181 92 1,099 3,S58 289 364 964 19l) 1,337 93 327 649 191 III 246 P 68 94 1,515 1,709 1,361 62 144 4 28 96 17 19 II 4 8 96 272 342 193 66 139 2 10 99 12 16 9 1 .2 I Il
AHMADABAD
'rota1 9.702 08,93~ 4.197 3.286 8,071 109 4,488
Division 0 48 119 19 22 65 2 15
Kajor Group 01 1 10 .. . . .. 02 37 66 17 20 49 · . .. 03 8 49 2 2 6 J! III
DlviBion 1 2 29 1 '1
Major Group 11 2 22 7
Divlalon 4 94 396 415 18 48 5 35
Major Group 40 34 199 II 6 10 3 18 41 1 4 1 4 .. . . 42 59 193 34 12 34 2 17
DlviIlon 5 58 152 18 82 84 6 84
:Major Group 110 .53 139 16 30 78 {> 29 51, 6 13 2 2 6 1 IS
Dinmon 7 2,002 12,187 1,109 528 1.828 16! De?
Kajor Group 70 384 6,760 71 145 383 48 305 72 1 4 .. 1 4 · . 73 12 29 4 7 18 I 7 74 1,503 2,915 1,028 346 850 75 .38 75 102 2,479 6 114 73 2>; 177
DiYilion 9 7,500 51,059 3,006 2,691 8,550 643 3,470
1iajor Group 90 571 22,671 76 143 404 III 607 91 1 2 .. 1 2 · . ,. 92 1,261 12,707 157 292 827 246 1,1102 93 1,381 6,326 607 698 1,643 80. 496 9. 1,497 . 3,308 1,000 213 1142 60 862 95 209 1,397 75 '3 1I3 18 123 96 2,560 4,477 1,182 1,290 2,995 42 246 119 30 171 9 11 30 6 35
182
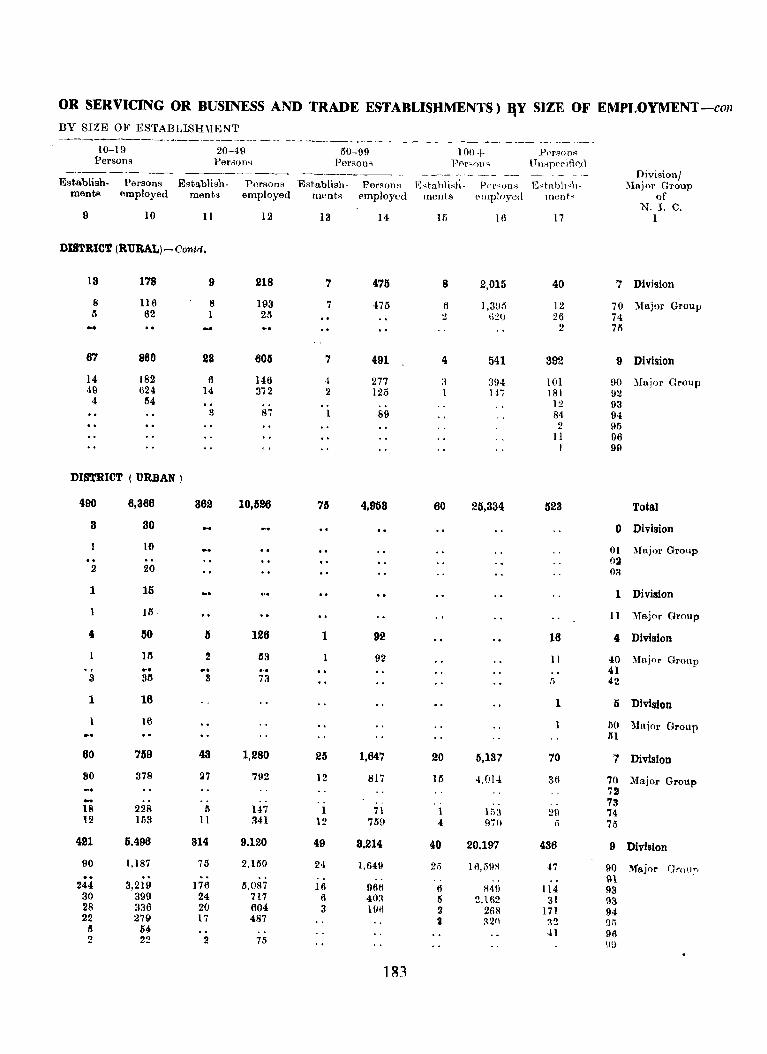
OR SERVICING OR BUSINESS AND TRADE ESTABLISHMENTS) :qY SIZE OF EMPLOYMENT -COli
BY SIZE OF ESTABLISH\IENT -------------.- .. ---~------- ---. ----.. -.----.---------~~-- -."-.----~--------
10-19 20-49 50-99 100+ PprsollFi Persons Peri;on~ Persoll~ Vp.r.:"oll~ tT n~p('r i fi<>" 1 ---- ------- -------~-~ ~-- --"-- --- Division/
Establish· Persons Establish· Porsons "Establish· Person" l~,tahli~h· P(,l'...;on.s E~tal>li~h· '.lajnr Group mente employed ments employed mentB employed Illent.~ pmploycl(l ment, of
N. I. C, 9 10 11 12 13 14 11; III 17 1
DISTRICT (RURAL)-Gontrf,
13 178 9 218 7 475 8 2,015 40 7 Division
8 116 8 193 7 475 tl 1,3!.Jii 12 70 }lajor Group II 62 1 25 :! 6:1q 26 74 - 2 711
67 860 23 605 '( 491 4 541 392 9 Division
14 182 6 146 4 277 :1 3!J4 101 90 '.Iajor Group 49 624 14 372 2 125 I H, 181 92 4 114 12 93
S 87 89 84 94 2 95
II 96 I 90
DISTRICT (URBAN)
490 6,366 862 10,526 75 4,953 60 25,334 523 Total
3 30 0 Division
10 01 '.fajor Group 0:1
2 20 03
1 15 1 Division
1 15 11 Major Gl'OUp
4 ISO II 126 1 92 16 4 Division
15 :! 113 92 II 40 ~Il1j()r Group ... ... 41 3 35 3 73 [i 42
1 16 1 5 Division
1 16 50 "'Iajo!' Group .. I'll
60 759 43 1,280 25 1,647 20 11,137 70 "I Division
80 378 :17 792 12 817 111 4,014 311 70 );Iajor Group 72
.. 73 18 228 /I H7 71 1 15:-\ 29 74 12 lli3 II 341 12 759 .( 970 Ii 75
421 5.496 314 9.120 49 3,214 40 20.197 436 9 Division
90 1,187 75 2,150 24 1,649 2,) 16,69S 47 90 Major GrOll;' 91
244 3,219 176 5,087 16 9611 6 il4!l 114 93 30 399 24 717 6 403 5 2,162 31 \13 28 336 20 604 3 19t1 2 26R 171 94 22 279 17 487 Z 32n 32 fJ!) II 54 41 96 2 22 2 75 9!J
183
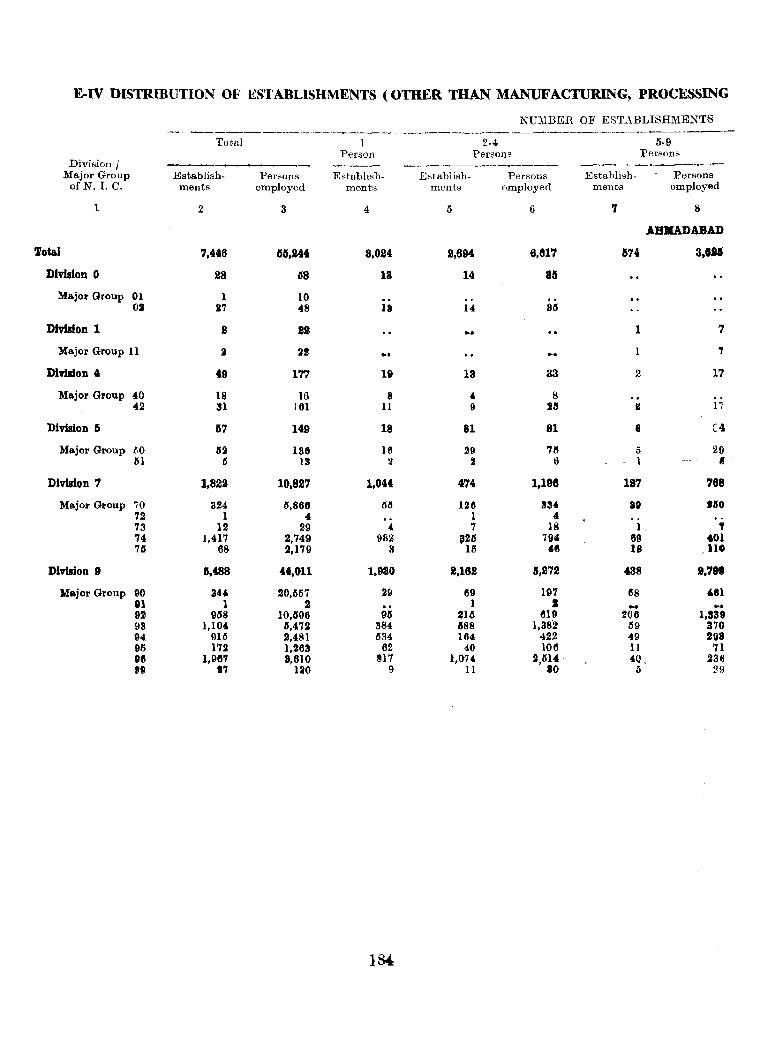
E-IV DISTRIBUTION OF ES~ABLISHMENTS (OTHER THAN MANUFACTURING, PROCESSING
NU~lBER OF ESTABLISHMENTS ~--.---------~----.-----------
Total 2-4 5·9 Person Persons Persons
Division / ---------- --_- --------_--- ------~-
Major Group Establish· Persons Establish- Establish· Persons Establish- Persons of N. I. C. ments employed ments ments employed ments employed
1 2 3 4 5 6 7 8
ABlIIADABAD
'1'ot&1 ',U6 65,244 3,024 2,694 6,817 574 3,8al
Division 0 28 lI8 13 14 85
Major Group 01 1 10 Oll 27 48 11 14 SiS
DIvision 1 8 2B ... 1 7
Ma.jor Group 11 ~ 2! .. '1
Division' 49 177 19 13 33 2 17
Ma.jor Group 40 18 18 8 • 8 .. 42 31 161 11 9 28 " 17
Division II 67 149 18 81 81 8 [4
Major Group W 1S2 136 16 29 7fj 5 29 51 IS 13 II II 6 1 ••
Division '7 1,822 10,827 1,044 474 1,198 IS7 788
Major Group 70 324 lI,866 M 126 1134 all .50 72 1 4 1 4 73 12 29 4- 7 18 1 , 74 1,417 2.749 982 ~2l1 794 69 401 7iS 68 2,179 S 15 '8 III llO
Division 9 11,488 44,011 1.980 t,162 11,272 438 1,'" Major Group 90 344 20,557 29 69 197 68 'Ill
81 1 2 1 I - ... 92 9118 10,1S06 96 216 819 206 1,339 93 1,104 lI,472 S84 1S88 1,382 59 370 94 915 2,481 634 164 422 49 298 95 172 1,263 62 40 106 11 71 98 1,96'7 3,610 @17 1,074 2,tH' (Q~ 234) 89 17 120 9 11 80 Ii 29
}S4
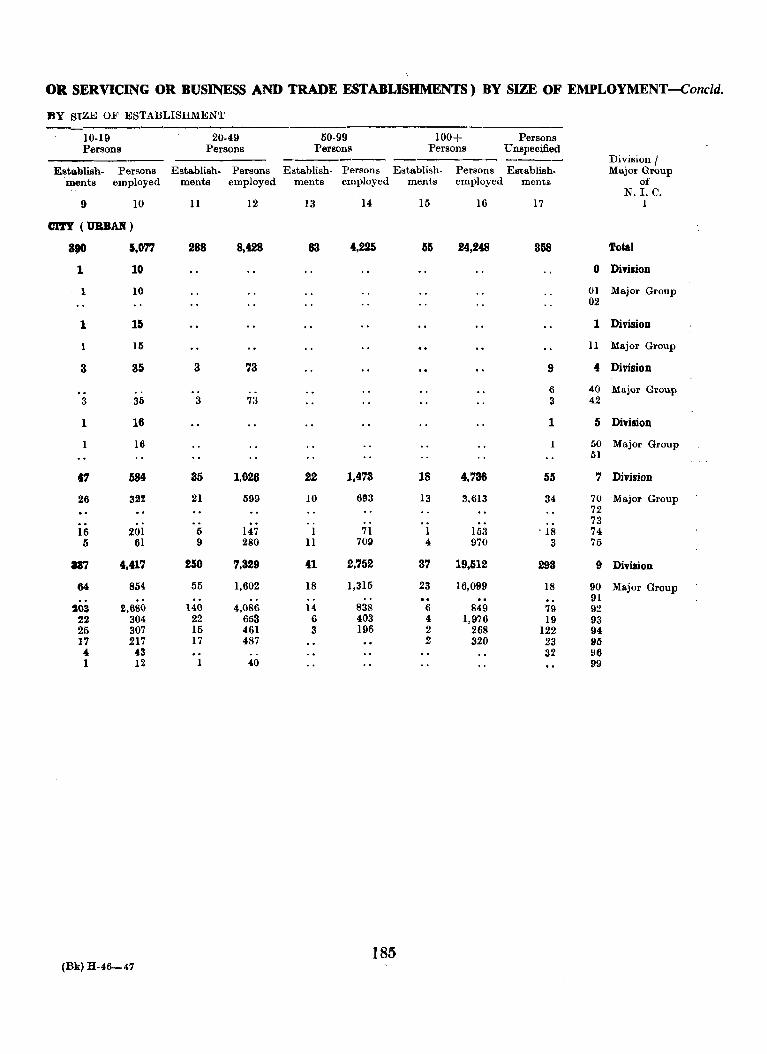
OR SERVICING OR BUSINESS AND TRADE ESTABLISHMENTS) BY SIZE OF EMPLOYMENT -Concld.
BY SIZE OF ESTABLISHMENT
10·19 20·49 50·99 100+ Persons Persons Persons Persons Persons Unspecified -------- --------- ----- Division I
Establish. Persons Esta.blish. Persons Establish· Persons Establish. Persons Establish. Major Group menta employed ments employed ments employed ments employed mente· of
N. I. C. 9 10 11 12 13 14 15 16 17 1
CITY (URBAN)
3$»0 5,077 288 8,428 83 4,225 55 24,248 358 Total
1 10 0 Division
1 10 01 Major Group 02
1 1i 1 Division
15 11 Major Group
3 35 3 73 9 4 Division
6 40 Major Group 3 35 3 73 3 42
1 16 1 5 Division
1 16 50 Major Group 51
41 584 35 1.026 22 1,473 18 4,736 55 7 Division
26 32! 21 599 10 6~3 13 3,613 34 70 Major Group 72 73
16 201 5 147 I 71 I 153 . 18 74 5 61 9 280 11 709 4 970 3 75
117 4,417 250 7,329 41 2,752 37 19,512 293 9 Division
64 854 55 1,602 18 1,315 23 16,099 18 90 91
Major Group
SOl 2,680 140 4,086 14 838 6 849 79 92 22 304 22 653 6 403 4 1,976 19 93 25 307 15 461 3 196 2 268 122 94 17 217 17 487 2 320 23 9~ 4 43 .. 32 96 1 12 I 40 99
185 (Bk) H·46-47
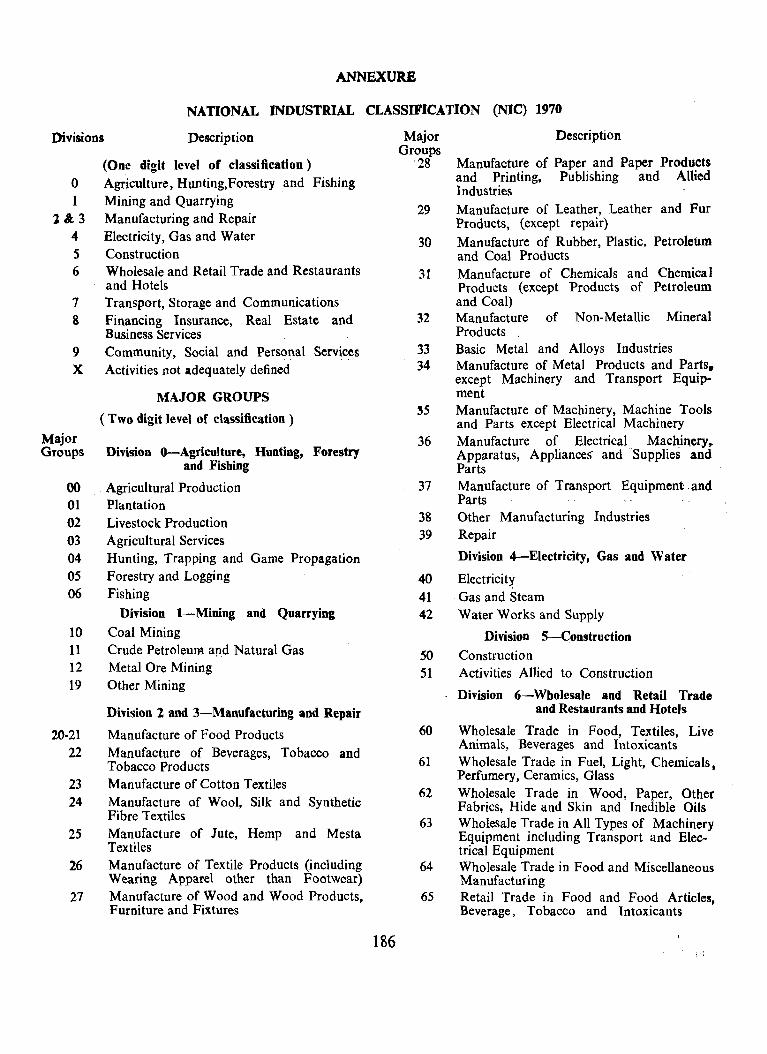
ANNEXURE
NATIONAL INDUSTRIAL CLASSIFICATION (NIC) 1970
Divisions Description
(One digit level of classification) o Agriculture, Hunting,Forestry and Fishing 1 Mining and Quarrying
1 &:, 3 Manufacturing and Repair 4 Electricity, Gas and Water 5 Construction 6 Wholesale and Retail Trade and Restaurants
and Hotels 7 Transport, Storage and Communications S Financing Insurance, Real Estate and
Business Services 9 Community, Social and Personal Services X Activities not adequately defined
Major Groups
00 01 02 03 04
05 06
10 11 12 19
20-21 22
23 24
25
26
27
MAJOR GROUPS
( Two digit level of classification)
Division O-Agriculture, Huoting, Forestry and Fishing
Agricultural Production PlCintation Livestock Production Agricultural Services Hunting, Trapping and Game Propagation Forestry and Logging Fishing
Division I-Mining and Quarrying
Coal Mining Crude Petroleum apd Natural Gas Metal Ore Mining Other Mining
Division 2 and 3-Manufacturing -and Repair
Manufacture of Food Products Manufacture of Beverages, Tobacco and Tobacco Products Manufacture of Cotton Textiles Manufacture of Wool, Silk and Synthetic Fibre Textiles Manufacture of Jute, Hemp and Mesta Textiles Manufacture of Textile Products (including Wearing Apparel other than Footwear) Manufacture of Wood and Wood Products, Furniture and Fixtures
186
Major Groups
28
29
30
31
32
33 34
35
36
37
38 39
40
41 42
SO 51
Description
Manufacture of Paper and Paper Products and Printing, Publishing and Allied Industries Manufacture of Leather, Leather and Fur Products, (except repair) Manufacture of Rubber, Plastic, Petroleum and Coal Products Manufacture of Chemicals and Chemical Products (except Products of Petroleum and Coal) Manufacture of Non-Metallic Mineral Products Basic Metal and Alloys Industries Manufacture of Metal Products and Parts. except Machinery and Transport Equip-ment Manufacture of Machinery, Machine Tools and Parts except Electrical Machinery Manufacture of Electrical Ma~hinecy .. Apparatus, Appliances- and Supplies and Parts Manufacture of Transport Equipment. and Parts Other Manufacturing Industries Repair
Division 4-Electricity, Gas and Water
Electricit~
Gas and Steam Water Works and Supply
Division 5-Construction Construction Activities Allied to Construction
Division 6-Wbolesale and Retail Trade and Restaurants and Hotels
60 Wholesale Trade in Food, Textiles, Live Animals, Beverages and Intoxicants
61 Wholesale Trade in Fuel, Light, Chemicals, Perfumery, Ceramics, Glass
62 Wholesale Trade in Wood, Paper, Other Fabrics, Hide and Skin and Inedible Oils
63 Wholesale Trade in All Types of Machinery Equipment including Transport and Electrical Equipment
64 Wholesale Trade in Food and Miscellaneous Manufacturing
65 Retail Trade in Food and Food Articles, Beverage, Tobacco and Intoxicants
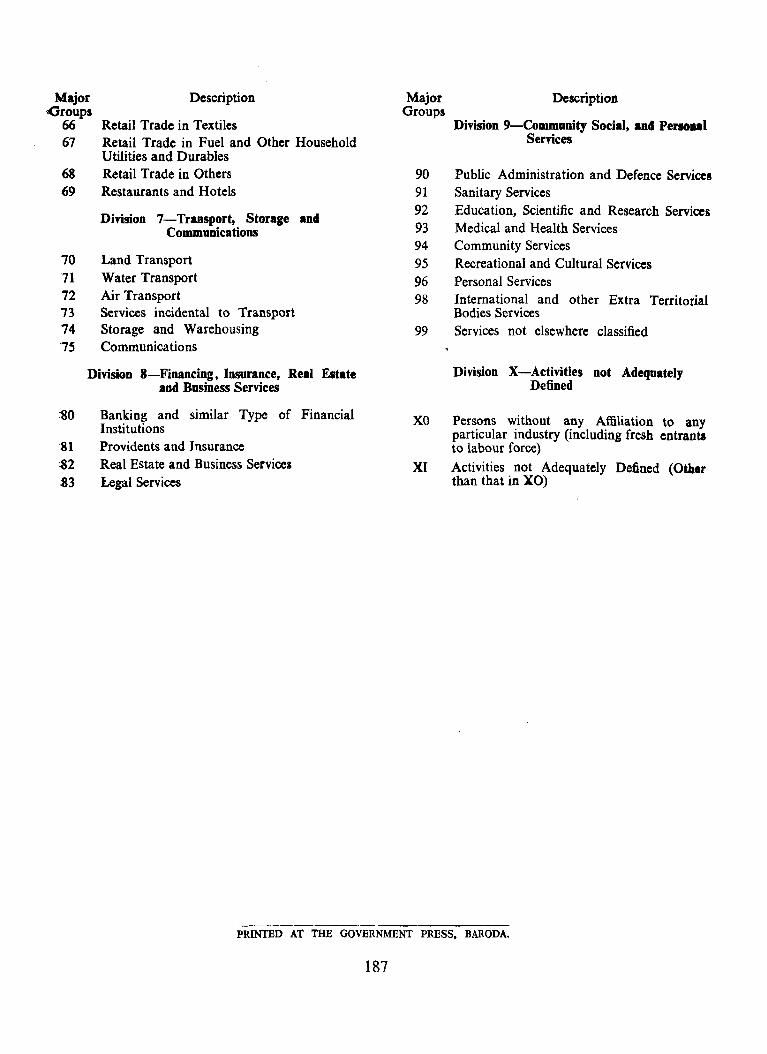
Major ·:Groups
66 67
68 69
70 71 72 73 74 75
Description
Retail Trade in Textiles Retail Trade in Fuel and Other Household Utilities and Durables Retail Trade in Others Restaurants and Hotels
Division 7-Transport, Storage and Communications
Land Transport Water Transport Air Transport Services incidental to Transport Storage and Warehousing Communications
Division 8-Financing. Insurance, Real Estate and Business Services
:So
'81 :82 :83
Banking and similar Type of Financial Institutions Providents and Insurance Real Estate and Business Services Legal Services
Major Groups
90 91 92 93 94 95 96 98
99
Description
Division 9-Community Social, anel PerMPI Services
Public Administration and Defence Services Sanitary Services Education, Scientific and Research Services Medical and Health Services Community Services Recreational and Cultural Services Personal Services International and other Extra Territorial Bodies Services Services not elsewhere classified
Division X-Activities not Adequately Defined
XO Persons without any Affiliation to any particular industry (including fresh entrants to labour force)
XI Activities not Adequately Defined (Other than that in leO)
PRINTED AT THE GOVERNMENT PRESS, BARODA.
187

SECTION III
SOCIO - ECONOMIC AND CULTURAL TABLES
(RURAL AREAS) AND
HOUSING TABLES

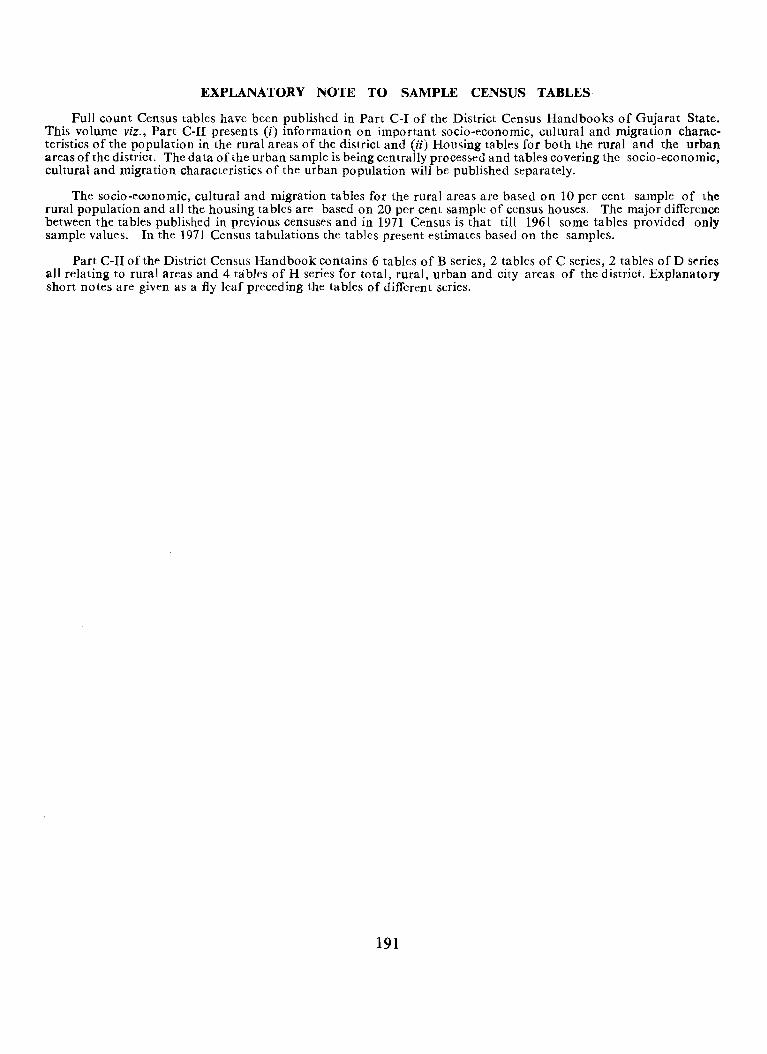
EXPLANATORY NOTE TO SAMPLE CENSUS TABLES
Full count Census tables have been published in Part C-I of the District Census Handbooks of Gujarat State. This volume viz., Part C-II presents (i) information on important socio-economic, cultural and migration characteristics of the popUlation in the rural areas of the district and (ii) Housing tables for both the rural and the urban areas of the district. The data of the urban sample is being centrally processed and tables covering the socio-economic, cultural and migration characteristics of the urban population will be published separately.
The socio-economic, cultural and migration tables for the rural areas are based on 10 per cent sample of the rural population and all the housing tables are based on 20 per cent sample of census houses. The major difference between the tables published in previous censuses and in 1971 Census is that till 1961 some tables provided only sample values. In the 1971 Census tabulations the tables present estimates based on the samples.
Part C-II of the District Census Handbook contains 6 tables of B series, 2 tables of C series, 2 tables of D series all relating to rural areas and 4 tables of H series for total, rural, urban and city areas of the district. Explanatory short notes are given as a fly leaf preceding the ta bIes of different series.
191
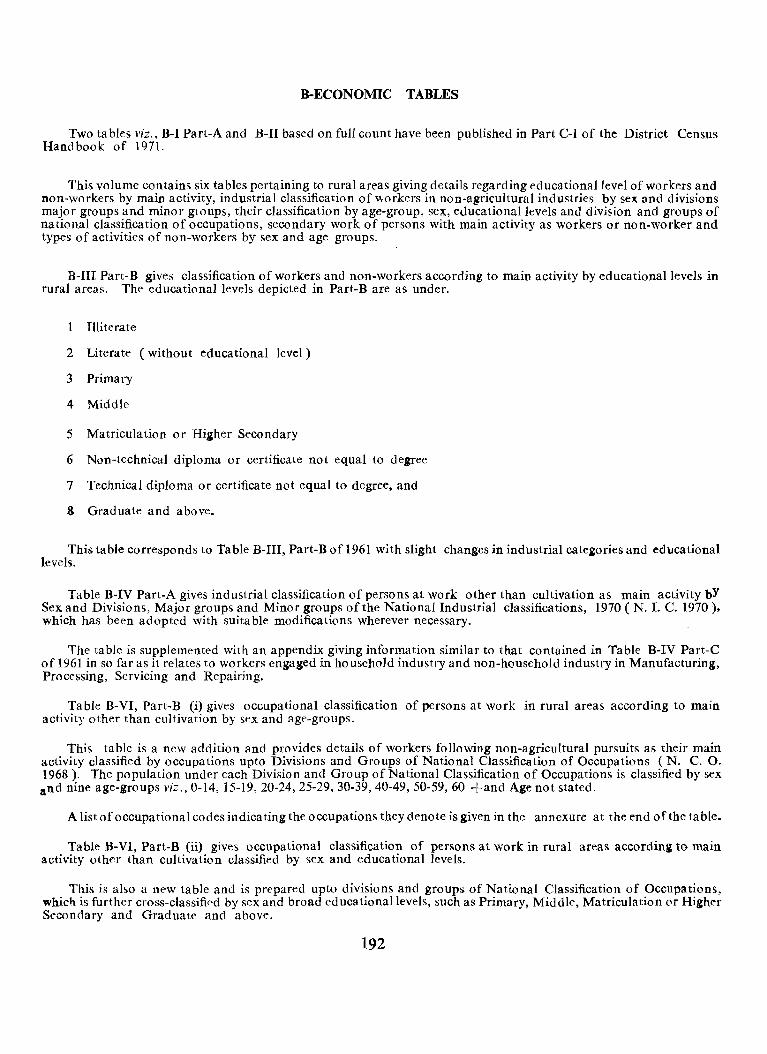
B-ECONOMIC TABLES
Two tables viz., B-1 Part-A and B-II based on full count have been published in Part C-I of the District Census Handbook of 1971.
This volume contains six tables pertaining to rural areas giving details regarding educational level of workers and non-workers by main activity, industrial classification of workers in non-agricultural industries by se~ and divisions major groups and minor glOUpS, their classification by age-group, sex, educational levels and division and groups of national classification of occupations, secondary work of persons with main activity as workers or non-worker and types of activities of non-workers by sex and age groups.
B-III Part-B gives classification of workers and non-workers according to main activity by educational levels in rural areas. The educational levels depicted in Part-B are as under.
Illiterate
2 Literate (without educational level)
3 Primary
4 Middle
5 Matriculation or Higher Secondary
6 Non-technical diploma or certificate not equal to degree
1 Technical diploma or certificate not equal to degree, and
8 Graduate and above.
This table corresponds to Table B-III, Part-B of 1961 with slight changes in industrial cate&ories and educational levels.
Table B-IV Part-A gives industrial classification of persons at work other than cultivation as main activity bY Sex and Divisions, Major groups and Minor groups of the National Industrial classifications, 1970 (N. I. C. 1970). which has been adopted with suitable modifications wherever necessary.
The table is supplemented with an appendix giving information similar to that contained in Table B-IV Part-C of 1961 in so far as it relates to workers engaged in household industry and non-household industry in Manufacturing, Processing, Servicing and Repairing.
Table B-VI, Part-B (i) gives occupational classification of persons at work in rural areas according to main activity other than cultivation by sex and age-groups.
This table is a new addition and provides details of workers following non-agricultural pursuits as their main activity classified by occupations upto Divisions and Groups of National Classification of Occupations (N. C. O. 1968). The population under each Division and Group of National Classification of Occupations is classified by sex and nine age-groups viz., 0-14,15-19,20-24,25-29,30-39,40-49,50-59,60 +and Age not stated.
A list of occupational codes indicating the occupations they denote is given in the annexure at the end of the table.
Table B-VI, Part-B (ii) gives occupational classification of persons at work in rural areas accordina to main activity oth~r than cultivation classified by sex and educational levels.
This is also a new table and is prepared upto divisions and groups of National Classification of Occupations, which is further cross-classifif'd by sex and broad educational levels, such as Primary, Middle, Matriculation or Higher Secondary and Graduate and above.
192
Table B-VII (rural) is a new and comprehensive table of 1971 Census providing statistics of main activity and liecondary work ofpopulation in the rural areas. The persons having main activity as cultivator, agricultural labourer working at household industry; at non-household industry, trade business or service and non-worker are further cross-tabulated in case of persons whose secondary work is either (i) as cultivator or Cii) as agricultural labourer or (iii) at household industry or (iv) at non-household industry, trade, business, service, etc.
In Table B-VIII ( rural), as against eight categories of non-working population in 1961 Census, the data is presented for seven categories of non-workers in this table, the last category 'Others' largely comprising the 'Unemployed'. This table is comparable at district level to the Table B-IX of 1961 Census wherein the details of nonworking-population by sex and broad age groups such as 0-14,15-34,35-59,60+ and Age not stated' are given for each type of activity of non-working population. As against five broad age-groups in 1961 Census, this table presents here nine age-groups l·iz., 0-14, 15-19,20-24,25-29,30-39,40-49, 50-59, 60+ and age not stated.
193 (Rk) H·1l9-4J~
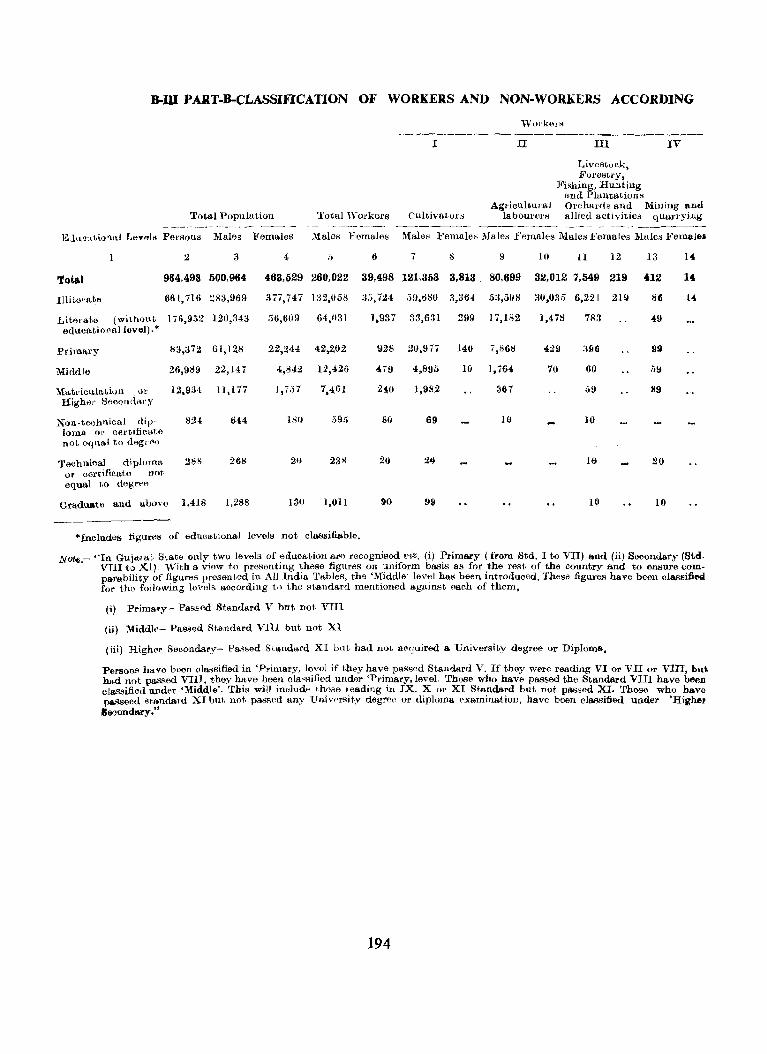
n-w PART-B-CLASSIFICATION OF WORKERS AND NON-WORKERS ACCORDING
'VOl'kef's
I II III IV
Livostock, .ITol'f;!"tl'Y,
Fishing, Hunting
Total Population Total ,,'ol'kers Cuitivato""
and Plantation8 Ag"ioultural Orchards and Milling and
labourerH allied activitie:; qURl'l'ying
El'lW\I,iO'lat L"y"l~ PersoUs Males Females }Ialos Female!> Males :Female~ Male:; :Females :Males Females Males lfemaleJ
'fotal
11li~ol'l\.t"
2 3
964,493 500,964
661,716 ::83,969
Literato (without 176,9;;2 120,343 educatio,'allevel).*
Primary 83,372 61,12.8
Middle 26,989 22,147
Matriculatiull or lIigh"'l' Secon'lary
12,9;34; 1I,lt7
Nou·toohoieal ,lip' 82-1 644 lorna 01' certificate not eq'\al to deg"""
Technical dipJolua 2SS 2615
or certificate not, equal to degree
Graduate and above 1,418 1,288
4 5 7 9
463,529 260,022 39,498 121.353 3,813 80,699
377,747 1:32,058 35,7:.14 59,680 3,364 a3,50S
56,609 64,031 1,937 33,631 299 17,182
22,2H 42,202 928 20,9i7 140 i,868
4,842 12,426 ~79 4,895 10 1,764
1,7.)7 7,4;61 .2~O 1,982 :367
ISO .595 80 69 10
211 23>< 20 21i
130 1,011 90 99
"Includes figures of educational levels not classifiable.
10 II 12 13 l~
32,012 7,549 219 412 14
30,03,') 6,221 219 86 1,(
1,478 783 49
429 396 99
70 60 59
:}9 89
10
HI 20
10 10
Not6 - "In Gujarat Sta.te only two levels of education are recognised Vbz. (i) Prima.ry (from Std. I to VII) and (ii) S&condary (Std. . VIII to XI), \Vith a view to presenting these figures on uniform basis 88 for the rest of the country and to ensure com·
parability of figures presented in All India Tables, t,he 'Middle' level has be&n introduoed. These figures have been c1&ssifieo for the following levels according to the standard mentioned against each of them,
(i) Primary- PasBed Standard Y but not YIII
(ii) Middle- P&ssed Standard VIII but not, XI
(iii) Higher Seeondary- Passed Standard XI bllt had not acquired a University degree or Diploma.
Persons havo been classified in 'p,.imary, level if they have passed Standard V. If they were reading VI or VII or VIII, but had not passed VIII. they have been olaHflified under 'Primary, level. Those who have passed the Standard VIII have been classified under 'Middle'. This will include t,hose reading in IX. X or XI Standard but not p~sed XI. Those who have p&sseed st3ndard XI but, not, passed any Univf'rsit,y degl'B~ or diploma examination, have been olassified under 'Highel
8ooond;wy."
194

TO MAIN ACTIVITY BY EDUCATIONAL LEVELS IN RURAL AREAS ONLY
'Vorkers -------------------~---------------
V VI VII VIII IX X Manuiaoturing, Processing,
Servioing and Repairs
(a) (b) TrtUlSport, Household Other than Storag<' Industry Hous!"hold~ Uonstr'uct Traut> and andCommu·
Inuustry tion Corrunerce nications Othcr Services Non-",,'orkel's ----- --- ----_- -------- --------~- ------ ------- ------Male;; 1!'om",les Males Females ;',lales Females Malt's Females Males Females Male" I"emales Males FemalE'S Educational Level ..
HI 16 17 18 19 20 21 22 23 24 25 26 27 28 1
8,826 746 12,838 764 1,757 203 9,547 345 5,552 51 12,290 1,331 240,942 424,031 'fotAl
2,317 646 3,820 684 688 193 1,759 305 1,322 41 2,657 223 151,911 342,023 Illiterate
2,7(1} 70 3,161 50 624 10 2,477 20 1,080 2,299 10 56,312 54,672 Literate ( Without educational ·level)*
2,(18 20 3,012 10 297 3,201 20 1,308 2,626 309 18,926 21,316 Primary
347 1,675 20 69 1,179 1,050 1,328 379 9,721 4,363 Middle
18S 10 922 59 852 713 10 2,230 220 3,716 1,517 Matriculation or Higher Secondary
10 HI 486 80 49 100 Non-technical diploma or certificate not equal t.o degree
79 10 99 20 30 Technical diploma or certificate not equal t·o degree
II} 15Q 10 711 69 1)65 90 !77 40 Graduate and above
195
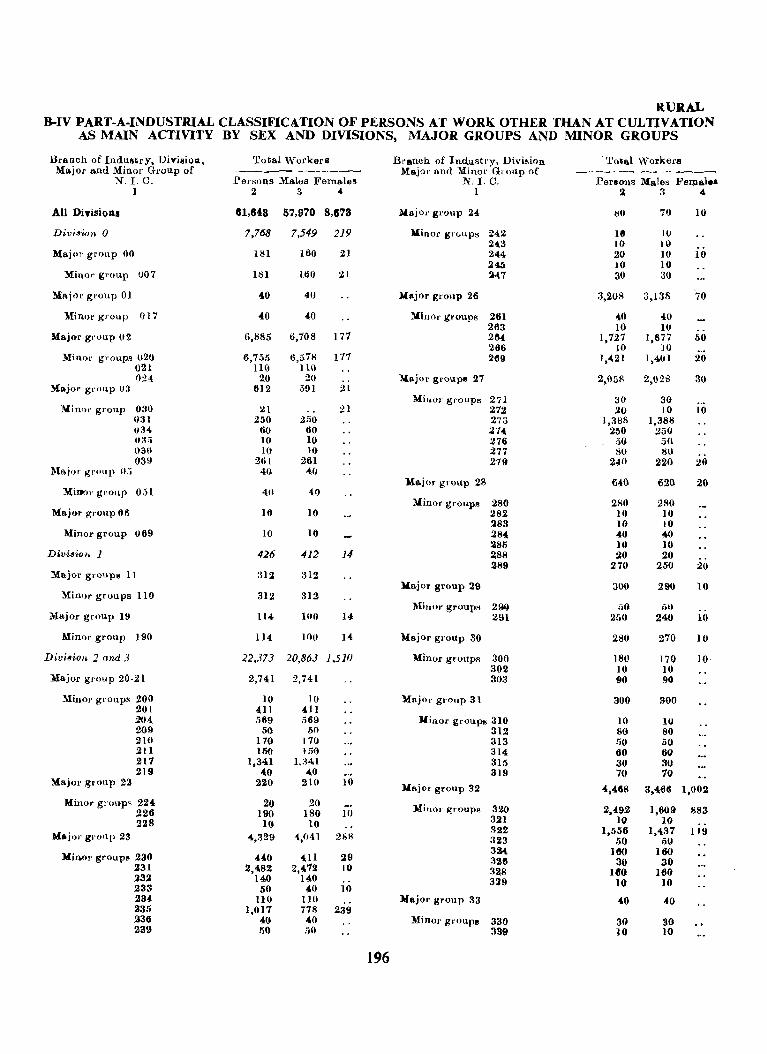
RURAL B-IV PART-A-INDVSTRIAL CLASSIFICATION OF PERSONS AT WORK OTHER THAN AT CULTIVATION
AS MAIN ACTIVITY BY SEX AND DIVISIONS, MAJOR GROUPS AND MINOR GROUPS
Brauch of IudustrY, Divisioll, Total'Vorkers Branch of Ind.ustry, Divi~ion . Tota.l vVorkere Major and Minor Group of ~~-~------ Major and Minor GroUp of _-__ ------------
~. I. c. Persons :Males Femalee N 1. c. Persons Males Felpal •• 1 2 3 4 1 2 3 4
All Divisions 81,843 57,970 8,673 llajor group 24 tiij 70 10
Divi .• io,. 0 7,768 7,549 219 Minor groups 242 H' 10 24a 10 10
Major group 00 181 160 21 244 20 10 10 246 10 10
Mino,· g,·oup 007 181 t60 21 ~7 30 30
MRjclr g.·oup 01 40 4U Major group 26 3,208 3,138 ·70
Minor group 017 40 40 ;\(inor groups 261 40 40 263 10 10
Major group 02 6,885 6,708 177 264 1,721 1,677 50 266 10 10
Mino.· g'·oups (21) 6,755 6,578 177 269 1,421 1,401 20 021 110 IlO OH 20 20 J.le.jOf group. 27 2,058 2,028 30
Major g'·oup 03 612 591 21 Minor group" 271 30 30
Mill<)J" group 030 21 21 272 20 10 10 031 250 250 273 1,388 1,388 034 60 60 2H 250 250 H:lii 10 10 276 .')0 50 03t; 10 \0 277 80 8U O:3!J 261 261 279 2411 220 29
Major group H:; 40 40 Yajor gl·OUp 28 640 620 20
MiJJo,· gl·oup ().'j 1 40 40 Minor group" 280 2S0 280
Major group 06 10 10 282 10 10 283 10 10
Minor group 069 10 10 28"- 40 Ml ~86 10 10
Division 1 426 412 14 288 :.l0 20 289 270 250 20
Major groups 11 312 312 }la-jOI· gl·OUp 29 300 290 10
Minor groups 110 312 312 Mifl()l" group" 200 .. 0 50
Major group 19 114 lUO 14 291 250 2-lO 10
Minor group 190 114 100 14 Major group 30 280 270 10
Diviaiol' 2 and 3 22,373 20,863 1,510 Minor groups 300 180 170 10 302 10 10
Major group 20·21 2,741 2,741 303 90 90
Minor group" 200 10 10 lInjor group 31 300 300 201 {II ,4.11 204 ,569 569 )(inol· g,·oupt! :no 10 10 209 50 1,0 312 80 80 210 170 170 313 50 .Ii 0 211 15() 1!)0 314 60 60 217 1,341 1,;~41 315 30 30 219 40 40 319 70 70
Major group 22 220 210 ]0 )(ajo)" group 32 ',468 3,466 1,002
Minor gr()\l'p~ 224 20 20 llinm- groups 320 2,492 1,609 883 226 190 180 10 228 10 10 321 10 10
Majo,· group 23 288 322 1,556 1,437 119 4,329 4,041 323 .50 f)O
Min.or gl'OU pB 230 440 411 29 324, 1110 160 32G 30 30 .231 2,482 2,412 10 328 160 160 23.2 l-lO 140 329 ]0 10 233 50 40 10
234 llO 110 Major group 33 40 40 235 1,017 718 239 236 40 40 Mino}' group" 330 30 30 239 50 50 339 ]0 10
196
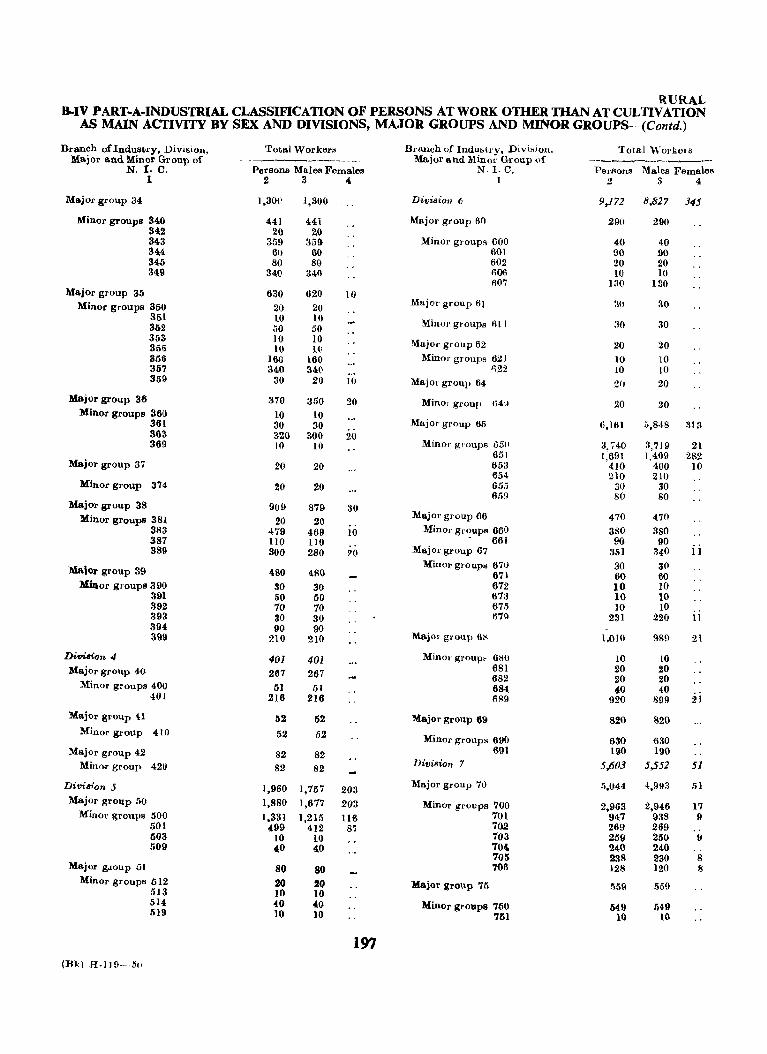
RURAL B-IV PART-A-INDUSTRIAL CLASSIFICATION OF PERSONS AT WORK OTHER THAN AT CULTIVATION
AS MAIN ACTIVITY BY SEX AND DIVISIONS, MAJOR GROUPS AND MINOR GROUPS- -(Contd.)
Branch oflnd.ustry, Division, Total WorktJrs Branch of Indubtl'Y' DiviMiOll. Total '..-oJ'kels Major a.nd Minor Group of --------_._- ~- Ma.jor a.nd Minot' Group "f ._---------._---
N. I. O. Persons Malee Fema.les N. I.e. Persons Males Females 1 2 3 4. I 2 3 4
Major grollp 34 J,aOl' 1,300 Divioioll 6 9,172 8,827 345
~inor groups 34() 441 44;1 Major group 60 290 290 34.2 20 20 343 359 33G Minor group,~ 600 40 40 34;4 60 60 601 !l0 W 345 80 80 602 20 20 34:9 34,() 340 1106 10 10
607 130 180 Ma.jor group 35 630 620 10
Minor groups 350 20 20 Major group 61 30 30 351 10 10
Minor groups 1)1 I 30 30 852 ,;0 50 353 JO 10 Major group 62 20 20 356 10 1(;
356 160 160 Minor groups 62 J 10 10 857 340 340 ')22 10 10 359 30 20 10 MajOl' group 64 2(' 20
Major group 36 370 350 20 Mino] group fl4!1 20 20 Minor groups 360 10 10
Major group 65 361 30 30 6,161 ;;,848 :113 363 320 300 20 369 10 10 Minol' gr'oups 6511 3,740 3,719 21
651 1,691 1,409 282 Major group 37 20 20 653 410 400 10
654 210 210 Minor group 374- 20 20 655 30 30
659 SO 80 Major group 38 909 879 30
Major group 66 Minor groupS 381 20 20 470 470 383 4;79 469 10 Minor gr~ups 660 380 3S0 387 110 110 661 90 90 389 300 280 20 Major grollp 67 351 340 II
Malor group 39 ~SO Minol' groups 670 30 30
480 671 60 60 Minor groups 390 30 30 672 10 10
391 50 50 673 10 10 392 70 70 67/j 10 10 393 30 30 67!i 231 220 l1 394 90 90 399 ?I 0 210 Ma.jOl· group 68 1.0]0 981l 21
Division 4 401 401 Minol' group> GSl! 10 10 Major group 40 267 267 681 20 20
682 20 20 Minor groups 400 51 51 684 40 40
401 216 216 6S9 920 899 2i Major group U 52 52 Major group 611 820 820
Minor group 410 52 52 Minor group,. 690 630 630 Major group 42 82 82 691 190 190
Minor group 420 82 82 Division 7 5,603 5,552 51
Division 5 1,960 1,757 203 Major group 70 5,044 4,993 51 Major group 50 1,880 1,677 203 Minor groups 700 2,963 2,946 17
Minol' groups 500 1,331 1,215 116 701 947 938 9 501 499 412 87 702 269 269 503 10 10 703 259 250 9 509 40 40 704- 240 240
705 238 230 8 Major g.toup 51 80 80 7011 128 120 8
Minor groups 512 20 20 Major group 7(, 559 559 513 10 10 514 (0 40 Minor gro~p8 750 549 649 519 10 10 751 10 10
197 (Bk) H.119---·oo
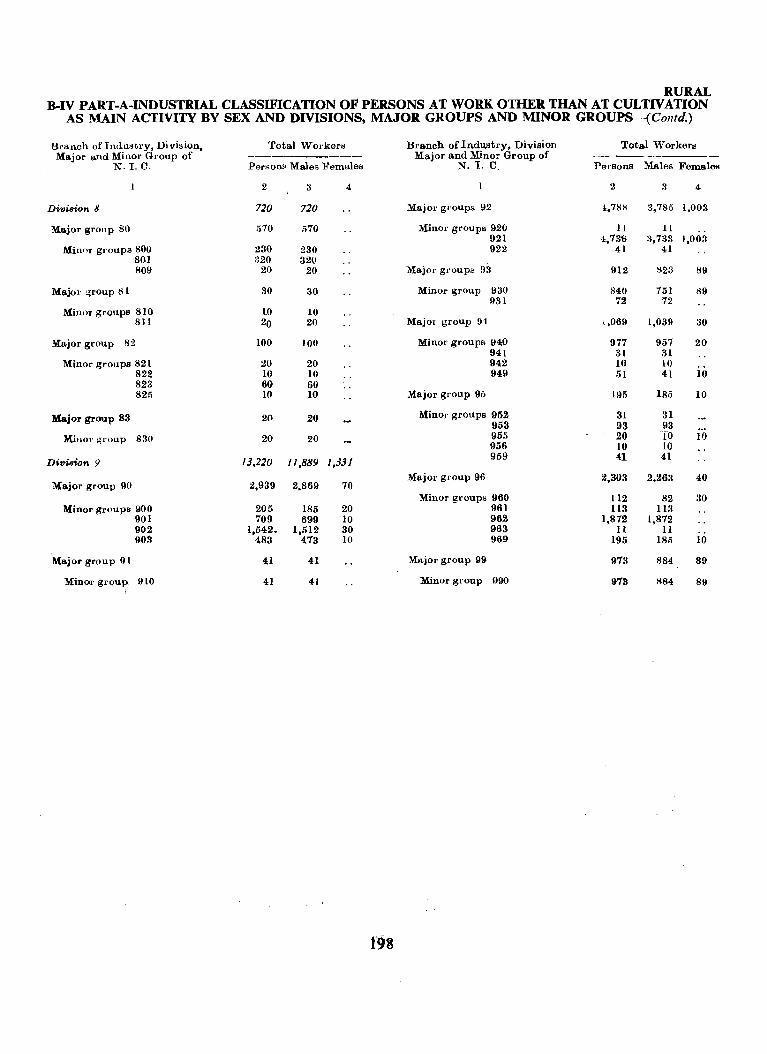
RURAL B-IV PART-A-INDUSTRIAL CLASSIFICATION OF PERSONS AT WORK OTHER THAN AT CULTIVATION
AS MAIN ACTIVITY BY SEX AND DIVISIONS, MAJOR GROUPS AND MINOR GROUPS---(Contd.)
Branch of Industry, Division, Total Workers Branch of Industry, DivisioJl Total Workers Major and Minor Group of ---------- Major and Minor Group of
N.I.C. PersonH Males Females N. I. C. Persons Males FemaieR
2 3 4 2 :{ 4
Dim8ion 8 720 720 Major g!'oups 112 i,7SS 3,785 1,003
Major group 80 ;')70 570 Minor groups 920 11 11 921 4,73'6 a,733 1,003
Minor groups 800 230 230 922 41 41 801 ;~20 320 809 20 20 Major groups 93 912 H23 89
Major v;roup 81 30 30 Minor group 930 840 751 89 931 12 72
Millt.r groups 810 10 10 81.1 20 20 Major group 94 l,069 1,039 30
Major group 82 100 100 Minor groups 940 917 957 20 941 31 31
Minor groups 821 20 20 942 10 10 822 10 10 949 51 41 10 823 60 60 825 10 10 Major group 9i) 195 185 10
Major group 83 20 20 Minor groups 952 31 31 953 93 93
MillOI' ~l'()UP 830 20 20 955 20 TO 10 956 10 10
Divi8ion 9 13,220 11,889 1,331 959 41 41
Major group 90 2,939 70 Major group 96 2,303 2.263 40
2,869 Minor groups 960 112 82 30
Minor groups 900 205 185 20 961 113 113 901 709 699 10 962 1,812 1,812 902 1,542. 1,512 30 963 11 II 903 483 4,73 10 969 195 185 10
Major group 91 4,1 41 Major group 99 973 884- 89
Minor group. 910 41 41 Minor group 990 913 884 89
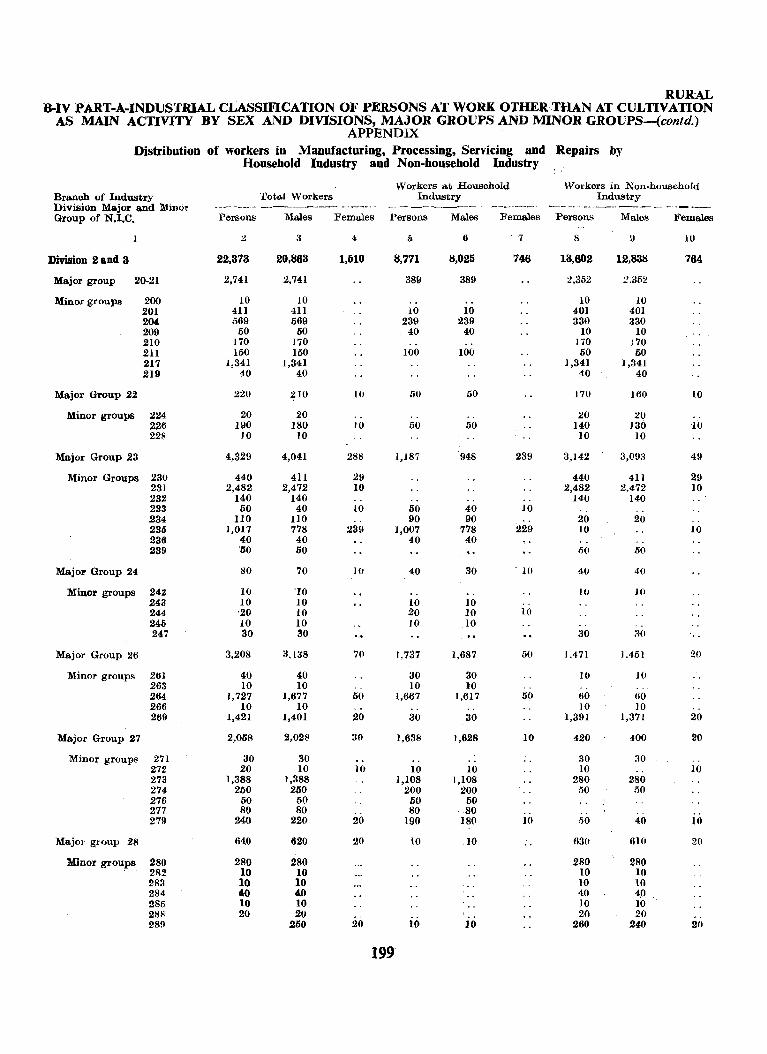
RURAL B-IV PART-A-INDUSTRIAL CLASSIFICATION OF PERSONS AT WORK OTHER THAN AT CULTIVATION
AS MAIN ACTIVITY BY SEX AND DIVISIONS, MAJOR GROUPS AND MINOR GROUPS-(contd.) APPENDIX
Distribution of workers in Manufacturing, Processing, Servicing and Repairs by Household Industry and Non-household Industry
Workers at Household Workers in Non·household Branoh of Industry Total Workers Industry Industry Division Major and 3I1in"f --_----_- -_------- ~------ -- - _------- - --__..-----. ---- --. --.-- ------- --_---Group of N.I.C. Persons Males Females Persons Ma.les Females Persons Males Females
1 :2 3 4 i) 6 7 1:1 \J 10
Division 2 and 3 22,373 20,863 l.510 8,771 8,025 746 13,602 12,838 764
Major group 20·21 2,741 2,741 389 389 2,352 2.352
Minor groups 200 10 10 10 10 201 41I 411 10 10 401 401 204 569 569 239 239 330 330 209 50 50 40 40 10 10 210 170 170 170 170 211 150 150 ]00 100 50 50 217 ],341 ],341 ],341 1,341 219 40 40 40 40
Major Group 22 220 210 1(I 50 1)0 170 ]60 10
Minor groups 224 20 20 20 20 226 190 180 ]0 50 50 140 130 10 228 10 10 ]0 ]0
Major Group 23 4,329 4,041 288 1,J87 948 239 3,142 3,093 49
Minor Groups 230 440 411 29 440 411 29 231 2,482 2,472 10 2,482 2,472 10 232 140 140 140 J40 233 50 40 10 50 40 JO 234 110 110 90 90 20 20 235 ],017 778 239 ],007 778 229 10 10 236 40 40 40 40 239 50 60 50 50
Major Group 24 1:10 70 ]0 40 30 ' 10 40 40
Minor groups 242 10 '10 10 10 243 10 10 to 10 ' ,
244 '20 10 20 10 10 .. 245 10 10 10 10 247 30 30 30 30 ' .
Major Group 26 3,208 3,138 70 1,737 1,687 50 1.471 1.451 20
Minor groups 261 40 40 30 30 10 10 263 10 10 10 10 264 1,727 1,677 50 1,667 1,617 50 60 60 266 10 10 10 10 269 1,421 1,401 20 30 30 1,391 1,371 20
Ma.jor Group 27 2,Oli8 2,028 30 ],638 1,628 10 420 400 20
Minor group" 271 30 30 30 30 272 20 10 l() 10 10 10 10 273 1,388 1,388 1,108 1,108 280 280 274 2liO 2liO 200 200 50 1)0 276 50 50 50 50 277 80 80 80 ,80 279 240 220 20 190 180 10 1')0 4.0 10
MajoJ' group 28 640 620 20 10 10 1130 fIlO 20
Minor groups 280 280 280 280 280 2R2 10 10 10 10 283 10 10 10 10 284 40 40 40 4,0 285 10 10 10 10 288 20 20 20 20 , ,
289 2liO 20 10 10 260 240 2()
199
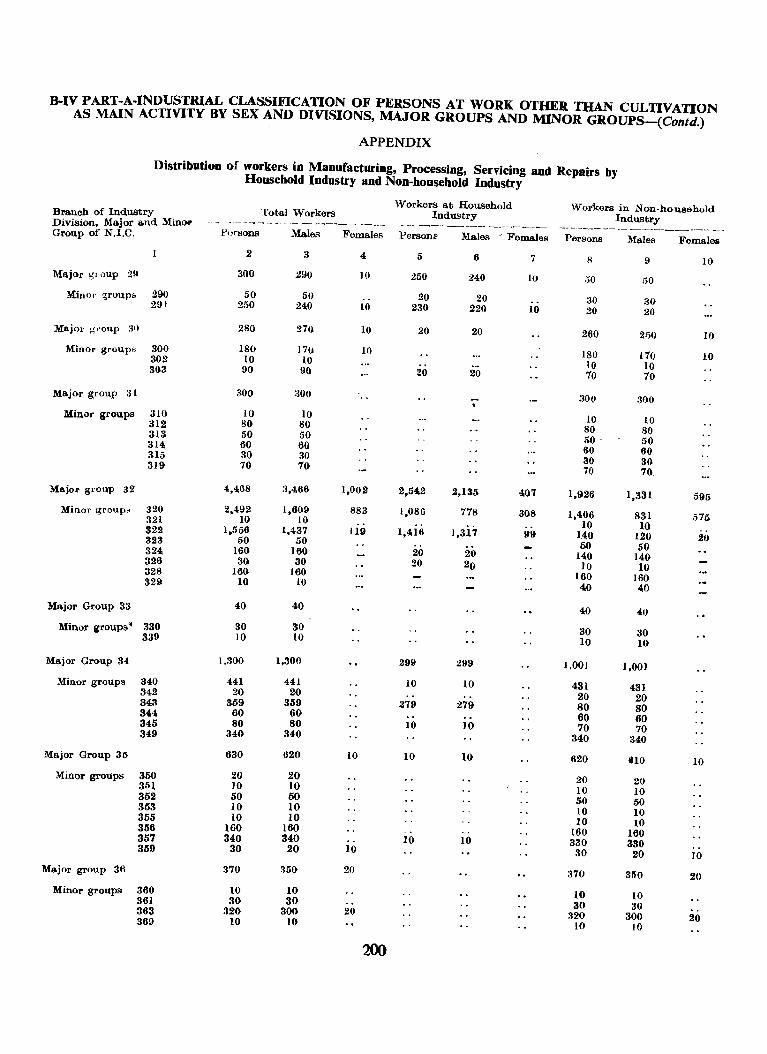
B-IV PART-A-INDUSTRIAL CLASSIFICATION OF PERSONS AT WORK OTlIER THAN CULTIVATION AS MAIN ACTIVITY BY SEX AND DIVISIONS, MAJOR GROUPS AND MINOR GROUPS-(Contd.)
APPENDIX
Distribution of workers in Manufacturing, Processing, Servicing and Repairs by Household Industry and NOD-household Industry
Workers at Household Workers in Non·household Branoh of Industry Total Workers Industry Industry Division, Major and MinOt! - - _-.--_-..",~ -~- .- ----.. _-- --_---~ - ----~-- --~------ - ~~----,---- -_ ~~------ _. Group of N.I.C. j>orsons Males Females Persons Males - Females Persons Males Female»
2 3 4 5 6 7 8 9 10 Major g"oup 29 300 290 10 250 240 10 ,,0 50
Minor groups 290 50 50 20 20 30 30 291 250 240 to 230 220 10 20 20
Majoi' g'('oup :30 280 270 10 20 20 260 250 10 Minor groups 300 180 170 10 180 170 10 302 10 10 10 10 303 90 90 20 20 10 10
Ma.jor group 31 300 :JOO .- 300 aoo , MinOr groups 310 10 10 10 10 312 80 80 SO 80 313 50 50 50 - 50 314 60 60 60 60 315 30 30 30 30 319 10 70 70 70.
Ma.jor group 32 4,4,68 3,466 1,002 2,54.2 2,135 4,07 1,926 1,331 595 Minol' grollpK 320 2,492 1,609 883 1.086 718 308 1,406 831 575 321 10 10 10 10 322 1.556 1,437 119 1,416 1,317 99 14;0 120 211 323 50 50 50 50 324 160 160 20 20 14.0 140 326 30 30 20 20 ]0 10 328 160 160 160 160 329 10 10 40 40
Major Group 33 40 40 40 40
Minor groups' 330 30 30 30 30 339 10 10 10 10
Major Group 34 1.300 1,300 299 299 l,OO} 1,001
Minor groups 340 441 441 10 10 431 431 342 20 20 20 20 34~ 359 359 279 279 80 80 344 60 60 60 60 345 80 80 10 JO 70 70 349 340 340 340 340 Major Group 36 630 620 10 10 10 620 no 10
Minor groups 350 20 20 20 20 351 10 10 10 10 352 50 50 50 50 353 10 10 10 10 355 10 10 10 10 356 160 160 160 160 357 340 340 10 10 330 330 359 30 20 10 30 20 10 Major group 36 370 350 20 370 3riO 20
Minor groups 360 10 10 10 10 361 30 30 30 30 363 320 300 20 320 300 20 369 10 10 10 10
200
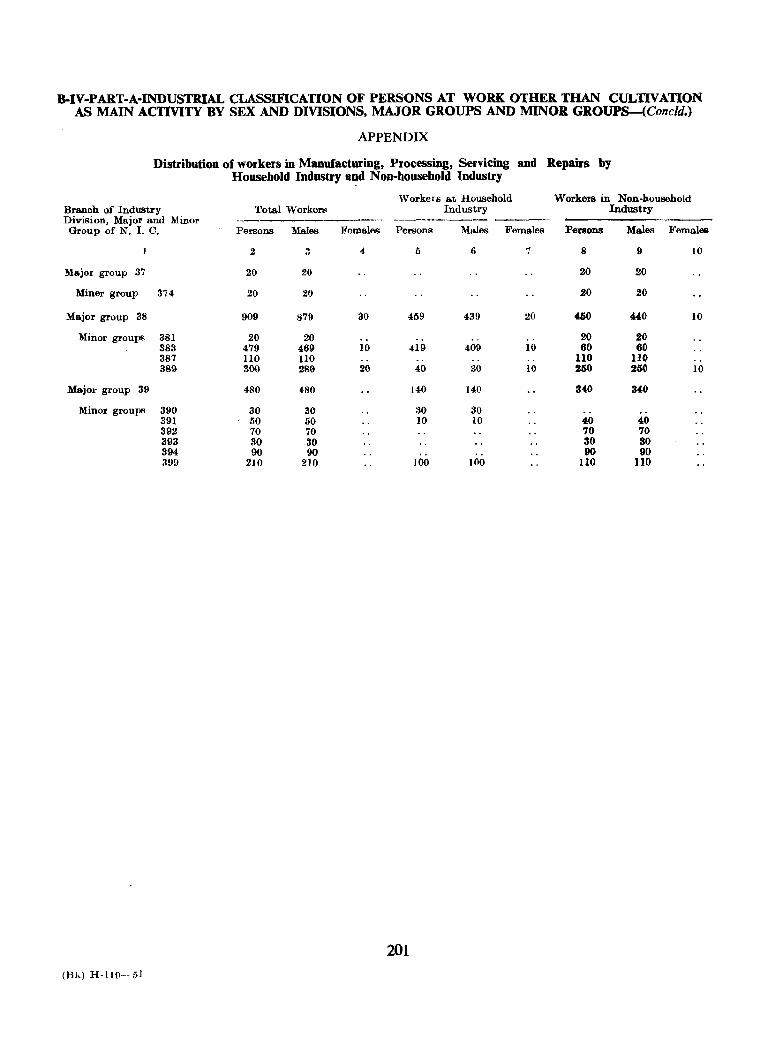
B-IV-PART-A-INDUSTRIAL CLASSIFICATION OF PERSONS AT WORK OTHER THAN CULTIVATION AS MAIN ACTIVITY BY SEX AND DIVISIONS. MAJOR GROUPS AND MINOR GROups-(Conc1d.)
APPENDIX
Distribution of workers in Manufacturing, Processing, Servicing and Repairs by Household Industry and Non-household Industry
Workers at; Household Workers in Non-household Branch of Industry Total Workers Industry Industry Division, Major and Minor -------Group of N. 1. C. Persons Males Females Persons Males Females Persons Males Femalee
2 3 4 5 6 7 8 9 10
Major group 37 20 20 20 20
Miner group 374 20 20 20 20
Major group 38 909 879 30 469 43!) 20 450 44O 10
Minor groups 381 20 20 .. ., 20 20 383 479 469 10 419 409 10 60 60 387 110 110 " 110 110 389 300 286 20 40 30 10 250 250 10
Major group 39 480 480 140 140 340 340
Minor groups 390 30 30 30 30 ., 391 50 50 10 10 40 40 392 70 70 70 70 393 30 _30 30 SO 394 90 90 .. " 90 90 399 210 210 100 100 110 110
201
(BI,) H·IJ9--I\J
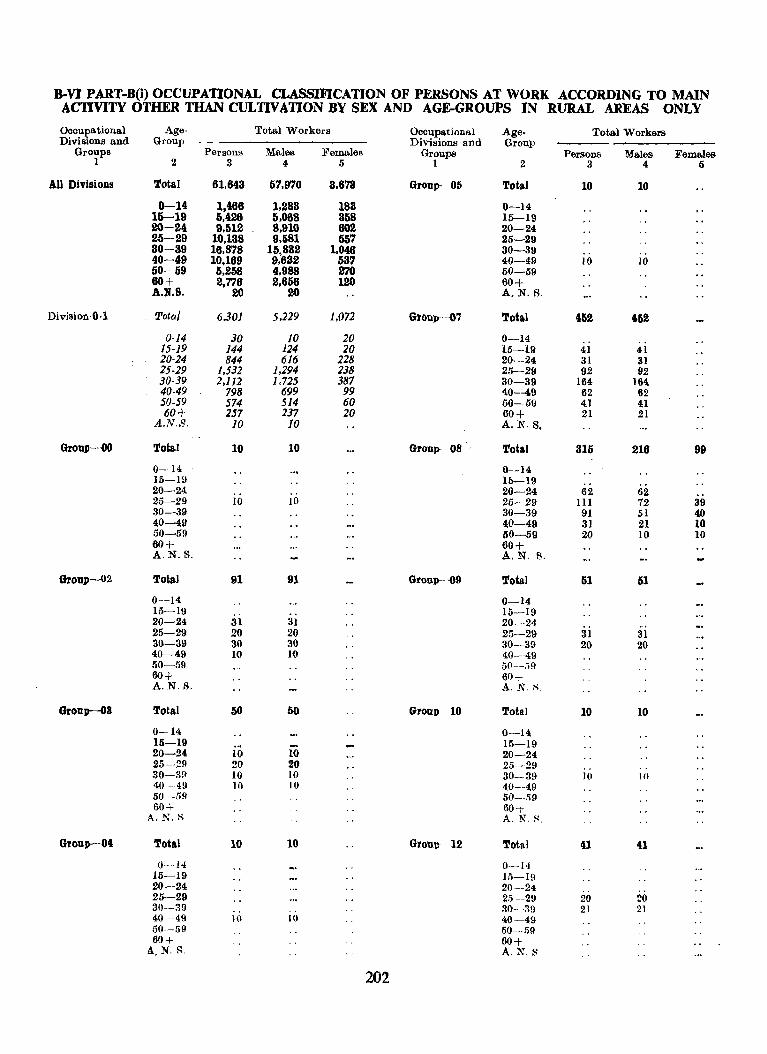
B-VI PART-B(i) OCCUPATIONAL CLASSIFICATION OF PERSONS AT WORK ACCORDING TO MAIN ACTIVITY OTHER THAN CUL1IV ATION BY SEX AND AGE-GROUPS IN RURAL AREAS ONLY
Oooupa tional Age· Total Workers Oooupational Age· Total Workers Divisions and Group Divisions and Group
GrOupS Persons Males Females Groups Persons Males Females 1 2 3 4 5 1 2 3 4 Ii
All Divisions Total 61,643 57,970 3,678 Group- 05 Total 10 10
0-14 1,466 1,283 183 0-J4 1~19 5,426 6,068 368 15-19 20-24 9,512 8,910 602 20-24 25-29 10,138 9,581 657 25-29 30--39 16,878 16,832 1,046 30-39 40-49 10,169 9,63.2 537 40-49 10 JO 50-59 5,258 4,988 270 50-59 60+ 2,776 2,656 120 60+ A.H.S. 20 20 A.N. S,
Division·O·1 Total 6.30J 5,229 1,072 Gronp· --07 Total 452 452
0-14 30 10 20 0-14 , . 15·19 144 124 20 15-19 41 41 20-24 844 616 228 20-24 31 31 25·29 1,532 1,294 238 25-29 92 92 30·39 ],112 1,725 387 30-39 164 164 40·49 798 699 99 40-49 62 62 50·59 574 514 60 50-59 41 U 60+ 257 137 20 60+ 21 21
A.N.S. 10 10 A.N.S.
Group-----OO Total 10 10 Group- {IS Total 315 216 99
0-14 0-14 15-19 10-19 20-24. 20-24 62 62 25-29 10 10 25-29 III 72 39 30-39 30-39 91 51 40 40-49 40-49 31 21 10 50-59 60-59 20 10 10 60+ 60+ A.N.S. A.N, S.
Group-02 Total 91 91 Group-~9 Total 51 61
0-14 0-14 15-19 15--19 20-24 31 31 20-24 25-29 20 20 25-29 31 31 30-39 30 30 30-39 20 20 40-49 10 10 40-49 50-59 50-·-;;9 60+ 60+ A.N.S. A. N. H.
Group----()3 Total 50 50 Group 10 Total 10 10
0-14 0-14; 15-19 15-19 20-24 10 10 20-24 25--29 20 20 25-29 .. 30-3!f 10 IO 30-39 10 1(1 40--49 10 10 40--4;9 50-59 50--.'i9 60+ 60+
A. N. s. A. N.f'.
Group-04 Total 10 10 Group 12 Total 41 41
0- ·14 O-I<! 15-19 In-l!f 20-24 20-24 25-29 2.'}-29 20 20 30--:l9 30--:l9 21 21 40---49 10 10 40--49 50-59 50--59 60+ 60+
A.N. A. A.N. A
202
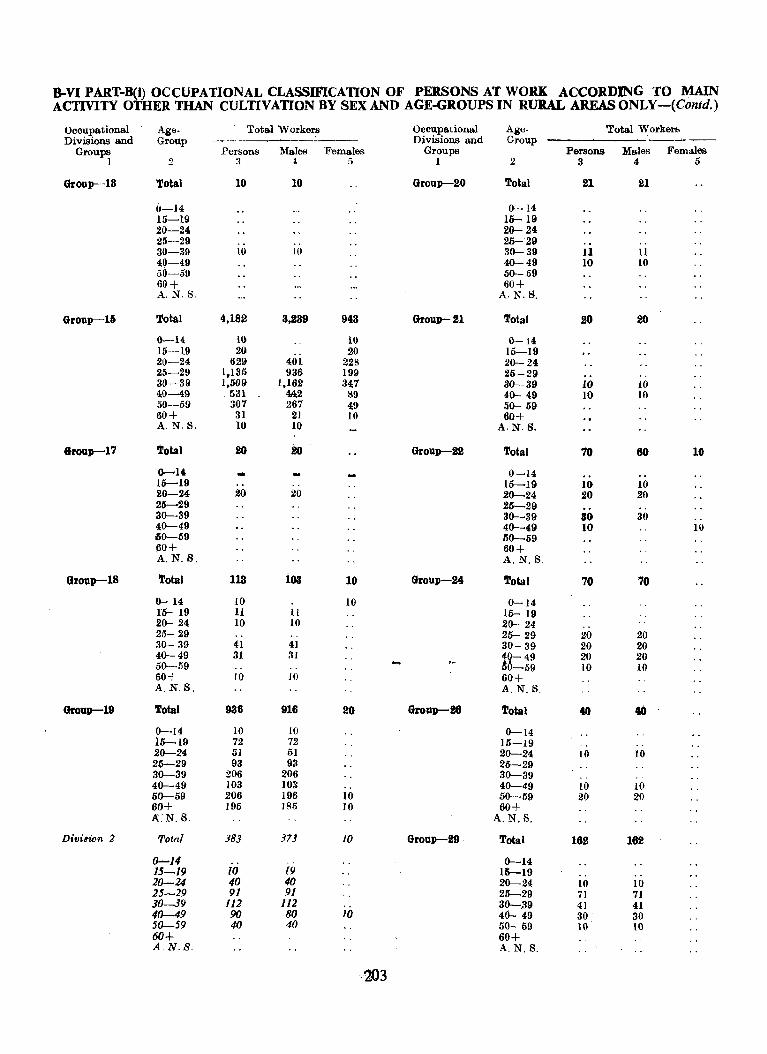
B-VI PART-D(i) OCCUPATIONAL CLASSIFICATION OF PERSONS AT WORK ACCORDING TO MAIN ACTIVITY OTHER THAN CULTIVATION BY SEX AND AGE-GROUPS IN RURAL AREASONLY-(Contd.)
Ocoupational Age- Total W orker8 Occupational Age- Total Workers Divisions and Group -------------------- Divisions and Group ---
Groups Persons Males Females Groups Persons Males Females J 2 :l ~ r, 1 2 3 4 5
Group--13 Total 10 10 Group--20 Total 21 21
0-]4 0-14 15-19 15-19 20-24 20- 24 25-29 .. 25-'29 30-39 to l() 30-39 11 II 4()-49 40-49 10 10 50-59 50-59 6()+ 60+ A. N, S. A.N.S.
Group-Iii Total 4,182 3,239 943 GrouP-leI Total 20 20
0-14 10 10 0-14 15--19 20 20 15-19 20-24 629 401 228 20-24 25-29 l,135 936 199 25-29 3()-39 1,509 1,162 :l47 30-39 10 10 40-49 531 4.42 89 40- 49 10 10 50-59 307 267 49 50- 59 60+ 31 21 10 6.0+ A.N,S. 10 10 A·NS.
6roup-17 'total 20 20 Group--22 Total 70 60 10
0--14 - 0-14 .. 15-19 .. 15-19 10 10 20-24 20 20 20-24 20 20 25---"29 25-29 .. 30-39 30-39 30 30 40-49 40-49 10 10 .60-59 50-59 j)0+ 60+ A.N.S. A.N.S.
Group-IS Total 113 103 10 Group-l!4 Total 70 70
0- 14 10 10 0-14 15- 19 II 11 15- 19 20- 24 10 10 20- 24 25- 29 .. 25- 29 20 20 30- 39 41 41 30- 39 20 20 40-49 31 31 40-49 20 20 50-59 M-59 10 10 60+ 10 IO 60+ A.N.S. A.N.S.
Group-l9 Total 936 916 20 Group-26 Total 40 40
0-14 10 LO 0-14 15-19 72 72 15-19 20-24 51 51 20-24 10 10 25-29 93 93 25-29 30-39 206 206 30-39 .. 40-49 103 103 40-49 to 10 50-59 206 196 10 50-59 20 20 60+ 195 J85 10 60+ A:N. S. A.N.S.
Divi8wn 2 Total 383 37J 10 Group-29 Total 162 1~
0-14 0-14 15-19 10 19 16-19 .. 20-24 40 40 20-24 10 10 25-29 91 91 25-29 71 7] JO-39 112 112 30-39 41 41 40-49 90 80 10 40- 49 30 30 50-59 40 40 50- 59 10 10 60+ 60+ AN.S. A.N.S.
203
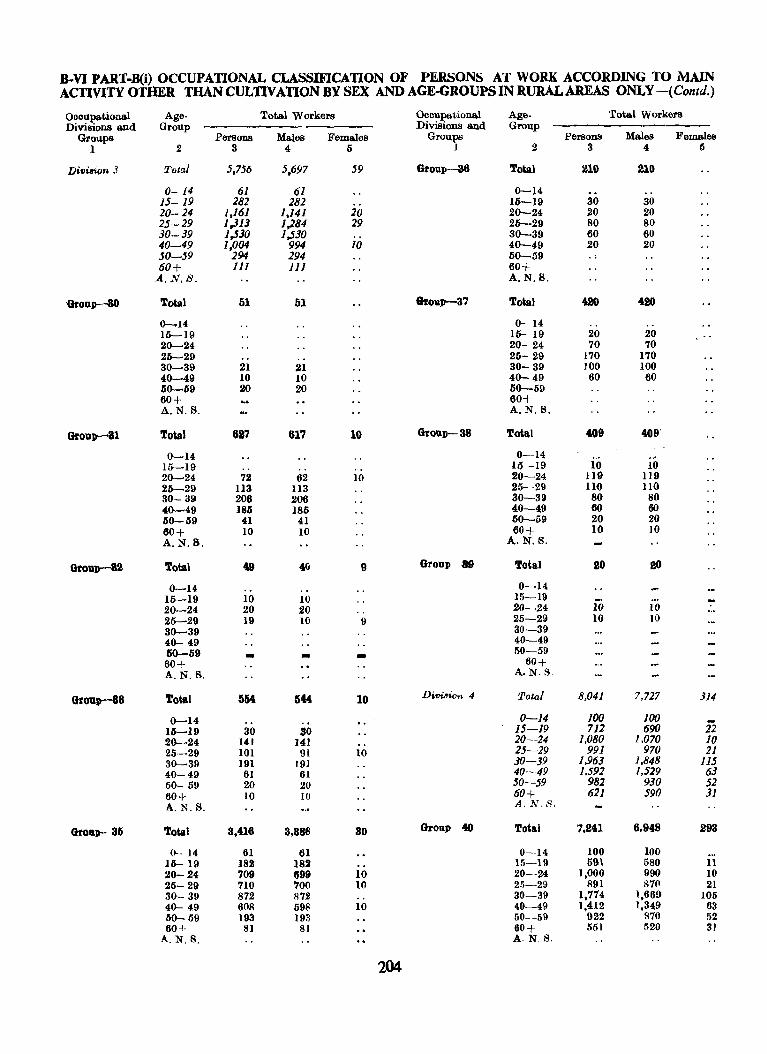
B.VJ PART-B(i) OCCUPATIONAL CLASSIFICATION OF PERSONS AT WORK ACCORDING TO MAIN ACTIVITY OTHER THAN CULTIVATION BY SEX AND AGE-GROUPSIN RURAL AREAS ONLY -( Contd.)
Oooupational Age- Total Workers Ocoupational Age- Total Workers Divisions and Group Divisions and Group
Groups Persons Males Females Groups Persons Males Females 1 .2 3 4 5 I .2 3 4 ()
D'"uwn 3 Total 5,756 5,697 59 Group---36 Total 210 210
0- 14 61 61 0-14 .. 15-19 282 282 15-19 30 30 20-24 1,161 1,141 20 20-.24 20 20 25-29 1,313 1,284 29 25-29 80 80 30-39 1,530 1,530 30-39 60 60 40-49 1,004 994 10 40-49 20 20 50--59 294 294 50-59 60+ 111 111 60+ A.N.B. A.N.B.
Groop--30 Total 51 51 &roup-a7 Total 420 420
0-14 0- 14 .. ., 15-19 15- 19 20 20 20-24 20- 24 70 70 25-29 .. . . 25- 29 170 170 30-39 21 21 30- 39 ]00 100 40-49 10 10 40-49 60 60 50--59 20 .20 50-59 60+ 60+ A.N.B. A.N.B.
Group-a1 Total 627 617 10 Group-as Total 409 409
0-14 0--14 15-19 .. . . . . 15--19 10 10 .20--.24 72 6.2 10 .20-.24 119 119 25-29 113 113 25--29 no 110 30- 39 .206 206 30-39 80 80 40--49 185 185 40-49 60 60 50-59 41 41 50-59 20 .20 60+ 10 10 60+ 10 ]0 A.N.B. A.N.S.
Grou)t-"""'82 Total 49 4Q 9 Groop 89 Total 20 20
0-14 .. 0-14 15-19 10 10 15-19 -.20-.24 20 20 20-24 10 10 ... 25-29 19 10 9 25-29 10 10 30--39 30-39 40- 49 40-49 60-59 - - - 50-59 60+ 60+ A.N.S. A.N.S
Group-88 Total 554 544 10 niwi<m 4 Total 8,041 7,727 314
0-14 0-/4 100 100 15-19 30 30 15-19 712 690 22 20--24 Ul 141 .. 20-24 1,080 1.070 10 25-29 101 91 10 25-29 991 970 21 30--39 191 191 30-39 1,963 1,848 115 40-49 61 6] 40---49 1.592 1,529 63 50- 59 .20 20 50-59 982 930 52 60+ 10 10 60+ 621 590 31 A. N.B. A.N.S.
Gr081)'" 36 Total 3,418 8,886 80 Group 40 Total 7.241 6.948 298
0-- 14 61 61 O-lot 100 100 ... 15- 19 182 182 15-19 591 580 11 20-24 709 699 10 20--24 1,000 990 10 25- 29 710 700 10 25-29 891 870 21 30- 39 87.2 872 .. 30--39 1,774 1,669 105 40-- 49 608 598 10 40-49 1 "U2 1,349 63 50-59 193 193 50-59 922 870 52 60+ 81 81 60+ 551 1120 31
A.N.S. A. N. s.
204
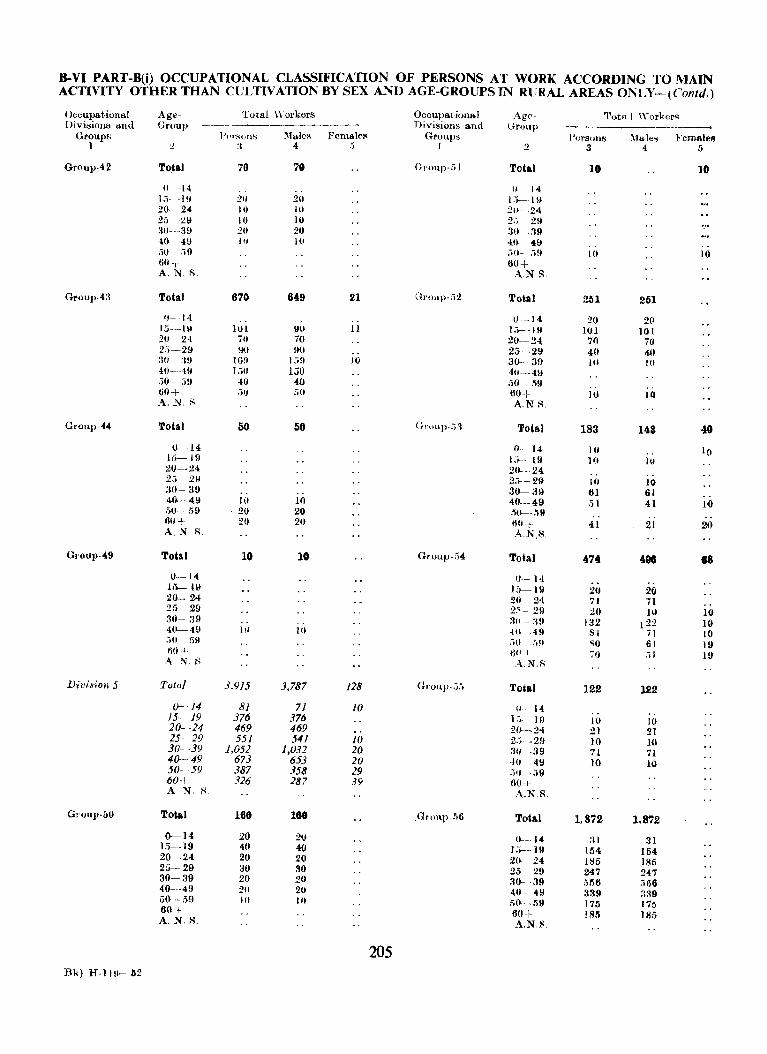
B-VI PART-B(i) OCCUPATIONAL CLASSIFICATION OF PERSONS AT WORK ACCORDING TO MAIN ACTIVITY OTHER THAN CULTIVATION BY SEX AND AGE-GROUPS IN RURAL AREAS ONLY-(Contd.)
Occupational Age- Total Workers Occupational Ag<'- Tota 1 'Yorker;;; DivilSions and Group -'-~- ---------- Divisions and Group _._-_
Group8 l'(\l'suns lfales Female!< Groups Porsons :'Ilales .Fcmale~ I J :l 4 :. I 2 :I 4. 5
Gl'oup-42 Total 70 70 (}rOIlP-.) I Total 10 10
0- -14 II - 14 1,)- - HI 211 20 t.i---.j II 20-- 24 10 10 211--·24 25- -2U 10 10 2 .• 29 30····39 20 20 3()"__":J9 -1.0- ·411 Itl 10 40-- 411 .W-- .i!) .• 0- ;;!l III 10 6(1-1- 60+ A. N. R. ANI.'
Gl'oup-4:l Total 670 849 21 Group-i;2 Total 261 251
fl- 14. t}-- 14 20 20 };';----HI lUI UU II 1.')---19 101 101 20- ·24 711 70 20--24 70 7() 23-29 ~l HO 25---29 40 4-11 :)(1 --:19 16!) 1;;11 10 30- 3!! HI W 40--411 1:;0 1.)0 40--4\1 ;;0- ;')!l ·HI 40 ,;0- :>9 60+ ;')0 ,io 60+ 10 HI A.N. H. A.NR.
GJ'onp-44 Total 50 50 (~f'Oll}J·;).'1 Total 183 143 40 1,).-·14 ().- -14 10 .. 10
1Ij-- l!l 1.,-- 19 HI 10 20--24 2(1 .... 24 25- 21-1 2.) - 29 10 10 30- 39 30-- 39 61 61 40-49 10 10 40--49 51 41 10 i,O- 59 - 20 20 .'iv-·lill 60+ :!O 20 11(1+ 41 21 20 A.N R. A.N.R
GI·oup-.9 Tot&1 10 10 Gl'oup.:14 Total 474 401 18 0- 14 1)- 14 jh- l~ 15-19 20 20 20-- 24 20-24 71 71 25- 29 2;'- 29 20 HI 10 30- 39 .. 3u .. :19 132 122 10 40-49 1(1 HI ·W ·49 81 71 10 .iO :)Ij .iU -r)~, ;;0 61 19 110 j. flO I 70 •• 1 19 A N R A.N.R
Di1:i8ioll 5 Tot,,/ 3.915 3,787 128 GJ'OlW·;i5 Total 122 122 (}--.J4 81 71 10 (j .. 14
15 19 376 376 ).-;. ·HI 10 10 20- ·24 469 469 20--24 21 21 25 29 551 541 10 2 .... -2!1 10 HI 30--39 1,052 1,032 20 au ·:19 71 71 40 49 673 653 20 4V 49 10 10 50 59 387 358 29 :;v ·.j9 60'1 326 287 39 60-1-A N. R. A.N.S.
Group·5/J Toial 160 180 .Gn)\11)..~·6 Total 1,872 1,8'(2
0--14 20 20 H-... 14 :H 31 L'5-·19 40 4.0 ].~- ]!J 154 154 20 ·24 20 20 20· 24 185 185 25-.. 29 :10 30 25- 29 247 247' 30-39 20 20 30- ·39 ;''iri6 ;;a6 40"·49 20 2(1 40 - 49 339 3:-19 i;O--- 59 JfI 10 1)0 ·rill 176 175 60 + 60+ IS/) 185 A. N. S. A.N.I<.
205 Bk) H-l1H-52
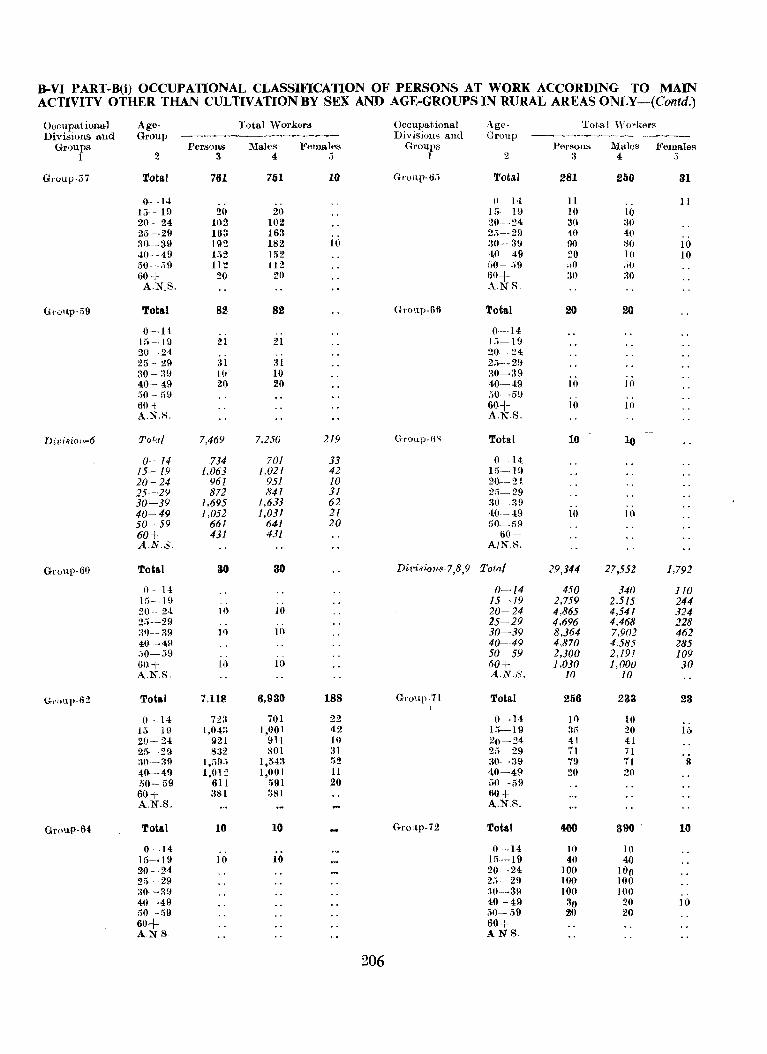
B-VI PART-B(i) OCCUPATIONAL CLASSIFICATION OF PERSONS AT WORK ACCORDING TO MAIN ACTIVITY OTHER THAN CULTIVATION BY SEX AND AGE-GROUPS IN RURAL AREAS ONLY-(Contd.)
Occupational Age- Total Workers Occupational Age- Tot,al Workers Divisions and Group ------------- Divisions and Group ----...:......---------------
Groups Persons Males Females Groups PersoilS Males Females 1 2 3 4 :; 1 2 :1 4 .3
Gl'oup-.37 Total 761 751 10 Gf'Otlp-6,) Total 281 2M 31
0--1.J, 0-14 II 11 1.3 - 19 20 20 15-- 19 10 10 20 24 102 102 20--24 3() :l() 25-29 163 163 2.-;--29 40 40 :lO-39 192 182 10 ~O- ~9 90 SO 10 40--49 152 152 40··49 20 10 10 50--59 112 112 50- :';9 50 ;'i0 60 -i- 20 20 60+ 30 30 A.N.S. A.NS.
Gl'onp-,39 Total 82 8! Group-66 Total 20 20
0--14 .- 0-14 1[.-·-19 2l 21 ];;-19 20--24 .- 20-24 25-· 29 31 31 25--29 30-:19 l(J 10 30-39 40- 49 20 20 40-49 10 III 50- 59 50--59 .. tln+ 60+ 10 10 A.N.S. A.N.S.
Dl:t,isio)l.-6 Total 7,469 7,250 219 G"oup-61\ Total 10 10
0- 14 734 70] 33 0-14 15- 19 1.063 1,021 42 lIi---HI 20-24 961 951 10 20-- 24 25--29 872 84] 31 2fl--29 30-39 1,695 1,633 62 30--39 .. 40-49 1,052 ],03] 21 40 --19 10 10 50-59 661 641 20 50--59 60+ 431 4Jl 60-A.N.S. A/N.S.
Gr(iup-60 Total 30 30 Dit'i8ion~-7,8,9 TolnT 29,344 27,552 1,792
0- 14 0--14 450 340 110 15--19 - . 15-19 2,759 2.5/5 244 20- 24 11) jO 20-24 4,865 4.541 324 25-29 .. 25-29 4,696 4.468 228 :~I)-- 39 ]1) 10 30--39 8.364 7.902 462 40-49 40--49 4,870 4.585 285 ,;0-':;9 50--59 2,300 2,191 109 60+ 10 10 60+ 1.030 1.000 30 A.NS. A.N.S. 10 10
Group-62 Total 7,118 6,930 188 Gl'oup-11 Total 256 233 23 \
0-14 72il 701 22 0-14, 11) 10 15 ]0 1,0·t:l 1,001 42 Hi-19 :l5 20 15 20-U 921 911 10 20--24 41 41 25--- 29 832 SOl 31 2;'i - 29 1L 71 :10--39 1,:)!l;) 1,543 !):! 30-39 19 71 8 40--49 1,01:: 1,OOl 11 40--49 :10 20 ,,0-59 611 ,,91 20 (iO -59 60+ 381 :J81 60+ A.N.S. A.N.R.
Group-64 Total 10 10 Grollp-72 Total 400 390 10
0--14 0-14 10 10 15--19 10 10 11)-19 40 40 20-24 20-24 100 100 2'> ·-29 2;;--29 100 100 :10-39 :10·~39 ]00 100 40--49 40-49 30 20 ]0 iiO -59 50-59 ZO 20 60+ 60+ ANS. ANS.
206
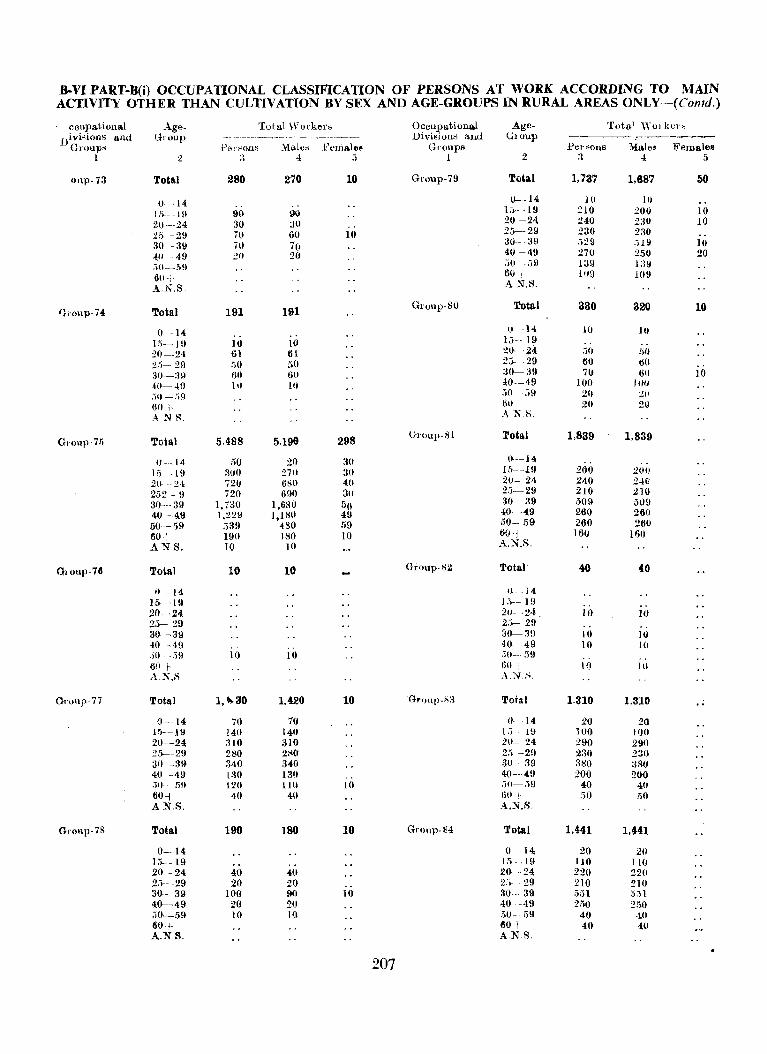
B-VI PART-B(i) OCCUPATIONAL CLASSIFICATION OF PERSONS AT WORK ACCORDING TO MAIN ACTIVITY OTHER THAN CULTIVATION BY SEX AND AGE-GROUPS IN RURAL AREAS ONLY-(Contd.)
ccnpational Age. Total WOl'kel'B Occupational Age- Tota! \Yorker, nivinions and Group _" -- -- .----~. _-- -----~-"-.---~- Divisions and GIOUp -------
GI'OUp'l Pen.;on~ Mi'lecl .Feniale8 Groups Pen;ons ~Iales Females 1 2 :l 4 j) 1 2 :l -l .'\
oup·73 Total 280 270 10 G r oup·79 Toial 1.737 1.687 50
0-·14 ~-14 10 J(j .. 15--19 210 200 10 ji).., 19 90 00
20 -·24 30 30 2\1---24 240 2311 10 ., 2:;--29 230 2:10 25 -29 70 60 10 ..
30--39 7\) 70 30 ·39 .129 :,Hi 10 .{H--49 211 20 40-49 270 250 20 .;tJ---MI .}O -- rill 131l I :l!1
60+ 60-\- IO\) 109
A.N.S AN.S.
G,·ollp·74 Total 191 191 G,oup-SO Total 330 320 10
0- ·14 0--14 10 HI .. ., 1.:; - 19
1.~---I!J 10 10 .. .. 20--24 61 61 20--24 ::;0 [,0
2.5--· 29 50 50 2.>--- 29 60 60 :30--;{!l 60 60 30--::19 70 till 10 4i1-4!l 10 HI 40--49 1(J0 11m .,)I_I---,,)9
;)0 -':;9 2(J ;w 60+ Go+ 20 20 ANR, AN,S.
Gl'on11 -7fJ Total 5.488 5.196 298 GnlUp·81 rotal 1,839 1,839
0--14 50 20 30 I).--H
1.')-- I \I :lOO 270 30 15-1\1 200 2011 20- -24 720 680 40 20- 24 240 240 252 - 9 720 690 30 23--2\1 210 210 aO---39 1. laO 1,680 50 :30---39 ,'>09 50\! 40~49 1,229 1,180 49 4.0 ·49 260 260 50--59 ;;39 480 fJ9 ;'>0- 59 260 260 60+ 190 180 10 6(J+ 160 lSI) AN.S. 10 10 A.~.S.
Gl'oup-76 Total 10 10 Group.82 Total 40 40
I) -14 U--14 15 --19 1.)-- 1 \I 20-·24 20- -24 10 1(}
2:1- 29 2,}- 29 ., 30-39 aO----3\1 10 10 40--49 .. 40 ·49 10 10 .,)0 -;)9 10 10 .)(1- :;9 . , .. 60+ 60+ 10 10 _-\,N,S A X;o;,
QI'0'up-77 Total 1,~30 1.420 10 -Gr')lq)-il:l Total 1.:nO 1,310
0-14 70 70 (J ·14 20 20 I !)--J!l 140 J4(J 1.> 1\1 100 JOO 20--24 310 310 20- 24 290 29H 25----29 280 2i'!O 2.1 -2!1 zao 230 30--:39 340 340 30 311 :380 ;{SO 40-49 1:~0 130 4{1-·4.9 200 ZOO .')1) -59 120 tlO HI iHl-- 'ill 40 40 60+ 40 40 iiO )- :;0 i\O AN.S, A.N.S,
Gl'onp·78 Total 190 180 10 G1' 0 11p.84 Total 1.441 1,441
0-14 0 -l4, ZO 20 L">--19 I;, - .19 110 llO 20-- 24 4.0 4\) 20- 24 220 220 23--29 20 20 2;)- 29 210 :no 30--39 100 90 10 30- 39 .,)51 :;:)1 400---49 20 20 40 -49 2/i0 2!)O ;;0-59 HI 10 ;;0 !ill 40 40 60-+- 60+ 40 4;0 A.NS. ANS
207
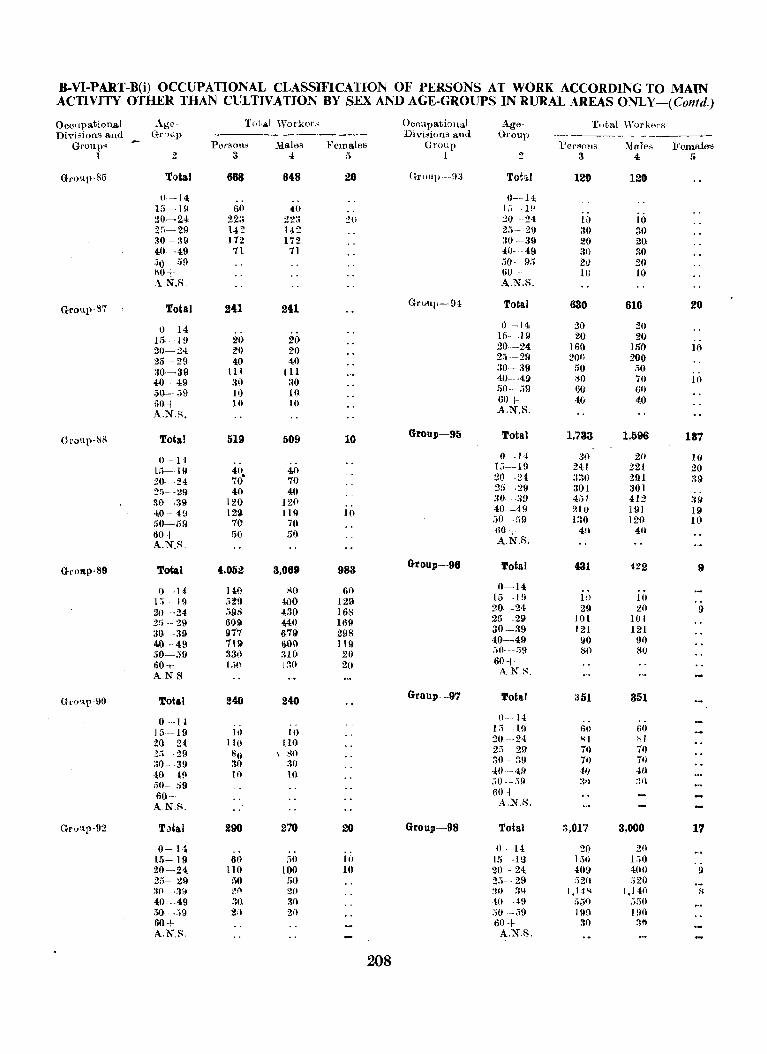
B-VI-PART-B(i) OCCUPATIONAL CLASSIFICA nON OF PERSONS AT WORK ACCORDING TO MAIN ACTIVITY OTHER THAN CULTIVATION BY SEXANDAGE-GROUPSINRURALAREASONLY-(Contd.)
Occnpational Ag~· Tot'a.l Worker, Occupational Age· Total H'orkers DiviBions and G,.>H'P Divisions and Group -----~---~-------
Group~ Person' Males Fema.les Gt'Oup P01'.:iOI15 :\fRJes Females 1 2 3 4 fi 1 2 3 4 I)
Gro1lp·R5 Total 688 648 28 Grollp--il3 Tohl 120 120 (l._l4; O--l{
15--1i1 60 40 Jii IP 20-24 22:; 22H 2\1 20 --24 10 10 2;)-29 142 142 25- 2i1 30 30 30 _. 39 172 172 :10 --39 20 20 4:0-49 11 71 4:0- 49 30 30 "0 - ;'if) 50--9 .• 20 20 liO+ 60 ; 10 10 AN.S A.N.S.
Grollp-87 Total 241 241 Or(,up-·9! Total 630 610 20
0-14 o -14 20 20
15--19 21) 20 15---19 20 20 20--24 20 20 20-24 160 InO 10 25--29 40 40 25 ---29 200 200
:lO-39 III III 30-39 50 ;,)0
40···49 30 :W 40-··49 80 70 10 50-.19 10 10 r.0--;)9 60 60
60 i 10 10 60+ 411 40 A.NS. A.N.S.
G"otlI,-8S Total 519 509 10 Group-95 Total 1.733 1,596 137
() -14 (1--14 30 20 10 lrl-IU 40 40 1 fi---19 24;1 221 20 20 ·24 7'0- 70 20 -2i :l30 291 39 2;'- -29 40 40 25---29 301 301
30 -·39 120 120 ;I()-- 39 4r.! 412 ;~9
.j,() - 4!J 12~ 119 J(\ 40--49 210 191 19 50-i,9 70 70 ;iO--MI 130 120 lO 60+ 50 50 (JO+ 4\1 40
A.N.S. A.N.S.
GrOltp-89 Total 4.052 3.061 983 Group-9S Total 431 422 9
0-·14 140 SO 60 0--14 1:; - 19 5:!9 .j,()O 129 15---UI In 10
20 --24 :>98 4;3() 16s 20--24 29 20 9 2:' 29 609 4:40 169 25-~29 101 101
:lO-39 917 679 298 30 ---1l9 121 121
4.0- 49 719 1)00 119 40-49 90 !)O
,,0--·;;9 33() :UO 2() ;;0---;'9 so 80
60+ 1::;0 1;'0 20 60-1' A.NS AN.R.
(hotlp·90 Total 240 240 Group--97 Total 351 351
0 -u o· 14 .. li'i---19 60 15--19 1,) H) 60
20 - 24 lit) 110 :W --24 SI Sl
25 29 80 \ $0 2:) 29 70 70
:10-·39 ~O :10 30- 39 70 71)
4;0 4~ li) to 40 -4f) to 40 flO-·- ;'9 .0;0- -.;(1 :1·', :lfl
60+ 60+
AN.S. A.N.S.
Group-92 TJtal 290 270 20 Group-98 Total :~.O17 3.000 17
0-14. 1)- I! 20 20 15-19 60 ;;0 10 15 ~19 l:;i) L,O 20~24 110 100 10 20 - 24 409 4()O I)
2;")- 29 50 ,.0 2;;--29 ;'20 ;;20 ;1(\ ·:w ?I" 2() ;10 39 1.14'1 J,140 S 40-49 30 30 40 ·49 ;;50 .,50 .)()·--59 :!n 20 .,0 -.;9 190 1 (I() 60+ (10+ :10 !lf1 A..N.t'. A.N.S.
208
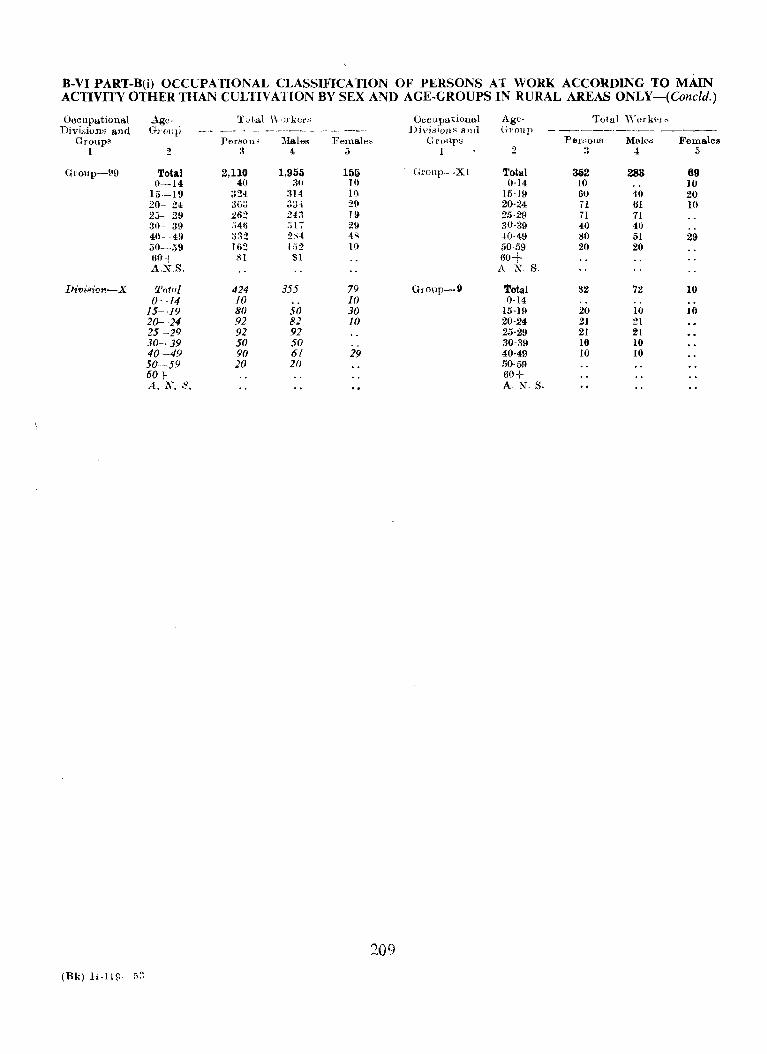
B-VI PART-B(i) OCCUPATIONAL CLASSIFICATION OF PERSONS AT WORK ACCORDING TO MAIN ACTIVITY OTHER THAN CULTIVATION BY SEX AND AGE-CROUPS IN RURAL AREAS ONLY-(Concld.)
Occupationa.l ~c- Tutal \\'''rker~ Occupational Age- Total \\' orkt'n Divi",ions and Gl'OllfJ --~-------.-.-~-------~-- J)iviBioJl~ ant] (Troup - ~ ----.-.------ ------~
Group' rer~on:-; }le.les Ftllna.le~ G-l'onps Persons Mok~ Fema.1es 1 2 :~ 4 [> 1 2 3 4 5
Gl'oup-!:I9 Total 2,110 1,955 155 Gronp--Xl Total 362 283 69 0-14 40 30 lI) 0-14 10 10
1;'>--19 :{~4 314 10 I5-l!:! 60 40 20 20- 24 3G~ 3:J4 2\1 20-24 71 61 10 25-29 262 243 19 25-29 71 71 ao -- 39 .,46 0")17 29 30-39 (0 40 40-49 :~:l~ 2S4 4;< 40-49 80 51 29 '-;0-59 I()2 [;,2 10 50-59 20 20 60+ ~1 81 60+ ASS. A X. S.
Div;siorf-X Tottll 424 355 79 Group-9 Total iS2 72 10 ()---14 10 10 0-}4
15-19 80 50 30 15-19 20 10 10 20---24 92 82 10 20-24 21 21 25-29 92 92 25-29 21 21 30-39 50 50 30-39 10 10 40-49 90 61 29 40-49 10 10 50--59 20 20 50-59 60+ 60+ A. N. S. A. N. S.
209
(Bk) H-119--"~
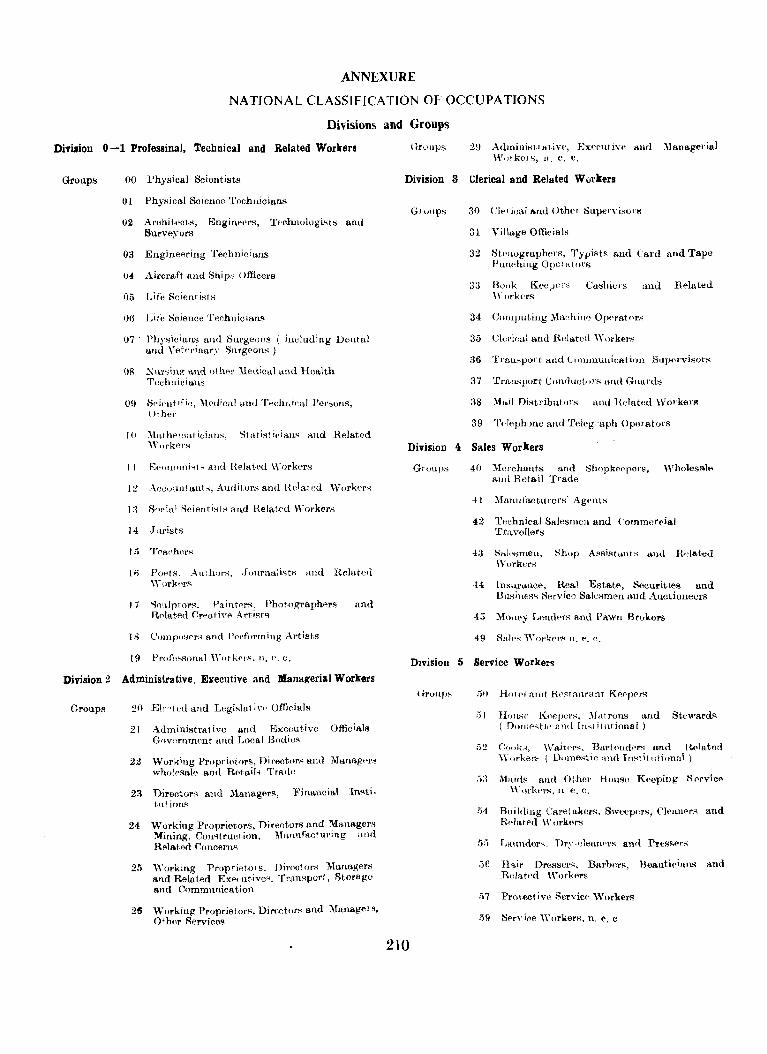
ANNEXURE
NATIONAL CLASSIFICATION OF OCCUPATIONS
Divisions and Groups
Division 0-1 Professinal, Technical and Related Workers Gruu}JS 2!J Admini6t1ativf', Ex('c'lltiv<' and )Ianagel"ial \V""kel'~, ", e, C,
Groups 00 Physical Scientists
Ul Physical Science Technicians
02 Archikcts, Engineers, Technulogi"tti and Surveyors
03 l~ngineerillg Technicians
04 Aircraft and Shi p~ Officel's
05 Life Scienti",ts
IHi Life Science Technicians
07' Physician,., and Surgeons ( incluJing Dental a.nd \' et"rinal',\' Surgeons)
OR X,lr,,;ng and othel' :\lectical and Health TC'chnicialls
O!J !;0it'ntifie, )[('<[ieal awl Tech"ical rel'~ons, Uther
10 :Ylathf'lllaticin,lls, Statisticians and Related '\VorkPl's
I:? Accountants, Auditor" and I{elated 'Wurkc'!''';
I " "
14
Hi
17
18
f'hria l Hcientist" and }{elat('tl 'Workers
JllI'ist,g
PodS, AIl1.h()]'s, .Jollrnali,~tl> and Related '\YoY'knrs
'lclllptorR, Paint"T". Phot,ographers and RpIat-ed Crpl1tivp Artist,R
19 Professonlll "'ol'k~,s, ll, 8, e,
Division 2 Administrative, Executive and Managerial Workers
Groups 20 J%":t,,d and Legislati\'" Officil\ls
2 I Administrative and E~xc(lut,ive Official~ Gov:lrnmpnt, and Local Bodi<li<
22 Working Propriet,ors, Di,'actors and "Ianagtll'S who'esale anc! Rf't.ail" Trad"
23 Director;; and :\iallagerfl, Financial Infltit·ut ions
24 Working Proprietors, Directors and :\-Ianagers Mining, Con'ltruct,ion, 1,f>tnllfactul'ing a.nd Rela.ted Concerns
25 "-orking Pl'oprietol s, Diy,.,ctors Managers and Related Ex""ut,ive", T,'an"'port, Storage and Communication
26 'Working Proprietors, Dif(\(]tor~ and }fanag'" g,
Oth"r RerviCA8
Division 3 t.:lerical and Related W urters
GIUUpS 30 CIt" ie,ll and Ot,h!'l' Supel'visons
31 Village Officials
32 St8llugraphers, TypiRts lind Card and Tape Punching Ol'Cl'CCtot'S
33 Buok l{ceJ""s '" OI'k"I's •
Cashicls and Related
34 Computing )Iaehino Op<'mtOI'H
35 CieJ'ie,,1 and Relate'] \Yorkers
36 1'1'I1U"'1'Ol't and C()lI11nuuication Sllp",'visol's
37 Trau,~port ContlllCt,()I'S and Gnard,;
:~s :\f .. il fh'ltribntors and Helated 'Yorkers;
39 1\'1eph'JIle an' I Telcg"aph Operators
Divisioll 4 Sales Workers
210
Groups 40 :YIu"challts alld Shopkct'pers, \Vholesal .. alltl Retail Trade
42
49
Technical Salesmen and Commercial Tr,wellers
S .. l"tlmeu, Shop A"sistullt,.; dlld Belated \Yorker,.;
Insur,Lllce, Real Estate, SecUl'ities and Business Service Salesmen and Auctioneers
Salps '''m'keY's 11, e, c.
Division 5 Service Workers
,,) I How;8 l{""p''I','', }Ltl,rons and Ste\l'ard~ (DOllw'ti" and Tu"tillltional )
ii2 COqi.;:,--4, \Vait('r·~. Bartond(~rs and Rplatod \\'oy'ker' ( Domfl"tic >!nd Tll"titlltional )
;,:l .Mairls and Other House Keeping 1';'-'1'vio" "'orkers, n, c, C,
.',)4 Bllil,ling Caretakers, Sweepers, (']t'!lJ1f'r,~ and Rf'latf'd "'orkers
55 Launders, Dry-"lean(,l's al1,l Press",'"
,,){j H"iy' Dres:;er~, Barh"l's, Beauticians and R"latf'd "'orkers
.'\7 Pro\.flcti"e Servic" 'Vorkel's
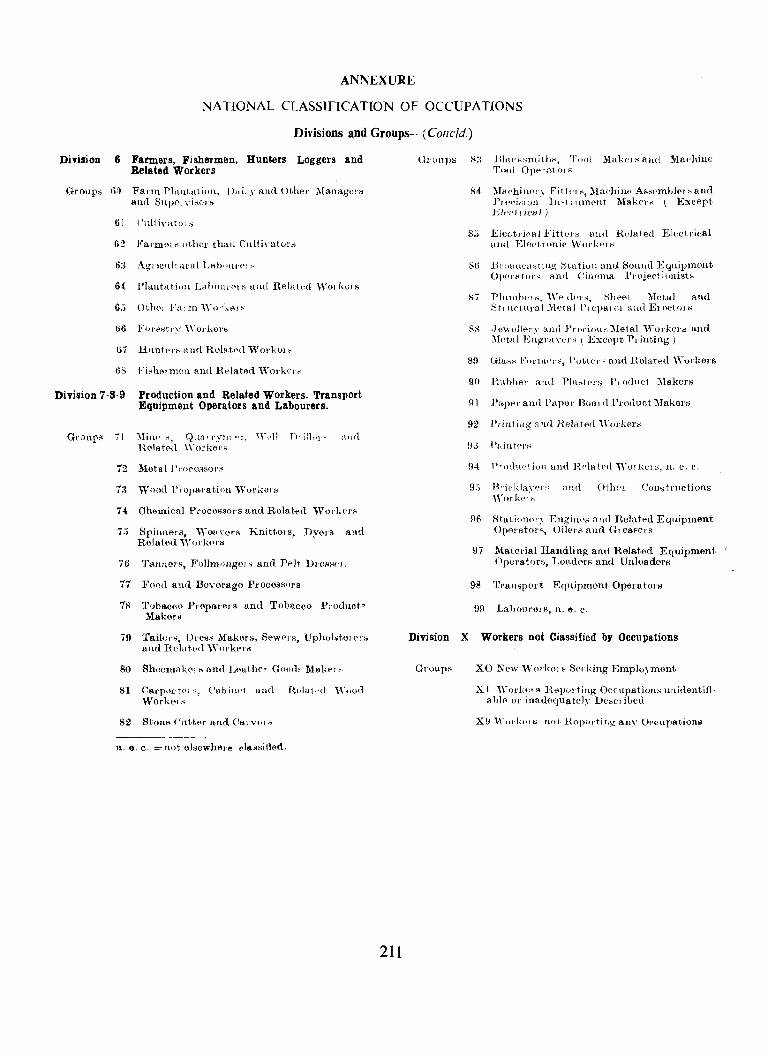
ANNEXURE
NATIONAL CLASSIFICATION OF OCCUPATIONS
DiYisions and Groups-,eoncld.)
Division 6 Farmers, Fishermen, Bunters Loggers and Related Workers
Groupo 60 Fa,nll'l.tllt'ttioll, I )"i, ,\' nnel Ot.her ;\[allltg(>"~ Bad Slq)(\tyb;.()I'~
61 l'ulth'atoi"
~.,
v.)
64 1'1>l.lltat,ioll Laholll"'I'B awl Related \YorlWJS
Division 7-8·9 Production and Related Workers, Transport Equipment Operators and Laboul'ers.
Gronpg 71 ::\linl' .'. Q,\n' ryltl "t. '\-1'11 n· ill"r' R(llflt,";l \Yorker8
13 ,,youc! Propal'atioll ·Worken.
14. Chemical Proce8~ors and Related 'Yorkf'rR
7.'" Spinners, ,,-I}f1 \'e[';; Knitt.l}t-S, Dyers and R<>lot,ed 'Yorkers
76 TalllL(lro, Fellm,mgers and Pelt DreI'Hf'! "
17 Food and Beverage Processors
18 Tobacco Preparels and Tobacco Product. Makers
79 Tailol'o. iJr8!!R l\iakMs, Sewers, lfphol.teJ ('J'S and Rc,lnt.('(1 'Y()J'ker~
80 Shoemal<o, K awl Loath!'J' Good" Ma1«'] ~
81 Carp'H:tPi ", ('ubilH'l all(l Rei a 1<'rl ,\\Cood Work!', ~
82 Stone Cl1tt"r and Ca.,,,,,,.,
ll. e. c. = not elsewhere classifh'd,.
211
Gronps s;; BIHcksmith~, Tool ~lak,', ~ all(l Ma('hinc T,~d 01''''''''( OJ S
S4 }IRchiJ\(1r~ Fittl'r,;, }[nehin(' As;"mbh'l "and Pn",j"i!j]l IH't'llnwnt Makpp; ( Except 1;;11'('II;C81)
8.3
80
,,,~ ,
88
Elcct,rical :FittL"" aUfI }{,dated Electrical [lnd Eloc(,ronic ""ork"J"
lJro"tlc"I,tiug 0tatiull and t:;oulld EquilJmont Ol'"rator" and Cinoma l'Hlje(,j ionish
Pltllnhel '. '\' el,I"l". Sl"wt :Motal and St"l\('tlll'al sletal Pl('IJ>U'" "ltd En,ctOlH
.J "wollery and Prnciou" Metal V" od,e)'~ and }1,.t,,1 Eligran'lN ( Excnpt l'rint,ing )
89 Glass FOrIll",.,', J'"t(.nr" and Belated 'Yorkors
9(1 l{lIbheJ' all,1 Pla~tt'rs 1', O(lllet ::\1akers
91 Paper and Papor BoardProduetl\1akers
92 Printing allil Hclaterl -\\'(}rkcr~
9.3
94 Pn)(htl'tiOll and Helat('!1 ,,'orhels, n. e. c.
9.; g"icldaypr" and \rork,· ',_
Oth,·,. COllstmctions
96 Statiotw,~' EttgiJ\('" and Helated Equipment 0p<>J'ators, Oiler;; Rud GJ eaFer;;
91 Matorial Handling and ReJat.('d Equipment Opel'ators, Loadorf< and Ullloaders
98 TJ'ansport Equipment Operators
99 Lahollre18, n. 6. c.
Division X Workers not Ciassified by Occupations
Group~ XO New ,\Vorkor8 SPIking Emplo~-ment
X I ". ork", 9 n")Jorting OccupatiollN uninentiftablt' or inadequateJ~- Dese' ibed
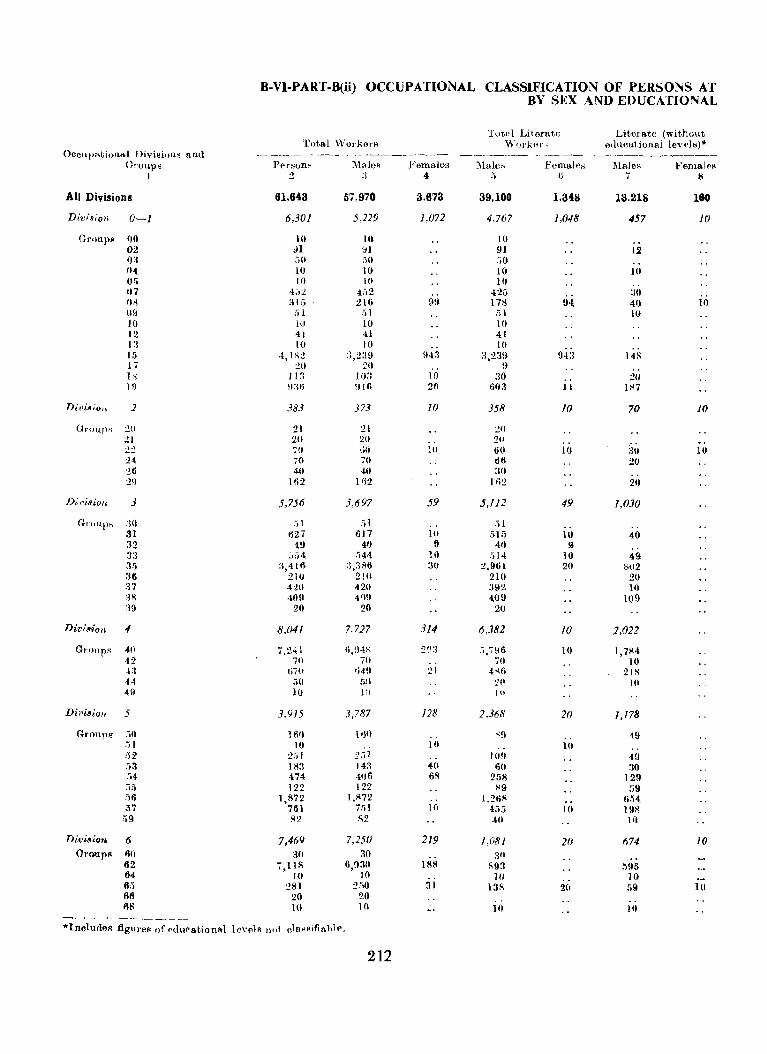
OCCllpatiol},,1 l)ivisil)lI~ and GrOllpS
I
All Divisions
0-1
GI'ClUPR 00 02 0:1 04 or. 07 Oil (HI
10 12 \:1 15 17 J,q 1'1
2
Groups :20 21
24 26 2'1
Diviaio" J
G,.<JIIPH :lO 31 32 33 3.~
36 17 :IS :19
Dit·iaion 4
G"ours 4-0 42 H 44 til
Diviaio/t 5
Group>! :i(j .j 1 .')2 ,,3 .')4 .. :") .16 37 .~9
Divisiot, 6 Gmups 110
62 64 65 66 118
B-VI-PART-.B(ii) OCCUPATIONAL CLASSlFICATION OF PERSONS AT BY SEX AND EDUCATIONAL
Total 'Vol·ken;
P{'r~ons
:2
61,643
6,301
10 91 .• 0 10 l(j
4.-,;/ :~ 1 r,
?il 10 41 10
4,IS2 20
113 !J:lIi
383
21 20 ';(t
70 411
]62
5,756
"I 627 tll
;';14 ~,416
21(1 420 4O!1
20
8,04/
7,241 in
liiO ;,0 10
3.915
Hln 10
251 1 R3 474 122
1,872 761 "2
7,469 :30
",118 10
281 20 10
'!lIn lOR
.J
57,970
5,229
10 91 50 10 ]()
4.~2 216
,1I 10 41 10
:3,2:19 20
10:1 B!G
373
21 2<1 ,';<1
70 411
Ui2
5,697
.'il 617
40 .,)44
:.\,:>1',6 210 420 41l!)
20
7.727
H,!l-!S 70
t;4!1
3,787
HlII ..
2.,1 14:~
406 122
1.1'172 i!ll '12
7,250 30
6,!l30 10
~;~
20 ](1
Femalos 4
3.673
1,072
94:1
10 20
10
HI
59
HI 9
10 3()
314
21
128
10
4()
fiR
Hl
219
188
31
Tuwl Literate "·o,.k"l' ,
J\lale~ FeJllale" .~ Ii
39,100
4.767
10 91 :;0 HI 10
42& 17S
.'il J(I 4.1 10
!l2:m , 9
30 603
358
2(1 20 60 66 :10
162
5,112
iii 515
411 'il4
2,96l 210 :l92 409
20
6,382
.;.796 iO
4~(;
2(1 10
2.368
"!I
10!I 60
258 89
1.:?fil'l 455 40
1.08/ 311
S93 ]()
138
10
1,348
1,048
!H
11
]0
10
49
HI II
10 20
10
]()
20
10
10
20
Literato (without e<jtlcatiollal leyl'[>!)*
Males .. 13,218
457
12
:10 40 10
I4S
2<1 IH7
70
all 20
20
],030
40
49 8U2
20 HI
109
1.022
1,784 ](1
21S W
1,178
49
49 30
129 59
6.H 198 ](1
674
.'i!l5 10 59
10
160
]0
10
10
Hi
10
10
*Inoludeg figlll'e~ of Nlurational l('Yf'I~ not 1J11l~"ifiahl ...
212

'WORK ACCORDING TO MAIN ACTIVITY OTHER THAN CULTIVATION CLASSIFIED LEVELS IN RURAL AREAS ONLY
Educational levels ---------- -- -----
Matriculation or Graduate and Occupational Primary Middle Higher Secondary above Divisions and
------------- ---~----- Groups Males Females Males Females Males Females Males Females
9 10 11 12 13 14 15 16
13,357 359 5.767 399 5.846 348 912 gO All Divisions
941 289 723 369 2.120 320 526 60 Divi8ion 0-]
10 00 Groups 10 4:9 20 02
16 30 10 03 04
11) 05 49 59 198 89 01 9 4:2 20 21 99 21 II) 08
11 10 20 09 10 10
11 I() 20 12 10 13
515 236 555 348 1.674 299 341 60 15 9 11
10 .. 18 ~~~ 11 .! B ;jv 111
9~ 90 99 . Divi8ion 2
10 10 20 Groups 10 10 21
10 10 10 22 10 20 16 24
20 10 26 69 20 53 29
1,397 10 921 1,487 9 277 30 Divi8ion 3
21 10 20 30 Groups 198 10 59 218 31
40 9 32 118 40 158 89 10 33 733 485 793 148 20 35
21 40 119 10 36 81 196 99 31
159 101 40 38 11) 10 39
2.784 10 1.0lJ 555 10 DilJiRion 4
2,566 10 931 015 40 Groups 20 40 42
178 4.0 40 10 43 10 44 10 49
883 10 218 10 89 Division 5
30 10 ' 50 Groups 11) 51
20 30 10 52 30 53
109 10 10 54 30 55
515 79 20 56 139 159 10 49 57
10 20 59
307 10 40 60 Division 6 10 20 ~O Groups
228 30 4:0 62 M
69 10 10 65 M 68
213
(Bk) H·II!J···-iil
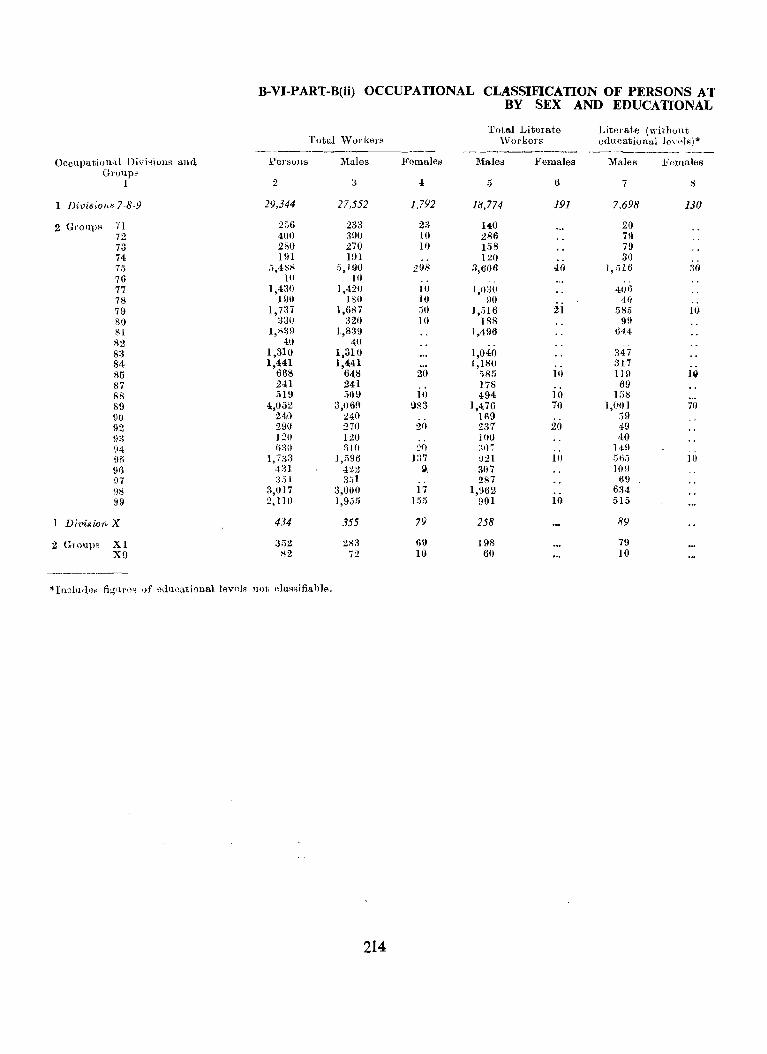
B-VI-PART-B(ii) OCCUPATIONAL CLASSIFICATION OF PERSONS AT BY SEX AND EDUCATIONAL
'l'otttl Literate Litm'ate (without Total "Yorkers 'Vorkers educational leY.,]R)*
---,--------- ._---------- --~-
Occupational Divi~ioll~ and PerSOllt! Males Females Male8 Females Males Ffllllales GI'Ullp~
1 2 3 4 5 6 7 1>
1 Divisions 7-8-9 29,344 27,552 1.792 18,774 191 7,698 130
2 GrollpR 71 2;)6 233 23 140 20 72 400 3!JO 10 286 79 7" .~ 280 270 10 158 79 74 191 191 120 30 7.5 .'),48S 5,190 2!)8 3,606 40 1,516 ."10 76 HI 10
"
77 1,4;)0 1,420 10 1,030 40t) 78 190 180 10 !)O 40 .. 79 1,737 1,687 50 J ,.516 21 58.5 10 80 a30 320 10 lAS 9!) 81 l,83fl 1,8:39 1,496 644 82 40 40 83 1,310 1,310 1,040 347 84 1,4H 1,441 J,I80 317 85 668 648 20 ;}85 10 Il9 JQ 87 2-H 241 178 69 fiB 519 ,309 10 494 10 158 89 4,032 3,0611 983 1,476 70 1,0() I 70 90 M() 24() 169 :;9 92 29(' 270 20 Z:17 20 49 9:~ 120 120 ]00 40 94 fo:31l r; 1ft :'fl :~i)~ 14.11 9i\ 1,7:;:3 1,,'\\)6 J:n :)21 11) 56;j II} 96 4:11 422 g, 307 HI9 97 :3.)1 :1:\1 2S7 6!)
9g 3,017 :3,000 17 1,962 634 l')9 2,llO 1,9.')5 155 901 10 515
Divi$ion X 434 355 79 258 89
2 GrollpR Xl :3[;2 2S3 69 ]98 79 X9 ll2 72 10 60 10
----------*InebHl')" fi'l'll'flR 'Jf oducational lev"I~ not dasRifiahle,
214
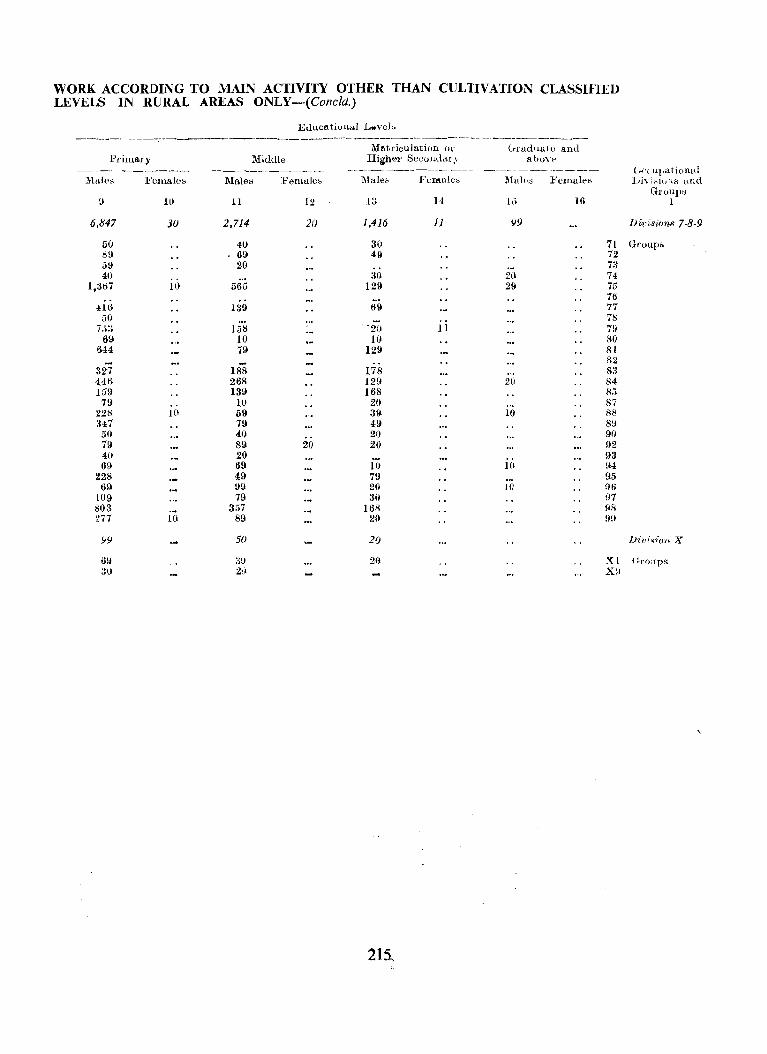
WORK ACCORDING TO MAIN ACTIVITY OTHER THAN CULTIVATION CLASSIFIH) LEV.ElS IN RURAL AREAS ONLY-(Concld.)
Educ~ti()ll"l L .. veb -----.-------------------.----------------------------- ~~ ----~------------
j,\1atl'iculation or G-r"duale and Primary :\iiddle Higher Secoll(lar~- abo,"t'
---~--------- ---~----.----- -~-------~- - ------ ---- ----- ~---.-.---~-Male" :Females Males Female~ l\I"le~ f'eIl'lale~ l\laks Fcmalt's
9 10 11 12 I" ., 14 H, 16
6,847 30 2,714 20 1,416 11 99
50 40 30 71 S9 69- 4;9 72 59 20 73 40 i& 30 20 74
1,307 565 129 29 75 76
416 139 69 77 ;30 78
7J:j 158 --20 11 79 69 10 10 80
644 19 129 81 82
327 188 178 83 4;46 268 129 20 84 159 139 168 85 19 10 20 87
22S I() 59 39- 10 88 347 79 49- 89 50 40 20 90 79 89 20 20 92 4() 20 93 69 69 10 10 (H
228 49 79 95 69 99 20 Hi ()6
109 19 30 :17 803 357 168 liS 277 10 89 20 !l[l
Y!I 50 20
6!J 31) 20 Xl 3U 2tl Xli
215"
(;{:(l'l,ational l;i"i~iuns and
Groups 1
Divisions 7-8-9
Groups
Di/)ision X
{Jrollps
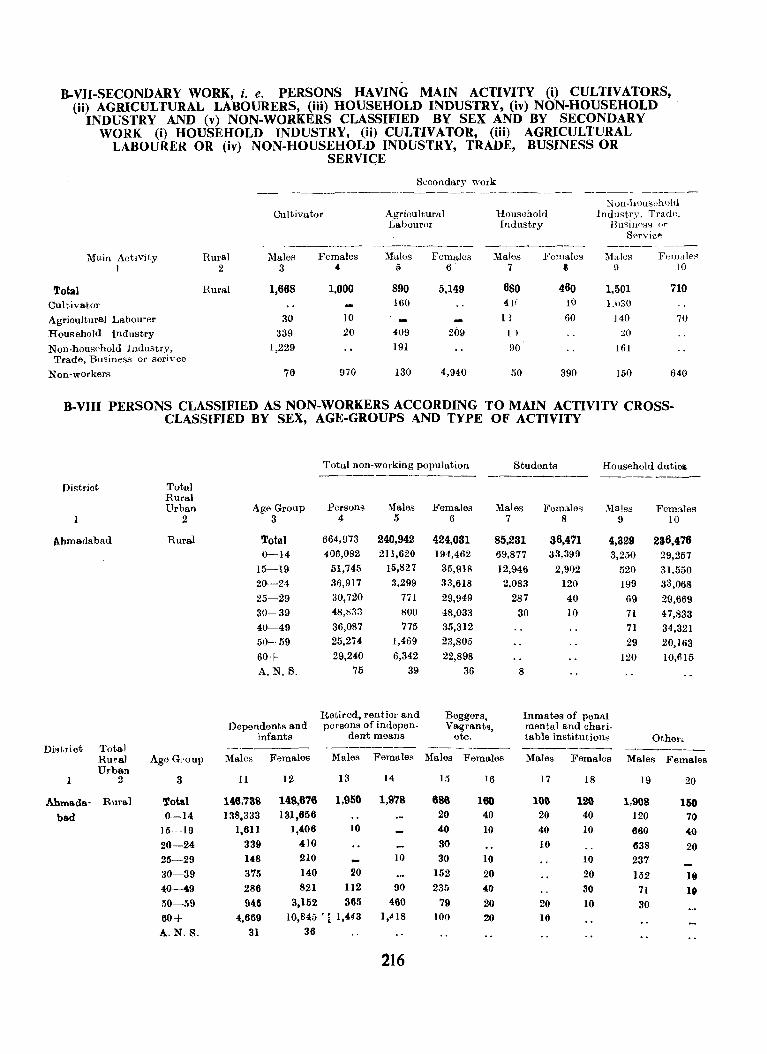
B-VlI-SECONDARY WORK, i. e. PERSONS HAVING MAIN ACTIVITY (i) CULTIVATORS, (ij) AGRICULTURAL LABOURERS, (iii) HOUSEHOLD INDUSTRY, (iv) NON-HOUSEHOLD
INDUSTRY AND (v) NON-WORKERS CLASSIFIED BY SEX AND BY SECONDARY WORK (i) HOUSEHOLD INDUSTRY, (ii) CULTIVATOR. (iii) AGRICULTURAL
LABOURER OR (iv) NON-HOUSEHOLD INDUSTRY, TRADE, BUSINESS OR SERVICE
Secondary work -.--~,....__-------~-- ---_--_ ---------_-_--_- -_---
Non-household Cultivator Agricultural Hous0hold Industry, Trad'"
Labourer Industry Buqiu(lsS or Sf'rvice
--------- --------- _--------- -------l'.iain Activity Rural l'.Iales Females ::\lales Females Males Females :Males Female~
1 2 3 ( 5 6 7 I !l 10
Total Rural 1,668 1,000 890 5,149 680 460 1,501 710
Cultivator 160 41( 10 1.030
Agricultural Labourer 30 10 II 60 J40 70
Household industry 339 20 409 209 l) 20
Non-household Industry, 1,229 191 90 161 Trade, Business or sorivce
Non-workers 70 970 130 4,940 50 390 [50 640
B-VIII PERSONS CLASSIFIED AS NON-WORKERS ACCORDING TO MAIN ACTIVITY CROSSCLASSIFIED BY SEX, AGE-GROUPS AND TYPE OF ACTIVITY
Total non-working population Students Household dutieB -------------- -~------- ---------
District Total Rural Urban Age Group Persons :\lales Females Males Females Ma·]es Females
2 3 4 5 6 7 8 9 10
i\.bmadabad Rural Total 664,973 240,942 424,031 85,231 36,471 4,329 236,476 (}--14 406,082 211,620 194,462 69,877 33,399 3,250 29,257
15-19 51,745 15,827 35,918 12,946 2,902 520 31.550 20-U 36,917 3,299 33,618 2,083 120 199 33,068 25-29 30,720 771 29,949 287 40 69 29,669 30-39 48,83:1 800 48,033 30 10 71 47,833 40-49 36,087 775 35,312 71 34,321 50-59 25,274 1,469 23,805 29 20,163
60+ 29,240 6,342 22,898 120 10,615 A.N. S_ 75 39 36 8
Retired, rentier and Beggers, Inmates of penal Dependents and persons of indepen- Vagrants, mental and chari-
infants dent means etc. table institutionR Othen District Total --------- ~------- -------- ------_ -------
.Ru·sl Age Group Males Females Males Females Males Females Males Females Males Females Urban
2 3 11 ]2 13 14 15 16 17 18 19 20
Ahmada- Rural Total 146,738 148,676 1,950 1,978 686 160 100 120 1,908 158 bad 0-14 138,333 131,656 20 40 20 40 120 70
15-19 1,611 1,406 10 40 10 40 10 660 4.<1 20-24 339 410 30 10 638 20 25-29 148 lHO 10 30 10 10 237 30-39 375 140 20 152 20 20 152 18 40-4,9 286 821 112 90 235 40 30 71 10 50-59 946 3,152 365 460 79 20 20 10 30 60+ 4,669 10,845 '[ 1,443 1,418 100 20 10
A.N.S_ 31 36
216
C-SOCIAL AND CULTURAL TABLES
Tables based on full count viz., C-V, C-VII and C-VIII Parts. A and B with their appendices have been published in Part C-I of the District Census Handbook. In the present volume the following two tables giving estimates as based on 10 per cent sample of rural individual slips are published.
Table C-I1 ( rural) gives data on age and marital status of the rural population.
This table corresponds to Table C-II of 1961 prepared on full count basis and Table CollI of 1951 prepared on the basis of a 10 per cent sample. The age groups and marital status categories are the same as in 1961 but differ from Table CollI of 1951. In place of the three categories of marital status viz., unmarried, married and widowed or divorced adopted in 1951 Census, the 1961 and 1971 Census tables give five categories viz., (1) never married, (2) married, (3) widowed, (4) divorced I separated and (5) un-specified.
Table C-III Part-A rural gives information on age, sex and education in the rural areas. Comparable tables of previous censuses are Table C-IV of 1951 Census prepared on 10 per cent sample basis and Table C-IlI Part-A of 1961 Census prepared on full count basis and for all areas.
The age groups in this table are 0-4, 5-9, 10-14, 15-19, 20-24, 25-34, 35 -+- and Age not stated. The educationaJ levels correspond to table B-llI Part-B. This table provides a measure of literacy in the population as well as in the -different age-groups.
217
(Blrl H.1l9-55
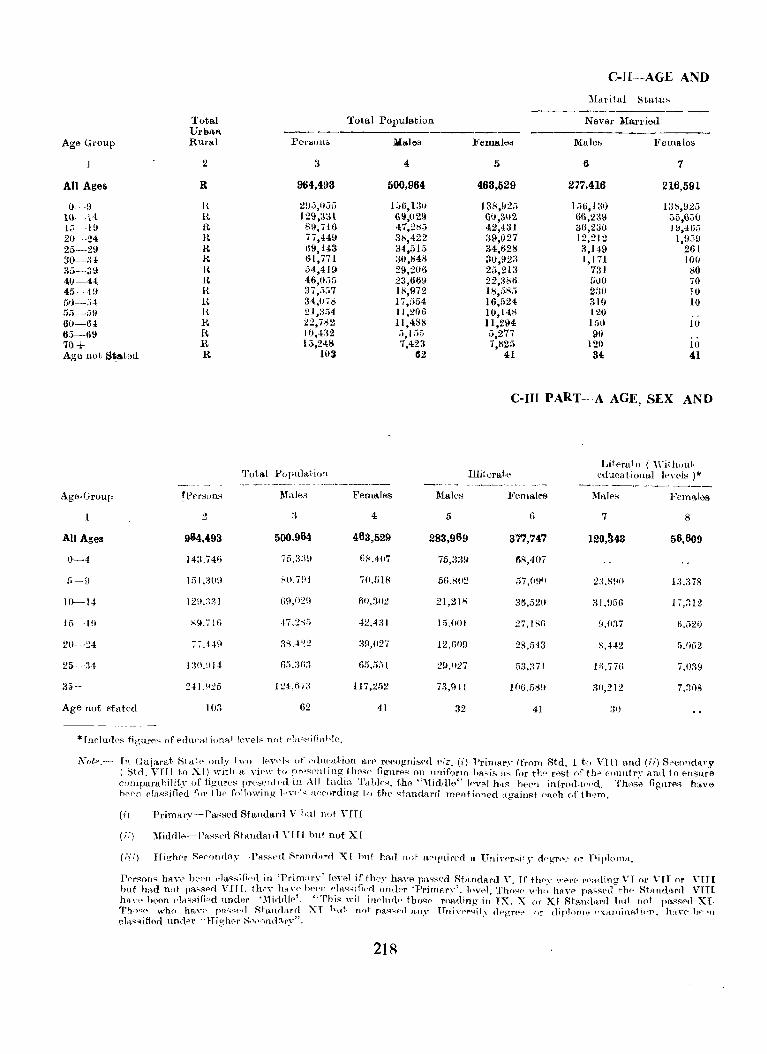
C-II--AGE AND
---- -------Total Total Population Neve!' Married Urba'l
Age Group Rural Per)l)OllS lLales :Female" Male" Femalo"
2 3 4 5 6 7
All Ages R 964,493 500,964 463,529 27('.416 216,591
O-!l it 2\),),0;;;; 156,1311 1 38,!125 136,130 1:;1>,925 l(} l4 B, 129,331 611,() 29 60,3H2 6(),2:3U 55,6J() 1;:;--I!! R 20-·24 It 25--29 It
89,716 47,2H:i 42,431 36,230 JU,4u5 ii,44!) 38,422 :~9,()21 12,:!l2 1,9,39 1;9,143 34,515 34,628 a,J49 261
30---;1 ! R 1}I,771 30,848 30,92;1 1,171 IOU 35-39 K, 54,4J9 29,206 25,213 7:11 80 40-4,.1 R 46,0,;;; 23,669 22,386 [tUO 70 45-4\1 R 3i,,':>7 J8,972 18,585 2:W 10 51)--,,4 It :H,078 17,554 16,524 310 10 55--5H It 21,:Ji,4 J 1,206 10,148 120 60-61 It 22,71>2 11,488 11,294 Ii)!) 10 6;)-69 It 10,-1,:12 .1,1 i):'j 5,277 9v 7()+ It 15,248 7,423 7,825 120 10 Age not S~llot()d. R lOl G2 41 34. 401
C-III PART-A AGE, SEX AND
Literato ( Witllllut, Total Populatioll Illiterate educatiunal len,l" )*
--.- --_ --_- . ----_-_--_-- . _--_-_------- - ---_--_----- --...---- ------~----Ago-Group 'Persuns l\lale,'l Females Malt'" Femali'>8 Males Females
2 3 4 5 6 7 8
All Ages 984,493 500,964 463,529 283,969 377,747 120,~43 56,609
0-4 143.741; 75,3:1\1 61-1.4117 75,33\1 ~8,407
(i-O 151,3tH) 1-IO,70J 70.518 56.802 57,0\10 2:1.1-1\10 1:1.:n8
W--I4 12\1.:1'11 ()!),02B (\0,302 21,211' 31'1,52(1 ;{1.956 17,:1l2
15--1\1 S9,7 [f; 47.2,.;5 42,4:~1 15.001 27, I Sf) ~ •. O37 f).521)
2()- .. 24 ';7.4-!H 3:'1.422 39,027 I2,50!) 21\,543 S,H2 ;'.0[>2
25·- -:14 1:10.\)]4 ()[,.:lfi:l (li),.";;l 29,1.27 53,~{7] 111.776 7,039
35+ 241.\125 124,5,;; 117,252 73,!lH ]O6,58!1 30,212 7,:108
Age not. sfated 103 62 41 32 41 :~O
* fnp,lurlf"s figures of flnncai lonal levels not ('la.~~i fiah]c.
Not".- rll Gujarat f-ltak <lilly t"'l> h,·\,('I, of' ,'(llwation art' ro"ognjs~d 1';Z, (i) Primar." (from Rtd, I t,., VII) and (ii) Sf'c()ndary ( I:)td, VTlI to XI) with it vip\\" to pr"SI'lItlng these figurf>'s on uniform hasi" a,,, for th,· rest ofth" eOlllltrY a.mI to PllSllrEl
cumparai)ili£y of figure" l're"ellh·d. in ,,\11 IlHlia '1'",])1<,.,. f.he "'fiddle" IF'v,,! h>ts heen intrndll""d. Th"s~ figl1fPS h:J.ve hN'(l ejassifiNI [",. tlw foll,,,\-ing I.'\·,,!;; ,wcnrdmg t.o f.he> .qfandal'(j mE'ntioned against .. >teh of th,'m,
(i) Primary-Passed Sfandal'l\ V Lal not VITI
(ii) :\Tiddle--T'",.;s,>n. RtandRlIi "~I [[ huf not XI
Pf'r"on~ han> hE-('n "la,,;;ifiprl in 'l)rim".ry' lewel if the)' have pa~~ed Rfa.ndard V, Tf th",' ""'"(' rp,,(IingYT (II' YrT or VITI huf. h".ct not """"prl YlfT. fh .. ,- h",'(' hpf'n rhl.s"ifi"(j nn(jpr 'Prirnar,"" l"vAl, Th08(, wh,; 11ll."p pR,~spd th" Rt,tndard VITI ha\'(, ht'fln ('Iaqsific'd nnder ';\Tid.(l!,,', "Thi" \rill ifl('lurl .. tho"p rnlHling in TX. X or Xl Stanil,trd hnt flOt pass('rl XI. Thr)q~ who ha,Y(' Pft"'::::('(~ Rtandar(l XI hut, nnt pa.~.~t',l an,v' l_Tnivf'!"~ity rlpf!rpp q~' djplnln~ f'xI-t1l1iIlR.tlIIT'. h(t\~(' lW'~n cla,,~ifiArl llnrlnr "High"t' R,,,"mti.:\r,v",
218
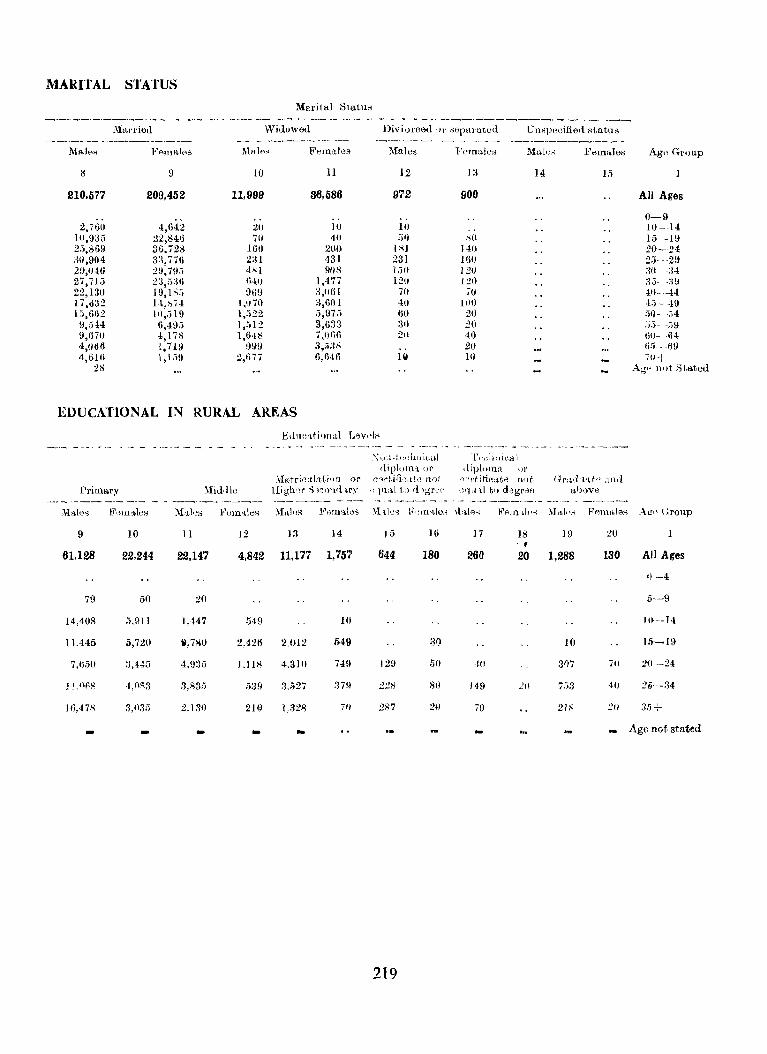
MARITAL STATUS
Mal'ital Statu~
Marrieu WiuoweU
M".],," F"mal"8 ::\1 .. 1,," Females
~ \) 10 11
210,577 209,452 11,999 36,586
2,760 4,IH2 20 lU lU,9:Hj 22,846 70 40 25,869 36.728 160 200 30,\)04 3:l,776 2:H 4:31 29,1146 2!!,7H:i 4S1 908 27,7 LJ 23,5:jH tHo 1,477 22,130 19, l~ii %9 :3,061 17,6:32 H,~,4 1,1)70 3,601 1,'),662 II),.} I!) 1,,)22 5,97.i 9,,344 6,49;) ],512 3,63:3 9,670 4,178 1,618 7,1)1)6 4,066 1,719 9!1H 3,.;:18 4,61tl 1,1.i9 2,1)77 6,646
28
EDUCATIONAL IN RURAL AREAS
Primary ;'vlarrimllati()rJ ()~
I:{igh')l' :-> )'JO,,<1 Iry
Diviurced 'J!, sepalUteu Unspecified ~tatus
",[ales
]2
972
10 "I)
PH 231 1!j1l 120
70 40 GO :31) 2,.
lij
,-";.JH-tcr.ilui",,1 ,Ii p\.Jlll"l OJ'
wwt,iti~(_ttn not '~Iltl;l.l t() ,i ~gr(H~
219
FOlnaios Ma!o~ FelnaIel> Agn Group
) :3
900
,';0 140 160 120 120 ,0
11)0 20 20 40 20 10
rl'I;]jllieal .liplnll1>l <1)'
"-·,,titio:tte fl<lf,
')'l 'I tl t,) degrclEl
14 Hi
lir<l(ll'lt" <llld above
:W
All Ages
0-9 10 -- 14 15 -UI 20-24 2.j" 211 :~(J :14 3.3 -:Hl 411-- -44 4.)-- ·19 ;,0--.'\4 .3;)- -:,9 1)1)- 64 li;,-- -I}!)
"70-t-Ag" not I'ltated
130 All Ages
5-9
H~-J4
15-19
70 20--Z4
20 3.5+
Age not stated

D-MIGRATION TABLES
Though migration tables were compiled and published in the State volume Part II-C during 1961 Census, they were not reproduced in the District Census Handbooks. In 1971 Census it was decided to incorporate migration tables in the District Census Handbooks so far as they relate to the districts. These tables included in this part are D-I (with its two appendices) and D-VI. The major difference between the migration table of 1961 Census and those of 1971 Census is that the 1971 data is presented with reference to the last residence and not to birth place except in the case of Table D-I which is related to place of birth.
Table D-I ( rural) gives the distribution of population by birth place according to rural and urban areas. It corresponds to Table D-ll of 1961 Census in which the place of birth was classified as rural/urban for those individuals whose birth place happened to be within the country. Similarly the place of enumeration was classified separately by rural and urban areas. This give the indication of rural! urban migration based on the place of birth. The same pattern has been followed during 1971 Census.
There are two appendices viz., D-I Appendix I and D-I Appendix II which provide information on the interdistrict migration. While Appendix I gives data regarding in-migration of persons born in the districts of the State other than the district of enumeration, Appendix II furnishes details of out-migration of persons born in the district of enumeration. Both the appendices are new additions and meant for presentation in the District Census Handbooks only.
Table D-VI (rural) is a new table for 1971 Census and provides information on migrants based on the place of last residence, by age-groups, marital status, duration of residence and sex.
221
(Bk) H·1l8--&&
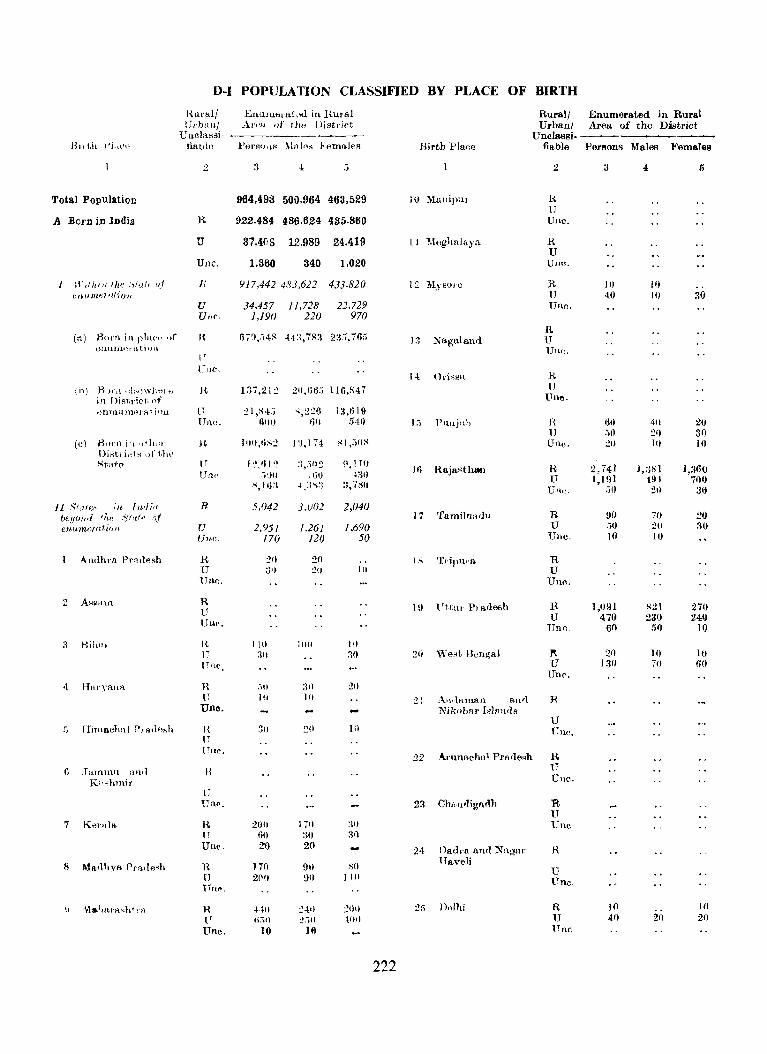
D-I POPULATION CLASSIFIED BY PLACE OF BIRTH
Hllral/ Euumel'at"d in Rural Rural/ Enumerated in Rural ! Jl'buuj AI''''' or tJ", District Urbani Area of the Distriot
Ullcla~di- Uncla.ssi· Bi!ti, t~ j'll'U tiablo Perso,1R :1.1:11(',~ Females Birth Place flable Pereons Males Females
2 :l ± :; 2 :I 4 /)
Total Population 964,493 500,964 463,529 JI) ,MutlipuI' 1~ U
A Born in India R 922.484 486,624 435,.860 UUe,
U 37,4(,S 12,989 24.419 II 'MogJlUlayn. .l{
U Unc. 1,360 340 }'020 Ulle.
Wd/"",Ihe .')/0/' v.l H Y17,442483,622 433.820 12 Mysol'e R 10 10 e.,.u;n~l',aiolf U 40 10 30
U 34,457 11,728 22,729 Une. Uu{'. 1,190 220 970
R (It) Born inplf1.(·" "f I{ lIi~ •. '4R H:l,7S:J 2:1:;.70;, ]., Nagalalld U .>
eHllnV~l'atii)ll Ullt~. I' Ulle.
14 OriH~H, }{
(b) }:3')I'J\ ,d;-iH\v}l.tntl n 137,212 2i1,llfj.:J 116,S.i7 U in Dist,r;et. of {THe.
t)nTt}ltluMfal idll U :lI,K·t'J ",226 13,6111 Une. AOO flll ;)40 ]., 1"lni,t)) R 1)11 4H 20
U ;;0 21) 30 (c) B~)f'n j:l fjl1!t\)' H 10ll,liS2 1 !J,I 7,1, ~ I ,:.O~ Une. :,w Itl IO
I)i~tl j.,t" of 0", ~t.R1'fl IT 1:'/11:' :).'i()~ fl, i H)
16 RajasthlMl R 2,141 l,:lli 1 1,360 Un" :;:1(1 IljIJ oJ,31) U 1,191 491 700
"', II):! ",:1":) :1,180 Ull". :.0 21} 30
II Sidle.' in Indi" R 5,042 3,()02 2,040 DeHu,," 'he :';'Pdtf' of 17 Tamilnadll R 90 70 20 C'nu'ln(:'j'(l/'i(Jf~ U 2,951 /,261 1,690 U :;0 20 30
Une. 170 120 50 Unc. 10 10
An(lhrll Pr"tlesh B 211 20 1:-; 'J'dpul'a R U :3'1 211 111 U Un~. Une.
2 A~~!iln R 19 l TtttH PI adesh R 1,091 )l21 27()
U Une, U 4.70 230 240
Unll. 60 .')1) 10
3 Hi]",,, It 1\0 11111 111 U :11) :\0 2H 'We8t l3en~aJ l't 21) If) 10 TIne. U 1311 70 60
Un .... 4 Hl-nyaltH, n :ill :lO 211
U 10 10 :!! A.tl·-lHl"IlSn an ,I R Une. Nikohar I.~1811,ls
U ;; lIimaeh'll Pnv1.""h R 30 20 In Une,
n File.
22 "-\rllllRchal Prllue"h H.
6 ,Ta)l\lnll ",HI H U
K:',hmir Une.
II Un .... 2~ Ohftn.!igFlflh R
U 7 Kf)l'Id» I~ 200 1711 :10 Dne,
n 60 30 30 Dne. ZO 20 24 l)adl'8 anc] Na;:lR" R
8 Ma,Ihyft PHI,Ie"h R 170 (1) :-;0 HaveTi U
U 2(,IJ 90 110 line, TiJtl'!.
\1 M~'lal'!i"'hj"l1 H Hn ~4tl ;?tlll ~5 ]),,11\; R 10 III
l" t).'}1) :!.")o tOO U 40 20 20 Unc. 10 HI Uae
222
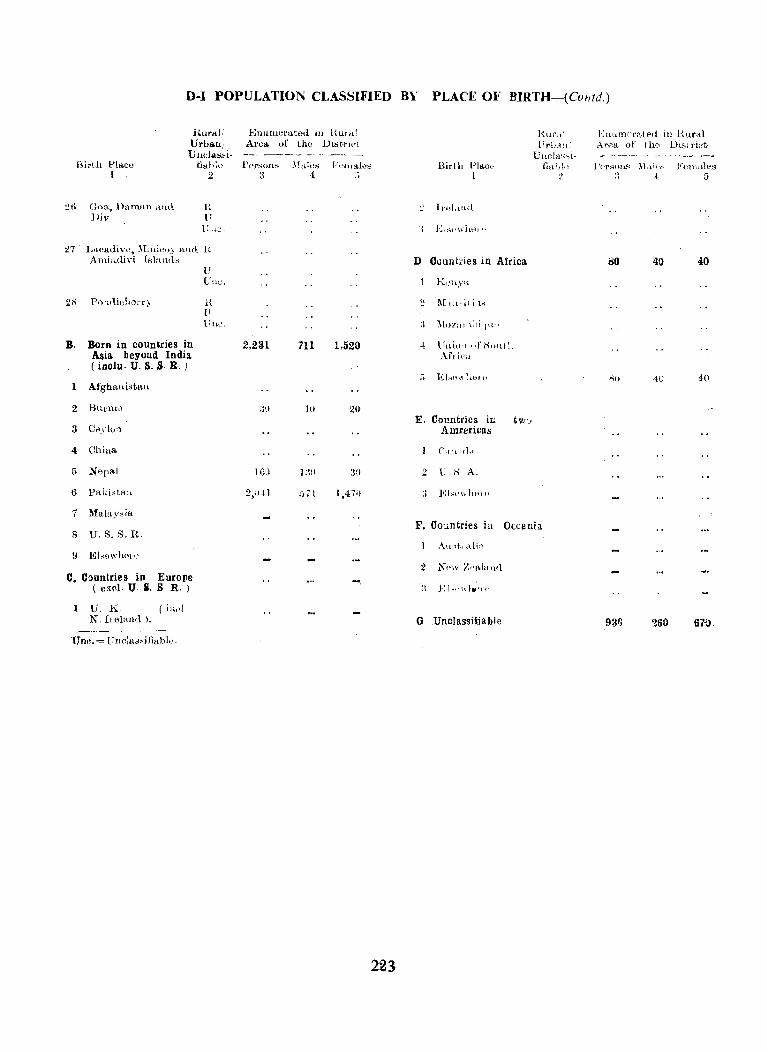
D-I POPULATION CLASSIFIED BY PLACE 0:"- BIRTH-(Cofltd.)
Hurdl/ Enllmel'ated III [{Ula! HUT'd Ellllm('rate(i in Bur"l Uruani ArtJll. uf til(; Dist,rJ('t lfl'b,,,; Af0a of tho Dis: riut Ullul .. ::;"i- ----- -_.- _- ----~~. -_ Dllcla,~i- --~--------.- '-"---~-
Birth Place fi.i;ll,j_(._~ Persons ~!ale" FelHa.le~ Birth Plan,,- fill.f_.IH J \'rsonk ~l.t.I(,,, Ff\11~ ,les [ 2 ;; 4 .. 1 ;> " .{ 5 ,.
2tl Gna, })nman (tIld 1: ,> I I'()I.. [,,1 l>jv (f
l: .• ". :1 Ets1·whe! !'
'27 LtlCadi ve, l\Iiuieuy and 1: Amin<Uvi I"lan(h; D Count,ies in Africa 80 41) iO
U L'"u, K,_~n..v:\
2S PO'1flich,)l' r} H " 1\[ ! r,t;, i: i 1.., (I
tTl"', .. ~IOZiIJ \:l!'lu"\
B, BOrR in countries in 2,231 711 1.520 ,( Unitl't ',f~oHt~l Asia beyond Indiil Ail'ir," ( inclu· U. S. S R, )
f) Ebn\\ ~ .. eJ H
Afghallistaa SO 40 40
2 !:I,II'll'" ;h) 10 2l~
E. Countries in tv" .. 3 Cfl,do:l Amrericas
4, China C\"t !tl.,
5 Nepal 16(~ J :~!I 30 2 (J :..; A.
6 Paki"t,Il" 2,i)-U ~'j:- 1 1,4 ~(I ,> EI,..;p\\ ltt~l (,
7 Malay,ia F. Countries ill Oceania
8 U.S.S.R. AH~t"t1.li;'
II ElsO\vhfllE' 2 N('\\f Zna,la ll(l
C. Countries in Europe ( exel. U i. S. R. ) " }~ I ;..;~. \\ lw--' n'
I U, K ( iael N. Ireland l. G .Unclassiiiable 93G 260 671J.
Un~. = Fnn)a",,.ifi,,bl, •.
223
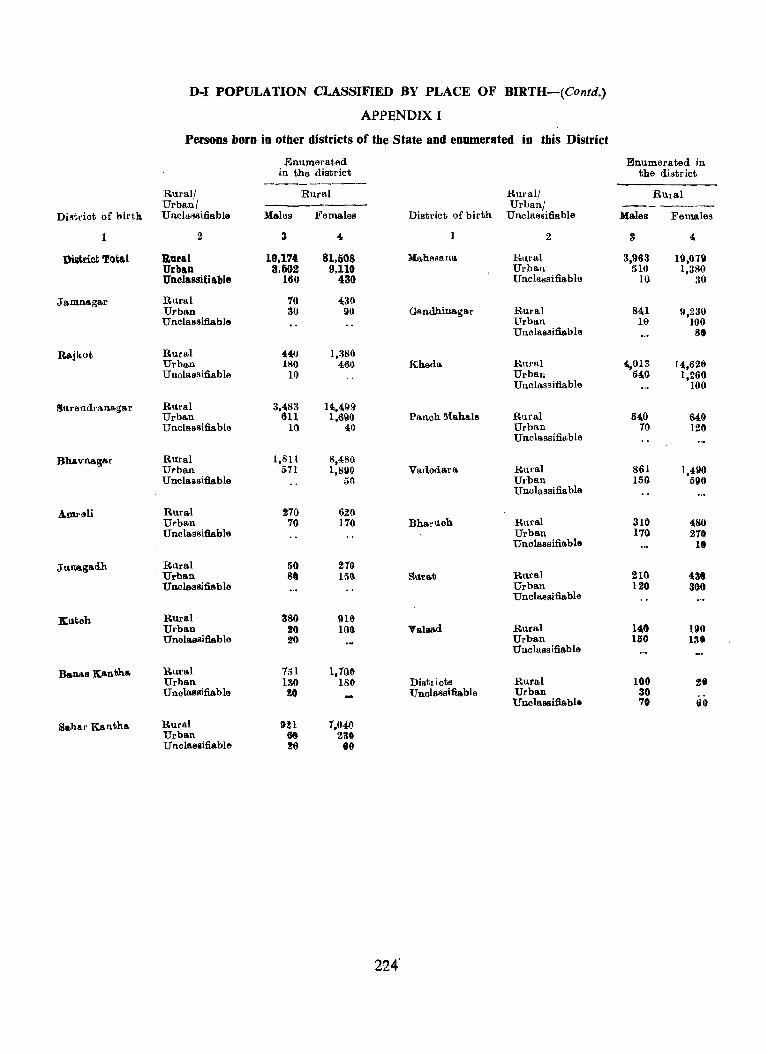
D-I POPULATION CLASSIFIED BY PLACE OF BIRTH-(Contd.)
APPENDIX I
Persons born in other districts of the State and enumerated in this District
Enumerated Enumerated in in the district the district ---_-_-_.-
Rural! Rural Rural! Rural Urban! Urban! _--------
Di"triat of birth Unolassifiable Hales Females District of birth Unclassifiable Males Females
1 2 3 4- 1 2 3 4.
DUtrlct 'fotal Ra.ral 19.174 81,508 llahesana Rural 3,963 11l,07Q Urban 3,502 9,110 Urban 510 1,380 Unclassifiable 160 430 Unclassifiable 10 30
Jamn&ga.r Rural '16 430 Urban 30 90 Gandhinagar Rural 841 9,23() Uncla!!sifiable Urban 19 100
Uuolassifiable 88
Rajkot Rural 44;fJ 1,380 Urban 180 460 Kheda Rural 4,013 14,620 Unolassifiable 10 Urban 540 1,260
Unclassifiable 100
Jllrendran&gar Rural 3.4083 14.499 Urban 6ll 1,61l0 Panah Ma.hal!! Rllral 540 640 Unclassifiable II) 40 Urban '10 12~
Unclassifiable
Bhavll.agar RUral 1,811 8.480 Urban 511 1,890 Vadodara Rural 861 1,490 Unolassiflable 50 Urban 150 506
Ull.Classifiable
Amreli Rural 270 620 Urban '10 1'10 Bhat'uoh Rural 310 4.80 Unc1assifia.ble Urban 1'10 270
Unclassifia.ble 18
JUll3ga.d.h Rural 50 270 Urba.n St 150 Sur at Rural 210 438 Unoiassifiable Urban 120 306
Unclassifiable
Kutoh Rural 380 916 Urban 10 100 Valaad Rural 14.a 190 Unolaesifiable 20 Urban 150 13.
Unclassifiable
&nas Itan,h& Ru~al 1i)l 1.70" Urban 130 180 Districts Rural lao 2$ U nolassifiable !O U nola.ssifiable Urban 30
Uncla88ifiabl. 70 60
Saba.t' Ka.nilha Rural 9U 7,040 Urba.n 6e 23. UnalaiJsifiable !6 8&
224'
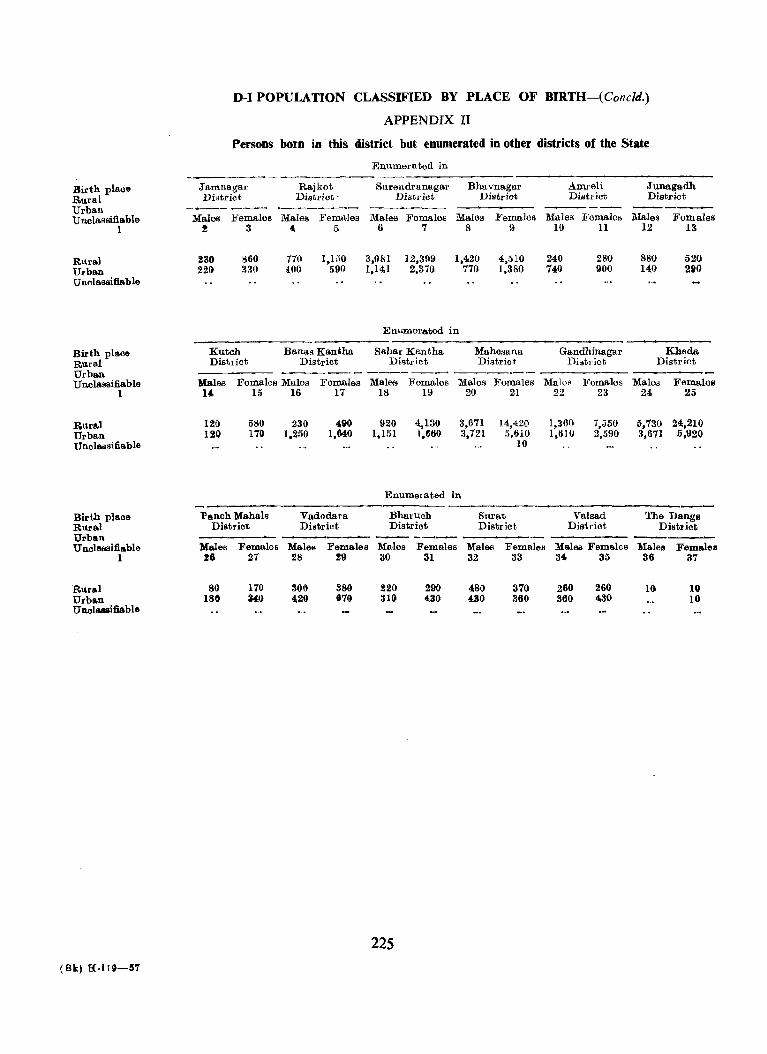
Birth place Ru.ral Urban U nolassifiable
1
Rural Urban U nelassifi&ble
Birth place Ru.ral Urban Unolassifiable
1
Rural Urban Unclaasifiable
Birth place Rural Urban U nolsssifiable
1
Rural Urbll.n Unolaaaifiable
(Bk) Ho1lO-1I7
D-J POPULATION CLASSIFIED BY PLACE OF BIRTH-(Concld.)
APPENDIX II
Persons born in this district but enumerated in other districts of the State
Euumerated in
Jaronagar Rajkot Surendranagar Bhavnagar Amreli Junagadh District Dietl"ict - District Distriot Distriot Distriot ~---- ----
Males ]:<'emale3 Males Females Males Females Males Females Males Female8 Males Females ! 3 4. 5 6 7 8 9 10 11 12 13
230 860 710 1,150 3,081 12,399 1,420 4,510 240 280 880 520 220 330 4;00 590 1,14,1 2,310 710 1,380 740 900 14.0 290
Enumerated in
Kutch Banas Kantha Sabar Kantha Mahesana Gaudhinagar Kheda District District Distriet District. Distriet Distriet -_. - ---- --.~ ---~-.~- ___ o~_
Males Females Males Females Males Females Males Females Males Females Males Females 14, 15 16 17 18 19 20 21 22 23 24 25
l!() 580 230 4,90 920 4,130 3,671 14,420 1,360 7,550 5,730 24,210 120 170 1,250 1,640 1,151 1,660 3,121 5,610 1,610 2,590 3,611 5,920
10
Enumerated in
Panch Mahala Vadodara Bharucb Surat Val sad The Dangs District District Distriot District District District
----.~--
Males Females Males Females Males Females Males Females Males Females Malee Females %6 27 28 29 30 31 32 33 34 35 36 37
SO 170 300 3SG 220 290 480 370 260 260 10 10 ISO 140 4,2() 670 310 430 430 360 360 430 10
225
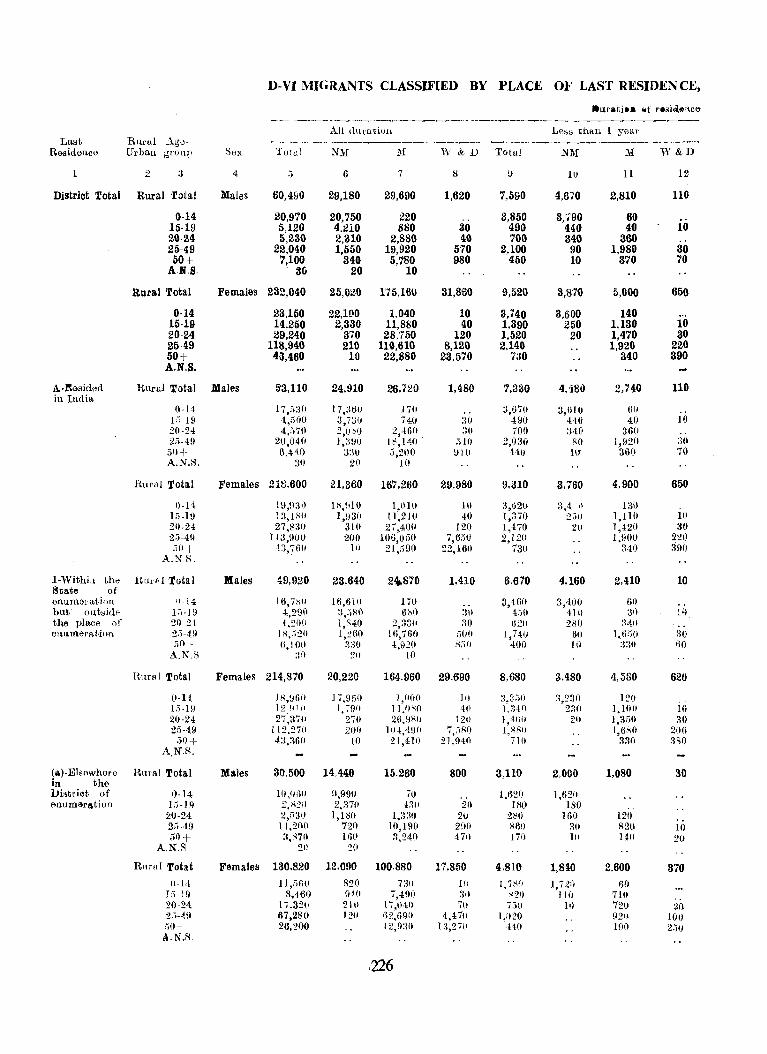
D-VI MIGRANTS CLASSIFIED BY PLACE OF' LAST RESIDEN CE,
.ltUfiiti •• (Of r.sidto!tctt ---- --_. ---~~------_..------- -----------.-~------------~--
All dUl'aviun LeB>; thall 1 year Last Rlu:al Age- ~-~ --.----~--~-----~--- ._-,...._..._-- --------~------------
Residence Urban group ~ex 'Tot..-:,l NlVl )1 1Y & D Total NJ\.I :.vI 1V &D
2 :~ 4 ;) 6 7 8 (I 111 11 12
District Total Rural 'lota! Males 60,490 29,180 29,690 1,620 7,590 4,670 2,810 110
0-14 20,970 20,750 220 3,850 3:;90 60 15-19 5,120 4,210 880 30 490 440 40 10 20·24 5,230 2,310 2,880 40 700 340 360 25-49 22,040 1,550 19,920 570 2,100 90 1,980 30 50+ 7,100 340 5,780 980 450 10 370 70
A.N.S. 31i 20 10
Rural Total Females 232,040 25,O1!0 175,160 31,860 9,520 3,870 5,000 650
0-14 23,150 22,100 1.040 10 3,740 3,600 140 15·19 14,250 2,330 11,880 40 1,390 250 1,130 10 20-24 29,240 370 28,750 120 1,520 20 1,470 30 25-49 113,940 210 110,610 8,120 2,140 1,920 220 50+ 43,460 10 22,880 23,570 730 340 390 A.N,S.
A·)'tesido(l Rtlral Total Males 5'3,110 24,910 26,',20 1,480 7,330 4,480 2,740 110 in India
0-14 17,ii3(1 17,::60 170 .. 3~67o. 3,GlO 6(1 10-19 4,;;00 3,73(1 74(J 30 4!J(J 440 40 10 20-24 4,570 2,0~0 2,460 30 700 :HO 360 2;;-49 20,040 ] ,:l\JO lfo\,140 ;)10 2,030 ~o 1,\120 30 iill+ 6.44.0 :3:\0 i),200 (110 HO l(J 360 7'0 A.N.S. 3(1 20 ]0
Rurid Total Females 218,600 21,360 167,260 29,980 9,310 3,760 4,900 650
0-1~ IIJ,n') 18,!HO l,lil0 10 3,li20 3,4 I} 13H 15-19 l:),lHO 1,93() 11,210 40 1,370 2.;() I,IlO 10 20-24 27,830 310 27',400 12() 1,470 2\1 1,420 30 2;)-49 11;},900 200 106,0;,0 7,600 2,120 1,900 220 .;0+ J..J~ 76U 111 21,:i90 22,160 730 340 39()
A.~S.
I-Withiu thtl HUl HI Total Males 49,920 23,640 241,870 1,410 6,670 4,160 2,410 10 State of enumeration lI-l4 16,7~(I 16,610 170 3,460 3,400 60 ii, but· outsidE' l:i- ]!) '!',290 3,;)80 6g0 30 4:;0 410 3()
the place of 20-24 .i,ZOO 1,S40 2~:l3H :w 620 280 :l,W enumeration 2.'-4!) 18,:;20 1,26(1 16,76(1 ;;0(1 1,740 60 1,6iiO ~O
:;0+ 6,1011 :);~O 4,920 il;;O 4(1) 1\1 :3:10 flO A.NS :lO 2ft to
Hnrai Total Females 214,870 20,220 164.960 29,690 8,680 3.480 4,580 620
(I-Ii 11';,(16(1 J7.950 1,(1(1(1 10 :3));;0 ~,23(1 I2() },,-19 1Z (jill 1,7911 J 1,()~0 4(1 l,:W) 2:W 1,10n 10 2()·24 27~370 270 26,9:>;0 1211 1, "1()(1 20 1,31)0 30 25-4;9 112,27(1 200 1(14.490 7,;)~O 1,8Ri' 1,6S0 200
,j()-+- 4:1,:16(1 10 21,410 21,94fl 7W 330 3,,0 A.NR.
(a)-Elsf'wherEl Rural Total Males 30.500 14.440 15.260 800 3,110 2.000 1,080 30 in the District of 0-14 1O,Oi)1I n,9!)1) i() 1,620 1,62(1 611llmaration l;, -J 9 2,';20 2.370 4311 20 18() 180
ZO-24 2,D3iJ 1,180 1,3~() 20 280 lui) 120 21)-49 11,2()(l 720 10,190 290 HoO ~() R20 10 (iO+ :{,H70 160 3.~4(1 470 17(' In 140 20
A.N.R 20 ~O
Rn ... ll Totat Females 130.820 12.090 100.880 17,850 4.810 1,840 2.600 370
0-14 11,:,(i0 820 nil Hi 1.7HII ],72(1 60 ] ,;- Hi 8,460 940 i,490 ::0 .-.:20 110 710 20·24 1,,32(; 2W 1~,l)4() 70 Ti(l I,) 720 20 2.>--H} 67,280 1211 62,(i<)f) 4,470 1,il20 9211 100 ,;0+ 26,200 12,9:111 13,2 70 440 1911 2;,1) A.N.i'';.
,226
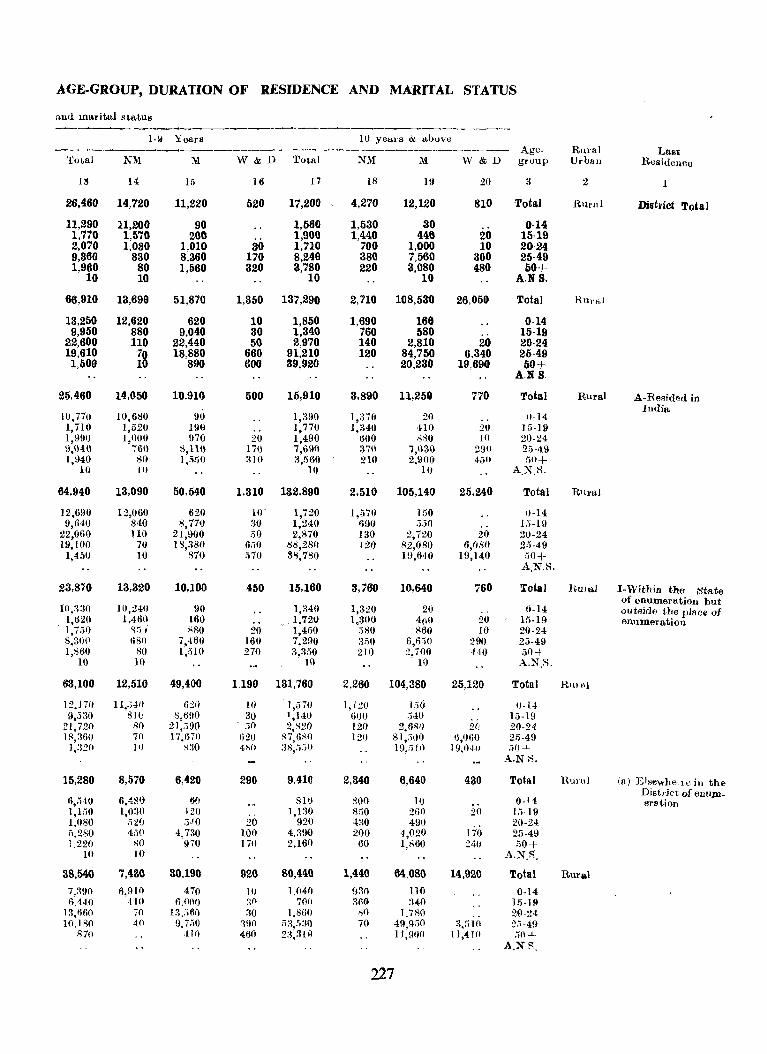
AGE-GROUP, DURATION OF RESIDENCE AND MARITAL STATUS
and marital status
1-9 YeaI' 8 10 years & above ----- ------- --------_------------ Age- Rm'al Last
Total NM M W&D Total NM M W &D group Urban Residence
III 14 I.~ 16 17 18 19 20 3 2
26,460 14 .. 720 11,220 520 17,200 4,270 12,120 810 Total RUrAl Distxict Total
11,290 11,200 90 1,560 1,530 30 0-14 1,770 1,570 200 1,900 1,440 446 20 15-19 2,070 1,030 1,010 30 1,710 700 1,000 10 20-24 9,360 830 8.360 170 8,249 380 7,560 300 25-49 1,960 80 1,560 320 3,780 220 3,080 480 50+
10 10 10 10 A.NS.
66,910 13,699 51,870 1,350 137,298 2,710 108,530 26,050 Total HUl'aJ
13,250 12,620 620 10 1,850 1,690 168 0-14 9,950 880 9,040 30 1,340 760 580 15-19
22,600 110 22,440 50 2,970 140 2,810 20 20-24 19,610 'iO 18,880 660 91,210 120 84,750 6,340 25-49 1,500 10 890 600 39,920 20,230 19,690 50+
A,NS
25,460 14,050 10,910 500 15,910 3,890 1l,251a 770 Total Rural A-Resided in
10,770 10,680 90 1,390 1,370 India
20 ., 0-14 1,710 1,520 190 .. 1,770 1,340 410 2U 1;)-19 1,990 1,000 970 20 1,490 6UO IlS0 10 20-24 9,040 760 8,110 170 7,690 370 7,030 290 25-49 1,940 80 1,,~!)0 :041 a,560 210 2,900 4541 50+
10 10 11) 1 II A.N.S.
64,940 13,090 50,540 1,310 132,890 2,510 105,140 25.240 Total RllraJ
12,690 12,060 620 10' 1,720 ) ,570 1.50 1)-14 9,640 840 8,770 30 1,240 690 :;,50 11;-19
22,060 110 21,900 :-;0 2,870 130 2,720 20 20-24 19,100 70 18,380 6i-;0 88,280 120 82,080 6,080 20';-49
1,450 10 870 .~70 38,780 19,640 19,140 ;')0+ A.N.S.
23,870 13,320 10,100 450 15,160 8,760 10,640 760 Total HUlal 1-Within the State of enumeration but
10,:130 HI,24U 90 1,:340 1,320 20 0-14 outside the plaCiI of 1'620 1,460 _ 160 .. .1.720 1,300 400 20 15-19 enumeration " , 1,7M) <;;),' 880 20 1,450 ;380 860 10 20-24 8,30(' 680 7,460 160 7,290 350 6,6:-;0 200 2;3-49 1,860 80 1,.'110 270 3,350 210 2,700 440 .~O+
10 10 II) 10 A.N.S.
63,100 12,510 49,400 1.190 131,760 2,260 104,380 25,120 Total Hlll''']
12,170 11,.;40 6:W lO 1,;370 1,L:W L}(j 0-14 9,.330 8](, 8,690 30 1,140 600 .340 15-19
21,720 80 2(>90 :;0 2,820 121) 2,680 2(j 20-24 IS,360 70 17,610 tl20 S7,680 120 81,:JOO 1),060 25-49
1,320 Jf) s:lO 4>',0 :JS,:;.;O 19,:')1 f) J9,f)·jJj I}O+ A.NS.
15,280 8,570 6,420 290 9.UI! 2,340 6,640 430 Total HUla} (a) Elsewhe.le ill the
6,4S0 00 SH) 800 H) 0-14 DistriC't of enu.lll_
6,540 erl1tion 1,150 1,030 120 1,I:l0 8;;0 260 20 1.'5-19 1,080 ,~20 .;10 20 920 430 49() 20-24 :\280 450 4,730 100 4.390 200 4,020 170 25-49 1,220 SO !liO ]70 2,160 60 1,860 24H .')0+
10 10 A.N.S.
S8,540 7,4S0 30.190 920 80,440 1,440 M.080 14,920 Total Rural
7,390 6,910 410 10 1.040 930 lIO 0-14 6.440 410 6.000 :;:0 70f, 36@ :l40 Hi-HI
13,660 70 13,;',60 30 1,860 80 1.7S0 20-24 10.1S0 40 9.7.~O ~90 53,-'iaO 70 49,9.')0 3,:iIO ~!i-49
S70 -tl(j 46() 2:~,:H(j 11,900 11,'(10 ;,()+ A.NR.
227
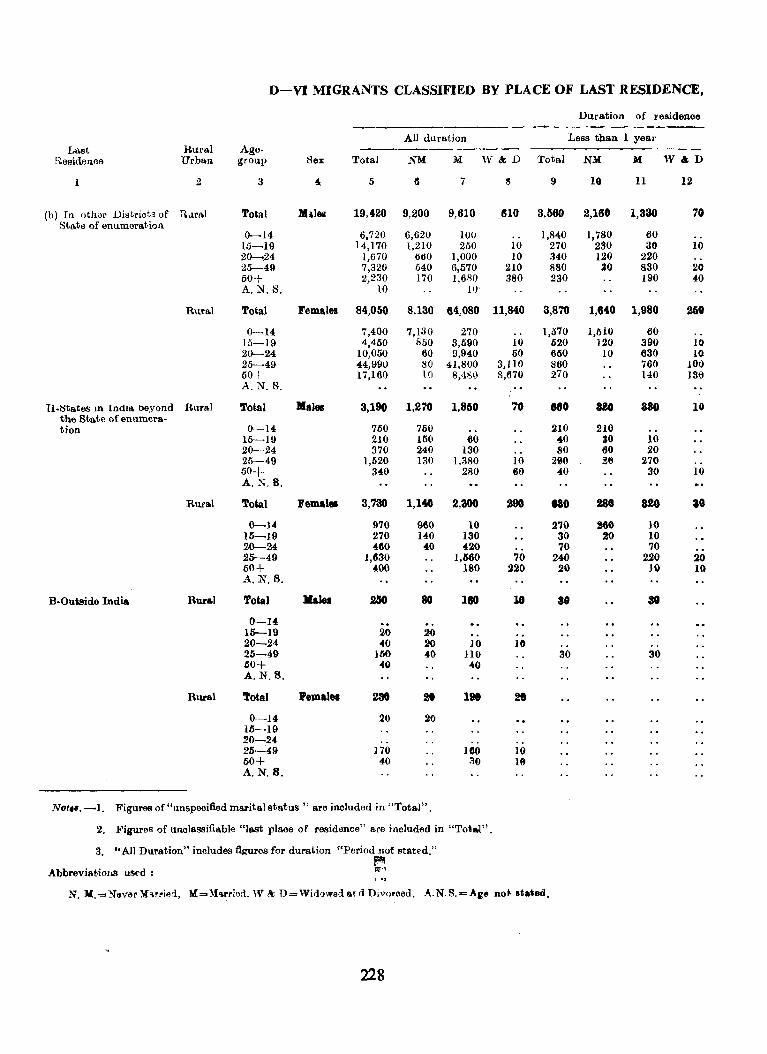
D-VI MIGRANTS CLASSIFlED BY PLACE OF LAST RESIDENCE,
Duration of residence
All duration Less than 1 year Last Rural Age- ----------- ----
l'tesidence Urban group Sex Total NM M W&D Total NM }{ W&D
1 2 3 ~ 5 6 7 ~ 9 10 11 12
(b) In othor Distriots of Rlll."al Total M"les 19,420 9,20B 9,610 :610 3,660 2,160 1,330 70 State of enumeration
0-14 6,720 6,62U lUO 1,840 1,780 60 15-19 14,170 1,210 260 10 270 230 30 10 20--,24 1,670 660 1,000 10 340 120 220 25-49 7,320 540 6,570 210 880 30 830 20 50+ 2,230 170 1,6~0 380 230 190 40 A.N.S. 10 10
Rural Total Females 84,050 8,130 64,080 11,840 3,870 1,640 1,980 260
0-14 7,400 7,130 270 1,570 1,510 60 15-19 4,450 850 3,590 10 620 120 390 10 20-24 10,050 60 9,940 60 660 10 630 10 25-49 44,990 80 41,800 3,ll0 860 760 100 60+ 17,160 10 8,480 8,670 270 140 136 A.N. S. ".
II.tStates In India beyond Rural Total Males 3,190 1,270 1,860 'i'O eeo UO 38G 18 the State of enumera-tion 0-14 760 760 .11l0 210
15-19 210 150 60 40 30 10 20-24 370 240 130 80 60 20 25-49 1,520 130 1,380 10 290 ~6 276 50+ 340 280 80 40 30 10 A.N.B.
Rural Total I'emalel 3,730 1,140 2,300 290 taO 280 820 ao 0-14 970 960 10 270 !66 10
16-19 270 140 130 30 ~ 10 20-24 4C10 40 426 70 70 26--49 1,630 1,660 70 240 220 20 50+ 400 180 220 20 10 10 A.N.B.
B·Ou18ide India Rval Total Kales 2lIO 80 110 18 38 30
0-14 15-19 20 20 20-24 40 20 ]0 HI 25-49 160 40 110 30 30 50+ 40 40 A.N.S.
Rural Total remalea 230 2t 198 20
0-14 20 i{)
15-19 20-24 20-49 ]70 16() 19 50+ 40 30 19 A.N.S.
Not,f.-I. Figul'l)8 of "unspecified marital status" are inoluded in "Total" .
2. Figures of unolassifiable "last place of residence" are included in "Total" .
3. .. All Duration" includes filrol'es for duration "Period not stated." ptI
Abbreviatioll,s USE'd : f'n
N. M.=Never:\hrried, M= M'lrri(lri. \V & D= Wid"wed ard Divopoed. .~.N.S.=.Aie not It.ted.
228
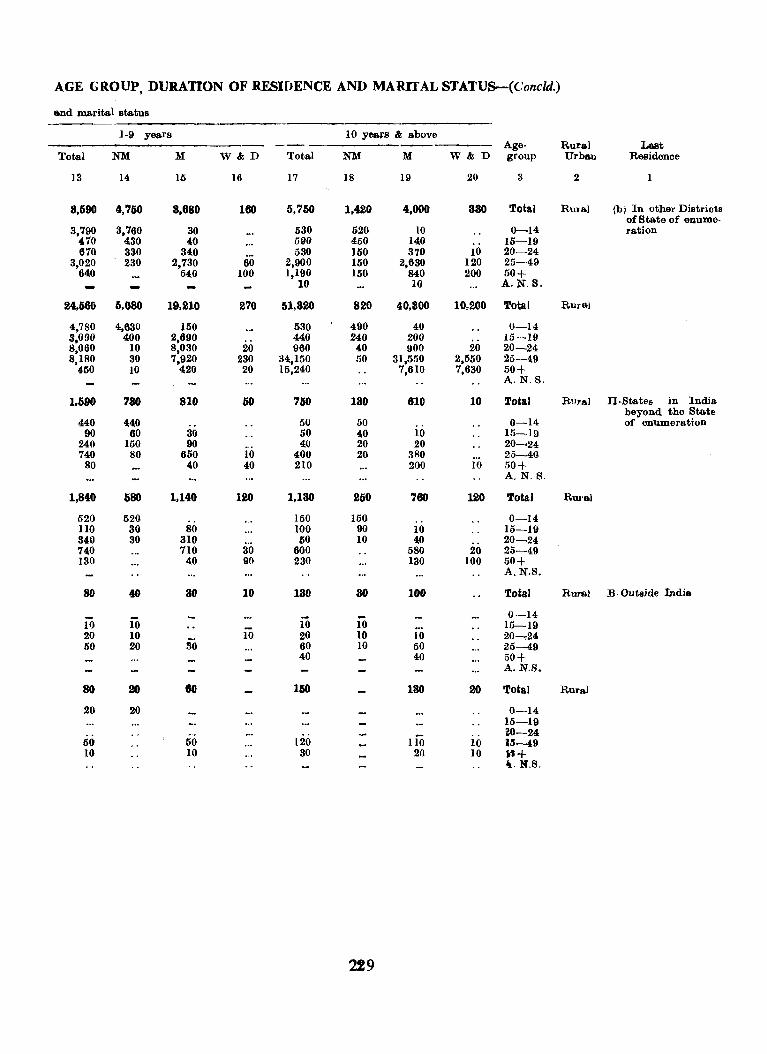
AGE GROUP, DURATION OF RESIDENCE AND MARlfAL STATUS-(Concld.)
and marital status
1-9 years 10 ye&1s & above --- Age. Rural Last
Total .NM M W&D Total .NM M W&D group Urban Residenoe
]3 14 15 16 17 ]8 19 20 3 2
8,690 4,760 3.680 160 6,760 1.420 4,000 380 Total Rm'sl (b) In other Districts of State of enume·
3,790 3,760 30 530 520 10 0-14 ration 470 430 40 590 450 140 15-19 670 330 340 530 ]50 370 10 20-24
3,020 230 2,730 60 2,900 150 2,630 120 25-49 640 540 100 1,190 150 840 200 50+ - 10 10 A.N.S.
24.666 6,080 19,210 270 51,320 820 40,300 10,200 Total Ruraj
4,780 4,630 150 530 490 40 0-14 S,090 400 2,690 440 240 200 15-19 8,060 10 8,030 20 960 40 900 20 20-24 8,180 30 1,920 230 34,150 50 31,550 2,550 25-49
450 10 420 20 15,240 1,610 1,630 50+ A.N.S.
1,690 730 810 50 750 180 610 10 Total Rural ll·States in India beyond the State
440 440 50 50 0-14 of enumeration 90 60 30 50 40 10 15-19
240 150 90 40 20 20 20-24 740 80 650 10 400 20 380 25-40
80 40 40 210 200 10 .50+ A. N. S.
1,840 580 1.140 120 1,130 260 760 120 Total Rw'al
520 520 150 150 0-14 110 30 80 100 90 10 15-19 840 30 310 50 10 40 20-24 740 710 30 600 580 20 25-49 130 40 90 230 130 100 50+
A.N.S.
80 40 30 10 130 30 100 Total Rural B·Outside India
0-14 10 10 10 10 15-19 20 10 10 20 10 10 20--.:24 50 20 SO 60 10 50 25-49
40 40 50+ A. N.S.
80 20 80 160 130 20 Total Rural
20 20 0-14 15-19 00-24
50 50 120 110 10 15-49 10 10 30 20 10 )S+
'-. N.S.
219

H-HOUSING TABLES
The 1961 Housing Census was the first of its kind in the history of Indian Census. In 1961 Census a comprehensive house list for collecting detailed information regarding each census house, and industrial establishment formed part of the statutory census schedules. Detailed information on housing such as use, category, tenure status, material of wall and roof, number of rooms in a census household and of persons residing therein, as well as data relating to establishments, workshops and factories was collected.
During 1971 also housing data on more or less similar lines has been collected and following tables have been complied from the houselists taking a 20 per cent sample of Census Houses.
H-I Census houses and the uses to which they are put.
H-II Distribution of Census Houses by predominant material of wall and predominant material of roof.
Appendix-Distribution of Residential Census Houses by material of wall cross-classified by material of roof.
H-III Households classified by number of members and by number of rooms occupied.
H-IV Households classified by size and tenure status.
The major difference in 1961 and 1971 tabulation is that while in 1961 tables were presented down to taluka level and towns with population of 50,000 or more during 1971 they have been presented upto district a nd city level only. The 1961 cities were taken as the base for tabulation of 1971 houselisting data. Further 1971 housing tables give estimates based on a 20 per cent sample as against the sample figures given in all tables of 'E' series except Table E-I in 1961 Census.
Table H-I gives estimates of Census Houses and the uses to which they are put. This table corresponds to Table E-I of 1961 with a few changes.
Table H-II gives distribution of Census Houses by predominant material of wall and predominant material of roof, giving the structural condition of the houses according to the type of material used for wall and roof. This table corresponds to Table E-IV of 1961 with the difference that in 1971 this table is prepared for census houses while in 1961 Census households living in census houses used wholly or partly as dwe1lings were classified by material of wall and roof.
Tabl.! H-III gives distribution of households classified by number of members and by number of rooms occupied. The table will help in the measurement of congestion and overcrowding in households. This table corresponds to Table E-V of 1961 Census excepting that additional information for households with unspecified number of rooms and households with details unspecified are shown in 1971. Institutional households are not reckoned for the purpose this table.
Table H-IV gives distribution of households classified by size and tenure status and gives information on composition of households e. g. households having one person, two persons, etc., and by their tenure status i. e. whether living in owned or rented houses. The institutional households are excluded from this table.
This table is similar to Table E-II of 1961 Census. In 1961 Census, however, households living in census house used wholly or partly as dwelling were classified by tenure status, whereas in 1971 Census households with number of members are cross-classified by tenure status.
231
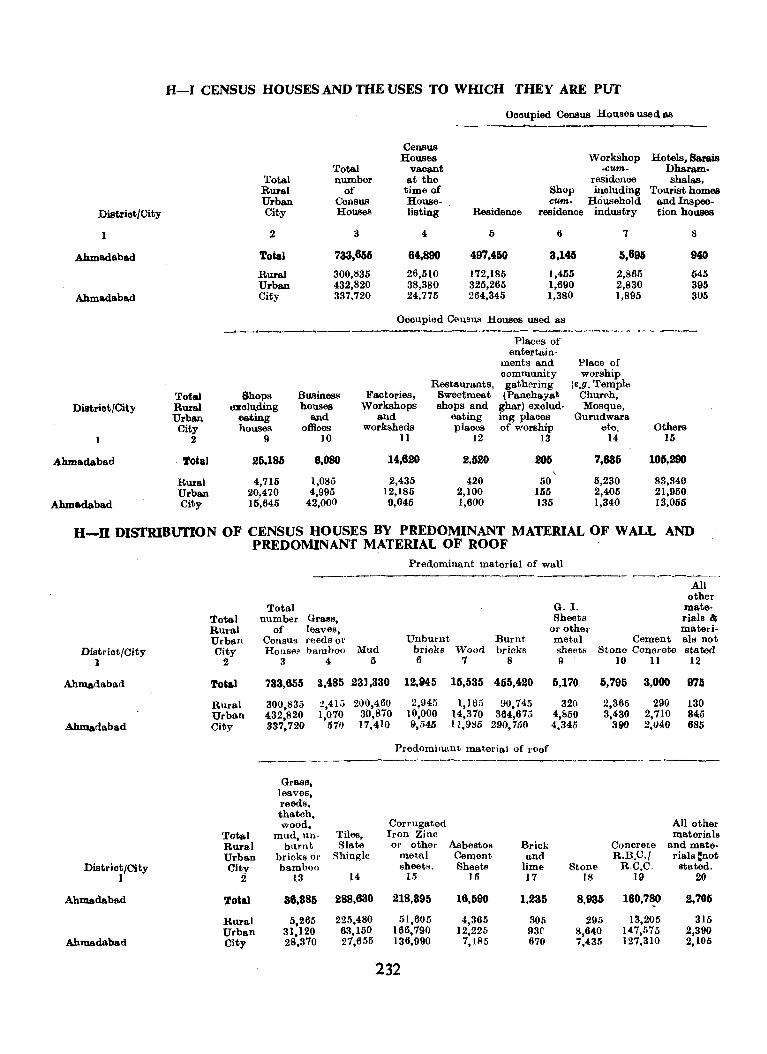
Distriot/City
I
Ahmadabad
Ahmadabad
Distriot/City
Ahmadabad
Ahmadabad
H-I CENSUS HOUSES AND mE USES TO WIDCH THEY ARE PUT
Oooupied Census Houses used as
Census Houses Workshop Hotels, Barais
Total vacant .cum· Dharam· Total nwnber at the residence shalas, Rural of time of Shop including Tourist homes Urban Census House· cum· Household and Inspeo. City Houses listing Residenoe residence industry tion houSes
2 :3 4 5 6 7 8
Total 733.655 64.890 497.450 3,145 5,695 940
Rural 300,1;35 26,510 172,185 1,455 2,865 545 Urban 432,820 38,380 325,265 1,690 2,830 395 City 337.720 24,775 264.345 1,380 1,895 305
Oooupied Ceu.sllS Rouses used as
Places of entertain·
ments and Place of oommunity
Restaurants, gathering worship
(e.g. Temple Total Shops Business Factories, Sweetmeat (Panchayat Churoh, Rural exoluding houses Workshops shops and ghar) exclud· Mosque, Urban eating lind and eating ing places Gurudwara City houses offioes worksheds plaoes of worship etc. Others
2 9 10 11 12 13 14 15
Total 25,1~ 8,080 14,620 2.520 205 7.835 105,290
Rural 4,715 1,085 2,435 420 50 5,230 83,340 Urban 20.470 4,995 12,185 2,100 155 2,405 21,950. City 15-,645 42,000 9,045 1,600 135 1,340 13.055
H-U DISTRIBUTION OF CENSUS HOUSES BY PREDOMINANT MATERIAL OF WALL AND PREDOMINANT MATERIAL OF ROOF
District/City 1
Ahmadabad
Ahmadabad
Distriot/City I
Ahmadabad
Ahmadabad
Total Rural Urban City
2
'fotal
Rural Urban City
Total Rural Urban City
2
Total
Rural Urban City
Predominant material of wall
Total num bel' Grass,
of leaves. Census reeds 01' Houses bamboo
3 4 Mud
5
733,655 3,485 23] ,330
300.835 2,41i) 200,460 30,870
Unburnt bricks Wood 6 7
12,945 15,535
2,945 1,165 10,000 14,370
Burnt. brickR
8
455,420
90,745 364,67.5 432,820 1,070
337,720 570 17,410 9,545 11,985 290,750
Predominant material of 1'00f
-------_-_ Grass,
leaves, reeds, thatch, wood, Corrugated
mud, un· Tiles, Iron Zinc burnt Slate or other Asbestos Brick
bricks Or Shingle metal Cement and bamboo sheets. Sheets lime
13 14 15 Hi 17
36,385 288,630 218,395 16,590 1,235
5.265 225,480 51,605 4,365 305 31,120 63,150 166,790 12,225 93C 28,370 27,655 136,990 7,1!l5 670
.232
G.!. Sheets
All other
materials &; materi-or other
metal sheets 9
Cement als not Stono Concrete stated
10 11 12
6.170
320 4,850 4,345
6,795
2,365 3,430
300
3,000
290 2,710 2,040
975
130 845 685
All other materials
Concrete and mate-RB.C./ rials :not
Stone RC.C_ stated. 18 19 20
8,935 160,780 2,706
295 13,205 315 8,640 147,575 2,390 7,435 127,310 2,105
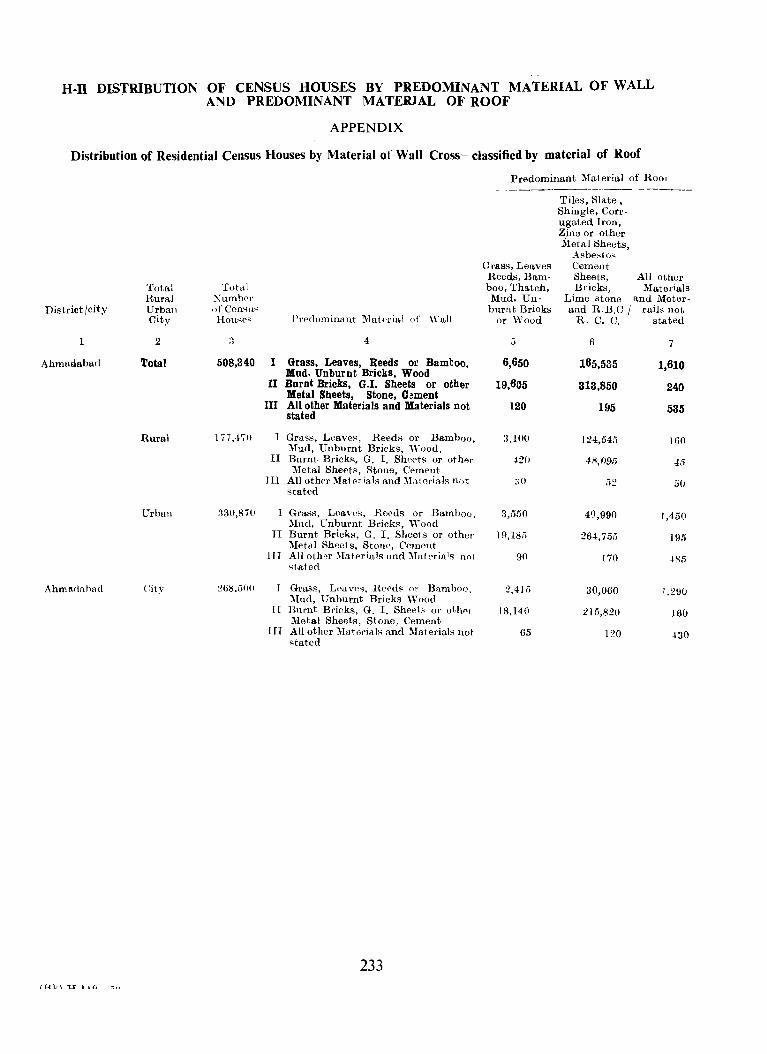
H-n DISTRIBUTION OF CENSUS HOUSES BY PREDOMINANT MATERIAL OF WALL , AND PREDOMINANT MATERJAL OF ROOF
APPENDIX
Distribution of Residential Census Houses by Material of Wall Cross~ classified by material of Roof
District jcity
1
Ahmadabad
Ahmlt(iahud
fUl.-\ "lJ 1 In
Total Rural Urban Cit~-
2
Total
Rural
Urban
Tutal Xumbcl' ()f Consll~
Hou><f'S
.,
.)
508,340
Prcdominant ~]a(('rial of "'ali
4
I Grass, Leaves, Reeds or Bamboo, Mud, Unburnt Bricks, Wood
II Burnt Bricks, G.r. Sheets or other Metal Sheets, Stone, Cement
III All other Materials and Materials not stated
Iii ,.iiO I Grass, Leaves, Reeds or Bamboo, )Iud, Unburnt Bricks, "'ood.
n Burnt. Brick>;, G. I. Sheets or other Metal Sheets, Stone, Cement
HI All other :\fatNials and l\btorials n()t stated
:130,870 I Grass, Loaves, Roeds or Bamboo, )Iud, Unburnt Brieks, 'Yood
n Burnt. Bricks, G. I. Sheets or other )Ietal Sheets, Stone, Cement
lIT All oth"r l\[atf'l'ials and )[atf'ria's not >!t.ated
:!H8.50U Grass, Leaves, Heed~ 01' Bilmboo. \Iud, l;nburnt Bricks Wood
rI Burnt Bricks, G. I. Sheets or o(·h"l Metal Sheet·s, Stone, Cement
] IT All othor \Ialerials and ~Jaterials not stated
233
Predominant Material of Rool
Grass, Leaves Reeds, Bamboo, Thatch, Mud, Unburnt Bricks
or "\'ood
6,650
19,605
120
:1,100
42()
3,550
19,18,;
90
:?,41f)
18,140
65
Tiles, Slate, Shingle, Corrugated Iron, Zine or other .t\'1etal Sheets,
Asbestos Cement Sheets, All other Blick~, Materials
Lime stano and Meterand R.B.C j rails not
R. C. C. stated
6
165,535
313,850
1f15
124,54;}
40,990
264,7,'>5
170
:30,060
215,820
120
7
1,610
240
535
1()0
4.5
50
1,450
195
1,200
160
,130
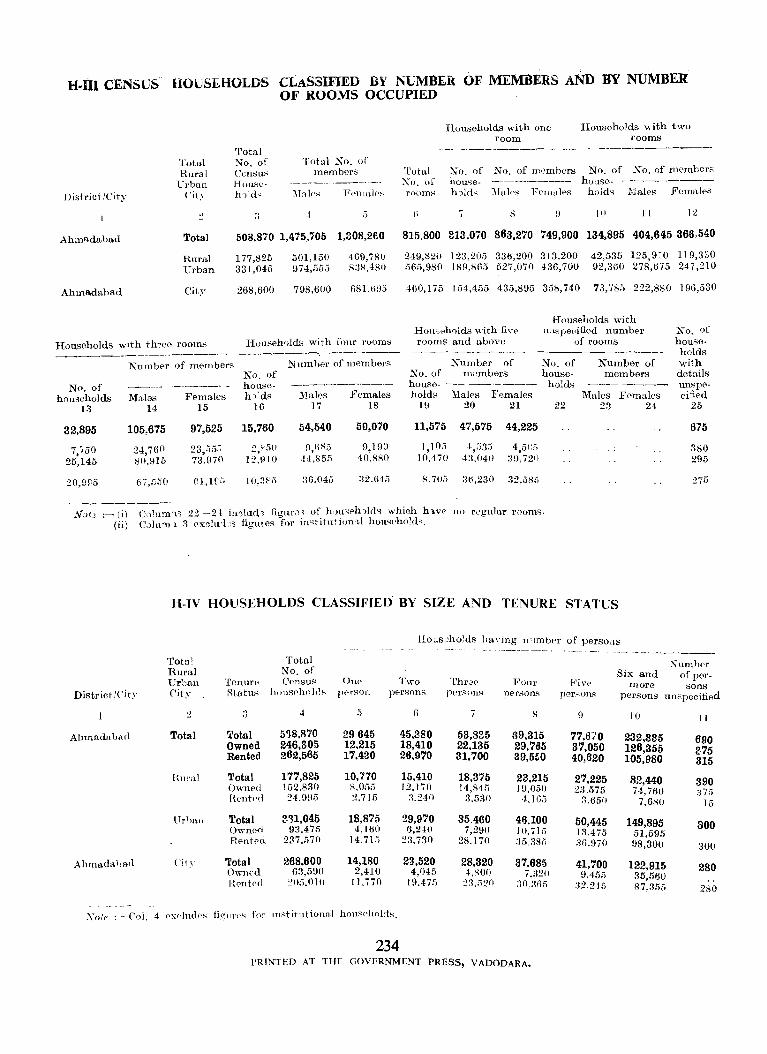
H-lll CENSUS HOUSEHOLDS CLASSIFIED BY NUMBEU OF MEMBERS ANn BY NUMBER OF ROOMS OCCUPIED
Total Total ::-.ro. of Total Xo. of' Rural Ccn~us members
"Grban Hous!:' --_._------District ICity ('it ~ h-J-d, \filks Ff"llHtl('~
.J ., ~ ;) .. Ahmadabad Total 508,870 1,475,705 1,308,260
HUl'al 177,825 501,lS0 46!),780 Urban 331,045 974,55.) 8:18,480
Ahmadabad City 268,600 798,600 681,tHl5
Households wIth th~ee rooms Households with four rooms -----------~----~
~~-~.-----,---~---
No. of households
13
32,895
7,~50 25,145
20,££'5
Number of members
Males 14
105,675
24,760 80.915
6"1,[;50
Females 15
No. of house. h)'ds
16
97,525 15,760
23,.55-1 2/5(1 73.07() 12,910
()I,H';, lO.3fii
Numher of members
Males 17
54,540
fl,fiR;, 44,85r,
!l6,045
Females 18
50,070
9,lno 40,880
:l2.(,4i>
Households with one Households with two room rooms
------~--~~--- - -------~---
Total Xo. of ~o. of members No. of No. of members :'\0. of house. -~------ house· ---------
l'OOIl1S holrls '.rillps Fpmalt's holds ::'.lales Females
(\ I S \) 10 11 12
815,800 313,070 863,270 749,900 134,895 404,645 366,540
:H!),S2iJ 123,205 336,200 313.200 42,535 125,9~0 119,3:;0 565,98() 189,865 527.070 436,700 92,360 278,675 247,210
460,17i5 154,455 4B5,895 358,740 73,785 222,880 196,530
HOllS0h()lds with fivp rooms and above
Households with luspecified number
of rooms No. of house· holds with details unspe· cified
Kumher of ~o. of Xo. of mombers house· house· -- ------ holds holds Males Females
1!l 20 21 22
11,575 47,575 44,225
1,10.) ~,;;:l.' 4,5(;0'') 10,470 4:1,040 :)1).7211
8.705 :36,230 32,580}
Number of members
Males Fomales 23 24 25
675
380 295
275
Not] :- (i) G)lumTl 22 -21 iU0Jucl) figur;:H of h,)u'E'hJld~ which h'1v(' no r~gnlar !"'oms. (ii) CJIU"lll 3 ex~hd?~ figures fol' inc;titution'tl hOllq"hold'.
H-IV HOUSEHOLDS CLASSIFIED BY SIZE AND TENURE STATUS
l:ioCls,hoJds having n'lmb('r of persoils ------_-_----- -_-- -~- -_ - - - - --------
Totnl Total Numher Rural No. of erban TenlHl' Consul" Oue T\,·o Thr8' Foul'
Six and of per. Fiv{>
District/Cit~- Cit~· Status hOllsf'hol,!s pf'rson persons more sons
persons persons per_qons persons unspecified
.) .) 4 f5 (i i 8 ,) n 10 II
Ahmadaba(l Total 'l'otal 5~8,870 29645 45,380 53,335 69,315 77.670 232,335 690 Owned 246,305 12.215 18,410 22.135 29,765 37,050 126,355 Rented 262,565 17,430 26.970 31,700 39,560 40,620 105,980
375 315
Hl1l'lll Total 177,825 10,'1'70 15.410 18.375 23,215 27,225 82,440 Owned 102.830 K.055 12,170 14,845 19,050
390
f{entf'd :!4.9(1:-; 2,715 3.240 :3,5;~O 23,575 74,760 :Pii
-LID!; 3.650 7,680 ]5
Urhnll Total 3'31,045 18,875 29,970 35.460 46,100 50,445 149,895 Owne~1 9:l,4ii> 4,16() 6,24() 7,290 300 JO,7W 13,475 51,595 Rentf'Cl 237,570 14.71i; :?3.73() 28.170 ;15,381; :~G.97(1 98,300 300
Ahmada')a(] ('it~· Total 268,600 14,180 23,520 28,320 37.685 41,700 122,915 OW)H'd 6:l,r,OO 2,410 4,045 4.RO() 7,320 280 R('ntpd 20!l.01(1 lLi7() 19.47r,
9.4.513 35,560 2:l.;i20 :lO,3Gi) :12.24.~ 87,:155 280
Sole : .. Col_ 4 ('x('ll1d('~ figll1't'S f()l' in~t itntional honspholds.
234 PRINTED AT THE GOVERNMENT PRESS, VADODARA.
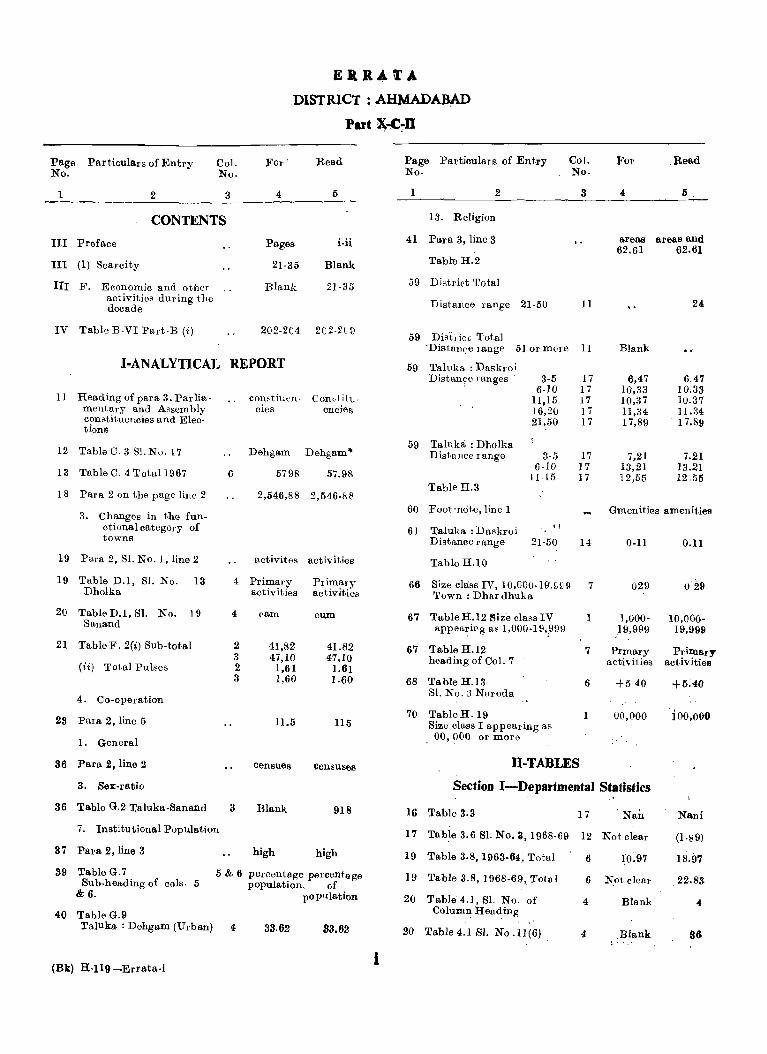
EltR41'A
,DISTRICT : ~HMADABAD
Part ~7D
Page Particulars of Entry Col. FOr \ Read Page Particulars of Entry Col. For Read No. No. No. No.
1 2 3 4 5 1 2 3 4 5,
CONTENTS 13. Religion
i·ii 41 Para 3, line 3 areas areas and III Preface Pages 62.61 62.61
III (1) Scarcity 21-35 Blank Table H.2
III F. Economic and other Blank 21-35 59 District Total
activities during the decade Distance range 21-50 11 24
IV Table B-VI Part-B (i) 202-2C4 2C2-2C \) 59 Disilic~ Total
'Distanqe'range 51 or mere 11 Blank
I~ANALYTICAL REPORT 59 Tall.1ka : Daskroi Distan(Je ranges 3-5 17 6,47 6.47
6-10 17 10,33 10.33 11 Heading of para 3. Parlia- conctiuen- Cow,tit u · II,15 17 10,37 10.37
mentary and Assembly cies encies 16,20 17 11,34 1l.34 constituencies and Elec- 21,50 17 17,89 ' 17.89 tions
59 Taluka : Dholka 12 Table C. 3 S1. No. 17 Dehgam Dehgam* Distance range 3-5 17 7,21 7.21
6-10 17 13,21 13.21 13 Table C. 4 Total 1967 6 5798 57.98 11·15 17 12,55 12.55 Table H.3
18 Para 2 on the page line 2 2,546,88 2,546.88
3. Changes in the fun-60 Foot-note, line 1 Gmenities amenities
II ctional category of 61 Taluka : Daskroi towns Distance range 21-50 14 0-11 O.ll
19 Para 2, S1. No.1, line 2 activites activities Table H.I0
19 Table D.l, S1. No. 13 4 Primary Primary 66 Size class IV, 10,GOO-19,££9 7 029 029 Dholka activities activities Town: Dhardhuka
20 TableD.l, Sl. No. 19 4 cam cum 67 Table H.12 Size class IV 1 1,000- 10,000-Sanand appearipg as 1,000-19',999 ,19,999 19,999
21 Table F. 2(i) Sub-total 2 41,82 41.82 67 Table H.12 7 Prmary Primary 3 47,10 47.10 heading of Col. 7 activities activities (ii) Total Pulses 2 1,61 1.61 3 1,60 1.60 68 Table K.13 6 +540 +5A()
S1. No.3 Naroda 4. Co-operation 70 TableH.19 1 00,000 ioo,ooO 28 Para 2, line 5 11.5 llS Size class I appearing as
00,000 or more l. General
86 Para 2, line 2 censues censuses Il-TABLES
3. Sex-ratio Section I-Departmental St~tistics 36 Table G.2 Taluka-Banand 3 Blank 918 16 Table 3.3 17 . Nan Nani
7. Institutional Population 17 Table 3.6 81. NO.3, 1968-69 12 Not clear (I,S9) 37 Para 2, line 3 high high 19 Table 3.8, 1963-64, Total 6 1:0.97 18.97 39 Table G.7 5 & 6 percentage percentage 19 Table 3.8, 1968-69" Total 6 Not clear 22.83 SUb-heading of cols. 5 population. of
& 6. pOP'1lation 20 Table 4.1, 81. No. of 4 Blank 4 40 Table G.9 Column HeadiIlg
Taluka : Dehgam (Urban) 4 38.62 88.62 20 Table 4.1 S)' No .11(6) 4 Blank 86
(Bk) K-Il9-Errata-i 1
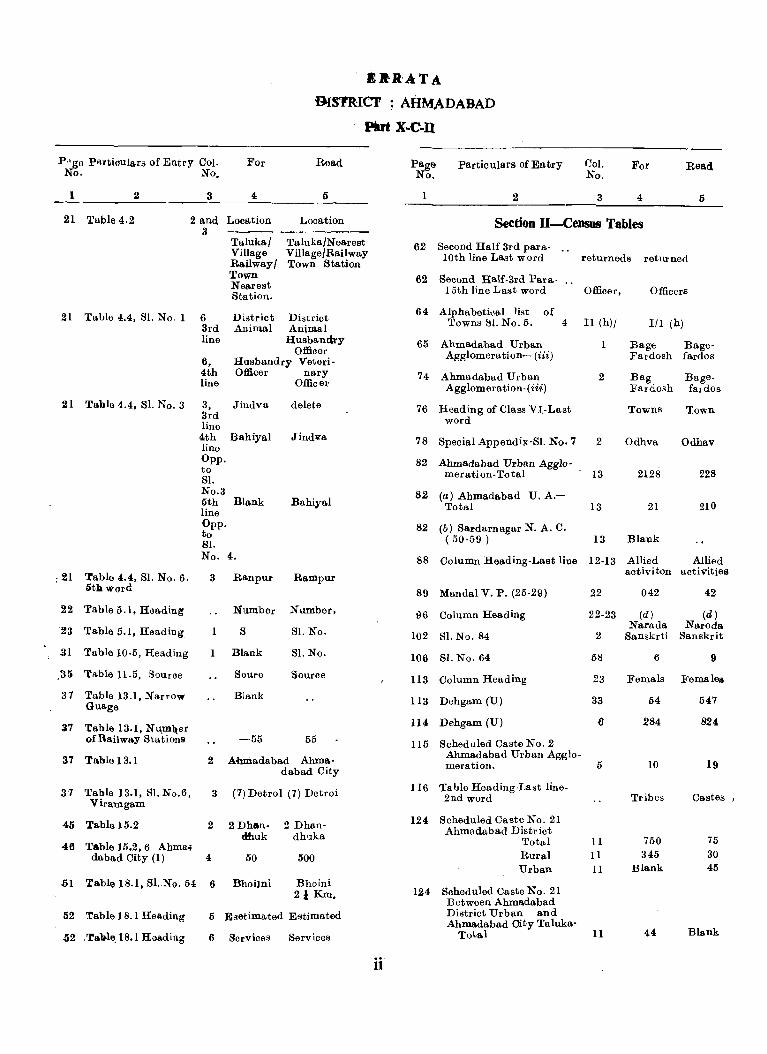
... RATA
9IS'lRICT ; AHMADABAD
Pin x-c:.n
P"go partioulars of Entry Col. No. No.
For Read
1 2 3 4 Ii
21 Table 4.2 2 and Location Location a ---- ------
Talukal Village Railway! Town Nearest Station.
Taluka/N earest Village/Railway Town Station
21 Table 4.4, 81. No.1 6 District District
21 Table 4.4, 81. No.3
: 21 Table 4.4, S1. No.6. 5th word
22 Tableo.l,Heading
'23 Table 5.1, Heading
31 Table 10·5, Heading
39 Table 11.5, 80urae
37 Table 13.1, Narrow Guage
37 Table 13.1, Nu..m~er of Railway Stations
37 Table 13.1
37 Table 13.1, SI.No.6, Viralllgam
3rd Animal Animal line Husbanrhy
Officer 6, Husbandry Veteri-4th Officer nary line Offic er
3, Jindva 3rd line 4th Bahiyal line Opp. to S1. No.3 5th Blank line Opp. to 81. No.4.
3 Ranpur
Number
8
Blank
Soure
Blank
delete
Jindva
Bahiyal
Rampur
Number,
81. No.
Sl. No_
Source
-55 55
2 Ahmadabad Ahma.dabad City
3 (7) Detrol (7) Detroi
45 Table 15.2 2 2 Dhan- 2 Dhan-dhuk dhuka
46 Table 15.2,6 Ahma. dabad City (1) 4 50 500
-51 Table 18.1, Sl.No. 54
52 Table 18.1 Heading
-52 .Ta'}}le,18.1 Heading
6 BhoiJni Bhoini 21 Km.
5 Es&timated E'stimated
6 Services Services
if
Page No.
1
Particulars of Entry
2
Col. No.
3
For Read
4 5
Section ll-Census Tables
62 Second Half 3rd para· .. lOth line Last word
62 Second Half-3rd Para-15th line Last word
64 Alphabetillol list of
returneds returned
Officer, Officers
Towns ~L No.5. 4 II (h)/ III (h)
65 Ahmadabad Urban 1 Bage Bage-Agglomeration- (iii) Fardosh fardos
74 Ahmadabad Urban 2 Bag Bage-Agglomeration-(iii) Fardosh fardos
76 Heading of Class VI-Last word
78 Special Appendix-Sl. No.7
82 Ahmadabad Urban Agglomeration-Total
82 (a) Ahmadabad U. A.Total
82 (b) 8ardarnagar N. A. C. ( 50-59 )
Towns
2 Odhva
13 2128
13 21
13 Blank
Town
Odhav
228
210
88 Column Heading-Last line 12-13 Allied Allied activiton activities
89 MandaI V. P_ (25-29)
96 Column Heading
102 Sl. No. 84
106 Sl. No. 64
113 Column Heading
22 042
22-23 (d) Narada
2 8anskrti
58 6
23 Femals
113 Dehgam (U) 33 54
114 Dehgam (U) 6
115 Scheduled Caste No. 2 Ahmadabad Urban Agglo-meration. 5
116 Table Heading-Last line-2nd word
124 Scheduled Caste No. 21 Ahmadabad District
Totltl Rural Urban
124 Scheduled Caste No. 21 Between Ahmadabad District Urban and Ahmadabad City Taluka-
Total
11 11 11
11
284
10
Tribes
750 345
Blank
44
42
(d) Naroda
Sanskrit
9
Females
547
824
19
Castes I
75 30 45
Blank
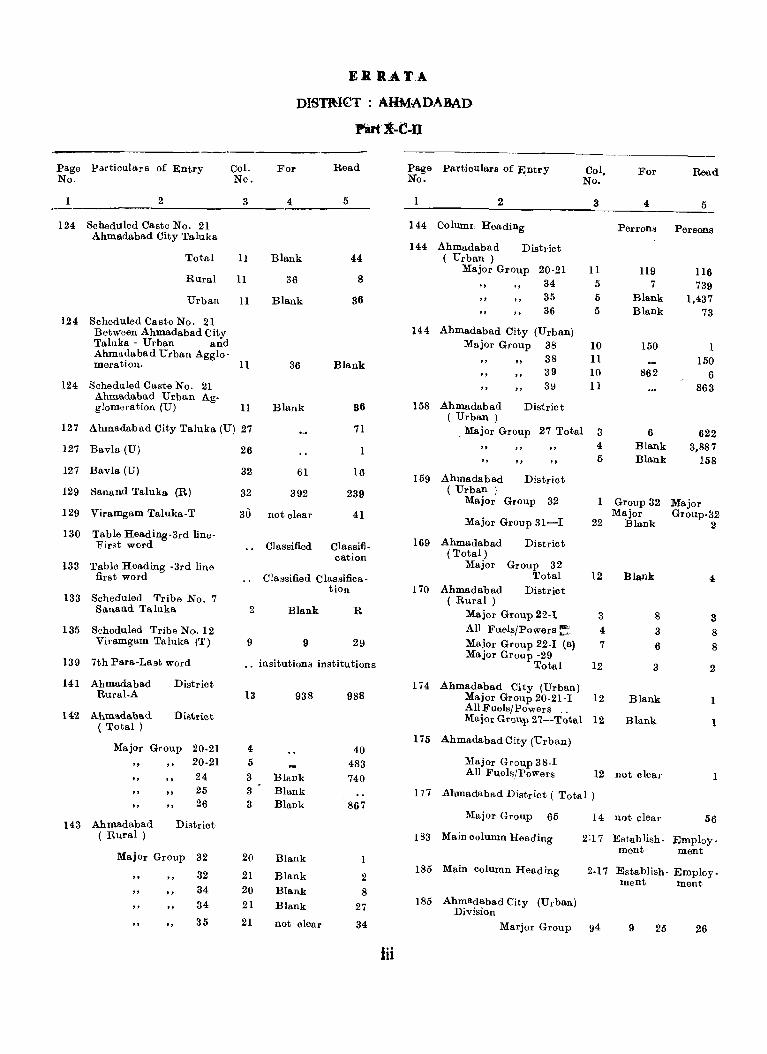
Page Particulars of Entry No.
2
124 Scheduled Caste No. 21 Ahmadabad City Taluka
Total
Rural
Urban
Col. Nc.
3
11
11
11
ERRATA
DISTl\I€T : A.HMADABAD
Part :t-C-D
For
4
Blank
36
Blank
Read
5
44
8
36
Page Particulars of E_ntry No.
1 2
144 Coluror, Heading
144 Ahroadabad District ( Urban)
Major Group 20-21 34
" "
35 36
144 Ahmadabad City (Urban) Major Group 38
Col. No.
3
For Read
4 5
Perrons Persons
11 119 116 5 7 739 5 5
Blank Blank
150
1,437 73
124 Scheduled Caste No. 21 Between Ahmadabad City Taluka . Urban and Ahmadabad Urban Agglo-roeration. 11 36 Blank " 38
39 39
10 11 10 11
1 150
6 863 124 Scheduled Caste No. 21
Ahmadabad Urban Agglomeration (U) 11 Blank
127 Ahroadabad City Taluka (U) 27
36
71
1 127 Bavla (U)
127 Bavla (U)
129 Sanand Taluka (R)
129 Virarogaro Taluka-T
130 Table Heading-3rd lineFirst word
133 Table Heading -3rd line first word
133 Scheduled Tribe No.7 Sanand Taluka
135 Scheduled Tribe No. 12 Virarogam Taluka (T)
139 7th Para-Last word
141 Ahmadabad Rural-A
142 Ahm\l.daba.d ( Total)
District
District
Major Group 20-21
" "
143 Ahmadabad ( Rural)
"
20-21
24 25 26
District
Maj Or Group 32
32
" " "
34
34
35
26
32 61 16
32 392 239
30 not olear 41
2
9
13
4 5
3 3 3
20
21
20 21
21
Classified Classification
Classified Classification
Blank R
9 29
insitutions institutions
938
Blank Blank BlaDk
Blank
Blank
Blank
Blank
not clear
988
40 483
740
867
2
8
27
34
iii
" 158 Ahmadabad
( Urban)
862
District
_ Major Group 27 Total 3 6 Blank Blank
622 3,887
158 "
" 159 Ahmadabad District
169
170
( Urban) Major Group 32
Major Group 31-1
Ahmadabad District (Total)
Major Group 32 Total
Ahmadabad District ( Rural)
Major Group 22-1
All Fuels/Powers ~ Major Group 22-1 (a) Major Group -29
Total
4 5
1 Group 32 Major Major Group-32
22 Blank 2
12
3 4 7
12
Blank
8
3
6
3
3 8 8
2
174 Ahmadabad City (Urban) Major Group 20-21-1 12 All Fuels/Powers ..
Blank 1
1 Major Group 27-Total 12 Blank
175 Ahmadabad City (Urban)
Major Group 38-1 All Fuels/Powers 12 not c1eaJ' 1
177 Ahmadabad Dist,rict ( Total)
Major Group 65
183 Main column Heading
185 Main column Heading
185 Ahmadabad City (Urban) Division
14 not clear 56
2:17 Establish- Employ-ment ment
2-17 Establish- Employ-ment ment
Marjor Group 94 9 25 26
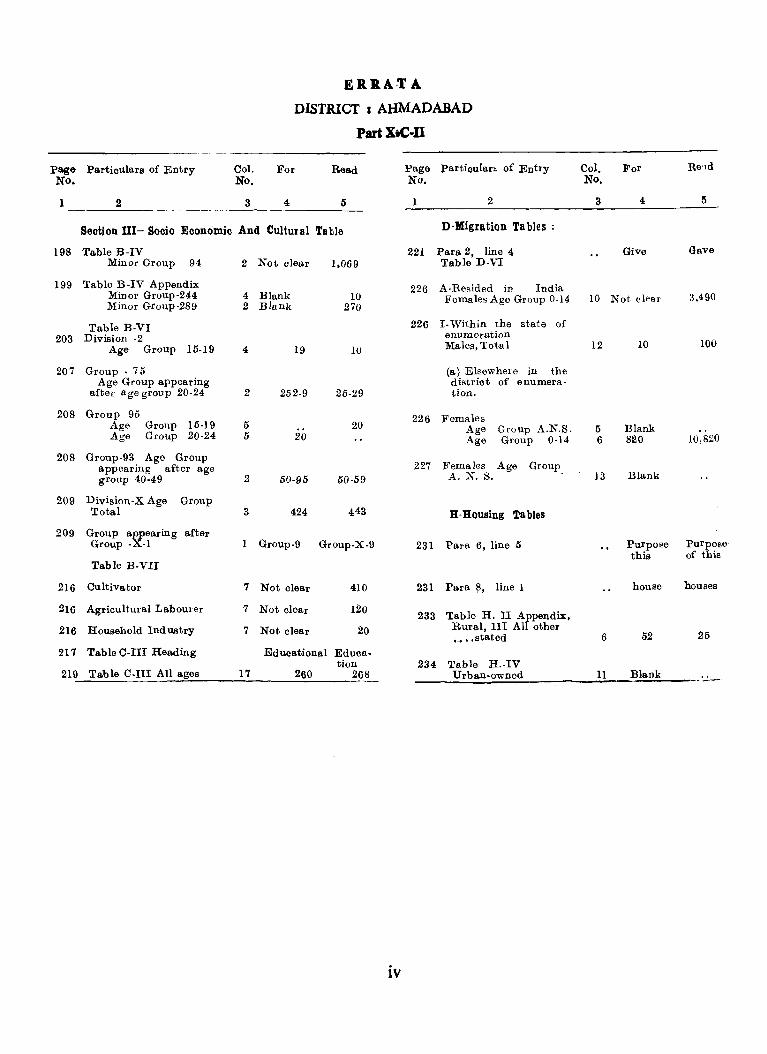
ERRA,TA
DISTRICT I AHMADABAD
PartXiC·ll
Page Partioulars of Entry Col. For Read Page partioular~ of Entry Col. For Re1d No. No. No. No.
1 2 3 4 5 2 3 4 5
Section III- Socio Economic And Cultural Ta Ue D-Migration Tables:
198 Table B-IV 221 Para 2, line 4 Give Gave Minor Group 94 2 Not clear 1,069 Table D-VI
199 Table B-IV Appendix 226 A-Resided in India Minor Group-244 4 Blank 10 Females Age Group 0-14 10 Not clear 3,490 Minor Group·289 2 Blank 270
Table B-VI 226 I- Within the state of 203 Division -2 enumeration
Age Group 15-19 4 19 10 Males, Total 12 10 100
207 Group. 75 (a) Elsewhere in the Age Group appearing district of enumera-
after age group 20-24 2 252-9 25-29 tion.
208 Group 95 226 Females Age Group 15-19 5 20 Age Group A.N.S. 5 Blank Age Group 20-24 5 20 Age Group 0-14 6 820 10,820
208 Group-03 Age Group appearing after age 227 Females Age Group group 40-49 2 50-95 50-59 A. N. S. 13 Blank
209 Division-X Age Group Total 3 424 443 H-Housing Tables
209 Group appearing after Group -X-I Group-9 Group-X-9 231 Para 6, line I) Purpose purpose
this of this Table B-VII
216 Cultivator 7 Not clear 410 231 Para ~, line 1 house houses
216 Agricultural Labourer 7 Not clear 120 233 Table H. II Appendix,
216 Household Ind natry 7 Not clear 20 Rural, III All other 25 u •• stated 6 52
217 Table C-III Heading Educational Educa. tion 234 Table H.-IV
219 Tab Ie C·III All ages 17 260 268 Urban-owned 11 Blank ---
iv