Distribution of uranium isotopes in surface water of the Llobregat river basin (Northeast Spain
7
Distribution of uranium isotopes in surface water of the Llobregat river basin (Northeast Spain) A. Camacho a, * , R. Devesa b , I. Vallés a , I. Serrano a , J. Soler b , S. Blázquez a , X. Ortega a , L. Matia b a Institut de Tècniques Energètiques, Universitat Politècnica de Catalunya, ETSEIB, Avda. Diagonal 647, 08028 Barcelona, Spain b Aigües de Barcelona, Avda. Diagonal 211, 08018 Barcelona, Spain article info Article history: Received 11 March 2010 Received in revised form 19 July 2010 Accepted 14 August 2010 Available online 25 September 2010 Keywords: Surface water Uranium isotopes Radioactive disequilibrium Spain abstract A study is presented on the distribution of 234 U, 238 U, 235 U isotopes in surface water of the Llobregat river basin (Northeast Spain), from 2001 to 2006. Sixty-six superficial water samples were collected at 16 points distributed throughout the Llobregat river basin. Uranium isotopes were measured by alpha spectrometry (PIPS detectors). The test procedure was validated according to the quality requirements of the ISO17025 standard. The activity concentration for the total dissolved uranium ranges from 20 to 261 mBq L 1 . The highest concentrations of uranium were detected in an area with formations of sedi- mentary rock, limestone and lignite. A high degree of radioactive disequilibrium was noted among the uranium isotopes. The 234 U/ 238 U activity ratiovaried between 1.1 and 1.9 and the waters with the lowest uranium activity registered the highest level of 234 U/ 238 U activity ratio. Correlations between uranium activity in the tested water and chemical and physical characteristics of the aquifer were found. Ó 2010 Elsevier Ltd. All rights reserved. 1. Introduction Surface waters play an important role in the migration and redistribution of radio-nuclides in the earth’s crust. Concentration of uranium in water is influenced by the chemical and physical characteristics of the aquifer and by the uranium contents of the involved geological formation. Furthermore, knowledge of the 234 U/ 238 U activity ratio in the ecosystem provides information about the mechanisms and processes of uranium transport and origin. The 234 U/ 238 U activity ratio is estimated to be greater than 1 in the range 1.1e 1.3 in river waters (Skwarzec et al., 2002; Andersson et al., 1995; Porcelli et al., 1997; Riotte and Chabaux, 1999; Chabaux et al., 2001; Riotte et al., 2003; Kronfeld et al., 2004). In the literature some factors are suggested that influence the uranium isotope ratio: the age of the rocks, rock type and climate differences. (1) In rocks older than a few million years, 234 U/ 238 U activity ratios should be in secular equilibrium. However, the highly energetic alpha decay of 238 U damages a mineral’s crystalline lattice and allows 234 U to be more mobile during weathering of rock by meteoric waters. Increased physical weathering and the resulting decrease in grain size increase the mineral surface area (per unit volume). This increases the number of alpha recoil fractures that are exposed to the surface of the grains which, in turn, allows for an increased rate of 234 U removal (e.g., Robinson et al., 2004). The rate of removal is expected to decline with time as the more labile uranium is removed first, leaving the less mobile uranium in the mineral crystalline lattices (Latham and Schwarcz, 1987). (2) Rock type determines rock weathering rates. Carbonates weather the most rapidly followed by shales and sandstones, while plutonic and metamorphic shield rocks weather the most slowly. (3) Climate differences have been hypothesized to affect the 234 U/ 238 U activity ratio in surface waters of southern Africa and in other rivers throughout the world (Kronfeld and Vogel, 1991; Kronfeld et al., 2004). These authors suggest that rivers that drain regions with arid climates are more likely to have 234 U/ 238 U activity ratios that are greater than those that drain regions with humid climates. Their reason is based on the idea that regions with arid climates have higher rates of physical weathering which, in turn, create more surfaces from which to leach recoil 234 U. Conversely, Kronfeld and Vogel (1991) hypothesize that rivers in humid regions yield 234 U/ 238 U activity ratios that are closer to those of the parent rocks that their surface waters drain. Nowadays, average values for uranium content in rivers are based on a few large rivers which have been sampled a minimal number of times (e.g., Palmer and Edmond, 1993; Sarin et al., 1990; Windom et al., 2000). Limited sampling of rivers may not capture the temporal variations in uranium concentrations so, when possible, a time-series analysis of dissolved uranium ought to be made. Only a few studies have considered temporal dissolved uranium variations along with other trace metals within * Corresponding author. E-mail address: [email protected] (A. Camacho). Contents lists available at ScienceDirect Journal of Environmental Radioactivity journal homepage: www.elsevier.com/locate/jenvrad 0265-931X/$ e see front matter Ó 2010 Elsevier Ltd. All rights reserved. doi:10.1016/j.jenvrad.2010.08.005 Journal of Environmental Radioactivity 101 (2010) 1048e1054
-
Upload
universidadfedericosantamaria -
Category
Documents
-
view
3 -
download
0
Transcript of Distribution of uranium isotopes in surface water of the Llobregat river basin (Northeast Spain

lable at ScienceDirect
Journal of Environmental Radioactivity 101 (2010) 1048e1054
Contents lists avai
Journal of Environmental Radioactivity
journal homepage: www.elsevier .com/locate / jenvrad
Distribution of uranium isotopes in surface water of the Llobregat river basin(Northeast Spain)
A. Camacho a,*, R. Devesa b, I. Vallés a, I. Serrano a, J. Soler b, S. Blázquez a, X. Ortega a, L. Matia b
a Institut de Tècniques Energètiques, Universitat Politècnica de Catalunya, ETSEIB, Avda. Diagonal 647, 08028 Barcelona, SpainbAigües de Barcelona, Avda. Diagonal 211, 08018 Barcelona, Spain
a r t i c l e i n f o
Article history:Received 11 March 2010Received in revised form19 July 2010Accepted 14 August 2010Available online 25 September 2010
Keywords:Surface waterUranium isotopesRadioactive disequilibriumSpain
* Corresponding author.E-mail address: [email protected] (A. Cam
0265-931X/$ e see front matter � 2010 Elsevier Ltd.doi:10.1016/j.jenvrad.2010.08.005
a b s t r a c t
A study is presented on the distribution of 234U, 238U, 235U isotopes in surface water of the Llobregat riverbasin (Northeast Spain), from 2001 to 2006. Sixty-six superficial water samples were collected at 16points distributed throughout the Llobregat river basin. Uranium isotopes were measured by alphaspectrometry (PIPS detectors). The test procedure was validated according to the quality requirements ofthe ISO17025 standard. The activity concentration for the total dissolved uranium ranges from 20 to261 mBq L�1. The highest concentrations of uranium were detected in an area with formations of sedi-mentary rock, limestone and lignite. A high degree of radioactive disequilibrium was noted among theuranium isotopes. The 234U/238U activity ratio varied between 1.1 and 1.9 and the waters with the lowesturanium activity registered the highest level of 234U/238U activity ratio. Correlations between uraniumactivity in the tested water and chemical and physical characteristics of the aquifer were found.
� 2010 Elsevier Ltd. All rights reserved.
1. Introduction
Surface waters play an important role in the migration andredistribution of radio-nuclides in the earth’s crust. Concentrationof uranium in water is influenced by the chemical and physicalcharacteristics of the aquifer and by the uranium contents of theinvolved geological formation. Furthermore, knowledge of the234U/238U activity ratio in the ecosystem provides informationabout the mechanisms and processes of uranium transport andorigin. The 234U/238U activity ratio is estimated to be greater than 1in the range 1.1e1.3 in river waters (Skwarzec et al., 2002;Andersson et al., 1995; Porcelli et al., 1997; Riotte and Chabaux,1999; Chabaux et al., 2001; Riotte et al., 2003; Kronfeld et al., 2004).
In the literature some factors are suggested that influence theuranium isotope ratio: the age of the rocks, rock type and climatedifferences. (1) In rocks older than a few million years, 234U/238Uactivity ratios should be in secular equilibrium. However, the highlyenergetic alpha decay of 238U damages amineral’s crystalline latticeand allows 234U to be more mobile during weathering of rock bymeteoric waters. Increased physical weathering and the resultingdecrease in grain size increase the mineral surface area (per unitvolume). This increases the number of alpha recoil fractures thatare exposed to the surface of the grains which, in turn, allows for an
acho).
All rights reserved.
increased rate of 234U removal (e.g., Robinson et al., 2004). The rateof removal is expected to decline with time as the more labileuranium is removed first, leaving the less mobile uranium in themineral crystalline lattices (Latham and Schwarcz, 1987). (2) Rocktype determines rock weathering rates. Carbonates weather themost rapidly followed by shales and sandstones, while plutonic andmetamorphic shield rocks weather the most slowly. (3) Climatedifferences have been hypothesized to affect the 234U/238U activityratio in surface waters of southern Africa and in other riversthroughout the world (Kronfeld and Vogel, 1991; Kronfeld et al.,2004). These authors suggest that rivers that drain regions witharid climates are more likely to have 234U/238U activity ratios thatare greater than those that drain regions with humid climates.Their reason is based on the idea that regions with arid climateshave higher rates of physical weathering which, in turn, createmore surfaces fromwhich to leach recoil 234U. Conversely, Kronfeldand Vogel (1991) hypothesize that rivers in humid regions yield234U/238U activity ratios that are closer to those of the parent rocksthat their surface waters drain.
Nowadays, average values for uranium content in rivers arebased on a few large rivers which have been sampled a minimalnumber of times (e.g., Palmer and Edmond, 1993; Sarin et al., 1990;Windom et al., 2000). Limited sampling of rivers may not capturethe temporal variations in uranium concentrations so, whenpossible, a time-series analysis of dissolved uranium ought tobe made. Only a few studies have considered temporal dissolveduranium variations along with other trace metals within

A. Camacho et al. / Journal of Environmental Radioactivity 101 (2010) 1048e1054 1049
a watershed (Snow and Spalding, 1994; Shiller, 1997). Less commonare studies which concentrate on the temporal variability ofuranium disequilibrium isotope ratios in rivers (e.g., Riotte andChabaux, 1999; Riotte et al., 2003).
Here, we undertake a detailed study of the spatial and temporalvariability of isotopic dissolved uranium in the Llobregat River andits tributaries (Northeast Spain). Previous studies on dissolvedisotopes in drinking waters from the Llobregat River (Ortega et al.,1988, 1996) had shown that the origin of gross alpha and betaactivity was due to uranium isotopes and 40K, respectively. Thus,the main aims of this study are to determine the concentration ofdissolved 234U, 238U, 235U isotopes which will discuss as total dis-solved uranium activity and 234U/238U ratio and its possiblespatiotemporal variations in surface waters of the Llobregat RiverBasin from 2001 to 2006, and to study weathering and mobility ofuranium in this basin. This is the first temporal study of uraniumconcentrations and isotope ratios of the Llobregat River, and moreimportantly, the first in which there is a temporal analysis of thesame parameters in the major Llobregat tributaries. To study thelevel of uranium isotopes in the Llobregat basin is also importantbecause its waters are the source of drinking water of importantCatalan cities such as Barcelona, Martorell, Manresa, Igualada, andothers.
2. Materials and methods
2.1. Study area: overview of the Llobregat River Basin
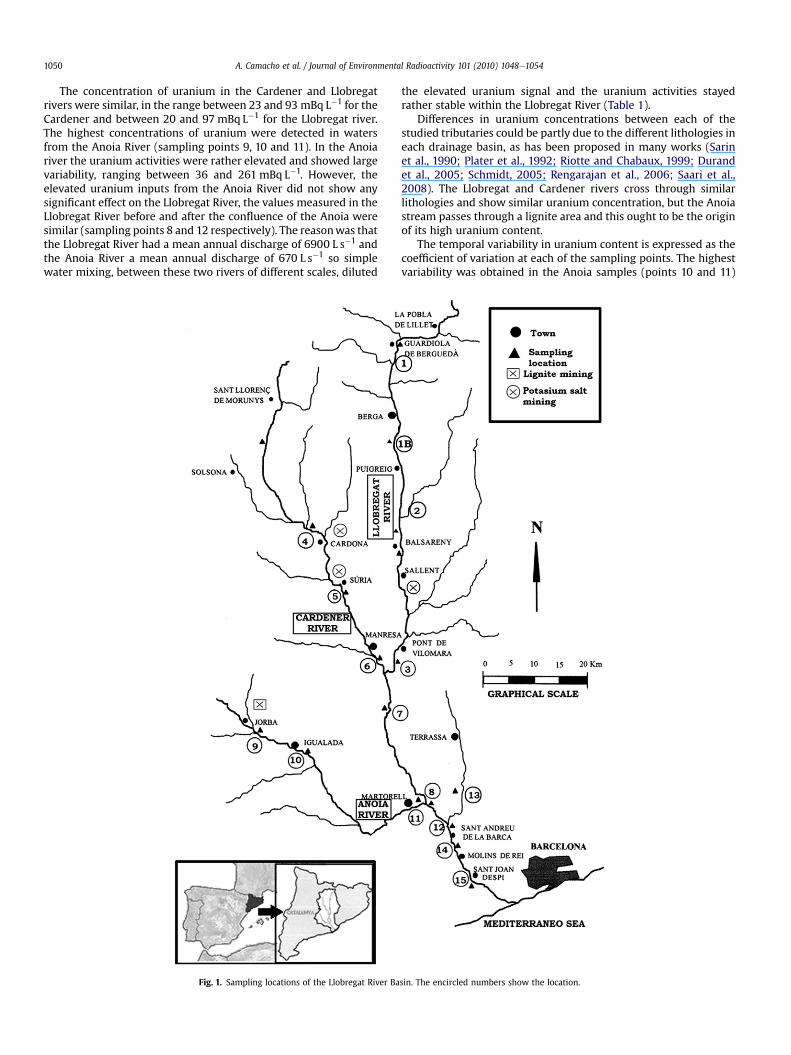
The area of study (Fig. 1) comprises three rivers named the Llobregat, Cardenerand Anoia. The Llobregat is the second longest river in Catalonia, Northeast Spain.The total length of the river from Guardiola de Berguedà to the mouth of the riverclose to the treatment plant located at S. Joan Despí is 160 km and drains a basin of4948 km2. The source of the River Llobregat is at an altitude of 1295 m in the CatalanPyrenees and in the upper part it is stored at La Baells dam and flows directly into theMediterranean Sea, 5 km from Barcelona. Its prominent tributaries which join itfrom the left bank are:
- the Anoia River with a length of 65 km and a basin of 930 km2 from Jorba toMartorell.
- the Cardener River with a length of 87 km and a basin of 1373 km2 from Car-dona up to the confluence with the Llobregat River.
The Llobregat valley has been themain industrial axis of Catalonia since the 19thcentury, coexisting with important agricultural activities. The textile industry,hydropower generation and potash mining have been the main industrial activitiesoperating in the upper and central parts of the Llobregat catchment area. Thisanthropogenic pressure on the river has drastically increased with the mainexpansion of the metropolitan area of Barcelona in the lower part of the basin sincethe 1950s.
Geologically, the Llobregat catchment area is developed in all the main struc-tural units of the NE Iberian Peninsula: Pyrenees, Ebro Basin and Catalan CoastalRanges. The catchment lithology includes meta-sedimentary rocks (conglomerates,sandstones, slates, schists, and marbles), and igneous rocks (granitoids) of thePalaeozoic basement, as well as extensiveMesozoic and Cenozoic sedimentary rocks(conglomerates, sandstones, pelites, limestones and some evaporite and lignite-bearing formations).
The climate in the Llobregat catchment area is Mediterranean with a strongseasonal fluctuation in temperature and precipitation. Furthermore, there areimportant geographic differences between the upper and lower parts of the basin.Mean monthly temperatures range from 4 �C in January to 15 �C in August in theupper part of the basin and from 8 �C in January to 22 �C in August in the lower part.Most precipitation occurs in spring (MarcheJune) and autumn (SeptembereDe-cember), with virtually no precipitation during summer (JuneeSeptember) andwinter (DecembereMarch). The Llobregat River receives waters from snow melt inthe source region and from seasonal rains and/or several tributaries along its course.Yearly precipitation exceeds 1000 mm in the Pyrenees and is less than 600 mm nearthe coast.
The Llobregat River water shows high salinity due to both natural and anthro-pogenic processes in its middle and lower courses with a dry residue about900 mg L�1. The geological formations located in the middle of the river basin nearthe towns of Sallent, Cardona and Suria contain levels with abundant calciumsulfates (anhydrite, gypsum) and NaeK chlorides (halite, silvite and carnalite).
The potash mining industry has exploited potassium chlorides since the 1920s,generating important volumes of tales.
2.2. Sampling and sample preparation
The chosen sampling points are shown in Fig 1 with the location numbersencircled. Nine sampling points (1, 1B, 2, 3, 7, 8, 12, 14 and 15) are in the course of theLlobregat River, three points (4, 5 and 6) in the Cardener River and three points (9,10and 11) in the Anoia River. Site 13 is located in a small stream, named Riera de Rubí,to which many different industrial and domestic wastewaters discharge.
During six years for the period 2001e2006, integrated grab water samples werecollected from some of the 16 points distributed throughout the Llobregat RiverBasin (Fig. 1).
A total of 66 samples were collected from stream to estuary throughout differentsampling campaigns covering a wide range of flow rate. In order to study the vari-ability with the season and the flow rate, the sampling was made in spring (SP) forthree campaigns, in autumn (A) for three campaigns and in summer (SU) for onecampaign.
Immediately after sampling, the fresh water was passed through a 0.45-micrometre-pore-size filter to separate dissolved from particulate phases. Inte-grated samples were used for this study and consisted of a mix of three-monthlysamples taken each month.
For the radiochemical methods the integrated samples were acidified with nitricacid at 1/1000 after filtration and kept in polyethylene containers.
2.3. Radiochemical method and measurement techniques
Conductivity and alkalinity were determined by a robotic titrosampler withconductivity module (Metröhm 855 and 856 respectively). Chloridewas analyzed byionic chromatography (Dionex ICS-2000). The river flow rates were determined bymeans of ultrasonic meters at sampling points 8 and 15, and were estimated visuallybehind a hydraulic structure, channel and weir, at the other sampling points.
Uraniumwas separated with a known amount of 232U tracer by ferric hydroxideprecipitation. The precipitate was dissolved in 8M nitric acid and the solution waspassed through an anion exchange column (Dowex 1�8, 100e200 mesh) that hadbeen preconditioned with 8M nitric acid. Following this, the uranium was elutedwith 1 MHCl. A detailed description of the experimental procedurewas presented atVallés (1994). Finally, the sample was electrodeposited onto stainless steel planchets(Hallstadius, 1984).
The activity concentration of uranium isotopes (234U, 235U and 238U) wasdetermined by alpha spectrometry using PIPS detectors with a 450 mm2 active area.The typical radiochemical yields for the uranium were about 80e95%, the limit ofdetection for this method was 0.5 mBq L�1 and the uncertainty (k¼ 2) was about10%. The uncertainties are derived from counting statistics and uncertainties in thespiked 232U. The precision of uranium concentration based on repeat measurementsof the water samples is �4%. The test procedure was validated according to thequality requirements of the ISO17025 standard (ISO, 2005).
3. Results and discussion
3.1. Total dissolved uranium activity
Activities of 234U presented a range between 11 and142 mBq L�1, of 235U a range between 0.3 and 5.7 mBq L�1 and of238U a range between 8 and 114 mBq L�1 in the studied period. Totaldissolved uranium activity calculated as the sum of the 234U, 235Uand 238U activities will use above in order to discuss the spatial-temporal behavior of the uranium isotopes in the Llobregat RiverBasin.
Table 1 shows the distribution of total dissolved uraniumactivity in the Llobregat River Basin for the period 2001e2006, theaverage value is also presented, together with the coefficient ofvariation, the mean flow rate and coefficient of variation for theflow rate for each of the sampled points. The activity concentrationfor the dissolved uranium ranged from 20 to 261 mBq L�1. Theaverage activity and the standard deviation for the dissolveduranium was 70� 52 mBq L�1 (n¼ 66). Therefore the uraniumactivity was non-homogeneous in the investigated watershed andhigher than the global average river water uranium 2.3 mBq L�1
(Palmer and Edmond,1993; Sarin et al., 1990;Windom et al., 2000).It should be pointed out nevertheless that these values were muchlower than the guidance levels for 238U and 234U in drinking waterpresented at the WHO guidelines (WHO, 2008).
A. Camacho et al. / Journal of Environmental Radioactivity 101 (2010) 1048e10541050
The concentration of uranium in the Cardener and Llobregatrivers were similar, in the range between 23 and 93 mBq L�1 for theCardener and between 20 and 97 mBq L�1 for the Llobregat river.The highest concentrations of uranium were detected in watersfrom the Anoia River (sampling points 9, 10 and 11). In the Anoiariver the uranium activities were rather elevated and showed largevariability, ranging between 36 and 261 mBq L�1. However, theelevated uranium inputs from the Anoia River did not show anysignificant effect on the Llobregat River, the values measured in theLlobregat River before and after the confluence of the Anoia weresimilar (sampling points 8 and 12 respectively). The reasonwas thatthe Llobregat River had a mean annual discharge of 6900 L s�1 andthe Anoia River a mean annual discharge of 670 L s�1 so simplewater mixing, between these two rivers of different scales, diluted
Fig. 1. Sampling locations of the Llobregat River Ba
the elevated uranium signal and the uranium activities stayedrather stable within the Llobregat River (Table 1).
Differences in uranium concentrations between each of thestudied tributaries could be partly due to the different lithologies ineach drainage basin, as has been proposed in many works (Sarinet al., 1990; Plater et al., 1992; Riotte and Chabaux, 1999; Durandet al., 2005; Schmidt, 2005; Rengarajan et al., 2006; Saari et al.,2008). The Llobregat and Cardener rivers cross through similarlithologies and show similar uranium concentration, but the Anoiastream passes through a lignite area and this ought to be the originof its high uranium content.
The temporal variability in uranium content is expressed as thecoefficient of variation at each of the sampling points. The highestvariability was obtained in the Anoia samples (points 10 and 11)
sin. The encircled numbers show the location.

Table 1Dissolved uranium activity in the Llobregat River Basin.
Samplingpoint
River Meanflow(L s�1)
Coefficient ofvariation of flow
Uranium (mBq L�1)a Coefficientof variation
Year (Seasonb) Mean
2001 (SP) 2002 (A) 2003 (SP) 2003 (A) 2004 (SP) 2005 (A) 2006 (SU)
1 Llobregat 348643.4
26� 4 20� 4 22� 4 23 14.3
1 bis Llobregat 407622.9
29� 4 24� 4 30� 4 28 11.3
2 Llobregat 512332.2
38� 5 42� 5 40 6.9
3 Llobregat 651638.3
39� 4 48� 5 52� 6 72� 6 60� 6 29� 4 50 30.2
4 Cardener 280425.3
36� 4 23� 4 45� 5 35� 5 35 26.3
5 Cardener 351229.7
82� 7 63� 6 73 18.3
6 Cardener 354916.8
43� 7 48� 6 73� 8 93� 7 74� 8 42� 5 62 33.7
7 Llobregat 1061434.0
76� 6 67� 7 31� 5 58 41.7
8 Llobregat 911235.8
40� 5 34� 5 55� 6 82� 7 66� 6 34� 5 52 37.6
9 Anoia 243107.2
220� 11 170� 8 241� 11 261� 17 210� 11 221 15.6
10 Anoia 52646.0
114� 5 186� 11 123� 8 141 27.9
11 Anoia 121056.1
36� 5 86� 7 112� 10 90� 8 50� 6 75 41.4
12 Llobregat 906041.2
42� 6 63� 6 85� 9 73� 7 39� 5 60 33.1
13 Riera Rubí 6081.9
54� 6 52� 6 53 2.7
14 Llobregat 954140.9
64� 6 93� 9 66� 6 37� 5 65 35.3
15 Llobregat 848051.3
62� 6 75� 7 67� 9 62� 5 97� 9 67� 8 42� 5 68 24.3
a Uranium activity per year included the counting uncertainty (k¼ 2).b SP, spring; A, autumn; SU, summer.
A. Camacho et al. / Journal of Environmental Radioactivity 101 (2010) 1048e1054 1051
because rivers with a very low discharge might be more susceptibleto register change inweathering or dilution by rain (Schmidt, 2005;Saari et al., 2008). The Anoia River had also the highest variability initsflowratewith values between107and46% for the studiedperiod.
001
051
002
052
003
)PS(1002 )A(2002 )PS(3002
)A(3002 )PS(4002 )A(5002
)US(6002
0
05
Ura
niu
m a
ctivity (m
Bq
/L
)
gnilpmaS
tagerbolL bolLrenedraC
5432b11 76
Fig. 2. Spatiotemporal distribution of dissolved uranium activity in the Llobregat river basin(SP, spring; A, autumn; SU, summer). Lines are drawn joining points belonging to the same
Both the variability in uranium content and the annual flow ratewere high along the Llobregat River Basin. Therefore, this couldsuggest that the temporal variability is related to changes in theflow rate.
snoitacol
tagerbolLaionAtager
íbuRareiR
tagerbolL
98 514131211101
for the period 2001e2006. The sampling locations in the different rivers are indicatedyear.
Table 3Statistical parameters for some chemical and physical characteristics of the Llo-bregat River Basin.
River Statistical Flow rate Conductivity Carbonates Chloride
Table 2Uranium activity ratios in the Llobregat River Basin in the period 2001e2006 (uncertainty k¼ 2).
Samplingpoint
River 234U/238U (Activity ratio)
Year (Seasona) Mean Coefficientof variation
2001 (SP) 2002 (A) 2003 (SP) 2003 (A) 2004 (SP) 2005 (A) 2006 (SU)
1 Llobregat 1.39� 0.24 1.37� 0.30 1.55� 0.25 1.44 6.81 bis Llobregat 1.42� 0.20 1.89� 0.35 1.64� 0.23 1.65 14.42 Llobregat 1.41� 0.17 1.30� 0.16 1.35 5.73 Llobregat 1.60� 0.16 1.40� 0.14 1.45� 0.16 1.46� 0.13 1.49� 0.14 1.37� 0.19 1.46 5.54 Cardener 1.40� 0.16 1.45� 0.25 1.24� 0.14 1.46� 0.19 1.39 7.45 Cardener 1.37� 0.11 1.28� 0.13 1.32 5.26 Cardener 1.60� 0.28 1.37� 0.16 1.32� 0.14 1.37� 0.11 1.47� 0.15 1.30� 0.16 1.40 7.97 Llobregat 1.40� 0.12 1.33� 0.13 1.33� 0.20 1.35 3.28 Llobregat 1.41� 0.17 1.47� 0.22 1.40� 0.15 1.39� 0.12 1.46� 0.14 1.50� 0.22 1.44 3.19 Anoia 1.14� 0.06 1.16� 0.06 1.10� 0.05 1.24� 0.08 1.23� 0.06 1.17 5.210 Anoia 1.26� 0.06 1.10� 0.06 1.26� 0.08 1.20 7.811 Anoia 1.61� 0.21 1.46� 0.12 1.38� 0.13 1.46� 0.13 1.59� 0.18 1.50 6.512 Llobregat 1.59� 0.22 1.45� 0.14 1.38� 0.15 1.45� 0.13 1.47� 0.21 1.47 5.313 Riera Rubí 1.55� 0.16 1.39� 0.15 1.47 7.614 Llobregat 1.33� 0.12 1.39� 0.14 1.47� 0.14 1.53� 0.22 1.43 6.215 Llobregat 1.48� 0.14 1.50� 0.14 1.46� 0.19 1.39� 0.12 1.33� 0.13 1.46� 0.16 1.41� 0.16 1.43 4.1
a SP, spring; A, autumn; SU, summer.
A. Camacho et al. / Journal of Environmental Radioactivity 101 (2010) 1048e10541052
Fig. 2 shows the spatial-temporal behavior of the uraniumcontent along the catchment area for the period 2001e2006. Theuranium content increased along the Llobregat and Cardener riversand decreased along the Anoia river. The spatial behavior wasalmost the same throughout the basin for the studied years becauseparallel lines are drawnwhen the values obtained for the same yearare joined.
3.2. 234U/238U activity ratio
The distribution of the 234U/238U activity ratio in the LlobregatRiver Basin for the period 2001e2006 is reported in Table 2.
The 234U/238U activity ratios in the Llobregat River Basin variedbetween 1.1 and 1.9. The mean uranium activity ratio and thestandard deviation was 1.41�0.13 (n¼ 66) which was higher thanthe average of 1.17 and outside the range 1.1e1.3 reported atbibliography (Chabaux et al., 2001; Skwarzec et al., 2002), but itwas the expected value for surface waters flowing over carbonates(Riotte and Chabaux, 1999). The temporal uranium activity ratio inthe Llobregat River Basin remained nearly the same over thestudied period with the variability lower than 10% in almost all thesampling points.
With regard to the spatial behavior of the uranium activity ratio,the highest values were detected inwaters from the Llobregat River
5.1
6.1
7.1
8.1
9.1
2
)PS(1002 )A(2002 )PS(3002 )A(3002
)PS(4002 )A(5002 )US(6002
1
1.1
2.1
3.1
4.1
0620120610110601
234U
/ 238U
activity ratio
)L/qBm(ytivitcamuinarU
Fig. 3. Variation of the 234U/238U activity ratio with the total dissolved uraniumactivity in the Llobregat River Basin (SP, spring; A, autumn; SU, summer).
in the upper part of the basin (sampling point 1B). This could be dueto the contribution of groundwater as was argued by Durand et al.(2005) and Riotte and Chabaux (1999) or to the influence of thestorage at the La Baells dam. The smallest 234U/238U activity ratiowas observed at sampling points 9 and 10 from the Anoia Riverwhich were the points with the higher uranium concentration.
Fig. 3 shows 234U/238U activity ratio as a function of uraniumconcentration. The waters with the lowest uranium activity regis-tered the highest level of 234U/238U activity ratio (Lee et al., 2001) soan inverse behavior was found between uranium concentrationand 234U/238U activity ratio.
3.3. Statistical study between total dissolved uranium activity andchemical and physical parameters
Table 3 shows the statistical parameters for some chemicals(conductivity, carbonate and chloride) and physical (flow rate)characteristics for the studied rivers at the Llobregat watershed. All
parameter (L/s) (mS/cm) (mg/L) (mg/L)
Llobregat Data 54 48 30 54Arithmetic mean 6900 1140 210 305Standard deviation 3300 370 17 322Minimum 1967 490 180 27Maximum 15270 1570 245 1635
Cardener Data 18 18 6 18Arithmetic mean 3190 1245 200 350Standard deviation 605 575 12 360Minimum 2100 460 180 25Maximum 4250 2320 210 1570
Anoia Data 18 18 12 18Arithmetic mean 670 2520 325 465Standard deviation 540 610 19 270Minimum 10 1660 285 165Maximum 2160 4075 350 1180
Rubí Data 6 6 6 6Arithmetic mean 815 2275 370 520Standard deviation 300 155 20 50Minimum 600 2065 325 450Maximum 1400 2470 390 580

Table 4Correlation studies between the total dissolved uranium activity, the inorganicconstituents and flow rate in waters from the Llobregat River Basin.
Correlated parameters Level of significance Pearson’s coefficient
Uranium/flow rate (61) 99 �0.386Uranium/conductivity (57) 99 0.603Uranium/carbonate (37) 95 0.374Carbonate/flow rate (54) 99 �0.644Chloride/flow rate (96) 95 �0.214Conductivity/flow rate (90) 99 �0.418Chloride/conductivity (90) 99 0.436Carbonate/conductivity (54) 99 0.778
The number of correlated data is in brackets.
051
002
052
003
To
tal d
isso
lved
u
ran
iu
m activity (m
Bq
/L
)
)PS(1002 )A(2002)A,PS(3002 )PS(4002
)A(5002 )US(6002
0
05
001
000810006100041000210000100080006000400020
)s/L(etarwolF
Fig. 5. Total dissolved uranium activity versus flow rate in the Llobregat River Basin(SP, spring; A, autumn; SU, summer).
A. Camacho et al. / Journal of Environmental Radioactivity 101 (2010) 1048e1054 1053
statistical analyses were carried out using SPSS V-17 software. Theselected chemical parameters were conductivity as a measurementof the total ionic content of the water and chloride and carbonate(the majority anions in the watershed) in order to distinguish if anyparticular anion were correlated with the total dissolved uraniumactivity. The highest concentrations of chloride, carbonates andconductivity were detected inwaters from the Anoia River and Rubístream and similar chemical characteristic were observed for boththe Llobregat and the Cardener rivers.
Correlation analysis between the total dissolved uraniumactivity, the ionic content of the water and the flow rate is pre-sented in Table 4. The total dissolved uranium activity showsignificant correlation with flow rate, conductivity and carbonatesbut is not correlated with the chloride content of the samples. Anoverall positive correlation between dissolved uranium and dis-solved ions (anions and cations) is expected in rivers if duringchemical weathering of rocks and minerals ions and uranium arereleased in approximately the same ratio. Similar correlationsbetween uranium and carbonates were also reported for worldrivers (Rengarajan et al., 2006) because the formation of uranylcarbonate complexes in oxidant environments should contribute tothe uranium solution. Also the significantly inverse correlationbetween uranium activities and the flow rate in waters from theLlobregat River Basin was similar to those reported for the SeineRiver (Schmidt, 2005).
It was also found correlation between the physical and chemicalparameters of the waters (Table 4). It was obtained a negativecorrelation between flow rate and the chemical parameters(conductivity, carbonate and chloride) and positive correlationbetween the chemical parameters conductivity versus carbonatesand chlorides during the studied period.
041
061
081
002
022
042
062
082 )PS(1002 )A(2002 )A,PS(3002
)PS(4002 )A(5002 )US(6002
0
02
04
06
08
001
021
0053000300520002005100010050
To
tal d
isso
lved
u
ran
iu
m activity (m
Bq
/L
)
(ytivitcudnoC )mc/S
Fig. 4. Total dissolved uranium activity versus conductivity in the Llobregat River Basin(SP, spring; A, autumn; SU, summer).
Figs. 4 and 5 exhibited the close relation between the ioniccontent of the samples or the flow rate and the total dissolveduranium activity in waters from the Llobregat River Basin.
4. Conclusions
The results obtained in this work present the first substantialdata set of dissolved uranium and 234U/238U activity ratio withinthe catchment of the Llobregat River.
The total uranium activity in the Llobregat Basin is not constantalong the basin with values between 20 and 261 mBq L�1 and itis higher than the global average river water uranium of2.5 mBq L�1. The highest concentrations of uranium weredetected in the Anoia River because it drains through an areawith formations of lignite.The temporal total uranium activity variability at each of thesampling points was high and related with the changes in theflow rate.The spatial behavior is almost the same throughout the basin forthe studied years.A high degree of radioactive disequilibrium was noted amongthe uranium isotopes. The 234U/238U activity ratio variedbetween 1.1 and 1.9 and the waters with the lowest uraniumactivity registered the highest level of 234U/238U activity ratio.The 234U/238U activity ratios in the Llobregat River Basinremained nearly the same over the studied period with vari-ability lower than 10% in almost all the sampling points.The mean 234U/238U activity ratio and the standard deviationwas 1.41�0.13, which is the expected value for surface watersflowing over carbonates. The lowest 234U/238U activity ratioswith values near equilibriumwere obtained for the Anoiawaterswhich drain lignite.Correlations between total dissolved uranium activity in thetested water and chemical and physical characteristics of theaquifer have been found.
Acknowledgements
This study was made possible by financing from the AGBARFoundation.
References
Andersson, P.S., Wasserburg, G.J., Chen, J.H., Papanastassiou, D.A., Ingri, J., 1995. 238U,234U and 232Th-230Th- in the Baltic Sea and River Water. Earth Planet. Sci. Lett.130, 217e234.

A. Camacho et al. / Journal of Environmental Radioactivity 101 (2010) 1048e10541054
Chabaux, F., Riotte, J., Clauer, N., France-Lanord, C., 2001. Isotopic tracing of thedissolved U fluxes of Himalayan rivers: implications for present and past Ubudgets of the GangeseBrahmaputra system. Geochim. Cosmochim. Acta 65(19), 3201e3217.
Durand, S., Chabaux, F., Rihs, S., Duringer, P., Elsass, P., 2005. U isotope ratios astracers of groundwater inputs into surface waters: example of the Upper Rhinehydrosystem. Chem. Geol. 220, 1e19.
Hallstadius, L., 1984. A method for the electrodeposition of actinides. Nuclear Ins-trum. Methods Phys. Res. Sect. A Accelerators Spectrometers Detectors Asso-ciated Equipment 223 (2, 3), 266e267.
ISO/IEC 17025, 2005. General requirements for the competence of testing andcalibration laboratories.
Kronfeld, J., Vogel, J.C., 1991. Uranium isotopes in surface waters from southernAfrica. Earth Planet. Sci. Lett. 105, 191e195.
Kronfeld, J., Godfrey-Smith, D.I., Johannessen, D., Zentilli, M., 2004. Uranium seriesisotopes in the Avon Valley, Nova Scotia. J. Environ. Radioact. 73, 335e352.
Latham, A.G., Schwarcz, H.P., 1987. On the possibility of determining rates of removalof uranium from crystalline igneous rocks using U-series disequilibria-1: a U-leach model, and its applicability to whole-rock data. Appl. Geochem. 2, 55e65.
Lee, M.H., Choi, G.S., Cho, Y.H., Lee, C.W., Shin, H.S., 2001. Concentrations andactivity ratios of uranium isotopes in the groundwater of the Okchun Belt inKorea. J. Environ. Radioact. 57, 105e116.
Ortega,X., Vallés, I., Isamat, F., Perramón, J., Salvatella,V.,1988. Studyof the radioactivecontents in Barcelona’s water supply during 1986. AQUA 6, 300e305.
Ortega, X., Vallés, I., Serrano, I., 1996. Natural radioactivity in drinking water inCatalonia (Spain). Environ. Int. 22 (Suppl. 1), S347eS354.
Palmer, M.R., Edmond, J.M., 1993. Uranium in river water. Geochim. Cosmochim.Acta 57 (20), 4947e4955.
Plater, A.J., Ivanovich, M., Dugdale, R.E., 1992. Uranium series disequilibrium in riversediments and waters: the significance of anomalous activity ratios. Appl.Geochem. 7, 101e110.
Porcelli, D., Andersson, P.S., Wasserburg, G.J., Ingri, J., Baskaran, M., 1997. Theimportance of colloids and mires for the transport of uranium isotopes throughthe Kalix River watershed and Baltic Sea. Geochim. Cosmochim. Acta 61 (19),4095e4113.
Rengarajan, R., Sarin, M.M., Krishnaswami, S., 2006. Dissolved uranium and234U/238U in the Yamuna and the Chambal rivers, India. Aquatic Geochem. 12,73e101.
Riotte, J., Chabaux, F., 1999. (234U/238U) Activity ratios in freshwaters as tracers ofhydrological processes: the Strengbach watershed (Vosges, France). Geochim.Cosmochim. Acta 63 (9), 1263e1275.
Riotte, J., Chabaux, F., Benedetti, M., Dia, A., Gérard, M., Boulègue, J., Etamé, J., 2003.Uranium colloidal transport and origins of the 234Ue238U fractionation insurface waters: new insights from Mount Cameroon. Chem. Geol. 202,365e381.
Robinson, L.F., Henderson, G.M., Hall, L., Matthews, I., 2004. Climatic control ofriverine and seawater uranium-isotope ratios. Science 305, 851e854.
Saari, H.-K., Schmidt, S., Huguet, S., Lanoux, A., 2008. Spatiotemporal variation ofdissolved 238U in the Gironde fluvial-estuarine system (France). J. Environ.Radioact. 99, 426e435.
Sarin, M.M., Krishnaswami, S., Somayajulu, B.L.K., Moore, W.S., 1990. Chemistry ofuranium thorium and radium isotopes in the GangaeBrahmaputra riversystem: weathering processes and fluxes to the bay of Bengal. Geochim. Cos-mochim. Acta 54 (5), 1387e1396.
Schmidt, S., 2005. Investigation of disolved uranium content in the watershed ofSeine River (France). J. Environ. Radioact. 78, 1e10.
Shiller, A.M., 1997. Dissolved trace elements in the Mississippi River: seasonal,interannual, and decadal variability. Geochim. Cosmochim. Acta 61, 4321e4330.
Skwarzec, B., Borylo, A., Struminska, D., 2002. 234U and 238U isotopes in water andsediments of the southern Baltic. J. Environ. Radioact. 61, 345e363.
Snow, D.D., Spalding, R.F., 1994. Uranium isotopes in the Platte River drainage basinof the North American High Plains region. Appl. Geochem. 9, 271e278.
Vallés, I., 1994. Desarrollo de metodologías de análisis de la radiactividad en aguas.Aplicación a aguas de bebida. Ph.D. thesis, Barcelona University, pp. 52e84.
Windom, H., Smith, R., Niencheski, F., Alexander, C., 2000. Uranium in rivers andestuaries of globally diverse, smaller watershed. Mar. Chem. 68, 307e321.
World Health Organization, 2008. Radiological aspects, in: guidelines for drinking-water quality. Incorporating the first and second addenda. In: Recommenda-tions, third ed., vol. 1. WHO, ISBN 978 92 4 154761 1 (WEB version) (NLMclassification: WA 675)203e204.