Cryopreservation of organs by vitrification: perspectives and recent advancesq

S C I E N C E O F T H E T O T A L E N V I R O N M E N T 3 9 0 ( 2 0 0 8 ) 5 6 9 – 5 7 8
ava i l ab l e a t www.sc i enced i rec t . com
www.e l sev i e r. com/ loca te / sc i to tenv
Distribution of trace elements in organs of six species ofcetaceans from the Ligurian Sea (Mediterranean), and therelationship with stable carbon and nitrogen ratios
R. Capellia, K. Dasb, R. De Pellegrinia, G. Dravaa, G. Lepointb, C. Miglioa,V. Mingantia,⁎, R. Poggic
aDipartimento di Chimica e Tecnologie Farmaceutiche ed Alimentari - Università degli Studi di Genova - Via Brigata Salerno,13 I-16147 Genova, ItalybMARE center, Laboratory for Oceanology, University of Liège, B6 Sart-Tilman, B-4000 Liège, BelgiumcMuseo Civico di Storia Naturale “Giacomo Doria” - Via Brigata Liguria, 9 I-16121 Genova, Italy
A R T I C L E I N F O
⁎ Corresponding author. Tel.: +39 010 3532605E-mail address: [email protected] (V
0048-9697/$ – see front matter © 2007 Elsevidoi:10.1016/j.scitotenv.2007.10.036
A B S T R A C T
Article history:Received 8 January 2007Received in revised form12 October 2007Accepted 17 October 2007Available online 26 November 2007
Mercury (total and organic), cadmium, lead, copper, iron, manganese, selenium and zincconcentrations were measured in different organs of 6 different cetacean species strandedin an area of extraordinary ecological interest (Cetaceans’ Sanctuary of the MediterraneanSea) along the coast of the Ligurian Sea (North-West Mediterranean). Stable-isotopes ratiosof carbon (13C/12C) and nitrogen (15N/14N) were also measured in the muscle. A significantrelationship exists between 15N/14N, mercury concentration and the trophic level. Thedistribution of essential and non-essential trace elements was studied on several organs,and a significant relationship between selenium and mercury, with a molar ratio close to 1,was found in the cetaceans’ kidney, liver and spleen, regardless of their species. Highselenium concentrations are generally associated with a low organic to total mercury ratio.While narrow ranges of concentrations were observed for essential elements in mostorgans, mercury and selenium concentrations are characterised by a wide range ofvariation. Bio-accumulation and bio-amplification processes in cetaceans can be betterunderstood by comparing trace element concentrations with the stable-isotopes data.
© 2007 Elsevier B.V. All rights reserved.
Keywords:CetaceansMercuryStable isotopesTrace elementsTrophic position
1. Introduction
Due to its favourable oceanographic, climatic and geomor-phological factors, the “Cetaceans’ Sanctuary of the Mediter-ranean Sea” which includes the Ligurian Sea, is considered asan ecologically interesting area, compared to the rest of theMediterranean (Notarbartolo et al., 1992).
The Mediterranean cetacean species find their breeding andfeeding needs in these waters. These species include finwhalesBalaenoptera physalus, sperm whales Physeter macrocephalus,Cuvier's beaked whales Ziphius cavirostris, long-finned pilotwhales Globicephala melas, Risso's dolphins Grampus griseus,
; fax: +39 010 3532684.. Minganti).
er B.V. All rights reserved
common bottlenose dolphins Tursiops truncatus, striped dol-phins Stenella coeruleoalba, and short-beaked common dolphinsDelphinus delphis.
Yet, the anthropogenic activities have a great pressure onthis rich faunal biodiversity. Marine mammals, being highlysensitive to environmental changes, and at the top of thetrophic chain, are importantmarine health indicators, and theimpact of pollutants on their health has given way to a lot ofconcern. Several studies on trace elements concentration indifferent species were published over the last years (Leonzioet al., 1992; Law, 1996; Cardellicchio et al., 2000; Das et al.,2003a).
.

Table 1 –Morphological data of the 12 specimens, dateand site of sampling
Species Code Datedd/mm/yyyy
Site Sex Lengthm
WeightKg
B. physalus Bp1 01/05/1991
Gulf ofGenova
M 17.7 26000
B. physalus Bp2 06/12/2001
Gulf ofGenova
F 13.5 7000
P. macrocephalusa Pm 14/02/2002
Varazze(SV)
F 5.10 2500
G. griseusb Gg1 02/07/1992
Genova M 2.30 165
G. griseus Gg2 08/04/1992
Albenga(SV)
F 2.98 230
G. griseus Gg3 02/02/2004
Ceriale(SV)
M 3.25 296
S. coeruleoalba Sc1 01/09/1990
Varigotti(SV)
M 1.91 76
S. coeruleoalba b Sc2 27/02/1991
Arenzano(GE)
F 1.65 50
S. coeruleoalba b Sc3 08/02/2001
Genova M 1.56 35
T. truncatus c Tt1 14/11/1999
Camogli(GE)
M 1.78 73
T. truncatusb Tt2 16/07/2002
Genova F 2.78 159
Z. cavirostris Zc 04/02/1992
Andora(IM)
M 5.35 1500
a Young specimen.b Subadult specimen.c Suckling specimen.
Table 2 – Quality control
Element Certified value(μg g−1 d.w.)
Found value(μg g−1 d.w.)
Recovery%
Hg-tot 0.27±0.06 0.27±0.02 100Hg-org 0.152±0.013 0.152±0.009 100Cd 26.7±0.6 26.4±2.2 99Pb 0.35±0.13 0.38±0.02 109Cu 106±10 95±5 90Fe 105±13 105±7 100Mn 13.6±1.2 13.6±1.0 100Se 5.63±0.67 5.53±0.76 98Zn 180±6 178±9 99
Results obtained on the Certified Reference Material TORT-2(Lobster hepatopancreas homard, Institute for EnvironmentalChemistry, National Research Council Canada, Ottawa, Canada).Concentrations are given in μg g−1 dry weight. The found values arereported as mean values of 8 determinations with 95% confidenceintervals. Organicmercury concentration is reported as μg of Hg g−1,and the certified value refers to methylmercury concentration(expressed as mercury). Percent recovery is also reported.
570 S C I E N C E O F T H E T O T A L E N V I R O N M E N T 3 9 0 ( 2 0 0 8 ) 5 6 9 – 5 7 8
Apart from the environmental contamination, many otherfactors have an influence on the trace elements concentrationin marine mammals, such as: age, body condition and diet(Das et al., 2004). Usually, stomach contents analysis are doneto understand the food habits in the Mediterranean area(Wurtz et al., 1992; Wurtz and Marrale, 1993; Orsi Relini et al.,1994). Even if these kinds of studies are useful to identify preyspecies, they still give indication only to the last meal of theanimal and not on its feeding habits (Das et al., 2003b). Sinceisotope ratios in animal tissues and in their food are closelyconnected, carbon and nitrogen stable-isotope analyses havebecome an excellent means to obtain further informationabout marinemammals feeding ecology (Kelly, 2000). The δ13Cvalue is used to indicate relative contributions to the diet ofpotential primary sources, and can show the differencebetween onshore and offshore areas, or between pelagic andbenthic prey species (De Niro and Epstein, 1978). On the otherhand, δ15N value shows a stepwise increase in the trophic level
of a food chain. This becomes a reliable indication to theanimal trophic position (De Niro and Epstein, 1981).
Isotopic signatures have also recently been used to tracethe contaminants transfer in the food chain (Hobson et al.,2002; Borrell et al., 2006). Yet, few studies have focused onheavy metals (Cabana and Rasmussen, 1994; Das et al., 2003a;Das et al., 2004). In this work, metal concentrations (total andorganic mercury, cadmium, lead, copper, iron, manganese,selenium and zinc) and stable nitrogen and carbon signaturewere measured in the tissues and organs of six different ceta-cean species from the Ligurian Sea: 2 fin whales (B. physalus,Linnaeus, 1758), 1 sperm whale (P. macrocephalus, Linnaeus,1821), 3 Risso's dolphins (G. griseus,Cuvier, 1812), 3 stripeddolphins (S. coeruleoalba, Meyen, 1833), 2 bottlenose dolphins(T. truncatus, Montagu, 1821) and 1 Cuvier's beaked whale(Z. cavirostris, Cuvier, 1823). These animals stranded in the“Cetaceans' Sanctuary of the Mediterranean Sea” along theLigurian sea, or were found dead offshore during 1990–2004.The small number of specimens available in this kind ofstudies, which are sometimes carried out on single animals, isvery common, and it is for this reason that studies do not offerstatistical analysis data. Nevertheless, they provide usefulinformation, since it is to be borne inmind that it is difficult tocollect these samples, always belonging to individuals founddead, and not caught.
The sampled species belong to different trophic chainlevels. B. physalus is the onlymysticete regularly present in theMediterranean Sea, feeding on krill (Orsi Relini and Cappello,1992). The other cetaceans are odontocetes: Z. cavirostris andG. griseus mainly feed on squids (Carlini et al., 1992a; Carliniet al., 1992b), P. macrocephalus feeds mostly on cephalopods(squids and octopus), and, to a lesser extent, on fish (Clarkeet al., 1993; Roberts, 2003). S. coeruleoalba and T. truncatus canfeed mostly on fish and squids at a lesser scale (Pulcini et al.,1992; Orsi Relini et al., 1994).
This work aims to: (i) study the distribution of essential andnon-essential trace elements in different organs. To have a fullinsight of accumulation/detoxification mechanisms, severalorgans are to be studied, since no single organ indicator is

Table 3 – Concentrations (means of 2 determinations) of the different elements in the organs and tissues of the cetaceans,reported as μg g−1 dry weight, organic mercury as μg of Hg g−1
Specimen Fresh/dry Hg-tot(μg g−1
d.w.)
Hg-org(μg g−1
d.w.)
Hg-org/tot(%)
Se(μg g−1
d.w.)
Cd(μg g−1
d.w.)
Pb(μg g−1
d.w.)
Cu(μg g−1
d.w.)
Fe(μg g−1
d.w.)
Mn(μg g−1
d.w.)
Zn(μg g−1
d.w.)
MuscleB. physalus Bp1 5.18 2.64 2.57 97 0.90 0.04 0.137 1.6 437 0.77 70
Bp2 5.02 0.65 0.59 91 1.16 0.04 0.051 3.2 305 0.51 143P. macrocephalus Pm 3.70 1.13 0.78 69 1.88 b l.o.d. b l.o.d. 1.6 383 0.35 113G. griseus Gg1 3.99 5.86 5.72 98 1.97 b l.o.d. b l.o.d. 3.0 373 0.26 53
Gg2 3.97 139 23.62 17 44.98 0.38 b l.o.d. 3.7 1144 0.68 75Gg3 4.18 128 22.08 17 96.94 0.52 b l.o.d. 2.9 913 0.72 87
S. coeruleoalba Sc1 3.48 8.11 6.76 83 2.62 b l.o.d. b l.o.d. 5.1 765 1.13 33Sc2 3.80 59.43 30.70 52 16.91 0.10 0.155 2.9 537 0.49 53Sc3 4.19 16.59 13.54 82 3.10 0.28 0.223 6.4 882 2.54 69
T. truncatus Tt1 3.59 2.57 1.97 77 2.56 b l.o.d. b l.o.d. 5.4 381 0.95 43Tt2 4.35 166 74.41 45 34.33 0.12 0.263 4.0 791 0.98 129
Z. cavirostris Zc1 3.87 21.79 20.34 93 4.69 0.06 b l.o.d. 1.6 833 0.36 39
MilkT. truncatus Tt1 7.21 1.47 1.28 87 2.40 b l.o.d. 0.180 6.3 71 2.56 34
LiverB. physalus Bp2 4.16 0.11 0.10 94 3.20 0.04 0.041 4.7 2070 1.87 29P. macrocephalus Pm 4.02 4.24 0.29 7 4.59 b l.o.d b l.o.d. 12.4 1124 2.49 142G. griseus Gg1 3.96 19.25 5.21 27 18.34 2.35 0.390 10.8 1337 6.90 104
Gg2 3.76 2746 76.81 3 1408 38 2.687 10.7 8496 11.36 130Gg3 3.94 2132 31.24 1 1187 12.64 2.413 9.5 12356 16.43 138
S. coeruleoalba Sc1 3.64 137 20.30 15 63.75 5.39 0.472 43.4 864 17.03 327Sc2 3.87 452 41.50 9 269 1.60 0.735 19.6 815 6.42 89Sc3 3.84 360 34.88 10 117 3.51 0.211 41.3 1044 11.19 231
T. truncatus Tt1 3.76 13.55 2.66 20 8.73 b l.o.d. 0.155 21.8 1337 10.71 288Tt2 4.59 3737 129 3 1708 3.02 0.457 95.1 3478 14.93 243
Z. cavirostris Zc1 3.77 258 27.31 11 142 10.34 0.726 26.4 797 6.11 130
KidneyB. physalus Bp2 5.98 0.87 0.14 15 8.68 1.56 0.172 11.6 407 2.37 122P. macrocephalus Pm 3.63 1.33 0.18 14 4.48 0.04 0.069 10.3 449 1.66 77G. griseus Gg1 4.44 9.89 2.67 27 11.30 20 0.278 12.3 376 3.18 84
Gg2 4.79 67.57 12.30 18 45.04 71 0.088 6.7 737 2.07 90Gg3 3.33 67.38 15.28 23 42.35 15.47 0.110 7.4 542 3.35 96
S. coeruleoalba Sc1 5.00 25.20 9.80 39 29.24 34 0.429 15.5 255 3.26 129Sc2 5.02 47.67 21.82 46 29.12 34 0.198 10.6 840 2.31 93Sc3 4.47 39.30 19.56 50 18.25 9.54 0.254 13.0 683 2.47 113
T. truncatus Tt1 4.12 5.85 1.21 21 7.85 0.03 0.087 13.5 305 2.41 86Tt2 5.03 288 64.31 22 101 9.83 0.210 38.9 855 2.75 140
Z. cavirostris Zc1 4.37 25.60 12.39 48 21.25 60 0.490 10.2 830 2.53 96
HeartG. griseus Gg1 4.08 4.25 3.05 72 4.75 0.09 0.077 8.0 438 1.55 88
Gg2 4.23 50.52 21.67 43 21.78 0.49 0.172 8.5 447 1.70 93Gg3 5.29 224 28.38 13 132 0.56 b l.o.d. 6.8 710 2.22 101
S. coeruleoalba Sc1 4.57 16.18 13.70 85 14.73 0.43 0.173 12.1 474 1.87 109Sc2 4.64 39.76 37.09 93 6.37 0.46 0.048 13.2 368 1.96 107Sc3 4.34 18.37 14.87 81 4.43 0.34 0.064 11.7 502 1.91 110
T. truncatus Tt1 4.27 1.89 1.86 98 3.26 b l.o.d. b l.o.d. 12.0 377 1.51 110Tt2 4.57 146 97.56 67 13.23 0.10 b l.o.d. 15.0 453 1.71 124
Z. cavirostris Zc1 4.83 30.60 25.30 83 4.97 0.62 0.053 8.8 482 1.71 93
LungP. macrocephalus Pm 5.01 1.13 0.36 32 10.33 0.16 b l.o.d. 16.6 775 3.89 490G. griseus Gg1 5.05 2.59 1.65 64 16.45 0.30 b l.o.d. 3.5 1290 1.52 49
Gg2 4.91 278 8.21 3 168 0.62 b l.o.d. 3.6 2303 2.27 45Gg3 6.54 121 10.70 9 77.88 0.48 0.085 2.2 1141 1.01 44
S. coeruleoalba Sc1 4.89 9.41 5.15 55 20.60 0.25 b l.o.d. 2.8 927 1.74 104Sc2 4.67 277 13.97 5 83.18 0.51 b l.o.d. 3.4 1533 2.44 77
(continued on next page)(continued on next page)
571S C I E N C E O F T H E T O T A L E N V I R O N M E N T 3 9 0 ( 2 0 0 8 ) 5 6 9 – 5 7 8

Table 3 (continued)
Specimen Fresh/dry Hg-tot(μg g−1
d.w.)
Hg-org(μg g−1
d.w.)
Hg-org/tot(%)
Se(μg g−1
d.w.)
Cd(μg g−1
d.w.)
Pb(μg g−1
d.w.)
Cu(μg g−1
d.w.)
Fe(μg g−1
d.w.)
Mn(μg g−1
d.w.)
Zn(μg g−1
d.w.)
Sc3 3.84 20.25 7.23 36 8.71 0.35 0.081 2.5 1123 1.77 152LungT. truncatus Tt1 4.97 1.58 0.91 58 7.74 b l.o.d. b l.o.d. 3.4 780 1.56 102
Tt2 4.89 136 32.68 24 43.55 0.31 b l.o.d. 7.9 1207 2.04 72
BrainG. griseus Gg1 5.33 3.77 1.92 51 3.07 b l.o.d. b l.o.d. 13.4 99 1.35 64
Gg2 4.90 106 10.78 10 100 0.28 b l.o.d. 5.6 128 2.35 64Gg3 3.61 141 11.52 8 96.71 0.33 b l.o.d. 4.9 228 1.34 33
S. coeruleoalba Sc1 4.68 4.65 4.17 90 3.51 0.01 b l.o.d. 12.1 178 1.61 50Sc2 4.94 35.85 12.14 34 22.61 0.05 b l.o.d. 6.3 138 1.82 56
T. truncatus Tt1 5.00 1.05 0.64 61 2.55 b l.o.d. b l.o.d. 6.7 82 2.37 58Tt2 6.00 75.15 – – 15.81 0.05 1.11 15.5 182 1.36 64
SpleenB. physalus Bp2 3.95 1.84 0.91 49 4.19 0.39 0.095 20.6 2305 21.32 244G. griseus Gg1 4.65 3.40 2.33 69 14.47 0.19 b l.o.d. 3.4 1091 1.89 70
Gg3 2.49 581 9.60 2 506 0.82 0.271 2.1 9059 4.19 41S. coeruleoalba Sc2 4.49 409 22.40 5 154 0.50 b l.o.d. 4.1 5566 6.02 81T. truncatus Tt2 4.41 240 55.65 23 79.41 0.21 b l.o.d. 4.9 5725 5.33 70
The ratio organic/total mercury as percentage and the ratio fresh/dry weight are also reported. When concentrations are below the detectionlimits are reported as “b l.o.d”.
572 S C I E N C E O F T H E T O T A L E N V I R O N M E N T 3 9 0 ( 2 0 0 8 ) 5 6 9 – 5 7 8
available; (ii) study the trophic levels and metal concentra-tions in cetaceans, using stable isotopes (δ13C) and (δ15N). Thisaims to better explain the diet transfer and bio-magnificationor bio-accumulation processes; (iii) provide a database ofspecimens which are difficult to attain, yet are useful ifcompared with literature data.
2. Materials and methods
2.1. Sampling
Cetaceans stranded along the Ligurian coast, or found dead inthe Ligurian Sea (North-West Italy), were collected during theperiod from September 1990 to February 2004 (Table 1). Thespecimens were classified and measured. Morphological data(sex, body length and body weight) are reported in Table 1,together with the sampling date and site. Muscle tissue, liver
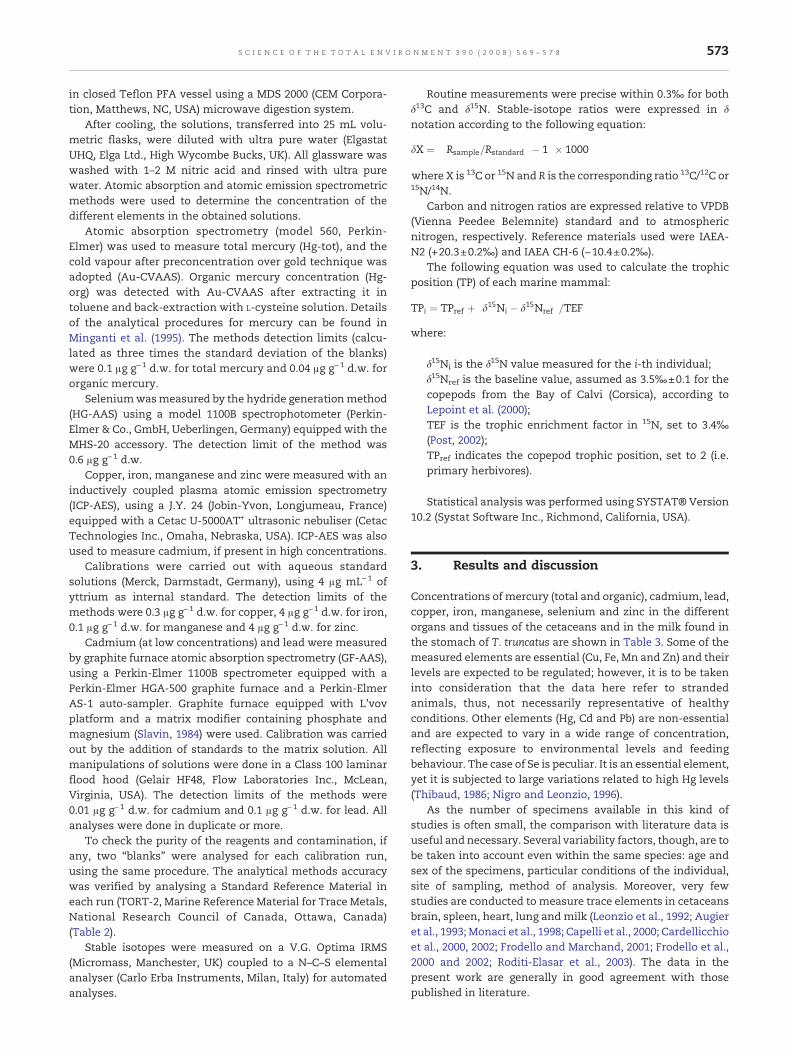
Fig. 1 –Comparison between this study and literature data regardRanges of mercury concentrations are reported as μg g−1 d.w. aftby Monaci et al. (1998).
and kidneywere taken from each animal. Themuscle tissue ofonly one of the B. physalus was in a good condition and fit foranalysis.Whenever possible, lungs, hearts, spleens and brainswere also sampled. Themilk in the stomach of the T. truncatussuckling was collected and analysed.
Until analysed, the tissues and organs were stored at−25 °C, then weighed, freeze-dried and weighed again, tocalculate the fresh/dry weight ratio. The samples, homoge-nisedwith an electricmill, were divided into two sub-samples:one to determine the mercury concentration (total andorganic), cadmium, lead, and the essential elements copper,iron,manganese, selenium and zinc; and the other tomeasurethe stable isotopes.
2.2. Analytical methods
The samples (0.2 g dry wt.) were mineralised with 3.5 mL of65% m/m nitric acid (Suprapur, Merck, Darmstadt, Germany)
ing mercury concentrations in Stenella coeruleoalba muscle.er logarithmic transform. Median instead of range is reported
573S C I E N C E O F T H E T O T A L E N V I R O N M E N T 3 9 0 ( 2 0 0 8 ) 5 6 9 – 5 7 8
in closed Teflon PFA vessel using a MDS 2000 (CEM Corpora-tion, Matthews, NC, USA) microwave digestion system.
After cooling, the solutions, transferred into 25 mL volu-metric flasks, were diluted with ultra pure water (ElgastatUHQ, Elga Ltd., High Wycombe Bucks, UK). All glassware waswashed with 1–2 M nitric acid and rinsed with ultra purewater. Atomic absorption and atomic emission spectrometricmethods were used to determine the concentration of thedifferent elements in the obtained solutions.
Atomic absorption spectrometry (model 560, Perkin-Elmer) was used to measure total mercury (Hg-tot), and thecold vapour after preconcentration over gold technique wasadopted (Au-CVAAS). Organic mercury concentration (Hg-org) was detected with Au-CVAAS after extracting it intoluene and back-extraction with L-cysteine solution. Detailsof the analytical procedures for mercury can be found inMinganti et al. (1995). The methods detection limits (calcu-lated as three times the standard deviation of the blanks)were 0.1 μg g−1 d.w. for total mercury and 0.04 μg g−1 d.w. fororganic mercury.
Seleniumwasmeasured by the hydride generationmethod(HG-AAS) using a model 1100B spectrophotometer (Perkin-Elmer & Co., GmbH, Ueberlingen, Germany) equipped with theMHS-20 accessory. The detection limit of the method was0.6 μg g−1 d.w.
Copper, iron, manganese and zinc were measured with aninductively coupled plasma atomic emission spectrometry(ICP-AES), using a J.Y. 24 (Jobin-Yvon, Longjumeau, France)equipped with a Cetac U-5000AT+ ultrasonic nebuliser (CetacTechnologies Inc., Omaha, Nebraska, USA). ICP-AES was alsoused to measure cadmium, if present in high concentrations.
Calibrations were carried out with aqueous standardsolutions (Merck, Darmstadt, Germany), using 4 μg mL−1 ofyttrium as internal standard. The detection limits of themethods were 0.3 μg g−1 d.w. for copper, 4 μg g−1 d.w. for iron,0.1 μg g−1 d.w. for manganese and 4 μg g−1 d.w. for zinc.
Cadmium (at low concentrations) and lead were measuredby graphite furnace atomic absorption spectrometry (GF-AAS),using a Perkin-Elmer 1100B spectrometer equipped with aPerkin-Elmer HGA-500 graphite furnace and a Perkin-ElmerAS-1 auto-sampler. Graphite furnace equipped with L'vovplatform and a matrix modifier containing phosphate andmagnesium (Slavin, 1984) were used. Calibration was carriedout by the addition of standards to the matrix solution. Allmanipulations of solutions were done in a Class 100 laminarflood hood (Gelair HF48, Flow Laboratories Inc., McLean,Virginia, USA). The detection limits of the methods were0.01 μg g−1 d.w. for cadmium and 0.1 μg g−1 d.w. for lead. Allanalyses were done in duplicate or more.
To check the purity of the reagents and contamination, ifany, two “blanks” were analysed for each calibration run,using the same procedure. The analytical methods accuracywas verified by analysing a Standard Reference Material ineach run (TORT-2, Marine Reference Material for Trace Metals,National Research Council of Canada, Ottawa, Canada)(Table 2).
Stable isotopes were measured on a V.G. Optima IRMS(Micromass, Manchester, UK) coupled to a N–C–S elementalanalyser (Carlo Erba Instruments, Milan, Italy) for automatedanalyses.
Routine measurements were precise within 0.3‰ for bothδ13C and δ15N. Stable-isotope ratios were expressed in δnotation according to the following equation:
dX ¼ Rsample=Rstandard� �� 1� �� 1000
where X is 13C or 15N and R is the corresponding ratio 13C/12C or15N/14N.
Carbon and nitrogen ratios are expressed relative to VPDB(Vienna Peedee Belemnite) standard and to atmosphericnitrogen, respectively. Reference materials used were IAEA-N2 (+20.3±0.2‰) and IAEA CH-6 (−10.4±0.2‰).
The following equation was used to calculate the trophicposition (TP) of each marine mammal:
TPi ¼ TPref þ d15Ni � d15Nref� �
=TEF
where:
δ15Ni is the δ15N value measured for the i-th individual;δ15Nref is the baseline value, assumed as 3.5‰±0.1 for thecopepods from the Bay of Calvi (Corsica), according toLepoint et al. (2000);TEF is the trophic enrichment factor in 15N, set to 3.4‰(Post, 2002);TPref indicates the copepod trophic position, set to 2 (i.e.primary herbivores).
Statistical analysis was performed using SYSTAT® Version10.2 (Systat Software Inc., Richmond, California, USA).
3. Results and discussion
Concentrations of mercury (total and organic), cadmium, lead,copper, iron, manganese, selenium and zinc in the differentorgans and tissues of the cetaceans and in the milk found inthe stomach of T. truncatus are shown in Table 3. Some of themeasured elements are essential (Cu, Fe, Mn and Zn) and theirlevels are expected to be regulated; however, it is to be takeninto consideration that the data here refer to strandedanimals, thus, not necessarily representative of healthyconditions. Other elements (Hg, Cd and Pb) are non-essentialand are expected to vary in a wide range of concentration,reflecting exposure to environmental levels and feedingbehaviour. The case of Se is peculiar. It is an essential element,yet it is subjected to large variations related to high Hg levels(Thibaud, 1986; Nigro and Leonzio, 1996).
As the number of specimens available in this kind ofstudies is often small, the comparison with literature data isuseful and necessary. Several variability factors, though, are tobe taken into account even within the same species: age andsex of the specimens, particular conditions of the individual,site of sampling, method of analysis. Moreover, very fewstudies are conducted to measure trace elements in cetaceansbrain, spleen, heart, lung andmilk (Leonzio et al., 1992; Augieret al., 1993;Monaci et al., 1998; Capelli et al., 2000; Cardellicchioet al., 2000, 2002; Frodello and Marchand, 2001; Frodello et al.,2000 and 2002; Roditi-Elasar et al., 2003). The data in thepresent work are generally in good agreement with thosepublished in literature.

Fig. 2 –Comparison between this study and literature data regarding mercury concentrations in Stenella coeruleoalba liver.Ranges of mercury concentrations are reported as μg g−1 d.w. after logarithmic transform. Median instead of range is reportedby Monaci et al. (1998).
574 S C I E N C E O F T H E T O T A L E N V I R O N M E N T 3 9 0 ( 2 0 0 8 ) 5 6 9 – 5 7 8
The special, rarely collected and analysed milk sampleshows that the concentrations of the different elements arecomparable with the values measured in muscle tissue of thecalf. Iron is found in much smaller quantities, though, whilemanganese and lead are in bigger amounts. Mercury isprevalent in the organic form (87% of the total). Only onework (Frodello et al., 2002) has been published about metalconcentrations in the milk of a nursing T. truncatus fromCorsica. The work contains data in agreement with ours,except for the lead concentrations (0.180 μg g−1 d.w. in ourwork, 3.7 μg−1 d.w. in Frodello et al., 2002).
3.1. Mercury
A lot of data are available about mercury concentration inmuscle and liver; S. coeruleoalba and T. truncatus are the mostfrequently studied species.
Mercury concentrations are largely variable, as can be seenin Table 3: low values in B. physalus, P. macrocephalus and theT. truncatus suckling specimen, higher concentrations inZ. cavirostris and S. coeruleoalba, and extremely high in G.griseus and one T. truncatus.
Figs. 1 and 2 show total mercury concentrations measuredby several authors, in the S. coeruleoalba muscle and liverrespectively. These data are compared with the informationgiven in this study. To represent such highly variable datain the same graph, the concentrations are expressed as μg g−1
d.w. after logarithmic transform. Each bar represents therange of values published in literature for specimens collectedin the same geographical area. Sometimes 1 bar refers toseveral different studies. The number of individuals sampledin each study is also reported. Concentrations expressed asfresh weight in the original literature were converted to dryweight using the factor of 0.25, as suggested by Becker et al.(1995). Our data are in agreement with those measured inspecimens from Mediterranean: mercury concentrations inmuscle and liver of specimens from Atlantic are lower (Lawet al., 1991; Das et al., 2003a). André et al. (1991), though,makesan exception. Their data are compatible with ours for theAtlantic specimens data. Yet, they found higher concentra-tions in the Mediterranean ones. Higher mercury concentra-
tions in Mediterranean individuals than in the Atlantic ones,are frequently detected in T. truncatus (Mediterranean: Leonzioet al., 1992; Storelli and Marcotrigiano, 2002. Atlantic: Lawet al., 1991; Holsbeek et al., 1998; Carvalho et al., 2002).
The highest concentrations are found in G. griseus andT. truncatus, with more than 100 μg g−1 d.w. in muscle. Thevalues in literature are comparable and even higher, with themaximum ranging from 156 to 334 μg g−1 d.w. in T. truncatus(Leonzio et al., 1992; Frodello et al., 2000; Roditi-Elasar et al.,2003) and from 123 to 1580 μg g−1 d.w. in G. griseus (Storelliet al., 1999; Frodello et al., 2000; Shoham-Frider et al., 2002).The liver is the organ where the highest mercury concentra-tions are detected, as they reach more than 2000 μg g−1 d.w.Again, literature data show higher values, with the maximumranging from 4250 to 13155 μg g−1 d.w. in T. truncatus (Leonzioet al., 1992; Frodello et al., 2000) and from 3298 to 5304 μg g−1
d.w. in G. griseus (Storelli et al., 1999; Frodello et al., 2000;Shoham-Frider et al., 2002).
It is to be noticed that, in the same species, young indi-viduals (Gg1 and Tt1) show drastically lower mercury con-centrations than adults (orders ofmagnitude), which indicatesthe strong effect of age on mercury accumulation. The samething was reported by Shoham-Frider et al. (2002), regardingthe T. truncatus from the Mediterranean coast of Israel.
The species showing the lowest concentrations areB. physalus, which is in agreement with literature (Sanperaet al., 1993, 1996; Hernández et al., 2000; Law et al., 2001) andP. macrocephalus (Law et al., 1996; Holsbeek et al., 1999).
High concentrations of total mercury (often higher than100 μg g−1 d.w.) are also observed in other organs, i.e. spleen,lung, kidney, which are all organs involved in detoxificationand elimination processes.
Significant correlations (pb0.05) between total and organicmercury are observed in muscle (r=0.825), liver (r=0.906) andkidney (r=0.966), where high levels of total mercury corre-spond to high levels of organic mercury.
The ratio organic to totalmercury, expressed as percentage,ranges between 1% and 98%. This percentage is generally highin muscle and heart, and low in liver, especially in the case ofvery high concentrations of total mercury (Storelli et al., 1998).In most cases, mercury is present in its inorganic form.

Fig. 3 –Correlation between selenium and total mercury concentrations in different organs of cetaceans from the Ligurian Sea.Concentrations are expressed as μmol g−1 d.w. Symbols are: B=brain; H=hearth; K=kidney; Li=liver; Lu=lung; Mk=milk;Mu=muscle; S=spleen. The line represents the 1 to 1 molar ratio.
575S C I E N C E O F T H E T O T A L E N V I R O N M E N T 3 9 0 ( 2 0 0 8 ) 5 6 9 – 5 7 8
3.2. Selenium
Selenium concentrations are highly variable, and rangebetween 0.90 μg g−1 d.w. and 1708 μg g−1 d.w. The lowestvalues are detected in muscle, while the highest are in theliver. The trend is similar to that in the case of mercury. Inseveral organs the G. griseus Gg2 and Gg3 and the T. truncatusTt2 show the maximum selenium concentrations measuredin this study (higher than 1000 μg g−1 in liver). Compara-ble levels in liver were also found by Leonzio et al. (1992),Storelli et al. (1998, 1999) and Shoham-Frider et al. (2002).All the organs and tissues with the exception of spleen,show a significant correlation between mercury and se-lenium concentrations (correlation coefficients between0.802 and 0.995; pb0.02). Except for B. physalus andP. macrocephalus, the molar ratio between inorganic mercuryand selenium is nearly 1 in the liver of adult individuals(mean value 0.8), in agreement with the observations of sev-eral authors (Monaci et al., 1998; Cardellicchio et al., 2000). Thisconfirms the existence of a fact that there is a bio-transfor-mation process in which methylmercury is converted intothe less toxic inorganic form (Thibaud, 1986), with subse-quent formation of granules of mercury selenide (Nigro andLeonzio, 1996).
As evident in Fig. 3, many organs (kidney, liver, spleen),regardless of the species, show a clear relationship (rN0.99,pb0.001) between selenium and mercury concentrationwith a ratio of nearly 1, when moles are used to expressthese concentrations. Not so many data are available in thecase of brain, heart and spleen, and the relationship isuncertain. The correlation in the muscle tissue is r=0.80 andp=0.010.
3.3. Cadmium and lead
In several cases cadmium concentrations are below detectionlimit, and, when measurable, they are low in all the organsand tissues (between 0.01 and 0.82 μg g−1 d.w.), except for theliver and kidney of G. griseus (38 and 71 μg g− 1 d.w.,
respectively). Kidney is the critical organ for cadmiumaccumulation, according to Wagemann and Muir (1984), whofound that cetaceans show cadmiumconcentrations higher bya factor of 2–5 in renal tissue than in hepatic tissue. The highcadmium values measured in G. griseus, Z. cavirostris, and S.coeruleoalba can be attributed to the big consumption of squids,generally rich in cadmium (Storelli et al., 1999). In agreementwith the findings of several authors (Leonzio et al., 1992;Roditi-Elasar et al., 2003), T. truncatus shows renal cadmiumlevels lower than S. coeruleoalba, as a result of the differentamount of cephalopods in their diet.
As for lead, about 50% of the valuesmeasured fall below thedetection limit; the remaining values range between 0.04 and0.74 μg g−1 d.w., except for two anomalous values (2.7 and2.4 μg g−1 d.w.) in the liver of twoG. griseus (Gg2 and Gg3). Apartfrom Tt2, all values measured in the brain, where high leadconcentrations could be critical for impairment of the centralnervous system, are below the detection limit.
3.4. Essential elements (copper, iron, manganese, zinc)
Essential elements vary in a narrow range in each organ of thedifferent species, except for iron, whose concentrations showa wide range (from 71 to 12356 μg g−1 d.w.). Its lowest valuesare inmilk and brain, and the highest in liver, spleen and lung.Low variability is characteristic of bio-essential elements,which are subject to regulation mechanisms (Law et al., 1991).
Copper concentrations, in particular, range between 1.6 μgg−1 d.w. in the muscle of 3 individuals and 43.4 μg g−1 d.w. inthe liver of one S. coeruleoalba, with the sole exception of onehigh value (95.1 μg g−1 d.w. in the liver of T. truncatus Tt2). Mostof the values are below 20 μg g−1 d.w. The highest concentra-tions are in liver and kidney, and the lowest in muscle andlung. The measured values proved to be similar in the sameorgans of the different species. Law et al. (1991) hypothesisedthat the liver concentrations range is 3–30 μg g−1 fresh weight,due to a regulation mechanism active in marine mammals.This is in agreement with the present study (0.3–20.7 μg g−1
fresh weight).

Fig. 4 –δ13C and δ15N in the muscle of the different cetaceansfrom the Ligurian Sea. Symbols as in Table 1.
576 S C I E N C E O F T H E T O T A L E N V I R O N M E N T 3 9 0 ( 2 0 0 8 ) 5 6 9 – 5 7 8
Manganese concentrations range between 0.26 and21.32 μg g−1 d.w. The lowest values are in the muscle, andthe highest in the liver and spleen. Most of the values arebelow 10 μg g−1 d.w., and the concentrations narrowly vary ineach organ.
Zinc concentrations range between 29 μg g−1 d.w. (in theliver of Bp2, the individual in under-nutrition condition) and490 μg g−1 d.w. (in the lung of P. macrocephalus). The highestvalues are in liver (especially of S. coeruleoalba and T. truncatus)and the lowest in milk, brain and muscle. As is the case forcopper, the values measured in the different organs andtissues are similar for the different species. Law et al. (1991)hypothesised that the liver concentrations range is 5–100 μgg−1 fresh weight, again due to a regulation mechanism activein marine mammals. This is in agreement with the presentstudy (5–98 μg g−1 fresh weight).
Significant correlations (pb0.05) can be observed betweencopper, manganese and zinc in several organs.
3.5. Stable isotopes
The results of δ13C and δ15N measurements in the muscle ofthe different cetaceans are reported in Table 4.
The isotopic signatures show two marine mammal groups(Fig. 4), with different δ13C and δ15N values. The first group,characterised by high δ13C and δ15N values, includes 3 speci-mens of G. griseus, Z. cavirostris and the adult specimen ofT. truncatus, all at trophic positions higher than 4. The secondgroup, including the 3 S. coeruleoalba and the 2 B. physalusspecimens, showed lower values of δ13C and δ15N, being atlevels below the fourth trophic position. P. macrocephalus andthe sucklingT. truncatus are distinct from the other individuals,and show low values of δ13C and the highest values of δ15N. Inthe case of the suckling T. truncatus, the trophic position wasnot calculated, since the δ15N signature reflected that of themother's milk. The trophic levels obtained for the differentspecies in this study are substantially in agreement with theliterature data based on diet composition (Pauly et al., 1998).
Fig. 5 shows the relationship between δ15N and theconcentration of total mercury. Two outliers are evident (Pmand Tt1). They belong to species with high trophic position.
Table 4 – δ13C and δ15N values in muscle of the cetaceansfrom Ligurian Sea
Specimen δ13C (‰) δ15N (‰) TP
B. physalus Bp1 −18.5 8.3 3.4Bp2 −18.6 9.3 3.7
P. macrocephalus Pm −18.1 13.1 4.8G. griseus Gg1 −17.5 10.5 4.1
Gg2 −17.2 11.9 4.5Gg3 −16.9 11.8 4.4
S. coeruleoalba Sc1 −18.2 8.9 3.6Sc2 −18.2 9.5 3.8Sc3 −18.4 8.9 3.6
T. truncatus Tt1 −18.6 13.5 –Tt2 −17.1 12.6 4.7
Z. cavirostris Zc1 −17.3 10.8 4.2
Mean results are expressed as ‰. The value of trophic position isalso reported, except for Tt1, see text.
Yet, being young in age, they are characterised by a lowcontamination level. Except for these two specimens, there isa significant relationship between δ15N and the concentrationof total mercury (r=0.86; pb0.05). The slope of the regressionof the logarithmic transform of total mercury concentrationand δ15N is often used as a quantitative measure of bio-magnification rate within the food web; published data range0.17–0.48 for temperate lakes (Kidd, 1998) and 0.23–0.25 forbenthic and pelagic food webs (Kidd et al., 2003). To make ourdata comparable with literature, mercury concentrations werecalculated on fresh weight basis, and the slope of theregression line is 0.41. However, the comparison of this resultwith the cited data is questionable, since the food webconsidered is deeply different from those reported by otherauthors. No data on cetacean food web were found forcomparison.
Fig. 5 –Relationship between concentration of total mercuryand δ15N in the muscle of the different cetaceans from theLigurian Sea. Symbols as in Table 1.

577S C I E N C E O F T H E T O T A L E N V I R O N M E N T 3 9 0 ( 2 0 0 8 ) 5 6 9 – 5 7 8
In conclusion, according to the literature data, narrowranges of concentrations were observed for essential elementsin most organs, while mercury and selenium concentrationsspan up to three orders of magnitude. Yet, suchwide ranges ofconcentration make difficult to draw any adequate interpre-tation, and the attempt of using complementary parameters(such as stable-isotopes data) may lead to a better compre-hension of bio-accumulation and bio-amplification processesin cetaceans.
Acknowledgements
We would like to thank Dr. Camilla Siccardi for metal analysisand Mr. Renzo Biondo for stable-isotope analysis.
R E F E R E N C E S
André J, Boudou A, Ribeyre F, Bernhard M. Comparative study ofmercury accumulation in dolphins (Stenella coeruleoalba) fromFrench Atlantic and Mediterranean coasts. Sci Total Environ1991;104:191–209.
Augier H, Park WK, Ronneau C. Mercury contamination of thestriped dolphin Stenella coeruleoalba Meyen from the FrenchMediterranean coasts. Mar Pollut Bull 1993;26:306–11.
Becker PR, Mackey EA, Demiralp R, Suydam R, Early G, Koster BJ,et al. Relationship of silver with selenium and mercury in theliver of two species of toothed whales (Odontocetes). MarPollut Bull 1995;30:262–71.
Borrell A, Aguilar A, Tornero V, Sequeira M, Fernández G, Alís S.Organochlorine compounds and stable isotopes indicatebottlenose dolphin subpopulation structure around the IberianPeninsula. Environ Int 2006;32:516–23.
Cabana G, Rasmussen JB. Modelling food chain structure andcontaminant bioaccumulation using stable nitrogen isotopes.Nature 1994;372:255–7.
Capelli R, Drava G, De Pellegrini R, Minganti V, Poggi R. Study oftrace elements in organs and tissues of striped dolphins(Stenella coeruleoalba) found dead near the Ligurian Sea (Italy).Adv Environ Res 2000;4:31–43.
Cardellicchio N, Giandomenico S, Ragone P, Di Leo A. Tissuedistribution ofmetals in striped dolphin (Stenella coeruleoalba) fromthe Apulian coasts, Southern Italy. Mar Environ Res 2000;49:55–66.
Cardellicchio N, Decataldo A, Di Leo A, Giandomenico S. Traceelements in organs and tissues of striped dolphins(Stenella coeruleoalba) from the Mediterranean Sea (SouthernItaly). Chemosphere 2002;49:85–90.
Carlini R, Pulcini M, Wurtz M. Cephalopods from the stomach of aCuvier's beakedwhale (Ziphius cavirostris, Cuvier 1823) strandedat Fiumicino, central Tyrrhenian coast. Eur Res Cetaceans1992a;6:190–2.
Carlini R, Pulcini M, Wurtz M. Cephalopods from the stomach of aRisso's dolphins (Grampus griseus, Cuvier 1812) stranded alongthe central Tyrrhenian coast. Eur Res Cetaceans 1992b;6:196–8.
Carvalho ML, Pereira RA, Brito J. Heavy metals in soft tissues ofTursiops truncatus and Delphinus delphis from west AtlanticOcean by X-ray spectrometry. Sci Total Environ2002;292:247–54.
Clarke MR, Martins HR, Pascoe P. The diet of sperm whales(Physeter macrocephalus Linnaeus 1758) off the Azores. PhilosTrans R Soc B 1993;339(1287):67–82.
Das K, Beans C, Holsbeek L, Mauger G, Berrow SD, Rogan E, et al.Marine mammals from northeast Atlantic: relationshipbetween their trophic status as determined by δ13C and δ15N
measurements and their trace metal concentrations. MarEnviron Res 2003a;56:349–65.
Das K, Debacker V, Pillet S, Bouquegneau JM. Heavy metals inmarine mammals. In: Vos JG, Bossart G, Fournier M, O'Shea T,editors. Toxicology of marine mammals. Washington DC:Taylor & Francis; 2003b. p. 135–67.
Das K, Siebert U, Fontaine M, Jauniaux T, Holsbeek L, BouquegnauJM. Ecological and pathological factors related to trace metalconcentrations in Harbour porpoises from the North Sea andadjacent areas. Mar Ecol Prog Ser 2004;281:283–95.
De Niro MJ, Epstein S. Influence of diet on the distribution of carbonisotopes in animals. Geochim Cosmochim Acta 1978;42:495–506.
DeNiroMJ, Epstein S. Influenceofdiet on thedistributionofnitrogenisotopes in animals. Geochim Cosmochim Acta 1981;45:341–51.
Frodello JP, Marchand B. Cadmium, copper, lead, and zinc in fivetoothed whale species of the Mediterranean Sea. Int J Toxicol2001;20:339–43.
Frodello JP, Romèo M, Viale D. Distribution of mercury in theorgans and tissues of five toothed whale species of theMediterranean. Environ Pollut 2000;108:447–52.
Frodello JP, Viale D, Marchand B. Metal concentrations in the milkand tissues of a nursing Tursiops truncatus female. Mar PollutBull 2002;44:551–76.
Hernández F, Serrano R, Roig-Navarro AF,Martínez-Bravo Y, López FJ.Persistent organochlorines and organophosphorus compoundsandheavyelements incommonwhale (Balaenopteraphysalus) fromtheWestern Mediterranean Sea. Mar Pollut Bull 2000;40:426–33.
Hobson KA, Fisk A, Karnovsky N, Holst M, Gagnon JM, Fortier M. Astable isotope (δ13C, δ15N) model for the North Water food web:implications for evaluating trophodynamics and the flow ofenergy and contaminants. Deep-Sea Res PT II 2002;49:5131–50.
Holsbeek L, Siebert U, Joiris CR. Heavymetals in dolphins strandedon the French Atlantic coast. Sci Total Environ 1998;217:241–9.
Holsbeek L, Joiris CR, Debacker V, Ali IB, Roose P, Nellissen JP, et al.Heavy metals, organochlorines and polycyclic aromatichydrocarbons in sperm whales stranded in the Southern NorthSea during the 1994/1995 winter. Mar Pollut Bull 1999;38:304–13.
Kelly JF. Stable isotopes of carbon and nitrogen in the study ofavian andmammalian trophic ecology. Can J Zool 2000;78:1–27.
Kidd KA. Use of stable isotope ratios in freshwater and marinebiomagnification studies. In: Rose J, editor. EnvironmentalToxicology: current developments. Amsterdam, TheNetherlands: Gordon and Breach Science Publishers; 1998.p. 357–76.
Kidd KA, Bootsma HA, Hesslein RH, Lockhart WL, Hecky RE.Mercury concentrations in the food web of Lake Malawi, EastAfrica. J Great Lakes Res 2003;29(Suppl. 2):258–66.
Law RJ. Metals in marine mammals. In: Beyer WN, Heinz GH,Redmon-Norwood AW, editors. Environmental contaminantsin wildlife. Interpreting Tissue Concentrations. SETAC SpecialPublication Series. Boca Raton, FL: Lewis Publishers Inc/CRCPress; 1996. p. 357–76.
Law RJ, Fileman CF, Hopkins AD, Baker JR, Harwood J, Jackson DB,et al. Concentration of trace metals in the livers of marinemammals (seals, porpoises and dolphins) from waters aroundthe British Isles. Mar Pollut Bull 1991;22:183–91.
Law RJ, Stringer RL, Allchin CR, Jones BR. Metals andorganochlorines in sperm whales (Physeter macrocephalus)stranded around the North Sea during the 1994/1995 winter.Mar Pollut Bull 1996;32:72–7.
Law RJ, Bennett ME, Blake SJ, Allchin CR, Jones BR, Spurrier CJH.Metals and organochlorines in pelagic cetaceans stranded onthe coasts of England andWales. Mar Pollut Bull 2001;42:522–6.
LeonzioC, Focardi S, Fossi C.Heavymetals and seleniumin strandeddolphins of the Northern Tyrrhenian (NW Mediterranean). SciTotal Environ 1992;119:77–84.
Lepoint G, Nyssen F, Gobert S, Dauby P, Bouquegneau JM. Relativeimpact of a seagrass bed and its adjacent epilithic algalcommunity in consumer diets. Mar Biol 2000;136:513–8.

578 S C I E N C E O F T H E T O T A L E N V I R O N M E N T 3 9 0 ( 2 0 0 8 ) 5 6 9 – 5 7 8
Minganti V, Capelli R, Fiorentino F, De Pellegrini R, Vacchi M.Variations of mercury and selenium concentrations inAdamussium colbecki and Pagothenia bernacchii from Terra NovaBay (Antarctica) during a five years period. Int J Environ AnChem 1995;61:239–48.
Monaci F, Borrel A, Leonzio C, Marsili L, Calzada N. Trace elementsin striped dolphins (Stenella coeruleoalba) from the westernMediterranean. Environ Pollut 1998;99:61–8.
NigroM, Leonzio C. Intracellular storage ofmercury and selenium indifferent marine vertebrates. Mar Ecol Prog Ser 1996;135:137–43.
Notarbartolo G, Ausenda F, Orsi Relini L, Relini G. Una propostadi gestione dell’ambiente pelagico: la Riserva della Biosferanel Bacino corso-ligure provenzale. Atti XXII Congresso dellaSocietà Italiana di Biologia Marina, 20–24 May 1991, SantaMargherita di Pula, Cagliari, Oebalia, 17. Supplemento; 1992.p. 517–21.
Orsi Relini L, Cappello M. The fin whale and other large pelagicfilters as samplers of Meganyctiphanes norvegica. Rapp CommInt Mer Medit 1992;33:263.
Orsi Relini L, Cappello M, Poggi R. The stomach content of somebottlenose dolphins (Tursiops truncatus) from the Ligurian Sea.Eur Res Cetaceans 1994;8:192–5.
Pauly D, Trites AW, Capuli E, Christensen V. Diet composition andtrophic levels of marine mammals. ICES J Mar Sci,1998;55:467–81.
Post DM. Using stable isotopes to estimate trophic position:models, methods, and assumptions. Ecology 2002;83:703–18.
Pulcini M, Carlini R, Wurtz M. Stomach contents of striped dolphin(Stenella coeruleoalba, Meyen 1833) from the south-centralTyrrhenian coast. Eur Res Cetaceans 1992;6:194–6.
Roberts SM. Examination of the stomach contents from aMediterranean spermwhale found south of Crete, Greece. J MarBiol Ass UK 2003;83:667–70.
Roditi-Elasar M, Kerem D, Hornung H, Kress N, Shoham-Frider E,Goffman O, et al. Heavy metal levels in bottlenose and stripeddolphins off the Mediterranean coast of Israel. Mar Pollut Bull2003;46:503–12.
Sanpera C, Capelli R, Minganti V, Jover L. Total and organicmercury in North Atlantic fin whales: distribution pattern andbiological related changes. Mar Pollut Bull 1993;26:135–9.
Sanpera C, González M, Jover L. Heavy metals in two populationsof North Atlantic Fin Whales (Balaenoptera physalus). EnvironPollut 1996;91:299–307.
Shoham-Frider E, Amiel S, Roditi-Elasar M, Kress N. Risso'sdolphin (Grampus griseus) stranding on the coast of Israel(eastern Mediterranean). Autopsy results and trace metalconcentrations. Sci Total Environ 2002;295:157–66.
Slavin W. Graphite furnace AAS: A source book. Norwalk: ThePerkin Elmer Corporation; 1984. 230 pp.
Storelli MM, Marcotrigiano GO. Subcellular distribution of heavymetals in livers and kidneys of Stenella coeruleoalba and Tursiopstruncatus from the Mediterranean Sea. Mar Pollut Bull2002;44:71–81.
Storelli MM, Ceci E, Marcotrigiano GO. Comparison of totalmercury, methylmercury, and selenium in muscle tissues andin the liver of Stenella coeruleoalba (Meyen) and Caretta caretta(Linnaeus). B Environ Contam Tox 1998;61:541–7.
Storelli MM, Zizzo N, Marcotrigiano GO. Heavy metals andmethylmercury in tissues of Risso's dolphin (Grampus griseus)and Cuvier's beaked whale (Ziphius cavirostris) stranded in Italy(South Adriatic Sea). B Environ Contam Tox 1999;63:703–10.
Thibaud Y. The role of biochemical processes in the accumulationof mercury by marine organisms. FAO/UNEP/WHO/IOC/IAEAMeeting on the Biogeochemical Cycle of Mercury in theMediterranean, 27–31 August 1984, Siena, 325. FAO Fish Rep;1986. p. 150–62. (Suppl.).
Wagemann R, Muir DCG. Concentrations of heavy metals andorganochlorines in marine mammals of northern waters:overview and evaluation. Can Tech Rep Fish Aquat Sci1984;1279:1–97.
Wurtz M, Marrale D. Food of striped dolphin Stenella coeruleoalba inthe Ligurian Sea. J Mar Biol Assoc UK 1993;73(3):571–8.
Wurtz M, Pulcini M, Marrale D. Mediterranean cetaceans andfisheries. Do they exploit the same resources? Eur ResCetaceans 1992;6:37–40.
Copyright © 2022 FDOKUMEN