Distribution of dissolved trace metals in coastal regions of Indian Sundarban mangrove wetland: A...
11
Distribution of dissolved trace metals in coastal regions of Indian Sundarban mangrove wetland: a multivariate approach Bhaskar Deb Bhattacharya a , Dulal Chandra Nayak b , Santosh Kumar Sarkar a, * , Sejuiti Naha Biswas a , Dibyendu Rakshit a , Md. Kawser Ahmed c a Department of Marine Science, University of Calcutta, 35, Ballygunge Circular Road, Calcutta 700019, India b National Bureau of Soil Survey and Land Use Planning (ICAR), Regional Center, Block DK, Sector II, Salt Lake, Calcutta, India c Department of Oceanography, Lab. of Ecology, Environment and Climate Chnage, Earth and Environmental Sciences Faculty, University of Dhaka, Dhaka 1000, Bangladesh article info Article history: Received 1 October 2013 Received in revised form 12 April 2014 Accepted 15 April 2014 Available online 25 April 2014 Keywords: Trace metals Carcinogenic risk Canonical correspondence analysis Sundarban mangrove wetland abstract The work first documents detailed account of the seasonal variations of total dissolved trace metals in the coastal regions of Sundarban mangrove wetland (a UNESCO World Heritage Site) using a graphite- furnace atomic absorption spectrophotometer. Considering all three different seasons (premonsoon, monsoon and postmonsoon), the average concentrations and relative variability of the metals exhibited the following sequential order: Mn (223 mgl 1 ; 261.50 mgl 1 ) > Cr (39.30 mgl 1 ; 32.08 mgl 1 ) > Zn (57.25 mgl 1 ; 59.78 mgl 1 ) > Ni (36.23 mgl 1 ; 43.28 mgl 1 ) > Cu (33.88 mgl 1 ; 48.85 mgl 1 ) > Pb (14.76 mgl 1 ; 19.76 mgl 1 )> Co (20.73 mgl 1 ; 25.18 mgl 1 ) > Cd (5.53 mgl 1 ; 5.68 mgl 1 ). Concentrations of Cu (maximum 48.85 mgl 1 ) exceeded the WHO recommended value. The results of the carcinogenic risks for the metals revealed that dermal absorption (CDI dermal ) of Cr, Pb and Cd might be a matter of concern. Chromium is significantly correlated with majority of the metals indicating their identical behaviour during transport in this coastal environment. Results of canonical correspondence analyses (CCA) confirmed that two study sites in Sundarban, namely Canning and Dhamakhali, clustered at about 85% similarity loading as they suffer from huge load of domestic sewage effluents discharged from the megacity Calcutta resulting maximum concentrations of majority of the trace metals. Ó 2014 Elsevier Ltd. All rights reserved. 1. Introduction Among the inorganic contaminants of the river water, trace metals are getting importance for their non-degradable nature and often accumulate through tropic level causing a deleterious bio- logical effect (Jain, 1978; Kar et al., 2008). Metals enter the aquatic environment from a variety of sources (Solomons and Förtsner, 1984). Although most metals are naturally occurring through the biogeochemical cycle (Garrett, 2000), they may also be added to environment through anthropogenic sources, including industrial and domestic effluents containing toxic metals as well as metal chelates (Amman et al., 2002), urban storm, water runoff (Lantzy and Mackenzie, 1979; Nriagu, 1979; Ross, 1994), landfill leachate, atmospheric sources and boating activities (Forstner and Wittman, 1979). These point and non-point sources of pollution are responsible for deterioration of water quality posing threat on human beings and sustaining aquatic biodiversity (Ghosh and Vass, 1997; Das et al., 1997). The determination of the physicochemical parameters of surface waters such as pH, temperature, dissolved oxygen (DO), and turbidity is also pertinent because they can modify heavy metal chemistry and toxicity on aquatic life and consequently act as indicators of water pollution (Everaarts and Nieuwenhuize, 1995; Lim et al., 1995; Demirak et al., 2006; Deheyn and Latz, 2006). Trace metals can be enriched by aquatic organisms and can therefore be converted to organic complexes that may even be more toxic (Jain, 2004). Surface water is a vital resource for local development and ecological sustainability, and recycling of trace metal pollutants in stream water can lead to further risks to human health and aqueous ecosystems (Rai, 2008). Adverse effects such as deformities, cancer, and death of aquatic animals together with their terrestrial predators may also be induced (Coeurdassier et al., 2010; Volpe et al., 2009). Certain trace metals have profiles that are nutrient-like, like cadmium (Cd) and copper (Cu), which is indicative of their involvement in biological cycles (Boye et al., 2012). In contrast other metals have a scavenged- * Corresponding author. Tel.: þ91 33 2475 3680 (3 lines); fax: þ91 33 2461 4849. E-mail addresses: [email protected], [email protected] (S. K. Sarkar). Contents lists available at ScienceDirect Journal of Cleaner Production journal homepage: www.elsevier.com/locate/jclepro http://dx.doi.org/10.1016/j.jclepro.2014.04.030 0959-6526/Ó 2014 Elsevier Ltd. All rights reserved. Journal of Cleaner Production 96 (2015) 233e243
Transcript of Distribution of dissolved trace metals in coastal regions of Indian Sundarban mangrove wetland: A...
lable at ScienceDirect
Journal of Cleaner Production 96 (2015) 233e243
Contents lists avai
Journal of Cleaner Production
journal homepage: www.elsevier .com/locate/ jc lepro
Distribution of dissolved trace metals in coastal regions of IndianSundarban mangrove wetland: a multivariate approach
Bhaskar Deb Bhattacharya a, Dulal Chandra Nayak b, Santosh Kumar Sarkar a,*,Sejuiti Naha Biswas a, Dibyendu Rakshit a, Md. Kawser Ahmed c
aDepartment of Marine Science, University of Calcutta, 35, Ballygunge Circular Road, Calcutta 700019, IndiabNational Bureau of Soil Survey and Land Use Planning (ICAR), Regional Center, Block DK, Sector II, Salt Lake, Calcutta, IndiacDepartment of Oceanography, Lab. of Ecology, Environment and Climate Chnage, Earth and Environmental Sciences Faculty, University of Dhaka, Dhaka1000, Bangladesh
a r t i c l e i n f o
Article history:Received 1 October 2013Received in revised form12 April 2014Accepted 15 April 2014Available online 25 April 2014
Keywords:Trace metalsCarcinogenic riskCanonical correspondence analysisSundarban mangrove wetland
* Corresponding author. Tel.: þ91 33 2475 3680 (3 lE-mail addresses: [email protected], deb
K. Sarkar).
http://dx.doi.org/10.1016/j.jclepro.2014.04.0300959-6526/� 2014 Elsevier Ltd. All rights reserved.
a b s t r a c t
The work first documents detailed account of the seasonal variations of total dissolved trace metals in thecoastal regions of Sundarban mangrove wetland (a UNESCO World Heritage Site) using a graphite-furnace atomic absorption spectrophotometer. Considering all three different seasons (premonsoon,monsoon and postmonsoon), the average concentrations and relative variability of the metals exhibitedthe following sequential order: Mn (223 mg l�1; 261.50 mg l�1) > Cr (39.30 mg l�1; 32.08 mg l�1) > Zn(57.25 mg l�1; 59.78 mg l�1) > Ni (36.23 mg l�1; 43.28 mg l�1) > Cu (33.88 mg l�1; 48.85 mg l�1) > Pb(14.76 mg l�1; 19.76 mg l�1)> Co (20.73 mg l�1; 25.18 mg l�1) > Cd (5.53 mg l�1; 5.68 mg l�1). Concentrationsof Cu (maximum 48.85 mg l�1) exceeded the WHO recommended value. The results of the carcinogenicrisks for the metals revealed that dermal absorption (CDIdermal) of Cr, Pb and Cd might be a matter ofconcern. Chromium is significantly correlated with majority of the metals indicating their identicalbehaviour during transport in this coastal environment. Results of canonical correspondence analyses(CCA) confirmed that two study sites in Sundarban, namely Canning and Dhamakhali, clustered at about85% similarity loading as they suffer from huge load of domestic sewage effluents discharged from themegacity Calcutta resulting maximum concentrations of majority of the trace metals.
� 2014 Elsevier Ltd. All rights reserved.
1. Introduction
Among the inorganic contaminants of the river water, tracemetals are getting importance for their non-degradable nature andoften accumulate through tropic level causing a deleterious bio-logical effect (Jain, 1978; Kar et al., 2008). Metals enter the aquaticenvironment from a variety of sources (Solomons and Förtsner,1984). Although most metals are naturally occurring through thebiogeochemical cycle (Garrett, 2000), they may also be added toenvironment through anthropogenic sources, including industrialand domestic effluents containing toxic metals as well as metalchelates (Amman et al., 2002), urban storm, water runoff (Lantzyand Mackenzie, 1979; Nriagu, 1979; Ross, 1994), landfill leachate,atmospheric sources and boating activities (Forstner and Wittman,1979). These point and non-point sources of pollution are
ines); fax: þ91 33 2461 [email protected] (S.
responsible for deterioration of water quality posing threat onhuman beings and sustaining aquatic biodiversity (Ghosh and Vass,1997; Das et al., 1997). The determination of the physicochemicalparameters of surface waters such as pH, temperature, dissolvedoxygen (DO), and turbidity is also pertinent because they canmodify heavy metal chemistry and toxicity on aquatic life andconsequently act as indicators of water pollution (Everaarts andNieuwenhuize, 1995; Lim et al., 1995; Demirak et al., 2006;Deheyn and Latz, 2006). Trace metals can be enriched by aquaticorganisms and can therefore be converted to organic complexesthat may even be more toxic (Jain, 2004). Surface water is a vitalresource for local development and ecological sustainability, andrecycling of trace metal pollutants in stream water can lead tofurther risks to human health and aqueous ecosystems (Rai, 2008).Adverse effects such as deformities, cancer, and death of aquaticanimals together with their terrestrial predators may also beinduced (Coeurdassier et al., 2010; Volpe et al., 2009). Certain tracemetals have profiles that are nutrient-like, like cadmium (Cd) andcopper (Cu), which is indicative of their involvement in biologicalcycles (Boye et al., 2012). In contrast othermetals have a scavenged-
B.D. Bhattacharya et al. / Journal of Cleaner Production 96 (2015) 233e243234
type behaviour like Pb (Flegal and Patterson, 1983). The outcome ofthis study will also serve as pollution indicators andmay lead in thequest of developing a novel metal pollution index for Sundarbanmangrove ecosystem. Apart from that, these baseline data arebeneficiary for policy makers, who may be more familiar withconventional information, to mitigate a scheme on pollution con-trol technology.
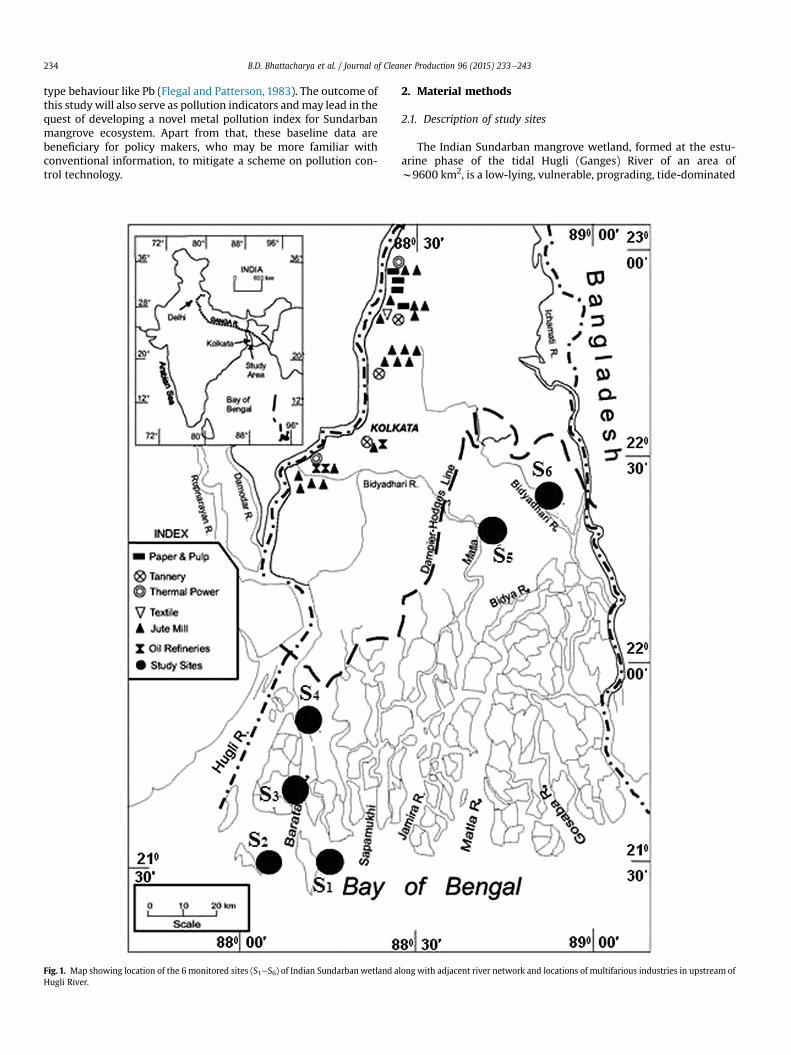
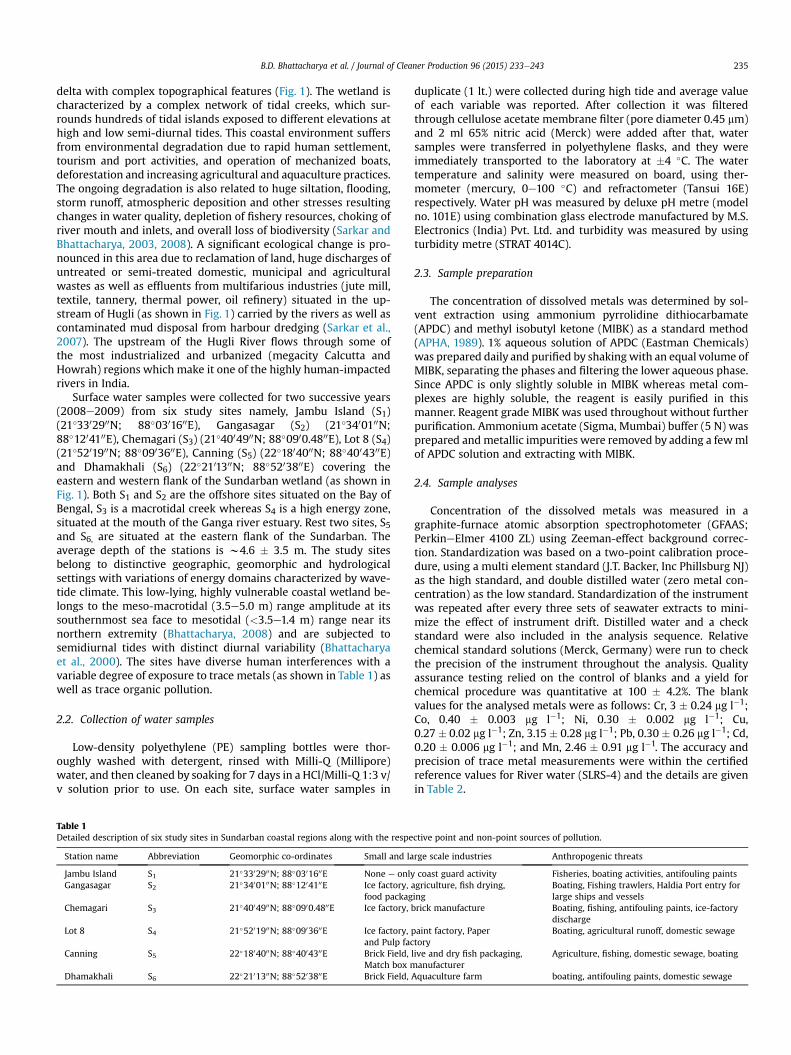
Fig. 1. Map showing location of the 6 monitored sites (S1eS6) of Indian Sundarbanwetland aHugli River.
2. Material methods
2.1. Description of study sites
The Indian Sundarban mangrove wetland, formed at the estu-arine phase of the tidal Hugli (Ganges) River of an area ofw9600 km2, is a low-lying, vulnerable, prograding, tide-dominated
long with adjacent river network and locations of multifarious industries in upstream of
B.D. Bhattacharya et al. / Journal of Cleaner Production 96 (2015) 233e243 235
delta with complex topographical features (Fig. 1). The wetland ischaracterized by a complex network of tidal creeks, which sur-rounds hundreds of tidal islands exposed to different elevations athigh and low semi-diurnal tides. This coastal environment suffersfrom environmental degradation due to rapid human settlement,tourism and port activities, and operation of mechanized boats,deforestation and increasing agricultural and aquaculture practices.The ongoing degradation is also related to huge siltation, flooding,storm runoff, atmospheric deposition and other stresses resultingchanges in water quality, depletion of fishery resources, choking ofriver mouth and inlets, and overall loss of biodiversity (Sarkar andBhattacharya, 2003, 2008). A significant ecological change is pro-nounced in this area due to reclamation of land, huge discharges ofuntreated or semi-treated domestic, municipal and agriculturalwastes as well as effluents from multifarious industries (jute mill,textile, tannery, thermal power, oil refinery) situated in the up-stream of Hugli (as shown in Fig. 1) carried by the rivers as well ascontaminated mud disposal from harbour dredging (Sarkar et al.,2007). The upstream of the Hugli River flows through some ofthe most industrialized and urbanized (megacity Calcutta andHowrah) regions which make it one of the highly human-impactedrivers in India.
Surface water samples were collected for two successive years(2008e2009) from six study sites namely, Jambu Island (S1)(21�3302900N; 88�0301600E), Gangasagar (S2) (21�3400100N;88�1204100E), Chemagari (S3) (21�4004900N; 88�0900.4800E), Lot 8 (S4)(21�5201900N; 88�0903600E), Canning (S5) (22�1804000N; 88�4004300E)and Dhamakhali (S6) (22�2101300N; 88�5203800E) covering theeastern and western flank of the Sundarban wetland (as shown inFig. 1). Both S1 and S2 are the offshore sites situated on the Bay ofBengal, S3 is a macrotidal creek whereas S4 is a high energy zone,situated at the mouth of the Ganga river estuary. Rest two sites, S5and S6, are situated at the eastern flank of the Sundarban. Theaverage depth of the stations is w4.6 � 3.5 m. The study sitesbelong to distinctive geographic, geomorphic and hydrologicalsettings with variations of energy domains characterized by wave-tide climate. This low-lying, highly vulnerable coastal wetland be-longs to the meso-macrotidal (3.5e5.0 m) range amplitude at itssouthernmost sea face to mesotidal (<3.5e1.4 m) range near itsnorthern extremity (Bhattacharya, 2008) and are subjected tosemidiurnal tides with distinct diurnal variability (Bhattacharyaet al., 2000). The sites have diverse human interferences with avariable degree of exposure to trace metals (as shown in Table 1) aswell as trace organic pollution.
2.2. Collection of water samples
Low-density polyethylene (PE) sampling bottles were thor-oughly washed with detergent, rinsed with Milli-Q (Millipore)water, and then cleaned by soaking for 7 days in a HCl/Milli-Q 1:3 v/v solution prior to use. On each site, surface water samples in
Table 1Detailed description of six study sites in Sundarban coastal regions along with the respe
Station name Abbreviation Geomorphic co-ordinates Small and la
Jambu Island S1 21�3302900N; 88�0301600E None e onlyGangasagar S2 21�3400100N; 88�1204100E Ice factory, a
food packagChemagari S3 21�4004900N; 88�0900.4800E Ice factory, b
Lot 8 S4 21�5201900N; 88�0903600E Ice factory, pand Pulp fac
Canning S5 22�1804000N; 88�4004300E Brick Field,Match box m
Dhamakhali S6 22�2101300N; 88�5203800E Brick Field,
duplicate (1 lt.) were collected during high tide and average valueof each variable was reported. After collection it was filteredthrough cellulose acetate membrane filter (pore diameter 0.45 mm)and 2 ml 65% nitric acid (Merck) were added after that, watersamples were transferred in polyethylene flasks, and they wereimmediately transported to the laboratory at �4 �C. The watertemperature and salinity were measured on board, using ther-mometer (mercury, 0e100 �C) and refractometer (Tansui 16E)respectively. Water pH was measured by deluxe pH metre (modelno. 101E) using combination glass electrode manufactured by M.S.Electronics (India) Pvt. Ltd. and turbidity was measured by usingturbidity metre (STRAT 4014C).
2.3. Sample preparation
The concentration of dissolved metals was determined by sol-vent extraction using ammonium pyrrolidine dithiocarbamate(APDC) and methyl isobutyl ketone (MIBK) as a standard method(APHA, 1989). 1% aqueous solution of APDC (Eastman Chemicals)was prepared daily and purified by shaking with an equal volume ofMIBK, separating the phases and filtering the lower aqueous phase.Since APDC is only slightly soluble in MIBK whereas metal com-plexes are highly soluble, the reagent is easily purified in thismanner. Reagent grade MIBK was used throughout without furtherpurification. Ammonium acetate (Sigma, Mumbai) buffer (5 N) wasprepared andmetallic impurities were removed by adding a fewmlof APDC solution and extracting with MIBK.
2.4. Sample analyses
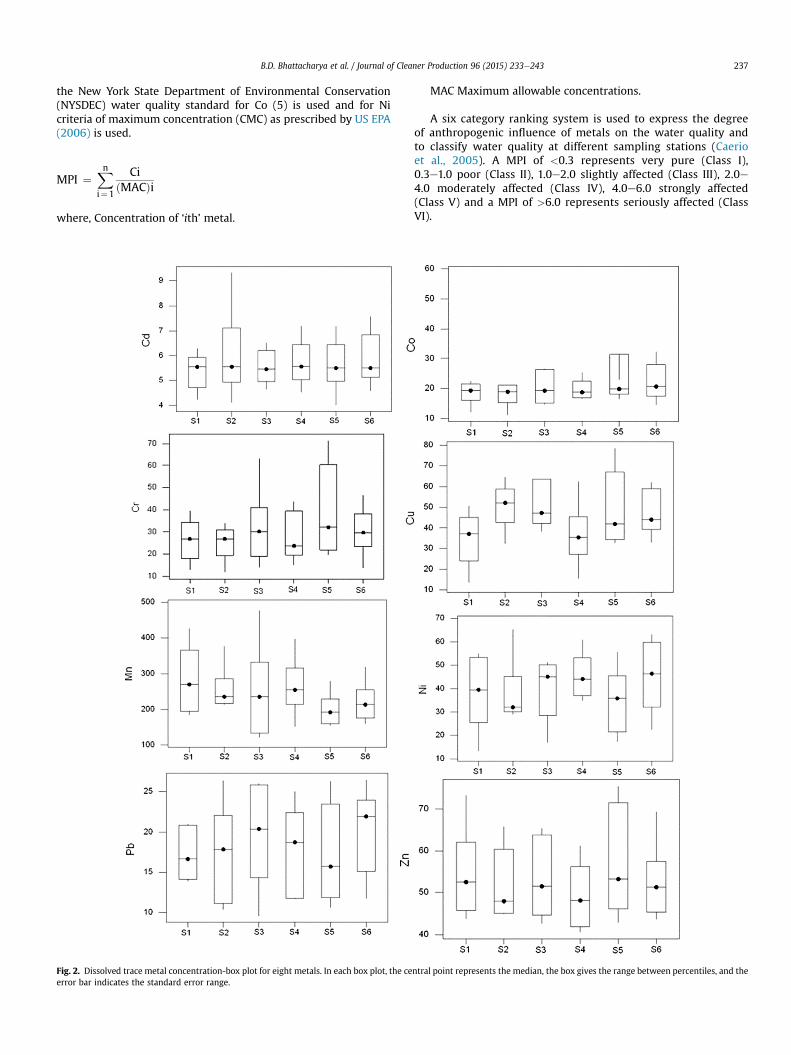
Concentration of the dissolved metals was measured in agraphite-furnace atomic absorption spectrophotometer (GFAAS;PerkineElmer 4100 ZL) using Zeeman-effect background correc-tion. Standardization was based on a two-point calibration proce-dure, using a multi element standard (J.T. Backer, Inc Phillsburg NJ)as the high standard, and double distilled water (zero metal con-centration) as the low standard. Standardization of the instrumentwas repeated after every three sets of seawater extracts to mini-mize the effect of instrument drift. Distilled water and a checkstandard were also included in the analysis sequence. Relativechemical standard solutions (Merck, Germany) were run to checkthe precision of the instrument throughout the analysis. Qualityassurance testing relied on the control of blanks and a yield forchemical procedure was quantitative at 100 � 4.2%. The blankvalues for the analysed metals were as follows: Cr, 3 � 0.24 mg l�1;Co, 0.40 � 0.003 mg l�1; Ni, 0.30 � 0.002 mg l�1; Cu,0.27 � 0.02 mg l�1; Zn, 3.15 � 0.28 mg l�1; Pb, 0.30 � 0.26 mg l�1; Cd,0.20 � 0.006 mg l�1; and Mn, 2.46 � 0.91 mg l�1. The accuracy andprecision of trace metal measurements were within the certifiedreference values for River water (SLRS-4) and the details are givenin Table 2.
ctive point and non-point sources of pollution.
rge scale industries Anthropogenic threats
coast guard activity Fisheries, boating activities, antifouling paintsgriculture, fish drying,ing
Boating, Fishing trawlers, Haldia Port entry forlarge ships and vessels
rick manufacture Boating, fishing, antifouling paints, ice-factorydischarge
aint factory, Papertory
Boating, agricultural runoff, domestic sewage
live and dry fish packaging,anufacturer
Agriculture, fishing, domestic sewage, boating
Aquaculture farm boating, antifouling paints, domestic sewage
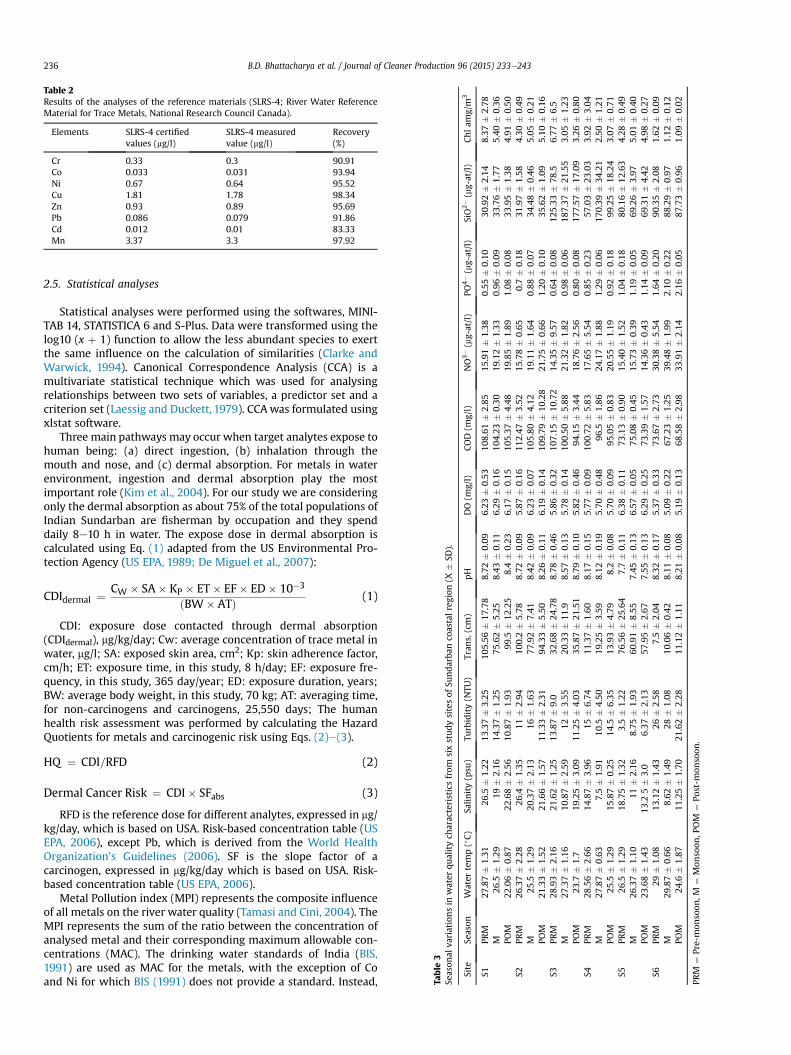
Table 2Results of the analyses of the reference materials (SLRS-4; River Water ReferenceMaterial for Trace Metals, National Research Council Canada).
Elements SLRS-4 certifiedvalues (mg/l)
SLRS-4 measuredvalue (mg/l)
Recovery(%)
Cr 0.33 0.3 90.91Co 0.033 0.031 93.94Ni 0.67 0.64 95.52Cu 1.81 1.78 98.34Zn 0.93 0.89 95.69Pb 0.086 0.079 91.86Cd 0.012 0.01 83.33Mn 3.37 3.3 97.92
Table
3Se
ason
alva
riationsin
water
qualitych
aracteristicsfrom
sixstudysitesof
Sundarba
nco
astalregion
(X�
SD).
Site
Season
Water
temp(�C)
Salin
ity(psu
)Tu
rbidity(N
TU)
Tran
s.(cm)
pH
DO
(mg/l)
COD
(mg/l)
NO3�(mg-at/l)
PO4�(mg-at/l)
SiO2�(mg-at/l)
Chlam
g/m
3
S1PR
M27
.87�
1.31
26.5
�1.22
13.37�
3.25
105.56
�17
.78
8.72
�0.09
6.23
�0.53
108.61
�2.85
15.91�
1.38
0.55
�0.10
30.92�
2.14
8.37
�2.78
M26
.5�
1.29
19�
2.16
14.37�
1.25
75.62�
5.25
8.43
�0.11
6.29
�0.16
104.23
�0.30
19.12�
1.33
0.96
�0.09
33.76�
1.77
5.40
�0.36
POM
22.06�
0.87
22.68�
2.56
10.87�
1.93
99.5
�12
.25
8.4�
0.23
6.17
�0.15
105.37
�4.48
19.85�
1.89
1.08
�0.08
33.95�
1.38
4.91
�0.50
S2PR
M26
.37�
2.28
26.4
�1.35
11�
2.94
100.2�
5.78
8.72
�0.09
5.87
�0.16
112.47
�3.52
15.78�
0.65
0.7�
0.18
31.97�
1.58
4.30
�0.49
M25
.5�
1.29
20.37�
2.13
16�
1.63
77.92�
7.41
8.42
�0.09
6.23
�0.07
105.80
�4.12
19.11�
1.64
0.88
�0.07
34.48�
0.46
5.05
�0.21
POM
21.33�
1.52
21.66�
1.57
11.33�
2.31
94.33�
5.50
8.26
�0.11
6.19
�0.14
109.79
�10
.28
21.75�
0.66
1.20
�0.10
35.62�
1.09
5.10
�0.16
S3PR
M28
.93�
2.16
21.62�
1.25
13.87�
9.0
32.68�
24.78
8.78
�0.46
5.86
�0.32
107.15
�10
.72
14.35�
9.57
0.64
�0.08
125.33
�78
.56.77
�6.5
M27
.37�
1.16
10.87�
2.59
12�
3.55
20.33�
11.9
8.57
�0.13
5.78
�0.14
100.50
�5.88
21.32�
1.82
0.98
�0.06
187.37
�21
.55
3.05
�1.23
POM
23.7
�1.7
19.25�
3.09
11.25�
4.03
35.87�
21.51
8.79
�0.10
5.82
�0.46
94.15�
3.44
18.76�
2.56
0.80
�0.08
177.57
�17
.09
3.26
�0.80
S4PR
M28
.56�
2.66
14.87�
3.96
15�
6.74
11.37�
1.60
8.17
�0.15
5.77
�0.09
100.72
�5.83
17.65�
5.54
0.85
�0.23
57.03�
23.03
3.92
�3.04
M27
.87�
0.63
7.5�
1.91
10.5
�4.50
19.25�
3.59
8.12
�0.19
5.70
�0.48
96.5
�1.86
24.17�
1.88
1.29
�0.06
170.39
�34
.21
2.50
�1.21
POM
25.5
�1.29
15.87�
0.25
14.5
�6.35
13.93�
4.79
8.2�
0.08
5.70
�0.09
95.05�
0.83
20.55�
1.19
0.92
�0.18
99.25�
18.24
3.07
�0.71
S5PR
M26
.5�
1.29
18.75�
1.32
3.5�
1.22
76.56�
25.64
7.7�
0.11
6.38
�0.11
73.13�
0.90
15.40�
1.52
1.04
�0.18
80.16�
12.63
4.28
�0.49
M26
.37�
1.10
11�
2.16
8.75
�1.93
60.91�
8.55
7.45
�0.13
6.57
�0.05
75.08�
0.45
15.73�
0.39
1.19
�0.05
69.26�
3.97
5.01
�0.40
POM
23.68�
1.43
13.2
5�
3.0
6.37
�2.13
57.95�
2.67
7.55
�0.13
6.29
�0.25
73.39�
1.57
14.36�
0.43
1.14
�0.09
69.31�
4.42
4.98
�0.27
S6PR
M29
�1.08
13.12�
1.43
26�
2.58
7.5�
2.04
8.32
�0.17
5.37
�0.33
73.67�
2.73
30.38�
5.54
1.64
�0.20
90.35�
2.08
1.62
�0.09
M29
.87�
0.66
8.62
�1.49
28�
1.08
10.06�
0.42
8.11
�0.08
5.09
�0.22
67.23�
1.25
39.48�
1.99
2.10
�0.22
88.29�
0.97
1.12
�0.12
POM
24.6
�1.87
11.25�
1.70
21.62�
2.28
11.12�
1.11
8.21
�0.08
5.19
�0.13
68.58�
2.98
33.91�
2.14
2.16
�0.05
87.73�
0.96
1.09
�0.02
PRM
¼Pre-mon
soon
,M¼
Mon
soon
,POM
¼Po
st-m
onsoon
.
B.D. Bhattacharya et al. / Journal of Cleaner Production 96 (2015) 233e243236
2.5. Statistical analyses
Statistical analyses were performed using the softwares, MINI-TAB 14, STATISTICA 6 and S-Plus. Data were transformed using thelog10 (x þ 1) function to allow the less abundant species to exertthe same influence on the calculation of similarities (Clarke andWarwick, 1994). Canonical Correspondence Analysis (CCA) is amultivariate statistical technique which was used for analysingrelationships between two sets of variables, a predictor set and acriterion set (Laessig and Duckett, 1979). CCAwas formulated usingxlstat software.
Three main pathways may occur when target analytes expose tohuman being: (a) direct ingestion, (b) inhalation through themouth and nose, and (c) dermal absorption. For metals in waterenvironment, ingestion and dermal absorption play the mostimportant role (Kim et al., 2004). For our study we are consideringonly the dermal absorption as about 75% of the total populations ofIndian Sundarban are fisherman by occupation and they spenddaily 8e10 h in water. The expose dose in dermal absorption iscalculated using Eq. (1) adapted from the US Environmental Pro-tection Agency (US EPA, 1989; De Miguel et al., 2007):
CDIdermal ¼ CW � SA� KP � ET� EF� ED� 10�3
ðBW� ATÞ (1)
CDI: exposure dose contacted through dermal absorption(CDIdermal), mg/kg/day; Cw: average concentration of trace metal inwater, mg/l; SA: exposed skin area, cm2; Kp: skin adherence factor,cm/h; ET: exposure time, in this study, 8 h/day; EF: exposure fre-quency, in this study, 365 day/year; ED: exposure duration, years;BW: average body weight, in this study, 70 kg; AT: averaging time,for non-carcinogens and carcinogens, 25,550 days; The humanhealth risk assessment was performed by calculating the HazardQuotients for metals and carcinogenic risk using Eqs. (2)e(3).
HQ ¼ CDI=RFD (2)
Dermal Cancer Risk ¼ CDI� SFabs (3)
RFD is the reference dose for different analytes, expressed in mg/kg/day, which is based on USA. Risk-based concentration table (USEPA, 2006), except Pb, which is derived from the World HealthOrganization’s Guidelines (2006). SF is the slope factor of acarcinogen, expressed in mg/kg/day which is based on USA. Risk-based concentration table (US EPA, 2006).
Metal Pollution index (MPI) represents the composite influenceof all metals on the river water quality (Tamasi and Cini, 2004). TheMPI represents the sum of the ratio between the concentration ofanalysed metal and their corresponding maximum allowable con-centrations (MAC). The drinking water standards of India (BIS,1991) are used as MAC for the metals, with the exception of Coand Ni for which BIS (1991) does not provide a standard. Instead,
B.D. Bhattacharya et al. / Journal of Cleaner Production 96 (2015) 233e243 237
the New York State Department of Environmental Conservation(NYSDEC) water quality standard for Co (5) is used and for Nicriteria of maximum concentration (CMC) as prescribed by US EPA(2006) is used.
MPI ¼Xn
i¼1
CiðMACÞi
where, Concentration of ‘ith’ metal.
Fig. 2. Dissolved trace metal concentration-box plot for eight metals. In each box plot, the ceerror bar indicates the standard error range.
MAC Maximum allowable concentrations.
A six category ranking system is used to express the degreeof anthropogenic influence of metals on the water quality andto classify water quality at different sampling stations (Caerioet al., 2005). A MPI of <0.3 represents very pure (Class I),0.3e1.0 poor (Class II), 1.0e2.0 slightly affected (Class III), 2.0e4.0 moderately affected (Class IV), 4.0e6.0 strongly affected(Class V) and a MPI of >6.0 represents seriously affected (ClassVI).
ntral point represents the median, the box gives the range between percentiles, and the
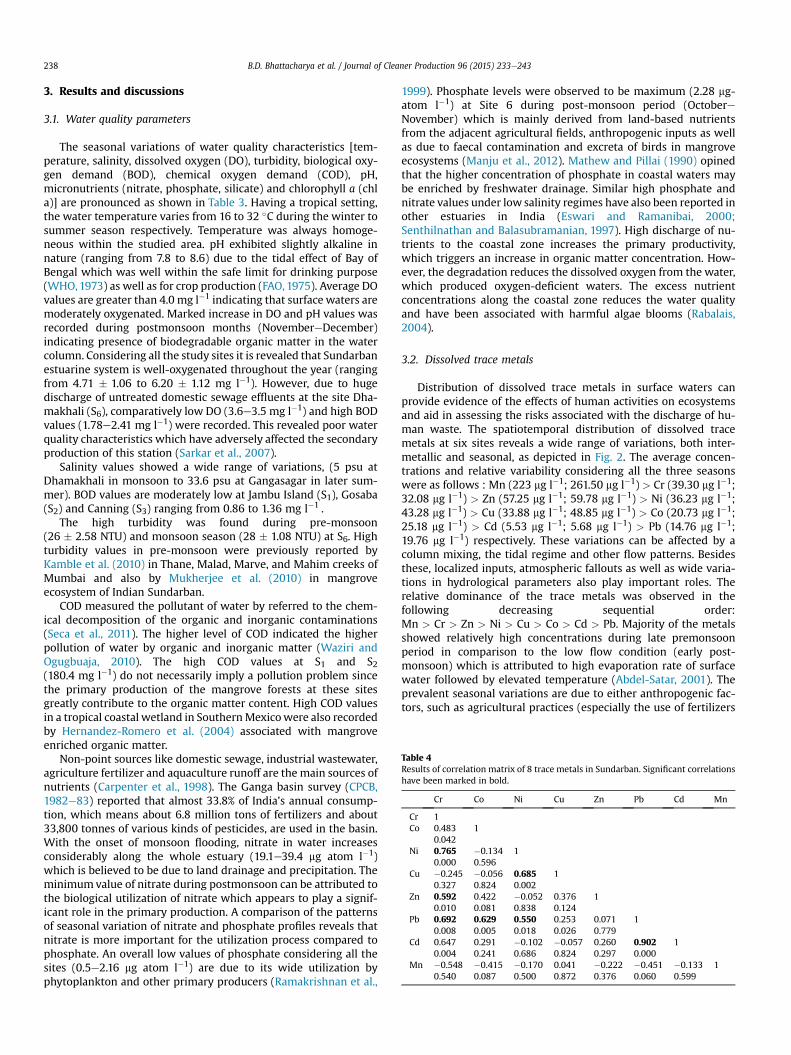
Table 4Results of correlation matrix of 8 trace metals in Sundarban. Significant correlationshave been marked in bold.
Cr Co Ni Cu Zn Pb Cd Mn
Cr 1Co 0.483
0.0421
Ni 0.7650.000
�0.1340.596
1
Cu �0.2450.327
�0.0560.824
0.6850.002
1
Zn 0.5920.010
0.4220.081
�0.0520.838
0.3760.124
1
Pb 0.6920.008
0.6290.005
0.5500.018
0.2530.026
0.0710.779
1
Cd 0.6470.004
0.2910.241
�0.1020.686
�0.0570.824
0.2600.297
0.9020.000
1
Mn �0.5480.540
�0.4150.087
�0.1700.500
0.0410.872
�0.2220.376
�0.4510.060
�0.1330.599
1
B.D. Bhattacharya et al. / Journal of Cleaner Production 96 (2015) 233e243238
3. Results and discussions
3.1. Water quality parameters
The seasonal variations of water quality characteristics [tem-perature, salinity, dissolved oxygen (DO), turbidity, biological oxy-gen demand (BOD), chemical oxygen demand (COD), pH,micronutrients (nitrate, phosphate, silicate) and chlorophyll a (chla)] are pronounced as shown in Table 3. Having a tropical setting,the water temperature varies from 16 to 32 �C during the winter tosummer season respectively. Temperature was always homoge-neous within the studied area. pH exhibited slightly alkaline innature (ranging from 7.8 to 8.6) due to the tidal effect of Bay ofBengal which was well within the safe limit for drinking purpose(WHO,1973) as well as for crop production (FAO,1975). Average DOvalues are greater than 4.0 mg l�1 indicating that surface waters aremoderately oxygenated. Marked increase in DO and pH values wasrecorded during postmonsoon months (NovembereDecember)indicating presence of biodegradable organic matter in the watercolumn. Considering all the study sites it is revealed that Sundarbanestuarine system is well-oxygenated throughout the year (rangingfrom 4.71 � 1.06 to 6.20 � 1.12 mg l�1). However, due to hugedischarge of untreated domestic sewage effluents at the site Dha-makhali (S6), comparatively low DO (3.6e3.5 mg l�1) and high BODvalues (1.78e2.41 mg l�1) were recorded. This revealed poor waterquality characteristics which have adversely affected the secondaryproduction of this station (Sarkar et al., 2007).
Salinity values showed a wide range of variations, (5 psu atDhamakhali in monsoon to 33.6 psu at Gangasagar in later sum-mer). BOD values are moderately low at Jambu Island (S1), Gosaba(S2) and Canning (S3) ranging from 0.86 to 1.36 mg l�1 .
The high turbidity was found during pre-monsoon(26 � 2.58 NTU) and monsoon season (28 � 1.08 NTU) at S6. Highturbidity values in pre-monsoon were previously reported byKamble et al. (2010) in Thane, Malad, Marve, and Mahim creeks ofMumbai and also by Mukherjee et al. (2010) in mangroveecosystem of Indian Sundarban.
COD measured the pollutant of water by referred to the chem-ical decomposition of the organic and inorganic contaminations(Seca et al., 2011). The higher level of COD indicated the higherpollution of water by organic and inorganic matter (Waziri andOgugbuaja, 2010). The high COD values at S1 and S2(180.4 mg l�1) do not necessarily imply a pollution problem sincethe primary production of the mangrove forests at these sitesgreatly contribute to the organic matter content. High COD valuesin a tropical coastal wetland in SouthernMexicowere also recordedby Hernandez-Romero et al. (2004) associated with mangroveenriched organic matter.
Non-point sources like domestic sewage, industrial wastewater,agriculture fertilizer and aquaculture runoff are the main sources ofnutrients (Carpenter et al., 1998). The Ganga basin survey (CPCB,1982e83) reported that almost 33.8% of India’s annual consump-tion, which means about 6.8 million tons of fertilizers and about33,800 tonnes of various kinds of pesticides, are used in the basin.With the onset of monsoon flooding, nitrate in water increasesconsiderably along the whole estuary (19.1e39.4 mg atom l�1)which is believed to be due to land drainage and precipitation. Theminimumvalue of nitrate during postmonsoon can be attributed tothe biological utilization of nitrate which appears to play a signif-icant role in the primary production. A comparison of the patternsof seasonal variation of nitrate and phosphate profiles reveals thatnitrate is more important for the utilization process compared tophosphate. An overall low values of phosphate considering all thesites (0.5e2.16 mg atom l�1) are due to its wide utilization byphytoplankton and other primary producers (Ramakrishnan et al.,
1999). Phosphate levels were observed to be maximum (2.28 mg-atom l�1) at Site 6 during post-monsoon period (OctobereNovember) which is mainly derived from land-based nutrientsfrom the adjacent agricultural fields, anthropogenic inputs as wellas due to faecal contamination and excreta of birds in mangroveecosystems (Manju et al., 2012). Mathew and Pillai (1990) opinedthat the higher concentration of phosphate in coastal waters maybe enriched by freshwater drainage. Similar high phosphate andnitrate values under low salinity regimes have also been reported inother estuaries in India (Eswari and Ramanibai, 2000;Senthilnathan and Balasubramanian, 1997). High discharge of nu-trients to the coastal zone increases the primary productivity,which triggers an increase in organic matter concentration. How-ever, the degradation reduces the dissolved oxygen from the water,which produced oxygen-deficient waters. The excess nutrientconcentrations along the coastal zone reduces the water qualityand have been associated with harmful algae blooms (Rabalais,2004).
3.2. Dissolved trace metals
Distribution of dissolved trace metals in surface waters canprovide evidence of the effects of human activities on ecosystemsand aid in assessing the risks associated with the discharge of hu-man waste. The spatiotemporal distribution of dissolved tracemetals at six sites reveals a wide range of variations, both inter-metallic and seasonal, as depicted in Fig. 2. The average concen-trations and relative variability considering all the three seasonswere as follows : Mn (223 mg l�1; 261.50 mg l�1) > Cr (39.30 mg l�1;32.08 mg l�1) > Zn (57.25 mg l�1; 59.78 mg l�1) > Ni (36.23 mg l�1;43.28 mg l�1) > Cu (33.88 mg l�1; 48.85 mg l�1) > Co (20.73 mg l�1;25.18 mg l�1) > Cd (5.53 mg l�1; 5.68 mg l�1) > Pb (14.76 mg l�1;19.76 mg l�1) respectively. These variations can be affected by acolumn mixing, the tidal regime and other flow patterns. Besidesthese, localized inputs, atmospheric fallouts as well as wide varia-tions in hydrological parameters also play important roles. Therelative dominance of the trace metals was observed in thefollowing decreasing sequential order:Mn > Cr > Zn > Ni > Cu > Co > Cd > Pb. Majority of the metalsshowed relatively high concentrations during late premonsoonperiod in comparison to the low flow condition (early post-monsoon) which is attributed to high evaporation rate of surfacewater followed by elevated temperature (Abdel-Satar, 2001). Theprevalent seasonal variations are due to either anthropogenic fac-tors, such as agricultural practices (especially the use of fertilizers
B.D. Bhattacharya et al. / Journal of Cleaner Production 96 (2015) 233e243 239
and biocides) or wastewater discharge, or concerned with hydro-logical processes (such as water temperature, pH, and river flow).
The range of Cd values revealed small range of variations from4.00 mg l�1 (at Gangasagar inmonsoon) to 9.32 mg l�1 (at Chemagariin premonsoon). Recordable levels of Cd have been measured inmost of the cases, indicating occurrence of sources of cadmiumwithin this area of the estuary (Botte et al., 2007). The maximum
Scree p
0
0.002
0.004
0.006
0.008
0.01
0.012
0.014
0.016
0.018
0.02
F1 F2 F3 F4
axi
Eig
en
va
lu
e
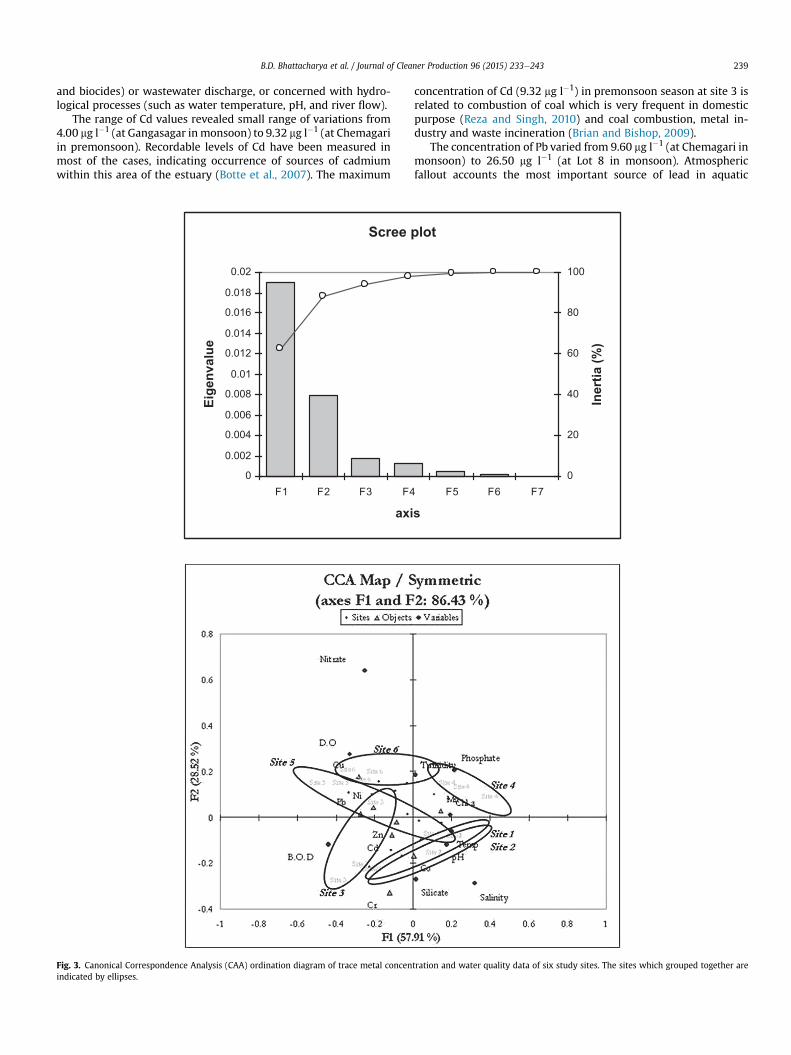
Fig. 3. Canonical Correspondence Analysis (CAA) ordination diagram of trace metal concenindicated by ellipses.
concentration of Cd (9.32 mg l�1) in premonsoon season at site 3 isrelated to combustion of coal which is very frequent in domesticpurpose (Reza and Singh, 2010) and coal combustion, metal in-dustry and waste incineration (Brian and Bishop, 2009).
The concentration of Pb varied from 9.60 mg l�1 (at Chemagari inmonsoon) to 26.50 mg l�1 (at Lot 8 in monsoon). Atmosphericfallout accounts the most important source of lead in aquatic
lot
F5 F6 F7
s
0
20
40
60
80
100
In
ertia
(%
)
tration and water quality data of six study sites. The sites which grouped together are
Table 5Reference Dose (RFD), Hazard Quotient (HQ) and Dermal Cancer Risk for eachelement.
Elements RFDdermal HQdermal Dermal cancer risk
Cr 0.015 0.79 1.77 � 10�4
Ni 5.4 2.94 � 10�4 8.58 � 10�3
Cu 12 7.35 � 10�4 0.10Zn 60 1.05 � 10�4 0.38Pb 0.42 8.58 � 10�4 1.51 � 10�4
Cd 0.005 0.22 5.61 � 10�6
Mn 0.8 0.06 0.04
0
1
2
3
4
5
S1 S2 S3 S4 S5 S6Stations
MPI
Fig. 4. Metal Pollution Index (MPI) at 6 study sites (S1eS6) of Sundarban.
B.D. Bhattacharya et al. / Journal of Cleaner Production 96 (2015) 233e243240
environments (Moore and Ramamurthy, 1993; Sadiq, 1992) whichis concerned for the enrichment of Pb at sites 2 and 4 alongwith theanthropogenic inputs and wastes through runoff into these aquaticenvironments (Ray et al., 2006). Rainfall (annual average precipi-tation 1600 mm), also acts as an external lead source and therelease of adsorbed leadmight be possible explanations (Saad et al.,2003). In addition, Pb has been identified as an excellent tracer foranthropogenic sources of dust and particles to surface waters(Boyle, 2001).
Chromium (12.53 mg l�1 (at Chemagari in monsoon) to71.30 mg l�1 (at Jambu Island in premonsoon) and Ni (13.46 mg l�1
(at Dhamakhali in monsoon) to 63.19 mg l�1 (at Jambu Island inmonsoon) followed similar trend of distribution showing insignif-icant differences [F ¼ 0.57; (p ¼ 0.591) for Cr] among them. Theobserved results allowed sustaining the occurrence of a source of Niin this estuarine environment which was high during post-monsoon, concerned to the effect of rain run-off (Phiri et al.,2005). Previous studies also endorsed that the atmospheric pre-cipitation is very much responsible for metal contamination insurface water (Wong et al., 2003; Wu et al., 2008; Pandey et al.,2009).
The levels of Cu ranged from 30.90 mg l�1 (at Canning in post-monsoon) to 78.60 mg l�1 (at Dhamakhali in monsoon), while thecorresponding mean values for each study site is as follows:36.73�12 mg l�1 at Jambu Island, 43.39� 9.33 mg l�1 at Gangasagar,47 � 12.69 mg l�1 at Chemagari, 37.72 � 6.09 mg l�1 at Lot 8,47.44 � 20.84 mg l�1 at Canning and 56.06 � 15.44 mg l�1 at Dha-makhali and there exists significant differences between them[F ¼ 0.15; p ¼ 0.561]. The enrichment of Cu indicates that there ispotential source of Cu (Reza and Singh, 2010) which is attributed todomestic sewage and monsoon run-off from the adjacent agricul-tural fields (Wu et al., 2008). Copper enters the water systemthrough mineral dissolution, industrial effluents, because of its useas algicide and insecticide and through corrosion of copper alloywater distribution pipes (Gyamfi et al., 2012). It may occur in simpleionic form or in one of many complexes with groups, such as cya-nides, chlorides, ammonia or organic ligands. The riverine contri-bution is of key importance in the inputs of Cu and Zn to the coastalregions of Sundarban. In contrast, Cd and Pb are introduced, in part,by atmospheric transport, as asserted by Renner et al. (1998).
Concentration of Zn ranges from 42.26 mg l�1 (at Canning inpremonsoon) to 75.40 mg l�1 (at Dhamakhali in postmonsoon). Therelatively higher concentration of Zn in three study sites (namelyS2, S1 and S6) is attributed to the presence of unused remains of zincsulphate in fertilizers (Wu et al., 2008) which mixes with the waterfrom the adjacent agricultural field. Moreover, immersion ofthousands of idols in these estuarine waters is also of great concernfor enrichment of trace metals (zinc, lead etc.) as well as variousorganic and inorganic matter, oil and grease etc. (Central PollutionControl Board, 2003) present in clay/plaster of paris and the syn-thetic paints very much used in the idols.
The analysis of Co has shown values from 14.78 mg l�1 (atChemagari in premonsoon) to 56.40 mg l�1 (at Jambu Island inmonsoon). Maximum value of Co was found at site 3 during pre-monsoon (56.40 mg l�1) which is due to the effluents from metalalloys industrial sewage runoffs from ships (Brian and Bishop,2009).
The range of Mn values showed high variations between studiedstations, minimum 122 mg l�1 (at Lot 8 in monsoon) to maximum476 mg l�1 (at Jambu Island in monsoon) and this high value isattributed to the riverine inputs as well as from natural erosionprocesses (Szefer et al., 1995). Majority of the trace metals showedhigh concentrations during the summer periodwhich is due to highevaporation rate of surface water followed by elevated temperature(Abdel-Satar, 2001).
3.3. Statistical interpretations
There was no significant correlations between the concentra-tions of trace metals and water temperature. However, Cd and Crexhibited significant positive correlations with pH, while Mnindicated a negative correlation with pH. Results of correlationmatrix revealed that Cr is significantly correlated with majority ofthe metals (Ni, Pb, Zn, Cd) indicating their identical behavioursduring transport in coastal environment. The negative relation-ships of Mn with majority of the metals (excepting Cu) suggestthat Mn-oxide may be only a minor host phase for these metals.Non-significant correlations of Mn with all the metals are due tothe different processes like biological effects and external inputsoperating in estuarine system (Ray et al., 2006). Significant cor-relations between Cu with Co (r ¼ 0.69) and Ni (0.76), Ni with Zn(r ¼ 0.514) and Pb (0.638) and Zn with Cd (r ¼ 0.857) (as shown inTable 4) indicate the possible enrichment of all these four metalspartly through terrigenous origin and partly due to the biologicalproduction especially uptake of particulate trace metals byphytoplankton as endorsed by Knaner and Martin (1973). Resultsof dendrogram showed that Canning (S5) and Dhamakhali (S6)clustered at about 85% of the level of similarity as both the sitessuffer from untreated sewage and domestic effluents from themegacity Calcutta. Chemagari (S3) formed a separate cluster at 42%similarity level as majority of the heavy metals showed maximumconcentrations at this site and the enrichments are mainly due toregular boating and fishing activities, fish docking, brick transportand mechanized boat repairing almost throughout the year. TheCCA map (Fig. 3) allows to simultaneously visualizing the tracemetal concentration, the sites, and the variables (temperature,salinity, dissolved oxygen, nitrate, phosphate, silicate and chloro-phyll a concentration in surface water. Both the Sites 1 and 2 foundto be overlapped as these are situated on the open ocean,depending upon the temperature, salinity and pH of the surfacewater. In trace metals only Co was found to be associated withthese two sites.
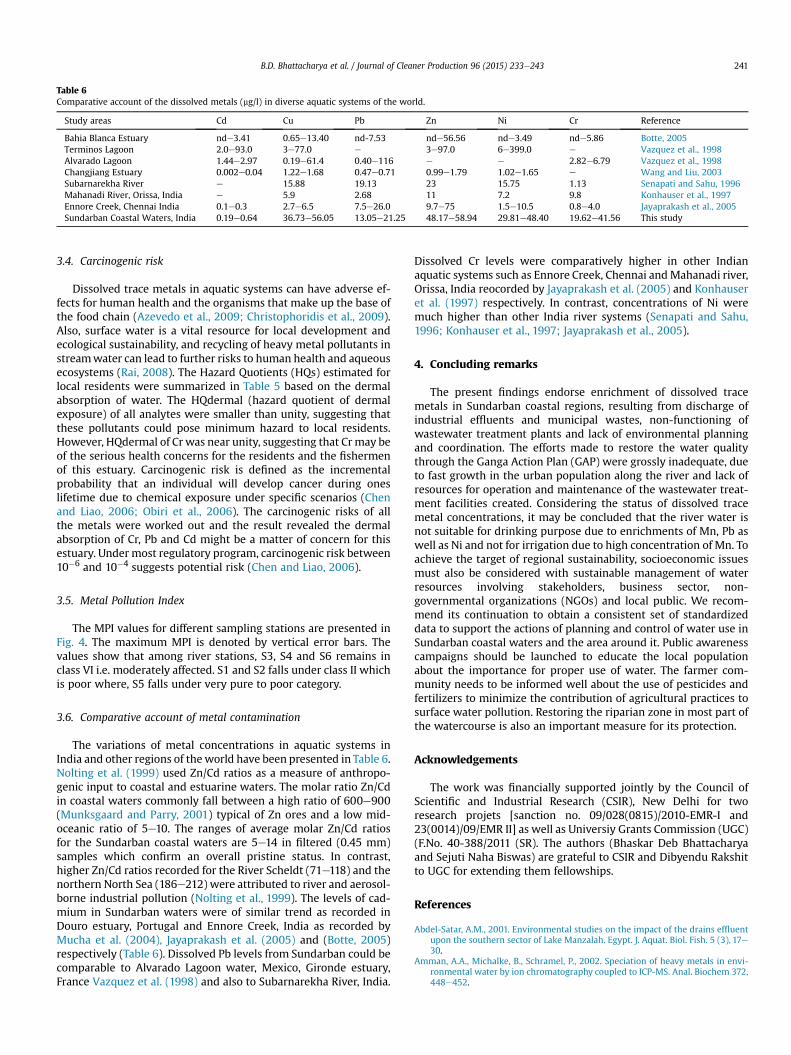
Table 6Comparative account of the dissolved metals (mg/l) in diverse aquatic systems of the world.
Study areas Cd Cu Pb Zn Ni Cr Reference
Bahia Blanca Estuary nde3.41 0.65e13.40 nd-7.53 nde56.56 nde3.49 nde5.86 Botte, 2005Terminos Lagoon 2.0e93.0 3e77.0 e 3e97.0 6e399.0 e Vazquez et al., 1998Alvarado Lagoon 1.44e2.97 0.19e61.4 0.40e116 e e 2.82e6.79 Vazquez et al., 1998Changjiang Estuary 0.002e0.04 1.22e1.68 0.47e0.71 0.99e1.79 1.02e1.65 e Wang and Liu, 2003Subarnarekha River e 15.88 19.13 23 15.75 1.13 Senapati and Sahu, 1996Mahanadi River, Orissa, India e 5.9 2.68 11 7.2 9.8 Konhauser et al., 1997Ennore Creek, Chennai India 0.1e0.3 2.7e6.5 7.5e26.0 9.7e75 1.5e10.5 0.8e4.0 Jayaprakash et al., 2005Sundarban Coastal Waters, India 0.19e0.64 36.73e56.05 13.05e21.25 48.17e58.94 29.81e48.40 19.62e41.56 This study
B.D. Bhattacharya et al. / Journal of Cleaner Production 96 (2015) 233e243 241
3.4. Carcinogenic risk
Dissolved trace metals in aquatic systems can have adverse ef-fects for human health and the organisms that make up the base ofthe food chain (Azevedo et al., 2009; Christophoridis et al., 2009).Also, surface water is a vital resource for local development andecological sustainability, and recycling of heavy metal pollutants instreamwater can lead to further risks to human health and aqueousecosystems (Rai, 2008). The Hazard Quotients (HQs) estimated forlocal residents were summarized in Table 5 based on the dermalabsorption of water. The HQdermal (hazard quotient of dermalexposure) of all analytes were smaller than unity, suggesting thatthese pollutants could pose minimum hazard to local residents.However, HQdermal of Cr was near unity, suggesting that Crmay beof the serious health concerns for the residents and the fishermenof this estuary. Carcinogenic risk is defined as the incrementalprobability that an individual will develop cancer during oneslifetime due to chemical exposure under specific scenarios (Chenand Liao, 2006; Obiri et al., 2006). The carcinogenic risks of allthe metals were worked out and the result revealed the dermalabsorption of Cr, Pb and Cd might be a matter of concern for thisestuary. Under most regulatory program, carcinogenic risk between10�6 and 10�4 suggests potential risk (Chen and Liao, 2006).
3.5. Metal Pollution Index
The MPI values for different sampling stations are presented inFig. 4. The maximum MPI is denoted by vertical error bars. Thevalues show that among river stations, S3, S4 and S6 remains inclass VI i.e. moderately affected. S1 and S2 falls under class II whichis poor where, S5 falls under very pure to poor category.
3.6. Comparative account of metal contamination
The variations of metal concentrations in aquatic systems inIndia and other regions of theworld have been presented in Table 6.Nolting et al. (1999) used Zn/Cd ratios as a measure of anthropo-genic input to coastal and estuarine waters. The molar ratio Zn/Cdin coastal waters commonly fall between a high ratio of 600e900(Munksgaard and Parry, 2001) typical of Zn ores and a low mid-oceanic ratio of 5e10. The ranges of average molar Zn/Cd ratiosfor the Sundarban coastal waters are 5e14 in filtered (0.45 mm)samples which confirm an overall pristine status. In contrast,higher Zn/Cd ratios recorded for the River Scheldt (71e118) and thenorthern North Sea (186e212) were attributed to river and aerosol-borne industrial pollution (Nolting et al., 1999). The levels of cad-mium in Sundarban waters were of similar trend as recorded inDouro estuary, Portugal and Ennore Creek, India as recorded byMucha et al. (2004), Jayaprakash et al. (2005) and (Botte, 2005)respectively (Table 6). Dissolved Pb levels from Sundarban could becomparable to Alvarado Lagoon water, Mexico, Gironde estuary,France Vazquez et al. (1998) and also to Subarnarekha River, India.
Dissolved Cr levels were comparatively higher in other Indianaquatic systems such as Ennore Creek, Chennai andMahanadi river,Orissa, India reocorded by Jayaprakash et al. (2005) and Konhauseret al. (1997) respectively. In contrast, concentrations of Ni weremuch higher than other India river systems (Senapati and Sahu,1996; Konhauser et al., 1997; Jayaprakash et al., 2005).
4. Concluding remarks
The present findings endorse enrichment of dissolved tracemetals in Sundarban coastal regions, resulting from discharge ofindustrial effluents and municipal wastes, non-functioning ofwastewater treatment plants and lack of environmental planningand coordination. The efforts made to restore the water qualitythrough the Ganga Action Plan (GAP) were grossly inadequate, dueto fast growth in the urban population along the river and lack ofresources for operation and maintenance of the wastewater treat-ment facilities created. Considering the status of dissolved tracemetal concentrations, it may be concluded that the river water isnot suitable for drinking purpose due to enrichments of Mn, Pb aswell as Ni and not for irrigation due to high concentration of Mn. Toachieve the target of regional sustainability, socioeconomic issuesmust also be considered with sustainable management of waterresources involving stakeholders, business sector, non-governmental organizations (NGOs) and local public. We recom-mend its continuation to obtain a consistent set of standardizeddata to support the actions of planning and control of water use inSundarban coastal waters and the area around it. Public awarenesscampaigns should be launched to educate the local populationabout the importance for proper use of water. The farmer com-munity needs to be informed well about the use of pesticides andfertilizers to minimize the contribution of agricultural practices tosurface water pollution. Restoring the riparian zone in most part ofthe watercourse is also an important measure for its protection.
Acknowledgements
The work was financially supported jointly by the Council ofScientific and Industrial Research (CSIR), New Delhi for tworesearch projets [sanction no. 09/028(0815)/2010-EMR-I and23(0014)/09/EMR II] as well as Universiy Grants Commission (UGC)(F.No. 40-388/2011 (SR). The authors (Bhaskar Deb Bhattacharyaand Sejuti Naha Biswas) are grateful to CSIR and Dibyendu Rakshitto UGC for extending them fellowships.
References
Abdel-Satar, A.M., 2001. Environmental studies on the impact of the drains effluentupon the southern sector of Lake Manzalah. Egypt. J. Aquat. Biol. Fish. 5 (3), 17e30.
Amman, A.A., Michalke, B., Schramel, P., 2002. Speciation of heavy metals in envi-ronmental water by ion chromatography coupled to ICP-MS. Anal. Biochem 372,448e452.
B.D. Bhattacharya et al. / Journal of Cleaner Production 96 (2015) 233e243242
APHA, 1989. Standard Methods for the Examination of Water and Seawater, 17th ed.EPHA, Washington, USA. 1193.
Azevedo, J.S., Serafim, A., Company, R., et al., 2009. Biomarkers of exposure to metalcontamination and lipid peroxidation in the benthic fish Cathorops spixii fromtwo estuaries in South America, Brazil. Ecotoxicol 18, 1001e1010.
Bhattacharya, A., Sarkar, S.K., Das, S.K., Giri, S., Bose, G., Mitra, K., Dey, D., 2000.Holocene tidal flat sedimentation in the sundarban Biosphere Reserve, North-east India. In: Coastal Zone Management, SDMCET Dharwar and IGCP 367,Special Publication, vol. 2, pp. 51e56.
Bhattacharya, A., 2008. The morphodynamic setting and substrate behavior of theSunderban mangrove wetland of India. Sarovar Sourabh 4 (2), 2e9.
B.I.S, 1991. Bureau of Indian Standards Drinking water specification, 1st revision, ISS10500.
Botté, S.E., 2005. El rol de la vegetación en el ciclo biogeoquímico de los metalespesados en humedales del estuario de Bahía Blanca. Ph.D. Thesis. UniversidadNacional del Sur, Argentina, 317.
Botte, S.E., Freije, R.H., Marcovecchio, J.E., 2007. Dissolved heavy metal (Cd, Pb, Cr,Ni) concentrations in surface water and Porewater from Bahıa Blanca estuarytidal Flats. Bull. Environ. Contam. Toxicol. 79, 415e421.
Boye, M., Wake, B.D., Lopez Garcia, P., Bown, J., Baker, A.R., Achterberg, E.P., 2012.Distributions of dissolved trace metals (Cd, Cu, Mn, Pb, Ag) in the southeasternAtlantic and the Southern Ocean. Biogeosci. Discuss. 9, 3579e3613.
Boyle, E.A., 2001. Anthropogenic trace elements in the Ocean. In: Steele, J.H.,Turekain, K.K. (Eds.), Encyclopedia of Ocean Sciences. Academic Press, pp. 162e169.
Brian, S.C., Bishop, M., 2009. Seasonal and spatial variation of metal loads fromnatural flows in the upper Tenmile Creek watershed, Montana. Mine WaterEnviron. 28 (3), 166e181.
Caerio, S., Costa, M.H., Ramos, T.B., Fernandes, F., Silveira, N., Coimbra, A.,Mederios, G., Painho, M., 2005. Assessing heavy metal contamination in SadoEstuary sediment: an index analysis approach. Ecol. Indic. 5, 155e169.
Carpenter, S.R., Carco, N.F., Correll, D.L., Howarth, R.W., Sharpley, A.N., Smith, V.H.,1998. Nonpoint pollution of surface waters with phosphorus and nitrogen. Ecol.Appl. 8 (3), 559e568.
Central Pollution Board, 2003. Environmental Information System. Ministry ofEnvironment and Forest, Govt. of India. Annual Report 2002 e 2003, ChapterVII. http://cpcbenvis.nic.in/ar2003/ar2-3ch7.htm.
Chen, S.C., Liao, C.M., 2006. Health risk assessment on human exposed to envi-ronmental polycyclic aromatic hydrocarbons pollution sources. Sci. Tot. Envi-ron. 366, 112e123.
Christophoridis, C., Dedepsidis, D., Fytianos, K., 2009. Occurrence and distribution ofselected heavy metals in the surface sediments of Thermaikos Gulf, N. Greece.Assessment using pollution indicators. J. Hazard. Mater. 168, 1082e1091.
Clarke, K.R., Warwick, R.M., 1994. Changes in Marine Communities: an Approach toStatistical Analysis and Interpretation. Plymouth Marine Laboratory, Plymouth.
Coeurdassier, M., Scheifler, R., Mench, M., et al., 2010. Arsenic transfer and impactson snails exposed to stabilized and untreated As-contaminated soils. Environ.Pollut. 158, 2078e2083.
Central Pollution Control Board, 1982e83. Survey report of CUPS/12/1982e83Assimilation Capacity of Point Pollution Load: The River Yamuna in the UT ofDelhi.
Das, R.K., Bhowmick, S., Ghosh, S.P., Dutta, S., 1997. Coliform and fecal coliformbacterial load in a stretch of Hooghly. In: Vass, K.K., Sinha, M. (Eds.), Proc. Nat.Sem. Changing Pers. Inland Fish. Inland Fish. Soc. India, Barrackpore.
De Miguel, E., Iribarren, I., Chacon, E., Ordonez, A., Charlesworth, S., 2007. Risk-based evaluation of the exposure of children to trace elements in playgroundsin Madrid (Spain). Chemosphere 66, 505e513.
Deheyn, D.D., Latz, M.I., 2006. Bioavailability of metals along a contaminationgradient in San Diego Bay (California, USA). Chemosphere 65, 818e834.
Demirak, A., Yilmaz, F., Tuna, A.L., Ozdemir, N., 2006. Heavy metals in water, sedi-ment and tissues of Leuciscus cephalus from a stream in southwestern Turkey.Chemosphere 63, 1451e1458.
Eswari, Y.N.K., Ramanibai, R., 2000. Trace metal distribution in the estuarine watersof Chennai, Southeast of India. Proc. Anal. Tech. Monit. Environ., 333e338.
Everaarts, J.M., Nieuwenhuize, J., 1995. Heavy metals in surface sediments andepibenthic macroinvertebrates from the coastal zone and continental slope ofKenya. Mar. Pollut. Bull. 31, 281e289.
FAO, 1975. Manual of methods in aquatic environment Khan, Y. S. A.; Hussain, M. S.;Hossain, S. M. G.; Hallimuzzaman, research, Food and Agricultural Organizationof the United A. H. M., 1998. An environmental assessment of trace Nations, Part1: methods of detection, measurement and metals in Ganges-Brahamputra-Meghna Estuary. J. Rem. Monit. water Pollut. Sens. Environ. 2, 103e117.
Flegal, A.R., Patterson, C.C., 1983. Vertical concentration profiles of lead in theCentral Pacific at 15� N and 20� S. Earth Planet. Sci. Lett. 64, 19e32.
Förstner, U., Whitman, G.T.W., 1979. Metal Pollution in the Aquatic Environment.Springer, Berlin, Heidelberg, New York.
Garrett, R.G., 2000. Natural sources of metals to the environment. Hum. Ecol. RiskAssess. 6, 945e963.
Ghosh, S., Vass, K.K., 1997. Role of sewage treatment plant in environmental miti-gation. In: Vass, K.K., Sinha, M. (Eds.), Proc. Nat. Sem. Changing Pers. Inland Fish.Inland Fish. Soc. India Barrackpore, pp. 36e40.
Gyamfi, E.T., Ackah, M., Anim, A.K., Hanson, J.K., Kpattah, L., Enti-Brown, S., Adjei-Kyereme, Y., Nyarko, E.S., 2012. Chemical analysis of potable water samplesfrom selected suburbs of Accra, Ghana. Proc. Int. Acad. Ecol. Environ. Sci. 2 (2),118e127.
Hernandez-Romero, A.H., Hernandez, C.T., Malo, E.A., Bello-Mendoza, R., 2004.Water quality and presence of pesticides in a tropical coastal wetland insouthern Mexico. Mar. Pollut. Bull. 48, 11e41.
Jain, C.K., 2004. Metal fractionation study on bed sediments of River Yamuna, India.Water Res. 38, 569e578.
Jain, V.K., 1978. Studies on effect of cadmium on the growth pattern of Phaseolusaurius varieties. ABSII. Bot. Conf. JIBS, 57e84.
Jayaprakash, M., Srinivasalu, S., Jonathan, M.P., Ram Mohan, V., 2005. A baselinestudy of physico-chemical parameters and trace metals in waters of EnnoreCreek, Chennai, India. Mar. Pollut. Bull. 50, 583e608.
Kamble, S.R., Ritesh, Vijay, Sohony, R.A., 2010. Water quality assessment of creeksand coast in Mumbai, India: a spatial and temporal analysis. ESRI India. In: 11thESRI India User Conference 2010, pp. 1e6.
Kar, D., Sur, P., Mandal, S.K., Saha, T., Kole, R.K., 2008. Assessment of heavy metalpollution in surface water. Int. J. Environ. Sci. Technol. 5 (1), 119e124.
Kim, E., Little, J.C., Chiu, N., 2004. Estimating exposure to chemical contaminants indrinking water. Environ. Sci. Technol. 38, 1799e1806.
Knaner, G.A., Martin, J.H., 1973. Seasonal variations of cadmium, copper, Manganese,Lead and zinc in water and phytoplankton in Monterey Bay, California. Limnol.Oceanogr. 18, 597e604.
Konhauser, K.O., Powell, M.A., Fyfe, W.S., Longstaffe, F.J., Tripathy, S., 1997. Traceelement geochemistry of river sediment, Orissa State, India. J. Hydrol. 193, 258e269.
Laessig, R.E., Duckett, E.J., 1979. Canonical correlation analysis: potential for envi-ronmental health planning. Am. J. Public Health 69 (4), 353e359.
Lantzy, R.J., Mackenzie, F.T., 1979. Atmospheric trace metals: global cycles andassessment of man’s impact. Geochim. Cosmochim. Act. 43, 511e525.
Lim, P.E., Lee, C.K., Din, Z., 1995. Accumulation of heavy metals by cultured oystersfrom Merbok Estuary, Malaysia. Mar. Pollut. Bull. 31, 420e423.
Manju, M.N., Resmi, P., Girish Kumar, T.T., Raathesh Kumar, C.S., Rahul, R.,Joseph, M.M., Chandramohankumar, N., 2012. Assessment of water qualityparameters in mangrove ecosystems along Kerala coast: a statistical approach.Int. J. Environ. Res. 6 (4), 893e902.
Mathew, L., Pillai, N., 1990. Chemical characteristics of the waters around Andamansduring late winter. In: Proceedings of the First Workshop on Scientific Results ofFORV Sagar Sampada, pp. 15e18.
Moore, J.R., Ramamoorthy, S., 1993. Heavy metals in natural waters, AppliedMonitoring and Impact Assessment. Springer-Verlag Inc., New York.
Mucha, A.P., Bordalo, A.A., Vasconcelos, M.T.S.D., 2004. Sediment quality in the riverestuary based on trace metal contents, macrobenthic community and elutriatesediment toxicity test (ESTT). J. Environ. Monit. 6, 585e592.
Mukherjee, D., Das, M., Sen, G.K., 2010. Water quality assessment in the mangroveecosystem of Indian Sundarbans. Asian J. Microbiol. 12 (3), 561e563.
Munksgaard, N.C., Parry, D.L., 2001. Trace metals, arsenic and lead isotopes in dis-solved and particulate phases of North Australian coastal and estuarineseawater. Mar. Chem. 75, 165e184.
Nolting, R.F., de Barr, H.J.W., Timmermans, K.R., Bakker, K., 1999. Chemical fractionof zinc versus cadmium among other metals nickel, copper and lead in thenorthern North Sea. Mar. Chem. 67, 267e287.
Nriagu, J.O., 1979. Global inventory of natural and anthropogenic emissions of tracemetals to the atmosphere. Nature 279, 409e411.
Obiri, S., Dodoo, D.K., Okai-Sam, F., Essumang, D.K., 2006. Cancer health riskassessment of exposure to arsenic by workers of Anglo-Gold Ashanti-Obuasigold mine. Bull. Environ. Contam. Toxicol. 76, 195e201.
Pandey, J., Shubhashish, K., Pandey, R., 2009. Metal contamination of Ganga River(India) as influenced by atmospheric deposition. Bull. Environ. Contam. Toxicol.83 (2), 204e209.
Phiri, O., Mumba, P., Moyo, B.H.Z., Kadewa, W., 2005. Assessment of the impact ofindustrial effluents on water quality of receiving Rivers in urban areas ofMalawi. Int. J. Environ. Sci. Technol. 2 (3), 237e244.
Rabalais, N.N., 2004. Eutrophication. In: Robinson, A.R., McCarthy, J., Rothschild, B.J.(Eds.), The Global Coastal Ocean Multiscale Interdisciplinary Processes, The Sea,vol. 13. Harvard University Press, pp. 819e865.
Rai, P.K., 2008. Heavy metal pollution in aquatic ecosystems and its phytor-emediation using wetland plants: an ecosustainable approach. Int. J. Phytor-emediat. 10, 133e160.
Ramakrishnan, R., Perumal, P., Santhanam, P., 1999. Spatio-temporal variations ofhydrographical features in the Pichavaram mangroves and Mohi aqua farm,Southeast coast of India. In: Proc. Intl. Sem. Appl. Hydrogeochem., AnnamalaiUniversity, Annamalai Nagar, India. Dept. of Geology, Annamalai University,Chidambaram, Tamil Nadu, pp. 197e203.
Ray, A.K., Tripathy, S.C., Patra, S., Sarma, V.V., 2006. Assessment of Godavari estu-arine mangrove ecosystem through trace metal studies. Environ. Int. 32, 219e223.
Renner, R.M., Glasby, G.P., Szefer, P., 1998. Endmember analysis of heavy-metalpollution in surficial sediments from the Gulf of Gdansk and the southernBaltic Sea off Poland. Appl. Geochem 13, 313e318.
Reza, R., Singh, G., 2010. Heavy metal contamination and its indexing approach forRiver Water. Int. J. Environ. Sci. Technol. 7 (4), 785e792.
Ross, S.M., 1994. Toxic Metals in soil-plant systems. Wiley, Chichester, U. K.Saad, Z., Kazpard, V., Slim, K., Nabhan, P., 2003. Natural and anthropogenic in-
fluence on the quality of Ibrahim river water Lebanon. J. Eur. D’Hydrologie 4,85e100.
Sadiq, M., 1992. Toxic Metal Chemist in Marine Environments. Marcel Dekker, NewYork.
B.D. Bhattacharya et al. / Journal of Cleaner Production 96 (2015) 233e243 243
Sarkar, S.K., Bhattacharya, B.D., 2008. Biodiversity of zooplankton in Sundarbancoastal regions India, variations due to phytoplankton bloom. In: Proc. Sixt. Nat.Symp. Ground Water Conserv. (NSE e 16).
Sarkar, S.K., Saha, M., Takada, H., Bhattacharya, A., Mishra, P., Bhattacharya, B., 2007.Water quality management in the lower stretch of the River Ganges, east coastof India: an approach through environmental education. J. Clean. Prod. 15 (16),1459e1467.
Sarkar, S.K., Bhattacharya, A.K., 2003. Conservation of biodiversity of the coastalresources of Sundarbans, Northeast India: an integrated approach throughenvironmental education. Mar. Pollut. Bull. 47, 260e264.
Seca, G., Rosli, N., Ngayop, J., Arianto, C.I., 2011. Status of water quality based on thephysico-chemical assessment on river water at Wildlife Sanctuary Sibutimangrove forest. Miri Sarawak. Am. J. Environ. Sci. 7 (3), 269e275.
Senapati, N.K., Sahu, K.C., 1996. Heavy metal distribution in Subarnarekha river, eastcoast of India. Indian J. Mar. Sci. 25 (2), 109e114.
Senthilnathan, S., Balasubramanian, T., 1997. Distribution of heavy metals in estu-aries of southeast coast of India. Indian J. Mar. Sci. 26, 95e97.
Solomons, W., Förstner, U., 1984. Metals in the Hydrocycle. Springer, Berlin, Hei-delberg, New York.
Szefer, P., Glasby, G.P., Pempkowiak, J., Kaliszan, R., 1995. Extraction studies ofheavy-metal pollutants in surficial sediments from the southern Baltic Sea offPoland. Chem. Geol. 120, 111e126.
Tamasi, G., Cini, R., 2004. Heavy metals in drinking waters from Mount Amiata.Possible risks from arsenic for public health in the province of Siena. Sci. Tot.Environ. 327, 41e51.
US Environmental Protection Agency, 1989. Risk Assess. Guidel. Superfund (RAGS).In: Human health evaluation manual (Part A) OWSER Directive 9285. 7e01A.EPA-540/1-89-002, vol. 1.
US EPA, 2006. ENERGY STAR Overview of 2006 Achievements. U.S. EnvironmentalProtection Agency, Climate Protection Partnerships Division, Washington, DC.March 1.
Vazquez, G.F., Diaz, R.A., Salvador, L.G., 1998. Dissolved metals in Alvarado lagoon,Mexico. Environ. Int. 24, 721e727.
Volpe, M.G., La Cara, F., Volpe, F., et al., 2009. Heavy metal uptake in the enologicalfood chain. Food Chem. 117, 553e560.
Wang, Z., Liu, C., 2003. Distribution and partition behavior of heavy metals betweendissolved and acid-soluble fractions along a salinity gradient in the ChangjiangEstuary, eastern China. Chem. Geol. 202, 383e396.
Waziri, M., Ogugbuaja, V.O., 2010. Interrelationship between physico-chemicalwater pollution indicators: a case study of River Yobe-Nigeria. Am. J. Sci. Ind.Res. 1, 76e80.
Wong, C.S.C., Li, X.D., Zhang, G., Qi, S.H., Peng, X.Z., 2003. Atmospheric deposition ofheavy metals in the Pearl River Delta, China. Atmos. Environ. 37 (6), 767e776.
World Health Organization, 1973. Trace Elements in Human Nutrition: Manganese.Report of a WHO expert committee. World Health Organization, Geneva,pp. 34e36 (Technical Report Series No. 532).
World Health Organization, 2006. Guidelines for Drinking Water Quality. In:Recommendation, third ed., vol. 1. World Health Organization, Geneva.
Wu, Y.F., Liu, C.Q., Tu, C.L., 2008. Atmospheric deposition of metals in TSP of guiyang,PR China. Bull. Environ. Contam. Toxicol. 80 (5), 465e468.