Distributed Visualization and Analysis of Fluid Dynamics Data
6
Distributed Visualization and Analysis of Fluid Dynamics Data Hans-Christian HEGE , Tino WEINKAUF , Steffen PROHASKA , and Andrei HUTANU Zuse Institute Berlin, Scientific Visualization Group, Germany {hege,weinkauf,prohaska,hutanu}@zib.de, http://www.zib.de/visual/ Fluid dynamics applications require a good understanding of the underlying physical phenomena. Therefore, effective procedures are necessary for analyzing and visualiz- ing the various physical fields. Beside interactive and perceptually efficient techniques for visualizing flow fields directly, there is strong demand for methods that uncover hidden flow structures. Some recently developed feature based visual analysis meth- ods are exemplarily presented. Fluid flow data typically are large and often are stored remotely or distributedly. The interactive visual analysis of such large data sets requires new software architectures – ideally utilizing emerging Grid standards. We discuss such architectures and report on specific realizations in the framework of the visualization system Amira. Keywords: flow visualization, vector fields, feature extraction, topology, distributed systems, Grid technology 1 Introduction The goal of visual data analysis is to extract and to graphically present essential characteristics of data sets – particularly data sets that are too complex or too large to be inspected by other means. Fluid dynamics (FD) applications, like e.g. optimization of technical designs, often re- quire a detailed understanding of the underlying physical phenomena. Mental comprehension of these phenomena can be greatly supported by ef- fective procedures for analyzing scalar, vector and tensor fields – in combination with techniques for creation of intuitively perceivable visualizations and means for interactive exploration. Beside visualization techniques that depict fluid flows directly, there is strong demand for meth- ods that reveal hidden flow structures as well as changes of such structures due to parameter vari- ations. Here we will discuss a few techniques both for direct visualization and feature extraction, which have been recently developed at ZIB. (7) In typical application scenarios the data sets to be analyzed are large and often remotely or dis- tributedly stored. Interactive analysis of such data sets requires new data structures, new al- gorithms and new software architectures. It is an interesting question to what extend the emerg- ing Grid technology standards and Grid services can be used for that. We discuss such distributed architectures from a general point of view and re- port on systems for interactive analysis of large, remote data as well as collaborative work, based on the visualization system Amira. (28) 2 Visualization Techniques for FD Fluid flow phenomena are represented by station- ary or time-dependent fields. Here we focus on the major data class, namely vector fields. In the last decade, a number of approaches for analyzing and visualizing vector fields have been developed. We distinguish between methods that directly de- pict vector fields and those that first extract fea- tures and then display these. 2.1 Direct Visualization The probably most successful direct visualization technique for 2D vector fields is the so-called line integral convolution (LIC), (6) which first was de- veloped for stationary fields. In this method a noise field is convolved along the field lines, result- ing in textures that are highly correlated along the field lines and almost uncorrelated perpen- dicular to these. The resulting grey value tex- ture often is colored to depict an additional scalar field, c.f. Fig. 1. The original method, which was too slow for practical use, has been accelerated
-
Upload
khangminh22 -
Category
Documents
-
view
4 -
download
0
Transcript of Distributed Visualization and Analysis of Fluid Dynamics Data
Distributed Visualization and Analysis of Fluid Dynamics Data
Hans-Christian HEGE?, Tino WEINKAUF?, Steffen PROHASKA?, and Andrei HUTANU?
? Zuse Institute Berlin, Scientific Visualization Group, Germany{hege,weinkauf,prohaska,hutanu}@zib.de, http://www.zib.de/visual/
Fluid dynamics applications require a good understanding of the underlying physicalphenomena. Therefore, effective procedures are necessary for analyzing and visualiz-ing the various physical fields. Beside interactive and perceptually efficient techniquesfor visualizing flow fields directly, there is strong demand for methods that uncoverhidden flow structures. Some recently developed feature based visual analysis meth-ods are exemplarily presented. Fluid flow data typically are large and often arestored remotely or distributedly. The interactive visual analysis of such large datasets requires new software architectures – ideally utilizing emerging Grid standards.We discuss such architectures and report on specific realizations in the framework ofthe visualization system Amira.
Keywords: flow visualization, vector fields, feature extraction, topology, distributedsystems, Grid technology
1 Introduction
The goal of visual data analysis is to extract andto graphically present essential characteristics ofdata sets – particularly data sets that are toocomplex or too large to be inspected by othermeans. Fluid dynamics (FD) applications, likee.g. optimization of technical designs, often re-quire a detailed understanding of the underlyingphysical phenomena. Mental comprehension ofthese phenomena can be greatly supported by ef-fective procedures for analyzing scalar, vector andtensor fields – in combination with techniques forcreation of intuitively perceivable visualizationsand means for interactive exploration.
Beside visualization techniques that depict fluidflows directly, there is strong demand for meth-ods that reveal hidden flow structures as well aschanges of such structures due to parameter vari-ations. Here we will discuss a few techniques bothfor direct visualization and feature extraction,which have been recently developed at ZIB.(7)
In typical application scenarios the data sets tobe analyzed are large and often remotely or dis-tributedly stored. Interactive analysis of suchdata sets requires new data structures, new al-gorithms and new software architectures. It is aninteresting question to what extend the emerg-ing Grid technology standards and Grid services
can be used for that. We discuss such distributedarchitectures from a general point of view and re-port on systems for interactive analysis of large,remote data as well as collaborative work, basedon the visualization system Amira.(28)
2 Visualization Techniques for FD
Fluid flow phenomena are represented by station-ary or time-dependent fields. Here we focus onthe major data class, namely vector fields. In thelast decade, a number of approaches for analyzingand visualizing vector fields have been developed.We distinguish between methods that directly de-pict vector fields and those that first extract fea-tures and then display these.
2.1 Direct Visualization
The probably most successful direct visualizationtechnique for 2D vector fields is the so-called lineintegral convolution (LIC),(6) which first was de-veloped for stationary fields. In this method anoise field is convolved along the field lines, result-ing in textures that are highly correlated alongthe field lines and almost uncorrelated perpen-dicular to these. The resulting grey value tex-ture often is colored to depict an additional scalarfield, c.f. Fig. 1. The original method, which wastoo slow for practical use, has been accelerated
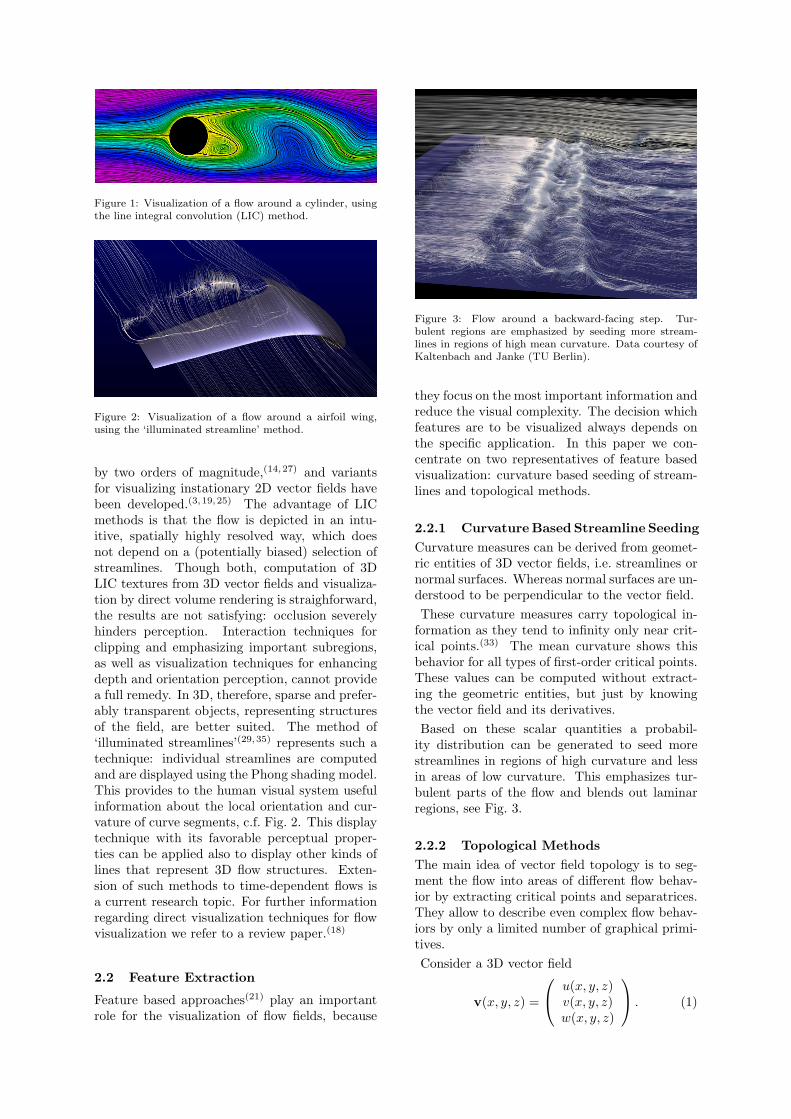
Figure 1: Visualization of a flow around a cylinder, usingthe line integral convolution (LIC) method.
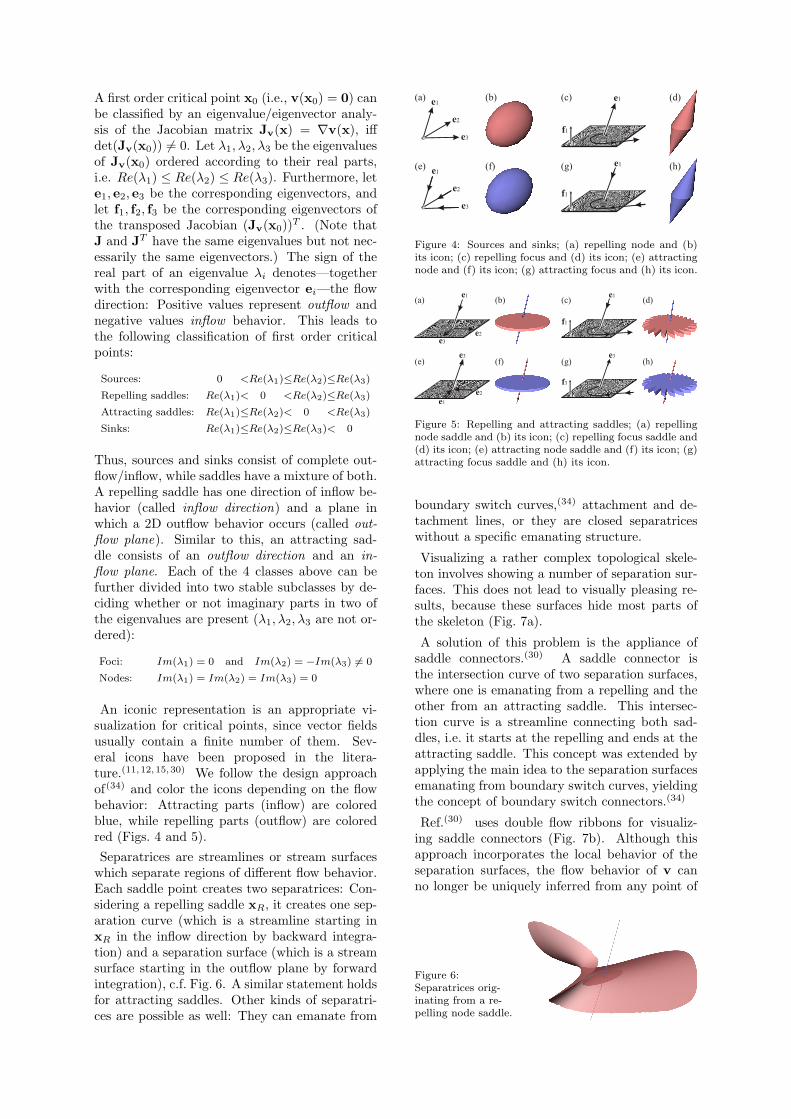
Figure 2: Visualization of a flow around a airfoil wing,using the ‘illuminated streamline’ method.
by two orders of magnitude,(14,27) and variantsfor visualizing instationary 2D vector fields havebeen developed.(3, 19,25) The advantage of LICmethods is that the flow is depicted in an intu-itive, spatially highly resolved way, which doesnot depend on a (potentially biased) selection ofstreamlines. Though both, computation of 3DLIC textures from 3D vector fields and visualiza-tion by direct volume rendering is straighforward,the results are not satisfying: occlusion severelyhinders perception. Interaction techniques forclipping and emphasizing important subregions,as well as visualization techniques for enhancingdepth and orientation perception, cannot providea full remedy. In 3D, therefore, sparse and prefer-ably transparent objects, representing structuresof the field, are better suited. The method of‘illuminated streamlines’(29,35) represents such atechnique: individual streamlines are computedand are displayed using the Phong shading model.This provides to the human visual system usefulinformation about the local orientation and cur-vature of curve segments, c.f. Fig. 2. This displaytechnique with its favorable perceptual proper-ties can be applied also to display other kinds oflines that represent 3D flow structures. Exten-sion of such methods to time-dependent flows isa current research topic. For further informationregarding direct visualization techniques for flowvisualization we refer to a review paper.(18)
2.2 Feature Extraction
Feature based approaches(21) play an importantrole for the visualization of flow fields, because
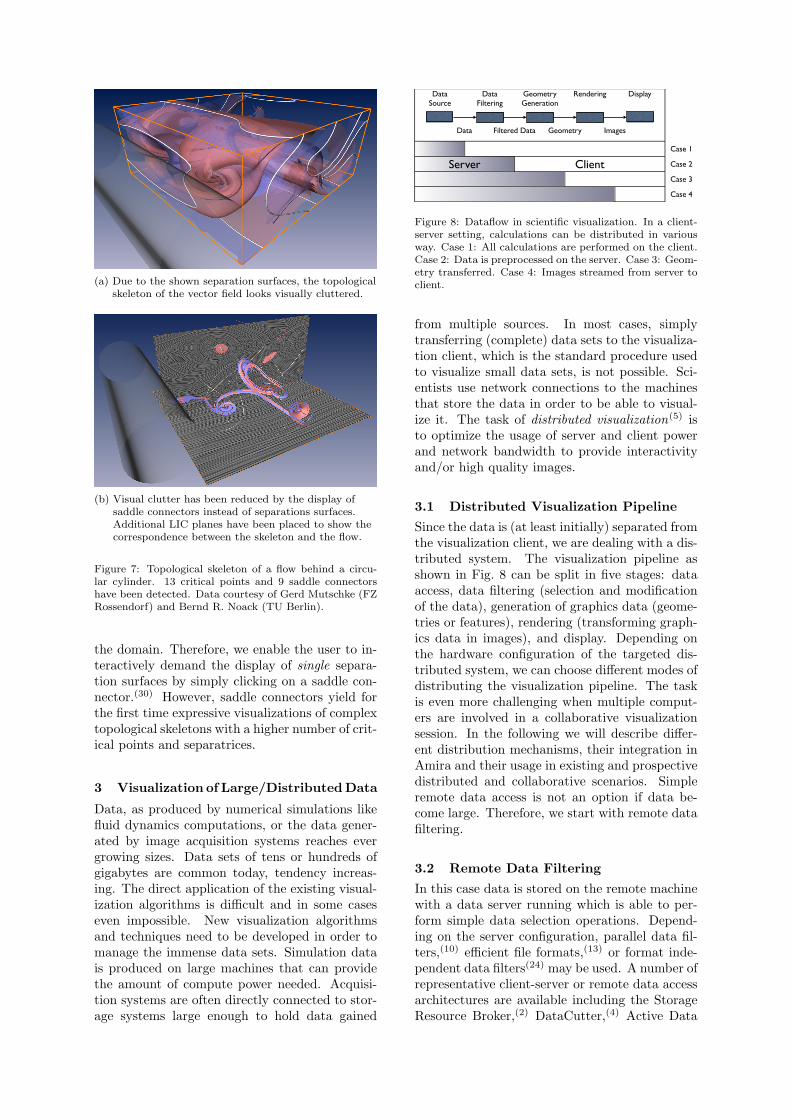
Figure 3: Flow around a backward-facing step. Tur-bulent regions are emphasized by seeding more stream-lines in regions of high mean curvature. Data courtesy ofKaltenbach and Janke (TU Berlin).
they focus on the most important information andreduce the visual complexity. The decision whichfeatures are to be visualized always depends onthe specific application. In this paper we con-centrate on two representatives of feature basedvisualization: curvature based seeding of stream-lines and topological methods.
2.2.1 CurvatureBased Streamline SeedingCurvature measures can be derived from geomet-ric entities of 3D vector fields, i.e. streamlines ornormal surfaces. Whereas normal surfaces are un-derstood to be perpendicular to the vector field.These curvature measures carry topological in-
formation as they tend to infinity only near crit-ical points.(33) The mean curvature shows thisbehavior for all types of first-order critical points.These values can be computed without extract-ing the geometric entities, but just by knowingthe vector field and its derivatives.Based on these scalar quantities a probabil-
ity distribution can be generated to seed morestreamlines in regions of high curvature and lessin areas of low curvature. This emphasizes tur-bulent parts of the flow and blends out laminarregions, see Fig. 3.
2.2.2 Topological MethodsThe main idea of vector field topology is to seg-ment the flow into areas of different flow behav-ior by extracting critical points and separatrices.They allow to describe even complex flow behav-iors by only a limited number of graphical primi-tives.Consider a 3D vector field
v(x, y, z) =
u(x, y, z)v(x, y, z)w(x, y, z)
. (1)
A first order critical point x0 (i.e., v(x0) = 0) canbe classified by an eigenvalue/eigenvector analy-sis of the Jacobian matrix Jv(x) = ∇v(x), iffdet(Jv(x0)) 6= 0. Let λ1, λ2, λ3 be the eigenvaluesof Jv(x0) ordered according to their real parts,i.e. Re(λ1) ≤ Re(λ2) ≤ Re(λ3). Furthermore, lete1, e2, e3 be the corresponding eigenvectors, andlet f1, f2, f3 be the corresponding eigenvectors ofthe transposed Jacobian (Jv(x0))T . (Note thatJ and JT have the same eigenvalues but not nec-essarily the same eigenvectors.) The sign of thereal part of an eigenvalue λi denotes—togetherwith the corresponding eigenvector ei—the flowdirection: Positive values represent outflow andnegative values inflow behavior. This leads tothe following classification of first order criticalpoints:
Sources: 0 <Re(λ1)≤Re(λ2)≤Re(λ3)
Repelling saddles: Re(λ1)< 0 <Re(λ2)≤Re(λ3)
Attracting saddles: Re(λ1)≤Re(λ2)< 0 <Re(λ3)
Sinks: Re(λ1)≤Re(λ2)≤Re(λ3)< 0
Thus, sources and sinks consist of complete out-flow/inflow, while saddles have a mixture of both.A repelling saddle has one direction of inflow be-havior (called inflow direction) and a plane inwhich a 2D outflow behavior occurs (called out-flow plane). Similar to this, an attracting sad-dle consists of an outflow direction and an in-flow plane. Each of the 4 classes above can befurther divided into two stable subclasses by de-ciding whether or not imaginary parts in two ofthe eigenvalues are present (λ1, λ2, λ3 are not or-dered):
Foci: Im(λ1) = 0 and Im(λ2) = −Im(λ3) 6= 0
Nodes: Im(λ1) = Im(λ2) = Im(λ3) = 0
An iconic representation is an appropriate vi-sualization for critical points, since vector fieldsusually contain a finite number of them. Sev-eral icons have been proposed in the litera-ture.(11,12,15,30) We follow the design approachof(34) and color the icons depending on the flowbehavior: Attracting parts (inflow) are coloredblue, while repelling parts (outflow) are coloredred (Figs. 4 and 5).Separatrices are streamlines or stream surfaces
which separate regions of different flow behavior.Each saddle point creates two separatrices: Con-sidering a repelling saddle xR, it creates one sep-aration curve (which is a streamline starting inxR in the inflow direction by backward integra-tion) and a separation surface (which is a streamsurface starting in the outflow plane by forwardintegration), c.f. Fig. 6. A similar statement holdsfor attracting saddles. Other kinds of separatri-ces are possible as well: They can emanate from
e1
e2
e3
e1
f1
(a) (b) (c) (d)
(e) (f) (g) (h)e1
e2
e3
e1
f1
Figure 4: Sources and sinks; (a) repelling node and (b)its icon; (c) repelling focus and (d) its icon; (e) attractingnode and (f) its icon; (g) attracting focus and (h) its icon.
e1
e2
e3
e1
f1
e1
e2
e3 e3
f3
(a) (c) (d)(b)
(e) (f) (g) (h)
Figure 5: Repelling and attracting saddles; (a) repellingnode saddle and (b) its icon; (c) repelling focus saddle and(d) its icon; (e) attracting node saddle and (f) its icon; (g)attracting focus saddle and (h) its icon.
boundary switch curves,(34) attachment and de-tachment lines, or they are closed separatriceswithout a specific emanating structure.
Visualizing a rather complex topological skele-ton involves showing a number of separation sur-faces. This does not lead to visually pleasing re-sults, because these surfaces hide most parts ofthe skeleton (Fig. 7a).
A solution of this problem is the appliance ofsaddle connectors.(30) A saddle connector isthe intersection curve of two separation surfaces,where one is emanating from a repelling and theother from an attracting saddle. This intersec-tion curve is a streamline connecting both sad-dles, i.e. it starts at the repelling and ends at theattracting saddle. This concept was extended byapplying the main idea to the separation surfacesemanating from boundary switch curves, yieldingthe concept of boundary switch connectors.(34)
Ref.(30) uses double flow ribbons for visualiz-ing saddle connectors (Fig. 7b). Although thisapproach incorporates the local behavior of theseparation surfaces, the flow behavior of v canno longer be uniquely inferred from any point of
Figure 6:Separatrices orig-inating from a re-pelling node saddle.
(a) Due to the shown separation surfaces, the topologicalskeleton of the vector field looks visually cluttered.
(b) Visual clutter has been reduced by the display ofsaddle connectors instead of separations surfaces.Additional LIC planes have been placed to show thecorrespondence between the skeleton and the flow.
Figure 7: Topological skeleton of a flow behind a circu-lar cylinder. 13 critical points and 9 saddle connectorshave been detected. Data courtesy of Gerd Mutschke (FZRossendorf) and Bernd R. Noack (TU Berlin).
the domain. Therefore, we enable the user to in-teractively demand the display of single separa-tion surfaces by simply clicking on a saddle con-nector.(30) However, saddle connectors yield forthe first time expressive visualizations of complextopological skeletons with a higher number of crit-ical points and separatrices.
3 Visualization of Large/DistributedData
Data, as produced by numerical simulations likefluid dynamics computations, or the data gener-ated by image acquisition systems reaches evergrowing sizes. Data sets of tens or hundreds ofgigabytes are common today, tendency increas-ing. The direct application of the existing visual-ization algorithms is difficult and in some caseseven impossible. New visualization algorithmsand techniques need to be developed in order tomanage the immense data sets. Simulation datais produced on large machines that can providethe amount of compute power needed. Acquisi-tion systems are often directly connected to stor-age systems large enough to hold data gained
DataSource
DataFiltering
GeometryGeneration
Rendering Display
Case 1
Server Client Case 2
Case 3
Case 4
Data Filtered Data Geometry Images
Figure 8: Dataflow in scientific visualization. In a client-server setting, calculations can be distributed in variousway. Case 1: All calculations are performed on the client.Case 2: Data is preprocessed on the server. Case 3: Geom-etry transferred. Case 4: Images streamed from server toclient.
from multiple sources. In most cases, simplytransferring (complete) data sets to the visualiza-tion client, which is the standard procedure usedto visualize small data sets, is not possible. Sci-entists use network connections to the machinesthat store the data in order to be able to visual-ize it. The task of distributed visualization(5) isto optimize the usage of server and client powerand network bandwidth to provide interactivityand/or high quality images.
3.1 Distributed Visualization Pipeline
Since the data is (at least initially) separated fromthe visualization client, we are dealing with a dis-tributed system. The visualization pipeline asshown in Fig. 8 can be split in five stages: dataaccess, data filtering (selection and modificationof the data), generation of graphics data (geome-tries or features), rendering (transforming graph-ics data in images), and display. Depending onthe hardware configuration of the targeted dis-tributed system, we can choose different modes ofdistributing the visualization pipeline. The taskis even more challenging when multiple comput-ers are involved in a collaborative visualizationsession. In the following we will describe differ-ent distribution mechanisms, their integration inAmira and their usage in existing and prospectivedistributed and collaborative scenarios. Simpleremote data access is not an option if data be-come large. Therefore, we start with remote datafiltering.
3.2 Remote Data Filtering
In this case data is stored on the remote machinewith a data server running which is able to per-form simple data selection operations. Depend-ing on the server configuration, parallel data fil-ters,(10) efficient file formats,(13) or format inde-pendent data filters(24) may be used. A number ofrepresentative client-server or remote data accessarchitectures are available including the StorageResource Broker,(2) DataCutter,(4) Active Data
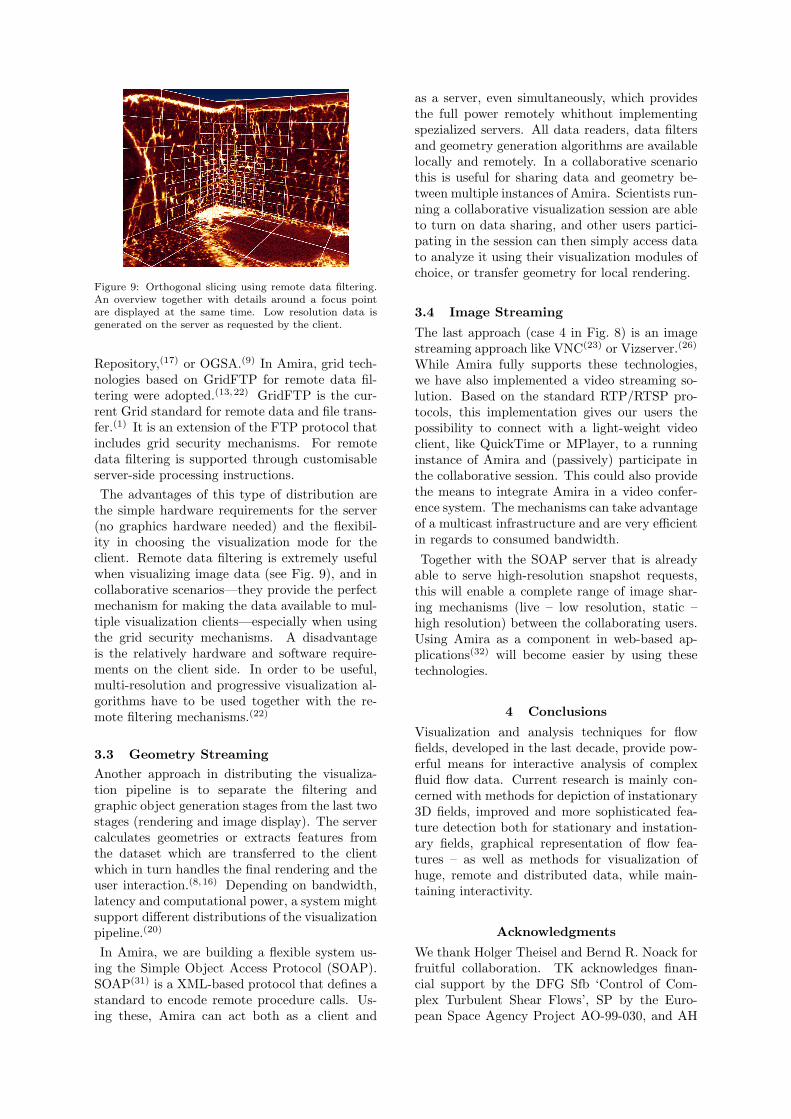
Figure 9: Orthogonal slicing using remote data filtering.An overview together with details around a focus pointare displayed at the same time. Low resolution data isgenerated on the server as requested by the client.
Repository,(17) or OGSA.(9) In Amira, grid tech-nologies based on GridFTP for remote data fil-tering were adopted.(13,22) GridFTP is the cur-rent Grid standard for remote data and file trans-fer.(1) It is an extension of the FTP protocol thatincludes grid security mechanisms. For remotedata filtering is supported through customisableserver-side processing instructions.The advantages of this type of distribution are
the simple hardware requirements for the server(no graphics hardware needed) and the flexibil-ity in choosing the visualization mode for theclient. Remote data filtering is extremely usefulwhen visualizing image data (see Fig. 9), and incollaborative scenarios—they provide the perfectmechanism for making the data available to mul-tiple visualization clients—especially when usingthe grid security mechanisms. A disadvantageis the relatively hardware and software require-ments on the client side. In order to be useful,multi-resolution and progressive visualization al-gorithms have to be used together with the re-mote filtering mechanisms.(22)
3.3 Geometry StreamingAnother approach in distributing the visualiza-tion pipeline is to separate the filtering andgraphic object generation stages from the last twostages (rendering and image display). The servercalculates geometries or extracts features fromthe dataset which are transferred to the clientwhich in turn handles the final rendering and theuser interaction.(8, 16) Depending on bandwidth,latency and computational power, a system mightsupport different distributions of the visualizationpipeline.(20)
In Amira, we are building a flexible system us-ing the Simple Object Access Protocol (SOAP).SOAP(31) is a XML-based protocol that defines astandard to encode remote procedure calls. Us-ing these, Amira can act both as a client and
as a server, even simultaneously, which providesthe full power remotely whithout implementingspezialized servers. All data readers, data filtersand geometry generation algorithms are availablelocally and remotely. In a collaborative scenariothis is useful for sharing data and geometry be-tween multiple instances of Amira. Scientists run-ning a collaborative visualization session are ableto turn on data sharing, and other users partici-pating in the session can then simply access datato analyze it using their visualization modules ofchoice, or transfer geometry for local rendering.
3.4 Image Streaming
The last approach (case 4 in Fig. 8) is an imagestreaming approach like VNC(23) or Vizserver.(26)
While Amira fully supports these technologies,we have also implemented a video streaming so-lution. Based on the standard RTP/RTSP pro-tocols, this implementation gives our users thepossibility to connect with a light-weight videoclient, like QuickTime or MPlayer, to a runninginstance of Amira and (passively) participate inthe collaborative session. This could also providethe means to integrate Amira in a video confer-ence system. The mechanisms can take advantageof a multicast infrastructure and are very efficientin regards to consumed bandwidth.
Together with the SOAP server that is alreadyable to serve high-resolution snapshot requests,this will enable a complete range of image shar-ing mechanisms (live – low resolution, static –high resolution) between the collaborating users.Using Amira as a component in web-based ap-plications(32) will become easier by using thesetechnologies.
4 Conclusions
Visualization and analysis techniques for flowfields, developed in the last decade, provide pow-erful means for interactive analysis of complexfluid flow data. Current research is mainly con-cerned with methods for depiction of instationary3D fields, improved and more sophisticated fea-ture detection both for stationary and instation-ary fields, graphical representation of flow fea-tures – as well as methods for visualization ofhuge, remote and distributed data, while main-taining interactivity.
Acknowledgments
We thank Holger Theisel and Bernd R. Noack forfruitful collaboration. TK acknowledges finan-cial support by the DFG Sfb ‘Control of Com-plex Turbulent Shear Flows’, SP by the Euro-pean Space Agency Project AO-99-030, and AH
by the European Commission Project ‘GridLab’,IST-2001-32133. All visualizations in this paperhave been created using Amira – a system for ad-vanced 3D visualization and volume modeling,(28)
see http://amira.zib.de/.
References(1) W. Allcock, J. Bester, and J. Bresnahan et. al.
GridFTP: Protocol extensions to FTP for the Grid.GWD-R (Recommendation), April 2003.
(2) C. Baru, R. Moore, A. Rajasekar, and M. Wan. TheSDSC Storage Resource Broker. Proceedings of CAS-CON’98, Toronto, Canada, 1998.
(3) J. Becker and M. Rumpf. Visualization of time-dependent velocity fields by texture transport. InEurographics Workshop on Visualization in Scien-tific Computing, pages 91–102, 1998.
(4) M.D. Beynon and R. Ferreira et. al. DataCutter:Middleware for filtering very large scientific datasetson archival storage systems. In Proc. 2000 MassStorage Systems Conf., pages 119–133. IEEE CSPress, 2000.
(5) K.W. Brodlie, D.A. Duce, J.R. Gallop, J.P.R.B. Wal-ton, and J.D. Wood. Distributed and collaborativevisualization. Computer Graphics Forum, 23(2):223–251, 2004.
(6) B. Cabral and L. Leedom. Imaging vector fields us-ing line integral convolution. Computer Graphics,27:263–272, 1993.
(7) ZIB Dept. Scientific Visualization. ScientificVisualization – Current Research P/frerojects.www.zib.de/visual/projects, 2004.
(8) K. Engel, R. Westermann, and T. Ertl. Isosurfaceextraction techniques for web-based volume visual-ization. In IEEE Visualization ’99, pages 139–146,1999.
(9) I. Foster, C. Kesselman, J. M. Nick, and S. Tuecke.Grid Services for Distributed System Integration.Computer, 35(6):37–46, 2002.
(10) L. A. Freitag and R. M. Loy. Adaptive, multiresolu-tion visualization of large data sets using a distrib-uted memory octree. In Proc. SC99: High Perfor-mance Networking and Computing, Portland, OR,November 1999. ACM Press and IEEE CS Press.
(11) A. Globus, C. Levit, and T. Lasinski. A tool forvisualizing the topology of three-dimensional vectorfields. In IEEE Visualization ’91, pages 33–40, 1991.
(12) H. Hauser and E. Groller. Thorough insights by en-hanced visualization of flow topology. In 9th Int.Symposium on Flow Visualization, CDROM, 2000.
(13) H.-C. Hege, A. Hutanu, and R. Kahler et. al. Pro-gressive retrieval and hierarchical visualization oflarge remote data. In Proc. 2003 Workshop on Adap-tive Grid Middleware, pages 60–72, 2003.
(14) H.-C. Hege and D. Stalling. Fast LIC with piecewisepolynominal filter kernels. In Mathematical Visu-alization - Algorithms, Applications and Numerics,pages 295–312. Springer, 1998.
(15) J. Helman and L. Hesselink. Visualizing vector fieldtopology in fluid flows. IEEE Computer Graphicsand Applications, 11:36–46, May 1991.
(16) N. Jensen, S. Olbrich, H. Pralle, and S. Raasch. Anefficient system for collaboration in tele-immersiveenvironments. In Fourth EG Workshop on ParallelGraphics and Visualization, pages 123–131, 2002.
(17) T. Kurc and U. Catalyurek et. al. Visualization oflarge data sets with the active data repository. IEEEComput. Graph. Appl., 21(4):24–33, 2001.
(18) R. S. Laramee, H. Hauser, H. Doleisch, and B. Vrolijket. al. The state of the art in flow visualiza-tion: Dense and texture-based techniques. ComputerGraphics Forum, 23(2):203–221, 2004.
(19) Z. P. Liu and R. J. Moorhead. AUFLIC: An acceler-ated algorithm for unsteady flow line integral convo-lution. In Eurographics / IEEE TCVG Symposiumon Visualization ’02, pages 43–52, 2002.
(20) E. J. Luke and C. D. Hansen. Semotus visum: a flex-ible remote visualization framework. In IEEE Visu-alization ’02, pages 61–68, 2002.
(21) F. H. Post, B. Vrolijk, and H. Hauser et.al. Fea-ture extraction and visualisation of flow fields. InEurographics 2002, State of the Art Reports, pages69–100, 2002.
(22) S. Prohaska, A. Hutanu, R. Kahler, and H.-C. Hege.Interactive exploration of large remote micro-CTscans. In IEEE Visualization, pages 345–352, 2004.
(23) T. Richardson, Q. Stafford-Fraser, K. R. Wood, andA. Hopper. Virtual network computing. IEEE Inter-net Computing, 2(1):33–38, January/February 1998.
(24) T. Schutt, A. Merzky, A. Hutanu, and F. Schintke.Remote partial file access using compact pattern de-scriptions. In 4th International Symposium on Clus-ter Computing and the Grid (CCgrid), 2004.
(25) H. W. Shen and D. Kao. UFLIC - A line integral con-volution algorithm for visualizing unsteady flows. InR. Yagel and H. Hagen, editors, Proc. IEEE Visual-ization ’97, pages 317–323, 1997.
(26) Silicon Graphics, Inc., 1600 Amphitheatre Pkwy,Mountain View, CA 94043, United States.OpenGL Vizserver 3.1 White Paper - Application-Transparent Remote Interactive Visualization andCollaboration, April 2003.
(27) D. Stalling and H. Hege. Fast and resolution indepen-dent line integral convolution. Proceedings Siggraph’95, pages 249–256, 1995. Los Angeles.
(28) D. Stalling, M. Westerhoff, and H.-C. Hege. Amira –a highly interactive system for visual data analysis.In C.R. Johnson and C.D. Hansen, editors, Visual-ization Handbook. Academic Press, 2004.
(29) D. Stalling, M. Zockler, and H.-C. Hege. Fast dis-play of illuminated field lines. IEEE Transactionson Visualization and Computer Graphics, 3(2):118–128, 1997.
(30) H. Theisel, T. Weinkauf, H.-C. Hege, and H.-P. Sei-del. Saddle connectors - an approach to visualizingthe topological skeleton of complex 3D vector fields.In IEEE Visualization 2003, pages 225–232, 2003.
(31) W3C XML Protocol Working Group.http://www.w3.org/TR/soap/.
(32) Y. Wang, D. A. Yuen, Z. A. Garbow, and G. Er-lebacher. Web-based service of a visualization pack-age “Amira” for the geosciences. Visual Geosciences,2003. Accepted.
(33) T. Weinkauf and H. Theisel. Curvature measures of3D vector fields and their applications. In Journalof WSCG, volume 10:2, pages 507–514, 2002.
(34) T. Weinkauf, H. Theisel, H.-C. Hege, and H.-P. Sei-del. Boundary switch connectors for topological vi-sualization of complex 3D vector fields. In Data Vi-sualization 2004. VisSym’04, pages 183–192, 2004.
(35) M. Zockler, D. Stalling, and H. C. Hege. Interac-tive visualization of 3D-vector fields using illumi-nated stream lines. In Proc. IEEE Visualization ’96,pages 107–113, 1996.