Polymorphism and Methylation of Four Genes Expressed in Salivary
Li et al. Genome Biology (2015) 16:115 DOI 10.1186/s13059-015-0685-2
RESEARCH Open Access
Distinct roles of DNMT1-dependent andDNMT1-independent methylation patterns inthe genome of mouse embryonic stem cells
Zhiguang Li1†, Hongzheng Dai1†, Suzanne N. Martos1, Beisi Xu2, Yang Gao1, Teng Li1, Guangjing Zhu1,Dustin E. Schones2 and Zhibin Wang3,1,4*Abstract
Background: DNA methylation patterns are initiated by de novo DNA methyltransferases DNMT3a/3b adding methylgroups to CG dinucleotides in the hypomethylated genome of early embryos. These patterns are faithfully maintainedby DNMT1 during DNA replication to ensure epigenetic inheritance across generations. However, this two-step modelis based on limited data.
Results: We generated base-resolution DNA methylomes for a series of DNMT knockout embryonic stem cells, withdeep coverage at highly repetitive elements. We show that DNMT1 and DNMT3a/3b activities work complementarilyand simultaneously to establish symmetric CG methylation and CHH (H = A, T or C) methylation. DNMT3a/3b can addmethyl groups to daughter strands after each cycle of DNA replication. We also observe an unexpected divisionof labor between DNMT1 and DNMT3a/3b in suppressing retrotransposon long terminal repeats and long interspersedelements, respectively. Our data suggest that mammalian cells use a specific CG density threshold to predeterminemethylation levels in wild-type cells and the magnitude of methylation reduction in DNMT knockout cells. Only geneswith low CG density can be induced or, surprisingly, suppressed in the hypomethylated genome. Lastly, we do not findany association between gene body methylation and transcriptional activity.
Conclusions: We show the concerted actions of DNMT enzymes in the establishment and maintenance ofmethylation patterns. The finding of distinct roles of DNMT1-dependent and -independent methylation patterns ingenome stability and regulation of transcription provides new insights for understanding germ cell development,neuronal diversity, and transgenerational epigenetic inheritance and will help to develop next-generation DNMTinhibitors.
BackgroundDNA methylation patterns play key roles in the controlof genomic imprinting, gene transcription, and genomestability [1–4]. Normal methylation patterns are essentialfor embryonic development and aberrant methylationpatterns are associated with numerous human diseases,including many imprinting disorders and various types
* Correspondence: [email protected]†Equal contributors3Fenxian Central Hospital, 9588 Nanfeng Hwy, Fengxian District, Shanghai201406, China1Department of Environmental Health Sciences, Laboratory of HumanEnvironmental Epigenomes, Bloomberg School of Public Health, JohnsHopkins University, 615 N. Wolfe Street, Room E7816, Baltimore, MD 21205,USAFull list of author information is available at the end of the article
© 2015 Li et al. This is an Open Access article(http://creativecommons.org/licenses/by/4.0),provided the original work is properly creditedcreativecommons.org/publicdomain/zero/1.0/
of cancer [3, 5, 6]. Cancer cells are characterized by globalhypomethylation and promoter-specific hypermethylation,which have been implicated in carcinogenesis [7, 8]. Giventhe importance of DNA methylation patterns in humanhealth, understanding how methylation patterns are set upand maintained by DNA methyltransferases (DNMTs) isof great importance. The standard model is that de novomethyltransferases DNMT3a/3b establish the methyl-CGlandscape in the genome prior to implantation. Afterward,DNMT1 ensures the faithful copying of CG methylationfrom parental to daughter strand at replication forks [1,2]. However, this ‘two-step’ model is based on limited dataand new observations, such as CHH (H = A, T, and C)methylation, do not fit it [9]. Furthermore, in cells withimpaired DNMT3a/3b but fully functional DNMT1, up to
distributed under the terms of the Creative Commons Attribution Licensewhich permits unrestricted use, distribution, and reproduction in any medium,. The Creative Commons Public Domain Dedication waiver (http://) applies to the data made available in this article, unless otherwise stated.
Li et al. Genome Biology (2015) 16:115 Page 2 of 15
30 % of CG sites in repeat regions of the mouse genomeare hemimethylated [10]. This suggests that methylationinheritance mediated solely by DNMT1 is imperfect. Re-cent studies further show that DNMT1 may also have denovo methyltransferase activity [11, 12], underscoring theimportance of refining the model by which DNA methyla-tion patterns are established and maintained [13].DNA methylation patterns are critical to maintain gen-
ome stability by repressing transposable elements (TEs)in the genome [14]; however, the mechanisms wherebymethylation patterns repress TEs remain to be fullyelucidated. About 40 % of mammalian genomes arecomposed of repetitive elements, including long inter-spersed nuclear elements (LINEs) and long terminal re-peats (LTRs) [15]. LINE1 (L1) elements are still activein the human genome and L1-mediated retrotransposi-tion events account for approximately 1 of every 1000spontaneous disease-producing insertions in the humangenome [16, 17]. Retrotransposition activity and relatedmutations are much higher in the mouse genome than thehuman genome (almost 100-fold difference) due to thefact that active LTRs exist in mouse but not in human[18]. While commonly associated with adverse effects, ret-rotransposition can also be beneficial to host cells. For ex-ample, L1 retrotransposition may contribute to neuronaldiversity [19]. Loss of DNMT1 leads to a significant loss ofmethylation at intracisternal A-particle (IAP)-related ele-ments and extensive transcription of IAPs in mouseembryos [20]. Despite their importance, it remains un-clear how DNMTs coordinate to achieve genome stability.Furthermore, understanding the mechanisms that controlthe reprogramming of IAP methylation states will lead toa better understanding of transgenerational epigenetic in-heritance and the fetal origins of adult disease [21–23].For example, environmental exposure-induced increasesin methylation of an IAP upstream of the Agouti gene inearly embryos explains the variation of coat color and pro-pensity for disease in adult mice [24, 25].It has been demonstrated that DNA methylation has a
strong correlation with repression of gene transcription bycellular transfection of unmethylated and methylated coun-terparts of the same sequence in vitro [26] and using trans-genic mice in vivo [27]. In line with this, DNMT1 inhibitordrugs have been developed to relieve the inhibition of DNAmethylation on silenced tumor suppressor genes. However,progress with these inhibitor drugs in the treatment of vari-ous cancers has lagged behind expectations. While the USFood and Drug Administration has approved two DNMT1inhibitor drugs for the treatment of myelodysplastic syn-dromes, many more drugs have failed in clinical trials [28].A recent report that DNMT1 inhibitor drug-induced de-methylation causes the re-activation of both tumor sup-pressor genes and pro-metastatic genes raises concernsabout promoting metastasis [29]. Such reports reveal the
complexity of the underlying mechanisms. A better under-standing of the mechanisms of re-activation of silencedtumor suppressor genes would help in the development ofnext-generation DNMT inhibitor drugs.Recently, methylation of transcribed regions has been
proposed to promote gene expression [30]. RNA-seq stud-ies in wild-type (WT) and DNMT1−/−/3a−/−/3b−/− tripleknockout (TKO) embryonic stem (ES) cells, however,indicated that the expression of the majority of genesin the mouse genome did not change much [31]. Becauseof the previous lack of methylome data, the underlyingmechanisms for how DNA methylation regulates gene ex-pression have not been characterized [31].By analyzing deep sequencing-generated base-resolution
methylomes of WT and a series of DNMT knockout (KO)mouse ES cells [32–34], we identified previously unappre-ciated roles for DNMTs in the establishment and mainten-ance of DNA methylation patterns. We present a refinedmodel that is better suited to explain how distinct DNMTenzymatic activities maintain strand-balanced methylation,suppress TEs, and regulate a subset of genes that havehigh methylation and low CG density at promoter regions.
ResultsBase-resolution methylomes of DNMT knockout ES cellsTo understand the establishment and maintenance of DNAmethylation patterns, we used bisulfite deep sequencing(BS-seq) to generate base-resolution DNA methylomes ofWT, DNMT1−/− (1KO), DNMT3a−/−/3b−/− (DKO), andDNMT1−/−/3a−/−/3b−/− (TKO) cells [32–34]. To rule outthe scenario where DNMTs retain enzymatic activity fromalternative splicing in KO cells, as observed in thedisruption of human DNMT1 [35], we performed RNA-seq analyses to detect any potential alternative splicing(Figure S1 in Additional file 1). Interestingly, while alterna-tive splicing of DNMT1 was observed in both 1KO andTKO cells, the enzymatic domain encoded by exons 32–33 were disrupted. The presence of alternative splicing inboth human and mouse DNMT1 KO cell lines suggestsDNMT1 may play roles that are independent of itsmethylation activity. Similarly, DNMT3b seemed to haveweak alternative splicing, but enzymatic domains of bothDNMT3a and DNMT3b were depleted in either DKO orTKO cells (Figure S1 in Additional file 1). We next exam-ined the DNA methylomes of these cell lines at base reso-lution with BS-seq. Genomic DNA from different celllines were treated with bisulfite and sequenced with theIllumina HiSeq platform. The sequencing data are of highquality (Figure S2 in Additional file 1) and the sequencingdepth is comparable to that of recent mouse DNA methy-lomes [36] (Figure S3 in Additional file 1). To improve thealignment of sequenced reads to repetitive elements to gaininsights into the effects of DNMT on genome stability, wedeveloped and used a new alignment algorithm, anchored
Li et al. Genome Biology (2015) 16:115 Page 3 of 15
cluster end-mapping (ACE-mapping), which has comparableperformance to published methods (see detail in Materialsand methods).
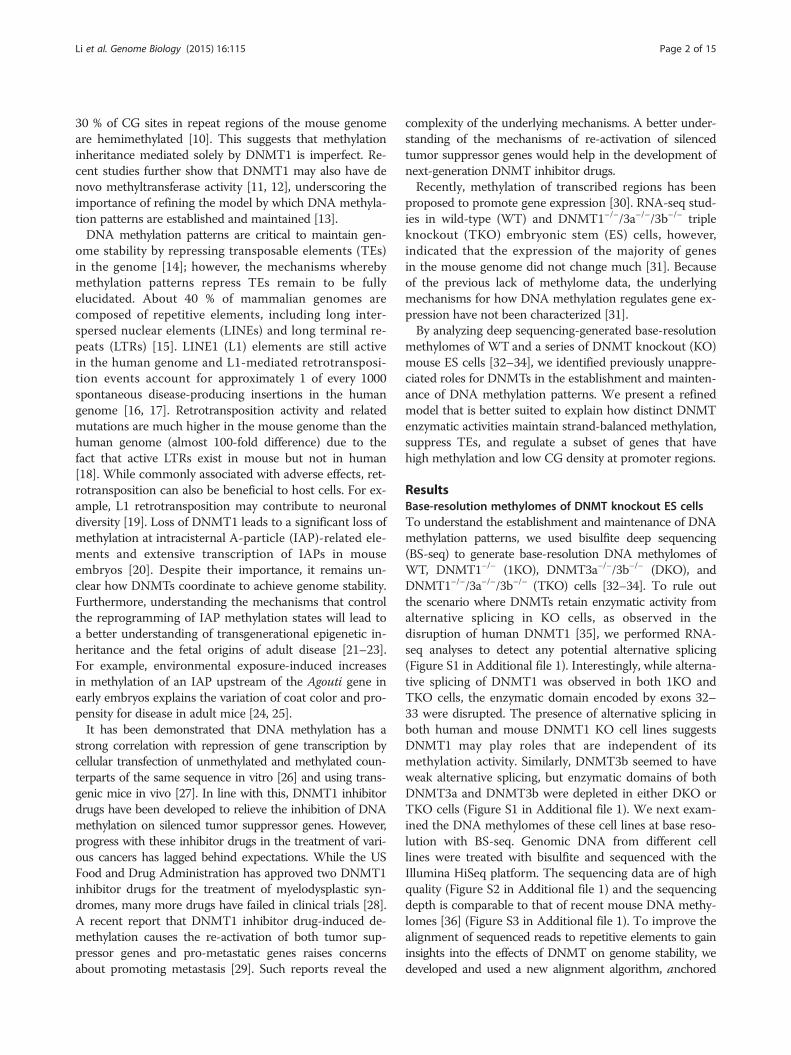
CG density predetermines the magnitude of methylationreductionWith base-resolution methylomes of WT and DNMT-deficient cells, we aimed to investigate the mechanismsof how DNA methylation patterns are established andmaintained. Loss of DNMT function leads to dramaticdecreases in methylation levels in 1KO, DKO, and TKOcells (Fig. 1a, b; Figure S4 in Additional file 1). The me-dian methylation level in WT is around 78 %, whichdrops to below 20 % in 1KO and DKO cells, and closeto 0 % in TKO cells (Fig. 1a). These observations areconsistent with previous studies demonstrating that theTKO cells have ~0.4 % methylation compared with WTby randomly sequencing bisulfite-treated genomic DNA[33]. In 1KO and DKO cells, 42 % and 56 % of CG sites,respectively, have methylation levels <10 % comparedwith WT, and only very few sites have methylationlevels >50 % (Figure S4b–e in Additional file 1). Methy-lation loss due to lack of maintenance DNMT1 is dif-ferent from that caused by disruption of de novo
Fig. 1 CG density predetermines the magnitude of methylation reduction.calculated as described in materials and methods and all CG sites with coveraregions in the mouse genome. c–e Correlation of DNA methylation with CG destimates (KDE) was applied to reflect the relative number of CG sites that shalight blue, yellow, light red, and dark red, represent the relative number of CGand Pearson correlation coefficients are shown. CG density is defined as the nchromosome 3 only
DNMT3a/3b. As indicated in Figure S5 in Additional file1, although most CG sites have low methylation in both1KO and DKO cells, there are sites that remain highlymethylated in each cell type. No significant differenceswere observed in methylation reduction at promoters,gene bodies, or intergenic regions (Fig. 1b).Next, we focused on the role of CG islands in shaping
the landscape of methylation patterns. The distributionof CG sites is one of the major factors shaping DNAmethylation patterns [9, 36]. We used CG density, de-fined as the number of CG sites within a window of 300bp upstream and downstream of the CG of interest (seeMaterials and methods), throughout our studies. As ex-pected, we observed a negative correlation between CGdensity and methylation (Fig. 1c–e). Unexpectedly, ouranalyses revealed that a CG density of ~30 is a thresholdthat predetermines the methylation level in WT cellsand the magnitude of methylation reduction in DKOand 1KO cells (Fig. 1c–e). The high methylation rates ofsites with CG density <30 are significantly reduced in1KO and DKO cells, whereas methylation of sites withdensity >30 was essentially unchanged in these cells.We subsequently examined how methylation is affected
by DNMT deficiency in non-CG contexts, including GC,
a Methylation reduction in DNMT KO ES cells. Methylation rates werege >6 were used. b Methylation at promoter, gene body, and intergenicensity. A two-dimensional density transformation based on kernel densityre similar methylation levels and CG density. The colors from dark blue tosites, i.e., KDE density. The numbers of CG sites with enough coverageumber of CG sites within a 600-bp window. Data in (c–e) are from
Li et al. Genome Biology (2015) 16:115 Page 4 of 15
CWG, and GWC (W = A or T). These contexts have verylow methylation levels compared with CG (Figure S4a inAdditional file 1) but lack of DNMT enzymes led tomethylation decreases in these sequences as well. Thetrend is similar between GC and GWC, but the CWGcontext is special, having extremely low methylation in allfour cell lines (Figure S4a in Additional file 1).
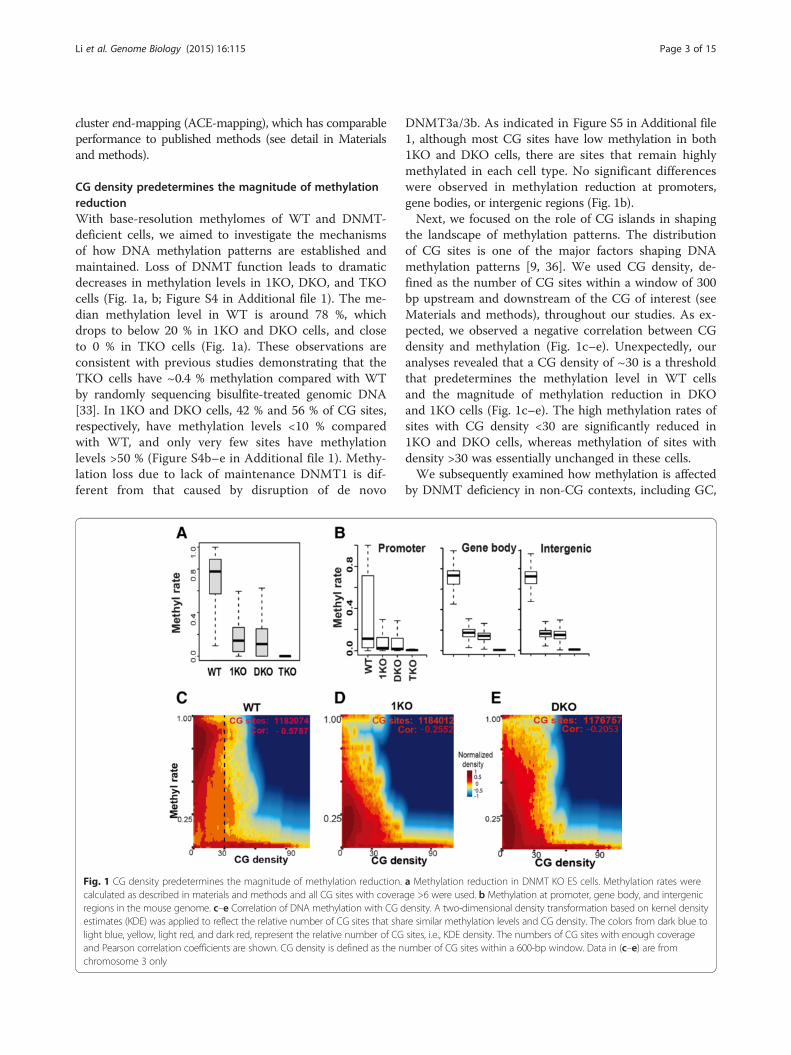
De novo DNMT3a/3b and maintenance DNMT1 workcomplementarily and simultaneously to retainmethylation patternsThe faithful copying of cytosine methylation by DNMT1from parental to daughter strand has been proposedto ensure inheritance of epigenetic information acrossgenerations; however, CHH (H = A, T, or C) methylationcannot be maintained in such a way because the daughterstrands have no cytosines in the triplet. CHH methylationtherefore suggests a more complex model. We proposethat there are at least two scenarios to potentially explainepigenetic inheritance: 1) DNMT1 is responsible for main-tenance of symmetric CG methylation, but DNMT3a/3bare designated to methylate CHH sites during each cycleof DNA replication; or 2) all three DNA methyltransfer-ases are needed to maintain CG methylation symmetry aswell as to transmit CHH methylation across generations.
Fig. 2 Both DNMT1 maintenance-dependent and -independent activities areon the sense and antisense DNA strands in WT, 1KO, and DKO cells. The CG stransformation was applied and color represents two-dimensional transformaMaterials and methods for details). e CHH methylation in 1KO cells unveils the
To investigate the plausibility of these scenarios, weanalyzed CHH methylation and asymmetric CG methyla-tion in our data. As expected, the symmetry of CG methy-lation in WT cells is high, with a Pearson correlationcoefficient (PCC) of 0.8948 (Fig. 2a). Without DNMT1activity, the PCC in 1KO cells is 0.1883. While the correl-ation is low, there are still many CG sites with symmetricmethylation (Fig. 2b). The symmetry of these CG sitesin the absence of DNMT1 maintenance suggests thatDNMT3a/3b continually add methyl groups to cytosineon daughter strands after each cycle of DNA replication,consistent with DNMT3a/3b being able to directly interactwith Np95 [37]. In comparison, DKO cells have a PCC of0.4429 (Fig. 2c), indicating that DNMT3a/3b de novo ac-tivities are required to maintain CG methylation symmetryto the level of WT cells. Next, we measured the level ofmethylation bias at each CG site on both the sense andantisense strands by introducing the concept of a biasindex (BI), defined as the difference between CG methyla-tion rates on the sense and antisense strands and normal-ized by the sum of rates on both strands. About 80 % ofCG sites have a BI in the range of −0.2 to 0.2 in WT cells.In contrast, only 30 % of sites in 1KO cells and 40 % ofsites in DKO cells are within this range (Fig. 2d). Bothmethylation correlation and BI analyses were reproduciblein two independently prepared replicates in three cell
required for attaining full methylation. a-c Correlation of CG methylationites with coverage ≥10 on each strand were used. A two-dimensionalted density. Cor correlation coefficient. d Distribution of bias index (seeexistence of DNMT1 maintenance-independent patterns
Li et al. Genome Biology (2015) 16:115 Page 5 of 15
types (Figures S6 and S7 in Additional file 1). These datafurther indicate that DNMT1 alone, without DNMT3a/3b,cannot maintain genome-wide symmetric CG methylationin 1KO cells and that DNMT3a/3b in the absence ofDNMT1 can provide some degree of methylation sym-metry. These mechanistic insights are consistent with thefact that several species of marine algae have no DNMT1gene, but still show symmetric methylation [38].While the results discussed above (Fig. 2b–d) apply to
CG methylation, we were also interested in CHH methyla-tion. Figure 2e shows one selected region from chromo-some 3 with methylation at 29 CHH sites and one CG sitein WT and 1KO cells. The existence of CHH methylationin the absence of DNMT1 activity in 1KO cells validatesour expectation that CHH methylation activities arise eitherfrom de novo DNMT3a/3b or from RNA-specific DNMT2(only DNMT1/2/3a/3b have enzymatic activity). Such CHHmethylation is integral to the final methylome (Fig. 2e), andfurther reinforces our understanding that DNMT1 main-tenance-dependent and -independent methylation activitieshave some kind of 'division of labor'.
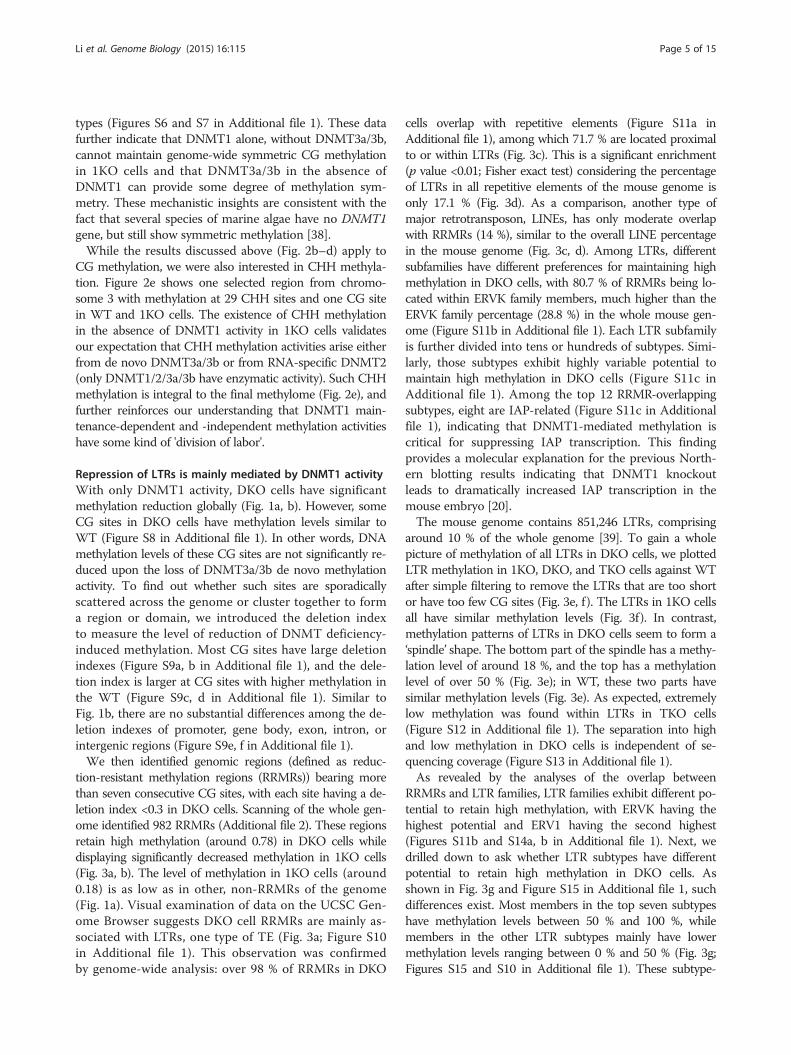
Repression of LTRs is mainly mediated by DNMT1 activityWith only DNMT1 activity, DKO cells have significantmethylation reduction globally (Fig. 1a, b). However, someCG sites in DKO cells have methylation levels similar toWT (Figure S8 in Additional file 1). In other words, DNAmethylation levels of these CG sites are not significantly re-duced upon the loss of DNMT3a/3b de novo methylationactivity. To find out whether such sites are sporadicallyscattered across the genome or cluster together to forma region or domain, we introduced the deletion indexto measure the level of reduction of DNMT deficiency-induced methylation. Most CG sites have large deletionindexes (Figure S9a, b in Additional file 1), and the dele-tion index is larger at CG sites with higher methylation inthe WT (Figure S9c, d in Additional file 1). Similar toFig. 1b, there are no substantial differences among the de-letion indexes of promoter, gene body, exon, intron, orintergenic regions (Figure S9e, f in Additional file 1).We then identified genomic regions (defined as reduc-
tion-resistant methylation regions (RRMRs)) bearing morethan seven consecutive CG sites, with each site having a de-letion index <0.3 in DKO cells. Scanning of the whole gen-ome identified 982 RRMRs (Additional file 2). These regionsretain high methylation (around 0.78) in DKO cells whiledisplaying significantly decreased methylation in 1KO cells(Fig. 3a, b). The level of methylation in 1KO cells (around0.18) is as low as in other, non-RRMRs of the genome(Fig. 1a). Visual examination of data on the UCSC Gen-ome Browser suggests DKO cell RRMRs are mainly as-sociated with LTRs, one type of TE (Fig. 3a; Figure S10in Additional file 1). This observation was confirmedby genome-wide analysis: over 98 % of RRMRs in DKO
cells overlap with repetitive elements (Figure S11a inAdditional file 1), among which 71.7 % are located proximalto or within LTRs (Fig. 3c). This is a significant enrichment(p value <0.01; Fisher exact test) considering the percentageof LTRs in all repetitive elements of the mouse genome isonly 17.1 % (Fig. 3d). As a comparison, another type ofmajor retrotransposon, LINEs, has only moderate overlapwith RRMRs (14 %), similar to the overall LINE percentagein the mouse genome (Fig. 3c, d). Among LTRs, differentsubfamilies have different preferences for maintaining highmethylation in DKO cells, with 80.7 % of RRMRs being lo-cated within ERVK family members, much higher than theERVK family percentage (28.8 %) in the whole mouse gen-ome (Figure S11b in Additional file 1). Each LTR subfamilyis further divided into tens or hundreds of subtypes. Simi-larly, those subtypes exhibit highly variable potential tomaintain high methylation in DKO cells (Figure S11c inAdditional file 1). Among the top 12 RRMR-overlappingsubtypes, eight are IAP-related (Figure S11c in Additionalfile 1), indicating that DNMT1-mediated methylation iscritical for suppressing IAP transcription. This findingprovides a molecular explanation for the previous North-ern blotting results indicating that DNMT1 knockoutleads to dramatically increased IAP transcription in themouse embryo [20].The mouse genome contains 851,246 LTRs, comprising
around 10 % of the whole genome [39]. To gain a wholepicture of methylation of all LTRs in DKO cells, we plottedLTR methylation in 1KO, DKO, and TKO cells against WTafter simple filtering to remove the LTRs that are too shortor have too few CG sites (Fig. 3e, f). The LTRs in 1KO cellsall have similar methylation levels (Fig. 3f). In contrast,methylation patterns of LTRs in DKO cells seem to form a‘spindle’ shape. The bottom part of the spindle has a methy-lation level of around 18 %, and the top has a methylationlevel of over 50 % (Fig. 3e); in WT, these two parts havesimilar methylation levels (Fig. 3e). As expected, extremelylow methylation was found within LTRs in TKO cells(Figure S12 in Additional file 1). The separation into highand low methylation in DKO cells is independent of se-quencing coverage (Figure S13 in Additional file 1).As revealed by the analyses of the overlap between
RRMRs and LTR families, LTR families exhibit different po-tential to retain high methylation, with ERVK having thehighest potential and ERV1 having the second highest(Figures S11b and S14a, b in Additional file 1). Next, wedrilled down to ask whether LTR subtypes have differentpotential to retain high methylation in DKO cells. Asshown in Fig. 3g and Figure S15 in Additional file 1, suchdifferences exist. Most members in the top seven subtypeshave methylation levels between 50 % and 100 %, whilemembers in the other LTR subtypes mainly have lowermethylation levels ranging between 0 % and 50 % (Fig. 3g;Figures S15 and S10 in Additional file 1). These subtype-
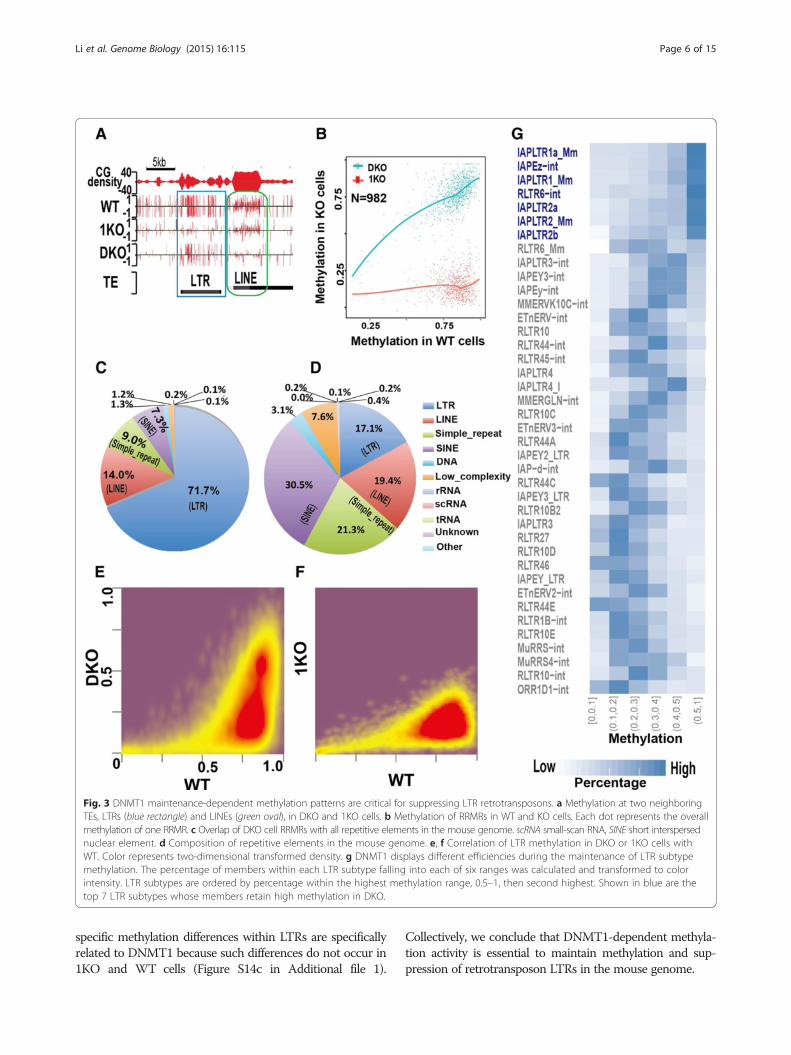
Fig. 3 DNMT1 maintenance-dependent methylation patterns are critical for suppressing LTR retrotransposons. a Methylation at two neighboringTEs, LTRs (blue rectangle) and LINEs (green oval), in DKO and 1KO cells. b Methylation of RRMRs in WT and KO cells. Each dot represents the overallmethylation of one RRMR. c Overlap of DKO cell RRMRs with all repetitive elements in the mouse genome. scRNA small-scan RNA, SINE short interspersednuclear element. d Composition of repetitive elements in the mouse genome. e, f Correlation of LTR methylation in DKO or 1KO cells withWT. Color represents two-dimensional transformed density. g DNMT1 displays different efficiencies during the maintenance of LTR subtypemethylation. The percentage of members within each LTR subtype falling into each of six ranges was calculated and transformed to colorintensity. LTR subtypes are ordered by percentage within the highest methylation range, 0.5–1, then second highest. Shown in blue are thetop 7 LTR subtypes whose members retain high methylation in DKO.
Li et al. Genome Biology (2015) 16:115 Page 6 of 15
specific methylation differences within LTRs are specificallyrelated to DNMT1 because such differences do not occur in1KO and WT cells (Figure S14c in Additional file 1).
Collectively, we conclude that DNMT1-dependent methyla-tion activity is essential to maintain methylation and sup-pression of retrotransposon LTRs in the mouse genome.
Li et al. Genome Biology (2015) 16:115 Page 7 of 15
Repression of LINEs is mainly mediated by DNMT3a/3bactivitySimilar to DKO cells, the methylation of some CG sitesin 1KO cells is relatively well maintained compared witha globally significant reduction (Figs. 3a and 4a). In otherwords, DNA methylation levels of these CG sites arenot significantly reduced upon the loss of DNMT1 activity.Similar to analyses in Fig. 3b, we identified RRMRs (n =639) exhibiting higher methylation in 1KO than in DKOand TKO cells (Fig. 4b; Additional file 3). The majority ofthese RRMRs are located within or close to repetitive ele-ments (Figure S16a in Additional file 1). Visual inspectionon the UCSC Genome Browser indicated that these RRMRsoverlap LINEs (Figs. 3a and 4c; Figure S17 in Additionalfile 1). Whole genome analysis indicated that 68 % ofRRMRs fall within LINEs, much higher than the LINE per-centage (19.4 %) in the mouse genome. In contrast, only 5.7% are within LTRs, which is lower than the LTR percentagein the mouse genome (17.1 %) (Figs. 3d and 4c). Like LTRs,LINEs are composed of hundreds of subtypes. Thesesubtypes apparently have different capabilities to retainhigh methylation in 1KO cells, with 54.8 % and 27.7 % of
Fig. 4 DNMT3a/3b-dependent (i.e., DNMT1 maintenance-independent) mea Correlation of methylation in 1KO and WT cells. CG sites with coverage ≥10density. b Methylation of RRMRs in three different ES KO cell lines relative to Wgenome. SINE short interspersed nuclear element. d Overlap of 1KO cell RRMRof all LINE subtypes overlapping with RRMRs. e Percentages of different LINE sES KO cell lines relative to WT
RRMRs overlapping L1Md_A and L1Md_T subtypes,respectively, far beyond their percentage in all LINEsubtypes (Fig. 4d, e; Figure S16b, c in Additional file 1).Interestingly, the overlapping of LINEs with RRMRs isconfined to the promoter region of LINEs (Fig. 3a;Figure S17 in Additional file 1), suggesting a criticalrole of such high methylation in repressing LINE retro-transposition and/or transcription. Next, we analyzed allLINE promoters in the mouse genome after simple fil-tering to remove short and low CG density LINEs. As withthe findings using the RRMR strategy, these results sug-gest DNMT3a/3b is crucial for maintaining methylation inLINE promoters. The methylation of LINEs in 1KO cellsis always higher than that in DKO cells (Fig. 4f).The above analyses indicate that: 1) LTRs exhibit spe-
cial methylation retention from DNMT1 activity afterDNMT3a/3b knock-out (Fig. 3); 2) LINE promoters ex-hibit similar retention from DNMT3a/3b activities afterDNMT1 knock-out (Fig. 4); and 3) protein-coding genesdo not show this methylation retention (Fig. 1b; additionalexamples in Figures S10 and S17 in Additional file 1).Therefore, our results provide a molecular explanation
thylation patterns are critical for suppressing LINE retrotransposons.in both cells were used. Color represents two-dimensional transformedT. c Overlap of 1KO cell RRMRs with repetitive elements in the mouses with LINE subtypes. Shown are percentages of each LINE subtype outubtypes in the mouse genome. f Methylation of LINEs in three different
Li et al. Genome Biology (2015) 16:115 Page 8 of 15
of previous Southern blotting results [33, 34] (seesummarized data from previous reports in Figure S18in Additional file 1). To confirm this variability,methylation along the body of these three elementswas further analyzed. Genes, LINEs and LTRs in themouse genome were divided into 10 groups accordingto their CG density. Their bodies were divided into 50,20, and 15 bins, respectively, with each bin having thesame number of CG sites. An 'overall methylation rate'and median CG density were calculated for each binwithin each group (Figure S19 in Additional file 1). Asexpected, LTRs show higher methylation in DKO than1KO cells and this high methylation spreads throughthe whole LTR body, while LINEs show higher methy-lation in 1KO than DKO cells and this high methyla-tion is restricted to promoter regions (Figure S19 inAdditional file 1). Only the LINEs or LTRs with highCG density display such differences, while those withlow CG density retained similar levels of methylationbetween 1KO and DKO cells.Strikingly, the role of CG density in shaping methylation
patterns is different for the three elements. For genes andLINEs, the CG density is inversely correlated with methy-lation level. While for LTRs, this trend seems to be re-versed, with higher CG density being accompanied byhigher methylation (compare CG density and WT methy-lation in Figure S19 in Additional file 1). It is clear thatLINE promoters always have higher methylation thangene promoters (compare gene and LINE methylation inWT, 1KO, and DKO cells in Figure S19 in Additionalfile 1). This difference does not result from the fact thatCG density in gene promoters is higher than that in LINEpromoters, because a select set of genes with similar CGdensities as LINE promoter regions also exhibit lowermethylation (Figure S20 in Additional file 1). Intriguingly,LINEs in 1KO cells do not display the typical pattern ofmethylation — slowly increasing throughout the genebody — but display similar methylation across the wholeLINE body. This observation indicates that DNMT3a/3b inDNMT1−/− 1KO cells have equal chances to methylate CGsites regardless of CG density. However, this typical patternis apparent in WT cells, whose only difference with 1KOcells is the intact DNMT1, suggesting that DNMT1 isresponsible for this pattern by preferentially retainingmethylation at regions of low CG density. This idea isfurther confirmed by the observation that the DKO cells,which have lost DNMT3a/3b activities but retain intactDNMT1, still have the typical methylation pattern. It is no-ticeable that the above observations are independent ofcoverage depth. As shown in Figure S21 in Additionalfile 1, the three groups with different coverage depth, GR1(lowest coverage), GR2 (medium), and GR3 (highest), havevery similar methylation patterns in WT, 1KO, and DKOcells for both LINEs and LTRs.
Hypomethylation induces or unexpectedly represses thetranscription of protein-coding genes with low CG densityOur data from extensive bioinformatic analyses indicatethat DNMT1-dependent and -independent methylationpatterns are responsible for inhibiting the transcription ofretrotransposon LTRs and LINEs, respectively. Next, weinvestigated how reduced methylation can affect transcrip-tion of protein-coding genes. Understanding these mecha-nisms might help to improve the application of DNMT1inhibitors in the induction of silenced tumor suppressorgenes during treatment of various cancers. First, we exam-ined methylation at the promoters and transcription startsites (TSSs) of genes in four ES cell lines (Figure S22 inAdditional file 1). In WT cells, DNA methylation aroundTSSs is negatively correlated with gene transcription, asexpected. The trend is conserved in 1KO and DKO cells,even though their methylation levels are significantlyreduced (Figure S22 in Additional file 1). Due to the hypo-methylation in TKO cells, such negative correlation can-not be detected (Figure S22 in Additional file 1). Exceptfor a minority of genes, however, genes in TKO cells havesimilar expression levels as in WT cells (Fragments PerKilobase of exon per Million fragments mapped (FPKM)PCC = 0.9558) (Fig. 5b), consistent with a former report[31]. On the other hand, some genes do exhibit changes ofexpression in TKO cells (Fig. 5a, b; Additional file 4). Thesegenes show special features in terms of DNA methylationand CG density (Fig. 5c, d; Figures S23 and S24 inAdditional file 1). The average promoter methylationreaches 75 % for up-regulated genes (fold change >2.5),drops to 11 % for down-regulated genes (fold change <−2.5), and further drops to 2 % for unchanged genes. Mean-while, we observed that up-regulated, down-regulated, andunchanged genes have CG densities of 24, 30, and 60, re-spectively (Fig. 5d).To more thoroughly examine these special features,
genes were divided into 500 subgroups according to foldchange between TKO and WT cells. The median foldchange in each subgroup was plotted against overall pro-moter methylation of WT cells in the same subgroup.Genes with fold change around 0 have low DNA methyla-tion and high CG density, whereas genes with large foldchanges (up-regulated) show significantly higher methyla-tion and lower CG density (Fig. 5c). Unexpectedly, a smallgroup of down-regulated genes also displayed hyperme-thylation. While the up-regulation of genes due to the lossof hypermethylation is in line with current understandingof the inhibitory role of promoter methylation, the down-regulation of genes upon the loss of promoter hyperme-thylation is unexpected. Whether it is an indirect effect,such as the expression of a transcription repressor, re-mains to be determined. At this resolution, gene bodymethylation seems to have no effect on expression deregu-lation in TKO cells (Figure S25 in Additional file 1).
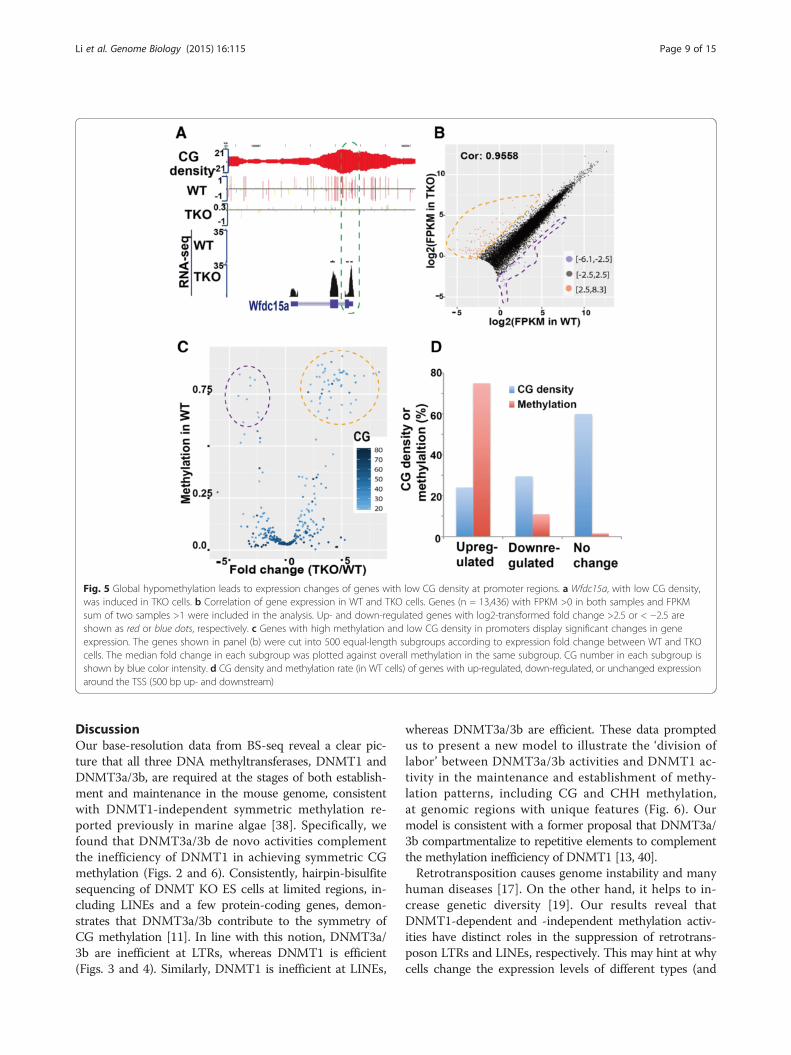
Fig. 5 Global hypomethylation leads to expression changes of genes with low CG density at promoter regions. a Wfdc15a, with low CG density,was induced in TKO cells. b Correlation of gene expression in WT and TKO cells. Genes (n = 13,436) with FPKM >0 in both samples and FPKMsum of two samples >1 were included in the analysis. Up- and down-regulated genes with log2-transformed fold change >2.5 or < −2.5 areshown as red or blue dots, respectively. c Genes with high methylation and low CG density in promoters display significant changes in geneexpression. The genes shown in panel (b) were cut into 500 equal-length subgroups according to expression fold change between WT and TKOcells. The median fold change in each subgroup was plotted against overall methylation in the same subgroup. CG number in each subgroup isshown by blue color intensity. d CG density and methylation rate (in WT cells) of genes with up-regulated, down-regulated, or unchanged expressionaround the TSS (500 bp up- and downstream)
Li et al. Genome Biology (2015) 16:115 Page 9 of 15
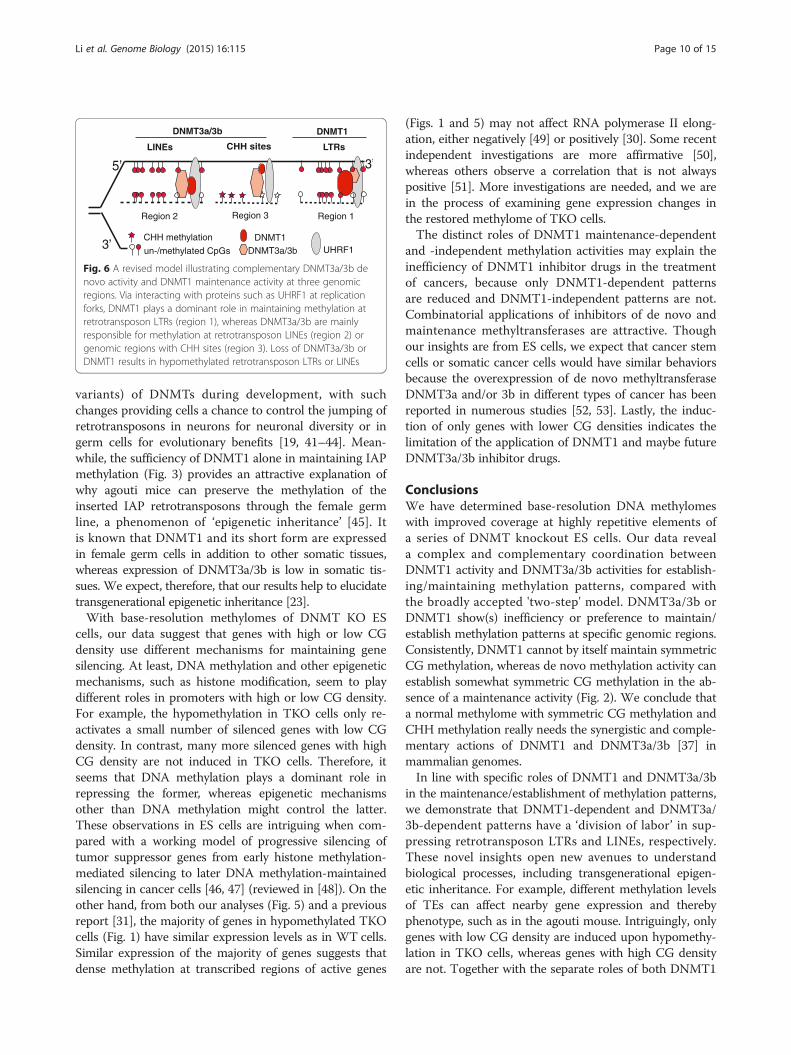
DiscussionOur base-resolution data from BS-seq reveal a clear pic-ture that all three DNA methyltransferases, DNMT1 andDNMT3a/3b, are required at the stages of both establish-ment and maintenance in the mouse genome, consistentwith DNMT1-independent symmetric methylation re-ported previously in marine algae [38]. Specifically, wefound that DNMT3a/3b de novo activities complementthe inefficiency of DNMT1 in achieving symmetric CGmethylation (Figs. 2 and 6). Consistently, hairpin-bisulfitesequencing of DNMT KO ES cells at limited regions, in-cluding LINEs and a few protein-coding genes, demon-strates that DNMT3a/3b contribute to the symmetry ofCG methylation [11]. In line with this notion, DNMT3a/3b are inefficient at LTRs, whereas DNMT1 is efficient(Figs. 3 and 4). Similarly, DNMT1 is inefficient at LINEs,
whereas DNMT3a/3b are efficient. These data promptedus to present a new model to illustrate the ‘division oflabor’ between DNMT3a/3b activities and DNMT1 ac-tivity in the maintenance and establishment of methy-lation patterns, including CG and CHH methylation,at genomic regions with unique features (Fig. 6). Ourmodel is consistent with a former proposal that DNMT3a/3b compartmentalize to repetitive elements to complementthe methylation inefficiency of DNMT1 [13, 40].Retrotransposition causes genome instability and many
human diseases [17]. On the other hand, it helps to in-crease genetic diversity [19]. Our results reveal thatDNMT1-dependent and -independent methylation activ-ities have distinct roles in the suppression of retrotrans-poson LTRs and LINEs, respectively. This may hint at whycells change the expression levels of different types (and
5’
LTRs LINEs
Region 1 Region 2
3’ un-/methylated CpGs DNMT3a/3bDNMT1
UHRF1
DNMT1 DNMT3a/3b
CHH methylation
CHH sites
Region 3
Fig. 6 A revised model illustrating complementary DNMT3a/3b denovo activity and DNMT1 maintenance activity at three genomicregions. Via interacting with proteins such as UHRF1 at replicationforks, DNMT1 plays a dominant role in maintaining methylation atretrotransposon LTRs (region 1), whereas DNMT3a/3b are mainlyresponsible for methylation at retrotransposon LINEs (region 2) orgenomic regions with CHH sites (region 3). Loss of DNMT3a/3b orDNMT1 results in hypomethylated retrotransposon LTRs or LINEs
Li et al. Genome Biology (2015) 16:115 Page 10 of 15
variants) of DNMTs during development, with suchchanges providing cells a chance to control the jumping ofretrotransposons in neurons for neuronal diversity or ingerm cells for evolutionary benefits [19, 41–44]. Mean-while, the sufficiency of DNMT1 alone in maintaining IAPmethylation (Fig. 3) provides an attractive explanation ofwhy agouti mice can preserve the methylation of theinserted IAP retrotransposons through the female germline, a phenomenon of ‘epigenetic inheritance’ [45]. Itis known that DNMT1 and its short form are expressedin female germ cells in addition to other somatic tissues,whereas expression of DNMT3a/3b is low in somatic tis-sues. We expect, therefore, that our results help to elucidatetransgenerational epigenetic inheritance [23].With base-resolution methylomes of DNMT KO ES
cells, our data suggest that genes with high or low CGdensity use different mechanisms for maintaining genesilencing. At least, DNA methylation and other epigeneticmechanisms, such as histone modification, seem to playdifferent roles in promoters with high or low CG density.For example, the hypomethylation in TKO cells only re-activates a small number of silenced genes with low CGdensity. In contrast, many more silenced genes with highCG density are not induced in TKO cells. Therefore, itseems that DNA methylation plays a dominant role inrepressing the former, whereas epigenetic mechanismsother than DNA methylation might control the latter.These observations in ES cells are intriguing when com-pared with a working model of progressive silencing oftumor suppressor genes from early histone methylation-mediated silencing to later DNA methylation-maintainedsilencing in cancer cells [46, 47] (reviewed in [48]). On theother hand, from both our analyses (Fig. 5) and a previousreport [31], the majority of genes in hypomethylated TKOcells (Fig. 1) have similar expression levels as in WT cells.Similar expression of the majority of genes suggests thatdense methylation at transcribed regions of active genes
(Figs. 1 and 5) may not affect RNA polymerase II elong-ation, either negatively [49] or positively [30]. Some recentindependent investigations are more affirmative [50],whereas others observe a correlation that is not alwayspositive [51]. More investigations are needed, and we arein the process of examining gene expression changes inthe restored methylome of TKO cells.The distinct roles of DNMT1 maintenance-dependent
and -independent methylation activities may explain theinefficiency of DNMT1 inhibitor drugs in the treatmentof cancers, because only DNMT1-dependent patternsare reduced and DNMT1-independent patterns are not.Combinatorial applications of inhibitors of de novo andmaintenance methyltransferases are attractive. Thoughour insights are from ES cells, we expect that cancer stemcells or somatic cancer cells would have similar behaviorsbecause the overexpression of de novo methyltransferaseDNMT3a and/or 3b in different types of cancer has beenreported in numerous studies [52, 53]. Lastly, the induc-tion of only genes with lower CG densities indicates thelimitation of the application of DNMT1 and maybe futureDNMT3a/3b inhibitor drugs.
ConclusionsWe have determined base-resolution DNA methylomeswith improved coverage at highly repetitive elements ofa series of DNMT knockout ES cells. Our data reveala complex and complementary coordination betweenDNMT1 activity and DNMT3a/3b activities for establish-ing/maintaining methylation patterns, compared withthe broadly accepted 'two-step' model. DNMT3a/3b orDNMT1 show(s) inefficiency or preference to maintain/establish methylation patterns at specific genomic regions.Consistently, DNMT1 cannot by itself maintain symmetricCG methylation, whereas de novo methylation activity canestablish somewhat symmetric CG methylation in the ab-sence of a maintenance activity (Fig. 2). We conclude thata normal methylome with symmetric CG methylation andCHH methylation really needs the synergistic and comple-mentary actions of DNMT1 and DNMT3a/3b [37] inmammalian genomes.In line with specific roles of DNMT1 and DNMT3a/3b
in the maintenance/establishment of methylation patterns,we demonstrate that DNMT1-dependent and DNMT3a/3b-dependent patterns have a ‘division of labor’ in sup-pressing retrotransposon LTRs and LINEs, respectively.These novel insights open new avenues to understandbiological processes, including transgenerational epigen-etic inheritance. For example, different methylation levelsof TEs can affect nearby gene expression and therebyphenotype, such as in the agouti mouse. Intriguingly, onlygenes with low CG density are induced upon hypomethy-lation in TKO cells, whereas genes with high CG densityare not. Together with the separate roles of both DNMT1
Li et al. Genome Biology (2015) 16:115 Page 11 of 15
and DNMT3a/3b in maintaining/establishing methylationpatterns, our results provide potential explanations for theinefficiency of DNMT1 inhibitors alone in the treatmentof human diseases.
Materials and methodsES cell cultureMouse ES cells WT J1, DNMT1 knockout 36c/c (1KO)and DNMT3a/DNMT3b double knock out (DKO) werekindly provided by Drs En Li and Taiping Chen [34, 54].DNMT1/DNMT3a/DNMT3b triple knockout cells (TKO)were kindly provided by Dr Masaki Okano [33]. Cells weremaintained without feeder cells on 0.1 % gelatin coatedPetri dish in Dulbecco's modified Eagle's medium (DMEM)supplemented with 15 % fetal bovine serum (ES cell grade),2 mM glutamine, 10 μM mercapto-ethanol, 100 U/mlLIF, penicillin/streptomycin mixture 100 μg/ml, 1× non-essential amino acids.
BS-seq library constructionGenomic DNA (1–5 μg) was sheared to 200–500 bpby Covaris S220 sonicator (Covaris, USA). End repairwas then performed following the manufacturer’s in-structions (End-It DNA end repair kit, Epicentre, USA).After Ampure XP (Sigma, USA) purification, adenine wasadded to the 3′ end with 3 μl DNA Taq polymerase(M0267S, NEB) and 1 mM dATP in 50 μl reaction solu-tion incubated at 70 °C for 30 minutes. After Ampure XPpurification, 1 μl of Illumina Trueseq adaptors were ligatedwith 4 μl T4 DNA ligase (M0202L, NEB) in 40 μl reactionsolution and incubated at 16 °C overnight. Adaptor-ligatedDNA fragments of 300–600 bp were collected from 2 %agarose gel, and then bisulfite-treated using an ImprintDNA modification Kit (MOD50-1 KIT, Sigma, USA)according to the manufacturer's instructions. To ensureconversion of uracil to thymine and avoid the potentialPCR-induced bias [55], we minimized PCR cycles (6–10 cycles) to amplify the libraries, and fragments of300–600 bp were then collected using 2 % agarose gelelectrophoresis.
Bisulfite Sanger sequencingGenomic DNA was bisulfite-treated according to themanufacturer’s instructions (Imprint DNA ModificationKit, Sigma, USA). About 40–50 ng of converted genomicDNA was used for Nested PCR. Primers were designedusing Methyl Primer Express 1.0 (Applied Biosystems).Purified PCR products were cloned into pCR2.1 vector(TA Cloning Kit, Invitrogen). White colonies were se-lected through blue/white screening and sent for Sangersequencing.
Anchored cluster end-mappingWe developed the ACE-mapping method to use the featurethat both ends of a DNA cluster (a clonal amplificationfrom the same DNA fragment during cluster generation)are sequenced in paired-end sequencing and one uniquelyaligned mate pair can be used to rescue its mate when themate has multiple hits in the genome by using knowledgeof the appropriate fragment length in library construction.Similar strategies have been independently used by othermapping methods like MOSAIK [56] and segemehl [57].ACE-mapping is able to increase the mapping efficiency athighly repetitive elements. The mouse reference genome(UCSC mm9) was subjected to two types of nucleotide re-placement by changing C to T (C2T genome) or G to A(G2A genome) and indexes were made using bowtie-build.Reads also underwent nucleotide replacement by changingcytosine in read 1 of paired-end sequencing to thymine andguanine in read 2 to adenine. Mapping was done usingbowtie (version 0.12.7) [58] by allowing three mismatchesin the leading 40 bases and a Phred score of up to 140at mismatched positions. Twenty multiple alignmentswere allowed at most for each read, i.e., using k = 20when running bowtie.
Removing PCR amplification biases by monoclonizationPCR of bisulfite-treated DNA sometimes shows favorableamplification of unmethylated sequences, which can causeincorrect representation of real methylation in a sequence-specific and often strand-specific manner [55]. To avoidpotential biased amplifications, we included one step ofmonoclonization in our data processing pipeline bytreating all reads derived from the common DNA frag-ment via PCR as one. The idea of monoclonization isbased on the fact that there is a very low chance ofchromosomes from different cells being broken at thesame positions during sonication. So the chance is verylow that both read mates of different DNA fragmentsalign to the same chromosome positions. During dataprocessing, we reduce the multiple read pairs that an-chor to the same chromosome positions at both endsto one clone by keeping the read pair that has the highestmapping score. As shown in Figure S3 in Additional file 1,WT cells have 817,717,346 tags (i.e., read pairs), but only301,635,930 clones. Monoclonization, although decreasingsequencing coverage depth, can alleviate the effects ofPCR bias. The number of monoclones could reach 36.9 %to 53.9 % of the total tag number (Figure S3 in Additionalfile 1). As shown in Figure S26 in Additional file 1, threefragments were generated from three different cells duringsonication with two of them methylated and one unmethy-lated at the indicated CG site. The actual methylation rate(MR) should be 67 %. However, the MR becomes 0.3 onthe top strand after PCR because fragments 1 and 2 areamplified 10 times (from 1 molecule to 10) and fragment 3
Li et al. Genome Biology (2015) 16:115 Page 12 of 15
is amplified 50 times (from 1 to 50) due to PCR bias. Aftermonoclonization, all the 10 or 50 DNA molecules werereduced to one since they map to the same chromosomepositions on two ends, which gives a MR of 0.67 again.For the bottom strand, since no PCR bias exists, theMR is always 0.67. Extremely high coverage is requiredto completely remove PCR bias (unpublished data, Dr.Zhibin Wang at Bloomberg School of Public Health,Johns Hopkins University). Usually, about 30× coverage orless is achieved in current reports (including ENCODE).Under these conditions, monoclonization is able to allevi-ate, but cannot completely remove, the effects of PCR bias.
Calculation of methylation levelsWe use MR to represent methylation level, which issimilar to methylation score used in the study by Stadleret al. [36]. We use the following formula:
S ¼ rC = rC þ rTð Þ;
where rC is the number of reads that remain C afterbisulfite treatment, and rT is the number of reads thatbecome T after bisulfite treatment.
Calculation of overall methylationOverall MRs were used to measure the overall methylationof all Cs, CGs, or CWGs (W = A or T) in the whole gen-ome, or in specific elements such as LTRs and LINEs. Foroverall methylation of a genomic region, we used the fol-lowing formula:
S ¼ ΣrC = ΣrC þ ΣrTð Þ;
where Σ is the sum of the rC or rT values on every CGsite within the region. Except for the analysis of strandbias methylation, the two cytosines in a CG site werecombined together to calculate methylation or overallmethylation.
Bias indexBI was defined to measure the degree of methylationbias on two complementary DNA strands and calculatedwith the following formula:
BI ¼ Sn ‐ Spð Þ = Sn þ Spð Þ;
where Sn is the MR on the negative (or antisense)strand, and Sp is the MR on the positive (or sense)strand. CG sites with Sn = 0 and Sp = 0 were consideredunbiased (i.e., corrected so that BI = 0, rather thanundefined).
Deletion index and RRMRsA deletion index (Di) was calculated to measure the degreeof methylation deletion/reduction compared with WT that
was caused by the knocking-out of DNMTs. It is calculatedusing the following formula:
Di ¼ Swt ‐ Skoð Þ = Swt;
where Swt is the MR in WT, and Sko is the MR in1KO or DKO cells. RRMRs were searched for consider-ing them as regions having five or seven consecutive CGsites with each CG having a deletion index <0.3 in 1KOand DKO cells, respectively.
Overlap of RRMRs with repetitive elementsA repetitive element table was downloaded from theUCSC genome browser for mouse genome mm9, whichwas created using RepeatMasker [59]. Overlap was lo-cated using the 'findOverlaps' function in the 'IRanges'package of R software with a gap of 200 bp and 50 bpfor 1KO and DKO cell RRMRs, respectively. Visual in-spection of the genome browser indicated 1KO cellRRMRs are mainly located at LINE promoter regions.We decided to focus on the promoter regions that aredownstream of TSSs and span one-fourth of the inter-ested LINE.
Analysis of methylation in LINEs and LTRsWe examined the methylation of all LINEs that meet thefollowing criteria: length >1500 bp, CG number >30, andcoverage >50 in all four cells. The coverage of a LINE isthe sum of coverage at each CG site within that LINE.The analysis was restricted to LINE promoter regions,defined as 100 bp upstream and 1000 bp downstream ofthe TSS of a LINE. LTRs also underwent similar filtering,and the ones having CG density >9 and coverage >50 infour cells were selected. For LTRs, the full region wasused for analysis. The methylation level of a LINE orLTR was calculated using overall methylation method. Itshould be pointed out that coverage is usually moreshallow in repetitive regions of LINEs and LTRs than ina protein coding gene (Figure S21a in Additional file 1).The effect is more obvious in LINEs than LTRs, prob-ably because LINEs are usually longer (could be 6–7 kb),which makes short-read anchoring more difficult. Cover-age profiles of LINEs show higher coverage in head andtail marginal regions, but lower in body regions (FigureS21B in Additional file 1). However, the coverage pro-files of LTRs do not show such characteristics, probablydue to the fact that LTRs are shorter and easier to fullycover using the uniquely anchored mate (Figure S21C inAdditional file 1). However, the slight decrease in cover-age does not affect the conclusion we made about theroles of DNMT1 and DNTM3a/3b in LINE and LTRregions as shown in Figure S21d, e in Additional file 1.
Li et al. Genome Biology (2015) 16:115 Page 13 of 15
Heatmap of methylation in LTR subtypesLTRs in the mouse genome are classified into 11 families,and further into 471 subtypes or repNames. Each subtypecan have as low as 1 or as high as 47,854 members. Thesubtypes with >50 members after filtering as described inthe Analysis of methylation in LINEs and LTRs section wereused for heatmap generation. All the members under a sub-type were divided into six groups according to their methy-lation level: [0, 0.1], [0.1, 0.2], [0.2, 0.3], [0.3, 0.4], [0.4, 0.5],and [0.5, 1]. Then, the percentage falling into each rangewas calculated and represented as a color by the geom_tilefunction in the ggplot2 package of R software.
Binning of genomic elementsThe genomic elements, including genes, LINEs, andLTRs, were divided into bins by two approaches: 1) eachbin having the same length or 2) each bin having thesame number of CGs. The first method was employed toinvestigate methylation in gene promoter regions. Genepromoter regions, comprising 4 kb up- and downstreamof the TSS, were divided into 40 bins. Genes were sortedfirst by expression level (FPKM) then by CG numberwithin promoter, and divided into 500 groups, with eachgroup having the same number of genes. Methylationfor each bin within each group was calculated by theoverall method as described above. The second approachwas used to investigate CG density and methylation distri-bution along genes, LINEs, and LTRs. These three elementswere filtered by the criteria of CG density >50, >20, or >15and length >3000, >1000, >300, respectively. The regions offiltered genes, LINEs, or LTRs were cut into 50, 20, and 15bins, respectively. The aforementioned genes, LINEs, orLTRs were further divided into ten equal-sized groupsbased on CG density number. Within each group, bins inthe same sequential order among group members weretreated together to obtain an overall MR, which was usedin Figure S20 in Additional file 1 (bottom three panels). ForCG density, the median of all CG sites in the aforemen-tioned bins was used to generate the top panel of FigureS20 in Additional file 1.
Alignment of RNA-seq dataWT and TKO RNA-seq data were downloaded fromthe Gene Expression Omnibus (accession numbers GSM727427 and GSM727428) [31]. DKO and 1KO RNA-seqdata were generated in this work. STAR (version 2.1.4a,default parameters) was used to align RNA-seq reads tomouse reference genome mm9 (NCBIM37) [60]. Cuffdiffin the Cufflinks package (version 2.1.1) [61] was used toestimate the expression level by FPKM value based onEnsembl annotation database release 67.
Analysis of the correlation between DNA methylation andgene expressionFold change was calculated as the log2-transformed ratiobetween the WT and TKO FPKM value for each gene.Genes were filtered by the following criteria: 1) FPKMvalue for both WT and TKO >0; 2) sum of FPKM valuesfor WT and TKO >1; and 3) fold change in the range[−6, 6]. Genes passing the filtering (n = 13,436) were cutinto 500 equal-length groups by either fold change orWT FPKM. Overall methylation score, median foldchange, CG number, and FPKM were calculated for eachsubgroup. All the CG sites inside the 500 bp up- anddownstream of the TSSs within a subgroup were usedfor overall methylation calculation. Methylation wasplotted against fold change using the ggplot2 package inR software with CG density represented as color shadesto reveal the impact of promoter DNA methylation andCG number on gene deregulation. FPKM values werelog2 transformed and plotted against log2-transformedmethylation score to reveal the expression level ofderegulated gene subgroups using the same R packagewith deregulation status as color aesthetics.
Methylome dataThe methylome data in this report have been depositedin the Gene Expression Omnibus (accession numberGSE61457).
Additional files
Additional file 1: Supplemental Figures S1–S26.
Additional file 2: Table listing identified RRMRs in DKO cells.
Additional file 3: Table listing identified RRMRs in 1KO cells.
Additional file 4: Table listing gene expression in FPKM of WT andTKO cells.
Abbreviations1KO: DNMT1 knockout; ACE: anchored cluster end; BI: bias index;BS-seq: bisulfite deep sequencing; DKO: DNMT3a/3b double knockout;DNMT: DNA methyltransferase; ES: embryonic stem; IAP: intracisternalA-particle; KO: knockout; LINE: long interspersed nuclear element; LTR: longterminal repeat; MR: methylation rate; PCC: Pearson correlation coefficient;RRMR: reduction-resistant methylated region; TE: transposable element;TKO: DNMT1−/−/3a−/−/3b−/− triple knockout; TSS: transcription start site;WT: wild type.
Competing interestsThe authors declare that they have no competing interests.
Authors’ contributionsZW conceived and supervised the project. HD, SNM, YG, TL, and GZperformed the experiments. ZL wrote the computational programs andperformed bioinformatic analyses with methylomes. SNM also contributedbioinformatic analysis. BX, and DES contributed to the gene expressionanalyses. ZL and ZW wrote the manuscript with important contributionsfrom HD, BX, and DES. All authors read and approved the final manuscript.
AcknowledgementsThis project was supported by Kimmel Scholarship from the Sidney KimmelFoundation for Cancer Research, Ho-Ching Yang Memorial Faculty Award
Li et al. Genome Biology (2015) 16:115 Page 14 of 15
from JHSPH, and EHS startup to ZW. BX and DS are supported by theK22HL101950 and City of Hope. Research reported in this publication includedwork performed in the Pathology and Integrative Genomics Cores of the City ofHope supported by the National Cancer Institute of the National Institutes ofHealth under award number P30CA33572. We thank Drs En Li and Taiping Chenat Novartis/MD Anderson and Dr Masaki Okano at RIKEN for ES cells used in thisproject. We also thank Dr Keji Zhao at NHLBI/NIH for critical reading of thismanuscript and Dr Haig H Kazazian at JHU for their helpful discussion of thisproject and/or comments on transposable elements/mobile DNA. We alsothank Hopkins GRCF and Bayview sequencing facilities.
Author details1Department of Environmental Health Sciences, Laboratory of HumanEnvironmental Epigenomes, Bloomberg School of Public Health, JohnsHopkins University, 615 N. Wolfe Street, Room E7816, Baltimore, MD 21205,USA. 2Department of Diabetes Complications and Metabolism, BeckmanResearch Institute, City of Hope, Duarte, CA 91010, USA. 3Fenxian CentralHospital, 9588 Nanfeng Hwy, Fengxian District, Shanghai 201406, China. 4TheSidney Kimmel Comprehensive Cancer Center and Department of Oncology,School of Medicine, Johns Hopkins University, Baltimore, MD 21205, USA.
Received: 10 November 2014 Accepted: 28 May 2015
References1. Cedar H, Bergman Y. Linking DNA methylation and histone modification:
patterns and paradigms. Nat Rev Genet. 2009;10:295–304.2. Probst AV, Dunleavy E, Almouzni G. Epigenetic inheritance during the cell
cycle. Nat Rev Mol Cell Biol. 2009;10:192–206.3. Ferguson-Smith AC. Genomic imprinting: the emergence of an epigenetic
paradigm. Nat Rev Genet. 2011;12:565–75.4. Feng S, Jacobsen SE, Reik W. Epigenetic reprogramming in plant and
animal development. Science. 2010;330:622–7.5. Cedar H, Bergman Y. Programming of DNA methylation patterns. Annu Rev
Biochem. 2012;81:97–117.6. Chang G, Gao S, Hou X, Xu Z, Liu Y, Kang L, et al. High-throughput sequen-
cing reveals the disruption of methylation of imprinted gene in inducedpluripotent stem cells. Cell Res. 2014;24:293–306.
7. Baylin SB, Jones PA. A decade of exploring the cancer epigenome - biologicaland translational implications. Nat Rev Cancer. 2011;11:726–34.
8. Varley KE, Gertz J, Bowling KM, Parker SL, Reddy TE, Pauli-Behn F, et al.Dynamic DNA methylation across diverse human cell lines and tissues.Genome Res. 2013;23:555–67.
9. Lister R, Pelizzola M, Dowen RH, Hawkins RD, Hon G, Tonti-Filippini J, et al.Human DNA methylomes at base resolution show widespread epigenomicdifferences. Nature. 2009;462:315–22.
10. Liang G, Chan MF, Tomigahara Y, Tsai YC, Gonzales FA, Li E, et al. Cooperativitybetween DNA methyltransferases in the maintenance methylation of repetitiveelements. Mol Cell Biol. 2002;22:480–91.
11. Arand J, Spieler D, Karius T, Branco MR, Meilinger D, Meissner A, et al. In vivocontrol of CpG and non-CpG DNA methylation by DNA methyltransferases.PLoS Genet. 2012;8, e1002750.
12. Shock LS, Thakkar PV, Peterson EJ, Moran RG, Taylor SM. DNA methyltransferase1, cytosine methylation, and cytosine hydroxymethylation in mammalianmitochondria. Proc Natl Acad Sci U S A. 2011;108:3630–5.
13. Jones PA, Liang G. Rethinking how DNA methylation patterns are maintained.Nat Rev Genet. 2009;10:805–11.
14. Seisenberger S, Popp C, Reik W. Retrotransposons and germ cells: reproduction,death, and diversity. F1000 Biol Rep. 2010;2:44.
15. Goodier JL, Kazazian Jr HH. Retrotransposons revisited: the restraint andrehabilitation of parasites. Cell. 2008;135:23–35.
16. Chen JM, Chuzhanova N, Stenson PD, Ferec C, Cooper DN. Meta-analysis ofgross insertions causing human genetic disease: novel mutational mechanismsand the role of replication slippage. Hum Mutat. 2005;25:207–21.
17. Kazazian Jr HH, Moran JV. The impact of L1 retrotransposons on the humangenome. Nat Genet. 1998;19:19–24.
18. Maksakova IA, Romanish MT, Gagnier L, Dunn CA, van de Lagemaat LN,Mager DL. Retroviral elements and their hosts: insertional mutagenesis inthe mouse germ line. PLoS Genet. 2006;2, e2.
19. Coufal NG, Garcia-Perez JL, Peng GE, Yeo GW, Mu Y, Lovci MT, et al. L1retrotransposition in human neural progenitor cells. Nature. 2009;460:1127–31.
20. Walsh CP, Chaillet JR, Bestor TH. Transcription of IAP endogenous retroviruses isconstrained by cytosine methylation. Nat Genet. 1998;20:116–7.
21. Lane N, Dean W, Erhardt S, Hajkova P, Surani A, Walter J, et al. Resistance ofIAPs to methylation reprogramming may provide a mechanism forepigenetic inheritance in the mouse. Genesis. 2003;35:88–93.
22. Barker DJ. The developmental origins of adult disease. Eur J Epidemiol. 2003;18:733–6.23. Martos SN, Tang WY, Wang Z. Elusive inheritance: Transgenerational effects
and epigenetic inheritance in human environmental disease. Prog BiophysMol Biol. 2015;10.1016/j.pbiomolbio. 2015.02.011.
24. Dolinoy DC, Weidman JR, Waterland RA, Jirtle RL. Maternal genistein alterscoat color and protects Avy mouse offspring from obesity by modifying thefetal epigenome. Environ Health Perspect. 2006;114:567–72.
25. Dolinoy DC, Huang D, Jirtle RL. Maternal nutrient supplementation counteractsbisphenol A-induced DNA hypomethylation in early development. Proc NatlAcad Sci U S A. 2007;104:13056–61.
26. Stein R, Razin A, Cedar H. In vitro methylation of the hamster adeninephosphoribosyltransferase gene inhibits its expression in mouse L cells. ProcNatl Acad Sci U S A. 1982;79:3418–22.
27. Siegfried Z, Eden S, Mendelsohn M, Feng X, Tsuberi BZ, Cedar H. DNAmethylation represses transcription in vivo. Nat Genet. 1999;22:203–6.
28. Kelly TK, De Carvalho DD, Jones PA. Epigenetic modifications as therapeutictargets. Nat Biotechnol. 2010;28:1069–78.
29. Chik F, Szyf M. Effects of specific DNMT gene depletion on cancer celltransformation and breast cancer cell invasion; toward selective DNMTinhibitors. Carcinogenesis. 2011;32:224–32.
30. Wu H, Coskun V, Tao J, Xie W, Ge W, Yoshikawa K, et al. Dnmt3a-dependentnonpromoter DNA methylation facilitates transcription of neurogenic genes.Science. 2010;329:444–8.
31. Karimi MM, Goyal P, Maksakova IA, Bilenky M, Leung D, Tang JX, et al. DNAmethylation and SETDB1/H3K9me3 regulate predominantly distinct sets ofgenes, retroelements, and chimeric transcripts in mESCs. Cell Stem Cell.2011;8:676–87.
32. Li E, Beard C, Jaenisch R. Role for DNA methylation in genomic imprinting.Nature. 1993;366:362–5.
33. Tsumura A, Hayakawa T, Kumaki Y, Takebayashi S, Sakaue M, Matsuoka C,et al. Maintenance of self-renewal ability of mouse embryonic stem cells inthe absence of DNA methyltransferases Dnmt1, Dnmt3a and Dnmt3b.Genes Cells. 2006;11:805–14.
34. Okano M, Bell DW, Haber DA, Li E. DNA methyltransferases Dnmt3a andDnmt3b are essential for de novo methylation and mammalian development.Cell. 1999;99:247–57.
35. Spada F, Haemmer A, Kuch D, Rothbauer U, Schermelleh L, Kremmer E,et al. DNMT1 but not its interaction with the replication machinery isrequired for maintenance of DNA methylation in human cells. J Cell Biol.2007;176:565–71.
36. Stadler MB, Murr R, Burger L, Ivanek R, Lienert F, Scholer A, et al. DNA-bindingfactors shape the mouse methylome at distal regulatory regions. Nature.2011;480:490–5.
37. Meilinger D, Fellinger K, Bultmann S, Rothbauer U, Bonapace IM, KlinkertWE, et al. Np95 interacts with de novo DNA methyltransferases, Dnmt3aand Dnmt3b, and mediates epigenetic silencing of the viral CMV promoterin embryonic stem cells. EMBO Rep. 2009;10:1259–64.
38. Huff JT, Zilberman D. Dnmt1-independent CG methylation contributes tonucleosome positioning in diverse eukaryotes. Cell. 2014;156:1286–97.
39. Mandal PK, Kazazian Jr HH. SnapShot: Vertebrate transposons. Cell.2008;135:192–2. e191.
40. Jeong S, Liang G, Sharma S, Lin JC, Choi SH, Han H, et al. Selective anchoringof DNA methyltransferases 3A and 3B to nucleosomes containing methylatedDNA. Mol Cell Biol. 2009;29:5366–76.
41. Jeong M, Sun D, Luo M, Huang Y, Challen GA, Rodriguez B, et al. Largeconserved domains of low DNA methylation maintained by Dnmt3a. NatGenet. 2014;46:17–23.
42. Smith ZD, Chan MM, Mikkelsen TS, Gu H, Gnirke A, Regev A, et al. A uniqueregulatory phase of DNA methylation in the early mammalian embryo.Nature. 2012;484:339–44.
43. Molaro A, Hodges E, Fang F, Song Q, McCombie WR, Hannon GJ, et al.Sperm methylation profiles reveal features of epigenetic inheritance andevolution in primates. Cell. 2011;146:1029–41.
44. La Salle S, Mertineit C, Taketo T, Moens PB, Bestor TH, Trasler JM. Windowsfor sex-specific methylation marked by DNA methyltransferase expressionprofiles in mouse germ cells. Dev Biol. 2004;268:403–15.
Li et al. Genome Biology (2015) 16:115 Page 15 of 15
45. Morgan HD, Sutherland HG, Martin DI, Whitelaw E. Epigenetic inheritance atthe agouti locus in the mouse. Nat Genet. 1999;23:314–8.
46. Schlesinger Y, Straussman R, Keshet I, Farkash S, Hecht M, Zimmerman J,et al. Polycomb-mediated methylation on Lys27 of histone H3 pre-marksgenes for de novo methylation in cancer. Nat Genet. 2007;39:232–6.
47. McGarvey KM, Fahrner JA, Greene E, Martens J, Jenuwein T, Baylin SB. Silencedtumor suppressor genes reactivated by DNA demethylation do not return to afully euchromatic chromatin state. Cancer Res. 2006;66:3541–9.
48. Ohm JE, Baylin SB. Stem cell chromatin patterns: an instructive mechanismfor DNA hypermethylation? Cell Cycle. 2007;6:1040–3.
49. Lorincz MC, Dickerson DR, Schmitt M, Groudine M. Intragenic DNA methylationalters chromatin structure and elongation efficiency in mammalian cells. NatStruct Mol Biol. 2004;11:1068–75.
50. Yang X, Han H, De Carvalho DD, Lay FD, Jones PA, Liang G. Gene bodymethylation can alter gene expression and is a therapeutic target in cancer.Cancer Cell. 2014;26:577–90.
51. Wagner JR, Busche S, Ge B, Kwan T, Pastinen T, Blanchette M. The relationshipbetween DNA methylation, genetic and expression inter-individual variation inuntransformed human fibroblasts. Genome Biol. 2014;15:R37.
52. Linhart HG, Lin H, Yamada Y, Moran E, Steine EJ, Gokhale S, et al. Dnmt3bpromotes tumorigenesis in vivo by gene-specific de novo methylation andtranscriptional silencing. Genes Dev. 2007;21:3110–22.
53. Roll JD, Rivenbark AG, Jones WD, Coleman WB. DNMT3b overexpressioncontributes to a hypermethylator phenotype in human breast cancer celllines. Mol Cancer. 2008;7:15.
54. Lei H, Oh SP, Okano M, Juttermann R, Goss KA, Jaenisch R, et al. De novoDNA cytosine methyltransferase activities in mouse embryonic stem cells.Development. 1996;122:3195–205.
55. Warnecke PM, Stirzaker C, Melki JR, Millar DS, Paul CL, Clark SJ. Detectionand measurement of PCR bias in quantitative methylation analysis ofbisulphite-treated DNA. Nucleic Acids Res. 1997;25:4422–6.
56. Lee WP, Stromberg MP, Ward A, Stewart C, Garrison EP, Marth GT. MOSAIK:a hash-based algorithm for accurate next-generation sequencing short-readmapping. PLoS One. 2014;9, e90581.
57. Otto C, Stadler PF, Hoffmann S. Fast and sensitive mapping of bisulfite-treatedsequencing data. Bioinformatics. 2012;28:1698–704.
58. Langmead B, Trapnell C, Pop M, Salzberg SL. Ultrafast and memory-efficientalignment of short DNA sequences to the human genome. Genome Biol.2009;10:R25.
59. Smit AFA, Hubley R, Green P. RepeatMasker Open-4.0. 2013–2015. http://www.repeatmasker.org.
60. Dobin A, Davis CA, Schlesinger F, Drenkow J, Zaleski C, Jha S, et al. STAR:ultrafast universal RNA-seq aligner. Bioinformatics. 2013;29:15–21.
61. Trapnell C, Hendrickson DG, Sauvageau M, Goff L, Rinn JL, Pachter L.Differential analysis of gene regulation at transcript resolution with RNA-seq.Nat Biotechnol. 2013;31:46–53.
Submit your next manuscript to BioMed Centraland take full advantage of:
• Convenient online submission
• Thorough peer review
• No space constraints or color figure charges
• Immediate publication on acceptance
• Inclusion in PubMed, CAS, Scopus and Google Scholar
• Research which is freely available for redistribution
Submit your manuscript at www.biomedcentral.com/submit
Copyright © 2022 FDOKUMEN