Transport of sulfur dioxide from the Asian Pacific Rim to the North Pacific troposphere
Distinct impact of tropical SSTs on summer North Pacific high andwestern North Pacific subtropical high
Kyung-Sook Yun,1 Sang-Wook Yeh,2 and Kyung-Ja Ha1
Received 26 September 2012; revised 6 February 2013; accepted 6 February 2013; published 23 May 2013.
[1] The distinct impact of tropical Indian Ocean (IO) and western Pacific (WP) sea surfacetemperatures (SSTs) after the El Niño winter has been investigated in relation to thesummer North Pacific high (NPH) and western North Pacific subtropical high (WNPSH).After the El Niño winter, warming of the IO leads to a summer eastern Pacific (EP) SSTanomaly distinct from the cooling of WP; EP cooling occurs in the extreme IO warmingcase and EP warming in the WP cooling case. Both the warming of the IO and cooling ofthe WP are responsible for the development of the WNPSH, whereas the summer EPcooling induces an enhanced NPH, especially if it coexists with IO warming. The IOwarming triggers an abrupt termination of the El Niño event by causing the easterlyanomaly in the WP, which leads to the coexistence of IO warming and EP cooling duringthe boreal summer. The tropical EP cooling may change the North Pacific SST anomaliesvia the atmospheric bridge and consequently strengthen the extratropical NPH. Theexperimental results, which have been obtained from the use of atmospheric generalcirculation model, support the distinct roles of EP cooling on the NPH and of IO warmingand WP cooling on the WNPSH. This finding suggests that the combined effect of IOwarming and EP cooling generates a coupled pattern of NPH and WNPSH.
Citation: Yun, K.-S., S.-W. Yeh, and K.-J. Ha (2013), Distinct impact of tropical SSTs on summer North Pacific high andwestern North Pacific subtropical high, J. Geophys. Res. Atmos., 118, 4107–4116, doi:10.1002/jgrd.50253.
1. Introduction
[2] Sea surface temperature (SST) warming of the easternPacific (EP) during the El Niño winter causes warming ofthe Indian Ocean (IO) and cooling of the western Pacific(WP) through the atmospheric bridge process [Klein et al.,1999; Alexander et al., 2002; Moon et al., 2011]. Excitationof midlatitude circulation by these tropical heat sourceshas been investigated as the teleconnection patterns ofPacific–North American (PNA) [Wallace and Gutzler,1981] and Pacific–Japan (PJ) [Nitta, 1987]. In particular, ithas been reported that the IO warming and WP cooling afterthe El Niño winter, which are maintained until the ensuingsummer, play a significant role in modulating summertimeextratropical circulation [Wang et al., 2000; Yun et al.,2008; Xie et al., 2009; Chowdary et al., 2010]. For example,Chowdary et al. [2010] have shown the importance of bothIO warming and WP cooling on rainfall prediction overthe western North Pacific (WNP) after the mature phase ofEl Niño by using 11 coupled model hindcast results.[3] For more accurate summer predictions, much attention
has been paid to the mechanism and relative role of
IO warming andWP cooling in relation to summerWNP rainfalland circulation. With delayed impact of El Niño/SouthernOscillation (ENSO), positive thermodynamic feedback[Wang et al., 2000; 2003] and Kelvin wave-induced Ekmandivergence [Xie et al., 2009; Chowdary et al., 2010] havebeen roughly suggested as key mechanisms in determiningthe change in the WNP subtropical high (WNPSH). Accordingto the previous mechanism proposed byWang et al. [2000],local WP cooling suppresses WNP convection, whichgenerates a low-level WNPSH anomaly to its west. TheWNPSH-induced easterly anomalies enhancemean trade windsand cause a reduction in WP SST through enhancedevaporative cooling and turbulent mixing. The lattermechanism of Xie et al. [2009] is caused by tropical IOwarming. This phenomenon causes a baroclinic Kelvinwave into the EP and resultant northeasterly wind anomaliesin the WP, which consequently induces the suppressedconvection and WNPSH. On the other hand, Wu et al. [2010]have demonstrated that the impacts of IO warming andWP cooling on the WNPSH have a different subseasonalcontribution during the El Niño decaying summer. Theeffect of IO warming is greater in the late summer, whileWP cooling exerts a significant impact in the early summer.[4] Consequently, both IO warming and WP cooling
influence the summertime WNPSH, and their impacts aremainly restricted to the WNPSH. However, the summermean anticyclone circulation occupies a much larger domainover the North Pacific, which is generally dominated bythe North Pacific high (NPH). The WNPSH indicates ananomalous anticyclone over the WNP region [broadly10�N–30�N, 100�E–160�E], which is caused by the westward
1Division of Earth Environmental System, Pusan National University,Busan, South Korea.
2Department of Environmental Marine Science, Hanyang University,ERICA, South Korea.
Corresponding author: K.-J. Ha, Department of Atmospheric Sciences,Pusan National University, Busan 609–735, South Korea. ([email protected])
©2013. American Geophysical Union. All Rights Reserved.2169-897X/13/10.1002/jgrd.50253
4107
JOURNAL OF GEOPHYSICAL RESEARCH: ATMOSPHERES, VOL. 118, 4107–4116, doi:10.1002/jgrd.50253, 2013

extension of the NPH [Lu, 2001]. During the boreal summer,NPH dynamics is determined by topography and monsoonalheating [Rodwell and Hoskins, 2001], local air–sea interaction[Seager et al., 2003], and near-surface thermal contrastbetween a hotter land and a cooler ocean [Miyasakaand Nakamura, 2005]. Thus, the change in NPH plays animportant role in modulating the Northern Hemisphereplanetary waves and summer monsoon systems.[5] Our primary goal is to investigate the distinct role of
IO warming and WP cooling after the El Niño winteragainst the summer WNPSH and NPH by using a modernglobal observation dataset (1979–2010). Previous studies[Ding et al., 2010; Li et al., 2010] have alluded to theinterdecadal change in the relationship between tropicalSSTs and the WNPSH and NPH after the late 1970s. Forexample, Li et al. [2010] reported a strengthened relationshipafter the late 1970s between the preceding winter ENSOand the East Asian summer monsoon, which is closelyassociated with the change in the relationship between theWNPSH and tropical SSTs. The analysis after 1979 helps toexclude the effect of interdecadal change on this relationshipafter the late 1970s. In addition, because EP warming doesnot persist into the ensuing summer, the impact of the EPSST change on the extratropical WNPSH and NPH is notyet firmly addressed. The role of EP SST change during theboreal summer will be discussed in relation to the IO–WPSST and North Pacific anticyclone circulation. For this,the responses of an atmospheric general circulation model(AGCM) to the specified IO, WP, and EP SST forcing areexamined in the extratropical North Pacific. This paper isorganized as follows. Section 2 describes the data, methods,numerical model, and experimental design. The effects oftropical IO warming, WP cooling, and EP SST change onthe summer extratropical circulation are suggested inSection 3. Section 4 examines individual and combined impactsof IO, WP, and EP SSTs by using the AGCM numericalexperiment. In the last section, we provide a discussionand conclusion of the main results.
2. Data and Model Experiment
[6] To analyze the characteristics of tropical SST andextratropical circulation, the seasonal mean fields obtained fromNational Centers for Environmental Prediction/Department ofEnergy (NCEP/DOE) reanalysis for the period 1979–2010[Kanamitsu et al., 2002] were used. The SST data wereobtained from the British Atmospheric Data Centre (BADC)Hadley Centre Sea Ice and Sea Surface Temperature data set(HadISST) [Rayner et al., 2003] for the period 1979–2010.For the detailed structure in the statistical significance, thesignificances are shown in the 90%, 95%, and 99% confidencelevels of a two-tailed Student’s t-distribution. To investigatethe individual impact of tropical SSTs on summertimeextratropical circulation, the EP, IO, and WP SSTs weredefined by the anomaly area averaged over the EP region[Niño3.4 region; 5�S–5�N, 170�W–120�W], IO region[5�S–5�N, 50�E–100�E], and the WP region [5�S–5�N,120�E–160�E], respectively. Since most tropical SSTs tendto peak in the boreal winter, the results are mainly displayedin the December–January–February (DJF) seasonal meanSST anomalies.
[7] As shown in Figure 1, the IO SST anomaly is wellcorrelated with the EP SST anomaly (r ~ 0.70) during borealwinter. A close linkage is also shown in the WP–EP SSTrelationship (r ~�0.66). However, the IO SST is notsignificantly related to the WP SST (r ~�0.18), implyingthat extreme ENSO events can induce a different responsein IO and WP SST regions. On the other hand, tropicalwinter SSTs show distinct features in long-term changes,including no trend in EP SST, an increasing trend in IOSST, and a decadal change in WP SST after the mid-1990s.A remarkable long-term change in IO and WP SSTs has beenreported in numerous previous studies [e.g., Wang andMehta,2008]. Note that most warm IO SST (i.e., W–IO) yearsbelong to the period after the mid-1990s, and all cold WPSST (i.e., C–WP) years belong to that before the mid-1990s.An investigation of the distinct impact of IO and WP SSTson the summertime subtropical high may contribute to anunderstanding of the long-term change (i.e., an increasingtrend or decadal change) in the Northern Pacific climate.[8] To diagnose the impact of extreme IO warming and
WP cooling after the El Niño winter, the W–IO years andC–WP years are categorized as follows: extreme W–IOyears are defined as years in which the DJF IO SST anomalyis greater than 1 standard deviation, whereas extreme C–WPyears are defined as those in which the DJF WP SST anomalyis less than �1 standard deviation. If both indices of IO andWP SST exceed this criterion, the year is classified into acase of the greater SST anomaly among W–IO and C–WPcases. Thus, five W–IO years are selected as 1988, 1998,2003, 2007, and 2010, and five C–WP years are 1980,1983, 1987, 1992, and 1993. The chosen extreme casesoccur during the El Niño winter and are displayed in Figure 1.[9] For the purpose of demonstrating the relative role of
different SST forcing, an AGCM experiment was performedusing the ECHAM4.6 model from the Max Planck Institutefor Meteorology in Hamburg, Germany, which was built onthe weather forecast model of the ECMWF. ECHAM4.6 is a
Figure 1. Interannual variability of normalized tropicalwintertime (DJF) SSTAs. The black bar indicates EP SST,while the red line denotes IO SST; the blue line representsWP SST. Red and blue open circles represent the selectedextreme warm IO (W–IO) and cold WP SSTs (C–WP) years,respectively.
YUN ET AL.: EFFECT OF TROPICAL SSTS ON NPH AND WNPSH
4108

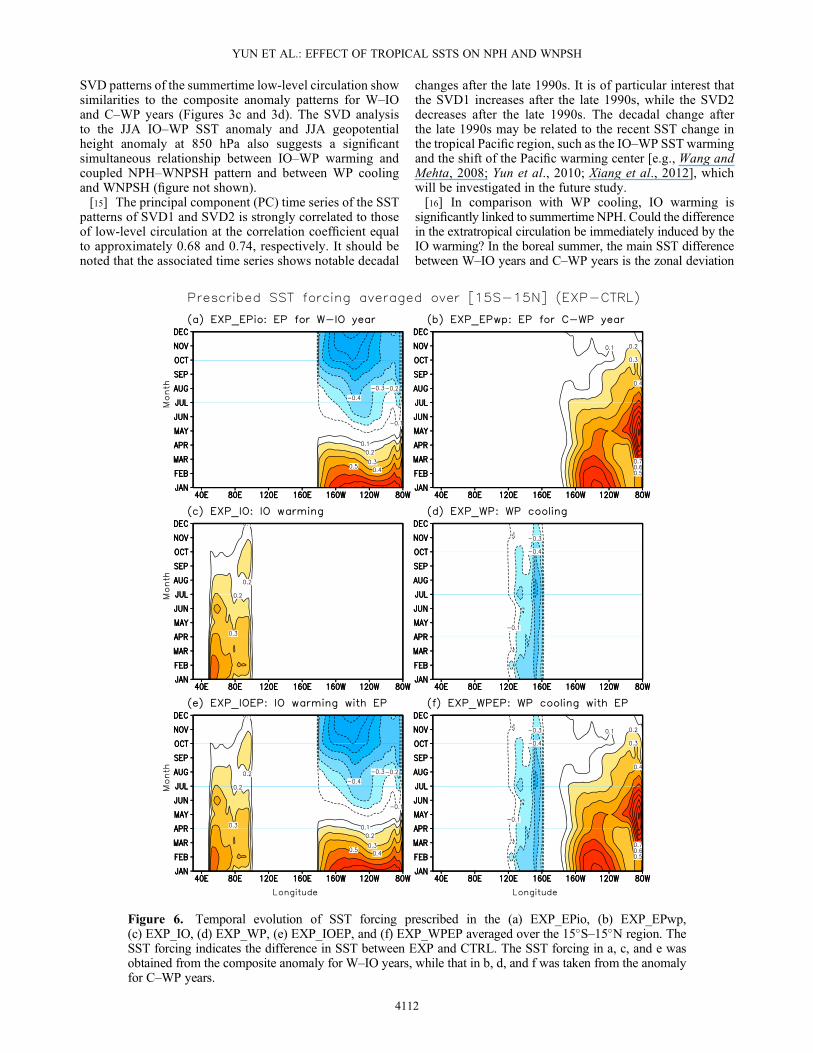
global spectral model that includes triangular truncationat wave number 42 and a 19-level hybrid sigma-pressurecoordinate system. A detailed description of this model islisted in Roeckner et al., [1996]. After 30-year integration,the results from the last 25 years of the simulation were used.The control experiment (CTRL) is simply run in the clima-tological SST, 1979 to 2010. In each experiment (e.g.,EXP_IO and EXP_WP), the EP, IO, and WP SST forcingswere specified by the composite SST anomaly to the clima-tological SST, in the domain of EP, WP, and IO along theequatorial band [15�S–15�N]. In detail, the SST forcing inEXP_IO and EXP_IOEP was obtained from the compositeanomaly for W–IO years, while that in EXP_WP andEXP_WPEP was given from the anomaly for C–WP years.The temporal evolution of prescribed SST forcing in eachexperiment is presented in Figure 6.
3. Effect of Tropical SSTs onExtratropicalCirculation
[10] To investigate the distinct peculiarity of IO warmingandWP cooling after the El Niño winter, we have shown thecomposite SST, precipitation, and low-level geopotentialheight anomaly fields for the chosen W–IO and C–WPyears, respectively (Figures 2 and 3). The tropical SSTsshow different seasonal evolutions from winter to summer
between the W–IO and C–WP years. During the winterseason, the SST composite anomaly for W–IO years presentsevident IO and EP warming, while that for C–WP yearsdisplays significantWP cooling and EPwarming (Figures 2aand 2b). The following springtime SST anomalies exhibitthe persistent IO warming and WP cooling for W–IO andC–WP years, respectively (Figures 2c and 2d). Despite theanalogous wintertime ENSO signal, a significant differencebetween W–IO and C–WP years appears in the EP SSTanomaly such that decaying EP warming for W–IO yearsand sustained EP warming for C–WP years. The distinctEP SST anomaly between IO warming and WP cooling yearsis manifested stronger in the summer season (Figures 2e and2f). For the C–WP years, the remarkable EP warming signalpersists until the following summer season. This persistentEP warming is compared with significant EP cooling for theW–IO years. In relation to the abrupt decay of EP warmingfor the W–IO years, previous studies [e.g., Kug and Kang,2006; Yoo et al., 2010] have revealed that the IO warming-induced easterly anomaly in the WP triggers the upwellingof oceanic Kelvin wave and consequently induces a rapidtermination of the El Niño event. On the other hand, forthe W–IO (C–WP) years, the IO warming (WP cooling)persists until the following summer. On the basis of thelonger period of 1950–2007, Ding and Li [2012] have also
Figure 2. Composite SST anomalies from DJF to JJA season for (left) DJF W–IO and (right) C–WPyears during 1979–2010, respectively. Shading indicates the values at the 90%, 95%, and 99% confidencelevels.
YUN ET AL.: EFFECT OF TROPICAL SSTS ON NPH AND WNPSH
4109

reported the significant ENSO-related IO warming and WPcooling. These results correspond strongly to the evolutionarychange in IO, WP, and EP SSTs displayed in Figure 2.Therefore, for the W–IO years, the IO–Pacific dipole SSTpattern of IO–WP warming and EP cooling prevails, whilethe Pacific dipole pattern of WP cooling and EP warmingappears in the C–WP years.[11] The abrupt phase change of ENSO from El Niño
winter into La Niña summer is presented in Figures 2a and2e. During the boreal summer, persistent IO warming isresponsible for the increased and decreased rainfall amountsover the IO and WP regions, respectively (Figure 3a). Thezonal dipole precipitation pattern is strongly connected withan ascent over the IO accompanied by a descent over theWP through changes in the Walker circulation [Watanabeand Jin, 2002; Yun et al., 2008]. However, the WP coolinginduces a meridional dipole pattern of precipitation(Figure 3b). The remarkable differences in rainfall over theNorth Pacific are mainly shown in the WNP [10�N–20�N,120�E–160�E], WP [5�S–5�N, 140�E–180�], and Northeastern Pacific [NEP; 2�N–12�N, 160�W–120�W] regions(denoted by red boxes in Figures 3a and 3b). These resultsimply the relative importance of the reduced WNP rainfallfor C–WP years and the weakened WP and NEP rainfallfor W–IO years. In relation to the different rainfall structurecaused by the IO warming and WP cooling, the anomalousrainfall may act as important sources in modulating thechange in extratropical circulation.[12] In the Gill-type Rossby wave response to the suppressed
convection in the WNP, a significant WNPSH is evident inthe northeast of the decreased rainfall (Figure 3c). The IOimpact on the WNPSH is explained by the IO-induced
Kelvin wave and the resultant northeasterly wind anomaliesin the WP [Xie et al., 2009]. Along the southern edge of theWNPSH, a significant easterly anomaly, which contributesto the rapid phase transition of El Niño into La Niña, ismanifested in the equatorial WP.[13] Of particular interest is the fact that the IO warming is
related to the enhancement of a broadly expanded subtropicalhigh over the North Pacific, which is often referred to as theNPH. Meanwhile, the combination of WP cooling and EPwarming is associated only with strengthened WNPSHand is more closely related to the meridional wave train patternover the WNP than the combination of IO warming and EPcooling (Figure 3d). The WNP reduced rainfall is responsiblefor the anomalous anticyclone circulation over the WNPand, in turn, the cyclonic anomaly to the north of theWNPSH,through the Rossby wave train emanating northeastwardinto the extratropical region. The prominent effect of WPcooling on the WNPSH could be explained by positivethermodynamic feedback suggested by Wang et al. [2000;2003], in which the cooling suppresses convection andlatent heating to further excite the Rossby waves from theanomalous anticyclone. This anticyclonic anomaly coolsthe ocean to its east because of enhanced evaporativecooling and turbulent mixing.[14] Consequently, the summertime extratropical circulation
for the W–IO years differs significantly from that for theC–WP years. To prove the different role of IO warmingand WP cooling after the El Niño winter on summertimecirculation, we apply a singular value decomposition(SVD) analysis to the DJF IO–WP SST anomaly over[20�S–20�N, 50�E–160�E] and the June–July–August (JJA)geopotential height anomaly at 850 hPa over [10�N–55�N,
Figure 3. Composite anomaly of (a–b) JJA precipitation and (c–d) geopotential height at 850 hPa for(a, c) DJF W–IO and (b, d) C–WP years during 1979–2010, respectively. Shading indicates the valuesat the 90%, 95%, and 99% confidence levels. The arrow in (c-d) denotes the wind anomaly at 850 hPa.
YUN ET AL.: EFFECT OF TROPICAL SSTS ON NPH AND WNPSH
4110
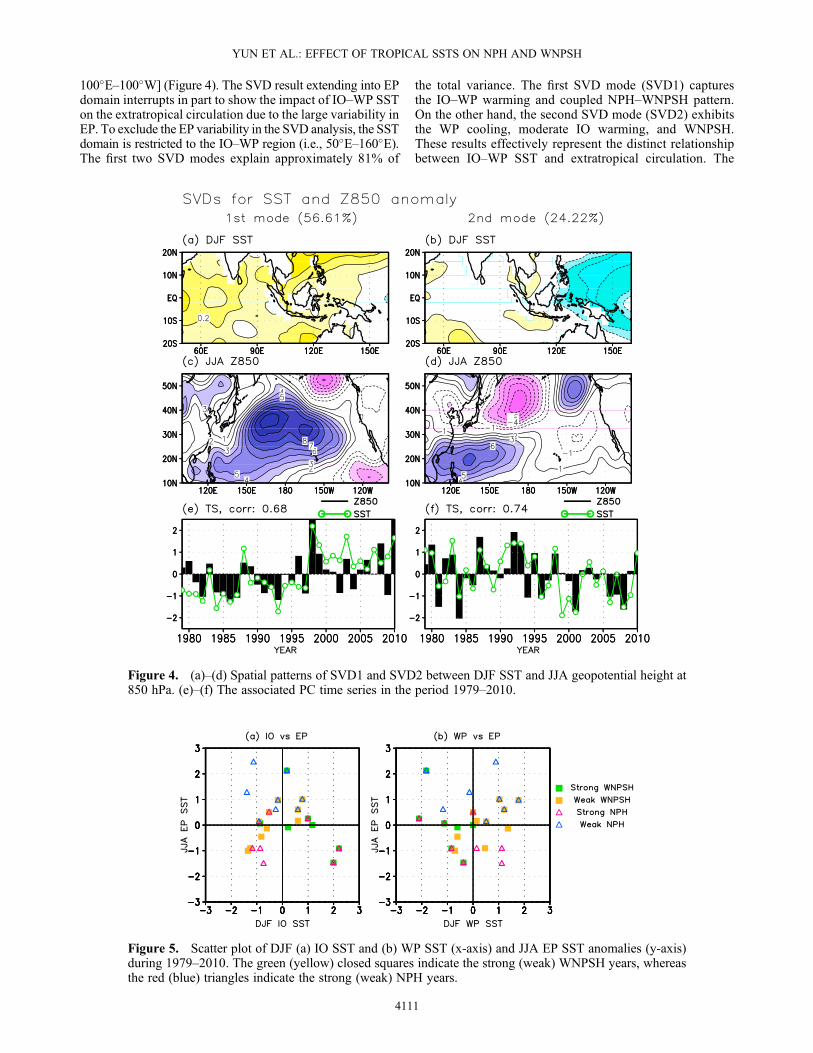
100�E–100�W] (Figure 4). The SVD result extending into EPdomain interrupts in part to show the impact of IO–WP SSTon the extratropical circulation due to the large variability inEP. To exclude the EP variability in the SVD analysis, the SSTdomain is restricted to the IO–WP region (i.e., 50�E–160�E).The first two SVD modes explain approximately 81% of
the total variance. The first SVD mode (SVD1) capturesthe IO–WP warming and coupled NPH–WNPSH pattern.On the other hand, the second SVD mode (SVD2) exhibitsthe WP cooling, moderate IO warming, and WNPSH.These results effectively represent the distinct relationshipbetween IO–WP SST and extratropical circulation. The
Figure 4. (a)–(d) Spatial patterns of SVD1 and SVD2 between DJF SST and JJA geopotential height at850 hPa. (e)–(f) The associated PC time series in the period 1979–2010.
Figure 5. Scatter plot of DJF (a) IO SST and (b) WP SST (x-axis) and JJA EP SST anomalies (y-axis)during 1979–2010. The green (yellow) closed squares indicate the strong (weak) WNPSH years, whereasthe red (blue) triangles indicate the strong (weak) NPH years.
YUN ET AL.: EFFECT OF TROPICAL SSTS ON NPH AND WNPSH
4111
SVD patterns of the summertime low-level circulation showsimilarities to the composite anomaly patterns for W–IOand C–WP years (Figures 3c and 3d). The SVD analysisto the JJA IO–WP SST anomaly and JJA geopotentialheight anomaly at 850 hPa also suggests a significantsimultaneous relationship between IO–WP warming andcoupled NPH–WNPSH pattern and between WP coolingand WNPSH (figure not shown).[15] The principal component (PC) time series of the SST
patterns of SVD1 and SVD2 is strongly correlated to thoseof low-level circulation at the correlation coefficient equalto approximately 0.68 and 0.74, respectively. It should benoted that the associated time series shows notable decadal
changes after the late 1990s. It is of particular interest thatthe SVD1 increases after the late 1990s, while the SVD2decreases after the late 1990s. The decadal change afterthe late 1990s may be related to the recent SST change inthe tropical Pacific region, such as the IO–WP SST warmingand the shift of the Pacific warming center [e.g., Wang andMehta, 2008; Yun et al., 2010; Xiang et al., 2012], whichwill be investigated in the future study.[16] In comparison with WP cooling, IO warming is
significantly linked to summertime NPH. Could the differencein the extratropical circulation be immediately induced by theIO warming? In the boreal summer, the main SST differencebetween W–IO years and C–WP years is the zonal deviation
Figure 6. Temporal evolution of SST forcing prescribed in the (a) EXP_EPio, (b) EXP_EPwp,(c) EXP_IO, (d) EXP_WP, (e) EXP_IOEP, and (f) EXP_WPEP averaged over the 15�S–15�N region. TheSST forcing indicates the difference in SST between EXP and CTRL. The SST forcing in a, c, and e wasobtained from the composite anomaly for W–IO years, while that in b, d, and f was taken from the anomalyfor C–WP years.
YUN ET AL.: EFFECT OF TROPICAL SSTS ON NPH AND WNPSH
4112

between WP and EP (i.e., WP warming and EP cooling) forW–IO years (Figure 2e). What role do these EP coolingand WP warming play in the relationship between tropicalSSTs and extratropical circulation? In fact, the NPH ismore closely correlated with the summer EP SST anomaly(r ~�0.50) than with the summer WP SST anomaly(r ~ 0.35). The summer WP warming may be a response tothe EP cooling via the atmospheric bridge. To investigatethe role of summer EP cooling on this relationship, we haveshown a scatter plot of DJF IO SST (or WP SST) and JJAEP SST in terms of the magnitude of NPH and WNPSH(Figure 5) in which the NPH and WNPSH are simplydefined as the area-averaged sea level pressure anomaliesover the region [30�N� 40�N, 170�W� 140�W] and [15�N25�N, 110�E� 150�E], respectively. Here, the strong (weak)highs indicate normalized anomaly of highs greater than 0.7(less than �0.7). The threshold of 0.7 supplies an adequatesample size for the extreme NPH and WNPSH cases; that
is, the extreme cases chosen for both strong and weak yearsare nearly half the total sample size.[17] In the scatter plot, the strong WNPSHs (denoted by
green squares) are mostly shown in winter IO warming andWP cooling, regardless of the summer EP SST anomaly. Onthe contrary, the weakWNPSHs (indicated by yellow squares)tend to occur in winter IO cooling and WP warming. Asnoted in previous studies [e.g., Wu et al., 2010; Chowdaryet al., 2010], the correlation coefficient between the summerWNPSH and winter IO SST (WP SST) is approximately0.53 (�0.52), which reflects the close relationship betweenthe winter IO warming (or WP cooling) and strongWNPSH. On the other hand, strong NPHs (shown by redtriangles) roughly occur in summer EP cooling, and theweak NPHs (displayed by blue triangles) occur in EPwarming. The winter IO and WP SST anomalies exhibitno linear relationship with the magnitude of summer NPH.As a result, the NPH is more closely associated with the
Figure 7. Difference in 850 hPa geopotential height anomaly between CTRL and EXP runs:(a) EXP_EPio, (b) EXP_EPwp, (c) EXP_IO, (d) EXP_WP, (e) EXP_IOEP, and (f) EXP_WPEP. Shadingindicates the values significant at the 90%, 95%, and 99% confidence levels.
YUN ET AL.: EFFECT OF TROPICAL SSTS ON NPH AND WNPSH
4113
summer EP SST anomaly (r ~�0.50) than the winter IOSST (r ~ 0.25) or WP SST anomaly (r ~�0.18) (Figure 5).The summer EP cooling warms the tropical WP andextratropical central North Pacific and cools the water alongthe west coast of North America through the atmosphericbridge [Alexander et al., 2002], which may be significantlylinked to the enhanced NPH.
4. Numerical Experiment on Distinct Impact ofTropical SSTs
[18] In section 3, we suggest the effects of tropical IO, WP,and EP SSTs on extratropical circulation. Both IO SST andWP SST after the El Niño winter are related to WNPSH; IOwarming-induced summer EP cooling forces NPH variability.In relation to a different seasonal evolution of SST, the winterIO warming results in EP cooling in the following summer,while the winter WP cooling accompanies moderate EPwarming in the ensuing summer. Because of the time-laggedrelationship between IO SST (or WP SST) and EP SST, it isdifficult to separate the effects of these SSTs in the composite
analysis. To examine the distinct role between IO, WP, andEP SST anomalies on extratropical circulation, we haveperformed numerical experiments with the observed SSTforcing by using ECHAM4.6 AGCM. As shown in Figure 6,the SST forcing in each experiment is prescribed by themonthly anomaly of composite SST for the W–IO and C–WPyears. As an example, EXP_IOEP has IO warming and EPcooling during the boreal summer, while EXP_WPEPexhibits the WP cooling and the EP warming.[19] Figure 7 displays the differences in low-level JJA
geopotential height anomalies between the CTRL and eachexperiment (i.e., EXP minus CTRL). As expected, both IOwarming andWP cooling induce a strongWNPSH (Figures 7cand 7d). However, IO warming is not responsible for theenhanced NPH. The EP SST anomaly for W–IO yearsinduces an enhanced summer NPH (Figure 7a). The strongNPH anomaly is compared with the cyclonic anomaly forC–WP years (Figure 7b). On the other hand, the experimentresults indicate that both IO and EP impacts (Figure 7e)generate a more strengthened NPH anomaly with theWNPSHthan that with EP impact only (Figure 7a). The coupled pattern
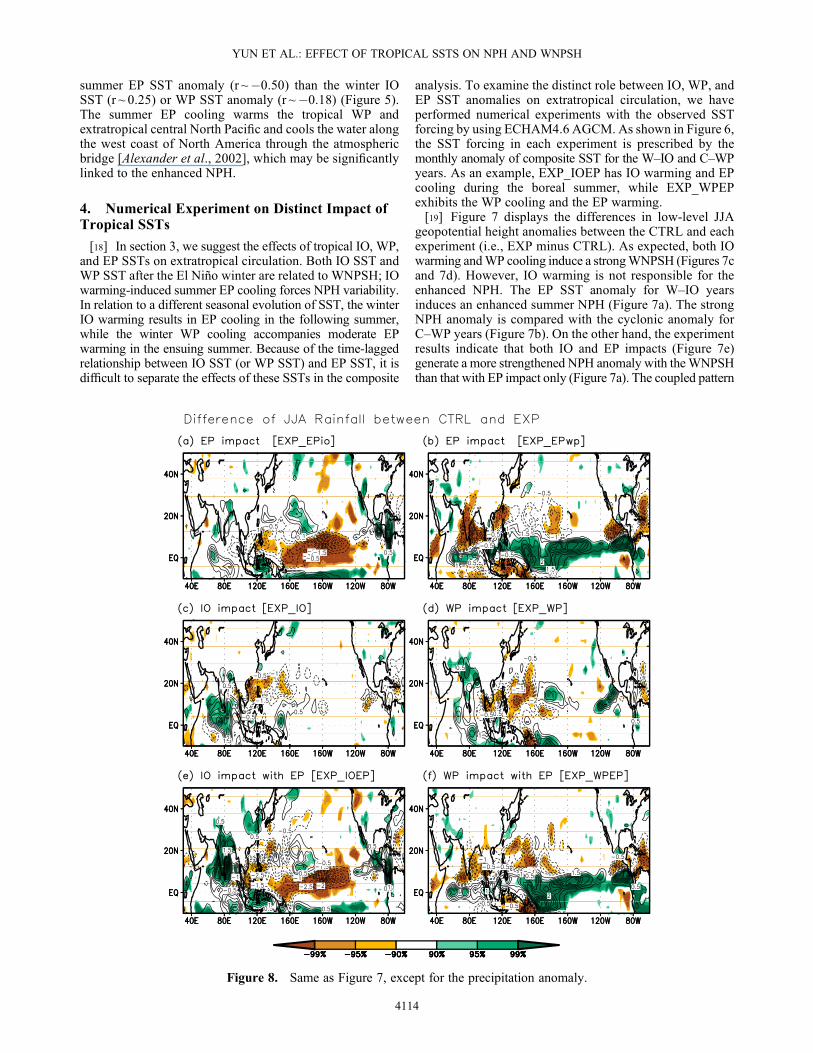
Figure 8. Same as Figure 7, except for the precipitation anomaly.
YUN ET AL.: EFFECT OF TROPICAL SSTS ON NPH AND WNPSH
4114

of NPH and WNPSH in EXP_IOEP is similar to the observedpattern for W–IO years shown in Figure 3c. Although theNPH is more strongly related to the summer EP cooling, thecombined effect (or interaction) between IO warming andEP cooling could play an important role in generating thecoupled pattern of NPH and WNPSH. The combined effectof WP cooling and EP warming (Figure 7f) also forms a morestrengthened WNPSH anomaly than that of WP coolingonly (Figure 7d) or EP warming only (Figure 7b), indicatingthe importance of the interaction between WP and EP SSTs.Considering EP SST anomaly affects the NPH variability,the combination of WP cooling and EP warming may causevariability both inWNPSH and NPH. However, the result ofnumerical experiment in Figure 7f is not well compared withthe observed low-level structure in Figure 3d, in particularfor the NPH variability (at about 40�N, 180). In detail, thecombination of WP cooling and EP warming in Figure 3dinduces North Pacific cyclonic anomaly, while the simulatedpattern in Figure 7f does not show the North Pacific cyclonicanomaly. The inconsistency between numerical experimentand observation results makes it difficult to draw a clearconclusion for the combined effect on the NPH variability,which should be investigated in future study.[20] Similar to the differences in low-level circulation, the
EP impacts in EXP_EPio and EXP_EPwp runs affectmainly the tropical Pacific (i.e., WP and NEP) rainfallanomaly which may be closely related to the change inNPH (Figures 8a and 8b). Impacts of IO SST and WP SSTlead to enhanced (reduced) rainfall over the IO (WNP) region(Figures 8c and 8d). Eventually, the experiment results of bothIO and EP impacts (Figure 8e) reveal a weakened rainfallanomaly in the WNP, WP, and NEP regions, while that inboth WP and EP impacts shows reduced WNP rainfall andenhanced WP and NEP rainfall anomalies (Figure 8f). Thedifference in precipitation strongly resembles the observedrainfall pattern in the composite analysis for the W–IO andC–WP years (Figures 3a and 3b). This resemblance suggeststhat both IO warming and EP cooling are important forthe coupled structure of NPH–WNPSH, while both WPcooling and EP warming are significantly connected withthe WNPSH. The strong connection between extratropicalpressure variability and tropical SST corresponds well tothe tropical–extratropical relationship suggested in previousstudies [e.g., Yu et al., 2010; Yu and Kim, 2011].
5. Discussion and Conclusion
[21] We investigate the distinct impact of tropical SSTs,including IO, WP, and EP SST, on the summer NPH andWNPSH. Unlike the close relationship of IO–WP SST withEP SST, the IO SST anomaly is not significantly correlatedwith the WP SST anomaly. The IO warming and WPcooling after the El Niño winter introduce different summerSST structures including IO–WP SST warming and EPcooling for W–IO years and WP cooling and EP warmingfor C–WP years. Consequently, the IO warming and WPcooling are responsible for the WNPSH variability, whereasthe summer EP cooling forces the NPH variability. TheSVD analysis supports a notable relationship between IOwarming and the coupled pattern of NPH–WNPSH, whichis strongly associated with the decadal change after the late1990s. This change may be attributed to the recent IO–WP
SST warming and the shift of Pacific warming center [Wangand Mehta, 2008; Xiang et al., 2012]. It should be noted thatthe decadal change in IO–WP SST differs from that in EPSST after the late 1990s. The change in IO–WP SST occursin the global warming mode, while that in EP SST isexceedingly modulated by interdecadal Pacific oscillation(IPO) [Dai, 2012]. The detailed dynamics should beinvestigated in a future study.[22] The IO warming causes the summer EP SST cooling
by inducing an easterly anomaly in the WP [Kug and Kang,2006], which leads to the coexistence of IO warming and EPcooling. Tropical EP coolingmay change the North Pacific SSTanomalies through the atmospheric bridge and, consequently,strengthen the extratropical NPH. The experimental resultsverify the distinct roles of EP cooling on the NPH and ofIO warming and WP cooling on the WNPSH. The coupledpattern of NPH and WNPSH is significantly related to thecombined effect of IO warming and EP cooling. In relationto the combined effect of WP cooling and EP warming,the strengthened WNPSH variability is shown. Consideringthe impact of EP SST anomaly on the NPH variability, thecombination of WP cooling and EP warming may causevariability both in WNPSH and NPH. However, there isan inconsistency between numerical experiment and obser-vation results for the NPH variability. This discrepancymight be a result of the lack of midlatitude SST variabilityin model experiments, as AGCM is forced by tropical SSTvariability. The combined effect of WP cooling and EPwarming on the NPH variability should be investigated inthe further study, using more detailed and careful numericalexperiments. TheWP SST anomaly, which shows a remarkabledecadal change in background mean state, may contributeto some extent to the relationship between tropical SSTsand extratropical circulation [Moon et al., 2012]. However,the question of the relative role of WP SST anomaly onthe extratropical circulation remains unsolved. In addition,response of midlatitude atmosphere to cool WP SST may bedifferent from that to warmWP SST. The issue on asymmetryof WP SST forcing and effect of decadal change inbackground mean state will be explored in the near future.[23] Despite the impact of tropical SSTs on the extratropics,
strengthening of the extratropical NPH can induce changesin tropical SSTs [e.g., Yu et al., 2010]. However, it isdifficult to confirm the detailed dynamical process of thetropical–extratropical relationship on the coupling processbetween EP SST and extratropical circulation over theNorth Pacific, which will be investigated in a future study,through coupled model experiment. This result provides newinsights into the impact of tropical SSTs on extratropicalsummer climate. Therefore, this finding may help us to moreeffectively predict summer climates.
[24] Acknowledgments. This work was supported by GRL grant of theNational Research Foundation (NRF) funded by the Korean Government(MEST 2011–0021927).
ReferencesAlexander, M. A., I. Blade, M. Newman, J. R. Lanzante, N.-C. Lau, andJ. D. Scott (2002), The atmospheric bridge: The influence of ENSOteleconnections on air-sea interaction over the global oceans, J. Climate,15, 2205–2231.
Chowdary, J. S., S.-P. Xie, J.-Y. Lee, Y. Kosaka, and B. Wang (2010),Predictability of summer northwest Pacific climate in 11 coupled model
YUN ET AL.: EFFECT OF TROPICAL SSTS ON NPH AND WNPSH
4115
hindcasts: Local and remote forcing, J. Geophys. Res., 115, D22121,doi:10.1029/2010JD014595.
Dai, A. (2012), The influence of the inter-decadal Pacific oscillation on USprecipitation during 1923–2010, Clim. Dyn., doi:10.1007/s00382-012-1446-5, Published online.
Ding, R., K. Ha, and J. Li (2010), Interdecadal shift in the relationshipbetween the East Asian summer monsoon and the tropical Indian Ocean,Clim. Dyn., 34, 1059–1071.
Ding, R., and J. Li (2012), Influences of ENSO teleconnection on thepersistence of sea surface temperature in the tropical Indian Ocean,J. Climate, doi:10.1175/JCLI-D-11-00739.1, in press.
Kanamitsu, M., W. Ebisuzaki, J. Woollen, S. K. Yang, J. J. Hnilo,M. Fiorino, and G. L. Potter (2002), NCEP-DOE AMIP-II reanalysis(R-2), Bull. Amer. Meteor. Soc., 83, 1631–1643.
Klein, S. A., B. J. Soden, and N.-C. Lau (1999), Remote sea surface temperaturevariations during ENSO: Evidence for a tropical atmospheric bridge,J. Climate, 12, 917–932.
Kug, J.-S., and I.-S. Kang (2006), Interactive feedback between ENSO andthe Indian Ocean, J. Climate, 19, 1784–1801, doi:10.1175/JCLI3660.1.
Li, J., Z. Wu, Z. Jiang, and J. He (2010), Can global warming strengthen theEast Asian summer monsoon?, J. Climate, 23, 6696–6705, doi:10.1175/2010JCLI3434.1.
Lu, R. (2001), Interannual variability of the summertime North Pacificsubtropical high and its relation to atmospheric convection over the warmpool, J. Meteor. Soc. Japan, 79(3), 771–783.
Miyasaka, T., and H. Nakamura (2005), Structure and formationmechanisms of the Northern Hemisphere summer subtropical highs,J. Climate, 18, 5046–5065, doi:10.1175/JCLI3599.1.
Moon, J.-Y., B. Wang, and K.-J. Ha (2011), ENSO regulation of MJOteleconnection, Clim, Dyn., 37, 1133–1149.
Moon, J.-Y., B. Wang, K.-J. Ha, and J.-Y. Lee (2012), Teleconnectionsassociated with Northern Hemisphere summer monsoon intraseasonaloscillation, Clim, Dyn., online published, DOI 10.1007/s00382-012-1394-0.
Nitta, T. (1987), Convective activities in the tropical western pacific andtheir impact on the northern hemisphere summer circulation, J. Meteor.Soc. Japan, 65, 373–390.
Rayner, N. A., D. E. Parker, E. B. Horton, C. K. Folland, L. V. Alexander,D. P. Rowell, E. C. Kent, and A. Kaplan (2003), Global analyses of seasurface temperature, sea ice, and night marine air temperature since thelate nineteenth century, J. Geophys. Res., 108(D14), 4407, doi:10.1029/2002JD002670.
Rodwell, M., and B. J. Hoskins (2001), Subtropical anticyclones andsummer monsoons, J. Climate, 14, 3192–3211.
Roeckner, E., and Coauthors (1996), The atmospheric general circulationmodel ECHAM-4: Model description and simulation of present-dayclimate, Max Planck Institute for Meteorology Rep., 218, 90 pp.
Seager, R., R. Murtugudde, N. Raik, A. Clement, N. Gordon, and J. Miller(2003), Air-sea interaction and the seasonal cycle of the subtropicalanticyclones, J. Climate, 16, 1948–1966, doi:10.1175/1520-0442(2003)016<1948:AIATSC>2.0.CO;2.
Wallace, J. M., and D. S. Gutzler (1981), Teleconnections in thegeopotential height field during the Northern Hemisphere winter, Mon.Wea. Rev., 109, 784–812.
Wang, B., R. Wu, and X. Fu (2000), Pacific-East Asia teleconnection: Howdoes ENSO affect East Asian climate?, J. Climate, 13, 1517–1536.
Wang, B., R.Wu, and T. Li (2003), Atmosphere-warm ocean interaction and itsimpact on Asian-Australian monsoon variation, J. Climate, 16, 1195–1211.
Wang, H., and V. M. Mehta (2008), Decadal variability of the Indo-Pacificwarm pool and its association with atmospheric and oceanic variability inthe NCEP-NCAR and SODA reanalyses, J. Climate, 21, 5545–5565.
Watanabe, M., and F.-F. Jin (2002), Role of Indian Ocean warming in thedevelopment of Philippine Sea anticyclone during ENSO, Geophys.Res. Lett., 29(10), doi:10.1029/2001GL014318.
Wu, B., T. Li, and T. Zhou (2010), Relative contributions of the IndianOcean and local SST anomalies to the maintenance of the western NorthPacific anomalous anticyclone during the El Niño decaying summer,J. Climate, 23, 2974–2986.
Xiang, B., B. Wang, and T. Li (2012), A new paradigm for the predominanceof standing central Pacific warming after the late 1990s, Clim. Dyn.,doi:10.1007/s00382-012-1427-8, published online.
Xie, S.-P., K. Hu, J. Hafner, H. Tokinaga, Y. Du, G. Huang, and T. Sampe(2009), Indian Ocean capacitor effect on Indo-western Pacific climateduring the summer following El Niño, J. Climate, 22, 730–747,doi:10.1175/2008JCLI2544.1.
Yoo, S.-H., J. Fasullo, S. Yang, and C.-H. Ho (2010), On the relationshipbetween Indian Ocean sea surface temperature and the transition fromEl Niño to La Niña. J. Geophys. Res., 115, D15114, doi:10.1029/2009JD012978.
Yu, J.-. Y., H.-Y. Kao, and T. Lee (2010), Subtropics-related interannualsea surface temperature variability in the equatorial central Pacific,J. Climate, 23, 2869–2884, doi:10.1175/2010JCLI3171.1.
Yu, J.-Y., and S. T. Kim (2011), Relationships between extratropical sealevel pressure variations and the central Pacific and eastern Pacific typesof ENSO, J. Climate, 24, 708–720, doi:10.1175/2010JCLI3688.1.
Yun, K.-S., K.-H. Seo, and K.-J. Ha (2008), Relationship between ENSOand northward propagating intraseasonal oscillation in the east Asiansummer monsoon system, J. Geophys. Res., 113, D14120, doi:10.1029/2008JD009901.
Yun, K.-S., K.-J. Ha, B. Wang, and R. Ding (2010), Decadal cooling in theIndian summer monsoon after 1997/1998 the El Niño and its impact onthe East Asian summer monsoon, Geophys. Res. Lett., 37, L01805,doi:10.1029/ 2009GL041539.
YUN ET AL.: EFFECT OF TROPICAL SSTS ON NPH AND WNPSH
4116
Copyright © 2022 FDOKUMEN