Distinct flavobacterial communities in contrasting water masses of the North Atlantic Ocean
16
ORIGINAL ARTICLE Distinct flavobacterial communities in contrasting water masses of the North Atlantic Ocean Paola R Go ´ mez-Pereira 1 , Bernhard M Fuchs 1 , Cecilia Alonso 2 , Matthew J Oliver 3 , Justus EE van Beusekom 4 and Rudolf Amann 1 1 Department of Molecular Ecology, Max-Planck Institute for Marine Microbiology, Bremen, Germany; 2 Departamento de Microbiologı´a, Instituto de Investigaciones Biolo ´gicas Clemente Estable, Montevideo, Uruguay; 3 College of Earth, Ocean and Environment, University of Delaware, Lewes, DE, USA and 4 Coastal Ecology Department, Alfred Wegener Institute for Polar and Marine Research, Hafenstrasse, List/Sylt, Germany Members of the class Flavobacteria in the phylum Bacteroidetes are among the most abundant picoplankton in coastal and polar oceans. Their diversity is high in marine waters. However, quantitative information about distribution patterns of flavobacterial clades is scarce. We analyzed the diversity and clade-specific abundances of individual Flavobacteria in different oceanic provinces in the North Atlantic Ocean. Samples were taken along the 301W meridian between the East Greenland current and the North Atlantic subtropical gyre. Comparative sequence analysis of 16S ribosomal RNA (rRNA) gene libraries revealed high diversity and significant spatial variability within the class Flavobacteria. Published and newly designed oligonucleotide probes were used to enumerate eleven flavobacterial clades by catalyzed reporter deposition fluorescence in situ hybridization (CARD-FISH). We found that different provinces harbor distinct flavobacterial communities. Clade DE2 accounted for a substantial fraction of total Flavobacteria only in the Polar Biome (BPLR), whereas the VISION clades VIS1 and VIS4 significantly increased in the Arctic (ARCT) province. Members of the genus Polaribacter were the most abundant clade in all the water masses analyzed, with highest absolute numbers in BPLR and ARCT. We improved the CARD-FISH protocol to quantify the rare clades VIS2, VIS3, VIS5 and VIS6, which were present in abundances below 0.5%. They all showed pronounced regional distribution patterns. Microscopic analysis proved a specific enrichment of Flavobacteria in the phycosphere of nanophytoplankton of BPLR and ARCT. Our results suggest that different marine flavobacterial clades have distinct niches and different life strategies. The ISME Journal (2010) 4, 472–487; doi:10.1038/ismej.2009.142; published online 7 January 2010 Subject Category: microbial population and community ecology Keywords: CARD-FISH; bacterioplankton; marine; probe design; rare populations; nanophytoplankton Introduction Members of the Bacteroidetes phylum, formerly also known as Cytophaga–Flavobacteria–Bacteroides cluster, constitute one of the major groups of picoplankton (Glo ¨ ckner et al., 1999; Kirchman, 2002). Bacteroidetes thrive in a variety of marine systems, including hydrothermal vents (Sievert et al., 2000; Kormas et al., 2006), coastal sediments (Llobet-Brossa et al., 1998) and waters (Eilers et al., 2001; O’Sullivan et al., 2004) and in open ocean waters (Simon et al., 1999; Abell and Bowman, 2005; Schattenhofer et al., 2009). Taxonomically, the phylum Bacteroidetes consists of the classes Bacteroidia, Flavobacteria, Sphingobacteria and Cytophagia, the latter previously included in the class Sphingobacteria (Ludwig et al., 2008). There is more and more evidence, for example, from com- parative 16S ribosomal RNA (rRNA) sequence analysis, that Flavobacteria is the dominant class of Bacteroidetes in marine picoplankton (for example, Kirchman et al., 2003; Alonso et al., 2007; Chen et al., 2008). High abundance has been linked to cold waters (Simon et al., 1999; Abell and Bowman, 2005), phytoplankton blooms (Simon et al., 1999), photic zone (Schattenhofer et al., 2009) and upwel- ling systems (Alonso-Saez et al., 2007). This dis- tribution suggests a preference for more productive conditions. However, Flavobacteria have also been detected in oligotrophic marine surface waters in significant numbers (Schattenhofer et al., 2009). Sequence-based studies have shown the domi- nance of particular flavobacterial phylotypes during algal blooms, whereas other clades of Flavobacteria Received 24 August 2009; revised 12 November 2009; accepted 22 November 2009; published online 7 January 2010 Correspondence: B Fuchs, Department of Molecular Ecology, Max-Planck Institute for Marine Microbiology, Celsiusstr 1, 28359 Bremen, Germany. E-mail: [email protected] The ISME Journal (2010) 4, 472–487 & 2010 International Society for Microbial Ecology All rights reserved 1751-7362/10 $32.00 www.nature.com/ismej
Transcript of Distinct flavobacterial communities in contrasting water masses of the North Atlantic Ocean
ORIGINAL ARTICLE
Distinct flavobacterial communities in contrastingwater masses of the North Atlantic Ocean
Paola R Gomez-Pereira1, Bernhard M Fuchs1, Cecilia Alonso2, Matthew J Oliver3,Justus EE van Beusekom4 and Rudolf Amann1
1Department of Molecular Ecology, Max-Planck Institute for Marine Microbiology, Bremen, Germany;2Departamento de Microbiologıa, Instituto de Investigaciones Biologicas Clemente Estable, Montevideo,Uruguay; 3College of Earth, Ocean and Environment, University of Delaware, Lewes, DE, USA and 4CoastalEcology Department, Alfred Wegener Institute for Polar and Marine Research, Hafenstrasse, List/Sylt,Germany
Members of the class Flavobacteria in the phylum Bacteroidetes are among the most abundantpicoplankton in coastal and polar oceans. Their diversity is high in marine waters. However,quantitative information about distribution patterns of flavobacterial clades is scarce. We analyzedthe diversity and clade-specific abundances of individual Flavobacteria in different oceanicprovinces in the North Atlantic Ocean. Samples were taken along the 301W meridian between theEast Greenland current and the North Atlantic subtropical gyre. Comparative sequence analysis of16S ribosomal RNA (rRNA) gene libraries revealed high diversity and significant spatial variabilitywithin the class Flavobacteria. Published and newly designed oligonucleotide probes were usedto enumerate eleven flavobacterial clades by catalyzed reporter deposition fluorescence in situhybridization (CARD-FISH). We found that different provinces harbor distinct flavobacterialcommunities. Clade DE2 accounted for a substantial fraction of total Flavobacteria only in thePolar Biome (BPLR), whereas the VISION clades VIS1 and VIS4 significantly increased in the Arctic(ARCT) province. Members of the genus Polaribacter were the most abundant clade in all the watermasses analyzed, with highest absolute numbers in BPLR and ARCT. We improved the CARD-FISHprotocol to quantify the rare clades VIS2, VIS3, VIS5 and VIS6, which were present in abundancesbelow 0.5%. They all showed pronounced regional distribution patterns. Microscopic analysisproved a specific enrichment of Flavobacteria in the phycosphere of nanophytoplankton of BPLRand ARCT. Our results suggest that different marine flavobacterial clades have distinct niches anddifferent life strategies.The ISME Journal (2010) 4, 472–487; doi:10.1038/ismej.2009.142; published online 7 January 2010Subject Category: microbial population and community ecologyKeywords: CARD-FISH; bacterioplankton; marine; probe design; rare populations; nanophytoplankton
Introduction
Members of the Bacteroidetes phylum, formerlyalso known as Cytophaga–Flavobacteria–Bacteroidescluster, constitute one of the major groups ofpicoplankton (Glockner et al., 1999; Kirchman,2002). Bacteroidetes thrive in a variety of marinesystems, including hydrothermal vents (Sievertet al., 2000; Kormas et al., 2006), coastal sediments(Llobet-Brossa et al., 1998) and waters (Eilers et al.,2001; O’Sullivan et al., 2004) and in open oceanwaters (Simon et al., 1999; Abell and Bowman,2005; Schattenhofer et al., 2009). Taxonomically,the phylum Bacteroidetes consists of the classes
Bacteroidia, Flavobacteria, Sphingobacteria andCytophagia, the latter previously included in theclass Sphingobacteria (Ludwig et al., 2008). There ismore and more evidence, for example, from com-parative 16S ribosomal RNA (rRNA) sequenceanalysis, that Flavobacteria is the dominant classof Bacteroidetes in marine picoplankton (for example,Kirchman et al., 2003; Alonso et al., 2007; Chenet al., 2008). High abundance has been linked tocold waters (Simon et al., 1999; Abell and Bowman,2005), phytoplankton blooms (Simon et al., 1999),photic zone (Schattenhofer et al., 2009) and upwel-ling systems (Alonso-Saez et al., 2007). This dis-tribution suggests a preference for more productiveconditions. However, Flavobacteria have also beendetected in oligotrophic marine surface waters insignificant numbers (Schattenhofer et al., 2009).
Sequence-based studies have shown the domi-nance of particular flavobacterial phylotypes duringalgal blooms, whereas other clades of Flavobacteria
Received 24 August 2009; revised 12 November 2009; accepted 22November 2009; published online 7 January 2010
Correspondence: B Fuchs, Department of Molecular Ecology,Max-Planck Institute for Marine Microbiology, Celsiusstr 1, 28359Bremen, Germany.E-mail: [email protected]
The ISME Journal (2010) 4, 472–487& 2010 International Society for Microbial Ecology All rights reserved 1751-7362/10 $32.00
www.nature.com/ismej
dominated before the blooms (Riemann et al., 2000;O’Sullivan et al., 2004; Pinhassi et al., 2004). Inaddition, Flavobacteria could be localized in thephycosphere (Rooney-Varga et al., 2005; Sapp et al.,2007), which is the space immediately surroundingan algal cell (Bell and Mitchell, 1972). Moreover,this association might depend on the compositionand dynamics of the phytoplankton and flavobacter-ial communities (Grossart et al., 2005; Rooney-Vargaet al., 2005). However, most of these studies werenot combined with a quantitative technique and,therefore, there is no information about the clade-specific population sizes.
Cell abundances and distribution patterns ofmembers of the phylum Bacteroidetes in marinepicoplankton have been obtained by fluorescencein situ hybridization (FISH) using probes CF319a(Manz et al., 1996) and CFB560 (O’Sullivan et al.,2002); the specificity of these two probes hasrecently been reviewed (Amann and Fuchs, 2008).Evidence for distribution patterns of distinct flavo-bacterial clades, however, is sparse. Examplesinclude FISH-based quantifications of the cladeCytophaga marinoflava-latercula, the unculturedcluster DE2 and the genus Polaribacter. Cytophagamarinoflava-latercula was shown to constitute up to6% of total picoplankton population during springand summer, off the island of Helgoland, in theGerman Bight of the North Sea (Eilers et al., 2001).Clade DE2, originally retrieved from the DelawareEstuary, was found to account for up to 10% ofpicoplankton population in this estuary as well as inthe Chukchi Sea, Arctic Ocean (Kirchman et al.,2003; Malmstrom et al., 2007). Members of the genusPolaribacter have been shown to form prominentfractions in polar oceans (Brinkmeyer et al., 2003;Malmstrom et al., 2007).
This study was performed in the North Atlanticbetween the East Greenland current and the NorthAtlantic subtropical gyre (NAST), an area character-ized by annual spring blooms known as one of themost conspicuous seasonal events in the worldocean (for example, Ducklow and Harris, 1993). Thespring bloom starts north of about 401N latitude andsubsequently develops northwards (Longhurst,1998). The concentration of chlorophyll a remainshigh during summer and it gradually returns towinter concentrations (Henson et al., 2006). Duringsummer, there is a shift from dominance by the420 mm chlorophyll fraction to dominance by theo20 mm chlorophyll fraction (Gifford et al., 1995). Incontrast, the NAST is an oligotrophic area with lowlevels of primary production (Longhurst, 1995).Thus, the North Atlantic Ocean is characterized bystrong gradients that could influence the distribu-tion patterns of picoplankton groups.
The objective of this study is to quantify flavo-bacterial clades that inhabit these contrasting ocea-nic provinces in the northern North Atlantic Oceanand to identify environmental factors that controltheir abundance. We analyzed samples of four
oceanic provinces as defined by Longhurst (1995),which encompassed nine significantly differentwater masses according to the classification ofOliver and Irwin (2008). We hypothesized that: (i)members of the class Flavobacteria are presentthroughout the transect, (ii) general flavobacterialabundances are higher at the more northern stationswhere temperature is low and nutrient concentra-tion high, and in the euphotic zone in whichphytoplankton abundance is high, (iii) the flavobac-terial diversity varies locally, and (iv) differentflavobacterial clades prevail in different watermasses and are correlated with distinct environ-mental parameters (for example, temperature,nutrient concentration and phytoplankton abundance).
Materials and methods
Samples were taken along a transect in the NorthAtlantic Ocean from 66139.270N; 29136.650W (station2¼S2) to 34124.870N; 28128.900W (S19) during theVISION cruise (diVersIty, Structure and functION)MSM03/01 on board the research vessel Maria S.Merian from September 21 to September 30, 2006(Figure 1a, Table 1). Along this transect, each stationwas sampled at 12 depths, from 10 m down to 250 mor 500 m. Samples were collected with a rosette of 20-lNiskin bottles mounted on a conductivity–tempera-ture–density profiler. Chlorophyll a fluorescence wasmeasured on board by a flow through fluoro-meter (microFlu-Chl, TriOS Optical Sensors GmbH,Oldenburg, Germany). Total picoplankton and nano-phytoplankton populations were enumerated afterfixation with particle-free formaldehyde solution(37% w/v, Fluka, Taufkirchen, Germany; final con-centration, 1% v/v) and staining with SYBR Green(1:10000 dilution of stock; Sigma-Aldrich, Taufkirchen,Germany) (Marie et al., 1997) using a FACScaliburflow cytometer equipped with an air-cooled laserproviding blue light at 488 nm as described pre-viously (Tarran et al., 2006). Profiles were groupedaccording to oceanic provinces defined by twoclassification systems (Longhurst, 1998; Oliver andIrwin 2008). The Longhurstian provinces used inthis study include the Boreal Polar (BPLR), theArctic (ARCT), the North Atlantic Drift (NADR) andthe North Atlantic Subtropical East (NAST)provinces. Oliver and Irwin (2008) delineatedprovinces by objectively clustering satellite ob-served thermal and optical properties. The pro-vinces defined by Oliver and Irwin (2008) werecomputed on the basis of the September 2006 meanof the Advanced Very High Resolution Radiometer(AVHRR) sea surface temperature and the Sea-viewing Wide Field-of-view Sensor (SeaWiFS) waterleaving radiance.
Nutrient analysisWater samples for nutrients analysis were filtereddirectly after sampling through 0.45-mm in-line
Flavobacteria distribution in the North Atlantic OceanPR Gomez-Pereira et al
473
The ISME Journal
filters attached to a 60-ml pre-cleaned syringe intotwo 12-ml polystyrole tubes. Samples were stored at4 1C (dissolved silicate) or �80 1C (NH4
þ , PO43�, NO3
�
and NO2�). The samples were spectrophotometri-
cally measured with a continuous-flow analyzer
using standard AA3 methods (Seal Analytical,Norderstedt, Germany) using a variant of the methodof Grasshoff et al. (1983). The s.d. values werecalculated for repeated measurements of five surfacesamples (20 m) and five deep samples (200 m), and
65°
60°
55°
50°
45°
40°
35°
30°- 45° - 40° - 35° - 30° - 25° - 20° - 15° - 10° - 5° -45° -40° -35° -30° -25° -20° -15° -10° -5°
- 45° - 40° - 35° - 30° - 25° - 20° - 15° - 10° - 5° -45° -40° -35° -30° -25° -20° -15° -10° -5°70°
65°
60°
55°
50°
45°
40°
35°
30°
70°
65°
60°
55°
50°
45°
40°
35°
30°
70°
65°
60°
55°
50°
45°
40°
35°
30°
70°
0 200 400
mk
2
3
4
5
6
7
8
9
10
11
12
13
14
15
16
17
1819
NADR
BPLR2
3
4
5
6
7
8
9
10
11
12
13
14
15
16
17
18 19
NAST
ARCT
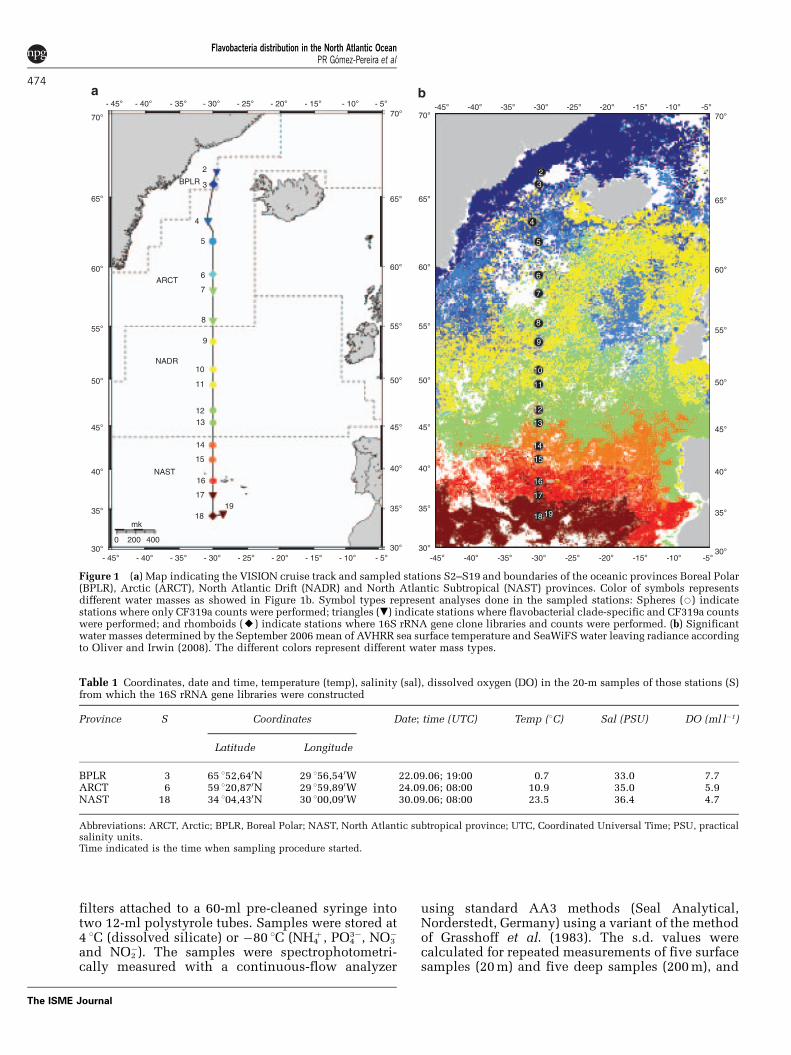
Figure 1 (a) Map indicating the VISION cruise track and sampled stations S2–S19 and boundaries of the oceanic provinces Boreal Polar(BPLR), Arctic (ARCT), North Atlantic Drift (NADR) and North Atlantic Subtropical (NAST) provinces. Color of symbols representsdifferent water masses as showed in Figure 1b. Symbol types represent analyses done in the sampled stations: Spheres (J) indicatestations where only CF319a counts were performed; triangles (.) indicate stations where flavobacterial clade-specific and CF319a countswere performed; and rhomboids (E) indicate stations where 16S rRNA gene clone libraries and counts were performed. (b) Significantwater masses determined by the September 2006 mean of AVHRR sea surface temperature and SeaWiFS water leaving radiance accordingto Oliver and Irwin (2008). The different colors represent different water mass types.
Table 1 Coordinates, date and time, temperature (temp), salinity (sal), dissolved oxygen (DO) in the 20-m samples of those stations (S)from which the 16S rRNA gene libraries were constructed
Province S Coordinates Date; time (UTC) Temp (1C) Sal (PSU) DO (ml l�1)
Latitude Longitude
BPLR 3 65 152,640N 29 156,540W 22.09.06; 19:00 0.7 33.0 7.7ARCT 6 59 120,870N 29 159,890W 24.09.06; 08:00 10.9 35.0 5.9NAST 18 34 104,430N 30 100,090W 30.09.06; 08:00 23.5 36.4 4.7
Abbreviations: ARCT, Arctic; BPLR, Boreal Polar; NAST, North Atlantic subtropical province; UTC, Coordinated Universal Time; PSU, practicalsalinity units.Time indicated is the time when sampling procedure started.
Flavobacteria distribution in the North Atlantic OceanPR Gomez-Pereira et al
474
The ISME Journal
were for PO43� and NO2
� 0.01 mM at all levels, forNO2þ3 0.03 mM at the 1mM level and 0.07 mM at the18 mM level, and for NH4
þ 0.07–0.08 mM at all levels.
DNA extraction and 16S rRNA gene librariesThe 16S rRNA gene libraries were constructed fromthe 20-m samples at S3, S6 and S18 (Figure 1).Approximately 100-l samples were pooled from fiveNiskin bottles, pre-filtered through a 10-mM steelmesh cartridge (Wolftechnik, Weil der Stadt,Germany), and microorganisms were collected oncellulose acetate filters (142 mm diameter, 0.2 mM
pore size; Sartorius, Goettingen, Germany). Filterswere stored at �80 1C. DNA was extracted from the0.2-mM filters according to procedure used by Zhouet al. (1996).
Almost complete bacterial 16S rRNA genes wereamplified from the extracted DNA using theprimer pairs GM3F, 50-AGAGTTTGATCMTGGC-30,and GM4R, 50-TACCTTGTTACGACTT-30 (Muyzeret al., 1995). The PCR was run at the followingcycling conditions: initial denaturation at 96 1C for3 min, followed by 20 cycles consisting of denatura-tion (96 1C for 1 min), annealing (48 1C for 2 min) andextension (72 1C for 3 min) and a final step at 72 1Cfor 15 min. The PCR products were purified usingthe QIAquick PCR purification kit (QIAGEN,Hilden, Germany), ligated using the TOPO TAcloning kit (Invitrogen, Karlsruhe, Germany) orpGEM-T-Easy (Promega, Mannheim, Germany) andcloned into high-efficiency competent cells ofEscherichia coli (JM109). Libraries were screenedfor Bacteroidetes containing clones by PCR with theprimer pair CF315-F, 50-ACKGGYACTGAGAYACGG-30; and CF967-R, 50-GGTAAGGTTCCTCGCGTA-30
(Chen et al., 2006). The PCR reaction and cyclingconditions were as described above but with 30cycles. Annealing temperature was 61 1C afteroptimization of the primers to avoid false positives.Plasmids of positive clones were isolated withMontage plasmid MiniPrep96 kit (Millipore,Eschborn, Germany) and 50–100 ng of templatewas used per sequencing reaction performed withABI BigDye and ABI PRISM3100 Genetic Analyser(Applied Biosystems, Darmstadt, Germany). Allsequences were checked for chimera origin usingthe online tool Bellerophon from Greengenes (Huberet al., 2004; DeSantis et al., 2006) and possiblechimera sequences were excluded from furtheranalysis. The 16S rRNA gene sequences of thisstudy were deposited in GeneBank under theaccession numbers FN433282–FN433465.
Phylogenetic reconstructionSequences were analyzed with the software packageARB (Ludwig et al., 2004) using Silva databaserelease 96, October 2008 (Pruesse et al., 2007).Phylogenetic reconstruction was done followingthe ‘standard operating procedure for phylogenetic
inference’ (Peplies et al., 2008). Operational taxo-nomic units were calculated with DOTUR (Distance-Based OTU and Richness; Schloss and Handelsman,2005) using the furthest neighbor algorithm from adistance matrix generated in ARB. From the DOTURresults, we identified all the sequences that con-tributed to each operational taxonomic unit. Thesedata were imported to EstimateS (Colwell, 2005) andsimilarity indexes calculated according to Chaoet al. (2005). Coverage index of the clone librarieswas calculated using the formula C¼ (1�n/N) *100,where N represents the number of all clonescarrying a Bacteroidetes insert and n the number ofphylotypes at 99% identity appearing only once inthe library (Good 1953; Kemp and Aller 2004).
Catalyzed reporter deposition (CARD)-FISHSamples for CARD-FISH were fixed with particle-free formaldehyde solution (37% w/v, Fluka; finalconcentration, 1% v/v) for 2 h at room temperature.Water samples were filtered with low pressure Hgonto polycarbonate filters (type GTTP; 0.2 mM poresize; 47 mm diameter; Millipore, Eschborn,Germany) in varying volumes. Typically 15–30 mlwas filtered from the surface water layer and50–150 ml from samples below 100 m depth. Inaddition, 500-ml aliquots were filtered from thesurface water layer. The filters were stored frozen at�20 1C for further analyses. The CARD-FISH proce-dure was performed according to Pernthaler et al.(2004) with modifications as published elsewhere(Schattenhofer et al., 2009). Hybridizations weredone with horseradish peroxidase-labeled oligo-nucleotides probes (Biomers, Ulm, Germany) at vary-ing formamide concentrations depending on theprobe used (Table 2). Working solutions of probesand competitors (both at 50 ng ml�1) were mixed withhybridization buffer in a 1:1:300 proportion andhybridization was carried out overnight at 46 1C. Theprobe-delivered horseradish peroxidase was de-tected with tyramides that were custom labeledwith fluorescein (Molecular Probes, Eugene, OR,USA). Subsequently, all cells were stained with4,6-diamidino-2-phenylindole (1mg ml–1). Hybridizedand 4,6-diamidino-2-phenylindole-stained cellswere quantified on an Axioplan II Imaging epifluor-escence microscope (Zeiss, Jena, Germany).
The signals in the negative control (NON338)were low, accounting for less than one cell in 10fields. Differences in clade abundance betweenprovinces were tested by t-test on log (xþ 1)transformed data. If data did not pass normalityand equal variance test, Mann–Whitney–Wilcoxontest was applied.
For the evaluation of Bacteroidetes associatedwith nanophytoplankton cells, hybridizations wereperformed on 500-ml samples from surface watersusing probes, CF319a and SAR11-441, targeting theSAR11 clade (Morris et al., 2002) at 25% formamide.Nanophytoplankton cells were identified by
Flavobacteria distribution in the North Atlantic OceanPR Gomez-Pereira et al
475
The ISME Journal
epifluorescence microscopy from their pigment fluor-escence and an approximate diameter of 5–10 mM.Pictures were taken with a black and white camera(AxioCam MRm; Carl Zeiss, Jena, Germany). Thephycosphere, which is defined as the area immedi-ately surrounding nanophytoplankton cells (Belland Mitchell, 1972), was delimited and measuredon the micrographs using the software AxioVisionRel. 4.7.2 (Carl Zeiss). More than 30 nanophyto-plankton cells were evaluated in more than 10images. The CF319a- and SAR11-positive signalswere quantified inside the phycosphere, includingthe nanophytoplankton cell, and outside of it. Ratiosof counts per area unit between inside and outsidethe phycosphere were calculated and used forstatistical analysis with the t-test.
Testing a modified counting protocol for rarepopulationsFor quantification of rare populations, we enumer-ated picoplankton populations from filters contain-ing increasing volumes of water samples. Sampleswere taken at the German North Sea island Helgo-land (54111.30N; 07154.00E) and were filtered onpolycarbonate filters (0.2 mM pore size) in increasingamounts from 10, 25, 50, 100, 250 to 400 ml intriplicates for each volume. Hybridizations wereperformed as described above using probes ROS537,for members of the Roseobacter clade (Eilers et al.,2001) at 35% formamide; NOR5-730, for members ofthe gammaproteobacterial NOR5/OM60 clade (Eilerset al., 2001) at 50% formamide and PLA46, forPlantomycetes (Neef et al., 1998) at 30%. The
NON338 probe was used as negative control at35% formamide. Only the probe-conferred fluores-cence was counted in 20 microscopic fields for eachvolume replicate and the absolute abundance ofthe clade was determined after subtraction of thenegative control. To test whether significant differ-ences exit among the different volumes, one-wayanalysis of variance was applied. When normality orequal variance test were not passed, analysis ofvariance on ranks was used.
Probe designOligonucleotide probes targeting the 16S rRNA offlavobacterial clades were designed with the probedesign tool in ARB, as well as unlabeled competitoroligonucleotides (Manz et al., 1992; Table 2;Supplementary Table 1). For optimization of strin-gency conditions, a series of hybridizations atincreasing formamide concentrations (10–50%)were evaluated. The optimal formamide concentra-tion was the highest concentration before signalintensity decreased (Supplementary Table 2).Unlabeled competitor oligonucleotides, whichallow a single mismatch discrimination by blockingnon-target probe-binding sites (Manz et al., 1992),were used at all times to assure specificity (Supple-mentary Table 1).
Probe POL740 (Malmstrom et al., 2007) wasre-evaluated on the strain Polaribacter filamentus(DSMZ13964, German Collection of Microorganismsand Cell Cultures, Braunschweig, Germany).The LEE82 and DOK827 probes were tested onLeeuwenhoekiella sp. and Dokdonia sp. strains,
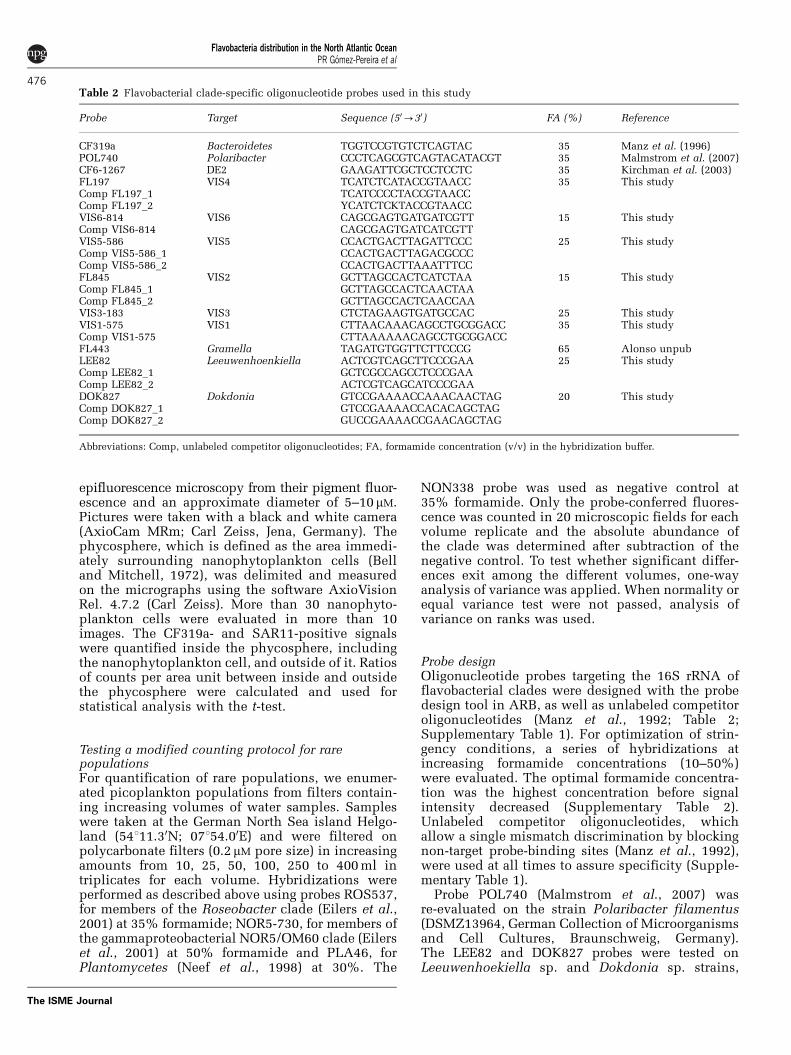
Table 2 Flavobacterial clade-specific oligonucleotide probes used in this study
Probe Target Sequence (50-30) FA (%) Reference
CF319a Bacteroidetes TGGTCCGTGTCTCAGTAC 35 Manz et al. (1996)POL740 Polaribacter CCCTCAGCGTCAGTACATACGT 35 Malmstrom et al. (2007)CF6-1267 DE2 GAAGATTCGCTCCTCCTC 35 Kirchman et al. (2003)FL197 VIS4 TCATCTCATACCGTAACC 35 This studyComp FL197_1 TCATCCCCTACCGTAACCComp FL197_2 YCATCTCKTACCGTAACCVIS6-814 VIS6 CAGCGAGTGATGATCGTT 15 This studyComp VIS6-814 CAGCGAGTGATCATCGTTVIS5-586 VIS5 CCACTGACTTAGATTCCC 25 This studyComp VIS5-586_1 CCACTGACTTAGACGCCCComp VIS5-586_2 CCACTGACTTAAATTTCCFL845 VIS2 GCTTAGCCACTCATCTAA 15 This studyComp FL845_1 GCTTAGCCACTCAACTAAComp FL845_2 GCTTAGCCACTCAACCAAVIS3-183 VIS3 CTCTAGAAGTGATGCCAC 25 This studyVIS1-575 VIS1 CTTAACAAACAGCCTGCGGACC 35 This studyComp VIS1-575 CTTAAAAAACAGCCTGCGGACCFL443 Gramella TAGATGTGGTTCTTCCCG 65 Alonso unpubLEE82 Leeuwenhoenkiella ACTCGTCAGCTTCCCGAA 25 This studyComp LEE82_1 GCTCGCCAGCCTCCCGAAComp LEE82_2 ACTCGTCAGCATCCCGAADOK827 Dokdonia GTCCGAAAACCAAACAACTAG 20 This studyComp DOK827_1 GTCCGAAAACCACACAGCTAGComp DOK827_2 GUCCGAAAACCGAACAGCTAG
Abbreviations: Comp, unlabeled competitor oligonucleotides; FA, formamide concentration (v/v) in the hybridization buffer.
Flavobacteria distribution in the North Atlantic OceanPR Gomez-Pereira et al
476
The ISME Journal
respectively. The strains were isolated duringthe cruise and kindly provided by J Harder(unpublished data).
Multi- and univariated statistics on FlavobacteriaabundancesMultivariate statistical analyses were applied to testthe differences in the flavobacterial communityamong the different water masses. A similaritymatrix was calculated with Bray–Curtis coefficienton square root-transformed abundance data. TheBray–Curtis matrix was represented by hierarchicalagglomerative cluster analysis using groupaverage as the linkage algorithm. Significance ofthe grouping in the cluster analysis was tested usingsimilarity profile permutation test at 99% signifi-cance level. The similarity profile permutation testsfor statistically significant evidence of genuineclusters in an a priori unstructured set of samples(Clarke et al., 2008). Multivariate statistics wereperformed with software Primer v6 (Version 6.1.5,Primer-E, Plymouth, UK; Clarke and Gorley, 2006).
Correlations between environmental variablesand flavobacterial abundances were analyzed withSpearman rank correlation test. The test wasperformed with physicochemical parameters(temperature, salinity, dissolved silicate, NH4
þ andPO4
3�, which is correlated with NO3� and NO2
�),chlorophyll a fluorescence and abundance of nano-phytoplankton and of different microphytoplanktonclasses (dinoflagellates, diatoms and coccolitho-phores). Microphytoplankton data were kindlyprovided by J Ufkes and V Smetacek (personalcommunication). Correlations with counts obtainedwith probe CF319a were performed with data fromsurface to 50 m of all stations. The significance levelof the correlations was adjusted by the Bonferronicorrection for multiple comparisons, according towhich the P-value is divided by the total number ofsimultaneous independent comparisons (Legendreand Legendre, 1998). All univariated statisticalanalyses were performed using the software Sigma-Stat 3.5 (SYSTAT, Santa Clara, CA, USA).
Results
Characterization of study areaBoundaries of the oceanic provinces as defined bythe Longhurstian classification were in good agree-ment with delimitations according to Oliver andIrwin (2008), based on the satellite-observed thermaland optical properties of the study area duringSeptember 2006 (Figure 1b). However, the fourLonghurstian provinces could be further separatedby the latter approach into nine distinct watermasses (Figure 1). The northernmost stations (S2and S3) were located at the boundary of BPLR andARCT provinces and satellite-derived water massesconfirmed that they represented a separate area.These stations had an average chlorophyll a con-
centration of 0.7 mg l�1, surface water temperaturebelow 3 1C and low salinity (o33 PSU, practicalsalinity units) (Supplementary Figures 1, 2a and b).Within ARCT province, four water masses (stationsS4, S5, S6, S7þS8) were differentiated withchlorophyll a concentrations ranging between 0.3and 1 mg l�1, and temperature between 10 and 12 1C.Along the NADR province (S9–S13), the tempera-ture gradually increased up to 20 1C. In thesouthernmost water body (S17–S19) of the NASTprovince (S14–S19), the temperature reached 24 1C,and chlorophyll a had the lowest value ofo0.1 mg l�1. The concentrations of phosphate(PO4
3�), nitrate (NO3�), nitrite (NO2
�) and dissolvedsilicate (Si) in the upper 50 m were higher in theBPLR and ARCT provinces, ranging between 0.2 and0.6 mM, 2.0 and 6.5 mM, 0.1 and 0.2 mM, and 0.6 and3.2 mM, respectively. The concentrations decreasedalong the NADR province to very low concentrationsin the NAST with PO4
3�, NO3�, NO2
�o0.06 mM, and Sio0.3 mM. The NH4
þ concentrations ranged between0.2 and 0.6 mM in surface layers and decreased belowdetection limit in deeper waters.
The abundance of picoplankton in the surfacemixed layer was higher in the BPLR, ARCT andNADR provinces (0.4–1.1� 106 cells per ml) than inthe NAST province (0.2–0.6� 106 cells per ml;Supplementary Figure 2c). The abundance ofnanophytoplankton was also higher in the uppermix layer of the BPLR, ARCT and NADR provinces(4.9–36� 103 cells per ml) than in the NASTprovince (2.7–8.2� 103 cells per ml; SupplementaryFigure 2d).
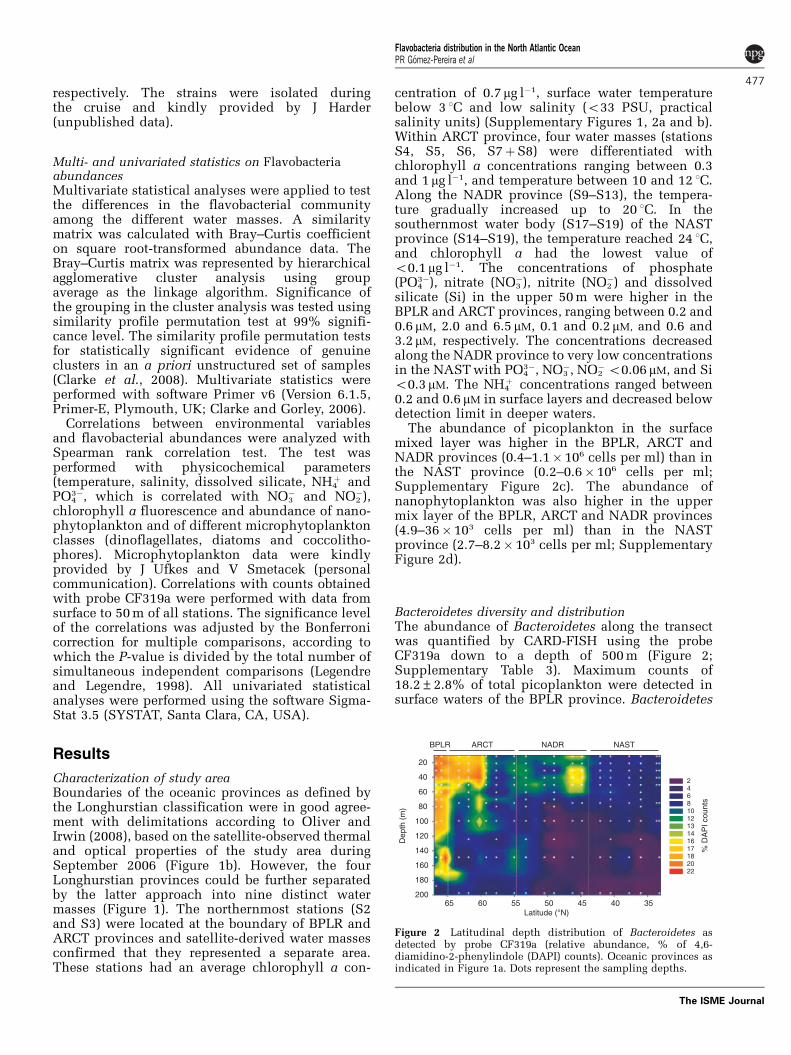
Bacteroidetes diversity and distributionThe abundance of Bacteroidetes along the transectwas quantified by CARD-FISH using the probeCF319a down to a depth of 500 m (Figure 2;Supplementary Table 3). Maximum counts of18.2±2.8% of total picoplankton were detected insurface waters of the BPLR province. Bacteroidetes
% D
AP
I cou
nts
Latitude (°N)35404550556065
Dep
th (
m)
20
40
60
80
100
120
140
160
180
200
2468101213141617182022
BPLR ARCT NADR NAST
Figure 2 Latitudinal depth distribution of Bacteroidetes asdetected by probe CF319a (relative abundance, % of 4,6-diamidino-2-phenylindole (DAPI) counts). Oceanic provinces asindicated in Figure 1a. Dots represent the sampling depths.
Flavobacteria distribution in the North Atlantic OceanPR Gomez-Pereira et al
477
The ISME Journal
abundance decreased along ARCT and NADR pro-vinces to a minimum of 7.0±1.1% in the NASTprovince. Abundances decreased with depth andwere between 0.9 and 8% at 200 m. As theabundance of Bacteroidetes was highest inthe upper 50 m, we focused further analysis on themixed surface water layer.
As a basis for the subsequent quantification offlavobaterial clades, three 16S rRNA gene libraries wereconstructed with general bacterial primers from surfacewater samples of S3 (BPLR), S6 (ARCT) and S18 (NAST)in which Bacteroidetes represented 19, 17 and 7% ofpicoplankton population, respectively. We screened atotal of 1632 clones of which 190 carried a Bacteroidetesinsert. After removal of six putative chimeric sequences,we further analyzed 71 clones from S3 (6141400nt, 58unique), 55 from S6 (5241400nt, 43 unique), and 58from S18 (5541400nt, 54 unique). We opted for almostfull-length 16S rRNA sequences to facilitate subsequentprobe design.
The coverage of the Bacteroidetes diversity at 99%sequence identity level was high at S3 and S6 with79 and 92%, respectively. It was lower at S18 (63%).Moreover, the three libraries had little overlap intheir diversity (Supplementary Table 4). The simi-larity between S3 and S6 was low with indicesranging between 0.1–0.3 and no operational taxo-nomic units were shared between S3/S6 and S18.Similarity indices at 97% identity confirmed that S3and S6 were more similar to each other (0.2–0.4)than both were to S18 (0.02–0.05).
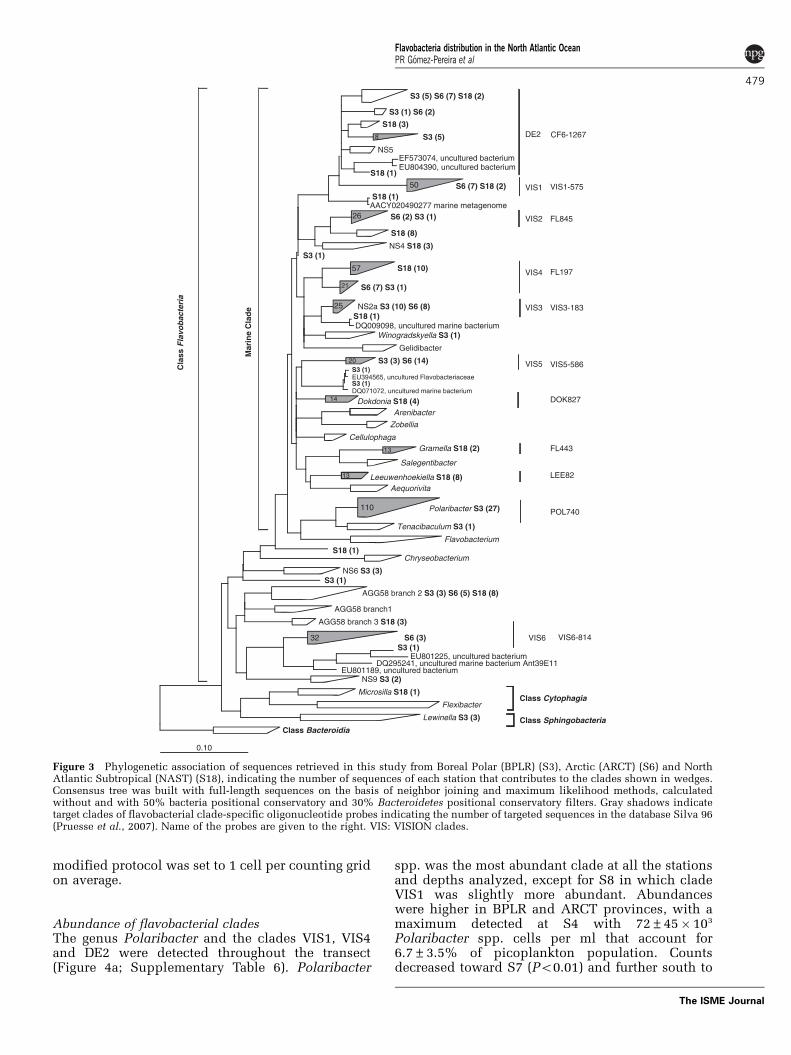
Comparative sequence analysis showed thatsequences affiliated with the class Flavobacteriadominated all three libraries (Figure 3) despite thefact that the primer pair used for screening had asimilar coverage of the two classes Flavobacteriaand Sphingobacteria (Chen et al., 2006), includingthe new class Cytophagia. A total of 180 sequencesbelonged to the class Flavobacteria, only three to theclass Sphingobacteria, one to the class Cytophagiaand none to the class Bacteroidia.
A detailed phylogenetic analysis placed 83% ofthe flavobacterial sequences (151/180) within the‘marine clade’ that comprises genera that have beenexclusively isolated from marine habitats (Bowman,2006). A total of 43 sequences within the marineclade grouped closely with those of cultured genera.For example, S3 contained 27 sequences affiliatedwith the genus Polaribacter. They all had the targetsite of probe POL740 (Malmstrom et al., 2007). FromS18, we obtained eight sequences of Leeuwenhoe-kiella spp. and four of Dokdonia spp. For these twogenera, probes were designed in this study (LEE82,DOK827; Supplementary Table 5). Another 107sequences clustered with yet uncultured cladesmostly retrieved from various marine pelagic envi-ronments, both coastal and open ocean, as well astemperate and polar sites. Sequences related toclade DE2, originally described by sequences re-trieved from the Delaware Estuary (Kirchman et al.,2003), were present in S3 (11), S6 (9) and S18 (6).
The DE2 clade was subsequently quantified usingthe probe CF6-1267 (Kirchman et al., 2003).
We also defined new clades on the basis ofsequences from the VISION cruise. Clade VIS1contained 9 and clade VIS4 contained 18 sequencesthat originated mainly from S6 and S18. The probesVIS1-575 and FL197 were designed to quantify VIS1and VIS4, respectively. The VIS2 clade includessequences from both coastal and open ocean environ-ments; this clade was quantified by probe FL845.Clade VIS5, targeted by VIS5-586, contained se-quences from S3 and S6, and also sequences fromother diverse marine habitats. The VIS3 clade, targetedby VIS3-183, contained 10 sequences from S3 and 8from S6 that were most closely related to sequencespreviously retrieved from the North Sea (Alonso et al.,2007). A total of 19 sequences were related to theuncultured lineage ‘AGG58’ (DeLong et al., 1993;O’Sullivan et al., 2004). Moreover, three sequencesfrom S6 clustered tightly with those of a natural ironfertilization event (West et al., 2008). We named thisclade VIS6 and targeted it with probe VIS6-814.
Quantifying rare flavobacterial cladesFirst FISH analyses using probes for the clades VIS2,VIS3, VIS5 and VIS6 resulted in counts of less than 1cell per microscopic field, corresponding to relativeabundances of 0.5% and lower. Similarly, in the moresouthern stations, the otherwise abundant cladesVIS1, VIS4 and DE2 dropped below 0.5% of totalbacteria in abundance. Such infrequent events werebelow the threshold for confident quantification byFISH. We therefore tested whether this limitationcould be overcome by filtering larger volumes result-ing in a higher cell density. Probe-specific countsproportionally increased with increasing amounts offiltered sample (r2¼ 0.9; Supplementary Figures 3a, cand e). Signals in controls for unspecific staining byCARD-FISH stayed low, accounting for only 1–2signals in 10 microscopic fields, in both the filtersthrough which high and low volumes of seawaterwere filtered (from here on named high- and low-volume filters). Although calculated clade abun-dances were not significantly different, the s.e. valueswere markedly lower for the high-volume filters(Supplementary Figures 3d and f). Moreover, whencells of clade DE2, detected by probe CF6-1267, werecounted on low- and high-volume filters from S3, nostatistical difference was detected in the counts(P40.05). On the basis of these results, except forPolaribacter spp. all flavobacterial clades werequantified on 500-ml filters.
On these filters, the average numbers of probe-positive cells per counting grid for the abundantclades were in the range of 20–226 for probe VIS1-575; 5–200 for probe FL197; and 1–78 for probeCF6-1267 along the transect. For the low-abundanceclades, the numbers ranged from 1–55 for VIS3-183;1–38 for VIS6-586; 5–10 for FL845; and 1–9 for VIS5-586. The lower limit for quantification with the
Flavobacteria distribution in the North Atlantic OceanPR Gomez-Pereira et al
478
The ISME Journal
modified protocol was set to 1 cell per counting gridon average.
Abundance of flavobacterial cladesThe genus Polaribacter and the clades VIS1, VIS4and DE2 were detected throughout the transect(Figure 4a; Supplementary Table 6). Polaribacter
spp. was the most abundant clade at all the stationsand depths analyzed, except for S8 in which cladeVIS1 was slightly more abundant. Abundanceswere higher in BPLR and ARCT provinces, with amaximum detected at S4 with 72±45� 103
Polaribacter spp. cells per ml that account for6.7±3.5% of picoplankton population. Countsdecreased toward S7 (Po0.01) and further south to
S3 (5) S6 (7) S18 (2)
S3 (1) S6 (2)
S18 (3)
S3 (5)8
NS5EF573074, uncultured bacteriumEU804390, uncultured bacterium
S18 (1)
S6 (7) S18 (2)50
S18 (1)AACY020490277 marine metagenome
S6 (2) S3 (1)26
S18 (8)
NS4 S18 (3)S3 (1)
S18 (10)57
S6 (7) S3 (1)21
NS2a S3 (10) S6 (8)25S18 (1)DQ009098, uncultured marine bacterium
Winogradskyella S3 (1)
Gelidibacter
S3 (3) S6 (14)20S3 (1)EU394565, uncultured FlavobacteriaceaeS3 (1)DQ071072, uncultured marine bacterium
Dokdonia S18 (4) 14
Arenibacter
Zobellia
CellulophagaGramella S18 (2) 13
Salegentibacter
Leeuwenhoekiella S18 (8)13
Aequorivita
Polaribacter S3 (27)110
Tenacibaculum S3 (1)
FlavobacteriumS18 (1)
Chryseobacterium
NS6 S3 (3)S3 (1)
AGG58 branch 2 S3 (3) S6 (5) S18 (8)
AGG58 branch1
AGG58 branch 3 S18 (3)
S6 (3)32S3 (1)
EU801225, uncultured bacteriumDQ295241, uncultured marine bacterium Ant39E11
EU801189, uncultured bacteriumNS9 S3 (2)
Microsilla S18 (1)
Flexibacter
Lewinella S3 (3)
Class Bacteroidia
0.10
DE2
VIS1
VIS2
VIS3
VIS4
VIS6
VIS5Cla
ss Flavo
bac
teria
Mar
ine
Cla
de
Class Sphingobacteria
VIS6-814
POL740
LEE82
FL443
DOK827
VIS5-586
VIS3-183
FL197
FL845
VIS1-575
CF6-1267
Class Cytophagia
Figure 3 Phylogenetic association of sequences retrieved in this study from Boreal Polar (BPLR) (S3), Arctic (ARCT) (S6) and NorthAtlantic Subtropical (NAST) (S18), indicating the number of sequences of each station that contributes to the clades shown in wedges.Consensus tree was built with full-length sequences on the basis of neighbor joining and maximum likelihood methods, calculatedwithout and with 50% bacteria positional conservatory and 30% Bacteroidetes positional conservatory filters. Gray shadows indicatetarget clades of flavobacterial clade-specific oligonucleotide probes indicating the number of targeted sequences in the database Silva 96(Pruesse et al., 2007). Name of the probes are given to the right. VIS: VISION clades.
Flavobacteria distribution in the North Atlantic OceanPR Gomez-Pereira et al
479
The ISME Journal
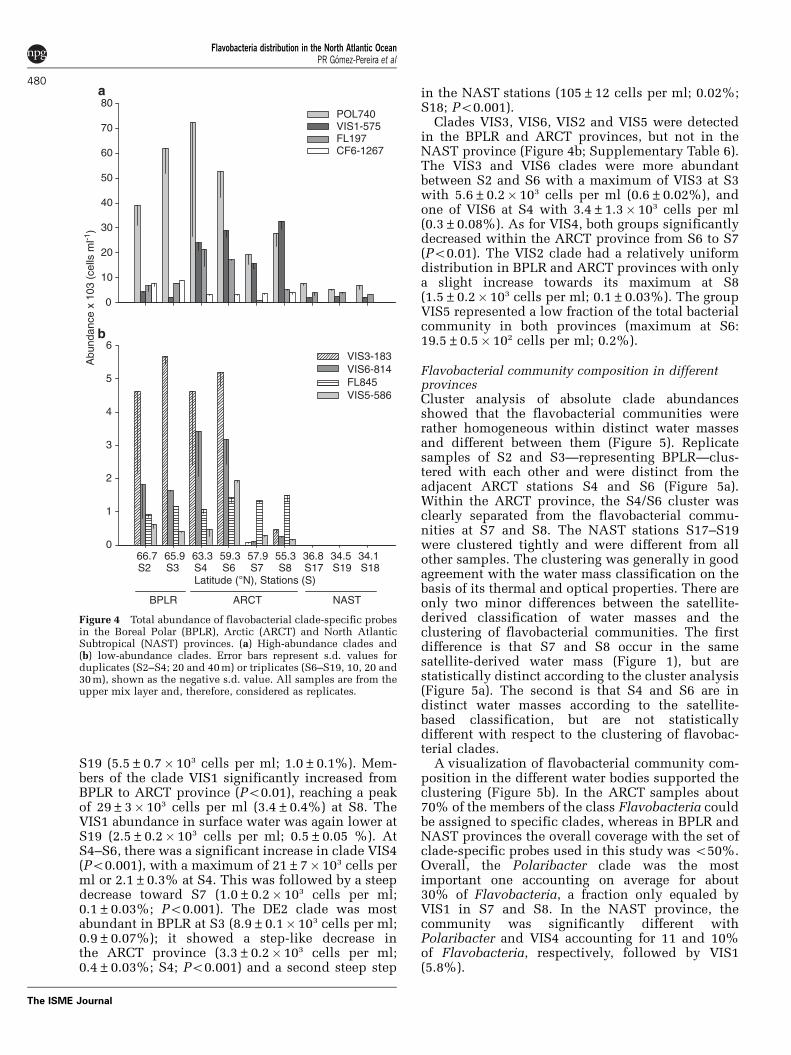
S19 (5.5±0.7� 103 cells per ml; 1.0±0.1%). Mem-bers of the clade VIS1 significantly increased fromBPLR to ARCT province (Po0.01), reaching a peakof 29±3� 103 cells per ml (3.4±0.4%) at S8. TheVIS1 abundance in surface water was again lower atS19 (2.5±0.2� 103 cells per ml; 0.5±0.05 %). AtS4–S6, there was a significant increase in clade VIS4(Po0.001), with a maximum of 21±7� 103 cells perml or 2.1±0.3% at S4. This was followed by a steepdecrease toward S7 (1.0±0.2� 103 cells per ml;0.1±0.03%; Po0.001). The DE2 clade was mostabundant in BPLR at S3 (8.9±0.1� 103 cells per ml;0.9±0.07%); it showed a step-like decrease inthe ARCT province (3.3±0.2� 103 cells per ml;0.4±0.03%; S4; Po0.001) and a second steep step
in the NAST stations (105±12 cells per ml; 0.02%;S18; Po0.001).
Clades VIS3, VIS6, VIS2 and VIS5 were detectedin the BPLR and ARCT provinces, but not in theNAST province (Figure 4b; Supplementary Table 6).The VIS3 and VIS6 clades were more abundantbetween S2 and S6 with a maximum of VIS3 at S3with 5.6±0.2� 103 cells per ml (0.6±0.02%), andone of VIS6 at S4 with 3.4±1.3� 103 cells per ml(0.3±0.08%). As for VIS4, both groups significantlydecreased within the ARCT province from S6 to S7(Po0.01). The VIS2 clade had a relatively uniformdistribution in BPLR and ARCT provinces with onlya slight increase towards its maximum at S8(1.5±0.2� 103 cells per ml; 0.1±0.03%). The groupVIS5 represented a low fraction of the total bacterialcommunity in both provinces (maximum at S6:19.5±0.5� 102 cells per ml; 0.2%).
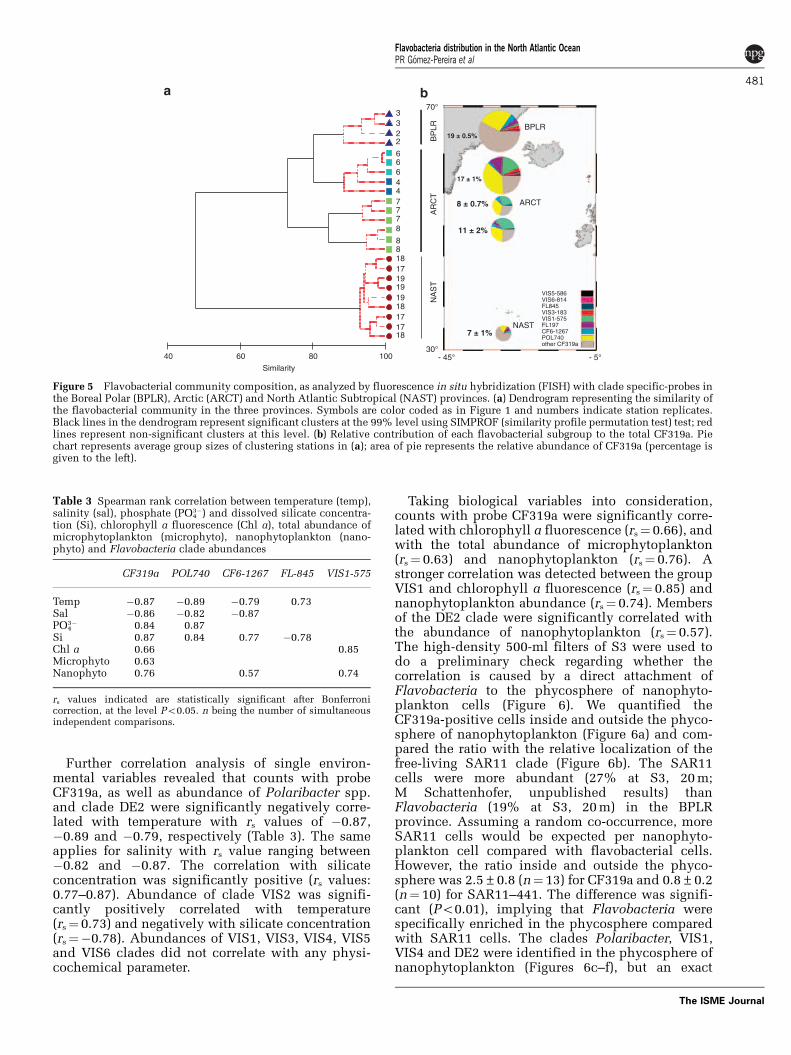
Flavobacterial community composition in differentprovincesCluster analysis of absolute clade abundancesshowed that the flavobacterial communities wererather homogeneous within distinct water massesand different between them (Figure 5). Replicatesamples of S2 and S3—representing BPLR—clus-tered with each other and were distinct from theadjacent ARCT stations S4 and S6 (Figure 5a).Within the ARCT province, the S4/S6 cluster wasclearly separated from the flavobacterial commu-nities at S7 and S8. The NAST stations S17–S19were clustered tightly and were different from allother samples. The clustering was generally in goodagreement with the water mass classification on thebasis of its thermal and optical properties. There areonly two minor differences between the satellite-derived classification of water masses and theclustering of flavobacterial communities. The firstdifference is that S7 and S8 occur in the samesatellite-derived water mass (Figure 1), but arestatistically distinct according to the cluster analysis(Figure 5a). The second is that S4 and S6 are indistinct water masses according to the satellite-based classification, but are not statisticallydifferent with respect to the clustering of flavobac-terial clades.
A visualization of flavobacterial community com-position in the different water bodies supported theclustering (Figure 5b). In the ARCT samples about70% of the members of the class Flavobacteria couldbe assigned to specific clades, whereas in BPLR andNAST provinces the overall coverage with the set ofclade-specific probes used in this study was o50%.Overall, the Polaribacter clade was the mostimportant one accounting on average for about30% of Flavobacteria, a fraction only equaled byVIS1 in S7 and S8. In the NAST province, thecommunity was significantly different withPolaribacter and VIS4 accounting for 11 and 10%of Flavobacteria, respectively, followed by VIS1(5.8%).
Latitude (°N), Stations (S)
66.7 65.9 63.3 59.3 57.9 55.3 36.8 34.5 34.10
1
2
3
4
5
6VIS3-183VIS6-814 FL845VIS5-586
Abu
ndan
ce x
103
(ce
lls m
l-1)
0
10
20
30
40
50
60
70
80POL740VIS1-575FL197CF6-1267
S2 S3 S4 S6 S7 S8 S17 S19 S18
BPLR ARCT NAST
Figure 4 Total abundance of flavobacterial clade-specific probesin the Boreal Polar (BPLR), Arctic (ARCT) and North AtlanticSubtropical (NAST) provinces. (a) High-abundance clades and(b) low-abundance clades. Error bars represent s.d. values forduplicates (S2–S4; 20 and 40 m) or triplicates (S6–S19, 10, 20 and30 m), shown as the negative s.d. value. All samples are from theupper mix layer and, therefore, considered as replicates.
Flavobacteria distribution in the North Atlantic OceanPR Gomez-Pereira et al
480
The ISME Journal
Further correlation analysis of single environ-mental variables revealed that counts with probeCF319a, as well as abundance of Polaribacter spp.and clade DE2 were significantly negatively corre-lated with temperature with rs values of �0.87,�0.89 and �0.79, respectively (Table 3). The sameapplies for salinity with rs value ranging between�0.82 and �0.87. The correlation with silicateconcentration was significantly positive (rs values:0.77–0.87). Abundance of clade VIS2 was signifi-cantly positively correlated with temperature(rs¼ 0.73) and negatively with silicate concentration(rs¼�0.78). Abundances of VIS1, VIS3, VIS4, VIS5and VIS6 clades did not correlate with any physi-cochemical parameter.
Taking biological variables into consideration,counts with probe CF319a were significantly corre-lated with chlorophyll a fluorescence (rs¼ 0.66), andwith the total abundance of microphytoplankton(rs¼ 0.63) and nanophytoplankton (rs¼ 0.76). Astronger correlation was detected between the groupVIS1 and chlorophyll a fluorescence (rs¼ 0.85) andnanophytoplankton abundance (rs¼ 0.74). Membersof the DE2 clade were significantly correlated withthe abundance of nanophytoplankton (rs¼ 0.57).The high-density 500-ml filters of S3 were used todo a preliminary check regarding whether thecorrelation is caused by a direct attachment ofFlavobacteria to the phycosphere of nanophyto-plankton cells (Figure 6). We quantified theCF319a-positive cells inside and outside the phyco-sphere of nanophytoplankton (Figure 6a) and com-pared the ratio with the relative localization of thefree-living SAR11 clade (Figure 6b). The SAR11cells were more abundant (27% at S3, 20 m;M Schattenhofer, unpublished results) thanFlavobacteria (19% at S3, 20 m) in the BPLRprovince. Assuming a random co-occurrence, moreSAR11 cells would be expected per nanophyto-plankton cell compared with flavobacterial cells.However, the ratio inside and outside the phyco-sphere was 2.5±0.8 (n¼ 13) for CF319a and 0.8±0.2(n¼ 10) for SAR11–441. The difference was signifi-cant (Po0.01), implying that Flavobacteria werespecifically enriched in the phycosphere comparedwith SAR11 cells. The clades Polaribacter, VIS1,VIS4 and DE2 were identified in the phycosphere ofnanophytoplankton (Figures 6c–f), but an exact
other CF319a
VIS5-586VIS6-814FL845VIS3-183VIS1-575FL197CF6-1267POL740
NAST
70°
30°- 45° - 5°
19 ± 0.5%
7 ± 1%
11 ± 2%
ARCT
BPLR
17 ± 1%
8 ± 0.7%
1817171819
1919
171888
877744666
2233
100806040
Similarity
BP
LRA
RC
TN
AS
T
Figure 5 Flavobacterial community composition, as analyzed by fluorescence in situ hybridization (FISH) with clade specific-probes inthe Boreal Polar (BPLR), Arctic (ARCT) and North Atlantic Subtropical (NAST) provinces. (a) Dendrogram representing the similarity ofthe flavobacterial community in the three provinces. Symbols are color coded as in Figure 1 and numbers indicate station replicates.Black lines in the dendrogram represent significant clusters at the 99% level using SIMPROF (similarity profile permutation test) test; redlines represent non-significant clusters at this level. (b) Relative contribution of each flavobacterial subgroup to the total CF319a. Piechart represents average group sizes of clustering stations in (a); area of pie represents the relative abundance of CF319a (percentage isgiven to the left).
Table 3 Spearman rank correlation between temperature (temp),salinity (sal), phosphate (PO4
3�) and dissolved silicate concentra-tion (Si), chlorophyll a fluorescence (Chl a), total abundance ofmicrophytoplankton (microphyto), nanophytoplankton (nano-phyto) and Flavobacteria clade abundances
CF319a POL740 CF6-1267 FL-845 VIS1-575
Temp �0.87 �0.89 �0.79 0.73Sal �0.86 �0.82 �0.87PO4
3� 0.84 0.87Si 0.87 0.84 0.77 �0.78Chl a 0.66 0.85Microphyto 0.63Nanophyto 0.76 0.57 0.74
rs values indicated are statistically significant after Bonferronicorrection, at the level Po0.05. n being the number of simultaneousindependent comparisons.
Flavobacteria distribution in the North Atlantic OceanPR Gomez-Pereira et al
481
The ISME Journal
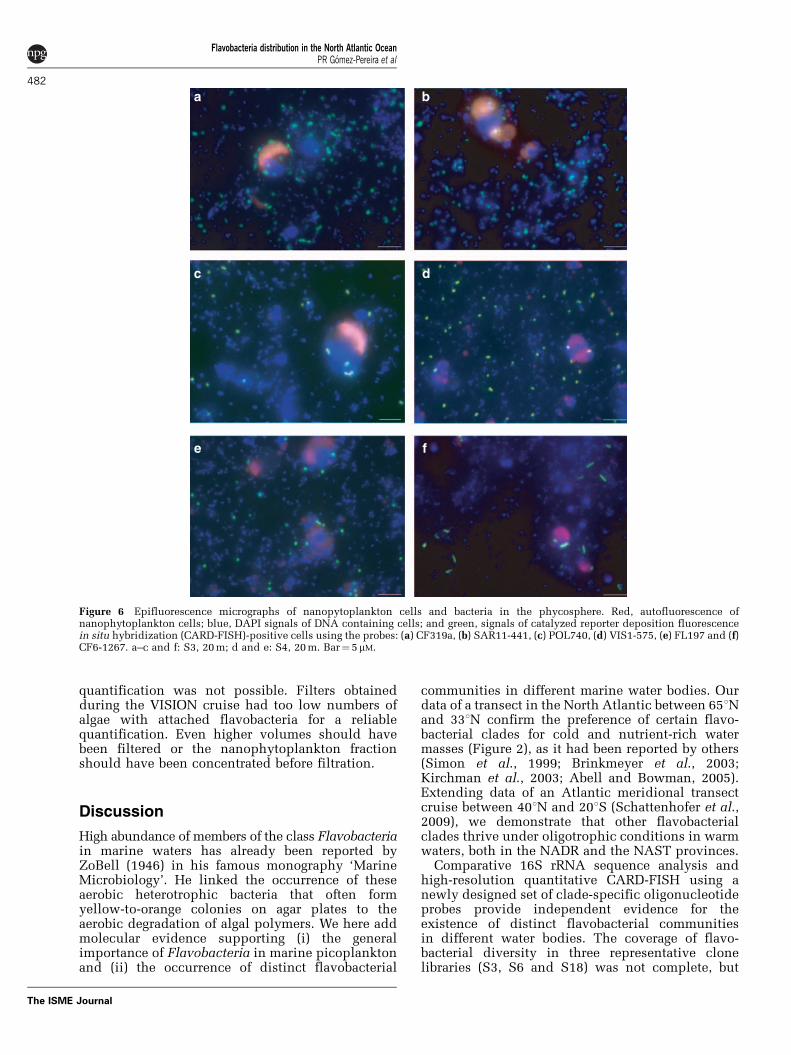
quantification was not possible. Filters obtainedduring the VISION cruise had too low numbers ofalgae with attached flavobacteria for a reliablequantification. Even higher volumes should havebeen filtered or the nanophytoplankton fractionshould have been concentrated before filtration.
Discussion
High abundance of members of the class Flavobacteriain marine waters has already been reported byZoBell (1946) in his famous monography ‘MarineMicrobiology’. He linked the occurrence of theseaerobic heterotrophic bacteria that often formyellow-to-orange colonies on agar plates to theaerobic degradation of algal polymers. We here addmolecular evidence supporting (i) the generalimportance of Flavobacteria in marine picoplanktonand (ii) the occurrence of distinct flavobacterial
communities in different marine water bodies. Ourdata of a transect in the North Atlantic between 651Nand 331N confirm the preference of certain flavo-bacterial clades for cold and nutrient-rich watermasses (Figure 2), as it had been reported by others(Simon et al., 1999; Brinkmeyer et al., 2003;Kirchman et al., 2003; Abell and Bowman, 2005).Extending data of an Atlantic meridional transectcruise between 401N and 201S (Schattenhofer et al.,2009), we demonstrate that other flavobacterialclades thrive under oligotrophic conditions in warmwaters, both in the NADR and the NAST provinces.
Comparative 16S rRNA sequence analysis andhigh-resolution quantitative CARD-FISH using anewly designed set of clade-specific oligonucleotideprobes provide independent evidence for theexistence of distinct flavobacterial communitiesin different water bodies. The coverage of flavo-bacterial diversity in three representative clonelibraries (S3, S6 and S18) was not complete, but
Figure 6 Epifluorescence micrographs of nanopytoplankton cells and bacteria in the phycosphere. Red, autofluorescence ofnanophytoplankton cells; blue, DAPI signals of DNA containing cells; and green, signals of catalyzed reporter deposition fluorescencein situ hybridization (CARD-FISH)-positive cells using the probes: (a) CF319a, (b) SAR11-441, (c) POL740, (d) VIS1-575, (e) FL197 and (f)CF6-1267. a–c and f: S3, 20 m; d and e: S4, 20 m. Bar¼ 5 mM.
Flavobacteria distribution in the North Atlantic OceanPR Gomez-Pereira et al
482
The ISME Journal
with values between 63% (NAST) and 92% (ARCT)was sufficient to clearly prove that there was onlylittle overlap between the different water bodies. S3and S18 shared only 2–5% of its phylotypes(Supplementary Table 4), whereas S3 and S6, whichwere more similar in terms of environmentalcharacteristics, shared 25–40% of flavobacterialphylotypes.
The CARD-FISH quantification added numbers insupport of distinct flavobacterial populations alongthe transect (Figures 4 and 5). These shifts coincidedwith transitions from one water mass to another(Figure 5a). Within the ARCT province, for example,a sharp decrease in chlorophyll a fluorescence wasevident from S6 to S7, which was mirrored byan abrupt reduction of VIS3, VIS4 and VIS6populations as well as of total Flavobacteria(Figures 1,2 and 4).
Overall, we identified marked distributionpatterns of flavobacterial clades in contrasting waterbodies of the North Atlantic Ocean. Our results arein line with the increasing body of evidencethat distinct picoplankton populations show pro-nounced seasonal (Fuhrman et al., 2006), latitudinal(Fuhrman et al., 2008) and depth (DeLong et al.,2006) distribution patterns in marine systems. Forexample, SAR11 abundances follow distinct annualdistribution patterns in the euphotic and uppermesopelagic zones of the Sargasso Sea (Carlsonet al., 2009). Different high light- and low light-adapted ecotypes of Prochlorococcus show markeddepth distributions in the subtropical and tropicalAtlantic Ocean (Johnson et al., 2006). Similarly,characteristic latitudinal distribution patterns ofSynechococcus clades have been identified, withparticular clades dominating temperate mesotrophicwaters (Zwirglmaier et al., 2007).
Distinct distribution patterns of abundantflavobacterial cladesThe CARD-FISH analysis proved that members ofthe genus Polaribacter were present throughout thetransect, although related sequences were onlyretrieved from BPLR province. The absolute num-bers in the surface waters were consistently highand ranged between 7� 104 (S4) and 5� 103 (S19)cells per ml. The abundance was negatively corre-lated with temperature indicating a preference forcolder water masses of less than 10 1C, which iswithin the optimal growth temperature of severalcultured strains (Gosink et al., 1998). Our datafurther support the importance of Polaribacter spp.in polar environments (Bano and Hollibaugh, 2002;Brinkmeyer et al., 2003). Yet, although abundancesof Polaribacter spp. decreased more than one orderof magnitude in NAST province, in which thetemperature was more than 20 1C, they were stillthe largest of the flavobacterial clades in these bluewaters. This could be the result of a more cosmopo-litan distribution of a single Polaribacter lineage.
Alternatively, this could reflect a lack of discrimina-tion, by probe POL740, of several mutually exclu-sive species in different water bodies. Recently,P. dokdonensis has been described to have a growthoptimum of 25–28 1C (Yoon et al., 2006). P. dokdo-nensis MED152 can grow in nutrient-poor environ-ments and use proteorhodopsin for generatingenergy from light (Gonzalez et al., 2008). Consideringthe high abundance of Polaribacter spp. and itssignificant intra-genus diversity both in its physio-logy and in 16S rRNA similarity, for example,P. dokdonensis shares only 96.2–96.8% with theother Polaribacter spp. type strains (Yoon et al.,2006), we recommend that future studies shouldattempt to subdivide this important genus. Wehypothesize that this will reveal uncoupled popula-tion dynamics of warm- and cold-water phylotypeswith different life styles.
In contrast to Polaribacter spp., clades VIS1 andVIS4—both encompassing mostly 16S rRNA genesequences from temperate and subtropical openocean sites—had more narrow population maxima.The VIS1 clade was above 1� 104 cells per mlthroughout ARCT province only, a density reachedby VIS4 at S4 and S6, but not at S7 and S8. CladeDE2 was again different, with a maximum slightlybelow 1� 104 cells per ml in BPLR. The DE2 cladecomprises sequences that have mostly been re-trieved from coastal systems, such as the DelawareEstuary (Kirchman et al., 2003), the North Sea(Eilers et al., 2001, Alonso et al., 2007) and thecoast of Plymouth (O’Sullivan et al., 2004). Theabundance of DE2 in our open ocean samples wassignificantly lower than the 10% previouslyreported, for example, for the Delaware Estuary(Kirchman et al., 2003). On our transect, the BPLRstations might have been the ones with the mostsignificant coastal influence.
Toward a reliable quantification of rare flavobacterialpopulationsA major output of this study was a protocol for theidentification and quantification of rare clades(Figure 4b). The VIS2, VIS3, VIS5 and VIS6 cladesconsistently formed groups of o0.5% relativeabundance. In this study, we could quantify thesepopulations down to absolute numbers of only 102
cells per ml, which was equivalent to detecting onetarget cell in 104 non-target cells. Interestingly, ofthe rare clades only the abundance of VIS2 wasexplained by an environmental variable. It waspositively correlated with temperature (rs¼ 0.73).This group consists of sequences retrieved fromcoastal environments and open ocean, but nonefrom polar origin pointing at a preference for warmerwaters.
As mentioned above, the rare clades, VIS3 andVIS6, significantly decreased from S6 to S7(Figure 4b; Supplementary Table 6), mirroring achange in the optical properties of the water masses
Flavobacteria distribution in the North Atlantic OceanPR Gomez-Pereira et al
483
The ISME Journal
(Figure1b and Figure 5a). Clade VIS6 comprises alsophylotypes previously retrieved during a phyto-plankton bloom in naturally iron-fertilized waters(West et al., 2008); West et al. (2008) had reported adominance of these phylotypes during the bloom.In this study, we could not detect a correlationbetween abundance of VIS6 and micro- or nanophyto-plankton abundance or chlorophyll a fluorescence.
Except for Polaribacter spp. readily culturableflavobacteria were rarely detected. Members ofthe genus Gramella could not be detected in any ofthe samples, whereas those of genera Dokdonia andLeeuwenhoekiella were only observed in samplesfrom the NAST province. Their abundance was toolow to be quantified, but their conspicuously largemorphology allowed for a confident identification inall three last stations (S17–S19). Genome analysis ofDokdonia spp. MED134 revealed that this straincontains a gene for proteorhodopsin and its growthis enhanced when exposed to light under low orintermediate labile organic matter concentrations(Gomez-Consarnau et al., 2007), which could pointto an adaptation of this group to oligotrophicenvironments.
In summary, the rare flavobacterial clades alsoshowed differential distribution patterns. Theseclades, except for one case, did not correlate withother biological or environmental variables. WithCARD-FISH of high volume filters, quantitativestudies on ‘the rare biosphere’ (Sogin et al., 2006)are now within reach. Moreover, rare clades can beresponsible for most of the uptake of key nutrients(Musat et al., 2008) and can carry out fundamentalecosystem processes (Kuypers et al., 2005). Addi-tional studies are now required to find out whetherthe rare flavobacterial clades are always present inlow numbers, or if they bloom under particularconditions. Their exact ecosystem functions are yetto be elucidated.
Phytoplankton association of flavobacterial cladesLinks between members of the class Flavobacteriaand phytoplankton have been frequently reported(Simon et al., 1999; O’Sullivan et al., 2004; Pinhassiet al., 2004; Grossart et al., 2005; Sapp et al., 2007).Phytoplankton cells release polymers, mainly poly-saccharides, to the phycosphere during all thephases of their growth (Myklestad, 1995). Therefore,the association of Flavobacteria with algae has beenrelated to their potential ability to degrade mole-cules released by phytoplankton (Kirchman, 2002).During phytoplankton blooms certain flavobacterialclades develop short-term maxima, whereas othersdominate before the blooms (Riemann et al., 2000;Pinhassi et al., 2004; West et al., 2008). Flavobacteriallineages might respond differentially to phyto-plankton as a consequence of a physiological abilityto take up different compounds released by algalcells. For example, the use of complex macromole-cules varies among cultured genera of the class
Flavobacteria (Bernardet and Nakagawa, 2006).Furthermore, genomic data point to a specializationof distinct flavobacterial clades for degradation ofpolysaccharides and proteins (Bauer et al., 2006;Woyke et al., 2009).
In our study, we detected a significantly positivecorrelation between total Flavobacteria, as quanti-fied by probe CF319a, and nanophytoplankton, aswell as for the clades VIS1 and DE2 with nanophy-toplankton (Table 3). Microscopy demonstrated thatcells of four flavobacterial clades: VIS1, DE2, VIS4and Polaribacter, did indeed reside in the phyco-sphere of nanophytoplankton cells (Figures 6c–f).As this observation could be a consequence ofrandom agglomeration of cells during filtration, wecompared the localization of CF319a-positive cellswith the localization of the abundant alphaproteo-bacterial SAR11 clade. Our results clearly indicate apreference of Flavobacteria for attachment to nano-phytoplankton at S3 in comparison with a typicalfree-living bacterium like SAR11 (Giovannoni et al.,1990; Rappe et al., 2002). Follow-up studies shouldsimultaneously identify nanophytoplankton speciesand flavobacterial clades to investigate the presenceof distinct and predictable species-specific interac-tions. We are confident that the combination ofgenomic data on metabolic potential, substrateincubation experiments and information on in situco-localization will soon yield detailed insight inhow exactly this group of ‘old’ marine bacteria isinteracting with phytoplankton.
Acknowledgements
We thank the Captain, Officers and Crew of the FS Maria SMerian (cruise MSM03/01) for their help during thecruise. We also thank Mrs M Schattenhofer for her helpduring sampling. We acknowledge the help of J Harder,J Ufkes and V Smetacek for providing unpublished data.We thank G Gerdts for advices on statistical analysis.Satellite analysis was funded by NASA Research Oppor-tunities in Space and Earth Science, Terrestrial Ecologyand Biodiversity Program NNH05ZDA001N. This studywas funded by the Max Planck Society.
References
Abell GCJ, Bowman JP. (2005). Ecological and biogeo-graphic relationships of class Flavobacteria in theSouthern Ocean. FEMS Microbiol Ecol 51: 265–277.
Alonso C, Warnecke F, Amann R, Pernthaler J. (2007).High local and global diversity of Flavobacteria inmarine plankton. Environ Microbiol 9: 1253–1266.
Alonso-Saez L, Aristegui J, Pinhassi J, Gomez-ConsarnauL, Gonzalez JM, Vaque D et al. (2007). Bacterialassemblage structure and carbon metabolism along aproductivity gradient in the NE Atlantic Ocean. AquatMicrob Ecol 46: 43–53.
Flavobacteria distribution in the North Atlantic OceanPR Gomez-Pereira et al
484
The ISME Journal
Amann R, Fuchs BM. (2008). Single-cell identification inmicrobial communities by improved fluorescencein situ hybridization techniques. Nat Rev Microbiol6: 339–348.
Bano N, Hollibaugh JT. (2002). Phylogenetic compositionof bacterioplankton assemblages from the ArcticOcean. Appl Environ Microb 68: 505–518.
Bauer M, Kube M, Teeling H, Richter M, Lombardot T,Allers E et al. (2006). Whole genome analysis of themarine Bacteroidetes ‘Gramella forsetii’ reveals adap-tations to degradation of polymeric organic matter.Environ Microbiol 8: 2201–2213.
Bell W, Mitchell R. (1972). Chemotactic and growthtesponses of marine bacteria to algal extracellularproducts. Biol Bull 143: 265.
Bernardet JF, Nakagawa Y. (2006). Introduction to theFamily Flavobacteriacea. In: Dworkin M, Falkow S,Rosenberg E, Schleifer KH, Stackebrandt E (eds).The Porkaryotes, 3rd edn. Springer-Verlag: New York.pp 550–580.
Bowman JP. (2006). The marine clade of the familyFlavobacteriaceae: the genera Aequorivita, Arenibac-ter, Cellulophaga, Croceibacter, Formosa, Gelidibacter,Gillisia, Maribacter, Mesonia, Muricauda, Polaribac-ter, Psychroexus, Psychroserpens, Robiginitalea, Sale-gentibacter, Tenacibaculum, Ulvibacter, Vitellibacterand Zobellia. In: Dworkin M, Falkow S, Rosenberg E,Schleifer KH, Stackebrandt E (eds). The Prokaryotes,3rd edn. Springer-Verlag: New York. pp 677–694.
Brinkmeyer R, Knittel K, Jurgens J, Weyland H, Amann R,Helmke E. (2003). Diversity and structure of bacterialcommunities in arctic versus antarctic pack ice. ApplEnviron Microb 69: 6610–6619.
Carlson CA, Morris R, Parsons R, Treusch AH, GiovannoniSJ, Vergin K. (2009). Seasonal dynamics of SAR11populations in the euphotic and mesopelagic zones ofthe northwestern Sargasso Sea. ISME J 3: 283–295.
Chao A, Chazdon RL, Colwell RK, Shen TJ. (2005). A newstatistical approach for assessing similarity of speciescomposition with incidence and abundance data. EcolLett 8: 148–159.
Chen XH, Zeng Y, Jiao N. (2008). Characterization ofCytophaga–Flavobacteria community structure in theBering Sea by cluster-specific 16S rRNA gene ampli-fication analysis. J Microbiol Biotechnol 18: 194–198.
Chen XH, Zeng YH, Jiao NZ. (2006). Development andevaluation of specific 16S rDNA primers for marineCytophaga–Flavobacteria cluster. Mol Ecol Notes 6:1278–1281.
Clarke KR, Gorley RN. (2006). PRIMER v6: User manual/tutorial. PRIMER-E: Plymouth, UK.
Clarke KR, Somerfield PJ, Gorley RN. (2008). Testing ofnull hypotheses in exploratory community analyses:similarity profiles and biota-environment linkage.J Exp Mar Biol Ecol 366: 56–69.
Colwell RK. (2005). EstimateS: Statistical estimation ofspecies richness and shared species from samples.Version 7.5.User’s Guide and application publishedat:http://purl.oclc.org/estimates.
DeLong EF, Franks DG, Alldredge AL. (1993). Phyloge-netic diversity of aggregate-attached vs free-livingmarine bacterial assemblages. Limnol Oceanogr 38:924–934.
DeLong EF, Preston CM, Mincer T, Rich V, Hallam SJ,Frigaard NU et al. (2006). Community genomicsamong stratified microbial assemblages in the ocean’sinterior. Science 311: 496–503.
DeSantis TZ, Hugenholtz P, Larsen N, Rojas M, Brodie EL,Keller K et al. (2006). Greengenes, a chimera-checked16S rRNA gene database and workbench compatiblewith ARB. Appl Environ Microb 72: 5069–5072.
Ducklow HW, Harris RP. (1993). Introduction to the JGOFSnorth Atlantic bloom experiment. Deep-Sea Res Pt Ii40: 1–8.
Eilers H, Pernthaler J, Peplies J, Glockner FO, Gerdts G,Amann R. (2001). Isolation of novel pelagic bacteriafrom the German bight and their seasonal contribu-tions to surface picoplankton. Appl Environ Microbiol67: 5134–5142.
Fuhrman JA, Hewson I, Schwalbach MS, Steele JA, BrownMV, Naeem S. (2006). Annually reoccurring bacterialcommunities are predictable from ocean conditions.Proc Natl Acad Sci USA 103: 13104–13109.
Fuhrman JA, Steele JA, Hewson I, Schwalbach MS, BrownMV, Green JL et al. (2008). A latitudinal diversitygradient in planktonic marine bacteria. Proc Natl AcadSci USA 105: 7774–7778.
Gifford DJ, Fessenden LM, Garrahan PR, Martin E. (1995).Grazing by microzooplankton and mesozooplanktonin the high-latitude North Atlantic Ocean springversus summer dynamics. J Geophys Res-Oceans100: 6665–6675.
Giovannoni SJ, Britschgi TB, Moyer CL, Field KG. (1990).Genetic diversity in Sargasso Sea bacterioplankton.Nature 345: 60–63.
Glockner FO, Fuchs BM, Amann R. (1999). Bacterioplank-ton compositions of lakes and oceans: a first compari-son based on fluorescence in situ hybridization. ApplEnviron Microbiol 65: 3721–3726.
Gomez-Consarnau L, Gonzalez JM, Coll-Llado M, GourdonP, Pascher T, Neutze R et al. (2007). Light stimulatesgrowth of proteorhodopsin-containing marine Flavo-bacteria. Nature 445: 210–213.
Gonzalez JM, Fernandez-Gomez B, Fernandez-Guerra A,Gomez-Consarnau L, Sanchez O, Coll-Llado M et al.(2008). Genome analysis of the proteorhodopsin-containing marine bacterium Polaribacter spMED152 (Flavobacteria). Proc Natl Acad Sci USA105: 8724–8729.
Good IJ. (1953). The population frequencies of species andthe estimation of population parameters. Biometrika40: 237–264.
Gosink JJ, Woese CR, Staley JT. (1998). Polaribacter gen.nov., with three new species, P. irgensii sp. nov.,P. franzmannii sp. nov., and P. filamentus sp. nov., gasvacuolate polar marine bacteria of the Cytophaga–Flavobacterium–Bacteroides group and reclassifica-tion of ‘Flectobacillus glomeratus’ as Polaribacterglomeratus comb. nov. Int J Syst Bacteriol 48: 223–235.
Grasshoff K, Kremling K, Ehrhardt M. (1983). Methods ofSeawater Analysis. Wiley-VHC: Berlin, Germany,p 419.
Grossart HP, Levold F, Allgaier M, Simon M, Brinkhoff T.(2005). Marine diatom species harbour distinct bacter-ial communities. Environ Microbiol 7: 860–873.
Henson SA, Robinson I, Allen JT, Waniek JJ. (2006). Effectof meteorological conditions on interannual variabilityin timing and magnitude of the spring bloom in theIrminger Basin, North Atlantic. Deep-Sea Res Pt I 53:1601–1615.
Huber T, Faulkner G, Hugenholtz P. (2004). Bellerophon:a program to detect chimeric sequences inmultiple sequence alignments. Bioinformatics 20:2317–2319.
Flavobacteria distribution in the North Atlantic OceanPR Gomez-Pereira et al
485
The ISME Journal
Johnson ZI, Zinser ER, Coe A, McNulty NP, WoodwardEMS, Chisholm SW. (2006). Niche partitioning amongProchlorococcus ecotypes along ocean-scale environ-mental gradients. Science 311: 1737–1740.
Kemp PF, Aller JY. (2004). Bacterial diversity in aquaticand other environments: what 16S rDNA libraries cantell us. FEMS Microbiol Ecol 47: 161–177.
Kirchman DL. (2002). The ecology of Cytophaga–Flavo-bacteria in aquatic environments. FEMS MicrobiolEcol 39: 91–100.
Kirchman DL, Yu LY, Cottrell MT. (2003). Diversity andabundance of uncultured Cytophaga-like bacteria inthe Delaware Estuary. Appl Environ Microbiol 69:6587–6596.
Kormas KA, Tivey MK, Von Damm K, Teske A. (2006).Bacterial and archaeal phylotypes associated withdistinct mineralogical layers of a white smoker spirefrom a deep-sea hydrothermal vent site (9 degrees N,East Pacific Rise). Environ Microbiol 8: 909–920.
Kuypers MMM, Lavik G, Woebken D, Schmid M, FuchsBM, Amann R et al. (2005). Massive nitrogen loss fromthe Benguela upwelling system through anaerobicammonium oxidation. Proc Natl Acad Sci USA 102:6478–6483.
Legendre P, Legendre L. (1998). Numerical Ecology,Second English edn. Elsevier: Amsterdam, theNetherlands.
Llobet-Brossa E, Rossello-Mora R, Amann R. (1998).Microbial community composition of Wadden Seasediments as revealed by fluorescence in situ hybridi-zation. Appl Environ Microb 64: 2691–2696.
Longhurst A. (1995). Seasonal cycles of pelagic produc-tion and consumption. Prog Oceanogr 36: 77–167.
Longhurst A. (1998). Ecological geography of the sea, 1stedn. Academic Press: London.
Ludwig W, Euzeby JP, Whitman WB. (2008). DraftTaxonomic outline of the Bacteroidetes, Plancto-mycetes, Chlamydiae, Spirochaetes, Fibrobacteres,Fusobacteria, Acidobacteria, Verrucomicrobia, Dictyo-glomi, and Gemmatimonadetes. In: Hedlund B,Krieg NR, Ludwig W, Paster BJ, Staley JT, Ward Net al. (eds). Bergey’s Manual of Systematic Bacterio-logy, 2nd edn. Springer -Verlag: New York,pp 5–10.
Ludwig W, Strunk O, Westram R, Richter L, Meier H,Yadhukumar et al. (2004). ARB: a softwareenvironment for sequence data. Nucleic Acids Res32: 1363–1371.
Malmstrom RR, Straza TRA, Cottrell MT, Kirchman DL.(2007). Diversity, abundance, and biomass productionof bacterial groups in the western Arctic Ocean. AquatMicrob Ecol 47: 45–55.
Manz W, Amann R, Ludwig W, Vancanneyt M,Schleifer KH. (1996). Application of a suite of 16SrRNA-specific oligonucleotide probes designed toinvestigate bacteria of the phylum cytophaga–flavo-bacter–bacteroides in the natural environment.Microbiol 142: 1097–1106.
Manz W, Amann R, Ludwig W, Wagner M, Schleifer KH.(1992). Phylogenetic oligodeoxynucleotide probes forthe major subclasses of proteobacteria—problems andsolutions. Syst Appl Microbiol 15: 593–600.
Marie D, Partensky F, Jacquet S, Vaulot D. (1997).Enumeration and cell cycle analysis of naturalpopulations of marine picoplankton by flow cytometryusing the nucleic acid stain SYBR Green I. ApplEnviron Microb 63: 186–193.
Morris RM, Rappe MS, Connon SA, Vergin KL, SieboldWA, Carlson CA et al. (2002). SAR11 clade dominatesocean surface bacterioplankton communities. Nature420: 806–810.
Musat N, Halm H, Winterholler B, Hoppe P, Peduzzi S,Hillion F et al. (2008). A single-cell view on theecophysiology of anaerobic phototrophic bacteria.Proc Natl Acad Sci USA 105: 17861–17866.
Muyzer G, Teske A, Wirsen CO, Jannasch HW. (1995).Phylogenetic-relationships of Thiomicrospira speciesand their identification in deep-sea hydrothermal ventsamples by denaturing gradient gel-electrophoresis of16S rDNA fragments. Arch Microbiol 164: 165–172.
Myklestad SM. (1995). Release of extracellular productsby phytoplankton with special emphasis on polysac-charides. Sci Total Environ 165: 155–164.
Neef A, Amann R, Schlesner H, Schleifer KH. (1998).Monitoring a widespread bacterial group: in situdetection of planctomycetes with 16S rRNA-targetedprobes. Microbiology 144: 3257–3266.
O’Sullivan LA, Fuller KE, Thomas EM, Turley CM, Fry JC,Weightman AJ. (2004). Distribution and culturabilityof the uncultivated ‘AGG58 cluster’ of Bacteroidetesphylum in aquatic environments. FEMS MicrobiolEcol 47: 359–370.
O’Sullivan LA, Weightman AJ, Fry JC. (2002). Newdegenerate cytophaga-flexibacter-bacteroides-specific16S ribosomal DNA-targeted oligonucleotide probesreveal high bacterial diversity in river taff epilithon.Appl Environ Microb 68: 2093–2093.
Oliver MJ, Irwin AJ. (2008). Objective global oceanbiogeographic provinces. Geophys Res Lett 35:L15601 doi:10.1029/2008GL034238.
Peplies J, Kottmann R, Ludwig W, Glockner FO. (2008).A standard operating procedure for phylogeneticinference (SOPPI) using (rRNA) marker genes. SystAppl Microbiol 31: 251–257.
Pernthaler A, Pernthaler J, Amann R. (2004). Sensitivemulticolor fluorescence in situ hybridization for theidentification of environmental microorganisms. In:Kowalchuk G, de Bruijn FJ, Head IM, AkkermansADL, van Elsas JD (eds). Molecular Microbial EcologyManual, 2nd edn. Kluwer Academic Publishers:Dordrecht, the Netherlands. pp 711–726.
Pinhassi J, Sala MM, Havskum H, Peters F, Guadayol O,Malits A et al. (2004). Changes in bacterioplanktoncomposition under different phytoplankton regimens.Appl Environ Microb 70: 6753–6766.
Pruesse E, Quast C, Knittel K, Fuchs BM, Ludwig WG,Peplies J et al. (2007). SILVA: a comprehensive onlineresource for quality checked and aligned ribosomalRNA sequence data compatible with ARB. NucleicAcids Res 35: 7188–7196.
Rappe MS, Connon SA, Vergin KL, Giovannoni SJ. (2002).Cultivation of the ubiquitous SAR11 marine bacterio-plankton clade. Nature 418: 630–633.
Riemann L, Steward GF, Azam F. (2000). Dynamics ofbacterial community composition and activity duringa mesocosm diatom bloom. Appl Environ Microb 66:578–587.
Rooney-Varga JN, Giewat MW, Savin MC, Sood S,LeGresley M, Martin JL. (2005). Links betweenphytoplankton and bacterial community dynamics ina coastal marine environment. Microbial Ecol 49:163–175.
Sapp M, Schwaderer AS, Wiltshire KH, Hoppe HG, GerdtsG, Wichels A. (2007). Species-specific bacterial
Flavobacteria distribution in the North Atlantic OceanPR Gomez-Pereira et al
486
The ISME Journal
communities in the phycosphere of microalgae?Microbial Ecol 53: 683–699.
Schattenhofer M, Fuchs BM, Amann R, Zubkov MV,Tarran GA, Pernthaler J. (2009). Latitudinal distribu-tion of prokaryotic picoplankton populations in theAtlantic Ocean. Environ Microbiol 11: 2078–2093.
Schloss PD, Handelsman J. (2005). Introducing DOTUR, acomputer program for defining operational taxonomicunits and estimating species richness. Appl EnvironMicrob 71: 1501–1506.
Sievert SM, Kuever J, Muyzer G. (2000). Identification of16S ribosomal DNA-defined bacterial populations at ashallow submarine hydrothermal vent near MilosIsland (Greece). Appl Environ Microb 66: 3102–3109.
Simon M, Glockner FO, Amann R. (1999). Differentcommunity structure and temperature optima ofheterotrophic picoplankton in various regions of theSouthern Ocean. Aquat Microb Ecol 18: 275–284.
Sogin ML, Morrison HG, Huber JA, Welch DM, Huse SM,Neal PR et al. (2006). Microbial diversity in the deepsea and the underexplored ‘rare biosphere’. Proc NatlAcad Sci USA 103: 12115–12120.
Tarran GA, Heywood JL, Zubkov MV. (2006). Latitudinalchanges in the standing stocks of nano- and picoeu-
karyotic phytoplankton in the Atlantic Ocean. Deep-Sea Res Pt Ii 53: 1516–1529.
West NJ, Obernosterer I, Zemb O, Lebaron P. (2008). Majordifferences of bacterial diversity and activity insideand outside of a natural iron-fertilized phytoplanktonbloom in the Southern Ocean. Environ Microbiol 10:738–756.
Woyke T, Xie G, Copeland A, Gonzalez JM, Han C, Kiss Het al. (2009). Assembling the marine metagenome, onecell at a time. PloS ONE 4: e5299.
Yoon JH, Kang SJ, Oh TK. (2006). Polaribacter dokdonen-sis sp nov., isolated from seawater. Int J Syst Evol Micr56: 1251–1255.
Zhou JZ, Bruns MA, Tiedje JM. (1996). DNA recovery fromsoils of diverse composition. Appl Environ Microb 62:316–322.
ZoBell CE. (1946). Marine Microbiology: A monographon Hydrobacteriology. Chronica Botanica: Waltham,Massachusetts.
Zwirglmaier K, Heywood JL, Chamberlain K,Woodward EM, Zubkov MV, Scanlan DJ. (2007).Basin-scale distribution patterns of picocyanobacteriallineages in the Atlantic Ocean. Environ Microbiol 9:1278–1290.
Supplementary Information accompanies the paper on The ISME Journal website (http://www.nature.com/ismej)
Flavobacteria distribution in the North Atlantic OceanPR Gomez-Pereira et al
487
The ISME Journal