Distinct evolutions of haze pollution from winter to the ...
20
Atmos. Chem. Phys., 22, 1669–1688, 2022 https://doi.org/10.5194/acp-22-1669-2022 © Author(s) 2022. This work is distributed under the Creative Commons Attribution 4.0 License. Research article Distinct evolutions of haze pollution from winter to the following spring over the North China Plain: role of the North Atlantic sea surface temperature anomalies Linye Song 1 , Shangfeng Chen 2 , Wen Chen 2 , Jianping Guo 3 , Conglan Cheng 1 , and Yong Wang 4 1 Institute of Urban Meteorology, China Meteorological Administration, Beijing, China 2 Center for Monsoon System Research, Institute of Atmospheric Physics, Chinese Academy of Sciences, Beijing, China 3 State Key Laboratory of Severe Weather, Chinese Academy of Meteorological Sciences, Beijing, China 4 Department of forecasting models, ZAMG, Central Institute for Meteorology and Geodynamics, Vienna, Austria Correspondence: Shangfeng Chen ([email protected]) Received: 22 March 2021 – Discussion started: 15 July 2021 Revised: 7 November 2021 – Accepted: 20 December 2021 – Published: 3 February 2022 Abstract. This study reveals that haze pollution (HP) over the North China Plain (NCP) in winter can persist to the following spring during most years. The persistence of haze pollution over the NCP (HP NCP ) is attributed to the maintenance of an anticyclonic anomaly (AA) over northeast Asia and southerly wind anomalies over the NCP. Southerly wind anomalies over the NCP reduce surface wind speed and increase relative humidity, which are conducive to above-normal HP NCP both in winter and spring. However, there exist several years when above- normal HP NCP in winter are followed by below-normal HP NCP in the following spring. The reversed HP NCP in winter and spring in these years is due to the inverted atmospheric anomalies over northeast Asia. In particular, AA over northeast Asia in winter is replaced by a cyclonic anomaly (CA) in the following spring. The resultant spring northerly wind anomalies over the NCP are conducive to below-normal HP NCP . These two distinctive evolutions of HP NCP and atmospheric anomalies over northeast Asia from winter to spring are attributed to the different evolutions of sea surface temperature anomalies (SSTAs) in the North Atlantic. In the persistent years, warm North Atlantic SSTAs in winter persist to the following spring via a positive air–sea interaction process and induce a negative spring North Atlantic Oscillation (NAO)-like pattern, which contributes to the AA over northeast Asia via an atmospheric wave train. By contrast, in the reverse years, cold SSTAs in the North Atlantic are maintained from winter to spring, which induce a positive spring NAO-like pattern and lead to a CA over northeast Asia via an atmospheric wave train. Hence, this study improves our understanding of the characteristics of haze pollution evolution from winter to the following spring and suggests the potential role of North Atlantic SSTAs to serve as an important preceding signal for haze pollution prediction one season ahead over the North China Plain. 1 Introduction Haze pollution has become a serious air quality issue in China accompanying rapid urbanization and fast economic development (e.g., Ding and Liu, 2004; Wang and Chen, 2016; Zhang et al., 2018). It has been well recognized that the occurrence of haze pollution events can exert substantial im- pacts on human health, air transportation, ground traffic, agri- culture production, and regional climate change (e.g., Koren et al., 2012; Fu et al., 2014; F. Wang et al., 2014; Y. Wang et al., 2014; Wu et al., 2016; Tie et al., 2016; Cohen et al., 2017; Guo et al., 2018; Zhang et al., 2018; Lu et al., 2019). For example, Cohen et al. (2017) reported that nearly 4.2 mil- lion premature deaths in the world in 2015 were attributed Published by Copernicus Publications on behalf of the European Geosciences Union.
-
Upload
khangminh22 -
Category
Documents
-
view
2 -
download
0
Transcript of Distinct evolutions of haze pollution from winter to the ...

Atmos. Chem. Phys., 22, 1669–1688, 2022https://doi.org/10.5194/acp-22-1669-2022© Author(s) 2022. This work is distributed underthe Creative Commons Attribution 4.0 License.
Research
article
Distinct evolutions of haze pollution from winter to thefollowing spring over the North China Plain: role of
the North Atlantic sea surface temperature anomalies
Linye Song1, Shangfeng Chen2, Wen Chen2, Jianping Guo3, Conglan Cheng1, and Yong Wang4
1Institute of Urban Meteorology, China Meteorological Administration, Beijing, China2Center for Monsoon System Research, Institute of Atmospheric Physics,
Chinese Academy of Sciences, Beijing, China3State Key Laboratory of Severe Weather, Chinese Academy of Meteorological Sciences, Beijing, China
4Department of forecasting models, ZAMG, Central Institute for Meteorology and Geodynamics,Vienna, Austria
Correspondence: Shangfeng Chen ([email protected])
Received: 22 March 2021 – Discussion started: 15 July 2021Revised: 7 November 2021 – Accepted: 20 December 2021 – Published: 3 February 2022
Abstract. This study reveals that haze pollution (HP) over the North China Plain (NCP) in winter can persistto the following spring during most years. The persistence of haze pollution over the NCP (HPNCP) is attributedto the maintenance of an anticyclonic anomaly (AA) over northeast Asia and southerly wind anomalies over theNCP. Southerly wind anomalies over the NCP reduce surface wind speed and increase relative humidity, whichare conducive to above-normal HPNCP both in winter and spring. However, there exist several years when above-normal HPNCP in winter are followed by below-normal HPNCP in the following spring. The reversed HPNCP inwinter and spring in these years is due to the inverted atmospheric anomalies over northeast Asia. In particular,AA over northeast Asia in winter is replaced by a cyclonic anomaly (CA) in the following spring. The resultantspring northerly wind anomalies over the NCP are conducive to below-normal HPNCP. These two distinctiveevolutions of HPNCP and atmospheric anomalies over northeast Asia from winter to spring are attributed to thedifferent evolutions of sea surface temperature anomalies (SSTAs) in the North Atlantic. In the persistent years,warm North Atlantic SSTAs in winter persist to the following spring via a positive air–sea interaction processand induce a negative spring North Atlantic Oscillation (NAO)-like pattern, which contributes to the AA overnortheast Asia via an atmospheric wave train. By contrast, in the reverse years, cold SSTAs in the North Atlanticare maintained from winter to spring, which induce a positive spring NAO-like pattern and lead to a CA overnortheast Asia via an atmospheric wave train. Hence, this study improves our understanding of the characteristicsof haze pollution evolution from winter to the following spring and suggests the potential role of North AtlanticSSTAs to serve as an important preceding signal for haze pollution prediction one season ahead over the NorthChina Plain.
1 Introduction
Haze pollution has become a serious air quality issue inChina accompanying rapid urbanization and fast economicdevelopment (e.g., Ding and Liu, 2004; Wang and Chen,2016; Zhang et al., 2018). It has been well recognized that theoccurrence of haze pollution events can exert substantial im-
pacts on human health, air transportation, ground traffic, agri-culture production, and regional climate change (e.g., Korenet al., 2012; Fu et al., 2014; F. Wang et al., 2014; Y. Wanget al., 2014; Wu et al., 2016; Tie et al., 2016; Cohen et al.,2017; Guo et al., 2018; Zhang et al., 2018; Lu et al., 2019).For example, Cohen et al. (2017) reported that nearly 4.2 mil-lion premature deaths in the world in 2015 were attributed
Published by Copernicus Publications on behalf of the European Geosciences Union.

1670 L. Song et al.: Distinct haze pollution evolution from winter to the following spring over North China
to the overexposure to PM2.5. In addition, haze pollutionis suggested to have resulted in a decrease of about 1.2 %–3.8 % of the annual gross national product (GNP; Zhang andCrooks, 2012). Furthermore, increasing concentration of an-thropogenic aerosol, which is related to the enhanced hazepollution, could exert significant impacts on atmosphericcirculation and regional precipitation change (Koren et al.,2012; F. Wang et al., 2014). Considering the notable impactsof haze pollution, it is of great scientific importance to im-prove our understanding of the factors contributing to hazepollution and the associated mechanisms.
A number of previous studies have investigated the factorsresponsible for the variations in haze pollution in China onmultiple timescales. The long-term increasing trend of hazepollution in China is generally attributable to rapid increasesin anthropogenic emissions (e.g., Che et al., 2009; Ding andLiu, 2014; Zhao et al., 2016; Cheng et al., 2019). For ex-ample, Zhao et al. (2016) showed that the notable increas-ing trend of haze pollution in winter over eastern China hasa close relationship with the gross domestic product (GDP)in China. Several studies have suggested that changes in themeteorological conditions due to global warming also playa role in the long-term trend of haze pollution in China(e.g., Cai et al., 2017; Liu et al., 2017; Ding et al., 2017;Zhang et al., 2020).
On the interannual and interdecadal timescales, variationsin the haze pollution in China are suggested to be mainlycontrolled by meteorological conditions. For instance, Dangand Liao (2019) reported that changes in meteorological con-ditions accounted for about 70 % of the variation in the an-nual haze days in the Beijing–Tianjin–Hebei region. Zhaoet al. (2016) suggested that the Pacific Decadal Oscillationcould exert marked impacts on the interdecadal variation inthe haze pollution in eastern China via inducing large-scaleatmospheric circulation anomalies over East Asia. The Pa-cific Decadal Oscillation is the first leading mode of sea sur-face temperature anomalies (SSTAs) in the North Pacific onthe interdecadal timescale (Mantua et al., 1997; Zhang et al.,1997; Duan et al., 2013). Xiao et al. (2014) showed that theAtlantic Multidecadal Oscillation modulates haze pollutionin China via triggering an atmospheric wave train over Eura-sia. The Atlantic Multidecadal Oscillation is the dominantmode of SSTAs in the North Atlantic on the multidecadaltimescale (Kerr, 2000). Compared to the interdecadal varia-tion, many more studies have examined the factors for theinterannual variation in haze pollution in China, mainly con-centrating on boreal winter. It is shown that interannual varia-tion in haze pollution in eastern China can be impacted by theArctic Oscillation (Yin et al., 2015), East Asian winter mon-soon (Li et al., 2016; Chen et al., 2020), El Niño–SouthernOscillation (ENSO) (Chang et al., 2016; Liu et al., 2017; Liet al., 2017; He et al., 2019), North Atlantic SSTAs (Xiao etal., 2014), Arctic sea ice (Wang et al., 2015; Yin and Wang,2017), Eurasian snow cover (Yin and Wang, 2018), and theEast Atlantic–Western Russian (EAWR) teleconnection pat-
tern (Yin and Wang, 2017; Chen et al., 2020). A recent studyhas examined the factors modulating the interannual varia-tion in springtime haze pollution in the North China Plain Re-gion (NCPR) (Chen et al., 2019). Note that the NCPR is oneof the most important regions in China with very dense pop-ulation, high levels of traffic activity, and a highly developedeconomy. In addition, the NCPR is also the most pollutedregion in China (Yin et al., 2015). It is indicated that NorthAtlantic SSTAs and the North Atlantic Oscillation (NAO, thefirst leading mode of interannual atmospheric variability overthe North Atlantic region; Hurrell, 1995) play important rolesin determining the haze pollution over the NCPR via modu-lating atmospheric circulation anomalies over northeast Asiathrough triggering an atmospheric wave train extending fromthe North Atlantic across Europe to East Asia (Chen et al.,2019). However, Chen et al. (2019) mainly focused on in-vestigating the physical mechanism and were limited to oneseason of spring. Although there are many previous studiesinvestigating the interannual variations in haze pollution overthe NCPR, they mainly separate winter and spring and viewthem independently. However, impacts of haze pollution maydepend strongly on the time period of seasonal persistence.Hence, an important question is raised of whether there ex-ists a relation between interannual variation in haze pollu-tion over the NCPR in winter and the following spring. Inparticular, could the wintertime haze pollution persist fromwinter to the following spring? If so, what are the plausi-ble factors contributing to the across-season persistence ofhaze pollution over the NCPR from winter to the succedentspring? Understanding the evolution features of the haze pol-lution from winter to spring and the associated mechanismswould have important implications for the seasonal predic-tion of haze pollution over the NCPR. In this study, the issuesraised above will be investigated and addressed.
The remainder of this paper is organized as follows. Sec-tion 2 describes the data and methods used in this study. Sec-tion 3 examines relation of interannual variations betweenwinter and spring haze pollution over the NCPR and com-pares the two distinct types of haze evolutions found in thispaper. Section 4 examines the factors responsible for the dif-ferent evolutions of haze pollution over the NCPR from win-ter to the following spring. A summary and discussion areprovided in Sect. 5.
2 Data and methods
2.1 Data
Monthly mean horizontal winds, geopotential height, rela-tive humidity, surface wind speed, and surface heat fluxesare obtained from the National Centers for Environmen-tal Prediction–National Center for Atmospheric Research(NCEP–NCAR) reanalysis (Kalnay et al., 1996; https://psl.noaa.gov/data/gridded/data.ncep.reanalysis.html, last access:6 February 2021), which are available from January 1948 to
Atmos. Chem. Phys., 22, 1669–1688, 2022 https://doi.org/10.5194/acp-22-1669-2022
L. Song et al.: Distinct haze pollution evolution from winter to the following spring over North China 1671
the present. Surface heat fluxes are the sum of the surface la-tent and sensible heat fluxes and surface shortwave and long-wave radiation. Atmospheric data from the NCEP–NCAR re-analysis have a horizontal resolution of 2.5◦× 2.5◦ in thelongitude–latitude grids, while surface heat fluxes are onT62 Gaussian grids. Monthly mean sea surface temperature(SST) data are derived from the National Oceanic and At-mospheric Administration (NOAA) Extended ReconstructedSST version 5 (ERSSTV5) from January 1854 to the present(Huang et al., 2017; https://psl.noaa.gov/data/gridded/data.noaa.ersst.v5.html, last access: 6 February 2021), with a hor-izontal resolution of 2◦× 2◦ in the longitude–latitude grids.Atmospheric teleconnection indices, including the EAWRindex and NAO index, are provided by the NOAA ClimatePrediction Center (https://www.cpc.ncep.noaa.gov/data/, lastaccess: 6 February 2021).
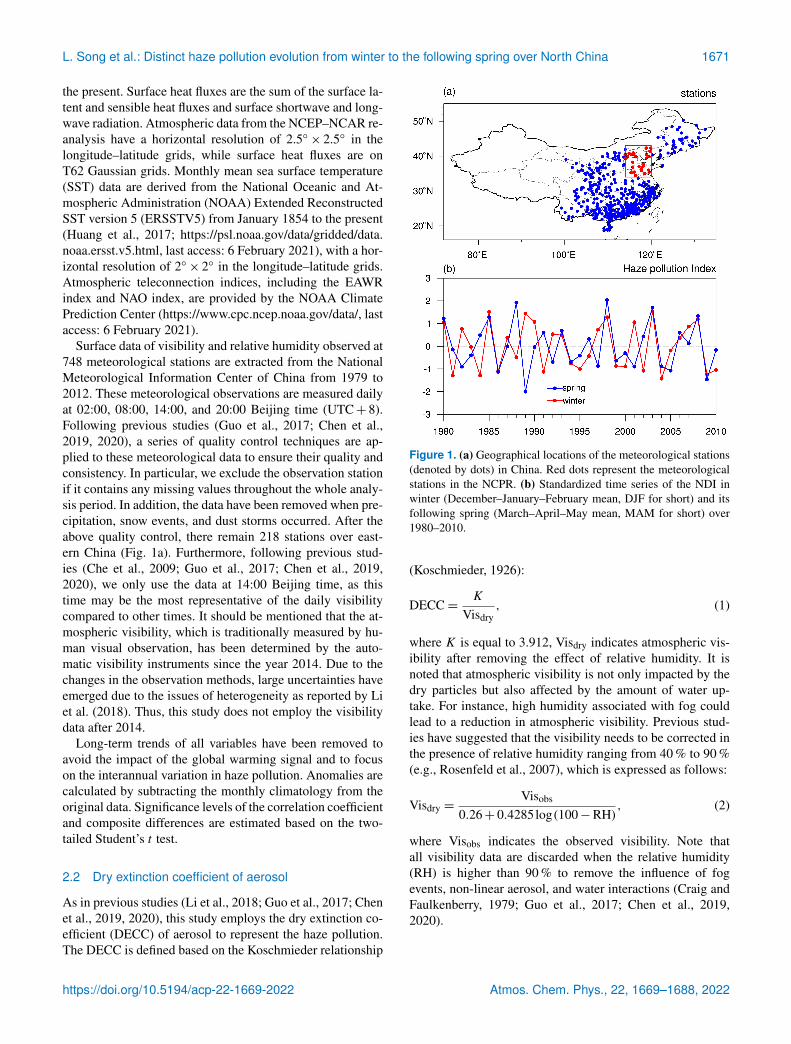
Surface data of visibility and relative humidity observed at748 meteorological stations are extracted from the NationalMeteorological Information Center of China from 1979 to2012. These meteorological observations are measured dailyat 02:00, 08:00, 14:00, and 20:00 Beijing time (UTC+ 8).Following previous studies (Guo et al., 2017; Chen et al.,2019, 2020), a series of quality control techniques are ap-plied to these meteorological data to ensure their quality andconsistency. In particular, we exclude the observation stationif it contains any missing values throughout the whole analy-sis period. In addition, the data have been removed when pre-cipitation, snow events, and dust storms occurred. After theabove quality control, there remain 218 stations over east-ern China (Fig. 1a). Furthermore, following previous stud-ies (Che et al., 2009; Guo et al., 2017; Chen et al., 2019,2020), we only use the data at 14:00 Beijing time, as thistime may be the most representative of the daily visibilitycompared to other times. It should be mentioned that the at-mospheric visibility, which is traditionally measured by hu-man visual observation, has been determined by the auto-matic visibility instruments since the year 2014. Due to thechanges in the observation methods, large uncertainties haveemerged due to the issues of heterogeneity as reported by Liet al. (2018). Thus, this study does not employ the visibilitydata after 2014.
Long-term trends of all variables have been removed toavoid the impact of the global warming signal and to focuson the interannual variation in haze pollution. Anomalies arecalculated by subtracting the monthly climatology from theoriginal data. Significance levels of the correlation coefficientand composite differences are estimated based on the two-tailed Student’s t test.
2.2 Dry extinction coefficient of aerosol
As in previous studies (Li et al., 2018; Guo et al., 2017; Chenet al., 2019, 2020), this study employs the dry extinction co-efficient (DECC) of aerosol to represent the haze pollution.The DECC is defined based on the Koschmieder relationship
Figure 1. (a) Geographical locations of the meteorological stations(denoted by dots) in China. Red dots represent the meteorologicalstations in the NCPR. (b) Standardized time series of the NDI inwinter (December–January–February mean, DJF for short) and itsfollowing spring (March–April–May mean, MAM for short) over1980–2010.
(Koschmieder, 1926):
DECC=K
Visdry, (1)
where K is equal to 3.912, Visdry indicates atmospheric vis-ibility after removing the effect of relative humidity. It isnoted that atmospheric visibility is not only impacted by thedry particles but also affected by the amount of water up-take. For instance, high humidity associated with fog couldlead to a reduction in atmospheric visibility. Previous stud-ies have suggested that the visibility needs to be corrected inthe presence of relative humidity ranging from 40 % to 90 %(e.g., Rosenfeld et al., 2007), which is expressed as follows:
Visdry =Visobs
0.26+ 0.4285log(100−RH), (2)
where Visobs indicates the observed visibility. Note thatall visibility data are discarded when the relative humidity(RH) is higher than 90 % to remove the influence of fogevents, non-linear aerosol, and water interactions (Craig andFaulkenberry, 1979; Guo et al., 2017; Chen et al., 2019,2020).
https://doi.org/10.5194/acp-22-1669-2022 Atmos. Chem. Phys., 22, 1669–1688, 2022

1672 L. Song et al.: Distinct haze pollution evolution from winter to the following spring over North China
2.3 Wave activity flux
We use the wave activity flux defined by Takaya and Naka-mura (2001) to examine the stationary Rossby wave propa-gation, which can be expressed as follows:
W =1
2 |U |
×
U(v′
2−ψ ′v′x
)+V
(−u′v′+ψ ′u′x
)U(−u′v′+ψ ′u′x
)+V
(u′
2+ψ ′u′y
)foRap
N2Ho
{U(v′T ′−ψ ′T ′x
)+V
(−u′T ′−ψ ′T ′y
)} , (3)
where U = (U,V ) is the climatological wind vector.V=
(u′,v′
)denotes geostrophic wind anomalies. ψ ′ is
geostrophic stream function anomalies. Ho, p, and N rep-resent scale height, pressure normalized by 1000 hPa, andBrunt–Väisälä frequency, respectively. Ra, T ′, and fo denotethe gas constant of the dry air, air temperature anomalies,and the Coriolis parameter at 45◦ N, respectively. Subscriptsx and y are the derivatives in the zonal and meridional di-rections, respectively. The climatological mean is calculatedover the 1980–2010 period.
2.4 Barotropic model
The present study employs a linear barotropic model to in-vestigate the role of the SST anomalies (SSTAs) over the sub-tropical and tropical North Atlantic in triggering atmosphericRossby wave train over middle–high latitudes of Eurasia.Previous studies have demonstrated that cold (warm) SSTAsin the subtropical and tropical regions are able to induce con-vergence (divergence) anomalies in the upper tropospherethat act as effective sources of atmospheric stationary Rossbywaves (Hodson et al., 2010; Watanabe, 2004; Zuo et al.,2013; Wu et al., 2011; Chen et al., 2016, 2020). Basedon a simple barotropic vorticity equation (Watanabe, 2004;Sardeshmukh and Hoskins, 1988; Chen et al., 2020), thebarotropic model is established by
∂t∇2ψ ′+ J
(ψ,∇2ψ ′
)+ J
(ψ ′,∇2ψ + f
)+α∇2ψ ′
+ ν∇6ψ ′ = S′, (4)
where ψ ′ and ψ are the perturbation stream function andbasic state stream function, respectively. f and J representthe Coriolis parameter and Jacobian operator, respectively. S′
represents the vorticity source generated by the atmosphericdivergence. The barotropic model consists in a biharmonicdiffusion and a linear damping that indicate the Rayleigh fric-tion. Note that solution of the above equation associated withthe barotropic model is determined by the vorticity perturba-tion (S′) and the basic state. In the present analysis, the basicstate is chosen at the 300 hPa level over 1979–2010 usingthe NCEP–NCAR reanalysis data. O’Reilly et al. (2018) re-ported that results of the barotropic model experiments are
insensitive to the basic states chosen from the upper tropo-sphere (e.g., from 350 to 200 hPa). It should be mentionedthat the basic state is chosen from the upper troposphere be-cause the strongest convergence/divergence anomalies gen-erated by the tropical and subtropical SST cooling/warmingtend to be observed in the upper troposphere (e.g., Sun et al.,2015; O’Reilly et al., 2018; Chen et al., 2020).
3 Connection of haze pollution over the NCPR inwinter and spring
Following previous analyses (Yin and Wang, 2016; Chen etal., 2019, 2020), the NCPR corresponds to the region span-ning 34–43◦ N and 114–120◦ E (Fig. 1a). Slight changes inthe region to represent the NCPR do not affect the main re-sults of this study. Figure 1a shows that there are a total of28 meteorological observational stations in the NCPR (reddots in the box). As in previous studies (Yin and Wang, 2016;Chen et al., 2019, 2020), this analysis defines a NCPR DECCindex (NDI for short) by averaging the DECC anomalies overthe abovementioned 28 stations to describe variation in hazepollution over the NCPR (Fig. 1b). We have examined thefirst empirical orthogonal function mode (EOF1) of interan-nual variations in the DECC over the NCPR in winter andspring (Fig. 2a and b). Spatial patterns of the EOF1 in win-ter and spring are featured by same-sign DECC anomaliesover the NCPR, except for a small patch of regions (Fig. 2aand b). In addition, the correlation coefficient between theprincipal component (PC) time series corresponding to theEOF1 of winter DECC anomalies (Fig. 2c, red line) and thewinter NDI (Fig. 1b, red line) is as high as 0.86, significantat the 99.9 % confidence level. Similarly, the correlation co-efficient between the PC1 time series of the spring DECCanomalies (Fig. 2c, blue line) and the spring NDI (Fig. 1b,blue line) reaches 0.93. The above evidence suggests that the28 stations in the NCPR can generally be considered whole.
The correlation coefficient between the winter and springNDI over 1980–2011 is 0.30, exceeding the 90 % confidencelevel according to the two-tailed Student’s t test. Note thatwe have also employed the Monte Carlo method to evalu-ate the robustness of the winter–spring haze connection byconstructing 10 000 random realizations of spring haze timeseries. The correlation coefficient with a permutation of 90 %(95 %) confidence is about 0.23 (0.3). Therefore, the MonteCarlo permutation tests demonstrate that the linkage betweenthe winter and spring haze can pass the 95 % confidencelevel. From Fig. 1b, 20 out of 32 years with positive or neg-ative winter haze pollution anomalies are followed by same-sign anomalies of haze pollution in the following spring overthe North China Plain (Fig. 1b). This indicates that the por-tion is about 62.5 % for the persistent relationship betweenthe winter and spring haze. In particular, most of the posi-tive (negative) values of the winter NDI are followed by ex-tremely large (small) values of the spring NDI (for exam-
Atmos. Chem. Phys., 22, 1669–1688, 2022 https://doi.org/10.5194/acp-22-1669-2022

L. Song et al.: Distinct haze pollution evolution from winter to the following spring over North China 1673
Figure 2. The first EOF mode (EOF1) of interannual anomalies of the DECC in (a) winter and (b) spring over the NCPR (i.e., 34–43◦ Nand 114–120◦ E) for the period of 1979–2010. (c) The corresponding PC time series of the EOF1 of interannual anomalies of the DECC inwinter (red line) and spring (blue line). The green dots in (a–b) indicate the stations in the NCPR.
ple, years of 1980, 1985, 1986). The above evidence collec-tively suggests a close in-phase variation in the haze pollu-tion in winter and the following spring. In particular, if hazepollution in winter is less (more) serious over the NCPR, airconditions over the NCPR in the following spring also tendto be better (worse) than normal.
From Fig. 1b, there also exist several years when values ofthe winter and following spring NDI are strongly opposed,showing out-of-phase variation. In these years, large nega-tive (positive) values of the winter NDI are followed by largepositive (negative) spring NDIs (Fig. 1b). For instance, in1984 and 1991, the winter NDIs are significantly negative,while the following spring NDIs are significantly positive(Fig. 1b). In 1982 and 1989, large positive values of the win-ter NDI are followed by large negative values of the springNDI (Fig. 1b). In the following, positive (negative) phases ofthe winter and spring NDIs are identified when the normal-ized NDIs are larger (less) than 0.43. Previous studies haveindicated that a value of ±0.43 standard deviation can sep-arate a time series into three portions (positive and negativephases and normal conditions) with nearly the same samplesizes. Note that the use of ±0.5 standard deviation as thethreshold to define anomalous NDI years leads to similar re-sults but with smaller sample sizes. Table 1 presents the yearswhen winter and spring NDIs are in phase and out of phase.According to Table 1, there are a total of 11 (9) years for the
in-phase (out-of-phase) years. In the following, out-of-phase(in-phase) years are called reverse (persistent) years for con-venience of descriptions.
We employ composite analysis to compare evolutions ofthe DECC and atmospheric anomalies between the persis-tent and reverse years. Note that in performing the compositeanalysis, we reversed the anomalies when the winter NDI isnegative since, to a large extent, the DECC and atmosphericcirculation anomalies over the NCPR are symmetric betweenthe positive and negative phases of the winter NDI. Hence,the descriptions below correspond to the positive phases ofthe winter NDI but also apply to the negative phases exceptwith opposite signs.
Figure 3 shows composite anomalies of the DECC inwinter and the following spring in the persistent and re-verse years. For the persistent years, large positive DECCanomalies (indicating more serious haze pollution) are seenover the NCPR and surrounding regions (Fig. 3a). DECCanomalies in winter over southern China are weak, suggest-ing a weak relation of the haze pollution between northernand southern China, consistent with previous studies (e.g., Liet al., 2017; He et al., 2019). Large positive DECC anomaliesover the NCPR are maintained to the succedent spring withcomparable amplitude (Fig. 3a and c). For the reverse years,large positive DECC anomalies also appear over the NCPR inwinter (Fig. 3b). However, in the following spring, the NCPR
https://doi.org/10.5194/acp-22-1669-2022 Atmos. Chem. Phys., 22, 1669–1688, 2022

1674 L. Song et al.: Distinct haze pollution evolution from winter to the following spring over North China
Table 1. Lists of the persistent and reverse years.
Persistence (11 years) Reverse (9 years)
1980, 1985, 1986, 1993, 1994, 1998, 1982, 1984, 1988, 1989, 1991, 1992,1999, 2003, 2004, 2008, 2009 1997, 2001, 2002
and surrounding regions are dominated by significantly neg-ative values of the DECC (Fig. 3d) (indicating air conditionsin spring become better), which is in sharp contrast to thepersistent years (Fig. 3c).
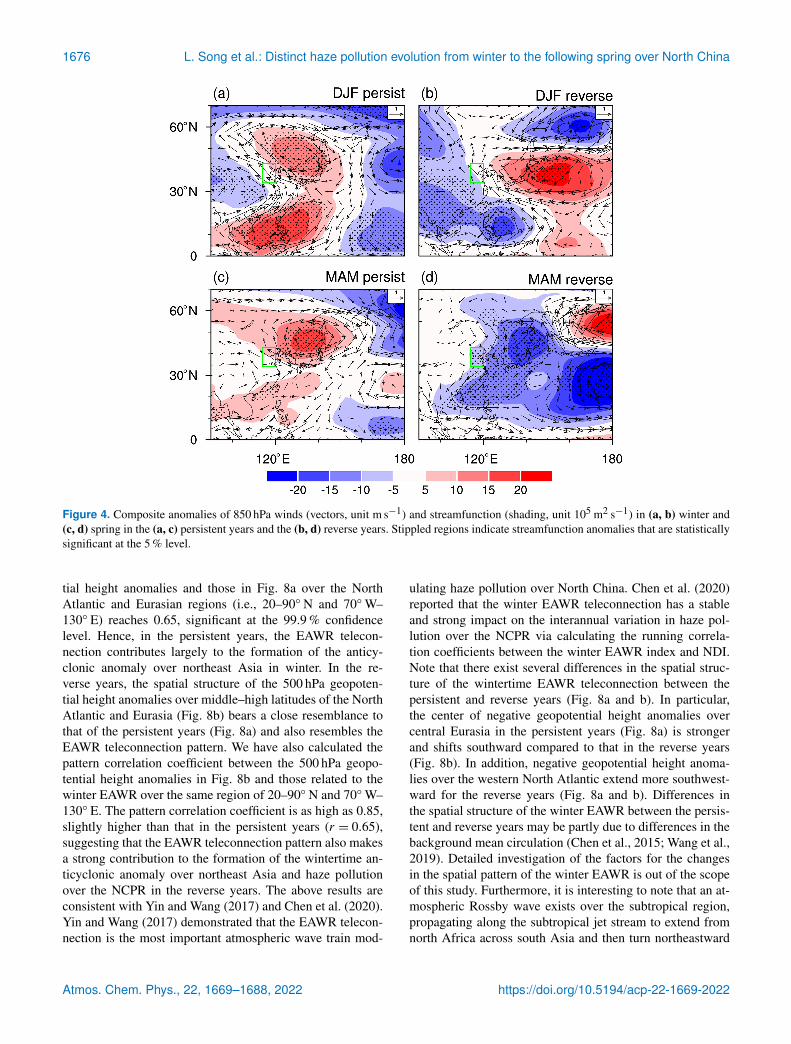
Studies have demonstrated that meteorological conditionsrelated to the atmospheric anomalies can explain above 66 %of interannual and interdecadal variations in haze pollutionover most parts of eastern China (Zhang et al., 2013; Chenet al., 2019; He et al., 2019; Dang and Liao, 2019; Ma andZhang, 2020). Hence, it is expected that different evolutionsof the DECC anomalies from winter to the following springover the NCPR may be associated with the distinct evolutionsof atmospheric anomalies. Composite anomalies of windsand the streamfunction at 850 hPa in winter and the followingspring for the persistent and reverse years are shown in Fig. 4.In the persistent years, a significant anticyclonic anomaly isseen over northeast Asia, accompanied by strong southerlywind anomalies over the NCPR and northerly wind anoma-lies over mid-latitudes of the North Pacific (Fig. 4a). In ad-dition, another marked anticyclonic anomaly appears overthe South China Sea and Philippine Sea, leading to strongsoutherly wind anomalies over southern China (Fig. 4a). Theanomalous anticyclone over northeast Asia and associatedsoutherly wind anomalies over the NCPR are maintained tothe following spring (Fig. 4c).
For the reverse years, a strong anticyclonic anomaly alsoexists over northeast Asia but with a southeastward dis-placement (Fig. 4b) compared to that in the persistent years.Note that NCPR is also dominated by strong southerly windanomalies (Fig. 4b). In contrast, the South China Sea andPhilippine Sea are covered by an anomalous cyclone, to-gether with northerly wind anomalies over southern China(Fig. 4b). Moreover, an anticyclonic anomaly occurs aroundthe Russian Far East, accompanied by westerly wind anoma-lies to the north of Japan (Fig. 4b). In the following spring,the pronounced anticyclonic anomaly over northeast Asiaand associated southerly wind anomalies over the NCPR arereplaced by a marked cyclonic anomaly and northerly windanomalies (Fig. 4d).
Hence, there appears a prominent difference in the atmo-spheric anomalies over northeast Asia between the persis-tent and reverse years. Specifically, in the persistent years,the anomalous anticyclone over northeast Asia and southerlywind anomalies over the NCPR are maintained from winterto the following spring. By contrast, in the reverse years, thewintertime anticyclonic anomaly is replaced by a cyclonicanomaly over northeast Asia, accompanied by a reversal of
meridional wind anomalies over the NCPR from winter tothe succedent spring.
The atmospheric anomalies can impact haze pollution overthe NCPR in winter and spring via modulating surface windspeed, relative humidity, and boundary layer height (BLH)(e.g., Chen et al., 2019, 2020; He et al., 2019; Dang and Liao,2019; Li et al., 2021). The increase (decrease) in the surfacewind speed is (is not) conducive to the horizontal diffusionof pollutants, thus contributing to a below- (above-)normalDECC and less (more) serious haze pollution (Chen et al.,2019; Li et al., 2021). An increase (decrease) in the BLHtends to favor (suppress) vertical diffusion of pollutants andthus results in a below- (above-)normal DECC (Zhang et al.,2016; Wang et al., 2018). Furthermore, large (small) relativehumidity is (is not) conducive to the generation of secondaryorganic compounds and secondary aerosol species (such asSO2−
4 and NO−3 ), which contribute to more (less) serioushaze pollution over the NCPR (Yu et al., 2005; Hennigan etal., 2008; Chen et al., 2019; Li et al., 2021; Ma and Zhang,2020).
Composite anomalies of low-level (850 hPa) wind speed,relative humidity and the BLH in winter and spring areshown in Figs. 5–7, respectively. In winter, low-level windspeed is significantly decreased over the NCPR with a north-westward extension to Lake Baikal and an eastward exten-sion to the western North Pacific for both the persistent andthe reverse years (Fig. 5a and b). The southerly wind anoma-lies to the western side of the anticyclonic anomaly overnortheast Asia (Fig. 4a and b) are opposed to the climato-logical northerly winds dominated by the East Asian win-ter monsoon (not shown) and lead to decreases in the totalwind speed (Fig. 5a and b), which contributes to more serioushaze pollution (Fig. 3a and b). In addition, southerly windanomalies tend to bring more water vapor northward fromthe Southern Ocean and result in an increase in the relativehumidity (Fig. 6a and b), which is conducive to the formationof secondary aerosol species (Yu et al., 2005; Hennigan et al.,2008; Chen et al., 2019) and contributes to more serious hazepollution over the NCPR in winter (Fig. 2a and b). Moreover,a large decrease in the BLH over the NCPR, which is asso-ciated with the anomalous anticyclone there, also contributesto an above-normal DECC via suppressing the vertical diffu-sion of pollutants (Fig. 7a and b) (Zhang et al., 2016; Wanget al., 2018). In the persistent years, sustenance of the an-ticyclonic anomaly over northeast Asia and southerly windanomalies over the NCPR to the following spring (Fig. 4c)contribute to an above-normal DECC in spring (Fig. 3c) via
Atmos. Chem. Phys., 22, 1669–1688, 2022 https://doi.org/10.5194/acp-22-1669-2022

L. Song et al.: Distinct haze pollution evolution from winter to the following spring over North China 1675
Figure 3. Composite anomalies of the DECC (unit km−1) in (a, b) winter and (c, d) spring in the (a, c) persistent years and the (b, d)reverse years. Stippled regions indicate anomalies significant at the 5 % level.
reducing surface wind speed and the BLH (Figs. 5c and 7c)and increasing relative humidity (Fig. 6c). By contrast, in thereverse years, reversal of atmospheric anomalies over north-east Asia from an anticyclonic anomaly in winter (Fig. 4b)to a cyclonic anomaly in the following spring (Fig. 4d) re-sults in the inverted DECC anomalies over the NCPR (Fig. 3band d). In spring, the cyclonic anomaly over northeast Asiaincrease the low-level total wind speed (Fig. 5d) and BLH(Fig. 7d), which are conducive to the horizontal and verticaldispersion of pollutants and contribute to better air condi-tions. Additionally, the anomalous northerly winds (Fig. 4d)lead to a decrease in the relative humidity (Fig. 6d) via carry-ing colder and drier air from higher latitudes, suppressing thegeneration of secondary organic compounds and secondaryaerosol species, and contributing to the mitigation of hazepollution (Fig. 3d). The above evidence suggests that the dis-tinct evolutions of haze pollution over the NCPR between thepersistent and reverse years are closely related to the differentevolutions of atmospheric anomalies over northeast Asia.
Atmospheric anomalies over northeast Asia related to in-terannual variations in haze pollution over the NCPR areclosely associated with an upstream atmospheric wave trainover the North Atlantic and middle–high latitudes of Eura-sia. Studies have demonstrated that atmospheric wave trains
that originated from the North Atlantic across Eurasia to EastAsia make a strong contribution to interannual variationsin haze pollution and climate anomalies over North China(Yin and Wang, 2016, 2017; Zhao et al., 2019; Chen et al.,2019, 2020). Composite anomalies of geopotential height at500 hPa over larger areas in winter and the succedent springfor the persistent and reverse years are presented in Fig. 8.To examine the possible sources of the atmospheric wavetrains over Eurasia, we also present the wave activity fluxesin Fig. 8, which describe propagation directions of the at-mospheric Rossby waves. Spatial structures of the geopo-tential height anomalies at 850 and 200 hPa (not shown) arehighly similar to those at 500 hPa in Fig. 8, indicating a verti-cally barotropic structure of the atmospheric anomalies overmiddle–high latitudes of the North Atlantic and Eurasia.
In the persistent years, an EAWR-like teleconnection pat-tern is obviously observed extending from the North At-lantic across Europe to East Asia, with negative geopo-tential height anomalies (corresponding to cyclonic anoma-lies) over middle–high latitudes of the North Atlantic andcentral Eurasia and positive geopotential height anomalies(corresponding to anticyclonic anomalies) over western Eu-rope and northeast Asia (Fig. 8a). The pattern correlationcoefficient between the EAWR-related 500 hPa geopoten-
https://doi.org/10.5194/acp-22-1669-2022 Atmos. Chem. Phys., 22, 1669–1688, 2022
1676 L. Song et al.: Distinct haze pollution evolution from winter to the following spring over North China
Figure 4. Composite anomalies of 850 hPa winds (vectors, unit m s−1) and streamfunction (shading, unit 105 m2 s−1) in (a, b) winter and(c, d) spring in the (a, c) persistent years and the (b, d) reverse years. Stippled regions indicate streamfunction anomalies that are statisticallysignificant at the 5 % level.
tial height anomalies and those in Fig. 8a over the NorthAtlantic and Eurasian regions (i.e., 20–90◦ N and 70◦W–130◦ E) reaches 0.65, significant at the 99.9 % confidencelevel. Hence, in the persistent years, the EAWR telecon-nection contributes largely to the formation of the anticy-clonic anomaly over northeast Asia in winter. In the re-verse years, the spatial structure of the 500 hPa geopoten-tial height anomalies over middle–high latitudes of the NorthAtlantic and Eurasia (Fig. 8b) bears a close resemblance tothat of the persistent years (Fig. 8a) and also resembles theEAWR teleconnection pattern. We have also calculated thepattern correlation coefficient between the 500 hPa geopo-tential height anomalies in Fig. 8b and those related to thewinter EAWR over the same region of 20–90◦ N and 70◦W–130◦ E. The pattern correlation coefficient is as high as 0.85,slightly higher than that in the persistent years (r = 0.65),suggesting that the EAWR teleconnection pattern also makesa strong contribution to the formation of the wintertime an-ticyclonic anomaly over northeast Asia and haze pollutionover the NCPR in the reverse years. The above results areconsistent with Yin and Wang (2017) and Chen et al. (2020).Yin and Wang (2017) demonstrated that the EAWR telecon-nection is the most important atmospheric wave train mod-
ulating haze pollution over North China. Chen et al. (2020)reported that the winter EAWR teleconnection has a stableand strong impact on the interannual variation in haze pol-lution over the NCPR via calculating the running correla-tion coefficients between the winter EAWR index and NDI.Note that there exist several differences in the spatial struc-ture of the wintertime EAWR teleconnection between thepersistent and reverse years (Fig. 8a and b). In particular,the center of negative geopotential height anomalies overcentral Eurasia in the persistent years (Fig. 8a) is strongerand shifts southward compared to that in the reverse years(Fig. 8b). In addition, negative geopotential height anoma-lies over the western North Atlantic extend more southwest-ward for the reverse years (Fig. 8a and b). Differences inthe spatial structure of the winter EAWR between the persis-tent and reverse years may be partly due to differences in thebackground mean circulation (Chen et al., 2015; Wang et al.,2019). Detailed investigation of the factors for the changesin the spatial pattern of the winter EAWR is out of the scopeof this study. Furthermore, it is interesting to note that an at-mospheric Rossby wave exists over the subtropical region,propagating along the subtropical jet stream to extend fromnorth Africa across south Asia and then turn northeastward
Atmos. Chem. Phys., 22, 1669–1688, 2022 https://doi.org/10.5194/acp-22-1669-2022

L. Song et al.: Distinct haze pollution evolution from winter to the following spring over North China 1677
Figure 5. Composite anomalies of 850 hPa wind speed (unit m s−1) in (a, b) winter and (c, d) spring in the (a, c) persistent years and the (b,d) reverse years. Stippled regions indicate anomalies that are statistically significant at the 5 % level.
to northeast Asia in the reverse years (Fig. 8b). This subtrop-ical wave train also makes a contribution to the formationof the anticyclonic anomaly over northeast Asia and interan-nual variation in haze pollution over the NCPR as has beenindicated by Chen et al. (2020).
In spring, a negative NAO-like pattern appears over theNorth Atlantic in the persistent years, featuring negativegeopotential height anomalies around 40–50◦ N and positiveanomalies over 60–70◦ N in the persistent years (Fig. 8c).The pattern correlation coefficient between the spring NAO-related 500 hPa geopotential height anomalies and the com-posited 500 hPa geopotential height anomalies in Fig. 6cover the North Atlantic region (30–80◦ N and 20–60◦W)is as high as −0.75. This result is consistent with Chenet al. (2019), which indicates that the negative (positive)phase of the spring NAO contributes to the formation ofan anomalous anticyclone (cyclone) over northeast Asia andleads to more (less) serious haze pollution over the NCPRvia an eastward-propagating wave train. However, in the re-verse years, there exists a positive NAO-like pattern over theNorth Atlantic (Fig. 8d), which is in sharp contrast to thatin the persistent years (Fig. 8c). In particular, the patterncorrelation between the 500 hPa geopotential height anoma-
lies in Fig. 8c and spring NAO-related anomalies over 30–80◦ N and 20–60◦W reaches 0.6. As indicated by Chen etal. (2019), the positive spring NAO would contribute to abelow-normal DECC over the NCPR.
The distinct evolutions of the average NCPR DECC, sur-face wind speed, relative humidity, the winter EAWR in-dex, and the spring NAO index are summarized in Fig. 9.In winter, the positive phase of the EAWR teleconnectioncontributes to anticyclonic anomalies over northeast Asiaand associated southerly wind anomalies over the NCPR,which further lead to positive DECC anomalies in both thepersistent and the reverse years via reducing surface windspeed and BLH and increasing relative humidity (Fig. 9a). Inspring, the negative (positive) phase of the spring NAO con-tributes to the formation of the anomalous anticyclone (cy-clone) over northeast Asia and results in positive (negative)DECC anomalies over the NCPR via increasing (decreasing)relative humidity and decreasing (increasing) surface windspeed and BLH in the persistent (reverse) years (Fig. 9b).The above evidence strongly indicates that different evolu-tions of atmospheric anomalies over the North Atlantic andmiddle–high-latitude Eurasia play a crucial role in the dis-tinct evolutions of the haze pollution over the NCPR.
https://doi.org/10.5194/acp-22-1669-2022 Atmos. Chem. Phys., 22, 1669–1688, 2022

1678 L. Song et al.: Distinct haze pollution evolution from winter to the following spring over North China
Figure 6. Composite anomalies of 850 hPa relative humidity (unit %) in (a, b) winter and (c, d) spring in the (a, c) persistent years and the(b, d) reverse years. Stippled regions indicate anomalies that are statistically significant at the 5 % level.
4 Mechanism for the different evolutions ofatmospheric anomalies over the North Atlanticand Eurasia
What is the possible mechanism for the different evolutionsof atmospheric anomalies over the North Atlantic and Eura-sia? Considering that the internal atmospheric process couldnot explain the connection of the atmospheric anomalies be-tween two seasons, the evolution of atmospheric anoma-lies over the North Atlantic may be related to the under-lying SSTAs. Previous studies have demonstrated that theNorth Atlantic is a region with strong air–sea interaction(Czaja et al., 2002; Czaja and Frankignoul, 2002; Huang andShukla, 2005; Pan, 2005; Peng et al., 2003; Wu et al., 2009;Chen et al., 2016, 2019). On one hand, atmospheric anoma-lies over the North Atlantic could lead to SSTAs via mod-ulating surface heat fluxes (Czaja et al., 2002; Huang andShukla, 2005; Wu et al., 2009; Chen et al., 2015). The con-nection between the atmospheric anomalies and SSTAs overthe North Atlantic is the closest when atmospheric anoma-lies lead SSTAs by about 1 month (Czaja and Frankignoul,2002; Huang and Shukla, 2005). On the other hand, SSTAsin the North Atlantic have a strong feedback on the over-
lying atmospheric circulation via the heating-induced atmo-spheric Rossby wave response and the interaction betweenlow-frequency mean flow and synoptic-scale eddies (Peng etal., 2003; Pan, 2005; Czaja and Frankignoul, 2002; Chen etal., 2020). In particular, a number of studies have suggestedthat the development and evolution of atmospheric anomaliesand SSTAs over the North Atlantic can be attributed to thepositive air–sea interaction process there (Czaja and Frankig-noul, 1999; Rodwell and Folland, 2002; Visbeck et al., 2003;Czaja et al., 2003; Wu and Liu, 2005; Hu and Huang, 2006;Chen et al., 2019, 2020).
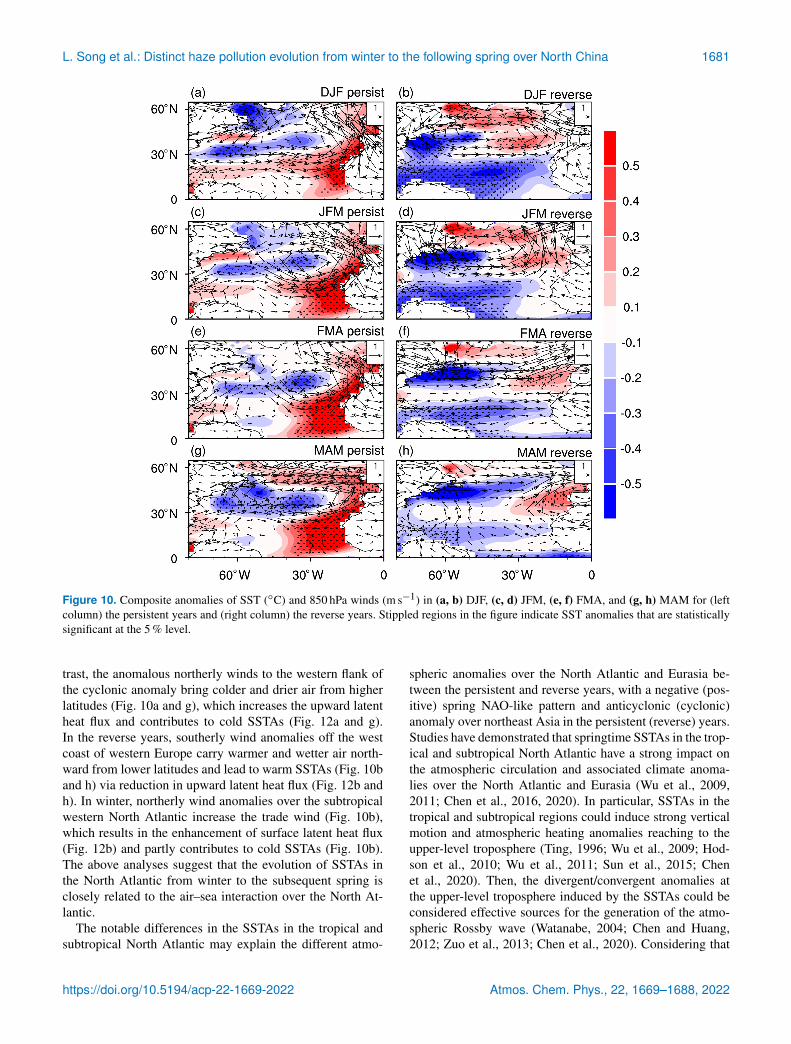
Evolutions of SSTAs in the North Atlantic are examinedin Fig. 10. In the persistent years, significant cold SSTAs areseen in the central North Atlantic around 30◦ N and off theeast coast of Canada, together with notable warm SSTAs inthe subtropical eastern North Atlantic with a northeastwardextension to the west coast of Europe (Fig. 10a). The warmSSTAs in the subtropical northeastern Pacific and the coldSSTAs in the central North Atlantic are maintained to thefollowing spring with an increase in the amplitude. In ad-dition, the high-latitude North Atlantic is covered by warmSSTAs in spring. This forms a significant tripolar SSTA pat-tern in spring. Note that the tripolar SSTA pattern is also
Atmos. Chem. Phys., 22, 1669–1688, 2022 https://doi.org/10.5194/acp-22-1669-2022

L. Song et al.: Distinct haze pollution evolution from winter to the following spring over North China 1679
Figure 7. Composite anomalies of boundary layer height (BLH, unit m) in (a, b) winter and (c, d) spring in the (a, c) persistent years andthe (b, d) reverse years. Stippled regions indicate anomalies that are statistically significant at the 5 % level.
Figure 8. Composite anomalies of 500 hPa geopotential height (shading, unit m) and wave activity fluxes (vectors, unit m2 s−2) in (a, b)winter and (c, d) spring in the (a, c) persistent years and the (b, d) reverse years.
https://doi.org/10.5194/acp-22-1669-2022 Atmos. Chem. Phys., 22, 1669–1688, 2022

1680 L. Song et al.: Distinct haze pollution evolution from winter to the following spring over North China
Figure 9. (a) Composite anomalies of the EAWR index, wind speed(“wspd”) at 850 hPa (4−1 m s−1), relative humidity (“rhum”) at850 hPa (%), BLH (101 m), and DECC (“DEC”) (10−2 km−1) aver-aged over the NCPR in winter for the persistent years (red bars) andthe reverse years (blue bars). (b) Composite anomalies of the NAOindex, wind speed at 850 hPa (m s−1), relative humidity at 850 hPa(%), BLH (101 m), and DECC (km−1) averaged over the NCPR inspring for the persistent years (red bars) and the reverse years (bluebars).
the first EOF mode of interannual variation in SSTAs inthe North Atlantic (not shown) (Chen et al., 2016, 2020).Studies have demonstrated that warm (cold) SSTAs in thetropical and subtropical North Atlantic related to the tripo-lar SST anomaly pattern could induce a negative NAO-likepattern via the Rossby wave type atmospheric response andwave–mean flow interaction process according to observa-tional analysis and numerical experiments (Peng et al., 2003;Pan, 2005; Czaja and Frankignoul, 2002; Chen et al., 2016,2020).
In the reverse years, significant cold SSTAs are seen inthe tropical and subtropical western North Atlantic in winter(Fig. 10b), which can persist to the following spring with adecrease in the amplitude (Fig. 10h) and are in sharp contrastto those in the persistent years (Fig. 10a, c, e, and g). It isreasonable to speculate that the opposite SSTAs in the trop-ical and subtropical North Atlantic may be responsible forthe opposite atmospheric anomalies over the North Atlantic,which will be confirmed later based on the linear barotropicmodel.
Evolutions of SSTAs in the North Atlantic from winterto the following spring are related to the air–sea interaction.Figure 11 shows composite anomalies of the surface net heatfluxes for the persistent and reverse years. Values of the sur-face heat fluxes have been taken to be positive (negative)when their directions are downward (upward) and contributeto warm (cold) SSTAs. We have also examined compositeanomalies of the SST tendency (not shown). It shows thatspatial patterns of anomalies of the SST tendency in mostparts of the North Atlantic are similar to those of the sur-face net heat flux anomalies. This suggests that changes inthe surface net heat fluxes can largely explain evolutions ofSSTAs in the North Atlantic from winter to the followingspring. For example, in the persistent years, significant pos-itive net heat flux anomalies are seen over the subtropicalnortheastern Atlantic from winter to spring (Fig. 11a, c, e,and g), which could explain the formation and enhancementof the positive SSTAs there (Fig. 11a, c, e, and g). In addition,the negative surface net heat flux anomalies to the east ofCanada explain the generation and maintenance of the nega-tive SSTAs there. Moreover, the positive surface net heat fluxanomalies over high latitudes contribute to warm SSTAs. Inthe reverse years, positive net heat flux anomalies appear offthe west coast of western Europe (Fig. 11b, d, f, h), whichexplain the maintenance of the warm SSTAs (Fig. 10b, d, f,h). In addition, positive net surface heat flux anomalies overthe subtropical western North Atlantic in February–March–April (FMA) and MAM (Fig. 11f and h) explain the decreasein the amplitude of the negative SSTAs there (Fig. 10f and h).
Surface net heat flux anomalies are related to the overly-ing atmospheric circulation changes. Surface heat flux con-sists of four components, including the surface longwave andshortwave radiation and the surface latent and sensible heatfluxes. We find that surface net heat flux anomalies (Fig. 12)are dominated by changes in the surface latent heat flux(Fig. 12). Amplitudes of the surface sensible heat fluxes andsurface longwave and shortwave radiation are much weakercompared to those of the surface latent heat flux and thus arenot presented. In the persistent years, the anomalous south-westerly winds over subtropical northeastern Atlantic in win-ter and spring oppose the climatological northeasterly winds(Fig. 10a and g). This results in a decrease in the total windspeed and decrease in the upward latent heat flux (Fig. 12aand g) and thus contributes to warm SSTAs (Fig. 10a andg). Note that the warm SSTAs in the subtropical northeast-ern Atlantic could induce an anomalous cyclone to its north-west via a Rossby wave type atmospheric response (Czajaand Frankignoul, 1999, 2002; Huang and Shukla, 2005; Huand Huang, 2006; Chen et al., 2016, 2020) and help main-tain the anomalous cyclone over the mid-latitude North At-lantic from winter to spring (Fig. 10a and g). Similarly, theanomalous easterly winds along 60◦ N over the North At-lantic oppose the climatological westerly winds (Fig. 10a andg), which leads to warm SSTAs there via reduction in windspeed and upward latent heat fluxes (Fig. 12a and g). By con-
Atmos. Chem. Phys., 22, 1669–1688, 2022 https://doi.org/10.5194/acp-22-1669-2022
L. Song et al.: Distinct haze pollution evolution from winter to the following spring over North China 1681
Figure 10. Composite anomalies of SST (◦C) and 850 hPa winds (m s−1) in (a, b) DJF, (c, d) JFM, (e, f) FMA, and (g, h) MAM for (leftcolumn) the persistent years and (right column) the reverse years. Stippled regions in the figure indicate SST anomalies that are statisticallysignificant at the 5 % level.
trast, the anomalous northerly winds to the western flank ofthe cyclonic anomaly bring colder and drier air from higherlatitudes (Fig. 10a and g), which increases the upward latentheat flux and contributes to cold SSTAs (Fig. 12a and g).In the reverse years, southerly wind anomalies off the westcoast of western Europe carry warmer and wetter air north-ward from lower latitudes and lead to warm SSTAs (Fig. 10band h) via reduction in upward latent heat flux (Fig. 12b andh). In winter, northerly wind anomalies over the subtropicalwestern North Atlantic increase the trade wind (Fig. 10b),which results in the enhancement of surface latent heat flux(Fig. 12b) and partly contributes to cold SSTAs (Fig. 10b).The above analyses suggest that the evolution of SSTAs inthe North Atlantic from winter to the subsequent spring isclosely related to the air–sea interaction over the North At-lantic.
The notable differences in the SSTAs in the tropical andsubtropical North Atlantic may explain the different atmo-
spheric anomalies over the North Atlantic and Eurasia be-tween the persistent and reverse years, with a negative (pos-itive) spring NAO-like pattern and anticyclonic (cyclonic)anomaly over northeast Asia in the persistent (reverse) years.Studies have demonstrated that springtime SSTAs in the trop-ical and subtropical North Atlantic have a strong impact onthe atmospheric circulation and associated climate anoma-lies over the North Atlantic and Eurasia (Wu et al., 2009,2011; Chen et al., 2016, 2020). In particular, SSTAs in thetropical and subtropical regions could induce strong verticalmotion and atmospheric heating anomalies reaching to theupper-level troposphere (Ting, 1996; Wu et al., 2009; Hod-son et al., 2010; Wu et al., 2011; Sun et al., 2015; Chenet al., 2020). Then, the divergent/convergent anomalies atthe upper-level troposphere induced by the SSTAs could beconsidered effective sources for the generation of the atmo-spheric Rossby wave (Watanabe, 2004; Chen and Huang,2012; Zuo et al., 2013; Chen et al., 2020). Considering that
https://doi.org/10.5194/acp-22-1669-2022 Atmos. Chem. Phys., 22, 1669–1688, 2022

1682 L. Song et al.: Distinct haze pollution evolution from winter to the following spring over North China
Figure 11. Composite anomalies of surface net heat fluxes (W m−2) in (a, b) DJF, (c, d) JFM, (e, f) FMA, and (g, h) MAM for (left column)the persistent years and (right column) the reverse years. Stippled regions in the figure indicate anomalies that are statistically significant atthe 5 % level.
the atmospheric wave trains extending from the North At-lantic to Eurasia in Fig. 6c and d resemble an atmosphericstationary Rossby wave with an equivalent barotropic verti-cal structure, the mechanism for their formation could be ex-amined based on the barotropic vorticity equation (Wu et al.,2011; Zuo et al., 2013; Chen et al., 2016, 2020; O’Reilly etal., 2018). Hence, in the following, we perform model simu-lations with a barotropic model (Sardeshmukh and Hoskins,1988; Watanabe, 2004; O’Reilly et al., 2018) to confirm thepossible roles of the spring SSTAs in the North Atlantic inthe formation of atmospheric anomalies over the North At-lantic and Eurasia. Studies indicate that the barotropic modelhas a good performance in capturing the key dynamics ofthe atmospheric response to the atmospheric heating associ-ated with the SSTAs in the tropical and subtropical regions(Wu et al., 2011; Sun et al., 2015; Zuo et al., 2013; Chenet al., 2016, 2020). Three experiments are performed: thefirst experiment is forced by the spring climatological meanvorticity (denoted as EXP_Ctrl); the second experiment isforced by the spring climatological mean vorticity plus the
given divergent anomalies over the subtropical northeasternAtlantic with a center at 20◦ N, 20◦W and maximum inten-sity of 7×10⁻⁶ s−1 according to the spatial pattern of springSSTAs in Fig. 10g (denoted as EXP_persist); the third ex-periment is forced by the spring climatological mean vortic-ity plus the given convergent anomalies over the subtropi-cal northwestern Atlantic with a center at 15◦ N, 60◦W andmaximum intensity of 7× 10⁻⁶ s−1 according to the spatialpattern of spring cold SSTAs in the tropical North Atlantic inFig. 10h (denoted as EXP_reverse). The above three experi-ments are integrated for 40 d.
Figure 13a displays the difference in atmospheric re-sponses averaged during model days 31–40 betweenEXP_persist and EXP_Ctrl with green contours representingthe prescribed divergent anomalies. In addition, the differ-ence in the responses between EXP_reverse and EXP_Ctrl isexhibited in Fig. 13b. It is noted that the barotropic model ex-periments can reach equilibrium state quickly within only afew days (Sardeshmukh and Hoskins, 1988; Zuo et al., 2013;Chen et al., 2016). Hence, the atmospheric responses aver-
Atmos. Chem. Phys., 22, 1669–1688, 2022 https://doi.org/10.5194/acp-22-1669-2022

L. Song et al.: Distinct haze pollution evolution from winter to the following spring over North China 1683
Figure 12. Composite anomalies of surface latent heat fluxes (W m−2) in (a, b) DJF, (c, d) JFM, (e, f) FMA, and (g, h) MAM for (leftcolumn) the persistent years and (right column) the reverse years. Stippled regions in the figure indicate anomalies that are statisticallysignificant at the 5 % level.
aged during model days 31–40 are highly similar to thoseaveraged during other model days (not shown) (e.g., 25–35and 20–40 d). In general, the barotropic model experimentscan well reproduce the distinct atmospheric anomalies be-tween the persistent and reverse years.
In response to the prescribed divergent anomalies over thesubtropical northeastern Atlantic related to the warm SSTAsthere, there appears a positive NAO-like pattern with negativegeopotential anomalies over mid-latitudes (along 30◦ N) andpositive anomalies over high latitudes (along 60◦ N) of theNorth Atlantic (Fig. 13a), largely similar to the spatial pat-tern of spring atmospheric anomalies in the persistent yearsin Fig. 8c. By contrast, in response to the prescribed con-vergent anomalies over the subtropical northwestern Atlanticassociated with the cold SSTAs, there exists a negative NAO-like pattern, with negative geopotential anomalies over highlatitudes (along 60◦ N) and negative anomalies over mid-latitudes (along 30◦ N) of the North Atlantic (Fig. 13b),in concert with the spatial distribution of the atmosphericanomalies in the reverse years in Fig. 8d. In addition, it is
surprising to see that the barotropic model experiment wellsimulates the anticyclonic (cyclone) anomaly over northeastAsia and related southerly (northerly) wind anomalies overthe NCPR in response to the prescribed forcing in the sub-tropical northeastern (northwestern) Atlantic as indicated inFig. 13a (b). This is consistent with the observed spring at-mospheric anomalies over East Asia for the persistent (re-verse) years, although the centers of the wave train over Eura-sia in the barotropic experiments are not totally identical tothose in the observations. In general, the above barotropic ex-periments further confirm the notion that the striking differ-ences in the atmospheric anomalies over the North Atlanticand Eurasia (including northeast Asia) between the persis-tent and reverse years can be attributable to the distinct SSTanomalies in the North Atlantic.
5 Summary and discussions
This study examines different evolutions of haze pollutionover the NCPR from winter to the succedent spring accord-
https://doi.org/10.5194/acp-22-1669-2022 Atmos. Chem. Phys., 22, 1669–1688, 2022

1684 L. Song et al.: Distinct haze pollution evolution from winter to the following spring over North China
Figure 13. (a) Barotropic model height perturbation (unit m) av-eraged from days 31 to 40 as a response to the given divergenceanomaly (green contours with an interval of 10−6 s−1) over thesubtropical eastern North Atlantic with the center at 20◦ N, 20◦W.(b) Barotropic model height perturbation (unit m) averaged fromdays 31 to 40 as a response to the given convergence anomaly (greencontours with an interval of 10−6 s−1) over the subtropical westernNorth Atlantic with the center at 15◦ N, 60◦W. Vectors in (a, b)indicate the corresponding wave activity fluxes.
ing to the analyses based on observational data and reanal-yses. It is found that interannual variation in haze pollution(as indicated by the DECC) over the NCPR in winter has amarginal positive relation with that in the following spring,with a correlation coefficient of about 0.3 over 1980–2011between the haze pollution index in winter and spring, sig-nificant at the 90 % confidence level. This indicates that inmost years when haze pollution over the NCPR is more (less)serious in winter, air conditions in the following spring arealso worse (better) than normal. Additionally, it is found thatthere are some years when DECC anomalies in the followingspring are significantly opposed to those in winter. We thenfocus on comparing atmospheric anomalies for the two typesof year (i.e., persistent years and reverse years) to understandwhy there occur two completely different evolutions of hazepollution over the NCPR from winter to the following spring,as schematically summarized in Fig. 14.
In the persistent years, an above-normal DECC (indicat-ing more serious haze pollution) over the NCPR could bemaintained to the succedent spring (Fig. 14a and b). Thisis attributable to the persistence of the anticyclonic anomalyover northeast Asia and associated southerly wind anoma-
lies to its west side over the NCPR (Fig. 14a and b). Thesoutherly wind anomalies over the NCPR oppose the cli-matological mean northerly winds, reduce the surface windspeed and BLH, and decrease the dispersion of the pollutants,which finally lead to more serious haze pollution in winterand spring. In addition, the southerly wind anomalies carrywetter and warmer air from lower latitudes and lead to anincrease in the relative humidity, which is also conducive tohaze pollution. As has been demonstrated by previous stud-ies, the increase in the relative humidity is conducive to thegeneration of secondary organic compounds and secondaryaerosol species, which also makes an important contributionto the occurrence of haze pollution events over the NCPR(Yu et al., 2005; Hennigan et al., 2008). Formation of the an-ticyclonic anomaly over northeast Asia in winter is closelyrelated to the EAWR teleconnection pattern, while in springit is related to the positive phase of the spring NAO and warmSSTAs in the subtropical northeastern Atlantic (Fig. 14a).
In the reverse years, an anticyclonic anomaly also appearsover northeast Asia and associated southerly wind anoma-lies occur over NCPR in winter, which contribute to anabove-normal DECC (Fig. 14c). In addition, formation ofthe anomalous anticyclone over northeast Asia is also re-lated to the EAWR pattern (Fig. 14c). However, in the follow-ing spring, northeast Asia is covered by a cyclonic anomalywhich is related to the positive phase of the NAO and coldSSTAs in the subtropical North Atlantic (Fig. 14d), which isin sharp contrast to the persistent years. The northerly windanomalies over the NCPR to the west flank of the anomalouscyclone result in a decrease in the DECC over the NCPR viareduction in relative humidity and increasing surface windspeed (Fig. 14d).
The distinct evolutions of atmospheric anomalies over theNorth Atlantic and Eurasia (including northeast Asia) arefound to be closely related to the different evolutions ofSSTAs in the North Atlantic. In the persistent (reverse) years,positive (negative) SSTAs in the subtropical northeastern(northwestern) Atlantic are maintained to the followingspring due to the positive air–sea interaction process. Then,positive (negative) spring SSTAs in the subtropical NorthAtlantic contribute to the formation of a negative (positive)NAO-like pattern over the North Atlantic, the generation ofanticyclonic (cyclonic) anomaly over northeast Asia, and theoccurrence of associated southerly (northerly) wind anoma-lies over the NCPR via an atmospheric Rossby wave train.Results of barotropic model simulations with three experi-ments further confirm the observed findings.
In this study, we find that negative SSTAs in the sub-tropical northwestern Atlantic play an important role in theformation of the positive NAO-like atmospheric anomaly inthe reverse years. It seems that wintertime surface heat fluxchanges induced by the EAWR-related atmospheric anoma-lies cannot fully explain the formation of strong cold SSTAsin the subtropical northwestern Atlantic. This suggests thatother factors, which remain to be explored, may also be im-
Atmos. Chem. Phys., 22, 1669–1688, 2022 https://doi.org/10.5194/acp-22-1669-2022

L. Song et al.: Distinct haze pollution evolution from winter to the following spring over North China 1685
Figure 14. Schematic diagram showing evolutions of DECC, SST, and atmospheric circulation anomalies from winter to spring for (a, b) thepersistent cases and (c, d) the reverse cases. Solid red contours (dashed blue contours) indicate anticyclonic circulation anomalies (cycloniccirculation anomalies). Red (blue) shading in the North Atlantic indicates positive (negative) SST anomalies.
portant for the formation of the negative SST anomalies.Studies have indicated that ENSO-related SSTAs in the trop-ical Pacific also have a strong impact on atmospheric anoma-lies over East Asia and haze pollution over eastern China(Wang et al., 2000; Li et al., 2017; Zhang et al., 2017; Heet al., 2019). We have examined evolutions of SSTAs in thetropical Pacific from winter to the subsequent spring in thepersistent and reverse years. Results show that SSTAs inthe tropical Pacific related to ENSO are weak in both thepersistent and the reverse years (not shown). This suggeststhat ENSO-related SSTAs may not make a contribution tothe interannual variation in haze pollution over the NCPR,which is consistent with a recent study by He et al. (2019). Itis reported that ENSO-related SSTAs in the tropical Pacifichave a significant impact on the haze pollution over southernChina. By contrast, the impact of ENSO on the haze pollu-tion over North China is weak (He et al., 2019). Furthermore,previous studies have indicated that Arctic sea ice anomaliesover Eurasia may also be important for the formation of theatmospheric anomalies over East Asia in association with thehaze pollution over north China (Wang et al., 2015; Yin andWang, 2017). We have examined Arctic sea ice anomaliesin winter and spring for the persistent and reverse years. Wefind that sea ice anomalies over most portions of the Arcticare weak and statistically insignificant (results not shown).This suggests that Arctic sea ice changes are not likely tohave an important role in the distinct evolutions of haze pol-lution from winter to the subsequent spring over the NCPRfor the persistent and reverse years.
Code availability. Figures in this study were constructed with theNCAR Command Language (http://www.ncl.ucar.edu/, last access:
8 September 2019). All codes used in this study are available fromthe corresponding author (Shangfeng Chen).
Data availability. Atmospheric data are derived from the NCEP–NCAR reanalysis (http://www.esrl.noaa.gov/psd/data/gridded/data.ncep.reanalysis.html, last access: 6 February 2021) (NCEP-NCAR, 2021). SST data are obtained from http://www.esrl.noaa.gov/psd/data/gridded/data.noaa.ersst.v5.html (last access: 6 Febru-ary 2021) (NOAA, 2021). Atmospheric teleconnection indicesare obtained from https://www.cpc.ncep.noaa.gov/data/teledoc/telecontents.shtml (last access: 6 February 2021) (CPC, 2021). Sur-face data of visibility and relative humidity can be obtained fromthe authors upon request.
Author contributions. LS and SC designed the research, per-formed the analysis, and wrote the paper. WC, JG, CC, and YWdiscussed the results and commented on the manuscript.
Competing interests. The contact author has declared that nei-ther they nor their co-authors have any competing interests.
Disclaimer. Publisher’s note: Copernicus Publications remainsneutral with regard to jurisdictional claims in published maps andinstitutional affiliations.
Acknowledgements. We thank the three anonymous reviewersfor their constructive suggestions and comments, which helped toimprove the paper.
https://doi.org/10.5194/acp-22-1669-2022 Atmos. Chem. Phys., 22, 1669–1688, 2022

1686 L. Song et al.: Distinct haze pollution evolution from winter to the following spring over North China
Financial support. This research has been supported by the Bei-jing Natural Science Foundation (grant no. 8212025), the Na-tional Natural Science Foundation of China (grant nos. 41721004and 41961144025), and the Chinese Academy of Sciences KeyResearch Program of Frontier Sciences (grant no. QYZDY-SSWDQC024).
Review statement. This paper was edited by Ashu Dastoor andreviewed by three anonymous referees.
References
Cai, W. J., Li, K., Liao, H., Wang, H. J., and Wu, L. X.: Weatherconditions conducive to Beijing severe haze more frequent underclimate change, Nat. Clim. Change, 7, 257–263, 2017.
Chang, L., Xu, J., Tie, X., and Wu, J.: Impact of the 2015 ElNiño event on winter air quality in China, Sci. Rep., 6, 34275,https://doi.org/10.1038/srep34275, 2016.
Che, H., Zhang, X., Li, Y., Zhou, Z., Qu, J., and Hao, X.: Hazetrends over the capital cities of 31 provinces in China, 1981–2005, Theor. Appl. Climatol., 97, 235–242, 2009.
Chen, G. S. and Huang, R. H.: Excitation mechanisms of the tele-connection patterns affecting the July precipitation in NorthwestChina, J. Climate, 25, 7834–7851, 2012.
Chen, S., Wu, R., and Chen, W.: The changing relationship be-tween interannual variations of the North Atlantic Oscillationand northern tropical Atlantic SST, J. Climate, 28, 485–504,2015.
Chen, S., Wu, R., and Liu, Y.: Dominant modes of interannual vari-ability in Eurasian surface air temperature during boreal spring,J. Climate, 29, 1109–1125, 2016.
Chen, S., Guo, J., Song, L., Li, J., Liu, L., and Cohen, J.: Interan-nual variation of the spring haze pollution over the North ChinaPlain: Roles of atmospheric circulation and sea surface tempera-ture, Int. J. Climatol., 39, 783–798, 2019.
Chen, S., Guo, J., Song, L., Cohen, J., and Wang, Y.: Temporaldisparity of the atmospheric systems contributing to interannualvariation of wintertime haze pollution in the North China Plain,Int. J. Climatol., 40, 128–144, 2020.
Cheng, J., Su, J., Cui, T., Li, X., Dong, X., Sun, F., Yang, Y.,Tong, D., Zheng, Y., Li, Y., Li, J., Zhang, Q., and He, K.:Dominant role of emission reduction in PM2.5 air quality im-provement in Beijing during 2013–2017: a model-based de-composition analysis, Atmos. Chem. Phys., 19, 6125–6146,https://doi.org/10.5194/acp-19-6125-2019, 2019.
Climate Prediction Center (CPC): Climate Prediction Center at-mospheric teleconnections, CPC [data set], available at: https://www.cpc.ncep.noaa.gov/data/teledoc/telecontents.shtml, last ac-cess: 6 February 2021.
Cohen, A., Brauer, M., Burnett, R., Anderson, H., Frostad, J., Es-tep, K., Balakrishnan, K., Brunekreef, B., Dandona, L., Dandona,R., Feigin, V., Freedman, G., Hubbell, B., Jobling, A., Kan, H.,Knibbs, L., Liu, Y., Martin, R., Morawska, L., Pope, C., Shin,H., Straif, K., Shaddick, G., Thomas, M., Dingenen, R., Donke-laar, A., Vos, T., Murray, C., and Forouzanfar, M.: Estimates and25-year trends of the global burden of disease attributable to am-
bient air pollution: An analysis of data from the Global Burdenof Diseases Study 2015, Lancet, 389, 1907–1918, 2017.
Craig, C. D. and Faulkenberry, G. D.: The application of ridit analy-sis to detect trends in visibility, Atmos. Environ., 13, 1617–1622,1979.
Czaja, A. and Frankignoul, C.: Influence of the North Atlantic SSTon the atmospheric circulation, Geophys. Res. Lett., 26, 2969–2972, 1999.
Czaja, A. and Frankignoul, C.: Observed impact of Atlantic SSTanomalies on the North Atlantic oscillation, J. Climate, 15, 606–623, 2002.
Czaja, A., van der Vaart P., and Marshall, J.: A diagnostic studyof the role of remote forcing in tropical Atlantic variabil-ity, J. Climate, 15, 3280–3290, https://doi.org/10.1175/1520-0442(2002)015<3280:ADSOTR>2.0.CO;2, 2002.
Czaja, A., Robertson, A. W., and Huck, T.: The role of Atlanticocean–atmosphere coupling in affecting North Atlantic Oscilla-tion variability. The North Atlantic Oscillation: Climatic Signifi-cance and Environmental Impact, edited by: Hurrell, J. W., Geo-phys. Monogr., vol. 134, Amer. Geophys. Union, 147–172, 2003.
Dang, R. and Liao, H.: Severe winter haze days in the Beijing–Tianjin–Hebei region from 1985 to 2017 and the roles of an-thropogenic emissions and meteorology, Atmos. Chem. Phys.,19, 10801–10816, https://doi.org/10.5194/acp-19-10801-2019,2019.
Ding, Y. H. and Liu, Y. J.: Analysis of long-term variations of fogand haze in China in recent 50 years and their relations with at-mospheric humidity, Sci. China Earth Sci., 57, 36–46, 2014.
Ding, Y., Wu, P., Liu, Y., and Song, Y.: Environmental and dynamicconditions for the occurrence of persistent haze events in NorthChina, Engineering, 3, 266–271, 2017.
Duan, W., Song, L., Li, Y., and Mao, J. Modulation of PDO onthe predictability of the interannual variability of early summerrainfall over South China, J. Geophys. Res., 118, 13008–13021,https://doi.org/10.1002/2013JD019862, 2013.
Fu, G. Q., Xu, W. Y., Yang, R. F., Li, J. B., and Zhao, C. S.: Thedistribution and trends of fog and haze in the North China Plainover the past 30 years, Atmos. Chem. Phys., 14, 11949–11958,https://doi.org/10.5194/acp-14-11949-2014, 2014.
Guo, J., Liu, H., Li, Z., Rosenfeld, D., Jiang, M., Xu, W., Jiang,J. H., He, J., Chen, D., Min, M., and Zhai, P.: Aerosol-inducedchanges in the vertical structure of precipitation: a perspectiveof TRMM precipitation radar, Atmos. Chem. Phys., 18, 13329–13343, https://doi.org/10.5194/acp-18-13329-2018, 2018.
Guo, J. P., Su, T., Li, Z., Miao, Y., Li, J., Liu, H., Xu, H., Cribb, M.,and Zhai, P.: Declining frequency of summertime local-scale pre-cipitation over eastern China from 1970 to 2010 and its potentiallink to aerosols, Geophys. Res. Lett., 44, 5700–5708, 2017.
He, C., Liu, R., Wang, X., Liu, S. C., Zhou, T., and Liao, W.: Howdoes El Niño-Southern Oscillation modulate the interannual vari-ability of winter haze days over eastern China?, Sci. Total Envi-ron., 651, 1892–1902, 2019.
Hennigan, C. J., Bergin, M. H., Dibb, J. E., and Weber, R.J.: Enhanced secondary organic aerosol formation due to wa-ter uptake by fine particles, Geophys. Res. Lett., 35, L18801,https://doi.org/10.1029/2008GL035046, 2008.
Hodson, D. L. R., Sutton, R. T., Cassou, C., Keenlyside, N., Oku-mura, Y., and Zhou, T. J.: Climate impacts of recent multidecadal
Atmos. Chem. Phys., 22, 1669–1688, 2022 https://doi.org/10.5194/acp-22-1669-2022

L. Song et al.: Distinct haze pollution evolution from winter to the following spring over North China 1687
changes in Atlantic Ocean sea surface temperature: A multi-model comparison, Clim. Dynam., 34, 1041–1058, 2010.
Hu, Z.-Z. and Huang, B.: On the significance of the relationshipbetween the North Atlantic Oscillation in early winter and At-lantic sea surface temperature anomalies, J. Geophys. Res., 111,D12103, https://doi.org/10.1029/2005JD006339, 2006.
Huang, B. and Shukla, J.: Ocean–atmosphere interactions in thetropical and subtropical Atlantic Ocean. J. Climate, 18, 1652–1672, 2005.
Huang B., Thorne P. W., Banzon, V. F., Boyer, T., Chepurin, G.,Lawrimore, J. H., Menne, M. J., Smith, T. M., Vose, R. S., andZhang, H. M.: Extended reconstructed sea surface temperature,version 5 (ERSSTv5): Upgrades, validations, and intercompar-isons, J. Climate, 30, 8179–8205, https://doi.org/10.1175/JCLI-D-16-0836.1, 2017.
Hurrell, J. W.: Decadal trends in the North Atlantic Oscillation, Sci-ence, 269, 676–679, 1995.
Kalnay, E., Kanamitsu, M., Kistler, R., Collins, W., Deaven, D.,Gandin, L., Iredell, M., Saha, S., White, G., Woollen, J., Zhu, Y.,Leetmaa, A., Reynolds, R., Chelliah, M., Ebisuzaki, W., Higgins,W., Janowiak, J., Mo, K. C., Ropelewski, C., Wang, J., Jenne, R.,and Joseph, D.: The NCEP/NCAR 40-year reanalysis project, B.Am. Meteorol. Soc., 77, 437–471, 1996.
Kerr, R. A.: A North Atlantic climate pacemaker for the centuries,Science, 288, 1984–1986, 2000.
Koren, I., Altaratz, O., Remer, L. A., Feingold, G., Martins, J. V.,and Heiblum, R. H.: Aerosol-induced intensification of precipi-tation from the Tropics to the mid-latitudes, Nat. Geosci., 5, 118–122, 2012.
Koschmieder, H.: Theorie der horizontalen Sichtweite Beit, Physicsof the Atmosphere, 12, 33–55, 1926.
Li, J., Li, C., and Zhao, C.: Different trends in extreme and mediansurface aerosol extinction coefficients over China inferred fromquality-controlled visibility data, Atmos. Chem. Phys., 18, 3289–3298, https://doi.org/10.5194/acp-18-3289-2018, 2018.
Li, Q., Zhang, R., and Wang, Y.: Interannual variation of the win-tertime fog-haze days across central and eastern China and itsrelation with East Asian winter monsoon, Int. J. Climatol., 36,346–354, 2016.
Li, T., Wang, B., Wu, B., and Zhou, T.: Theories on formation of ananomalous anticyclone in Western North Pacific during El Niño:a review, J. Meteorol. Res. 31, 987–1006, 2017.
Li, X., Yu, C., Deng, X., He, D., Zhao, Z., Mo, H., Mo, J.,and Wu, Y.: Mechanism for synoptic and intra-seasonal oscil-lation of visibility in Beijing-Tianjin-Hebei region, Theor. Appl.Climatol., 143, 1005–1015, https://doi.org/10.1007/s00704-020-03466-z, 2021.
Liu, T., Gong, S., He, J., Yu, M., Wang, Q., Li, H., Liu, W., Zhang,J., Li, L., Wang, X., Li, S., Lu, Y., Du, H., Wang, Y., Zhou, C.,Liu, H., and Zhao, Q.: Attributions of meteorological and emis-sion factors to the 2015 winter severe haze pollution episodes inChina’s Jing-Jin-Ji area, Atmos. Chem. Phys., 17, 2971–2980,https://doi.org/10.5194/acp-17-2971-2017, 2017.
Lu, X., Lin, C., Li, W., Chen, Y., Huang, Y., Fung, J., and Lau,A.: Analysis of the adverse health effects of PM2.5 from 2001to 2017 in China and the role of urbanization in aggravating thehealth burden, Sci. Total Environ., 652, 683–695, 2019.
Ma, J. and Zhang, R.: Opposite interdecadal variations of winter-time haze occurrence over North China Plain and Yangtze River
Delta regions in 1980–2013, Sci. Total Environ., 732, 139240,https://doi.org/10.1016/j.scitotenv.2020.139240, 2020.
Mantua, N. J., Hare, S. R., Zhang, Y., Wallace, J. M., and Fran-cis, R. C.: A Pacific interdecadal climate oscillation with impactson salmon production, B. Am. Meteorol. Soc., 78, 1069–1079,1997.
NCEP-NCAR: Monthly and daily mean atmospheric reanalysisdata, NCEP-NCAR [data set], available at: http://www.esrl.noaa.gov/psd/data/gridded/data.ncep.reanalysis.html, last access: 6February 2021.
NOAA: NOAA Extended Reconstructed Sea Surface Temperature(SST) V5 data sets, NOAA [data set], available at: http://www.esrl.noaa.gov/psd/data/gridded/data.noaa.ersst.v5.html, last ac-cess: 6 February 2021.
O’Reilly, C. H., Woollings, T., and Zanna, L.: The impact of trop-ical precipitation on summertime Euro-Atlantic circulation via acircumglobal wave train, J. Climate, 31, 6481–6504, 2018.
Pan, L.-L.: Observed positive feedback between the NAO and theNorth Atlantic SSTA tripole, Geophys. Res. Lett., 32, L06707,https://doi.org/10.1029/2005GL022427, 2005.
Peng, S., Robinson, W. A., and Li, S.: Mechanisms for the NAOresponses to the North Atlantic SST tripole, J. Climate, 16, 1987–2004, 2003.
Rodwell, M. J. and Folland, C. K.: Atlantic air–sea interaction andseasonal predictability, Q. J. Roy. Meteor. Soc., 128, 1413–1443,2002.
Rosenfeld, D., Dai, J., Yu, X., Yao, Z., Xu, X., Yang, X., and Du,C.: Inverse relations between amounts of air pollution and oro-graphic precipitation, Science, 315, 1396–1398, 2007.
Sardeshmukh, P. D. and Hoskins, B. J.: The generation of globalrotational flow by steady idealized tropical divergence, J. Atmos.Sci., 45, 1228–1251, 1988.
Sun, C., Li, J. P., and Zhao, S. Remote influence of Atlantic mul-tidecadal variability on Siberian warm season precipitation, Sci.Rep., 5, 16853, https://doi.org/10.1038/srep16853, 2015.
Takaya, K. and Nakamura, H.: A formulation of a phaseindependentwave activity flux for stationary and migratory quasigeostrophiceddies on a zonally varying basic flow, J. Atmos. Sci., 58, 608–627, 2001.
Tie, X., Huang, R., and Dai, W.: Effect of heavy haze and aerosolpollution on rice and wheat productions in China, Sci. Rep., 6,29612, https://doi.org/10.1038/srep29612, 2016.
Ting, M. F.: Steady linear response to tropical heating in barotropicand baroclinic models, J. Atmos. Sci., 53, 1698–1709, 1996.
Visbeck, M., Chassignet, E., Curry, R., and Delworth, T.: Theocean’s response to North Atlantic variability. The North AtlanticOscillation, edited by: Hurrell, J., Kushnir, Y., Ottersen, G., andVisbeck, M., Geophys. Monogr., 134, 113–145, 2003.
Wang, B., Wu, R. G., and Fu, X. H.: Pacific–East Asian teleconnec-tion: how does ENSO affect East Asian climate?, J. Climate, 13,1517–1536, 2000.
Wang, F., Guo, J., Wu, Y., Zhang, X., Deng, M., Li, X., Zhang,J., and Zhao, J.: Satellite observed aerosol-induced variability inwarm cloud properties under different meteorological conditionsover eastern China, Atmos. Environ., 84, 122–132, 2014.
Wang, H.-J. and Chen, H.-P.: Understanding the recent trend ofhaze pollution in eastern China: roles of climate change, At-mos. Chem. Phys., 16, 4205–4211, https://doi.org/10.5194/acp-16-4205-2016, 2016.
https://doi.org/10.5194/acp-22-1669-2022 Atmos. Chem. Phys., 22, 1669–1688, 2022

1688 L. Song et al.: Distinct haze pollution evolution from winter to the following spring over North China
Wang, H.-J., Chen, H.-P., and Liu, J.-P.: Arctic sea ice decline inten-sified haze pollution in eastern China, Atmos. Ocean. Sci. Lett.,8, 1–9, https://doi.org/10.3878/AOSL20140081, 2015.
Wang, L., Liu, Y., Zhang, Y., Chen, W., and Chen, S.: Time-varyingstructure of the wintertime Eurasian pattern: Role of the NorthAtlantic sea surface temperature and atmospheric mean flow,Clim. Dynam., 52, 2467–2479, 2019.
Wang, X., Wei, W., Cheng, S., Li, J., Zhang, H., and Lv, Z.: Charac-teristics and classification of PM2.5 pollution episodes in Beijingfrom 2013 to 2015, Sci. Total Environ., 612, 170–179, 2018.
Wang, Y., Zhang, R., and Saravanan, R.: Asian pollution climat-ically modulates mid-latitude cyclones following hierarchicalmodeling and observational analysis, Nat. Commun., 5, 3098,https://doi.org/10.1038/ncomms4098, 2014.
Watanabe, M.: Asian jet waveguide and a downstream extension ofthe North Atlantic Oscillation, J. Climate, 17, 4674–4691, 2004.
Wu, G., Li, Z.-Q., Fu, C., Zhang, X., Zhang, R.-Y., Zhang, R.,Zhou, T., Li, J., Li, J., Zhou, D., Wu, L., Zhou, L., He, B.,and Huang, R.: Advances in studying interactions betweenaerosols and monsoon in China, Sci. China Earth Sci., 59, 1–16,https://doi.org/10.1007/s11430-015-5198-z, 2016.
Wu, L. and Liu, Z.: North Atlantic decadal variability: Air–sea cou-pling, oceanic memory, and potential Northern Hemisphere res-onance, J. Climate, 18, 331–349, 2005.
Wu, R., Yang, S., Liu, S., Sun, L., Lian, Y., and Gao, Z.: NortheastChina summer temperature and North Atlantic SST, J. Geophys.Res., 116, D16116, https://doi.org/10.1029/2011JD015779,2011.
Wu, Z., Wang, B., Li, J., and Jin, F.-F.: An empirical sea-sonal prediction model of the East Asian summer monsoonusing ENSO and NAO, J. Geophys. Res., 114, D18120,https://doi.org/10.1029/2009JD011733, 2009.
Xiao, D., Li, Y., Fan, S., Zhang, R., Sun, J., and Wang, Y.: Plausibleinfluence of Atlantic Ocean SST anomalies on winter haze inChina, Theor. Appl. Climatol., 122, 249–257, 2014.
Yin, Z. and Wang, H.: The relationship between the sub-tropical western Pacific SST and haze over north-centralNorth China Plain, Int. J. Climatol., 36, 3479–3491,https://doi.org/10.1002/joc.4570, 2016.
Yin, Z. and Wang, H.: Role of atmospheric circulations in hazepollution in December 2016, Atmos. Chem. Phys., 17, 11673–11681, https://doi.org/10.5194/acp-17-11673-2017, 2017.
Yin, Z. and Wang, H.: The strengthening relationship betweenEurasian snow cover and December haze days in central NorthChina after the mid-1990s, Atmos. Chem. Phys., 18, 4753–4763,https://doi.org/10.5194/acp-18-4753-2018, 2018.
Yin, Z., Wang, H., and Guo, W.: Climatic change features of fogand haze in winter over North China and Huang-Huai Area, Sci.China Earth Sci., 58, 1370–1376, 2015.
Yu, J. Z., Huang, X. F., Xu, J., and Hu, M.: When aerosol sulfategoes up, so does oxalate: implication for the formation mecha-nisms of oxalate, Environ. Sci. Technol., 39, 128–133, 2005.
Zhang, J., Liu, J., Ren, L., Wei, J., Duan, J., Zhang, L., Zhou, X., andSun, Z.: PM2.5 induces male reproductive toxicity via mitochon-drial dysfunction, DNA damage and RIPK1 mediated apoptoticsignaling pathway, Sci. Total Environ., 634, 1435–1444, 2018.
Zhang, R. H., Min, Q. Y., and Su, J. Z.: Impact of El Niño on at-mospheric circulations over East Asia and rainfall in China: roleof the anomalous western North Pacific anticyclone, Sci. ChinaEarth Sci., 60, 1124–1132, 2017.
Zhang, X., Huang, Y., Zhu, W., and Rao, R.: Aerosol characteristicsduring summer haze episodes from different source regions overthe coast city of North China Plain, J. Quant. Spectrosc. Ra., 122,180–193, 2013.
Zhang, Y., Wallace, J. M., and Battisti, D. S.: ENSO-like inter-decadal variability: 1900–93, J. Climate, 10, 1004–1020, 1997.
Zhang, Y., Yin, Z., and Wang, H.: Roles of climate variabil-ity on the rapid increases of early winter haze pollution inNorth China after 2010, Atmos. Chem. Phys., 20, 12211–12221,https://doi.org/10.5194/acp-20-12211-2020, 2020.
Zhang, Z., Zhang, X., Gong, D., Kim, S.-J., Mao, R., and Zhao,X.: Possible influence of atmospheric circulations on winter hazepollution in the Beijing–Tianjin–Hebei region, northern China,Atmos. Chem. Phys., 16, 561–571, https://doi.org/10.5194/acp-16-561-2016, 2016.
Zhao, S., Li, J., and Sun, C.: Decadal variability in the oc-currence of wintertime haze in central eastern China tiedto the Pacific Decadal Oscillation, Sci. Rep., 6, 27424,https://doi.org/10.1038/srep27424, 2016.
Zhao, W., Chen, S., Chen, W., Yao, S., Nath, D., and Yu, B.: Inter-annual variations of the rainy season withdrawal of the monsoontransitional zone in China, Clim. Dynam., 53, 2031–2046, 2019.
Zuo, J., Li, W., Sun, C., Xu, L., and Ren, H.: Impact of the North At-lantic sea surface temperature tripole on the East Asian summermonsoon, Adv. Atmos. Sci., 30, 1173–1186, 2013.
Atmos. Chem. Phys., 22, 1669–1688, 2022 https://doi.org/10.5194/acp-22-1669-2022