Distinct Patterns of Cerebral Extravasation by Evans Blue and ...
9
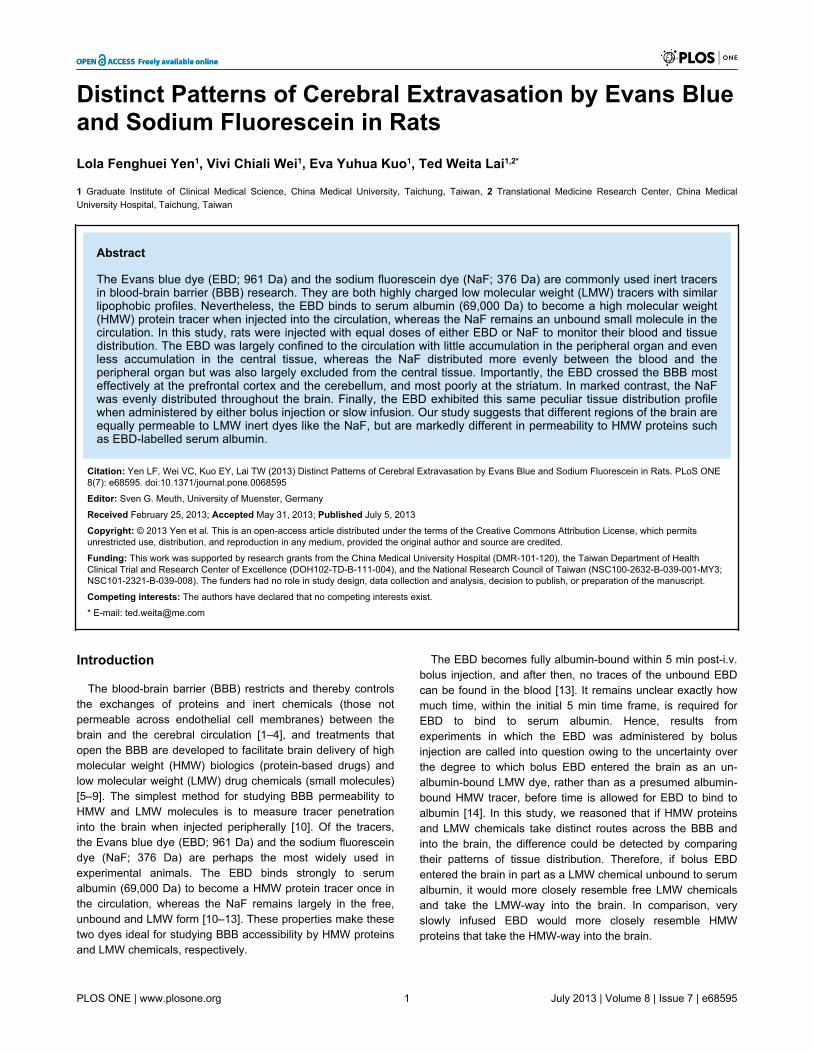
Distinct Patterns of Cerebral Extravasation by Evans Blue and Sodium Fluorescein in Rats Lola Fenghuei Yen 1 , Vivi Chiali Wei 1 , Eva Yuhua Kuo 1 , Ted Weita Lai 1,2* 1 Graduate Institute of Clinical Medical Science, China Medical University, Taichung, Taiwan, 2 Translational Medicine Research Center, China Medical University Hospital, Taichung, Taiwan Abstract The Evans blue dye (EBD; 961 Da) and the sodium fluorescein dye (NaF; 376 Da) are commonly used inert tracers in blood-brain barrier (BBB) research. They are both highly charged low molecular weight (LMW) tracers with similar lipophobic profiles. Nevertheless, the EBD binds to serum albumin (69,000 Da) to become a high molecular weight (HMW) protein tracer when injected into the circulation, whereas the NaF remains an unbound small molecule in the circulation. In this study, rats were injected with equal doses of either EBD or NaF to monitor their blood and tissue distribution. The EBD was largely confined to the circulation with little accumulation in the peripheral organ and even less accumulation in the central tissue, whereas the NaF distributed more evenly between the blood and the peripheral organ but was also largely excluded from the central tissue. Importantly, the EBD crossed the BBB most effectively at the prefrontal cortex and the cerebellum, and most poorly at the striatum. In marked contrast, the NaF was evenly distributed throughout the brain. Finally, the EBD exhibited this same peculiar tissue distribution profile when administered by either bolus injection or slow infusion. Our study suggests that different regions of the brain are equally permeable to LMW inert dyes like the NaF, but are markedly different in permeability to HMW proteins such as EBD-labelled serum albumin. Citation: Yen LF, Wei VC, Kuo EY, Lai TW (2013) Distinct Patterns of Cerebral Extravasation by Evans Blue and Sodium Fluorescein in Rats. PLoS ONE 8(7): e68595. doi:10.1371/journal.pone.0068595 Editor: Sven G. Meuth, University of Muenster, Germany Received February 25, 2013; Accepted May 31, 2013; Published July 5, 2013 Copyright: © 2013 Yen et al. This is an open-access article distributed under the terms of the Creative Commons Attribution License, which permits unrestricted use, distribution, and reproduction in any medium, provided the original author and source are credited. Funding: This work was supported by research grants from the China Medical University Hospital (DMR-101-120), the Taiwan Department of Health Clinical Trial and Research Center of Excellence (DOH102-TD-B-111-004), and the National Research Council of Taiwan (NSC100-2632-B-039-001-MY3; NSC101-2321-B-039-008). The funders had no role in study design, data collection and analysis, decision to publish, or preparation of the manuscript. Competing interests: The authors have declared that no competing interests exist. * E-mail: [email protected] Introduction The blood-brain barrier (BBB) restricts and thereby controls the exchanges of proteins and inert chemicals (those not permeable across endothelial cell membranes) between the brain and the cerebral circulation [1–4], and treatments that open the BBB are developed to facilitate brain delivery of high molecular weight (HMW) biologics (protein-based drugs) and low molecular weight (LMW) drug chemicals (small molecules) [5–9]. The simplest method for studying BBB permeability to HMW and LMW molecules is to measure tracer penetration into the brain when injected peripherally [10]. Of the tracers, the Evans blue dye (EBD; 961 Da) and the sodium fluorescein dye (NaF; 376 Da) are perhaps the most widely used in experimental animals. The EBD binds strongly to serum albumin (69,000 Da) to become a HMW protein tracer once in the circulation, whereas the NaF remains largely in the free, unbound and LMW form [10–13]. These properties make these two dyes ideal for studying BBB accessibility by HMW proteins and LMW chemicals, respectively. The EBD becomes fully albumin-bound within 5 min post-i.v. bolus injection, and after then, no traces of the unbound EBD can be found in the blood [13]. It remains unclear exactly how much time, within the initial 5 min time frame, is required for EBD to bind to serum albumin. Hence, results from experiments in which the EBD was administered by bolus injection are called into question owing to the uncertainty over the degree to which bolus EBD entered the brain as an un- albumin-bound LMW dye, rather than as a presumed albumin- bound HMW tracer, before time is allowed for EBD to bind to albumin [14]. In this study, we reasoned that if HMW proteins and LMW chemicals take distinct routes across the BBB and into the brain, the difference could be detected by comparing their patterns of tissue distribution. Therefore, if bolus EBD entered the brain in part as a LMW chemical unbound to serum albumin, it would more closely resemble free LMW chemicals and take the LMW-way into the brain. In comparison, very slowly infused EBD would more closely resemble HMW proteins that take the HMW-way into the brain. PLOS ONE | www.plosone.org 1 July 2013 | Volume 8 | Issue 7 | e68595
-
Upload
khangminh22 -
Category
Documents
-
view
0 -
download
0
Transcript of Distinct Patterns of Cerebral Extravasation by Evans Blue and ...
Distinct Patterns of Cerebral Extravasation by Evans Blueand Sodium Fluorescein in RatsLola Fenghuei Yen1, Vivi Chiali Wei1, Eva Yuhua Kuo1, Ted Weita Lai1,2*
1 Graduate Institute of Clinical Medical Science, China Medical University, Taichung, Taiwan, 2 Translational Medicine Research Center, China MedicalUniversity Hospital, Taichung, Taiwan
Abstract
The Evans blue dye (EBD; 961 Da) and the sodium fluorescein dye (NaF; 376 Da) are commonly used inert tracersin blood-brain barrier (BBB) research. They are both highly charged low molecular weight (LMW) tracers with similarlipophobic profiles. Nevertheless, the EBD binds to serum albumin (69,000 Da) to become a high molecular weight(HMW) protein tracer when injected into the circulation, whereas the NaF remains an unbound small molecule in thecirculation. In this study, rats were injected with equal doses of either EBD or NaF to monitor their blood and tissuedistribution. The EBD was largely confined to the circulation with little accumulation in the peripheral organ and evenless accumulation in the central tissue, whereas the NaF distributed more evenly between the blood and theperipheral organ but was also largely excluded from the central tissue. Importantly, the EBD crossed the BBB mosteffectively at the prefrontal cortex and the cerebellum, and most poorly at the striatum. In marked contrast, the NaFwas evenly distributed throughout the brain. Finally, the EBD exhibited this same peculiar tissue distribution profilewhen administered by either bolus injection or slow infusion. Our study suggests that different regions of the brain areequally permeable to LMW inert dyes like the NaF, but are markedly different in permeability to HMW proteins suchas EBD-labelled serum albumin.
Citation: Yen LF, Wei VC, Kuo EY, Lai TW (2013) Distinct Patterns of Cerebral Extravasation by Evans Blue and Sodium Fluorescein in Rats. PLoS ONE8(7): e68595. doi:10.1371/journal.pone.0068595
Editor: Sven G. Meuth, University of Muenster, Germany
Received February 25, 2013; Accepted May 31, 2013; Published July 5, 2013
Copyright: © 2013 Yen et al. This is an open-access article distributed under the terms of the Creative Commons Attribution License, which permitsunrestricted use, distribution, and reproduction in any medium, provided the original author and source are credited.
Funding: This work was supported by research grants from the China Medical University Hospital (DMR-101-120), the Taiwan Department of HealthClinical Trial and Research Center of Excellence (DOH102-TD-B-111-004), and the National Research Council of Taiwan (NSC100-2632-B-039-001-MY3;NSC101-2321-B-039-008). The funders had no role in study design, data collection and analysis, decision to publish, or preparation of the manuscript.
Competing interests: The authors have declared that no competing interests exist.
* E-mail: [email protected]
Introduction
The blood-brain barrier (BBB) restricts and thereby controlsthe exchanges of proteins and inert chemicals (those notpermeable across endothelial cell membranes) between thebrain and the cerebral circulation [1–4], and treatments thatopen the BBB are developed to facilitate brain delivery of highmolecular weight (HMW) biologics (protein-based drugs) andlow molecular weight (LMW) drug chemicals (small molecules)[5–9]. The simplest method for studying BBB permeability toHMW and LMW molecules is to measure tracer penetrationinto the brain when injected peripherally [10]. Of the tracers,the Evans blue dye (EBD; 961 Da) and the sodium fluoresceindye (NaF; 376 Da) are perhaps the most widely used inexperimental animals. The EBD binds strongly to serumalbumin (69,000 Da) to become a HMW protein tracer once inthe circulation, whereas the NaF remains largely in the free,unbound and LMW form [10–13]. These properties make thesetwo dyes ideal for studying BBB accessibility by HMW proteinsand LMW chemicals, respectively.
The EBD becomes fully albumin-bound within 5 min post-i.v.bolus injection, and after then, no traces of the unbound EBDcan be found in the blood [13]. It remains unclear exactly howmuch time, within the initial 5 min time frame, is required forEBD to bind to serum albumin. Hence, results fromexperiments in which the EBD was administered by bolusinjection are called into question owing to the uncertainty overthe degree to which bolus EBD entered the brain as an un-albumin-bound LMW dye, rather than as a presumed albumin-bound HMW tracer, before time is allowed for EBD to bind toalbumin [14]. In this study, we reasoned that if HMW proteinsand LMW chemicals take distinct routes across the BBB andinto the brain, the difference could be detected by comparingtheir patterns of tissue distribution. Therefore, if bolus EBDentered the brain in part as a LMW chemical unbound to serumalbumin, it would more closely resemble free LMW chemicalsand take the LMW-way into the brain. In comparison, veryslowly infused EBD would more closely resemble HMWproteins that take the HMW-way into the brain.
PLOS ONE | www.plosone.org 1 July 2013 | Volume 8 | Issue 7 | e68595

Despite the marked differences in functional molecularweight, results from experiments using either EBD or NaF areoften mix-matched in the literature, with original and reviewarticles going into details on the physiology, pathology, andpharmacology of the BBB but not clearly differentiatingbetween BBB against HMW tracers and BBB against LMWtracers. In this study, we report the blood and tissue distributionof the EBD and the NaF when injected into experimental rats.In particular, we used statistical pattern analysis to differentiatebetween the routes taken by either dyes into the brain.
Materials and Methods
AnimalsSixty-six male Sprague-Dawley rats (P49-P71; 260-400g)
were used in this study. They were housed and cared for inaccordance with the Institutional Guidelines of the ChinaMedical University for the Care and Use of ExperimentalAnimals (IGCMU-CUEA), and all experimental procedureswere approved by the Institutional Animal Care and UseCommittee (IACUC) of the China Medical University (Taichung,Taiwan) (Protocol No. 101-274-N).
Dye injection and sample collectionEach rat was anesthetized with urethane, and its femoral
vein and artery were cannulated to facilitate dye injection andblood collection. Body temperature was monitored at all times,and controlled at ~37 °C by an automated heating pad thatreceived active feedback from the rectal probe. The ratsreceived either (1) EBD by i.v. bolus injection, (2) NaF by i.v.bolus injection, or (3) EBD by i.v. slow infusion at a rate of 1ml/hr. The dyes were prepared as 4% solutions (except whenindicated otherwise) dissolved in 0.9% saline, and injected at adose of 2 ml/kg into the cannulated femoral vein. Bloodsamples were collected from the femoral artery prior to and at5, 30, 60, 90, and 120 min post-dye injection. Following thefinal blood collection, each rat was euthanized under urethane-anesthesia by perfusion with 0.9% saline to rid the circulationof dye (as described previously [15]). Thereafter, the tissueparenchyma containing only the extravasated dye wascollected.
Brain regionsThe isolated brain was coronal sectioned into 2-mm slices,
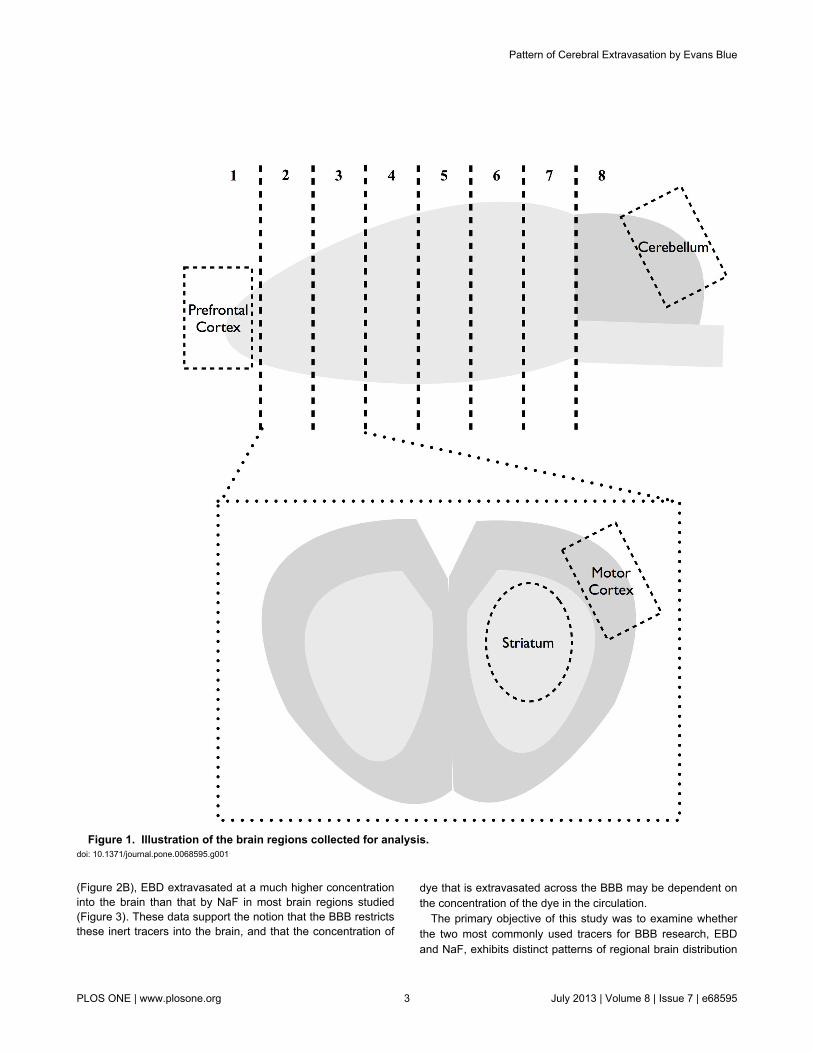
with cutting points corresponding to (distance from bregma):section 1: +5.6mm, section 2: +3.6mm, section 3: +1.6mm,section 4: -0.4mm, section 5: -2.4mm, and section 6: -4.4mm.As illustrated in Figure 1, the prefrontal cortex was isolatedfrom section 1, and the motor cortex and the striatum wereisolated from sections 2 and 3. The cerebellum wasconservatively isolated to avoid collection of the brain stemunderneath.
Sample processing and photospectrometryBlood and tissue samples were processed using the dye-
extraction method described previously, which completelyrecovered dyes from binding to tissue, serum albumin, andother proteins [16]. The blood samples were centrifuged at
10,000 rpm for 10 min, and the supernatants were mixed with1: 3 volume of 50% trichloroacetic acid (TCA; dissolved in 0.9%saline) and centrifuged again (10,000 rpm for 10 min). The finalsupernatants were diluted with 1: 300 volume of 50% TCA, andthen 1: 3 volume of 95% ethanol prior to photospectrometricdetermination of EBD (620nm excitation/680nm emission) andNaF (440nm excitation/525nm emission) fluorescence. Thebrain and liver tissues were dry-weighted, homogenized in 1: 3volume of 50% TCA, centrifuged (10,000 rpm for 10 min), andthe supernatants were diluted with 1: 3 volume of 95% ethanolprior to photospectrometric determination of EBD and NaFfluorescence.
Data presentation and statistical analysisData were presented as mean±SEM. The change in blood
concentration of dye in matched subjects was analyzed byTWO-WAY repeated measures ANOVA, followed by Sidak’smultiple comparisons test. Paired comparisons between bloodand liver dye contents of matched subjects were done withpaired t test. Comparisons of tissue dye contents betweenanimals receiving either EBD or NaF were done with unpaired ttest. Pattern analyses that examines regional specificity of dyedistribution in matched brain tissues were done by ONE-WAYrepeated measures ANOVA, followed by multiple comparisonstests with Tukey’s or Holm-Sidak. Cross-comparisons of dyedistribution patterns between two groups of animals withmatched brain tissues were done using TWO-WAY repeatedmeasures ANOVA.
Results
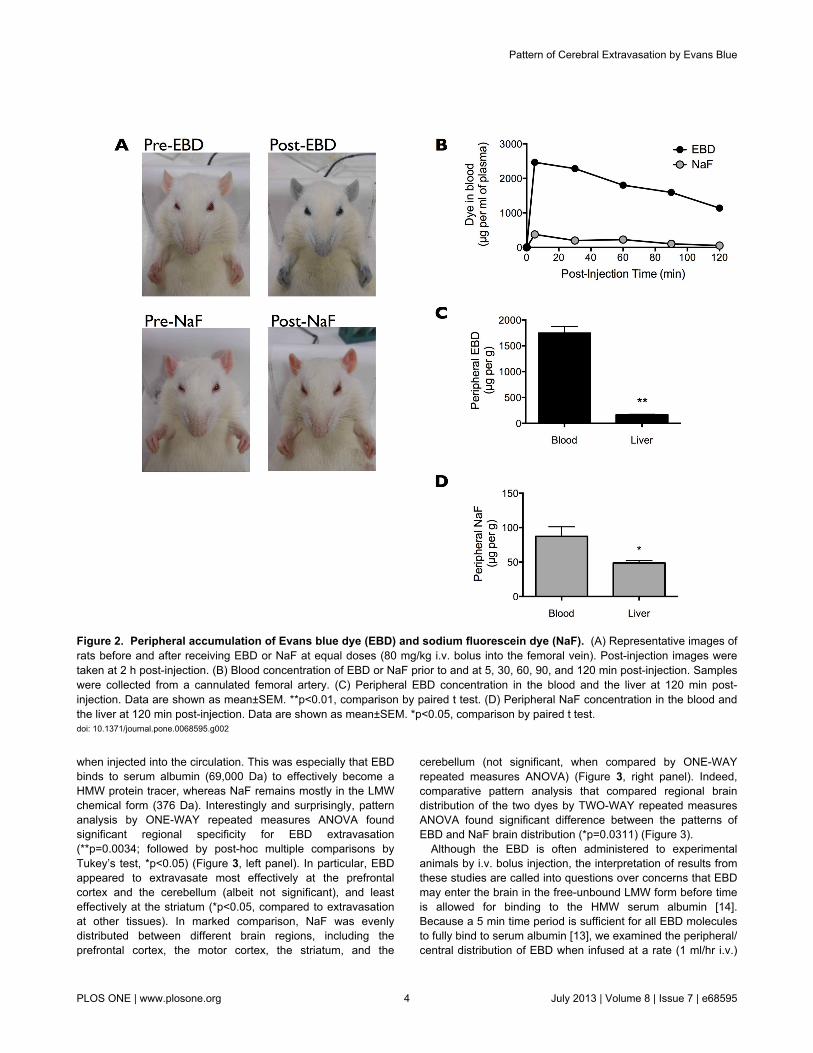
Consistent with previous reports, EBD (80 mg/kg i.v. bolus)rendered the rat eyes, ears, nose, and paws dark blue, and thisblue coloration persisted for the 2 h duration of the experiment(Figure 2A, top panels). In comparison, NaF (80 mg/kg i.v.bolus) turned the rat orange, but the coloration was much lessapparent and appeared to quickly subside over the 2 h courseof the experiment (Figure 2A, bottom panels).
Given that EBD but not NaF binds strongly to serum albumin[10–13], the peripheral distribution of the two dyes should bequite distinct. EBD injection resulted in a substantialaccumulation of the dye in the blood, especially in comparisonto the injection of the same-dose NaF (Figure 2B). Moreover,direct comparison between blood and liver dye contentsshowed that EBD resided largely in the blood (1746 ± 127µg/ml) rather than in the peripheral organ (164 ± 13 µg/g)(Figure 2C). In contrast, NaF was more evenly distributedbetween the blood (87 ± 14 µg/ml) and the peripheral organ (49± 4 µg/g) (Figure 2D). Our findings are in line with the ampleevidence showing that EBD but not NaF binds strongly toserum albumin, and thus EBD but not NaF residedpredominantly in the blood.
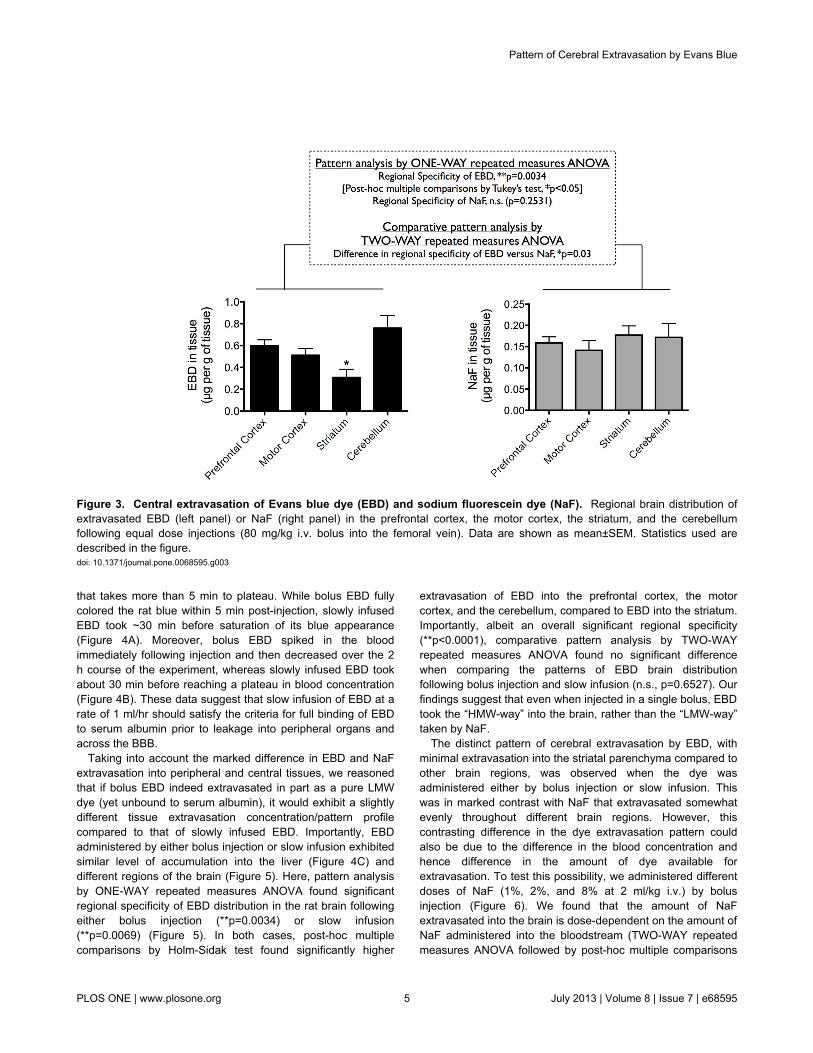
The BBB is known to restrict extravasation of inert tracerssuch as EBD and NaF into the brain [10], and in ourexperiment, these two dyes were indeed largely excluded fromthe brain parenchyma (Figure 3), with concentrations rangingfrom 0.2–0.9 µg per g of brain tissue compared to >40 µg per gof liver tissue. Moreover, and consistent with higher circulatingEBD concentration and lower circulating NaF concentration
Pattern of Cerebral Extravasation by Evans Blue
PLOS ONE | www.plosone.org 2 July 2013 | Volume 8 | Issue 7 | e68595
(Figure 2B), EBD extravasated at a much higher concentrationinto the brain than that by NaF in most brain regions studied(Figure 3). These data support the notion that the BBB restrictsthese inert tracers into the brain, and that the concentration of
dye that is extravasated across the BBB may be dependent onthe concentration of the dye in the circulation.
The primary objective of this study was to examine whetherthe two most commonly used tracers for BBB research, EBDand NaF, exhibits distinct patterns of regional brain distribution
Figure 1. Illustration of the brain regions collected for analysis. doi: 10.1371/journal.pone.0068595.g001
Pattern of Cerebral Extravasation by Evans Blue
PLOS ONE | www.plosone.org 3 July 2013 | Volume 8 | Issue 7 | e68595
when injected into the circulation. This was especially that EBDbinds to serum albumin (69,000 Da) to effectively become aHMW protein tracer, whereas NaF remains mostly in the LMWchemical form (376 Da). Interestingly and surprisingly, patternanalysis by ONE-WAY repeated measures ANOVA foundsignificant regional specificity for EBD extravasation(**p=0.0034; followed by post-hoc multiple comparisons byTukey’s test, *p<0.05) (Figure 3, left panel). In particular, EBDappeared to extravasate most effectively at the prefrontalcortex and the cerebellum (albeit not significant), and leasteffectively at the striatum (*p<0.05, compared to extravasationat other tissues). In marked comparison, NaF was evenlydistributed between different brain regions, including theprefrontal cortex, the motor cortex, the striatum, and the
cerebellum (not significant, when compared by ONE-WAYrepeated measures ANOVA) (Figure 3, right panel). Indeed,comparative pattern analysis that compared regional braindistribution of the two dyes by TWO-WAY repeated measuresANOVA found significant difference between the patterns ofEBD and NaF brain distribution (*p=0.0311) (Figure 3).
Although the EBD is often administered to experimentalanimals by i.v. bolus injection, the interpretation of results fromthese studies are called into questions over concerns that EBDmay enter the brain in the free-unbound LMW form before timeis allowed for binding to the HMW serum albumin [14].Because a 5 min time period is sufficient for all EBD moleculesto fully bind to serum albumin [13], we examined the peripheral/central distribution of EBD when infused at a rate (1 ml/hr i.v.)
Figure 2. Peripheral accumulation of Evans blue dye (EBD) and sodium fluorescein dye (NaF). (A) Representative images ofrats before and after receiving EBD or NaF at equal doses (80 mg/kg i.v. bolus into the femoral vein). Post-injection images weretaken at 2 h post-injection. (B) Blood concentration of EBD or NaF prior to and at 5, 30, 60, 90, and 120 min post-injection. Sampleswere collected from a cannulated femoral artery. (C) Peripheral EBD concentration in the blood and the liver at 120 min post-injection. Data are shown as mean±SEM. **p<0.01, comparison by paired t test. (D) Peripheral NaF concentration in the blood andthe liver at 120 min post-injection. Data are shown as mean±SEM. *p<0.05, comparison by paired t test.doi: 10.1371/journal.pone.0068595.g002
Pattern of Cerebral Extravasation by Evans Blue
PLOS ONE | www.plosone.org 4 July 2013 | Volume 8 | Issue 7 | e68595
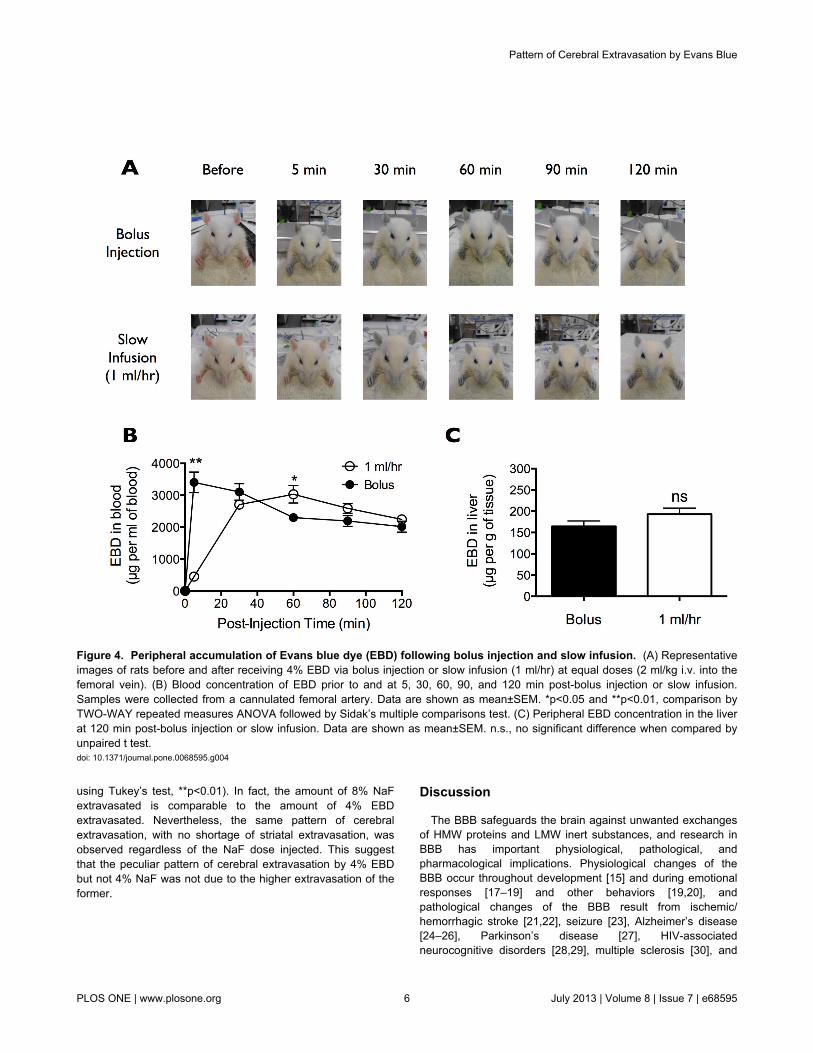
that takes more than 5 min to plateau. While bolus EBD fullycolored the rat blue within 5 min post-injection, slowly infusedEBD took ~30 min before saturation of its blue appearance(Figure 4A). Moreover, bolus EBD spiked in the bloodimmediately following injection and then decreased over the 2h course of the experiment, whereas slowly infused EBD tookabout 30 min before reaching a plateau in blood concentration(Figure 4B). These data suggest that slow infusion of EBD at arate of 1 ml/hr should satisfy the criteria for full binding of EBDto serum albumin prior to leakage into peripheral organs andacross the BBB.
Taking into account the marked difference in EBD and NaFextravasation into peripheral and central tissues, we reasonedthat if bolus EBD indeed extravasated in part as a pure LMWdye (yet unbound to serum albumin), it would exhibit a slightlydifferent tissue extravasation concentration/pattern profilecompared to that of slowly infused EBD. Importantly, EBDadministered by either bolus injection or slow infusion exhibitedsimilar level of accumulation into the liver (Figure 4C) anddifferent regions of the brain (Figure 5). Here, pattern analysisby ONE-WAY repeated measures ANOVA found significantregional specificity of EBD distribution in the rat brain followingeither bolus injection (**p=0.0034) or slow infusion(**p=0.0069) (Figure 5). In both cases, post-hoc multiplecomparisons by Holm-Sidak test found significantly higher
extravasation of EBD into the prefrontal cortex, the motorcortex, and the cerebellum, compared to EBD into the striatum.Importantly, albeit an overall significant regional specificity(**p<0.0001), comparative pattern analysis by TWO-WAYrepeated measures ANOVA found no significant differencewhen comparing the patterns of EBD brain distributionfollowing bolus injection and slow infusion (n.s., p=0.6527). Ourfindings suggest that even when injected in a single bolus, EBDtook the “HMW-way” into the brain, rather than the “LMW-way”taken by NaF.
The distinct pattern of cerebral extravasation by EBD, withminimal extravasation into the striatal parenchyma compared toother brain regions, was observed when the dye wasadministered either by bolus injection or slow infusion. Thiswas in marked contrast with NaF that extravasated somewhatevenly throughout different brain regions. However, thiscontrasting difference in the dye extravasation pattern couldalso be due to the difference in the blood concentration andhence difference in the amount of dye available forextravasation. To test this possibility, we administered differentdoses of NaF (1%, 2%, and 8% at 2 ml/kg i.v.) by bolusinjection (Figure 6). We found that the amount of NaFextravasated into the brain is dose-dependent on the amount ofNaF administered into the bloodstream (TWO-WAY repeatedmeasures ANOVA followed by post-hoc multiple comparisons
Figure 3. Central extravasation of Evans blue dye (EBD) and sodium fluorescein dye (NaF). Regional brain distribution ofextravasated EBD (left panel) or NaF (right panel) in the prefrontal cortex, the motor cortex, the striatum, and the cerebellumfollowing equal dose injections (80 mg/kg i.v. bolus into the femoral vein). Data are shown as mean±SEM. Statistics used aredescribed in the figure.doi: 10.1371/journal.pone.0068595.g003
Pattern of Cerebral Extravasation by Evans Blue
PLOS ONE | www.plosone.org 5 July 2013 | Volume 8 | Issue 7 | e68595
using Tukey’s test, **p<0.01). In fact, the amount of 8% NaFextravasated is comparable to the amount of 4% EBDextravasated. Nevertheless, the same pattern of cerebralextravasation, with no shortage of striatal extravasation, wasobserved regardless of the NaF dose injected. This suggestthat the peculiar pattern of cerebral extravasation by 4% EBDbut not 4% NaF was not due to the higher extravasation of theformer.
Discussion
The BBB safeguards the brain against unwanted exchangesof HMW proteins and LMW inert substances, and research inBBB has important physiological, pathological, andpharmacological implications. Physiological changes of theBBB occur throughout development [15] and during emotionalresponses [17–19] and other behaviors [19,20], andpathological changes of the BBB result from ischemic/hemorrhagic stroke [21,22], seizure [23], Alzheimer’s disease[24–26], Parkinson’s disease [27], HIV-associatedneurocognitive disorders [28,29], multiple sclerosis [30], and
Figure 4. Peripheral accumulation of Evans blue dye (EBD) following bolus injection and slow infusion. (A) Representativeimages of rats before and after receiving 4% EBD via bolus injection or slow infusion (1 ml/hr) at equal doses (2 ml/kg i.v. into thefemoral vein). (B) Blood concentration of EBD prior to and at 5, 30, 60, 90, and 120 min post-bolus injection or slow infusion.Samples were collected from a cannulated femoral artery. Data are shown as mean±SEM. *p<0.05 and **p<0.01, comparison byTWO-WAY repeated measures ANOVA followed by Sidak’s multiple comparisons test. (C) Peripheral EBD concentration in the liverat 120 min post-bolus injection or slow infusion. Data are shown as mean±SEM. n.s., no significant difference when compared byunpaired t test.doi: 10.1371/journal.pone.0068595.g004
Pattern of Cerebral Extravasation by Evans Blue
PLOS ONE | www.plosone.org 6 July 2013 | Volume 8 | Issue 7 | e68595

obesity [20]. In addition, because the BBB is a major obstaclefor drug delivery into the brain, its pharmacology has beeninvestigated widely [8,9,31–35]. Nevertheless, the literature hasin large failed to emphasize the differences between the HMW-way and the LMW-way across the BBB into the brain.
We report here that the HMW-way and the LMW-way acrossthe BBB represent two distinct routes into the brain, and suchdistinction can be made by comparing the regions of the brainmost accessible to the respective substance. For instance,HMW proteins marked by EBD entered the brain mostefficiently from the prefrontal cortex and the cerebellum, andleast effectively from the striatum. In comparison, LMW inerttracers like NaF was evenly distributed across different brainregions. The reason for the difference warrants future research.One likely explanation is that different regions of the BBB havedifferent systems for actively importing and/or exporting HMWproteins, whereas LMW substances are allowed to passivelymove across in a restricted manner. Another possibility is thatthe BBB has brain region-specific different-sized physicalbarrier that bars HMW proteins from moving into and out of thebrain, and that these brain-region-specific large barriers arecircumvented by LMW inert tracers. Whatever the reasonbehind the regional-dependency of the HMW-way by not theLMW-way, our data re-emphasize the notion that the BBB is
substance/molecular weight-specific, and should not begeneralized otherwise.
Based on these distinct patterns of brain distribution, wereasoned that bolus and slowly infused EBD both entered thebrain via the HMW-way, and this is in line with the notion thatEBD binds strongly to serum albumin immediately followingbolus injection [10–13]. This work advocates the use of bolusEBD in BBB research, and ameliorates the concerns that EBDadministered by i.v. bolus, the most widely used route ofadministration in EBD-based BBB studies, may behave like aLMW dye rather than a HMW protein tracer [14]. Moreover, thisprovides a good example of how pattern analysis of EBD braindistribution can be used to determine whether a chemicalsubstance enters the brain via the HMW/EBD-way or the LMW/NaF-way.
Disruption (or closure) of the BBB, as part of a physiologicalresponse, resulting from a disease, or induced by apharmacological agent, could result in increased or decreasedaccess to either or both of the HMW (EBD-labelled) protein andthe LMW inert substances (such as NaF). Thus,pharmacological agents designed to selectively facilitate orprevent the HMW/EBD-way or the LMW/NaF-way across theBBB may have advantages over agents that are less selective.In any case, these two different routes of entrance into the
Figure 5. Central extravasation of Evans blue dye (EBD) following bolus injection and slow infusion. Regional braindistribution of extravasated EBD in the prefrontal cortex, the motor cortex, the striatum, and the cerebellum following bolus injection(left panel) or slow infusion (right panel) (80 mg/kg i.v. into the femoral vein). Data are shown as mean±SEM. Statistics used aredescribed in the figure.doi: 10.1371/journal.pone.0068595.g005
Pattern of Cerebral Extravasation by Evans Blue
PLOS ONE | www.plosone.org 7 July 2013 | Volume 8 | Issue 7 | e68595

brain emphasize the need to categorize the BBB depending onthe substance in question.
Author Contributions
Conceived and designed the experiments: TWL. Performed theexperiments: LFY VCW EYK. Analyzed the data: LFY VCWTWL. Wrote the manuscript: TWL.
References
1. Reese TS, Karnovsky MJ (1967) Fine structural localization of a blood-brain barrier to exogenous peroxidase. J Cell Biol 34: 207-217. doi:10.1083/jcb.34.1.207. PubMed: 6033532.
2. Brightman MW, Reese TS (1969) Junctions between intimatelyapposed cell membranes in the vertebrate brain. J Cell Biol 40:648-677. doi:10.1083/jcb.40.3.648. PubMed: 5765759.
3. Marchi N, Cavaglia M, Fazio V, Bhudia S, Hallene K et al. (2004)Peripheral markers of blood-brain barrier damage. Clin Chim Acta 342:1-12. doi:10.1016/j.cccn.2003.12.008. PubMed: 15026262.
4. Weiss N, Miller F, Cazaubon S, Couraud PO (2009) The blood-brainbarrier in brain homeostasis and neurological diseases. BiochimBiophys Acta 1788: 842-857. doi:10.1016/j.bbamem.2008.10.022.PubMed: 19061857.
5. Doolittle ND, Miner ME, Hall WA, Siegal T, Jerome E et al. (2000)Safety and efficacy of a multicenter study using intraarterialchemotherapy in conjunction with osmotic opening of the blood-brainbarrier for the treatment of patients with malignant brain tumors. Cancer88: 637-647. doi:10.1002/(SICI)1097-0142(20000201)88:3. PubMed:10649259.
6. Rapoport SI (2001) Advances in osmotic opening of the blood-brainbarrier to enhance CNS chemotherapy. Expert Opin Investig Drugs 10:1809-1818. doi:10.1517/13543784.10.10.1809. PubMed: 11772287.
7. Angelov L, Doolittle ND, Kraemer DF, Siegal T, Barnett GH et al.(2009) Blood-brain barrier disruption and intra-arterial methotrexate-based therapy for newly diagnosed primary CNS lymphoma: a multi-
institutional experience. J Clin Oncol 27: 3503-3509. doi:10.1200/JCO.2008.19.3789. PubMed: 19451444.
8. Carman AJ, Mills JH, Krenz A, Kim DG, Bynoe MS (2011) Adenosinereceptor signaling modulates permeability of the blood-brain barrier. JNeurosci 31: 13272-13280. doi:10.1523/JNEUROSCI.3337-11.2011.PubMed: 21917810.
9. Chen KB, Wei VC, Yen LF, Poon KS, Liu YC et al. (2013) Intravenousmannitol does not increase blood-brain barrier permeability to inertdyes in the adult rat forebrain. Neuroreport 24: 303-307. doi:10.1097/WNR.0b013e32835f8acb. PubMed: 23426109.
10. Kaya M, Ahishali B (2011) Assessment of permeability in barrier type ofendothelium in brain using tracers: Evans blue, sodium fluorescein, andhorseradish peroxidase. Methods Mol Biol 763: 369-382. doi:10.1007/978-1-61779-191-8_25. PubMed: 21874465.
11. Saria A, Lundberg JM (1983) Evans blue fluorescence: quantitative andmorphological evaluation of vascular permeability in animal tissues. JNeurosci Methods 8: 41-49. doi:10.1016/0165-0270(83)90050-X.PubMed: 6876872.
12. Patterson CE, Rhoades RA, Garcia JG (1992) Evans blue dye as amarker of albumin clearance in cultured endothelial monolayer andisolated lung. J Appl Physiol 72: 865-873. doi:10.1063/1.351760.PubMed: 1568982.
13. Wolman M, Klatzo I, Chui E, Wilmes F, Nishimoto K et al. (1981)Evaluation of the dye-protein tracers in pathophysiology of the blood-
Figure 6. Central extravasation of sodium fluorescein dye (NaF) in a dose-dependent manner. Regional brain distribution ofextravasated NaF in the prefrontal cortex, the motor cortex, the striatum, and the cerebellum following bolus injection (2 ml/kg i.v.into the femoral vein) of 1%, 2%, or 8% NaF. Data are shown as mean±SEM. **p<0.01 when compared by TWO-WAY repeatedmeasures ANOVA followed by Tukey’s multiple comparisons test.doi: 10.1371/journal.pone.0068595.g006
Pattern of Cerebral Extravasation by Evans Blue
PLOS ONE | www.plosone.org 8 July 2013 | Volume 8 | Issue 7 | e68595
brain barrier. Acta Neuropathol 54: 55-61. doi:10.1007/BF00691332.PubMed: 7234328.
14. Kozler P, Pokorný J (2003) Altered blood-brain barrier permeability andits effect on the distribution of Evans blue and sodium fluorescein in therat brain applied by intracarotid injection. Physiol Res 52: 607-614.PubMed: 14535837.
15. Chen KB, Kuo EY, Poon KS, Cheng KS, Chang CS et al. (2012)Increase in Evans blue dye extravasation into the brain in the latedevelopmental stage. Neuroreport 23: 699-701. doi:10.1097/WNR.0b013e3283556dcc. PubMed: 22729097.
16. Uyama O, Okamura N, Yanase M, Narita M, Kawabata K et al. (1988)Quantitative evaluation of vascular permeability in the gerbil brain aftertransient ischemia using Evans blue fluorescence. J Cereb Blood FlowMetab 8: 282-284. doi:10.1038/jcbfm.1988.59. PubMed: 3343300.
17. Skultétyová I, Tokarev D, Jezová D (1998) Stress-induced increase inblood-brain barrier permeability in control and monosodium glutamate-treated rats. Brain Res Bull 45: 175-178. doi:10.1016/S0361-9230(97)00335-3. PubMed: 9443836.
18. Esposito P, Gheorghe D, Kandere K, Pang X, Connolly R et al. (2001)Acute stress increases permeability of the blood-brain-barrier throughactivation of brain mast cells. Brain Res 888: 117-127. doi:10.1016/S0006-8993(00)03026-2. PubMed: 11146058.
19. Belova I, Jonsson G (1982) Blood-brain barrier permeability andimmobilization stress. Acta Physiol Scand 116: 21-29. doi:10.1111/j.1748-1716.1982.tb10594.x. PubMed: 6891559.
20. Banks WA (2012) Role of the blood-brain barrier in the evolution offeeding and cognition. Ann N Y Acad Sci 1264: 13-19. doi:10.1111/j.1749-6632.2012.06568.x. PubMed: 22612379.
21. ElAli A, Doeppner TR, Zechariah A, Hermann DM (2011) Increasedblood-brain barrier permeability and brain edema after focal cerebralischemia induced by hyperlipidemia: role of lipid peroxidation andcalpain-1/2, matrix metalloproteinase-2/9, and RhoA overactivation.Stroke 42: 3238-3244. doi:10.1161/STROKEAHA.111.615559.PubMed: 21836084.
22. Manaenko A, Chen H, Kammer J, Zhang JH, Tang J (2011)Comparison Evans Blue injection routes: Intravenous versusintraperitoneal, for measurement of blood-brain barrier in a micehemorrhage model. J Neurosci Methods 195: 206-210. doi:10.1016/j.jneumeth.2010.12.013. PubMed: 21168441.
23. Librizzi L, Noè F, Vezzani A, de Curtis M, Ravizza T (2012) Seizure-induced brain-borne inflammation sustains seizure recurrence andblood-brain barrier damage. Ann Neurol 72: 82-90. doi:10.1002/ana.23567. PubMed: 22829270.
24. Bell RD, Winkler EA, Singh I, Sagare AP, Deane R et al. (2012)Apolipoprotein E controls cerebrovascular integrity via cyclophilin A.Nature 485: 512-516. PubMed: 22622580.
25. Castellano JM, Deane R, Gottesdiener AJ, Verghese PB, Stewart FR etal. (2012) Low-density lipoprotein receptor overexpression enhancesthe rate of brain-to-blood Abeta clearance in a mouse model of beta-amyloidosis. Proc Natl Acad Sci U S A.
26. Zlokovic BV (2011) Neurovascular pathways to neurodegeneration inAlzheimer’s disease and other disorders. Nat Rev Neurosci 12:723-738. PubMed: 22048062.
27. Pisani V, Stefani A, Pierantozzi M, Natoli S, Stanzione P et al. (2012)Increased blood-cerebrospinal fluid transfer of albumin in advancedParkinson’s disease. J Neuroinflammation 9: 188. doi:10.1186/1742-2094-9-188. PubMed: 22870899.
28. Gorantla S, Poluektova L, Gendelman HE (2012) Rodent models forHIV-associated neurocognitive disorders. Trends Neurosci 35:197-208. doi:10.1016/j.tins.2011.12.006. PubMed: 22305769.
29. Zhong Y, Zhang B, Eum SY, Toborek M (2012) HIV-1 Tat triggersnuclear localization of ZO-1 via Rho signaling and cAMP responseelement-binding protein activation. J Neurosci 32: 143-150. doi:10.1523/JNEUROSCI.4266-11.2012. PubMed: 22219277.
30. Arima Y, Harada M, Kamimura D, Park JH, Kawano F et al. (2012)Regional neural activation defines a gateway for autoreactive T cells tocross the blood-brain barrier. Cell 148: 447-457. doi:10.1016/j.cell.2012.01.022. PubMed: 22304915.
31. Hjouj M, Last D, Guez D, Daniels D, Sharabi S et al. (2012) MRI studyon reversible and irreversible electroporation induced blood brainbarrier disruption. PLOS ONE 7: e42817. doi:10.1371/journal.pone.0042817. PubMed: 22900052.
32. Joshi S, Ergin A, Wang M, Reif R, Zhang J et al. (2011) Inconsistentblood brain barrier disruption by intraarterial mannitol in rabbits:implications for chemotherapy. J Neuro Oncol 104: 11-19. doi:10.1007/s11060-010-0466-4. PubMed: 21153681.
33. Malpass K (2011) New methods to permeabilize the blood-brain barrier.Nat Rev Neurol 7: 597. doi:10.1038/nrneurol.2011.171. PubMed:22009285.
34. Tung YS, Marquet F, Teichert T, Ferrera V, Konofagou EE (2011)Feasibility of noninvasive cavitation-guided blood-brain barrier openingusing focused ultrasound and microbubbles in nonhuman primates.Appl Phys Lett 98: 163704. doi:10.1063/1.3580763. PubMed:21580802.
35. Marquet F, Tung YS, Teichert T, Ferrera VP, Konofagou EE (2011)Noninvasive, transient and selective blood-brain barrier opening in non-human primates in vivo. PLOS ONE 6: e22598. doi:10.1371/journal.pone.0022598. PubMed: 21799913.
Pattern of Cerebral Extravasation by Evans Blue
PLOS ONE | www.plosone.org 9 July 2013 | Volume 8 | Issue 7 | e68595