Regional Haze State Implementation Plan - NC.GOV
429
PRE-HEARING DRAFT Regional Haze State Implementation Plan for North Carolina Class I Areas (2019 – 2028 Planning Period) Prepared by North Carolina Department of Environmental Quality Division of Air Quality August 30, 2021
-
Upload
khangminh22 -
Category
Documents
-
view
4 -
download
0
Transcript of Regional Haze State Implementation Plan - NC.GOV

PRE-HEARING DRAFT
Regional Haze State Implementation Plan for
North Carolina Class I Areas
(2019 – 2028 Planning Period)
Prepared by
North Carolina Department of Environmental Quality
Division of Air Quality
August 30, 2021

(This page intentionally left blank)

Preface: This document contains North Carolina's Regional Haze State Implementation Plan (SIP) for the second planning period (January 1, 2019 – December 31, 2028) for mandatory Federal Class I areas in the State. This SIP was prepared in accordance with the Federal Regional Haze Rule provisions specified in 40 CFR 51.308(f) and the U.S. Environmental Protection Agency's guidance for implementing the rule to comply with Section 169 of the Clean Air Act, as amended in 1990. This SIP also contains the second five-year progress report as required in 40 CFR 51.308(g) of the Regional Haze Rule.

(This page intentionally left blank)

Pre-hearing Draft i NC Regional Haze SIP for Second Planning Period (2019 – 2028) August 30, 2021
EXECUTIVE SUMMARY
Introduction Pursuant to the requirements contained in Sections 169, 169A, and 169B of the Clean Air Act (CAA), and the subsequent implementing regulations contained in 40 CFR 51.308, the State of North Carolina, Department of Environmental Quality (DEQ), has developed this State Implementation Plan (SIP) revision for regional haze. The SIP revision represents commitments and actions taken by the state addressing the requirements of these regulations for the second planning period (January 1, 2019 through December 21, 2028) towards the goal of attaining natural visibility conditions in North Carolina’s mandatory Federal Class I areas and those Class I areas in other states that may be affected by emissions from North Carolina.1 North Carolina has the following five Class I areas (as defined in 40 CFR Part 81.400) within its borders (see Figure Ex-1):
• Great Smoky Mountains National Park (GSMNP), • Joyce Kilmer-Slickrock Wilderness Area (JOYC), • Linville Gorge Wilderness Area (LIGO), • Shining Rock Wilderness Area, (SHRO), and • Swanquarter Wilderness Area (SWAN).
The Great Smoky Mountains National Park and Joyce Kilmer-Slickrock Wilderness Area are in both North Carolina and Tennessee.
Figure Ex-1-1. Mandatory Federal Class I Areas in North Carolina Regional Haze and Tracking Metrics Regional haze is defined as visibility impairment that is caused by atmosphere-entrained air pollutants emitted from numerous anthropogenic (manmade) and natural sources located over a wide geographic area. These emissions are often transported long distances. Haze is caused when sunlight is absorbed or scattered by airborne particles which, in turn, reduce the clarity,
1 For brevity, mandatory Federal Class I area(s) is also referred to as “Class I area(s)” in this Executive Summary.

Pre-hearing Draft ii NC Regional Haze SIP for Second Planning Period (2019 – 2028) August 30, 2021
contrast, color, and viewing distance of what is seen. Regional haze refers to haze that impairs visibility in all directions uniformly. Pollution from particulate matter (PM) is the major cause of reduced visibility (haze) in the United States. PM affects visibility through the scattering and absorption of light, and fine particles – particles similar in size to the wavelength of light – are most efficient, per unit of mass, at reducing visibility. Fine particles are produced by a variety of natural and anthropogenic sources. Fine particles may either be emitted directly or formed from emissions of precursors, the most significant of which are sulfur oxides, such as sulfur dioxide (SO2), and nitrogen oxides (NOx). Reducing fine particles in the atmosphere is generally considered to be an effective method of reducing regional haze and thus improving visibility. An easily understood measure of visibility to most people is visual range. Visual range is the greatest distance, in kilometers or miles, at which a dark object can be viewed against the sky. However, the most useful measure of visibility impairment is light extinction, which affects the clarity and color of objects being viewed. The measure used by the regional haze rule (RHR) is the deciview (dv) haze index, calculated directly from light extinction using a logarithmic scale. Light extinction is measured in units of inverse megameters (Mm-1) by Interagency Monitoring of Protected Visual Environments (IMPROVE) monitors located in Class I areas. The Class I areas in North Carolina each have one IMPROVE monitor except for the Joyce Kilmer-Slickrock Wilderness Area which relies upon light extinction data measured by the IMPROVE monitor for the Great Smoky Mountains National Park. For the current and future planning periods, the RHR requires states to track progress for the 20% most anthropogenically impaired and 20% clearest days. IMPROVE monitors are operated about every 3rd day (approximately 122 days per year). The number of days making up 20% of the days IMPROVE monitors are operated typically ranges from 22-24 days depending on the year and when the monitors are operated. For the 20% most impaired days, a state must demonstrate progress during the planning period toward achieving natural conditions in each Class I area. For the clearest days, a state must demonstrate no degradation in visibility from the baseline period. The most impaired and clearest days may change from one year to the next based on meteorology and emissions contributions from sources within and outside of North Carolina. Furthermore, the composition of the PM species contributing to visibility impairment changes as pollutants are controlled to reduce regional haze. Because of these dynamics, the RHR lays out an iterative process for states to develop and adjust their SIPs as needed to demonstrate ongoing progress toward attaining natural visibility conditions in Class I areas. Overview of SIP The data and analysis necessary to meet the requirements of the RHR are considerable and require a significant, regional coordinated effort. To develop this proposed SIP revision, North Carolina has relied on the work of the Southeast regional planning group VISTAS (Visibility Improvement State and Tribal Association of the Southeast). VISTAS is directed by the state air directors of ten southeastern states, including the eight U.S. Environmental Protection Agency (EPA) Region 4 states plus the EPA Region 3 states of Virginia and West Virginia. VISTAS also included the Eastern Band of Cherokee Indians who represented the tribal authorities, and the Knox County, Tennessee local air pollution control agency who represented the local air pollution control agencies, within the ten southeastern states.

Pre-hearing Draft iii NC Regional Haze SIP for Second Planning Period (2019 – 2028) August 30, 2021
The ten states, through VISTAS, completed most of the technical requirements using contracted resources. To help coordinate and direct the technical work, VISTAS created the Coordinating Committee, the Technical Analysis Workgroup, the Data Analysis Workgroup, and the SIP Template Workgroup. Each state had at least one representative participating in each group. These workgroups discussed and reviewed the work completed by the contractors used by VISTAS. These data and analyses produced by VISTAS form the technical basis for North Carolina’s proposed SIP revision. Throughout the technical work and SIP development process, VISTAS and the individual states provided updates to EPA Regions 3 and 4; the federal land managers (FLMs) from the National Park Service, the U.S. Fish and Wildlife Service, and the U.S. Forest Service; and conservation and industrial organizations. The following sections summarize the key elements of the North Carolina’ proposed regional haze SIP. 1. Baseline, Current, and Natural Visibility Conditions Table Ex-1 shows the baseline visibility conditions, current visibility conditions, and natural visibility conditions for the 20% most impaired days calculated for each Class I area. Also displayed are the levels of progress made between the baseline and 2018 and the additional visibility improvement needed to achieve natural conditions. A comparison of current to baseline visibility conditions shows a 41% improvement in the haze index for Great Smoky Mountains National Park and Joyce Kilmer-Slickrock Wilderness Area; 42% improvement for the Linville Gorge Wilderness Area); 43% improvement for the Shining Rock Wilderness Area; and 34% improvement for the Swanquarter Wilderness Area.
Table Ex-1-1. Visibility Progress on 20% Most Impaired Days (dv)
Class I Area
Baseline (2000-2004)
Current Conditions (2014-2018)
Natural Conditions
Actual Progress to Date (Current
– Baseline)*
Additional Progress Needed to Reach
Natural Conditions (Natural – Current)*
Great Smoky Mountains National Park
29.11 17.21 10.05 -11.90 -7.16
Joyce Kilmer-Slickrock Wilderness Area
29.11 17.21 10.05 -11.90 -7.16
Linville Gorge Wilderness Area 28.05 16.42 9.70 -11.63 -6.72
Shining Rock Wilderness Area 28.13 15.49 10.25 -12.64 -5.24
Swanquarter Wilderness Area 23.79 16.30 10.01 -7.49 -6.29
* A negative value represents a reduction in deciviews and, therefore, indicates an improvement in visibility. For the 20% clearest days, Table Ex-2 shows that from the baseline period through 2018 visibility has improved thus showing no degradation from the baseline visibility for each of North Carolina’s Class I areas.

Pre-hearing Draft iv NC Regional Haze SIP for Second Planning Period (2019 – 2028) August 30, 2021
Table Ex-1-2. Visibility Progress on 20% Clearest Days (dv)
Class I Area Baseline
(2000-2004)
Current Conditions (2014-2018)
Actual Progress to Date (Current –
Baseline) Great Smoky Mountains National Park 13.58 8.35 -5.23 Joyce Kilmer-Slickrock Wilderness Area 13.58 8.35 -5.23 Linville Gorge Wilderness Area 11.11 7.61 -3.50 Shining Rock Wilderness Area 7.70 4.40 -3.30 Swanquarter Wilderness Area 12.34 10.61 -1.41
* A negative value represents a reduction in deciviews and, therefore, indicates an improvement in visibility. 2. Long-Term Strategy (LTS) for Regional Haze North Carolina’s LTS relies on several state and federal programs, reasonable progress analyses of point source facilities both within and out-of-state, and other actions which are expected to provide emissions reductions through the second planning period. The elements of the LTS developed for the second planning period include:
• Federal and State Foundation Control Programs • Reasonable Progress and Four-Factor Analyses of North Carolina Facilities • Reasonable Progress Analysis for Out-of-State Facilities • Additional Programs and Initiatives Supporting Past and Future Emissions Reductions • Emission Reductions Not Included in 2028 Emissions Projections and RPGs
North Carolina’s LTS for the second planning period builds on the federal and state programs implemented during the first planning period to maintain and advance the progress achieved to date. Control measures implemented during the first planning period include, among other things, applicable Federal programs (e.g., mobile source rules, Maximum Achievable Control Technology (MACT) standards), Federal consent agreements, and Federal and State control strategies for power plants. North Carolina’s Clean Smokestacks Act (CSA) significantly reduced SO2 and NOx emissions from coal-fired power plants and emission reductions from these sources have remained well below the CSA emissions caps. North Carolina’s LTS for the second planning period includes additional Federal measures for stationary (e.g., boiler MACT for industrial, commercial, and institutional facilities) and mobile (e.g., Tier 3 vehicle and fuel standards) sources that have been implemented since the previous LTS as well as Federal consent decrees and State consent orders addressing emissions at individual point source facilities. It also includes the results of reasonable progress/four-factor analyses completed on North Carolina facilities identified as having a significant contribution to visibility impairment at Class I areas in North Carolina.2 To select emissions sources to be examined for reasonable progress/four-factor analysis, North Carolina selected stationary source facilities with a ≥1.00% Particulate Matter Source
2 Section 169A(g)(1) of the CAA and paragraph 51.308(f)(2)(i) of the RHR require a state to evaluate the following four “statutory” factors when establishing the RPG for any Class I area within a state: (1) cost of compliance, (2)

Pre-hearing Draft v NC Regional Haze SIP for Second Planning Period (2019 – 2028) August 30, 2021
Apportionment Technology (PSAT) threshold for sulfate or nitrate to determine if additional controls are technically feasible and cost effective.3 For Class I areas in North Carolina, a total of 19 facilities exceeded the ≥1.00% PSAT threshold for sulfate only. Three of these facilities are located in North Carolina, and the NCDAQ requested four-factor analyses from those facilities for the reduction of SO2 emissions. The state also requested reasonable progress analyses for 16 additional facilities in 10 different states. There were no facilities in North Carolina identified as significantly contributing to out-of-state Class I areas. Based on the four-factor analyses, no additional SO2 control technologies were identified for implementation at Domtar. Both Blue Ridge Paper Products and PCS Phosphate installed controls from 2017 through 2019 that significantly reduced SO2 emissions at these facilities, and the four-factor analyses for these two facilities did not identify any additional SO2 controls that were technically feasible or cost effective. Based on the significant SO2 emission reductions that these two facilities achieved at the beginning of this second planning period, the NCDAQ determined that existing controls demonstrate reasonable progress. 3. Reasonable Progress Goals (RPGs) Consistent with paragraph 40 CFR 51.308(f)(3) of the RHR, North Carolina developed the LTS to support establishing RPGs for 2028 for each Class I area within the state (expressed in dv). These goals demonstrate progress from the baseline period (2000-2004) towards achieving natural visibility conditions for the 20% most anthropogenically impaired days and ensure no degradation in visibility for the 20% clearest days. Table Ex-3 contains the 2028 RPGs developed for the most impaired and clearest days at each of North Carolina’s Class I areas.
Table Ex-1-3. Comparison of 2028 RPGs to Current and Natural Conditions (dv)
Class I Area 20% Most Impaired Days 20% Clearest Days
Current Conditions
Natural Conditions
2028 RPG
Current Conditions
Natural Conditions
2028 RPG
Great Smoky Mountains National Park 17.28 10.05 15.03 8.40 4.62 8.96
Joyce Kilmer-Slickrock Wilderness Area 17.28 10.05 15.03 8.40 4.62 8.96
Linville Gorge Wilderness Area 16.40 9.70 14.25 7.61 4.07 8.21 Shining Rock Wilderness Area 15.51 10.01 13.31 4.40 4.07 4.54 Swanquarter Wilderness Area 16.17 9.79 15.27 10.59 5.46 10.77
time necessary for compliance, (3) energy and non-air quality environmental impacts of compliance, and (4) remaining useful life of any existing source subject to such requirements. 3 VISTAS used Comprehensive Air Quality Model with Extensions (CAMx) PSAT modeling to refine estimates of source contributions to modeled visibility impacts for individual Class I areas in 2028. PSAT uses multiple tracer families to track the fate of both primary and secondary PM. PSAT allows emissions to be tracked (tagged) for individual facilities as well as various combinations of sectors and geographic areas (e.g., by state).

Pre-hearing Draft vi NC Regional Haze SIP for Second Planning Period (2019 – 2028) August 30, 2021
4. Progress Report This SIP also includes the second progress report for the first planning period which addresses paragraphs of the 40 CFR 51.308(g)(1) through (5) of the RHR. This progress report covers the period 2011 through 2018 but includes the RHR rule requirement to report 2019 emissions representing the most recent year for which North Carolina has submitted emissions inventory information to EPA. This progress report documents that all control measures outlined in North Carolina’s first regional haze SIP have been implemented and that North Carolina has achieved the 2018 RPGs projected for each Class I area in the state. The LTS for the first planning period, in addition to unplanned emission reductions associated with the closure of facilities and economic forces, have reduced statewide SO2, NOx, Particulate matter with an aerodynamic diameter ≤2.5 micrometers (PM2.5), and volatile organic compounds (VOC) emissions by 71%, 40%, 20%, and 13%, respectively, from calendar years 2011 to 2019. The significant reductions in SO2 and NOx emissions achieved by North Carolina and neighboring states during the first planning period have significantly improved visibility by reducing ammonium sulfate as shown in Figures Ex-2 and Ex-3. These two figures show the change in light extinction by species at each IMPROVE monitoring site corresponding to each Class I area in North Carolina between the years 20084 and 2018 for the 20% most impaired and 20% clearest days, respectively. Although ammonium nitrate contributions to light extinction have increased in recent years (i.e., 2016-2018), sulfate is still the highest contributor to visibility impairment in North Carolina’s Class I areas. It is unclear why ammonium nitrate has started to increase at some but not all Class I areas when point and mobile source NOx emissions have been declining. VISTAS modeling for 2028 suggests that sources outside of North Carolina may be the likely contributor. However, further research is needed to identify the emission sources and geographic location of those sources contributing to the ammonium nitrate fraction to identify cost-effective strategies for addressing this concern.
4 Complete 2008 data was not available for Swanquarter, so 2009 was used for this comparison.

Pre-hearing Draft vii NC Regional Haze SIP for Second Planning Period (2019 – 2028) August 30, 2021
Figure Ex-1-2. Light Extinction by Species on 20% Most Impaired Days at the Beginning
and End of First Planning Period
0
20
40
60
80
100
120
140
160
GSMNP2008
GSMNP2018
LIGO2008
LIGO2018
SHRO2008
SHRO2018
SWAN2009
SWAN2018
Ligh
t Ext
inct
ion
(Mm
-1)
Rayleigh Ammonium Sulfate Ammonium NitrateOMC LAC SoilCM Sea Salt

Pre-hearing Draft viii NC Regional Haze SIP for Second Planning Period (2019 – 2028) August 30, 2021
Figure Ex-1-3. Light Extinction by Species on 20% Clearest Days at the Beginning and
End of First Planning Period 5. Commitments The NCDAQ commits to completing the next mid-point review of the LTS as required in the RHR (40 CFR 51.308(f)) due by January 31, 2025, to determine if any adjustments are needed to maintain progress toward achieving natural conditions for the 20% most impaired days and showing no degradation in visibility for the 20% clearest days. The NCDAQ also commits to completing the next comprehensive revision to its regional haze plan for the third planning period (2029-2038) due to EPA by July 31, 2028, and every ten years thereafter. Conclusion Visibility in North Carolina’s Class I areas vastly improved in the first planning period and further improvements are expected to continue through the second planning period. For this second planning period, North Carolina has built on its LTS for the first planning period that continues to demonstrate significant progress toward achieving natural conditions in each Class I area. Figure Ex-4 and Table Ex-4 show the improvement in visual range in miles on the 20% most impaired days at each IMPROVE monitoring site corresponding to North Carolina’s Class I areas. In Figure Ex-4, the uniform rate of progress (URP) is represented by the light gray bars in the foreground; the dark blue bars represent the 5-year average of IMPROVE monitoring data for 2000-2004, 2004-2008, and 2014-2018; and the light blue bars represent the projected RPGs for
0
5
10
15
20
25
30
35
40
GSMNP2008
GSMNP2018
LIGO2008
LIGO2018
SHRO2008
SHRO2018
SWAN2009
SWAN2018
Ligh
t Ext
inct
ion
(Mm
-1)
Rayleigh Ammonium Sulfate Ammonium NitrateOMC LAC SoilCM Sea Salt

Pre-hearing Draft ix NC Regional Haze SIP for Second Planning Period (2019 – 2028) August 30, 2021
2028. Based on the emission reductions that have occurred through 2018 and are projected to occur through 2028, visible range is expected to improve by about 41 miles for the Great Smoky Mountains National Park and Joyce Kilmer-Slickrock Wilderness Area, 44 miles for the Linville Gorge Wilderness Area, 49 miles for the Shining Rock Wilderness Area, and 30 miles for the Swanquarter Wilderness Area. These improvements place North Carolina Class I areas from 12 to 24 years ahead of the URP goal in 2028. Additionally, clearest day visibility conditions are expected to remain better than the baseline period for all North Carolina Class I areas.
Figure Ex-1-4. Visual Range on 20% Most Impaired Days Compared to the URP
Table Ex-1-4. Improvement in Visual Range on 20% Most Impaired Days (Miles)
Class I Area
Average Visual Range,
2000-2004
Average Visual Range,
2004-2008 2008 URP
Average Visual Range,
2014-2018 2018 URP
Projected Visual Range, 2028
2028 URP
Great Smoky Mountains National Park 13.19 13.90 14.98 43.35 20.57 53.91 28.27
Joyce Kilmer-Slickrock Wilderness Area 13.19 13.90 14.98 43.35 20.57 53.91 28.27
Linville Gorge Wilderness Area 14.66 14.65 16.57 46.91 22.50 58.28 30.55
Shining Rock Wilderness Area 14.55 16.63 16.39 51.49 22.08 64.03 29.74
Swanquarter Wilderness Area 22.45 18.90 24.61 47.48 30.96 52.63 38.96
0
10
20
30
40
50
60
70
Great SmokyMountains
Linville Gorge Shining Rock Swanquarter
Monitored Visual Range, 5-year average (miles) Model Projected Visual Range, 2028 (miles)URP-Equivalent Visual Range (miles)
20042008
2028
2018
20042008
2028
2018
Visu
al R
ange
(Mile
s)
2004
20042008
2008
20182018
2028
2028

Pre-hearing Draft x NC Regional Haze SIP for Second Planning Period (2019 – 2028) August 30, 2021

Pre-hearing Draft xi NC Regional Haze SIP for Second Planning Period (2019 – 2028) August 30, 2021
ACKNOWLEDGEMENTS This regional haze SIP was produced by the North Carolina Division of Air Quality (NCDAQ), with significant help from the Visibility Improvement – State and Tribal Association of the Southeast VISTAS leadership. Below are the names of the staff involved in this process. NCDAQ Staff: Management Leadership Michael Abraczinskas, NCDAQ, Director Michael Pjetraj, NCDAQ, Deputy Director Planning Section Randy Strait, Planning Section Chief Tammy Manning, Supervisor, Attainment Planning Branch Joshua Bartlett Andrew Bollman Bradley McLamb Elliot Tardif Heather Wylie Ming Xie Asheville Regional Office Brendan Davey, Regional Supervisor Christopher Scott Washington Regional Office Betsy Huddleston, Regional Supervisor Robert Bright Kurt Tidd VISTAS Staff: Chad Lafontaine, Metro4/SESARM Executive Directory and VISTAS Technical Program Coordinator John Hornback, Metro4/SESARM Executive Director and VISTAS Technical Program Coordinator (retired) Thank you to John Hornback for his tireless leadership and management support to the VISTAS member agencies to procure and manage the contract work from December 2017 through August 2020. Also thank you to Chad Lafontaine for a seamless transition in VISTAS leadership and management support to complete the regional haze project work. The NCDAQ worked closely with the VISTAS state and local air programs and tribal authorities through technical coordination, technical discussions, and technical support. This regional haze

Pre-hearing Draft xii NC Regional Haze SIP for Second Planning Period (2019 – 2028) August 30, 2021
plan could not have been completed without the combined efforts of the staff from these state agencies: VISTAS State Agencies: Alabama Department of Environmental Management Florida Department of Environmental Protection Georgia Department of Natural Resources Kentucky Department of Environmental Protection Mississippi Department of Environmental Quality South Carolina Department of Health and Environmental Control Tennessee Department of Environment and Conservation Virginia Department of Environmental Quality West Virginia Department of Environmental Protection Contractors: This work could not have been completed without the expertise and dedication of the VISTAS contractors that performed the technical work. Eastern Research Group, Inc. (ERG) provided support on updating the modeling inventory for 2028, development of the Area of Influence analyses, and overall contract management. Stacie Enoch/ERG Karla Faught/ERG Steve Mendenhall/ERG Regi Oommen/ERG (Contract Lead) Heather Perez/ERG Tyler Richman/ERG Jennifer Sellers/ERG Jody Tisano/ERG Robin Weyl/ERG Darcy Wilson/ERG Lindsay Dayton/ERG (now with EPA) Bebhinn Do/ERG (now with EPA) Noel Hilliard/ERG (now with EPA) Cindy Loomis/Alpine Dennis McNally/Alpine Alpine Geophysics provided photochemical-grid air quality modeling support. Gregory Stella/Alpine (Subcontract Lead)

Pre-hearing Draft xiii NC Regional Haze SIP for Second Planning Period (2019 – 2028) August 30, 2021
TABLE OF CONTENTS 1.0 INTRODUCTION .............................................................................................................. 1
1.1 What is Regional Haze? .................................................................................................. 1 1.2 What are the Requirements under the Clean Air Act for Addressing Regional Haze? .. 1 1.3 General Overview of Regional Haze SIP Requirements ................................................ 3 1.4 Mandatory Federal Class I Areas in North Carolina ...................................................... 5 1.5 Regional Planning and Coordination .............................................................................. 6 1.6 State and FLM Coordination .......................................................................................... 8 1.7 Cross-Reference to Regional Haze Rule Requirements ................................................. 8
2.0 ESTIMATES OF NATURAL BACKGROUND CONDITIONS IN CLASS I AREAS AND ASSESSMENT OF BASELINE AND CURRENT CONDITIONS AND ESTIMATE OF NATURAL BACKGROUND CONDITIONS IN CLASS I AREAS ... 11
2.1 IMPROVE Algorithm ................................................................................................... 13 2.2 IMPROVE Monitoring Sites......................................................................................... 14 2.3 Estimating Natural Conditions for VISTAS Class I Areas ........................................... 15
2.3.1 Natural Background Conditions on 20% Clearest Days .......................................... 15
2.3.2 Natural Background Conditions on 20% Most Impaired Days ................................ 15
2.3.3 Summary of Natural Background Conditions for VISTAS Class I Areas ............... 16
2.4 Baseline Conditions ...................................................................................................... 16
2.4.1 Baseline Conditions for 20% Clearest and 20% Most Impaired Days for VISTAS Class I Areas ............................................................................................................. 17
2.4.2 Pollutant Contributions to Visibility Impairment (2000-2004 Baseline Data) ........ 17
2.5 Modeling Base Period (2009-2013) .............................................................................. 23
2.5.1 Modeling Base Period (2009-2013) for 20% Clearest and 20% Most Impaired Days for VISTAS Class I Areas ........................................................................................ 23
2.5.2 Pollutant Contributions to Visibility Impairment (2009-2013 Modeling Base Period Data) ......................................................................................................................... 24
2.6 Current Conditions ........................................................................................................ 28
2.6.1 Current Conditions (2014-2018) for 20% Clearest and 20% Most Impaired Days for VISTAS Class I Areas .............................................................................................. 28
2.6.2 Pollutant Contributions to Visibility Impairment (2014-2018 Current Data) .......... 29
2.7 Comparisons of Baseline, Current, and Natural Background Visibility ....................... 33
3.0 GLIDEPATHS TO NATURAL CONDITIONS IN 2064 ................................................ 34
4.0 EMISSION INVENTORIES USED FOR VISIBILITY ANALYSES ............................ 37
4.1 Overview ....................................................................................................................... 37 4.2 2011 and 2028 elv3 Emissions Inventory ..................................................................... 38
4.2.1 Stationary Point Sources ........................................................................................... 39
4.2.2 Nonpoint Sources ..................................................................................................... 40

Pre-hearing Draft xiv NC Regional Haze SIP for Second Planning Period (2019 – 2028) August 30, 2021
4.2.3 Nonroad Mobile Sources .......................................................................................... 40
4.2.4 Onroad Mobile Sources ............................................................................................ 41
4.2.5 Biogenic Sources ...................................................................................................... 41
4.2.6 Point Fires (Events) .................................................................................................. 41
4.2.7 Summary of 2011 Base Year Emissions Inventory for North Carolina ................... 42
4.3 2028 elv5 (Revision to 2028 elv3) Emissions Inventory .............................................. 42
5.0 REGIONAL HAZE MODELING METHODS AND INPUTS ....................................... 44
5.1 Analysis Method ........................................................................................................... 44 5.2 Model Selection ............................................................................................................ 46
5.2.1 Selection of Photochemical Grid Model .................................................................. 46
5.2.2 Selection of Meteorological Model .......................................................................... 47
5.2.3 Selection of Emissions Processing System .............................................................. 48
5.3 Selection of the Modeling Year .................................................................................... 50 5.4 Modeling Domains........................................................................................................ 50
5.4.1 Horizontal Modeling Domain ................................................................................... 50
5.4.2 Vertical Modeling Domain .............................................................................................. 51
6.0 MODEL PERFORMANCE EVALUATION ................................................................... 53
6.1 Ozone Model Performance Evaluation ......................................................................... 54 6.2 Acid Deposition Model Performance Evaluation ......................................................... 59 6.3 PM Model Performance Goals and Criteria.................................................................. 63 6.4 PM Model Performance Evaluation for the VISTAS Modeling Domain..................... 65 6.5 PM Model Performance Evaluation for Class I Areas in North Carolina .................... 79 6.6 Summary and Conclusions ......................................................................................... 111
7.0 LONG-TERM STRATEGY (LTS) ................................................................................ 113
7.1 Overview of the LTS Development Process ............................................................... 113 7.2 Expected Visibility in 2028 for North Carolina’s Class I Areas Under Existing and
Planned Emissions Control Programs ......................................................................... 114
7.2.1 Control Measures and Other Emission Reduction Actions for First Planning Period (2008-2018) ............................................................................................................ 115
7.2.2 Control Measures and Other Emission Reduction Actions for Second Planning Period (2019-2028) ................................................................................................. 121
7.2.3 Construction Activities, Agricultural and Forestry Smoke Management .............. 130
7.2.4 Projected VISTAS 2028 Emissions Inventory ....................................................... 130
7.2.5 EPA Inventories ...................................................................................................... 140
7.2.6 2028 Model Projections .......................................................................................... 144
7.2.7 Additional Programs and Initiatives Supporting Past and Future Emissions Reductions .............................................................................................................. 157

Pre-hearing Draft xv NC Regional Haze SIP for Second Planning Period (2019 – 2028) August 30, 2021
7.2.8 Emissions Reductions Not Included in the 2028 RPG Modeling .......................... 162
7.3 Relative Contribution from International Emissions to Visibility Impairment in 2028 at VISTAS Class I Areas ................................................................................................ 164
7.4 Relative Contributions to Visibility Impairment: Pollutants, Source Categories, and Geographic Areas ....................................................................................................... 166
7.5 Area of Influence Analyses for North Carolina Class I Areas .................................... 178
7.5.1 Back Trajectory Analyses ....................................................................................... 178
7.5.2 Residence Time Plots ............................................................................................. 189
7.5.3 Extinction-Weighted Residence Time Plots ........................................................... 200
7.5.4 Emissions/Distance Extinction Weighted Residence Time Plots .......................... 211
7.5.5 Ranking of Sources for North Carolina Class I Areas ........................................... 217
7.6 PSAT Modeling .......................................................................................................... 224
7.6.1 Selection of Facilities for PSAT Modeling for Class I Areas in North Carolina ... 231
7.6.2 PSAT Contributions at North Carolina Class I Areas ............................................ 232
7.6.3 AoI versus PSAT Contributions ............................................................................. 262
7.7 Selection of Sources for Reasonable Progress Evaluation ......................................... 265
7.7.1 Overview of the Selection Process ......................................................................... 265
7.7.2 Selection of Facilities Impacting Class I Areas in North Carolina ........................ 266
7.7.3 Review of Facilities Not Selected for Reasonable Progress Analysis.................... 268
7.8 Evaluating Reasonable Progress using the Four Statutory Factors for Specific Emission Sources ........................................................................................................................ 284
7.8.1 Reasonable Progress Evaluation of North Carolina Facilities ............................... 284
7.8.2 Summary and Conclusions ..................................................................................... 298
7.8.3 Materials Proposed for Adoption into the Regulatory Portion of the North Carolina SIP .......................................................................................................................... 300
7.9 Consideration of Five Additional Factors ................................................................... 304
7.9.1 Dust and Fine Soil from Construction Activities ................................................... 304
7.9.2 Smoke Management ............................................................................................... 305
7.10 Materials for Inclusion in the Regulatory Portion of the SIP ..................................... 306
8.0 REASONABLE PROGRESS GOALS (RPGs) for 2028 ............................................... 306
8.1 2028 RPGs for 20% Most Impaired and 20% Clearest Days ..................................... 306 8.2 Uncertainties Associated with RPG Estimates ........................................................... 308 8.3 Long Term Strategy (LTS) ......................................................................................... 309
8.3.1 Federal and State Foundation Control Programs .................................................... 309
8.3.2 Reasonable Progress and Four-Factor Analyses for North Carolina Facilities ...... 309
8.3.3 Reasonable Progress Analysis for Out-of-State Facilities ...................................... 310

Pre-hearing Draft xvi NC Regional Haze SIP for Second Planning Period (2019 – 2028) August 30, 2021
8.3.4 Additional Programs and Initiatives Supporting Past and Future Emissions Reductions .............................................................................................................. 312
8.3.5 Emission Reductions Not Included in 2028 Emissions Projections and RPGs ...... 312
8.4 Summary and Conclusions ......................................................................................... 313
9.0 MONITORING STRATEGY ......................................................................................... 313
10.0 CONSULTATION PROCESS ....................................................................................... 317
10.1 Interstate Consultation ................................................................................................ 318
10.1.1 Emission Sources in Other States with Impacts on Class I Areas in North Carolina 318
10.1.2 North Carolina Emission Source Impacts on Class I Areas in Other States .......... 324
10.2 Outreach ...................................................................................................................... 324 10.3 Consultation with MANE-VU .................................................................................... 325 10.4 Federal Land Manager Consultation ........................................................................... 329 10.5 The NCDEQ Environmental Justice Program and Outreach Plan Regarding the
Regional Haze SIP ...................................................................................................... 350
11.0 COMPREHENSIVE PERIODIC IMPLEMENTATION PLAN REVISIONS ............. 354
12.0 DETERMINATION OF ADEQUACY OF THE EXISTING PLAN ............................ 356
13.0 PROGRESS REPORT .................................................................................................... 357
13.1 Background ................................................................................................................. 357 13.2 Status of Implementation of Control Measures (40 CFR 51.308 (g)(1)) .................... 358 13.3 Summary of Emission Reductions Achieved (40 CFR 51.308(g)(2)) ........................ 362
13.3.1 EGU SO2 Emission Reductions .............................................................................. 362
13.3.2 Non-EGU SO2 Emission Reductions ..................................................................... 364
13.4 Assessment of Visibility Conditions (40 CFR 51.308(g)(3)) ..................................... 365
13.4.1 Reasonable Progress Goals for 2018 ...................................................................... 365
13.4.2 Visibility Conditions .............................................................................................. 366
13.4.3 Visibility Trends ..................................................................................................... 368
13.5 Analyses of Emissions (40 CFR 51.308(g)(4))........................................................... 373
13.5.1 SO2 Emissions (2011-2019) ................................................................................... 374
13.5.2 NOx Emissions (2011-2019) ................................................................................... 375
13.5.3 PM2.5 Emissions (2011-2019) ................................................................................ 377
13.5.4 PM10 Emissions (2011-2019) ................................................................................. 378
13.5.5 VOC Emissions (2011-2019) ................................................................................. 380
13.6 Changes to Anthropogenic Emissions (40 CFR 51.308(g)(5)) ................................... 381 13.7 Conclusions ................................................................................................................. 385

Pre-hearing Draft xvii NC Regional Haze SIP for Second Planning Period (2019 – 2028) August 30, 2021
LIST OF TABLES
Table Ex-1-1. Visibility Progress on 20% Most Impaired Days (dv)........................................... iii Table Ex-1-2. Visibility Progress on 20% Clearest Days (dv) ..................................................... iv Table Ex-1-3. Comparison of 2028 RPGs to Current and Natural Conditions (dv) ...................... v Table Ex-1-4. Improvement in Visual Range on 20% Most Impaired Days (Miles) ................... ix Table 1-1. Mandatory Federal Class I Areas in the VISTAS Region ............................................ 7 Table 1-2. Cross-reference of Sections of the SIP to Regional Haze Rule Requirements
Specified in 40 CFR 51.308(f), (g), and (i)......................................................................... 8 Table 2-1. VISTAS Class I Areas and IMPROVE Site Identification Numbers......................... 14 Table 2-2. Average Natural Background Conditions for VISTAS Class I Areas ....................... 16 Table 2-3. Baseline Visibility Conditions for VISTAS Class I Areas (2000-2004) .................... 17 Table 2-4. Modeling Base Period (2009-2013) Conditions for VISTAS Class I Areas .............. 24 Table 2-5. Current Conditions (2014-2018) for VISTAS Class I Areas ..................................... 29 Table 2-6. Comparison of Baseline, Current, and Natural Conditions for 20% Most Impaired
Days (dv) ........................................................................................................................... 33 Table 2-7. Comparison of Baseline, Current, and Natural Conditions for 20% Clearest Days (dv)
........................................................................................................................................... 33 Table 4-1. Uses and Documentation of VISTAS’ Initial and Revised / Final 2028 Emissions
Inventory for Regional Haze Modeling ............................................................................ 37 Table 4-2. 2011 Emissions Inventory Summary for North Carolina (TPY)................................ 42 Table 4-3. VISTAS 2028 versus New EPA 2028 ........................................................................ 43 Table 4-4. Comparison of ERTACv16.0 to ERTACv2.7 SO2 Emission Projections for 2028 ... 43 Table 4-5. Comparison of ERTACv16.0 to ERTACv2.7 NOx Emission Projections for 2028 .. 43 Table 5-1. VISTAS II Modeling Domain Specifications ............................................................ 51 Table 5-2. WRF and CAMx Layers and Their Approximate Height Above Ground Level ....... 52 Table 6-1. Performance Statistics for MDA8 Ozone ≥ 60 ppb by Month for VISTAS States
Based on Data at AQS Network Sites............................................................................... 54 Table 6-2. Weekly Wet Deposition MPE Metrics for NADP Sites in the VISTAS 12 Km
Domain .............................................................................................................................. 61 Table 6-3. Accumulated Annual Wet Deposition MPE Metrics for NADP Sites in the VISTAS
12 Km Domain .................................................................................................................. 61 Table 6-4. Weekly Dry Deposition MPE Metrics for CASTNet Sites in the VISTAS 12 Km
Domain .............................................................................................................................. 62 Table 6-5. Accumulated Annual Wet Deposition MPE Metrics for CASTNet Sites in the
VISTAS 12 Km Domain ................................................................................................... 62 Table 6-6. Fine Particulate Matter Performance Goals and Criteria ........................................... 64 Table 6-7. Fine Particulate Matter Performance Goals and Criteria ........................................... 64 Table 6-8. Species Mapping from CAMx into Observation Network ......................................... 64 Table 6-9. Overview of Utilized Ambient Data Monitoring Networks ....................................... 65 Table 6-10. Sulfate Model Performance Criteria for 20% Most Impaired Days in 2011 .......... 111 Table 7-1. Summary of Foundation Control Programs ............................................................. 115 Table 7-2. Summary of Historical and 2028 Projected Emissions for Duke Energy Facilities
affected by Federal Consent Decree (Tons) .................................................................... 124 Table 7-3. Summary of Historical and 2028 Projected Emissions for PCS Phosphate, Aurora,
North Carolina (Tons) ..................................................................................................... 126 Table 7-4. Summary of Historical and 2028 Projected Emissions for Ardagh Glass, Henderson,
North Carolina (Tons) ..................................................................................................... 127

Pre-hearing Draft xviii NC Regional Haze SIP for Second Planning Period (2019 – 2028) August 30, 2021
Table 7-5. Summary of Historical and 2028 Projected Emissions for BRPP, Canton, North Carolina (Tons) ............................................................................................................... 128
Table 7-6. CPI USA North Carolina LLC Facilities – Actual Emissions for 2016 – 2019 and Modeled Emissions for 2028 .......................................................................................... 130
Table 7-7. 2011 and 2028 Criteria Pollutant Emissions, VISTAS States .................................. 135 Table 7-8. 2028 Visibility Projections for VISTAS and Nearby Class I Areas ........................ 146 Table 7-9. Summary of Additional Programs and Initiatives .................................................... 157 Table 7-10 Total Avoided Emissions in 2008 – 2019 Due to REPS ......................................... 159 Table 7-11. Historical and 2028 Projected Annual Emissions Associated with Facility Closures
not included in 2028 Emissions Projections (Tons) ....................................................... 162 Table 7-12. Summary of Historical and 2028 Projected Emissions for Edgecombe Genco Power
Station, Battleboro, North Carolina (Tons)..................................................................... 163 Table 7-13. VISTAS Class I Area International Anthropogenic Emissions 2028 Impairment,
Mm-1 ................................................................................................................................ 164 Table 7-14. North Carolina Statewide Contributions of 2028 SO2 and NOx Emissions for all
Source Sectors to Total Visibility Impairment for the 20% Most Impaired Days for Class I Areas in the VISTAS Modeling Domain (Mm-1) ........................................................ 176
Table 7-15. NOx and SO2 Source Contributions to Visibility Impairment on the 20% Most Impaired Days at Great Smoky Mountains National Park .............................................. 217
Table 7-16. NOx and SO2 Source Contributions to Visibility Impairment on the 20% Most Impaired Days at Joyce Kilmer-Slickrock Wilderness Area .......................................... 218
Table 7-17. NOx and SO2 Source Contributions to Visibility Impairment on the 20% Most Impaired Days at Linville Gorge Wilderness Area......................................................... 218
Table 7-18. NOx and SO2 Source Contributions to Visibility Impairment on the 20% Most Impaired Days at Shining Rock Wilderness Area .......................................................... 218
Table 7-19. NOx and SO2 Source Contributions to Visibility Impairment on the 20% Most Impaired Days at Swanquarter Wilderness Area ............................................................ 218
Table 7-20. Facilities with ≥1.00% Sulfate + Nitrate AoI Contribution to Visibility Impairment on the 20% Most Impaired Days at Great Smoky Mountains National Park ................. 220
Table 7-21. Facilities with ≥1.00% Sulfate + Nitrate AoI Contribution to Visibility Impairment on the 20% Most Impaired Days at Joyce Kilmer-Slickrock Wilderness Area .............. 221
Table 7-22. Facilities with ≥1.00% Sulfate + Nitrate AoI Contribution to Visibility Impairment on the 20% Most Impaired Days at Linville Gorge Wilderness Area ............................ 222
Table 7-23. Facilities with ≥1.00% Sulfate + Nitrate AoI Contribution to Visibility Impairment on the 20% Most Impaired Days at Shining Rock Wilderness Area .............................. 223
Table 7-24. Facilities with ≥1.00% Sulfate + Nitrate AoI Contribution to Visibility Impairment on the 20% Most Impaired Days at Swanquarter Wilderness Area ................................ 224
Table 7-25. PSAT Tags Selected for Facilities in AL and FL ................................................... 226 Table 7-26. PSAT Tags Selected for Facilities in GA, KY, MS, NC, SC, and TN ................... 227 Table 7-27. PSAT Tags Selected for Facilities in VA and WV ................................................ 228 Table 7-28. PSAT Tags Selected for Facilities in AR, MO, MD, PA, IL, IN, and OH ............ 229 Table 7-29. Facilities Selected by North Carolina for PSAT Tagging ...................................... 232 Table 7-30. Revised Final PSAT Results for North Carolina Facility Sulfate and Nitrate Impacts
on North Carolina Class I Areas ..................................................................................... 233 Table 7-31. PSAT Results for Great Smoky Mountains National Park .................................... 234 Table 7-32. PSAT Results for Joyce Kilmer-Slickrock Wilderness Area ................................. 240 Table 7-33. PSAT Results for Linville Gorge Wilderness Area ............................................... 245 Table 7-34. PSAT Results for Shining Rock Wilderness Area ................................................. 250

Pre-hearing Draft xix NC Regional Haze SIP for Second Planning Period (2019 – 2028) August 30, 2021
Table 7-35. PSAT Results for Swanquarter Wilderness Area ................................................... 256 Table 7-36. Facilities in North Carolina Selected for Reasonable Progress Analysis ............... 267 Table 7-37. Facilities in VISTAS States (not including North Carolina) Selected for Reasonable
Progress Analysis ............................................................................................................ 267 Table 7-38. Facilities Located Outside of VISTAS States Selected for Reasonable Progress
Analysis........................................................................................................................... 268 Table 7-39. Original and Revised Emissions and PSAT Contributions for Duke Energy Marshall
and SGL Carbon ............................................................................................................. 269 Table 7-40. Facilities Not Selected for PSAT Modeling with AoI Between 1% and 3% for
Sulfate and Nitrate Combined ......................................................................................... 271 Table 7-41. Comparison of SO2 Emissions between 2017, 2018, 2019, and 2028 ................... 272 Table 7-42. Comparison of NOx Emissions between 2017, 2018, 2019, and 2028................... 274 Table 7-43. Controls, Operating Status, and Federal Rules for Duke Energy Facilities ........... 276 Table 7-44. Controls, Operating Status, and Federal Rules for Other Facilities ....................... 279 Table 7-45. Acronyms for Controls, Operating Status and Federal Rules for Duke Energy and
Other Facility Tables....................................................................................................... 282 Table 7-46. Initial PSAT Modeling Results Based on VISTAS 2028elv5 Emissions .............. 285 Table 7-47. Revised PSAT Modeling Results Based on 2028elv5 Modeled Emissions ........... 285 Table 7-48. Summary of Annual SO2 Emissions for BRPP ...................................................... 287 Table 7-49. Summary of Visibility Impacts from BRPP on Shining Rock Wilderness Area the
for 20% Most Impaired Days .......................................................................................... 288 Table 7-50. Summary of Visibility Impacts from BRPP on the Great Smoky Mountains National
Park for the 20% Most Impaired Days ........................................................................... 288 Table 7-51. BRPP’s Boiler Control Technologies Identified and Evaluated for Technical
Feasibility ........................................................................................................................ 289 Table 7-52. ULSD Conversion Cost-Effectiveness Calculation for BRPP Boilers................... 290 Table 7-53. DSI System Cost-Effectiveness Calculation for BRPP Boilers ............................. 290 Table 7-54. Summary of Four-Factor Analysis Results for BRPP Boilers ............................... 290 Table 7-55. Summary of Annual SO2 Emissions for Domtar .................................................... 291 Table 7-56. Domtar No. 1 Hog Fuel Boiler Historical Emissions ............................................. 293 Table 7-57. Domtar No. 2 Hog Fuel Boiler Control Technology Identified and Evaluated for
Technical Feasibility ....................................................................................................... 293 Table 7-58. Cost-Effectiveness of Controls for No. 2 Hog Fuel Boiler .................................... 294 Table 7-59. Summary of Visibility Impacts from Domtar for 20% Most Impaired Days ......... 295 Table 7-60. Summary of Annual SO2 Emissions for PCS Phosphate ....................................... 295 Table 7-61. Catalyst Performance Before and After Upgrades for Acid Plants at PCS Phosphate
......................................................................................................................................... 297 Table 7-62. Summary of Visibility Impacts from PCS for 20% Most Impaired Days for PCS
Phosphate ........................................................................................................................ 297 Table 7-63. PCS’s Sulfuric Acid Plant Control Technologies Identified and Evaluated for
Technical Feasibility ....................................................................................................... 298 Table 8-1. Baseline, Current, and Natural Visibility Conditions and 2028 RPGs for 20% Most
Impaired Days for North Carolina Class I Areas (deciviews) ........................................ 307 Table 8-2. Baseline, Current, and Natural Visibility Conditions and 2028 RPGs for 20%
Clearest Days for North Carolina Class I Areas (deciviews) ......................................... 308 Table 9-1. North Carolina Class I Areas and Representative IMPROVE Monitor ................... 314 Table 10-1. Number of Out-of-State Facilities with ≥1.00% Sulfate Contribution to NC Class I
Areas in 2028 .................................................................................................................. 319

Pre-hearing Draft xx NC Regional Haze SIP for Second Planning Period (2019 – 2028) August 30, 2021
Table 10-2. Out-of-State Facilities with ≥1.00% Sulfate PSAT Contribution in 2028 in North Carolina Class I Areas .................................................................................................... 320
Table 10-3. Summary of VISTAS Consultation Meetings and Calls ........................................ 324 Table 10-4. MANE-VU Consultation with VISTAS States - Correspondence and Meetings .. 326 Table 10-5. Number of Days by Month Included in 20% Most Impaired Days for 2011 and 2016
– 2019 for Great Smoky Mountains National Park and Linville Gorge and Shining Rock Wilderness Areas ............................................................................................................ 337
Table 10-6. Days on Which Nitrate Exceeded Sulfate Concentrations for the 20% Most Impaired Days for Great Smoky Mountains National Park and Linville Gorge and Shining Rock Wilderness Areas ..................................................................................... 338
Table 10-7. Comparison of Emission Sectors for 2011, 2017 and 2028 Emissions and Total Reductions....................................................................................................................... 340
Table 10-8. Facility-Level Comparison of Sulfate versus Nitrate Visibility Impairment for the Great Smoky Mountains National Park and Linville Gorge and Shining Rock Wilderness Areas ............................................................................................................................... 343
Table 10-9. Comparison of Baseline Conditions to 2018 Observed and 2028 Modeled Visibility for 20% Most Impaired Days for Everglades National Park versus Class I Areas in North Carolina ........................................................................................................................... 347
Table 13-1. Key Control Measures and Other Emission Reduction Actions by Source Sector 359 Table 13-2. MACT Source Categories with Compliance Dates on or after 2002 ..................... 360 Table 13-3. Comparison of 2011 and 2018 Emissions for Coal-Fired EGUs Evaluated During
First Planning Period (TPY) ........................................................................................... 363 Table 13-4. Comparison of 2011 and 2018 Emissions for Non-EGU Facilities Evaluated During
First Planning Period (TPY) ........................................................................................... 365 Table 13-5. 2018 RPGs for Visibility Impairment in North Carolina's Class I Areas, 20% Worst
and Best/Clearest Days (dv)* .......................................................................................... 366 Table 13-6. Current Observed Visibility Impairment, Change from Baseline, and Comparison to
2018 RPGs, 20% Worst & 20% Most Impaired Days (dv) ............................................ 367 Table 13-7. Current Observed Visibility Impairment, Change from Baseline, and Comparison to
2018 RPGs, 20% Best/Clearest Days ............................................................................. 367 Table 13-8. Observed Visibility Impairment for Five-Year Periods through 2018, 20% Worst
Days, 20% Most Impaired Days, 20% Best/Clearest Days (dv) ..................................... 368 Table 13-9. Annual Anthropogenic SO2 Emissions Trends for NC (2011-2019) ..................... 374 Table 13-10. Annual Anthropogenic NOx Emissions Trends for NC (2011-2019) .................. 376 Table 13-11. Annual Anthropogenic PM2.5 Emissions Trends for NC (2011-2019) ................ 377 Table 13-12. Annual Anthropogenic PM10 Emissions Trends for NC (2011-2019) ................. 379 Table 13-13. Annual Anthropogenic VOC Emissions Trends for NC (2011-2019) ................. 380 Table 13-14. Annual Anthropogenic SO2 and NOx Emissions Trends by RPO and VISTAS
States (2011, 2014, and 2017)......................................................................................... 381
LIST OF FIGURES
Figure Ex-1-1. Mandatory Federal Class I Areas in North Carolina .............................................. i Figure Ex-1-2. Light Extinction by Species on 20% Most Impaired Days at the Beginning and
End of First Planning Period ............................................................................................. vii Figure Ex-1-3. Light Extinction by Species on 20% Clearest Days at the Beginning and End of
First Planning Period........................................................................................................ viii

Pre-hearing Draft xxi NC Regional Haze SIP for Second Planning Period (2019 – 2028) August 30, 2021
Figure Ex-1-4. Visual Range on 20% Most Impaired Days Compared to the URP ..................... ix Figure 1-1. Geographical Areas of Regional Planning Organizations .......................................... 3 Figure 1-2. North Carolina's Mandatory Federal Class I Areas .................................................... 6 Figure 1-3. Mandatory Federal Class I Areas in the VISTAS Region .......................................... 7 Figure 2-1. 2000-2004 Reconstructed Extinction for the 20% Most Impaired Days at the Great
Smoky Mountains National Park and Joyce Kilmer – Slickrock Wilderness Area .......... 18 Figure 2-2. 2001-2004 Reconstructed Extinction for the 20% Most Impaired Days at Linville
Gorge Wilderness Area ..................................................................................................... 19 Figure 2-3. 2001-2004 Reconstructed Extinction for the 20% Most Impaired Days at Shining
Rock Wilderness Area ...................................................................................................... 19 Figure 2-4. 2001-2004 Reconstructed Extinction for the 20% Most Impaired Days at
Swanquarter Wilderness Area ........................................................................................... 19 Figure 2-5. Average Light Extinction, 20% Most Impaired Days, 2000-2004, VISTAS and
Neighboring Class I Areas ................................................................................................ 20 Figure 2-6. Average Light Extinction, 20% Clearest Days, 2000-2004, VISTAS and
Neighboring Class I Areas ................................................................................................ 21 Figure 2-7. 2009-2013 Reconstructed Extinction for the 20% Most Impaired Days at the Great
Smoky Mountains National Park and Joyce Kilmer-Slickrock Wilderness Area ............ 25 Figure 2-8. 2009-2013 Reconstructed Extinction for the 20% Most Impaired Days at Linville
Gorge Wilderness Area ..................................................................................................... 25 Figure 2-9. 2009-2013 Reconstructed Extinction for the 20% Most Impaired Days at Shining
Rock Wilderness Area ...................................................................................................... 26 Figure 2-10. 2009-2013 Reconstructed Extinction for the 20% Most Impaired Days at
Swanquarter Wilderness Area ........................................................................................... 26 Figure 2-11. Average Light Extinction, 20% Most Impaired Days, 2009-2013, VISTAS and
Neighboring Class I Areas ................................................................................................ 27 Figure 2-12. Average Light Extinction, 20% Clearest Days, 2009-2013, VISTAS and
Neighboring Class I Areas ................................................................................................ 28 Figure 2-13. 2014-2018 Reconstructed Extinction for the 20% Most Impaired Days at the Great
Smoky Mountains National Park and Joyce Kilmer-Slickrock Wilderness Area ............ 30 Figure 2-14. 2014-2018 Reconstructed Extinction for the 20% Most Impaired Days at the
Linville Gorge Wilderness Area ....................................................................................... 30 Figure 2-15. 2014-2018 Reconstructed Extinction for the 20% Most Impaired Days at the
Shining Rock Wilderness Area ......................................................................................... 31 Figure 2-16. 2014-2018 Reconstructed Extinction for the 20% Most Impaired Days at the
Swanquarter Wilderness Area ........................................................................................... 31 Figure 2-17. Average Light Extinction, 20% Most Impaired Days, 2014-2018, VISTAS and
Neighboring Class I Areas ................................................................................................ 32 Figure 2-18. Average Light Extinction, 20% Clearest Days, 2014-2018, VISTAS and
Neighboring Class I Areas ................................................................................................ 32 Figure 3-1. Uniform Rate of Progress Glidepath for 20% Most Impaired Days at Great Smoky
Mountains National Park and Joyce Kilmer-Slickrock Wilderness Area ......................... 35 Figure 5-1. Map of 12Km CAMx Modeling Domains; VISTAS_12 Domain Represented as
Inner Red Domain ............................................................................................................. 51 Figure 6-1. Mean Bias (ppb) of MDA8 Ozone ≥ 60 ppb Over the Period May-September 2011 at
AQS Monitoring Sites in VISTAS12 Domain (top) and in North Carolina (bottom). ..... 55

Pre-hearing Draft xxii NC Regional Haze SIP for Second Planning Period (2019 – 2028) August 30, 2021
Figure 6-2. Normalized Mean Bias (%) of MDA8 Ozone ≥ 60 ppb Over the Period May-September 2011 at AQS Monitoring Sites in VISTAS12 Domain (top) and in North Carolina (bottom). ............................................................................................................. 56
Figure 6-3. Mean Error(ppb) of MDA8 Ozone ≥ 60 ppb Over the Period May-September 2011 at AQS Monitoring Sites in VISTAS12 Domain (top) and in North Carolina (bottom). . 57
Figure 6-4. Normalized Mean Error (%) of MDA8 Ozone >= 60 ppb Over the Period May-September 2011 at AQS Monitoring Sites in VISTAS12 Domain(top) and in North Carolina (bottom). ............................................................................................................. 58
Figure 6-5. Deposition Monitors Included in the VISTAS II Database ...................................... 60 Figure 6-6. Soccer Plots of Total PM2.5 by Network and Month for VISTAS and Non-VISTAS
Sites ................................................................................................................................... 67 Figure 6-7. Soccer Plots by Network and Month for VISTAS and Non-VISTAS Sites ............. 68 Figure 6-8. Soccer Plots of Nitrate by Network and Month for VISTAS and Non-VISTAS Sites
........................................................................................................................................... 69 Figure 6-9. Soccer Plots of OC by Network and Month for VISTAS and Non-VISTAS Sites .. 70 Figure 6-10. Soccer Plots of EC by Network and Month for VISTAS and Non-VISTAS Sites. 71 Figure 6-11. Observed Sulfate (Top) and Modeled NMB (Bottom) for Sulfate on the 20% Most-
Impaired Days at IMPROVE Monitor Locations ............................................................. 73 Figure 6-12. Observed Nitrate (Top) and Modeled NMB (Bottom) for Nitrate on the 20% Most
Impaired Days at Improve Monitor Locations.................................................................. 74 Figure 6-13. Observed OC (Top) and Modeled NMB (Bottom) for OC on the 20% Most-
Impaired Days at IMPROVE Monitor Locations ............................................................. 75 Figure 6-14. Observed EC (Top) and Modeled NMB (Bottom) for EC on the 20% Most-
Impaired Days at IMPROVE Monitor Locations ............................................................. 76 Figure 6-15. Observed Total PM2.5 (Top) and Modeled NMB (Bottom) for Total PM2.5 on the
20% Most-Impaired Days at IMPROVE Monitor Locations ........................................... 77 Figure 6-16. Observed Sea Salt (Top) and Modeled NMB (Bottom) for Sea Salt on the 20%
Most-Impaired Days at IMPROVE Monitor Locations.................................................... 78 Figure 6-17. Stacked Bar Charts for Average PM2.5 Concentrations (top) and Light Extinction
(bottom) at Great Smoky Mountains National Park on the 20% Most Impaired days (1st and 2nd columns) and 20% Clearest Days (3rd and 4th columns): Observation (left) and Modeled (Right) ................................................................................................................ 80
Figure 6-18. Stacked Bar Charts for Average PM2.5 Concentrations (top) and Light Extinction (bottom) at Linville Gorge Wilderness Area on the 20% Most-Impaired days (1st and 2nd columns) and 20% Clearest Days (3rd and 4th columns): Observation (left) and Modeled (Right) ............................................................................................................................... 81
Figure 6-19. Stacked Bar Charts for Average PM2.5 Concentrations (top) and Light Extinction (bottom) at Swanquarter Wilderness Area on the 20% Most-Impaired days (1st and 2nd columns) and 20% Clearest Days (3rd and 4th columns): Observation (left) and Modeled (Right) ............................................................................................................................... 82
Figure 6-20. Stacked Bar Charts for Daily PM2.5 Concentrations at Great Smoky Mountains National Park on the 20% Most Impaired Days: Observation (left) and Modeled (Right)........................................................................................................................................... 83
Figure 6-21. Stacked Bar Charts for Daily PM2.5 Concentrations at Great Smoky Mountains National Park on the 20% Clearest Days: Observation (left) and Modeled (Right) ......... 83
Figure 6-22. Stacked Bar Charts for Light Extinction at Great Smoky Mountains National Park on the 20% Most-Impaired Days: Observation (left) and Modeled (Right) ..................... 84

Pre-hearing Draft xxiii NC Regional Haze SIP for Second Planning Period (2019 – 2028) August 30, 2021
Figure 6-23. Stacked Bar Charts for Light Extinction at Great Smoky Mountains National Park on the 20% Clearest Days: Observation (left) and Modeled (Right) ................................ 84
Figure 6-24. Stacked Bar Charts for Daily PM2.5 Concentrations at Linville Gorge Wilderness Area on the 20% Most-Impaired Days: Observation (left) and Modeled (Right) ............ 85
Figure 6-25. Stacked Bar Charts for Daily PM2.5 Concentrations at Linville Gorge Wilderness Area on the 20% Clearest Days: Observation (left) and Modeled (Right) ....................... 85
Figure 6-26 Stacked Bar Charts for Light Extinction at Linville Gorge Wilderness Area on the 20% Most-Impaired Days: Observation (left) and Modeled (Right) ................................ 86
Figure 6-27 Stacked Bar Charts for Light Extinction at Linville Gorge Wilderness Area on the 20% Clearest Days: Observation (left) and Modeled (Right) ........................................... 86
Figure 6-28. Stacked Bar Charts for Daily PM2.5 Concentrations at Swanquarter Wilderness Area on the 20% Most-Impaired Days: Observation (left) and Modeled (Right) ............ 87
Figure 6-29. Stacked Bar Charts for Daily PM2.5 Concentrations at Swanquarter Wilderness Area on the 20% Clearest Days: Observation (left) and Modeled (Right) ....................... 87
Figure 6-30. Stacked Bar Charts for Light Extinction at Swanquarter Wilderness Area on the 20% Most-Impaired Days: Observation (left) and Modeled (Right) ................................ 88
Figure 6-31. Stacked Bar Charts for Light Extinction at Swanquarter Wilderness Area on the 20% Clearest Days: Observation (left) and Modeled (Right) ........................................... 88
Figure 6-32. Scatter Plot for Daily PM2.5 (top left), Sulfate (top right), Nitrate (bottom left), and Organic Carbon (bottom right) Concentrations at Great Smoky Mountains National Park on the 20% Most Impaired Days ...................................................................................... 89
Figure 6-33. Scatter Plot for Daily Elemental Carbon (top left), Crustal (top right), Sea Salt (bottom left), and Coarse Mass (bottom right) Concentrations at Great Smoky Mountains National Park on the 20% Most Impaired Days ............................................................... 90
Figure 6-34. Scatter Plot for Daily PM2.5 (top left), Sulfate (top right), Nitrate (bottom left), and Organic Carbon (bottom right) Concentrations at Great Smoky Mountains National Park on the 20% Clearest Days. ................................................................................................ 91
Figure 6-35 Scatter Plot for Daily Elemental Carbon (top left), Crustal (top right), Sea Salt (bottom left), and Coarse Mass (bottom right) Concentrations at Great Smoky Mountains National Park on the 20% Clearest Days .......................................................................... 92
Figure 6-36. Scatter Plot for Daily PM2.5 (top left), Sulfate (top right), Nitrate (bottom left), and Organic Carbon (bottom right) Concentrations at Linville Gorge Wilderness Area on the 20% Most Impaired Days ................................................................................................. 93
Figure 6-37. Scatter Plot for Daily Elemental Carbon (top left), Crustal (top right), Sea Salt (bottom left), and Coarse Mass (bottom right) Concentrations at Linville Gorge Wilderness Area on the 20% Most Impaired Days ........................................................... 94
Figure 6-38. Scatter Plot for Daily PM2.5 (top left), Sulfate (top right), Nitrate (bottom left), and Organic Carbon (bottom right) Concentrations at Linville Gorge Wilderness Area on the 20% Clearest Days ............................................................................................................ 95
Figure 6-39. Scatter Plot for Daily Elemental Carbon (top left), Crustal (top right), Sea Salt (bottom left), and Coarse Mass (bottom right) Concentrations at Linville Gorge Wilderness Area on the 20% Clearest Days ..................................................................... 96
Figure 6-40. Scatter Plot for Daily PM2.5 (top left), Sulfate (top right), Nitrate (bottom left), and Organic Carbon (bottom right) Concentrations at Swanquarter Wilderness Area on the 20% Most Impaired Days ................................................................................................. 97
Figure 6-41. Scatter Plot for Daily Elemental Carbon (top left), Crustal (top right), Sea Salt (bottom left), and Coarse Mass (bottom right) Concentrations at Swanquarter Wilderness Area on the 20% Most Impaired Days .............................................................................. 98

Pre-hearing Draft xxiv NC Regional Haze SIP for Second Planning Period (2019 – 2028) August 30, 2021
Figure 6-42. Scatter Plot for Daily PM2.5 (top left), Sulfate (top right), Nitrate (bottom left), and Organic Carbon (bottom right) Concentrations at Swanquarter Wilderness Area on the 20% Clearest Days ............................................................................................................ 99
Figure 6-43. Scatter Plot for Daily Elemental Carbon (top left), Crustal (top right), Sea Salt (bottom left), and Coarse Mass (bottom right) Concentrations at Swanquarter Wilderness Area on the 20% Clearest Days ...................................................................................... 100
Figure 6-44. Soccer Plot for Sulfate, Nitrate, Elemental Carbon, Organic Carbon, Coarse Mass, and Crustal Concentrations on the 20% Most Impaired Days at Great Smoky Mountains National Park .................................................................................................................. 101
Figure 6-45. Soccer Plot for Sulfate, Nitrate, Elemental Carbon, Organic Carbon, Coarse Mass, and Crustal Concentrations on the 20% Clearest Days at Great Smoky Mountains National Park .................................................................................................................. 102
Figure 6-46. Soccer Plot for Sulfate, Nitrate, Elemental Carbon, Organic Carbon, Coarse Mass, and Crustal Concentrations on the 20% Most Impaired Days at Linville Gorge Wilderness Area .............................................................................................................. 102
Figure 6-47. Soccer Plot for Sulfate, Nitrate, Elemental Carbon, Organic Carbon, Coarse Mass, and Crustal Concentrations on the 20% Clearest Days at Linville Gorge Wilderness Area......................................................................................................................................... 103
Figure 6-48. Soccer Plot for Sulfate, Nitrate, Elemental Carbon, Organic Carbon, Coarse Mass, and Crustal Concentrations on the 20% Most Impaired Days at Swanquarter Wilderness Area ................................................................................................................................. 103
Figure 6-49. Soccer Plot for Sulfate, Nitrate, Elemental Carbon, Organic Carbon, Coarse Mass, and Crustal Concentrations on the 20% Clearest Days at Swanquarter Wilderness Area......................................................................................................................................... 104
Figure 6-50. Bugle Plots of MFB (top) and MFE (bottom) for Sulfate, Nitrate, Elemental Carbon, Organic Carbon, Coarse Mass, and Crustal Concentrations on the 20% Most Impaired Days at Great Smoky Mountains National Park .............................................. 105
Figure 6-51. Bugle Plots of MFB (top) and MFE (bottom) for Sulfate, Nitrate, Elemental Carbon, Organic Carbon, Coarse Mass, and Crustal Concentrations on the 20% Clearest Days at Great Smoky Mountains National Park ............................................................. 106
Figure 6-52. Bugle Plots of MFB (top) and MFE (bottom) for Sulfate, Nitrate, Elemental Carbon, Organic Carbon, Coarse Mass, and Crustal Concentrations on the 20% Most Impaired Days at Linville Gorge Wilderness Area......................................................... 107
Figure 6-53. Bugle Plots of MFB (top) and MFE (bottom) for Sulfate, Nitrate, Elemental Carbon, Organic Carbon, Coarse Mass, and Crustal Concentrations on the 20% Clearest Days at Linville Gorge Wilderness Area ........................................................................ 108
Figure 6-54. Bugle Plots of MFB (top) and MFE (bottom) for Sulfate, Nitrate, Elemental Carbon, Organic Carbon, Coarse Mass, and Crustal Concentrations on the 20% Most Impaired Days at Swanquarter Wilderness Area ............................................................ 109
Figure 6-55. Bugle Plots of MFB (top) and MFE (bottom) for Sulfate, Nitrate, Elemental Carbon, Organic Carbon, Coarse Mass, and Crustal Concentrations on the 20% Clearest Days at Swanquarter Wilderness Area ........................................................................... 110
Figure 7-1. Clean Smokestacks Act Emissions Reductions ..................................................... 119 Figure 7-2. SO2 Emissions for 2011 and 2028 for VISTAS States ........................................... 132 Figure 7-3. NOx Emissions for 2011 and 2028 for VISTAS States........................................... 132 Figure 7-4. SO2 Emissions for 2011 and 2028 for Other RPOs ................................................ 133 Figure 7-5. NOx Emissions for 2011 and 2028 for Other RPOs ................................................ 134 Figure 7-6. SO2 Emissions from VISTAS States....................................................................... 141
Pre-hearing Draft xxv NC Regional Haze SIP for Second Planning Period (2019 – 2028) August 30, 2021
Figure 7-7. NOx Emissions from VISTAS States ...................................................................... 142 Figure 7-8. North Carolina SO2 Emissions ................................................................................ 143 Figure 7-9. North Carolina NOx Emissions ............................................................................... 144 Figure 7-10. Great Smoky Mountains National Park and Joyce Kilmer-Slickrock Wilderness
Area URP on the 20% Most Impaired Days ................................................................... 148 Figure 7-11. Linville Gorge Wilderness Area URP on the 20% Most Impaired Days ............. 148 Figure 7-12. Shining Rock Wilderness Area URP on the 20% Most Impaired Days ............... 149 Figure 7-13. Swanquarter Wilderness Area URP on the 20% Most Impaired Days ................. 149 Figure 7-14. Percent of URP in 2028......................................................................................... 150 Figure 7-15. Great Smoky Mountains National Park 20% Most Impaired Days in 2000-2004,
20% Most Impaired Days in 2028, and Natural Conditions ........................................... 151 Figure 7-16. Linville Gorge Wilderness Area 20% Most Impaired Days in 2000-2004, 20%
Most Impaired Days in 2028, and Natural Conditions ................................................... 152 Figure 7-17. Shining Rock Wilderness Area 20% Most Impaired Days in 2000-2004, 20% Most
Impaired Days in 2028, and Natural Conditions ............................................................ 153 Figure 7-18. 20% Clearest Days Rate of Progress for Great Smoky Mountains National Park and
Joyce Kilmer – Slickrock Wilderness Area .................................................................... 154 Figure 7-19. 20% Clearest Days Rate of Progress for Linville Gorge Wilderness Area........... 155 Figure 7-20. 20% Clearest Days Rate of Progress for Shining Rock Wilderness Area ............ 155 Figure 7-21. 20% Clearest Days Rate of Progress for Swanquarter Wilderness Area .............. 156 Figure 7-22. Percent Visibility Improvement on 20% Clearest Days ....................................... 157 Figure 7-23. 2028 Nitrate Visibility Impairment, 20% Most Impaired Days, VISTAS Class I
Areas ............................................................................................................................... 167 Figure 7-24. 2028 Sulfate Visibility Impairment, 20% Most Impaired Days, VISTAS Class I
Areas ............................................................................................................................... 168 Figure 7-25. 2028 Visibility Impairment from Sulfate on 20% Most Impaired Days, VISTAS
Class I Areas ................................................................................................................... 169 Figure 7-26. 2028 Visibility Impairment from Nitrate on 20% Most Impaired Days, VISTAS
Class I Areas ................................................................................................................... 170 Figure 7-27. 2028 Contribution to Light Extinction on the 20% Most Impaired Days at
Swanquarter .................................................................................................................... 171 Figure 7-28. 2028 Contribution to Light Extinction on the 20% Most Impaired Days at Shining
Rock ................................................................................................................................ 172 Figure 7-29. 2028 Contribution to Light Extinction on the 20% Most Impaired Days at Linville
Gorge............................................................................................................................... 173 Figure 7-30. 2028 Contribution to Light Extinction on the 20% Most Impaired Days at Joyce
Kilmer-Slickrock............................................................................................................. 174 Figure 7-31. 2028 Contribution to Light Extinction on the 20% Most Impaired Days at Great
Smoky Mountains ........................................................................................................... 175 Figure 7-32. 100-Meter Back Trajectories for the 20% Most Impaired Visibility Days (2011-
2016) from Great Smoky Mountains National Park ....................................................... 179 Figure 7-33. 100-Meter Back Trajectories for the 20% Most Impaired Visibility Days (2011-
2016) from Joyce Kilmer-Slickrock Wilderness Area.................................................... 180 Figure 7-34. 100-Meter Back Trajectories for the 20% Most Impaired Visibility Days (2011-
2016) from Linville Gorge Wilderness Area .................................................................. 180 Figure 7-35. 100-Meter Back Trajectories for the 20% Most Impaired Visibility Days (2011-
2016) from Shining Rock Wilderness Area .................................................................... 181

Pre-hearing Draft xxvi NC Regional Haze SIP for Second Planning Period (2019 – 2028) August 30, 2021
Figure 7-36. 100-Meter Back Trajectories for the 20% Most Impaired Visibility Days (2011-2016) from Swanquarter Wilderness Area ..................................................................... 181
Figure 7-37. 100-Meter Back Trajectories by Season for the 20% Most Impaired Visibility Days (2011-2016) from Great Smoky Mountains National Park ............................................ 182
Figure 7-38. 100-Meter Back Trajectories by Season for the 20% Most Impaired Visibility Days (2011-2016) from Joyce Kilmer-Slickrock Wilderness Area ......................................... 183
Figure 7-39. 100-Meter Back Trajectories by Season for the 20% Most Impaired Visibility Days (2011-2016) from Linville Gorge Wilderness Area ....................................................... 184
Figure 7-40. 100-Meter Back Trajectories by Season for the 20% Most Impaired Visibility Days (2011-2016) from Shining Rock Wilderness Area ......................................................... 185
Figure 7-41. 100-Meter Back Trajectories by Season for the 20% Most Impaired Visibility Days (2011-2016) from Swanquarter Wilderness Area ........................................................... 186
Figure 7-42. 100-Meter, 500-Meter, 1000-Meter, and 1500-Meter Back Trajectories for the 20% Most Impaired Days (2011-2016) from Great Smoky Mountains National Park .......... 187
Figure 7-43. 100-Meter, 500-Meter, 1000-Meter, and 1500-Meter Back Trajectories for the 20% Most Impaired Days (2011-2016) from Joyce Kilmer-Slickrock Wilderness Area ....... 187
Figure 7-44. 100-Meter, 500-Meter, 1000-Meter, and 1500-Meter Back Trajectories for the 20% Most Impaired Days (2011-2016) from Linville Gorge Wilderness Area ..................... 188
Figure 7-45. 100-Meter, 500-Meter, 1000-Meter, and 1500-Meter Back Trajectories for the 20% Most Impaired Days (2011-2016) from Shining Rock Wilderness Area ....................... 188
Figure 7-46. 100-Meter, 500-Meter, 1000-Meter, and 1500-Meter Back Trajectories for the 20% Most Impaired Days (2011-2016) from Swanquarter Wilderness Area ......................... 189
Figure 7-47. Residence Time (Counts per 12-Km Modeling Grid Cell) for Great Smoky Mountains National Park – Full View (top) and Class I Zoom (bottom) ....................... 190
Figure 7-48. Residence Time (% of Total Counts per 12-Km Modeling Grid Cell for Great Smoky Mountains National Park – Full View (top) and Class I Zoom (bottom) ........... 191
Figure 7-49. Residence Time (Counts per 12-Km Modeling Grid Cell) for Joyce Kilmer-Slickrock Wilderness Area – Full View (top) and Class I Zoom (bottom) .................... 192
Figure 7-50. Residence Time (% of Total Counts per 12-Km Modeling Grid Cell for Joyce Kilmer-Slickrock Wilderness Area – Full View (top) and Class I Zoom (bottom)........ 193
Figure 7-51. Residence Time (Counts per 12-Km Modeling Grid Cell) for Linville Gorge Wilderness Area – Full View (top) and Class I Zoom (bottom)..................................... 194
Figure 7-52. Residence Time (% of Total Counts per 12-Km Modeling Grid Cell for Linville Gorge Wilderness Area – Full View (top) and Class I Zoom (bottom) .......................... 195
Figure 7-53. Residence Time (Counts per 12-Km Modeling Grid Cell) for Shining Rock Wilderness Area – Full View (top) and Class I Zoom (bottom)..................................... 196
Figure 7-54. Residence Time (% of Total Counts per 12-Km Modeling Grid Cell for Shining Rock Wilderness Area – Full View (top) and Class I Zoom (bottom) ........................... 197
Figure 7-55. Residence Time (Counts per 12-Km Modeling Grid Cell) for Swanquarter Wilderness Area – Full View (top) and Class I Zoom (bottom)..................................... 198
Figure 7-56. Residence Time (% of Total Counts per 12Km Modeling Grid Cell for Swanquarter Wilderness Area – Full View (top) and Class I Zoom (bottom)..................................... 199
Figure 7-57. Sulfate Extinction Weighted Residence Time (Sulfate EWRT per 12Km Modeling Grid Cell) for Great Smoky Mountains National Park - Full View (top) and Class I Zoom (bottom)........................................................................................................................... 201
Figure 7-58. Nitrate Extinction Weighted Residence Time (Nitrate EWRT per 12-Km Modeling Grid Cell) for Great Smoky Mountains National Park - Full View (top) and Class I Zoom (bottom)........................................................................................................................... 202

Pre-hearing Draft xxvii NC Regional Haze SIP for Second Planning Period (2019 – 2028) August 30, 2021
Figure 7-59. Sulfate Extinction Weighted Residence Time (Sulfate EWRT per 12Km Modeling Grid Cell) for Joyce Kilmer-Slickrock Wilderness Area - Full View (top) and Class I Zoom (bottom) ................................................................................................................ 203
Figure 7-60. Nitrate Extinction Weighted Residence Time (Nitrate EWRT per 12-Km Modeling Grid Cell) for Joyce Kilmer-Slickrock Wilderness Area - Full View (top) and Class I Zoom (bottom) ................................................................................................................ 204
Figure 7-61. Sulfate Extinction Weighted Residence Time (Sulfate EWRT per 12Km Modeling Grid Cell) for Linville Gorge Wilderness Area - Full View (top) and Class I Zoom (bottom)........................................................................................................................... 205
Figure 7-62. Nitrate Extinction Weighted Residence Time (Nitrate EWRT per 12-Km Modeling Grid Cell) for Linville Gorge Wilderness Area - Full View (top) and Class I Zoom (bottom)........................................................................................................................... 206
Figure 7-63. Sulfate Extinction Weighted Residence Time (Sulfate EWRT per 12Km Modeling Grid Cell) for Shining Rock Wilderness Area - Full View (top) and Class I Zoom (bottom)........................................................................................................................... 207
Figure 7-64. Nitrate Extinction Weighted Residence Time (Nitrate EWRT per 12-Km Modeling Grid Cell) for Shining Rock Wilderness Area - Full View (top) and Class I Zoom (bottom)........................................................................................................................... 208
Figure 7-65. Sulfate Extinction Weighted Residence Time (Sulfate EWRT per 12Km Modeling Grid Cell) for Swanquarter Wilderness Area - Full View (top) and Class I Zoom (bottom)......................................................................................................................................... 209
Figure 7-66. Nitrate Extinction Weighted Residence Time (Nitrate EWRT per 12-Km Modeling Grid Cell) for Swanquarter Wilderness Area - Full View (top) and Class I Zoom (bottom)......................................................................................................................................... 210
Figure 7-67. Sulfate Emissions/Distance Extinction Weighted Residence Time (% of Total Q/d*EWRT per 12Km Modeling Grid Cell) for Great Smoky Mountains National Park......................................................................................................................................... 212
Figure 7-68. Nitrate Emissions/Distance Extinction Weighted Residence Time (% of Total Q/d*EWRT per 12Km Modeling Grid Cell) for Great Smoky Mountains National Park......................................................................................................................................... 212
Figure 7-69. Sulfate Emissions/Distance Extinction Weighted Residence Time (% of Total Q/d*EWRT per 12Km Modeling Grid Cell) for Joyce Kilmer-Slickrock Wilderness Area......................................................................................................................................... 213
Figure 7-70. Nitrate Emissions/Distance Extinction Weighted Residence Time (% of Total Q/d*EWRT per 12Km Modeling Grid Cell) for Joyce Kilmer-Slickrock Wilderness Area– Full View (top) and Class I Zoom (bottom)......................................................... 213
Figure 7-71. Sulfate Emissions/Distance Extinction Weighted Residence Time (% of Total Q/d*EWRT per 12Km Modeling Grid Cell) for Linville Gorge Wilderness Area ........ 214
Figure 7-72. Nitrate Emissions/Distance Extinction Weighted Residence Time (% of Total Q/d*EWRT per 12Km Modeling Grid Cell) for Linville Gorge Wilderness Area ........ 214
Figure 7-73. Sulfate Emissions/Distance Extinction Weighted Residence Time (% of Total Q/d*EWRT per 12Km Modeling Grid Cell) for Shining Rock Wilderness Area .......... 215
Figure 7-74. Nitrate Emissions/Distance Extinction Weighted Residence Time (% of Total Q/d*EWRT per 12Km Modeling Grid Cell) for Shining Rock Wilderness Area .......... 215
Figure 7-75. Sulfate Emissions/Distance Extinction Weighted Residence Time (% of Total Q/d*EWRT per 12Km Modeling Grid Cell) for Swanquarter Wilderness Area ............ 216
Figure 7-76. Nitrate Emissions/Distance Extinction Weighted Residence Time (% of Total Q/d*EWRT per 12Km Modeling Grid Cell) for Swanquarter Wilderness Area ............ 216

Pre-hearing Draft xxviii NC Regional Haze SIP for Second Planning Period (2019 – 2028) August 30, 2021
Figure 7-77. Ratio of AoI/PSAT % Contributions for Sulfate as a Function of Distance from the Facility to the Class I Area.............................................................................................. 263
Figure 7-78. Fractional Bias for Sulfate as a Function of Distance from the Facility to the Class I Area ................................................................................................................................. 264
Figure 9-1. IMPROVE Monitoring Network in North Carolina ............................................... 315 Figure 9-2. VISTAS IMPROVE Monitoring Network ............................................................. 315 Figure 10-1. Comparison of Five-Year Average (2009-2013 vs. 2015-2019) Particle
Contributions to Light Extinction for 20% Most Impaired Days at Great Smoky Mountains National Park ................................................................................................ 332
Figure 10-2. Comparison of Five-Year Average (2009-2013 vs. 2015-2019) Particle Contributions to Light Extinction for 20% Most Impaired Days at Linville Gorge Wilderness Area .............................................................................................................. 333
Figure 10-3. Comparison of Five-Year Average (2009-2013 vs. 2015-2019) Particle Contributions to Light Extinction for 20% Most Impaired Days at Shining Rock Wilderness Area .............................................................................................................. 334
Figure 10-4. Particle Contributions to Light Extinction for 20% Most Impaired Days at Great Smoky Mountains National Park for 2011-2019 ............................................................ 335
Figure 10-5. Particle Contributions to Light Extinction for 20% Most Impaired Days at Linville Gorge Wilderness Area for 2011-2019 ........................................................................... 335
Figure 10-6. Particle Contributions to Light Extinction for 20% Most Impaired Days at Shining Rock Wilderness Area for 2011-2019 ............................................................................ 336
Figure 10-7. Comparison of Ammonium Sulfate and Ammonium Nitrate Five-Year Average (2009 – 2013 vs. 2015 – 2019) Contributions to Visibility Impairment for 20% Most Impaired Days at Great Smoky Mountains National Park .............................................. 337
Figure 10-8. North Carolina SO2 Emissions Trends by Sector ................................................. 339 Figure 10-9. North Carolina NOx Emissions Trends by Sector ................................................ 339 Figure 10-10. Projected 2028 Speciated Visibility Impairment for 20% Most Impaired Days at
Great Smoky Mountains National Park (GSMNP), and Linville Gorge Wilderness Area (LIGO), and Shining Rock Wilderness Area (SHRO).................................................... 342
Figure 10-11. Map of Potentially Underserved Communities for Great Smoky Mountains National Park, Joyce Kilmer-Slickrock Wilderness Area, Linville Gorge Wilderness Area and Shining Rock Wilderness Area ................................................................................ 352
Figure 10-12. Map of Potentially Underserved Communities for Swanquarter Wilderness Area.......................................................................................................................................... 353
Figure 10-13. The Commission of Indian Affairs Statewide Map ............................................ 354 Figure 13-1. Visibility Conditions at Great Smoky Mountains National Park and Joyce Kilmer-
Slickrock Wilderness Area for the 20% worst days ....................................................... 369 Figure 13-2. Visibility Conditions at Great Smoky Mountains National Park and Joyce Kilmer-
Slickrock Wilderness Area for the 20% best days .......................................................... 370 Figure 13-3. Visibility Conditions at Linville Gorge Wilderness Area for the 20% worst days370 Figure 13-4. Visibility Conditions at Linville Gorge Wilderness Area for the 20% best days . 371 Figure 13-5. Visibility Conditions at Shining Rock Wilderness Area for the 20% worst days 371 Figure 13-6. Visibility Conditions at Shining Rock Wilderness Area for the 20% best days ... 372 Figure 13-7. Visibility Conditions at Swanquarter Wilderness Area for the 20% worst days .. 372 Figure 13-8. Visibility Conditions at Swanquarter Wilderness Area for the 20% best days..... 373 Figure 13-9. Annual Anthropogenic SO2 Emissions Trends for NC (2011-2019) .................... 375 Figure 13-10. Annual Anthropogenic NOx Emissions Trends for NC (2011-2019) ................. 377 Figure 13-11. Annual Anthropogenic PM2.5 Emissions Trends for NC (2011-2019) ............... 378

Pre-hearing Draft xxix NC Regional Haze SIP for Second Planning Period (2019 – 2028) August 30, 2021
Figure 13-12. Annual Anthropogenic PM10 Emissions Trends for NC (2011-2019) ................ 379 Figure 13-13. Annual Anthropogenic VOC Emissions Trends for NC (2011-2019) ................ 381 Figure 13-14. Annual Anthropogenic SO2 Emissions Trends by RPO and VISTAS States ..... 383 Figure 13-15. Annual Anthropogenic NOx Emissions Trends by RPO and VISTAS States .... 383 Figure 13-16. Average light extinction for the 20% Worst Days in 2011-2018 at Southeast and
Neighboring Class I Areas .............................................................................................. 384 Figure 13-17. Average light extinction for the 20% Most Impaired Days in 2011-2018 at
Southeast and Neighboring Class I Areas ....................................................................... 385
TABLE OF APPENDICES [Appendices specific to North Carolina only are identified with an astrick.] Appendix Title File Name
A Project Reports Appendix_A.1_A-2_A-3_for_SIP_Combined.pdf A-1 VISTAS II Quality Assurance Project Plan Included in combined file above A-2 VISTAS II Work Plan Included in combined file above
A-3 VISTAS II Final Project Report for Contract Included in combined file above
B Emissions Preparation and Processing Appendix_B1a_B1b_B2a_B2b_ for_SIP_Combined.pdf
B-1a VISTAS II Task 2A - Emission Inventory Updates Report (AOI and PSAT) Included in combined file above
B-1b VISTAS II Task 3A - Conversion of the Task 2A 2028 Point Source Files for Emissions Processing with SMOKE
Included in combined file above
B-1b (Appendix
A)
Southeastern VISTAS II Regional Haze Project: Documentation of 2028 Mass Emissions Inventory for Small Electricity Generating Units (EGUs) for States not included in the VISTAS II Region
Included in combined file above (in Appendix B-1b and Appendix B-2b)
B-1b (Appendix
B)
Contains a memorandum and supporting attachments summarizing the problems with the elv3 modeling that were corrected in the elv5 modeling
APP_B_ELV3_REASSESSMENT.zip
B-2a VISTAS II Task 2B - Emission Inventory Updates Report (2028 Visibility Estimates) Included in combined file above
B-2b
VISTAS II Task 3B - Conversion of the Task 2B 2028 Point Source Remodeling Files for Emissions Processing with SMOKE
Included in combined file above
B-3*
North Carolina Point Sources Emissions Projections for 2028 [Note: Documents NC methods for preparing 2028 point source inventory from 2016 base year]
Appendix_B-3_NC_Point_Source_2028_Projections_for_SIP.pdf
C Monitoring, Meteorological, and Other Data Acquisition and Preparation Appendix_C_for_SIP.pdf
D Area of Influence Analyses
D-1 Area of Influence Analyses Appendix_D-1_for_SIP.pdf
D-2 Area of Influence and HYSPLIT Graphics for VISTAS and Nearby Class I Areas
Appendix_D-2_AoI_and_HYSPLIT_graphics_for_VISTAS_and_Nearby_ClassI_Areas.pdf

Pre-hearing Draft xxx NC Regional Haze SIP for Second Planning Period (2019 – 2028) August 30, 2021
Appendix Title File Name
E Visibility and Source Apportionment Projections
E-1a Regional Haze Modeling for Southeastern VISTAS II Regional Haze Analysis Project – Final Modeling Protocol June 27, 2018
Appendix_E-1a_Vistas Modeling Protocol_for_SIP.pdf
E-1b
Regional Haze Modeling for Southeastern VISTAS II Regional Haze Analysis Project Final Modeling Protocol Update and Addendum to the Approved Modeling Protocol for Task 6.1 (June 2018) August 31, 2020
Appendix_E-1b_Modeling_Protocol_Update_for_SIP.pdf
E-2a
Regional Haze Modeling for Southwestern VISTAS II Regional Haze Analysis Project 2011el and 2028el CAMx Benchmarking Report Task 6 Benchmark Report #1 Covering Benchmark Runs #1 and #2 August 17, 2020
Appendix_E-2a_BMR1_Runs1_2_for_SIP.pdf
E-2b
Regional Haze Modeling for Southeastern VISTAS II Regional Haze Analysis Project 2011el CAMx Version 6.32 and 6.40 Comparison Report Task 6 Benchmark Report Number #2 Covering Benchmark Run #3 August 17, 2020
Appendix_E-2b_BMR2_Run3_for_SIP.pdf
E-2c
Regional Haze Modeling for Southeastern VISTAS II Regional Haze Analysis Project 2011el CAMx Version 6.40 12km VISTAS and EPA 12km Continental Grid Comparison Report Benchmark Report Task 6 Benchmark Report #3 Covering Benchmark Run #5 August 17, 2020
Appendix_E-2c_BMR3_Run5_for_SIP.pdf
E-2d
Regional Haze Modeling for Southeastern VISTAS II Regional Haze Analysis Project 2028 CAMx Version 6.32 and 6.40 Comparison Report Task 6 Benchmark Report #4 Covering Benchmark Run #4 August 17, 2020
Appendix_E-2d_BMR4_Run4_for_SIP.pdf
E-2e
Regional Haze Modeling for Southeastern VISTAS II Regional Haze Analysis Project 2028elv3 CAMx Version 6.40 12km VISTAS and EPA 12km Continental Grid Comparison Report Task 6 Benchmark Report Number #5 Covering Benchmark Run #6 August 17, 2020
Appendix_E-2e_BMR5_Run6_for_SIP.pdf
E-2f
Regional Haze Modeling for Southeastern VISTAS II Regional Haze Analysis Project 2028 Emissions Version V3 and V5 Comparison Report Benchmark Report Task 6 Benchmark Report #6 Covering Benchmark Run #7 September 22, 2020
Appendix_E-2f_BMR6_Run7_for_SIP.pdf
E-3
Model Performance Evaluation for Particulate Matter and Regional Haze of the CAMx 6.40 Modeling System and the VISTAS II 2011 Updated Modeling Platform for Task 8.0 October 29, 2020
Appendix_E-3_MPE_PM_and_RH_for_SIP.pdf

Pre-hearing Draft xxxi NC Regional Haze SIP for Second Planning Period (2019 – 2028) August 30, 2021
Appendix Title File Name
E-3 2011 Model Performance Results by Pollutant and Quarter - CASTNET Sites APP_A1-MPE by Station and Season-1.pdf
E-3 2011 Model Performance Results by Pollutant and Quarter - CSN Sites APP_A2-MPE by Station and Season-2.pdf
E-3 2011 Model Performance Results by Pollutant and Season - IMPROVE Sites APP_A3-MPE by Station and Season-3.pdf
E-3 Model Performance Evaluation Charts – IMPROVE Sites
APP_C_maps_pred_obs_mpe_results_station_all_dates_IMPROVE.xlsx
E-3 Mass Budgets and bext Budgets – IMPROVE Sites APP_F_PM_EXINCTION_MPE.xlsx
E-4
Deposition Model Performance Evaluation Southeastern VISTAS II Regional Haze Analysis Project (Task 8.1), Revised Final – January 22, 2021
Appendix_E-4_(MPE_Deposition)_for_SIP.pdf
E-5
Model Performance Evaluation for Ozone of the CAMx 6.40 Modeling System and the VISTAS II 2011 Updated Modeling Platform (Task 8.0) August 17, 2020
Appendix_E-5_MPE_Ozone_for_SIP.pdf
E-5 Ozone Monitoring Sites for MPE AppendixA1-OzoneMPEbyStation.xlsx
E-6 Future Year Model Projections Task 9a September 23, 2020
Appendix_E-6_(Future Year_Model_Projections)_for_SIP
E-6 Fine, Total Mass, and Daily Extinction Budgets
APP_A_ag_v6_40.2028elv5.vistas_12_SESARM (4 Sept 2020).xlsx
E-6 Stacked Bar Charts for Clearest and Most Impaired Days APP_B_StackedBarCharts.xlsx
E-6 URP Charts APP_C_SESARM_2028elv5_URP_20200903.xlsx
E-7a Particulate Source Apportionment Technology Modeling Results Task 7 August 31, 2020
Appendix_E-7a_PSAT_Model Results_for_SIP.pdf
E-7a Modeling results for PSAT-Tagged Sources (adjusted Sept 2020)
ATTACHMENT_A_PSAT_TAG_RESULTS_adjusted_09-02-2020.xlsx
E-7a Modeling results for PSAT-Tagged Sources (original)
ATTACHMENT_A_PSAT_TAG_RESULTS_Original.xlsm
E-7b Roadmap for PSAT Scaled Adjustments Appendix_E-7b_ Roadmap_for_PSAT_Scaled_Adjustments_for_SIP.pdf
E-7b Modeling results for PSAT-Tagged Sources (adjusted Sept 2020)
ATTACHMENT_A_PSAT_TAG_RESULTS_adjusted_09-02-2020.xlsx
E-7b Summary of AOI Data for Vistas States VISTAS AOI Data Summary.xlsx
E-7b Comparison of original and updated modeling
VISTAS Emissions 2028 Comparisons Remodeling 200902.xlsx
E-7b PSAT Percent Contribution Rankings VISTAS PSAT Percent Contribution Rankings 02-09-2021 calcs.xlsx
E-7b PSAT Percent Contribution Rankings VISTAS PSAT Percent Contribution Rankings 02-09-2021.xlsx
E-8 SMAT 2028 Bulk- EPA 2019 Modeling with Graphics Appendix_E-8_SMAT_2028_Bulk_for_SIP
F Consultation
F-1* NC Letters to VISTAS States Appendix F-1_for_SIP.pdf
F-2 VISTAS State to NonVISTAS State Consultation
F-2a VISTAS Consultation with AR Office of Air Quality Appendix_F-2a.pdf

Pre-hearing Draft xxxii NC Regional Haze SIP for Second Planning Period (2019 – 2028) August 30, 2021
Appendix Title File Name
F-2b VISTAS Consultation with IN Office of Air Quality Appendix_F-2b.pdf
F-2c VISTAS Consultation with MO Air Pollution Control Program Appendix_F-2c.pdf
F-2d VISTAS Letter to OH Division of Air Pollution Control Appendix_F-2d.pdf
F-2e VISTAS Consultation with PA Bureau of Air Quality Appendix_F-2e.pdf
F-2f MDE Consultation with VERSO Corporation – Luke Mill Appendix_F-2f.pdf
F-3 EPA_FLM_Stakeholder Outreach and Presentations Appendix_F-3a_to_F-3n.pdf
F-4* North Carolina’s Consultation with MANE-VU Appendix_F-4_NC_Consultation_with_MANE-VU.pdf
F-5* Environmental Justice Reports Appendix_F-5_for_SIP F-5a* Western NC EJSCREEN Report Included in combined file above F-5b* Swanquarter EJSCREEN Report Included in combined file above
G NC Reasonable Progress Assessments
G-1* Reasonable Progress Assessment for Blue Ridge Paper Products, LLC – Canton, NC Appendix_G-1_BRPP.pdf
G-2* Reasonable Progress Assessment for Domtar Paper Company, LLC – Plymouth, NC
Appendix_G-2_Domtar.pdf
G-2a* Four Factor Analysis for Domtar Paper Company, LLC – Plymouth, NC Included in combined file above
G-2b* Domtar Paper Company – Permit No. 04291T49 Included in combined file above
G-3* Reasonable Progress Assessment for PCS Phosphate Company, Inc. – Aurora, NC Appendix_G-3_PCS_Phosphate.pdf
G-3a* Four-Factor Analysis for PCS Phosphate Company, Inc. – Aurora, NC Included in combined file above
G-3b* PCS Phosphate Company – Permit No. 04176T63 Included in combined file above
H* Federal Land Manager Consultation and Comments Appendix_H1-H3_For_SIP.pdf
H-1* Consultation with FLM PowerPoint Presentation (April 20, 2021) Included in combined file above
H-2* Comments received from NPS Air Resources Division (June 4, 2021) Included in combined file above
H-3* Comments received from USFS (June 3, 2021) Included in combined file above

Pre-hearing Draft xxxiii NC Regional Haze SIP for Second Planning Period (2019 – 2028) August 30, 2021
List of Acronyms
The following acronyms are from either the SIP template dated August 28, 2020 or North Carolina’s Round 1 SIP. Acronyms highlighted in red are from the final Blue Ridge Paper Products SIP. Until we go final with the pre-draft, it is ok to add acronyms you find as we prepare the pre-draft SIP but do not delete any. Please color code the added acronyms in something other than red. We will run a check on the final pre-draft and delete any unused acronyms (or add any acronyms missed). Note that the list in the following table can be sorted in alphabetical order.
Acronym Definition AEO Annual Energy Outlook AERR Air Emissions Reporting Requirements AFWA Air Force Weather Agency AIRMon Atmospheric Integrated Research Monitoring Network (AIRMon) AL Alabama AMoN Ammonia Monitoring Network AoI Area of Influence AP-42 Compilation of Air Pollutant Emissions Factors AQS Air Quality System ARRA American Recovery and Reinvestment Act ARW Advanced Research WRF model BART Best Available Retrofit Technology BEIS Biogenic Emission Inventory System BELD Biogenic Emissions Land Use Database BLM Bureau of Land Management bext Visibility Impairment, Mm-1 CAA Clean Air Act CAIR Clean Air Interstate Rule CAM Compliance Assurance Monitoring CAMD Clean Air Markets Division CAMx Comprehensive Air Quality Model with Extensions CART Classification and Regression Tree CASTNet Clean Air Status and Trends Network CEDS Comprehensive Environmental Data System CEM Continuous Emissions Monitoring CENRAP Central Regional Air Planning Association CERR Consolidated Emissions Reporting Rule CFR Code of Federal Regulations CM Course Particle Mass CMAQ Community Multi-scale Air Quality Model CMS Continuous Monitoring Systems CO Carbon Monoxide CONUS Continental U.S. CoST Control Strategy Tool CSA Clean Smokestack Act CSAPR Cross-State Air Pollution Rule CSN Chemical Speciation Network CTG Control Technique Guideline

Pre-hearing Draft xxxiv NC Regional Haze SIP for Second Planning Period (2019 – 2028) August 30, 2021
Acronym Definition CWT Concentration Weighted Trajectory CY Calendar Year d Distance (Kilometers) DEC Duke Energy Carolinas, LLC DEP Duke Energy Progress, Inc. DERA Diesel Emissions Reduction Act DRR Data Requirements Rule dv Deciview EC Elemental Carbon EGU Electricity Generating Unit EIA Energy Information Administration EIS Emissions Inventory System EMF Emissions Modeling Framework EMT Environmental Mitigation Trust EO-80 Executive Order 80 EPA United States Environmental Protection Agency ERTAC Eastern Regional Technical Advisory Committee ESP Electrostatic Precipitator EWRT Extinction-Weighted Residence Time FAA Federal Aviation Administration FCCS Fuel Characteristic Classification System FDDA Four-Dimensional Data Assimilation FGD Flue Gas Desulfurization FIA Forest Inventory and Analysis FL Florida FLM Federal Land Manager FRM Federal Reference Method FS Forest Service FSL Forecast Systems Laboratory FWS United States Fish and Wildlife Service g/bhp-hr Grams per Brake Horsepower-Hour GA Georgia GACT Generally Available Control Technology gal Gallon
GEOS-Chem Goddard Earth Observing System-Three-Dimensional Chemical Transport Model
GHG Greenhouse Gas gpm Gallons Per Minute
GRSM1 (TN) IMPROVE Site Designation for Great Smoky Mountains National Park and Joyce Kilmer-Slickrock Wilderness Area
GVWR Gross Vehicle Weight Rating H2(SO4) Hydrogen Sulfate HAP Hazardous Air Pollutant HC Hydrocarbons HCL hydrochloric acid HMP Hazard Mapping System HNH4SO4 Ammonium Bisulfate HNH4SO4 Ammonium Bisulfate

Pre-hearing Draft xxxv NC Regional Haze SIP for Second Planning Period (2019 – 2028) August 30, 2021
Acronym Definition hp Horsepower hr Hour HYSPLIT Hybrid Single Particle Lagrangian Integration Trajectory Model I&M inspection and maintenance IBEAM Internet-Based Environment for Application Management ICI Industrial/Commercial/Institutional ID Identification Code No. I&M Inspection and Maintenance IMPROVE Interagency Monitoring of Protected Visual Environments IPM Integrated Planning Model ITN Itinerate Operations At Airports Km Kilometers kW Kilowatt KY Kentucky LADCO Lake Michigan Air Directors Consortium lb Pound lb/MMBtu Pound per Million British Thermal Units LEV California Low Emission Vehicle Standards LIGO1 (NC) IMPROVE Site Designation for Linville Gorge Wilderness Area LLC Limited Liability Company LN Low NOx Combustion Technology LTO landing-and-take-off m Meter m3 Cubic Meter MACT Maximum Achievable Control Technology MANE-VU Mid-Atlantic/Northeast Visibility Union MARAMA Mid-Atlantic Regional Air Management Association MATS Mercury and Air Toxics Standard MB Mean Bias mb Millibar MDA8 Maximum Daily 8-Hour Average ME Mean Error MFB Mean Fractional Bias MFE Mean Fractional Error MGE Mean Gross Error MJO Multi-Jurisdictional Organizations MOU Memorandum of Understanding Mm-1 Inverse Megameters MMBtu Million British thermal unit MMBtu/hr Million British Thermal Units Per Hour MMscf Million Standard Cubic Feet MOVES Motor Vehicle Emission Simulator MS Mississippi MW Megawatt N2O Nitrous Oxide NAAQS National Ambient Air Quality Standard NaCl sodium chloride, sea salt NACAA National Association of Clean Air Agencies

Pre-hearing Draft xxxvi NC Regional Haze SIP for Second Planning Period (2019 – 2028) August 30, 2021
Acronym Definition NAD83 North American Datum of 1983 NADP National Acid Deposition Program NAICS North American Industrial Classification System NESCAUM Northeast States for Coordinated Air Use Management NC North Carolina NCAC North Carolina Administrative Code NCAR National Center for Atmospheric Research NCASI National Council for Air and Stream Improvement NCDA&CS North Carolina Department of Agriculture and Consumer Services NCDAQ North Carolina Division of Air Quality NCDEQ North Carolina Department of Environmental Quality NCDOT North Carolina Department of Transportation NCEP National Centers for Environmental Prediction NCFS North Carolina Forest Service NCGS North Carolina General Statute NED National Elevation Data NEEDS National Electric Energy Database Systems NEI National Emissions Inventory NESHAP National Emissions Standards for Hazardous Air Pollutants NH3 Ammonia (NH4)2SO4 Ammonium Sulfate NH4
+ Ammonium Ion NLCD National Land Cover Database NMB Normalized Mean Bias NME Normalized Mean Error NMHC Non-Methane Hydrocarbons NMIM National Mobile Inventory Model NO nitric oxide NO3
- Nitrate Ion NOAA National Oceanic and Atmospheric Administration NODA Notice Of Data Availability NOx Oxides of Nitrogen NPS National Park Service NSPS New Source Performance Standards NTN National Trends Network OAQPS EPA Office of Air Quality Planning and Standards OSBM Office of State Management and Budget OTC Ozone Transport Commission PM Particulate Matter PM10 Particulate matter with an aerodynamic diameter ≤10 micrometers PM2.5 Particulate matter with an aerodynamic diameter ≤2.5 micrometers POM Particulate Organic Matter ppb Parts Per Billion ppm Parts Per Million ppmvd Parts Per Million Volume Dry PSAT Particulate Matter Source Apportionment Technology PSD Prevention of Significant Deterioration PTE Potential-to-Emit

Pre-hearing Draft xxxvii NC Regional Haze SIP for Second Planning Period (2019 – 2028) August 30, 2021
Acronym Definition Q Quantity of emissions, Tons Per Year RACT Reasonably Available Control Technology RECS Renewable Energy Credits REPS Renewable Energy and Energy Efficiency Portfolio Standard RF Recovery Furnace RFG Reformulated Gasoline RHR Regional Haze Rule RICE Reciprocating Internal Combustion Engine RMSD Root Mean Square Deviation RMSE Root Mean Square Error RPG Reasonable Progress Goal RPO Regional Planning Organization RRF Relative Reduction Factor RT Residence Time RTO Regenerative Thermal Oxidizer SAP Sulfuric Acid Plant SC South Carolina SCC Source Classification Code scf Standard Cubic Feet SCR Selective Catalytic Reduction SDT Smelt Dissolving Tank SEARCH Southeastern Aerosol Research and Characterization SHRO1 (NC) Linville Gorge Wilderness Area Shining Rock Wilderness Area SIA Second IMPROVE Algorithm SIP State Implementation Plan SMOKE Sparse Matrix Operator Kernel Emissions SNCR Selective Non-Catalytic Reduction SO2 Sulfur Dioxide SO4
-2 Sulfate Ion SOAP Secondary Organic Aerosol Partitioning SOC Special Order by Consent STN Speciated Trends Network SUV Sport Utility Vehicle SWAN1 (NC) Linville Gorge Wilderness Area Swanquarter Wilderness Area TAFS Terminal Area Forecast System TDM Travel Demand Model TIP Tribal Implementation Plan TN Tennessee TPY Tons Per Year TRS Total Reduced Sulfur TSD Technical Support Document TSM Total Suspended Metals TVA Tennessee Valley Authority ULSD Ultra-Low Sulfur Diesel URP Uniform Rate Of Progress USDA United States Department of Agriculture USDA-FS United States Department of Agriculture-Forest Service USDI United States Department of Interior
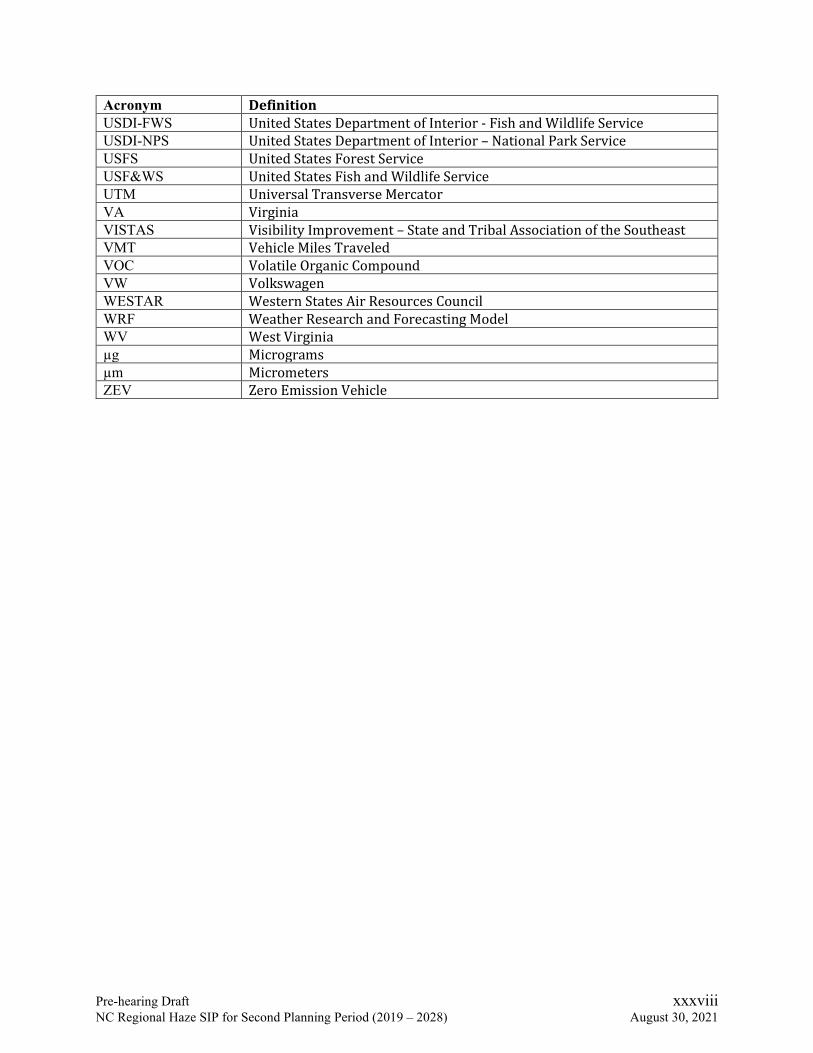
Pre-hearing Draft xxxviii NC Regional Haze SIP for Second Planning Period (2019 – 2028) August 30, 2021
Acronym Definition USDI-FWS United States Department of Interior - Fish and Wildlife Service USDI-NPS United States Department of Interior – National Park Service USFS United States Forest Service USF&WS United States Fish and Wildlife Service UTM Universal Transverse Mercator VA Virginia VISTAS Visibility Improvement – State and Tribal Association of the Southeast VMT Vehicle Miles Traveled VOC Volatile Organic Compound VW Volkswagen WESTAR Western States Air Resources Council WRF Weather Research and Forecasting Model WV West Virginia µg Micrograms µm Micrometers ZEV Zero Emission Vehicle

Pre-hearing Draft 1 NC Regional Haze SIP for Second Planning Period (2019 – 2028) August 30, 2021
1.0 INTRODUCTION
1.1 What is Regional Haze? Regional haze is defined as visibility impairment that is caused by atmosphere-entrained air pollutants emitted from numerous anthropogenic and natural sources located over a wide geographic area. These emissions are often transported long distances. Haze is caused when sunlight is absorbed or scattered by airborne particles which, in turn, reduce the clarity, contrast, color, and viewing distance of what is seen. Regional haze refers to haze that impairs visibility in all directions uniformly. Pollution from particulate matter (PM) is the major cause of reduced visibility (haze) in the United States, including many of our national parks, forests, and wilderness areas (including 156 mandatory Federal Class I areas5 as defined in 40 CFR Part 81.400). PM affects visibility through the scattering and absorption of light, and fine particles – particles similar in size to the wavelength of light – are most efficient, per unit of mass, at reducing visibility. Fine particles are produced by a variety of natural and manmade sources. Fine particles may either be emitted directly or formed from emissions of precursors, the most significant of which are sulfur oxides such as sulfur dioxide (SO2) and nitrogen oxides (NOx). Reducing fine particles in the atmosphere is generally considered to be an effective method of reducing regional haze and thus improving visibility. Fine particles also adversely impact human health, especially respiratory and cardiovascular systems. The United States Environmental Protection Agency (EPA) has set national ambient air quality standards (NAAQS) for daily and annual levels of fine particles with an aerodynamic diameter ≤2.5 micrometers (µm) (PM2.5). In the Southeast, the most important sources of PM2.5 and its precursors are coal-fired power plants, industrial boilers, process heaters, and other stationary combustion sources. Other significant contributors to PM2.5 and visibility impairment include the following source categories: mobile, onroad, and non-road engine emissions; stationary non-combustion emissions (area sources); wildfires and prescribed burning emission; and wind-blown dust.
1.2 What are the Requirements under the Clean Air Act for Addressing Regional Haze? In Section 169A of the 1977 Amendments to the Clean Air Act (CAA), Congress set forth a program for protecting visibility in Class I areas that calls for the “prevention of any future, and the remedying of any existing, impairment of visibility caused by anthropogenic (manmade) air pollution.” On December 2, 1980, the EPA promulgated regulations to address visibility impairment (45 FR 80084) that is “reasonably attributable” to a single source or small groups of sources. These regulations represented the first phase in addressing visibility impairment and deferred action on regional haze that emanates from a variety of sources until monitoring, modeling, and scientific knowledge about the relationships between pollutants and visibility impairment improved.
5 For brevity, mandatory Federal Class I area(s) is also referred to as “Class I area(s)” in this document.

Pre-hearing Draft 2 NC Regional Haze SIP for Second Planning Period (2019 – 2028) August 30, 2021
In the 1990 Amendments to the CAA, Congress added section 169B and called on EPA to issue regional haze rules. The regional haze rule (RHR) that EPA promulgated on July 1, 1999, (64 FR 35713) revised the existing visibility regulations to integrate provisions addressing regional haze impairment and establish a comprehensive visibility protection program for mandatory Federal Class I areas.6 Each state was required to submit state implementation plans (SIPs) to EPA by December 17, 2007 which set out its plan for complying with the RHR for the first ten-year planning period covering 2008 – 2018. Each state was required to consult and coordinate with other states and with Federal Land Managers (FLMs) in developing its SIP. Paragraph 40 CFR 51.308(f) of the 1999 rule required states to submit periodic comprehensive revisions of their regional haze plans by July 31, 2018 and every ten years thereafter. However, on January 10, 2017, EPA revised, among other things, paragraph 40 CFR 51.308(f) of the RHR to change the deadlines for submitting revisions and updates to regional haze plans to July 31, 2021, July 31, 2028, and every 10 years thereafter. This SIP was prepared for the second planning period from January 1, 2019 through December 31, 2028. The RHR addressed the combined visibility effects of various pollution sources over a wide geographic region. This wide-reaching pollution net meant that many states – even those without Class I areas – would be required to participate in haze reduction efforts. Five regional planning organizations (RPOs) were formed to assist with the coordination and cooperation needed to address the visibility issue. These five RPOs are illustrated in Figure 1-1.7 The Southeastern States Air Resource Managers, Inc. (SESARM) has been designated by EPA as the entity responsible for coordinating regional haze evaluations for the ten Southeastern states (Alabama, Florida, Georgia, Kentucky, Mississippi, North Carolina, South Carolina, Tennessee, Virginia, and West Virginia), local air pollution control agencies, and tribal authorities. These parties collaborated through the Regional Planning Organization known as Visibility Improvement - State and Tribal Association of the Southeast (VISTAS) to prepare the technical analyses and planning activities associated with visibility and related regional air quality issues supporting development of regional haze SIPs for the first and second planning periods. For the second planning period, local air pollution control agencies were represented by the Knox County, Tennessee local air pollution control agency and tribal authorities were represented by the Eastern Band of Cherokee Indians.
6 The regional haze regulations were amended on July 6, 2005 (70 FR 39104), October 13, 2006 (71 FR 60612), June 7, 2012 (77 FR 33642), and January 10, 2017 (82 FR 3078). 7 URL: https://www.epa.gov/visibility/visibility-regional-planning-organizations

Pre-hearing Draft 3 NC Regional Haze SIP for Second Planning Period (2019 – 2028) August 30, 2021
Figure 1-1. Geographical Areas of Regional Planning Organizations
1.3 General Overview of Regional Haze SIP Requirements The RHR at 40 CFR 51.308(d) requires all states to submit a SIP for regional haze. Paragraph 51.308(f) of the RHR requires each state to periodically revise and submit revisions to its regional haze SIP. All regional haze SIPs must include the following:
• Reasonable Progress Goals (RPGs) for each Class I area located within the state; • Natural, baseline, and current visibility conditions for each Class I area within the state; • A long-term strategy (LTS) to address visibility for each Class I area within the state and
for each Class I area located outside the state that may be affected by emissions from the state;
• A monitoring strategy for measuring, characterizing, and reporting that is representative of all Class I areas within the state; and
• Other requirements and analyses. The RHR requires states to establish RPGs, expressed in deciviews (dv), for the end of each implementation period (approximately 10 years) that reflect the visibility conditions that are projected to be achieved by the end of the applicable implementation period as a result of enforceable measures required by the RHR and other requirements of the CAA (40 CFR 51.308(f)(3)). The goals must show progress towards achieving natural visibility conditions by providing for improvement in visibility for the most impaired days and ensuring no degradation in visibility for the clearest days over each ten-year period. The RHR requires states to compute natural visibility conditions for both the 20% most impaired days and the 20% clearest days (40 CFR 51.308(f)(1)). For the 20% most impaired days, the RHR directs each state with a Class I area to contruct the uniform rate of progress (URP or “glidepath”) from 2000 to 2064 to use as a guide for evaluating progress toward attaining natural visibility conditions. Data from the Interagency Monitoring of Protected Visual Environments

Pre-hearing Draft 4 NC Regional Haze SIP for Second Planning Period (2019 – 2028) August 30, 2021
(IMPROVE) network are used to establish baseline and natural visibility metrics.8 States are to establish baseline visibility conditions using a 5-year average of monitoring data for 2000-2004 and natural visibility conditions for 2064. A line is drawn between the two data points to determine the URP for the most impaired days. Days with the lowest 20% annual values of the daily haze index are used to represent the clearest days. The requirement of the RHR for 20% clearest days is to ensure that no degradation from the baseline (2000-2004) occurs. For this second planning period, regional haze SIPs must include the current visibility conditions for the most impaired and clearest days, the actual progress made towards natural visibility since the baseline period, and the actual progress made during the previous implementation period. The period for calculating current visibility conditions is the most recent 5-year period for which data are available. For this SIP, the current visibility conditions include data from years 2014 to 2018. The period for evaluating actual progress made is from the baseline period (2000 to 2004) up to and including the 5-year period for calculating current visibility conditions (40 CFR 51.308(f)(1)(i)-(iv)). The 2028 RPGs for each Class I area must be met through measures contained in the state’s LTS. The LTS must address regional haze visibility impairment for each Class I area within the state and for each Class I area located outside the state that may be affected by emissions from the state. The LTS must include enforceable emissions limitations, compliance schedules, and other measures as necessary to demonstrate reasonable progress. Section 169A of the CAA requires a state to consider the four statutory factors (costs of compliance, time necessary for compliance, energy and non-air quality environmental impacts and remaining useful life) when developing the LTS upon which it bases the RPGs for each Class I area. States are also required to consider the following additional factors in developing their LTS: ongoing air pollution control programs; measures to mitigate the impact of construction activities; source retirement and replacement schedules; smoke management programs for agriculture and forestry; and the anticipated net effect of visibility due to projected changes in point, area, and mobile source emissions over the period addressed by the LTS (40 CFR 51.308(f)(2)(iv)). States must include a monitoring strategy for measuring, characterizing, and reporting of regional haze visibility impairment that is representative of all Class I areas within the state. The RHR states that compliance with this requirement may be met through participation in the IMPROVE network (40 CFR 51.308(f)(6)). States are required to evaluate progress toward meeting RPGs every 5 years to assure that emissions controls are on track with emissions reduction forecasts in each SIP. On January 10, 2017, EPA amended 40 CFR 51.308(f) so that the plan revision for the second planning period will also serve as a progress report and thus address the periodic report requirement specified in 40 CFR 51.308(g)(1) through (5). The next progress report will be due to EPA by January 31,
8 URL: http://vista.cira.colostate.edu/Improve/

Pre-hearing Draft 5 NC Regional Haze SIP for Second Planning Period (2019 – 2028) August 30, 2021
2025. If emissions reductions are not on track to ensure progress, then states would need to take action to assure emissions controls by 2028 will be consistent with the SIP or to revise the SIP to be consistent with the revised emissions forecast (40 CFR 51.308(f) and 40 CFR 51.308(g)). The EPA provided several guidance documents listed below to assist the states in implementation of the RHR requirements, including documents that specifically address the second implementation period. North Carolina followed these guidance documents in developing the technical analyses reported in this plan.
• Guidance for Estimating Natural Visibility Conditions Under the Regional Haze Rule (EPA-454/B-03-005, September 2003)
• General Principles for 5-year Regional Haze Progress Reports for the Initial Regional Haze State Implementation Plans (Intended to Assist States and EPA Regional Offices in Development and Review of the Progress Reports) (EPA, April 2013)
• Technical Guidance for Tracking Visibility Progress for the Second Implementation Period of the Regional Haze Program (EPA, December 20, 2018)
• Guidance on Regional Haze State Implementation Plans for the Second Implementation Period (EPA, August 20, 2019)
• Technical Support Document for EPA’s 2028 Regional Haze Modeling (EPA, September 19, 2019)
• Recommendation for the Use of Patched and Substituted Data and Clarification of Data Completeness for Tracking Visibility Progress for the Second Implementation Period of the Regional Haze Program (EPA, June 3, 2020)
• Clarifications Regarding Regional Haze State Implementation Plans for the Second Implementation Period (July 8, 2021)
1.4 Mandatory Federal Class I Areas in North Carolina
North Carolina’s Class I areas (see 40 CFR 81.422) include the Great Smoky Mountains National Park (GSMNP), Joyce Kilmer-Slickrock Wilderness Area, Linville Gorge Wilderness Area, Shining Rock Wilderness Area, and Swanquarter Wilderness Area (see Figure 1-2). The GSMNP and Joyce Kilmer – Slickrock Wilderness Area are located in both North Carolina and Tennessee. Therefore, North Carolina and Tennessee coordinated with each other to establish the RPGs for Great Smoky Mountains National Park and Joyce Kilmer-Slickrock Wilderness Area. Joyce-Kilmer Slickrock does not contain an IMPROVE site. Thus, the rate of progress for GSMNP is considered representative of Joyce Kilmer-Slickrock.
As required by the RHR, the NCDAQ has also considered the impacts of emission sources outside of North Carolina that may affect visibility at these North Carolina Class I areas and

Pre-hearing Draft 6 NC Regional Haze SIP for Second Planning Period (2019 – 2028) August 30, 2021
emission sources within North Carolina that may affect visibility at Class I areas in neighboring states. Through VISTAS, the Southeastern states worked together to assess state-by-state contributions to visibility impairment in specific Class I areas. This technical work is discussed further in Sections 5, 6, and 7 of this SIP. Consultations between North Carolina and other states are summarized in Section 10.
Figure 1-2. North Carolina's Mandatory Federal Class I Areas
1.5 Regional Planning and Coordination Successful implementation of a regional haze program involves long-term regional coordination among states. SESARM formed VISTAS in 2001 to coordinate technical work and long-range planning for addressing visibility impairment in each of the eighteen Class I areas in the VISTAS region (see Figure 1-3 and Table 1-1). North Carolina participated as a member state in VISTAS during the first and second planning periods. The objectives of VISTAS are as follows:
• To coordinate and document natural, baseline, and natural conditions for each Class I area in the Southeast;
• To develop base year and future year emission inventories to support air quality modeling;
• To develop methodologies for screening sources and groups of sources for reasonable progress analysis;
• To conduct photochemical grid modeling to support development of RPGs for each Class I area; and
• To share information to support each state in developing the LTS for its SIP. In addition, VISTAS states also coordinated with regional haze planning conducted by other RPOs to share information and undertake consultation as needed to address visibility impairment associated with (1) sources impacting Class I areas in the VISTAS region, and (2) sources in the VISTAS region potentially impacting visibility impairment in another region.

Pre-hearing Draft 7 NC Regional Haze SIP for Second Planning Period (2019 – 2028) August 30, 2021
Figure 1-3. Mandatory Federal Class I Areas in the VISTAS Region Table 1-1. Mandatory Federal Class I Areas in the VISTAS Region
State Area Name Acreage Federal Land Manager Alabama Sipsey Wilderness Area 12,646 USDA-FS
Florida Chassahowitzka Wilderness Area 23,360 USDI-FWS Everglades National Park 1,397,429 USDI-NPS St. Marks Wilderness Area 17,745 USDI-FWS
Georgia Cohutta Wilderness Area 33,776 USDA-FS Okefenokee Wilderness Area 343,850 USDI-FWS Wolf Island Wilderness Area 5,126 USDI-FWS
Kentucky Mammoth Cave National Park 51,303 USDI-NPS
North Carolina
Great Smoky Mountains National Park 273,551 USDI-NPS Joyce Kilmer-Slickrock Wilderness Area 10,201 USDA-FS Linville Gorge Wilderness Area 7,575 USDA-FS Shining Rock Wilderness Area 13,350 USDA-FS Swanquarter Wilderness Area 9,000 USDI-FWS
South Carolina Cape Romain Wilderness Area 28,000 USDI-FWS
Tennessee Great Smoky Mountains National Park 241,207 USDI-NPS Joyce Kilmer-Slickrock Wilderness Area 3,832 USDA-FS
Virginia James River Face Wilderness Area 8,703 USDA-FS Shenandoah National Park 190,535 USDI-NPS
West Virginia Dolly Sods Wilderness Area 10,215 USDA-FS Otter Creek Wilderness Area 20,000 USDA-FS

Pre-hearing Draft 8 NC Regional Haze SIP for Second Planning Period (2019 – 2028) August 30, 2021
1.6 State and FLM Coordination As required by 40 CFR 51.308(i) and CAA Section 169A(d), the regional haze SIP must include procedures for continuing consultation between the states and FLMs on the implementation of the visibility protection program, including development and review of periodic implementation plan revisions and 5-year progress reports, and on the implementation of other programs having the potential to contribute to impairment of visibility in any Class I area within the State. The three FLMs for Class I areas in North Carolina are the United States Department of Interior (USDI) Fish and Wildlife Service (FWS), the National Park Service (NPS), and the United States Department of Agriculture (USDA) Forest Service (FS). Coordination of North Carolina’s obligations to periodically revise its regional haze SIP with the FLMs is also discussed in Section 11. The NCDAQ formally commits to follow the consultation procedures as prescribed in 40 CFR 51.308(i) in making these future implementation plan reviews and revisions. The FLMs were involved in the preparation of this regional haze SIP. Documentation of North Carolina’s consultation with the FLMs is presented in Section 10.4 and Appendix H.
1.7 Cross-Reference to Regional Haze Rule Requirements Table 1-2 identifies each section of the SIP that addresses RHR requirements specified in 40 CFR 51.308(f), (g), and (i) for this second planning period.
Table 1-2. Cross-reference of Sections of the SIP to Regional Haze Rule Requirements Specified in 40 CFR 51.308(f), (g), and (i)
Rule Section
Chapter/Section in SIP Description
(f) 11 Requirements for periodic comprehensive revisions of implementation plans for regional haze.
(f)(1) 2.1, 2.2, 2.3, 2.4, 2.6, 3
Calculations of baseline, current, and natural visibility conditions; progress to date; and the uniform rate of progress.
(f)(1)(i) 2.4 Baseline visibility conditions for the most impaired and clearest days. (f)(1)(ii) 2.3 Natural visibility conditions for the most impaired and clearest days (f)(1)(iii) 2.6 Current visibility conditions for the most impaired and clearest days. (f)(1)(iv) 2.7 Progress to date for the most impaired and clearest days. (f)(1)(v) 2.7 Differences between current visibility condition and natural visibility
condition (f)(1)(vi)(A) 3 Uniform rate of progress. (f)(1)(vi)(B) not applicable Any adjustments to rate of progress. (f)(2) 7 Long-term strategy for regional haze. (f)(2)(i) 7 Emission reduction measures that are necessary to make reasonable
progress by considering the four factors. (f)(2)(ii) 10 Consult with those States that have emissions that are reasonably
anticipated to contribute to visibility impairment in the mandatory Federal Class I area.
(f)(2)(ii)(A) 10 Demonstrate that it has included in its implementation plan all measures agreed to during state-to-state consultations.

Pre-hearing Draft 9 NC Regional Haze SIP for Second Planning Period (2019 – 2028) August 30, 2021
Rule Section
Chapter/Section in SIP Description
(f)(2)(ii)(B) 10 Consider the emission reduction measures identified by other States for their sources.
(f)(2)(ii)(C) 10 In any situation in which a State cannot agree with another State on the emission reduction measures necessary to make reasonable progress in a mandatory Federal Class I area, the State must describe the actions taken to resolve the disagreement.
(f)(2)(iii) 2, 4, 5, 6, 7.2, 7.7, 7.8, 7.9, 9, 10
Document the technical basis, including modeling, monitoring, cost, engineering, and emissions information, on which the State is relying to determine the emission reduction measures that are necessary to make reasonable progress in each mandatory Federal Class I area it affects.
(f)(2)(vi)(A) 7.2 Emission reductions due to ongoing air pollution control programs, including measures to address reasonably attributable visibility impairment.
(f)(2)(vi)(B) 7.2.3, 7.9.1 Measures to mitigate the impacts of construction activities. (f)(2)(vi)(C) 7.2.2 Source retirement and replacement schedules. (f)(2)(vi)(D) 7.2.3, 7.9.2 Basic smoke management practices for prescribed fire used for
agricultural and wildland vegetation management purposes and smoke management programs.
(f)(2)(vi)(E) 8 The anticipated net effect on visibility due to projected changes in point, area, and mobile source emissions over the period addressed by the long-term strategy.
(f)(3)(i) 8 Reasonable progress goals. State must establish reasonable progress goals (expressed in deciviews) that reflect the visibility conditions that are projected to be achieved by the end of the applicable implementation period as a result of those enforceable emissions limitations, compliance schedules, and other measures.
(f)(3)(ii)(A) not applicable If a State in which a mandatory Federal Class I area is located establishes a reasonable progress goal for the most impaired days that provides for a slower rate of improvement in visibility than the uniform rate of progress calculated under paragraph (f)(1)(vi) of this section, the State must demonstrate, based on the analysis required by paragraph (f)(2)(i) of this section, that there are no additional emission reduction measures for anthropogenic sources or groups of sources in the State that may reasonably be anticipated to contribute to visibility impairment in the Class I area that would be reasonable to include in the long-term strategy.
(f)(3)(ii)(B) 7, 8 If a State contains sources which are reasonably anticipated to contribute to visibility impairment in a mandatory Federal Class I area in another State for which a demonstration by the other State is required under (f)(3)(ii)(A), the State must demonstrate that there are no additional emission reduction measures for anthropogenic sources or groups of sources in the State that may reasonably be anticipated to contribute to visibility impairment in the Class I area that would be reasonable to include in its own long-term strategy. The State must provide a robust demonstration, including documenting the criteria used to determine which sources or groups or sources were evaluated and how the four factors required by paragraph (f)(2)(i) were taken into consideration in selecting the measures for inclusion in its long-term strategy.

Pre-hearing Draft 10 NC Regional Haze SIP for Second Planning Period (2019 – 2028) August 30, 2021
Rule Section
Chapter/Section in SIP Description
(f)(4) not applicable If the Administrator, Regional Administrator, or the affected Federal Land Manager has advised a State of a need for additional monitoring to assess reasonably attributable visibility impairment at the mandatory Federal Class I area in addition to the monitoring currently being conducted, the State must include in the plan revision an appropriate strategy for evaluating reasonably attributable visibility impairment in the mandatory Federal Class I area by visual observation or other appropriate monitoring techniques.
(f)(5) 7.2.5, 13 An assessment of any significant changes in anthropogenic emissions within or outside of the state that have occurred since the period addressed in the most recent plan required under paragraph (f) of this section including whether or not these changes in anthropogenic emissions were anticipated in that most recent plan and whether they have limited or impeded progress in reducing pollutant emissions and improving visibility.
(f)(6) 9 Monitoring strategy and other implementation plan requirements. Must submit with the implementation plan a monitoring strategy for measuring, characterizing, and reporting of regional haze visibility impairment that is representative of all mandatory Federal Class I areas within the State. Compliance with this requirement may be met through participation in the Interagency Monitoring of Protected Visual Environments network.
(f)(6)(i) not applicable The establishment of any additional monitoring sites or equipment needed to assess whether reasonable progress goals to address regional haze for all mandatory Federal Class I areas within the State are being acheived.
(f)(6)(ii) 9 Procedures by which monitoring data and other information are used in determining the contribution of emissions from within the State.
(f)(6)(iii) not applicable For a state with no mandatory Class I federal areas, procedures by which monitoring data and other information are used to in determining the contribution of emissions from within the State to regional haze visibility impairment at mandatory Federal Class I areas in other states.
(f)(6)(iv) 9 The implementation plan must provide for the reporting of all visibility monitoring data to the Administrator at least annually for each mandatory Federal Class I area in the State.
(f)(6)(v) 4, 7.2.4 A statewide inventory of emissions of pollutants that are reasonably anticipated to cause or contribute to visibility impairment in any mandatory Federal Class I area.
(f)(6)(vi) 9 Other elements, including reporting, recordkeeping, and other measures, necessary to assess and report on visibility.
(g)(1) 13.2 Periodic progress reports must contain at a minimum the following elements: (1) A description of the status of implementation of all measures included in the implementation plan for achieving reasonable progress goals for mandatory Federal Class I areas both within and outside the State.
(g)(2) 13.3 (2) A summary of the emissions reductions achieved throughout the State through implementation of the measures described in paragraph (g)(1) of this section.

Pre-hearing Draft 11 NC Regional Haze SIP for Second Planning Period (2019 – 2028) August 30, 2021
Rule Section
Chapter/Section in SIP Description
(g)(3) 13.4 For each mandatory Federal Class I area within the State, the State must assess the following visibility conditions and changes, with values for most impaired, least impaired and/or clearest days as applicable expressed in terms of 5-year averages of these annual values. The period for calculating current visibility conditions is the most recent 5-year period preceding the required date of the progress report for which data are available as of a date 6 months preceding the required date of the progress report.
(g)(4) 13.5 An analysis tracking the change over the period since the period addressed in the most recent plan required under 40 CFR 51.308(f) in emissions of pollutants contributing to visibility impairment from all sources and activities within the State. Emissions changes should be identified by type of source or activity. With respect to all sources and activities, the analysis must extend at least through the most recent year for which the state has submitted emissions inventory information to the Administrator in compliance with the triennial reporting requirements of subpart A of this part as of a date 6 months preceding the required date of the progress report.
(g)(5) 13.6 An assessment of any significant changes in anthropogenic emissions within or outside the State that have occurred since the period addressed in the most recent plan required under 40 CFR 51.308(f) including whether or not these changes in anthropogenic emissions were anticipated in that most recent plan and whether they have limited or impeded progress in reducing pollutant emissions and improving visibility.
(g)(6) 13.7 An assessment of whether the current implementation plan elements and strategies are sufficient to enable the State, or other States with mandatory Federal Class I areas affected by emissions from the State, to meet all established RPGs for the period covered by the most recent plan required 40 CFR 51.308(f).
(g)(7) 13.8 For progress reports for the first implementation period only, a review of the State's visibility monitoring strategy and any modifications to the strategy as necessary.
(g)(8) 13.9 For a state with a long-term strategy that includes a smoke management program for prescribed fires on wildland that conducts a periodic program assessment, a summary of the most recent periodic assessment of the smoke management program including conclusions if any that were reached in the assessment as to whether the program is meeting its goals regarding improving ecosystem health and reducing the damaging effects of catastrophic wildfires.
(i) 10.4 State and FLM coordination.

Pre-hearing Draft 11 NC Regional Haze SIP for Second Planning Period (2019 – 2028) August 30, 2021
2.0 ESTIMATES OF NATURAL BACKGROUND CONDITIONS IN CLASS I AREAS AND ASSESSMENT OF BASELINE AND CURRENT CONDITIONS AND ESTIMATE OF NATURAL BACKGROUND CONDITIONS IN CLASS I AREAS
The goal of the RHR is to restore natural visibility conditions to the 156 Class I areas identified in the 1977 Clean Air Act Amendments. Section 40 CFR 51.301 of the RHR contains the following definitions: Natural conditions reflect naturally occurring phenomena that reduce visibility as measured in terms of light extinction, visual range, contrast, or coloration, and may refer to the conditions on a single day or set of days. These phenomena include, but are not limited to, humidity, fire events, dust storms, volcanic activity, and biogenic emissions from soils and trees. These phenomena may be near or far from a Class I area and may be outside the United States. Natural visibility means visibility (contrast, coloration, and texture) on a day or days that would have existed under natural conditions. Natural visibility varies with time and location, is estimated or inferred rather than directly measured, and may have long-term trends due to long-term trends in natural conditions. Natural visibility condition means the average of individual values of daily natural visibility unique to each Class I area for either the most impaired days or the clearest days. The regional haze SIPs must contain measures that demonstrate progress toward achieving natural visibility conditions by reducing anthropogenic (i.e., manmade, emissions that cause haze). An easily understood measure of visibility to most people is visual range. Visual range is the greatest distance, in kilometers or miles, at which a dark object can be viewed against the sky. For evaluating the relative contributions of pollutants to visibility impairment, however, the most useful measure of visibility impairment is light extinction, which affects the clarity and color of objects being viewed. The measure used by the RHR is the deciview index, as required by 40 CFR 51.301. Deciviews (dv) are calculated directly from light extinction using the following logarithmic equation:
𝑑𝑑𝑑𝑑 = 10 ∗ ln (𝑏𝑏𝑒𝑒𝑒𝑒𝑒𝑒
10 ∗ 𝑀𝑀𝑚𝑚−1)

Pre-hearing Draft 12 NC Regional Haze SIP for Second Planning Period (2019 – 2028) August 30, 2021
In this equation, the atmospheric light extinction coefficient, bext, is expressed in units of inverse megameters (Mm-1).9 The dv units are useful for tracking progress in improving visibility because each dv change is an equal incremental change in visibility perceived by the human eye. Most people can detect a change in visibility at one dv. The RHR requires that the SIP present the following three visibility metrics for each Class I area in the state:
• Natural conditions,
• Baseline conditions, and
• Current conditions. Each of the three metrics includes the concentration data of the visibility-impairing pollutants as different terms in the IMPROVE light extinction algorithm, with respective extinction coefficients and relative humidity factors. Total light extinction when converted to dv is calculated for the average of the 20% clearest and 20% most impaired days. The terminology for these two sets of days changed for the second round of regional haze planning owing to a focus on anthropogenically-induced visibility impairment.10 "Natural" visibility is determined by estimating the natural concentrations of visibility pollutants and then calculating total light extinction. "Baseline" visibility is the starting point for the improvement of visibility conditions. Baseline visibility is calculated from the average of the IMPROVE monitoring data for 2000 through 2004. The comparison of initial baseline conditions from 2000-2004 to natural visibility conditions indicates the amount of improvement necessary to attain natural visibility by 2064. Each state must estimate natural visibility levels for Class I areas within its borders as required by 40 CFR 51.308(f)(1). Another important set of visibility monitoring data is the base period used for air quality modeling projections, in this case monitoring data from years 2009 through 2013. These monitoring data are used in conjunction with inventory and meteorological data to project expected visibility parameters for each Class I area, as described in Sections 5, 6, and 7. "Current conditions" are assessed every five years as part of the regional haze planning process where actual progress in reducing visibility impairment is compared to the reductions delineated in the SIP. The five-year period comprising current conditions in this SIP is 2014-2018, inclusive.
9 Colorado State University, "The IMPROVE Algorithm." URL: http://vista.cira.colostate.edu/Improve/haze-metrics-converter/ 10 EPA, “Technical Guidance on Tracking Visibility Progress for the Second Implementation Period of the Regional Haze Program”, December 2018. URL: https://www.epa.gov/sites/production/files/2018-12/documents/technical_guidance_tracking_visibility_progress.pdf
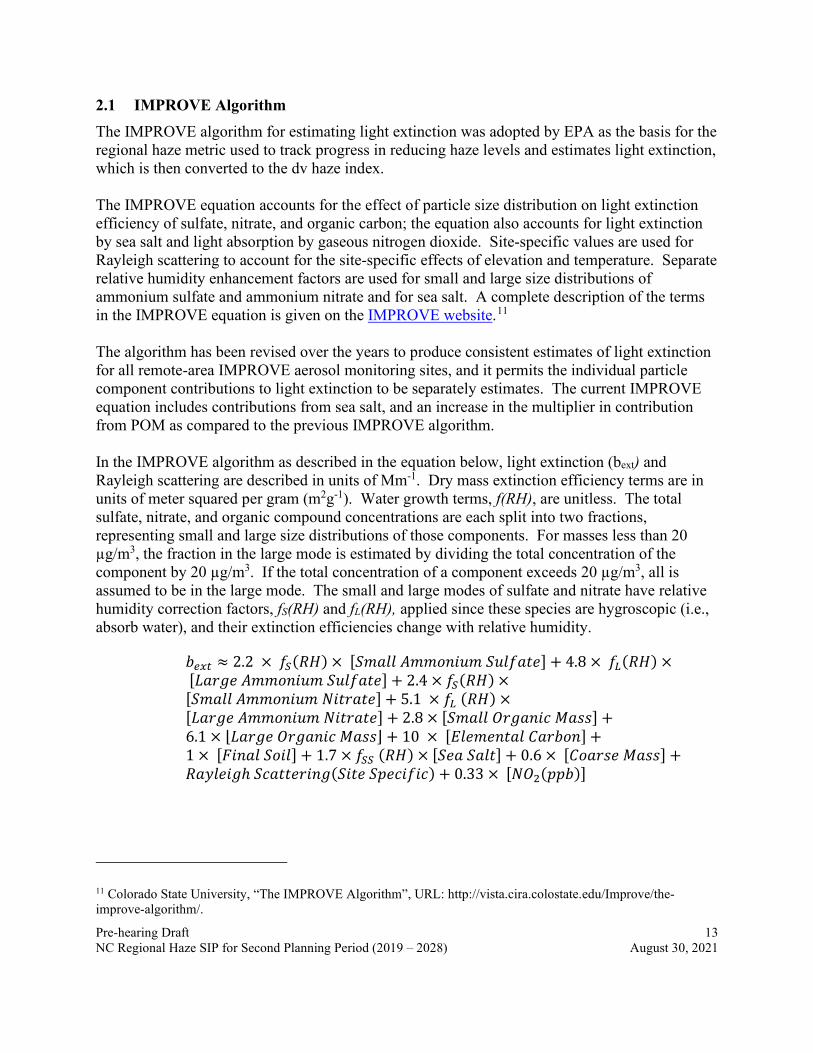
Pre-hearing Draft 13 NC Regional Haze SIP for Second Planning Period (2019 – 2028) August 30, 2021
2.1 IMPROVE Algorithm The IMPROVE algorithm for estimating light extinction was adopted by EPA as the basis for the regional haze metric used to track progress in reducing haze levels and estimates light extinction, which is then converted to the dv haze index. The IMPROVE equation accounts for the effect of particle size distribution on light extinction efficiency of sulfate, nitrate, and organic carbon; the equation also accounts for light extinction by sea salt and light absorption by gaseous nitrogen dioxide. Site-specific values are used for Rayleigh scattering to account for the site-specific effects of elevation and temperature. Separate relative humidity enhancement factors are used for small and large size distributions of ammonium sulfate and ammonium nitrate and for sea salt. A complete description of the terms in the IMPROVE equation is given on the IMPROVE website.11 The algorithm has been revised over the years to produce consistent estimates of light extinction for all remote-area IMPROVE aerosol monitoring sites, and it permits the individual particle component contributions to light extinction to be separately estimates. The current IMPROVE equation includes contributions from sea salt, and an increase in the multiplier in contribution from POM as compared to the previous IMPROVE algorithm. In the IMPROVE algorithm as described in the equation below, light extinction (bext) and Rayleigh scattering are described in units of Mm-1. Dry mass extinction efficiency terms are in units of meter squared per gram (m2g-1). Water growth terms, f(RH), are unitless. The total sulfate, nitrate, and organic compound concentrations are each split into two fractions, representing small and large size distributions of those components. For masses less than 20 µg/m3, the fraction in the large mode is estimated by dividing the total concentration of the component by 20 µg/m3. If the total concentration of a component exceeds 20 µg/m3, all is assumed to be in the large mode. The small and large modes of sulfate and nitrate have relative humidity correction factors, fS(RH) and fL(RH), applied since these species are hygroscopic (i.e., absorb water), and their extinction efficiencies change with relative humidity.
𝑏𝑏𝑒𝑒𝑒𝑒𝑒𝑒 ≈ 2.2 × 𝑓𝑓𝑆𝑆(𝑅𝑅𝑅𝑅) × [𝑆𝑆𝑚𝑚𝑆𝑆𝑆𝑆𝑆𝑆 𝐴𝐴𝑚𝑚𝑚𝑚𝐴𝐴𝐴𝐴𝐴𝐴𝐴𝐴𝑚𝑚 𝑆𝑆𝐴𝐴𝑆𝑆𝑓𝑓𝑆𝑆𝑆𝑆𝑆𝑆] + 4.8 × 𝑓𝑓𝐿𝐿(𝑅𝑅𝑅𝑅) × [𝐿𝐿𝑆𝑆𝐿𝐿𝐿𝐿𝑆𝑆 𝐴𝐴𝑚𝑚𝑚𝑚𝐴𝐴𝐴𝐴𝐴𝐴𝐴𝐴𝑚𝑚 𝑆𝑆𝐴𝐴𝑆𝑆𝑓𝑓𝑆𝑆𝑆𝑆𝑆𝑆] + 2.4 × 𝑓𝑓𝑆𝑆(𝑅𝑅𝑅𝑅) ×[𝑆𝑆𝑚𝑚𝑆𝑆𝑆𝑆𝑆𝑆 𝐴𝐴𝑚𝑚𝑚𝑚𝐴𝐴𝐴𝐴𝐴𝐴𝐴𝐴𝑚𝑚 𝑁𝑁𝐴𝐴𝑆𝑆𝐿𝐿𝑆𝑆𝑆𝑆𝑆𝑆] + 5.1 × 𝑓𝑓𝐿𝐿 (𝑅𝑅𝑅𝑅) ×[𝐿𝐿𝑆𝑆𝐿𝐿𝐿𝐿𝑆𝑆 𝐴𝐴𝑚𝑚𝑚𝑚𝐴𝐴𝐴𝐴𝐴𝐴𝐴𝐴𝑚𝑚 𝑁𝑁𝐴𝐴𝑆𝑆𝐿𝐿𝑆𝑆𝑆𝑆𝑆𝑆] + 2.8 × [𝑆𝑆𝑚𝑚𝑆𝑆𝑆𝑆𝑆𝑆 𝑂𝑂𝐿𝐿𝐿𝐿𝑆𝑆𝐴𝐴𝐴𝐴𝑂𝑂 𝑀𝑀𝑆𝑆𝑀𝑀𝑀𝑀] +6.1 × ⌊𝐿𝐿𝑆𝑆𝐿𝐿𝐿𝐿𝑆𝑆 𝑂𝑂𝐿𝐿𝐿𝐿𝑆𝑆𝐴𝐴𝐴𝐴𝑂𝑂 𝑀𝑀𝑆𝑆𝑀𝑀𝑀𝑀⌋ + 10 × [𝐸𝐸𝑆𝑆𝑆𝑆𝑚𝑚𝑆𝑆𝐴𝐴𝑆𝑆𝑆𝑆𝑆𝑆 𝐶𝐶𝑆𝑆𝐿𝐿𝑏𝑏𝐴𝐴𝐴𝐴] +1 × [𝐹𝐹𝐴𝐴𝐴𝐴𝑆𝑆𝑆𝑆 𝑆𝑆𝐴𝐴𝐴𝐴𝑆𝑆] + 1.7 × 𝑓𝑓𝑆𝑆𝑆𝑆 (𝑅𝑅𝑅𝑅) × [𝑆𝑆𝑆𝑆𝑆𝑆 𝑆𝑆𝑆𝑆𝑆𝑆𝑆𝑆] + 0.6 × [𝐶𝐶𝐴𝐴𝑆𝑆𝐿𝐿𝑀𝑀𝑆𝑆 𝑀𝑀𝑆𝑆𝑀𝑀𝑀𝑀] +𝑅𝑅𝑆𝑆𝑅𝑅𝑆𝑆𝑆𝑆𝐴𝐴𝐿𝐿ℎ 𝑆𝑆𝑂𝑂𝑆𝑆𝑆𝑆𝑆𝑆𝑆𝑆𝐿𝐿𝐴𝐴𝐴𝐴𝐿𝐿(𝑆𝑆𝐴𝐴𝑆𝑆𝑆𝑆 𝑆𝑆𝑆𝑆𝑆𝑆𝑂𝑂𝐴𝐴𝑓𝑓𝐴𝐴𝑂𝑂) + 0.33 × [𝑁𝑁𝑂𝑂2(𝑆𝑆𝑆𝑆𝑏𝑏)]
11 Colorado State University, “The IMPROVE Algorithm”, URL: http://vista.cira.colostate.edu/Improve/the-improve-algorithm/.
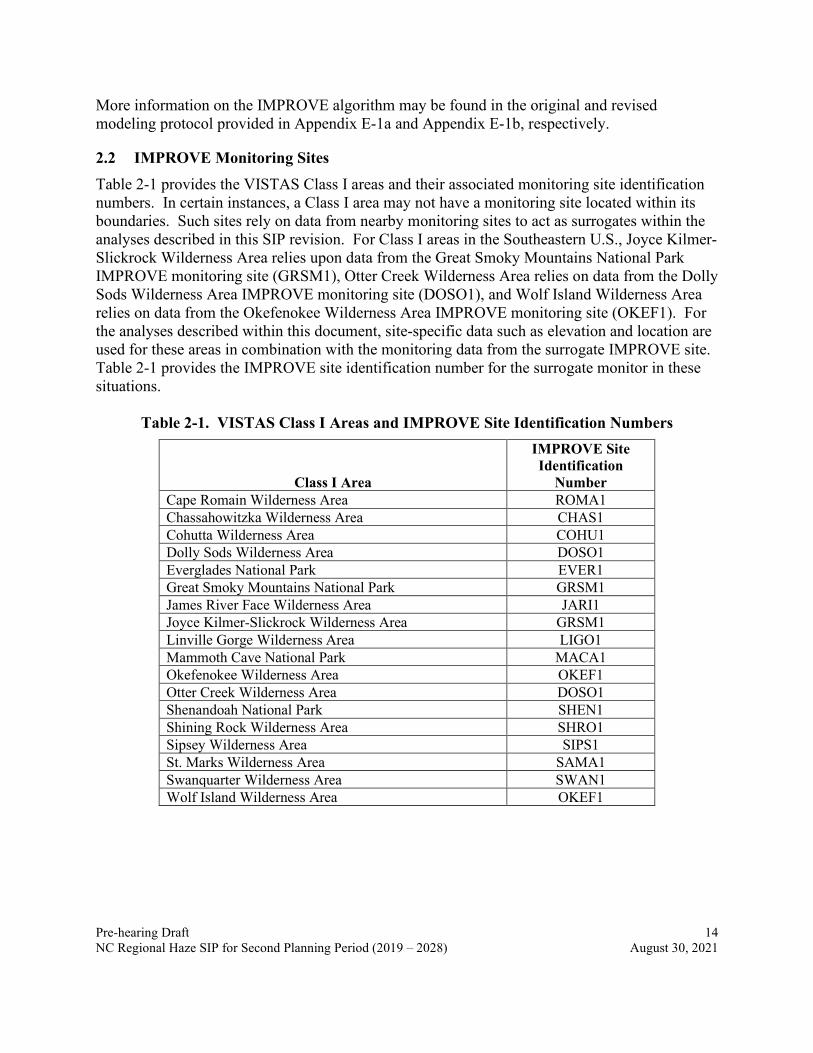
Pre-hearing Draft 14 NC Regional Haze SIP for Second Planning Period (2019 – 2028) August 30, 2021
More information on the IMPROVE algorithm may be found in the original and revised modeling protocol provided in Appendix E-1a and Appendix E-1b, respectively.
2.2 IMPROVE Monitoring Sites Table 2-1 provides the VISTAS Class I areas and their associated monitoring site identification numbers. In certain instances, a Class I area may not have a monitoring site located within its boundaries. Such sites rely on data from nearby monitoring sites to act as surrogates within the analyses described in this SIP revision. For Class I areas in the Southeastern U.S., Joyce Kilmer-Slickrock Wilderness Area relies upon data from the Great Smoky Mountains National Park IMPROVE monitoring site (GRSM1), Otter Creek Wilderness Area relies on data from the Dolly Sods Wilderness Area IMPROVE monitoring site (DOSO1), and Wolf Island Wilderness Area relies on data from the Okefenokee Wilderness Area IMPROVE monitoring site (OKEF1). For the analyses described within this document, site-specific data such as elevation and location are used for these areas in combination with the monitoring data from the surrogate IMPROVE site. Table 2-1 provides the IMPROVE site identification number for the surrogate monitor in these situations.
Table 2-1. VISTAS Class I Areas and IMPROVE Site Identification Numbers
Class I Area
IMPROVE Site Identification
Number Cape Romain Wilderness Area ROMA1 Chassahowitzka Wilderness Area CHAS1 Cohutta Wilderness Area COHU1 Dolly Sods Wilderness Area DOSO1 Everglades National Park EVER1 Great Smoky Mountains National Park GRSM1 James River Face Wilderness Area JARI1 Joyce Kilmer-Slickrock Wilderness Area GRSM1 Linville Gorge Wilderness Area LIGO1 Mammoth Cave National Park MACA1 Okefenokee Wilderness Area OKEF1 Otter Creek Wilderness Area DOSO1 Shenandoah National Park SHEN1 Shining Rock Wilderness Area SHRO1 Sipsey Wilderness Area SIPS1 St. Marks Wilderness Area SAMA1 Swanquarter Wilderness Area SWAN1 Wolf Island Wilderness Area OKEF1

Pre-hearing Draft 15 NC Regional Haze SIP for Second Planning Period (2019 – 2028) August 30, 2021
2.3 Estimating Natural Conditions for VISTAS Class I Areas Natural background visibility, as defined in Guidance for Estimating Natural Visibility Conditions Under the Regional Haze Program, EPA-454/B-03-005, September 2003,12 is based on annual average concentrations of fine particle components. There are two separate methodologies to compute natural conditions: one methodology for the 20% clearest days and one for the 20% most impaired days. In the first round of regional haze planning as well as the first mid-course review, these days were referred to as the 20% best and 20% worst days, respectively. These terms were updated to "clearest" and "most impaired" as part of two recent actions by EPA: a rule amending requirements for state plans finalized in January 2017,13 and EPA guidance that updates recommended methodologies for tracking visibility impairment, issued in December 2018.14 Also, as part of EPA’s 2018 guidance memo, the recommended methodology for computing natural conditions for the 20% most impaired days changed, while no change was made for the 20% clearest days. The 2018 guidance memo provided IMPROVE monitoring data from 1990 through 2017. Natural background conditions using the current IMPROVE equation are calculated separately for each Class I area, and the methodologies for calculating background conditions for the 20% most impaired days and the 20% clearest days are discussed in the preceding sections. Broadly speaking, however, the current calculation of natural background allows Rayleigh scattering to vary with elevation. Secondly, natural conditions are adjusted (as with the 20% most impaired days) to reflect impacts of natural events that are unrecognized in the computation of visibility under natural background conditions. 2.3.1 Natural Background Conditions on 20% Clearest Days The EPA’s 2018 guidance memo notes that days with the lowest 20% annual values of the daily haze index are used to represent the clearest days and are not selected based on the lowest anthropogenic impairment. The RHR requirements for 20% clearest days is to ensure that no degradation from the baseline (2000-2004) occurs and do not rely on a comparison to the estimated natural background conditions on the 20% clearest days. 2.3.2 Natural Background Conditions on 20% Most Impaired Days The methodology for computing natural background values for the 20% most impaired days separates observed visibility impairment into natural and anthropogenic contributions. The days with the highest anthropogenic visibility impairment contribution are what now comprise the 20% most impaired days, as opposed to the entirety of the visibility impairment portfolio that comprised the 20% haziest days previously. The reason for this change was to separate visibility impairment associated with significant natural events such as wildfires and dust storms, over
12 URL: https://www3.epa.gov/ttnamti1/files/ambient/visible/tracking.pdf 13 Final Rule: Protection of Visibility: Amendments to Requirements for State Plans, 82 FR 3078, January 10, 2017. 14 EPA, “Technical Guidance on Tracking Visibility Progress for the Second Implementation Period of the Regional Haze Program”, December 2018. URL: https://www.epa.gov/sites/production/files/2018-12/documents/technical_guidance_tracking_visibility_progress.pdf

Pre-hearing Draft 16 NC Regional Haze SIP for Second Planning Period (2019 – 2028) August 30, 2021
which states have no control, from visibility impairment associated with anthropogenic emissions sources, which states may control. Further, the EPA notes that visibility conditions have never been measured without any anthropogenic impairment whatsoever, and so such conditions must be estimated. Within these 20% most impaired days at a given Class I site, the natural visibility impairment for each day measured at said Class I site from 2000 to 2014, inclusive, are aggregated. That average value then becomes the natural background endpoint for the 20% most impaired days at the given Class I site. The 2018 EPA guidance (p. 15) notes that these new natural background visibility values are "consistently" lower than the prior natural values for 20% haziest days. The natural background conditions computed and utilized by VISTAS for the 20% most impaired days at Class I sites follow the 2018 EPA guidance without exception. 2.3.3 Summary of Natural Background Conditions for VISTAS Class I Areas Table 2-2 provides a summary of the natural background conditions for VISTAS Class I areas.
Table 2-2. Average Natural Background Conditions for VISTAS Class I Areas
Class I Areas
Average for 20% Most Impaired
Days (dv)*
Average for 20%
Clearest Days (dv)*
Average for 20% Most Impaired
Days (Mm-1)
Average for 20% Clearest Days (Mm-1)
Great Smoky Mountains National Park 10.05 4.62
27.32 15.87
Joyce Kilmer-Slickrock Wilderness Area 10.05 4.62
27.32 15.87
Linville Gorge Wilderness Area 9.70 4.07 26.38 15.02 Shining Rock Wilderness Area 10.25 2.49 27.87 12.83 Swanquarter Wilderness Area 10.01 5.71 27.21 17.70 * Data taken from Table 1 in the EPA memorandum with subject: Technical addendum including updated visibility data through 2018 for the memo titled, "Recommendation for the use of Patched and Substituted Data and Clarification of Data Completeness for Tracking Visibility Progress for the Second Implementation Period of the Regional Haze Program."15
2.4 Baseline Conditions Baseline visibility conditions at each North Carolina Class I area are estimated using sampling data collected at IMPROVE monitoring sites at four of the five Class I areas. A five-year average (2000 to 2004) was calculated for the 20% clearest days as well as the 20% most impaired days at each Class I site in accordance with 40 CFR 51.308(f)(1); Guidance for Tracking Progress Under the Regional Haze Rule, EPA-454-03-004, September 2003; and the 2018 EPA guidance. IMPROVE data records for Great Smoky Mountains National Park and
15 URL: https://www.epa.gov/sites/production/files/2020-06/documents/memo_data_for_regional_haze_technical_addendum.pdf

Pre-hearing Draft 17 NC Regional Haze SIP for Second Planning Period (2019 – 2028) August 30, 2021
Linville Gorge Wilderness Area for the period 2000 to 2004 meet the EPA requirements for data completeness (75% for the year and 50% for each quarter). IMPROVE data records for Shining Rock Wilderness Area and Swanquarter Wilderness Area had missing data in more than one year between 2000 to 2004. Data records for these sites were filled using data substitution procedures outlined in Appendix C-1. Data at Swanquarter were further amended due to a filter issue that was discovered to affect data from 2003-2005.16 The IMPROVE monitor at Great Smoky Mountains National Park is used to represent visibility in the Joyce Kilmer Wilderness Area which does not have an IMPROVE monitor. 2.4.1 Baseline Conditions for 20% Clearest and 20% Most Impaired Days for VISTAS
Class I Areas Table 2-3 provides a summary of the baseline conditions (2000-2004) for the 20% clearest and 20% most impaired days at VISTAS Class I areas. The baseline dv index values for the 20% most impaired and 20% clearest days at these Class I areas are based on data and calculations included in Table 1 in the EPA memorandum with subject: Technical addendum including updated visibility data through 2018 for the memo titled, "Recommendation for the use of Patched and Substituted Data and Clarification of Data Completeness for Tracking Visibility Progress for the Second Implementation Period of the Regional Haze Program."17
Table 2-3. Baseline Visibility Conditions for VISTAS Class I Areas (2000-2004)
Class I Areas
Average for 20% Most Impaired Days (dv)
Average for 20% Clearest
Days (dv)
Average for 20% Most Impaired
Days (Mm-1)
Average for 20%
Clearest Days (Mm-1)
Great Smoky Mountains National Park 29.11 13.58 183.75 38.88 Joyce Kilmer-Slickrock Wilderness Area 29.11 13.58 183.75 38.88 Linville Gorge Wilderness Area 28.05 11.11 165.27 30.37 Shining Rock Wilderness Area 28.13 7.70 166.60 21.60 Swanquarter Wilderness Area 23.79 12.34 107.94 34.35
2.4.2 Pollutant Contributions to Visibility Impairment (2000-2004 Baseline Data) The 20% most impaired visibility days at the Southern Appalachian sites (in North Carolina: Great Smoky Mountains, Joyce Kilmer, Linville Gorge, and Shining Rock) during the baseline period generally occurred in the period April to September, with sulfate being the largest component. To illustrate this, Figures 2-1 through 2-4 display the 2000 – 2004 reconstructed extinction for the 20% most impaired days for the Class I areas in North Carolina. Similar plots for the other VISTAS Class I areas can be found in Appendix C-2. During the baseline period, the peak visibility impairment days occur in the summer under stagnant weather conditions with
16 URL: http://vista.cira.colostate.edu/DataWarehouse/IMPROVE/Data/SummaryData/RHR_2018/Updated/Changes%20to%20IMPROVE%20RHR%20Metric%20Data%20Processing%20since%2010_2019%20v5_20.pptx 17 URL: https://www.epa.gov/sites/production/files/2020-06/documents/memo_data_for_regional_haze_technical_addendum.pdf

Pre-hearing Draft 18 NC Regional Haze SIP for Second Planning Period (2019 – 2028) August 30, 2021
high relative humidity, high temperatures, and low wind speeds. The 20% clearest days at the Southern Appalachian sites can occur at any time of year. At Swanquarter and other coastal sites, the 20% most impaired and clearest visibility days are distributed throughout the year.
Figure 2-1. 2000-2004 Reconstructed Extinction for the 20% Most Impaired Days at the Great Smoky Mountains National Park and Joyce Kilmer – Slickrock Wilderness Area
0
50
100
150
200
250
300
350
400
450
03/2
206
/03
06/2
807
/12
08/1
208
/23
10/2
106
/09
06/2
407
/15
07/2
408
/05
08/1
408
/26
09/1
903
/27
06/2
207
/16
07/3
108
/09
08/2
409
/11
09/2
305
/24
06/1
106
/29
07/1
708
/07
08/1
608
/25
09/0
606
/08
06/2
007
/08
07/2
908
/10
08/2
809
/12
10/0
3
2000 2001 2002 2003 2004
Inve
rse
Meg
amet
ers
(Mm
-1)
E_Sea_SaltE_CME_SoilE_LACE_OMCE_NitrateE_SulfateE_Rayleigh
0
50
100
150
200
250
300
350
400
05/0
406
/09
06/2
707
/15
08/0
208
/11
08/2
009
/07
05/0
807
/19
07/2
808
/06
08/2
108
/30
09/1
111
/01
04/2
705
/27
07/1
407
/26
08/1
608
/25
09/0
906
/08
06/2
007
/23
08/0
408
/16
08/2
509
/12
09/3
0
2001 2002 2003 2004
Inve
rse
Meg
amet
ers
(Mm
-1)
E_Sea_SaltE_CME_SoilE_LACE_OMCE_NitrateE_SulfateE_Rayleigh

Pre-hearing Draft 19 NC Regional Haze SIP for Second Planning Period (2019 – 2028) August 30, 2021
Figure 2-2. 2001-2004 Reconstructed Extinction for the 20% Most Impaired Days at Linville Gorge Wilderness Area
Figure 2-3. 2001-2004 Reconstructed Extinction for the 20% Most Impaired Days at Shining Rock Wilderness Area
Figure 2-4. 2001-2004 Reconstructed Extinction for the 20% Most Impaired Days at Swanquarter Wilderness Area
0
100
200
300
400
500
60005
/01
06/1
206
/24
07/1
507
/30
08/0
808
/17
08/2
609
/19
05/2
306
/10
07/0
707
/22
07/3
108
/09
09/0
509
/17
05/2
406
/20
07/1
708
/10
08/2
209
/03
09/2
706
/20
07/2
007
/29
08/1
608
/31
09/2
410
/21
2001 2002 2003 2004
Inve
rse
Meg
amet
ers
(Mm
-1)
E_Sea_SaltE_CME_SoilE_LACE_OMCE_NitrateE_SulfateE_Rayleigh
0
50
100
150
200
250
300
01/1
905
/10
06/0
907
/06
07/1
508
/11
08/2
911
/30
04/0
504
/29
05/2
607
/04
07/2
208
/21
09/1
111
/01
02/1
703
/07
06/0
507
/17
08/0
108
/22
09/2
110
/18
05/0
605
/18
06/2
307
/11
07/2
008
/25
10/2
7
2001 2002 2003 2004
Inve
rse
Meg
amet
ers
(Mm
-1)
E_Sea_SaltE_CME_SoilE_LACE_OMCE_NitrateE_SulfateE_Rayleigh

Pre-hearing Draft 20 NC Regional Haze SIP for Second Planning Period (2019 – 2028) August 30, 2021
Figure 2-5 displays the average light extinction for the 20% most impaired days during the baseline period (2000-2004) for each VISTAS Class I area and for nearby Class I areas. Figure 2-6 displays the average light extinction for the 20% clearest during the baseline period (2000-2004) for each VISTAS Class I area and for nearby Class I areas.
Figure 2-5. Average Light Extinction, 20% Most Impaired Days, 2000-2004, VISTAS and
Neighboring Class I Areas

Pre-hearing Draft 21 NC Regional Haze SIP for Second Planning Period (2019 – 2028) August 30, 2021
Figure 2-6. Average Light Extinction, 20% Clearest Days, 2000-2004, VISTAS and
Neighboring Class I Areas These bar charts (Figure 2-1 through Figure 2-6) are based on the IMPROVE data file called sia_impairment_daily_budgets_10_18.zip and therefore have not been updated with the patching and substitution algorithms described in EPA's June 3, 2020, guidance memorandum entitled, "Recommendation for the Use of Patched and Substituted Data and Clarification of Data Completeness for Tracking Visibility Progress for the Second Implementation Period of the Regional Haze Program."18 Changes to the daily data from the application of these routines is expected to be slight and will not change the conclusions of this SIP. Ammonium sulfate, (NH4)2SO4, is the most important contributor to visibility impairment and fine particle mass on the 20% most impaired and 20% clearest visibility days at all the North Carolina Class I areas during the baseline period. During this time period, sulfate levels on the 20% most impaired days accounted for 75% to 90% of anthropogenically-driven visibility impairment. Sulfate particles are formed in the atmosphere from SO2 emissions. Sulfate particles occur as hydrogen sulfate, H2SO4; ammonium bisulfate, HNH4SO4; and ammonium sulfate, (NH4)2SO4, depending on the availability of ammonia, NH3, in the atmosphere. Sulfur dioxide emissions are primarily caused by the combustion of coal and some fuel oils; however,
18 URL: https://www.epa.gov/visibility/memo-and-technical-addendum-ambient-data-usage-and-completeness-regional-haze-program

Pre-hearing Draft 22 NC Regional Haze SIP for Second Planning Period (2019 – 2028) August 30, 2021
several industrial processes result in production and emission of SO2, for example those employed in kraft pulp and paper production or phosphate manufacturing. Across the VISTAS region, sulfate levels are higher at the Southern Appalachian sites than at the coastal sites (Figure 2-5). On the 20% clearest days, sulfate levels are more uniform across the region (Figure 2-6). [Note that in these two figures, levels at Great Smoky Mountains National Park should be considered to be representative of levels at Joyce Kilmer-Slickrock Wilderness, levels at Okefenokee Wilderness should be considered representative of Wolf Island Wilderness, and levels at Dolly Sods Wilderness should be considered representative of levels at Otter Creek Wilderness.] The best average visibility and lowest sulfate values on the clearest days occurred at Shining Rock. Shining Rock, at 1,621 meters elevation, is likely influenced on the clearest days by regional transport of air masses above the boundary layer. Particulate Organic Matter (POM) is shown as organic matter carbon (OMC) in the figures. POM is the second most important contributor to fine particle mass and light extinction on the 20% most impaired and the 20% clearest days at the North Carolina Class I areas during the baseline period. Days for which visibility impairment is associated with elevated levels of POM and elemental carbon (EC) which are associated with natural events such as wildland fires are largely removed from the 20% most impaired days because they are regarded as natural sources. Significant fire impacts are infrequent at Class I areas in North Carolina. In the fall, winter, and spring, more of the carbon is attributable to wood burning while in the summer months more of the carbon mass is attributable to biogenic emissions from vegetation. Ammonium nitrate (NH4NO3) is formed in the atmosphere by reaction of ammonia (NH3) and NOx. Nitrogen oxide emissions are overwhelmingly caused by any type of stationary or mobile source combustion. The heat of combustion causes atmospheric nitrogen to form oxides, so this byproduct occurs during the combustion of nearly any fuel. In the VISTAS region, nitrate formation is limited by availability of ammonia and by temperature. Ammonia preferentially reacts with SO2 and sulfate before reacting with NOx. Particle nitrate is formed at lower temperatures; at elevated temperatures nitric acid remains in gaseous form. For this reason, particle nitrate levels are very low in the summer and a minor contributor to visibility impairment during the baseline period of 2000-2004. Particle nitrate concentrations are higher on winter days and are more important for the coastal sites where the 20% most impaired days occur during the winter months. Elemental Carbon (EC) is shown as light absorbing carbon (LAC) in this section's figures. EC is a comparatively minor contributor to visibility impairment in the baseline period. Sources include agriculture, prescribed, wildland, and wildfires and incomplete combustion of fossil fuels. EC levels are higher at urban monitors than at the Class I areas and suggest controls of primary PM at fossil fuel combustion sources would be more effective to reduce PM2.5 in urban areas than to improve visibility in Class I areas.

Pre-hearing Draft 23 NC Regional Haze SIP for Second Planning Period (2019 – 2028) August 30, 2021
Soil fine particles are minor contributors to visibility impairment at most southeastern sites on most days in the baseline period. Occasional episodes of elevated fine soil can be attributed to Saharan dust episodes, particularly at Everglades, Florida, but rarely are seen in other VISTAS Class I areas; these contributions are now largely teased out as natural routine events. Due to its small contribution to anthropogenic visibility impairment in southeastern Class I areas, fine soil control strategies to improve visibility would not be effective. Sea salt (NaCl) is observed at the coastal sites. During the baseline period, sea salt contributions to visibility impairment are most important on the 20% clearest days when sulfate and POM levels are low. Sea salt levels do not contribute significantly to visibility on the 20% most impaired visibility days. The new IMPROVE equation uses Chloride ion, Cl-, from routine IMPROVE measurements to calculate sea salt levels. VISTAS used Cl- to calculate sea salt contributions to visibility following IMPROVE guidance. Coarse mass (CM) is also shown as extinction coarse mass (ECM). CM are particles with diameters between 2.5 and 10 microns. This component has a relatively small contribution to visibility impairment because the light extinction efficiency of coarse mass is very low compared to the extinction efficiency for sulfate, nitrate, and carbon. Rayleigh scattering is the scattering of sunlight off the molecules of the atmosphere and varies with the elevation of the monitoring site. For VISTAS monitoring sites, this value varies from 10 to 12 Mm-1.
2.5 Modeling Base Period (2009-2013) Visibility projections discussed in Sections 5, 6, and 7 use IMPROVE data from 2009-2013 to estimate future year visibility at Class I areas. For each Class I area, estimated anthropogenic impairment observations from each IMPROVE site for the five-year period surrounding the 2011 modeling base year comprise the data representing the modeling base period. The year 2011 was selected as the modeling base year because the VISTAS 2028 emissions inventory is based on the 2011 Version 6 EPA modeling platform, which at the commencement of the VISTAS second round of planning for regional haze was the most current, complete modeling platform available. For the analyses in this SIP, this period consists of those years surrounding 2011 (i.e., 2009-2013). While not required by the RHR, examination of these data provides insight into the future year visibility projections for the VISTAS Class I areas. 2.5.1 Modeling Base Period (2009-2013) for 20% Clearest and 20% Most Impaired Days
for VISTAS Class I Areas Table 2-4 provides a summary of the conditions for the 20% clearest and 20% most impaired days at VISTAS Class I areas during 2009-2013, the period used as the modeling basis for this SIP revision's projection analysis described in Sections 5, 6, and 7. The baseline light extinction and dv index values for the 20% most impaired and 20% clearest days at the Class I areas are based on data and calculations included in Appendix E-6 of this SIP.

Pre-hearing Draft 24 NC Regional Haze SIP for Second Planning Period (2019 – 2028) August 30, 2021
Table 2-4. Modeling Base Period (2009-2013) Conditions for VISTAS Class I Areas
Class I Areas
Average for 20% Most Impaired Days (dv)
Average for 20% Clearest
Days (dv)
Average for 20% Most Impaired
Days (Mm-1)
Average for 20%
Clearest Days (Mm-1)
Great Smoky Mountains National Park 21.39 10.63 88.03 29.76 Joyce Kilmer-Slickrock Wilderness Area 21.39 10.63 88.03 29.76 Linville Gorge Wilderness Area 20.39 9.70 79.82 26.93 Shining Rock Wilderness Area* 20.39 9.70 67.19 17.09 Swanquarter Wilderness Area 19.76 11.76 75.64 32.75 * The IMPROVE monitoring data at Shining Rock Wilderness Area is missing complete data for 2010 and 2011.
After consultation with North Carolina, a three-year average of 2009, 2012, and 2013 IMPROVE data was used to calculate the visibility (dv) for both the 20% clearest and 20% most impaired days at Shining Rock.
2.5.2 Pollutant Contributions to Visibility Impairment (2009-2013 Modeling Base Period Data)
Figures 2-7 through 2-10 show the 2009 – 2013 reconstructed extinction for the 20% most impaired days for the Class I areas in North Carolina. Similar plots for the other VISTAS Class I areas can be found in Appendix C-2. During the modeling base period, the peak visibility impairment days continue to occur in the summer although winter episodes became more prevalent. On nearly all days, sulfate continues to be the dominant visibility impairing pollutant. Nitrate impacts become more significant on some of the 20% most impaired days. The figures also show the improvement in visibility impairment when compared to Figures 2-1 through 2-4. While maximum values in Figure 2-1 are in the range of 400 Mm-1, for example, maximum values in Figure 2-4 are in the 180 Mm-1 range, highlighting the impact of the many control programs implemented during the intervening period.

Pre-hearing Draft 25 NC Regional Haze SIP for Second Planning Period (2019 – 2028) August 30, 2021
Figure 2-7. 2009-2013 Reconstructed Extinction for the 20% Most Impaired Days at the
Great Smoky Mountains National Park and Joyce Kilmer-Slickrock Wilderness Area
Figure 2-8. 2009-2013 Reconstructed Extinction for the 20% Most Impaired Days at
Linville Gorge Wilderness Area
0
20
40
60
80
100
120
140
160
180
200
01/2
504
/16
06/1
506
/27
07/1
207
/24
08/2
609
/13
01/0
803
/03
06/0
407
/04
08/0
308
/15
08/3
009
/23
12/1
902
/23
07/0
507
/20
07/2
908
/07
08/1
908
/31
02/0
605
/06
05/1
806
/02
06/2
308
/04
08/2
509
/15
01/0
702
/27
07/1
208
/02
08/2
309
/07
09/1
911
/03
2009 2010 2011 2012 2013
Inve
rse
Meg
amet
ers
(Mm
-1)
E_Sea_SaltE_CME_SoilE_LACE_OMCE_NitrateE_SulfateE_Rayleigh
0
20
40
60
80
100
120
140
160
02/1
506
/15
06/2
707
/12
07/2
108
/23
09/0
712
/06
02/0
703
/03
07/0
107
/16
08/0
608
/24
09/1
709
/26
01/2
706
/05
07/2
608
/04
08/1
308
/22
08/3
109
/27
04/2
705
/18
06/2
307
/29
08/2
209
/12
10/0
611
/08
05/1
007
/18
08/0
508
/23
09/0
709
/19
10/2
5
2009 2010 2011 2012 2013
Inve
rse
Meg
amet
ers
(Mm
-1)
E_Sea_SaltE_CME_SoilE_LACE_OMCE_NitrateE_SulfateE_Rayleigh

Pre-hearing Draft 26 NC Regional Haze SIP for Second Planning Period (2019 – 2028) August 30, 2021
Figure 2-9. 2009-2013 Reconstructed Extinction for the 20% Most Impaired Days at
Shining Rock Wilderness Area
Figure 2-10. 2009-2013 Reconstructed Extinction for the 20% Most Impaired Days at
Swanquarter Wilderness Area Figure 2-11 displays the average light extinction for the 20% most impaired days during the modeling base period (2009-2013) for each VISTAS Class I area and for nearby Class I areas.
0
20
40
60
80
100
120
140
160
01/2
505
/28
06/1
506
/21
06/2
707
/12
07/1
807
/24
08/1
108
/20
08/2
609
/13
04/0
305
/09
05/1
806
/23
07/0
808
/04
08/1
608
/25
09/1
209
/30
10/1
206
/09
07/1
207
/24
08/0
508
/14
08/2
609
/01
09/0
709
/16
09/2
210
/01
10/2
5
2009 2012 2013
Inve
rse
Meg
amet
ers
(Mm
-1)
E_Sea_SaltE_CME_SoilE_LACE_OMCE_NitrateE_SulfateE_Rayleigh
0
20
40
60
80
100
120
140
160
180
200
01/1
304
/04
06/0
306
/15
06/3
007
/15
08/1
112
/06
01/1
402
/13
04/2
306
/13
06/2
207
/10
08/3
009
/17
01/0
301
/18
03/2
504
/30
07/1
108
/13
09/1
212
/17
02/0
302
/18
05/1
207
/26
08/1
910
/06
11/1
101
/07
02/1
503
/17
04/2
507
/24
08/2
910
/04
2009 2010 2011 2012 2013
Inve
rse
Meg
amet
ers
(Mm
-1)
E_Sea_SaltE_CME_SoilE_LACE_OMCE_NitrateE_SulfateE_Rayleigh

Pre-hearing Draft 27 NC Regional Haze SIP for Second Planning Period (2019 – 2028) August 30, 2021
Figure 2-11 shows that for the VISTAS Class I areas, sulfate continues to be the driver for 20% worst visibility days. In all VISTAS Class I areas except Mammoth Cave, organic matter is the second leading cause of visibility impairment on average during 20% most impaired days. In neighboring Class I areas and at Mammoth Cave, nitrate is the second leading cause of visibility impairment on average 20% most impaired days.
Figure 2-11. Average Light Extinction, 20% Most Impaired Days, 2009-2013, VISTAS and
Neighboring Class I Areas Figure 2-12 displays the average light extinction for the 20% clearest days during the modeling base period (2009-2013) for each VISTAS Class I area and for nearby Class I areas. On the 20% clearest days, sulfate continues to be the main component of visibility impairing pollution for VISTAS and nearby Class I areas. Comparison to Figure 2-6 shows that no degradation of visibility occurs between the 2000-2004 and 2009-2013 data sets, and in most cases improvement on 20% clearest days occurs.

Pre-hearing Draft 28 NC Regional Haze SIP for Second Planning Period (2019 – 2028) August 30, 2021
Figure 2-12. Average Light Extinction, 20% Clearest Days, 2009-2013, VISTAS and
Neighboring Class I Areas These bar charts (Figure 2-7 through Figure 2-12) are based on the IMPROVE data file called sia_impairment_daily_budgets_10_18.zip and therefore have not been updated with the patching and substitution algorithms described in EPA's 2020 guidance memo. Changes to the daily data from the application of these routines is expected to be slight and will not change the conclusions of this SIP.
2.6 Current Conditions The current visibility estimates are comprised of measurements from the five-year period between 2014 and 2018, inclusive. 2.6.1 Current Conditions (2014-2018) for 20% Clearest and 20% Most Impaired Days for
VISTAS Class I Areas Table 2-5 provides a summary of the current conditions (2014-2018) for the 20% clearest and 20% most impaired days at VISTAS Class I areas. These data reflect values included in Table 1 of the EPA memorandum with subject: Technical addendum including updated visibility data through 2018 for the memo issued June 3, 2020 titled, "Recommendation for the use of Patched

Pre-hearing Draft 29 NC Regional Haze SIP for Second Planning Period (2019 – 2028) August 30, 2021
and Substituted Data and Clarification of Data Completeness for Tracking Visibility Progress for the Second Implementation Period of the Regional Haze Program."19
Table 2-5. Current Conditions (2014-2018) for VISTAS Class I Areas
Class I Areas
Average for 20%
Most Impaired Days (dv)
Average for 20% Clearest Days (dv)
Average for 20% Most Impaired
Days (Mm-1)
Average for 20%
Clearest Days (Mm-1)
Great Smoky Mountains National Park 17.21 8.35 55.90 23.05 Joyce Kilmer-Slickrock Wilderness Area 17.21 8.35 55.90 23.05 Linville Gorge Wilderness Area 16.42 7.61 51.65 21.40 Shining Rock Wilderness Area 15.49 4.40 47.07 15.53 Swanquarter Wilderness Area 16.30 10.61 51.04 28.89
2.6.2 Pollutant Contributions to Visibility Impairment (2014-2018 Current Data) Figures 2-13 through 2-16 display the 2014 – 2018 reconstructed extinction for the 20% most impaired days for the Class I areas in North Carolina. For the VISTAS region and neighboring Class I areas, Figure 2-17 and Figure 2-18 show light extinction averaged from 2014-2018 IMPROVE data for the 20% most impaired and clearest days, respectively. These bar charts (Figure 2-13 through Figure 2-18) are based on the IMPROVE data file called sia_impairment_daily_budgets_10_18.zip for data through 2017. For 2018 data, the IMPROVE data file called sia_impairment_daily_budgets_4_20_2.zip was used. Therefore, the data through 2017 have not been updated with the patching and substitution algorithms described in EPA's 2020 guidance memo. Changes to the daily data from the application of these routines are expected to be slight and will not change the conclusions of this SIP. These figures continue to demonstrate improved visibility when compared to the 2009-2013 data or the 2000-2004 data. Emissions of SO2 and other visibility impairing pollutants are reducing, as discussed in Section 8, and these reductions are resulting in better visibility. Figure 2-17 presents average data for 20% most impaired days and shows that on average sulfate continues to be the predominant visibility impairing pollutant for Class I areas in North Carolina and the VISTAS region as a whole. However, the data in Figures 2-13 through 2-16, which are daily monitoring values, show that occasionally nitrate is the predominant visibility impairing pollutant on certain days, generally in winter months. This occasional nitrate signal (observed most notably in 2017 and 2018) is a recent development and will be investigated further in the coming years to determine if any action needs to be taken in the next planning period of North
19 URL: https://www.epa.gov/sites/production/files/2020-06/documents/memo_data_for_regional_haze_technical_addendum.pdf

Pre-hearing Draft 30 NC Regional Haze SIP for Second Planning Period (2019 – 2028) August 30, 2021
Carolina’s regional haze SIP. A more detailed discussion on nitrate contribution to visibility impairment in North Carolina’s Class I areas is given in Section 7.4 of this SIP.
Figure 2-13. 2014-2018 Reconstructed Extinction for the 20% Most Impaired Days at the
Great Smoky Mountains National Park and Joyce Kilmer-Slickrock Wilderness Area
Figure 2-14. 2014-2018 Reconstructed Extinction for the 20% Most Impaired Days at the
Linville Gorge Wilderness Area
0
20
40
60
80
100
120
14002
/07
03/2
406
/13
08/0
608
/15
09/1
710
/26
12/1
301
/27
02/1
102
/26
03/2
205
/03
07/2
908
/31
12/1
101
/19
02/2
106
/14
07/0
208
/07
08/3
109
/30
01/0
705
/19
07/1
208
/08
09/1
309
/22
11/1
512
/12
01/0
501
/29
03/2
107
/07
07/2
209
/20
11/1
012
/07
2014 2015 2016 2017 2018
Inve
rse
Meg
amet
ers
(Mm
-1)
E_Sea_SaltE_CME_SoilE_LACE_OMCE_NitrateE_SulfateE_Rayleigh
0
10
20
30
40
50
60
70
80
90
100
02/0
706
/13
06/2
807
/19
08/0
608
/15
08/3
009
/23
01/2
703
/01
04/3
007
/17
07/2
608
/04
08/2
809
/12
01/1
604
/24
07/0
207
/20
08/2
509
/06
09/2
110
/03
01/0
703
/14
05/1
907
/15
08/0
508
/26
09/2
211
/15
01/0
503
/18
04/1
106
/28
07/1
308
/12
09/2
010
/08
2014 2015 2016 2017 2018
Inve
rse
Meg
amet
ers
(Mm
-1)
E_Sea_SaltE_CME_SoilE_LACE_OMCE_NitrateE_SulfateE_Rayleigh

Pre-hearing Draft 31 NC Regional Haze SIP for Second Planning Period (2019 – 2028) August 30, 2021
Figure 2-15. 2014-2018 Reconstructed Extinction for the 20% Most Impaired Days at the Shining Rock Wilderness Area
Figure 2-16. 2014-2018 Reconstructed Extinction for the 20% Most Impaired Days at the Swanquarter Wilderness Area
0
10
20
30
40
50
60
70
80
90
100
02/0
705
/23
06/2
207
/16
08/0
608
/18
09/1
710
/23
04/2
705
/06
07/2
007
/29
08/1
308
/22
09/1
802
/21
05/0
606
/26
07/2
008
/07
08/3
109
/24
10/0
301
/13
02/1
506
/03
07/2
108
/26
09/2
511
/03
12/1
201
/17
04/1
106
/07
07/0
407
/19
08/3
010
/05
2014 2015 2016 2017 2018
Inve
rse
Meg
amet
ers
(Mm
-1)
E_Sea_SaltE_CME_SoilE_LACE_OMCE_NitrateE_SulfateE_Rayleigh
0
10
20
30
40
50
60
70
80
90
100
01/2
902
/10
02/2
803
/21
05/1
109
/17
12/1
012
/31
02/1
102
/26
03/2
205
/21
08/1
308
/25
10/0
901
/04
02/0
603
/07
06/2
608
/07
10/0
312
/14
01/0
401
/19
02/0
303
/29
05/1
908
/14
09/2
812
/21
01/0
501
/17
04/1
106
/01
07/1
611
/19
12/1
0
2014 2015 2016 2017 2018
Inve
rse
Meg
amet
ers
(Mm
-1)
E_Sea_SaltE_CME_SoilE_LACE_OMCE_NitrateE_SulfateE_Rayleigh

Pre-hearing Draft 32 NC Regional Haze SIP for Second Planning Period (2019 – 2028) August 30, 2021
Figure 2-17. Average Light Extinction, 20% Most Impaired Days, 2014-2018, VISTAS and Neighboring Class I Areas
Figure 2-18. Average Light Extinction, 20% Clearest Days, 2014-2018, VISTAS and
Neighboring Class I Areas

Pre-hearing Draft 33 NC Regional Haze SIP for Second Planning Period (2019 – 2028) August 30, 2021
2.7 Comparisons of Baseline, Current, and Natural Background Visibility The RHR requires that SIPs include an evaluation of progress made since the baseline period toward improving visibility on the 20% most impaired days and 20% clearest days for each state's Class I areas (40 CFR 51.308(f)(1)(iv)). The rule also requires that the SIP enumerate the deciview value by which the current visibility condition exceeds the natural visibility condition, for each state's Class I areas on the 20% most impaired days and the 20% clearest days (40 CFR 51.308(f)(1)(v)). Table 2-6 summarizes this data for each Class I area located in VISTAS for the 20% most impaired days. On 20% most impaired days, data for current conditions show that significant progress has been made as compared to baseline conditions. In many cases, the improvement in visibility from baseline conditions demonstrated by the 2014-2018 visibility data is more than half of the improvement needed to achieve natural conditions.
Table 2-6. Comparison of Baseline, Current, and Natural Conditions for 20% Most Impaired Days (dv)
Class I Areas
2000-2004 Baseline
Conditions
2014-2018 Current
Conditions
Change in Visibility,
Baseline to Current
Natural Background Conditions
Difference Between Current
Conditions and Natural Background
Great Smoky Mountains National Park 29.11 17.21 11.90 10.05 7.16 Joyce Kilmer-Slickrock Wilderness Area 29.11 17.21 11.90 10.05 7.16
Linville Gorge Wilderness Area 28.05 16.42 11.63 9.70 6.72 Shining Rock Wilderness Area 28.13 15.49 12.64 10.25 5.24 Swanquarter Wilderness Area 23.79 16.30 7.49 10.01 6.29 Table 2-7 summarizes this data for each Class I area located in VISTAS for the 20% clearest days. On 20% clearest days, data for current conditions show that visibility on these days has improved from the baseline conditions for all VISTAS Class I areas.
Table 2-7. Comparison of Baseline, Current, and Natural Conditions for 20% Clearest Days (dv)
Class I Areas
2000-2004 Baseline
Conditions
2014-2018 Current
Conditions
Change in Visibility,
Baseline to Current
Natural Background Conditions
Difference Between Current
Conditions and Natural Background
Great Smoky Mountains National Park 13.58 8.35 5.23 4.62 3.73 Joyce Kilmer-Slickrock Wilderness Area 13.58 8.35 5.23 4.62 3.73
Linville Gorge Wilderness Area 11.11 7.61 3.50 4.07 3.54 Shining Rock Wilderness Area 7.70 4.40 3.30 2.49 1.91 Swanquarter Wilderness Area 12.34 10.61 1.73 5.71 4.90

Pre-hearing Draft 34 NC Regional Haze SIP for Second Planning Period (2019 – 2028) August 30, 2021
3.0 GLIDEPATHS TO NATURAL CONDITIONS IN 2064
In accordance with 40 CFR 51.308(f)(1)(vi)(A), each state must calculate a uniform rate of progress (URP), also known as a "glidepath," for each mandatory Federal Class I area located within that state. Starting at the baseline period of 2000-2004, the state must compare the baseline visibility condition for the most impaired days to the natural visibility condition for the most impaired days and determine the uniform rate of visibility improvement (measured in deciviews of improvement per year) that would need to be maintained during each implementation period in order to attain natural visibility conditions by the end of 2064. Glidepaths were developed for each mandatory Federal Class I area in the VISTAS region. The glidepaths were developed in accordance with EPA’s guidance for tracking progress and used data collected from the IMPROVE monitoring sites as described in Section 2 of this document. Glidepaths are one of the indicators used in setting reasonable progress goals. Figures 3-1 through 3-4 show the glidepaths for the 20% most impaired days for Great Smoky Mountains National Park, Joyce Kilmer-Slickrock Wilderness Area, Linville Gorge Wilderness Area, Shining Rock Wilderness Area, and Swanquarter Wilderness Area. Joyce Kilmer-Slickrock Wilderness Area relies upon data from the Great Smoky Mountains National Park IMPROVE monitoring site (GRSM1) because it does not have an IMPROVE monitor. Therefore, the glidepath chart for Great Smoky Mountains National Park is used to represent that of Joyce Kilmer-Slickrock Wilderness Area. Natural background visibility at all five Class I areas is predicted to be between 9.70 and 10.25 deciviews. The Class I areas with the steepest slope from baseline to natural background conditions are Great Smoky Mountains National Park and Joyce Kilmer-Slickrock Wilderness Area, while the Swanquarter Wilderness Area has the gentlest slope from the baseline level of visibility impairment to natural conditions. The data in Figures 3-1 through 3-4 are derived from Table 1 in the EPA’s June 3, 2020 memorandum titled: Technical addendum including updated visibility data through 2018 for the memo titled, "Recommendation for the use of Patched and Substituted Data and Clarification of Data Completeness for Tracking Visibility Progress for the Second Implementation Period of the Regional Haze Program."20
20 URL: https://www.epa.gov/sites/production/files/2020-06/documents/memo_data_for_regional_haze_technical_addendum.pdf

Pre-hearing Draft 35 NC Regional Haze SIP for Second Planning Period (2019 – 2028) August 30, 2021
Figure 3-1. Uniform Rate of Progress Glidepath for 20% Most Impaired Days at Great
Smoky Mountains National Park and Joyce Kilmer-Slickrock Wilderness Area
Figure 3-2. Uniform Rate of Progress Glidepath for 20% Most Impaired Days at Linville
Gorge Wilderness Area

Pre-hearing Draft 36 NC Regional Haze SIP for Second Planning Period (2019 – 2028) August 30, 2021
Figure 3-3. Uniform Rate of Progress Glidepath for 20% Most Impaired Days at Shining
Rock Wilderness Area
Figure 3-4. Uniform Rate of Progress Glidepath for 20% Most Impaired Days at
Swanquarter Wilderness Area
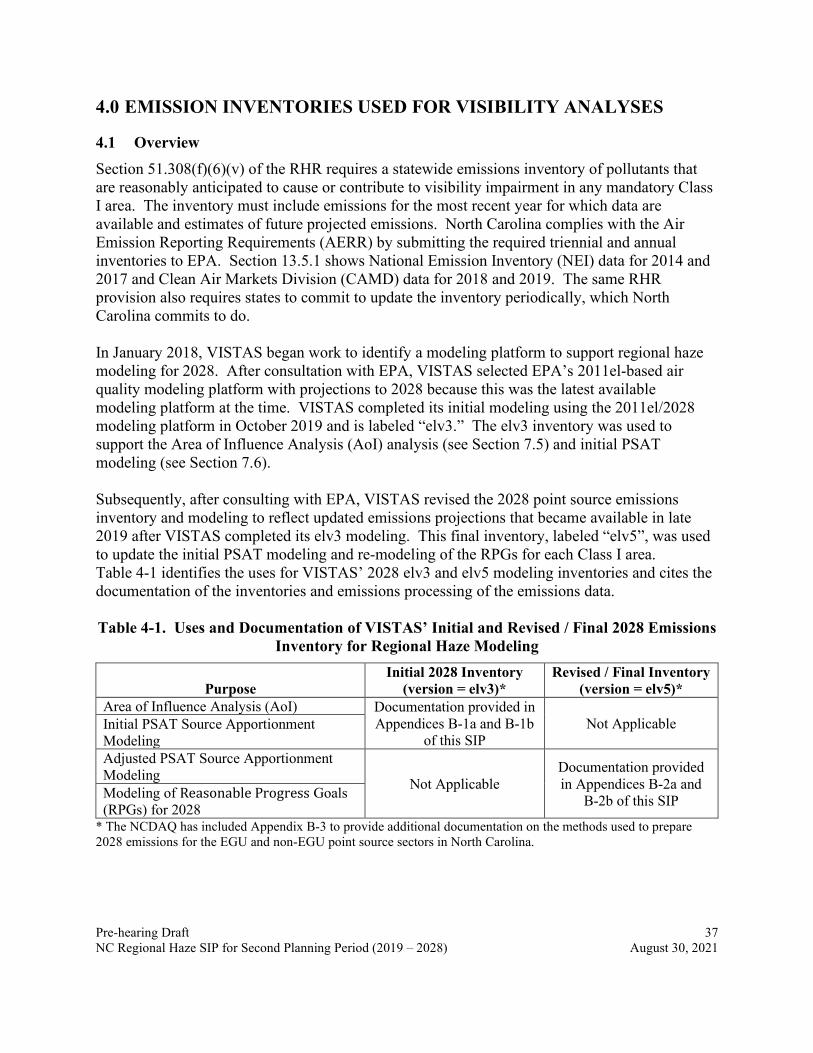
Pre-hearing Draft 37 NC Regional Haze SIP for Second Planning Period (2019 – 2028) August 30, 2021
4.0 EMISSION INVENTORIES USED FOR VISIBILITY ANALYSES
4.1 Overview Section 51.308(f)(6)(v) of the RHR requires a statewide emissions inventory of pollutants that are reasonably anticipated to cause or contribute to visibility impairment in any mandatory Class I area. The inventory must include emissions for the most recent year for which data are available and estimates of future projected emissions. North Carolina complies with the Air Emission Reporting Requirements (AERR) by submitting the required triennial and annual inventories to EPA. Section 13.5.1 shows National Emission Inventory (NEI) data for 2014 and 2017 and Clean Air Markets Division (CAMD) data for 2018 and 2019. The same RHR provision also requires states to commit to update the inventory periodically, which North Carolina commits to do. In January 2018, VISTAS began work to identify a modeling platform to support regional haze modeling for 2028. After consultation with EPA, VISTAS selected EPA’s 2011el-based air quality modeling platform with projections to 2028 because this was the latest available modeling platform at the time. VISTAS completed its initial modeling using the 2011el/2028 modeling platform in October 2019 and is labeled “elv3.” The elv3 inventory was used to support the Area of Influence Analysis (AoI) analysis (see Section 7.5) and initial PSAT modeling (see Section 7.6). Subsequently, after consulting with EPA, VISTAS revised the 2028 point source emissions inventory and modeling to reflect updated emissions projections that became available in late 2019 after VISTAS completed its elv3 modeling. This final inventory, labeled “elv5”, was used to update the initial PSAT modeling and re-modeling of the RPGs for each Class I area. Table 4-1 identifies the uses for VISTAS’ 2028 elv3 and elv5 modeling inventories and cites the documentation of the inventories and emissions processing of the emissions data. Table 4-1. Uses and Documentation of VISTAS’ Initial and Revised / Final 2028 Emissions
Inventory for Regional Haze Modeling
Purpose Initial 2028 Inventory
(version = elv3)* Revised / Final Inventory
(version = elv5)* Area of Influence Analysis (AoI) Documentation provided in
Appendices B-1a and B-1b of this SIP
Not Applicable Initial PSAT Source Apportionment Modeling Adjusted PSAT Source Apportionment Modeling Not Applicable
Documentation provided in Appendices B-2a and
B-2b of this SIP Modeling of Reasonable Progress Goals (RPGs) for 2028
* The NCDAQ has included Appendix B-3 to provide additional documentation on the methods used to prepare 2028 emissions for the EGU and non-EGU point source sectors in North Carolina.

Pre-hearing Draft 38 NC Regional Haze SIP for Second Planning Period (2019 – 2028) August 30, 2021
The following pollutants were included in the inventories and modeling: SO2, NOx, VOC, PM25-PRI, PM10-PRI, and NH3. For combustion sources, the PM2.5 and PM10 emissions included in the modeling inventories include both the filterable and condensable fractions. The modeling inventories also included carbon monoxide (CO) and are included in emissions tables in this SIP. However, CO is not a visibility impairing pollutant and thus, CO data were not evaluated for this regional haze plan. Section 4.2 provides a summary of the emission source sectors included in the 2011 base year inventory and methods used to develop the 2028 elv3 inventory for VISTAS modeling. VISTAS relied on the 2028 emissions projections included in EPA’s 2011el-based modeling platform for all sectors except the point EGU and point non-EGU sectors for which VISTAS updated 2028 emissions. Section 4.3 provides an overview of revisions completed to the 2028 elv3 inventory to develop the final 2028 elv5 inventory for the point source sectors. Section 7.2.4 of this SIP provides further documentation of the VISTAS projected 2028 emissions inventory including comparisons of 2011 and 2028 emissions by state. Section 7.2.5 provides summaries comparing recent EPA inventories for 2014, 2016, and 2017.
4.2 2011 and 2028 elv3 Emissions Inventory VISTAS contracted with ERG to perform emission inventory work as part of the air quality modeling analysis. VISTAS started with EPA’s 2011el-based air quality modeling platform with projections to 2028 because this was the latest available modeling platform at the time. This modeling platform includes emissions, meteorology, and other inputs for 2011, as the base year for the modeling described in EPA’s technical support document (TSD) entitled "Documentation for the EPA’s Preliminary 2028 Regional Haze Modeling."21 The VISTAS states did not revise the 2011 base year emissions inventory. The EPA projected the 2011 base year emissions22 to a 2028 future year base case scenario. As noted in EPA’s TSD, the 2011 base year emissions and methods for projecting these emissions to 2028 are in large part similar to the data and methods used by EPA in the final Cross-State Air Pollution Rule (CSAPR) Update23 and the subsequent notice of data availability (NODA)24 to support ozone transport for the 2015 ozone NAAQS. With the assistance of ERG, the VISTAS states revised the 2028 point source inventory. There are six different emissions inventory source sectors: stationary point sources, nonpoint (formerly called “stationary area”) sources, nonroad and onroad mobile sources, biogenic sources, and point fires, which are reported as events in the NEI.25 The following sections define
21 EPA OAQPS, Documentation for the EPA's Preliminary 2028 Regional Haze Modeling, October 2017. 22 URL: https://www.epa.gov/air-emissions-modeling/2011-version-63-technical-support-document. 23 URL: https://www.epa.gov/airmarkets/final-cross-state-air-pollution-rule-update. 24 URL: https://www.epa.gov/airmarkets/notice-data-availability-preliminary-interstate-ozone-transport-modeling-
data-2015-ozone. 25 Note that prescribed fires and wildfires are designated events in the NEI.

Pre-hearing Draft 39 NC Regional Haze SIP for Second Planning Period (2019 – 2028) August 30, 2021
each emissions inventory source sector and the emission estimation methods applied to estimate emissions for each sector. 4.2.1 Stationary Point Sources Point source emissions are emissions from individual sources having a fixed location. Generally, these sources must have permits to operate, and their emissions are inventoried on a regular schedule and provided at the facility level. In North Carolina, large sources emitting at least 100 tons per year (TPY) of a criteria pollutant, 10 TPY of a single hazardous air pollutant (HAP), or 25 TPY total HAPs are inventoried annually. Smaller sources are inventoried upon permit renewal and the current permit renewal cycle in North Carolina is eight years. The point source emissions data can be grouped as EGU and other industrial point sources called non-EGUs. Airport-related sources; including aircraft, airport ground support equipment, and jet refueling; are also part of the point source sector. In previous modeling platforms, airport-related sources were included in the nonroad sector.
Electricity Generating Units (EGUs) The EGU sector contains emissions from EGUs in the 2011 NEI v2 point inventory that could be matched to units found in the National Electric Energy Database System (NEEDS) v5.15. In most cases, the base year 2011 inventory for the EGU sources used 2011 continuous emissions monitoring (CEM) data reported to EPA/CAMD. These data provide hourly emissions profiles for SO2 and NOx that can be used in air quality modeling. Emissions profiles are used to estimate emissions of other pollutants (VOCs, CO, NH3, PM2.5) based on measured emissions of SO2 and NOx. The NEEDS database of units includes many smaller emitting EGUs that are not included in the CAMD hourly CEMS programs. Thus, there are more units in the NEEDS database than have CEMS data. Emissions from EGUs vary daily and seasonally as a function of variability in energy demand and utilization and outage schedules. The temporalization of EGU units matched to CEMS is based on the base year CEMS data for those units, whereas regional profiles are used for the remaining units. For projection year 2028 EGU point sources, the VISTAS states considered the EPA 2028el, the EPA 2023en, or 2028 emissions from the Eastern Regional Technical Advisory Committee (ERTAC) EGU projection tool from the most recent CONUS 2.7 run. The EPA 2028el emissions inventory for EGUs were created by the Integrated Planning Model (IPM) version 5.16. This scenario represents the implementation of the Cross-State Air Pollution Rule (CSAPR) Rule and CSAPR Update Rule, Mercury and Air Toxics (MATS) Rule, Clean Power Plan (CPP), EPA actions related to implementing the RHR during the first planning period, the Cooling Water Intakes Rule, and Combustion Residuals from Electric Utilities (CCR). The CPP was later vacated. Impacts of the CPP assumed that coal-fired EGUs would be shut down and replaced by natural gas-fired EGUs. Thus, the EPA 2028el projected emissions for EGU emissions are not reflective of probable emissions for 2028. The ERTAC EGU emissions did not consider the impacts of the CPP. After evaluating the different projection options, each VISTAS state determined the estimated emissions for each EGU for the projected year 2028. For non-VISTAS states, the EPA 2028el EGU emissions were replaced with the 2028

Pre-hearing Draft 40 NC Regional Haze SIP for Second Planning Period (2019 – 2028) August 30, 2021
ERTACv2.7 EGU emissions. North Carolina used ERTACv2.7 emissions data for its 2028 elv3 EGU inventory (see Appendix B-3).
Other Industrial Point Sources and Airport-Related Sources The non-EGU sector uses annual emissions contained in the 2011 NEIv2. These emissions are temporally allocated to month, day, and hour using source category code (SCC)-based allocation factors. The Control Strategy Tool (CoST) was used to apply most non-EGU projection/growth factors, controls, and facility/unit/stack-level closures to the 2011 NEI-based emissions modeling inventories to create future year inventory for 2028. Similar to the EGU sector, each state was able to adjust the 2028 non-EGU inventory based on their knowledge of each source. Airport-related source emissions for the base year 2011 were developed from the 2011 NEIv2. Aircraft emissions for 2011 are projected to future year 2028 by applying activity growth using data on itinerant (ITN) operations at airports. The ITN operations are defined as aircraft take-offs or aircraft landings. The EPA used projected ITN information available from the Federal Aviation Administration’s (FAA) Terminal Area Forecast (TAF) System. For non-EGU point sources, North Carolina applied growth and control factors to 2016 emissions to estimate 2028 elv3 emissions (see Appendix B-3). 4.2.2 Nonpoint Sources Nonpoint sources are those sources whose individual emissions are relatively small, but due to the large number of these sources, the collective emissions from the source category could be significant (e.g., dry cleaners, service stations, combustion of fuels for heating, agricultural sources). Emissions are estimated by multiplying an emission factor by some known indicator of collective activity, such as fuel usage, number of households, or population. Nonpoint source emissions are estimated at the county level. The base year 2011 nonpoint source inventory was developed from the 2011NEIv2. The CoST was used to apply most nonpoint projection/growth factors, controls, and facility/unit/stack-level closures to the 2011 NEI-based emissions modeling inventories to create future year inventory for 2028. 4.2.3 Nonroad Mobile Sources Nonroad mobile sources are equipment that can move but do not use the roadways, such as construction equipment, railroad locomotives, commercial marine vessels, and lawn equipment. The emissions from these sources, like nonpoint sources, are estimated at the county level. For the majority of the nonroad mobile sources, the emissions for 2011 were estimated using the EPA’s National Mobile Inventory Model (NMIM, 2005). For the two source categories not included in the NMIM, i.e., railroad locomotives and commercial marine, more traditional methods of estimating the emissions were used. For the source categories estimated using the EPA’s NMIM model, the model growth assumptions were used to create the 2028 future year inventory. The NMIM model takes into consideration regulations affecting emissions from these source categories. The 2028 future-year commercial marine vessels and railroad locomotives emissions account for increased fuel consumption based on Energy Information Administration (EIA) fuel consumption projections for freight, and emissions reductions resulting from emissions standards from the Final Locomotive-Marine rule.

Pre-hearing Draft 41 NC Regional Haze SIP for Second Planning Period (2019 – 2028) August 30, 2021
4.2.4 Onroad Mobile Sources Onroad mobile sources include passenger cars, motorcycles, minivans, sport-utility vehicles, light-duty trucks, heavy-duty trucks, and buses that are normally operated on public roadways. The emissions from these sources are estimated at the county level. For onroad vehicles, the Motor Vehicle Emissions Simulator (MOVES) model (MOVES2014a) was used to develop base year 2011 emissions. Key inputs for MOVES include information on the age of vehicles on the roads, vehicle miles traveled, the average speeds on the roads, the mix of vehicles on the roads, any programs in place in an area to reduce emissions for motor vehicles (e.g., emissions inspection programs), and temperature. The MOVES model takes into consideration regulations that affect emissions from this source sector. The MOVES model then was run for 2028 inventory using input data reflective of that year. 4.2.5 Biogenic Sources Biogenic sources are natural sources of emissions like trees, crops, grasses, and natural decay of plants. The emissions from these sources are estimated at the county level. Biogenic emissions for 2011 were developed using the Biogenic Emission Inventory System version 3.61 (BEIS3.61) within the Sparse Matrix Operator Kernel Emissions (SMOKE). BEIS3.61 creates gridded, hourly, model-species emissions from vegetation and soil. BEIS3.61 includes the incorporation of Version 4.1 of the Biogenic Emissions Land use Database (BELD4) and the incorporation of a canopy model to estimate leaf-level temperatures. BELD version 4.1 is based on an updated version of the USDA-United States Forest Service (USFS) Forest Inventory and Analysis (FIA) vegetation speciation-based data from 2001 to 2014 from the FIA version 5.1. Canopy coverage is based on the Landsat satellite National Land Cover Database (NLCD) product from 2011. The 2011 biogenic emissions are used for the 2028 future year without any changes. 4.2.6 Point Fires (Events)26 The point fires sector, which are reported as events in the NEI, includes emissions from both prescribed fires and wildfires. The point fire sector excludes agricultural burning and other open burning sources that are included in the nonpoint sector. Fire emissions are specified at geographic coordinates (point locations) and have daily emissions values. Emissions are day-specific and include satellite-derived latitude/longitude of the fire’s origin and other parameters associated with the emissions such as acres burned and fuel load, which allow estimation of plume rise. Fire emissions for the base year 2011 were taken from the 2011NEIv2. The point source day-specific emission estimates for 2011 fires rely on SMARTFIRE 2, which uses the National Oceanic and Atmospheric Administration’s (NOAA’s) Hazard Mapping System (HMS) fire location information as input. Additional inputs include the CONSUMEv3.0 software application and the Fuel Characteristic Classification System (FCCS) fuel-loading database to
26 In EPA’s National Emissions Inventory, prescribed and wildfires are included in a category called “Events”.

Pre-hearing Draft 42 NC Regional Haze SIP for Second Planning Period (2019 – 2028) August 30, 2021
estimate fire emissions from wildfires and prescribed burns on a daily basis. The 2011 fire emissions are used for the 2028 future year without any changes. 4.2.7 Summary of 2011 Base Year Emissions Inventory for North Carolina In the 2011 base year emissions inventory for North Carolina, shown in Table 4-2, the majority of SO2 emissions (89.3%) are emitted by point sources, the EGU sector (66.6%) and non-EGU Point (22.8%). NOx emissions are spread throughout the sectors with the onroad sector contributing the highest percentage of the total NOx emissions for the state at 55.2%, followed by the EGU sector at 13.2% and the Non-road sector at 12.7%. Appendix B provides documentation of 2011 inventory and emissions summaries for the VISTAS states.
Table 4-2. 2011 Emissions Inventory Summary for North Carolina (TPY) Sector CO NH3 NOx PM10 PM2.5 SO2 VOC
EGU 35,106 216 48,813 9,915 7,572 79,022 956 Non-EGU Point 43,994 1,471 35,138 10,129 6,982 27,050 37,172 Nonpoint 116,898 168,537 31,121 207,809 52,107 10,486 117,162 Onroad 1,145,623 4,486 204,008 10,447 5,510 1,082 112,173 Non-Road 462,851 62 46,950 4,799 4,568 131 61,753 Point-Fires 86,087 727 3,466 13,552 11,745 950 6,671 Total 1,890,559 175,499 369,496 256,651 88,484 118,721 335,887
4.3 2028 elv5 (Revision to 2028 elv3) Emissions Inventory After completing modeling in October 2019, EPA completed work on a new 2016 base year modeling platform (2016v1) and prepared a 2028 projection year inventory for which it used to conduct regional haze modeling for 2028.27 In addition, ERTAC revised the base year of the ERTAC EGU projections tool from 2011 to 2016 and developed new estimates of 2028 emissions from the 2016 base year. The RHR and guidance indicate that future year projections should be as accurate as possible. Therefore, for point sources, VISTAS compared the VISTAS 2028 elv3 projections to the EPA and ERTAC 2028 projections from a 2016 base year. Table 4-3 compares the 2028 point source emissions from VISTAS’ elv3 inventory to the EPA’s 2028 emissions (projected from EPA’s 2016v1 platform).28 The emissions in Table 4-3 were extracted from the VISTAS12 modeling domain, which covers the eastern U.S. As shown in Table 4-3, EPA’s SO2 emissions are 45.61%
27 The EPA's Technical Support Document for EPA’S Updated 2028 Regional Haze Modeling is available at: https://www.epa.gov/visibility/technical-support-document-epas-updated-2028-regional-haze-modeling. 28 The EPA’s 2016v1 modeling platform and 2016 Version 1 Technical Support Document are available at: https://www.epa.gov/air-emissions-modeling/2016-version-1-technical-support-document. The starting point for the 2016 inventory was the 2014 National Emissions Inventory (NEI), version 2 (2014NEIv2), although many inventory sectors were updated to represent the year 2016 through the incorporation of 2016-specific state and local data along with nationally-applied adjustment methods. For non-EGU point sources, North Carolina provided to EPA point source 2028 projections from 2016 bae year emissions. The EPA used the Integrated Planning Model to develop 2028 projections for EGUs.

Pre-hearing Draft 43 NC Regional Haze SIP for Second Planning Period (2019 – 2028) August 30, 2021
lower than VISTAS’ elv3 estimates, and EPA's NOx emissions are 20.19% lower than VISTAS' elv3 estimates. Table 4-4 and Table 4-5 compare 2028 SO2 and NOx emissions, respectively, for ERTACv2.7 (2011 base year) and ERTACv16.0 (2016 base year) for the VISTAS and adjacent Regional Planning Organizations (RPOs). The ERTACv2.7 was used in the VISTAS’ elv3 modeling for the non-VISTAS states in the VISTAS modeling domain. As explained in Section 4.2.1.1, each VISTAS state determined 2028 emissions for the EGUs in its state. These comparisons indicated that for EGUs, the 2028 emissions developed using ERTACv16.0 are significantly lower than the 2028 emissions developed using ERTACv2.7. For VISTAS, the 2028 ERTACv16.0 projections for SO2 are about 41% lower than the 2028 ERTACv2.7 projections, and 2028 ERTACv16.0 projections for NOx are 25.8% lower than the 2028 ERTACv2.7 projections. The reasons for the large differences in the 2028 emissions between the VISTAS’ elv3 inventory and EPA’s 2016v1 platform (and between ERTACv2.7 and ERTACv16.0) are believed to be associated the retirement of coal-fired EGUs and industrial boilers as well as economic factors (e.g., conversion of coal to natural gas when natural gas prices became competitive with coal prices) not captured in the VISTAS’ elv3 2028 projections from the 2011 base year.
Table 4-3. VISTAS 2028 versus New EPA 2028
Pollutant VISTAS 2028
(TPY)
EPA 2016v1/2028
(TPY) Difference
(TPY) Difference
(%) SO2 2,574,542.02 1,400,287.10 1,174,254.92 45.61% NOx 2,641,463.83 2,108,115.50 533,348.33 20.19%
Table 4-4. Comparison of ERTACv16.0 to ERTACv2.7 SO2 Emission Projections for 2028
RPO v16.0 2028
(TPY) v2.7 2028
(TPY) Difference
(TPY) Difference
(%) CENSARA 367,683.7 760,828.2 -393,144.5 -51.67% LADCO 266,047.0 379,577.5 -113,530.5 -29.91% MANE-VU 78,657.0 196,672.6 -118,015.6 -60.01% VISTAS 161,502.5 273,582.1 -112,079.6 -40.97% Total 976,471.2 1,783,376.5 -806,905.3 -45.25%
Table 4-5. Comparison of ERTACv16.0 to ERTACv2.7 NOx Emission Projections for 2028
RPO v16.0 2028
(TPY) v2.7 2028
(TPY) Difference
(TPY) Difference
(%) CENSARA 244,499.3 354,795.1 -110,295.8 -31.09% LADCO 166,429.4 198,966.9 -32,537.4 -16.35% MANE-VU 56,315.3 83,432.5 -27,117.2 -32.50% VISTAS 200,791.1 270,615.7 -69,824.6 -25.80% Total 840,973.6 1,166,663.1 -325,689.5 -27.92%

Pre-hearing Draft 44 NC Regional Haze SIP for Second Planning Period (2019 – 2028) August 30, 2021
Thus, after consulting with EPA, VISTAS decided to revise the 2028 elv3 point source inventory to use 2016 as the base year to incorporate SO2 and NOx emission reductions not previously captured in the 2028 elv3 inventory. These improvements to 2028 emissions are detailed in the VISTAS emissions inventory report in Appendix B-2a and Appendix B-2b.29 Each VISTAS state was given the opportunity to adjust any point source emissions in the 2028 inventory. North Carolina used a combination of ERTACv16.0 and ERTACv2.7 emissions data to update the 2028 EGU inventory (see Appendix B-3). For EGUs in the non-VISTAS states, ERTACv2.7 2028 emissions were replaced with the ERTACv16.0 2028 emissions, except for the LADCO states where ERTACv2.7 2028 emissions were replaced with ERTACv16.1 2028 emissions.
5.0 REGIONAL HAZE MODELING METHODS AND INPUTS
Modeling for regional haze was performed by VISTAS for the ten southeastern states, including North Carolina. The following sections outline the methods and inputs used by VISTAS for the regional modeling. Additional details are provided in the modeling protocol in Appendix E-1a (original modeling protocol) and Appendix E-1b (revised modeling protocol).
5.1 Analysis Method The modeling analysis is a complex technical evaluation that begins by selection of the modeling system. For the most part, the modeling analysis approach for regional haze followed EPA’s 2011el-based air quality modeling platform, which includes emissions, meteorology, and other inputs for 2011 as the base year for the modeling.30 The EPA projected the 2011 base year emissions to a 2028 future year base case scenario. The EPA's work is the foundation of the emissions used in the VISTAS analysis, with significant revisions to 2028 point source emissions as described in Appendix B. As noted in EPA’s documentation, the 2011 base year emissions and methods for projecting these emissions to 2028 are in large part similar to the data and methods used by EPA in the final CSAPR Update31 and the subsequent NODA32 to support ozone transport modeling for the 2015 ozone NAAQS. VISTAS decided to use the following modeling systems:
• Meteorological Model: The Weather Research and Forecasting (WRF) model is a mesoscale numerical weather prediction system designed to serve both operational
29 When comparing emissions processing results from the elv3 modeling and the subsequent elv5 modeling, several issues were identified within the elv3 modeling framework, including differences in modeled emissions being significantly different than expected emissions (i.e., the mass emissions used as inputs to the SMOKE emissions processor vs. after processing). These issues, which are documented in a memorandum included Appendix B-1b, affected the 2028 elv3 RPGs but did not affect the AOI or PSAT modeling results. Consequently, the RPGs modeled with the 2028 elv3 and elv5 inventories cannot be compared. 30 Documentation for the EPA’s Preliminary 2028 Regional Haze Modeling. U.S. Environmental Protection Agency, Office of Air Quality Planning and Standards. October 2017. 31 URL: https://www.epa.gov/airmarkets/final-cross-state-air-pollution-rule-update 32 URL: https://www.epa.gov/airmarkets/notice-data-availability-preliminary-interstate-ozone-transport-modeling-
data-2015-ozone
Pre-hearing Draft 45 NC Regional Haze SIP for Second Planning Period (2019 – 2028) August 30, 2021
forecasting and atmospheric research needs.33 The Advanced Research WRF (ARW) version of WRF was used in this regional haze analysis study. It features multiple dynamical cores, a three-dimensional variational (3DVAR) data assimilation system, and a software architecture allowing for computational parallelism and system extensibility. WRF is suitable for a broad spectrum of applications across scales ranging from meters to thousands of kilometers.
• Emissions Model: Emissions processing was completed using the SMOKE model for most source categories. The exceptions include EGUs for certain areas, as well as the biogenic and mobile sectors. For certain areas in the modeling domain, the ERTAC EGU Forecasting Tool34 was used to grow base year hourly EGU emissions inventories into future projection years. The tool uses base year hourly EPA CAMD data, fuel specific growth rates, and other information to estimate future emissions.
• The Biogenic Emission Inventory System (BEIS) model was used to estimate biogenic emissions. Special processors were used for fires, windblown dust, lightning, and sea salt emissions. The 2014 MOtor Vehicle Emission Simulator (MOVES) onroad mobile source emissions model was used by EPA with SMOKE-MOVES to generate onroad mobile source emissions with EPA generated vehicle activity data provided in the 2028 regional haze analysis.
• Air Quality Model: The Comprehensive Air Quality Model with Extensions (CAMx) Version 6.40 was used in this study, with the secondary organic aerosol partitioning (SOAP) algorithm module as the default. The CAMx photochemical grid model, which supports two-way grid nesting was used. The setup is based on the same WRF/SMOKE/CAMx modeling system used in the EPA 2011/2028el platform modeling. The Particulate Source Apportionment Technology (PSAT) tool of CAMx was selected to develop source contribution and significant contribution calculations.
Episode selection is an important component of any modeling analysis. The EPA guidance recommends choosing time periods that reflect the variety of meteorological conditions representing visibility impairment on the 20% clearest and 20% most impaired days in the Class I areas being modeled. This is best accomplished by modeling a full year. For this analysis,
33 Skamarock, W. C. 2004. Evaluating Mesoscale NWP Models Using Kinetic Energy Spectra. Mon. Wea. Rev., Volume 132, pp. 3019-3032. December 2004. (http://www.mmm.ucar.edu/individual/skamarock/spectra_mwr_2004.pdf). Skamarock, W. C., J. B. Klemp, J. Dudhia, D. O. Gill, D. M. Barker, W. Wang and J. G. Powers. 2005. A Description of the Advanced Research WRF Version 2. National Center for Atmospheric Research (NCAR), Boulder, CO. June 2005. (http://www.mmm.ucar.edu/wrf/users/docs/arw_v2.pdf) Skamarock, W. C. 2006. Positive-Definite and Monotonic Limiters for Unrestricted-Time-Step Transport Schemes. Mon. Wea. Rev., Volume 134, pp. 2241-2242. June 2006. (http://www.mmm.ucar.edu/individual/skamarock/advect3d_mwr.pdf). 34 URL: http://www.marama.org/2013-ertac-egu-forecasting-tool-documentation

Pre-hearing Draft 46 NC Regional Haze SIP for Second Planning Period (2019 – 2028) August 30, 2021
VISTAS performed modeling for the full 2011 calendar year with 10 days of model spin-up in 2010. Once base year model performance was deemed adequate, the future year emissions were processed. The air quality modeling results were used to determine a relative reduction in future visibility impairment, which was used to determine future visibility conditions and reasonable progress goals.
5.2 Model Selection To ensure that a modeling study is defensible, care must be taken in the selection of the models to be used. The models selected must be scientifically appropriate for the intended application and be freely accessible to all stakeholders. "Scientifically appropriate" means that the models address important physical and chemical phenomena in sufficient detail, using peer-reviewed methods. "Freely accessible" means that model formulations and coding are freely available for review and that the models are available to stakeholders, and their consultants, for execution and verification at no or low cost. The following sections outline the criteria for selecting a modeling system that is both defensible and capable of meeting the study's goals. These criteria were used in selecting the modeling system for this modeling demonstration. 5.2.1 Selection of Photochemical Grid Model
Criteria For a photochemical grid model to qualify as a candidate for use in a regional haze SIP, a state needs to show that it meets the same general criteria as a model for a national ambient air quality standard (NAAQS) attainment demonstration. The EPA’s current modeling guidelines35 lists the following criteria for model selection:
• It should not be proprietary;
• It should have received a scientific peer review;
• It should be appropriate for the specific application on a theoretical basis;
• It should be used with databases that are available and adequate to support its application;
• It should be shown to have performed well in past modeling applications;
• It should be applied consistently with an established protocol on methods and procedures;
• It should have a User's Guide and technical description;
35 Richard A. Wayland to Regional Air Division Directors, Region 1-10, “Modeling Guidance for Demonstrating Air Quality Goals for Ozone, PM2.5, and Regional Haze”. URL: https://www3.epa.gov/ttn/scram/guidance/guide/O3-PM-RH-Modeling_Guidance-2018.pdf

Pre-hearing Draft 47 NC Regional Haze SIP for Second Planning Period (2019 – 2028) August 30, 2021
• The availability of advanced features (e.g., probing tools or science algorithms) is desirable; and
• When other criteria are satisfied, resource considerations may be important and are a legitimate concern. Overview of CAMx
The CAMx model36 is a state-of-science “One-Atmosphere” photochemical grid model capable of addressing ozone, PM, visibility, and acid deposition at a regional scale for periods up to one year.37 CAMx is a publicly-available open-source computer modeling system for the integrated assessment of gaseous and particulate air pollution, and meets all the photochemical grid model criteria above. Built on today’s understanding that air quality issues are complex, interrelated, and reach beyond the urban scale, CAMx is designed to: (a) simulate air quality over many geographic scales; (b) treat a wide variety of inert and chemically active pollutants including ozone, inorganic and organic PM2.5 and PM10 and mercury and toxics; (c) provide source-receptor, sensitivity, and process analyses; and (d) be computationally efficient and easy to use. EPA has approved the use of CAMx for numerous ozone, PM, and regional haze SIPs throughout the U.S. and has used this model to evaluate regional mitigation strategies including those for most recent regional-scale rules (e.g., CSAPR and CSAPR Update). 5.2.2 Selection of Meteorological Model
Criteria Meteorological models, either through objective, diagnostic, or prognostic analysis, extend available information about the state of the atmosphere to the grid upon which photochemical grid modeling is to be carried out. The criteria for selecting a meteorological model are based on both the model’s ability to accurately replicate important meteorological phenomena in the region of study and the model's ability to interface with the rest of the modeling systems – particularly the photochemical grid model. With these issues in mind, the following criteria were established for the meteorological model to be used in this study:
• Non-hydrostatic formulation
• Reasonably current, peer reviewed formulation
• Simulates cloud physics
• Publicly available at no or low cost
• Output available in Input/Output Applications Programming Interface(I/O API) format
• Supports four dimensional data assimilation (FDDA)
• Enhanced treatment of planetary boundary layer heights for AQ modeling
36 URL: http://www.camx.com 37 Ramboll Environ, 2016. User's Guide Comprehensive Air Quality Model with Extensions Version 6.40, www.camx.com. Ramboll Environ International Corporation, Novato, CA.
Pre-hearing Draft 48 NC Regional Haze SIP for Second Planning Period (2019 – 2028) August 30, 2021
Overview of WRF The WRF38 model is a mesoscale numerical weather prediction system designed to serve both operational forecasting and atmospheric research needs.39 The ARW version of WRF was used in this regional haze analysis study and meets all the meteorological model criteria above. It features multiple dynamical cores, a three-dimensional variational data assimilation system, and a software architecture allowing for computational parallelism and system extensibility. WRF is suitable for a broad spectrum of applications across scales ranging from meters to thousands of kilometers. The effort to develop WRF has been a collaborative partnership, principally among the National Center for Atmospheric Research (NCAR), NOAA, the National Centers for Environmental Prediction (NCEP) and the Forecast Systems Laboratory (FSL), the Air Force Weather Agency (AFWA), the Naval Research Laboratory, the University of Oklahoma, and the FAA. WRF allows researchers the ability to conduct simulations reflecting either real data or idealized configurations. WRF is a model that provides operational weather forecasting. It is flexible and computationally efficient while offering the advances in physics, numerics, and data assimilation contributed by the research community. The configuration used for this modeling demonstration, as well as a more detailed description of the WRF model, can be found in the EPA’s meteorological modeling report.40 5.2.3 Selection of Emissions Processing System
Criteria The principal criterion for an emissions processing system is that it accurately prepares emissions files in a format suitable for the photochemical grid model being used. The following list includes clarification of this criterion and additional desirable criteria for effective use of the system.
• File system compatibility with the I/O API;
• File portability;
• Ability to grid emissions on a Lambert conformal projection;
• Report capability;
38 URL: http://www.wrf-model.org/index.php 39 Skamarock, W. C. 2004. Evaluating Mesoscale NWP Models Using Kinetic Energy Spectra. Mon. Wea. Rev., Volume 132, pp. 3019-3032. December 2004. (http://www.mmm.ucar.edu/individual/skamarock/spectra_mwr_2004.pdf). Skamarock, W. C., J. B. Klemp, J. Dudhia, D. O. Gill, D. M. Barker, W. Wang and J. G. Powers. 2005. A Description of the Advanced Research WRF Version 2. National Center for Atmospheric Research (NCAR), Boulder, CO. June 2005. (http://www.mmm.ucar.edu/wrf/users/docs/arw_v2.pdf) Skamarock, W. C. 2006. Positive-Definite and Monotonic Limiters for Unrestricted-Time-Step Transport Schemes. Mon. Wea. Rev., Volume 134, pp. 2241-2242. June 2006. (http://www.mmm.ucar.edu/individual/skamarock/advect3d_mwr.pdf). 40 URL: https://www.epa.gov/sites/production/files/2020-10/documents/met_tsd_2011_final_11-26-14.pdf Meteorological Model Performance for Annual 2011 WRF v3.4 Simulation

Pre-hearing Draft 49 NC Regional Haze SIP for Second Planning Period (2019 – 2028) August 30, 2021
• Graphical analysis capability;
• MOVES mobile source emissions;
• BEIS version 3;
• Ability to process emissions for the proposed domain in a reasonable amount of time;
• Ability to process control strategies;
• No or low cost for acquisition and maintenance; and
• Expandable to support other species and mechanisms. Overview of SMOKE
The SMOKE41 modeling system is an emissions modeling system that generates hourly gridded speciated emission inputs of mobile onroad, nonroad, nonpoint area, point, fire and biogenic emission sources for photochemical grid models42,43 and meets all the emissions processing system criteria above. As with most ‘emissions models’, SMOKE is principally an emissions processing system; its purpose is to provide an efficient, modern tool for converting existing base emissions inventory data into the hourly gridded speciated formatted emission files required by a photochemical grid model. For biogenic, mobile, and EGU sources, external emission models/processors were used to prepare SMOKE inputs. The EPA used MOVES2014a to prepare the mobile source inventory which was the latest version of MOVES available at the time. MOVES2014 includes the latest onroad mobile source emissions factor information. Emission factors developed by EPA were used in this analysis. SMOKE-MOVES uses an emissions factor look-up table from MOVES, county-level gridded vehicle miles travelled (VMT) and other activity data, and hourly gridded meteorological data (typically from WRF) to generate hourly gridded speciated onroad mobile source emissions inputs. The ERTAC EGU Forecasting Tool44 was developed through a collaborative effort to improve emission inventories among the Northeastern, Mid-Atlantic, Southeastern, and Lake Michigan area states; other member states; industry representatives; and multi-jurisdictional organization (MJO) representatives. The tool was used for some states to grow base year hourly EGU emissions inventories into future projection years. The tool uses base year hourly EPA CAMD data, fuel specific growth rates, and other information to estimate future emissions. Biogenic emissions were modeled by EPA using version 3.61 of BEIS. First developed in 1988, BEIS estimates VOC emissions from vegetation and nitric oxide (NO) emissions from soils.
41 URL: http://www.smoke-model.org/index.cfm 42 Coats, C.J. 1995. Sparse Matrix Operator Kernel Emissions (SMOKE) Modeling System, MCNC Environmental Programs, Research Triangle Park, NC.. 43 Houyoux, M.R., Vukovich, J.M., Coats, C.J., Wheeler, N.J.M., Kasibhatla, P.S.,2000. Emissions Inventory Development and Processing for the Seasonal Model for Regional Air Quality. (SMRAQ) project, Journal of Geophysical Research – Atmospheres, 105(D7), 9079-9090. 44 URL: http://www.marama.org/2013-ertac-egu-forecasting-tool-documentation

Pre-hearing Draft 50 NC Regional Haze SIP for Second Planning Period (2019 – 2028) August 30, 2021
Because of resource limitations, recent BEIS development has been restricted to versions that are built within the SMOKE system.
5.3 Selection of the Modeling Year A crucial step to SIP modeling is the selection of the period of time to model so that air quality conditions may be well represented and so that changes in air quality in response to changes in emissions may be projected. The EPA’s most recent regional haze modeling guidance45 contains recommended procedures for selecting modeling episodes. The VISTAS regional haze modeling used the annual calendar year 2011 modeling period. Calendar year 2011 satisfies the criteria in EPA’s modeling guidance episode selection discussion and is consistent with the base year modeling platform. Specifically, EPA’s guidance recommends choosing a time period which reflects the variety of meteorological conditions that represent visibility impairment on the 20% clearest and 20% most-impaired days in the Class I areas being modeled (high and low concentrations necessary). This is best accomplished by modeling a full calendar year. In addition, the 2011/2028 modeling platform was the most recent available platform when VISTAS started its modeling work. The EPA's 2016-based platform became available at a later date after VISTAS had already invested a considerable amount of time and money into the modeling analysis. Using the 2016-based platform was not feasible from a monetary perspective, nor could such work be done in a timely manner.
5.4 Modeling Domains 5.4.1 Horizontal Modeling Domain The VISTAS modeling used a 12-kilometer (Km) continental U.S. (CONUS_12 or 12US2) domain. The 12-Km nested grid modeling domain (Figure 5-1) represents the CAMx 12-Km air quality and SMOKE/BEIS emissions modeling domain. As shown in EPA’s meteorological model performance evaluation document,46 the WRF meteorological modeling was run on a larger 12-Km modeling domain than the 12-Km domain that was used for CAMx. The WRF meteorological modeling domains are defined larger than the air quality modeling domains because meteorological models can sometimes produce artifacts in the meteorological variables near the boundaries as the prescribed boundary conditions come into dynamic balance with the coupled equations and numerical methods in the meteorological model.
45 URL: https://www.epa.gov/sites/production/files/2019-08/documents/8-20-2019_-_regional_haze_guidance_final_guidance.pdf Peter Tsirigotis to Regional Air Division Directors, Region 1-10, Aug 20, 2019, “Guidance on Regional Haze State Implementation Plan for the Second Planning Period” 46 Meteorological Model Performance for Annual 2011 WRF v3.4 Simulation. URL: https://www.epa.gov/sites/production/files/2020-10/documents/met_tsd_2011_final_11-26-14.pdf

Pre-hearing Draft 51 NC Regional Haze SIP for Second Planning Period (2019 – 2028) August 30, 2021
An additional VISTAS_12 domain was prepared that is a subset of the CONUS_12 domain. Development of the VISTAS_12 domain (also presented in Figure 5-1) requires the EPA CONUS_12 simulation to be run using CAMx Version 6.40 modeling saving 3-dimensional concentration fields for extraction using the CAMx BNDEXTR program. Dimensions for both VISTAS_12 and CONUS_12 domains are provided in Table 5-1.
Figure 5-1. Map of 12Km CAMx Modeling Domains; VISTAS_12 Domain Represented as Inner Red Domain
Table 5-1. VISTAS II Modeling Domain Specifications Domain Columns Rows Vertical Layers X Origin (Km) Y Origin (Km)
CONUS_12 396 246 25 -2,412 -1,620
VISTAS_12 269 242 25 -912 -1,596
5.4.2 Vertical Modeling Domain The CAMx vertical structure is primarily defined by the vertical layers used in the WRF meteorological modeling. The WRF model employs a terrain following coordinate system defined by pressure, using multiple layer interfaces that extend from the surface to 50 millibar (mb) (approximately 19-Km above sea level). The EPA ran WRF using 35 vertical layers. A layer averaging scheme is adopted for CAMx simulations whereby multiple WRF layers are combined into one CAMx layer to reduce the air quality model computational time. Table 5-2

Pre-hearing Draft 52 NC Regional Haze SIP for Second Planning Period (2019 – 2028) August 30, 2021
displays the approach for collapsing the WRF 35 vertical layers to 25 vertical layers in CAMx and is consistent with EPA’s draft 2028 regional haze modeling.47 Table 5-2. WRF and CAMx Layers and Their Approximate Height Above Ground Level
CAMx Layer
WRF Layers Sigma P Pressure (mb)
Approximate Height
(meters above ground level)
25 35 0.00 50.00 17,556 25 34 0.05 97.50 14,780 24 33 0.10 145.00 12,822 24 32 0.15 192.50 11,282 23 31 0.20 240.00 10,002 23 30 0.25 382.50 7,064 22 29 0.30 335.00 7,932 22 28 0.35 382,50 7,064 21 27 0.40 430.00 6,275 21 26 0.45 477.50 5,553 20 25 0.50 525.00 4,885 20 24 0.55 572.50 4,264 19 23 0.60 620.00 3,683 18 22 0.65 667.50 3,136 17 21 0.70 715.00 2,619 16 20 0.74 753.00 2,226 15 19 0.77 781.50 1,941 14 18 0.80 810.00 1,665 13 17 0.82 829.00 1,485 12 16 0.84 848.00 1,308 11 15 0.86 867.00 1,134 10 14 0.88 886.00 964 9 13 0.90 905.00 797 9 12 0.91 914.50 714 8 11 0.92 924.00 632 8 10 0.93 933.50 551 7 9 0.94 943.00 470 7 8 0.95 952.50 390 6 7 0.96 962.00 311 5 6 0.97 971.50 232 4 5 0.98 981.00 154 4 4 0.99 985.75 115 3 3 0.99 985.75 115 2 2 1.00 995.25 38 1 1 1.00 997.63 19
47 URL: https://www3.epa.gov/ttn/scram/reports/Updated_2028_Regional_Haze_Modeling-TSD-2019.pdf Richard A. Wayland to Regional Air Division Directors, September 19, 2019, “Availability of Modeling Data and Associated Technical Support Document for the EPA’s Updated 2028 Visibility Air Quality Modeling”, Table 2-2

Pre-hearing Draft 53 NC Regional Haze SIP for Second Planning Period (2019 – 2028) August 30, 2021
6.0 MODEL PERFORMANCE EVALUATION
Model performance evaluations (MPEs), which compare modeled concentrations to observed concentrations, are important for demonstrating confidence in the air quality modeling system. The MPE metrics were developed from the Model Performance Evaluation, Analysis, and Plotting Software (MAPS) tool.48 For this evaluation, VISTAS selected the mean bias (MB), mean error (ME), normalized mean bias (NMB), and normalized mean error (NME) to characterize model performance, statistics which are consistent with the recommendations in Simon et al. (2012),49 the photochemical modeling guidance (EPA, 2018),50 and EPA’s recent performance evaluation of the 2011en platform (EPA, 2018).51 Mean fractional bias (MFB), mean fractional error (MFE), and root mean square error (RMSE) were also evaluated for the acid deposition MPE. The VISTAS 2011 modeling platform (VISTAS2011) used meteorological modeling files developed by EPA. The evaluation of the meteorological modeling can be found in the EPA’s document titled "Meteorological Model Performance for Annual 2011 WRF v3.4 Simulation."52 In keeping with the one-atmosphere objective of the CAMx modeling platform, model performance was evaluated for ozone, fine particles, and acid deposition. For the model performance analysis, model predictions were paired in space and time with observational data from various monitoring networks. Modeled 8-hour ozone concentrations were compared to observations from the EPA’s Air Quality System (AQS) network. Modeled 24-hour speciated PM concentrations were compared to observations from IMPROVE, Chemical Speciation Network (CSN) (formerly Speciation Trends Network), and Clean Air Status and Trends Network (CASTNet) monitoring networks. Modeled weekly speciated wet and dry deposition species were compared to observations from the National Acid Deposition Program (NADP) and CASTNet. The following sections provide details on the MPE results for ozone, fine particles, and acid deposition. Performance assessed at the "one atmosphere" level was deemed acceptable for ozone, particulate matter (PM), and wet/dry deposition at various monitoring sites. Overall, the VISTAS2011 modeling platform was found to be representative and acceptable for use in regulatory modeling applications for ozone, PM, and regional haze.
48 McNally, D. and T. W. Tesche. 1993. Model Performance Evaluation, Analysis, and Plotting Software (MAPS). Alpine Geophysics, LLC. Arvada, CO. 49 Simon, H., K. Baker and S. Phillips. 2012. Compilations and Interpretation of Photochemical Model Performance Statistics Published between 2006 and 2012. Atmos. Env. 61 (2012) 124-139. December. 50 EPA, 2018. Modeling Guidance for Demonstrating Air Quality Goals for Ozone, PM2.5, and Regional Haze. Internet address: https://www3.epa.gov/ttn/scram/guidance/guide/O3-PM-RH-Modeling_Guidance-2018.pdf. 51 EPA. 2018. Air Quality Modeling Technical Support Document for the Updated 2023 Projected Ozone Design Values. Office of Air Quality Planning and Standards, United States Environmental Protection Agency. June 2018. 52 URL: https://www.epa.gov/sites/production/files/2020-10/documents/met_tsd_2011_final_11-26-14.pdf

Pre-hearing Draft 54 NC Regional Haze SIP for Second Planning Period (2019 – 2028) August 30, 2021
6.1 Ozone Model Performance Evaluation As indicated by the statistics in Table 6-1, bias and error for maximum daily 8-hour average (MDA8) ozone are relatively low in the region. The MB for MDA8 ozone is ≥ 60 parts per billion (ppb) during each month (May through September) was within ±5 ppb at AQS sites in the VISTAS states, ranging from -0.13 ppb (September) to 3.79 ppb (July). The ME is less than 10 ppb in all months. The NMB is within ±5% for AQS sites in all months except July (5.63%). The MB and NMB statistics indicate a tendency for the model to over predict MDA8 ozone concentrations in the months of May through August and slightly under predict MDA8 ozone concentrations in September for AQS sites. The NME is less than 15% in the region across all months. Table 6-1. Performance Statistics for MDA8 Ozone ≥ 60 ppb by Month for VISTAS States
Based on Data at AQS Network Sites Region Month # of Obs MB (ppb) ME (ppb) NMB (%) NME (%) VISTAS May 838 2.48 6.11 3.79 9.34 VISTAS Jun 2028 1.73 7.11 2.57 10.55 VISTAS Jul 1233 3.79 8.88 5.63 13.21 VISTAS Aug 1531 2.38 6.94 3.59 10.48 VISTAS Sep 681 -0.13 6.09 -0.19 9.08
Figure 6-1 through Figure 6-4 show the spatial variability in bias and error at monitor locations. As shown in Figure 6-1, MB is within ±5 ppb at most sites across the VISTAS12 domain with a maximum under-prediction of 23.44 ppb at one site (AQS monitor 550030010) in Ashland County, WI and a maximum over-prediction of 17.95 ppb in York County, SC (AQS monitor 450910006); both with small sample sizes (n=1 and n=7, respectively). A positive MB is generally seen in the range of 5 to 10 ppb with regions of 10 to 15 ppb over-prediction seen scattered throughout the domain. The model has a tendency to underestimate in the western portion of the domain and overestimate in the eastern portion of the domain. As shown in Figure 6-2, NMB for days with observed MDA8 ozone ≥ 60 ppb is within ±10% at the majority of monitoring sites across the VISTAS12 modeling domain. Monitors in Ashland County, WI and York County, SC again bookend the NMB range with 38.03% and 27.44%, respectively. There are regional differences in model performance, as the model tends to over predict at most sites in the eastern region of the VISTAS12 domain and generally underpredict at sites in and around the western and northwestern borders of the domain. As shown in Figure 6-3, ME is generally 10 ppb or less at most of the sites across the VISTAS12 modeling domain although the Ashland, WI and York, SC monitors show much higher ME of 23.44 and 17.95 ppb, respectively. VISTAS states show less than 10% of their monitors above 10 ppb model error, with the majority of those within this value. As shown in Figure 6-4, the NME for days with observed MDA8 ≥ 60 ppb is less than 15% at the vast majority of monitoring sites across the VISTAS12 modeling domain. Noted exceptions seen are monitors 450910006 (York County, SC), 470370011 (Davidson County, TN), and 120713002 (Lee County, FL) with

Pre-hearing Draft 55 NC Regional Haze SIP for Second Planning Period (2019 – 2028) August 30, 2021
NMEs of 27.44%, 25.4%, and 23.07%, respectively. Somewhat elevated NMEs (> 15%) are seen in and around many of the VISTAS state metro areas. Additional details on the ozone model performance evaluation can be found in Appendix E-5.
Figure 6-1. Mean Bias (ppb) of MDA8 Ozone ≥ 60 ppb Over the Period May-September
2011 at AQS Monitoring Sites in VISTAS12 Domain (top) and in North Carolina (bottom).

Pre-hearing Draft 56 NC Regional Haze SIP for Second Planning Period (2019 – 2028) August 30, 2021
Figure 6-2. Normalized Mean Bias (%) of MDA8 Ozone ≥ 60 ppb Over the Period May-
September 2011 at AQS Monitoring Sites in VISTAS12 Domain (top) and in North Carolina (bottom).

Pre-hearing Draft 57 NC Regional Haze SIP for Second Planning Period (2019 – 2028) August 30, 2021
Figure 6-3. Mean Error(ppb) of MDA8 Ozone ≥ 60 ppb Over the Period May-September
2011 at AQS Monitoring Sites in VISTAS12 Domain (top) and in North Carolina (bottom).

Pre-hearing Draft 58 NC Regional Haze SIP for Second Planning Period (2019 – 2028) August 30, 2021
Figure 6-4. Normalized Mean Error (%) of MDA8 Ozone >= 60 ppb Over the Period May-
September 2011 at AQS Monitoring Sites in VISTAS12 Domain(top) and in North Carolina (bottom).

Pre-hearing Draft 59 NC Regional Haze SIP for Second Planning Period (2019 – 2028) August 30, 2021
6.2 Acid Deposition Model Performance Evaluation The primary source for deposition data is the National Atmospheric Deposition Program (NADP).53 The NADP monitoring networks used in this evaluation include:
• National Trends Network (NTN)
• Atmospheric Integrated Research Monitoring Network (AIRMon)
• Ammonia Monitoring Network (AMoN) Dry deposition information is also available from CASTNet. The data from NTN and AIRMon were used in the wet deposition MPE, and the data from CASTNET and AMoN were used for dry deposition MPE. The MPE focused on the monitors from these networks within the VISTAS 12-Km modeling domain (Figure 6-5). Table 6-2 summarizes the aggregated weekly MPE metrics for wet deposition in the VISTAS 12-Km domain. The model demonstrates a negative MB for the ammonium ion (NH4
+) and the sulfate ion (SO4
-2) and a positive MB for the nitrate ion (NO3-) compared to the weekly NTN
observations. The AIRMon sites have a larger positive MB for all pollutants. When considering the total accumulated wet deposition for the calendar year, there is still under prediction of NH4
+ and SO42-, and a slight over prediction of NO3
-. However, continued improvement is seen from the seasonal accumulated performance with respect to the NME and r values, as presented in Table 6-3. The weekly dry deposition MB and ME presented in Table 6-4 would seem to suggest relatively good model performance for the CASTNET sites. The higher NMB, MFB, NME, and MFE values are due to small values in the denominator. As presented in Table 6-5, most pollutants, except for NO3, are under predicted, based on the total accumulated dry deposition. SO2 and HNO3 have the worst under prediction of all the pollutants, followed by Cl-. Additional details on the wet and dry acid deposition model performance evaluation can be found in Appendix E-4.
53 National Atmospheric Deposition Program (NRSP-3). 2018. NADP Program Office, Wisconsin State Laboratory of Hygiene, 465 Henry Mall, Madison, WI 53706. URL: http://nadp.slh.wisc.edu/

Pre-hearing Draft 60 NC Regional Haze SIP for Second Planning Period (2019 – 2028) August 30, 2021
Figure 6-5. Deposition Monitors Included in the VISTAS II Database

Pre-hearing Draft 61 NC Regional Haze SIP for Second Planning Period (2019 – 2028) August 30, 2021
Table 6-2. Weekly Wet Deposition MPE Metrics for NADP Sites in the VISTAS 12 Km Domain
Network Pollutant n MB
(kg/ha) ME
(kg/ha) NMB (%)
NME (%)
r (unitless)
MFB (%)
MFE (%)
RMSE (unitless)
NTN NH4+ 3,404 -0.025 0.045 -32% 58% 0.629 -19% 34% 0.092
NTN NO3- 3,404 0.024 0.123 12% 62% 0.642 6% 29% 0.242
NTN SO4-2 3,404 -0.001 0.118 0% 57% 0.681 0% 29% 0.245
AIRMon NH4+ 158 -0.003 0.020 -31% 76% 0.534 -7% 41% 0.041
AIRMon NO3- 158 0.051 0.097 67% 127% 0.398 25% 47% 0.192
AIRMon SO4-2 158 0.018 0.091 20% 100% 0.352 9% 46% 0.197
MB= mean bias, ME = mean error, NMB = normalized mean bias, NME = normalized mean error, MFB = mean fractional bias, MFE = mean fractional error, RMSE = root mean square error.
Table 6-3. Accumulated Annual Wet Deposition MPE Metrics for NADP Sites in the VISTAS 12 Km Domain
Pollutant n MB
(kg/ha) MGE
(kg/ha) NMB (%)
NME (%) r (unitless) MFB (%) MFE (%)
RMSE (unitless)
NH4+ 99 -1.245 1.246 -38% 38% 0.861 -23% 23% 1.536
NO3- 99 0.134 1.453 2% 17% 0.901 1% 8% 1.933
SO42- 99 -0.585 1.604 -7% 18% 0.916 -3% 9% 2.142
MB= mean bias, MGE = mean gross error, NMB = normalized mean bias, NME = normalized mean error, MFB = mean fractional bias, MFE = mean fractional error, RMSE = root mean square error.

Pre-hearing Draft 62 NC Regional Haze SIP for Second Planning Period (2019 – 2028) August 30, 2021
Table 6-4. Weekly Dry Deposition MPE Metrics for CASTNet Sites in the VISTAS 12 Km Domain
Network Pollutant n MB
(kg/ha) ME
(kg/ha) NMB (%)
NME (%)
r (unitless)
MFB (%)
MFE (%)
RMSE (unitless)
CASTNet Cl- 965 -0.001 0.001 -87% 89% 0.796 -77% 79% 0.004
CASTNet NH4+ 965 0.001 0.003 13% 51% 0.603 6% 24% 0.004
CASTNet SO42- 965 0.0004 0.007 3% 43% 0.650 1% 21% 0.009
CASTNet SO2 965 -0.031 0.031 -96% 96% 0.656 -93% 93% 0.052
CASTNet NO3- 965 0.001 0.004 12% 80% 0.601 6% 37% 0.006
CASTNet HNO3 965 -0.062 0.062 -95% 95% 0.612 -90% 90% 0.077
AMoN NH3 355 -0.007 0.007 -95% 95% 0.463 91% 91% 0.013
MB= mean bias, ME = mean error, NMB = normalized mean bias, NME = normalized mean error, MFB = mean fractional bias, MFE = mean fractional error, RMSE = root mean square error.
Table 6-5. Accumulated Annual Wet Deposition MPE Metrics for CASTNet Sites in the VISTAS 12 Km Domain
Pollutant n MB
(kg/ha) MGE
(kg/ha) NMB (%) NME (%) r
(unitless) MFB (%) MFE (%)
RMSE (unitless)
Cl- 19 -0.054 0.054 -88% 88% 0.981 -78% 78% 0.156
NH4+ 19 -0.002 0.077 -1% 27% 0.688 0% 14% 0.090
SO42- 19 -0.067 0.219 -8% 27% 0.537 -4% 14% 0.268
SO2 19 -1.616 1.616 -97% 97% 0.869 -94% 94% 2.221
NO3- 19 0.001 0.113 1% 46% 0.572 0% 23% 0.154
HNO3 19 -3.272 3.272 -95% 95% 0.607 -91% 91% 3.688
MB= mean bias, MGE = mean gross error, NMB = normalized mean bias, NME = normalized mean error, MFB = mean fractional bias, MFE = mean fractional error, RMSE = root mean square error.

Pre-hearing Draft 63 NC Regional Haze SIP for Second Planning Period (2019 – 2028) August 30, 2021
6.3 PM Model Performance Goals and Criteria Because PM2.5 is a mixture, the current EPA PM modeling guidance54 recommends that a meaningful performance evaluation should include an assessment of how well the model is able to predict individual chemical components that constitute PM2.5. Consistent with EPA’s performance evaluation of the regional haze 2028 analysis,55 in addition to total PM2.5, the following components of PM2.5 were also examined.
• Sulfate ion (SO42-)
• Nitrate ion (NO3-)
• Ammonium ion (NH4+)
• Elemental Carbon (EC)
• Organic Carbon (OC) and/or Organic Carbon Mass (OCM)
• Crustal (weighted average of the most abundant trace elements in ambient air)
• Sea salt constituents (Na+ and Cl-) Recommended benchmarks for photochemical model performance statistics56,57 were used to assess the applicability of the VISTAS modeling platform for Regional Haze SIP purposes. The goal and criteria values noted in Table 6-6 and Table 6-7 were used for this modeling. Based on EPA’s guidance and the referenced publication, the temporal scales for the 24-hour total and speciated PM should not exceed 3 months (or 1 season) and the spatial scales should range from urban to less than or equal to 1,000 Km. This indicates that model performance should be evaluated based on the entire domain and not based on a comparison of modeled to observed values for an individual Class I area.
54 URL: https://www.epa.gov/sites/production/files/2020-10/documents/o3-pm-rh-modeling_guidance-2018.pdf 55 EPA, 2019: Technical Support Document for EPA’s Updated 2028 Regional Haze Modeling, Office of Air Quality Planning and Standards United States Environmental Protection Agency, September 2019, https://www.epa.gov/sites/production/files/2019-10/documents/updated_2028_regional_haze_modeling-tsd-2019_0.pdf. 56 Boylan, J.W., and A.G. Russell. 2006. PM and light extinction model performance metrics, goals, and criteria for three dimensional air quality models. Atmos. Environ. 40:4946– 59. doi:10.1016/j.atmosenv.2005.09.087. 57 Emery, C.A., Z. Liu, A. Russell, M. Odman, G. Yarwood and N. Kumar. 2017. Recommendations on statistics and benchmarks to assess photochemical model performance, Journal of the Air & Waste Management Association, 67:5, 582-598, DOI: 10.1080/10962247.2016.1265027.

Pre-hearing Draft 64 NC Regional Haze SIP for Second Planning Period (2019 – 2028) August 30, 2021
Table 6-6. Fine Particulate Matter Performance Goals and Criteria
Species NMB, Goal
NMB, Criteria
NME, Goal
NME, Criteria
24-hr PM2.5 and sulfate (SO4)
<± 10% <± 30% < 35% < 50%
24-hr nitrate (NO3) <± 10% <± 65% < 65% < 115% 24-hr OC <± 15% <± 50% < 45% < 65% 24-hr EC <± 20% <± 40% < 50% < 75%
Table 6-7. Fine Particulate Matter Performance Goals and Criteria
Species MFB, Goal
MFB, Criteria
MFE, Goal
MFE, Criteria
24-hr PM2.5 and sulfate <± 30% <± 60% < 50% < 75%
24-hr nitrate <± 30% <± 60% < 50% < 75% 24-hr OC <± 30% <± 60% < 50% < 75% 24-hr EC <± 30% <± 60% < 50% < 75%
The mapping of the CAMx species into the observed species is presented in Table 6-8.
Table 6-8. Species Mapping from CAMx into Observation Network Network Observed Species CAMx Species IMPROVE NO3 PNO3 IMPROVE SO4 PSO4 IMPROVE NH4 PNH4 IMPROVE OM = 1.8*OC SOA1+SOA2+SOA3+SOA4 +SOPA+SOPB+POA IMPROVE EC PEC IMPROVE SOIL FPRM+FCRS IMPROVE PM2.5 PSO4+PNO3+PNH4+SOA1+SOA2+SOA3+SOA4
+SOPA+SOPB+POA+PEC+FPRM+FCRS+NA+PCL CSN PM2.5 PSO4+PNO3+PNH4+SOA1+SOA2+SOA3+SOA4
+SOPA+SOPB+POA+PEC+FPRM+FCRS+NA+PCL CSN NO3 PNO3 CSN SO4 PSO4 CSN NH4 PNH4 CSN OM = 1.4*OC SOA1+SOA2+SOA3+SOA4 +SOPA+SOPB+POA CSN EC PEC
Several graphic displays of model performance were prepared, including:
• Performance goal plots (“soccer plots”) that summarize model performance by species, region, and season.
• Concentration performance plots (“bugle plots”) that display fractional bias or error as a function of concentration by species, region, monitoring network, and month.

Pre-hearing Draft 65 NC Regional Haze SIP for Second Planning Period (2019 – 2028) August 30, 2021
• Scatter plots of predicted and observed concentrations by species, monitoring network, and month.
• Time series plots of predicted and observed concentrations by species, monitoring site, and month.
• Spatially averaged time series plots.
• Time series plots of monthly fractional bias and error by species, region, and network. Both soccer plots and bugle plots offer a convenient way to examine model performance with respect to set goals and criteria. The bugle plots have the added benefit of adjusting the goals and criteria to consider the concentration of the species. Analysis of bugle plots generally suggests that greater emphasis should be placed on performance of those components with the greatest contribution to PM mass and visibility impairment (e.g., sulfate and organic carbon) and that greater bias and error could be accepted for components with smaller contributions to total PM mass (e.g., elemental carbon, nitrate, and soil).
6.4 PM Model Performance Evaluation for the VISTAS Modeling Domain Further discussion of model performance in this document focuses on the comparison of observational data from the CASTNET, CSN, and IMPROVE monitors (Table 6-9 in the VISTAS12 modeling domain and model output data from the VISTAS2011 annual air quality modeling.
Table 6-9. Overview of Utilized Ambient Data Monitoring Networks Monitoring Network Chemical Species Measured Sampling Period
IMPROVE Speciated PM2.5 and PM10; light extinction data
1 in 3 days; 24-hour average
CASTNET Speciated PM2.5, and O3 1-week average CSN Speciated PM2.5 24-hour average
The evaluation primarily focused on the air quality model’s performance with respect to individual components of fine PM, as good model performance of the component species will dictate good model performance of total or reconstituted fine PM. Model performance of the total fine PM and the resulting total light extinction was also examined to evaluate the overall model performance. Appendix E-3 provides a complete list of model performance statistics. The soccer plots for all VISTAS and non-VISTAS monitors are included here for summary purposes. Plots have been developed for the monthly average performance statistics for the most significant light scattering component species (i.e. sulfate, nitrate, organic carbon, and elemental carbon). The soccer plots of monthly concentrations show values for total PM2.5 (Figure 6-6) at CSN, IMPROVE monitors and sulfate (Figure 6-7), nitrate (Figure 6-8), organic carbon (Figure 6-9), and elemental carbon (Figure 6-10) at CSN, IMPROVE, CASTNET monitors in VISTAS and

Pre-hearing Draft 66 NC Regional Haze SIP for Second Planning Period (2019 – 2028) August 30, 2021
non-VISTAS states in the modeling domain. PM2.5 is mostly inside the NMB and NME criteria for CSN/VISTAS, CSN/non-VISTAS, IMPROVE/VISTAS, and IMPROVE/non-VISTAS. Sulfate is mostly inside the NMB and NME criteria for CSN/VISTAS, CSN/non-VISTAS, IMPROVE/VISTAS, and IMPROVE/non-VISTAS; but mostly outside the NMB and NME criteria for CASTNet/VISTAS and CASTNet/non-VISTAS. Nitrate is mostly inside the NMB and NME criteria for CASTNet/VISTAS, CASTNet/non-VISTAS, CSN/VISTAS, CSN/non-VISTAS, IMPROVE/VISTAS, and IMPROVE/non-VISTAS. Organic carbon is mostly inside the NMB and NME criteria for IMPROVE/VISTAS and IMPROVE/non-VISTAS; but mostly outside the NMB and NME criteria for CSN/VISTAS and CSN/non-VISTAS. Elemental carbon is mostly inside the NMB and NME criteria for CSN/VISTAS, IMPROVE/VISTAS, and IMPROVE/non-VISTAS; but mostly outside the NMB and NME criteria for and CSN/non-VISTAS. Figure 6-6 contains soccer plots of NMB and NME for total PM2.5 at CSN and IMPROVE monitors. Most CSN values are within the NMB and NME criteria. For IMPROVE, four months are outside the NMB and NME criteria for the VISTAS states and six months are outside the NMB and NME criteria for the non-VISTAS states. Please see Table 6-6 (above) for values associated with the goal (blue line) and criteria values (red line).

Pre-hearing Draft 67 NC Regional Haze SIP for Second Planning Period (2019 – 2028) August 30, 2021
Figure 6-6. Soccer Plots of Total PM2.5 by Network and Month for VISTAS and Non-
VISTAS Sites Figure 6-7 contains soccer plots of NMB and NME for sulfate at CASTNET, CSN, and IMPROVE monitors. For CASTNet, seven months are outside the NMB and NME criteria for the VISTAS states and seven months are outside the NMB and NME criteria for the non-VISTAS states. Most CSN values are within the NMB and NME criteria. For IMPROVE, two months are outside the NMB and NME criteria for the VISTAS states and no months are outside the NMB and NME criteria for the non-VISTAS states.

Pre-hearing Draft 68 NC Regional Haze SIP for Second Planning Period (2019 – 2028) August 30, 2021
Figure 6-7. Soccer Plots by Network and Month for VISTAS and Non-VISTAS Sites
Figure 6-8 contains soccer plots of NMB and NME for nitrate at CASTNET, CSN, and IMPROVE monitors. Most CASTNet and CSN values are within the NMB and NME criteria. For IMPROVE, two months are outside the NMB and NME criteria for the VISTAS states and one month is outside the NMB and NME criteria for the non-VISTAS states.

Pre-hearing Draft 69 NC Regional Haze SIP for Second Planning Period (2019 – 2028) August 30, 2021
Figure 6-8. Soccer Plots of Nitrate by Network and Month for VISTAS and Non-VISTAS
Sites Figure 6-9 contains soccer plots of NMB and NME for organic carbon at CASTNET, CSN, and IMPROVE monitors. Most CSN values are outside the NMB and NME criteria. For IMPROVE, no months are outside the NMB and NME criteria for the VISTAS states and four months are outside the NMB and NME criteria for the non-VISTAS states.

Pre-hearing Draft 70 NC Regional Haze SIP for Second Planning Period (2019 – 2028) August 30, 2021
Figure 6-9. Soccer Plots of OC by Network and Month for VISTAS and Non-VISTAS Sites Figure 6-10 contains soccer plots of NMB and NME for elemental carbon at CASTNET, CSN, and IMPROVE monitors. For CSN, two months are outside the NMB and NME criteria for the VISTAS states and six months are outside the NMB and NME criteria for the non-VISTAS states. For IMPROVE, one month is outside the NMB and NME criteria for the VISTAS states and five months are outside the NMB and NME criteria for the non-VISTAS states.

Pre-hearing Draft 71 NC Regional Haze SIP for Second Planning Period (2019 – 2028) August 30, 2021
Figure 6-10. Soccer Plots of EC by Network and Month for VISTAS and Non-VISTAS
Sites Spatial plots summarizing IMPROVE observations and model NMB on the 20% most-impaired days are shown in Figure 6-11 through Figure 6-16. In each figure the top graphic presents the observed concentration and the bottom graphic presents the NMB. For sulfate (Figure 6-11), predictions on the 20% most-impaired days are biased low across all regions, with the most significant percentage under predictions occurring in the southwest quarter of the VISTAS12 modeling domain. Some isolated over predictions are observed in a few Class I areas near the outer domain boundaries and in the northeast. Predictions of nitrate (Figure 6-12) on the 20% most-impaired days in the VISTAS12 modeling domain are mixed with a high positive bias in the north and a mix of negative and positive bias in the southeast. A general positive bias of OC (Figure 6-13) is observed across the region on the 20% most-impaired days. In the SESARM states the OC has approximately the same NMB at monitors with high observed concentrations as monitors with lower observed concentrations. For EC

Pre-hearing Draft 72 NC Regional Haze SIP for Second Planning Period (2019 – 2028) August 30, 2021
(Figure 6-14) the model shows a slight under prediction at monitors in the northern portion of the SESARM states and a positive bias at monitors in the southern SESARM region. On the 20% most-impaired days, model performance for total PM2.5 (Figure 6-15) is overall biased low across most quadrants of the VISTAS12 modeling domain (corresponding closely to the sulfate performance). A slight over prediction of PM2.5 on those days is observed in the Northern Plains and Upper Midwest, primarily along the Canadian border (corresponding closely to high nitrate concentrations and performance). Sea salt (Figure 6-16) is generally over predicted along boundaries with ocean water bodies (Atlantic Ocean and Gulf of Mexico) and is expectedly under predicted across the rest of the VISTAS12 modeling domain.

Pre-hearing Draft 73 NC Regional Haze SIP for Second Planning Period (2019 – 2028) August 30, 2021
Figure 6-11. Observed Sulfate (Top) and Modeled NMB (Bottom) for Sulfate on the 20%
Most-Impaired Days at IMPROVE Monitor Locations

Pre-hearing Draft 74 NC Regional Haze SIP for Second Planning Period (2019 – 2028) August 30, 2021
Figure 6-12. Observed Nitrate (Top) and Modeled NMB (Bottom) for Nitrate on the 20%
Most Impaired Days at Improve Monitor Locations

Pre-hearing Draft 75 NC Regional Haze SIP for Second Planning Period (2019 – 2028) August 30, 2021
Figure 6-13. Observed OC (Top) and Modeled NMB (Bottom) for OC on the 20% Most-
Impaired Days at IMPROVE Monitor Locations

Pre-hearing Draft 76 NC Regional Haze SIP for Second Planning Period (2019 – 2028) August 30, 2021
Figure 6-14. Observed EC (Top) and Modeled NMB (Bottom) for EC on the 20% Most-
Impaired Days at IMPROVE Monitor Locations

Pre-hearing Draft 77 NC Regional Haze SIP for Second Planning Period (2019 – 2028) August 30, 2021
Figure 6-15. Observed Total PM2.5 (Top) and Modeled NMB (Bottom) for Total PM2.5 on
the 20% Most-Impaired Days at IMPROVE Monitor Locations

Pre-hearing Draft 78 NC Regional Haze SIP for Second Planning Period (2019 – 2028) August 30, 2021
Figure 6-16. Observed Sea Salt (Top) and Modeled NMB (Bottom) for Sea Salt on the 20%
Most-Impaired Days at IMPROVE Monitor Locations

Pre-hearing Draft 79 NC Regional Haze SIP for Second Planning Period (2019 – 2028) August 30, 2021
6.5 PM Model Performance Evaluation for Class I Areas in North Carolina The following section provides a detailed model performance evaluation for Great Smoky Mountains National Park, Joyce Kilmer-Slickrock Wilderness area, Linville Gorge Wilderness area, Shining Rock Wilderness Area, and Swanquarter Wilderness area. This evaluation includes average stacked bar charts, day-by-day stacked bar charts, scatter plots, soccer plots, and bugle plots for the 20% most-impaired days and 20% clearest days. The Great Smoky Mountains National Park IMPROVE monitor was used to represent the Joyce Kilmer-Slickrock Wilderness Area and Shining Rock Wilderness Area. An IMPROVE monitor exists at Shining Rock Wilderness Area as well, but observed data for 2011 failed to meet completeness criteria, which is why the evaluation for Great Smoky Mountains National Park was also used to represent the Shining Rock Wilderness Area in this report. Figure 6-17 through Figure 6-19 contain the average stacked bar charts for Great Smoky Mountains National Park, Linville Gorge Wilderness Area, and Swanquarter Wilderness Area, respectively. All figures include (1) observed and modeled mass concentrations of PM constituents and (2) observed and modeled light extinctions constituents on the 20% most-impaired days and the 20% clearest days. It should be noted that values used for these stacked bar charts are from a 3x3 grid cell matrix around each IMPROVE monitor (not just the grid cell containing the monitor). The color codes for the stacked bars are:
• Yellow = mass concentrations of or light extinction due to sulfates
• Red = mass concentrations of or light extinction due to nitrates
• Green = mass concentrations of or light extinction due to organic carbon
• Black = mass concentrations of or light extinction due to elemental carbon
• Brown = mass concentrations of or light extinction due to soil
• Blue = mass concentrations of or light extinction due to sea salt
• Gray = mass concentrations of or light extinction due to coarse mass Overall, modeled and observed PM2.5 concentrations and light extinctions at Great Smoky Mountains National Park, Linville Gorge Wilderness Area, and Swanquarter Wilderness Area match well on 20% clearest days. Model performance for sulfate at all areas is biased low on 20% most-impaired days. Figure 6-20 through Figure 6-25 and Figure 6-26 through Figure 6-31 contain the day-by-day stacked bar charts for Great Smoky Mountains National Park, Linville Gorge Wilderness Area, and Swanquarter Wilderness Area, respectively. These charts allow a side-by-side comparison of observed and modeled speciated PM concentrations and speciated light extinctions on each 20% most-impaired and 20% clearest days. The speciated components are presented in the same order for both the observations (left bar) and modeled data (right bar) to help identify specific days when the predicted mass concentrations or light extinction for the components differ from the observed values. The total height of the bar provides the total PM concentrations or the total

Pre-hearing Draft 80 NC Regional Haze SIP for Second Planning Period (2019 – 2028) August 30, 2021
reconstructed light extinction values. It should be noted that values used for these stacked bar charts are from the grid cell where each IMPROVE monitor is located. Sulfates and organic carbon are the largest contributors to light extinction in the North Carolina Class I areas on both the 20% most-impaired days and the 20% clearest days (see Figure 6-17 through Figure 6-31). The stacked bar charts also suggest that nitrates can be important on the 20% clearest days. Model performance discussion for individual species were further examined with scatter plots.
Figure 6-17. Stacked Bar Charts for Average PM2.5 Concentrations (top) and Light
Extinction (bottom) at Great Smoky Mountains National Park on the 20% Most Impaired days (1st and 2nd columns) and 20% Clearest Days (3rd and 4th columns): Observation
(left) and Modeled (Right)

Pre-hearing Draft 81 NC Regional Haze SIP for Second Planning Period (2019 – 2028) August 30, 2021
Figure 6-18. Stacked Bar Charts for Average PM2.5 Concentrations (top) and Light
Extinction (bottom) at Linville Gorge Wilderness Area on the 20% Most-Impaired days (1st and 2nd columns) and 20% Clearest Days (3rd and 4th columns): Observation (left) and
Modeled (Right)

Pre-hearing Draft 82 NC Regional Haze SIP for Second Planning Period (2019 – 2028) August 30, 2021
Figure 6-19. Stacked Bar Charts for Average PM2.5 Concentrations (top) and Light
Extinction (bottom) at Swanquarter Wilderness Area on the 20% Most-Impaired days (1st and 2nd columns) and 20% Clearest Days (3rd and 4th columns): Observation (left) and
Modeled (Right)

Pre-hearing Draft 83 NC Regional Haze SIP for Second Planning Period (2019 – 2028) August 30, 2021
Figure 6-20. Stacked Bar Charts for Daily PM2.5 Concentrations at Great Smoky Mountains National Park on the 20% Most Impaired Days: Observation (left) and
Modeled (Right)
Figure 6-21. Stacked Bar Charts for Daily PM2.5 Concentrations at Great Smoky
Mountains National Park on the 20% Clearest Days: Observation (left) and Modeled (Right)

Pre-hearing Draft 84 NC Regional Haze SIP for Second Planning Period (2019 – 2028) August 30, 2021
Figure 6-22. Stacked Bar Charts for Light Extinction at Great Smoky Mountains National
Park on the 20% Most-Impaired Days: Observation (left) and Modeled (Right)
Figure 6-23. Stacked Bar Charts for Light Extinction at Great Smoky Mountains National
Park on the 20% Clearest Days: Observation (left) and Modeled (Right)

Pre-hearing Draft 85 NC Regional Haze SIP for Second Planning Period (2019 – 2028) August 30, 2021
Figure 6-24. Stacked Bar Charts for Daily PM2.5 Concentrations at Linville Gorge
Wilderness Area on the 20% Most-Impaired Days: Observation (left) and Modeled (Right)
Figure 6-25. Stacked Bar Charts for Daily PM2.5 Concentrations at Linville Gorge
Wilderness Area on the 20% Clearest Days: Observation (left) and Modeled (Right)

Pre-hearing Draft 86 NC Regional Haze SIP for Second Planning Period (2019 – 2028) August 30, 2021
Figure 6-26 Stacked Bar Charts for Light Extinction at Linville Gorge Wilderness Area on
the 20% Most-Impaired Days: Observation (left) and Modeled (Right)
Figure 6-27 Stacked Bar Charts for Light Extinction at Linville Gorge Wilderness Area on
the 20% Clearest Days: Observation (left) and Modeled (Right)

Pre-hearing Draft 87 NC Regional Haze SIP for Second Planning Period (2019 – 2028) August 30, 2021
Figure 6-28. Stacked Bar Charts for Daily PM2.5 Concentrations at Swanquarter
Wilderness Area on the 20% Most-Impaired Days: Observation (left) and Modeled (Right)
Figure 6-29. Stacked Bar Charts for Daily PM2.5 Concentrations at Swanquarter
Wilderness Area on the 20% Clearest Days: Observation (left) and Modeled (Right)

Pre-hearing Draft 88 NC Regional Haze SIP for Second Planning Period (2019 – 2028) August 30, 2021
Figure 6-30. Stacked Bar Charts for Light Extinction at Swanquarter Wilderness Area on
the 20% Most-Impaired Days: Observation (left) and Modeled (Right)
Figure 6-31. Stacked Bar Charts for Light Extinction at Swanquarter Wilderness Area on
the 20% Clearest Days: Observation (left) and Modeled (Right) Figure 6-32 and Figure 6-33 contain scatter plots of daily observations vs. modeled concentration for PM2.5, sulfate, nitrate, organic carbon, elemental carbon, crustal (labeled as soil), sea salt, and coarse mass (labeled as PMC) for Great Smoky Mountains National Park on the 20% most-impaired days. Nitrate, organic carbon, crustal was generally over predicted, while PM2.5, sulfate, and coarse mass were generally under predicted. Elemental carbon, and sea salt show both over

Pre-hearing Draft 89 NC Regional Haze SIP for Second Planning Period (2019 – 2028) August 30, 2021
predictions and under predictions.
Figure 6-32. Scatter Plot for Daily PM2.5 (top left), Sulfate (top right), Nitrate (bottom left),
and Organic Carbon (bottom right) Concentrations at Great Smoky Mountains National Park on the 20% Most Impaired Days

Pre-hearing Draft 90 NC Regional Haze SIP for Second Planning Period (2019 – 2028) August 30, 2021
Figure 6-33. Scatter Plot for Daily Elemental Carbon (top left), Crustal (top right), Sea
Salt (bottom left), and Coarse Mass (bottom right) Concentrations at Great Smoky Mountains National Park on the 20% Most Impaired Days

Pre-hearing Draft 91 NC Regional Haze SIP for Second Planning Period (2019 – 2028) August 30, 2021
Figure 6-34 and Figure 6-35 contain scatter plots of daily observations vs. modeled concentration for PM2.5, sulfate, nitrate, organic carbon, elemental carbon, crustal (labeled as soil), sea salt, and coarse mass (labeled as PMC) for Great Smoky Mountains National Park on the 20% clearest days. PM2.5, nitrate, elemental carbon, and crustal were generally over predicted. Sulfate, organic carbon, sea salt, and coarse mass show both over predictions and under predictions.
Figure 6-34. Scatter Plot for Daily PM2.5 (top left), Sulfate (top right), Nitrate (bottom left),
and Organic Carbon (bottom right) Concentrations at Great Smoky Mountains National Park on the 20% Clearest Days.

Pre-hearing Draft 92 NC Regional Haze SIP for Second Planning Period (2019 – 2028) August 30, 2021
Figure 6-35 Scatter Plot for Daily Elemental Carbon (top left), Crustal (top right), Sea Salt (bottom left), and Coarse Mass (bottom right) Concentrations at Great Smoky Mountains
National Park on the 20% Clearest Days

Pre-hearing Draft 93 NC Regional Haze SIP for Second Planning Period (2019 – 2028) August 30, 2021
Figure 6-36 and Figure 6-37 contain scatter plots of daily observations vs. modeled concentration for PM2.5, sulfate, nitrate, organic carbon, elemental carbon, crustal (labeled as soil), sea salt, and coarse mass (labeled as PMC) for Linville Gorge Wilderness Area on the 20% most impaired days. Nitrate, crustal, and organic carbon was generally over predicted, while PM2.5, sulfate, elemental carbon and coarse mass was generally under predicted. Organic carbon and sea salt show both over predictions and under predictions.
Figure 6-36. Scatter Plot for Daily PM2.5 (top left), Sulfate (top right), Nitrate (bottom left), and Organic Carbon (bottom right) Concentrations at Linville Gorge Wilderness Area on
the 20% Most Impaired Days

Pre-hearing Draft 94 NC Regional Haze SIP for Second Planning Period (2019 – 2028) August 30, 2021
Figure 6-37. Scatter Plot for Daily Elemental Carbon (top left), Crustal (top right), Sea
Salt (bottom left), and Coarse Mass (bottom right) Concentrations at Linville Gorge Wilderness Area on the 20% Most Impaired Days
Figure 6-38 and Figure 6-39 contain scatter plots of daily observations vs. modeled concentration for PM2.5, sulfate, nitrate, organic carbon, elemental carbon, crustal (labeled as soil), sea salt, and coarse mass (labeled as PMC) for Linville Gorge Wilderness Area on the 20% clearest days. PM2.5, sulfate, nitrate, elemental carbon, and crustal were generally over predicted. Organic carbon, sea salt, and coarse mass show both over predictions and under predictions.

Pre-hearing Draft 95 NC Regional Haze SIP for Second Planning Period (2019 – 2028) August 30, 2021
Figure 6-38. Scatter Plot for Daily PM2.5 (top left), Sulfate (top right), Nitrate (bottom left), and Organic Carbon (bottom right) Concentrations at Linville Gorge Wilderness Area on
the 20% Clearest Days

Pre-hearing Draft 96 NC Regional Haze SIP for Second Planning Period (2019 – 2028) August 30, 2021
Figure 6-39. Scatter Plot for Daily Elemental Carbon (top left), Crustal (top right), Sea
Salt (bottom left), and Coarse Mass (bottom right) Concentrations at Linville Gorge Wilderness Area on the 20% Clearest Days
Figure 6-40 and Figure 6-41 contain scatter plots of daily observations vs. modeled concentration for PM2.5, sulfate, nitrate, organic carbon, elemental carbon, crustal (labeled as soil), sea salt, and coarse mass (labeled as PMC) for Swanquarter Wilderness Area on the 20% clearest days. Sulfate and Coarse mass was generally under predicted while sea salt was generally over predicted. PM2.5, nitrate, organic carbon, elemental carbon, and crustal show both over predictions and under predictions.

Pre-hearing Draft 97 NC Regional Haze SIP for Second Planning Period (2019 – 2028) August 30, 2021
Figure 6-40. Scatter Plot for Daily PM2.5 (top left), Sulfate (top right), Nitrate (bottom left),
and Organic Carbon (bottom right) Concentrations at Swanquarter Wilderness Area on the 20% Most Impaired Days

Pre-hearing Draft 98 NC Regional Haze SIP for Second Planning Period (2019 – 2028) August 30, 2021
Figure 6-41. Scatter Plot for Daily Elemental Carbon (top left), Crustal (top right), Sea
Salt (bottom left), and Coarse Mass (bottom right) Concentrations at Swanquarter Wilderness Area on the 20% Most Impaired Days
Figure 6-42 and Figure 6-43 contain scatter plots of daily observations vs. modeled concentration for PM2.5, sulfate, nitrate, organic carbon, elemental carbon, crustal (labeled as soil), sea salt, and coarse mass (labeled as PMC) for Linville Gorge Wilderness Area on the 20% clearest days. Elemental Carbon was generally overpredicted while coarse mass was generally underpredicted. PM2.5, sulfate, nitrate, organic carbon, crustal, and sea salt show both over predictions and under predictions.

Pre-hearing Draft 99 NC Regional Haze SIP for Second Planning Period (2019 – 2028) August 30, 2021
Figure 6-42. Scatter Plot for Daily PM2.5 (top left), Sulfate (top right), Nitrate (bottom left),
and Organic Carbon (bottom right) Concentrations at Swanquarter Wilderness Area on the 20% Clearest Days

Pre-hearing Draft 100 NC Regional Haze SIP for Second Planning Period (2019 – 2028) August 30, 2021
Figure 6-43. Scatter Plot for Daily Elemental Carbon (top left), Crustal (top right), Sea
Salt (bottom left), and Coarse Mass (bottom right) Concentrations at Swanquarter Wilderness Area on the 20% Clearest Days
Figure 6-44 through Figure 6-49 are soccer plots showing NMB and NME for modeled sulfate, nitrate, organic carbon, elemental carbon, crustal, and coarse mass for Great Smoky mountains National Park, Linville Gorge Wilderness Area, and Swanquarter Wilderness Area on the 20% most impaired days and the 20% clearest days. For Great Smoky Mountains National Park on the 20% most impaired days, sulfate, nitrate, organic carbon, elemental carbon, and coarse mass meet the NMB and NME criteria while crustal does not. For Great Smoky Mountains National Park on the 20% clearest days, sulfate, organic carbon, and coarse mass meet the NMB and NME criteria while nitrate, elemental carbon, and crustal do not. For Linville Gorge Wilderness

Pre-hearing Draft 101 NC Regional Haze SIP for Second Planning Period (2019 – 2028) August 30, 2021
Area on the 20% most impaired days, sulfate, organic carbon, elemental carbon, and coarse mass meet the NMB and NME criteria while nitrate and crustal do not. For Linville Gorge Wilderness Area on the 20% clearest days, sulfate, organic carbon, elemental carbon, and coarse mass meet the NMB and NME criteria while nitrate and crustal do not. For Swanquarter Wilderness Area on the 20% most impaired days, sulfate, nitrate, organic carbon, and elemental carbon meet the NMB and NME criteria while coarse mass and crustal do not. For Swanquarter Wilderness Area on the 20% clearest days, sulfate, nitrate, organic carbon, and elemental carbon meet the NMB and NME criteria while coarse mass and crustal do not.
Figure 6-44. Soccer Plot for Sulfate, Nitrate, Elemental Carbon, Organic Carbon, Coarse
Mass, and Crustal Concentrations on the 20% Most Impaired Days at Great Smoky Mountains National Park

Pre-hearing Draft 102 NC Regional Haze SIP for Second Planning Period (2019 – 2028) August 30, 2021
Figure 6-45. Soccer Plot for Sulfate, Nitrate, Elemental Carbon, Organic Carbon, Coarse Mass, and Crustal Concentrations on the 20% Clearest Days at Great Smoky Mountains
National Park
Figure 6-46. Soccer Plot for Sulfate, Nitrate, Elemental Carbon, Organic Carbon, Coarse
Mass, and Crustal Concentrations on the 20% Most Impaired Days at Linville Gorge Wilderness Area

Pre-hearing Draft 103 NC Regional Haze SIP for Second Planning Period (2019 – 2028) August 30, 2021
Figure 6-47. Soccer Plot for Sulfate, Nitrate, Elemental Carbon, Organic Carbon, Coarse Mass, and Crustal Concentrations on the 20% Clearest Days at Linville Gorge Wilderness
Area
Figure 6-48. Soccer Plot for Sulfate, Nitrate, Elemental Carbon, Organic Carbon, Coarse
Mass, and Crustal Concentrations on the 20% Most Impaired Days at Swanquarter Wilderness Area

Pre-hearing Draft 104 NC Regional Haze SIP for Second Planning Period (2019 – 2028) August 30, 2021
Figure 6-49. Soccer Plot for Sulfate, Nitrate, Elemental Carbon, Organic Carbon, Coarse Mass, and Crustal Concentrations on the 20% Clearest Days at Swanquarter Wilderness
Area Figure 6-50 and Figure 6-51 are bugle plots showing MFB and MFE for modeled sulfate, nitrate, organic carbon, elemental carbon, crustal, and coarse mass for Great Smoky Mountains National Park on the 20% most impaired days and the 20% clearest days. On the 20% most impaired days, all species meet the MFB and MFE criteria (red line). On the 20% clearest days, all species meet the MFB and MFE goal (green line) and criteria (red line).

Pre-hearing Draft 105 NC Regional Haze SIP for Second Planning Period (2019 – 2028) August 30, 2021
Figure 6-50. Bugle Plots of MFB (top) and MFE (bottom) for Sulfate, Nitrate, Elemental
Carbon, Organic Carbon, Coarse Mass, and Crustal Concentrations on the 20% Most Impaired Days at Great Smoky Mountains National Park

Pre-hearing Draft 106 NC Regional Haze SIP for Second Planning Period (2019 – 2028) August 30, 2021
Figure 6-51. Bugle Plots of MFB (top) and MFE (bottom) for Sulfate, Nitrate, Elemental Carbon, Organic Carbon, Coarse Mass, and Crustal Concentrations on the 20% Clearest
Days at Great Smoky Mountains National Park

Pre-hearing Draft 107 NC Regional Haze SIP for Second Planning Period (2019 – 2028) August 30, 2021
Figure 6-52 and Figure 6-53 are bugle plots showing MFB and MFE for modeled sulfate, nitrate, organic carbon, elemental carbon, crustal, and coarse mass for Linville Gorge Wilderness Area on the 20% most impaired days and the 20% clearest days. On the 20% most impaired days, sulfate, nitrate, elemental carbon, organic carbon, and crustal meet the MFB criteria (red line) while coarse mass does not. On the 20% most impaired days, all species meet the MFE criteria (red line). On the 20% clearest days, all species meet the MFB criteria (red line) and MFE goal (green line).
Figure 6-52. Bugle Plots of MFB (top) and MFE (bottom) for Sulfate, Nitrate, Elemental
Carbon, Organic Carbon, Coarse Mass, and Crustal Concentrations on the 20% Most Impaired Days at Linville Gorge Wilderness Area

Pre-hearing Draft 108 NC Regional Haze SIP for Second Planning Period (2019 – 2028) August 30, 2021
Figure 6-53. Bugle Plots of MFB (top) and MFE (bottom) for Sulfate, Nitrate, Elemental Carbon, Organic Carbon, Coarse Mass, and Crustal Concentrations on the 20% Clearest
Days at Linville Gorge Wilderness Area Figure 6-54 and Figure 6-55 are bugle plots showing MFB and MFE for modeled sulfate, nitrate, organic carbon, elemental carbon, crustal, and coarse mass for Swanquarter Wilderness Area on the 20% most impaired days and the 20% clearest days. On the 20% most impaired days, sulfate, nitrate, elemental carbon, organic carbon, and crustal meet the MFB and MFE criteria (red line) while coarse mass does not. On the 20% clearest days, sulfate, nitrate, elemental carbon, organic carbon, and crustal meet the MFB criteria (red line) and MFE goal (green line), while coarse mass does not.

Pre-hearing Draft 109 NC Regional Haze SIP for Second Planning Period (2019 – 2028) August 30, 2021
Figure 6-54. Bugle Plots of MFB (top) and MFE (bottom) for Sulfate, Nitrate, Elemental
Carbon, Organic Carbon, Coarse Mass, and Crustal Concentrations on the 20% Most Impaired Days at Swanquarter Wilderness Area

Pre-hearing Draft 110 NC Regional Haze SIP for Second Planning Period (2019 – 2028) August 30, 2021
Figure 6-55. Bugle Plots of MFB (top) and MFE (bottom) for Sulfate, Nitrate, Elemental Carbon, Organic Carbon, Coarse Mass, and Crustal Concentrations on the 20% Clearest
Days at Swanquarter Wilderness Area

Pre-hearing Draft 111 NC Regional Haze SIP for Second Planning Period (2019 – 2028) August 30, 2021
6.6 Summary and Conclusions The EPA guidance states that it is not appropriate to assign “bright line” criteria that distinguish between adequate and inadequate model performance with a single model performance test.58 The EPA guidance recommends that a “weight of evidence” approach be used to determine whether a particular modeling application is acceptable for use in regulatory demonstrations.59 The EPA recommends that air agencies conduct a variety of performance tests and weigh them qualitatively to assess model performance.60 In following EPA’s guidance, VISTAS evaluated the model performance statistics for all VISTAS Class I areas collectively. For example, Table 6-10 shows sulfate model performance statistics for the Class I areas in VISTAS and Class I areas closely surrounding VISTAS. The criterion for each statistic presented in Table 6-6 and Table 6-7 is listed in the first row of Table 6-10. The values highlighted in red in Table 6-10 indicate that the criteria were not met. As such, the averages of the statistics were calculated. The second to last row of Table 6-10 shows the average of all the Class I areas and the last row shows the average of all VISTAS Class I areas. Of the five statistics listed in the table, the NMB was only slightly outside of the criteria based on the overall average for all the Class I areas and the overall average for the VISTAS Class I areas. The other four statistics meet the criteria.
Table 6-10. Sulfate Model Performance Criteria for 20% Most Impaired Days in 2011
Class I Area # Obs. NMB
(<±30%)* MFB
(<±60%) NME
(<50%) MFE
(<75%) r
(>0.4) Breton 22 -41.83 -60.47 47.93 65.77 0.27 Brigantine 23 -32.93 -39.18 32.93 39.18 0.79 Caney Creek 11 -46.01 -70.20 52.63 75.57 0.49 Cape Romain 24 -28.85 -36.98 36.03 44.17 0.62 Chassahowitzka 24 -39.37 -48.96 44.06 54.49 -0.06 Cohutta 18 -28.18 -32.67 33.06 38.07 0.14 Dolly Sods 24 -27.18 -30.24 34.55 37.86 0.63 Everglades 14 -12.14 -19.56 38.62 43.10 0.20 Great Smoky Mountains 23 -36.92 -46.25 41.47 51.74 0.22 Hercules - Glade 20 -31.75 -41.93 37.76 47.55 0.70 James River Face 24 -36.62 -44.57 36.89 44.88 0.52 Linville Gorge 23 -16.32 -19.66 30.87 35.20 0.49 Mammoth Cave 23 -38.26 -48.89 38.27 48.91 0.80 Mingo 19 -31.40 -38.96 31.88 39.67 0.64 Okefenokee 22 -41.42 -58.55 43.98 61.54 0.52 Saint Marks 22 -40.16 -56.91 48.30 65.37 0.37
58 EPA Modeling Guidance for Demonstrating Air Quality Goals for Ozone, PM2.5 and Regional Haze, November 2018. 59 Ibid 60 Ibid

Pre-hearing Draft 112 NC Regional Haze SIP for Second Planning Period (2019 – 2028) August 30, 2021
Class I Area # Obs. NMB
(<±30%)* MFB
(<±60%) NME
(<50%) MFE
(<75%) r
(>0.4) Shenandoah 24 -24.34 -30.57 29.31 35.53 0.74 Shining Rock61 0 -- -- -- -- -- Sipsey 19 -35.37 -43.37 35.37 43.37 0.75 Swanquarter 22 -25.28 -32.13 31.56 37.56 0.60 Upper Buffalo 23 -17.00 -27.18 30.66 37.22 0.71 AVERAGE - ALL 424 -31.82 -40.97 37.27 46.7 0.62 AVERAGE - VISTAS 306 -31.33 -39.76 36.93 45.95 0.63
In addition, when comparing modeled and observed values for individual monitors, bias and error are generally mitigated when using the RRF approach to estimate future-year impairment. The RRF method is used to estimate the percent change in each PM species associated with changes in emissions from the 2011 base year to the 2028 projection year. Thus, under or over predictions of modeled concentrations for individual monitors are canceled when using the RRF approach. Furthermore, since it is important to estimate the change in visibility impairment from the base to the future year, it is important to hold other factors constant (e.g., temporal profiles for emissions sources) when applying the RRF approach.62 For the VISTAS modeling, the percent change in PM species concentrations from 2011 to 2028 were applied to the 5-year average of observed speciated data, centered on the modeled base year (i.e., 2009 – 2013), to estimate the projected future year visibility impairment for each Class I area with an IMPROVE monitor. Use of the RRF approach applied to five years of monitoring data provides a reasonable estimate of future visibility impairment for Class I areas. Overall, based on the weight of evidence approach recommended by EPA’s photochemical grid modeling guidance, model performance at the "one atmosphere" level was deemed acceptable for ozone, wet/dry deposition, and PM species at various monitoring sites. The NCDAQ concludes that the one atmosphere modeling performed by VISTAS is representative of conditions in the southeastern states and is acceptable for use in regulatory modeling applications for ozone, PM, and regional haze for Class I areas in North Carolina.
61 Shining Rock did not have valid monitoring data for 2011. 62 An exception would be if for an emissions source the permit is revised after the 2011 base year in a way that would change the temporal profile of how the emissions source is operated (e.g., only requiring a control on the source to be operated seasonally. For this situation, it would be appropriate to change the temporal profile in the future year to reflect how the control is operated on the emission source.

Pre-hearing Draft 113 NC Regional Haze SIP for Second Planning Period (2019 – 2028) August 30, 2021
7.0 LONG-TERM STRATEGY (LTS)
Section 40 CFR 51.308(f)(2) of the RHR requires states to submit a long-term strategy (LTS) addressing regional haze visibility impairment for each Class I area within the state and for each Class I area located outside the state that may be affected by emissions from the state. The LTS must include the enforceable emissions limitations, compliance schedules, and other measures that are necessary to demonstrate ongoing progress toward attaining natural conditions for the 20% most impaired days and show no degradation in the 20% clearest days. Section 40 CFR 51.308(f)(3) of the RHR requires that states containing Class I areas establish RPGs expressed in deciviews (dv). These RPGs must reflect the visibility conditions that are projected to be achieved by the end of the applicable planning period as a result of those enforceable emission limitations, compliance schedules, and other measures established as part of the LTS. The RPGs for each Class I area must cover each ten-year planning period. The RPGs, while not directly federally enforceable, must be met through measures contained in the state’s LTS through year 2028. This section discusses North Carolina’s LTS for the first planning period (2008 – 2018) and the second planning period (2019 – 2028) that builds on the LTS for the first planning period.
7.1 Overview of the LTS Development Process The monitor data and the modeling analyses included with the first regional haze SIP established that, for the VISTAS region, the key contributors to regional haze in the 2000-2004 baseline timeframe were large stationary sources of SO2 emissions. In Section 2 of this SIP, Figure 2-1 through Figure 2-4 show the daily visibility data for the 20% most impaired days during the baseline period for North Carolina’s Class I areas. Sulfate accounted for the majority of the pollutant impairing species on these days. Visibility data for the baseline period for most VISTAS Class I areas showed this same trend. More current speciation data for years 2014 through 2018 show significant visibility improvement on the 20% most impaired days. As shown in Figure 2-13 through Figure 2-16 of Section 2 of this SIP, sulfate continues to be the predominant visibility impairing species for North Carolina’s Class I areas. Unlike the data for the baseline period of 2000 to 2004, where nearly all days with poor visibility were heavily dominated by sulfate impairment, the 2014 to 2018 data show some 20% most impaired days having large organic matter or nitrate impacts at North Carolina’s Class I areas. The organic matter components on poor visibility days are associated with episodic events while the nitrate components are associated with anthropogenic emissions. However, the visibility during the majority of 20% most impaired days at North Carolina’s Class I areas during the period 2014 to 2018 continue to be impacted most heavily by sulfate. The 2014 to 2018 IMPROVE data for other VISTAS Class I areas, provided in Appendix C-2, show similar trends. Therefore, reducing SO2 emissions continues to be important for generating further visibility improvements for the second planning period. Keeping this conclusion in mind, this section addresses the following questions:

Pre-hearing Draft 114 NC Regional Haze SIP for Second Planning Period (2019 – 2028) August 30, 2021
• Assuming implementation of existing federal and state air regulatory requirements in North Carolina and the VISTAS region, how much visibility improvement, compared to the glidepath, is expected in each of the Class I areas located in North Carolina by 2028?
• Which mandatory Class I areas located outside of North Carolina are significantly impacted by visibility impairing pollutants originating from within North Carolina?
• If additional emission reductions were needed, from what pollutants and source categories would the greatest visibility benefits be realized by 2028?
• Where are these pollutants and source categories located?
• Which specific individual sources in those geographic locations have the greatest visibility impacts at a given Class I area?
• What additional emission controls represent continuing progress for those specific sources?
7.2 Expected Visibility in 2028 for North Carolina’s Class I Areas Under Existing and Planned Emissions Control Programs
During the first SIP planning period (2008-2018), North Carolina’s LTS along with economic factors resulted in unprecedented SO2 and NOx emission reductions that have improved visibility in North Carolina’s Class I areas 20 or more years ahead of schedule. North Carolina’s LTS for the second planning period (2019-2028) builds on the federal and state programs implemented during the first planning period to maintain and advance the progress achieved to date. Table 7-1 provides a summary of the foundation control programs included in the modeling of the RPGs for the first and second planning periods. Section 7.2.1 summarizes the federal and state control programs included in North Carolina’s LTS for the first planning period. Section 7.2.2 summarizes control measures and programs North Carolina has added to its LTS for the second planning period (2019-2028). Section 7.2.3 addresses Section 51.308(f)(2)(iv) of the RHR that requires states to consider five additional factors when developing a LTS. Section 7.2.4 documents the VISTAS 2028 emissions inventory and Section 7.2.5 discusses how the VISTAS inventory compares to EPA EPA’s 2028 inventory. The 2028 RPG modeling projections for North Carolina’s Class I areas is discussed in Section 7.2.6. Section 7.2.7 identifies additional state programs and initiatives that have been supporting or are anticipated to support future emission reductions but are not federally enforceable and therefore not included in North Carolina’s LTS. Section 7.2.8 identifies facility closures that occurred after development of the 2028 projection year inventory and modeling upon which North Carolina’s RPGs are based. North Carolina has not revised the RPGs for its five Class I areas to account for these emission reductions. However, these additional emission reductions will support progress toward achieving the 2028 RPGs.

Pre-hearing Draft 115 NC Regional Haze SIP for Second Planning Period (2019 – 2028) August 30, 2021
Table 7-1. Summary of Foundation Control Programs
Jurisdiction Control Program
Initial Implementation
Year(s) Control Programs Included in RPG Modeling for First Planning Period (2008-2018) Federal Tier 2 Vehicle and Fuel Standards 2004 - 2009
Heavy-Duty Gasoline and Diesel Highway Vehicles Standards 2002 - 2010 Large Nonroad Diesel Engines and Fuel Standards Rule 2007 - 2014 Nonroad Spark-Ignition Engines and Recreational Engines Standards 2004 - 2012 Reciprocating Internal Combustion Engines (RICE) National Emissions Standards for Hazardous Air Pollutants (NESHAP) 2013
NOx SIP Call, Clean Air Interstate Rule (CAIR), and Cross State Air Pollution Rule (CSAPR)
2004 - 2007, 2009 - 2010, 2015 - 2017
State Clean Smokestacks Act (CSA) 2007 - 2013 Alternative to Source Specific Best Available Retrofit Technology (BART) Demonstration for Electricity Generating Units (EGUs) 2016
Clean Air Bill/Vehicle Emissions Inspection and Maintenance (I&M) Program 2003 -2006
Control Programs Included in RPG Modeling for Second Planning Period (2019-2028) Federal Tier 3 Vehicle and Fuel Standards 2017 - 2025
Medium and Heavy-Duty Gasoline and Diesel Highway Vehicle Standards 2014 - 2018
Utility New Source Performance Standards (NSPS)* 2012 Mercury and Air Toxics Standard (MATS)* 2015 - 2017 Boiler NESHAP – Section 112(j) and Section 112(d) 2011 and 2019 2010 1-Hour SO2 NAAQS 2010 - 2020 NOx Emission Standards for Ocean-going Vessels 2016 Consent Decree between EPA and Tennessee Valley Authority (TVA) 2018 - 2019 Consent Decree between EPA and Duke Energy Corporation* 2015 Consent Decree between EPA and PCS Subsidiaries 2014 Consent Decree between EPA and Saint-Gobain Containers, Inc. / Ardagh Glass* 2010
State Source-Specific SO2 SIP for Evergreen Packaging / Blue Ridge Paper Products 2020
Special Orders by Consent (SOC) for CPI USA North Carolina LLC 2021
* Some of the emissions for this measure may be included in the 2016 base year emissions used for preparing the 2028 emissions projections for modeling. However, the measure was not included in the LTS for North Carolina’s SIP for the first planning period. Therefore, it is included in North Carolina’s SIP for the second planning period. 7.2.1 Control Measures and Other Emission Reduction Actions for First Planning Period
(2008-2018) The LTS for the first planning period includes federally and state enforceable control programs. These programs will remain enforceable through the second RH planning period. Sources subject to these measures are prohibited from reducing the effectiveness of emission controls or

Pre-hearing Draft 116 NC Regional Haze SIP for Second Planning Period (2019 – 2028) August 30, 2021
removing emission controls to ensure no backsliding occurs. Any change must first approved by EPA as a revision to the North Carolina SIP,consistent with Section 110(l) of the CAA. Federal control programs impacting onroad and nonroad engines will continue to provide emission reductions beyond the first implementation period in which they were adopted because of fleet-vehicle and equipment turnover (i.e., replacement of older vehicles or equipment with newer vehicles or equipment). The reductions from these programs, as described below, are included in the 2028 future year estimates upon which visibility projections are based. In addition, federal control programs that were implemented during but not included in North Carolina’s LTS for the first planning period are included in the LTS for the second planning period.
Federal Control Programs
• Tier 2 Vehicle and Fuel Standards: For new passenger cars and light light-duty trucks, the Tier 2 standards phase-in began in 2004, with full implementation in the 2007 model year. These standards required passenger vehicles in each manufacturer’s fleet to meet an average standard of 0.07 grams of NOx per mile by 2007. The Tier 2 standards also cover passenger vehicles over 8,500 pounds gross vehicle weight rating (i.e., larger pickup trucks and sport utility vehicles [SUVs]). For these vehicles, the standards were phased in beginning in 2008, with full compliance required by 2009. The Tier 2 standards require vehicles to be 77% to 95% cleaner. Fuel standards required that most refiners and importers meet a corporate average gasoline sulfur standard of 120 ppm and a cap of 300 ppm beginning in 2004. Additionally, in January 2006, the sulfur content of gasoline was required to be on average 30 ppm. Lower sulfur content gasoline assists in lowering NOx emissions by increasing the efficiency of the catalytic converter. Most gasoline sold in North Carolina prior to January 2006 had a sulfur content of about 300 ppm. These emission reductions are federally enforceable.
• Heavy-duty Gasoline and Diesel Highway Vehicle Standards: Implementation of these standards, designed to reduce NOx and VOC emissions from heavy-duty gasoline and diesel highway vehicles, began with model year 2004 vehicles with full implementation occurring in 2010.63 The program was estimated to reduce NOx emissions by 95% and required that the sulfur content of fuel ultimately be reduced to 15 ppm. These emission reductions are federally enforceable.
• Large Nonroad Diesel Engine Standards: EPA promulgated rules for new large nonroad diesel engines, such as those used in construction, agricultural and industrial equipment, to be phased in between 2008 and 2014. The EPA mandated reductions in sulfur content in nonroad diesel fuels, as follows: 500 ppm effective June 2007; and 15 ppm effective June
63 As part of a consent decree related to high NOx emissions from heavy-duty diesel engines during certain driving modes caused by an engine control strategy that EPA considered an illegal “emission defeat device,” most engine manufacturers were required to comply with the 2004 emission standards by October 2002.

Pre-hearing Draft 117 NC Regional Haze SIP for Second Planning Period (2019 – 2028) August 30, 2021
2010.64 The combined engine and fuel requirements are estimated to reduce NOx emissions by 90% and reduce the sulfur content in nonroad diesel fuel to 15 ppm. These emission reductions are federally enforceable.
• Nonroad Spark-ignition Engine and Recreational Engine Standards: Tier 1 of these standards was implemented in 2004 and Tier 2 began in 2007, with the final engine standards coming on-line in 2012. These engine standards apply to all new engines sold in the United States and all engines imported after these standards began, and apply to large spark-ignition engines (forklifts and airport ground service equipment), recreational vehicles (off-highway motorcycles and all-terrain-vehicles), and recreational marine diesel engines. These emission reductions are federally enforceable.
• RICE National Emissions Standards for Hazardous Air Pollutants (NESHAP): The RICE NESHAP has provided emission reductions of NOx, VOC, PM, and SO2. RICE owners and operators were required to comply with the NESHAP by May 3, 2013. These emission reductions are federally enforceable.
• NOx SIP Call, Clean Air Interstate Rule (CAIR), and Cross State Air Pollution Rule (CSAPR) Rules: EPA promulgated the NOx SIP Call in October 1998 to reduce ozone transport and precursor emissions from upwind states contributing to ozone attainment and maintenance issues in downwind states. A central component of the NOx SIP Call included the Budget Trading Program, which was a cap-and-trade system to reduce NOx emissions from EGUs and large industrial boilers during the ozone season (May 1 through September 30). In May 2005, EPA promulgated CAIR to reduce NOx and SO2 emissions from EGUs. In so doing, CAIR incorporated the EGUs and large boilers covered by the NOx Budget Trading Program but did not incorporate budgets for other sectors covered by the NOx Budget Trading Program (e.g., onroad and nonroad sources). On December 23, 2008, the United States Court of Appeals for the District of Columbia Circuit issued an opinion remanding the CAIR program to EPA without vacatur. Therefore, because of EPA’s “anti-backsliding” rules, North Carolina remains subject to the NOx SIP Call’s ozone season EGU budgets. After the court challenges to CAIR, EPA issued CSAPR in July 2011. As amended, CSAPR required 28 states to limit their statewide emissions of SO2 and/or NOx in order to reduce or eliminate the states’ contributions to fine particulate matter (PM2.5) and/or ground-level ozone pollution in other states. The emissions limitations are defined in terms of maximum statewide “budgets” for emissions of annual SO2, annual NOx, and/or ozone-season NOx by each state’s large EGUs. The EPA excluded large industrial boilers from CSAPR, resulting in a group of “orphaned” industrial units that are still subject to the NOx SIP call budget for these sources. North Carolina EGUs are subject to the Phase I and II annual NOx and SO2 budgets as of January 1, 2015 and January 1, 2017, respectively. However, it is important to
64 The EPA also set the same diesel sulfur content requirements for locomotive and marine fuels.

Pre-hearing Draft 118 NC Regional Haze SIP for Second Planning Period (2019 – 2028) August 30, 2021
note that North Carolina does not have an ozone season budget for EGUs under the CSAPR program. Although the state is not relying on CSAPR for ozone season reductions, CSAPR is a federally enforceable program that has yielded residual NOx and SO2 emissions reduction benefits. As of EPA’s 2018 progress report for the power sector’s air programs, CSAPR was estimated to reduce annual EGU SO2 and NOx emissions by 91% and 73% below 2005 levels, respectively.
State Control Programs
• Clean Smokestacks Act (CSA): This state law required coal-fired power plants to reduce annual NOx emissions by 77% by 2009, and to reduce annual SO2 emissions by 49% by 2009 and 73% by 2013. This law set a NOx emissions cap of 56,000 tons/year for 2009 and SO2 emissions caps of 250,000 tons/year and 130,000 tons/year for 2009 and 2013, respectively. In 2013, the power plants subject to this law had combined NOx emissions of 38,857 tons/year, well below the 56,000 tons/year cap. The emissions cap has been met in all subsequent years as well. With the requirement to meet annual emissions caps and disallowing the purchase of NOx credits to meet the caps, the Clean Smokestacks Act reduces NOx emissions beyond the requirements of the NOx SIP Call. These emissions limits are enforceable at both the federal and state level. From 2002 through 2019, coal-fired EGUs subject to this legislation reduced total NOx and SO2 emissions by 117,782 tons (82%) and 443,889 tons (97%), respectively (see Figure 7.1). The state’s coal-fired EGUs are among the most efficient and least polluting in the nation. Also, since 2005, the state significantly transitioned to cleaner burning natural gas for electric power generation and has continued to increase its renewable energy capacity under the Southeast’s only Renewable Energy and Energy Efficiency Portfolio Standard. While coal accounted for 96% of North Carolina’s total fossil-fueled electricity generation in 2005, coal use dropped to only 42% and 43% in 2018 and 2019, respectively. The state has also transitioned to become second in the nation for solar photovoltaic capacity.

Pre-hearing Draft 119 NC Regional Haze SIP for Second Planning Period (2019 – 2028) August 30, 2021
Figure 7-1. Clean Smokestacks Act Emissions Reductions
• Best Available Retrofit Technology (BART) for EGUs: Pursuant to 40 CFR §51.308 of the RH rule, North Carolina prepared and submitted to EPA for approval a Regional Haze SIP Revision for North Carolina Class I Areas - Alternative to Source Specific Best Available Retrofit Technology Demonstration (BART) for Electric Generating Units, October 31, 2014. This SIP revision contained the technical information and data supporting North Carolina's Alternative to Source-Specific BART determinations for BART-eligible coal-fired EGUs. The SIP revision demonstrated that the North Carolina's CSA met the Alternative BART requirements and achieved greater emissions reductions of SO2 and NOx than otherwise would be achieved by applying BART to each individually affected EGU. The EPA approved the SIP revision on May 24, 2016.65
• Clean Air Bill/Vehicle Emissions Inspection and Maintenance (I&M) Program: In 1999, the North Carolina State Legislation passed the Clean Air Bill that expanded the on-road vehicle I&M program from 9 to 48 counties. This program reduces NOx, VOC, and carbon monoxide (CO) emissions. The rule for the I&M program was submitted to EPA for adoption into the SIP in August 2002 and was federally approved in October 2002. Therefore, these emission reductions are both state and federally enforceable. On February 5, 2015, EPA approved a change to North Carolina’s I&M rules triggered by a state law which exempted plug-in vehicles and the three newest model year vehicles with less than 70,000 miles on their odometers from emission inspection in all areas in North Carolina
65 Final Rule: Air Plan Approval; North Carolina; Regional Haze (81 FR 32652, May 24, 2016).

Pre-hearing Draft 120 NC Regional Haze SIP for Second Planning Period (2019 – 2028) August 30, 2021
where I&M is required.66 In North Carolina’s Section 110(l) demonstration, the state showed that the change in the compliance rate from 95% to 96% more than compensated for the NOx and VOC emissions increase. The EPA’s 2011/2028 el modeling platform for onroad mobile sources does not account for revisions to North Carolina’s I&M program starting in 2018 because the inventory was prepared before EPA approved the I&M SIP revisions. These revisions are documented in the following paragraphs for completeness. As documented in the EPA-approved Section 110(l) noninterference demonstration for each revision to the program, the I&M program benefits are minimal due to cleaner cars and cleaner fuels, and the following changes to the I&M SIP are not likely to interfere with any of the NAAQS or affect visibility in North Carolina’s Class I areas. The 2017 session of the North Carolina General Assembly enacted Session Law 2017-10, Senate Bill 131 (An Act to Provide Further Regulatory Relief to the Citizens of North Carolina). Section 3.5.(a) of the Act amended North Carolina General Statute (NCGS) §143-215.107A(c) to remove 26 of 48 counties from North Carolina’s I&M program. For the 22 counties remaining in the I&M program, Section 3.5.(b) of the Act also amended NCGS §20-183.2(b) by changing the vehicle model year coverage. Specifically, the Act requires the following changes to North Carolina’s I&M program: Eliminate the following 26 counties from vehicle I&M requirements: Brunswick, Burke, Caldwell, Carteret, Catawba, Chatham, Cleveland, Craven, Edgecombe, Granville, Harnett, Haywood, Henderson, Lenoir, Moore, Nash, Orange, Pitt, Robeson, Rutherford, Stanly, Stokes, Surry, Wayne, Wilkes, and Wilson. o Retain the vehicle I&M program in the following 22 counties: Alamance, Buncombe,
Cabarrus, Cumberland, Davidson, Durham, Forsyth, Franklin, Gaston, Guilford, Iredell, Johnston, Lee, Lincoln, Mecklenburg, New Hanover, Onslow, Randolph, Rockingham, Rowan, Union, and Wake.
o For the 22 counties remaining in the program, change the model year vehicle coverage to: (i) a vehicle with a model year within 20 years of the current year and older than the three most recent model years, or (ii) a vehicle with a model year within 20 years of the current year and has 70,000 miles or more on its odometer. Previously, the program applied to (i) a 1996 or later model year vehicle and older than the three most recent model years, or (ii) a 1996 or later model year vehicle and has 70,000 miles or more on its odometer.
On September 25, 2018, EPA approved removal of the 26 counties from the I&M program (83 FR 48383) which became effective on December 1, 2018. On September 11, 2019, EPA
66 Approval and Promulgation of Implementation Plans; North Carolina; Inspection and Maintenance Program Updates, 80 FR, 6455.

Pre-hearing Draft 121 NC Regional Haze SIP for Second Planning Period (2019 – 2028) August 30, 2021
approved revisions to the vehicle model year coverage for the 22 counties that remain subject to the I&M program (84 FR 47889) which became effective on December 1, 2019.
The 2020 session of the North Carolina General Assembly enacted Session Law 2020-05, House Bill 85 (An Act to Remove Lee, Onslow, and Rockingham Counties from the Motor Vehicle Emissions Inspection Program). Section 1 of the Act amended North Carolina General Statue (NCGS) §143-215.107A(c) to remove 3 of 22 counties from North Carolina’s I&M program: Lee, Onslow, and Rockingham. Section 3 of the Act identifies that this change will become effective on the later of the following dates, and applies to motor vehicles inspected, or due to be inspected, on or after that effective date: (1) January 1, 2021; or (2) the first day of a month that is 60 days after the Secretary of the Department of Environmental Quality certifies to the Revisor of Statutes that EPA has approved this I&M program amendment to North Carolina’s SIP. The I&M rules are state and federally enforceable.
7.2.2 Control Measures and Other Emission Reduction Actions for Second Planning Period (2019-2028) Federal Control Programs
• Tier 3 Vehicle and Fuel Standards: Federal Tier 3 vehicle standards require all passenger
vehicles in a manufacturer’s fleet, including light-duty trucks and SUVs, to meet an average standard of 0.03 grams/per mile of NOx. Heavy-duty passenger vehicles must meet average standards of 0.178 to 0.247 grams/per mile of NOx depending on vehicle classification. Implementation began in 2017, with full compliance required by 2025. Compared to Tier 2, the Tier 3 tailpipe standards for light-duty vehicles are expected to reduce combined NOx + non-methane organic gases by approximately 80%. Tier 3 vehicle standards also include evaporative standards using onboard diagnostics that result in a 50% reduction in VOC emissions over Tier 2. The rule reduced the sulfur content of gasoline to 10 ppm in January 2017. Reduced sulfur content in gasoline will also enable the controls on vehicles already in use to operate more effectively. These emission reductions are federally enforceable.
• Medium- and Heavy-duty Vehicle Fuel Consumption and Greenhouse Gas (GHG) Standards: In September 2011, EPA and the National Highway Traffic Safety Administration promulgated joint rules to reduce GHG emissions and improve fuel efficiency of combination tractor trucks, heavy-duty pickups and vans, and vocational trucks beginning with model year 2014 and applying to all model years by 2018. The decrease in fuel consumption is expected to result in a 7% to 20% decrease in NOx emissions. These emission reductions are federally enforceable.
• Utility NSPS: On February 16, 2012, EPA published a final rule for the NSPS for fossil-fuel fired electric utility, industrial-commercial-institutional and small industrial-commercial-institutional steam generating units. In the NSPS, EPA revised the standards that new coal- and oil-fired power plants must meet for NOx, SO2, and PM. The emission standards apply to all applicable facilities that are constructed, reconstructed, or modified after May 3, 2011.

Pre-hearing Draft 122 NC Regional Haze SIP for Second Planning Period (2019 – 2028) August 30, 2021
The rule can be expected to result in the reduction of both NOx and SO2 emissions in addition to the reduction in mercury and other air toxic emissions. The emission reductions associated with the revised NSPS are federally enforceable.
• Utility Mercury and Air Toxics Standard (MATS): On February 16, 2012 (77 FR 9304), EPA promulgated the NESHAP from Coal- and Oil-Fired Electric Steam Generating Units and Standards of Performance for Fossil-Fuel-Fired Electric Utility, Industrial-Commercial-Institutional, and Small Industrial-Commercial-Institutional Steam Generating Units. The standard applies to EGUs burning fossil fuel and sets standards for certain HAP emissions, many of which are acid gases. Control of these acid gases often have the co-benefit of reducing SO2 emissions. Sources had until April 16, 2015, to comply with the rule unless granted a one-year extension for control installation or an additional extension for reliability reasons with all sources required to comply by April 2017. The EGUs in NC are permitted for mercury using the mercury emission standards in the MATS rule. However, they initially met and continue to meet these standards as a result of the Clean Smokestacks Act (CSA) that was enacted in 2002. The controls used to reduce NOx and SO2 emissions that are required to meet the CSA requirements, also reduce mercury emissions.67
• Boiler NESHAP/MACT: Facilities with affected units were required to comply with the NESHAP by January 31, 2016 for all states except North Carolina which had a compliance date of May 20, 2019. Because of delays associated with EPA’s promulgation of the boiler NESHAP, in 2009 North Carolina adopted and implemented equivalent emission limitations by permit under CAA Section 112(j). After EPA finalized the NESHAP, facilities subject to the Section 112(j) were required to revise their permits to comply with the Section 112(d) requirements by May 20, 2020. Some facilities in North Carolina complied with the NESHAP by converting affected units from burning coal to natural gas resulting in additional reductions in NOx, SO2, CO, and PM emissions. These emission reductions are federally enforceable. Appendix B-3 to this SIP documents the methodologies the DAQ used to account for criteria air pollutant emission reductions associated with the boiler NESHAP when developing the 2028 projection year inventory to support regional haze modeling.
• 2010 1-Hour SO2 NAAQS: On June 22, 2010 (75 FR 35520), EPA finalized a new primary 1-hour NAAQS of 75 ppb for SO2. Using inventory and other technical data as support, EPA determined that anthropogenic SO2 emissions originate chiefly from point sources, with fossil fuel combustion at EGUs accounting for 66% and fossil fuel combustion at other industrial facilities accounting for 29% of total anthropogenic SO2 emissions. The EPA simultaneously revised ambient air monitoring requirements for SO2, requiring fewer monitors due to the use of a hybrid approach combining air quality modeling and monitoring
67 Final Report of the Division of Air Quality to the Environmental Management Commission on the Control of Mercury Emissions from Coal-Fired Electric Steam Generating Units In accordance with 15A NCAC 02D .2509(b), July 1, 2012, https://deq.nc.gov/about/divisions/air-quality/air-quality-outreach/news/clean-air-legislation/clean-smokestacks-act.

Pre-hearing Draft 123 NC Regional Haze SIP for Second Planning Period (2019 – 2028) August 30, 2021
to determine compliance with the standard. Much of this work focused on the evaluation of point source emissions. For large SO2 sources subject to the SO2 Data Requirements Rule, North Carolina demonstrated compliance through modeling or monitoring.68 Brunswick County was designated “unclassifiable” on July 12, 2016, as part of the EPA’s Round 2 action. Subsequently, on December 31, 2017, EPA designated the majority of the state as “attainment/unclassifiable” as part of its Round 3 designation. North Carolina conducted source-oriented monitoring for one facility each in Limestone Township in Buncombe, Beaverdam Township in Haywood, and Cunningham Township in Person County for calendar years 2017 – 2019 to develop design values to support EPA’s final Round 4 designations for the state. On December 21, 2020, EPA issued final “attainment/ unclassifiable” designations for these three remaining townships.69
• NOx Emission Standards for Ocean-going Vessels: On April 4, 2014, new NOx emission standards for ocean-going vessels became effective and applied to ships constructed after 2015. These standards are found in MARPOL Annex VI,70 the international convention for the prevention of pollution from ocean-going ships. These requirements also mandate the use of significantly cleaner fuels by all large ocean-going vessels when operated near the coastline. The cleaner fuels will result in significant reductions in SO2 and PM emissions from ocean-going vessels. These requirements apply to vessels operating in waters of the United States as well as ships operating within 200 nautical miles of the coast of North America, also known as the North American Emission Control Area.
• Federal Consent Decrees: Tennessee Valley Authority (TVA) Consent Decree, January 11, 201771 In January 2009, a federal court required TVA coal-fired EGUs to install controls to significantly reduce SO2 and NOx emissions. After an appeals court reversed the decision, North Carolina, TVA, and several other parties agreed to a settlement. The settlement caps NOx and SO2 emissions at all of TVA’s coal-fired facilities to permanent levels of 52,000 tons of NOx in 2018 and 110,000 tons of SO2 in 2019. These emission reductions are federally enforceable.
68 Data Requirements Rule for the 2010 1-Hour Sulfur Dioxide (SO2) Primary National Ambient Air Quality Standard (NAAQS), Final Rule, 80 FR 51052, August 21, 2015 (https://www.govinfo.gov/content/pkg/FR-2015-08-21/pdf/2015-20367.pdf). 69 Air Quality Designations for the 2010 Primary Sulfur Dioxide (SO2) National Ambient Air Quality Standard - Round 4, Final Rule, effective on April 30, 2021, https://www.epa.gov/sulfur-dioxide-designations/epa-completes-fourth-round-sulfur-dioxide-designations. 70 https://www.epa.gov/enforcement/marpol-annex-vi-and-act-prevent-pollution-ships-apps. 71 The consent decree is available at EPA’s website at: https://www.epa.gov/enforcement/consent-decree-tennessee-valley-authority-tva.

Pre-hearing Draft 124 NC Regional Haze SIP for Second Planning Period (2019 – 2028) August 30, 2021
Duke Energy Corporation (Civil No. 1:00 cv 1262), September 10, 201572 A consent decree between EPA and Duke Energy Corporation was finalized in September 2015 to resolve CAA Prevention of Significant Deterioration (PSD) program violations at 13 EGUs at five the following five plants: • GG Allen (Units 1 and 2) – ORIS ID 2718, EIS Facility ID 8137511, NC ID 3600039 • Buck (Units 3, 4, and 5) - ORIS ID 2720, EIS Facility ID 8506911, NC ID 8000004 • Cliffside (Units 1, 2, 3, and 4) - ORIS ID 2721, EIS Facility ID 8300611, NC ID 8100028 • Dan River (Unit 3) - ORIS ID 2723, EIS Facility ID 8009611, NC ID 7900015 • Riverbend (Units 4, 6, and 7) - ORIS ID 2732, EIS Facility ID 8176211, NC ID 3600040 The consent decree required 11 of 13 EGUs that had been shut down prior to finalizing the consent decree to be a permanent and an enforceable obligation. At the GG Allen plant, the consent decree requires Duke to permanently retire Units 1 and 2 (165 megawatts (MW) each) by 2024. In the interim, Duke must continuously operate existing NOx pollution controls at Allen Units 1 and 2 and comply with a 365-day rolling average emission rate of 0.250 pound per million British Thermal Units (lb/mmBTU). Each unit must also meet a NOx tonnage cap of 600 tons per year (TPY). Duke must also continuously operate existing SO2 controls at GG Allen Units 1 and 2 and comply with a 365-day rolling average emission rate of 0.120 lb/mmBTU. In addition, to help mitigate the harm from the alleged violations, the settlement requires Duke to retire an additional 265 MW unit (i.e., Unit 3) at the GG Allen plant by 2024. The consent decree also requires Duke to spend at least $4.4 million on environmental mitigation projects. Some projects are mandatory, and some are optional as described in the consent decree. Table 7-2 summarizes actual criteria pollutant emissions for 2016-2019 and 2028 emissions (projected from 2016 emissions) used in the elv5 regional haze modeling for these Duke Energy facilities. The Riverbend facility air permit was inactivated on December 6, 2013 and the facility closed in 2014.
Table 7-2. Summary of Historical and 2028 Projected Emissions for Duke Energy Facilities affected by Federal Consent Decree (Tons)
Pollutant 2011 2014 2016 2017 2018 2019 2028 Duke Energy Carolinas, LLC - Allen Steam Station CO 1,804.34 984.77 718.46 454.95 380.10 414.92 364.95 NOx 4,401.64 4,018.53 2,168.28 1,610.22 1,440.96 1,347.63 1,410.10 PM10-PRI 534.51 291.49 88.05 65.21 64.89 71.51 165.51 PM25-PRI 485.14 263.31 67.57 48.82 49.56 57.02 100.95 SO2 1,665.32 1,718.20 676.03 354.02 246.01 147.87 575.40 VOC 53.38 29.88 21.59 14.47 12.43 13.40 11.30
72 The consent decree is available at EPA’s website at: https://www.epa.gov/enforcement/duke-energy-corporation-clean-air-act-caa-settlement.

Pre-hearing Draft 125 NC Regional Haze SIP for Second Planning Period (2019 – 2028) August 30, 2021
Pollutant 2011 2014 2016 2017 2018 2019 2028 Duke Energy Carolinas, LLC - Buck Combined Cycle Facility CO 581.26 82.32 15.72 16.13 16.45 14.03 240.81 NOx 656.25 656.25 147.41 150.67 156.38 130.13 266.71 PM10-PRI 262.95 93.07 56.10 57.39 58.41 50.08 194.83 PM25-PRI 230.47 80.67 56.10 57.39 58.41 50.08 180.32 SO2 3,840.47 7.90 10.40 10.60 10.90 9.10 22.80 VOC 11.52 33.24 9.27 9.52 9.70 8.30 42.73 Duke Energy Carolinas, LLC - Cliffside Steam Station CO 631.70 1,149.66 612.32 1,581.61 934.95 580.53 134.21 NOx 712.01 2,106.74 1,172.36 1,645.65 1,953.62 2,488.59 326.63 PM10-PRI 545.97 269.79 162.69 240.45 255.95 305.87 58.94 PM25-PRI 381.99 216.07 142.07 212.44 230.46 284.84 51.78 SO2 310.05 1,253.94 585.91 858.48 1,350.45 1,383.06 160.99 VOC 32.19 19.19 14.16 11.94 23.55 46.03 3.99 Duke Energy Carolinas, LLC - Dan River Combined Cycle Facility CO 354.28 85.13 107.45 113.02 107.94 98.97 663.90 NOx 539.90 116.61 232.60 259.83 249.18 272.76 422.28 PM10-PRI 146.84 131.34 163.84 166.37 170.20 151.82 328.86 PM25-PRI 119.17 131.34 162.32 165.55 169.43 150.85 317.83 SO2 1,947.81 8.21 10.39 10.36 10.96 9.72 31.93 VOC 4.59 29.70 36.61 42.28 36.81 33.10 83.60 Duke Energy Carolinas, LLC - Riverbend Steam CO 760.21 0.00 0.00 0.00 0.00 0.00 0.00 NOx 1,105.97 0.00 0.00 0.00 0.00 0.00 0.00 PM10-PRI 547.20 0.00 0.00 0.00 0.00 0.00 0.00 PM25-PRI 463.14 0.00 0.00 0.00 0.00 0.00 0.00 SO2 7,118.89 0.00 0.00 0.00 0.00 0.00 0.00 VOC 12.35 0.00 0.00 0.00 0.00 0.00 0.00 Total Emissions for Duke Energy Facilities CO 4,131.79 2,301.88 1,453.95 2,165.71 1,439.44 1,108.45 1,403.87 NOx 7,415.77 6,898.13 3,720.65 3,666.37 3,800.14 4,239.11 2,425.72 PM10-PRI 2,037.47 785.69 470.68 529.42 549.45 579.28 748.14 PM25-PRI 1,679.91 691.39 428.06 484.20 507.86 542.79 650.88 SO2 14,822.54 2,988.25 1,282.73 1,233.46 1,618.32 1,549.75 791.12 VOC 114.03 112.01 81.63 78.21 82.49 100.83 141.63

Pre-hearing Draft 126 NC Regional Haze SIP for Second Planning Period (2019 – 2028) August 30, 2021
PCS Subsidiaries - PCS Nitrogen Fertilizer, L.P., AA Sulfuric, Inc., and White Springs Agricultural) Chemicals, Inc. (Case No. 3:14-cv-00707-BAJ-SCR), November 6, 2014)73 The consent decree resolved claims that these PCS subsidiaries violated the CAA when they modified facilities in ways that released excess SO2 emissions into surrounding communities. The settlement required PCS Nitrogen Fertilizer, AA Sulfuric Inc., and White Springs Agricultural Chemicals Inc. to install, upgrade, and operate state-of-the-art pollution reduction measures and install emissions monitors at eight sulfuric acid plants at facilities in Aurora, North Carolina (three plants), White Springs, Florida (four plants), and Geismar, Louisiana (one plant). It was estimated that the three companies would spend $50 million on these SO2 control measures. PCS Phosphate (EIS Facility ID 8479311, NC ID 0700071) in Aurora, North Carolina completed implementation of controls on the facility from 2017 – 2019. For the purpose of modeling future year emissions, it was assumed that the controls would be applied starting January 1 of the following year. Details on the controls installed on the three acid plants at the facility are documented in Section 7.8 of this SIP. Table 7-3 summarizes actual criteria pollutant emissions for 2016-2019 and 2028 emissions (projected from 2016 emissions) used in the elv5 regional haze modeling for the PCS Phosphate facility. Table 7-3. Summary of Historical and 2028 Projected Emissions for PCS Phosphate,
Aurora, North Carolina (Tons)
Pollutant 2016 2017 2018 2019 2028 CO 620.80 527.70 424.30 390.70 655.93 NOx 468.70 407.90 431.10 457.20 495.58 PM 10 900.83 900.13 803.52 818.98 952.07 PM 2.5 233.03 235.83 225.82 234.63 278.87 SO2 5,193.68 3,139.72 3,439.36 2,307.21 4,845.90 VOC 175.97 155.90 277.50 160.20 186.00
Saint-Gobain Containers, Inc. (Civil Action No. 2:10-cv-00121-TSZ), May 7, 2010 (EIS Facility ID 8010411, NC ID 9100069)74 This global consent decree affected Saint-Gobain’s Ardagh Glass, Inc. glass manufacturing facility in Henderson (Vance County), North Carolina. The consent decree and air quality permit (Permit No. 02834T26) for the facility were reviewed during development of the 2028 projection year inventory and it was identified that the emission reductions associated with NOx controls for Furnace No. 1 (GF-1) were not reflected in the 2016 base year used as the starting point for preparing the 2028 inventory. For furnace No. 1, the facility received EPA
73 The consent decree is available at EPA’s website at: https://www.epa.gov/enforcement/pcs-nitrogen-fertilizer-clean-air-act-settlement. 74 The consent decree is available at EPA’s website at: https://www.epa.gov/enforcement/saint-gobain-containers-inc-clean-air-act-settlement.

Pre-hearing Draft 127 NC Regional Haze SIP for Second Planning Period (2019 – 2028) August 30, 2021
approval to implement SCR instead of Oxyfuel Technology via letter from the EPA dated June 25, 2015. Therefore, an 80% control efficiency was applied to the 2016 base year emissions to estimate 2028 emissions. Controls for NOx and SO2 for other processes at the facility were installed prior to 2016 and the post control emissions were reflected in the 2016 base year inventory. Table 7-4 summarizes actual criteria pollutant emissions for 2016-2019 and 2028 emissions (projected from 2016 emissions) used in the elv5 regional haze modeling for the Ardagh Glass facility. Table 7-4. Summary of Historical and 2028 Projected Emissions for Ardagh Glass,
Henderson, North Carolina (Tons)
Pollutant 2016 2017 2018 2019 2028 CO 69.55 73.68 70.19 74.39 85.17 NOx 488.12 307.70 283.45 289.67 376.90 PM 10 50.75 50.02 49.66 49.90 62.27 PM 2.5 50.74 50.01 49.65 49.89 62.26 SO2 148.27 141.86 150.29 171.33 181.93 VOC 19.27 20.86 20.16 21.01 23.65
State Control Programs
• Source-Specific SO2 SIP for Evergreen Packaging / Blue Ridge Paper Products, LLC (BRPP) (EIS Facility ID 7920511, NC ID 4400159) BRPP, a subsidiary of Evergreen Packaging, is located in the City of Canton, Beaverdam Township, Haywood County, in western North Carolina. This facility is a vertically integrated pulp and paper mill that produces specialty paperboard packaging products. On October 9, 2017, the North Carolina Environmental Management Commission and Evergreen Packaging/BRPP entered into a Special Order by Consent (SOC 2017-002) to implement process modifications, upgrade existing control equipment, and install new control equipment to reduce SO2 emissions and keep associated ambient concentrations below the 2010 1-hour SO2 NAAQS.75 The SOC required BRPP to submit a permit application and modeling analysis by March 1, 2018, to characterize the facility’s emission sources and develop allowable SO2 emission limitations based on modeled predictions of ambient SO2 concentrations. The SOC also contained a timeline for the facility to complete planned changes in order to comply with the CAA Section 112(d) boiler maximum achievable control technology
75 Special Order by Consent (SOC 2017-002) Made and Entered into Pursuant to North Carolina General Statute 143-215.110 by and between Blue Ridge Paper Products, Inc., and the Environmental Management Commission, October 9, 2017.

Pre-hearing Draft 128 NC Regional Haze SIP for Second Planning Period (2019 – 2028) August 30, 2021
(MACT) rule by May 20, 2019 per the CAA Section 112(j) requirements in its permit.76 To comply with the boiler MACT Section 112(d) rule, the facility invested approximately $50 million in planned improvements to install two new natural gas-fired boilers, permanently shut down two coal-fired boilers, and install new wet scrubbers and rebuild the electrostatic precipitators (ESPs) on two additional coal-fired boilers. Although the MACT standards control hazardous air pollutants (HAPs), these investments in controls for HAPs also significantly reduced SO2 emissions. BRPP complied with the SOC and, as a result, reduced its annual SO2 emissions to 405 tons or by 93% (5,470 tons) from 2017 to 2019. These emission reductions have led to corresponding reductions in ambient SO2 concentrations near the facility. As demonstrated through the North Carolina’s Title V permitting process, modeling of the emission limitations included in the permit show attainment of the NAAQS, and the monitoring, recordkeeping, and reporting requirements included in the permit support compliance with the emission limitations. On September 3, 2020, the North Carolina DEQ/DAQ submitted a request to EPA to revise the North Carolina SIP to incorporate into the SIP the more stringent SO2 limits (than those currently contained in the SIP) and associated operating restrictions and monitoring, recordkeeping, reporting and testing requirements established in BRPP’s Title V operating permit (Permit No. 08961T29) as permanent and federally enforceable under Section 110(a) of the CAA. This request was completed to strengthen the SIP for complying with the 2010 1-hour SO2 NAAQS in Beaverdam Township. The EPA subsequently approved the request on November 24, 2020.77 On December 21, 2020, EPA designated Beaverdam Township “attainment/unclassifiable” for the 2010 1-hour SO2 NAAQS. Table 7-5 summarizes actual criteria pollutant emissions for 2016-2019 and 2028 emissions (projected from 2016 emissions) used in the elv5 regional haze modeling for BRPP.
Table 7-5. Summary of Historical and 2028 Projected Emissions for BRPP, Canton, North Carolina (Tons)
Pollutant 2016 2017 2018 2019 2028 CO 1,500.32 1,830.70 1,632.69 1,672.13 1,118.13 NOx 4,224.22 3,418.59 3,006.74 2,967.74 2,926.78 PM 10 675.70 558.09 499.04 538.52 320.02 PM 2.5 530.71 476.00 414.46 441.06 251.40 SO2 7,195.93 5,875.43 2,901.00 405.00 405.00 VOC 1,377.79 1,420.30 1,637.84 1,587.94 1,361.54
76 40 CFR Subpart DDDDD, National Emission Standards for Hazardous Air Pollutants for Major Sources: Industrial, Commercial, and Institutional Boilers and Process Heaters (Sections 63.7480 - 63.7575). 77 85 FR 74884, Air Plan Approval; NC; Blue Ridge Paper SO2 Emission Limits, Final Rule, November 24, 2020.

Pre-hearing Draft 129 NC Regional Haze SIP for Second Planning Period (2019 – 2028) August 30, 2021
• CPI USA North Carolina LLC - Special Orders by Consent (SOC)
CPI operated two EGU facilities, one in Person County and one in Brunswick County, to generate electricity for the power grid. At the Person County facility (EIS Facility ID 7826311, NC ID 7300056), CPI operated three steam generating boilers that burned wood/biomass and tire-derived fuel. At the Brunswick County facility (EIS Facility ID 8176711, NC ID 1000067), CPI operated six steam generating boilers that burned wood/biomass and tire-derived fuel. In 2020, the North Carolina Environmental Management Commission entered into SOCs with CPI USA North Carolina LLC concerning emission sources at the Person County facility (air permit number 05856, signed on May 12, 2020) and Brunswick County facility (air permit number 05884, signed on November 4, 2020) to resolve compliance issues and reduce SO2 emissions as follows. o For the Person County facility (SOC 2020-001 signed May 12, 2020), CPI agreed to the
following conditions to reduce SO2 emissions at their facility:78 adhere to a revised emission limit of 0.95 pounds per million Btu (24-hour block
average) and by no later than March 31, 2021, the company will cease operation of all emission
sources and request rescission of their air permit.
o For the Brunswick County facility (SOC 2020-003 signed November 4, 2020), CPI agreed to the following conditions to reduce SO2 emissions:79 adhere to a revised emission limit of 1.1 pounds per million Btu per unit (24-hour
block average) operate the facility in a manner that complies with the 1-hour NAAQS for SO2, and to cease operation of all emission sources and request rescission of the air permit for
the Brunswick County facility by March 31, 2021. For each facility, Table 7-6 summarizes actual criteria pollutant emissions for 2016-2019 and 2028 emissions (projected from 2016 emissions) used in the elv5 regional haze modeling. Based on 2019 annual emissions, closure of the two facilities will reduce SO2 and NOx emissions by over 5,500 tons and 1,300 tons, respectively. These SOCs were finalized after the 2028 modeling inventory was developed which, at that time, did not anticipate that the two facilities would close in 2021.
78 Special Order by Consent (SOC 2020-001) Made and Entered into Pursuant to North Carolina General Statute 143-215.110 by and between CPI USA North Carolina LLC and the Environmental Management Commission, May 12, 2020. 79 Special Order by Consent (SOC 2020-003) Made and Entered into Pursuant to North Carolina General Statute 143-215.110 by and between CPI USA North Carolina LLC and the Environmental Management Commission, November 4, 2020.

Pre-hearing Draft 130 NC Regional Haze SIP for Second Planning Period (2019 – 2028) August 30, 2021
Table 7-6. CPI USA North Carolina LLC Facilities – Actual Emissions for 2016 – 2019 and Modeled Emissions for 2028
Actual Annual Emissions (Tons) Modeled Emissions
(Tons) Pollutant 2016 2017 2018 2019 2028
Brunswick County CO 1,585.09 1,210.70 1,312.51 1,227.97 17.49 NOx 929.40 918.10 884.33 893.23 272.42 PM10 95.96 90.88 96.85 107.23 20.50 PM2.5 77.40 66.81 56.79 56.63 15.60 SO2 4,609.00 3,616.10 3,295.60 3,297.80 119.83 VOC 9.21 8.54 8.65 8.80 1.73 Person County CO 834.91 733.16 737.54 746.34 10.13 NOx 441.17 466.34 465.35 457.94 142.50 PM10 59.22 62.99 60.81 27.29 10.07 PM2.5 50.24 53.00 51.37 18.36 8.58 SO2 2,315.30 2,410.10 2,306.40 2,237.00 66.34 VOC 11.40 12.01 11.57 11.33 0.75 Total Emissions for Brunswick and Person County CO 2,420 1,943.86 2,050.05 1,974.31 27.62 NOx 1,370.57 1,384.44 1,349.68 1,351.17 414.93 PM10 155.18 153.87 157.66 134.52 30.57 PM2.5 127.64 119.81 108.16 74.99 24.17 SO2 6,924.3 6,026.2 5,602 5,534.8 186.17 VOC 20.61 20.55 20.22 20.13 2.47
7.2.3 Construction Activities, Agricultural and Forestry Smoke Management In addition to accounting for specific emission reductions due to ongoing air pollution programs as required under the regional haze regulation section 40 CFR 51.308(d)(3)(v)(A), states are also required to consider the air quality benefits of measures to mitigate the impacts of construction activities (40 CFR 51.308(f)(2)(iv)(B)) and agricultural and forestry smoke management (40 CFR 51.308(f)(2)(iv)(D)). Section 7.9.1 and Section 7.9.2 provide more information on these activities. 7.2.4 Projected VISTAS 2028 Emissions Inventory The VISTAS emissions inventory for 2028 accounts for post-2011 emission reductions from federal, state, local, and site-specific control programs (see Section 7.2.2). The VISTAS 2028 emissions inventory is based on EPA's 2028 "el" emissions inventory data sets.80 Onroad and
80 URL: ftp://ftp.epa.gov/EmisInventory/2011v6/v3platform/2028emissions/.

Pre-hearing Draft 131 NC Regional Haze SIP for Second Planning Period (2019 – 2028) August 30, 2021
non-road mobile source emissions were created for 2028 using the 2014a version of the Motor Vehicle Emissions Simulator (MOVES2014a). Nonpoint area source emissions were prepared using growth and control factors simulating changes in economic conditions and environmental regulations anticipated to be fully implemented by calendar year 2028. For EGU sources in projected year 2028, VISTAS states considered the EPA 2028 el, the EPA 2023en, or 2028 emissions from the ERTAC EGU projection tool CONUS2.7 run and CONUS16.0 run. The EPA 2028el emissions inventory for EGUs considered the impacts of the Clean Power Plan (CPP), which was later vacated. Additionally, the EPA 2028el EGU emissions inventory used results from IPM. IPM assumes units may retire or sit idle in future years based solely on economic decisions determined within the tool. Impacts of the CPP, IPM economic retirements, and IPM economic idling resulted in many coal-fired EGUs being shut down. Thus, the EPA 2028el projected emissions for EGUs are not reflective of estimated emissions for 2028. The ERTAC EGU tool outputs do not consider the impacts of the CPP. For states outside of VISTAS, EGU estimates were derived from CONUS16.0 and CONUS16.1 outputs. For non-EGU point source projections to year 2028, VISTAS states considered the EPA 2023en and EPA 2028el emissions and in some cases supplied their own emissions data. For example, Georgia used 2016 emissions (or 2014 emissions if 2016 was not available) to represent 2028 emissions for the 33 non-EGU facilities with over 100 TPY of SO2 in 2011, exclusive of Hartsfield-Jackson Atlanta International Airport. North Carolina prepared its 2028 non-EGU point source emissions inventory by applying facility closures and growth and control factors to its 2016 base year (the most recent year available at the time and also used in EPA’s 2016 modeling platform). Appendix B-3 provides documentation of the methods North Carolina used to develop 2028 emissions for EGU and non-EGU point sources. These updates for 2028 are documented in the ERG emissions inventory report included in Appendix B-2a (Emission Inventory Updates Report (2028 Visibility Estimates)) and Appendix B-2b (Conversion of the Task 2B 2028 Point Source Remodeling Files for Emissions Processing with SMOKE). Figure 7-2 and Figure 7-3 show the expected decrease in SO2 and NOx emissions, respectively, across the VISTAS states from 2011 to 2028.

Pre-hearing Draft 132 NC Regional Haze SIP for Second Planning Period (2019 – 2028) August 30, 2021
Figure 7-2. SO2 Emissions for 2011 and 2028 for VISTAS States
Figure 7-3. NOx Emissions for 2011 and 2028 for VISTAS States

Pre-hearing Draft 133 NC Regional Haze SIP for Second Planning Period (2019 – 2028) August 30, 2021
For SO2 emissions, which are the largest contributors to haze in the Southeastern U.S., emissions across the VISTAS region are expected to decrease from 1,633,000 tons in 2011 to 448,000 tons in 2028, a 73% decrease. The EGU sector accounts for most of the reductions although in some states industrial SO2 emissions are also expected to decrease significantly. Emissions of NOx in VISTAS are projected to drop from 3,343,000 tons in 2011 to 1,528,000 tons in 2028, a 54% reduction. Most of these reductions come from the onroad sector, and such reductions are heavily dependent on federal control programs. The NOx reductions from the EGU sector are also expected to continue although NOx emissions from EGUs now make up a much smaller portion of the overall anthropogenic NOx inventory as compared to inventories from prior the planning period. The expected SO2 and NOx emission reductions are due to state and federal control programs, the use of cleaner burning fuels (e.g., conversion of EGU and industrial boilers from coal to natural gas), the construction and operation of renewable energy sources, and economic factors. Figure 7-4 and Figure 7-5 show the 2011 and 2028 emissions for SO2 and NOx, respectively, in other areas of the country. These data show significant drops in both pollutants from all other RPOs. For Class I areas that are disproportionately impacted by emissions from states in RPOs other than VISTAS, these reductions will help improve visibility impairment by 2028.
Figure 7-4. SO2 Emissions for 2011 and 2028 for Other RPOs

Pre-hearing Draft 134 NC Regional Haze SIP for Second Planning Period (2019 – 2028) August 30, 2021
Figure 7-5. NOx Emissions for 2011 and 2028 for Other RPOs
Table 7-7 summarizes criteria pollutant emissions by state and Tier 1 NEI source sector from the 2011 and 2028 emissions inventories. The complete inventories and discussion of the methodology are contained in Appendix B-2a and Appendix B-2b.

Pre-hearing Draft 135 NC Regional Haze SIP for Second Planning Period (2019 – 2028) August 30, 2021
Table 7-7. 2011 and 2028 Criteria Pollutant Emissions, VISTAS States
State Tier 1 Sector 2011 CO
(tpy) 2028 CO
(tpy)
2011 NOx (tpy)
2028 NOx (tpy)
2011 PM10 (tpy)
2028 PM10 (tpy)
2011 PM2.5 (tpy)
2028 PM2.5 (tpy)
2011 SO2 (tpy)
2028 SO2 (tpy)
2011 VOC (tpy)
2028 VOC (tpy)
AL Chemical & Allied Product Mfg 3,123 3,122 2,411 2,409 704 704 650 650 6,559 6,583 1,629 1,576
AL Fuel Comb. Elec. Util. 9,958 6,748 61,687 18,098 7,323 1,714 4,866 1,190 179,323 7,965 1,152 910 AL Fuel Comb. Industrial 71,865 73,890 35,447 27,842 46,274 47,304 34,664 39,088 41,322 18,806 3,283 3,413 AL Fuel Comb. Other 12,104 11,352 4,229 4,100 1,689 1,584 1,654 1,549 417 193 2,038 1,796 AL Highway Vehicles 701,397 182,602 152,732 30,113 8,001 4,984 4,611 1,322 683 262 75,523 15,013 AL Metals Processing 10,991 10,759 5,947 5,434 5,359 4,326 4,647 3,844 13,298 13,072 1,843 1,550 AL Miscellaneous 670,765 666,279 14,735 14,567 445,039 494,515 108,297 113,981 6,746 6,679 159,034 158,720 AL Off-Highway 261,788 253,400 47,801 25,355 3,584 1,781 3,369 1,653 1,074 193 43,396 22,709
AL Other Industrial Processes 19,708 18,908 21,546 20,732 17,032 16,269 8,749 8,095 9,569 15,773 14,327 13,927
AL Petroleum & Related Industries 14,882 9,353 11,226 7,416 373 310 354 292 19,196 3,365 22,103 15,109
AL Solvent Utilization 124 119 135 120 83 74 61 54 1 1 46,790 46,658 AL Storage & Transport 65 65 51 51 870 823 653 604 2 2,767 18,726 12,302
AL Waste Disposal & Recycling 45,712 45,712 1,876 1,876 7,885 7,885 6,531 6,531 175 175 3,620 3,620
AL Subtotals: 1,822,482 1,282,309 359,823 158,113 544,216 582,273 179,106 178,853 278,365 75,834 393,464 297,303
FL Chemical & Allied Product Mfg 117 117 1,393 1,279 415 337 348 295 21,948 14,260 1,231 1,230
FL Fuel Comb. Elec. Util. 36,344 25,254 69,049 26,425 11,621 8,680 9,607 7,973 95,087 24,565 1,931 1,497 FL Fuel Comb. Industrial 72,200 78,811 31,291 29,867 33,061 38,121 28,979 33,504 15,715 8,477 4,576 3,617 FL Fuel Comb. Other 25,015 23,851 4,601 4,590 3,498 3,278 3,448 3,248 1,183 303 4,330 3,860 FL Highway Vehicles 1,784,678 679,511 308,752 72,019 21,329 19,834 9,377 4,412 2,104 823 183,609 51,019 FL Metals Processing 742 480 80 80 199 192 165 159 337 31 62 49 FL Miscellaneous 992,515 960,190 22,844 21,346 384,091 466,941 129,258 138,297 10,473 9,727 231,259 228,825 FL Off-Highway 1,120,490 1,125,776 159,796 94,782 14,009 6,737 13,181 6,231 20,051 2,973 166,582 88,560
FL Other Industrial Processes 13,065 13,065 8,885 12,313 28,504 28,693 11,836 12,042 4,338 4,315 14,485 14,315
FL Petroleum & Related Industries 802 828 279 293 92 93 63 64 211 211 2,847 2,252
FL Solvent Utilization 3 3 2 2 34 33 30 30 <0.5 <0.5 151,477 151,367 FL Storage & Transport 104 104 154 154 1,177 971 592 528 29 29 101,966 68,391
FL Waste Disposal & Recycling 27,944 28,108 1,240 2,301 4,151 4,199 3,492 3,534 1,224 1,265 2,707 2,734
FL Subtotal: 4,074,019 2,936,098 608,366 265,451 502,181 578,109 210,376 210,317 172,700 66,979 867,062 617,716

Pre-hearing Draft 136 NC Regional Haze SIP for Second Planning Period (2019 – 2028) August 30, 2021
State Tier 1 Sector 2011 CO
(tpy) 2028 CO
(tpy)
2011 NOx (tpy)
2028 NOx (tpy)
2011 PM10 (tpy)
2028 PM10 (tpy)
2011 PM2.5 (tpy)
2028 PM2.5 (tpy)
2011 SO2 (tpy)
2028 SO2 (tpy)
2011 VOC (tpy)
2028 VOC (tpy)
GA Chemical & Allied Product Mfg 502 476 959 931 476 406 408 353 1,580 1,054 2,571 2,399
GA Fuel Comb. Elec. Util. 13,543 10,611 56,037 25,481 9,061 5,150 6,298 4,242 188,009 18,411 1,195 1,016 GA Fuel Comb. Industrial 21,837 19,771 22,274 17,788 3,198 2,672 2,752 2,311 21,358 9,769 1,737 1,618 GA Fuel Comb. Other 20,021 19,536 11,233 10,857 2,204 1,998 2,152 1,950 4,660 4,187 3,056 2,730 GA Highway Vehicles 1,018,645 305,264 223,223 48,973 12,518 8,914 6,829 2,289 1,088 443 109,005 25,629 GA Metals Processing 344 344 149 149 156 156 82 82 92 92 57 57 GA Miscellaneous 1,022,524 984,133 40,646 39,003 858,861 998,804 220,258 232,719 11,424 10,688 78,048 75,220 GA Off-Highway 471,960 477,533 74,217 40,838 5,923 2,974 5,594 2,769 2,562 967 60,843 36,837
GA Other Industrial Processes 24,548 17,280 15,893 13,130 47,506 45,021 17,925 15,808 3,705 2,268 22,763 20,583
GA Petroleum & Related Industries 6 6 none
reported none
reported 23 22 11 13 none reported
none reported 132 131
GA Solvent Utilization 25 24 30 28 31 31 30 30 <0.5 <0.5 84,352 83,997
GA Storage & Transport 49 49 21 21 1,015 1,014 511 502 none reported
none reported 33,985 23,439
GA Waste Disposal & Recycling 227,703 227,696 7,636 7,628 26,852 26,851 26,222 26,221 223 222 17,363 17,361
GA Subtotals: 2,821,707 2,062,723 452,318 204,827 967,824 1,094,013 289,072 289,289 234,701 48,101 415,107 291,017
KY Chemical & Allied Product Mfg 62 62 241 241 817 816 708 708 1,663 393 2,202 2,189
KY Fuel Comb. Elec. Util. 15,547 12,253 92,756 33,258 13,874 7,409 9,495 5,781 247,556 49,728 1,749 1,067 KY Fuel Comb. Industrial 10,848 10,870 20,009 17,876 2,247 2,505 1,981 2,214 5,774 4,819 1,422 1,031 KY Fuel Comb. Other 48,175 43,582 5,765 5,477 6,891 6,158 6,781 6,072 1,868 1,166 8,390 7,183 KY Highway Vehicles 498,702 157,636 115,685 27,819 5,480 3,448 3,345 1,015 502 209 50,326 12,938 KY Metals Processing 61,446 61,446 1,611 1,611 4,151 4,111 3,402 3,383 6,021 3,200 2,081 2,081 KY Miscellaneous 190,510 180,432 3,486 3,034 204,775 230,661 44,517 47,310 1,742 1,528 43,514 42,725 KY Off-Highway 201,625 193,150 56,646 29,793 3,573 1,557 3,392 1,464 641 402 31,999 17,094
KY Other Industrial Processes 4,985 4,992 5,682 5,662 26,177 25,483 9,042 8,737 6,468 6,465 31,759 31,489
KY Petroleum & Related Industries 31,312 67,128 24,707 47,426 683 2,795 633 2,745 522 1,561 31,085 44,846
KY Solvent Utilization 3 3 5 5 83 81 73 72 <0.5 <0.5 44,118 44,031 KY Storage & Transport 23 23 6 6 2,005 1,804 484 427 3 3 22,606 16,169
KY Waste Disposal & Recycling 25,288 25,288 1,156 1,156 5,335 5,330 4,532 4,527 161 161 2,352 2,352
KY Subtotals: 1,088,526 756,865 327,755 173,364 276,091 292,158 88,385 84,455 272,921 69,635 273,603 225,195
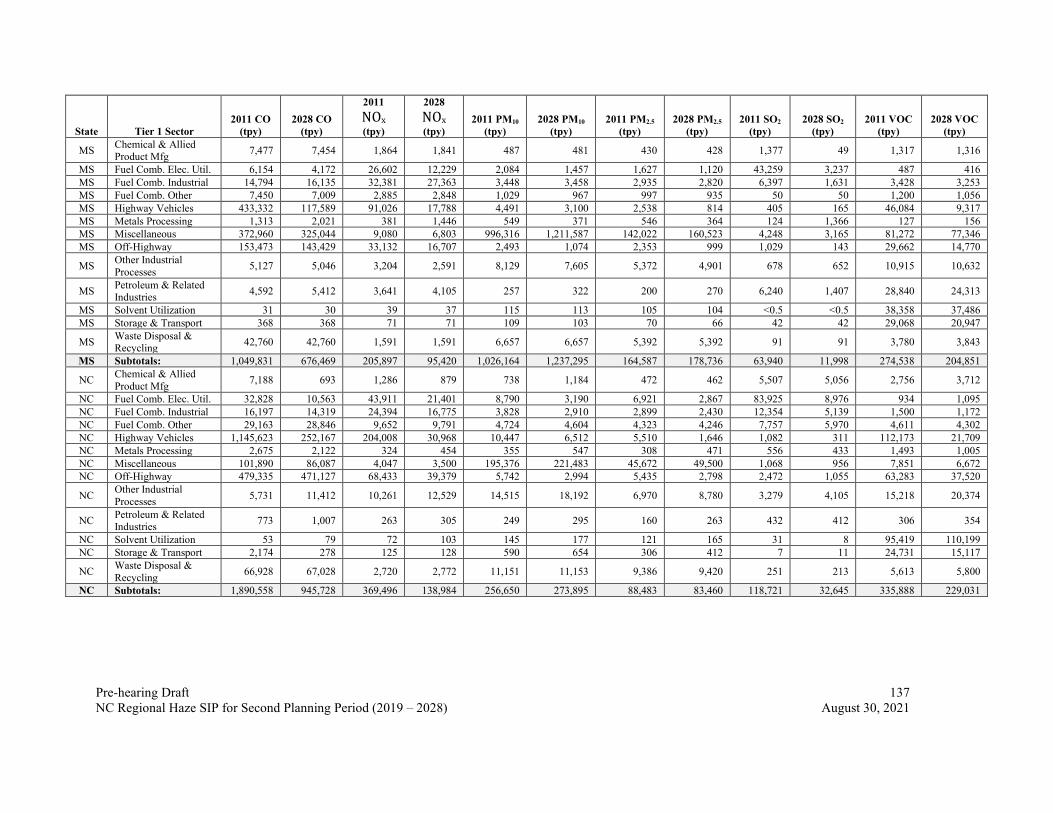
Pre-hearing Draft 137 NC Regional Haze SIP for Second Planning Period (2019 – 2028) August 30, 2021
State Tier 1 Sector 2011 CO
(tpy) 2028 CO
(tpy)
2011 NOx (tpy)
2028 NOx (tpy)
2011 PM10 (tpy)
2028 PM10 (tpy)
2011 PM2.5 (tpy)
2028 PM2.5 (tpy)
2011 SO2 (tpy)
2028 SO2 (tpy)
2011 VOC (tpy)
2028 VOC (tpy)
MS Chemical & Allied Product Mfg 7,477 7,454 1,864 1,841 487 481 430 428 1,377 49 1,317 1,316
MS Fuel Comb. Elec. Util. 6,154 4,172 26,602 12,229 2,084 1,457 1,627 1,120 43,259 3,237 487 416 MS Fuel Comb. Industrial 14,794 16,135 32,381 27,363 3,448 3,458 2,935 2,820 6,397 1,631 3,428 3,253 MS Fuel Comb. Other 7,450 7,009 2,885 2,848 1,029 967 997 935 50 50 1,200 1,056 MS Highway Vehicles 433,332 117,589 91,026 17,788 4,491 3,100 2,538 814 405 165 46,084 9,317 MS Metals Processing 1,313 2,021 381 1,446 549 371 546 364 124 1,366 127 156 MS Miscellaneous 372,960 325,044 9,080 6,803 996,316 1,211,587 142,022 160,523 4,248 3,165 81,272 77,346 MS Off-Highway 153,473 143,429 33,132 16,707 2,493 1,074 2,353 999 1,029 143 29,662 14,770
MS Other Industrial Processes 5,127 5,046 3,204 2,591 8,129 7,605 5,372 4,901 678 652 10,915 10,632
MS Petroleum & Related Industries 4,592 5,412 3,641 4,105 257 322 200 270 6,240 1,407 28,840 24,313
MS Solvent Utilization 31 30 39 37 115 113 105 104 <0.5 <0.5 38,358 37,486 MS Storage & Transport 368 368 71 71 109 103 70 66 42 42 29,068 20,947
MS Waste Disposal & Recycling 42,760 42,760 1,591 1,591 6,657 6,657 5,392 5,392 91 91 3,780 3,843
MS Subtotals: 1,049,831 676,469 205,897 95,420 1,026,164 1,237,295 164,587 178,736 63,940 11,998 274,538 204,851
NC Chemical & Allied Product Mfg 7,188 693 1,286 879 738 1,184 472 462 5,507 5,056 2,756 3,712
NC Fuel Comb. Elec. Util. 32,828 10,563 43,911 21,401 8,790 3,190 6,921 2,867 83,925 8,976 934 1,095 NC Fuel Comb. Industrial 16,197 14,319 24,394 16,775 3,828 2,910 2,899 2,430 12,354 5,139 1,500 1,172 NC Fuel Comb. Other 29,163 28,846 9,652 9,791 4,724 4,604 4,323 4,246 7,757 5,970 4,611 4,302 NC Highway Vehicles 1,145,623 252,167 204,008 30,968 10,447 6,512 5,510 1,646 1,082 311 112,173 21,709 NC Metals Processing 2,675 2,122 324 454 355 547 308 471 556 433 1,493 1,005 NC Miscellaneous 101,890 86,087 4,047 3,500 195,376 221,483 45,672 49,500 1,068 956 7,851 6,672 NC Off-Highway 479,335 471,127 68,433 39,379 5,742 2,994 5,435 2,798 2,472 1,055 63,283 37,520
NC Other Industrial Processes 5,731 11,412 10,261 12,529 14,515 18,192 6,970 8,780 3,279 4,105 15,218 20,374
NC Petroleum & Related Industries 773 1,007 263 305 249 295 160 263 432 412 306 354
NC Solvent Utilization 53 79 72 103 145 177 121 165 31 8 95,419 110,199 NC Storage & Transport 2,174 278 125 128 590 654 306 412 7 11 24,731 15,117
NC Waste Disposal & Recycling 66,928 67,028 2,720 2,772 11,151 11,153 9,386 9,420 251 213 5,613 5,800
NC Subtotals: 1,890,558 945,728 369,496 138,984 256,650 273,895 88,483 83,460 118,721 32,645 335,888 229,031

Pre-hearing Draft 138 NC Regional Haze SIP for Second Planning Period (2019 – 2028) August 30, 2021
State Tier 1 Sector 2011 CO
(tpy) 2028 CO
(tpy)
2011 NOx (tpy)
2028 NOx (tpy)
2011 PM10 (tpy)
2028 PM10 (tpy)
2011 PM2.5 (tpy)
2028 PM2.5 (tpy)
2011 SO2 (tpy)
2028 SO2 (tpy)
2011 VOC (tpy)
2028 VOC (tpy)
SC Chemical & Allied Product Mfg 1,217 1,217 165 165 132 131 77 76 9 4 2,110 1,843
SC Fuel Comb. Elec. Util. 16,809 13,527 26,752 10,993 10,851 3,290 8,604 2,672 71,899 10,762 607 573 SC Fuel Comb. Industrial 19,560 21,191 17,924 17,505 10,314 11,286 8,273 9,498 15,748 9,386 1,103 1,117 SC Fuel Comb. Other 12,508 11,800 3,283 3,351 1,701 1,580 1,660 1,546 339 309 2,128 1,867 SC Highway Vehicles 475,876 155,913 109,374 23,263 6,618 4,504 3,766 1,152 504 215 51,164 12,546 SC Metals Processing 53,733 53,811 780 861 572 581 480 489 5,139 5,182 457 457 SC Miscellaneous 214,147 200,969 4,602 4,033 280,281 341,123 51,363 56,686 1,978 1,902 48,908 47,771 SC Off-Highway 240,507 233,340 35,569 19,154 3,036 1,477 2,856 1,369 2,268 360 35,104 19,097
SC Other Industrial Processes 17,912 17,827 10,251 11,697 7,581 7,311 4,149 3,897 5,223 5,724 15,036 14,754
SC Petroleum & Related Industries
none reported
none reported
none reported
none reported
none reported
none reported
none reported
none reported
none reported
none reported 31 29
SC Solvent Utilization 7 7 1 1 14 14 13 12 <0.5 <0.5 41,039 39,341 SC Storage & Transport 39 39 26 26 346 282 139 119 1 1 30,397 21,258
SC Waste Disposal & Recycling 48,668 48,667 1,817 1,806 7,055 7,042 5,746 5,735 140 139 4,073 4,059
SC Subtotals: 1,100,983 758,308 210,544 92,855 328,501 378,621 87,126 83,251 103,248 33,984 232,157 164,712
TN Chemical & Allied Product Mfg 14,866 14,862 811 804 755 755 426 426 492 489 4,412 4,397
TN Fuel Comb. Elec. Util. 5,529 3,771 27,156 8,006 5,191 2,618 4,172 2,444 120,170 10,059 769 585 TN Fuel Comb. Industrial 18,910 22,671 27,988 25,234 10,632 12,293 9,018 10,691 27,778 8,076 1,129 1,239 TN Fuel Comb. Other 25,945 23,479 9,207 8,441 3,470 3,044 3,182 2,928 5,441 779 5,168 4,906 TN Highway Vehicles 739,041 233,423 182,796 44,927 9,927 6,734 5,778 1,811 769 338 80,463 20,483 TN Metals Processing 5,066 5,066 611 611 1,492 1,492 1,251 1,251 572 681 2,923 2,923 TN Miscellaneous 133,301 124,792 2,840 2,450 150,164 165,066 36,986 39,404 1,347 1,162 31,052 30,344 TN Off-Highway 309,062 298,569 60,384 33,596 4,242 2,032 4,010 1,898 767 625 46,292 25,501
TN Other Industrial Processes 5,668 6,244 7,449 8,189 11,527 11,224 6,034 5,779 2,550 1,468 15,672 14,828
TN Petroleum & Related Industries 2,706 4,956 1,812 3,193 189 307 160 278 243 149 3,559 3,517
TN Solvent Utilization 72 72 84 84 328 328 288 288 15 15 67,091 67,091 TN Storage & Transport 56 56 37 29 520 393 238 184 5 4 29,921 19,812
TN Waste Disposal & Recycling 26,959 26,959 1,392 1,392 5,710 5,710 4,813 4,813 174 137 2,549 2,839
TN Subtotals: 1,287,181 764,920 322,567 136,956 204,147 211,996 76,356 72,195 160,323 23,982 291,000 198,465

Pre-hearing Draft 139 NC Regional Haze SIP for Second Planning Period (2019 – 2028) August 30, 2021
State Tier 1 Sector 2011 CO
(tpy) 2028 CO
(tpy)
2011 NOx (tpy)
2028 NOx (tpy)
2011 PM10 (tpy)
2028 PM10 (tpy)
2011 PM2.5 (tpy)
2028 PM2.5 (tpy)
2011 SO2 (tpy)
2028 SO2 (tpy)
2011 VOC (tpy)
2028 VOC (tpy)
VA Chemical & Allied Product Mfg 83 83 7,707 1,734 169 169 73 73 203 203 486 485
VA Fuel Comb. Elec. Util. 4,984 6,232 30,213 10,677 5,794 3,858 1,157 1,456 69,077 1,903 742 448 VA Fuel Comb. Industrial 13,713 11,294 22,048 13,962 5,883 5,071 4,817 4,376 14,349 5,776 950 871 VA Fuel Comb. Other 77,919 74,900 11,470 11,034 11,302 10,748 11,002 10,507 4,884 3,264 12,940 11,877 VA Highway Vehicles 566,315 232,611 145,507 35,427 7,106 4,302 4,368 1,309 711 279 63,152 18,550 VA Metals Processing 3,016 3,016 812 812 859 858 724 723 5,196 5,196 270 270 VA Miscellaneous 167,730 164,877 3,186 3,077 141,777 156,214 33,384 36,128 1,487 1,439 39,308 39,107 VA Off-Highway 383,506 391,290 67,844 37,836 5,029 2,576 4,747 2,398 3,355 892 48,417 30,266
VA Other Industrial Processes 5,644 7,256 12,766 10,337 12,394 12,839 5,001 5,400 7,028 5,294 6,937 7,107
VA Petroleum & Related Industries 12,445 12,993 9,618 9,748 406 541 284 424 59 65 8,525 12,152
VA Solvent Utilization <0.5 0 <0.5 0 66 68 61 63 <0.5 <0.5 85,760 93,969 VA Storage & Transport 5 6 2 2 351 353 286 301 <0.5 <0.5 23,556 16,224
VA Waste Disposal & Recycling 33,103 33,192 2,283 2,305 5,745 5,758 4,925 4,932 1,469 1,483 4,317 4,380
VA Subtotals: 1,268,463 937,750 313,456 136,951 196,881 203,355 70,829 68,090 107,818 25,794 295,360 235,706
WV Chemical & Allied Product Mfg 247 249 402 278 330 296 246 229 145 106 2,000 1,036
WV Fuel Comb. Elec. Util. 10,106 8,663 54,289 49,885 11,066 6,822 9,100 5,462 93,080 47,746 1,011 1,162 WV Fuel Comb. Industrial 4,424 3,896 16,592 10,820 1,977 1,291 1,086 492 16,306 6,241 540 581 WV Fuel Comb. Other 19,471 18,115 8,661 6,695 2,893 2,751 2,803 2,671 760 677 4,059 3,472 WV Highway Vehicles 185,437 55,258 41,840 10,124 2,101 1,273 1,269 375 179 72 20,493 5,208 WV Metals Processing 24,179 24,088 1,806 1,839 1,468 1,362 1,046 973 2,069 1,956 520 499 WV Miscellaneous 86,791 86,171 1,296 1,277 76,122 76,051 15,876 15,810 684 677 20,396 20,356 WV Off-Highway 89,194 89,372 22,397 11,934 1,428 696 1,341 649 204 35 15,934 8,932
WV Other Industrial Processes 2,726 2,616 2,464 1,941 21,016 20,439 3,655 3,664 1,983 1,350 1,283 1,443
WV Petroleum & Related Industries 27,645 42,008 22,041 29,242 692 1,514 594 1,511 6,144 191 47,734 130,121
WV Solvent Utilization <0.5 <0.5 <0.5 none reported 13 2 13 2 <0.5 none
reported 14,315 13,610
WV Storage & Transport 2 2 4 21 465 220 182 74 <0.5 <0.5 8,621 5,687
WV Waste Disposal & Recycling 31,785 31,786 1,152 1,152 4,840 4,840 3,981 3,981 63 63 2,622 2,606
WV Subtotals: 482,007 362,224 172,944 125,208 124,411 117,557 41,192 35,893 121,617 59,114 139,528 194,713 VIST
AS Totals: 16,885,75
7 11,483,394 3,343,166 1,528,129 4,427,066 4,969,272 1,295,512 1,284,539 1,634,354 448,066 3,517,707 2,658,709

Pre-hearing Draft 140 NC Regional Haze SIP for Second Planning Period (2019 – 2028) August 30, 2021
7.2.5 EPA Inventories The EPA created a 2016 base year emissions inventory for modeling purposes in a collaborative effort with states and RPOs. The 2016 emissions inventory data for the point source and EGU sectors originated with state submissions to the EIS and, for those units subject to 40 CFR Part 75 monitoring requirements, unit level reporting to CAMD for SO2 and NOx emissions. Other source sector data were estimated by EPA, through emissions inventory tools, or estimates based upon state supplied input. This data set includes a full suite of 2016 base year inventories and projection year data for 2023 and 2028.81 The 2023 and 2028 projections from 2016 relied upon IPM for estimates of EGU activity and emissions. The EPA has provided emission summaries of this information at state and source classification code (SCC) levels for both the 2016 base year and EPA's previous 2014 base year. The EPA used the 2014 NEI data to create the 2014 base year data set. Point source and EGU sector information for the 2014 NEI originated with state submissions or from unit-level reporting to CAMD. Other sectors in the 2014 NEI were created by EPA based on tool inputs supplied by state staff, contractor estimates, and additional sources. Evaluation of these data sets show trends that are similar to those in the VISTAS emissions inventory. The EPA has also prepared and published the 2017 NEI based on point source and EGU sector data that originated with state EIS submissions and unit-level reporting to CAMD.82 The EPA developed other emissions sectors of the 2017 NEI using state-supplied input files for emission estimation tools, contractor estimates, and additional sources of data. These data represent the January 2021 version of this database, which includes all sectors and pollutants for emissions across the United States. Figure 7-6 provides the estimated actual SO2 emissions within the EPA inventories for 2014, 2016, and 2017 by Tier 1 category within the ten VISTAS states; the emissions inventories for years 2023 and 2028, projected from the base year 2016 data by EPA; and the 2011 and 2028 VISTAS inventories used in the RPG modeling. The 2011 and 2014 data show that SO2 emissions were predominantly emitted from electric utility fuel combustion and industrial fuel combustion within the VISTAS region. Significant SO2 reductions occurred by 2016, and additional reductions occurred in 2017. These SO2 reductions are most pronounced in the electric utility fuel combustion category. The EPA's 2023 and 2028 data forecast continued declines in SO2 emissions from this category. The VISTAS 2028 data also project additional SO2 emission reductions across the VISTAS states although these projections are higher than the EPA 2028 projections. Figure 7-7 provides the estimated actual NOx emissions within the EPA inventories for 2014, 2016, and 2017 by Tier 1 category within the ten VISTAS states; the emissions inventories for years 2023 and 2028, projected from the base year 2016 data by EPA; and the 2011 and 2028
81 URL: https://www.epa.gov/air-emissions-modeling/2016v1-platform 82 URL: https://www.epa.gov/air-emissions-inventories/2017-national-emissions-inventory-nei-data

Pre-hearing Draft 141 NC Regional Haze SIP for Second Planning Period (2019 – 2028) August 30, 2021
VISTAS inventories used in the RPG modeling. The 2011, 2014, and 2016 data show that NOx emissions were predominantly emitted from onroad and off-highway source sectors. Significant reductions in NOx occurred by 2016 as compared to 2011. During this time period, reductions in emissions from onroad and off-highway source sectors as well as the electrical utility fuel combustion sector contributed to this drop. The EPA's 2023 and 2028 projections forecast continued declines in NOx emissions, most notably from the onroad and off-highway source sectors. The VISTAS 2028 data also project additional NOx emission reductions across the VISTAS states although the estimated reductions are not as great as those from EPA. The VISTAS 2028 data are higher than the EPA 2028 projections largely due to differences in projection methodologies for EGUs and some non-EGUs. For example, EPA relied upon IPM results that generally have lower SO2 and NOx emissions than ERTAC results. The IPM tool may retire or idle coal fired EGUs and certain coal fired industrial boilers that occasionally provide electricity to the grid due to economic assumptions within the model. ERTAC projections do not use economic decisions to forecast retirements or idling of units in future years. Rather, states provide estimated retirement dates based on information provided by the facility owners, consent decrees, permits, or other types of documentation. The ERTAC projections, therefore, tend to be more conservative.
Figure 7-6. SO2 Emissions from VISTAS States
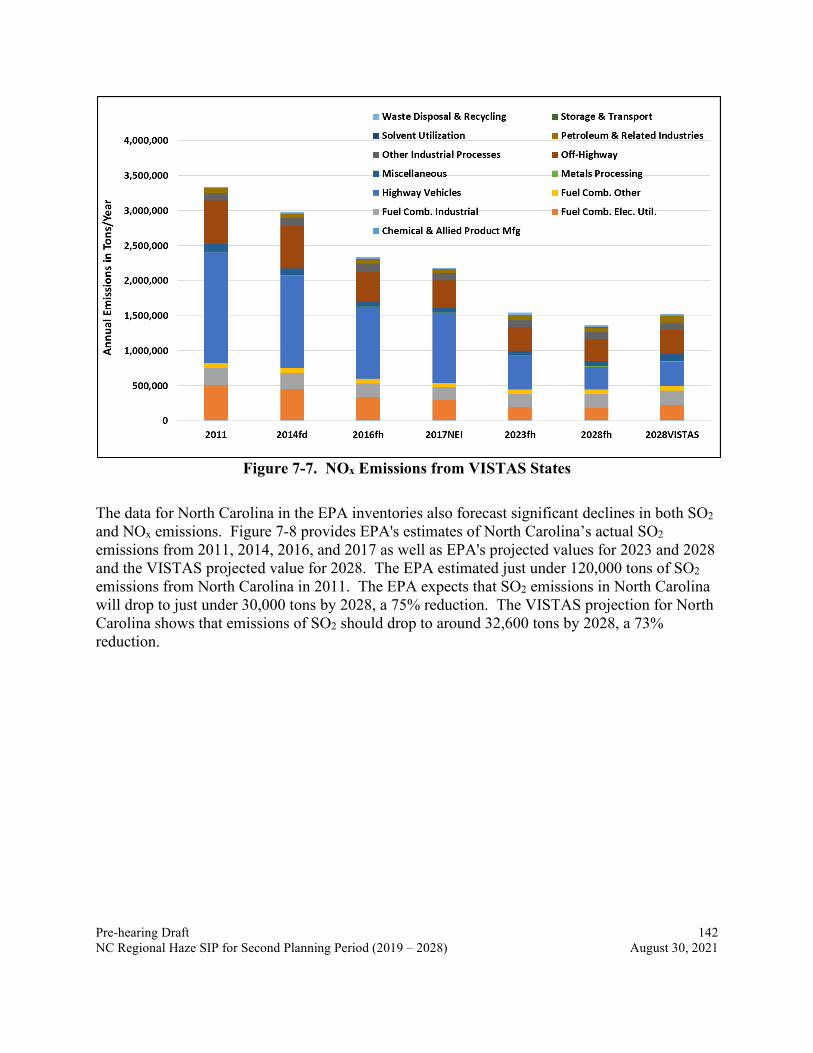
Pre-hearing Draft 142 NC Regional Haze SIP for Second Planning Period (2019 – 2028) August 30, 2021
Figure 7-7. NOx Emissions from VISTAS States
The data for North Carolina in the EPA inventories also forecast significant declines in both SO2 and NOx emissions. Figure 7-8 provides EPA's estimates of North Carolina’s actual SO2 emissions from 2011, 2014, 2016, and 2017 as well as EPA's projected values for 2023 and 2028 and the VISTAS projected value for 2028. The EPA estimated just under 120,000 tons of SO2 emissions from North Carolina in 2011. The EPA expects that SO2 emissions in North Carolina will drop to just under 30,000 tons by 2028, a 75% reduction. The VISTAS projection for North Carolina shows that emissions of SO2 should drop to around 32,600 tons by 2028, a 73% reduction.

Pre-hearing Draft 143 NC Regional Haze SIP for Second Planning Period (2019 – 2028) August 30, 2021
Figure 7-8. North Carolina SO2 Emissions
Figure 7-9 provides EPA's estimates of actual NOx emissions in North Carolina from 2011, 2014, 2016, and 2017. The figure also shows EPA's projected values for 2023 and 2028, using 2016 as the base year, and the VISTAS projections for 2028. The EPA estimated about 369,500 tons of NOx emissions from North Carolina in 2011. The EPA expects that NOx emissions in North Carolina will drop to under 150,000 tons by 2028, a 59% reduction. The VISTAS projections estimate that North Carolina NOx emissions will drop to about 139,000 tons by 2028, a 62% reduction.
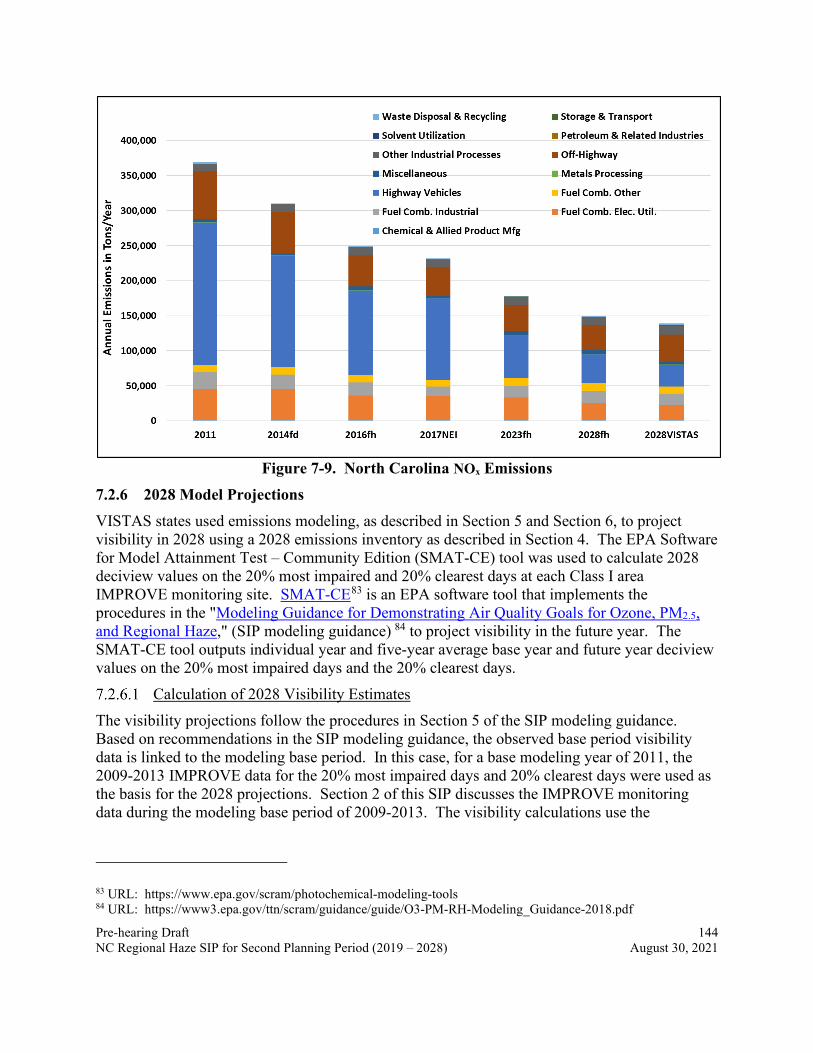
Pre-hearing Draft 144 NC Regional Haze SIP for Second Planning Period (2019 – 2028) August 30, 2021
Figure 7-9. North Carolina NOx Emissions
7.2.6 2028 Model Projections VISTAS states used emissions modeling, as described in Section 5 and Section 6, to project visibility in 2028 using a 2028 emissions inventory as described in Section 4. The EPA Software for Model Attainment Test – Community Edition (SMAT-CE) tool was used to calculate 2028 deciview values on the 20% most impaired and 20% clearest days at each Class I area IMPROVE monitoring site. SMAT-CE83 is an EPA software tool that implements the procedures in the "Modeling Guidance for Demonstrating Air Quality Goals for Ozone, PM2.5, and Regional Haze," (SIP modeling guidance) 84 to project visibility in the future year. The SMAT-CE tool outputs individual year and five-year average base year and future year deciview values on the 20% most impaired days and the 20% clearest days.
Calculation of 2028 Visibility Estimates The visibility projections follow the procedures in Section 5 of the SIP modeling guidance. Based on recommendations in the SIP modeling guidance, the observed base period visibility data is linked to the modeling base period. In this case, for a base modeling year of 2011, the 2009-2013 IMPROVE data for the 20% most impaired days and 20% clearest days were used as the basis for the 2028 projections. Section 2 of this SIP discusses the IMPROVE monitoring data during the modeling base period of 2009-2013. The visibility calculations use the
83 URL: https://www.epa.gov/scram/photochemical-modeling-tools 84 URL: https://www3.epa.gov/ttn/scram/guidance/guide/O3-PM-RH-Modeling_Guidance-2018.pdf

Pre-hearing Draft 145 NC Regional Haze SIP for Second Planning Period (2019 – 2028) August 30, 2021
IMPROVE equation discussed in Section 2.1. As noted in Section 2.1, the IMPROVE algorithm uses PM species concentrations and relative humidity data to calculate visibility impairment as extinction (bext) in units of inverse megameters. The 2028 future year visibility on the 20% most impaired days and the 20% clearest days at each Class I area is estimated by using the observed IMPROVE data from years 2009-2013 and the relative percent modeled change in PM species between 2011 and 2028. The following steps describe the process. The SIP modeling guidance contains more detailed description and examples.
• Step 1 - For each Class I area (i.e., IMPROVE site), estimate anthropogenic impairment (Mm-1) on each day using observed speciated PM2.5 data plus PM10 data (and other information) for each of the five years comprising the modeling base period (2009-2013) and rank the days on this indicator.85 This ranking will determine the 20% most impaired days. For each Class I area, also rank observed visibility (in deciviews) on each day using observed speciated PM2.5 data plus PM10 data for each of the five years comprising the modeling base period. This ranking will determine the 20% clearest days.
• Step 2 - For each of the five years comprising the base period, calculate the mean deciviews for the 20% most impaired days and the 20% clearest days. For each Class I area, calculate the five-year mean deciviews for the 20% most impaired and the 20% clearest days from the five year-specific values.
• Step 3 - Use an air quality model to simulate air quality with base period (2011) emissions and future year (2028) emissions. Use the resulting information to develop monitor site-specific relative response factors (RRFs) for each component of PM identified in the “revised” IMPROVE equation. The RRFs are an average percent change in species concentrations based on the measured 20% most impaired days and 20% clearest days from 2011 to 2028. The calendar days from 2011 identified from the IMPROVE data are matched by day to the modeled days. RRFs are calculated separately for sulfate, nitrate, organic carbon mass, elemental carbon, fine soil mass, and coarse mass. The observed sea salt is primarily from natural sources that are not expected to be year-sensitive, and the modeled sea salt is uncertain. Therefore, the sea salt RRF for all monitor sites is assumed to be 1.0.
• Step 4 – For each monitor site, multiply the species-specific RRFs by the measured daily species concentration data during the 2009-2013 base period for each day in the measured 20% most impaired day data set and each day in the 20% clearest day data set. This results in daily future year 2028 PM species concentration data.
85 EPA, “Technical Guidance on Tracking Visibility Progress for the Second Implementation Period of the Regional Haze Program”, December 2018. URL: https://www.epa.gov/sites/production/files/2018-12/documents/technical_guidance_tracking_visibility_progress.pdf

Pre-hearing Draft 146 NC Regional Haze SIP for Second Planning Period (2019 – 2028) August 30, 2021
• Step 5 - Using the results in Step 4 and the IMPROVE algorithm described in Section 2, calculate the future daily extinction coefficients for the previously identified 20% most impaired days and 20% clearest days in each of the five base years.
• Step 6 - Calculate daily deciview values (from total daily extinction) and then compute the future year (2028) average mean deciviews for the 20% most impaired days and 20% clearest days for each year. Average the five years together to get the final future mean deciview values for the 20% most impaired days and 20% clearest days.
In cases where an IMPROVE monitor is located within a Class I area, the five-year average modeling base period visibility is used with modeled concentrations from the grid cell containing the IMPROVE monitor to calculate future year RRFs and visibility results. In cases within VISTAS states where an IMPROVE monitor is not located within a Class I Area, surrogate IMPROVE monitors are assigned to establish modeling base period visibility values. See Section 2.2 for a description and listing of these sites. When using a surrogate IMPROVE monitor site, the five-year average modeling base period visibility from the surrogate location is used with modeled concentrations from the actual modeled grid cell at the centroid of the Class I area to calculate future year RRFs and visibility results. In Class I areas outside of the VISTAS states, surrogate monitor modeling base period data and RRFs are used to project future year visibility.
Calculation of 2028 Visibility Projection Results Table 7-8 provides the 2028 visibility projections for North Carolina’s five Class I areas. More information on these projections may be found in Appendix E-6 (Future Year Model Projections).
Table 7-8. 2028 Visibility Projections for VISTAS and Nearby Class I Areas
Class I Area Site ID
2028 20% Clearest
Days (dv)
2028 20% Clearest Days
(Mm-1)
2028 20% Most
Impaired Days (dv)
2028 20% Most Impaired
Days (Mm-1) Great Smoky Mountains National Park GRSM1 8.96 25.02 15.03 46.08
Joyce Kilmer-Slickrock Wilderness Area GRSM1 8.97 25.02 14.88 45.36
Linville Gorge Wilderness Area LIGO1 8.21 23.06 14.25 42.61
Shining Rock Wilderness Area SHRO1 4.54 15.74 13.31 37.86
Swanquarter Wilderness Area SWAN1 10.77 29.61 15.27 47.42
Model Results for the VISTAS 2028 Inventory Compared to the URP Glide Paths for North Carolina Class I Areas
Using 2000 through 2004 IMPROVE monitoring data, the dv values for the 20% clearest days in each year were averaged together, producing a single average dv value for the clearest days

Pre-hearing Draft 147 NC Regional Haze SIP for Second Planning Period (2019 – 2028) August 30, 2021
during that time period. Similarly, the dv values for the 20% most impaired days in each year were averaged together, producing a single average dv value for the days with the most anthropogenic visibility impairment during that time period. These values form the base line for visibility at each Class I area and are used to gauge improvements. In this second round of visibility planning, 2011 represents the base year for air quality modeling projections. To develop an average 2011 impairment suitable for use in air quality projections, 2009 through 2013 IMPROVE monitoring data were used. The dv values for the 20% clearest days in each year are averaged together to produce a single average dv value for the clearest days. The 20% most impaired days were also averaged from this timeframe to produce a single value for the 20% most impaired days. Figure 7-10 through Figure 7-13 illustrate the predicted visibility improvement on the 20% most impaired days by 2028, compared to the URP glide paths for each North Carolina Class I area. The pink line represents the URP at each Class I area. The URP starts at the 2000-2004 average of the 20% most impaired days and ends in 2064 at the estimated natural condition value for each Class I area. This line shows a uniform, linear progression between the 2000-2004 baseline and the target natural condition in 2064. The model projections shown in blue triangles start at 2011 (the observed 2009-2013 average of the visibility on the 20% most impaired days) and end at the 2028 projected visibility values for the 20% most impaired days based on existing and planned emissions controls during the period of the long-term strategy associated with this round of planning. Blue diamonds on these figures represent IMPROVE monitoring data on the 20% most impaired days at each Class I area, and the brown lines denote the five-year rolling average of each set of IMPROVE monitoring data. At all five Class I areas in North Carolina, visibility improvements on the 20% most impaired days are expected to be significantly better than the uniform rate of progress glide path by 2028.

Pre-hearing Draft 148 NC Regional Haze SIP for Second Planning Period (2019 – 2028) August 30, 2021
Figure 7-10. Great Smoky Mountains National Park and Joyce Kilmer-Slickrock
Wilderness Area URP on the 20% Most Impaired Days
Figure 7-11. Linville Gorge Wilderness Area URP on the 20% Most Impaired Days

Pre-hearing Draft 149 NC Regional Haze SIP for Second Planning Period (2019 – 2028) August 30, 2021
Figure 7-12. Shining Rock Wilderness Area URP on the 20% Most Impaired Days
Figure 7-13. Swanquarter Wilderness Area URP on the 20% Most Impaired Days

Pre-hearing Draft 150 NC Regional Haze SIP for Second Planning Period (2019 – 2028) August 30, 2021
As illustrated in Figure 7-14, visibility improvements at all the VISTAS Class I areas except the Everglades are projected to be better than the uniform rate of progress. In Figure 7-14, the percentage displayed represents the difference between the 2028 projected visibility value from and the VISTAS modeling analyses and the expected visibility improvement by 2028 on the URP. Because this calculation is based on level of haze, in deciviews, negative percentages indicate that the 2028 projected visibility value is better than the expected visibility by 2028 on the URP while positive percentages indicate that the 2028 projected visibility value is worse than the expected visibility by 2028 on the URP. For example, haze in the Great Smoky Mountains National Park is projected to be 30% lower than the expected visibility for 2028 on the URP. Likewise, for Linville Gorge Wilderness Area it is 31%, for Shining Rock Wilderness Area it is 36%, and for Swanquarter Wilderness Area is 18%. For these areas, visibility ranges from 18% to 36% better than the URP by 2028, resulting in visibility improvements that are well ahead of the timeline noted on the URP.
Figure 7-14. Percent of URP in 2028

Pre-hearing Draft 151 NC Regional Haze SIP for Second Planning Period (2019 – 2028) August 30, 2021
Figure 7-15 through Figure 7-17 illustrate the visibility improvement in 20% most impaired days. These figures show scenery at the Great Smoky Mountains National Park, Linville Gorge Wilderness Area, and Shining Rock Wilderness Area impacted at levels equivalent to the 2000-2004 baseline conditions on the 20% most impaired days, the 2028 projections based on the VISTAS inventory, and natural conditions.
Figure 7-15. Great Smoky Mountains National Park 20% Most Impaired Days in 2000-
2004, 20% Most Impaired Days in 2028, and Natural Conditions

Pre-hearing Draft 152 NC Regional Haze SIP for Second Planning Period (2019 – 2028) August 30, 2021
Figure 7-16. Linville Gorge Wilderness Area 20% Most Impaired Days in 2000-2004, 20%
Most Impaired Days in 2028, and Natural Conditions

Pre-hearing Draft 153 NC Regional Haze SIP for Second Planning Period (2019 – 2028) August 30, 2021
Figure 7-17. Shining Rock Wilderness Area 20% Most Impaired Days in 2000-2004, 20%
Most Impaired Days in 2028, and Natural Conditions In addition to improving visibility on the 20% most impaired visibility days, states are also required to protect visibility on the 20% clearest days at the Class I areas to ensure no degradation of visibility on these clearest days occurs. Figure 7-18 through Figure 7-21 show the improvements expected on the 20% clearest visibility days using the VISTAS emissions inventory and associated reductions. The green line represents the 2000-2004 average baseline

Pre-hearing Draft 154 NC Regional Haze SIP for Second Planning Period (2019 – 2028) August 30, 2021
conditions for the 20% clearest days. The model projections shown in blue triangles start at 2011 (the observed 2009-2013 average of the visibility on the 20% clearest days) and end at the 2028 projected visibility values for the 20% clearest days based on existing and planned emissions controls during the period of the long-term strategy associated with this round of planning. Blue diamonds depict IMPROVE monitoring data values, and the gray line denotes IMPROVE monitoring data five year averages. As noted in these figures, visibility conditions in 2028 on the 20% clearest visibility days are expected to continue to improve at each site.
Figure 7-18. 20% Clearest Days Rate of Progress for Great Smoky Mountains National
Park and Joyce Kilmer – Slickrock Wilderness Area

Pre-hearing Draft 155 NC Regional Haze SIP for Second Planning Period (2019 – 2028) August 30, 2021
Figure 7-19. 20% Clearest Days Rate of Progress for Linville Gorge Wilderness Area
Figure 7-20. 20% Clearest Days Rate of Progress for Shining Rock Wilderness Area

Pre-hearing Draft 156 NC Regional Haze SIP for Second Planning Period (2019 – 2028) August 30, 2021
Figure 7-21. 20% Clearest Days Rate of Progress for Swanquarter Wilderness Area
As illustrated in Figure 7-22, visibility on the 20% clearest days is projected to improve in 2028 at all VISTAS and non-VISTAS Class I areas as a result of the emission control programs included in the VISTAS 2028 emissions inventory. In this figure, a zero percent change indicates no change in visibility. A negative percentage indicates improvement in projected visibility while a positive change indicates visibility degradation. The percent improvement on 20% clearest days is projected to be -34% for the Great Smoky Mountains National Park, -26% for Linville Gorge Wilderness Area, -41% for Shining Rock Wilderness Area, and -12% for Swanquarter Wilderness Area.

Pre-hearing Draft 157 NC Regional Haze SIP for Second Planning Period (2019 – 2028) August 30, 2021
Figure 7-22. Percent Visibility Improvement on 20% Clearest Days
7.2.7 Additional Programs and Initiatives Supporting Past and Future Emissions Reductions
This section discusses additional programs and initiatives that support efforts to continue to control SO2, NOx, and other criteria air pollutant emissions throughout North Carolina. These programs are important for maintaining statewide compliance with the NAAQS as well as supporting progress toward improving visibility in Class I areas in North Carolina as well as neighboring states. Table 7-9 identifies the programs and initiatives as well as when they were implemented in the state.
Table 7-9. Summary of Additional Programs and Initiatives Control Program Year(s) of Initial Implementation
State Programs Open Burning Rule First adopted 1971; last amended 2016 Grant Program 1995 - 2020 Renewable Energy and Energy Efficiency Portfolio Standard (REPS) 2008 - 2019
Air Awareness Program 2008 Advance Program 2019 Volkswagen Settlement 2020 and future years Executive Order 80 (EO-80) and Clean Energy Plan 2025 - 2050 Duke Energy Corporation Initiative CO2 Emissions Reduction Goals 2030 - 2050

Pre-hearing Draft 158 NC Regional Haze SIP for Second Planning Period (2019 – 2028) August 30, 2021
State Programs
This section provides a summary of state programs that have been implemented in North Carolina to support maintenance of the NAAQS and to improve visibility in North Carolina’s Class I areas. Although these are important programs for North Carolina, they have not been relied upon as federally enforceable measures for controlling visibility impairment in Class I areas. • Renewable Energy and Energy Efficiency Portfolio Standard (REPS): On August 20, 2007,
with the signing of Session Law 2007-397 (Senate Bill 3),86 North Carolina became the first state in the Southeast to adopt a Renewable Energy and Energy Efficiency Portfolio Standard (REPS). Under this new law, investor-owned utilities in North Carolina are required to meet up to 12.5% of their energy needs through renewable energy resources or energy efficiency measures. Rural electric cooperatives and municipal electric suppliers are subject to a 10% REPS requirement. The final rules implementing the REPS law were adopted by the North Carolina Utilities Commission on February 29, 2008.87 Although the law sets forth a number of details, electric power suppliers generally may comply with the REPS requirement in several ways, including the use of renewable fuels in existing electric generating facilities, the generation of power at new renewable energy facilities, the purchase of power from renewable energy facilities, the purchase of renewable energy certificates, or the implementation of energy efficiency measures. Renewable energy facilities include facilities that generate electric power by the use of a renewable energy resource, combined heat and power systems, and solar thermal energy facilities. Renewable energy resource includes a solar electric, solar thermal, wind, hydropower, geothermal, or ocean current or wave energy resource; a biomass resource, including agricultural waste, animal waste, wood waste, spent pulping liquors, combustible residues, combustible liquids, combustible gases, energy crops, or landfill methane; waste heat derived from a renewable energy resource and used to produce electricity or useful, measurable thermal energy at a retail electric customer's facility; or hydrogen derived from a renewable energy resource. North Carolina has made great strides toward diversifying its energy portfolio in a manner that meets the needs of consumers and businesses, provides greater energy diversification, and grows the economy. Since 2008, renewable energy credits (RECS) generated by renewable energy and energy efficiency programs has avoided substantial SO2, NOx, and CO2 emissions. These avoided emissions are displayed in Table 7-10.
86 Session Law 2007-397 (Senate Bill 3), https://www.ncleg.net/Sessions/2007/Bills/Senate/PDF/S3v6.pdf. 87 Final Rules for Implementing Senate Bill 3, https://starw1.ncuc.net/NCUC/ViewFile.aspx?Id=6e5009d5-491e-4d3e-8ce0-9ff6fe493cdd.

Pre-hearing Draft 159 NC Regional Haze SIP for Second Planning Period (2019 – 2028) August 30, 2021
Table 7-10 Total Avoided Emissions in 2008 – 2019 Due to REPS RECS (MWh) Emissions Avoided (tons)
Year Non-Emitting RE* EE CO2 NOx SO2 2008 539,142 22,907 336,037 251 1,128 2009 790,184 80,008 503,208 316 857 2010 829,824 504,289 787,834 562 1,272 2011 719,672 1,134,040 1,036,715 777 1,367 2012 773,196 1,288,141 1,088,383 860 1,075 2013 1,420,290 2,119,916 1,801,727 1,348 1,532 2014 1,687,381 2,722,860 2,160,432 1,517 1,517 2015 2,131,664 6,218,251 3,855,939 2,601 2,365 2016 3,634,409 4,069,988 3,341,555 2,150 1,714 2017 4,848,953 4,812,048 4,026,254 2,618 1,869 2018 5,794,734 5,572,279 4,544,373 2,990 1,870 2019 6,445,573 5,658,772 4,839,148 3,183 1,991
* Non-Emitting sources include hydropower, solar, and wind projects.
• Executive Order 80: In 2018, the Governor of North Carolina signed Executive Order 80 (EO-80) in support of the goals of the 2015 Paris Agreement and the U.S. Climate Alliance. EO-80 sets out the achievement of the following objectives by 2025: Reduce state greenhouse gas emissions to 40 percent below 2005 levels. Increase the number of registered zero-emission vehicles to a minimum of 80,000/ Reduce energy consumption per square foot in state-owned buildings by at least 40
percent from fiscal year 2002-2003 levels.
• Clean Energy Plan: In addition to outlining specific activities to implement the above, EO-80 includes a provision for the development of a Clean Energy Plan (CEP). The purpose of the CEP is to encourage the use of clean energy resources in North Carolina, including energy efficiency, solar, wind, energy storage and other innovative technologies, and the integration of these resources in the development of a modern/resilient electric grid. The CEP was released in October 2019, and outlines several CEP goals, and key recommendations.88 These goals/recommendations are identified below. Goals Reduce electric power sector greenhouse gas emissions 70% below 2005 levels by
2030 and attain carbon neutrality by 2050. Foster long-term energy affordability and price stability for North Carolina’s
residents and businesses by modernizing regulatory and planning processes. Accelerate clean energy innovation, development, and deployment to create
economic opportunities for both rural and urban areas of the state.
88 NC DEQ, State Energy Office, “North Carolina Clean Energy Plan, Transitioning to a 21st Century Electricity System, Policy and Action Recommendations,” October 2019, available from https://files.nc.gov/ncdeq/climate-change/clean-energy-plan/NC_Clean_Energy_Plan_OCT_2019_.pdf.

Pre-hearing Draft 160 NC Regional Haze SIP for Second Planning Period (2019 – 2028) August 30, 2021
Key Recommendations Develop carbon reduction policy designs for accelerated retirement of uneconomic coal
assets and other market-based and clean energy policy options. Develop and implement policies and tools such as performance-based mechanisms,
multi-year rate planning, and revenue decoupling, that better align utility incentives with public interest, grid needs, and state policy.
Modernize the grid to support clean energy resource adoption, resilience, and other public interest outcomes.
• Air Awareness Program: The North Carolina Air Awareness Program is a public outreach
and education program of the DAQ. The goal of the program is to reduce air pollution though voluntary actions by individuals and organizations. The program seeks to educate individuals about (1) the sources of air pollution; (2) the health effects of air pollution and how these effects can be mitigated by modification of outdoor activities on ozone action days; and (3) simple "action tips", such as carpooling, vehicle maintenance and energy conservation that reduce individual contributions to air pollution. One of the major program components is the daily air quality forecast. The DAQ produces the 8-hour ozone forecasts and corresponding air quality index for the 1997 8-hour ozone nonattainment area from March 1 through October 31 of each year.89
• Advance Program: The DAQ joined the EPA Advance program in September 2017. The EPA Advance Program encourages collaborations between state, local, and community organizations to encourage emissions reductions in areas that are currently in attainment of the ozone and PM2.5 NAAQS. The program provides a flexible framework for organizations who want closer involvement and support from the DAQ and EPA in achieving these emission reductions. In 2019, the DAQ developed a set of Advance Program plans that could be used to leverage Air Awareness Program projects in support of continued NAAQS maintenance.90
• Open Burning Rule (15A NCAC 02D .1903): This rule prohibits open burning of man-made materials throughout the state. Additionally, the rule prohibits nearly all types of open burning in a county that the DAQ, or the Forsyth County Office of Environmental Assistance and Protection, has forecasted to be in an Air Quality Action Day Code "Orange" or above during the 24-hour time period covered by that Air Quality Action Day. Daily forecasts are issued for PM2.5 for each day of the year and daily ozone forecasts are issued from March 1 through October 31 of each year. The open burning rule reduces NOx, VOC, CO, PM2.5, and PM10.
• Grant Programs: The DAQ has offered multiple forms of grant funding from state and federal funds to help cover the costs associated with emission reduction projects across the
89 DAQ, “N.C. Air Awareness,” available from https://deq.nc.gov/ncairawareness. 90 DAQ, “Ozone and Particulate Matter Advance Programs Path Forward,” October 2019.

Pre-hearing Draft 161 NC Regional Haze SIP for Second Planning Period (2019 – 2028) August 30, 2021
state. These projects include diesel engine replacements, diesel oxidation catalyst retrofits, marine diesel repowers, replacing gasoline vehicles with electric vehicles, vehicle replacement and many more. Grant projects that have been awarded have helped to reduce PM, NOx, CO and VOC emissions from mobile sources, and have included federal funds from the Diesel Emissions Reduction Act (DERA) and the American Recovery and Reinvestment Act (ARRA). The DERA and ARRA funds have been used to retrofit, repower or replace existing diesel engines from on-road and nonroad mobile source vehicles/equipment. Even though these emission reductions are voluntary and not enforceable, they still represent permanent reductions.
• Volkswagen Settlement: In 2015, Volkswagen (VW) publicly admitted that it had secretly and deliberately installed defeat-device software designed to cheat emissions tests and deceive federal and state regulators in approximately 590,000 model year 2009 to 2016 motor vehicles containing 2.0 and 3.0 liter diesel engines. The United States Department of Justice filed a complaint against VW, alleging that the company had violated the CAA. In October 2016 and May 2017, the U.S. District Court, Northern District of California (“Court”), approved two partial settlements related to the affected 2.0- and 3.0-liter vehicles, respectively, totaling $14.9 billion (“the VW Settlement”). The VW Settlement is being implemented through the First Partial Consent Decree and Second Partial Consent Decree. Under these consent decrees, VW has agreed to: (1) dedicate $10 Billion to the recall of at least 85% of the affected 2.0 and 3.0 liter vehicles; (2) invest $2 Billion in zero-emission vehicle infrastructure and promotion (“Zero Emission Vehicle Investment Plan”); and (3) establish a $2.9 Billion Environmental Mitigation Trust (EMT) to mitigate the environmental effects of the excess NOx emissions from the affected vehicles. The purpose of the EMT is to execute environmental mitigation projects that reduce emissions of NOx. In accordance with the EMT goal, North Carolina will use the funds to achieve significant NOx emissions reductions across the state by soliciting for projects from all eligible mitigation actions. Based on the distribution of violating vehicles registered across the state, North Carolina plans to allocate the funds between urban/suburban counties (68%) and rural counties (32%). North Carolina will select projects throughout the state that will reduce or eliminate emissions of NOx focusing on the most cost-effective projects, the quantity of NOx emission reductions and other factors. North Carolina has submitted its mitigation plan for the state’s $92 million share of the EMT on August 22, 2018. This plan details how the state will invest the first 33% ($30.6 million) of the state’s allocation in Phase 1 on projects to significantly reduce NOx emissions and improve air quality. Project solicitations for Phase 1 for the Diesel Bus & Vehicle and the Direct Current (DC) Fast Charging Infrastructure Programs, the solicitation closed on September 30, 2019. 116 applications were received with a total of 102 applications eligible for funding between the two programs with an approximate total of $46.8 million in requests for projects. Seventy applications were selected for full or partial funding with 69 project awards accepted totaling

Pre-hearing Draft 162 NC Regional Haze SIP for Second Planning Period (2019 – 2028) August 30, 2021
$26 million. A total of 27.7 annual tons of NOx is estimated to be mitigated when projects are completed for the two programs. On November 17, 2020, the Request for Proposals was released for the Phase 1 Level 2 Charging Infrastructure Rebate Program with approximately $1.15 million available to install Zero Emission Vehicle (ZEV) Level 2 charging infrastructure. The primary goal of this program is to continue the state’s goal to increase use of ZEVs in the state and available charging infrastructure. North Carolina will start Phase 2 planning of the Volkswagen Settlement Program in 2021 with a revised Mitigation Plan and a stakeholder process for input on how the remaining funds should be used.
Duke Energy Corporation Initiative Carbon Dioxide (CO2) Emission Reduction Goals: As one of the nation’s largest electricity providers and North Carolina’s largest electricity producer, Duke Energy Corporation has announced major goals to reduce the company’s carbon emissions. In September 2019, Duke Energy accelerated their carbon-reduction goals as follows (1) by 2030, achieve at least a 50% reduction in CO2 emissions from 2005 levels (in 2017, Duke goal was a 40% reduction by 2030); and (2) by 2050, strive for net-zero CO2 emissions.91 7.2.8 Emissions Reductions Not Included in the 2028 RPG Modeling From March 25, 2018 through Dec. 31, 2020, a total of 96 non-EGU point source facilities have closed and for which the air permits have been rescinded after the NCDAQ prepared the 2028 inventory from the 2016 base year inventory. Table 7-11 shows the total annual criteria air pollutant emissions reported by the facilities in 2016 and projected 2028 emissions for the facilities.
Table 7-11. Historical and 2028 Projected Annual Emissions Associated with Facility Closures not included in 2028 Emissions Projections (Tons)
Pollutant Actual 2016 Projected 2028 CO 217.85 239.30 NOx 248.24 287.11 PM10-PRI 136.26 184.67 PM25-PRI 87.44 110.22 SO2 204.13 208.34 VOC 1,448.94 1,649.41
91 Duke Energy News Center, “Duke Energy aims to achieve net-zero carbon emissions by 2050,” available from https://news.duke-energy.com/releases/duke-energy-aims-to-achieve-net-zero-carbon-emissions-by-2050?_ga=2.241389191.460722529.1607446146-1750199547.1607446146.

Pre-hearing Draft 163 NC Regional Haze SIP for Second Planning Period (2019 – 2028) August 30, 2021
In addition, Edgecombe Genco Power Station, LLC (ORIS ID 10384, EIS Facility ID 8124311, NC ID 3300146), Battleboro, North Carolina, was a co-generation facility with steam generating units permitted to burn various fuels (i.e., coal/natural gas/No. 2 fuel oil/No. 4 fuel oil/tire derived fuel (TDF)/wood chips) . This facility discontinued operation in 2018 and the DAQ rescinded the air quality permit for the facility on July 20, 2020.92 Table 7-12 summarizes recent historical emissions (2016-2019) and projected 2028 emissions for the Edgecombe Genco Power Station. Although this facility generated electricity for the power grid, it was not included in the ERTAC projections because it was a co-generation facility and therefore was included in the 2028 projections for non-EGU point sources. The emissions in Table 7-12 are not included in Table 7-11.
Table 7-12. Summary of Historical and 2028 Projected Emissions for Edgecombe Genco Power Station, Battleboro, North Carolina (Tons)
Pollutant Actual 2016
Actual 2017
Actual 2018
Actual 2019
Projected 2028
CO 23.50 18.28 20.50 0.00 23.50 NOx 450.46 355.14 399.60 0.00 450.47 PM10-PRI 5.93 3.99 4.14 0.00 5.50 PM25-PRI 0.42 0.35 0.38 0.00 0.58 SO2 31.03 28.14 51.88 0.00 31.03 VOC 1.22 1.06 1.13 0.00 1.17
On January 14, 2021, the USEPA entered into a consent decree93 with Pilkington North America, Inc., which owns and operates a float glass manufacturing facility in Laurinburg, North Carolina. The consent decree mandates, among other things, the installation and operation of control equipment for NOX, SO2, and PM, as well as emission limits for each of these pollutants. The compliance date set forth in the consent decree is March 31, 2023. There is also a requirement that the facility must request either a federally enforceable permit or revision the North Carolina’s SIP to make these requirements and limits permanent and enforceable by March 31, 2024. To control NOX, the Pilkington is required to install an SCR or ceramic filter system with 90% control efficiency and to meet an emission limit of 80% control. To control SO2 emissions, the plant is required to install a dry scrubber or ceramic filter system to meet an emission limit of 1.2 lb/ton glass produced. To control PM emissions, the plant is required to install a particulate control device to meet the emission limit of 0.45 lb/ton glass produced.
92 This facility was not included in the ERTAC EGU projections tool.
93 https://www.justice.gov/file/1359731/download

Pre-hearing Draft 164 NC Regional Haze SIP for Second Planning Period (2019 – 2028) August 30, 2021
7.3 Relative Contribution from International Emissions to Visibility Impairment in 2028 at VISTAS Class I Areas
International anthropogenic emissions are beyond the control of states preparing regional haze SIPs. Therefore, the RHR at 40 CFR 51.308(f)(1)(vi)(B) allows states to optionally propose an adjustment of the 2064 uniform rate of progress endpoint to account for international anthropogenic impacts, if the adjustment has been developed using scientifically valid data and methods. On September 19, 2019, EPA released Technical Support Document for EPA's Updated 2028 Regional Haze Modeling.94 This document provides the results of EPA's updated 2028 visibility modeling analyses and includes projections of both domestic and international source contributions. EPA used source apportionment results to calculate the estimated source contribution of international anthropogenic emissions to visibility impairment at Class I areas on the 20% most impaired days. EPA used these estimated contributions to derive adjusted glidepath endpoints for each Class I area. In this study, EPA used the CAMx PSAT tool to tag certain sectors. EPA processed each sector through the SMOKE model and tracked each sector in PSAT as an individual source tag. The EPA tracked sulfate, nitrate, ammonium, secondary organic aerosols, and primary PM in this manner. International anthropogenic emissions within this study include anthropogenic emissions from Canada and Mexico, Type C3-class commercial marine emissions outside of the emissions control area as described in Section 7.2.2, and international anthropogenic boundary conditions. Results from this study show that international anthropogenic boundary conditions account for a sizable fraction of sulfate concentrations in the west in certain months, and to a lesser extent nitrate. Estimated international anthropogenic visibility impairment ranges from 3.0 Mm-1 to 19.7 Mm-1. For Class I areas located in VISTAS, total international anthropogenic emissions impacts range from 4.10 Mm-1 to 8.80 Mm-1. Table 7-13 provides the estimated international anthropogenic visibility impacts to VISTAS Class I area from EPA's study.
Table 7-13. VISTAS Class I Area International Anthropogenic Emissions 2028 Impairment, Mm-1
Class I Area Name State Site ID
Non-US C3
Marine Canada Mexico Boundary
International
Total International
Anthropogenic Cape Romain Wilderness Area SC ROMA 0.50 0.81 1.24 3.68 6.23
Chassahowitzka Wilderness Area FL CHAS 1.30 0.62 1.01 3.81 6.75
Cohutta Wilderness Area GA COHU 0.10 1.31 0.68 3.20 5.29
Dolly Sods Wilderness Area WV DOSO 0.05 2.11 0.53 2.31 4.99
94 https://www.epa.gov/visibility/technical-support-document-epas-updated-2028-regional-haze-modeling.

Pre-hearing Draft 165 NC Regional Haze SIP for Second Planning Period (2019 – 2028) August 30, 2021
Class I Area Name State Site ID
Non-US C3
Marine Canada Mexico Boundary
International
Total International
Anthropogenic Everglades National Park FL EVER 2.28 0.48 0.36 4.65 7.77
Great Smoky Mountains National Park
TN GRSM 0.09 1.38 0.54 2.83 4.48
James River Face Wilderness Area VA JARI 0.04 2.01 0.38 2.56 4.99
Joyce Kilmer-Slickrock Wilderness Area
GA JOYC 0.09 1.38 0.54 2.83 4.84
Linville Gorge Wilderness Area NC LIGO 0.04 1.42 0.39 2.26 4.10
Mammoth Cave National Park KY MACA 0.02 3.34 0.30 3.28 6.94
Okefenokee Wilderness Area GA OKEF 0.99 0.98 2.23 4.60 8.80
Otter Creek Wilderness Area WV OTCR 0.05 2.11 0.53 2.31 4.99
Shenandoah National Park VA SHEN 0.02 1.98 0.30 2.42 4.72
Shining Rock Wilderness Area NC SHRO 0.09 1.01 1.00 2.61 4.70
Sipsey Wilderness Area AL SIPS 0.09 1.45 0.74 2.83 5.12
St. Marks Wilderness Area FL SAMA 0.59 0.76 1.43 3.78 6.57
Swanquarter Wilderness Area VA SWAN 0.16 1.91 0.65 2.42 5.13
Wolf Island Wilderness Area GA WOLF 0.99 0.98 2.23 4.60 8.80
North Carolina's Class I areas are expected to be well beneath the 2028 URP goal based on VISTAS modeling, which includes current and forthcoming control programs. The estimated international emissions impact is 4.48 Mm-1 for the for Great Smoky Mountains National Park, 4.84 Mm-1 for the Joyce Kilmer-Slickrock Wilderness Area, 4.10 Mm-1 for the Linville Gorge Wilderness Area, 4.70 Mm-1 for the Shining Rock Wilderness Area, and 5.13 Mm-1 for the Swanquarter Wilderness Area. Adjustments to the 2028 URP goal based on these estimated visibility impairment contributions of international anthropogenic emissions would not change the conclusion that these areas will experience visibility improvements that are significantly better than those on the URP. Therefore, in this round of regional haze planning, North Carolina is not updating the 2028 uniform rate of progress goals based on EPA's contribution study of international anthropogenic emissions.

Pre-hearing Draft 166 NC Regional Haze SIP for Second Planning Period (2019 – 2028) August 30, 2021
7.4 Relative Contributions to Visibility Impairment: Pollutants, Source Categories, and Geographic Areas
To determine what areas and emissions source sectors impact VISTAS Class I areas, VISTAS relied on PSAT results examining the impacts of sulfate and nitrate from the following geographic areas and emissions sectors:
• Total SO2 and NOx emissions from each VISTAS state; • Total SO2 and NOx emissions from the CENRAP, MANE-VU, and LADCO regional
planning organizations; • Total SO2 and NOx emissions from EGUs from each VISTAS state; • Total SO2 and NOx emissions from EGUs from CENRAP, MANE-VU, and LADCO
regional planning organizations; • Total SO2 and NOx emissions from non-EGU point sources from each VISTAS state; and • Total SO2 and NOx emissions from non-EGU point sources from CENRAP, MANE-VU,
and LADCO regional planning organizations. Visibility impacts in 2028 estimated by PSAT for each region (10 individual VISTAS states plus three RPOs), emission sector (total, EGU, and non-EGU), and pollutant (SO2 and NOx) at each Class I area are available for comparison. Figure 7-23 shows the 2028 nitrate impairment from each region at Class I areas within VISTAS. Most Class I areas in VISTAS show contributions of less than 4 Mm-1 from nitrate in 2028, with the exceptions being Mammoth Cave National Park, Sipsey Wilderness Area, Cape Romain Wilderness Area, and Swanquarter Wilderness Area. All mandatory Class I areas in VISTAS (except Everglades National Park and Okefenokee Wilderness Area) show contributions to nitrate impairment from the CENRAP, LADCO, and MANE-VU sources (dark gray, gray, and light gray, respectively), as well as the sum of the other VISTAS states, that are larger than home state contributions. Figure 7-24 shows the 2028 sulfate impairment from each region at Class I areas within VISTAS. All areas, except Everglades National Park, show sulfate impacts of at least 10 Mm-1. All Class I areas in VISTAS (except Everglades National Park) show contributions to sulfate impairment from CENRAP, LADCO, and MANE-VU sources (dark gray, gray, and light gray, respectively), as well as the sum of the other VISTAS states, that are larger than home state contributions.

Pre-hearing Draft 167 NC Regional Haze SIP for Second Planning Period (2019 – 2028) August 30, 2021
Figure 7-23. 2028 Nitrate Visibility Impairment, 20% Most Impaired Days, VISTAS Class
I Areas

Pre-hearing Draft 168 NC Regional Haze SIP for Second Planning Period (2019 – 2028) August 30, 2021
Figure 7-24. 2028 Sulfate Visibility Impairment, 20% Most Impaired Days, VISTAS Class
I Areas These data in these figures indicate that sulfate will continue to be the primary driver of visibility impairment in most VISTAS Class I areas, much more so than nitrate. These data also show that emissions from sources located outside of the home state and outside VISTAS have a significant impact on visibility in VISTAS Class I areas. Figure 7-25 and Figure 7-26 provide comparisons of projected light extinction from sulfate and nitrate in 2028 at Class I areas in VISTAS. These figures show the light extinction associated with all emissions within the pollutant inventory, the light extinction caused by emissions from the EGU sector, and light extinction caused by emissions from the non-EGU point source sector. Figure 7-25 shows these data for sulfate visibility impairment. Comparison of bar heights in this figure demonstrates that sulfate visibility impairment from the EGU and non-EGU point source sectors comprise the majority of the total sulfate visibility impairment at all Class I areas within VISTAS except Everglades National Park. Figure 7-25 also shows that for some VISTAS Class I areas, visibility impairment due to sulfate from the EGU sector is significantly higher than visibility impairment due to sulfate from the non-EGU sector. Exceptions to this observation are Everglades National Park, Okefenokee Wilderness Area, Cape Romain Wilderness Area, St. Marks Wilderness Area, and Wolf Island Wilderness Area. In the case of Everglades National Park, total sulfate impairment in 2028 is expected to be less than 5 Mm-1, and EGU and non-EGU sulfate contributions are minimal. Projections for Okefenokee, Cape Romain, St. Marks,

Pre-hearing Draft 169 NC Regional Haze SIP for Second Planning Period (2019 – 2028) August 30, 2021
and Wolf Island show that EGU and non-EGU sulfate contributions are the majority of sulfate impairment but that the relative impacts from each sector are similar. Figure 7-26 provides nitrate light extinction data in 2028 for Class I areas in VISTAS. In all but four cases, the total nitrate light extinction estimated for 2028 is well beneath 4 Mm-1. In the case of Mammoth Cave National Park, Cape Romain Wilderness Area, Sipsey Wilderness Area, and Swanquarter Wilderness Area, total nitrate impairment is more than 4 Mm-1, but the contributions from the EGU and non-EGU point source sectors are well under half of the total nitrate contribution. Across all VISTAS Class I areas, nitrate contributions from point sources – both EGU and non-EGU – constitute a small percentage of total nitrate contributions. In North Carolina in particular, the majority of the state’s current NOx emission portfolio comes from the mobile sector (cars, trucks, etc.) because in-state point-source NOx emissions (from EGU’s in particular) have significantly decreased over the last 25 years.95 Figure 7-25 and Figure 7-26 show that sulfates generally contribute more to light extinction in 2028 at VISTAS federal mandatory Class I areas than nitrates and that sulfates from EGU and non-EGU point source sectors contribute the majority of the sulfate light extinction at most of these areas. Results in Figure 7-26 also show that the majority of nitrate light extinction is not caused by NOx emissions from EGU and non-EGU point sources.
Figure 7-25. 2028 Visibility Impairment from Sulfate on 20% Most Impaired Days,
VISTAS Class I Areas
95 Air Quality Trends in North Carolina, October 2020, https://files.nc.gov/ncdeq/Air%20Quality/Air_Quality_Trends_in_North_Carolina_122118.pdf

Pre-hearing Draft 170 NC Regional Haze SIP for Second Planning Period (2019 – 2028) August 30, 2021
Figure 7-26. 2028 Visibility Impairment from Nitrate on 20% Most Impaired Days,
VISTAS Class I Areas These PSAT analyses support the following conclusions concerning the visibility impairing emissions, the source categories responsible for these emissions, and the locations of the pollutant emitting activities:
• Sulfate will generally be a much larger contributor to visibility impairment in 2028 at VISTAS Class I areas than nitrates.
• Emissions from other regional planning organizations (MANE-VU, LADCO, and CENRAP) generally have higher contributions to 2028 visibility impairment at Class I areas in VISTAS than the emissions from the home state.
• Emissions from EGUs and non-EGU point sources contribute the majority of the total sulfate contributions to visibility impairment in 2028 at Class I areas in VISTAS.
Figure 7-27 through Figure 7-31 provide more detailed comparisons for the Swanquarter Wilderness Area, Shining Rock Wilderness Area, Linville Gorge Wilderness Area, Joyce Kilmer-Slickrock Wilderness Area, and the Great Smokies National Park, respectively. These figures show that projected light extinction in 2028 from total sulfate is significantly larger than light extinction from total nitrate. Across the interior Class I areas (e.g., Shining Rock National Park, Linville Gorge, Joyce Kilmer-Slickrock, and the Great Smokies National Park), projected total sulfate extinction is greater than 17 Mm-1 while total projected total nitrate extinction is less than 3.5 Mm-1. At Swanquarter, the projected sulfate extinction is 16.6 Mm-1 with projected nitrate extinction is 4.5 Mm-1. Of these nitrate contributions, North Carolina sources contribute a small percentage to total nitrate impairment in all cases, anywhere from less than 1% of all nitrate visibility impairment at Great Smokies National Park to 13% at Swanquarter. These figures also show that sulfate from EGUs and non-EGUs account for the majority of the total sulfate impact at these Class I areas in North Carolina. For Great Smoky Mountains

Pre-hearing Draft 171 NC Regional Haze SIP for Second Planning Period (2019 – 2028) August 30, 2021
National Park, the 2028 sulfate extinction from EGUs and non-EGU point sources is 11.2 Mm-1, comprising 63.8% of the total sulfate extinction of 19.0 Mm-1; for Joyce Kilmer-Slickrock Wilderness, the 2028 sulfate extinction from EGUs and non-EGU point sources is 12.0 Mm-1, comprising 64.5% of the total sulfate extinction of 18.6 Mm-1; for Linville Gorge, the 2028 sulfate extinction from EGUs and non-EGU point sources is 11.8 Mm-1, comprising 65.7% of the total sulfate extinction of 17.9 Mm-1; for Shining Rock, the 2028 sulfate extinction from EGUs and non-EGU point sources is 11.3 Mm-1, comprising 64% of the total sulfate extinction of 17.6 Mm-1; finally, for Swanquarter Wilderness Area, the 2028 sulfate extinction from EGUs and non-EGU point sources is 9.1 Mm-1, comprising 54.9% of the total sulfate extinction of 16.7 Mm-1. Lastly, these figures show that sulfates originating in the LADCO region contribute substantially to the estimated 2028 sulfate impairment at these Class I areas in North Carolina. For Great Smoky Mountains National Park, sulfates originating within LADCO contribute 10.7 Mm-1 to visibility impairment in 2028, or 57% of the total sulfate impact; for Joyce Kilmer-Slickrock Wilderness, 10.2 Mm-1 or 55% of total sulfate impact; for Linville Gorge, 9.4 Mm-1 or 52% of total sulfate impact; for Shining Rock, 8.8 Mm-1 or 50% of total sulfate impact; finally, for Swanquarter Wilderness Area, 6.9 Mm-1 or 42% of total sulfate impact.
Figure 7-27. 2028 Contribution to Light Extinction on the 20% Most Impaired Days at
Swanquarter

Pre-hearing Draft 172 NC Regional Haze SIP for Second Planning Period (2019 – 2028) August 30, 2021
Figure 7-28. 2028 Contribution to Light Extinction on the 20% Most Impaired Days at
Shining Rock

Pre-hearing Draft 173 NC Regional Haze SIP for Second Planning Period (2019 – 2028) August 30, 2021
Figure 7-29. 2028 Contribution to Light Extinction on the 20% Most Impaired Days at
Linville Gorge

Pre-hearing Draft 174 NC Regional Haze SIP for Second Planning Period (2019 – 2028) August 30, 2021
Figure 7-30. 2028 Contribution to Light Extinction on the 20% Most Impaired Days at
Joyce Kilmer-Slickrock
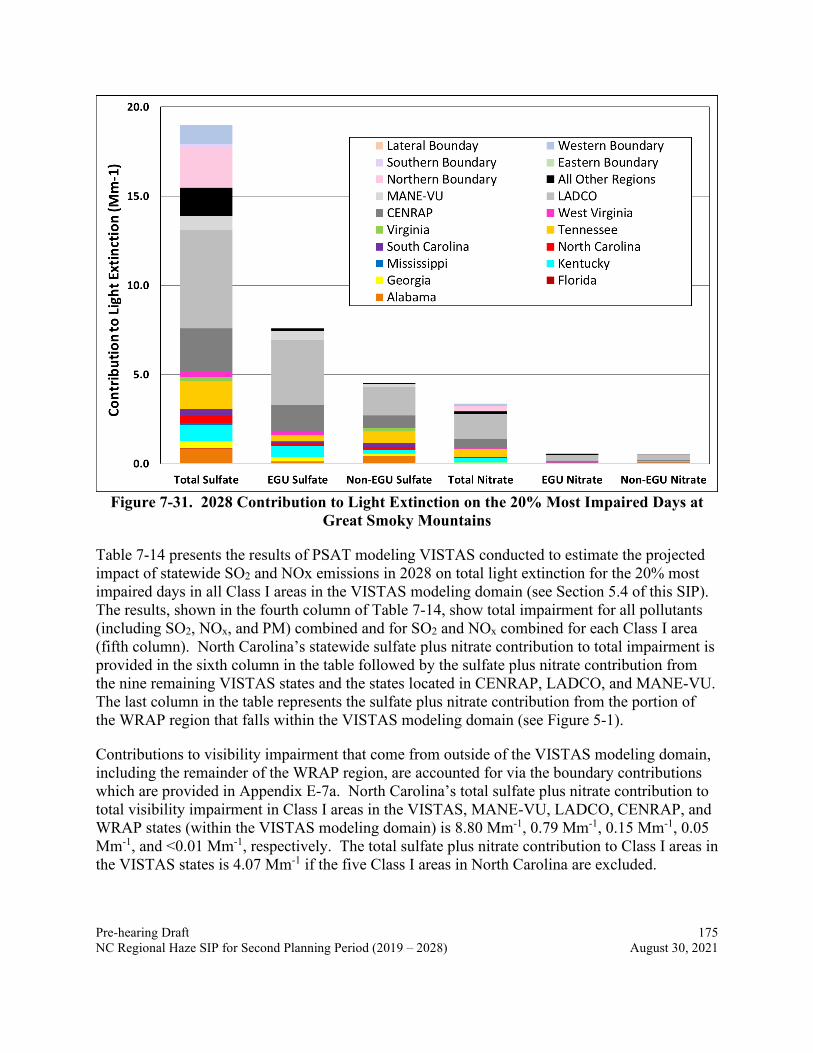
Pre-hearing Draft 175 NC Regional Haze SIP for Second Planning Period (2019 – 2028) August 30, 2021
Figure 7-31. 2028 Contribution to Light Extinction on the 20% Most Impaired Days at
Great Smoky Mountains
Table 7-14 presents the results of PSAT modeling VISTAS conducted to estimate the projected impact of statewide SO2 and NOx emissions in 2028 on total light extinction for the 20% most impaired days in all Class I areas in the VISTAS modeling domain (see Section 5.4 of this SIP). The results, shown in the fourth column of Table 7-14, show total impairment for all pollutants (including SO2, NOx, and PM) combined and for SO2 and NOx combined for each Class I area (fifth column). North Carolina’s statewide sulfate plus nitrate contribution to total impairment is provided in the sixth column in the table followed by the sulfate plus nitrate contribution from the nine remaining VISTAS states and the states located in CENRAP, LADCO, and MANE-VU. The last column in the table represents the sulfate plus nitrate contribution from the portion of the WRAP region that falls within the VISTAS modeling domain (see Figure 5-1).
Contributions to visibility impairment that come from outside of the VISTAS modeling domain, including the remainder of the WRAP region, are accounted for via the boundary contributions which are provided in Appendix E-7a. North Carolina’s total sulfate plus nitrate contribution to total visibility impairment in Class I areas in the VISTAS, MANE-VU, LADCO, CENRAP, and WRAP states (within the VISTAS modeling domain) is 8.80 Mm-1, 0.79 Mm-1, 0.15 Mm-1, 0.05 Mm-1, and <0.01 Mm-1, respectively. The total sulfate plus nitrate contribution to Class I areas in the VISTAS states is 4.07 Mm-1 if the five Class I areas in North Carolina are excluded.

Pre-hearing Draft 176 NC Regional Haze SIP for Second Planning Period (2019 – 2028) August 30, 2021
Table 7-14. North Carolina Statewide Contributions of 2028 SO2 and NOx Emissions for all Source Sectors to Total Visibility Impairment for the 20% Most Impaired Days for
Class I Areas in the VISTAS Modeling Domain (Mm-1) Sulfate + Nitrate Impairment
RPO State Class I Area
Total Impair-
ment (All Pollutant Species)
Total Impair-
ment NC
All Other
VISTAS States
CENRAP Region
LADCO Region
MANE-VU
Region
WRAP Region within
VISTAS Modeling Domain
CENRAP AR CACR 63.20 23.06 0.02 0.87 16.80 3.10 0.06 2.20 CENRAP AR UPBU 60.59 22.70 0.03 1.14 15.29 3.22 0.09 2.94 CENRAP LA BRET2 63.36 23.46 0.04 4.22 11.34 4.40 0.08 3.40 CENRAP MO HEGL 65.88 30.55 0.02 1.17 18.92 6.89 0.09 3.46 CENRAP MO MING 70.75 33.20 0.04 3.32 11.67 14.70 0.18 3.31 CENRAP OK WIMO 62.62 21.17 <0.01 0.27 15.27 1.24 <0.01 4.38 CENRAP TX BIBE 41.72 7.85 <0.01 0.05 1.96 0.07 <0.01 5.77 CENRAP TX CAVE 34.39 8.28 <0.01 0.10 2.71 0.09 <0.01 5.38 CENRAP TX GUMO 34.39 8.28 <0.01 0.10 2.71 0.09 <0.01 5.38 LADCO MI ISLE 47.51 17.53 0.01 0.35 6.19 7.88 0.20 2.89 LADCO MI SENE 56.63 24.18 0.04 0.89 4.63 14.63 0.70 3.29 LADCO MN BOWA 42.54 15.33 <0.01 0.19 8.72 3.65 0.11 2.66 MANE-
VU ME ACAD 45.50 5.78 0.13 0.56 0.51 1.45 2.96 2.44
MANE-VU ME MOOS 43.29 8.04 0.05 0.32 0.45 1.24 1.96 1.75
MANEVU ME ROCA 43.29 5.78 0.05 0.32 0.45 1.24 1.96 1.75
MANE-VU NH GRGU 35.56 10.12 0.05 0.66 1.13 3.18 1.91 3.20
MANE-VU NH PRRA 35.56 10.12 0.05 0.66 1.13 3.18 1.91 3.20
MANE-VU NJ BRIG 63.05 26.18 0.34 1.68 1.63 8.48 9.96 4.08
MANE-VU VT LYBR2 42.30 16.32 0.14 1.26 1.39 4.67 5.10 3.77
VISTAS AL SIPS 52.88 23.07 0.09 5.83 3.98 10.86 0.46 1.86 VISTAS FL CHAS 53.92 15.63 0.21 8.00 3.21 1.76 0.22 2.22 VISTAS FL EVER 47.70 4.63 0.02 1.68 0.68 0.17 0.03 2.05 VISTAS FL SAMA 52.91 18.76 0.12 7.34 5.26 2.21 0.39 3.44 VISTAS GA COHU 45.28 18.04 0.38 5.85 1.76 6.88 0.87 2.30 VISTAS GA OKEF 54.66 19.47 0.67 9.07 2.27 3.60 1.01 2.84 VISTAS GA WOLF 53.59 19.29 0.78 8.35 2.15 3.44 1.15 3.41 VISTAS KY MACA 68.18 36.70 0.01 5.82 5.61 20.62 0.63 4.01 VISTAS NC LIGO 42.52 15.99 0.95 4.19 2.55 5.54 1.15 1.62

Pre-hearing Draft 177 NC Regional Haze SIP for Second Planning Period (2019 – 2028) August 30, 2021
Sulfate + Nitrate Impairment
RPO State Class I Area
Total Impair-
ment (All Pollutant Species)
Total Impair-
ment NC
All Other
VISTAS States
CENRAP Region
LADCO Region
MANE-VU
Region
WRAP Region within
VISTAS Modeling Domain
VISTAS NC SHRO 42.09 15.43 1.13 3.97 2.80 5.11 0.75 1.67 VISTAS NC SWAN 46.39 16.40 1.83 3.87 0.72 4.19 3.23 2.56 VISTAS NC/TN GRSM 45.75 18.42 0.89 9.77 1.87 3.74 1.57 2.36 VISTAS NC/TN JOYC 45.12 17.76 0.43 5.62 2.96 6.84 0.82 1.76 VISTAS SC ROMA 52.82 20.20 0.41 5.16 3.21 6.46 0.76 1.78 VISTAS VA JARI 49.09 19.01 0.45 4.21 1.70 8.26 2.15 2.24 VISTAS VA SHEN 43.05 19.16 0.24 3.43 1.43 8.57 3.48 2.02 VISTAS WV DOSO 46.13 22.50 0.10 4.69 2.03 11.56 2.20 1.92 VISTAS WV OTCR 46.00 22.32 0.11 4.77 2.08 11.58 1.81 1.98 WRAP CO EANE 17.23 0.52 <0.01 0.00 0.04 <0.01 0.00 0.47 WRAP CO FLTO 17.23 0.52 <0.01 0.00 0.04 <0.01 0.00 0.47 WRAP CO GRSA 23.22 1.64 <0.01 <0.01 0.41 <0.01 <0.01 1.22 WRAP CO MABE 17.23 0.52 <0.01 0.00 0.04 <0.01 0.00 0.47 WRAP CO MOZI 17.64 0.86 <0.01 0.00 0.07 0.00 0.00 0.79 WRAP CO RAWA 17.64 0.86 <0.01 0.00 0.07 0.00 0.00 0.79 WRAP CO ROMO 23.72 2.67 <0.01 <0.01 0.48 <0.01 0.00 2.19 WRAP CO WEEL 17.23 0.52 <0.01 0.00 0.04 <0.01 0.00 0.47 WRAP MT MELA 51.88 11.71 <0.01 0.00 1.12 0.52 0.02 10.05 WRAP MT ULBE 32.66 3.23 <0.01 0.00 0.37 0.39 0.00 2.47 WRAP ND THRO 46.07 10.12 <0.01 <0.01 1.49 0.50 0.02 8.12 WRAP NM BAND 25.33 1.98 <0.01 <0.01 0.68 0.02 0.00 1.28 WRAP NM BOAP 30.33 2.56 <0.01 0.02 0.93 <0.01 <0.01 1.60 WRAP NM PECO 19.67 1.33 <0.01 <0.01 0.54 <0.01 0.00 0.78 WRAP NM SACR 46.02 12.65 <0.01 0.04 4.48 0.06 <0.01 8.06 WRAP NM SAPE 19.58 0.87 <0.01 <0.01 0.29 <0.01 0.00 0.57 WRAP NM WHIT 28.18 4.41 <0.01 0.05 1.50 0.06 <0.01 2.79 WRAP NM WHPE 19.67 1.33 <0.01 <0.01 0.54 <0.01 0.00 0.78 WRAP SD BADL 37.55 9.12 <0.01 0.02 4.32 1.03 <0.01 3.73 WRAP SD WICA 31.66 7.08 <0.01 <0.01 2.37 0.31 0.00 4.39

Pre-hearing Draft 178 NC Regional Haze SIP for Second Planning Period (2019 – 2028) August 30, 2021
7.5 Area of Influence Analyses for North Carolina Class I Areas As discussed in Section 2, analysis of the IMPROVE monitoring data for the modeling base period (2009-2013) and current conditions (2014-2018) shows sulfate as the most important pollutant (followed by nitrate) contributing to visibility impairment in VISTAS Class I areas. Therefore, the area of influence (AoI) analysis focused on sulfate and nitrate for the purpose of identifying the sectors and emission sources with the potentially highest contribution to visibility impairment in VISTAS and non-VISTAS Class I. Consistent with the regional haze guidance for source-selection analyses, VISTAS used 2028 emissions for the AoI analysis.96 The AoI analysis was performed for each Class I area for source sectors (EGU, non-EGU point, onroad, nonroad, and fires) at the county-level. This analysis identified EGU and non-EGU point sources as the sectors that accounted for the vast majority of visibility impairment in VISTAS Class I areas in 2028. Then, the AoI analysis was conducted for all EGU and non-EGU facilities in the modeling domain to determine the relative visibility impairment impacts at each Class I area associated with sulfate and nitrate. The results of the facility-level AoI analyses were then used to rank and prioritize facilities for further evaluation. The following sections explain the steps followed to develop the AoI analyses. Appendix D-1 (Area of Influence Analyses) provides a detailed discussion of the AoI methods and results. Appendix D-2 provides AoI and HYSPLIT graphics for the VISTAS and Nearby Class I areas. 7.5.1 Back Trajectory Analyses The first step was to generate Hybrid Single Particle Lagrangian Integration Trajectory (HYSPLIT)97 back trajectories for IMPROVE monitoring sites in North Carolina and neighboring Class I areas for 2011-2016 on the 20% most impaired days. Back trajectory analyses use interpolated measured or modeled meteorological fields to estimate the most likely central path of air masses that arrive at a receptor at a given time. The method essentially follows a parcel of air backward in hourly steps for a specified length of time. The HYSPLIT runs included starting heights of 100 meters (m), 500 m, 1000 m, and 1500 m. Trajectories were run 72 hours backwards in time for each height at each location. Trajectories were run with start times of 12:00 a.m. (midnight of the start of the day), 6:00 a.m., 12:00 p.m., 6:00 p.m., and 12:00 a.m. (midnight at the end of the day) local time. Figure 7-32 through Figure 7-36 contain the 100-meter back trajectories for the 20% most impaired visibility days (2011-2016) at the Great Smoky Mountains National Park, Joyce
96 EPA, Guidance on Regional Haze State Implementation Plans for the Second Implementation Period, August 20, 2019, p. 17, https://www.epa.gov/sites/production/files/2019-08/documents/8-20-2019_-_regional_haze_guidance_final_guidance.pdf.
97 Stein, A. F., Draxler, R. R., Rolph, G. D., Stunder, B. J. B., Cohen, M. D., and Ngan, F., (2015). NOAA’s HYSPLIT atmospheric transport and dispersion modeling system, Bull. Amer. Meteor. Soc., 96, 2059-2077, http://dx.doi.org/10.1175/BAMS-D-14-00110.1.

Pre-hearing Draft 179 NC Regional Haze SIP for Second Planning Period (2019 – 2028) August 30, 2021
Kilmer-Slickrock Wilderness Area, Linville Gorge Wilderness Area, Shining Rock Wilderness Area, and Swanquarter Wilderness Area, respectively. Figure 7-37 through Figure 7-41 contain the 100-meter back trajectories by season for the 20% most impaired visibility days (2011-2016) at the Great Smoky Mountains National Park, Joyce Kilmer-Slickrock Wilderness Area, Linville Gorge Wilderness Area, Shining Rock Wilderness Area, and Swanquarter Wilderness Area, respectively. Figure 7-42 through Figure 7-46 contain the 100-meter, 500-meter, 1000-meter, and 1500-meter back trajectories for the 20% most impaired visibility days (2011-2016) at the Great Smoky Mountains National Park, Joyce Kilmer-Slickrock Wilderness Area, Linville Gorge Wilderness Area, Shining Rock Wilderness Area, and Swanquarter Wilderness Area, respectively. These back trajectories for the 20% most impaired days were then used to develop residence time (RT) plots.
Figure 7-32. 100-Meter Back Trajectories for the 20% Most Impaired Visibility Days
(2011-2016) from Great Smoky Mountains National Park

Pre-hearing Draft 180 NC Regional Haze SIP for Second Planning Period (2019 – 2028) August 30, 2021
Figure 7-33. 100-Meter Back Trajectories for the 20% Most Impaired Visibility Days
(2011-2016) from Joyce Kilmer-Slickrock Wilderness Area
Figure 7-34. 100-Meter Back Trajectories for the 20% Most Impaired Visibility Days
(2011-2016) from Linville Gorge Wilderness Area
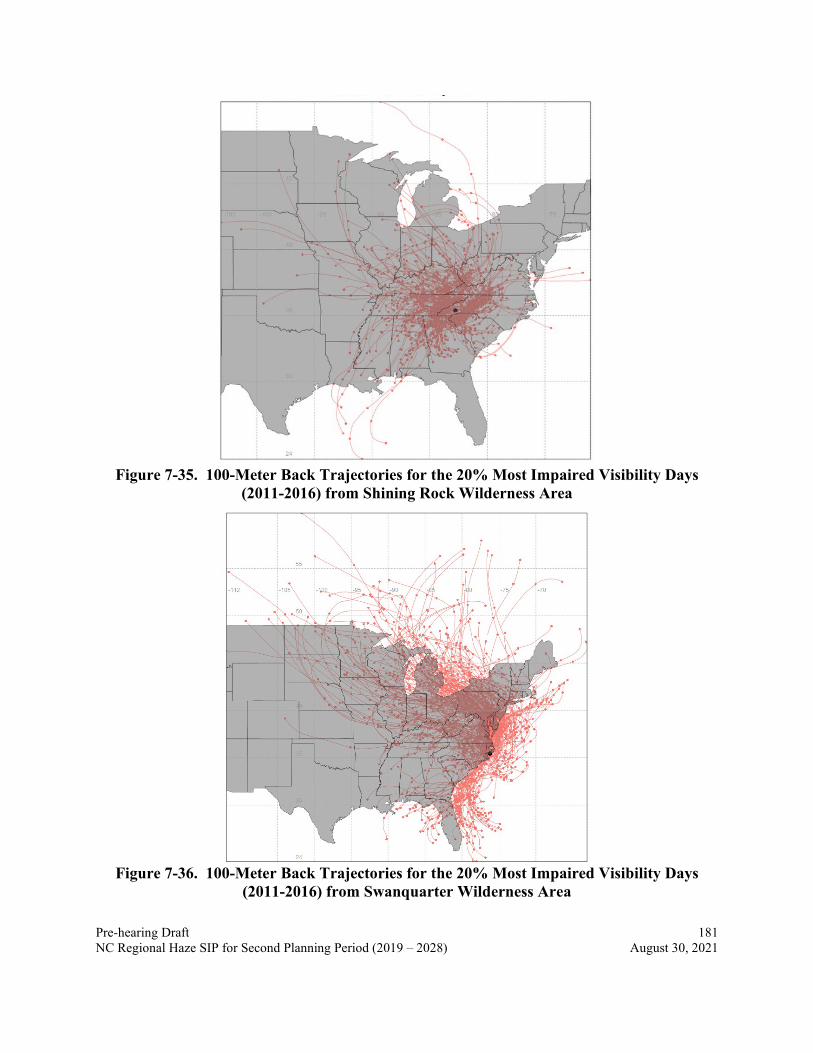
Pre-hearing Draft 181 NC Regional Haze SIP for Second Planning Period (2019 – 2028) August 30, 2021
Figure 7-35. 100-Meter Back Trajectories for the 20% Most Impaired Visibility Days
(2011-2016) from Shining Rock Wilderness Area
Figure 7-36. 100-Meter Back Trajectories for the 20% Most Impaired Visibility Days
(2011-2016) from Swanquarter Wilderness Area

Pre-hearing Draft 182 NC Regional Haze SIP for Second Planning Period (2019 – 2028) August 30, 2021
Figure 7-37. 100-Meter Back Trajectories by Season for the 20% Most Impaired Visibility
Days (2011-2016) from Great Smoky Mountains National Park

Pre-hearing Draft 183 NC Regional Haze SIP for Second Planning Period (2019 – 2028) August 30, 2021
Figure 7-38. 100-Meter Back Trajectories by Season for the 20% Most Impaired Visibility
Days (2011-2016) from Joyce Kilmer-Slickrock Wilderness Area

Pre-hearing Draft 184 NC Regional Haze SIP for Second Planning Period (2019 – 2028) August 30, 2021
Figure 7-39. 100-Meter Back Trajectories by Season for the 20% Most Impaired Visibility
Days (2011-2016) from Linville Gorge Wilderness Area

Pre-hearing Draft 185 NC Regional Haze SIP for Second Planning Period (2019 – 2028) August 30, 2021
Figure 7-40. 100-Meter Back Trajectories by Season for the 20% Most Impaired Visibility
Days (2011-2016) from Shining Rock Wilderness Area

Pre-hearing Draft 186 NC Regional Haze SIP for Second Planning Period (2019 – 2028) August 30, 2021
Figure 7-41. 100-Meter Back Trajectories by Season for the 20% Most Impaired Visibility
Days (2011-2016) from Swanquarter Wilderness Area
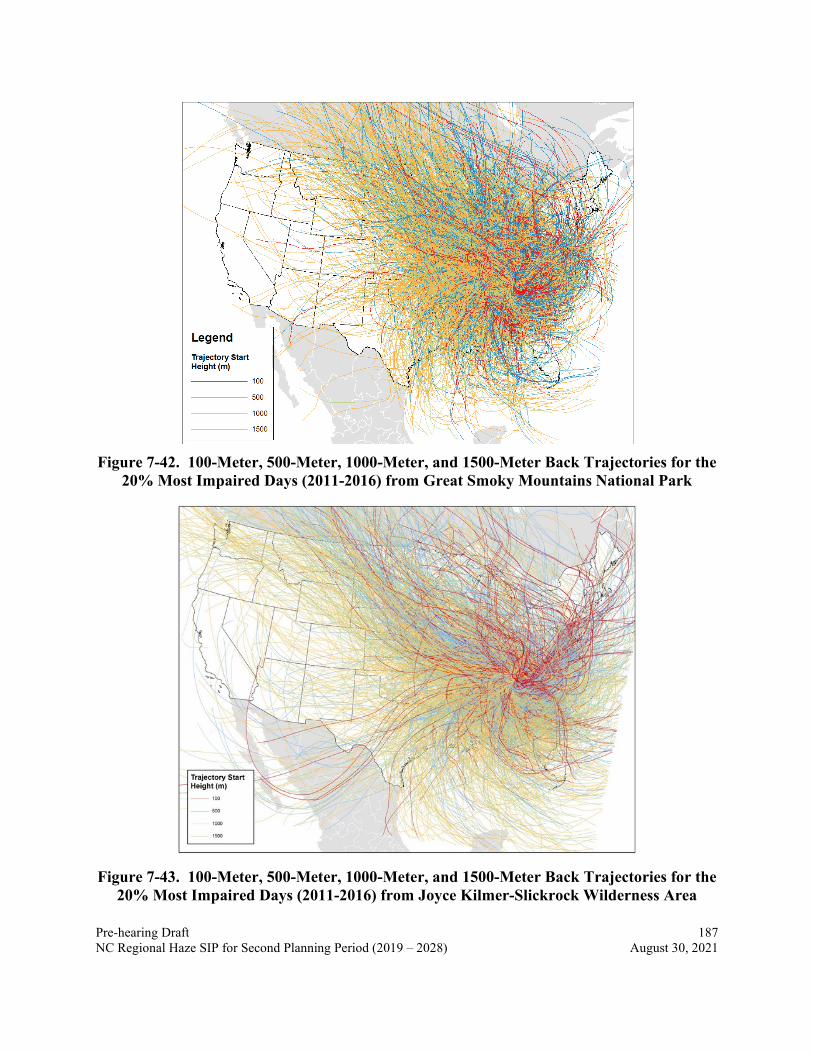
Pre-hearing Draft 187 NC Regional Haze SIP for Second Planning Period (2019 – 2028) August 30, 2021
Figure 7-42. 100-Meter, 500-Meter, 1000-Meter, and 1500-Meter Back Trajectories for the
20% Most Impaired Days (2011-2016) from Great Smoky Mountains National Park
Figure 7-43. 100-Meter, 500-Meter, 1000-Meter, and 1500-Meter Back Trajectories for the
20% Most Impaired Days (2011-2016) from Joyce Kilmer-Slickrock Wilderness Area

Pre-hearing Draft 188 NC Regional Haze SIP for Second Planning Period (2019 – 2028) August 30, 2021
Figure 7-44. 100-Meter, 500-Meter, 1000-Meter, and 1500-Meter Back Trajectories for the
20% Most Impaired Days (2011-2016) from Linville Gorge Wilderness Area
Figure 7-45. 100-Meter, 500-Meter, 1000-Meter, and 1500-Meter Back Trajectories for the
20% Most Impaired Days (2011-2016) from Shining Rock Wilderness Area

Pre-hearing Draft 189 NC Regional Haze SIP for Second Planning Period (2019 – 2028) August 30, 2021
Figure 7-46. 100-Meter, 500-Meter, 1000-Meter, and 1500-Meter Back Trajectories for the
20% Most Impaired Days (2011-2016) from Swanquarter Wilderness Area 7.5.2 Residence Time Plots The next step was to plot RT for each Class I area using six years of back trajectories for the 20% most impaired visibility days in 2011-2016. Residence time is the frequency that winds pass over a specific geographic area (model grid cell or county) on the path to a Class I area. Residence time plots include all trajectories for each Class I area. Figure 7-47 through Figure 7-56 contain the RT plots (counts per 12-Km modeling grid cell, and percent of total counts per 12-Km modeling grid cell) for Great Smoky Mountains National Park, Joyce Kilmer-Slickrock Wilderness Area, Linville Gorge Wilderness Area, Shining Rock Wilderness Area, and Swanquarter Wilderness Area, respectively. As illustrated in these figures, winds influencing all five areas on the 20% most impaired days come from all directions, and there is no single predominant wind direction influencing the 20% most impaired visibility days. It should be noted that there are lower RTs in western North Carolina in grid cells that are east, southeast, and northeast of Great Smoky Mountains National Park and nearby Joyce Kilmer-Slickrock Wilderness Area due to the meteorological impacts associated with the Southern Appalachian Mountains.

Pre-hearing Draft 190 NC Regional Haze SIP for Second Planning Period (2019 – 2028) August 30, 2021
Figure 7-47. Residence Time (Counts per 12-Km Modeling Grid Cell) for Great Smoky
Mountains National Park – Full View (top) and Class I Zoom (bottom)

Pre-hearing Draft 191 NC Regional Haze SIP for Second Planning Period (2019 – 2028) August 30, 2021
Figure 7-48. Residence Time (% of Total Counts per 12-Km Modeling Grid Cell for Great
Smoky Mountains National Park – Full View (top) and Class I Zoom (bottom)

Pre-hearing Draft 192 NC Regional Haze SIP for Second Planning Period (2019 – 2028) August 30, 2021
Figure 7-49. Residence Time (Counts per 12-Km Modeling Grid Cell) for Joyce Kilmer-
Slickrock Wilderness Area – Full View (top) and Class I Zoom (bottom)

Pre-hearing Draft 193 NC Regional Haze SIP for Second Planning Period (2019 – 2028) August 30, 2021
Figure 7-50. Residence Time (% of Total Counts per 12-Km Modeling Grid Cell for Joyce
Kilmer-Slickrock Wilderness Area – Full View (top) and Class I Zoom (bottom)

Pre-hearing Draft 194 NC Regional Haze SIP for Second Planning Period (2019 – 2028) August 30, 2021
Figure 7-51. Residence Time (Counts per 12-Km Modeling Grid Cell) for Linville Gorge
Wilderness Area – Full View (top) and Class I Zoom (bottom)

Pre-hearing Draft 195 NC Regional Haze SIP for Second Planning Period (2019 – 2028) August 30, 2021
Figure 7-52. Residence Time (% of Total Counts per 12-Km Modeling Grid Cell for
Linville Gorge Wilderness Area – Full View (top) and Class I Zoom (bottom)

Pre-hearing Draft 196 NC Regional Haze SIP for Second Planning Period (2019 – 2028) August 30, 2021
Figure 7-53. Residence Time (Counts per 12-Km Modeling Grid Cell) for Shining Rock
Wilderness Area – Full View (top) and Class I Zoom (bottom)

Pre-hearing Draft 197 NC Regional Haze SIP for Second Planning Period (2019 – 2028) August 30, 2021
Figure 7-54. Residence Time (% of Total Counts per 12-Km Modeling Grid Cell for
Shining Rock Wilderness Area – Full View (top) and Class I Zoom (bottom)

Pre-hearing Draft 198 NC Regional Haze SIP for Second Planning Period (2019 – 2028) August 30, 2021
Figure 7-55. Residence Time (Counts per 12-Km Modeling Grid Cell) for Swanquarter
Wilderness Area – Full View (top) and Class I Zoom (bottom)

Pre-hearing Draft 199 NC Regional Haze SIP for Second Planning Period (2019 – 2028) August 30, 2021
Figure 7-56. Residence Time (% of Total Counts per 12Km Modeling Grid Cell for
Swanquarter Wilderness Area – Full View (top) and Class I Zoom (bottom)
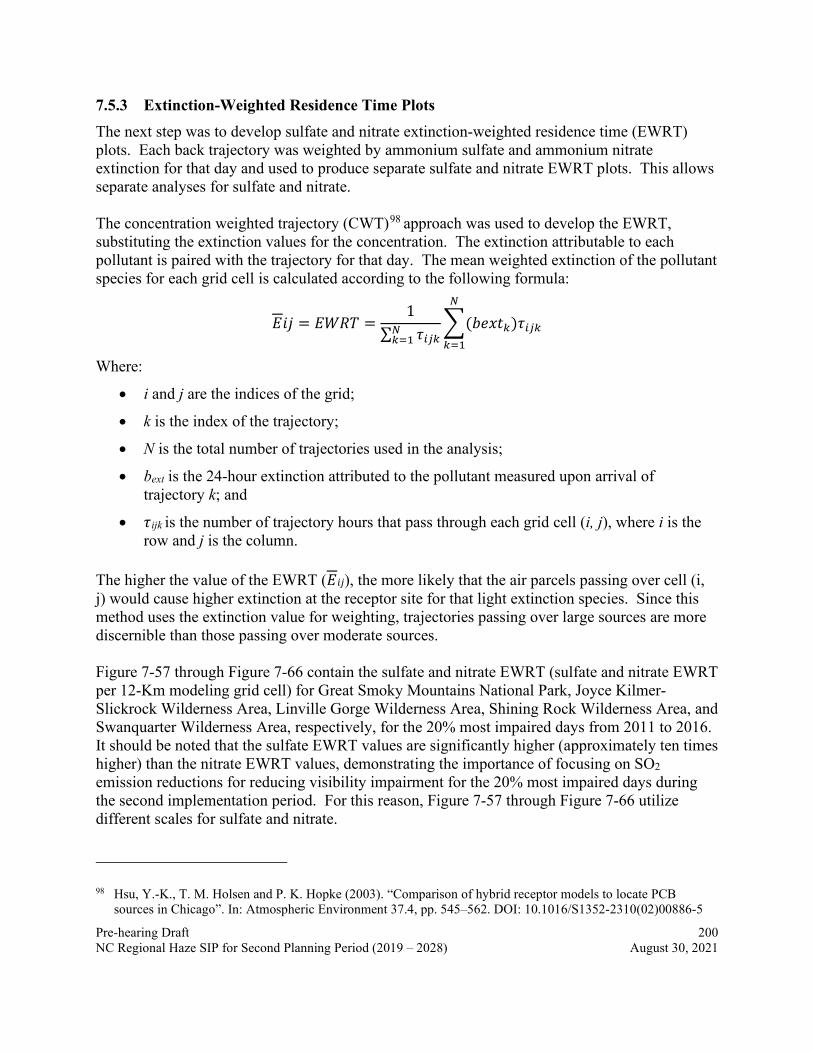
Pre-hearing Draft 200 NC Regional Haze SIP for Second Planning Period (2019 – 2028) August 30, 2021
7.5.3 Extinction-Weighted Residence Time Plots The next step was to develop sulfate and nitrate extinction-weighted residence time (EWRT) plots. Each back trajectory was weighted by ammonium sulfate and ammonium nitrate extinction for that day and used to produce separate sulfate and nitrate EWRT plots. This allows separate analyses for sulfate and nitrate. The concentration weighted trajectory (CWT)98 approach was used to develop the EWRT, substituting the extinction values for the concentration. The extinction attributable to each pollutant is paired with the trajectory for that day. The mean weighted extinction of the pollutant species for each grid cell is calculated according to the following formula:
𝐸𝐸𝐴𝐴𝑖𝑖 = 𝐸𝐸𝐸𝐸𝑅𝑅𝐸𝐸 =1
∑ 𝜏𝜏𝑖𝑖𝑖𝑖𝑖𝑖𝑁𝑁𝑖𝑖=1
�(𝑏𝑏𝑆𝑆𝑏𝑏𝑆𝑆𝑖𝑖)𝜏𝜏𝑖𝑖𝑖𝑖𝑖𝑖
𝑁𝑁
𝑖𝑖=1
Where:
• i and j are the indices of the grid;
• k is the index of the trajectory;
• N is the total number of trajectories used in the analysis;
• bext is the 24-hour extinction attributed to the pollutant measured upon arrival of trajectory k; and
• 𝜏𝜏ijk is the number of trajectory hours that pass through each grid cell (i, j), where i is the row and j is the column.
The higher the value of the EWRT (𝐸𝐸𝐴𝐴𝑖𝑖), the more likely that the air parcels passing over cell (i, j) would cause higher extinction at the receptor site for that light extinction species. Since this method uses the extinction value for weighting, trajectories passing over large sources are more discernible than those passing over moderate sources. Figure 7-57 through Figure 7-66 contain the sulfate and nitrate EWRT (sulfate and nitrate EWRT per 12-Km modeling grid cell) for Great Smoky Mountains National Park, Joyce Kilmer-Slickrock Wilderness Area, Linville Gorge Wilderness Area, Shining Rock Wilderness Area, and Swanquarter Wilderness Area, respectively, for the 20% most impaired days from 2011 to 2016. It should be noted that the sulfate EWRT values are significantly higher (approximately ten times higher) than the nitrate EWRT values, demonstrating the importance of focusing on SO2 emission reductions for reducing visibility impairment for the 20% most impaired days during the second implementation period. For this reason, Figure 7-57 through Figure 7-66 utilize different scales for sulfate and nitrate.
98 Hsu, Y.-K., T. M. Holsen and P. K. Hopke (2003). “Comparison of hybrid receptor models to locate PCB sources in Chicago”. In: Atmospheric Environment 37.4, pp. 545–562. DOI: 10.1016/S1352-2310(02)00886-5

Pre-hearing Draft 201 NC Regional Haze SIP for Second Planning Period (2019 – 2028) August 30, 2021
Figure 7-57. Sulfate Extinction Weighted Residence Time (Sulfate EWRT per 12Km
Modeling Grid Cell) for Great Smoky Mountains National Park - Full View (top) and Class I Zoom (bottom)

Pre-hearing Draft 202 NC Regional Haze SIP for Second Planning Period (2019 – 2028) August 30, 2021
Figure 7-58. Nitrate Extinction Weighted Residence Time (Nitrate EWRT per 12-Km
Modeling Grid Cell) for Great Smoky Mountains National Park - Full View (top) and Class I Zoom (bottom)

Pre-hearing Draft 203 NC Regional Haze SIP for Second Planning Period (2019 – 2028) August 30, 2021
Figure 7-59. Sulfate Extinction Weighted Residence Time (Sulfate EWRT per 12Km
Modeling Grid Cell) for Joyce Kilmer-Slickrock Wilderness Area - Full View (top) and Class I Zoom (bottom)

Pre-hearing Draft 204 NC Regional Haze SIP for Second Planning Period (2019 – 2028) August 30, 2021
Figure 7-60. Nitrate Extinction Weighted Residence Time (Nitrate EWRT per 12-Km Modeling Grid Cell) for Joyce Kilmer-Slickrock Wilderness Area - Full View (top) and
Class I Zoom (bottom)

Pre-hearing Draft 205 NC Regional Haze SIP for Second Planning Period (2019 – 2028) August 30, 2021
Figure 7-61. Sulfate Extinction Weighted Residence Time (Sulfate EWRT per 12Km Modeling Grid Cell) for Linville Gorge Wilderness Area - Full View (top) and Class I
Zoom (bottom)

Pre-hearing Draft 206 NC Regional Haze SIP for Second Planning Period (2019 – 2028) August 30, 2021
Figure 7-62. Nitrate Extinction Weighted Residence Time (Nitrate EWRT per 12-Km Modeling Grid Cell) for Linville Gorge Wilderness Area - Full View (top) and Class I
Zoom (bottom)

Pre-hearing Draft 207 NC Regional Haze SIP for Second Planning Period (2019 – 2028) August 30, 2021
Figure 7-63. Sulfate Extinction Weighted Residence Time (Sulfate EWRT per 12Km
Modeling Grid Cell) for Shining Rock Wilderness Area - Full View (top) and Class I Zoom (bottom)

Pre-hearing Draft 208 NC Regional Haze SIP for Second Planning Period (2019 – 2028) August 30, 2021
Figure 7-64. Nitrate Extinction Weighted Residence Time (Nitrate EWRT per 12-Km
Modeling Grid Cell) for Shining Rock Wilderness Area - Full View (top) and Class I Zoom (bottom)

Pre-hearing Draft 209 NC Regional Haze SIP for Second Planning Period (2019 – 2028) August 30, 2021
Figure 7-65. Sulfate Extinction Weighted Residence Time (Sulfate EWRT per 12Km
Modeling Grid Cell) for Swanquarter Wilderness Area - Full View (top) and Class I Zoom (bottom)

Pre-hearing Draft 210 NC Regional Haze SIP for Second Planning Period (2019 – 2028) August 30, 2021
Figure 7-66. Nitrate Extinction Weighted Residence Time (Nitrate EWRT per 12-Km
Modeling Grid Cell) for Swanquarter Wilderness Area - Full View (top) and Class I Zoom (bottom)

Pre-hearing Draft 211 NC Regional Haze SIP for Second Planning Period (2019 – 2028) August 30, 2021
7.5.4 Emissions/Distance Extinction Weighted Residence Time Plots Extinction weighted residence times were then combined with 12-Km gridded SO2 and NOx emissions from the 2028 emissions inventory. As a way of incorporating the effects of transport, deposition, and chemical transformation of point source emissions along the path of the trajectories, these data were weighted by 1/d, where d was calculated as the distance, in kilometers, between the center of the grid cell in which a source is located and the center of the grid cell in which the IMPROVE monitor is located. For Class I areas without an IMPROVE monitor (i.e., Joyce Kilmer-Slickrock Wilderness Area), the grid cell for the centroid of the Class I area was used. The grid cell total point SO2 or NOx emissions (Q, in tons per year) were divided by the distance (d, in kilometers) to the trajectory origin for a final value (Q/d). This value was then multiplied by the sulfate or nitrate EWRT grid values (i.e., EWRT*(Q/d)) on a grid cell by grid cell basis. Next, the sulfate and nitrate EWRT *(Q/d) values were normalized by the domain-wide total and displayed as a percentage. This information allows the individual facilities to be ranked from highest to lowest based on sulfate and/or nitrate contributions. Figure 7-67 through Figure 7-76 contain the sulfate and nitrate emissions/distance times EWRT values (percent of total Q/d*EWRT per 12-Km modeling grid cell) for Great Smoky Mountains National Park, Joyce Kilmer-Slickrock Wilderness Area, Linville Gorge Wilderness Area, Shining Rock Wilderness Area, and Swanquarter Wilderness Area, respectively. These maps help visualize the location of the sources of the largest visibility impacts associated with sulfate and nitrate for each Class I area.

Pre-hearing Draft 212 NC Regional Haze SIP for Second Planning Period (2019 – 2028) August 30, 2021
Figure 7-67. Sulfate Emissions/Distance Extinction Weighted Residence Time (% of Total
Q/d*EWRT per 12Km Modeling Grid Cell) for Great Smoky Mountains National Park
Figure 7-68. Nitrate Emissions/Distance Extinction Weighted Residence Time (% of Total
Q/d*EWRT per 12Km Modeling Grid Cell) for Great Smoky Mountains National Park

Pre-hearing Draft 213 NC Regional Haze SIP for Second Planning Period (2019 – 2028) August 30, 2021
Figure 7-69. Sulfate Emissions/Distance Extinction Weighted Residence Time (% of Total
Q/d*EWRT per 12Km Modeling Grid Cell) for Joyce Kilmer-Slickrock Wilderness Area
Figure 7-70. Nitrate Emissions/Distance Extinction Weighted Residence Time (% of Total Q/d*EWRT per 12Km Modeling Grid Cell) for Joyce Kilmer-Slickrock Wilderness Area–
Full View (top) and Class I Zoom (bottom)

Pre-hearing Draft 214 NC Regional Haze SIP for Second Planning Period (2019 – 2028) August 30, 2021
Figure 7-71. Sulfate Emissions/Distance Extinction Weighted Residence Time (% of Total
Q/d*EWRT per 12Km Modeling Grid Cell) for Linville Gorge Wilderness Area
Figure 7-72. Nitrate Emissions/Distance Extinction Weighted Residence Time (% of Total
Q/d*EWRT per 12Km Modeling Grid Cell) for Linville Gorge Wilderness Area

Pre-hearing Draft 215 NC Regional Haze SIP for Second Planning Period (2019 – 2028) August 30, 2021
Figure 7-73. Sulfate Emissions/Distance Extinction Weighted Residence Time (% of Total
Q/d*EWRT per 12Km Modeling Grid Cell) for Shining Rock Wilderness Area
Figure 7-74. Nitrate Emissions/Distance Extinction Weighted Residence Time (% of Total
Q/d*EWRT per 12Km Modeling Grid Cell) for Shining Rock Wilderness Area

Pre-hearing Draft 216 NC Regional Haze SIP for Second Planning Period (2019 – 2028) August 30, 2021
Figure 7-75. Sulfate Emissions/Distance Extinction Weighted Residence Time (% of Total
Q/d*EWRT per 12Km Modeling Grid Cell) for Swanquarter Wilderness Area
Figure 7-76. Nitrate Emissions/Distance Extinction Weighted Residence Time (% of Total Q/d*EWRT per 12Km Modeling Grid Cell) for Swanquarter Wilderness Area

Pre-hearing Draft 217 NC Regional Haze SIP for Second Planning Period (2019 – 2028) August 30, 2021
7.5.5 Ranking of Sources for North Carolina Class I Areas The Q/d*EWRT data was further paired with additional point source metadata that defined the facility. Such data included facility identification numbers, facility names, state and county of location, Federal Information Processing Standard (FIPS) codes, North American Industry Classification System (NAICS) codes, and industry description. Spreadsheets for individual Class I areas were then exported from the database for further analysis by the states. This information allows the individual facilities to be ranked from highest to lowest based on sulfate and/or nitrate contributions. It should be noted that while point sources account for most of the sulfate extinction, these sources only account for a portion of the nitrate extinction. Much of the nitrate extinction can be attributable to the onroad and nonpoint sectors. As such, a similar analysis for county level data was conducted, that included county total point source contributions. This allows the point source contribution to be directly compared to the other source categories. Similar analyses were conducted to rank SO2 and NOx emissions contributions for the county-level sources (nonpoint, onroad, non-road, fires, and total point source sectors). The process was similar to the process for point sources previously described, except calculations of RT and EWRT were completed at the county-level as opposed to grid cells. The calculation of “d” was from the centroid of the county to the trajectory origin, in Km. Similar to point sources, the final spatial join was made between the county-level EWRT, emissions, and source information for each sector. Table 7-14 through Table 7-18 contain the NOx and SO2 source contributions to visibility impairment on the 20% most impaired days at Great Smoky Mountains National Park, Joyce Kilmer-Slickrock Wilderness Area, Linville Gorge Wilderness Area, Shining Rock Wilderness Area, and Swanquarter Wilderness Area, respectively. Based on the sector contributions given in the tables below, it is clear that SO2 from point sources is the dominant source category at all North Carolina Class I areas. Table 7-15. NOx and SO2 Source Contributions to Visibility Impairment on the 20% Most
Impaired Days at Great Smoky Mountains National Park Category NOx SO2 Total
Nonpoint 8.49% 10.71% 19.21% Non-Road, MAR 3.14% 0.10% 3.24% Non-Road, Other 4.73% 0.29% 5.02% Onroad 11.57% 1.52% 13.09% Point 6.96% 49.86% 56.81% Pt_Fires_Prescribed 0.31% 2.32% 2.63% Total 35.20% 64.80% 100.00%

Pre-hearing Draft 218 NC Regional Haze SIP for Second Planning Period (2019 – 2028) August 30, 2021
Table 7-16. NOx and SO2 Source Contributions to Visibility Impairment on the 20% Most Impaired Days at Joyce Kilmer-Slickrock Wilderness Area
Category NOx SO2 Total Nonpoint 4.76% 7.69% 12.45% Non-Road, MAR 2.25% 0.11% 2.36% Non-Road, Other 2.71% 0.21% 2.92% Onroad 7.34% 0.84% 8.18% Point 6.21% 64.07% 70.28% Pt_Fires_Prescribed 0.44% 3.37% 3.81% Total 23.71% 76.29% 100.00%
Table 7-17. NOx and SO2 Source Contributions to Visibility Impairment on the 20% Most
Impaired Days at Linville Gorge Wilderness Area Category NOx SO2 Total
Nonpoint 1.70% 9.97% 11.67% Non-Road, MAR 0.60% 0.13% 0.73% Non-Road, Other 0.79% 0.14% 0.93% Onroad 1.87% 0.53% 2.39% Point 3.05% 79.90% 82.95% Pt_Fires_Prescribed 0.09% 1.24% 1.33% Total 8.09% 91.91% 100.00%
Table 7-18. NOx and SO2 Source Contributions to Visibility Impairment on the 20% Most
Impaired Days at Shining Rock Wilderness Area Category NOx SO2 Total
Nonpoint 4.23% 12.29% 16.52% Non-Road, MAR 1.12% 0.07% 1.18% Non-Road, Other 2.70% 0.17% 2.87% Onroad 5.95% 0.67% 6.62% Point 9.68% 61.52% 71.20% Pt_Fires_Prescribed 0.24% 1.37% 1.60% Total 23.92% 76.08% 100.00%
Table 7-19. NOx and SO2 Source Contributions to Visibility Impairment on the 20% Most
Impaired Days at Swanquarter Wilderness Area Category NOx SO2 Total
Nonpoint 3.59% 4.22% 7.81% Non-Road, MAR 3.54% 0.31% 3.85% Non-Road, Other 8.79% 0.16% 8.95% Onroad 4.18% 0.23% 4.41% Point 7.30% 66.52% 73.82% Pt_Fires_Prescribed 0.33% 0.82% 1.16% Total 27.74% 72.26% 100.00%
An additional analysis was conducted by adding new columns to normalize the EWRT*(Q/d) by the area of each county to develop a metric to compare the contributions from counties on a

Pre-hearing Draft 219 NC Regional Haze SIP for Second Planning Period (2019 – 2028) August 30, 2021
relative basis. The previous calculation (prior to being normalized by area) had a propensity to attribute higher contributions to larger counties simply because they typically contained more emission sources and more hourly trajectory end points. Normalizing the contribution by the area of the county (i.e., EWRT*(Q/d) per square Km) provides a sense of the source emission density within the county. This allows county contributions to be directly compared, without large counties being weighted more heavily by simply having more emission sources and more hourly trajectory end points. County contributions (normalized or non-normalized by area) can be found in Appendix D. All county and emissions source identifying information was joined in an Access database with calculations of Q/d, EWRT, EWRT*(Q/d), fraction and sum contributions, and other source information. The database was then used to generate individual spreadsheets for each Class I area. Table 7-19 through Table 7-23 contains the AoI NOx and SO2 facility contributions to visibility impairment on the 20% most impaired days at Great Smoky Mountains National Park, Joyce Kilmer-Slickrock Wilderness Area, Linville Gorge Wilderness Area, Shining Rock Wilderness Area, and Swanquarter Wilderness Area, respectively. These tables only show the facilities contributing more than 1.00% sulfate + nitrate. The full list of all facilities can be found in Appendix D. The lists of individual facilities identified by the AoI analysis for each Class I area were used to determine the facilities to tag in the PSAT source contribution analysis.

Pre-hearing Draft 220 NC Regional Haze SIP for Second Planning Period (2019 – 2028) August 30, 2021
Table 7-20. Facilities with ≥1.00% Sulfate + Nitrate AoI Contribution to Visibility Impairment on the 20% Most Impaired Days at Great Smoky Mountains National Park
State Facility
ID Facility Name Distance
(Km)
2028 NOx (TPY)
2028 SO2
(TPY) Nitrate
(%) Sulfate
(%)
Sulfate + Nitrate
(%)
TN 47145-4979111 TVA Kingston Fossil Plant 60.0 1687.4 1,886.1 0.71% 7.38% 8.09%
TN 47009-9159211 Mc Ghee Tyson 19.7 594.7 78.6 3.01% 4.31% 7.32%
TN 47163-3982311 Eastman Chemical Company 160.1 6900.3 6,420.2 0.19% 6.01% 6.20%
IN 18147-8017211
Indiana Michigan Power - Rockport 375.5 8806.8 30,536.3 0.21% 4.66% 4.87%
TN 47093-4979911 Cemex - Knoxville Plant 44.3 711.5 121.5 0.90% 1.71% 2.62%
OH 39053-8148511
General James M. Gavin Power Plant 400.5 8122.5 41595.8 0.04% 2.25% 2.29%
GA 13015-2813011
Ga Power Company - Plant Bowen 189.7 6643.3 10453.4 0.04% 2.10% 2.14%
OH 39025-8294311
Duke Energy Ohio, Wm. H. Zimmer Station 360.0 7150.0 22133.9 0.09% 1.84% 1.93%
IN 18077-7744211
Indiana Kentucky Electric Corporation 368.7 6188.5 9038.1 0.13% 1.60% 1.72%
IL 17127-7808911 Joppa Steam 474.4 4706.3 20509.3 0.04% 1.62% 1.67%
IN 18125-7362411
Indianapolis Power & Light Petersburg 435.6 10665.3 18141.9 0.12% 1.48% 1.60%
KY 21041-5198511 KY Utilities Co - Ghent Station 359.2 7939.9 10169.3 0.09% 1.43% 1.52%
TN 47105-4129211 TATE & LYLE, Loudon 36.1 252.5 110.2 0.23% 1.22% 1.45%
KY 21145-6037011 TVA - Shawnee Fossil Plant 465.3 7007.3 19504.7 0.02% 1.34% 1.35%
IN 18051-7363111 Gibson 456.3 12280.3 23117.2 0.07% 1.25% 1.32%
KY 21183-5561611
Big Rivers Electric Corp - Wilson Station 345.8 1151.9 6934.2 0.03% 1.17% 1.20%
WV 54073-4782811
Monongahela Power Co – Pleasants Power Station 475.9 5497.4 16817.4 0.02% 1.06% 1.08%
KY 21091-7352411 Century Aluminum of KY LLC 360.5 197.7 5044.2 0.00% 1.07% 1.07%
WV 54079-6789111
Appalachian Power Company - John E Amos Plant 367.1 4878.1 10,984.2 0.01% 1.05% 1.06%
TN 47009-4143611 ALCOA Inc. - South Plant 16.4 109.4 5.3 0.66% 0.35% 1.01%

Pre-hearing Draft 221 NC Regional Haze SIP for Second Planning Period (2019 – 2028) August 30, 2021
Table 7-21. Facilities with ≥1.00% Sulfate + Nitrate AoI Contribution to Visibility Impairment on the 20% Most Impaired Days at Joyce Kilmer-Slickrock Wilderness Area
State Facility
ID Facility Nae Distance
(Km)
2028 NOx (TPY)
2028 SO2
(TPY) Nitrate
(%) Sulfate
(%)
Sulfate + Nitrate
(%)
TN 47145-4979111 TVA Kingston Fossil Plant 73.7 1,687.4 1,886.1 0.57% 7.86% 8.42%
TN 47163-3982311 Eastman Chemical Company 179.2 6,900.3 6,420.2 0.16% 5.88% 6.05%
OH 39053-8148511
General James M. Gavin Power Plant 425.1 8,122.5 41,595.8 0.05% 4.73% 4.78%
IN 18147-8017211
Indiana Michigan Power - Rockport 391.2 8,806.8 30,536.3 0.14% 4.33% 4.47%
GA 13015-2813011
Ga Power Company - Plant Bowen 166.2 6,643.3 10,453.4 0.10% 3.61% 3.71%
OH 39025-8294311
Duke Energy Ohio, Wm. H. Zimmer Station 385.1 7,150.0 22,133.9 0.06% 3.63% 3.69%
IN 18125-7362411
Indianapolis Power & Light Petersburg 453.0 10,665.3 18,141.9 0.14% 2.16% 2.30%
IN 18051-7363111 Gibson 471.7 12,280.3 23,117.2 0.11% 2.00% 2.10%
TN 47009-9159211 Mc Ghee Tyson 44.3 594.7 78.6 0.69% 1.34% 2.03%
AR 05063-1083411
Entergy Arkansas Inc. - Independence Plant 674.4 14,133.2 32,050.5 0.05% 1.58% 1.63%
KY 21091-7352411 Century Aluminum of KY, LLC 377.1 197.7 5,044.2 <0.01% 1.59% 1.59%
TN 47093-4979911 Cemex - Knoxville Plant 69.7 711.5 121.5 0.51% 0.84% 1.36%
KY 21111-7353711
Louisville Gas & Electric Co., Mill Creek Station 340.9 4,169.1 4,335.3 0.12% 1.21% 1.33%
TN 47105-4129211 TATE & LYLE, Loudon 48.1 252.5 110.2 0.18% 1.01% 1.19%
KY 21041-5198511 KY Utilities Co - Ghent Station 383.0 7,939.9 10,169.3 0.07% 1.10% 1.17%
IN 18077-7744211
Indiana Kentucky Electric Corporation 391.6 6,188.5 9,038.1 0.04% 1.06% 1.10%
IN 18019-8198511 ESSROC Cement Corp 369.5 2,365.0 4,681.2 0.04% 1.03% 1.07%
IL 17127-7808911 Joppa Steam 482.1 4,706.3 20,509.3 <0.01% 1.03% 1.04%

Pre-hearing Draft 222 NC Regional Haze SIP for Second Planning Period (2019 – 2028) August 30, 2021
Table 7-22. Facilities with ≥1.00% Sulfate + Nitrate AoI Contribution to Visibility Impairment on the 20% Most Impaired Days at Linville Gorge Wilderness Area
State Facility
ID Facility Name Distance
(Km)
2028 NOx (TPY)
2028 SO2
(TPY) Nitrate
(%) Sulfate
(%)
Sulfate + Nitrate
(%)
TN 47163-3982311 Eastman Chemical Company 81.9 6,900.3 6,420.2 0.68% 19.21% 19.90%
NC 37035-8370411
Duke Energy Carolinas, LLC - Marshall Steam Station 97.2 7,511.3 4,139.2 0.41% 6.33% 6.73%
OH 39053-8148511
General James M. Gavin Power Plant 329.2 8,122.5 41,595.8 0.04% 5.90% 5.94%
VA 51027-4034811 Jewell Coke Company LLP 140.4 520.2 5,090.9 0.01% 5.34% 5.35%
NC 37023-8513011 SGL Carbon LLC 32.5 21.7 261.6 0.01% 4.05% 4.06%
OH 39025-8294311
Duke Energy Ohio, Wm. H. Zimmer Station 380.3 7,150.0 22,133.9 0.03% 2.82% 2.85%
NC 37161-8300611
Duke Energy Carolinas, LLC - Cliffside Steam Station 85.3 1,947.7 1,082.3 0.11% 2.38% 2.49%
WV 54073-4782811
Monongahela Power Co – Pleasants Power Station 381.0 5,497.4 16,817.4 0.03% 2.04% 2.07%
NC 37169-8514011
Duke Energy Carolinas, LLC - Belews Creek Steam Station 172.2 5,264.3 4,946.1 0.08% 1.93% 2.01%
TN 47073-2934811
AGC Industries - Greenland Plant 94.7 2,068.1 441.6 0.24% 1.74% 1.98%
WV 54079-6789111
Appalachian Power Company - John E Amos Plant 277.7 4,878.1 10,984.2 <0.01% 1.78% 1.80%
IN 18147-8017211
Indiana Michigan Power - Rockport 503.5 8,806.8 30,536.3 0.01% 1.18% 1.19%

Pre-hearing Draft 223 NC Regional Haze SIP for Second Planning Period (2019 – 2028) August 30, 2021
Table 7-23. Facilities with ≥1.00% Sulfate + Nitrate AoI Contribution to Visibility Impairment on the 20% Most Impaired Days at Shining Rock Wilderness Area
State Facility ID Facility Name Distance
(Km)
2028 NOx (TPY)
2028 SO2
(TPY) Nitrate
(%) Sulfate
(%)
Sulfate + Nitrate
(%)
NC 37087-7920511
Blue Ridge Paper Products - Canton Mill 16.9 2,992.4 1,127.1 6.65% 41.29% 47.93%
TN 47163-3982311 Eastman Chemical Company 126.9 6,900.3 6,420.2 0.40% 4.43% 4.83%
NC 37035-8370411
Duke Energy Carolinas, LLC - Marshall Steam Station 166.0 7,511.3 4,139.2 0.49% 2.19% 2.68%
NC 37021-NEW_2706 Asheville 22.6 848.5 17.0 1.97% 0.37% 2.33%
NC 37161-8300611
Duke Energy Carolinas, LLC - Cliffside Steam Station 94.1 1,947.7 1,082.3 0.28% 1.57% 1.85%
GA 13015-2813011
Ga Power Company - Plant Bowen 241.6 6,643.3 10,453.4 0.07% 1.70% 1.77%
NC 37169-8514011
Duke Energy Carolinas, LLC - Belews Creek Steam Station 264.4 5,264.3 4,946.1 0.14% 1.42% 1.56%
TN 47145-4979111 TVA Kingston Fossil Plant 167.7 1,687.4 1,886.1 0.10% 1.40% 1.50%
OH 39025-8294311
Duke Energy Ohio, Wm. H. Zimmer Station 406.7 7,150.0 22,133.9 0.03% 1.37% 1.40%
OH 39053-8148511
General James M. Gavin Power Plant 397.3 8,122.5 41,595.8 0.01% 1.39% 1.40%
VA 51027-4034811 Jewell Coke Company LLP 214.7 520.2 5,090.9 <0.01% 1.33% 1.34%
WV 54079-6789111
Appalachian Power Company - John E Amos Plant 352.1 4,878.1 10,984.2 0.04% 1.22% 1.25%

Pre-hearing Draft 224 NC Regional Haze SIP for Second Planning Period (2019 – 2028) August 30, 2021
Table 7-24. Facilities with ≥1.00% Sulfate + Nitrate AoI Contribution to Visibility Impairment on the 20% Most Impaired Days at Swanquarter Wilderness Area
State Facility
ID Facility Name Distance
(Km)
2028 NOx
(TPY)
2028 SO2
(TPY) Nitrate
(%) Sulfate
(%)
Sulfate + Nitrate
(%)
NC 37013-8479311
PCS Phosphate Company, Inc. - Aurora 52.5 495.6 4,845.9 0.57% 37.89% 38.47%
NC 37117-8049311
Domtar Paper Company, LLC 69.0 1,796.5 687.4 1.02% 2.27% 3.29%
PA 42005-3866111
Genon NE Mgmt Co/Keystone Station 640.2 6,578.5 56,939.2 0.08% 3.00% 3.08%
NC 37145-7826011
Duke Energy Progress, LLC - Roxboro Steam Electric Plant
282.6 4,527.9 6,665.5 0.18% 2.05% 2.23%
MD 24003-6084311
Raven Power Fort Smallwood LLC 414.7 4,387.8 10,942.9 0.16% 1.76% 1.92%
OH 39053-8148511
General James M. Gavin Power Plant 651.5 8,122.5 41,595.8 0.06% 1.77% 1.83%
NC 37049-8504911
Marine Corps Air Station - Cherry Point 88.4 201.1 607.8 0.05% 1.31% 1.36%
7.6 PSAT Modeling VISTAS used CAMx PSAT modeling to refine estimates of source contributions to modeled visibility impacts for individual Class I areas in 2028. PSAT uses multiple tracer families to track the fate of both primary and secondary PM. PSAT allows emissions to be tracked (tagged) for individual facilities as well as various combinations of sectors and geographic areas (e.g., by state). VISTAS used the SO2 and NOx facility contributions from the AoI analysis to help select sources to be tagged with PSAT. Each state used the AoI results to develop its initial list of facilities for tagging. The VISTAS states then compared their lists and collaborated on developing the final list of facilities in both the VISTAS and non-VISTAS states for which AoI impacts were significant enough to warrant further evaluation. In the end, SO2 and NOx emissions for 87 individual facilities were tagged and the visibility contributions (Mm-1) for the 20% most impaired days were determined at all Class I areas in the VISTAS_12 modeling domain. Some of the 87 facilities were selected by more than one state. In addition, PSAT tags previously discussed in Section 7.4 include total sulfate and nitrate contributions from EGU + non-EGU point sources at each Class I area. This allows a percent contribution (individual facility contribution divided by the total sulfate and nitrate contributions from EGU + non-EGU point sources) to be determined for each facility at each Class I area. If the sulfate contribution was greater than or equal to 1.00%, the facility was considered for reasonable progress analysis for SO2. If the nitrate contribution was greater than or equal to 1.00%, then the facility was considered for reasonable progress analysis for NOx. Details of the PSAT modeling can be found in Appendix E-7a (PSAT Report) and details of the percent contribution calculations can be found in Appendix 7-6b (Roadmap).

Pre-hearing Draft 225 NC Regional Haze SIP for Second Planning Period (2019 – 2028) August 30, 2021
Table 7-24 through Table 7-27 identify by state the 87 facilities that were tagged for PSAT modeling. The tables also compare 2028 SO2 and NOx emissions from the VISTAS elv3 inventory used for the AoI analysis and initial PSAT modeling to the revised 2028 SO2 and NOx emissions from the VISTAS elv5 inventory used to adjust the PSAT results and for the RPG modeling. Table 7-24 lists PSAT tags selected for facilities in AL and FL. Table 7-25 lists PSAT tags selected for facilities in GA, KY, MS, NC, SC, and TN. Table 7-26 lists PSAT tags selected for facilities in VA and WV. Table 7-27 lists PSAT tags selected for facilities in AR, MO, PA, IL, IN, and OH. The contributions from all 87 PSAT-tagged facilities were evaluated at all Class I areas in the VISTAS_12 domain. A detailed description of the PSAT modeling and post-processing for creating PSAT contributions for Class I areas is contained in Appendix E-7a and Appendix E-7b.

Pre-hearing Draft 226 NC Regional Haze SIP for Second Planning Period (2019 – 2028) August 30, 2021
Table 7-25. PSAT Tags Selected for Facilities in AL and FL
2028 Emissions for AoI Analysis (TPY)
2028 Emissions for Revised PSAT Analysis (TPY)
Difference (PSAT minus AOI)
State RPO Facility ID Facility Name SO2 NOx SO2 NOx SO2 NOx AL VISTAS 01097-949811 Akzo Nobel Chemicals Inc 3,335.72 20.7127 3,335.72 20.7127 0.00 0.00 AL VISTAS 01097-1056111 Ala Power - Barry 6,025.60 2181.928 3,007.57 2275.757 -3,018.02 93.83 AL VISTAS 01129-1028711 American Midstream Chatom, LLC 3,106.38 425.873 0.00 0 -3,106.38 -425.87 AL VISTAS 01073-1018711 Drummond Company, Inc. 2,562.17 1228.549 2,562.17 1228.549 0.00 0.00 AL VISTAS 01053-7440211 Escambia Operating Company LLC 18,974.39 349.323 3,782.18 349.323 -15,192.21 0.00 AL VISTAS 01053-985111 Escambia Operating Company LLC 8,589.60 149.6403 88.01 0 -8,501.59 -149.64 AL VISTAS 01103-1000011 Nucor Steel Decatur LLC 170.23 331.2415 170.23 331.2415 0.00 0.00 AL VISTAS 01109-985711 Sanders Lead Co 7,951.06 121.71 7,951.06 121.71 0.00 0.00
AL VISTAS 01097-1061611 Union Oil of California - Chunchula Gas Plant 2,573.15 349.2253 0.00 0 -2,573.15 -349.23
FL VISTAS 12123-752411 Buckeye Florida, Limited Partnership 1,520.42 1830.714 1,520.42 1830.714 0.00 0.00 FL VISTAS 12086-900111 CEMEX Construction Materials FL. LLC. 29.51 910.359 29.51 2599.99 0.00 1,689.63 FL VISTAS 12017-640611 Duke Energy Florida, Inc. (DEF) 5,306.41 2489.847 2,613.52 1048.136 -2,692.90 -1,441.71 FL VISTAS 12086-900011 Florida Power & Light (PTF) 13.05 170.614 13.05 170.6135 0.00 0.00 FL VISTAS 12033-752711 Gulf Power - Crist 2,615.65 2998.389 572.17 1146.823 -2,043.48 -1,851.57 FL VISTAS 12086-3532711 Homestead City Utilities 0.00 97.09 0.00 97.0895 0.00 0.00 FL VISTAS 12031-640211 JEA 2,094.48 651.7859 2,150.50 1037.028 56.01 385.24 FL VISTAS 12105-717711 Mosaic Fertilizer, LLC 7,900.67 310.4175 4,490.96 310.4176 -3,409.70 0.00 FL VISTAS 12057-716411 Mosaic Fertilizer, LLC 3,034.06 159.7073 1,804.38 168.7565 -1,229.68 9.05 FL VISTAS 12105-919811 Mosaic Fertilizer, LLC 4,425.56 141.0243 4,300.52 141.0243 -125.04 0.00 FL VISTAS 12089-845811 Rayonier Performance Fibers LLC 561.97 2327.098 561.97 2327.098 0.00 0.00 FL VISTAS 12089-753711 Rock Tenn CP, LLC 2,606.72 2316.773 2,606.72 2316.772 0.00 0.00 FL VISTAS 12005-535411 Rock Tenn CP, LLC 2,590.88 1404.893 2,590.88 1404.893 0.00 0.00
FL VISTAS 12129-2731711 Tallahassee City Purdom Generating Station 2.86 121.457 2.86 121.4573 0.00 0.00
FL VISTAS 12057-538611 Tampa Electric Company (TEC) 6,084.90 2665.034 6,084.90 2665.034 0.00 0.00 FL VISTAS 12086-899911 Tarmac America LLC 9.38 879.699 9.38 2376 0.00 1,496.30 FL VISTAS 12047-769711 White Springs Agricultural Chemicals, Inc. 3,197.77 112.4077 1,557.04 102.1919 -1,640.73 -10.22

Pre-hearing Draft 227 NC Regional Haze SIP for Second Planning Period (2019 – 2028) August 30, 2021
Table 7-26. PSAT Tags Selected for Facilities in GA, KY, MS, NC, SC, and TN
2028 Emissions for AoI Analysis (TPY)
2028 Emissions for Revised PSAT Analysis (TPY)
Difference (PSAT minus AoI)
State RPO Facility ID Facility Name SO2 NOx SO2 NOx SO2 NOx GA VISTAS 13127-3721011 Brunswick Cellulose Inc 294.20 1554.51 294.20 1554.51 0.00 0.00 GA VISTAS 13015-2813011 Georgia Power Company - Plant Bowen 10,453.41 6643.316 10,453.41 6643.316 0.00 0.00
GA VISTAS 13103-536311 Georgia-Pacific Consumer Products LP (Savannah River Mill) 1,860.18 351.518 1,860.18 351.5183 0.00 0.00
GA VISTAS 13051-3679811 International Paper – Savannah 3,945.38 1560.73 3,945.38 1560.73 0.00 0.00 GA VISTAS 13115-539311 Temple Inland 1,791.00 1773.352 1,791.00 1773.352 0.00 0.00
KY VISTAS 21183-5561611 Big Rivers Electric Corp - Wilson Station 6,934.16 1151.95 6,934.16 1151.95 0.00 0.00
KY VISTAS 21091-7352411 Century Aluminum of KY LLC 5,044.16 197.6568 2,223.56 197.6568 -2,820.60 0.00
KY VISTAS 21177-5196711 TVA - Paradise Fossil Plant 2,990.23 2927.425 13.20 740.7 -2,977.03 -2,186.73
KY VISTAS 21145-6037011 TVA - Shawnee Fossil Plant 19,504.75 7007.342 19,504.75 7007.342 0.00 0.00
MS VISTAS 28059-8384311 Chevron Products Company, Pascagoula Refinery 741.60 1534.122 741.60 1534.122 0.00 0.00
MS VISTAS 28059-6251011 Mississippi Power Company, Plant Victor J Daniel 224.40 3736.469 231.92 3829.723 7.53 93.25
NC VISTAS 37087-7920511 Blue Ridge Paper Products - Canton Mill 1,127.07 2992.369 404.70 2926.777 -722.37 -65.59
NC VISTAS 37117-8049311 Domtar Paper Company, LLC 687.45 1796.493 687.45 1796.494 0.00 0.00
NC VISTAS 37035-8370411 Duke Energy Carolinas, LLC - Marshall Steam Station 4,139.21 7511.305 2,654.15 5355.788 -1,485.05 -
2,155.52 NC VISTAS 37013-8479311 PCS Phosphate Company, Inc. - Aurora 4,845.90 495.5774 4,845.90 495.5774 0.00 0.00 NC VISTAS 37023-8513011 SGL Carbon LLC 261.64 21.689 261.64 21.68888 0.00 0.00 SC VISTAS 45015-4834911 ALUMAX of South Carolina 3,751.69 108.0817 3,751.69 108.0817 0.00 0.00 SC VISTAS 45043-5698611 International Paper Georgetown Mill 2,767.52 2031.263 2,767.52 2031.263 0.00 0.00 SC VISTAS 45019-4973611 Kapstone Charleston Kraft, LLC 1,863.65 2355.817 1,863.65 2355.817 0.00 0.00 SC VISTAS 45015-4120411 Santee Cooper Cross Generating Station 4,281.17 3273.466 4,281.17 3273.466 0.00 0.00
SC VISTAS 45043-6652811 Santee Cooper Winyah Generating Station 2,246.86 1772.533 2,246.86 1772.533 0.00 0.00
SC VISTAS 45015-8306711 SCE&G Williams 392.48 992.735 392.48 992.7348 0.00 0.00

Pre-hearing Draft 228 NC Regional Haze SIP for Second Planning Period (2019 – 2028) August 30, 2021
2028 Emissions for AoI Analysis (TPY)
2028 Emissions for Revised PSAT Analysis (TPY)
Difference (PSAT minus AoI)
State RPO Facility ID Facility Name SO2 NOx SO2 NOx SO2 NOx TN VISTAS 47093-4979911 Cemex - Knoxville Plant 121.47 711.5 121.47 711.5 0.00 0.00 TN VISTAS 47163-3982311 Eastman Chemical Company 6,420.16 6900.333 6,420.16 6900.333 0.00 0.00 TN VISTAS 47105-4129211 TATE & LYLE, Loudon 472.76 883.2545 166.61 230.3145 -306.15 -652.94 TN VISTAS 47001-6196011 TVA Bull Run Fossil Plant 622.54 964.1556 0.00 0 -622.54 -964.16 TN VISTAS 47161-4979311 TVA Cumberland Fossil Plant 8,427.33 4916.515 8,427.33 4916.514 0.00 0.00
TN VISTAS 47145-4979111 TVA Kingston Fossil Plant 1,886.09 1687.38 424.37 379.6604 -1,461.72 -1,307.72
Table 7-27. PSAT Tags Selected for Facilities in VA and WV
2028 Emissions for AoI Analysis (TPY)
2028 Emissions for Revised PSAT Analysis (TPY)
Difference (PSAT minus AoI)
State RPO Facility ID Facility Name SO2 NOx SO2 NOx SO2 NOx VA VISTAS 51027-4034811 Jewell Coke Company LLP 5,090.95 520.17 5,090.95 520.17 0.00 0.00 VA VISTAS 51580-5798711 Meadwestvaco Packaging Resource Group 2,115.31 1985.69 2,115.31 1985.69 0.00 0.00 VA VISTAS 51023-5039811 Roanoke Cement Company 2,290.17 1972.966 2,290.17 1972.97 0.00 0.00
WV VISTAS 54033-6271711 Allegheny Energy Supply Co, LLC - Harrison 10,082.94 11830.88 10,356.24 10017.31 273.30 -1,813.57
WV VISTAS 54049-4864511 American Bituminous Power-Grant Town Plant 2,210.25 1245.102 2,823.63 1735.70 613.37 490.60
WV VISTAS 54079-6789111 Appalachian Power Company - John E Amos Plant 10,984.24 4878.096 6,098.36 7292.59 -4,885.88 2,414.49
WV VISTAS 54023-6257011 Dominion Resources, Inc. - Mount Storm Power Station 2,123.64 1984.136 954.03 965.28 -1,169.61 -1,018.84
WV VISTAS 54041-6900311 Equitrans - Copley Run CS 70 0.10 511.0605 0.10 511.06 0.00 0.00 WV VISTAS 54083-6790711 Files Creek 6C4340 0.15 643.3533 0.15 643.35 0.00 0.00 WV VISTAS 54083-6790511 Glady 6C4350 0.11 343.2882 0.11 343.29 0.00 0.00 WV VISTAS 54093-6327811 Kingsford Manufacturing Company 16.96 140.883 16.96 140.89 0.00 0.00 WV VISTAS 54061-16320111 Longview Power 2,313.73 1556.573 2,336.89 2237.24 23.16 680.67 WV VISTAS 54051-6902311 Mitchell Plant 5,372.40 2719.623 4,230.41 3966.73 -1,141.99 1,247.11 WV VISTAS 54061-6773611 Monongahela Power Co.- Fort Martin Power 4,881.87 13743.32 3,056.87 11997.76 -1,825.00 -1,745.56

Pre-hearing Draft 229 NC Regional Haze SIP for Second Planning Period (2019 – 2028) August 30, 2021
Table 7-28. PSAT Tags Selected for Facilities in AR, MO, MD, PA, IL, IN, and OH
State RPO Facility ID Facility Name
2028 Emissions for AoI Analysis (TPY)
2028 Emissions for Revised PSAT Analysis (TPY)
Difference (PSAT minus AoI)
SO2 NOx SO2 NOx SO2 NOx
AR CENRAP 05063-1083411 Entergy Arkansas Inc. - Independence Plant 32,050.49 14133.211 13,643.45 4486.266 -18,407.04 -9,646.95
MO CENRAP 29143-5363811 New Madrid Power Plant-Marston 16,783.71 4394.099 11,158.33 4054.043 -5,625.38 -340.06 MD MANE-VU 24001-7763811 Luke Paper Company 9,876.00 3607.004 9,876.00 3607.004 0.00 0.00
PA MANE-VU 42005-3866111 Genon NE Mgmt Co/Keystone Station 56,939.25 6578.469 21,066.37 5086.296 -35,872.88 -1,492.17
PA MANE-VU 42063-3005211 Homer City Gen LP/Center TWP 11,865.70 5215.958 9,274.88 4962.31 -2,590.82 -253.65
PA MANE-VU 42063-3005111 NRG Wholesale GEN/Seward Gen Station 8,880.26 2254.634 6,813.94 1632.909 -2,066.32 -621.73
IL LADCO 17127-7808911 Joppa Steam 20,509.28 4706.348 8,041.13 1994.888 -12,468.15 -2,711.46
IN LADCO 18173-8183111 Alcoa Warrick Power Plt Agc Div of AL 5,071.28 11158.555 1,459.43 3024.678 -3,611.85 -8,133.88
IN LADCO 18051-7363111 Gibson 23,117.23 12280.34 12,999.61 8620.009 -10,117.62 -3,660.33
IN LADCO 18147-8017211 Indiana Michigan Power - Rockport 30,536.33 8806.768 10,779.01 8475.081 -19,757.32 -331.69
IN LADCO 18125-7362411 Indianapolis Power & Light Petersburg 18,141.88 10665.27 9,422.13 5355.617 -8,719.75 -5,309.65
IN LADCO 18129-8166111 Sigeco AB Brown South Indiana Gas & Ele 7,644.70 1578.591 0.16 28.95738 -7,644.54 -1,549.63
OH LADCO 39081-8115711 Cardinal Power Plant - Cardinal Operating Company 7,460.79 2467.306 9,891.89 4044.845 2,431.10 1,577.54
OH LADCO 39031-8010811 Conesville Power Plant (0616000000) 6,356.23 9957.873 0.00 0 -6,356.23 -9,957.87
OH LADCO 39025-8294311 Duke Energy Ohio, Wm. H. Zimmer Station 22,133.90 7149.97 10,346.34 5864.068 -11,787.56 -1,285.90
WV VISTAS 54073-4782811 Monongahela Power Co – Pleasants Power Station 16,817.43 5497.37 11,501.78 5729.00 -5,315.65 231.63
WV VISTAS 54061-6773811 Morgantown Energy Associates 828.64 655.5805 3.30 216.02 -825.34 -439.56

Pre-hearing Draft 230 NC Regional Haze SIP for Second Planning Period (2019 – 2028) August 30, 2021
State RPO Facility ID Facility Name
2028 Emissions for AoI Analysis (TPY)
2028 Emissions for Revised PSAT Analysis (TPY)
Difference (PSAT minus AoI)
SO2 NOx SO2 NOx SO2 NOx
OH LADCO 39053-8148511 General James M. Gavin Power Plant 41,595.81 8122.51 21,838.61 7982.595 -19,757.20 -139.92
OH LADCO 39053-7983011 Ohio Valley Electric Corp., Kyger Creek Station 3,400.14 9143.837 4,278.04 6267.251 877.91 -2,876.59

Pre-hearing Draft 231 NC Regional Haze SIP for Second Planning Period (2019 – 2028) August 30, 2021
7.6.1 Selection of Facilities for PSAT Modeling for Class I Areas in North Carolina Since SO2 and NOx emissions from point sources were estimated to have the largest AoI contribution to visibility impairment at the Class I areas in North Carolina (see Table 7-14 through Table 7-18), North Carolina used the fraction of total sulfate plus nitrate visibility impairment (projected to 2028) from individual point source facilities as the metric for which an AoI threshold would be chosen to select sources for PSAT tagging. The NCDAQ approached selecting North Carolina facilities for tagging from a regional perspective. Based on the AoI results, several of the facilities with the highest AoI impacts at Class I areas in North Carolina are located outside of North Carolina. This is in part attributable to the Clean Smokestacks Act North Carolina adopted in 2002 that required coal-fired power plants to reduce annual NOx emissions by 77% by 2009, and to reduce annual SO2 emissions by 49% by 2009 and 73% by 2013. North Carolina is the only state that adopted a state law requiring power plants to install controls to reduce NOx and SO2 emissions for improving visibility and controlling acid deposition in the region. Therefore, it is not unexpected that several power plants outside of North Carolina have higher AoI impacts on North Carolina Class I areas than power plants in North Carolina. The NCDAQ reviewed the 37 facilities identified in Table 7-19 through Table 7-23 with an AoI contribution of ≥1% for sulfate and nitrate combined for one or more of the Class I areas in North Carolina. Based on this review, and consultation with Tennessee and the other VISTAS states, the NCDAQ selected North Carolina facilities with an AoI contribution of ≥3% for sulfate and nitrate combined for PSAT analysis which is consistent with the threshold selected by Tennessee. The 3% AoI threshold identified the five facilities shown in Table 7-28 with the highest AoI contributions to North Carolina Class I areas and Class I areas in nearby states. Each state within VISTAS established an AoI threshold specific to that state to select sources for PSAT modeling. For the facilities selected for PSAT analysis by other VISTAS states, 8 facilities had an AoI contribution of ≥3% and an additional 11 facilities had an AoI contribution of ≥1% and ≤3% for one or more Class I areas in the Southeast or neighboring regions. Thus, a total of 24 facilities were selected by the VISTAS States for further analysis using PSAT modeling to better understand each facility’s contribution to visibility impairment for Class I areas in North Carolina. Section 7.7.3 of this SIP provides information on why additional facilities were not selected for PSAT modeling including the five North Carolina facilities with an AoI contribution of between 1% and 3% for one or more Class I areas in North Carolina. In addition, the NCDAQ also considered the fact that emissions are continuing to decline early in the second planning period and are expected to maintain a rate that is parallel with the URP for each of North Carolina’s Class I areas based on the federal and state control programs and actions discuss in Section 7.2 of this SIP. Given these considerations, and the fact that the regional haze planning is an iterative process that requires the state to evaluate and adjust the LTS as needed during future planning periods, the NCDAQ believes that the facilities selected by North Carolina and other VISTAS states for PSAT modeling is a reasonable number of facilities for which to evaluate further for reasonable progress analyses.
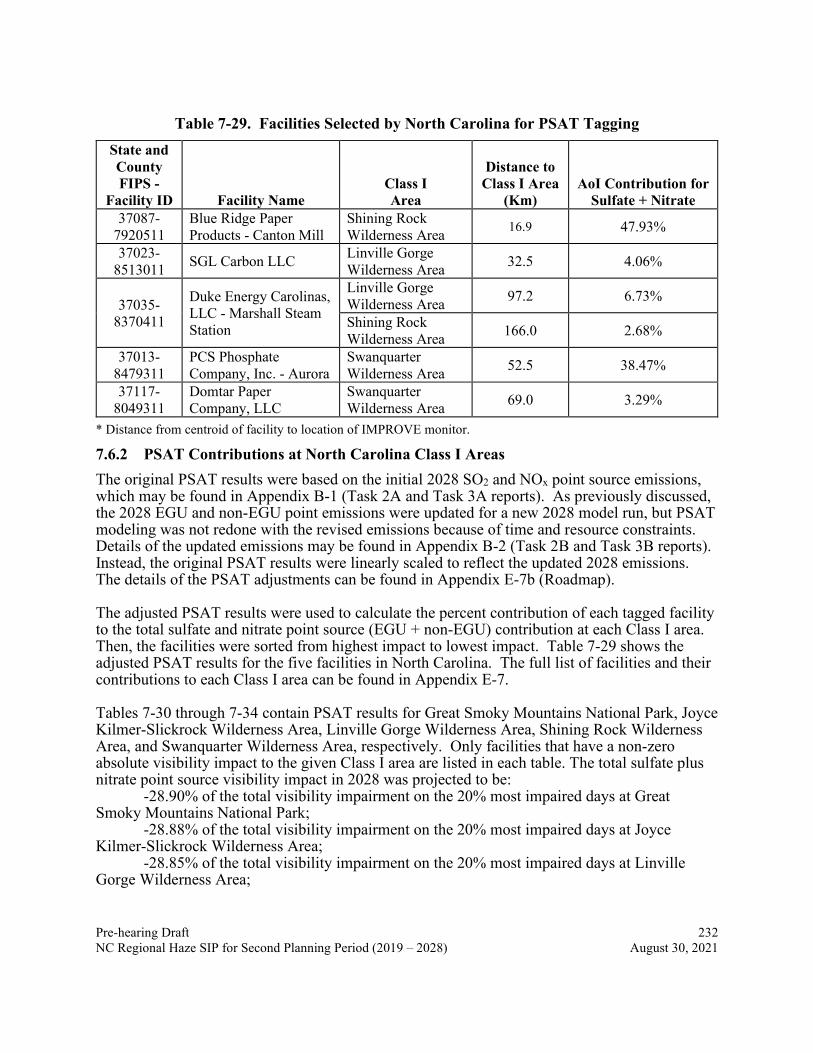
Pre-hearing Draft 232 NC Regional Haze SIP for Second Planning Period (2019 – 2028) August 30, 2021
Table 7-29. Facilities Selected by North Carolina for PSAT Tagging
State and County FIPS -
Facility ID Facility Name Class I Area
Distance to Class I Area
(Km) AoI Contribution for
Sulfate + Nitrate 37087-
7920511 Blue Ridge Paper Products - Canton Mill
Shining Rock Wilderness Area 16.9 47.93%
37023-8513011 SGL Carbon LLC Linville Gorge
Wilderness Area 32.5 4.06%
37035-8370411
Duke Energy Carolinas, LLC - Marshall Steam Station
Linville Gorge Wilderness Area 97.2 6.73%
Shining Rock Wilderness Area 166.0 2.68%
37013-8479311
PCS Phosphate Company, Inc. - Aurora
Swanquarter Wilderness Area 52.5 38.47%
37117-8049311
Domtar Paper Company, LLC
Swanquarter Wilderness Area 69.0 3.29%
* Distance from centroid of facility to location of IMPROVE monitor.
7.6.2 PSAT Contributions at North Carolina Class I Areas The original PSAT results were based on the initial 2028 SO2 and NOx point source emissions, which may be found in Appendix B-1 (Task 2A and Task 3A reports). As previously discussed, the 2028 EGU and non-EGU point emissions were updated for a new 2028 model run, but PSAT modeling was not redone with the revised emissions because of time and resource constraints. Details of the updated emissions may be found in Appendix B-2 (Task 2B and Task 3B reports). Instead, the original PSAT results were linearly scaled to reflect the updated 2028 emissions. The details of the PSAT adjustments can be found in Appendix E-7b (Roadmap). The adjusted PSAT results were used to calculate the percent contribution of each tagged facility to the total sulfate and nitrate point source (EGU + non-EGU) contribution at each Class I area. Then, the facilities were sorted from highest impact to lowest impact. Table 7-29 shows the adjusted PSAT results for the five facilities in North Carolina. The full list of facilities and their contributions to each Class I area can be found in Appendix E-7. Tables 7-30 through 7-34 contain PSAT results for Great Smoky Mountains National Park, Joyce Kilmer-Slickrock Wilderness Area, Linville Gorge Wilderness Area, Shining Rock Wilderness Area, and Swanquarter Wilderness Area, respectively. Only facilities that have a non-zero absolute visibility impact to the given Class I area are listed in each table. The total sulfate plus nitrate point source visibility impact in 2028 was projected to be:
-28.90% of the total visibility impairment on the 20% most impaired days at Great Smoky Mountains National Park;
-28.88% of the total visibility impairment on the 20% most impaired days at Joyce Kilmer-Slickrock Wilderness Area;
-28.85% of the total visibility impairment on the 20% most impaired days at Linville Gorge Wilderness Area;

Pre-hearing Draft 233 NC Regional Haze SIP for Second Planning Period (2019 – 2028) August 30, 2021
-27.90% of the total visibility impairment on the 20% most impaired days at Shining Rock Wilderness Area;
-22.20% of the total visibility impairment on the 20% most impaired days at Swanquarter Wilderness Area;
Table 7-30. Revised Final PSAT Results for North Carolina Facility Sulfate and Nitrate
Impacts on North Carolina Class I Areas
Facility Name Distance
(Km) Sulfate (Mm-1)
EGU+Non-EGU
(Mm-1) Sulfate, % Nitrate (Mm-1)
EGU+Non-EGU
(Mm-1) Nitrate,
% Great Smoky Mountains National Park Blue Ridge Paper Products 100.3 0.0136 13.23 0.1032 0.0020 13.23 0.0148 PCS Phosphate 650.3 0.0180 13.23 0.1361 0.0000 13.23 0.0000 Duke Energy Marshall 270.0 0.0430 13.23 0.3248 0.0007 13.23 0.0054 SGL Carbon 200.8 0.0010 13.23 0.0076 0.0000 13.23 0.0000 Domtar Paper Company 648.1 0.0030 13.23 0.0227 0.0000 13.23 0.0000 Joyce Kilmer-Slickrock Wilderness Area Blue Ridge Paper Products 104.0 0.0140 13.03 0.1075 0.0020 13.03 0.0150 PCS Phosphate 653.8 0.0200 13.03 0.1535 0.0000 13.03 0.0000 Duke Energy Marshall 274.3 0.0455 13.03 0.3494 0.0007 13.03 0.0055 SGL Carbon 207.1 0.0010 13.03 0.0077 0.0000 13.03 0.0000 Domtar Paper Company 653.7 0.0040 13.03 0.0307 0.0000 13.03 0.0000 Linville Gorge Wilderness Area Blue Ridge Paper Products 95.40 0.0169 12.27 0.1376 0.0010 12.27 0.0080 PCS Phosphate 471.2 0.0200 12.27 0.1630 0.0000 12.27 0.0000 Duke Energy Marshall 97.20 0.1064 12.27 0.8678 0.0036 12.27 0.0291 SGL Carbon 32.50 0.0300 12.27 0.2446 0.0000 12.27 0.0000 Domtar Paper Company 465.2 0.0050 12.27 0.0408 0.0000 12.27 0.0000 Shining Rock Wilderness Area Blue Ridge Paper Products 16.90 0.1332 11.75 1.1341 0.0117 11.75 0.0999 PCS Phosphate 544.7 0.0200 11.75 0.1703 0.0000 11.75 0.0000 Duke Energy Marshall 166.0 0.0859 11.75 0.7315 0.0021 11.75 0.0182 SGL Carbon 102.1 0.0020 11.75 0.0170 0.0000 11.75 0.0000 Domtar Paper Company 545.4 0.0050 11.75 0.0426 0.0000 11.75 0.0000 Swanquarter Wilderness Area Blue Ridge Paper Products 601.9 0.0043 10.29 0.0419 0.0029 10.29 0.0285 PCS Phosphate 52.5 0.3290 10.29 3.1967 0.0070 10.29 0.0680 Duke Energy Marshall 431.5 0.0641 10.29 0.6230 0.0150 10.29 0.1455 SGL Carbon 501.1 0.0020 10.29 0.0194 0.0000 10.29 0.0000 Domtar Paper Company 69.00 0.1090 10.29 1.0591 0.0220 10.29 0.2138

Pre-hearing Draft 234 NC Regional Haze SIP for Second Planning Period (2019 – 2028) August 30, 2021
Table 7-31. PSAT Results for Great Smoky Mountains National Park
State Facility ID Facility Name Distance
(Km)
Final Revised Sulfate PSAT
(Mm-1)
Final Revised
EGU+NEG (Mm-1)
Final Revised Sulfate PSAT (%)
Final Revised Nitrate PSAT
(Mm-1)
Final Revised
EGU+NEG (Mm-1)
Final Revised Nitrate PSAT (%)
OH 39053-8148511
General James M. Gavin Power Plant
400.53 0.5198 13.2255 3.93 0.0029 13.2255 0.02
KY 21145-6037011
Tennessee Valley Authority (Tva) - Shawnee Fossil Plant
465.29 0.1830 13.2255 1.38 0.0110 13.2255 0.08
TN 47163-3982311
Eastman Chemical Company 160.12 0.1700 13.2255 1.29 0.0070 13.2255 0.05
PA 42005-3866111
Genon Ne Mgmt Co/Keystone Sta 688.19 0.1661 13.2255 1.26 0.0008 13.2255 0.01
IN 18147-8017211
Indiana Michigan Power Dba Aep Rockport
375.48 0.1656 13.2255 1.25 0.0346 13.2255 0.26
IN 18051-7363111
Gibson 456.28 0.1462 13.2255 1.11 0.0372 13.2255 0.28
OH 39025-8294311
Duke Energy Ohio, Wm. H. Zimmer Station
359.99 0.1360 13.2255 1.03 0.0025 13.2255 0.02
WV 54033-6271711
Allegheny Energy Supply Co, Llc-Harrison
524.75 0.1294 13.2255 0.98 0.0025 13.2255 0.02
GA 13015-2813011
Ga Power Company - Plant Bowen 189.71 0.1250 13.2255 0.95 0.0010 13.2255 0.01
WV 54073-4782811
Monongahela Power Co-Pleasants Power Sta
475.85 0.1231 13.2255 0.93 0.0021 13.2255 0.02
MD 24001-7763811
Luke Paper Company 606.24 0.1220 13.2255 0.92 0.0000 13.2255 0.00
OH 39081-8115711
Cardinal Power Plant (Cardinal Operating Company)
587.50 0.1167 13.2255 0.88 0.0000 13.2255 0.00
OH 39053-7983011
Ohio Valley Electric Corp., Kyger Creek Station
398.42 0.1120 13.2255 0.85 0.0007 13.2255 0.01

Pre-hearing Draft 235 NC Regional Haze SIP for Second Planning Period (2019 – 2028) August 30, 2021
State Facility ID Facility Name Distance
(Km)
Final Revised Sulfate PSAT
(Mm-1)
Final Revised
EGU+NEG (Mm-1)
Final Revised Sulfate PSAT (%)
Final Revised Nitrate PSAT
(Mm-1)
Final Revised
EGU+NEG (Mm-1)
Final Revised Nitrate PSAT (%)
IN 18125-7362411
Indianapolis Power & Light Petersburg
435.64 0.1085 13.2255 0.82 0.0281 13.2255 0.21
VA 51027-4034811
Jewell Coke Company Llp 246.41 0.1030 13.2255 0.78 0.0000 13.2255 0.00
AR 05063-1083411
Entergy Arkansas Inc-Independence Plant
675.93 0.1005 13.2255 0.76 0.0006 13.2255 0.00
MO 29143-5363811
New Madrid Power Plant-Marston 516.00 0.0997 13.2255 0.75 0.0009 13.2255 0.01
KY 21183-5561611
Big Rivers Electric Corp - Wilson Station
345.81 0.0840 13.2255 0.64 0.0040 13.2255 0.03
TN 47161-4979311
Tva Cumberland Fossil Plant 344.96 0.0800 13.2255 0.60 0.0040 13.2255 0.03
WV 54079-6789111
Appalachian Power Company - John E Amos Plant
367.15 0.0744 13.2255 0.56 0.0030 13.2255 0.02
IL 17127-7808911
Joppa Steam 474.38 0.0717 13.2255 0.54 0.0021 13.2255 0.02
SC 45015-4120411
Santee Cooper Cross Generating Station
432.03 0.0640 13.2255 0.48 0.0000 13.2255 0.00
PA 42063-3005211
Homer City Gen Lp/ Center Twp 682.88 0.0586 13.2255 0.44 0.0010 13.2255 0.01
TN 47145-4979111
Tva Kingston Fossil Plant 60.03 0.0535 13.2255 0.40 0.0036 13.2255 0.03
AL 01073-1018711
Drummond Company, Inc. 345.58 0.0480 13.2255 0.36 0.0000 13.2255 0.00
AL 01109-985711
Sanders Lead Co 466.40 0.0430 13.2255 0.33 0.0000 13.2255 0.00
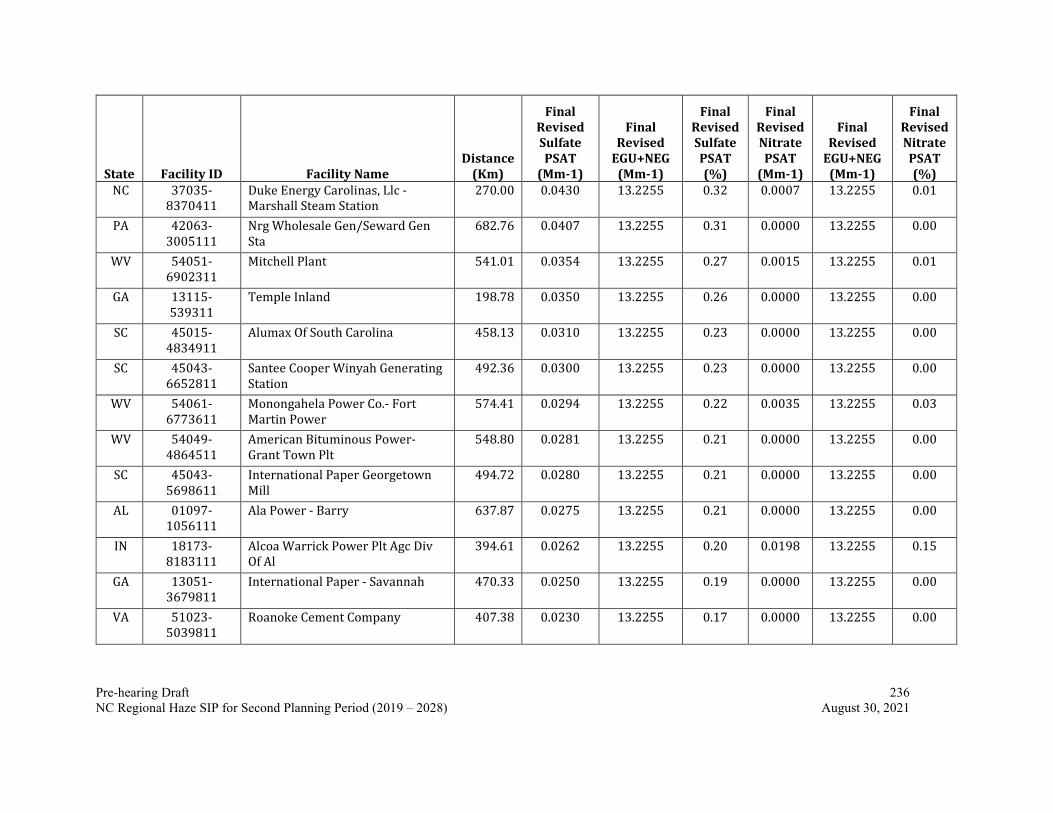
Pre-hearing Draft 236 NC Regional Haze SIP for Second Planning Period (2019 – 2028) August 30, 2021
State Facility ID Facility Name Distance
(Km)
Final Revised Sulfate PSAT
(Mm-1)
Final Revised
EGU+NEG (Mm-1)
Final Revised Sulfate PSAT (%)
Final Revised Nitrate PSAT
(Mm-1)
Final Revised
EGU+NEG (Mm-1)
Final Revised Nitrate PSAT (%)
NC 37035-8370411
Duke Energy Carolinas, Llc - Marshall Steam Station
270.00 0.0430 13.2255 0.32 0.0007 13.2255 0.01
PA 42063-3005111
Nrg Wholesale Gen/Seward Gen Sta
682.76 0.0407 13.2255 0.31 0.0000 13.2255 0.00
WV 54051-6902311
Mitchell Plant 541.01 0.0354 13.2255 0.27 0.0015 13.2255 0.01
GA 13115-539311
Temple Inland 198.78 0.0350 13.2255 0.26 0.0000 13.2255 0.00
SC 45015-4834911
Alumax Of South Carolina 458.13 0.0310 13.2255 0.23 0.0000 13.2255 0.00
SC 45043-6652811
Santee Cooper Winyah Generating Station
492.36 0.0300 13.2255 0.23 0.0000 13.2255 0.00
WV 54061-6773611
Monongahela Power Co.- Fort Martin Power
574.41 0.0294 13.2255 0.22 0.0035 13.2255 0.03
WV 54049-4864511
American Bituminous Power-Grant Town Plt
548.80 0.0281 13.2255 0.21 0.0000 13.2255 0.00
SC 45043-5698611
International Paper Georgetown Mill
494.72 0.0280 13.2255 0.21 0.0000 13.2255 0.00
AL 01097-1056111
Ala Power - Barry 637.87 0.0275 13.2255 0.21 0.0000 13.2255 0.00
IN 18173-8183111
Alcoa Warrick Power Plt Agc Div Of Al
394.61 0.0262 13.2255 0.20 0.0198 13.2255 0.15
GA 13051-3679811
International Paper - Savannah 470.33 0.0250 13.2255 0.19 0.0000 13.2255 0.00
VA 51023-5039811
Roanoke Cement Company 407.38 0.0230 13.2255 0.17 0.0000 13.2255 0.00

Pre-hearing Draft 237 NC Regional Haze SIP for Second Planning Period (2019 – 2028) August 30, 2021
State Facility ID Facility Name Distance
(Km)
Final Revised Sulfate PSAT
(Mm-1)
Final Revised
EGU+NEG (Mm-1)
Final Revised Sulfate PSAT (%)
Final Revised Nitrate PSAT
(Mm-1)
Final Revised
EGU+NEG (Mm-1)
Final Revised Nitrate PSAT (%)
VA 51580-5798711
Meadwestvaco Packaging Resource Group
426.66 0.0210 13.2255 0.16 0.0000 13.2255 0.00
KY 21091-7352411
Century Aluminum Of Ky Llc 360.46 0.0185 13.2255 0.14 0.0000 13.2255 0.00
NC 37013-8479311
Pcs Phosphate Company, Inc. - Aurora
650.31 0.0180 13.2255 0.14 0.0000 13.2255 0.00
SC 45019-4973611
Kapstone Charleston Kraft Llc 475.41 0.0170 13.2255 0.13 0.0000 13.2255 0.00
TN 47093-4979911
Cemex - Knoxville Plant 44.25 0.0150 13.2255 0.11 0.0060 13.2255 0.05
AL 01097-949811
Akzo Nobel Chemicals Inc 641.75 0.0140 13.2255 0.11 0.0000 13.2255 0.00
AL 01053-7440211
Escambia Operating Company Llc 598.46 0.0138 13.2255 0.10 0.0000 13.2255 0.00
NC 37087-7920511
Blue Ridge Paper Products - Canton Mill
100.26 0.0136 13.2255 0.10 0.0020 13.2255 0.01
WV 54061-16320111
Longview Power 572.53 0.0121 13.2255 0.09 0.0000 13.2255 0.00
FL 12005-535411
Rocktenn Cp Llc 628.66 0.0120 13.2255 0.09 0.0000 13.2255 0.00
TN 47105-4129211
Tate & Lyle, Loudon 36.10 0.0092 13.2255 0.07 0.0016 13.2255 0.01
GA 13103-536311
Georgia-Pacific Consumer Products Lp (Savannah River Mill)
445.14 0.0080 13.2255 0.06 0.0000 13.2255 0.00
WV 54023-6257011
Dominion Resources, Inc. - Mount Storm Power Station
572.64 0.0072 13.2255 0.05 0.0000 13.2255 0.00

Pre-hearing Draft 238 NC Regional Haze SIP for Second Planning Period (2019 – 2028) August 30, 2021
State Facility ID Facility Name Distance
(Km)
Final Revised Sulfate PSAT
(Mm-1)
Final Revised
EGU+NEG (Mm-1)
Final Revised Sulfate PSAT (%)
Final Revised Nitrate PSAT
(Mm-1)
Final Revised
EGU+NEG (Mm-1)
Final Revised Nitrate PSAT (%)
SC 45015-8306711
Sce&G Williams 469.69 0.0050 13.2255 0.04 0.0000 13.2255 0.00
AL 01103-1000011
Nucor Steel Decatur Llc 307.31 0.0050 13.2255 0.04 0.0000 13.2255 0.00
FL 12089-753711
Rock Tenn Cp, Llc 596.04 0.0050 13.2255 0.04 0.0000 13.2255 0.00
FL 12031-640211
Jea 619.61 0.0041 13.2255 0.03 0.0000 13.2255 0.00
NC 37117-8049311
Domtar Paper Company, Llc 648.15 0.0030 13.2255 0.02 0.0000 13.2255 0.00
FL 12123-752411
Buckeye Florida, Limited Partnership
618.36 0.0020 13.2255 0.02 0.0000 13.2255 0.00
FL 12017-640611
Duke Energy Florida, Inc. (Def) 749.25 0.0020 13.2255 0.01 0.0000 13.2255 0.00
FL 12047-769711
White Springs Agricultural Chemicals,Inc
585.86 0.0019 13.2255 0.01 0.0000 13.2255 0.00
MS 28059-6251011
Mississippi Power Company, Plant Victor J Daniel
710.94 0.0010 13.2255 0.01 0.0000 13.2255 0.00
FL 12057-538611
Tampa Electric Company (Tec) 881.37 0.0010 13.2255 0.01 0.0000 13.2255 0.00
FL 12089-845811
Rayonier Performance Fibers Llc 597.48 0.0010 13.2255 0.01 0.0000 13.2255 0.00
GA 13127-3721011
Brunswick Cellulose Inc 543.51 0.0010 13.2255 0.01 0.0000 13.2255 0.00
NC 37023-8513011
Sgl Carbon Llc 200.78 0.0010 13.2255 0.01 0.0000 13.2255 0.00

Pre-hearing Draft 239 NC Regional Haze SIP for Second Planning Period (2019 – 2028) August 30, 2021
State Facility ID Facility Name Distance
(Km)
Final Revised Sulfate PSAT
(Mm-1)
Final Revised
EGU+NEG (Mm-1)
Final Revised Sulfate PSAT (%)
Final Revised Nitrate PSAT
(Mm-1)
Final Revised
EGU+NEG (Mm-1)
Final Revised Nitrate PSAT (%)
MS 28059-8384311
Chevron Products Company, Pascagoula Refinery
724.47 0.0010 13.2255 0.01 0.0000 13.2255 0.00
FL 12033-752711
Gulf Power - Crist 640.08 0.0007 13.2255 0.00 0.0000 13.2255 0.00
FL 12105-717711
Mosaic Fertilizer Llc 882.90 0.0006 13.2255 0.00 0.0000 13.2255 0.00
AL 01053-985111
Escambia Operating Company Llc 597.02 0.0003 13.2255 0.00 0.0000 13.2255 0.00
KY 21177-5196711
Tennessee Valley Authority - Paradise Fossil Plant
326.56 0.0002 13.2255 0.00 0.0010 13.2255 0.01
IN 18129-8166111
Sigeco Ab Brown South Indiana Gas & Ele
420.67 0.0000 13.2255 0.00 0.0001 13.2255 0.00

Pre-hearing Draft 240 NC Regional Haze SIP for Second Planning Period (2019 – 2028) August 30, 2021
Table 7-32. PSAT Results for Joyce Kilmer-Slickrock Wilderness Area
State Facility ID Facility Name Distance
(Km)
Final Revised Sulfate PSAT
(Mm-1)
Final Revised
EGU+NEG (Mm-1)
Final Revised Sulfate PSAT (%)
Final Revised Nitrate PSAT
(Mm-1)
Final Revised
EGU+NEG (Mm-1)
Final Revised Nitrate PSAT (%)
OH 39053-8148511
General James M. Gavin Power Plant
400.53 0.4725 13.0309 3.63 0.0020 13.0309 0.02
KY 21145-6037011
Tennessee Valley Authority (Tva) - Shawnee Fossil Plant
465.29 0.1890 13.0309 1.45 0.0140 13.0309 0.11
TN 47163-3982311
Eastman Chemical Company 160.12 0.1780 13.0309 1.37 0.0030 13.0309 0.02
PA 42005-3866111
Genon Ne Mgmt Co/Keystone Sta 688.19 0.1539 13.0309 1.18 0.0000 13.0309 0.00
IN 18147-8017211
Indiana Michigan Power Dba Aep Rockport
375.48 0.1539 13.0309 1.18 0.0298 13.0309 0.23
GA 13015-2813011
Ga Power Company - Plant Bowen 189.71 0.1520 13.0309 1.17 0.0010 13.0309 0.01
IN 18051-7363111
Gibson 456.28 0.1395 13.0309 1.07 0.0288 13.0309 0.22
OH 39025-8294311
Duke Energy Ohio, Wm. H. Zimmer Station
359.99 0.1370 13.0309 1.05 0.0016 13.0309 0.01
WV 54073-4782811
Monongahela Power Co-Pleasants Power Sta
475.85 0.1204 13.0309 0.92 0.0010 13.0309 0.01
MD 24001-7763811
Luke Paper Company 606.24 0.1160 13.0309 0.89 0.0000 13.0309 0.00
WV 54033-6271711
Allegheny Energy Supply Co, Llc-Harrison
524.75 0.1140 13.0309 0.87 0.0008 13.0309 0.01
VA 51027-4034811
Jewell Coke Company Llp 246.41 0.1140 13.0309 0.87 0.0000 13.0309 0.00
AR 05063-1083411
Entergy Arkansas Inc-Independence Plant
675.93 0.1111 13.0309 0.85 0.0010 13.0309 0.01

Pre-hearing Draft 241 NC Regional Haze SIP for Second Planning Period (2019 – 2028) August 30, 2021
State Facility ID Facility Name Distance
(Km)
Final Revised Sulfate PSAT
(Mm-1)
Final Revised
EGU+NEG (Mm-1)
Final Revised Sulfate PSAT (%)
Final Revised Nitrate PSAT
(Mm-1)
Final Revised
EGU+NEG (Mm-1)
Final Revised Nitrate PSAT (%)
OH 39081-8115711
Cardinal Power Plant (Cardinal Operating Company)
587.50 0.1034 13.0309 0.79 0.0000 13.0309 0.00
MO 29143-5363811
New Madrid Power Plant-Marston 516.00 0.1011 13.0309 0.78 0.0009 13.0309 0.01
IN 18125-7362411
Indianapolis Power & Light Petersburg
435.64 0.0992 13.0309 0.76 0.0221 13.0309 0.17
OH 39053-7983011
Ohio Valley Electric Corp., Kyger Creek Station
398.42 0.0969 13.0309 0.74 0.0007 13.0309 0.01
KY 21183-5561611
Big Rivers Electric Corp - Wilson Station
345.81 0.0830 13.0309 0.64 0.0040 13.0309 0.03
TN 47161-4979311
Tva Cumberland Fossil Plant 344.96 0.0790 13.0309 0.61 0.0060 13.0309 0.05
IL 17127-7808911
Joppa Steam 474.38 0.0729 13.0309 0.56 0.0030 13.0309 0.02
WV 54079-6789111
Appalachian Power Company - John E Amos Plant
367.15 0.0688 13.0309 0.53 0.0015 13.0309 0.01
SC 45015-4120411
Santee Cooper Cross Generating Station
432.03 0.0660 13.0309 0.51 0.0000 13.0309 0.00
AL 01073-1018711
Drummond Company, Inc. 345.58 0.0570 13.0309 0.44 0.0000 13.0309 0.00
PA 42063-3005211
Homer City Gen Lp/ Center Twp 682.88 0.0555 13.0309 0.43 0.0000 13.0309 0.00
TN 47145-4979111
Tva Kingston Fossil Plant 60.03 0.0535 13.0309 0.41 0.0043 13.0309 0.03
AL 01109-985711
Sanders Lead Co 466.40 0.0490 13.0309 0.38 0.0000 13.0309 0.00
NC 37035-8370411
Duke Energy Carolinas, Llc - Marshall Steam Station
270.00 0.0455 13.0309 0.35 0.0007 13.0309 0.01

Pre-hearing Draft 242 NC Regional Haze SIP for Second Planning Period (2019 – 2028) August 30, 2021
State Facility ID Facility Name Distance
(Km)
Final Revised Sulfate PSAT
(Mm-1)
Final Revised
EGU+NEG (Mm-1)
Final Revised Sulfate PSAT (%)
Final Revised Nitrate PSAT
(Mm-1)
Final Revised
EGU+NEG (Mm-1)
Final Revised Nitrate PSAT (%)
GA 13115-539311
Temple Inland 198.78 0.0430 13.0309 0.33 0.0010 13.0309 0.01
PA 42063-3005111
Nrg Wholesale Gen/Seward Gen Sta
682.76 0.0376 13.0309 0.29 0.0000 13.0309 0.00
SC 45015-4834911
Alumax Of South Carolina 458.13 0.0330 13.0309 0.25 0.0000 13.0309 0.00
AL 01097-1056111
Ala Power - Barry 637.87 0.0329 13.0309 0.25 0.0000 13.0309 0.00
SC 45043-6652811
Santee Cooper Winyah Generating Station
492.36 0.0320 13.0309 0.25 0.0000 13.0309 0.00
WV 54051-6902311
Mitchell Plant 541.01 0.0315 13.0309 0.24 0.0000 13.0309 0.00
SC 45043-5698611
International Paper Georgetown Mill
494.72 0.0300 13.0309 0.23 0.0000 13.0309 0.00
GA 13051-3679811
International Paper - Savannah 470.33 0.0270 13.0309 0.21 0.0000 13.0309 0.00
WV 54061-6773611
Monongahela Power Co.- Fort Martin Power
574.41 0.0269 13.0309 0.21 0.0009 13.0309 0.01
WV 54049-4864511
American Bituminous Power-Grant Town Plt
548.80 0.0256 13.0309 0.20 0.0000 13.0309 0.00
IN 18173-8183111
Alcoa Warrick Power Plt Agc Div Of Al
394.61 0.0250 13.0309 0.19 0.0163 13.0309 0.12
VA 51023-5039811
Roanoke Cement Company 407.38 0.0230 13.0309 0.18 0.0000 13.0309 0.00
VA 51580-5798711
Meadwestvaco Packaging Resource Group
426.66 0.0220 13.0309 0.17 0.0000 13.0309 0.00
NC 37013-8479311
Pcs Phosphate Company, Inc. - Aurora
650.31 0.0200 13.0309 0.15 0.0000 13.0309 0.00

Pre-hearing Draft 243 NC Regional Haze SIP for Second Planning Period (2019 – 2028) August 30, 2021
State Facility ID Facility Name Distance
(Km)
Final Revised Sulfate PSAT
(Mm-1)
Final Revised
EGU+NEG (Mm-1)
Final Revised Sulfate PSAT (%)
Final Revised Nitrate PSAT
(Mm-1)
Final Revised
EGU+NEG (Mm-1)
Final Revised Nitrate PSAT (%)
SC 45019-4973611
Kapstone Charleston Kraft Llc 475.41 0.0180 13.0309 0.14 0.0000 13.0309 0.00
KY 21091-7352411
Century Aluminum Of Ky Llc 360.46 0.0176 13.0309 0.14 0.0000 13.0309 0.00
AL 01097-949811
Akzo Nobel Chemicals Inc 641.75 0.0170 13.0309 0.13 0.0000 13.0309 0.00
AL 01053-7440211
Escambia Operating Company Llc 598.46 0.0165 13.0309 0.13 0.0000 13.0309 0.00
NC 37087-7920511
Blue Ridge Paper Products - Canton Mill
100.26 0.0140 13.0309 0.11 0.0020 13.0309 0.02
TN 47093-4979911
Cemex - Knoxville Plant 44.25 0.0140 13.0309 0.11 0.0040 13.0309 0.03
FL 12005-535411
Rocktenn Cp Llc 628.66 0.0130 13.0309 0.10 0.0000 13.0309 0.00
WV 54061-16320111
Longview Power 572.53 0.0121 13.0309 0.09 0.0000 13.0309 0.00
GA 13103-536311
Georgia-Pacific Consumer Products Lp (Savannah River Mill)
445.14 0.0090 13.0309 0.07 0.0000 13.0309 0.00
TN 47105-4129211
Tate & Lyle, Loudon 36.10 0.0081 13.0309 0.06 0.0013 13.0309 0.01
WV 54023-6257011
Dominion Resources, Inc. - Mount Storm Power Station
572.64 0.0072 13.0309 0.06 0.0000 13.0309 0.00
SC 45015-8306711
Sce&G Williams 469.69 0.0060 13.0309 0.05 0.0000 13.0309 0.00
AL 01103-1000011
Nucor Steel Decatur Llc 307.31 0.0060 13.0309 0.05 0.0000 13.0309 0.00
FL 12089-753711
Rock Tenn Cp, Llc 596.04 0.0060 13.0309 0.05 0.0000 13.0309 0.00
FL 12031-640211
Jea 619.61 0.0051 13.0309 0.04 0.0000 13.0309 0.00

Pre-hearing Draft 244 NC Regional Haze SIP for Second Planning Period (2019 – 2028) August 30, 2021
State Facility ID Facility Name Distance
(Km)
Final Revised Sulfate PSAT
(Mm-1)
Final Revised
EGU+NEG (Mm-1)
Final Revised Sulfate PSAT (%)
Final Revised Nitrate PSAT
(Mm-1)
Final Revised
EGU+NEG (Mm-1)
Final Revised Nitrate PSAT (%)
NC 37117-8049311
Domtar Paper Company, Llc 648.15 0.0040 13.0309 0.03 0.0000 13.0309 0.00
FL 12047-769711
White Springs Agricultural Chemicals,Inc
585.86 0.0024 13.0309 0.02 0.0000 13.0309 0.00
MS 28059-6251011
Mississippi Power Company, Plant Victor J Daniel
710.94 0.0021 13.0309 0.02 0.0000 13.0309 0.00
FL 12123-752411
Buckeye Florida, Limited Partnership
618.36 0.0020 13.0309 0.02 0.0000 13.0309 0.00
FL 12017-640611
Duke Energy Florida, Inc. (Def) 749.25 0.0020 13.0309 0.02 0.0000 13.0309 0.00
FL 12057-538611
Tampa Electric Company (Tec) 881.37 0.0010 13.0309 0.01 0.0000 13.0309 0.00
FL 12089-845811
Rayonier Performance Fibers Llc 597.48 0.0010 13.0309 0.01 0.0000 13.0309 0.00
GA 13127-3721011
Brunswick Cellulose Inc 543.51 0.0010 13.0309 0.01 0.0000 13.0309 0.00
NC 37023-8513011
Sgl Carbon Llc 200.78 0.0010 13.0309 0.01 0.0000 13.0309 0.00
MS 28059-8384311
Chevron Products Company, Pascagoula Refinery
724.47 0.0010 13.0309 0.01 0.0000 13.0309 0.00
FL 12105-919811
Mosaic Fertilizer, Llc 877.97 0.0010 13.0309 0.01 0.0000 13.0309 0.00
FL 12033-752711
Gulf Power - Crist 640.08 0.0009 13.0309 0.01 0.0000 13.0309 0.00
FL 12105-717711
Mosaic Fertilizer Llc 882.90 0.0006 13.0309 0.00 0.0000 13.0309 0.00
AL 01053-985111
Escambia Operating Company Llc 597.02 0.0004 13.0309 0.00 0.0000 13.0309 0.00

Pre-hearing Draft 245 NC Regional Haze SIP for Second Planning Period (2019 – 2028) August 30, 2021
State Facility ID Facility Name Distance
(Km)
Final Revised Sulfate PSAT
(Mm-1)
Final Revised
EGU+NEG (Mm-1)
Final Revised Sulfate PSAT (%)
Final Revised Nitrate PSAT
(Mm-1)
Final Revised
EGU+NEG (Mm-1)
Final Revised Nitrate PSAT (%)
KY 21177-5196711
Tennessee Valley Authority - Paradise Fossil Plant
326.56 0.0002 13.0309 0.00 0.0008 13.0309 0.01
IN 18129-8166111
Sigeco Ab Brown South Indiana Gas & Ele
420.67 0.0000 13.0309 0.00 0.0001 13.0309 0.00
Table 7-33. PSAT Results for Linville Gorge Wilderness Area
State Facility ID Facility Name Distance
(Km)
Final Revised Sulfate PSAT
(Mm-1)
Final Revised
EGU+NEG (Mm-1)
Final Revised Sulfate PSAT (%)
Final Revised Nitrate PSAT
(Mm-1)
Final Revised
EGU+NEG (Mm-1)
Final Revised Nitrate PSAT (%)
TN 47163-3982311
Eastman Chemical Company 160.12 0.5220 12.2663 4.26 0.0130 12.2663 0.11
OH 39053-8148511
General James M. Gavin Power Plant
400.53 0.4457 12.2663 3.63 0.0020 12.2663 0.02
MD 24001-7763811
Luke Paper Company 606.24 0.2490 12.2663 2.03 0.0000 12.2663 0.00
PA 42005-3866111
Genon Ne Mgmt Co/Keystone Sta 688.19 0.2349 12.2663 1.92 0.0000 12.2663 0.00
KY 21145-6037011
Tennessee Valley Authority (Tva) - Shawnee Fossil Plant
465.29 0.1720 12.2663 1.40 0.0020 12.2663 0.02
TN 47161-4979311
Tva Cumberland Fossil Plant 344.96 0.1540 12.2663 1.26 0.0010 12.2663 0.01
GA 13015-2813011
Ga Power Company - Plant Bowen 189.71 0.1460 12.2663 1.19 0.0000 12.2663 0.00
IN 18147-8017211
Indiana Michigan Power Dba Aep Rockport
375.48 0.1423 12.2663 1.16 0.0115 12.2663 0.09

Pre-hearing Draft 246 NC Regional Haze SIP for Second Planning Period (2019 – 2028) August 30, 2021
State Facility ID Facility Name Distance
(Km)
Final Revised Sulfate PSAT
(Mm-1)
Final Revised
EGU+NEG (Mm-1)
Final Revised Sulfate PSAT (%)
Final Revised Nitrate PSAT
(Mm-1)
Final Revised
EGU+NEG (Mm-1)
Final Revised Nitrate PSAT (%)
IN 18051-7363111
Gibson 456.28 0.1378 12.2663 1.12 0.0084 12.2663 0.07
MO 29143-5363811
New Madrid Power Plant-Marston 516.00 0.1343 12.2663 1.09 0.0000 12.2663 0.00
VA 51027-4034811
Jewell Coke Company Llp 246.41 0.1320 12.2663 1.08 0.0000 12.2663 0.00
AR 05063-1083411
Entergy Arkansas Inc-Independence Plant
675.93 0.1107 12.2663 0.90 0.0003 12.2663 0.00
NC 37035-8370411
Duke Energy Carolinas, Llc - Marshall Steam Station
270.00 0.1064 12.2663 0.87 0.0036 12.2663 0.03
IN 18125-7362411
Indianapolis Power & Light Petersburg
435.64 0.1059 12.2663 0.86 0.0065 12.2663 0.05
WV 54073-4782811
Monongahela Power Co-Pleasants Power Sta
475.85 0.0944 12.2663 0.77 0.0010 12.2663 0.01
OH 39053-7983011
Ohio Valley Electric Corp., Kyger Creek Station
398.42 0.0856 12.2663 0.70 0.0014 12.2663 0.01
OH 39025-8294311
Duke Energy Ohio, Wm. H. Zimmer Station
359.99 0.0846 12.2663 0.69 0.0033 12.2663 0.03
PA 42063-3005211
Homer City Gen Lp/ Center Twp 682.88 0.0750 12.2663 0.61 0.0000 12.2663 0.00
WV 54079-6789111
Appalachian Power Company - John E Amos Plant
367.15 0.0744 12.2663 0.61 0.0015 12.2663 0.01
OH 39081-8115711
Cardinal Power Plant (Cardinal Operating Company)
587.50 0.0742 12.2663 0.61 0.0000 12.2663 0.00
KY 21183-5561611
Big Rivers Electric Corp - Wilson Station
345.81 0.0730 12.2663 0.60 0.0010 12.2663 0.01
PA 42063-3005111
Nrg Wholesale Gen/Seward Gen Sta
682.76 0.0691 12.2663 0.56 0.0000 12.2663 0.00

Pre-hearing Draft 247 NC Regional Haze SIP for Second Planning Period (2019 – 2028) August 30, 2021
State Facility ID Facility Name Distance
(Km)
Final Revised Sulfate PSAT
(Mm-1)
Final Revised
EGU+NEG (Mm-1)
Final Revised Sulfate PSAT (%)
Final Revised Nitrate PSAT
(Mm-1)
Final Revised
EGU+NEG (Mm-1)
Final Revised Nitrate PSAT (%)
IL 17127-7808911
Joppa Steam 474.38 0.0639 12.2663 0.52 0.0004 12.2663 0.00
WV 54033-6271711
Allegheny Energy Supply Co, Llc-Harrison
524.75 0.0596 12.2663 0.49 0.0000 12.2663 0.00
SC 45015-4120411
Santee Cooper Cross Generating Station
432.03 0.0480 12.2663 0.39 0.0000 12.2663 0.00
AL 01109-985711 Sanders Lead Co 466.40 0.0370 12.2663 0.30 0.0000 12.2663 0.00 GA 13115-539311 Temple Inland 198.78 0.0320 12.2663 0.26 0.0000 12.2663 0.00 NC 37023-
8513011 Sgl Carbon Llc 200.78 0.0300 12.2663 0.24 0.0000 12.2663 0.00
SC 45043-5698611
International Paper Georgetown Mill
494.72 0.0280 12.2663 0.23 0.0000 12.2663 0.00
WV 54051-6902311
Mitchell Plant 541.01 0.0276 12.2663 0.22 0.0000 12.2663 0.00
IN 18173-8183111
Alcoa Warrick Power Plt Agc Div Of Al
394.61 0.0268 12.2663 0.22 0.0052 12.2663 0.04
SC 45015-4834911
Alumax Of South Carolina 458.13 0.0260 12.2663 0.21 0.0000 12.2663 0.00
AL 01097-1056111
Ala Power - Barry 637.87 0.0260 12.2663 0.21 0.0000 12.2663 0.00
SC 45043-6652811
Santee Cooper Winyah Generating Station
492.36 0.0250 12.2663 0.20 0.0000 12.2663 0.00
TN 47145-4979111
Tva Kingston Fossil Plant 60.03 0.0225 12.2663 0.18 0.0002 12.2663 0.00
KY 21091-7352411
Century Aluminum Of Ky Llc 360.46 0.0225 12.2663 0.18 0.0000 12.2663 0.00
AL 01073-1018711
Drummond Company, Inc. 345.58 0.0220 12.2663 0.18 0.0000 12.2663 0.00

Pre-hearing Draft 248 NC Regional Haze SIP for Second Planning Period (2019 – 2028) August 30, 2021
State Facility ID Facility Name Distance
(Km)
Final Revised Sulfate PSAT
(Mm-1)
Final Revised
EGU+NEG (Mm-1)
Final Revised Sulfate PSAT (%)
Final Revised Nitrate PSAT
(Mm-1)
Final Revised
EGU+NEG (Mm-1)
Final Revised Nitrate PSAT (%)
VA 51023-5039811
Roanoke Cement Company 407.38 0.0220 12.2663 0.18 0.0000 12.2663 0.00
NC 37013-8479311
Pcs Phosphate Company, Inc. - Aurora
650.31 0.0200 12.2663 0.16 0.0000 12.2663 0.00
AL 01053-7440211
Escambia Operating Company Llc 598.46 0.0187 12.2663 0.15 0.0000 12.2663 0.00
VA 51580-5798711
Meadwestvaco Packaging Resource Group
426.66 0.0180 12.2663 0.15 0.0000 12.2663 0.00
WV 54061-6773611
Monongahela Power Co.- Fort Martin Power
574.41 0.0169 12.2663 0.14 0.0009 12.2663 0.01
NC 37087-7920511
Blue Ridge Paper Products - Canton Mill
100.26 0.0169 12.2663 0.14 0.0010 12.2663 0.01
WV 54023-6257011
Dominion Resources, Inc. - Mount Storm Power Station
572.64 0.0157 12.2663 0.13 0.0000 12.2663 0.00
AL 01097-949811 Akzo Nobel Chemicals Inc 641.75 0.0150 12.2663 0.12 0.0000 12.2663 0.00 GA 13051-
3679811 International Paper - Savannah 470.33 0.0120 12.2663 0.10 0.0000 12.2663 0.00
SC 45019-4973611
Kapstone Charleston Kraft Llc 475.41 0.0120 12.2663 0.10 0.0000 12.2663 0.00
WV 54049-4864511
American Bituminous Power-Grant Town Plt
548.80 0.0102 12.2663 0.08 0.0000 12.2663 0.00
FL 12005-535411 Rocktenn Cp Llc 628.66 0.0080 12.2663 0.07 0.0000 12.2663 0.00 NC 37117-
8049311 Domtar Paper Company, Llc 648.15 0.0050 12.2663 0.04 0.0000 12.2663 0.00
TN 47093-4979911
Cemex - Knoxville Plant 44.25 0.0050 12.2663 0.04 0.0010 12.2663 0.01

Pre-hearing Draft 249 NC Regional Haze SIP for Second Planning Period (2019 – 2028) August 30, 2021
State Facility ID Facility Name Distance
(Km)
Final Revised Sulfate PSAT
(Mm-1)
Final Revised
EGU+NEG (Mm-1)
Final Revised Sulfate PSAT (%)
Final Revised Nitrate PSAT
(Mm-1)
Final Revised
EGU+NEG (Mm-1)
Final Revised Nitrate PSAT (%)
GA 13103-536311 Georgia-Pacific Consumer Products Lp (Savannah River Mill)
445.14 0.0050 12.2663 0.04 0.0000 12.2663 0.00
TN 47105-4129211
Tate & Lyle, Loudon 36.10 0.0042 12.2663 0.03 0.0000 12.2663 0.00
SC 45015-8306711
Sce&G Williams 469.69 0.0040 12.2663 0.03 0.0000 12.2663 0.00
FL 12031-640211 Jea 619.61 0.0031 12.2663 0.03 0.0000 12.2663 0.00 FL 12089-753711 Rock Tenn Cp, Llc 596.04 0.0030 12.2663 0.02 0.0000 12.2663 0.00 AL 01103-
1000011 Nucor Steel Decatur Llc 307.31 0.0020 12.2663 0.02 0.0000 12.2663 0.00
FL 12123-752411 Buckeye Florida, Limited Partnership
618.36 0.0020 12.2663 0.02 0.0000 12.2663 0.00
FL 12017-640611 Duke Energy Florida, Inc. (Def) 749.25 0.0020 12.2663 0.02 0.0000 12.2663 0.00 FL 12047-769711 White Springs Agricultural
Chemicals,Inc 585.86 0.0015 12.2663 0.01 0.0000 12.2663 0.00
MS 28059-6251011
Mississippi Power Company, Plant Victor J Daniel
710.94 0.0010 12.2663 0.01 0.0000 12.2663 0.00
FL 12057-538611 Tampa Electric Company (Tec) 881.37 0.0010 12.2663 0.01 0.0000 12.2663 0.00 FL 12089-845811 Rayonier Performance Fibers Llc 597.48 0.0010 12.2663 0.01 0.0000 12.2663 0.00 GA 13127-
3721011 Brunswick Cellulose Inc 543.51 0.0010 12.2663 0.01 0.0000 12.2663 0.00
MS 28059-8384311
Chevron Products Company, Pascagoula Refinery
724.47 0.0010 12.2663 0.01 0.0000 12.2663 0.00
FL 12105-919811 Mosaic Fertilizer, Llc 877.97 0.0010 12.2663 0.01 0.0000 12.2663 0.00 FL 12033-752711 Gulf Power - Crist 640.08 0.0007 12.2663 0.01 0.0000 12.2663 0.00
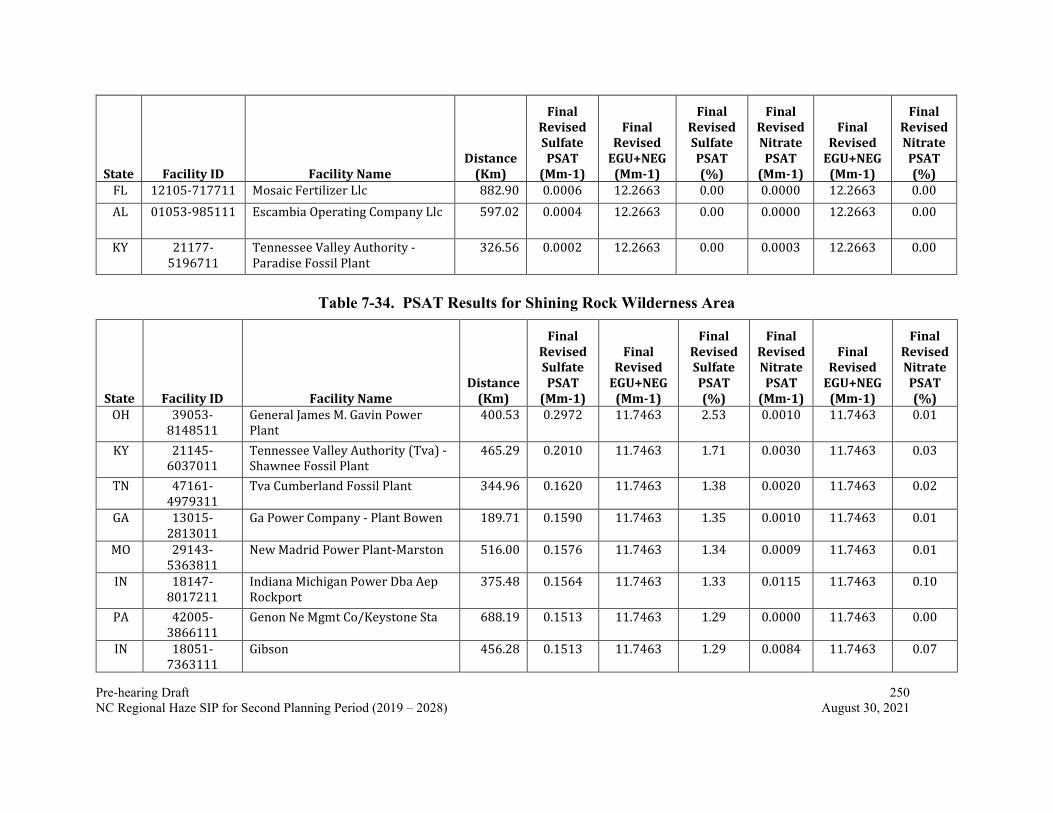
Pre-hearing Draft 250 NC Regional Haze SIP for Second Planning Period (2019 – 2028) August 30, 2021
State Facility ID Facility Name Distance
(Km)
Final Revised Sulfate PSAT
(Mm-1)
Final Revised
EGU+NEG (Mm-1)
Final Revised Sulfate PSAT (%)
Final Revised Nitrate PSAT
(Mm-1)
Final Revised
EGU+NEG (Mm-1)
Final Revised Nitrate PSAT (%)
FL 12105-717711 Mosaic Fertilizer Llc 882.90 0.0006 12.2663 0.00 0.0000 12.2663 0.00 AL 01053-985111 Escambia Operating Company Llc 597.02 0.0004 12.2663 0.00 0.0000 12.2663 0.00
KY 21177-5196711
Tennessee Valley Authority - Paradise Fossil Plant
326.56 0.0002 12.2663 0.00 0.0003 12.2663 0.00
Table 7-34. PSAT Results for Shining Rock Wilderness Area
State Facility ID Facility Name Distance
(Km)
Final Revised Sulfate PSAT
(Mm-1)
Final Revised
EGU+NEG (Mm-1)
Final Revised Sulfate PSAT (%)
Final Revised Nitrate PSAT
(Mm-1)
Final Revised
EGU+NEG (Mm-1)
Final Revised Nitrate PSAT (%)
OH 39053-8148511
General James M. Gavin Power Plant
400.53 0.2972 11.7463 2.53 0.0010 11.7463 0.01
KY 21145-6037011
Tennessee Valley Authority (Tva) - Shawnee Fossil Plant
465.29 0.2010 11.7463 1.71 0.0030 11.7463 0.03
TN 47161-4979311
Tva Cumberland Fossil Plant 344.96 0.1620 11.7463 1.38 0.0020 11.7463 0.02
GA 13015-2813011
Ga Power Company - Plant Bowen 189.71 0.1590 11.7463 1.35 0.0010 11.7463 0.01
MO 29143-5363811
New Madrid Power Plant-Marston 516.00 0.1576 11.7463 1.34 0.0009 11.7463 0.01
IN 18147-8017211
Indiana Michigan Power Dba Aep Rockport
375.48 0.1564 11.7463 1.33 0.0115 11.7463 0.10
PA 42005-3866111
Genon Ne Mgmt Co/Keystone Sta 688.19 0.1513 11.7463 1.29 0.0000 11.7463 0.00
IN 18051-7363111
Gibson 456.28 0.1513 11.7463 1.29 0.0084 11.7463 0.07

Pre-hearing Draft 251 NC Regional Haze SIP for Second Planning Period (2019 – 2028) August 30, 2021
State Facility ID Facility Name Distance
(Km)
Final Revised Sulfate PSAT
(Mm-1)
Final Revised
EGU+NEG (Mm-1)
Final Revised Sulfate PSAT (%)
Final Revised Nitrate PSAT
(Mm-1)
Final Revised
EGU+NEG (Mm-1)
Final Revised Nitrate PSAT (%)
MD 24001-7763811
Luke Paper Company 606.24 0.1410 11.7463 1.20 0.0000 11.7463 0.00
NC 37087-7920511
Blue Ridge Paper Products - Canton Mill
100.26 0.1332 11.7463 1.13 0.0117 11.7463 0.10
OH 39025-8294311
Duke Energy Ohio, Wm. H. Zimmer Station
359.99 0.1290 11.7463 1.10 0.0016 11.7463 0.01
AR 05063-1083411
Entergy Arkansas Inc-Independence Plant
675.93 0.1286 11.7463 1.09 0.0006 11.7463 0.01
TN 47163-3982311
Eastman Chemical Company 160.12 0.1280 11.7463 1.09 0.0030 11.7463 0.03
IN 18125-7362411
Indianapolis Power & Light Petersburg
435.64 0.1008 11.7463 0.86 0.0095 11.7463 0.08
NC 37035-8370411
Duke Energy Carolinas, Llc - Marshall Steam Station
270.00 0.0859 11.7463 0.73 0.0021 11.7463 0.02
KY 21183-5561611
Big Rivers Electric Corp - Wilson Station
345.81 0.0800 11.7463 0.68 0.0010 11.7463 0.01
IL 17127-7808911
Joppa Steam 474.38 0.0725 11.7463 0.62 0.0004 11.7463 0.00
WV 54073-4782811
Monongahela Power Co-Pleasants Power Sta
475.85 0.0657 11.7463 0.56 0.0000 11.7463 0.00
OH 39053-7983011
Ohio Valley Electric Corp., Kyger Creek Station
398.42 0.0654 11.7463 0.56 0.0007 11.7463 0.01
WV 54033-6271711
Allegheny Energy Supply Co, Llc-Harrison
524.75 0.0585 11.7463 0.50 0.0000 11.7463 0.00
OH 39081-8115711
Cardinal Power Plant (Cardinal Operating Company)
587.50 0.0583 11.7463 0.50 0.0000 11.7463 0.00
VA 51027-4034811
Jewell Coke Company Llp 246.41 0.0580 11.7463 0.49 0.0000 11.7463 0.00

Pre-hearing Draft 252 NC Regional Haze SIP for Second Planning Period (2019 – 2028) August 30, 2021
State Facility ID Facility Name Distance
(Km)
Final Revised Sulfate PSAT
(Mm-1)
Final Revised
EGU+NEG (Mm-1)
Final Revised Sulfate PSAT (%)
Final Revised Nitrate PSAT
(Mm-1)
Final Revised
EGU+NEG (Mm-1)
Final Revised Nitrate PSAT (%)
AL 01109-985711
Sanders Lead Co 466.40 0.0560 11.7463 0.48 0.0000 11.7463 0.00
SC 45015-4120411
Santee Cooper Cross Generating Station
432.03 0.0550 11.7463 0.47 0.0000 11.7463 0.00
PA 42063-3005211
Homer City Gen Lp/ Center Twp 682.88 0.0485 11.7463 0.41 0.0000 11.7463 0.00
WV 54079-6789111
Appalachian Power Company - John E Amos Plant
367.15 0.0461 11.7463 0.39 0.0015 11.7463 0.01
PA 42063-3005111
Nrg Wholesale Gen/Seward Gen Sta 682.76 0.0422 11.7463 0.36 0.0000 11.7463 0.00
GA 13115-539311
Temple Inland 198.78 0.0350 11.7463 0.30 0.0000 11.7463 0.00
SC 45015-4834911
Alumax Of South Carolina 458.13 0.0290 11.7463 0.25 0.0000 11.7463 0.00
IN 18173-8183111
Alcoa Warrick Power Plt Agc Div Of Al
394.61 0.0271 11.7463 0.23 0.0057 11.7463 0.05
SC 45043-6652811
Santee Cooper Winyah Generating Station
492.36 0.0270 11.7463 0.23 0.0000 11.7463 0.00
SC 45043-5698611
International Paper Georgetown Mill
494.72 0.0270 11.7463 0.23 0.0000 11.7463 0.00
AL 01097-1056111
Ala Power - Barry 637.87 0.0255 11.7463 0.22 0.0000 11.7463 0.00
VA 51023-5039811
Roanoke Cement Company 407.38 0.0250 11.7463 0.21 0.0000 11.7463 0.00
AL 01073-1018711
Drummond Company, Inc. 345.58 0.0240 11.7463 0.20 0.0000 11.7463 0.00
TN 47145-4979111
Tva Kingston Fossil Plant 60.03 0.0216 11.7463 0.18 0.0007 11.7463 0.01

Pre-hearing Draft 253 NC Regional Haze SIP for Second Planning Period (2019 – 2028) August 30, 2021
State Facility ID Facility Name Distance
(Km)
Final Revised Sulfate PSAT
(Mm-1)
Final Revised
EGU+NEG (Mm-1)
Final Revised Sulfate PSAT (%)
Final Revised Nitrate PSAT
(Mm-1)
Final Revised
EGU+NEG (Mm-1)
Final Revised Nitrate PSAT (%)
GA 13051-3679811
International Paper - Savannah 470.33 0.0210 11.7463 0.18 0.0000 11.7463 0.00
AL 01053-7440211
Escambia Operating Company Llc 598.46 0.0205 11.7463 0.17 0.0000 11.7463 0.00
NC 37013-8479311
Pcs Phosphate Company, Inc. - Aurora
650.31 0.0200 11.7463 0.17 0.0000 11.7463 0.00
VA 51580-5798711
Meadwestvaco Packaging Resource Group
426.66 0.0200 11.7463 0.17 0.0000 11.7463 0.00
WV 54051-6902311
Mitchell Plant 541.01 0.0197 11.7463 0.17 0.0000 11.7463 0.00
KY 21091-7352411
Century Aluminum Of Ky Llc 360.46 0.0190 11.7463 0.16 0.0000 11.7463 0.00
FL 12005-535411
Rocktenn Cp Llc 628.66 0.0170 11.7463 0.14 0.0000 11.7463 0.00
WV 54061-6773611
Monongahela Power Co.- Fort Martin Power
574.41 0.0157 11.7463 0.13 0.0009 11.7463 0.01
SC 45019-4973611
Kapstone Charleston Kraft Llc 475.41 0.0150 11.7463 0.13 0.0000 11.7463 0.00
AL 01097-949811
Akzo Nobel Chemicals Inc 641.75 0.0140 11.7463 0.12 0.0000 11.7463 0.00
WV 54049-4864511
American Bituminous Power-Grant Town Plt
548.80 0.0102 11.7463 0.09 0.0000 11.7463 0.00
WV 54023-6257011
Dominion Resources, Inc. - Mount Storm Power Station
572.64 0.0085 11.7463 0.07 0.0000 11.7463 0.00
GA 13103-536311
Georgia-Pacific Consumer Products Lp (Savannah River Mill)
445.14 0.0070 11.7463 0.06 0.0000 11.7463 0.00
NC 37117-8049311
Domtar Paper Company, Llc 648.15 0.0050 11.7463 0.04 0.0000 11.7463 0.00

Pre-hearing Draft 254 NC Regional Haze SIP for Second Planning Period (2019 – 2028) August 30, 2021
State Facility ID Facility Name Distance
(Km)
Final Revised Sulfate PSAT
(Mm-1)
Final Revised
EGU+NEG (Mm-1)
Final Revised Sulfate PSAT (%)
Final Revised Nitrate PSAT
(Mm-1)
Final Revised
EGU+NEG (Mm-1)
Final Revised Nitrate PSAT (%)
SC 45015-8306711
Sce&G Williams 469.69 0.0050 11.7463 0.04 0.0000 11.7463 0.00
FL 12031-640211
Jea 619.61 0.0041 11.7463 0.03 0.0000 11.7463 0.00
FL 12089-753711
Rock Tenn Cp, Llc 596.04 0.0040 11.7463 0.03 0.0000 11.7463 0.00
TN 47093-4979911
Cemex - Knoxville Plant 44.25 0.0040 11.7463 0.03 0.0020 11.7463 0.02
TN 47105-4129211
Tate & Lyle, Loudon 36.10 0.0039 11.7463 0.03 0.0003 11.7463 0.00
AL 01103-1000011
Nucor Steel Decatur Llc 307.31 0.0030 11.7463 0.03 0.0000 11.7463 0.00
FL 12123-752411
Buckeye Florida, Limited Partnership
618.36 0.0030 11.7463 0.03 0.0000 11.7463 0.00
FL 12047-769711
White Springs Agricultural Chemicals,Inc
585.86 0.0024 11.7463 0.02 0.0000 11.7463 0.00
FL 12057-538611
Tampa Electric Company (Tec) 881.37 0.0020 11.7463 0.02 0.0000 11.7463 0.00
NC 37023-8513011
Sgl Carbon Llc 200.78 0.0020 11.7463 0.02 0.0000 11.7463 0.00
FL 12017-640611
Duke Energy Florida, Inc. (Def) 749.25 0.0020 11.7463 0.02 0.0000 11.7463 0.00
FL 12105-717711
Mosaic Fertilizer Llc 882.90 0.0011 11.7463 0.01 0.0000 11.7463 0.00
MS 28059-6251011
Mississippi Power Company, Plant Victor J Daniel
710.94 0.0010 11.7463 0.01 0.0000 11.7463 0.00
FL 12089-845811
Rayonier Performance Fibers Llc 597.48 0.0010 11.7463 0.01 0.0000 11.7463 0.00
GA 13127-3721011
Brunswick Cellulose Inc 543.51 0.0010 11.7463 0.01 0.0000 11.7463 0.00

Pre-hearing Draft 255 NC Regional Haze SIP for Second Planning Period (2019 – 2028) August 30, 2021
State Facility ID Facility Name Distance
(Km)
Final Revised Sulfate PSAT
(Mm-1)
Final Revised
EGU+NEG (Mm-1)
Final Revised Sulfate PSAT (%)
Final Revised Nitrate PSAT
(Mm-1)
Final Revised
EGU+NEG (Mm-1)
Final Revised Nitrate PSAT (%)
MS 28059-8384311
Chevron Products Company, Pascagoula Refinery
724.47 0.0010 11.7463 0.01 0.0000 11.7463 0.00
FL 12105-919811
Mosaic Fertilizer, Llc 877.97 0.0010 11.7463 0.01 0.0000 11.7463 0.00
FL 12033-752711
Gulf Power - Crist 640.08 0.0009 11.7463 0.01 0.0000 11.7463 0.00
FL 12057-716411
Mosaic Fertilizer, Llc 874.26 0.0006 11.7463 0.01 0.0000 11.7463 0.00
AL 01053-985111
Escambia Operating Company Llc 597.02 0.0005 11.7463 0.00 0.0000 11.7463 0.00
KY 21177-5196711
Tennessee Valley Authority - Paradise Fossil Plant
326.56 0.0002 11.7463 0.00 0.0005 11.7463 0.00

Pre-hearing Draft 256 NC Regional Haze SIP for Second Planning Period (2019 – 2028) August 30, 2021
Table 7-35. PSAT Results for Swanquarter Wilderness Area
State Facility ID Facility Name Distance
(Km)
Final Revised Sulfate PSAT
(Mm-1)
Final Revised
EGU+NEG (Mm-1)
Final Revised Sulfate PSAT (%)
Final Revised Nitrate PSAT
(Mm-1)
Final Revised
EGU+NEG (Mm-1)
Final Revised Nitrate PSAT (%)
MD 24001-7763811 Luke Paper Company 606.24 0.4380 10.2918 4.26 0.0080 10.2918 0.08
PA 42005-3866111 GENON NE MGMT CO/KEYSTONE STA 688.19 0.3752 10.2918 3.65 0.0093 10.2918 0.09
NC 37013-8479311 PCS Phosphate Company, Inc. - Aurora 650.31 0.3290 10.2918 3.20 0.0070 10.2918 0.07
OH 39053-8148511 General James M. Gavin Power Plant 400.53 0.2195 10.2918 2.13 0.0049 10.2918 0.05
OH 39081-8115711 Cardinal Power Plant (Cardinal Operating Company)
587.50 0.2029 10.2918 1.97 0.0066 10.2918 0.06
WV 54033-6271711 Allegheny Energy Supply Co, LLC-Harrison 524.75 0.1859 10.2918 1.81 0.0127 10.2918 0.12
PA 42063-3005211 HOMER CITY GEN LP/ CENTER TWP 682.88 0.1509 10.2918 1.47 0.0076 10.2918 0.07
WV 54073-4782811
MONONGAHELA POWER CO-PLEASANTS POWER STA
475.85 0.1272 10.2918 1.24 0.0052 10.2918 0.05
GA 13015-2813011 Ga Power Company - Plant Bowen 189.71 0.1120 10.2918 1.09 0.0030 10.2918 0.03
NC 37117-8049311 Domtar Paper Company, LLC 648.15 0.1090 10.2918 1.06 0.0220 10.2918 0.21
PA 42063-3005111 NRG WHOLESALE GEN/SEWARD GEN STA
682.76 0.1021 10.2918 0.99 0.0029 10.2918 0.03

Pre-hearing Draft 257 NC Regional Haze SIP for Second Planning Period (2019 – 2028) August 30, 2021
State Facility ID Facility Name Distance
(Km)
Final Revised Sulfate PSAT
(Mm-1)
Final Revised
EGU+NEG (Mm-1)
Final Revised Sulfate PSAT (%)
Final Revised Nitrate PSAT
(Mm-1)
Final Revised
EGU+NEG (Mm-1)
Final Revised Nitrate PSAT (%)
KY 21145-6037011 Tennessee Valley Authority (TVA) - Shawnee Fossil Plant
465.29 0.0990 10.2918 0.96 0.0020 10.2918 0.02
IN 18147-8017211 INDIANA MICHIGAN POWER DBA AEP ROCKPORT
375.48 0.0907 10.2918 0.88 0.0048 10.2918 0.05
IN 18051-7363111 Gibson 456.28 0.0849 10.2918 0.83 0.0056 10.2918 0.05
WV 54051-6902311 MITCHELL PLANT 541.01 0.0787 10.2918 0.77 0.0073 10.2918 0.07
TN 47163-3982311 Eastman Chemical Company 160.12 0.0750 10.2918 0.73 0.0050 10.2918 0.05
IN 18125-7362411 INDIANAPOLIS POWER & LIGHT PETERSBURG
435.64 0.0737 10.2918 0.72 0.0035 10.2918 0.03
WV 54061-6773611 MONONGAHELA POWER CO.- FORT MARTIN POWER
574.41 0.0657 10.2918 0.64 0.0244 10.2918 0.24
NC 37035-8370411 Duke Energy Carolinas, LLC - Marshall Steam Station
270.00 0.0641 10.2918 0.62 0.0150 10.2918 0.15
SC 45015-4120411 SANTEE COOPER CROSS GENERATING STATION
432.03 0.0640 10.2918 0.62 0.0060 10.2918 0.06
VA 51027-4034811 Jewell Coke Company LLP 246.41 0.0620 10.2918 0.60 0.0010 10.2918 0.01
OH 39025-8294311 Duke Energy Ohio, Wm. H. Zimmer Station 359.99 0.0589 10.2918 0.57 0.0016 10.2918 0.02
WV 54079-6789111 APPALACHIAN POWER COMPANY - JOHN E AMOS PLANT
367.15 0.0566 10.2918 0.55 0.0060 10.2918 0.06

Pre-hearing Draft 258 NC Regional Haze SIP for Second Planning Period (2019 – 2028) August 30, 2021
State Facility ID Facility Name Distance
(Km)
Final Revised Sulfate PSAT
(Mm-1)
Final Revised
EGU+NEG (Mm-1)
Final Revised Sulfate PSAT (%)
Final Revised Nitrate PSAT
(Mm-1)
Final Revised
EGU+NEG (Mm-1)
Final Revised Nitrate PSAT (%)
WV 54049-4864511 AMERICAN BITUMINOUS POWER-GRANT TOWN PLT
548.80 0.0460 10.2918 0.45 0.0042 10.2918 0.04
OH 39053-7983011 Ohio Valley Electric Corp., Kyger Creek Station
398.42 0.0440 10.2918 0.43 0.0027 10.2918 0.03
VA 51023-5039811 Roanoke Cement Company 407.38 0.0430 10.2918 0.42 0.0030 10.2918 0.03
SC 45043-5698611 International Paper Georgetown Mill 494.72 0.0410 10.2918 0.40 0.0040 10.2918 0.04
KY 21183-5561611 Big Rivers Electric Corp - Wilson Station 345.81 0.0390 10.2918 0.38 0.0010 10.2918 0.01
SC 45015-4834911 Alumax Of South Carolina 458.13 0.0370 10.2918 0.36 0.0000 10.2918 0.00
VA 51580-5798711 Meadwestvaco Packaging Resource Group 426.66 0.0370 10.2918 0.36 0.0030 10.2918 0.03
TN 47161-4979311 TVA Cumberland Fossil Plant 344.96 0.0340 10.2918 0.33 0.0010 10.2918 0.01
MO 29143-5363811 NEW MADRID POWER PLANT-MARSTON 516.00 0.0339 10.2918 0.33 0.0009 10.2918 0.01
IL 17127-7808911 Joppa Steam 474.38 0.0333 10.2918 0.32 0.0004 10.2918 0.00
SC 45043-6652811
SANTEE COOPER WINYAH GENERATING STATION
492.36 0.0320 10.2918 0.31 0.0050 10.2918 0.05
GA 13051-3679811 International Paper - Savannah 470.33 0.0290 10.2918 0.28 0.0030 10.2918 0.03
SC 45019-4973611 Kapstone Charleston Kraft LLC 475.41 0.0240 10.2918 0.23 0.0040 10.2918 0.04

Pre-hearing Draft 259 NC Regional Haze SIP for Second Planning Period (2019 – 2028) August 30, 2021
State Facility ID Facility Name Distance
(Km)
Final Revised Sulfate PSAT
(Mm-1)
Final Revised
EGU+NEG (Mm-1)
Final Revised Sulfate PSAT (%)
Final Revised Nitrate PSAT
(Mm-1)
Final Revised
EGU+NEG (Mm-1)
Final Revised Nitrate PSAT (%)
AR 05063-1083411 ENTERGY ARKANSAS INC-INDEPENDENCE PLANT
675.93 0.0200 10.2918 0.19 0.0006 10.2918 0.01
FL 12031-640211 JEA 619.61 0.0185 10.2918 0.18 0.0016 10.2918 0.02
WV 54023-6257011 Dominion Resources, Inc. - Mount Storm Power Station
572.64 0.0184 10.2918 0.18 0.0024 10.2918 0.02
FL 12089-753711 ROCK TENN CP, LLC 596.04 0.0180 10.2918 0.17 0.0040 10.2918 0.04
IN 18173-8183111 Alcoa Warrick Power Plt Agc Div of AL 394.61 0.0150 10.2918 0.15 0.0024 10.2918 0.02
KY 21091-7352411 Century Aluminum of KY LLC 360.46 0.0141 10.2918 0.14 0.0000 10.2918 0.00
AL 01109-985711 Sanders Lead Co 466.40 0.0120 10.2918 0.12 0.0000 10.2918 0.00
FL 12057-538611 Tampa Electric Company (TEC) 881.37 0.0110 10.2918 0.11 0.0010 10.2918 0.01
FL 12105-717711 Mosaic Fertilizer LLC 882.90 0.0108 10.2918 0.10 0.0000 10.2918 0.00
GA 13103-536311 Georgia-Pacific Consumer Products LP (Savannah River Mill)
445.14 0.0100 10.2918 0.10 0.0010 10.2918 0.01
FL 12105-919811 Mosaic Fertilizer, LLC 877.97 0.0097 10.2918 0.09 0.0000 10.2918 0.00
GA 13115-539311 TEMPLE INLAND 198.78 0.0070 10.2918 0.07 0.0010 10.2918 0.01
TN 47145-4979111 TVA Kingston Fossil Plant 60.03 0.0054 10.2918 0.05 0.0004 10.2918 0.00
FL 12047-769711 White Springs Agricultural Chemicals,Inc
585.86 0.0054 10.2918 0.05 0.0000 10.2918 0.00
AL 01073-1018711 Drummond Company, Inc. 345.58 0.0050 10.2918 0.05 0.0000 10.2918 0.00

Pre-hearing Draft 260 NC Regional Haze SIP for Second Planning Period (2019 – 2028) August 30, 2021
State Facility ID Facility Name Distance
(Km)
Final Revised Sulfate PSAT
(Mm-1)
Final Revised
EGU+NEG (Mm-1)
Final Revised Sulfate PSAT (%)
Final Revised Nitrate PSAT
(Mm-1)
Final Revised
EGU+NEG (Mm-1)
Final Revised Nitrate PSAT (%)
FL 12123-752411 Buckeye Florida, Limited Partnership 618.36 0.0050 10.2918 0.05 0.0010 10.2918 0.01
FL 12017-640611 Duke Energy Florida, Inc. (DEF) 749.25 0.0049 10.2918 0.05 0.0004 10.2918 0.00
NC 37087-7920511 Blue Ridge Paper Products - Canton Mill 100.26 0.0043 10.2918 0.04 0.0029 10.2918 0.03
AL 01053-7440211 Escambia Operating Company LLC 598.46 0.0042 10.2918 0.04 0.0000 10.2918 0.00
SC 45015-8306711 SCE&G WILLIAMS 469.69 0.0040 10.2918 0.04 0.0020 10.2918 0.02
FL 12005-535411 ROCKTENN CP LLC 628.66 0.0040 10.2918 0.04 0.0000 10.2918 0.00
FL 12089-845811 Rayonier Performance Fibers LLC 597.48 0.0040 10.2918 0.04 0.0040 10.2918 0.04
GA 13127-3721011 Brunswick Cellulose Inc 543.51 0.0040 10.2918 0.04 0.0020 10.2918 0.02
FL 12057-716411 Mosaic Fertilizer, LLC 874.26 0.0036 10.2918 0.03 0.0000 10.2918 0.00
AL 01097-949811 Akzo Nobel Chemicals Inc 641.75 0.0030 10.2918 0.03 0.0000 10.2918 0.00
AL 01097-1056111 Ala Power - Barry 637.87 0.0025 10.2918 0.02 0.0000 10.2918 0.00
NC 37023-8513011 SGL Carbon LLC 200.78 0.0020 10.2918 0.02 0.0000 10.2918 0.00
TN 47105-4129211 Tate & Lyle, Loudon 36.10 0.0014 10.2918 0.01 0.0003 10.2918 0.00
WV 54061-16320111 LONGVIEW POWER 572.53 0.0010 10.2918 0.01 0.0000 10.2918 0.00
AL 01103-1000011 Nucor Steel Decatur LLC 307.31 0.0010 10.2918 0.01 0.0000 10.2918 0.00
TN 47093-4979911 Cemex - Knoxville Plant 44.25 0.0010 10.2918 0.01 0.0010 10.2918 0.01
WV 54093-6327811 KINGSFORD MANUFACTURING COMPANY
536.29 0.0010 10.2918 0.01 0.0000 10.2918 0.00

Pre-hearing Draft 261 NC Regional Haze SIP for Second Planning Period (2019 – 2028) August 30, 2021
State Facility ID Facility Name Distance
(Km)
Final Revised Sulfate PSAT
(Mm-1)
Final Revised
EGU+NEG (Mm-1)
Final Revised Sulfate PSAT (%)
Final Revised Nitrate PSAT
(Mm-1)
Final Revised
EGU+NEG (Mm-1)
Final Revised Nitrate PSAT (%)
MS 28059-8384311 Chevron Products Company, Pascagoula Refinery
724.47 0.0010 10.2918 0.01 0.0000 10.2918 0.00
FL 12033-752711 Gulf Power - Crist 640.08 0.0002 10.2918 0.00 0.0004 10.2918 0.00
AL 01053-985111 Escambia Operating Company LLC 597.02 0.0001 10.2918 0.00 0.0000 10.2918 0.00
WV 54061-6773811 MORGANTOWN ENERGY ASSOCIATES 566.59 0.0001 10.2918 0.00 0.0003 10.2918 0.00
KY 21177-5196711 Tennessee Valley Authority - Paradise Fossil Plant
326.56 0.0000 10.2918 0.00 0.0003 10.2918 0.00
WV 54041-6900311 EQUITRANS - COPLEY RUN CS 70 479.37 0.0000 10.2918 0.00 0.0010 10.2918 0.01
WV 54083-6790511 GLADY 6C4350 513.26 0.0000 10.2918 0.00 0.0010 10.2918 0.01
WV 54083-6790711 FILES CREEK 6C4340 507.74 0.0000 10.2918 0.00 0.0010 10.2918 0.01
MS 28059-6251011 Mississippi Power Company, Plant Victor J Daniel
710.94 0.0000 10.2918 0.00 0.0010 10.2918 0.01

Pre-hearing Draft 262 NC Regional Haze SIP for Second Planning Period (2019 – 2028) August 30, 2021
7.6.3 AoI versus PSAT Contributions After the PSAT modeling was completed, a comparison was made of PSAT results to AoI results. The PSAT results used in this comparison did not incorporate any PSAT adjustments discussed in Appendix E-7b (Roadmap for PSAT Scaled Adjustments) to better match the emissions used in the AoI analysis. Only PSAT contributions greater than or equal to 1.00% were included in the analysis. Figure 7-77 shows three plots of the ratio of AoI/PSAT contributions for sulfate, nitrate, and sulfate + nitrate, respectively, as a function of distance from the facility to the Class I area. Figure 7-78 shows three plots of the fractional bias (FB) for sulfate, nitrate, and sulfate + nitrate, respectively, as a function of distance from the facility to the Class I area. The FB is equal to 2*(AoI – PSAT)/(AoI + PSAT). The FB gives equal weight to over predictions and under predictions. If FB equals 100%, then the AoI contribution is three times higher than the PSAT contribution. Based on Figure 7-77 and Figure 7-78, AoI tends to overestimate impacts for facilities near the Class I area. This appears to be the case for both sulfates and nitrates. In fact, if the facility is <100 Km from the Class I area, the AoI results are generally (with a few exception for nitrates) three times or more higher than the PSAT results. Even in those exceptions, those AoI-computed nitrate impacts for facilities close to a Class I area were always higher than PSAT-computed nitrate impacts. As a result, some sources near a Class I area were tagged for PSAT but were found to not have a significant contribution to visibility impairment. PSAT is the most reliable modeling tool for tracking facility contributions to visibility impairment at Class I areas. Therefore, AoI impacts for nearby sources can be adjusted downward to remove the systematic bias in the contributions. Also, AoI tends to underestimate impacts for facilities in other states that are far away from the Class I area. Although AoI may underestimate the impact of some far away sources, the visibility impairment of those sources were likely included in the PSAT analysis and found to be significantly contributing to visibility impairment in the Class I area because they were tagged for PSAT analysis by states with Class I areas that are closer to those sources.

Pre-hearing Draft 263 NC Regional Haze SIP for Second Planning Period (2019 – 2028) August 30, 2021
Figure 7-77. Ratio of AoI/PSAT % Contributions for Sulfate as a Function of Distance
from the Facility to the Class I Area
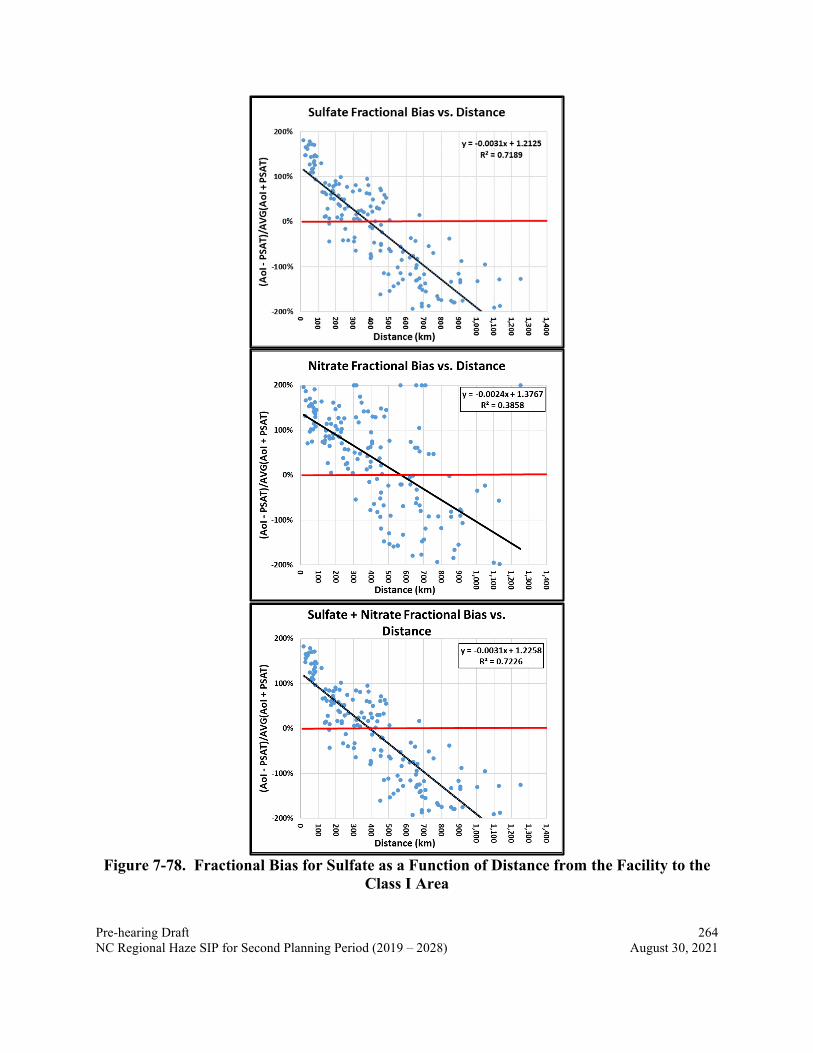
Pre-hearing Draft 264 NC Regional Haze SIP for Second Planning Period (2019 – 2028) August 30, 2021
Figure 7-78. Fractional Bias for Sulfate as a Function of Distance from the Facility to the
Class I Area

Pre-hearing Draft 265 NC Regional Haze SIP for Second Planning Period (2019 – 2028) August 30, 2021
7.7 Selection of Sources for Reasonable Progress Evaluation 7.7.1 Overview of the Selection Process The EPA has made clear each state has the authority to select the sources to evaluate for reasonable progress analysis and to determine the factors used in making such selection to select sources so long as the factors used in the process are explained and justified in the state’s plan. Section 169A(b) requires EPA to “provide guidelines to the States” [emphasis added] and “require each applicable implementation plan for a State” [emphasis added] to address reasonable progress including the requirement for long-term strategies. In promulgating its RHR, EPA stated that “The State must include in its implementation plan a description of the criteria it used to determine which sources or groups of sources it evaluated and how the four factors were taken into consideration in selecting the measures for inclusion in its long-term strategy.” [emphasis added] The EPA’s August 20, 2019, guidance on Regional Haze SIPs for the second implementation period, goes on to clearly state that the selection of emission sources for analysis is the responsibility of the state. Guidance on Regional Haze State Implementation Plans for the Second Implementation Period, 10 (2019). This EPA guidance states the following: “The RHR does not explicitly list factors that a state must or may not consider when selecting the sources for which it will determine what control measures are necessary to make reasonable progress. A state opting to select a set of its sources to analyze must reasonably choose factors and apply them in a reasonable way given the statutory requirement to make reasonable progress towards natural visibility. Factors could include, but are not limited to, baseline source emissions, baseline source visibility impacts (or a surrogate metric for the impacts), the in-place emission control measures and by implication the emission reductions that are possible to achieve at the source through additional measures, the four statutory factors (to the extent they have been characterized at this point in SIP development), potential visibility benefits (also to the extent they have been characterized at this point in SIP development), and the five additional required factors listed in 40 CFR 51.308(f)(2)(iv).” The 2019 EPA guidance goes on to discuss which pollutants to consider. The guidance discusses methods for estimating baseline visibility impacts for selected sources, including residence time analysis and photochemical modeling, both of which were used by North Carolina and other VISTAS states. The selection of pollutants to consider and the residence time analysis are discussed in Section 7.4 and Section 7.5 of this SIP. This Section (7.6) discusses the use of photochemical modeling to better understand source contribution to modeled visibility and further refine the sources selected for a reasonable progress analysis. The EPA guidance also discussed using estimates of visibility impacts to select sources including the use of a visibility impact threshold level for selecting sources. North Carolina, as well as the other VISTAS states, used a two-step process for selecting sources. The first step was a screening analysis using the SO2 and NOx source category and facility contributions from the AoI analysis described in Section 7.5. The second step was CAMx PSAT modeling of the

Pre-hearing Draft 266 NC Regional Haze SIP for Second Planning Period (2019 – 2028) August 30, 2021
sources selected in the first step. Sources were then selected for reasonable progress analysis. This two-step process was used to select sources that have the largest contribution to visibility impairment, and thus, greatest opportunity for improvement, at Class I areas. This process also resulted in selecting several sources that North Carolina, and sources in states that contribute to North Carolina Class I areas, could analyze with the limited resources available to the states. As explained in Section 7.6.3, PSAT modeling resulted in significantly different results than the AoI analysis. Therefore, it is appropriate to have different percentage thresholds for these two steps in the selection process. The EPA’s guidance states, "Whatever threshold is used, the state must justify why the use of that threshold is a reasonable approach…" The justification for the thresholds used in both steps of the selection process are described in this plan. In the regional haze SIPs developed for the first round of planning, many VISTAS states used the AoI approach and a 1% threshold by emission unit. In this second round of planning for regional haze SIPs, all VISTAS states used the AoI/PSAT approach and a ≥ 1.00% PSAT threshold by facility for screening sources for reasonable progress evaluation. Using a facility basis for emission estimates pulled in more facilities as compared to an emission unit-by-unit basis for emission estimates. As a result, more facilities with smaller visibility impacts (in Mm-
1) were examined as compared to the first round of regional haze planning. Overall, the VISTAS screening approach results in a reasonable number of sources that can be evaluated with limited state resources and focuses on the sources and pollutants with the largest impacts. 7.7.2 Selection of Facilities Impacting Class I Areas in North Carolina Based on the PSAT results presented in Table 7-29 through Table 7-34, the VISTAS states agreed that all facilities with a ≥ 1.00% PSAT threshold for sulfate or nitrate would be examined for reasonable progress analysis. For Class I areas in North Carolina, a total of 19 facilities exceeded the ≥ 1.00% PSAT threshold. Table 7-35 lists the facilities in North Carolina selected for reasonable progress analysis, Table 7-36 lists the facilities in VISTAS States (not including North Carolina) selected for reasonable progress analysis, and Table 7-37 lists the facilities in non-VISTAS states selected for reasonable progress analysis. The NCDAQ requested that each of the three facilities in North Carolina complete a four-factor analysis. Section 7.8 documents the four-factor analysis and responses. The NCDAQ sent a letter to each state with a facility listed in Table 7-36 and Table 7-37 to request a reasonable progress analysis for each facility. The request letters and responses are provided in Section 10 of this SIP. For Great Smoky Mountains National Park (see Table 7-30), the total sulfate plus nitrate point source visibility impact in 2028 was 28.90% of the total visibility impairment on the 20% most impaired days. Of this total point source facility impact, the seven (7) facilities have a sulfate contribution ≥1.00% and account for 11.3% of the point source sulfate plus nitrate visibility impact in 2028. For Joyce Kilmer-Slickrock Wilderness Area (see Table 7-31), the total sulfate plus nitrate point source visibility impact in 2028 was 28.88% of the total visibility impairment on the 20% most impaired days. Of this total point source facility impact, the seven (7) facilities have a sulfate

Pre-hearing Draft 267 NC Regional Haze SIP for Second Planning Period (2019 – 2028) August 30, 2021
contribution ≥1.00% and account for 12.1% of the point source sulfate plus nitrate visibility impact in 2028. For Linville Gorge Wilderness Area (see Table 7-32), the total sulfate plus nitrate point source visibility impact in 2028 was 28.85% of the total visibility impairment on the 20% most impaired days. Of this total point source facility impact, the eleven (11) facilities have a sulfate contribution ≥1.00% and account for 20.1% of the point source sulfate plus nitrate visibility impact in 2028. For Shining Rock Wilderness Area (see Table 7-33), the total sulfate plus nitrate point source visibility impact in 2028 was 27.90% of the total visibility impairment on the 20% most impaired days. Of this total point source facility impact, the thirteen (13) facilities have a sulfate contribution ≥1.00% and account for 17.8% of the point source sulfate plus nitrate visibility impact in 2028. For Swanquarter Wilderness Area (see Table 7-34), the total sulfate plus nitrate point source visibility impact in 2028 was 22.20% of the total visibility impairment on the 20% most impaired days. Of this total point source facility impact, the ten (10) facilities have a sulfate contribution ≥1.00% and account for 21.90% of the point source sulfate plus nitrate visibility impact in 2028. In summary, for Class I areas in North Carolina, a total of 19 facilities exceeded the ≥ 1.00% PSAT threshold for sulfate. The NCDAQ reviewed facilities with <1% sulfate or <1% nitrate contribution to one or more of the Class I areas in North Carolina (see Section 7.7.3). Based on this review, the NCDAQ did not identify any uncontrolled or lightly controlled facilities that were large contributors to anthropogenic light extinction at any of North Carolina’s Class I areas. As previously discussed in Section 7.6.1, point source facilities (particularly power plants) outside North Carolina had higher impacts than many of the largest point source facilities within North Carolina due to the significant SO2 and NOx emission reductions that occurred during the first planning period due to the state’s adoption of the Clean Smokestacks Act. Thus, NCDAQ concludes that the 1% PSAT threshold captured a reasonable number of facilities for reasonable progress analysis for their potential impacts on Class I areas in North Carolina.
Table 7-36. Facilities in North Carolina Selected for Reasonable Progress Analysis State Facility ID Facility Name NC 37087-7920511 Blue Ridge Paper Products - Canton Mill NC 37117-8049311 Domtar Paper Company, LLC NC 37013-8479311 PCS Phosphate Company, Inc. - Aurora
Table 7-37. Facilities in VISTAS States (not including North Carolina) Selected for
Reasonable Progress Analysis State Facility ID Facility Name GA 13015-2813011 Georgia Power Company – Plant Bowen KY 21145-6037011 TVA – Shawnee Fossil Plant TN 47161-4979311 TVA – Cumberland Fossil Plant TN 47163-3982311 Eastman Chemical Company VA 51027-4034811 Jewell Coke Company LLP

Pre-hearing Draft 268 NC Regional Haze SIP for Second Planning Period (2019 – 2028) August 30, 2021
State Facility ID Facility Name WV 54033-6271711 Allegheny Energy Supply Co, LLC - Harrison WV 54073-4782811 Monongahela Power Co – Pleasants Power Station
Table 7-38. Facilities Located Outside of VISTAS States Selected for Reasonable Progress
Analysis State Facility ID Facility Name AR 05063-1083411 Entergy Arkansas Inc. - Independence Plant IN 18051-7363111 Gibson IN 18147-8017211 Indiana Michigan Power - Rockport
MO 29143-5363811 New Madrid Power Plant-Marston PA 42063-3005211 Homer City Gen LP/Center TWP PA 42005-3866111 Genon NE Mgmt Co/Keystone Station OH 39081-8115711 Cardinal Power Plant - Cardinal Operating Company OH 39053-8148511 General James M. Gavin Power Plant OH 39025-8294311 Duke Energy Ohio, Wm. H. Zimmer Station
7.7.3 Review of Facilities Not Selected for Reasonable Progress Analysis This section provides a summary of why certain facilities were not selected for a reasonable progress analysis.
Facilities with <1.00% PSAT Contribution Table 7-38 shows the original emissions and PSAT modeling results for Duke Energy Marshall and SGL Carbon to the revised 2028 emissions and adjusted PSAT modeling results. These two facilities were screened out for further analysis for the following reasons. SGL Carbon For non-EGU point sources, the DAQ started with North Carolina’s 2016 base year inventory (the most recent base year available when the 2028 inventory was prepared) and applied facility and emission unit closure information along with growth and control factors to estimate 2028 emissions. SGL Carbon has two natural gas-fired boilers that are subject to GACT and MACT requirements. The 2028 emissions from the original to the revised inventory did not change; therefore, the PSAT modeling results did not change. However, given that the total modeled emissions inventory was updated between the original and revised modeling, the relative contribution is slightly different as indicated in Table 7-38. Based on SO2 emissions of 261.6 tpy, PSAT modeling for SGL Carbon indicates that the highest impact is 0.24% for sulfate at the Linville Gorge Wilderness Area (LIGO). At 32.5 km away, it is closest to this Class I area, and therefore has the highest impact at this Class I area. However, as discussed in section 7.6.3, PSAT modeling is regarded as more reliable than the AoI analysis for estimating visibility impacts. In fact -- when analyzing projected sulfate visibility impairment -- the difference between AoI and PSAT modeling is at least threefold when looking at facilities located <100km to a given Class I area. A comparison of projected sulfate AOI vs PSAT results at LIGO shows that SGL Carbon’s

Pre-hearing Draft 269 NC Regional Haze SIP for Second Planning Period (2019 – 2028) August 30, 2021
AoI impacts are actually over 16x higher than PSAT impacts. Given that PSAT modeling is more reliable than AoI modeling (including the underestimation of impacts from distant sources with AoI modeling) this facility was not considered for a reasonable progress / four-factor analysis because its PSAT contribution to the nearest Class I area is <1.00% for sulfate. Note that there were no NOx impacts due to the low NOx emission rates for this facility (21.7 tpy). Duke Energy Marshall The original 2028 emissions for this facility were based on ERTACv2.7 projections from 2011 to 2028. The revised emissions are based in part on ERTACv16.0 projections from 2016 to 2028. Based on the original (higher) SO2 emissions of 4,139.2 tpy, PSAT modeling for Duke Energy Marshall indicates the highest impact is 0.91% for sulfate at the Linville Gorge Wilderness Area because it is closest to this Class I area. Based on revised SO2 emissions of 2,654.2 tpy, PSAT modeling for Duke Energy Marshall indicates the impact is 0.87% for sulfate at the Linville Gorge Wilderness Area. Therefore, this facility was not considered for reasonable further analysis because its PSAT contribution to the nearest Class I area was <1.00% for sulfate and <1.00% for nitrate.
Table 7-39. Original and Revised Emissions and PSAT Contributions for Duke Energy Marshall and SGL Carbon
Facility Name Distance
(Km)
Original 2028 Emissions (Tons)
Original PSAT Impact (%)
Revised 2028 Emissions (Tons)
Revised PSAT Impact (%)
SO2 NOx SO2 NOx SO2 NOx SO2 NOx Great Smoky Mountains National Park Duke Energy Marshall 270.0 4,139.2 7,511.3 0.35 0.01 2,654.2 5,355.8 0.32 0.01
SGL Carbon 200.8 261.6 21.7 0.01 <0.01 261.6 21.7 0.01 <0.01 Joyce Kilmer-Slickrock Wilderness Area Duke Energy Marshall 274.3 4,139.2 7,511.3 0.37 0.01 2,654.2 5,355.8 0.35 0.01
SGL Carbon 207.1 261.6 21.7 0.01 <0.01 261.6 21.7 0.01 <0.01 Linville Gorge Wilderness Area Duke Energy Marshall 97.20 4,139.2 7,511.3 0.91 0.03 2,654.2 5,355.8 0.87 0.03
SGL Carbon 32.50 261.6 21.7 0.17 <0.01 261.6 21.7 0.24 <0.01 Shining Rock Wilderness Area Duke Energy Marshall 166.0 4,139.2 7,511.3 0.77 0.02 2,654.2 5,355.8 0.73 0.02
SGL Carbon 102.1 261.6 21.7 0.01 <0.01 261.6 21.7 0.02 <0.01 Swanquarter Wilderness Area Duke Energy Marshall 431.5 4,139.2 7,511.3 0.66 0.14 2,654.2 5,355.8 0.62 0.15
SGL Carbon 501.1 261.6 21.7 0.01 <0.01 261.6 21.7 0.02 <0.01
Facilities Not Selected for PSAT Modeling The NCDAQ reviewed facilities with an AoI between 1% and 3% to Class I areas in North Carolina that were not selected for PSAT modeling (see Table 7-39). In addition, the NCDAQ also compared recent emissions for 2017, 2018, and 2019 to projected 2028 emissions used to support the RPG modeling. Facilities with more than a 1,000-ton difference between recent and
Pre-hearing Draft 270 NC Regional Haze SIP for Second Planning Period (2019 – 2028) August 30, 2021
projected 2028 SO2 and NOx emissions were identified for further review (see Table 7-40 and Table 7-41, respectively). These tables also include non-EGU facilities for which the National Park Service and a third party requested to be reviewed. EGU (Duke Energy) Facilities Table 7-42 provides a summary of the Duke Energy facilities with coal units showing SO2 and NOx controls, operating status during the second planning period, and applicable federal rules. Acronyms and abbreviations used in Table 7-42 are defined in Table 7-44. The NCDAQ reviewed existing SO2 and NOx controls for the Duke Energy facilities and determined that existing controls will remain in place and serve to support continued progress for the second planning period. As noted in Section 7.6.3, AoI results for sulfates are at least three times higher than the PSAT results for facilities that are <100 Km from a given Class I area. In North Carolina’s case, such facilities include Duke Energy's Cliffside Steam Station and Asheville Steam Electric Plant, both of which had combined sulfate and nitrate AoI values of less than 3%. Other sources that are further away from Class I areas like Roxboro and Belews Creek are unlikely to be significantly contributing based on AoI, which are less than 3% combined and analysis done in Section 7.6.3 indicates that combined AoI-computed impacts are generally higher than PSAT-computed impacts out to 300 km (see Figure 7-78). In addition, as noted in Section 7.2.7 of this SIP, it is likely that North Carolina’s EGU fleet will undergo changes to mitigate carbon dioxide emissions that will require moving away from coal to less carbon intensive fuels which has not been accounted for in the EGU projections supporting the AoI and PSAT analyses. Based on the current emissions, projected 2028 emissions and current control information, the NCDAQ concluded that it was not necessary to request that the facilities complete a reasonable progress / four-factor analysis to demonstrate progress toward achieving the modeled 2028 RPGs discussed in Section 8 of this SIP. The NCDAQ will continue to track the impact of SO2 and NOx emissions associated with these facilities on visibility in North Carolina’s Class I areas and evaluate progress during the next five-year progress report for regional haze. Non-EGU Facilities For other non-EGU facilities identified in Table 7-39 through Table 7-41, Table 7-43 provides a summary of unit-level SO2 and NOx emission controls, operating status during the second planning period, and applicable federal rules. Acronyms and abbreviations used in Table 7-43 are defined in Table 7-44. The NCDAQ reviewed existing SO2 and NOx controls for these facilities and determined that existing controls will remain in place and serve to support continued progress for the second planning period. Some facilities like Craven County Wood Energy are <100 Km from the Class I area indicating that the AoI results – for sulfates -- for these facilities would be at least three times higher than expected has the facilities been modeled with PSAT. Nitrate-based AoI results for these facilities were all very low, and based on the data analysis given in 7.6.3 comparing

Pre-hearing Draft 271 NC Regional Haze SIP for Second Planning Period (2019 – 2028) August 30, 2021
AoI results vs PSAT results for nitrates as well as nitrates + sulfates, there was no concern that any of these sources were significantly contributing to visibility impairment at any Class I area. Based on the current and projected 2028 emissions and current control information, the NCDAQ concluded that it was not necessary to request that the facilities complete a reasonable progress / four-factor analysis to demonstrate continued progress toward achieving the modeled 2028 RPGs. As with the EGU section, the NCDAQ will continue to track the impact of SO2 and NOx emissions associated with these facilities on visibility in North Carolina’s Class I areas and evaluate progress during the next five-year progress report for regional haze. Table 7-40. Facilities Not Selected for PSAT Modeling with AoI Between 1% and 3% for
Sulfate and Nitrate Combined
State Facility ID Facility Name Distance
(Km)
2028 NOx (TPY)
2028 SO2
(TPY) Nitrate
(%) Sulfate
(%)
Sulfate + Nitrate
(%) Linville Gorge Wilderness Area
NC 37161-8300611
Duke Energy Carolinas, LLC - Cliffside Steam Station 85.3 1,947.7 1,082.3 0.11% 2.38% 2.49%
NC 37169-8514011
Duke Energy Carolinas, LLC - Belews Creek Steam Station 172.2 5,264.3 4,946.1 0.08% 1.93% 2.01%
Shining Rock Wilderness Area
NC 37021-NEW_2706
Duke Energy Progress, Inc. - Asheville Steam Electric Plant 22.6 848.5 17.0 1.97% 0.37% 2.33%
NC 37161-8300611
Duke Energy Carolinas, LLC - Cliffside Steam Station 94.1 1,947.7 1,082.3 0.28% 1.57% 1.85%
NC 37169-8514011
Duke Energy Carolinas, LLC - Belews Creek Steam Station 264.4 5,264.3 4,946.1 0.14% 1.42% 1.56%
Swanquarter Wilderness Area
NC 37145-7826011
Duke Energy Progress, LLC - Roxboro Steam Electric Plant 282.6 4,527.9 6,665.5 0.18% 2.05% 2.23%
NC 37049-8504911
Marine Corps Air Station - Cherry Point 88.4 201.1 607.8 0.05% 1.31% 1.36%

Pre-hearing Draft 272 NC Regional Haze SIP for Second Planning Period (2019 – 2028) August 30, 2021
Table 7-41. Comparison of SO2 Emissions between 2017, 2018, 2019, and 2028
EIS Facility
ID Facility
Distance to
Nearest Class I Area (Km)
2017 (TPY)
2018 (TPY)
2019 (TPY)
2028 Original (TPY)
2028 Remodel
(TPY)
2028 Remodel
minus 2017
(TPY)
2028 Remodel
minus 2018
(TPY)
2028 Remod
el minus 2019
(TPY)
Sulfate AoI Contribution
(%)
Sulfate + Nitrate AoI
Contribution (%)
8514011
Duke Energy Carolinas, LLC - Belews Creek Steam Station
LIGO (172.19) 4,522 4,115 3,370 4,946 1,385 -3,137 -2,730 -1,985 1.93% 2.01%
7826011 Duke Energy Progress - Roxboro Plant
LIGO (263.38) 3,414 3,604 4,142 6,665 2,258 -1,156 -1,346 -1,884 0.92% 0.96%
7826111 Duke Energy Progress, Inc. - Mayo Facility
SWAN (269.89) 1,511 1,413 1,123 1,770 2,274 763 861 1,151 0.31% 0.37%
8506811 Carolina Stalite Company
LIGO (154.05) 1,440 1,164 947 1,972 1,972 532 808 1,025 0.63% 0.64%
8122711 International Paper - Riegelwood Mill
SWAN (220.08) 1,285 1,611 1,341 649 649 -636 -962 -692 0.29% 0.34%
8300611
Duke Energy Carolinas, LLC - Cliffside Steam Station
LIGO (85.32) 858 1,350 1,383 1,082 161 -697 -1,189 -1,222 2.38% 2.49%
8392811
Duke Energy Progress , Inc. - Asheville Steam Electric Plant
SHRO (22.86) 791 780 711 17 39 -752 -741 -672 0.01% 0.06%
8376711 Pilkington North America, Inc.
LIGO (267.6) 383 385 414 506 506 123 121 92 0.05% 0.07%
8137511
Duke Energy Carolinas, LLC - Allen Steam Station
LIGO (120.47) 354 246 148 476 575 221 329 427 0.31% 0.34%
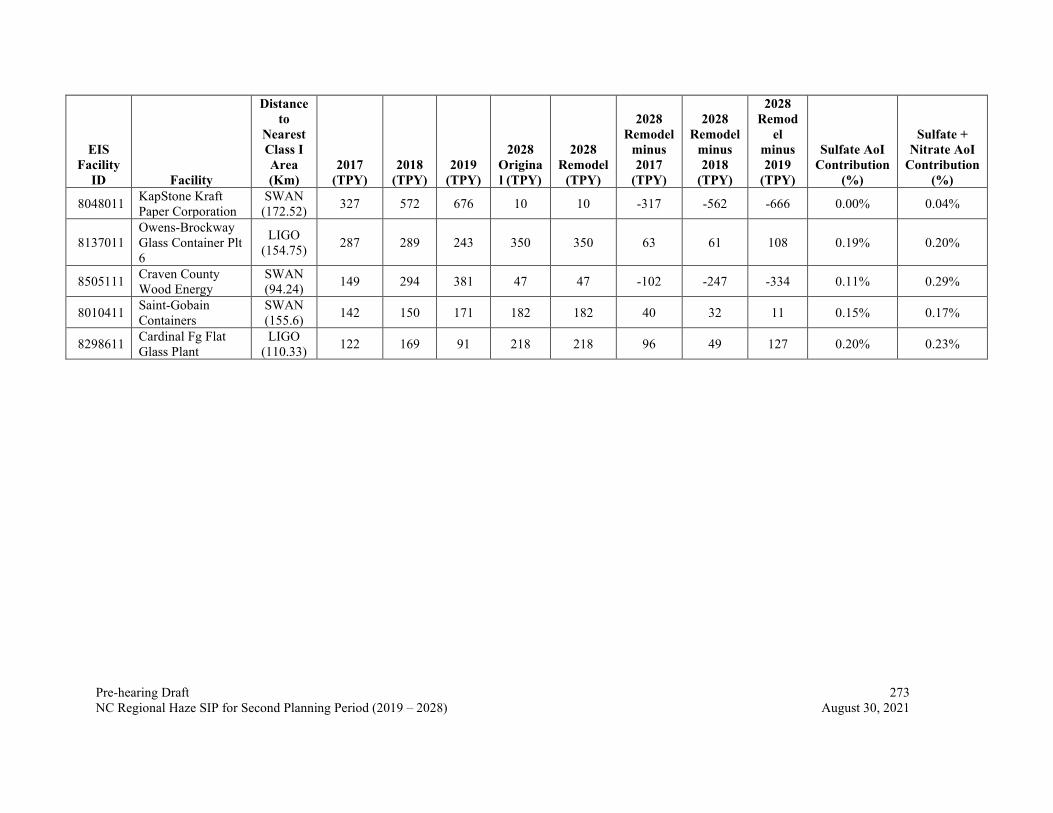
Pre-hearing Draft 273 NC Regional Haze SIP for Second Planning Period (2019 – 2028) August 30, 2021
EIS Facility
ID Facility
Distance to
Nearest Class I Area (Km)
2017 (TPY)
2018 (TPY)
2019 (TPY)
2028 Original (TPY)
2028 Remodel
(TPY)
2028 Remodel
minus 2017
(TPY)
2028 Remodel
minus 2018
(TPY)
2028 Remod
el minus 2019
(TPY)
Sulfate AoI Contribution
(%)
Sulfate + Nitrate AoI
Contribution (%)
8048011 KapStone Kraft Paper Corporation
SWAN (172.52) 327 572 676 10 10 -317 -562 -666 0.00% 0.04%
8137011 Owens-Brockway Glass Container Plt 6
LIGO (154.75) 287 289 243 350 350 63 61 108 0.19% 0.20%
8505111 Craven County Wood Energy
SWAN (94.24) 149 294 381 47 47 -102 -247 -334 0.11% 0.29%
8010411 Saint-Gobain Containers
SWAN (155.6) 142 150 171 182 182 40 32 11 0.15% 0.17%
8298611 Cardinal Fg Flat Glass Plant
LIGO (110.33) 122 169 91 218 218 96 49 127 0.20% 0.23%

Pre-hearing Draft 274 NC Regional Haze SIP for Second Planning Period (2019 – 2028) August 30, 2021
Table 7-42. Comparison of NOx Emissions between 2017, 2018, 2019, and 2028
EIS Facility
ID Facility
Distance to
Nearest Class I Area (Km)
2017 (TPY)
2018 (TPY)
2019 (TPY)
2028 Original (TPY)
2028 Remodel
(TPY)
2028 Remodel
minus 2017
(TPY)
2028 Remodel
minus 2018
(TPY)
2028 Remodel
minus 2019
(TPY)
Nitrate AoI Contribution
(%)
Sulfate + Nitrate AoI
Contribution (%)
8514011
Duke Energy Carolinas, LLC - Belews Creek Steam Station
LIGO (172.19) 7,054 7,303 5,668 5,264 1,867 -5,187 -5,436 -3,801 0.08% 2.01%
7826011 Progress Energy - Roxboro Plant
LIGO (263.38) 5,774 5,614 4,886 4,528 1,532 -4,242 -4,082 -3,354 0.04% 0.96%
8376711 Pilkington North America, Inc.
LIGO (267.6) 3,614 3,697 3,552 4,797 4,797 1,183 1,100 1,245 0.02% 0.07%
8300611
Duke Energy Carolinas, LLC - Cliffside Steam Station
LIGO (85.32) 1,646 1,954 2,486 1,948 327 -1,319 -1,627 -2,159 0.11% 2.49%
8122711 International Paper - Riegelwood Mill
SWAN (220.08) 1,620 1,711 1,603 1,175 1,175 -445 -536 -428 0.06% 0.34%
8137511
Duke Energy Carolinas, LLC - Allen Steam Station
LIGO (120.47) 1,610 1,441 1,346 1,125 1,410 -200 -31 64 0.03% 0.34%
7826111 Duke Energy Progress, Inc. - Mayo Facility
SWAN (269.89) 1,305 1,584 1,280 1,395 1,680 375 96 400 0.06% 0.37%
7265811
Duke Energy Progress - H.F. Lee Steam Electric Plant
SWAN (171.04) 1,095 1,204 951 1,212 2,295 1,200 1,091 1,344 0.08% 0.10%
8048011 KapStone Kraft Paper Corporation
SWAN (172.52) 987 929 893 419 419 -568 -510 -474 0.03% 0.04%

Pre-hearing Draft 275 NC Regional Haze SIP for Second Planning Period (2019 – 2028) August 30, 2021
EIS Facility
ID Facility
Distance to
Nearest Class I Area (Km)
2017 (TPY)
2018 (TPY)
2019 (TPY)
2028 Original (TPY)
2028 Remodel
(TPY)
2028 Remodel
minus 2017
(TPY)
2028 Remodel
minus 2018
(TPY)
2028 Remodel
minus 2019
(TPY)
Nitrate AoI Contribution
(%)
Sulfate + Nitrate AoI
Contribution (%)
8506811 Carolina Stalite Company
LIGO (154.05) 708 590 617 853 853 145 263 236 0.01% 0.64%
8505111 Craven County Wood Energy
SWAN (94.24) 630 488 507 508 508 -122 20 1 0.18% 0.29%
8392811
Duke Energy Progress , Inc. - Asheville Steam Electric Plant
SHRO (22.86) 628 902 776 874 2,035 1,407 1,133 1,259 0.06% 0.00%
7980211 Weyerhaeuser NR Company Vanceboro Pulp
SWAN (86.80) 521 512 562 722 722 201 210 160 0.24% 0.98%
8137011 Owens-Brockway Glass Container Plt 6
LIGO (154.75) 431 435 599 527 527 96 92 -72 0.01% 0.20%
8298611 Cardinal Fg Flat Glass Plant
LIGO (110.33) 429 467 222 795 795 366 328 573 0.02% 0.23%
8311911 Nucor Steel Hertford
SWAN (114.17) 384 298 336 409 409 25 111 73 0.09% 0.28%
8010411 Saint-Gobain Containers
SWAN (155.6) 308 283 290 377 377 69 94 87 0.02% 0.17%
7377911 PPG Industries Fiber Glass Products, Inc.
LIGO (151.54) 128 112 98 198 198 70 86 100 0.00% 0.03%
7732911 Baxter Healthcare Corporation
LIGO (16.11) 125 124 132 124 124 -1 0 -8 0.18% 0.62%
8299711 Jackson Paper Manufacturing Company
SHRO (40.28) 101 106 107 119 119 18 13 12 0.07% 0.01%

Pre-hearing Draft 276 NC Regional Haze SIP for Second Planning Period (2019 – 2028) August 30, 2021
Table 7-43. Controls, Operating Status, and Federal Rules for Duke Energy Facilities
Federal Rules
EIS ID Facility Name SO2 Controls NOx Controls Operating Status / Retirement
Date NSPS MACT Part 63 PSD
8370411
Duke Energy Carolinas, LLC - Marshall Steam Station
Units 1, 2, 4-wet FGD system, flue gas conditioning; Unit 3-wet FGD system
Units 1, 2, 4-SNCR and SOFA/LOFIR; Unit 3-SCR and SOFA/LOFIR
Operating. Based on Duke's 2020 Integrated Resource Plan (IRP) Projections, Units 1, 2, 3, and 4 are projected to be retired in 2035.
IIII, OOO, Y
6C, 5U, 4Z
Class-Major, Units 1, 2, 3, 4-PSD avoidance limit for PM/PM10.
8300611
Duke Energy Carolinas, LLC - Cliffside Steam Station
Units 5, 6-wet FGD system and flue gas conditioning
Unit 5-SCR and ammonia injection; Unit 6-SCR
Operating, Unit 5 permitted to operate on NG, startup date=10/31/2018. Unit 6 permitted to co-fire NG, startup date=11/25/2018. Based on Duke's 2020 Integrated Resource Plan (IRP) Projections, Unit 5 is projected to be retired in 2026 and Unit 6 is projected to be retired in 2049.
Da, Db, IIII, OOO, Y
5D, 5U, 4Z
Class-Major, Unit 5, 6 and associated equipment for each unit-PSD avoidance limit for SO2, NOx
8137511
Duke Energy Carolinas, LLC - Allen Steam Station
Units 1, 2-Wet FGD system; Units 3, 4 and 5-Wet FGD system and flue gas conditioning
Units 1, 2, 3, 4, 5-SNCR
Operating, coal units 1, 2, and 3 under EPA consent order to cease operation by Dec. 31, 2024. Based on Duke's 2020 IRP Projections, Units 4 and 5 are also projected to be retired in 2024.
Dc, IIII, JJJJ, OOO
5D, 5U, 4Z
Class-Major, Units 1, 2, 3, 4, 5-PSD avoidance limits for PM/PM10/PM2.5; dry flyash system-PSD avoidance limit for PM10.
8392811
Duke Energy Progress , Inc. - Asheville Steam Electric Plant
Permanently shut down 2 coal boilers Jan. 29, 2020.
Operating, two coal boilers replaced by two NGCC units, unit 5 began commercial operation on August 8, 2019 and unit 7 began commercial operation on September 3, 2019.

Pre-hearing Draft 277 NC Regional Haze SIP for Second Planning Period (2019 – 2028) August 30, 2021
Federal Rules
EIS ID Facility Name SO2 Controls NOx Controls Operating Status / Retirement
Date NSPS MACT Part 63 PSD
7826011
Duke Energy Progress, LLC - Roxboro Steam Electric Plant
Units 1, 2, 3, 4-FGD system
Units 1, 2, 3, 4-SCR and low NOx burners
Operating, Duke 2020 IRP Projections: Units 1 and 2 are projected to be retired in 2029. Units 3 and 4 are projected to be retired in 2028.
D, Db, IIII, OOO, Y
5U, 4Z
PSD Major, Units 4A, 4B-PSD avoidance for PM/PM10/PM2.5, SO2, NOx, VOC, CO, Pb and GHG as CO2e.
7826111
Duke Energy Progress, LLC - Mayo Electric Generating Plant
Units 1a, 1b-FGD and sorbent injection
Units 1a, 1b-SCR
Operating, Duke 2020 IRP Projections: Unit 1 is projected to be retired in 2029.
D, OOO, Y
5U, 4Z Class-Major, Unit 1A, 1B, PSD for SO2, NOx, PM, PSD avoidance limit for PM2.5.
8514011
Duke Energy Carolinas, LLC - Belews Creek Steam Station
Units 1, 2-FGD and flue gas conditioning
Units 1, 2-SCR, low NOx burner with OFA and ammonia injection
Operating, Duke 2020 IRP Projections: Units 1 and 2 are projected to be retired in 2039.
IIII, JJJJ, OOO
5D, 5U, 4Z
PSD Major, Units 1, 2-PSD avoidance limits for NOx, PM/PM10 /PM2.5, SO2, HF, Pb and GHG as CO2e; 2 NG-fired boilers and natural gas supply line heaters-PSD avoidance limits for CO and VOC; dry flyash handling project-PSD avoidance limits for PM; limestone rail unloading and handling operations-PSD avoidance limit for PM.

Pre-hearing Draft 278 NC Regional Haze SIP for Second Planning Period (2019 – 2028) August 30, 2021
Federal Rules
EIS ID Facility Name SO2 Controls NOx Controls Operating Status / Retirement
Date NSPS MACT Part 63 PSD
7265811
Duke Energy Progress, LLC - H.F. Lee Steam Electric Plant
Units 1a, 1b, 1c-SCR; Unit 14-dry low NOx combustor and water injection
Operating, Only NG emissions reported in 2019, Units 5, 6, 7 did not operate in 2019. Units 10, 11, 12, 13 did not report SO2 emissions and have no controls reported.
Dc, GG, IIII, Kb, KKKK
5D, 5U, 4Y, 4Z
Class-Major, Units 10, 11, 12, 13-PSD for NOx, SO2, CO, VOC, PM/PM10 and sulfuric acid; Units 14-PSD avoidance limits for NOx, SO2, sulfuric acid and PM/PM10; Units 1A, 1B, 1C-PSD avoidance limits for NOx, SO2, PM/PM10/PM2.5, CO, VOC, Sulfuric acid and Pb; flyash feed stock processing reactor-PSD avoidance limits for PM/PM10/PM2.5, CO, and VOC.

Pre-hearing Draft 279 NC Regional Haze SIP for Second Planning Period (2019 – 2028) August 30, 2021
Table 7-44. Controls, Operating Status, and Federal Rules for Other Facilities
Federal Rules
EIS ID Facility Name SO2 Controls NOx Controls
Operating Status /
Retirement Date NSPS
MACT Part 63 PSD
8298611 Cardinal FG Company
P01 glass melting furnace-Dry sorbent injection
P01 glass melting furnace-Ammonia injection
Operating. CC, IIII 4Z
Status-Minor, P01-PSD avoidance limits for SO2, CO, NOx; Annealing lehr-PSD avoidance limit for SO2.
8299711 Jackson Paper Manufacturing Company
PSD avoidance limit for SO2
Operating. 6J Status-Minor, JP-021 (boiler) - PSD avoidance limits for CO and SO2
8506811 Carolina Stalite Company
Kilns 1, 3, 4, 5, 6-lime slurry injection; Kiln 2-lme slurry injection, pack bed scrubber; Kiln 17-lime slurry injection, packed-bed wet scrubber (NaOH sorbent)
Operating. UUU 6C Status-Major, ES-1 through ES-6 and ES-14 (kilns)-PSD for PM and SO2.
8376711 Pilkington North America, Inc.
PSD avoidance limit for SO2
Operating. 5D, 4Z Status-Major, ES-2 consisting of a melter glass refiner and annealing lehr-PSD for PM and SO2.
8122711 International Paper - Riegelwood Mill
No 2 and No 5 Power Boilers-Venturi scrubbers; Lime kiln 3, 4-wet scrubber venturi type
PSD avoidance limit for NOx
Operating BB, Kb
5D, MM, S, 4Z
Status-Major, No. 2 and No. 5 Power Boilers, No. 15 and 18 paper machines with dryers-PSD for PM10, SO2 and NOx; lime kilns 3, 4-PSD avoidance limit for NOx; 2 temporary package boilers-PSD avoidance limits for various pollutants including SO2 and NOx,

Pre-hearing Draft 280 NC Regional Haze SIP for Second Planning Period (2019 – 2028) August 30, 2021
Federal Rules
EIS ID Facility Name SO2 Controls NOx Controls
Operating Status /
Retirement Date NSPS
MACT Part 63 PSD
8048011
WestRock Kraft Paper, LLC. (formerly KapStone Kraft Paper Corporation)
No 1 Power Boiler-Venturi Scrubber
PSD avoidance limit for NOx
Operating. BB, Db, IIII
5D, MM, S, 4Z
Status-Major, No. 7 Recovery furnace-PSD avoidance limits for various pollutants including SO2 and NOx.
8010411 Ardagh Glass Inc. (formerly Saint-Gobain Containers)
Combustion sources subject to SO2 emission limit in 15A NCAC 2D .0516
GF-1-Filtration system consisting of ceramic filter media with embedded catalyst
Operating. CC, IIII 6S, 4Z
Status-Major, did not trigger PSD tracking for any pollutants. GF-1 subject to 15A NCAC 2D .0516 Sulfur Dioxide Emissions From Combustion Sources.
8504911 Marine Corps Air Station - Cherry Point
Combustion sources subject to SO2 emission limit in 15A NCAC 2D .0516
Central Heating Plant Boilers 1-4 – low NOx burners and flue gas recirculation
Operating. No controls on boilers.
Dc, IIII
Boiler-112J, DDDDD, GG, ZZZZ
Status-Major, 12 boilers and 95 emergency generators and fire pumps contribute over 95% of SO2 emissions. All combustion sources subject to 15A NCAC 2D .0516 Sulfur Dioxide Emissions From Combustion Sources.
8137011 Owens-Brockway Glass Container Inc.
PSD avoidance limit for SO2
PSD avoidance limit for NOx
Operating. IIII 6S, ZZZZ
Status-Major, three NG-fired furnaces and three NG-fired molten glass refiners-PSD avoidance limits or NOx, SO2 and PM/PM10/PM2.5.
8505111 Craven County Wood Energy, L.P. PSD avoidance
limit for NOx Operating. Db 6J, ZZZZ
Status-Major, one biomass, NG, Propane and used oil-fired boiler and associated sources-PSD avoidance limits for PM/PM10, VOC, CO, and NOx.

Pre-hearing Draft 281 NC Regional Haze SIP for Second Planning Period (2019 – 2028) August 30, 2021
Federal Rules
EIS ID Facility Name SO2 Controls NOx Controls
Operating Status /
Retirement Date NSPS
MACT Part 63 PSD
8311911 Nucor Steel - Hertford
PSD avoidance limit for SO2
PSD avoidance limit for NOx
Operating.
AAa, Dc, IIII, JJJJ
6C, YYYYY, ZZZZ
Status-Major, Electric arc furnace, ladle metallurgy furnace, continuous slab caster and non-vented NG-fired combustion sources-PSD avoidance limits for PM10/PM2.5, SO2, NOx, CO and VOC.
7732911 Baxter Healthcare Corporation
PSD avoidance limit for SO2
Wood-fired boiler-OFA Operating. Dc,
IIII 6J, ZZZZ
Status-Minor, Wood-fired boiler, No.2 fuel oil-fired boiler, 7 No. 2 fuel oil-fired peak shaver generators, 2 NG/No. 2 fuel oil-fired boilers-PSD avoidance limits for PM, SO2, NOx and CO.
7980211
International Paper - New Bern Mill (formerly Weyerhaeuser NR Company Vanceboro Pulp)
No. 2 Power Boiler-Caustic Scrubber, chevron-type mist eliminator
PSD avoidance limit for NOx
Operating.
BB, BBa, Db, IIII
DDDDD, MM, S, ZZZZ
Status-Major, No.1 power boiler-PSD avoidance limits for PM/PM10 filterable only, SO2, and NOx.
7377911
Electric Glass Fiber America, LLC (formerly PPG Industries Fiber Glass Products, Inc)
PSD avoidance limit for SO2
PSD avoidance limit for NOx
Operating. CC DDDDD, ZZZZ
Status-Major, Single level fiberglass furnace 502-PSD avoidance limits for PM/PM10, Fluorides and SO2; Double level fiberglass furnace 507-PSD avoidance limits for PM/ PM10, Fluorides, NOx, CO, Pb, and SO2.

Pre-hearing Draft 282 NC Regional Haze SIP for Second Planning Period (2019 – 2028) August 30, 2021
Table 7-45. Acronyms for Controls, Operating Status and Federal Rules for Duke Energy and Other Facility Tables
Acronym/Abbreviation Description FGD Flue Gas Desulfurization FSI Furnace Sorbent Injection LOFIR LOwered FIRed Low NOx Technology MACT Maximum Achievable Control Technology MATS Mercury and Air Toxics Standards NCAC North Carolina Administrative Code NG Natural Gas NSPS New Source Performance Standards OFA OverFire Air ROFA Rotating OverFire Air SCR Selected Catalytic Reduction SNCR Selected Non-Catalytic Reduction SOFA Separated OverFire Air
MACT (40 CFR 63) Subpart AA National Emission Standards for Hazardous Air Pollutants from Phosphoric Acid Manufacturing Plants BB National Emission Standards for Hazardous Air Pollutants from Phosphate Fertilizers Production Plants
Boiler-112(j) 40 CFR 63.55(a) Maximum achievable control technology (MACT) determinations for affected sources subject to case-by-case determination of equivalent emission limitations.
CCCCCC/6C National Emission Standards for Hazardous Air Pollutants for Source Category: Gasoline Dispensing Facilities DDDDD/5D (Boiler MACT)
National Emission Standards for Hazardous Air Pollutants for Major Sources: Industrial, Commercial, and Institutional Boilers and Process Heaters
GG National Emission Standards for Aerospace Manufacturing and Rework Facilities H National Emission Standards for Organic Hazardous Air Pollutants for Equipment Leaks
JJJJJJ/6J National Emission Standards for Hazardous Air Pollutants for Industrial, Commercial, and Institutional Boilers Area Sources
MM National Emission Standards for Hazardous Air Pollutants for Chemical Recovery Combustion Sources at Kraft, Soda, Sulfite, and Stand-Alone Semichemical Pulp Mills
S National Emission Standards for Hazardous Air Pollutants from the Pulp and Paper Industry

Pre-hearing Draft 283 NC Regional Haze SIP for Second Planning Period (2019 – 2028) August 30, 2021
Acronym/Abbreviation Description SSSSSS/6S National Emission Standards for Hazardous Air Pollutants for Glass Manufacturing Area Sources UUUUU/5U (MATS) National Emission Standards for Hazardous Air Pollutants: Coal- and Oil-Fired Electric Utility Steam Generating Units YYYY/4Y National Emission Standards for Hazardous Air Pollutants for Stationary Combustion Turbines YYYYY/5Y National Emission Standards for Aerospace Manufacturing and Rework Facilities ZZZZ/4Z National Emissions Standards for Hazardous Air Pollutants for Stationary Reciprocating Internal Combustion Engines NSPS (40 CFR 60) Subpart
AAa Standards of Performance for Steel Plants: Electric Arc Furnaces and Argon-Oxygen Decarburization Vessels Constructed After August 17, 1983
BB Standards of Performance for Kraft Pulp Mills
BBa Standards of Performance for Kraft Pulp Mill Affected Sources for Which Construction, Reconstruction, or Modification Commenced After May 23, 2013
CC Standards of Performance for Glass Manufacturing Plants D Standards of Performance for Fossil-Fuel-Fired Steam Generators Da Standards of Performance for Electric Utility Steam Generating Units (Boilers) Db Standards of Performance for Industrial-Commercial-Institutional Steam Generating Units Dc Standards of Performance for Small Industrial-Commercial-Institutional Steam Generating Units GG Standards of Performance for Stationary Gas Turbines H Standards of Performance for Sulfuric Acid Plants IIII Standards of Performance for Stationary Compression Ignition Internal Combustion Engines JJJJ Standards of Performance for Stationary Spark Ignition Internal Combustion Engines Kb Standards of Performance for Volatile Organic Liquid Storage Vessels Including Petroleum Storage Vessels KKKK Standards of Performance for Stationary Combustion Turbines OOO Standards of Performance for Nonmetallic Mineral Processing Plants UUU Standards of Performance for Calciners and Dryers in Mineral Industries Y Standards of Performance for Coal Preparation and Processing Plants

Pre-hearing Draft 284 NC Regional Haze SIP for Second Planning Period (2019 – 2028) August 30, 2021
7.8 Evaluating Reasonable Progress using the Four Statutory Factors for Specific Emission Sources
Section 169A(g)(1) of the CAA and the RHR at 51.308(f)(2)(i) require a state to evaluate the following four “statutory” factors when establishing the RPG for any Class I area within a State: (1) cost of compliance, (2) time necessary for compliance, (3) energy and non-air quality environmental impacts of compliance, and (4) remaining useful life of any existing source subject to such requirements. Based on the PSAT modeling analysis (see Section 7.6), North Carolina selected a facility for reasonable progress evaluation if the facility was estimated to have ≥1.00% sulfate or ≥1.00% nitrate contribution to visibility impairment in 2028 in at least one of North Carolina’s Class I areas. As a result, North Carolina identified the following three facilities for a reasonable progress assessment for sulfate based on the results presented in Section 7.7. The NCDAQ followed EPA’s August 20, 2019, guidance in in evaluating the four statutory factors for the facilities in North Carolina selected for reasonable progress analysis as identified in Table 7-35. Shining Rock Wilderness Area
• Blue Ridge Paper Products, LLC – Canton, NC (BRPP), Haywood County (Facility ID 7920511)
Swanquarter Wilderness Area
• Domtar Paper Company, LLC – Plymouth, NC (Domtar), Martin County, (Facility ID 8049311)
• PCS Phosphate Company, Inc. – Aurora, NC (PCS Phosphate), Beaufort County (Facility ID 8479311)
Based on PSAT modeling, no other facilities within North Carolina were identified to have ≥1.00% sulfate or ≥1.00% nitrate contribution to visibility impairment in 2028 in any of North Carolina’s Class I areas nor Class I areas outside of North Carolina. In addition, no other state contacted the NCDAQ requesting a reasonable progress evaluation or four-factor analysis for a stationary source facility within North Carolina. North Carolina also identified 12 facilities in eight states (AR, GA, IN, KY, MO, OH, PA, and VA) that were estimated to have ≥1.00% sulfate to visibility impairment in 2028 in at least one of North Carolina’s Class I areas. The consultation process with the states is documented in Section 10 of this SIP.
7.8.1 Reasonable Progress Evaluation of North Carolina Facilities
For each of the three North Carolina facilities identified for a reasonable progress evaluation, the NCDAQ requested that the facility review the 2028 SO2 emissions used to support the initial PSAT modeling based on the elv5 emissions inventory. Each facility reviewed the emissions and provided revisions. The NCDAQ updated the PSAT contribution based on a ratio of the modeled and revised emissions provided by the facility and determined that each facility’s

Pre-hearing Draft 285 NC Regional Haze SIP for Second Planning Period (2019 – 2028) August 30, 2021
potential contribution to visibility impairment remained at ≥1.00% for SO2 for at least one of North Carolina’s Class I areas. The NCDAQ then requested that each facility complete a four-factor analysis on the emission units that accounted for the majority of SO2 emissions in 2016 and 2028. Table 7-45 identifies the facilities and their initial and revised PSAT contribution to the Class I area to which their potential contribution to visibility impairment in 2028 was ≥1.00% sulfate contribution.
Table 7-46. Initial PSAT Modeling Results Based on VISTAS 2028elv5 Emissions Initial 2028elv5 2028elv5 Revised by Facility
Facility Name Class I Area
Inverse Megameters
(Mm-1) Percent
Contribution
Inverse Megameters
(Mm-1) Percent
Contribution BRPP Shining Rock 0.133 1.08% 0.160 1.30% Domtar Swanquarter 0.109 1.00% 0.176 1.61% PCS Phosphate Swanquarter 0.329 3.02% 0.207 1.91%
Subsequently, the PSAT contributions were adjusted to account for issues imbedded in the modeled emissions for elv3 (see Appendix B of this SIP).99 The revised PSAT contributions are shown in Table 7-46. This revised PSAT contributions did not change the selection of facilities for a reasonable progress assessment for North Carolina.
Table 7-47. Revised PSAT Modeling Results Based on 2028elv5 Modeled Emissions Initial Revised
Facility Name Class I Area
Inverse Megameters
(Mm-1) Percent
Contribution
Inverse Megameters
(Mm-1) Percent
Contribution BRPP Shining Rock 0.133 1.13% 0.160 1.36% Domtar Swanquarter 0.109 1.06% 0.176 1.70% PCS Phosphate Swanquarter 0.329 3.20% 0.207 2.03%
The NCDAQ requested that each facility use the following five-step approach for each SO2 emissions unit identified for a four-factor analysis to identify control measures with the highest level of control effectiveness that are both technically feasible and cost effective:
Step 1: Identify all control technologies; Step 2: Eliminate technically infeasible options; Step 3: Rank remaining control technologies by control effectiveness;
99 See Appendix B (Task 6 – Benchmark Run #7 Report Review and 2028 elv3 Reassessment) of the Task 3A report.

Pre-hearing Draft 286 NC Regional Haze SIP for Second Planning Period (2019 – 2028) August 30, 2021
Step 4: Application of the four statutory factors (cost of compliance, time necessary for compliance, energy and non-air quality environmental impacts, remaining useful life of existing source) to control technologies identified in Step 3 and document the results; and
Step 5: Select control technology and control effectiveness. For each of the three facilities, the following documents the initial and revised emissions for 2028, a description of the SO2 emission units evaluated, a summary of control measures identified and eliminated from further consideration, a summary of the results of the four-factor analysis completed for each SO2 control technically determined to be technically feasible, and the NCDAQ’s decision on if additional controls are warranted (i.e., technically feasible and cost effective). Appendix G provides the correspondence between the NCDAQ and each facility and each facility’s reasonable progress assessment and four factor analysis.
Blue Ridge Paper Products, LLC (BRPP)
From 2017 to 2019, BRPP implemented SO2 controls on existing processes and replaced two coal fired boilers with new natural gas fired boilers to comply with an SOC between the North Carolina Environmental Management Commission and BRPP. The controls were installed in part to comply with the boiler MACT but also to strengthen North Carolina’s SIP for demonstrating compliance with the 2010 1-hour SO2 standard for Beaverdam Township where the facility is located. The NCDAQ submitted a source specific SIP for this facility on (include date submitted) containing permitted allowable SO2 limits for the more significant sources of SO2 emissions. The EPA approved the source specific SIP on November 25, 2020.100 The EPA has approved these permitted allowable SO2 limits into the North Carolina SIP; therefore, making the limits permanent and federally enforceable. These limits are included in Table 7-47. For the initial PSAT modeling, the NCDAQ estimated 2028 emissions as equal to 2019 actual emissions reflecting actual emissions after BRPP complied with the SOC. The initial PSAT modeling showed the facility contribution to visibility impairment at Shining Rock Wilderness Area to be 1.08% in 2028 for sulfate. BRPP provided revised 2028 emissions which were 78.4 tons more than the 2028 emissions upon which the initial PSAT modeling was based. The NCDAQ revised the PSAT contribution based on the ratio of the initial and revised 2028 emissions which increased BRPP’s contribution to Shining Rock Wilderness Area from 1.08% to 1.30% in 2028. The DAQ identified the Riley Coal Boiler, No. 4 Power Boiler, and Riley Bark Boiler as the most significant sources of SO2 emissions after BRPP implemented SO2 controls from 2017 to 2019 and requested that BRPP complete a four-factor analysis of controls for the three emission units. Therefore, the NCDAQ requested that BRPP complete a four-factor analysis for the three emission units. For each of the three emission units, Table 7-47 shows 2019, initial 2028, and revised 2028 SO2 emissions. The table also shows total SO2 emissions for the facility (upon which the initial
100 Final Rule: Air Plan Approval; NC; Blue Ridge Paper SO2 Emission Limits, 85 FR 74884, November 24, 2020.

Pre-hearing Draft 287 NC Regional Haze SIP for Second Planning Period (2019 – 2028) August 30, 2021
PSAT modeling was conducted) and the total emissions for the three units as a percentage of total facility emissions. The three boilers accounted for about 90% of total facility emissions in 2016 and these boilers are estimated to account for 92% of total facility emissions in 2028.
Table 7-48. Summary of Annual SO2 Emissions for BRPP
Unit
Federally Enforceable SO2 Limit
(lb/hr)
2019 Emissions
(Tons)
Projected 2028 Emissions,
Initial (Tons)
Projected 2028 Emissions,
Revised (Tons) Riley Coal Boiler 61.32 115.08 115.08 183.77 No. 4 Power Boiler 82.22 195.21 195.21 195.21 Riley Bark Boiler 68.00 55.07 55.07 64.75 Totals for 3 Units - 365.36 365.36 443.73 Total Facility Emissions - 405 405 483 Total Emissions for 3 units as a Percentage of Total Facility Emissions
- 90.2% 90.2% 91.8%
Description of SO2 Emission Units 1. Riley Coal; ID No. G25, 399 MMBtu/hr: This unit is equipped with natural gas/kerosene ignitors and burns pulverized coal during normal operation. This unit is subject to boiler Maximum Achievable Control Technology (MACT) Subpart DDDDDD. It is equipped with an ESP and a wet scrubber. The unit and wet scrubber are operated to achieve an SO2 control efficiency of 90%. 2. No. 4 Power Boiler; ID No. G66, 535 MMBtu/hr: This unit is equipped with natural gas startup burners and burns pulverized coal during normal operation. This unit is subject to boiler MACT Subpart DDDDDD and a New Source Performance Standard (NSPS) Sulfur limit of 1.2 lb SO2/million BTU. It is equipped with an ESP and a wet scrubber. The unit and wet scrubber are operated to achieve an SO2 control efficiency of 90%. 3. Riley Bark; ID No. G66: This unit is a hybrid suspension/grate design and burns a mixture of biomass and coal during normal operation at an aveage rate of 60% coal to 40% biomass. It is equipped with a wet scrubber that achieves about 90% control of SO2 emissions. Summary of Recent SO2 Reductions and Visibility Impacts From 2017-2019, BRPP significantly reduced actual SO2 emissions by 93% (5,470 tons). The NCDAQ evaluated the SO2 emission reductions the facility achieved from 2017-2019 and associated improvements in visibility at the Shining Rock Wilderness Area. As shown in Table 7-48, projected 2028 total visibility impairment -- anthropogenic and natural -- at the Shining Rock Wilderness Area is 39.658 Mm-1 (13.78 dv) for the 20% most impaired days. Based on PSAT modeling, the controls installed by the facility from 2017-2019 reduced the facility’s visibility impairment impact at the Shining Rock Wilderness Area by about 92% (from 1.938

Pre-hearing Draft 288 NC Regional Haze SIP for Second Planning Period (2019 – 2028) August 30, 2021
Mm-1 to 0.160 Mm-1 for sulfate, or 0.46 dv). This translates to an increase in the visible range of about 2.87 miles. Table 7-49. Summary of Visibility Impacts from BRPP on Shining Rock Wilderness Area
the for 20% Most Impaired Days
Projected BRPP 2028
Emissions Before Controls Projected 2028 Emissions
with Controls Total Facility Emissions (tons) 5,875 485 Projected 2028 Facility-Specific Visibility Impairment to Shining Rock Wilderness Area (Mm-1)
1.938 0.160
Projected 2028 Total Visibility Impairment at the Shining Rock Wilderness Area (Mm-1)
39.658 37.88
Projected 2028 RPG at the Shining Rock Wilderness Area (dv)* 13.78 13.32
Visual Range (miles)* 61.11 63.98 * Represents projected 2028 total (anthropogenic and natural) visibility impairment computed using the IMPROVE Haze Metrics Converter (URL: http://vista.cira.colostate.edu/Improve/haze-metrics-converter/). Table 7-49 shows the impact of the SO2 emission reductions for the Great Smoky Mountains National Park. Projected 2028 total visibility impairment -- anthropogenic and natural -- at the Great Smoky Mountains National Park is 45.95 Mm-1 (15.25 dv) for the 20% most impaired days. Based on PSAT modeling, the controls installed by the facility from 2017-2019 reduced the facility’s visibility impairment impact at the Great Smoky Mountains National Park by about 92% (from 0.194 Mm-1 to 0.016 Mm-1 for sulfate, or 0.04 dv). This translates to an increase in the visible range of about 0.23 miles.
Table 7-50. Summary of Visibility Impacts from BRPP on the Great Smoky Mountains National Park for the 20% Most Impaired Days
Projected BRPP 2028 Emissions Before
Controls Projected 2028 Emissions
with Controls Total Facility Emissions (tons) 5,875 485 Projected 2028 Facility-Specific Visibility Impairment to Great Smoky Mountains National Park (Mm-1)
0.194 0.016
Projected 2028 Total Visibility Impairment at the Great Smoky Mountains National Park (Mm-1)
45.95 45.75
Projected 2028 RPG at the Great Smoky Mountains National Park (dv)* 15.25 15.21
Visual Range (miles)* 52.74 52.97 * Represents projected 2028 total (anthropogenic and natural) visibility impairment computed using the IMPROVE Haze Metrics Converter (URL: http://vista.cira.colostate.edu/Improve/haze-metrics-converter/).

Pre-hearing Draft 289 NC Regional Haze SIP for Second Planning Period (2019 – 2028) August 30, 2021
Control Technology Evaluation Table 7-50 identifies the control technologies identified and evaluated for technical feasibility for controlling SO2 emissions for the Riley Coal Boiler, No. 4 Power Boiler, and Riley Bark Boiler.
Table 7-51. BRPP’s Boiler Control Technologies Identified and Evaluated for Technical Feasibility
Control Technology Feasible Explanation Convert to natural gas No Insufficient local/regional supply to fuel any of the three boilers.
Convert to biomass No For the Riley Coal and No. 4 Power Boilers, the boiler designs preclude replacing coal with biomass.
Wet scrubber No
Wet scrubbers with 90% control efficiency already installed on all three boilers. It was considered technically infeasible to add additional caustic to exceed the design limitations of the scrubbers. In the case of the Riley Coal Boiler, increasing the pH would increase scaling and plugging of the scrubber, reducing its effectiveness and availability.
Convert coal to ultra-low sulfur diesel (ULSD) Yes Completed four-factor analysis for all three boilers.
Dry sorbent injection (DSI)
Yes (for 2 units)
Completed four-factor analysis for Riley Coal and No. 4 Power Boilers. Considered infeasible for Riley Bark Boiler because this unit does not have any dry control device for PM. Adding DSI would overload the wet scrubber and increase PM emissions.
Convert Riley Bark Boiler to 100% biomass No
The design of the over-fire air system as well as the size and limited potential for expansion of the biomass storage, delivery and feed systems prevent the firing of 100% biomass. Co-firing coal also promotes stable boiler operation and more uniform and efficient combustion because the biomass characteristics (moisture content, size and shape, etc.) can exhibit short-term variability, impacting boiler efficiency.
Four-Factor Analysis Replacing Coal with Ultra-Low Sulfur Diesel (ULSD) Conversion 1. Cost of compliance – Based on information provided by Blue Ridge Paper, the cost per ton
of SO2 removed by switching to ULSD for the 3 boilers ranged from $126,060 to $185,565 (see Table 7-51). This analysis did not include the capital cost of installing ULSD burners and relies solely on the current price difference between ULSD and coal as well as the projected amount of coal to be burned in the units in 2028.
2. Time necessary for compliance – At least three years, due to corporate funding approval, permitting, re-engineering, and planned outage scheduling.
3. Remaining useful life of source – Twenty-five years or more. 4. Energy and non-air quality environmental impacts – No significant impacts.

Pre-hearing Draft 290 NC Regional Haze SIP for Second Planning Period (2019 – 2028) August 30, 2021
Table 7-52. ULSD Conversion Cost-Effectiveness Calculation for BRPP Boilers
Riley Coal Boiler No. 4 Power Boiler Riley Bark Boiler Annualized Cost for Coal Firing $8,541,000 $12,914,965 $4,863,578 Annualized Cost for Equivalent ULSD Firing Cost
$31,461,384 $45,069,344 $15,068,975
Annualized Cost Difference $22,920,384 $32,154,379 $10,205,397 Annual Emission Reduction 181.82 tons 192.42 tons 55.00 tons Cost-effectiveness $126,060/ton $167,107/ton $185,565/ton
Trona DSI Conversion 1. Cost of compliance – Dry sorbent injection (DSI) in the form of trona injection prior to the
dry PM control device was evaluated for the units equipped with ESPs (Riley Coal and No. 4 Power Boiler). This evaluation cites a 2017 Sargent and Lundy report which indicates that 50% SO2 control can be achieved by injecting trona ahead of the ESP without increasing PM emissions. The cost of removing the SO2 in this way was calculated to be $14,932 for the Riley Coal boiler and $16,119 for the No. 4 Power boiler (see Table 7-52).
2. Time necessary for compliance – At least three years, due to corporate funding approval, permitting, re-engineering, and planned outage scheduling.
3. Remaining useful life of source – Twenty-five years or more. 4. Energy and non-air quality environmental impacts – Adding DSI would increase energy
usage as well as PM emissions from materials handling and landfill operations. It would also decrease the useful life of the mill landfill and increase truck traffic on local streets.
Table 7-53. DSI System Cost-Effectiveness Calculation for BRPP Boilers
Riley Coal Boiler No. 4 Power Boiler Capital Cost $5,413,330 $5,404,505 Annualized Cost $1,372,032 $1,573,329 Annual Emission Reduction 91.9 tons 97.6 tons Cost-effectiveness $14,932/ton $16,119/ton
Table 7-53 provides a summary of the costs-effectiveness of ULSD conversion and trona DSI controls for the Riley Coal and No. 4 Power Boilers and ULSD conversion for the Riley Bark Boiler.
Table 7-54. Summary of Four-Factor Analysis Results for BRPP Boilers
Unit
2028 Emissions (tons SO2) Control Technology
SO2 Reduction
(%)
Cost Effectiveness of
Control ($/ton SO2)
Riley Coal Boiler 183.77 ULSD Conversion 99% $126,061 Trona DSI 50% $14,932

Pre-hearing Draft 291 NC Regional Haze SIP for Second Planning Period (2019 – 2028) August 30, 2021
Unit
2028 Emissions (tons SO2) Control Technology
SO2 Reduction
(%)
Cost Effectiveness of
Control ($/ton SO2)
No. 4 Power Boiler 195.21 ULSD Conversion 99% $167,105 Trona DSI 50% $16,119
Riley Bark Boiler 64.75 ULSD Conversion 85% $185,553 The assumptions made when calculating the capital recovery factors include an interest rate of 3.75% and 30 years remaining useful life of the control. The calculations were done using 2020 dollars. Over the past 3 years (2017 through 2019), BRPP has completed significant capital investments in boilers and recovery furnaces (including new emissions controls) that have significantly reduced SO2 emissions by 93% (5,470 tons). These emissions units were chosen for emissions reductions because they had a more significant modeled impact on compliance with the SO2 NAAQS than other emission units at the mill. Much of the SO2 emission reductions have occurred during the past 2 years, during which time the facility reduced emissions by 86% (2,497 tons). These emissions reductions have been made federally enforceable through inclusion in the site-specific SIP for BRPP.
Domtar
The NCDAQ requested that Domtar complete a reasonable progress assessment for the hog fuel boilers at its Plymouth, North Carolina facility. Table 7-54 shows 2016 base year SO2 emissions, initial 2028 projected emissions upon which the initial PSAT and final RPG modeling is based, and revised 2028 emissions provided by the facility used to prepare the revised PSAT contributions to visibility impairment to the Swanquarter Wilderness Area. The facility has altered usage of No. 1 Hog Fuel Boiler to preclude firing of non-condensible gases (NCGs); therefore, revised 2028 emissions for this unit are projected based on the current configuration as of 2020. The two boilers accounted for over 98% of total facility emissions in 2016 and the No. 2 Hog Fuel Boiler is estimated to account for 91% of total facility emissions in 2028.
Table 7-55. Summary of Annual SO2 Emissions for Domtar
Unit
2016 Emissions
(tons)
Projected 2028 Emissions, Initial
(tons)
Projected 2028 Emissions, Revised
(tons) No. 1 Hog Fuel Boiler 174.83 167.84 12.00 No. 2 Hog Fuel Boiler 526.28 505.23 1,009.57 Total Emissions for 2 Units 701.11 673.07 1,021.57 Total Facility Emissions 715.26 687.45 1,120.41 Total Emissions for 2 units as a Percentage of Total Facility Emissions
98% 98% 91%

Pre-hearing Draft 292 NC Regional Haze SIP for Second Planning Period (2019 – 2028) August 30, 2021
Description of SO2 Emission Units 1. No. 1 Hog Fuel Boiler; 1,021 MMBtu/hr (any combination of fuels) or 835 MMBtu/hr (hog fuel with any other fuels). This unit is permitted to burn lignin, natural gas, biomass, no.2 fuel oil, used oil, or sludge. It is controlled for PM by electroscrubbers and for SO2 by low-sulfur fuels and inherent bark scrubbing. This unit is subject to MACT Subpart DDDDD and NSPS Subpart D. This unit is permitted to combust high-volume low-concentration (HVLC) pulp mill gases but cannot currently do so because the supply lines have been physiscally severed. The plant intends to maintain this disconnection indefinitely. Since the boiler now burns only low-sulfur fuels, it is no longer a significant source of SO2 emissions. These fuel restrictions and emissions decreases are not state or federally enforceable, but they can be used to inform a reasonable projection of the actual emission level for 2028. For this reason, No. 1 Hog Fuel Boiler is considered to be effectively controlled for SO2 and was not included in the four-factor analysis evaluation. To reduce emissions to meet the requirements of the Boiler MACT, the mill has transitioned the No. 1 Hog Fuel Boiler to fire primarily natural gas and No. 2 fuel oil while discontinuing combustion of HVLC at this boiler and has upgraded the PM control device on the No. 2 Hog Fuel Boiler as part of a plant optimization project. As a result of this optimization project, the No. 1 Hog Fuel Boiler is no longer a significant source of SO2. 2. No. 2 Hog Fuel Boiler; 889 MMBtu/hr. This unit is permitted to burn lignin, natural gas, biomass, No.2 fuel oil, used oil, or sludge. It is controlled for PM by ESP and for SO2 by low-sulfur fuels and inherent bark scrubbing. This unit is subject to MACT Subpart DDDDD and NSPS Subpart D. A primary use of this unit is to combust HVLC and low-volume high-concentration (LVHC) pulp mill gases as well as stripper off-gases (SOG) in order to satisfy the HAP control requirements of 40 CFR 63 Subpart S. As a backup control of HVLC gas, the plant has installed a Thermal Oxidizer in 2019 which operates only when the No. 2 Hog Fuel Boiler is unavailable for HVLC control. Average emissions from the Thermal Oxidizer are 47 tons SO2/year. No. 1 Hog Fuel Boiler Demonstration that Current Measures Are Not Necessary for Reasonable Progress Section 4.1 of the the July 8, 2021 EPA regional haze clarification memo101 states, “Specifically, if a state can demonstrate that a source will continue to implement its existing measures and will not increase its emission rate, it may not be necessary to require those measures under the regional haze program in order to prevent future emission increases.” No. 1 Hog Fuel Boiler has been disconnected from the HVLC collection system and is no longer a primary control device for those gases. It did not operate at all in 2020, and in any future operation it is expected to fire natural gas or biomass. Projected 2028 emissions for this unit are 12 tons of SO2 based on the
101 https://www.epa.gov/system/files/documents/2021-07/clarifications-regarding-regional-haze-state-implementation-plans-for-the-second-implementation-period.pdf.

Pre-hearing Draft 293 NC Regional Haze SIP for Second Planning Period (2019 – 2028) August 30, 2021
conservative assumption of a 100% biomass-fired operating scenario. Projected 2028 emissions for No. 1 Hog Fuel Boiler are based on the maximum annual firing rate of the boiler on biomass (835 MMBtu/hr, 8,760 hr/yr) and the SO2 median emission factor from Table 10.4 of National Council for Air and Stream Improvement (NCASI) Technical Bulletin 1020 (3.18E-03 lb/MMBtu), representing the fuel that results in the highest annual SO2 emissions. This rate is far below the permit emissions limits of 2.3 lb/MMBtu and 0.8 lb/MMBtu. Table 7-55 contains emissions and emission rate data for the boiler from 2015 through 2020. It is evident from the steep decline in 2019 following disconnection of HVLC lines that the current and future SO2 emissions from this unit are expected to be insignificant. Because the unit is expected to produce SO2 emissions well below its historical emissions and existing permit limits for the duration of the second planning period and beyond, no active measures are necessary to make reasonable progress for this unit.
Table 7-56. Domtar No. 1 Hog Fuel Boiler Historical Emissions
2015 2016 2017 2018 2019 2020 2028
(expected) Emissions (tons) 183.89 174.83 200.10 223.12 58.22 0.00 12.00 Emissions rate (lb/MMBtu) 0.114 0.114 0.114 0.114 0.063 0.00 0.00318
Control Technology Evaluation Table 7-56 identifies the control technologies identified and evaluated for technical feasibility for controlling SO2 emissions for the No. 2 Hog Fuel Boiler. The No.1 Hog Fuel Boiler was not included in the control technology evaluation because it is currently equipped to burn only natural gas and biomass, with no. 2 fuel oil as a backup fuel, all of which are low sulfur fuels. Domtar intends to retain the unit in case there is a need for additional steam in the future. This informed the conservative estimate of 12 tons of SO2 emissions in 2028.
Table 7-57. Domtar No. 2 Hog Fuel Boiler Control Technology Identified and Evaluated for Technical Feasibility
Control Technology Feasible Explanation
Low-sulfur fuels No
The boiler is permitted to burn natural gas, No. 2 fuel oil, and biomass are low-sulfur fuels. However, an important function of the boiler is to burn high-sulfur fuels (i.e., HVLC, LVHC, and SOG) to comply with the HAP control requirements of 40 CFR 63 Subpart S.
Wet scrubber Yes Completed four-factor analysis. Dry sorbent injection (DSI) Yes Completed four-factor analysis.
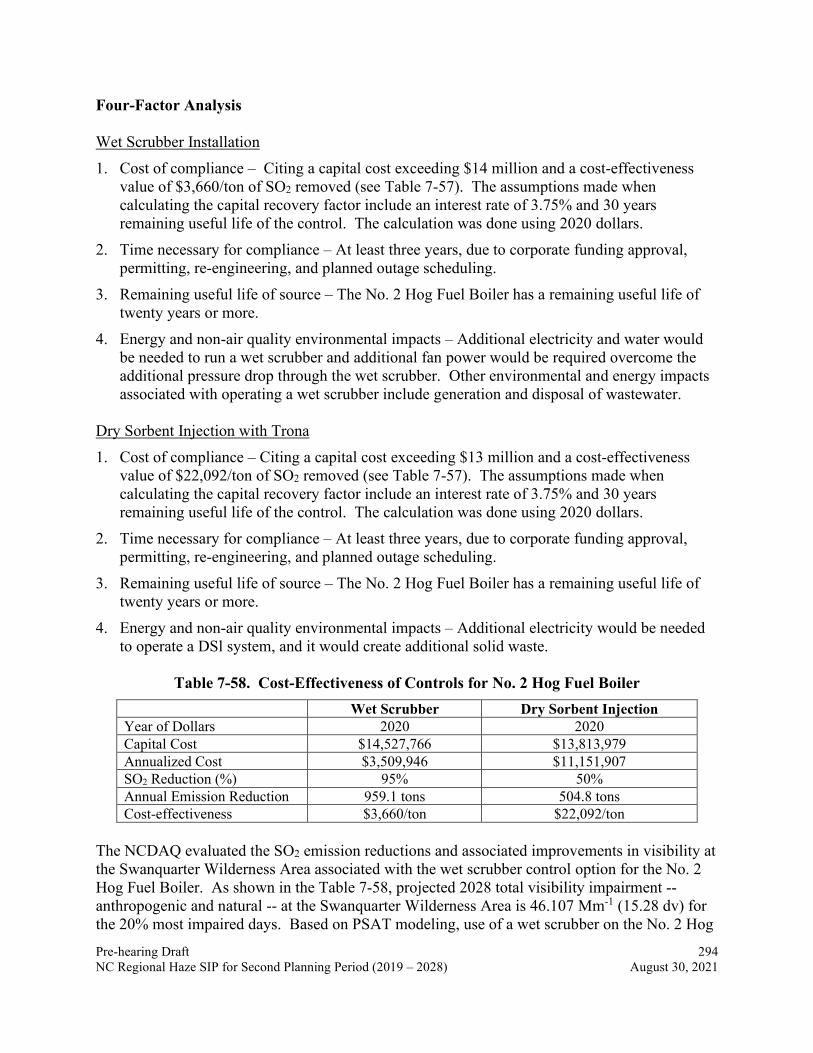
Pre-hearing Draft 294 NC Regional Haze SIP for Second Planning Period (2019 – 2028) August 30, 2021
Four-Factor Analysis Wet Scrubber Installation 1. Cost of compliance – Citing a capital cost exceeding $14 million and a cost-effectiveness
value of $3,660/ton of SO2 removed (see Table 7-57). The assumptions made when calculating the capital recovery factor include an interest rate of 3.75% and 30 years remaining useful life of the control. The calculation was done using 2020 dollars.
2. Time necessary for compliance – At least three years, due to corporate funding approval, permitting, re-engineering, and planned outage scheduling.
3. Remaining useful life of source – The No. 2 Hog Fuel Boiler has a remaining useful life of twenty years or more.
4. Energy and non-air quality environmental impacts – Additional electricity and water would be needed to run a wet scrubber and additional fan power would be required overcome the additional pressure drop through the wet scrubber. Other environmental and energy impacts associated with operating a wet scrubber include generation and disposal of wastewater.
Dry Sorbent Injection with Trona 1. Cost of compliance – Citing a capital cost exceeding $13 million and a cost-effectiveness
value of $22,092/ton of SO2 removed (see Table 7-57). The assumptions made when calculating the capital recovery factor include an interest rate of 3.75% and 30 years remaining useful life of the control. The calculation was done using 2020 dollars.
2. Time necessary for compliance – At least three years, due to corporate funding approval, permitting, re-engineering, and planned outage scheduling.
3. Remaining useful life of source – The No. 2 Hog Fuel Boiler has a remaining useful life of twenty years or more.
4. Energy and non-air quality environmental impacts – Additional electricity would be needed to operate a DSl system, and it would create additional solid waste.
Table 7-58. Cost-Effectiveness of Controls for No. 2 Hog Fuel Boiler
Wet Scrubber Dry Sorbent Injection Year of Dollars 2020 2020 Capital Cost $14,527,766 $13,813,979 Annualized Cost $3,509,946 $11,151,907 SO2 Reduction (%) 95% 50% Annual Emission Reduction 959.1 tons 504.8 tons Cost-effectiveness $3,660/ton $22,092/ton
The NCDAQ evaluated the SO2 emission reductions and associated improvements in visibility at the Swanquarter Wilderness Area associated with the wet scrubber control option for the No. 2 Hog Fuel Boiler. As shown in the Table 7-58, projected 2028 total visibility impairment -- anthropogenic and natural -- at the Swanquarter Wilderness Area is 46.107 Mm-1 (15.28 dv) for the 20% most impaired days. Based on PSAT modeling, use of a wet scrubber on the No. 2 Hog

Pre-hearing Draft 295 NC Regional Haze SIP for Second Planning Period (2019 – 2028) August 30, 2021
Fuel Boiler to reduce SO2 emissions by 95% reduction would reduce the facility’s visibility impairment impact at the Swanquarter Wilderness Area by about 86% (from 0.176 Mm-1 to 0.024 Mm-1 for sulfate). However, the reduced emissions would only improve the visibility index by 0.03 dv and visual range by about 0.16 mile because the facility’s relative impact to total visibility impairment at the Swanquarter Wilderness Area is very low (i.e., 0.176/46.107 Mm-
1 or 0.38% of total impairment). The wet scrubber would reduce the facility’s contribution to total impairment by only 0.152 Mm-1 (0.33%).
Table 7-59. Summary of Visibility Impacts from Domtar for 20% Most Impaired Days
Projected Domtar 2028 Emissions Without Additional Controls
Projected 2028 Emissions with Wet Scrubber Installed
on No. 2 Hog Fuel Boiler Total Facility Emissions (tons) 1,108.41 149.32 Projected 2028 Facility-Specific Visibility Impairment to Swanquarter Wilderness Area (Mm-1)
0.176 0.024
Projected 2028 Total Visibility Impairment at the Swanquarter Wilderness Area (Mm-1)
46.107 45.955
Projected 2028 RPG at the Swanquarter Wilderness Area (dv)*
15.28 15.25
Visual Range (miles) * 52.58 52.74 * Represents projected 2028 total (anthropogenic and natural) visibility impairment computed using the IMPROVE Haze Metrics Converter (URL: http://vista.cira.colostate.edu/Improve/haze-metrics-converter/).
PCS Phosphate
The NCDAQ requested that PCS Phosphate complete a reasonable progress assessment for each of the three sulfuric acid plants at its Aurora, North Carolina facility. Table 7-59 shows 2016 base year SO2 emissions, initial 2028 projected emissions upon which the initial PSAT and final RPG modeling is based, and revised 2028 emissions provided by the facility used to prepare the revised PSAT contributions to visibility impairment to the Swanquarter Wilderness Area. The three sulfuric acid plants accounted for over 97% of total facility emissions in 2016 and are estimated to account for 94% of total facility emissions in 2028.
Table 7-60. Summary of Annual SO2 Emissions for PCS Phosphate
Unit
2016 Emissions
(tons)
Projected 2028 Emissions,
Initial (tons)
Projected 2028 Emissions,
Revised (tons) Sulfuric Acid Plant No. 5 1,609 1,495 792 Sulfuric Acid Plant No. 6 1,818 1,689 852 Sulfuric Acid Plant No. 7 1,607 1,493 1,232 Total Emissions for 3 Acid Plants 5,033 4,677 2,876 Total Facility Emissions 5,193.68 4,845.90 3,044.89

Pre-hearing Draft 296 NC Regional Haze SIP for Second Planning Period (2019 – 2028) August 30, 2021
Unit
2016 Emissions
(tons)
Projected 2028 Emissions,
Initial (tons)
Projected 2028 Emissions,
Revised (tons) Total Emissions for 3 units as a Percentage of Total Facility Emissions
97% 97% 94%
Description of SO2 Emission Units Three dual-absorption sulfuric acid plants (Nos. 5, 6, and 7): sulfur dioxide is formed at the sulfuric acid plants when elemental sulfur is oxidized in the presence of oxygen at elevated temperature in a horizontal spray-type burner. The SO2 is converted to sulfur trioxide (SO3). The percentage of SO2 that is converted to SO3 increases through each pass through a catalytic conversion system, such that well over 99% of SO2 gases passing through the converter system are converted to SO3. The converted SO3 passes through a series of absorption towers containing water to produce concentrated sulfuric acid. Minimization of SO2 emissions is achieved by increasing the amount of conversion of SO2 to SO3. Catalyst is typically replaced on a three-year cycle to maintain desired conversion rates. Summary of Recent SO2 Reductions and Visibility Impacts To satisfy New Source Review (NSR) requirements at certain sulfuric acid plants, PCS Phosphate entered into a federal consent decree with EPA and Louisiana Department of Environmental Quality to reduce SO2 emissions at several of the company’s facilities including the facility located in Aurora, North Carolina.102 In response to the consent decree, from 2017-2019, PCS Phosphate imlpemented significant upgrades to enhance the SO2 conversions in the catalytic systems on Sulfuric Acid Plants Nos. 5, 6 and 7 pursuant to air quality permitting completed in 2015 at its Aurora, North Carolina facility. These upgrades included utilization of enhanced catalyst and significant increases to the surface area available for reaction in certain passes of the catalytic systems. The NCDAQ has revised the Title V permit (Permit No. 04176T62) for the facility to include the SO2 emission limits for the three acid plants that PCS established with EPA per the consent decree. The Title V permit prohibits relaxation of these emissions limits after the consent decree has been terminated and specifies that the limits are federally enforceable. PCS conducted an evaluation of emissions before and after the catalyst upgrades made between 2017 and 2019. Significant SO2 emission reductions were realized by all three plants as shown in Table 7-60. Continuous emission monitoring system (CEMS) records before and after the catalyst system upgrades show a reduction of SO2 (on a basis of lb SO2/ton acid produced) of 63%, 51%, and 24% in Plants 5, 6 and 7, respectively. Plant 7 had already implemented aspects
102 PCS Subsidiaries - PCS Nitrogen Fertilizer, L.P., AA Sulfuric, Inc., and White Springs Agricultural) Chemicals, Inc. (Case No. 3:14-cv-00707-BAJ-SCR), November 6, 2014). The consent decree is available at EPA’s website at: https://www.epa.gov/enforcement/pcs-nitrogen-fertilizer-clean-air-act-settlement.

Pre-hearing Draft 297 NC Regional Haze SIP for Second Planning Period (2019 – 2028) August 30, 2021
of the enhanced system, which accounts for this plant having the lowest reduction. The resulting emission rate for each plant is 1.1, 1.2, and 1.2 lb SO2/ton acid, respectively. The average emissions from all three sulfuric acid plants over the first six months following changeouts were approximately 70% below the NSPS limit.
Table 7-61. Catalyst Performance Before and After Upgrades for Acid Plants at PCS Phosphate
Description
Emissions (lb SO2/ton acid)
% Lower than NSPS (4 lb SO2/ton acid)
Plant 5 Plant 6 Plant 7 Plant 5 Plant 6 Plant 7 180-Day Average Following Standard Turnaround 3.0 2.5 1.6 24% 36% 61%
180-Day Average Following Upgrade Turnaround 1.1 1.2 1.2 72% 69% 70%
Emissions Reduction from Upgrade 63% 51% 24% Relative to the DAQ’s original 2028 emissions projections, these capital improvements decreased 2028 SO2 emissions by 39% (1,801 tons) for the three sulfuric acid plants combined or by 37% for the entire facility. As shown in the Table 7-61, projected 2028 total visibility impairment -- anthropogenic and natural -- at the Swanquarter Wilderness Area is 46.107 Mm-1 (15.28 dv) for the 20% most impaired days. Based on PSAT modeling, the controls installed by the facility reduced the facility’s visibility impairment impact at the Swanquarter Wilderness Area by about 37% (from 0.329 Mm-1 to 0.207 Mm-1 for sulfate, or 0.02 dv). However, the reduced emissions would only improve the visibility index by 0.02 dv and visual range by about 0.11 mile because the facility’s relative impact to total visibility impairment at the Swanquarter Wilderness Area is very low (i.e., 0.329/46.107 Mm-1 or 0.71% of total impairment). Thus, the controls installed from 2017-2019 are estimated to reduce the facility’s contribution to total impairment by only 0.122 Mm-1 (0.26%).
Table 7-62. Summary of Visibility Impacts from PCS for 20% Most Impaired Days for PCS Phosphate
Original Projected
2028 Emissions Projected 2028 Emissions with Upgraded Controls
Total Facility Emissions (tons) 4,845.90 3,044.89 Projected 2028 Facility-Specific Visibility Impairment to the Swanquarter Wilderness Area (Mm-1)
0.329 0.207
Projected 2028 Total Visibility Impairment at the Swanquarter Wilderness Area (Mm-1)
46.107 45.985
Projected 2028 RPG at the Swanquarter Wilderness Area (Mm-1)* 15.28 15.26
Visual Range (miles)* 52.58 52.69

Pre-hearing Draft 298 NC Regional Haze SIP for Second Planning Period (2019 – 2028) August 30, 2021
* Represents projected 2028 total (anthropogenic and natural) visibility impairment computed using the IMPROVE Haze Metrics Converter (URL: http://vista.cira.colostate.edu/Improve/haze-metrics-converter/). The PSAT modeling based on projected 2028 SO2 emissions after the installation of controls from 2017-2019 indicated that the facility’s sulfate contribution was ≥1.00% relative to all other point source facilities included in the VISTAS modeling domain. Therefore, the DAQ identified the three sulfuric acid plants as the most significant remaining sources of SO2 emissions and requested that PCS Phosphate complete a four-factor analysis of controls for the three emission units. The three acid plants account for about 97% of total facility SO2 emissions in 2016 and the are estimated to account for about 94% of total facility emissions in 2028. Control Technology Evaluation Table 7-62 identifies the control technologies identified and evaluated for technical feasibility for controlling SO2 emissions from each of the three sulfuric acid plants which would have the potential to provide incremental SO2 reductions beyond those already achieved via the catalysts upgrade. PCS was unable to identify any technically feasible control technologies. The facility opted to submit an evaluation of its recently-installed controls (dual absorption process with cesium catalyst) in the framework of a four-factor analysis, though this was not required and does not represent an applicable control measure for additional reductions during the second planning period. Table 7-63. PCS’s Sulfuric Acid Plant Control Technologies Identified and Evaluated for
Technical Feasibility
Control Technology Technically
Feasible Explanation
Sodium sulfite-bisulfite scrubbing No
Has not been demonstrated commercially as providing reliable emissions control at a sulfur-burning sulfuric acid manufacturing plant.
Molecular sieve No Has not been commercially demonstrated, so it was considered technically infeasible for reducing SO2 emissions in this application.
Ammonia scrubbing No
Commercially undemonstrated on dual absorption plants because (1) many similar projects across the country have been shut down due to operational difficulties, and (2) it is unknown whether additional control of SO2 emissions would be achieved by a retrofit with this type of system.
7.8.2 Summary and Conclusions
The following discusses the basis for the NCDAQ’s conclusions regarding the results of the four-factor analysis for each of the three facilities.
BRPP Based on the four-factor analysis, BRPP identified no cost-effective control measures to further reduce SO2 emissions for the three boilers evaluated. Thus, given that the facility has already

Pre-hearing Draft 299 NC Regional Haze SIP for Second Planning Period (2019 – 2028) August 30, 2021
significantly reduced its SO2 emissions at the beginning of the second implementation period, the NCDAQ concludes additional controls are not needed for the purpose of remedying any existing anthropogenic visibility impairment at the Shining Rock Wilderness Area. For the purpose of preventing any future anthropogenic visibility impairment at the Shining Rock Wilderness Area, EPA has previously adopted existing SO2 measures for the Riley Coal Boiler, No. 4 Power Boiler, and Riley Bark Boiler into the SIP at 40 CFR 52.1770(d) as “EPA-Approved North Carolina Source-Specific Requirements.” Therefore, the NCDAQ requests that EPA accept this action as fulfilling the requirements of Section 169A(b)(2) of the CAA.
Domtar
To determine the measures necessary for reasonable progress for the two hog fuel boilers at Domtar, each boiler was evaluated independently because they are operated differently. A four-factor analysis was not performed on the No. 1 Hog Fuel Boiler, because SO2 emissions have dropped to very low levels from 2019 onward following the disconnection NCG supply lines to the unit. The boiler was not operated in 2020 and is expected to be operated infrequently, if at all, in the foreseeable future. If operated, the boiler is configured to burn only natural gas or biomass. Emissions from this unit are not expected to exceed 12 tons of SO2 annually in its current configuration. Based on these projections, the NCDAQ has provided a demonstration in Section 7.8.1.2 showing that current measures in place at the boiler are not necessary for reasonable progress. In its four-factor analysis of the No. 2 Hog Fuel Boiler, Domtar identified the use of a wet scrubber and DSI as technically feasible SO2 control options and completed a four-factor analysis for each option. The wet scrubber was estimated to achieve 95% reduction in SO2 emissions at $3,660 per ton of SO2 reduction (based on 2020 dollars). The DSI option was estimated to achieve 50% reduction in SO2 emissions at $22,092 per ton of SO2 reduction (based on 2020 dollars). The NCDAQ has determined that there are no cost-effective control measures available based on the results of the four-factor analysis, and additional controls are not needed for the purpose of remedying any existing anthropogenic visibility impairment at the Swanquarter Wilderness Area for the second planning period. For the purpose of preventing any future anthropogenic visibility impairment at the Swanquarter Wilderness Area, the NCDAQ is proposing that the existing measures be adopted into the SIP as presented in Section 7.8.3.1 as required by Section 169A(b)(2) of the CAA.
PCS Phosphate
Based upon the four-factor analysis, PCS Phosphate identified no technically feasible control measures to further reduce SO2 emissions for the three sulfuric acid plants evaluated. Thus, given that the facility has already significantly reduced its SO2 emissions at the beginning of the second implementation period, the NCDAQ concludes additional controls are not available for the purpose of remedying any existing anthropogenic visibility impairment at the Swanquarter Wilderness Area. For the purpose of preventing any future anthropogenic visibility impairment at the Swanquarter Wilderness Area, the NCDAQ is proposing that the existing measures for Sulfuric Acid Plant No. 5, No. 6, and No. 7 be adopted into the SIP as presented in Section 7.8.3.2 as required by Section 169A(b)(2) of the CAA.
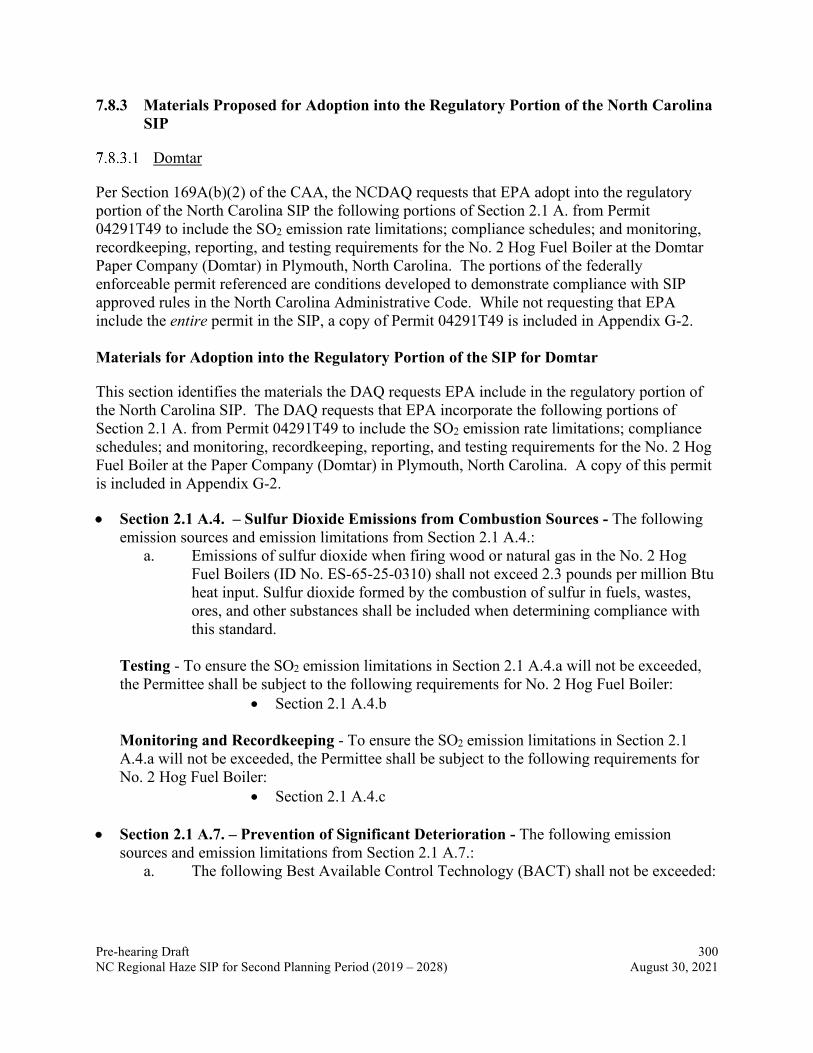
Pre-hearing Draft 300 NC Regional Haze SIP for Second Planning Period (2019 – 2028) August 30, 2021
7.8.3 Materials Proposed for Adoption into the Regulatory Portion of the North Carolina SIP
Domtar
Per Section 169A(b)(2) of the CAA, the NCDAQ requests that EPA adopt into the regulatory portion of the North Carolina SIP the following portions of Section 2.1 A. from Permit 04291T49 to include the SO2 emission rate limitations; compliance schedules; and monitoring, recordkeeping, reporting, and testing requirements for the No. 2 Hog Fuel Boiler at the Domtar Paper Company (Domtar) in Plymouth, North Carolina. The portions of the federally enforceable permit referenced are conditions developed to demonstrate compliance with SIP approved rules in the North Carolina Administrative Code. While not requesting that EPA include the entire permit in the SIP, a copy of Permit 04291T49 is included in Appendix G-2. Materials for Adoption into the Regulatory Portion of the SIP for Domtar
This section identifies the materials the DAQ requests EPA include in the regulatory portion of the North Carolina SIP. The DAQ requests that EPA incorporate the following portions of Section 2.1 A. from Permit 04291T49 to include the SO2 emission rate limitations; compliance schedules; and monitoring, recordkeeping, reporting, and testing requirements for the No. 2 Hog Fuel Boiler at the Paper Company (Domtar) in Plymouth, North Carolina. A copy of this permit is included in Appendix G-2.
• Section 2.1 A.4. – Sulfur Dioxide Emissions from Combustion Sources - The following emission sources and emission limitations from Section 2.1 A.4.:
a. Emissions of sulfur dioxide when firing wood or natural gas in the No. 2 Hog Fuel Boilers (ID No. ES-65-25-0310) shall not exceed 2.3 pounds per million Btu heat input. Sulfur dioxide formed by the combustion of sulfur in fuels, wastes, ores, and other substances shall be included when determining compliance with this standard.
Testing - To ensure the SO2 emission limitations in Section 2.1 A.4.a will not be exceeded, the Permittee shall be subject to the following requirements for No. 2 Hog Fuel Boiler:
• Section 2.1 A.4.b Monitoring and Recordkeeping - To ensure the SO2 emission limitations in Section 2.1 A.4.a will not be exceeded, the Permittee shall be subject to the following requirements for No. 2 Hog Fuel Boiler:
• Section 2.1 A.4.c
• Section 2.1 A.7. – Prevention of Significant Deterioration - The following emission sources and emission limitations from Section 2.1 A.7.:
a. The following Best Available Control Technology (BACT) shall not be exceeded:

Pre-hearing Draft 301 NC Regional Haze SIP for Second Planning Period (2019 – 2028) August 30, 2021
Emission Source Fuel Fired
Regulated NSR Pollutant BACT Control Method
No. 2 Hog Fuel Boiler (ID No. ES-65-25-0310)
Oil and wood/lignin
Sulfur dioxide
0.80 pounds per million Btu heat input
Combination firing of oil with bark/wood/lignin residue
Testing - To ensure the SO2 emission limitations in Section 2.1 A.7.a will not be exceeded, the Permittee shall be subject to the following requirements for No. 2 Hog Fuel Boiler:
• Section 2.1 A.7.b
Monitoring and Recordkeeping - To ensure the SO2 emission limitations in Section 2.1 A.7.a will not be exceeded, the Permittee shall be subject to the following requirements for No. 2 Hog Fuel Boiler as they apply to SO2 emissions:
• Section 2.1 A.7.d • Section 2.1 A.7.f
Reporting - To ensure the SO2 emission limitations in Section 2.1 A.7.a will not be exceeded, the Permittee shall be subject to the following requirements for No. 2 Hog Fuel Boiler:
• Section 2.1 A.7.g
Compliance Schedule – The Permittee has already demonstrated compliance and shall continue to demonstrate compliance with the SO2 requirements in Section 2.1 A.4. and the SO2 requirements in Section 2.1 A.7.
PCS Phosphate
Per Section 169A(b)(2) of the CAA, the NCDAQ requests that EPA adopt into the regulatory portion of the North Carolina SIP the following portions of Section 2.5 A.1. from Permit 04176T63 to include the SO2 emission rate limitations; compliance schedules; and monitoring, recordkeeping, reporting, and testing requirements for Sulfuric Acid Plant No. 5, No. 6, and No. 7 at the PCS Phosphate plant located in Aurora, North Carolina. While not requesting that EPA include the entire permit in the SIP, a copy of Permit 04176T63 is included in Appendix G-3. Materials for Adoption into the Regulatory Portion of the SIP for PCS Phosphate
This section identifies the materials the DAQ requests EPA include in the regulatory portion of the North Carolina SIP. The DAQ requests that EPA incorporate the following portions of Section 2.5 A.1. from Permit 04176T63 to include the SO2 emission rate limitations; compliance schedules; and monitoring, recordkeeping, reporting, and testing requirements for Sulfuric Acid

Pre-hearing Draft 302 NC Regional Haze SIP for Second Planning Period (2019 – 2028) August 30, 2021
Plant No. 5, No. 6, and No. 7 at the PCS Phosphate plant located in Aurora, North Carolina. A copy of this permit is included in Appendix G-3 of this regional haze SIP.
• Section 2.5 A.1.b through f – Emission Limitations - The following emission sources and emission limitations from Section 2.5 A.1:
b. Sulfur dioxide emissions from Sulfuric Acid Plant No. 5 (ID No. S-5) shall not exceed the following emissions limitations: i. Short-Term Limit: 3.2 pounds per ton of 100 percent sulfuric acid production on
a 3-hour rolling average basis.
ii. Long-Term Limit: 2.5 pounds per ton of 100 percent sulfuric acid production on a 365-day rolling average basis.
c. Sulfur dioxide emissions from Sulfuric Acid Plant No. 6 (ID No. S-6) shall not exceed the following emissions limitations: i. Short-Term Limit: 3.3 pounds per ton of 100 percent sulfuric acid production on
a 3-hour rolling average basis.
ii. Long-Term Limit: 2.5 pounds per ton of 100 percent sulfuric acid production on a 365-day rolling average basis.
d. Sulfur dioxide emissions from Sulfuric Acid Plant No. 7 (ID No. S-7) shall not exceed the following emissions limitations: i. Short-Term Limit: 3.0 pounds per ton of 100 percent sulfuric acid production on
a 3-hour rolling average basis. ii. Long-Term Limit: 1.75 pounds per ton of 100 percent sulfuric acid production
on a 365-day rolling average basis.
• Section 2.5 A.1.g – Compliance Deadlines g. By no later than the applicable compliance deadline specified below, the
Permittee shall comply with the SO2 limits in Section 2.5 A.1.b through A.1.d, above.
i. The compliance deadline for Sulfuric Acid Plant No. 5 (ID No. S-5) is January 1, 2020.
ii. The compliance deadline for Sulfuric Acid Plant No. 6 (ID No. S-6) is January 1, 2018.
iii. Except as provided in Paragraph 9.e of Consent Decree Civil Action No. 14-707-BAJ-SCR, the compliance deadline for Sulfuric Acid Plant No. 7 (ID No. S-7) is January 1, 2019.
• Section 2.5 A.1.h & i – Startup, Shutdown, and Malfunction Requirements - To ensure the emission limitations in Section 2.5 A.1.b through f will not be exceeded, the Permittee shall be subject to the following requirements:
h. The short-term sulfur dioxide emission limits in Section 2.5 A.1.b, A.1.c,

Pre-hearing Draft 303 NC Regional Haze SIP for Second Planning Period (2019 – 2028) August 30, 2021
and A.1.d, above, do not apply during periods of startup, shutdown, or malfunction.
i. The long-term sulfur dioxide emission limits in Section 2.5 A.1.b, A.1.c, and A.1.d, above, apply at all times, including during periods of startup, shutdown, or malfunction.
• Section 2.5 A.1.j – Testing Requirements - To ensure the emission limitations in Section 2.5 A.1.b through f will not be exceeded, the Permittee shall be subject to the following requirements:
• Section 2.5 A.1.j • Section 2.5 A.1.j.i • Section 2.5 A.1.j.ii • Section 2.5 A.1.j.iii • Section 2.5 A.1.j.iv
• Section 2.5 A.1.k through p – Emissions Monitoring Requirements - To ensure the emission limitations in Section 2.5 A.1.b through f will not be exceeded, the Permittee shall be subject to the following requirements:
• Section 2.5 A.1.k
• Section 2.5 A.1.l
• Section 2.5 A.1.m • Section 2.5 A.1.m.i • Section 2.5 A.1.m.ii • Section 2.5 A.1.m.iii • Section 2.5 A.1.m.iv • Section 2.5 A.1.m.iv
• Section 2.5 A.1.m.iv.A • Section 2.5 A.1.m.iv.B
• Section 2.5 A.1.m.v
• Section 2.5 A.1.n • Section 2.5 A.1.n.i • Section 2.5 A.1.n.ii
• Section 2.5 A.1.o
• Section 2.5 A.1.p
• Attachment 3 - CEMS Plan for SO2 Emissions
Pre-hearing Draft 304 NC Regional Haze SIP for Second Planning Period (2019 – 2028) August 30, 2021
• Section 2.5 A.1.q – Recordkeeping Requirements - To ensure the emission limitations in Section 2.5 A.1.b through f will not be exceeded, the Permittee shall be subject to the following requirements:
• Section 2.5 A.1.q
7.9 Consideration of Five Additional Factors Section 51.308(f)(2)(iv) of the RHR requires that states must consider five additional factors when developing a long-term strategy. These five additional factors are:
A. Emission reductions due to ongoing air pollution control programs, including measures to address reasonably attributable visibility impairment;
B. Measures to mitigate the impacts of construction activities; C. Source retirement and replacement schedules; D. Basic smoke management practices for prescribed fire used for agricultural and wildland
vegetation management purposes and smoke management programs; and E. The anticipated net effect on visibility due to projected changes in point, area, and mobile
source emissions over the period addressed by the long-term strategy. Factors B and D are addressed in Section 7.9.1 and Section 7.9.2, respectively. Factor A and Factor C are addressed in Section 7.2. Factor E is addressed in Section 8. 7.9.1 Dust and Fine Soil from Construction Activities The primary visibility impairing pollutant associated with construction activities is fine dust and soil (a component of PM2.5). As discussed in Section 2.4 of this SIP, based on a summary of IMPROVE monitoring data for North Carolina’s Class I areas, fine soils (shown as “Soil” in the Section 2.4 figures) have been a relatively minor contributor to visibility impairment on the 20% most impaired days from the base period (2000-2004) through 2018. Actions that specifically address Section 308(f)(2)(iv)(B) of the RHR regarding construction activities include NCDOT Division of Highways regulations addressing control of erosion, siltation, and pollution from construction activities. Section 107-13(E) of the Division of Highways General Contract Specifications, Division 1 General Requirements, reads as follows: (E) Dust Control103 “The Contractor shall control dust throughout the life of the project within the project area and at all other areas affected by the construction of the project, including, but not specifically limited to, unpaved secondary roads, haul roads, access roads, disposal sites, borrow and material sources, and production sites. Dust control shall not be considered effective where the
103 See page 1-66 at: https://connect.ncdot.gov/resources/Specifications/2006DrawingsEnglishUnits/2006%20Standard%20Spec%20Book.pdf.

Pre-hearing Draft 305 NC Regional Haze SIP for Second Planning Period (2019 – 2028) August 30, 2021
amount of dust creates a potential or actual unsafe condition, public nuisance, or condition endangering the value, utility, or appearance of any property. The Contractor will not be directly compensated for any dust control measures necessary, as this work will be considered incidental to the work covered by the various contract items.” In addition, North Carolina rule 15A NCAC 02D .0540 (Particulates from Fugitive Dust Emission Sources) is a SIP-approved rule that requires subject facilities to control PM from fugitive dust emission sources generated within plant boundaries from activities such as “unloading and loading areas, process areas, stockpiles, stock pile working, plant parking lots, and plant roads (including access roads and haul roads).”104 Note that benefits from the rule and the NCDOT dust ordinance have not been included in the VISTAS modeling for 2028. 7.9.2 Smoke Management The primary visibility impairing pollutant associated with wildfires, prescribed wildland fires, and agricultural burning is EC (a component of PM2.5). As discussed in Section 2.4 of this SIP, based on a summary of IMPROVE monitoring data for North Carolina’s Class I areas, EC (shown as “LAC” in the Section 2.4 figures) has been a relatively minor contributor to visibility impairment on the 20% most impaired days from the base period (2000-2004) through 2018. Days for which visibility impairment is associated with elevated levels of POM and elemental carbon (EC) have been associated with natural events such as wildland fires and have largely been removed from the 20% most impaired days because they are regarded as natural sources. The North Carolina Department of Agriculture and Consumer Services (NCDA&CS) and North Carolina Forest Service (NCFS) are responsible for managing prescribed burning on agricultural and forest lands in North Carolina, and coordinating with other State, Local, and Federal agencies to control wildfires. The NCDAQ has an excellent working relationship with the NCDA&CS and NCFS to support prescribed burning while mitigating the impacts of smoke on air pollution statewide. To specifically address Section 308(f)(2)(iv)(D) of the RHR as well as to coordinate statewide compliance with the NAAQS and mitigate local impacts of smoke, the NCDAQ and NCDA&CS established a Memorandum of Understanding (MOU) in July 2009 to establish the principles of the working relationship between the agencies and to educate the public about North Carolina’s open burning rules.105 The MOU was updated in August 2017 to reflect that the NCFS was transferred from the former North Carolina Department of Environment and Natural Resources to the NCDA&CS, clarify roles and responsibilities, and define on-going coordination of information and training.106
104 https://files.nc.gov/ncdeq/Air%20Quality/rules/rules/15A-NCAC-02D-.0540.pdf. 105 Memorandum of Understanding Between the North Carolina Department of Environment and Natural Resources, Division of Air Quality, and the North Carolina Department of Agriculture on the Open Burning of Agricultural Lands for Agricultural Management Practices under Title 15A North Carolina Administrative Code 2D .1903, July 29, 2009. 106 Memorandum of Understanding Between the North Carolina Department of Environmental Quality Division of Air Quality and the North Carolina Department of Agriculture and Consumer Services on Open Burning Without An Air Quality Permit Pursuant to Title 15A North Carolina Administrative Code 2D .1900, August 30, 2017, https://files.nc.gov/ncdeq/Air%20Quality/enf/openburn/Open_Burning_MOU_NCDAQ_with_NCDACS.pdf.

Pre-hearing Draft 306 NC Regional Haze SIP for Second Planning Period (2019 – 2028) August 30, 2021
Since the submittal of North Carolina’s first regional haze SIP in December 2007, the NCFS prepared Guidelines for Managing Smoke from Forestry Burning Operations which lays out a framework for prescribed burners to follow to mitigate PM2.5 emissions and regional haze impacts associated with prescribed burning.107 The guidelines were most recently updated in May 2020 to incorporate the latest information available to support prescribed burners. Finally, the NCDAQ and the NCFS have also participated in the Southeastern Prescribed Fire and Smoke Management Summit since its inception in 2013. Participating in the Summit has been extremely valuable for sharing information to foster understanding and cooperation toward achieving both air quality and prescribed fire goals throughout the Southeast.
7.10 Materials for Inclusion in the Regulatory Portion of the SIP
8.0 REASONABLE PROGRESS GOALS (RPGs) for 2028
Consistent with the RHR at 40 CFR 51.308(f)(3), North Carolina developed a LTS to support establishing RPGs for 2028 for each Class I area within the state (expressed in dv) that, from the baseline period (2000-2004), demonstrates progress towards achieving natural visibility conditions for the 20% most anthropogenically impaired days, and ensures no degradation in visibility for the 20% clearest days. The NCDAQ followed EPA’s August 20, 2019 guidance in developing the 2028 RPGs for the following Class I areas in North Carolina:
• Great Smoky Mountains National Park (GSMNP) • Joyce Kilmer-Slickrock Wilderness Area • Linville Gorge Wilderness Area • Shining Rock Wilderness Area • Swanquarter Wilderness Area
Both the GSMNP and Joyce Kilmer-Slickrock Wilderness Area are in North Carolina and Tennessee. Through the VISTAS regional haze planning process, North Carolina and Tennessee worked together to share information and agree to the RPGs for these two Class I areas.
8.1 2028 RPGs for 20% Most Impaired and 20% Clearest Days The 2028 RPGs are based on the VISTAS modeling previously discussed in Section 7.2.6 of this SIP. Although the RPGs are not directly federally enforceable, they do provide an estimate of the progress expected during the next few years to maintain a path toward achieving natural visibility conditions by the year2064.
107 North Carolina Department of Agriculture and Consumer Services, North Carolina Forest Service, The North Carolina Smoke Management Program, Guidelines for Managing Smoke from Forestry Burning Operations, Revised May 15, 2020, https://www.ncforestservice.gov/fire_control/pdf/SMP_REVISION_2020.pdf.

Pre-hearing Draft 307 NC Regional Haze SIP for Second Planning Period (2019 – 2028) August 30, 2021
For the 20% most impaired days, Table 8-1 shows baseline, current, and natural visibility conditions; the uniform rate of progress (URP) for 2028; and modeled RPGs for 2028 for each Class I area. The RPGs modeled for 2028 are well below baseline conditions as well as the 2028 URP (ranging from 69% to 84% of the 2028 URP) thus demonstrating continued progress toward achieving natural conditions by the year 2064. The 2028 RPGs place each Class I area from 10 to 20 years ahead of where they would need to be to meet the URP goals in the future. For the 20% clearest days, Table 8-2 shows baseline, current, and natural visibility conditions, and estimated RPGs for 2028. The 2028 RPGs range from 66% to 90% below baseline visibility conditions showing no degradation in visibility for the 20% clearest days.
Table 8-1. Baseline, Current, and Natural Visibility Conditions and 2028 RPGs for 20% Most Impaired Days for North Carolina Class I Areas (deciviews)
Class I Area
Baseline (2000-2004)1
2028 URP2
Current Conditions
(2014-2018)2 2028 RPG3
Baseline minus 2028 RPG
2028 URP minus 2028
RPG (Percent of URP)
Natural Conditions2
GSMNP 29.11 21.49 17.21 15.03 14.08 6.46 (70%) 10.05 Joyce Kilmer-Slickrock 29.11 21.49 17.21 15.03 14.08 6.46 (70%) 10.05
Linville Gorge 28.05 20.71 16.42 14.25 13.80 6.46 (69%) 9.70
Shining Rock 28.13 20.98 15.49 13.31 14.82 7.67 (63%) 10.014
Swanquarter 23.79 18.28 16.30 15.27 8.52 3.01 (84%) 9.79 1 The baseline data in Table 8-1 are derived from the 2018 data set on the VIEWS website (sia_impairment_group_means_04_20_2.zip).108 2 From “V6_GlidePath_MI20_unitDeciview_Rev.xlsm” spreadsheet. Improvement values are the difference between the baseline visibility for each glide path chart and the 2028 projected value. 3 Value is based on the data set supporting EPA 2018 Guidance Memo for IMPROVE data, Dec. 20, 2018.
108 URL: http://vista.cira.colostate.edu/Improve/rhr-archived-data/.

Pre-hearing Draft 308 NC Regional Haze SIP for Second Planning Period (2019 – 2028) August 30, 2021
Table 8-2. Baseline, Current, and Natural Visibility Conditions and 2028 RPGs for 20% Clearest Days for North Carolina Class I Areas (deciviews)
Class I Area
Baseline (2000-2004)1
2028 RPG2
Current Conditions
(2014-2018)2
Baseline minus 2028
RPG
Percent of
Baseline Natural
Conditions2 GSMNP 13.58 8.96 8.35 4.62 66% 4.62 Joyce Kilmer-Slickrock 13.58 8.96 8.35 4.62 66% 4.62
Linville Gorge 11.11 8.21 7.61 2.90 74% 4.07
Shining Rock 7.70 4.54 4.40 3.16 59% 2.49
Swanquarter 12.34 10.77 10.61 1.57 87% 5.71 1 The baseline data in Table 8-2 are derived from the 2018 data set on the VIEWS website (sia_group_means_04_20_2.zip).109 2 From “V6_GlidePath_20C_unitDeciview_Rev.xlsm” spreadsheet. Improvement values are the difference between the baseline visibility for each glide path chart and the 2028 projected value. 4 Value is based on the data set supporting EPA 2018 Guidance Memo for IMPROVE data, Dec. 20, 2018.
8.2 Uncertainties Associated with RPG Estimates
An important element in developing the RPGs is the accuracy of the emissions estimated for 2028 that support the modeling. For North Carolina, estimated visibility improvements by 2028 in each Class I area are based on (1) estimated emissions reductions associated with existing federal and state measures implemented or expected to be implemented during the second planning period, (2) emissions reductions associated with facility closures that occurred after the 2016 point source emissions base year (i.e., January 1, 2017 through November 18, 2018), and (3) estimates of emissions changes associated with economic growth and other factors. In preparing the 2028 emissions for point sources, North Carolina started with a 2016 base year inventory which include emission reductions associated with federal and state control programs and consent decrees included in the LTS for the first planning period. By using this approach, the LTS for the second planning period builds on the LTS for the first planning period. For EGUs, North Carolina relied on the ERTAC forecast tool to estimate emissions for 2028. However, as we have learned since the EGU modeling was completed in 2020, the EGU projections can change depending on modeling assumptions, responses to market forces, and future federal and state policies.110
For the 20% clearest days, the RPGs for North Carolina’s Class I areas show an improvement in visibility in 2028 relative to current visibility. These goals, based on the modeling results, are
109 URL: http://vista.cira.colostate.edu/Improve/rhr-archived-data/. 110 EPA “Regional Haze Guidance on Regional Haze State Implementation Plans for the Second Implementation Period,” EPA-457/B-19-003, August 2019, page 17, accessed from https://www.epa.gov/visibility/guidance-regional-haze-state-implementation-plans-second-implementation-period. See Appendix B-3 of this SIP that documented 2028 emissions projections for North Carolina EGU and non-EGU point sources.

Pre-hearing Draft 309 NC Regional Haze SIP for Second Planning Period (2019 – 2028) August 30, 2021
discussed in greater detail in Section 7.2.6. The modeling performance for North Carolina Class I areas is slightly better over the 20% most impaired days as opposed to the 20% clearest days, but the final report on the modeling informing the RPG’s provided in this report makes clear that the modeling performance overall is satisfactory to use in regulatory modeling (see Appendix E-2f). Additionally, much of the model bias is to the high side across the clearest days (see Appendix E-3), which suggests that 2028 visibility might be lower than modeled. Based on this information, the NCDAQ has good confidence that future visibility values in North Carolina Class I areas will be better than current visibility conditions.
Thus, the 2028 emission estimates and modeling include uncertainty because of assumptions about economic factors that affect emissions growth, unanticipated facility closures, and future control programs that are not defined well enough to model. North Carolina cannot control how emissions control programs are implemented in other states; however, North Carolina is committed to implementing the federal and state control programs included in its LTS (see Section 7.2) and coordinating with neighboring states regarding emissions activity that may affect Class I areas in North Carolina.
8.3 Long Term Strategy (LTS)
North Carolina’s LTS builds on the structure of the LTS used for its SIP for the first planning period. This section provides a summary of North Carolina’s LTS for the second planning period which includes the following elements that are discussed in more detail in Section 7 and Section 10 of this SIP:
• Federal and State Foundation Control Programs (Section 7.2) • Reasonable Progress and Four-Factor Analyses of North Carolina Facilities (Section 7.8) • Reasonable Progress Analysis for Out-of-State Facilities (Section 10) • Additional Programs and Initiatives Supporting Past and Future Emissions Reductions
(Section 7.2.7) • Emission Reductions Not Included in 2028 Emissions Projections and RPGs (see Section
7.2.8) 8.3.1 Federal and State Foundation Control Programs
North Carolina’s LTS includes the federal and state control programs and consent decrees documented in Section 7.2 of this SIP for the second planning period. Once approved by EPA, these programs will be federally enforceable for the purpose of fulfilling Section 40 CFR 40 CFR 51.308(f)(3) of the RHR rule. The NCDAQ believes that its LTS for the second planning period will keep each of its Class I areas on a path to continue to improve visibility through 2028. North Carolina is committed to implementing its LTS for the second planning period and will evaluate progress during the next 5-year progress report.
8.3.2 Reasonable Progress and Four-Factor Analyses for North Carolina Facilities
North Carolina’s LTS also addresses the four statutory factors in accordance with Section 40 CFR 51.308(f)(2) of the RHR. North Carolina requested that three facilities complete a reasonable progress/four-factor analysis for SO2 emissions based on their estimated contribution
Pre-hearing Draft 310 NC Regional Haze SIP for Second Planning Period (2019 – 2028) August 30, 2021
to visibility impairment at Shinning Rock Wilderness Area (Blue Ridge Paper Products) and Swanquarter Wilderness Area (PCS Phosphate and Domtar) (see Section 7.8 of this SIP). The NCDAQ determined that because BRPPs and PCS Phosphate installed controls and significantly reduced SO2 emissions from 2017 through 2019, that existing controls demonstrate progress for the second planning period. For the reasons discussed in Section 7.8, the NCDAQ decided not to require Domtar to install and operate a wet scrubber on the No. 2 Hog Fuel Boiler. North Carolina considered the results of the analyses in selecting the RPGs for the most impaired and clearest days for each Class I area. As a result, given that the RPGs demonstrate continued progress for the purpose of this second planning period, North Carolina decided not to adjust the RPGs based on the four-factor analyses for the three facilities.
For point sources, North Carolina was not contacted by another state to request consultation regarding contributions to visibility impairment in a Class I area outside of North Carolina. MANE-VU requested consultation regarding statewide emissions contributions for all sectors to Class I areas in their states. The NCDAQ participated in MANE-VU’s consultation process which is documented in Section 10 of this SIP. As a result of this consultation process, the NCDAQ believes that its LTS is sufficient to address MANE-VU’s concerns and will continue an ongoing dialogue with MANE-VU to determine if in the future North Carolina would need to adopt any measures to further reduce emissions to assist with improving visibility impairment in MANE-VU Class I areas.
8.3.3 Reasonable Progress Analysis for Out-of-State Facilities
The following provides a summary of the responses North Carolina has received requesting each state with a facility with ≥1.00% sulfate contribution to Class I areas in North Carolina to complete a reasonable progress analysis for the facility. The NCDAQ expects each state to which a letter was sent will address the request in its regional haze SIP, including those states that are unable to provide a response prior to North Carolina completing its SIP for submittal to EPA. The out-of-state consultation process is documented in Section 10 of this SIP.
Great Smoky Mountains National Park and Joyce Kilmer – Slickrock Wilderness Area
Seven (7) out-of-state facilities were selected for reasonable progress analysis because their sulfate contribution to visibility impairment in Great Smoky Mountains National Park is ≥1.00% (see Table 7-30). Eight (8) facilities, including the same 7 selected for Great Smoky Mountains plus Georgia Power Company - Plant Bowen, were selected for their ≥1.00% sulfate contribution visibility impairment at the Joyce Kilmer – Slickrock Wilderness Area (see Table 7-31). No North Carolina facilities were identified with a ≥1.00% sulfate or ≥1.00% nitrate contribution to the Great Smoky Mountains National Park or Joyce Kilmer – Slickrock Wilderness Area.
Of the out-of-state facilities, Eastman Chemical Company in Tennessee had the third highest contribution to Great Smoky Mountains National Park and highest contribution to Joyce Kilmer – Slickrock Wilderness Area (1.29% and 1.37%, respectively, for sulfate). This facility has agreed to shut down 3 coal-fired boilers by December 31, 2028 and has agreed to an SO2 emissions limit of 1,396 tons per year for 2 additional boilers after a dry sorbent injection system

Pre-hearing Draft 311 NC Regional Haze SIP for Second Planning Period (2019 – 2028) August 30, 2021
installation is completed. Another source impacting both Class I areas is Wm. H Zimmer station in Ohio, which has committed to shutting down in 2027.
Reasonable progress analyses of the remaining Ohio and Pennsylvania facilities have indicated that the facilities were unable to identify any reasonable control measures beyond their existing controls. Responses from the facilities in Georgia, Kentucky, and Indiana are still outstanding.
Linville Gorge Wilderness Area
Eleven (11) facilities out-of-state were selected for reasonable progress analysis because their sulfate contribution to visibility impairment to the Linville Gorge Wilderness Area is ≥1.00% (see Table 7-32). No North Carolina facilities were identified with a sulfate or nitrate contribution ≥1.00% to the Linville Gorge Wilderness Area.
Eastman Chemical Company had the highest contribution to visibility impairment at Linville Gorge (4.26% for sulfate), and it has committed to reductions as described in Section 8.3.3.1. Luke Paper Company in Maryland had the third highest contribution (2.03% for sulfate), and this facility has closed, and its air quality permit has been rescinded by the state (see Section 10 of this SIP).
Reasonable progress analyses of the remaining Ohio, Pennsylvania, Tennessee, and Virginia facilities have indicated that the facilities were unable to identify any reasonable control measures beyond their existing controls. Responses from the facilities in Georgia, Kentucky, Missouri, and Indiana are still outstanding.
Shining Rock Wilderness Area
One (1) North Carolina facility and twelve (12) out-of-state facilities were selected for reasonable progress analysis because their sulfate contribution to visibility impairment to the Shining Rock Wilderness Area is ≥1.00% (see Table 7-33). The North Carolina facility (Blue Ridge Paper Products) completed a four-factor analysis (see Section 7.8 of this SIP).
Regarding the twelve out-of-state facilities, Luke Paper Company and Wm. H. Zimmer Station had the ninth and eleventh highest contributions (1.20% and 1.10%, respectively, for sulfate), and these facilities are or will be shut down as described in Sections 8.3.3.1 and 8.3.3.2 above. Eastman Chemical Company is another contributor to the visibility impairment at Shining Rock that has committed to making SO2 reductions in the second planning period. Arkansas has provided a four-factor analysis for the Entergy Arkansas Inc-Independence Plant (1.09% sulfate contribution at Shining Rock) and has proposed that the facility take an SO2 emissions limit on the dry scrubbers unless planned cessation of operations becomes federally enforceable before July 31, 2040.
Reasonable progress analyses of the remaining Ohio, Pennsylvania, and Tennessee facilities have indicated that the facilities were unable to identify any reasonable control measures beyond their existing controls. Responses from the facilities in Georgia, Kentucky, Missouri, and Indiana are still outstanding.

Pre-hearing Draft 312 NC Regional Haze SIP for Second Planning Period (2019 – 2028) August 30, 2021
Swanquarter Wilderness Area
Two (2) North Carolina facilities and eight (8) out-of-state facilities were selected for reasonable progress analysis because their sulfate contribution to visibility impairment to the Swanquarter Wilderness Area is ≥1.00% (see Table 7-34). The two North Carolina facilities (PCS Phosphate and Domtar) completed a four-factor analysis (see Section 7.8 of this SIP).
Of the remaining 8 out-of-state facilities, Luke Paper Company in Maryland had the highest contribution (≥4.26% for sulfate), and this facility has closed as described in Section 8.3.3.2. Reasonable progress analyses of the remaining Ohio and Pennsylvania facilities have indicated that the facilities were unable to identify any reasonable control measures beyond their existing controls. Responses from the facilities in Georgia and West Virginia are still outstanding.
8.3.4 Additional Programs and Initiatives Supporting Past and Future Emissions Reductions
Section 7.2.7 of this SIP describes several additional programs and initiatives supporting past and future emissions reductions. During the second planning period, the NCDAQ anticipates that the Renewable Energy and Energy Efficiency Portfolio Standard (REPS) will continue to provide emission reductions from the electric power sector. The state is also investing significant resources to implement Governor Cooper’s Executive Order 80 (EO-80) and Clean Energy Plan by working with the power generation and consumption sectors to reduce carbon dioxide (CO2) and other greenhouse gas (GHG) emissions. In 2019, Duke Energy Corporation announced goals to significantly reduce the company’s carbon emissions as follows: (1) by 2030, achieve at least a 50% reduction in CO2 emissions from 2005 levels (in 2017, Duke goal was a 40% reduction by 2030); and (2) by 2050, strive for net-zero CO2 emissions.111 Thus, it is anticipated that the power sector will need to change its power generation fleet to move away from coal toward cleaner and renewable fuels which will further reduce SO2 and NOx emissions.
8.3.5 Emission Reductions Not Included in 2028 Emissions Projections and RPGs
As discussed in Section 7.2.8 of this SIP, the NCDAQ anticipates additional emission reductions during the second planning period that were either not known at the time the NCDAQ prepared its 2028 emissions inventory or are associated with programs and initiatives for which it is difficult to estimate emission reductions at the time this SIP was prepared. For example, as shown in Table 7-11, since preparing the 2028 non-EGU point source inventory, an additional 96 non-EGU point source facilities have permanently closed from March 25, 2018 through December 31, 2020. These facility closures have decreased 2016 and projected 2028 SO2 emissions by 204.13 and 208.34 tons, respectively. The facility closures have decreased 2016 and projected 2028 NOx emissions by 248.24 and 287.11 tons, respectively.
111 Duke Energy News Center, “Duke Energy aims to achieve net-zero carbon emissions by 2050,” available from https://news.duke-energy.com/releases/duke-energy-aims-to-achieve-net-zero-carbon-emissions-by-2050?_ga=2.241389191.460722529.1607446146-1750199547.1607446146.

Pre-hearing Draft 313 NC Regional Haze SIP for Second Planning Period (2019 – 2028) August 30, 2021
8.4 Summary and Conclusions
For each of North Carolina’s Class I areas, the VISTAS modeling demonstrated that the modeled 2028 RPGs provide for an improvement in visibility better than the URP for the 20% most impaired days and ensures no degradation in visibility for the 20% clearest days over the 2019 - 2028 planning period. The modeled RPGs incorporate estimates of emission reductions associated with the federal and state control measures and consent decrees included in North Carolina’s LTS, as well as estimates of emission reductions associated with control programs and consent decrees implemented in other states that contribute to visibility impairment in North Carolina’s Class I areas.
The LTS will reduce SO2 and NOx emissions to keep the state on track toward achieving the RPGs. North Carolina will also continue to work with the states to which the NCDAQ sent consultation letters to determine the extent to which emissions can be reduced from the out-of-state facilities identified as having a significant contribution to visibility impairment to Class I areas in North Carolina.
9.0 MONITORING STRATEGY
The SIP is to be accompanied by a strategy for monitoring regional haze visibility impairment. Specifically, the Rule states at 40 CFR 51.308(f)(6):
“(6) The State must submit with the implementation plan a monitoring strategy for measuring, characterizing, and reporting of regional haze visibility impairment that is representative of all mandatory Federal Class I areas within the State. Compliance with this requirement may be met through participation in the Interagency Monitoring of Protected Visual Environments network. The implementation plan must also provide for the following:
(i) The establishment of any additional monitoring sites or equipment needed to assess whether reasonable progress goals to address regional haze for all Class I areas within the State are being achieved.
(ii) Procedures by which monitoring data and other information are used in determining the contribution of emissions from within the State to regional haze visibility impairment at Class I areas both within and outside the State.
(iii) For a State with no mandatory Class I Federal areas, procedures by which monitoring data and other information are used in determining the contribution of emissions from within the State to regional haze visibility impairment at Class I areas in other States.
(iv) The implementation plan must provide for the reporting of all visibility monitoring data to the Administrator at least annually for each Class I area in the State. To the extent possible, the State should report visibility monitoring data electronically.

Pre-hearing Draft 314 NC Regional Haze SIP for Second Planning Period (2019 – 2028) August 30, 2021
(v) A statewide inventory of emissions of pollutants that are reasonably anticipated to cause or contribute to visibility impairment in any Class I area. The inventory must include emissions for the most recent year for which data are available and estimates of future projected emissions. The State must also include a commitment to update the inventory periodically.
(vi) Other elements, including reporting, recordkeeping, and other measures, necessary to assess and report on visibility.”
Such monitoring is intended to provide the data needed to satisfy four objectives:
• Track the expected visibility improvements resulting from emissions reductions identified in this SIP.
• Better understand the atmospheric processes of importance to haze.
• Identify chemical species in ambient particulate matter and relate them to emissions from sources.
• Evaluate regional air quality models for haze and construct RRFs for using those models.
The primary monitoring network for regional haze, both nationwide and in North Carolina, is the IMPROVE network. Given that IMPROVE monitoring data from 2000-2004 serves as the baseline for the regional haze program, the future regional haze monitoring strategy must necessarily be based on, or directly comparable to, IMPROVE. The IMPROVE measurements provide the only long-term record available for tracking visibility improvement or degradation, and, therefore, North Carolina relies on the IMPROVE network for complying with the regional haze monitoring requirement in the rule.
As shown in Table 9-1 and Figure 9-1, there are currently three IMPROVE sites in North Carolina (two sites at different locations in the mountains and one on the coast). The Great Smoky Mountains National Park is in North Carolina and Tennessee and the IMPROVE monitor for the Park is located just across the border in Tennessee at Look Rock. The Joyce Kilmer-Slickrock Wilderness Area relies on data from the Great Smoky Mountains National Park IMPROVE monitoring site (GRSM1) because it does not have an IMPROVE monitor. Figure 9-2 shows the IMPROVE monitoring network for the VISTAS region.
Table 9-1. North Carolina Class I Areas and Representative IMPROVE Monitor Class I Area IMPROVE Site Designation Great Smoky Mountains National Park GRSM1 (TN) Joyce Kilmer-Slickrock Wilderness Area GRSM1 (TN) Linville Gorge Wilderness Area LIGO1 (NC) Shining Rock Wilderness Area SHRO1 (NC) Swanquarter Wilderness Area SWAN1 (NC)

Pre-hearing Draft 315 NC Regional Haze SIP for Second Planning Period (2019 – 2028) August 30, 2021
Figure 9-1. IMPROVE Monitoring Network in North Carolina
Figure 9-2. VISTAS IMPROVE Monitoring Network

Pre-hearing Draft 316 NC Regional Haze SIP for Second Planning Period (2019 – 2028) August 30, 2021
The IMPROVE measurements are central to North Carolina’s regional haze monitoring strategy because the current IMPROVE monitors in North Carolina represent unique air sheds and it is difficult to visualize how the objectives listed above could be met without the monitoring provided by IMPROVE network. Any reduction in the scope of the IMPROVE network in North Carolina and neighboring Class I areas would jeopardize the state’s ability to demonstrate progress toward visibility improvement in its Class I areas and plan for appropriate future programs. In particular, North Carolina’s regional haze strategy relies on emission reductions that will result from federal and state programs in North Carolina and in neighboring states, which occur on different time scales and will most likely not be spatially uniform. Monitoring at Class I areas is important to document the different air quality responses to the emissions reductions that occur in those unique air sheds during the second implementation period to assessprogress toward attaining natural visibility conditions. Because each IMPROVE monitor in North Carolina represents a unique airshed and a significant component of the contributions are regional, any reduction of the IMPROVE network by shutting down these monitoring sites impedes tracking progress or planning improvements at the affected Class I areas. If any one of the three IMPROVE monitors are shut down, North Carolina, in consultation with the EPA and FLMs, will develop an alternative approach for meeting the tracking goal, perhaps by seeking contingency funding to carry out limited monitoring or by relying on data from nearby urban monitoring sites to demonstrate trends in speciated PM2.5 mass. Data produced by the IMPROVE monitoring network will be used for preparing the 5-year progress reports and the 10-year comprehensive SIP revisions, each of which relies on analysis of the preceding five years of IMPROVE monitor data. Consequently, the monitoring data from the IMPROVE sites need to be readily available and up to date. Presumably, the IMPROVE network will continue to process information from its own measurements at about the same pace and with the same attention to quality as it has shown to date. A website has been maintained by Colorado State University, FLMs, and RPOs to provide ready access to the IMPROVE data and data analysis tools. These databases provide a valuable resource for states and the funding and necessary upkeep of the repository is crucial. The remainder of this section addresses the requirements of 40 CFR 51.308(f)(6). North Carolina relies on the IMPROVE monitoring network to fulfill the requirements in paragraphs 40 CFR 51.308(f)(6)(i) through (iv) and paragraph (vi). • 51.803(f)(6)(i): North Carolina believes the existing IMPROVE monitors for the state’s
Class I areas are adequate and does not believe any additional monitoring sites or equipment are needed to assess whether RPGs for all Class I areas within the state are being achieved.
• 51.308(f)(6)(ii): Data produced by the IMPROVE monitoring network will be used for preparing the five-year progress reports and the 10-year comprehensive SIP revisions, each of which rely on analysis of the preceding five years of IMPROVE monitor data.

Pre-hearing Draft 317 NC Regional Haze SIP for Second Planning Period (2019 – 2028) August 30, 2021
• 51.308(f)(6)(iii): This provision for states with no Class I areas does not apply to North Carolina.
• 51.308(f)(6)(iv): North Carolina believes the existing IMPROVE monitors for the State’s Class I areas are sufficient for the purposes of this SIP revision. IMPROVE is a cooperative measurement effort managed by a Steering Committee that consists of representatives from various organizations (EPA, National Park Service (NPS), USFS, USF&WS, Bureau of Land Management (BLM), National Oceanic and Atmospheric Administration (NOAA), four organizations representing state air quality organizations (National Association of Clean Air Agencies (NACAA), Western States Air Resources Council (WESTAR), Northeast States for Coordinated Air Use Management (NESCAUM), and MARAMA), and three Associate Members: Arizona Department of Environmental Quality (DEQ), Environment Canada, and the South Korea Ministry of Environment). North Carolina believes that participation of the state organizations in the IMPROVE Steering Committee adequately represents the needs of the state. The IMPROVE program establishes current visibility and aerosol conditions in mandatory Class I areas; identifies chemical species and emission sources responsible for existing man-made visibility impairment; documents long-term trends in visibility; and provides regional haze monitoring at mandatory Class I Federal areas. (Source: http://vista.cira.colostate.edu/Improve/improve-program/). The NPS manages and oversees the IMPROVE monitoring network. The IMPROVE monitoring network samples particulate matter from which the chemical composition of the sampled particles is determined. The measured chemical composition is then used to calculate visibility. Samples are collected and data are reviewed, validated, and verified by the NPS and NPS contractors before submission to EPA’s Air Quality System (AQS), https://www.epa.gov/aqs). The network also posts raw (http://views.cira.colostate.edu/fed/) and summary data (http://vista.cira.colostate.edu/Improve/rhr-summary-data/) to assist states and local air agencies and multijurisdictional organizations. Details about the IMPROVE monitoring network and procedures are available at http://vista.cira.colostate.edu/Improve/.
• 51.308(f)(6)(v): The requirements of 40 CFR 51.308(f)(6)(v) are addressed in Section 4, Section 7.2.4, and Section 13.1 of the SIP. North Carolina will continue to participate in SESARM/VISTAS efforts for projecting future emissions and continue to comply with the Air Emissions Reporting Requirements (AERR) rule to periodically update emissions inventories.
• 51.308(f)(6)(vi): There are no elements, including reporting, recordkeeping, or other measures, necessary to address and report on visibility for North Carolina 's Class I areas or Class I areas outside the state that are affected by sources in North Carolina.
10.0 CONSULTATION PROCESS
The VISTAS states have jointly developed the technical analyses that define the amount of visibility improvement that can be achieved by 2028 as compared to the uniform rate of progress for each Class I area. VISTAS initially used an AoI analysis to identify the areas and source

Pre-hearing Draft 318 NC Regional Haze SIP for Second Planning Period (2019 – 2028) August 30, 2021
sectors most likely contributing to poor visibility in Class I areas. This AoI analysis involved running the HYSPLIT Model to determine the origin of the air parcels affecting visibility within each Class I area. This information was then spatially combined with emissions data to determine the pollutants, sectors, and individual sources that are most likely contributing to the visibility impairment at each Class I area. This information indicated that the pollutants and sector with the largest impact on visibility impairment in 2028 were SO2 and NOx from point sources.
Next, VISTAS states used the results of the AoI analysis to identify sources to “tag” for PSAT modeling. PSAT modeling uses “reactive tracers” to apportion particulate matter among different sources, source categories, and regions. PSAT was implemented with the CAMx photochemical model to determine visibility impairment due to individual sources. PSAT results showed that in 2028 the majority of visibility impairment at VISTAS Class I areas will continue to be from point source SO2 and NOx emissions. Using the PSAT data, VISTAS states identified, for the reasonable progress analyses, sources shown to have a sulfate or nitrate impact on one or more Class I areas greater than or equal to 1.00% of the total sulfate plus nitrate point source visibility impairment on the 20% most impaired days for each Class I area. The states collectively accepted the conclusions of these analyses for use in evaluating reasonable progress.
10.1 Interstate Consultation
This section addresses paragraph 40 CFR 51.308(f)(2) of the RHR that requires each state to addresses in its LTS visibility impairment for each Class I area located outside the State that may be affected by emissions from the State. The LTS must include the enforceable emissions limitations, compliance schedules, and other measures that are necessary to make reasonable progress, as determined pursuant to paragraphs 40 CFR 51.308(f)(2)(i) through (iv). Subsection 10.1.1 documents North Carolina’s consultation with other states with emission sources with impact Class I Areas in North Carolina, and Section 10.1.2 addresses North Carolina impacts on Class I areas outside of the state.
10.1.1 Emission Sources in Other States with Impacts on Class I Areas in North Carolina
In evaluating controls, each VISTAS state with a Class I area initiated a consultation process by sending a letter to each other VISTAS state with one or more facilities identified as having greater than or equal to 1.00% of the total sulfate plus nitrate point source visibility impairment on the 20% most impaired days. The letter requested that the VISTAS state provide a response indicating its plans for conducting a reasonable progress analysis for each facility.
In addition, VISTAS sent a letter to each non-VISTAS state with one or more facilities identified as having greater than or equal to 1.00% of the total sulfate plus nitrate point source visibility impairment on the 20% most impaired days in one or more VISTAS Class I areas. The letter requested that the non-VISTAS state verify if the 2028 SO2 and NOx emissions modeled for each facility identified in the letter were correct. If the emissions have decreased since the modeling was initiated, the non-VISTAS state was asked to provide updated emissions so that the facility contribution could be adjusted using the PSAT results to determine if additional analysis of controls would be necessary. If a non-VISTAS state did not decrease the 2028 emissions

Pre-hearing Draft 319 NC Regional Haze SIP for Second Planning Period (2019 – 2028) August 30, 2021
modeled, the non-VISTAS state was asked to provide a response indicating its plans for conducting a reasonable progress analysis for each facility.
There are several facilities for which PSAT modeling indicated a contribution to visibility impairment of ≥1.00% for sulfate in one or more of North Carolina’s Class I areas. The NCDAQ sent letters to each state requesting a reasonable progress analyses of the facilities. For sources outside of the VISTAS states, a similar letter was sent by VISTAS to obtain the analyses.
Table 10-1 provides a summary of the VISTAS and non-VISTAS states to which a letter was sent and identifies the total number of facilities impacting each Class I area in North Carolina. Table 10-2 identifies each facility and its PSAT contribution to each Class I area in North Carolina. Appendix F-1 provides the consultation letters from NCDAQ to each VISTAS state and the responses to the letters. Appendix F-2 provides the consultation letters from VISTAS to each non-VISTAS state and the responses to the letters. Note that when the letters were sent that the final PSAT values were not completed. The information in Table 10-1 and Table 10-2 is based on the final PSAT results. The final PSAT results did not change the facilities in VISTAS and Non-VISTAS states for which North Carolina requested a reasonable progress analysis.
Table 10-1. Number of Out-of-State Facilities with ≥1.00% Sulfate Contribution to NC Class I Areas in 2028
Class I Area Region States GSMNP VISTAS KY, TN Non-VISTAS IN, PA, OH Total States 5 Total Facilities 7 Joyce Kilmer –Slickrock (JOYC) VISTAS GA, KY, TN
Non-VISTAS IN, PA, OH Total States 6 Total Facilities 8 Linville Gorge VISTAS VA, TN, KY, GA Non-VISTAS IN, MD, MO, PA, OH Total States 9 Total Facilities 11 Shining Rock VISTAS TN, KY, GA
Non-VISTAS AR, IN, MD, MO, PA, OH
Total States 9 Total Facilities 13 Swanquarter VISTAS GA, WV Non-VISTAS MD, PA, OH Total States 5 Total Facilities 10

Pre-hearing Draft 320 NC Regional Haze SIP for Second Planning Period (2019 – 2028) August 30, 2021
Table 10-2. Out-of-State Facilities with ≥1.00% Sulfate PSAT Contribution in 2028 in North Carolina Class I Areas
Facility State Class 1 Area
Impacted
Percent Impairment
Impact Letter Sent by and
Date Response Received
North Carolina Letters Sent to VISTAS States Georgia Power Company – Plant Bowen
GA Joyce Kilmer-Slickrock
1.17% TN, October 23, 2020
None
Linville Gorge 1.19% NC, January 22, 2021 None Shining Rock 1.35% NC, January 22, 2021 None Swanquarter 1.09% NC, January 22, 2021 None
Tennessee Valley Authority – Shawnee Fossil Plant
KY Great Smoky Mountains
1.38% NC, February 1, 2021 None
Joyce Kilmer-Slickrock
1.45%
Linville Gorge 1.40% Shining Rock 1.71%
TVA Cumberland Fossil Plant
TN Linville Gorge 1.26% NC, February 1, 2021 February 18, 2021 July 7, 2021
Shining Rock 1.38%
Eastman Chemical Company
TN Great Smoky Mountains
1.29% NC, February 1, 2021 February 18, 2021 July 7, 2021
Joyce Kilmer-Slickrock
1.37%
Shining Rock 1.09% Linville Gorge 4.26%
Jewell Coke Company LLP
VA Linville Gorge 1.08% NC, November 6, 2020
None
Allegheny Energy Supply Co, LLC - Harrison
WV Swanquarter 1.80% NC, January 25, 2021 None
Monongahela Power Co – Pleasants Power Station
WV Swanquarter 1.24% NC, January 25, 2021 None
VISTAS Letters Sent to Non-VISTAS States Entergy Arkansas Inc-Independence Plant
AR Shining Rock 1.09% VISTAS, June 22, 2020
July 7, 2020 (email response)
Gibson IN Great Smoky Mountains
1.11% VISTAS, June 22, 2020
None
Joyce Kilmer-Slickrock
1.07%
Linville Gorge 1.12% Shining Rock 1.29%
Indiana Michigan Power IN Great Smoky Mountains
1.25% VISTAS, June 22, 2020
None

Pre-hearing Draft 321 NC Regional Haze SIP for Second Planning Period (2019 – 2028) August 30, 2021
Facility State Class 1 Area
Impacted
Percent Impairment
Impact Letter Sent by and
Date Response Received
Joyce Kilmer-Slickrock
1.18%
Shining Rock 1.33% Linville Gorge 1.16%
New Madrid Power Plant-Marston
MO Linville Gorge 1.09% VISTAS, June 22, 2020
October 19, 2020 Shining Rock 1.34%
Homer City Gen LP/Center TWP
PA Swanquarter 1.47% VISTAS, June 22, 2020
July 8, 2020
Genon NE Mgmt Co/Keystone Station
PA Great Smoky Mountains
1.26% VISTAS, June 22, 2020
July 8, 2020
Joyce Kilmer-Slickrock
1.18%
Linville Gorge 1.92% Shining Rock 1.29% Swanquarter 3.65%
Cardinal Power Plant - Cardinal Operating Company
OH Swanquarter 1.97% VISTAS, June 22, 2020
October 29, 2020
General James M. Gavin Power Plant
OH Great Smoky Mountains
3.93% VISTAS, June 22, 2020
October 29, 2020
Joyce Kilmer-Slickrock
3.63%
Linville Gorge 3.63% Shining Rock 2.53% Swanquarter 2.13%
Duke Energy Ohio, Wm. H. Zimmer Station
OH Great Smoky Mountains
1.03% VISTAS, June 22, 2020
October 29, 2020
Joyce Kilmer-Slickrock
1.05%
Shining Rock 1.10%
Responses from VISTAS States
The following briefly summarizes the response received for each facility. The NCDAQ expects each state to which a letter was sent will address the request in its regional haze SIP, including those states that are unable to provide a response prior to North Carolina completing its SIP for submittal to EPA.
Tennessee - TVA Cumberland Fossil Plant
TVA Cumberland submitted a four-factor analysis to Tennessee on July 29, 2020. In that analysis, TVA concluded that no further SO2 reductions are necessary or reasonably cost

Pre-hearing Draft 322 NC Regional Haze SIP for Second Planning Period (2019 – 2028) August 30, 2021
effective for reasonable progress because the coal units at the plant are controlled with wet FGD systems that provide 97% SO2 control which are the most efficient means of SO2 control for coal boilers.
Two possible upgrades to the FGD systems were evaluated: wall rings installation and spray header redesign. The SO2 control cost effectiveness of installing wall rings was estimated to be $3,100/ton, and that of the spray header project was estimated to be $6,500/ton. Additionally, TVA Cumberland calculated a visibility improvement cost effectiveness ($/dv), based upon a modeled improvement of 0.008 deciviews112 if both improvements were implemented. This resulted in cost-effectiveness values of more than $500 million/deciview for the wall rings and more than $1 billion/deciviews for the spray nozzle upgrade. Based on these values as well as expected retirement of the plant prior to 2035, TVA Cumberland does not consider either upgrade to its SO2 controls to be reasonably cost effective. On July 7, 2021, the Tennessee DAPC sent a consultation letter to NCDAQ stating that the Tennessee draft SIP will not require any further controls to TVA Cumberland because DAPC concluded that no further SO2 controls are necessary or cost effective for reasonable progress.
Tennessee - Eastman Chemical Company
Eastman Chemical Company submitted a four-factor analysis to Tennessee on August 13, 2020. In that analysis, Eastman stated that they plan to cease operation of boilers 18, 19, and 20, and are in the process of installing a dry sorbent injection system for the control of SO2 from boilers 23 and 24. In a letter dated February 8, 2021, Eastman proposed to shut down boilers 18, 19, and 20 by December 31, 2028, and agreed to a limit of 1,396 tons per year for boilers 23 and 24. On July 7, 2021, the Tennessee DAPC sent a consultation letter to NCDAQ stating that the Tennessee draft SIP will require Eastman to cease operations of the boilers 18, 19, and 20 and will require them to install a dry sorbent injection system to control SO2 emissions from boilers 23 and 24.
Responses from Non-VISTAS States
Arkansas - Entergy Arkansas Inc-Independence Plant
Independence plant has proposed to take an SO2 emissions limit on the dry scrubbers unless planned cessation of operations becomes federally enforceable before July 31, 2040.
Missouri - New Madrid Power Plant-Marston, MO
Missouri Department of Natural Resources’ Air Pollution Control Program responded to the NCDAQ’s request indicating that they have requested that the facility complete a four-factor
112 Potential visibility improvement was modeled for four Class I areas impacted by emissions from TVA Cumberland: Mammoth Cave – 0.006 dv; Sipsey Wilderness Area – 0.008 dv; Shining Rock Wilderness Area – 0.006 dv; Linville Gorge Wilderness Area – 0.005 dv.

Pre-hearing Draft 323 NC Regional Haze SIP for Second Planning Period (2019 – 2028) August 30, 2021
analysis. However, the New Madrid Power Plant four-factor analysis was not obtained in time to be included in this SIP.
Pennsylvania - Homer City Gen LP/Center TWP
Homer City Generating Station submitted a four-factor analysis to Pennsylvania on October 30, 2020. Homer City indicated that the units are currently controlled by BACT-level controls for SO2, NOx, and PM which meet the low emitting EGU threshold set forth in the MATS rule. In the four-factor analysis, Homer City evaluated several technically feasible upgrades to the controls in place for SO2 and NOx emissions. For SO2, potential controls measures included conversion to low sulfur coal, an upgrade/replacement to novel integrated desulfurization system (NIDS), and partial natural gas conversion. SO2 cost per ton estimates for these measures ranged from $7,245 to $15,580. For NOx, potential controls measures included replacing the low NOx burners/separated over-fired air (LNB/SOFA), replacement of selective catalytic reduction (SCR) system, and new NH3 vaporizers. NOx cost per ton estimates for these measures ranged from $8,170 to $43,883. Homer City concluded that these costs, when considered alongside lengthy times to implement and increases in energy consumption and other pollutants, were not reasonable.
Pennsylvania - Genon NE Mgmt Co/Keystone Station
Keystone Generating Station submitted a four-factor analysis to Pennsylvania on July 29, 2020, and they submitted a revision to this analysis on January 11, 2021. Keystone indicated that the units are currently controlled by BACT-level controls for SO2 and NOx. Keystone did not identify any technically feasible controls for SO2, because the units are already controlled by wet FGD and dry sorbent injection. For NOx control, Keystone did evaluate potential tuning and upgrading of the low NOx burners installed the units. The cost effectiveness of this upgrade was estimated to be $16,322/ton NOx removed. Keystone did not identify any reasonable control measures for NOx or SO2 as a result of the four-factor analysis.
Ohio - Cardinal Power Plant - Cardinal Operating Company
A reasonable progress analysis provided by the state of Ohio indicated that due to the presence of an FGD and SCR system of at least 90% effectiveness, this facility is considered to be effectively controlled. Boilers B001, B002, and B003 have federally enforceable SO2 emissions limits of 1.056 lb/MMBtu, 1.056 lb/MMBtu, and 0.66 lb/MMBtu. Boilers B001, B002, and B009 are required to be continuously controlled by FGD systems with an effective control efficiency of 95%.
Ohio - General James M. Gavin Power Plant, OH
A reasonable progress analysis provided by the state of Ohio indicated that due to the presence of an FGD and SCR system of at least 90% effectiveness, this facility is considered to be effectively controlled. Boilers B003 and B004 have federally enforceable SO2 emissions limits of 7.41 lb/MMBtu. Both boilers are required to be continuously controlled by FGD systems with

Pre-hearing Draft 324 NC Regional Haze SIP for Second Planning Period (2019 – 2028) August 30, 2021
an effective control efficiency of 95%. Ohio has requested a four-factor analysis from the facility.
Ohio - Duke Energy Ohio, Wm. H. Zimmer Station, OH
According to the state of Ohio, Zimmer Power Station has announced a planned shutdown in 2027. The intention of the state of Ohio is to make this commitment sufficiently federally enforceable to avoid the need for a four-factor analysis.
10.1.2 North Carolina Emission Source Impacts on Class I Areas in Other States
The NCDAQ evaluated the impacts of North Carolina’s statewide SO2 and NOx emissions on Class I areas outside of North Carolina and determined that North Carolina’s statewide impacts were not significant enough to warrant consultation with other states with Class I areas. North Carolina consulted with each VISTAS state during the development of its LTS and none of the VISTAS states requested consultation with North Carolina regarding North Carolina’s statewide impacts on Class I areas and none of the VISTAS states requested a reasonable progress analysis for any of North Carolina’s emission sources. As discussed in Section 10.2 of this SIP, VISTAS held a webinar on April 21, 2020, to present to the RPOs and their member states the VISTAS modeling analysis and results to make them aware of the impacts on Class I areas in their states. This information was also made available upon request from states outside of VISTAS and provided on the SESARM website. Based on these modeling results, no other non-VISTAS states with Class I areas requested consultation with North Carolina or a reasonable progress analysis of North Carolina emission sources.
10.2 Outreach
The VISTAS states participated in national conferences and consultation meetings with other states, RPOs, FLMs, and EPA throughout the SIP development process to share information. VISTAS held calls and webinars with FLMs, EPA, RPOs and their member states, and other stakeholders (industry and non-governmental organizations) to explain the overall analytical approach, methodologies, tools, and assumptions used during the SIP development process and considered their comments along the way. The chronology of these meetings and conferences is presented in Table 10-3.
Table 10-3. Summary of VISTAS Consultation Meetings and Calls Date Meetings and Calls Participants
December 5-7, 2017
Denver, CO, National Regional Haze Meeting – VISTAS States gave several presentations
FLMs; EPA OAQPS1, Region 3, Region 4; RPOs; various VISTAS agency attendees
September 5, 2018 Teleconference and VISTAS Presentation RPOs, CC2/TAWG3
January 31, 2018 Teleconference and VISTAS Presentation FLMs, EPA Region 4, CC/TAWG
August 1, 2018 Teleconference and VISTAS Presentation FLMs; EPA OAQPS, Region 3, Region 4; CC/TAWG
June 3, 2019 Teleconference and VISTAS Presentation FLMs; EPA OAQPS, Region 3, Region 4; CC/TAWG

Pre-hearing Draft 325 NC Regional Haze SIP for Second Planning Period (2019 – 2028) August 30, 2021
Date Meetings and Calls Participants October 28-30,
2019 St Louis, MO, National Regional Haze Meeting – VISTAS States gave presentations
FLMs; EPA OAQPS, Region 3, Region 4; RPOs; various VISTAS agency attendees
April 2, 2020 Teleconference and VISTAS Presentation FLMs; EPA OAQPS, Region 3, Region 4; CC/TAWG
April 21, 2020 Webinar and VISTAS Presentation RPOs, CC/TAWG
May 11, 2020 Webinar and VISTAS Presentation FLMs; EPA OAQPS, Region 3, Region 4; CC/TAWG
May 20, 2020 Webinar and VISTAS Presentation Stakeholders; FLMs; EPA OAQPS, Region 3, Region 4; RPOs; and member states, STAD, CC/TAWG
August 4, 2020 Webinar and VISTAS Presentation FLMs; EPA OAQPS, Region 3, Region 4; RPOs and Member States; CC/TAWG
September 15, 2020 Webinar and VISTAS Presentation NPS
1 Office of Air Quality Planning and Standards (OAQPS) 2 VISTAS Coordinating Committee (CC) 3 VISTAS Technical Advisory Work Group (TAWG)
Beginning in January 2018, VISTAS held the first of several formal consultation calls with EPA and the FLMs to review the methodologies used to evaluate source lists for four-factor analyses. The development of AoI values for each Class I area with the HYSPLIT model was presented to identify source regions for which additional controls might be considered and that are likely to have the greatest impact on each Class I area. Additionally, information was shared on how states identified specific facilities within the AoI values to be tagged by the CAMx photochemical model to further identify impacts associated with those facilities on each Class I area. Based on the results of these two analyses, each state agreed to evaluate reasonable control measures for sources that met or exceeded individual state thresholds for four-factor analyses. Each state would consider sources within their state and would identify sources in neighboring states for consideration. States acknowledged that the review process would differ among states since some Class I areas are projected to see visibility improvements near the uniform rate of progress while most Class I areas are projected to have greater improvements than the uniform rate of progress.
Subsequent calls were held with EPA, FLMs and stakeholders to share revised analyses of sources in their state and neighboring states for each Class I area, as well as their criteria for listing sources and their plans for further interstate consultation.
Additionally, the NCDAQ attended a National Regional Haze Conference in St. Louis, Missouri in October 2019 to discuss national and regional modeling to date and to plan next steps for submitting 2028 regional haze SIPs. North Carolina was part of a southeastern state breakout session with FLMs and EPA discussing the modeling and future expectations from all parties. Documentation of these meetings/calls can be found in Appendix F-3.
10.3 Consultation with MANE-VU
The following documents the VISTAS states' participation in Mid-Atlantic/Northeast Visibility Union (MANE-VU) consultation meetings. Table 10-4 provides the correspondence and

Pre-hearing Draft 326 NC Regional Haze SIP for Second Planning Period (2019 – 2028) August 30, 2021
meetings that occurred during the consultation process. MANE-VU prepared the MANE-VU Regional Haze Consultation Report in which it documented consultation meetings, comments received, and responses to comments which is available from MANE-VU’s website.113 Appendix F-4 provides documentation of North Carolina’s consultation with MANE-VU including North Carolina’s and VISTAS’ comments on the MANE-VU Ask.
Table 10-4. MANE-VU Consultation with VISTAS States - Correspondence and Meetings Date Description
October 16, 2017 Letter from Dave Foerter, Executive Director, MANE-VU/OTC, to Secretary Michael Regan, North Carolina Department of Environmental Quality (NCDEQ) (formerly Department of Environment and Natural Resources). Purpose: Invitation to join State-to-State consultation meetings starting October 20, 2017.
October 20, 2017 MANE-VU Conference Call. Inter-RPO Consultation #1, Introduction and Overview of MANE-VU Analyses and Ask.
December 1, 2017 MANE-VU Conference Call. Inter-Regional Consultation #2, Discussion of the Ask and listening to upwind states and FLM questions.
December 18, 2017 MANE-VU Conference Call. Inter-Regional Consultation #3, Overview of technical analyses behind the Ask, source contributions, 4-factor analysis, and available technical products.
January 12, 2018 MANE-VU Conference Call. Inter-Regional Consultation #4, Reasonable Progress Overview.
January 27, 2018 Letter from John E. Hornback, Executive Director, Metro 4/SESARM/VISTAS, to Dave Foerter, Executive Director, MANE-VU/OTC. Purpose: Comments on timing; technical analysis – inventories, modeling, and evaluation; and permanence and enforceability of control measures not adopted by VISTAS states.
January 30, 2018 Email from Randy Strait, Supervisor of Attainment Planning Branch, Division of Air Quality, NCDEQ to Joseph Jakuta, Program Manager, MANE-VU/OTC, and David Healy, Air Quality Analyst/Modeler, New Hampshire Dept. of Environmental Services. Purpose: Documentation of errors with CALPUFF for KapStone Kraft Paper and documentation showing that 2016 SO2 emissions were 95% lower and 2016 NOx emissions were 18% lower than in the 2011 emissions used in MANE-VU’s modeling. Email reply from Dave Healy on January 31, 2018, confirmed that there was an error in the Ask and that KapStone Kraft Paper’s contribution is <3Mm-1.
February 16, 2018 Letter from Michael Abraczinskas, Director, Division of Air Quality, NCDEQ to Dave Foerter, Executive Director, MANE-VU/OTC. Purpose: Comments on MANE-VU Inter-RPO Ask regarding flaws in analysis for North Carolina emissions sources.
March 23, 2018 MANE-VU Conference Call. Inter-RPO Consultation #5. Executive Summaries, SIP submittal plans, and perspectives from upwind states.
May 8, 2018 Letter from Clark Freise, MANE-VU Chair (NH DES) and David Foerter, MANE-VU Executive Director, to Secretary Michael Regan, North Carolina NCDEQ. Purpose: Acknowledgement of participation in MANE-VU consultation calls and receipt of comments on MANE-VU Ask.
On October 16, 2016, MANE-VU notified Alabama, Florida, Kentucky, North Carolina, Tennessee, Virginia, and West Virginia that its analysis of upwind emissions from these states
113 MANE-VU Regional Haze Consultation Report, July 27, 2018, MANE-VU Technical Support Committee, https://otcair.org/MANEVU/Upload/Publication/Correspondence/MANE-VU_RH_ConsultationReport_Appendices_ThankYouLetters_08302018.pdf

Pre-hearing Draft 327 NC Regional Haze SIP for Second Planning Period (2019 – 2028) August 30, 2021
may contribute to visibility impairment at one or more MANE-VU Class I areas located in Maine, New Hampshire, New Jersey, and Vermont. MANE-VU invited each VISTAS state to participate in its consultation process involving five conference calls from October 20, 2017 to March 23, 2018 to explain their methodologies, data sources, and assumptions used in its contribution analyses. MANE-VU's technical analyses were based on actual 2015 emissions for EGUs and 2011 emissions for other emission sources. MANE-VU's criteria for identifying upwind states for consultation included:
• Point Source Emissions Analysis: Kentucky, North Carolina, Virginia, and West Virginia were identified as having at least one facility estimated to contribute ≥3 Mm-1 to light extinction in at least one MANE-VU Class I area based on CALPUFF modeling of the facility’s SO2 and NOx emissions.
• Statewide Emissions Analysis for all Sectors: Alabama, Florida, Kentucky, North Carolina, Tennessee, Virginia, and West Virginia were estimated to contribute ≥2% of the visibility impairment at one or more MANE-VU Class I areas and/or an average mass impact of over 1% (0.01 μg/m3). This methodology involved a weight-of-evidence approach based on emissions (tons per year) divided by distance (kilometers) (Q/d) calculations, CALPUFF modeling, and the use of HYSPLIT back trajectories as a quality check.
All seven VISTAS states participated in MANE-VU's five consultation calls and reviewed the technical information supporting MANE-VU's conclusions. On January 27, 2018, VISTAS submitted a letter to MANE-VU documenting its appreciation for the opportunity to participate in the consultation process and identified the following concerns and recommendations:
• Timing: At the time the consultation calls were held, the MANE-VU states indicated that they planned to submit their regional haze SIPs to EPA by the original July 2018 deadline. VISTAS noted that its states planned to complete their regional haze technical analysis in 2019 with the intention of submitting regional haze SIPs by July 31, 2021. The differing schedules resulted in the seven VISTAS states included in MANE-VU's Ask being requested to assess the MANE-VU analysis without the benefit of the forthcoming VISTAS technical work. Subsequently, schedules were delayed, and VISTAS has shared the results of its emissions inventory and modeling analyses with the MANE-VU states during consultation calls in 2020 (see Table 10-4). VISTAS's technical analyses, which are based on more recent emissions inventory data and robust modeling tools, indicate that VISTAS state contributions to MANE-VU Class I areas are below the thresholds established by MANE-VU.
• Technical Analysis – Inventories, Modeling, and Evaluation: The MANE-VU states' analysis used emission inventories that are inconsistent with the recent EPA regional haze modeling platform. These inventories do not fully reflect emission reductions expected from southeastern EGUs by 2028 and other sources as well. Modeling results derived from use of the outdated emissions inventories may not allow conclusive determinations of impacts, if any, from VISTAS states on Class I areas in the MANE-VU region.

Pre-hearing Draft 328 NC Regional Haze SIP for Second Planning Period (2019 – 2028) August 30, 2021
In many cases, the sources of the alleged contributions to downwind receptors are located thousands of miles away from the MANE-VU Class I areas. The MANE-VU states used the CALPUFF model and the Q/d screening approach to identify contributions that they allege are significant. CALPUFF should not be used for transport distances greater than 300 Km since there are serious conceptual concerns with the use of puff dispersion models for very long-range transport which can result in overestimations of surface concentrations by a factor of three to four.114 The preamble to the recent Revisions to the Guideline on Air Quality Models that modified Appendix W of 40 CFR Part 51 states, in part, "the EPA has fully documented the past and current concerns related to the regulatory use of the CALPUFF modeling system and believes that these concerns, including the well documented scientific and technical issues with the modeling system, support the EPA’s decision to remove it as a preferred model in Appendix A of the Guideline."115 The reliability of the Q/d screening approach diminishes over distance and especially beyond 300 Km. If the MANE-VU states wish to evaluate emission impacts more than 300 Km downwind from sources, a scientifically reliable approach is essential such as the CAMx model with the PSAT source apportionment method. In response to VISTAS concerns about inaccuracies in the MANE-VU analysis that were shared during the December 18, 2018 technical call, the MANE-VU states suggested that the seven VISTAS states could reassess contributions using their own information to correct the MANE-VU analysis. The VISTAS states affirmed their commitment to conduct a thorough technical review of emission impacts during their forthcoming analysis. However, it was incumbent on the MANE-VU states to correct the errors inherent in their own analysis and reassess the states with which consultation would be necessary. The MANE-VU Ask included year-round use of effective control technologies on EGUs; a four-factor analysis on sources with potential for visibility impacts of ≥3.0 Mm-1 at any MANE-VU Class I area; establishment of an ultra-low sulfur fuel oil standard; updated permits, enforceable agreements, and/or rules to lock in lower emission rates for EGUs and other large emission sources that had recently reduced emissions or were scheduled to do so; and efforts to decrease energy demand through use of energy efficiency and increased use of combined heat and power and other clean distributed generation technologies. The MANE-VU Ask failed to recognize fully the improved controls, fuel switches, retirements, and energy demand reductions that had already been achieved in the Southeast. Further, the MANE- VU states suggested that the Southeast adopt control measures that would produce little if any visibility improvement at MANE-VU Class I
114 Interagency Workgroup on Air Quality Modeling (IWAQM) Phase 2 Summary Report and Recommendations for Modeling Long Range Transport Impacts (December 1998). 115 Federal Register, Vol. 82, No. 10, Tuesday, January 17, 2017, Page 5195.

Pre-hearing Draft 329 NC Regional Haze SIP for Second Planning Period (2019 – 2028) August 30, 2021
areas. VISTAS recommended that the MANE-VU states refine their analyses and establish a sound basis for any actions requested of the seven VISTAS states and incorporate such expectations in MANE-VU SIPs.
• Permanent and Enforceable: Regional haze SIPs (including the reasonable progress goals that are set for each Class I area) should only include emission reductions that are permanent, quantifiable, and enforceable. Therefore, the MANE-VU states should only include in their regional haze SIPs emission control presumptions for the seven VISTAS states that are clearly necessary and effective and have been made permanent and enforceable via state rulemaking or permit revisions. For MANE-VU states to include within their regional haze SIPs emission controls in other states that are not permanent and enforceable, and which the state in question has no intention of adopting, would be inconsistent with the CAA and RHR and could result in adverse comments from the seven VISTAS states during the MANE-VU regional haze SIP public comment period.
During the consultation process, Florida, North Carolina, Tennessee, Virginia, and West Virginia submitted to MANE-VU updated information on emissions associated with facilities identified in the MANE-VU Ask and documenting concerns with MANE-VUs approach and conclusions. As a result of their active participation the MANE-VU consultation process, the VISTAS states fulfilled the consultation requirements specified in the RHR (51.308(f)(2)(ii)).
10.4 Federal Land Manager Consultation The NCDAQ provided a draft of this regional haze SIP to the FLMs for the formal 60-day consultation process from April 5 through June 5, 2021. On April 20, the NCDAQ held a consultation meeting with the FLMs to provide an overview of the draft SIP, analytical approaches for source selection analysis, and results of the four-factor analysis for North Carolina facilities. The NPS initiated a consultation call with the NCDAQ to provide its preliminary comments on May 14 and its final comments on May 25. The USFS and USF&WS were invited to these calls. The USFS and NPS provided written comments on June 3 and June 4, respectively. The USF&WS did not provide any comments during the consultation period. The following provides a summary of comments provided by the NPS (regarding the GSMNP) and USFS (regarding Joyce Kilmer-Slickrock, Linville Gorge, and Shining Rock Wilderness Areas) and the NCDAQ’s responses to the comments. Appendix H to this SIP includes the full set of comments provided by the NPS and USFS. 10.4.1 Exclusion of NOx from Four-Factor Analysis NPS Comment Ammonium nitrate from NOx emissions is a significant anthropogenic haze causing pollutant. Over the past ten years the importance of ammonium nitrate on the 20% most-impaired days has increased for many Class I areas in the VISTAS region, including at Great Smoky Mountains NP. As SO2 emissions decline and the seasonality of most-impaired days shifts, NOx emissions are increasingly important for many VISTAS Class I areas.

Pre-hearing Draft 330 NC Regional Haze SIP for Second Planning Period (2019 – 2028) August 30, 2021
The North Carolina rationale for excluding NOx emissions from reasonable progress four-factor analyses is based on an outdated modeling base year (2011) and associated inaccurate assumptions about the current and future distribution of most-impaired days in the modeling assessment. We recognize that the modeling methods follow EPA guidance and are technically correct, however the result is not representative of current conditions. The importance of ammonium nitrate and the distribution of most-impaired days has changed significantly since the 2011 base year. In 2011, ammonium sulfate-dominated extinction on the 20% most-impaired days which occurred mostly during the warmer, summer months. Currently, ammonium nitrate extinction which is highest during the cooler months of the year is now included among the 20% most-impaired days. As a result, 2028 projections based on the 2011 most-impaired days miss the importance of ammonium nitrate extinction. This is supported by the past five-years of IMPROVE monitoring data. The NPS recommends that North Carolina acknowledge more recent monitoring data in their source selection process and consider NOx emission reduction opportunities as relevant to addressing regional haze during this planning period. Reducing NOx emissions would have additional regional co-benefits for ozone and nitrogen deposition. Great Smoky Mountains NP is currently part of two limited maintenance plans for ozone and has 12 acidified streams on the Clean Water Act 303(d) list for pH-impaired surface waters from excessive atmospheric nitrogen and sulfur deposition. A total maximum daily load (TMDL) of nitrogen and sulfur deposition was established to restore these streams which will require additional nitrogen and sulfur reductions to reach these protective critical loads. While much of the region’s NOx emissions come from mobile sources, emissions inventories also show a significant quantity of NOx emissions from point sources in North Carolina that could be addressed under the regional haze program. USFS Comments The draft RH SIP only evaluates SO2 emission sources for reasonable progress evaluations / four-factor analyses. USDA Forest Service appreciates the discussion within the draft RH SIP regarding nitrate formation in the VISTAS region. We understand that nitrate formation in the VISTAS region is limited by the availability of ammonia (which preferentially reacts with SO2 and sulfates before reacting with NOx) and by temperature, with particle nitrate concentrations highest in the winter months. We also recognize that sulfates have been the main contributor to visibility impairment at Class I Areas within the southern US. Additionally, the substantial emission reductions of both SO2 and NOx from coal-fired power plants over the past decade within NC as a result of the Clean Smokestacks Act are admirable and a model for other states. The emissions data show that most NOx emissions within NC are from the mobile sector. However, the nitrate contribution to visibility impairment is increasing as sulfur dioxide emissions decrease, and there are still significant NOx sources within the point sector in NC. We request that NCDAQ consider evaluating NOx sources, along with SO2 sources, for reasonable progress during this planning period. NCDAQ Response

Pre-hearing Draft 331 NC Regional Haze SIP for Second Planning Period (2019 – 2028) August 30, 2021
In preparing its response to these comments, the NCDAQ documents in the following sections its review of the IMPROVE monitoring data, SO2 and NOx emissions trends from 2011 – 2028, and PSAT modeling for 2028 for Class I areas in North Carolina. The NCDAQ’s summary and conclusions of the data regarding these comments is presented at the end of this section. Note that after reviewing the monitoring data supporting development of this SIP, NCDAQ obtained the 2019 IMPROVE data from the USF&WS in May of 2021, and it is considered in this response.116 Therefore, the NCDAQ has included 2019 IMPROVE data in this response. Because IMPROVE monitoring data from GSMNP is used to represent visibility impairment at Joyce Kilmer-Slickrock Wilderness Area (see Section 1.4), the discussion of the IMPROVE monitoring data for the GSMNP also applies to the Joyce Kilmer-Slickrock Wilderness Area, except where noted. Review of IMPROVE Monitor Data for Great Smoky Mountains National Park and Linville Gorge and Shining Rock Wilderness Areas For each of the three Class I areas, Figure 10-1 through Figure 10-3 compare the relative particle contributions to light extinction for the five-year average of 2009 – 2013 and 2015 – 2019 measured by IMPROVE monitors for the 20% most impaired days. When preparing the projected RPGs for 2028, based on EPA’s modeling guidance, the species-specific RRFs were applied to the 2009 – 2013 average measured by the monitor for each Class I area. Comparison of these five-year periods show that while total impairment has declined significantly in each of the three Class I areas, the relative percentage of PM species contributions has also changed somewhat. The relative ammonium nitrate and organic carbon contributions have increased from the first to the second five-year period for the Great Smoky Mountains National Park and the Linville Gorge and Shining Rock Wilderness Areas. During the 2015 – 2019 period, the ammonium nitrate and organic carbon contributions are equal for the Great Smoky Mountains, but organic carbon contributions at the Linville Gorge and Shining Rock Wilderness Areas are much higher than the ammonium nitrate contributions to total visibility impairment. However, during the 2015 – 2019 period, ammonium sulfate continues to be the dominant visibility impairing species at all three Class I areas. For each of the three Class I areas, Figure 10-4 through Figure 10-6 show particle contributions to light extinction from 2011 through 2019 for the 20% most impaired days. For the Great Smoky Mountains National Park, ammonium nitrate levels increased in 2017 and 2018 but returned to 2015 levels in 2019. A similar trend is observed for the Shining Rock Wilderness Areas where the ammonium nitrate increased in 2017 and 2018 but returned to 2016 levels in 2019. For the Linville Gorge Wilderness Area, ammonium nitrate levels also increased slightly in 2017 and 2018 and declined slightly in 2019. It is unclear why the ammonium nitrate
116 IMPROVE monitoring data for 2019 were downloaded from a temporary Google Drive link provided in an email from Scott Copeland of the USDA Forest Service. As of July 31, 2021, these data have not been officially published on the IMPROVE website alongside data for previous years.

Pre-hearing Draft 332 NC Regional Haze SIP for Second Planning Period (2019 – 2028) August 30, 2021
contribution to total impairment has fluctuated in recent years and further research is needed to understand the factors contributing (e.g., emission sources, weather, and meteorology) to the nitrate fraction at these three Class I areas.
Figure 10-1. Comparison of Five-Year Average (2009-2013 vs. 2015-2019) Particle Contributions to Light Extinction for 20% Most Impaired Days at Great Smoky
Mountains National Park
Ammonium Sulfate, 76.3%
Ammonium Nitrate, 5.2%
Organic Carbon, 11.1%Elemental Carbon, 4.1%
Fine Soil, 0.5%Coarse Mass, 2.5%
Fine Sea Salt, 0.3%
Most Impaired Days 2009-2013
Ammonium Sulfate, 54.4%
Ammonium Nitrate, 16.6%
Organic Carbon, 17.4%
Elemental Carbon, 5.7%Fine Soil, 0.6%
Coarse Mass, 4.8%Fine Sea Salt, 0.5%
Most Impaired Days 2015-2019

Pre-hearing Draft 333 NC Regional Haze SIP for Second Planning Period (2019 – 2028) August 30, 2021
Figure 10-2. Comparison of Five-Year Average (2009-2013 vs. 2015-2019) Particle Contributions to Light Extinction for 20% Most Impaired Days at Linville Gorge
Wilderness Area
Ammonium Sulfate, 77.2%
Ammonium Nitrate, 2.5%
Organic Carbon, 12.5%Elemental Carbon, 4.4%
Fine Soil, 0.5%Coarse Mass, 2.6% Fine Sea Salt, 0.3%
Most Impaired Days 2009-2013
Ammonium Sulfate, 56.9%
Ammonium Nitrate, 8.0%
Organic Carbon, 22.4%
Elemental Carbon, 6.8%Fine Soil, 0.6%
Coarse Mass, 4.9%Fine Sea Salt, 0.4%
Most Impaired Days 2015-2019

Pre-hearing Draft 334 NC Regional Haze SIP for Second Planning Period (2019 – 2028) August 30, 2021
Figure 10-3. Comparison of Five-Year Average (2009-2013 vs. 2015-2019) Particle Contributions to Light Extinction for 20% Most Impaired Days at Shining Rock
Wilderness Area
Ammonium Sulfate, 74.5%
Ammonium Nitrate, 5.5%
Organic Carbon, 12.5%Elemental Carbon, 3.6%
Fine Soil, 0.6%Coarse Mass, 2.8% Fine Sea Salt, 0.5%
Most Impaired Days 2009-2013
Ammonium Sulfate, 58.1%
Ammonium Nitrate, 10.3%
Organic Carbon, 19.4%
Elemental Carbon, 5.3%Fine Soil, 0.9%
Coarse Mass, 5.1%Fine Sea Salt, 0.7%
Most Impaired Days 2015-2019

Pre-hearing Draft 335 NC Regional Haze SIP for Second Planning Period (2019 – 2028) August 30, 2021
Figure 10-4. Particle Contributions to Light Extinction for 20% Most Impaired Days at
Great Smoky Mountains National Park for 2011-2019
Figure 10-5. Particle Contributions to Light Extinction for 20% Most Impaired Days at
Linville Gorge Wilderness Area for 2011-2019
0
10
20
30
40
50
60
70
80
90
100
2011
2012
2013
2014
2015
2016
2017
2018
2019
Extin
ctio
n (M
m-1
)
Sea Salt
CM
Soil
LAC
OMC
Ammonium Nitrate
Ammonium Sulfate

Pre-hearing Draft 336 NC Regional Haze SIP for Second Planning Period (2019 – 2028) August 30, 2021
Figure 10-6. Particle Contributions to Light Extinction for 20% Most Impaired Days at
Shining Rock Wilderness Area for 2011-2019 Figure 10-7 compares the five-year average of 2009 – 2013 and 2015 – 2019 for ammonium sulfate and ammonium nitrate contributions to visibility impairment for all Class I areas in the VISTAS region. These data clearly show that although ammonium nitrate contributions have increased slightly for some Class I areas, ammonium sulfate remains as the dominant visibility impairment species through 2019. The NPS points to the shift in the 20% most impaired days from primarily summer months to fall, winter, and spring months which is illustrated in Table 10-5. Table 10-6 shows the number of days where nitrate exceeded sulfate concentrations. They note that use of 2011 as the basis for the 20% most impaired days does not reflect current trends. Although the days and seasons that make up the 20% most impaired days have shifted somewhat from 2011 to 2016 – 2019, the total number of days that are dominated by sulfate still exceeds the total number of days dominated by nitrate for each year. For example, 23 days of IMPROVE monitoring data make up the 20% most impaired days for the Great Smoky Mountains National Park. In 2011, all 23 days were dominated by sulfate. In 2016, 2017, 2018, and 2019 the total number of days where nitrate exceeded sulfate impairment were 1, 3, 7, and 5 days, respectively. At nearby Linville Gorge and Shining Rock Wilderness Areas, no days in 2016 were nitrate dominant, and no more than 4 days were nitrate dominant from 2017 – 2019. This illustrates that sulfate is still the dominant visibility impairing pollutant for these three Class I areas for this second planning period. Additional research will be needed to understand why nitrate contributions are fluctuating from year to year and shifting between seasons within a given year. This fluctuation does not necessarily mean that the higher nitrate fractions are associated with EGU and non-EGU point sources.
0.0
10.0
20.0
30.0
40.0
50.0
60.0
2012
2013
2014
2015
2016
2017
2018
2019
Extin
ctio
n (M
m-1
)
Sea Salt
CM
Soil
LAC
OMC
Ammonium Nitrate
Ammonium Sulfate

Pre-hearing Draft 337 NC Regional Haze SIP for Second Planning Period (2019 – 2028) August 30, 2021
Figure 10-7. Comparison of Ammonium Sulfate and Ammonium Nitrate Five-Year
Average (2009 – 2013 vs. 2015 – 2019) Contributions to Visibility Impairment for 20% Most Impaired Days at Great Smoky Mountains National Park
Table 10-5. Number of Days by Month Included in 20% Most Impaired Days for 2011 and 2016 – 2019 for Great Smoky Mountains National Park and Linville Gorge and Shining
Rock Wilderness Areas
Year Winter Spring Summer Fall Total
Days Dec Jan Feb Mar Apr May Jun Jul Aug Sep Oct Nov Great Smoky Mountains National Park
2011 2 1 1 1 7 9 1 1 23 2016 3 3 2 3 2 5 3 1 1 23 2017 4 1 1 1 2 1 3 3 5 2 23 2018 1 5 3 1 1 5 1 2 1 3 23 2019 2 1 4 1 2 4 7 1 1 23
Linville Gorge 2011 2 1 1 2 3 11 3 23 2016 1 1 1 1 1 1 5 4 6 2 1 24 2017 2 2 1 1 3 2 3 4 4 2 24 2018 2 3 2 1 2 5 2 3 2 2 24 2019 1 1 3 1 2 4 4 7 1 24
Shining Rock 2011 Not available due to incomplete data for 2011 2016 1 1 1 2 2 4 5 5 2 1 24 2017 3 1 3 2 1 4 2 4 1 2 23 2018 2 2 1 2 3 5 2 2 1 2 22 2019 1 1 1 4 4 9 1 21
0
10
20
30
40
50
60
70
80
90
100
CHAS
1CH
AS1
COH
U1CO
HU1
DOSO
1DO
SO1
EVER
1EV
ER1
GRSM
1GR
SM1
JARI
1JA
RI1
LIGO
1LI
GO1
MAC
A1M
ACA1
OKEF
1OK
EF1
ROM
A1RO
MA1
SAM
A1SA
MA1
SHEN
1SH
EN1
SHRO
1SH
RO1
SIPS
1SI
PS1
SWAN
1SW
AN1
Ligh
t Ext
inct
ion
(Mm
-1)
Ammonium NitrateAmmonium Sulfate
Left side is 2009-2013 AVERAGE, Right side is 2015-2019 AVERAGE

Pre-hearing Draft 338 NC Regional Haze SIP for Second Planning Period (2019 – 2028) August 30, 2021
Table 10-6. Days on Which Nitrate Exceeded Sulfate Concentrations for the 20% Most Impaired Days for Great Smoky Mountains National Park and Linville Gorge and Shining
Rock Wilderness Areas Class I Area 2011 2016 2017 2018 2019
Great Smoky Mountains National Park Jan. 19 Jan. 7 Jan. 2, 5, & 17 Jan. 15 & 24 Dec. 12 & 15 Mar. 9 & 21 Mar. 7 & 22 Nov. 28 Nov. 20 Dec. 2
Total Days 0 1 3 7 5
Linville Gorge Jan. 10 Jan. 5 Jan. 12 Dec. 15 Mar. 24 Mar. 7 & 22 Nov. 28 Dec. 8
Total Days 0 0 2 3 4
Shining Rock Dec. 15 Jan.5 Mar. 24
Total Days N/A 0 1 2 0 Emissions Trends and PSAT Modeling for 2028 For North Carolina, Figure 10-8 and Figure 10-9 show statewide sector-level contributions to total emissions for SO2 and NOx, respectively. The 2011 and 2028 emissions are from the modeling platform used for modeling RPGs for Class I areas in North Carolina. The 2017 emissions are from the 2017 National Emissions Inventory (NEI). Table 10-7 summarizes the emissions by the major source categories [i.e., mobile (onroad and nonroad), stationary point (all point sources), and miscellaneous (includes predominately prescribed fires and wildfires)]. From 2011 – 2017, SO2 and NOx emissions have been reduced by 65% and 37%, respectively. From 2017 – 2028, SO2 and NOx emissions are projected to decline an additional 22% and 40%, respectively, due to federal and state control programs. Point sources that combust coal and oil containing sulfur (EGUs and non-EGUs) and industries that emit SO2 (e.g., pulp and paper) are the major sources of SO2 emissions and, therefore, can be easily linked to sulfate contributions at Class I areas. However, NOx emissions are associated with fuel combustion in both the mobile and stationary source sectors. Unlike SO2, it is difficult to identify the specific sources of NOx that contribute to nitrate at an IMPROVE monitor on a given day of the year. For North Carolina, in 2017, highway (onroad) and off-highway (nonroad) vehicles considered together account for about 68% of total statewide emissions for all sectors.

Pre-hearing Draft 339 NC Regional Haze SIP for Second Planning Period (2019 – 2028) August 30, 2021
Figure 10-8. North Carolina SO2 Emissions Trends by Sector
Figure 10-9. North Carolina NOx Emissions Trends by Sector

Pre-hearing Draft 340 NC Regional Haze SIP for Second Planning Period (2019 – 2028) August 30, 2021
Table 10-7. Comparison of Emission Sectors for 2011, 2017 and 2028 Emissions and Total Reductions
Emission Inventory
Year
Onroad and
Nonroad Stationary
Point Miscel-
laneous* Total
Emissions
Onroad and
Nonroad Stationary
Point Miscel-
laneous* NOx Emissions (TPY) Percent of Total Emissions
2011 272441 93008 4047 369496 74% 25% 1% 2017 NEI 157428 71619 2631 231679 68% 31% 1%
2028 VISTAS 70347 65137 3500 138984 51% 47% 3%
SO2 Emissions (TPY) 2011 3554 114099 1068 118721 3% 96% 1%
2017 NEI 1826 40246 0 42073 4% 96% 0% 2028
VISTAS 1366 30323 956 32645 4% 93% 3%
NOx SO2 Total Reduction from 2011 to 2017 37% 65% Total Reduction from 2017 to 2028 40% 22%
* Miscellaneous emissions include predominately prescribed fires and wildfires. Section 7.4 (Relative Contributions to Visibility Impairment: Pollutants, Source Categories, and Geographic Areas) of this SIP presents the PSAT modeling results for 2028 for the most impaired days for Class I areas in the VISTAS region. Figure 7-23 (2028 Nitrate Visibility Impairment, 20% Most Impaired Days, VISTAS Class I Areas) shows that contributions to nitrate impairment from the CENRAP, LADCO, and MANE-VU sources, as well as the sum contributions from the other VISTAS states, are significantly larger than contributions from North Carolina sources. Figure 7-31 (2028 Contribution to Light Extinction on the 20% Most Impaired Days at Great Smoky Mountains) shows that in 2028 the nitrate contribution is associated primarily with mobile (onroad and nonroad) and nonpoint stationary sources and point sources (EGU and non-EGU) outside of North Carolina. As shown in the right-most two columns in this figure, nitrate contributions from point sources (EGU or non-EGU) in North Carolina are negligible. This finding also applies to the Linville Gorge, Shining Rock, and Joyce Kilmer-Slickrock (see Figure 7-28 through Figure 7-30). Requiring additional NOx controls on point sources in North Carolina would have little to no impact on improving visibility in the Great Smoky Mountains National Park and Linville Gorge and Shining Rock Wilderness Areas. Further research is needed to understand which sources are contributing to the nitrate fraction both in North Carolina and out-of-state. Table 7-14 presents the PSAT-modeled visibility impairment for 2028 for all Class I areas within the VISTAS modeling domain. This table shows combined sulfate and nitrate visibility impairment across all emissions sectors, for North Carolina and all other regions within the

Pre-hearing Draft 341 NC Regional Haze SIP for Second Planning Period (2019 – 2028) August 30, 2021
modeling domain. As presented in Table 7-14, the modeling results show that North Carolina contributes less than 0.89 Mm-1 to Class I areas in neighboring states. Subsequent analysis of these data show that North Carolina contributed no more than 0.59 Mm-1 in sulfates or nitrates to Class I areas in neighboring states. Summary and Conclusions The NCDAQ reviewed all available IMPROVE monitoring data for the Class I areas in North Carolina during the development of this SIP. Both SO2 and NOx emissions sources (both stationary and mobile) were analyzed during the AoI and PSAT modeling work to consider in the source selection step. The NCDAQ also considered the flexibilities provided to the states in deciding how to prioritize pollutants and emission sources for improving visibility during the second planning period as documented in EPA’s 2019 regional haze guidance. In so doing, for the second planning period, the NCDAQ concluded that ammonium sulfate is the dominant pollutant followed by organic carbon and ammonium nitrate. The NPS stated in their comments that “The North Carolina rationale for excluding NOx emissions from reasonable progress four-factor analyses is based on an outdated modeling base year (2011) and associated inaccurate assumptions about the current and future distribution of most-impaired days in the modeling assessment.” However, the NCDAQ disagrees with this comment for the following reasons: • Emissions and modeling work needs to begin three years before SIPs are due because of the
significant amount of time required to complete the work one year in advance of preparing the SIPs. For this planning period, funds were not available to the states to build a new modeling platform with a more recent base year. Consequently, the 2011 base year modeling platform was selected because it was the best platform available at the time the modeling work began in early 2018. VISTAS discussed the selection of modeling platforms with EPA prior to starting this work and EPA agreed that using EPA’s 2011 modeling platform was the latest available at the time and was sufficient to support the development of regional haze SIPs for the second planning period.
• About 18 months after VISTAS started its modeling using the 2011 platform, EPA released a new platform with a 2016 base year and then decided to conduct regional haze modeling for 2028 using the 2016 platform. The EPA modeling used 2016 meteorology and calculated RRFs (percent reduction between 2016 and 2028) were applied to 2014 – 2017 IMPROVE data to calculate RPGs for 2028. Figure 10-10 compares the projected speciated modeling results from the EPA and VISTAS modeling for the three Class I areas. The 2028 visibility impairment projection for the 20% most impaired days are generally similar, not only the sum of all the pollutants -- the RPG -- but also how much visibility impairment comes from each species. A common takeaway from both model projections is ammonium sulfate is expected to remain the dominant pollutant through 2028, and by a factor of 4 or greater, over ammonium nitrate at Class I areas in North Carolina. It is also worth noting that VISTAS’ projected total light extinction for 2028 that is lower than EPA’s projected 2028 visibility at all North Carolina Class I areas (which is due to differences in the emission projections and

Pre-hearing Draft 342 NC Regional Haze SIP for Second Planning Period (2019 – 2028) August 30, 2021
size of the modeling domains). However, this analysis demonstrates that sulfate remains the dominant pollutant and will remain so over the coming planning period, whether 2011 or 2016 meteorology, and associated 20% most impaired days, are used.
Figure 10-10. Projected 2028 Speciated Visibility Impairment for 20% Most Impaired
Days at Great Smoky Mountains National Park (GSMNP), and Linville Gorge Wilderness Area (LIGO), and Shining Rock Wilderness Area (SHRO)
• The NCDAQ analyzed visibility impairment per ton of sulfate and nitrate emissions, respectively, at all North Carolina facilities selected for PSAT analysis (see Table 7-28), as well as all facilities outside of North Carolina selected by the NCDAQ for reasonable progress analysis (see Tables 7-36 and 7-37). The visibility impairment per ton of emissions for sulfate was compared against the same for nitrate as a ratio as follows:
𝐿𝐿𝑆𝑆𝑆𝑆𝐴𝐴𝐴𝐴(𝑓𝑓𝑆𝑆𝑂𝑂𝐴𝐴𝑆𝑆𝐴𝐴𝑆𝑆𝑅𝑅,𝐶𝐶𝑆𝑆𝑆𝑆𝑀𝑀𝑀𝑀 𝐼𝐼 𝑆𝑆𝐿𝐿𝑆𝑆𝑆𝑆) = �𝑆𝑆𝐴𝐴𝑆𝑆𝑓𝑓𝑆𝑆𝑆𝑆𝑆𝑆 𝑉𝑉𝐴𝐴𝑀𝑀𝐴𝐴𝑏𝑏𝐴𝐴𝑆𝑆𝐴𝐴𝑆𝑆𝑅𝑅 𝐼𝐼𝑚𝑚𝑆𝑆𝑆𝑆𝐴𝐴𝐿𝐿𝑚𝑚𝑆𝑆𝐴𝐴𝑆𝑆 𝐴𝐴𝐴𝐴 𝑀𝑀𝑚𝑚 − 1
2028 𝑆𝑆𝑂𝑂2 𝐸𝐸𝑚𝑚𝐴𝐴𝑀𝑀𝑀𝑀𝐴𝐴𝐴𝐴𝐴𝐴𝑀𝑀 𝐴𝐴𝐴𝐴 𝑆𝑆𝑆𝑆𝑅𝑅 �
�𝑁𝑁𝐴𝐴𝑆𝑆𝐿𝐿𝑆𝑆𝑆𝑆𝑆𝑆 𝑉𝑉𝐴𝐴𝑀𝑀𝐴𝐴𝑏𝑏𝐴𝐴𝑆𝑆𝐴𝐴𝑆𝑆𝑅𝑅 𝐼𝐼𝑚𝑚𝑆𝑆𝑆𝑆𝐴𝐴𝐿𝐿𝑚𝑚𝑆𝑆𝐴𝐴𝑆𝑆 𝐴𝐴𝐴𝐴 𝑀𝑀𝑚𝑚 − 12028 𝑁𝑁𝑂𝑂𝑏𝑏 𝐸𝐸𝑚𝑚𝐴𝐴𝑀𝑀𝑀𝑀𝐴𝐴𝐴𝐴𝐴𝐴𝑀𝑀 𝐴𝐴𝐴𝐴 𝑆𝑆𝑆𝑆𝑅𝑅 �
0
10
20
30
40
50
60
GSMNPEPA
2028
GSMNPVISTAS
2028
LIGOEPA
2028
LIGOVISTAS
2028
SHROEPA
2028
SHROVISTAS
2028
Ligh
t Ext
inct
ion
(Mm
-1)
Rayleigh Ammonium Sulfate Ammonium Nitrate OMC LAC Soil CM Sea Salt

Pre-hearing Draft 343 NC Regional Haze SIP for Second Planning Period (2019 – 2028) August 30, 2021
The sulfate to nitrate ratios by facility to the Great Smoky Mountains National Park and Joyce Kilmer-Slickrock, Linville Gorge, and Shining Rock Wilderness Areas are shown in Table 10-8 (the cells with “N/A” indicate a nitrate PSAT visibility impact of zero associated with NOx emissions). Visibility impacts from sulfate as a function of Mm-1 per ton are universally higher than the same for nitrate, in some cases by a factor of 100 or more. These results indicate that reducing one ton of SO2 has a significantly higher impact on improving visibility at these Class I areas rather than controlling one ton of NOx supporting the NCDAQ’s decision, in part, to focus on requesting facilities to perform four-factor analyses on only SO2 emissions for this second planning period.
Table 10-8. Facility-Level Comparison of Sulfate versus Nitrate Visibility Impairment for the Great Smoky Mountains National Park and Linville Gorge and Shining Rock
Wilderness Areas
Facility
Great Smoky
Mountains National
Park
Joyce Kilmer-
Slickrock Wilderness
Area
Linville Gorge
Wilderness Area
Shining Rock
Wilderness Area
Blue Ridge Paper Products - Canton Mill 50.4 51.8 124.8 82.1 Domtar Paper Company, LLC N/A N/A N/A N/A Duke Energy Carolinas, LLC - Marshall Steam Station
121.6 128.8 60.2 81.1
PCS Phosphate Company, Inc. - Aurora N/A N/A N/A N/A SGL Carbon LLC N/A N/A N/A N/A Genon NE Mgmt Co/Keystone Station 51.9 N/A N/A N/A TVA – Cumberland Fossil Plant 11.7 7.7 89.8 47.3 Georgia Power Company – Plant Bowen 79.4 96.6 N/A 101.0 TVA – Shawnee Fossil Plant 6.0 4.9 30.9 24.1 Eastman Chemical Company 26.1 63.8 43.2 45.9 Jewell Coke Company LLP N/A N/A N/A N/A Allegheny Energy Supply Co, LLC-Harrison
49.3 130.2 N/A N/A
Monongahela Power Co – Pleasants Power Station
29.4 57.5 45.1 N/A
Entergy Arkansas Inc. - Independence Plant 52.0 38.4 114.7 66.6 New Madrid Power Plant-Marston 39.3 39.8 N/A 62.0 Homer City Gen LP/Center TWP 33.0 N/A N/A N/A Gibson 2.6 3.2 10.8 11.9 Indiana Michigan Power - Rockport 3.8 4.1 9.7 10.6 Cardinal Power Plant - Cardinal Operating Company
N/A N/A N/A N/A
Duke Energy Ohio, Wm. H. Zimmer Station 31.3 47.3 14.6 44.6 General James M. Gavin Power Plant 64.4 87.9 82.9 110.5

Pre-hearing Draft 344 NC Regional Haze SIP for Second Planning Period (2019 – 2028) August 30, 2021
1 “N/A” indicates a nitrate PSAT visibility impact of zero associated with NOx emissions.
• The regional haze planning process is iterative (with SIPs due every 10 years and progress reports due every 5 years) which provides an opportunity to further evaluate source contributions and meteorological conditions that contribute to the nitrate concentrations on specific days at each Class I area. The NCDAQ believes that further research is needed to understand what emission sources and meteorology conditions are contributing to the variability in the nitrate from 2016 – 2019. Further research is also needed to understand what emission sources and meteorology conditions are contributing to the organic carbon fraction as well. The 2028 PSAT modeling completed for this SIP indicates that EGUs and non-EGU facilities in North Carolina have an insignificant contribution to the ammonium nitrate fraction at Class I areas in North Carolina. The modeling suggests that mobile sources in-state and out-of-state and point sources located out-of-state are the main contributors to the nitrate fraction. During the next planning period, the NCDAQ commits to working with the NPS and other interested state and federal agencies to understand the emission sources that are contributing to nitrate and organic carbon concentrations at Class I areas in North Carolina.
10.4.2 Source Selection NPS Comment When identifying emission sources to evaluate for haze reduction opportunities, VISTAS and NC evaluated the potential visibility effects of individual facilities on Class I areas using extinction weighted residence times (EWRT) combined with emissions over distance (Q/d) for individual facilities in an area of influence analysis (AoI). Despite NPS concerns regarding 2028 projections (discussed above), we find this approach is more robust than an emissions divided by distance (Q/d) approach, as it accounts for meteorology on the 20% most-impaired days. In June 2019 NPS recommended that North Carolina evaluate 20 facilities based upon Q/d). Our source selection concern stems from the screening thresholds used that resulted in the selection of very few sources for analysis and offers less protection for the more-impacted Class I areas. We advised VISTAS states of this concern in April 2020. VISTAS states, including North Carolina, used a two-part screening process. Both steps used an individual-facility-percent-of-total-impact screening metric. This type of metric biases the results against the more-visually-impacted Class I areas. In fact, source impacts would have to be 80 times larger to identify a source for analysis in the most-visually-impaired VISTAS Class I area compared to the least-visually-impaired Class I area. The absolute value of the VISTAS thresholds to identify a source affecting Great Smoky Mountains NP is 19 times higher than was needed to identify a source affecting Everglades NP in Florida (the least-visually-impaired VISTAS Class I area). USFS Comment Section 7.8 of NC’s draft RH SIP discusses the methodology that NCDAQ used to determine which sources to analyze for additional controls. Sources both within and out of North Carolina

Pre-hearing Draft 345 NC Regional Haze SIP for Second Planning Period (2019 – 2028) August 30, 2021
were included in the screening (i.e., in the ‘denominator’ of the contribution evaluation), and a source was selected for reasonable progress evaluation / four-factor analysis if the facility was estimated to have a ≥ 1.00% sulfate or ≥ 1.00% nitrate contribution to visibility impairment in 2028 at one or more NC Class I Areas. Three NC facilities were selected for further evaluation, and 12 additional out-of-state facilities were identified as having a ≥ 1.00% sulfate contribution to visibility impairment. USDA Forest Service understands and recognizes that EPA has afforded states the flexibility to screen facilities for additional analysis if that screening is based on reasonable methods. However, we request that NC consider only in-state facilities in the denominator of the contribution equation when screening for sulfate and nitrate visibility contributions at a Class I Area. This methodology would result in a more robust reasonable progress evaluation by focusing on sources permitted by NCDAQ. Additionally, since evaluations / four-factor analyses are time consuming and require additional resources, we would also suggest that NCDAQ consider conducting four-factor analysis on a source category basis rather than on an individual facility basis when warranted. NCDAQ Response The NCDAQ appreciates the analyses the NPS prepared using the Q/d*EWRT values generated by VISTAS. This approach is superior to the Q/d approach which does not account for meteorology or properly weight SO2 vs. NOx impacts on visibility impairment. At some locations, 1 ton of SO2 reduction can have anywhere from twice to more than 100 times the impact on visibility impairment as 1 ton of NOx reduction (see Section 10.4.1 and Table 10-8). The NCDAQ reviewed the NPS analysis and, although it is informative, has taken a different approach to source selection. This approach does recognize the significant progress North Carolina has and is expected to achieve in the future toward improving visibility in its Class I areas which is consistent with EPA’s August 20, 2019 guidance. Regarding the selection of sources for analysis (Step 3), EPA states:
Page 5, Table 1: Select the emission sources for which an analysis of emission control measures will be completed in the second implementation period and explain the bases for these selections. For the purpose of this source selection step, a state may consider estimated visibility impacts (or surrogate metrics for visibility impacts), the four statutory factors, the five required factors listed in section 51.308(f)(2)(iv), and other factors that are reasonable to consider.
Page 9: “A key flexibility of the regional haze program is that a state is not required to evaluate all sources of emissions in each implementation period. Instead, a state may reasonably select a set of sources for an analysis of control measures. The guidance that an analysis of control measures is not required for every source in each implementation period is based on CAA section 169A(b)(2), which requires each SIP to contain emission limits, schedules of compliance, and other measures as may be necessary to make reasonable progress, but …does not provide direction regarding the particular sources or source categories to which such emission limits, etc., must apply. Selecting a set of sources for analysis of control measures in each implementation period is also consistent

Pre-hearing Draft 346 NC Regional Haze SIP for Second Planning Period (2019 – 2028) August 30, 2021
with the Regional Haze Rule, which sets up an iterative planning process and anticipates that a state may not need to analyze control measures for all its sources in a given SIP revision. Specifically, section 51.308(f)(2)(i) of the Regional Haze Rule requires a SIP to include a description of the criteria the state has used to determine the sources or groups of sources it evaluated for potential controls. Accordingly, it is reasonable and permissible for a state to distribute its own analytical work, and the compliance expenditures of source owners, over time by addressing some sources in the second implementation period and other sources in later periods. For the sources that are not selected for an analysis of control measures for purposes of the second implementation period, it may be appropriate for a state to consider whether measures for such sources are necessary to make reasonable progress in later implementation periods.”
Consistent with the RHR, North Carolina followed a process (documented in Sections 7.7 and 7.8) for narrowing the list of sources to consider for selecting for a four-factor analysis. In so doing, the NCDAQ relied on the latest available tools (i.e., PSAT) to understand source impacts on visibility impairment in each Class I area. From the comparison of AoI to PSAT modeling of stationary sources, it became apparent that the AoI methodology overstates impacts close to Class I areas (i.e., <100 Km) and understates impacts associated with stationary sources located further away (i.e., >100 Km) from Class I areas. To prepare for the Round 1 SIP, North Carolina is the only state in the U.S. that evaluated and adopted a rule (i.e., CSA) to significantly control SO2 and NOx emissions from the entire EGU sector. This early action along with significant SO2 and NOx emission reductions from federal and state measures implemented after the CSA has significantly improved visibility throughout North Carolina and border states. These actions have led to the situation that exists today where, as demonstrated from the PSAT modeling, stationary sources outside of North Carolina have a much higher impact on Class I areas in North Carolina than sources in the state. The NCDAQ selected facilities for a reasonable progress/four-factor analysis if the facility’s PSAT contribution was ≥1.00% for sulfate or nitrate. This threshold identified 16 out-of-state facilities in 10 states and 3 North Carolina facilities for reasonable progress/four-factor analysis. Given that this is a “regional” program, the NCDAQ determined that selection of a total of 19 facilities impacting North Carolina Class I areas is reasonable and that it is important to engage with the 10 states with facilities with some of the highest impacts on Class I areas in North Carolina. The factors that contribute to visibility impairment in each Class I area are unique to each Class I area. These factors include geographic location (coastal plain vs. mountains), meteorological patterns, location of emission sources relative to the Class I area, and the types and amounts of the pollutants from both anthropogenic and natural sources. For example, the factors that influence visibility impairment in the Everglades National Park are much different than the factors that impact the Great Smoky Mountains National Park. These are the reasons why the baseline condition (2000-2004) varies between Class I areas. Table 10-9 shows baseline conditions, 2018 observed conditions vs. the URP, and 2028 modeled visibility vs. the URP for the Everglades National Park and Class I Areas in North Carolina. The baseline condition for the Everglades National Park ranges from about 8.6 to 9.6 dv lower than

Pre-hearing Draft 347 NC Regional Haze SIP for Second Planning Period (2019 – 2028) August 30, 2021
baseline conditions for the Great Smoky Mountains National Park and the Linville Gorge and Shining Rock Wilderness Areas. Although natural conditions for the Everglades National Park ranges from about 1.4 to 2 dv lower than natural conditions for the Great Smoky Mountains National Park and the Linville Gorge and Shining Rock Wilderness Areas, the Class I areas in North Carolina still need to achieve a much more significant reduction in emissions to achieve natural conditions as compared to other areas like the Everglades National Park.117 North Carolina recognized this challenge early on which is reflected in the significant improvement in visibility in the Class I areas in the state. For example, in comparing the difference between the 2018 URP minus observed data for each Class I area, the Class I areas in North Carolina have achieved from about 5.3 to 6.4 dv more improvement than the Everglades National Park. For 2028, the Everglades National Park is just 1.57 dv below the URP. The 2028 modeled RPGs for the Class I areas in North Carolina are less than the 2028 URP for the Everglades National Park. Thus, for a given Class I area, it is reasonable for a state to select more sources for four-factor analysis if the Class I area is just below or at the URP, and to select fewer sources if the Class I area is well below the URP. The last column of Table 10-9 shows the amount of visibility improvement projected for 2028 relative to the 2028 URP for each Class I area. These data show that the Class I areas in North Carolina are expected to continue to achieve significantly more progress than the Everglades National Park. Thus, the NCDAQ does not agree that the methods it used for source selection resulted in any bias toward Class I areas in North Carolina.
Table 10-9. Comparison of Baseline Conditions to 2018 Observed and 2028 Modeled Visibility for 20% Most Impaired Days for Everglades National Park versus Class I Areas
in North Carolina
Class I Area
Baseline Average (2000-2004)
2014-2018 Average
Observed1 2018 URP
2018 URP
minus Observed
2028 Modeled
RPG 2028 URP
2028 URP
minus Modeled
Everglades National Park 19.52 14.82 16.91 2.09 13.952 15.52 1.57 Great Smoky Mountains National Park 29.11 17.28 24.66 7.38 15.03 21.49 6.46
Linville Gorge 28.05 16.40 23.77 7.37 14.25 20.71 6.46 Shining Rock 28.13 15.51 23.96 8.45 13.31 20.98 7.76
1 These values represent the average of IMPROVE monitoring data for 2014-2018. 2 Based on EPA’s regional haze modeling for 2028. 10.4.3 Evaluation of NOx Controls for Duke Energy Facilities NPS Comment
117 Table 2-2 and Table 2-3 of this SIP present natural and baseline conditions for Class I areas in North Carolina, respectively. Baseline and natural conditions for the Everglades National Park can be found in Table 4-1 of Appendix E-6.

Pre-hearing Draft 348 NC Regional Haze SIP for Second Planning Period (2019 – 2028) August 30, 2021
We recommend that North Carolina reconsider their source selection decisions by using the underlying VISTAS EWRT*Q/d analysis and applying different thresholds. As we shared during our consultation meeting, this approach identifies five Duke Energy facilities in addition to Blue Ridge Paper Products (already identified by North Carolina) as affecting visibility at Great Smoky Mountains NP. We agree that Blue Ridge Paper Products and the Duke Energy sources identified are already effectively controlled for SO2. However, our initial evaluation indicates that NOx controls at these facilities could be improved. Specifically, we recommend that North Carolina evaluate options to improve on the current NOx control efficiencies, especially the 35–39% NOx emission control efficiency achieved by the existing SNCR at Duke Energy Marshall Steam Station units 1, 2, and 4. There were existing NOx controls associated with these units when the SNCR was added. This percent control efficiency represents the additional control efficiency that the SNCR contributed. These numbers do not represent the overall control efficiency associated with these units. NCDAQ Response The NPS requested a four-factor analysis for NOx for the following Duke Energy facilities:
• Duke Energy Carolinas, LLC - Belews Creek Steam Station • Duke Energy Carolinas, LLC - Cliffside Steam Station • Duke Energy Progress, LLC - Roxboro Steam Electric Plant • Duke Energy Progress, LLC - Mayo Electric Generating Plant • Duke Energy Carolinas, LLC - Marshall Steam Station
Table 7-41 (Comparison of NOx Emissions between 2017, 2018, 2019, and 2028) and Table 7-42 (Controls, Operating Status, and Federal Rules for Duke Energy Facilities) in Section 7.7.3 of this SIP document show actual and projected NOx emissions and NOx controls, respectively, for the coal boilers at the facilities. All coal units at the Belews Creek, Cliffside, and Roxboro are controlled with SCR and combustion controls which represent the best available NOx control systems for coal fired boilers. In addition, projected 2028 NOx emissions are to decrease below recent actual emissions for 2017 through 2019. The two coal fired units at Mayo are also controlled with SCR. The NOx emissions for Mayo are projected to increase somewhat relative to 2017-2019 levels. For the Marshall Steam Station, the NCDAQ reviewed the NOx controls for coal fired units 1, 2, and 4. These units were equipped with SNCR to reduce NOx emissions as part of Duke Energy’s overall NOx control program to comply with the CSA. In addition to SNCR, all three units are also equipped with combustion controls including a low NOx concentric firing system and overfire air/lowered fired low NOx technologies (SOFA/LOFIR). For these three units, the NOx control efficiency ranges from 38-44% for combustion controls (concentric firing system with SOFA/LOFIR) and an additional 32-39% for SNCR. The combined combustion control plus SNCR control efficiency for these units ranges from 58 to 66%. Unit 4 is equipped with combustion controls and SCR. Coal units 3 and 4 currently have the capability to burn natural gas and coal units 1 and 2 are scheduled to be upgraded to burn natural gas in the fall of 2021. The NOx rate is typically less when burning natural gas verses coal. As discussed in Section 7.7.3.1 of this SIP, the PSAT modeling results for total NOx emissions for this facility ranged

Pre-hearing Draft 349 NC Regional Haze SIP for Second Planning Period (2019 – 2028) August 30, 2021
from 0.01% to 0.03% on Class I areas in North Carolina which is well below the 1.00% threshold the NCDAQ used to select sources for a four-factor analysis. Overall, all sources of NOx have been decreasing during the recent period that nitrates have increased. This is to some extent associated with more ammonia available to react with nitric acid as the proportion of SO2 to NOx emissions declines; however, further research is needed to confirm this since the change in the nitrate fraction relative to the sulfate fraction appears to be variable from year to year. The PSAT modeling for 2028 shows that the main contributors to the nitrate fraction in Class I areas in North Carolina not associated with EGUs and non-EGU point sources in North Carolina. All the Duke Energy facilities are well controlled for NOx. Considering this information, along with the fact that sulfates are still the dominate species contributing to light extinction in Class I areas in North Carolina, it is not reasonable to request facilities that are already well-controlled for NOx emissions to conduct a four-factor analysis. 10.4.4 Prescribed Fire Emissions USFS Comment Fire plays an important role in shaping the vegetation and landscape in western North Carolina. Recurring fire has been a part of the landscape for thousands of years. Aggressive fire suppression, coupled with an array of other disturbances (e.g., logging and chestnut blight), has changed the historic composition and structure of the forests. Periodic prescribed burning and other vegetation management can recreate the ecological role of fire in a controlled manner. Fire and fuels management supports a variety of desired conditions and objectives across the Forests (e.g., community protection, hazardous fuels reduction, native ecosystems restoration, historic fire regimes restoration, wildlife openings, and open woodland creation, etc.). The Land Management Plan for the Pisgah and Nantahala National Forests calls for an increase in the use of prescribed fire to increase forest resilience. The 2017 Regional Haze Rule includes a provision to allow states to adjust the glidepath to account for prescribed fire. The draft NC RH SIP states that prescribed fire emissions were taken from the 2011 National Emissions Inventory (NEI) and were carried forward into the 2028 future year emissions without any changes. Recent data on prescribed fire activity, especially within the USDA Forest Service, show that the number of acres burned in prescribed fires during 2011 were lower than all other recent years. For example, within the southern region of the Forest Service a total of 749,080 acres were treated with prescribed fire in 2011, while the average number of acres treated annually from the years 2007-2019 was 980,422. The 2021 target for treatment by prescribed fire within the USDA Forest Service southern region is well over 1 million acres. Furthermore, the Land Management Plans for each of the southern Forests call for a cumulative total of up to 2.1 million acres per year to be treated with prescribed fire in the future. Therefore, keeping prescribed fire emissions steady from to 2028 undercounts emissions in the VISTAS states by up to fifty percent. At this point in the draft RH SIP review process, a quantitative analysis to adjust the glidepaths for actual prescribed fire projections is not practical. While prescribed fire is currently a minor contributor to visibility impairment on the 20% most impaired days, the USDA Forest Service would like assurances that NCDAQ will continue to recognize the important

Pre-hearing Draft 350 NC Regional Haze SIP for Second Planning Period (2019 – 2028) August 30, 2021
ecological role of prescribed fire and in the future adjust the glidepath to account for prescribed fire emissions accordingly. NCDAQ Response The NCDAQ has been a long-time supporter of the use of prescribed fire as a landscape management tool throughout North Carolina. As discussed in Section 7.9.2 (Smoke Management) of this SIP, the NCDAQ works closely with other state and federal agencies to share information and resources and provide consistent messaging in support of prescribed burning and will continue to do so. Using this approach, the NCDAQ has been effective with managing air quality during periods of prescribed fire activity in North Carolina. The EPA’s revised method for selecting the 20% most impaired days to a large extent eliminates days where light extinction is primarily associated with fire activity. This methodology helps to minimize impacts associated with fire activity in the 20% most impaired days evaluated during the development of this SIP. For future planning periods, should the 20% most impaired days show a significant increase in organic carbon that can be attributed to prescribed burning activity, the NCDAQ will consult with the USFS and other North Carolina state and federal agencies as well as with Tennessee to determine if an adjustment to the glidepath in 2064 is necessary for Class I areas in the state. Finally, each year the NCDAQ works closely with the NCFS and federal agencies to collect activity data for prescribed burning and wildfires statewide. During years when EPA prepares the NEI, the NCDAQ submits the activity data for the NEI year to EPA who then calculates the emissions using the SMARTFIRE2-Bluesky modeling framework. Projection of emissions associated with prescribed burning and wildfires is very difficult to do because the amount of activity is highly variable depending on weather conditions and other factors. In addition, projections of increased activity relative to a base year would require creating new fires with assigned location coordinates, fuel type, and the size of each burn which is impractical. Thus, it is standard practice to carry the base year emissions forward to the projection year. Since 2011, the NCDAQ has coordinated with state and federal agencies to improve the collection of activity data which will better reflect the location, size, and duration of fires in the state.
10.5 The NCDEQ Environmental Justice Program and Outreach Plan Regarding the Regional Haze SIP
Environmental justice (EJ) is the fair treatment and meaningful involvement of all people regardless of race, color, national origin, or income, with respect to the development, implementation, and enforcement of environmental laws, regulations, and policies (US EPA).
The EJ Program in the North Carolina Department of Environmental Quality (NCDEQ) was in place for several years and matured to its current role and function in the Department under the direction and support of the Cooper Administration.
NCDEQ’s EJ Program is responsible for assessing the sociodemographic composition of communities in locations proximate to projects pursuing regulatory action with the Department.

Pre-hearing Draft 351 NC Regional Haze SIP for Second Planning Period (2019 – 2028) August 30, 2021
Sociodemographic data at the state-, county-, census tract-, and local-level are pulled from the US EPA’s EJSCREEN Tool, NCDEQ’s Community Mapping System and EJ Tool, and the US Census Bureau. Generally, the EJ Program conducts these analyses when certain types of permit applications or modifications are under NCDEQ review.
If a proposed project is identified as being located within or near a potentially underserved community, an EJ Report is prepared which helps informs the outreach conducted in that community. NCDEQ defines a potentially underserved community as follows:
Racial composition:
• Share of nonwhites is over fifty percent OR • Share of nonwhites is at least ten percent higher than county or state share;
AND
Poverty rate:
• Share of population experiencing poverty is over twenty percent AND • Share of households in poverty is at least five percent higher than the county or state
share
NCDEQ’s Public Participation Plan outlines some of the options for tailored outreach and engagement the Department will conduct in potentially underserved communities. Additionally, the Limited English Proficiency Plan outlines the process of conducting outreach to individuals and communities who may need language assistance in the form of translation or interpretation services.
NCDEQ also works to maintain an open dialogue and line of communication with environmental justice communities, by providing outreach to individuals on an EJ Listserv and through the Department’s work and support of the Secretary’s Environmental Justice and Equity Advisory Board that was established in 2018.
Based on these available tools used by the EJ program, the following EJ evaluation has been conducted to inform the specific EJ focused outreach for this program:
1) Overlaid the Class 1 areas with the most up-to-date map of potentially underserved block groups. The Class 1 areas within North Carolina’s borders are Joyce Kilmer – Slickrock Wilderness Area, Great Smoky Mountains National Park, Shining Rock Wilderness Area, Linville Gorge Wilderness Area, and Swanquarter Wilderness Area. (Figures 10-11 and 10-12)
2) Consulted the Commission of Indian Affairs statewide map to identify potential overlay with federally and state recognized tribes. (Figure 10-13)

Pre-hearing Draft 352 NC Regional Haze SIP for Second Planning Period (2019 – 2028) August 30, 2021
3) Run preliminary EJSCREEN reports around the Class 1 areas118. (Appendix F-5)
Based on the results of the above screenings, the following outreach will be conducted to ensure opportunity for meaningful involvement during the comment period of the Regional Haze State Implementation Plan for North Carolina.
1) Specific outreach to known communities within potentially underserved block groups that overlap or are within 1 mile of the Class 1 areas.
2) Provide project information and updates to the Eastern Band of the Cherokee Nation. 3) Include the DEQ Secretary’s EJ and Equity Advisory Board as well as the EJ listserv on
communications about the comment period and associated public hearing. 4) Provide a phone number in the case of limited internet access for rural and hard to reach
communities, for both the comment period and public hearing. 5) Include a contact for requests for translation services.
Figure 10-11. Map of Potentially Underserved Communities for Great Smoky Mountains National Park, Joyce Kilmer-Slickrock Wilderness Area, Linville Gorge Wilderness Area
and Shining Rock Wilderness Area
118 The Great Smoky Mountains Class 1 area was too large to perform the EJSCREEN analysis so that area was not included in this portion of the analysis.

Pre-hearing Draft 353 NC Regional Haze SIP for Second Planning Period (2019 – 2028) August 30, 2021
Figure 10-12. Map of Potentially Underserved Communities for Swanquarter Wilderness
Area.

Pre-hearing Draft 354 NC Regional Haze SIP for Second Planning Period (2019 – 2028) August 30, 2021
Figure 10-13. The Commission of Indian Affairs Statewide Map
11.0 COMPREHENSIVE PERIODIC IMPLEMENTATION PLAN REVISIONS
40 CFR Section 51.308(f) of the RHR requires North Carolina to revise its regional haze SIP and submit a plan revision to EPA by July 31, 2021, July 31, 2028, and every ten years thereafter. This plan is submitted to meet the July 31, 2021 requirement. In accordance with the requirements listed in Section 51.308(f), North Carolina commits to revising and submitting this regional haze SIP by July 31, 2028, and every ten years thereafter. In addition, Section 51.308(g) of the RHR requires periodic reports evaluating progress towards the RPGs established for each mandatory Class I area. The periodic reports are due by January 31, 2025, July 31, 2033, and every ten years thereafter. North Carolina commits to meeting all of the requirements for 40 CFR 51.308(g), including revising and submitting this regional haze progress report by January 31, 2025, July 31, 2033, and every ten years thereafter. The progress report will evaluate the progress made towards the RPG for each of the Class I areas located within North Carolina and in each Class I area located outside North Carolina that may be affected by emissions from North Carolina sources. All requirements listed in Section 51.308(g) shall be addressed in the periodic report. The requirements listed in 51.308(g) include the following:

Pre-hearing Draft 355 NC Regional Haze SIP for Second Planning Period (2019 – 2028) August 30, 2021
(1) A description of the status of implementation of all measures included in the implementation plan for achieving reasonable progress goals for Class I areas both within and outside the state.
(2) A summary of the emissions reductions achieved throughout the state through implementation of the measures described in paragraph (g)(1) of this section.
(3) For each Class I area within the state, the state must assess the following visibility conditions and changes, with values for most impaired, least impaired and/or clearest days as applicable expressed in terms of 5-year averages of these annual values. The period for calculating current visibility conditions is the most recent 5-year period preceding the required date of the progress report for which data are available as of a date 6 months preceding the required date of the progress report.
(i) The current visibility conditions for the most impaired and clearest days;
(ii) The difference between current visibility conditions for the most impaired and clearest days and baseline visibility conditions;
(iii)The change in visibility impairment for the most impaired and clearest days over the period since the period addressed in the most recent plan required under paragraph 51.308(f).
(4) An analysis tracking the change over the period since the period addressed in the most recent plan required under paragraph 51.308(f) in emissions of pollutants contributing to visibility impairment from all sources and activities within the state. Emissions changes should be identified by type of source or activity. With respect to all sources and activities, the analysis must extend at least through the most recent year for which the state has submitted emissions inventory information to the Administrator in compliance with the triennial reporting requirements of subpart A of 40 CFR 51 as of a date six months preceding the required date of the progress report. With respect to sources that report directly to a centralized emissions data system operated by the Administrator, the analysis must extend through the most recent year for which the Administrator has provided a state-level summary of such reported data or an internet-based tool by which the state may obtain such a summary as of a date six months preceding the required date of the progress report. The state is not required to backcast previously reported emissions to be consistent with more recent emissions estimation procedures, and may draw attention to actual or possible inconsistencies created by changes in estimation procedures.
(5) An assessment of any significant changes in anthropogenic emissions within or outside the state that have occurred since the period addressed in the most recent plan required under 40 CFR 51.308(f) including whether or not these changes in anthropogenic emissions were anticipated in that most recent plan and whether they have limited or impeded progress in reducing pollutant emissions and improving visibility.

Pre-hearing Draft 356 NC Regional Haze SIP for Second Planning Period (2019 – 2028) August 30, 2021
(6) An assessment of whether the current implementation plan elements and strategies are sufficient to enable the state, or other states with Class I areas affected by emissions from the state, to meet all established reasonable progress goals for the period covered by the most recent plan required under 40 CFR 51.308(f).
(7) For progress reports for the first implementation period only, a review of the state's visibility monitoring strategy and any modifications to the strategy as necessary.
(8) For a state with a long-term strategy that includes a smoke management program for prescribed fires on wildland that conducts a periodic program assessment, a summary of the most recent periodic assessment of the smoke management program including conclusions if any that were reached in the assessment as to whether the program is meeting its goals regarding improving ecosystem health and reducing the damaging effects of catastrophic wildfires.
More specifically, the initial five-year Progress Report (due by January 31, 2025, July 31, 2033, and every 10 years thereafter) will examine the effect of emission reductions as well as seek to evaluate the effectiveness of emission management measures implemented. Therefore, this Progress Report will provide for a comparison of emission inventories, ultimately expressing the change in visibility for the most impaired and least impaired days over the past five years. Moreover, due to the uncertainty of some measures, this Progress Report will also provide the opportunity to evaluate the overall effectiveness of proposed measures to reduce visibility impairment to include the effect of state and federal measures. In keeping with the EPA’s requirements and recommendations related to consultation, each five-year review will also enlist the support of appropriate state, local, and tribal air pollution control agencies as well as the corresponding FLMs. The NCDAQ believes that its New Source Review regulations for both nonattainment areas as well as the prevention of significant deterioration will address emissions from new sources that may be located near a Class I area, or increase emissions from major modifications to existing sources. In addition to the NCDAQ regulations that would govern these sources, consultation with the FLMs is also required for sources that are subject to the new source review regulations. The NCDAQ also commits to ongoing consultation with the FLMs throughout the implementation process, including annual discussion of the implementation process and the most recent IMPROVE monitoring data.
12.0 DETERMINATION OF ADEQUACY OF THE EXISTING PLAN
At the same time North Carolina is required to submit any progress reports to EPA, depending on the findings of the 5-year progress report, North Carolina commits to taking one of the actions listed in 40 CFR Section 51.308(h). The findings of the 5-year progress report will determine which action is appropriate and necessary.

Pre-hearing Draft 357 NC Regional Haze SIP for Second Planning Period (2019 – 2028) August 30, 2021
List of Possible Actions - 40 CFR Section 51.308(h): (1) If North Carolina determines that the existing SIP requires no further substantive revision
to achieve established goals, it will provide to EPA a declaration that further revision of the SIP is not needed.
(2) If North Carolina determines that the existing SIP may be inadequate to ensure reasonable
progress due to emissions from other states that participated in the regional planning process, it will provide notification to EPA, and collaborate with the states that participated in regional planning to address the SIP’s deficiencies.
(3) If North Carolina determines that the current SIP may be inadequate to ensure reasonable
progress due to emissions from another country, it will provide notification of such, along with available information making such a demonstration, to EPA.
(4) If North Carolina determines that the existing SIP is inadequate to ensure reasonable
progress due to emissions within the state, it will revise its SIP to address the plan’s deficiencies within one year after submitting such notification to EPA.
13.0 PROGRESS REPORT
13.1 Background On December 17, 2007, North Carolina submitted to EPA for approval its SIP for regional haze to the EPA Region 4.119 The EPA finalized the limited approval of a revision to North Carolina’s SIP on June 13, 2012.120 In a separate action published on June 7, 2012, EPA finalized a limited disapproval of this same SIP for relying on the Clean Air Interstate Rule (CAIR) as being equal to or better than Best Available Retrofit Technology (BART) and concerns about a long-term strategy sufficient to achieve RPGs.121 To correct the deficiency, on October 31, 2014, North Carolina submitted to EPA for approval a SIP revision based on the requirements specified in the RHR (70 FR 39104) and Alternative BART Final Rulemaking (71 FR 60612).122 On June 23, 2016, EPA approved the SIP revision because the SIP revision corrected the deficiencies that led to EPA’s limited disapproval of the State’s regional haze SIP on June 7, 2012, and converted its June 27, 2012, limited approval to a full approval.123
119 Regional Haze State Implementation Plan for North Carolina Class I Areas, December 17, 2007. 120 Final Rule: Approvals and Promulgations of Implementation Plans: State of North Carolina; Regional Haze State Implementation Plan (77 FR 38185, June 27, 2012). Signed June 13, 2012, by Mr. Stanley Meiburg, Acting Regional Administrator, EPA Region 4, with an effective date of July 27, 2012. 121 Final Rule: Air Plan Approval; North Carolina; Regional Haze Progress Report (81 FR 58400, August 25, 2016). Signed May 30, 2012, by Ms. Lisa P. Jackson, EPA Administrator, with an effective date of August 6, 2012. 122 Regional Haze SIP Revision for North Carolina Class I Areas - Alternative to Source Specific Best Available Retrofit Technology Demonstration (BART) for Electric Generating Units, October 31, 2014. 123 Final Rule: Air Plan Approval; North Carolina; Regional Haze (81 FR 32652, May 24, 2016). Signed May 12, 2016, by Ms. Heather McTeer Toney, Regional Administrator, EPA Region 4, with an effective date of June 23, 2016.

Pre-hearing Draft 358 NC Regional Haze SIP for Second Planning Period (2019 – 2028) August 30, 2021
Paragraph 40 CFR 51.308(g) of the RHR requires that states report on the success of the long-term strategy at specific intervals. Each state must submit a report to EPA every five years evaluating the progress towards the RPG for each Class I area located within the state and in each Class I area located outside the state which may be affected by emissions from within the state. At a minimum, the progress report must cover the first year not covered by the previously submitted progress report through the most recent year of data available prior to submission. The revised RHR no longer requires the progress report to be a formal SIP submittal; however, a state is required to provide an opportunity for public comment on each progress report before submitting the final to EPA. On June 15, 2016, North Carolina submitted the first regional haze progress report to EPA, which demonstrated that North Carolina was on track to meet the RPGs set in the regional haze SIP.124 The EPA approved this progress report on August 25, 2016.125 This previous progress report covered the period from 2006-2010. In accordance with 40 CFR 51.308(f)(5) of the RHR rule, this progress report addresses the requirements specified in 40 CFR 51.308(g)(1) through (g)(5) of the RHR rule for the period 2011-2018.
13.2 Status of Implementation of Control Measures (40 CFR 51.308 (g)(1)) Paragraph 40 CFR 51.308(g)(1) of the RHR requires a state to provide a description of the status of implementation of all measures included in the implementation plan for achieving reasonable progress goals for Class I areas both within and outside the State. Table 13-1 provides a list of key control measures and other emission reduction actions by source sector included in North Carolina’s long-term strategy (LTS) for the first planning period (2008-2018). The table also identifies actions that were not anticipated when North Carolina prepared the LTS for its first regional haze SIP but contributed to emission reductions during the first planning period. The measures include, among other things, applicable Federal programs (e.g., mobile source rules, Maximum Achievable Control Technology standards), Federal consent agreements, and Federal and state control strategies for EGUs. Section 7.2.1 of this SIP provides a brief description of each measure/action except for the extensive list of MACT standards which are identified in Table 13-2. The point source sectors in the following tables include Industrial Processes, Fuel Combustion Electric Utility, and Fuel Combustion Industrial. The Fuel Combustion Other category also
124 Regional Haze 5-Year Periodic Review State Implementation Plan for North Carolina Class I Areas, May 31, 2013. 125 Final Rule: Air Plan Approval; North Carolina; Regional Haze Progress Report (81 FR 58400, August 25, 2016). Signed August 15, 2016, by Ms. Heather McTeer Toney, Regional Administrator, EPA Region 4, with an effective date of September 26, 2016.
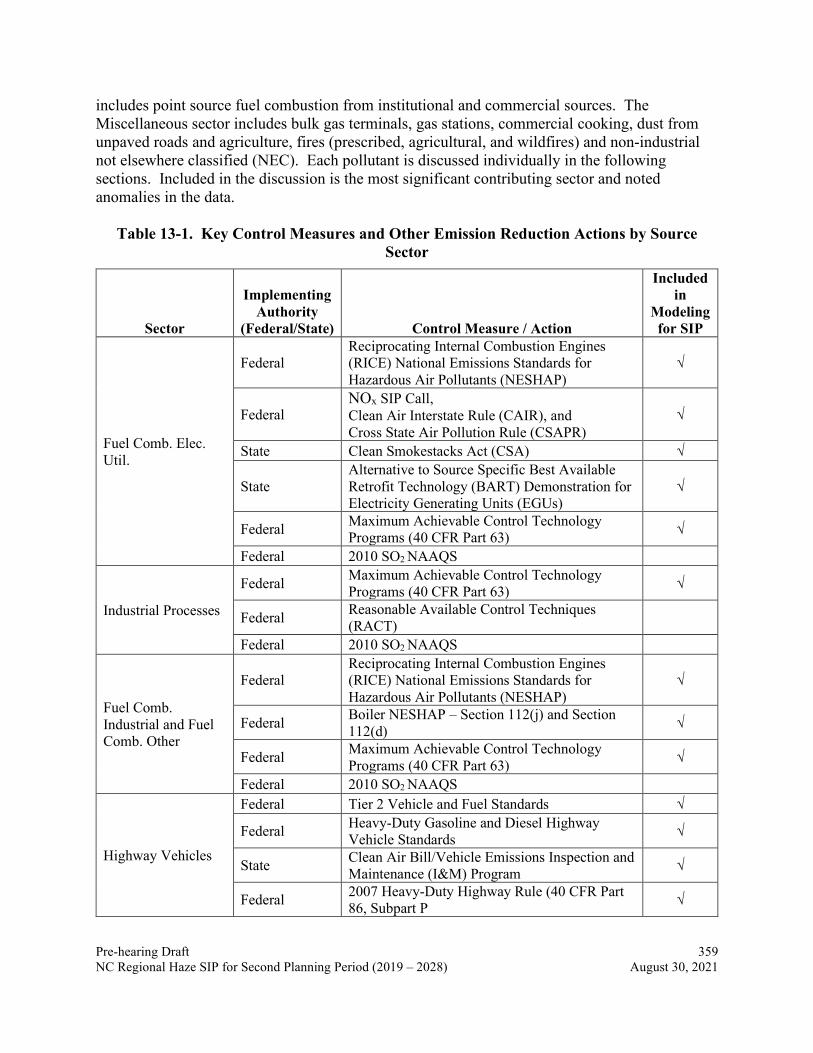
Pre-hearing Draft 359 NC Regional Haze SIP for Second Planning Period (2019 – 2028) August 30, 2021
includes point source fuel combustion from institutional and commercial sources. The Miscellaneous sector includes bulk gas terminals, gas stations, commercial cooking, dust from unpaved roads and agriculture, fires (prescribed, agricultural, and wildfires) and non-industrial not elsewhere classified (NEC). Each pollutant is discussed individually in the following sections. Included in the discussion is the most significant contributing sector and noted anomalies in the data.
Table 13-1. Key Control Measures and Other Emission Reduction Actions by Source Sector
Sector
Implementing Authority
(Federal/State) Control Measure / Action
Included in
Modeling for SIP
Fuel Comb. Elec. Util.
Federal Reciprocating Internal Combustion Engines (RICE) National Emissions Standards for Hazardous Air Pollutants (NESHAP)
√
Federal NOx SIP Call, Clean Air Interstate Rule (CAIR), and Cross State Air Pollution Rule (CSAPR)
√
State Clean Smokestacks Act (CSA) √
State Alternative to Source Specific Best Available Retrofit Technology (BART) Demonstration for Electricity Generating Units (EGUs)
√
Federal Maximum Achievable Control Technology Programs (40 CFR Part 63) √
Federal 2010 SO2 NAAQS
Industrial Processes
Federal Maximum Achievable Control Technology Programs (40 CFR Part 63) √
Federal Reasonable Available Control Techniques (RACT)
Federal 2010 SO2 NAAQS
Fuel Comb. Industrial and Fuel Comb. Other
Federal Reciprocating Internal Combustion Engines (RICE) National Emissions Standards for Hazardous Air Pollutants (NESHAP)
√
Federal Boiler NESHAP – Section 112(j) and Section 112(d) √
Federal Maximum Achievable Control Technology Programs (40 CFR Part 63) √
Federal 2010 SO2 NAAQS
Highway Vehicles
Federal Tier 2 Vehicle and Fuel Standards √
Federal Heavy-Duty Gasoline and Diesel Highway Vehicle Standards √
State Clean Air Bill/Vehicle Emissions Inspection and Maintenance (I&M) Program √
Federal 2007 Heavy-Duty Highway Rule (40 CFR Part 86, Subpart P √

Pre-hearing Draft 360 NC Regional Haze SIP for Second Planning Period (2019 – 2028) August 30, 2021
Sector
Implementing Authority
(Federal/State) Control Measure / Action
Included in
Modeling for SIP
Off-Highway Federal Large Nonroad Diesel Engines and Fuel
Standards Rule √
Federal Nonroad Spark Ignition Engines and Recreational Engines Standards √
Waste Disposal & Recycling Federal Maximum Achievable Control Technology
Programs (40 CFR Part 63) √
Miscellaneous None
Table 13-2. MACT Source Categories with Compliance Dates on or after 2002
MACT Source Category 40CFR63 Subpart
Date Promulgated
Existing Source
Compliance Date
Pollutants Affected
Hazardous Waste Combustion (Phase I)
Parts 63(EEE),
261 and 270 9/30/99 9/30/03 PM
Oil & Natural Gas Production HH 6/17/99 6/17/02 VOC
Polymers and Resins III OOO 1/20/00 1/20/03 VOC
Portland Cement Manufacturing LLL 6/14/99 6/10/02 PM
Publicly Owned Treatment Works (POTW) VVV 10/26/99 10/26/02 VOC
Secondary Aluminum Production RRR 3/23/00 3/24/03 PM
Combustion Sources at Kraft, Soda, and Sulfite Pulp & Paper Mills (Pulp and Paper MACT II)
MM 1/12/01 1/12/04 VOC
Municipal Solid Waste Landfills AAAA 1/16/03 1/16/04 VOC
Coke Ovens L 10/27/93 Phased from 1995-2010 VOC
Coke Ovens: Pushing, Quenching, and Battery Stacks CCCCC 4/14/03 4/14/06 VOC
Asphalt Roofing Manufacturing and Asphalt Processing (two source categories)
LLLLL 4/29/03 5/1/06 VOC
Metal Furniture (Surface Coating) RRRR 5/23/03 5/23/06 VOC Printing, Coating, and Dyeing of Fabrics OOOO 5/29/03 5/29/06 VOC

Pre-hearing Draft 361 NC Regional Haze SIP for Second Planning Period (2019 – 2028) August 30, 2021
MACT Source Category 40CFR63 Subpart
Date Promulgated
Existing Source
Compliance Date
Pollutants Affected
Wood Building Products (Surface Coating) QQQQ 5/28/03 5/28/06 VOC
Lime Manufacturing AAAAA 1/5/04 1/5/07 PM, SO2 Site Remediation TSDF GGGGG 10/8/03 10/8/06 VOC Iron & Steel Foundries EEEEE 4/22/04 04/23/07 VOC Taconite Iron Ore Processing RRRRR 10/30/03 10/30/06 PM, SO2 Miscellaneous Coating Manufacturing HHHHH 12/11/03 12/11/06 VOC
Metal Can (Surface Coating) KKKK 11/13/03 11/13/06 VOC Plastic Parts and Products (Surface Coating) PPPP 4/19/04 4/19/07 VOC
Miscellaneous Metal Parts and Products (Surface Coating) MMMM 1/2/04 1/2/07 VOC
Industrial, Commercial, and Institutional Boilers and Process Heaters for Major Sources c
DDDDD 1/31/13 1/31/16 PM SO2
Industrial, Commercial, and Institutional Boilers and Process Heaters for Area Sources
JJJJJJ 2/1/13 3/21/14 PM SO2
Plywood and Composite Wood Products DDDD 7/30/04 10/1/07 VOC
Reciprocating Internal Combustion Engines ZZZZ 6/15/04 6/15/07 NOx, VOC
Auto and Light-Duty Truck (Surface Coating) IIII 4/26/04 4/26/07 VOC
Wet Formed Fiberglass Mat Production HHHH 4/11/02 4/11/05 VOC
Metal Coil (Surface Coating) SSSS 6/10/02 6/10/05 VOC Paper and Other Web Coating (Surface Coating) JJJJ 12/4/02 12/4/05 VOC
Petroleum Refineries UUU 4/11/02 4/11/05 VOC Miscellaneous Organic Chemical Production (MON) FFFF 11/10/03 05/10/08 VOC
The following Section 13.3, Section 13.5, and Section 13.6 provide documentation of the emission reductions associated with the implementation of the measures included in the long-term strategy for the first planning period. North Carolina’s previous progress report documents the implementation of measures by other states (e.g., Florida, Georgia, Indiana, Kentucky, Maryland, South Carolina, Ohio, Tennessee, Virginia, and West Virginia) to reduce EGU and

Pre-hearing Draft 362 NC Regional Haze SIP for Second Planning Period (2019 – 2028) August 30, 2021
non-EGU point source emissions that may have improved visibility in Class I areas in North Carolina.
13.3 Summary of Emission Reductions Achieved (40 CFR 51.308(g)(2)) Paragraph 40 CFR 51.308(g)(2) of the RHR specifies that a state must provide a summary of the emissions reductions achieved throughout the State through implementation of the measures described in 40 CFR 51.308(g)(1). This section provides a summary of emissions reduced as a result of implementation measures described in Section 13-2. It specifically focuses on SO2 emission reductions because, for the first planning period, ammonium sulfate has been determined to be the most important contributor to visibility impairment and fine particle mass on the 20% worst and 20% best visibility days at all the North Carolina Class I areas. Sulfate particles are formed in the atmosphere from SO2 emissions. Additional discussion on pollutant contributions to visibility impairment is provided in Section 2.5 and Section 2.6 of this SIP. 13.3.1 EGU SO2 Emission Reductions Table 13-3 lists the coal-fired EGUs in North Carolina that were previously projected to have controls installed by 2018 in the original regional haze SIP. This table compares actual 2011 to the Integrated Planning Model (IPM) predicted 2018 emissions used in the modeling for the original regional haze SIP, as well as actual 2018 that have become available after the previous progress report was prepared in 2013 covering the period 2006-2010. The actual 2011 and 2018 emissions data for these sources was obtained from the USEPA’s Clean Air Markets (CAMD) database. The table also identifies the EGU the retirement date, if applicable. As shown in Table 13-3, the 2018 projections SO2 emissions were estimated to increase by 27% relative to 2011 emissions; however, a comparison of 2011 to 2018 actual emissions show a decrease of 79%. Duke Energy Progress (DEP) and Duke Progress Carolinas (DEC) facilities together emitted a total of 73,456 tons of SO2 emissions in 2011 and 15,130 tons in 2018. Since the EGU sector represents over 50% of statewide SO2 emissions from stationary sources, this is a clear sign that the Class I areas in North Carolina are on track to meet or exceed their emission reduction goals. For NOx emissions, both utilities emitted a total of 39,285 tons in 2011 and 27,305 tons in 2018 from their coal-fired EGUs in North Carolina. Their statewide NOx emissions dropped over 11,980 tons representing a 30% reduction from 2011-2018. The state’s CSA is one of the most important actions that North Carolina implemented to achieve early reductions for improving visibility in North Carolina’s Class I areas. The state law required the coal-fired EGUs subject to the CSA (identified in Table 13-3) to reduce annual NOx emissions by 77% by 2009, and to reduce annual SO2 emissions by 49% by 2009 and 73% by 2013. This law set a NOx emissions cap of 56,000 TPY starting in 2009, and SO2 emissions caps of 250,000 TPY and 130,000 tons/year starting in 2009 and 2013, respectively. The affected EGUs were equipped with flue-gas desulfurization scrubbers to control SO2 and either selective catalytic reduction or non-selective catalytic reduction to control NOx emissions. In 2011, the affected EGUs were 16,176 tons (30%) below the 2009 NOx cap and 56,546 tons (43%) below

Pre-hearing Draft 363 NC Regional Haze SIP for Second Planning Period (2019 – 2028) August 30, 2021
the 2013 SO2 cap. In 2018, the CSA affected EGUs were 28,695 tons (51%) below the 2009 NOx cap and 114,869 tons (88%) below the 2013 SO2 cap. Thus, the affected EGUs have continued to remain well below the NOx and SO2 emission caps.
Table 13-3. Comparison of 2011 and 2018 Emissions for Coal-Fired EGUs Evaluated During First Planning Period (TPY)
Company - Facility
Emission Unit
Actual Emissions
(2011 CAMD)
VISTAS IPM
Projections (2018)
Difference (2011-2018
VISTAS)
Actual Emissions
(2018 CAMD)
Difference (2011 CAMD
- 2018 CAMD)
Retirement Date (2011
- 2018) DEP - Asheville
1 1,039 576 463 390 649 1/29/2020 2 1,203 499 704 388 815 1/29/2020
DEP - Cape Fear
5 3,415 3,379 36 0 3,415 9/30/2012 6 4,688 4,300 388 0 4,688 9/30/2012
DEP - H.F. Lee
1 1,545 2,918 -1,373 0 1,545 9/30/2012 2 1,015 2,363 -1,348 0 1,015 9/30/2012 3 7,047 6,976 71 0 7,047 9/30/2012
DEP - Mayo
1A 4,053 954 3,099 784 3,269 1B 3,182 953 2,229 628 2,554
DEP - Roxboro
1 1,650 999 651 444 1,206 2 1,864 2,438 -574 1,207 657
3A 1,383 1,071 312 442 941 3B 1,336 1,071 265 471 865 4A 1,610 1,253 357 571 1,039 4B 1,491 1,253 238 470 1,021
DEP - L.V. Sutton
1 2,048 2,357 -309 0 2,048 11/27/2013 2 2,083 3,711 -1,628 0 2,083 11/27/2013 3 8,850 1,037 7,813 0 8,850 11/27/2013
DEP - Weather-spoon
1 226 912 -686 0 226 1/20/2012 2 545 1,151 -606 0 545 1/20/2012 3 1,143 2,756 -1,613 0 1,143 1/20/2012
DEC - GG Allen
1 225 173 52 23 202 2 202 216 -14 25 177 3 366 741 -375 38 328 4 400 728 -328 42 358 5 472 715 -243 118 354
DEC - Buck
5 0 1,104 -1,104 0 0 5/14/2011 6 0 1,064 -1,064 0 0 5/14/2011 7 0 610 -610 0 0 5/14/2011 8 1,932 3,155 -1,223 0 1,932 3/31/2013 9 1,907 4,001 -2,094 0 1,907 3/31/2013 1 0 1,049 -1,049 0 0 10/1/2011

Pre-hearing Draft 364 NC Regional Haze SIP for Second Planning Period (2019 – 2028) August 30, 2021
Company - Facility
Emission Unit
Actual Emissions
(2011 CAMD)
VISTAS IPM
Projections (2018)
Difference (2011-2018
VISTAS)
Actual Emissions
(2018 CAMD)
Difference (2011 CAMD
- 2018 CAMD)
Retirement Date (2011
- 2018)
DEC - Cliffside
2 0 882 -882 0 0 10/1/2011 3 0 1,962 -1,962 0 0 10/1/2011 4 0 2,014 -2,014 0 0 10/1/2011 5 308 1,952 -1,644 441 -133 6* 0 0 0 908 -908
DEC - Dan River
1 438 3,464 -3,026 0 438 3/31/2012 2 440 1,498 -1,058 0 440 3/31/2012 3 1,069 1,837 -768 0 1,069 3/31/2012
DEC - Marshall
1 577 2,243 -1,666 485 92 2 681 2,208 -1,527 345 336 3 1,291 485 806 1,440 -149 4 1,305 470 835 1,351 -46
DEC - Riverbend
7 1,128 2,592 -1,464 0 1,128 3/31/2013 8 1,204 1,511 -307 0 1,204 3/31/2013 9 2,381 3,973 -1,592 0 2,381 3/31/2013 10 2,406 3,973 -1,567 0 2,406 3/31/2013
DEC - Belews Creek
1 1,676 2,536 -860 2,460 -784
2 1,632 3,218 -1,586 1,659 -27
Totals 73,456 93,301 -19,845 15,130 58,326 Percent Reduction in Actual Emissions from 2011 to 2018 79%
* New coal unit started up January 24, 2012.
13.3.2 Non-EGU SO2 Emission Reductions In the previous progress report, the NCDAQ reported on the status of SO2 emissions for the following five non-EGU facilities: Blue Ridge Paper Products - Canton Mill; Domtar Paper Company - Plymouth Mill; International Paper - New Bern Mill; PCS Phosphate - Aurora; and Coastal Carolina Clean Power – Kenansville. These five facilities were identified during development of the first regional haze SIP for a reasonable progress evaluation. Based on that evaluation, no additional SO2 controls were required of the facilities at the time. The previous 5-year progress report, prepared in 2013, presented actual 2011 and estimated 2018 emissions used for modeling (which were higher than 2011 actual emissions for all five facilities). We now have actual 2018 emissions for these facilities which are compared to actual 2011 emissions in Table 13-4. Except for Domtar Paper Company, SO2 emissions were significantly reduced or eliminated as the results of installing SO2 controls or because the facility closed. Overall, there has been a 58% reduction in SO2 emissions associated with the five facilities.

Pre-hearing Draft 365 NC Regional Haze SIP for Second Planning Period (2019 – 2028) August 30, 2021
Table 13-4. Comparison of 2011 and 2018 Emissions for Non-EGU Facilities Evaluated During First Planning Period (TPY)
Company - Facility
EIS Facility
ID
Actual Emissions
(2011)
VISTAS Projections
(2018)
Difference (2011-2018 VISTAS)
Actual Emissio
ns (2018)
Difference (2011 – 2018
Actual) Notes Blue Ridge Paper Products - Canton Mill
7920511 8,512 10,147 -1,635 4,495 4,017
PCS Phosphate - Aurora
8479311 5,395 6,059 -664 3,439 1,956
Domtar Paper Company - Plymouth Mill
8049311 711 3,865 -3,154 872 -161 Formerly Weyerhaeuser - Plymouth Mill
International Paper - New Bern Mill
8122711 506 1,200 -694 1 505
Formerly Weyerhaeuser – New Bern/Vanceboro Mill
Coastal Carolina Clean Power - Kenansville
8003211 107 1,834 -1,727 0 107
Formerly Cogentrix. Facility permanently closed effective 6/27/2017
Totals 15,231 23,105 -7,874 8,807 6,424
Percent Reduction in Actual Emissions from 2011 to 2018 58%
13.4 Assessment of Visibility Conditions (40 CFR 51.308(g)(3)) Paragraph 40 CFR 51.308(g)(3) of the RHR specifies that a state document the following: For each Class I area within the State, the State must assess the following visibility conditions and changes, with values for most impaired, least impaired and/or clearest days as applicable expressed in terms of 5-year averages of these annual values. The period for calculating current visibility conditions is the most recent 5-year period preceding the required date of the progress report for which data are available as of a date 6 months preceding the required date of the progress report. 13.4.1 Reasonable Progress Goals for 2018 Table 13-5 compares baseline visibility to the 2018 RPGs for Class I areas in North Carolina for the 20% worst and 20% best visibility days, which were the metrics used in the first regional haze planning period (see Section 13.4.2 for the rationale for this). The 2018 RPGs are based on the revised RPGs presented in Table 4-2 of North Carolina’s first "Regional Haze 5-Year Periodic Review State Implementation Plan for North Carolina Class I Areas” dated May 31, 2013. An IMPROVE monitor is not located in the Joyce Kilmer-Slickrock Wilderness Area so
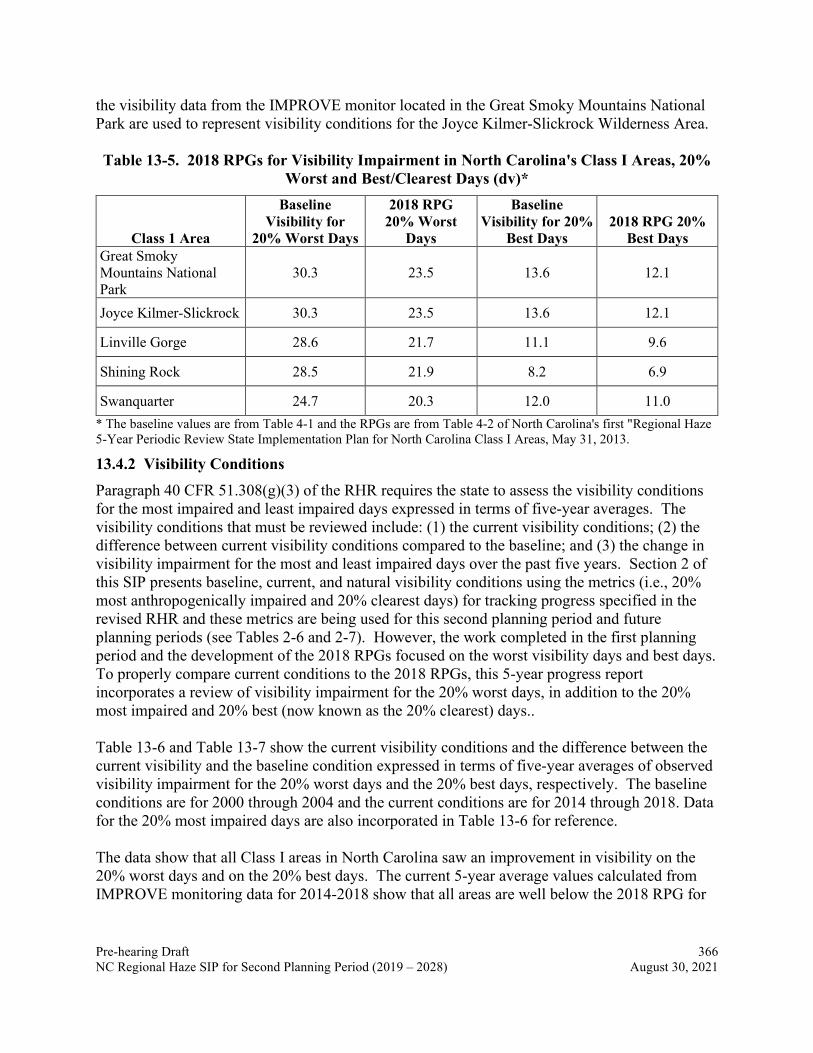
Pre-hearing Draft 366 NC Regional Haze SIP for Second Planning Period (2019 – 2028) August 30, 2021
the visibility data from the IMPROVE monitor located in the Great Smoky Mountains National Park are used to represent visibility conditions for the Joyce Kilmer-Slickrock Wilderness Area. Table 13-5. 2018 RPGs for Visibility Impairment in North Carolina's Class I Areas, 20%
Worst and Best/Clearest Days (dv)*
Class 1 Area
Baseline Visibility for
20% Worst Days
2018 RPG 20% Worst
Days
Baseline Visibility for 20%
Best Days 2018 RPG 20%
Best Days Great Smoky Mountains National Park
30.3 23.5 13.6 12.1
Joyce Kilmer-Slickrock 30.3 23.5 13.6 12.1
Linville Gorge 28.6 21.7 11.1 9.6
Shining Rock 28.5 21.9 8.2 6.9
Swanquarter 24.7 20.3 12.0 11.0 * The baseline values are from Table 4-1 and the RPGs are from Table 4-2 of North Carolina's first "Regional Haze 5-Year Periodic Review State Implementation Plan for North Carolina Class I Areas, May 31, 2013.
13.4.2 Visibility Conditions Paragraph 40 CFR 51.308(g)(3) of the RHR requires the state to assess the visibility conditions for the most impaired and least impaired days expressed in terms of five-year averages. The visibility conditions that must be reviewed include: (1) the current visibility conditions; (2) the difference between current visibility conditions compared to the baseline; and (3) the change in visibility impairment for the most and least impaired days over the past five years. Section 2 of this SIP presents baseline, current, and natural visibility conditions using the metrics (i.e., 20% most anthropogenically impaired and 20% clearest days) for tracking progress specified in the revised RHR and these metrics are being used for this second planning period and future planning periods (see Tables 2-6 and 2-7). However, the work completed in the first planning period and the development of the 2018 RPGs focused on the worst visibility days and best days. To properly compare current conditions to the 2018 RPGs, this 5-year progress report incorporates a review of visibility impairment for the 20% worst days, in addition to the 20% most impaired and 20% best (now known as the 20% clearest) days.. Table 13-6 and Table 13-7 show the current visibility conditions and the difference between the current visibility and the baseline condition expressed in terms of five-year averages of observed visibility impairment for the 20% worst days and the 20% best days, respectively. The baseline conditions are for 2000 through 2004 and the current conditions are for 2014 through 2018. Data for the 20% most impaired days are also incorporated in Table 13-6 for reference. The data show that all Class I areas in North Carolina saw an improvement in visibility on the 20% worst days and on the 20% best days. The current 5-year average values calculated from IMPROVE monitoring data for 2014-2018 show that all areas are well below the 2018 RPG for

Pre-hearing Draft 367 NC Regional Haze SIP for Second Planning Period (2019 – 2028) August 30, 2021
the 20% worst days. On the 20% best days, the observed 5-year average values for 2014-2018 show that all areas are below the 2018 goal of no degradation.
Table 13-6. Current Observed Visibility Impairment, Change from Baseline, and Comparison to 2018 RPGs, 20% Worst & 20% Most Impaired Days (dv)
Class I Area
Baseline Average
(2000-2004)
Current Average
(2014-2018)
Difference, Current – Baseline
2018 RPG
Difference, Current –
RPG 20% Worst Days Great Smoky Mountains National Park
30.3 18.7 -11.6 23.5 -4.8
Joyce Kilmer-Slickrock 30.3 18.7 -11.6 23.5 -4.8 Linville Gorge 28.6 18.3 -10.3 21.7 -3.4 Shining Rock 28.5 17.5 -11.0 21.9 -4.4 Swanquarter 24.7 18.2 -6.5 20.3 -2.1 20% Most Impaired Days Great Smoky Mountains National Park
29.11 17.21 -11.90 N/A N/A
Joyce Kilmer-Slickrock 29.11 17.21 -11.90 N/A N/A Linville Gorge 28.05 16.42 -11.63 N/A N/A Shining Rock 28.13 15.49 -12.64 N/A N/A Swanquarter 23.79 16.30 -7.49 N/A N/A
Table 13-7. Current Observed Visibility Impairment, Change from Baseline, and
Comparison to 2018 RPGs, 20% Best/Clearest Days
Class I Area
Baseline Average
(2000-2004)
Current Average
(2014-2018)
Difference, Current – Baseline
2018 RPG
Difference, current – RPG
Great Smoky Mountains National Park 13.6 8.4 -5.2 12.1 -3.7
Joyce Kilmer-Slickrock 13.6 8.4 -5.2 12.1 -3.7 Linville Gorge 11.1 7.6 -3.5 9.5 -1.9 Shining Rock 8.2 4.4 -3.8 6.9 -2.5 Swanquarter 12.0 10.6 -1.4 10.9 -0.3
The Swanquarter Wilderness Area observed a slight degradation in visibility for the 20% best days during the initial 2006-2010 evaluation period. The NCDAQ documented in its 2013 progress report that visibility at Swanquarter during the 20% best days was expected to improve in the coming years and no additional actions were needed. Based on an evaluation of the IMPROVE data, visibility has since improved at Swanquarter and 2018 values are both below the baseline and below the 2018 RPG.

Pre-hearing Draft 368 NC Regional Haze SIP for Second Planning Period (2019 – 2028) August 30, 2021
13.4.3 Visibility Trends Table 13-8 shows the change in visibility impairment for the 20% worst, 20% most impaired, and 20% best days over the past 5 years in terms of the 5-year averages. For the 20% worst days, the overall trend is towards improvement in visibility, although it should be noted that a slight increase in 20% worst day impairment in the Shining Rock Wilderness area occurred in 2016 due to unprecedented wildfire activity upwind of the region (see Figure 13-5). On the 20% most impaired days and 20% best days, a similar trend towards improvement is seen. Note that the change in visibility impairment for the 20% most impaired days for each Class I area in North Carolina is presented in Sections 3 and 7 (see Figure 7-10 Through Figure 7-13).
Table 13-8. Observed Visibility Impairment for Five-Year Periods through 2018, 20% Worst Days, 20% Most Impaired Days, 20% Best/Clearest Days (dv)
2010 - 2014 2011 - 2015 2012 - 2016 2013 - 2017 2014 - 2018 20% Worst Days Great Smoky Mountains National Park
21.9 20.9 19.7 19.1 18.7
Joyce Kilmer-Slickrock 21.9 20.9 19.7 19.1 18.7 Linville Gorge 20.9 20.0 19.2 18.8 18.3 Shining Rock 18.9 18.5 18.7 18.0 17.5 Swanquarter 21.4 20.5 19.1 18.6 18.2 20% Most Impaired Days Great Smoky Mountains National Park
20.8 19.7 18.4 17.8 17.3
Joyce Kilmer-Slickrock 20.8 19.7 18.4 17.8 17.3 Linville Gorge 19.6 18.6 17.4 17.0 16.4 Shining Rock 17.7 17.3 16.9 16.2 15.5 Swanquarter 18.9 17.8 17.2 16.8 16.2 20% Best/Clearest Days Great Smoky Mountains National Park
10.7 9.7 9.2 8.8 8.4
Joyce Kilmer-Slickrock 10.7 9.7 9.2 8.8 8.4 Linville Gorge 9.5 8.5 8.4 8.0 7.6 Shining Rock 5.2 4.8 4.8 4.6 4.4 Swanquarter 11.5 11.2 11.2 10.8 10.6
The following figures show the data in Table 13-8, as well as the URP for the 20% worst and 20% best days for the Class I areas in North Carolina. For the 20% worst day figures, the blue diamonds are the average annual visibility impairment, the thin burgundy line is the rolling 5-year average, the pink line is the URP, the light purple line with triangles is the modeled predictions used to establish the RPGs listed in Table 13-6, and the thick green line represents predicted natural conditions in 2064. For the 20% best day figures, the blue diamonds are the average annual visibility impairment, the thin burgundy line is the rolling 5-year average, and the

Pre-hearing Draft 369 NC Regional Haze SIP for Second Planning Period (2019 – 2028) August 30, 2021
light purple line with triangles is the modeled predictions used to establish the RPGs listed in Table 13-7. Note that Section 7.2.6.3 present similar charts for the 20% most anthropogenically impaired and 20% clearest days.
Figure 13-1. Visibility Conditions at Great Smoky Mountains National Park and Joyce
Kilmer-Slickrock Wilderness Area for the 20% worst days

Pre-hearing Draft 370 NC Regional Haze SIP for Second Planning Period (2019 – 2028) August 30, 2021
Figure 13-2. Visibility Conditions at Great Smoky Mountains National Park and Joyce
Kilmer-Slickrock Wilderness Area for the 20% best days
Figure 13-3. Visibility Conditions at Linville Gorge Wilderness Area for the 20% worst
days

Pre-hearing Draft 371 NC Regional Haze SIP for Second Planning Period (2019 – 2028) August 30, 2021
Figure 13-4. Visibility Conditions at Linville Gorge Wilderness Area for the 20% best days
Figure 13-5. Visibility Conditions at Shining Rock Wilderness Area for the 20% worst
days

Pre-hearing Draft 372 NC Regional Haze SIP for Second Planning Period (2019 – 2028) August 30, 2021
Figure 13-6. Visibility Conditions at Shining Rock Wilderness Area for the 20% best days
Figure 13-7. Visibility Conditions at Swanquarter Wilderness Area for the 20% worst days
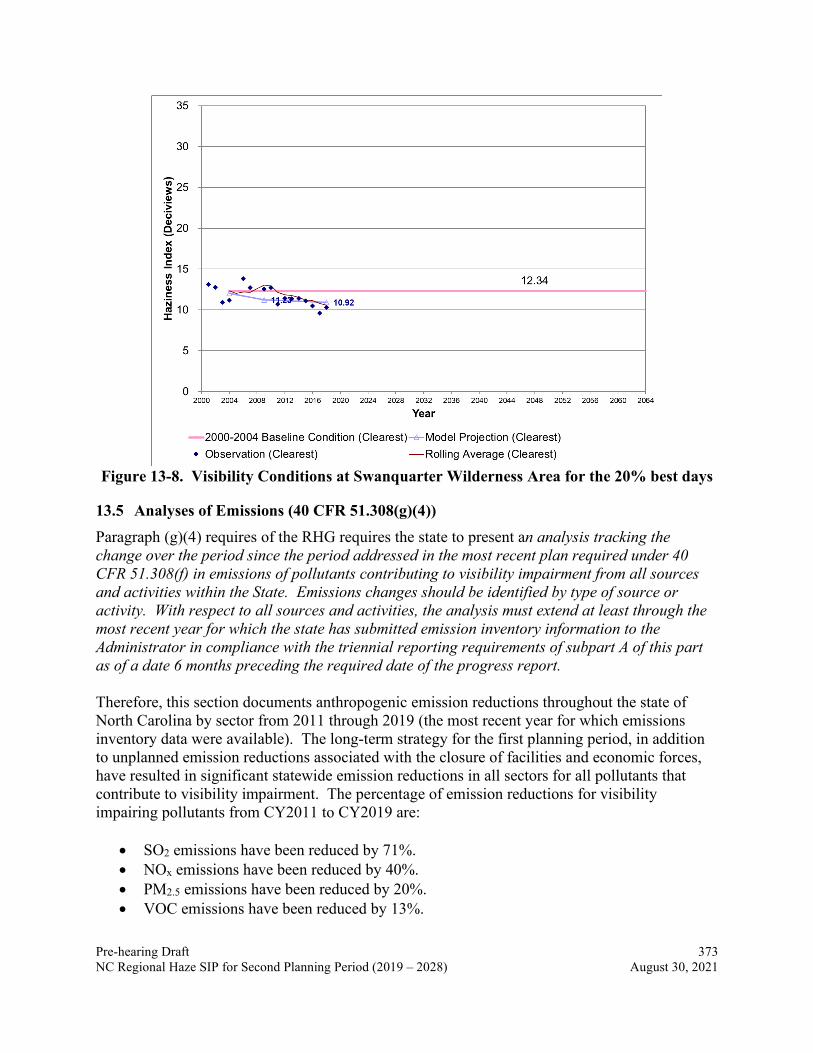
Pre-hearing Draft 373 NC Regional Haze SIP for Second Planning Period (2019 – 2028) August 30, 2021
Figure 13-8. Visibility Conditions at Swanquarter Wilderness Area for the 20% best days
13.5 Analyses of Emissions (40 CFR 51.308(g)(4)) Paragraph (g)(4) requires of the RHG requires the state to present an analysis tracking the change over the period since the period addressed in the most recent plan required under 40 CFR 51.308(f) in emissions of pollutants contributing to visibility impairment from all sources and activities within the State. Emissions changes should be identified by type of source or activity. With respect to all sources and activities, the analysis must extend at least through the most recent year for which the state has submitted emission inventory information to the Administrator in compliance with the triennial reporting requirements of subpart A of this part as of a date 6 months preceding the required date of the progress report. Therefore, this section documents anthropogenic emission reductions throughout the state of North Carolina by sector from 2011 through 2019 (the most recent year for which emissions inventory data were available). The long-term strategy for the first planning period, in addition to unplanned emission reductions associated with the closure of facilities and economic forces, have resulted in significant statewide emission reductions in all sectors for all pollutants that contribute to visibility impairment. The percentage of emission reductions for visibility impairing pollutants from CY2011 to CY2019 are:
• SO2 emissions have been reduced by 71%. • NOx emissions have been reduced by 40%. • PM2.5 emissions have been reduced by 20%. • VOC emissions have been reduced by 13%.

Pre-hearing Draft 374 NC Regional Haze SIP for Second Planning Period (2019 – 2028) August 30, 2021
• PM10 emissions have been reduced by 4%. The data shown in the following tables and figures are from the following data sources:126
• 2011 NEI ( https://www.epa.gov/air-emissions-inventories/2011-national-emissions-inventory-nei-data)
• 2014 NEI (2014fd, https://www.epa.gov/air-emissions-inventories/2014-national-emissions-inventory-nei-data)
• 2016 Modeling Platform (2016fh, https://www.epa.gov/air-emissions-modeling/2016v1-platform), The starting point for the 2016 inventory was the 2014 National Emissions Inventory (NEI), version 2 (2014NEIv2), although many inventory sectors were updated to represent the year 2016 through the incorporation of 2016-specific state and local data along with nationally-applied adjustment methods.
• 2017 NEI - CY2017 NEI data used in the following tables and charts was obtained from the most recent version posted in January 2021 of the CY2017 NEI. (https://www.epa.gov/air-emissions-inventories/2017-national-emissions-inventory-nei-data)
• 2018 EIS and 2019 EIS - For CYs 2018 and 2019 emissions from EIS, these emission inventories were constructed from each year’s point source emissions submitted by NCDAQ and NC’s three Local Programs as required by AERR and submitted to EIS plus emissions for highway vehicles (onroad mobile), off-highway (nonroad mobile), and miscellaneous were pulled forward from the CY2017 triennial NEI.
13.5.1 SO2 Emissions (2011-2019) Table 13-9 and Figure 13-9 show statewide anthropogenic SO2 emission trends and reductions from 2011 through 2019. The dominate source of SO2 emissions in North Carolina are originating from the electric utility sector which accounted for 71% and 62% of total statewide SO2 emissions in 2011 and 2019, respectively. Emissions from this sector have been steadily decreasing since 2011 along with other fuel combustion sources. Sulfur dioxide emissions from other sectors have been consistently decreasing since 2011.
Table 13-9. Annual Anthropogenic SO2 Emissions Trends for NC (2011-2019)
Sector 2011 2014 2016 2017 2018 2019 Industrial Processes 9,812 9,181 10,641 8,224 9,063 5,715 Fuel Comb. Elec. Util. 83,925 49,258 35,768 26,413 25,448 21,597 Fuel Comb. Industrial 12,354 5,374 5,215 4,196 4,923 3,483 Fuel Comb. Other 7,757 2,086 2,520 1,211 1,109 569 Highway Vehicles 1,082 1,108 1,245 1,132 1,132 1,132
126 Comparisons of emission inventories from different calendar years have inherent discrepancies that may affect emission trends. Advances in technology, improved modeling information, and changes in emission factors and methodology can affect the emissions reported for the different sectors. Models estimating emissions from aircraft and mobile sources have been improved and implemented during this period.

Pre-hearing Draft 375 NC Regional Haze SIP for Second Planning Period (2019 – 2028) August 30, 2021
Sector 2011 2014 2016 2017 2018 2019 Miscellaneous 1,068 1,299 2,671 1,317 1,317 1,317 Off-Highway 2,472 2,760 1,027 694 694 694 Waste Disposal & Recycling 251 216 201 203 205 205 Statewide Sector Totals 118,721 71,282 59,288 43,389 43,891 34,712 Percent Reduction from 2011 40% 50% 63% 63% 71%
Figure 13-9. Annual Anthropogenic SO2 Emissions Trends for NC (2011-2019) 13.5.2 NOx Emissions (2011-2019) Table 13-10 and Figure 13-10 show statewide anthropogenic NOx emission trends and reductions from 2011 through 2019. The highway vehicle sector accounts for approximately 50% and off-highway vehicle sectors account for nearly 20% of the total NOx emissions for the state of North Carolina. The percent of total NOx for highway vehicles ranges from 48% in CY2016 to 55% in CY2011. Off-highway vehicles account for 19% for CY2011 and CY2014 and 18% for CYs 2017 through 2019. Emissions from vehicles are declining as the vehicle fleet moves toward cleaner vehicles and fuels. The fuel combustion sectors including the electric utility sector NOx emissions have declined overall from 77,957 tons in 2011 to 50,267 tons in 2019. NOx controls added to the electric utility sector account for 30% of the emission reductions in these sectors. Higher NOx emissions from fuel combustion electric utility in CY2018 may be attributed to temperatures that
-
10,000
20,000
30,000
40,000
50,000
60,000
70,000
80,000
90,000
2011 2014 2016 2017 2018 2019
Tons
/ Ye
ar
Industrial ProcessesFuel Comb. Elec. Util.Fuel Comb. IndustrialFuel Comb. OtherHighway VehiclesMiscellaneousOff-HighwayWaste Disposal & Recycling

Pre-hearing Draft 376 NC Regional Haze SIP for Second Planning Period (2019 – 2028) August 30, 2021
contributed to the top ten warmest annual temperature recorded at monitors127 in four major cities:
• Asheville-highest recorded annual temperature in 63 years of record, • Charlotte-sixth highest in 77 years of record, • Raleigh-ninth highest in 74 years of record and • Greensboro-tenth highest in 90 years of record.
Industrial process emission fluctuations from CYs 2011 to 2019 are probably linked to the economy. Miscellaneous emissions show an increase in CY2016 due to increased emissions from prescribed fires and wildfires but otherwise emissions from this sector are steady. Waste Disposal and Recycling sector emissions have remained relatively steady after a drop in emissions between CY2011 and CY2014.
Table 13-10. Annual Anthropogenic NOx Emissions Trends for NC (2011-2019)
Sector 2011 2014 2016 2017 2018 2019 Industrial Processes 12,331 13,351 13,316 13,504 13,538 11,986 Fuel Comb. Elec. Util. 43,911 44,185 35,444 35,056 39,346 35,444 Fuel Comb. Industrial 24,394 20,572 18,727 12,366 10,368 7,545 Fuel Comb. Other 9,652 10,728 10,340 9,716 7,393 7,278 Highway Vehicles 204,008 159,301 120,721 116,228 116,228 116,228 Miscellaneous 4,047 2,445 5,409 2,715 2,715 2,715 Off-Highway 68,433 59,069 44,446 41,200 41,200 41,200 Waste Disposal & Recycling 2,720 830 830 895 888 868 Statewide Sector Totals 369,496 310,481 249,233 231,679 231,676 223,264 Percent Reduction from 2011 16% 33% 37% 37% 40%
127 NOAA National Climate Report - Annual 2018, 2018 Record Setters, https://www.ncdc.noaa.gov/sotc/national/201813/supplemental/page-1

Pre-hearing Draft 377 NC Regional Haze SIP for Second Planning Period (2019 – 2028) August 30, 2021
Figure 13-10. Annual Anthropogenic NOx Emissions Trends for NC (2011-2019)
13.5.3 PM2.5 Emissions (2011-2019) Table 13-11 and Figure 13-11 show statewide anthropogenic PM2.5 emission trends and reductions from 2011 through 2019. Over 50% of the PM2.5 emissions in North Carolina are emitted by the miscellaneous sector. Miscellaneous particulate emissions are steady except for CY2016. The increase in PM2.5 emissions from this sector is driven by emissions from prescribed fires and wildfires that are more than double the emissions reported in CY2011. Agricultural dust increased slightly and agricultural fires decreased during this same period. The higher PM2.5 emissions for fuel combustion industrial sector for CYs 2014 and 2016 which were based on CY2014 emissions, are due to biomass fuel use industrial boilers. In CY2017, emissions from biomass fuel use for the industrial fuel combustion had been reduced by 90% resulting in the decrease in PM2.5 emissions in CY2017. The majority of emissions in fuel combustion other sector are attributed to residential wood combustion (8,949 tons) for CYs 2017-2019. A major change in emission estimation method from 2014NEI to 2017NEI increased emissions from residential wood combustion source for numerous states including North Carolina. CY2016 emissions were similar to the 2014NEI emissions since the CY2016 were estimated based on the 2014NEI. The slight increase in waste disposal and recycling is attributed to nonpoint waste sources and this increase may be due to updates in emission estimation methodology. All other sectors have remained steady or decreased during this period.
Table 13-11. Annual Anthropogenic PM2.5 Emissions Trends for NC (2011-2019)
-
50,000.00
100,000.00
150,000.00
200,000.00
250,000.00
2011 2014fd 2016fh 2017NEI 2018 NEI 2019 EIS
Ton
s / Y
ear
Industrial ProcessesFuel Comb. Elec. Util.Fuel Comb. IndustrialFuel Comb. OtherHighway VehiclesMiscellaneousOff-HighwayWaste Disposal & Recycling

Pre-hearing Draft 378 NC Regional Haze SIP for Second Planning Period (2019 – 2028) August 30, 2021
Sector 2011 2014 2016 2017 2018 2019 Industrial Processes 8,337 9,847 9,593 6,761 6,786 4,184 Fuel Comb. Elec. Util. 6,921 4,694 3,453 3,105 3,175 2,736 Fuel Comb. Industrial 2,899 10,970 10,349 1,725 1,673 1,115 Fuel Comb. Other 4,323 5,980 6,016 9,225 9,232 9,087 Highway Vehicles 5,510 4,591 3,245 3,115 3,115 3,115 Miscellaneous 45,672 43,060 56,450 43,443 43,443 43,443 Off-Highway 5,435 4,406 3,381 3,179 3,179 3,179 Waste Disposal & Recycling 9,386 2,288 2,309 3,830 3,828 3,788 Statewide Sector Totals 88,483 85,836 94,796 74,383 74,431 70,647 Percent Reduction from 2011 3% -7% 16% 16% 20%
Figure 13-11. Annual Anthropogenic PM2.5 Emissions Trends for NC (2011-2019)
13.5.4 PM10 Emissions (2011-2019) Table 13-12 and Figure 13-12 show statewide anthropogenic PM10 emission trends and reductions from 2011 through 2019. Similar to trends in PM2.5 emissions, miscellaneous emissions are the driving sector for PM10 emissions and PM10 emissions from this sector are steady from CY2014 to CY2019 except for CY2016. Increased emissions from prescribed fires and wildfires are the contributing factor to this increase. Also, in the miscellaneous sector, agricultural dust emissions increased slightly, and agricultural fires decrease in CY2016. Larger PM10 emissions in CYs 2014 and 2016 are due to biomass fuel use in industrial boilers and a 90% decrease in CY2017 for emissions from this fuel category. Increases in fuel combustion
-
10,000
20,000
30,000
40,000
50,000
60,000
2011 2014 2016 2017 2018 2019
Ton
s / Y
ear
Industrial ProcessesFuel Comb. Elec. Util.Fuel Comb. IndustrialFuel Comb. OtherHighway VehiclesMiscellaneousOff-HighwayWaste Disposal & Recycling

Pre-hearing Draft 379 NC Regional Haze SIP for Second Planning Period (2019 – 2028) August 30, 2021
other are attributed to residential wood combustion. As noted with PM2.5, this increase is due to a change in emission estimation methodology from 2014NEI to 2017NEI. Slight increase in waste disposal and recycling is attributed to nonpoint waste sources and this increase may be due to updates in emission estimation methodology. Emissions from highway vehicles, off-highway vehicles, fuel combustion from electric utilities have been decreasing since CY2011.
Table 13-12. Annual Anthropogenic PM10 Emissions Trends for NC (2011-2019)
Sector 2011 2014 2016 2017 2018 2019 Industrial Processes 16,592 17,557 17,089 14,835 14,792 10,829 Fuel Comb. Elec. Util. 8,790 5,190 3,751 3,287 3,323 2,951 Fuel Comb. Industrial 3,828 12,729 12,029 1,984 1,913 1,216 Fuel Comb. Other 4,724 6,149 6,181 9,344 9,336 9,121 Highway Vehicles 10,447 9,032 7,189 7,045 7,045 7,045 Miscellaneous 195,376 214,381 233,318 206,628 206,628 206,628 Off-Highway 5,742 4,671 3,575 3,367 3,367 3,367 Waste Disposal & Recycling 11,151 2,724 2,732 4,215 4,212 4,167 Statewide Sector Totals 256,650 272,433 285,864 250,705 250,616 245,324 Percent Reduction from 2011 -6% -11% 2% 2% 4%
Figure 13-12. Annual Anthropogenic PM10 Emissions Trends for NC (2011-2019)
0
50,000
100,000
150,000
200,000
250,000
2011 2014 2016 2017 2018 2019
Ton
s / Y
ear
Industrial ProcessesFuel Comb. Elec. Util.Fuel Comb. IndustrialFuel Comb. OtherHighway VehiclesMiscellaneousOff-HighwayWaste Disposal & Recycling

Pre-hearing Draft 380 NC Regional Haze SIP for Second Planning Period (2019 – 2028) August 30, 2021
13.5.5 VOC Emissions (2011-2019) Table 13-13 and Figure 13-13 show statewide anthropogenic VOC emission trends and reductions from 2011 through 2019. Industrial processes are the most significant contributor to anthropogenic VOC emissions. Contributions range from 42% to 50% of the statewide total VOC emissions. Highway and off-highway sectors are the second and third highest contributors to VOC emission. However, emissions from these sectors have been steadily decreasing as cleaner vehicles enter the fleet. One anomaly in decreasing or steady VOC emissions among the other sectors is the miscellaneous sector for CY2016. Emissions from prescribed fires and wildfires which are included in the miscellaneous sector show over a tenfold increase from CY2011 to CY2016 (2011en-6671, 2016fh-71360).
Table 13-13. Annual Anthropogenic VOC Emissions Trends for NC (2011-2019)
Sector 2011 2014 2016 2017 2018 2019 Industrial Processes 139,923 159,799 161,047 151,103 152,922 140,465 Fuel Comb. Elec. Util. 934 866 988 863 926 795 Fuel Comb. Industrial 1,500 1,670 1,454 1,016 972 723 Fuel Comb. Other 4,611 6,823 6,866 10,861 10,876 10,773 Highway Vehicles 112,173 84,601 67,076 57,863 57,863 57,863 Miscellaneous 7,851 50,709 86,468 44,299 44,299 44,299 Off-Highway 63,283 49,459 37,862 35,301 35,301 35,301 Waste Disposal & Recycling 5,613 2,600 2,644 2,784 2,838 2,850 Statewide Sector Totals 335,888 356,527 364,405 304,090 305,997 293,069 Percent Reduction from 2011 -6% -8% 9% 9% 13%

Pre-hearing Draft 381 NC Regional Haze SIP for Second Planning Period (2019 – 2028) August 30, 2021
Figure 13-13. Annual Anthropogenic VOC Emissions Trends for NC (2011-2019)
13.6 Changes to Anthropogenic Emissions (40 CFR 51.308(g)(5)) Paragraph 40 CFR 51.308(g)(4) of the RHR specifies that a state assess if any significant changes in anthropogenic emissions within or outside the State that have occurred since the period addressed in the most recent plan required under 40 CFR 51.308(f) including whether or not these changes in anthropogenic emissions were anticipated in that most recent plan and whether they have limited or impeded progress in reducing pollutant emissions and improving visibility. To address this paragraph, the NCDAQ reviewed anthropogenic SO2 and NOx emissions trends for the VISTAS states and each of the Regional Planning Organizations (RPOs) based on emissions included in the 2011, 2014, and 2017 NEI. The emissions trends are shown in Table 13-14, and the data in this table are presented in bar charts in Figure 13-14 and Figure 13-15 for SO2 and NOx emissions, respectively. These data show a significant decline in both SO2 and NOx emissions during the 2011 through 2018 period covered by this progress report both within North Carolina, each VISTAS state, and non-VISTAS states included in the RPOs covering the rest of the U.S. Table 13-14. Annual Anthropogenic SO2 and NOx Emissions Trends by RPO and VISTAS
States (2011, 2014, and 2017)
0
20,000
40,000
60,000
80,000
100,000
120,000
140,000
160,000
180,000
2011 2014 2016 2017 2018 2019
Ton
s / Y
ear
Industrial ProcessesFuel Comb. Elec. Util.Fuel Comb. IndustrialFuel Comb. OtherHighway VehiclesMiscellaneousOff-HighwayWaste Disposal & Recycling

Pre-hearing Draft 382 NC Regional Haze SIP for Second Planning Period (2019 – 2028) August 30, 2021
SO2 Emissions (TPY) NOx Emissions (TPY) RPO/State 2011 2014 2017 2011 2014 2017 CENSARA 1,552,522 1,215,472 966,258 3,668,137 3,197,228 2,614,611
LADCO 1,899,157 1,250,232 486,481 2,664,749 2,259,264 1,608,532 WESTAR/WRAP 595,077 450,132 445,217 3,015,273 2,610,400 2,197,499
MANE-VU 739,180 503,720 169,617 1,661,320 1,468,719 1,067,962 VISTAS 1,634,354 1,210,228 446,961 3,343,166 2,984,899 2,184,753
VISTAS States AL 278,365 201,422 59,519 359,823 339,558 221,815 FL 172,700 164,434 78,173 608,366 583,991 414,369 GA 234,701 102,155 38,188 452,318 349,908 290,072 KY 272,921 224,782 71,804 327,755 299,784 198,435 MS 63,940 108,445 12,724 205,897 179,687 138,059 NC 118,721 71,282 42,073 369,496 310,480 231,679 SC 103,248 52,795 23,440 210,544 179,663 153,314 TN 160,323 94,202 46,738 322,567 272,996 200,581 VA 107,818 77,210 27,188 313,456 278,652 208,371 WV 121,617 113,500 47,117 172,944 190,181 128,059
For North Carolina, a significant reduction in SO2 and NOx emissions was anticipated as a result of the CSA and other control measures included in its long-term strategy for the first planning period. However, unanticipated facility closures and economic forces (such as natural gas prices becoming competitive with coal prices) have contributed to the transition from coal to natural gas in the EGU and non-EGU point source sectors which has contributed to lower SO2 emissions as well. North Carolina has significantly transitioned to cleaner burning natural gas for electric power generation and has continued to increase its renewable energy capacity under the Southeast’s only Renewable Energy and Energy Efficiency Portfolio Standard. The state has also transitioned to become third in the nation for solar photovoltaic capacity.

Pre-hearing Draft 383 NC Regional Haze SIP for Second Planning Period (2019 – 2028) August 30, 2021
Figure 13-14. Annual Anthropogenic SO2 Emissions Trends by RPO and VISTAS States
Figure 13-15. Annual Anthropogenic NOx Emissions Trends by RPO and VISTAS States
Figure 13-16 shows the average light extinction for the 20% worst days over the 5-year period 2011 through 2018 for all Class I areas in the Southeast. Figure 13-17 shows the average light extinction for the 20% most impaired days over the 5-year period 2011 through 2018 for all Class I areas in the Southeast. These figures demonstrate that on the 20% worst days and 20% most impaired days in the Class I areas in North Carolina, sulfates (SO4) continue to be the major concern during the first planning period, which is formed from the SO2 emissions from stationary point sources. As shown in Figure 13-16 and Figure 13-17, the significant reduction
0200000400000600000800000
100000012000001400000160000018000002000000
Ton
s / Y
ear
2011 2014 2017
0
500000
1000000
1500000
2000000
2500000
3000000
3500000
4000000
Ton
s / Y
ear
2011 2014 2017

Pre-hearing Draft 384 NC Regional Haze SIP for Second Planning Period (2019 – 2028) August 30, 2021
in SO2 and NOx emissions in North Carolina as well as neighboring states has resulted in significant improvements in visible range in Class I areas in North Carolina as well as Class I areas in nearby states. Based on these data, there does not appear to be any anthropogenic emissions within North Carolina that would have limited or impeded progress in reducing pollutant emissions or improving visibility.
Figure 13-16. Average light extinction for the 20% Worst Days in 2011-2018 at Southeast
and Neighboring Class I Areas

Pre-hearing Draft 385 NC Regional Haze SIP for Second Planning Period (2019 – 2028) August 30, 2021
Figure 13-17. Average light extinction for the 20% Most Impaired Days in 2011-2018 at
Southeast and Neighboring Class I Areas
13.7 Conclusions
This progress report documents that all control measures outlined in North Carolina’s regional haze SIP have been implemented and that North Carolina has exceeded all RPGs projected for 2018. Reductions in SO2 emissions have been significant and greater than VISTAS projected. In spite of significant reduction in SO2, sulfates continue to play a significant role in visibility impairment, especially for 20% most anthropogenically impaired days. As SO2 emissions continue to drop in future planning periods, nitrates may begin to have a larger relative impact on regional haze in Class I areas. The next regional haze progress report is due in July 2025 and will cover progress in the second implementation period.

Pre-hearing Draft 386 NC Regional Haze SIP for Second Planning Period (2019 – 2028) August 30, 2021
(This page intentionally left blank)