Disruption of PPARγ signaling results in mouse prostatic intraepithelial neoplasia involving active...
23
Disruption of PPARγ signaling results in mouse prostatic intraepithelial neoplasia involving active autophagy Ming Jiang *,1 , Suzanne Fernandez 1 , W. Gray Jerome 2,3 , Yue He 2 , Xiuping Yu 1 , Hui Cai 4 , Braden Boone 5 , Yajun Yi 6 , Mark A. Magnuson 7 , Pradip Roy-Burman 8 , Robert J. Matusik 1,2 , Scott B. Shappell 9 , and Simon W. Hayward *,1,2 1 Department of Urologic Surgery, Vanderbilt-Ingram Comprehensive Cancer Center and Vanderbilt University Medical Center, Nashville, Tennessee 37232, USA 2 Department of Cancer Biology, Vanderbilt-Ingram Comprehensive Cancer Center and Vanderbilt University Medical Center, Nashville, Tennessee 37232, USA 3 Department of Pathology, Vanderbilt-Ingram Comprehensive Cancer Center and Vanderbilt University Medical Center, Nashville, Tennessee 37232, USA 4 Department of Medicine and Public Health, Vanderbilt-Ingram Comprehensive Cancer Center and Vanderbilt University Medical Center, Nashville, Tennessee 37232, USA 5 Department of Microarray Shared Resource, Vanderbilt-Ingram Comprehensive Cancer Center and Vanderbilt University Medical Center, Nashville, Tennessee 37232, USA 6 Department of Genetic Medicine, Vanderbilt-Ingram Comprehensive Cancer Center and Vanderbilt University Medical Center, Nashville, Tennessee 37232, USA 7 Department of Molecular Physiology and Biophysics, Vanderbilt-Ingram Comprehensive Cancer Center and Vanderbilt University Medical Center, Nashville, Tennessee 37232, USA 8 Department of Pathology, Keck School of Medicine, University of Southern California, Los Angeles, California 90089, USA 9 Mosaic Diagnostics, Dallas, Texas 75206, USA. Abstract Peroxisome proliferator-activated receptor-gamma (PPARγ) regulates the interface between cellular lipid metabolism, redox status and organelle differentiation. Conditional prostatic epithelial knockout of PPARγ in mice resulted in focal hyperplasia which developed into mouse prostatic intraepithelial neoplasia (mPIN). The grade of PIN became more severe with time. Electron microscopy (EM) showed accumulated secondary lysosomes containing cellular organelles and debris suggestive of autophagy. Consistent with this analysis the autophagy marker LC3 was found to be upregulated in areas of PIN in PPARγ KO tissues. We selectively knocked down PPARγ2 isoform in wild-type mouse prostatic epithelial cells and examined the consequences of this in a tissue recombination model. Histopathologically grafted tissues resembled the conditional PPARγ KO mouse prostates. EM studies of PPARγ- and PPARγ2- deficient epithelial cells in vitro were suggestive of autophagy, consistent with the prostatic tissue Users may view, print, copy, download and text and data- mine the content in such documents, for the purposes of academic research, subject always to the full Conditions of use: http://www.nature.com/authors/editorial_policies/license.html#terms * Corresponding authors: 1 . Ming Jiang, M.D., Ph.D., Department of Urologic Surgery, A-1302 MCN, Vanderbilt University Medical Center, Nashville, TN 37232-2765. [email protected]. Telephone: 615-343-5984, Fax: 615-322-8990.. 2 . Simon W. Hayward, Ph.D., Department of Urologic Surgery, A-1302 MCN, Vanderbilt University Medical Center, Nashville, TN 37232-2765. [email protected]. Telephone: 615-322-5823. FAX: 615-322-8990.. NIH Public Access Author Manuscript Cell Death Differ. Author manuscript; available in PMC 2010 September 1. Published in final edited form as: Cell Death Differ. 2010 March ; 17(3): 469–481. doi:10.1038/cdd.2009.148. NIH-PA Author Manuscript NIH-PA Author Manuscript NIH-PA Author Manuscript
-
Upload
northshoreuniverisityhealthsystem -
Category
Documents
-
view
0 -
download
0
Transcript of Disruption of PPARγ signaling results in mouse prostatic intraepithelial neoplasia involving active...

Disruption of PPARγ signaling results in mouse prostaticintraepithelial neoplasia involving active autophagy
Ming Jiang*,1, Suzanne Fernandez1, W. Gray Jerome2,3, Yue He2, Xiuping Yu1, Hui Cai4,Braden Boone5, Yajun Yi6, Mark A. Magnuson7, Pradip Roy-Burman8, Robert J. Matusik1,2,Scott B. Shappell9, and Simon W. Hayward*,1,2
1Department of Urologic Surgery, Vanderbilt-Ingram Comprehensive Cancer Center andVanderbilt University Medical Center, Nashville, Tennessee 37232, USA2Department of Cancer Biology, Vanderbilt-Ingram Comprehensive Cancer Center and VanderbiltUniversity Medical Center, Nashville, Tennessee 37232, USA3Department of Pathology, Vanderbilt-Ingram Comprehensive Cancer Center and VanderbiltUniversity Medical Center, Nashville, Tennessee 37232, USA4Department of Medicine and Public Health, Vanderbilt-Ingram Comprehensive Cancer Centerand Vanderbilt University Medical Center, Nashville, Tennessee 37232, USA5Department of Microarray Shared Resource, Vanderbilt-Ingram Comprehensive Cancer Centerand Vanderbilt University Medical Center, Nashville, Tennessee 37232, USA6Department of Genetic Medicine, Vanderbilt-Ingram Comprehensive Cancer Center andVanderbilt University Medical Center, Nashville, Tennessee 37232, USA7Department of Molecular Physiology and Biophysics, Vanderbilt-Ingram Comprehensive CancerCenter and Vanderbilt University Medical Center, Nashville, Tennessee 37232, USA8Department of Pathology, Keck School of Medicine, University of Southern California, LosAngeles, California 90089, USA9Mosaic Diagnostics, Dallas, Texas 75206, USA.
AbstractPeroxisome proliferator-activated receptor-gamma (PPARγ) regulates the interface betweencellular lipid metabolism, redox status and organelle differentiation. Conditional prostaticepithelial knockout of PPARγ in mice resulted in focal hyperplasia which developed into mouseprostatic intraepithelial neoplasia (mPIN). The grade of PIN became more severe with time.Electron microscopy (EM) showed accumulated secondary lysosomes containing cellularorganelles and debris suggestive of autophagy. Consistent with this analysis the autophagy markerLC3 was found to be upregulated in areas of PIN in PPARγ KO tissues. We selectively knockeddown PPARγ2 isoform in wild-type mouse prostatic epithelial cells and examined theconsequences of this in a tissue recombination model. Histopathologically grafted tissuesresembled the conditional PPARγ KO mouse prostates. EM studies of PPARγ- and PPARγ2-deficient epithelial cells in vitro were suggestive of autophagy, consistent with the prostatic tissue
Users may view, print, copy, download and text and data- mine the content in such documents, for the purposes of academic research,subject always to the full Conditions of use: http://www.nature.com/authors/editorial_policies/license.html#terms
*Corresponding authors: 1. Ming Jiang, M.D., Ph.D., Department of Urologic Surgery, A-1302 MCN, Vanderbilt UniversityMedical Center, Nashville, TN 37232-2765. [email protected]. Telephone: 615-343-5984, Fax: 615-322-8990.. 2. SimonW. Hayward, Ph.D., Department of Urologic Surgery, A-1302 MCN, Vanderbilt University Medical Center, Nashville, TN37232-2765. [email protected]. Telephone: 615-322-5823. FAX: 615-322-8990..
NIH Public AccessAuthor ManuscriptCell Death Differ. Author manuscript; available in PMC 2010 September 1.
Published in final edited form as:Cell Death Differ. 2010 March ; 17(3): 469–481. doi:10.1038/cdd.2009.148.
NIH
-PA Author Manuscript
NIH
-PA Author Manuscript
NIH
-PA Author Manuscript

analysis. This was confirmed by examining expression of beclin-1 and LC3. Gene expressionprofiling in PPARγ-/γ2-deficient cells indicated a major dysregulation of cell cycle control andmetabolic signaling networks related to peroxisomal and lysosomal maturation, lipid oxidationand degradation. The putative autophagic phenotypes of PPARγ-deficient cells could be rescuedby re-expression of either γ1 or γ2 isoform. We conclude that disruption of PPARγ signalingresults in autophagy and oxidative stress during mPIN pathogenesis.
KeywordsPeroxisome proliferator-activated receptor gamma (γ), PPARγ; Peroxisome proliferator responseelement, PPRE; Peroxisome; Lysosome; Mitochondria; Autophagy; Fatty acid oxidation;Oxidative Stress; Differentiation; Prostatic Intraepithelial Neoplasia, PIN
IntroductionPeroxisome proliferator-activated receptors (PPARs) regulate gene transcription in responseto peroxisome proliferators, fatty acids, and other endogenous ligands (1,2). There are twoisoforms of PPARγ denoted as PPARγ1 and PPARγ2. These represent proteins derivedfrom alternative start sites in the same gene giving rise to two isoforms, with PPARγ2having an earlier start site with an additional 30 amino acid residues (3). PPARγ regulatesdifferentiation, proliferation and apoptosis in both stromal (4) and parenchymal epithelialcells (5-8), involving in many signaling pathways during the pathogenesis of inflammationand oxidative stress (9,10). The links between PPARγ target genes and the relevance ofalterations of PPARγ functions to human pathology are beginning to be elucidated (11).
Many prostate cancer (Pca) patients with early disease could potentially be treatedconservatively. Tissue-based and in vitro studies suggest that alterations in PPARγ activitymay be involved in Pca and that PPARγ may be a candidate target for Pca therapy (12-14).
Recent studies have reported autophagy in prostate cancer cell lines (15-17). To gaininsights into whether autophagy is involved in the processes of dysregulated lipidmetabolism and induced oxidative stress accompanying the prostate proliferative epitheliallesions, we characterized the PPARγ-deficient mouse prostate models. Autophagyaccompanied the altered cellular proliferation and differentiation that resulted from PPARγ-deficiency in mouse prostate models. This paper examines the links between PPARγactivity and the subcellular and histopathologic changes taking place in the murine prostate.Details of these changes were examined using parallel in vitro models.
ResultsProgressive mPIN in PBCre4 tg/0/PPARγ flox/flox transgenic mice
We generated PBCre4 tg/0/PPARγ flox/flox double transgenic mice on a C57/Bl6background. A PBCre4 tg/0/PPARγ flox/flox mouse line was selected which strongly excisedexon 2 of PPARγ (both γ1 and γ2 isoforms) in the anterior (AP) and ventral prostate (VP)with weaker excision in the lateral (LP) and dorsal (DP) prostatic lobes. Loss of prostaticPPARγ protein expression was confirmed using immunohistochemistry (Supplement S1a).
The prostatic phenotypes of mice carrying two flox alleles but no Cre were indistinguishablefrom their WT counterparts. Beginning at three months of age we observed histologicalterations indicative of mPIN in the KO mice (18,19). Epithelial hyperplasia with mildcytologic atypia and local inflammatory cell accumulation was observed in the AP and VP(Figure 1a), but not in the DP and LP. The involved lobes showed epithelial stratification,
Jiang et al. Page 2
Cell Death Differ. Author manuscript; available in PMC 2010 September 1.
NIH
-PA Author Manuscript
NIH
-PA Author Manuscript
NIH
-PA Author Manuscript

consistent with increased cell proliferation. Nuclei were enlarged, with mild hyperchromasiaand focally more prominent nucleoli, compatible with lesions previously categorized asmouse prostatic intraepithelial neoplasia (PIN) I in genetically engineered mouse (GEM)models (19) here designated low grade PIN (LGPIN).
Older KO mice showed progressively more widespread prostatic epithelial hyperplasia withincreased nuclear atypia in AP and VP, satisfying key criteria for NCI MMHCC mPIN (18).These progressive changes were similar to lesions designated as PIN II and III (19) (Figures1b-c) here designated high grade PIN (HGPIN). Cytoplasm was increasingly amphophilic,suggesting decreased secretory differentiation. Nuclear enlargement with chromatinclumping and prominent nucleoli was noted (Figure 1). No foci of invasive carcinoma wereidentified in PPARγ KO mice up to 15 months of age.
No significant gross differences were seen between prostatic lobe weights from 12 monthold KO and WT mice (Supplement S1b). In the AP, decreased branching and associatedexpansion of some individual AP ducts were noted in KO versus control mice, firstdiscernible in the 7-12 month age group (Figure 1d).
PAS staining illustrated decreased luminal secretions in the conditional PPARγ KO mouseprostatic epithelia (Supplement S1c). AR (Supplement S1c) and cytokeratin 18 (CK-18)(data not shown) were expressed throughout the luminal epithelium of the normal prostateand decreased in the PIN epithelium.
The stroma was thickened around mPIN lesions with strong co-expression of α-smoothmuscle (SM)-actin (Supplement S1c) and vimentin (data not shown) consistent with areactive myofibroblastic phenotype. An inflammatory response composed of mononuclearcells consistent with macrophages and lymphocytes was observed in 25% of the PPARγ KOprostates, whereas it is not commonly noted in WT mouse prostates (18).
Histologically, limited hyperplasia was found in the AP and DP of WT mice from 3 months.More widespread hyperplasia was seen in the AP and VP of PPARγ KO mice from earlystages. mPIN was observed in the AP and VP of PPARγ KO mice (Figures 1e-1h). Thescores given in Figures 1 e-h represent incidence of disease. When extent of disease wasexamined it was noted that the individual foci were markedly larger in older versus youngermice. Samples were scored by the presence of the most severe phenotype irrespective of itsprevalence. mPIN was not seen in WT mouse prostates. In marked contrast, a 36.4%incidence of PIN (27.3% LGPIN plus 9.1% HGPIN) was observed in the AP of PPARγ KOprostate in ≤6 months, 26.9% PIN (7.7% plus 19.2%) in 7-12 month animals and 25% PIN(10% plus 15%) in ≥13 months old mice. 100% PIN (54.5% plus 45.5%) was found in theVP of PPARγ KO prostates in ≤6 months, 84.6% PIN (38.5% plus 46.1%) in 7-12 monthsand 60% PIN in (40% plus 20%) in ≥13 months. Histopathologic characterization indicatesthat PPARγ is a regulator of mouse prostate epithelial cell differentiation and that its lossresults in generally progressive mPIN.
Establishment of PPARγ- and PPARγ2-deficient mouse prostate epithelial cell linesTwo PPARγ- and PPARγ2-deficient cell lines were developed. A spontaneouslyimmortalized line was generated from the prostatic epithelium of a KO mouse. These mPrE-PPARγ KO (mPrE-γKO) cells incorporate complete functional deletion of PPARγ,confirmed by PCR analysis (Figure 2a). A human U6-driven mouse PPARγ2 shRNAretroviral construct was introduced into a WT mouse prostatic epithelial cell line (mPrE)(20). These cells are designated mPrE-PPARγ2 shRNA (mPrE-γ2sh). Western blot analysisdemonstrated that the mPrE-γKO cells have no PPARγ1 and γ2 protein expression while
Jiang et al. Page 3
Cell Death Differ. Author manuscript; available in PMC 2010 September 1.
NIH
-PA Author Manuscript
NIH
-PA Author Manuscript
NIH
-PA Author Manuscript

the PPARγ2 shRNA construct was effective at reducing PPARγ2 protein expression(Figure 2b). The pSIR empty vector was used to make control cells (mPrE-pSIR).
mPrE-γKO and mPrE-γ2sh cells appeared similar, the cells were small and elongated withenlarged nuclei (Figures 2c and 2e). The PPARγ- and PPARγ2-deficient cells grew asdiscreet individual cells with reduced cell-cell contact and with increased viability andproliferation (Figures 2d and 2f). Cell cycle analysis also showed fewer cells in S phase withmild increase in G0/G1 arrest and essentially no change in G2/M (Supplemental table 1).mPrE-γKO and mPrE-γ2sh cells formed notably larger clones in a clonogenicity assay, thaneither mPrE or mPrE-pSIR cells (Figure 2g). Suppression of PPARγ activity was confirmedusing a luciferase reporter driven by a triple AOX-PPRE (21) (Figure 2h). PPARγ proteinwas undetectable by immunofluorescence (IF) staining in the nuclei of mPrE-γKO andmPrE-γ2sh cells (Figure 3a). p63 and CK-14 proteins were used to identify basal epithelialcells (18). But, p63 was weak to absent and cytokeratin (CK-14) protein expression wasweaker in PPARγ-/γ2-deficient cells in vitro (Figure 3a and Supplement S2a). β-cateninprotein expression was lost in the cellular membrane of growing colonies but was detectedin the nuclei (Figure 3a). Western blot analysis demonstrated that p63, CK-14, β-catenin andE-cadherin proteins decreased in mPrE-γKO and mPrE-γ2sh cells compared to mPrE andmPrE-pSIR controls (Figure 3b).
PPARγ- and PPARγ2-suppression in a prostatic tissue recombination model resulted inmPIN pathogenesis
To determine the consequences of PPARγ- and PPARγ2-suppression in mouse epithelialcells in vivo with physiologically relevant epithelial-stromal interactions, we used a tissuerecombination model. Recombinants composed of untransfected mPrE cells or controlmPrE-pSIR recombined with rat UGM formed glandular structures lined with cuboidal tocolumnar secretory epithelium surrounded by stroma resembling normal rodent prostate,consistent with previous observations (20) (Figure 3c-f). Tissue recombinants using eithermPrE-γKO or mPrE-γ2sh cells exhibited similar mPIN phenotypes within two months ofgrafting (Figures 3c-f). Mild degrees of epithelial stratification, mild nuclear alterations, andreduced secretory differentiation were detected. These results parallel the mPIN prostatelesions of PBCre4 tg/0/PPARγ flox/flox mice. Reduced luminal secretions were noted inmPrE-γ2sh recombinants versus the controls, further suggesting reduced secretorydifferentiation (Figure 3). Of note, focal disruption of the basal membrane of reconstructedmPrE-γKO mouse prostate glands was seen on both H&E and Periodic acid Schiff (PAS)stained sections, and in some cases a few epithelial cells had migrated locally from the basalcell layer into surrounding stroma (Figures 3c), reminiscent of microinvasive carcinoma asdefined in intact GEM prostates (18).
Autophagocytosis in PPARγ knockout and PPARγ2 knockdown mouse prostate epithelialcells
Ultrastructural analysis was performed on AP tissues from 12-month-old conditionalPPARγ KO and WT mice. WT AP is illustrated (Figure 4a). Foci of mPIN PPARγ KOmouse were examined by electron microscopy. The secretory luminal cells of WT prostatewere cylindrical with supra-nuclear vesicles including some budding from the roughendoplasmic reticulum (RER) (Figures 4b-c). Number, size and distribution ofmitochondria, lysosomes and peroxisomes were unremarkable. Secretory vesicles werefound budding from the Golgi, and mature and exocytosing secretory vesicles were alsoobserved. In contrast, the PPARγ KO luminal epithelial cells in mPIN regions had a numberof abnormal features. There were enlarged nuclei with large nucleoli and few clear storagevesicles were seen in the cytoplasm. Many of the mitochondria appeared to be degeneratingand there were 2.4-fold more lysosomes in the HGPIN compared to WT epithelium (Figures
Jiang et al. Page 4
Cell Death Differ. Author manuscript; available in PMC 2010 September 1.
NIH
-PA Author Manuscript
NIH
-PA Author Manuscript
NIH
-PA Author Manuscript

4e-f). The lysosomes varied in size and many showed features suggestive ofautophagocytosis, including both early and late autophagosomes (22). The PPARγ KOepithelial cells in mPIN foci contained clusters of variably sized autophagic vacuoles(autophagosomes) containing loose granular to more dense flocculent substance. Featuressuggesting autophagocytosis included double membranes, internal vesicles, and the presenceof organelles such as mitochondria, peroxisomes, and rough endoplasmic reticulum withinthe lysosome (Figures 4f-j). There were also a number of multivesicular bodies (Figure 4f).Fewer normal-appearing secretory vesicles were present (Figures 4e-f). In some places, thebasement membrane was disrupted at the site of basal cell attachment (Figure 4e). Thesechanges were consistent with a reduction in secretory differentiation of prostatic luminalcells and possible increase in autophagy in the proliferating mPIN regions.
mPrE-pSIR and mPrE cells exhibited normal number, size and distribution of cellularorganelles and secretory vesicles (Figures 4k and 4m). In contrast, the mPrE-γKO andmPrE-γ2sh cells had a substantially increased range of lysosomal sizes where the majoritywere small and distributed as clusters within the cytoplasm. Many of these were complexwith lipid whorls and internalized material, including mitochondria, peroxisomes and roughendoplasmic reticulum, in various stages of digestion (Figures 4l and 4n). Thus, while thechanges were more dramatic in the mPrE-γ2sh cells, the overall ultrastructural alterationswere reminiscent of the cytoplasmic changes noted in the prostatic epithelium fromPPARγKO mice and were consistent with increased autophagocytosis (autophagy).
Gene expression profiles in the mPrE-γKO cells vs. mPrE cells or mPrE-γ2sh cells vs.mPrE-pSIR cells demonstrated major changes (Table 1) including alterations in signalingpathways involving genes of the nuclear receptor II subfamily, cell cycle control(dedifferentiation), peroxisomal and mitochondrial lipid transporter and oxidationmetabolism (oxidative stress/hypoxia) and ubiquitination/proteosomal degradation.Ingenuity Pathway Analysis (IPA, Ingenuity Systems) was used to evaluate changes basedon microarray data. The top canonic pathway and network related to PPARγ-signalingsignatures were metabolism pathway/oxidative stress (Supplement S3a-b) and cell cyclecontrol/dedifferentiation (Supplement S4a-b). Effects were generally consistent betweenPPARγ KO and PPARγ2 shRNA prostate epithelial cells as compared to control cells.
Altered expression patterns of autophagy-associated proteins were detected in mPrE-γKOand mPrE-γ2sh cells compared to the control cells (Figure 5a). LC-3 (Atg8), beclin-1(Atg6), activated caspase-3, PCNA (Figure 5a), and COX-2 and vimentin (Supplement S2a)were increased, whereas catalase (Figure 5a) and PMP70 (data not shown) were decreasedin two PPARγ-/γ2-deficient cell lines.
Monodansylcadaverine (MDC), a marker of autophagy (22), was visualized in the mPrE andmPrE-γKO, mPrE-pSIR and mPrE-γ2sh cells under 5% FBS (regular growth) or 2.5% FBS(semi-starvation) culture conditions. Elevated MDC signaling was seen in both mPrE-γKOand mPrE-γ2sh as compared to control cells. This was enhanced in 2.5% FBS culturemedium (Figure 5b). Lysosomes and mitochondria were tracked, using LysoTracker(DND-99) and MitoTracker (22), respectively, under the 5% or 2.5% FBS cultureconditions. The LysoTracker (Supplement S2b) and MitoTracker (data not shown) signalingwere strongly increased in PPARγ-/γ2-deficient cell lines in 2.5% FBS culture medium.
In vivo, catalase (Figure 5c) and PMP70 (data not shown) proteins were found to bedecreased or lost in mPIN foci of KO mice. In contrast, LC-3 protein (Figure 5c) wasincreased in the mPIN foci of KO mice compared to the epithelium of WT mice.
Jiang et al. Page 5
Cell Death Differ. Author manuscript; available in PMC 2010 September 1.
NIH
-PA Author Manuscript
NIH
-PA Author Manuscript
NIH
-PA Author Manuscript

Active PPARγ1/γ2 signaling suppresses the phenotypes in mPrE-PPARγ KO cells andmPrE-PPARγ2 knockdown tissue recombinants
To dissect the biological functions of PPARγ1 and PPARγ2 isoforms we re-expressedPPARγ1 or PPARγ2 cDNA into mPrE-γKO cells viral transduction of wild-type full-lengthcDNA (23). Three cell lines, mPrE-PPARγ KO-empty vector (mPrE-γKO-EV), mPrE-PPARγ KO-PPARγ1 WT (mPrE-γKO-γ1WT) and mPrE-PPARγ KO-PPARγ2 WT(mPrE-γKO-γ2WT), were established (Figure 6a). Western blotting confirmed re-expression of the PPARγ1 or PPARγ2 isoform (Figure 6b). IF staining showed positivenuclear PPARγ protein in mPrE-γKO-γ1WT and mPrE-γKO-γ2WT cells compared to thecontrol mPrE-γKO-EV cells (Figure 6a). While total β-catenin levels were not greatlyaltered there was a marked shift in localization from the nuclei in the KO cells to thecytoplasm and membrane in the PPARγ1-/γ2-expressing cells (Figure 6a). Elevated levelsof E-cadherin (Figure 6b), but not CK-14 and p63 proteins (data not shown), were seen inmPrE-γKO-γ1WT and mPrE-γKO-γ2WT cells. EM showed decreased lysosome andautophagosome volume and increased numbers of mitochondria in the PPARγ1-/γ2-rescuedmPrE-γKO cells compared to the control mPrE-γKO-EV cells (Figure 6c). mPrE-γKO-γ1WT and mPrE-γKO-γ2WT cells showed decreased cell viability and proliferation(Supplement S5a) as well as clonal formation (Supplement S5b). As expected mPrE-γKO-γ1WT and mPrE-γKO-γ2WT cells showed increased PPRE-activity by a luciferasereporter assay (Supplement S5c). IF staining showed increased levels of CK-14 and catalase(Supplement S5d), decreased levels of caspase-3 activation (Figure 6a), LC3 and PCNA(Supplement S5c), and beclin-1 (data not show) in the PPARγ1-/γ2-rescued cells comparedto the mPrE-γKO-EV control cells.
Tissue recombinants of mPrE-γ2sh cells showed decreased secretion andimmunophenotypic features of PIN phenotypes cnsistent with PPARγ KO mouse prostates.These included reduction in p63 positive basal cells and AR (Figure 6d) with lesionprogression and phenotypic alterations in stromal cells visualized by α-SM-actin staining(Figure 6d). Basal cells progressively decreased as the mPIN lesion progressed, similar tothe pattern recognized in human PIN progression and in progressively severe mPIN in someGEM models (18). To examine the potential for targeted chemoprevention withpharmacologic PPARγ agonists, tissue recombinants composed of mPrE-γ2sh cells plus ratUGM were grown for three months in animals which were continuously fed on chowcontaining the PPARγ agonist Rosiglitazone. At sacrifice the grafts in these animals were ofsimilar size to mPrE-pSIR controls and on histologic examination, secretory differentiationof luminal epithelial cells and intraluminal secretions were increased compared to mPrE-γ2sh recombinants without drug treatment. mPIN-like changes were reduced compared tografts of control mice fed on standard animal chow. Rosiglitazone treatment enhanced p63and AR expression and also modified the stromal compartment in mPrE-γ2sh tissuerecombinants (Figure 6d).
These data support the roles of reduced PPARγ function in the development of mPIN andindicate that re-expression of either PPARγ1 or PPARγ2 isoform in PPARγ KO cells isable to rescue the phenotype. Rosiglitazone treatment suppressed mPIN formation in mPrE-γ2sh tissue recombinants, likely by activating transcription through PPARγ1, althoughPPARγ-independent effects cannot be excluded.
DiscussionElucidating the molecular pathologic mechanisms underlying prostatic carcinogenesis mayallow for more conservative targeted medical treatments for certain low risk patients withprecursor lesions or organ confined, small volume, low grade carcinomas. The ability tomedically inhibit progression of HGPIN to Pca or the progression of small, lower grade Pcas
Jiang et al. Page 6
Cell Death Differ. Author manuscript; available in PMC 2010 September 1.
NIH
-PA Author Manuscript
NIH
-PA Author Manuscript
NIH
-PA Author Manuscript

to larger, higher grade tumors would represent a significant advance for Pca patientmanagement.
We propose that PPARγ is a key regulator in the maintenance of peroxisomal,mitochondrial and lysosomal functions. Genetic disruption of PPARγ or PPARγ2 signalingin mouse prostate epithelial cells resulted in dysregulated expression patterns of peroxisomaland mitochondrial genes whose products are involved in lipid transportation and oxidationpathways. Active autophagosomes and abnormally increased numbers of lysosomes werefound in PPARγ- and PPARγ2- deficient prostatic epithelia. In vitro these phenotypes wererescued by re-expression of PPARγ1 and PPARγ2 isoform in mPrE-PPARγ KO cells. Invivo, changes consequent to loss of PPARγ were associated with hyperplasia, PINformation and progression to malignancy, which in the case of PPARγ2 suppression couldbe rescued using high levels of the PPARγ agonist Rosiglitazone. The pathophysiologicalroles of PPARγ in cellular peroxisomal and mitochondrial fatty acid oxidation andautophagy based on results are summarized in Figure 7.
Alterations in lipid metabolism resulting in loss of PPARγ-signaling have been suggested topredispose the prostate to premalignant or malignant changes (24-26). The current studydemonstrates, for the first time, that PPARγ loss-of-function in wild-type mouse prostaticepithelium results in progressive epithelial hyperplasia with atypia, indicative of mPIN.Using both intact mice with targeted knockout of PPARγ in prostate epithelium and a tissuerecombination model with selective gene modulation in the epithelial compartment reducedPPARγ function was associated with increased activation of oxidative stress, autophagicactivity, and activation of pro-inflammatory signaling pathways. This establishes conditionsfor subsequent malignant transformation which would be expected to occur stochastically,resulting from epithelial genomic damage potentially caused by reactive oxygen species(ROS) (26). The results described here parallel reported changes in gene expressionresulting in reduced ligands for PPARγ in the human prostate and provide the first directevidence that loss of PPARγ expression or function can lead to prostatic neoplasia in vivo.
Reduced activation of PPARγ due to reduced formation of endogenous ligands for PPARγmost likely explains its role early in human Pca development (8,27,28). Our studiesdemonstrate that PPARγ plays a role in maintaining peroxisomal, mitochondrial andlysosomal biogenesis and maturation during prostatic epithelial cellular growth anddifferentiation. Catalase and PMP70 proteins were decreased in PPARγ- and PPARγ2-deficient prostate epithelial cells. Degenerated mitochondria were found in two PPARγ- and-γ2-deficient prostate epithelial cell lines. Active autophagosomes and abnormally increasednumbers of lysosomes were found in PPARγ- and PPARγ2-deficient prostatic epithelia.These changes were associated with mouse PIN formation and progression. Microarrayanalysis revealed alterations to peroxisomal and mitochondrial fatty acid transportersynthesis and oxidative metabolism in both PPARγ- and -γ2-deficient mPrE cells ascompared to the control cells. Disruption of PPARγ-signaling results in altered fatty acidmetabolism and induction of oxidative stress and hypoxia, as supported by the increasedHypoxia up-regulated 1 (Hyou-1) and Hairless (Hr), and decreased Hairy and enhancer ofsplit1 (Hes1) gene expression in addition COX-2, GSTs and uPAR which show similarchanges in expression patterns in clinical samples of human PIN and in other mouse models(29,30). A number of these altered genes contain a PPRE domain (31,32) suggesting thatthese might be directly regulated. However, regulation of crucial genes could also occurindirectly, as a secondary consequence of reduced PPARγ-signaling. The combination oflight microscopic, ultrastructural, immunophenotypic, and gene expression data areconsistent with dramatic changes in multiple subcellular organelles including mitochondria,peroxisomes and lysosomes, which likely contribute to the observed neoplastic phenotypes.
Jiang et al. Page 7
Cell Death Differ. Author manuscript; available in PMC 2010 September 1.
NIH
-PA Author Manuscript
NIH
-PA Author Manuscript
NIH
-PA Author Manuscript

Our data suggest that the oxidative stress induced by PPARγ loss-of-function results inlysosomal autophagy which can contribute to malignant progression (33). Staining usinglysosome tracker Red DNT-99 and autophagy markers MDC, LC-3 and beclin-1 showedincreased signal strength in PPARγ- and -γ2-deficient mPrE cells in vitro and in vivoconfirming autophagosome formation induced by active lysosomes, consistent with electronmicroscopy showing lysosomal changes. Changes included increased lysosomal numberwith variable sized including many small structures, often accumulating in clusters inPPARγ-deficient mPrE cells. This appears to be an abnormal autophagic response whichdoes not result in cell death, possibly allowing individual cells to avoid an increase inapoptotic activity (indicated by increased caspase-3 activation) induced by loss of PPARγactivity.
The role of autophagy in cancer is complex (34). Autophagy may be pro-tumorigenic,promoting tumor cell survival and restricting necrosis (35,36). Alternatively autophagycould represent either a barrier, or an adaptive response, to cancer. Here, using both deletion(PPARγ KO) and suppression (PPARγ2 shRNA) of PPARγ in mouse prostate epithelialcells, we show increased autophagic activity. We suggest that PIN may indirectly resultfrom the deregulation of pro-inflammatory pathways following PPARγ inactivationcombined with extension of life span via increased autophagic capacity. This outcome maybe related to disruption of peroxisomal lipid oxidation/metabolism signaling pathways.
Early prostate cancer has been linked to a loss of enzymes including 15-lipoxygenase-2 (15-LOX-2) which is involved in the generation of 15(S)-hydroxyeicosatetraenoic acid (15-HETE) (8,27). Such a scenario justifies the consideration of PPARγ agonists aschemopreventive agents to inhibit the genesis of early stage prostate cancer. Based upon thedata presented here we would suggest that modulation of PPARγ signaling by glitazonedrugs be considered as an addition to anti-oxidant diets to inhibit progression of HGPIN toprostate cancer.
Materials and methodsAnimal experiments
Floxed PPARγ (37) and PBCre4 (38) transgenic mouse lines have been describedpreviously. PBCre4 mice were backcrossed in C57/Bl6 for more than 10 generations.Double transgenic PBCre4 tg/0/PPARγ flox/flox mice were generated by breeding the PBCre4and floxed PPARγ transgenic lines and were maintained in a C57/Bl6 background. Wild-type littermates were used as the control groups. PCR primers for PPARγ genotyping andfor detecting DNA recombination and excision have been previously reported (37). Adultmale severe combined immunodeficient (SCID) mice [C.B.17/IcrHsd-scid] were purchased(Harlan, Indianapolis, IN). All work involving animals was performed under protocolsreviewed and approved by the Vanderbilt IACUC.
H&E, immunofluorescence (IF) and immunohistochemical (IHC) stainingMouse prostate lobes and tissue recombinants were dissected and fixed in 10% phosphate-buffered formalin overnight, transferred to 50% ethanol, then embedded in paraffin.Samples were sectioned for 8 successive layers at 5 μm intervals and stained withhematoxylin and eosin (H&E). IF and IHC were performed as previously described (27).The observation was under a fluorescence microscope (ZEISS, Axio imager M1) equippedwith an appropriate filter system.
Jiang et al. Page 8
Cell Death Differ. Author manuscript; available in PMC 2010 September 1.
NIH
-PA Author Manuscript
NIH
-PA Author Manuscript
NIH
-PA Author Manuscript

Electron microscopy (EM)Prostate tissue and fresh cell pellets were fixed in 2.5% glutaraldehyde in cacodylate buffer(0.1M, pH 7.2) overnight at 4°C and washed in the same buffer for 30 minutes followed bypost-fixation for 2 hours at 4°C in 1% osmium tetroxide (OsO4) in cacodylate buffer. Afterfixation, the material was dehydrated through a graded series of alcohols and embedded inSpurr Resin. For light microscopic analysis, semi-thin sections (2 μm) were stained withtoluidine blue. Ultrathin sections (70 nm) were cut and ultrastructural analysis wasperformed on a Phillips CM-12 Transmission Electron Microscope operated at 80 KeV.Images were acquired using an AMT digital camera system. For quantification of lysosomenumber per area of cell cytoplasm examined, four separate thin sections were analyzed. Thenumber of cross sections through lysosomes was counted and the area of cell cytoplasmrepresented in the four thin sections was determined. Given that most lysosomes are roughlyspherical in shape, a lysosome would not be sampled twice in this procedure. Although, theexact number of lysosomes per cell cannot be obtained using this procedure, differences inthe relative occurrence of lysosomes between wild type and PPARγ-deficient cells can beestimated with reasonable accuracy.
Tissue recombinants and sub-renal capsule xenograftingSingle cell suspensions of rat UGM were prepared from E18.5 embryonic fetuses aspreviously described (20).Viable cells were counted using a hemacytometer. To preparetissue recombinants, rat UGM was mixed with genetically modified mouse prostateepithelial cells at a ratio of 250,000 to 400,000. The cell mixture was pelleted andresuspended in 50 μL of rat-tail collagen (pretitrated to pH 7.4). After polymerization, thecollagen was overlaid with growth medium. After incubation at 37°C overnight, the tissuerecombinants were grafted under the renal capsule of intact CB17Icr/Hsd-SCID mouse.Hosts were sacrificed at 4 weeks, 8 weeks and 12 weeks post-grafting. The kidneys with thegrafts were removed and imaged before processing for histology.
Administration of Rosiglitazone to miceHost SCID mice were fed by prepared BRL-49653 (Avandia or Rosiglitazone) chow (0.005% Rosiglitazone) RTD C056 (TestDiet, Richmond, IN) (39) for seven days beforexenografting surgery. And then subsequently for three months until sacrifice. The controlmice were fed matched regular rodent chow.
Statistical analysisA Statistical Analysis System (version 9.1, SAS Institute, Cary, NC) was used. Pathologicalindex of wild-type and PPARγ knockout mice were divided into four groups of Normal,Hyperplasia, LGPIN and HGPIN. Percent of each index in each lobe, (AP, VP, LP or DP),at different ages; ≤6 months, 7-12 months and ≥13 months was analyzed by Fisher's ExactTest. Differences were considered statistically significant at P < 0.05.
Accession numberAll microarray data have been deposited at the GEO database, accession number GSE13867and a link for review: http://www.ncbi.nlm.nih.gov/geo/query/acc.cgi?token=dbgfxmkkaieiuny&acc=GSE13867.
Supplementary MaterialRefer to Web version on PubMed Central for supplementary material.
Jiang et al. Page 9
Cell Death Differ. Author manuscript; available in PMC 2010 September 1.
NIH
-PA Author Manuscript
NIH
-PA Author Manuscript
NIH
-PA Author Manuscript
AcknowledgmentsThe authors appreciate EM core lab members for help with E.M., Vanderbilt MCN III Animal facility for animalcare, Vanderbilt Microarray Shared Resource (VMSR) facility for microarray work. The pCMX-mouse PPARγ1and PPARγ2 wild-type full-length cDNA expression plasmids and PPARγ-Luciferase reporter plasmid (PPRE)3-tk-luciferase were gifts from Dr. V.K.K. Chatterjee, University of Cambridge, Cambridge, UK. The pQCXIP-mouse PPARγ1 and PPARγ2 wild-type full-length cDNA vectors were gifts from Drs. Y. Eugene Chen and JifengZhang, University of Michigan Medical Center. The CK-14 (LL001) antibody was a gift from Dr. EB Lane,Universty of Dundee, Scotland and the α-LC-3 antiserum from Dr. Tamotsu Yoshimori, National Institute ofGenetics (NIG), Mishima, Japan. The work was supported by NIH R01 DK67049 and DOD-PCRP,W81XWH-07-1-0479 grants to S.W.H. NIH R01 CA113392 and NIH R01 CA59705 grants to P.R-B, NIH R01DK055748 to R.J.M. The VUMC Research EM Resource is supported by NIH grants DK20539, CA68485 andDK58404. The Vanderbilt Microarray Shared Resource is supported by the Vanderbilt Ingram Cancer Center (P30CA68485), the Vanderbilt Digestive Disease Center (P30 DK58404) and the Vanderbilt Vision Center (P30EY08126). We also thank the Frances Williams Preston Laboratories of the TJ Martell Foundation for support. Thecontent of this paper is solely the responsibility of the authors and does not necessarily represent the official viewsof the National Institutes of Health.
Abbreviations
Pca prostate cancer or prostate carcinoma
PIN prostatic intraepithelial neoplasia
PPRE peroxisome proliferator response element
mPrE a non-malignant mouse prostate epithelial cell linespontaneously immortalized from an adult wild-type C57Bl6mouse
mPrE-PPARγ KO(mPrE-γKO)
a PPARγ knockout mouse prostate epithelial cell linespontaneously immortalized from an adult PBCre4
tg/0/PPARγ flox/flox mouse prostate
mPrE-pSIR-PPARγ2shRNA (mPrE-γ2sh)
a PPARγ2 knockdown mouse prostate epithelial cell linetransfected by U6-mouse PPARγ2 shRNA in pSIR retroviralvector into mPrE cells
mPrE-pSIR-emptyvector (mPrE-pSIR)
a control pSIR vector-transfected mouse prostate epithelial cellline
mPrE-PPARγ KO-PPARγ1 wild-type(WT) (mPrE-γKO-γ1WT)
mPrE-γKO overexpressing mouse PPAR γ1 WT full-lengthcDNA. mPrE-PPARγ KO-PPARγ2 wild-type (WT) (mPrE-γKO-γ2WT), mPrE-γKO overexpressing mouse PPAR γ2 WTfull-length cDNA. mPrE-PPARγ KO-empty vector (EV)(mPrE-γKO-EV) transduction control, mPrE-γKO retrovirallytransduced using a control empty vector
UGS urogenital sinus
UGM urogenital mesenchymal cell
KO knockout
KD knockdown
References1. Yu K, Bayona W, Kallen CB, Harding HP, Ravera CP, McMahon G, et al. Differential activation of
peroxisome proliferator-activated receptors by eicosanoids. J Biol Chem. Oct 13; 1995 270(41):23975–23983. [PubMed: 7592593]
Jiang et al. Page 10
Cell Death Differ. Author manuscript; available in PMC 2010 September 1.
NIH
-PA Author Manuscript
NIH
-PA Author Manuscript
NIH
-PA Author Manuscript

2. Hihi AK, Michalik L, Wahli W. PPARs: transcriptional effectors of fatty acids and their derivatives.Cell Mol Life Sci. May; 2002 59(5):790–798. [PubMed: 12088279]
3. Tontonoz P, Hu E, Graves RA, Budavari AI, Spiegelman BM. mPPAR gamma 2: tissue-specificregulator of an adipocyte enhancer. Genes & development. May 15; 1994 8(10):1224–1234.[PubMed: 7926726]
4. Michalik L, Desvergne B, Dreyer C, Gavillet M, Laurini RN, Wahli W. PPAR expression andfunction during vertebrate development. The International journal of developmental biology. Jan;2002 46(1):105–114. [PubMed: 11902671]
5. Mao-Qiang M, Fowler AJ, Schmuth M, Lau P, Chang S, Brown BE, et al. Peroxisome-proliferator-activated receptor (PPAR)-gamma activation stimulates keratinocyte differentiation. J InvestDermatol. Aug; 2004 123(2):305–312. [PubMed: 15245430]
6. Sarraf P, Mueller E, Jones D, King FJ, DeAngelo DJ, Partridge JB, et al. Differentiation andreversal of malignant changes in colon cancer through PPARgamma. Nature medicine. Sep; 19984(9):1046–1052.
7. Saez E, Tontonoz P, Nelson MC, Alvarez JG, Ming UT, Baird SM, et al. Activators of the nuclearreceptor PPARgamma enhance colon polyp formation. Nature medicine. Sep; 1998 4(9):1058–1061.
8. Shappell SB, Gupta RA, Manning S, Whitehead R, Boeglin WE, Schneider C, et al. 15S-Hydroxyeicosatetraenoic acid activates peroxisome proliferator-activated receptor gamma andinhibits proliferation in PC3 prostate carcinoma cells. Cancer research. Jan 15; 2001 61(2):497–503.[PubMed: 11212240]
9. Hsi LC, Wilson LC, Eling TE. Opposing effects of 15-lipoxygenase-1 and -2 metabolites on MAPKsignaling in prostate. Alteration in peroxisome proliferator-activated receptor gamma. J Biol Chem.Oct 25; 2002 277(43):40549–40556. [PubMed: 12189136]
10. Karin M, Ben-Neriah Y. Phosphorylation meets ubiquitination: the control of NF-[kappa]Bactivity. Annu Rev Immunol. 2000; 18:621–663. [PubMed: 10837071]
11. Michalik L, Desvergne B, Wahli W. Peroxisome-proliferator-activated receptors and cancers:complex stories. Nature reviews. Jan; 2004 4(1):61–70.
12. Mueller E, Smith M, Sarraf P, Kroll T, Aiyer A, Kaufman DS, et al. Effects of ligand activation ofperoxisome proliferator-activated receptor gamma in human prostate cancer. Proceedings of theNational Academy of Sciences of the United States of America. Sep 26; 2000 97(20):10990–10995. [PubMed: 10984506]
13. Hisatake JI, Ikezoe T, Carey M, Holden S, Tomoyasu S, Koeffler HP. Down-Regulation ofprostate-specific antigen expression by ligands for peroxisome proliferator-activated receptorgamma in human prostate cancer. Cancer research. Oct 1; 2000 60(19):5494–5498. [PubMed:11034093]
14. Smith MR, Kantoff PW. Peroxisome proliferator-activated receptor gamma (PPargamma) as anovel target for prostate cancer. Invest New Drugs. May; 2002 20(2):195–200. [PubMed:12099579]
15. Li M, Jiang X, Liu D, Na Y, Gao GF, Xi Z. Autophagy protects LNCaP cells under androgendeprivation conditions. Autophagy. Jan 1; 2008 4(1):54–60. [PubMed: 17993778]
16. Chang CL, Liao JJ, Huang WP, Lee H. Lysophosphatidic acid inhibits serum deprivation-inducedautophagy in human prostate cancer PC-3 cells. Autophagy. May-Jun; 2007 3(3):268–270.[PubMed: 17329959]
17. Cao C, Subhawong T, Albert JM, Kim KW, Geng L, Sekhar KR, et al. Inhibition of mammaliantarget of rapamycin or apoptotic pathway induces autophagy and radiosensitizes PTEN nullprostate cancer cells. Cancer research. Oct 15; 2006 66(20):10040–10047. [PubMed: 17047067]
18. Shappell SB, Thomas GV, Roberts RL, Herbert R, Ittmann MM, Rubin MA, et al. Prostatepathology of genetically engineered mice: definitions and classification. Cancer research. Mar 15;2004 64(6):2270–2305. The consensus report from the Bar Harbor meeting of the Mouse Modelsof Human Cancer Consortium Prostate Pathology Committee. [PubMed: 15026373]
19. Park JH, Walls JE, Galvez JJ, Kim M, Abate-Shen C, Shen MM, et al. Prostatic intraepithelialneoplasia in genetically engineered mice. The American journal of pathology. Aug; 2002 161(2):727–735. [PubMed: 12163397]
Jiang et al. Page 11
Cell Death Differ. Author manuscript; available in PMC 2010 September 1.
NIH
-PA Author Manuscript
NIH
-PA Author Manuscript
NIH
-PA Author Manuscript

20. Day KC, McCabe MT, Zhao X, Wang Y, Davis JN, Phillips J, et al. Rescue of embryonicepithelium reveals that the homozygous deletion of the retinoblastoma gene confers growth factorindependence and immortality but does not influence epithelial differentiation or tissuemorphogenesis. J Biol Chem. Nov 15; 2002 277(46):44475–44484. [PubMed: 12191999]
21. Brockman JA, Gupta RA, Dubois RN. Activation of PPARgamma leads to inhibition ofanchorage-independent growth of human colorectal cancer cells. Gastroenterology. Nov; 1998115(5):1049–1055. [PubMed: 9797355]
22. Munafo DB, Colombo MI. A novel assay to study autophagy: regulation of autophagosomevacuole size by amino acid deprivation. Journal of cell science. Oct; 2001 114(Pt 20):3619–3629.[PubMed: 11707514]
23. Zhang J, Fu M, Cui T, Xiong C, Xu K, Zhong W, et al. Selective disruption of PPARgamma 2impairs the development of adipose tissue and insulin sensitivity. Proceedings of the NationalAcademy of Sciences of the United States of America. Jul 20; 2004 101(29):10703–10708.[PubMed: 15249658]
24. Yang MS, Ji KA, Jeon SB, Jin BK, Kim SU, Jou I, et al. Interleukin-13 enhancescyclooxygenase-2 expression in activated rat brain microglia: implications for death of activatedmicroglia. J Immunol. Jul 15; 2006 177(2):1323–1329. [PubMed: 16818793]
25. Jiang M, Shappell SB, Hayward SW. Approaches to understanding the importance and clinicalimplications of peroxisome proliferator-activated receptor gamma (PPARg) signaling in prostatecancer. J Cell Biochem. 2004; 91:513–527. [PubMed: 14755682]
26. Pathak SK, Sharma RA, Steward WP, Mellon JK, Griffiths TR, Gescher AJ. Oxidative stress andcyclooxygenase activity in prostate carcinogenesis: targets for chemopreventive strategies. Eur JCancer. Jan; 2005 41(1):61–70. [PubMed: 15617991]
27. Shappell SB, Boeglin WE, Olson SJ, Kasper S, Brash AR. 15-lipoxygenase-2 (15-LOX-2) isexpressed in benign prostatic epithelium and reduced in prostate adenocarcinoma. The Americanjournal of pathology. Jul; 1999 155(1):235–245. [PubMed: 10393855]
28. Shappell SB, Keeney DS, Zhang J, Page R, Olson SJ, Brash AR. 15-Lipoxygenase-2 expression inbenign and neoplastic sebaceous glands and other cutaneous adnexa. J Invest Dermatol. Jul; 2001117(1):36–43. [PubMed: 11442747]
29. Kirschenbaum A, Liotta DR, Yao S, Liu XH, Klausner AP, Unger P, et al. Immunohistochemicallocalization of cyclooxygenase-1 and cyclooxygenase-2 in the human fetal and adult malereproductive tracts. The Journal of clinical endocrinology and metabolism. Sep; 2000 85(9):3436–3441. [PubMed: 10999846]
30. Bostwick DG, Meiers I, Shanks JH. Glutathione S-transferase: differential expression of alpha, mu,and pi isoenzymes in benign prostate, prostatic intraepithelial neoplasia, and prostaticadenocarcinoma. Human pathology. Sep; 2007 38(9):1394–1401. [PubMed: 17555796]
31. Keen HL, Ryan MJ, Beyer A, Mathur S, Scheetz TE, Gackle BD, et al. Gene expression profilingof potential PPARgamma target genes in mouse aorta. Physiological genomics. Jun 17; 200418(1):33–42. [PubMed: 15054141]
32. Perera RJ, Marcusson EG, Koo S, Kang X, Kim Y, White N, et al. Identification of novelPPARgamma target genes in primary human adipocytes. Gene. Mar 15.2006 369:90–99.[PubMed: 16380219]
33. Hippert MM, O'Toole PS, Thorburn A. Autophagy in cancer: good, bad, or both? Cancer research.Oct 1; 2006 66(19):9349–9351. [PubMed: 17018585]
34. Bergmann A. Autophagy and cell death: no longer at odds. Cell. Dec 14; 2007 131(6):1032–1034.[PubMed: 18083090]
35. Degenhardt K, Mathew R, Beaudoin B, Bray K, Anderson D, Chen G, et al. Autophagy promotestumor cell survival and restricts necrosis, inflammation, and tumorigenesis. Cancer cell. Jul; 200610(1):51–64. [PubMed: 16843265]
36. Maiuri MC, Zalckvar E, Kimchi A, Kroemer G. Self-eating and self-killing: crosstalk betweenautophagy and apoptosis. Nat Rev Mol Cell Biol. Sep; 2007 8(9):741–752. [PubMed: 17717517]
37. Jones JR, Shelton KD, Guan Y, Breyer MD, Magnuson MA. Generation and functionalconfirmation of a conditional null PPARgamma allele in mice. Genesis. Feb; 2002 32(2):134–137.[PubMed: 11857800]
Jiang et al. Page 12
Cell Death Differ. Author manuscript; available in PMC 2010 September 1.
NIH
-PA Author Manuscript
NIH
-PA Author Manuscript
NIH
-PA Author Manuscript
38. Wu X, Wu J, Huang J, Powell WC, Zhang J, Matusik RJ, et al. Generation of a prostate epithelialcell-specific Cre transgenic mouse model for tissue-specific gene ablation. Mechanisms ofdevelopment. Mar; 2001 101(1-2):61–69. [PubMed: 11231059]
39. Duan SZ, Ivashchenko CY, Russell MW, Milstone DS, Mortensen RM. Cardiomyocyte-specificknockout and agonist of peroxisome proliferator-activated receptor-gamma both induce cardiachypertrophy in mice. Circulation research. Aug 19; 2005 97(4):372–379. [PubMed: 16051889]
Jiang et al. Page 13
Cell Death Differ. Author manuscript; available in PMC 2010 September 1.
NIH
-PA Author Manuscript
NIH
-PA Author Manuscript
NIH
-PA Author Manuscript

Figure 1. Progressive mouse prostatic intraepithelial neoplasia (mPIN) in conditional PPARγKO mouse prostates(a, b and c) H&E stained sections illustrate the progressive development of mPIN from alow grade at the age of 3 months (a) to a high grade at the age of 7 months (b) and 12months (c) in the AP and VP of PPARγ KO mice prostatic epithelium, compared to a pairedWT control mouse. Scale bar = 100 μm in the panels. (d) Gross appearance of the fourmouse prostate lobes, anterior (AP), ventral (VP), lateral (LP) and dorsal prostate (DP),dissected from 12 month old WT and conditional PPARγ KO mice, illustrating similar grossappearance. Scale bar = 1 mm between two small bars. (e, f, g and h) Summary of theincidence of high grade PIN (HGPIN), low grade PIN (LGPIN), Hyperplasia and Normal inthe AP, VP, LP and DP of age matched groups of WT and PPARγ KO mouse groups at theages of ≤ 6 months (3 WT, 11 KO), 7-12 months (48 WT, 26 KO) and ≥ 13 months (7 WT,20 KO), Total 58 WT mice and 57 KO. *: P < 0.01 by Fisher's Exact Test.
Jiang et al. Page 14
Cell Death Differ. Author manuscript; available in PMC 2010 September 1.
NIH
-PA Author Manuscript
NIH
-PA Author Manuscript
NIH
-PA Author Manuscript

Figure 2. Establishment and characterization of the stable mPrE-PPARγ knockout and mPrE-PPARγ2 knockdown cell lines(a) Demonstration of genomic DNA for PPARγ alleles in control mouse tail (Con,PBCre4 0/0/PPARγ flox/WT), mPrE, mPrE-pSIR and mPrE-γ2sh cell lines and its deletion(upper panel) and concurrent presence of a PPARγ flox-out band (lower panel) in the mPrE-KO cell lines by PCR. (b) Western blot showing loss of PPARγ1 (−γ1) and PPARγ2 (−γ2)proteins expression in mPrE-γKO cells and reduced PPARγ2 expression in mPrE-γ2shcells as compared to mPrE and mPrE-pSIR control cells. A Phosphorylated-PPARγ1 (P-γ1)band showed only in LNCaP and PC-3 cells. (c and d) The effect of loss of PPARγ oncellular morphology and proliferation. Phenotypically the control mPrE cells showedcobblestone morphology while mPrE-γKO cells exhibited a more extended spindle-likephenotype with loss of cell-cell contacts. Scale bar = 50 μm. Loss of PPARγ resulted inincreased cellular proliferation as determined by MTT assay. (e and f) The cellularmorphology and proliferation of mPrE-γ2sh and mPrE-pSIR cells in culture. Phenotypicallythese cells showed changes similar to those evoked by the knockout of PPARγ in the mPrE-γKO cells. Suppression of PPARγ2 protein expression resulted in increased cellularproliferation. (g) mPrE-γKO and mPrE-γ2sh cells form larger clones compared to controlmPrE and mPrE-pSIR cells when tested using a clonogenicity assay. (h) PPRE activitydetected by a luciferase reporter showed a >85% decrease in the mPrE-γ2sh cells ascompared to mPrE controls. Signal was undetectable in mPrE-γKO cells. Rosiglitazone hasno effect on PPRE activity of mPrE-γKO cells. However it shows mild activation on PPREactivity of mPrE-γ2sh cells, confirming that these cells retain a weakened ability to respondto this PPARγ agonist.
Jiang et al. Page 15
Cell Death Differ. Author manuscript; available in PMC 2010 September 1.
NIH
-PA Author Manuscript
NIH
-PA Author Manuscript
NIH
-PA Author Manuscript

Figure 3. Consequences of PPARγ deletion and suppression in prostate epithelial cells(a) PPARγ, p63 and β-catenin proteins detected by immunofluorescence in mPrE, mPrE-γKO, mPrE-pSIR and mPrE-γ2Sh cells. Note the loss of nuclear PPARγ staining in mPrE-γKO and mPrE-γ2sh cells as compared to the control cells confirming the efficiency ofdisruption of PPARγ protein expression (higher magnification in the inset). Loss of PPARγis associated with a loss of cobblestone morphology, cell-cell contacts, and an associateddecrease in nuclear localization of p63 protein and membranous localization of β-catenin aswell as nuclear transfer of β-catenin. Scale bar (PPARγ) = 100 μm. Scale bar (p63 and β-catenin) = 50 μm. (b) Western blot analysis demonstrated that p63, CK-14, β-catenin and E-cadherin proteins decreased in mPrE-γKO and mPrE-γ2sh cells compared to mPrE andmPrE-pSIR controls. LNCaP and PC-3 cells were used as the controls. (c and e) Histologyof tissue recombinants using rat urogenital sinus mesenchyme (UGM) with mPrE, mPrE-γKO, mPrE-pSIR and mPrE-γ2Sh cells examined at two months post-grafting. The controlrecombinants resembled prostatic glandular differentiation although with some flattening ofepithelial layers consistent with previous descriptions. Tissue recombinants made usingmPrE-γKO (c) and mPrE-γ2sh (e) cells grew less readily. Histopathologically thesestructures exhibited a phenotype consistent with mPIN with epithelial crowding and tuftingand out-growths (arrow). Scale bar = 50 μm. (d and f) Gross appearance of tissuerecombinants using mPrE and mPrE-pSIR cells were similar, showing glandulardifferentiation by two months post grafting. In contrast tissue recombinants made usingmPrE-γKO (d) cells and mPrE-γ2sh (f) cells grew less readily and exhibited a lessobviously glandular phenotype.
Jiang et al. Page 16
Cell Death Differ. Author manuscript; available in PMC 2010 September 1.
NIH
-PA Author Manuscript
NIH
-PA Author Manuscript
NIH
-PA Author Manuscript

Figure 4. Increased autophagic features in the ultrastructure of PPARγ knockout prostateepithelium and mPrE-PPARγ2 shRNA cellsLight and electron microscopy of prostate tissue indicated significant morphologicaldifferences between WT (a-c) and PPARγ KO (d-f) mice at the age of 12 months. Toluidineblue staining of thick plastic sections (a and d) indicated increased cellularity and fewersecretory vesicles in the epithelium from PPARγ KO mice prostate. Scale bar (a and d) = 50μm. Ultrastructurally, the WT mouse prostate epithelial cells showed a normal distributionof cytoplasmic constituents, organelles and secretory vesicles (b and c). In contrast, thePPARγ KO cells had abnormal appearing mitochondria and increased numbers oflysosomes. The lysosomes had varied morphology. Some exhibited a classical appearance (eand f) or appeared as multivesicular bodies (f) while others had the appearance ofautophagosomes (g-j). Scale bars: (b) = 2 μm, (c) = 500 nm, (e) = 2 μm, (f) = 500 nm, (g) =500 nm, (h) = 100 nm, (i) = 100 nm and (j) = 500 nm. Cytoplasmic organelles in mPrE andmPrE-pSIR cells had a normal distribution and ultrastructural appearance (k and m). Incontrast mPrE-γKO cell demonstrated a decrease in mitochondria and increase in secondarylysosomes (l). Inset: increase magnification image lysosome containing numerousmembranes and other debris, suggestive of autophagosome. mPrE-γ2sh cells had increasedlysosomes, many having the appearance of autophagosomes (n). Inset: autophagosome.Scale bars (k) = 500 nm, (l) = 1 μm, (m) = 2 μm and (n) = 500 nm.
Jiang et al. Page 17
Cell Death Differ. Author manuscript; available in PMC 2010 September 1.
NIH
-PA Author Manuscript
NIH
-PA Author Manuscript
NIH
-PA Author Manuscript

Figure 5. Alterations in autophagy-associated protein expression in mPrE-PPARγ knockout andmPrE-PPARγ2 shRNA cells(a) Catalase, LC-3 (Atg8), beclin-1 (Atg6), caspase-3 and PCNA proteins were detected byimmunofluorescence staining in mPrE and mPrE-γKO, mPrE-pSIR and mPrE-γ2sh cellsgrown on glass slides for three days. Decreased catalase and increased LC-3 and beclin-1were seen in mPrE-γKO and mPrE-γ2sh cells compared to mPrE and mPrE-pSIR cells.These results suggested active autophagic body formation in the cells. Meanwhile, caspase-3and PCNA were increased in PPARγ-/γ2-deficient cells. Scale bar = 50μm in the panels.(b) MDC, a marker of autophagy, was visualized in mPrE and mPrE-γKO, mPrE-pSIR andmPrE-γ2sh cells under the 5% FBS regular or 2.5% FBS half-starvation culture conditions.Elevated staining was seen in both mPrE-γKO and mPrE-γ2sh cells as compared to mPrEand mPrE-pSIR cells. The signals were strongly increased in PPARγ-/γ2-deficient cells inthe 2.5% FBS culture media. Scale bar = 50 μm in the panels. (c) Immunofluorescencestaining of catalase and LC-3 in wild-type (WT) and PPARγ knockout (KO) prostate tissueat ages of 7 months. Low levels of catalase expression and high expression of LC-3 proteinwere seen in the PIN regions (arrows) of PPARγ KO mouse prostate epithelium comparedto WT and more normal-appearing areas (arrowhead). Scale bar = 50 μm in the panels.
Jiang et al. Page 18
Cell Death Differ. Author manuscript; available in PMC 2010 September 1.
NIH
-PA Author Manuscript
NIH
-PA Author Manuscript
NIH
-PA Author Manuscript

Figure 6. Rescue of phenotypes of mouse PPARγ-deficient prostate epithelial cells by re-expression of either PPARγ1 or PPARγ2 isoform or treatment by Rosiglitazone(a) Phase-contrast microscopy morphology of control mPrE-γKO-empty vector and mPrE-γKO-PPARγ1 or -PPARγ2 WT cDNA cells, showing a return to a cobblestone morphologyfollowing reintroduction of each PPARγ isoform. IF staining confirmed expression ofPPARγ protein in the nuclei of mPrE-γKO-γ1WT and mPrE-γKO-γ2WT cells (insetboxes). β-catenin protein was predominantly nuclear in mPrE-γKO whereas in mPrE-γKO-γ1WT and mPrE-γKO-γ2WT cells the protein was found in the cytoplasm and onintercellular membrane interfaces. Caspase-3 was decreased in mPrE-γKO-γ1WT andmPrE-γKO-γ2WT cells compared to mPrE-γKO-EV cells. Scale bar = 50 μm. (b) Westernblot analysis demonstrated PPARγ1 protein in mPrE-γKO-γ1WT and PPARγ2 in mPrE-γKO-γ2WT cells. β-catenin and E-cadherin protein levels increased in mPrE-γKO-γ1WTand mPrE-γKO-γ2WT cells compared to mPrE-γKO-EV control cells. (c) mPrE-γKO-EVcells had decreased mitochondria and increased lipid droplets and secondary lysosomes,similar to mPrE-γKO cells. Scale bar = 2 μm. However introduction of the mouse PPARγ1wild-type cDNA increased mitochondria above wild-type values and decreased the presenceof secondary lysosomes and lipid accumulation. Scale bar = 250 nm. Likewise, introductionof the mouse PPARγ2 wild-type cDNA into mPrE-γKO cells restored the level ofmitochondria and reduced the instances of secondary lysosomes and lipid droplets. Scale bar= 500 nm. (d) Tissue recombinants made using control (mPrE-pSIR) or mPrE-γ2sh cellswith rat UGM. Sections were examined for secretion by PAS. In control recombinants anormal prostatic phenotype with secretion was noted. In contrast in the mPrE-γ2shcontaining recombinants a low grade mPIN (arrow) with less secretion into the luminalspace and thickened stromal was seen. p63 and AR protein were decreased in the mPrE-γ2sh containing recombinants, but α-SM-actin protein expression was increased comparedto tissue recombinants of mPrE-pSIR. Mice carrying tissue recombinants made by mPrE-pSIR and mPrE-γ2sh cells were administered Rosiglitazone chow (0.005% Rosiglitazone)from the time of grafting until sacrifice at three months. Tissue recombinants of mPrE-γ2sh
Jiang et al. Page 19
Cell Death Differ. Author manuscript; available in PMC 2010 September 1.
NIH
-PA Author Manuscript
NIH
-PA Author Manuscript
NIH
-PA Author Manuscript
in these mice (designated mPrE-γ2sh+Rosi.) showed secretion, and increased p63 protein inthe basal layer and p63 negative-luminal differentiation by IHC staining (arrows). Theserecombinants showed well-differentiated prostatic glandular structure and a more normal-appearing stroma. Scale bar = 50 μm in the panels.
Jiang et al. Page 20
Cell Death Differ. Author manuscript; available in PMC 2010 September 1.
NIH
-PA Author Manuscript
NIH
-PA Author Manuscript
NIH
-PA Author Manuscript

Figure 7. Disruption of PPARγ resulted in mouse prostate carcinogenesis involving oxidativestress and autophagyThe simplified diagram brings together data from the studies and presents a modelillustrating how the PPARγ signaling contributes to prostate carcinogenesis from wild-typeto mPIN formation and to set up conditions that would predispose cells to further malignantprogression. These data suggested an important role for the PPARγ gene in maintaining thematuration, differentiation and turnover of subcellular organelles (peroxisomes,mitochondria and lysosomes) during mouse prostatic organogenesis and development. Inparticular this model suggests that a mechanism by which loss of PPARγ could lead tomouse PIN related to the disruption of cellular peroxisomal and mitochondrial lipidmetabolism and oxidative stress (hypoxia) and active autophagy for the extended life spanand cellular dedifferentiation.
Jiang et al. Page 21
Cell Death Differ. Author manuscript; available in PMC 2010 September 1.
NIH
-PA Author Manuscript
NIH
-PA Author Manuscript
NIH
-PA Author Manuscript
NIH
-PA Author Manuscript
NIH
-PA Author Manuscript
NIH
-PA Author Manuscript
Jiang et al. Page 22
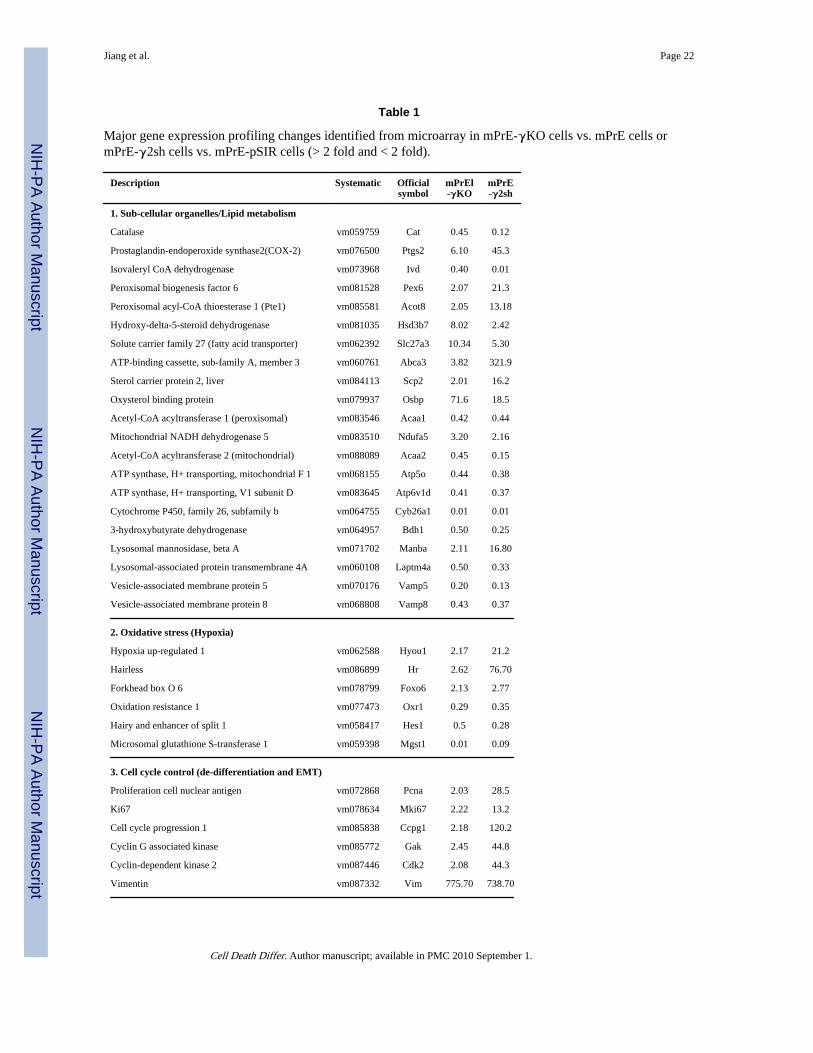
Table 1
Major gene expression profiling changes identified from microarray in mPrE-γKO cells vs. mPrE cells ormPrE-γ2sh cells vs. mPrE-pSIR cells (> 2 fold and < 2 fold).
Description Systematic Officialsymbol
mPrEl-γKO
mPrE-γ2sh
1. Sub-cellular organelles/Lipid metabolism
Catalase vm059759 Cat 0.45 0.12
Prostaglandin-endoperoxide synthase2(COX-2) vm076500 Ptgs2 6.10 45.3
Isovaleryl CoA dehydrogenase vm073968 Ivd 0.40 0.01
Peroxisomal biogenesis factor 6 vm081528 Pex6 2.07 21.3
Peroxisomal acyl-CoA thioesterase 1 (Pte1) vm085581 Acot8 2.05 13.18
Hydroxy-delta-5-steroid dehydrogenase vm081035 Hsd3b7 8.02 2.42
Solute carrier family 27 (fatty acid transporter) vm062392 Slc27a3 10.34 5.30
ATP-binding cassette, sub-family A, member 3 vm060761 Abca3 3.82 321.9
Sterol carrier protein 2, liver vm084113 Scp2 2.01 16.2
Oxysterol binding protein vm079937 Osbp 71.6 18.5
Acetyl-CoA acyltransferase 1 (peroxisomal) vm083546 Acaa1 0.42 0.44
Mitochondrial NADH dehydrogenase 5 vm083510 Ndufa5 3.20 2.16
Acetyl-CoA acyltransferase 2 (mitochondrial) vm088089 Acaa2 0.45 0.15
ATP synthase, H+ transporting, mitochondrial F 1 vm068155 Atp5o 0.44 0.38
ATP synthase, H+ transporting, V1 subunit D vm083645 Atp6v1d 0.41 0.37
Cytochrome P450, family 26, subfamily b vm064755 Cyb26a1 0.01 0.01
3-hydroxybutyrate dehydrogenase vm064957 Bdh1 0.50 0.25
Lysosomal mannosidase, beta A vm071702 Manba 2.11 16.80
Lysosomal-associated protein transmembrane 4A vm060108 Laptm4a 0.50 0.33
Vesicle-associated membrane protein 5 vm070176 Vamp5 0.20 0.13
Vesicle-associated membrane protein 8 vm068808 Vamp8 0.43 0.37
2. Oxidative stress (Hypoxia)
Hypoxia up-regulated 1 vm062588 Hyou1 2.17 21.2
Hairless vm086899 Hr 2.62 76.70
Forkhead box O 6 vm078799 Foxo6 2.13 2.77
Oxidation resistance 1 vm077473 Oxr1 0.29 0.35
Hairy and enhancer of split 1 vm058417 Hes1 0.5 0.28
Microsomal glutathione S-transferase 1 vm059398 Mgst1 0.01 0.09
3. Cell cycle control (de-differentiation and EMT)
Proliferation cell nuclear antigen vm072868 Pcna 2.03 28.5
Ki67 vm078634 Mki67 2.22 13.2
Cell cycle progression 1 vm085838 Ccpg1 2.18 120.2
Cyclin G associated kinase vm085772 Gak 2.45 44.8
Cyclin-dependent kinase 2 vm087446 Cdk2 2.08 44.3
Vimentin vm087332 Vim 775.70 738.70
Cell Death Differ. Author manuscript; available in PMC 2010 September 1.

NIH
-PA Author Manuscript
NIH
-PA Author Manuscript
NIH
-PA Author Manuscript
Jiang et al. Page 23
Description Systematic Officialsymbol
mPrEl-γKO
mPrE-γ2sh
4. Nuclear receptors/cofactors subfamily
Peroxisome proliferative activated receptor, gamma, vm078414 Ppargc1b 0.01 0.01
coactivator 1beta
Vitamin D receptor vm076701 Vdr 0.01 0.01
Cellular retinoic acid binding protein II vm057044 Crabp2 0.01 0.01
cAMP responsive element binding protein 1 vm086761 Creb1 0.01 0.01
Global gene expression profiling in mPrE-PPARγ knockout cells vs. mPrE cells or mPrE-PPARγ2 knockdown cells vs. mPrE-pSIR cells. Themajor signaling pathway changes in mPrE-γKO cells vs. mPrE cells and mPrE-γ2sh cells vs. mPrE-pSIR cells by microarray analysis wereinvolved in metabolic lipid oxidation, subcellular organelles/autophagy, oxidative stress, cell cycle regulation/cellular dedifferentiation and nuclearreceptors/PPRE. Expression value of an individual gene was by the comparison of mPrE-γKO cells vs. mPrE cells or mPrE-γ2sh cells vs. mPrE-pSIR control cells.
Cell Death Differ. Author manuscript; available in PMC 2010 September 1.