![[MI 611-205] PH10 DolpHin Series pH Sensors and ORP10 ...](https://static.fdokumen.com/doc/165x107/63374b82479381eb2301dd3f/mi-611-205-ph10-dolphin-series-ph-sensors-and-orp10-.jpg)
Disentangling social networks from spatiotemporal dynamics: the temporal structure of a dolphin...
12
This article appeared in a journal published by Elsevier. The attached copy is furnished to the author for internal non-commercial research and education use, including for instruction at the authors institution and sharing with colleagues. Other uses, including reproduction and distribution, or selling or licensing copies, or posting to personal, institutional or third party websites are prohibited. In most cases authors are permitted to post their version of the article (e.g. in Word or Tex form) to their personal website or institutional repository. Authors requiring further information regarding Elsevier’s archiving and manuscript policies are encouraged to visit: http://www.elsevier.com/copyright
Transcript of Disentangling social networks from spatiotemporal dynamics: the temporal structure of a dolphin...

This article appeared in a journal published by Elsevier. The attachedcopy is furnished to the author for internal non-commercial researchand education use, including for instruction at the authors institution
and sharing with colleagues.
Other uses, including reproduction and distribution, or selling orlicensing copies, or posting to personal, institutional or third party
websites are prohibited.
In most cases authors are permitted to post their version of thearticle (e.g. in Word or Tex form) to their personal website orinstitutional repository. Authors requiring further information
regarding Elsevier’s archiving and manuscript policies areencouraged to visit:
http://www.elsevier.com/copyright

Author's personal copy
Disentangling social networks from spatiotemporal dynamics: the temporalstructure of a dolphin society
Maurício Cantor a,b,*, Leonardo Liberali Wedekin b, Paulo Roberto Guimarães c,Fábio Gonçalves Daura-Jorge a, Marcos Roberto Rossi-Santos b, Paulo César Simões-Lopes a
a Laboratório de Mamíferos Aquáticos, Departamento de Ecologia e Zoologia, Universidade Federal de Santa Catarina, Brazilb Instituto Baleia Jubarte, BrazilcDepartamento de Ecologia, Universidade de São Paulo, Brazil
a r t i c l e i n f o
Article history:Received 21 February 2012Initial acceptance 23 March 2012Final acceptance 16 May 2012Available online 20 July 2012MS. number: A12-00133R
Keywords:animal societyGuiana dolphinmodularitypopulation turnoverranging behavioursocial structureSotalia guianensis
Social networks are static illustrations of dynamic societies, within which social interactions areconstantly changing. Fundamental sources of variation include ranging behaviour and temporal demo-graphic changes. Spatiotemporal dynamics can favour or limit opportunities for individuals to interact,and then a network may not essentially represent social processes. We examined whether a socialnetwork can embed such nonsocial effects in its topology, whereby emerging modules depict spatially ortemporally segregated individuals. To this end, we applied a combination of spatial, temporal anddemographic analyses to a long-term study of the association patterns of Guiana dolphins, Sotaliaguianensis. We found that association patterns are organized into a modular social network. Space usewas unlikely to reflect these modules, since dolphins’ ranging behaviour clearly overlapped. However,a temporal demographic turnover, caused by the exit/entrance of individuals (most likely emigration/immigration), defined three modules of associations occurring at different times. Although this factorcould mask real social processes, we identified the temporal scale that allowed us to account for thesedemographic effects. By looking within this turnover period (32 months), we assessed fissionefusiondynamics of the poorly known social organization of Guiana dolphins. We highlight that spatiotem-poral dynamics can strongly influence the structure of social networks. Our findings show that hypo-thetical social units can emerge due to the temporal opportunities for individuals to interact. Therefore,a thorough search for a satisfactory spatiotemporal scale that removes such nonsocial noise is criticalwhen analysing a social system.� 2012 The Association for the Study of Animal Behaviour. Published by Elsevier Ltd. All rights reserved.
Animal societies are the complex results of the dynamismevoked by a group-living strategy. These societies are composed ofa tangle of relationships that vary in number and strength amongindividuals. There is increasing evidence showing that decoding thestructure of such a social network is an effective approach forunravelling the underlying processes organizing an animal society(e.g. Lusseau 2003; Croft et al. 2008; Foster et al. 2012; Mourieret al. 2012; Daura-Jorge et al. 2012).
The general structure of a social network is fundamentally basedon the number and strength of dyadic social relationships (Fig. 1a).Animals that form brief groups (or large aggregations) may beengaged in numerous and ephemeral associations (e.g. Clapham1996). Because virtually all of the individuals could interact,mainly for short duration, a random social network would arise. In
contrast, long-lasting associations can lead to a disconnectednetwork composed of strongly connected components represent-ing isolated social units. These stable groups are usually observed inmatrilineal societies (e.g. Whitehead 2003). Between these twoextremes are the fluid groups, of intermediate size and durationthat occur at different levels in space and time. These groups arecharacteristic of populations with fissionefusion dynamics (Aureliet al. 2008). Such a heterogeneous pattern of social interactionscan lead to a modular network structure composed of weaklyinterlinked groups of individuals, which are strongly internallyconnected. These modules may correspond to different functionalsocial units (e.g. Lusseau et al. 2006; Guimarães et al. 2007), a large-scale level of complexity within the networked system (Newman2011).
Different social processes can drive the emergence of thesesocial modules in natural populations. For instance, animals can bebrought together by several common biological factors, such as sex,age (Lusseau & Newman 2004; Mourier et al. 2012), kinship (e.g.Frère et al. 2010; Wiszniewski et al. 2010), foraging specializations
* Correspondence and present address: M. Cantor, Department of Biology,Dalhousie University, 1355 Oxford Street, Halifax, NS B3H 4J1, Canada.
E-mail address: [email protected] (M. Cantor).
Contents lists available at SciVerse ScienceDirect
Animal Behaviour
journal homepage: www.elsevier .com/locate/anbehav
0003-3472/$38.00 � 2012 The Association for the Study of Animal Behaviour. Published by Elsevier Ltd. All rights reserved.http://dx.doi.org/10.1016/j.anbehav.2012.06.019
Animal Behaviour 84 (2012) 641e651
Author's personal copy
(e.g. Daura-Jorge et al. 2012), habitat utilization (e.g. Wiszniewskiet al. 2009), or local ecological conditions (e.g. Foster et al. 2012).However, social matrices include more than social affinities orecological factors (e.g. Wolf et al. 2007). Social networks are staticdepictions of dynamic societies; but we know that social interac-tions constantly vary in time and/or space (Aureli et al. 2008).Therefore, occasionally a modular structure may be inappropriatebecause it can be influenced by such nonsocial mechanisms.
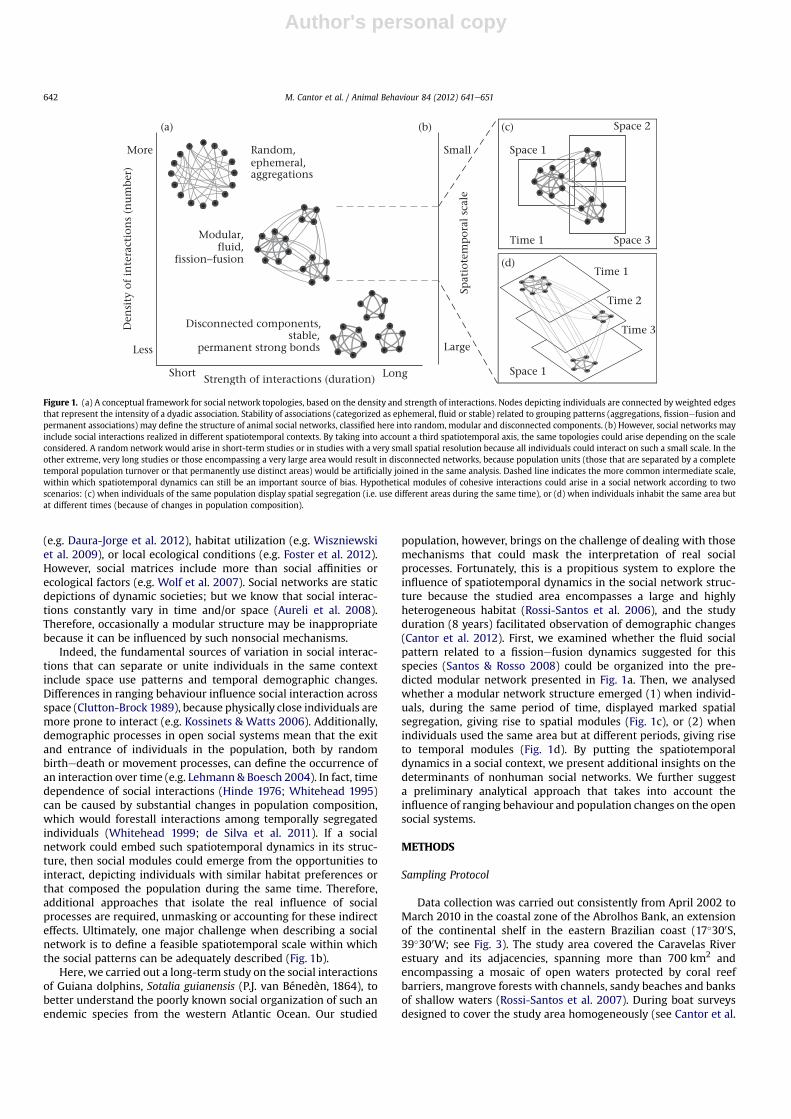
Indeed, the fundamental sources of variation in social interac-tions that can separate or unite individuals in the same contextinclude space use patterns and temporal demographic changes.Differences in ranging behaviour influence social interaction acrossspace (Clutton-Brock 1989), because physically close individuals aremore prone to interact (e.g. Kossinets & Watts 2006). Additionally,demographic processes in open social systems mean that the exitand entrance of individuals in the population, both by randombirthedeath or movement processes, can define the occurrence ofan interaction over time (e.g. Lehmann & Boesch 2004). In fact, timedependence of social interactions (Hinde 1976; Whitehead 1995)can be caused by substantial changes in population composition,which would forestall interactions among temporally segregatedindividuals (Whitehead 1999; de Silva et al. 2011). If a socialnetwork could embed such spatiotemporal dynamics in its struc-ture, then social modules could emerge from the opportunities tointeract, depicting individuals with similar habitat preferences orthat composed the population during the same time. Therefore,additional approaches that isolate the real influence of socialprocesses are required, unmasking or accounting for these indirecteffects. Ultimately, one major challenge when describing a socialnetwork is to define a feasible spatiotemporal scale within whichthe social patterns can be adequately described (Fig. 1b).
Here, we carried out a long-term study on the social interactionsof Guiana dolphins, Sotalia guianensis (P.J. van Bénedèn, 1864), tobetter understand the poorly known social organization of such anendemic species from the western Atlantic Ocean. Our studied
population, however, brings on the challenge of dealing with thosemechanisms that could mask the interpretation of real socialprocesses. Fortunately, this is a propitious system to explore theinfluence of spatiotemporal dynamics in the social network struc-ture because the studied area encompasses a large and highlyheterogeneous habitat (Rossi-Santos et al. 2006), and the studyduration (8 years) facilitated observation of demographic changes(Cantor et al. 2012). First, we examined whether the fluid socialpattern related to a fissionefusion dynamics suggested for thisspecies (Santos & Rosso 2008) could be organized into the pre-dicted modular network presented in Fig. 1a. Then, we analysedwhether a modular network structure emerged (1) when individ-uals, during the same period of time, displayed marked spatialsegregation, giving rise to spatial modules (Fig. 1c), or (2) whenindividuals used the same area but at different periods, giving riseto temporal modules (Fig. 1d). By putting the spatiotemporaldynamics in a social context, we present additional insights on thedeterminants of nonhuman social networks. We further suggesta preliminary analytical approach that takes into account theinfluence of ranging behaviour and population changes on the opensocial systems.
METHODS
Sampling Protocol
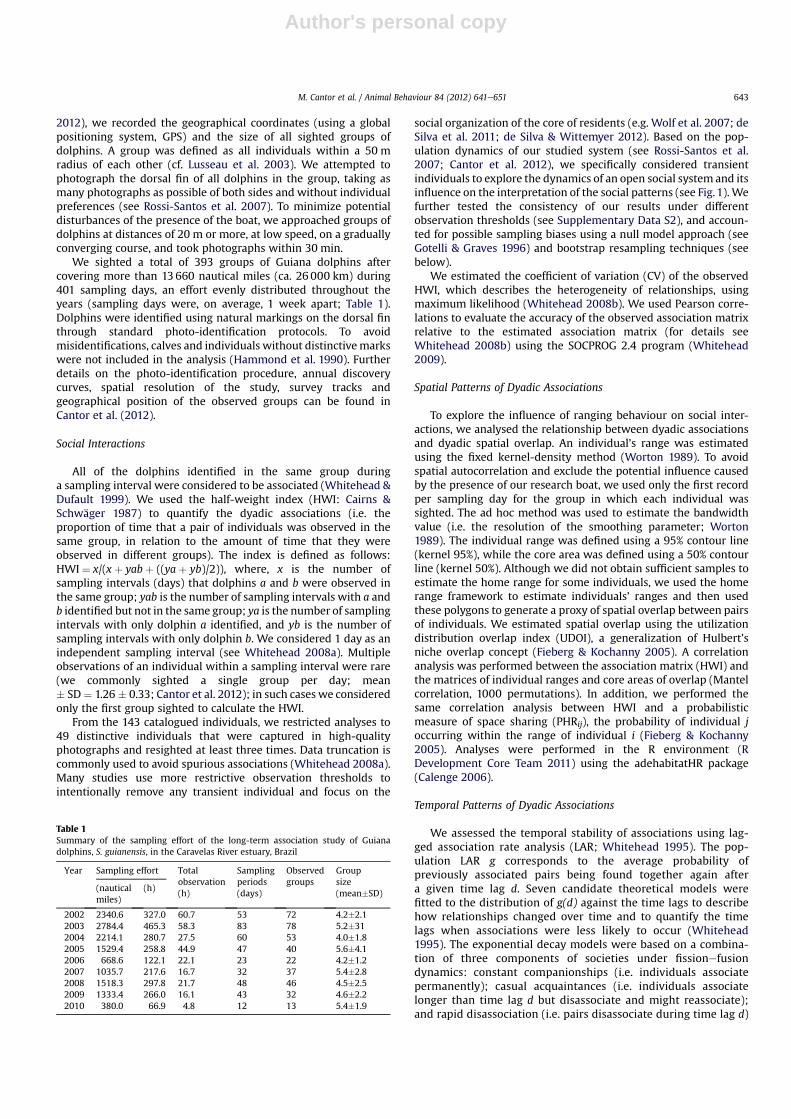
Data collection was carried out consistently from April 2002 toMarch 2010 in the coastal zone of the Abrolhos Bank, an extensionof the continental shelf in the eastern Brazilian coast (17�300S,39�300W; see Fig. 3). The study area covered the Caravelas Riverestuary and its adjacencies, spanning more than 700 km2 andencompassing a mosaic of open waters protected by coral reefbarriers, mangrove forests with channels, sandy beaches and banksof shallow waters (Rossi-Santos et al. 2007). During boat surveysdesigned to cover the study area homogeneously (see Cantor et al.
Disconnected components,
permanent strong bonds
Small
LargeLess
More
Strength of interactions (duration)
Den
sity
of
inte
ract
ion
s (n
um
ber)
Random,ephemeral,aggregations
Modular,fluid,
fission−fusion
(a) (b) (c)
Spat
iote
mp
oral
sca
le
Short Long
(d)Time 1
Time 2
Time 3
Time 1 Space 3
Space 2
Space 1
Space 1
stable,
Figure 1. (a) A conceptual framework for social network topologies, based on the density and strength of interactions. Nodes depicting individuals are connected by weighted edgesthat represent the intensity of a dyadic association. Stability of associations (categorized as ephemeral, fluid or stable) related to grouping patterns (aggregations, fissionefusion andpermanent associations) may define the structure of animal social networks, classified here into random, modular and disconnected components. (b) However, social networks mayinclude social interactions realized in different spatiotemporal contexts. By taking into account a third spatiotemporal axis, the same topologies could arise depending on the scaleconsidered. A random network would arise in short-term studies or in studies with a very small spatial resolution because all individuals could interact on such a small scale. In theother extreme, very long studies or those encompassing a very large area would result in disconnected networks, because population units (those that are separated by a completetemporal population turnover or that permanently use distinct areas) would be artificially joined in the same analysis. Dashed line indicates the more common intermediate scale,within which spatiotemporal dynamics can still be an important source of bias. Hypothetical modules of cohesive interactions could arise in a social network according to twoscenarios: (c) when individuals of the same population display spatial segregation (i.e. use different areas during the same time), or (d) when individuals inhabit the same area butat different times (because of changes in population composition).
M. Cantor et al. / Animal Behaviour 84 (2012) 641e651642
Author's personal copy
2012), we recorded the geographical coordinates (using a globalpositioning system, GPS) and the size of all sighted groups ofdolphins. A group was defined as all individuals within a 50 mradius of each other (cf. Lusseau et al. 2003). We attempted tophotograph the dorsal fin of all dolphins in the group, taking asmany photographs as possible of both sides and without individualpreferences (see Rossi-Santos et al. 2007). To minimize potentialdisturbances of the presence of the boat, we approached groups ofdolphins at distances of 20 m or more, at low speed, on a graduallyconverging course, and took photographs within 30 min.
We sighted a total of 393 groups of Guiana dolphins aftercovering more than 13660 nautical miles (ca. 26 000 km) during401 sampling days, an effort evenly distributed throughout theyears (sampling days were, on average, 1 week apart; Table 1).Dolphins were identified using natural markings on the dorsal finthrough standard photo-identification protocols. To avoidmisidentifications, calves and individuals without distinctivemarkswere not included in the analysis (Hammond et al. 1990). Furtherdetails on the photo-identification procedure, annual discoverycurves, spatial resolution of the study, survey tracks andgeographical position of the observed groups can be found inCantor et al. (2012).
Social Interactions
All of the dolphins identified in the same group duringa sampling interval were considered to be associated (Whitehead &Dufault 1999). We used the half-weight index (HWI: Cairns &Schwäger 1987) to quantify the dyadic associations (i.e. theproportion of time that a pair of individuals was observed in thesame group, in relation to the amount of time that they wereobserved in different groups). The index is defined as follows:HWI ¼ x/(x þ yab þ ((ya þ yb)/2)), where, x is the number ofsampling intervals (days) that dolphins a and b were observed inthe same group; yab is the number of sampling intervals with a andb identified but not in the same group; ya is the number of samplingintervals with only dolphin a identified, and yb is the number ofsampling intervals with only dolphin b. We considered 1 day as anindependent sampling interval (see Whitehead 2008a). Multipleobservations of an individual within a sampling interval were rare(we commonly sighted a single group per day; mean� SD ¼ 1.26 � 0.33; Cantor et al. 2012); in such cases we consideredonly the first group sighted to calculate the HWI.
From the 143 catalogued individuals, we restricted analyses to49 distinctive individuals that were captured in high-qualityphotographs and resighted at least three times. Data truncation iscommonly used to avoid spurious associations (Whitehead 2008a).Many studies use more restrictive observation thresholds tointentionally remove any transient individual and focus on the
social organization of the core of residents (e.g. Wolf et al. 2007; deSilva et al. 2011; de Silva & Wittemyer 2012). Based on the pop-ulation dynamics of our studied system (see Rossi-Santos et al.2007; Cantor et al. 2012), we specifically considered transientindividuals to explore the dynamics of an open social system and itsinfluence on the interpretation of the social patterns (see Fig.1). Wefurther tested the consistency of our results under differentobservation thresholds (see Supplementary Data S2), and accoun-ted for possible sampling biases using a null model approach (seeGotelli & Graves 1996) and bootstrap resampling techniques (seebelow).
We estimated the coefficient of variation (CV) of the observedHWI, which describes the heterogeneity of relationships, usingmaximum likelihood (Whitehead 2008b). We used Pearson corre-lations to evaluate the accuracy of the observed association matrixrelative to the estimated association matrix (for details seeWhitehead 2008b) using the SOCPROG 2.4 program (Whitehead2009).
Spatial Patterns of Dyadic Associations
To explore the influence of ranging behaviour on social inter-actions, we analysed the relationship between dyadic associationsand dyadic spatial overlap. An individual’s range was estimatedusing the fixed kernel-density method (Worton 1989). To avoidspatial autocorrelation and exclude the potential influence causedby the presence of our research boat, we used only the first recordper sampling day for the group in which each individual wassighted. The ad hoc method was used to estimate the bandwidthvalue (i.e. the resolution of the smoothing parameter; Worton1989). The individual range was defined using a 95% contour line(kernel 95%), while the core area was defined using a 50% contourline (kernel 50%). Although we did not obtain sufficient samples toestimate the home range for some individuals, we used the homerange framework to estimate individuals’ ranges and then usedthese polygons to generate a proxy of spatial overlap between pairsof individuals. We estimated spatial overlap using the utilizationdistribution overlap index (UDOI), a generalization of Hulbert’sniche overlap concept (Fieberg & Kochanny 2005). A correlationanalysis was performed between the association matrix (HWI) andthe matrices of individual ranges and core areas of overlap (Mantelcorrelation, 1000 permutations). In addition, we performed thesame correlation analysis between HWI and a probabilisticmeasure of space sharing (PHRij), the probability of individual joccurring within the range of individual i (Fieberg & Kochanny2005). Analyses were performed in the R environment (RDevelopment Core Team 2011) using the adehabitatHR package(Calenge 2006).
Temporal Patterns of Dyadic Associations
We assessed the temporal stability of associations using lag-ged association rate analysis (LAR; Whitehead 1995). The pop-ulation LAR g corresponds to the average probability ofpreviously associated pairs being found together again aftera given time lag d. Seven candidate theoretical models werefitted to the distribution of g(d) against the time lags to describehow relationships changed over time and to quantify the timelags when associations were less likely to occur (Whitehead1995). The exponential decay models were based on a combina-tion of three components of societies under fissionefusiondynamics: constant companionships (i.e. individuals associatepermanently); casual acquaintances (i.e. individuals associatelonger than time lag d but disassociate and might reassociate);and rapid disassociation (i.e. pairs disassociate during time lag d)
Table 1Summary of the sampling effort of the long-term association study of Guianadolphins, S. guianensis, in the Caravelas River estuary, Brazil
Year Sampling effort Totalobservation(h)
Samplingperiods(days)
Observedgroups
Groupsize(mean�SD)
(nauticalmiles)
(h)
2002 2340.6 327.0 60.7 53 72 4.2�2.12003 2784.4 465.3 58.3 83 78 5.2�312004 2214.1 280.7 27.5 60 53 4.0�1.82005 1529.4 258.8 44.9 47 40 5.6�4.12006 668.6 122.1 22.1 23 22 4.2�1.22007 1035.7 217.6 16.7 32 37 5.4�2.82008 1518.3 297.8 21.7 48 46 4.5�2.52009 1333.4 266.0 16.1 43 32 4.6�2.22010 380.0 66.9 4.8 12 13 5.4�1.9
M. Cantor et al. / Animal Behaviour 84 (2012) 641e651 643

Author's personal copy
(Whitehead 1995). The most parsimonious model was selectedusing the quasi-Akaike Information Criterion (QAICc), consid-ering the overdispersion of the data (Burnham & Anderson2002). To determine the occurrence of nonrandom associations,we compared LARs to null association rates (NAR), during whichall individuals could be randomly associated (restricting theoriginal number of associates and individual observationfrequencies; Whitehead 1995). Standard errors for the LAR andNAR estimates were obtained using a jackknife procedure(Whitehead 1995). These analyses were performed for all indi-viduals (including those resighted less than three times) to avoida positive bias (Whitehead 2008a) using the SOCPROG 2.4program (Whitehead 2009).
Demographic Effects
To assess the effect of demographic processes on associationpatterns, we used lagged identification rates (LIR; Whitehead2001) to infer information about individual additions to ordeletions from the population. This analysis estimated theprobability of resighting an individual in the study area (R) aftertime lag d in comparison to a randomly chosen individual. LIR isconstant when the population is closed but declines briefly whenindividuals are leaving the population. To identify factorsresponsible for declining LIR, we fitted seven models to theobserved LIR using a combination of demographic parameters:population size (N), mean residence time (a), mean time outsidethe study area (b), emigration (l), immigration (m) and mortalityrates (d) (see Whitehead 2001). The parameters of the modelwere estimated by maximizing the summed loglikelihoods(Whitehead 2001). The QAICc was used to select the mostparsimonious model (Burnham & Anderson 2002). The LIRconfidence intervals (CI) were obtained using bootstrap repli-cates (see Whitehead 2008a). All LIR analyses were run in theSOCPROG 2.4 program (Whitehead 2009).
To examine the relation, if any, between association probabil-ities and absence of individuals in the study area (due to mortalityand/or emigration), we used a linear regression between the LARand LIR for the same time lags under a geometric progression.Based on the LAR and LIR best-fitting models, we defined the timelag in which the association and identification rates had lowprobabilities of continued existence. To take into account theeffect of the presence/absence of individuals on the decay ofassociation probabilities, we analysed the temporal scale of theturnover of individuals between different periods. We divided thetotal study length (96 months) into integer periods of months (6,8, 12, 16, 32 and 48 months) and used a Whittaker’s indexdissimilarity matrix to quantify differences between periodsbased on the presence of individuals in the population. Thesignificance of the observed dissimilarity in each period waschecked by comparing the empirical values to the 95% CI of nulldistributions generated using a null model (NM1; seeSupplementary Table S1). At each of the 1000 iterations, individ-uals were randomized into these integer periods of months, butconstrained by the number of times they were sighted during theentire study.
Social Network Topology
Social interactions were described using an undirectedweighted network (Boccaletti et al. 2006). Nodes representingindividuals were connected by edges, the thicknesses of whichwere proportional to the weight of association (HWI). To explorethe network topology, we used two global properties. (1) Weused a clustering coefficient to quantify the degree to which
nodes tended to cluster together, representing the chance that anindividual’s associates were associated with each other. Werelied on the averaged weight of the edges of a triplet to definethe weighted clustering coefficient (Cw,am; see Opsahl &Panzarasa 2009). (2) We used modularity (M) to quantify thetendency of nodes to cluster into cohesive subgraphs. A modularsocial network is composed of weakly interlinked social units ofindividuals that internally are strongly connected to each other.We calculated modularity using a module identification algo-rithm (Guimerá & Amaral 2005a, b) combined with a stochasticoptimization technique, the simulated annealing (SA) method(Guimerá et al. 2004). This procedure was used to identify thenetwork partition that yielded the greatest degree of modularity,maximizing the difference between the observed density of theedges within modules and the density expected by chance. TheSA method is one of the most effective methods available (fora comparison see Danon et al. 2005; Olesen et al. 2007), and wefurther verified the consistency of the results (SupplementaryData S1). We also evaluated network structure consistency dueto the removal of sporadically observed individuals, by calcu-lating the clustering coefficient and modularity under differentobservation thresholds (Supplementary Data S2). In addition, wefurther explored how our sampling effort could affect thenetwork properties using the bootstrap method to calculateprecision (SD).
We tested the empirical network properties (and HWI, seebelow) with a null distribution obtained from 20 000 randomnetworks of the same size generated by a second null model (NM2;Supplementary Table S1). NM2 reallocated the individuals intogroups (i.e. the 1s in the raw group� individual matrix), con-strained by group size (marginal totals of rows) and individualsighting frequency (marginal totals of columns). The resulting cellshad different probabilities of being filled according to features ofthe original dataset (see similar models proposed in: Bascompteet al. 2003; Vázquez et al. 2009). Empirical values were signifi-cant if they differed from typical values of the benchmark distri-bution (i.e. if they fell outside the 95% CI, based on a two-tailedtest).
To test whether spatiotemporal mechanisms affected thenetwork topology, we analysed their relationship with theemergence of modules. If differences in space use are important,we expected that individuals composing a certain module wouldpresent a higher spatial overlap (individual range and core areas)than that expected by chance, while individuals from differentmodules would present lower spatial overlaps. To test thetemporal effect, we classified individuals according to the periodin which they were sighted (32-month periods; see Results) andcompared the proportion of dolphins from the different sightingperiods in each module. If modules are defined by a temporalsegregation, then individuals from the same periods should bemore concentrated into the same modules than expected bychance. The significance of both results was checked using a thirdnull model (NM3; Supplementary Table S1). We compared themean observed values (individual range and core area overlap;proportion of individuals per period) within and betweenmodules to the 95% CI of null distributions of individualsrandomly assigned to modules (1000 iterations), while con-straining module size (e.g. Daura-Jorge et al. 2012). With the sameapproach, we further tested the temporal effect by comparing theHWI (Supplementary Data S3) and two local network properties(shortest path length and centrality; Supplementary Data S4)between the different classes of sighting periods. We expectedindividuals in the same class to occupy the same social position inthe network (central or peripheral), to show stronger relation-ships (higher association indices amongst themselves) and to be
M. Cantor et al. / Animal Behaviour 84 (2012) 641e651644

Author's personal copy
closer in the network (lower average shortest path length) thanindividuals of different classes.
Association Patterns
Animal association patterns are usually evaluated using MonteCarlo simulations (Bejder et al. 1998), employing a pairwiseswapping algorithm that permutes individuals into groups.Because this approach may be biased (Krause et al. 2009), as analternative, we tested the hypothesis of a random social patternfor this Guiana dolphin population using the null model NM2.Note that our randomization constrained the same features of theoriginal data as would a conventional algorithm (see Bejder et al.1998).
To rule out demographic effects, we first defined themaximum scale over which associations could be analysed, usingthe LAR and individual turnover analyses to separate individualsinto periods (32 months, see Results). Then, each of the three32-month periods (i.e. 62, 43 and 49 sampled days, respectively)was split into shorter periods during which demographic effectswere less likely to occur (see Whitehead 1999). It is reasonable toassume for this species that the population is closed withinperiods of 2 months. During each of the 20 000 null modeliterations, a 2-month period was randomly selected and therandomization procedure was carried out only within that period(Whitehead 1999).
The existence of long-term preferred companionships (across2-month periods) in the population would be indicated by a highCV for all observed HWIs. Short-term preferred companionships(within a 2-month period) would be indicated by a low observedHWI mean and a low proportion of nonzero HWIs (Whitehead1999, 2008a). The P value was defined by the proportion ofrandom matrices whose statistics were higher than the observedvalues (significant difference indicated by P > 0.95; seeWhitehead 1999, 2008a). To quantify the number of preferred andavoided associations, the test was extended to dyadic HWI values(cf. Bejder et al. 1998). Association estimates at or below the 2.5percentile in the null distribution were considered as avoidance,and those at or above the 97.5 percentile were considered aspreference.
RESULTS
The Guiana dolphin population was organized as a well differ-entiated society (HWI CV: S � SE ¼ 0.87 � 0.03; S > 0.5; seeWhitehead 2008b) and the estimated association matrix wasa moderate but feasible representation of the true pattern(r � SE ¼ 0.51 � 0.03; 0.4 � r > 0.8; see Whitehead 2008b).
Social Network Topology
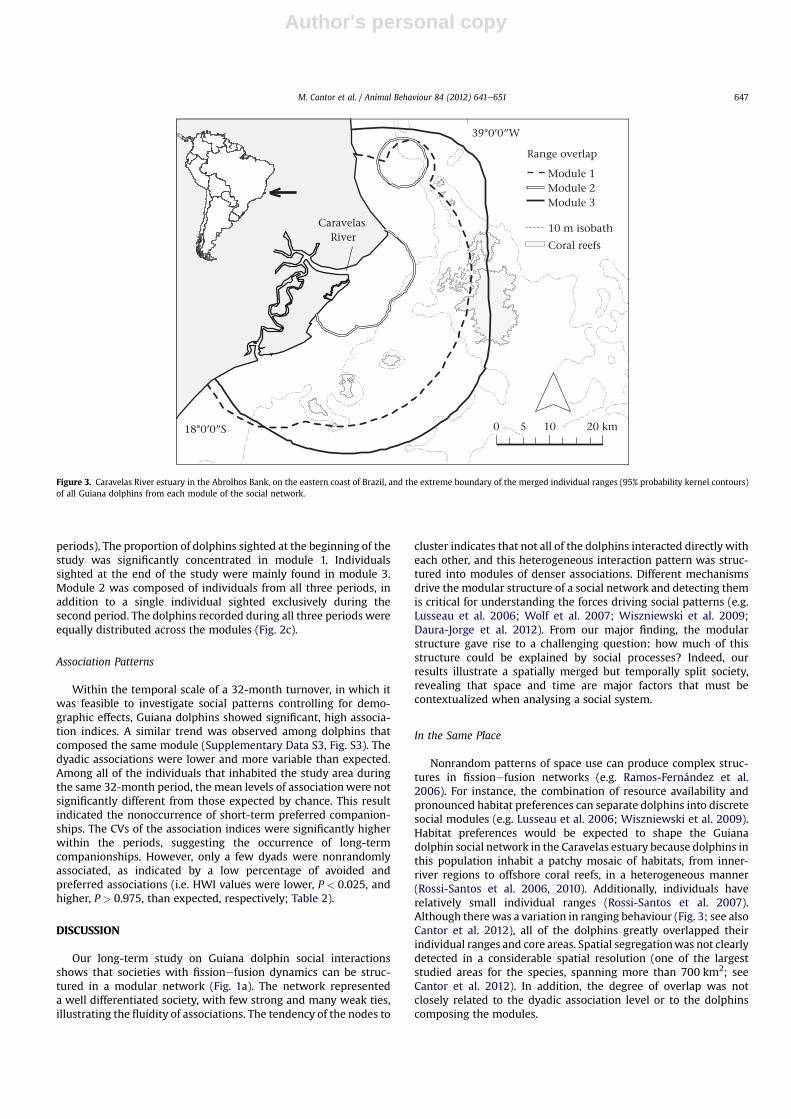
The social network of Guiana dolphins was formed by a singlecomponent of 49 individuals (nodes), connected by 438 weightededges (mean HWI � SD ¼ 0.167� 0.114). The average clusteringcoefficient was higher than expected (Cw,am � SD ¼ 0.665 � 0.020;95% CI ¼ 0.586e0.659), indicating a high tendency of individuals tocluster together. The social network was more modular than itsrandom counterparts (Mobs � SD ¼ 0.209 � 0.041; Mrandom � SD ¼0.119 � 0.005; 95% CI ¼ 0.110e0.129). The partitioning was consis-tent (Supplementary Data S1) and divided the network into threemodules containing M1 ¼ 21, M2 ¼ 6 and M3 ¼ 22 individuals(Fig. 2a). The network topology was maintained in a more restric-tive observation threshold (Supplementary Data S2, Fig. S2). Theprecise estimates (low SD) of the observed network metrics
suggested that the sampling effort was sufficient to provide a reli-able description of the network structure.
Spatial Patterns and Network Topology
Spatial distribution did not influence dolphins’ probability ofassociating. Individuals that used more similar areas (i.e. pairs witha higher spatial use overlap) did not tend to show higher associa-tion indices. Therewas no correlation between HWIij and PHRij 95%(Mantel test: r ¼ 0.009, Nassoc. ¼ 666, P ¼ 0.460) and a significantbut weak correlation between HWIij and individual range (Manteltest: UDOI 95%: r ¼ 0.311, Nassoc. ¼ 666, P ¼ 0.001) or core areaoverlap (UDOI 50%: r ¼ 0.283, Nassoc. ¼ 666, P ¼ 0.001).
Dolphins from different modules were spatially overlapped(Figs 2b, 3). Neither individual ranges nor core areas of overlapwithin modules were as high as expected, except for a slightlyhigher mean individual range overlap in module 1 (mean ¼ 0.97,95% CI ¼ 0.64e0.96; Fig. 2b). Likewise, individual ranges and coreareas of overlap of dolphins from different modules did not differfrom those expected by chance, apart from a slightly smaller meanindividual range overlap between modules 2 and 3 (mean ¼ 0.49,95% CI ¼ 0.57e0.93; Fig. 2b).
Temporal Patterns and Network Topology
LAR decreased throughout the study, indicating the timedependence of association probabilities and a significant dissocia-tion over the study. The most parsimonious LAR model (based onthe QAICc) suggested that most associations were brief, becauserapid dissociations and casual acquaintances were commonfeatures (Supplementary Table S2). These associations werenonrandom because the association rate remained higher than thatof the null association model over the entire study period (Fig. 4a).
Time also influenced the probability of resighting individuals inthe study area. LIR showed the same pattern of decline during thestudy as that of LAR (Fig. 4b). Three LIR exponential decay modelswere supported by the QAICc (DQAICc � 2). The first two modelsconsisted of parameters that indicated the occurrence of emigra-tion or mortality. The third model suggested the occurrence ofreimmigration, in which temporary emigrants returned to thepopulation (Supplementary Table S3).
LAR and LIR were highly and positively correlated both for theobserved values (R2 ¼ 0.924, t ¼ 9.85, P < 0.0001) and for thevalues predicted by the best-fitting models (R2 ¼ 0.999, t ¼ 237.01,P < 0.0001). This strong relationship suggested interplay betweenprobabilities of association and presence in the study area. From thebest-fitted LAR model, the probability of associations was esti-mated to decline by half after approximately 975 days, while thebest LIR model predicted the same decrease after approximatelythe same amount of time (964 days) (Fig. 4a, b). This time lag wasexactly the same period during which individual turnover washigher than that expected by chance (975 daysz 32 months).Significant changes in the population composition were onlydetectedwhen the entire studywas divided into three periods of 32months (Fig. 4c).
The scale of such a high population turnover was reflected in thenetwork modular topology. Modules were composed of individualsthat were in the population during the same time (i.e. that wereobserved during one or more 32-month periods; Fig. 2a, c). Thus,hereafter individuals were categorized according to three sightingperiods: Beginning (individuals sighted exclusively during the first32-month period, plus individuals sighted during both the first andsecond periods), End (individuals sighted only during the thirdperiod, plus individuals sighted during both the second and thirdperiods), or All (individuals sighted during all three 32-month
M. Cantor et al. / Animal Behaviour 84 (2012) 641e651 645

Author's personal copy
1st 1 + 2 2nd 3rd All2 + 3
30
10
50
70
Ind
ivid
ual
s (%
)N13
A1
A13
A4
A5
A8
B1
B10
B2
B3
B4
B5
B8
C10
C12C14
C16
C17
C18
C19
C2
C22
C3
C30C4
C5C7C9
D1
D2
D3
D31
D4
D7
E1
N1
N103N105
N11N127
N14
N163
N27 N46
N48
N54
N7N8
N83
(a)
(b)
2 32 x 31 x 2 1 x 3
(c)
0.2 50%
95%
M3
M2
M1
All
End
Beg
Modules
32-month periods
1
0.6
Mea
n s
pat
ial
over
lap
1
Figure 2. (a) Social network of Guiana dolphins displaying three modules (M1: square; M2: triangle; M3: circle), defined by sighting period. White nodes indicate dolphins sightedat the beginning of the study; black nodes indicate dolphins sighted at the end of the study; grey nodes indicate dolphins sighted throughout the entire study (see text). Node C19represents the individual sighted exclusively during the second period. (b) Mean spatial overlap of dolphins within (white bands) and between (grey bands) the three modules. Pairsof data points in each band correspond to the kernel-based spatial overlap, where mean core area overlap (50% utilization distribution overlap index, UDOI) is shown below thedashed line and mean individual range overlap (95% UDOI) is shown above the dashed line. (c) Proportion of dolphins from the different 32-month sighting periods (1st, 2nd and3rd) composing the three modules (the triplet data points in each band). Grey bands refer to dolphins sighted during periods of transition (1 þ 2 and 2 þ 3) and recorded during theentire study (All). Whiskers in (b) and (c) represent 95% confidence intervals generated using null model NM3.
M. Cantor et al. / Animal Behaviour 84 (2012) 641e651646
Author's personal copy
periods). The proportion of dolphins sighted at the beginning of thestudy was significantly concentrated in module 1. Individualssighted at the end of the study were mainly found in module 3.Module 2 was composed of individuals from all three periods, inaddition to a single individual sighted exclusively during thesecond period. The dolphins recorded during all three periods wereequally distributed across the modules (Fig. 2c).
Association Patterns
Within the temporal scale of a 32-month turnover, in which itwas feasible to investigate social patterns controlling for demo-graphic effects, Guiana dolphins showed significant, high associa-tion indices. A similar trend was observed among dolphins thatcomposed the same module (Supplementary Data S3, Fig. S3). Thedyadic associations were lower and more variable than expected.Among all of the individuals that inhabited the study area duringthe same 32-month period, the mean levels of associationwere notsignificantly different from those expected by chance. This resultindicated the nonoccurrence of short-term preferred companion-ships. The CVs of the association indices were significantly higherwithin the periods, suggesting the occurrence of long-termcompanionships. However, only a few dyads were nonrandomlyassociated, as indicated by a low percentage of avoided andpreferred associations (i.e. HWI values were lower, P < 0.025, andhigher, P > 0.975, than expected, respectively; Table 2).
DISCUSSION
Our long-term study on Guiana dolphin social interactionsshows that societies with fissionefusion dynamics can be struc-tured in a modular network (Fig. 1a). The network representeda well differentiated society, with few strong and many weak ties,illustrating the fluidity of associations. The tendency of the nodes to
cluster indicates that not all of the dolphins interacted directly witheach other, and this heterogeneous interaction pattern was struc-tured into modules of denser associations. Different mechanismsdrive the modular structure of a social network and detecting themis critical for understanding the forces driving social patterns (e.g.Lusseau et al. 2006; Wolf et al. 2007; Wiszniewski et al. 2009;Daura-Jorge et al. 2012). From our major finding, the modularstructure gave rise to a challenging question: how much of thisstructure could be explained by social processes? Indeed, ourresults illustrate a spatially merged but temporally split society,revealing that space and time are major factors that must becontextualized when analysing a social system.
In the Same Place
Nonrandom patterns of space use can produce complex struc-tures in fissionefusion networks (e.g. Ramos-Fernández et al.2006). For instance, the combination of resource availability andpronounced habitat preferences can separate dolphins into discretesocial modules (e.g. Lusseau et al. 2006; Wiszniewski et al. 2009).Habitat preferences would be expected to shape the Guianadolphin social network in the Caravelas estuary because dolphins inthis population inhabit a patchy mosaic of habitats, from inner-river regions to offshore coral reefs, in a heterogeneous manner(Rossi-Santos et al. 2006, 2010). Additionally, individuals haverelatively small individual ranges (Rossi-Santos et al. 2007).Although therewas a variation in ranging behaviour (Fig. 3; see alsoCantor et al. 2012), all of the dolphins greatly overlapped theirindividual ranges and core areas. Spatial segregationwas not clearlydetected in a considerable spatial resolution (one of the largeststudied areas for the species, spanning more than 700 km2; seeCantor et al. 2012). In addition, the degree of overlap was notclosely related to the dyadic association level or to the dolphinscomposing the modules.
39°0’0”W
18°0’0”S 0 10 20 km5
Coral reefs
Caravelas River
Module 1Module 2Module 3
Range overlap
10 m isobath
Figure 3. Caravelas River estuary in the Abrolhos Bank, on the eastern coast of Brazil, and the extreme boundary of the merged individual ranges (95% probability kernel contours)of all Guiana dolphins from each module of the social network.
M. Cantor et al. / Animal Behaviour 84 (2012) 641e651 647

Author's personal copy
Such a nested ranging behaviour among Guiana dolphins fromdifferent modules suggests that space use patterns are not enoughto explain the modular topology observed in this study. However,nonsocial factors can still be influencing this dolphin socialnetwork (see Whitehead 1999; Parsons et al. 2009; Elliser &Herzing 2011). We showed that the population dynamics has splitthis society into temporal modules.
At Different Times
Time dependence is an essential feature of sociality that wasclear in the Guiana dolphins associations we studied. The proba-bilities of association between individuals decreased over time, andthe population essentially displayed grouping patterns generalizedas rapid dissociations (which last for less than 1 day) and casualacquaintances (which last longer than 1 day and then disassociate).Such temporal patterns can have many causes (Whitehead 2008a),such as environmental features, dispersion, physiology (seeWhitehead 1995) or geographical traits (Lusseau et al. 2003). Thedecay of the association probabilities of the Guiana dolphinsobserved here was mainly due to a demographic effect.
The association probabilities among Guiana dolphins werestrongly coupled with their permanence in the study area, sug-gesting that dissociations were also a result of the absence ofsome individuals. Because this population is characterized by anapparently stable population size and individual variation inresidence patterns (Cantor et al. 2012), the movement of indi-viduals through our studied area and adjacencies is probably themain demographic mechanism for additions and deletions ofindividuals in the population. In fact, emigration and reimmigra-tion are relevant demographic parameters for this population,which was highlighted by a robust-design markerecapture modelconsidering temporary emigration from the same dataset (Cantoret al. 2012) and the best LIR models presented here. In addition,since this population shows high survival probabilities (Cantoret al. 2012), we would expect that, if exit of individuals weremainly promoted by death events, then the LIR exponentialdecays would be less pronounced than those observed. Therefore,movement processes affected the association patterns by pre-venting some individuals from using the area at the same time. Asa consequence, the association probabilities decayed over time,inflating the occurrence of associations of short duration (casualacquaintances).
The exit of individuals from a fissionefusion social system canchange its dynamics by decreasing stability and increasing groupsize (e.g. Lehmann & Boesch 2004), whichmay define distinct socialunits (e.g. Elliser & Herzing 2011). The Guiana dolphin populationunderwent a marked population turnover, with a change in thepopulation composition from the beginning to the end of the study.We identified the temporal scale of large changes in the populationcomposition as a 32-month period, during which the associationand identification rates had their most pronounced decay. Asa result, the individuals sighted within these periods were found tobe concentrated in certain modules of the network.
The modular network configuration further suggests a pop-ulation composed of a core of long-term resident individuals alongwith other visitors that use larger areas around the highly hetero-geneous local habitat (see Cantor et al. 2012). The module divisionwas corroborated by the dolphins’ association intensity and theirpositions in the network, both of which were independently clas-sified according to the period that each dolphin was present in thepopulation (see Supplementary Data S3, S4, Figs S2, S3). Transientindividuals (those sighted exclusively at the beginning and end ofthe study) were more closely and strongly connected amongthemselves and occupied a peripheral position in the network. Incontrast, resident individuals (sighted throughout the entire study)were spread through all of the modules and had a more centralposition in the social network (Supplementary Data S4), being thecore of the population. These results support the proposal ofnonsocial factors leading to a modular structure, because thepopulation turnover observed here defines three temporal units inthe Guiana dolphin network (Fig. 1d). We suppose that this turn-over was mainly promoted by transient individuals that use the
101 102 103
0.02
0.04
0.06
0.08
Lagg
ed i
den
tifi
cati
on r
ate
Data
Lagg
ed a
ssoc
iati
on r
ate
0.35
0.15
0.05
(a)
(b)
(c)
8 12 16 24 32
0.57
0.61
0.65
0.69
Tu
rnov
er o
f in
div
idu
als
(βw
)
(12)
(8)
(6)
(4)
(3)
(16)
R(d) =0.051 x e−(3.8x 10⁻⁴xd)
0.269 x−( 4.3 10
−4)Lagged
Nullg(d) = e
dx
0.25
6
Period length (months)
100
Time lag (days)
Figure 4. (a) Lagged association rates (LAR) for all individuals, suggesting rapiddissociations and casual acquaintances (see Supplementary Table S2). Null associationrates represent cases in which animals associated randomly. (b) Lagged identificationrates (LIR) were best described using a model that indicated the occurrence ofemigration and mortality (see Supplementary Table S3). Bars represent the SE esti-mated using a jackknifing procedure. Dashed lines in (a) and (b) indicate theapproximate time lag (z975 days) during which LAR and LIR decayed by half. (c)Differences between individuals composing the population (turnover) as a function oftime period. Values in parentheses indicate the number of periods into which the totalstudy length was divided. Whiskers represent 95% confidence intervals generatedusing null model NM1.
M. Cantor et al. / Animal Behaviour 84 (2012) 641e651648

Author's personal copy
study area occasionally (Supplementary Data S2), driving the firstlevel of complexity in social organization.
Static Network Structure, Fluid Social Structure
At a fine temporal scale, when we excluded the demographicturnover effect, a nonrandom fluidity in the social relationshipsacross this Guiana dolphin population was evident. The same fluidgrouping pattern observed throughout the entire study was foundwithin the 32-month turnover scale (see SupplementaryFig. S4aec). Scaling down to the dyads, the association levelswere mostly low and variable, but a few nonrandom preferencesand avoidances were noticed among many fluid associations.
These outcomes point to fissionefusion dynamics in this Guianadolphin population: there was high temporal variation in groupsize and composition, even with moderate spatial cohesion amongmembers (see Aureli et al. 2008). Considering the agreement of ourfindings with those from another studied population (Santos &Rosso 2008), we suggest that the fissionefusion social organiza-tion may be a general pattern for Guiana dolphins. However, thereis evidence of a latitudinal difference in the average group size inthis species that should be further explored (e.g. Daura-Jorge et al.2005; Santos & Rosso 2007). Social systems with fissionefusiondynamics usually show pronounced group size variation asa response to several ecological variables (Wrangham 1982), andthis variability may affect social interactions and organization(Gowans et al. 2008). Because Guiana dolphins are exposed todifferent habitat structure and prey abundance throughout theirdistribution, a varying degree of fissionefusion dynamics may beobserved for different populations, with additional factors influ-encing the emergence of social units.
Conclusions
The Guiana dolphin society observed here combined the fluidassociations of a fissionefusion system with a predicted modularstructure that was mainly defined by a high population turnoverthat temporally segregated the individuals. Our findings show thatthe emergence of different social units in a population can be drivenby mechanisms that are simpler than those previously considered,including the temporal opportunities for individuals to interact.
We emphasize the weakness of blindly focusing on a fixedillustration of a dynamic system. Social networks may not alwaysessentially represent social processes. Because social analyses aredata-hungry, the common practice involves perusing socialmatrices piled up by long-term efforts (see Whitehead 2008a).Such databases usually came from studies that were not directlydesigned to collect social data and may include different adjacentareas and several years (Whitehead 2008a). In such cases, it is
possible that nonsocial or indirect effects are underlying the socialpatterns. This is because an interaction in a social network isusually defined by the co-occurrence of individuals in a group(Whitehead & Dufault 1999; Croft et al. 2008), which createsa contact network; thus individuals observed in different areas orperiods of time would be part of different modules.
Particularly, the network may contain demographic effects thatgenerate unwanted bias in social patterns. We need to discernbetween population changes mainly caused by death/birth andthose caused bymovement processes. The former scenario containslittle or no social information (seeWhitehead 1999, 2008a) and canyield social modules that are only sampling artefacts. In this case,some temporally segregated individuals (i.e. that are not in thepopulation at the same time) would be placed in separate artificialunits. Population changes mainly caused by emigration/immigra-tion movements can also carry the same biases if not properlyaccounted for; but it may still be an indirect social mechanism,evidencing habitat selection, social avoidance/preference, andindividual heterogeneity in philopatry, ranging behaviour orsociality.
As network formalism becomes popular in behaviouralsciences, we need a thorough search for the satisfactory scalesthat place social processes apart from nonsocial noise. To this end,one should contextualize both the spatial and temporal mecha-nisms by combining social analyses with other methods (i.e.markerecapture modelling to elucidate population dynamics;spatial analyses to estimate ranging behaviour; lagged identifi-cation and association rates to evaluate time dependence).Isolating the social mechanism that draws a social networkensures a more realistic portrayal of the target population’s socialsystem and an adequate interpretation of open, dynamic andcomplex animal societies.
Acknowledgments
We thank Instituto Baleia Jubarte (IBJ) for infrastructure, exec-utive management and support in field and lab work, especially toU. Farias for field assistance, and F. Penin, T. Costa and A. Borges forhelping with photoidentification. IBJ is sponsored by PetróleoBrasileiro S.A. (Petrobras) and Fibria Celulose. This study wasdeveloped in the Graduate Program in Ecology at UniversidadeFederal de Santa Catarina (UFSC). M.C. was supported by the Bra-zilian Ministry of Education (CAPES), the Animal Behavior SocietyDeveloping Nations Funding, the Society for Marine Mammalogyand the Cetacean Society International; P.R.G. was supported byFAPESP. We are grateful to R. Guimerà for providing the modularityalgorithm, F.M.D. Marquitti for the Combo programs, M.M. Pires, T.Opsahl, D.R. Barneche, G.O. Longo for insigthful discussions, W.Rossiter and D. Janiger for aiding the project and the two
Table 2Guiana dolphins’ observed and expected association index (HWI), calculated using the null model NM2, for all of the individuals sighted during each 32-month period
First period Second period Third period
Groups 130 141 138Individuals 33 36 36Preferred 4 (11.5%) 4 (12.9%) 9 (29.0%)Avoided 2 (7.7%) 4 (12.9%) 4 (12.9%)HWI Observed Expected P Observed Expected P Observed Expected PMean 0.094 0.094 0.487 0.066 0.066 0.499 0.067 0.063 0.171SD 0.110 0.108 0.954* 0.107 0.094 0.998* 0.115 0.097 0.999*CV 1.170 1.153 0.952* 1.611 1.432 0.998* 1.724 1.532 0.993*Nonzero 0.580 0.571 0.656 0.433 0.440 0.358 0.394 0.409 0.022
Asterisks indicate significant results (one-tailed test at a ¼ 0.05). Preferred/avoided dyads showed higher/lower HWI than that expected by chance (two-tailed test ata ¼ 0.05); percentage is based on the expected number of significant dyads (5% of possible pairs). CV: coefficient of variation; nonzero: proportion of nonzero HWI.
M. Cantor et al. / Animal Behaviour 84 (2012) 641e651 649

Author's personal copy
anonymous referees, whose suggestions greatly improved ourmanuscript.
Supplementary Material
Supplementary material for this article is available, in the onlineversion, at http://dx.doi.org/10.1016/j.anbehav.2012.06.019.
References
Aureli, F., Schaffner, C. M., Boesch, C., Bearder, S. K., Call, J., Chapman, C. A.,Connor, R., Di Fiore, A., Dunbar, R. I. M., Henzi, S. P., et al. 2008. Fis-sionefusion dynamics: new research frameworks. Current Anthropology, 49,627e654.
Bascompte, J., Jordano, P., Melián, C. J. & Olesen, J. M. 2003. The nested assemblyof planteanimal mutualistic networks. Proceedings of the National Academy ofSciences, U.S.A., 100, 9383e9387.
Bejder, L., Fletcher, D. & Bräger, S. 1998. A method for testing association patternsof social animals. Animal Behaviour, 56, 719e725.
Boccaletti, S., Latora, V., Moreno, Y., Chavez, M. & Hwang, D. U. 2006. Complexnetworks: structure and dynamics. Physics Report, 424, 175e308.
Burnham, K. P. & Anderson, D. R. 2002. Model Selection and Multimodel Inference:a Practical Information-theoretic Approach. New York: SpringereVerlag.
Cairns, J. S. & Schwäger, S. J. 1987. A comparison of association indices. AnimalBehaviour, 35, 1454e1469.
Calenge, C. 2006. The package adehabitat for the R software: a tool for the analysisof space and habitat use by animals. Ecological Modelling, 197, 516e519.
Cantor, M., Wedekin, L. L., Daura-Jorge, F. G., Rossi-Santos, M. R. & Simões-Lopes, P. C. 2012. Assessing population parameters and trends of Guianadolphins (Sotalia guianensis): an eight-year markerecapture study. MarineMammal Science, 28, 63e83.
Clapham, P. J. 1996. The social and reproductive biology of humpback whales: anecological perspective. Mammal Review, 26, 27e49.
Clutton-Brock, T. H. 1989. Mammalian mating systems. Proceedings of the RoyalSociety B, 236, 339e372.
Croft, D. P., James, R. & Krause, J. 2008. Exploring Animal Social Networks.Princeton, New Jersey: Princeton University Press.
Danon, L., Diaz-Guilera, A., Duch, J. & Arenas, A. 2005. Comparing communitystructure identification. Journal of Statistical Mechanics: Theory and Experiment,2005, P09008, http://dx.doi.org/10.1088/1742-5468/2005/09/P09008.
Daura-Jorge, F. G., Wedekin, L. L., Piacentini, V. Q. & Simões-Lopes, P. C. 2005.Seasonal and daily patterns of group size, cohesion and activity of the estuarinedolphin, Sotalia guianensis (PJ Van Bénéden) (Cetacea, Delphinidae), in southernBrazil. Brazilian Journal of Zoology, 22, 1014e1021.
Daura-Jorge, F. G., Cantor, M., Ingram, S., Lusseau, D. & Simões-Lopes, P. C. 2012.The structure of a bottlenose dolphin society is coupled to a unique foragingcooperation with artisanal fishermen. Biology Letters, http://dx.doi.org/10.1098/rsbl.2012.0174, published online 2 May 2012.
Elliser, C. R. & Herzing, D. L. 2011. Replacement dolphins? Social restructuring ofa resident pod of Atlantic bottlenose dolphins, Tursiops truncatus, after twomajor hurricanes. Marine Mammal Science, 27, 39e59.
Fieberg, J. & Kochanny, C. O. 2005. Quantifying home-range overlap: the impor-tance of the utilization distribution. Journal of Wildlife Management, 69,1346e1359.
Foster, E. A., Franks, D. W., Morrel, L. J., Balcomb, K. C., Parsons, K. M., vanGinneken, A. & Croft, D. P. 2012. Social network correlates of food availabilityin an endangered population of killer whales, Orcinus orca. Animal Behaviour,83, 731e736.
Frère, C. H., Krützen, M., Mann, J., Connor, R. C., Bejder, L. & Sherwin, W. B. 2010.Social and genetic interactions drive fitness variation in a free-living dolphinpopulation. Proceedings of the National Academy of Sciences, U.S.A., 107,19949e19954.
Gotelli, N. J. & Graves, G. R. 1996. Null Models in Ecology. Washington, D.C.:Smithsonian Institution Press
Gowans, S., Würsig, B. & Karczmarski, L. 2008. The social structure and strategiesof delphinids: predictions based on an ecological framework. Advances inMarine Biology, 53, 195e294.
Guimarães, P. R., Jr, de Menezes, M. A., Baird, R. W., Lusseau, D., Guimarães, P. &Reis, S. F. 2007. Vulnerability of a killer whale social network to diseaseoutbreaks. Physical Review E, 76, 042901.
Guimerá, R. & Amaral, L. A. N. 2005a. Cartography of complex networks: modulesand universal roles. Journal of Statistical Mechanics: Theory and Experiment,2005, P02001, http://dx.doi.org/10.1088/1742-5468/2005/02/P02001.
Guimerá, R. & Amaral, L. A. N. 2005b. Functional cartography of complex meta-bolic networks. Nature, 433, 895e900.
Guimerá, R., Sales-Pardo, M. & Amaral, L. A. N. 2004. Modularity from fluctuationsin random graphs and complex networks. Physical Review E, 70, 025101.
Hammond, P. S., Mizroch, S. A. & Donovan, G. P. 1990. Individual Recognition ofCetaceans: Use of Photo-identification and Other Techniques to Estimate Pop-ulation Parameters. Report of the International Whaling Commission, Special Issue12. Cambridge: International Whaling Commission.
Hinde, R. A. 1976. Interactions, relationships and social structure. Man, 11, 1e17.
Kossinets, G. & Watts, D. J. 2006. Empirical analysis of an evolving social network.Science, 311, 88e90.
Krause, S., Mattner, L., James, R., Guttridge, T., Corcoran, M. J., Gruber, S. H. &Krause, J. 2009. Social network analysis and valid Markov chain Monte Carlotests of null models. Behavioral Ecology and Sociobiology, 63, 1089e1096.
Lehmann, J. & Boesch, C. 2004. To fission or to fusion: effects of community size onwild chimpanzee (Pan troglodytes verus) social organisation. Behavioral Ecologyand Sociobiology, 56, 207e216.
Lusseau, D. 2003. The emergent properties of a dolphin social network. Proceedingsof the Royal Society B, Supplement, 270, S186eS188.
Lusseau, D. & Newman, M. E. J. 2004. Identifying the role that animals play intheir social networks. Proceedings of the Royal Society B, Supplement, 271,S477eS481.
Lusseau, D., Schneider, K., Boisseau, O. J., Haase, P., Slooten, E. & Dawson, S. M.2003. The bottlenose dolphin community of Doubtful Sound features a largeproportion of long lasting associations: can geographic isolation explain thisunique trait? Behavioral Ecology and Sociobiology, 54, 396e405.
Lusseau, D., Wilson, B., Hammond, P. S., Grellier, K., Durban, J. W., Parsons, K. M.,Barton, T. R. & Thompson, P. M. 2006. Quantifying the influence of sociality onpopulation structure in bottlenose dolphins. Journal of Animal Ecology, 75, 14e24.
Mourier, J., Vercelloni, J. & Planes, S. 2012. Evidence of social communities ina spatially structured network of a free-ranging shark species. Animal Behaviour,83, 389e401.
Newman, M. E. J. 2011. Communities, modules and large-scale structure innetworks. Nature Physics, 8, 25e31.
Olesen, J. M., Bascompte, J., Dupont, Y. L. & Jordano, P. 2007. The modularity ofpollination networks. Proceedings of the National Academy of Sciences, U.S.A.,104,19891e19896.
Opsahl, T. & Panzarasa, P. 2009. Clustering in weighted networks. Social Networks,31, 155e163.
Parsons, K. M., Balcomb, K. C., III, Ford, J. K. B. & Durban, J. W. 2009. The socialdynamics of southern resident killer whales and conservation implications forthis endangered population. Animal Behaviour, 77, 963e971.
R Development Core Team 2011. R: A Language and Environment for StatisticalComputing. Vienna, Austria: R Foundation for Statistical Computing. http://www.R-project.org.
Ramos-Fernández, G., Boyer, D. & Gómez, V. P. 2006. A complex social structurewith fissionefusion properties can emerge from a simple foraging model.Behavioral Ecology and Sociobiology, 60, 536e549.
Rossi-Santos, M. R., Wedekin, L. L. & Sousa-Lima, R. S. 2006. Distribution andhabitat use of small cetaceans in the coast of the Abrolhos Bank, eastern Brazil.Latin American Journal of Aquatic Mammals, 5, 23e28.
Rossi-Santos, M. R., Wedekin, L. L. & Monteiro-Filho, E. L. A. 2007. Residence andsite fidelity of Sotalia guianensis in the Caravelas River estuary, Bahia State,northeastern Brazil. Journal of the Marine Biological Association of the UnitedKingdom, 87, 207e212.
Rossi-Santos, M. R., Wedekin, L. L. & Monteiro-Filho, E. L. A. 2010. Habitat use ofthe Guiana dolphin, Sotalia guianensis (Cetacea, Delphinidae), in the CaravelasRiver estuary, eastern Brazil. Latin American Journal of Aquatic Mammals, 8,111e116.
Santos, M. C. O. & Rosso, S. 2007. Ecological aspects of marine tucuxi dolphins(Sotalia guianensis) based on group size and composition in the Cananéiaestuary, Southeastern Brazil. Latin American Journal of Aquatic Mammals, 6,71e82.
Santos, M. C. O. & Rosso, S. 2008. Social organization of marine tucuxi dolphins,Sotalia guianensis, in the Cananéia estuary, southeastern Brazil. Journal ofMammalogy, 89, 347e355.
de Silva, S. & Wittemyer, G. 2012. A comparison of social organization in Asianelephants and African savannah elephants. International Journal of Primatology,http://dx.doi.org/10.1007/s10764-011-9564-1, published online 26 January2012.
de Silva, S., Ranjeewa, A. D. G. & Kryazhimskiy, S. 2011. The dynamics of socialnetworks among female Asian elephants. BMC Ecology, 11, 17.
Vázquez, D. P., Chacoff, N. P. & Cagnolo, L. 2009. Evaluating multiple determinantsof the structure of mutualistic networks. Ecology, 90, 2039e2046.
Whitehead, H. 1995. Investigating structure and temporal scale in social organi-zations using identified individuals. Behavioral Ecology, 6, 199e208.
Whitehead, H. 1999. Testing association patterns of social animals. Animal Behav-iour, 57, F26eF29.
Whitehead, H. 2001. Analysis of animal movements using opportunistic individualidentifications: application to sperm whales. Ecology, 82, 1427e1432.
Whitehead, H. 2003. Sperm Whale Societies: Social Evolution in the Ocean. Chicago:University of Chicago Press.
Whitehead, H. 2008a. Analyzing Animal Societies: Quantitative Methods for Verte-brate Social Analysis. Chicago: University of Chicago Press.
Whitehead, H. 2008b. Precision and power in the analysis of social structure usingassociations. Animal Behaviour, 75, 1093e1099.
Whitehead, H. 2009. SOCPROG programs: analyzing animal social structures.Behavioral Ecology and Sociobiology, 63, 765e778.
Whitehead, H. & Dufault, S. 1999. Techniques for analyzing vertebrate socialstructure using identified individuals: review and recommendations. Advancesin the Study of Behavior, 28, 33e74.
Wiszniewski, J., Allen, S. J. & Möller, L. M. 2009. Social cohesion in a hierarchicallystructured embayment population of Indo-Pacific bottlenose dolphins. AnimalBehaviour, 77, 1449e1457.
M. Cantor et al. / Animal Behaviour 84 (2012) 641e651650

Author's personal copy
Wiszniewski, J., Lusseau, D. & Möller, L. M. 2010. Female bisexual kinship tiesmaintain social cohesion in a dolphin network. Animal Behaviour, 80, 895e904.
Wolf, J. B. W., Mawdsley, D., Trillmich, F. & James, R. 2007. Social structure ina colonial mammal: unravelling hidden structural layers and their foundationsby network analysis. Animal Behaviour, 74, 1293e1302.
Worton, B. J. 1989. Kernel methods for estimating the utilization distribution inhome-range studies. Ecology, 70, 164e168.
Wrangham, R. W. 1982. Mutualism, kinship and social evolution. In: CurrentProblems in Sociobiology (Ed. by Kings’ College Sociobiology Group), pp.269e289. Cambridge: Cambridge University Press.
M. Cantor et al. / Animal Behaviour 84 (2012) 641e651 651