Discrimination between anthropogenic (pollution) and lithogenic magnetic fraction in urban soils...
9
Discrimination between anthropogenic (pollution) and lithogenic magnetic fraction in urban soils (Delhi, India) using environmental magnetism Narendra K. Meena a, ⁎, Sabyasachi Maiti b,1 , Ankush Shrivastava c a Wadia Institute of Himalayan Geology, 33, GMS Road Dehradun, 248001, India b Department of Geology and Geophysics, Indian Institute of Technology Kharagpur, 721302, India c Department of Geology, University of Delhi, Delhi-110007, India abstract article info Article history: Received 10 May 2010 Accepted 2 December 2010 Available online 14 December 2010 Keywords: Delhi Environmental magnetism Magnetic domain Magnetic mineral Urban soil pollution Pedogenesis Saturation remanence Paramagnetic/diamagnetic Anthropogenic In this paper magnetic property of the Delhi topsoil has been used to characterize the potentially polluted areas in terms of magnetic minerals and grain (Magnetic Domain) concentration as a factor of toxic metals and other mutagenic pollutant concentration. The Saturation magnetisation (Ms) and Saturation remanence (Mrs) has been taken as proxy for ferrimagnetic mineral concentration. However, delineation of anthropogenic magnetic fraction from lithogenic (geogenic) magnetic fraction has been done by the paramagnetic/diamagnetic contribution of soil with the fact that the fresh soil contains higher paramagnetic and diamagnetic minerals than polluted. Predominantly, the topsoils of Delhi are dominated with ferrimagnetic minerals (Magnetite and Maghemite phase). Significantly the industrial areas contain highest concentration of the ferrimagnetic minerals with negligible paramagnetic/diamagnetic fraction which leads to anthropogenic contribution. Heavy traffic and densely populated areas of the Delhi exhibit moderate to low soil pollution while green areas show lowest with higher paramagnetic/diamagnetic contribution. The soils in Delhi are dominated with Pseudo-Single Domain (PSD) magnetic grain, though the industrial areas in Delhi show coarser Multidomain (MD) grains in comparison to Stable Single Domain (SSD) in forest areas. Our study reveals that the fine grain particle does not show significant link with higher concentration of ferrimagnetic minerals at least in soils. The presence of the lithogenic magnetite crystal in the forest soil and anthropogenically produced spherules in industrial areas and higher concentration of the heavy metal in Delhi soil strengthen our findings. © 2011 Elsevier B.V. All rights reserved. 1. Introduction Delhi being third largest and fifth highly populated metropolitan city of the world consumes huge amount of fossil fuel; causing extensive air pollution. Additionally, its atmosphere contains higher concentration of aerosol particles (1 to 10 μ) from aeolian dust migrated from western dessert (Yadav and Rajamani, 2006), vehicles, vehicular abrasion/corrosion of asphalt road, construction works (Gadi et al., 2000; Monkkonen et al., 2004), and fly ashes from coal-fired power stations (Mehra et al., 1998; Morris, et al., 1995; Sachdeva and Attri, 2008) with high heavy metal concentra- tions (Khemani et al., 1985; Khillare et al., 2004; Samara and Voutsa, 2005). However, post-implementation of CNG has reduced its effect significantly (Balachandran et al., 2000; Goyal, 2003; Khaiwal et al., 2006; Srivastava and Jain, 2007). These pollutants settled and mixed in topsoils through various transporting agents like water, air and anthropogenic activities and contaminate the fresh topsoil. The repetition of this process enhances the concen- tration of toxic pollutants in topsoils. The soil transfers these to the food chain (vegetables and animals) and they indirectly enter in the human body and cause serious threat to health. In terms of the soil pollution studies, a few studies were done by previous workers (Ahmad and Alam, 2004; Bhattacharya et al., 1993; Sharmila et al., 2008). The present study is the subsequent attempt of previous study by Maiti et al. (2005), which provides potential soil pollution areas of Delhi with an additional discrimination scheme using environmental magnetism. Although the technique is well-established for studying several urban issues, such as, land and water pollution (Dearing et al., 1997), industrial emissions and pollution (Petrovsky and Elwood, 1999), road traffic, fly ash and aerosols (Dekkers and Petersen, 1992; Goddu et al., 2004; Hoffmann et al., 1999; Jordanova et al., 2004, 2008; Kapicka et al., 2000; Muxworthy et al., 2001) by analyzing the concentration, composition and granulometry of the magnetic material (Evans and Heller, 2003); in the present study an alternative emphasis on paramagnetic and diamagnetic characteristic of soil have been elaborated for such discrimination. We here considered firstly Journal of Applied Geophysics 73 (2011) 121–129 ⁎ Corresponding author. Tel.: + 91 1352525357. E-mail addresses: [email protected], [email protected] (N.K. Meena). 1 Present affiliation: UPES, Dehradun 248007, India. 0926-9851/$ – see front matter © 2011 Elsevier B.V. All rights reserved. doi:10.1016/j.jappgeo.2010.12.003 Contents lists available at ScienceDirect Journal of Applied Geophysics journal homepage: www.elsevier.com/locate/jappgeo
-
Upload
independent -
Category
Documents
-
view
0 -
download
0
Transcript of Discrimination between anthropogenic (pollution) and lithogenic magnetic fraction in urban soils...
Journal of Applied Geophysics 73 (2011) 121–129
Contents lists available at ScienceDirect
Journal of Applied Geophysics
j ourna l homepage: www.e lsev ie r.com/ locate / jappgeo
Discrimination between anthropogenic (pollution) and lithogenic magnetic fractionin urban soils (Delhi, India) using environmental magnetism
Narendra K. Meena a,⁎, Sabyasachi Maiti b,1, Ankush Shrivastava c
a Wadia Institute of Himalayan Geology, 33, GMS Road Dehradun, 248001, Indiab Department of Geology and Geophysics, Indian Institute of Technology Kharagpur, 721302, Indiac Department of Geology, University of Delhi, Delhi-110007, India
⁎ Corresponding author. Tel.: +91 1352525357.E-mail addresses: [email protected], narendes@gma
1 Present affiliation: UPES, Dehradun 248007, India.
0926-9851/$ – see front matter © 2011 Elsevier B.V. Aldoi:10.1016/j.jappgeo.2010.12.003
a b s t r a c t
a r t i c l e i n f oArticle history:Received 10 May 2010Accepted 2 December 2010Available online 14 December 2010
Keywords:DelhiEnvironmental magnetismMagnetic domainMagnetic mineralUrban soil pollutionPedogenesisSaturation remanenceParamagnetic/diamagneticAnthropogenic
In this paper magnetic property of the Delhi topsoil has been used to characterize the potentially pollutedareas in terms of magnetic minerals and grain (Magnetic Domain) concentration as a factor of toxic metalsand other mutagenic pollutant concentration. The Saturation magnetisation (Ms) and Saturation remanence(Mrs) has been taken as proxy for ferrimagnetic mineral concentration. However, delineation ofanthropogenic magnetic fraction from lithogenic (geogenic) magnetic fraction has been done by theparamagnetic/diamagnetic contribution of soil with the fact that the fresh soil contains higher paramagneticand diamagnetic minerals than polluted. Predominantly, the topsoils of Delhi are dominated withferrimagnetic minerals (Magnetite and Maghemite phase). Significantly the industrial areas contain highestconcentration of the ferrimagnetic minerals with negligible paramagnetic/diamagnetic fraction which leadsto anthropogenic contribution. Heavy traffic and densely populated areas of the Delhi exhibit moderate to lowsoil pollution while green areas show lowest with higher paramagnetic/diamagnetic contribution. The soils inDelhi are dominated with Pseudo-Single Domain (PSD) magnetic grain, though the industrial areas in Delhishow coarser Multidomain (MD) grains in comparison to Stable Single Domain (SSD) in forest areas. Ourstudy reveals that the fine grain particle does not show significant link with higher concentration offerrimagnetic minerals at least in soils. The presence of the lithogenic magnetite crystal in the forest soil andanthropogenically produced spherules in industrial areas and higher concentration of the heavy metal inDelhi soil strengthen our findings.
il.com (N.K. Meena).
l rights reserved.
© 2011 Elsevier B.V. All rights reserved.
1. Introduction
Delhi being third largest and fifth highly populated metropolitancity of the world consumes huge amount of fossil fuel; causingextensive air pollution. Additionally, its atmosphere contains higherconcentration of aerosol particles (1 to 10 μ) from aeolian dustmigrated from western dessert (Yadav and Rajamani, 2006),vehicles, vehicular abrasion/corrosion of asphalt road, constructionworks (Gadi et al., 2000; Monkkonen et al., 2004), and fly ashesfrom coal-fired power stations (Mehra et al., 1998; Morris, et al.,1995; Sachdeva and Attri, 2008) with high heavy metal concentra-tions (Khemani et al., 1985; Khillare et al., 2004; Samara andVoutsa, 2005). However, post-implementation of CNG has reducedits effect significantly (Balachandran et al., 2000; Goyal, 2003;Khaiwal et al., 2006; Srivastava and Jain, 2007). These pollutantssettled and mixed in topsoils through various transporting agents
like water, air and anthropogenic activities and contaminate thefresh topsoil. The repetition of this process enhances the concen-tration of toxic pollutants in topsoils. The soil transfers these to thefood chain (vegetables and animals) and they indirectly enter in thehuman body and cause serious threat to health. In terms of the soilpollution studies, a few studies were done by previous workers(Ahmad and Alam, 2004; Bhattacharya et al., 1993; Sharmila et al.,2008). The present study is the subsequent attempt of previousstudy by Maiti et al. (2005), which provides potential soil pollutionareas of Delhi with an additional discrimination scheme usingenvironmental magnetism.
Although the technique is well-established for studying severalurban issues, such as, land and water pollution (Dearing et al., 1997),industrial emissions and pollution (Petrovsky and Elwood, 1999),road traffic, fly ash and aerosols (Dekkers and Petersen, 1992; Godduet al., 2004; Hoffmann et al., 1999; Jordanova et al., 2004, 2008;Kapicka et al., 2000; Muxworthy et al., 2001) by analyzing theconcentration, composition and granulometry of the magneticmaterial (Evans and Heller, 2003); in the present study an alternativeemphasis on paramagnetic and diamagnetic characteristic of soil havebeen elaborated for such discrimination. We here considered firstly
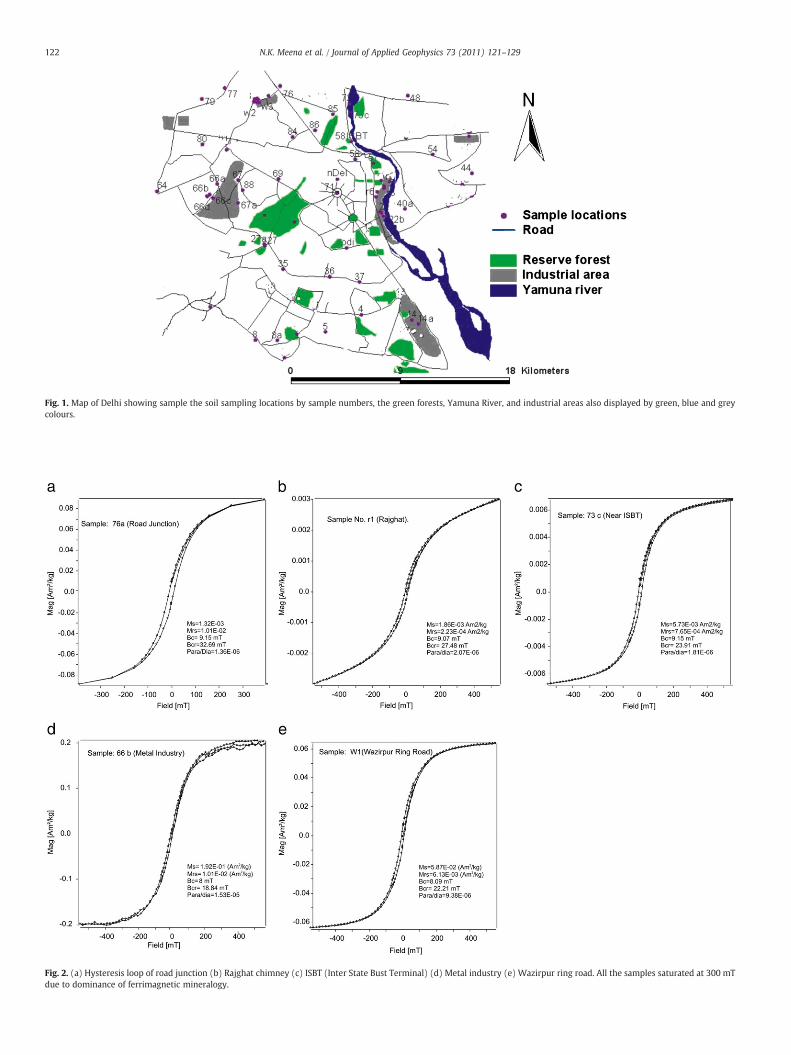
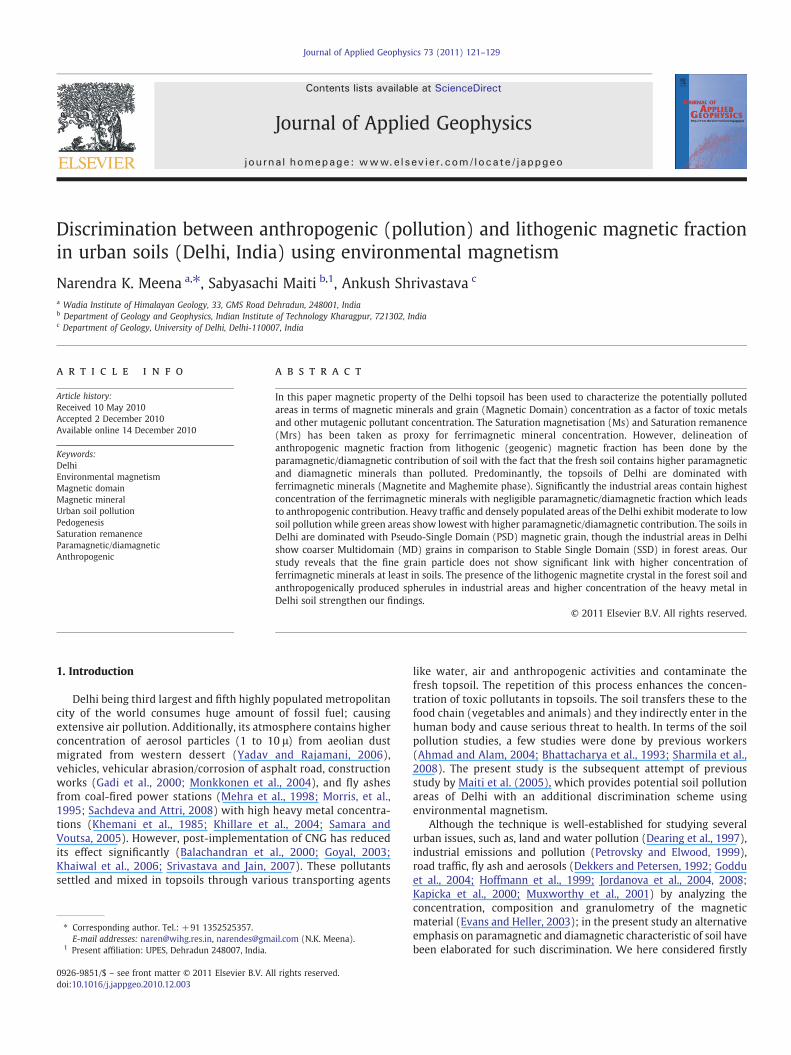
Fig. 1. Map of Delhi showing sample the soil sampling locations by sample numbers, the green forests, Yamuna River, and industrial areas also displayed by green, blue and greycolours.
Fig. 2. (a) Hysteresis loop of road junction (b) Rajghat chimney (c) ISBT (Inter State Bust Terminal) (d) Metal industry (e) Wazirpur ring road. All the samples saturated at 300 mTdue to dominance of ferrimagnetic mineralogy.
122 N.K. Meena et al. / Journal of Applied Geophysics 73 (2011) 121–129
Fig. 3. Day plot (Day et al., 1977) shows type of magnetic domain in Delhi soil samplesvarious domain regions are labeled as ‘SSD’ Stable Single Domain, ‘PSD’ PsudosingleDomain and ‘MD’ Multidomain. The size of magnetic grain was calculated after Dunlop(2002).
123N.K. Meena et al. / Journal of Applied Geophysics 73 (2011) 121–129
the obvious natural fact of production of paramagnetic minerals (e.g.,clay mineral) and diamagnetic minerals (e.g., quartz, feldspar, micaand organic matter) profoundly enriched in soil; secondly, thepresence of the anthropogenically produced magnetic fraction,which significantly dominate those paramagnetic/diamagnetic con-tributions. Thus, the ferrimagnetic fraction with higher paramagnetic/diamagnetic contribution here has been considered as lithogenic.Consequently, the clubbing of the paramagnetic/diamagnetic contri-bution with ferrimagnetic concentration along with magnetic domainand Scanning Election Microscopic (SEM) can enable the finding ofanthropogenic pollution.
Fig. 4. (a) Map shows spatial distribution of the Saturation magnetization (Ms), thehigher value of Ms indicates the higher concentration of the magnetic minerals(ferrimagnetic) in Delhi soils. (b) Show spatial distribution of the Saturation remanence(Mrs), the higher values of Mrs also indicate dominance of ferrimagnetic minerals inDelhi soils. (c) Show the paramagnetic/diamagnetic contribution in Delhi soil thehigher value of slope indicates lower contribution of paramagnetic and diamagneticminerals in soils.
2. Physiographic setting of Delhi
Delhi (28°44′ N, 76°30′ E), the National capital of the India, has thetotal geographical area of 1483 km2; out of which 107 km2 and 176 km2
account for tree cover and forest cover respectively (State forest surveyreport, 2008) around 21% of the total land area is spaced by roads.Climatically, the area falls under semiarid region with average rainfall of60 cm/year mostly during monsoon months (July–October). The winterand summer seasons prevail fromOctober toMarch and fromApril to Julyrespectively.
Physiographically, Delhi can be subdivided into three physiographicunits (1) Delhi ridges (2) Yamuna flood plain, and (3) the plains. Thetopsoil inDelhi developed fromquaternary sediments, classified as olderalluvium plains in western part and newly flood deposited alluvial ineastern part (Chibbar, 1985; Thussu and Chopra, 1991). However, thethickfine grain sediments found on the quartzite ridges are suggested tobe loessdepositedduringPleistoceneglaciations (Tripathi andRajamani,1999). All three types of sediments show different geochemicalcomposition (Tripathi and Rajamani, 1999). However, magneticallythey are restrictedwithin ferrimagnetic fractionwhile in repeatedlywetand dry condition the exposed loessic sediments oxidized towardhematite (Evans and Heller, 2003). On the other hand, the newlydeposited alluvial usually contain detrital fraction as they deposited inepisodic high energy events.
3. Methods
3.1. Sampling
Total 36 representative top soil (0–5 cm) samples were collectedfromvarious locations; broadly categorised as road side (14), agricultural
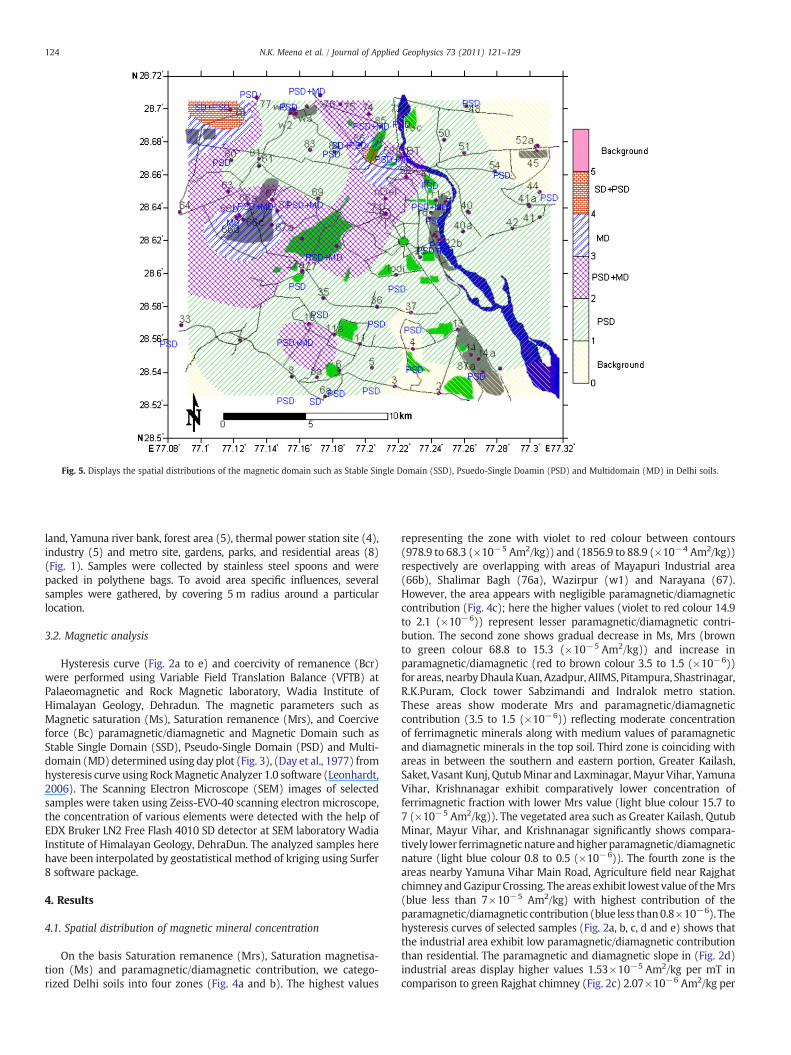
Fig. 5. Displays the spatial distributions of the magnetic domain such as Stable Single Domain (SSD), Psuedo-Single Doamin (PSD) and Multidomain (MD) in Delhi soils.
124 N.K. Meena et al. / Journal of Applied Geophysics 73 (2011) 121–129
land, Yamuna river bank, forest area (5), thermal power station site (4),industry (5) and metro site, gardens, parks, and residential areas (8)(Fig. 1). Samples were collected by stainless steel spoons and werepacked in polythene bags. To avoid area specific influences, severalsamples were gathered, by covering 5 m radius around a particularlocation.
3.2. Magnetic analysis
Hysteresis curve (Fig. 2a to e) and coercivity of remanence (Bcr)were performed using Variable Field Translation Balance (VFTB) atPalaeomagnetic and Rock Magnetic laboratory, Wadia Institute ofHimalayan Geology, Dehradun. The magnetic parameters such asMagnetic saturation (Ms), Saturation remanence (Mrs), and Coerciveforce (Bc) paramagnetic/diamagnetic and Magnetic Domain such asStable Single Domain (SSD), Pseudo-Single Domain (PSD) and Multi-domain (MD) determined using day plot (Fig. 3), (Day et al., 1977) fromhysteresis curve using RockMagnetic Analyzer 1.0 software (Leonhardt,2006). The Scanning Electron Microscope (SEM) images of selectedsamples were taken using Zeiss-EVO-40 scanning electron microscope,the concentration of various elements were detected with the help ofEDX Bruker LN2 Free Flash 4010 SD detector at SEM laboratory WadiaInstitute of Himalayan Geology, DehraDun. The analyzed samples herehave been interpolated by geostatistical method of kriging using Surfer8 software package.
4. Results
4.1. Spatial distribution of magnetic mineral concentration
On the basis Saturation remanence (Mrs), Saturation magnetisa-tion (Ms) and paramagnetic/diamagnetic contribution, we catego-rized Delhi soils into four zones (Fig. 4a and b). The highest values
representing the zone with violet to red colour between contours(978.9 to 68.3 (×10−5 Am2/kg)) and (1856.9 to 88.9 (×10−4 Am2/kg))respectively are overlapping with areas of Mayapuri Industrial area(66b), Shalimar Bagh (76a), Wazirpur (w1) and Narayana (67).However, the area appears with negligible paramagnetic/diamagneticcontribution (Fig. 4c); here the higher values (violet to red colour 14.9to 2.1 (×10−6)) represent lesser paramagnetic/diamagnetic contri-bution. The second zone shows gradual decrease in Ms, Mrs (brownto green colour 68.8 to 15.3 (×10−5 Am2/kg)) and increase inparamagnetic/diamagnetic (red to brown colour 3.5 to 1.5 (×10−6))for areas, nearbyDhaulaKuan, Azadpur, AIIMS, Pitampura, Shastrinagar,R.K.Puram, Clock tower Sabzimandi and Indralok metro station.These areas show moderate Mrs and paramagnetic/diamagneticcontribution (3.5 to 1.5 (×10−6)) reflecting moderate concentrationof ferrimagnetic minerals along with medium values of paramagneticand diamagnetic minerals in the top soil. Third zone is coinciding withareas in between the southern and eastern portion, Greater Kailash,Saket, Vasant Kunj, QutubMinar and Laxminagar,Mayur Vihar, YamunaVihar, Krishnanagar exhibit comparatively lower concentration offerrimagnetic fraction with lower Mrs value (light blue colour 15.7 to7 (×10−5 Am2/kg)). The vegetated area such as Greater Kailash, QutubMinar, Mayur Vihar, and Krishnanagar significantly shows compara-tively lower ferrimagnetic nature andhigher paramagnetic/diamagneticnature (light blue colour 0.8 to 0.5 (×10−6)). The fourth zone is theareas nearby Yamuna Vihar Main Road, Agriculture field near Rajghatchimney andGazipur Crossing. The areas exhibit lowest value of theMrs(blue less than 7×10⁻⁵ Am2/kg) with highest contribution of theparamagnetic/diamagnetic contribution (blue less than0.8×10−6). Thehysteresis curves of selected samples (Fig. 2a, b, c, d and e) shows thatthe industrial area exhibit low paramagnetic/diamagnetic contributionthan residential. The paramagnetic and diamagnetic slope in (Fig. 2d)industrial areas display higher values 1.53×10⁻⁵ Am2/kg per mT incomparison to green Rajghat chimney (Fig. 2c) 2.07×10⁻⁶ Am2/kg per
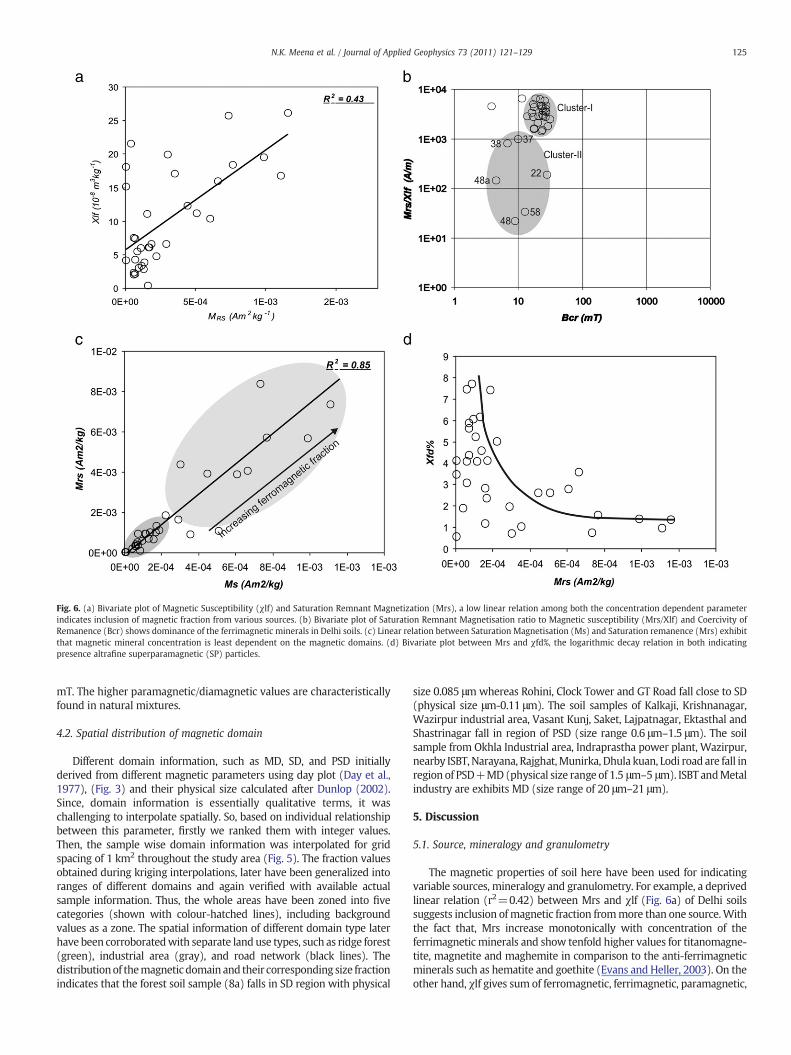
Fig. 6. (a) Bivariate plot of Magnetic Susceptibility (χlf) and Saturation Remnant Magnetization (Mrs), a low linear relation among both the concentration dependent parameterindicates inclusion of magnetic fraction from various sources. (b) Bivariate plot of Saturation Remnant Magnetisation ratio to Magnetic susceptibility (Mrs/Xlf) and Coercivity ofRemanence (Bcr) shows dominance of the ferrimagnetic minerals in Delhi soils. (c) Linear relation between Saturation Magnetisation (Ms) and Saturation remanence (Mrs) exhibitthat magnetic mineral concentration is least dependent on the magnetic domains. (d) Bivariate plot between Mrs and χfd%, the logarithmic decay relation in both indicatingpresence altrafine superparamagnetic (SP) particles.
125N.K. Meena et al. / Journal of Applied Geophysics 73 (2011) 121–129
mT. The higher paramagnetic/diamagnetic values are characteristicallyfound in natural mixtures.
4.2. Spatial distribution of magnetic domain
Different domain information, such as MD, SD, and PSD initiallyderived from different magnetic parameters using day plot (Day et al.,1977), (Fig. 3) and their physical size calculated after Dunlop (2002).Since, domain information is essentially qualitative terms, it waschallenging to interpolate spatially. So, based on individual relationshipbetween this parameter, firstly we ranked them with integer values.Then, the sample wise domain information was interpolated for gridspacing of 1 km2 throughout the study area (Fig. 5). The fraction valuesobtained during kriging interpolations, later have been generalized intoranges of different domains and again verified with available actualsample information. Thus, the whole areas have been zoned into fivecategories (shown with colour-hatched lines), including backgroundvalues as a zone. The spatial information of different domain type laterhave been corroboratedwith separate land use types, such as ridge forest(green), industrial area (gray), and road network (black lines). Thedistributionof themagneticdomain and their corresponding size fractionindicates that the forest soil sample (8a) falls in SD region with physical
size 0.085 μm whereas Rohini, Clock Tower and GT Road fall close to SD(physical size μm-0.11 μm). The soil samples of Kalkaji, Krishnanagar,Wazirpur industrial area, Vasant Kunj, Saket, Lajpatnagar, Ektasthal andShastrinagar fall in region of PSD (size range 0.6 μm–1.5 μm). The soilsample from Okhla Industrial area, Indraprastha power plant, Wazirpur,nearby ISBT, Narayana, Rajghat,Munirka, Dhula kuan, Lodi road are fall inregion of PSD+MD(physical size range of 1.5 μm–5 μm). ISBT andMetalindustry are exhibits MD (size range of 20 μm–21 μm).
5. Discussion
5.1. Source, mineralogy and granulometry
The magnetic properties of soil here have been used for indicatingvariable sources, mineralogy and granulometry. For example, a deprivedlinear relation (r2=0.42) between Mrs and χlf (Fig. 6a) of Delhi soilssuggests inclusion ofmagnetic fraction frommore than one source.Withthe fact that, Mrs increase monotonically with concentration of theferrimagnetic minerals and show tenfold higher values for titanomagne-tite, magnetite and maghemite in comparison to the anti-ferrimagneticminerals such as hematite and goethite (Evans and Heller, 2003). On theother hand, χlf gives sum of ferromagnetic, ferrimagnetic, paramagnetic,
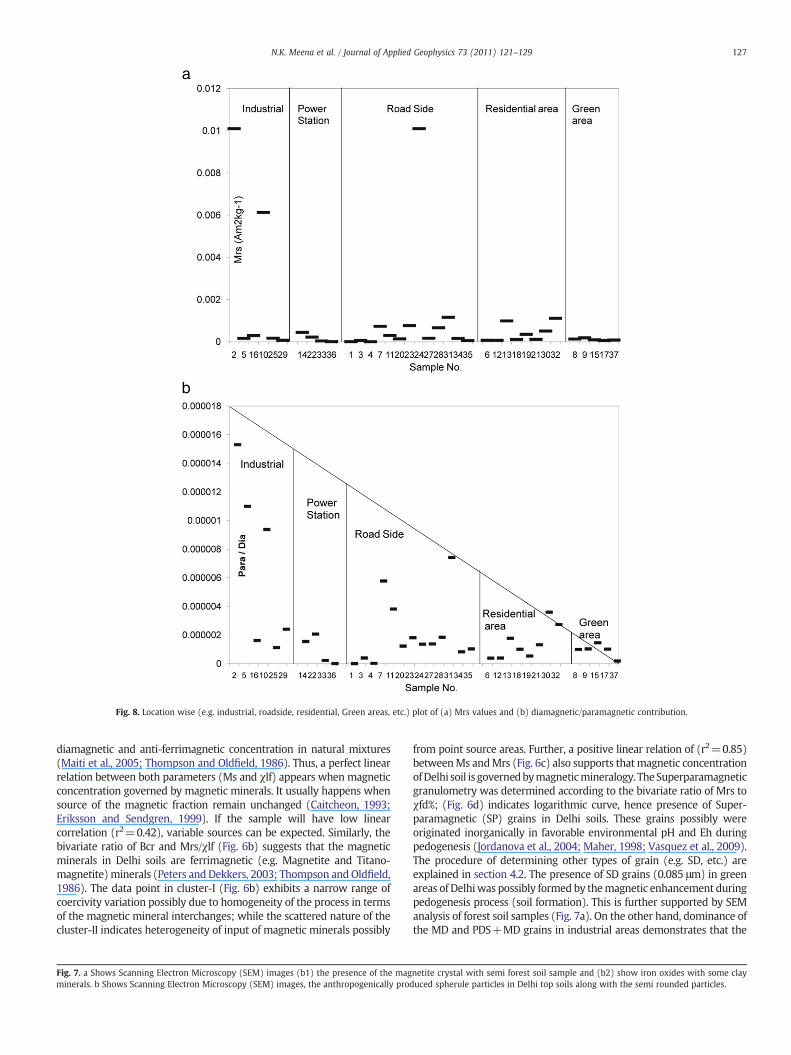
Fig. 8. Location wise (e.g. industrial, roadside, residential, Green areas, etc.) plot of (a) Mrs values and (b) diamagnetic/paramagnetic contribution.
127N.K. Meena et al. / Journal of Applied Geophysics 73 (2011) 121–129
diamagnetic and anti-ferrimagnetic concentration in natural mixtures(Maiti et al., 2005; Thompson and Oldfield, 1986). Thus, a perfect linearrelation between both parameters (Ms and χlf) appears when magneticconcentration governed by magnetic minerals. It usually happens whensource of the magnetic fraction remain unchanged (Caitcheon, 1993;Eriksson and Sendgren, 1999). If the sample will have low linearcorrelation (r2=0.42), variable sources can be expected. Similarly, thebivariate ratio of Bcr and Mrs/χlf (Fig. 6b) suggests that the magneticminerals in Delhi soils are ferrimagnetic (e.g. Magnetite and Titano-magnetite)minerals (Peters and Dekkers, 2003; Thompson and Oldfield,1986). The data point in cluster-I (Fig. 6b) exhibits a narrow range ofcoercivity variation possibly due to homogeneity of the process in termsof the magnetic mineral interchanges; while the scattered nature of thecluster-II indicates heterogeneity of input of magnetic minerals possibly
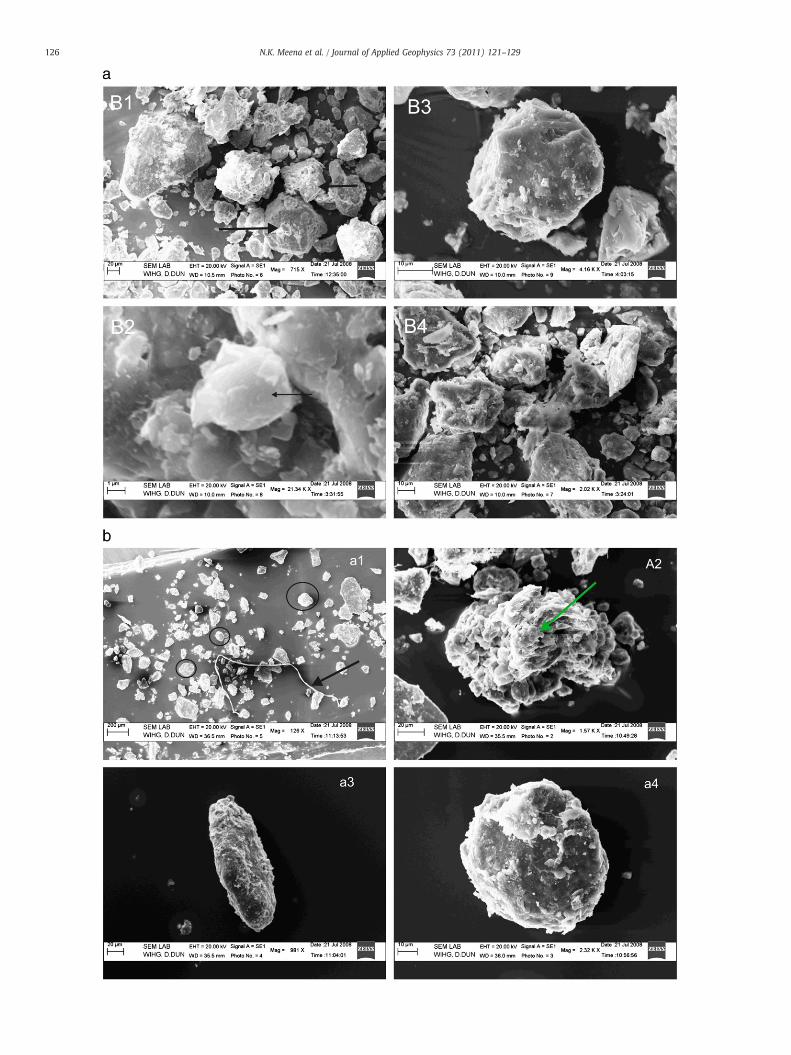
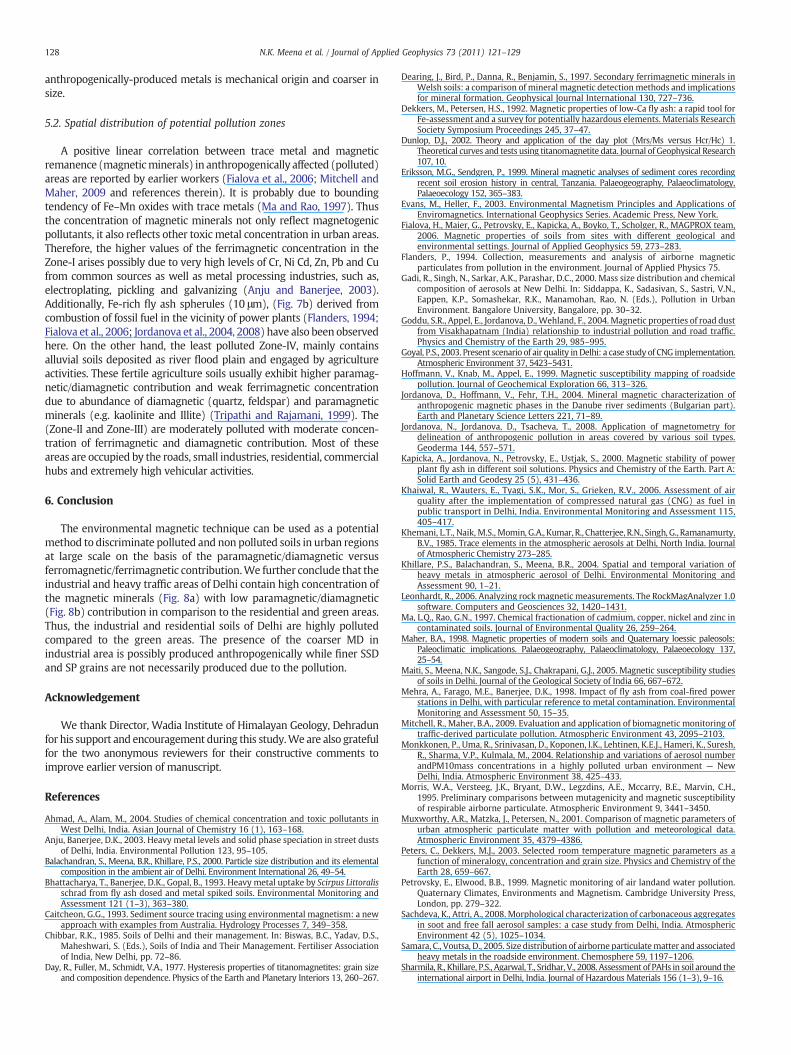
Fig. 7. a Shows Scanning Electron Microscopy (SEM) images (b1) the presence of the magminerals. b Shows Scanning Electron Microscopy (SEM) images, the anthropogenically prod
from point source areas. Further, a positive linear relation of (r2=0.85)betweenMs andMrs (Fig. 6c) also supports thatmagnetic concentrationofDelhi soil is governedbymagneticmineralogy. TheSuperparamagneticgranulometry was determined according to the bivariate ratio of Mrs toχfd%; (Fig. 6d) indicates logarithmic curve, hence presence of Super-paramagnetic (SP) grains in Delhi soils. These grains possibly wereoriginated inorganically in favorable environmental pH and Eh duringpedogenesis (Jordanova et al., 2004; Maher, 1998; Vasquez et al., 2009).The procedure of determining other types of grain (e.g. SD, etc.) areexplained in section 4.2. The presence of SD grains (0.085 μm) in greenareas of Delhiwas possibly formed by themagnetic enhancement duringpedogenesis process (soil formation). This is further supported by SEManalysis of forest soil samples (Fig. 7a). On the other hand, dominance ofthe MD and PDS+MD grains in industrial areas demonstrates that the
netite crystal with semi forest soil sample and (b2) show iron oxides with some clayuced spherule particles in Delhi top soils along with the semi rounded particles.
128 N.K. Meena et al. / Journal of Applied Geophysics 73 (2011) 121–129
anthropogenically-produced metals is mechanical origin and coarser insize.
5.2. Spatial distribution of potential pollution zones
A positive linear correlation between trace metal and magneticremanence (magneticminerals) in anthropogenically affected (polluted)areas are reported by earlier workers (Fialova et al., 2006; Mitchell andMaher, 2009 and references therein). It is probably due to boundingtendency of Fe–Mn oxides with trace metals (Ma and Rao, 1997). Thusthe concentration of magnetic minerals not only reflect magnetogenicpollutants, it also reflects other toxic metal concentration in urban areas.Therefore, the higher values of the ferrimagnetic concentration in theZone-I arises possibly due to very high levels of Cr, Ni Cd, Zn, Pb and Cufrom common sources as well as metal processing industries, such as,electroplating, pickling and galvanizing (Anju and Banerjee, 2003).Additionally, Fe-rich fly ash spherules (10 μm), (Fig. 7b) derived fromcombustion of fossil fuel in the vicinity of power plants (Flanders, 1994;Fialova et al., 2006; Jordanova et al., 2004, 2008) have also been observedhere. On the other hand, the least polluted Zone-IV, mainly containsalluvial soils deposited as river flood plain and engaged by agricultureactivities. These fertile agriculture soils usually exhibit higher paramag-netic/diamagnetic contribution and weak ferrimagnetic concentrationdue to abundance of diamagnetic (quartz, feldspar) and paramagneticminerals (e.g. kaolinite and Illite) (Tripathi and Rajamani, 1999). The(Zone-II and Zone-III) are moderately polluted with moderate concen-tration of ferrimagnetic and diamagnetic contribution. Most of theseareas are occupied by the roads, small industries, residential, commercialhubs and extremely high vehicular activities.
6. Conclusion
The environmental magnetic technique can be used as a potentialmethod to discriminate polluted and non polluted soils in urban regionsat large scale on the basis of the paramagnetic/diamagnetic versusferromagnetic/ferrimagnetic contribution.We further conclude that theindustrial and heavy traffic areas of Delhi contain high concentration ofthe magnetic minerals (Fig. 8a) with low paramagnetic/diamagnetic(Fig. 8b) contribution in comparison to the residential and green areas.Thus, the industrial and residential soils of Delhi are highly pollutedcompared to the green areas. The presence of the coarser MD inindustrial area is possibly produced anthropogenically while finer SSDand SP grains are not necessarily produced due to the pollution.
Acknowledgement
We thank Director, Wadia Institute of Himalayan Geology, Dehradunfor his support and encouragement during this study.We are also gratefulfor the two anonymous reviewers for their constructive comments toimprove earlier version of manuscript.
References
Ahmad, A., Alam, M., 2004. Studies of chemical concentration and toxic pollutants inWest Delhi, India. Asian Journal of Chemistry 16 (1), 163–168.
Anju, Banerjee, D.K., 2003. Heavy metal levels and solid phase speciation in street dustsof Delhi, India. Environmental Pollution 123, 95–105.
Balachandran, S., Meena, B.R., Khillare, P.S., 2000. Particle size distribution and its elementalcomposition in the ambient air of Delhi. Environment International 26, 49–54.
Bhattacharya, T., Banerjee, D.K., Gopal, B., 1993. Heavy metal uptake by Scirpus Littoralisschrad from fly ash dosed and metal spiked soils. Environmental Monitoring andAssessment 121 (1–3), 363–380.
Caitcheon, G.G., 1993. Sediment source tracing using environmental magnetism: a newapproach with examples from Australia. Hydrology Processes 7, 349–358.
Chibbar, R.K., 1985. Soils of Delhi and their management. In: Biswas, B.C., Yadav, D.S.,Maheshwari, S. (Eds.), Soils of India and Their Management. Fertiliser Associationof India, New Delhi, pp. 72–86.
Day, R., Fuller, M., Schmidt, V.A., 1977. Hysteresis properties of titanomagnetites: grain sizeand composition dependence. Physics of the Earth and Planetary Interiors 13, 260–267.
Dearing, J., Bird, P., Danna, R., Benjamin, S., 1997. Secondary ferrimagnetic minerals inWelsh soils: a comparison of mineral magnetic detectionmethods and implicationsfor mineral formation. Geophysical Journal International 130, 727–736.
Dekkers, M., Petersen, H.S., 1992. Magnetic properties of low-Ca fly ash: a rapid tool forFe-assessment and a survey for potentially hazardous elements. Materials ResearchSociety Symposium Proceedings 245, 37–47.
Dunlop, D.J., 2002. Theory and application of the day plot (Mrs/Ms versus Hcr/Hc) 1.Theoretical curves and tests using titanomagnetite data. Journal of Geophysical Research107, 10.
Eriksson, M.G., Sendgren, P., 1999. Mineral magnetic analyses of sediment cores recordingrecent soil erosion history in central, Tanzania. Palaeogeography, Palaeoclimatology,Palaeoecology 152, 365–383.
Evans, M., Heller, F., 2003. Environmental Magnetism Principles and Applications ofEnviromagnetics. International Geophysics Series. Academic Press, New York.
Fialova, H., Maier, G., Petrovsky, E., Kapicka, A., Boyko, T., Scholger, R., MAGPROX team,2006. Magnetic properties of soils from sites with different geological andenvironmental settings. Journal of Applied Geophysics 59, 273–283.
Flanders, P., 1994. Collection, measurements and analysis of airborne magneticparticulates from pollution in the environment. Journal of Applied Physics 75.
Gadi, R., Singh, N., Sarkar, A.K., Parashar, D.C., 2000. Mass size distribution and chemicalcomposition of aerosols at New Delhi. In: Siddappa, K., Sadasivan, S., Sastri, V.N.,Eappen, K.P., Somashekar, R.K., Manamohan, Rao, N. (Eds.), Pollution in UrbanEnvironment. Bangalore University, Bangalore, pp. 30–32.
Goddu, S.R., Appel, E., Jordanova, D., Wehland, F., 2004. Magnetic properties of road dustfrom Visakhapatnam (India) relationship to industrial pollution and road traffic.Physics and Chemistry of the Earth 29, 985–995.
Goyal, P.S., 2003. Present scenario of air quality inDelhi: a case study of CNG implementation.Atmospheric Environment 37, 5423–5431.
Hoffmann, V., Knab, M., Appel, E., 1999. Magnetic susceptibility mapping of roadsidepollution. Journal of Geochemical Exploration 66, 313–326.
Jordanova, D., Hoffmann, V., Fehr, T.H., 2004. Mineral magnetic characterization ofanthropogenic magnetic phases in the Danube river sediments (Bulgarian part).Earth and Planetary Science Letters 221, 71–89.
Jordanova, N., Jordanova, D., Tsacheva, T., 2008. Application of magnetometry fordelineation of anthropogenic pollution in areas covered by various soil types.Geoderma 144, 557–571.
Kapicka, A., Jordanova, N., Petrovsky, E., Ustjak, S., 2000. Magnetic stability of powerplant fly ash in different soil solutions. Physics and Chemistry of the Earth. Part A:Solid Earth and Geodesy 25 (5), 431–436.
Khaiwal, R., Wauters, E., Tyagi, S.K., Mor, S., Grieken, R.V., 2006. Assessment of airquality after the implementation of compressed natural gas (CNG) as fuel inpublic transport in Delhi, India. Environmental Monitoring and Assessment 115,405–417.
Khemani, L.T., Naik, M.S., Momin, G.A., Kumar,R., Chatterjee, R.N., Singh, G., Ramanamurty,B.V., 1985. Trace elements in the atmospheric aerosols at Delhi, North India. Journalof Atmospheric Chemistry 273–285.
Khillare, P.S., Balachandran, S., Meena, B.R., 2004. Spatial and temporal variation ofheavy metals in atmospheric aerosol of Delhi. Environmental Monitoring andAssessment 90, 1–21.
Leonhardt, R., 2006. Analyzing rock magnetic measurements. The RockMagAnalyzer 1.0software. Computers and Geosciences 32, 1420–1431.
Ma, L.Q., Rao, G.N., 1997. Chemical fractionation of cadmium, copper, nickel and zinc incontaminated soils. Journal of Environmental Quality 26, 259–264.
Maher, B.A., 1998. Magnetic properties of modern soils and Quaternary loessic paleosols:Paleoclimatic implications. Palaeogeography, Palaeoclimatology, Palaeoecology 137,25–54.
Maiti, S., Meena, N.K., Sangode, S.J., Chakrapani, G.J., 2005. Magnetic susceptibility studiesof soils in Delhi. Journal of the Geological Society of India 66, 667–672.
Mehra, A., Farago, M.E., Banerjee, D.K., 1998. Impact of fly ash from coal-fired powerstations in Delhi, with particular reference to metal contamination. EnvironmentalMonitoring and Assessment 50, 15–35.
Mitchell, R., Maher, B.A., 2009. Evaluation and application of biomagnetic monitoring oftraffic-derived particulate pollution. Atmospheric Environment 43, 2095–2103.
Monkkonen, P., Uma, R., Srinivasan, D., Koponen, I.K., Lehtinen, K.E.J., Hameri, K., Suresh,R., Sharma, V.P., Kulmala, M., 2004. Relationship and variations of aerosol numberandPM10mass concentrations in a highly polluted urban environment — NewDelhi, India. Atmospheric Environment 38, 425–433.
Morris, W.A., Versteeg, J.K., Bryant, D.W., Legzdins, A.E., Mccarry, B.E., Marvin, C.H.,1995. Preliminary comparisons between mutagenicity and magnetic susceptibilityof respirable airborne particulate. Atmospheric Environment 9, 3441–3450.
Muxworthy, A.R., Matzka, J., Petersen, N., 2001. Comparison of magnetic parameters ofurban atmospheric particulate matter with pollution and meteorological data.Atmospheric Environment 35, 4379–4386.
Peters, C., Dekkers, M.J., 2003. Selected room temperature magnetic parameters as afunction of mineralogy, concentration and grain size. Physics and Chemistry of theEarth 28, 659–667.
Petrovsky, E., Elwood, B.B., 1999. Magnetic monitoring of air landand water pollution.Quaternary Climates, Environments and Magnetism. Cambridge University Press,London, pp. 279–322.
Sachdeva, K., Attri, A., 2008. Morphological characterization of carbonaceous aggregatesin soot and free fall aerosol samples: a case study from Delhi, India. AtmosphericEnvironment 42 (5), 1025–1034.
Samara, C., Voutsa, D., 2005. Size distribution of airborne particulatematter and associatedheavy metals in the roadside environment. Chemosphere 59, 1197–1206.
Sharmila, R., Khillare, P.S., Agarwal, T., Sridhar, V., 2008. Assessment of PAHs in soil around theinternational airport in Delhi, India. Journal of Hazardous Materials 156 (1–3), 9–16.

129N.K. Meena et al. / Journal of Applied Geophysics 73 (2011) 121–129
Srivastava, A., Jain, V.K., 2007. A study to characterize the suspended particulate mattersin an indoor environment in Delhi, India. Building and Environment 42,2046–2052.
State forest survey report, 2008. Department of Forest and Environment, New Delhi,India.
Thompson, R., Oldfield, F., 1986. Environmental Magnetism. Allen and Unwin, London,p. 227.
Thussu, J.L., Chopra, S.C., 1991. Compilation of quadrangle maps of Haryana. RecordsGeological Survey of India 128, 1–3.
Tripathi, J.K., Rajamani, V., 1999. Geochemistry of the loessic sediments on Delhi ridge,eastern Thar Desert, Rajasthan: implication for exogenic processes. ChemicalGeology 155, 265–278.
Vasquez, C.A., Orgeira, M.J., Sinito, A.M., 2009. Origin of superparamagnetic particles inArgiudolls developed on loess. Buenos Aires (Argentina) Environmental Geology56, 1653–1661.
Yadav, S., Rajamani, V., 2006. Air quality and trace metal chemistry of different sizefractions of aerosols in N–NW India — implications for source diversity.Atmospheric Environment 40, 698–712.