NSQF- Fitter- Spinning Preparatory.pdf - National Qualification ...
Upload
uantwerpenCategory
view
5download
0
ARTICLE IN PRESS
123456789
101112131415161718192021222324252627282930313233343536373839404142434445464748495051525354555657
b i o s y s t e m s e n g i n e e r i n g x x x ( 2 0 0 9 ) 1 – 1 4
YBENG1177_proof � 10 February 2009 � 1/14
Avai lab le a t www.sc iencedi rec t .com
journa l homepage : www.e lsev ie r . com/ loca te / i ssn /15375110
585960616263646566676869707172
OFResearch Paper: PMdPower and Machinery
Discrete element simulations of the influence of fertiliserphysical properties on the spread pattern from spinning discspreaders
737475767778
ROP. Van Liedekerke*, E. Tijskens, H. Ramon
Department BIOSYST, K.U.Leuven, Kasteelpark Arenberg 30, B-3001 Leuven, Belgium
7980818283848586
a r t i c l e i n f o
Article history:
Received 14 August 2008
Received in revised form
20 January 2009
Accepted 21 January 2009
Published online -
* Corresponding author.E-mail address: Paul.VanLiedekerke@biw
8788899091
1537-5110/$ – see front matter ª 2009 IAgrEdoi:10.1016/j.biosystemseng.2009.01.006
Please cite this article in press as: Van Liproperties on the spread patternj.biosystemseng.2009.01.006
ECTEDP
This paper describes a sensitivity study of the flow of granular fertiliser particles on
a spinning disc using a discrete element model. The aim was to get a qualitative insight in
the influences of individual physical properties of the particles (such as friction coefficient,
restitution, and shape) as well as their bulk behaviour on the resulting spread pattern. The
results show that certain particle properties, particularly friction coefficients, have a large
influence on the spread pattern, and hence should examined carefully in the process of
producing granular fertilisers, perhaps by particle coating, or taken into account when
applying the fertiliser in the field. Other properties, such as particle stiffness hardly affect
the results. Furthermore, it was shown that the friction coefficient and shape of a particle
strongly interfere in their particular influence on the spread pattern. Overall, the discrete
element model could provide a powerful instrument for the manufacturers in the devel-
opment of new kinds of spreaders and fertilisers.
ª 2009 IAgrE. Published by Elsevier Ltd. All rights reserved.
9293 94 R9596
R1. Introduction Villette et al., 2005). These studies showed machine properties1
979899
100101102103104105106107108109110
UNCOManufactures of fertiliser spreaders have, over many years,
built up experience in obtaining the optimal machine settings
for various types of fertilisers and application conditions.
However, expensive calibration methods for the spread
pattern remain essential for this purpose. Modelling, to
improve the operation and control of centrifugal fertiliser
spreaders in agriculture, dates back to the pioneering work of
Patterson and Reece (1962); Inns and Reece (1962); Mennel and
Reece (1963); Dobler and Flatow (1968) and later Pitt et al.
(1982). Renewed interest in the 1990s resulted in a series of
Ph.D. studies on the subject (Adjroudi, 1993; Tissot, 1995;
Olieslagers, 1997) and research papers (Hofstee, 1995; Oliesl-
agers et al., 1996; Reumers et al., 2003; Dintwa et al., 2004, and
.kuleuven.be (P. Van Lied. Published by Elsevier Ltd
edekerke, P. et al., Discrfrom spinning disc
and settings, such as the radius or the rotational speed of the
disc, were not the only factors that influence the behaviour of
fertiliser grains during spreading. It is commonly known by
farmers, and been reported by authors (Hofstee, 1995) that
modifying the particle friction coefficient or application rate
influences the spread pattern. However, as all the spreader
models noted above are based on the accumulation of single
particle trajectories with small changes in initial conditions,
they are unable to provide understanding of the influence of
particle interactions on particle flow (Olieslagers, 1997).
The modelling of an interactive particle flow on a centrif-
ugal spreader was introduced by Van Liedekerke et al. (2006,
2008) using discrete element modelling Q(DEM) simulations.
Validation of the model was carried out for using single
ekerke).
111112113114. All rights reserved.
ete element simulations of the influence of fertiliser physicalspreaders, Biosystems Engineering (2009), doi:10.1016/
TDPROOF
2
Nomenclature
A (cross) sectional area [m2]
cN damping coefficient in Kono–Kuwabara model
(Kuwabara and Kono, 1987) [N s m�3/2]
d distance between the two particles of a cluster [m]
e restitution coefficient
I inertia tensor [kg m2]
kN,T normal or tangential particle stiffness [N m�3/2]
m mass [kg]
mc mass of cluster particle generated by overlapping
spheres [kg]
N normal contact force [N]
n normal direction vector
p model output
R particle radius [mm]
R average particle radius [mm]
Rs particle radius [mm]
t tangential direction vector
T tangential contact force [N]
v particle velocity [m s�1]
v average particle velocity [m s�1]
v0 initial downward velocity (IDV) of the particles in
the bin [m s�1]
v12 relative velocity of two colliding particles [m s�1]
X model parameter
S model sensitivity
a compartment angle in CSP [�]
a average compartment angle in CSP [�]
b width of cylindrical spread pattern [�]
dN,T normal or tangential virtual overlap component
[m]
c cluster eccentricity
m friction coefficient
mwp wall-particle friction coefficient
mpp particle-particle (internal) friction coefficient
r particle density [kg m�3]
rb bulk density [kg m�3]
J bulk flow [kg s�1]
sv standard variation on the particle velocities
[m s�1]
sR standard variation on the particle radius [mm]
u angular velocity vector of the particle [rad s�1]
Ud disc rotational speed [rpm] or [rad s�1]
Abbreviations
CSP cylindrical spread pattern
DEM Discrete Element Method
IDV initial downward velocity
b i o s y s t e m s e n g i n e e r i n g x x x ( 2 0 0 9 ) 1 – 1 42
ARTICLE IN PRESS
115116117118119120121122123124125126127128129130131132133134135136137138139140141142143144145146147148149150151152153154155156157158159160161162163164165166167168169170171
172173174175176177178179180181182183184185186187188189190191192193194195196197198199200201202203204205206207208209210
YBENG1177_proof � 10 February 2009 � 2/14
RREC
particle and particle flow experiments. It was found that,
despite fertiliser particle properties being difficult to measure,
and exact experiment conditions (e.g. initial conditions and
machine geometries) almost impossible to simulate, generally
acceptable agreement can be found between experimental
and simulated spread patterns. In this paper, DEM simulations
will be used to explore the sensitivity of the spread pattern to
the physical properties of fertiliser (e.g. particle friction coef-
ficients, stiffness, diameter, and shape). It should borne in
mind that the main goal is to develop trends and not exact
predictions concerning the influence of these properties on
particle flow on the disc and their effect on the particle
distribution at the edge of the disc.
211212213214215216217218219220221222223224225226227228
UNCO
2. DEM computational procedure
Current fertiliser spreader hoppers commonly hold from 104
to108 particles that are non-spherical and whose initial
conditions are only approximately known to (i.e. they are
located in a bin prior to being dropped onto the spinning disc).
As a result, for computational reasons, the DEM procedure has
the following restrictions:
1. Spheres are used as basic particles with a radius normal
distributionNðR; sRÞ withR ¼ 1:26 mm, and sR¼ 0.15 mm.
2. The spreader geometry is constructed in three-dimensions
using simple surfaces, such as cylinders, rectangles, and
discs.
3. Each simulation uses 7000 particles. Particles are kept in
a cylindrical ‘‘bin’’. Particles crossing the disc edge are
recycled to the cylinder where they randomly (by gravity)
Please cite this article in press as: Van Liedekerke, P. et al., Discrproperties on the spread pattern from spinning discj.biosystemseng.2009.01.006
Efall back into the particle stack (see Fig. 1). In this way, the
number of particles in the simulation remains constant.
Once the particles reach the bin orifice (approximately
10 mm above the orifice edge), their initial downward
velocity (IDV) is fixed to a predetermined value. However,
from the orifice edge downwards, particles are further
accelerated by gravity. In this way, the bulk flow of the
particles through the bin can be controlled by the IDV. This
mechanism was described more in detail in Van Liedekerke
et al. (in press) Q.
In DEM simulations, the interaction force model has
normal n and tangential directions t. The normal
interaction force is based on Hertz–Kono–Kuwabara
model (Kuwabara and Kono, 1987), while the tangential
force is a general ‘‘slip-stick’’ model (Schafer et al.,
1996). Thus
�T ¼ �signðv12ÞminðkTdT;mjNjÞt ðnormal forceÞN ¼ �min
�0; jdNj1=2
�kNdN þ cN
_dN
��n ðtangential forceÞ (1)
where T is the tangential contact force and N is the normal
force. The quantity dN, termed the ‘‘virtual overlap’’, is
computed as the difference of the distance of the two particles
and the sum of their radii. The model parameter list is
determined by kN,T (kN¼ kT for the simplicity) and cN, the non-
linear contact stiffness and damping parameter respectively,
and m is the sliding friction coefficient, which plays a crucial
role in the rolling-sliding regime of the particles (see Section
4). A graphical representation of two bodies in contact
according to DEM is shown in Fig. 2. We refer to Van Liede-
kerke et al. (2006, in press) and Schafer et al. (1996) for more
details on the principles of a DEM simulation.
ete element simulations of the influence of fertiliser physicalspreaders, Biosystems Engineering (2009), doi:10.1016/

TPROOF
Fig. 1 – (a) Dimensions of the standard spinning disc (plan view) and vanes used in the DEM simulations. (b) Particle
recycling to the bin after they leave the disc.
b i o s y s t e m s e n g i n e e r i n g x x x ( 2 0 0 9 ) 1 – 1 4 3
ARTICLE IN PRESS
229230231232233234235236237238239240241242243244245246247248249250251252253254255256257258259260261262263264265266267268269270271272273274275276277278279280281282283284285
286287288289290291292293294295296297298299300301302303304305306307308309310311312313314315316317318319320321
YBENG1177_proof � 10 February 2009 � 3/14
REC
For irregular particle shapes, instead of using a rolling
friction coefficient (Brilliantov and Poschel, 1998), a two-
sphere cluster is proposed. Using a rolling friction coefficient
in the equations of motion only adds a proportional correction
to the moment of forces acting on the particle. Therefore this
approach has less physical meaning. However, even a perfect
sphere has a rolling resistance (which largely depends on the
Young modulus of the particle), but this was not incorporated
in the model. Sphere clusters have been investigated by
various researchers to account for irregularly shaped particles
in granular flow or to model cohesive forces among particles.
Favier et al. (1999), Vu-quoc et al. (2000) studied rigid sphere
clusters, and Bucholtz and Poschel (1994) bonded (or cohesive)
UNCOR
Fig. 2 – Definition of the normal and tangential contact
force on two bodies in contact according to DEM.
322323324325
Please cite this article in press as: Van Liedekerke, P. et al., Discrproperties on the spread pattern from spinning discj.biosystemseng.2009.01.006
EDspheres. In this paper rigid clusters, containing two spheres of
equal radius Rs, as represented in Fig. 3 were considered.
Although irregularly shaped particles lose their freedom of
free rolling, two-sphere clusters still have a degree of freedom
for rolling, because of their axial symmetry. Introducing
a third sphere, not lying on this axis, could eliminate this
degree of freedom, but it was not used here because compu-
tationally it is too expensive. The mass of the clusters was
assumed to equal to that of the initially used spheres. In all
cases, we restricted the distance d between the spheres along
to the X-axis to d� 2Rs, where Rs is the particle radius. We
define c as:
c ¼ d=2 (2)
Generally, one calculates the mass of two intersecting
spheres mc by volume integration of each in X direction,
limited by c:
Fig. 3 – (a) A two-sphere cluster; (b) type B cluster; (c) type A
cluster.
326327328329330331332333334335336337338339340341342
ete element simulations of the influence of fertiliser physicalspreaders, Biosystems Engineering (2009), doi:10.1016/

T
Table 2 – Influence of particle friction coefficients,stiffness, restitution coefficient, flow rate, radius, andshape on the CSP
Particle property Value kN
(N m�3/2)a (�) b (�) v
(m s�1)sv
W-P friction 0.1 134.9 32.2 20.7 0.75
b i o s y s t e m s e n g i n e e r i n g x x x ( 2 0 0 9 ) 1 – 1 44
ARTICLE IN PRESS
343344345346347348349350351352353354355356357358359360361362363364365366367368369370371372373374375376377378379380381382383384385386387388389390391392393394395396397398399
400401402403404405406407408409410411412413414415416417418419420421422423424425426427428429430431432433434435436437438439440441
YBENG1177_proof � 10 February 2009 � 4/14
ORREC
mc ¼ 2r
Z c
�Rs
Z ffiffiffiffiffiffiffiffiffiffiR2
s�x2p
�ffiffiffiffiffiffiffiffiffiffiR2
s�x2p
Z ffiffiffiffiffiffiffiffiffiffiffiffiffiffiffiR2
s�x2�y2p
�ffiffiffiffiffiffiffiffiffiffiffiffiffiffiffiR2
s�x2�y2p dzdydx (3)
with r particle density. For an overlapping sphere cluster, the
inertia tensor with respect to the XYZ frame is obtained
applying Eq. (3). If the X-boundary for each sphere part ranges
from �Rs to c, then:
I ¼ 2r
Z c
�Rs
Z ffiffiffiffiffiffiffiffiffiffiR2
s�x2p
�ffiffiffiffiffiffiffiffiffiffiR2
s�x2p
�Z ffiffiffiffiffiffiffiffiffiffiffiffiffiffiffi
R2s�x2�y2
p
�ffiffiffiffiffiffiffiffiffiffiffiffiffiffiffiR2
s�x2�y2p
0@ y2 þ z2 �yz �ðx� cÞz
�yz ðx� cÞ2þz2 �ðx� cÞz�ðx� cÞz �ðx� cÞz y2 þ ðx� cÞ2
1Adzdydx
(4)
Two types of clusters are distinguished in the simulations.
The first group is half-overlapping spheres (type A). The mass
of a half-overlapping spheres cluster is obtained by setting
c¼ Rs/2 in Eq. (3). By imposing the restriction on equal mass to
a spherical particle (m ¼ r4=3pR3s ), we obtain following radius
for each sphere:
Rs ¼ffiffiffiffiffiffiffiffi4=93
pR (5)
The second group consists of adjoined spheres (type B). The
mass of a non-overlapping spheres cluster is obtained by
setting c¼ Rs in Eq. (3). Hence, we obtain:
Rs ¼Rffiffiffi23p (6)
3. Sensitivity study
For the parameter study, a distributor disc (0.3 m radius) was
simulated by a flat circular plate with two vanes (each of
30 mm height) spinning at 52.4 rad s�1 (500 rpm). The vanes
have horizontal flaps of approximately 10–20 mm to minimise
particle overspill. All vane edges had 2 mm thick cylindrical
chamfers to avoid discontinuous contacts. A 20 mm radius
cylindrical bin was located 70 mm from the disc centre and
100 mm above the disc plane (see Fig. 1)
All particle properties X shown in Table 1 are within
a range X˛½XlowXhigh�. These values were obtained from
measurements (Van Liedekerke et al., 2006, in press). They are
UNC
Table 1 – Input model parameter names and their default,low and high values
Parameter Defaultvalue
Lowvalue
Highvalue
P-P friction coefficient mpp 0.5 0.1 0.7
W-P friction coefficient mwp 0.35 0.1 0.7
W-P normal stiffness
kN(N m�3/2)
1.3E7 1.3E6 1.3E8
Restitution coefficient e 0.5 0.25 0.8
Particle average radius R
(mm)
1.26
(sR¼0.15)
1 2
Bulk flow J (kg s�1) 0.5 0.25 0.75
Particle shape c (m) 0 RS/2 Rs
Please cite this article in press as: Van Liedekerke, P. et al., Discrproperties on the spread pattern from spinning discj.biosystemseng.2009.01.006
EDPROOF
similar to other values found in literature (Hofstee, 1992;
Aphale et al., 2003; Grift et al., 2006). For all model parameters,
default values are defined, which are used as reference when
this specific parameter is kept constant, and others are
varying. They could be the average of [Xlow Xhigh] but this is not
particularly necessary. For some parameters, this range is not
easy to determine. In particular, for particle-particle (P-P)
friction, no accurate data is available and as a result the range
could be quite large. However, we can assume that friction
coefficients generally are in the in the range 0.1–0.7. A choice
of the low, high, and default input values for the DEM simu-
lations can be seen in Table 1. The sensitivity Sp,x, applied to
this parameter study is defined as the proportion of the model
output difference to the relative difference in model input:
Sp;X ¼DpX��Xhigh � Xlow
�� (7)
where Dp is the variation on the model output variable p,
andX ¼ ðXlow þ XhighÞ=2. A more rigorous approach to sensi-
tivity analysis would suggest the method proposed by Saltelli
et al. (2004) based on the calculation of the variances of the
model input and output should be used. However, despite the
usefulness of this approach, many simulations are required
(typically 1000) to compute these variances so this method
would not be feasible here.
In each simulation, the individual particle coordinates
were recorded at the edge of the disc, from which a particle
distribution can be derived (called the cylindrical spread
pattern or CSP). In these spread pattern measurements, the
particles are collected in segmental compartments along the
edge of the disc (Reumers et al., 2003). Each compartment is
characterised by an angle a, starting from zero (see Fig. 1). The
resolution of the segments is usually 10�. In the simulations,
after determining in which compartment the particles are
coefficient, mwp 0.3 154.1 34.1 19.2 0.79
0.5 162.9 35.3 18.7 1.04
0.7 166.1 36 18.6 1.1
P-P friction
coefficient,mpp
0.1 149.4 35.6 19.6 0.71
0.3 156.0 34.6 19.2 0.81
0.5 157.9 34.7 19.0 0.86
0.7 158.7 35.1 18.9 0.89
Restitutione/
stiffness kN
(N m�3/2)
0.2 4.106 158.6 34.1 19.0 0.77
4.108 157.8 34.5 19.0 0.83
0.8 4.106 157.7 35.8 19.0 0.93
4.108 157.2 35.2 19.0 0.96
Flow rate, J (kg s�1) 0.25 155.8 28.0 19.2 0.73
0.75 158.0 36.2 19.0 0.91
Particle average
radius, R (m)
0.001 159.6 35.1 19.0 0.88
0.002 150.1 38.8 19.2 0.98
Particle shape, c(m) Sphere 157.8 34.7 19.0 0.87
Type A 159.8 32.8 18.9 0.80
Type B 160.2 31.4 18.8 0.90
442443444445446447448449450451452453454455456
ete element simulations of the influence of fertiliser physicalspreaders, Biosystems Engineering (2009), doi:10.1016/
b i o s y s t e m s e n g i n e e r i n g x x x ( 2 0 0 9 ) 1 – 1 4 5
ARTICLE IN PRESS
457458459460461462463464465466467468469470471472473474475476477478479480481482483484485486487488489490491492493494495496497498499500501502503504505506507508509510511512513
514515516517518519520521522523524525526527528529530
YBENG1177_proof � 10 February 2009 � 5/14
located, the model output variables are calculated by using the
following quantities:
� The average mass distribution angle along the disc edge,
a ¼P
ifiai
� The width of the pattern, b ¼ffiffiffiffiffiffiffiffiffiffiffiffiffiffiffiffiffiffiffiffiffiffiffiffiffiffiffiffiP
ifiðai � aÞ2
r
where ai is the angular position of each compartment, and fi
are the particle mass fractions in this compartment. From the
simulations, one can further the extract average particle
discharge speed v.
Before describing the quantitative work using Eq. (7), more
insight into the underlying mechanisms between model
output and model parameters is given.
In Table 2, the results of he model output are summarised,
giving the average angle,a; the width of the cylindrical pattern,
b; the average outlet speed (not counting the particles which
bounce with the vane edge), and v with standard deviation sv.
T 3
531532533534535536537538539540541542543544545546547548549550
REC
4. Influence of fertiliser particle properties
4.1. Wall-particle (W-P) friction coefficient
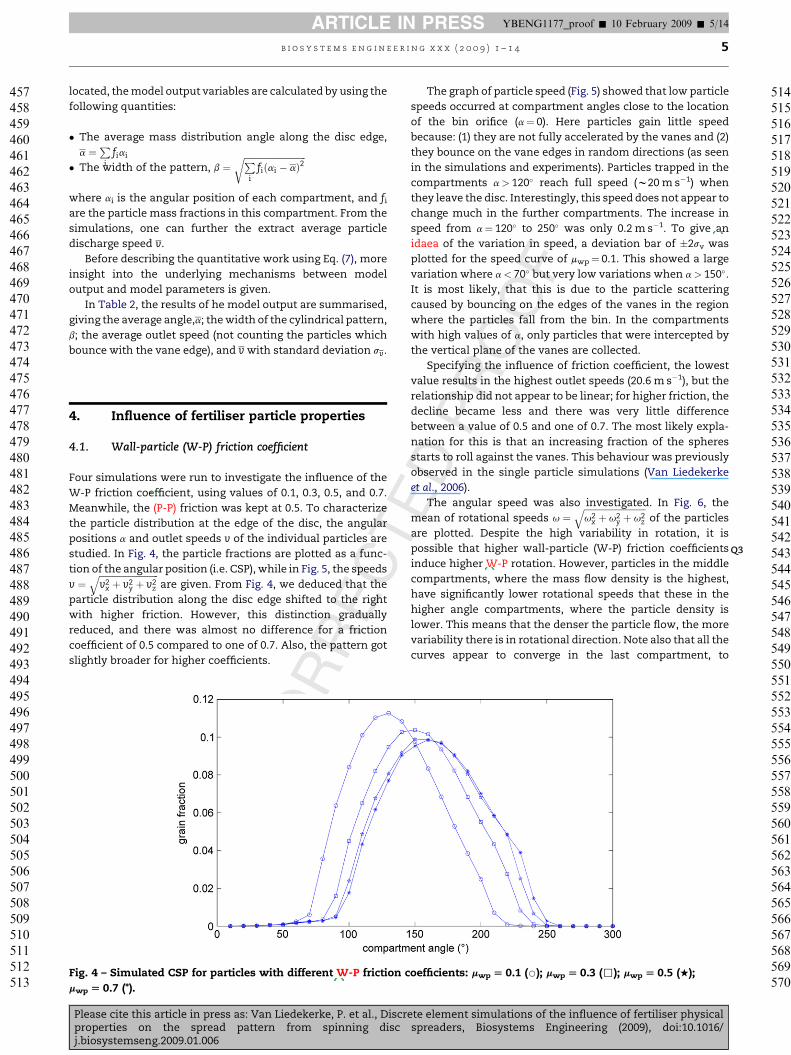
Four simulations were run to investigate the influence of the
W-P friction coefficient, using values of 0.1, 0.3, 0.5, and 0.7.
Meanwhile, the (P-P) friction was kept at 0.5. To characterize
the particle distribution at the edge of the disc, the angular
positions a and outlet speeds v of the individual particles are
studied. In Fig. 4, the particle fractions are plotted as a func-
tion of the angular position (i.e. CSP), while in Fig. 5, the speeds
v ¼ffiffiffiffiffiffiffiffiffiffiffiffiffiffiffiffiffiffiffiffiffiffiffiffiffiffiffiv2
x þ v2y þ v2
z
qare given. From Fig. 4, we deduced that the
particle distribution along the disc edge shifted to the right
with higher friction. However, this distinction gradually
reduced, and there was almost no difference for a friction
coefficient of 0.5 compared to one of 0.7. Also, the pattern got
slightly broader for higher coefficients.
UNCOR
Fig. 4 – Simulated CSP for particles with different W-P friction c
mwp [ 0.7 (*).
Please cite this article in press as: Van Liedekerke, P. et al., Discrproperties on the spread pattern from spinning discj.biosystemseng.2009.01.006
EDPROOF
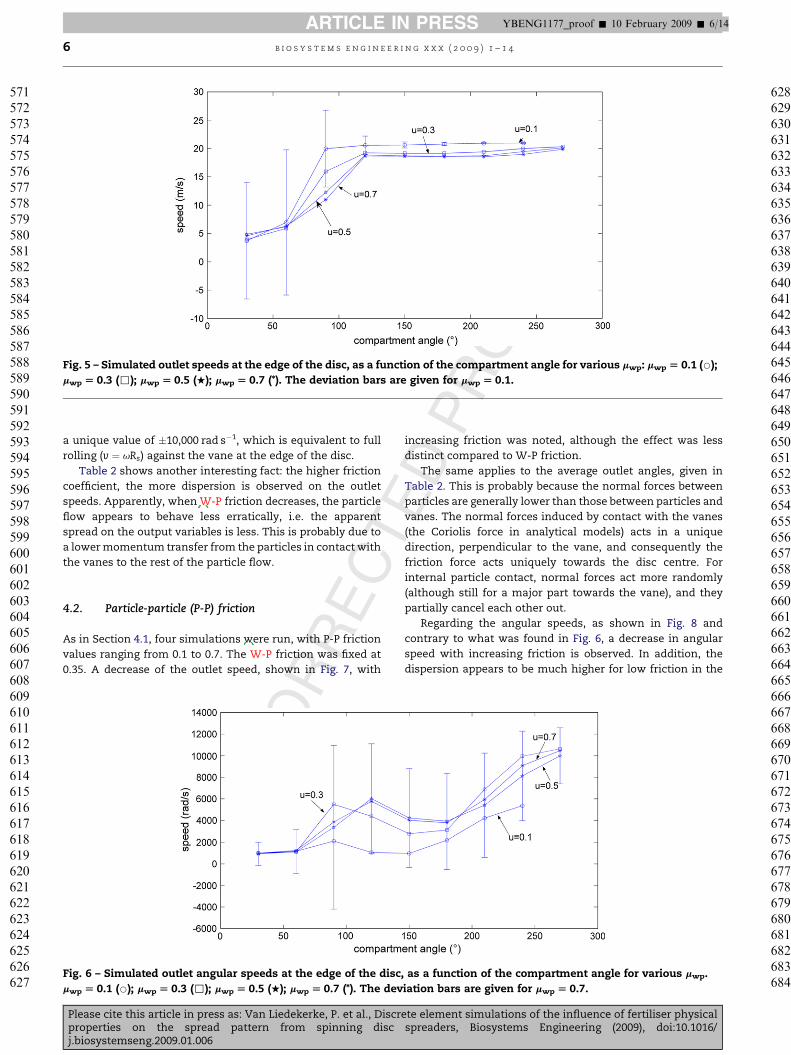
The graph of particle speed (Fig. 5) showed that low particle
speeds occurred at compartment angles close to the location
of the bin orifice (a¼ 0). Here particles gain little speed
because: (1) they are not fully accelerated by the vanes and (2)
they bounce on the vane edges in random directions (as seen
in the simulations and experiments). Particles trapped in the
compartments a> 120� reach full speed (w20 m s�1) when
they leave the disc. Interestingly, this speed does not appear to
change much in the further compartments. The increase in
speed from a¼ 120� to 250� was only 0.2 m s�1. To give an
idaea of the variation in speed, a deviation bar of �2sv was
plotted for the speed curve of mwp¼ 0.1. This showed a large
variation where a< 70� but very low variations when a> 150�.
It is most likely, that this is due to the particle scattering
caused by bouncing on the edges of the vanes in the region
where the particles fall from the bin. In the compartments
with high values of a, only particles that were intercepted by
the vertical plane of the vanes are collected.
Specifying the influence of friction coefficient, the lowest
value results in the highest outlet speeds (20.6 m s�1), but the
relationship did not appear to be linear; for higher friction, the
decline became less and there was very little difference
between a value of 0.5 and one of 0.7. The most likely expla-
nation for this is that an increasing fraction of the spheres
starts to roll against the vanes. This behaviour was previously
observed in the single particle simulations (Van Liedekerke
et al., 2006).
The angular speed was also investigated. In Fig. 6, the
mean of rotational speeds u ¼ffiffiffiffiffiffiffiffiffiffiffiffiffiffiffiffiffiffiffiffiffiffiffiffiffiffiffiffiu2
x þ u2y þ u2
z
qof the particles
are plotted. Despite the high variability in rotation, it is
possible that higher wall-particle (W-P Q) friction coefficients
induce higher W-P rotation. However, particles in the middle
compartments, where the mass flow density is the highest,
have significantly lower rotational speeds that these in the
higher angle compartments, where the particle density is
lower. This means that the denser the particle flow, the more
variability there is in rotational direction. Note also that all the
curves appear to converge in the last compartment, to
oefficients: mwp [ 0.1 (B); mwp [ 0.3 (,); mwp [ 0.5 (+);
551552553554555556557558559560561562563564565566567568569570
ete element simulations of the influence of fertiliser physicalspreaders, Biosystems Engineering (2009), doi:10.1016/
T
ROOF
Fig. 5 – Simulated outlet speeds at the edge of the disc, as a function of the compartment angle for various mwp: mwp [ 0.1 (B);
mwp [ 0.3 (,); mwp [ 0.5 (+); mwp [ 0.7 (*). The deviation bars are given for mwp [ 0.1.
b i o s y s t e m s e n g i n e e r i n g x x x ( 2 0 0 9 ) 1 – 1 46
ARTICLE IN PRESS
571572573574575576577578579580581582583584585586587588589590591592593594595596597598599600601602603604605606607608609610611612613614615616617618619620621622623624625626627
628629630631632633634635636637638639640641642643644645646647648649650651652653654655656657658
YBENG1177_proof � 10 February 2009 � 6/14
a unique value of �10,000 rad s�1, which is equivalent to full
rolling (v ¼ uRs) against the vane at the edge of the disc.
Table 2 shows another interesting fact: the higher friction
coefficient, the more dispersion is observed on the outlet
speeds. Apparently, when W-P friction decreases, the particle
flow appears to behave less erratically, i.e. the apparent
spread on the output variables is less. This is probably due to
a lower momentum transfer from the particles in contact with
the vanes to the rest of the particle flow.
C 659660661662663664 RE4.2. Particle-particle (P-P) friction
As in Section 4.1, four simulations were run, with P-P friction
values ranging from 0.1 to 0.7. The W-P friction was fixed at
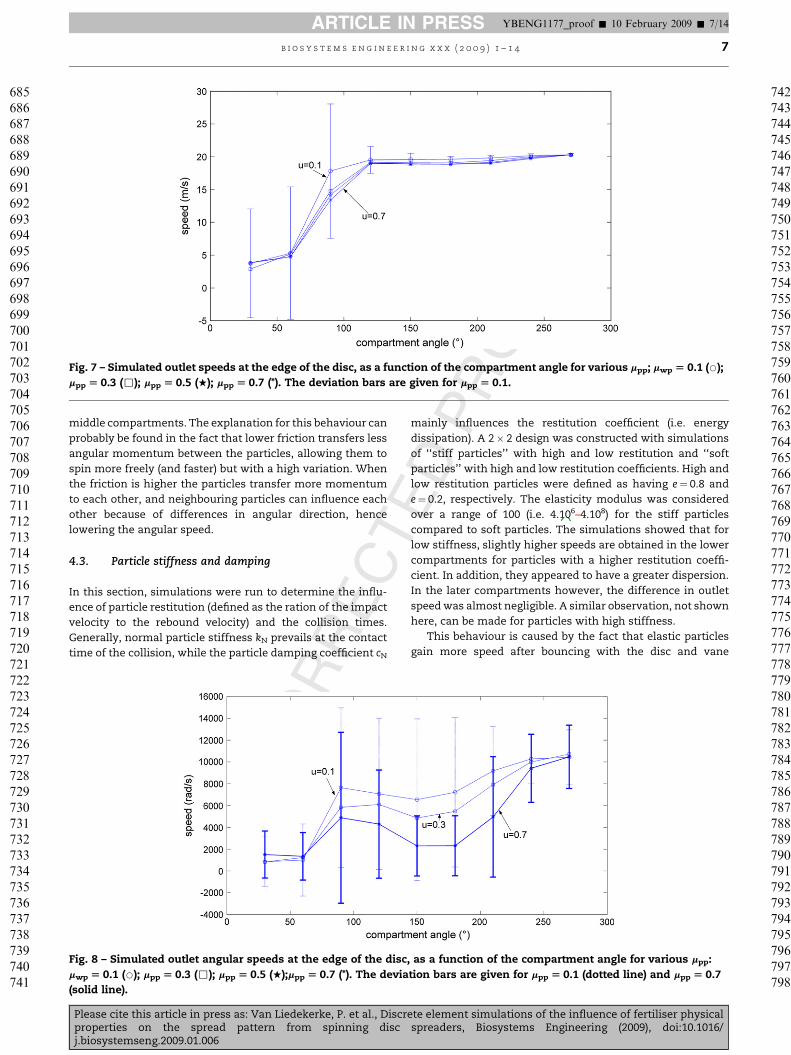
0.35. A decrease of the outlet speed, shown in Fig. 7, with
UNCOR
Fig. 6 – Simulated outlet angular speeds at the edge of the disc
mwp [ 0.1 (B); mwp [ 0.3 (,); mwp [ 0.5 (+); mwp [ 0.7 (*). The dev
Please cite this article in press as: Van Liedekerke, P. et al., Discrproperties on the spread pattern from spinning discj.biosystemseng.2009.01.006
EDPincreasing friction was noted, although the effect was less
distinct compared to W-P friction.
The same applies to the average outlet angles, given in
Table 2. This is probably because the normal forces between
particles are generally lower than those between particles and
vanes. The normal forces induced by contact with the vanes
(the Coriolis force in analytical models) acts in a unique
direction, perpendicular to the vane, and consequently the
friction force acts uniquely towards the disc centre. For
internal particle contact, normal forces act more randomly
(although still for a major part towards the vane), and they
partially cancel each other out.
Regarding the angular speeds, as shown in Fig. 8 and
contrary to what was found in Fig. 6, a decrease in angular
speed with increasing friction is observed. In addition, the
dispersion appears to be much higher for low friction in the
, as a function of the compartment angle for various mwp.
iation bars are given for mwp [ 0.7.
665666667668669670671672673674675676677678679680681682683684
ete element simulations of the influence of fertiliser physicalspreaders, Biosystems Engineering (2009), doi:10.1016/
T
ROOF
Fig. 7 – Simulated outlet speeds at the edge of the disc, as a function of the compartment angle for various mpp; mwp [ 0.1 (B);
mpp [ 0.3 (,); mpp [ 0.5 (+); mpp [ 0.7 (*). The deviation bars are given for mpp [ 0.1.
b i o s y s t e m s e n g i n e e r i n g x x x ( 2 0 0 9 ) 1 – 1 4 7
ARTICLE IN PRESS
685686687688689690691692693694695696697698699700701702703704705706707708709710711712713714715716717718719720721722723724725726727728729730731732733734735736737738739740741
742743744745746747748749750751752753754755756757758759760761762763764765766767768769770771772773774775776777
YBENG1177_proof � 10 February 2009 � 7/14
REC
middle compartments. The explanation for this behaviour can
probably be found in the fact that lower friction transfers less
angular momentum between the particles, allowing them to
spin more freely (and faster) but with a high variation. When
the friction is higher the particles transfer more momentum
to each other, and neighbouring particles can influence each
other because of differences in angular direction, hence
lowering the angular speed.
4.3. Particle stiffness and damping
In this section, simulations were run to determine the influ-
ence of particle restitution (defined as the ration of the impact
velocity to the rebound velocity) and the collision times.
Generally, normal particle stiffness kN prevails at the contact
time of the collision, while the particle damping coefficient cN
UNCOR
Fig. 8 – Simulated outlet angular speeds at the edge of the disc,
mwp [ 0.1 (B); mpp [ 0.3 (,); mpp [ 0.5 (+);mpp [ 0.7 (*). The devia
(solid line).
Please cite this article in press as: Van Liedekerke, P. et al., Discrproperties on the spread pattern from spinning discj.biosystemseng.2009.01.006
EDPmainly influences the restitution coefficient (i.e. energy
dissipation). A 2� 2 design was constructed with simulations
of ‘‘stiff particles’’ with high and low restitution and ‘‘soft
particles’’ with high and low restitution coefficients. High and
low restitution particles were defined as having e¼ 0.8 and
e¼ 0.2, respectively. The elasticity modulus was considered
over a range of 100 (i.e. 4.106–4.108) for the stiff particles
compared to soft particles. The simulations showed that for
low stiffness, slightly higher speeds are obtained in the lower
compartments for particles with a higher restitution coeffi-
cient. In addition, they appeared to have a greater dispersion.
In the later compartments however, the difference in outlet
speed was almost negligible. A similar observation, not shown
here, can be made for particles with high stiffness.
This behaviour is caused by the fact that elastic particles
gain more speed after bouncing with the disc and vane
as a function of the compartment angle for various mpp:
tion bars are given for mpp [ 0.1 (dotted line) and mpp [ 0.7
778779780781782783784785786787788789790791792793794795796797798
ete element simulations of the influence of fertiliser physicalspreaders, Biosystems Engineering (2009), doi:10.1016/
T
b i o s y s t e m s e n g i n e e r i n g x x x ( 2 0 0 9 ) 1 – 1 48
ARTICLE IN PRESS
799800801802803804805806807808809810811812813814815816817818819820821822823824825826827828829830831832833834835836837838839840841842843844845846847848849850851852853854855
856857858859860861862863864865866867868869870871872873874875876877878879880881882883884885886887888889890891892893
YBENG1177_proof � 10 February 2009 � 8/14
REC
(edges). Particles stiffness appears to have very little influence
on the spread pattern. Overall, the influence of particle stiff-
ness and elasticity on the particle output speed is low.
For the CSP plots, all curves showed no greater relative
difference than 1.5%. Average outlet angles were not affected
by stiffness or elasticity. Concerning the pattern width b;
slightly higher values were found for the more elastic parti-
cles. The most likely cause is the larger initial area on the disc
for the more elastic particles, which lose less energy when
colliding with the disc and therefore spread more. Because of
the small differences observed, the results are not shown in
plots but summarised in Table 2.
4.4. Influence of bulk flow
The mass flow rate is modelled by giving the particles an IDV
v0 in m s�1. The flow rate J is calculated by:
J ¼ rbAv0 (8)
where A is the cross-sectional area of the orifice, and rb is the
bulk density of the particle stack in the bin. Two simulations
were run, one with a flow of 0.25 kg s�1, and one with
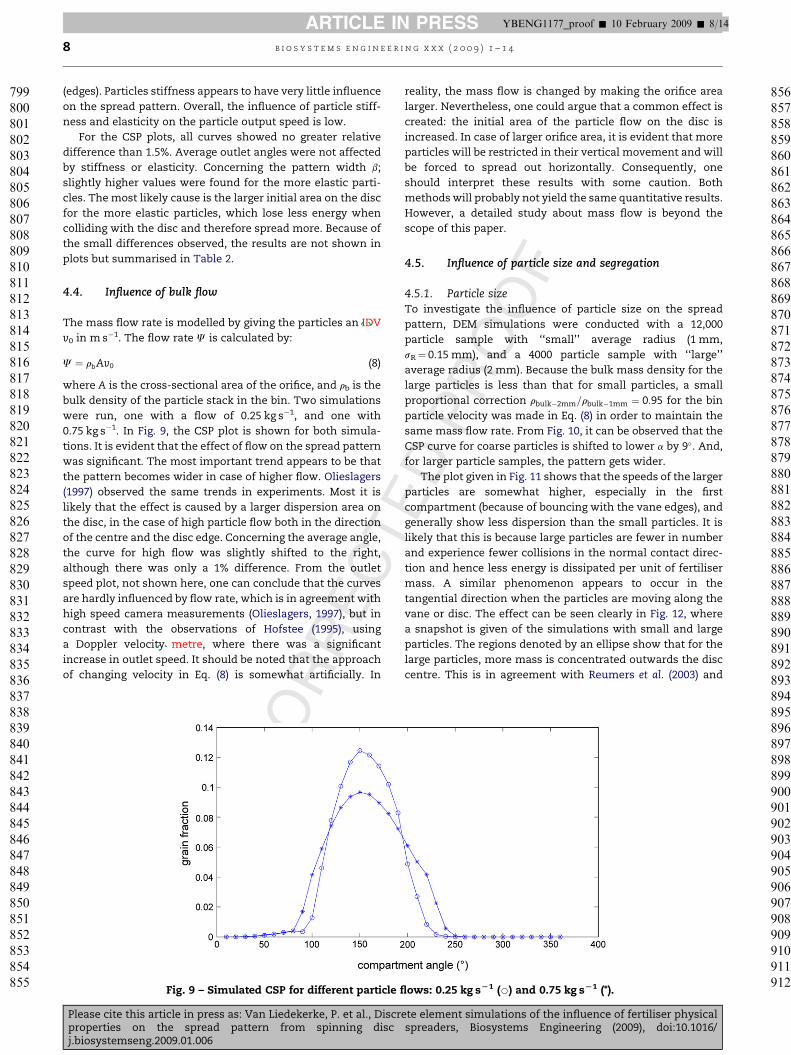
0.75 kg s�1. In Fig. 9, the CSP plot is shown for both simula-
tions. It is evident that the effect of flow on the spread pattern
was significant. The most important trend appears to be that
the pattern becomes wider in case of higher flow. Olieslagers
(1997) observed the same trends in experiments. Most it is
likely that the effect is caused by a larger dispersion area on
the disc, in the case of high particle flow both in the direction
of the centre and the disc edge. Concerning the average angle,
the curve for high flow was slightly shifted to the right,
although there was only a 1% difference. From the outlet
speed plot, not shown here, one can conclude that the curves
are hardly influenced by flow rate, which is in agreement with
high speed camera measurements (Olieslagers, 1997), but in
contrast with the observations of Hofstee (1995), using
a Doppler velocity metre, where there was a significant
increase in outlet speed. It should be noted that the approach
of changing velocity in Eq. (8) is somewhat artificially. In
UNCOR
Fig. 9 – Simulated CSP for different particle fl
Please cite this article in press as: Van Liedekerke, P. et al., Discrproperties on the spread pattern from spinning discj.biosystemseng.2009.01.006
reality, the mass flow is changed by making the orifice area
larger. Nevertheless, one could argue that a common effect is
created: the initial area of the particle flow on the disc is
increased. In case of larger orifice area, it is evident that more
particles will be restricted in their vertical movement and will
be forced to spread out horizontally. Consequently, one
should interpret these results with some caution. Both
methods will probably not yield the same quantitative results.
However, a detailed study about mass flow is beyond the
scope of this paper.
EDPROOF4.5. Influence of particle size and segregation
4.5.1. Particle sizeTo investigate the influence of particle size on the spread
pattern, DEM simulations were conducted with a 12,000
particle sample with ‘‘small’’ average radius (1 mm,
sR¼ 0.15 mm), and a 4000 particle sample with ‘‘large’’
average radius (2 mm). Because the bulk mass density for the
large particles is less than that for small particles, a small
proportional correction rbulk�2mm=rbulk�1mm ¼ 0:95 for the bin
particle velocity was made in Eq. (8) in order to maintain the
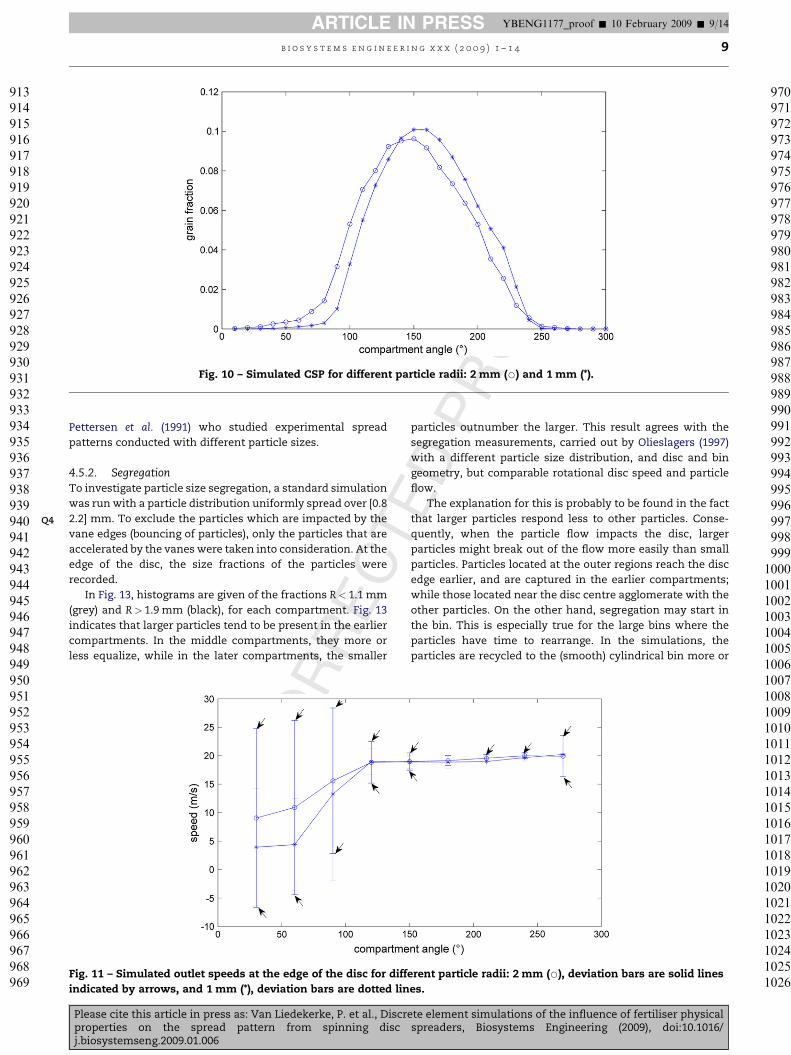
same mass flow rate. From Fig. 10, it can be observed that the
CSP curve for coarse particles is shifted to lower a by 9�. And,
for larger particle samples, the pattern gets wider.
The plot given in Fig. 11 shows that the speeds of the larger
particles are somewhat higher, especially in the first
compartment (because of bouncing with the vane edges), and
generally show less dispersion than the small particles. It is
likely that this is because large particles are fewer in number
and experience fewer collisions in the normal contact direc-
tion and hence less energy is dissipated per unit of fertiliser
mass. A similar phenomenon appears to occur in the
tangential direction when the particles are moving along the
vane or disc. The effect can be seen clearly in Fig. 12, where
a snapshot is given of the simulations with small and large
particles. The regions denoted by an ellipse show that for the
large particles, more mass is concentrated outwards the disc
centre. This is in agreement with Reumers et al. (2003) and
ows: 0.25 kg sL1 (B) and 0.75 kg sL1 (*).
894895896897898899900901902903904905906907908909910911912
ete element simulations of the influence of fertiliser physicalspreaders, Biosystems Engineering (2009), doi:10.1016/
T
ROOF
Q4
Fig. 10 – Simulated CSP for different particle radii: 2 mm (B) and 1 mm (*).
b i o s y s t e m s e n g i n e e r i n g x x x ( 2 0 0 9 ) 1 – 1 4 9
ARTICLE IN PRESS
913914915916917918919920921922923924925926927928929930931932933934935936937938939940941942943944945946947948949950951952953954955956957958959960961962963964965966967968969
970971972973974975976977978979980981982983984985986987988989990991992993994995996997998999
100010011002100310041005
YBENG1177_proof � 10 February 2009 � 9/14
REC
Pettersen et al. (1991) who studied experimental spread
patterns conducted with different particle sizes.
4.5.2. SegregationTo investigate particle size segregation, a standard simulation
was run with a particle distribution uniformly spread over [0.8
2.2] mm. To exclude the particles which are impacted by the
vane edges (bouncing of particles), only the particles that are
accelerated by the vanes were taken into consideration. At the
edge of the disc, the size fractions of the particles were
recorded.
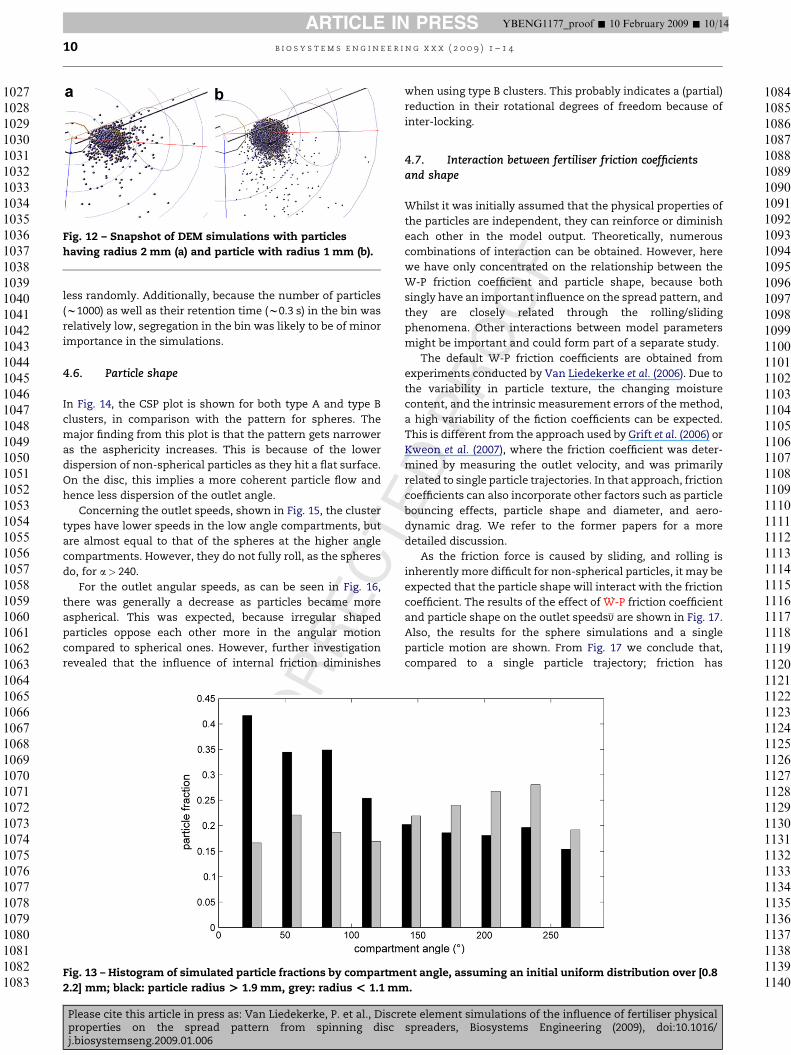
In Fig. 13, histograms are given of the fractions R< 1.1 mm
(grey) and R> 1.9 mm (black), for each compartment. Fig. 13
indicates that larger particles tend to be present in the earlier
compartments. In the middle compartments, they more or
less equalize, while in the later compartments, the smaller
UNCOR
Fig. 11 – Simulated outlet speeds at the edge of the disc for diff
indicated by arrows, and 1 mm (*), deviation bars are dotted lin
Please cite this article in press as: Van Liedekerke, P. et al., Discrproperties on the spread pattern from spinning discj.biosystemseng.2009.01.006
EDPparticles outnumber the larger. This result agrees with the
segregation measurements, carried out by Olieslagers (1997)
with a different particle size distribution, and disc and bin
geometry, but comparable rotational disc speed and particle
flow.
The explanation for this is probably to be found in the fact
that larger particles respond less to other particles. Conse-
quently, when the particle flow impacts the disc, larger
particles might break out of the flow more easily than small
particles. Particles located at the outer regions reach the disc
edge earlier, and are captured in the earlier compartments;
while those located near the disc centre agglomerate with the
other particles. On the other hand, segregation may start in
the bin. This is especially true for the large bins where the
particles have time to rearrange. In the simulations, the
particles are recycled to the (smooth) cylindrical bin more or
erent particle radii: 2 mm (B), deviation bars are solid lines
es.
100610071008100910101011101210131014101510161017101810191020102110221023102410251026
ete element simulations of the influence of fertiliser physicalspreaders, Biosystems Engineering (2009), doi:10.1016/
T
Fig. 12 – Snapshot of DEM simulations with particles
having radius 2 mm (a) and particle with radius 1 mm (b).
b i o s y s t e m s e n g i n e e r i n g x x x ( 2 0 0 9 ) 1 – 1 410
ARTICLE IN PRESS
102710281029103010311032103310341035103610371038103910401041104210431044104510461047104810491050105110521053105410551056105710581059106010611062106310641065106610671068106910701071107210731074107510761077107810791080108110821083
1084108510861087108810891090109110921093109410951096109710981099110011011102110311041105110611071108110911101111111211131114111511161117111811191120
YBENG1177_proof � 10 February 2009 � 10/14
REC
less randomly. Additionally, because the number of particles
(w1000) as well as their retention time (w0.3 s) in the bin was
relatively low, segregation in the bin was likely to be of minor
importance in the simulations.
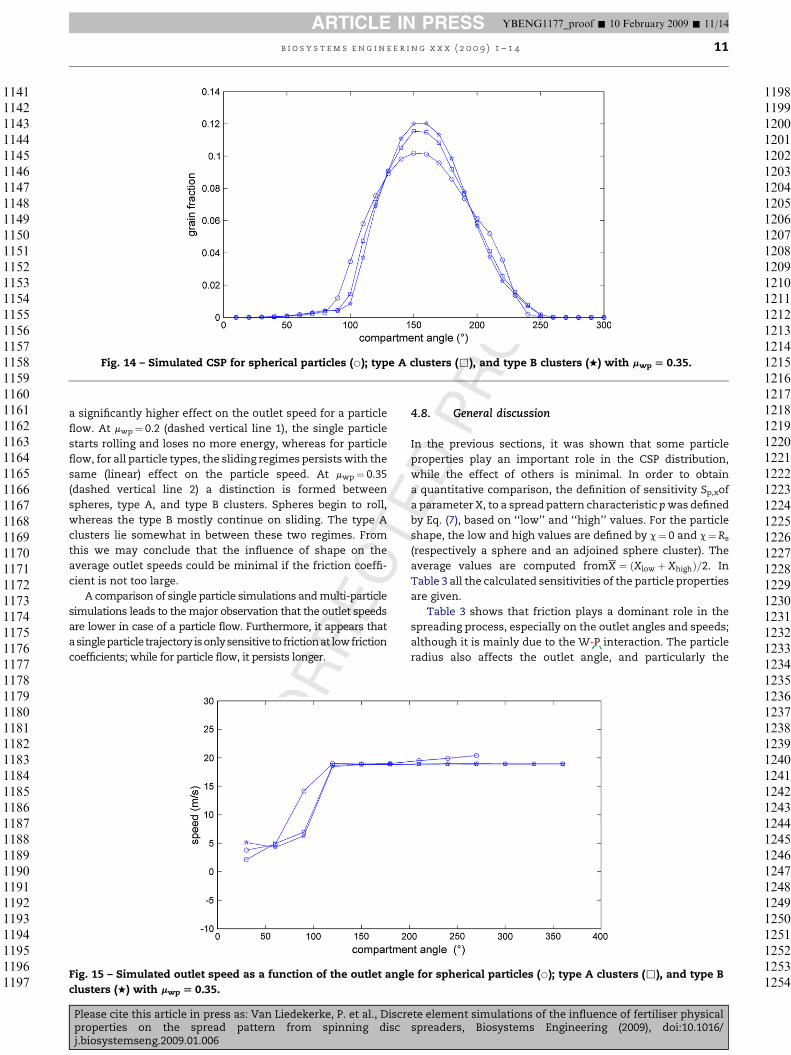
4.6. Particle shape
In Fig. 14, the CSP plot is shown for both type A and type B
clusters, in comparison with the pattern for spheres. The
major finding from this plot is that the pattern gets narrower
as the asphericity increases. This is because of the lower
dispersion of non-spherical particles as they hit a flat surface.
On the disc, this implies a more coherent particle flow and
hence less dispersion of the outlet angle.
Concerning the outlet speeds, shown in Fig. 15, the cluster
types have lower speeds in the low angle compartments, but
are almost equal to that of the spheres at the higher angle
compartments. However, they do not fully roll, as the spheres
do, for a> 240.
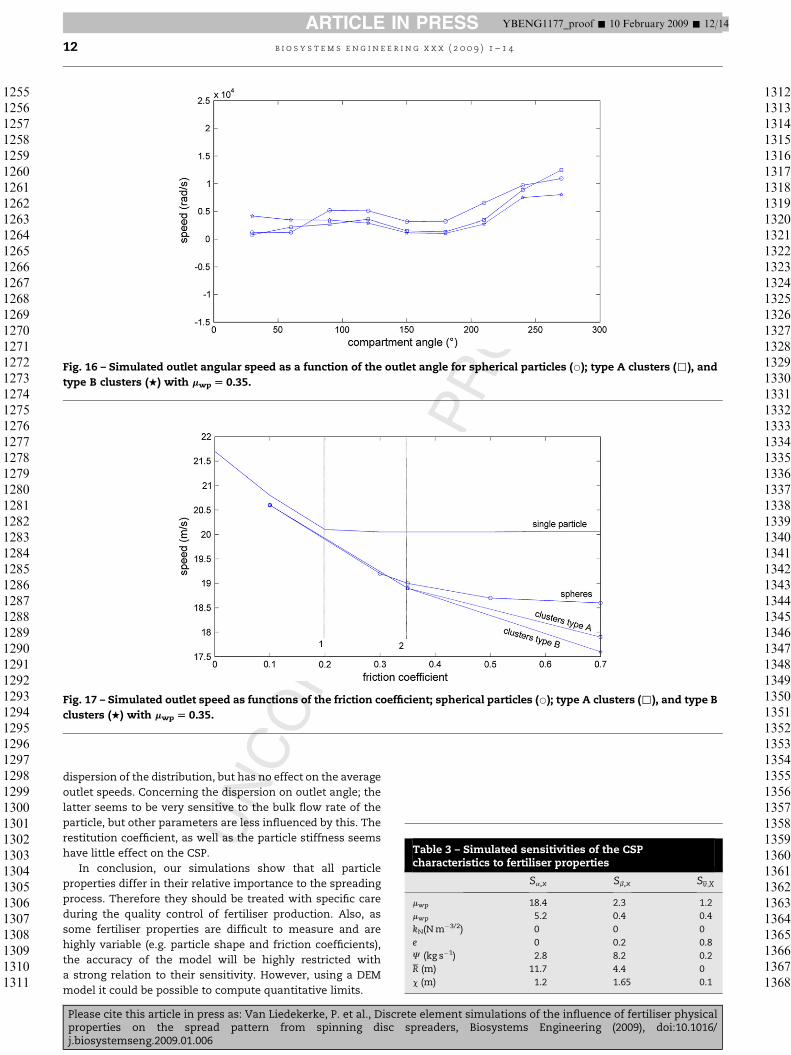
For the outlet angular speeds, as can be seen in Fig. 16,
there was generally a decrease as particles became more
aspherical. This was expected, because irregular shaped
particles oppose each other more in the angular motion
compared to spherical ones. However, further investigation
revealed that the influence of internal friction diminishes
UNCOR
Fig. 13 – Histogram of simulated particle fractions by compartme
2.2] mm; black: particle radius > 1.9 mm, grey: radius < 1.1 mm
Please cite this article in press as: Van Liedekerke, P. et al., Discrproperties on the spread pattern from spinning discj.biosystemseng.2009.01.006
when using type B clusters. This probably indicates a (partial)
reduction in their rotational degrees of freedom because of
inter-locking.
EDPROOF
4.7. Interaction between fertiliser friction coefficientsand shape
Whilst it was initially assumed that the physical properties of
the particles are independent, they can reinforce or diminish
each other in the model output. Theoretically, numerous
combinations of interaction can be obtained. However, here
we have only concentrated on the relationship between the
W-P friction coefficient and particle shape, because both
singly have an important influence on the spread pattern, and
they are closely related through the rolling/sliding
phenomena. Other interactions between model parameters
might be important and could form part of a separate study.
The default W-P friction coefficients are obtained from
experiments conducted by Van Liedekerke et al. (2006). Due to
the variability in particle texture, the changing moisture
content, and the intrinsic measurement errors of the method,
a high variability of the fiction coefficients can be expected.
This is different from the approach used by Grift et al. (2006) or
Kweon et al. (2007), where the friction coefficient was deter-
mined by measuring the outlet velocity, and was primarily
related to single particle trajectories. In that approach, friction
coefficients can also incorporate other factors such as particle
bouncing effects, particle shape and diameter, and aero-
dynamic drag. We refer to the former papers for a more
detailed discussion.
As the friction force is caused by sliding, and rolling is
inherently more difficult for non-spherical particles, it may be
expected that the particle shape will interact with the friction
coefficient. The results of the effect of W-P friction coefficient
and particle shape on the outlet speedsv are shown in Fig. 17.
Also, the results for the sphere simulations and a single
particle motion are shown. From Fig. 17 we conclude that,
compared to a single particle trajectory; friction has
nt angle, assuming an initial uniform distribution over [0.8
.
11211122112311241125112611271128112911301131113211331134113511361137113811391140
ete element simulations of the influence of fertiliser physicalspreaders, Biosystems Engineering (2009), doi:10.1016/
T
OOF
Fig. 14 – Simulated CSP for spherical particles (B); type A clusters (,), and type B clusters (+) with mwp [ 0.35.
b i o s y s t e m s e n g i n e e r i n g x x x ( 2 0 0 9 ) 1 – 1 4 11
ARTICLE IN PRESS
114111421143114411451146114711481149115011511152115311541155115611571158115911601161116211631164116511661167116811691170117111721173117411751176117711781179118011811182118311841185118611871188118911901191119211931194119511961197
119811991200120112021203120412051206120712081209121012111212121312141215121612171218121912201221122212231224122512261227122812291230123112321233
YBENG1177_proof � 10 February 2009 � 11/14
REC
a significantly higher effect on the outlet speed for a particle
flow. At mwp¼ 0.2 (dashed vertical line 1), the single particle
starts rolling and loses no more energy, whereas for particle
flow, for all particle types, the sliding regimes persists with the
same (linear) effect on the particle speed. At mwp¼ 0.35
(dashed vertical line 2) a distinction is formed between
spheres, type A, and type B clusters. Spheres begin to roll,
whereas the type B mostly continue on sliding. The type A
clusters lie somewhat in between these two regimes. From
this we may conclude that the influence of shape on the
average outlet speeds could be minimal if the friction coeffi-
cient is not too large.
A comparison of single particle simulations and multi-particle
simulations leads to the major observation that the outlet speeds
are lower in case of a particle flow. Furthermore, it appears that
asingleparticle trajectory isonlysensitivetofrictionat lowfriction
coefficients; while for particle flow, it persists longer.
UNCOR
Fig. 15 – Simulated outlet speed as a function of the outlet angl
clusters (+) with mwp [ 0.35.
Please cite this article in press as: Van Liedekerke, P. et al., Discrproperties on the spread pattern from spinning discj.biosystemseng.2009.01.006
EDPR
4.8. General discussion
In the previous sections, it was shown that some particle
properties play an important role in the CSP distribution,
while the effect of others is minimal. In order to obtain
a quantitative comparison, the definition of sensitivity Sp,xof
a parameter X, to a spread pattern characteristic p was defined
by Eq. (7), based on ‘‘low’’ and ‘‘high’’ values. For the particle
shape, the low and high values are defined by c¼ 0 and c¼ Rs
(respectively a sphere and an adjoined sphere cluster). The
average values are computed fromX ¼ ðXlow þ XhighÞ=2. In
Table 3 all the calculated sensitivities of the particle properties
are given.
Table 3 shows that friction plays a dominant role in the
spreading process, especially on the outlet angles and speeds;
although it is mainly due to the W-P interaction. The particle
radius also affects the outlet angle, and particularly the
e for spherical particles (B); type A clusters (,), and type B
123412351236123712381239124012411242124312441245124612471248124912501251125212531254
ete element simulations of the influence of fertiliser physicalspreaders, Biosystems Engineering (2009), doi:10.1016/
ORRECTEDPROOF
Fig. 16 – Simulated outlet angular speed as a function of the outlet angle for spherical particles (B); type A clusters (,), and
type B clusters (+) with mwp [ 0.35.
Fig. 17 – Simulated outlet speed as functions of the friction coefficient; spherical particles (B); type A clusters (,), and type B
clusters (+) with mwp [ 0.35.
Table 3 – Simulated sensitivities of the CSPcharacteristics to fertiliser properties
Sa,x Sb,x Sv;X
mwp 18.4 2.3 1.2
mwp 5.2 0.4 0.4
kN(N m�3/2) 0 0 0
e 0 0.2 0.8
J (kg s�1) 2.8 8.2 0.2
R (m) 11.7 4.4 0
c (m) 1.2 1.65 0.1
b i o s y s t e m s e n g i n e e r i n g x x x ( 2 0 0 9 ) 1 – 1 412
ARTICLE IN PRESS
125512561257125812591260126112621263126412651266126712681269127012711272127312741275127612771278127912801281128212831284128512861287128812891290129112921293129412951296129712981299130013011302130313041305130613071308130913101311
131213131314131513161317131813191320132113221323132413251326132713281329133013311332133313341335133613371338133913401341134213431344134513461347134813491350135113521353135413551356135713581359136013611362136313641365136613671368
YBENG1177_proof � 10 February 2009 � 12/14
UNCdispersion of the distribution, but has no effect on the average
outlet speeds. Concerning the dispersion on outlet angle; the
latter seems to be very sensitive to the bulk flow rate of the
particle, but other parameters are less influenced by this. The
restitution coefficient, as well as the particle stiffness seems
have little effect on the CSP.
In conclusion, our simulations show that all particle
properties differ in their relative importance to the spreading
process. Therefore they should be treated with specific care
during the quality control of fertiliser production. Also, as
some fertiliser properties are difficult to measure and are
highly variable (e.g. particle shape and friction coefficients),
the accuracy of the model will be highly restricted with
a strong relation to their sensitivity. However, using a DEM
model it could be possible to compute quantitative limits.
Please cite this article in press as: Van Liedekerke, P. et al., Discrete element simulations of the influence of fertiliser physicalproperties on the spread pattern from spinning disc spreaders, Biosystems Engineering (2009), doi:10.1016/j.biosystemseng.2009.01.006

Q5
b i o s y s t e m s e n g i n e e r i n g x x x ( 2 0 0 9 ) 1 – 1 4 13
ARTICLE IN PRESS
136913701371137213731374137513761377137813791380138113821383138413851386138713881389139013911392139313941395139613971398139914001401140214031404140514061407140814091410141114121413141414151416141714181419142014211422142314241425
1426142714281429143014311432143314341435143614371438
YBENG1177_proof � 10 February 2009 � 13/14
5. Conclusions
In this paper, DEM simulations were used to investigate the
model sensitivity to parameters that influence the spread
pattern. These parameters concern the properties of indi-
vidual fertiliser particles as well as their bulk flow (rate). Some
of the results of this study were compared with tendencies
found by other authors.
Several authors (Pattersson and Reece, 1962; Hofstee, 1995;
Olieslagers, 1997; Aphale et al., 2004) have concluded that
friction is one of the main fertiliser properties that influence
the spread pattern. The DEM simulations agree with these
conclusions, but show that some nuances:
T
R
6
7
14391440144114421443144414451446144714481449145014511452145314541455145614571458145914601461146214631464146514661467146814691470147114721473147414751476147714781479148014811482
UNCORREC
� The more spherical the particles are the less sensitive the
particle flow is for higher W-P friction.
� Internal particle friction has little influence on the spread
pattern compared to (P-P) friction.
� For higher flow rates, W-P friction becomes more important.
� Higher W-P friction causes particles to spread further in the
field.
A variation in the coefficient of restitution showed that it
has very little influence on the CSP, and produces a wider
pattern with more elastic particles. However, no variation in
the outlet speeds was observed. Furthermore, the stiffness of
the particles does appear to have any significant effect on the
spread pattern. It is likely that the normal interaction forces
are less important and the energy loss due to these interac-
tions is low compared to the tangential contact force, which is
largely influenced by friction.
Another important parameter for the spread patterns is the
particle size. It was shown by simulations that larger particle
samples tend to spread out further along the disc edge, while
they are also forced to leave the disc at lower outlet angles. In
agreement with experiments, segregation occurs in the
simulations, as bigger particles tend to leave the disc earlier
than the smaller fractions.
It was clearly shown that an increase in flow rate results in
a broader mass distribution along the disc edge, but outlet
speeds remain almost unaffected if the disc rotational speed
of the disc is not reduced by the increased mass load.
The effect of particle shape was investigated by the use of
two-sphere clusters with a distinction made between half-
overlapping and adjoined spheres. It was found that the more
irregular the particles, the more coherent the particle flow (i.e.
less variable in speed and position). Furthermore, it was
shown that outlet speeds are only influenced when the fric-
tion coefficient exceeds approximately 0.35, because all types
of particles slide until this point. When friction increases,
a bifurcation develops among all particle types and from this
point irregular particles persist in sliding, whereas more
spherical particles start rolling.
This research shows that all particle properties differ in
their relative importance for the spreading process and
therefore some should be treated with specific care in the
fertiliser production quality control, or in the spreading
application itself. Although the results of the simulations
exhibit the same tendencies as found in experiments, we
Please cite this article in press as: Van Liedekerke, P. et al., Discrproperties on the spread pattern from spinning discj.biosystemseng.2009.01.006
OOF
stress that the results were obtained with a simplified model
and hence should be treated with caution. More specifically,
following areas need investigation:
� Comparing the particle flow obtained from the artificial
orifice with a real orifice and bin.
� Studying of the cluster representation of irregular particles
(particle shape).
� P-P friction coefficients, despite their importance in the
model, are difficult to measure.
� Validation en search for alternative contact force models as
presented.
Further particle flow and single particle experiments vali-
dating the model are therefore necessary. Therefore, ongoing
research with recent techniques such as presented by Villette
et al. (2008) and Kweon et al. (2007) could assist in this.
However, it is clear that DEM simulations could be poten-
tially helpful tool in the design and optimisation of granular
fertiliser application.
DPUncited references
Dintwa, 2006; Mohsenin, 1986.
EAcknowledgements
The authors are very grateful to the IWT, FWO and the
K.U.Leuven Research Fund for financial support and to Ama-
zone Werke GmbH, Hasbargen, Germany.
r e f e r e n c e s Q
Adjroudi R (1993). Comportement d’un flux de particles solidesheterogenes sous l’action d’un lanceur rotatif. [Behaviour ofa flux of heterogeneous solid particles during treatment bya centrifugal spreader]. Ph.D. thesis, Institut NationalAgronomique, Paris-Grignon, France.
Aphale A; Bolander N; Park J; Shaw L; Svec J; Wassgren C (2003).Granular fertiliser particle dynamics on and off a spinnerspreader. Biosystems Engineering, 85(3), 319–329.
Brilliantov N V; Poschel T (1998). Rolling friction of a viscoussphere on a hard plane. Europhysics Letters, 42, 511–516.
Bucholtz V; Poschel T (1994). Numerical investigation of theevolution of sandpiles. Physical A, 202, 390.
Dintwa E; Van Liedekerke P; Tijskens E; Ramon H (2004). Modelfor simulation of particle flow on a centrifugal fertilizerspreader. Biosystems Engineering, 84(4), 407–415.
Dintwa E (2006). Development of accurate contact force modelsfor use with Discrete Element Method (DEM) The Discreteelement Method (DEM) modelling of bulk fruit handlingprocesses. Ph.D. thesis, Faculteit Landbouwkundige enToegepaste Biologische Wetenschappen, K.U.Leuven,Belgium. Q
Dobler K; Flatow J (1968). Berechnung der wurfgange beimschleuderdungerstreuern. [Calculation of particle trajectories,forced by a centrifugal spreader]. Grundlagen derLandtechnik, 18(4), 129–164.
ete element simulations of the influence of fertiliser physicalspreaders, Biosystems Engineering (2009), doi:10.1016/
T
Q8
b i o s y s t e m s e n g i n e e r i n g x x x ( 2 0 0 9 ) 1 – 1 414
ARTICLE IN PRESS
1483
1484
1485
1486
1487
1488
1489
1490
1491
1492
1493
1494
1495
1496
1497
1498
1499
1500
1501
1502
1503
1504
1505
1506
1507
1508
1509
1510
1511
1512
1513
1514
1515
1516
1517
1518
1519
1520
1521
1522
1523
1524
1525
1526
1527
1528
1529
1530
1531
1532
1533
1534
1535
1536
1537
1538
1539
1540
1541
1542
1543
1544
1545
1546
1547
1548
1549
1550
1551
1552
1553
1554
1555
1556
YBENG1177_proof � 10 February 2009 � 14/14
Favier J F; Abbaspour-Fard M H; Kremmer M; Raji A O (1999).Shape representation of (axisymmetrical) non sphericalparticles in DEM using multi-element model particles.Engineering Computations, 16(4), 467–480.
Grift T E; Kweon G; Hofstee J W; Piron E; Villette S (2006). Dynamicfriction coefficient measurement of granular fertiliserparticles. Biosystems Engineering, 95(4), 507–515.
Hofstee J W (1995). Handling and spreading of fertilizers part 5:the spinning disc type fertilizer spreader. Journal ofAgricultural Engineering Research, 62, 143–162.
Hofstee J W (1992). Handling and spreading of fertilizers part 2: thephysical properties of fertilizer, measuring methods and data.Journal of Agricultural Engineering Research, 53, 141–162.
Inns F M; Reece A R (1962). The theory of the centrifugaldistributor II: motion on the disc, off-centre feed. Journal ofAgricultural Engineering Research, 7(4), 345–353.
KuwabaraG;KonoK (1987).Restitutioncoefficientinacollisionbetween2spheres. Japanese Journal of Applied Physics, 26(8), 1230–1233.
Kweon G; Grift T E; Miclet D (2007). A spinning-tube device fordynamic friction coefficient measurement of granularfertiliser particles. Biosystems Engineering, 97(2), 131–143.
Mennel R M; Reece A R (1963). The theory of the centrifugaldistributor III: particle trajectories. Journal of AgriculturalEngineering Research, 8(1), 78–84.
Mohsenin N (1986). Physical Properties of Plant and AnimalMaterials. Gordon and Breach.
Olieslagers R; Ramon H; De Baerdemaeker J (1996). Calculation offertilizer distribution patterns from a spinning disc spreaderby means of a simulation model. Journal of AgriculturalEngineering Research, 63, 137–152.
Olieslagers R (1997). Fertilizer distribution modelling forcentrifugal spreader design. Ph.D. thesis, FaculteitLandbouwkundige en Toegepaste BiologischeWetenschappen, K.U.Leuven, Belgium.
Patterson D E; Reece A R (1962). The theory of the centrifugaldistributor I: motion on the disc, near-centre feed. Journal ofAgricultural Engineering Research, 7(3), 232–240.
UNCORREC
Please cite this article in press as: Van Liedekerke, P. et al., Discrproperties on the spread pattern from spinning discj.biosystemseng.2009.01.006
EDPROOF
Petterssen J M; Svendsen J A; Ovland S A (1991). Method ofstudying the influence of fertilizer particle size on thedistribution from a twin-disc spreader. Journal of AgriculturalEngineering Research, 50(4), 291–303.
Pitt R E; Farmer G S; Walker L P (1982). Approximating equationsfor rotary distributor spread patterns. Transactions of theASAE, 25(6), 1544–1552.
Reumers J; Tijskens E; Ramon H; De Baerdemaeker J (2003).Experimental characterisation of dynamical properties offertiliser grains in a centrifugal disk spreader: towards analternative for spreading hall measurements. BiosystemsEngineering, 86(3), 327–337.
Saltelli A; Tarantola S; Campolongo F; Ratto M (2004). SensitivityAnalysis in Practice. A Guide to Assessing Scientific Models.John Wiley & Sons Publishers.
Schafer J; Dippel S; Wolf D E (1996). Force schemes in simulationsof granular materials. Journal de Physique (France), 6, 5–20.
Tissot S (1995). Analyse de l’homogeneite de la repartitiontransversale des engrais epandus par des distributeurscentrifuges. [Analysis of the homogeneity of the transversedistribution of fertiliser distributed by centrifugal spreaders.]Ph.D. thesis, Faculte des Sciences Agronomiques deGembloux, Belgium.
Van Liedekerke P; Tijskens E; Dintwa E; Anthonis J; Ramon H(2006). A discrete element model for simulation of a spinningdisc fertilizer spreader I: single particle simulations. PowderTechnology, 170(2), 71–85.
Van Liedekerke P; Tijskens E; Dintwa E; Rioual F; Vangeyte J;Ramon H. DEM simulations of the particle flow ona centrifugal fertilizer spreader. Powder Technology (in press).
VilletteS;CointaultF;PironE;ChopinetB (2005). Centrifugal spreading:an analytical model for the motion of fertiliser particles ona spinning disc. Biosystems Engineering, 92(2), 157–164.
Vu-Quoc L; Zhang X; Walton O R (2000). A 3-D discrete-elementmethod for dry granular flows of ellipsoidal particles.Computer Methods in Applied Mechanics and Engineering,187, 483–528.
ete element simulations of the influence of fertiliser physicalspreaders, Biosystems Engineering (2009), doi:10.1016/
Copyright © 2022 FDOKUMEN