Diffusion tensor imaging: the normal evolution of ADC, RA, FA, and eigenvalues studied in multiple...
11
PAEDIATRIC NEURORADIOLOGY Diffusion tensor imaging: the normal evolution of ADC, RA, FA, and eigenvalues studied in multiple anatomical regions of the brain Ulrike Löbel & Jan Sedlacik & Daniel Güllmar & Werner A. Kaiser & Jürgen R. Reichenbach & Hans-Joachim Mentzel Received: 3 September 2008 / Accepted: 12 December 2008 / Published online: 9 January 2009 # Springer-Verlag 2009 Abstract Introduction The aim of our work was to investigate the process of myelination in healthy patients using the diffusion parameters apparent diffusion coefficient (ADC), relative anisotropy (RA), fractional anisotropy (FA), and eigenvalues. Age-dependent changes were assessed using the slope m of the fit functions that best described the data. Materials and methods Seventy-two patients (3 weeks– 19 years) without pathological magnetic resonance imaging findings were selected from all pediatric patients scanned with diffusion tensor imaging over a 5-year period at our institution. ADC, RA, FA, and eigenvalue maps were calculated and regions of interest were selected in anteri- or/posterior pons, genu/splenium of corpus callosum (CC), anterior/posterior limb of internal capsule (IC), and white matter (WM) regions (frontal, temporal, parietal, occipital WM). Statistical analysis was performed using Spearman correlation coefficient and regression analysis. Results Mean values ranged 71.6×10 -5 to 90.3×10 -5 mm 2 /s (pons/parietal WM) for ADC, 0.32–0.94 (frontal WM/CC) for RA, and 0.36–0.81 (frontal WM/splenium) for FA. Logarithmic fit functions best described the data. Strong age influences were observed for CC, pons, and parietal/ frontal WM and changes were significant for all three eigenvalues, most pronounced for perpendicular eigenvalues. Changes in RA and FA differed depending on the structure anisotropy. Conclusions Changes observed for ADC, RA, FA, and eigenvalues with age were consistent with previous find- ings. Changes detected for RA and FA varied due to the different scaling of both parameters. We found that the use of the largely linear scaled RA adds more valuable information for the assessment of age-dependent structural changes as compared to FA. Additionally, we report normative values for the diffusion parameters studied. Keywords Brain development . Diffusion tensor imaging . Myelination . Pediatric . Anisotropy Introduction Diffusion tensor imaging (DTI) is a novel method in magnetic resonance imaging (MRI) that has increasingly been used to study the development of the human brain in vivo and to allusively investigate its state of myelination [1]. Unlike T 1 - and T 2 -weighted magnetic resonance (MR) images where changes in myelination are not observable Neuroradiology (2009) 51:253–263 DOI 10.1007/s00234-008-0488-1 U. Löbel : W. A. Kaiser : H.-J. Mentzel Institute of Diagnostic and Interventional Radiology, University Hospital Jena, Jena, Germany U. Löbel (*) : J. Sedlacik Department of Radiological Sciences, St. Jude Children’ s Research Hospital, 262 Danny Thomas Place, Mail Stop 220, Memphis, TN 38105-2794, USA e-mail: [email protected] J. Sedlacik : D. Güllmar : J. R. Reichenbach Medical Physics Group, Institute of Diagnostic and Interventional Radiology, University Hospital Jena, Jena, Germany D. Güllmar Biomagnetic Center, Department of Neurology, University Hospital Jena, Jena, Germany
-
Upload
independent -
Category
Documents
-
view
1 -
download
0
Transcript of Diffusion tensor imaging: the normal evolution of ADC, RA, FA, and eigenvalues studied in multiple...
PAEDIATRIC NEURORADIOLOGY
Diffusion tensor imaging: the normal evolution of ADC, RA,FA, and eigenvalues studied in multiple anatomical regionsof the brain
Ulrike Löbel & Jan Sedlacik & Daniel Güllmar &
Werner A. Kaiser & Jürgen R. Reichenbach &
Hans-Joachim Mentzel
Received: 3 September 2008 /Accepted: 12 December 2008 / Published online: 9 January 2009# Springer-Verlag 2009
AbstractIntroduction The aim of our work was to investigate theprocess of myelination in healthy patients using thediffusion parameters apparent diffusion coefficient (ADC),relative anisotropy (RA), fractional anisotropy (FA), andeigenvalues. Age-dependent changes were assessed usingthe slope m of the fit functions that best described the data.Materials and methods Seventy-two patients (3 weeks–19 years) without pathological magnetic resonance imagingfindings were selected from all pediatric patients scannedwith diffusion tensor imaging over a 5-year period at ourinstitution. ADC, RA, FA, and eigenvalue maps werecalculated and regions of interest were selected in anteri-or/posterior pons, genu/splenium of corpus callosum (CC),
anterior/posterior limb of internal capsule (IC), and whitematter (WM) regions (frontal, temporal, parietal, occipitalWM). Statistical analysis was performed using Spearmancorrelation coefficient and regression analysis.Results Mean values ranged 71.6×10⁻⁵ to 90.3×10⁻⁵ mm2/s(pons/parietal WM) for ADC, 0.32–0.94 (frontal WM/CC)for RA, and 0.36–0.81 (frontal WM/splenium) for FA.Logarithmic fit functions best described the data. Strongage influences were observed for CC, pons, and parietal/frontal WM and changes were significant for all threeeigenvalues, most pronounced for perpendicular eigenvalues.Changes in RA and FA differed depending on the structureanisotropy.Conclusions Changes observed for ADC, RA, FA, andeigenvalues with age were consistent with previous find-ings. Changes detected for RA and FA varied due to thedifferent scaling of both parameters. We found that the useof the largely linear scaled RA adds more valuableinformation for the assessment of age-dependent structuralchanges as compared to FA. Additionally, we reportnormative values for the diffusion parameters studied.
Keywords Brain development . Diffusion tensor imaging .
Myelination . Pediatric . Anisotropy
Introduction
Diffusion tensor imaging (DTI) is a novel method inmagnetic resonance imaging (MRI) that has increasinglybeen used to study the development of the human brain invivo and to allusively investigate its state of myelination[1]. Unlike T1- and T2-weighted magnetic resonance (MR)images where changes in myelination are not observable
Neuroradiology (2009) 51:253–263DOI 10.1007/s00234-008-0488-1
U. Löbel :W. A. Kaiser :H.-J. MentzelInstitute of Diagnostic and Interventional Radiology,University Hospital Jena,Jena, Germany
U. Löbel (*) : J. SedlacikDepartment of Radiological Sciences,St. Jude Children’s Research Hospital,262 Danny Thomas Place, Mail Stop 220,Memphis, TN 38105-2794, USAe-mail: [email protected]
J. Sedlacik :D. Güllmar : J. R. ReichenbachMedical Physics Group, Institute of Diagnostic and InterventionalRadiology, University Hospital Jena,Jena, Germany
D. GüllmarBiomagnetic Center, Department of Neurology,University Hospital Jena,Jena, Germany
after the age of 12 and 24 months, respectively [2, 3], DTIhas proven its ability to detect developmental changes eveninto adulthood [4].
Changes in diffusion indices during normal aging havepreviously been attributed to the development of the myelinsheath [5–7]. Normal myelination of the brain proceedsfrom primary cortices to secondary cortices and toassociative cortices. These processes have been intenselystudied in postmortem tissue [8]. However, DTI for the firsttime provides a way to study and quantitatively evaluatemyelination in vivo.
A quantitative analysis of developmental changes isenabled by the investigation of different diffusion parame-ters. Of these, apparent diffusion coefficient (ADCav) as theaverage of the three eigenvalues and fractional anisotropy(FA) have been used most commonly. While ADCav
decreases, FA increases during normal brain development[9, 10]. Other rotationally invariant parameters include thetrace as well as the determinant, the volume ratio or therelative anisotropy (RA) [11]. Further analysis of DTI databased on eigenvalue maps has shown that the increase in FAis mainly due to a decrease in perpendicular eigenvalues.However, to date, there is still a lack of understanding ofhow the process of myelination contributes to the observeddevelopmental changes of both diffusion parameters men-tioned above [12, 13]. Moreover, several studies discoveredthat myelination may not be the only factor to contribute tochanges in ADCav and FA [12, 14–16]. Axonal water andthe packing of axonal fibers may also result in changes ofthe ADCav and FAwith age [13]. However, it seems that thecorrelation of age-related FA changes to underlying struc-tural changes remains challenging as the parameter does notbehave linearly [11]. Consequently, the sensitivity of FA tostructural changes is dependent on the region anisotropy[17]. In contrast, RA remains linear over a large range andhas been proposed as more logical choice [11]. Compared toFA, RA shows reduced intensity of isotropic background,hypointensities in anisotropic regions, and increased noisein high-anisotropic areas, which induces intensity disconti-nuities [18]. Under this directive, RA should be moresuitable to describe white matter changes in regions withintermediate anisotropy.
The aim of our work was to investigate the process ofmyelination in selected brain structures of healthy patientsusing the diffusion parameters ADCav, RA, FA, and paralleland perpendicular eigenvalues. Age-dependent changeswere assessed using the slope m of the fit functions thatbest described the data. We speculated that the process ofmyelination can be followed using the diffusion parametersas aforementioned and that RA may add valuable informa-tion for the assessment of structural changes duringmyelination. Additionally, we report normative values forthe diffusion parameters studied.
Materials and methods
Subjects
We retrospectively reviewed all MRI studies of childrenand adolescents up to the age of 20 years that had presentedto our institution between 2001 and 2004, and whose MRIscans were found to be normal by an experienced pediatricradiologist. Prior to scanning, parents and/or patients gavewritten informed consent to a study protocol which hadbeen approved by the local Ethics Committee. Patients withbrain lesions such as hemorrhage, tumor, malformation, orinflammation and patients who had received chemotherapy,undergone brain surgery, and were diagnosed with anorexianervosa or any metabolic disorder were excluded. Addi-tionally, we excluded patients with possible white matter(WM) abnormalities due to systemic diseases such asdiagnosed epilepsy, leukemia, encephalitis, meningitis,hydrocephalus, Goldenhar syndrome, systemic lupus eryth-ematosus, Morbus Wegener, and psychiatric diseases.
Based on these criteria, we were able to enroll 72 patientsaged 3 weeks to 19 years. These patients had undergone MRexamination due to scalp and facial lesions or tumors,headaches and emesis of unknown origin, facial nerve paresis,strabismus, amblyacousia, or for MR evaluation of a singleseizure event. All patients included in this study were born at38 weeks of gestation or later, therefore not considered preterm.
Procedures and techniques
MR imaging was performed on a 1.5-T scanner (MagnetomVision plus, Siemens, Erlangen, Germany) by using thestandard CP transmit/receive head coil or, for the youngestchildren, the system’s knee coil. DTI was performed using aTRSE-EPI-DTI sequence [19] with the following parame-ters: six different diffusion encoding directions with bvalues of 0 and 1,000 s/mm2; TR/TE=4,000/100 ms;matrix 96×128, field of view 240×240 mm correspondingto a voxel size of 2.5×1.8 mm which was interpolated to amatrix of 256×256 mm with voxel sizes of 0.94×0.94 mm;number of signals acquired, 2. 19 slices were acquiredacross the brain, each of 5 mm thickness and a gap of1.5 mm. With the sequence lasting 32 s, the measuring timein addition to the routine protocol was about 1 min.
Analysis of the eigenvalues of the diffusion tensor dataand calculation of the diffusion parameters ADCav, RA, andFA were performed with MatLab (The MathWorks, Natick,MA, USA) as described previously [1]. The b0 images andthe calculated ADCav, RA, FA, and eigenvalue maps weretransferred to the medical image viewer and analyzing toolMRIcro [20].
Data from the images and maps were obtained in 12regions of interest (ROIs) and their corresponding locations
254 Neuroradiology (2009) 51:253–263
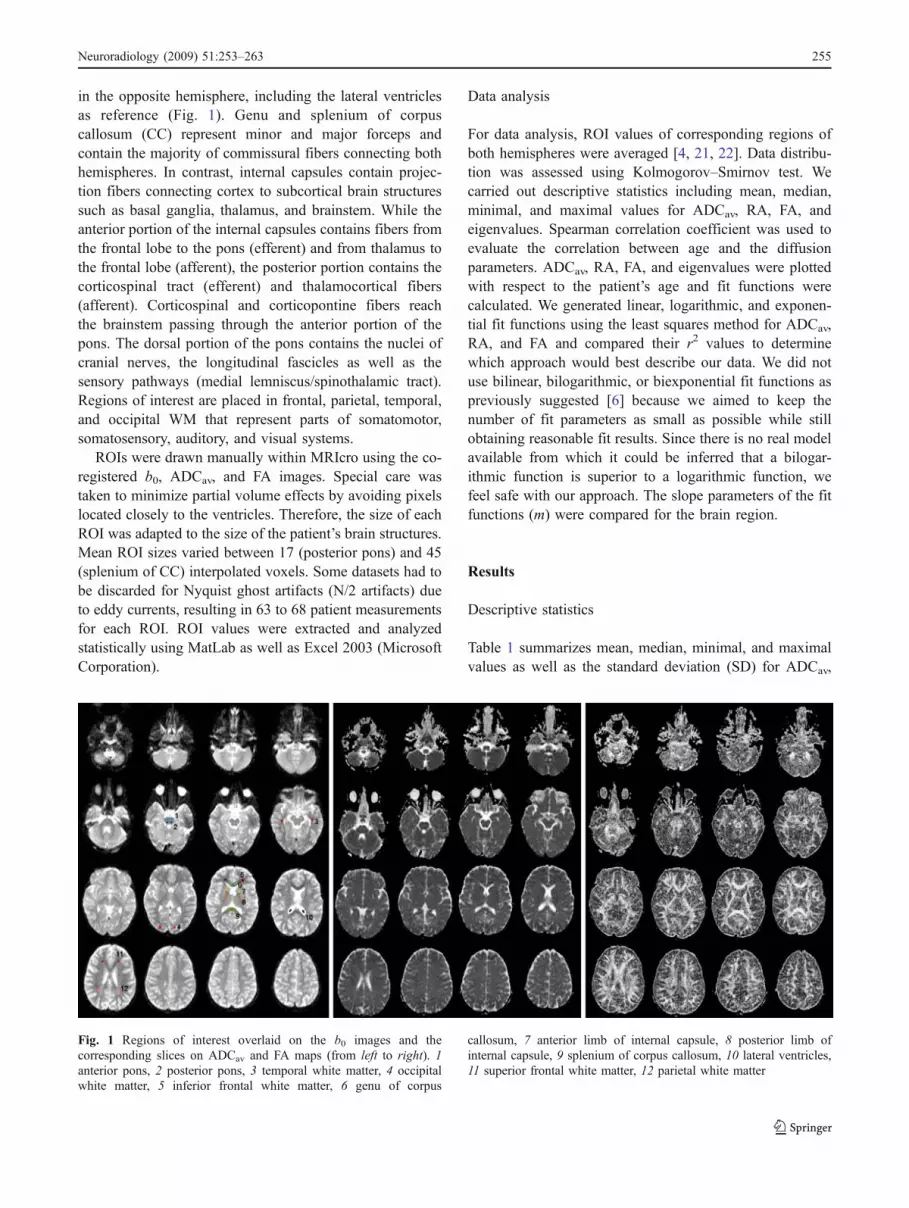
in the opposite hemisphere, including the lateral ventriclesas reference (Fig. 1). Genu and splenium of corpuscallosum (CC) represent minor and major forceps andcontain the majority of commissural fibers connecting bothhemispheres. In contrast, internal capsules contain projec-tion fibers connecting cortex to subcortical brain structuressuch as basal ganglia, thalamus, and brainstem. While theanterior portion of the internal capsules contains fibers fromthe frontal lobe to the pons (efferent) and from thalamus tothe frontal lobe (afferent), the posterior portion contains thecorticospinal tract (efferent) and thalamocortical fibers(afferent). Corticospinal and corticopontine fibers reachthe brainstem passing through the anterior portion of thepons. The dorsal portion of the pons contains the nuclei ofcranial nerves, the longitudinal fascicles as well as thesensory pathways (medial lemniscus/spinothalamic tract).Regions of interest are placed in frontal, parietal, temporal,and occipital WM that represent parts of somatomotor,somatosensory, auditory, and visual systems.
ROIs were drawn manually within MRIcro using the co-registered b0, ADCav, and FA images. Special care wastaken to minimize partial volume effects by avoiding pixelslocated closely to the ventricles. Therefore, the size of eachROI was adapted to the size of the patient’s brain structures.Mean ROI sizes varied between 17 (posterior pons) and 45(splenium of CC) interpolated voxels. Some datasets had tobe discarded for Nyquist ghost artifacts (N/2 artifacts) dueto eddy currents, resulting in 63 to 68 patient measurementsfor each ROI. ROI values were extracted and analyzedstatistically using MatLab as well as Excel 2003 (MicrosoftCorporation).
Data analysis
For data analysis, ROI values of corresponding regions ofboth hemispheres were averaged [4, 21, 22]. Data distribu-tion was assessed using Kolmogorov–Smirnov test. Wecarried out descriptive statistics including mean, median,minimal, and maximal values for ADCav, RA, FA, andeigenvalues. Spearman correlation coefficient was used toevaluate the correlation between age and the diffusionparameters. ADCav, RA, FA, and eigenvalues were plottedwith respect to the patient’s age and fit functions werecalculated. We generated linear, logarithmic, and exponen-tial fit functions using the least squares method for ADCav,RA, and FA and compared their r2 values to determinewhich approach would best describe our data. We did notuse bilinear, bilogarithmic, or biexponential fit functions aspreviously suggested [6] because we aimed to keep thenumber of fit parameters as small as possible while stillobtaining reasonable fit results. Since there is no real modelavailable from which it could be inferred that a bilogar-ithmic function is superior to a logarithmic function, wefeel safe with our approach. The slope parameters of the fitfunctions (m) were compared for the brain region.
Results
Descriptive statistics
Table 1 summarizes mean, median, minimal, and maximalvalues as well as the standard deviation (SD) for ADCav,
Fig. 1 Regions of interest overlaid on the b0 images and thecorresponding slices on ADCav and FA maps (from left to right). 1anterior pons, 2 posterior pons, 3 temporal white matter, 4 occipitalwhite matter, 5 inferior frontal white matter, 6 genu of corpus
callosum, 7 anterior limb of internal capsule, 8 posterior limb ofinternal capsule, 9 splenium of corpus callosum, 10 lateral ventricles,11 superior frontal white matter, 12 parietal white matter
Neuroradiology (2009) 51:253–263 255
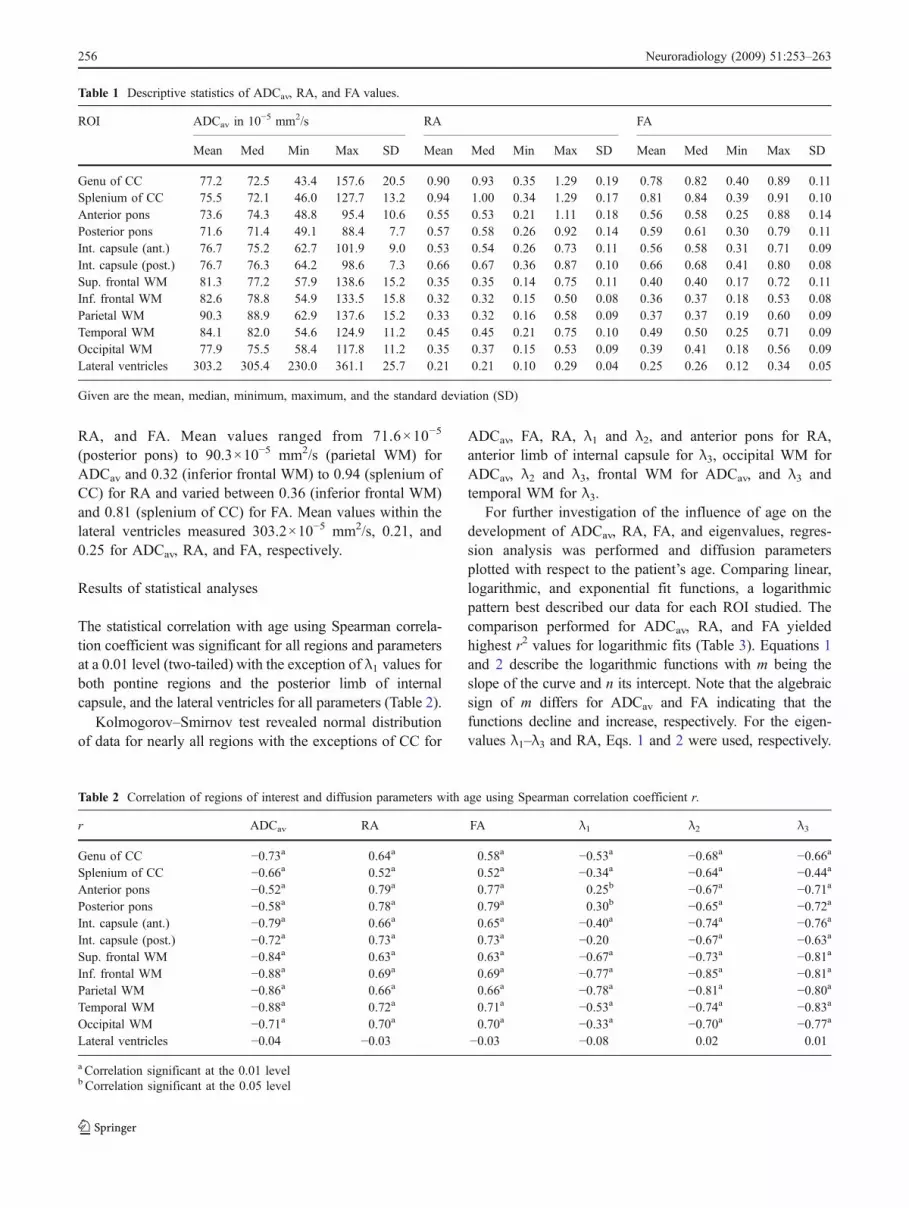
RA, and FA. Mean values ranged from 71.6×10⁻⁵
(posterior pons) to 90.3×10⁻⁵ mm2/s (parietal WM) forADCav and 0.32 (inferior frontal WM) to 0.94 (splenium ofCC) for RA and varied between 0.36 (inferior frontal WM)and 0.81 (splenium of CC) for FA. Mean values within thelateral ventricles measured 303.2×10⁻⁵ mm2/s, 0.21, and0.25 for ADCav, RA, and FA, respectively.
Results of statistical analyses
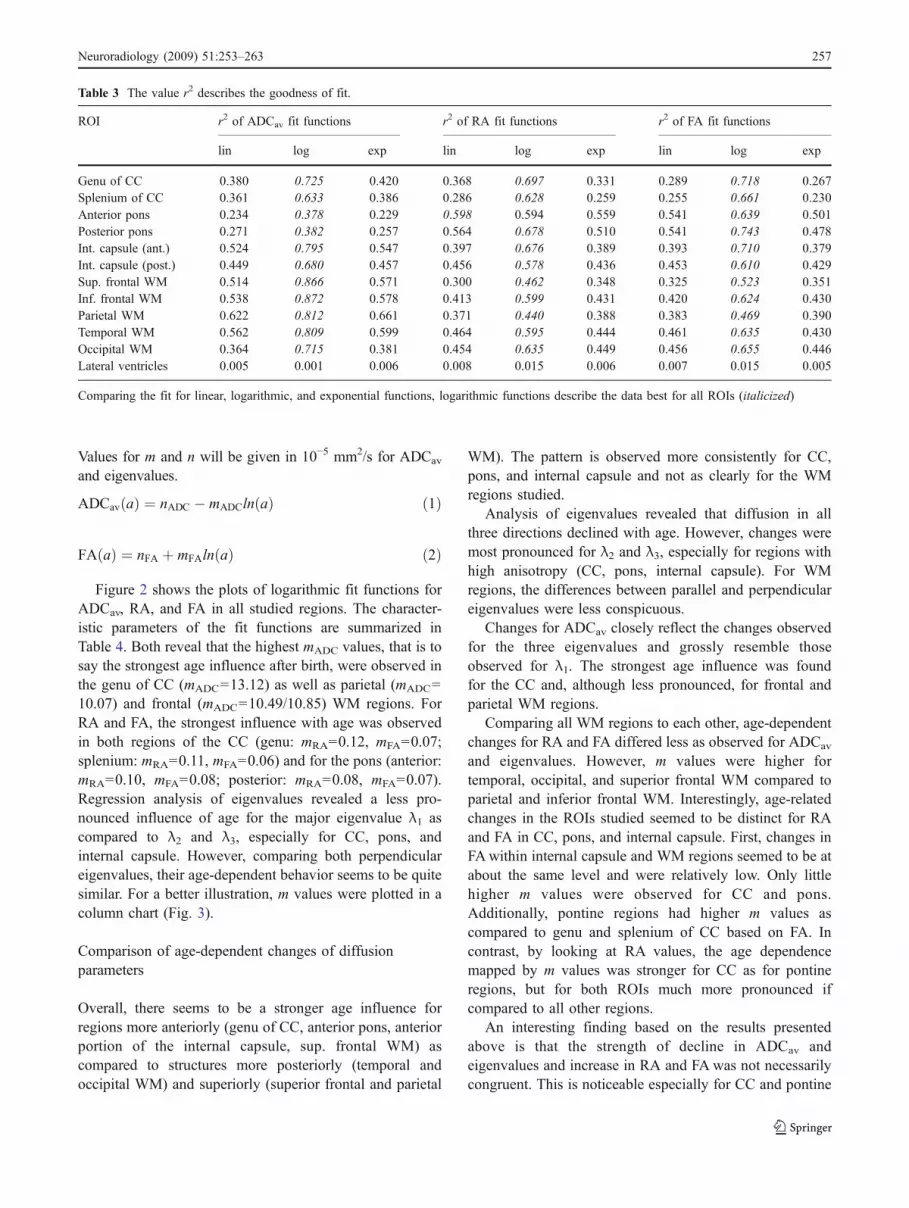
The statistical correlation with age using Spearman correla-tion coefficient was significant for all regions and parametersat a 0.01 level (two-tailed) with the exception of λ1 values forboth pontine regions and the posterior limb of internalcapsule, and the lateral ventricles for all parameters (Table 2).
Kolmogorov–Smirnov test revealed normal distributionof data for nearly all regions with the exceptions of CC for
ADCav, FA, RA, λ1 and λ2, and anterior pons for RA,anterior limb of internal capsule for λ3, occipital WM forADCav, λ2 and λ3, frontal WM for ADCav, and λ3 andtemporal WM for λ3.
For further investigation of the influence of age on thedevelopment of ADCav, RA, FA, and eigenvalues, regres-sion analysis was performed and diffusion parametersplotted with respect to the patient’s age. Comparing linear,logarithmic, and exponential fit functions, a logarithmicpattern best described our data for each ROI studied. Thecomparison performed for ADCav, RA, and FA yieldedhighest r2 values for logarithmic fits (Table 3). Equations 1and 2 describe the logarithmic functions with m being theslope of the curve and n its intercept. Note that the algebraicsign of m differs for ADCav and FA indicating that thefunctions decline and increase, respectively. For the eigen-values λ1–λ3 and RA, Eqs. 1 and 2 were used, respectively.
Table 2 Correlation of regions of interest and diffusion parameters with age using Spearman correlation coefficient r.
r ADCav RA FA λ1 λ2 λ3
Genu of CC −0.73a 0.64a 0.58a −0.53a −0.68a −0.66a
Splenium of CC −0.66a 0.52a 0.52a −0.34a −0.64a −0.44a
Anterior pons −0.52a 0.79a 0.77a 0.25b −0.67a −0.71a
Posterior pons −0.58a 0.78a 0.79a 0.30b −0.65a −0.72a
Int. capsule (ant.) −0.79a 0.66a 0.65a −0.40a −0.74a −0.76a
Int. capsule (post.) −0.72a 0.73a 0.73a −0.20 −0.67a −0.63a
Sup. frontal WM −0.84a 0.63a 0.63a −0.67a −0.73a −0.81a
Inf. frontal WM −0.88a 0.69a 0.69a −0.77a −0.85a −0.81a
Parietal WM −0.86a 0.66a 0.66a −0.78a −0.81a −0.80a
Temporal WM −0.88a 0.72a 0.71a −0.53a −0.74a −0.83a
Occipital WM −0.71a 0.70a 0.70a −0.33a −0.70a −0.77a
Lateral ventricles −0.04 −0.03 −0.03 −0.08 0.02 0.01
a Correlation significant at the 0.01 levelb Correlation significant at the 0.05 level
Table 1 Descriptive statistics of ADCav, RA, and FA values.
ROI ADCav in 10−5 mm2/s RA FA
Mean Med Min Max SD Mean Med Min Max SD Mean Med Min Max SD
Genu of CC 77.2 72.5 43.4 157.6 20.5 0.90 0.93 0.35 1.29 0.19 0.78 0.82 0.40 0.89 0.11Splenium of CC 75.5 72.1 46.0 127.7 13.2 0.94 1.00 0.34 1.29 0.17 0.81 0.84 0.39 0.91 0.10Anterior pons 73.6 74.3 48.8 95.4 10.6 0.55 0.53 0.21 1.11 0.18 0.56 0.58 0.25 0.88 0.14Posterior pons 71.6 71.4 49.1 88.4 7.7 0.57 0.58 0.26 0.92 0.14 0.59 0.61 0.30 0.79 0.11Int. capsule (ant.) 76.7 75.2 62.7 101.9 9.0 0.53 0.54 0.26 0.73 0.11 0.56 0.58 0.31 0.71 0.09Int. capsule (post.) 76.7 76.3 64.2 98.6 7.3 0.66 0.67 0.36 0.87 0.10 0.66 0.68 0.41 0.80 0.08Sup. frontal WM 81.3 77.2 57.9 138.6 15.2 0.35 0.35 0.14 0.75 0.11 0.40 0.40 0.17 0.72 0.11Inf. frontal WM 82.6 78.8 54.9 133.5 15.8 0.32 0.32 0.15 0.50 0.08 0.36 0.37 0.18 0.53 0.08Parietal WM 90.3 88.9 62.9 137.6 15.2 0.33 0.32 0.16 0.58 0.09 0.37 0.37 0.19 0.60 0.09Temporal WM 84.1 82.0 54.6 124.9 11.2 0.45 0.45 0.21 0.75 0.10 0.49 0.50 0.25 0.71 0.09Occipital WM 77.9 75.5 58.4 117.8 11.2 0.35 0.37 0.15 0.53 0.09 0.39 0.41 0.18 0.56 0.09Lateral ventricles 303.2 305.4 230.0 361.1 25.7 0.21 0.21 0.10 0.29 0.04 0.25 0.26 0.12 0.34 0.05
Given are the mean, median, minimum, maximum, and the standard deviation (SD)
256 Neuroradiology (2009) 51:253–263
Values for m and n will be given in 10−5 mm2/s for ADCav
and eigenvalues.
ADCav að Þ ¼ nADC � mADCln að Þ ð1Þ
FA að Þ ¼ nFA þ mFAln að Þ ð2Þ
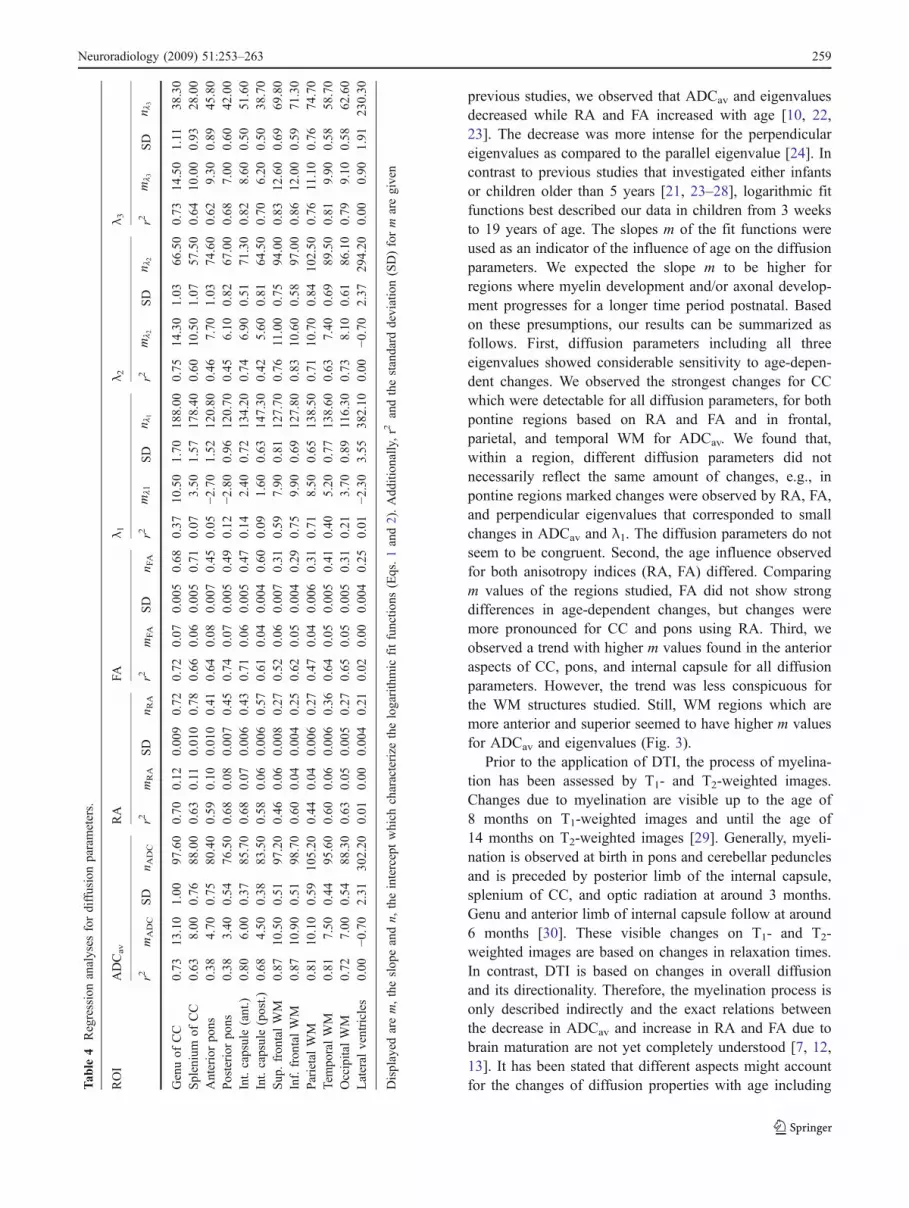
Figure 2 shows the plots of logarithmic fit functions forADCav, RA, and FA in all studied regions. The character-istic parameters of the fit functions are summarized inTable 4. Both reveal that the highest mADC values, that is tosay the strongest age influence after birth, were observed inthe genu of CC (mADC=13.12) as well as parietal (mADC=10.07) and frontal (mADC=10.49/10.85) WM regions. ForRA and FA, the strongest influence with age was observedin both regions of the CC (genu: mRA=0.12, mFA=0.07;splenium: mRA=0.11, mFA=0.06) and for the pons (anterior:mRA=0.10, mFA=0.08; posterior: mRA=0.08, mFA=0.07).Regression analysis of eigenvalues revealed a less pro-nounced influence of age for the major eigenvalue λ1 ascompared to λ2 and λ3, especially for CC, pons, andinternal capsule. However, comparing both perpendiculareigenvalues, their age-dependent behavior seems to be quitesimilar. For a better illustration, m values were plotted in acolumn chart (Fig. 3).
Comparison of age-dependent changes of diffusionparameters
Overall, there seems to be a stronger age influence forregions more anteriorly (genu of CC, anterior pons, anteriorportion of the internal capsule, sup. frontal WM) ascompared to structures more posteriorly (temporal andoccipital WM) and superiorly (superior frontal and parietal
WM). The pattern is observed more consistently for CC,pons, and internal capsule and not as clearly for the WMregions studied.
Analysis of eigenvalues revealed that diffusion in allthree directions declined with age. However, changes weremost pronounced for λ2 and λ3, especially for regions withhigh anisotropy (CC, pons, internal capsule). For WMregions, the differences between parallel and perpendiculareigenvalues were less conspicuous.
Changes for ADCav closely reflect the changes observedfor the three eigenvalues and grossly resemble thoseobserved for λ1. The strongest age influence was foundfor the CC and, although less pronounced, for frontal andparietal WM regions.
Comparing all WM regions to each other, age-dependentchanges for RA and FA differed less as observed for ADCav
and eigenvalues. However, m values were higher fortemporal, occipital, and superior frontal WM compared toparietal and inferior frontal WM. Interestingly, age-relatedchanges in the ROIs studied seemed to be distinct for RAand FA in CC, pons, and internal capsule. First, changes inFAwithin internal capsule and WM regions seemed to be atabout the same level and were relatively low. Only littlehigher m values were observed for CC and pons.Additionally, pontine regions had higher m values ascompared to genu and splenium of CC based on FA. Incontrast, by looking at RA values, the age dependencemapped by m values was stronger for CC as for pontineregions, but for both ROIs much more pronounced ifcompared to all other regions.
An interesting finding based on the results presentedabove is that the strength of decline in ADCav andeigenvalues and increase in RA and FA was not necessarilycongruent. This is noticeable especially for CC and pontine
Table 3 The value r2 describes the goodness of fit.
ROI r2 of ADCav fit functions r2 of RA fit functions r2 of FA fit functions
lin log exp lin log exp lin log exp
Genu of CC 0.380 0.725 0.420 0.368 0.697 0.331 0.289 0.718 0.267Splenium of CC 0.361 0.633 0.386 0.286 0.628 0.259 0.255 0.661 0.230Anterior pons 0.234 0.378 0.229 0.598 0.594 0.559 0.541 0.639 0.501Posterior pons 0.271 0.382 0.257 0.564 0.678 0.510 0.541 0.743 0.478Int. capsule (ant.) 0.524 0.795 0.547 0.397 0.676 0.389 0.393 0.710 0.379Int. capsule (post.) 0.449 0.680 0.457 0.456 0.578 0.436 0.453 0.610 0.429Sup. frontal WM 0.514 0.866 0.571 0.300 0.462 0.348 0.325 0.523 0.351Inf. frontal WM 0.538 0.872 0.578 0.413 0.599 0.431 0.420 0.624 0.430Parietal WM 0.622 0.812 0.661 0.371 0.440 0.388 0.383 0.469 0.390Temporal WM 0.562 0.809 0.599 0.464 0.595 0.444 0.461 0.635 0.430Occipital WM 0.364 0.715 0.381 0.454 0.635 0.449 0.456 0.655 0.446Lateral ventricles 0.005 0.001 0.006 0.008 0.015 0.006 0.007 0.015 0.005
Comparing the fit for linear, logarithmic, and exponential functions, logarithmic functions describe the data best for all ROIs (italicized)
Neuroradiology (2009) 51:253–263 257
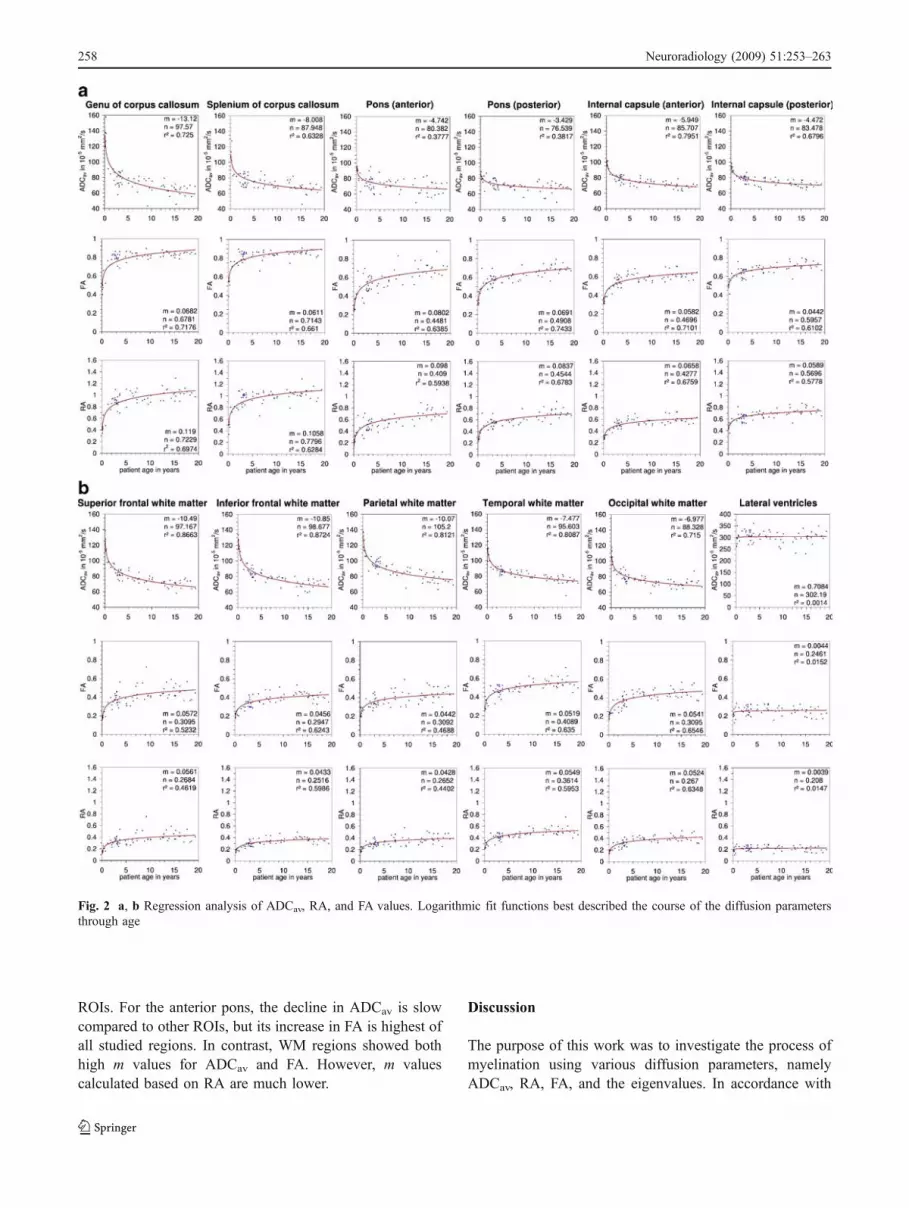
ROIs. For the anterior pons, the decline in ADCav is slowcompared to other ROIs, but its increase in FA is highest ofall studied regions. In contrast, WM regions showed bothhigh m values for ADCav and FA. However, m valuescalculated based on RA are much lower.
Discussion
The purpose of this work was to investigate the process ofmyelination using various diffusion parameters, namelyADCav, RA, FA, and the eigenvalues. In accordance with
Fig. 2 a, b Regression analysis of ADCav, RA, and FA values. Logarithmic fit functions best described the course of the diffusion parametersthrough age
258 Neuroradiology (2009) 51:253–263
previous studies, we observed that ADCav and eigenvaluesdecreased while RA and FA increased with age [10, 22,23]. The decrease was more intense for the perpendiculareigenvalues as compared to the parallel eigenvalue [24]. Incontrast to previous studies that investigated either infantsor children older than 5 years [21, 23–28], logarithmic fitfunctions best described our data in children from 3 weeksto 19 years of age. The slopes m of the fit functions wereused as an indicator of the influence of age on the diffusionparameters. We expected the slope m to be higher forregions where myelin development and/or axonal develop-ment progresses for a longer time period postnatal. Basedon these presumptions, our results can be summarized asfollows. First, diffusion parameters including all threeeigenvalues showed considerable sensitivity to age-depen-dent changes. We observed the strongest changes for CCwhich were detectable for all diffusion parameters, for bothpontine regions based on RA and FA and in frontal,parietal, and temporal WM for ADCav. We found that,within a region, different diffusion parameters did notnecessarily reflect the same amount of changes, e.g., inpontine regions marked changes were observed by RA, FA,and perpendicular eigenvalues that corresponded to smallchanges in ADCav and λ1. The diffusion parameters do notseem to be congruent. Second, the age influence observedfor both anisotropy indices (RA, FA) differed. Comparingm values of the regions studied, FA did not show strongdifferences in age-dependent changes, but changes weremore pronounced for CC and pons using RA. Third, weobserved a trend with higher m values found in the anterioraspects of CC, pons, and internal capsule for all diffusionparameters. However, the trend was less conspicuous forthe WM structures studied. Still, WM regions which aremore anterior and superior seemed to have higher m valuesfor ADCav and eigenvalues (Fig. 3).
Prior to the application of DTI, the process of myelina-tion has been assessed by T1- and T2-weighted images.Changes due to myelination are visible up to the age of8 months on T1-weighted images and until the age of14 months on T2-weighted images [29]. Generally, myeli-nation is observed at birth in pons and cerebellar pedunclesand is preceded by posterior limb of the internal capsule,splenium of CC, and optic radiation at around 3 months.Genu and anterior limb of internal capsule follow at around6 months [30]. These visible changes on T1- and T2-weighted images are based on changes in relaxation times.In contrast, DTI is based on changes in overall diffusionand its directionality. Therefore, the myelination process isonly described indirectly and the exact relations betweenthe decrease in ADCav and increase in RA and FA due tobrain maturation are not yet completely understood [7, 12,13]. It has been stated that different aspects might accountfor the changes of diffusion properties with age includingT
able
4Regressionanalyses
fordiffusionparameters.
ROI
ADCav
RA
FAλ 1
λ 2λ 3
r2mADC
SD
n ADC
r2mRA
SD
n RA
r2mFA
SD
n FA
r2m
l1SD
n l1
r2m
l 2SD
n l2
r2m
l 3SD
n l3
Genuof
CC
0.73
13.10
1.00
97.60
0.70
0.12
0.00
90.72
0.72
0.07
0.00
50.68
0.37
10.50
1.70
188.00
0.75
14.30
1.03
66.50
0.73
14.50
1.11
38.30
Splenium
ofCC
0.63
8.00
0.76
88.00
0.63
0.11
0.01
00.78
0.66
0.06
0.00
50.71
0.07
3.50
1.57
178.40
0.60
10.50
1.07
57.50
0.64
10.00
0.93
28.00
Anteriorpo
ns0.38
4.70
0.75
80.40
0.59
0.10
0.01
00.41
0.64
0.08
0.00
70.45
0.05
−2.70
1.52
120.80
0.46
7.70
1.03
74.60
0.62
9.30
0.89
45.80
Posterior
pons
0.38
3.40
0.54
76.50
0.68
0.08
0.00
70.45
0.74
0.07
0.00
50.49
0.12
−2.80
0.96
120.70
0.45
6.10
0.82
67.00
0.68
7.00
0.60
42.00
Int.capsule(ant.)
0.80
6.00
0.37
85.70
0.68
0.07
0.00
60.43
0.71
0.06
0.00
50.47
0.14
2.40
0.72
134.20
0.74
6.90
0.51
71.30
0.82
8.60
0.50
51.60
Int.capsule(post.)
0.68
4.50
0.38
83.50
0.58
0.06
0.00
60.57
0.61
0.04
0.00
40.60
0.09
1.60
0.63
147.30
0.42
5.60
0.81
64.50
0.70
6.20
0.50
38.70
Sup
.fron
talWM
0.87
10.50
0.51
97.20
0.46
0.06
0.00
80.27
0.52
0.06
0.00
70.31
0.59
7.90
0.81
127.70
0.76
11.00
0.75
94.00
0.83
12.60
0.69
69.80
Inf.fron
talWM
0.87
10.90
0.51
98.70
0.60
0.04
0.00
40.25
0.62
0.05
0.00
40.29
0.75
9.90
0.69
127.80
0.83
10.60
0.58
97.00
0.86
12.00
0.59
71.30
ParietalWM
0.81
10.10
0.59
105.20
0.44
0.04
0.00
60.27
0.47
0.04
0.00
60.31
0.71
8.50
0.65
138.50
0.71
10.70
0.84
102.50
0.76
11.10
0.76
74.70
Tem
poralWM
0.81
7.50
0.44
95.60
0.60
0.06
0.00
60.36
0.64
0.05
0.00
50.41
0.40
5.20
0.77
138.60
0.63
7.40
0.69
89.50
0.81
9.90
0.58
58.70
OccipitalWM
0.72
7.00
0.54
88.30
0.63
0.05
0.00
50.27
0.65
0.05
0.00
50.31
0.21
3.70
0.89
116.30
0.73
8.10
0.61
86.10
0.79
9.10
0.58
62.60
Lateral
ventricles
0.00
−0.70
2.31
302.20
0.01
0.00
0.00
40.21
0.02
0.00
0.00
40.25
0.01
−2.30
3.55
382.10
0.00
−0.70
2.37
294.20
0.00
0.90
1.91
230.30
Displayed
arem,theslop
eandn,
theinterceptwhich
characterize
thelogarithmic
fitfunctio
ns(Eqs.1and2).Add
ition
ally,r2
andthestandard
deviation(SD)form
aregiven
Neuroradiology (2009) 51:253–263 259
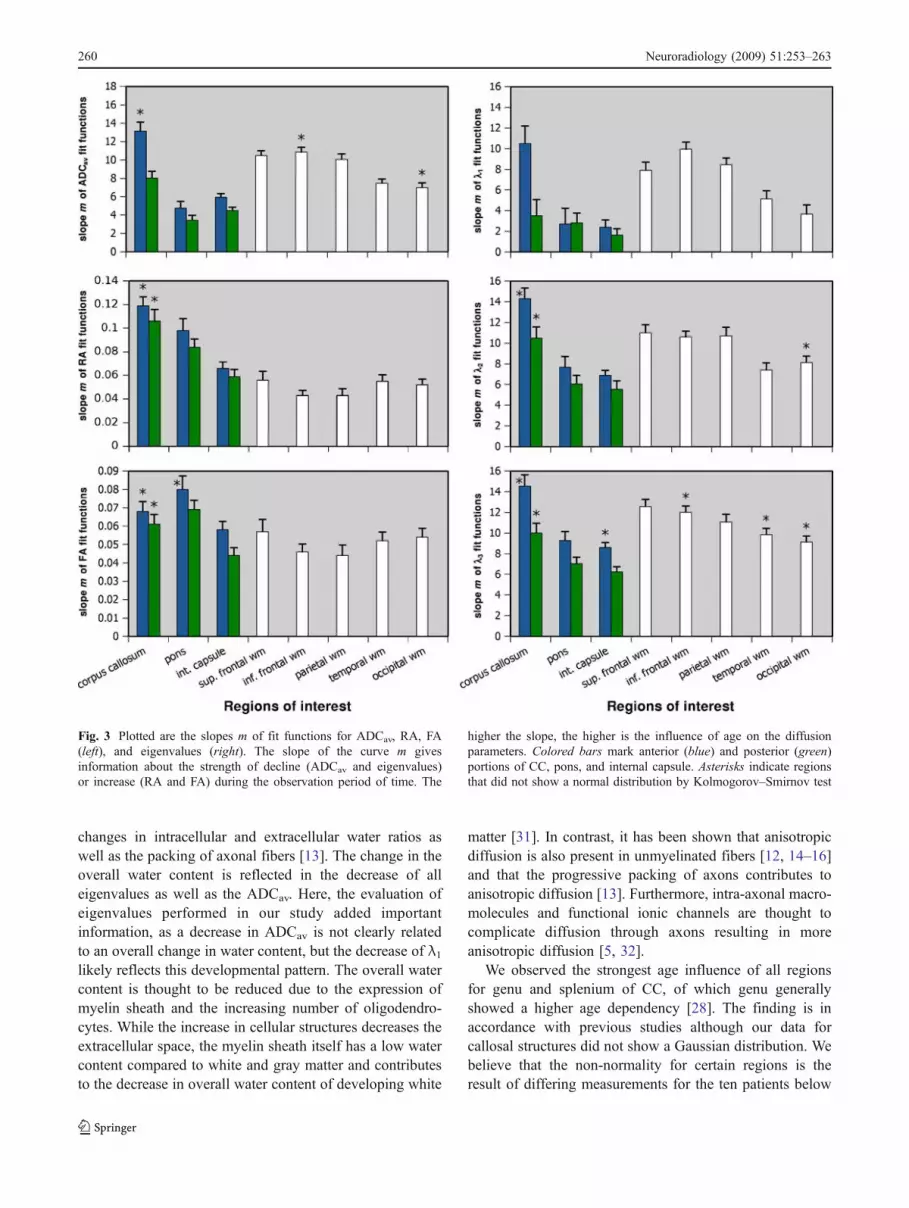
changes in intracellular and extracellular water ratios aswell as the packing of axonal fibers [13]. The change in theoverall water content is reflected in the decrease of alleigenvalues as well as the ADCav. Here, the evaluation ofeigenvalues performed in our study added importantinformation, as a decrease in ADCav is not clearly relatedto an overall change in water content, but the decrease of λ1likely reflects this developmental pattern. The overall watercontent is thought to be reduced due to the expression ofmyelin sheath and the increasing number of oligodendro-cytes. While the increase in cellular structures decreases theextracellular space, the myelin sheath itself has a low watercontent compared to white and gray matter and contributesto the decrease in overall water content of developing white
matter [31]. In contrast, it has been shown that anisotropicdiffusion is also present in unmyelinated fibers [12, 14–16]and that the progressive packing of axons contributes toanisotropic diffusion [13]. Furthermore, intra-axonal macro-molecules and functional ionic channels are thought tocomplicate diffusion through axons resulting in moreanisotropic diffusion [5, 32].
We observed the strongest age influence of all regionsfor genu and splenium of CC, of which genu generallyshowed a higher age dependency [28]. The finding is inaccordance with previous studies although our data forcallosal structures did not show a Gaussian distribution. Webelieve that the non-normality for certain regions is theresult of differing measurements for the ten patients below
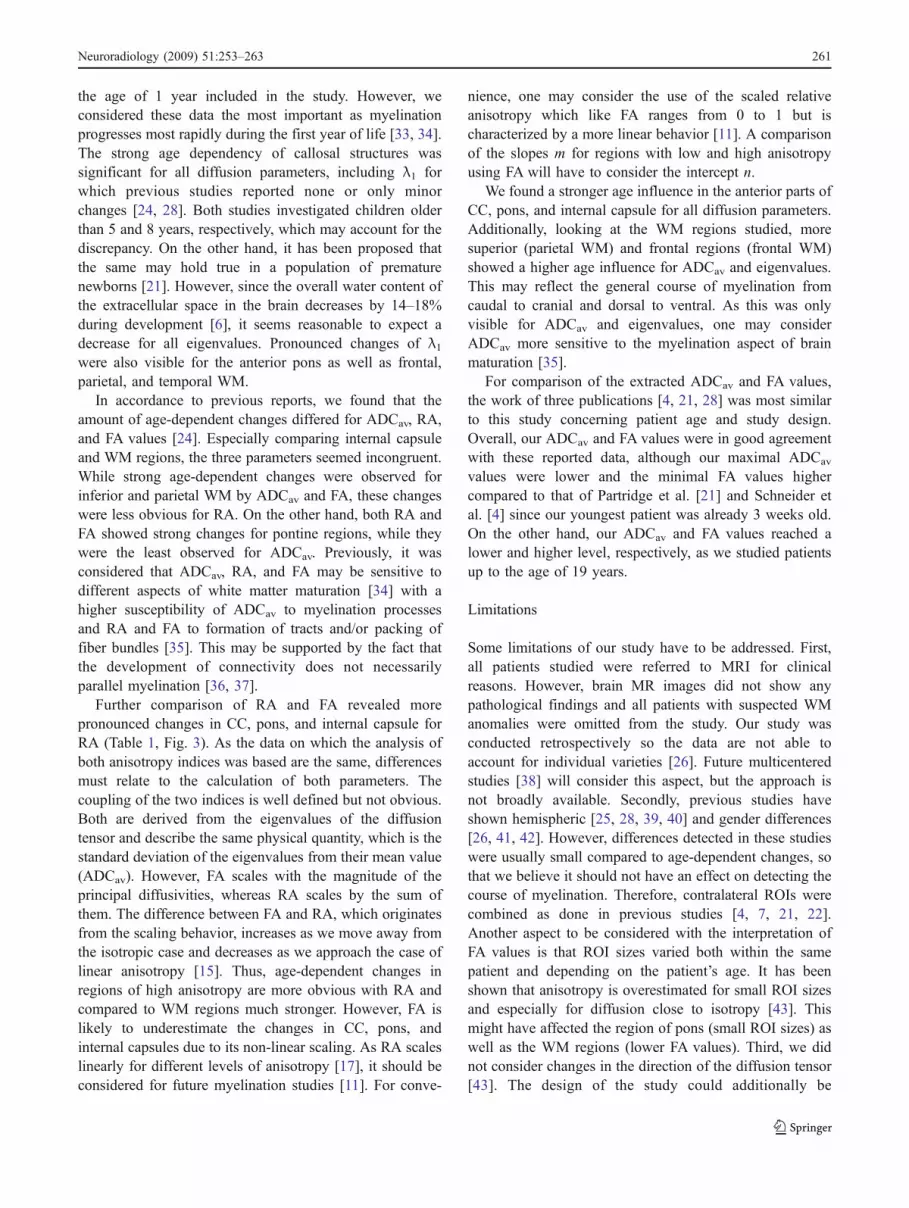
Fig. 3 Plotted are the slopes m of fit functions for ADCav, RA, FA(left), and eigenvalues (right). The slope of the curve m givesinformation about the strength of decline (ADCav and eigenvalues)or increase (RA and FA) during the observation period of time. The
higher the slope, the higher is the influence of age on the diffusionparameters. Colored bars mark anterior (blue) and posterior (green)portions of CC, pons, and internal capsule. Asterisks indicate regionsthat did not show a normal distribution by Kolmogorov–Smirnov test
260 Neuroradiology (2009) 51:253–263
the age of 1 year included in the study. However, weconsidered these data the most important as myelinationprogresses most rapidly during the first year of life [33, 34].The strong age dependency of callosal structures wassignificant for all diffusion parameters, including λ1 forwhich previous studies reported none or only minorchanges [24, 28]. Both studies investigated children olderthan 5 and 8 years, respectively, which may account for thediscrepancy. On the other hand, it has been proposed thatthe same may hold true in a population of prematurenewborns [21]. However, since the overall water content ofthe extracellular space in the brain decreases by 14–18%during development [6], it seems reasonable to expect adecrease for all eigenvalues. Pronounced changes of λ1were also visible for the anterior pons as well as frontal,parietal, and temporal WM.
In accordance to previous reports, we found that theamount of age-dependent changes differed for ADCav, RA,and FA values [24]. Especially comparing internal capsuleand WM regions, the three parameters seemed incongruent.While strong age-dependent changes were observed forinferior and parietal WM by ADCav and FA, these changeswere less obvious for RA. On the other hand, both RA andFA showed strong changes for pontine regions, while theywere the least observed for ADCav. Previously, it wasconsidered that ADCav, RA, and FA may be sensitive todifferent aspects of white matter maturation [34] with ahigher susceptibility of ADCav to myelination processesand RA and FA to formation of tracts and/or packing offiber bundles [35]. This may be supported by the fact thatthe development of connectivity does not necessarilyparallel myelination [36, 37].
Further comparison of RA and FA revealed morepronounced changes in CC, pons, and internal capsule forRA (Table 1, Fig. 3). As the data on which the analysis ofboth anisotropy indices was based are the same, differencesmust relate to the calculation of both parameters. Thecoupling of the two indices is well defined but not obvious.Both are derived from the eigenvalues of the diffusiontensor and describe the same physical quantity, which is thestandard deviation of the eigenvalues from their mean value(ADCav). However, FA scales with the magnitude of theprincipal diffusivities, whereas RA scales by the sum ofthem. The difference between FA and RA, which originatesfrom the scaling behavior, increases as we move away fromthe isotropic case and decreases as we approach the case oflinear anisotropy [15]. Thus, age-dependent changes inregions of high anisotropy are more obvious with RA andcompared to WM regions much stronger. However, FA islikely to underestimate the changes in CC, pons, andinternal capsules due to its non-linear scaling. As RA scaleslinearly for different levels of anisotropy [17], it should beconsidered for future myelination studies [11]. For conve-
nience, one may consider the use of the scaled relativeanisotropy which like FA ranges from 0 to 1 but ischaracterized by a more linear behavior [11]. A comparisonof the slopes m for regions with low and high anisotropyusing FA will have to consider the intercept n.
We found a stronger age influence in the anterior parts ofCC, pons, and internal capsule for all diffusion parameters.Additionally, looking at the WM regions studied, moresuperior (parietal WM) and frontal regions (frontal WM)showed a higher age influence for ADCav and eigenvalues.This may reflect the general course of myelination fromcaudal to cranial and dorsal to ventral. As this was onlyvisible for ADCav and eigenvalues, one may considerADCav more sensitive to the myelination aspect of brainmaturation [35].
For comparison of the extracted ADCav and FA values,the work of three publications [4, 21, 28] was most similarto this study concerning patient age and study design.Overall, our ADCav and FA values were in good agreementwith these reported data, although our maximal ADCav
values were lower and the minimal FA values highercompared to that of Partridge et al. [21] and Schneider etal. [4] since our youngest patient was already 3 weeks old.On the other hand, our ADCav and FA values reached alower and higher level, respectively, as we studied patientsup to the age of 19 years.
Limitations
Some limitations of our study have to be addressed. First,all patients studied were referred to MRI for clinicalreasons. However, brain MR images did not show anypathological findings and all patients with suspected WManomalies were omitted from the study. Our study wasconducted retrospectively so the data are not able toaccount for individual varieties [26]. Future multicenteredstudies [38] will consider this aspect, but the approach isnot broadly available. Secondly, previous studies haveshown hemispheric [25, 28, 39, 40] and gender differences[26, 41, 42]. However, differences detected in these studieswere usually small compared to age-dependent changes, sothat we believe it should not have an effect on detecting thecourse of myelination. Therefore, contralateral ROIs werecombined as done in previous studies [4, 7, 21, 22].Another aspect to be considered with the interpretation ofFA values is that ROI sizes varied both within the samepatient and depending on the patient’s age. It has beenshown that anisotropy is overestimated for small ROI sizesand especially for diffusion close to isotropy [43]. Thismight have affected the region of pons (small ROI sizes) aswell as the WM regions (lower FA values). Third, we didnot consider changes in the direction of the diffusion tensor[43]. The design of the study could additionally be
Neuroradiology (2009) 51:253–263 261
improved through optimization of image resolution, byconducting a 3.0-T MRI study and considering intra-observer or interobserver variability for ROI placements.
Conclusion
In agreement with previous studies, we were able todemonstrate a monotonous decrease of ADCav and eigen-values as well as a monotonous increase of RA and FAwithage. We compared the slopes m of logarithmic fit functionsto gain information about the strength of age influence. Acomparison of m values and conclusions about structuralchanges in distinct brain locations for ADCav, eigenvalues,and RA was found to be straightforward due to a linearbehavior of these diffusion parameters. Comparing regionswith different levels of anisotropy, e.g., CC and WMregions using FA, appeared to be more difficult. Here, onewould have to consider the intercept n since the sameamount of change in the lower compared to higher range ofFA values does not express comparable molecular orstructural changes. Therefore, future studies should consid-er the additional evaluation of RA together with FA or acorrection for the degree of anisotropy. However, conclu-sions about the underlying structural changes, that is axonaland glial development and myelination processes, remainchallenging as their behavior in development is notnecessarily congruent and ADCav, RA, and FA may actdifferent for microstructural changes. Further evaluation ofeigenvalues and in addition the evaluation of changes of thedirection of the diffusion tensor [43] may improve ourunderstanding of the diffusion parameters and their inter-pretation with respect to corresponding structural changes.
Acknowledgement The authors want to thank Zoltán Patay, M.D.,Ph.D. of the Department of Radiological Sciences at St. JudeChildren’s Research Hospital, Memphis, TN, USA for his supportduring the preparation of this manuscript and many helpful dis-cussions and suggestions for its improvement.
We wish to express our gratitude to Mehmet Kocak of theDepartment of Biostatistics at St. Jude Children’s Research Hospital,Memphis, TN, USA for the review of statistical data analysis andmany helpful suggestions.
Conflict of interest statement We declare that we have no conflictof interest.
References
1. Basser PJ, Pierpaoli C (1996) Microstructural and physiologicalfeatures of tissues elucidated by quantitative-diffusion-tensorMRI. J Magn Reson B 111:209–219. doi:10.1006/jmrb.1996.0086
2. van der Knaap MS, Valk J (1990) MR imaging of the variousstages of normal myelination during the 1st year of life.Neuroradiology 31:459–470. doi:10.1007/BF00340123
3. Staudt M, Krageloh-Mann I, Grodd W (2000) Normal myelinationof the child brain on MRI—a meta-analysis. Rofo 172:802–811
4. Schneider JFL, Il’yasov KA, Hennig J, Martin E (2004) Fastquantitative diffusion-tensor imaging of cerebral white matterfrom the neonatal period to adolescence. Neuroradiology 46:258–266. doi:10.1007/s00234-003-1154-2
5. Barkovich AJ (2000) Concepts of myelin and myelination inneuroradiology. AJNR Am J Neuroradiol 21:1099–1109
6. Mukherjee P, Miller JH, Shimony JS, Conturo TE, Lee BCP, AlmliCR, McKinstry RC (2001) Normal brain maturation duringchildhood: developmental trends characterized with diffusion-tensorimaging. Radiology 221:349–358. doi:10.1148/radiol.2212001702
7. Neil J, Miller J, Mukherjee P, Huppi PS (2002) Diffusion tensorimaging of normal and injured developing human brain—a technicalreview. NMR Biomed 15:543–552. doi:10.1002/nbm.784
8. Yakovlev PI, Lecours AR (1967) The myelogenetic cycles of regionalmaturation of the brain. In: Minkowski A (ed) Regional developmentof the brain in early life. Blackwell Scientific, London, pp 3–70
9. Morriss MC, Zimmerman RA, Bilaniuk LT, Hunter JV, Hasel-grove JC (1999) Changes in brain water diffusion duringchildhood. Neuroradiology 41:929–934. doi:10.1007/s002340050869
10. Engelbrecht V, Scherer A, Rassek M, Witsack HJ, Modder U (2002)Diffusion-weighted MR imaging in the brain in children: findings inthe normal brain and in the brain with white matter diseases.Radiology 222:410–418. doi:10.1148/radiol.2222010492
11. Kingsley PB (2006) Introduction to diffusion tensor imagingmathematics: part II. Anisotropy, diffusion-weighting factors, andgradient encoding schemes. Concepts Magn Reson Part A28A:123–154. doi:10.1002/cmr.a.20049
12. Beaulieu C (2002) The basis of anisotropic water diffusion in thenervous system—a technical review. NMR Biomed 15:435–455.doi:10.1002/nbm.782
13. Le Bihan D (2003) Looking into the functional architecture of thebrain with diffusion MRI. Nat Rev Neurosci 4:469–480.doi:10.1038/nrn1119
14. Gulani V, Webb AG, Duncan ID, Lauterbur PC (2001) Apparentdiffusion tensor measurements in myelin-deficient rat spinal cords.Magn Reson Med 45:191–195. doi:10.1002/1522-2594(200102)45:2<191::AID-MRM1025>3.0.CO;2-9
15. Song SK, Sun SW, Ramsbottom MJ, Chang C, Russell J, CrossAH (2002) Dysmyelination revealed through MRI as increasedradial (but unchanged axial) diffusion of water. Neuroimage17:1429–1436. doi:10.1006/nimg.2002.1267
16. Prayer D, Roberts T, Barkovich AJ, Prayer L, Kucharczyk J, MoseleyM, Arieff A (1997) Diffusion-weightedMRI of myelination in the ratbrain following treatment with gonadal hormones. Neuroradiology39:320–325. doi:10.1007/s002340050416
17. Bammer R (2003) Basic principles of diffusion-weighted imaging.Eur J Radiol 45:169–184. doi:10.1016/S0720-048X(02)00303-0
18. Papadakis NG, Xing D, Houston GC, Smith JM, Smith MI, JamesMF, Parsons AA, Huang CLH, Hall LD, Carpenter TA (1999) Astudy of rotationally invariant and symmetric indices of diffusionanisotropy. Magn Reson Imaging 17:881–892. doi:10.1016/S0730-725X(99)00029-6
19. Reese TG, Heid O, Weisskoff RM, Wedeen VJ (2003) Reductionof eddy-current-induced distortion in diffusion MRI using a twice-refocused spin echo. Magn Reson Med 49:177–182. doi:10.1002/mrm.10308
20. Rorden C, Brett M (2000) Stereotaxic display of brain lesions.Behav Neurol 12:191–200
21. Partridge SC, Mukherjee P, Henry RG, Miller SP, Berman JI, JinH, Lu Y, Glenn OA, Ferriero DM, Barkovich AJ, Vigneron DB(2004) Diffusion tensor imaging: serial quantitation of whitematter tract maturity in premature newborns. Neuroimage22:1302–1314. doi:10.1016/j.neuroimage.2004.02.038
262 Neuroradiology (2009) 51:253–263
22. Zhai GH, Lin WL, Wilber KP, Gerig G, Gilmore JH (2003)Comparisons of regional white matter diffusion in healthy neonatesand adults performed with a 3.0-T head-only MR imaging unit.Radiology 229:673–681. doi:10.1148/radiol.2293021462
23. McGraw P, Liang LX, Provenzale JM (2002) Evaluation ofnormal age-related changes in anisotropy during infancy andchildhood as shown by diffusion tensor imaging. AJR Am JRoentgenol 179:1515–1522
24. Lebel C, Walker L, Leemans A, Phillips L, Beaulieu C (2008)Microstructural maturation of the human brain from childhood toadulthood. Neuroimage 40:1044–1055. doi:10.1016/j.neuroimage.2007.12.053
25. Bonekamp D, Nagae LM, Degaonkar M, Matson M, AbdallaWMA, Barker PB, Mori S, Horska A (2007) Diffusion tensorimaging in children and adolescents: reproducibility, hemispheric,and age-related differences. Neuroimage 34:733–742.doi:10.1016/j.neuroimage.2006.09.020
26. Giedd JN, Blumenthal J, Jeffries NO, Castellanos FX, Liu H,Zijdenbos A, Paus T, Evans AC, Rapoport JL (1999) Braindevelopment during childhood and adolescence: a longitudinalMRI study. Nat Neurosci 2:861–863. doi:10.1038/13158
27. Nusbaum AO, Tang CY, Buchsbaum MS, Wei TC, Atlas SW(2001) Regional and global changes in cerebral diffusion withnormal aging. AJNR Am J Neuroradiol 22:136–142
28. Snook L, Paulson LA, Roy D, Phillips L, Beaulieu C (2005)Diffusion tensor imaging of neurodevelopment in children andyoung adults. Neuroimage 26:1164–1173. doi:10.1016/j.neuroimage.2005.03.016
29. Staudt M, Krageloh-Mann I, Grodd W (2000) Normal myelinationof the child brain on MRI—a meta-analysis. Rofo 172:802–811
30. Paus T, Collins DL, Evans AC, Leonard G, Pike B, Zijdenbos A(2001) Maturation of white matter in the human brain: a review ofmagnetic resonance studies. Brain Res Bull 54:255–266.doi:10.1016/S0361-9230(00)00434-2
31. van der Knaap MS, Valk J (2005) Magnetic resonance ofmyelination and myelin disorders, 3rd edn. Springer, New York,pp 1–19 Myelin and white matter
32. Wimberger DM, Roberts TP, Barkovich AJ, Prayer LM, MoseleyME, Kucharczyk J (1995) Identification of premyelination bydiffusion-weighted MRI. J Comput Assist Tomogr 19:28–33.doi:10.1097/00004728-199501000-00005
33. Forbes KPN, Pipe JG, Bird CR (2002) Changes in brain waterdiffusion during the 1st year of life. Radiology 222:405–409.doi:10.1148/radiol.2222010179
34. Provenzale JM, Liang L, DeLong D, White LE (2007) Diffusiontensor imaging assessment of brain white matter maturationduring the first postnatal year. AJR Am J Roentgenol 189:476–486. doi:10.2214/AJR.07.2132
35. Gilmore JH, Lin W, Corouge I, Vetsa YSK, Smith JK, Kang C,Gu H, Hamer RM, Lieberman JA, Gerig G (2007) Early postnataldevelopment of corpus callosum and corticospinal white matterassessed with quantitative tractography. AJNR Am J Neuroradiol28:1789–1795. doi:10.3174/ajnr.A0751
36. Cohen-Cory S (2002) The developing synapse: construction andmodulation of synaptic structures and circuits. Science 298:770–776. doi:10.1126/science.1075510
37. Keyser A (1983) Basic aspects of development and maturation ofthe brain—embryological contributions to neuroendocrinology.Psychoneuroendocrinology 8:157–181. doi:10.1016/0306-4530(83)90054-9
38. Evans AC, Brain Dev CG (2006) The NIH MRI study of normalbrain development. Neuroimage 30:184–202. doi:10.1016/j.neuroimage.2005.09.068
39. Buchel C, Raedler T, Sommer M, Sach M, Weiller C, Koch MA(2004) White matter asymmetry in the human brain: a diffusiontensor MRI study. Cereb Cortex 14:945–951. doi:10.1093/cercor/bhh055
40. Helenius J, Soinne L, Perkio J, Salonen O, Kangasmaki A, KasteM, Carano RAD, Aronen HJ, Tatlisumak T (2002) Diffusion-weighted MR imaging in normal human brains in various agegroups. AJNR Am J Neuroradiol 23:194–199
41. De Bellis MD, Keshavan MS, Beers SR, Hall J, Frustaci K,Masalehdan A, Noll J, Boring AM (2001) Sex differences in brainmaturation during childhood and adolescence. Cereb Cortex11:552–557. doi:10.1093/cercor/11.6.552
42. Naganawa S, Sato K, Katagiri T, Mimura T, Ishigaki T (2003)Regional ADC values of the normal brain: differences due to age,gender, and laterality. Eur Radiol 13:6–11
43. Wu YC, Field AS, Chung MK, Badie B, Alexander AL (2004)Quantitative analysis of diffusion tensor orientation: theoreticalframework. Magn Reson Med 52:1146–1155. doi:10.1002/mrm.20254
Neuroradiology (2009) 51:253–263 263